UNITED STATES
SECURITIES AND EXCHANGE COMMISSION
Washington, D.C. 20549
FORM N-CSR
CERTIFIED SHAREHOLDER REPORT OF REGISTERED
MANAGEMENT INVESTMENT COMPANIES
Investment Company Act file number 811-07257
SEI Institutional Investments Trust
(Exact name of registrant as specified in charter)
SEI Investments
One Freedom Valley Drive
Oaks, PA 19456
(Address of principal executive offices) (Zip code)
SEI Investments
One Freedom Valley Drive
Oaks, PA 19456
CT Corporation
101 Federal Street
Boston, MA 02110
(Name and address of agent for service)
Registrant’s telephone number, including area code: 1-800-342-5734
Date of fiscal year end: May 31, 2009
Date of reporting period: May 31, 2009
| Item 1. | Reports to Stockholders. |

SEI Institutional Investments Trust
Annual Report as of May 31, 2009
Large Cap Fund
Large Cap Diversified Alpha Fund
Large Cap Disciplined Equity Fund
Large Cap Index Fund
Small Cap Fund
Small/Mid Cap Equity Fund
U.S. Managed Volatility Fund
International Equity Fund
World Equity Ex-US Fund
Screened World Equity Ex-US Fund
Enhanced LIBOR Opportunities Fund
Core Fixed Income Fund
High Yield Bond Fund
Long Duration Fund
Emerging Markets Debt Fund
Real Return Fund
TABLE OF CONTENTS
The Trust files its complete schedule of portfolio holdings with the Securities and Exchange Commission for the first and third quarters of each fiscal year on Form N-Q within sixty days after the end of the period. The Trust’s Forms N-Q are available on the Commission’s website at http://www.sec.gov, and may be reviewed and copied at the Commission’s Public Reference Room in Washington, DC. Information on the operation of the Public Reference Room may be obtained by calling 1-800-SEC-0330.
A description of the policies and procedures that the Trust uses to determine how to vote proxies relating to portfolio securities, as well as information relating to how a Fund voted proxies relating to portfolio securities during the most recent 12-month period ended June 30, is available (i) without charge, upon request, by calling 1-800-DIAL-SEI; and (ii) on the Commission’s website at http://www.sec.gov.
MANAGEMENT’S DISCUSSION AND ANALYSIS OF FUND PERFORMANCE
SEI INSTITUTIONAL INVESTMENTS TRUST — MAY 31, 2009
Large Cap Fund
Objective
The Large Cap Fund (“the Fund”) seeks to provide long-term growth of capital and income.
Strategy
The Fund employs a multi-manager structure under the general supervision of SEI Investments Management Corporation (“SIMC”) to gain exposure to U.S. large-cap equities, adding value through stock selection while managing risk in the form of capitalization, economic sectors and other factor exposures. The Fund is jointly sub-advised by nine investment managers. Assets of the Fund are strategically allocated among its sub-advisers, each of which has responsibility for asset allocation and stock selection for its respective assets under management.
Quantitative Management Associates, LLC is a quantitative manager that seeks to overweight stocks with attractive fundamental and technical characteristics. INTECH Investment Management, LLC (“INTECH”) employs a volatility capture strategy. SEI added a third core manager over the past year, Legg Mason Capital Management, Inc’s (“Legg Mason”) “Value Trust”, which focuses on contrarian, value-oriented investing that typically invests in higher-beta securities. Two of the growth managers, Montag & Caldwell, Inc. and Goldman Sachs Asset Management, L.P., seek to identify stocks with underappreciated growth characteristics and high-quality earnings growth. Delaware Management Company is a growth manager that tends to focus on companies with strong secular growth prospects. The final growth manager, Legg Mason, which was also added during the past year, utilizes a valuation-sensitive approach to growth investing that helps to identify and invest in underappreciated growth companies. The two value managers, Aronson + Johnson + Ortiz, L.P. (“AJO”) and LSV Asset Management, focus on quality companies with good management and attractive valuations. Both managers also seek a degree of momentum as a complement to their value discipline.
Changes to Portfolio
In August 2008, SEI added two Legg Mason strategies to the portfolio. The core portfolio, managed by Bill Miller, takes a contrarian, value-oriented approach and will often invest in higher-beta stocks. The team performs detailed scenario and probabilistic analysis to estimate
intrinsic value. The growth portfolio, managed by Robert Hagstrom, takes a value-oriented approach to growth investing. The team tends to be fairly thematic in idea generation. The large-cap value portfolio managed by AllianceBernstein, L.P. was terminated during the first quarter of 2009 due to organizational changes at the firm.
Analysis
The U.S. equity market, as measured by the Russell 1000 Index, lost 32.95% during the fiscal year ended May 31, 2009. After a five-year bull run that ended in the beginning of 2008, U.S. large-cap stocks turned decisively lower as the deterioration in credit markets led to a full-blown liquidity crisis by the fall of 2008. The fear over potential collapse of the U.S. and world financial systems exacerbated the deterioration of economic activity, which worsened significantly after the collapse of Lehman Brothers. U.S. financial institutions were forced to write down hundreds of billions of dollars while hedge funds de-leveraged their portfolios. Fears related to the sub-prime mortgage crisis were exacerbated as U.S. real estate markets spiraled downward. In addition, energy prices were extraordinarily volatile, surging to all-time highs in the summer of 2008 before eventually collapsing and bottoming out near $35 per barrel for oil. This was a $100 drop in the price of oil in just over six months as global demand collapsed following the economic crises. Financial turmoil led to unprecedented government actions to aid the U.S. financial system, including the Troubled Asset Relief Program (“TARP”) I & II, Term Asset-Backed Securities Loan Facility (“TALF”) and a massive $800 billion stimulus package. This was in addition to the expansion of the Fed’s balance sheet. Markets reached their lows in March; they were off over 50% from October 2007 levels. From these lows, markets rebounded by close to 35% through the end of May as investors began to discount the government intervention and became hopeful of an intermediate-term economic recovery. Financials led the way in this recent rally, following subsiding investor fears about the nationalization of some major financial institutions.
For the fiscal year, growth stocks outperformed their value counterparts by more than 4.5% in the large-cap universe. Most of this differential was realized in the last five months of the fiscal year. All ten Global Industry Classification Standard (GICS) sectors posted negative performance during a difficult market period. The Financials
| | |
| SEI Institutional Investments Trust / Annual Report / May 31, 2009 | | 1 |
MANAGEMENT’S DISCUSSION AND ANALYSIS OF FUND PERFORMANCE
SEI INSTITUTIONAL INVESTMENTS TRUST — MAY 31, 2009
Large Cap Fund (Concluded)
sector was the worst-performing sector, down close to 47%, followed closely by Industrials as well as Energy and Materials due to the rapid deterioration in the U.S. and global economies. Conversely, more defensive sectors, including Consumer Staples and Healthcare, strongly outperformed the broad market, driven by a flight to quality in the first nine months of the fiscal year. The Consumer Staples sector continued to outperform Consumer Discretionary as U.S. consumers drastically increased their personal savings rates and constrained their budgets to the bare necessities. From a factor perspective, price and earnings momentum were the two worst-performing factors for the fiscal year despite having a very strong 2008. Value and small size were among the best factors as extreme multiple compression weighed heavily on high-P/E stocks and investors shifted their focus back to mid-cap stocks in 2009.
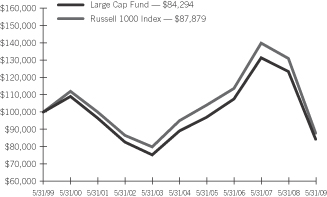
The Fund outperformed its benchmark for the fiscal year ended May 31, 2009, returning -31.73% versus its benchmark, the Russell 1000 Index return of -32.95%. Overall performance was largely driven by 2009 performance, when the Fund rebounded from the difficult period of the first seven months of the fiscal year. The second half of 2008, particularly the fourth quarter, was marked by significant forced selling and de-leveraging in equity markets. These technical factors tended to decouple stock performance from underlying fundamentals. Outperformance for the entire fiscal period can largely be attributed to positive stock selection within the Financials and Healthcare sectors. Three out of the four fundamental growth managers beat the Russell 1000 Growth Index. Goldman Sachs Asset Management, L.P. strongly outperformed due to its positive stock selection within Healthcare. Montag & Caldwell, Inc. benefited from a flight to quality, given their mega-cap exposure and large overweight to Consumer Staples and underweight to Industrials. Legg Mason lagged on the growth side, as it was a difficult market environment for the manager’s valuation-sensitive approach, which led to poor stock selection in Financials. The excess return generated by the growth managers was partially mitigated by the negative relative performance from the core managers. INTECH underperformed as high market volatility, a positive factor in their model, was not enough to offset the negative impact of high cross-correlations among stocks. Legg Mason’s value
mandate also weighed on the portfolio, as the second half of 2008 was a very difficult environment for the manager’s contrarian approach. Although this has significantly reversed in 2009, particularly since the rally began in March, it has not been enough to offset earlier underperformance. The value managers had mixed results in the strategy. Prior to its termination in the first quarter of 2009, AllianceBernstein struggled due to its value style, which negatively impacted stock selection throughout the majority of the GICS sectors. However, LSV Asset Management and AJO outperformed the Russell 1000 Value index, mostly due to their strong stock selection within the Financials sectors. In particular, AJO benefited from its emphasis on management quality, while LSV Asset Management benefited from the sharp recovery of its value factors in the final three months of the fiscal year.
Large Cap Fund
AVERAGE ANNUAL TOTAL RETURN1
| | | | | | | | | | |
| | | One Year
Return | | Annualized
3 Year
Return | | Annualized
5 Year
Return | | Annualized
10 Year
Return | | Annualized
Inception
to Date |
| Large Cap Fund, Class A | | (31.73)% | | (7.82)% | | (1.09)% | | (1.69)% | | 4.28% |
Comparison of Change in the Value of a $100,000 Investment in the Large Cap Fund, versus the Russell 1000 Index
| | 1 | | For the period ended May 31, 2009. Past performance is not an indication of future performance. Class A shares were offered beginning 6/14/96. Returns shown do not reflect the deduction of taxes that a shareholder would pay on fund distributions or the redemption of fund shares. The returns for certain periods reflect fee waivers and/or reimbursements in effect for that period; absent fee waivers and reimbursements, performance would have been lower. |
| | |
| 2 | | SEI Institutional Investments Trust / Annual Report / May 31, 2009 |
MANAGEMENT’S DISCUSSION AND ANALYSIS OF FUND PERFORMANCE
SEI INSTITUTIONAL INVESTMENTS TRUST — MAY 31, 2009
Large Cap Diversified Alpha Fund
Objective
The Large Cap Diversified Alpha Fund (“the Fund”) seeks to provide long-term capital growth by investing in the equity securities of large companies and in portfolio strategies designed to correlate to a portfolio composed of large-cap equity securities. While the Fund is expected to have an absolute return and risk profile similar to the broad U.S. large-cap equity market, returns may be derived in part from investing significant portions of the Fund in securities outside of the large-cap market.
Strategy
The Fund uses a multi-manager approach under the general supervision of SEI Investments Management Corporation (“SIMC”), allocating the assets among multiple sub-advisers that use different investment strategies to seek returns in excess of those generated from a broad U.S. large-cap benchmark. This allocation among investment strategies aims to diversify the sources from which sub-advisers seek to achieve excess returns (i.e., returns in excess of a benchmark index), thereby diversifying the relative risk of the Fund.
Some sub-advisers may engage in short sales, which may total up to 30% of the value of their Fund allocation. They may then use the proceeds from the sale to purchase long positions in additional equity securities. Some sub-advisers may also use portfolio strategies that are designed to correlate with a portfolio of large-cap equity securities but are composed of derivative instruments backed by other types of securities.
Three core managers apply quantitative modeling. Quantitative Management Associates, LLC seeks to overweight stocks with attractive fundamental and technical characteristics. Analytic Investors LLC. tends to emphasize stocks whose characteristics have been rewarded over the past 18-24 months. INTECH Investment Management, LLC (“INTECH”) employs a volatility capture strategy. SEI added a fourth core manager over the past year, Legg Mason Capital Management’s “Value Trust”, which focuses on contrarian, value-oriented investing that typically selects higher-beta securities. The value manager, Aronson + Johnson + Ortiz L.P. (“AJO”), focuses on quality companies with good management, attractive valuations, and positive momentum. Delaware Management Company (“Delaware”) is a growth manager that tends to focus on expanding areas of the market with strong secular growth prospects. Legg Mason
Capital Management, Inc’s (“Legg Mason”) growth strategy, which was also added over the past year, utilizes a valuation-sensitive approach to growth investing that helps identify and invest in underappreciated growth companies. Hyperion Brookfield Asset Management and Declaration Management & Research co-manage the Libor Plus Pool L.P., which seeks to transport alpha generated in the U.S. fixed-income securitized sector market to the equity market.
Changes to Portfolio
In August 2008, SEI added two Legg Mason strategies to the portfolio. The core portfolio, managed by Bill Miller, takes a contrarian, value-oriented approach and will often invest in higher beta stocks. The team performs detailed scenario and probabilistic analysis to estimate intrinsic value. The growth portfolio, managed by Robert Hagstrom, takes a value-oriented approach to growth investing. The team tends to be fairly thematic in idea generation. In December 2008, SEI terminated Smith Breeden Associates, Inc. from the Libor Plus Pool L.P. due to a loss of conviction in their investment process and ability to efficiently evaluate the securitized sector market. Declaration Management and Research took over the management of their assets within the pool. In October 2008, due to unprecedented de-leveraging and the subsequent impact to the costs of short-selling, the Fund turned off this capability. As of fiscal year-end, SEI is evaluating third-party brokers as well as the current market environment in order to prudently re-engage this strategy at an opportune time.
Analysis
The U.S. equity market, as measured by the Russell 1000 Index, lost 32.95% during the fiscal year ended May 31, 2009. After a five-year bull run that ended in the beginning of 2008, U.S. large-cap stocks turned decisively lower as the deterioration in credit markets led to a full-blown liquidity crisis by the fall of 2008. Fears over a potential collapse of the U.S. and world financial systems exacerbated the deterioration of economic activity, which worsened after the collapse of Lehman Brothers. U.S. financial institutions were forced to write down hundreds of billions of dollars while hedge funds de-leveraged their portfolios. Fears related to the sub-prime mortgage crisis were exacerbated as U.S. real estate markets spiraled downward. In addition, energy prices surged to all-time highs in the summer of 2008 before eventually collapsing and bottoming out near $35 per barrel. This was a $100-per-barrel price drop in just over six months
| | |
| SEI Institutional Investments Trust / Annual Report / May 31, 2009 | | 3 |
MANAGEMENT’S DISCUSSION AND ANALYSIS OF FUND PERFORMANCE
SEI INSTITUTIONAL INVESTMENTS TRUST — MAY 31, 2009
Large Cap Diversified Alpha Fund (Concluded)
as global demand collapsed following the economic crises. Financial turmoil led to unprecedented government actions to aid the U.S. financial system, including the Troubled Asset Relief Program (“TARP”) I & II, Term Asset-Backed Securities Loan Facility (“TALF”) and a massive $800 billion stimulus package. This was in addition to the expansion of the Fed’s balance sheet. Markets reached their lows in March; they were off over 50% from October 2007 levels. From these lows, markets rebounded by close to 35% through the end of May as investors began to discount the government intervention and became hopeful of an intermediate-term economic recovery. Financials led the way in this recent rally, following subsiding investor fears about the nationalization of some major financial institutions.
For the fiscal year, growth stocks outperformed their value counterparts by more than 4.5% in the large-cap universe. Most of this differential was realized in the last five months of the fiscal year. All ten Global Industry Classification Standard (“GICS”) sectors posted negative performance during a difficult market period. The Financials sector was the worst-performing sector, down close to 47%, followed by Industrials as well as Energy and Materials, due to the rapid deterioration in the U.S. and global economies. Conversely, the more defensive sectors, including Consumer Staples and Healthcare, strongly outperformed the broad market, driven by a flight to quality in the first nine months of the fiscal year. The Consumer Staples sector continued to outperform Consumer Discretionary as U.S. consumers drastically increased their personal savings rates and constrained their budgets to the bare necessities. From a factor perspective, price and earnings momentum were the two worst-performing factors for the fiscal year despite having a very strong 2008. Value and small size were among the best-performing factors as extreme multiple compression weighed heavily on high-P/E stocks and investors shifted their focus back to mid-cap stocks in 2009.
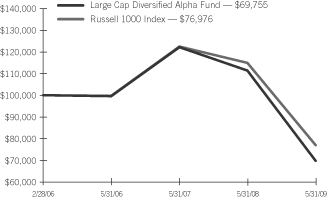
The Fund underperformed its benchmark for the fiscal year ended May 31, 2009, returning -37.33% versus the Russell 1000 Index return of -32.95%. The Fund was primarily impacted by poor stock selection in the Consumer Discretionary and Information Technology sectors as well as its underweight to Consumer Staples during the flight-to-quality rally in the fall of 2008. The largest detractor within the Fund was the enhanced-cash alpha pool, which underperformed the large-cap market. Spreads widened to historical levels, with mortgage-backed and asset-backed securities coming under severe pressure due to the seizure of credit markets. Analytic Investors, LLC’s dynamic
factor positioning, which emphasizes stock characteristics that have recently been in favor, struggled as investors’ preferences shifted rapidly amid high market volatility. INTECH underperformed despite benefiting from increased relative volatility in the market as stock selection weighed on performance. Quantitative Management Associates, LLC also detracted from Fund performance due to its emphasis on forward-based value and earnings momentum factors. Finally, the two Legg Mason mandates negatively impacted the Fund with underperformance occurring in the second half of 2008. Since the beginning of 2009, especially since the rally began in March, both strategies have added significant value, although it was not enough to offset earlier underperformance. On the positive side, the strategy had positive contributions from AJO and Delaware. AJO’s focus on management and balance sheet quality led to superior security selection, particularly within the Financials sector. Delaware benefited from strong stock selection within the Information Technology sector, particularly within IT services.
Large Cap Diversified Alpha Fund
AVERAGE ANNUAL TOTAL RETURN1
| | | | | | |
| | | One Year
Return | | Annualized
3 Year Return | | Annualized
Inception
to Date |
| Large Cap Diversified Alpha Fund, Class A | | (37.33)% | | (11.17)% | | (10.49)% |
Comparison of Change in the Value of a $100,000 Investment in the Large Cap Diversified Alpha Fund, versus the Russell 1000 Index
| | 1 | | For the period ended May 31, 2009. Past performance is no indication of future performance. Class A shares were offered beginning 2/28/06. Returns shown do not reflect the deduction of taxes that a shareholder would pay on fund distributions or the redemption of fund shares. The returns for certain periods reflect fee waivers and/or reimbursements in effect for that period; absent fee waivers and reimbursements, performance would have been lower. |
| | |
| 4 | | SEI Institutional Investments Trust / Annual Report / May 31, 2009 |
MANAGEMENT’S DISCUSSION AND ANALYSIS OF FUND PERFORMANCE
SEI INSTITUTIONAL INVESTMENTS TRUST — MAY 31, 2009
Large Cap Disciplined Equity Fund
Objective
The Large Cap Disciplined Equity Fund (the “Fund”) seeks to provide long-term growth of capital by investing in the equity securities of large companies and in portfolio strategies designed to correlate to a portfolio composed of large-cap equity securities. While the Fund is expected to have an absolute return and risk profile similar to the broad U.S. large-cap equity market, returns may be derived in part from investing significant portions of the Fund in securities outside of the large-cap market.
Strategy
The Fund seeks to exceed the total return of the S&P 500 Index with a similar level of volatility by investing primarily in a portfolio of common stocks included in the S&P 500 Index, as well as other equity securities and derivative instruments whose value is derived from the performance of the S&P 500 Index. The Fund also employs overlay strategies for return enhancement and alpha source diversification. The Fund uses a multi-manager approach, using sub-advisers that offer different investment philosophies to manage portions of the Fund’s portfolio. All of the sub-advisers employ rigorous risk-control processes in order to manage relative risk against the benchmark.
Three managers apply pure quantitative modeling. Quantitative Management Associates, LLC seeks to overweight stocks with attractive fundamental and technical characteristics. Analytic Investors, Inc. tends to emphasize stocks whose characteristics have been rewarded over the past 18-24 months. INTECH investment Management, LLC (“INTECH”) employs a volatility capture strategy which seeks to generate alpha by capitalizing on market inefficiencies associated with the natural volatility of stock prices. Hyperion Brookfield Asset Management and Declaration Management & Research co-manage the Libor Plus Pool L.P., which seeks to transport alpha generated in the U.S. fixed-income securitized sector market to the equity market. In the last quarter of the fiscal year, SEI added Massachusetts Financial Services Company (“MFS”), a blended research portfolio that utilizes fundamental inputs within its risk-controlled quantitative model.
Changes to Portfolio
Over the period, SEI added MFS’s blended research portfolio. This portfolio utilizes fundamental inputs within its risk-controlled quantitative model to help diversify the Fund’s alpha sources. SEI terminated AlphaSimplex’s Global Tactical Asset-Allocation (“GTAA”) overlay portfolio in order to more effectively allocate Fund assets across SEI’s sub-advisers. Finally, SEI terminated Smith Breeden Associates, Inc. from the Libor Plus Pool L.P. due to a loss of conviction in its investment process and its ability to efficiently evaluate the securitized sector market. Declaration Management & Research took over the management of Smith Breeden’s assets within the pool. In October 2008, due to unprecedented deleveraging and the subsequent impact to the costs of short-selling, the Fund turned off this capability. As of fiscal year-end, SEI is evaluating third-party brokers as well as the current market environment in order to prudently re-engage this strategy at an opportune time.
Analysis
The U.S. equity market, as measured by the S&P 500 Index, fell 32.57% during the fiscal year ended May 31, 2009. After a five-year bull run that ended in the beginning of 2008, U.S. large-cap stocks turned decisively lower as the deterioration in credit markets led to a full-blown liquidity crisis by the fall of 2008. Fears over a potential collapse of the U.S. and world financial systems exacerbated the deterioration in economic activity, which worsened significantly after the collapse of Lehman Brothers. U.S. financial institutions were forced to write down hundreds of billions of dollars while hedge funds de-leveraged their portfolios. Fears related to the sub-prime mortgage crisis were exacerbated as U.S. real estate markets spiraled downward. In addition, energy prices surged to all-time highs in the summer of 2008 before eventually collapsing and bottoming out near $35 per barrel. This was a $100-per-barrel price drop in just over six months as global demand collapsed following the economic crises. Financial turmoil led to unprecedented government actions to aid the U.S. financial system, including the Troubled Asset Relief Program (“TARP”) I & II, Term Asset-Backed Securities Loan Facility (“TALF”) and a massive $800 billion stimulus package. This was in addition to
| | |
| SEI Institutional Investments Trust / Annual Report / May 31, 2009 | | 5 |
MANAGEMENT’S DISCUSSION AND ANALYSIS OF FUND PERFORMANCE
SEI INSTITUTIONAL INVESTMENTS TRUST — MAY 31, 2009
Large Cap Disciplined Equity Fund (Concluded)
the expansion of the Fed’s balance sheet. Markets reached their lows in March; they were off over 50% from October 2007 levels. From these lows, markets rebounded by close to 35% through the end of May as investors began to discount the government intervention and became hopeful of an intermediate-term economic recovery. Financials led the way in this recent rally, following subsiding investor fears about the nationalization of some major financial institutions.
For the fiscal year, growth stocks outperformed their value counterparts by more than 4.5% in the large-cap universe. Most of this differential was realized in the last five months of the fiscal year. All ten Global Industry Classification Standard (GICS) sectors posted negative performance during a difficult market period. The Financials sector was the worst-performing sector, down close to 47%, followed by Industrials as well as Energy and Materials due to the rapid deterioration in the U.S. and global economies. Conversely, the more defensive sectors, including Consumer Staples and Healthcare, strongly outperformed the broad market, driven by a flight to quality in the first nine months of the fiscal year. The Consumer Staples sector continued to outperform Consumer Discretionary as U.S. consumers drastically increased their personal savings rates and constrained their budgets to the bare necessities. From a factor perspective, price and earnings momentum were the two worst-performing factors for the fiscal year despite having a very strong 2008. Value and small size were among the best factors as extreme multiple compression weighed heavily on high-P/E stocks and investors shifted their focus back to mid-cap stocks in 2009.
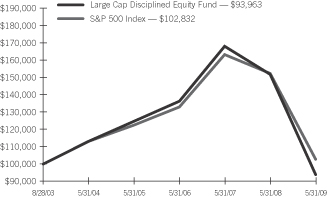
The Fund underperformed its benchmark for the fiscal year ended May 31, 2009 returning -38.18% versus the S&P 500 Index return of -32.57%. The Fund was negatively impacted by poor security selection in the Consumer Discretionary and Information Technology sectors, which was driven primarily by its value exposure. The fiscal year proved to be a difficult period for quantitative managers, given the overall factor volatility and the very large inflection point witnessed in the first quarter of 2009. The largest detractor to Fund performance within the fiscal year was the enhanced-cash alpha pool, which dramatically underperformed the U.S. equity market. Spreads widened to historical levels with mortgage-backed and asset-backed
securities coming under severe pressure as credit markets seized up in the fall of 2008. Analytic Investors Inc’s dynamic factor positioning, which emphasizes stock characteristics that have recently been in favor, had a particularly difficult time given the rapid shift in investor preferences amid high market volatility. INTECH underperformed as high relative volatility, a positive factor in its model, was not enough to offset the negative impact of high cross-correlations among stocks. Most of the manager’s underperformance occurred during the market rally beginning early March 2009. Quantitative Management Associates, LLC also detracted from Fund performance due to negative stock selection within value stocks. Finally, MFS outperformed the benchmark slightly for the short period since its inception in April 2009 until the end of the fiscal year, despite the fact the manager has a high-quality bias and the period was marked by a lower-quality rally.
Large Cap Disciplined Equity Fund
AVERAGE ANNUAL TOTAL RETURN1
| | | | | | | | |
| | | One Year
Return | | Annualized
3 Year
Return | | Annualized
5 Year
Return | | Annualized
Inception
to Date |
Large Cap Disciplined
Equity Fund, Class A | | (38.18)% | | (11.70)% | | (3.66)% | | (1.08)% |
Comparison of Change in the Value of a $100,000 Investment in the Large Cap Disciplined Equity Fund, versus the S&P 500 Index
| | 1 | | For the period ended May 31, 2009. Past performance is not an indication of future performance. Class A shares were offered beginning 8/28/03. Returns shown do not reflect the deduction of taxes that a shareholder would pay on fund distributions or the redemption of fund shares. The returns for certain periods reflect fee waivers and/or reimbursements in effect for that period; absent fee waivers and reimbursements, performance would have been lower. |
| | |
| 6 | | SEI Institutional Investments Trust / Annual Report / May 31, 2009 |
MANAGEMENT’S DISCUSSION AND ANALYSIS OF FUND PERFORMANCE
SEI INSTITUTIONAL INVESTMENTS TRUST — MAY 31, 2009
Large Cap Index Fund
Objective
The Large Cap Index Fund (the “Fund”) seeks to provide investment results that correspond to the aggregate price and dividend performance of the securities in the Russell 1000 Index (the “Index”).
Strategy
The Fund attempts to match the performance of the widely-followed Russell 1000 Index by replicating its composition in full. Deviation of performance between the Fund and the Index, measured by tracking error, is typically attributable to trading costs and cash reserves held for liquidity needs. The presence of cash in the Fund may result in underperformance relative to the Index in rising markets, and out-performance in declining markets. To mitigate these effects, the Fund may use stock index futures to hedge its cash position. Futures contracts enable the Fund to maintain exposure to the market with reduced trading expenses, since the cost of the futures contracts is relatively nominal. The value of the stock index futures held by the Fund may not exceed 20% of the Fund’s assets.
Analysis
The U.S. equity market, as measured by the Russell 1000 Index, lost 32.95% during the fiscal year ended May 31st, 2009. After a five-year bull run that ended in the beginning of 2008, U.S. large-cap stocks turned decisively lower as deterioration in credit markets led to a full-blown liquidity crisis by the fall of 2008. Fears over a potential collapse of global financial systems exacerbated the deterioration in backdrop economic activity, which worsened significantly after the collapse of Lehman Brothers. The sub-prime mortgage meltdown led to the destruction of credit and an eventual collapse in U.S. housing prices. U.S. financial institutions were forced to write down hundreds of billions of dollars while hedge funds de-leveraged their portfolios. Fears related to the sub-prime mortgage crisis were exacerbated as U.S. real estate markets spiraled downward. In addition, energy prices surged to all-time highs in the summer of 2008 before eventually collapsing and bottoming out near $35 per barrel. This was a $100-per-barrel price drop in just over six months as global demand collapsed following the economic downturn. The collapse in Lehman Brothers led to unprecedented government
actions through the bailout of the U.S. financial system, including the Troubled Asset Relief Program (“TARP”) I & II, Term Asset-Backed Securities Loan Facility (“TALF”) and a massive $800 billion stimulus package. Trillions of dollars were injected into the financial system via capital injections into banks and the Fed expanded its balance sheet. Markets reached their lows during March, when they were off over 50% from October 2007 levels. Government actions and hopes for a recovery emerged in late March; markets reversed course and returned almost 35% through May 31. Financials have led the way in the recent rally following investors’ subsiding fears about nationalization; however, there are still many potential dangers to the U.S. financial system as credit card and commercial real estate losses continue to mount.
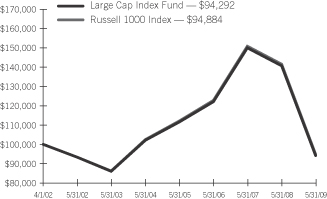
The Fund performed in line with the index during the period, returning -32.99% compared to the Russell 1000 Index return of -32.95%. For the fiscal year, growth stocks outperformed their value counterparts by more than 4.5% in the large cap universe. Most of this differential was realized in the last five months of the fiscal year. The market environment was extremely volatile as price and earnings momentum were the two best-performing factors heading into 2009, but became the worst-performing factors for the trailing twelve months at the end of the fiscal year. Value and small size were the best-performing factors, as extreme multiple compression weighed heavily on high P/E stocks and investors shifted their focus back to mid caps in 2009. All ten Global Industry Classification Standard (“GICS”) sectors posted negative performance during a difficult market period. The Fund’s performance was primarily impacted by the Financials sector, which was the worst sector with a decline close to 47%, followed closely by Industrials as well as Energy and Materials due to the rapid deterioration in the U.S. and global economies. Conversely, the Fund’s allocations, which mirror its index, in more defensive sectors including Consumer Staples and Healthcare stocks helped to mitigate the downside by benefiting from a flight to quality in the first nine months of the fiscal year. The Consumer Staples sector continued to outperform Consumer Discretionary as U.S. consumers drastically increased their personal savings rate and constrained their budgets to the bare necessities.
| | |
| SEI Institutional Investments Trust / Annual Report / May 31, 2009 | | 7 |
MANAGEMENT’S DISCUSSION AND ANALYSIS OF FUND PERFORMANCE
SEI INSTITUTIONAL INVESTMENTS TRUST — MAY 31, 2009
Large Cap Index Fund (Concluded)
Large Cap Index Fund
AVERAGE ANNUAL TOTAL RETURN1
| | | | | | | | |
| | | One Year
Return | | Annualized
3 Year
Return | | Annualized
5 Year
Return | | Annualized
Inception
to Date |
| Large Cap Index Fund, Class A | | (32.99)% | | (8.27)% | | (1.60)% | | (0.82)% |
Comparison of Change in the Value of a $100,000 Investment in the Large Cap Index Fund, versus the Russell 1000 Index
| | 1 | | For the period ended May 31, 2009. Past performance is not an indication of future performance. Class A shares were offered beginning 4/1/02. Returns shown do not reflect the deduction of taxes that a shareholder would pay on fund distributions or the redemption of fund shares. The returns for certain periods reflect fee waivers and/or reimbursements in effect for that period; absent fee waivers and reimbursements, performance would have been lower. |
| | |
| 8 | | SEI Institutional Investments Trust / Annual Report / May 31, 2009 |
MANAGEMENT’S DISCUSSION AND ANALYSIS OF FUND PERFORMANCE
SEI INSTITUTIONAL INVESTMENTS TRUST — MAY 31, 2009
Small Cap Fund
Objective
The Small Cap Fund (“the Fund”) seeks to provide long-term capital appreciation by investing in equity securities of smaller U.S. companies.
Strategy
With respect to this Fund, SEI Investments Management Corp. (“SIMC”) employs a multi-manager structure to gain exposure to U.S. small-cap stocks, adding value through stock selection while managing risk in the form of capitalization, economic sectors and other factor exposures. The Fund is jointly sub-advised by a variety of investment managers. Assets of the Fund are strategically allocated among its sub-advisers, each of which has a responsibility for stock selection for a portion of the Fund’s assets. The Fund is structured to outperform over a full market cycle with exposure to a diverse array of managers. Three core managers apply a quantitative approach in their respective portfolios. Five of the Fund’s managers are specifically geared towards the growth segment of the market, with specific exposure to earnings momentum, quality growth and anticipatory growth. The Fund has seven value-oriented managers with exposure to deep-value and relative-value segments of the market that look to exploit market dislocations and technical mispricing through intrinsic valuation models. The Fund also has a dedicated micro-cap manager which provides a specialist within that market segment, giving the Fund a diversifying alpha source through exposure to the smallest market caps. Finally, the Fund has a dedicated REIT manager who provides exposure to public REITs.
Changes to Portfolio
In July 2008, Oppenheimer Capital, LLC’s opportunistic small-cap growth portfolio was added to the Fund. Oppenheimer, LLC’s process seeks to buy the stocks of three types of companies: 1) high-growth companies with substantial cash flow that is being invested back into the business; 2) sustainable-growth companies with a solid business model that has been unfairly affected by market conditions and yields an attractive relative valuation; and 3) sound companies experiencing a market overreaction to negative company-specific news. In February 2009, SEI terminated Mazama Capital Management due to a loss in conviction in its investment process as well as its correlation relative to new manager hires that had similar exposures with better execution.
Analysis
The U.S. equity market, as measured by the Russell 2000 Index, fell 31.79% during the fiscal year ended May 31, 2009. After a five-year bull run ended in the beginning of 2008, U.S. small-cap stocks turned decisively lower as the deterioration in credit markets led to a full-blown liquidity crisis by the fall of 2008. Anxiety surrounding a potential collapse of global financial systems exacerbated the deterioration in economic activity, which worsened significantly after the collapse of Lehman Brothers. U.S. financial institutions were forced to write down hundreds of billions of dollars while hedge funds de-leveraged their portfolios. Fears related to the sub-prime mortgage crisis were exacerbated as U.S. real estate markets spiraled downward. In addition, energy prices surged to all-time highs in the summer of 2008 before eventually collapsing and bottoming out near $35 per barrel for oil. This was a $100-per-barrel price drop in just over six months as global demand collapsed following the economic fallout. Financial turmoil led to unprecedented government actions to aid the U.S. financial system, including the Troubled Asset Relief Program (“TARP”) I & II, Term Asset-Backed Securities Loan Facility (“TALF”) and a massive $800 billion stimulus package. This was in addition to the expansion of the Fed’s balance sheet. Markets reached their lows in March when they were off over 50% from October 2007 levels. From these lows, markets rebounded by close to 35% through the end of May as investors began to discount the government intervention and became hopeful of an intermediate-term economic recovery. Early cyclicals have led the way higher in the Russell 2000 since March, with Energy, Materials and Consumer Discretionary stocks strongly outperforming on a relative basis. This has largely been driven by a general pickup in Chinese demand and a resurgence in oil prices, which have doubled since the bottom was reached in February.
For the fiscal year, small-cap growth stocks ended slightly ahead of value stocks due to a 12% out-performance in the first five months of 2009. All ten Global Industry Classification Standard (“GICS”) sectors posted negative absolute returns for the one-year period. Energy was the worst-performing sector, down close to 55%, followed by Industrials as well as Consumer Discretionary and Materials, due to the rapid deterioration in the U.S. and global economies. Conversely, the more defensive sectors, including Consumer Staples and Utilities
| | |
| SEI Institutional Investments Trust / Annual Report / May 31, 2009 | | 9 |
MANAGEMENT’S DISCUSSION AND ANALYSIS OF FUND PERFORMANCE
SEI INSTITUTIONAL INVESTMENTS TRUST — MAY 31, 2009
Small Cap Fund (Concluded)
stocks, strongly outperformed the broad market, driven by a flight to quality in the first nine months of the fiscal year. The Consumer Staples sector continued to outperform Consumer Discretionary as U.S. consumers drastically increased their personal savings rates and constrained their budgets to the bare necessities. Price and earnings momentum were the two worst-performing factors for the fiscal year despite having a very strong 2008. Conversely, value and small size were among the best-performing factors as extreme multiple compression weighed heavily on high-P/E stocks and investors shifted their focus to smaller companies late in the fiscal year.
The Fund lagged its benchmark, the Russell 200 Index, for the fiscal year ended May 31, 2009, returning -34.27% compared to the Russell 2000 Index return of -31.79%. The majority of underperformance occurred in the third and fourth quarters of 2008, which was marked by significant technical factors in the market. In particular, there was significant short covering of the Russell 2000 ETF and Regional Bank ETF, which SEI believes drove a temporary decoupling of stock prices and underlying fundamentals. During this period, there was a significant imbalance between general active fund management performance and the index. The Fund posted poor performance on a relative basis, principally due to stock selection over the period. The core quantitative managers underperformed for the period as it was a very challenging environment for quantitative management. The combination of very high factor volatility, a significant inflection point in March and the negative impact of de-leveraging on higher-quality stocks weighed heavily on these managers. Our value managers helped mitigate some of the relative underperformance; a majority of them outperformed the Russell 2000 Value index by a fairly wide margin. In particular, Artisan Partners Limited Partnership benefited from strong stock selection within the Information Technology sector, and Neuberger Berman rebounded strongly in 2009 due to positive selection in Healthcare and an underweight to Financials. Performance was more challenging in the growth space. Negative stock selection and an overweight to Energy weighed on Wellington Management Company, LLP. McKinley Capital Management, Inc. struggled in the second half of the fiscal year as performance of the momentum factor fell off dramatically. Also, Mazama Capital Management. Inc. weighed on the Fund’s performance due to poor stock selection in the Consumer Discretionary and Energy sectors. Finally, the Fund’s
specialist REIT manager, Security Capital Research & Management, Inc. weighed on the Fund. REITs fell sharply under considerable pressure due to debt refinancing issues as credit markets seized up and many investors became concerned about potential bankruptcies and mass liquidations within the industry.
The Fund is positioned to capture opportunities in the small-cap space under a variety of market conditions. To this end, the Fund seeks to minimize unintended exposures to the Russell 2000 Index in order to put the focus on stock selection by specialist sub-advisers. The Fund has an overweight to the Information Technology sector in the expectation that businesses will spend on technology to improve productivity in the second half of 2009, especially in light of spare capacity in current utilization rates. The Fund is underweight Financials, particularly regional banks, which managers believe will still face mounting problems.
Small Cap Fund
AVERAGE ANNUAL TOTAL RETURN1
| | | | | | | | | | |
| | | One Year
Return | | Annualized
3 Year
Return | | Annualized
5 Year
Return | | Annualized
10 Year
Return | | Annualized
Inception
to Date |
| Small Cap Fund, Class A | | (34.27)% | | (11.91)% | | (2.25)% | | 3.38% | | 4.72% |
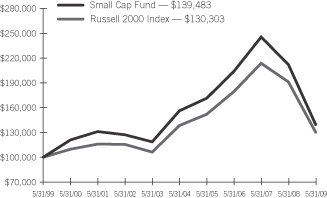
Comparison of Change in the Value of a $100,000 Investment in the Small Cap Fund, versus the Russell 2000 Index
| | 1 | | For the period ended May 31, 2009. Past performance is not an indication of future performance. Class A shares were offered beginning 6/14/96. Returns shown do not reflect the deduction of taxes that a shareholder would pay on fund distributions or the redemption of fund shares. The returns for certain periods reflect fee waivers and/or reimbursements in effect for that period; absent fee waivers and reimbursements, performance would have been lower. |
| | |
| 10 | | SEI Institutional Investments Trust / Annual Report / May 31, 2009 |
MANAGEMENT’S DISCUSSION AND ANALYSIS OF FUND PERFORMANCE
SEI INSTITUTIONAL INVESTMENTS TRUST — MAY 31, 2009
Small/Mid Cap Equity Fund
Objective
The Small-Mid Cap Equity Fund (the “Fund”) seeks to provide long-term capital appreciation by investing in equity securities of small-to mid- cap companies.
Strategy
SEI Investments (“SEI”) employs a multi-manager structure, focusing on small- and mid-cap U.S. equities. The Fund adds value through stock selection while managing risk in the form of capitalization, economic sectors and other factor exposures. The Fund is jointly sub-advised by eleven investment managers. Fund assets are strategically allocated among its various sub-advisers who are each responsible for selecting stocks for a portion of assets under management. The Fund is structured to outperform over a full market cycle with exposure to a diverse array of managers. Three core managers apply a quantitative approach in their respective portfolios. Four of the Fund’s managers are specifically geared towards the growth segment of the market, seeking companies whose future growth prospects are underestimated or undervalued by the market. Also, the Fund has four value-oriented managers with exposure to deep-value and relative-value segments of the market, aiming to exploit market dislocations and mispricings through intrinsic valuation models. Finally, the Fund has a dedicated REIT manager who provides exposure to public REITs, which are typically underweighted by small/mid-cap managers due to a lack of coverage and because these securities are often outside the expertise of most of these managers.
Changes to Portfolio
In July 2008, SEI added Wells Capital Management, Inc. (“Wells”), a small- and mid-cap growth manager. Its strategy emphasizes companies that it believes have minimal downward earnings revision risk while still maintaining exposure to higher growth. In particular, Wells generates new ideas in two ways: two-thirds of ideas come from proprietary fundamental research, supported by a network of industry professionals and experts, and the remaining third comes from a network of regional brokers specializing in small-cap research. SEI believes this manager is a strong diversifier within the current small/mid-cap fundamental manager line-up. In February 2009, SEI terminated Mazama Capital Management, Inc. (“Mazama”) due to a loss of conviction in its investment process as well as its correlation relative to new manager hires that had similar exposures with better execution.
Analysis
The Russell 2500 Index, which tracks small-and mid-cap stocks, declined 33.45% during the fiscal year ended May 31, 2009. After a five-year bull run that ended in the fall of 2007, U.S. small/mid- cap stocks turned decisively lower as the deterioration in credit markets led to a full-blown liquidity crisis by the fall of 2008. Anxiety surrounding a potential collapse of the U.S. and world financial systems exacerbated the deterioration in economic activity, which became increasingly worse after the collapse of Lehman Brothers. U.S. financial institutions were forced to write down hundreds of billions of dollars while hedge funds de-leveraged their portfolios. Fears related to the sub-prime mortgage crisis were exacerbated as U.S. real estate markets spiraled downward. In addition, energy prices surged to all-time highs in the summer of 2008 before eventually collapsing and bottoming out near $35 per barrel for oil. This was a $100-per-barrel drop in just over six months as global demand collapsed following the economic crises. Financial turmoil led to unprecedented government actions to aid the U.S. financial system, including the Troubled Asset Relief Program (“TARP”) I & II, Term Asset-Backed Securities Loan Facility (“TALF”) and a massive $800 billion stimulus package. This was in addition to the Fed’s expanded balance sheet. Markets reached their lows in March when they were off over 50% from October 2007 levels. From these lows, markets rebounded by almost 35% through the end of May as investors began to discount the government intervention and became hopeful of an intermediate-term economic recovery. Early cyclicals have led the way higher in the Russell 2500 since March 2009, with Energy, Materials and Consumer Discretionary stocks strongly outperforming on a relative basis. This has largely been driven by a general pickup in Chinese demand and a resurgence in oil prices, which have doubled since the bottom was reached in February.
For the fiscal year, small/mid-cap value stocks ended slightly ahead of their growth counterparts, although growth significantly closed the gap, outperforming value by 12% in the first five months of 2009. All ten Global Industry Classification Standard (“GICS”) sectors posted negative absolute returns for the one-year period. Energy was the worst-performing sector, down close to 54%, followed by Industrials, Consumer Discretionary and Materials, due to the rapid deterioration in the U.S. and global economies. Conversely, the more defensive sectors, including Consumer Staples and Utilities, strongly outperformed the broad market, driven by a flight to quality in the first
| | |
| SEI Institutional Investments Trust / Annual Report / May 31, 2009 | | 11 |
MANAGEMENT’S DISCUSSION AND ANALYSIS OF FUND PERFORMANCE
SEI INSTITUTIONAL INVESTMENTS TRUST — MAY 31, 2009
Small/Mid Cap Equity Fund (Concluded)
nine months of the fiscal year. The Consumer Staples sector continued to outperform Consumer Discretionary as U.S. consumers drastically increased their personal savings rate and constrained their budgets to the bare necessities. Price and earnings momentum were the two worst-performing factors for the fiscal year despite having a very strong 2008. Conversely, value and small size were among the best factors as extreme multiple compression weighed heavily on high-P/E stocks and investors shifted their focus to smaller companies late in the fiscal year.
The Fund underperformed its benchmark for the fiscal year ended May 31, 2009, returning -34.70% versus the Russell 2500 Index, which returned -33.45%. The majority of underperformance occurred in the third and fourth quarters of 2008, which was marked by significant technical factors in the market. In particular, there was significant short covering of the small-cap Russell 2000 ETF and Regional Bank ETF, which SEI believes drove a temporary decoupling of stock prices from underlying fundamentals. During this period, there was a significant imbalance between general active fund management performance and the index. Over the entire period, the Fund posted poor performance on a relative basis, principally due to negative stock selection in Financials and Energy. Core quantitative managers underperformed in what was a very challenging environment for quantitative management. The combination of high factor volatility, a significant inflection point in March and the negative impact of deleveraging on higher-quality stocks weighed heavily on these managers. Value managers helped mitigate some of the relative underperformance, with a majority of them outperforming the Russell 2500 Value Index by a fairly wide margin. In particular, Lee Munder Investments, Ltd. benefited from strong stock selection in the Information Technology and Consumer Discretionary sectors. Integrity Asset Management, LLC’s opportunistic value discipline drove superior stock selection in Financials. LSV Asset Management benefited from its exposure to the “cheapest” two deciles as traditional value recovered sharply in 2009. In the growth space, Wellington Management Company, LLP lagged, hurt by a large overweight to Energy as well as poor stock selection within that sector. Mazama also weighed on the Fund’s performance due to poor stock selection in the Consumer Discretionary and Energy sectors. Finally,
the Fund’s specialist REIT manager, Security Capital Research & Management, Inc., detracted from performance. REITs fell sharply under considerable pressure due to debt refinancing issues as credit markets seized up and many investors became concerned about potential bankruptcies and mass liquidation within the industry.
The Fund is positioned to capture opportunities in the small- and mid- cap space under a variety of market conditions. To this end, the Fund seeks to minimize unintended exposures to the Russell 2500 Index in order to put the focus on stock selection by the specialist sub-advisers. However, the Fund does continue to have an overweight to Information Technology in expectation of businesses spending on technology to improve productivity in the second half of 2009, especially in light of spare capacity in current utilization rates. Also, the Fund is underweight Financials, particularly regional banks, which managers believe will still face mounting problems.
Small/Mid Cap Equity Fund
AVERAGE ANNUAL TOTAL RETURN1
| | | | | | | | |
| | | One Year
Return | | Annualized
3 Year
Return | | Annualized
5 Year
Return | | Annualized
Inception
to Date |
| Small/Mid Cap Equity Fund, Class A | | (34.70)% | | (11.31)% | | (1.45)% | | (0.08)% |
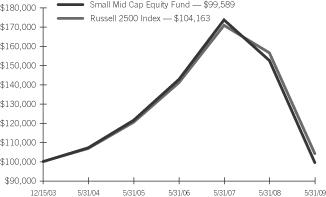
Comparison of Change in the Value of a $100,000 Investment in the Small Mid Cap Equity Fund, versus the Russell 2500 Index
| | 1 | | For the period ended May 31, 2009. Past performance is not an indication of future performance. Class A shares were offered beginning 12/15/03. Returns shown do not reflect the deduction of taxes that a shareholder would pay on fund distributions or the redemption of fund shares. The returns for certain periods reflect fee waivers and/or reimbursements in effect for that period; absent fee waivers and reimbursements, performance would have been lower. |
| | |
| 12 | | SEI Institutional Investments Trust / Annual Report / May 31, 2009 |
MANAGEMENT’S DISCUSSION AND ANALYSIS OF FUND PERFORMANCE
SEI INSTITUTIONAL INVESTMENTS TRUST — MAY 31, 2009
U.S. Managed Volatility Fund
Objective
The U.S. Managed Volatility Fund (the “Fund”) invests in common stocks and other equity securities, and it employs a broad range of investment strategies intended to generate capital appreciation with the intent of achieving a lower level of volatility than the broad U.S. equity markets.
Strategy
The Fund uses a multi-manager approach, relying on a number of sub-advisers with differing investment approaches to manage portions of the Fund’s portfolio under the general supervision of the Fund’s adviser, SEI Investments Management Corp (“SIMC”). Each sub-adviser manages its portion of the Fund’s assets by employing various investment approaches intended to achieve returns similar to the broad U.S. equity markets but with a lower level of volatility over the long term. The Fund seeks to achieve lower volatility by constructing a portfolio of securities that effectively weights securities based on their total expected risk and return, without regard to market capitalization, industry or tracking error targets relative to the broad market. As such, the Fund is expected to have meaningful differentiations in terms of sector weights and short-term performance relative to broad market indices.
The Fund utilizes Aronson + Johnson + Ortiz, L.P. (“AJO”) and Analytic Investors, LLC as sub-advisers; each manager brings a differentiated investment and risk model.
Analysis
The U.S. equity market, as measured by the Russell 3000 Index, lost 32.85% during the fiscal year ended May 31, 2009. After a five-year bull run that ended in the beginning of 2008, U.S. stocks turned decisively lower as the deterioration in credit markets led to a full blown liquidity crisis by the fall of 2008. The potential collapse of the global financial system exacerbated the deterioration in the economic backdrop, which worsened significantly in the fall of 2008 after the collapse of Lehman Brothers and several other large financial institutions. The sub-prime mortgage meltdown that started in 2007 and led to the destruction of credit and eventual collapse in U.S. housing prices drove investor fears that eventually caused volatility to spike to historic levels. U.S. financial institutions were forced to write
down hundreds of billions of dollars, while hedge fund managers de-leveraged their portfolios. The collapse in Lehman Brothers led to unprecedented government actions through the bailout of the U.S. financial system with Troubled Asset Relief Programs (“TARP”) I and II, the introduction of the Term Asset-Backed Loan Facility (“TALF”) to get asset backed security markets functioning again, a massive $800 billion stimulus package aimed at creating/saving 4 million jobs and trillions of dollars injected into the financial system via capital injections into banks and the expansion of the Fed’s balance sheet. Government actions have proven to be successful in the near term, as markets have rebounded strongly (close to 35%) since hitting their lows in March (off close to 57% from the peak in October 2007).
For the fiscal year, lower-beta stocks outperformed, driven by a flight to quality. Most of this differential was realized in the first nine months of the fiscal year. The market environment was extremely volatile, as price and earnings momentum were the two best-performing factors heading into 2009 for the fiscal year but ended as the worst-performing factors for the trailing twelve months at the end of the fiscal year. Small size has been the best-performing factor year to date in 2009. Typically, small-cap stocks outperform large-cap stocks in the second half of a recession. This led to a reversal in the trend seen over the previous fiscal year, with large-cap stocks underperforming their small-cap brethren, as measured by the Russell 1000 Index and Russell 2000 Index, during the fiscal year. Sector performance was extremely volatile and mixed over the course of the fiscal year; however, all ten Global Industry Classification Standard (“GICS”) sector posted negative absolute returns. The Financials sector was the worst-performing sector, down close to 47%, followed closely by Industrials as well as Energy and Materials due to the rapid deterioration in the global economy. On the other hand, Consumer Staples and Healthcare stocks led the way, with both sectors outperforming the U.S. market on relative basis, as measured by the Russell 1000, by close to 15% as massive deleveraging led to a flight to quality, particularly in the fall of 2008. In the end, this environment benefited lower-beta stocks for the first three quarters of the fiscal year.
Since its inception on December 30, 2008, the Fund has returned -4.16%. Investors have witnessed a sharp pullback to the March lows followed by an equally sharp rally; during the rally, high-beta stocks
| | |
| SEI Institutional Investments Trust / Annual Report / May 31, 2009 | | 13 |
MANAGEMENT’S DISCUSSION AND ANALYSIS OF FUND PERFORMANCE
SEI INSTITUTIONAL INVESTMENTS TRUST — MAY 31, 2009
U.S. Managed Volatility Fund (Concluded)
gained momentum, specifically in April. Given that the Fund is not managed against a specific benchmark, we would expect it to vary significantly from the broad market’s performance on a shorter term basis. The Fund generally favors stocks with relatively low beta to the overall equity market, such as Utilities and Consumer Staple, and largely avoids stocks with high beta, such as Information Technology. We would expect the Fund to have a difficult time keeping up with strong market rallies but would provide downside protection in bear markets. In the recent fiscal period, which only includes the final five months of the fiscal year, the broad equity market gained close to 4%; however, despite the relatively small gain, it was triggered by a massive 35% rally off the March lows. In this type of market environment, the Fund performed as expected, beating the overall market through March but ultimately falling short and underperforming over the full period, which was marked by a high-beta, low-quality rally. The Fund underperformed by roughly 700 basis points since inception, driven by poor security selection in the Financials and Consumer Discretionary sectors as well as a large underweight to the Information Technology sector. It is important to point out, however, that the strategy has outperformed the market as measured by the Russell 3000 Index by 700 basis points (per annum) with a 13% lower risk level as measured by standard deviation from peak (October 2007) to (March 2009). Analytic Investors, LLC and AJO both underperformed during the period due to an overall emphasis on lower-beta stocks, which led to their poor stock selection. AJO’s focus on management quality was the primary driver of poor stock selection within the Financials sector. Analytic’s focus on being underweight earnings volatility and thus overweight lower-beta stocks drove its negative stock selection.
There were no sub-adviser changes for the Fund during the fiscal period.
| | |
| 14 | | SEI Institutional Investments Trust / Annual Report / May 31, 2009 |
MANAGEMENT’S DISCUSSION AND ANALYSIS OF FUND PERFORMANCE
SEI INSTITUTIONAL INVESTMENTS TRUST — MAY 31, 2009
International Equity Fund
Objective
The International Equity Fund (“the Fund”) seeks to provide long-term capital appreciation by investing in equity securities of foreign issuers.
Strategy
The Fund invests primarily in common stocks and other equity securities; issuers comprise a broad range of capitalizations and are located in at least three countries outside of the U.S. The Fund invests primarily in companies located in developed countries but may also invest in companies located in emerging markets. The Fund uses a multi-manager approach, relying upon a number of sub-advisors with differing investment philosophies to manage portions of the Fund’s portfolio under the general supervision of SEI Investments Management Corporation (“SIMC”).
Changes to the Portfolio
For the fiscal year ended May 31, 2009, manager changes in the International Equity Fund were made to diversify sources of returns, upgrade manager opportunities and address concerns with existing managers. In July 2008, Capital Guardian and Fuller & Thaler were terminated as their mandates were no longer optimal for the Fund. Principal Global Investors, LLC was added in August 2008 to provide core growth exposure. In January 2009, Declaration Management + Research, LLC replaced Smith Breeden and now manages the existing mandate. AllianceBernstein was terminated in March 2009 due to concerns regarding changes in its organizational structure. In April, Acadian Asset Management, Inc. (“Acadian”), INTECH Investment Management, LLC (“INTECH”), and Wellington Management Company, LLP (“Wellington”) were funded to provide exposure to factor momentum, statistical and relative-value alpha sources.
Analysis
International equities experienced a steep decline from May 2008 through early March 2009, falling almost 57%. This precipitous decline was the result of the widespread global economic crisis. Developed international markets dealt with housing turmoil, financial sector crises, and plummeting commodity prices that affected the overall economy. Unemployment soared and investor sentiment languished. Fortunately, governments and central banks took action,
spurring unprecedented global coordination. A multi-pronged approach was implemented to address the turmoil, which included central banks cutting rates to record levels and governments implementing sizable fiscal stimulus packages. The markets had a significant rally from March 9 through the end of May, skyrocketing 46% off of market lows. Economic data still presented a mixed bag of results, but incremental improvements and green shoots in the economy revealed signs of life. While there is still a long and likely bumpy road to recovery, investor confidence and market performance improved by the end of May.
For the fiscal year ended May 31, 2009, the Fund returned -44.32%, lagging behind its benchmark the MSCI EAFE Index, which returned -36.61%. Markets were highly volatile and manager performance varied throughout the year. AllianceBernstein, a deep-value manager that focuses on bottom-up company fundamentals, struggled the most. Its stock selection in Financials, Autos, and Energy was punished at various points during the year. However, this manager had significant outperformance after the March 9 rally that was led by deep-value stocks. Quantitative managers, such as Quantitative Management Associates, LLC and AXA Rosenberg Investment Management LLC, tend to perform better in trending markets, but they gave up performance when market inflection points exhibited rapid changes in market leadership. The continued illiquidity in the credit market detracted from Smith Breeden’s performance for most of the year, but improving credit markets in the months leading up to May 31 resulted in positive performance for that mandate (now managed by Declaration Management + Research, LLC). New managers that were added in April included Wellington, Acadian, and INTECH; all have had positive performance since inception in the Fund.
At the sector level, stock selection in Materials and Industrials detracted the most, as those sectors experienced significant sell-offs during the fourth quarter of 2008. Stock selection in more defensive sectors such as Healthcare and Consumer Staples positively contributed to performance. Country performance, which is the outcome of underlying stock decisions, was better in Europe ex-UK versus the UK and Japan.
| | |
| SEI Institutional Investments Trust / Annual Report / May 31, 2009 | | 15 |
MANAGEMENT’S DISCUSSION AND ANALYSIS OF FUND PERFORMANCE
SEI INSTITUTIONAL INVESTMENTS TRUST — MAY 31, 2009
International Equity Fund (Concluded)
International Equity Fund
AVERAGE ANNUAL TOTAL RETURN1
| | | | | | | | | | |
| | | One Year
Return | | Annualized
3 Year
Return | | Annualized
5 Year
Return | | Annualized
10 Year
Return | | Annualized
Inception
to Date |
| International Equity Fund, Class A | | (44.32)% | | (12.35)% | | 0.03% | | 0.21% | | 2.03% |
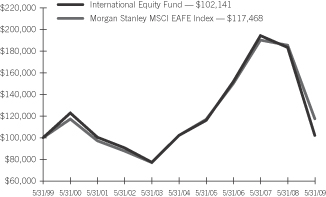
Comparison of Change in the Value of a $100,000 Investment in the International Equity Fund, versus the Morgan Stanley MSCI EAFE Index
| | 1 | | For the period ended May 31, 2009. Past performance is not an indication of future performance. Class A shares were offered beginning 6/14/96. Returns shown do not reflect the deduction of taxes that a shareholder would pay on fund distributions or the redemption of fund shares. The returns for certain periods reflect fee waivers and/or reimbursements in effect for that period; absent fee waivers and reimbursements, performance would have been lower. |
| | |
| 16 | | SEI Institutional Investments Trust / Annual Report / May 31, 2009 |
MANAGEMENT’S DISCUSSION AND ANALYSIS OF FUND PERFORMANCE
SEI INSTITUTIONAL INVESTMENTS TRUST — MAY 31, 2009
World Equity Ex-US Fund
Objective
The World Equity Ex-U.S. Fund (“the Fund”) seeks to provide long-term capital appreciation by investing in equity securities of foreign issuers.
Strategy
The Fund invests primarily in common stocks and other equity securities; issuers comprise a broad range of capitalizations and are located outside of the U.S. The Fund invests primarily in companies located in developed countries but may also invest in companies located in emerging markets. The Fund uses a multi-manager approach, relying upon a number of sub-advisors with differing investment philosophies to manage portions of the Fund’s portfolio under the general supervision of SEI Investments Management Corporation (“SIMC”).
Changes to the Portfolio
For the fiscal year ended May 31, 2009, manager changes in the World Equity Ex-U.S. Fund were made to diversify sources of returns, upgrade manager opportunities and address concerns with existing managers. In July 2008, Capital Guardian and Fuller & Thaler were terminated as their mandates were no longer optimal for the Fund. Principal Global Investors, LLC was added in August 2008 to provide core growth exposure. In January 2009, Declaration Management + Research, LLC replaced Smith Breeden and now manages the existing mandate. Artisan Partners Limited Partnership was also added in January 2009 to provide fundamental stock selection in emerging markets. AllianceBernstein was terminated in March 2009 due to concerns regarding changes in its organizational structure. In April, Acadian Asset Management, Inc. (“Acadian”), INTECH Investment Management, LLC (“INTECH”), and Wellington Management Company, LLP (“Wellington”) were funded to provide exposure to factor momentum, statistical and relative-value alpha sources.
Analysis
For the one-year period ended May 31, 2009, the MSCI All Country World Ex-U.S. Index declined 35.88%. In international developed markets, equities experienced a steep decline from May 2008 through early March 2009, falling almost 57%. The precipitous decline was
the result of the widespread global economic crisis. Developed international markets dealt with housing turmoil, financial sector crises, and plummeting commodity prices, which affected the overall economy. Unemployment soared and investor sentiment languished. Fortunately, governments and central banks took action, prompting unprecedented global coordination. A multi-pronged approach was implemented to address the turmoil, which included central banks cutting rates to record levels and governments implementing sizable fiscal stimulus packages. Markets had a significant rally from March 9 through the end of May, skyrocketing over 46% off of market lows.
Emerging-markets equities fell 34.13% for the one-year period. Emerging markets are largely commodity-driven and many are net exporters. The huge sell-off in commodities and decline in global demand resulted in the third and fourth quarters of 2008 being among the worst declines in the history of the MSCI Emerging Markets Index. However, in the first quarter of 2009, emerging markets diverged from its developed counterparts and rallied through the end of May 2009. Rising oil prices, domestic demand, and expectations that stimulus packages will further increase demand for commodities helped fuel the rally.
Overall, economic data presented a mixed bag of results, but incremental improvements and green shoots in the economy revealed signs of life. While a long and likely bumpy road to recovery remains, investor confidence and market performance improved by the end of May.
For the one year period ended May 31, 2009, the Fund returned -42.38%, lagging behind its benchmark the MSCI All Country World Ex-U.S. Index, which returned -35.88%. Markets were highly volatile and manager performance varied throughout the year. AllianceBernstein, a deep-value manager that focuses on bottom-up company fundamentals, struggled the most. Its stock selection in Financials, Autos, and Energy were punished at various points in the year. However, this manager had significant outperformance after the March 9 rally that was led by deep-value stocks. Quantitative managers, such as Quantitative Management Associates, LLC and AXA Rosenberg Investment Management LLC, tend to perform better in trending markets, but they gave up performance when market inflection points exhibited rapid changes in market leadership.
| | |
| SEI Institutional Investments Trust / Annual Report / May 31, 2009 | | 17 |
MANAGEMENT’S DISCUSSION AND ANALYSIS OF FUND PERFORMANCE
SEI INSTITUTIONAL INVESTMENTS TRUST — MAY 31, 2009
World Equity Ex-US Fund (Concluded)
Continued illiquidity in the credit markets detracted from Smith Breeden’s performance for most of the year, but improving credit markets in the months leading up to May 31 resulted in positive performance for the mandate (now managed by Declaration Management + Research, LLC). New managers that were added in April included Wellington, Acadian, and INTECH; all of these managers have had positive performance since inception in the Fund.
At the sector level, stock selection in Materials and Industrials detracted the most as those sectors experienced significant sell-offs during the fourth quarter of 2008. Stock selection in more defensive sectors such as Healthcare and Consumer Staples positively contributed to performance. Country performance, which is the outcome of underlying stock decisions, was best in emerging markets, with Europe ex-UK performing better than the UK and Japan on the developed side.
World Equity Ex-US Fund
AVERAGE ANNUAL TOTAL RETURN1
| | | | | | |
| | | One Year
Return | | Annualized
3 Year
Return | | Annualized
Inception
to Date |
| World Equity Ex-US Fund, Class A | | (42.38)% | | (9.46)% | | (0.67)% |
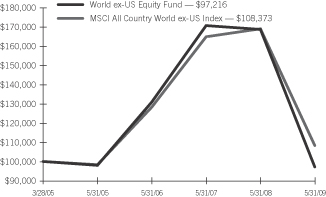
Comparison of Change in the Value of a $100,000 Investment in the World ex-US Equity Fund, versus the MSCI All Country World ex-US Index
| | 1 | | For the period ended May 31, 2009. Past performance is not an indication of future performance. Class A shares were offered beginning 3/28/05. Returns shown do not reflect the deduction of taxes that a shareholder would pay on fund distributions or the redemption of fund shares. The returns for certain periods reflect fee waivers and/or reimbursements in effect for that period; absent fee waivers and reimbursements, performance would have been lower. |
| | |
| 18 | | SEI Institutional Investments Trust / Annual Report / May 31, 2009 |
MANAGEMENT’S DISCUSSION AND ANALYSIS OF FUND PERFORMANCE
SEI INSTITUTIONAL INVESTMENTS TRUST — MAY 31, 2009
Screened World Equity Ex-US Fund
Objective
The Screened World Equity Ex-U.S. Fund (“the Fund”) seeks to provide long-term capital appreciation by investing in equity securities of foreign issuers, excluding companies whose activities directly or indirectly benefit the governments of countries that support terrorism, genocide or human rights abuses.
Changes to Portfolio
For the fiscal year ended May 31, 2009, one manager change occurred in the Screened World Equity Ex-U.S. Fund. AllianceBernstein was terminated in March 2009 due to concerns regarding changes in its organizational structure.
Analysis
For the one-year period ended May 31, 2009, the MSCI All Country World Ex-U.S. Index was down 35.55%. In international developed markets, equities experienced a steep decline from May 2008 through early March 2009, falling almost 57%. The precipitous decline was the result of the widespread global economic crisis. Developed international markets dealt with housing turmoil, financial sector crises, and plummeting commodity prices that affected the entire global economy. Unemployment soared and investor sentiment languished. Fortunately, governments and central banks took action, prompting unprecedented global coordination. A multi-pronged approach was implemented to address the turmoil, which included central banks cutting rates to record levels and governments implementing sizable fiscal stimulus packages. The markets had a significant rally from March 9 through the end of May, skyrocketing over 46% off of market lows.
Emerging markets fell 34.13% for the one-year period. Emerging markets are largely commodity-driven and many are net exporters. The huge sell-off in commodities and decline in global demand resulted in the third and fourth quarters of 2008 being among the worst declines in the history of the MSCI Emerging Markets Index. However, in the first quarter of 2009, emerging markets diverged from its developed counterparts and rallied through the end of May 2009. Rising oil prices, domestic demand, and expectations that stimulus packages will further increase demand for commodities helped fuel the rally.
Overall, economic data presented a mixed bag of results, but incremental improvements and green shoots in the economy revealed signs of life. While a long and likely bumpy road to recovery remains, investor confidence and market performance improved by the end of May.
The Fund was opened on June 30, 2008 and returned -35.12% for the ten-month time period; the MSCI All Country World Ex-U.S. Index returned -30.14% for the same time period. Markets were highly volatile, and manager performance varied throughout the year. AllianceBernstein, a deep-value manager that focuses on bottom-up fundamentals when selecting companies, detracted from performance as its stock selection in Financials, Autos, and Energy were punished at various points in the year. However, the manager had significant outperformance after the March 9 rally, led by deep-value stocks. Quantitative managers, such as Quantitative Management Associates, LLC and AXA Rosenberg Investment Management LLC, tend to perform better in trending markets, but they gave up performance when market inflection points exhibited rapid changes in market leadership.
At the sector level, stock selection in Materials and Industrials detracted the most, as those sectors experienced significant sell-offs during the fourth quarter of 2008. Stock selection in more defensive sectors such as Healthcare and Consumer Staples contributed to performance. Country performance, which is the outcome of underlying stock decisions, was best in emerging markets and worst in Western Europe.
| | |
| SEI Institutional Investments Trust / Annual Report / May 31, 2009 | | 19 |
MANAGEMENT’S DISCUSSION AND ANALYSIS OF FUND PERFORMANCE
SEI INSTITUTIONAL INVESTMENTS TRUST — MAY 31, 2009
Screened World Equity Ex-US Fund (Concluded)
Screened World Equity Ex-US Fund
AVERAGE ANNUAL TOTAL RETURN1
| | |
| | | Cumulative
Inception
to Date |
| Screened World Equity Ex-US Fund, Class A | | (35.12)% |
Comparison of Change in the Value of a $100,000 Investment in the Screened World Equity ex-US Fund, versus the MSCI All Country World ex-US Index
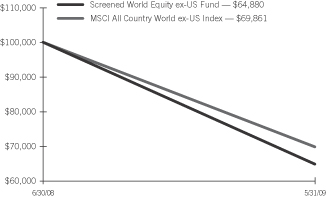
| | 1 | | For the period ended May 31, 2009. Past performance is not an indication of future performance. Class A shares were offered beginning 6/30/08. Returns shown do not reflect the deduction of taxes that a shareholder would pay on fund distributions or the redemption of fund shares. The returns for certain periods reflect fee waivers and/or reimbursements in effect for that period; absent fee waivers and reimbursements, performance would have been lower. |
| | |
| 20 | | SEI Institutional Investments Trust / Annual Report / May 31, 2009 |
MANAGEMENT’S DISCUSSION AND ANALYSIS OF FUND PERFORMANCE
SEI INSTITUTIONAL INVESTMENTS TRUST — MAY 31, 2009
Enhanced LIBOR Opportunities Fund
Objective
Using multiple sub-advisers, the Enhanced LIBOR Opportunities Fund (the “Fund”) seeks to provide an enhanced return above the Merrill Lynch 3-Month Constant Maturity London Interbank Offered Rate (“LIBOR”).
Strategy
The Fund’s investment strategy focuses on generating absolute return through the management of securities in multiple asset classes, including currency management. The Fund’s managers employ security selection to invest in a diversified portfolio of short-duration investment-grade and non-investment-grade securities, including bank loans. Active currency management is also utilized to enhance long-term performance.
Analysis
For the twelve months ended May 31, 2009, the U.S. fixed-income market experienced one of its most turbulent periods on record. In 2008, the U.S. economy fell into recession when the sharp decline in housing prices and equity markets eroded consumer confidence and brought retail spending to a near standstill. The credit market seized up as illiquidity and stress in the financial system triggered a huge flight to U.S. Treasury securities and created a dysfunctional bond market. The market witnessed such unthinkable events as the nationalization of Fannie Mae and Freddie Mac, the takeovers of Bear Stearns, Merrill Lynch, Wachovia, Washington Mutual and Countrywide Savings & Loan, the cataclysmic bankruptcy of Lehman Brothers, and the collapse of one of the nation’s largest money-market funds. In response to this unprecedented global financial crisis, the Federal Reserve (“Fed”) reacted aggressively to cut the federal funds rate to near zero. Additionally, the Fed and the Treasury Department launched a quantitative easing campaign to promote liquidity and restore market confidence. In 2009, thanks to the accommodative government efforts, the pace of economic contraction slowed and credit markets started to recover. Liquidity conditions and market sentiment significantly improved, evidenced by an increase in corporate bond issuance, a narrowing of yield spreads in the agency mortgage sector, a retreat of inter-bank lending rates and improving equity markets. Encouraged by these events, investors increased their
risk appetites and moved away from Treasury securities, driving a credit rally across all fixed-income spread sectors. Improved capital market sentiment was accompanied by a notable increase in longer-term Treasury yields, as 10-year Treasury yields approached 4% and 30-year yields neared 4.5%. The rise in yields was also driven by unprecedented increases in Treasury issuance and rising fears of inflation.
The Fund returned -22.20% for the twelve months ended May 31, 2009, compared to 2.67% for the Merrill Lynch 3-Month Constant Maturity London Interbank Offered Rate, its benchmark. During the period, enhanced-cash, bank-loan and currency strategies all detracted from performance.
Due to the strong flight to safety in 2008, the Fund’s large allocation to spread sectors underperformed, particularly Non-Agency Mortgage-Backed Securities (“MBS”), Commercial Mortgage-Backed Securities, and senior bank loans. The heavy exposure to Non-Agency MBS was the largest detractor. Although these securities experienced significant price volatility in 2008, most of the securities in the portfolio were well-seasoned, short-average-life securities at the top of the capital structure, which provided excellent default and loss protection.
The Fund’s allocation of roughly 30% to senior bank loans was the other major detractor from performance in 2008. Valuations in these below-investment-grade instruments fell dramatically during the period despite their seniority in the capital structure, reflecting increased concerns about economic strength and corporate profitability. As the New Year began, the bank-loan sector rallied significantly as stronger demand overwhelmed the dearth of supply. The bank-loan market still appears attractive versus historical valuations as the average par-value-weighted loan price remains approximately 14% below the previous cycle’s low. Finally, the Fund’s currency strategy hurt performance during the period due to an increase in volatility and underperformance of higher-yielding currencies. In March 2009, we eliminated the currency strategy, as it became highly correlated with other strategies and the opportunities presented were not as attractive.
During 2009, there has been a broad recovery for the spread sectors, largely due to government initiatives aimed at improving liquidity conditions. The Fund has enjoyed a notable advantage in return on its
| | |
| SEI Institutional Investments Trust / Annual Report / May 31, 2009 | | 21 |
MANAGEMENT’S DISCUSSION AND ANALYSIS OF FUND PERFORMANCE
SEI INSTITUTIONAL INVESTMENTS TRUST — MAY 31, 2009
Enhanced LIBOR Opportunities Fund (Concluded)
benchmark so far, but has yet to recapture its significant underperformance from the calamity of 2008. Looking forward, although economic conditions remain uncertain, the Fund offers attractive value and a large income advantage for its investors. Continued improvement in capital market sentiment will also provide upside return as pricing recovers in stressed sectors of the market.
Enhanced LIBOR Opportunities Fund
AVERAGE ANNUAL TOTAL RETURN1
| | | | |
| | | One Year
Return | | Annualized
Inception
to Date |
| Enhanced LIBOR Opportunities Fund, Class A | | (22.20)% | | (10.81)% |
Comparison of Change in the Value of a $100,000 Investment in the Enhanced LIBOR Opportunities Fund, versus the Merrill Lynch 3-Month Constant-Maturity LIBOR
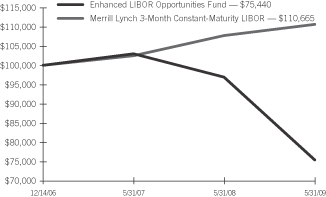
| | 1 | | For the period ended May 31, 2009. Past performance is not an indication of future performance. Class A shares were offered beginning 12/14/06. Returns shown do not reflect the deduction of taxes that a shareholder would pay on fund distributions or the redemption of fund shares. The returns for certain periods reflect fee waivers and/or reimbursements in effect for that period; absent fee waivers and reimbursements, performance would have been lower. |
| | |
| 22 | | SEI Institutional Investments Trust / Annual Report / May 31, 2009 |
MANAGEMENT’S DISCUSSION AND ANALYSIS OF FUND PERFORMANCE
SEI INSTITUTIONAL INVESTMENTS TRUST — MAY 31, 2009
Core Fixed Income Fund
Objective
The Core Fixed Income Fund (“the Fund”) seeks to provide current income consistent with the preservation of capital.
Strategy
The Fund’s investment strategy focuses on sector rotation, both among and within sectors, and issue selection. Risk is principally controlled by explicitly limiting the Fund’s interest rate exposure relative to the Barclays Capital U.S. Aggregate Bond Index. The Fund’s sub-advisers focus on four key areas in determining portfolio structure: duration weighting, term structure, sector allocation, and issue selection. While the duration and term structure decisions underlie the implementation process, the sub-advisers primarily concentrate on sector and issue selection to add value. In addition, the sub-advisers may use derivatives for tactical hedging purposes and to implement portfolio strategies more efficiently.
Analysis
For the twelve months ended May 31, 2009, the U.S. fixed-income market experienced perhaps one of its most turbulent periods on record. In 2008, the U.S. economy fell into recession when the sharp decline in housing prices and equity markets eroded consumer confidence and brought retail spending to a near standstill. The credit market seized up as illiquidity and stress in the financial system triggered a huge flight to U.S. Treasury securities and created a dysfunctional bond market. The market witnessed such unthinkable events as the nationalization of Fannie Mae and Freddie Mac, the takeovers of Bear Stearns, Merrill Lynch, Wachovia, Washington Mutual and Countrywide Savings & Loan, the cataclysmic bankruptcy of Lehman Brothers and the collapse of one of the nation’s largest money-market funds. In response to this unprecedented global financial crisis, the Federal Reserve (“Fed”) reacted aggressively to cut the federal funds rate to near zero. Additionally, the Fed and the Treasury Department launched a quantitative easing campaign to promote liquidity and restore market confidence. In 2009, thanks to the accommodative government efforts, the pace of economic contraction slowed and credit markets started to recover. Liquidity conditions and market sentiment significantly improved, evidenced by an increase in corporate bond issuance, a narrowing of yield spreads
in the agency mortgage sector, a retreat of inter-bank lending rates, and improving equity markets. Encouraged by these events, investors increased their risk appetites and moved away from Treasury securities, driving a credit rally across all fixed-income spread sectors. Improved capital market sentiment was accompanied by a notable increase in longer-term Treasury yields, as 10-year Treasury yields approached 4% and 30-year yields neared 4.5%. The rise in yields was also driven by unprecedented increases in Treasury issuance and rising fears of inflation.
For the fiscal year ended May 31, 2009, the Fund returned 1.85% versus 5.37% for its benchmark the Barclays Capital U.S. Aggregate Bond Index. The Fund’s overweight position in Mortgage-Backed Securities (“MBS”), particularly Non-Agency MBS, was the primary source of underperformance for the period. The Fund maintained a modest underweight to the Corporate sector for the first half of the period, which was advantageous as yield spreads widened in this sector. However, overweight exposure to BBB-rated securities and security selection within the Financials sector had a negative impact on return. The Fund was positioned with a yield-curve-steepening bias for the majority of the period, which added to relative performance as the Fed eased rates and yields fell. The success of the interest-rate strategy, however, was not enough to offset the large underperformance in the mortgage sector. As market conditions began to improve during the first half of 2009, the Fund’s relative and absolute returns improved significantly; however, it has yet to recapture its shortfall in relative performance from the calamity of 2008. Looking forward, although economic conditions remain uncertain, the portfolio offers attractive value and a large income advantage for investors. Continued improvement in capital market sentiment will also provide upside return as pricing recovers in the stressed sectors of the market.
| | |
| SEI Institutional Investments Trust / Annual Report / May 31, 2009 | | 23 |
MANAGEMENT’S DISCUSSION AND ANALYSIS OF FUND PERFORMANCE
SEI INSTITUTIONAL INVESTMENTS TRUST — MAY 31, 2009
Core Fixed Income Fund (Concluded)
Core Fixed Income Fund
AVERAGE ANNUAL TOTAL RETURN1
| | | | | | | | | | |
| | | One Year
Return | | Annualized
3 Year
Return | | Annualized
5 Year
Return | | Annualized
10 Year
Return | | Annualized
Inception
to Date |
| Core Fixed Income Fund, Class A | | 1.85% | | 4.61% | | 4.08% | | 5.44% | | 6.03% |
Comparison of Change in the Value of a $100,000 Investment in the Core Fixed Income Fund, versus the Barclays Aggregate Bond Index
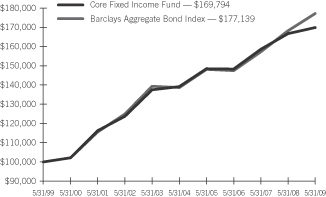
| | 1 | | For the period ended May 31, 2009. Past performance is not an indication of future performance. Class A shares were offered beginning 6/14/96. Returns shown do not reflect the deduction of taxes that a shareholder would pay on fund distributions or the redemption of fund shares. The returns for certain periods reflect fee waivers and/or reimbursements in effect for that period; absent fee waivers and reimbursements, performance would have been lower. |
| | |
| 24 | | SEI Institutional Investments Trust / Annual Report / May 31, 2009 |
MANAGEMENT’S DISCUSSION AND ANALYSIS OF FUND PERFORMANCE
SEI INSTITUTIONAL INVESTMENTS TRUST — MAY 31, 2009
High Yield Bond Fund
Objective
The High Yield Bond Fund (“the Fund”) seeks to maximize total return by investing primarily in a diversified portfolio of higher-yielding, lower-rated fixed-income securities.
Strategy
Under normal circumstances, the Fund will invest at least 80% of its net assets in high-yield fixed-income securities. The Fund will invest primarily in fixed-income securities rated below investment grade (“junk bonds”), including corporate bonds and debentures, convertible and preferred securities and zero-coupon obligations. The Fund uses a multi-manager approach, relying on a number of sub-advisors with differing investment philosophies to manage portions of the Fund’s portfolio under the general supervision of SEI Investments Management Corporation (“SIMC”). To a limited extent, SIMC may also directly manage a portion of the Fund’s portfolio, selecting securities that offer a high current yield as well as total return potential. The Fund’s securities are diversified as to issuers and industries. The Fund’s average weighted maturity may vary and will generally not exceed ten years. There is no limit placed on the maturity or credit quality of any security. The Fund will invest primarily in securities rated BB, B, CCC, CC, C and D. However, it may also invest in investment-grade (AAA, AA, A and BBB) or non-rated securities.
Analysis
For the fiscal year ended May 31, 2009, the high-yield market, as measured by the Fund’s benchmark, the Merrill Lynch High Yield Master II Constrained Index, declined 8.29%, and the leveraged loan market, as measured by the Credit Suisse Leveraged Loan Index, fell 11.14%. During calendar-year 2008, the high-yield bond market returned -26.11%, which was easily the all-time worst calendar year return on record, surpassing the previous record of -5.20% set in 2000. For the fiscal period, credit quality spreads widened 524 basis points to finish the period at 1,171 basis points, down significantly from the peak of 2,168 basis points reached in December 2008. The Moody’s global issuer default rate increased substantially from 1.88% to 9.23%, which is above the 4.72% 20-year average, but below the prior peak in default rates of 10.89% from the last credit downturn in
January 2002. The outlook for defaults remains grim; Moody’s anticipates the rate to peak at 13.5% in November 2009, and Standard & Poor’s expects the rate to reach 14.3% in April 2010. Issuance in the primary market was relatively quiet over the period, with $77.2 billion coming to market compared to an average of $112.7 billion per year since 1997. High-yield mutual funds received little interest from investors when the fiscal year began, but inflows turned sharply positive to end the period, as $14.7 billion flowed into high-yield funds during the first five months of 2009, totaling $16.3 billion for the fiscal year. Strong demand for the asset class, combined with a limited amount of new supply, led to improved technical conditions that helped propel a 38.51% rally from December 12, 2008 through May 31, 2009. For the fiscal year, higher-quality securities outperformed their lower-quality counterparts, as investors became more defensive over the period, with BBs posting a return of -2.59%, followed by Bs at -12.79%, and CCCs at -18.35%.
From a sector perspective, the Printing/Publishing and Forestry/Paper sectors were the worst-performing sectors in high yield on a contribution-to-return basis, as both experienced a large share of defaults (R.H. Donnelley, Idearc, Smurfit-Stone, Bowater), which led to underperformance. Another poor performer was the Gaming sector, as casino operators are struggling to stay afloat in this recession due to a sharp decline in discretionary spending that resulted in a precipitous drop in gambling revenues. The best-performing sector on a contribution-to-return basis was the Banking sector, which has sharply grown in size in 2009 due to the inclusion of GMA, after the Federal Reserve approved its bank holding company application, and the recent additions of several fallen angels as part of the index’s month-end rebalance. Other notable additions have been hybrid securities from the large money-center banks of Bank of America and Citigroup, as well as debt securities from AIG and CIT Group. This sector has outperformed in recent months as there are early signs of stabilization and recovery in the global Financials sector. The Auto Loans sector was the second-best performer, benefiting from a multitude of positive actions taken by the government to support these companies.
The Fund trailed the index with a -13.79% return during the period, compared to the Merrill Lynch High Yield Master II Constrained Index,
| | |
| SEI Institutional Investments Trust / Annual Report / May 31, 2009 | | 25 |
MANAGEMENT’S DISCUSSION AND ANALYSIS OF FUND PERFORMANCE
SEI INSTITUTIONAL INVESTMENTS TRUST — MAY 31, 2009
High Yield Bond Fund (Concluded)
which declined 8.29%. Major detractors during the period were
underweights to General Motors Acceptance Corporation (“GMAC”) and Ford Motor Credit (“FMC”), and an overweight to Simmons. Positive developments for GMAC and FMC began in the second half of December and have continued in 2009. In December, the government decided to lend money to General Motors (“GM”). Then, the Fed approved GMAC’s application to become a bank holding company, and the Treasury followed up with a $5 billion preferred investment in GMAC. Furthermore, the government has announced that as part of the Chrysler reorganization, GMAC will take over the functions of Chrysler’s auto-loan arm and receive a fresh $7.5 billion in cash to facilitate its continued lending to car buyers and dealers of bankrupt Chrysler LLC as well as to those of GM. The combination of all of these government actions taken to support the industry led to outperformance for both auto-loan companies. Additionally, Ford’s efforts to strengthen its balance sheet boosted performance. The company was able to reduce automotive debt by 38%, or $9.9 billion, through a buyback of bonds and loans. The Fund’s underweight to these two auto-loan companies had a negative impact on performance. The Fund’s overweight to Simmons was also a detractor as the bedding industry suffered from reduced demand and increased costs for fuel and raw materials. These negative factors caused Simmons to reduce its earnings estimate, and the rating agencies have recognized this, downgrading the company several times throughout the period due to the company’s diminished financial flexibility and high leverage.
The major contributors to the Fund’s performance during the period were positive security selection in GM and Charter Communications, and an underweight to Washington Mutual. Both GM and Charter struggled throughout the year and ultimately filed for bankruptcy. The restructuring plans of both companies had adverse affects on the prices of securities within each firm’s capital structure, but the Fund benefited from the positive security selection decisions that were made. The Fund’s lack of exposure to Washington Mutual also lifted relative performance as regulators declared the company failing and unstable after a panicky depositor run on the banking unit and arranged to sell its branch network and other valuable assets to JPMorgan.
High Yield Bond Fund
AVERAGE ANNUAL TOTAL RETURN1
| | | | | | |
| | | One Year
Return | | Annualized
3 Year
Return | | Annualized
Inception
to Date |
| High Yield Bond Fund, Class A | | (13.79)% | | (2.00)% | | (0.38)% |
Comparison of Change in the Value of a $100,000 Investment in the High Yield Bond Fund, versus the Merrill Lynch US High Yield Master II Constrained Index
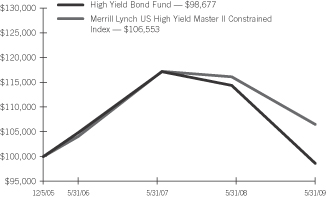
| | 1 | | For the period ended May 31, 2009. Past performance is not an indication of future performance. Class A shares were offered beginning 12/05/05. Returns shown do not reflect the deduction of taxes that a shareholder would pay on fund distributions or the redemption of fund shares. The returns for certain periods reflect fee waivers and/or reimbursements in effect for that period; absent fee waivers and reimbursements, performance would have been lower. |
| | |
| 26 | | SEI Institutional Investments Trust / Annual Report / May 31, 2009 |
MANAGEMENT’S DISCUSSION AND ANALYSIS OF FUND PERFORMANCE
SEI INSTITUTIONAL INVESTMENTS TRUST — MAY 31, 2009
Long Duration Fund
Objective
The Long Duration Fund (the “Fund”) seeks to duplicate the return characteristics of high-quality corporate bonds with a duration range of 10-13 years.
Strategy
The Fund’s investment strategy is designed to aid investors, especially corporate pension plans, with asset and liability management in order to reduce funding status volatility caused by changes in interest rates. The Fund seeks to duplicate the risk and return characteristics of a long fixed-income securities portfolio with an approximate duration of 10 to 13 years by using cash bonds and derivative securities, including interest-rate swap agreements and Treasury futures contracts, for the purpose of managing the overall duration of the Fund. Additionally, the Fund will invest in other fixed-income securities, including U.S. agency, corporate and structured securities, to produce incremental return. Due to its long duration or interest-rate sensitivity, the Fund may experience large positive and negative absolute returns depending on changes in interest rates.
Analysis
For the twelve months ended May 31, 2009, the U.S. fixed-income market experienced perhaps one of its most turbulent periods on record. In 2008, the U.S. economy fell into recession when the sharp decline in housing prices and equity markets eroded consumer confidence and brought retail spending to a near standstill. The credit market seized up as illiquidity and stress in the financial system triggered a huge flight to U.S. Treasury securities and created a dysfunctional bond market. The market witnessed such unthinkable events as the nationalization of Fannie Mae and Freddie Mac, the takeovers of Bear Stearns, Merrill Lynch, Wachovia, Washington Mutual and Countrywide Savings & Loan, the cataclysmic bankruptcy of Lehman Brothers, and the collapse of one of the nation’s largest money-market funds. In response to this unprecedented global financial crisis, the Federal Reserve (“Fed”) reacted aggressively to cut the federal funds rate to near zero. Additionally, the Fed and the Treasury Department launched a quantitative easing campaign to promote liquidity and restore market confidence. In 2009, thanks to the accommodative government efforts, the pace of economic
contraction slowed and credit markets started to recover. Liquidity conditions and market sentiment significantly improved, evidenced by an increase in corporate bond issuance, a narrowing of yield spreads in the agency mortgage sector, a retreat of inter-bank lending rates, and improving equity markets. Encouraged by these events, investors increased their risk appetites and moved away from Treasury securities, driving a credit rally across all fixed-income spread sectors. Improved capital market sentiment was accompanied by a notable increase in longer-term Treasury yields, as 10-year Treasury yields approached 4% and 30-year yields neared 4.5%. The rise in yields was also driven by unprecedented increases in Treasury issuance and rising fears of inflation.
For the fiscal year ended May 31, 2009, the Fund returned -3.89% compared to 14.79% for its benchmark, the Barclays 15 year Bellweather Swap Index. The Fund’s performance suffered during the period as yield spreads widened to unprecedented levels for many of the non-Treasury sectors of the market. The primary source of underperformance came from the portfolio’s significant allocation to mortgage- and asset-backed securities, which were the worst-performing sectors of the fixed-income market during the period. While these holdings were primarily in senior positions in the capital structure, pricing in all sectors of the mortgage market, particularly the non-agency sectors, suffered as liquidity deteriorated. The portfolio’s corporate allocation also detracted from performance as yield spreads widened in this sector due to poor liquidity and increased concerns about economic strength and corporate profitability.
In early 2009, the Fund implemented a revised investment strategy that focuses more exclusively on long-duration Treasury, agency and corporate obligations and relies less on interest-rate swaps and other derivatives as a source of duration. This strategy was designed to reduce exposure to swaps, which had performed quite well in 2008 but were vulnerable to a reversal of market conditions, as well as to emphasize corporate exposure, which has a stronger correlation to most pension-fund liabilities. This strategy has proved successful in early 2009 as corporate bonds have performed quite well due to an improvement in investor sentiment and market liquidity.
| | |
| SEI Institutional Investments Trust / Annual Report / May 31, 2009 | | 27 |
MANAGEMENT’S DISCUSSION AND ANALYSIS OF FUND PERFORMANCE
SEI INSTITUTIONAL INVESTMENTS TRUST — MAY 31, 2009
Long Duration Fund (Concluded)
Long Duration Fund
AVERAGE ANNUAL TOTAL RETURN1
| | | | | | | | |
| | | One Year
Return | | Annualized
3 Year
Return | | Annualized
5 Year
Return | | Annualized
Inception
to Date |
| Long Duration Fund, Class A | | (3.89)% | | (0.40)% | | 1.36% | | 0.97% |
Comparison of Change in the Value of a $100,000 Investment in the Long Duration Fund, versus the Barclays Long US Treasury Index, and the Barclays 15 Year Bellweather Swap Index
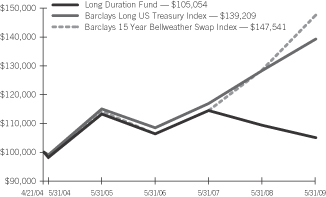
| | 1 | | For the period ended May 31, 2009. Past performance is not an indication of future performance. Class A shares were offered beginning 4/21/04. Returns shown do not reflect the deduction of taxes that a shareholder would pay on fund distributions or the redemption of fund shares. The returns for certain periods reflect fee waivers and/or reimbursements in effect for that period; absent fee waivers and reimbursements, performance would have been lower. |
| | 2 | | The Lehman 15 Year Bellweather Swap Index is the most appropriate measure of the Fund’s performance. |
| | |
| 28 | | SEI Institutional Investments Trust / Annual Report / May 31, 2009 |
MANAGEMENT’S DISCUSSION AND ANALYSIS OF FUND PERFORMANCE
SEI INSTITUTIONAL INVESTMENTS TRUST — MAY 31, 2009
Emerging Markets Debt Fund
Objective
The Emerging Markets Debt Fund (the “Fund”) seeks to maximize total return.
Strategy
Under normal circumstances, the Fund will invest at least 80% of its net assets in fixed-income securities of emerging-market issuers. The Fund will invest primarily in U.S.-dollar-denominated debt securities of government, government-related and corporate issuers in emerging-market countries, as well as entities organized to restructure the outstanding debt of such issuers. The Fund uses a multi-manager approach, relying upon a number of sub-advisors with differing investment philosophies to manage portions of the Fund’s portfolio under the general supervision of SEI Investments Management Corporation (“SIMC”). The sub-advisors will spread the Fund’s holdings across a number of countries and industries to limit its exposure to a single emerging-market economy. There are no restrictions on the Fund’s average portfolio maturity or on the maturity of any specific security. There is not a minimum rating standard for the Fund’s securities, and the Fund’s securities will generally be in the lower or lowest rating categories (including those below investment grade, commonly referred to as “junk bonds”).
Analysis
The Fund underperformed the market during the twelve-month period ended May 31, 2009, returning -3.55% vs. -1.32% for its benchmark, the J.P. Morgan EMBI Global Diversified Index. At the start of the period, emerging-markets debt appeared to have avoided the effects of market deterioration as higher commodity prices and strong economic growth countered fears of a global recession. Russia’s conflict with Georgia in August 2008 sparked concerns within the asset class, but it wasn’t until the U.S. government’s takeover of Fannie Mae and Freddie Mac and the collapse of Lehman Brothers that emerging-markets debt felt the effects of the global financial crisis. As fears of a global recession rose, commodity prices declined on falling demand and the credit crisis intensified. In September and October, the market returned -6.68% and -16.03%, respectively, and on October 24, the market attained its lowest point of the year, returning -27.84%. At their 2008 peak, spreads reached 901 basis
points, levels not seen since the Argentine default in 2002, which were 739 basis points wider than the all-time tightest levels for the asset class reached in June 2007. Ratings agencies took action and issued various downgrades across all regions and sectors of the asset class, including Russia, Hungary and Argentina. Emerging-markets debt eventually stabilized in mid-December after negative sentiment abated, enabling it to produce a 7.5% return for the month, its highest monthly return in 2008. Attractive spread valuations, International Monetary Fund (“IMF”) bailout packages, and massive government intervention lured investors back into the asset class, and liquidity began to improve significantly.
After experiencing one of the worst performing quarters in emerging-markets history, positive momentum experienced in December carried into the first quarter of 2009, with central banks slashing rates in an attempt to improve credit conditions and spur growth. The biggest story came over speculation that the IMF’s involvement in assisting nations experiencing significant deterioration would drastically increase. This proved true at the G-20 Summit, as world leaders pledged more than $1 trillion in emergency aid; a new Flexible Credit Line (“FCL”) was also implemented and geared as an insurance policy to higher-quality countries. The $250 billion FCL allotment reserved for these countries provided an additional cushion and resulted in significant spread tightening.
While emerging markets are likely to experience slower growth, they are still expected to outperform the struggling developed markets where fiscal deficits continue to rise as a result of stimulus packages and government support. Technicals have improved and flows continue to enter the asset class on renewed interest in higher-yielding assets. Sovereigns took advantage of the improved market tone and came to market with $17 billion of new issuance in the first quarter, largely among higher-quality credits. That number drastically increased after the G-20 summit and totaled over $50 billion year-to-date through May. Issuance in the corporate market had been non-existent until Gazprom, Russia’s energy giant, came to market as the country’s first company to issue dollar debt since July 2008. New issuance combined with emergency lending from the IMF and other multilateral agencies helped sustain positive momentum in the market.
| | |
| SEI Institutional Investments Trust / Annual Report / May 31, 2009 | | 29 |
MANAGEMENT’S DISCUSSION AND ANALYSIS OF FUND PERFORMANCE
SEI INSTITUTIONAL INVESTMENTS TRUST — MAY 31, 2009
Emerging Markets Debt Fund (Concluded)
The largest detractor from the Fund’s relative performance over the period was an overweight position in Argentina. Argentine debt continued to plunge in the fourth quarter over investor concerns that the government will nationalize the pension system and use those assets to service the country’s debt. This, along with falling commodity prices, an ongoing dispute with the government and farmers over export taxes, and poor fiscal policies, resulted in significant spread widening and implied default valuations. An overweight to Russia also hurt relative performance as a highly-levered corporate sector caused investors to reduce their holdings in Russian assets, leaving its economy exposed as it relied heavily on external financing to support growth. These events, along with price declines in oil, the country’s largest export, resulted in a 35% reduction in international reserves used to stabilize a weakening ruble. Also hurting relative performance was selection in the corporate market, where spreads widened to over 1,000 basis points. Most emerging-markets corporate bonds have a shorter life and, as they begin to mature in the very near future, refinancing the debt could prove difficult.
The Fund’s underweight to Ecuador added to performance as the government threatened and eventually announced a default on its global bonds. While Ecuador is able to meet the payment from a fiscal standpoint, the government decided not to service the debt, which came as a surprise to many. Falling oil prices negatively impact Ecuador’s fiscal position, as oil is the country’s largest export and biggest contributor to government revenues. An overweight to Brazil assisted performance, as the country was better positioned to withstand the crisis than its regional counterparts. The central bank also slashed rates to encourage spending and help spur growth. An
overweight position in Ukraine also added to relative performance as government leaders resolved some of their differences and met the IMF’s conditions in order to receive the second tranche of its $16 billion loan.
Emerging Markets Debt Fund
AVERAGE ANNUAL TOTAL RETURN1
| | | | | | |
| | | One Year
Return | | Annualized
3 Year
Return | | Annualized
Inception
to Date |
| Emerging Markets Debt Fund, Class A | | (3.55)% | | 5.34% | | 4.88% |
Comparison of Change in the Value of a $100,000 Investment in the Emerging Markets Debt Fund, versus the J.P. Morgan EMBI Global Diversified Index
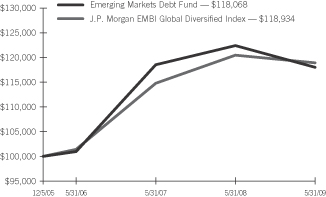
| | 1 | | For the period ended May 31, 2009. Past performance is not an indication of future performance. Class A shares were offered beginning 12/05/05. Returns shown do not reflect the deduction of taxes that a shareholder would pay on fund distributions or the redemption of fund shares. The returns for certain periods reflect fee waivers and/or reimbursements in effect for that period; absent fee waivers and reimbursements, performance would have been lower. |
| | |
| 30 | | SEI Institutional Investments Trust / Annual Report / May 31, 2009 |
MANAGEMENT’S DISCUSSION AND ANALYSIS OF FUND PERFORMANCE
SEI INSTITUTIONAL INVESTMENTS TRUST — MAY 31, 2009
Real Return Fund
Objective
The Real Return Fund (formerly known as “Real Return Plus Fund”) (the “Fund”) seeks to maximize total return relative to the Barclays Capital 1-5 Year U.S. Treasury Inflation Notes Index.
Strategy
The Fund uses a multi-manager approach under the general supervision of SEI Investments Management Corporation (“SIMC”), allocating the assets among multiple sub-advisors using different investment strategies designed to produce a total return that exceeds the rate of inflation in the U.S. To a limited extent, SIMC may also directly manage a portion of the Fund’s portfolio. Under normal circumstances, the Fund will invest primarily in investment-grade securities, including inflation-indexed bonds of varying maturities issued by the U.S. Treasury, other U.S. government agencies and instrumentalities and non-government entities such as corporations. An inflation-indexed bond is a bond that is structured so that its principal value will change with inflation. The Fund may also invest in other financial instruments or use other investment techniques to seek to obtain market exposure to the securities in which the Fund primarily invests.
Market Review
For the 12 months ended May 31, 2009, the U.S. fixed-income market experienced one of its most turbulent periods on record. In 2008, the U.S. economy fell into recession when the sharp decline in housing prices and equity markets eroded consumer confidence and brought retail spending to a near standstill. The credit market seized up as illiquidity and stress in the financial system triggered a huge flight to U.S. Treasury securities and created a dysfunctional bond market. The market witnessed such unthinkable events as the nationalization of Fannie Mae and Freddie Mac, the takeovers of Bear Stearns, Merrill Lynch, Wachovia, Washington Mutual and Countrywide Savings & Loan, the cataclysmic bankruptcy of Lehman Brothers, and the collapse of one of the nation’s largest money-market funds. In response to this unprecedented global financial crisis, the Federal Reserve (“Fed”) reacted aggressively to cut the federal funds rate to near zero. Additionally, the Fed and the Treasury Department launched a quantitative easing campaign to promote liquidity and
restore market confidence. In 2009, thanks to the accommodative government efforts, the pace of economic contraction slowed and credit markets started to recover. Liquidity conditions and market sentiment significantly improved, evidenced by an increase in corporate bond issuance, a narrowing of yield spreads in the agency mortgage sector, a retreat of inter-bank lending rates and improving equity markets. Encouraged by these events, investors increased their risk appetites and moved away from Treasury securities, driving a credit rally across all fixed-income spread sectors. Improved capital market sentiment was accompanied by a notable increase in longer-term Treasury yields, as 10-year Treasury yields approached 4% and 30-year yields neared 4.5%. The rise in yields was also driven by unprecedented increases in Treasury issuance and rising fears of inflation.
Portfolio Review and Outlook
For the majority of the 12 month period ended May 31, 2009 (prior to an investment objective and strategy change in May 2009), the Fund operated under its prior investment objective in which it sought to maximize total return relative to the Barclays Capital 1-10 Year U.S. Treasury Inflation Notes Index via overlay investment by Global Tactical Asset Allocation (“GTAA”) managers.
In May 2009, SEI decided that it would forego combining GTAA and passive Treasury Inflation-Protected Securities (“TIPS”) management in favor of an active TIPS strategy without GTAA overlay. The Fund’s name was changed to the Real Return Fund, and its benchmark was changed to the Barclays Capital 1-5 Year U.S. TIPS Index. By moving to TIPS within a shorter maturity range, there should be comparable inflation protection with less volatility, which corresponds to the Fund’s goal of providing an inflation-protected, low-risk anchor for the overall portfolio.
Prior to the May 2009 objective and strategy change, the Fund’s investment strategy focused on providing passive implementation of the Barclays Capital 1-10 Year U.S. Treasury Inflation Notes Index and then seeking active management performance through GTAA management. GTAA investment strategies involve directional bets in the relative performance of equity markets, bond markets and currencies among both developed and emerging countries. Risk in the strategy is controlled at three levels. First, each manager
| | |
| SEI Institutional Investments Trust / Annual Report / May 31, 2009 | | 31 |
MANAGEMENT’S DISCUSSION AND ANALYSIS OF FUND PERFORMANCE
SEI INSTITUTIONAL INVESTMENTS TRUST — MAY 31, 2009
Real Return Fund (Concluded)
diversifies within its individual strategy to provide risk control. Second, the manager selection process enhances diversification through the selection of managers with different styles. Third, the GTAA component of the strategy itself is sized to provide long-term GTAA alpha while preserving the inflation beta of the TIPS.
The Fund trailed its benchmark by 21 basis points, declining by 0.17% for the 12 months ended May 31, 2009, compared to an increase of 0.04% for its benchmark the Barclays Capital 1-10 Year U.S. Treasury Inflation Notes Index.
Deflationary concerns in the wake of sell-offs in the global equity markets during the second half of 2008 were replaced by a flight to inflationary safe havens in response to massive fiscal stimulus spending, increasing government debt issuances, and central bank monetizing of debt later in the fiscal year.
The Fund’s GTAA managers experienced a challenging environment for the fiscal year. Generally speaking, currency selection proved to be the most consistent positive contributor to performance, as increasing risk aversion and a flight to liquidity benefited safe-haven currencies. Country selection within equities provided mixed results for much of the year, as poor performance in relative valuation was offset by stronger performance in flow-based and macroeconomic factors.
In fixed income, country and asset class selection suffered, as most global Treasury markets rose, counter to valuation indicators; investors fled to safe havens in the face of increasing equity volatility. Bond markets, particularly in the latter half of 2008, exhibited unusual characteristics where markets yielding above historical norms underperformed markets with suppressed yields.
For the passive TIPS strategy, the manager bought securities based on the Fund’s benchmark. Performance from this strategy was similar to the index.
Real Return Fund
AVERAGE ANNUAL TOTAL RETURN1
| | | | |
| | | One Year
Return | | Annualized
Inception
to Date |
| Real Return Fund, Class A | | (0.17)% | | 6.10% |
Comparison of Change in the Value of a $100,000 Investment in the Real Return Fund, versus the Barclays 1-5 Year US TIPS Index, and the Barclays 1-10 Year US TIPS Index
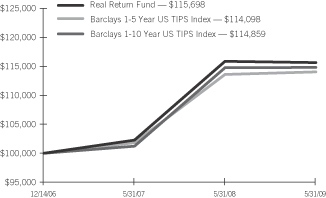
| | 1 | | For the period ended May 31, 2009. Past performance is not an indication of future performance. Class A shares were offered beginning 12/14/06. Returns shown do not reflect the deduction of taxes that a shareholder would pay on fund distributions or the redemption of fund shares. The returns for certain periods reflect fee waivers and/or reimbursements in effect for that period; absent fee waivers and reimbursements, performance would have been lower. |
| | |
| 32 | | SEI Institutional Investments Trust / Annual Report / May 31, 2009 |
SCHEDULE OF INVESTMENTS
Large Cap Fund
May 31, 2009
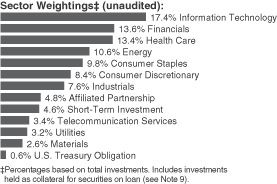
| | | | | |
| Description | | Shares | | Market Value
($ Thousands) |
| | | | | |
| | |
COMMON STOCK — 94.3% | | | | | |
| | |
Consumer Discretionary — 8.8% | | | | | |
Advance Auto Parts | | 4,600 | | $ | 196 |
Aeropostale* | | 4,300 | | | 149 |
Amazon.com* (A) | | 24,300 | | | 1,895 |
American Eagle Outfitters | | 1,000 | | | 15 |
Ameristar Casinos | | 8,300 | | | 167 |
Apollo Group, Cl A* | | 10,700 | | | 632 |
Autoliv | | 4,000 | | | 111 |
AutoNation* | | 500 | | | 8 |
AutoZone* | | 2,587 | | | 394 |
Barnes & Noble (A) | | 4,300 | | | 106 |
Bed Bath & Beyond* | | 500 | | | 14 |
Best Buy | | 4,600 | | | 161 |
Big Lots* | | 1,000 | | | 23 |
Black & Decker | | 700 | | | 22 |
Blyth | | 1,700 | | | 56 |
BorgWarner | | 400 | | | 13 |
Brinker International | | 700 | | | 12 |
Cablevision Systems, Cl A | | 12,026 | | | 229 |
Career Education* | | 5,800 | | | 117 |
Carmax* | | 600 | | | 7 |
Carnival | | 600 | | | 15 |
CBS, Cl B | | 13,300 | | | 98 |
Centex | | 2,000 | | | 17 |
Charlotte Russe Holding* | | 6,300 | | | 64 |
Coach | | 44,110 | | | 1,159 |
Comcast, Cl A | | 150,117 | | | 2,067 |
Core-Mark Holding* | | 2,100 | | | 55 |
Darden Restaurants | | 3,100 | | | 112 |
Deckers Outdoor* | | 1,700 | | | 98 |
Dick’s Sporting Goods* | | 2,000 | | | 36 |
DIRECTV Group* (A) | | 22,100 | | | 497 |
DISH Network, Cl A* | | 41,800 | | | 686 |
Dollar Tree* | | 1,300 | | | 58 |
Domino’s Pizza* (A) | | 5,000 | | | 45 |
DR Horton | | 1,300 | | | 12 |
DreamWorks Animation SKG, Cl A* | | 3,600 | | | 100 |
Eastman Kodak (A) | | 177,900 | | | 464 |
Expedia* | | 600 | | | 11 |
| | | | | |
| Description | | Shares | | Market Value
($ Thousands) |
| | | | | |
Family Dollar Stores | | 8,600 | | $ | 260 |
Foot Locker | | 5,200 | | | 58 |
Ford Motor* | | 6,400 | | | 37 |
GameStop, Cl A* (A) | | 9,300 | | | 232 |
Gannett (A) | | 8,000 | | | 38 |
Gap | | 62,500 | | | 1,116 |
Garmin (A) | | 17,900 | | | 374 |
Gentex | | 500 | | | 6 |
Genuine Parts | | 3,758 | | | 126 |
Goodyear Tire & Rubber* (A) | | 5,500 | | | 63 |
Grand Canyon Education* | | 6,300 | | | 85 |
H&R Block | | 38,700 | | | 565 |
Hanesbrands* | | 300 | | | 5 |
Harley-Davidson (A) | | 10,900 | | | 185 |
Harman International Industries | | 1,300 | | | 24 |
Hasbro | | 28,500 | | | 724 |
Hillenbrand | | 1,500 | | | 26 |
Home Depot | | 40,700 | | | 943 |
International Game Technology | | 28,200 | | | 490 |
International Speedway, Cl A | | 8,300 | | | 206 |
| | | | | |
ITT Educational Services* | | 1,600 | | | 147 |
J.C. Penney | | 33,800 | | | 882 |
Jarden* | | 600 | | | 11 |
John Wiley & Sons, Cl A | | 400 | | | 13 |
Johnson Controls | | 13,016 | | | 260 |
KB Home | | 600 | | | 9 |
Kohl’s* | | 4,994 | | | 212 |
Landry’s Restaurants (A) | | 2,300 | | | 23 |
Leggett & Platt | | 24,700 | | | 363 |
Lennar, Cl A | | 4,800 | | | 46 |
Liberty Global, Cl A* (A) | | 2,474 | | | 34 |
Liberty Media - Capital, Ser A* | | 500 | | | 7 |
Liberty Media - Entertainment, Cl A* | | 7,500 | | | 181 |
Limited Brands (A) | | 59,200 | | | 740 |
Lincoln Educational Services* | | 5,900 | | | 109 |
Lowe’s | | 86,850 | | | 1,651 |
Macy’s | | 800 | | | 9 |
Magna International, Cl A | | 1,800 | | | 58 |
Marriott International, Cl A (A) | | 18,700 | | | 437 |
Mattel | | 800 | | | 13 |
McDonald’s | | 58,685 | | | 3,462 |
McGraw-Hill | | 31,900 | | | 960 |
Meredith | | 500 | | | 13 |
MGM Mirage* | | 2,300 | | | 17 |
Monro Muffler | | 2,100 | | | 56 |
Newell Rubbermaid | | 2,000 | | | 23 |
News, Cl A | | 56,200 | | | 550 |
NIKE, Cl B | | 53,180 | | | 3,034 |
Nordstrom | | 200 | | | 4 |
Office Depot* | | 900 | | | 4 |
Omnicom Group | | 20,100 | | | 613 |
O’Reilly Automotive* | | 2,300 | | | 83 |
Panera Bread, Cl A* (A) | | 900 | | | 48 |
Penn National Gaming* | | 1,400 | | | 46 |
| | |
| SEI Institutional Investments Trust / Annual Report / May 31, 2009 | | 33 |
SCHEDULE OF INVESTMENTS
Large Cap Fund (Continued)
May 31, 2009
| | | | | |
| Description | | Shares | | Market Value
($ Thousands) |
| | | | | |
PetSmart | | 9,600 | | $ | 195 |
Polo Ralph Lauren, Cl A | | 1,700 | | | 91 |
priceline.com* | | 100 | | | 11 |
Pulte Homes (A) | | 2,100 | | | 18 |
RadioShack | | 21,200 | | | 285 |
Regal Entertainment Group, Cl A | | 600 | | | 8 |
Ross Stores | | 20,400 | | | 799 |
Royal Caribbean Cruises | | 1,700 | | | 26 |
Scientific Games, Cl A* | | 2,500 | | | 45 |
Scripps Networks Interactive, Cl A | | 700 | | | 19 |
Sears Holdings* (A) | | 24,650 | | | 1,402 |
Shaw Communications, Cl B | | 9,700 | | | 169 |
Sherwin-Williams | | 4,925 | | | 260 |
Smith & Wesson Holding* (A) | | 19,700 | | | 104 |
Snap-On | | 1,817 | | | 57 |
Stanley Works | | 8,600 | | | 307 |
Staples (A) | | 88,100 | | | 1,802 |
Starbucks* | | 4,900 | | | 70 |
Starwood Hotels & Resorts Worldwide (A) | | 17,280 | | | 423 |
Strayer Education (A) | | 200 | | | 37 |
Sturm Ruger | | 1,300 | | | 15 |
Target | | 39,244 | | | 1,542 |
Texas Roadhouse, Cl A* | | 2,100 | | | 24 |
Tiffany | | 300 | | | 8 |
Tim Hortons | | 1,000 | | | 26 |
Time Warner | | 85,832 | | | 2,010 |
Time Warner Cable, Cl A | | 21,270 | | | 655 |
TJX (A) | | 28,600 | | | 844 |
Toll Brothers* | | 1,400 | | | 26 |
VF | | 3,759 | | | 214 |
Viacom, Cl B* | | 12,918 | | | 286 |
Virgin Media | | 9,100 | | | 79 |
Walt Disney | | 102,342 | | | 2,479 |
Weight Watchers International | | 38,500 | | | 902 |
Whirlpool (A) | | 10,700 | | | 451 |
Williams-Sonoma | | 2,500 | | | 32 |
Wyndham Worldwide | | 4,300 | | | 51 |
Wynn Resorts* | | 200 | | | 7 |
Yum! Brands | | 26,150 | | | 906 |
| | | | | |
| | | | | 46,287 |
| | | | | |
| | |
Consumer Staples — 10.2% | | | | | |
Altria Group | | 30,138 | | | 515 |
Archer-Daniels-Midland | | 59,300 | | | 1,632 |
Avon Products | | 30,620 | | | 813 |
BJ’s Wholesale Club* (A) | | 12,100 | | | 426 |
Brown-Forman, Cl B | | 7,075 | | | 310 |
Bunge (A) | | 6,900 | | | 436 |
Campbell Soup | | 36,000 | | | 998 |
Central European Distribution* | | 400 | | | 10 |
Chiquita Brands International* (A) | | 19,400 | | | 203 |
Church & Dwight | | 400 | | | 20 |
Clorox | | 9,900 | | | 519 |
Coca-Cola | | 109,721 | | | 5,394 |
| | | | | |
| Description | | Shares | | Market Value
($ Thousands) |
| | | | | |
Coca-Cola Enterprises | | 13,500 | | $ | 225 |
Colgate-Palmolive | | 34,126 | | | 2,251 |
ConAgra Foods | | 54,600 | | | 1,015 |
Constellation Brands, Cl A* | | 10,800 | | | 125 |
Corn Products International | | 16,700 | | | 441 |
Costco Wholesale | | 49,630 | | | 2,408 |
CVS Caremark | | 75,167 | | | 2,240 |
Dean Foods* | | 600 | | | 11 |
Del Monte Foods | | 48,000 | | | 393 |
Dr Pepper Snapple Group* | | 700 | | | 15 |
Energizer Holdings* | | 900 | | | 47 |
Estee Lauder, Cl A | | 2,100 | | | 70 |
General Mills | | 25,146 | | | 1,287 |
Hansen Natural* | | 1,100 | | | 40 |
Herbalife | | 7,100 | | | 207 |
Hershey | | 12,000 | | | 423 |
HJ Heinz (A) | | 14,007 | | | 512 |
JM Smucker | | 5,900 | | | 237 |
Kellogg | | 17,482 | | | 756 |
Kimberly-Clark | | 16,954 | | | 880 |
Kraft Foods, Cl A | | 64,884 | | | 1,694 |
Kroger | | 61,822 | | | 1,410 |
Lorillard | | 359 | | | 24 |
McCormick | | 1,781 | | | 54 |
Molson Coors Brewing, Cl B | | 1,200 | | | 53 |
NBTY* | | 400 | | | 10 |
Pepsi Bottling Group | | 26,500 | | | 871 |
PepsiAmericas | | 600 | | | 16 |
PepsiCo | | 85,817 | | | 4,467 |
Philip Morris International | | 20,538 | | | 876 |
Prestige Brands Holdings* | | 8,600 | | | 54 |
Procter & Gamble | | 192,847 | | | 10,016 |
Reynolds American | | 18,184 | | | 727 |
Safeway | | 75,300 | | | 1,526 |
Sara Lee | | 43,000 | | | 387 |
Smithfield Foods* (A) | | 1,200 | | | 15 |
Spartan Stores | | 8,900 | | | 110 |
Supervalu | | 31,400 | | | 521 |
Sysco | | 11,624 | | | 279 |
Tyson Foods, Cl A | | 6,500 | | | 87 |
Walgreen | | 58,200 | | | 1,734 |
Wal-Mart Stores | | 82,612 | | | 4,109 |
Whole Foods Market | | 800 | | | 15 |
| | | | | |
| | | | | 53,914 |
| | | | | |
| | |
Energy — 11.2% | | | | | |
Alpha Natural Resources* (A) | | 3,400 | | | 94 |
Anadarko Petroleum | | 15,400 | | | 736 |
Apache | | 4,900 | | | 413 |
Arch Coal | | 2,000 | | | 37 |
Baker Hughes | | 2,701 | | | 106 |
BJ Services | | 3,400 | | | 53 |
Cabot Oil & Gas | | 700 | | | 25 |
| | |
| 34 | | SEI Institutional Investments Trust / Annual Report / May 31, 2009 |
| | | | | |
| Description | | Shares | | Market Value
($ Thousands) |
| | | | | |
Cameron International* | | 40,858 | | $ | 1,276 |
Chesapeake Energy | | 14,300 | | | 324 |
Chevron | | 127,884 | | | 8,526 |
Cimarex Energy | | 4,500 | | | 147 |
ConocoPhillips | | 121,297 | | | 5,560 |
Consol Energy | | 1,200 | | | 49 |
Delek US Holdings | | 2,000 | | | 20 |
Denbury Resources* | | 4,600 | | | 79 |
Devon Energy | | 9,300 | | | 588 |
Diamond Offshore Drilling (A) | | 3,100 | | | 261 |
Dresser-Rand Group* | | 14,600 | | | 409 |
El Paso | | 1,600 | | | 16 |
Encore Acquisition* | | 2,400 | | | 85 |
ENSCO International | | 1,500 | | | 58 |
EOG Resources | | 20,400 | | | 1,493 |
Exterran Holdings* | | 3,900 | | | 78 |
Exxon Mobil | | 251,955 | | | 17,473 |
FMC Technologies* | | 700 | | | 29 |
Forest Oil* | | 700 | | | 13 |
Frontier Oil | | 3,100 | | | 54 |
Frontline (A) | | 2,600 | | | 61 |
Geokinetics* | | 1,300 | | | 17 |
Halliburton | | 92,920 | | | 2,131 |
Harvest Natural Resources* | | 3,900 | | | 21 |
Helix Energy Solutions Group* | | 500 | | | 6 |
Helmerich & Payne | | 300 | | | 10 |
Hess | | 9,473 | | | 631 |
Holly | | 4,800 | | | 116 |
Marathon Oil | | 63,164 | | | 2,014 |
Massey Energy (A) | | 2,300 | | | 53 |
Murphy Oil | | 9,400 | | | 555 |
Nabors Industries* | | 2,600 | | | 46 |
National Oilwell Varco* | | 2,444 | | | 94 |
Newfield Exploration* | | 500 | | | 18 |
Noble Energy | | 300 | | | 18 |
Occidental Petroleum | | 26,600 | | | 1,785 |
Oceaneering International* | | 700 | | | 36 |
Overseas Shipholding Group (A) | | 3,700 | | | 125 |
Patterson-UTI Energy | | 10,600 | | | 152 |
Peabody Energy | | 7,100 | | | 241 |
Petro-Canada | | 4,800 | | | 214 |
PetroHawk Energy* | | 6,300 | | | 159 |
Pioneer Natural Resources | | 2,100 | | | 59 |
Pride International* | | 3,000 | | | 73 |
Quicksilver Resources* | | 1,300 | | | 15 |
Range Resources | | 200 | | | 9 |
Schlumberger | | 67,236 | | | 3,848 |
SEACOR Holdings* | | 8,100 | | | 619 |
Smith International | | 2,900 | | | 85 |
Southern Union (A) | | 1,700 | | | 30 |
Southwestern Energy* | | 1,300 | | | 56 |
Spectra Energy | | 28,400 | | | 456 |
St. Mary Land & Exploration | | 1,800 | | | 39 |
Suncor Energy | | 15,314 | | | 542 |
| | | | | |
| Description | | Shares | | Market Value
($ Thousands) |
| | | | | |
Sunoco | | 12,500 | | $ | 380 |
Superior Energy Services* | | 2,400 | | | 55 |
Tesoro (A) | | 11,100 | | | 188 |
Tidewater | | 16,100 | | | 767 |
Transocean* | | 9,000 | | | 715 |
Unit* | | 300 | | | 10 |
Valero Energy | | 69,100 | | | 1,546 |
Walter Industries | | 2,000 | | | 65 |
Weatherford International* | | 29,400 | | | 609 |
Western Refining (A) | | 17,200 | | | 245 |
Whiting Petroleum* | | 2,000 | | | 94 |
Williams | | 5,200 | | | 87 |
XTO Energy | | 38,637 | | | 1,652 |
| | | | | |
| | | | | 58,749 |
| | | | | |
|
Financials — 14.2% |
ACE | | 4,200 | | | 185 |
Affiliated Managers Group* | | 300 | | | 17 |
Aflac | | 72,340 | | | 2,568 |
Allied World Assurance Holdings | | 5,900 | | | 223 |
Allstate | | 79,120 | | | 2,036 |
AMB Property‡ | | 1,000 | | | 18 |
American Express | | 48,497 | | | 1,205 |
American Financial Group | | 20,300 | | | 435 |
American International Group (A) | | 18,800 | | | 32 |
AmeriCredit* (A) | | 3,100 | | | 39 |
Ameriprise Financial | | 51,400 | | | 1,552 |
Annaly Capital Management‡ (A) | | 35,100 | | | 489 |
AON | | 2,161 | | | 78 |
Arch Capital Group* | | 1,300 | | | 74 |
Argo Group International Holdings* | | 2,800 | | | 78 |
Arthur J Gallagher | | 900 | | | 19 |
Associated Banc | | 1,200 | | | 17 |
Assurant | | 8,107 | | | 192 |
Astoria Financial | | 13,500 | | | 104 |
AvalonBay Communities‡ | | 203 | | | 13 |
Axis Capital Holdings | | 20,900 | | | 499 |
Bancorpsouth (A) | | 5,100 | | | 113 |
Bank of America | | 241,681 | | | 2,724 |
Bank of Hawaii | | 2,400 | | | 90 |
Bank of New York Mellon | | 122,986 | | | 3,417 |
BB&T (A) | | 50,201 | | | 1,126 |
BOK Financial | | 12,300 | | | 499 |
Boston Properties‡ | | 700 | | | 34 |
Brandywine Realty Trust‡ | | 30,900 | | | 230 |
BRE Properties‡ | | 1,700 | | | 42 |
Brookfield Asset Management, Cl A | | 32,100 | | | 565 |
Brown & Brown (A) | | 8,600 | | | 166 |
Camden Property Trust‡ | | 500 | | | 15 |
Capital One Financial | | 53,650 | | | 1,311 |
Capitol Federal Financial | | 1,500 | | | 63 |
Cardinal Financial | | 3,100 | | | 25 |
CB Richard Ellis Group, Cl A* | | 1,400 | | | 10 |
Charles Schwab | | 177,635 | | | 3,126 |
| | |
| SEI Institutional Investments Trust / Annual Report / May 31, 2009 | | 35 |
SCHEDULE OF INVESTMENTS
Large Cap Fund (Continued)
May 31, 2009
| | | | | |
| Description | | Shares | | Market Value
($ Thousands) |
| | | | | |
Chubb | | 34,860 | | $ | 1,382 |
Cincinnati Financial | | 28,600 | | | 647 |
CIT Group (A) | | 10,800 | | | 41 |
Citigroup (A) | | 66,115 | | | 246 |
City National (A) | | 2,300 | | | 84 |
CME Group, Cl A | | 10,190 | | | 3,277 |
CNA Financial (A) | | 2,400 | | | 35 |
Comerica | | 11,000 | | | 238 |
Commerce Bancshares (A) | | 4,330 | | | 136 |
Credicorp | | 2,700 | | | 163 |
Cullen/Frost Bankers | | 2,900 | | | 142 |
Digital Realty Trust‡ | | 300 | | | 11 |
Discover Financial Services | | 17,750 | | | 170 |
Duke Realty‡ (A) | | 24,200 | | | 230 |
Eaton Vance | | 2,500 | | | 68 |
Endurance Specialty Holdings (A) | | 20,900 | | | 574 |
Equity Residential‡ | | 2,300 | | | 56 |
Essex Property Trust‡ (A) | | 500 | | | 34 |
Everest Re Group | | 6,400 | | | 443 |
Federal Realty Investment Trust‡ | | 100 | | | 5 |
Federated Investors, Cl B | | 5,700 | | | 143 |
Fidelity National Financial, Cl A | | 600 | | | 8 |
Fifth Third Bancorp | | 2,400 | | | 17 |
First Horizon National | | 2,850 | | | 35 |
Flushing Financial | | 2,900 | | | 29 |
Forest City Enterprises, Cl A | | 3,700 | | | 26 |
Franklin Resources | | 9,371 | | | 626 |
Fulton Financial (A) | | 2,800 | | | 16 |
Goldman Sachs Group | | 28,064 | | | 4,057 |
Greenlight Capital Re, Cl A* | | 3,800 | | | 63 |
Hallmark Financial Services* | | 2,600 | | | 18 |
Hanover Insurance Group | | 400 | | | 14 |
Hartford Financial Services Group | | 13,323 | | | 191 |
HCC Insurance Holdings | | 6,100 | | | 151 |
HCP‡ | | 9,700 | | | 225 |
Health Care REIT‡ (A) | | 1,100 | | | 38 |
Hercules Technology Growth Capital | | 761 | | | 6 |
Hospitality Properties Trust‡ | | 7,000 | | | 98 |
Host Hotels & Resorts‡ | | 16,200 | | | 152 |
HRPT Properties Trust‡ | | 4,000 | | | 19 |
Hudson City Bancorp | | 48,700 | | | 625 |
Huntington Bancshares (A) | | 29,800 | | | 117 |
IntercontinentalExchange* | | 23,100 | | | 2,490 |
Invesco | | 800 | | | 12 |
Jefferies Group | | 4,000 | | | 86 |
Jones Lang LaSalle | | 800 | | | 28 |
JPMorgan Chase | | 188,570 | | | 6,958 |
Keycorp (A) | | 22,400 | | | 112 |
LaSalle Hotel Properties‡ | | 5,100 | | | 70 |
Lazard, Cl A | | 1,400 | | | 40 |
Legg Mason | | 600 | | | 12 |
Leucadia National (A) | | 4,300 | | | 90 |
Liberty Property Trust‡ | | 3,900 | | | 91 |
Lincoln National | | 15,500 | | | 294 |
| | | | | |
| Description | | Shares | | Market Value
($ Thousands) |
| | | | | |
Loews | | 15,647 | | $ | 423 |
M&T Bank (A) | | 1,600 | | | 80 |
Mack-Cali Realty‡ | | 400 | | | 10 |
Marsh & McLennan | | 12,325 | | | 233 |
Marshall & Ilsley | | 3,200 | | | 21 |
MBIA* (A) | | 7,900 | | | 51 |
Mercury General | | 500 | | | 17 |
MetLife | | 3,690 | | | 116 |
Montpelier Re Holdings | | 22,000 | | | 294 |
Moody’s (A) | | 12,300 | | | 337 |
Morgan Stanley | | 74,877 | | | 2,270 |
NASDAQ OMX Group* | | 600 | | | 13 |
New York Community Bancorp (A) | | 15,900 | | | 176 |
NewAlliance Bancshares (A) | | 11,900 | | | 154 |
Northern Trust | | 6,695 | | | 386 |
NYSE Euronext | | 76,700 | | | 2,301 |
OneBeacon Insurance Group, Cl A | | 8,300 | | | 90 |
optionsXpress Holdings | | 11,100 | | | 190 |
PartnerRe | | 1,000 | | | 65 |
People’s United Financial | | 2,900 | | | 46 |
PHH* | | 6,300 | | | 97 |
Platinum Underwriters Holdings | | 13,200 | | | 381 |
Plum Creek Timber‡ | | 300 | | | 10 |
PNC Financial Services Group | | 21,929 | | | 999 |
Principal Financial Group | | 8,700 | | | 193 |
Progressive | | 16,500 | | | 266 |
ProLogis‡ (A) | | 7,100 | | | 60 |
Prospect Capital (A) | | 10,400 | | | 89 |
Protective Life | | 8,400 | | | 104 |
Prudential Financial | | 56,800 | | | 2,267 |
Public Storage‡ | | 2,200 | | | 147 |
Ramco-Gershenson Properties‡ | | 2,400 | | | 22 |
Raymond James Financial (A) | | 7,600 | | | 121 |
Regions Financial (A) | | 37,655 | | | 158 |
RenaissanceRe Holdings | | 1,600 | | | 73 |
Riskmetrics Group* | | 1,200 | | | 19 |
Simon Property Group‡ | | 316 | | | 17 |
SL Green Realty‡ (A) | | 9,800 | | | 224 |
SLM* (A) | | 9,900 | | | 66 |
StanCorp Financial Group | | 7,600 | | | 236 |
State Street | | 36,100 | | | 1,677 |
SunTrust Banks (A) | | 5,100 | | | 67 |
Synovus Financial | | 400 | | | 1 |
T. Rowe Price Group | | 5,032 | | | 204 |
TCF Financial (A) | | 4,400 | | | 63 |
TD Ameritrade Holding* | | 4,900 | | | 83 |
TFS Financial | | 1,200 | | | 13 |
Torchmark | | 4,345 | | | 174 |
Transatlantic Holdings | | 400 | | | 15 |
Travelers | | 46,018 | | | 1,871 |
UDR‡ (A) | | 2,223 | | | 24 |
Unum Group | | 44,200 | | | 756 |
US Bancorp (A) | | 66,255 | | | 1,272 |
Validus Holdings | | 2,400 | | | 55 |
| | |
| 36 | | SEI Institutional Investments Trust / Annual Report / May 31, 2009 |
| | | | | |
| Description | | Shares | | Market Value
($ Thousands) |
| | | | | |
Valley National Bancorp (A) | | 10,266 | | $ | 125 |
Ventas‡ | | 300 | | | 9 |
Vornado Realty Trust‡ (A) | | 705 | | | 33 |
Waddell & Reed Financial, Cl A | | 1,100 | | | 27 |
Walter Investment Management‡* | | 349 | | | 5 |
Webster Financial | | 2,000 | | | 15 |
Wells Fargo | | 260,764 | | | 6,650 |
Whitney Holding | | 100 | | | 1 |
Wilmington Trust | | 500 | | | 7 |
World Acceptance* (A) | | 2,100 | | | 42 |
WR Berkley | | 6,800 | | | 147 |
XL Capital, Cl A | | 5,100 | | | 52 |
Zions Bancorporation | | 1,900 | | | 26 |
| | | | | |
| | | | | 74,604 |
| | | | | |
|
Health Care — 14.0% |
Abbott Laboratories | | 71,208 | | | 3,209 |
Aetna | | 124,800 | | | 3,342 |
Allergan | | 84,400 | | | 3,725 |
American Medical Systems Holdings* (A) | | 8,000 | | | 121 |
AmerisourceBergen | | 16,500 | | | 612 |
Amgen* | | 70,300 | | | 3,511 |
Amylin Pharmaceuticals* (A) | | 26,450 | | | 299 |
Baxter International | | 28,384 | | | 1,453 |
Beckman Coulter | | 200 | | | 11 |
Becton Dickinson | | 6,747 | | | 457 |
Biogen Idec* (A) | | 9,300 | | | 482 |
Boston Scientific* | | 14,200 | | | 133 |
Bristol-Myers Squibb | | 71,413 | | | 1,423 |
C.R. Bard | | 6,070 | | | 434 |
Cantel Medical* | | 7,800 | | | 106 |
Cardinal Health | | 5,984 | | | 214 |
Celgene* | | 6,276 | | | 265 |
Cephalon* (A) | | 2,400 | | | 140 |
Cerner* | | 500 | | | 29 |
CIGNA | | 20,814 | | | 461 |
Covance* | | 600 | | | 25 |
Coventry Health Care* | | 12,500 | | | 226 |
Covidien | | 23,700 | | | 847 |
Cyberonics* (A) | | 2,800 | | | 41 |
DaVita* | | 4,300 | | | 194 |
Dentsply International | | 1,700 | | | 50 |
Edwards Lifesciences* | | 3,700 | | | 236 |
Eli Lilly | | 70,904 | | | 2,451 |
Endo Pharmaceuticals Holdings* | | 25,400 | | | 405 |
Enzon Pharmaceuticals* (A) | | 5,400 | | | 43 |
Express Scripts* | | 9,500 | | | 608 |
Forest Laboratories* | | 49,300 | | | 1,168 |
Gen-Probe* | | 5,200 | | | 222 |
Genzyme* | | 700 | | | 41 |
Gilead Sciences* (A) | | 83,618 | | | 3,604 |
Health Management Associates, Cl A* | | 900 | | | 5 |
Health Net* | | 1,400 | | | 21 |
HLTH* | | 6,500 | | | 76 |
| | | | | |
| Description | | Shares | | Market Value
($ Thousands) |
| | | | | |
Humana* | | 8,900 | | $ | 279 |
Idexx Laboratories* (A) | | 400 | | | 17 |
Illumina* (A) | | 600 | | | 22 |
IMS Health | | 11,100 | | | 134 |
Intuitive Surgical* (A) | | 3,000 | | | 449 |
Invacare | | 2,400 | | | 41 |
Inverness Medical Innovations* | | 1,400 | | | 46 |
Isis Pharmaceuticals* | | 2,000 | | | 28 |
Johnson & Johnson | | 149,234 | | | 8,232 |
Kindred Healthcare* | | 2,800 | | | 37 |
Kinetic Concepts* | | 13,100 | | | 340 |
King Pharmaceuticals* | | 48,300 | | | 457 |
Laboratory Corp of America Holdings* | | 2,452 | | | 149 |
Life Technologies* | | 326 | | | 13 |
LifePoint Hospitals* | | 3,000 | | | 82 |
Lincare Holdings* | | 11,200 | | | 244 |
Masimo* (A) | | 6,200 | | | 148 |
McKesson | | 6,917 | | | 285 |
Medco Health Solutions* | | 51,846 | | | 2,379 |
Medtronic | | 43,971 | | | 1,510 |
Merck | | 123,364 | | | 3,402 |
Mylan Laboratories* (A) | | 21,400 | | | 283 |
Noven Pharmaceuticals* | | 9,200 | | | 102 |
Novo Nordisk ADR | | 23,800 | | | 1,239 |
Omnicare | | 4,900 | | | 132 |
PerkinElmer | | 500 | | | 8 |
Pfizer | | 307,179 | | | 4,666 |
Pharmaceutical Product Development | | 1,500 | | | 30 |
Quest Diagnostics | | 16,900 | | | 883 |
Schering-Plough | | 100,800 | | | 2,459 |
Sepracor* | | 5,400 | | | 84 |
St. Jude Medical* | | 21,650 | | | 845 |
Stryker | | 18,791 | | | 722 |
Synovis Life Technologies* | | 1,400 | | | 27 |
Techne | | 200 | | | 12 |
Teleflex | | 2,900 | | | 130 |
Teva Pharmaceutical Industries ADR | | 9,610 | | | 445 |
Thermo Fisher Scientific* | | 27,673 | | | 1,077 |
UnitedHealth Group | | 217,500 | | | 5,785 |
Universal Health Services, Cl B | | 7,900 | | | 434 |
Valeant Pharmaceuticals International* | | 2,600 | | | 60 |
Varian Medical Systems* | | 1,600 | �� | | 57 |
VCA Antech* | | 1,100 | | | 27 |
Vertex Pharmaceuticals* | | 2,900 | | | 87 |
Warner Chilcott, Cl A* (A) | | 17,300 | | | 228 |
Watson Pharmaceuticals* | | 8,400 | | | 254 |
WellPoint* | | 35,700 | | | 1,663 |
Wyeth | | 45,860 | | | 2,057 |
Zimmer Holdings* | | 26,205 | | | 1,167 |
| | | | | |
| | | | | 73,947 |
| | | | | |
|
Industrials — 7.9% |
3M | | 10,798 | | | 617 |
ABB ADR | | 15,300 | | | 252 |
| | |
| SEI Institutional Investments Trust / Annual Report / May 31, 2009 | | 37 |
SCHEDULE OF INVESTMENTS
Large Cap Fund (Continued)
May 31, 2009
| | | | | |
| Description | | Shares | | Market Value
($ Thousands) |
| | | | | |
Aecom Technology* | | 3,100 | | $ | 99 |
American Reprographics* | | 2,900 | | | 25 |
American Science & Engineering | | 300 | | | 19 |
Ampco-Pittsburgh | | 1,100 | | | 29 |
Avery Dennison | | 300 | | | 8 |
BE Aerospace* | | 1,200 | | | 18 |
Beacon Roofing Supply* | | 7,900 | | | 114 |
Boeing | | 24,305 | | | 1,090 |
Bucyrus International, Cl A | | 300 | | | 9 |
Burlington Northern Santa Fe | | 11,880 | | | 861 |
C.H. Robinson Worldwide | | 3,687 | | | 187 |
Carlisle | | 4,300 | | | 98 |
Caterpillar | | 27,200 | | | 964 |
Chart Industries* | | 6,900 | | | 146 |
Cintas | | 2,200 | | | 51 |
Continental Airlines, Cl B* (A) | | 2,500 | | | 23 |
Cooper Industries, Cl A | | 4,100 | | | 135 |
Corrections of America* | | 300 | | | 5 |
CSX | | 25,090 | | | 797 |
Cummins | | 14,800 | | | 480 |
Danaher (A) | | 6,820 | | | 412 |
Deere | | 6,200 | | | 270 |
Delta Air Lines* (A) | | 600 | | | 4 |
Dover | | 22,600 | | | 711 |
Dun & Bradstreet | | 2,007 | | | 164 |
Eaton | | 2,300 | | | 100 |
Emerson Electric (A) | | 30,848 | | | 990 |
Expeditors International Washington (A) | | 48,500 | | | 1,591 |
Fastenal (A) | | 8,000 | | | 266 |
FedEx | | 7,800 | | | 432 |
First Solar* (A) | | 700 | | | 133 |
Flowserve | | 700 | | | 51 |
Fluor (A) | | 32,600 | | | 1,532 |
Foster Wheeler* | | 16,000 | | | 424 |
Gardner Denver* | | 19,000 | | | 538 |
GATX (A) | | 1,100 | | | 28 |
General Cable* (A) | | 2,000 | | | 76 |
General Dynamics | | 32,786 | | | 1,865 |
General Electric (A) | | 612,443 | | | 8,256 |
Goodrich | | 7,000 | | | 340 |
Graco | | 1,200 | | | 27 |
Hertz Global Holdings* | | 2,800 | | | 19 |
Honeywell International | | 8,922 | | | 296 |
Hubbell, Cl B | | 2,000 | | | 66 |
IDEX | | 3,600 | | | 84 |
Illinois Tool Works | | 3,200 | | | 103 |
Ingersoll-Rand, Cl A | | 1,700 | | | 34 |
Iron Mountain* | | 100 | | | 3 |
ITT | | 11,760 | | | 484 |
Jacobs Engineering Group* | | 3,200 | | | 137 |
JB Hunt Transport Services (A) | | 2,200 | | | 68 |
Joy Global | | 100 | | | 3 |
Kansas City Southern* | | 2,600 | | | 43 |
KBR | | 2,600 | | | 48 |
| | | | | |
| Description | | Shares | | Market Value
($ Thousands) |
| | | | | |
Kennametal | | 4,000 | | $ | 76 |
L-3 Communications Holdings, Cl 3 | | 8,500 | | | 625 |
Landstar System | | 400 | | | 15 |
Lincoln Electric Holdings (A) | | 2,400 | | | 98 |
Lockheed Martin | | 8,185 | | | 684 |
Manpower | | 900 | | | 38 |
Masco | | 1,400 | | | 15 |
McDermott International* | | 2,700 | | | 59 |
Monster Worldwide* | | 500 | | | 6 |
MSC Industrial Direct, Cl A (A) | | 1,800 | | | 65 |
Norfolk Southern | | 30,200 | | | 1,123 |
Northrop Grumman | | 31,259 | | | 1,488 |
Owens Corning* | | 1,000 | | | 14 |
Paccar | | 300 | | | 9 |
Pall | | 500 | | | 13 |
Parker Hannifin | | 8,400 | | | 355 |
Pentair | | 4,900 | | | 123 |
Pitney Bowes | | 2,100 | | | 48 |
Polypore International* | | 2,500 | | | 25 |
Precision Castparts | | 2,565 | | | 212 |
Quanta Services* | | 32,000 | | | 730 |
Raytheon | | 17,488 | | | 781 |
Republic Services, Cl A | | 5,715 | | | 130 |
Robert Half International (A) | | 700 | | | 15 |
Rockwell Automation | | 800 | | | 25 |
Roper Industries | | 1,000 | | | 43 |
RR Donnelley & Sons | | 42,400 | | | 572 |
Ryder System | | 200 | | | 6 |
Shaw Group* | | 16,200 | | | 441 |
Southwest Airlines | | 22,000 | | | 148 |
Spirit Aerosystems Holdings, Cl A* | | 1,000 | | | 14 |
Stericycle* | | 2,502 | | | 125 |
SunPower, Cl A* (A) | | 2,000 | | | 58 |
Terex* (A) | | 16,100 | | | 216 |
Textron | | 1,900 | | | 22 |
Thomas & Betts* | | 16,300 | | | 500 |
Timken | | 100 | | | 2 |
Toro | | 1,500 | | | 46 |
Trinity Industries (A) | | 1,500 | | | 23 |
Tyco International | | 27,400 | | | 756 |
Union Pacific | | 21,762 | | | 1,072 |
United Parcel Service, Cl B | | 39,900 | | | 2,041 |
United Rentals* | | 1,000 | | | 5 |
United Technologies | | 35,019 | | | 1,842 |
URS* | | 2,900 | | | 139 |
USG* | | 700 | | | 8 |
UTi Worldwide* | | 2,200 | | | 29 |
Valmont Industries | | 100 | | | 7 |
Waste Management | | 19,900 | | | 549 |
Watson Wyatt Worldwide, Cl A | | 800 | | | 31 |
WESCO International* | | 3,600 | | | 96 |
WW Grainger | | 4,200 | | | 331 |
| | | | | |
| | | | | 41,519 |
| | | | | |
| | |
| 38 | | SEI Institutional Investments Trust / Annual Report / May 31, 2009 |
| | | | | |
| Description | | Shares | | Market Value
($ Thousands) |
| | | | | |
|
Information Technology — 18.2% |
Accenture, Cl A | | 20,000 | | $ | 599 |
Activision Blizzard* | | 62,280 | | | 752 |
Acxiom | | 26,400 | | | 282 |
Adobe Systems* | | 46,800 | | | 1,319 |
Advanced Micro Devices* | | 5,700 | | | 26 |
Affiliated Computer Services, Cl A* | | 3,900 | | | 175 |
Agilent Technologies* | | 500 | | | 9 |
Agilysys | | 4,900 | | | 32 |
Akamai Technologies* | | 1,700 | | | 38 |
Alliance Data Systems* (A) | | 4,400 | | | 178 |
Altera | | 17,000 | | | 289 |
Amdocs* | | 12,500 | | | 271 |
Amphenol, Cl A | | 1,000 | | | 33 |
Analog Devices | | 7,000 | | | 171 |
Apple* | | 57,417 | | | 7,798 |
Arris Group* | | 4,600 | | | 56 |
Autodesk* | | 200 | | | 4 |
Automatic Data Processing | | 11,546 | | | 439 |
Avnet* | | 7,900 | | | 182 |
BMC Software* | | 7,100 | | | 242 |
Brightpoint* | | 2,900 | | | 17 |
Broadcom, Cl A* | | 16,420 | | | 418 |
Brocade Communications Systems* | | 1,100 | | | 8 |
CA | | 70,800 | | | 1,236 |
Cadence Design Systems* | | 2,800 | | | 16 |
Ciena* | | 1,200 | | | 13 |
Cisco Systems* | | 259,920 | | | 4,809 |
Citrix Systems* | | 500 | | | 16 |
Cognizant Technology Solutions, Cl A* | | 1,600 | | | 40 |
CommScope* | | 1,400 | | | 37 |
Computer Sciences* | | 20,500 | | | 870 |
Compuware* | | 16,100 | | | 123 |
Convergys* | | 1,900 | | | 18 |
Corning | | 1,300 | | | 19 |
Cree* (A) | | 2,700 | | | 82 |
Cypress Semiconductor* | | 6,800 | | | 58 |
Dell* | | 110,720 | | | 1,282 |
Diebold | | 4,500 | | | 111 |
Dolby Laboratories, Cl A* | | 3,900 | | | 141 |
eBay* (A) | | 110,900 | | | 1,954 |
Electronic Arts* | | 52,126 | | | 1,198 |
EMC* | | 131,400 | | | 1,544 |
Equinix* | | 300 | | | 22 |
F5 Networks* | | 5,800 | | | 184 |
Factset Research Systems | | 500 | | | 26 |
Fidelity National Information Services | | 1,051 | | | 20 |
Fiserv* | | 200 | | | 9 |
Global Payments | | 1,300 | | | 47 |
Google, Cl A* | | 18,389 | | | 7,672 |
Harris | | 9,400 | | | 292 |
Harris Stratex Networks, Cl A* | | 3,329 | | | 16 |
Hewitt Associates, Cl A* | | 13,900 | | | 403 |
Hewlett-Packard | | 134,660 | | | 4,626 |
| | | | | |
| Description | | Shares | | Market Value
($ Thousands) |
| | | | | |
IAC* | | 800 | | $ | 13 |
Ingram Micro, Cl A* | | 48,200 | | | 796 |
Integrated Device Technology* | | 3,700 | | | 21 |
Intel | | 114,846 | | | 1,805 |
Interactive Intelligence* | | 5,700 | | | 74 |
International Business Machines | | 41,471 | | | 4,407 |
International Rectifier* | | 1,100 | | | 16 |
Intuit* | | 75,500 | | | 2,055 |
Itron* | | 1,000 | | | 58 |
Jabil Circuit | | 8,900 | | | 70 |
JDS Uniphase* | | 4,100 | | | 22 |
Juniper Networks* (A) | | 62,000 | | | 1,533 |
Lam Research* (A) | | 1,400 | | | 37 |
Lender Processing Services | | 200 | | | 6 |
Lexmark International, Cl A* | | 5,000 | | | 82 |
Linear Technology | | 28,797 | | | 674 |
Macrovision Solutions* | | 8 | | | — |
Marvell Technology Group* | | 6,000 | | | 69 |
Mastercard, Cl A (A) | | 12,300 | | | 2,169 |
McAfee* | | 7,800 | | | 306 |
MEMC Electronic Materials* | | 1,400 | | | 27 |
Metavante Technologies* | | 4,900 | | | 126 |
Mettler Toledo International* | | 4,100 | | | 292 |
Microchip Technology (A) | | 4,300 | | | 93 |
Micron Technology* | | 9,600 | | | 48 |
Microsoft | | 292,074 | | | 6,101 |
Molex (A) | | 5,400 | | | 82 |
Motorola | | 26,100 | | | 158 |
National Instruments | | 3,800 | | | 81 |
National Semiconductor (A) | | 8,200 | | | 114 |
NCR* | | 31,300 | | | 336 |
NetApp* | | 3,200 | | | 62 |
NeuStar, Cl A* | | 7,400 | | | 148 |
Nokia ADR | | 45,300 | | | 693 |
Novell* | | 900 | | | 4 |
Novellus Systems* | | 1,100 | | | 20 |
Nvidia* | | 5,300 | | | 55 |
ON Semiconductor* | | 5,200 | | | 36 |
Oracle | | 85,781 | | | 1,680 |
Paychex | | 21,700 | | | 594 |
QLogic* (A) | | 700 | | | 10 |
Qualcomm | | 176,707 | | | 7,703 |
Rambus* | | 2,700 | | | 35 |
Red Hat* | | 5,800 | | | 116 |
Research In Motion* (A) | | 38,010 | | | 2,989 |
RightNow Technologies* | | 12,700 | | | 112 |
SAIC* | | 2,500 | | | 44 |
SanDisk* | | 2,500 | | | 39 |
Seagate Technology | | 35,800 | | | 312 |
Silicon Laboratories* | | 2,500 | | | 84 |
Sohu.com* | | 400 | | | 25 |
Sun Microsystems* | | 6,600 | | | 59 |
Sybase* | | 1,800 | | | 59 |
Symantec* | | 176,140 | | | 2,746 |
| | |
| SEI Institutional Investments Trust / Annual Report / May 31, 2009 | | 39 |
SCHEDULE OF INVESTMENTS
Large Cap Fund (Continued)
May 31, 2009
| | | | | |
| Description | | Shares | | Market Value
($ Thousands) |
| | | | | |
Synopsys* | | 13,400 | | $ | 261 |
Tellabs* | | 6,900 | | | 38 |
Teradata* | | 71,600 | | | 1,547 |
Texas Instruments | | 86,932 | | | 1,686 |
Trimble Navigation* | | 5,000 | | | 96 |
Tyco Electronics | | 11,600 | | | 201 |
Varian Semiconductor Equipment Associates* | | 1,300 | | | 31 |
VeriSign* (A) | | 72,600 | | | 1,700 |
Visa, Cl A | | 87,790 | | | 5,944 |
Vishay Intertechnology* (A) | | 18,400 | | | 102 |
VMware, Cl A* (A) | | 2,800 | | | 87 |
Western Digital* | | 13,400 | | | 333 |
Western Union | | 57,192 | | | 1,008 |
Xerox | | 59,079 | | | 402 |
Xilinx | | 28,200 | | | 585 |
Yahoo!* (A) | | 136,600 | | | 2,164 |
Zebra Technologies, Cl A* | | 16,400 | | | 358 |
| | | | | |
| | | | | 96,061 |
| | | | | |
| | |
Materials — 2.8% | | | | | |
Air Products & Chemicals | | 600 | | | 39 |
Airgas | | 300 | | | 13 |
AK Steel Holding | | 1,100 | | | 16 |
Alcoa (A) | | 12,700 | | | 117 |
Allegheny Technologies | | 700 | | | 25 |
Ball | | 1,500 | | | 60 |
Bemis | | 13,100 | | | 329 |
Carpenter Technology | | 2,400 | | | 54 |
Celanese, Cl A | | 5,600 | | | 115 |
Cliffs Natural Resources | | 2,900 | | | 79 |
Commercial Metals | | 800 | | | 14 |
Crown Holdings* | | 2,400 | | | 56 |
Dow Chemical | | 12,800 | | | 226 |
E.I. Du Pont de Nemours | | 13,500 | | | 384 |
Eagle Materials (A) | | 4,400 | | | 108 |
Eastman Chemical | | 24,300 | | | 1,007 |
Ecolab | | 5,000 | | | 187 |
FMC | | 2,000 | | | 109 |
Freeport-McMoRan Copper & Gold, Cl B | | 8,400 | | | 457 |
International Flavors & Fragrances | | 1,000 | | | 32 |
International Paper | | 14,400 | | | 207 |
Koppers Holdings | | 4,500 | | | 114 |
Lubrizol | | 20,900 | | | 934 |
Martin Marietta Materials | | 200 | | | 17 |
MeadWestvaco | | 1,300 | | | 21 |
Monsanto | | 24,217 | | | 1,989 |
Mosaic | | 4,200 | | | 230 |
Nalco Holding | | 11,100 | | | 193 |
NewMarket | | 900 | | | 65 |
Nucor | | 18,900 | | | 830 |
Olympic Steel | | 1,800 | | | 33 |
Packaging of America | | 2,800 | | | 45 |
Pactiv* | | 8,400 | | | 188 |
| | | | | |
| Description | | Shares | | Market Value
($ Thousands) |
| | | | | |
PPG Industries | | 18,900 | | $ | 840 |
Praxair | | 35,031 | | | 2,564 |
Reliance Steel & Aluminum | | 2,400 | | | 91 |
RPM International | | 700 | | | 11 |
Scotts Miracle-Gro, Cl A | | 500 | | | 17 |
Sealed Air | | 200 | | | 4 |
Sigma-Aldrich | | 400 | | | 19 |
Sonoco Products | | 10,300 | | | 251 |
Southern Copper (A) | | 26,200 | | | 548 |
Steel Dynamics | | 1,000 | | | 15 |
Syngenta ADR | | 25,000 | | | 1,220 |
Terra Industries | | 300 | | | 8 |
Titanium Metals | | 1,600 | | | 15 |
United States Steel | | 800 | | | 27 |
Valspar | | 21,400 | | | 489 |
Vulcan Materials (A) | | 1,700 | | | 75 |
| | | | | |
| | | | | 14,487 |
| | | | | |
| | |
Telecommunication Services — 3.6% | | | | | |
American Tower, Cl A* | | 27,674 | | | 882 |
AT&T | | 344,834 | | | 8,548 |
CenturyTel (A) | | 12,600 | | | 389 |
Crown Castle International* | | 94,993 | | | 2,305 |
Embarq | | 3,700 | | | 156 |
Frontier Communications | | 25,218 | | | 184 |
iPCS* | | 2,500 | | | 45 |
Leap Wireless International* (A) | | 2,700 | | | 101 |
MetroPCS Communications* (A) | | 8,000 | | | 137 |
NII Holdings* | | 19,900 | | | 407 |
NTELOS Holdings | | 8,700 | | | 155 |
Qwest Communications International | | 9,500 | | | 41 |
SBA Communications, Cl A* | | 2,200 | | | 56 |
Sprint Nextel* | | 38,200 | | | 197 |
Telephone & Data Systems | | 8,400 | | | 255 |
Verizon Communications | | 170,262 | | | 4,982 |
Windstream | | 3,000 | | | 25 |
| | | | | |
| | | | | 18,865 |
| | | | | |
| | |
Utilities — 3.4% | | | | | |
AES* | | 316,687 | | | 3,164 |
AGL Resources | | 700 | | | 20 |
Allegheny Energy | | 100 | | | 3 |
Alliant Energy | | 17,600 | | | 418 |
| | | | | |
Ameren | | 19,300 | | | 449 |
American Electric Power | | 29,837 | | | 786 |
American Water Works | | 15,700 | | | 271 |
Aqua America | | 3,500 | | | 58 |
Atmos Energy | | 17,300 | | | 415 |
Calpine* | | 5,400 | | | 73 |
Centerpoint Energy | | 300 | | | 3 |
CMS Energy (A) | | 25,200 | | | 286 |
Consolidated Edison | | 8,000 | | | 284 |
Constellation Energy Group (A) | | 1,800 | | | 49 |
| | |
| 40 | | SEI Institutional Investments Trust / Annual Report / May 31, 2009 |
| | | | | |
| Description | | Shares/Face Amount
($ Thousands) | | Market Value
($ Thousands) |
| | | | | |
Dominion Resources | | 19,104 | | $ | 607 |
DTE Energy | | 25,800 | | | 780 |
Duke Energy | | 11,400 | | | 161 |
Edison International | | 26,400 | | | 772 |
Energen | | 8,900 | | | 331 |
Entergy | | 5,600 | | | 418 |
Exelon | | 9,354 | | | 449 |
FirstEnergy | | 11,203 | | | 423 |
FPL Group | | 4,800 | | | 271 |
Hawaiian Electric Industries (A) | | 9,300 | | | 160 |
Integrys Energy Group | | 2,700 | | | 73 |
MDU Resources Group (A) | | 10,300 | | | 190 |
Mirant* (A) | | 40,100 | | | 626 |
National Fuel Gas (A) | | 12,800 | | | 429 |
NiSource | | 46,500 | | | 497 |
Northeast Utilities | | 2,000 | | | 42 |
NRG Energy* (A) | | 8,586 | | | 193 |
NSTAR | | 7,300 | | | 219 |
NV Energy | | 24,000 | | | 240 |
OGE Energy | | 2,900 | | | 75 |
Oneok | | 600 | | | 18 |
Pepco Holdings | | 42,700 | | | 554 |
PG&E | | 11,219 | | | 412 |
Pinnacle West Capital | | 19,200 | | | 531 |
PPL | | 10,965 | | | 356 |
Progress Energy | | 3,600 | | | 128 |
Public Service Enterprise Group | | 17,240 | | | 549 |
Questar | | 200 | | | 7 |
RRI Energy* | | 2,200 | | | 12 |
SCANA | | 2,400 | | | 72 |
Sempra Energy | | 28,767 | | | 1,314 |
Southern | | 6,439 | | | 183 |
TECO Energy | | 5,900 | | | 66 |
UGI | | 9,800 | | | 237 |
Vectren | | 1,000 | | | 23 |
Wisconsin Energy | | 600 | | | 24 |
Xcel Energy | | 745 | | | 13 |
| | | | | |
| | | | | 17,734 |
| | | | | |
Total Common Stock
(Cost $486,200) ($ Thousands) | | | | | 496,167 |
| | | | | |
| |
U.S. TREASURY OBLIGATION — 0.6% | | | |
U.S. Treasury Bills | | | | | |
0.276%, 06/11/09 (B) (C) | | $3,200 | | | 3,200 |
| | | | | |
Total U.S. Treasury Obligation
(Cost $3,200) ($ Thousands) | | | | | 3,200 |
| | | | | |
| | | | | |
| Description | | Shares | | Market Value
($ Thousands) |
| | | | | |
| | |
CASH EQUIVALENT — 4.8% | | | | | |
SEI Daily Income Trust, Prime
Obligation Fund, Cl A, 0.270%†** | | 25,475,132 | | $ | 25,475 |
| | | | | |
Total Cash Equivalent
(Cost $25,475) ($ Thousands) | | | | | 25,475 |
| | | | | |
| |
AFFILIATED PARTNERSHIP — 5.0% | | | |
SEI Liquidity Fund, L.P.
0.820%†** (D) | | 26,681,968 | | | 26,236 |
| | | | | |
Total Affiliated Partnership
(Cost $26,682) ($ Thousands) | | | | | 26,236 |
| | | | | |
Total Investments — 104.7%
(Cost $541,557) ($ Thousands) | | | | $ | 551,078 |
| | | | | |
A summary of the open futures contracts held by the Fund at May 31, 2009, is as follows:
| | | | | | | |
Type of Contract | | Number of
Contracts
Long | | Expiration
Date | | Unrealized
Appreciation
($ Thousands) |
S&P Composite Index | | 89 | | Jun-2009 | | $ | 1,335 |
S&P Mid 400 Index E-MINI | | 43 | | Jun-2009 | | | 184 |
| | | | | | | |
| | | | | | $ | 1,519 |
| | | | | | | |
Percentages are based on a Net Assets of $526,421 ($ Thousands)
| * | | Non-income producing security. |
| ** | | The rate reported is the 7-day effective yield as of May 31, 2009. |
| † | | Investment in Affiliated Security (see Note 4). |
| ‡ | | Real Estate Investment Trust |
| (A) | | This security or a partial position of this security is on loan at May 31, 2009. The total value of securities on loan at May 31, 2009 was $26,438 ($ Thousands). |
| (B) | | Zero coupon security. The rate reported is the effective yield at time of purchase. |
| (C) | | Security, or a portion thereof, has been pledged as collateral on open futures contracts. |
| (D) | | This security was purchased with cash collateral held from securities on loan. The total value of such securities as of May 31, 2009 was $26,236 ($ Thousands). |
ADR — American Depositary Receipt
Cl — Class
L.P. — Limited Partnership
Ser — Series
Amounts designated as “—” are $0 or have been rounded to $0
The accompanying notes are an integral part of the financial statements.
| | |
| SEI Institutional Investments Trust / Annual Report / May 31, 2009 | | 41 |
SCHEDULE OF INVESTMENTS
Large Cap Diversified Alpha Fund
May 31, 2009
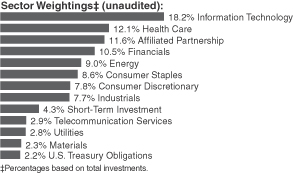
| | | | | |
| Description | | Shares | | Market Value
($ Thousands) |
| | | | | |
| | |
COMMON STOCK — 76.4% | | | | | |
| | |
Consumer Discretionary — 7.3% | | | | | |
Advance Auto Parts | | 3,200 | | $ | 136 |
Aeropostale* | | 13,000 | | | 450 |
Amazon.com* | | 12,625 | | | 985 |
American Greetings, Cl A | | 5,300 | | | 36 |
Ameristar Casinos | | 3,700 | | | 74 |
Apollo Group, Cl A* | | 10,300 | | | 609 |
AutoZone* | | 1,800 | | | 274 |
Bed Bath & Beyond* | | 300 | | | 8 |
Best Buy | | 2,300 | | | 81 |
Big Lots* | | 11,400 | | | 262 |
Black & Decker | | 600 | | | 19 |
Blyth | | 1,300 | | | 43 |
Brinker International | | 7,300 | | | 131 |
Cablevision Systems, Cl A | | 7,400 | | | 141 |
California Pizza Kitchen* | | 5,000 | | | 70 |
Career Education* | | 4,100 | | | 82 |
Centex | | 1,100 | | | 9 |
Charlotte Russe Holding* | | 4,700 | | | 48 |
Chipotle Mexican Grill, Cl A* | | 2,200 | | | 174 |
Coach | | 32,100 | | | 843 |
Comcast, Cl A | | 152,832 | | | 2,104 |
Core-Mark Holding* | | 500 | | | 13 |
Darden Restaurants | | 1,900 | | | 69 |
Deckers Outdoor* | | 1,100 | | | 64 |
Dick’s Sporting Goods* | | 700 | | | 12 |
DIRECTV Group* | | 24,023 | | | 541 |
DISH Network, Cl A* | | 38,326 | | | 629 |
Dollar Tree* | | 800 | | | 36 |
Domino’s Pizza* | | 2,500 | | | 23 |
DR Horton | | 1,100 | | | 10 |
DreamWorks Animation SKG, Cl A* | | 2,400 | | | 67 |
Eastman Kodak | | 75,500 | | | 197 |
Family Dollar Stores | | 4,200 | | | 127 |
Foot Locker | | 4,300 | | | 48 |
Ford Motor* | | 16,340 | | | 94 |
GameStop, Cl A* | | 6,900 | | | 172 |
Gap | | 43,365 | | | 774 |
Garmin | | 17,300 | | | 361 |
| | | | | |
| Description | | Shares | | Market Value
($ Thousands) |
| | | | | |
Genuine Parts | | 2,200 | | $ | 74 |
Goodyear Tire & Rubber* | | 1,000 | | | 11 |
Grand Canyon Education* | | 4,700 | | | 64 |
H&R Block | | 46,729 | | | 682 |
Harley-Davidson | | 1,100 | | | 19 |
Harman International Industries | | 600 | | | 11 |
Hasbro | | 8,600 | | | 218 |
Hillenbrand | | 1,900 | | | 32 |
Home Depot | | 13,800 | | | 320 |
International Game Technology | | 17,200 | | | 299 |
International Speedway, Cl A | | 2,700 | | | 67 |
ITT Educational Services* | | 1,000 | | | 92 |
J.C. Penney | | 13,300 | | | 347 |
Jarden* | | 2,800 | | | 50 |
John Wiley & Sons, Cl A | | 300 | | | 9 |
Johnson Controls | | 3,300 | | | 66 |
Kohl’s* | | 3,200 | | | 136 |
Las Vegas Sands* | | 5,592 | | | 55 |
Leggett & Platt | | 24,000 | | | 352 |
Lennar, Cl A | | 2,200 | | | 21 |
| | | | | |
Liberty Global, Cl A* | | 1,500 | | | 21 |
Liberty Media - Entertainment, Cl A* | | 4,500 | | | 109 |
Limited Brands | | 8,600 | | | 108 |
Lincoln Educational Services* | | 3,300 | | | 61 |
Lowe’s | | 6,500 | | | 124 |
Mattel | | 700 | | | 11 |
McDonald’s | | 20,000 | | | 1,180 |
McGraw-Hill | | 2,000 | | | 60 |
MGM Mirage* | | 1,400 | | | 10 |
Monro Muffler | | 2,700 | | | 72 |
NetFlix* | | 7,700 | | | 303 |
Newell Rubbermaid | | 1,000 | | | 12 |
NIKE, Cl B | | 17,550 | | | 1,001 |
O’Reilly Automotive* | | 1,000 | | | 36 |
Panera Bread, Cl A* | | 6,000 | | | 319 |
Penn National Gaming* | | 800 | | | 26 |
PetMed Express* | | 1,000 | | | 15 |
PetSmart | | 5,500 | | | 112 |
Pinnacle Entertainment* | | 800 | | | 9 |
Polo Ralph Lauren, Cl A | | 1,400 | | | 75 |
Pulte Homes | | 1,400 | | | 12 |
RadioShack | | 12,437 | | | 167 |
Ross Stores | | 10,300 | | | 403 |
Royal Caribbean Cruises | | 700 | | | 11 |
Scientific Games, Cl A* | | 2,700 | | | 48 |
Scripps Networks Interactive, Cl A | | 500 | | | 14 |
Sears Holdings* | | 11,300 | | | 642 |
Shaw Communications, Cl B | | 28,300 | | | 492 |
Sherwin-Williams | | 5,800 | | | 306 |
Smith & Wesson Holding* | | 12,500 | | | 66 |
Snap-On | | 1,200 | | | 38 |
Stanley Works | | 700 | | | 25 |
Staples | | 45,200 | | | 924 |
Starbucks* | | 2,600 | | | 37 |
| | |
| 42 | | SEI Institutional Investments Trust / Annual Report / May 31, 2009 |
| | | | | |
| Description | | Shares | | Market Value
($ Thousands) |
| | | | | |
Strayer Education | | 200 | | $ | 37 |
Target | | 10,700 | | | 421 |
Texas Roadhouse, Cl A* | | 4,100 | | | 48 |
Tiffany | | 300 | | | 9 |
Tim Hortons | | 500 | | | 13 |
Time Warner | | 41,866 | | | 980 |
Time Warner Cable, Cl A | | 10,383 | | | 320 |
TJX | | 35,716 | | | 1,054 |
Toll Brothers* | | 900 | | | 17 |
VF | | 2,600 | | | 148 |
Virgin Media | | 2,300 | | | 20 |
Walt Disney | | 18,590 | | | 450 |
Weight Watchers International | | 19,500 | | | 457 |
Williams-Sonoma | | 900 | | | 12 |
Wyndham Worldwide | | 900 | | | 11 |
Yum! Brands | | 15,950 | | | 552 |
| | | | | |
| | | | | 24,139 |
| | | | | |
|
Consumer Staples — 8.1% |
Altria Group | | 22,000 | | | 376 |
Archer-Daniels-Midland | | 30,300 | | | 834 |
Avon Products | | 7,600 | | | 202 |
BJ’s Wholesale Club* | | 8,800 | | | 310 |
Brown-Forman, Cl B | | 17,759 | | | 779 |
Bunge | | 7,386 | | | 467 |
Campbell Soup | | 10,500 | | | 291 |
Chiquita Brands International* | | 10,000 | | | 105 |
Church & Dwight | | 400 | | | 20 |
Clorox | | 5,700 | | | 299 |
Coca-Cola | | 23,400 | | | 1,150 |
Colgate-Palmolive | | 7,500 | | | 494 |
ConAgra Foods | | 39,800 | | | 740 |
Constellation Brands, Cl A* | | 7,100 | | | 82 |
Corn Products International | | 2,500 | | | 66 |
Costco Wholesale | | 26,278 | | | 1,275 |
CVS Caremark | | 27,104 | | | 808 |
Dean Foods* | | 500 | | | 9 |
Del Monte Foods | | 6,400 | | | 52 |
Dr Pepper Snapple Group* | | 5,700 | | | 124 |
Energizer Holdings* | | 400 | | | 21 |
Estee Lauder, Cl A | | 3,430 | | | 113 |
General Mills | | 11,400 | | | 584 |
Hansen Natural* | | 700 | | | 26 |
Herbalife | | 12,000 | | | 351 |
Hershey | | 7,500 | | | 264 |
HJ Heinz | | 7,900 | | | 289 |
JM Smucker | | 3,500 | | | 141 |
Kellogg | | 8,100 | | | 350 |
Kimberly-Clark | | 9,500 | | | 493 |
Kraft Foods, Cl A | | 19,160 | | | 500 |
Kroger | | 39,300 | | | 896 |
Lorillard | | 100 | | | 7 |
McCormick | | 1,500 | | | 46 |
Molson Coors Brewing, Cl B | | 200 | | | 9 |
| | | | | |
| Description | | Shares | | Market Value
($ Thousands) |
| | | | | |
NBTY* | | 100 | | $ | 3 |
Pepsi Bottling Group | | 14,300 | | | 470 |
PepsiAmericas | | 500 | | | 13 |
PepsiCo | | 29,650 | | | 1,543 |
Philip Morris International | | 35,849 | | | 1,529 |
Prestige Brands Holdings* | | 2,600 | | | 16 |
Procter & Gamble | | 71,696 | | | 3,724 |
Reynolds American | | 13,700 | | | 547 |
Safeway | | 13,400 | | | 272 |
Sara Lee | | 11,131 | | | 100 |
Smithfield Foods* | | 500 | | | 6 |
Spartan Stores | | 4,200 | | | 52 |
Supervalu | | 18,000 | | | 299 |
Sysco | | 80,968 | | | 1,940 |
Tyson Foods, Cl A | | 54,990 | | | 733 |
Walgreen | | 43,199 | | | 1,287 |
Wal-Mart Stores | | 33,000 | | | 1,641 |
Weis Markets | | 500 | | | 17 |
Whole Foods Market | | 500 | | | 9 |
| | | | | |
| | | | | 26,774 |
| | | | | |
| | |
Energy — 8.4% | | | | | |
Alpha Natural Resources* | | 2,200 | | | 61 |
Anadarko Petroleum | | 3,100 | | | 148 |
Apache | | 2,227 | | | 188 |
Arch Coal | | 1,000 | | | 18 |
Baker Hughes | | 1,600 | | | 62 |
BJ Services | | 3,100 | | | 48 |
Cabot Oil & Gas | | 400 | | | 14 |
Cameron International* | | 500 | | | 16 |
Chesapeake Energy | | 7,000 | | | 159 |
Chevron | | 72,678 | | | 4,845 |
Cimarex Energy | | 600 | | | 20 |
ConocoPhillips | | 45,021 | | | 2,064 |
Consol Energy | | 700 | | | 29 |
Delek US Holdings | | 1,100 | | | 11 |
Denbury Resources* | | 2,600 | | | 45 |
Devon Energy | | 1,200 | | | 76 |
Diamond Offshore Drilling | | 2,700 | | | 228 |
Dresser-Rand Group* | | 9,100 | | | 255 |
Encore Acquisition* | | 1,700 | | | 60 |
ENSCO International | | 1,300 | | | 51 |
EOG Resources | | 11,142 | | | 815 |
Exterran Holdings* | | 2,500 | | | 50 |
Exxon Mobil | | 146,001 | | | 10,125 |
FMC Technologies* | | 400 | | | 17 |
Forest Oil* | | 800 | | | 15 |
Frontier Oil | | 15,100 | | | 264 |
Frontline | | 1,900 | | | 44 |
Halliburton | | 24,986 | | | 573 |
Harvest Natural Resources* | | 2,600 | | | 14 |
Helmerich & Payne | | 100 | | | 4 |
Hess | | 400 | | | 27 |
Holly | | 500 | | | 12 |
| | |
| SEI Institutional Investments Trust / Annual Report / May 31, 2009 | | 43 |
SCHEDULE OF INVESTMENTS
Large Cap Diversified Alpha Fund (Continued)
May 31, 2009
| | | | | |
| Description | | Shares | | Market Value
($ Thousands) |
| | | | | |
Marathon Oil | | 10,900 | | $ | 347 |
Massey Energy | | 2,100 | | | 48 |
Murphy Oil | | 11,410 | | | 673 |
Nabors Industries* | | 2,400 | | | 43 |
National Oilwell Varco* | | 2,289 | | | 88 |
Newfield Exploration* | | 300 | | | 11 |
Noble Energy | | 100 | | | 6 |
Occidental Petroleum | | 23,653 | | | 1,587 |
Oceaneering International* | | 700 | | | 36 |
Patterson-UTI Energy | | 3,100 | | | 44 |
Peabody Energy | | 6,400 | | | 217 |
PetroHawk Energy* | | 5,300 | | | 134 |
Pioneer Natural Resources | | 1,500 | | | 42 |
Pride International* | | 2,400 | | | 58 |
Schlumberger | | 11,700 | | | 670 |
SEACOR Holdings* | | 6,000 | | | 458 |
Smith International | | 2,000 | | | 58 |
Southern Union | | 1,600 | | | 28 |
Southwestern Energy* | | 1,100 | | | 48 |
Spectra Energy | | 18,300 | | | 294 |
St. Mary Land & Exploration | | 1,400 | | | 30 |
Sunoco | | 15,100 | | | 459 |
Superior Energy Services* | | 1,600 | | | 37 |
Tesoro | | 5,300 | | | 90 |
Tidewater | | 1,800 | | | 86 |
Transocean* | | 5,150 | | | 409 |
Unit* | | 300 | | | 10 |
Valero Energy | | 34,500 | | | 772 |
Venoco* | | 1,500 | | | 11 |
Walter Industries | | 1,100 | | | 36 |
Western Refining | | 4,500 | | | 64 |
Whiting Petroleum* | | 1,400 | | | 66 |
Williams | | 8,400 | | | 141 |
XTO Energy | | 9,000 | | | 385 |
| | | | | |
| | | | | 27,844 |
| | | | | |
| | |
Financials — 9.7% | | | | | |
Affiliated Managers Group* | | 400 | | | 22 |
Aflac | | 31,200 | | | 1,108 |
Allied World Assurance Holdings | | 3,800 | | | 143 |
Allstate | | 14,500 | | | 373 |
AMB Property‡ | | 600 | | | 11 |
American Express | | 50,658 | | | 1,259 |
American Financial Group | | 18,600 | | | 398 |
AmeriCredit* | | 1,000 | | | 13 |
Ameriprise Financial | | 22,900 | | | 692 |
Annaly Capital Management‡ | | 12,800 | | | 178 |
AON | | 1,500 | | | 54 |
Arch Capital Group* | | 700 | | | 40 |
Argo Group International Holdings* | | 1,300 | | | 36 |
Arthur J Gallagher | | 500 | | | 11 |
Associated Banc | | 700 | | | 10 |
Assurant | | 2,700 | | | 64 |
AvalonBay Communities‡ | | 203 | | | 13 |
| | | | | |
| Description | | Shares | | Market Value
($ Thousands) |
| | | | | |
Axis Capital Holdings | | 9,000 | | $ | 215 |
Bancorpsouth | | 2,800 | | | 62 |
Bank of America | | 98,662 | | | 1,112 |
Bank of Hawaii | | 2,457 | | | 92 |
Bank of New York Mellon | | 60,508 | | | 1,681 |
BB&T | | 3,900 | | | 88 |
BlackRock, Cl A | | 113 | | | 18 |
Boston Properties‡ | | 300 | | | 15 |
Brandywine Realty Trust‡ | | 19,600 | | | 146 |
BRE Properties‡ | | 1,100 | | | 28 |
Brown & Brown | | 5,600 | | | 108 |
Camden Property Trust‡ | | 400 | | | 12 |
Capital One Financial | | 18,100 | | | 442 |
Capitol Federal Financial | | 1,000 | | | 42 |
Cardinal Financial | | 1,100 | | | 9 |
CB Richard Ellis Group, Cl A* | | 1,300 | | | 9 |
Charles Schwab | | 81,576 | | | 1,436 |
Chubb | | 14,900 | | | 591 |
Cincinnati Financial | | 9,200 | | | 208 |
Citigroup | | 6,800 | | | 25 |
City National | | 1,100 | | | 40 |
CME Group, Cl A | | 3,920 | | | 1,261 |
CNA Financial | | 800 | | | 12 |
Colonial Properties Trust‡ | | 5,100 | | | 40 |
Comerica | | 600 | | | 13 |
Commerce Bancshares | | 2,675 | | | 84 |
Community Bank System | | 600 | | | 9 |
Compass Diversified Holdings | | 800 | | | 7 |
Credicorp | | 8,300 | | | 500 |
Cullen/Frost Bankers | | 1,600 | | | 78 |
Digital Realty Trust‡ | | 200 | | | 7 |
Discover Financial Services | | 8,200 | | | 78 |
Duke Realty‡ | | 16,400 | | | 156 |
Eaton Vance | | 1,400 | | | 38 |
Endurance Specialty Holdings | | 12,800 | | | 352 |
Equity Residential‡ | | 2,300 | | | 56 |
Essex Property Trust‡ | | 400 | | | 27 |
Everest Re Group | | 300 | | | 21 |
Federated Investors, Cl B | | 900 | | | 23 |
Fidelity National Financial, Cl A | | 400 | | | 6 |
Fifth Third Bancorp | | 1,500 | | | 10 |
First Horizon National | | 1,232 | | | 15 |
Franklin Resources | | 8,740 | | | 584 |
Fulton Financial | | 1,500 | | | 9 |
Goldman Sachs Group | | 8,500 | | | 1,229 |
Greenlight Capital Re, Cl A* | | 600 | | | 10 |
Hanover Insurance Group | | 300 | | | 10 |
Hartford Financial Services Group | | 4,200 | | | 60 |
HCC Insurance Holdings | | 4,000 | | | 99 |
HCP‡ | | 1,800 | | | 42 |
Health Care‡ | | 800 | | | 27 |
Hospitality Properties Trust‡ | | 1,000 | | | 14 |
Host Hotels & Resorts‡ | | 6,600 | | | 62 |
HRPT Properties Trust‡ | | 4,000 | | | 19 |
| | |
| 44 | | SEI Institutional Investments Trust / Annual Report / May 31, 2009 |
| | | | | |
| Description | | Shares | | Market Value
($ Thousands) |
| | | | | |
Hudson City Bancorp | | 46,200 | | $ | 593 |
IntercontinentalExchange* | | 11,800 | | | 1,272 |
Invesco | | 800 | | | 12 |
Investment Technology Group* | | 7,100 | | | 148 |
Jefferies Group | | 2,500 | | | 54 |
Jones Lang LaSalle | | 300 | | | 11 |
JPMorgan Chase | | 45,184 | | | 1,667 |
Keycorp | �� | 3,100 | | | 16 |
Knight Capital Group, Cl A* | | 22,800 | | | 392 |
LaSalle Hotel Properties‡ | | 3,600 | | | 49 |
Lazard, Cl A | | 700 | | | 20 |
Leucadia National | | 3,200 | | | 67 |
Liberty Property Trust‡ | | 2,600 | | | 61 |
Lincoln National | | 2,800 | | | 53 |
Loews | | 10,500 | | | 284 |
M&T Bank | | 1,000 | | | 50 |
Mack-Cali Realty‡ | | 100 | | | 2 |
Marsh & McLennan | | 7,900 | | | 149 |
Marshall & Ilsley | | 1,900 | | | 13 |
MBIA* | | 23,332 | | | 151 |
Mercury General | | 200 | | | 7 |
MetLife | | 2,100 | | | 66 |
Montpelier Re Holdings | | 6,300 | | | 84 |
Moody’s | | 2,500 | | | 68 |
Morgan Stanley | | 11,200 | | | 340 |
NASDAQ OMX Group* | | 500 | | | 11 |
New York Community Bancorp | | 1,000 | | | 11 |
Northern Trust | | 10,805 | | | 623 |
NYSE Euronext | | 44,400 | | | 1,332 |
Odyssey Re Holdings | | 5,600 | | | 225 |
OneBeacon Insurance Group, Cl A | | 2,100 | | | 23 |
optionsXpress Holdings | | 7,200 | | | 123 |
PartnerRe | | 400 | | | 26 |
People’s United Financial | | 1,700 | | | 27 |
PHH* | | 3,500 | | | 54 |
Platinum Underwriters Holdings | | 11,500 | | | 332 |
Plum Creek Timber‡ | | 200 | | | 7 |
PNC Financial Services Group | | 7,176 | | | 327 |
Principal Financial Group | | 2,617 | | | 58 |
Progressive | | 5,100 | | | 82 |
ProLogis‡ | | 2,400 | | | 20 |
Prospect Capital | | 700 | | | 6 |
Prudential Financial | | 7,800 | | | 311 |
Public Storage‡ | | 3,322 | | | 221 |
Ramco-Gershenson Properties‡ | | 1,500 | | | 14 |
Raymond James Financial | | 4,900 | | | 78 |
Rayonier‡ | | 10,810 | | | 432 |
Regions Financial | | 4,750 | | | 20 |
RenaissanceRe Holdings | | 900 | | | 41 |
Simon Property Group‡ | | 114 | | | 6 |
SL Green Realty‡ | | 6,400 | | | 147 |
SLM* | | 6,800 | | | 45 |
StanCorp Financial Group | | 4,700 | | | 146 |
State Street | | 14,150 | | | 657 |
| | | | | |
| Description | | Shares | | Market Value
($ Thousands) |
| | | | | |
T. Rowe Price Group | | 22,490 | | $ | 912 |
TCF Financial | | 2,200 | | | 32 |
TD Ameritrade Holding* | | 19,500 | | | 332 |
TFS Financial | | 19,503 | | | 222 |
Torchmark | | 400 | | | 16 |
Travelers | | 18,400 | | | 748 |
UDR‡ | | 1,997 | | | 22 |
United America Indemnity, Cl A* | | 2,400 | | | 11 |
Unum Group | | 6,400 | | | 110 |
US Bancorp | | 43,655 | | | 838 |
Validus Holdings | | 2,100 | | | 48 |
Valley National Bancorp | | 6,184 | | | 75 |
Ventas‡ | | 100 | | | 3 |
Vornado Realty Trust‡ | | 305 | | | 14 |
Waddell & Reed Financial, Cl A | | 400 | | | 10 |
Walter Investment Management‡* | | 310 | | | 4 |
Webster Financial | | 1,900 | | | 14 |
Wells Fargo | | 65,893 | | | 1,680 |
White Mountains Insurance Group | | 100 | | | 22 |
World Acceptance* | | 1,400 | | | 28 |
WR Berkley | | 9,700 | | | 210 |
XL Capital, Cl A | | 1,600 | | | 16 |
Zions Bancorporation | | 900 | | | 12 |
| | | | | |
| | | | | 32,175 |
| | | | | |
| | |
Health Care — 11.3% | | | | | |
Abbott Laboratories | | 18,200 | | | 820 |
Aetna | | 58,183 | | | 1,558 |
Allergan | | 29,500 | | | 1,302 |
American Medical Systems Holdings* | | 4,900 | | | 74 |
AMERIGROUP* | | 6,700 | | | 193 |
AmerisourceBergen | | 42,426 | | | 1,574 |
Amgen* | | 59,134 | | | 2,953 |
Amylin Pharmaceuticals* | | 1,300 | | | 15 |
Baxter International | | 6,600 | | | 338 |
Becton Dickinson | | 4,700 | | | 318 |
Biogen Idec* | | 12,000 | | | 621 |
Boston Scientific* | | 4,000 | | | 38 |
Bristol-Myers Squibb | | 35,600 | | | 709 |
C.R. Bard | | 1,800 | | | 129 |
Cantel Medical* | | 1,400 | | | 19 |
Cardinal Health | | 39,852 | | | 1,425 |
Celgene* | | 4,400 | | | 186 |
Cephalon* | | 1,500 | | | 87 |
Cerner* | | 300 | | | 17 |
CIGNA | | 900 | | | 20 |
Computer Programs & Systems | | 400 | | | 14 |
Covance* | | 500 | | | 21 |
Covidien | | 7,575 | | | 271 |
DaVita* | | 2,800 | | | 126 |
Dentsply International | | 1,600 | | | 47 |
Edwards Lifesciences* | | 2,500 | | | 160 |
Eli Lilly | | 14,000 | | | 484 |
Endo Pharmaceuticals Holdings* | | 19,000 | | | 303 |
| | |
| SEI Institutional Investments Trust / Annual Report / May 31, 2009 | | 45 |
SCHEDULE OF INVESTMENTS
Large Cap Diversified Alpha Fund (Continued)
May 31, 2009
| | | | | |
| Description | | Shares | | Market Value
($ Thousands) |
| | | | | |
Enzon Pharmaceuticals* | | 6,200 | | $ | 50 |
Express Scripts* | | 6,582 | | | 422 |
Forest Laboratories* | | 28,300 | | | 670 |
Gen-Probe* | | 3,900 | | | 166 |
Genzyme* | | 500 | | | 29 |
Gilead Sciences* | | 37,793 | | | 1,629 |
Health Net* | | 700 | | | 11 |
HLTH* | | 3,800 | | | 45 |
Humana* | | 3,000 | | | 94 |
Idexx Laboratories* | | 300 | | | 12 |
Illumina* | | 400 | | | 15 |
IMS Health | | 7,100 | | | 85 |
Intuitive Surgical* | | 1,500 | | | 224 |
Invacare | | 2,200 | | | 37 |
Inverness Medical Innovations* | | 900 | | | 29 |
Isis Pharmaceuticals* | | 2,600 | | | 36 |
Johnson & Johnson | | 79,959 | | | 4,411 |
Kindred Healthcare* | | 500 | | | 7 |
King Pharmaceuticals* | | 8,400 | | | 79 |
Laboratory Corp of America Holdings* | | 2,100 | | | 128 |
Life Technologies* | | 144 | | | 6 |
LifePoint Hospitals* | | 1,800 | | | 49 |
Lincare Holdings* | | 15,600 | | | 340 |
Masimo* | | 3,500 | | | 84 |
McKesson | | 39,877 | | | 1,641 |
Medco Health Solutions* | | 26,800 | | | 1,230 |
Medtronic | | 23,025 | | | 791 |
Merck | | 36,041 | | | 994 |
Mylan Laboratories* | | 12,100 | | | 160 |
Noven Pharmaceuticals* | | 1,600 | | | 18 |
Novo Nordisk ADR | | 12,100 | | | 630 |
Omnicare | | 12,000 | | | 324 |
PerkinElmer | | 500 | | | 8 |
Pfizer | | 151,300 | | | 2,298 |
Pharmaceutical Product Development | | 1,000 | | | 20 |
Quest Diagnostics | | 10,000 | | | 522 |
ResMed* | | 1,200 | | | 44 |
Schering-Plough | | 20,604 | | | 503 |
Sepracor* | | 800 | | | 12 |
St. Jude Medical* | | 100 | | | 4 |
Stryker | | 15,322 | | | 589 |
SurModics* | | 500 | | | 10 |
Synovis Life Technologies* | | 600 | | | 12 |
Techne | | 100 | | | 6 |
Teleflex | | 1,900 | | | 85 |
Tenet Healthcare* | | 13,602 | | | 49 |
Thermo Fisher Scientific* | | 1,800 | | | 70 |
UnitedHealth Group | | 102,444 | | | 2,725 |
Universal Health Services, Cl B | | 800 | | | 44 |
Valeant Pharmaceuticals International* | | 600 | | | 14 |
Varian Medical Systems* | | 1,000 | | | 36 |
VCA Antech* | | 400 | | | 10 |
Vertex Pharmaceuticals* | | 2,100 | | | 63 |
Warner Chilcott, Cl A* | | 11,900 | | | 157 |
| | | | | |
| Description | | Shares | | Market Value
($ Thousands) |
| | | | | |
Watson Pharmaceuticals* | | 100 | | $ | 3 |
WellPoint* | | 15,400 | | | 717 |
Wyeth | | 17,864 | | | 801 |
Zimmer Holdings* | | 6,625 | | | 295 |
| | | | | |
| | | | | 37,365 |
| | | | | |
| | |
Industrials — 7.2% | | | | | |
3M | | 5,200 | | | 297 |
Aecom Technology* | | 1,900 | | | 61 |
AGCO* | | 23,739 | | | 685 |
Allegiant Travel, Cl A* | | 3,900 | | | 157 |
American Reprographics* | | 1,200 | | | 11 |
American Science & Engineering | | 900 | | | 56 |
Ampco-Pittsburgh | | 500 | | | 13 |
Badger Meter | | 300 | | | 12 |
BE Aerospace* | | 700 | | | 10 |
Beacon Roofing Supply* | | 7,600 | | | 110 |
Boeing | | 10,275 | | | 461 |
Bucyrus International, Cl A | | 100 | | | 3 |
Burlington Northern Santa Fe | | 5,800 | | | 420 |
C.H. Robinson Worldwide | | 2,400 | | | 122 |
Carlisle | | 2,200 | | | 50 |
Caterpillar | | 15,175 | | | 538 |
Chart Industries* | | 1,800 | | | 38 |
Cintas | | 1,100 | | | 26 |
Continental Airlines, Cl B* | | 1,300 | | | 12 |
Cooper Industries, Cl A | | 3,500 | | | 115 |
Corrections of America* | | 100 | | | 2 |
CSX | | 16,600 | | | 527 |
Cummins | | 9,900 | | | 321 |
Danaher | | 600 | | | 36 |
Deere | | 2,450 | | | 107 |
Delta Air Lines* | | 575 | | | 3 |
Dover | | 13,300 | | | 418 |
Dun & Bradstreet | | 1,300 | | | 106 |
Emerson Electric | | 6,400 | | | 205 |
Expeditors International Washington | | 24,400 | | | 800 |
Fastenal | | 5,000 | | | 166 |
FedEx | | 200 | | | 11 |
First Solar* | | 400 | | | 76 |
Flowserve | | 500 | | | 37 |
Fluor | | 26,620 | | | 1,250 |
Foster Wheeler* | | 8,700 | | | 231 |
Gardner Denver* | | 7,700 | | | 218 |
GATX | | 500 | | | 13 |
General Cable* | | 800 | | | 31 |
General Dynamics | | 19,518 | | | 1,111 |
General Electric | | 179,400 | | | 2,418 |
Goodrich | | 11,700 | | | 568 |
Graco | | 800 | | | 18 |
Harsco | | 6,936 | | | 202 |
Hertz Global Holdings* | | 1,500 | | | 10 |
Honeywell International | | 300 | | | 10 |
Hubbell, Cl B | | 1,200 | | | 40 |
| | |
| 46 | | SEI Institutional Investments Trust / Annual Report / May 31, 2009 |
| | | | | |
| Description | | Shares | | Market Value
($ Thousands) |
| | | | | |
IDEX | | 3,400 | | $ | 79 |
Illinois Tool Works | | 1,800 | | | 58 |
ITT | | 8,100 | | | 334 |
Jacobs Engineering Group* | | 2,094 | | | 90 |
JB Hunt Transport Services | | 1,600 | | | 49 |
Joy Global | | 134 | | | 5 |
Kansas City Southern* | | 1,600 | | | 27 |
KBR | | 37,393 | | | 689 |
Kennametal | | 3,400 | | | 64 |
L-3 Communications Holdings, Cl 3 | | 8,400 | | | 617 |
Landstar System | | 400 | | | 15 |
Lincoln Electric Holdings | | 1,700 | | | 69 |
Lockheed Martin | | 10,647 | | | 890 |
Manpower | | 600 | | | 26 |
McDermott International* | | 1,500 | | | 33 |
MSC Industrial Direct, Cl A | | 1,100 | | | 40 |
Norfolk Southern | | 14,000 | | | 521 |
Northrop Grumman | | 17,700 | | | 843 |
Owens Corning* | | 9,800 | | | 137 |
Pall | | 400 | | | 10 |
Pentair | | 4,500 | | | 113 |
Pitney Bowes | | 1,500 | | | 34 |
Polypore International* | | 2,900 | | | 29 |
Precision Castparts | | 200 | | | 17 |
Quanta Services* | | 18,450 | | | 421 |
Raytheon | | 20,200 | | | 902 |
Republic Services, Cl A | | 3,560 | | | 81 |
Robert Half International | | 300 | | | 6 |
Rockwell Automation | | 400 | | | 12 |
Roper Industries | | 600 | | | 26 |
Ryder System | | 200 | | | 6 |
Shaw Group* | | 11,700 | | | 318 |
Southwest Airlines | | 91,899 | | | 620 |
Steelcase, Cl A | | 1,900 | | | 9 |
Stericycle* | | 1,500 | | | 75 |
SunPower, Cl A* | | 1,300 | | | 38 |
Terex* | | 900 | | | 12 |
Textron | | 900 | | | 10 |
Thomas & Betts* | | 9,200 | | | 282 |
Timken | | 18,919 | | | 320 |
Toro | | 500 | | | 16 |
Trinity Industries | | 3,700 | | | 56 |
Tyco International | | 17,300 | | | 478 |
Union Pacific | | 19,500 | | | 961 |
United Parcel Service, Cl B | | 21,425 | | | 1,096 |
United Rentals* | | 2,300 | | | 11 |
United Technologies | | 5,100 | | | 268 |
URS* | | 1,900 | | | 91 |
UTi Worldwide* | | 1,500 | | | 20 |
Waste Management | | 13,349 | | | 368 |
Watson Wyatt Worldwide, Cl A | | 1,300 | | | 49 |
WESCO International* | | 5,200 | | | 139 |
WW Grainger | | 2,700 | | | 213 |
| | | | | |
| | | | | 23,825 |
| | | | | |
| | | | | |
| Description | | Shares | | Market Value
($ Thousands) |
| | | | | |
| | |
Information Technology — 17.0% | | | | | |
Accenture, Cl A | | 29,064 | | $ | 870 |
Acxiom | | 9,900 | | | 106 |
Adobe Systems* | | 25,300 | | | 713 |
Advanced Micro Devices* | | 2,600 | | | 12 |
Affiliated Computer Services, Cl A* | | 2,300 | | | 103 |
Agilysys | | 1,300 | | | 8 |
Akamai Technologies* | | 1,100 | | | 25 |
Alliance Data Systems* | | 2,800 | | | 113 |
Altera | | 10,500 | | | 179 |
Amdocs* | | 1,600 | | | 35 |
Amphenol, Cl A | | 500 | | | 17 |
Analog Devices | | 5,700 | | | 139 |
Anixter International* | | 4,800 | | | 197 |
Apple* | | 22,325 | | | 3,032 |
Arris Group* | | 6,400 | | | 77 |
Automatic Data Processing | | 7,300 | | | 277 |
Avnet* | | 11,200 | | | 258 |
BMC Software* | | 5,500 | | | 187 |
Brightpoint* | | 2,700 | | | 16 |
Broadcom, Cl A* | | 4,000 | | | 102 |
CA | | 30,600 | | | 534 |
Cadence Design Systems* | | 1,700 | | | 10 |
Cisco Systems* | | 160,500 | | | 2,969 |
Cognizant Technology Solutions, Cl A* | | 800 | | | 20 |
CommScope* | | 900 | | | 24 |
Computer Sciences* | | 12,100 | | | 514 |
Compuware* | | 5,000 | | | 38 |
Convergys* | | 4,700 | | | 44 |
Corning | | 72,352 | | | 1,063 |
Cree* | | 2,300 | | | 70 |
Cypress Semiconductor* | | 5,000 | | | 43 |
Dell* | | 121,678 | | | 1,409 |
Diebold | | 10,200 | | | 252 |
Dolby Laboratories, Cl A* | | 3,200 | | | 115 |
Earthlink* | | 1,800 | | | 14 |
eBay* | | 101,354 | | | 1,786 |
Electronic Arts* | | 37,845 | | | 870 |
EMC* | | 66,900 | | | 786 |
Equinix* | | 200 | | | 15 |
F5 Networks* | | 12,400 | | | 394 |
Factset Research Systems | | 500 | | | 26 |
Fidelity National Information Services | | 344 | �� | | 7 |
Fiserv* | | 200 | | | 8 |
Flextronics International* | | 45,900 | | | 182 |
Global Payments | | 900 | | | 32 |
Google, Cl A* | | 7,495 | | | 3,127 |
Harris Stratex Networks, Cl A* | | 3,080 | | | 15 |
Hewitt Associates, Cl A* | | 13,100 | | | 380 |
Hewlett-Packard | | 87,400 | | | 3,002 |
Ingram Micro, Cl A* | | 22,200 | | | 367 |
Integrated Device Technology* | | 2,000 | | | 11 |
Intel | | 171,716 | | | 2,699 |
Interactive Intelligence* | | 1,200 | | | 16 |
| | |
| SEI Institutional Investments Trust / Annual Report / May 31, 2009 | | 47 |
SCHEDULE OF INVESTMENTS
Large Cap Diversified Alpha Fund (Continued)
May 31, 2009
| | | | | |
| Description | | Shares | | Market Value
($ Thousands) |
| | | | | |
International Business Machines | | 23,775 | | $ | 2,527 |
International Rectifier* | | 700 | | | 10 |
Intuit* | | 38,800 | | | 1,056 |
Itron* | | 600 | | | 35 |
j2 Global Communications* | | 600 | | | 13 |
Jabil Circuit | | 5,900 | | | 46 |
JDS Uniphase* | | 1,900 | | | 10 |
Juniper Networks* | | 1,300 | | | 32 |
Lam Research* | | 1,200 | | | 31 |
Lexmark International, Cl A* | | 2,900 | | | 47 |
Linear Technology | | 6,700 | | | 157 |
Marvell Technology Group* | | 4,300 | | | 49 |
Mastercard, Cl A | | 8,992 | | | 1,586 |
McAfee* | | 3,300 | | | 129 |
MEMC Electronic Materials* | | 700 | | | 13 |
Metavante Technologies* | | 2,400 | | | 62 |
Mettler Toledo International* | | 200 | | | 14 |
Microchip Technology | | 2,700 | | | 58 |
Micron Technology* | | 4,900 | | | 25 |
Microsoft | | 296,782 | | | 6,200 |
Molex | | 4,884 | | | 75 |
Motorola | | 83,876 | | | 508 |
National Instruments | | 2,600 | | | 55 |
National Semiconductor | | 5,200 | | | 72 |
NCR* | | 2,200 | | | 24 |
NetApp* | | 2,400 | | | 47 |
NeuStar, Cl A* | | 16,900 | | | 339 |
Nokia ADR | | 24,300 | | | 372 |
Novellus Systems* | | 600 | | | 11 |
Nvidia* | | 3,500 | | | 37 |
ON Semiconductor* | | 2,400 | | | 16 |
Oracle | | 45,200 | | | 885 |
Paychex | | 12,400 | | | 339 |
Pegasystems | | 700 | | | 19 |
QLogic* | | 14,600 | | | 199 |
Qualcomm | | 58,400 | | | 2,546 |
Quest Software* | | 800 | | | 10 |
Rambus* | | 1,100 | | | 14 |
Red Hat* | | 4,100 | | | 82 |
RightNow Technologies* | | 5,600 | | | 49 |
SAIC* | | 1,300 | | | 23 |
SanDisk* | | 1,900 | | | 30 |
Seagate Technology | | 1,500 | | | 13 |
Silicon Laboratories* | | 2,400 | | | 81 |
Sohu.com* | | 200 | | | 13 |
Sun Microsystems* | | 4,200 | | | 38 |
Sybase* | | 13,400 | | | 436 |
Symantec* | | 100,100 | | | 1,561 |
Tellabs* | | 3,200 | | | 18 |
Teradata* | | 36,300 | | | 784 |
Texas Instruments | | 132,264 | | | 2,566 |
Trimble Navigation* | | 3,200 | | | 61 |
Tyco Electronics | | 200 | | | 4 |
Varian Semiconductor Equipment Associates* | | 500 | | | 12 |
| | | | | |
| Description | | Shares | | Market Value
($ Thousands) |
| | | | | |
VeriSign* | | 36,700 | | $ | 859 |
Visa, Cl A | | 39,608 | | | 2,682 |
VMware, Cl A* | | 1,900 | | | 59 |
Western Digital* | | 8,400 | | | 209 |
Western Union | | 3,754 | | | 66 |
Xerox | | 9,800 | | | 67 |
Xilinx | | 18,600 | | | 386 |
Yahoo!* | | 67,700 | | | 1,072 |
| | | | | |
| | | | | 56,147 |
| | | | | |
| | |
Materials — 2.1% | | | | | |
Airgas | | 200 | | | 8 |
AK Steel Holding | | 500 | | | 7 |
Allegheny Technologies | | 300 | | | 11 |
Ashland | | 10,280 | | | 275 |
Ball | | 1,100 | | | 44 |
Bemis | | 18,700 | | | 469 |
Cabot | | 1,907 | | | 30 |
Celanese, Cl A | | 1,900 | | | 39 |
Cliffs Natural Resources | | 2,861 | | | 78 |
Commercial Metals | | 1,700 | | | 29 |
Crown Holdings* | | 8,200 | | | 193 |
Dow Chemical | | 30,856 | | | 546 |
E.I. Du Pont de Nemours | | 2,600 | | | 74 |
Eagle Materials | | 1,700 | | | 42 |
Ecolab | | 6,804 | | | 254 |
FMC | | 1,200 | | | 65 |
Freeport-McMoRan Copper & Gold, Cl B | | 600 | | | 33 |
Huntsman | | 14,391 | | | 91 |
International Flavors & Fragrances | | 400 | | | 13 |
International Paper | | 700 | | | 10 |
Kaiser Aluminum | | 2,300 | | | 71 |
Koppers Holdings | | 1,600 | | | 40 |
Lubrizol | | 10,200 | | | 456 |
Martin Marietta Materials | | 100 | | | 8 |
MeadWestvaco | | 2,100 | | | 34 |
Monsanto | | 3,700 | | | 304 |
Mosaic | | 1,900 | | | 104 |
Nalco Holding | | 32,300 | | | 561 |
NewMarket | | 1,100 | | | 80 |
Newmont Mining | | 3,314 | | | 162 |
Nucor | | 5,000 | | | 219 |
Olympic Steel | | 800 | | | 15 |
Packaging of America | | 2,400 | | | 38 |
Pactiv* | | 4,372 | | | 98 |
PPG Industries | | 5,000 | | | 222 |
Praxair | | 14,700 | | | 1,076 |
Reliance Steel & Aluminum | | 300 | | | 11 |
RPM International | | 100 | | | 2 |
Scotts Miracle-Gro, Cl A | | 400 | | | 14 |
Sealed Air | | 100 | | | 2 |
Sigma-Aldrich | | 300 | | | 15 |
Sonoco Products | | 4,834 | | | 118 |
Southern Copper | | 10,900 | | | 228 |
| | |
| 48 | | SEI Institutional Investments Trust / Annual Report / May 31, 2009 |
| | | | | |
| Description | | Shares | | Market Value
($ Thousands) |
| | | | | |
Steel Dynamics | | 600 | | $ | 9 |
Syngenta ADR | | 12,700 | | | 620 |
United States Steel | | 500 | | | 17 |
Valspar | | 4,300 | | | 98 |
Vulcan Materials | | 1,200 | | | 53 |
| | | | | |
| | | | | 6,986 |
| | | | | |
|
Telecommunication Services — 2.7% |
AT&T | | 155,627 | | | 3,858 |
Atlantic Telegraph-Network | | 400 | | | 9 |
CenturyTel | | 6,000 | | | 185 |
Crown Castle International* | | 34,400 | | | 835 |
Embarq | | 2,500 | | | 105 |
Frontier Communications | | 21,900 | | | 160 |
Leap Wireless International* | | 1,500 | | | 56 |
MetroPCS Communications* | | 3,900 | | | 67 |
NII Holdings* | | 54,857 | | | 1,122 |
NTELOS Holdings | | 3,700 | | | 66 |
Qwest Communications International | | 3,200 | | | 14 |
SBA Communications, Cl A* | | 1,400 | | | 36 |
Sprint Nextel* | | 121,357 | | | 625 |
Telephone & Data Systems | | 400 | | | 12 |
US Cellular* | | 6,163 | | | 256 |
Verizon Communications | | 51,600 | | | 1,510 |
Windstream | | 1,950 | | | 16 |
| | | | | |
| | | | | 8,932 |
| | | | | |
|
Utilities — 2.6% |
AES* | | 151,470 | | | 1,513 |
AGL Resources | | 400 | | | 12 |
Ameren | | 7,100 | | | 165 |
American Electric Power | | 7,200 | | | 190 |
American Water Works | | 5,500 | | | 95 |
Aqua America | | 2,100 | | | 35 |
Atmos Energy | | 4,300 | | | 103 |
Calpine* | | 32,044 | | | 434 |
CMS Energy | | 1,700 | | | 19 |
Consolidated Edison | | 4,300 | | | 153 |
Dominion Resources | | 8,300 | | | 264 |
DTE Energy | | 5,000 | | | 151 |
Duke Energy | | 1,500 | | | 21 |
Edison International | | 13,500 | | | 395 |
El Paso Electric* | | 1,900 | | | 25 |
Energen | | 3,293 | | | 122 |
Entergy | | 500 | | | 37 |
Exelon | | 4,020 | | | 193 |
FirstEnergy | | 8,000 | | | 302 |
FPL Group | | 200 | | | 11 |
Hawaiian Electric Industries | | 7,600 | | | 131 |
Integrys Energy Group | | 1,700 | | | 46 |
MDU Resources Group | | 6,300 | | | 116 |
Mirant* | | 10,300 | | | 161 |
National Fuel Gas | | 1,400 | | | 47 |
| | | | | |
| Description | | Shares/Face Amount
($ Thousands) | | Market Value
($ Thousands) |
| | | | | |
Northeast Utilities | | 600 | | $ | 12 |
NRG Energy* | | 26,911 | | | 606 |
NSTAR | | 4,700 | | | 141 |
NV Energy | | 24,700 | | | 247 |
OGE Energy | | 1,800 | | | 47 |
Oneok | | 500 | | | 15 |
Pepco Holdings | | 13,300 | | | 173 |
PG&E | | 3,400 | | | 125 |
Pinnacle West Capital | | 3,000 | | | 83 |
PPL | | 28,333 | | | 920 |
Progress Energy | | 2,200 | | | 78 |
Public Service Enterprise Group | | 20,300 | | | 647 |
Questar | | 300 | | | 10 |
RRI Energy* | | 1,900 | | | 10 |
SCANA | | 1,500 | | | 45 |
Sempra Energy | | 10,200 | | | 466 |
Southern | | 4,100 | | | 117 |
TECO Energy | | 4,000 | | | 45 |
UGI | | 5,500 | | | 133 |
Vectren | | 500 | | | 11 |
Wisconsin Energy | | 200 | | | 8 |
Xcel Energy | | 700 | | | 12 |
| | | | | |
| | | | | 8,692 |
| | | | | |
Total Common Stock
(Cost $265,063) ($ Thousands) | | | | | 252,879 |
| | | | | |
|
U.S. TREASURY OBLIGATIONS — 2.1% |
U.S. Treasury Bills | | | | | |
0.276%, 06/11/09 (A) (B) | | $6,500 | | | 6,500 |
0.352%, 02/11/10 (A) (B) | | 500 | | | 499 |
| | | | | |
| | | | | 6,999 |
| | | | | |
Total U.S. Treasury Obligations
(Cost $6,998) ($ Thousands) | | | | | 6,999 |
| | | | | |
|
CASH EQUIVALENT — 4.0% |
SEI Daily Income Trust, Prime Obligation Fund, Cl A, 0.270%**† | | 13,369,323 | | | 13,369 |
| | | | | |
Total Cash Equivalent
(Cost $13,369) ($ Thousands) | | | | | 13,369 |
| | | | | |
|
AFFILIATED PARTNERSHIP — 10.8% |
SEI LIBOR Plus Portfolio† | | 6,068,171 | | | 35,741 |
| | | | | |
Total Affiliated Partnership
(Cost $54,112) ($ Thousands) | | | | | 35,741 |
| | | | | |
Total Investments — 93.3%
(Cost $339,542) ($ Thousands) | | | | $ | 308,988 |
| | | | | |
| | |
| SEI Institutional Investments Trust / Annual Report / May 31, 2009 | �� | 49 |
SCHEDULE OF INVESTMENTS
Large Cap Diversified Alpha Fund (concluded)
May 31, 2009
A summary of the open futures contracts held by the Fund at May 31, 2009, is as follows:
| | | | | | | |
Type of
Contract | | Number of
Contracts
Long | | Expiration
Date | | Unrealized
Appreciation
($ Thousands) |
S&P 500 Index EMINI | | 35 | | Jun-2009 | | $ | 298 |
S&P Composite Index | | 346 | | Jun-2009 | | | 11,061 |
| | | | | | | |
| | | | | | $ | 11,359 |
| | | | | | | |
Percentages are based on a Net Assets of $331,002 ($ Thousands).
| * | | Non-income producing security. |
| ** | | The rate reported is the 7-day effective yield as of May 31, 2009 |
| † | | Investment in Affiliated Security (see Note 4). |
| ‡ | | Real Estate Investment Trust. |
| (A) | | Zero coupon security. The rate reported is the effective yield at time of purchase. |
| (B) | | Security, or a portion thereof, has been pledged as collateral on open futures contracts. |
ADR — American Depositary Receipt
Cl — Class
LIBOR — London Interbank Offered Rate
The accompanying notes are an integral part of the financial statements.
| | |
| 50 | | SEI Institutional Investments Trust / Annual Report / May 31, 2009 |
SCHEDULE OF INVESTMENTS
Large Cap Disciplined Equity Fund
May 31, 2009
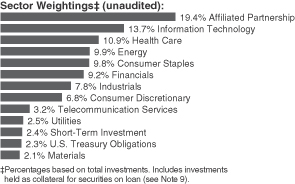
| | | | | |
| Description | | Shares | | Market Value
($ Thousands) |
| | | | | |
| | |
COMMON STOCK — 83.2% | | | | | |
| | |
Consumer Discretionary — 7.4% | | | | | |
Amazon.com* (A) | | 194,170 | | $ | 15,143 |
American Greetings, Cl A (A) | | 80,100 | | | 549 |
Ameristar Casinos | | 30,800 | | | 618 |
Apollo Group, Cl A* | | 225,960 | | | 13,354 |
AutoZone* (A) | | 16,400 | | | 2,495 |
Bed Bath & Beyond* | | 18,200 | | | 512 |
Best Buy (A) | | 442,096 | | | 15,517 |
Big Lots* (A) | | 152,200 | | | 3,502 |
Black & Decker | | 13,000 | | | 417 |
Brinker International | | 42,408 | | | 759 |
Carnival | | 10,600 | | | 270 |
Centex (A) | | 55,100 | | | 465 |
Charlotte Russe Holding* | | 33,000 | | | 335 |
Coach (A) | | 389,000 | | | 10,219 |
Comcast, Cl A | | 3,731,627 | | | 51,384 |
Darden Restaurants (A) | | 343,500 | | | 12,424 |
Deckers Outdoor* (A) | | 19,400 | | | 1,124 |
DIRECTV Group* (A) | | 244,307 | | | 5,497 |
DISH Network, Cl A* | | 526,940 | | | 8,642 |
Domino’s Pizza* (A) | | 24,800 | | | 225 |
DR Horton | | 50,500 | | | 465 |
Family Dollar Stores (A) | | 115,900 | | | 3,508 |
Ford Motor* (A) | | 911,010 | | | 5,238 |
Fortune Brands | | 180,220 | | | 6,310 |
GameStop, Cl A* (A) | | 258,400 | | | 6,447 |
Gap | | 163,249 | | | 2,914 |
Genuine Parts | | 84,500 | | | 2,829 |
Goodyear Tire & Rubber* | | 30,200 | | | 345 |
Grand Canyon Education* (A) | | 25,900 | | | 351 |
H&R Block | | 784,341 | | | 11,452 |
Harley-Davidson (A) | | 18,300 | | | 311 |
Harman International Industries (A) | | 42,000 | | | 783 |
Hasbro (A) | | 633,760 | | | 16,104 |
Home Depot (A) | | 687,085 | | | 15,913 |
International Speedway, Cl A | | 7,600 | | | 188 |
J.C. Penney | | 55,300 | | | 1,443 |
Johnson Controls | | 567,326 | | | 11,307 |
| | | | | |
| Description | | Shares | | Market Value
($ Thousands) |
| | | | | |
KB Home | | 18,600 | | $ | 279 |
Kohl’s* | | 65,100 | | | 2,765 |
Las Vegas Sands* (A) | | 197,416 | | | 1,956 |
Leggett & Platt | | 600,600 | | | 8,817 |
Lennar, Cl A (A) | | 99,000 | | | 941 |
Limited Brands (A) | | 264,700 | | | 3,311 |
Lincoln Educational Services* | | 21,900 | | | 404 |
Lowe’s | | 315,500 | | | 5,998 |
Macy’s | | 841,100 | | | 9,824 |
Marriott International, Cl A (A) | | 337,623 | | | 7,887 |
Mattel | | 60,900 | | | 951 |
McDonald’s | | 546,032 | | | 32,211 |
McGraw-Hill | | 99,525 | | | 2,995 |
Monro Muffler | | 26,800 | | | 716 |
News, Cl A | | 709,000 | | | 6,934 |
NIKE, Cl B (A) | | 19,800 | | | 1,130 |
Nordstrom (A) | | 261,806 | | | 5,155 |
NVR* (A) | | 12,280 | | | 6,077 |
O’Reilly Automotive* (A) | | 24,100 | | | 869 |
Panera Bread, Cl A* (A) | | 83,200 | | | 4,430 |
PetMed Express* (A) | | 31,500 | | | 461 |
Pinnacle Entertainment* | | 16,100 | | | 172 |
Polo Ralph Lauren, Cl A (A) | | 55,500 | | | 2,987 |
Pulte Homes (A) | | 13,000 | | | 114 |
RadioShack (A) | | 193,058 | | | 2,595 |
Rent-A-Center, Cl A* | | 40,800 | | | 797 |
Ross Stores (A) | | 112,600 | | | 4,409 |
Royal Caribbean Cruises | | 316,140 | | | 4,761 |
Scripps Networks Interactive, Cl A (A) | | 7,100 | | | 197 |
Sherwin-Williams | | 78,600 | | | 4,150 |
Smith & Wesson Holding* | | 90,500 | | | 478 |
Snap-On | | 29,700 | | | 925 |
Stanley Works | | 17,700 | | | 632 |
Staples | | 302,440 | | | 6,185 |
Starbucks* | | 441,794 | | | 6,357 |
Sturm Ruger | | 12,600 | | | 149 |
Target | | 311,562 | | | 12,244 |
Texas Roadhouse, Cl A* | | 66,500 | | | 773 |
Tiffany (A) | | 58,100 | | | 1,648 |
Time Warner | | 446,785 | | | 10,464 |
Time Warner Cable, Cl A | | 196,428 | | | 6,048 |
TJX (A) | | 245,433 | | | 7,243 |
Tractor Supply* (A) | | 36,400 | | | 1,397 |
VF (A) | | 65,000 | | | 3,693 |
Walt Disney | | 1,100,414 | | | 26,652 |
Whirlpool (A) | | 4,700 | | | 198 |
Wyndham Worldwide | | 76,000 | | | 896 |
Wynn Resorts* (A) | | 11,600 | | | 430 |
Yum! Brands | | 242,500 | | | 8,398 |
| | | | | |
| | | | | 448,462 |
| | | | | |
| | |
Consumer Staples — 10.7% | | | | | |
Altria Group (A) | | 1,438,860 | | | 24,590 |
Archer-Daniels-Midland | | 442,020 | | | 12,164 |
| | |
| SEI Institutional Investments Trust / Annual Report / May 31, 2009 | | 51 |
SCHEDULE OF INVESTMENTS
Large Cap Disciplined Equity Fund (Continued)
May 31, 2009
| | | | | |
| Description | | Shares | | Market Value
($ Thousands) |
| | | | | |
Brown-Forman, Cl B (A) | | 303,748 | | $ | 13,319 |
Bunge (A) | | 126,456 | | | 8,001 |
Campbell Soup | | 218,400 | | | 6,054 |
Chiquita Brands International* | | 42,700 | | | 446 |
Clorox (A) | | 34,400 | | | 1,804 |
Coca-Cola (A) | | 929,997 | | | 45,719 |
Coca-Cola Enterprises | | 325,210 | | | 5,418 |
Colgate-Palmolive | | 226,000 | | | 14,905 |
Constellation Brands, Cl A* (A) | | 110,200 | | | 1,274 |
Corn Products International | | 26,051 | | | 688 |
Costco Wholesale (A) | | 429,309 | | | 20,830 |
CVS Caremark | | 536,808 | | | 15,997 |
Dean Foods* | | 16,200 | | | 305 |
Del Monte Foods | | 38,000 | | | 311 |
Dr Pepper Snapple Group* | | 41,400 | | | 900 |
Estee Lauder, Cl A | | 32,098 | | | 1,062 |
General Mills | | 533,220 | | | 27,290 |
Hershey | | 121,500 | | | 4,279 |
HJ Heinz (A) | | 79,000 | | | 2,890 |
Hormel Foods (A) | | 50,597 | | | 1,758 |
JM Smucker | | 76,400 | | | 3,076 |
Kellogg | | 141,100 | | | 6,103 |
Kimberly-Clark | | 236,194 | | | 12,256 |
Kraft Foods, Cl A | | 643,483 | | | 16,801 |
Kroger (A) | | 917,264 | | | 20,913 |
Lorillard | | 4,400 | | | 301 |
McCormick | | 20,700 | | | 632 |
Molson Coors Brewing, Cl B | | 2,700 | | | 119 |
PepsiCo | | 962,949 | | | 50,121 |
Philip Morris International | | 1,426,201 | | | 60,813 |
Procter & Gamble (A) | | 1,989,371 | | | 103,328 |
Reynolds American | | 178,700 | | | 7,142 |
Safeway (A) | | 349,400 | | | 7,079 |
Sara Lee | | 820,966 | | | 7,380 |
Spartan Stores | | 28,300 | | | 351 |
Supervalu | | 191,760 | | | 3,183 |
Sysco (A) | | 911,010 | | | 21,828 |
Tyson Foods, Cl A (A) | | 780,165 | | | 10,392 |
Walgreen | | 820,616 | | | 24,446 |
Wal-Mart Stores | | 1,632,746 | | | 81,213 |
| | | | | |
| | | | | 647,481 |
| | | | | |
| | |
Energy — 10.8% | | | | | |
Anadarko Petroleum | | 174,100 | | | 8,319 |
Apache | | 350,739 | | | 29,553 |
Baker Hughes | | 71,401 | | | 2,789 |
Berry Petroleum, Cl A | | 17,500 | | | 342 |
BJ Services | | 66,900 | | | 1,046 |
Cabot Oil & Gas | | 186,445 | | | 6,550 |
Cameron International* | | 16,700 | | | 522 |
Chesapeake Energy | | 115,200 | | | 2,610 |
Chevron (A) | | 1,741,819 | | | 116,127 |
ConocoPhillips (A) | | 728,626 | | | 33,400 |
Consol Energy | | 158,420 | | | 6,521 |
| | | | | |
| Description | | Shares | | Market Value
($ Thousands) |
| | | | | |
Denbury Resources* | | 81,200 | | $ | 1,396 |
Devon Energy | | 66,900 | | | 4,231 |
Diamond Offshore Drilling (A) | | 65,400 | | | 5,512 |
Dresser-Rand Group* | | 90,200 | | | 2,526 |
El Paso | | 119,200 | | | 1,162 |
ENSCO International | | 63,000 | | | 2,450 |
EOG Resources | | 106,460 | | | 7,792 |
Exxon Mobil (A) | | 3,393,791 | | | 235,359 |
Halliburton | | 815,522 | | | 18,700 |
Hess | | 190,960 | | | 12,716 |
Marathon Oil (A) | | 648,344 | | | 20,669 |
Massey Energy (A) | | 83,500 | | | 1,911 |
Murphy Oil | | 132,339 | | | 7,809 |
Nabors Industries* (A) | | 297,980 | | | 5,328 |
National Oilwell Varco* | | 105,800 | | | 4,086 |
Noble | | 150,840 | | | 5,184 |
Noble Energy | | 6,000 | | | 357 |
Occidental Petroleum (A) | | 503,643 | | | 33,800 |
Peabody Energy (A) | | 148,000 | | | 5,029 |
Pioneer Natural Resources | | 96,700 | | | 2,719 |
Range Resources | | 4,200 | | | 192 |
Rowan | | 30,700 | | | 628 |
Schlumberger (A) | | 563,908 | | | 32,273 |
SEACOR Holdings* | | 1,900 | | | 145 |
Smith International | | 72,800 | | | 2,125 |
Southwestern Energy* | | 129,900 | | | 5,647 |
Spectra Energy | | 398,600 | | | 6,398 |
Sunoco | | 81,900 | | | 2,492 |
Tesoro (A) | | 452,000 | | | 7,657 |
USEC* (A) | | 87,700 | | | 469 |
Valero Energy | | 245,300 | | | 5,487 |
Western Refining (A) | | 77,000 | | | 1,097 |
World Fuel Services (A) | | 28,200 | | | 1,197 |
XTO Energy | | 42,925 | | | 1,836 |
| | | | | |
| | | | | 654,158 |
| | | | | |
| | |
Financials — 10.1% | | | | | |
Aflac | | 361,060 | | | 12,818 |
Allied World Assurance Holdings | | 27,800 | | | 1,049 |
Allstate | | 254,647 | | | 6,552 |
American Express | | 864,404 | | | 21,480 |
American Financial Group (A) | | 116,700 | | | 2,500 |
Ameriprise Financial | | 177,236 | | | 5,353 |
Annaly Capital Management‡ | | 233,800 | | | 3,259 |
AON | | 37,400 | | | 1,346 |
Apartment Investment & Management, Cl A‡ | | 7,218 | | | 68 |
Apollo Investments* | | 110,300 | | | 608 |
Assurant (A) | | 139,500 | | | 3,296 |
AvalonBay Communities‡ (A) | | 5,100 | | | 314 |
Bank of America (A) | | 4,009,362 | | | 45,185 |
Bank of New York Mellon | | 1,007,553 | | | 27,990 |
BB&T (A) | | 186,400 | | | 4,179 |
BlackRock, Cl A (A) | | 68,669 | | | 10,953 |
| | |
| 52 | | SEI Institutional Investments Trust / Annual Report / May 31, 2009 |
| | | | | |
| Description | | Shares | | Market Value
($ Thousands) |
| | | | | |
BOK Financial (A) | | 17,261 | | $ | 700 |
Boston Properties‡ (A) | | 22,700 | | | 1,097 |
Brandywine Realty Trust‡ | | 115,400 | | | 860 |
Capital One Financial | | 27,400 | | | 670 |
CB Richard Ellis Group, Cl A* | | 48,300 | | | 353 |
Charles Schwab (A) | | 1,440,369 | | | 25,350 |
Chubb | | 277,670 | | | 11,010 |
Cincinnati Financial | | 13,100 | | | 296 |
Citigroup (A) | | 434,051 | | | 1,615 |
CME Group, Cl A | | 4,200 | | | 1,351 |
Colonial Properties Trust‡ (A) | | 63,500 | | | 494 |
Comerica | | 27,100 | | | 588 |
Community Bank System (A) | | 24,600 | | | 381 |
Cousins Properties‡ (A) | | 17,300 | | | 156 |
Discover Financial Services | | 117,200 | | | 1,120 |
Duke Realty‡ (A) | | 132,400 | | | 1,259 |
Endurance Specialty Holdings | | 66,400 | | | 1,824 |
Equity Residential‡ | | 176,050 | | | 4,285 |
Federated Investors, Cl B (A) | | 13,800 | | | 345 |
Fifth Third Bancorp (A) | | 58,500 | | | 404 |
First Horizon National (A) | | 96,288 | | | 1,169 |
Forest City Enterprises, Cl A | | 25,700 | | | 182 |
Franklin Resources | | 86,039 | | | 5,752 |
Goldman Sachs Group | | 296,383 | | | 42,848 |
Hartford Financial Services Group | | 120,464 | | | 1,728 |
HCP‡ | | 65,400 | | | 1,519 |
Health Care‡ (A) | | 7,400 | | | 253 |
Host Hotels & Resorts‡ | | 401,900 | | | 3,770 |
Hudson City Bancorp | | 53,100 | | | 681 |
IntercontinentalExchange* | | 9,500 | | | 1,024 |
Invesco | | 48,800 | | | 764 |
JPMorgan Chase | | 2,055,977 | | | 75,865 |
Keycorp | | 184,300 | | | 921 |
Legg Mason | | 31,300 | | | 603 |
Leucadia National (A) | | 54,300 | | | 1,134 |
Lincoln National | | 278,000 | | | 5,268 |
Loews | | 177,800 | | | 4,810 |
LTC Properties‡ | | 6,900 | | | 144 |
Marsh & McLennan | | 266,400 | | | 5,040 |
Marshall & Ilsley (A) | | 42,100 | | | 277 |
MBIA* (A) | | 531,951 | | | 3,431 |
MetLife | | 390,143 | | | 12,290 |
Montpelier Re Holdings | | 32,700 | | | 438 |
Moody’s (A) | | 62,300 | | | 1,706 |
Morgan Stanley (A) | | 398,616 | | | 12,086 |
MSCI, Cl A* (A) | | 39,600 | | | 842 |
NASDAQ OMX Group* | | 21,400 | | | 452 |
New York Community Bancorp (A) | | 324,490 | | | 3,589 |
Northern Trust | | 210,888 | | | 12,158 |
NYSE Euronext | | 50,200 | | | 1,506 |
optionsXpress Holdings | | 55,400 | | | 947 |
People’s United Financial | | 13,100 | | | 207 |
PHH* | | 26,800 | | | 413 |
Plum Creek Timber‡ (A) | | 4,400 | | | 152 |
| | | | | |
| Description | | Shares | | Market Value
($ Thousands) |
| | | | | |
PNC Financial Services Group (A) | | 321,740 | | $ | 14,655 |
Principal Financial Group | | 283,733 | | | 6,299 |
Progressive | | 70,700 | | | 1,140 |
ProLogis‡ (A) | | 410,400 | | | 3,484 |
Protective Life | | 38,300 | | | 473 |
Prudential Financial | | 315,000 | | | 12,572 |
PS Business Parks‡ | | 7,400 | | | 332 |
Public Storage‡ (A) | | 179,665 | | | 11,967 |
Rayonier‡ (A) | | 162,669 | | | 6,507 |
Regions Financial | | 210,400 | | | 882 |
Riskmetrics Group* | | 10,000 | | | 161 |
Simon Property Group‡ (A) | | 9,847 | | | 527 |
SLM* | | 340,500 | | | 2,251 |
StanCorp Financial Group | | 96,500 | | | 2,993 |
State Street | | 231,529 | | | 10,754 |
SunTrust Banks | | 25,500 | | | 336 |
T. Rowe Price Group (A) | | 436,039 | | | 17,690 |
TD Ameritrade Holding* (A) | | 234,800 | | | 4,001 |
TFS Financial | | 24,800 | | | 283 |
Torchmark | | 7,800 | | | 313 |
Travelers | | 444,270 | | | 18,064 |
Unum Group | | 191,100 | | | 3,270 |
US Bancorp | | 1,252,226 | | | 24,043 |
Validus Holdings | | 15,800 | | | 360 |
Ventas‡ | | 16,000 | | | 486 |
Vornado Realty Trust‡ (A) | | 18,500 | | | 863 |
Wells Fargo (A) | | 2,296,952 | | | 58,572 |
World Acceptance* (A) | | 19,000 | | | 381 |
XL Capital, Cl A (A) | | 61,100 | | | 618 |
Zions Bancorporation (A) | | 29,700 | | | 406 |
| | | | | |
| | | | | 609,760 |
| | | | | |
| | |
Health Care — 12.0% | | | | | |
Abbott Laboratories | | 671,426 | | | 30,254 |
Aetna | | 372,703 | | | 9,981 |
American Medical Systems Holdings* (A) | | 69,800 | | | 1,059 |
AmerisourceBergen (A) | | 413,563 | | | 15,343 |
Amgen* | | 1,025,771 | | | 51,227 |
Baxter International | | 344,900 | | | 17,655 |
Becton Dickinson | | 185,095 | | | 12,527 |
Biogen Idec* | | 177,823 | | | 9,209 |
Boston Scientific* | | 595,860 | | | 5,601 |
Bristol-Myers Squibb | | 1,024,847 | | | 20,415 |
Cardinal Health | | 491,928 | | | 17,586 |
Celgene* | | 227,600 | | | 9,614 |
Cephalon* (A) | | 138,100 | | | 8,053 |
CIGNA | | 51,200 | | | 1,135 |
Coventry Health Care* | | 16,700 | | | 301 |
Covidien | | 265,942 | | | 9,500 |
DaVita* | | 83,200 | | | 3,753 |
Eli Lilly (A) | | 490,972 | | | 16,973 |
Endo Pharmaceuticals Holdings* | | 108,000 | | | 1,720 |
Express Scripts* | | 175,100 | | | 11,215 |
Forest Laboratories* | | 467,193 | | | 11,068 |
| | |
| SEI Institutional Investments Trust / Annual Report / May 31, 2009 | | 53 |
SCHEDULE OF INVESTMENTS
Large Cap Disciplined Equity Fund (Continued)
May 31, 2009
| | | | | |
| Description | | Shares | | Market Value
($ Thousands) |
| | | | | |
Gen-Probe* | | 7,000 | | $ | 298 |
Genzyme* | | 76,200 | | | 4,506 |
Gilead Sciences* (A) | | 573,361 | | | 24,712 |
Hill-Rom Holdings (A) | | 52,043 | | | 841 |
Humana* (A) | | 211,054 | | | 6,612 |
IMS Health | | 93,500 | | | 1,126 |
Invacare | | 40,100 | | | 681 |
Johnson & Johnson (A) | | 2,015,911 | | | 111,198 |
Kindred Healthcare* | | 22,400 | | | 294 |
King Pharmaceuticals* | | 303,700 | | | 2,873 |
Laboratory Corp of America Holdings* | | 29,700 | | | 1,811 |
Lincare Holdings* | | 28,400 | | | 619 |
McKesson | | 398,645 | | | 16,404 |
Medco Health Solutions* | | 215,848 | | | 9,905 |
Medtronic | | 705,952 | | | 24,250 |
Merck | | 1,536,557 | | | 42,378 |
Millipore* | | 5,200 | | | 327 |
Mylan Laboratories* (A) | | 400,000 | | | 5,284 |
PerkinElmer | | 77,100 | | | 1,254 |
Pfizer (A) | | 4,374,019 | | | 66,441 |
Quest Diagnostics | | 180,000 | | | 9,400 |
ResMed* | | 26,000 | | | 964 |
Schering-Plough | | 889,274 | | | 21,698 |
Sepracor* | | 69,000 | | | 1,080 |
St. Jude Medical* | | 18,000 | | | 702 |
Stryker (A) | | 398,019 | | | 15,300 |
Thermo Fisher Scientific* | | 138,770 | | | 5,400 |
UnitedHealth Group | | 863,256 | | | 22,963 |
Valeant Pharmaceuticals International* | | 19,300 | | | 444 |
Varian Medical Systems* | | 13,000 | | | 465 |
Warner Chilcott, Cl A* | | 43,900 | | | 578 |
Waters* | | 5,100 | | | 221 |
Watson Pharmaceuticals* | | 67,300 | | | 2,036 |
WellPoint* | | 336,906 | | | 15,690 |
Wyeth | | 742,281 | | | 33,299 |
Zimmer Holdings* | | 112,280 | | | 5,002 |
| | | | | |
| | | | | 721,245 |
| | | | | |
| | |
Industrials — 8.5% | | | | | |
3M | | 266,076 | | | 15,193 |
AGCO* (A) | | 334,424 | | | 9,652 |
Allegiant Travel, Cl A* (A) | | 66,500 | | | 2,683 |
Avery Dennison | | 3,300 | | | 91 |
Beacon Roofing Supply* (A) | | 21,700 | | | 314 |
Boeing | | 232,218 | | | 10,415 |
Burlington Northern Santa Fe | | 203,600 | | | 14,749 |
C.H. Robinson Worldwide (A) | | 154,702 | | | 7,862 |
Caterpillar | | 80,628 | | | 2,859 |
Chart Industries* | | 16,400 | | | 348 |
Cintas (A) | | 35,800 | | | 834 |
Cooper Industries, Cl A | | 59,900 | | | 1,966 |
CSX | | 336,472 | | | 10,686 |
Cummins | | 78,340 | | | 2,541 |
Danaher | | 124,900 | | | 7,538 |
| | | | | |
| Description | | Shares | | Market Value
($ Thousands) |
| | | | | |
Dover | | 335,520 | | $ | 10,549 |
Dun & Bradstreet | | 50,400 | | | 4,122 |
Eaton | | 163,340 | | | 7,105 |
Emerson Electric (A) | | 215,430 | | | 6,913 |
Equifax | | 12,000 | | | 327 |
Fastenal (A) | | 66,100 | | | 2,196 |
FedEx | | 115,331 | | | 6,393 |
Flowserve | | 78,394 | | | 5,767 |
Fluor (A) | | 410,659 | | | 19,293 |
General Dynamics | | 576,569 | | | 32,807 |
General Electric | | 6,770,130 | | | 91,261 |
Harsco | | 259,297 | | | 7,535 |
Honeywell International | | 48,253 | | | 1,600 |
Illinois Tool Works | | 7,200 | | | 233 |
Iron Mountain* | | 14,000 | | | 381 |
ITT (A) | | 191,000 | | | 7,865 |
Jacobs Engineering Group* (A) | | 129,200 | | | 5,542 |
KBR | | 466,183 | | | 8,587 |
Lockheed Martin | | 516,444 | | | 43,190 |
Manitowoc | | 44,200 | | | 288 |
Masco | | 32,300 | | | 335 |
Norfolk Southern | | 283,200 | | | 10,535 |
Northrop Grumman | | 428,686 | | | 20,414 |
Paccar (A) | | 87,069 | | | 2,599 |
Pall | | 26,700 | | | 686 |
Pitney Bowes | | 19,800 | | | 453 |
Precision Castparts | | 65,910 | | | 5,442 |
Raytheon | | 218,200 | | | 9,743 |
Republic Services, Cl A | | 28,440 | | | 648 |
Robert Half International (A) | | 53,100 | | | 1,136 |
Rockwell Automation | | 8,900 | | | 273 |
Ryder System | | 1,400 | | | 40 |
Southwest Airlines | | 1,564,741 | | | 10,546 |
Stericycle* | | 105,200 | | | 5,258 |
Teledyne Technologies* | | 17,800 | | | 585 |
Textron | | 25,000 | | | 288 |
Thomas & Betts* | | 92,300 | | | 2,832 |
Timken (A) | | 368,120 | | | 6,225 |
Titan International | | 91,200 | | | 824 |
Trinity Industries (A) | | 55,900 | | | 852 |
Union Pacific | | 333,350 | | | 16,424 |
United Parcel Service, Cl B | | 360,260 | | | 18,423 |
United Technologies | | 465,881 | | | 24,510 |
Waste Management (A) | | 488,071 | | | 13,466 |
Watson Wyatt Worldwide, Cl A | | 13,700 | | | 520 |
WESCO International* | | 184,700 | | | 4,937 |
WW Grainger (A) | | 90,800 | | | 7,158 |
| | | | | |
| | | | | 514,837 |
| | | | | |
| | |
Information Technology — 15.0% | | | | | |
Accenture, Cl A | | 555,997 | | | 16,641 |
Acxiom | | 81,000 | | | 866 |
Adobe Systems* | | 141,000 | | | 3,973 |
Advanced Micro Devices* | | 71,500 | | | 325 |
| | |
| 54 | | SEI Institutional Investments Trust / Annual Report / May 31, 2009 |
| | | | | |
| Description | | Shares | | Market Value
($ Thousands) |
| | | | | |
Affiliated Computer Services, Cl A* | | 70,800 | | $ | 3,182 |
Agilent Technologies* | | 172,201 | | | 3,139 |
Akamai Technologies* | | 278,930 | | | 6,209 |
Altera (A) | | 354,200 | | | 6,028 |
Analog Devices | | 171,400 | | | 4,184 |
Apple* | | 452,721 | | | 61,484 |
Applied Materials | | 25,700 | | | 289 |
Arris Group* | | 94,100 | | | 1,141 |
Autodesk* | | 21,300 | | | 457 |
Automatic Data Processing | | 223,953 | | | 8,512 |
BMC Software* | | 89,900 | | | 3,066 |
Broadcom, Cl A* | | 159,000 | | | 4,051 |
Cisco Systems* (A) | | 3,700,619 | | | 68,461 |
Citrix Systems* (A) | | 218,980 | | | 6,878 |
Cognizant Technology Solutions, Cl A* | | 21,100 | | | 532 |
Computer Sciences* | | 100,200 | | | 4,254 |
Compuware* | | 291,300 | | | 2,223 |
Convergys* (A) | | 178,500 | | | 1,651 |
Corning | | 1,265,253 | | | 18,599 |
Dell* (A) | | 1,649,292 | | | 19,099 |
Dolby Laboratories, Cl A* (A) | | 33,400 | | | 1,204 |
Earthlink* | | 41,200 | | | 323 |
eBay* (A) | | 1,035,813 | | | 18,251 |
Electronic Arts* | | 559,002 | | | 12,852 |
EMC* | | 1,423,290 | | | 16,724 |
Fidelity National Information Services | | 48,600 | | | 936 |
Fiserv* | | 25,900 | | | 1,097 |
FLIR Systems* | | 22,200 | | | 499 |
Google, Cl A* | | 99,358 | | | 41,455 |
Harris Stratex Networks, Cl A* | | 16,296 | | | 78 |
Hewlett-Packard | | 2,003,048 | | | 68,805 |
Ingram Micro, Cl A* | | 47,300 | | | 781 |
Intel (A) | | 5,067,283 | | | 79,658 |
International Business Machines | | 805,314 | | | 85,589 |
Intuit* (A) | | 47,200 | | | 1,285 |
j2 Global Communications* | | 19,000 | | | 424 |
Jabil Circuit | | 174,500 | | | 1,366 |
JDS Uniphase* | | 56,900 | | | 307 |
Juniper Networks* (A) | | 69,100 | | | 1,709 |
Lexmark International, Cl A* | | 202,600 | | | 3,310 |
Linear Technology (A) | | 250,100 | | | 5,855 |
Mastercard, Cl A (A) | | 85,327 | | | 15,046 |
McAfee* | | 48,100 | | | 1,887 |
MEMC Electronic Materials* | | 20,000 | | | 386 |
Mettler Toledo International* | | 11,600 | | | 826 |
Microchip Technology (A) | | 65,500 | | | 1,413 |
Micron Technology* (A) | | 59,600 | | | 301 |
Microsoft (A) | | 5,016,113 | | | 104,787 |
Motorola | | 1,845,355 | | | 11,183 |
National Semiconductor (A) | | 550,510 | | | 7,641 |
NetApp* (A) | | 16,200 | | | 316 |
Nvidia* (A) | | 151,650 | | | 1,582 |
ON Semiconductor* (A) | | 142,600 | | | 977 |
Oracle | | 1,662,296 | | | 32,564 |
| | | | | |
| Description | | Shares | | Market Value
($ Thousands) |
| | | | | |
Paychex | | 166,000 | | $ | 4,543 |
QLogic* | | 21,200 | | | 289 |
Qualcomm | | 965,829 | | | 42,100 |
Red Hat* | | 15,700 | | | 313 |
Riverbed Technology* | | 10,600 | | | 213 |
SanDisk* | | 97,200 | | | 1,522 |
Silicon Laboratories* (A) | | 41,900 | | | 1,409 |
Sun Microsystems* | | 90,100 | | | 811 |
Symantec* (A) | | 704,900 | | | 10,989 |
Tellabs* | | 66,700 | | | 370 |
Tessera Technologies* | | 28,500 | | | 671 |
Texas Instruments | | 1,427,432 | | | 27,692 |
| | | | | |
Tyco Electronics (A) | | 293,820 | | | 5,104 |
VeriSign* (A) | | 147,900 | | | 3,462 |
Visa, Cl A (A) | | 302,125 | | | 20,457 |
Western Union | | 390,990 | | | 6,893 |
Xerox | | 145,500 | | | 989 |
Xilinx (A) | | 569,500 | | | 11,811 |
Yahoo!* | | 17,400 | | | 276 |
| | | | | |
| | | | | 906,575 |
| | | | | |
|
Materials — 2.4% |
Air Products & Chemicals | | 72,050 | | | 4,667 |
AK Steel Holding | | 75,100 | | | 1,074 |
Alcoa | | 23,100 | | | 213 |
Allegheny Technologies | | 13,400 | | | 475 |
Ashland | | 219,350 | | | 5,879 |
Ball | | 63,100 | | | 2,511 |
Bemis (A) | | 143,000 | | | 3,588 |
Celanese, Cl A | | 94,840 | | | 1,945 |
CF Industries Holdings | | 8,300 | | | 644 |
Compass Minerals International (A) | | 34,300 | | | 1,840 |
Dow Chemical (A) | | 716,995 | | | 12,676 |
E.I. Du Pont de Nemours (A) | | 132,791 | | | 3,781 |
Eagle Materials (A) | | 31,600 | | | 777 |
Ecolab | | 305,395 | | | 11,406 |
Freeport-McMoRan Copper & Gold, Cl B | | 61,333 | | | 3,338 |
International Flavors & Fragrances | | 11,400 | | | 364 |
International Paper | | 117,280 | | | 1,685 |
Kaiser Aluminum | | 16,900 | | | 525 |
MeadWestvaco | | 91,600 | | | 1,463 |
Monsanto | | 108,820 | | | 8,940 |
Nalco Holding (A) | | 108,100 | | | 1,877 |
NewMarket | | 8,800 | | | 639 |
Newmont Mining (A) | | 317,048 | | | 15,494 |
Nucor | | 10,800 | | | 474 |
Owens-Illinois* | | 321,650 | | | 9,209 |
Pactiv* | | 193,000 | | | 4,323 |
PPG Industries | | 265,290 | | | 11,797 |
Praxair | | 290,610 | | | 21,273 |
Rock-Tenn, Cl A | | 34,600 | | | 1,328 |
Sealed Air | | 10,700 | | | 214 |
Sigma-Aldrich | | 18,700 | | | 906 |
Titanium Metals (A) | | 133,700 | | | 1,238 |
| | |
| SEI Institutional Investments Trust / Annual Report / May 31, 2009 | | 55 |
SCHEDULE OF INVESTMENTS
Large Cap Disciplined Equity Fund (Continued)
May 31, 2009
| | | | | |
| Description | | Shares | | Market Value
($ Thousands) |
| | | | | |
United States Steel (A) | | 84,400 | | $ | 2,876 |
Vulcan Materials (A) | | 51,900 | | | 2,299 |
Weyerhaeuser | | 8,600 | | | 289 |
| | | | | |
| | | | | 142,027 |
| | | | | |
|
Telecommunication Services — 3.5% |
American Tower, Cl A* | | 12,200 | | | 389 |
AT&T (A) | | 4,483,872 | | | 111,155 |
CenturyTel (A) | | 217,300 | | | 6,704 |
Embarq | | 109,100 | | | 4,584 |
Frontier Communications (A) | | 809,000 | | | 5,890 |
NII Holdings* | | 456,339 | | | 9,337 |
NTELOS Holdings | | 39,100 | | | 699 |
Qwest Communications
International (A) | | 1,056,220 | | | 4,605 |
Sprint Nextel* | | 3,006,893 | | | 15,485 |
Verizon Communications | | 1,682,938 | | | 49,243 |
Windstream (A) | | 548,213 | | | 4,610 |
| | | | | |
| | | | | 212,701 |
| | | | | |
|
Utilities — 2.8% |
AES* | | 405,539 | | | 4,051 |
Allegheny Energy | | 121,020 | | | 3,026 |
Ameren | | 128,454 | | | 2,988 |
American Electric Power | | 417,750 | | | 11,004 |
American Water Works | | 32,800 | | | 567 |
Calpine* | | 336,398 | | | 4,558 |
Centerpoint Energy | | 26,100 | | | 264 |
CMS Energy (A) | | 223,100 | | | 2,530 |
Consolidated Edison | | 60,000 | | | 2,128 |
Constellation Energy Group | | 102,300 | | | 2,791 |
Dominion Resources | | 237,100 | | | 7,537 |
DTE Energy | | 186,200 | | | 5,633 |
Duke Energy | | 158,900 | | | 2,248 |
Dynegy, Cl A* (A) | | 114,803 | | | 231 |
Edison International | | 164,612 | | | 4,813 |
Energen | | 83,077 | | | 3,092 |
Entergy | | 15,200 | | | 1,134 |
Exelon (A) | | 315,305 | | | 15,138 |
FirstEnergy | | 19,300 | | | 729 |
FPL Group (A) | | 137,390 | | | 7,767 |
IDACORP | | 26,800 | | | 624 |
Integrys Energy Group | | 48,800 | | | 1,322 |
Mirant* | | 74,400 | | | 1,162 |
Nicor | | 67,300 | | | 2,116 |
NiSource | | 62,100 | | | 664 |
Northeast Utilities | | 57,200 | | | 1,189 |
NRG Energy* (A) | | 555,388 | | | 12,496 |
Pepco Holdings (A) | | 354,900 | | | 4,607 |
PG&E (A) | | 193,074 | | | 7,088 |
Pinnacle West Capital (A) | | 99,400 | | | 2,748 |
PPL | | 832,159 | | | 27,020 |
Progress Energy | | 59,400 | | | 2,109 |
Public Service Enterprise Group | | 298,370 | | | 9,509 |
| | | | | | |
| Description | | Shares/Face Amount
($ Thousands) | | Market Value
($ Thousands) |
| | | | | | |
Questar | | | 22,600 | | $ | 766 |
SCANA | | | 10,700 | | | 321 |
Sempra Energy | | | 57,480 | | | 2,626 |
Southern | | | 189,700 | | | 5,389 |
TECO Energy (A) | | | 278,400 | | | 3,124 |
UGI | | | 40,800 | | | 984 |
Unisource Energy | | | 20,700 | | | 527 |
Wisconsin Energy | | | 900 | | | 35 |
Xcel Energy | | | 52,100 | | | 893 |
| | | | | | |
| | | | | | 169,548 |
| | | | | | |
Total Common Stock
(Cost $4,920,310) ($ Thousands) | | | | | | 5,026,794 |
| | | | | | |
|
U.S. TREASURY OBLIGATIONS (B) (C) — 2.5% |
U.S. Treasury Bills | | | | | | |
0.216%, 06/11/09 | | $ | 140,600 | | | 140,596 |
0.110%, 06/18/09 | | | 5,500 | | | 5,499 |
0.351%, 02/11/10 | | | 6,645 | | | 6,629 |
| | | | | | |
Total U.S. Treasury Obligations
(Cost $152,719) ($ Thousands) | | | | | | 152,724 |
| | | | | | |
| |
CASH EQUIVALENT — 2.6% | | | |
SEI Daily Income Trust, Prime Obligation Fund, Cl A,
0.260%**† | | | 157,703,807 | | | 157,704 |
| | | | | | |
Total Cash Equivalent
(Cost $157,704) ($ Thousands) | | | | | | 157,704 |
| | | | | | |
|
AFFILIATED PARTNERSHIPS — 21.3% |
SEI LIBOR Plus Portfolio† | | | 97,632,893 | | | 575,058 |
SEI Liquidity Fund, L.P., 0.820%**† (D) | | | 720,492,703 | | | 709,901 |
| | | | | | |
Total Affiliated Partnerships
(Cost $1,627,304) ($ Thousands) | | | | | | 1,284,959 |
| | | | | | |
Total Investments — 109.6%
(Cost $6,858,037) ($ Thousands) | | | | | $ | 6,622,181 |
| | | | | | |
| | |
| 56 | | SEI Institutional Investments Trust / Annual Report / May 31, 2009 |
A summary of the open futures contracts held by the Fund at May 31, 2009, is as follows:
| | | | | | | |
Type of
Contract | | Number of
Contracts
Long | | Expiration
Date | | Unrealized
Appreciation
($ Thousands) |
S&P 500 Index EMINI | | 602 | | Jun-2009 | | $ | 5,136 |
S&P Composite Index | | 4,271 | | Jun-2009 | | | 200,067 |
| | | | | | | |
| | | | | | $ | 205,203 |
| | | | | | | |
A summary of the outstanding forward foreign currency contracts held by the Fund at May 31, 2009, is as follows:
| | | | | | | | | | | | |
Maturity
Date | | | | Currency
to Deliver
(Thousands) | | | | Currency
to Receive
(Thousands) | | Unrealized
Appreciation
(Depreciation)
($ Thousands) | |
6/17/09 | | CAD | | 4,900 | | USD | | 3,851 | | $ | (622 | ) |
6/17/09 | | CHF | | 4,500 | | USD | | 3,920 | | | (301 | ) |
6/17/09 | | EUR | | 3,500 | | USD | | 4,463 | | | (490 | ) |
6/17/09 | | GBP | | 1,750 | | USD | | 2,426 | | | (395 | ) |
6/17/09 | | JPY | | 112,500 | | USD | | 1,152 | | | (27 | ) |
6/17/09 | | NOK | | 4,000 | | USD | | 572 | | | (64 | ) |
6/17/09 | | NZD | | 1,800 | | USD | | 903 | | | (249 | ) |
6/17/09 | | SEK | | 6,000 | | USD | | 676 | | | (116 | ) |
6/17/09 | | USD | | 3,999 | | CAD | | 4,900 | | | 474 | |
6/17/09 | | USD | | 4,006 | | CHF | | 4,500 | | | 215 | |
6/17/09 | | USD | | 4,706 | | EUR | | 3,500 | | | 247 | |
6/17/09 | | USD | | 2,534 | | GBP | | 1,750 | | | 288 | |
6/17/09 | | USD | | 1,147 | | JPY | | 112,500 | | | 32 | |
6/17/09 | | USD | | 629 | | NOK | | 4,000 | | | 7 | |
6/17/09 | | USD | | 1,002 | | NZD | | 1,800 | | | 150 | |
6/17/09 | | USD | | 744 | | SEK | | 6,000 | | | 48 | |
| | | | | | | | | | | | |
| | | | | | | | | | $ | (803 | ) |
| | | | | | | | | | | | |
Percentages are based on a Net Assets of $6,043,119 ($ Thousands)
| * | | Non-income producing security. |
| ** | | The rate reported is the 7-day effective yield as of May 31, 2009 |
| † | | Investment in Affiliated Security (see Note 4). |
| ‡ | | Real Estate Investment Trust |
| (A) | | This security or a partial position of this security is on loan at May 31, 2009. The total value of securities on loan at May 31, 2009 was $712,934 ($ Thousands). |
| (B) | | Zero coupon security. The rate reported is the effective yield at time of purchase. |
| (C) | | Security, or a portion thereof, has been pledged as collateral on open futures contracts. |
| (D) | | This security was purchased with cash collateral held from securities on loan. The total value of such securities as of May 31, 2009 was $709,901 ($ Thousands). |
CAD — Canadian Dollar
CHF — Swiss Franc
Cl — Class
EUR — Euro
GBP — British Pound Sterling
JPY — Japanese Yen
L.P. — Limited Partnership
NOK — Norwegian Krone
NZD — New Zealand Dollar
SEK — Swedish Krona
USD — U.S. Dollar
The accompanying notes are an integral part of the financial statements.
| | |
| SEI Institutional Investments Trust / Annual Report / May 31, 2009 | | 57 |
SCHEDULE OF INVESTMENTS
Large Cap Index Fund
May 31, 2009
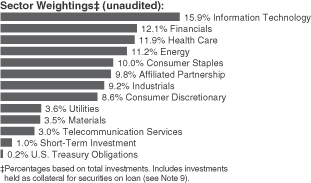
| | | | | |
| Description | | Shares | | Market Value
($ Thousands) |
| | | | | |
| | |
COMMON STOCK — 98.0% | | | | | |
| | |
Consumer Discretionary — 9.4% | | | | | |
Abercrombie & Fitch, Cl A (A) | | 3,602 | | $ | 108 |
Advance Auto Parts | | 3,808 | | | 162 |
Amazon.com* (A) | | 12,189 | | | 951 |
American Eagle Outfitters | | 7,171 | | | 106 |
AnnTaylor Stores* | | 1,847 | | | 14 |
Apollo Group, Cl A* | | 4,764 | | | 281 |
Ascent Media, Cl A* (A) | | 362 | | | 10 |
Autoliv | | 3,018 | | | 84 |
AutoNation* (A) | | 4,132 | | | 66 |
AutoZone* (A) | | 1,407 | | | 214 |
Barnes & Noble (A) | | 1,238 | | | 31 |
Bed Bath & Beyond* | | 9,715 | | | 273 |
Best Buy (A) | | 12,547 | | | 440 |
Big Lots* | | 3,500 | | | 81 |
Black & Decker (A) | | 2,468 | | | 79 |
BorgWarner (A) | | 4,682 | | | 151 |
Boyd Gaming (A) | | 1,651 | | | 17 |
Brinker International | | 4,483 | | | 80 |
Brink’s Home Security Holdings* | | 1,300 | | | 37 |
Burger King Holdings | | 3,500 | | | 58 |
Cablevision Systems, Cl A | | 8,742 | | | 166 |
Career Education* | | 3,759 | | | 75 |
Carmax* (A) | | 8,360 | | | 94 |
Carnival | | 16,400 | | | 417 |
CBS, Cl B | | 23,169 | | | 171 |
Centex (A) | | 5,156 | | | 43 |
Central European Media Enterprises, Cl A* | | 1,000 | | | 19 |
Chipotle Mexican Grill, Cl A* (A) | | 1,200 | | | 95 |
Choice Hotels International | | 1,484 | | | 40 |
Clear Channel Outdoor Holdings, Cl A* | | 700 | | | 2 |
Coach (A) | | 11,967 | | | 314 |
Comcast, Cl A (A) | | 107,925 | | | 1,486 |
CTC Media* | | 1,100 | | | 11 |
Darden Restaurants | | 5,622 | | | 203 |
DeVry | | 2,400 | | | 105 |
Dick’s Sporting Goods* | | 2,958 | | | 53 |
DIRECTV Group* (A) | | 20,558 | | | 463 |
| | | | | |
| Description | | Shares | | Market Value
($ Thousands) |
| | | | | |
Discovery Communications, Cl C* | | 11,021 | | $ | 230 |
DISH Network, Cl A* | | 8,362 | | | 137 |
Dollar Tree* | | 3,553 | | | 159 |
DR Horton | | 12,868 | | | 118 |
DreamWorks Animation SKG, Cl A* | | 3,434 | | | 96 |
Eastman Kodak | | 11,567 | | | 30 |
EW Scripps, Cl A (A) | | 757 | | | 1 |
Expedia* (A) | | 7,434 | | | 129 |
Family Dollar Stores (A) | | 5,462 | | | 165 |
Foot Locker | | 6,869 | | | 76 |
Ford Motor* | | 120,484 | | | 692 |
Fortune Brands | | 5,720 | | | 200 |
GameStop, Cl A* (A) | | 6,400 | | | 160 |
Gannett (A) | | 9,359 | | | 45 |
Gap | | 17,159 | | | 306 |
Garmin (A) | | 4,300 | | | 90 |
General Motors (A) | | 19,781 | | | 15 |
Gentex | | 6,132 | | | 72 |
Genuine Parts | | 6,071 | | | 203 |
Goodyear Tire & Rubber* (A) | | 8,552 | | | 98 |
Guess? | | 2,100 | | | 54 |
H&R Block | | 12,025 | | | 176 |
Hanesbrands* | | 4,143 | | | 70 |
Harley-Davidson (A) | | 9,303 | | | 158 |
Harman International Industries (A) | | 2,768 | | | 52 |
Hasbro | | 4,867 | | | 124 |
Hearst-Argyle Television, Cl A | | 863 | | | 4 |
Hillenbrand | | 2,824 | | | 48 |
Home Depot | | 65,015 | | | 1,506 |
HSN* | | 932 | | | 10 |
International Game Technology | | 12,243 | | | 213 |
International Speedway, Cl A | | 1,512 | | | 37 |
Interpublic Group* | | 16,975 | | | 89 |
Interval Leisure Group* | | 932 | | | 9 |
ITT Educational Services* | | 1,521 | | | 140 |
J.C. Penney | | 8,251 | | | 215 |
Jarden* | | 3,100 | | | 55 |
John Wiley & Sons, Cl A | | 1,842 | | | 58 |
Johnson Controls | | 22,345 | | | 445 |
Jones Apparel Group | | 2,953 | | | 27 |
KB Home (A) | | 3,380 | | | 51 |
Kohl’s* (A) | | 11,619 | | | 494 |
Lamar Advertising, Cl A* (A) | | 2,540 | | | 47 |
Las Vegas Sands* (A) | | 7,293 | | | 72 |
Leggett & Platt (A) | | 6,319 | | | 93 |
Lennar, Cl A | | 5,830 | | | 55 |
Liberty Global, Cl A* (A) | | 11,071 | | | 153 |
Liberty Media - Capital, Ser A* | | 3,492 | | | 49 |
Liberty Media - Entertainment, Cl A* | | 19,468 | | | 470 |
Liberty Media - Interactive, Cl A* (A) | | 21,447 | | | 126 |
Limited Brands (A) | | 9,657 | | | 121 |
Liz Claiborne | | 2,661 | | | 12 |
LKQ* | | 5,800 | | | 89 |
Lowe’s | | 55,510 | | | 1,055 |
| | |
| 58 | | SEI Institutional Investments Trust / Annual Report / May 31, 2009 |
| | | | | |
| Description | | Shares | | Market Value
($ Thousands) |
| | | | | |
Macy’s | | 16,730 | | $ | 195 |
Marriott International, Cl A (A) | | 11,050 | | | 258 |
Mattel | | 13,342 | | | 208 |
McDonald’s | | 43,580 | | | 2,571 |
McGraw-Hill | | 12,039 | | | 362 |
MDC Holdings | | 1,516 | | | 47 |
Meredith (A) | | 1,358 | | | 37 |
MGM Mirage* | | 8,439 | | | 63 |
Mohawk Industries* (A) | | 2,266 | | | 87 |
Morningstar* | | 500 | | | 21 |
New York Times, Cl A (A) | | 4,824 | | | 32 |
Newell Rubbermaid (A) | | 10,965 | | | 126 |
News, Cl A | | 87,585 | | | 857 |
NIKE, Cl B | | 13,648 | | | 778 |
Nordstrom (A) | | 7,412 | | | 146 |
NVR* (A) | | 224 | | | 111 |
Office Depot* | | 8,789 | | | 41 |
OfficeMax | | 1,974 | | | 16 |
Omnicom Group | | 12,044 | | | 367 |
O’Reilly Automotive* | | 5,340 | | | 193 |
Orient-Express Hotels, Cl A | | 1,000 | | | 7 |
Panera Bread, Cl A* (A) | | 1,162 | | | 62 |
Penn National Gaming* | | 2,389 | | | 79 |
Penske Auto Group (A) | | 1,200 | | | 15 |
PetSmart | | 5,273 | | | 107 |
Phillips-Van Heusen | | 2,300 | | | 68 |
Polo Ralph Lauren, Cl A (A) | | 2,280 | | | 123 |
priceline.com* | | 1,500 | | | 165 |
Pulte Homes (A) | | 8,618 | | | 76 |
RadioShack (A) | | 5,571 | | | 75 |
Regal Entertainment Group, Cl A | | 2,688 | | | 34 |
Ross Stores | | 5,271 | | | 206 |
Royal Caribbean Cruises | | 5,900 | | | 89 |
Saks* (A) | | 7,306 | | | 28 |
Scientific Games, Cl A* (A) | | 2,366 | | | 42 |
Scripps Networks Interactive, Cl A (A) | | 3,072 | | | 85 |
Sears Holdings* (A) | | 2,028 | | | 115 |
Service International | | 8,794 | | | 47 |
Sherwin-Williams | | 3,737 | | | 197 |
Signet Jewelers | | 3,800 | | | 68 |
Sirius XM Radio* (A) | | 166,602 | | | 58 |
Snap-On | | 2,391 | | | 74 |
Stanley Works | | 3,109 | | | 111 |
Staples | | 26,464 | | | 541 |
Starbucks* | | 27,306 | | | 393 |
Starwood Hotels & Resorts Worldwide (A) | | 7,384 | | | 181 |
Strayer Education (A) | | 600 | | | 111 |
Target (A) | | 29,985 | | | 1,179 |
Thor Industries (A) | | 1,000 | | | 20 |
Ticketmaster Entertainment* | | 932 | | | 7 |
Tiffany (A) | | 5,025 | | | 143 |
Tim Hortons (A) | | 6,786 | | | 180 |
Time Warner | | 45,979 | | | 1,077 |
Time Warner Cable, Cl A | | 13,284 | | | 409 |
| | | | | |
| Description | | Shares | | Market Value
($ Thousands) |
| | | | | |
TJX (A) | | 15,954 | | $ | 471 |
Toll Brothers* | | 5,251 | | | 98 |
TRW Automotive Holdings* | | 993 | | | 9 |
Urban Outfitters* (A) | | 4,020 | | | 82 |
VF | | 3,217 | | | 183 |
Viacom, Cl B* | | 20,969 | | | 465 |
Virgin Media | | 10,420 | | | 91 |
WABCO Holdings | | 2,224 | | | 38 |
Walt Disney | | 73,284 | | | 1,775 |
Warner Music Group* | | 662 | | | 4 |
Washington Post, Cl B | | 257 | | | 93 |
Weight Watchers International | | 1,662 | | | 39 |
Whirlpool (A) | | 2,987 | | | 126 |
Williams-Sonoma | | 3,362 | | | 44 |
Wyndham Worldwide | | 6,168 | | | 73 |
Wynn Resorts* | | 2,296 | | | 85 |
Yum! Brands | | 17,848 | | | 618 |
| | | | | |
| | | | | 33,381 |
| | | | | |
| | |
Consumer Staples — 11.0% | | | | | |
Alberto-Culver, Cl B | | 3,687 | | | 86 |
Altria Group (A) | | 80,668 | | | 1,379 |
Archer-Daniels-Midland | | 24,279 | | | 668 |
Avon Products | | 16,006 | | | 425 |
Bare Escentuals* | | 2,500 | | | 22 |
BJ’s Wholesale Club* (A) | | 1,872 | | | 66 |
Brown-Forman, Cl B | | 3,818 | | | 167 |
Bunge (A) | | 4,500 | | | 285 |
Campbell Soup | | 7,678 | | | 213 |
Central European Distribution* (A) | | 1,300 | | | 33 |
Church & Dwight | | 2,532 | | | 127 |
Clorox (A) | | 5,103 | | | 268 |
Coca-Cola | | 89,120 | | | 4,381 |
Coca-Cola Enterprises | | 12,715 | | | 212 |
Colgate-Palmolive | | 19,575 | | | 1,291 |
ConAgra Foods | | 16,886 | | | 314 |
Constellation Brands, Cl A* | | 7,431 | | | 86 |
Corn Products International | | 3,000 | | | 79 |
Costco Wholesale | | 16,381 | | | 795 |
CVS Caremark | | 54,952 | | | 1,637 |
Dean Foods* | | 5,587 | | | 105 |
Del Monte Foods | | 8,458 | | | 69 |
Dr Pepper Snapple Group* | | 9,900 | | | 215 |
Energizer Holdings* | | 2,741 | | | 143 |
Estee Lauder, Cl A | | 3,954 | | | 131 |
General Mills | | 12,696 | | | 650 |
Hansen Natural* | | 2,900 | | | 106 |
Herbalife | | 2,100 | | | 61 |
Hershey | | 5,698 | | | 201 |
HJ Heinz (A) | | 11,837 | | | 433 |
Hormel Foods (A) | | 2,539 | | | 88 |
JM Smucker | | 4,411 | | | 178 |
Kellogg | | 9,403 | | | 407 |
Kimberly-Clark | | 15,818 | | | 821 |
| | |
| SEI Institutional Investments Trust / Annual Report / May 31, 2009 | | 59 |
SCHEDULE OF INVESTMENTS
Large Cap Index Fund (Continued)
May 31, 2009
| | | | | |
| Description | | Shares | | Market Value
($ Thousands) |
| | | | | |
Kraft Foods, Cl A | | 56,615 | | $ | 1,478 |
Kroger | | 24,873 | | | 567 |
Lorillard | | 6,550 | | | 447 |
McCormick | | 4,393 | | | 134 |
Mead Johnson Nutrition, Cl A* | | 1,100 | | | 34 |
Molson Coors Brewing, Cl B | | 4,262 | | | 188 |
NBTY* | | 1,800 | | | 45 |
Pepsi Bottling Group | | 4,982 | | | 164 |
PepsiAmericas | | 2,594 | | | 68 |
PepsiCo | | 60,937 | | | 3,172 |
Philip Morris International | | 76,168 | | | 3,248 |
Procter & Gamble | | 115,574 | | | 6,003 |
Reynolds American | | 6,410 | | | 256 |
Rite Aid* (A) | | 19,101 | | | 22 |
Safeway | | 16,420 | | | 333 |
Sara Lee | | 26,151 | | | 235 |
Smithfield Foods* (A) | | 3,975 | | | 49 |
Supervalu | | 8,589 | | | 143 |
Sysco | | 22,648 | | | 543 |
Tyson Foods, Cl A | | 11,965 | | | 159 |
Walgreen | | 37,625 | | | 1,121 |
Wal-Mart Stores | | 86,079 | | | 4,281 |
Whole Foods Market (A) | | 5,052 | | | 95 |
| | | | | |
| | | | | 38,927 |
| | | | | |
| | |
Energy — 12.4% | | | | | |
Alpha Natural Resources* | | 3,000 | | | 83 |
Anadarko Petroleum | | 19,240 | | | 919 |
Apache | | 12,659 | | | 1,067 |
Arch Coal | | 5,912 | | | 109 |
Atwood Oceanics* | | 1,900 | | | 50 |
Baker Hughes | | 11,601 | | | 453 |
BJ Services | | 11,588 | | | 181 |
Cabot Oil & Gas | | 4,100 | | | 144 |
Cameron International* | | 8,044 | | | 251 |
Chesapeake Energy | | 22,866 | | | 518 |
Chevron | | 79,302 | | | 5,287 |
Cimarex Energy | | 3,400 | | | 111 |
CNX Gas* | | 800 | | | 25 |
ConocoPhillips | | 59,276 | | | 2,717 |
Consol Energy | | 6,744 | | | 278 |
Continental Resources* (A) | | 1,000 | | | 30 |
Denbury Resources* | | 9,848 | | | 169 |
Devon Energy | | 17,213 | | | 1,088 |
Diamond Offshore Drilling (A) | | 2,709 | | | 228 |
Dresser-Rand Group* | | 3,034 | | | 85 |
El Paso | | 25,903 | | | 253 |
Encore Acquisition* | | 2,300 | | | 82 |
ENSCO International | | 5,623 | | | 219 |
EOG Resources | | 9,645 | | | 706 |
Exterran Holdings* | | 2,900 | | | 58 |
Exxon Mobil | | 190,712 | | | 13,226 |
FMC Technologies* | | 5,060 | | | 211 |
Forest Oil* | | 4,114 | | | 78 |
| | | | | |
| Description | | Shares | | Market Value
($ Thousands) |
| | | | | |
Foundation Coal Holdings | | 2,000 | | $ | 59 |
Frontier Oil | | 4,600 | | | 80 |
Frontline (A) | | 2,200 | | | 51 |
Global Industries* (A) | | 5,800 | | | 41 |
Halliburton | | 32,997 | | | 757 |
Helix Energy Solutions Group* | | 3,100 | | | 35 |
Helmerich & Payne (A) | | 4,250 | | | 149 |
Hercules Offshore* (A) | | 2,000 | | | 9 |
Hess | | 10,612 | | | 707 |
Holly | | 2,000 | | | 48 |
IHS, Cl A* | | 1,500 | | | 72 |
Key Energy Services* (A) | | 4,300 | | | 28 |
Marathon Oil | | 26,776 | | | 854 |
Mariner Energy* (A) | | 3,100 | | | 45 |
Massey Energy (A) | | 3,761 | | | 86 |
Murphy Oil | | 7,154 | | | 422 |
Nabors Industries* | | 11,000 | | | 197 |
National Oilwell Varco* | | 16,080 | | | 621 |
Newfield Exploration* | | 5,199 | | | 188 |
Noble Energy | | 6,462 | | | 384 |
Occidental Petroleum (A) | | 31,554 | | | 2,118 |
Oceaneering International* | | 2,000 | | | 103 |
Oil States International* (A) | | 1,700 | | | 44 |
Overseas Shipholding Group | | 727 | | | 25 |
Patriot Coal* (A) | | 2,234 | | | 20 |
Patterson-UTI Energy (A) | | 6,332 | | | 91 |
Peabody Energy | | 10,074 | | | 342 |
PetroHawk Energy* | | 10,200 | | | 257 |
Pioneer Natural Resources | | 4,744 | | | 133 |
Plains Exploration & Production* | | 4,191 | | | 118 |
Pride International* | | 6,729 | | | 163 |
Quicksilver Resources* | | 5,102 | | | 57 |
Range Resources | | 5,739 | | | 263 |
Rowan | | 3,986 | | | 81 |
SandRidge Energy* | | 3,500 | | | 38 |
Schlumberger | | 45,800 | | | 2,621 |
SEACOR Holdings* | | 900 | | | 69 |
Smith International | | 8,031 | | | 234 |
Southern Union (A) | | 3,868 | | | 67 |
Southwestern Energy* | | 12,876 | | | 560 |
Spectra Energy | | 23,709 | | | 380 |
St. Mary Land & Exploration | | 2,700 | | | 58 |
Sunoco | | 4,556 | | | 139 |
Superior Energy Services* | | 3,500 | | | 81 |
Teekay | | 2,100 | | | 34 |
Tesoro (A) | | 4,846 | | | 82 |
Tetra Technologies* | | 2,000 | | | 17 |
Tidewater | | 2,170 | | | 103 |
Unit* | | 1,527 | | | 51 |
Valero Energy | | 19,836 | | | 444 |
W&T Offshore (A) | | 900 | | | 9 |
Walter Industries | | 1,800 | | | 59 |
Whiting Petroleum* | | 1,900 | | | 89 |
| | |
| 60 | | SEI Institutional Investments Trust / Annual Report / May 31, 2009 |
| | | | | |
| Description | | Shares | | Market Value
($ Thousands) |
| | | | | |
Williams | | 21,846 | | $ | 367 |
XTO Energy | | 21,388 | | | 915 |
| | | | | |
| | | | | 43,691 |
| | | | | |
| | |
Financials — 13.3% | | | | | |
Affiliated Managers Group* | | 1,733 | | | 97 |
Aflac | | 17,956 | | | 637 |
Alexandria Real Estate Equities‡ | | 1,400 | | | 50 |
Alleghany* | | 238 | | | 62 |
Allied Capital | | 5,864 | | | 17 |
Allied World Assurance Holdings | | 2,000 | | | 76 |
Allstate | | 20,725 | | | 533 |
AMB Property‡ (A) | | 5,244 | | | 94 |
American Capital (A) | | 6,121 | | | 17 |
American Express | | 38,134 | | | 948 |
American Financial Group | | 3,314 | | | 71 |
American International Group (A) | | 90,476 | | | 153 |
American National Insurance | | 722 | | | 57 |
AmeriCredit* (A) | | 5,672 | | | 72 |
Ameriprise Financial | | 8,200 | | | 248 |
Annaly Capital Management‡ | | 20,011 | | | 279 |
AON | | 10,450 | | | 376 |
Apartment Investment &
Management, Cl A‡ | | 4,399 | | | 42 |
Arch Capital Group* (A) | | 1,800 | | | 102 |
Arthur J Gallagher | | 3,704 | | | 78 |
Associated Banc (A) | | 5,184 | | | 75 |
Assurant (A) | | 4,693 | | | 111 |
Astoria Financial | | 3,514 | | | 27 |
AvalonBay Communities‡ (A) | | 2,841 | | | 175 |
Axis Capital Holdings | | 4,900 | | | 117 |
Bancorpsouth (A) | | 3,600 | | | 80 |
Bank of America | | 243,118 | | | 2,740 |
Bank of Hawaii | | 1,982 | | | 74 |
Bank of New York Mellon | | 44,109 | | | 1,225 |
BB&T (A) | | 25,106 | | | 563 |
BlackRock, Cl A | | 685 | | | 109 |
BOK Financial | | 775 | | | 31 |
Boston Properties‡ | | 4,484 | | | 217 |
Brandywine Realty Trust‡ | | 2,500 | | | 19 |
BRE Properties‡ (A) | | 2,020 | | | 50 |
Brown & Brown | | 4,724 | | | 91 |
Camden Property Trust‡ | | 2,247 | | | 67 |
Capital One Financial (A) | | 16,825 | | | 411 |
CapitalSource (A) | | 5,982 | | | 22 |
Capitol Federal Financial (A) | | 1,027 | | | 43 |
CB Richard Ellis Group, Cl A* | | 7,417 | | | 54 |
CBL & Associates Properties‡ (A) | | 2,133 | | | 13 |
Charles Schwab | | 35,285 | | | 621 |
Chubb | | 13,818 | | | 548 |
Cincinnati Financial | | 5,686 | | | 129 |
CIT Group (A) | | 17,424 | | | 67 |
Citigroup (A) | | 205,645 | | | 765 |
City National (A) | | 1,738 | | | 64 |
| | | | | |
| Description | | Shares | | Market Value
($ Thousands) |
| | | | | |
CME Group, Cl A | | 2,574 | | $ | 828 |
CNA Financial | | 700 | | | 10 |
Comerica | | 5,953 | | | 129 |
Commerce Bancshares | | 2,494 | | | 78 |
Conseco* | | 5,277 | | | 13 |
Cullen/Frost Bankers | | 2,368 | | | 116 |
Developers Diversified Realty‡ | | 4,235 | | | 21 |
Digital Realty Trust‡ (A) | | 2,900 | | | 104 |
Discover Financial Services | | 18,589 | | | 178 |
Douglas Emmett‡ (A) | | 5,400 | | | 50 |
Duke Realty‡ (A) | | 7,909 | | | 75 |
E*Trade Financial* (A) | | 22,138 | | | 32 |
Eaton Vance (A) | | 4,210 | | | 114 |
Endurance Specialty Holdings (A) | | 2,200 | | | 60 |
Equity Residential‡ | | 10,087 | | | 245 |
Erie Indemnity, Cl A | | 1,119 | | | 39 |
Essex Property Trust‡ | | 1,069 | | | 73 |
Everest Re Group | | 2,300 | | | 159 |
Fannie Mae (A) | | 49,033 | | | 36 |
Federal Home Loan Mortgage (A) | | 17,707 | | | 14 |
Federal Realty Investment Trust‡ (A) | | 2,296 | | | 121 |
Federated Investors, Cl B | | 3,658 | | | 92 |
Fidelity National Financial, Cl A | | 8,604 | | | 120 |
Fifth Third Bancorp (A) | | 19,582 | | | 135 |
First American | | 3,784 | | | 86 |
First Citizens BancShares, Cl A | | 200 | | | 27 |
First Horizon National (A) | | 8,582 | | | 104 |
Forest City Enterprises, Cl A | | 5,142 | | | 37 |
Franklin Resources | | 5,803 | | | 388 |
Fulton Financial (A) | | 8,095 | | | 47 |
Genworth Financial, Cl A (A) | | 17,892 | | | 106 |
GLG Partners (A) | | 1,900 | | | 7 |
Goldman Sachs Group | | 19,275 | | | 2,787 |
Hanover Insurance Group | | 2,193 | | | 75 |
Hartford Financial Services Group | | 12,710 | | | 182 |
HCC Insurance Holdings (A) | | 4,641 | | | 115 |
HCP‡ | | 10,774 | | | 250 |
Health Care REIT‡ (A) | | 3,983 | | | 136 |
Hospitality Properties Trust‡ | | 4,066 | | | 57 |
Host Hotels & Resorts‡ | | 22,100 | | | 207 |
HRPT Properties Trust‡ (A) | | 8,002 | | | 38 |
Hudson City Bancorp | | 19,328 | | | 248 |
Huntington Bancshares (A) | | 14,534 | | | 57 |
IntercontinentalExchange* | | 2,600 | | | 280 |
Invesco | | 16,400 | | | 257 |
Investment Technology Group* | | 1,500 | | | 31 |
iStar Financial‡ (A) | | 3,295 | | | 10 |
Janus Capital Group | | 7,265 | | | 74 |
Jefferies Group | | 5,414 | | | 117 |
Jones Lang LaSalle | | 1,600 | | | 56 |
JPMorgan Chase | | 142,034 | | | 5,241 |
Keycorp | | 19,195 | | | 96 |
Kilroy Realty‡ | | 1,600 | | | 34 |
Kimco Realty‡ (A) | | 11,644 | | | 136 |
| | |
| SEI Institutional Investments Trust / Annual Report / May 31, 2009 | | 61 |
SCHEDULE OF INVESTMENTS
Large Cap Index Fund (Continued)
May 31, 2009
| | | | | |
| Description | | Shares | | Market Value
($ Thousands) |
| | | | | |
Lazard, Cl A | | 3,100 | | $ | 88 |
Legg Mason (A) | | 5,581 | | | 108 |
Leucadia National (A) | | 7,020 | | | 146 |
Liberty Property Trust‡ | | 3,806 | | | 89 |
Lincoln National | | 10,288 | | | 195 |
Loews | | 11,736 | | | 318 |
M&T Bank (A) | | 2,583 | | | 130 |
Macerich‡ (A) | | 3,368 | | | 57 |
Mack-Cali Realty‡ | | 2,798 | | | 69 |
Markel* | | 350 | | | 100 |
Marsh & McLennan | | 19,165 | | | 363 |
Marshall & Ilsley (A) | | 10,160 | | | 67 |
MBIA* (A) | | 4,859 | | | 31 |
Mercury General | | 1,196 | | | 40 |
MetLife | | 19,009 | | | 599 |
MF Global* (A) | | 2,800 | | | 17 |
MGIC Investment | | 4,615 | | | 20 |
Moody’s (A) | | 7,727 | | | 212 |
Morgan Stanley | | 40,378 | | | 1,224 |
MSCI, Cl A* | | 2,100 | | | 45 |
NASDAQ OMX Group* | | 5,400 | | | 114 |
Nationwide Health Properties‡ (A) | | 3,900 | | | 104 |
New York Community Bancorp (A) | | 13,372 | | | 148 |
Northern Trust | | 9,305 | | | 536 |
NYSE Euronext | | 9,800 | | | 294 |
Old Republic International (A) | | 9,490 | | | 97 |
OneBeacon Insurance Group, Cl A | | 1,100 | | | 12 |
PartnerRe (A) | | 2,100 | | | 137 |
People’s United Financial | | 12,834 | | | 203 |
Plum Creek Timber‡ (A) | | 6,321 | | | 219 |
PNC Financial Services Group | | 16,122 | | | 734 |
Popular (A) | | 9,430 | | | 28 |
Principal Financial Group | | 12,218 | | | 271 |
Progressive | | 25,380 | | | 409 |
ProLogis‡ (A) | | 16,188 | | | 137 |
Protective Life | | 3,309 | | | 41 |
Prudential Financial | | 16,363 | | | 653 |
Public Storage‡ (A) | | 4,768 | | | 318 |
Raymond James Financial (A) | | 4,221 | | | 67 |
Rayonier‡ | | 3,203 | | | 128 |
Regency Centers‡ | | 2,908 | | | 104 |
Regions Financial | | 41,987 | | | 176 |
Reinsurance Group of America, Cl A | | 2,899 | | | 107 |
RenaissanceRe Holdings | | 2,400 | | | 110 |
SEI (B) | | 5,642 | | | 87 |
Simon Property Group‡ (A) | | 10,789 | | | 577 |
SL Green Realty‡ | | 1,868 | | | 43 |
SLM* (A) | | 18,214 | | | 120 |
St. Joe* | | 3,761 | | | 96 |
StanCorp Financial Group | | 2,042 | | | 63 |
State Street | | 19,094 | | | 887 |
Student Loan | | 102 | | | 4 |
SunTrust Banks | | 14,146 | | | 186 |
Synovus Financial (A) | | 11,672 | | | 38 |
| | | | | |
| Description | | Shares | | Market Value
($ Thousands) |
| | | | | |
T. Rowe Price Group | | 9,780 | | $ | 397 |
Taubman Centers‡ (A) | | 2,200 | | | 54 |
TCF Financial (A) | | 4,301 | | | 62 |
TD Ameritrade Holding* | | 9,645 | | | 164 |
TFS Financial (A) | | 3,700 | | | 42 |
Torchmark (A) | | 3,050 | | | 123 |
Transatlantic Holdings | | 955 | | | 37 |
Travelers | | 22,944 | | | 933 |
Tree.com* | | 155 | | | 2 |
UDR‡ | | 5,793 | | | 64 |
Unitrin | | 1,260 | | | 18 |
Unum Group | | 12,805 | | | 219 |
US Bancorp | | 73,043 | | | 1,402 |
Valley National Bancorp (A) | | 5,730 | | | 70 |
Ventas‡ | | 5,444 | | | 165 |
Vornado Realty Trust‡ (A) | | 5,873 | | | 274 |
Waddell & Reed Financial, Cl A | | 3,000 | | | 73 |
Walter Investment Management‡* | | 969 | | | 13 |
Washington Federal (A) | | 3,063 | | | 40 |
Webster Financial | | 1,346 | | | 10 |
Weingarten Realty Investors‡ | | 4,467 | | | 71 |
Wells Fargo | | 182,466 | | | 4,653 |
Wesco Financial | | 41 | | | 12 |
White Mountains Insurance Group | | 247 | | | 54 |
Whitney Holding (A) | | 2,257 | | | 28 |
Wilmington Trust (A) | | 2,292 | | | 33 |
WR Berkley | | 5,614 | | | 122 |
XL Capital, Cl A | | 11,900 | | | 120 |
Zions Bancorporation (A) | | 4,502 | | | 62 |
| | | | | |
| | | | | 47,128 |
| | | | | |
| | |
Health Care — 13.1% | | | | | |
Abbott Laboratories | | 59,276 | | | 2,671 |
Abraxis Bioscience* | | 340 | | | 18 |
Aetna | | 17,034 | | | 456 |
Allergan | | 11,496 | | | 507 |
AmerisourceBergen | | 5,662 | | | 210 |
Amgen* | | 39,267 | | | 1,961 |
Amylin Pharmaceuticals* (A) | | 5,800 | | | 66 |
Baxter International | | 24,175 | | | 1,237 |
Beckman Coulter | | 2,512 | | | 136 |
Becton Dickinson | | 9,244 | | | 626 |
Biogen Idec* (A) | | 11,300 | | | 585 |
BioMarin Pharmaceutical* (A) | | 4,100 | | | 57 |
Boston Scientific* | | 56,339 | | | 530 |
Bristol-Myers Squibb | | 76,213 | | | 1,518 |
Brookdale Senior Living (A) | | 1,200 | | | 14 |
C.R. Bard | | 3,685 | | | 263 |
Cardinal Health | | 13,429 | | | 480 |
Celgene* (A) | | 17,292 | | | 730 |
Cephalon* (A) | | 2,648 | | | 154 |
Cerner* (A) | | 2,674 | | | 156 |
Charles River Laboratories International* | | 2,843 | | | 89 |
CIGNA | | 11,055 | | | 245 |
| | |
| 62 | | SEI Institutional Investments Trust / Annual Report / May 31, 2009 |
| | | | | |
| Description | | Shares | | Market Value
($ Thousands) |
| | | | | |
Community Health Systems* | | 4,062 | | $ | 107 |
Cooper | | 1,604 | | | 42 |
Covance* | | 2,536 | | | 107 |
Coventry Health Care* | | 6,262 | | | 113 |
Covidien | | 18,900 | | | 675 |
DaVita* | | 4,108 | | | 185 |
Dentsply International (A) | | 5,798 | | | 170 |
Edwards Lifesciences* | | 2,207 | | | 141 |
Eli Lilly | | 37,961 | | | 1,312 |
Endo Pharmaceuticals Holdings* | | 4,797 | | | 76 |
Express Scripts* | | 7,922 | | | 507 |
Forest Laboratories* | | 11,373 | | | 270 |
Gen-Probe* | | 2,227 | | | 95 |
Genzyme* | | 10,053 | | | 595 |
Gilead Sciences* | | 35,550 | | | 1,532 |
Health Management Associates, Cl A* (A) | | 7,922 | | | 46 |
Health Net* | | 4,702 | | | 70 |
Henry Schein* | | 3,584 | | | 163 |
Hill-Rom Holdings (A) | | 2,724 | | | 44 |
HLTH* | | 4,776 | | | 56 |
Hologic* | | 10,000 | | | 127 |
Hospira* (A) | | 5,881 | | | 203 |
Humana* | | 6,275 | | | 197 |
Idexx Laboratories* (A) | | 2,552 | | | 107 |
Illumina* (A) | | 4,900 | | | 180 |
IMS Health | | 7,361 | | | 89 |
Intuitive Surgical* (A) | | 1,500 | | | 224 |
Inverness Medical Innovations* (A) | | 2,800 | | | 91 |
Johnson & Johnson (A) | | 108,109 | | | 5,963 |
Kinetic Concepts* (A) | | 2,413 | | | 63 |
King Pharmaceuticals* | | 10,126 | | | 96 |
Laboratory Corp of America Holdings* | | 4,111 | | | 251 |
Life Technologies* | | 6,870 | | | 266 |
LifePoint Hospitals* | | 2,376 | | | 65 |
Lincare Holdings* | | 3,027 | | | 66 |
McKesson | | 10,366 | | | 427 |
Medco Health Solutions* (A) | | 19,220 | | | 882 |
Mednax* | | 2,000 | | | 81 |
Medtronic | | 43,185 | | | 1,483 |
Merck | | 82,440 | | | 2,274 |
Millipore* (A) | | 2,186 | | | 137 |
Mylan Laboratories* (A) | | 12,119 | | | 160 |
Omnicare (A) | | 4,231 | | | 114 |
Patterson* (A) | | 4,883 | | | 101 |
PerkinElmer | | 4,834 | | | 79 |
Perrigo (A) | | 3,100 | | | 83 |
Pfizer | | 259,655 | | | 3,944 |
Pharmaceutical Product Development | | 4,284 | | | 86 |
Quest Diagnostics | | 5,944 | | | 310 |
ResMed* | | 3,055 | | | 113 |
Schering-Plough | | 62,409 | | | 1,523 |
Sepracor* | | 4,661 | | | 73 |
St. Jude Medical* | | 12,746 | | | 497 |
Stryker (A) | | 11,604 | | | 446 |
| | | | | |
| Description | | Shares | | Market Value
($ Thousands) |
| | | | | |
Techne | | 1,541 | | $ | 93 |
Teleflex | | 1,640 | | | 74 |
Tenet Healthcare* (A) | | 15,994 | | | 58 |
Thermo Fisher Scientific* | | 16,225 | | | 631 |
UnitedHealth Group | | 47,329 | | | 1,259 |
Universal Health Services, Cl B | | 1,688 | | | 93 |
Varian Medical Systems* | | 4,630 | | | 166 |
VCA Antech* (A) | | 3,539 | | | 86 |
Vertex Pharmaceuticals* | | 6,400 | | | 191 |
Warner Chilcott, Cl A* | | 3,200 | | | 42 |
Waters* | | 3,872 | | | 168 |
Watson Pharmaceuticals* | | 4,218 | | | 128 |
WellCare Health Plans* | | 1,100 | | | 21 |
WellPoint* (A) | | 19,231 | | | 896 |
Wyeth | | 51,240 | | | 2,299 |
Zimmer Holdings* | | 8,725 | | | 389 |
| | | | | |
| | | | | 46,410 |
| | | | | |
| | |
Industrials — 10.2% | | | | | |
3M | | 27,146 | | | 1,550 |
Aecom Technology* | | 3,900 | | | 125 |
AGCO* | | 3,800 | | | 110 |
Alexander & Baldwin (A) | | 1,782 | | | 44 |
Alliant Techsystems* (A) | | 1,336 | | | 115 |
Ametek | | 4,147 | | | 130 |
AMR* (A) | | 11,186 | | | 50 |
Armstrong World Industries* (A) | | 700 | | | 12 |
Avery Dennison | | 4,210 | | | 116 |
Avis Budget Group* | | 2,784 | | | 13 |
BE Aerospace* | | 3,600 | | | 54 |
Boeing (A) | | 28,991 | | | 1,300 |
Brink’s | | 1,800 | | | 48 |
Bucyrus International, Cl A (A) | | 2,600 | | | 75 |
Burlington Northern Santa Fe | | 10,898 | | | 790 |
C.H. Robinson Worldwide (A) | | 6,386 | | | 324 |
Carlisle | | 2,666 | | | 61 |
Caterpillar | | 23,288 | | | 826 |
Cintas | | 5,257 | | | 122 |
Continental Airlines, Cl B* (A) | | 4,700 | | | 44 |
Con-way | | 1,523 | | | 49 |
Cooper Industries, Cl A | | 6,400 | | | 210 |
Copa Holdings, Cl A (A) | | 1,100 | | | 38 |
Copart* | | 2,613 | | | 80 |
Corporate Executive Board | | 1,696 | | | 30 |
Corrections of America* | | 3,900 | | | 60 |
Covanta Holding* (A) | | 4,900 | | | 74 |
Crane | | 2,400 | | | 57 |
CSX | | 15,232 | | | 484 |
Cummins | | 7,512 | | | 244 |
Danaher (A) | | 9,651 | | | 582 |
Deere | | 16,318 | | | 709 |
Delta Air Lines* (A) | | 30,800 | | | 179 |
Donaldson | | 3,172 | | | 107 |
Dover | | 7,057 | | | 222 |
| | |
| SEI Institutional Investments Trust / Annual Report / May 31, 2009 | | 63 |
SCHEDULE OF INVESTMENTS
Large Cap Index Fund (Continued)
May 31, 2009
| | | | | |
| Description | | Shares | | Market Value
($ Thousands) |
| | | | | |
Dun & Bradstreet | | 2,056 | | $ | 168 |
Eaton | | 6,126 | | | 266 |
Emerson Electric | | 29,620 | | | 951 |
Equifax | | 5,156 | | | 140 |
Expeditors International Washington | | 7,948 | | | 261 |
Fastenal (A) | | 5,062 | | | 168 |
FedEx | | 11,744 | | | 651 |
First Solar* (A) | | 1,800 | | | 342 |
Flowserve | | 2,300 | | | 169 |
Fluor (A) | | 6,608 | | | 310 |
FTI Consulting* | | 2,000 | | | 101 |
Gardner Denver* | | 2,300 | | | 65 |
GATX (A) | | 2,100 | | | 53 |
General Cable* (A) | | 1,800 | | | 69 |
General Dynamics | | 15,072 | | | 858 |
General Electric | | 403,623 | | | 5,441 |
Goodrich | | 4,592 | | | 223 |
Graco (A) | | 2,624 | | | 59 |
Harsco | | 3,470 | | | 101 |
Hertz Global Holdings* (A) | | 16,400 | | | 112 |
Honeywell International | | 28,090 | | | 931 |
Hubbell, Cl B | | 2,292 | | | 76 |
IDEX | | 3,593 | | | 84 |
Illinois Tool Works | | 17,680 | | | 571 |
Ingersoll-Rand, Cl A | | 11,643 | | | 236 |
Iron Mountain* | | 7,063 | | | 193 |
ITT | | 6,802 | | | 280 |
Jacobs Engineering Group* | | 4,502 | | | 193 |
JB Hunt Transport Services (A) | | 2,872 | | | 88 |
John Bean Technologies | | 768 | | | 12 |
Joy Global | | 3,633 | | | 125 |
Kansas City Southern* | | 3,700 | | | 61 |
KBR | | 5,684 | | | 105 |
Kennametal | | 3,300 | | | 62 |
Kirby* | | 2,300 | | | 77 |
L-3 Communications Holdings, Cl 3 | | 4,577 | | | 336 |
Landstar System | | 2,165 | | | 82 |
Lennox International | | 1,600 | | | 50 |
Lincoln Electric Holdings (A) | | 1,700 | | | 69 |
Lockheed Martin | | 12,729 | | | 1,065 |
Manitowoc (A) | | 5,700 | | | 37 |
Manpower | | 3,184 | | | 135 |
Masco | | 14,309 | | | 148 |
McDermott International* | | 8,300 | | | 182 |
Monster Worldwide* (A) | | 5,218 | | | 61 |
MSC Industrial Direct, Cl A (A) | | 1,520 | | | 55 |
Norfolk Southern | | 14,133 | | | 526 |
Northrop Grumman | | 12,178 | | | 580 |
Oshkosh Truck (A) | | 3,559 | | | 42 |
Owens Corning* | | 2,700 | | | 38 |
Paccar | | 13,770 | | | 411 |
Pall | | 4,845 | | | 124 |
Parker Hannifin | | 6,304 | | | 266 |
Pentair | | 4,061 | | | 102 |
| | | | | |
| Description | | Shares | | Market Value
($ Thousands) |
| | | | | |
Pitney Bowes | | 7,685 | | $ | 176 |
Precision Castparts | | 5,246 | | | 433 |
Quanta Services* | | 7,900 | | | 180 |
Raytheon | | 15,168 | | | 677 |
Republic Services, Cl A | | 12,142 | | | 277 |
Robert Half International (A) | | 5,676 | | | 121 |
Rockwell Automation | | 5,704 | | | 175 |
Rockwell Collins | | 5,962 | | | 253 |
Roper Industries | | 3,500 | | | 151 |
RR Donnelley & Sons | | 8,477 | | | 114 |
Ryder System | | 2,306 | | | 65 |
Shaw Group* | | 3,500 | | | 95 |
Southwest Airlines | | 27,020 | | | 182 |
Spirit Aerosystems Holdings, Cl A* (A) | | 4,700 | | | 65 |
SPX | | 1,711 | | | 79 |
Steelcase, Cl A | | 2,475 | | | 12 |
Stericycle* | | 3,126 | | | 156 |
SunPower, Cl A* (A) | | 3,300 | | | 96 |
Terex* | | 4,248 | | | 57 |
Textron | | 9,722 | | | 112 |
Thomas & Betts* | | 1,867 | | | 57 |
Timken | | 3,560 | | | 60 |
Toro (A) | | 1,560 | | | 48 |
Trinity Industries (A) | | 3,500 | | | 53 |
Union Pacific | | 19,616 | | | 967 |
United Parcel Service, Cl B | | 26,341 | | | 1,347 |
United Rentals* | | 1,723 | | | 8 |
United Technologies | | 37,366 | | | 1,966 |
URS* | | 3,300 | | | 159 |
USG* (A) | | 2,298 | | | 28 |
UTi Worldwide* | | 3,500 | | | 46 |
Valmont Industries | | 600 | | | 41 |
Waste Management (A) | | 18,494 | | | 510 |
WESCO International* | | 2,000 | | | 54 |
WW Grainger | | 2,881 | | | 227 |
| | | | | |
| | | | | 35,992 |
| | | | | |
| | |
Information Technology — 17.6% | | | | | |
Accenture, Cl A | | 22,600 | | | 676 |
Activision Blizzard* | | 22,056 | | | 266 |
ADC Telecommunications* | | 2,967 | | | 21 |
Adobe Systems* | | 20,102 | | | 566 |
Advanced Micro Devices* (A) | | 23,634 | | | 107 |
Affiliated Computer Services, Cl A* | | 3,547 | | | 159 |
Agilent Technologies* | | 12,864 | | | 235 |
Akamai Technologies* | | 6,918 | | | 154 |
Alliance Data Systems* (A) | | 2,112 | | | 86 |
Altera (A) | | 11,073 | | | 188 |
Amdocs* | | 7,700 | | | 167 |
Amphenol, Cl A | | 6,892 | | | 230 |
Analog Devices | | 10,812 | | | 264 |
Ansys* | | 3,400 | | | 102 |
Apple* | | 33,823 | | | 4,593 |
Applied Materials | | 51,155 | | | 576 |
| | |
| 64 | | SEI Institutional Investments Trust / Annual Report / May 31, 2009 |
| | | | | |
| Description | | Shares | | Market Value
($ Thousands) |
| | | | | |
Arrow Electronics* | | 5,089 | | $ | 123 |
Atmel* | | 18,900 | | | 73 |
Autodesk* (A) | | 8,737 | | | 188 |
Automatic Data Processing | | 19,592 | | | 745 |
Avnet* | | 6,110 | | | 141 |
AVX | | 1,424 | | | 13 |
BMC Software* | | 7,089 | | | 242 |
Broadcom, Cl A* (A) | | 19,368 | | | 494 |
Broadridge Financial Solutions | | 5,873 | | | 97 |
Brocade Communications Systems* | | 13,400 | | | 98 |
CA | | 14,438 | | | 252 |
Cadence Design Systems* (A) | | 8,663 | | | 49 |
Ciena* (A) | | 4,114 | | | 45 |
Cisco Systems* | | 226,627 | | | 4,193 |
Citrix Systems* | | 6,787 | | | 213 |
Cognizant Technology Solutions, Cl A* | | 10,788 | | | 272 |
CommScope* | | 2,400 | | | 63 |
Computer Sciences* | | 5,564 | | | 236 |
Compuware* | | 8,551 | | | 65 |
Convergys* | | 5,569 | | | 52 |
Corning | | 59,658 | | | 877 |
Cree* (A) | | 3,222 | | | 98 |
Cypress Semiconductor* | | 4,400 | | | 38 |
Dell* | | 68,743 | | | 796 |
Diebold | | 2,729 | | | 67 |
Dolby Laboratories, Cl A* (A) | | 2,143 | | | 77 |
DST Systems* | | 1,395 | | | 54 |
eBay* | | 41,911 | | | 739 |
EchoStar, Cl A* | | 2,132 | | | 34 |
Electronic Arts* | | 11,865 | | | 273 |
EMC* | | 78,364 | | | 921 |
Equinix* (A) | | 1,200 | | | 89 |
F5 Networks* | | 2,938 | | | 93 |
Factset Research Systems (A) | | 1,800 | | | 95 |
Fairchild Semiconductor International, Cl A* | | 3,400 | | | 24 |
Fidelity National Information Services | | 7,728 | | | 149 |
Fiserv* | | 5,769 | | | 244 |
FLIR Systems* (A) | | 5,400 | | | 121 |
Genpact* | | 3,100 | | | 32 |
Global Payments (A) | | 3,134 | | | 113 |
Google, Cl A* | | 9,044 | | | 3,773 |
Harris | | 5,289 | | | 164 |
Harris Stratex Networks, Cl A* | | 1,313 | | | 6 |
Hewitt Associates, Cl A* | | 3,863 | | | 112 |
Hewlett-Packard | | 94,601 | | | 3,250 |
IAC* | | 3,232 | | | 52 |
Ingram Micro, Cl A* | | 7,023 | | | 116 |
Integrated Device Technology* | | 5,600 | | | 32 |
Intel (A) | | 219,858 | | | 3,456 |
International Business Machines | | 52,698 | | | 5,601 |
International Rectifier* | | 3,355 | | | 49 |
Intersil, Cl A | | 5,361 | | | 66 |
Intuit* | | 11,986 | | | 326 |
Itron* (A) | | 1,400 | | | 82 |
| | | | | |
| Description | | Shares | | Market Value
($ Thousands) |
| | | | | |
Jabil Circuit | | 7,174 | | $ | 56 |
JDS Uniphase* (A) | | 7,340 | | | 40 |
Juniper Networks* (A) | | 19,725 | | | 488 |
Kla-Tencor | | 6,709 | | | 181 |
Lam Research* (A) | | 5,091 | | | 133 |
Lender Processing Services | | 4,014 | | | 117 |
Lexmark International, Cl A* | | 2,786 | | | 46 |
Linear Technology | | 8,157 | | | 191 |
LSI* | | 26,248 | | | 117 |
Marvell Technology Group* | | 19,300 | | | 221 |
Mastercard, Cl A | | 2,800 | | | 494 |
McAfee* | | 5,573 | | | 219 |
MEMC Electronic Materials* | | 8,938 | | | 172 |
Metavante Technologies* | | 3,120 | | | 80 |
Mettler Toledo International* | | 1,336 | | | 95 |
Microchip Technology (A) | | 7,322 | | | 158 |
Micron Technology* (A) | | 31,016 | | | 157 |
Microsoft | | 307,900 | | | 6,432 |
Molex (A) | | 4,770 | | | 73 |
Motorola | | 84,934 | | | 515 |
National Instruments | | 1,936 | | | 41 |
National Semiconductor (A) | | 9,156 | | | 127 |
NCR* | | 6,689 | | | 72 |
NetApp* (A) | | 12,755 | | | 249 |
NeuStar, Cl A* | | 2,700 | | | 54 |
Novell* | | 15,326 | | | 64 |
Novellus Systems* | | 4,377 | | | 79 |
Nuance Communications* | | 7,700 | | | 95 |
Nvidia* (A) | | 20,556 | | | 214 |
ON Semiconductor* (A) | | 14,500 | | | 99 |
Oracle | | 149,567 | | | 2,930 |
Paychex (A) | | 12,107 | | | 331 |
QLogic* (A) | | 4,380 | | | 60 |
Qualcomm | | 62,150 | | | 2,709 |
Rambus* | | 4,500 | | | 58 |
Red Hat* (A) | | 6,927 | | | 138 |
SAIC* | | 8,300 | | | 145 |
Salesforce.com* (A) | | 4,138 | | | 157 |
SanDisk* | | 9,143 | | | 143 |
Seagate Technology | | 19,600 | | | 171 |
Silicon Laboratories* | | 1,600 | | | 54 |
Sohu.com* | | 1,000 | | | 63 |
Sun Microsystems* | | 27,469 | | | 247 |
Symantec* | | 31,648 | | | 493 |
Synopsys* | | 5,782 | | | 113 |
Tech Data* | | 2,250 | | | 72 |
Tellabs* | | 16,789 | | | 93 |
Teradata* | | 6,789 | | | 147 |
Teradyne* | | 5,563 | | | 40 |
Texas Instruments | | 50,108 | | | 972 |
Total System Services | | 6,691 | | | 91 |
Trimble Navigation* | | 4,914 | | | 94 |
Tyco Electronics | | 17,900 | | | 311 |
Unisys* | | 8,532 | | | 12 |
| | |
| SEI Institutional Investments Trust / Annual Report / May 31, 2009 | | 65 |
SCHEDULE OF INVESTMENTS
Large Cap Index Fund (Continued)
May 31, 2009
| | | | | |
| Description | | Shares | | Market Value
($ Thousands) |
| | | | | |
Varian Semiconductor Equipment Associates* | | 3,200 | | $ | 75 |
VeriSign* | | 7,585 | | | 178 |
Visa, Cl A (A) | | 17,000 | | | 1,151 |
Vishay Intertechnology* (A) | | 5,950 | | | 33 |
VMware, Cl A* | | 1,900 | | | 59 |
WebMD Health, Cl A* | | 300 | | | 8 |
Western Digital* | | 8,830 | | | 219 |
Western Union | | 26,328 | | | 464 |
Xerox | | 33,251 | | | 226 |
Xilinx | | 10,357 | | | 215 |
Yahoo!* (A) | | 52,181 | | | 827 |
Zebra Technologies, Cl A* | | 2,025 | | | 44 |
| | | | | |
| | | | | 62,285 |
| | | | | |
| | |
Materials — 3.8% | | | | | |
Air Products & Chemicals | | 7,894 | | | 511 |
Airgas | | 3,315 | | | 140 |
AK Steel Holding | | 3,800 | | | 54 |
Albemarle | | 3,744 | | | 106 |
Alcoa (A) | | 36,402 | | | 336 |
Allegheny Technologies (A) | | 4,097 | | | 145 |
Aptargroup | | 2,800 | | | 87 |
Ashland | | 2,476 | | | 66 |
Ball | | 3,875 | | | 154 |
Bemis | | 3,974 | | | 100 |
Cabot | | 2,273 | | | 36 |
Carpenter Technology | | 1,400 | | | 31 |
Celanese, Cl A | | 5,183 | | | 106 |
Century Aluminum* | | 1,100 | | | 7 |
CF Industries Holdings | | 1,900 | | | 148 |
Cliffs Natural Resources | | 5,300 | | | 144 |
Commercial Metals (A) | | 4,900 | | | 83 |
Crown Holdings* | | 6,451 | | | 152 |
Cytec Industries | | 1,581 | | | 34 |
Domtar* | | 23,537 | | | 27 |
Dow Chemical | | 43,070 | | | 762 |
E.I. Du Pont de Nemours | | 34,792 | | | 991 |
Eagle Materials (A) | | 2,000 | | | 49 |
Eastman Chemical | | 3,142 | | | 130 |
Ecolab | | 6,491 | | | 242 |
FMC | | 2,960 | | | 161 |
Freeport-McMoRan Copper &
Gold, Cl B (A) | | 15,912 | | | 866 |
Greif, Cl A | | 1,500 | | | 72 |
Huntsman | | 5,129 | | | 32 |
International Flavors & Fragrances | | 3,291 | | | 105 |
International Paper | | 15,755 | | | 226 |
Intrepid Potash* (A) | | 1,300 | | | 42 |
Lubrizol | | 2,834 | | | 127 |
Martin Marietta Materials | | 1,663 | | | 135 |
MeadWestvaco (A) | | 7,258 | | | 116 |
Monsanto | | 21,150 | | | 1,738 |
Mosaic | | 5,778 | | | 316 |
| | | | | |
| Description | | Shares | | Market Value
($ Thousands) |
| | | | | |
Nalco Holding (A) | | 5,917 | | $ | 103 |
Newmont Mining | | 18,133 | | | 886 |
Nucor | | 11,890 | | | 522 |
Owens-Illinois* | | 6,591 | | | 189 |
Packaging of America | | 4,599 | | | 74 |
Pactiv* | | 5,183 | | | 116 |
PPG Industries | | 6,123 | | | 272 |
Praxair | | 12,125 | | | 888 |
Reliance Steel & Aluminum | | 2,200 | | | 84 |
RPM International | | 4,469 | | | 69 |
Schnitzer Steel Industries, Cl A | | 1,000 | | | 55 |
Scotts Miracle-Gro, Cl A | | 1,806 | | | 62 |
Sealed Air | | 6,568 | | | 131 |
Sigma-Aldrich | | 4,548 | | | 220 |
Sonoco Products | | 4,046 | | | 99 |
Southern Copper (A) | | 8,748 | | | 183 |
Steel Dynamics | | 5,700 | | | 85 |
Temple-Inland (A) | | 3,675 | | | 47 |
Terra Industries | | 3,700 | | | 103 |
Titanium Metals (A) | | 3,358 | | | 31 |
United States Steel (A) | | 5,683 | | | 194 |
Valspar | | 3,564 | | | 81 |
Vulcan Materials (A) | | 4,057 | | | 180 |
Weyerhaeuser | | 7,878 | | | 265 |
| | | | | |
| | | | | 13,516 |
| | | | | |
| | |
Telecommunication Services — 3.3% | | | | | |
American Tower, Cl A* | | 14,922 | | | 476 |
AT&T | | 227,833 | | | 5,648 |
CenturyTel (A) | | 3,601 | | | 111 |
Clearwire, Cl A* (A) | | 2,500 | | | 11 |
Crown Castle International* | | 10,496 | | | 255 |
Embarq | | 5,432 | | | 228 |
Frontier Communications (A) | | 12,955 | | | 94 |
Leap Wireless International* (A) | | 2,200 | | | 83 |
Level 3 Communications* (A) | | 67,400 | | | 72 |
MetroPCS Communications* (A) | | 9,600 | | | 164 |
NII Holdings* | | 6,620 | | | 135 |
Qwest Communications International (A) | | 55,696 | | | 243 |
SBA Communications, Cl A* (A) | | 4,200 | | | 107 |
Sprint Nextel* | | 104,444 | | | 538 |
Telephone & Data Systems | | 4,102 | | | 124 |
US Cellular* | | 831 | | | 35 |
Verizon Communications | | 109,415 | | | 3,201 |
Windstream | | 17,547 | | | 148 |
| | | | | |
| | | | | 11,673 |
| | | | | |
| | |
Utilities — 3.9% | | | | | |
AES* | | 24,724 | | | 247 |
AGL Resources | | 3,247 | | | 94 |
Allegheny Energy | | 6,166 | | | 154 |
Alliant Energy | | 4,376 | | | 104 |
Ameren (A) | | 7,690 | | | 179 |
American Electric Power | | 17,950 | | | 473 |
| | |
| 66 | | SEI Institutional Investments Trust / Annual Report / May 31, 2009 |
| | | | | |
| Description | | Shares | | Market Value
($ Thousands) |
| | | | | |
American Water Works | | 2,900 | | $ | 50 |
Aqua America (A) | | 5,477 | | | 90 |
Atmos Energy | | 3,691 | | | 89 |
Calpine* | | 14,000 | | | 190 |
Centerpoint Energy | | 12,615 | | | 128 |
CMS Energy (A) | | 9,542 | | | 108 |
Consolidated Edison (A) | | 10,216 | | | 362 |
Constellation Energy Group | | 7,358 | | | 201 |
Dominion Resources | | 21,812 | | | 693 |
DPL (A) | | 4,546 | | | 99 |
DTE Energy | | 5,964 | | | 180 |
Duke Energy | | 47,819 | | | 677 |
Dynegy, Cl A* | | 22,518 | | | 45 |
Edison International | | 12,179 | | | 356 |
Energen | | 2,937 | | | 109 |
Entergy | | 7,198 | | | 537 |
Equities | | 4,766 | | | 178 |
Exelon | | 24,929 | | | 1,197 |
FirstEnergy | | 11,481 | | | 434 |
FPL Group | | 15,473 | | | 875 |
Great Plains Energy (A) | | 4,871 | | | 73 |
Hawaiian Electric Industries (A) | | 3,746 | | | 65 |
Integrys Energy Group | | 3,002 | | | 81 |
MDU Resources Group (A) | | 7,221 | | | 133 |
Mirant* (A) | | 5,661 | | | 88 |
National Fuel Gas | | 3,289 | | | 110 |
NiSource | | 10,821 | | | 116 |
Northeast Utilities | | 6,407 | | | 133 |
NRG Energy* (A) | | 9,100 | | | 205 |
NSTAR | | 4,228 | | | 127 |
NV Energy | | 8,300 | | | 83 |
OGE Energy (A) | | 3,768 | | | 97 |
Oneok | | 4,129 | | | 121 |
Pepco Holdings | | 7,844 | | | 102 |
PG&E (A) | | 13,418 | | | 493 |
Pinnacle West Capital | | 3,992 | | | 110 |
PPL | | 14,026 | | | 455 |
Progress Energy | | 10,461 | | | 371 |
Public Service Enterprise Group (A) | | 19,152 | | | 610 |
Questar | | 6,346 | | | 215 |
RRI Energy* | | 14,659 | | | 80 |
SCANA | | 4,520 | | | 136 |
Sempra Energy | | 9,423 | | | 431 |
Southern | | 29,103 | | | 827 |
TECO Energy (A) | | 8,600 | | | 97 |
UGI | | 4,350 | | | 105 |
Vectren | | 3,491 | | | 79 |
Wisconsin Energy (A) | | 4,549 | | | 180 |
Xcel Energy | | 16,981 | | | 291 |
| | | | | |
| | | | | 13,863 |
| | | | | |
Total Common Stock
(Cost $348,740) ($ Thousands) | | | | | 346,866 |
| | | | | |
| | | | | |
| Description | | Shares/Face Amount
($ Thousands) | | Market Value
($ Thousands) |
| | | | | |
|
U.S. TREASURY OBLIGATIONS (C) (D) — 0.2% |
U.S. Treasury Bills | | | | | |
0.216%, 06/11/09 | | $558 | | $ | 558 |
0.180%, 07/02/09 | | 70 | | | 70 |
| | | | | |
| | | | | 628 |
| | | | | |
Total U.S. Treasury Obligations
(Cost $628) ($ Thousands) | | | | | 628 |
| | | | | |
| | |
CASH EQUIVALENT — 1.1% | | | | | |
SEI Daily Income Trust, Prime Obligation Fund, Cl A, 0.260%**† | | 3,999,205 | | | 3,999 |
| | | | | |
Total Cash Equivalent
(Cost $3,999) ($ Thousands) | | | | | 3,999 |
| | | | | |
| |
AFFILIATED PARTNERSHIP — 10.9% | | | |
SEI Liquidity Fund, L.P.,
0.820%**† (E) | | 39,140,369 | | | 38,379 |
| | | | | |
Total Affiliated Partnership
(Cost $39,140) ($ Thousands) | | | | | 38,379 |
| | | | | |
Total Investments — 110.2%
(Cost $392,507) ($ Thousands) | | | | $ | 389,872 |
| | | | | |
A summary of the open futures contracts held by the Fund at May 31, 2009, is as follows:
| | | | | | | |
Type of
Contract | | Number of
Contracts
Long | | Expiration
Date | | Unrealized
Appreciation
($ Thousands) |
S&P 500 Index EMINI | | 130 | | Jun-2009 | | $ | 1,005 |
S&P Mid 400 Index E-MINI | | 6 | | Jun-2009 | | | 72 |
| | | | | | | |
| | | | | | $ | 1,077 |
| | | | | | | |
Percentages are based on a Net Assets of $353,892 ($ Thousands)
| * | | Non-income producing security. |
| ** | | The rate reported is the 7-day effective yield as of May 31, 2009 |
| † | | Investment in Affiliated Security (see Note 4). |
| ‡ | | Real Estate Investment Trust |
| (A) | | This security or a partial position of this security is on loan at May 31, 2009. The total value of securities on loan at May 31, 2009 was $38,438 ($ Thousands). |
| (B) | | The Fund may purchase securities of certain companies with which it is affiliated to the extent these companies are represented in its benchmark index. |
| (C) | | Zero coupon security. The rate reported is the effective yield at time of purchase. |
| (D) | | Security, or a portion thereof, has been pledged as collateral on open futures contracts. |
| (E) | | This security was purchased with cash collateral held from securities on loan. The total value of such securities as of May 31, 2009 was $38,379 ($ Thousands). |
Cl — Class
L.P. — Limited Partnership
The accompanying notes are an integral part of the financial statements.
| | |
| SEI Institutional Investments Trust / Annual Report / May 31, 2009 | | 67 |
SCHEDULE OF INVESTMENTS
Small Cap Fund
May 31, 2009

| | | | | |
| Description | | Shares | | Market Value
($ Thousands) |
| | | | | |
| | |
COMMON STOCK — 95.5% | | | | | |
| | |
Consumer Discretionary — 12.3% | | | | | |
Aaron’s (A) | | 44,973 | | $ | 1,465 |
Abercrombie & Fitch, Cl A (A) | | 18,544 | | | 558 |
Advance Auto Parts | | 31,000 | | | 1,320 |
Aeropostale* | | 46,495 | | | 1,610 |
American Eagle Outfitters | | 93,275 | | | 1,381 |
American Greetings, Cl A (A) | | 43,000 | | | 295 |
American Public Education* | | 65,979 | | | 2,156 |
America’s Car-Mart* | | 23,900 | | | 391 |
Amerigon* (A) | | 105,398 | | | 468 |
Ameristar Casinos | | 31,660 | | | 635 |
AnnTaylor Stores* | | 31,599 | | | 231 |
Arbitron | | 38,500 | | | 766 |
Arctic Cat | | 54,500 | | | 218 |
Asbury Automotive Group | | 38,200 | | | 363 |
Autoliv | | 12,600 | | | 350 |
Bally Technologies* | | 46,300 | | | 1,296 |
Barnes & Noble | | 63,900 | | | 1,579 |
Bebe Stores (A) | | 139,739 | | | 1,126 |
Belo, Cl A | | 203,518 | | | 366 |
Big 5 Sporting Goods | | 46,300 | | | 502 |
Big Lots* | | 33,130 | | | 762 |
BJ’s Restaurants* (A) | | 43,462 | | | 623 |
Bluegreen* | | 11,599 | | | 31 |
Blyth | | 7,875 | | | 262 |
Bob Evans Farms (A) | | 19,500 | | | 503 |
Brink’s Home Security Holdings* | | 35,400 | | | 1,020 |
Brown Shoe (A) | | 93,848 | | | 762 |
Buckle (A) | | 19,686 | | | 704 |
Buffalo Wild Wings* | | 33,193 | | | 1,178 |
Cabela’s* | | 5,169 | | | 69 |
Callaway Golf | | 126,939 | | | 904 |
Capella Education* (A) | | 8,722 | | | 455 |
Career Education* (A) | | 42,197 | | | 847 |
Carrols Restaurant Group* | | 54,100 | | | 406 |
Carter’s* | | 14,449 | | | 342 |
Casual Male Retail Group* | | 294,400 | | | 515 |
| | | | | |
| Description | | Shares | | Market Value
($ Thousands) |
| | | | | |
Cato, Cl A (A) | | 88,537 | | $ | 1,703 |
CEC Entertainment* | | 36,791 | | | 1,182 |
Centex | | 88,100 | | | 743 |
Century Casinos* | | 169,247 | | | 433 |
Charlotte Russe Holding* | | 63,118 | | | 641 |
Cheesecake Factory* | | 10,200 | | | 175 |
Chico’s FAS* (A) | | 95,659 | | | 934 |
Childrens Place Retail Stores* (A) | | 24,800 | | | 891 |
Christopher & Banks | | 46,129 | | | 239 |
Cinemark Holdings | | 63,314 | | | 672 |
CKE Restaurants | | 30,477 | | | 251 |
Columbia Sportswear (A) | | 20,800 | | | 660 |
Cooper Tire & Rubber (A) | | 60,640 | | | 643 |
Corinthian Colleges* (A) | | 93,450 | | | 1,437 |
Cracker Barrel Old Country Store (A) | | 42,989 | | | 1,351 |
CROCS* | | 24,214 | | | 70 |
CSS Industries | | 5,900 | | | 107 |
DeVry | | 10,243 | | | 446 |
Dick’s Sporting Goods* (A) | | 50,805 | | | 904 |
DineEquity (A) | | 8,400 | | | 233 |
DR Horton | | 13,706 | | | 126 |
DreamWorks Animation SKG, Cl A* | | 21,500 | | | 599 |
Dress Barn* | | 54,948 | | | 870 |
DSW, Cl A* (A) | | 123,448 | | | 1,404 |
Eastman Kodak | | 25,448 | | | 66 |
Einstein Noah Restaurant Group* | | 6,600 | | | 52 |
Entercom Communications, Cl A (A) | | 44,561 | | | 71 |
Ethan Allen Interiors (A) | | 76,975 | | | 944 |
EW Scripps, Cl A (A) | | 36,466 | | | 71 |
Exide Technologies* | | 69,493 | | | 425 |
Federal Mogul, Cl A* | | 70,989 | | | 710 |
FGX International Holdings* | | 13,400 | | | 180 |
Finish Line, Cl A | | 174,951 | | | 1,209 |
Foot Locker (A) | | 93,507 | | | 1,039 |
Fossil* | | 17,700 | | | 396 |
Fred’s, Cl A | | 6,428 | | | 83 |
Fuel Systems Solutions* (A) | | 21,403 | | | 452 |
Fuqi International* | | 7,300 | | | 89 |
Furniture Brands International | | 21,776 | | | 91 |
Gannett | | 12,378 | | | 59 |
Genesco* | | 12,481 | | | 322 |
Gentex | | 13,900 | | | 164 |
Gildan Activewear, Cl A* (A) | | 44,100 | | | 725 |
Guess? | | 26,800 | | | 692 |
Gymboree* | | 22,855 | | | 842 |
Hanesbrands* (A) | | 30,500 | | | 515 |
Harte-Hanks (A) | | 39,300 | | | 331 |
Hasbro | | 3,223 | | | 82 |
hhgregg* | | 7,100 | | | 117 |
Hibbett Sports* (A) | | 36,049 | | | 650 |
Hillenbrand | | 8,061 | | | 138 |
Iconix Brand Group* | | 92,935 | | | 1,505 |
Interactive Data | | 683 | | | 16 |
International Speedway, Cl A | | 35,400 | | | 878 |
| | |
| 68 | | SEI Institutional Investments Trust / Annual Report / May 31, 2009 |
| | | | | |
| Description | | Shares | | Market Value
($ Thousands) |
| | | | | |
Isle of Capri Casinos* (A) | | 43,281 | | $ | 569 |
J Crew Group* | | 79,330 | | | 2,051 |
Jack in the Box* (A) | | 36,100 | | | 949 |
Jackson Hewitt Tax Service | | 22,900 | | | 91 |
Jakks Pacific* (A) | | 21,300 | | | 272 |
Jarden* (A) | | 145,791 | | | 2,592 |
Jo-Ann Stores* | | 46,919 | | | 1,014 |
Jones Apparel Group | | 55,073 | | | 501 |
Journal Communications, Cl A | | 152,400 | | | 230 |
K12* (A) | | 29,400 | | | 514 |
Lakeland Industries* | | 89,000 | | | 730 |
Landry’s Restaurants (A) | | 9,800 | | | 99 |
Life Time Fitness* (A) | | 157,426 | | | 2,909 |
Lifetime Brands | | 87,800 | | | 294 |
Lincoln Educational Services* | | 9,900 | | | 183 |
Lions Gate Entertainment* | | 109,800 | | | 681 |
Live Nation* | | 25,985 | | | 149 |
LodgeNet Interactive* | | 12,020 | | | 70 |
Lululemon Athletica* (A) | | 148,566 | | | 1,876 |
M/I Homes | | 29,600 | | | 342 |
Maidenform Brands* | | 25,200 | | | 326 |
Marvel Entertainment* (A) | | 46,565 | | | 1,545 |
Matthews International, Cl A | | 11,000 | | | 314 |
MDC Holdings | | 5,569 | | | 171 |
MDC Partners, Cl A* | | 386,300 | | | 2,125 |
Media General, Cl A (A) | | 22,087 | | | 59 |
Men’s Wearhouse (A) | | 17,911 | | | 306 |
Meredith (A) | | 29,100 | | | 784 |
Morningstar* (A) | | 31,085 | | | 1,288 |
National CineMedia | | 45,359 | | | 567 |
National Presto Industries | | 1,454 | | | 119 |
Nautilus* | | 9,043 | | | 13 |
NetFlix* (A) | | 43,920 | | | 1,732 |
New Frontier Media | | 164,090 | | | 361 |
New York* | | 21,301 | | | 77 |
Nordstrom | | 31,600 | | | 622 |
NutriSystem | | 13,000 | | | 178 |
NVR* | | 1,720 | | | 851 |
O’Charleys | | 55,684 | | | 449 |
Office Depot* | | 54,585 | | | 254 |
OfficeMax | | 153,200 | | | 1,264 |
Orient-Express Hotels, Cl A | | 235,499 | | | 1,677 |
Oxford Industries | | 6,000 | | | 56 |
Panera Bread, Cl A* (A) | | 16,770 | | | 893 |
Papa John’s International* | | 959 | | | 26 |
Peet’s Coffee & Tea* (A) | | 17,853 | | | 466 |
Penn National Gaming* (A) | | 10,780 | | | 357 |
PEP Boys-Manny Moe & Jack | | 51,000 | | | 360 |
PetSmart | | 58,299 | | | 1,187 |
PF Chang’s China Bistro* (A) | | 27,146 | | | 867 |
Phillips-Van Heusen | | 28,094 | | | 828 |
Pinnacle Entertainment* | | 66,732 | | | 711 |
Polaris Industries (A) | | 25,294 | | | 804 |
Princeton Review* | | 267,100 | | | 1,250 |
| | | | | |
| Description | | Shares | | Market Value
($ Thousands) |
| | | | | |
Pulte Homes | | 14,208 | | $ | 125 |
RadioShack | | 8,700 | | | 117 |
RC2* (A) | | 33,878 | | | 407 |
RCN* | | 10,687 | | | 59 |
Regis | | 80,624 | | | 1,413 |
Rent-A-Center, Cl A* (A) | | 63,109 | | | 1,232 |
Retail Ventures* | | 209,167 | | | 546 |
Ruby Tuesday* | | 73,100 | | | 452 |
Ryland Group (A) | | 19,684 | | | 336 |
Scholastic | | 62,900 | | | 1,233 |
Scientific Games, Cl A* (A) | | 46,179 | | | 823 |
Shoe Carnival* | | 9,000 | | | 96 |
Shutterfly* (A) | | 65,428 | | | 934 |
Sinclair Broadcast Group, Cl A (A) | | 39,677 | | | 70 |
Skechers U.S.A., Cl A* | | 23,400 | | | 222 |
Sonic* | | 59,000 | | | 556 |
Sonic Automotive, Cl A (A) | | 8,100 | | | 77 |
Sotheby’s | | 22,993 | | | 244 |
Spartan Motors | | 59,968 | | | 566 |
Stage Stores | | 151,738 | | | 1,841 |
Stamps.com* | | 28,525 | | | 253 |
Standard Pacific* (A) | | 109,163 | | | 266 |
Starwood Hotels & Resorts Worldwide (A) | | 37,800 | | | 925 |
Steinway Musical Instruments* | | 338 | | | 4 |
Steven Madden* | | 21,741 | | | 592 |
Stewart Enterprises, Cl A | | 53,704 | | | 222 |
Strayer Education | | 4,000 | | | 737 |
Systemax* | | 9,900 | | | 121 |
Tempur-Pedic International (A) | | 76,570 | | | 845 |
Texas Roadhouse, Cl A* | | 79,125 | | | 920 |
Thor Industries (A) | | 39,100 | | | 786 |
Thunderbird Resorts* (B) (H) (J) | | 154,500 | | | 232 |
Timberland, Cl A* | | 7,223 | | | 104 |
Tractor Supply* (A) | | 47,177 | | | 1,811 |
True Religion Apparel* (A) | | 27,780 | | | 641 |
Tupperware Brands | | 5,400 | | | 131 |
Under Armour, Cl A* | | 37,325 | | | 916 |
Unifirst | | 800 | | | 27 |
Universal Electronics* | | 11,113 | | | 218 |
Urban Outfitters* | | 40,365 | | | 824 |
Valassis Communications* | | 9,600 | | | 62 |
Volcom* | | 9,600 | | | 131 |
Warner Music Group* | | 154,524 | | | 1,051 |
Wendy’s, Cl A | | 55,940 | | | 235 |
Wet Seal, Cl A* | | 9,452 | | | 30 |
Williams-Sonoma | | 16,600 | | | 215 |
WMS Industries* (A) | | 57,278 | | | 2,032 |
World Wrestling Entertainment, Cl A | | 18,900 | | | 236 |
| | | | | |
| | | | | 121,006 |
| | | | | |
| | |
Consumer Staples — 3.6% | | | | | |
Alberto-Culver, Cl B | | 21,700 | | | 504 |
Alliance One International* | | 237,000 | | | 1,128 |
American Italian Pasta, Cl A* | | 37,956 | | | 1,049 |
| | |
| SEI Institutional Investments Trust / Annual Report / May 31, 2009 | | 69 |
SCHEDULE OF INVESTMENTS
Small Cap Fund (Continued)
May 31, 2009
| | | | | |
| Description | | Shares | | Market Value
($ Thousands) |
| | | | | |
American Oriental Bioengineering* (A) | | 61,000 | | $ | 296 |
Andersons | | 10,600 | | | 266 |
Asiatic Development (Malaysia) | | 299,500 | | | 463 |
B&G Foods, Cl A | | 3,708 | | | 27 |
Bare Escentuals* | | 30,500 | | | 267 |
BJ’s Wholesale Club* (A) | | 30,200 | | | 1,064 |
Boston Beer, Cl A* | | 9,446 | | | 269 |
Cal-Maine Foods (A) | | 25,000 | | | 611 |
Casey’s General Stores | | 65,833 | | | 1,661 |
Central Garden and Pet, Cl A* | | 54,072 | | | 532 |
Central Garden and Pet* | | 37,082 | | | 395 |
Chattem* | | 8,600 | | | 514 |
China Sky One Medical* (A) | | 14,240 | | | 210 |
Chiquita Brands International* | | 112,500 | | | 1,176 |
Coca-Cola Bottling | | 2,400 | | | 117 |
Constellation Brands, Cl A* | | 63,900 | | | 739 |
Corn Products International | | 36,942 | | | 976 |
Cosan Industria e Comercio (Brazil)* | | 99,400 | | | 777 |
Darling International* | | 96,727 | | | 732 |
Dean Foods* | | 38,015 | | | 715 |
Del Monte Foods | | 213,181 | | | 1,744 |
Farmer Bros | | 2,600 | | | 58 |
Flowers Foods | | 87,760 | | | 1,858 |
Fresh Del Monte Produce* | | 19,800 | | | 351 |
Hansen Natural* | | 680 | | | 25 |
Herbalife | | 40,217 | | | 1,175 |
Ingles Markets, Cl A | | 14,100 | | | 211 |
J&J Snack Foods | | 2,619 | | | 98 |
Lancaster Colony (A) | | 6,237 | | | 287 |
Lance (A) | | 51,596 | | | 1,101 |
Molson Coors Brewing, Cl B | | 19,500 | | | 858 |
Nash Finch | | 7,169 | | | 210 |
NBTY* | | 42,900 | | | 1,059 |
Nu Skin Enterprises, Cl A | | 28,804 | | | 418 |
Pantry* (A) | | 53,751 | | | 1,071 |
Prestige Brands Holdings* | | 30,549 | | | 190 |
Pricesmart | | 12,100 | | | 202 |
Ralcorp Holdings* | | 6,838 | | | 392 |
Ruddick | | 26,807 | | | 674 |
Sanderson Farms (A) | | 45,360 | | | 1,978 |
Smart Balance* | | 208,035 | | | 1,539 |
Spartan Stores | | 3,352 | | | 42 |
Susser Holdings* | | 2,400 | | | 33 |
TreeHouse Foods* | | 22,084 | | | 590 |
Tyson Foods, Cl A (A) | | 28,291 | | | 377 |
United Natural Foods* | | 4,800 | | | 109 |
Universal (A) | | 58,300 | | | 2,159 |
USANA Health Sciences* | | 4,300 | | | 114 |
Vector Group (A) | | 37,229 | | | 545 |
Viterra, Cl Common Subscription Recei* | | 63,800 | | | 539 |
WD-40 | | 186 | | | 5 |
Weis Markets | | 5,614 | | | 196 |
Winn-Dixie Stores* | | 21,600 | | | 330 |
Zhongpin* (A) | | 23,300 | | | 246 |
| | | | | |
| | | | | 35,272 |
| | | | | |
| | | | | |
| Description | | Shares | | Market Value
($ Thousands) |
| | | | | |
| | |
Energy — 6.0% | | | | | |
Allis-Chalmers Energy* (A) | | 34,700 | | $ | 94 |
Alon USA Energy | | 26,200 | | | 348 |
Alpha Natural Resources* (A) | | 20,794 | | | 573 |
Approach Resources* | | 87,400 | | | 781 |
Arch Coal | | 54,075 | | | 1,002 |
Arena Resources* (A) | | 64,159 | | | 2,298 |
Atlas America | | 14,700 | | | 271 |
Atwood Oceanics* (A) | | 13,800 | | | 365 |
Berry Petroleum, Cl A (A) | | 39,575 | | | 772 |
Boots & Coots International Control* | | 44,288 | | | 58 |
BPZ Energy PIPE* | | 63,000 | | | 451 |
BPZ Resources* (A) | | 52,600 | | | 376 |
Bristow Group* | | 5,800 | | | 183 |
Bronco Drilling* | | 2,926 | | | 17 |
Cal Dive International* (A) | | 75,936 | | | 766 |
CARBO Ceramics | | 8,000 | | | 302 |
Carrizo Oil & Gas* (A) | | 99,221 | | | 2,118 |
Cimarex Energy (A) | | 28,600 | | | 933 |
Clayton Williams Energy* | | 4,261 | | | 104 |
Complete Production Services* | | 39,929 | | | 283 |
Comstock Resources* (A) | | 28,584 | | | 1,138 |
Concho Resources* | | 16,212 | | | 520 |
Contango Oil & Gas* | | 5,500 | | | 274 |
Continental Resources* | | 13,300 | | | 394 |
Core Laboratories | | 5,500 | | | 522 |
CVR Energy* | | 32,735 | | | 313 |
Delek US Holdings | | 37,334 | | | 383 |
Denbury Resources* | | 11,600 | | | 199 |
DHT Maritime | | 137,200 | | | 792 |
Dresser-Rand Group* | | 107,813 | | | 3,019 |
Encore Acquisition* | | 9,633 | | | 342 |
ENSCO International | | 2,924 | | | 114 |
EXCO Resources* | | 160,517 | | | 2,470 |
Exterran Holdings* | | 17,057 | | | 340 |
Forest Oil* (A) | | 30,900 | | | 587 |
Foundation Coal Holdings | | 9,600 | | | 282 |
Geokinetics* | | 4,400 | | | 58 |
GeoMet* | | 326,692 | | | 408 |
Global Industries* (A) | | 103,300 | | | 723 |
GMX Resources* | | 38,421 | | | 679 |
Goodrich Petroleum* (A) | | 72,282 | | | 1,931 |
Gran Tierra Energy* | | 14,234 | | | 43 |
Gulfmark Offshore* | | 3,530 | | | 108 |
Gulfport Energy* | | 27,600 | | | 172 |
Helix Energy Solutions Group* | | 24,623 | | | 277 |
Holly | | 64,620 | | | 1,563 |
Hornbeck Offshore Services* | | 14,512 | | | 403 |
Infinity Bio-Energy* | | 635,045 | | | 31 |
InterOil* (A) | | 11,145 | | | 399 |
ION Geophysical* | | 123,636 | | | 350 |
James River Coal* | | 11,900 | | | 267 |
Key Energy Services* | | 94,036 | | | 606 |
Kinder Morgan Management LLC* | | 25,880 | | | 1,162 |
| | |
| 70 | | SEI Institutional Investments Trust / Annual Report / May 31, 2009 |
| | | | | |
| Description | | Shares | | Market Value
($ Thousands) |
| | | | | |
Mahalo Energy* | | 266,500 | | $ | 1 |
Matrix Service* (A) | | 31,260 | | | 354 |
McMoRan Exploration* | | 11,828 | | | 80 |
Newpark Resources* | | 22,465 | | | 65 |
Oil Sands Quest* (A) | | 599,200 | | | 611 |
Oil Sands Quest PIPE* | | 74,000 | | | 76 |
Oil States International* | | 12,300 | | | 321 |
Omni Energy Services* | | 9,655 | | | 22 |
Overseas Shipholding Group (A) | | 16,200 | | | 548 |
Parker Drilling* (A) | | 80,700 | | | 378 |
Patterson-UTI Energy | | 48,900 | | | 701 |
Penn Virginia GP Holdings | | 2,170 | | | 27 |
PetroHawk Energy* | | 104,138 | | | 2,624 |
Petroquest Energy* | | 115,870 | | | 642 |
Pioneer Drilling* | | 900 | | | 6 |
Quicksilver Resources* | | 267,393 | | | 3,008 |
Rentech* (A) | | 294,500 | | | 156 |
Rosetta Resources* | | 3,800 | | | 33 |
RPC (A) | | 56,300 | | | 583 |
SEACOR Holdings* (A) | | 9,400 | | | 718 |
Southern Union (A) | | 95,200 | | | 1,655 |
St. Mary Land & Exploration | | 21,200 | | | 459 |
StealthGas | | 16,100 | | | 80 |
Superior Energy Services* | | 44,269 | | | 1,021 |
Swift Energy* (A) | | 48,741 | | | 801 |
T-3 Energy Services, Cl 3* | | 17,180 | | | 249 |
Teekay Tankers, Cl A (A) | | 19,300 | | | 238 |
Tesoro (A) | | 34,331 | | | 582 |
Tetra Technologies* | | 129,100 | | | 1,123 |
Venoco* | | 30,400 | | | 218 |
W&T Offshore (A) | | 98,898 | | | 1,009 |
Walter Industries | | 7,124 | | | 233 |
Western Refining (A) | | 81,441 | | | 1,161 |
Westmoreland Coal* | | 7,600 | | | 67 |
Whiting Petroleum* | | 32,133 | | | 1,506 |
Willbros Group* | | 84,712 | | | 1,293 |
World Fuel Services (A) | | 83,358 | | | 3,538 |
| | | | | |
| | | | | 59,151 |
| | | | | |
| | |
Financials — 17.5% | | | | | |
Abington Bancorp | | 12,200 | | | 99 |
Advance America Cash Advance Centers | | 105,763 | | | 476 |
Advanta, Cl B (A) | | 33,450 | | | 23 |
Affiliated Managers Group* | | 27,947 | | | 1,568 |
Agree Realty‡ | | 9,300 | | | 161 |
Alexandria Real Estate Equities‡ | | 24,310 | | | 873 |
Allied World Assurance Holdings | | 27,200 | | | 1,027 |
AMB Property‡ (A) | | 45,250 | | | 808 |
AMBAC Financial Group (A) | | 23,853 | | | 30 |
American Campus Communities‡ | | 33,609 | | | 773 |
American Equity Investment Life Holding (A) | | 84,980 | | | 494 |
American Financial Group (A) | | 26,715 | | | 572 |
American Physicians Capital | | 1,500 | | | 58 |
| | | | | |
| Description | | Shares | | Market Value
($ Thousands) |
| | | | | |
American Safety Insurance Holdings* | | 8,200 | | $ | 102 |
Amerisafe* | | 22,680 | | | 366 |
Amtrust Financial Services (A) | | 24,643 | | | 236 |
Anthracite Capital‡ (A) | | 77,200 | | | 83 |
Anworth Mortgage Asset‡ (A) | | 452,675 | | | 3,015 |
Apartment Investment & Management, Cl A‡ (A) | | 189,364 | | | 1,789 |
Ares Capital | | 96,700 | | | 740 |
Arrow Financial | | 2,248 | | | 56 |
Aspen Insurance Holdings | | 115,875 | | | 2,675 |
Associated Banc (A) | | 28,400 | | | 411 |
Associated Estates Realty‡ | | 13,320 | | | 79 |
Assured Guaranty (A) | | 39,100 | | | 513 |
Astoria Financial | | 40,907 | | | 315 |
AvalonBay Communities‡ (A) | | 25,333 | | | 1,557 |
Bancfirst | | 2,060 | | | 79 |
Banco Latinoamericano de Exportaciones, Cl E | | 52,100 | | | 660 |
Bancorp Rhode Island | | 9,500 | | | 195 |
Bancorpsouth (A) | | 26,028 | | | 579 |
Bank Mutual | | 23,179 | | | 210 |
Bank of the Ozarks (A) | | 34,439 | | | 871 |
BankFinancial | | 11,200 | | | 100 |
Berkshire Hills Bancorp | | 24,500 | | | 524 |
BGC Partners, Cl A | | 8,400 | | | 28 |
BioMed Realty Trust‡ | | 13,400 | | | 132 |
Boston Private Financial Holdings (A) | | 15,170 | | | 76 |
Boston Properties‡ (A) | | 57,200 | | | 2,764 |
Brasil Brokers Participacoes | | 530,500 | | | 714 |
Brookline Bancorp | | 31,000 | | | 305 |
Calamos Asset Management, Cl A | | 51,466 | | | 639 |
Camden National | | 1,200 | | | 39 |
Capitol Federal Financial | | 10,232 | | | 431 |
Capstead Mortgage‡ | | 117,978 | | | 1,407 |
Cardinal Financial | | 80,177 | | | 650 |
Cardtronics* | | 140,848 | | | 456 |
Care Investment Trust‡ | | 9,400 | | | 56 |
Cash America International | | 10,630 | | | 245 |
Cathay General Bancorp (A) | | 10,300 | | | 107 |
CB Richard Ellis Group, Cl A* | | 108,950 | | | 795 |
CBL & Associates Properties‡ (A) | | 44,038 | | | 274 |
Cedar Shopping Centers‡ | | 17,300 | | | 89 |
Center Financial | | 2,200 | | | 7 |
Central Pacific Financial (A) | | 55,477 | | | 332 |
Chemical Financial | | 12,948 | | | 244 |
Chimera Investment‡ | | 403,500 | | | 1,408 |
Citizens & Northern | | 2,500 | | | 52 |
Citizens Republic Bancorp* | | 36,000 | | | 41 |
City Holding | | 13,520 | | | 429 |
CNA Surety* (A) | | 37,621 | | | 571 |
Cogdell Spencer‡ | | 207,948 | | | 780 |
Cohen & Steers | | 23,700 | | | 366 |
Colonial Properties Trust‡ | | 33,217 | | | 258 |
Columbia Banking System | | 26,725 | | | 291 |
| | |
| SEI Institutional Investments Trust / Annual Report / May 31, 2009 | | 71 |
SCHEDULE OF INVESTMENTS
Small Cap Fund (Continued)
May 31, 2009
| | | | | |
| Description | | Shares | | Market Value
($ Thousands) |
| | | | | |
Commerce Bancshares (A) | | 5,448 | | $ | 171 |
Community Bank System | | 39,795 | | | 617 |
Compass Diversified Holdings | | 6,970 | | | 61 |
Conseco* | | 67,100 | | | 162 |
Corporate Office Properties Trust‡ (A) | | 41,600 | | | 1,235 |
Cousins Properties‡ (A) | | 37,400 | | | 337 |
Crawford, Cl B* | | 12,524 | | | 56 |
Cullen/Frost Bankers | | 2,364 | | | 116 |
CVB Financial (A) | | 46,535 | | | 295 |
Danvers Bancorp | | 40,700 | | | 602 |
Delphi Financial Group, Cl A | | 56,774 | | | 1,081 |
Developers Diversified Realty‡ | | 34,619 | | | 170 |
Dime Community Bancshares | | 14,315 | | | 128 |
Dollar Financial* (A) | | 74,400 | | | 749 |
Douglas Emmett‡ (A) | | 99,100 | | | 922 |
DuPont Fabros Technology‡ | | 50,314 | | | 476 |
Education Realty Trust‡ | | 65,376 | | | 305 |
eHealth* | | 19,600 | | | 314 |
EMC Insurance Group | | 3,571 | | | 78 |
Employers Holdings | | 69,394 | | | 847 |
Encore Bancshares* | | 23,320 | | | 157 |
Endurance Specialty Holdings (A) | | 48,811 | | | 1,341 |
Entertainment Properties Trust‡ (A) | | 8,700 | | | 177 |
Equity Lifestyle Properties‡ | | 8,957 | | | 351 |
Equity One‡ (A) | | 58,653 | | | 847 |
Equity Residential‡ | | 85,250 | | | 2,075 |
ESSA Bancorp | | 27,704 | | | 386 |
Essex Property Trust‡ (A) | | 18,100 | | | 1,232 |
Evercore Partners, Cl A | | 74,989 | | | 1,449 |
Extra Space Storage‡ | | 66,769 | | | 501 |
Ezcorp, Cl A* | | 30,681 | | | 373 |
FBL Financial Group, Cl A | | 32,400 | | | 235 |
FCStone Group* | | 46,531 | | | 190 |
Federal Realty Investment Trust‡ (A) | | 26,400 | | | 1,390 |
Federated Investors, Cl B (A) | | 30,597 | | | 766 |
Financial Federal | | 28,000 | | | 694 |
First American (A) | | 47,350 | | | 1,080 |
First Bancorp | | 18,700 | | | 143 |
First Cash Financial Services* | | 6,296 | | | 95 |
First Citizens BancShares, Cl A | | 1,300 | | | 172 |
First Commonwealth Financial | | 28,504 | | | 211 |
First Community Bancshares | | 7,400 | | | 129 |
First Financial Bancorp | | 92,266 | | | 787 |
First Financial Bankshares (A) | | 11,550 | | | 564 |
First Financial Holdings | | 20,800 | | | 186 |
First Horizon National (A) | | 67,516 | | | 820 |
First Merchants (A) | | 9,500 | | | 94 |
First Midwest Bancorp (A) | | 24,993 | | | 217 |
First Niagara Financial Group (A) | | 38,900 | | | 494 |
First Potomac Realty Trust‡ | | 52,832 | | | 554 |
FirstMerit (A) | | 65,143 | | | 1,134 |
Flagstone Reinsurance Holdings | | 9,400 | | | 90 |
FNB (Pennsylvania) | | 73,342 | | | 490 |
Forestar Group* | | 29,225 | | | 355 |
| | | | | |
| Description | | Shares | | Market Value
($ Thousands) |
| | | | | |
FPIC Insurance Group* (A) | | 18,552 | | $ | 552 |
Franklin Street Properties‡ | | 6,431 | | | 81 |
Fulton Financial (A) | | 87,809 | | | 510 |
General Shopping Brasil (Brazil)* | | 252,400 | | | 511 |
Getty Realty‡ | | 20,568 | | | 375 |
GFI Group | | 21,100 | | | 127 |
Glacier Bancorp (A) | | 30,300 | | | 502 |
Gladstone Capital | | 14,282 | | | 102 |
Gluskin Sheff + Associates (Canada) | | 58,900 | | | 767 |
Great Southern Bancorp (A) | | 11,213 | | | 246 |
Greenhill | | 17,700 | | | 1,301 |
Grubb & Ellis (A) | | 520,860 | | | 360 |
Hallmark Financial Services* | | 10,552 | | | 73 |
Hancock Holding (A) | | 41,638 | | | 1,454 |
Hanover Insurance Group | | 35,741 | | | 1,226 |
Harleysville Group | | 9,890 | | | 290 |
Hatteras Financial‡ | | 67,000 | | | 1,670 |
HCP‡ | | 108,100 | | | 2,511 |
Health Care REIT‡ (A) | | 6,735 | | | 231 |
Healthcare Realty Trust‡ (A) | | 5,985 | | | 99 |
Hercules Technology Growth Capital | | 196,748 | | | 1,476 |
Hersha Hospitality Trust‡ | | 72,700 | | | 199 |
Highwoods Properties‡ (A) | | 5,800 | | | 131 |
Home Bancshares (A) | | 12,900 | | | 257 |
Home Federal Bancorp | | 29,800 | | | 282 |
Horace Mann Educators | | 30,678 | | | 277 |
Horizon Financial | | 400 | | | 1 |
Hospitality Properties Trust‡ | | 19,100 | | | 267 |
Host Hotels & Resorts‡ | | 104,650 | | | 982 |
HRPT Properties Trust‡ (A) | | 180,000 | | | 855 |
IBERIABANK | | 4,200 | | | 183 |
Independent Bank | | 2,234 | | | 45 |
Infinity Property & Casualty (A) | | 24,207 | | | 891 |
Inland Real Estate‡ | | 59,277 | | | 414 |
Interactive Brokers Group, Cl A* | | 21,000 | | | 312 |
International Bancshares (A) | | 16,100 | | | 181 |
Investment Technology Group* (A) | | 19,545 | | | 406 |
Investors Bancorp* | | 24,500 | | | 214 |
Investors Real Estate Trust‡ (A) | | 50,300 | | | 448 |
IPC Holdings | | 39,196 | | | 974 |
Janus Capital Group | | 109,510 | | | 1,110 |
Jones Lang LaSalle | | 22,785 | | | 799 |
Kansas City Life Insurance | | 16,900 | | | 397 |
KBW* (A) | | 57,869 | | | 1,506 |
Knight Capital Group, Cl A* | | 65,584 | | | 1,129 |
LaSalle Hotel Properties‡ | | 31,300 | | | 428 |
LTC Properties‡ | | 47,818 | | | 995 |
M&T Bank (A) | | 7,877 | | | 396 |
Macerich‡ (A) | | 65,150 | | | 1,100 |
Mack-Cali Realty‡ | | 13,200 | | | 326 |
MainSource Financial Group | | 22,500 | | | 179 |
MarketAxess Holdings* | | 126,086 | | | 1,330 |
Max Capital Group | | 52,200 | | | 825 |
MB Financial | | 23,000 | | | 235 |
| | |
| 72 | | SEI Institutional Investments Trust / Annual Report / May 31, 2009 |
| | | | | |
| Description | | Shares | | Market Value
($ Thousands) |
| | | | | |
Meadowbrook Insurance Group | | 269,268 | | $ | 1,990 |
Medallion Financial | | 10,500 | | | 78 |
Medical Properties Trust‡ (A) | | 63,100 | | | 398 |
MFA Mortgage Investments‡ | | 540,983 | | | 3,387 |
Mid-America Apartment Communities‡ (A) | | 10,964 | | | 398 |
Montpelier Re Holdings | | 46,113 | | | 617 |
MSCI, Cl A* | | 72,122 | | | 1,534 |
NASB Financial | | 1,000 | | | 29 |
National Health Investors‡ | | 6,643 | | | 176 |
National Interstate | | 2,755 | | | 44 |
National Penn Bancshares | | 24,016 | | | 146 |
National Retail Properties‡ (A) | | 14,215 | | | 243 |
Nationwide Health Properties‡ | | 6,513 | | | 173 |
Navigators Group* | | 26,674 | | | 1,167 |
NBT Bancorp | | 8,054 | | | 177 |
Nelnet, Cl A* | | 109,275 | | | 925 |
NewAlliance Bancshares (A) | | 48,192 | | | 624 |
NorthStar Realty Finance‡ (A) | | 1,044 | | | 3 |
NYSE Euronext | | 5,000 | | | 150 |
OceanFirst Financial | | 22,560 | | | 283 |
Odyssey Re Holdings | | 3,900 | | | 157 |
Old National Bancorp (A) | | 50,326 | | | 603 |
Omega Healthcare Investors‡ | | 42,304 | | | 676 |
optionsXpress Holdings | | 36,312 | | | 620 |
Oriental Financial Group | | 33,900 | | | 336 |
Pacific Continental | | 3,200 | | | 39 |
PacWest Bancorp (A) | | 85,797 | | | 1,212 |
Park National (A) | | 2,200 | | | 139 |
Pennsylvania Commerce Bancorp* | | 1,100 | | | 20 |
Pennsylvania Real Estate Investment Trust‡ (A) | | 41,600 | | | 232 |
Penson Worldwide* (A) | | 68,420 | | | 676 |
Peoples Bancorp (A) | | 5,900 | | | 105 |
PHH* | | 103,698 | | | 1,597 |
Pico Holdings* (A) | | 19,258 | | | 538 |
Platinum Underwriters Holdings | | 80,558 | | | 2,322 |
PMA Capital, Cl A* | | 25,119 | | | 122 |
Portfolio Recovery Associates* | | 3,821 | | | 138 |
Post Properties‡ | | 85,250 | | | 1,298 |
Presidential Life | | 26,874 | | | 232 |
ProAssurance* | | 22,641 | | | 1,024 |
ProLogis‡ (A) | | 126,750 | | | 1,076 |
Prospect Capital | | 96,800 | | | 825 |
Prosperity Bancshares (A) | | 57,288 | | | 1,608 |
Provident Financial Services | | 16,514 | | | 162 |
PS Business Parks‡ | | 18,632 | | | 836 |
Public Storage‡ | | 21,324 | | | 1,420 |
Radian Group | | 54,265 | | | 154 |
RAIT Financial Trust‡ (A) | | 45,800 | | | 57 |
RAM Holdings* (A) | | 6,600 | | | 2 |
Raymond James Financial (A) | | 12,700 | | | 202 |
Realty Income‡ (A) | | 28,230 | | | 606 |
Redwood Trust‡ (A) | | 111,900 | | | 1,781 |
Regency Centers‡ | | 20,600 | | | 734 |
| | | | | |
| Description | | Shares | | Market Value
($ Thousands) |
| | | | | |
Reinsurance Group of America, Cl A | | 21,360 | | $ | 786 |
RenaissanceRe Holdings | | 9,800 | | | 448 |
Renasant | | 17,800 | | | 244 |
Republic Bancorp, Cl A | | 14,100 | | | 342 |
Riskmetrics Group* | | 64,895 | | | 1,043 |
RLI | | 7,654 | | | 359 |
S&T Bancorp | | 12,600 | | | 188 |
Safety Insurance Group | | 26,300 | | | 821 |
Sanders Morris Harris Group (A) | | 15,900 | | | 86 |
Sandy Spring Bancorp | | 8,500 | | | 116 |
Santander BanCorp (A) | | 15,400 | | | 113 |
Saul Centers‡ | | 14,250 | | | 409 |
SCBT Financial | | 22,900 | | | 516 |
SeaBright Insurance Holdings* | | 51,505 | | | 417 |
Selective Insurance Group | | 36,900 | | | 487 |
Senior Housing Properties Trust‡ | | 54,134 | | | 907 |
Sierra Bancorp (A) | | 4,000 | | | 58 |
Signature Bank NY* (A) | | 40,806 | | | 1,104 |
Simmons First National, Cl A | | 2,736 | | | 75 |
Simon Property Group‡ (A) | | 55,414 | | | 2,963 |
Smithtown Bancorp | | 3,600 | | | 44 |
South Financial Group (A) | | 26,000 | | | 49 |
Southside Bancshares | | 14,481 | | | 332 |
Southwest Bancorp | | 8,815 | | | 82 |
Sovran Self Storage‡ | | 10,603 | | | 256 |
StanCorp Financial Group | | 2,186 | | | 68 |
State Bancorp | | 4,100 | | | 31 |
StellarOne (A) | | 14,140 | | | 174 |
Sterling Bancshares | | 146,505 | | | 929 |
Stewart Information Services | | 43,375 | | | 668 |
Strategic Hotels & Resorts‡ | | 105,700 | | | 122 |
Student Loan (A) | | 8,800 | | | 391 |
Sun Bancorp* | | 4,095 | | | 28 |
Sun Communities‡ (A) | | 42,800 | | | 604 |
Sunstone Hotel Investors‡ (A) | | 95,854 | | | 557 |
Susquehanna Bancshares (A) | | 32,383 | | | 231 |
SVB Financial Group* | | 18,126 | | | 488 |
SWS Group | | 46,369 | | | 594 |
Tanger Factory Outlet Centers‡ | | 1,779 | | | 58 |
Taubman Centers‡ (A) | | 20,600 | | | 510 |
TCF Financial (A) | | 97,488 | | | 1,400 |
TD Ameritrade Holding* | | 18,931 | | | 323 |
Texas Capital Bancshares* | | 33,100 | | | 508 |
Titanium Asset Management* (J) | | 132,700 | | | 663 |
Tompkins Financial | | 7,000 | | | 338 |
Tower Group | | 26,263 | | | 627 |
TradeStation Group* | | 57,579 | | | 472 |
Transatlantic Holdings | | 4,094 | | | 158 |
Trico Bancshares (A) | | 7,900 | | | 112 |
Trustco Bank (A) | | 156,067 | | | 880 |
Trustmark (A) | | 22,388 | | | 439 |
UCBH Holdings (A) | | 97,800 | | | 152 |
UMB Financial | | 2,478 | | | 99 |
Umpqua Holdings | | 9,042 | | | 77 |
| | |
| SEI Institutional Investments Trust / Annual Report / May 31, 2009 | | 73 |
SCHEDULE OF INVESTMENTS
Small Cap Fund (Continued)
May 31, 2009
| | | | | |
| Description | | Shares | | Market Value
($ Thousands) |
| | | | | |
United Bankshares (A) | | 21,577 | | $ | 455 |
United Community Banks | | 32,257 | | | 250 |
United Financial Bancorp | | 44,031 | | | 550 |
Uranium Participation* | | 107,800 | | | 769 |
Validus Holdings (A) | | 54,918 | | | 1,253 |
Value Creation*(H) (I) (J) | | 119,600 | | | 549 |
Ventas‡ | | 54,350 | | | 1,650 |
ViewPoint Financial Group | | 27,500 | | | 402 |
Vornado Realty Trust‡ (A) | | 50,485 | | | 2,356 |
Washington Federal (A) | | 20,981 | | | 275 |
Washington Real Estate Investment Trust‡ | | 20,324 | | | 444 |
Webster Financial (A) | | 43,406 | | | 324 |
WesBanco | | 16,400 | | | 269 |
Westamerica Bancorporation (A) | | 35,419 | | | 1,837 |
Western Alliance Bancorp* | | 163,351 | | | 1,130 |
Westfield Financial | | 48,900 | | | 450 |
Whitney Holding (A) | | 38,614 | | | 479 |
Willis Group Holdings | | 13,162 | | | 350 |
Wilshire Bancorp | | 14,400 | | | 69 |
Wintrust Financial | | 7,430 | | | 134 |
World Acceptance* (A) | | 56,423 | | | 1,130 |
WR Berkley (A) | | 24,500 | | | 531 |
WSFS Financial | | 23,379 | | | 620 |
Zenith National Insurance | | 52,109 | | | 1,118 |
Zions Bancorporation (A) | | 30,839 | | | 422 |
| | | | | |
| | | | | 172,995 |
| | | | | |
| | |
Health Care — 12.2% | | | | | |
Abaxis* (A) | | 73,848 | | | 1,292 |
Accelrys* | | 103,000 | | | 483 |
Achillion Pharmaceuticals* | | 116,122 | | | 143 |
Acorda Therapeutics* | | 49,549 | | | 1,223 |
Affymax* (A) | | 5,500 | | | 94 |
Albany Molecular Research* | | 31,519 | | | 276 |
Alexion Pharmaceuticals* (A) | | 65,164 | | | 2,378 |
Alkermes* | | 55,055 | | | 448 |
Alliance HealthCare Services* | | 93,401 | | | 645 |
Allscripts-Misys Healthcare Solutions (A) | | 92,390 | | | 1,193 |
Alnylam Pharmaceuticals* (A) | | 20,755 | | | 423 |
AMAG Pharmaceuticals* (A) | | 26,065 | | | 1,371 |
Amedisys* | | 17,976 | | | 547 |
American Medical Systems Holdings* | | 45,620 | | | 692 |
AMERIGROUP* (A) | | 26,531 | | | 766 |
AMN Healthcare Services* | | 106,435 | | | 766 |
Amsurg, Cl A* (A) | | 107,864 | | | 2,015 |
Analogic | | 5,356 | | | 195 |
Angiodynamics* | | 23,160 | | | 284 |
Arena Pharmaceuticals* (A) | | 215,200 | | | 794 |
Arqule* | | 13,537 | | | 67 |
Array Biopharma* | | 71,713 | | | 223 |
Assisted Living Concepts, Cl A* | | 5,328 | | | 82 |
athenahealth* (A) | | 71,480 | | | 2,157 |
Beckman Coulter | | 7,400 | | | 401 |
BioCryst Pharmaceuticals* (A) | | 152,100 | | | 611 |
| | | | | |
| Description | | Shares | | Market Value
($ Thousands) |
| | | | | |
Biogen Idec* | | 7,500 | | $ | 388 |
BioMarin Pharmaceutical* | | 177,017 | | | 2,475 |
Bio-Rad Laboratories, Cl A* | | 7,942 | | | 591 |
Bio-Reference Labs* | | 1,334 | | | 36 |
Bruker* | | 85,700 | | | 560 |
Cambrex* (A) | | 200,400 | | | 721 |
Cantel Medical* | | 10,200 | | | 139 |
Capital Senior Living* | | 1,658 | | | 7 |
Cardiome Pharma* | | 345,806 | | | 1,435 |
CardioNet* (A) | | 26,512 | | | 470 |
Catalyst Health Solutions* | | 56,148 | | | 1,201 |
Celera* | | 13,735 | | | 104 |
Celldex Therapeutics* | | 7,300 | | | 66 |
Centene* | | 53,979 | | | 981 |
Cephalon* | | 2,600 | | | 152 |
Cepheid* (A) | | 48,079 | | | 486 |
Charles River Laboratories International* (A) | | 52,500 | | | 1,650 |
Chemed (A) | | 38,348 | | | 1,468 |
Conceptus* (A) | | 26,584 | | | 421 |
Conmed* | | 125,362 | | | 1,974 |
Cooper (A) | | 91,617 | | | 2,429 |
Covance* | | 18,300 | | | 769 |
Coventry Health Care* | | 5,434 | | | 98 |
Cross Country Healthcare* | | 90,508 | | | 702 |
Cubist Pharmaceuticals* | | 89,072 | | | 1,520 |
Cyberonics* (A) | | 63,035 | | | 913 |
Cypress Bioscience* (A) | | 56,703 | | | 431 |
Dendreon* | | 6,700 | | | 152 |
Dionex* | | 486 | | | 27 |
Discovery Laboratories* (A) | | 57,900 | | | 63 |
Durect* | | 456,669 | | | 1,069 |
Edwards Lifesciences* | | 11,625 | | | 742 |
Emergent Biosolutions* | | 7,746 | | | 85 |
Endo Pharmaceuticals Holdings* | | 5,120 | | | 82 |
Enzo Biochem* | | 24,356 | | | 103 |
eResearch Technology* | | 53,565 | | | 321 |
Exelixis* (A) | | 68,727 | | | 381 |
Genoptix* | | 6,335 | | | 184 |
Gen-Probe* | | 11,700 | | | 499 |
Gentiva Health Services* | | 35,274 | | | 562 |
Greatbatch* | | 22,800 | | | 471 |
GTx* (A) | | 12,100 | | | 104 |
Haemonetics* | | 3,300 | | | 176 |
Hanger Orthopedic Group* | | 46,950 | | | 690 |
Health Net* | | 64,300 | | | 963 |
Healthsouth* (A) | | 72,395 | | | 857 |
Healthspring* | | 47,769 | | | 464 |
HealthTronics* | | 45,300 | | | 73 |
HMS Holdings* | | 21,915 | | | 770 |
ICU Medical* | | 13,000 | | | 470 |
Idera Pharmaceuticals* (A) | | 5,400 | | | 29 |
Idexx Laboratories* | | 20,100 | | | 841 |
I-Flow* | | 95,929 | | | 528 |
| | |
| 74 | | SEI Institutional Investments Trust / Annual Report / May 31, 2009 |
| | | | | |
| Description | | Shares | | Market Value
($ Thousands) |
| | | | | |
Immucor* | | 38,800 | | $ | 584 |
Immunomedics* | | 10,350 | | | 26 |
Incyte* (A) | | 226,300 | | | 745 |
Integra LifeSciences Holdings* (A) | | 10,301 | | | 267 |
InterMune* (A) | | 12,000 | | | 142 |
Invacare | | 31,729 | | | 539 |
Inverness Medical Innovations* | | 6,200 | | | 202 |
IPC The Hospitalist* | | 46,546 | | | 1,159 |
IRIS International* | | 3,010 | | | 36 |
Isis Pharmaceuticals* (A) | | 103,731 | | | 1,431 |
Kendle International* | | 22,484 | | | 234 |
Kensey Nash* | | 19,824 | | | 496 |
Kindred Healthcare* | | 83,790 | | | 1,100 |
Kinetic Concepts* (A) | | 14,300 | | | 371 |
King Pharmaceuticals* | | 132,483 | | | 1,253 |
LCA-Vision | | 42,200 | | | 262 |
LHC Group* | | 110,032 | | | 2,538 |
Life Sciences Research* | | 56,559 | | | 379 |
LifePoint Hospitals* (A) | | 44,666 | | | 1,217 |
Ligand Pharmaceuticals, Cl B* | | 39,120 | | | 117 |
Lincare Holdings* | | 9,700 | | | 211 |
Luminex* | | 21,133 | | | 335 |
Magellan Health Services* | | 32,677 | | | 976 |
Martek Biosciences (A) | | 63,223 | | | 1,340 |
Masimo* (A) | | 30,035 | | | 719 |
Matrixx Initiatives* | | 2,594 | | | 48 |
Maxygen* | | 45,783 | | | 325 |
Medarex* | | 54,523 | | | 395 |
Medcath* | | 5,778 | | | 62 |
Medical Staffing Network Holdings* | | 69,300 | | | 14 |
Medicines* | | 82,800 | | | 634 |
Medicis Pharmaceutical, Cl A | | 96,800 | | | 1,522 |
Medivation* (A) | | 13,730 | | | 311 |
Mednax* (A) | | 73,908 | | | 2,993 |
Meridian Bioscience | | 27,400 | | | 524 |
Merit Medical Systems* (A) | | 63,577 | | | 870 |
Molina Healthcare* | | 8,917 | | | 214 |
Momenta Pharmaceuticals* (A) | | 55,429 | | | 486 |
MWI Veterinary Supply* | | 32,333 | | | 945 |
Myriad Genetics* (A) | | 78,035 | | | 2,822 |
National Dentex* | | 9,100 | | | 72 |
Natus Medical* | | 23,700 | | | 242 |
Neogen* | | 21,398 | | | 472 |
Nighthawk Radiology Holdings* | | 38,481 | | | 152 |
NovaMed* | | 68,524 | | | 263 |
Noven Pharmaceuticals* | | 49,300 | | | 547 |
NPS Pharmaceuticals* | | 30,179 | | | 100 |
NuVasive* (A) | | 71,835 | | | 2,595 |
Odyssey HealthCare* (A) | | 75,400 | | | 740 |
Omnicell* | | 96,979 | | | 891 |
Onyx Pharmaceuticals* (A) | | 33,395 | | | 790 |
Optimer Pharmaceuticals* (A) | | 28,337 | | | 352 |
OSI Pharmaceuticals* | | 28,328 | | | 957 |
Osiris Therapeutics* | | 3,237 | | | 41 |
| | | | | |
| Description | | Shares | | Market Value
($ Thousands) |
| | | | | |
Owens & Minor | | 490 | | $ | 17 |
Palomar Medical Technologies* | | 14,503 | | | 147 |
Par Pharmaceutical* | | 86,466 | | | 1,154 |
Parexel International* | | 89,700 | | | 924 |
Patterson* (A) | | 15,459 | | | 318 |
PDL BioPharma | | 119,128 | | | 828 |
PerkinElmer | | 30,600 | | | 498 |
Pharmaceutical Product Development | | 2,688 | | | 54 |
PharMerica* (A) | | 68,445 | | | 1,201 |
Phase Forward* | | 147,302 | | | 2,062 |
Pozen* (A) | | 231,583 | | | 1,772 |
Progenics Pharmaceuticals* | | 10,100 | | | 52 |
Providence Service* | | 14,700 | | | 160 |
PSS World Medical* | | 23,956 | | | 385 |
Psychiatric Solutions* (A) | | 28,425 | | | 525 |
Quality Systems (A) | | 23,891 | | | 1,193 |
Questcor Pharmaceuticals* | | 16,781 | | | 72 |
Quidel* (A) | | 114,538 | | | 1,458 |
Regeneron Pharmaceuticals* | | 28,299 | | | 433 |
RehabCare Group* | | 15,754 | | | 344 |
Res-Care* | | 83,525 | | | 1,182 |
Rigel Pharmaceuticals* (A) | | 115,000 | | | 959 |
Seattle Genetics* | | 35,493 | | | 326 |
Sepracor* | | 24,423 | | | 382 |
Sirona Dental Systems* (A) | | 33,688 | | | 663 |
Somanetics* | | 18,836 | | | 317 |
SonoSite* | | 2,957 | | | 55 |
STERIS (A) | | 72,479 | | | 1,713 |
Sucampo Pharmaceuticals, Cl A* | | 3,800 | | | 21 |
Sun Healthcare Group* | | 49,894 | | | 463 |
Symmetry Medical* | | 39,408 | | | 303 |
Techne | | 18,430 | | | 1,111 |
Teleflex | | 30,179 | | | 1,354 |
Theravance* (A) | | 43,265 | | | 640 |
Thoratec* (A) | | 36,893 | | | 925 |
United Therapeutics* (A) | | 28,189 | | | 2,259 |
Universal American Financial* | | 11,900 | | | 107 |
Universal Health Services, Cl B (A) | | 19,089 | | | 1,049 |
US Physical Therapy* | | 5,213 | | | 70 |
Valeant Pharmaceuticals International* (A) | | 22,714 | | | 522 |
Varian* | | 51,462 | | | 1,792 |
Viropharma* (A) | | 44,702 | | | 311 |
Wright Medical Group* | | 19,588 | | | 305 |
XenoPort* | | 9,500 | | | 164 |
Zoll Medical* | | 8,600 | | | 144 |
| | | | | |
| | | | | 120,254 |
| | | | | |
| | |
Industrials — 15.9% | | | | | |
AAON | | 23,969 | | | 498 |
ABM Industries | | 400 | | | 6 |
Actuant, Cl A (A) | | 67,748 | | | 832 |
Acuity Brands (A) | | 40,052 | | | 1,089 |
Administaff | | 6,345 | | | 136 |
Aegean Marine Petroleum Network | | 202,150 | | | 3,224 |
| | |
| SEI Institutional Investments Trust / Annual Report / May 31, 2009 | | 75 |
SCHEDULE OF INVESTMENTS
Small Cap Fund (Continued)
May 31, 2009
| | | | | |
| Description | | Shares | | Market Value
($ Thousands) |
| | | | | |
AerCap Holdings* | | 315,282 | | $ | 2,018 |
Aerovironment* | | 34,453 | | | 962 |
Aircastle | | 53,100 | | | 355 |
Airtran Holdings* | | 236,200 | | | 1,197 |
Albany International, Cl A | | 8,800 | | | 117 |
Allegiant Travel, Cl A* (A) | | 17,590 | | | 710 |
Allen-Vanguard* | | 753,500 | | | 89 |
Altra Holdings* | | 34,200 | | | 226 |
American Ecology | | 7,081 | | | 135 |
American Reprographics* | | 22,540 | | | 196 |
American Science & Engineering | | 1,500 | | | 94 |
Ameron International | | 13,500 | | | 749 |
Ampco-Pittsburgh | | 27,900 | | | 724 |
AO Smith (A) | | 34,436 | | | 1,033 |
Apogee Enterprises | | 61,502 | | | 758 |
Applied Industrial Technologies (A) | | 54,800 | | | 1,138 |
Applied Signal Technology | | 13,300 | | | 278 |
Arkansas Best (A) | | 42,500 | | | 1,195 |
Armstrong World Industries* | | 8,310 | | | 149 |
Astec Industries* (A) | | 19,900 | | | 609 |
ATC Technology* | | 59,451 | | | 867 |
Axsys Technologies* | | 10,035 | | | 492 |
AZZ* | | 4,000 | | | 139 |
Badger Meter | | 14,365 | | | 584 |
Baldor Electric (A) | | 13,120 | | | 304 |
Barnes Group (A) | | 109,585 | | | 1,672 |
BE Aerospace* | | 147,156 | | | 2,190 |
Beacon Roofing Supply* (A) | | 62,090 | | | 900 |
Belden | | 42,461 | | | 778 |
Blount International* | | 3,148 | | | 26 |
Bowne | | 37,359 | | | 201 |
Brady, Cl A | | 27,584 | | | 684 |
Briggs & Stratton | | 47,115 | | | 716 |
Brink’s | | 46,500 | | | 1,236 |
C.H. Robinson Worldwide | | 4,100 | | | 208 |
Carlisle | | 37,389 | | | 855 |
CBIZ* (A) | | 27,447 | | | 198 |
Celadon Group* | | 184,289 | | | 1,399 |
Ceradyne* | | 49,528 | | | 1,119 |
Chart Industries* | | 14,045 | | | 298 |
Chicago Bridge & Iron | | 34,786 | | | 449 |
CIRCOR International | | 41,981 | | | 1,024 |
Clean Harbors* | | 2,800 | | | 153 |
Colfax* | | 12,600 | | | 103 |
Columbus McKinnon* | | 38,466 | | | 534 |
Comfort Systems USA (A) | | 91,500 | | | 854 |
Consolidated Graphics* | | 15,570 | | | 253 |
Continental Airlines, Cl B* (A) | | 25,064 | | | 234 |
Con-way | | 13,985 | | | 449 |
Copa Holdings, Cl A | | 29,322 | | | 1,021 |
Copart* | | 23,923 | | | 734 |
Corrections of America* | | 108,083 | | | 1,659 |
CoStar Group* (A) | | 83,206 | | | 2,966 |
Courier | | 15,245 | | | 239 |
| | | | | |
| Description | | Shares | | Market Value
($ Thousands) |
| | | | | |
CRA International* | | 44,139 | | $ | 1,163 |
Crane | | 123,165 | | | 2,904 |
Cubic | | 41,800 | | | 1,595 |
Danaos (A) | | 26,000 | | | 107 |
Deluxe | | 87,754 | | | 1,241 |
Diamond Management & Technology Consultants, Cl A | | 71,600 | | | 268 |
Diana Shipping | | 10,400 | | | 187 |
Dollar Thrifty Automotive Group* | | 8,045 | | | 69 |
Duff & Phelps, Cl A | | 37,134 | | | 552 |
Dycom Industries* | | 126,354 | | | 1,477 |
DynCorp International, Cl A* | | 36,399 | | | 527 |
EMCOR Group* | | 127,876 | | | 2,873 |
Encore Wire | | 3,300 | | | 70 |
EnergySolutions | | 7,800 | | | 63 |
EnerSys* | | 26,190 | | | 424 |
Ennis | | 20,621 | | | 223 |
EnPro Industries* (A) | | 53,316 | | | 939 |
ESCO Technologies* (A) | | 16,000 | | | 650 |
Fastenal | | 10,800 | | | 359 |
Federal Signal | | 43,500 | | | 373 |
Force Protection* | | 88,200 | | | 761 |
Forward Air | | 43,430 | | | 926 |
FreightCar America | | 36,575 | | | 612 |
FTI Consulting* | | 45,747 | | | 2,297 |
G&K Services, Cl A | | 23,096 | | | 495 |
Gardner Denver* | | 22,350 | | | 633 |
GATX | | 9,400 | | | 237 |
Genco Shipping & Trading (A) | | 11,200 | | | 293 |
GenCorp* | | 20,400 | | | 41 |
General Cable* | | 17,600 | | | 673 |
Genesee & Wyoming, Cl A* (A) | | 49,207 | | | 1,423 |
Geo Group* | | 103,387 | | | 1,689 |
GeoEye* (A) | | 21,100 | | | 453 |
Gibraltar Industries | | 34,983 | | | 270 |
GrafTech International* | | 28,700 | | | 292 |
Graham | | 37,781 | | | 529 |
Granite Construction (A) | | 11,042 | | | 404 |
GT Solar International* (A) | | 46,000 | | | 295 |
H&E Equipment Services* | | 94,500 | | | 624 |
Harsco | | 16,900 | | | 491 |
Hawaiian Holdings* | | 22,196 | | | 117 |
Healthcare Services Group | | 45,020 | | | 787 |
Heico, Cl A | | 11,858 | | | 353 |
HEICO CORP (A) | | 14,105 | | | 492 |
Heidrick & Struggles International | | 4,300 | | | 79 |
Herman Miller | | 20,194 | | | 287 |
Hexcel* | | 29,602 | | | 316 |
Horizon Lines, Cl A | | 147,524 | | | 785 |
Houston Wire & Cable | | 7,800 | | | 93 |
HUB Group, Cl A* | | 10,400 | | | 206 |
Hubbell, Cl B | | 23,400 | | | 777 |
Hudson Highland Group* | | 84,600 | | | 166 |
Huron Consulting Group* | | 50,050 | | | 2,294 |
| | |
| 76 | | SEI Institutional Investments Trust / Annual Report / May 31, 2009 |
| | | | | |
| Description | | Shares | | Market Value
($ Thousands) |
| | | | | |
ICF International* | | 67,245 | | $ | 1,789 |
ICT Group* | | 4,100 | | | 36 |
IDEX | | 62,585 | | | 1,461 |
IHS, Cl A* | | 24,450 | | | 1,174 |
II-VI* | | 21,270 | | | 511 |
Innerworkings* | | 180,176 | | | 840 |
Interface, Cl A | | 36,989 | | | 235 |
JB Hunt Transport Services | | 4,600 | | | 141 |
Joy Global | | 33,522 | | | 1,156 |
Kadant* | | 19,819 | | | 277 |
Kaman | | 9,967 | | | 158 |
Kansas City Southern* | | 98,351 | | | 1,622 |
Kaydon | | 42,970 | | | 1,478 |
KBR | | 42,000 | | | 774 |
Kelly Services, Cl A (A) | | 12,776 | | | 136 |
Kennametal | | 10,248 | | | 194 |
Kforce* | | 66,000 | | | 614 |
Kirby* | | 80,625 | | | 2,711 |
Knight Transportation | | 79,178 | | | 1,405 |
Knoll | | 74,886 | | | 519 |
Korn/Ferry International* | | 52,000 | | | 577 |
LaBarge* | | 12,400 | | | 94 |
Ladish* | | 53,426 | | | 630 |
Landstar System | | 18,415 | | | 700 |
Lawson Products | | 87 | | | 1 |
LB Foster, Cl A* | | 16,417 | | | 479 |
LECG* | | 98,700 | | | 288 |
Lindsay Manufacturing | | 2,800 | | | 89 |
LS Starrett, Cl A | | 1,700 | | | 15 |
Lydall* | | 18,860 | | | 70 |
M&F Worldwide* | | 28,652 | | | 480 |
Manitowoc (A) | | 39,133 | | | 255 |
Manpower | | 20,395 | | | 867 |
Marten Transport* | | 20,576 | | | 439 |
MasTec* | | 116,445 | | | 1,508 |
McDermott International* | | 29,600 | | | 650 |
Mcgrath Rentcorp | | 8,479 | | | 154 |
Met-Pro | | 13,900 | | | 120 |
Michael Baker* | | 14,900 | | | 626 |
Mine Safety Appliances | | 13,828 | | | 324 |
Monster Worldwide* (A) | | 61,100 | | | 714 |
MPS Group* | | 96,000 | | | 729 |
MSC Industrial Direct, Cl A (A) | | 34,200 | | | 1,244 |
Mueller Industries | | 43,012 | | | 945 |
Mueller Water Products, Cl A | | 92,062 | | | 332 |
MYR Group* | | 21,810 | | | 417 |
NACCO Industries, Cl A | | 10,900 | | | 382 |
Navistar International* | | 24,800 | | | 987 |
Nordson (A) | | 7,100 | | | 273 |
Northwest Pipe* | | 11,750 | | | 458 |
Old Dominion Freight Line* | | 103,565 | | | 3,050 |
On Assignment* | | 17,208 | | | 61 |
Orbital Sciences* | | 27,500 | | | 405 |
Oshkosh Truck | | 14,444 | | | 171 |
| | | | | |
| Description | | Shares | | Market Value
($ Thousands) |
| | | | | |
Pacer International (A) | | 127,076 | | $ | 330 |
Pall | | 35,000 | | | 899 |
Paragon Shipping, Cl A | | 20,700 | | | 109 |
Pike Electric* | | 9,126 | | | 100 |
Powell Industries* | | 9,700 | | | 381 |
PRG-Schultz International* | | 23,488 | | | 67 |
Quanex Building Products | | 72,375 | | | 799 |
Quanta Services* | | 75,888 | | | 1,731 |
Rand Logistics* | | 22,200 | | | 59 |
Raven Industries | | 17,420 | | | 478 |
Regal-Beloit (A) | | 39,820 | | | 1,573 |
Republic Airways Holdings* (A) | | 103,276 | | | 605 |
Resources Connection* | | 56,837 | | | 1,053 |
Ritchie Bros Auctioneers | | 32,315 | | | 740 |
Robbins & Myers | | 14,592 | | | 279 |
RSC Holdings* (A) | | 180,400 | | | 1,086 |
Rush Enterprises, Cl A* | | 61,133 | | | 713 |
Ryder System | | 64,600 | | | 1,820 |
Saia* | | 20,106 | | | 276 |
School Specialty* (A) | | 61,675 | | | 1,173 |
Shaw Group* | | 2,695 | | | 73 |
Silvercorp Metals* | | 270,500 | | | 874 |
Skywest | | 84,786 | | | 869 |
Spherion* | | 130,900 | | | 450 |
Standard Parking* | | 49,409 | | | 738 |
Standard Register | | 23,194 | | | 77 |
Steelcase, Cl A (A) | | 74,100 | | | 358 |
SYKES Enterprises* | | 8,357 | | | 136 |
TAL International Group (A) | | 78,300 | | | 778 |
Tecumseh Products, Cl A* | | 81,300 | | | 657 |
Teledyne Technologies* | | 44,289 | | | 1,456 |
Terex* (A) | | 107,281 | | | 1,440 |
Tetra Tech* | | 77,873 | | | 1,999 |
Textainer Group Holdings | | 79,000 | | | 821 |
Textron (A) | | 82,500 | | | 949 |
Thermadyne Holdings* | | 183 | | | 1 |
Timken | | 6,704 | | | 113 |
Titan Machinery* | | 125,640 | | | 1,578 |
Toro | | 3,173 | | | 98 |
TransDigm Group* (A) | | 43,775 | | | 1,717 |
Tredegar | | 35,705 | | | 501 |
Triumph Group | | 10,456 | | | 412 |
TrueBlue* | | 56,800 | | | 485 |
UAL* | | 94,100 | | | 438 |
Ultralife* | | 23,500 | | | 163 |
United Rentals* (A) | | 13,777 | | | 66 |
US Airways Group* | | 162,700 | | | 420 |
Vitran, Cl A* | | 74,969 | | | 600 |
Wabtec | | 47,638 | | | 1,700 |
Waste Connections* | | 35,022 | | | 890 |
Waste Services* | | 31,400 | | | 182 |
Watson Wyatt Worldwide, Cl A | | 24,928 | | | 946 |
Watts Water Technologies, Cl A | | 16,460 | | | 338 |
Werner Enterprises (A) | | 56,443 | | | 1,015 |
| | |
| SEI Institutional Investments Trust / Annual Report / May 31, 2009 | | 77 |
SCHEDULE OF INVESTMENTS
Small Cap Fund (Continued)
May 31, 2009
| | | | | |
| Description | | Shares | | Market Value
($ Thousands) |
| | | | | |
WESCO International* | | 80,519 | | $ | 2,152 |
Woodward Governor | | 35,600 | | | 731 |
Xerium Technologies* | | 2,922 | | | 2 |
YRC Worldwide* (A) | | 31,300 | | | 81 |
| | | | | |
| | | | | 156,649 |
| | | | | |
| | |
Information Technology — 20.0% | | | | | |
3Com* | | 220,586 | | | 953 |
Actel* | | 48,400 | | | 546 |
Actuate* | | 54,700 | | | 265 |
Acxiom | | 77,328 | | | 827 |
Adaptec* | | 58,242 | | | 158 |
ADC Telecommunications* | | 125,870 | | | 886 |
Adtran | | 10,650 | | | 221 |
Advanced Energy Industries* | | 99,689 | | | 942 |
Advent Software* (A) | | 32,408 | | | 995 |
Akamai Technologies* | | 87,573 | | | 1,949 |
Alliance Semiconductor | | 77,500 | | | 30 |
Amkor Technology* | | 61,500 | | | 279 |
Anixter International* | | 23,717 | | | 973 |
Ansys* | | 11,396 | | | 340 |
Applied Micro Circuits* (A) | | 176,250 | | | 1,378 |
Ariba* | | 203,609 | | | 1,928 |
ARM Holdings ADR (A) | | 185,500 | | | 976 |
Arris Group* | | 417,689 | | | 5,062 |
Arrow Electronics* | | 46,336 | | | 1,121 |
Art Technology Group* | | 538,084 | | | 1,937 |
Atmel* | | 366,829 | | | 1,412 |
ATMI* | | 86,329 | | | 1,401 |
Avnet* | | 7,790 | | | 179 |
Avocent* (A) | | 71,799 | | | 1,005 |
Axesstel* | | 57,762 | | | 13 |
Bankrate* (A) | | 38,498 | | | 1,159 |
Benchmark Electronics* | | 139,553 | | | 1,703 |
BigBand Networks* | | 31,200 | | | 163 |
Black Box | | 32,779 | | | 1,079 |
Blackboard* (A) | | 28,640 | | | 825 |
Blue Coat Systems* | | 8,200 | | | 116 |
BluePhoenix Solutions* | | 164,821 | | | 366 |
Brightpoint* | | 66,891 | | | 396 |
Broadridge Financial Solutions | | 60,536 | | | 1,003 |
Brocade Communications Systems* | | 431,700 | | | 3,169 |
Brooks Automation* | | 11,850 | | | 46 |
CACI International, Cl A* (A) | | 28,155 | | | 1,080 |
Cadence Design Systems* | | 36,200 | | | 205 |
Checkpoint Systems* | | 12,086 | | | 170 |
Ciber* | | 243,984 | | | 783 |
Ciena* | | 20,700 | | | 228 |
Cirrus Logic* | | 49,766 | | | 194 |
Cognex | | 58,510 | | | 766 |
Cogo Group* | | 30,200 | | | 197 |
Coherent* | | 33,266 | | | 649 |
CommScope* (A) | | 82,796 | | | 2,173 |
CommVault Systems* | | 8,102 | | | 100 |
| | | | | |
| Description | | Shares | | Market Value
($ Thousands) |
| | | | | |
Compuware* | | 19,827 | | $ | 151 |
comScore* | | 7,400 | | | 83 |
Comtech Telecommunications* | | 8,900 | | | 259 |
Comverse Technology* | | 157,000 | | | 1,115 |
Concur Technologies* (A) | | 69,332 | | | 2,045 |
CPI International* | | 22,480 | | | 246 |
CSG Systems International* (A) | | 93,440 | | | 1,287 |
CTS | | 159,753 | | | 922 |
Cybersource* (A) | | 91,080 | | | 1,184 |
Cymer* | | 31,500 | | | 874 |
Cypress Semiconductor* | | 21,485 | | | 185 |
Daktronics | | 18,300 | | | 157 |
DealerTrack Holdings* | | 160,954 | | | 2,310 |
Dice Holdings* | | 6,183 | | | 29 |
Diebold | | 32,981 | | | 815 |
Digi International* | | 72,500 | | | 628 |
Digital River* | | 3,587 | | | 137 |
Diodes* | | 35,960 | | | 553 |
Dolby Laboratories, Cl A* | | 10,000 | | | 361 |
DSP Group* | | 129,681 | | | 940 |
DTS* | | 118,519 | | | 3,137 |
Earthlink* (A) | | 167,526 | | | 1,313 |
EF Johnson Technologies* | | 103,800 | | | 72 |
Electro Rent | | 8,671 | | | 84 |
Electronic Arts* | | 14,367 | | | 330 |
Electronics for Imaging* | | 26,955 | | | 274 |
Emulex* | | 154,015 | | | 1,693 |
Entegris* | | 98,755 | | | 284 |
Entrust* | | 98,500 | | | 208 |
EPIQ Systems* (A) | | 48,258 | | | 735 |
Equinix* (A) | | 28,779 | | | 2,141 |
Euronet Worldwide* | | 80,660 | | | 1,287 |
ExlService Holdings* | | 700 | | | 7 |
F5 Networks* (A) | | 28,848 | | | 916 |
Factset Research Systems (A) | | 19,260 | | | 1,019 |
Fair Isaac | | 100,572 | | | 1,768 |
Fairchild Semiconductor International, Cl A* | | 107,327 | | | 758 |
FLIR Systems* | | 26,150 | | | 587 |
Formfactor* | | 57,709 | | | 1,047 |
Gartner* | | 10,816 | | | 166 |
GSI Commerce* (A) | | 104,006 | | | 1,338 |
Harris Stratex Networks, Cl A* | | 40,543 | | | 193 |
Heartland Payment Systems | | 110,352 | | | 844 |
Hewitt Associates, Cl A* | | 12,900 | | | 374 |
Hittite Microwave* | | 17,800 | | | 639 |
Hutchinson Technology* | | 17,689 | | | 37 |
i2 Technologies* | | 29,000 | | | 356 |
Ikanos Communications* | | 129,100 | | | 192 |
Imation (A) | | 174,639 | | | 1,687 |
Information Services Group* | | 164,808 | | | 453 |
Ingram Micro, Cl A* | | 10,443 | | | 172 |
Insight Enterprises* | | 33,899 | | | 256 |
Integral Systems* | | 21,649 | | | 165 |
| | |
| 78 | | SEI Institutional Investments Trust / Annual Report / May 31, 2009 |
| | | | | |
| Description | | Shares | | Market Value
($ Thousands) |
| | | | | |
Integrated Device Technology* | | 104,728 | | $ | 590 |
InterDigital* (A) | | 17,900 | | | 459 |
Intermec* | | 32,551 | | | 374 |
Intersil, Cl A | | 19,000 | | | 233 |
IXYS | | 40,100 | | | 380 |
j2 Global Communications* | | 23,728 | | | 529 |
Jabil Circuit | | 55,191 | | | 432 |
Jack Henry & Associates | | 31,158 | | | 572 |
JDA Software Group* | | 103,657 | | | 1,545 |
JDS Uniphase* | | 36,718 | | | 198 |
Kenexa* | | 23,900 | | | 231 |
Keynote Systems* (A) | | 59,300 | | | 431 |
Knot* (A) | | 144,036 | | | 1,178 |
Lam Research* | | 21,200 | | | 555 |
Lattice Semiconductor* | | 8,375 | | | 17 |
Lawson Software* (A) | | 383,037 | | | 2,015 |
LeCroy* (A) | | 71,700 | | | 292 |
Lexmark International, Cl A* | | 10,200 | | | 167 |
Linear Technology | | 19,700 | | | 461 |
Lionbridge Technologies* | | 59,300 | | | 98 |
Littelfuse* (A) | | 32,838 | | | 576 |
LTX-Credence* (A) | | 146,100 | | | 82 |
Majesco Entertainment* | | 12,985 | | | 18 |
Manhattan Associates* | | 51,800 | | | 911 |
Mantech International, Cl A* | | 83,232 | | | 3,192 |
Marvell Technology Group* | | 22,300 | | | 255 |
MAXIMUS (A) | | 41,500 | | | 1,656 |
Maxwell Technologies* | | 14,900 | | | 169 |
Measurement Specialties* | | 5,100 | | | 28 |
MEMC Electronic Materials* | | 40,400 | | | 779 |
Mentor Graphics* (A) | | 102,932 | | | 578 |
Mercury Computer Systems* | | 60,200 | | | 454 |
Merrimac Industries* | | 12,200 | | | 134 |
Methode Electronics | | 94,792 | | | 554 |
Micrel | | 79,500 | | | 584 |
Microsemi* (A) | | 87,101 | | | 1,172 |
MicroStrategy, Cl A* | | 21,381 | | | 1,001 |
Microtune* | | 6,200 | | | 14 |
MIPS Technologies, Cl A* | | 29,668 | | | 115 |
MKS Instruments* | | 70,256 | | | 949 |
ModusLink Global Solutions* | | 13,517 | | | 57 |
Monolithic Power Systems* | | 61,118 | | | 1,266 |
Monotype Imaging Holdings* | | 119,597 | | | 676 |
Move* | | 101,003 | | | 212 |
MTS Systems | | 24,799 | | | 550 |
Multi-Fineline Electronix* | | 43,000 | | | 823 |
NCR* | | 104,814 | | | 1,126 |
Ness Technologies* | | 108,700 | | | 372 |
Net 1 UEPS Technologies* | | 80,274 | | | 980 |
Netgear* | | 55,800 | | | 783 |
Netlogic Microsystems* (A) | | 13,318 | | | 436 |
Netscout Systems* | | 58,561 | | | 549 |
Novatel Wireless* (A) | | 72,000 | | | 841 |
Novell* | | 230,000 | | | 957 |
| | | | | |
| Description | | Shares | | Market Value
($ Thousands) |
| | | | | |
Nuance Communications* (A) | | 69,382 | | $ | 860 |
Omniture* (A) | | 156,779 | | | 1,853 |
Omnivision Technologies* | | 36,500 | | | 416 |
ON Semiconductor* | | 24,900 | | | 171 |
Open Text* (A) | | 23,557 | | | 830 |
Orbotech* | | 101,400 | | | 736 |
Orckit Communications* | | 61,800 | | | 199 |
OSI Systems* | | 56,300 | | | 1,036 |
Parametric Technology* | | 123,128 | | | 1,426 |
Park Electrochemical | | 36,462 | | | 703 |
Parkervision* (A) | | 126,000 | | | 411 |
Pegasystems | | 26,266 | | | 697 |
Perfect World ADR* | | 45,520 | | | 965 |
Perficient* | | 2,514 | | | 16 |
Perot Systems, Cl A* | | 36,552 | | | 499 |
Plantronics | | 29,600 | | | 528 |
PLATO Learning* | | 59,300 | | | 184 |
Plexus* (A) | | 18,339 | | | 335 |
PLX Technology* (A) | | 129,436 | | | 417 |
PMC - Sierra* (A) | | 92,927 | | | 705 |
Polycom* | | 35,100 | | | 608 |
Power Integrations (A) | | 46,701 | | | 1,030 |
Progress Software* | | 49,004 | | | 1,099 |
PROS Holdings* | | 2,656 | | | 21 |
QLogic* (A) | | 84,875 | | | 1,159 |
Quantum* (A) | | 646,689 | | | 744 |
Quest Software* | | 41,523 | | | 536 |
Radisys* (A) | | 40,200 | | | 348 |
RADWARE* | | 100,000 | | | 761 |
Richardson Electronics | | 25,765 | | | 101 |
RightNow Technologies* | | 17,341 | | | 152 |
Riverbed Technology* (A) | | 9,900 | | | 199 |
Rogers* | | 8,036 | | | 137 |
Rosetta Stone* | | 54,281 | | | 1,309 |
Rudolph Technologies* (A) | | 68,200 | | | 302 |
S1* | | 67,689 | | | 459 |
Sapient* | | 294,119 | | | 1,562 |
SAVVIS* | | 86,887 | | | 1,023 |
Scansource* | | 20,001 | | | 495 |
Seachange International* | | 171,900 | | | 1,272 |
Semtech* | | 25,756 | | | 414 |
Sierra Wireless* | | 50,600 | | | 329 |
Sigma Designs* (A) | | 18,700 | | | 289 |
Silicon Graphics International* | | 50,600 | | | 256 |
SkillSoft ADR* | | 126,595 | | | 1,034 |
Skyworks Solutions* (A) | | 217,854 | | | 2,076 |
Sohu.com* (A) | | 14,049 | | | 887 |
Solera Holdings* | | 57,048 | | | 1,306 |
Sonic Solutions* | | 18,640 | | | 33 |
SonicWALL* | | 11,900 | | | 61 |
SPSS* | | 45,299 | | | 1,512 |
SRA International, Cl A* | | 96,527 | | | 1,712 |
Standard Microsystems* | | 57,271 | | | 1,056 |
Starent Networks* | | 9,271 | | | 196 |
| | |
| SEI Institutional Investments Trust / Annual Report / May 31, 2009 | | 79 |
SCHEDULE OF INVESTMENTS
Small Cap Fund (Continued)
May 31, 2009
| | | | | |
| Description | | Shares | | Market Value
($ Thousands) |
| | | | | |
Stratasys* (A) | | 43,607 | | $ | 456 |
Switch & Data* | | 75,796 | | | 997 |
Sybase* (A) | | 103,741 | | | 3,375 |
Symmetricom* | | 13,030 | | | 67 |
Synaptics* (A) | | 52,740 | | | 1,852 |
Synchronoss Technologies* | | 73,679 | | | 894 |
SYNNEX* (A) | | 57,394 | | | 1,485 |
Synopsys* | | 15,460 | | | 301 |
Take-Two Interactive Software | | 48,900 | | | 423 |
Taleo, Cl A* | | 54,358 | | | 843 |
Tech Data* | | 18,600 | | | 596 |
Technitrol | | 53,500 | | | 188 |
Techwell* | | 50,600 | | | 326 |
Tekelec* (A) | | 161,992 | | | 2,645 |
TeleCommunication Systems, Cl A* | | 127,891 | | | 955 |
TeleTech Holdings* | | 30,300 | | | 349 |
Tellabs* | | 169,818 | | | 942 |
Teradyne* | | 316,013 | | | 2,260 |
Tessera Technologies* | | 61,747 | | | 1,453 |
THQ* | | 37,411 | | | 241 |
TIBCO Software* | | 374,659 | | | 2,484 |
TNS* | | 34,900 | | | 658 |
Trimble Navigation* | | 69,295 | | | 1,329 |
TriQuint Semiconductor* | | 29,400 | | | 131 |
TTM Technologies* (A) | | 79,000 | | | 703 |
Tyler Technologies* (A) | | 27,107 | | | 455 |
Ultimate Software Group* | | 31,076 | | | 631 |
Ultra Clean Holdings* | | 51,800 | | | 152 |
Ultratech* (A) | | 93,900 | | | 1,179 |
United Online | | 126,897 | | | 812 |
Utstarcom* (A) | | 127,300 | | | 263 |
Valueclick* | | 60,621 | | | 670 |
Varian Semiconductor Equipment Associates* | | 34,100 | | | 802 |
Veeco Instruments* (A) | | 60,935 | | | 642 |
Verigy* | | 74,002 | | | 888 |
Verint Systems* | | 68,400 | | | 583 |
Vishay Intertechnology* | | 17,181 | | | 95 |
VistaPrint* (A) | | 104,198 | | | 3,990 |
Vocus* | | 81,180 | | | 1,551 |
Websense* | | 2,200 | | | 40 |
Wind River Systems* | | 264,648 | | | 2,088 |
Wright Express* | | 64,550 | | | 1,605 |
Xyratex* | | 60,473 | | | 200 |
Zebra Technologies, Cl A* | | 37,400 | | | 817 |
Zoran* (A) | | 126,000 | | | 1,396 |
| | | | | |
| | | | | 197,042 |
| | | | | |
| | |
Materials — 4.0% | | | | | |
A. Schulman | | 72,547 | | | 1,083 |
AEP Industries* | | 4,996 | | | 124 |
AK Steel Holding | | 23,875 | | | 341 |
Albemarle | | 14,579 | | | 411 |
Allied Nevada Gold* | | 26,200 | | | 203 |
| | | | | |
| Description | | Shares | | Market Value
($ Thousands) |
| | | | | |
AM Castle | | 21,769 | | $ | 228 |
AMCOL International | | 25,000 | | | 535 |
Aptargroup (A) | | 38,087 | | | 1,181 |
Arch Chemicals | | 5,418 | | | 152 |
Bemis | | 12,287 | | | 308 |
Buckeye Technologies* | | 52,300 | | | 265 |
Bway Holding* | | 21,400 | | | 311 |
Cabot | | 23,317 | | | 372 |
Carpenter Technology | | 52,100 | | | 1,171 |
Celanese, Cl A | | 32,383 | | | 664 |
Century Aluminum* | | 8,500 | | | 51 |
Clearwater Paper* | | 13,900 | | | 329 |
Cliffs Natural Resources | | 14,300 | | | 390 |
Commercial Metals | | 37,815 | | | 642 |
Compass Minerals International | | 4,204 | | | 225 |
Crown Holdings* | | 94,740 | | | 2,227 |
Cytec Industries | | 55,198 | | | 1,186 |
Eagle Materials (A) | | 10,700 | | | 263 |
Ferro | | 35,900 | | | 133 |
Flotek Industries* | | 46,680 | | | 98 |
General Steel Holdings* | | 29,381 | | | 156 |
Glatfelter | | 39,877 | | | 409 |
H.B. Fuller | | 81,358 | | | 1,385 |
Headwaters* | | 47,375 | | | 188 |
Huntsman | | 76,741 | | | 485 |
Innophos Holdings | | 39,391 | | | 614 |
Innospec | | 5,584 | | | 50 |
International Flavors & Fragrances | | 15,323 | | | 489 |
Intrepid Potash* (A) | | 47,008 | | | 1,532 |
Jaguar Mining* | | 47,100 | | | 420 |
Kaiser Aluminum | | 9,700 | | | 301 |
Koppers Holdings | | 68,008 | | | 1,720 |
LSB Industries* | | 23,200 | | | 389 |
Myers Industries | | 52,696 | | | 532 |
Nalco Holding | | 45,765 | | | 795 |
Neenah Paper | | 35,764 | | | 290 |
NewMarket | | 24,575 | | | 1,783 |
Olin (A) | | 122,052 | | | 1,631 |
OM Group* (A) | | 50,814 | | | 1,347 |
Omnova Solutions* | | 17,503 | | | 44 |
Owens-Illinois* | | 13,000 | | | 372 |
Pactiv* | | 3,300 | | | 74 |
Quaker Chemical | | 28,200 | | | 389 |
Rock-Tenn, Cl A | | 15,900 | | | 610 |
Rockwood Holdings* | | 41,890 | | | 625 |
Royal Gold | | 3,300 | | | 154 |
RTI International Metals* | | 22,200 | | | 318 |
Schweitzer-Mauduit International | | 59,376 | | | 1,334 |
Sensient Technologies (A) | | 71,288 | | | 1,634 |
ShengdaTech* | | 13,096 | | | 51 |
Silgan Holdings | | 45,210 | | | 2,001 |
Solutia* | | 52,323 | | | 256 |
Spartech | | 47,400 | | | 201 |
Steel Dynamics (A) | | 42,155 | | | 630 |
| | |
| 80 | | SEI Institutional Investments Trust / Annual Report / May 31, 2009 |
| | | | | |
| Description | | Shares | | Market Value
($ Thousands) |
| | | | | |
Universal Stainless & Alloy* | | 46,200 | | $ | 642 |
Western Goldfields* (A) | | 319,300 | | | 987 |
Westlake Chemical (A) | | 36,893 | | | 754 |
Worthington Industries (A) | | 50,800 | | | 711 |
WR Grace* | | 39,371 | | | 511 |
| | | | | |
| | | | | 39,707 |
| | | | | |
| | |
Telecommunication Services — 1.3% | | | | | |
Alaska Communications Systems Group | | 36,264 | | | 246 |
Atlantic Telegraph-Network | | 12,100 | | | 276 |
Cbeyond* (A) | | 42,018 | | | 722 |
Centennial Communications* | | 35,458 | | | 298 |
Cincinnati Bell* | | 218,246 | | | 609 |
Cogent Communications Group* (A) | | 43,960 | | | 343 |
Consolidated Communications Holdings | | 17,986 | | | 185 |
Global Crossing* | | 12,500 | | | 105 |
Iowa Telecommunications Services | | 26,779 | | | 317 |
iPCS* | | 2,200 | | | 40 |
Neutral Tandem* | | 75,495 | | | 2,189 |
NTELOS Holdings | | 72,250 | | | 1,291 |
PAETEC Holding* | | 5,608 | | | 17 |
Premiere Global Services* | | 42,023 | | | 503 |
SBA Communications, Cl A* (A) | | 101,260 | | | 2,589 |
Syniverse Holdings* | | 112,610 | | | 1,684 |
tw telecom, Cl A* | | 92,985 | | | 1,103 |
US Cellular* | | 2,842 | | | 118 |
USA Mobility | | 51,282 | | | 573 |
| | | | | |
| | | | | 13,208 |
| | | | | |
| | |
Utilities — 2.7% | | | | | |
AGL Resources | | 23,975 | | | 693 |
Allegheny Energy | | 21,800 | | | 545 |
Allete (A) | | 30,228 | | | 799 |
Atmos Energy | | 14,137 | | | 339 |
Avista | | 4,196 | | | 66 |
Black Hills | | 27,198 | | | 582 |
Centerpoint Energy | | 74,300 | | | 752 |
Central Vermont Public Service | | 16,400 | | | 265 |
Chesapeake Utilities | | 3,200 | | | 105 |
Cia de Saneamento de Minas Gerais-COPASA (Brazil) | | 61,700 | | | 814 |
Cleco | | 49,098 | | | 1,005 |
CMS Energy (A) | | 44,400 | | | 504 |
El Paso Electric* | | 74,516 | | | 987 |
Empire District Electric | | 33,692 | | | 528 |
Energen | | 885 | | | 33 |
Great Plains Energy (A) | | 101,481 | | | 1,529 |
Hawaiian Electric Industries | | 15,400 | | | 266 |
IDACORP (A) | | 32,202 | | | 749 |
ITC Holdings | | 37,174 | | | 1,594 |
New Jersey Resources | | 19,375 | | | 645 |
Northwest Natural Gas | | 12,266 | | | 520 |
NorthWestern | | 112,906 | | | 2,420 |
| | | | | | |
| Description | | Shares/Face
Amount ($ Thousands) | | Market Value
($ Thousands) |
| | | | | | |
Ormat Technologies (A) | | | 17,300 | | $ | 690 |
PNM Resources | | | 52,013 | | | 481 |
Portland General Electric | | | 167,067 | | | 3,005 |
Southwest Gas | | | 18,766 | | | 390 |
Synthesis Energy Systems* | | | 65,600 | | | 36 |
UGI | | | 18,900 | | | 456 |
UIL Holdings | | | 20,500 | | | 425 |
Unisource Energy | | | 78,058 | | | 1,986 |
Vectren | | | 45,713 | | | 1,040 |
Westar Energy | | | 111,170 | | | 1,984 |
WGL Holdings (A) | | | 8,300 | | | 247 |
| | | | | | |
| | | | | | 26,480 |
| | | | | | |
Total Common Stock
(Cost $1,010,496) ($ Thousands) | | | | | | 941,764 |
| | | | | | |
| | |
CONVERTIBLE BONDS — 0.5% | | | | | | |
| | |
Consumer Discretionary — 0.1% | | | | | | |
Charming Shoppes | | | | | | |
1.125%, 05/01/14 | | $ | 1,452 | | | 775 |
Eddie Bauer Holdings | | | | | | |
5.250%, 04/01/14 | | | 1,556 | | | 295 |
| | | | | | |
| | | | | | 1,070 |
| | | | | | |
| | |
Energy — 0.1% | | | | | | |
Nova Biosource Fuels | | | | | | |
10.000%, 09/30/12 (B) (C) | | | 1,698 | | | 85 |
Rentech | | | | | | |
4.000%, 04/15/13 | | | 673 | | | 193 |
Scorpio Mining (H) (I) (J) | | | | | | |
7.000%, 05/05/11 | | | 425 | | | 321 |
| | | | | | |
| | | | | | 599 |
| | | | | | |
| | |
Financials — 0.1% | | | | | | |
Dollar Financial | | | | | | |
2.875%, 06/30/27 | | | 832 | | | 483 |
World Acceptance | | | | | | |
3.000%, 10/01/11 | | | 157 | | | 100 |
| | | | | | |
| | | | | | 583 |
| | | | | | |
| | |
Health Care — 0.1% | | | | | | |
Human Genome Sciences | | | | | | |
2.250%, 10/15/11 | | | 1,488 | | | 692 |
Incyte | | | | | | |
3.500%, 02/15/11 | | | 421 | | | 270 |
| | | | | | |
| | | | | | 962 |
| | | | | | |
| | |
Industrials — 0.1% | | | | | | |
NCI Building Systems | | | | | | |
2.125%, 11/15/24 | | | 1,014 | | | 847 |
| | | | | | |
| | |
| SEI Institutional Investments Trust / Annual Report / May 31, 2009 | | 81 |
SCHEDULE OF INVESTMENTS
Small Cap Fund (concluded)
May 31, 2009
| | | | | | |
| Description | | Face Amount
($ Thousands)/
Shares | | Market Value ($ Thousands) |
| | | | | | |
| |
Information Technology — 0.0% | | | |
Hutchinson Technology | | | | | | |
2.250%, 03/15/10 | | $ | 650 | | $ | 582 |
| | | | | | |
Total Convertible Bonds
(Cost $5,892) ($ Thousands) | | | | | | 4,643 |
| | | | | | |
| |
EXCHANGE TRADED FUND — 0.1% | | | |
iShares Russell 2000 Index Fund (A) | | | 7,514 | | | 378 |
| | | | | | |
Total Exchange Traded Fund
(Cost $511) ($ Thousands) | | | | | | 378 |
| | | | | | |
| | | Number of Warrants | | |
| | |
WARRANTS — 0.0% | | | | | | |
Oilsands Quest, Expires 05/12/11* | | | 98,350 | | | 34 |
Oilsands Quest, Expires 12/08/09* | | | 17,500 | | | — |
Rentech, Expires 04/25/12* (H) (I) (J) | | | 16,100 | | | 1 |
Titanium Asset Management,
Expires 06/21/11* (J) | | | 122,200 | | | 141 |
Washington Mutual (D) | | | 198,261 | | | 3 |
| | | | | | |
Total Warrants
(Cost $24) ($ Thousands) | | | | | | 179 |
| | | | | | |
| | | Number of Rights | | |
| | |
RIGHTS — 0.0% | | | | | | |
| | |
United States — 0.0% | | | | | | |
Allis-Chalmers Energy,
Expires 06/18/09 | | | 35 | | | 7 |
Ligand Pharma,
Expires 01/05/12 (H) (J) | | | 65 | | | — |
| | | | | | |
Total Rights
(Cost $0) ($ Thousands) | | | | | | 7 |
| | | | | | |
| |
U.S. TREASURY OBLIGATION — 0.6% | | | |
U.S. Treasury Bill | | | | | | |
0.216%, 06/11/09 (E) (F) | | | 5,500 | | | 5,500 |
| | | | | | |
Total U.S. Treasury Obligation
(Cost $5,500) ($ Thousands) | | | | | | 5,500 |
| | | | | | |
| |
CASH EQUIVALENT — 3.2% | | | |
SEI Daily Income Trust, Prime Obligation Fund, Cl A,
0.260%**† | | | 31,924,556 | | | 31,925 |
| | | | | | |
Total Cash Equivalent
(Cost $31,925) ($ Thousands) | | | | | | 31,925 |
| | | | | | |
| | | | | |
| Description | | Shares | | Market Value ($ Thousands) |
| | | | | |
| |
AFFILIATED PARTNERSHIP — 15.8% | | | |
SEI Liquidity Fund, L.P., | | | | | |
0.820%**† (G) | | 162,200,863 | | $ | 155,957 |
| | | | | |
Total Affiliated Partnership
(Cost $162,200) ($ Thousands) | | | | | 155,957 |
| | | | | |
Total Investments — 115.7%
(Cost $1,216,548) ($ Thousands) | | | | $ | 1,140,353 |
| | | | | |
A summary of the open futures contracts held by the Fund at May 31, 2009, is as follows:
| | | | | | | |
Type of
Contract | | Number of
Contracts
Long | | Expiration
Date | | Unrealized
Appreciation
($ Thousands) |
Russell 2000 Index E-MINI | | 499 | | Jun-2009 | | $ | 4,193 |
| | | | | | | |
Percentages are based on a Net Assets of $985,860 ($ Thousands)
| * | | Non-income producing security. |
| ** | | The rate reported is the 7-day effective yield as of May 31, 2009. |
| † | | Investment in Affiliated Security (see Note 4). |
| ‡ | | Real Estate Investment Trust. |
| (A) | | This security or a partial position of this security is on loan at May 31, 2009. The total value of securities on loan at May 31, 2009 was $160,061 ($ Thousands). |
| (B) | | Securities sold within terms of a private placement memorandum, exempt from registration under Section 144A of the Securities Act of 1933, as amended, and may be sold only to dealers in that program or other “accredited investors.” These securities have been determined to be liquid under guidelines established by the board of Trustees. |
| (C) | | Security in default on interest payments. Security is non-income producing. |
| (D) | | This warrant represents a potential distribution settlement in a legal claim and does not have a strike price or expiration date. |
| (E) | | Zero coupon security. The rate reported is the effective yield at time of purchase. |
| (F) | | Security, or a portion thereof, has been pledged as collateral on open futures contracts. |
| (G) | | This security was purchased with cash collateral held from securities on loan. The total value of such securities as of May 31, 2009 was $155,957 ($ Thousands). |
| (H) | | Securities considered illiquid. The total value of such securities as of May 31, 2009 was $1,103 ($ Thousands) and represents 0.11% of net assets. |
| (I) | | Securities considered restricted. The total value of such securities as of May 31, 2009 was $871 ($ Thousands) and represents 0.09% of net assets. |
| (J) | | Security fair valued using methods determined in good faith by the Valuation Committee of the Board of Trustees. The total value of such securities as of May 31, 2009 was $1,907 ($ Thousands) and represents 0.19% of net assets. |
ADR — American Depositary Receipt
Cl — Class
LLC — Limited Liability Company
L.P. — Limited Partnership
PIPE — Private Investment in Public Entity
Amounts designated as “—” are $O or have been rounded to $O
The accompanying notes are an integral part of the financial statements.
| | |
| 82 | | SEI Institutional Investments Trust / Annual Report / May 31, 2009 |
SCHEDULE OF INVESTMENTS
Small/Mid Cap Equity Fund
May 31, 2009
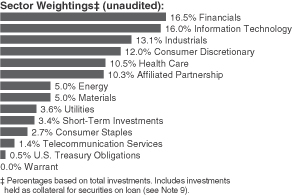
| | | | | |
| Description | | Shares | | Market Value
($ Thousands) |
| | | | | |
| | |
COMMON STOCK — 94.5% | | | | | |
| | |
Consumer Discretionary — 13.2% | | | | | |
Aaron’s | | 51,200 | | $ | 1,668 |
Abercrombie & Fitch, Cl A | | 30,352 | | | 914 |
Advance Auto Parts | | 88,509 | | | 3,770 |
Aeropostale* | | 5,400 | | | 187 |
American Eagle Outfitters | | 385,682 | | | 5,712 |
American Greetings, Cl A (A) | | 33,400 | | | 229 |
Amerigon* (A) | | 178,818 | | | 794 |
Ameristar Casinos | | 76,594 | | | 1,537 |
AnnTaylor Stores* | | 132,013 | | | 966 |
Apollo Group, Cl A* | | 34,100 | | | 2,015 |
Arbitron | | 105,700 | | | 2,104 |
Arctic Cat | | 68,000 | | | 273 |
Asbury Automotive Group | | 61,400 | | | 583 |
Autoliv | | 36,100 | | | 1,003 |
AutoNation* (A) | | 60,498 | | | 961 |
Bally Technologies* | | 108,500 | | | 3,038 |
Barnes & Noble | | 17,500 | | | 432 |
Bebe Stores | | 306,289 | | | 2,469 |
Bed Bath & Beyond* | | 27,500 | | | 773 |
Belo, Cl A | | 143,211 | | | 258 |
Big 5 Sporting Goods | | 11,600 | | | 126 |
Big Lots* | | 41,100 | | | 946 |
BJ’s Restaurants* (A) | | 84,749 | | | 1,215 |
Black & Decker (A) | | 25,900 | | | 831 |
Bob Evans Farms (A) | | 61,900 | | | 1,597 |
BorgWarner | | 33,472 | | | 1,079 |
Brinker International | | 104,700 | | | 1,874 |
Brink’s Home Security Holdings* | | 57,800 | | | 1,665 |
Brown Shoe (A) | | 93,346 | | | 758 |
Buckle | | 14,233 | | | 509 |
Callaway Golf | | 182,538 | | | 1,300 |
Career Education* (A) | | 92,694 | | | 1,861 |
Carter’s* | | 32,814 | | | 776 |
Cato, Cl A | | 181,063 | | | 3,484 |
CEC Entertainment* | | 83,429 | | | 2,681 |
| | | | | |
| Description | | Shares | | Market Value
($ Thousands) |
| | | | | |
Centex | | 304,400 | | $ | 2,566 |
Century Casinos* | | 374,318 | | | 958 |
Charlotte Russe Holding* | | 88,300 | | | 896 |
Cheesecake Factory* | | 29,107 | | | 498 |
Chico’s FAS* (A) | | 78,721 | | | 768 |
Chipotle Mexican Grill, Cl A* | | 3,000 | | | 238 |
Christopher & Banks | | 93,497 | | | 484 |
Cinemark Holdings | | 267,262 | | | 2,838 |
CKE Restaurants | | 36,806 | | | 303 |
Cooper Tire & Rubber | | 150,453 | | | 1,595 |
Corinthian Colleges* | | 19,400 | | | 298 |
Cracker Barrel Old Country Store (A) | | 88,057 | | | 2,767 |
CSS Industries | | 7,400 | | | 135 |
Darden Restaurants (A) | | 48,700 | | | 1,761 |
Deckers Outdoor* | | 2,600 | | | 151 |
DeVry | | 10,100 | | | 440 |
Dick’s Sporting Goods* (A) | | 311,572 | | | 5,546 |
Dillard’s, Cl A | | 40,000 | | | 378 |
DineEquity (A) | | 22,300 | | | 618 |
Dollar Tree* (A) | | 46,516 | | | 2,083 |
DR Horton (A) | | 178,897 | | | 1,648 |
DreamWorks Animation SKG, Cl A* | | 114,375 | | | 3,186 |
DSW, Cl A* (A) | | 172,948 | | | 1,966 |
Eastman Kodak | | 62,100 | | | 162 |
Entercom Communications, Cl A (A) | | 90,474 | | | 144 |
Ethan Allen Interiors | | 22,937 | | | 281 |
Exide Technologies* | | 106,400 | | | 651 |
Family Dollar Stores (A) | | 40,000 | | | 1,211 |
Federal Mogul, Cl A* | | 61,900 | | | 619 |
FGX International Holdings* | | 14,800 | | | 199 |
Finish Line, Cl A | | 192,539 | | | 1,330 |
Foot Locker (A) | | 263,992 | | | 2,933 |
Fossil* | | 14,500 | | | 325 |
Fred’s, Cl A | | 11,100 | | | 142 |
Fuqi International* | | 16,008 | | | 195 |
GameStop, Cl A* | | 117,500 | | | 2,932 |
Gannett | | 109,673 | | | 523 |
Genesco* | | 46,166 | | | 1,191 |
Gildan Activewear, Cl A* (A) | | 80,100 | | | 1,318 |
Goodyear Tire & Rubber* (A) | | 53,300 | | | 610 |
Gymboree* | | 53,370 | | | 1,967 |
H&R Block | | 108,023 | | | 1,577 |
Hanesbrands* (A) | | 83,500 | | | 1,411 |
Harley-Davidson (A) | | 101,038 | | | 1,715 |
Harman International Industries (A) | | 34,500 | | | 643 |
Hasbro | | 76,728 | | | 1,949 |
hhgregg* (A) | | 43,800 | | | 725 |
Hibbett Sports* (A) | | 52,468 | | | 946 |
Hillenbrand | | 12,500 | | | 214 |
Hooker Furniture (A) | | 49,800 | | | 618 |
Iconix Brand Group* | | 33,400 | | | 541 |
Interpublic Group* | | 193,636 | | | 1,015 |
ITT Educational Services* | | 20,523 | | | 1,884 |
| | |
| SEI Institutional Investments Trust / Annual Report / May 31, 2009 | | 83 |
SCHEDULE OF INVESTMENTS
Small/Mid Cap Equity Fund (Continued)
May 31, 2009
| | | | | |
| Description | | Shares | | Market Value
($ Thousands) |
| | | | | |
J Crew Group* | | 174,625 | | $ | 4,516 |
Jackson Hewitt Tax Service | | 27,600 | | | 110 |
Jarden* (A) | | 339,310 | | | 6,033 |
Jo-Ann Stores* | | 28,500 | | | 616 |
Jones Apparel Group | | 230,700 | | | 2,099 |
Landry’s Restaurants (A) | | 22,200 | | | 224 |
Las Vegas Sands* | | 171,700 | | | 1,702 |
Lear* (A) | | 35,400 | | | 44 |
Liberty Media - Interactive, Cl A* | | 143,600 | | | 841 |
Life Time Fitness* (A) | | 163,248 | | | 3,017 |
Lincoln Educational Services* | | 5,300 | | | 98 |
Live Nation* | | 498,878 | | | 2,854 |
M/I Homes (A) | | 49,000 | | | 566 |
Marvel Entertainment* | | 55,910 | | | 1,855 |
Mattel | | 76,664 | | | 1,197 |
MDC Holdings | | 17,714 | | | 544 |
Men’s Wearhouse | | 13,542 | | | 231 |
Meredith | | 6,208 | | | 167 |
MGM Mirage* | | 99,428 | | | 742 |
Morningstar* (A) | | 61,604 | | | 2,552 |
National CineMedia | | 343,334 | | | 4,295 |
NetFlix* (A) | | 33,500 | | | 1,321 |
Newell Rubbermaid (A) | | 100,589 | | | 1,158 |
Nordstrom | | 128,844 | | | 2,537 |
NutriSystem | | 20,300 | | | 278 |
NVR* | | 5,424 | | | 2,684 |
O’Charleys | | 20,053 | | | 162 |
OfficeMax | | 142,500 | | | 1,176 |
O’Reilly Automotive* (A) | | 68,300 | | | 2,462 |
Papa John’s International* | | 13,461 | | | 365 |
Penn National Gaming* (A) | | 79,684 | | | 2,635 |
PetSmart | | 225,678 | | | 4,595 |
PF Chang’s China Bistro* (A) | | 65,371 | | | 2,088 |
Phillips-Van Heusen | | 107,974 | | | 3,182 |
Polaris Industries | | 42,432 | | | 1,348 |
priceline.com* | | 21,500 | | | 2,367 |
Pulte Homes | | 77,451 | | | 682 |
RadioShack (A) | | 91,700 | | | 1,232 |
RC2* | | 27,224 | | | 327 |
RCN* | | 9,286 | | | 51 |
Regal Entertainment Group, Cl A | | 211,597 | | | 2,700 |
Regis | | 137,485 | | | 2,410 |
Rent-A-Center, Cl A* | | 118,462 | | | 2,314 |
Retail Ventures* | | 355,306 | | | 927 |
Ross Stores (A) | | 59,207 | | | 2,319 |
Ruby Tuesday* | | 79,800 | | | 493 |
Ryland Group (A) | | 50,432 | | | 861 |
Scholastic | | 31,200 | | | 612 |
Scientific Games, Cl A* (A) | | 182,998 | | | 3,263 |
Scripps Networks Interactive, Cl A | | 41,498 | | | 1,151 |
Sherwin-Williams | | 8,142 | | | 430 |
Shuffle Master* | | 2,779 | | | 12 |
Shutterfly* (A) | | 93,967 | | | 1,342 |
Sinclair Broadcast Group, Cl A (A) | | 93,100 | | | 164 |
| | | | | |
| Description | | Shares | | Market Value
($ Thousands) |
| | | | | |
Skechers U.S.A., Cl A* | | 35,093 | | $ | 333 |
Sonic Automotive, Cl A (A) | | 33,900 | | | 322 |
Sotheby’s | | 24,600 | | | 261 |
Spartan Motors | | 85,581 | | | 808 |
Stage Stores | | 126,204 | | | 1,531 |
Stamps.com* | | 31,600 | | | 281 |
Standard Pacific* (A) | | 206,231 | | | 503 |
Stanley Works | | 18,894 | | | 675 |
Starwood Hotels & Resorts Worldwide (A) | | 153,802 | | | 3,763 |
Strayer Education (A) | | 14,802 | | | 2,728 |
Systemax* | | 15,442 | | | 189 |
Tempur-Pedic International (A) | | 115,725 | | | 1,276 |
Thunderbird Resorts* (G) (I) | | 151,700 | | | 228 |
Timberland, Cl A* | | 26,397 | | | 380 |
Tractor Supply* (A) | | 88,234 | | | 3,386 |
Universal Electronics* | | 8,484 | | | 166 |
Urban Outfitters* | | 96,070 | | | 1,962 |
VF | | 11,400 | | | 648 |
WABCO Holdings | | 28,297 | | | 481 |
Warnaco Group* | | 11,780 | | | 372 |
Warner Music Group* | | 44,524 | | | 303 |
Weight Watchers International | | 67,300 | | | 1,577 |
Westport Innovations* | | 117,722 | | | 686 |
Whirlpool (A) | | 21,994 | | | 927 |
Williams-Sonoma | | 44,400 | | | 574 |
WMS Industries* | | 152,456 | | | 5,408 |
Wyndham Worldwide | | 67,900 | | | 800 |
Zumiez* (A) | | 78,664 | | | 702 |
| | | | | |
| | | | | 227,701 |
| | | | | |
| | |
Consumer Staples — 2.9% | | | | | |
Alberto-Culver, Cl B | | 46,200 | | | 1,074 |
Andersons | | 28,602 | | | 718 |
Asiatic Development (Malaysia) | | 578,000 | | | 893 |
Avon Products | | 39,869 | | | 1,059 |
BJ’s Wholesale Club* (A) | | 83,800 | | | 2,953 |
Boston Beer, Cl A* | | 12,535 | | | 358 |
Brown-Forman, Cl B | | 15,838 | | | 694 |
Cal-Maine Foods | | 5,785 | | | 141 |
Casey’s General Stores | | 46,764 | | | 1,180 |
Central Garden and Pet, Cl A* | | 42,127 | | | 415 |
Central Garden and Pet* | | 49,178 | | | 524 |
China Sky One Medical* | | 1,308 | | | 19 |
Chiquita Brands International* | | 93,410 | | | 976 |
Constellation Brands, Cl A* | | 33,424 | | | 386 |
Corn Products International | | 70,904 | | | 1,873 |
Cosan Industria e Comercio (Brazil)* | | 179,200 | | | 1,400 |
Darling International* | | 57,500 | | | 435 |
Dean Foods* | | 219,186 | | | 4,121 |
Del Monte Foods | | 406,656 | | | 3,326 |
Farmer Bros | | 2,100 | | | 47 |
Flowers Foods (A) | | 87,500 | | | 1,852 |
Hansen Natural* | | 16,900 | | | 620 |
Herbalife | | 39,700 | | | 1,160 |
| | |
| 84 | | SEI Institutional Investments Trust / Annual Report / May 31, 2009 |
| | | | | |
| Description | | Shares | | Market Value
($ Thousands) |
| | | | | |
J&J Snack Foods | | 8,104 | | $ | 304 |
JM Smucker | | 72,155 | | | 2,905 |
Lance (A) | | 63,600 | | | 1,357 |
Lorillard | | 25,410 | | | 1,736 |
McCormick | | 34,015 | | | 1,038 |
Molson Coors Brewing, Cl B | | 23,136 | | | 1,018 |
Nash Finch | | 8,452 | | | 248 |
NBTY* (A) | | 54,500 | | | 1,346 |
Nu Skin Enterprises, Cl A | | 8,980 | | | 130 |
Pantry* | | 81,788 | | | 1,629 |
Pepsi Bottling Group | | 53,300 | | | 1,751 |
PepsiAmericas | | 35,539 | | | 935 |
Prestige Brands Holdings* | | 30,244 | | | 188 |
Ralcorp Holdings* (A) | | 37,782 | | | 2,164 |
Sanderson Farms | | 15,737 | | | 686 |
Saskatchewan Wheat Pool* | | 66,600 | | | 562 |
Smithfield Foods* | | 26,100 | | | 324 |
Supervalu (A) | | 80,500 | | | 1,336 |
TreeHouse Foods* (A) | | 61,545 | | | 1,645 |
Tyson Foods, Cl A | | 130,972 | | | 1,745 |
Vector Group | | 22,695 | | | 333 |
Viterra* | | 59,400 | | | 502 |
Weis Markets | | 13,631 | | | 476 |
Zhongpin* (A) | | 25,400 | | | 269 |
| | | | | |
| | | | | 50,851 |
| | | | | |
| | |
Energy — 5.5% | | | | | |
Alliance Resource Partners | | 2,983 | | | 114 |
Alpha Natural Resources* | | 22,866 | | | 630 |
Arena Resources* | | 55,552 | | | 1,990 |
Berry Petroleum, Cl A | | 52,510 | | | 1,025 |
BPZ Energy PIPE* | | 54,500 | | | 390 |
BPZ Resources* (A) | | 145,000 | | | 1,037 |
Cal Dive International* | | 12,242 | | | 123 |
Cameron International* | | 35,932 | | | 1,122 |
Carrizo Oil & Gas* (A) | | 42,324 | | | 904 |
Cimarex Energy (A) | | 40,500 | | | 1,321 |
Clayton Williams Energy* (A) | | 10,519 | | | 258 |
Comstock Resources* | | 25,238 | | | 1,005 |
Concho Resources* | | 107,612 | | | 3,449 |
Contango Oil & Gas* | | 11,500 | | | 574 |
Continental Resources* | | 76,900 | | | 2,277 |
Core Laboratories | | 21,600 | | | 2,051 |
CVR Energy* | | 95,447 | | | 912 |
Denbury Resources* | | 51,100 | | | 878 |
Dresser-Rand Group* | | 179,086 | | | 5,014 |
Encore Acquisition* | | 24,547 | | | 871 |
ENSCO International | | 15,373 | | | 598 |
EXCO Resources* | | 62,900 | | | 968 |
Foundation Coal Holdings | | 56,100 | | | 1,647 |
Frontier Oil (A) | | 26,800 | | | 468 |
Goodrich Petroleum* | | 78,587 | | | 2,100 |
Gran Tierra Energy* | | 61,327 | | | 186 |
| | | | | |
| Description | | Shares | | Market Value
($ Thousands) |
| | | | | |
Gulfmark Offshore* | | 10,053 | | $ | 307 |
Helmerich & Payne | | 31,500 | | | 1,102 |
Hornbeck Offshore Services* (A) | | 39,504 | | | 1,096 |
Infinity Bio-Energy* | | 792,118 | | | 32 |
James River Coal* (A) | | 73,400 | | | 1,646 |
Key Energy Services* | | 197,212 | | | 1,272 |
Kinder Morgan Escrow* (G) | | 24,428 | | | — |
Kinder Morgan Management LLC* | | 61,638 | | | 2,767 |
Mahalo Energy* | | 329,000 | | | 1 |
Matrix Service* (A) | | 62,200 | | | 704 |
McMoRan Exploration* | | 63,518 | | | 431 |
Murphy Oil | | 40,350 | | | 2,381 |
Nabors Industries* | | 69,482 | | | 1,242 |
Newfield Exploration* | | 36,610 | | | 1,322 |
Newpark Resources* | | 63,975 | | | 184 |
Noble | | 96,000 | | | 3,300 |
Oceaneering International* | | 15,525 | | | 798 |
Oil Sands Quest* (A) | | 1,221,000 | | | 1,245 |
Overseas Shipholding Group (A) | | 31,000 | | | 1,048 |
PetroHawk Energy* | | 94,564 | | | 2,383 |
Pioneer Drilling* | | 98,100 | | | 614 |
Pioneer Natural Resources | | 40,339 | | | 1,134 |
Plains Exploration & Production* | | 6,300 | | | 178 |
Range Resources | | 117,072 | | | 5,363 |
Rentech* (A) | | 518,800 | | | 275 |
SEACOR Holdings* | | 16,900 | | | 1,291 |
Southwestern Energy* | | 58,142 | | | 2,527 |
Spectra Energy | | 67,824 | | | 1,089 |
Sunoco | | 36,200 | | | 1,102 |
Superior Energy Services* | | 76,618 | | | 1,767 |
Swift Energy* (A) | | 70,904 | | | 1,165 |
T-3 Energy Services, Cl 3* | | 49,294 | | | 716 |
Tesoro (A) | | 97,367 | | | 1,649 |
Tidewater (A) | | 51,800 | | | 2,469 |
Venoco* | | 32,800 | | | 236 |
W&T Offshore (A) | | 221,544 | | | 2,260 |
Walter Industries | | 25,670 | | | 838 |
Western Refining (A) | | 81,629 | | | 1,163 |
Westmoreland Coal* | | 6,300 | | | 55 |
Whiting Petroleum* | | 77,947 | | | 3,653 |
Willbros Group* | | 183,092 | | | 2,796 |
Williams | | 21,825 | | | 366 |
World Fuel Services (A) | | 155,848 | | | 6,614 |
| | | | | |
| | | | | 94,493 |
| | | | | |
| | |
Financials — 18.3% | | | | | |
1st Source | | 800 | | | 14 |
Advance America Cash Advance Centers | | 125,018 | | | 563 |
Advanta, Cl B (A) | | 53,400 | | | 37 |
Affiliated Managers Group* | | 61,796 | | | 3,467 |
Agree Realty‡ | | 10,300 | | | 178 |
Alexander’s‡ | | 713 | | | 192 |
Alexandria Real Estate Equities‡ | | 44,197 | | | 1,587 |
Allied Capital | | 26,700 | | | 80 |
| | |
| SEI Institutional Investments Trust / Annual Report / May 31, 2009 | | 85 |
SCHEDULE OF INVESTMENTS
Small/Mid Cap Equity Fund (Continued)
May 31, 2009
| | | | | |
| Description | | Shares | | Market Value
($ Thousands) |
| | | | | |
Allied World Assurance Holdings | | 13,200 | | $ | 498 |
AMB Property‡ (A) | | 77,800 | | | 1,389 |
AMBAC Financial Group (A) | | 53,730 | | | 67 |
Amcore Financial (A) | | 44,386 | | | 48 |
American Campus Communities‡ | | 79,173 | | | 1,820 |
American Equity Investment Life Holding | | 40,489 | | | 235 |
American Financial Group | | 191,868 | | | 4,110 |
AmeriCredit* (A) | | 53,300 | | | 677 |
Ameriprise Financial | | 54,100 | | | 1,634 |
Amerisafe* | | 30,700 | | | 496 |
Amtrust Financial Services | | 6,729 | | | 64 |
Annaly Capital Management‡ | | 187,037 | | | 2,607 |
Anthracite Capital‡ (A) | | 70,500 | | | 76 |
Anworth Mortgage Asset‡ | | 752,900 | | | 5,014 |
Apartment Investment & Management,
Cl A‡ (A) | | 327,358 | | | 3,093 |
Arch Capital Group* | | 41,882 | | | 2,383 |
Arrow Financial | | 3,474 | | | 87 |
Aspen Insurance Holdings | | 218,620 | | | 5,048 |
Associated Banc (A) | | 80,600 | | | 1,166 |
Astoria Financial | | 22,700 | | | 175 |
AvalonBay Communities‡ (A) | | 43,663 | | | 2,684 |
Axis Capital Holdings | | 31,600 | | | 755 |
Banco Latinoamericano de Exportaciones, Cl E | | 80,200 | | | 1,016 |
Bancorpsouth | | 40,223 | | | 895 |
Bank Mutual | | 69,351 | | | 629 |
Bank of Hawaii | | 17,847 | | | 668 |
Bank of the Ozarks (A) | | 26,700 | | | 675 |
BankFinancial | | 9,900 | | | 89 |
BioMed Realty Trust‡ | | 16,000 | | | 157 |
BlackRock, Cl A | | 1,859 | | | 297 |
Boston Private Financial Holdings | | 20,118 | | | 100 |
Boston Properties‡ (A) | | 122,585 | | | 5,923 |
Brasil Brokers Participacoes | | 888,400 | | | 1,195 |
Calamos Asset Management, Cl A | | 101,054 | | | 1,255 |
Capitol Federal Financial | | 12,503 | | | 526 |
Capstead Mortgage‡ | | 180,100 | | | 2,149 |
Cardinal Financial | | 186,238 | | | 1,510 |
Cardtronics* | | 313,474 | | | 1,016 |
Care Investment Trust‡ | | 7,700 | | | 46 |
Cash America International | | 12,175 | | | 280 |
CB Richard Ellis Group, Cl A* | | 183,028 | | | 1,336 |
CBL & Associates Properties‡ | | 42,870 | | | 267 |
Central Pacific Financial (A) | | 122,836 | | | 735 |
Chemical Financial | | 22,042 | | | 416 |
Chimera Investment‡ | | 684,400 | | | 2,388 |
Cincinnati Financial | | 32,300 | | | 730 |
CIT Group (A) | | 86,100 | | | 330 |
City Holding (A) | | 25,245 | | | 801 |
CNA Surety* | | 23,091 | | | 350 |
Cogdell Spencer‡ | | 294,700 | | | 1,105 |
Colonial BancGroup (A) | | 87,500 | | | 114 |
Colonial Properties Trust‡ | | 42,878 | | | 334 |
| | | | | |
| Description | | Shares | | Market Value
($ Thousands) |
| | | | | |
Columbia Banking System | | 40,560 | | $ | 441 |
Comerica | | 99,144 | | | 2,149 |
Commerce Bancshares | | 15,747 | | | 496 |
Community Bank System | | 22,025 | | | 341 |
Compass Diversified Holdings | | 23,804 | | | 209 |
Corporate Office Properties Trust‡ (A) | | 72,200 | | | 2,143 |
Cullen/Frost Bankers | | 15,830 | | | 775 |
CVB Financial | | 55,000 | | | 349 |
Delphi Financial Group, Cl A | | 41,029 | | | 781 |
Developers Diversified Realty‡ | | 98,756 | | | 485 |
Digital Realty Trust‡ (A) | | 70,450 | | | 2,520 |
Dime Community Bancshares | | 37,379 | | | 333 |
Dollar Financial* (A) | | 135,000 | | | 1,360 |
Douglas Emmett‡ (A) | | 163,950 | | | 1,525 |
DuPont Fabros Technology‡ | | 124,403 | | | 1,178 |
E*Trade Financial* | | 117,717 | | | 170 |
Eaton Vance | | 43,247 | | | 1,172 |
Education Realty Trust‡ | | 85,647 | | | 399 |
eHealth* | | 36,400 | | | 582 |
EMC Insurance Group | | 17,367 | | | 379 |
Employers Holdings | | 112,879 | | | 1,378 |
Endurance Specialty Holdings | | 130,810 | | | 3,593 |
Equity Lifestyle Properties‡ | | 7,665 | | | 301 |
Equity One‡ | | 70,566 | | | 1,019 |
Equity Residential‡ | | 146,800 | | | 3,573 |
Essex Property Trust‡ (A) | | 31,350 | | | 2,135 |
Everest Re Group | | 26,000 | | | 1,800 |
Extra Space Storage‡ | | 86,850 | | | 652 |
Ezcorp, Cl A* | | 42,310 | | | 514 |
FCStone Group* | | 61,510 | | | 251 |
Federal Realty Investment Trust‡ (A) | | 45,500 | | | 2,396 |
Federated Investors, Cl B (A) | | 64,399 | | | 1,612 |
Fidelity National Financial, Cl A | | 62,334 | | | 869 |
Financial Federal | | 77,600 | | | 1,924 |
First Bancorp | | 7,600 | | | 105 |
First Cash Financial Services* | | 21,972 | | | 332 |
First Commonwealth Financial | | 42,700 | | | 316 |
First Community Bancshares | | 6,800 | | | 119 |
First Financial Bancorp | | 120,942 | | | 1,032 |
First Financial Bankshares | | 5,014 | | | 245 |
First Horizon National (A) | | 214,557 | | | 2,605 |
First Mercury Financial | | 27,091 | | | 398 |
First Midwest Bancorp (A) | | 117,312 | | | 1,021 |
First Niagara Financial Group (A) | | 131,600 | | | 1,670 |
First Potomac Realty Trust‡ | | 119,998 | | | 1,259 |
FirstMerit | | 87,552 | | | 1,524 |
Flagstone Reinsurance Holdings | | 10,100 | | | 97 |
Flushing Financial | | 63,561 | | | 633 |
FNB (Pennsylvania) | | 73,100 | | | 488 |
Forest City Enterprises, Cl A | | 18,500 | | | 131 |
Forestar Group* | | 50,849 | | | 619 |
Fulton Financial (A) | | 159,870 | | | 929 |
General Shopping Brazil (Brazil)* | | 355,700 | | | 721 |
Getty Realty‡ | | 49,899 | | | 910 |
| | |
| 86 | | SEI Institutional Investments Trust / Annual Report / May 31, 2009 |
| | | | | |
| Description | | Shares | | Market Value
($ Thousands) |
| | | | | |
GFI Group | | 201,500 | | $ | 1,211 |
Glacier Bancorp (A) | | 60,300 | | | 999 |
Gluskin Sheff + Associates (Canada) | | 93,200 | | | 1,213 |
Grubb & Ellis | | 711,760 | | | 491 |
Hancock Holding (A) | | 73,520 | | | 2,568 |
Hanover Insurance Group | | 165,188 | | | 5,668 |
Hatteras Financial‡ | | 65,500 | | | 1,632 |
HCC Insurance Holdings (A) | | 29,200 | | | 721 |
HCP‡ | | 188,050 | | | 4,368 |
Health Care REIT‡ (A) | | 56,734 | | | 1,943 |
Healthcare Realty Trust‡ (A) | | 17,418 | | | 287 |
Hercules Technology Growth Capital (A) | | 366,275 | | | 2,747 |
Home Bancshares (A) | | 7,500 | | | 150 |
Horace Mann Educators (A) | | 110,685 | | | 1,000 |
Hospitality Properties Trust‡ (A) | | 144,900 | | | 2,024 |
Host Hotels & Resorts‡ | | 182,150 | | | 1,709 |
HRPT Properties Trust‡ (A) | | 344,900 | | | 1,638 |
Hudson City Bancorp | | 38,484 | | | 494 |
Huntington Bancshares (A) | | 218,511 | | | 857 |
IBERIABANK (A) | | 11,750 | | | 511 |
Infinity Property & Casualty | | 38,155 | | | 1,405 |
Inland Real Estate‡ | | 110,201 | | | 769 |
Interactive Brokers Group, Cl A* | | 38,400 | | | 571 |
Invesco | | 98,500 | | | 1,542 |
Investment Technology Group* (A) | | 73,635 | | | 1,532 |
Investors Real Estate Trust‡ (A) | | 95,800 | | | 853 |
IPC Holdings | | 77,700 | | | 1,931 |
Irwin Financial* | | 33,700 | | | 36 |
Jones Lang LaSalle | | 54,325 | | | 1,904 |
Kansas City Life Insurance | | 26,600 | | | 625 |
KBW* (A) | | 68,146 | | | 1,774 |
Keycorp (A) | | 329,500 | | | 1,648 |
Kilroy Realty‡ | | 29,714 | | | 633 |
Knight Capital Group, Cl A* (A) | | 158,505 | | | 2,728 |
Lazard, Cl A | | 38,600 | | | 1,092 |
LTC Properties‡ | | 22,800 | | | 474 |
Macerich‡ (A) | | 117,050 | | | 1,976 |
Mack-Cali Realty‡ (A) | | 101,700 | | | 2,513 |
MarketAxess Holdings* | | 371,814 | | | 3,922 |
Meadowbrook Insurance Group | | 187,600 | | | 1,386 |
MFA Mortgage Investments‡ (A) | | 1,045,491 | | | 6,545 |
MGIC Investment (A) | | 23,400 | | | 102 |
Mid-America Apartment Communities‡ | | 14,547 | | | 528 |
Montpelier Re Holdings | | 75,900 | | | 1,016 |
MSCI, Cl A* | | 217,317 | | | 4,622 |
National Health Investors‡ | | 12,700 | | | 336 |
National Penn Bancshares | | 55,185 | | | 334 |
National Retail Properties‡ (A) | | 45,693 | | | 782 |
Nationwide Health Properties‡ | | 81,142 | | | 2,156 |
Navigators Group* | | 25,545 | | | 1,117 |
Nelnet, Cl A* | | 76,300 | | | 646 |
New York Community Bancorp | | 95,191 | | | 1,053 |
NewAlliance Bancshares | | 83,159 | | | 1,076 |
NorthStar Realty Finance‡ | | 84,824 | | | 282 |
| | | | | |
| Description | | Shares | | Market Value
($ Thousands) |
| | | | | |
Northwest Bancorp | | 5,500 | | $ | 102 |
NYSE Euronext | | 32,825 | | | 985 |
OceanFirst Financial | | 7,600 | | | 95 |
Old National Bancorp | | 22,300 | | | 267 |
Omega Healthcare Investors‡ | | 25,219 | | | 403 |
optionsXpress Holdings | | 74,388 | | | 1,271 |
Oriental Financial Group | | 50,000 | | | 495 |
PacWest Bancorp (A) | | 75,404 | | | 1,065 |
PartnerRe | | 28,101 | | | 1,834 |
Penson Worldwide* (A) | | 145,862 | | | 1,441 |
People’s United Financial | | 19,175 | | | 303 |
PHH* (A) | | 283,161 | | | 4,361 |
Piper Jaffray* | | 4,387 | | | 158 |
Platinum Underwriters Holdings | | 117,756 | | | 3,395 |
Plum Creek Timber‡ | | 8,300 | | | 288 |
Post Properties‡ (A) | | 146,750 | | | 2,235 |
Presidential Life | | 20,700 | | | 178 |
ProAssurance* | | 20,430 | | | 924 |
ProLogis‡ (A) | | 220,000 | | | 1,868 |
Prospect Capital | | 175,500 | | | 1,495 |
Prosperity Bancshares (A) | | 107,653 | | | 3,021 |
Protective Life | | 118,200 | | | 1,461 |
Provident Financial Services | | 45,402 | | | 447 |
PS Business Parks‡ | | 26,808 | | | 1,203 |
Public Storage‡ (A) | | 36,854 | | | 2,455 |
Radian Group | | 34,500 | | | 98 |
RAIT Financial Trust‡ | | 69,000 | | | 85 |
RAM Holdings* | | 120,100 | | | 38 |
Rayonier‡ | | 6,966 | | | 279 |
Realty Income‡ (A) | | 75,671 | | | 1,625 |
Redwood Trust‡ (A) | | 75,100 | | | 1,196 |
Regency Centers‡ (A) | | 35,450 | | | 1,263 |
Regions Financial | | 217,200 | | | 910 |
Reinsurance Group of America, Cl A | | 88,974 | | | 3,273 |
RenaissanceRe Holdings | | 7,000 | | | 320 |
Republic Bancorp, Cl A (A) | | 48,700 | | | 1,181 |
Riskmetrics Group* (A) | | 190,072 | | | 3,054 |
RLI | | 9,000 | | | 422 |
S&T Bancorp | | 24,500 | | | 366 |
Sanders Morris Harris Group | | 13,700 | | | 74 |
Santander BanCorp (A) | | 14,100 | | | 104 |
Saul Centers ‡ | | 24,800 | | | 712 |
SeaBright Insurance Holdings* | | 19,012 | | | 154 |
Selective Insurance Group | | 42,600 | | | 563 |
Senior Housing Properties Trust‡ | | 53,242 | | | 892 |
Signature Bank NY* | | 62,711 | | | 1,696 |
Simmons First National, Cl A | | 5,700 | | | 156 |
Simon Property Group‡ (A) | | 95,803 | | | 5,123 |
Southside Bancshares | | 8,085 | | | 185 |
Sovran Self Storage‡ | | 42,200 | | | 1,019 |
St. Joe* | | 21,421 | | | 547 |
StanCorp Financial Group | | 57,306 | | | 1,778 |
Sterling Bancshares (A) | | 331,287 | | | 2,100 |
Strategic Hotels & Resorts‡ (A) | | 154,000 | | | 177 |
| | |
| SEI Institutional Investments Trust / Annual Report / May 31, 2009 | | 87 |
SCHEDULE OF INVESTMENTS
Small/Mid Cap Equity Fund (Continued)
May 31, 2009
| | | | | |
| Description | | Shares | | Market Value
($ Thousands) |
| | | | | |
Sun Communities‡ (A) | | 40,700 | | $ | 575 |
Sunstone Hotel Investors‡ (A) | | 259,977 | | | 1,510 |
Susquehanna Bancshares | | 99,300 | | | 709 |
SVB Financial Group* | | 38,520 | | | 1,038 |
SWS Group | | 53,400 | | | 684 |
Taubman Centers‡ (A) | | 36,500 | | | 903 |
TCF Financial (A) | | 273,777 | | | 3,931 |
TD Ameritrade Holding* | | 56,424 | | | 961 |
Titanium Asset Management* (I) | | 147,000 | | | 719 |
Tompkins Financial | | 8,700 | | | 421 |
Tower Group | | 24,000 | | | 573 |
Transatlantic Holdings | | 35,090 | | | 1,358 |
Triplecrown Acquisition* | | 101,923 | | | 966 |
Trustco Bank (A) | | 192,100 | | | 1,083 |
Trustmark (A) | | 60,603 | | | 1,187 |
UMB Financial | | 11,851 | | | 476 |
Umpqua Holdings | | 22,300 | | | 190 |
United Community Banks | | 39,345 | | | 305 |
Unitrin (A) | | 60,300 | | | 876 |
Unum Group | | 186,871 | | | 3,197 |
Uranium Participation* | | 208,900 | | | 1,491 |
Valley National Bancorp | | 7,682 | | | 93 |
Value Creation* (G) (H) (I) | | 85,600 | | | 393 |
Ventas‡ (A) | | 164,643 | | | 4,998 |
Vornado Realty Trust‡ (A) | | 87,000 | | | 4,059 |
Waddell & Reed Financial, Cl A | | 68,528 | | | 1,672 |
Washington Federal (A) | | 99,712 | | | 1,308 |
Washington Real Estate Investment Trust‡ | | 13,340 | | | 292 |
Webster Financial (A) | | 111,281 | | | 830 |
WesBanco (A) | | 16,500 | | | 271 |
Westamerica Bancorporation (A) | | 21,600 | | | 1,120 |
Western Alliance Bancorp* | | 275,498 | | | 1,906 |
Whitney Holding (A) | | 87,860 | | | 1,090 |
Willis Group Holdings | | 42,673 | | | 1,136 |
Wilmington Trust | | 16,800 | | | 242 |
Wintrust Financial | | 20,595 | | | 371 |
World Acceptance* (A) | | 108,957 | | | 2,182 |
WR Berkley (A) | | 69,018 | | | 1,497 |
Zenith National Insurance | | 11,200 | | | 240 |
Zions Bancorporation (A) | | 173,562 | | | 2,374 |
| | | | | |
| | | | | 315,041 |
| | | | | |
| | |
Health Care — 11.5% | | | | | |
Abaxis* (A) | | 20,617 | | | 361 |
Achillion Pharmaceuticals* | | 264,552 | | | 325 |
Acorda Therapeutics* | | 81,430 | | | 2,010 |
Adolor* | | 36,100 | | | 74 |
Affymax* | | 5,100 | | | 87 |
Albany Molecular Research* | | 42,000 | | | 368 |
Alexion Pharmaceuticals* (A) | | 97,714 | | | 3,566 |
AMAG Pharmaceuticals* (A) | | 17,237 | | | 907 |
Amedisys* | | 34,200 | | | 1,040 |
American Medical Systems Holdings* | | 104,279 | | | 1,582 |
AMERIGROUP* | | 46,467 | | | 1,341 |
| | | | | |
| Description | | Shares | | Market Value
($ Thousands) |
| | | | | |
AmerisourceBergen | | 35,137 | | $ | 1,304 |
AMN Healthcare Services* | | 114,700 | | | 826 |
Amsurg, Cl A* (A) | | 161,521 | | | 3,017 |
Amylin Pharmaceuticals* (A) | | 32,500 | | | 368 |
Analogic | | 5,205 | | | 190 |
Angiodynamics* | | 40,364 | | | 495 |
Arena Pharmaceuticals* (A) | | 391,100 | | | 1,443 |
Array Biopharma* | | 169,420 | | | 527 |
Assisted Living Concepts, Cl A* | | 9,189 | | | 141 |
Athenahealth* | | 68,815 | | | 2,077 |
Beckman Coulter | | 27,893 | | | 1,512 |
BioCryst Pharmaceuticals* (A) | | 275,600 | | | 1,108 |
Biogen Idec* | | 19,400 | | | 1,005 |
BioMarin Pharmaceutical* (A) | | 84,036 | | | 1,175 |
Bio-Rad Laboratories, Cl A* | | 13,524 | | | 1,007 |
Boston Scientific* | | 215,400 | | | 2,025 |
Bruker* | | 44,700 | | | 292 |
Cadence Pharmaceuticals* (A) | | 70,498 | | | 747 |
CardioNet* (A) | | 52,622 | | | 932 |
Catalyst Health Solutions* | | 139,509 | | | 2,984 |
Celera* | | 132,131 | | | 1,000 |
Centene* | | 96,173 | | | 1,748 |
Cephalon* (A) | | 21,905 | | | 1,277 |
Cepheid* (A) | | 95,332 | | | 963 |
Cerner* (A) | | 19,451 | | | 1,134 |
Charles River Laboratories International* | | 25,500 | | | 801 |
Chemed | | 21,677 | | | 830 |
Conceptus* (A) | | 52,655 | | | 835 |
Conmed* | | 232,523 | | | 3,662 |
Cooper | | 59,062 | | | 1,566 |
Corvel* | | 5,250 | | | 112 |
Covance* | | 33,325 | | | 1,400 |
Coventry Health Care* | | 103,323 | | | 1,865 |
Cubist Pharmaceuticals* | | 17,362 | | | 296 |
Cyberonics* (A) | | 25,500 | | | 370 |
DaVita* | | 43,800 | | | 1,976 |
Dendreon* | | 10,600 | | | 240 |
Dentsply International (A) | | 99,953 | | | 2,925 |
Depomed* | | 11,299 | | | 24 |
Dionex* | | 458 | | | 26 |
Electro-Optical Sciences* (A) | | 105,820 | | | 867 |
Emeritus* | | 43,544 | | | 626 |
Endo Pharmaceuticals Holdings* (A) | | 144,346 | | | 2,299 |
Enzo Biochem* | | 36,281 | | | 153 |
eResearch Technology* | | 127,382 | | | 763 |
ev3* | | 32,083 | | | 293 |
Forest Laboratories* | | 139,900 | | | 3,314 |
Gen-Probe* | | 82,682 | | | 3,525 |
Genzyme* | | 9,648 | | | 571 |
Greatbatch* | | 99,819 | | | 2,062 |
GTx* (A) | | 10,200 | | | 88 |
Health Management Associates, Cl A* | | 59,100 | | | 343 |
Health Net* | | 62,525 | | | 937 |
Healthsouth* (A) | | 129,507 | | | 1,533 |
| | |
| 88 | | SEI Institutional Investments Trust / Annual Report / May 31, 2009 |
| | | | | |
| Description | | Shares | | Market Value
($ Thousands) |
| | | | | |
Healthspring* | | 32,195 | | $ | 313 |
Henry Schein* | | 42,253 | | | 1,924 |
Hill-Rom Holdings | | 37,637 | | | 608 |
Hologic* | | 48,652 | | | 616 |
Humana* | | 21,100 | | | 661 |
ICU Medical* | | 5,903 | | | 213 |
Idexx Laboratories* (A) | | 60,384 | | | 2,527 |
I-Flow* | | 203,140 | | | 1,117 |
Illumina* | | 6,900 | | | 253 |
Immucor* | | 44,200 | | | 665 |
Incyte* (A) | | 398,000 | | | 1,309 |
InterMune* (A) | | 20,600 | | | 243 |
Intuitive Surgical* | | 4,085 | | | 611 |
inVentiv Health* | | 13,917 | | | 175 |
Inverness Medical Innovations* | | 86,783 | | | 2,823 |
IRIS International* | | 11,696 | | | 140 |
Isis Pharmaceuticals* | | 46,075 | | | 636 |
Kendle International* | | 30,751 | | | 320 |
Kensey Nash* | | 28,841 | | | 722 |
Kindred Healthcare* | | 65,735 | | | 863 |
Kinetic Concepts* (A) | | 86,900 | | | 2,253 |
King Pharmaceuticals* | | 549,857 | | | 5,202 |
Laboratory Corp of America Holdings* | | 34,700 | | | 2,115 |
LCA-Vision | | 55,500 | | | 345 |
LHC Group* | | 205,316 | | | 4,737 |
Life Technologies* | | 96,700 | | | 3,750 |
LifePoint Hospitals* | | 45,710 | | | 1,246 |
Lincare Holdings* | | 24,280 | | | 529 |
Magellan Health Services* (A) | | 66,674 | | | 1,991 |
Martek Biosciences | | 66,603 | | | 1,411 |
Maxygen* | | 55,975 | | | 397 |
Medicines* | | 128,400 | | | 984 |
Medicis Pharmaceutical, Cl A (A) | | 118,454 | | | 1,862 |
Mednax* (A) | | 161,645 | | | 6,547 |
Meridian Bioscience | | 36,700 | | | 701 |
Merit Medical Systems* | | 14,600 | | | 200 |
Mettler Toledo International* (A) | | 14,815 | | | 1,055 |
Millipore* | | 300 | | | 19 |
Molina Healthcare* | | 5,345 | | | 128 |
MWI Veterinary Supply* (A) | | 82,920 | | | 2,424 |
Mylan Laboratories* (A) | | 196,629 | | | 2,598 |
Myriad Genetics* | | 70,350 | | | 2,544 |
Neogen* | | 32,040 | | | 706 |
Nighthawk Radiology Holdings* | | 38,205 | | | 151 |
Noven Pharmaceuticals* | | 19,200 | | | 213 |
NPS Pharmaceuticals* | | 51,172 | | | 170 |
NuVasive* (A) | | 34,595 | | | 1,250 |
Odyssey HealthCare* | | 137,000 | | | 1,345 |
Omnicare (A) | | 41,100 | | | 1,111 |
Omnicell* | | 193,389 | | | 1,777 |
Onyx Pharmaceuticals* | | 3,000 | | | 71 |
Optimer Pharmaceuticals* (A) | | 56,432 | | | 700 |
Orthofix International* | | 10,500 | | | 266 |
OSI Pharmaceuticals* | | 60,706 | | | 2,052 |
| | | | | |
| Description | | Shares | | Market Value
($ Thousands) |
| | | | | |
Osiris Therapeutics* | | 20,670 | | $ | 261 |
Owens & Minor | | 8,900 | | | 312 |
Palomar Medical Technologies* | | 20,393 | | | 207 |
Par Pharmaceutical* | | 38,963 | | | 520 |
Parexel International* | | 16,000 | | | 165 |
Patterson* (A) | | 111,620 | | | 2,298 |
PDL BioPharma | | 77,208 | | | 537 |
PerkinElmer | | 55,037 | | | 895 |
Perrigo | | 45,100 | | | 1,211 |
Pharmaceutical Product Development | | 67,564 | | | 1,353 |
PharMerica* | | 12,681 | | | 222 |
Phase Forward* | | 143,967 | | | 2,016 |
Providence Service* | | 18,100 | | | 197 |
Psychiatric Solutions* (A) | | 45,872 | | | 846 |
Qiagen* | | 25,348 | | | 446 |
Quidel* (A) | | 119,500 | | | 1,521 |
Regeneron Pharmaceuticals* | | 12,400 | | | 190 |
Res-Care* | | 132,159 | | | 1,870 |
ResMed* | | 86,650 | | | 3,212 |
Rigel Pharmaceuticals* (A) | | 205,900 | | | 1,717 |
Sepracor* | | 86,623 | | | 1,356 |
Sirona Dental Systems* (A) | | 142,011 | | | 2,793 |
Somanetics* | | 29,142 | | | 490 |
SonoSite* | | 10,459 | | | 194 |
Sun Healthcare Group* | | 153,584 | | | 1,424 |
Symmetry Medical* | | 175,345 | | | 1,348 |
Techne | | 66,261 | | | 3,994 |
Teleflex | | 28,816 | | | 1,293 |
Theravance* (A) | | 129,613 | | | 1,918 |
Thoratec* (A) | | 32,408 | | | 813 |
United Therapeutics* (A) | | 19,474 | | | 1,561 |
Universal Health Services, Cl B (A) | | 50,002 | | | 2,747 |
Valeant Pharmaceuticals International* | | 12,000 | | | 276 |
Varian* | | 37,278 | | | 1,298 |
Varian Medical Systems* | | 36,600 | | | 1,309 |
Vertex Pharmaceuticals* (A) | | 86,468 | | | 2,578 |
Viropharma* (A) | | 105,100 | | | 731 |
Warner Chilcott, Cl A* (A) | | 64,200 | | | 845 |
Waters* | | 27,915 | | | 1,209 |
Watson Pharmaceuticals* (A) | | 132,681 | | | 4,014 |
Zimmer Holdings* | | 15,088 | | | 672 |
Zoll Medical* | | 9,800 | | | 165 |
| | | | | |
| | | | | 197,873 |
| | | | | |
| | |
Industrials — 14.4% | | | | | |
AAON (A) | | 25,200 | | | 524 |
Actuant, Cl A | | 137,895 | | | 1,693 |
Acuity Brands | | 34,204 | | | 930 |
Administaff | | 20,408 | | | 439 |
Aecom Technology* | | 54,689 | | | 1,745 |
Aircastle | | 158,700 | | | 1,062 |
Alexander & Baldwin | | 14,637 | | | 362 |
Allen-Vanguard* | | 1,184,500 | | | 141 |
Alliant Techsystems* | | 2,823 | | | 244 |
| | |
| SEI Institutional Investments Trust / Annual Report / May 31, 2009 | | 89 |
SCHEDULE OF INVESTMENTS
Small/Mid Cap Equity Fund (Continued)
May 31, 2009
| | | | | |
| Description | | Shares | | Market Value
($ Thousands) |
| | | | | |
Altra Holdings* | | 36,300 | | $ | 240 |
American Reprographics* | | 67,219 | | | 585 |
American Science & Engineering | | 2,200 | | | 138 |
Ameron International | | 25,100 | | | 1,392 |
Ametek | | 82,713 | | | 2,601 |
Ampco-Pittsburgh | | 17,800 | | | 462 |
AO Smith (A) | | 73,810 | | | 2,214 |
Apogee Enterprises | | 89,400 | | | 1,101 |
Applied Industrial Technologies (A) | | 71,500 | | | 1,485 |
Arkansas Best (A) | | 30,800 | | | 866 |
Armstrong World Industries* | | 16,659 | | | 298 |
ATC Technology* | | 62,027 | | | 904 |
Avery Dennison | | 36,295 | | | 1,000 |
Barnes Group (A) | | 239,880 | | | 3,661 |
BE Aerospace* | | 143,884 | | | 2,141 |
Belden | | 76,006 | | | 1,392 |
Blount International* | | 18,425 | | | 155 |
Brady, Cl A | | 34,988 | | | 867 |
Briggs & Stratton | | 116,200 | | | 1,766 |
Brink’s | | 109,742 | | | 2,918 |
Bucyrus International, Cl A | | 71,171 | | | 2,041 |
C.H. Robinson Worldwide | | 13,100 | | | 666 |
Carlisle | | 81,945 | | | 1,874 |
CBIZ* (A) | | 77,645 | | | 561 |
Ceradyne* | | 80,200 | | | 1,813 |
Chart Industries* | | 87,874 | | | 1,866 |
Chicago Bridge & Iron | | 69,009 | | | 891 |
Cintas | | 35,939 | | | 837 |
CIRCOR International | | 70,300 | | | 1,715 |
Colfax* | | 36,200 | | | 295 |
Columbus McKinnon* | | 22,815 | | | 317 |
Comfort Systems USA (A) | | 27,000 | | | 252 |
Consolidated Graphics* | | 83,530 | | | 1,356 |
Continental Airlines, Cl B* (A) | | 85,539 | | | 797 |
Con-way (A) | | 66,401 | | | 2,132 |
Copart* (A) | | 52,577 | | | 1,614 |
Corrections of America* (A) | | 168,075 | | | 2,580 |
CoStar Group* (A) | | 173,406 | | | 6,182 |
Courier | | 20,235 | | | 317 |
CRA International* | | 100,348 | | | 2,644 |
Crane | | 225,136 | | | 5,309 |
Cubic | | 58,700 | | | 2,239 |
Cummins | | 21,300 | | | 691 |
Delta Air Lines* (A) | | 105,234 | | | 612 |
Deluxe | | 76,019 | | | 1,075 |
Dover | | 47,299 | | | 1,487 |
Duff & Phelps, Cl A | | 70,855 | | | 1,053 |
Dun & Bradstreet | | 44,366 | | | 3,629 |
Dycom Industries* | | 290,583 | | | 3,397 |
DynCorp International, Cl A* (A) | | 79,578 | | | 1,151 |
EMCOR Group* (A) | | 160,314 | | | 3,602 |
EnergySolutions | | 2,722 | | | 22 |
Ennis | | 18,942 | | | 205 |
EnPro Industries* (A) | | 78,000 | | | 1,374 |
| | | | | |
| Description | | Shares | | Market Value
($ Thousands) |
| | | | | |
Equifax | | 52,314 | | $ | 1,424 |
ESCO Technologies* | | 11,700 | | | 475 |
Esterline Technologies* | | 55,366 | | | 1,514 |
Fastenal | | 32,627 | | | 1,084 |
Federal Signal | | 70,200 | | | 602 |
Flowserve | | 7,089 | | | 522 |
Fluor | | 8,725 | | | 410 |
Force Protection* | | 209,000 | | | 1,803 |
Forward Air | | 103,375 | | | 2,204 |
Foster Wheeler* | | 37,900 | | | 1,005 |
FTI Consulting* (A) | | 57,488 | | | 2,887 |
G&K Services, Cl A | | 35,815 | | | 768 |
Gardner Denver* | | 171,145 | | | 4,850 |
GATX | | 11,000 | | | 277 |
GenCorp* | | 56,725 | | | 114 |
General Cable* (A) | | 34,706 | | | 1,327 |
Genesee & Wyoming, Cl A* | | 65,700 | | | 1,900 |
Geo Group* | | 29,562 | | | 483 |
GeoEye* (A) | | 40,500 | | | 869 |
Goodrich | | 27,800 | | | 1,349 |
GrafTech International* | | 58,945 | | | 599 |
Graham (A) | | 47,046 | | | 659 |
Granite Construction (A) | | 14,703 | | | 538 |
GT Solar International* (A) | | 65,500 | | | 421 |
H&E Equipment Services* | | 192,925 | | | 1,273 |
Harsco | | 32,200 | | | 936 |
Heico, Cl A | | 23,474 | | | 698 |
Heidrick & Struggles International | | 33,051 | | | 606 |
Hexcel* | | 84,903 | | | 908 |
Horizon Lines, Cl A | | 338,664 | | | 1,802 |
Houston Wire & Cable (A) | | 46,845 | | | 559 |
Hubbell, Cl B | | 55,384 | | | 1,839 |
Huron Consulting Group* | | 29,600 | | | 1,356 |
ICF International* | | 95,860 | | | 2,550 |
IDEX (A) | | 79,705 | | | 1,861 |
IHS, Cl A* | | 122,410 | | | 5,876 |
Interface, Cl A | | 49,041 | | | 311 |
Interline Brands* | | 19,496 | | | 260 |
ITT | | 57,500 | | | 2,368 |
Jacobs Engineering Group* | | 28,214 | | | 1,210 |
JB Hunt Transport Services | | 59,004 | | | 1,813 |
Joy Global | | 20,868 | | | 719 |
Kadant* | | 26,284 | | | 367 |
Kaman | | 18,004 | | | 286 |
Kansas City Southern* | | 81,485 | | | 1,344 |
Kaydon | | 30,086 | | | 1,035 |
KBR | | 18,900 | | | 348 |
Kennametal | | 24,450 | | | 462 |
Kirby* (A) | | 120,611 | | | 4,055 |
Knoll | | 35,000 | | | 242 |
LaBarge* | | 10,500 | | | 80 |
Ladish* | | 17,469 | | | 206 |
Landstar System | | 44,925 | | | 1,707 |
LB Foster, Cl A* | | 32,308 | | | 942 |
| | |
| 90 | | SEI Institutional Investments Trust / Annual Report / May 31, 2009 |
| | | | | |
| Description | | Shares | | Market Value
($ Thousands) |
| | | | | |
Lincoln Electric Holdings | | 26,479 | | $ | 1,080 |
Lydall* | | 25,442 | | | 94 |
M&F Worldwide* | | 27,100 | | | 454 |
Manitowoc (A) | | 103,034 | | | 672 |
Manpower | | 52,014 | | | 2,211 |
Marten Transport* | | 19,000 | | | 405 |
MasTec* | | 84,100 | | | 1,089 |
Michael Baker* | | 18,100 | | | 761 |
Mine Safety Appliances | | 29,000 | | | 679 |
Mueller Industries | | 60,769 | | | 1,335 |
Mueller Water Products, Cl A | | 263,980 | | | 953 |
MYR Group* | | 33,875 | | | 647 |
Navigant Consulting* | | 133,725 | | | 1,593 |
NN | | 85,100 | | | 131 |
Old Dominion Freight Line* | | 139,358 | | | 4,104 |
Orbital Sciences* | | 62,500 | | | 920 |
Oshkosh Truck | | 69,437 | | | 824 |
Paccar | | 34,567 | | | 1,032 |
Pacer International | | 57,798 | | | 150 |
Pall | | 78,853 | | | 2,025 |
Parker Hannifin (A) | | 25,000 | | | 1,056 |
Pentair | | 45,000 | | | 1,126 |
Pitney Bowes | | 55,097 | | | 1,261 |
Powell Industries* | | 9,100 | | | 358 |
PRG-Schultz International* | | 20,415 | | | 59 |
Quanta Services* | | 68,325 | | | 1,559 |
Regal-Beloit (A) | | 12,270 | | | 485 |
Republic Airways Holdings* (A) | | 87,300 | | | 512 |
Resources Connection* | | 373,306 | | | 6,917 |
Ritchie Bros Auctioneers | | 76,865 | | | 1,760 |
Robbins & Myers | | 39,500 | | | 756 |
Rockwell Collins | | 22,966 | | | 974 |
RR Donnelley & Sons | | 128,995 | | | 1,739 |
RSC Holdings* (A) | | 202,600 | | | 1,220 |
Rush Enterprises, Cl A* | | 145,519 | | | 1,698 |
Ryder System | | 54,377 | | | 1,532 |
Saia* | | 7,741 | | | 106 |
School Specialty* | | 32,066 | | | 610 |
Seaboard | | 420 | | | 451 |
Shaw Group* | | 41,225 | | | 1,121 |
Silvercorp Metals* | | 489,500 | | | 1,581 |
Skywest | | 94,726 | | | 971 |
Southwest Airlines | | 107,910 | | | 727 |
Spirit Aerosystems Holdings, Cl A* | | 79,474 | | | 1,093 |
SPX | | 11,800 | | | 542 |
Standard Parking* | | 116,815 | | | 1,744 |
Standard Register | | 30,068 | | | 100 |
Steelcase, Cl A | | 111,301 | | | 538 |
Stericycle* | | 20,498 | | | 1,024 |
Sterling Construction* (A) | | 6,900 | | | 118 |
SYKES Enterprises* | | 291,563 | | | 4,752 |
TAL International Group (A) | | 140,900 | | | 1,399 |
Tecumseh Products, Cl A* | | 10,200 | | | 82 |
Teledyne Technologies* | | 21,612 | | | 710 |
| | | | | |
| Description | | Shares | | Market Value
($ Thousands) |
| | | | | |
Terex* (A) | | 201,989 | | $ | 2,711 |
Tetra Tech* (A) | | 87,432 | | | 2,244 |
Textainer Group Holdings (A) | | 143,500 | | | 1,491 |
Thomas & Betts* | | 65,583 | | | 2,012 |
Timken | | 36,748 | | | 621 |
Titan Machinery* | | 18,600 | | | 234 |
Toro | | 3,224 | | | 99 |
TransDigm Group* | | 58,765 | | | 2,305 |
Triumph Group | | 13,874 | | | 547 |
UAL* | | 165,300 | | | 770 |
Ultralife* (A) | | 25,800 | | | 179 |
United Rentals* (A) | | 64,052 | | | 304 |
United Stationers* | | 30,957 | | | 1,109 |
URS* | | 51,703 | | | 2,486 |
US Airways Group* | | 334,930 | | | 864 |
UTi Worldwide* | | 80,200 | | | 1,052 |
Wabtec | | 99,336 | | | 3,544 |
Waste Connections* | | 78,031 | | | 1,982 |
Waste Services* | | 19,600 | | | 114 |
Watson Wyatt Worldwide, Cl A | | 26,152 | | | 992 |
Watts Water Technologies, Cl A | | 19,717 | | | 404 |
WESCO International* | | 171,059 | | | 4,573 |
| | | | | |
| | | | | 248,502 |
| | | | | |
| | |
Information Technology — 17.6% | | | | | |
3Com* | | 405,858 | | | 1,753 |
ACI Worldwide* | | 31,700 | | | 473 |
Acxiom | | 127,285 | | | 1,361 |
ADC Telecommunications* (A) | | 270,496 | | | 1,904 |
Advanced Analogic Technologies* | | 222,163 | | | 1,051 |
Advanced Energy Industries* | | 168,044 | | | 1,588 |
Akamai Technologies* (A) | | 192,866 | | | 4,293 |
Alliance Data Systems* | | 76,952 | | | 3,117 |
Amkor Technology* | | 48,600 | | | 221 |
Amphenol, Cl A | | 66,800 | | | 2,230 |
Analog Devices | | 108,256 | | | 2,643 |
Anixter International* (A) | | 56,600 | | | 2,322 |
Ansys* | | 41,900 | | | 1,251 |
Applied Micro Circuits* (A) | | 118,900 | | | 930 |
Ariba* | | 119,081 | | | 1,128 |
Arris Group* | | 478,246 | | | 5,796 |
Arrow Electronics* | | 133,792 | | | 3,236 |
Art Technology Group* | | 706,137 | | | 2,542 |
Atmel* | | 896,857 | | | 3,453 |
ATMI* (A) | | 100,014 | | | 1,623 |
Avnet* | | 98,166 | | | 2,259 |
Avocent* | | 48,665 | | | 681 |
Bankrate* | | 54,835 | | | 1,651 |
Benchmark Electronics* | | 191,570 | | | 2,337 |
BigBand Networks* | | 22,600 | | | 118 |
Black Box | | 49,183 | | | 1,619 |
Blackboard* | | 4,100 | | | 118 |
BMC Software* | | 17,734 | | | 605 |
Brightpoint* | | 130,932 | | | 775 |
| | |
| SEI Institutional Investments Trust / Annual Report / May 31, 2009 | | 91 |
SCHEDULE OF INVESTMENTS
Small/Mid Cap Equity Fund (Continued)
May 31, 2009
| | | | | |
| Description | | Shares | | Market Value
($ Thousands) |
| | | | | |
Broadridge Financial Solutions | | 80,908 | | $ | 1,340 |
Brocade Communications Systems* | | 238,400 | | | 1,750 |
Brooks Automation* | | 32,276 | | | 126 |
CACI International, Cl A* | | 19,759 | | | 758 |
Checkpoint Systems* | | 31,434 | | | 441 |
Ciber* | | 68,105 | | | 219 |
Cirrus Logic* | | 55,073 | | | 214 |
Citrix Systems* | | 24,142 | | | 758 |
Cognex | | 22,800 | | | 298 |
Cogo Group* | | 30,200 | | | 197 |
Coherent* | | 39,232 | | | 766 |
CommScope* (A) | | 214,400 | | | 5,626 |
Computer Sciences* | | 75,653 | | | 3,212 |
Concur Technologies* (A) | | 44,873 | | | 1,324 |
Constant Contact* (A) | | 82,766 | | | 1,456 |
Convergys* (A) | | 140,900 | | | 1,303 |
CPI International* | | 5,700 | | | 62 |
Cree* | | 12,064 | | | 367 |
CSG Systems International* | | 91,765 | | | 1,264 |
CTS | | 129,490 | | | 747 |
Cymer* | | 7,815 | | | 217 |
Cypress Semiconductor* (A) | | 111,867 | | | 962 |
Daktronics | | 23,500 | | | 201 |
DealerTrack Holdings* (A) | | 358,409 | | | 5,143 |
Diebold | | 127,457 | | | 3,151 |
Diodes* (A) | | 108,259 | | | 1,664 |
Dolby Laboratories, Cl A* | | 58,900 | | | 2,124 |
DSP Group* (A) | | 234,641 | | | 1,701 |
DST Systems* | | 15,000 | | | 574 |
DTS* | | 137,120 | | | 3,630 |
eBay* | | 31,944 | | | 563 |
EF Johnson Technologies* | | 118,500 | | | 82 |
Electronics for Imaging* | | 57,619 | | | 586 |
Emulex* (A) | | 140,992 | | | 1,550 |
Entegris* | | 349,137 | | | 1,005 |
Equinix* (A) | | 90,867 | | | 6,760 |
Euronet Worldwide* | | 162,847 | | | 2,599 |
Factset Research Systems (A) | | 26,757 | | | 1,415 |
Fidelity National Information Services | | 27,416 | | | 528 |
Fiserv* | | 2,833 | | | 120 |
FLIR Systems* | | 38,680 | | | 869 |
Gartner* | | 178,889 | | | 2,746 |
Gerber Scientific* | | 112,900 | | | 365 |
Gevity HR | | 55,000 | | | 219 |
GSI Commerce* (A) | | 581,399 | | | 7,477 |
Harris Stratex Networks, Cl A* | | 38,147 | | | 182 |
Heartland Payment Systems | | 121,575 | | | 930 |
Hewitt Associates, Cl A* | | 44,472 | | | 1,290 |
i2 Technologies* (A) | | 37,800 | | | 464 |
IAC* | | 44,826 | | | 724 |
Imation (A) | | 206,882 | | | 1,998 |
Information Services Group* | | 395,374 | | | 1,087 |
Ingram Micro, Cl A* | | 121,336 | | | 2,005 |
Insight Enterprises* | | 72,500 | | | 547 |
| | | | | |
| Description | | Shares | | Market Value
($ Thousands) |
| | | | | |
Integral Systems* | | 48,340 | | $ | 367 |
Integrated Device Technology* | | 424,791 | | | 2,392 |
Intermec* | | 15,553 | | | 179 |
Internet Brands, Cl A* (A) | | 208,360 | | | 1,402 |
Intersil, Cl A | | 30,400 | | | 372 |
Intuit* | | 23,300 | | | 634 |
IXYS | | 6,300 | | | 60 |
j2 Global Communications* | | 39,800 | | | 888 |
Jabil Circuit | | 424,344 | | | 3,323 |
JDA Software Group* | | 147,600 | | | 2,199 |
JDS Uniphase* | | 77,552 | | | 418 |
Juniper Networks* | | 68,099 | | | 1,684 |
Kenexa* | | 113,700 | | | 1,100 |
Keynote Systems* | | 141,321 | | | 1,026 |
Knot* (A) | | 167,909 | | | 1,373 |
Kulicke & Soffa Industries* (A) | | 97,700 | | | 450 |
Lam Research* | | 41,419 | | | 1,085 |
Lawson Software* (A) | | 816,246 | | | 4,293 |
Lender Processing Services | | 62,000 | | | 1,801 |
Lexmark International, Cl A* | | 107,134 | | | 1,751 |
Linear Technology | | 32,300 | | | 756 |
Littelfuse* | | 43,571 | | | 764 |
LSI* | | 87,300 | | | 390 |
Mantech International, Cl A* | | 33,124 | | | 1,270 |
MAXIMUS (A) | | 33,423 | | | 1,334 |
MEMC Electronic Materials* | | 9,200 | | | 177 |
Metavante Technologies* | | 48,100 | | | 1,234 |
Methode Electronics | | 184,451 | | | 1,077 |
Micrel | | 22,500 | | | 165 |
Micron Technology* (A) | | 294,100 | | | 1,488 |
Microsemi* | | 239,663 | | | 3,226 |
MicroStrategy, Cl A* | | 11,234 | | | 526 |
Microtune* | | 44,650 | | | 103 |
MIPS Technologies, Cl A* | | 49,735 | | | 193 |
MKS Instruments* | | 43,440 | | | 587 |
Molex (A) | | 110,318 | | | 1,686 |
Monolithic Power Systems* | | 26,586 | | | 551 |
Monotype Imaging Holdings* (A) | | 284,763 | | | 1,609 |
Move* | | 254,616 | | | 535 |
MTS Systems | | 10,655 | | | 236 |
Multi-Fineline Electronix* | | 43,300 | | | 829 |
National Semiconductor | | 16,700 | | | 232 |
NCR* | | 234,184 | | | 2,515 |
Net 1 UEPS Technologies* | | 155,648 | | | 1,900 |
NetApp* | | 27,921 | | | 544 |
Netgear* | | 95,000 | | | 1,333 |
Netscout Systems* | | 132,489 | | | 1,243 |
Novatel Wireless* (A) | | 199,300 | | | 2,328 |
Novell* | | 57,300 | | | 238 |
Novellus Systems* (A) | | 30,300 | | | 543 |
Nuance Communications* (A) | | 143,033 | | | 1,774 |
Omniture* | | 435,538 | | | 5,148 |
ON Semiconductor* (A) | | 71,800 | | | 492 |
OSI Systems* | | 83,400 | | | 1,535 |
| | |
| 92 | | SEI Institutional Investments Trust / Annual Report / May 31, 2009 |
| | | | | |
| Description | | Shares | | Market Value
($ Thousands) |
| | | | | |
Parametric Technology* | | 192,731 | | $ | 2,232 |
Park Electrochemical | | 66,700 | | | 1,287 |
Parkervision* (A) | | 245,900 | | | 802 |
Pericom Semiconductor* | | 137,732 | | | 1,302 |
Perot Systems, Cl A* | | 69,254 | | | 946 |
Plexus* (A) | | 51,602 | | | 942 |
PMC-Sierra* | | 432,000 | | | 3,279 |
Polycom* (A) | | 78,600 | | | 1,361 |
Power Integrations (A) | | 92,305 | | | 2,036 |
Progress Software* | | 16,334 | | | 366 |
QLogic* (A) | | 15,300 | | | 209 |
Richardson Electronics | | 35,594 | | | 140 |
S1* | | 54,000 | | | 366 |
SAIC* | | 84,931 | | | 1,484 |
Salary.com* | | 193,513 | | | 381 |
Sapient* | | 284,178 | | | 1,509 |
SAVVIS* | | 201,768 | | | 2,375 |
Scansource* | | 44,733 | | | 1,107 |
Seachange International* | | 178,000 | | | 1,317 |
Semtech* | | 30,094 | | | 484 |
Sierra Wireless* | | 91,500 | | | 595 |
Sigma Designs* (A) | | 49,800 | | | 770 |
Silicon Laboratories* (A) | | 23,697 | | | 797 |
SkillSoft ADR* | | 892,331 | | | 7,290 |
Skyworks Solutions* | | 143,273 | | | 1,365 |
Sohu.com* | | 12,747 | | | 805 |
Solera Holdings* | | 280,540 | | | 6,424 |
SRA International, Cl A* | | 72,400 | | | 1,284 |
Sun Microsystems* | | 120,900 | | | 1,088 |
Sybase* (A) | | 161,773 | | | 5,263 |
Symmetricom* | | 19,352 | | | 100 |
Symyx Technologies* | | 27,213 | | | 132 |
Synaptics* | | 17,687 | | | 621 |
Synchronoss Technologies* | | 131,280 | | | 1,594 |
SYNNEX* (A) | | 82,808 | | | 2,143 |
Synopsys* | | 178,307 | | | 3,473 |
Take-Two Interactive Software | | 75,800 | | | 656 |
Taleo, Cl A* | | 22,689 | | | 352 |
Tech Data* | | 90,371 | | | 2,894 |
Technitrol | | 43,000 | | | 151 |
Techwell* | | 12,600 | | | 81 |
TeleCommunication Systems, Cl A* | | 17,200 | | | 129 |
TeleTech Holdings* | | 187,169 | | | 2,158 |
Tellabs* | | 344,507 | | | 1,912 |
Teradata* | | 131,342 | | | 2,837 |
Tessera Technologies* | | 48,842 | | | 1,149 |
TIBCO Software* | | 228,188 | | | 1,513 |
TNS* | | 12,200 | | | 230 |
Total System Services | | 59,200 | | | 808 |
Trimble Navigation* (A) | | 224,660 | | | 4,309 |
TTM Technologies* (A) | | 143,500 | | | 1,277 |
United Online | | 256,845 | | | 1,644 |
Valueclick* | | 114,838 | | | 1,269 |
Varian Semiconductor Equipment Associates* | | 87,195 | | | 2,051 |
| | | | | |
| Description | | Shares | | Market Value
($ Thousands) |
| | | | | |
Veeco Instruments* | | 19,150 | | $ | 202 |
Verigy* | | 38,200 | | | 458 |
Vishay Intertechnology* | | 50,700 | | | 280 |
VistaPrint* (A) | | 217,149 | | | 8,315 |
Vocus* (A) | | 250,632 | | | 4,790 |
WebMD Health, Cl A* (A) | | 23,543 | | | 639 |
Websense* | | 3,062 | | | 56 |
Western Digital* | | 88,975 | | | 2,211 |
Wind River Systems* | | 66,833 | | | 527 |
Wright Express* | | 216,891 | | | 5,394 |
Xyratex* | | 80,198 | | | 265 |
Zebra Technologies, Cl A* | | 68,000 | | | 1,484 |
Zygo* (A) | | 75,051 | | | 379 |
| | | | | |
| | | | | 304,231 |
| | | | | |
| | |
Materials — 5.5% | | | | | |
A. Schulman | | 131,521 | | | 1,964 |
AEP Industries* | | 3,400 | | | 84 |
Air Products & Chemicals | | 17,380 | | | 1,126 |
Airgas | | 107,441 | | | 4,540 |
AK Steel Holding | | 70,400 | | | 1,007 |
Albemarle | | 98,326 | | | 2,775 |
Allied Nevada Gold* | | 13,900 | | | 108 |
AM Castle | | 46,757 | | | 491 |
AMCOL International | | 45,000 | | | 963 |
Aptargroup | | 88,160 | | | 2,734 |
Ashland | | 40,100 | | | 1,075 |
Ball | | 3,000 | | | 119 |
Bemis | | 16,311 | | | 409 |
Buckeye Technologies* | | 72,371 | | | 367 |
Bway Holding* | | 21,300 | | | 309 |
Cabot | | 55,705 | | | 890 |
Carpenter Technology | | 56,500 | | | 1,270 |
Celanese, Cl A | | 149,834 | | | 3,073 |
Century Aluminum* | | 60,900 | | | 366 |
CF Industries Holdings | | 15,587 | | | 1,210 |
Clearwater Paper* | | 28,100 | | | 665 |
Cliffs Natural Resources | | 6,017 | | | 164 |
Commercial Metals (A) | | 80,277 | | | 1,362 |
Crown Holdings* | | 180,536 | | | 4,243 |
Cytec Industries | | 20,430 | | | 439 |
Domtar* | | 664,842 | | | 758 |
Eastman Chemical | | 33,100 | | | 1,372 |
Ecolab | | 49,000 | | | 1,830 |
FMC | | 61,809 | | | 3,359 |
General Steel Holdings* | | 59,689 | | | 316 |
Greif, Cl A | | 25,821 | | | 1,248 |
H.B. Fuller | | 52,600 | | | 895 |
Headwaters* | | 93,999 | | | 373 |
Huntsman | | 220,033 | | | 1,391 |
Innophos Holdings | | 116,643 | | | 1,819 |
Innospec | | 36,404 | | | 324 |
International Flavors & Fragrances | | 52,910 | | | 1,688 |
Intrepid Potash* (A) | | 24,415 | | | 796 |
| | |
| SEI Institutional Investments Trust / Annual Report / May 31, 2009 | | 93 |
SCHEDULE OF INVESTMENTS
Small/Mid Cap Equity Fund (Continued)
May 31, 2009
| | | | | |
| Description | | Shares | | Market Value
($ Thousands) |
| | | | | |
Jaguar Mining* | | 85,200 | | $ | 761 |
Koppers Holdings | | 29,859 | | | 755 |
LSB Industries* | | 11,491 | | | 193 |
Lubrizol | | 57,400 | | | 2,564 |
Minerals Technologies | | 9,404 | | | 368 |
Myers Industries | | 72,152 | | | 729 |
Nalco Holding (A) | | 227,135 | | | 3,943 |
Neenah Paper | | 71,290 | | | 577 |
NewMarket | | 47,436 | | | 3,442 |
Olin | | 25,378 | | | 339 |
OM Group* | | 14,277 | | | 378 |
Owens-Illinois* | | 125,675 | | | 3,598 |
Packaging of America | | 56,739 | | | 915 |
Pactiv* | | 120,402 | | | 2,697 |
PolyOne* | | 173,800 | | | 523 |
Reliance Steel & Aluminum | | 115,767 | | | 4,398 |
Rock-Tenn, Cl A | | 13,563 | | | 521 |
Rockwood Holdings* | | 150,560 | | | 2,246 |
RPM International | | 38,400 | | | 588 |
Schnitzer Steel Industries, Cl A | | 14,200 | | | 774 |
Schweitzer-Mauduit International | | 28,365 | | | 637 |
Scotts Miracle-Gro, Cl A (A) | | 23,800 | | | 816 |
Sealed Air | | 25,500 | | | 510 |
Sensient Technologies | | 25,300 | | | 580 |
Silgan Holdings | | 59,250 | | | 2,622 |
Solutia* | | 144,820 | | | 710 |
Sonoco Products | | 85,054 | | | 2,072 |
Spartech | | 4,423 | | | 19 |
Steel Dynamics (A) | | 191,870 | | | 2,867 |
Stillwater Mining* | | 38,900 | | | 288 |
Terra Industries | | 26,968 | | | 749 |
Titanium Metals | | 34,600 | | | 320 |
United States Steel (A) | | 9,679 | | | 330 |
Universal Stainless & Alloy* | | 83,500 | | | 1,160 |
US Concrete* | | 11,572 | | | 27 |
Valspar | | 7,061 | | | 161 |
Western Goldfields* | | 573,500 | | | 1,772 |
Worthington Industries | | 46,000 | | | 644 |
WR Grace* | | 26,025 | | | 338 |
| | | | | |
| | | | | 94,853 |
| | | | | |
| | |
Telecommunication Services — 1.6% | | | | | |
Alaska Communications Systems Group | | 108,525 | | | 735 |
Cbeyond* (A) | | 79,433 | | | 1,365 |
CenturyTel (A) | | 104,455 | | | 3,222 |
Cincinnati Bell* | | 262,011 | | | 731 |
Embarq (A) | | 50,586 | | | 2,126 |
Global Crossing* | | 23,100 | | | 193 |
Iowa Telecommunications Services | | 44,925 | | | 532 |
Neutral Tandem* | | 15,910 | | | 461 |
NII Holdings* | | 153,495 | | | 3,141 |
NTELOS Holdings | | 24,800 | | | 443 |
Premiere Global Services* | | 34,800 | | | 417 |
SBA Communications, Cl A* | | 306,066 | | | 7,826 |
| | | | | |
| Description | | Shares | | Market Value
($ Thousands) |
| | | | | |
Syniverse Holdings* | | 137,415 | | $ | 2,054 |
tw telecom inc, Cl A* | | 223,772 | | | 2,654 |
US Cellular* | | 11,256 | | | 467 |
USA Mobility | | 43,637 | | | 488 |
Windstream | | 37,705 | | | 317 |
| | | | | |
| | | | | 27,172 |
| | | | | |
| | |
Utilities — 4.0% | | | | | |
AGL Resources | | 95,825 | | | 2,771 |
Alliant Energy | | 59,463 | | | 1,411 |
Atmos Energy | | 59,135 | | | 1,419 |
Black Hills | | 13,917 | | | 298 |
Centerpoint Energy | | 155,000 | | | 1,569 |
Central Vermont Public Service | | 11,700 | | | 189 |
CH Energy Group | | 1,200 | | | 50 |
Chesapeake Utilities | | 3,500 | | | 115 |
Cia de Saneamento de Minas Gerais-COPASA (Brazil) | | 112,700 | | | 1,487 |
Cleco (A) | | 47,272 | | | 967 |
CMS Energy (A) | | 109,371 | | | 1,240 |
Consolidated Edison | | 23,185 | | | 822 |
DPL (A) | | 78,100 | | | 1,699 |
DTE Energy | | 12,152 | | | 368 |
Edison International | | 28,710 | | | 840 |
El Paso Electric* | | 20,628 | | | 273 |
Empire District Electric | | 49,556 | | | 777 |
Energen | | 53,145 | | | 1,978 |
Equities | | 64,026 | | | 2,385 |
Great Plains Energy | | 197,691 | | | 2,979 |
Hawaiian Electric Industries | | 72,800 | | | 1,256 |
IDACORP | | 10,950 | | | 255 |
ITC Holdings | | 48,709 | | | 2,089 |
Laclede Group | | 10,225 | | | 318 |
MDU Resources Group | | 76,863 | | | 1,419 |
Mirant* (A) | | 50,600 | | | 790 |
New Jersey Resources | | 53,192 | | | 1,770 |
Northeast Utilities (A) | | 155,234 | | | 3,227 |
Northwest Natural Gas (A) | | 32,579 | | | 1,383 |
NorthWestern | | 141,925 | | | 3,041 |
NV Energy | | 145,311 | | | 1,453 |
OGE Energy (A) | | 58,551 | | | 1,512 |
Pepco Holdings | | 32,000 | | | 415 |
Piedmont Natural Gas | | 24,500 | | | 555 |
Pinnacle West Capital | | 82,948 | | | 2,294 |
PNM Resources | | 47,800 | | | 442 |
Portland General Electric (A) | | 321,433 | | | 5,783 |
Questar | | 19,800 | | | 671 |
RRI Energy* | | 277,959 | | | 1,523 |
SCANA | | 71,554 | | | 2,148 |
Southwest Gas | | 3,045 | | | 63 |
UGI | | 129,423 | | | 3,121 |
Unisource Energy | | 58,300 | | | 1,483 |
Vectren | | 61,602 | | | 1,401 |
Westar Energy | | 218,230 | | | 3,895 |
| | |
| 94 | | SEI Institutional Investments Trust / Annual Report / May 31, 2009 |
| | | | | |
| Description | | Shares/Face Amount
($ Thousands) | | Market Value
($ Thousands) |
| | | | | |
Wisconsin Energy | | 46,162 | | $ | 1,821 |
Xcel Energy | | 65,529 | | | 1,124 |
| | | | | |
| | | | | 68,889 |
| | | | | |
Total Common Stock
(Cost $1,752,538) ($ Thousands) | | | | | 1,629,606 |
| | | | | |
| | |
CONVERTIBLE BONDS — 0.5% | | | | | |
| | |
Consumer Discretionary — 0.1% | | | | | |
Charming Shoppes | | | | | |
1.125%, 05/01/14 | | $2,612 | | | 1,394 |
Eddie Bauer Holdings | | | | | |
5.250%, 04/01/14 | | 2,849 | | | 541 |
| | | | | |
| | | | | 1,935 |
| | | | | |
| | |
Energy — 0.0% | | | | | |
Nova Biosource Fuels | | | | | |
10.000%, 09/30/12 (B) (C) | | 1,826 | | | 91 |
Rentech | | | | | |
4.000%, 04/15/13 | | 1,181 | | | 340 |
Scorpio Mining (G) (H) (I) | | | | | |
7.000%, 05/05/11 | | 509 | | | 384 |
| | | | | |
| | | | | 815 |
| | | | | |
| | |
Financials — 0.1% | | | | | |
Dollar Financial | | | | | |
2.875%, 06/30/27 | | 1,509 | | | 877 |
World Acceptance | | | | | |
3.000%, 10/01/11 | | 283 | | | 179 |
| | | | | |
| | | | | 1,056 |
| | | | | |
| | |
Health Care — 0.1% | | | | | |
Human Genome Sciences | | | | | |
2.250%, 10/15/11 | | 2,613 | | | 1,215 |
Incyte | | | | | |
3.500%, 02/15/11 | | 740 | | | 476 |
| | | | | |
| | | | | 1,691 |
| | | | | |
| | |
Industrials — 0.1% | | | | | |
NCI Building Systems | | | | | |
2.125%, 11/15/24 | | 1,828 | | | 1,526 |
| | | | | |
|
Information Technology — 0.1% |
Hutchinson Technology | | | | | |
2.250%, 03/15/10 | | 1,125 | | | 1,007 |
| | | | | |
Total Convertible Bonds
(Cost $8,988) ($ Thousands) | | | | | 8,030 |
| | | | | |
| | | | | |
| Description | | Shares/Face Amount
($ Thousands) | | Market Value
($ Thousands) |
| | | Number of
Warrants | | |
| | | | | |
| |
WARRANTS — 0.0% | | | |
Oilsands Quest, Expires 05/12/11* | | 330,350 | | $ | 116 |
Oilsands Quest, Expires 12/08/09* | | 20,000 | | | — |
Rentech, Expires 04/25/12* (G) (H) (I) | | 13,800 | | | — |
Titanium Asset Management, Expires 06/21/11* (I) | | 105,000 | | | 121 |
Triplecrown Acquisition, Expires 10/25/12* | | 200,851 | | | 18 |
| | | | | |
Total Warrants
(Cost $192) ($ Thousands) | | | | | 255 |
| | | | | |
| |
EXCHANGE TRADED FUND — 0.0% | | | |
iShares Russell 2000 Index Fund | | 9,971 | | | 501 |
| | | | | |
Total Exchange Traded Fund
(Cost $439) ($ Thousands) | | | | | 501 |
| | | | | |
| |
U.S. TREASURY OBLIGATION — 0.5% | | | |
U.S. Treasury Bills | | | | | |
0.260%, 06/11/09 (D) (E) | | $8,950 | | | 8,950 |
| | | | | |
Total U.S. Treasury Obligation
(Cost $8,949) ($ Thousands) | | | | | 8,950 |
| | | | | |
| |
CASH EQUIVALENT — 3.7% | | | |
SEI Daily Income Trust, Prime Obligation Fund, Cl A,
0.260%**† | | 64,619,966 | | | 64,620 |
| | | | | |
Total Cash Equivalent
(Cost $64,620) ($ Thousands) | | | | | 64,620 |
| | | | | |
| |
AFFILIATED PARTNERSHIP — 11.5% | | | |
SEI Liquidity Fund, L.P.,
0.820%**† (F) | | 204,857,735 | | | 197,531 |
| | | | | |
Total Affiliated Partnership
(Cost $204,858) ($ Thousands) | | | | | 197,531 |
| | | | | |
Total Investments — 110.7%
(Cost $2,040,584) ($ Thousands) | | | | $ | 1,909,493 |
| | | | | |
| | |
| SEI Institutional Investments Trust / Annual Report / May 31, 2009 | | 95 |
SCHEDULE OF INVESTMENTS
Small/Mid Cap Equity Fund (concluded)
May 31, 2009
A summary of the open futures contracts held by the Fund at May 31, 2009, is as follows:
| | | | | | | |
Type of
Contract | | Number of
Contracts
Long | | Expiration
Date | | Unrealized
Appreciation ($ Thousands) |
Russell 2000 Index E-MINI | | 724 | | Jun-2009 | | $ | 449 |
S&P Mid 400 Index E-MINI | | 533 | | Jun-2009 | | | 355 |
| | | | | | | |
| | | | | | $ | 804 |
| | | | | | | |
| Percentages | | are based on a Net Assets of $1,724,824 ($ Thousands) |
| * | | Non-income producing security. |
| ** | | The rate reported is the 7-day effective yield as of May 31, 2009. |
| † | | Investment in Affiliated Security (See Note 4). |
| ‡ | | Real Estate Investment Trust. |
| (A) | | This security or a partial position of this security is on loan at May 31, 2009. The total value of securities on loan at May 31, 2009 was $201,700 ($ Thousands). |
| (B) | | Security sold within terms of a private placement memorandum, exempt from registration under Section 144A of the Securities Act of 1933, as amended, and may be sold only to dealers in that program or other “accredited investors.” This security has been determined to be liquid under guidelines established by the board of Trustees. |
| (C) | | Security in default on interest payments. Security is non-income producing. |
| (D) | | Security, or a portion thereof, has been pledged as collateral on open futures contracts. |
| (E) | | Zero coupon security. The rate reported is the effective yield at time of purchase. |
| (F) | | This security was purchased with cash collateral held from securities on loan. The total value of such securities as of May 31, 2009 was $197,531 ($ Thousands). |
| (G) | | Securities considered illiquid. The total value of such securities as of May 31, 2009 was $1,005 ($ Thousands) and represents 0.06% of net assets. |
| (H) | | Securities considered restricted. The total value of such securities as of May 31, 2009 was $777 ($ Thousands) and represents 0.05% of net assets. |
| (I) | | Security fair valued using methods determined in good faith by the Valuation Committee of the Board of Trustees. The total value of such securities as of May 31, 2009 was $1,845 ($ Thousands) and represents 0.11% of net assets. |
ADR — American Depositary Receipt
Cl — Class
LLC — Limited Liability Company
L.P. — Limited Partnership
PIPE — Private Investment in Public Entity
Amounts designated as “—” are $O or have been rounded to $O.
The accompanying notes are an integral part of the financial statements.
| | |
| 96 | | SEI Institutional Investments Trust / Annual Report / May 31, 2009 |
SCHEDULE OF INVESTMENTS
U.S. Managed Volatility Fund
May 31, 2009
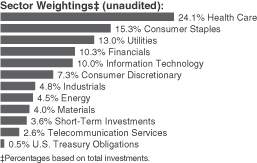
| | | | | |
Description | | Shares | | Market Value
($ Thousands) |
| | | | | |
| | |
COMMON STOCK — 96.1% | | | | | |
| | |
Consumer Discretionary — 7.3% | | | | | |
Aaron’s | | 29,300 | | $ | 954 |
Amazon.com* | | 5,364 | | | 418 |
Autoliv | | 32,600 | | | 906 |
Buckle | | 7,000 | | | 251 |
Burger King Holdings | | 51,000 | | | 844 |
Capella Education* | | 9,100 | | | 475 |
Carter’s* | | 29,900 | | | 707 |
Choice Hotels International | | 30,000 | | | 819 |
DIRECTV Group* | | 42,100 | | | 947 |
DreamWorks Animation SKG, Cl A* | | 34,300 | | | 955 |
Eastman Kodak | | 151,800 | | | 396 |
Genuine Parts | | 30,700 | | | 1,028 |
Gildan Activewear, Cl A* | | 57,800 | | | 951 |
H&R Block | | 43,500 | | | 635 |
International Speedway, Cl A | | 26,700 | | | 662 |
ITT Educational Services* | | 5,600 | | | 514 |
J.C. Penney | | 8,200 | | | 214 |
Jack in the Box* | | 25,800 | | | 678 |
Jarden* | | 39,800 | | | 708 |
John Wiley & Sons, Cl A | | 21,500 | | | 680 |
Matthews International, Cl A | | 14,300 | | | 408 |
Panera Bread, Cl A* | | 11,300 | | | 602 |
Starwood Hotels & Resorts Worldwide | | 14,800 | | | 362 |
Strayer Education | | 5,122 | | | 944 |
Tractor Supply* | | 19,800 | | | 760 |
Tupperware Brands | | 25,900 | | | 630 |
| | | | | |
| | | | | 17,448 |
| | | | | |
| | |
Consumer Staples — 15.3% | | | | | |
Alberto-Culver, Cl B | | 62,035 | | | 1,442 |
Altria Group | | 167,104 | | | 2,856 |
Brown-Forman, Cl B | | 35,554 | | | 1,559 |
Campbell Soup | | 69,947 | | | 1,939 |
Church & Dwight | | 16,900 | | | 850 |
Colgate-Palmolive | | 28,458 | | | 1,877 |
Dean Foods* | | 13,700 | | | 257 |
Flowers Foods | | 17,200 | | | 364 |
General Mills | | 36,794 | | | 1,883 |
| | | | | |
Description | | Shares | | Market Value
($ Thousands) |
| | | | | |
Green Mountain Coffee Roasters* | | 7,700 | | $ | 643 |
Hershey | | 35,338 | | | 1,245 |
Hormel Foods | | 90,379 | | | 3,140 |
JM Smucker | | 1,936 | | | 78 |
Kellogg | | 25,900 | | | 1,120 |
Kimberly-Clark | | 20,800 | | | 1,079 |
Kroger | | 74,446 | | | 1,698 |
Lorillard | | 44,295 | | | 3,027 |
McCormick | | 28,274 | | | 863 |
Molson Coors Brewing, Cl B | | 1,868 | | | 82 |
PepsiCo | | 3,062 | | | 159 |
Philip Morris International | | 72,558 | | | 3,094 |
Reynolds American | | 32,659 | | | 1,305 |
Ruddick | | 23,500 | | | 591 |
Safeway | | 33,411 | | | 677 |
Supervalu | | 18,800 | | | 312 |
Sysco | | 119,580 | | | 2,865 |
Wal-Mart Stores | | 29,621 | | | 1,473 |
| | | | | |
| | | | | 36,478 |
| | | | | |
| | |
Energy — 4.6% | | | | | |
Chevron | | 16,700 | | | 1,114 |
CNX Gas* | | 35,100 | | | 1,079 |
Enbridge | | 32,300 | | | 1,147 |
Encore Acquisition* | | 27,100 | | | 962 |
Exxon Mobil | | 44,526 | | | 3,088 |
Imperial Oil | | 6,700 | | | 272 |
Murphy Oil | | 3,800 | | | 224 |
Range Resources | | 11,000 | | | 504 |
SEACOR Holdings* | | 10,200 | | | 779 |
Spectra Energy | | 50,300 | | | 807 |
TransCanada | | 28,500 | | | 848 |
| | | | | |
| | | | | 10,824 |
| | | | | |
| | |
Financials — 10.3% | | | | | |
Arthur J Gallagher | | 8,697 | | | 182 |
Associated Banc | | 54,200 | | | 784 |
Bancorpsouth | | 44,691 | | | 994 |
Bank of Hawaii | | 56,872 | | | 2,129 |
BOK Financial | | 22,146 | | | 898 |
Brown & Brown | | 7,274 | | | 140 |
Capitol Federal Financial | | 14,613 | | | 615 |
Cincinnati Financial | | 27,600 | | | 624 |
Commerce Bancshares | | 67,755 | | | 2,132 |
Cullen/Frost Bankers | | 32,264 | | | 1,579 |
Endurance Specialty Holdings | | 32,800 | | | 901 |
Erie Indemnity, Cl A | | 24,900 | | | 862 |
Federated Investors, Cl B | | 37,600 | | | 941 |
First Niagara Financial Group | | 900 | | | 12 |
Fulton Financial | | 86,100 | | | 500 |
Hancock Holding | | 17,800 | | | 622 |
Hudson City Bancorp | | 75,700 | | | 971 |
IPC Holdings | | 6,200 | | | 154 |
Northern Trust | | 33,738 | | | 1,945 |
| | |
| SEI Institutional Investments Trust / Annual Report / May 31, 2009 | | 97 |
SCHEDULE OF INVESTMENTS
U.S. Managed Volatility Fund (Continued)
May 31, 2009
| | | | | |
Description | | Shares | | Market Value
($ Thousands) |
| | | | | |
People’s United Financial | | 167,407 | | $ | 2,645 |
Platinum Underwriters Holdings | | 21,800 | | | 629 |
Prosperity Bancshares | | 29,300 | | | 822 |
RenaissanceRe Holdings | | 5,700 | | | 261 |
TFS Financial | | 127,370 | | | 1,453 |
Trustmark | | 28,100 | | | 551 |
UMB Financial | | 18,600 | | | 747 |
United Bankshares | | 5,800 | | | 122 |
Valley National Bancorp | | 27,930 | | | 339 |
| | | | | |
| | | | | 24,554 |
| | | | | |
| | |
Health Care — 24.1% | | | | | |
Abbott Laboratories | | 63,350 | | | 2,855 |
AmerisourceBergen | | 102,989 | | | 3,821 |
Amgen* | | 59,853 | | | 2,989 |
Baxter International | | 53,912 | | | 2,760 |
Beckman Coulter | | 4,500 | | | 244 |
Becton Dickinson | | 43,313 | | | 2,931 |
Bristol-Myers Squibb | | 85,547 | | | 1,704 |
C.R. Bard | | 24,179 | | | 1,728 |
Cardinal Health | | 80,577 | | | 2,881 |
Celgene* | | 3,700 | | | 156 |
Cephalon* | | 1,904 | | | 111 |
Cubist Pharmaceuticals* | | 4,700 | | | 80 |
Edwards Lifesciences* | | 24,303 | | | 1,551 |
Endo Pharmaceuticals Holdings* | | 4,900 | | | 78 |
Forest Laboratories* | | 112,066 | | | 2,655 |
Genzyme* | | 67,612 | | | 3,999 |
Gilead Sciences* | | 64,747 | | | 2,791 |
Haemonetics* | | 12,600 | | | 671 |
Henry Schein* | | 7,116 | | | 324 |
HLTH* | | 46,191 | | | 545 |
Immucor* | | 28,500 | | | 429 |
Johnson & Johnson | | 50,919 | | | 2,809 |
Laboratory Corp of America Holdings* | | 15,200 | | | 926 |
LifePoint Hospitals* | | 34,300 | | | 935 |
McKesson | | 96,957 | | | 3,990 |
Merck | | 25,500 | | | 703 |
Millipore* | | 7,426 | | | 467 |
NuVasive* | | 23,800 | | | 860 |
Onyx Pharmaceuticals* | | 7,800 | | | 184 |
Owens & Minor | | 24,100 | | | 845 |
Patterson* | | 43,600 | | | 898 |
Perrigo | | 33,500 | | | 900 |
Psychiatric Solutions* | | 10,000 | | | 184 |
STERIS | | 26,500 | | | 626 |
Techne | | 55,720 | | | 3,358 |
United Therapeutics* | | 14,100 | | | 1,130 |
Varian Medical Systems* | | 6,234 | | | 223 |
Warner Chilcott, Cl A* | | 101,701 | | | 1,338 |
Watson Pharmaceuticals* | | 55,732 | | | 1,686 |
| | | | | |
| | | | | 57,365 |
| | | | | |
| | | | | |
Description | | Shares | | Market Value
($ Thousands) |
| | | | | |
| | |
Industrials — 4.8% | | | | | |
Alliant Techsystems* | | 10,100 | | $ | 871 |
C.H. Robinson Worldwide | | 18,600 | | | 945 |
Copa Holdings, Cl A | | 19,381 | | | 675 |
Curtiss-Wright | | 3,000 | | | 88 |
FTI Consulting* | | 18,100 | | | 909 |
Gardner Denver* | | 27,800 | | | 788 |
General Cable* | | 10,600 | | | 405 |
Granite Construction | | 16,600 | | | 607 |
Harsco | | 12,600 | | | 366 |
KBR | | 45,600 | | | 840 |
Knight Transportation | | 23,900 | | | 424 |
Landstar System | | 24,800 | | | 942 |
Lennox International | | 29,100 | | | 902 |
Robert Half International | | 19,300 | | | 413 |
Rollins | | 47,200 | | | 789 |
Simpson Manufacturing | | 6,800 | | | 142 |
Stericycle* | | 19,048 | | | 952 |
Valmont Industries | | 5,900 | | | 405 |
| | | | | |
| | | | | 11,463 |
| | | | | |
| | |
Information Technology — 10.1% | | | | | |
Accenture, Cl A | | 64,531 | | | 1,931 |
Adtran | | 35,900 | | | 746 |
Analog Devices | | 123,790 | | | 3,022 |
Atmel* | | 95,713 | | | 369 |
Cree* | | 5,075 | | | 154 |
Diebold | | 24,600 | | | 608 |
FLIR Systems* | | 29,100 | | | 654 |
Google, Cl A* | | 1,362 | | | 568 |
Hewitt Associates, Cl A* | | 14,000 | | | 406 |
IAC* | | 43,903 | | | 710 |
Ingram Micro, Cl A* | | 55,200 | | | 912 |
Intel | | 176,849 | | | 2,780 |
Lexmark International, Cl A* | | 52,593 | | | 860 |
Mantech International, Cl A* | | 5,900 | | | 226 |
Mastercard, Cl A | | 1,485 | | | 262 |
Micros Systems* | | 25,900 | | | 676 |
NeuStar, Cl A* | | 16,300 | | | 327 |
Perot Systems, Cl A* | | 66,300 | | | 906 |
SAIC* | | 7,397 | | | 129 |
Silicon Laboratories* | | 26,753 | | | 899 |
Sybase* | | 27,500 | | | 895 |
Synopsys* | | 25,697 | | | 501 |
Tech Data* | | 24,343 | | | 779 |
Texas Instruments | | 154,205 | | | 2,992 |
Visa, Cl A | | 4,772 | | | 323 |
WebMD Health, Cl A* | | 13,809 | | | 375 |
Xerox | | 39,600 | | | 269 |
Zebra Technologies, Cl A* | | 29,600 | | | 646 |
| | | | | |
| | | | | 23,925 |
| | | | | |
| | |
| 98 | | SEI Institutional Investments Trust / Annual Report / May 31, 2009 |
| | | | | |
Description | | Shares | | Market Value
($ Thousands) |
| | | | | |
| | |
Materials — 4.0% | | | | | |
Aptargroup | | 20,000 | | $ | 620 |
Bemis | | 17,300 | | | 434 |
Compass Minerals International | | 18,000 | | | 965 |
Greif, Cl A | | 18,700 | | | 904 |
Huntsman | | 129,800 | | | 820 |
Newmont Mining | | 66,810 | | | 3,265 |
Packaging of America | | 17,900 | | | 288 |
Pactiv* | | 32,000 | | | 717 |
Sensient Technologies | | 23,800 | | | 546 |
Steel Dynamics | | 30,100 | | | 450 |
Westlake Chemical | | 20,200 | | | 413 |
| | | | | |
| | | | | 9,422 |
| | | | | |
| | |
Telecommunication Services — 2.6% | | | | | |
AT&T | | 46,000 | | | 1,140 |
BCE | | 29,600 | | | 678 |
Cellcom Israel | | 39,600 | | | 1,057 |
MetroPCS Communications* | | 47,300 | | | 810 |
Rogers Communications, Cl B | | 35,000 | | | 1,045 |
Telephone & Data Systems | | 11,300 | | | 343 |
Verizon Communications | | 37,400 | | | 1,094 |
| | | | | |
| | | | | 6,167 |
| | | | | |
| | |
Utilities — 13.0% | | | | | |
AGL Resources | | 39,871 | | | 1,153 |
Alliant Energy | | 40,817 | | | 969 |
Ameren | | 41,100 | | | 956 |
Aqua America | | 49,539 | | | 817 |
Atmos Energy | | 71,924 | | | 1,726 |
Consolidated Edison | | 17,100 | | | 606 |
DPL | | 16,000 | | | 348 |
DTE Energy | | 32,600 | | | 986 |
Edison International | | 34,300 | | | 1,003 |
Energen | | 11,800 | | | 439 |
Hawaiian Electric Industries | | 65,785 | | | 1,135 |
IDACORP | | 25,500 | | | 593 |
Integrys Energy Group | | 32,900 | | | 891 |
Nicor | | 35,620 | | | 1,120 |
NiSource | | 62,600 | | | 669 |
Northeast Utilities | | 6,100 | | | 127 |
Northwest Natural Gas | | 8,400 | | | 357 |
NSTAR | | 38,893 | | | 1,170 |
OGE Energy | | 39,056 | | | 1,008 |
Pepco Holdings | | 74,700 | | | 970 |
PG&E | | 9,900 | | | 364 |
PPL | | 58,581 | | | 1,902 |
SCANA | | 23,241 | | | 698 |
Sempra Energy | | 29,607 | | | 1,353 |
South Jersey Industries | | 10,500 | | | 350 |
TECO Energy | | 81,300 | | | 912 |
UGI | | 84,985 | | | 2,049 |
Vectren | | 60,543 | | | 1,377 |
| | | | | |
| Description | | Shares/
Face Amount
($ Thousands) | | Market Value
($ Thousands) |
| | | | | |
Westar Energy | | 48,800 | | $ | 871 |
WGL Holdings | | 26,600 | | | 791 |
Wisconsin Energy | | 81,585 | | | 3,219 |
| | | | | |
| | | | | 30,929 |
| | | | | |
Total Common Stock
(Cost $215,961) ($ Thousands) | | | | | 228,575 |
| | | | | |
| |
U.S. TREASURY OBLIGATION — 0.5% | | | |
U.S. Treasury Bills | | | | | |
0.216%, 06/11/09 (A) (B) | | $1,200 | | | 1,200 |
| | | | | |
Total U.S. Treasury Obligation
(Cost $1,200) ($ Thousands) | | | | | 1,200 |
| | | | | |
| | |
CASH EQUIVALENT — 3.6% | | | | | |
SEI Daily Income Trust, Prime Obligation Fund, Cl A, | | | | | |
0.260%**† | | 8,584,482 | | | 8,584 |
| | | | | |
Total Cash Equivalent
(Cost $8,584) ($ Thousands) | | | | | 8,584 |
| | | | | |
Total Investments — 100.2%
(Cost $225,745) ($ Thousands) | | | | $ | 238,359 |
| | | | | |
A summary of the open futures contracts held by the Fund at May 31, 2009, is as follows:
| | | | | | | |
Type of
Contract | | Number of
Contracts
Long | | Expiration
Date | | Unrealized
Appreciation
($ Thousands) |
S&P 500 Index EMINI | | 212 | | Jun-2009 | | $ | 522 |
| | | | | | | |
| Percentages | | are based on a Net Assets of $237,860 ($ Thousands). |
| * | | Non-income producing security. |
| ** | | The rate reported is the 7-day effective yield as of May 31, 2009. |
| † | | Investment in Affiliated Security (See Note 4). |
| (A) | | Zero coupon security. The rate reported is the effective yield at time of purchase. |
| (B) | | Security or a portion thereof, has been pledged as collateral on open futures contracts. |
Cl — Class
The accompanying notes are an integral part of the financial statements.
| | |
| SEI Institutional Investments Trust / Annual Report / May 31, 2009 | | 99 |
SCHEDULE OF INVESTMENTS
International Equity Fund
May 31, 2009
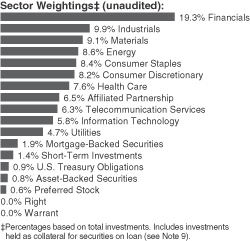
| | | | | |
| Description | | Shares | | Market Value
($ Thousands) |
| | | | | |
| | |
COMMON STOCK — 89.5% | | | | | |
| | |
Australia — 5.2% | | | | | |
AGL Energy | | 91,091 | | $ | 1,024 |
Alumina | | 25,673 | | | 28 |
Amcor | | 22,248 | | | 91 |
AMP | | 17,915 | | | 70 |
Aristocrat Leisure (A) | | 18,816 | | | 55 |
ASX | | 7,262 | | | 204 |
Australia & New Zealand Banking Group (A) | | 51,968 | | | 671 |
AWB | | 53,506 | | | 51 |
AXA Asia Pacific Holdings | | 41,080 | | | 127 |
Babcock & Brown (A) | | 11,693 | | | 2 |
Beach Petroleum | | 5,836 | | | 4 |
Bendigo Bank | | 13,894 | | | 68 |
BHP Billiton | | 164,924 | | | 4,632 |
Billabong International | | 23,663 | | | 150 |
BlueScope Steel | | 88,977 | | | 172 |
Boral | | 23,900 | | | 79 |
Brambles | | 37,217 | | | 177 |
Caltex Australia | | 35,884 | | | 346 |
CFS Retail Property Trust‡ (A) | | 105,315 | | | 139 |
Challenger Financial Services Group (A) | | 55,318 | | | 91 |
Coca-Cola Amatil | | 72,941 | | | 495 |
Cochlear | | 2,758 | | | 121 |
Commonwealth Bank of Australia | | 120,371 | | | 3,395 |
Computershare | | 81,551 | | | 583 |
Crown | | 36,575 | | | 214 |
CSL | | 99,697 | | | 2,353 |
David Jones | | 20,400 | | | 60 |
Dexus Property Group‡ | | 45,614 | | | 28 |
Downer EDI | | 7,346 | | | 28 |
Energy Resources of Australia | | 3,200 | | | 63 |
Fairfax Media (A) | | 16,607 | | | 15 |
Fortescue Metals Group* | | 5,607 | | | 12 |
Foster’s Group | | 157,279 | | | 621 |
Goodman Fielder | | 216,376 | | | 223 |
| | | | | |
| Description | | Shares | | Market Value
($ Thousands) |
| | | | | |
Goodman Group‡ | | 116,175 | | $ | 24 |
GPT Group‡ | | 39,545 | | | 16 |
Harvey Norman Holdings | | 700 | | | 2 |
Incitec Pivot | | 86,958 | | | 190 |
Insurance Australia Group | | 79,707 | | | 234 |
JB Hi-Fi | | 17,025 | | | 172 |
Leighton Holdings | | 2,184 | | | 40 |
Lion Nathan | | 31,004 | | | 294 |
Macquarie Group (A) | | 19,606 | | | 509 |
Macquarie Infrastructure Group (A) | | 172,464 | | | 194 |
Macquarie Office Trust‡ | | 34,360 | | | 5 |
Medusa Mining* | | 1,919 | | | 3 |
Metcash | | 100,828 | | | 340 |
Mirvac Group‡ | | 18,303 | | | 17 |
National Australia Bank (A) | | 69,993 | | | 1,252 |
Newcrest Mining | | 53,956 | | | 1,432 |
Nufarm | | 55,600 | | | 552 |
OneSteel | | 31,124 | | | 68 |
Orica | | 9,141 | | | 149 |
Origin Energy | | 75,061 | | | 894 |
Pacific Brands | | 174,604 | | | 111 |
Primary Health Care | | 10,014 | | | 43 |
Qantas Airways | | 19,365 | | | 30 |
QBE Insurance Group | | 26,610 | | | 417 |
Ramsay Health Care | | 1,900 | | | 17 |
Rio Tinto (A) | | 54,203 | | | 2,850 |
Santos | | 168,240 | | | 1,976 |
Sims Group | | 1,884 | | | 35 |
Sonic Healthcare | | 6,363 | | | 60 |
SP AusNet, Cl Miscellaneous | | 18,992 | | | 12 |
Suncorp-Metway | | 67,429 | | | 325 |
TABCORP Holdings | | 50,646 | | | 300 |
Tatts Group | | 291,204 | | | 577 |
Telstra | | 138,266 | | | 346 |
Toll Holdings | | 9,412 | | | 54 |
Transurban Group | | 5,355 | | | 18 |
Wesfarmers (A) | | 31,159 | | | 537 |
Westfield Group‡ | | 51,465 | | | 455 |
Westpac Banking | | 244,166 | | | 3,716 |
Woodside Petroleum | | 16,820 | | | 587 |
Woolworths | | 59,898 | | | 1,223 |
WorleyParsons | | 18,976 | | | 347 |
| | | | | |
| | | | | 36,815 |
| | | | | |
| | |
Austria — 0.4% | | | | | |
Erste Group Bank (A) | | 4,017 | | | 98 |
Mayr Melnhof Karton | | 216 | | | 19 |
OMV (A) | | 53,577 | | | 2,197 |
Strabag (A) | | 5,861 | | | 132 |
Telekom Austria (A) | | 3,855 | | | 60 |
Verbund-Oesterreichische Elektrizitaetswirtschafts, Cl A | | 3,054 | | | 166 |
Vienna Insurance Group | | 411 | | | 18 |
| | | | | |
| | | | | 2,690 |
| | | | | |
| | |
| 100 | | SEI Institutional Investments Trust / Annual Report / May 31, 2009 |
| | | | | |
| Description | | Shares | | Market Value
($ Thousands) |
| | | | | |
| | |
Belgium — 1.1% | | | | | |
Banque Nationale de Belgique | | 3 | | $ | 10 |
Belgacom | | 4,935 | | | 155 |
Colruyt | | 2,653 | | | 626 |
Delhaize Group (A) | | 27,888 | | | 2,059 |
Dexia (A) | | 37,705 | | | 241 |
D’ieteren | | 170 | | | 35 |
Fortis | | 73,071 | | | 278 |
Groupe Bruxelles Lambert | | 16,216 | | | 1,310 |
InBev (A) | | 45,988 | | | 1,624 |
KBC Groep | | 6,348 | | | 132 |
Mobistar | | 2,943 | | | 183 |
Nationale A Portefeuille | | 2,141 | | | 112 |
Solvay | | 6,514 | | | 599 |
Telenet Group Holding* | | 11,817 | | | 237 |
UCB (A) | | 13,735 | | | 460 |
| | | | | |
| | | | | 8,061 |
| | | | | |
| | |
Brazil — 0.4% | | | | | |
Brasil Telecom Participacoes ADR | | 2,183 | | | 98 |
Centrais Eletricas Brasileiras ADR | | 7,200 | | | 95 |
Cia de Saneamento Basico do Estado de Sao Paulo ADR | | 6,070 | | | 190 |
Cia Energetica de Minas Gerais ADR | | 54,250 | | | 718 |
Cia Paranaense de Energia ADR | | 4,553 | | | 64 |
Itau Unibanco Holding ADR | | 35,300 | | | 566 |
Petroleo Brasileiro ADR | | 16,600 | | | 731 |
Redecard | | 28,200 | | | 407 |
Telecomunicacoes de Sao Paulo ADR | | 2,500 | | | 58 |
Telegraph Norte Leste Participacoes ADR | | 10,800 | | | 191 |
| | | | | |
| | | | | 3,118 |
| | | | | |
| | |
Canada — 2.2% | | | | | |
Agnico-Eagle Mines | | 6,027 | | | 371 |
Agrium (A) | | 14,600 | | | 719 |
Bank of Montreal | | 9,800 | | | 392 |
Barrick Gold | | 15,492 | | | 585 |
Cameco | | 25,100 | | | 693 |
Canadian National Railway | | 22,900 | | | 982 |
Canadian Natural Resources | | 14,200 | | | 839 |
Canadian Utilities | | 5,800 | | | 187 |
CGI Group, Cl A* | | 33,700 | | | 312 |
EnCana | | 36,340 | | | 2,010 |
Goldcorp | | 47,690 | | | 1,895 |
IAMGOLD | | 31,085 | | | 348 |
Inmet Mining | | 8,800 | | | 349 |
Kinross Gold | | 44,000 | | | 890 |
National Bank of Canada | | 12,800 | | | 598 |
Potash Corp of Saskatchewan | | 8,300 | | | 961 |
Research In Motion* | | 10,410 | | | 819 |
Royal Bank of Canada | | 17,200 | | | 686 |
Talisman Energy | | 48,600 | | | 785 |
| | | | | |
| Description | | Shares | | Market Value
($ Thousands) |
| | | | | |
Toronto-Dominion Bank | | 22,200 | | $ | 1,126 |
| | | | | |
| | | | | 15,547 |
| | | | | |
| | |
Chile — 0.2% | | | | | |
Enersis ADR | | 99,400 | | | 1,701 |
| | | | | |
| | |
China — 1.0% | | | | | |
Anta Sports Products | | 381,000 | | | 420 |
China Communications Construction | | 277,000 | | | 389 |
China Life Insurance | | 333,650 | | | 1,226 |
China Railway Group* | | 782,000 | | | 654 |
China Shenhua Energy | | 221,500 | | | 748 |
Chongqing Machinery & Electric* | | 166,000 | | | 30 |
Huaneng Power International | | 284,000 | | | 189 |
Industrial & Commercial Bank of China | | 3,864,000 | | | 2,463 |
Li Ning (A) | | 154,500 | | | 381 |
Renhe Commercial Holdings* | | 3,286,000 | | | 654 |
| | | | | |
| | | | | 7,154 |
| | | | | |
| | |
Denmark — 1.1% | | | | | |
A P Moeller - Maersk, Cl A | | 8 | | | 50 |
A P Moeller - Maersk, Cl B | | 175 | | | 1,079 |
Carlsberg, Cl B | | 17,169 | | | 1,098 |
Coloplast, Cl B | | 1,906 | | | 132 |
Danisco | | 6,606 | | | 252 |
Danske Bank | | 26,503 | | | 451 |
H Lundbeck | | 42,979 | | | 963 |
Novo-Nordisk, Cl B | | 31,164 | | | 1,627 |
Novozymes, Cl B | | 4,234 | | | 338 |
Sydbank | | 923 | | | 20 |
Topdanmark* | | 1,552 | | | 188 |
TrygVesta | | 1,967 | | | 117 |
Vestas Wind Systems* | | 14,570 | | | 1,075 |
William Demant Holding* | | 837 | | | 48 |
| | | | | |
| | | | | 7,438 |
| | | | | |
| | |
Finland — 1.0% | | | | | |
Citycon | | 28,388 | | | 71 |
Elisa, Cl A | | 2,229 | | | 33 |
Fortum | | 3,544 | | | 87 |
Huhtamaki | | 7,887 | | | 82 |
Kesko, Cl B | | 1,858 | | | 54 |
Kone, Cl B | | 37,215 | | | 1,137 |
Konecranes | | 5,628 | | | 136 |
Metso* | | 6,511 | | | 125 |
Neste Oil | | 1,160 | | | 18 |
Nokia (A) | | 187,618 | | | 2,883 |
Orion, Cl B | | 4,908 | | | 80 |
Outokumpu | | 4,083 | | | 82 |
Pohjola Bank, Cl A | | 5,953 | | | 46 |
Rautaruukki | | 2,345 | | | 53 |
Sampo, Cl A | | 65,019 | | | 1,228 |
Stora Enso, Cl R | | 3,185 | | | 19 |
| | |
| SEI Institutional Investments Trust / Annual Report / May 31, 2009 | | 101 |
SCHEDULE OF INVESTMENTS
International Equity Fund (Continued)
May 31, 2009
| | | | | |
| Description | | Shares | | Market Value
($ Thousands) |
| | | | | |
UPM-Kymmene | | 19,630 | | $ | 185 |
Wartsila, Cl B (A) | | 23,048 | | | 832 |
| | | | | |
| | | | | 7,151 |
| | | | | |
| | |
France — 8.1% | | | | | |
Accor | | 1,552 | | | 70 |
Aeroports de Paris | | 953 | | | 70 |
Air France-KLM | | 14,000 | | | 225 |
Air Liquide | | 3,761 | | | 351 |
Alcatel-Lucent | | 6,500 | | | 17 |
Alstom (A) | | 14,904 | | | 952 |
Atos Origin | | 2,351 | | | 80 |
AXA | | 60,328 | | | 1,132 |
BioMerieux | | 153 | | | 13 |
BNP Paribas | | 55,696 | | | 3,864 |
Bouygues | | 35,666 | | | 1,476 |
Capital Gemini (A) | | 19,485 | | | 756 |
Carrefour (A) | | 854 | | | 38 |
Casino Guichard Perrachon (A) | | 2,997 | | | 220 |
Christian Dior (A) | | 7,428 | | | 572 |
Cie de Saint-Gobain (A) | | 21,967 | | | 802 |
Cie Generale de Geophysique-Veritas* | | 5,307 | | | 95 |
Cie Generale d’Optique Essilor International | | 1,595 | | | 74 |
CNP Assurances | | 7,255 | | | 689 |
Compagnie Generale des Etablissements Michelin, Cl B (A) | | 8,960 | | | 547 |
Credit Agricole (A) | | 47,176 | | | 698 |
Danone | | 722 | | | 36 |
Dassault Systemes | | 5,205 | | | 234 |
Eiffage | | 1,595 | | | 98 |
Electricite de France | | 213 | | | 11 |
Eramet (A) | | 1,575 | | | 438 |
Eutelsat Communications | | 22,000 | | | 561 |
Faiveley | | 176 | | | 14 |
France Telecom (A) | | 159,433 | | | 3,893 |
Gaz de France (A) | | 38,656 | | | 1,529 |
Gemalto* | | 9,510 | | | 315 |
Havas | | 94,330 | | | 253 |
Hermes International | | 1,440 | | | 194 |
ICADE‡ | | 821 | | | 70 |
Iliad | | 3,461 | | | 387 |
Imerys | | 1,111 | | | 48 |
Ipsen | | 490 | | | 23 |
Klepierre‡ | | 561 | | | 14 |
Lafarge | | 10,649 | | | 731 |
Lagardere S.C.A. | | 1,439 | | | 48 |
Legrand | | 6,750 | | | 143 |
L’Oreal | | 610 | | | 48 |
M6-Metropole Television | | 5,499 | | | 109 |
Moet Hennessy Louis Vuitton (A) | | 2,178 | | | 181 |
Natixis | | 185,317 | | | 381 |
Neopost | | 7,378 | | | 616 |
Nexans | | 414 | | | 23 |
Nexity | | 2,253 | | | 78 |
| | | | | |
| Description | | Shares | | Market Value
($ Thousands) |
| | | | | |
Pernod-Ricard (A) | | 922 | | $ | 58 |
Peugeot | | 13,853 | | | 423 |
PPR (A) | | 17,208 | | | 1,456 |
Publicis Groupe | | 15,829 | | | 517 |
Renault | | 38,375 | | | 1,490 |
Safran (A) | | 4,506 | | | 59 |
Sanofi-Aventis | | 126,240 | | | 8,067 |
Schneider Electric (A) | | 5,154 | | | 386 |
SCOR (A) | | 7,835 | | | 166 |
SES Global | | 28,441 | | | 569 |
Societe BIC (A) | | 2,365 | | | 130 |
Societe Des Autoroutes Paris-Rhin-Rhone | | 1,087 | | | 67 |
Societe Fonciere Financiere et de Participations FFP | | 2,756 | | | 144 |
Societe Generale (A) | | 49,801 | | | 2,926 |
Societe Television Francaise 1 | | 2,172 | | | 26 |
Sodexo | | 12,684 | | | 629 |
Suez Environnement (A) | | 41,367 | | | 754 |
Technip | | 21,353 | | | 1,060 |
Teleperformance | | 9,108 | | | 270 |
Thales (A) | | 13,329 | | | 630 |
Total (A) | | 152,022 | | | 8,781 |
Unibail-Rodamco‡ (A) | | 3,224 | | | 521 |
Vallourec (A) | | 364 | | | 46 |
Veolia Environnement (A) | | 2,856 | | | 85 |
Vinci (A) | | 21,096 | | | 1,022 |
Vivendi (A) | | 124,188 | | | 3,290 |
Wendel (A) | | 8,849 | | | 377 |
Zodiac Aerospace | | 1,789 | | | 58 |
| | | | | |
| | | | | 57,224 |
| | | | | |
| | |
Germany — 6.1% | | | | | |
Adidas | | 4,484 | | | 165 |
Allianz | | 30,509 | | | 3,032 |
BASF | | 72,885 | | | 3,095 |
Bayer (A) | | 53,951 | | | 3,089 |
Bayerische Motoren Werke | | 8,587 | | | 311 |
Beiersdorf | | 275 | | | 14 |
Bilfinger Berger | | 3,300 | | | 164 |
Commerzbank (A) | | 45,167 | | | 358 |
DaimlerChrysler | | 19,979 | | | 736 |
Demag Cranes | | 5,737 | | | 141 |
Deutsche Bank (A) | | 29,563 | | | 2,002 |
Deutsche Boerse | | 23,349 | | | 2,048 |
Deutsche Lufthansa | | 174,177 | | | 2,415 |
Deutsche Post | | 14,915 | | | 206 |
Deutsche Postbank (A) | | 12,401 | | | 291 |
Deutsche Telekom | | 42,039 | | | 485 |
Douglas Holding | | 225 | | | 9 |
E.ON (A) | | 116,143 | | | 4,128 |
Fraport Frankfurt Airport Services Worldwide (A) | | 1,024 | | | 42 |
Fresenius Medical Care (A) | | 28,562 | | | 1,205 |
GAGFAH | | 4,128 | | | 37 |
| | |
| 102 | | SEI Institutional Investments Trust / Annual Report / May 31, 2009 |
| | | | | |
| Description | | Shares | | Market Value
($ Thousands) |
| | | | | |
Hannover Rueckversicherung | | 43,426 | | $ | 1,640 |
HeidelbergCement (A) | | 4,867 | | | 176 |
Henkel | | 13,595 | | | 366 |
Hochtief | | 8,870 | | | 432 |
Infineon Technologies* | | 5,217 | | | 17 |
K+S | | 5,926 | | | 445 |
Lanxess | | 7,752 | | | 182 |
Linde | | 12,199 | | | 1,018 |
MAN | | 3,123 | | | 192 |
Merck KGaA | | 1,533 | | | 148 |
Metro | | 587 | | | 32 |
MTU Aero Engines Holding (A) | | 13,326 | | | 434 |
Muenchener Rueckversicherungs | | 19,116 | | | 2,703 |
Puma Rudolf Dassler Sport | | 75 | | | 17 |
Rheinmetall | | 1,343 | | | 56 |
RWE | | 63,055 | | | 5,256 |
SAP (A) | | 46,249 | | | 1,999 |
Siemens | | 21,100 | | | 1,544 |
Software | | 5,476 | | | 390 |
Solarworld | | 1,945 | | | 61 |
Suedzucker (A) | | 32,447 | | | 674 |
ThyssenKrupp | | 18,307 | | | 469 |
Tognum | | 12,000 | | | 184 |
TUI | | 15,747 | | | 140 |
United Internet | | 11,646 | | | 150 |
Volkswagen | | 1,555 | | | 471 |
Wacker Chemie | | 232 | | | 29 |
| | | | | |
| | | | | 43,198 |
| | | | | |
| | |
Greece — 0.6% | | | | | |
Hellenic Petroleum | | 7,589 | | | 77 |
Hellenic Telecommunications Organization | | 4,555 | | | 74 |
Marfin Investment Group | | 39,823 | | | 211 |
National Bank of Greece | | 18,940 | | | 518 |
OPAP | | 29,145 | | | 903 |
Public Power | | 89,944 | | | 2,048 |
| | | | | |
| | | | | 3,831 |
| | | | | |
| | |
Hong Kong — 2.6% | | | | | |
ASM Pacific Technology | | 4,000 | | | 24 |
Bank of East Asia | | 6,000 | | | 20 |
BOC Hong Kong Holdings | | 221,410 | | | 354 |
Cathay Pacific Airways | | 22,000 | | | 31 |
Cheung Kong Holdings | | 32,000 | | | 399 |
Cheung Kong Infrastructure Holdings | | 12,000 | | | 45 |
China Mobile | | 168,100 | | | 1,651 |
China Overseas Land & Investment | | 600,000 | | | 1,284 |
Chinese Estates Holdings | | 33,000 | | | 51 |
CLP Holdings | | 56,500 | | | 381 |
Dairy Farm International Holdings | | 3,300 | | | 18 |
Esprit Holdings | | 30,500 | | | 195 |
First Pacific | | 133,000 | | | 66 |
Genesis Energy Holdings* | | 1,300,000 | | | 61 |
| | | | | |
| Description | | Shares | | Market Value
($ Thousands) |
| | | | | |
Guoco Group | | 8,000 | | $ | 69 |
Hang Lung Group | | 24,000 | | | 110 |
Hang Lung Properties | | 157,000 | | | 536 |
Hang Seng Bank | | 30,730 | | | 443 |
Henderson Land Development | | 28,900 | | | 176 |
Hengan International Group | | 58,000 | | | 265 |
Hong Kong & China Gas | | 42,000 | | | 85 |
Hong Kong Exchanges and Clearing | | 57,000 | | | 890 |
HongKong Electric Holdings | | 117,500 | | | 631 |
Hopewell Highway Infrastructure | | 51,000 | | | 29 |
Hopewell Holdings | | 28,000 | | | 86 |
Huabao International Holdings | | 830,000 | | | 754 |
Hutchison Telecommunications Hong Kong Holdings* | | 362,000 | | | 45 |
Hutchison Telecommunications International | | 396,000 | | | 81 |
Hutchison Whampoa | | 205,980 | | | 1,454 |
Hysan Development | | 38,000 | | | 88 |
Jardine Matheson Holdings | | 5,800 | | | 149 |
Kerry Properties | | 12,500 | | | 54 |
Kingboard Chemical Holdings | | 37,000 | | | 97 |
Kingboard Laminates Holdings (A) | | 1,454,500 | | | 643 |
Lai Sun Development* | | 1,739,000 | | | 31 |
Li & Fung | | 288,000 | | | 781 |
Link REIT‡ | | 25,000 | | | 49 |
MTR | | 153,000 | | | 487 |
New World Development | | 77,000 | | | 147 |
Noble Group | | 356,000 | | | 396 |
NWS Holdings | | 4,000 | | | 9 |
Orient Overseas International | | 17,500 | | | 76 |
Pacific Century Premium Developments | | 145,000 | | | 33 |
Pico Far East Holdings | | 202,000 | | | 24 |
RCG Holdings | | 31,166 | | | 35 |
Road King Infrastructure | | 17,000 | | | 12 |
SEA Holdings | | 2,000 | | | 1 |
Shangri-La Asia | | 10,000 | | | 15 |
SIM Technology Group | | 222,000 | | | 25 |
SJM Holdings | | 130,000 | | | 57 |
Sun Hung Kai Properties | | 328,000 | | | 4,109 |
Swire Pacific, Cl A | | 10,500 | | | 105 |
Texwinca Holdings | | 5,000 | | | 3 |
VTech Holdings | | 6,000 | | | 32 |
Wharf Holdings | | 131,000 | | | 546 |
Wheelock | | 9,000 | | | 26 |
Wing On International | | 4,000 | | | 4 |
Yue Yuen Industrial Holdings | | 111,990 | | | 258 |
| | | | | |
| | | | | 18,526 |
| | | | | |
| | |
India — 0.2% | | | | | |
HDFC Bank | | 32,940 | | | 1,021 |
| | | | | |
| | |
Ireland — 0.2% | | | | | |
CRH | | 50,611 | | | 1,194 |
DCC | | 504 | | | 11 |
| | |
| SEI Institutional Investments Trust / Annual Report / May 31, 2009 | | 103 |
SCHEDULE OF INVESTMENTS
International Equity Fund (Continued)
May 31, 2009
| | | | | |
| Description | | Shares | | Market Value
($ Thousands) |
| | | | | |
Elan* | | 2,162 | | $ | 15 |
Experian | | 57,773 | | | 428 |
Kerry Group, Cl A | | 331 | | | 8 |
| | | | | |
| | | | | 1,656 |
| | | | | |
| | |
Israel — 0.4% | | | | | |
Check Point Software
Technologies* (A) | | 16,200 | | | 378 |
Teva Pharmaceutical Industries ADR | | 47,210 | | | 2,189 |
| | | | | |
| | | | | 2,567 |
| | | | | |
| | |
Italy — 2.7% | | | | | |
ACEA | | 22,852 | | | 296 |
Alleanza Assicurazioni (A) | | 12,761 | | | 93 |
Assicurazioni Generali (A) | | 4,581 | | | 102 |
Atlantia | | 19,444 | | | 412 |
Autogrill | | 1,572 | | | 15 |
Banca Carige | | 35,209 | | | 110 |
Banca Intesa | | 527,885 | | | 1,889 |
Banca Monte dei Paschi di Siena (A) | | 7,771 | | | 13 |
Banca Popolare di Milano | | 8,495 | | | 57 |
Banche Popolari Unite (A) | | 14,619 | | | 203 |
Banco Popolare Scarl | | 81,403 | | | 679 |
Benetton Group | | 11,971 | | | 112 |
Buzzi Unicem | | 15,838 | | | 225 |
Edison (A) | | 17,754 | | | 24 |
Enel | | 389,447 | | | 2,322 |
ENI | | 156,300 | | | 3,797 |
Exor | | 21,558 | | | 359 |
Fastweb* | | 6,208 | | | 157 |
Fiat (A) | | 23,292 | | | 250 |
Finmeccanica | | 30,679 | | | 435 |
Fondiaria-Sai | | 6,491 | | | 107 |
Geox (A) | | 82,415 | | | 653 |
Italcementi (A) | | 24,213 | | | 244 |
Lottomatica | | 918 | | | 18 |
Luxottica Group | | 5,028 | | | 105 |
Mediaset | | 39,162 | | | 231 |
Mediobanca | | 6,683 | | | 80 |
Mediolanum | | 7,662 | | | 38 |
Parmalat | | 35,276 | | | 88 |
Piccolo Credito Valtellinese Scarl | | 865 | | | 7 |
Pirelli | | 1,320,355 | | | 537 |
Prysmian | | 1,855 | | | 27 |
Saipem | | 732 | | | 19 |
Saras | | 10,730 | | | 32 |
Snam Rete Gas | | 13,815 | | | 60 |
Telecom Italia | | 2,482,128 | | | 3,308 |
Terna Rete Elettrica Nazionale | | 218,449 | | | 807 |
UniCredito Italiano | | 393,275 | | | 1,037 |
Unipol Gruppo Finanziario | | 144,000 | | | 189 |
| | | | | |
| | | | | 19,137 |
| | | | | |
| | | | | |
| Description | | Shares | | Market Value
($ Thousands) |
| | | | | |
| | |
Japan — 19.1% | | | | | |
77 Bank | | 36,000 | | $ | 195 |
Acom | | 710 | | | 19 |
Aderans Holdings | | 800 | | | 9 |
Advantest | | 2,300 | | | 41 |
Aeon | | 41,000 | | | 380 |
Aeon Mall | | 400 | | | 7 |
Aichi Bank | | 200 | | | 15 |
Aioi Insurance | | 19,000 | | | 90 |
Aisan Industry | | 1,200 | | | 8 |
Aisin Seiki | | 5,800 | | | 115 |
Ajinomoto | | 29,000 | | | 216 |
All Nippon Airways | | 26,000 | | | 97 |
Aloka | | 1,600 | | | 14 |
Alpine Electronics | | 10,300 | | | 94 |
Amada | | 23,000 | | | 151 |
AOKI Holdings | | 1,900 | | | 20 |
Aoyama Trading | | 3,200 | | | 54 |
Arakawa Chemical Industries | | 1,700 | | | 15 |
Asahi Breweries | | 33,600 | | | 463 |
Asahi Kasei | | 22,000 | | | 109 |
Asics | | 4,000 | | | 31 |
ASKUL | | 800 | | | 12 |
Astellas Pharma | | 112,900 | | | 3,840 |
Bank of Kyoto (A) | | 58,000 | | | 517 |
Bank of Nagoya | | 9,000 | | | 41 |
Bank of Yokohama | | 7,000 | | | 35 |
Belluna | | 2,150 | | | 8 |
Benesse | | 36,500 | | | 1,526 |
Best Denki | | 1,500 | | | 6 |
BML | | 1,200 | | | 24 |
Bridgestone | | 38,300 | | | 583 |
Canon | | 73,600 | | | 2,437 |
Canon Finetech | | 900 | | | 10 |
Canon Marketing Japan | | 17,000 | | | 233 |
Capcom | | 22,400 | | | 437 |
Casio Computer | | 3,800 | | | 34 |
Cawachi | | 3,700 | | | 69 |
Central Japan Railway | | 313 | | | 1,997 |
Chiba Bank | | 20,000 | | | 121 |
Chiba Kogyo Bank* | | 2,700 | | | 28 |
Chubu Electric Power | | 17,400 | | | 388 |
Chuetsu Pulp & Paper | | 8,000 | | | 22 |
Chugai Pharmaceutical | | 26,700 | | | 487 |
Chugoku Bank | | 14,000 | | | 189 |
Chugoku Electric Power | | 2,100 | | | 43 |
Chuo Denki Kogyo | | 8,000 | | | 58 |
Circle K Sunkus (A) | | 4,300 | | | 61 |
Citizen Holdings | | 11,100 | | | 56 |
Coca-Cola Central Japan | | 2,200 | | | 30 |
Cocokara Fine Holdings | | 2,500 | | | 35 |
Cosmo Oil | | 131,000 | | | 477 |
Create SD Holdings | | 800 | | | 14 |
Credit Saison | | 27,400 | | | 368 |
| | |
| 104 | | SEI Institutional Investments Trust / Annual Report / May 31, 2009 |
| | | | | |
| Description | | Shares | | Market Value
($ Thousands) |
| | | | | |
Culture Convenience Club | | 6,400 | | $ | 53 |
Dai Nippon Printing | | 40,000 | | | 514 |
Daicel Chemical Industries | | 4,000 | | | 22 |
Daihatsu Motor | | 45,000 | | | 434 |
Daiichi Sankyo | | 66,900 | | | 1,258 |
Daiichikosho | | 8,900 | | | 88 |
Daikin Industries | | 700 | | | 22 |
Daimei Telecom Engineering | | 3,000 | | | 27 |
Dainippon Ink and Chemicals | | 22,000 | | | 35 |
Dainippon Sumitomo Pharma | | 36,300 | | | 297 |
Daito Trust Construction | | 500 | | | 23 |
Daiwa House Industry | | 12,000 | | | 114 |
Daiwa Securities Group | | 78,000 | | | 487 |
DCM Japan Holdings | | 2,300 | | | 13 |
Dena | | 85 | | | 291 |
Denso (A) | | 33,500 | | | 795 |
Dentsu (A) | | 8,400 | | | 160 |
Dydo Drinco | | 1,400 | | | 37 |
eAccess | | 36 | | | 29 |
East Japan Railway | | 47,400 | | | 2,825 |
Ebara | | 100,000 | | | 307 |
Eisai | | 9,700 | | | 333 |
Electric Power Development | | 8,500 | | | 242 |
FamilyMart | | 14,600 | | | 426 |
Fanuc | | 13,300 | | | 1,072 |
Fast Retailing | | 11,900 | | | 1,408 |
Fuji Heavy Industries | | 32,000 | | | 126 |
Fuji Machine Manufacturing | | 1,300 | | | 17 |
Fuji Media Holdings | | 235 | | | 308 |
FUJIFILM Holdings | | 18,700 | | | 540 |
Fujishoji | | 19 | | | 20 |
Fujitec | | 3,000 | | | 14 |
Fujitsu | | 190,000 | | | 983 |
Fukuda Denshi | | 900 | | | 20 |
Fukuoka Financial Group | | 112,345 | | | 495 |
Furukawa Electric | | 20,000 | | | 73 |
Furuno Electric | | 1,700 | | | 9 |
Futaba | | 6,800 | | | 134 |
Fuyo General Lease | | 1,500 | | | 31 |
Godo Steel | | 22,000 | | | 70 |
Gunma Bank | | 12,000 | | | 64 |
Gunze | | 4,000 | | | 14 |
Hachijuni Bank | | 24,000 | | | 137 |
Hakuhodo DY Holdings | | 2,280 | | | 117 |
Hankyu Hanshin Holdings | | 49,000 | | | 240 |
Heiwa | | 5,400 | | | 62 |
Heiwado | | 2,400 | | | 29 |
HI-LEX | | 200 | | | 1 |
Hino Motors | | 8,000 | | | 24 |
Hirose Electric | | 1,200 | | | 134 |
Hiroshima Bank | | 23,000 | | | 91 |
Hisamitsu Pharmaceutical | | 11,600 | | | 376 |
Hitachi | | 200,000 | | | 664 |
Hitachi Cable | | 23,000 | | | 75 |
| | | | | |
| Description | | Shares | | Market Value
($ Thousands) |
| | | | | |
Hitachi Chemical | | 6,900 | | $ | 106 |
Hitachi High-Technologies | | 1,800 | | | 28 |
Hitachi Software Engineering | | 7,200 | | | 113 |
Hokuetsu Bank | | 14,000 | | | 27 |
Hokuhoku Financial Group | | 15,000 | | | 32 |
Hokuriku Electric Power | | 11,800 | | | 274 |
Honda Motor | | 100,000 | | | 2,896 |
Hoshizaki Electric | | 4,400 | | | 49 |
Hosiden | | 3,400 | | | 46 |
Hoya | | 5,900 | | | 122 |
Hyakugo Bank | | 14,000 | | | 70 |
Ibiden | | 27,300 | | | 782 |
Idemitsu Kosan | | 1,300 | | | 108 |
IHI | | 14,000 | | | 25 |
Inabata | | 19,200 | | | 64 |
Inpex Holdings | | 25 | | | 203 |
Isetan Mitsukoshi Holdings | | 1,900 | | | 17 |
Isuzu Motors | | 17,000 | | | 29 |
Ito En | | 1,400 | | | 19 |
Itochu | | 148,000 | | | 1,076 |
Itochu Enex | | 13,200 | | | 84 |
Itoham Foods | | 2,000 | | | 7 |
Iyo Bank | | 11,000 | | | 117 |
J Front Retailing | | 46,000 | | | 189 |
Jafco | | 2,400 | | | 74 |
Japan Airlines* (A) | | 1,073,000 | | | 2,084 |
Japan Petroleum Exploration | | 700 | | | 36 |
Japan Prime Realty Investment, Cl A‡ | | 16 | | | 32 |
Japan Real Estate Investment, Cl A‡ | | 5 | | | 39 |
Japan Retail Fund Investment, Cl A‡ | | 15 | | | 69 |
Japan Steel Works | | 71,890 | | | 937 |
Japan Tobacco | | 500 | | | 1,439 |
JBCC Holdings | | 3,700 | | | 25 |
JFE Holdings | | 19,800 | | | 663 |
JFE Shoji Holdings | | 14,000 | | | 51 |
JGC | | 7,000 | | | 116 |
Joyo Bank | | 31,000 | | | 153 |
JS Group | | 3,100 | | | 45 |
JSR | | 900 | | | 13 |
JTEKT | | 1,700 | | | 15 |
Jupiter Telecommunications | | 363 | | | 266 |
Kajima | | 51,000 | | | 158 |
Kakaku.com | | 14 | | | 52 |
Kamigumi | | 24,000 | | | 185 |
Kaneka | | 47,000 | | | 328 |
Kansai Electric Power | | 28,500 | | | 621 |
Kansai Paint | | 5,000 | | | 31 |
Kanto Auto Works | | 900 | | | 8 |
Kanto Natural Gas Development | | 4,000 | | | 25 |
Kao | | 6,000 | | | 132 |
Kasumi | | 3,000 | | | 13 |
Kawasaki Heavy Industries | | 26,000 | | | 58 |
Kawasaki Kisen Kaisha | | 1,000 | | | 5 |
Kawasumi Laboratories | | 1,000 | | | 6 |
| | |
| SEI Institutional Investments Trust / Annual Report / May 31, 2009 | | 105 |
SCHEDULE OF INVESTMENTS
International Equity Fund (Continued)
May 31, 2009
| | | | | |
| Description | | Shares | | Market Value
($ Thousands) |
| | | | | |
| | | | | |
KDDI | | 297 | | $ | 1,556 |
Keihin Electric Express Railway | | 6,000 | | | 46 |
Keio | | 39,000 | | | 232 |
Keisei Electric Railway | | 23,000 | | | 121 |
Keyence | | 600 | | | 125 |
Kikkoman | | 4,000 | | | 40 |
Kinden | | 30,000 | | | 247 |
Kintetsu | | 25,000 | | | 112 |
Kirin Holdings | | 52,000 | | | 655 |
Kissei Pharmaceutical | | 4,000 | | | 91 |
Kobayashi Pharmaceutical | | 6,300 | | | 226 |
Kohnan Shoji | | 1,300 | | | 12 |
Konica Minolta Holdings | | 207,000 | | | 2,140 |
Kose | | 3,100 | | | 65 |
Kubota | | 75,000 | | | 552 |
Kuraray | | 11,500 | | | 115 |
Kurita Water Industries | | 600 | | | 17 |
Kyocera | | 11,300 | | | 888 |
Kyoei Steel (A) | | 3,500 | | | 95 |
Kyorin | | 16,000 | | | 235 |
Kyowa Hakko Kogyo | | 7,000 | | | 73 |
Kyudenko | | 5,000 | | | 31 |
Kyushu Electric Power | | 11,300 | | | 238 |
Leopalace21 | | 29,700 | | | 262 |
Mabuchi Motor | | 1,100 | | | 55 |
Makita | | 2,200 | | | 49 |
Mandom | | 1,100 | | | 25 |
Marubeni | | 232,000 | | | 1,052 |
Marui Group | | 22,500 | | | 133 |
Matsui Securities | | 5,800 | | | 47 |
Mazda Motor | | 101,000 | | | 261 |
Mediceo Paltac Holdings | | 22,900 | | | 269 |
MEIJI Holdings* | | 3,100 | | | 104 |
Mie Bank | | 4,000 | | | 13 |
Mikuni Coca-Cola Bottling | | 2,100 | | | 17 |
Millea Holdings | | 31,000 | | | 908 |
Minebea | | 12,000 | | | 49 |
Ministop | | 3,000 | | | 47 |
Miraca Holdings | | 16,700 | | | 378 |
Mitsubishi | | 124,300 | | | 2,364 |
Mitsubishi Chemical Holdings | | 61,000 | | | 283 |
Mitsubishi Electric | | 1,000 | | | 6 |
Mitsubishi Estate | | 48,000 | | | 793 |
Mitsubishi Gas Chemical | | 56,000 | | | 318 |
Mitsubishi Heavy Industries | | 9,000 | | | 32 |
Mitsubishi Logistics | | 8,000 | | | 84 |
Mitsubishi Materials | | 44,000 | | | 147 |
Mitsubishi Motors* (A) | | 141,000 | | | 225 |
Mitsubishi Rayon | | 8,000 | | | 22 |
Mitsubishi Steel Manufacturing | | 17,000 | | | 41 |
Mitsubishi UFJ Financial Group | | 787,400 | | | 4,987 |
Mitsubishi UFJ Lease & Finance | | 670 | | | 18 |
Mitsui | | 39,400 | | | 504 |
Mitsui Chemicals | | 52,000 | | | 181 |
| | | | | |
| Description | | Shares | | Market Value
($ Thousands) |
| | | | | |
Mitsui Engineering & Shipbuilding | | 9,000 | | $ | 22 |
Mitsui Fudosan | | 32,000 | | | 536 |
Mitsui High-Tec | | 2,700 | | | 22 |
Mitsui Mining & Smelting | | 36,000 | | | 85 |
Mitsui OSK Lines | | 97,000 | | | 690 |
Mitsui Sugar | | 10,000 | | | 29 |
Mitsui Sumitomo Insurance Group Holdings | | 47,700 | | | 1,407 |
Mitsui Trust Holdings | | 113,000 | | | 417 |
Mitsumi Electric | | 5,100 | | | 98 |
Mizuho Financial Group (A) | | 297,400 | | | 714 |
Mizuno | | 5,000 | | | 23 |
Morinaga Milk Industry | | 14,000 | | | 48 |
Murata Manufacturing | | 6,500 | | | 275 |
N E Chemcat | | 1,000 | | | 10 |
Nafco | | 1,000 | | | 14 |
Nagase | | 8,000 | | | 76 |
Namco Bandai Holdings | | 1,700 | | | 18 |
NEC | | 593,000 | | | 2,320 |
NEC Networks & System Integration | | 5,100 | | | 56 |
NET One Systems | | 149 | | | 237 |
NGK Insulators | | 7,000 | | | 124 |
NGK Spark Plug | | 4,000 | | | 35 |
NHK Spring | | 38,000 | | | 216 |
Nichii Gakkan | | 1,900 | | | 16 |
Nidec | | 800 | | | 46 |
Nintendo | | 12,500 | | | 3,367 |
Nippon Building Fund, Cl A‡ | | 43 | | | 380 |
Nippon Densetsu Kogyo | | 8,000 | | | 78 |
Nippon Electric Glass | | 91,000 | | | 869 |
Nippon Express | | 13,000 | | | 55 |
Nippon Flour Mills | | 14,000 | | | 61 |
Nippon Konpo Unyu Soko | | 1,000 | | | 10 |
Nippon Meat Packers | | 7,000 | | | 84 |
Nippon Mining Holdings | | 157,000 | | | 893 |
Nippon Oil | | 153,000 | | | 933 |
Nippon Paper Group | | 3,100 | | | 88 |
Nippon Seiki | | 4,000 | | | 40 |
Nippon Sheet Glass | | 71,000 | | | 203 |
Nippon Shinyaku | | 2,000 | | | 23 |
Nippon Steel | | 19,000 | | | 73 |
Nippon Telegraph & Telephone | | 128,200 | | | 5,326 |
Nippon Yusen | | 47,000 | | | 225 |
Nipro | | 4,000 | | | 75 |
Nishi-Nippon City Bank | | 42,000 | | | 98 |
Nissan Chemical Industries | | 11,000 | | | 116 |
Nissan Motor | | 336,300 | | | 2,025 |
Nissan Shatai | | 7,000 | | | 52 |
Nisshin Seifun Group | | 13,500 | | | 153 |
Nisshin Steel | | 60,000 | | | 136 |
Nisshinbo Holdings | | 20,000 | | | 207 |
Nissin Food Products | | 800 | | | 25 |
Nissin Healthcare Food Service | | 2,300 | | | 26 |
Nitori | | 8,556 | | | 518 |
Nitto Denko | | 1,400 | | | 39 |
| | |
| 106 | | SEI Institutional Investments Trust / Annual Report / May 31, 2009 |
| | | | | |
| Description | | Shares | | Market Value
($ Thousands) |
| | | | | |
NOK | | 5,200 | | $ | 67 |
Nomura Holdings | | 119,800 | | | 899 |
Nomura Real Estate Holdings | | 3,200 | | | 58 |
Nomura Real Estate Office Fund, Cl A‡ | | 10 | | | 59 |
Nomura Research Institute | | 2,300 | | | 42 |
Noritsu Koki | | 2,900 | | | 24 |
NSK | | 4,000 | | | 19 |
NTT Data | | 9 | | | 27 |
NTT DoCoMo | | 946 | | | 1,414 |
NTT Urban Development | | 51 | | | 48 |
Obayashi | | 9,000 | | | 41 |
Odakyu Electric Railway, Cl B | | 15,000 | | | 129 |
Ohsho Food Service | | 1,600 | | | 27 |
OJI Paper | | 9,000 | | | 42 |
Okinawa Cellular Telephone | | 12 | | | 21 |
Okinawa Electric Power | | 400 | | | 21 |
Olympus | | 2,600 | | | 51 |
Omron | | 15,700 | | | 238 |
Ono Pharmaceutical | | 1,400 | | | 63 |
Onward Holdings | | 9,000 | | | 56 |
Oracle Japan | | 3,100 | | | 111 |
Oriental Land | | 1,200 | | | 79 |
Osaka Gas | | 165,000 | | | 524 |
Osaka Steel | | 3,200 | | | 57 |
Panasonic | | 83,400 | | | 1,196 |
Panasonic Electric Works | | 12,000 | | | 99 |
Raito Kogyo | | 11,600 | | | 27 |
Rakuten (A) | | 2,756 | | | 1,507 |
Resona Holdings (A) | | 27,000 | | | 405 |
Ricoh | | 54,000 | | | 739 |
Rohm | | 10,400 | | | 677 |
Roland | | 2,700 | | | 30 |
Ryoden Trading | | 7,000 | | | 35 |
Sakai Chemical Industry | | 9,000 | | | 33 |
San-In Godo Bank | | 2,000 | | | 17 |
Sanki Engineering | | 3,000 | | | 22 |
Sankyo | | 33,300 | | | 1,766 |
Sankyu | | 10,000 | | | 35 |
Sanshin Electronics | | 8,000 | | | 58 |
Santen Pharmaceutical | | 9,200 | | | 279 |
Sanyo Electric* | | 20,000 | | | 50 |
Sapporo Hokuyo Holdings | | 25,600 | | | 76 |
Sapporo Holdings | | 5,000 | | | 23 |
Sawai Pharmaceutical | | 700 | | | 37 |
Sazaby League | | 800 | | | 10 |
SBI Holdings | | 123 | | | 20 |
Secom | | 1,600 | | | 67 |
Sega Sammy Holdings | | 1,700 | | | 19 |
Seiko Epson | | 26,400 | | | 388 |
Seino Holdings | | 37,000 | | | 246 |
Sekisui Chemical | | 27,000 | | | 166 |
Sekisui House | | 22,000 | | | 213 |
Seven & I Holdings | | 82,700 | | | 2,006 |
Seven Bank | | 90 | | | 234 |
| | | | | |
| Description | | Shares | | Market Value
($ Thousands) |
| | | | | |
Sharp | | 15,000 | | $ | 169 |
Shikoku Electric Power | | 1,500 | | | 43 |
Shimamura | | 300 | | | 23 |
Shimano | | 5,500 | | | 200 |
Shimizu | | 21,000 | | | 95 |
Shin-Etsu Chemical | | 8,500 | | | 443 |
Shinko Securities | | 26,000 | | | 76 |
Shinmaywa Industries | | 9,000 | | | 30 |
Shinsei Bank | | 194,000 | | | 267 |
Shionogi | | 38,000 | | | 748 |
Shizuoka Bank | | 21,000 | | | 203 |
Showa Denko | | 18,000 | | | 27 |
Showa Shell Sekiyu | | 22,600 | | | 222 |
SKY Perfect JSAT Holdings | | 492 | | | 194 |
SMC | | 1,300 | | | 138 |
Snow Brand Milk Products | | 7,500 | | | 22 |
Softbank | | 32,900 | | | 598 |
Sompo Japan Insurance | | 6,000 | | | 44 |
Sony | | 43,400 | | | 1,134 |
Sony Financial Holdings | | 15 | | | 44 |
SRI Sports | | 6 | | | 5 |
Stanley Electric | | 2,500 | | | 40 |
Sumco | | 2,700 | | | 42 |
Sumikin Bussan | | 9,000 | | | 23 |
Sumitomo | | 113,800 | | | 1,141 |
Sumitomo Chemical | | 5,000 | | | 22 |
Sumitomo Electric Industries | | 10,800 | | | 123 |
Sumitomo Heavy Industries | | 9,000 | | | 38 |
Sumitomo Metal Industries | | 40,000 | | | 108 |
Sumitomo Metal Mining | | 8,000 | | | 114 |
Sumitomo Mitsui Financial Group (A) | | 77,900 | | | 3,012 |
Sumitomo Realty & Development | | 4,000 | | | 61 |
Sumitomo Rubber Industries | | 2,100 | | | 14 |
Sumitomo Trust & Banking | | 141,000 | | | 670 |
Suruga Bank | | 57,273 | | | 537 |
Suzuken | | 6,900 | | | 178 |
Suzuki Motor | | 33,300 | | | 739 |
T&D Holdings | | 6,750 | | | 191 |
Taiheiyo Cement | | 199,000 | | | 363 |
Taisei | | 38,000 | | | 94 |
Taisho Pharmaceutical | | 14,000 | | | 267 |
Taiyo Nippon Sanso | | 17,000 | | | 146 |
Takashimaya | | 25,000 | | | 157 |
Takeda Pharmaceutical | | 36,300 | | | 1,441 |
Takefuji (A) | | 28,880 | | | 167 |
Takeuchi Manufacturing | | 700 | | | 6 |
Tanabe Seiyaku | | 23,000 | | | 254 |
TDK | | 8,800 | | | 393 |
Teijin | | 71,000 | | | 195 |
Temp Holdings | | 1,700 | | | 12 |
Terumo | | 1,400 | | | 59 |
THK | | 3,900 | | | 58 |
TKC | | 1,100 | | | 21 |
Tobu Railway | | 22,000 | | | 120 |
| | |
| SEI Institutional Investments Trust / Annual Report / May 31, 2009 | | 107 |
SCHEDULE OF INVESTMENTS
International Equity Fund (Continued)
May 31, 2009
| | | | | |
| Description | | Shares | | Market Value
($ Thousands) |
| | | | | |
Toda | | 5,000 | | $ | 21 |
Toho | | 2,500 | | | 34 |
Tohokushinsha Film | | 1,900 | | | 13 |
Tokuyama | | 9,000 | | | 64 |
Tokyo Broadcasting System HD | | 8,200 | | | 116 |
Tokyo Electric Power | | 2,600 | | | 65 |
Tokyo Electron | | 1,500 | | | 69 |
Tokyo Energy & Systems | | 3,000 | | | 26 |
Tokyo Gas | | 42,000 | | | 154 |
Tokyo Steel Manufacturing | | 58,898 | | | 691 |
Tokyo Style | | 2,000 | | | 15 |
Tokyo Tekko | | 11,000 | | | 43 |
Tokyu | | 6,000 | | | 27 |
Tokyu Land | | 31,000 | | | 130 |
TonenGeneral Sekiyu | | 12,000 | | | 126 |
Toppan Forms | | 100 | | | 1 |
Toppan Printing | | 35,000 | | | 316 |
Topre | | 400 | | | 3 |
Topy Industries | | 1,000 | | | 2 |
Toray Industries | | 13,000 | | | 64 |
Toshiba TEC | | 34,000 | | | 138 |
Tosoh | | 18,000 | | | 56 |
TOTO | | 14,000 | | | 82 |
Towa Pharmaceutical | | 800 | | | 35 |
Toyo Engineering | | 10,000 | | | 36 |
Toyo Kohan | | 5,000 | | | 23 |
Toyo Seikan Kaisha | | 9,600 | | | 179 |
Toyo Suisan Kaisha | | 70,000 | | | 1,538 |
Toyoda Gosei | | 3,800 | | | 83 |
Toyota Auto Body | | 400 | | | 6 |
Toyota Industries | | 24,100 | | | 621 |
Toyota Motor | | 121,700 | | | 4,844 |
Toyota Tsusho | | 3,200 | | | 44 |
Trend Micro | | 3,500 | | | 116 |
TV Asahi | | 42 | | | 62 |
Ube Industries | | 19,000 | | | 45 |
Unicharm | | 400 | | | 28 |
Unipres | | 1,000 | | | 10 |
UNY | | 21,000 | | | 165 |
Ushio | | 2,700 | | | 40 |
USS | | 150 | | | 9 |
Valor | | 1,600 | | | 12 |
West Japan Railway | | 94 | | | 308 |
Yahoo! Japan | | 1,989 | | | 533 |
Yamaguchi Financial Group | | 21,000 | | | 260 |
Yamaha Motor | | 29,000 | | | 328 |
Yamato Holdings | | 4,000 | | | 50 |
Yamato Kogyo | | 9,800 | | | 266 |
Yamazaki Baking | | 38,000 | | | 390 |
Yaoko | | 800 | | | 23 |
Yodogawa Steel Works | | 13,000 | | | 68 |
Yurtec | | 4,000 | | | 20 |
| | | | | |
| | | | | 134,495 |
| | | | | |
| | | | | |
| Description | | Shares | | Market Value
($ Thousands) |
| | | | | |
| | |
Mauritius — 0.1% | | | | | |
Golden Agri-Resources (SGD) | | 1,180,400 | | $ | 351 |
| | | | | |
| | |
Netherlands — 4.8% | | | | | |
Aegon | | 95,186 | | | 597 |
Akzo Nobel | | 6,900 | | | 323 |
ArcelorMittal (A) | | 81,793 | | | 2,729 |
ASML Holding | | 26,366 | | | 545 |
Boskalis Westminster | | 782 | | | 19 |
Corio‡ | | 2,539 | | | 125 |
European Aeronautic Defense and Space (A) | | 196,757 | | | 3,219 |
Heineken | | 1,094 | | | 39 |
Heineken Holding | | 10,398 | | | 316 |
Imtech | | 539 | | | 11 |
ING Groep | | 89,131 | | | 948 |
James Hardie Industries | | 30,739 | | | 107 |
Koninklijke Ahold | | 341,187 | | | 4,163 |
Koninklijke DSM (A) | | 35,358 | | | 1,239 |
Koninklijke Philips Electronics | | 3,549 | | | 67 |
Koninklijke Vopak* | | 9,468 | | | 474 |
Nutreco Holding | | 1,826 | | | 76 |
QIAGEN* | | 2,623 | | | 47 |
Randstad Holding | | 14,212 | | | 439 |
Reed Elsevier | | 10,886 | | | 132 |
Royal Dutch Shell, Cl A | | 165,327 | | | 4,479 |
Royal Dutch Shell, Cl B | | 167,854 | | | 4,569 |
Royal Dutch Shell, Cl A (GBP) | | 108,753 | | | 2,935 |
Royal KPN | | 127,080 | | | 1,674 |
SBM Offshore | | 1,825 | | | 31 |
TNT | | 29,066 | | | 575 |
Unilever | | 165,210 | | | 3,977 |
Wolters Kluwer | | 2,755 | | | 53 |
| | | | | |
| | | | | 33,908 |
| | | | | |
| | |
New Zealand — 0.1% | | | | | |
Air New Zealand | | 40,400 | | | 28 |
Contact Energy | | 12,624 | | | 47 |
Fisher & Paykel Healthcare | | 22,215 | | | 41 |
Fletcher Building | | 29,152 | | | 122 |
Telecom of New Zealand | | 367,766 | | | 592 |
Vector | | 42,446 | | | 55 |
| | | | | |
| | | | | 885 |
| | | | | |
| | |
Norway — 0.6% | | | | | |
Aker Kvaerner | | 3,000 | | | 26 |
DnB | | 188,547 | | | 1,581 |
Fred Olsen Energy | | 500 | | | 18 |
Frontline | | 1,150 | | | 28 |
Norsk Hydro | | 4,000 | | | 22 |
Orkla | | 9,800 | | | 81 |
Petroleum Geo-Services* | | 16,400 | | | 107 |
Renewable Energy* | | 2,600 | | | 29 |
Seadrill | | 5,000 | | | 74 |
| | |
| 108 | | SEI Institutional Investments Trust / Annual Report / May 31, 2009 |
| | | | | |
| Description | | Shares | | Market Value
($ Thousands) |
| | | | | |
Statoil (A) | | 28,754 | | $ | 609 |
Telenor | | 49,802 | | | 422 |
Yara International | | 40,989 | | | 1,363 |
| | | | | |
| | | | | 4,360 |
| | | | | |
| | |
Papua New Guinea — 0.1% | | | | | |
Lihir Gold* | | 383,314 | | | 995 |
| | | | | |
| | |
Portugal — 0.3% | | | | | |
Banco Comercial Portugues, Cl R | | 55,859 | | | 60 |
Banco Espirito Santo | | 54,641 | | | 312 |
Cimpor Cimentos de Portugal* | | 12,245 | | | 84 |
Energias de Portugal (A) | | 268,139 | | | 1,081 |
Galp Energia SGPS, Cl B | | 2,531 | | | 40 |
Jeronimo Martins | | 795 | | | 5 |
Portugal Telecom | | 60,778 | | | 547 |
REN - Redes Energeticas Nacionais | | 13,117 | | | 55 |
| | | | | |
| | | | | 2,184 |
| | | | | |
| | |
Singapore — 1.1% | | | | | |
ComfortDelgro | | 184,000 | | | 165 |
DBS Group Holdings | | 149,000 | | | 1,223 |
Fraser and Neave | | 56,000 | | | 155 |
Jardine Cycle & Carriage | | 15,000 | | | 171 |
Keppel | | 46,000 | | | 231 |
Oversea-Chinese Banking | | 222,000 | | | 1,121 |
SembCorp Industries | | 56,000 | | | 122 |
SembCorp Marine | | 14,000 | | | 30 |
SIA Engineering | | 22,000 | | | 40 |
Singapore Airlines | | 9,600 | | | 83 |
Singapore Exchange | | 30,000 | | | 154 |
Singapore Technologies Engineering | | 149,000 | | | 241 |
Singapore Telecommunications (A) | | 353,000 | | | 739 |
United Industrial | | 6,000 | | | 7 |
United Overseas Bank | | 69,000 | | | 684 |
UOB-Kay Hian Holdings | | 33,000 | | | 31 |
UOL Group | | 29,000 | | | 67 |
Venture | | 2,000 | | | 10 |
Wheelock Properties | | 23,370 | | | 27 |
Wilmar International (A) | | 646,000 | | | 2,220 |
| | | | | |
| | | | | 7,521 |
| | | | | |
| | |
South Africa — 0.1% | | | | | |
Impala Platinum Holdings | | 24,730 | | | 598 |
| | | | | |
| | |
Spain — 3.3% | | | | | |
Abertis Infraestructuras | | 7,429 | | | 141 |
Acerinox (A) | | 6,071 | | | 110 |
ACS Actividades Construcciones y
Servicios (A) | | 18,634 | | | 975 |
Banco Bilbao Vizcaya
Argentaria (A) | | 142,153 | | | 1,734 |
Banco de Sabadell | | 32,433 | | | 208 |
| | | | | |
| Description | | Shares | | Market Value
($ Thousands) |
| | | | | |
Banco de Valencia | | 7,992 | | $ | 78 |
Banco Popular Espanol (A) | | 14,583 | | | 130 |
Banco Santander Central Hispano | | 501,691 | | | 5,337 |
Bankinter (A) | | 16,919 | | | 210 |
Ebro Puleva | | 10,166 | | | 160 |
EDP Renovaveis* | | 6,268 | | | 67 |
Enagas | | 12,043 | | | 224 |
Financiera Alba | | 4,609 | | | 217 |
Fomento de Construcciones y
Contratas | | 653 | | | 26 |
Gas Natural | | 28,654 | | | 519 |
Gestevision Telecinco | | 2,056 | | | 20 |
Grifols | | 17,042 | | | 309 |
Grupo Catalana Occidente | | 1,000 | | | 16 |
Iberdrola | | 154,788 | | | 1,331 |
Inditex | | 5,035 | | | 228 |
Indra Sistemas* | | 8,794 | | | 201 |
Mapfre | | 65,895 | | | 230 |
Red Electrica | | 5,898 | | | 277 |
Repsol | | 121,214 | | | 2,733 |
Sacyr Vallehermoso | | 12,985 | | | 213 |
Telefonica (A) | | 333,190 | | | 7,227 |
Zardoya Otis | | 9,802 | | | 220 |
| | | | | |
| | | | | 23,141 |
| | | | | |
| | |
Sweden — 1.6% | | | | | |
Alfa Laval (A) | | 12,654 | | | 121 |
Assa Abloy, Cl B | | 10,180 | | | 135 |
Atlas Copco, Cl B | | 4,311 | | | 39 |
Atlas Copco, Cl A (A) | | 27,954 | | | 283 |
Axis Communications | | 1,765 | | | 17 |
Bilia, Cl A | | 3,038 | | | 19 |
Boliden | | 32,098 | | | 251 |
Electrolux, Cl B | | 13,248 | | | 168 |
Elekta, Cl B (A) | | 5,369 | | | 75 |
Eniro (A) | | 16,032 | | | 21 |
Getinge, Cl B | | 2,961 | | | 40 |
Hennes & Mauritz, Cl B (A) | | 18,869 | | | 902 |
Holmen, Cl B | | 3,939 | | | 98 |
Husqvarna, Cl B | | 12,470 | | | 73 |
Investor, Cl B | | 41,347 | | | 647 |
Lundin Petroleum* | | 93,768 | | | 837 |
Meda, Cl A | | 17,222 | | | 126 |
Millicom International Cellular* | | 538 | | | 33 |
Nordea Bank | | 69,291 | | | 556 |
Scania, Cl B | | 8,037 | | | 82 |
Securitas, Cl B (A) | | 40,030 | | | 342 |
Skandinaviska Enskilda Banken, Cl A (A) | | 64,669 | | | 285 |
Skanska, Cl B | | 9,008 | | | 100 |
SKF, Cl B | | 5,990 | | | 71 |
SSAB, Cl A | | 1,431 | | | 19 |
Svenska Cellulosa, Cl A | | 1,904 | | | 22 |
Svenska Cellulosa, Cl B | | 122,610 | | | 1,420 |
Svenska Handelsbanken, Cl A (A) | | 17,782 | | | 347 |
| | |
| SEI Institutional Investments Trust / Annual Report / May 31, 2009 | | 109 |
SCHEDULE OF INVESTMENTS
International Equity Fund (Continued)
May 31, 2009
| | | | | |
| Description | | Shares | | Market Value
($ Thousands) |
| | | | | |
Swedbank | | 15,775 | | $ | 94 |
Swedish Match (A) | | 79,203 | | | 1,274 |
Tele2, Cl B | | 16,800 | | | 169 |
Telefonaktiebolaget LM Ericsson, Cl B (A) | | 257,662 | | | 2,383 |
TeliaSonera (A) | | 82,853 | | | 427 |
Trelleborg, Cl B (A) | | 2,072 | | | 7 |
Volvo, Cl A | | 6,176 | | | 39 |
Volvo, Cl B | | 3,220 | | | 21 |
| | | | | |
| | | | | 11,543 |
| | | | | |
| | |
Switzerland — 7.3% | | | | | |
ABB | | 129,355 | | | 2,141 |
ACE | | 30,853 | | | 1,357 |
Actelion* | | 9,237 | | | 479 |
Adecco | | 3,419 | | | 150 |
Baloise Holding | | 13,414 | | | 1,070 |
Banque Cantonale Vaudoise | | 673 | | | 259 |
BKW FMB Energie | | 52 | | | 4 |
Clariant | | 24,000 | | | 142 |
Compagnie Financiere Richemont | | 679 | | | 15 |
Credit Suisse Group | | 76,481 | | | 3,437 |
Elektrizitaets-Gesellschaft Laufenburg | | 25 | | | 24 |
Geberit | | 1,005 | | | 124 |
Givaudan | | 150 | | | 99 |
Helvetia Holding | | 770 | | | 210 |
Holcim* | | 6,457 | | | 342 |
Jelmoli Holding* | | 103 | | | 38 |
Kuehne + Nagel International | | 4,258 | | | 334 |
Lindt & Spruengli | | 126 | | | 229 |
Lonza Group | | 1,367 | | | 142 |
Nestle | | 315,599 | | | 11,507 |
Nobel Biocare Holding | | 932 | | | 22 |
Novartis | | 204,165 | | | 8,180 |
Pargesa Holding | | 893 | | | 61 |
Paris RE Holdings | | 5,693 | | | 111 |
Roche Holding | | 29,416 | | | 4,033 |
Schindler Holding | | 1,449 | | | 87 |
SGS | | 133 | | | 167 |
Sonova Holding | | 654 | | | 49 |
STMicroelectronics | | 4,240 | | | 32 |
Straumann Holding | | 98 | | | 18 |
Sulzer | | 3,387 | | | 228 |
Swatch Group | | 11,411 | | | 397 |
Swiss Life Holding | | 780 | | | 66 |
Swiss Reinsurance | | 11,545 | | | 377 |
Swisscom | | 5,455 | | | 1,619 |
Syngenta | | 14,489 | | | 3,538 |
Synthes | | 2,401 | | | 247 |
Transocean* | | 4,176 | | | 332 |
UBS | | 168,422 | | | 2,542 |
Valora Holding | | 166 | | | 33 |
Vontobel Holding | | 407 | | | 10 |
Xstrata | | 214,169 | | | 2,397 |
| | | | | |
| Description | | Shares | | Market Value
($ Thousands) |
| | | | | |
Zurich Financial Services | | 23,975 | | $ | 4,493 |
| | | | | |
| | | | | 51,142 |
| | | | | |
| | |
Taiwan — 0.6% | | | | | |
Chunghwa Telecom | | 540,726 | | | 1,033 |
HON HAI Precision Industry GDR | | 132,674 | | | 939 |
Taiwan Semiconductor Manufacturing | | 523,000 | | | 968 |
United Microelectronics ADR (A) | | 411,300 | | | 1,316 |
| | | | | |
| | | | | 4,256 |
| | | | | |
| | |
United Kingdom — 16.7% | | | | | |
3i Group | | 18,790 | | | 74 |
Admiral Group | | 5,855 | | | 82 |
Aggreko | | 26,451 | | | 251 |
Amec | | 100,787 | | | 1,107 |
Amlin | | 46,838 | | | 266 |
Anglo American | | 26,011 | | | 750 |
Antofagasta | | 235,442 | | | 2,418 |
Arriva | | 1,433 | | | 10 |
Associated British Foods | | 5,829 | | | 69 |
AstraZeneca | | 181,311 | | | 7,547 |
Autonomy* | | 91,923 | | | 2,296 |
Aviva | | 156,971 | | | 850 |
Babcock International Group | | 51,290 | | | 385 |
BAE Systems | | 1,025,352 | | | 5,694 |
Balfour Beatty | | 141,929 | | | 784 |
Barclays | | 551,273 | | | 2,673 |
Beazley Group | | 9,214 | | | 15 |
Berkeley Group Holdings* | | 17,550 | | | 253 |
BG Group | | 209,472 | | | 3,840 |
BHP Billiton | | 188,464 | | | 4,507 |
BP | | 1,112,931 | | | 9,178 |
British American Tobacco | | 191,305 | | | 5,231 |
British Land‡ | | 7,070 | | | 45 |
British Sky Broadcasting Group | | 18,823 | | | 135 |
BT Group, Cl A | | 1,087,819 | | | 1,537 |
Bunzl | | 10,255 | | | 85 |
Burberry Group | | 2,859 | | | 18 |
Cable & Wireless | | 330,017 | | | 720 |
Cadbury | | 160,076 | | | 1,395 |
Cairn Energy* | | 2,951 | | | 120 |
Cape* | | 36,691 | | | 91 |
Capita Group | | 13,767 | | | 160 |
Carillion | | 10,674 | | | 46 |
Carnival | | 24,775 | | | 643 |
Carphone Warehouse Group | | 13,088 | | | 36 |
Catlin Group | | 62,295 | | | 357 |
Centrica | | 704,112 | | | 2,805 |
Charter International | | 7,353 | | | 63 |
Chemring Group | | 669 | | | 22 |
Close Brothers Group | | 1,761 | | | 19 |
Cobham | | 171,135 | | | 494 |
Compass Group | | 372,065 | | | 2,159 |
De La Rue | | 4,290 | | | 58 |
| | |
| 110 | | SEI Institutional Investments Trust / Annual Report / May 31, 2009 |
| | | | | |
| Description | | Shares | | Market Value
($ Thousands) |
| | | | | |
Derwent London‡ | | 11,294 | | $ | 154 |
Diageo | | 104,219 | | | 1,424 |
Drax Group | | 16,174 | | | 128 |
DS Smith | | 37,674 | | | 45 |
Eurasian Natural Resources | | 88,419 | | | 936 |
Firstgroup | | 32,518 | | | 195 |
Friends Provident | | 71,162 | | | 77 |
GlaxoSmithKline | | 218,631 | | | 3,689 |
Group 4 Securicor | | 202,065 | | | 691 |
Hays | | 629,615 | | | 840 |
Healthcare Locums | | 18,106 | | | 53 |
Home Retail Group | | 217,030 | | | 817 |
HSBC Holdings | | 984,709 | | | 8,899 |
ICAP | | 25,046 | | | 160 |
IMI | | 9,431 | | | 53 |
Imperial Tobacco Group | | 63,477 | | | 1,648 |
Informa | | 24,013 | | | 94 |
Inmarsat | | 46,778 | | | 390 |
Intercontinental Hotels Group | | 10,244 | | | 109 |
International Power | | 25,167 | | | 112 |
Intertek Group | | 21,459 | | | 365 |
Invensys* | | 70,062 | | | 265 |
Investec | | 68,417 | | | 383 |
J Sainsbury | | 2,861 | | | 14 |
Johnson Matthey | | 3,237 | | | 64 |
Kazakhmys | | 15,279 | | | 172 |
Kingfisher | | 458,236 | | | 1,319 |
Ladbrokes | | 6,676 | | | 22 |
Legal & General Group | | 520,626 | | | 511 |
Lloyds Banking Group | | 19,356 | | | 21 |
LogicaCMG | | 150,960 | | | 180 |
London Stock Exchange Group | | 4,616 | | | 52 |
Lonmin | | 682 | | | 16 |
Man Group | | 13,207 | | | 52 |
Marks & Spencer Group | | 17,106 | | | 79 |
Meggitt | | 70,229 | | | 181 |
National Express Group | | 8,095 | | | 43 |
National Grid | | 160,029 | | | 1,548 |
Next | | 12,044 | | | 285 |
Old Mutual | | 842,956 | | | 1,010 |
Pace* | | 15,684 | | | 51 |
Pearson | | 32,961 | | | 350 |
Persimmon | | 31,757 | | | 188 |
Petrofac | | 43,860 | | | 470 |
Prudential | | 55,564 | | | 386 |
QinetiQ | | 26,048 | | | 62 |
Reckitt Benckiser Group | | 50,631 | | | 2,200 |
Reed Elsevier | | 54,442 | | | 441 |
Rexam | | 204,870 | | | 1,034 |
Rio Tinto | | 48,843 | | | 2,220 |
Rolls-Royce Group | | 25,576 | | | 136 |
Royal & Sun Alliance Insurance Group | | 428,515 | | | 875 |
Royal Bank of Scotland Group | | 79,053 | | | 49 |
SABMiller | | 26,267 | | | 541 |
| | | | | | |
| Description | | Shares/Face Amount
($ Thousands) | | Market Value
($ Thousands) |
| | | | | | |
Sage Group | | | 360,083 | | $ | 1,111 |
Schroders | | | 9,143 | | | 128 |
Scottish & Southern Energy | | | 2,766 | | | 52 |
Serco Group | | | 86,408 | | | 564 |
Severn Trent | | | 2,681 | | | 49 |
Shire | | | 42,482 | | | 588 |
Smith & Nephew | | | 3,548 | | | 26 |
Smiths Group | | | 33,175 | | | 389 |
Spectris | | | 5,133 | | | 41 |
Standard Chartered | | | 240,020 | | | 4,898 |
Tate & Lyle | | | 90,886 | | | 439 |
Tesco | | | 208,094 | | | 1,234 |
Thomas Cook Group | | | 19,594 | | | 71 |
Thomson Reuters | | | 8,258 | | | 227 |
Tomkins | | | 60,602 | | | 139 |
TUI Travel | | | 16,746 | | | 67 |
Tullett Prebon | | | 62,509 | | | 301 |
Tullow Oil | | | 44,026 | | | 711 |
Unilever (A) | | | 29,334 | | | 691 |
United Business Media | | | 10,043 | | | 71 |
United Utilities Group | | | 16,913 | | | 147 |
Vedanta Resources | | | 2,933 | | | 76 |
Vodafone Group | | | 4,184,506 | | | 7,854 |
Whitbread | | | 1,008 | | | 14 |
WM Morrison Supermarkets | | | 137,183 | | | 540 |
Wolseley | | | 1,600 | | | 27 |
WPP | | | 204,825 | | | 1,527 |
| | | | | | |
| | | | | | 117,369 |
| | | | | | |
| | |
United States — 0.2% | | | | | | |
Buckle | | | 1,600 | | | 57 |
Community Bank System | | | 1,200 | | | 19 |
Eastman Chemical | | | 1,500 | | | 62 |
PEP Boys-Manny Moe & Jack | | | 15,200 | | | 107 |
Rayonier‡ | | | 18,200 | | | 728 |
Temple-Inland | | | 7,185 | | | 92 |
Ventas‡ | | | 2,800 | | | 85 |
Whirlpool (A) | | | 4,500 | | | 190 |
| | | | | | |
| | | | | | 1,340 |
| | | | | | |
Total Common Stock
(Cost $611,310) ($ Thousands) | | | | | | 630,923 |
| | | | | | |
| |
MORTGAGE-BACKED SECURITIES — 2.0% | | | |
| |
Agency Mortgage-Backed Obligations — 0.9% | | | |
FHLMC CMO STRIPS, Ser 232, Cl IO, IO | | | | | | |
5.000%, 08/01/35 | | $ | 1,146 | | | 196 |
FNMA TBA | | | | | | |
6.500%, 06/01/37 | | | 2,300 | | | 2,450 |
6.000%, 06/17/19 to 06/01/37 | | | 3,500 | | | 3,671 |
| | | | | | |
| | | | | | 6,317 |
| | | | | | |
| | |
| SEI Institutional Investments Trust / Annual Report / May 31, 2009 | | 111 |
SCHEDULE OF INVESTMENTS
International Equity Fund (Continued)
May 31, 2009
| | | | | | |
| Description | | Face Amount
($ Thousands) | | Market Value
($ Thousands) |
| | | | | | |
| |
Non-Agency Mortgage-Backed Obligations — 1.1% | | | |
Banc of America Funding, Ser 2006-A, Cl 2A2 | | | | | | |
5.175%, 02/20/36 (C) | | $ | 125 | | $ | 12 |
Banc of America Mortgage Securities,
Ser 2004-10, Cl 2A1 | | | | | | |
5.000%, 12/25/19 | | | 457 | | | 427 |
Countrywide Alternative Loan Trust,
Ser 2004-33, Cl 1A1 | | | | | | |
4.979%, 12/25/34 (C) | | | 189 | | | 128 |
Countrywide Home Loan Mortgage Pass Through Trust, Ser 2006-HYB1, Cl 1A1 | | | | | | |
5.315%, 03/20/36 (C) | | | 431 | | | 209 |
Countrywide Home Loan Mortgage Pass Through Trust, Ser 2006-HYB2, Cl 1A1 | | | | | | |
5.295%, 04/20/36 (C) | | | 1,111 | | | 563 |
Countrywide Home Loan Mortgage Pass-Through Trust, Ser 2004-22, Cl A1 | | | | | | |
5.080%, 11/25/34 (C) | | | 418 | | | 318 |
Deutsche ALT-A Securities Alternate Loan Trust, Ser 2006- AB3, Cl A1 | | | | | | |
6.250%, 06/30/36 (C) | | | 506 | | | 348 |
DSLA Mortgage Loan Trust,
Ser 2004-AR4, Cl B1 | | | | | | |
0.928%, 01/19/45 (C) | | | 261 | | | 16 |
First Horizon Asset Securities,
Ser 2006-AR3, Cl 1A1 | | | | | | |
5.648%, 11/25/36 (C) | | | 569 | | | 416 |
GMAC Commercial Mortgage Securities,
Ser 2004-C2, Cl A2 | | | | | | |
4.760%, 08/10/38 | | | 240 | | | 237 |
Indymac Index Mortgage Loan Trust,
Ser 2004-AR6, Cl 1A | | | | | | |
4.933%, 10/25/34 (C) | | | 71 | | | 45 |
LB-UBS Commercial Mortgage Trust,
Ser 2003-C7, Cl A2 | | | | | | |
4.064%, 09/15/27 (C) | | | 525 | | | 521 |
LB-UBS Commercial Mortgage Trust,
Ser 2001-WM, Cl A2 | | | | | | |
6.530%, 07/14/16 (D) | | | 200 | | | 207 |
Master Adjustable Rate Mortgages Trust,
Ser 2004-6, Cl 2A1 | | | | | | |
4.360%, 07/25/34 (C) | | | 484 | | | 358 |
Master Adjustable Rate Mortgages Trust,
Ser 2005-2, Cl 3A1 | | | | | | |
4.788%, 03/25/35 (C) | | | 371 | | | 189 |
Merrill Lynch Mortgage Trust,
Ser 2006-1, Cl 1A | | | | | | |
4.941%, 02/25/36 (C) | | | 927 | | | 452 |
Morgan Stanley Capital I, Ser 2005-HQ5, Cl A2 | | | | | | |
4.809%, 01/14/42 | | | 343 | | | 346 |
| | | | | | |
| Description | | Face Amount
($ Thousands) | | Market Value
($ Thousands) |
| | | | | | |
Nomura Asset Acceptance,
Ser 2004-R1, Cl A1 | | | | | | |
6.500%, 03/25/34 (D) | | $ | 269 | | $ | 241 |
Nomura Asset Acceptance,
Ser 2004-R2, Cl A1 | | | | | | |
6.500%, 10/25/34 (C) (D) | | | 310 | | | 259 |
Nomura Asset Acceptance,
Ser 2007-1, Cl 1A1A | | | | | | |
5.995%, 03/25/47 (H) | | | 718 | | | 496 |
Residential Accredit Loans,
Ser 2005-QA3, Cl NB2 | | | | | | |
5.212%, 03/25/35 (C) | | | 1,103 | | | 539 |
Residential Accredit Loans,
Ser 2006-QO1, Cl 2A3 | | | | | | |
0.709%, 02/25/46 (C) | | | 237 | | | 25 |
Residential Asset Securitization Trust,
Ser 2004-IP2, Cl 3A1 | | | | | | |
5.022%, 12/25/34 (C) | | | 950 | | | 724 |
Salomon Brothers Mortgage Securities VII,
Ser 2000-C1, Cl A2 | | | | | | |
7.520%, 07/18/09 (C) | | | 252 | | | 254 |
Wells Fargo Mortgage Backed Securities Trust, Ser 2004-I, Cl B1 | | | | | | |
4.618%, 07/25/34 (C) | | | 54 | | | 26 |
| | | | | | |
| | | | | | 7,356 |
| | | | | | |
Total Mortgage-Backed Securities
(Cost $17,344) ($ Thousands) | | | | | | 13,673 |
| | | | | | |
| |
ASSET-BACKED SECURITIES — 0.8% | | | |
| | |
Automotive — 0.1% | | | | | | |
Honda Auto Receivables Owner Trust,
Ser 2009-2, Cl A2 | | | | | | |
2.220%, 08/15/11 | | | 250 | | | 251 |
USAA Auto Owner Trust,
Ser 2009-1, Cl A2 | | | | | | |
2.640%, 08/15/11 | | | 600 | | | 605 |
| | | | | | |
| | | | | | 856 |
| | | | | | |
| | |
Credit Cards — 0.1% | | | | | | |
American Express Credit Account Master Trust, Ser 2003-3, Cl A | | | | | | |
1.670%, 05/15/12 (C) | | | 250 | | | 250 |
Bank of America Credit Card Trust,
Ser 2006-A6, Cl A6 | | | | | | |
0.374%, 11/15/13 (C) | | | 200 | | | 195 |
Chase Issuance Trust, Ser 2007-A10 | | | | | | |
0.384%, 06/16/14 (C) | | | 200 | | | 193 |
MBNA Credit Card Master Note Trust,
Ser 2003-A4, Cl A4 | | | | | | |
0.564%, 09/17/12 (C) | | | 960 | | | 954 |
| | | | | | |
| | | | | | 1,592 |
| | | | | | |
| | |
| 112 | | SEI Institutional Investments Trust / Annual Report / May 31, 2009 |
| | | | | | |
| Description | | Face Amount
($ Thousands) | | Market Value
($ Thousands) |
| | | | | | |
| | |
Mortgage Related Securities — 0.6% | | | | | | |
ACE Securities, Ser 2003-NC1, Cl M | | | | | | |
1.479%, 07/25/33 (C) | | $ | 600 | | $ | 329 |
ACE Securities, Ser 2003-OP1, Cl M1 | | | | | | |
1.009%, 12/25/33 (C) | | | 250 | | | 118 |
Ameriquest Mortgage Securities,
Ser 2003-2, Cl M1 | | | | | | |
1.659%, 03/25/33 (C) | | | 306 | | | 158 |
Argent Securities, Ser 2003-W5, Cl M1 | | | | | | |
1.009%, 10/25/33 (C) | | | 250 | | | 134 |
Argent Securities, Ser 2003-W9, Cl M1 | | | | | | |
0.999%, 03/25/34 (C) | | | 343 | | | 207 |
Asset-Backed Securities Home Equity,
Ser 2003-HE5, Cl M1 | | | | | | |
1.469%, 09/15/33 (C) | | | 433 | | | 255 |
Citicorp Residential Mortgage Securities,
Ser 2006-2, Cl A4 | | | | | | |
5.775%, 09/25/36 (H) | | | 400 | | | 333 |
CNH Equipment Trust, Cl A2 | | | | | | |
2.400%, 05/16/11 | | | 370 | | | 371 |
Countrywide Asset-Backed Certificates,
Ser 2003-5, Cl MV2 | | | | | | |
1.909%, 01/25/34 (C) | | | 220 | | | 98 |
Home Equity Asset NIM Trust,
Ser 2003-4, Cl M2 | | | | | | |
2.709%, 10/25/33 (C) | | | 190 | | | 119 |
Merrill Lynch Mortgage Investors,
Ser 2003-HE1, Cl M2 | | | | | | |
1.959%, 07/25/34 (C) | | | 39 | | | 10 |
Morgan Stanley ABS Capital I,
Ser 2003-NC10, Cl M1 | | | | | | |
1.329%, 10/25/33 (C) | | | 527 | | | 319 |
Option One Mortgage Loan Trust,
Ser 2003-5, Cl M1 | | | | | | |
0.959%, 08/25/33 (C) | | | 95 | | | 46 |
Residential Asset Mortgage Products,
Ser 2003-RS11, Cl MII1 | | | | | | |
1.404%, 12/25/33 (C) | | | 54 | | | 19 |
Resmae Mortgage Loan Trust,
Ser 2006-1, Cl A2B | | | | | | |
0.459%, 02/25/36 (C) (D) | | | 1,400 | | | 627 |
Structured Asset Investment Loan Trust,
Ser 2003-BC4, Cl M2 | | | | | | |
3.309%, 06/25/33 (C) | | | 119 | | | 60 |
Terwin Mortgage Trust, Ser 2006- 6, Cl 2A1 | | | | | | |
4.500%, 06/25/36 | | | 215 | | | 37 |
| | | | | | |
| | | | | | 3,240 |
| | | | | | |
Total Asset-Backed Securities
(Cost $8,201) ($ Thousands) | | | | | | 5,688 |
| | | | | | |
| | | | | |
| Description | | Shares/
Face Amount
($ Thousands) | | Market Value
($ Thousands) |
| | | | | |
| |
PREFERRED STOCK — 0.6% | | | |
| | |
Brazil — 0.4% | | | | | |
Banco Bradesco | | 69,200 | | $ | 1,049 |
Petroleo Brasileiro | | 79,300 | | | 1,385 |
| | | | | |
| | | | | 2,434 |
| | | | | |
| | |
France — 0.0% | | | | | |
Bureau Veritas | | 2,697 | | | 133 |
| | | | | |
| | |
Germany — 0.2% | | | | | |
Draegerwerk | | 1,189 | | | 34 |
Fresenius | | 129 | | | 8 |
Henkel | | 1,298 | | | 40 |
Porsche Automobil Holding | | 11,419 | | | 701 |
RWE | | 3,356 | | | 244 |
Volkswagen (A) | | 4,387 | | | 314 |
| | | | | |
| | | | | 1,341 |
| | | | | |
| | |
Italy — 0.0% | | | | | |
Exor | | 11,716 | | | 115 |
| | | | | |
Total Preferred Stock
(Cost $4,392) ($ Thousands) | | | | | 4,023 |
| | | | | |
| |
CORPORATE OBLIGATIONS — 0.0% | | | |
| | |
United States — 0.0% | | | | | |
Discover Financial Services | | | | | |
6.450%, 06/12/17 (D) | | $100 | | | 81 |
Shinsei Finance Cayman | | | | | |
6.418%, 01/29/49 (C) (D) | | 490 | | | 152 |
| | | | | |
Total Corporate Obligations
(Cost $590) ($ Thousands) | | | | | 233 |
| | | | | |
| | | Number of
Rights | | |
| | |
RIGHTS — 0.0% | | | | | |
| | |
Australia — 0.0% | | | | | |
Billabong, Expires 06/23/09* | | 2,108 | | | — |
Bluescope Steel, Expires 06/08/09* | | 88,977 | | | 59 |
General Property Trust, Expires 06/18/09* | | 39,545 | | | 5 |
Pacific Brands, Expires 06/16/09* | | 130,953 | | | 19 |
Santos, Expires 06/18/09* | | 4,096 | | | 11 |
SP Ausnet, Expires 06/19/09* | | 18,992 | | | — |
| | | | | |
| | | | | 94 |
| | | | | |
| | |
Belgium — 0.0% | | | | | |
Fortis, Expires 07/01/14* (A) (E) | | 135,417 | | | — |
| | | | | |
| | |
| SEI Institutional Investments Trust / Annual Report / May 31, 2009 | | 113 |
SCHEDULE OF INVESTMENTS
International Equity Fund (Continued)
May 31, 2009
| | | | | |
| Description | | Face Amount
($ Thousands) | | Market Value
($ Thousands) |
| | | | | |
| | | Number of
Rights | | |
| | |
France — 0.0% | | | | | |
Casino Guichard Perrachon,
Expires 01/13/10* (A) | | 2,997 | | $ | — |
| | | | | |
| | |
Spain — 0.0% | | | | | |
Bankinter SA, Expires 06/04/09* (A) | | 16,919 | | | 13 |
| | | | | |
| | |
Sweden — 0.0% | | | | | |
Eniro AB, Expires 06/18/09* | | 48,096 | | | 31 |
| | | | | |
| | |
United Kingdom — 0.0% | | | | | |
Lloyds Banking Group, Expires 06/08/09* | | 12,025 | | | 5 |
| | | | | |
Total Rights
(Cost $77) ($ Thousands) | | | | | 143 |
| | | | | |
| | | Number of
Warrants | | |
| | |
WARRANT — 0.0% | | | | | |
| | |
Italy — 0.0% | | | | | |
Unione di Banche Italiane SCPA,
Expires 06/30/11* (A) | | 14,619 | | | — |
| | | | | |
Total Warrant
(Cost $0) ($ Thousands) | | | | | — |
| | | | | |
|
U.S. TREASURY OBLIGATIONS (B) (F) — 0.9% |
U.S. Treasury Bills | | | | | |
0.231%, 06/11/09 | | $4,075 | | | 4,075 |
0.090%, 06/18/09 | | 200 | | | 200 |
0.130%, 06/25/09 | | 1,000 | | | 1,000 |
0.141%, 08/20/09 | | 1,050 | | | 1,050 |
| | | | | |
Total U.S. Treasury Obligations
(Cost $6,325) ($ Thousands) | | | | | 6,325 |
| | | | | |
| | | | | | |
| Description | | Shares/Face Amount
($ Thousands) | | Market Value
($ Thousands) |
| |
CASH EQUIVALENT — 1.4% | | | |
| | |
United States — 1.4% | | | | | | |
SEI Daily Income Trust, Prime Obligation Fund, Cl A,
0.260%†** | | | 9,906,559 | | $ | 9,907 |
| | | | | | |
Total Cash Equivalent
(Cost $9,907) ($ Thousands) | | | | | | 9,907 |
| | | | | | |
| |
AFFILIATED PARTNERSHIP — 6.6% | | | |
| | |
United States — 6.6% | | | | | | |
SEI Liquidity Fund, L.P.,
0.820%†** (G) | | | 47,801,825 | | | 46,775 |
| | | | | | |
Total Affiliated Partnership
(Cost $47,802) ($ Thousands) | | | | | | 46,775 |
| | | | | | |
| | |
TIME DEPOSITS — 4.6% | | | | | | |
| | |
United States — 4.6% | | | | | | |
Brown Brothers Harriman | | | | | | |
7.250%, 06/01/09 | | ZAR | 798 | | | 99 |
2.072%, 06/01/09 | | AUD | 6 | | | 5 |
2.000%, 06/01/09 | | DKK | 1,224 | | | 233 |
1.550%, 06/01/09 | | NZD | 3 | | | 2 |
0.638%, 06/01/09 | | NOK | 1,157 | | | 184 |
0.138%, 06/01/09 | | EUR | 110 | | | 155 |
0.098%, 06/01/09 | | GBP | 13 | | | 21 |
0.066%, 06/01/09 | | CAD | 1 | | | 1 |
0.063%, 06/01/09 | | SEK | 3,171 | | | 418 |
0.060%, 06/01/09 | | | 30,933 | | | 30,933 |
0.020%, 06/01/09 | | CHF | 127 | | | 119 |
0.020%, 06/01/09 | | HKD | 260 | | | 33 |
0.010%, 06/01/09 | | JPY | 1,475 | | | 15 |
0.005%, 06/01/09 | | SGD | 20 | | | 14 |
| | | | | | |
Total Time Deposits
(Cost $32,232) ($ Thousands) | | | | | | 32,232 |
| | | | | | |
Total Investments — 106.4%
(Cost $738,180) ($ Thousands) | | | | | $ | 749,922 |
| | | | | | |
A summary of outstanding swap agreements held by the Fund at May 31, 2009, is as follows:
| | | | | | | | | | | | | | |
| Total Return Swap |
| Counterparty | | Reference Entity/Obligation | | Fund Pays | | Fund Receives | | Termination Date | | Notional Amount
(Thousands) | | Net Unrealized
Appreciation
($Thousands) |
| JPMorgan Chase Bank | | MSCI Daily TR Net EAFE USD Market Index | | 3-Month LIBOR Minus 40 Bps | | Price Return | | 10/15/09 | | $ | 31,643 | | $ | 5,445 |
| | | | | | | | | | | | | | |
| | | | | | | | | | | | | | | |
| Credit Default Swaps |
| Counterparty | | Reference Entity/Obligation | | Buy/Sell Protection | | (Pays)/
Receives Rate | | | Termination Date | | Notional Amount
(Thousands) | | Net Unrealized
Appreciation
($Thousands) |
| Bank of America | | Radian Group Inc., 7.750%, 06/01/11 | | BUY | | (0.39 | )% | | 12/20/13 | | $ | 750 | | $ | 337 |
| JPMorgan Chase Bank | | Hasbro Inc., 2.750%, 12/01/21 | | BUY | | (0.39 | ) | | 12/20/11 | | | 750 | | | 9 |
| JPMorgan Chase Bank | | Jones Apparel Group., 5.125%, 11/15/14 | | BUY | | (0.77 | ) | | 12/20/11 | | | 750 | | | 44 |
| JPMorgan Chase Bank | | Radian Group Inc., 7.750%, 06/01/11 | | BUY | | (0.39 | ) | | 12/20/13 | | | 750 | | | 296 |
| Merrill Lynch | | MDC Holdings Inc., 5.500%, 05/15/13 | | BUY | | (0.90 | ) | | 12/20/11 | | | 750 | | | 3 |
| | | | | | | | | | | | | | | |
| | | | | | | | | | | | | | $ | 689 |
| | | | | | | | | | | | | | | |
| | |
| 114 | | SEI Institutional Investments Trust / Annual Report / May 31, 2009 |
A summary of the open futures contracts held by the Fund at May 31, 2009, is as follows:
| | | | | | | | | |
Type of
Contract | | Number of
Contracts
Long (Short) | | | Expiration
Date | | Unrealized
Appreciation
(Depreciation)
($ Thousands) | |
DJ Euro Stoxx 50 Index | | 341 | | | Jun-2009 | | $ | 1,934 | |
FTSE 100 Index | | 100 | | | Jun-2009 | | | 759 | |
Hang Seng Index | | 9 | | | Jun-2009 | | | 60 | |
MSCI EAFE Index E-MINI | | (173 | ) | | Jun-2009 | | | (3,039 | ) |
Nikkei 225 Index | | 23 | | | Jun-2009 | | | 215 | |
SPI 200 Index | | 32 | | | Jun-2009 | | | 106 | |
Topix Index | | 97 | | | Jun-2009 | | | 895 | |
| | | | | | | | | |
| | | | | | | $ | 930 | |
| | | | | | | | | |
A summary of the outstanding forward foreign currency contracts held by the Fund at May 31, 2009, is as follows:
| | | | | | | | | | | | |
| Maturity Date | | Currency
to Deliver
(Thousands) | | Currency
to Receive
(Thousands) | | Unrealized
Appreciation
(Depreciation)
($ Thousands) | |
6/19/09 | | AUD | | 3,014 | | JPY | | 193,000 | | $ | (387 | ) |
6/19/09 | | CAD | | 14,751 | | USD | | 12,860 | | | (605 | ) |
6/19/09 | | HKD | | 64,551 | | USD | | 8,329 | | | 1 | |
6/19/09 | | JPY | | 193,000 | | AUD | | 3,109 | | | 462 | |
6/19/09 | | MXP | | 9,869 | | USD | | 762 | | | 14 | |
6/19/09 | | SGD | | 172 | | USD | | 119 | | | — | |
6/19/09 | | USD | | 6,823 | | AUD | | 8,851 | | | 251 | |
6/19/09 | | USD | | 10,342 | | GBP | | 6,592 | | | 287 | |
6/19/09 | | USD | | 753 | | MXP | | 9,869 | | | (5 | ) |
6/19/09 | | USD | | 2,164 | | SGD | | 3,164 | | | 26 | |
6/19/09 | | ZAR | | 2,585 | | USD | | 324 | | | 4 | |
6/19/09-7/21/09 | | USD | | 17,033 | | EUR | | 12,405 | | | 522 | |
6/19/09-7/21/09 | | USD | | 2,774 | | NZD | | 4,725 | | | 247 | |
6/19/09-7/22/09 | | NOK | | 1,658 | | USD | | 259 | | | (5 | ) |
6/19/09-10/21/09 | | AUD | | 356 | | USD | | 283 | | | (1 | ) |
6/19/09-10/21/09 | | CHF | | 1,450 | | USD | | 1,288 | | | (73 | ) |
6/19/09-10/21/09 | | JPY | | 188,322 | | USD | | 1,898 | | | (78 | ) |
6/19/09-10/21/09 | | USD | | 2,677 | | CHF | | 2,990 | | | 129 | |
6/19/09-10/21/09 | | USD | | 17,259 | | JPY | | 1,658,485 | | | 123 | |
6/19/09-11/20/09 | | CHF | | 1,200 | | NOK | | 6,973 | | | (20 | ) |
6/19/09-11/20/09 | | EUR | | 4,792 | | JPY | | 622,000 | | | (259 | ) |
6/19/09-11/20/09 | | GBP | | 6,293 | | JPY | | 905,000 | | | (651 | ) |
6/19/09-11/20/09 | | GBP | | 165 | | USD | | 266 | | | 1 | |
6/19/09-11/20/09 | | JPY | | 622,000 | | EUR | | 4,908 | | | 423 | |
6/19/09-11/20/09 | | JPY | | 905,000 | | GBP | | 6,426 | | | 866 | |
6/19/09-11/20/09 | | NOK | | 7,178 | | CHF | | 1,200 | | | (13 | ) |
6/19/09-11/20/09 | | NZD | | 5,306 | | USD | | 3,113 | | | (280 | ) |
6/19/09-11/20/09 | | USD | | 54 | | NOK | | 343 | | | — | |
6/22/09 | | EUR | | 790 | | SEK | | 8,450 | | | (2 | ) |
6/22/09 | | SEK | | 8,450 | | EUR | | 800 | | | 17 | |
6/22/09 | | SEK | | 1,643 | | USD | | 217 | | | — | |
6/22/09 | | USD | | 4,096 | | SEK | | 31,504 | | | 60 | |
6/22/09-11/20/09 | | EUR | | 137 | | USD | | 193 | | | (1 | ) |
7/21/09 | | EUR | | 863 | | SGD | | 1,700 | | | (45 | ) |
7/21/09 | | SGD | | 1,700 | | EUR | | 854 | | | 31 | |
7/21/09-10/21/09 | | AUD | | 2,381 | | CHF | | 2,000 | | | (12 | ) |
7/21/09-10/21/09 | | CHF | | 2,000 | | AUD | | 2,507 | | | 113 | |
7/21/09-10/21/09 | | CHF | | 7,200 | | GBP | | 4,269 | | | 120 | |
7/21/09-10/21/09 | | GBP | | 4,249 | | CHF | | 7,200 | | | (87 | ) |
7/21/09-11/20/09 | | CHF | | 6,400 | | EUR | | 4,265 | | | 25 | |
7/21/09-11/20/09 | | EUR | | 4,292 | | CHF | | 6,400 | | | (63 | ) |
7/22/09 | | JPY | | 84,000 | | NOK | | 6,324 | | | 123 | |
7/22/09 | | NOK | | 6,155 | | JPY | | 84,000 | | | (97 | ) |
8/21/09-9/21/09 | | NOK | | 5,486 | | SEK | | 6,800 | | | 27 | |
8/21/09-9/21/09 | | SEK | | 6,800 | | NOK | | 5,347 | | | (49 | ) |
8/21/09-11/20/09 | | GBP | | 1,823 | | SGD | | 4,100 | | | (99 | ) |
8/21/09-11/20/09 | | JPY | | 156,000 | | NZD | | 2,848 | | | 172 | |
8/21/09-11/20/09 | | NZD | | 2,642 | | JPY | | 156,000 | | | (41 | ) |
8/21/09-11/20/09 | | SGD | | 4,100 | | GBP | | 1,834 | | | 117 | |
| | | | | | | | | | | | |
| | | | | | | | | | $ | 1,288 | |
| | | | | | | | | | | | |
Percentages are based on a Net Assets of $704,876 ($ Thousands).
| * | | Non-income producing security. |
| ** | | The rate reported is the 7-day effective yield as of May 31, 2009. |
| † | | Investment in Affiliated Security (see Note 4). |
| ‡ | | Real Estate Investment Trust. |
| (A) | | This security or a partial position of this security is on loan at May 31, 2009. The total value of securities on loan at May 31, 2009 was $46,501 ($ Thousands). |
| (B) | | Security, or portion thereof, has been pledged as collateral on open futures contracts. |
| (C) | | Variable Rate Security — The rate reported on the Schedule of Investments is the rate in effect as of May 31, 2009. The date reported on the Schedule of Investments is the next reset date. |
| (D) | | Securities sold within terms of a private placement memorandum, exempt from registration under Section 144A of the Securities Act of 1933, as amended, and may be sold only to dealers in that program or other “accredited investors.” These securities have been determined to be liquid under guidelines established by the board of Trustees. |
| (E) | | Securities considered illiquid. The total value of such securities as of May 31, 2009 was $0 ($ Thousands) and represented 0.00% of Net Assets. |
| (F) | | Zero coupon security. The rate reported is the effective yield at time of purchase. |
| (G) | | This security was purchased with cash collateral held from securities on loan (see Note 9). The total value of such securities as of May 31, 2009 was $46,775 ($ Thousands). |
| (H) | | Step Bonds — The rate reflected on the Schedule of Investments is the effective yield on May 31, 2009. The coupon on a step bond changes on a specified date. |
ABS — Asset-Based Security
ADR — American Depositary Receipt
AUD — Australian Dollar
CAD — Canadian Dollar
CHF — Swiss Franc
Cl — Class
CMO — Collateralized Mortgage Obligation
DKK — Danish Krone
EUR — Euro
FHLMC — Federal Home Loan Mortgage Corporation
FNMA — Federal National Mortgage Association
GBP — British Pound Sterling
GDR — Global Depositary Receipt
HKD — Hong Kong Dollar
IO — Interest Only — face amount represents notional amount
JPY — Japanese Yen
LIBOR — London Interbank Offered Rate
MXP — Mexican Peso
NIM — Net Interest Margin
NOK — Norwegian Krone
NZD — New Zealand Dollar
SEK — Swedish Krone
Ser — Series
SGD — Singapore Dollar
STRIPS — Separately Traded Registered Interest and Principal Securities
TBA — To Be Announced
USD — U.S. Dollar
ZAR — South African Rand
Amounts designated as “—” are $0 or have been rounded to $0.
The accompanying notes are an integral part of the financial statements.
| | |
| SEI Institutional Investments Trust / Annual Report / May 31, 2009 | | 115 |
SCHEDULE OF INVESTMENTS
World Equity Ex-US Fund
May 31, 2009
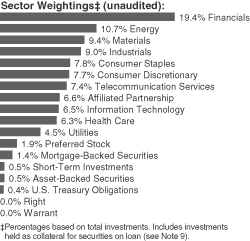
| | | | | |
| Description | | Shares | | Market Value
($ Thousands) |
| | | | | |
| | |
COMMON STOCK — 92.9% | | | | | |
| | |
Argentina — 0.2% | | | | | |
Telecom Argentina ADR* | | 55,500 | | $ | 466 |
Tenaris ADR (A) | | 96,050 | | | 2,936 |
Ternium ADR | | 48,880 | | | 836 |
| | | | | |
| | | | | 4,238 |
| | | | | |
| | |
Australia — 3.9% | | | | | |
AGL Energy | | 227,762 | | | 2,561 |
AJ Lucas Group | | 40,069 | | | 76 |
Alumina | | 90,636 | | | 99 |
Amcor | | 85,737 | | | 352 |
AMP | | 63,006 | | | 246 |
Aristocrat Leisure (A) | | 28,269 | | | 83 |
ASX | | 20,616 | | | 579 |
Australia & New Zealand Banking
Group (A) | | 171,873 | | | 2,220 |
AWB | | 120,275 | | | 115 |
AXA Asia Pacific Holdings | | 144,476 | | | 445 |
Beach Petroleum | | 738,774 | | | 467 |
Bendigo Bank | | 32,066 | | | 158 |
BHP Billiton | | 433,139 | | | 12,164 |
Billabong International | | 54,118 | | | 344 |
BlueScope Steel | | 281,828 | | | 545 |
Boral | | 83,976 | | | 276 |
Bradken | | 32,280 | | | 90 |
Brambles | | 165,397 | | | 786 |
Caltex Australia | | 141,941 | | | 1,367 |
Carnarvon Petroleum* | | 279,809 | | | 170 |
CFS Retail Property Trust‡ (A) | | 322,415 | | | 426 |
Coca-Cola Amatil | | 262,790 | | | 1,783 |
Cochlear | | 9,688 | | | 425 |
Commonwealth Bank of Australia | | 130,697 | | | 3,686 |
Computershare | | 275,971 | | | 1,974 |
| | | | | |
| Description | | Shares | | Market Value
($ Thousands) |
| | | | | |
Crown | | 118,753 | | $ | 695 |
CSL | | 332,169 | | | 7,839 |
David Jones | | 55,700 | | | 163 |
Dexus Property Group‡ | | 122,737 | | | 76 |
Dominion Mining | | 56,293 | | | 222 |
Downer EDI | | 24,087 | | | 92 |
Emeco Holdings | | 450,403 | | | 159 |
Energy Resources of Australia | | 18,800 | | | 372 |
Fairfax Media (A) | | 141,350 | | | 131 |
Fortescue Metals Group* | | 19,726 | | | 43 |
Foster’s Group | | 442,391 | | | 1,746 |
Goodman Fielder | | 391,938 | | | 404 |
Goodman Group‡ | | 337,515 | | | 69 |
GPT Group‡ | | 239,898 | | | 99 |
Harvey Norman Holdings | | 84,234 | | | 200 |
Iluka Resources* | | 201,416 | | | 522 |
Incitec Pivot | | 233,455 | | | 510 |
ING Industrial Fund‡ (A) | | 412,780 | | | 83 |
Insurance Australia Group | | 152,635 | | | 449 |
International Ferro Metals | | 108,603 | | | 69 |
IOOF Holdings | | 16,827 | | | 53 |
JB Hi-Fi | | 62,239 | | | 631 |
Leighton Holdings | | 14,722 | | | 273 |
Lion Nathan | | 139,082 | | | 1,319 |
Macquarie Group (A) | | 40,954 | | | 1,063 |
Macquarie Infrastructure Group (A) | | 687,111 | | | 774 |
Macquarie Office Trust‡ | | 235,429 | | | 36 |
Medusa Mining* | | 63,924 | | | 103 |
Metcash | | 392,161 | | | 1,321 |
Mirvac Group‡ | | 79,330 | | | 74 |
National Australia Bank (A) | | 212,425 | | | 3,800 |
Newcrest Mining | | 293,951 | | | 7,800 |
NRW Holdings | | 194,758 | | | 145 |
Nufarm | | 182,100 | | | 1,807 |
OneSteel | | 25,451 | | | 56 |
Orica | | 69,202 | | | 1,128 |
Origin Energy | | 201,516 | | | 2,400 |
OZ Minerals | | 154,689 | | | 110 |
Pacific Brands | | 231,936 | | | 147 |
Primary Health Care | | 23,968 | | | 103 |
Qantas Airways | | 72,360 | | | 112 |
QBE Insurance Group | | 135,113 | | | 2,119 |
Ramsay Health Care | | 5,500 | | | 49 |
Rio Tinto (A) | | 183,930 | | | 9,670 |
Sally Malay Mining* | | 95,778 | | | 159 |
Santos | | 532,646 | | | 6,255 |
Sims Group | | 6,628 | | | 124 |
Sino Gold Mining* | | 7,500 | | | 39 |
Sonic Healthcare | | 22,384 | | | 213 |
Straits Resources | | 85,379 | | | 118 |
Suncorp-Metway | | 308,745 | | | 1,489 |
TABCORP Holdings | | 107,478 | | | 637 |
Tatts Group | | 702,505 | | | 1,390 |
Telstra | | 467,631 | | | 1,172 |
| | |
| 116 | | SEI Institutional Investments Trust / Annual Report / May 31, 2009 |
| | | | | |
| Description | | Shares | | Market Value
($ Thousands) |
| | | | | |
Toll Holdings | | 33,101 | | $ | 188 |
Transurban Group | | 18,838 | | | 61 |
Washington H Soul Pattinson | | 15,863 | | | 129 |
Wesfarmers (A) | | 162,326 | | | 2,796 |
Westfield Group‡ | | 130,637 | | | 1,154 |
Westpac Banking | | 263,716 | | | 4,013 |
Woodside Petroleum | | 41,231 | | | 1,440 |
Woolworths | | 153,614 | | | 3,137 |
WorleyParsons | | 59,226 | | | 1,083 |
| | | | | |
| | | | | 106,070 |
| | | | | |
| | |
Austria — 0.4% | | | | | |
Erste Group Bank (A) | | 11,721 | | | 286 |
Mayr Melnhof Karton | | 54 | | | 5 |
OMV (A) | | 199,310 | | | 8,175 |
Strabag (A) | | 17,166 | | | 387 |
Telekom Austria (A) | | 13,543 | | | 210 |
Verbund - Oesterreichische Elektrizitaetswirtschafts, Cl A | | 10,742 | | | 582 |
Vienna Insurance Group | | 1,447 | | | 62 |
| | | | | |
| | | | | 9,707 |
| | | | | |
| | |
Belgium — 1.1% | | | | | |
Banque Nationale de Belgique | | 6 | | | 20 |
Belgacom | | 17,347 | | | 546 |
Colruyt | | 7,146 | | | 1,686 |
Delhaize Group (A) | | 83,529 | | | 6,166 |
Dexia (A) | | 47,185 | | | 301 |
D’ieteren | | 556 | | | 115 |
Euronav | | 6,731 | | | 113 |
Fortis | | 409,218 | | | 1,557 |
Groupe Bruxelles Lambert | | 54,615 | | | 4,414 |
InBev (A) | | 119,816 | | | 4,231 |
KBC Groep | | 29,731 | | | 619 |
Mobistar | | 10,349 | | | 642 |
Nationale A Portefeuille | | 9,060 | | | 473 |
Solvay | | 57,146 | | | 5,259 |
Telenet Group Holding* | | 36,489 | | | 731 |
UCB (A) | | 47,543 | | | 1,591 |
Umicore | | 23,344 | | | 563 |
| | | | | |
| | | | | 29,027 |
| | | | | |
| | |
Bermuda — 0.2% | | | | | |
Catlin Group | | 192,628 | | | 1,104 |
Dufry South America (BRL) | | 45,800 | | | 538 |
Frontline | | 4,000 | | | 96 |
Huabao International Holdings (HKD) | | 4,780,000 | | | 4,341 |
Seadrill (NOK) | | 17,600 | | | 260 |
| | | | | |
| | | | | 6,339 |
| | | | | |
| | |
Brazil — 2.0% | | | | | |
Abyara Planejamento Imobiliario* | | 12,700 | | | 16 |
All America Latina Logistica | | 160,100 | | | 933 |
| | | | | |
| Description | | Shares | | Market Value
($ Thousands) |
| | | | | |
Amil Participacoes | | 108,700 | | $ | 508 |
Banco Bradesco ADR | | 170,300 | | | 2,600 |
Banco do Brasil | | 179,200 | | | 1,935 |
Banestes Banco do Estado do Espirito Santo | | 12,200 | | | 59 |
Bradespar | | 7,000 | | | 99 |
Brascan Residential Properties | | 3,400 | | | 7 |
Brasil Telecom Participacoes ADR | | 15,000 | | | 672 |
Camargo Correa Desenvolvimento Imobiliario | | 58,200 | | | 115 |
Centrais Eletricas Brasileiras ADR | | 62,800 | | | 831 |
Cia de Saneamento Basico do Estado de Sao Paulo ADR | | 9,100 | | | 284 |
Cia de Saneamento Basico do Estado de Sao Paulo | | 102,000 | | | 1,595 |
Cia de Saneamento de Minas Gerais-COPASA (BRL) | | 56,500 | | | 746 |
Cia Energetica de Minas Gerais ADR | | 191,500 | | | 2,533 |
Cia Paranaense de Energia ADR | | 15,800 | | | 223 |
Cia Vale do Rio Doce ADR, Cl B | | 178,790 | | | 3,424 |
Cia Vale do Rio Doce | | 135,700 | | | 2,622 |
EDP - Energias do Brasil | | 45,900 | | | 645 |
Empresa Brasileira de Aeronautica | | 135,200 | | | 646 |
Eternit | | 31,100 | | | 112 |
Ez Tec Empreendimentos e Participacoes | | 77,700 | | | 169 |
Gerdau | | 37,100 | | | 297 |
Grendene | | 18,800 | | | 148 |
Hypermarcas* | | 123,000 | | | 1,409 |
Industrias Romi | | 30,900 | | | 126 |
Itau Unibanco Holding ADR (A) | | 292,699 | | | 4,698 |
Klabin Segall* | | 27,300 | | | 32 |
Localiza Rent A Car | | 142,600 | | | 888 |
Lojas Renner | | 110,800 | | | 1,181 |
OGX Petroleo e Gas Participacoes | | 4,333 | | | 2,143 |
Petroleo Brasileiro | | 245,200 | | | 5,402 |
Petroleo Brasileiro ADR, Cl A (A) | | 42,800 | | | 1,497 |
Petroleo Brasileiro ADR | | 133,314 | | | 5,870 |
Redecard | | 192,800 | | | 2,780 |
Rodobens Negocios Imobiliarios | | 84,400 | | | 715 |
Santos Brasil Participacoes | | 69,172 | | | 344 |
Souza Cruz | | 44,100 | | | 1,161 |
Telecomunicacoes de Sao Paulo ADR | | 6,700 | | | 155 |
Telegraph Norte Leste Participacoes ADR | | 100,300 | | | 1,777 |
Usinas Siderurgicas de Minas Gerais | | 88,400 | | | 1,645 |
Wilson Sons, Cl BDR | | 70,580 | | | 538 |
| | | | | |
| | | | | 53,580 |
| | | | | |
| | |
Canada — 5.8% | | | | | |
Agnico-Eagle Mines | | 12,621 | | | 777 |
Agrium (A) | | 92,690 | | | 4,539 |
Alimentation Couche Tard, Cl B | | 43,700 | | | 535 |
ARC Energy Trust | | 13,300 | | | 211 |
Astral Media, Cl A | | 5,900 | | | 167 |
Atco | | 20,200 | | | 660 |
| | |
| SEI Institutional Investments Trust / Annual Report / May 31, 2009 | | 117 |
SCHEDULE OF INVESTMENTS
World Equity Ex-US Fund (Continued)
May 31, 2009
| | | | | |
| Description | | Shares | | Market Value
($ Thousands) |
| | | | | |
Bank of Montreal (A) | | 138,980 | | $ | 5,555 |
Bank of Nova Scotia | | 105,180 | | | 3,665 |
Barrick Gold | | 129,920 | | | 4,905 |
BCE | | 59,400 | | | 1,353 |
Biovail | | 97,900 | | | 1,238 |
Brookfield Asset Management, Cl A | | 71,300 | | | 1,238 |
Cameco | | 88,200 | | | 2,434 |
Canadian Imperial Bank of Commerce | | 40,800 | | | 2,031 |
Canadian National Railway | | 110,360 | | | 4,732 |
Canadian Natural Resources | | 109,560 | | | 6,470 |
Canadian Utilities | | 18,300 | | | 591 |
Celestica* | | 44,320 | | | 289 |
CGI Group, Cl A* | | 332,810 | | | 3,083 |
Dorel Industries, Cl B | | 23,800 | | | 491 |
Emera | | 32,500 | | | 583 |
Empire, Cl A | | 23,500 | | | 1,020 |
Enbridge | | 55,500 | | | 1,960 |
EnCana | | 241,090 | | | 13,262 |
Fairfax Financial Holdings | | 1,900 | | | 489 |
First Quantum Minerals | | 4,500 | | | 200 |
George Weston | | 27,300 | | | 1,539 |
Gerdau Ameristeel | | 20,000 | | | 132 |
Goldcorp | | 175,680 | | | 6,968 |
Groupe Aeroplan | | 76,100 | | | 522 |
IAMGOLD | | 116,106 | | | 1,301 |
Inmet Mining | | 43,000 | | | 1,706 |
Jazz Air Income Fund | | 55,600 | | | 127 |
Kinross Gold | | 128,200 | | | 2,592 |
Loblaw | | 5,500 | | | 180 |
Manulife Financial | | 51,700 | | | 1,109 |
Metro, Cl A | | 134,750 | | | 4,721 |
Mullen Group | | 12,940 | | | 159 |
National Bank of Canada | | 87,050 | | | 4,065 |
Nexen | | 243 | | | 6 |
Nova Chemicals | | 22,300 | | | 128 |
NuVista Energy* | | 6,800 | | | 67 |
Open Text* | | 12,700 | | | 447 |
Penn West Energy Trust | | 99,700 | | | 1,389 |
Petro-Canada | | 79,450 | | | 3,444 |
Potash Corp of Saskatchewan | | 29,300 | | | 3,394 |
Potash Saskatchewan | | 33,930 | | | 3,898 |
Power Corp of Canada | | 12,400 | | | 288 |
Power Financial | | 4,470 | | | 105 |
Provident Energy Trust | | 59,600 | | | 304 |
Quebecor, Cl B | | 46,100 | | | 805 |
Research In Motion* | | 83,610 | | | 6,544 |
Royal Bank of Canada (A) | | 369,401 | | | 14,731 |
Sherritt International | | 66,900 | | | 297 |
Sierra Wireless* | | 31,000 | | | 202 |
Sino-Forest, Cl A* | | 124,200 | | | 1,439 |
Suncor Energy | | 4,600 | | | 161 |
Talisman Energy | | 895,910 | | | 14,479 |
Teck Cominco, Cl B | | 148,010 | | | 2,317 |
TELUS, Cl A | | 64,601 | | | 1,857 |
| | | | | |
| Description | | Shares | | Market Value
($ Thousands) |
| | | | | |
Toronto-Dominion Bank | | 174,000 | | $ | 8,829 |
TransCanada | | 57,300 | | | 1,693 |
Yamana Gold | | 38,210 | | | 448 |
Yellow Pages Income Fund (A) | | 242,440 | | | 1,254 |
| | | | | |
| | | | | 156,125 |
| | | | | |
| | |
Chile — 0.1% | | | | | |
Cia Cervecerias Unidas ADR | | 7,700 | | | 250 |
Cia Cervecerias Unidas | | 87,151 | | | 560 |
Embotelladora Andina ADR, Cl B | | 600 | | | 10 |
Enersis ADR | | 94,100 | | | 1,610 |
ENTEL Chile | | 47,749 | | | 614 |
| | | | | |
| | | | | 3,044 |
| | | | | |
| | |
China — 3.2% | | | | | |
AirMedia Group ADR* | | 99,807 | | | 667 |
Ajisen China Holdings | | 741,000 | | | 514 |
Anhui Conch Cement (A) | | 320,639 | | | 2,324 |
Anta Sports Products | | 1,345,000 | | | 1,483 |
Bank of China | | 35,901,000 | | | 16,282 |
Bank of Communications | | 1,486,000 | | | 1,380 |
China Communications Construction | | 977,000 | | | 1,373 |
China Communications Services | | 1,261,000 | | | 776 |
China Construction Bank | | 4,278,000 | | | 2,793 |
China Dongxiang Group | | 2,147,000 | | | 1,210 |
China Life Insurance | | 1,240,100 | | | 4,558 |
China Railway Construction* | | 1,919,000 | | | 2,786 |
China Railway Group* (A) | | 2,347,000 | | | 1,962 |
China Shenhua Energy | | 1,162,300 | | | 3,927 |
China Shineway Pharmaceutical Group | | 30,000 | | | 24 |
China Shipping Development (A) | | 1,534,000 | | | 2,308 |
China Telecom | | 3,679,000 | | | 1,753 |
Dongfeng Motor Group | | 1,504,000 | | | 1,464 |
Epure International | | 2,535,000 | | | 801 |
Fosun International | | 280,000 | | | 175 |
Guangshen Railway | | 473,000 | | | 225 |
Hangzhou Steam Turbine, Cl B | | 81,000 | | | 114 |
Huaneng Power International | | 832,000 | | | 553 |
Industrial & Commercial Bank of China (A) | | 28,997,000 | | | 18,482 |
Li Ning (A) | | 545,500 | | | 1,346 |
Mindray Medical International ADR | | 37,065 | | | 853 |
New Oriental Education & Technology Group ADR* | | 19,485 | | | 1,071 |
PetroChina | | 4,130,000 | | | 4,797 |
Ping An Insurance Group of China | | 412,000 | | | 2,884 |
Renhe Commercial Holdings* | | 9,440,000 | | | 1,879 |
Shanghai Friendship Group, Cl B* | | 210,300 | | | 224 |
Shanghai Jinqiao Export Processing Zone Development, Cl B | | 271,500 | | | 228 |
Shenzhen Chiwan Wharf Holdings,
Cl B* | | 139,300 | | | 157 |
Shenzhou International Group Holdings (HRD) | | 697,000 | | | 282 |
| | |
| 118 | | SEI Institutional Investments Trust / Annual Report / May 31, 2009 |
| | | | | |
| Description | | Shares | | Market Value
($ Thousands) |
| | | | | |
Sinotrans | | 148,000 | | $ | 39 |
Tingyi Cayman Islands Holding | | 616,000 | | | 923 |
Weichai Power | | 278,000 | | | 1,054 |
Weiqiao Textile | | 592,500 | | | 332 |
Yantai Changyu Pioneer Wine, Cl B | | 75,000 | | | 411 |
Yanzhou Coal Mining | | 756,000 | | | 955 |
Zhejiang Expressway | | 688,000 | | | 540 |
Zhuzhou CSR Times Electric, Cl H | | 696,000 | | | 1,022 |
| | | | | |
| | | | | 86,931 |
| | | | | |
| | |
Colombia — 0.0% | | | | | |
Almacenes Exito GDR (B) | | 89,029 | | | 516 |
| | | | | |
| | |
Czech Republic — 0.1% | | | | | |
CEZ | | 78,792 | | | 3,590 |
Philip Morris CR | | 151 | | | 47 |
| | | | | |
| | | | | 3,637 |
| | | | | |
| | |
Denmark — 0.8% | | | | | |
A P Moeller - Maersk, Cl A | | 26 | | | 161 |
A P Moeller - Maersk, Cl B | | 239 | | | 1,474 |
Carlsberg, Cl B | | 58,573 | | | 3,745 |
Coloplast, Cl B | | 6,701 | | | 465 |
Danisco | | 20,763 | | | 793 |
Danske Bank | | 84,373 | | | 1,435 |
East Asiatic | | 4,298 | | | 145 |
H Lundbeck | | 151,550 | | | 3,396 |
Novo-Nordisk, Cl B | | 77,253 | | | 4,033 |
Novozymes, Cl B (A) | | 6,638 | | | 530 |
Sydbank | | 2,582 | | | 56 |
Topdanmark* | | 3,250 | | | 393 |
TrygVesta | | 6,919 | | | 413 |
Vestas Wind Systems* | | 44,487 | | | 3,282 |
William Demant Holding* | | 2,945 | | | 167 |
| | | | | |
| | | | | 20,488 |
| | | | | |
| | |
Egypt — 0.1% | | | | | |
Commercial International Bank | | 64,147 | | | 524 |
Egyptian Financial Group-Hermes Holding | | 173,164 | | | 694 |
Egyptian International Pharmaceutical Industrial | | 27,750 | | | 126 |
National Societe Generale Bank SAE | | 39,685 | | | 192 |
Suez Cement | | 26,776 | | | 121 |
Telecom Egypt | | 238,000 | | | 752 |
Torah Portland Cement | | 6,000 | | | 27 |
| | | | | |
| | | | | 2,436 |
| | | | | |
| | |
Finland — 0.8% | | | | | |
Citycon | | 28,226 | | | 71 |
Elisa, Cl A | | 7,841 | | | 117 |
Fortum | | 12,466 | | | 307 |
Huhtamaki | | 13,347 | | | 139 |
Kesko, Cl B | | 6,536 | | | 189 |
| | | | | |
| Description | | Shares | | Market Value
($ Thousands) |
| | | | | |
Kone, Cl B | | 106,637 | | $ | 3,258 |
Konecranes | | 9,364 | | | 226 |
Metso* | | 33,788 | | | 649 |
Neste Oil | | 4,086 | | | 63 |
Nokia (A) | | 525,310 | | | 8,072 |
Orion, Cl B | | 17,251 | | | 282 |
Outokumpu | | 14,370 | | | 287 |
Pohjola Bank, Cl A | | 20,940 | | | 161 |
Rautaruukki | | 8,246 | | | 187 |
Sampo, Cl A | | 195,217 | | | 3,688 |
Stora Enso, Cl R | | 11,205 | | | 68 |
UPM-Kymmene | | 20,114 | | | 189 |
Wartsila, Cl B (A) | | 69,259 | | | 2,500 |
| | | | | |
| | | | | 20,453 |
| | | | | |
| | |
France — 6.5% | | | | | |
Accor (A) | | 5,457 | | | 244 |
Aeroports de Paris | | 3,351 | | | 246 |
Air France-KLM | | 41,866 | | | 672 |
Air Liquide | | 9,802 | | | 914 |
Alcatel-Lucent | | 22,877 | | | 58 |
Alstom | | 35,032 | | | 2,238 |
Atos Origin | | 14,292 | | | 486 |
AXA | | 219,311 | | | 4,116 |
BioMerieux | | 534 | | | 46 |
BNP Paribas | | 153,347 | | | 10,640 |
Bouygues | | 107,071 | | | 4,432 |
Capital Gemini (A) | | 20,937 | | | 812 |
Carrefour | | 3,006 | | | 135 |
Casino Guichard Perrachon | | 1,731 | | | 127 |
Christian Dior (A) | | 21,072 | | | 1,623 |
Cie de Saint-Gobain (A) | | 59,552 | | | 2,174 |
Cie Generale de Geophysique-Veritas* | | 26,912 | | | 481 |
Cie Generale d’Optique Essilor International | | 5,610 | | | 260 |
CNP Assurances | | 25,097 | | | 2,383 |
Compagnie Generale des Etablissements Michelin, Cl B (A) | | 31,598 | | | 1,930 |
Credit Agricole (A) | | 150,121 | | | 2,220 |
Credit Industriel et Commercial | | 65 | | | 10 |
Danone (A) | | 2,536 | | | 127 |
Dassault Systemes | | 18,305 | | | 821 |
Eiffage (A) | | 5,608 | | | 344 |
Electricite de France | | 749 | | | 39 |
Eramet | | 289 | | | 80 |
Eurazeo | | 2,123 | | | 100 |
Eutelsat Communications | | 68,996 | | | 1,758 |
France Telecom (A) | | 493,672 | | | 12,054 |
Gaz de France | | 116,816 | | | 4,621 |
Gemalto* | | 29,490 | | | 977 |
Havas | | 295,296 | | | 792 |
Hermes International (A) | | 5,061 | | | 681 |
ICADE‡ | | 2,887 | | | 245 |
Iliad | | 13,397 | | | 1,498 |
| | |
| SEI Institutional Investments Trust / Annual Report / May 31, 2009 | | 119 |
SCHEDULE OF INVESTMENTS
World Equity Ex-US Fund (Continued)
May 31, 2009
| | | | | |
| Description | | Shares | | Market Value
($ Thousands) |
| | | | | |
Imerys | | 3,907 | | $ | 168 |
Ipsen | | 1,727 | | | 81 |
Klepierre‡ | | 1,977 | | | 51 |
Lafarge | | 48,928 | | | 3,359 |
Lagardere S.C.A. | | 5,062 | | | 170 |
Legrand | | 23,740 | | | 504 |
L’Oreal (A) | | 2,145 | | | 170 |
M6-Metropole Television | | 19,333 | | | 384 |
Moet Hennessy Louis Vuitton (A) | | 7,658 | | | 639 |
Natixis | | 659,122 | | | 1,357 |
Neopost | | 19,964 | | | 1,666 |
Nexity | | 8,986 | | | 313 |
Pernod-Ricard (A) | | 3,244 | | | 204 |
Peugeot | | 141,370 | | | 4,313 |
PPR (A) | | 34,343 | | | 2,905 |
Publicis Groupe | | 27,704 | | | 905 |
Safran (A) | | 15,850 | | | 209 |
Sanofi-Aventis | | 376,060 | | | 24,031 |
Schneider Electric | | 14,714 | | | 1,101 |
SCOR (A) | | 27,555 | | | 583 |
SES Global | | 123,920 | | | 2,479 |
Societe BIC (A) | | 8,313 | | | 457 |
Societe Des Autoroutes Paris-Rhin-Rhone | | 3,236 | | | 200 |
Societe Generale (A) | | 94,685 | | | 5,563 |
Societe Television Francaise 1 (A) | | 7,640 | | | 90 |
Sodexo | | 46,868 | | | 2,325 |
Suez Environnement (A) | | 122,765 | | | 2,239 |
Technip | | 75,281 | | | 3,738 |
Teleperformance | | 28,174 | | | 836 |
Thales (A) | | 42,351 | | | 2,001 |
Total (A) | | 561,545 | | | 32,436 |
Unibail-Rodamco‡ (A) | | 14,576 | | | 2,355 |
Veolia Environnement (A) | | 10,044 | | | 297 |
Vinci (A) | | 69,372 | | | 3,359 |
Vivendi (A) | | 475,194 | | | 12,591 |
Wendel (A) | | 23,457 | | | 999 |
Zodiac Aerospace (A) | | 5,882 | | | 191 |
| | | | | |
| | | | | 175,653 |
| | | | | |
| | |
Germany — 4.4% | | | | | |
Adidas | | 19,305 | | | 709 |
Allianz | | 99,221 | | | 9,861 |
BASF | | 90,297 | | | 3,834 |
Bayer (A) | | 203,206 | | | 11,634 |
Bayerische Motoren Werke | | 16,373 | | | 593 |
Beiersdorf | | 962 | | | 47 |
Bilfinger Berger | | 7,132 | | | 356 |
Commerzbank (A) | | 131,941 | | | 1,044 |
DaimlerChrysler | | 56,925 | | | 2,096 |
Demag Cranes | | 13,297 | | | 327 |
Deutsche Bank (A) | | 89,511 | | | 6,063 |
Deutsche Boerse | | 82,321 | | | 7,222 |
Deutsche Lufthansa | | 213,028 | | | 2,953 |
Deutsche Post | | 28,144 | | | 389 |
| | | | | |
| Description | | Shares | | Market Value
($ Thousands) |
| | | | | |
Deutsche Postbank (A) | | 30,037 | | $ | 706 |
Deutsche Telekom | | 249,052 | | | 2,872 |
E.ON (A) | | 358,042 | | | 12,725 |
Fraport Frankfurt Airport Services Worldwide (A) | | 3,602 | | | 148 |
Fresenius Medical Care (A) | | 87,787 | | | 3,703 |
GAGFAH | | 19,994 | | | 180 |
Hannover Rueckversicherung | | 77,998 | | | 2,946 |
HeidelbergCement (A) | | 24,879 | | | 901 |
Henkel | | 9,135 | | | 246 |
Hochtief | | 18,918 | | | 921 |
Infineon Technologies* | | 15,301 | | | 49 |
K+S (A) | | 7,105 | | | 533 |
Lanxess | | 9,867 | | | 232 |
Linde | | 21,497 | | | 1,795 |
MAN | | 13,564 | | | 832 |
Merck KGaA | | 5,622 | | | 541 |
Metro | | 2,067 | | | 112 |
MTU Aero Engines Holding (A) | | 39,284 | | | 1,281 |
Muenchener Rueckversicherungs | | 62,199 | | | 8,795 |
Puma Rudolf Dassler Sport | | 266 | | | 62 |
Rheinmetall | | 1,126 | | | 47 |
RWE | | 193,664 | | | 16,144 |
SAP (A) | | 145,341 | | | 6,283 |
Siemens | | 46,962 | | | 3,437 |
Software (A) | | 22,826 | | | 1,625 |
Solarworld (A) | | 6,837 | | | 216 |
Suedzucker (A) | | 85,321 | | | 1,771 |
ThyssenKrupp | | 84,367 | | | 2,161 |
Tognum | | 22,909 | | | 351 |
TUI | | 9,330 | | | 83 |
United Internet | | 16,610 | | | 214 |
Volkswagen | | 4,503 | | | 1,365 |
Wacker Chemie | | 814 | | | 102 |
| | | | | |
| | | | | 120,507 |
| | | | | |
| | |
Greece — 0.4% | | | | | |
Hellenic Petroleum | | 26,699 | | | 270 |
Hellenic Telecommunications
Organization | | 16,030 | | | 262 |
Marfin Investment Group | | 177,959 | | | 943 |
National Bank of Greece | | 58,665 | | | 1,605 |
OPAP | | 88,048 | | | 2,728 |
Public Power | | 273,131 | | | 6,219 |
| | | | | |
| | | | | 12,027 |
| | | | | |
| | |
Hong Kong — 2.9% | | | | | |
ASM Pacific Technology | | 14,200 | | | 84 |
Bank of East Asia | | 21,400 | | | 71 |
Beijing Enterprises Holdings | | 62,000 | | | 282 |
BOC Hong Kong Holdings | | 494,690 | | | 791 |
Chaoda Modern Agriculture | | 2,878,400 | | | 1,825 |
Cheung Kong Holdings | | 115,000 | | | 1,433 |
Cheung Kong Infrastructure Holdings | | 32,000 | | | 119 |
| | |
| 120 | | SEI Institutional Investments Trust / Annual Report / May 31, 2009 |
| | | | | |
| Description | | Shares | | Market Value
($ Thousands) |
| | | | | |
China BlueChemical | | 934,000 | | $ | 547 |
China Mobile | | 1,683,000 | | | 16,527 |
China Overseas Land & Investment | | 2,576,000 | | | 5,515 |
China Pharmaceutical Group | | 792,000 | | | 456 |
China Resources Power Holdings | | 1,157,000 | | | 2,481 |
Chinese Estates Holdings | | 160,000 | | | 247 |
CLP Holdings | | 151,500 | | | 1,020 |
CNOOC | | 2,361,500 | | | 3,161 |
COSCO Pacific (A) | | 1,190,000 | | | 1,638 |
Dairy Farm International Holdings | | 19,400 | | | 105 |
Digital China Holdings | | 451,000 | | | 312 |
Esprit Holdings | | 95,690 | | | 612 |
First Pacific | | 468,000 | | | 233 |
Genesis Energy Holdings* | | 4,185,000 | | | 198 |
Guangdong Investment | | 1,716,000 | | | 872 |
Guoco Group | | 36,000 | | | 309 |
Hang Lung Group | | 84,000 | | | 384 |
Hang Lung Properties | | 624,000 | | | 2,130 |
Hang Seng Bank | | 88,400 | | | 1,273 |
Henderson Land Development | | 104,000 | | | 634 |
Hengan International Group | | 179,000 | | | 817 |
Hong Kong & China Gas | | 148,000 | | | 301 |
Hong Kong Exchanges and Clearing | | 180,200 | | | 2,815 |
HongKong Electric Holdings | | 394,000 | | | 2,117 |
Hopewell Highway Infrastructure | | 4,500 | | | 2 |
Hopewell Holdings | | 166,000 | | | 513 |
Hutchison Harbour Ring | | 734,000 | | | 57 |
Hutchison Telecommunications
Hong Kong Holdings* | | 1,170,000 | | | 145 |
Hutchison Telecommunications International | | 1,183,000 | | | 241 |
Hutchison Whampoa | | 822,980 | | | 5,811 |
Hysan Development | | 84,000 | | | 195 |
Industrial & Commercial Bank of China Asia | | 566,000 | | | 1,023 |
Jardine Matheson Holdings | | 29,200 | | | 752 |
Jardine Strategic Holdings | | 24,500 | | | 350 |
Kerry Properties | | 44,500 | | | 191 |
Kingboard Chemical Holdings | | 111,000 | | | 291 |
Kingboard Laminates Holdings (A) | | 5,129,000 | | | 2,266 |
Lai Sun Development* | | 5,616,000 | | | 99 |
Li & Fung | | 744,000 | | | 2,017 |
Link REIT‡ | | 76,000 | | | 149 |
MTR | | 492,000 | | | 1,566 |
New World Development | | 271,000 | | | 517 |
Noble Group | | 1,312,000 | | | 1,458 |
NWS Holdings | | 17,000 | | | 37 |
Orient Overseas International | | 93,000 | | | 404 |
Pacific Basin Shipping | | 51,000 | | | 36 |
Pacific Century Premium Developments | | 268,000 | | | 62 |
RCG Holdings | | 62,055 | | | 70 |
Shandong Chenming Paper
Holdings, Cl B | | 1,180,100 | | | 641 |
Shanghai Industrial Holdings | | 66,000 | | | 263 |
| | | | | |
| Description | | Shares | | Market Value
($ Thousands) |
| | | | | |
Shangri-La Asia | | 36,000 | | $ | 56 |
SIM Technology Group | | 620,000 | | | 71 |
Sinofert Holdings | | 222,000 | | | 108 |
SJM Holdings | | 791,000 | | | 345 |
Sun Hung Kai Properties | | 675,000 | | | 8,456 |
Swire Pacific, Cl A | | 37,500 | | | 376 |
Television Broadcasts | | 4,000 | | | 17 |
Texwinca Holdings | | 8,000 | | | 5 |
VTech Holdings | | 37,000 | | | 195 |
Wharf Holdings | | 156,000 | | | 651 |
Wheelock | | 138,270 | | | 396 |
Wing On International | | 32,000 | | | 35 |
Yue Yuen Industrial Holdings | | 239,120 | | | 550 |
| | | | | |
| | | | | 79,726 |
| | | | | |
| | |
Hungary — 0.1% | | | | | |
Egis Gyogyszergyar Nyrt | | 2,402 | | | 171 |
Magyar Telekom Telecommunications | | 252,000 | | | 753 |
MOL Hungarian Oil and Gas | | 12,462 | | | 782 |
Tiszai Vegyi Kombinat | | 6,481 | | | 66 |
| | | | | |
| | | | | 1,772 |
| | | | | |
| | |
India — 1.4% | | | | | |
Apollo Tyres | | 8,123 | | | 5 |
Bank of India | | 160,100 | | | 1,158 |
Bank of Maharashtra* | | 252,287 | | | 207 |
Bharat Electronics | | 27,000 | | | 772 |
Bharti Airtel* | | 123,144 | | | 2,164 |
Birla | | 32,250 | | | 157 |
Cairn India* | | 4,120 | | | 20 |
Colgate Palmolive India | | 7,546 | | | 76 |
Container of India | | 17,759 | | | 356 |
Coromandel Fertilisers | | 1,400 | | | 5 |
Dalmia Cement Bharat | | 1,710 | | | 5 |
Dena Bank | | 11,540 | | | 13 |
Dr Reddys Laboratories | | 30,000 | | | 414 |
Dr Reddys Laboratories ADR | | 42,471 | | | 571 |
GAIL India | | 177,863 | | | 1,139 |
Grasim Industries | | 6,390 | | | 288 |
Great Eastern Shipping | | 16,536 | | | 100 |
Gujarat Alkalies & Chemicals | | 53,480 | | | 119 |
Gujarat Flourochemicals | | 3,780 | | | 13 |
Gujarat Narmada Valley Fertilizers | | 93,505 | | | 188 |
Gujarat State Fertilisers | | 64,031 | | | 233 |
HCL Technologies | | 111,380 | | | 398 |
HDFC Bank | | 98,920 | | | 3,067 |
Hero Honda Motors | | 19,265 | | | 549 |
Hindalco Industries | | 362,780 | | | 656 |
Hindustan Unilever | | 189,240 | | | 930 |
Hindustan Zinc | | 73,746 | | | 919 |
Housing Development Finance | | 45,435 | | | 2,123 |
ICICI Bank | | 15,250 | | | 242 |
Indian Bank | | 246,705 | | | 724 |
Infosys Technologies | | 15,000 | | | 514 |
| | |
| SEI Institutional Investments Trust / Annual Report / May 31, 2009 | | 121 |
SCHEDULE OF INVESTMENTS
World Equity Ex-US Fund (Continued)
May 31, 2009
| | | | | |
| Description | | Shares | | Market Value
($ Thousands) |
| | | | | |
Infrastructure Development Finance Company* | | 861,558 | | $ | 2,293 |
ITC | | 134,666 | | | 527 |
Jindal Stainless | | 54,361 | | | 110 |
Kesoram Industries | | 23,450 | | | 153 |
Larsen & Toubro | | 80,181 | | | 2,408 |
Madras Cements | | 60,400 | | | 137 |
NTPC | | 403,170 | | | 1,855 |
Oil & Natural Gas | | 124,600 | | | 3,108 |
Pidilite Industries | | 8,568 | | | 23 |
Reliance Industries* | | 17,782 | | | 864 |
Sesa Goa* | | 54,684 | | | 194 |
Shipping of India | | 74,633 | | | 218 |
Steel Authority of India | | 327,332 | | | 1,209 |
Sterlite Industries India | | 29,058 | | | 388 |
Sun Pharmaceutical Industries | | 48,070 | | | 1,240 |
Syndicate Bank | | 16,560 | | | 28 |
Tata Chemicals | | 66,250 | | | 307 |
Tata Consultancy Services | | 149,648 | | | 2,251 |
Tata Power | | 62,490 | | | 1,433 |
UCO Bank | | 7,670 | | | 7 |
United Phosphorus | | 96,500 | | | 338 |
Wockhardt* | | 73,660 | | | 189 |
Zee Entertainment Enterprises | | 455,165 | | | 1,643 |
| | | | | |
| | | | | 39,048 |
| | | | | |
| | |
Indonesia — 0.3% | | | | | |
Bank Rakyat Indonesia | | 2,926,500 | | | 1,786 |
HM Sampoerna | | 114,500 | | | 116 |
Indofood Sukses Makmur | | 3,722,500 | | | 648 |
Perusahaan Gas Negara | | 374,000 | | | 105 |
Telekomunikasi Indonesia | | 4,919,300 | | | 3,621 |
Unilever Indonesia | | 1,061,000 | | | 812 |
| | | | | |
| | | | | 7,088 |
| | | | | |
| | |
Ireland — 0.2% | | | | | |
CRH | | 148,712 | | | 3,509 |
DCC | | 1,166 | | | 24 |
Elan* | | 7,604 | | | 54 |
Experian | | 243,811 | | | 1,806 |
Kerry Group, Cl A | | 1,164 | | | 28 |
| | | | | |
| | | | | 5,421 |
| | | | | |
| | |
Israel — 0.8% | | | | | |
Bank Leumi Le-Israel | | 150,000 | | | 422 |
Bezeq Israeli Telecommunication | | 1,294,684 | | | 2,412 |
Check Point Software Technologies* (A) | | 178,280 | | | 4,163 |
Discount Investment | | 16,000 | | | 281 |
Electra Israel | | 129 | | | 13 |
First International Bank of Israel* | | 36,000 | | | 332 |
Harel Insurance Investments & Financial Services* | | 9,000 | | | 343 |
Mizrahi Tefahot Bank* | | 88,000 | | | 517 |
| | | | | |
| Description | | Shares | | Market Value
($ Thousands) |
| | | | | |
Teva Pharmaceutical Industries ADR (A) | | 152,530 | | $ | 7,071 |
Teva Pharmaceutical Industries | | 108,000 | | | 5,011 |
Union Bank of Israel* | | 24,120 | | | 74 |
| | | | | |
| | | | | 20,639 |
| | | | | |
| | |
Italy — 2.2% | | | | | |
ACEA | | 67,859 | | | 879 |
Alleanza Assicurazioni (A) | | 44,892 | | | 327 |
Amplifon | | 54,260 | | | 210 |
Assicurazioni Generali (A) | | 5,266 | | | 118 |
Atlantia | | 60,210 | | | 1,277 |
Autogrill | | 4,717 | | | 44 |
Banca Carige | | 123,830 | | | 387 |
Banca Intesa | | 1,816,639 | | | 6,502 |
Banca Intesa RNC | | 50,457 | | | 151 |
Banca Monte dei Paschi di Siena (A) | | 27,337 | | | 47 |
Banca Popolare di Milano | | 32,921 | | | 221 |
Banche Popolari Unite (A) | | 51,612 | | | 716 |
Banco Popolare Scarl | | 311,371 | | | 2,596 |
Benetton Group | | 23,570 | | | 221 |
Buzzi Unicem | | 143,105 | | | 2,031 |
Danieli | | 9,463 | | | 182 |
DiaSorin | | 3,723 | | | 95 |
Edison (A) | | 184,719 | | | 249 |
Enel (A) | | 1,038,773 | | | 6,194 |
ENI (A) | | 456,073 | | | 11,079 |
Esprinet | | 15,215 | | | 142 |
Exor | | 56,733 | | | 945 |
Fiat (A) | | 187,976 | | | 2,021 |
Finmeccanica | | 149,838 | | | 2,122 |
Fondiaria-Sai | | 26,766 | | | 443 |
Geox (A) | | 290,581 | | | 2,303 |
Iride | | 6,606 | | | 13 |
Italcementi (A) | | 53,338 | | | 617 |
Lottomatica | | 3,228 | | | 65 |
Luxottica Group | | 17,565 | | | 366 |
Mediaset | | 137,649 | | | 811 |
Mediobanca | | 23,503 | | | 282 |
Mediolanum | | 26,947 | | | 134 |
Parmalat | | 124,160 | | | 308 |
Piccolo Credito Valtellinese Scarl | | 3,072 | | | 25 |
Pirelli | | 4,252,424 | | | 1,729 |
Prysmian | | 6,525 | | | 95 |
Saipem | | 2,574 | | | 66 |
Saras | | 37,747 | | | 113 |
Snam Rete Gas | | 48,603 | | | 211 |
Telecom Italia | | 6,585,256 | | | 8,898 |
Terna Rete Elettrica Nazionale | | 553,318 | | | 2,042 |
UniCredito Italiano | | 1,190,044 | | | 3,138 |
| | | | | |
| | | | | 60,415 |
| | | | | |
| | |
Japan — 15.2% | | | | | |
77 Bank | | 241,359 | | | 1,306 |
Acom | | 2,520 | | | 66 |
| | |
| 122 | | SEI Institutional Investments Trust / Annual Report / May 31, 2009 |
| | | | | |
| Description | | Shares | | Market Value
($ Thousands) |
| | | | | |
Aderans Holdings | | 4,300 | | $ | 46 |
Advantest | | 23,300 | | | 416 |
Aeon | | 125,100 | | | 1,159 |
Aeon Mall | | 1,400 | | | 24 |
Aichi Bank | | 900 | | | 68 |
Aida Engineering | | 1,000 | | | 3 |
Aioi Insurance | | 69,000 | | | 326 |
Aisan Industry | | 1,500 | | | 10 |
Aisin Seiki | | 6,300 | | | 125 |
Ajinomoto | | 75,000 | | | 558 |
Alfresa Holdings | | 1,300 | | | 54 |
All Nippon Airways | | 91,000 | | | 338 |
Alpine Electronics | | 28,800 | | | 264 |
Amada | | 51,000 | | | 335 |
AOKI Holdings | | 4,000 | | | 42 |
Aoyama Trading | | 7,700 | | | 131 |
Asahi Breweries | | 79,500 | | | 1,097 |
Asahi Kasei | | 77,000 | | | 382 |
Asics | | 28,000 | | | 216 |
Astellas Pharma | | 370,000 | | | 12,585 |
Bank of Kyoto (A) | | 188,000 | | | 1,678 |
Bank of Nagoya | | 23,000 | | | 106 |
Bank of Yokohama | | 26,000 | | | 129 |
Belluna | | 4,750 | | | 18 |
Benesse | | 84,800 | | | 3,544 |
Best Denki | | 10,500 | | | 45 |
BML | | 3,200 | | | 65 |
Bridgestone | | 128,500 | | | 1,956 |
Canon | | 235,000 | | | 7,782 |
Canon Finetech | | 4,800 | | | 53 |
Canon Marketing Japan | | 82,600 | | | 1,132 |
Capcom | | 73,000 | | | 1,423 |
Casio Computer | | 15,800 | | | 140 |
Cawachi | | 9,800 | | | 182 |
Central Japan Railway | | 1,111 | | | 7,089 |
Chiba Bank | | 68,000 | | | 413 |
Chiba Kogyo Bank* | | 7,100 | | | 73 |
Chubu Electric Power | | 60,700 | | | 1,355 |
Chuetsu Pulp & Paper | | 22,000 | | | 63 |
Chugai Pharmaceutical | | 115,600 | | | 2,109 |
Chugoku Bank | | 50,000 | | | 675 |
Chugoku Electric Power | | 34,800 | | | 719 |
Chuo Denki Kogyo | | 20,000 | | | 145 |
Circle K Sunkus (A) | | 19,000 | | | 270 |
Citizen Holdings | | 67,800 | | | 341 |
Coca-Cola Central Japan | | 6,200 | | | 85 |
Cosmo Oil | | 350,000 | | | 1,273 |
Create SD Holdings | | 2,700 | | | 46 |
Credit Saison | | 88,000 | | | 1,182 |
Dai Nippon Printing | | 156,000 | | | 2,006 |
Daicel Chemical Industries | | 15,000 | | | 81 |
Daihatsu Motor | | 133,000 | | | 1,283 |
Daiichi Sankyo | | 250,000 | | | 4,699 |
Daiichikosho | | 24,300 | | | 239 |
| | | | | |
| Description | | Shares | | Market Value
($ Thousands) |
| | | | | |
Daikin Industries | | 2,800 | | $ | 87 |
Daimei Telecom Engineering | | 3,000 | | | 27 |
Dainippon Sumitomo Pharma | | 120,300 | | | 985 |
Daio Paper | | 2,000 | | | 18 |
Daishi Bank | | 21,000 | | | 81 |
Daito Trust Construction | | 5,100 | | | 231 |
Daiwa House Industry | | 38,000 | | | 362 |
Daiwa Securities Group | | 232,000 | | | 1,448 |
DCM Japan Holdings | | 23,700 | | | 134 |
Dena (A) | | 152 | | | 520 |
Denso (A) | | 119,400 | | | 2,832 |
Dentsu (A) | | 63,300 | | | 1,207 |
Duskin | | 3,900 | | | 66 |
Dydo Drinco | | 3,600 | | | 94 |
eAccess | | 200 | | | 164 |
East Japan Railway | | 154,500 | | | 9,208 |
Ebara | | 363,000 | | | 1,114 |
Eisai | | 11,600 | | | 398 |
Electric Power Development | | 28,500 | | | 811 |
FamilyMart | | 45,100 | | | 1,317 |
Fanuc | | 40,900 | | | 3,298 |
Fast Retailing | | 35,500 | | | 4,201 |
Fuji Heavy Industries | | 120,000 | | | 472 |
Fuji Machine Manufacturing | | 4,300 | | | 56 |
FUJIFILM Holdings | | 22,700 | | | 656 |
Fujitec | | 1,000 | | | 4 |
Fujitsu | | 550,000 | | | 2,845 |
Fukuda Denshi | | 1,900 | | | 43 |
Fukuoka Financial Group | | 323,296 | | | 1,423 |
Furukawa Electric | | 69,000 | | | 251 |
Furuno Electric | | 4,100 | | | 21 |
Futaba | | 19,000 | | | 374 |
Fuyo General Lease | | 1,300 | | | 27 |
Global One Real Estate Investment‡ | | 53 | | | 354 |
Godo Steel | | 86,000 | | | 275 |
Gunma Bank | | 65,000 | | | 345 |
Gunze | | 64,000 | | | 222 |
H2O Retailing | | 20,000 | | | 117 |
Hachijuni Bank | | 71,000 | | | 405 |
Hakuhodo DY Holdings | | 6,390 | | | 327 |
Hankyu Hanshin Holdings | | 124,000 | | | 608 |
Heiwa | | 6,400 | | | 73 |
Heiwado | | 8,100 | | | 99 |
Higashi-Nippon Bank | | 20,000 | | | 47 |
Higo Bank | | 38,000 | | | 212 |
HI-LEX | | 2,800 | | | 21 |
Hirose Electric | | 4,400 | | | 490 |
Hiroshima Bank | | 88,000 | | | 350 |
Hisamitsu Pharmaceutical | | 38,900 | | | 1,260 |
Hitachi | | 914,000 | | | 3,034 |
Hitachi Cable | | 65,000 | | | 213 |
Hitachi Capital | | 800 | | | 9 |
Hitachi Chemical | | 10,400 | | | 161 |
Hitachi High-Technologies | | 6,300 | | | 97 |
| | |
| SEI Institutional Investments Trust / Annual Report / May 31, 2009 | | 123 |
SCHEDULE OF INVESTMENTS
World Equity Ex-US Fund (Continued)
May 31, 2009
| | | | | |
| Description | | Shares | | Market Value
($ Thousands) |
| | | | | |
Hitachi Software Engineering | | 19,900 | | $ | 311 |
Hokuetsu Bank | | 29,000 | | | 56 |
Hokuhoku Financial Group | | 51,000 | | | 108 |
Hokuriku Electric Power | | 37,100 | | | 862 |
Honda Motor | | 325,700 | | | 9,432 |
Hoshizaki Electric | | 12,500 | | | 139 |
House Foods | | 37,000 | | | 553 |
Hoya | | 21,000 | | | 435 |
Hyakugo Bank | | 30,000 | | | 149 |
Hyakujushi Bank | | 35,000 | | | 164 |
Ibiden | | 90,500 | | | 2,593 |
IBJ Leasing | | 200 | | | 3 |
Idemitsu Kosan | | 7,700 | | | 641 |
IHI | | 51,000 | | | 92 |
Inpex Holdings | | 297 | | | 2,407 |
Isetan Mitsukoshi Holdings | | 6,600 | | | 59 |
Isuzu Motors | | 161,000 | | | 277 |
Ito En | | 5,000 | | | 68 |
Itochu | | 415,000 | | | 3,017 |
Itochu Enex | | 36,600 | | | 234 |
Iyo Bank | | 37,000 | | | 395 |
J Front Retailing | | 131,000 | | | 538 |
Jafco | | 6,100 | | | 187 |
Japan Petroleum Exploration | | 3,400 | | | 176 |
Japan Prime Realty Investment, Cl A‡ | | 56 | | | 111 |
Japan Real Estate Investment, Cl A‡ | | 24 | | | 186 |
Japan Retail Fund Investment, Cl A‡ | | 52 | | | 241 |
Japan Steel Works | | 216,510 | | | 2,822 |
Japan Tobacco | | 1,937 | | | 5,574 |
JFE Holdings | | 92,600 | | | 3,100 |
JFE Shoji Holdings | | 35,000 | | | 128 |
JGC | | 25,000 | | | 414 |
Joyo Bank | | 66,000 | | | 327 |
JS Group | | 10,900 | | | 159 |
JSR | | 3,100 | | | 46 |
JTEKT | | 6,000 | | | 52 |
Jupiter Telecommunications | | 1,124 | | | 824 |
Kagoshima Bank | | 6,000 | | | 41 |
Kajima | | 183,000 | | | 568 |
Kakaku.com | | 54 | | | 200 |
Kamigumi | | 37,000 | | | 285 |
Kandenko | | 43,000 | | | 301 |
Kaneka | | 210,000 | | | 1,465 |
Kansai Electric Power | | 94,800 | | | 2,065 |
Kansai Paint | | 18,000 | | | 113 |
Kanto Auto Works | | 9,100 | | | 84 |
Kanto Natural Gas Development | | 8,000 | | | 50 |
Kao | | 70,000 | | | 1,543 |
Kasumi | | 10,000 | | | 43 |
Kawasaki Heavy Industries | | 228,000 | | | 511 |
Kawasaki Kisen Kaisha | | 166,000 | | | 749 |
KDDI | | 988 | | | 5,175 |
Keihin Electric Express Railway | | 23,000 | | | 177 |
Keio | | 138,000 | | | 820 |
| | | | | |
| Description | | Shares | | Market Value
($ Thousands) |
| | | | | |
Keisei Electric Railway | | 66,000 | | $ | 347 |
Keyence | | 2,100 | | | 439 |
Kikkoman | | 14,000 | | | 142 |
Kinden | | 71,000 | | | 585 |
Kintetsu | | 88,000 | | | 394 |
Kirin Holdings | | 157,000 | | | 1,977 |
Kissei Pharmaceutical | | 15,000 | | | 342 |
Kobayashi Pharmaceutical | | 17,800 | | | 639 |
Kohnan Shoji | | 4,600 | | | 42 |
Komatsu | | 26,300 | | | 382 |
Konica Minolta Holdings | | 49,000 | | | 506 |
Kose | | 6,200 | | | 130 |
K’s Holdings | | 5,600 | | | 124 |
Kubota (A) | | 255,000 | | | 1,876 |
Kuraray | | 40,000 | | | 400 |
Kurita Water Industries | | 2,000 | | | 55 |
Kyocera | | 40,500 | | | 3,184 |
Kyoei Steel (A) | | 8,800 | | | 238 |
Kyorin | | 48,000 | | | 706 |
Kyowa Hakko Kogyo | | 24,000 | | | 251 |
Kyudenko | | 11,000 | | | 69 |
Kyushu Electric Power | | 34,100 | | | 716 |
Leopalace21 | | 97,000 | | | 857 |
Mabuchi Motor | | 4,000 | | | 199 |
Makino Milling Machine | | 13,000 | | | 43 |
Makita | | 7,700 | | | 171 |
Mandom | | 3,200 | | | 73 |
Marubeni | | 498,000 | | | 2,258 |
Marui Group | | 62,700 | | | 371 |
Maruichi Steel Tube | | 2,500 | | | 48 |
Matsui Securities | | 20,300 | | | 166 |
Maxvalu Nishinihon | | 2,700 | | | 37 |
Mazda Motor | | 616,000 | | | 1,593 |
Mediceo Paltac Holdings | | 64,000 | | | 750 |
MEIJI Holdings* | | 9,319 | | | 311 |
Mie Bank | | 13,000 | | | 41 |
Mikuni Coca-Cola Bottling | | 4,600 | | | 37 |
Millea Holdings | | 93,000 | | | 2,725 |
Minebea | | 52,000 | | | 212 |
Ministop | | 10,400 | | | 163 |
Miraca Holdings | | 40,000 | | | 906 |
Mitsubishi | | 400,600 | | | 7,620 |
Mitsubishi Chemical Holdings | | 170,000 | | | 788 |
Mitsubishi Electric | | 187,000 | | | 1,084 |
Mitsubishi Estate | | 127,000 | | | 2,097 |
Mitsubishi Gas Chemical | | 155,000 | | | 882 |
Mitsubishi Heavy Industries | | 32,000 | | | 115 |
Mitsubishi Logistics | | 33,000 | | | 348 |
Mitsubishi Materials | | 156,000 | | | 520 |
Mitsubishi Motors* (A) | | 166,000 | | | 265 |
Mitsubishi Rayon | | 27,000 | | | 73 |
Mitsubishi Steel Manufacturing | | 99,000 | | | 240 |
Mitsubishi UFJ Financial Group | | 2,267,800 | | | 14,364 |
Mitsubishi UFJ Lease & Finance | | 2,360 | | | 65 |
| | |
| 124 | | SEI Institutional Investments Trust / Annual Report / May 31, 2009 |
| | | | | |
| Description | | Shares | | Market Value
($ Thousands) |
| | | | | |
Mitsui | | 135,100 | | $ | 1,729 |
Mitsui Chemicals | | 151,000 | | | 525 |
Mitsui Engineering & Shipbuilding | | 32,000 | | | 77 |
Mitsui Fudosan | | 104,000 | | | 1,741 |
Mitsui High-Tec | | 7,700 | | | 64 |
Mitsui Mining & Smelting | | 127,000 | | | 299 |
Mitsui OSK Lines | | 284,000 | | | 2,021 |
Mitsui Sugar | | 30,000 | | | 87 |
Mitsui Sumitomo Insurance Group Holdings | | 139,500 | | | 4,113 |
Mitsui Trust Holdings | | 236,000 | | | 872 |
Mitsumi Electric | | 22,600 | | | 436 |
Mizuho Financial Group (A) | | 497,400 | | | 1,194 |
Mizuno | | 16,000 | | | 74 |
Money Partners Group | | 124 | | | 70 |
Morinaga Milk Industry | | 26,000 | | | 89 |
Murata Manufacturing | | 22,000 | | | 929 |
N E Chemcat | | 1,000 | | | 10 |
Nafco | | 2,700 | | | 37 |
Nagase | | 39,000 | | | 370 |
Namco Bandai Holdings | | 6,100 | | | 65 |
NEC | | 1,487,000 | | | 5,819 |
NEC Fielding | | 2,100 | | | 24 |
NEC Networks & System Integration | | 14,300 | | | 157 |
NET One Systems | | 603 | | | 960 |
NGK Insulators | | 24,000 | | | 426 |
NGK Spark Plug | | 8,000 | | | 70 |
NHK Spring | | 55,000 | | | 312 |
Nidec | | 2,900 | | | 167 |
Nikon | | 52,000 | | | 782 |
Nintendo | | 39,100 | | | 10,532 |
Nippon Building Fund, Cl A‡ | | 140 | | | 1,237 |
Nippon Densetsu Kogyo | | 24,000 | | | 235 |
Nippon Electric Glass | | 227,000 | | | 2,167 |
Nippon Express | | 46,000 | | | 195 |
Nippon Flour Mills | | 53,000 | | | 232 |
Nippon Konpo Unyu Soko | | 9,000 | | | 88 |
Nippon Meat Packers | | 53,000 | | | 640 |
Nippon Mining Holdings | | 497,000 | | | 2,826 |
Nippon Oil | | 475,000 | | | 2,897 |
Nippon Paper Group | | 11,500 | | | 325 |
Nippon Seiki | | 9,000 | | | 91 |
Nippon Sheet Glass | | 167,000 | | | 479 |
Nippon Steel Trading | | 9,000 | | | 15 |
Nippon Telegraph & Telephone | | 240,500 | | | 9,991 |
Nippon Yusen | | 341,000 | | | 1,635 |
Nipro | | 14,000 | | | 261 |
Nishi-Nippon City Bank | | 149,000 | | | 347 |
Nissan Chemical Industries | | 38,000 | | | 401 |
Nissan Motor | | 1,087,900 | | | 6,550 |
Nissan Shatai | | 23,000 | | | 171 |
Nisshin Seifun Group | | 39,000 | | | 442 |
Nisshin Steel | | 78,000 | | | 177 |
Nisshinbo Holdings | | 23,000 | | | 238 |
| | | | | |
| Description | | Shares | | Market Value
($ Thousands) |
| | | | | |
Nissin Food Products | | 1,600 | | $ | 50 |
Nissin Healthcare Food Service | | 700 | | | 8 |
Nitori | | 21,798 | | | 1,320 |
Nitto Denko | | 5,200 | | | 146 |
NOK | | 18,300 | | | 235 |
Nomura Holdings | | 378,300 | | | 2,840 |
Nomura Real Estate Holdings (A) | | 11,400 | | | 205 |
Nomura Real Estate Office Fund, Cl A‡ | | 37 | | | 219 |
Nomura Research Institute | | 10,000 | | | 183 |
Noritsu Koki | | 8,200 | | | 68 |
NSK | | 13,000 | | | 63 |
NTT Data | | 268 | | | 801 |
NTT DoCoMo | | 3,713 | | | 5,551 |
NTT Urban Development | | 179 | | | 170 |
Obayashi | | 34,000 | | | 155 |
Odakyu Electric Railway, Cl B | | 53,000 | | | 455 |
OJI Paper | | 29,000 | | | 135 |
Okinawa Cellular Telephone | | 31 | | | 55 |
Okinawa Electric Power | | 2,300 | | | 122 |
Olympus | | 9,200 | | | 181 |
Omron | | 44,400 | | | 675 |
Ono Pharmaceutical | | 2,100 | | | 94 |
Onward Holdings | | 25,000 | | | 156 |
Oracle Japan (A) | | 10,200 | | | 366 |
Oriental Land | | 5,000 | | | 330 |
Osaka Gas | | 481,000 | | | 1,526 |
Osaka Steel | | 13,400 | | | 237 |
Panasonic | | 261,000 | | | 3,743 |
Panasonic Electric Works | | 38,000 | | | 315 |
Pioneer (A) | | 128,600 | | | 373 |
Plenus | | 3,800 | | | 56 |
Point | | 4,270 | | | 203 |
QP | | 63,100 | | | 631 |
Rakuten (A) | | 8,238 | | | 4,505 |
Resona Holdings (A) | | 47,500 | | | 713 |
Resorttrust | | 5,000 | | | 48 |
Ricoh | | 94,000 | | | 1,286 |
Rohm | | 34,900 | | | 2,272 |
Roland | | 2,100 | | | 24 |
Sakai Chemical Industry | | 18,000 | | | 65 |
San-A, Cl A | | 200 | | | 6 |
San-In Godo Bank | | 35,000 | | | 290 |
Sanki Engineering | | 43,000 | | | 312 |
Sankyo | | 121,000 | | | 6,416 |
Sankyu | | 33,000 | | | 117 |
Santen Pharmaceutical | | 27,700 | | | 841 |
Sanyo Electric* | | 70,000 | | | 175 |
Sapporo Hokuyo Holdings | | 76,400 | | | 226 |
Sapporo Holdings | | 22,000 | | | 100 |
Sawai Pharmaceutical | | 2,100 | | | 111 |
Sazaby League | | 1,900 | | | 24 |
SBI Holdings | | 432 | | | 70 |
Secom | | 8,200 | | | 342 |
Sega Sammy Holdings | | 5,800 | | | 64 |
| | |
| SEI Institutional Investments Trust / Annual Report / May 31, 2009 | | 125 |
SCHEDULE OF INVESTMENTS
World Equity Ex-US Fund (Continued)
May 31, 2009
| | | | | |
| Description | | Shares | | Market Value
($ Thousands) |
| | | | | |
Seiko Epson | | 56,500 | | $ | 829 |
Seino Holdings | | 109,000 | | | 726 |
Sekisui Chemical | | 37,000 | | | 227 |
Sekisui House | | 77,000 | | | 744 |
Senshukai | | 2,400 | | | 16 |
Seven & I Holdings | | 246,300 | | | 5,975 |
Seven Bank | | 278 | | | 722 |
Sharp | | 81,000 | | | 915 |
Shikoku Electric Power | | 5,000 | | | 141 |
Shimamura | | 1,300 | | | 100 |
Shimano | | 14,900 | | | 543 |
Shimizu | | 75,000 | | | 339 |
Shin-Etsu Chemical | | 21,100 | | | 1,099 |
Shinko Securities | | 64,000 | | | 187 |
Shinmaywa Industries | | 23,000 | | | 77 |
Shinsei Bank | | 772,000 | | | 1,061 |
Shionogi | | 134,000 | | | 2,636 |
Shizuoka Bank | | 72,000 | | | 698 |
Showa Denko | | 63,000 | | | 94 |
Showa Shell Sekiyu | | 58,000 | | | 571 |
Sinanen | | 3,000 | | | 16 |
Sintokogio | | 14,000 | | | 108 |
SKY Perfect JSAT Holdings | | 1,955 | | | 770 |
SMC | | 5,900 | | | 627 |
Snow Brand Milk Products | | 20,000 | | | 59 |
Softbank (A) | | 104,000 | | | 1,891 |
Sojitz | | 65,800 | | | 132 |
Sompo Japan Insurance | | 77,000 | | | 564 |
Sony | | 208,600 | | | 5,452 |
Sony Financial Holdings | | 55 | | | 161 |
SRI Sports | | 20 | | | 17 |
St. Marc Holdings | | 500 | | | 15 |
Stanley Electric | | 8,800 | | | 140 |
Sumco | | 39,700 | | | 612 |
Sumikin Bussan | | 25,000 | | | 64 |
Sumitomo | | 387,900 | | | 3,887 |
Sumitomo Chemical | | 20,000 | | | 88 |
Sumitomo Electric Industries | | 52,800 | | | 599 |
Sumitomo Heavy Industries | | 33,000 | | | 138 |
Sumitomo Metal Industries | | 298,000 | | | 806 |
Sumitomo Metal Mining | | 27,000 | | | 385 |
Sumitomo Mitsui Financial Group (A) | | 277,700 | | | 10,736 |
Sumitomo Realty & Development | | 12,000 | | | 184 |
Sumitomo Rubber Industries | | 7,200 | | | 49 |
Sumitomo Trust & Banking | | 395,000 | | | 1,876 |
Suruga Bank | | 179,731 | | | 1,684 |
Suzuken | | 21,900 | | | 564 |
Suzuki Motor | | 114,200 | | | 2,535 |
T&D Holdings | | 32,550 | | | 923 |
Taiheiyo Cement | | 646,000 | | | 1,178 |
Taisei | | 137,000 | | | 340 |
Taisho Pharmaceutical | | 15,000 | | | 286 |
Taiyo Nippon Sanso | | 59,000 | | | 505 |
Takashimaya (A) | | 67,000 | | | 422 |
| | | | | |
| Description | | Shares | | Market Value
($ Thousands) |
| | | | | |
Takeda Pharmaceutical | | 60,000 | | $ | 2,382 |
Takefuji (A) | | 55,990 | | | 325 |
Takeuchi Manufacturing | | 1,400 | | | 13 |
Tanabe Seiyaku | | 92,000 | | | 1,015 |
TDK | | 25,400 | | | 1,135 |
Teijin | | 189,000 | | | 518 |
Terumo | | 4,800 | | | 201 |
T-GAIA CORP | | 13 | | | 17 |
THK | | 13,900 | | | 208 |
TKC | | 3,300 | | | 63 |
Tobu Railway | | 79,000 | | | 431 |
Toho | | 8,700 | | | 119 |
Tohoku Electric Power | | 7,600 | | | 155 |
Tohokushinsha Film | | 7,200 | | | 48 |
Tokai Tokyo Securities | | 95,000 | | | 278 |
Tokuyama | | 22,000 | | | 157 |
Tokyo Broadcasting System HD | | 6,400 | | | 91 |
Tokyo Electric Power | | 63,400 | | | 1,593 |
Tokyo Electron | | 5,500 | | | 252 |
Tokyo Energy & Systems | | 14,000 | | | 120 |
Tokyo Gas | | 88,000 | | | 323 |
Tokyo Steel Manufacturing | | 118,092 | | | 1,386 |
Tokyo Style | | 4,000 | | | 31 |
Tokyo Tekko | | 30,000 | | | 118 |
Tokyu | | 21,000 | | | 95 |
Tokyu Land | | 47,000 | | | 196 |
TonenGeneral Sekiyu | | 43,000 | | | 450 |
Toppan Printing | | 67,000 | | | 604 |
Topre | | 400 | | | 3 |
Toray Industries | | 48,000 | | | 238 |
Toshiba TEC | | 94,000 | | | 383 |
Tosoh | | 91,000 | | | 281 |
TOTO | | 49,000 | | | 287 |
Towa Pharmaceutical | | 2,300 | | | 102 |
Toyo Kohan | | 11,000 | | | 52 |
Toyo Seikan Kaisha | | 40,500 | | | 756 |
Toyo Suisan Kaisha | | 180,000 | | | 3,955 |
Toyoda Gosei | | 13,300 | | | 291 |
Toyota Auto Body | | 12,100 | | | 176 |
Toyota Industries | | 64,900 | | | 1,671 |
Toyota Motor | | 357,400 | | | 14,225 |
Toyota Tsusho | | 53,600 | | | 742 |
Trend Micro | | 13,500 | | | 448 |
TV Asahi | | 137 | | | 201 |
Ube Industries | | 68,000 | | | 162 |
Unicharm | | 1,700 | | | 118 |
Unipres | | 3,000 | | | 30 |
UNY | | 55,000 | | | 431 |
Ushio | | 9,300 | | | 138 |
USS | | 520 | | | 29 |
Valor | | 6,600 | | | 50 |
Warabeya Nichiyo | | 6,500 | | | 81 |
Watabe Wedding | | 9,200 | | | 154 |
West Japan Railway | | 317 | | | 1,037 |
| | |
| 126 | | SEI Institutional Investments Trust / Annual Report / May 31, 2009 |
| | | | | |
| Description | | Shares | | Market Value
($ Thousands) |
| | | | | |
Yahoo! Japan (A) | | 3,633 | | $ | 973 |
Yamaguchi Financial Group | | 46,000 | | | 570 |
Yamaha | | 3,800 | | | 48 |
Yamaha Motor | | 71,100 | | | 804 |
Yamanashi Chuo Bank | | 16,000 | | | 82 |
Yamato Holdings | | 15,000 | | | 186 |
Yamato Kogyo | | 15,800 | | | 428 |
Yamazaki Baking | | 122,000 | | | 1,251 |
Yodogawa Steel Works | | 37,000 | | | 194 |
Yonekyu | | 3,500 | | | 35 |
Yurtec | | 9,000 | | | 46 |
| | | | | |
| | | | | 413,340 |
| | | | | |
| | |
Jersey — 0.0% | | | | | |
Regus | | 313,911 | | | 353 |
| | | | | |
| | |
Kazakhstan — 0.1% | | | | | |
KazMunaiGas Exploration Production GDR | | 66,164 | | | 1,465 |
| | | | | |
| | |
Malaysia — 0.3% | | | | | |
BIMB Holdings | | 25,000 | | | 8 |
British American Tobacco Malaysia | | 86,000 | | | 1,059 |
Hong Leong Bank | | 192,000 | | | 300 |
Hong Leong Financial Group | | 186,000 | | | 267 |
KLCC Property Holdings | | 103,700 | | | 93 |
Lion Industries | | 308,000 | | | 116 |
MMC | | 334,800 | | | 170 |
OSK Holdings | | 120,100 | | | 48 |
Petronas Dagangan | | 166,000 | | | 378 |
Petronas Gas | | 219,000 | | | 614 |
PPB Group | | 340,000 | | | 1,023 |
Proton Holdings | | 131,700 | | | 113 |
Public Bank | | 217,100 | | | 536 |
Resorts World | | 2,140,400 | | | 1,700 |
RHB Capital | | 130,900 | | | 154 |
Telekom Malaysia | | 1,870,800 | | | 1,407 |
Tenaga Nasional | | 461,000 | | | 1,080 |
| | | | | |
| | | | | 9,066 |
| | | | | |
| | |
Mauritius — 0.0% | | | | | |
Golden Agri-Resources (SGD) | | 3,628,960 | | | 1,080 |
| | | | | |
| | |
Mexico — 1.1% | | | | | |
America Movil ADR, Ser L | | 63,800 | | | 2,445 |
America Movil, Ser L | | 8,379,395 | | | 16,032 |
Banco Compartamos | | 162,912 | | | 459 |
Cydsa | | 85,300 | | | 58 |
Desarrolladora Homex ADR* | | 35,700 | | | 962 |
Embotelladoras Arca | | 151,900 | | | 386 |
Fomento Economico Mexicano | | 269,258 | | | 879 |
Grupo Continental | | 124,900 | | | 249 |
Grupo Financiero Banorte, Ser O | | 1,128,602 | | | 2,657 |
Grupo Lamosa* | | 17,900 | | | 10 |
| | | | | |
| Description | | Shares | | Market Value
($ Thousands) |
| | | | | |
Grupo Mexico, Ser B | | 1,344,815 | | $ | 1,288 |
Grupo Televisa | | 313,094 | | | 1,105 |
Grupo Televisa ADR | | 128,500 | | | 2,285 |
Industrias, Ser B* | | 3,700 | | | 11 |
Telefonos de Mexico | | 219,400 | | | 183 |
Urbi Desarrollos Urbanos* (A) | | 1,147,082 | | | 1,574 |
Wal-Mart de Mexico | | 197,200 | | | 581 |
| | | | | |
| | | | | 31,164 |
| | | | | |
| | |
Netherlands — 4.1% | | | | | |
Aegon | | 410,452 | | | 2,576 |
Akzo Nobel | | 9,951 | | | 466 |
ArcelorMittal (A) | | 248,117 | | | 8,277 |
ASML Holding | | 84,476 | | | 1,745 |
Boskalis Westminster | | 2,753 | | | 69 |
Corio‡ | | 8,931 | | | 441 |
Crucell* | | 2,975 | | | 66 |
European Aeronautic Defense and Space (A) | | 506,949 | | | 8,295 |
Heineken | | 3,848 | | | 138 |
Heineken Holding | | 23,950 | | | 727 |
Imtech | | 1,556 | | | 31 |
ING Groep | | 268,898 | | | 2,859 |
James Hardie Industries | | 108,109 | | | 377 |
Koninklijke Ahold | | 1,110,132 | | | 13,544 |
Koninklijke DSM | | 118,106 | | | 4,137 |
Koninklijke Philips Electronics | | 59,837 | | | 1,133 |
Koninklijke Vopak* | | 29,038 | | | 1,453 |
Nutreco Holding | | 1,785 | | | 74 |
Plaza Centers | | 414,511 | | �� | 467 |
QIAGEN* | | 9,222 | | | 164 |
Randstad Holding | | 47,854 | | | 1,479 |
Reed Elsevier | | 32,454 | | | 394 |
Royal Dutch Shell, Cl A | | 491,572 | | | 13,318 |
Royal Dutch Shell, Cl A (GBP) | | 357,717 | | | 9,656 |
Royal Dutch Shell, Cl B | | 473,073 | | | 12,876 |
Royal KPN | | 424,704 | | | 5,595 |
SBM Offshore | | 6,442 | | | 109 |
TNT | | 137,829 | | | 2,725 |
Unilever | | 775,146 | | | 18,663 |
Van Lanschot* | | 152 | | | 9 |
Wolters Kluwer | | 9,690 | | | 185 |
| | | | | |
| | | | | 112,048 |
| | | | | |
| | |
New Zealand — 0.1% | | | | | |
Air New Zealand | | 126,900 | | | 86 |
Contact Energy | | 44,407 | | | 164 |
Fletcher Building | | 102,522 | | | 430 |
Telecom of New Zealand | | 1,213,520 | | | 1,955 |
Vector | | 87,150 | | | 113 |
| | | | | |
| | | | | 2,748 |
| | | | | |
| | |
| SEI Institutional Investments Trust / Annual Report / May 31, 2009 | | 127 |
SCHEDULE OF INVESTMENTS
World Equity Ex-US Fund (Continued)
May 31, 2009
| | | | | |
| Description | | Shares | | Market Value
($ Thousands) |
| | | | | |
| | |
Norway — 0.4% | | | | | |
Aker Kvaerner | | 11,000 | | $ | 97 |
Austevoll Seafood | | 21,000 | | | 77 |
DnB | | 529,375 | | | 4,440 |
Norsk Hydro | | 13,800 | | | 75 |
Orkla | | 34,400 | | | 284 |
Petroleum Geo-Services* | | 61,700 | | | 402 |
Renewable Energy* | | 9,000 | | | 99 |
Statoil (A) | | 37,823 | | | 800 |
Telenor | | 63,598 | | | 539 |
Yara International | | 129,543 | | | 4,308 |
| | | | | |
| | | | | 11,121 |
| | | | | |
| | |
Pakistan — 0.0% | | | | | |
Pakistan Telecommunication | | 1,439,600 | | | 300 |
| | | | | |
| | |
Panama — 0.1% | | | | | |
Copa Holdings, Cl A | | 57,842 | | | 2,014 |
| | | | | |
| | |
Papua New Guinea — 0.1% | | | | | |
Lihir Gold* | | 1,212,907 | | | 3,148 |
| | | | | |
| | |
Peru — 0.1% | | | | | |
Credicorp | | 49,120 | | | 2,958 |
| | | | | |
| | |
Philippines — 0.1% | | | | | |
Globe Telecom | | 24,000 | | | 467 |
Philippine Long Distance Telephone ADR (A) | | 23,517 | | | 1,115 |
Philippine Long Distance Telephone | | 31,810 | | | 1,498 |
Pilipino Telephone | | 2,611,000 | | | 443 |
| | | | | |
| | | | | 3,523 |
| | | | | |
| | |
Poland — 0.2% | | | | | |
Cyfrowy Polsat | | 179,329 | | | 800 |
Gant Development* | | 8,467 | | | 66 |
KGHM Polska Miedz | | 2,143 | | | 47 |
Polish Oil & Gas | | 798,000 | | | 951 |
Polski Koncern Naftowy Orlen | | 161,301 | | | 1,473 |
Sygnity* | | 8,000 | | | 47 |
Telekomunikacja Polska | | 216,000 | | | 1,136 |
Zaklady Azotowe Pulawy | | 3,455 | | | 88 |
| | | | | |
| | | | | 4,608 |
| | | | | |
| | |
Portugal — 0.5% | | | | | |
Banco Comercial Portugues, Cl R | | 164,061 | | | 176 |
Banco Espirito Santo | | 167,767 | | | 956 |
Cimpor Cimentos de Portugal* | | 43,065 | | | 297 |
Energias de Portugal | | 1,758,438 | | | 7,090 |
Galp Energia SGPS, Cl B | | 8,901 | | | 141 |
Jeronimo Martins | | 2,795 | | | 19 |
Portugal Telecom | | 408,006 | | | 3,674 |
REN-Redes Energeticas Nacionais | | 137,734 | | | 573 |
| | | | | |
| | | | | 12,926 |
| | | | | |
| | | | | |
| Description | | Shares | | Market Value
($ Thousands) |
| | | | | |
| | |
Russia — 1.3% | | | | | |
Comstar United Telesystems GDR | | 219,501 | | $ | 1,090 |
Gazprom OAO ADR | | 470,745 | | | 11,011 |
Globaltrans Investment GDR* | | 101,157 | | | 455 |
Lukoil ADR | | 155,546 | | | 8,205 |
MMC Norilsk Nickel ADR | | 104,094 | | | 1,202 |
Mobile Telesystems ADR | | 106,737 | | | 4,428 |
Novolipetsk Steel GDR | | 12,319 | | | 238 |
Novorossiysk Commercial Sea Port GDR | | 40,117 | | | 380 |
Rosneft Oil GDR (B) | | 415,130 | | | 2,789 |
Sberbank GDR (A) | | 10,075 | | | 2,500 |
Surgutneftegaz ADR | | 75,300 | | | 633 |
Tatneft ADR | | 86,665 | | | 2,384 |
Uralkali GDR | | 53,986 | | | 1,021 |
Uralsvyazinform ADR | | 29,100 | | | 89 |
| | | | | |
| | | | | 36,425 |
| | | | | |
| | |
Singapore — 0.8% | | | | | |
ComfortDelgro | | 309,000 | | | 277 |
DBS Group Holdings | | 315,000 | | | 2,586 |
Fraser and Neave | | 167,000 | | | 462 |
Haw Par | | 18,000 | | | 57 |
Jardine Cycle & Carriage | | 48,000 | | | 548 |
Keppel | | 102,000 | | | 513 |
NatSteel | | 47,000 | | | 41 |
Oversea-Chinese Banking | | 732,000 | | | 3,695 |
SembCorp Industries | | 125,000 | | | 271 |
SIA Engineering | | 68,000 | | | 123 |
Singapore Airlines | | 78,000 | | | 676 |
Singapore Exchange | | 106,000 | | | 543 |
Singapore Land | | 4,000 | | | 15 |
Singapore Petroleum | | 42,000 | | | 178 |
Singapore Technologies Engineering | | 438,000 | | | 710 |
Singapore Telecommunications (A) | | 1,106,000 | | | 2,315 |
United Industrial | | 6,000 | | | 8 |
United Overseas Bank | | 241,000 | | | 2,390 |
UOB-Kay Hian Holdings | | 124,000 | | | 116 |
UOL Group | | 80,000 | | | 184 |
Wilmar International (A) | | 2,041,000 | | | 7,013 |
| | | | | |
| | | | | 22,721 |
| | | | | |
| | |
South Africa — 1.2% | | | | | |
ABSA Group | | 91,302 | | | 1,160 |
African Bank Investments | | 300,909 | | | 974 |
AngloGold Ashanti | | 13,500 | | | 573 |
Assore | | 3,875 | | | 234 |
AST Group | | 422,010 | | | 25 |
Aveng | | 134,400 | | | 586 |
DataTec | | 72,000 | | | 147 |
DRDGOLD | | 123,839 | | | 125 |
Enaleni Pharmaceuticals* | | 75,740 | | | 33 |
FirstRand | | 154,800 | | | 264 |
Freeworld Coatings | | 108,000 | | | 80 |
| | |
| 128 | | SEI Institutional Investments Trust / Annual Report / May 31, 2009 |
| | | | | |
| Description | | Shares | | Market Value
($ Thousands) |
| | | | | |
Gold Fields | | 286,661 | | $ | 3,878 |
Grindrod | | 433,466 | | | 845 |
Group | | 173,526 | | | 2,503 |
Harmony Gold Mining* | | 164,735 | | | 1,984 |
Hosken Consolidated Investments | | 12,750 | | | 70 |
Iliad Africa | | 44,000 | | | 41 |
Impala Platinum Holdings | | 149,120 | | | 3,606 |
Imperial Holdings | | 27,000 | | | 203 |
Investec | | 144,000 | | | 790 |
Lewis Group | | 36,000 | | | 202 |
Medi-Clinic | | 180,000 | | | 443 |
Metropolitan Holdings | | 204,000 | | | 296 |
Mondi | | 132,319 | | | 594 |
Mr Price Group | | 133,789 | | | 453 |
Nedbank Group | | 98,000 | | | 1,093 |
Omnia Holdings | | 2,522 | | | 16 |
Reunert | | 117,359 | | | 601 |
Sanlam | | 1,077,670 | | | 2,307 |
Santam | | 9,592 | | | 94 |
Sappi | | 593,837 | | | 2,034 |
Sasol (A) | | 90,849 | | | 3,409 |
Standard Bank Group | | 226,000 | | | 2,330 |
Steinhoff International Holdings | | 480,000 | | | 778 |
Tiger Brands | | 33,490 | | | 581 |
Wilson Bayly Holmes-Ovcon | | 15,591 | | | 201 |
| | | | | |
| | | | | 33,553 |
| | | | | |
| | |
South Korea — 2.4% | | | | | |
Daeduck GDS | | 23,060 | | | 170 |
Daewoo Shipbuilding & Marine Engineering | | 36,510 | | | 602 |
Daou Technology | | 14,800 | | | 98 |
Dongbu Insurance | | 24,650 | | | 483 |
Dongwon Industries | | 310 | | | 24 |
GS Holdings | | 29,500 | | | 740 |
GS Home Shopping | | 5,059 | | | 276 |
Hana Financial Group | | 45,280 | | | 1,086 |
Handsome | | 9,840 | | | 73 |
Hanwha | | 15,730 | | | 442 |
Hyundai Department Store | | 10,390 | | | 688 |
Hyundai Development | | 54,958 | | | 1,810 |
Hyundai Heavy Industries | | 10,380 | | | 1,800 |
Kangwon Land | | 75,310 | | | 983 |
KISCO Holdings | | 4,036 | | | 215 |
Kolon Industries | | 3,470 | | | 118 |
Korea Development Financing | | 2,340 | | | 56 |
Korea Electric Power | | 88,480 | | | 2,013 |
Korea Zinc | | 5,660 | | | 646 |
KT | | 49,410 | | | 1,341 |
KT Freetel | | 46,210 | | | 840 |
KT&G | | 37,230 | | | 2,022 |
Kyeryong Construction Industrial | | 10,480 | | | 206 |
LG | | 134,652 | | | 6,982 |
LG Chemical | | 15,260 | | | 1,870 |
| | | | | |
| Description | | Shares | | Market Value
($ Thousands) |
| | | | | |
LG Dacom | | 27,270 | | $ | 401 |
LG Electronics | | 50,217 | | | 4,841 |
LG Hausys* | | 1,304 | | | 126 |
LG Telecom | | 88,500 | | | 600 |
LG.Philips LCD | | 82,650 | | | 1,947 |
Lotte Shopping | | 6,620 | | | 1,276 |
MegaStudy | | 5,258 | | | 945 |
Namyang Dairy Products | | 74 | | | 30 |
Pacific | | 4,540 | | | 454 |
POSCO | | 7,081 | | | 2,371 |
S&T Holdings | | 4,400 | | | 43 |
Samsung Electronics | | 23,936 | | | 10,703 |
Samsung Fire & Marine Insurance | | 16,384 | | | 2,394 |
Samsung Heavy Industries | | 6,610 | | | 160 |
SeAH Holdings | | 317 | | | 17 |
Shinhan Financial Group | | 47,271 | | | 1,191 |
Shinsegae | | 10,409 | | | 3,643 |
SK Gas | | 710 | | | 32 |
SK Holdings | | 61,946 | | | 5,389 |
SK Telecom | | 10,508 | | | 1,472 |
S-Oil | | 12,140 | | | 560 |
Woori Investment & Securities | | 2,030 | | | 27 |
Youngone | | 17,620 | | | 136 |
| | | | | |
| | | | | 64,342 |
| | | | | |
| | |
Spain — 2.6% | | | | | |
Abertis Infraestructuras | | 26,127 | | | 495 |
Acerinox (A) | | 21,352 | | | 388 |
ACS Actividades Construcciones y | | | | | |
Servicios (A) | | 57,155 | | | 2,991 |
Banco Bilbao Vizcaya | | | | | |
Argentaria (A) | | 439,956 | | | 5,365 |
Banco de Sabadell | | 114,017 | | | 731 |
Banco de Valencia | | 28,108 | | | 276 |
Banco Popular Espanol (A) | | 51,288 | | | 458 |
Banco Santander | | 4,786 | | | 50 |
Banco Santander Central Hispano | | 1,339,919 | | | 14,253 |
Bankinter (A) | | 59,505 | | | 738 |
EDP Renovaveis* | | 22,044 | | | 235 |
Enagas | | 23,312 | | | 433 |
Financiera Alba | | 15,634 | | | 737 |
Fomento de Construcciones y Contratas | | 2,297 | | | 92 |
Gas Natural | | 69,785 | | | 1,265 |
Gestevision Telecinco | | 7,209 | | | 71 |
Grifols | | 52,793 | | | 956 |
Iberdrola | | 443,923 | | | 3,817 |
Inditex | | 17,710 | | | 802 |
Indra Sistemas* | | 30,928 | | | 708 |
Mapfre | | 111,502 | | | 389 |
Red Electrica | | 20,738 | | | 975 |
Repsol | | 437,189 | | | 9,859 |
Sacyr Vallehermoso (A) | | 49,800 | | | 817 |
Telefonica (A) | | 1,110,888 | | | 24,094 |
Zardoya Otis (A) | | 34,473 | | | 773 |
| | | | | |
| | | | | 71,768 |
| | | | | |
| | |
| SEI Institutional Investments Trust / Annual Report / May 31, 2009 | | 129 |
SCHEDULE OF INVESTMENTS
World Equity Ex-US Fund (Continued)
May 31, 2009
| | | | | |
| Description | | Shares | | Market Value
($ Thousands) |
| | | | | |
| | |
Sweden — 1.4% | | | | | |
Acando | | 10,251 | | $ | 17 |
Alfa Laval (A) | | 15,028 | | | 144 |
Assa Abloy, Cl B | | 35,802 | | | 474 |
Atlas Copco, Cl A (A) | | 16,909 | | | 171 |
Atlas Copco, Cl B | | 15,150 | | | 137 |
Boliden | | 64,333 | | | 503 |
Electrolux, Cl B | | 46,590 | | | 591 |
Elekta, Cl B (A) | | 13,142 | | | 183 |
Eniro (A) | | 46,184 | | | 62 |
Getinge, Cl B | | 10,415 | | | 140 |
Hennes & Mauritz, Cl B (A) | | 74,108 | | | 3,543 |
Holmen, Cl B | | 13,856 | | | 344 |
Husqvarna, Cl B | | 43,855 | | | 255 |
Investor, Cl B | | 134,528 | | | 2,107 |
Lundbergforetagen, Cl B | | 1,229 | | | 50 |
Lundin Petroleum* (A) | | 350,394 | | | 3,129 |
Meda, Cl A | | 55,400 | | | 405 |
Millicom International Cellular* | | 1,890 | | | 116 |
Nordea Bank | | 182,861 | | | 1,467 |
Scania, Cl B (A) | | 28,265 | | | 287 |
Securitas, Cl B (A) | | 91,848 | | | 785 |
Skandinaviska Enskilda
Banken, Cl A (A) | | 181,030 | | | 798 |
Skanska, Cl B | | 31,679 | | | 351 |
SKF, Cl B (A) | | 21,066 | | | 249 |
SSAB, Cl A | | 5,015 | | | 67 |
Svenska Cellulosa, Cl B | | 401,802 | | | 4,654 |
Svenska Handelsbanken, Cl A (A) | | 34,535 | | | 673 |
Swedbank (A) | | 146,202 | | | 875 |
Swedish Match (A) | | 275,211 | | | 4,426 |
Tele2, Cl B (A) | | 26,273 | | | 265 |
Telefonaktiebolaget LM
Ericsson, Cl B (A) | | 722,435 | | | 6,682 |
TeliaSonera (A) | | 532,933 | | | 2,747 |
Volvo, Cl A | | 21,723 | | | 139 |
Volvo, Cl B | | 11,334 | | | 73 |
West Siberian Resources GDR* | | 1,598,895 | | | 1,066 |
| | | | | |
| | | | | 37,975 |
| | | | | |
| | |
Switzerland — 5.7% | | | | | |
ABB | | 453,109 | | | 7,501 |
ACE | | 104,735 | | | 4,607 |
Actelion* | | 37,621 | | | 1,952 |
Addax Petroleum | | 10,800 | | | 354 |
Adecco | | 12,027 | | | 527 |
Baloise Holding | | 42,274 | | | 3,372 |
Banque Cantonale Vaudoise | | 2,733 | | | 1,050 |
Clariant | | 38,000 | | | 225 |
Compagnie Financiere Richemont | | 2,390 | | | 52 |
Credit Suisse Group (A) | | 221,841 | | | 9,969 |
Elektrizitaets-Gesellschaft Laufenburg | | 83 | | | 82 |
Ferrexpo (GBP) | | 89,602 | | | 236 |
| | | | | |
| Description | | Shares | | Market Value
($ Thousands) |
| | | | | |
Geberit | | 3,532 | | $ | 436 |
Givaudan | | 527 | | | 347 |
Helvetia Holding | | 1,660 | | | 453 |
Holcim* | | 34,280 | | | 1,818 |
Kuehne + Nagel International | | 5,273 | | | 414 |
Lindt & Spruengli | | 315 | | | 573 |
Lonza Group | | 4,807 | | | 499 |
Nestle | | 828,240 | | | 30,196 |
Nobel Biocare Holding | | 3,284 | | | 76 |
Novartis | | 639,572 | | | 25,626 |
Pargesa Holding | | 3,142 | | | 214 |
Paris RE Holdings | | 26,050 | | | 507 |
Roche Holding | | 90,813 | | | 12,450 |
Schindler Holding | | 6,265 | | | 374 |
SGS | | 467 | | | 586 |
Sonova Holding | | 2,301 | | | 171 |
STMicroelectronics | | 14,917 | | | 111 |
Straumann Holding | | 348 | | | 66 |
Sulzer | | 10,450 | | | 705 |
Swatch Group | | 30,877 | | | 1,074 |
Swiss Life Holding | | 2,126 | | | 180 |
Swiss Reinsurance | | 53,780 | | | 1,756 |
Swisscom | | 16,147 | | | 4,793 |
Syngenta | | 45,891 | | | 11,207 |
Synthes | | 6,833 | | | 704 |
Transocean* | | 12,931 | | | 1,028 |
UBS | | 552,762 | | | 8,343 |
Valora Holding | | 534 | | | 105 |
Vontobel Holding | | 921 | | | 24 |
Xstrata | | 820,669 | | | 9,184 |
Zurich Financial Services | | 66,725 | | | 12,503 |
| | | | | |
| | | | | 156,450 |
| | | | | |
| | |
Taiwan — 2.8% | | | | | |
Acer | | 830,301 | | | 1,517 |
Advanced Semiconductor Engineering | | 3,680,005 | | | 2,313 |
Asia Optical | | 143,000 | | | 184 |
Asustek Computer | | 898,231 | | | 1,279 |
AU Optronics ADR (A) | | 267,700 | | | 2,781 |
Cathay Financial Holding | | 761,000 | | | 1,247 |
Chang Hwa Commercial Bank | | 389,000 | | | 196 |
China Bills Finance* | | 935,000 | | | 284 |
China Manmade Fibers | | 746,000 | | | 157 |
Chinatrust Financial Holding | | 6,381,618 | | | 4,259 |
Chunghwa Telecom | | 2,876,790 | | | 5,497 |
Compal Electronics | | 1,690,598 | | | 1,444 |
CTCI | | 330,432 | | | 311 |
Far Eastern Textile | | 2,413,000 | | | 2,761 |
Far EasTone Telecommunications | | 1,477,000 | | | 1,713 |
Fubon Financial Holding | | 1,439,000 | | | 1,414 |
Gigabyte Technology | | 248,000 | | | 167 |
High Tech Computer | | 79,000 | | | 1,289 |
HON HAI Precision Industry GDR | | 467,804 | | | 3,181 |
HON HAI Precision Industry | | 1,728,616 | | | 6,623 |
| | |
| 130 | | SEI Institutional Investments Trust / Annual Report / May 31, 2009 |
| | | | | |
| Description | | Shares | | Market Value
($ Thousands) |
| | | | | |
Lite-On Technology | | 1,283,737 | | $ | 1,140 |
Macronix International | | 1,812,000 | | | 842 |
MediaTek | | 363,889 | | | 4,535 |
Mega Financial Holding | | 2,383,000 | | | 1,213 |
Micro-Star International | | 144,716 | | | 105 |
POU Chen | | 468,000 | | | 310 |
Quanta Computer | | 1,006,529 | | | 1,627 |
Shinkong Synthetic Fibers | | 348,000 | | | 99 |
Siliconware Precision Industries | | 20,172 | | | 27 |
Synnex Technology International | | 617,000 | | | 1,021 |
Taiwan Cooperative Bank | | 2,040,850 | | | 1,350 |
Taiwan Fertilizer | | 1,186,000 | | | 3,822 |
Taiwan Glass Industrial | | 354,000 | | | 247 |
Taiwan Mobile | | 464,000 | | | 826 |
Taiwan Semiconductor Manufacturing ADR (A) | | 702,289 | | | 7,683 |
Taiwan Semiconductor | | | | | |
Manufacturing | | 4,535,455 | | | 8,394 |
Teco Electric and Machinery | | 826,000 | | | 375 |
United Microelectronics | | 4,754,000 | | | 1,932 |
United Microelectronics ADR | | 260,600 | | | 834 |
Wistron | | 60,000 | | | 95 |
| | | | | |
| | | | | 75,094 |
| | | | | |
| | |
Thailand — 0.4% | | | | | |
Bangkok Bank NVDR | | 825,900 | | | 2,125 |
Bank of Ayudhya | | 2,241,900 | | | 766 |
Bumrungrad Hospital | | 800,300 | | | 643 |
Electricity Generating | | 40,200 | | | 82 |
Kasikornbank | | 546,900 | | | 934 |
Precious Shipping | | 757,500 | | | 379 |
PTT | | 370,000 | | | 2,386 |
Ratchaburi Electricity Generating Holding | | 201,800 | | | 221 |
Siam City Bank | | 394,800 | | | 161 |
Siam Commercial Bank | | 1,458,700 | | | 2,876 |
Thanachart Capital | | 478,600 | | | 181 |
Tisco Financial Group* | | 139,200 | | | 69 |
Total Access Communication | | 838,400 | | | 687 |
| | | | | |
| | | | | 11,510 |
| | | | | |
| | |
Turkey — 0.7% | | | | | |
Akbank | | 280,000 | | | 1,173 |
Aksa Akrilik Kimya Sanayii* | | 57,000 | | | 81 |
Anadolu Efes Biracilik Ve Malt Sanayii | | 110,623 | | | 900 |
Anadolu Hayat Emeklilik | | 315,909 | | | — |
Anadolu Sigorta | | 128,000 | | | 101 |
Cimsa Cimento Sanayi VE Tica | | 198,059 | | | 523 |
Eczacibasi Ilac Sanayi | | 243,000 | | | 197 |
Haci Omer Sabanci Holding | | 408,510 | | | 1,242 |
Izmir Demir Celik Sanayi* | | 44,000 | | | 68 |
KOC Holding* | | 435,000 | | | 994 |
Petrol Ofisi* | | 96,240 | | | 319 |
Tekfen Holding* | | 221,572 | | | 546 |
| | | | | |
| Description | | Shares | | Market Value
($ Thousands) |
| | | | | |
Trakya Cam Sanayi* | | 90,000 | | $ | 71 |
Tupras Turkiye Petrol Rafine | | 229,028 | | | 2,835 |
Turk Ekonomi Bankasi* | | 2,033,418 | | | 1,494 |
Turk Hava Yollari | | 208,736 | | | 1,204 |
Turk Sise ve Cam Fabrikalari | | 448,000 | | | 379 |
Turkcell Iletisim Hizmet | | 137,041 | | | 726 |
Turkiye Sinai Kalkinma Bankasi* | | 996,618 | | | 709 |
Turkiye Vakiflar Bankasi Tao, Cl D | | 4,726,499 | | | 6,470 |
| | | | | |
| | | | | 20,032 |
| | | | | |
| | |
United Kingdom — 13.3% | | | | | |
Admiral Group | | 20,579 | | | 287 |
Aggreko | | 64,858 | | | 617 |
Amec | | 306,207 | | | 3,364 |
Amlin | | 144,785 | | | 823 |
Anglo American | | 163,892 | | | 4,728 |
Antofagasta | | 614,409 | | | 6,310 |
Arriva | | 4,800 | | | 34 |
Associated British Foods | | 20,520 | | | 244 |
AstraZeneca | | 532,961 | | | 22,186 |
Autonomy* | | 257,467 | | | 6,432 |
Aviva | | 402,446 | | | 2,179 |
Avocet Mining* | | 53,317 | | | 68 |
Babcock International Group | | 118,507 | | | 889 |
BAE Systems | | 1,982,293 | | | 11,008 |
Balfour Beatty | | 337,213 | | | 1,862 |
Barclays | | 1,647,301 | | | 7,986 |
BBA Aviation | | 56,038 | | | 111 |
Beazley Group | | 23,082 | | | 38 |
Berkeley Group Holdings* | | 53,400 | | | 769 |
BG Group | | 650,269 | | | 11,921 |
BHP Billiton | | 590,620 | | | 14,123 |
BP | | 3,509,907 | | | 28,947 |
British American Tobacco | | 565,039 | | | 15,452 |
British Land‡ | | 24,853 | | | 157 |
British Sky Broadcasting Group | | 66,200 | | | 475 |
BT Group, Cl A | | 3,253,414 | | | 4,597 |
Bunzl | | 36,091 | | | 299 |
Burberry Group | | 10,055 | | | 62 |
Cable & Wireless | | 1,272,123 | | | 2,776 |
Cadbury | | 692,466 | | | 6,033 |
Cairn Energy* | | 10,375 | | | 421 |
Cape* | | 112,128 | | | 278 |
Capita Group | | 48,374 | | | 561 |
Carillion | | 5,351 | | | 23 |
Carnival | | 76,718 | | | 1,992 |
Centrica | | 2,616,143 | | | 10,423 |
Charter International | | 21,871 | | | 187 |
Close Brothers Group | | 69,700 | | | 743 |
Cobham | | 553,060 | | | 1,598 |
Compass Group | | 1,001,578 | | | 5,812 |
De La Rue | | 12,306 | | | 165 |
Delta | | 27,337 | | | 53 |
Derwent London‡ | | 78,853 | | | 1,077 |
| | |
| SEI Institutional Investments Trust / Annual Report / May 31, 2009 | | 131 |
SCHEDULE OF INVESTMENTS
World Equity Ex-US Fund (Continued)
May 31, 2009
| | | | | |
| Description | | Shares | | Market Value
($ Thousands) |
| | | | | |
Diageo | | 345,355 | | $ | 4,719 |
Drax Group | | 60,228 | | | 478 |
DS Smith | | 173,654 | | | 206 |
Enterprise Inns | | 24,874 | | | 60 |
Eurasian Natural Resources | | 213,086 | | | 2,257 |
Evolution Group | | 39,630 | | | 89 |
Firstgroup | | 160,551 | | | 964 |
Friends Provident | | 374,756 | | | 408 |
GlaxoSmithKline | | 646,882 | | | 10,914 |
Group 4 Securicor | | 528,167 | | | 1,806 |
Hamworthy | | 22,253 | | | 74 |
Hays | | 2,218,433 | | | 2,959 |
Healthcare Locums | | 55,412 | | | 161 |
Home Retail Group | | 364,234 | | | 1,372 |
HSBC Holdings | | 3,139,415 | | | 28,371 |
ICAP | | 43,656 | | | 279 |
IMI | | 33,170 | | | 186 |
Imperial Tobacco Group | | 216,061 | | | 5,607 |
Informa | | 56,288 | | | 221 |
Inmarsat | | 153,376 | | | 1,279 |
Intercontinental Hotels Group | | 36,029 | | | 382 |
International Power | | 22,000 | | | 98 |
Intertek Group | | 69,190 | | | 1,178 |
Invensys* | | 186,944 | | | 708 |
Investec | | 580,349 | | | 3,241 |
J Sainsbury | | 94,602 | | | 477 |
Johnson Matthey | | 11,386 | | | 224 |
Kazakhmys | | 38,678 | | | 437 |
Kingfisher | | 1,567,520 | | | 4,513 |
Ladbrokes | | 23,481 | | | 76 |
Legal & General Group | | 1,685,007 | | | 1,653 |
Lloyds Banking Group | | 1,210,950 | | | 1,330 |
LogicaCMG | | 343,912 | | | 411 |
London Stock Exchange Group | | 16,233 | | | 182 |
Lonmin | | 2,403 | | | 56 |
Man Group | | 42,580 | | | 168 |
Marks & Spencer Group | | 60,161 | | | 277 |
Marston’s | | 36,439 | | | 100 |
Meggitt | | 235,494 | | | 606 |
National Express Group | | 42,892 | | | 225 |
National Grid | | 441,317 | | | 4,269 |
Next | | 32,386 | | | 767 |
Old Mutual | | 2,267,683 | | | 2,717 |
Pace* | | 47,949 | | | 155 |
Pearson | | 155,206 | | | 1,649 |
Persimmon | | 98,295 | | | 583 |
Petrofac | | 99,571 | | | 1,067 |
Prudential | | 123,204 | | | 855 |
QinetiQ | | 37,581 | | | 89 |
Reckitt Benckiser Group | | 159,850 | | | 6,947 |
Reed Elsevier | | 166,766 | | | 1,351 |
Rexam | | 798,496 | | | 4,030 |
Rio Tinto | | 118,969 | | | 5,408 |
Rolls-Royce Group | | 90,019 | | | 480 |
| | | | | |
| Description | | Shares | | Market Value
($ Thousands) |
| | | | | |
Royal & Sun Alliance Insurance Group | | 1,335,128 | | $ | 2,727 |
Royal Bank of Scotland Group | | 278,239 | | | 172 |
SABMiller | | 122,884 | | | 2,531 |
Sage Group | | 1,140,775 | | | 3,520 |
Schroders | | 32,150 | | | 450 |
Scottish & Southern Energy | | 52,482 | | | 991 |
Serco Group | | 191,723 | | | 1,252 |
Severn Trent | | 9,431 | | | 171 |
Shire | | 130,636 | | | 1,808 |
Smith & Nephew | | 49,843 | | | 363 |
Smiths Group | | 103,884 | | | 1,219 |
Spectris | | 7,378 | | | 60 |
Standard Chartered | | 770,269 | | | 15,719 |
Tate & Lyle | | 337,131 | | | 1,630 |
Telecity Group* | | 24,008 | | | 118 |
Tesco | | 617,070 | | | 3,658 |
Thomas Cook Group | | 68,912 | | | 248 |
Thomson Reuters | | 44,732 | | | 1,228 |
Tomkins | | 213,136 | | | 489 |
Travis Perkins | | 2,792 | | | 25 |
TUI Travel | | 58,895 | | | 237 |
Tullett Prebon | | 191,155 | | | 919 |
Tullow Oil | | 138,987 | | | 2,243 |
Unilever | | 123,219 | | | 2,901 |
United Business Media | | 35,289 | | | 249 |
United Utilities Group | | 59,498 | | | 517 |
Vedanta Resources | | 10,354 | | | 267 |
Vodafone Group | | 11,855,939 | | | 22,252 |
Whitbread | | 3,548 | | | 50 |
WM Morrison Supermarkets | | 450,624 | | | 1,773 |
Wolseley | | 5,500 | | | 93 |
WPP | | 508,710 | | | 3,793 |
| | | | | |
| | | | | 360,902 |
| | | | | |
| | |
United States — 0.0% | | | | | |
Thomson Reuters (CAD) | | 41,700 | | | 1,268 |
| | | | | |
Total Common Stock
(Cost $2,421,192) ($ Thousands) | | | | | 2,528,789 |
| | | | | |
| | |
PREFERRED STOCK — 2.0% | | | | | |
| | |
Brazil — 1.8% | | | | | |
Banco Bradesco | | 322,900 | | | 4,896 |
Banco Daycoval | | 41,800 | | | 157 |
Brasil Telecom | | 179,700 | | | 1,294 |
Centrais Eletricas Brasileiras, Cl B | | 133,000 | | | 1,724 |
Centrais Eletricas de Santa Catarina | | 24,000 | | | 398 |
Cia Energetica de Minas Gerais | | 57,000 | | | 756 |
Cia Paranaense de Energia | | 97,000 | | | 1,379 |
Cia Vale do Rio Doce, Cl A | | 410,300 | | | 6,764 |
Confab Industrial | | 215,648 | | | 475 |
Construtora Sultepa | | 3,000 | | | 7 |
Duratex | | 23,300 | | | 219 |
Ferbasa-Ferro Ligas DA Bahia | | 46,000 | | | 174 |
| | |
| 132 | | SEI Institutional Investments Trust / Annual Report / May 31, 2009 |
| | | | | | |
| Description | | Shares/Face Amount
($ Thousands) | | Market Value
($ Thousands) |
| | | | | | |
Fertilizantes Fosfatados | | | 187,500 | | $ | 1,580 |
Itau Unibanco Holding | | | 244,084 | | | 3,947 |
Marcopolo | | | 237,400 | | | 542 |
NET Servicos de Comunicacao* | | | 334,000 | | | 3,307 |
Parana Banco | | | 28,400 | | | 90 |
Petroleo Brasileiro | | | 943,200 | | | 16,472 |
Randon Participacoes | | | 116,600 | | | 548 |
Tekno Industria e Comercio | | | 434 | | | 14 |
Telecomunicacoes de Sao Paulo | | | 52,600 | | | 1,217 |
Telegraph Norte Leste Participacoes | | | 34,100 | | | 604 |
Telemar Norte Leste | | | 15,700 | | | 453 |
Telemig Celular Participacoes | | | 4,000 | | | 109 |
Tim Participacoes | | | 350,600 | | | 689 |
Universo Online | | | 31,300 | | | 115 |
| | | | | | |
| | | | | | 47,930 |
| | | | | | |
| | |
France — 0.1% | | | | | | |
Bureau Veritas | | | 33,145 | | | 1,640 |
| | | | | | |
| | |
Germany — 0.1% | | | | | | |
Draegerwerk | | | 3,838 | | | 110 |
Fresenius | | | 454 | | | 26 |
Henkel | | | 4,566 | | | 141 |
KSB | | | 133 | | | 54 |
Porsche Automobil Holding | | | 32,104 | | | 1,970 |
RWE | | | 11,388 | | | 827 |
Volkswagen (A) | | | 12,992 | | | 931 |
| | | | | | |
| | | | | | 4,059 |
| | | | | | |
| | |
Italy — 0.0% | | | | | | |
Unipol Gruppo Finanziario | | | 47,789 | | | 43 |
| | | | | | |
Total Preferred Stock
(Cost $47,377) ($ Thousands) | | | | | | 53,672 |
| | | | | | |
| |
MORTGAGE-BACKED SECURITIES — 1.5% | | | |
| |
Agency Mortgage-Backed Obligations — 0.9% | | | |
FHLMC CMO STRIPS, Ser 232,
Cl IO,IO | | | | | | |
5.000%, 08/01/35 | | $ | 6,809 | | | 1,163 |
FHLMC CMO STRIPS, Ser 245,
Cl IO, IO | | | | | | |
5.000%, 05/15/37 | | | 984 | | | 171 |
FNMA TBA | | | | | | |
6.500%, 06/01/37 | | | 8,100 | | | 8,629 |
6.000%, 06/17/19 to 06/01/37 | | | 10,150 | | | 10,650 |
4.500%, 06/12/37 | | | 2,150 | | | 2,166 |
| | | | | | |
| | | | | | 22,779 |
| | | | | | |
| | | | | | |
| Description | | Face Amount
($ Thousands) | | Market Value
($ Thousands) |
| | | | | | |
|
Non-Agency Mortgage-Backed Obligations — 0.6% |
Adjustable Rate Mortgage Trust,
Ser 2005-5, Cl 1A1 | | | | | | |
4.188%, 09/25/35 (E) | | $ | 771 | | $ | 385 |
Banc of America Funding,
Ser 2006-A, Cl 2A2 | | | | | | |
5.175%, 02/20/36 (E) | | | 125 | | | 12 |
Bear Stearns Alt-A Trust,
Ser 2004-12, Cl 2A2 | | | | | | |
4.991%, 01/25/35 (E) | | | 556 | | | 313 |
Citigroup Mortgage Loan Trust,
Ser 2007-AR5, Cl 1A2A | | | | | | |
5.602%, 04/25/37 (E) | | | 2,135 | | | 1,031 |
Countrywide Alternative Loan Trust,
Ser 2004-33, Cl 1A1 | | | | | | |
4.979%, 12/25/34 (E) | | | 247 | | | 167 |
Countrywide Home Loan Mortgage Pass Through Trust,
Ser 2006-HYB2, Cl 1A1 | | | | | | |
5.295%, 04/20/36 (E) | | | 1,236 | | | 626 |
Countrywide Home Loan Mortgage Pass Through Trust,
Ser 2007-HYB2, Cl 3A1 | | | | | | |
5.388%, 02/25/47 (E) | | | 812 | | | 428 |
Countrywide Home Loan Mortgage Pass-Through Trust,
Ser 2004-22, Cl A1 | | | | | | |
5.080%, 11/25/34 (E) | | | 450 | | | 343 |
Countrywide Home Loan Mortgage Pass-Through Trust,
Ser 2007-HYB1, Cl 1A1 | | | | | | |
5.445%, 03/25/37 (E) | | | 1,162 | | | 530 |
Deutsche ALT-A Securities Alternate Loan Trust, Ser 2006- AB3, Cl A1 | | | | | | |
6.250%, 06/30/36 (E) | | | 506 | | | 348 |
DSLA Mortgage Loan Trust,
Ser 2004-AR4, Cl B1 | | | | | | |
0.928%, 01/19/45 (E) | | | 253 | | | 15 |
First Horizon Asset Securities,
Ser 2006-AR3, Cl 1A1 | | | | | | |
5.648%, 11/25/36 (E) | | | 1,138 | | | 833 |
GMAC Commercial Mortgage Securities, Ser 2004-C2, Cl A2 | | | | | | |
4.760%, 08/10/38 | | | 552 | | | 544 |
Indymac Index Mortgage Loan Trust,
Ser 2004-AR6, Cl 1A | | | | | | |
4.933%, 10/25/34 (E) | | | 78 | | | 50 |
LB-UBS Commercial Mortgage Trust,
Ser 2003-C7, Cl A2 | | | | | | |
4.064%, 09/15/27 (E) | | | 519 | | | 515 |
LB-UBS Commercial Mortgage Trust, Ser 2001-WM, Cl A2 | | | | | | |
6.530%, 07/14/16 (B) | | | 460 | | | 475 |
| | |
| SEI Institutional Investments Trust / Annual Report / May 31, 2009 | | 133 |
SCHEDULE OF INVESTMENTS
World Equity Ex-US Fund (Continued)
May 31, 2009
| | | | | | |
| Description | | Face Amount
($ Thousands) | | Market Value
($ Thousands) |
| | | | | | |
Master Adjustable Rate Mortgages Trust, Ser 2004-6, Cl 2A1 | | | | | | |
4.360%, 07/25/34 (E) | | $ | 605 | | $ | 447 |
Master Adjustable Rate Mortgages Trust, Ser 2005-2, Cl 3A1 | | | | | | |
4.788%, 03/25/35 (E) | | | 742 | | | 378 |
Merrill Lynch Mortgage Trust,
Ser 2006-1, Cl 1A | | | | | | |
4.941%, 02/25/36 (E) | | | 1,048 | | | 512 |
Morgan Stanley Capital I,
Ser 2005-HQ5, Cl A2 | | | | | | |
4.809%, 01/14/42 | | | 815 | | | 823 |
Morgan Stanley Mortgage Loan Trust, Ser 2007-11AR, Cl 2A5 | | | | | | |
5.819%, 06/25/37 (E) | | | 817 | | | 396 |
Morgan Stanley Mortgage Loan Trust, Ser 2007-14AR, Cl 6A1 | | | | | | |
6.303%, 11/25/37 (E) | | | 2,709 | | | 1,444 |
Nomura Asset Acceptance,
Ser 2004-R1, Cl A1 | | | | | | |
6.500%, 03/25/34 (B) | | | 269 | | | 241 |
Nomura Asset Acceptance,
Ser 2004-R2, Cl A1 | | | | | | |
6.500%, 10/25/34 (B) (E) | | | 310 | | | 259 |
Nomura Asset Acceptance,
Ser 2007-1, Cl 1A1A | | | | | | |
5.995%, 03/25/47 (H) | | | 1,085 | | | 750 |
Residential Accredit Loans,
Ser 2005-QA3, Cl NB2 | | | | | | |
5.212%, 03/25/35 (E) | | | 1,200 | | | 586 |
Residential Accredit Loans,
Ser 2006-QO1, Cl 2A3 | | | | | | |
0.709%, 02/25/46 (E) | | | 237 | | | 25 |
Residential Asset Securitization Trust, Ser 2004-IP2, Cl 3A1 | | | | | | |
5.022%, 12/25/34 (E) | | | 950 | | | 724 |
Salomon Brothers Mortgage
Securities VII, Ser 2000-C1, Cl A2 | | | | | | |
7.520%, 07/18/09 (E) | | | 597 | | | 602 |
Structured Adjustable Rate Mortgage Loan Trust, Ser 2006-3, Cl 2A1 | | | | | | |
5.949%, 04/25/36 (E) | | | 3,577 | | | 2,027 |
Structured Adjustable Rate Mortgage Loan Trust, Ser 2007-9, Cl 2A1 | | | | | | |
5.967%, 10/25/47 (E) | | | 1,679 | | | 835 |
Structured Asset Securities,
Ser 2006-NC1, Cl A4 | | | | | | |
0.459%, 05/25/36 (E) | | | 300 | | | 137 |
Wells Fargo Mortgage Backed Securities Trust, Ser 2004-I, Cl B1 | | | | | | |
4.618%, 07/25/34 (E) | | | 54 | | | 26 |
| | | | | | |
| | | | | | 16,827 |
| | | | | | |
Total Mortgage-Backed Securities
(Cost $51,132) ($ Thousands) | | | | | | 39,606 |
| | | | | | |
| | | | | | |
| Description | | Face Amount
($ Thousands) | | Market Value
($ Thousands) |
| | | | | | |
| |
ASSET-BACKED SECURITIES — 0.5% | | | |
| | |
Automotive — 0.0% | | | | | | |
Honda Auto Receivables Owner Trust,
Ser 2009-2, Cl A2 | | | | | | |
2.220%, 08/15/11 | | $ | 685 | | $ | 689 |
USAA Auto Owner Trust,
Ser 2009-1, Cl A2 | | | | | | |
2.640%, 08/15/11 | | | 950 | | | 959 |
| | | | | | |
| | | | | | 1,648 |
| | | | | | |
| | |
Credit Cards — 0.1% | | | | | | |
American Express Credit Account Master Trust, Ser 2003-3, Cl A | | | | | | |
1.670%, 05/15/12 (E) | | | 585 | | | 585 |
Bank of America Credit Card Trust, Ser 2006-A6, Cl A6 | | | | | | |
0.374%, 11/15/13 (E) | | | 460 | | | 449 |
Chase Issuance Trust, Ser 2007- A10 | | | | | | |
0.384%, 06/16/14 (E) | | | 460 | | | 444 |
MBNA Credit Card Master Note Trust, Ser 2003-A4, Cl A4 | | | | | | |
0.564%, 09/17/12 (E) | | | 1,520 | | | 1,510 |
| | | | | | |
| | | | | | 2,988 |
| | | | | | |
| | |
Mortgage Related Securities — 0.4% | | | | | | |
ACE Securities, Ser 2003-NC1, Cl M | | | | | | |
1.479%, 07/25/33 (E) | | | 650 | | | 357 |
ACE Securities, Ser 2003-OP1, Cl M1 | | | | | | |
1.009%, 12/25/33 (E) | | | 300 | | | 141 |
Aegis Asset Backed Securities Trust, Ser 2003-3, Cl M1 | | | | | | |
1.359%, 01/25/34 (E) | | | 38 | | | 14 |
Ameriquest Mortgage Securities, Ser 2003-2, Cl M1 | | | | | | |
1.659%, 03/25/33 (E) | | | 382 | | | 197 |
Argent Securities, Ser 2003-W5, Cl M1 | | | | | | |
1.009%, 10/25/33 (E) | | | 250 | | | 134 |
Argent Securities, Ser 2003-W9, Cl M1 | | | | | | |
0.999%, 03/25/34 (E) | | | 369 | | | 223 |
Asset-Backed Securities Home Equity, Ser 2003-HE5, Cl M1 | | | | | | |
1.469%, 09/15/33 (E) | | | 433 | | | 255 |
Citicorp Residential Mortgage Securities, Ser 2006-2, Cl A4 | | | | | | |
5.775%, 09/25/36 (H) | | | 920 | | | 765 |
Citigroup Mortgage Loan Trust, Ser 2007-AMC2, Cl A3A | | | | | | |
0.389%, 01/25/37 (E) | | | 845 | | | 606 |
CNH Equipment Trust, Cl A2 | | | | | | |
2.400%, 05/16/11 | | | 1,025 | | | 1,027 |
| | |
| 134 | | SEI Institutional Investments Trust / Annual Report / May 31, 2009 |
| | | | | | |
| Description | | Face Amount
($ Thousands) | | Market Value
($ Thousands) |
| | | | | | |
Countrywide Asset-Backed Certificates, Ser 2003-5, Cl MV2 | | | | | | |
1.909%, 01/25/34 (E) | | $ | 249 | | $ | 112 |
Credit Suisse Asset-Backed Mortgage Backed Trust, Ser 2007-1, Cl 1A1A | | | | | | |
5.898%, 12/25/37 (E) | | | 2,554 | | | 1,353 |
First Franklin Mortgage Loan Asset Backed Certificates,
Ser 2005-FF9, Cl A3 | | | | | | |
0.589%, 10/25/35 (E) | | | 681 | | | 543 |
Home Equity Asset NIM Trust,
Ser 2003-4, Cl M2 | | | | | | |
2.709%, 10/25/33 (E) | | | 188 | | | 117 |
Home Equity Asset Trust,
Ser 2006-5, Cl 2A3 | | | | | | |
0.459%, 10/25/36 (E) | | | 250 | | | 98 |
Merrill Lynch Mortgage Investors,
Ser 2003-HE1, Cl M2 | | | | | | |
1.959%, 07/25/34 (E) | | | 49 | | | 12 |
Morgan Stanley ABS Capital I,
Ser 2003-NC10, Cl M1 | | | | �� | | |
1.329%, 10/25/33 (E) | | | 571 | | | 345 |
Morgan Stanley ABS Capital I,
Ser 2005-HE6, Cl A2C | | | | | | |
0.629%, 11/25/35 (E) | | | 1,600 | | | 896 |
Option One Mortgage Loan Trust,
Ser 2003-5, Cl M1 | | | | | | |
0.959%, 08/25/33 (E) | | | 95 | | | 46 |
Residential Asset Mortgage Products,
Ser 2003-RS11, Cl MII1 | | | | | | |
1.404%, 12/25/33 (E) | | | 54 | | | 19 |
Resmae Mortgage Loan Trust,
Ser 2006-1, Cl A2B | | | | | | |
0.459%, 02/25/36 (B) (E) | | | 1,500 | | | 672 |
Securitized Asset Backed Receivables LLC Trust, Ser 2005-HE1, Cl A3C | | | | | | |
0.639%, 10/25/35 (E) | | | 335 | | | 282 |
Structured Asset Investment Loan Trust, Ser 2003-BC4, Cl M2 | | | | | | |
3.309%, 06/25/33 (E) | | | 159 | | | 81 |
Structured Asset Securities,
Ser 2007-BC1, Cl A4 | | | | | | |
0.439%, 02/25/37 (E) | | | 1,350 | | | 381 |
Structured Asset Securities,
Ser 2007-GEL2, Cl A1 | | | | | | |
0.459%, 05/25/37 (B) (E) | | | 2,133 | | | 1,476 |
Terwin Mortgage Trust,
Ser 2006-6, Cl 2A1 | | | | | | |
4.500%, 06/25/36 | | | 215 | | | 37 |
| | | | | | |
| | | | | | 10,189 |
| | | | | | |
Total Asset-Backed Securities
(Cost $21,403) ($ Thousands) | | | | | | 14,825 |
| | | | | | |
| | | | | |
| Description | | Face Amount
($ Thousands) | | Market Value
($ Thousands) |
| | | | | |
| | | Number of
Rights | | |
| | |
RIGHTS — 0.0% | | | | | |
| | |
Australia — 0.0% | | | | | |
Billabong, Expires 06/23/09* | | 2,102 | | $ | — |
Bluescope Steel, Expires 06/08/09* | | 168,500 | | | 112 |
General Property Trust,
Expires 06/18/09* | | 239,898 | | | 31 |
Pacific Brands, Expires 06/16/09* | | 173,952 | | | 25 |
Santos, Expires 06/18/09* | | 14,387 | | | 38 |
| | | | | |
| | | | | 206 |
| | | | | |
| | |
Belgium — 0.0% | | | | | |
Fortis, Expires 07/01/14* (A) (F) | | 261,082 | | | — |
| | | | | |
| | |
France — 0.0% | | | | | |
Casino Guichard Perrachon, Expires 01/13/10* | | 1,731 | | | — |
| | | | | |
| | |
Spain — 0.0% | | | | | |
Bankinter SA, Expires 06/04/09* (A) | | 59,505 | | | 46 |
| | | | | |
| | |
Sweden — 0.0% | | | | | |
Eniro AB, Expires 06/18/09* | | 138,552 | | | 89 |
| | | | | |
| | |
United Kingdom — 0.0% | | | | | |
Lloyds Banking Group, Expires 06/08/09* | | 752,363 | | | 359 |
Travis Perkins, Expires 06/15/09* | | 1,954 | | | 5 |
| | | | | |
| | | | | 364 |
| | | | | |
Total Rights
(Cost $734) ($ Thousands) | | | | | 705 |
| | | | | |
| | | Number of
Warrants | | |
| | |
WARRANT — 0.0% | | | | | |
| | |
Italy — 0.0% | | | | | |
Unione di Banche Italiane SCPA, Expires 06/30/11* (A) | | 51,612 | | | — |
| | | | | |
Total Warrant
(Cost $0) ($ Thousands) | | | | | — |
| | | | | |
| |
CORPORATE OBLIGATIONS — 0.0% | | | |
| | |
United States — 0.0% | | | | | |
Discover Financial Services 6.450%, 06/12/17 (B) | | $175 | | | 142 |
Shinsei Finance Cayman 6.418%, 01/29/49 (B) (E) | | 545 | | | 169 |
| | | | | |
Total Corporate Obligations
(Cost $720) ($ Thousands) | | | | | 311 |
| | | | | |
| | |
| SEI Institutional Investments Trust / Annual Report / May 31, 2009 | | 135 |
SCHEDULE OF INVESTMENTS
World Equity Ex-US Fund (Continued)
May 31, 2009
| | | | | | |
| Description | | Face Amount
($ Thousands)/Shares | | Market Value
($ Thousands) |
| | | | | | |
|
U.S. TREASURY OBLIGATIONS (C) (D) — 0.4% |
U.S. Treasury Bills
0.255%, 06/11/09 | | $ | 8,800 | | $ | 8,800 |
0.146%, 08/20/09 | | | 2,300 | | | 2,299 |
0.330%, 12/17/09 | | | 15 | | | 15 |
| | | | | | |
Total U.S. Treasury Obligations
(Cost $11,114) ($ Thousands) | | | | | | 11,114 |
| | | | | | |
| |
AFFILIATED PARTNERSHIP — 6.9% | | | |
| | |
United States — 6.9% | | | | | | |
SEI Liquidity Fund, L.P., 0.820%†** (G) | | | 191,730,062 | | | 189,087 |
| | | | | | |
Total Affiliated Partnership
(Cost $191,730) ($ Thousands) | | | | | | 189,087 |
| | | | | | |
| | |
TIME DEPOSITS — 2.1% | | | | | | |
| | |
United States — 2.1% | | | | | | |
Brown Brothers Harriman
7.250%, 06/01/09 | | ZAR | 5,566 | | | 693 |
2.072%, 06/01/09 | | AUD | 54 | | | 44 |
2.000%, 06/01/09 | | DKK | 2,347 | | | 446 |
1.550%, 06/01/09 | | NZD | 11 | | | 7 |
| | | | | |
| Description | | Shares/Face Amount
($ Thousands) | | Market Value
($ Thousands) |
| | | | | |
0.638%, 06/01/09 | | NOK | $ 48 | | $8 |
0.138%, 06/01/09 | | EUR | 996 | | 1,409 |
0.098%, 06/01/09 | | GBP | 256 | | 413 |
0.066%, 06/01/09 | | CAD | 262 | | 239 |
0.063%, 06/01/09 | | SEK | 7,512 | | 991 |
0.060%, 06/01/09 | | | 49,649 | | 49,649 |
0.020%, 06/01/09 | | CHF | 841 | | 788 |
0.020%, 06/01/09 | | HKD | 5,194 | | 670 |
0.010%, 06/01/09 | | JPY | 92,415 | | 968 |
0.005%, 06/01/09 | | SGD | 106 | | 73 |
| | | | | |
Total Time Deposits
(Cost $56,398) ($ Thousands) | | | | | 56,398 |
| | | | | |
| | |
CASH EQUIVALENT — 0.5% | | | | | |
| | |
United States — 0.5% | | | | | |
SEI Daily Income Trust, Prime Obligation Fund, Cl A, 0.260%†** | | | 13,156,981 | | 13,157 |
| | | | | |
Total Cash Equivalent
(Cost $13,157) ($ Thousands) | | | | | 13,157 |
| | | | | |
Total Investments — 106.8%
(Cost $2,814,957) ($ Thousands) | | | | | $2,907,664 |
| | | | | |
A summary of outstanding swap agreements held by the fund at May 31, 2009, is as follows:
| | | | | | | | | | | | | | |
| Total Return Swaps |
| Counterparty | | Reference Entity/Obligation | | Fund Pays | | Fund Receives | | Termination
Date | | Notional
Amount
(Thousands) | | Net Unrealized
Appreciation
($Thousands) |
| Merrill Lynch | | MSCI Daily TR Net EAFE USD Market Index | | 3-Month LIBOR Minus 48 Bps | | Price Return | | 06/30/09 | | $ | 10,951 | | $ | 3,119 |
| Merrill Lynch | | MSCI Daily TR Net EAFE USD Market Index | | 3-Month LIBOR Minus 50 Bps | | Price Return | | 08/01/09 | | | 9,729 | | | 1,141 |
| Morgan Stanley | | MSCI Daily TR Net EAFE USD Market Index | | 3-Month LIBOR | | Price Return | | 01/13/10 | | | 25,491 | | | 4,373 |
| | | | | | | | | | | | | | |
| | | | | | | | | | | | | $ | 8,633 |
| | | | | | | | | | | | | | |
| | | | | | | | | | | | | | | |
| Credit Default Swaps |
| Counterparty | | Reference Entity/Obligation | | Buy/Sell Protection | | (Pays)/
Receives Rate | | | Termination Date | | Notional Amount
(Thousands) | | Net Unrealized
Appreciation ($Thousands) |
| Bank of America | | Radian Group Inc., 7.750%, 06/01/11 | | BUY | | (0.39 | )% | | 12/20/13 | | $ | 1,000 | | $ | 449 |
| JPMorgan Chase Bank | | Hasbro Inc., 2.750%, 12/01/21 | | BUY | | (0.39 | ) | | 12/20/11 | | | 1,000 | | | 13 |
| JPMorgan Chase Bank | | Jones Apparel Group., 5.125%, 11/15/14 | | BUY | | (0.77 | ) | | 12/20/11 | | | 1,000 | | | 59 |
| JPMorgan Chase Bank | | Radian Group Inc., 7.750%, 06/01/11 | | BUY | | (0.39 | ) | | 12/20/13 | | | 1,000 | | | 395 |
| Merrill Lynch | | MDC Holdings Inc., 5.500%, 05/15/13 | | BUY | | (0.90 | ) | | 12/20/11 | | | 1,000 | | | 4 |
| | | | | | | | | | | | | | | |
| | | | | | | | | | | | | | $ | 920 |
| | | | | | | | | | | | | | | |
| | |
| 136 | | SEI Institutional Investments Trust / Annual Report / May 31, 2009 |
A summary of the open futures contracts held by the Fund at May 31, 2009, is as follows:
| | | | | | | | | |
| Type of Contract | | Number of
Contracts
Long (Short) | | | Expiration
Date | | Unrealized
Appreciation
(Depreciation)
($ Thousands) | |
DJ Euro Stoxx 50 Index | | 424 | | | Jun-2009 | | $ | 2,929 | |
FTSE 100 Index | | 123 | | | Jun-2009 | | | 917 | |
Hang Seng Index | | 9 | | | Jun-2009 | | | 66 | |
MSCI EAFE Index E-MINI | | (171 | ) | | Jun-2009 | | | (3,043 | ) |
MSCI Emerging Markets E-MINI | | 311 | | | Jun-2009 | | | 4,177 | |
Nikkei 225 Index | | 72 | | | Jun-2009 | | | 732 | |
S&P TSE 60 Index | | 58 | | | Jun-2009 | | | 1,323 | |
SPI 200 Index | | 35 | | | Jun-2009 | | | 193 | |
Topix Index | | 85 | | | Jun-2009 | | | 1,501 | |
U.S. 10-Year Treasury Note | | 15 | | | Sep-2009 | | | (32 | ) |
U.S. 5-Year Treasury Note | | 15 | | | Sep-2009 | | | (13 | ) |
| | | | | | | | | |
| | | | | | | $ | 8,750 | |
| | | | | | | | | |
A summary of the outstanding forward foreign currency contracts held by the Fund at May 31, 2009, is as follows:
| | | | | | | | | | | | |
| Maturity Date | | Currency
to Deliver
(Thousands) | | Currency
to Receive
(Thousands) | | Unrealized
Appreciation
(Depreciation)
($ Thousands) | |
6/11/09-6/19/09 | | USD | | 40,088 | | CAD | | 46,095 | | $ | 1,989 | |
6/19/09 | | AUD | | 3,900 | | JPY | | 259,000 | | | (403 | ) |
6/19/09 | | CAD | | 3,260 | | USD | | 2,950 | | | (26 | ) |
6/19/09 | | HKD | | 148,594 | | USD | | 19,173 | | | 2 | |
6/19/09 | | JPY | | 259,000 | | AUD | | 4,162 | | | 613 | |
6/19/09 | | MXP | | 89,399 | | USD | | 6,902 | | | 129 | |
6/19/09 | | SGD | | 2,973 | | USD | | 2,056 | | | (1 | ) |
6/19/09 | | USD | | 21,324 | | AUD | | 27,661 | | | 785 | |
6/19/09 | | USD | | 15,671 | | GBP | | 10,023 | | | 489 | |
6/19/09 | | USD | | 2,977 | | HKD | | 23,072 | | | — | |
6/19/09 | | USD | | 1,171 | | MXP | | 15,352 | | | (8 | ) |
6/19/09 | | USD | | 5,239 | | SGD | | 7,660 | | | 63 | |
6/19/09 | | USD | | 5,564 | | ZAR | | 46,670 | | | 227 | |
6/19/09-7/21/09 | | USD | | 8,674 | | EUR | | 6,190 | | | 86 | |
6/19/09-7/21/09 | | USD | | 4,520 | | NZD | | 7,758 | | | 439 | |
6/19/09-7/22/09 | | NOK | | 4,018 | | USD | | 626 | | | (13 | ) |
6/19/09-10/21/09 | | AUD | | 4,500 | | USD | | 3,575 | | | (19 | ) |
6/19/09-10/21/09 | | CHF | | 5,908 | | USD | | 5,236 | | | (311 | ) |
6/19/09-10/21/09 | | JPY | | 1,631,148 | | USD | | 16,745 | | | (356 | ) |
6/19/09-10/21/09 | | USD | | 37,879 | | JPY | | 3,644,548 | | | 321 | |
6/19/09-11/20/09 | | CHF | | 4,300 | | NOK | | 25,019 | | | (66 | ) |
6/19/09-11/20/09 | | EUR | | 8,937 | | JPY | | 1,185,000 | | | (214 | ) |
6/19/09-11/20/09 | | EUR | | 1,485 | | USD | | 2,048 | | | (52 | ) |
6/19/09-11/20/09 | | GBP | | 20,094 | | JPY | | 2,889,000 | | | (2,086 | ) |
6/19/09-11/20/09 | | GBP | | 532 | | USD | | 859 | | | 1 | |
6/19/09-11/20/09 | | JPY | | 1,185,000 | | EUR | | 9,424 | | | 903 | |
6/19/09-11/20/09 | | JPY | | 2,889,000 | | GBP | | 20,520 | | | 2,773 | |
6/19/09-11/20/09 | | NOK | | 25,747 | | CHF | | 4,300 | | | (50 | ) |
6/19/09-11/20/09 | | NZD | | 8,418 | | USD | | 5,085 | | | (294 | ) |
6/19/09-11/20/09 | | USD | | 3,946 | | NOK | | 25,082 | | | 40 | |
6/22/09 | | EUR | | 2,670 | | SEK | | 28,560 | | | (10 | ) |
6/22/09 | | SEK | | 28,560 | | EUR | | 2,705 | | | 59 | |
6/22/09 | | SEK | | 16,236 | | USD | | 2,139 | | | (3 | ) |
6/22/09 | | USD | | 8,403 | | SEK | | 64,628 | | | 124 | |
6/23/09 | | AUD | | 0 | | GBP | | 0 | | | — | |
7/21/09 | | EUR | | 2,992 | | SGD | | 5,900 | | | (149 | ) |
7/21/09 | | SGD | | 5,900 | | EUR | | 2,962 | | | 106 | |
7/21/09-10/21/09 | | AUD | | 8,333 | | CHF | | 7,000 | | | (42 | ) |
7/21/09-10/21/09 | | CHF | | 7,000 | | AUD | | 8,774 | | | 393 | |
7/21/09-10/21/09 | | CHF | | 23,000 | | GBP | | 13,636 | | | 378 | |
7/21/09-10/21/09 | | GBP | | 13,579 | | CHF | | 23,000 | | | (287 | ) |
7/21/09-11/20/09 | | CHF | | 21,100 | | EUR | | 14,060 | | | 81 | |
7/21/09-11/20/09 | | EUR | | 14,150 | | CHF | | 21,100 | | | (208 | ) |
7/22/09 | | JPY | | 259,000 | | NOK | | 19,546 | | | 388 | |
7/22/09 | | NOK | | 18,973 | | JPY | | 259,000 | | | (297 | ) |
8/21/09-9/21/09 | | NOK | | 17,841 | | SEK | | 22,100 | | | 87 | |
8/21/09-9/21/09 | | SEK | | 22,100 | | NOK | | 17,386 | | | (159 | ) |
8/21/09-11/20/09 | | GBP | | 6,570 | | SGD | | 14,800 | | | (343 | ) |
8/21/09-11/20/09 | | JPY | | 502,000 | | NZD | | 9,159 | | | 550 | |
8/21/09-11/20/09 | | NZD | | 8,499 | | JPY | | 502,000 | | | (131 | ) |
| | | | | | | | | | | |
| Maturity Date | | Currency
to Deliver
(Thousands) | | Currency
to Receive
(Thousands) | | Unrealized
Appreciation
(Depreciation)
($ Thousands) |
8/21/09-11/20/09 | | SGD | | 14,800 | | GBP | | 6,620 | | $ | 423 |
10/21/09 | | USD | | 2,541 | | CHF | | 2,900 | | | 184 |
| | | | | | | | | | | |
| | | | | | | | | | $ | 6,105 |
| | | | | | | | | | | |
| Percentages | | are based on a Net Assets of $2,721,757 ($ Thousands) |
| * | | Non-income producing security. |
| ** | | The rate reported is the 7-day effective yield as of May 31, 2009. |
| † | | Investment in Affiliated Security (see Note 4). |
| ‡ | | Real Estate Investment Trust |
| (A) | | This security or a partial position of this security is on loan at May 31, 2009. The total value of securities on loan at May 31, 2009 was $189,573 ($ Thousands). |
| (B) | | Securities sold within terms of a private placement memorandum, exempt from registration under Section 144A of the Securities Act of 1933, as amended, and may be sold only to dealers in that program or other “accredited investors.” These securities have been determined to be liquid under guidelines established by the board of Trustees. |
| (C) | | Zero coupon security. The rate reported on the Schedule of Investments is the effective yield at time of purchase. |
| (D) | | Security, or portion thereof, has been pledged as collateral on open future contracts. |
| (E) | | Variable Rate Security—The rate reported on the Schedule of Investments is the rate in effect as of May 31, 2009. The date reported on the Schedule of Investments is the next reset date. |
| (F) | | Securities considered illiquid. The total value of such securities as of May 31, 2009 was $0 ($ Thousands) and represented 0.00% of Net Assets. |
| (G) | | This security was purchased with cash collateral held from securities on loan (see Note 9). The total value of such securities as of May 31, 2009 was $189,087 ($ Thousands) |
| (H) | | Step Bonds — The rate reflected on the Schedule of Investments is the effective yield on May 31, 2009. The coupon on a step bond changes on a Specified date. |
ABS — Asset-Based Security
ADR — American Depositary Receipt
AUD — Australian Dollar
BRL — Brazilian Real
CAD — Canadian Dollar
CHF — Swiss Franc
Cl — Class
CMO — Collateralized Mortgage Obligation
DKK — Danish Krone
EUR — Euro
FHLMC — Federal Home Loan Mortgage Corporation
FNMA — Federal National Mortgage Association
GBP — British Pound Sterling
GDR — Global Depositary Receipt
HKD — Hong Kong Dollar
IO — Interest Only—face amount represents notional amount
JPY — Japanese Yen
LLC — Limited Liability Company
L.P. — Limited Partnership
LIBOR — London Interbank Offered Rate
MXP — Mexican Peso
NIM — Net Interest Margin
NOK — Norwegian Krone
NVDR — Non-Voting Depositary Receipt
NZD — New Zealand Dollar
SEK — Swedish Krone
Ser — Series
SGD — Singapore Dollar
STRIPS — Separately Traded Registered Interest and Principal Securities
TBA — To Be Announced
USD — U.S. Dollar
ZAR — South African Rand
Amounts designated as “—” are $O or have been rounded to $O.
The accompanying notes are an integral part of the financial statements.
| | |
| SEI Institutional Investments Trust / Annual Report / May 31, 2009 | | 137 |
SCHEDULE OF INVESTMENTS
Screened World Equity Ex-US Fund
May 31, 2009
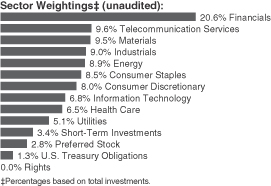
| | | | | |
| Description | | Shares | | Market Value
($ Thousands) |
| | | | | |
| | |
COMMON STOCK — 89.9% | | | | | |
| | |
Argentina — 0.0% | | | | | |
Telecom Argentina ADR* | | 2,500 | | $ | 21 |
| | | | | |
| | |
Australia — 3.9% | | | | | |
AGL Energy | | 1,200 | | | 14 |
ASX | | 400 | | | 11 |
Australia & New Zealand Banking Group | | 3,500 | | | 45 |
BHP Billiton | | 12,450 | | | 350 |
Billabong International | | 700 | | | 4 |
Brambles | | 1,100 | | | 5 |
Caltex Australia | | 4,132 | | | 40 |
CFS Retail Property Trust‡ | | 1,900 | | | 3 |
Coca-Cola Amatil | | 2,100 | | | 14 |
Commonwealth Bank of Australia | | 3,071 | | | 87 |
Computershare | | 6,163 | | | 44 |
Crown | | 2,600 | | | 15 |
CSL | | 7,117 | | | 168 |
David Jones | | 1,800 | | | 5 |
Dexus Property Group‡ | | 3,700 | | | 2 |
Energy Resources of Australia | | 600 | | | 12 |
Foster’s Group | | 4,400 | | | 17 |
Goodman Group‡ | | 5,700 | | | 1 |
GPT Group‡ | | 4,500 | | | 2 |
Harvey Norman Holdings | | 2,274 | | | 5 |
Incitec Pivot | | 3,000 | | | 7 |
ING Industrial Fund‡ | | 10,649 | | | 2 |
JB Hi-Fi | | 1,950 | | | 20 |
Lion Nathan | | 1,500 | | | 14 |
Macquarie Group | | 466 | | | 12 |
Macquarie Infrastructure Group | | 20,000 | | | 23 |
Macquarie Office Trust‡ | | 9,500 | | | 1 |
Metcash | | 4,000 | | | 13 |
National Australia Bank | | 5,200 | | | 93 |
Newcrest Mining | | 2,985 | | | 79 |
Nufarm | | 11,098 | | | 110 |
Origin Energy | | 3,850 | | | 46 |
Primary Health Care | | 400 | | | 2 |
QBE Insurance Group | | 1,200 | | | 19 |
| | | | | |
| Description | | Shares | | Market Value
($ Thousands) |
| | | | | |
Ramsay Health Care | | 200 | | $ | 2 |
Rio Tinto | | 2,687 | | | 141 |
Salmat | | 3,690 | | | 11 |
Santos | | 200 | | | 2 |
Sigma Pharmaceuticals | | 2,500 | | | 2 |
Stockland‡ | | 2,744 | | | 7 |
Suncorp-Metway | | 3,226 | | | 16 |
Tabcorp Holdings | | 1,996 | | | 12 |
Tatts Group | | 13,706 | | | 27 |
Telstra | | 8,300 | | | 21 |
Wesfarmers | | 4,703 | | | 82 |
Westfield Group‡ | | 2,700 | | | 24 |
Westpac Banking | | 5,850 | | | 89 |
Woodside Petroleum | | 1,188 | | | 41 |
Woolworths | | 10,382 | | | 212 |
WorleyParsons | | 2,071 | | | 38 |
| | | | | |
| | | | | 2,012 |
| | | | | |
| | |
Austria — 0.2% | | | | | |
Erste Group Bank | | 225 | | | 6 |
Mayr Melnhof Karton | | 13 | | | 1 |
OMV | | 1,870 | | | 77 |
Raiffeisen International Bank Holding | | 150 | | | 6 |
Strabag | | 432 | | | 10 |
Verbund - Oesterreichische Elektrizitaetswirtschafts, Cl A | | 460 | | | 25 |
| | | | | |
| | | | | 125 |
| | | | | |
| | |
Belgium — 0.8% | | | | | |
Colruyt | | 112 | | | 27 |
Delhaize Group | | 290 | | | 22 |
Dexia | | 3,018 | | | 19 |
Fortis | | 9,835 | | | 37 |
Groupe Bruxelles Lambert | | 918 | | | 74 |
InBev | | 3,399 | | | 120 |
KBC Groep | | 864 | | | 18 |
Solvay | | 600 | | | 55 |
Telenet Group Holding* | | 1,017 | | | 20 |
UCB | | 300 | | | 10 |
| | | | | |
| | | | | 402 |
| | | | | |
| | |
Brazil — 1.1% | | | | | |
Acos Villares | | 64,000 | | | 21 |
Banco Bradesco ADR | | 7,100 | | | 109 |
Banco do Brasil | | 8,100 | | | 88 |
Banestes Banco do Estado do Espirito Santo | | 1,500 | | | 7 |
Brascan Residential Properties | | 200 | | | — |
Camargo Correa Desenvolvimento Imobiliario | | 1,900 | | | 4 |
Cia de Saneamento Basico do Estado de Sao Paulo | | 5,000 | | | 78 |
Cia de Saneamento de Minas Gerais-COPASA (BRL) | | 2,500 | | | 33 |
EDP - Energias do Brasil | | 3,900 | | | 55 |
| | |
| 138 | | SEI Institutional Investments Trust / Annual Report / May 31, 2009 |
| | | | | |
| Description | | Shares | | Market Value
($ Thousands) |
| | | | | |
Eternit | | 1,500 | | $ | 5 |
Ez Tec Empreendimentos e Participacoes | | 3,100 | | | 7 |
Gerdau | | 1,500 | | | 12 |
Grendene | | 600 | | | 5 |
Industrias Romi | | 1,600 | | | 7 |
Klabin Segall* | | 1,200 | | | 1 |
Natura Cosmeticos | | 3,800 | | | 49 |
Redecard | | 2,800 | | | 40 |
Souza Cruz | | 2,100 | | | 55 |
Tecnisa (Brazil) | | 94 | | | — |
| | | | | |
| | | | | 576 |
| | | | | |
| | |
Canada — 7.3% | | | | | |
Agnico-Eagle Mines | | 495 | | | 30 |
Agrium | | 1,000 | | | 49 |
Alimentation Couche Tard, Cl B | | 1,200 | | | 15 |
Atco | | 500 | | | 16 |
ATS Automation Tooling Systems* | | 2,300 | | | 9 |
Bank of Montreal | | 3,830 | | | 153 |
Bank of Nova Scotia | | 2,800 | | | 98 |
Barrick Gold | | 4,899 | | | 185 |
BCE | | 600 | | | 14 |
Biovail | | 2,190 | | | 28 |
Bombardier, Cl B | | 29,700 | | | 102 |
Brookfield Asset Management, Cl A | | 2,100 | | | 36 |
Canadian Imperial Bank of Commerce | | 800 | | | 40 |
Canadian National Railway | | 2,900 | | | 124 |
Canadian Natural Resources | | 3,000 | | | 177 |
Canadian Oil Sands Trust | | 2,500 | | | 64 |
Canadian Utilities | | 500 | | | 16 |
Canfor* | | 1,300 | | | 7 |
Celestica* | | 100 | | | 1 |
CGI Group, Cl A* | | 9,800 | | | 91 |
Emera | | 900 | | | 16 |
Empire, Cl A | | 600 | | | 26 |
Enbridge | | 1,800 | | | 64 |
EnCana | | 7,319 | | | 403 |
First Quantum Minerals | | 200 | | | 9 |
George Weston | | 900 | | | 51 |
Gerdau Ameristeel | | 450 | | | 3 |
Goldcorp | | 5,730 | | | 227 |
Groupe Aeroplan | | 1,400 | | | 10 |
Husky Energy | | 900 | | | 27 |
IAMGOLD | | 2,938 | | | 33 |
Inmet Mining | | 1,600 | | | 63 |
Kinross Gold | | 4,700 | | | 95 |
Loblaw | | 100 | | | 3 |
Manulife Financial | | 900 | | | 19 |
Maple Leaf Foods | | 200 | | | 1 |
Metro, Cl A | | 1,700 | | | 60 |
National Bank of Canada | | 2,470 | | | 115 |
Nexen | | 707 | | | 17 |
Penn West Energy Trust | | 2,200 | | | 31 |
Petro-Canada | | 2,200 | | | 95 |
| | | | | |
| Description | | Shares | | Market Value
($ Thousands) |
| | | | | |
Potash Saskatchewan | | 700 | | $ | 80 |
Power Corp of Canada | | 780 | | | 18 |
Power Financial | | 470 | | | 11 |
Provident Energy Trust | | 1,300 | | | 7 |
QLT* | | 2,400 | | | 5 |
Quebecor, Cl B | | 400 | | | 7 |
Research In Motion* | | 2,695 | | | 211 |
RONA* | | 500 | | | 6 |
Royal Bank of Canada | | 5,100 | | | 203 |
Saskatchewan Wheat Pool, Cl Common Subscription Recei* | | 3,300 | | | 28 |
Sherritt International | | 1,500 | | | 7 |
Sino-Forest, Cl A* | | 2,700 | | | 31 |
Stantec* | | 230 | | | 6 |
Suncor Energy | | 600 | | | 21 |
Talisman Energy | | 12,800 | | | 207 |
Teck Cominco, Cl B | | 2,800 | | | 44 |
TELUS, Cl A | | 1,400 | | | 40 |
Toronto-Dominion Bank | | 2,400 | | | 122 |
TransCanada | | 2,491 | | | 74 |
West Fraser Timber | | 400 | | | 11 |
Yamana Gold | | 1,000 | | | 12 |
Yellow Pages Income Fund | | 7,200 | | | 37 |
| | | | | |
| | | | | 3,811 |
| | | | | |
| | |
Chile — 0.1% | | | | | |
Enersis ADR | | 4,500 | | | 77 |
| | | | | |
| | |
China — 2.8% | | | | | |
Anhui Conch Cement | | 10,000 | | | 72 |
Anta Sports Products | | 41,000 | | | 45 |
Bank of China | | 420,000 | | | 191 |
Bank of Communications | | 103,000 | | | 96 |
China Coal Energy | | 37,000 | | | 45 |
China Communications Services | | 67,000 | | | 41 |
China Construction Bank | | 172,000 | | | 112 |
China Life Insurance | | 46,000 | | | 169 |
China Shenhua Energy | | 47,000 | | | 159 |
China Shineway Pharmaceutical Group | | 24,000 | | | 19 |
China Telecom | | 236,000 | | | 113 |
CSG Holding | | 9,700 | | | 8 |
Guangshen Railway | | 52,000 | | | 25 |
Huaneng Power International | | 26,000 | | | 17 |
Industrial & Commercial Bank of China | | 553,000 | | | 353 |
Jiangling Motors, Cl B | | 3,600 | | | 3 |
Shenzhou International Group Holdings | | 39,000 | | | 16 |
| | | | | |
| | | | | 1,484 |
| | | | | |
| | |
Colombia — 0.0% | | | | | |
BanColombia ADR | | 600 | | | 17 |
| | | | | |
| | |
Czech Republic — 0.2% | | | | | |
CEZ | | 2,400 | | | 109 |
| | | | | |
| | |
| SEI Institutional Investments Trust / Annual Report / May 31, 2009 | | 139 |
SCHEDULE OF INVESTMENTS
Screened World Equity Ex-US Fund (Continued)
May 31, 2009
| | | | | |
| Description | | Shares | | Market Value
($ Thousands) |
| | | | | |
| | |
Denmark — 0.8% | | | | | |
A P Moeller-Maersk, Cl B | | 15 | | $ | 93 |
Carlsberg, Cl B | | 1,351 | | | 86 |
Danske Bank | | 2,492 | | | 43 |
Novo-Nordisk, Cl B | | 1,424 | | | 74 |
Sydbank | | 415 | | | 9 |
Vestas Wind Systems* | | 1,575 | | | 116 |
| | | | | |
| | | | | 421 |
| | | | | |
| | |
Egypt — 0.3% | | | | | |
Egyptian International Pharmaceutical Industrial | | 1,700 | | | 8 |
Orascom Telecom Holding | | 15,000 | | | 90 |
Suez Cement | | 1,000 | | | 5 |
Telecom Egypt | | 22,000 | | | 69 |
| | | | | |
| | | | | 172 |
| | | | | |
| | |
Finland — 0.5% | | | | | |
Fortum | | 1,388 | | | 34 |
Kone, Cl B | | 2,947 | | | 90 |
Metso* | | 1,196 | | | 23 |
Nokia | | 5,801 | | | 89 |
Sampo, Cl A | | 1,568 | | | 30 |
| | | | | |
| | | | | 266 |
| | | | | |
| | |
France — 4.9% | | | | | |
Air France-KLM | | 1,094 | | | 18 |
AXA | | 3,286 | | | 62 |
BNP Paribas | | 3,486 | | | 242 |
Bouygues | | 2,977 | | | 123 |
Carrefour | | 519 | | | 23 |
Christian Dior | | 600 | | | 46 |
Cie de Saint-Gobain | | 1,219 | | | 44 |
Cie Generale de Geophysique-Veritas* | | 1,123 | | | 20 |
CNP Assurances | | 319 | | | 30 |
Credit Agricole | | 3,365 | | | 50 |
Eutelsat Communications | | 1,158 | | | 30 |
France Telecom | | 10,813 | | | 264 |
Gaz de France | | 3,769 | | | 149 |
Gemalto* | | 776 | | | 26 |
Havas | | 8,000 | | | 21 |
Iliad | | 320 | | | 36 |
Lafarge | | 887 | | | 61 |
M6-Metropole Television | | 546 | | | 11 |
Natixis | | 21,049 | | | 43 |
Neopost | | 367 | | | 31 |
Nexity | | 646 | | | 22 |
PPR | | 1,148 | | | 97 |
Publicis Groupe | | 1,305 | | | 43 |
Renault | | 822 | | | 32 |
Sanofi-Aventis | | 5,923 | | | 379 |
Schneider Electric | | 647 | | | 48 |
SCOR | | 1,413 | | | 30 |
| | | | | |
| Description | | Shares | | Market Value
($ Thousands) |
| | | | | |
SES Global | | 1,405 | | $ | 28 |
Societe Des Autoroutes Paris-Rhin-Rhone | | 286 | | | 18 |
Societe Generale | | 635 | | | 37 |
Sodexo | | 900 | | | 45 |
Suez Environnement | | 5,125 | | | 93 |
Teleperformance | | 738 | | | 22 |
Thales | | 300 | | | 14 |
Unibail-Rodamco‡ | | 156 | | | 25 |
Vallourec | | 93 | | | 12 |
Vinci | | 946 | | | 46 |
Vivendi | | 7,618 | | | 202 |
Wendel | | 647 | | | 28 |
Zodiac Aerospace | | 536 | | | 17 |
| | | | | |
| | | | | 2,568 |
| | | | | |
| | |
Germany — 4.3% | | | | | |
Allianz | | 2,530 | | | 251 |
BASF | | 1,003 | | | 43 |
Bayer | | 493 | | | 28 |
Bayerische Motoren Werke | | 1,413 | | | 51 |
Bilfinger Berger | | 351 | | | 18 |
Commerzbank | | 2,250 | | | 18 |
DaimlerChrysler | | 961 | | | 35 |
Deutsche Bank | | 2,109 | | | 143 |
Deutsche Lufthansa | | 3,000 | | | 42 |
Deutsche Postbank | | 238 | | | 6 |
Deutsche Telekom | | 11,921 | | | 137 |
E.ON | | 5,747 | | | 204 |
Fresenius Medical Care | | 2,640 | | | 111 |
GAGFAH | | 4,000 | | | 36 |
Hannover Rueckversicherung | | 1,479 | | | 56 |
HeidelbergCement | | 150 | | | 5 |
Henkel | | 1,636 | | | 44 |
Hochtief | | 798 | | | 39 |
Infineon Technologies* | | 2,639 | | | 8 |
Lanxess | | 77 | | | 2 |
MTU Aero Engines Holding | | 274 | | | 9 |
Muenchener Rueckversicherungs | | 681 | | | 96 |
RWE | | 3,253 | | | 271 |
SAP | | 3,978 | | | 172 |
Siemens | | 2,113 | | | 155 |
Software | | 364 | | | 26 |
Suedzucker | | 2,341 | | | 49 |
ThyssenKrupp | | 1,728 | | | 44 |
Tognum | | 1,092 | | | 17 |
TUI | | 1,747 | | | 16 |
Volkswagen | | 81 | | | 25 |
Wacker Chemie | | 800 | | | 100 |
| | | | | |
| | | | | 2,257 |
| | | | | |
| | |
Greece — 0.4% | | | | | |
Marfin Investment Group | | 5,559 | | | 29 |
National Bank of Greece | | 1,545 | | | 42 |
OPAP | | 1,500 | | | 47 |
| | |
| 140 | | SEI Institutional Investments Trust / Annual Report / May 31, 2009 |
| | | | | |
| Description | | Shares | | Market Value
($ Thousands) |
| | | | | |
Public Power | | 4,178 | | $ | 95 |
| | | | | |
| | | | | 213 |
| | | | | |
| | |
Hong Kong — 3.8% | | | | | |
Beijing Enterprises Holdings | | 8,000 | | | 36 |
Chaoda Modern Agriculture | | 70,720 | | | 45 |
Cheung Kong Holdings | | 3,000 | | | 37 |
Cheung Kong Infrastructure Holdings | | 5,000 | | | 19 |
China BlueChemical | | 52,000 | | | 30 |
China Mobile | | 55,000 | | | 540 |
China Overseas Land & Investment | | 60,000 | | | 128 |
China Pharmaceutical Group | | 50,000 | | | 29 |
China Unicom | | 14,000 | | | 17 |
Chinese Estates Holdings | | 4,000 | | | 6 |
CLP Holdings | | 1,500 | | | 10 |
CNOOC | | 29,000 | | | 39 |
Dairy Farm International Holdings | | 1,800 | | | 10 |
Esprit Holdings | | 2,500 | | | 16 |
First Pacific | | 14,000 | | | 7 |
Guangdong Investment | | 92,000 | | | 47 |
Hang Lung Properties | | 10,000 | | | 34 |
Hang Seng Bank | | 1,300 | | | 19 |
Henderson Land Development | | 3,000 | | | 18 |
Hengan International Group | | 5,000 | | | 23 |
HKR International | | 6,400 | | | 3 |
Hong Kong Exchanges and Clearing | | 3,300 | | | 52 |
HongKong Electric Holdings | | 3,500 | | | 19 |
Hopewell Highway Infrastructure | | 1,500 | | | 1 |
Hutchison Whampoa | | 21,000 | | | 148 |
Industrial & Commercial Bank of China Asia | | 33,000 | | | 60 |
Jardine Matheson Holdings | | 400 | | | 10 |
Johnson Electric Holdings | | 15,000 | | | 4 |
Kingboard Chemical Holdings | | 2,000 | | | 5 |
Kingboard Laminates Holdings | | 12,000 | | | 5 |
Li & Fung | | 26,000 | | | 71 |
Link‡ | | 2,000 | | | 4 |
MTR | | 14,500 | | | 46 |
Noble Group | | 39,000 | | | 43 |
Pacific Century Premium Developments | | 10,000 | | | 2 |
Road King Infrastructure | | 4,000 | | | 3 |
SA International Holdings | | 6,000 | | | 2 |
Shandong Chenming Paper Holdings, Cl B | | 68,600 | | | 37 |
Shanghai Industrial Holdings | | 18,000 | | | 72 |
Sinofert Holdings | | 4,000 | | | 2 |
SmarTone Telecommunications Holding | | 2,500 | | | 2 |
Sun Hung Kai Properties | | 19,000 | | | 238 |
Texwinca Holdings | | 2,000 | | | 1 |
Wharf Holdings | | 4,000 | | | 17 |
Wheelock | | 11,000 | | | 32 |
Wing On International | | 1,000 | | | 1 |
Yue Yuen Industrial Holdings | | 4,000 | | | 9 |
| | | | | |
| | | | | 1,999 |
| | | | | |
| | | | | |
| Description | | Shares | | Market Value
($ Thousands) |
| | | | | |
| | |
India — 2.0% | | | | | |
HDFC Bank ADR | | 2,333 | | $ | 232 |
Infosys Technologies ADR | | 5,865 | | | 203 |
ITC* | | 15,822 | | | 62 |
Larsen & Toubro GDR | | 2,818 | | | 84 |
Reliance Industries GDR* (A) | | 4,648 | | | 448 |
| | | | | |
| | | | | 1,029 |
| | | | | |
| | |
Indonesia — 0.3% | | | | | |
Bank Central Asia | | 66,000 | | | 22 |
Bank Mandiri | | 212,000 | | | 62 |
Bank Rakyat Indonesia | | 38,000 | | | 23 |
Telekomunikasi Indonesia | | 57,000 | | | 42 |
United Tractors | | 12,000 | | | 12 |
| | | | | |
| | | | | 161 |
| | | | | |
| | |
Ireland — 0.3% | | | | | |
CRH | | 5,462 | | | 129 |
DCC | | 395 | | | 8 |
Experian | | 4,661 | | | 35 |
| | | | | |
| | | | | 172 |
| | | | | |
| | |
Israel — 1.0% | | | | | |
Check Point Software Technologies* | | 1,630 | | | 38 |
First International Bank of Israel* | | 6,000 | | | 55 |
Israel Chemicals | | 2,000 | | | 23 |
Teva Pharmaceutical Industries ADR | | 2,420 | | | 112 |
Teva Pharmaceutical Industries | | 4,646 | | | 216 |
Union Bank of Israel* | | 18,000 | | | 55 |
| | | | | |
| | | | | 499 |
| | | | | |
| | |
Italy — 2.0% | | | | | |
ACEA | | 3,168 | | | 41 |
Atlantia | | 2,124 | | | 45 |
Banca Intesa | | 30,814 | | | 110 |
Banco Popolare Scarl | | 9,774 | | | 81 |
Benetton Group | | 4,000 | | | 38 |
Buzzi Unicem | | 1,104 | | | 16 |
Edison | | 17,754 | | | 24 |
Enel | | 24,025 | | | 143 |
Exor | | 1,189 | | | 20 |
Fiat | | 3,594 | | | 39 |
Fondiaria-Sai | | 351 | | | 6 |
GranitiFiandre | | 2,514 | | | 10 |
Italcementi | | 1,404 | | | 16 |
Mediobanca | | 759 | | | 9 |
Prysmian | | 5,500 | | | 80 |
Telecom Italia | | 157,340 | | | 215 |
Terna Rete Elettrica Nazionale | | 13,393 | | | 49 |
UniCredito Italiano | | 25,220 | | | 67 |
Unipol Gruppo Finanziario | | 16,000 | | | 21 |
| | | | | |
| | | | | 1,030 |
| | | | | |
| | |
| SEI Institutional Investments Trust / Annual Report / May 31, 2009 | | 141 |
SCHEDULE OF INVESTMENTS
Screened World Equity Ex-US Fund (Continued)
May 31, 2009
| | | | | |
| Description | | Shares | | Market Value
($ Thousands) |
| | | | | |
| | |
Japan — 13.2% | | | | | |
ADEKA | | 400 | | $ | 3 |
Aderans Holdings | | 100 | | | 1 |
Aeon | | 2,800 | | | 26 |
Aisan Industry | | 300 | | | 2 |
AOKI Holdings | | 300 | | | 3 |
Aoyama Trading | | 300 | | | 5 |
Asahi Breweries | | 1,800 | | | 25 |
Astellas Pharma | | 2,600 | | | 88 |
Bank of Kyoto | | 4,265 | | | 38 |
Benesse | | 1,600 | | | 67 |
Bic Camera | | 23 | | | 7 |
Bridgestone | | 2,300 | | | 35 |
Canon | | 2,800 | | | 93 |
Capcom | | 1,400 | | | 27 |
Central Japan Railway | | 8 | | | 51 |
Chiba Kogyo Bank* | | 300 | | | 3 |
Chubu Electric Power | | 1,100 | | | 25 |
Chugai Pharmaceutical | | 1,500 | | | 27 |
Chugoku Electric Power | | 400 | | | 8 |
Circle K Sunkus | | 400 | | | 6 |
Cosmo Oil | | 19,000 | | | 69 |
Create SD Holdings | | 100 | | | 2 |
Credit Saison | | 1,400 | | | 19 |
Dai Nippon Printing | | 2,000 | | | 26 |
Daihatsu Diesel Manufacturing | | 2,000 | | | 12 |
Daihatsu Motor | | 4,000 | | | 39 |
Daiichi Sankyo | | 2,100 | | | 39 |
Daiichikosho | | 300 | | | 3 |
Dainippon Sumitomo Pharma | | 1,800 | | | 15 |
Daio Paper | | 1,000 | | | 9 |
Daiwa Securities Group | | 6,000 | | | 37 |
Dena | | 14 | | | 48 |
Denso | | 2,400 | | | 57 |
Dentsu | | 100 | | | 2 |
East Japan Railway | | 800 | | | 48 |
Eisai | | 900 | | | 31 |
Electric Power Development | | 700 | | | 20 |
FamilyMart | | 1,276 | | | 37 |
Fanuc | | 1,200 | | | 97 |
Fast Retailing | | 738 | | | 87 |
Fuji Heavy Industries | | 4,000 | | | 16 |
FUJIFILM Holdings | | 1,400 | | | 40 |
Fujitsu | | 16,000 | | | 83 |
Fukuoka Financial Group | | 8,261 | | | 36 |
Fuyo General Lease | | 200 | | | 4 |
Godo Steel | | 7,000 | | | 22 |
Hankyu Hanshin Holdings | | 2,000 | | | 10 |
Higashi-Nippon Bank | | 2,000 | | | 5 |
Hisamitsu Pharmaceutical | | 1,000 | | | 32 |
Hitachi | | 16,000 | | | 53 |
Hitachi Maxell | | 300 | | | 4 |
Hokuriku Electric Power | | 800 | | | 19 |
Honda Motor | | 9,235 | | | 267 |
| | | | | |
| Description | | Shares | | Market Value
($ Thousands) |
| | | | | |
Hyakugo Bank | | 2,000 | | $ | 10 |
Ibiden | | 1,100 | | | 32 |
Idemitsu Kosan | | 600 | | | 50 |
Ines | | 2,300 | | | 14 |
Inpex Holdings | | 5 | | | 41 |
Itochu Enex | | 200 | | | 1 |
J Front Retailing | | 3,000 | | | 12 |
Japan Airlines* | | 4,000 | | | 8 |
Japan Petroleum Exploration | | 300 | | | 15 |
Japan Steel Works | | 7,000 | | | 91 |
Japan Tobacco | | 11 | | | 32 |
JFE Holdings | | 2,400 | | | 80 |
JFE Shoji Holdings | | 2,000 | | | 7 |
Jupiter Telecommunications | | 30 | | | 22 |
Kaneka | | 3,000 | | | 21 |
Kansai Electric Power | | 1,200 | | | 26 |
Kao | | 2,000 | | | 44 |
Kawasaki Kisen Kaisha | | 2,000 | | | 9 |
KDDI | | 24 | | | 126 |
Kinden | | 3,000 | | | 25 |
Kirin Holdings | | 4,000 | | | 50 |
Kohnan Shoji | | 200 | | | 2 |
Komatsu | | 2,000 | | | 29 |
Kose | | 300 | | | 6 |
Kubota | | 5,000 | | | 37 |
Kyorin | | 1,000 | | | 15 |
Kyowa Hakko Kogyo | | 2,000 | | | 21 |
Leopalace21 | | 800 | | | 7 |
Maeda | | 2,000 | | | 8 |
Makino Milling Machine | | 1,000 | | | 3 |
Marubeni | | 12,000 | | | 54 |
Marui Group | | 1,500 | | | 9 |
Mazda Motor | | 15,000 | | | 39 |
MEIJI Holdings* | | 100 | | | 3 |
Millea Holdings | | 2,100 | | | 62 |
Mitsubishi | | 6,200 | | | 118 |
Mitsubishi Chemical Holdings | | 6,000 | | | 28 |
Mitsubishi Electric | | 6,000 | | | 35 |
Mitsubishi Estate | | 3,000 | | | 50 |
Mitsubishi Steel Manufacturing | | 5,000 | | | 12 |
Mitsubishi UFJ Financial Group | | 31,600 | | | 200 |
Mitsui | | 4,000 | | | 51 |
Mitsui Chemicals | | 4,000 | | | 14 |
Mitsui Fudosan | | 2,000 | | | 34 |
Mitsui OSK Lines | | 8,000 | | | 57 |
Mitsui Sumitomo Insurance Group Holdings | | 3,100 | | | 91 |
Mitsui Trust Holdings | | 2,000 | | | 7 |
Mizuho Financial Group | | 18,700 | | | 45 |
Morinaga Milk Industry | | 2,000 | | | 7 |
Murata Manufacturing | | 800 | | | 34 |
Nafco | | 200 | | | 3 |
Nagase | | 2,000 | | | 19 |
NEC | | 9,000 | | | 35 |
NET One Systems | | 12 | | | 19 |
| | |
| 142 | | SEI Institutional Investments Trust / Annual Report / May 31, 2009 |
| | | | | |
| Description | | Shares | | Market Value
($ Thousands) |
| | | | | |
Nikon | | 3,000 | | $ | 45 |
Nintendo | | 372 | | | 100 |
Nippon Building Fund, Cl A‡ | | 3 | | | 27 |
Nippon Electric Glass | | 9,000 | | | 86 |
Nippon Mining Holdings | | 12,000 | | | 68 |
Nippon Oil | | 11,000 | | | 67 |
Nippon Seiki | | 2,000 | | | 20 |
Nippon Steel | | 9,000 | | | 35 |
Nippon Telegraph & Telephone | | 6,100 | | | 253 |
Nippon Yusen | | 10,000 | | | 48 |
Nipponkoa Insurance | | 4,000 | | | 24 |
Nipro | | 1,000 | | | 19 |
Nissan Motor | | 25,000 | | | 151 |
Nissan Shatai | | 2,000 | | | 15 |
Nisshin Steel | | 2,000 | | | 5 |
Nitori | | 621 | | | 38 |
Nomura Holdings | | 5,000 | | | 38 |
NTT Data | | 3 | | | 9 |
NTT DoCoMo | | 34 | | | 51 |
Okinawa Electric Power | | 200 | | | 11 |
Omron | | 1,100 | | | 17 |
Onward Holdings | | 2,000 | | | 12 |
Osaka Gas | | 8,000 | | | 25 |
Panasonic | | 7,900 | | | 113 |
Rakuten | | 252 | | | 138 |
Resona Holdings | | 1,800 | | | 27 |
Ricoh | | 3,000 | | | 41 |
Rohm | | 600 | | | 39 |
Roland | | 200 | | | 2 |
San-In Godo Bank | | 1,000 | | | 8 |
Sankyo | | 500 | | | 27 |
Santen Pharmaceutical | | 600 | | | 18 |
Sapporo Hokuyo Holdings | | 2,500 | | | 7 |
Seiko Epson | | 900 | | | 13 |
Seino Holdings | | 2,000 | | | 13 |
Seven & I Holdings | | 7,600 | | | 184 |
Seven Bank | | 7 | | | 18 |
Shimano | | 300 | | | 11 |
Shin-Etsu Chemical | | 200 | | | 10 |
Shinsei Bank | | 19,000 | | | 26 |
Showa Shell Sekiyu | | 700 | | | 7 |
SKY Perfect JSAT Holdings | | 44 | | | 17 |
Softbank | | 2,300 | | | 42 |
Sojitz | | 1,400 | | | 3 |
Sony | | 2,800 | | | 73 |
SRI Sports | | 2 | | | 2 |
Sumco | | 1,000 | | | 15 |
Sumikin Bussan | | 2,000 | | | 5 |
Sumitomo | | 11,400 | | | 114 |
Sumitomo Chemical | | 7,000 | | | 31 |
Sumitomo Electric Industries | | 700 | | | 8 |
Sumitomo Mitsui Financial Group | | 1,500 | | | 58 |
Sumitomo Trust & Banking | | 6,000 | | | 29 |
Suruga Bank | | 3,996 | | | 37 |
| | | | | |
| Description | | Shares | | Market Value
($ Thousands) |
| | | | | |
Suzuken | | 500 | | $ | 13 |
Suzuki Motor | | 2,600 | | | 58 |
T&D Holdings | | 700 | | | 20 |
Taiheiyo Cement | | 10,000 | | | 18 |
Taisho Pharmaceutical | | 1,000 | | | 19 |
Takashimaya | | 3,000 | | | 19 |
Takeda Pharmaceutical | | 2,400 | | | 95 |
Takefuji | | 60 | | | — |
Tanabe Seiyaku | | 5,000 | | | 55 |
TDK | | 600 | | | 27 |
Teijin | | 5,000 | | | 14 |
Teikoku Piston Ring | | 1,800 | | | 8 |
Tochigi Bank | | 2,000 | | | 10 |
Tohoku Electric Power | | 600 | | | 12 |
Tokyo Electric Power | | 700 | | | 18 |
Tokyo Steel Manufacturing | | 1,600 | | | 19 |
Tokyo Tatemono | | 2,000 | | | 10 |
Toshiba TEC | | 2,000 | | | 8 |
Tosoh | | 2,000 | | | 6 |
Toyo Kohan | | 2,000 | | | 9 |
Toyo Suisan Kaisha | | 1,000 | | | 22 |
Toyota Industries | | 900 | | | 23 |
Toyota Motor | | 7,433 | | | 296 |
TV Asahi | | 4 | | | 6 |
Unipres | | 200 | | | 2 |
West Japan Railway | | 8 | | | 26 |
Yahoo! Japan | | 37 | | | 10 |
Yamaguchi Financial Group | | 1,000 | | | 12 |
Yamaha | | 100 | | | 1 |
Yamaha Motor | | 1,300 | | | 15 |
Yamato Kogyo | | 200 | | | 5 |
| | | | | |
| | | | | 6,854 |
| | | | | |
| | |
Malaysia — 0.7% | | | | | |
British American Tobacco Malaysia | | 3,000 | | | 37 |
Bumiputra-Commerce Holdings | | 44,000 | | | 108 |
Hong Leong Bank | | 11,000 | | | 17 |
Hong Leong Financial Group | | 7,200 | | | 10 |
JT International | | 7,200 | | | 9 |
Multi-Purpose Holdings | | 29,000 | | | 12 |
Nestle Malaysia | | 2,000 | | | 17 |
PLUS Expressways | | 6,000 | | | 6 |
PPB Group | | 16,000 | | | 48 |
Tanjong | | 5,000 | | | 19 |
Tenaga Nasional | | 34,000 | | | 80 |
| | | | | |
| | | | | 363 |
| | | | | |
| | |
Mauritius — 0.1% | | | | | |
Golden Agri-Resources (SGD) | | 87,520 | | | 26 |
| | | | | |
| | |
Mexico — 1.3% | | | | | |
America Movil, Ser L | | 130,600 | | | 250 |
Coca-Cola Femsa, Ser L | | 14,500 | | | 60 |
Consorcio ARA* | | 27,500 | | | 13 |
Cydsa | | 3,000 | | | 2 |
| | |
| SEI Institutional Investments Trust / Annual Report / May 31, 2009 | | 143 |
SCHEDULE OF INVESTMENTS
Screened World Equity Ex-US Fund (Continued)
May 31, 2009
| | | | | |
| Description | | Shares | | Market Value
($ Thousands) |
| | | | | |
Embotelladoras Arca | | 14,200 | | $ | 36 |
Grupo Aeroportuario del Pacifico, Ser B, Cl B | | 200 | | | — |
Grupo Continental | | 16,000 | | | 32 |
Grupo Financiero Banorte, Ser O | | 20,100 | | | 47 |
Grupo Mexico, Ser B | | 89,451 | | | 86 |
Grupo Simec, Ser B, Cl B* | | 5,500 | | | 12 |
Grupo Televisa | | 1,900 | | | 7 |
Industrias, Ser B* | | 8,800 | | | 27 |
Kimberly-Clark de Mexico, Cl A | | 7,000 | | | 27 |
Wal-Mart de Mexico | | 21,200 | | | 62 |
| | | | | |
| | | | | 661 |
| | | | | |
| | |
Netherlands — 2.0% | | | | | |
Aegon | | 5,810 | | | 36 |
Akzo Nobel | | 290 | | | 14 |
ArcelorMittal | | 3,779 | | | 126 |
ASML Holding | | 1,614 | | | 33 |
European Aeronautic Defense and Space | | 3,687 | | | 60 |
Heineken Holding | | 1,179 | | | 36 |
ING Groep | | 7,527 | | | 80 |
Koninklijke Ahold | | 23,318 | | | 285 |
Koninklijke DSM | | 1,701 | | | 60 |
Koninklijke Philips Electronics | | 2,979 | | | 56 |
Koninklijke Vopak* | | 1,064 | | | 53 |
Randstad Holding | | 1,128 | | | 35 |
Royal KPN | | 3,594 | | | 47 |
TNT | | 3,725 | | | 74 |
Unilever | | 1,367 | | | 33 |
| | | | | |
| | | | | 1,028 |
| | | | | |
| | |
New Zealand — 0.0% | | | | | |
Air New Zealand | | 4,300 | | | 3 |
Vector | | 4,500 | | | 6 |
| | | | | |
| | | | | 9 |
| | | | | |
| | |
Norway — 0.3% | | | | | |
DnB | | 8,600 | | | 72 |
Telenor | | 2,900 | | | 25 |
Yara International | | 1,050 | | | 35 |
| | | | | |
| | | | | 132 |
| | | | | |
| | |
Papua New Guinea — 0.2% | | | | | |
Lihir Gold* | | 35,829 | | | 93 |
| | | | | |
| | |
Philippines — 0.1% | | | | | |
Globe Telecom | | 1,000 | | | 19 |
Pilipino Telephone | | 268,000 | | | 46 |
| | | | | |
| | | | | 65 |
| | | | | |
| | |
Poland — 0.4% | | | | | |
Grupa Lotos* | | 4,000 | | | 24 |
Polish Oil & Gas | | 48,000 | | | 57 |
| | | | | |
| Description | | Shares | | Market Value
($ Thousands) |
| | | | | |
Polski Koncern Naftowy Orlen | | 6,000 | | $ | 55 |
Telekomunikacja Polska | | 10,000 | | | 52 |
| | | | | |
| | | | | 188 |
| | | | | |
| | |
Portugal — 0.5% | | | | | |
Banco Espirito Santo | | 4,169 | | | 24 |
Energias de Portugal | | 20,000 | | | 80 |
Galp Energia SGPS, Cl B | | 9,900 | | | 157 |
Portugal Telecom | | 1,850 | | | 17 |
| | | | | |
| | | | | 278 |
| | | | | |
| | |
Russia — 0.9% | | | | | |
MMC Norilsk Nickel ADR | | 3,119 | | | 36 |
Mobile Telesystems ADR | | 2,800 | | | 116 |
Novolipetsk Steel GDR | | 2,400 | | | 47 |
Rosneft Oil GDR | | 3,900 | | | 27 |
Sberbank GDR | | 200 | | | 50 |
Severstal GDR | | 6,900 | | | 39 |
Surgutneftegaz ADR | | 4,600 | | | 39 |
Tatneft ADR | | 4,666 | | | 128 |
| | | | | |
| | | | | 482 |
| | | | | |
| | |
Singapore — 1.1% | | | | | |
ComfortDelgro | | 13,000 | | | 12 |
DBS Group Holdings | | 8,000 | | | 66 |
Del Monte Pacific | | 5,000 | | | 2 |
Fraser and Neave | | 6,000 | | | 16 |
Hi-P International, Cl P | | 4,000 | | | 2 |
Jardine Cycle & Carriage | | 1,000 | | | 11 |
Keppel | | 8,000 | | | 40 |
Oversea-Chinese Banking | | 15,000 | | | 76 |
SembCorp Industries | | 6,000 | | | 13 |
SIA Engineering | | 1,000 | | | 2 |
Singapore Airlines | | 1,000 | | | 9 |
Singapore Land | | 2,000 | | | 7 |
Singapore Telecommunications | | 26,000 | | | 54 |
United Overseas Bank | | 4,000 | | | 40 |
Wilmar International | | 64,000 | | | 220 |
| | | | | |
| | | | | 570 |
| | | | | |
| | |
South Africa — 2.2% | | | | | |
AngloGold Ashanti | | 2,400 | | | 102 |
Assore | | 405 | | | 24 |
Aveng | | 8,000 | | | 35 |
Bidvest Group | | 6,060 | | | 71 |
DataTec | | 16,000 | | | 33 |
Distell Group | | 2,000 | | | 13 |
FirstRand | | 52,000 | | | 89 |
Gold Fields | | 6,000 | | | 81 |
Group | | 8,000 | | | 115 |
Harmony Gold Mining* | | 4,000 | | | 48 |
Hosken Consolidated Investments | | 6,000 | | | 33 |
Iliad Africa | | 9,808 | | | 9 |
| | |
| 144 | | SEI Institutional Investments Trust / Annual Report / May 31, 2009 |
| | | | | |
| Description | | Shares | | Market Value
($ Thousands) |
| | | | | |
Impala Platinum Holdings | | 3,680 | | $ | 89 |
Investec | | 5,000 | | | 27 |
Medi-Clinic | | 22,000 | | | 54 |
Metropolitan Holdings | | 36,000 | | | 52 |
Naspers, Cl N | | 1,000 | | | 24 |
Nedbank Group | | 6,000 | | | 67 |
Sanlam | | 36,000 | | | 77 |
Standard Bank Group | | 8,000 | | | 83 |
| | | | | |
| | | | | 1,126 |
| | | | | |
| | |
South Korea — 2.8% | | | | | |
GS Home Shopping | | 200 | | | 11 |
Hanwha | | 370 | | | 10 |
Hanwha Chemical | | 1,430 | | | 12 |
Hyundai Department Store | | 590 | | | 39 |
Hyundai Heavy Industries | | 700 | | | 121 |
Hyundai Mobis | | 740 | | | 70 |
Hyundai Motor | | 390 | | | 22 |
Kangwon Land | | 4,240 | | | 55 |
KISWIRE | | 310 | | | 11 |
Korea Electric Power | | 3,370 | | | 77 |
Korea Express* | | 80 | | | 6 |
Korea Zinc | | 300 | | | 34 |
KT | | 2,430 | | | 66 |
KT Freetel | | 2,570 | | | 47 |
KT&G | | 1,780 | | | 97 |
LG | | 1,680 | | | 87 |
LG Chemical | | 898 | | | 110 |
LG Dacom | | 1,090 | | | 16 |
LG Electronics | | 500 | | | 48 |
LG Telecom | | 5,390 | | | 36 |
Lotte Shopping | | 300 | | | 58 |
Namyang Dairy Products | | 30 | | | 12 |
Ottogi | | 110 | | | 12 |
Pacific | | 220 | | | 22 |
POSCO | | 160 | | | 54 |
Samsung Electronics | | 480 | | | 215 |
Shinsegae | | 240 | | | 84 |
SK Holdings | | 270 | | | 23 |
S-Oil | | 360 | | | 17 |
| | | | | |
| | | | | 1,472 |
| | | | | |
| | |
Spain — 3.0% | | | | | |
ACS Actividades Construcciones y Servicios | | 1,052 | | | 55 |
Banco Bilbao Vizcaya Argentaria | | 8,444 | | | 103 |
Banco Santander Central Hispano | | 31,207 | | | 332 |
Criteria Caixacorp | | 2,597 | | | 11 |
Gas Natural | | 898 | | | 16 |
Grifols | | 1,394 | | | 25 |
Iberdrola | | 14,481 | | | 125 |
Mapfre | | 10,000 | | | 35 |
Repsol | | 9,466 | | | 214 |
Sacyr Vallehermoso | | 500 | | | 8 |
| | | | | |
| Description | | Shares | | Market Value
($ Thousands) |
| | | | | |
Telefonica | | 28,368 | | $ | 615 |
| | | | | |
| | | | | 1,539 |
| | | | | |
| | |
Sweden — 1.1% | | | | | |
Boliden | | 2,081 | | | 16 |
Hennes & Mauritz, Cl B | | 609 | | | 29 |
Investor, Cl B | | 2,118 | | | 33 |
Nordea Bank | | 2,707 | | | 22 |
Securitas, Cl B | | 832 | | | 7 |
Skandinaviska Enskilda Banken, Cl A | | 6,293 | | | 28 |
Svenska Cellulosa, Cl B | | 9,109 | | | 106 |
Svenska Handelsbanken, Cl A | | 433 | | | 8 |
Swedbank | | 2,452 | | | 15 |
Swedish Match | | 2,407 | | | 39 |
Telefonaktiebolaget LM Ericsson, Cl B | | 17,746 | | | 164 |
TeliaSonera | | 22,394 | | | 115 |
| | | | | |
| | | | | 582 |
| | | | | |
| | |
Switzerland — 5.2% | | | | | |
ACE | | 725 | | | 32 |
Actelion* | | 602 | | | 31 |
Baloise Holding | | 969 | | | 77 |
Banque Cantonale Vaudoise | | 40 | | | 15 |
BKW FMB Energie | | 91 | | | 7 |
Credit Suisse Group | | 5,683 | | | 255 |
Gurit Holding | | 16 | | | 9 |
Helvetia Holding | | 100 | | | 27 |
Holcim* | | 316 | | | 17 |
Lindt & Spruengli | | 6 | | | 11 |
Nestle | | 14,829 | | | 541 |
Novartis | | 15,995 | | | 641 |
Petroplus Holdings | | 497 | | | 10 |
Roche Holding | | 1,460 | | | 200 |
Sulzer | | 496 | | | 33 |
Swatch Group | | 920 | | | 32 |
Swiss Reinsurance | | 1,210 | | | 40 |
Swisscom | | 328 | | | 97 |
Syngenta | | 420 | | | 103 |
Transocean* | | 937 | | | 75 |
UBS | | 7,184 | | | 108 |
Vontobel Holding | | 1,180 | | | 31 |
Xstrata | | 15,328 | | | 172 |
Zurich Financial Services | | 908 | | | 170 |
| | | | | |
| | | | | 2,734 |
| | | | | |
| | |
Taiwan — 3.2% | | | | | |
Acer | | 32,000 | | | 58 |
Asia Optical | | 8,060 | | | 10 |
Asustek Computer | | 64,090 | | | 91 |
China Bills Finance* | | 51,000 | | | 16 |
China Manmade Fibers | | 48,000 | | | 10 |
Chunghwa Telecom | | 113,053 | | | 216 |
Compal Electronics | | 84,400 | | | 72 |
| | |
| SEI Institutional Investments Trust / Annual Report / May 31, 2009 | | 145 |
SCHEDULE OF INVESTMENTS
Screened World Equity Ex-US Fund (Continued)
May 31, 2009
| | | | | |
| Description | | Shares | | Market Value
($ Thousands) |
| | | | | |
CTCI | | 19,204 | | $ | 18 |
Far Eastern Textile | | 70,000 | | | 80 |
Far EasTone Telecommunications | | 50,000 | | | 58 |
Fubon Financial Holding | | 79,000 | | | 78 |
Gigabyte Technology | | 19,000 | | | 13 |
HON HAI Precision Industry | | 24,000 | | | 92 |
Inventec | | 52,000 | | | 33 |
Kinpo Electronics | | 45,000 | | | 12 |
Lite-On Technology | | 69,000 | | | 61 |
Macronix International | | 99,000 | | | 46 |
Mega Financial Holding | | 160,000 | | | 82 |
Quanta Computer | | 53,320 | | | 86 |
Synnex Technology International | | 34,000 | | | 56 |
Taishin Financial Holding | | 118,000 | | | 43 |
Taiwan Cooperative Bank | | 105,000 | | | 69 |
Taiwan Glass Industrial | | 18,000 | | | 13 |
Taiwan Semiconductor Manufacturing | | 128,000 | | | 237 |
United Microelectronics | | 228,000 | | | 93 |
Wistron | | 8,000 | | | 13 |
| | | | | |
| | | | | 1,656 |
| | | | | |
| | |
Thailand — 0.2% | | | | | |
Bangkok Bank NVDR | | 31,000 | | | 80 |
Ratchaburi Electricity Generating Holding | | 4,000 | | | 4 |
Thanachart Capital | | 37,000 | | | 14 |
| | | | | |
| | | | | 98 |
| | | | | |
| | |
Turkey — 0.5% | | | | | |
Akbank | | 20,000 | | | 84 |
Eczacibasi Ilac Sanayi | | 48,000 | | | 39 |
KOC Holding* | | 27,000 | | | 62 |
Petrol Ofisi* | | 5,000 | | | 16 |
Turk Hava Yollari | | 6,332 | | | 36 |
Turk Sise ve Cam Fabrikalari | | 28,000 | | | 24 |
| | | | | |
| | | | | 261 |
| | | | | |
| | |
United Kingdom — 13.8% | | | | | |
Aggreko | | 2,969 | | | 28 |
Amec | | 9,495 | | | 104 |
Amlin | | 3,793 | | | 22 |
Anglo American | | 2,649 | | | 76 |
AstraZeneca | | 10,031 | | | 418 |
Autonomy* | | 6,942 | | | 173 |
Aviva | | 7,747 | | | 42 |
Babcock International Group | | 4,598 | | | 35 |
BAE Systems | | 37,729 | | | 210 |
Balfour Beatty | | 10,325 | | | 57 |
Barclays | | 41,704 | | | 202 |
Berkeley Group Holdings* | | 1,041 | | | 15 |
BG Group | | 20,962 | | | 384 |
BHP Billiton | | 14,781 | | | 353 |
BP | | 82,147 | | | 677 |
British American Tobacco | | 10,367 | | | 284 |
| | | | | |
| Description | | Shares | | Market Value
($ Thousands) |
| | | | | |
BT Group, Cl A | | 22,100 | | $ | 31 |
Cable & Wireless | | 24,000 | | | 52 |
Cape* | | 2,000 | | | 5 |
Carnival | | 2,040 | | | 53 |
Catlin Group | | 5,051 | | | 29 |
Centrica | | 54,251 | | | 216 |
Close Brothers Group | | 800 | | | 9 |
Cobham | | 9,399 | | | 27 |
Compass Group | | 32,398 | | | 188 |
Computacenter | | 3,000 | | | 9 |
De La Rue | | 1,031 | | | 14 |
Diageo | | 5,466 | | | 75 |
E2V Technologies | | 1,800 | | | 2 |
Firstgroup | | 900 | | | 5 |
Friends Provident | | 18,600 | | | 20 |
GlaxoSmithKline | | 12,519 | | | 211 |
Group 4 Securicor | | 12,751 | | | 44 |
Hiscox | | 3,000 | | | 16 |
Home Retail Group | | 9,844 | | | 37 |
HSBC Holdings | | 49,167 | | | 444 |
Imperial Tobacco Group | | 4,951 | | | 128 |
Informa | | 5,361 | | | 21 |
Inmarsat | | 4,081 | | | 34 |
International Power | | 7,420 | | | 33 |
Investec | | 4,379 | | | 25 |
J Sainsbury | | 3,895 | | | 20 |
Kingfisher | | 12,150 | | | 35 |
Legal & General Group | | 32,797 | | | 32 |
Lloyds Banking Group | | 26,370 | | | 29 |
LogicaCMG | | 4,192 | | | 5 |
Man Group | | 3,342 | | | 13 |
Meggitt | | 5,639 | | | 15 |
National Express Group | | 4,613 | | | 24 |
National Grid | | 6,963 | | | 67 |
Next | | 981 | | | 23 |
Old Mutual | | 52,378 | | | 63 |
Pearson | | 5,600 | | | 60 |
Persimmon | | 2,596 | | | 15 |
Prudential | | 6,367 | | | 44 |
Reckitt Benckiser Group | | 2,987 | | | 130 |
Reed Elsevier | | 1,563 | | | 13 |
Rio Tinto | | 3,290 | | | 150 |
Rolls-Royce Group | | 603 | | | 3 |
Royal & Sun Alliance Insurance Group | | 35,444 | | | 72 |
Royal Bank of Scotland Group | | 43,866 | | | 27 |
SABMiller | | 3,114 | | | 64 |
Sage Group | | 22,351 | | | 69 |
Scottish & Southern Energy | | 1,002 | | | 19 |
Serco Group | | 3,486 | | | 23 |
Shire | | 1,894 | | | 26 |
Smiths Group | | 2,303 | | | 27 |
Standard Chartered | | 13,319 | | | 272 |
Tate & Lyle | | 6,632 | | | 32 |
Tesco | | 20,100 | | | 119 |
| | |
| 146 | | SEI Institutional Investments Trust / Annual Report / May 31, 2009 |
| | | | | |
| Description | | Shares | | Market Value
($ Thousands) |
| | | | | |
Thomson Reuters | | 465 | | $ | 13 |
Tullow Oil | | 4,900 | | | 79 |
Unilever | | 3,194 | | | 75 |
Vodafone Group | | 297,043 | | | 558 |
WM Morrison Supermarkets | | 8,293 | | | 33 |
WPP | | 15,648 | | | 117 |
| | | | | |
| | | | | 7,174 |
| | | | | |
| | |
United States — 0.1% | | | | | |
Golden Star Resources* (CAD) | | 4,800 | | | 11 |
Thomson Reuters (CAD) | | 700 | | | 21 |
| | | | | |
| | | | | 32 |
| | | | | |
Total Common Stock
(Cost $50,101) ($ Thousands) | | | | | 46,844 |
| | | | | |
| | |
PREFERRED STOCK — 2.7% | | | | | |
| | |
Brazil — 2.6% | | | | | |
All America Latina Logistica | | 62 | | | — |
Banco Bradesco | | 5,500 | | | 83 |
Banco Daycoval | | 1,800 | | | 7 |
Brasil Telecom | | 6,600 | | | 46 |
Centrais Eletricas Brasileiras, Cl B | | 7,000 | | | 91 |
Centrais Eletricas de Santa Catarina | | 1,000 | | | 17 |
Cia de Bebidas das Americas | | 1,000 | | | 66 |
Cia de Transmissao de Energia Eletrica Paulista | | 1,000 | | | 24 |
Cia Energetica de Minas Gerais | | 3,750 | | | 50 |
Cia Energetica do Ceara | | 900 | | | 11 |
Cia Paranaense de Energia | | 5,000 | | | 71 |
Cia Vale do Rio Doce, Cl A | | 18,600 | | | 307 |
Confab Industrial | | 8,864 | | | 19 |
Duratex | | 1,900 | | | 18 |
Ferbasa-Ferro Ligas DA Bahia | | 2,000 | | | 8 |
Fertilizantes Fosfatados | | 9,200 | | | 78 |
Gerdau | | 9,600 | | | 100 |
Investimentos Itau | | 2,700 | | | 12 |
Itau Unibanco Holding | | 7,560 | | | 122 |
Parana Banco | | 1,300 | | | 4 |
Telecomunicacoes de Sao Paulo | | 2,300 | | | 53 |
Telegraph Norte Leste Participacoes | | 5,200 | | | 92 |
Telemar Norte Leste | | 2,300 | | | 66 |
Telemig Celular Participacoes | | 1,200 | | | 33 |
Universo Online | | 1,200 | | | 4 |
| | | | | |
| | | | | 1,382 |
| | | | | |
| | |
Germany — 0.1% | | | | | |
Porsche Automobil Holding | | 321 | | | 20 |
RWE | | 70 | | | 5 |
Volkswagen | | 249 | | | 18 |
| | | | | |
| | | | | 43 |
| | | | | |
Total Preferred Stock
(Cost $1,616) ($ Thousands) | | | | | 1,425 |
| | | | | |
| | | | | | | | |
| Description | | Face Amount
($ Thousands)/Shares | | Market Value
($ Thousands) |
| | | | | | | | |
| | | | | Number of
Rights | | |
| | | |
RIGHTS — 0.0% | | | | | | | | |
| | | |
Australia — 0.0% | | | | | | | | |
Billabong, Expires 06/23/09* | | | | | 127 | | $ | — |
General Property Trust, Expires 06/18/09* | | | | | 4,500 | | | 1 |
Stockland, Expires 06/22/09* | | | | | 1,097 | | | — |
| | | | | | | | |
| | | | | | | | 1 |
| | | | | | | | |
| | | |
Belgium — 0.0% | | | | | | | | |
Fortis, Expires 07/01/14* | | | | | 6,068 | | | — |
| | | | | | | | |
| | | |
United Kingdom — 0.0% | | | | | | | | |
Lloyds Banking Group, Expires 06/08/09* | | | | | 16,383 | | | 8 |
| | | | | | | | |
Total Rights
(Cost $11) ($ Thousands) | | | | | | | | 9 |
| | | | | | | | |
| |
U.S. TREASURY OBLIGATION — 1.3% | | | |
U.S. Treasury Bills
0.216%, 06/11/09 (B) (C) | | | | $ | 675 | | | 675 |
| | | | | | | | |
Total U.S. Treasury Obligation
(Cost $675) ($ Thousands) | | | | | | | | 675 |
| | | | | | | | |
| | | |
CASH EQUIVALENT — 3.3% | | | | | | | | |
| | | |
United States — 3.3% | | | | | | | | |
SEI Daily Income Trust, Prime Obligation Fund, Cl A, 0.260%†** | | | | | 1,708,838 | | | 1,709 |
| | | | | | | | |
Total Cash Equivalent
(Cost $1,709) ($ Thousands) | | | | | | | | 1,709 |
| | | | | | | | |
| | | |
TIME DEPOSITS — 1.2% | | | | | | | | |
| | | |
United States — 1.2% | | | | | | | | |
Brown Brothers Harriman | | | | | | | | |
7.250%, 06/01/09 | | ZAR | | | 184 | | | 23 |
2.072%, 06/01/09 | | AUD | | | 6 | | | 4 |
2.000%, 06/01/09 | | DKK | | | 3 | | | 1 |
1.550%, 06/01/09 | | NZD | | | 6 | | | 4 |
0.638%, 06/01/09 | | NOK | | | 21 | | | 3 |
0.138%, 06/01/09 | | EUR | | | 18 | | | 25 |
0.098%, 06/01/09 | | GBP | | | 25 | | | 40 |
0.066%, 06/01/09 | | CAD | | | 14 | | | 13 |
0.063%, 06/01/09 | | SEK | | | 111 | | | 15 |
0.060%, 06/01/09 | | | | | 418 | | | 418 |
0.020%, 06/01/09 | | CHF | | | 10 | | | 9 |
0.020%, 06/01/09 | | HKD | | | 155 | | | 20 |
0.010%, 06/01/09 | | JPY | | | 2,077 | | | 22 |
0.005%, 06/01/09 | | SGD | | | 6 | | | 4 |
| | | | | | | | |
Total Time Deposits
(Cost $601) ($ Thousands) | | | | | | | | 601 |
| | | | | | | | |
Total Investments — 98.4%
(Cost $54,713) ($ Thousands) | | | | | | | $ | 51,263 |
| | | | | | | | |
| | |
| SEI Institutional Investments Trust / Annual Report / May 31, 2009 | | 147 |
SCHEDULE OF INVESTMENTS
Screened World Equity Ex-US Fund (Concluded)
May 31, 2009
A summary of the open futures contracts held by the Fund at May 31, 2009, is as follows:
| | | | | | | |
Type of
Contract | | Number of
Contracts
Long (Short) | | Expiration
Date | | Unrealized
Appreciation
($ Thousands) |
DJ Euro Stoxx 50 Index | | 26 | | Jun-2009 | | $ | 105 |
FTSE 100 Index | | 7 | | Jun-2009 | | | 35 |
Hang Seng Index | | 1 | | Jun-2009 | | | 8 |
S&P TSE 60 Index | | 1 | | Jun-2009 | | | 14 |
SPI 200 Index | | 2 | | Jun-2009 | | | 2 |
Topix Index | | 7 | | Jun-2009 | | | 36 |
| | | | | | | |
| | | | | | $ | 200 |
| | | | | | | |
| Percentages | | are based on a Net Assets of $52,107 ($ Thousands). |
| * | | Non-income producing security. |
| ** | | The rate reported is the 7-day effective yield as of May 31, 2009. |
| † | | Investment in Affiliated Security (see Note 4). |
| ‡ | | Real Estate Investment Trust |
| (A) | | Securities sold within terms of a private placement memorandum, exempt from registration under Section 144A of the Securities Act of 1933, as amended, and may be sold only to dealers in that program or other “accredited investors.” These securities have been determined to be liquid under guidelines established by the board of Trustees. |
| (B) | | Zero coupon security. The rate reported is the effective yield at time of purchase. |
| (C) | | Security, or portion thereof, has been pledged as collateral on open futures contracts. |
ADR — American Depositary Receipt
AUD — Australian Dollar
BRL — Brazilian Real
CAD — Canadian Dollar
CHF — Swiss Franc
Cl — Class
DKK — Danish Krone
EUR — Euro
GBP — British Pound Sterling
GDR — Global Depositary Receipt
HKD — Hong Kong Dollar
JPY — Japanese Yen
NOK — Norwegian Krone
NVDR — Non-Voting Depositary Receipt
NZD — New Zealand Dollar
SEK — Swedish Krone
Ser — Series
SGD — Singapore Dollar
ZAR — South African Rand
Amounts designated as “—” are $O or have been rounded to $O.
The accompanying notes are an integral part of the financial statements.
| | |
| 148 | | SEI Institutional Investments Trust / Annual Report / May 31, 2009 |
SCHEDULE OF INVESTMENTS
Enhanced LIBOR Opportunities Fund
May 31, 2009
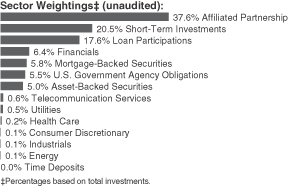
| | | | | | |
| Description | | Face Amount
($ Thousands) | | Market Value
($ Thousands) |
| | | | | | |
|
LOAN PARTICIPATIONS — 17.4% |
Boise Paper Holdings, 2nd Lien | | | | | | |
9.250%, 02/23/15 | | $ | 1,000 | | $ | 635 |
Brickman Group Holdings, Tranche B | | | | | | |
2.319%, 01/23/14 | | | 968 | | | 852 |
Burlington Coat Factory Warehouse, Ser C | | | | | | |
2.570%, 05/28/13 | | | 998 | | | 696 |
Calpine, 1st Lien | | | | | | |
4.095%, 03/29/14 | | | 1,980 | | | 1,721 |
CCS Medical | | | | | | |
4.470%, 09/30/12 | | | 957 | | | 469 |
Delta Air Lines | | | | | | |
2.294%, 04/30/12 | | | 980 | | | 840 |
Delta Air Lines, 2nd Lien | | | | | | |
3.664%, 04/30/14 | | | 983 | | | 631 |
Dollar General, Ser B-1 | | | | | | |
3.438%, 07/07/14 | | | 1,000 | | | 929 |
Dollar General, Ser B-2 | | | | | | |
3.069%, 07/07/14 | | | 1,000 | | | 915 |
First Data, Ser B-1 | | | | | | |
3.059%, 09/24/14 | | | 987 | | | 731 |
First Data, Ser B-1 | | | | | | |
3.059%, 09/24/14 | | | 990 | | | 732 |
Ginn La Conduit Lender, Ser A, 1st Lien | | | | | | |
8.545%, 06/08/11 (D) | | | 315 | | | 25 |
Ginn La Conduit Lender, Ser B, 1st Lien | | | | | | |
9.500%, 06/08/11 (D) | | | 676 | | | 54 |
Green Valley Ranch Gaming, 2nd Lien | | | | | | |
3.599%, 08/16/14 | | | 1,000 | | | 110 |
HCA, Ser B | | | | | | |
3.470%, 11/18/13 | | | 1,697 | | | 1,512 |
Hub International | | | | | | |
3.720%, 06/13/14 | | | 1,004 | | | 832 |
Hub International (Delayed Draw) | | | | | | |
3.720%, 06/13/14 | | | 225 | | | 187 |
IAP Worldwide Services, 1st Lien | | | | | | |
8.250%, 12/30/12 | | | 916 | | | 545 |
Knology | | | | | | |
2.668%, 06/30/12 | | | 968 | | | 862 |
| | | | | | |
| Description | | Face Amount
($ Thousands) | | Market Value
($ Thousands) |
| | | | | | |
Lake at Las Vegas Joint Venture (D) | | | | | | |
16.100%, 06/20/12 | | $ | 1,085 | | $ | 11 |
15.460%, 06/20/12 | | | 1,276 | | | 13 |
7.927%, 06/20/12 | | | 588 | | | 529 |
Lake at Las Vegas Joint Venture (Synthetic) (D) | | | | | | |
16.100%, 06/20/12 | | | 120 | | | 1 |
Level 3 Financing | | | | | | |
3.121%, 03/01/14 | | | 1,500 | | | 1,204 |
Life Tech | | | | | | |
5.250%, 11/21/15 | | | 1,990 | | | 1,983 |
Lifecare Holding (Rainier Acquisition) | | | | | | |
5.290%, 08/11/12 | | | 982 | | | 563 |
Manitowoc, Ser B | | | | | | |
6.500%, 08/25/14 | | | 998 | | | 834 |
Metroflag, 2nd Lien | | | | | | |
11.250%, 01/06/09 (D) | | | 1,500 | | | 75 |
Mylan Laboratories, Ser B | | | | | | |
4.331%, 10/02/14 | | | 1,940 | | | 1,839 |
Nielsen Finance LLC, Ser B | | | | | | |
2.382%, 08/09/13 | | | 485 | | | 425 |
Pinnacle Foods Group | | | | | | |
3.161%, 04/02/14 | | | 983 | | | 837 |
Serena Software | | | | | | |
2.915%, 03/10/13 | | | 922 | | | 772 |
Sirva Worldwide | | | | | | |
12.000%, 05/15/15 | | | 393 | | | 20 |
9.500%, 05/12/12 | | | 182 | | | 82 |
9.461%, 05/12/12 | | | 116 | | | 46 |
Sirva Worldwide (Unfunded) | | | | | | |
0.500%, 05/12/12 | | | 166 | | | 100 |
Spirit Finance | | | | | | |
4.028%, 08/01/13 | | | 1,000 | | | 267 |
Texas Competitive Electric, Ser B-2 | | | | | | |
3.881%, 10/10/14 | | | 1,980 | | | 1,367 |
US Airways Group | | | | | | |
2.809%, 03/21/14 | | | 723 | | | 396 |
Verint Systems | | | | | | |
3.590%, 05/27/14 | | | 1,864 | | | 1,417 |
WM Bolthouse Farms, 1st Lien | | | | | | |
2.813%, 12/16/12 | | | 697 | | | 644 |
Wm. Wrigley Jr., Ser B | | | | | | |
6.500%, 10/06/14 | | | 1,975 | | | 1,979 |
| | | | | | |
Total Loan Participations
(Cost $40,306) ($ Thousands) | | | | | | 28,682 |
| | | | | | |
|
CORPORATE OBLIGATIONS — 7.8% |
|
Consumer Discretionary — 0.1% |
Macy’s Retail Holdings | | | | | | |
5.350%, 03/15/12 | | | 225 | | | 207 |
| | | | | | |
| | |
| SEI Institutional Investments Trust / Annual Report / May 31, 2009 | | 149 |
SCHEDULE OF INVESTMENTS
Enhanced LIBOR Opportunities Fund (Continued)
May 31, 2009
| | | | | | |
| Description | | Face Amount
($ Thousands) | | Market Value
($ Thousands) |
| | | | | | |
| | |
Energy — 0.1% | | | | | | |
Canadian Natural Resources | | | | | | |
5.700%, 05/15/17 | | $ | 150 | | $ | 144 |
| | | | | | |
| | |
Financials — 6.4% | | | | | | |
Ameriprise Financial | | | | | | |
5.350%, 11/15/10 | | | 300 | | | 298 |
Banco Santander Chile | | | | | | |
1.634%, 06/09/09 (A) (B) | | | 450 | | | 443 |
Bank of America | | | | | | |
1.427%, 06/22/09 (A) | | | 500 | | | 504 |
1.339%, 07/30/09 (A) | | | 200 | | | 202 |
Capital One Financial MTN | | | | | | |
5.700%, 09/15/11 | | | 300 | | | 305 |
Capmark Financial Group | | | | | | |
3.106%, 08/10/09 (A) | | | 500 | | | 275 |
Citigroup | | | | | | |
1.554%, 06/09/09 (A) | | | 300 | | | 209 |
Citigroup Funding | | | | | | |
1.369%, 07/30/09 (A) | | | 500 | | | 506 |
0.596%, 09/03/09 (A) | | | 550 | | | 549 |
Comerica Bank | | | | | | |
0.373%, 06/19/09 (A) | | | 275 | | | 275 |
Everest Reinsurance Holdings | | | | | | |
8.750%, 03/15/10 | | | 295 | | | 300 |
General Electric Capital | | | | | | |
1.584%, 06/08/09 (A) | | | 150 | | | 150 |
1.531%, 06/12/09 (A) | | | 750 | | | 753 |
1.163%, 07/28/09 (A) | | | 275 | | | 261 |
1.016%, 06/21/09 (A) | | | 700 | | | 702 |
Genworth Global Funding Trusts MTN | | | | | | |
5.200%, 10/08/10 | | | 400 | | | 385 |
Hartford Financial Services Group | | | | | | |
7.900%, 06/15/10 | | | 250 | | | 250 |
JPMorgan Chase | | | | | | |
1.550%, 06/15/09 (A) | | | 500 | | | 502 |
JPMorgan Chase Capital XXI, Ser U | | | | | | |
1.966%, 08/03/09 (A) | | | 550 | | | 236 |
Liberty Property LP | | | | | | |
7.250%, 03/15/11‡ | | | 300 | | | 295 |
MBIA Insurance | | | | | | |
14.000%, 01/15/33 (A) (B) | | | 200 | | | 82 |
Monumental Global Funding | | | | | | |
1.331%, 07/15/09 (A) (B) | | | 450 | | | 316 |
Morgan Stanley | | | | | | |
1.526%, 06/13/09 (A) | | | 200 | | | 200 |
1.236%, 08/10/09 (A) | | | 350 | | | 352 |
Morgan Stanley, Ser G | | | | | | |
1.449%, 07/09/09 (A) | | | 400 | | | 331 |
Prudential Financial MTN | | | | | | |
5.100%, 12/14/11 | | | 300 | | | 299 |
Reinsurance Group of America | | | | | | |
5.625%, 03/15/17 | | | 300 | | | 226 |
| | | | | | |
| Description | | Face Amount
($ Thousands) | | Market Value
($ Thousands) |
| | | | | | |
State Street | | | | | | |
1.139%, 07/30/09 (A) | | $ | 285 | | $ | 265 |
Unitrin | | | | | | |
6.000%, 05/15/17 | | | 260 | | | 154 |
4.875%, 11/01/10 | | | 300 | | | 277 |
VTB 24 Capital PLC, Ser E MTN | | | | | | |
2.104%, 06/08/09 (A) | | | 200 | | | 196 |
Wachovia | | | | | | |
1.440%, 06/15/09 (A) | | | 425 | | | 408 |
| | | | | | |
| | | | | | 10,506 |
| | | | | | |
| | |
Health Care — 0.1% | | | | | | |
UnitedHealth Group | | | | | | |
2.286%, 08/07/09 (A) | | | 250 | | | 245 |
| | | | | | |
| | |
Industrials — 0.1% | | | | | | |
Continental Airlines, Ser 061G | | | | | | |
1.611%, 09/02/09 (A) | | | 300 | | | 201 |
| | | | | | |
|
Telecommunication Services — 0.5% |
Corning | | | | | | |
6.050%, 06/15/15 | | | 300 | | | 297 |
Telecom Italia Capital | | | | | | |
1.717%, 07/20/09 (A) | | | 300 | | | 283 |
Vodafone Group PLC | | | | | | |
0.940%, 08/27/09 (A) | | | 300 | | | 277 |
| | | | | | |
| | | | | | 857 |
| | | | | | |
| | |
Utilities — 0.5% | | | | | | |
KeySpan | | | | | | |
7.625%, 11/15/10 | | | 300 | | | 317 |
Ohio Power | | | | | | |
1.346%, 07/06/09 (A) | | | 270 | | | 266 |
Southern, Ser A | | | | | | |
5.300%, 01/15/12 | | | 175 | | | 184 |
| | | | | | |
| | | | | | 767 |
| | | | | | |
Total Corporate Obligations
(Cost $14,357) ($ Thousands) | | | | | | 12,927 |
| | | | | | |
| |
MORTGAGE-BACKED SECURITIES — 5.7% | | | |
|
Agency Mortgage-Backed Obligations — 0.6% |
FNMA | | | | | | |
4.750%, 04/19/10 | | | 1,000 | | | 1,034 |
| | | | | | |
|
Non-Agency Mortgage-Backed Obligations — 5.1% |
American Tower Trust, Ser 2007-1A, Cl D | | | | | | |
5.957%, 04/15/37 (B) | | | 250 | | | 206 |
Banc of America Funding,
Ser 2005-F, Cl 4A1 | | | | | | |
5.312%, 07/20/09 (A) | | | 474 | | | 317 |
Banc of America Funding,
Ser 2006-D, Cl 3A1 | | | | | | |
5.581%, 07/20/09 (A) | | | 398 | | | 256 |
| | |
| 150 | | SEI Institutional Investments Trust / Annual Report / May 31, 2009 |
| | | | | | |
| Description | | Face Amount
($ Thousands) | | Market Value
($ Thousands) |
| | | | | | |
Banc of America Large Loan,
Ser 2007-BMB1, Cl A1 | | | | | | |
0.854%, 06/15/09 (A) (B) | | $ | 195 | | $ | 143 |
Banc of America Mortgage Securities,
Ser 2005-A, Cl 2A1 | | | | | | |
4.445%, 07/25/09 (A) | | | 248 | | | 165 |
Bear Stearns Adjustable Rate Mortgage Trust, Ser 2005-9, Cl A1 | | | | | | |
4.625%, 07/25/09 (A) | | | 454 | | | 340 |
Bear Stearns Adjustable Rate Mortgage Trust, Ser 2006-1, Cl A1 | | | | | | |
4.625%, 07/25/09 (A) | | | 426 | | | 310 |
Bear Stearns Commercial Mortgage Securities, Ser 2001-TOP2, Cl A2 | | | | | | |
6.480%, 02/15/35 | | | 500 | | | 508 |
Citigroup Commercial Mortgage Trust,
Ser 2007-FL3A, Cl J | | | | | | |
1.294%, 06/15/09 (A) (B) | | | 155 | | | 7 |
Citigroup Mortgage Loan Trust,
Ser 2006-AR1, Cl 1A1 | | | | | | |
4.900%, 07/25/09 (A) | | | 446 | | | 339 |
Credit Suisse First Boston Mortgage Securities, Ser 2000-C1, Cl A2 | | | | | | |
7.545%, 04/15/62 | | | 276 | | | 280 |
Crown Castle Towers LLC,
Ser 2006-1A, Cl E | | | | | | |
6.065%, 11/15/36 (B) | | | 380 | | | 357 |
Crusade Global Trust, Ser 2007-1, Cl A1 | | | | | | |
1.167%, 07/20/09 (A) | | | 214 | | | 178 |
First Horizon Alternative Mortgage Trust,
Ser 2005-AA3, Cl 3A1 | | | | | | |
5.358%, 07/25/09 (A) | | | 245 | | | 135 |
First Horizon Mortgage Pass-Through Certificate, Ser 2005-AR4, Cl 2A1 | | | | | | |
5.340%, 07/25/09 (A) | | | 219 | | | 136 |
GMAC Mortgage Loan Trust,
Ser 2006-AR1, Cl 1A1 | | | | | | |
5.594%, 07/19/09 (A) | | | 436 | | | 247 |
GS Mortgage Securities,
Ser 2007-EOP, Cl K | | | | | | |
1.464%, 06/08/09 (A) (B) | | | 75 | | | 48 |
Harborview Mortgage Loan Trust,
Ser 2005-14, Cl 3A1A | | | | | | |
5.307%, 07/19/09 (A) | | | 296 | | | 193 |
JPMorgan Mortgage Trust,
Ser 2007-A4, Cl 1A1 | | | | | | |
5.429%, 07/25/09 (A) | | | 399 | | | 256 |
Master Adjustable Rate Mortgages Trust,
Ser 2005-6, Cl 5A1 | | | | | | |
5.048%, 07/25/09 (A) | | | 436 | | | 328 |
Merrill Lynch Mortgage Backed Securities Trust, Ser 2007-2, Cl 1A1 | | | | | | |
5.800%, 07/25/09 (A) | | | 450 | | | 257 |
| | | | | | |
| Description | | Face Amount
($ Thousands) | | Market Value
($ Thousands) |
| | | | | | |
Merrill Lynch Mortgage Investors,
Ser 2005-A1, Cl 2A1 | | | | | | |
4.233%, 07/25/09 (A) | | $ | 399 | | $ | 351 |
Merrill Lynch Mortgage Investors,
Ser 2005-A9, Cl 2A1E | | | | | | |
5.151%, 07/25/09 (A) | | | 375 | | | 267 |
Merrill Lynch Mortgage Investors,
Ser 2005-A9, Cl 2A1A | | | | | | |
5.151%, 07/25/09 (A) | | | 424 | | | 331 |
MLCC Mortgage Investors,
Ser 2006-1, Cl 2A1 | | | | | | |
5.295%, 07/25/09 (A) | | | 223 | | | 157 |
Morgan Stanley Capital I,
Ser 2007-XLFA, Cl C | | | | | | |
0.505%, 06/15/09 (A) (B) | | | 240 | | | 75 |
MortgageIT Trust, Ser 2005-4, Cl A1 | | | | | | |
0.589%, 06/25/09 (A) | | | 415 | | | 179 |
Residential Funding Mortgage Securities, Ser 2005-SA5, Cl 2A | | | | | | |
5.334%, 07/25/09 (A) | | | 162 | | | 110 |
Residential Funding Mortgage Securities, Ser 2006-SA1, Cl 1A1 | | | | | | |
5.672%, 07/25/09 (A) | | | 139 | | | 95 |
Residential Funding Mortgage Securities, Ser 2007-SA2, Cl 2A2 | | | | | | |
5.661%, 07/25/09 (A) | | | 306 | | | 170 |
Washington Mutual Mortgage Pass-Through Certificate,
Ser 2005-AR14, Cl 1A4 | | | | | | |
5.039%, 07/25/09 (A) | | | 426 | | | 306 |
Washington Mutual Mortgage Pass-Through Certificate,
Ser 2005-AR3, Cl A2 | | | | | | |
4.640%, 07/25/09 (A) | | | 381 | | | 303 |
Wells Fargo Mortgage-Backed Securities Trust, Ser 2004-EE, Cl 2A2 | | | | | | |
3.886%, 07/25/09 (A) | | | 307 | | | 270 |
Wells Fargo Mortgage-Backed Securities Trust, Ser 2004-Z, Cl 2A1 | | | | | | |
4.570%, 07/25/09 (A) | | | 403 | | | 351 |
Wells Fargo Mortgage-Backed Securities Trust, Ser 2005-AR16, Cl 3A2 | | | | | | |
4.921%, 07/25/09 (A) | | | 105 | | | 85 |
Wells Fargo Mortgage-Backed Securities Trust, Ser 2005-AR16, Cl 6A3 | | | | | | |
5.001%, 07/25/09 (A) | | | 157 | | | 126 |
Wells Fargo Mortgage-Backed Securities Trust, Ser 2006-AR2, Cl 2A3 | | | | | | |
5.071%, 07/25/09 (A) | | | 159 | | | 114 |
Wells Fargo Mortgage-Backed Securities Trust, Ser 2006-AR8, Cl 2A1 | | | | | | |
5.240%, 07/25/09 (A) | | | 273 | | | 178 |
| | | | | | |
| | | | | | 8,474 |
| | | | | | |
Total Mortgage-Backed Securities
(Cost $12,839) ($ Thousands) | | | | | | 9,508 |
| | | | | | |
| | |
| SEI Institutional Investments Trust / Annual Report / May 31, 2009 | | 151 |
SCHEDULE OF INVESTMENTS
Enhanced LIBOR Opportunities Fund (Continued)
May 31, 2009
| | | | | | |
| Description | | Face Amount
($ Thousands) | | Market Value
($ Thousands) |
| | | | | | |
|
U.S. GOVERNMENT AGENCY OBLIGATIONS — 5.5% |
FHLB | | | | | | |
3.000%, 06/11/10 | | $ | 1,500 | | $ | 1,536 |
1.375%, 05/16/11 | | | 1,500 | | | 1,507 |
1.020%, 02/26/10 | | | 2,000 | | | 2,006 |
0.634%, 05/05/10 (C) | | | 4,000 | | | 3,976 |
| | | | | | |
Total U.S. Government Agency Obligations
(Cost $9,010) ($ Thousands) | | | | | | 9,025 |
| | | | | | |
|
ASSET-BACKED SECURITIES — 5.0% |
| | |
Automotive — 2.3% | | | | | | |
AmeriCredit Automobile Receivables Trust, Ser 2006-1, Cl B | | | | | | |
5.200%, 03/06/11 | | | 104 | | | 104 |
AmeriCredit Automobile Receivables Trust, Ser 2007- CM, Cl A4A | | | | | | |
5.550%, 04/07/14 | | | 500 | | | 415 |
Americredit Prime Automobile Receivable, Ser 2007-2M, Cl A3 | | | | | | |
5.220%, 06/08/12 | | | 481 | | | 475 |
Capital Auto Receivables Asset Trust,
Ser 2007-1, Cl B | | | | | | |
5.150%, 09/17/12 | | | 230 | | | 188 |
Capital Auto Receivables Asset Trust,
Ser 2007-3, Cl A3A | | | | | | |
5.020%, 09/15/11 | | | 158 | | | 160 |
Capital One Auto Finance Trust,
Ser 2005-C, Cl A4A | | | | | | |
4.710%, 06/15/12 | | | 74 | | | 74 |
Capital One Auto Finance Trust,
Ser 2007-C, Cl A3A | | | | | | |
5.130%, 04/16/12 | | | 393 | | | 389 |
Carmax Auto Owner Trust,
Ser 2007-1, Cl C | | | | | | |
5.530%, 07/15/13 | | | 50 | | | 32 |
Carmax Auto Owner Trust,
Ser 2008-1, Cl A4B | | | | | | |
1.644%, 06/15/09 (A) | | | 485 | | | 460 |
Ford Credit Auto Owner Trust,
Ser 2007-B, Cl A3A | | | | | | |
5.150%, 11/15/11 | | | 230 | | | 236 |
GE Dealer Floorplan Master Note Trust,
Ser 2006-2, Cl C | | | | | | |
0.746%, 06/22/09 (A) | | | 120 | | | 48 |
Harley-Davidson Motorcycle Trust,
Ser 2007-1, Cl C | | | | | | |
5.540%, 04/15/15 | | | 105 | | | 54 |
Hyundai Auto Receivables Trust,
Ser 2007-A, Cl A3B | | | | | | |
0.744%, 06/15/09 (A) | | | 104 | | | 104 |
Merrill Auto Trust Securitization,
Ser 2007-1, Cl C | | | | | | |
5.960%, 12/15/13 | | | 236 | | | 203 |
| | | | | | |
| Description | | Face Amount
($ Thousands) | | Market Value
($ Thousands) |
| | | | | | |
Nissan Auto Receivables Owner Trust,
Ser 2007-B, Cl A3 | | | | | | |
5.030%, 05/16/11 | | $ | 135 | | $ | 138 |
Superior Wholesale Inventory Financing Trust, Ser 2007-AE1, Cl C | | | | | | |
0.944%, 06/15/09 (A) | | | 45 | | | 21 |
Superior Wholesale Inventory Financing Trust, Ser 2007-AE1, Cl B | | | | | | |
0.644%, 06/15/09 (A) | | | 25 | | | 14 |
Swift Master Auto Receivables Trust,
Ser 2007-2, Cl A | | | | | | |
0.994%, 06/15/09 (A) | | | 430 | | | 383 |
USAA Auto Owner Trust,
Ser 2007-2, Cl A3 | | | | | | |
4.900%, 02/15/12 | | | 181 | | | 185 |
| | | | | | |
| | | | | | 3,683 |
| | | | | | |
| | |
Credit Cards — 1.6% | | | | | | |
Advanta Business Card Master Trust,
Ser 2007-B1, Cl B | | | | | | |
0.566%, 06/22/09 (A) | | | 400 | | | 78 |
American Express Credit Account Master Trust, Ser 2007-2, Cl B | | | | | | |
0.524%, 06/15/09 (A) | | | 145 | | | 93 |
Bank of America Credit Card Trust,
Ser 2007-B5, Cl B5 | | | | | | |
0.944%, 06/15/09 (A) | | | 470 | | | 465 |
Capital One Multi-Asset Execution Trust,
Ser 2007-C2, Cl C2 | | | | | | |
0.644%, 06/15/09 (A) | | | 400 | | | 318 |
Chase Issuance Trust,
Ser 2005-C2, Cl C2 | | | | | | |
0.784%, 06/15/09 (A) | | | 400 | | | 330 |
Citibank Credit Card Issuance Trust,
Ser 2007-B5, Cl B5 | | | | | | |
1.021%, 06/08/09 (A) | | | 500 | | | 438 |
GE Capital Credit Card Master Note Trust,
Ser 2007-3, Cl C | | | | | | |
0.644%, 06/15/09 (A) | | | 500 | | | 420 |
Washington Mutual Master Note Trust,
Ser 2006-C3A, Cl C3A | | | | | | |
0.724%, 06/15/09 (A) (B) | | | 535 | | | 522 |
| | | | | | |
| | | | | | 2,664 |
| | | | | | |
| | |
Mortgage Related Securities — 0.6% | | | | | | |
First Franklin Mortgage Loan Asset,
Ser 2006-FF18, Cl A2B | | | | | | |
0.419%, 06/25/09 (A) | | | 275 | | | 114 |
First Franklin Mortgage Loan Asset,
Ser 2007-FF1, Cl M2 | | | | | | |
0.569%, 06/25/09 (A) | | | 285 | | | 1 |
Morgan Stanley Capital I,
Ser 2007-HE2, Cl M2 | | | | | | |
0.569%, 06/25/09 (A) | | | 150 | | | 1 |
| | |
| 152 | | SEI Institutional Investments Trust / Annual Report / May 31, 2009 |
| | | | | | |
| Description | | Face Amount
($ Thousands)/
Shares | | Market Value
($ Thousands) |
| | | | | | |
Morgan Stanley Home Equity Loan Trust, Ser 2005-3, Cl M1 | | | | | | |
0.759%, 06/25/09 (A) | | $ | 350 | | $ | 171 |
Morgan Stanley Home Equity Loan Trust, Ser 2005-4, Cl M1 | | | | | | |
0.719%, 06/25/09 (A) | | | 370 | | | 68 |
Option One Mortgage Loan Trust,
Ser 2005-3, Cl M1 | | | | | | |
0.779%, 06/25/09 (A) | | | 330 | | | 129 |
Option One Mortgage Loan Trust,
Ser 2005-5, Cl M1 | | | | | | |
0.699%, 06/25/09 (A) | | | 470 | | | 123 |
Option One Mortgage Loan Trust,
Ser 2007-FXD2, Cl 2A1 | | | | | | |
5.900%, 03/25/37 | | | 173 | | | 153 |
Option One Mortgage Loan Trust,
Ser 2007-HL1, Cl 2A1 | | | | | | |
0.429%, 06/25/09 (A) | | | 124 | | | 103 |
Residential Asset Securities,
Ser 2005-KS12, Cl M1 | | | | | | |
0.749%, 06/25/09 (A) | | | 375 | | | 134 |
Securitized Asset-Backed Receivables LLC, Ser 2007-NC2, Cl M2 | | | | | | |
0.569%, 06/25/09 (A) | | | 145 | | | 1 |
| | | | | | |
| | | | | | 998 |
| | | | | | |
|
Other Asset-Backed Securities — 0.5% |
ACAS Business Loan Trust,
Ser 2006-1A, Cl A | | | | | | |
0.890%, 08/27/09 (A) (B) | | | 416 | | | 233 |
ACAS Business Loan Trust,
Ser 2007-1A, Cl C | | | | | | |
1.704%, 08/17/09 (A) (B) | | | 425 | | | 21 |
Dominos Pizza Master Issuer LLC,
Ser 2007-1, Cl A2 | | | | | | |
5.261%, 04/25/37 (B) (F) | | | 400 | | | 254 |
Lambda Finance, Ser 2005-1A, Cl A3 | | | | | | |
1.113%, 08/17/09 (A) (B) | | | 257 | | | 210 |
Sierra Receivables Funding,
Ser 2007-2A, Cl A2 | | | | | | |
1.316%, 06/22/09 (A) (B) | | | 227 | | | 143 |
| | | | | | |
| | | | | | 861 |
| | | | | | |
Total Asset-Backed Securities
(Cost $12,200) ($ Thousands) | | | | | | 8,206 |
| | | | | | |
|
AFFILIATED PARTNERSHIP — 37.2% |
SEI LIBOR Plus Portfolio† | | | 10,420,126 | | | 61,375 |
| | | | | | |
Total Affiliated Partnership
(Cost $101,228) ($ Thousands) | | | | | | 61,375 |
| | | | | | |
| | | | | |
| Description | | Face Amount
($ Thousands)/Shares | | Market Value
($ Thousands) |
| | | | | |
|
EURODOLLAR — 0.1% |
| | |
Sovereign — 0.1% | | | | | |
Republic of Trinidad & Tobago | | | | | |
9.875%, 10/01/09 | | $ 150 | | $ | 153 |
| | | | | |
Total EuroDollar
(Cost $152) ($ Thousands) | | | | | 153 |
| | | | | |
|
COMMON STOCK — 0.0% |
Sirva Worldwide* (F) (G) | | 2,247 | | | 88 |
| | | | | |
Total Common Stock
(Cost $0) ($ Thousands) | | | | | 88 |
| | | | | |
| | |
CASH EQUIVALENT — 13.2% | | | | | |
SEI Daily Income Trust, Prime Obligation Fund, Cl A, 0.260%†** | | 21,868,678 | | | 21,869 |
| | | | | |
Total Cash Equivalent
(Cost $21,869) ($ Thousands) | | | | | 21,869 |
| | | | | |
|
REPURCHASE AGREEMENT — 7.0% |
Morgan Stanley & Co. (E) 0.170%, dated 05/31/09, to be repurchased on 06/01/09, repurchase price $11,500,163 (collateralized by U.S. Government obligations, ranging in par value $18,295- $37,934,471, 4.000%-10.500%, 04/01/11-12/01/38; with total market value $11,783,668) | | 11,500 | | | 11,500 |
| | | | | |
Total Repurchase Agreement
(Cost $11,500) ($ Thousands) | | | | | 11,500 |
| | | | | |
Total Investments — 98.9%
(Cost $223,461) ($ Thousands) | | | | $ | 163,333 |
| | | | | |
A summary of the open futures contracts held by the Fund at May 31, 2009, is as follows:
| | | | | | | | | |
Type of
Contract | | Number of
Contracts
Short | | | Expiration
Date | | Unrealized
(Depreciation)
($ Thousands) | |
U.S. 10-Year Treasury Note | | (4 | ) | | Sep-2009 | | $ | (5 | ) |
U.S. 2-Year Treasury Note | | (31 | ) | | Sep-2009 | | | (7 | ) |
U.S. 5-Year Treasury Note | | (8 | ) | | Sep-2009 | | | (2 | ) |
U.S. Long Treasury Bond | | (3 | ) | | Sep-2009 | | | (7 | ) |
| | | | | | | | | |
| | | | | | | $ | (21 | ) |
| | | | | | | | | |
| | |
| SEI Institutional Investments Trust / Annual Report / May 31, 2009 | | 153 |
SCHEDULE OF INVESTMENTS
Enhanced LIBOR Opportunities Fund (Concluded)
May 31, 2009
A summary of the outstanding forward foreign currency contracts held by the Fund at May 31, 2009, is as follows:
| | | | | | | | | | | | |
| Maturity Date | | Currency
to Deliver
(Thousands) | | Currency
to Receive
(Thousands) | | Unrealized
Appreciation
(Depreciation)
($ Thousands) | |
6/10/09 | | USD | | 46 | | EUR | | 34 | | $ | 3 | |
6/10/09-7/10/09 | | CHF | | 2,300 | | EUR | | 1,485 | | | (56 | ) |
6/10/09-7/10/09 | | EUR | | 1,508 | | CHF | | 2,300 | | | 24 | |
6/10/09-7/10/09 | | EUR | | 1,415 | | SGD | | 2,800 | | | (65 | ) |
6/10/09-7/10/09 | | JPY | | 196,000 | | NOK | | 14,509 | | | 251 | |
6/10/09-7/10/09 | | NOK | | 14,337 | | JPY | | 196,000 | | | (224 | ) |
6/10/09-7/10/09 | | NOK | | 172 | | USD | | 26 | | | (2 | ) |
6/10/09-7/10/09 | | SGD | | 2,800 | | EUR | | 1,394 | | | 35 | |
6/10/09-8/12/09 | | EUR | | 2,986 | | JPY | | 381,000 | | | (232 | ) |
6/10/09-8/12/09 | | JPY | | 381,000 | | EUR | | 3,070 | | | 350 | |
6/10/09-8/12/09 | | USD | | 1,339 | | NZD | | 2,370 | | | 176 | |
6/10/09-9/10/09 | | GBP | | 5,121 | | JPY | | 710,000 | | | (810 | ) |
6/10/09-9/10/09 | | JPY | | 710,000 | | GBP | | 5,018 | | | 645 | |
6/10/09-9/10/09 | | NZD | | 2,440 | | USD | | 1,350 | | | (210 | ) |
6/10/09-9/10/09 | | USD | | 191 | | GBP | | 133 | | | 24 | |
7/10/09 | | USD | | 8 | | AUD | | 11 | | | 1 | |
7/10/09-8/12/09 | | EUR | | 74 | | USD | | 99 | | | (6 | ) |
7/10/09-9/10/09 | | AUD | | 1,933 | | CHF | | 1,500 | | | (132 | ) |
7/10/09-9/10/09 | | CHF | | 1,500 | | AUD | | 1,925 | | | 126 | |
7/10/09-9/10/09 | | CHF | | 2,100 | | GBP | | 1,245 | | | 36 | |
7/10/09-9/10/09 | | GBP | | 1,271 | | CHF | | 2,100 | | | (77 | ) |
8/12/09 | | AUD | | 634 | | JPY | | 43,000 | | | (54 | ) |
8/12/09 | | CHF | | 500 | | NOK | | 2,843 | | | (18 | ) |
8/12/09 | | JPY | | 43,000 | | AUD | | 695 | | | 102 | |
8/12/09 | | NOK | | 2,903 | | CHF | | 500 | | | 9 | |
8/12/09 | | USD | | 9 | | NOK | | 60 | | | 0 | |
8/12/09-9/10/09 | | AUD | | 65 | | USD | | 44 | | | (7 | ) |
9/10/09 | | CHF | | 1,000 | | USD | | 850 | | | (90 | ) |
9/10/09 | | GBP | | 277 | | SGD | | 600 | | | (31 | ) |
9/10/09 | | JPY | | 42,000 | | NZD | | 826 | | | 85 | |
9/10/09 | | NZD | | 756 | | JPY | | 42,000 | | | (40 | ) |
9/10/09 | | SGD | | 600 | | GBP | | 272 | | | 23 | |
9/10/09 | | USD | | 855 | | CHF | | 1,000 | | | 85 | |
| | | | | | | | | | | | |
| | | | | | | | | | $ | (79 | ) |
| | | | | | | | | | | | |
Percentages are based on a Net Assets of $165,113 ($ Thousands).
| * | | Non-income producing security. |
| ** | | The rate reported is the 7-day effective yield as of May 31, 2009. |
| † | | Investment in Affiliated Security (see Note 4). |
| ‡ | | Real Estate Investment Trust |
| (A) | | Variable Rate Security — The rate reported is the rate in effect as of May 31, 2009. The date reported is the next reset date. |
| (B) | | Securities sold within terms of a private placement memorandum, exempt from registration under Section 144A of the Securities Act of 1933, as amended, and may be sold only to dealers in that program or other “accredited investors.” These securities have been determined to be liquid under guidelines established by the board of Trustees. |
| (C) | | Zero coupon security. The rate reported is the effective yield at time of purchase. |
| (D) | | Security in default on interest payments. |
| (E) | | Tri-Party Repurchase Agreement. |
| (F) | | Securities considered illiquid. The total value of such securities as of May 31, 2009 was $342 ($ Thousands) and represented 0.21% of net assets. |
| (G) | | Security fair valued using methods determined in good faith by the Valuation Committee of the Board of Trustees. The total value of such securities as of May 31, 2009 was $88 ($ Thousands) and represented 0.00% of net assets. |
AUD — Australian Dollar
CHF — Swiss Franc
Cl — Class
EUR — Euro
FHLB — Federal Home Loan Bank
FNMA — Federal National Mortgage Association
GBP — British Pound Sterling
JPY — Japanese Yen
LLC — Limited Liability Company
L.P. — Limited Partnership
MTN — Medium Term Note
NZD — New Zealand Dollar
NOK — Norwegian Dollar
Ser — Series
SGD — Singapore Dollar
USD — United States Dollar
The accompanying notes are an integral part of the financial statements.
| | |
| 154 | | SEI Institutional Investments Trust / Annual Report / May 31, 2009 |
SCHEDULE OF INVESTMENTS
Core Fixed Income Fund
May 31, 2009
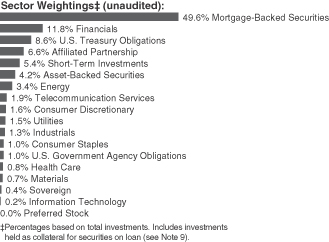
| | | | | | |
| Description | | Face Amount
($ Thousands) | | Market Value
($ Thousands) |
| | | | | | |
|
MORTGAGE-BACKED SECURITIES — 57.7% |
| |
Agency Mortgage-Backed Obligations — 41.9% | | | |
FHLMC | | | | | | |
7.500%, 08/01/30 to
06/01/32 | | $ | 742 | | $ | 809 |
7.000%, 11/01/15 to
09/01/25 | | | 203 | | | 222 |
6.500%, 06/01/17 to
09/01/38 | | | 44,307 | | | 47,369 |
6.000%, 08/01/16 to
08/01/38 | | | 55,901 | | | 58,818 |
5.500%, 12/01/13 to
09/01/38 | | | 261,464 | | | 271,445 |
5.000%, 10/01/14 to
12/01/34 | | | 53,105 | | | 55,258 |
4.000%, 09/01/18 to
10/01/33 | | | 6,139 | | | 6,213 |
FHLMC ARM (A) | | | | | | |
6.737%, 08/15/09 | | | 4,168 | | | 4,379 |
6.715%, 08/15/09 | | | 2,072 | | | 2,169 |
6.697%, 08/15/09 | | | 5,400 | | | 5,706 |
6.606%, 08/15/09 | | | 1,335 | | | 1,399 |
6.563%, 08/15/09 | | | 2,551 | | | 2,676 |
6.506%, 08/15/09 | | | 1,294 | | | 1,353 |
6.448%, 08/15/09 | | | 16,200 | | | 17,043 |
6.371%, 08/15/09 | | | 1,636 | | | 1,712 |
6.284%, 08/15/09 | | | 4,104 | | | 4,303 |
6.205%, 08/15/09 | | | 1,564 | | | 1,633 |
6.165%, 08/15/09 | | | 1,280 | | | 1,339 |
6.152%, 08/15/09 | | | 6,959 | | | 7,323 |
5.999%, 08/15/09 | | | 2,070 | | | 2,164 |
5.977%, 08/15/09 | | | 13 | | | 14 |
5.926%, 08/15/09 | | | 11,972 | | | 12,584 |
5.881%, 08/15/09 | | | 694 | | | 726 |
5.729%, 08/15/09 | | | 2 | | | 2 |
| | | | | | |
| Description | | Face Amount
($ Thousands) | | Market Value
($ Thousands) |
| | | | | | |
5.560%, 07/25/09 | | $ | 4,975 | | $ | 5,178 |
5.529%, 08/15/09 | | | 3,026 | | | 3,125 |
5.091%, 08/15/09 | | | 5,102 | | | 5,287 |
0.000%, 08/15/09 | | | 1,461 | | | 1,530 |
FHLMC CMO, Ser 1, Cl Z | | | | | | |
9.300%, 04/15/19 | | | 23 | | | 25 |
FHLMC CMO, Ser 1611, Cl Z | | | | | | |
6.500%, 11/15/23 | | | 11,344 | | | 12,173 |
FHLMC CMO, Ser 1983, Cl Z | | | | | | |
6.500%, 12/15/23 | | | 1,399 | | | 1,488 |
FHLMC CMO, Ser 2043, Cl CJ | | | | | | |
6.500%, 04/15/28 | | | 2,053 | | | 2,179 |
FHLMC CMO, Ser 2312, Cl Z | | | | | | |
6.500%, 05/15/31 | | | 1,531 | | | 1,628 |
FHLMC CMO, Ser 2389, Cl CD | | | | | | |
6.000%, 03/15/16 | | | 753 | | | 763 |
FHLMC CMO, Ser 2489, Cl PE | | | | | | |
6.000%, 08/15/32 | | | 1,007 | | | 1,064 |
FHLMC CMO, Ser 2542, Cl ES | | | | | | |
5.000%, 12/15/17 | | | 1,000 | | | 1,058 |
FHLMC CMO, Ser 2558, Cl BD | | | | | | |
5.000%, 01/15/18 | | | 4,137 | | | 4,373 |
FHLMC CMO, Ser 2564, Cl BQ | | | | | | |
5.500%, 10/15/17 | | | 2,779 | | | 2,962 |
FHLMC CMO, Ser 2590, Cl NU | | | | | | |
5.000%, 06/15/17 | | | 1,000 | | | 1,046 |
FHLMC CMO, Ser 2590, Cl BY | | | | | | |
5.000%, 03/15/18 | | | 1,346 | | | 1,421 |
FHLMC CMO, Ser 2603, Cl KT | | | | | | |
4.750%, 07/15/14 | | | 4,991 | | | 5,264 |
FHLMC CMO, Ser 2623, Cl AJ | | | | | | |
4.500%, 07/15/16 | | | 2,531 | | | 2,606 |
FHLMC CMO, Ser 2631, Cl MC | | | | | | |
5.000%, 02/15/32 | | | 484 | | | 508 |
FHLMC CMO, Ser 2671, Cl S | | | | | | |
14.127%, 06/15/09 (A) | | | 291 | | | 309 |
FHLMC CMO, Ser 2672, Cl HA | | | | | | |
4.000%, 09/15/16 | | | 1,221 | | | 1,255 |
FHLMC CMO, Ser 2676, Cl CY | | | | | | |
4.000%, 09/15/18 | | | 2,291 | | | 2,306 |
FHLMC CMO, Ser 2684, Cl SN | | | | | | |
26.528%, 06/15/09 (A) | | | 200 | | | 208 |
FHLMC CMO, Ser 2690, Cl TV | | | | | | |
4.500%, 11/15/25 | | | 1,800 | | | 1,808 |
FHLMC CMO, Ser 2727, Cl PW | | | | | | |
3.570%, 06/15/29 | | | 789 | | | 804 |
FHLMC CMO, Ser 2733, Cl ME | | | | | | |
5.000%, 01/15/34 | | | 6,302 | | | 6,384 |
FHLMC CMO, Ser 2765, Cl CT | | | | | | |
4.000%, 03/15/19 | | | 1,557 | | | 1,518 |
FHLMC CMO, Ser 2778, Cl JD | | | | | | |
5.000%, 12/15/32 | | | 1,974 | | | 2,075 |
FHLMC CMO, Ser 2780, Cl TB | | | | | | |
3.000%, 12/15/24 | | | 238 | | | 239 |
| | |
| SEI Institutional Investments Trust / Annual Report / May 31, 2009 | | 155 |
SCHEDULE OF INVESTMENTS
Core Fixed Income Fund (Continued)
May 31, 2009
| | | | | | |
| Description | | Face Amount
($ Thousands) | | Market Value
($ Thousands) |
| | | | | | |
FHLMC CMO, Ser 2790, Cl TN | | | | | | |
4.000%, 05/15/24 | | $ | 2,779 | | $ | 2,659 |
FHLMC CMO, Ser 2827, Cl CS | | | | | | |
15.553%, 06/15/09 (A) | | | 150 | | | 151 |
FHLMC CMO, Ser 2843, Cl BC | | | | | | |
5.000%, 08/15/19 | | | 1,740 | | | 1,838 |
FHLMC CMO, Ser 2875, Cl HB | | | | | | |
4.000%, 10/15/19 | | | 954 | | | 912 |
FHLMC CMO, Ser 2945, Cl SA | | | | | | |
11.674%, 06/15/09 (A) | | | 4,221 | | | 4,475 |
FHLMC CMO, Ser 2981, Cl FA | | | | | | |
0.744%, 06/15/09 (A) | | | 1,215 | | | 1,187 |
FHLMC CMO, Ser 2985, Cl JR | | | | | | |
4.500%, 06/15/25 | | | 4,161 | | | 4,192 |
FHLMC CMO, Ser 3000, Cl PA | | | | | | |
3.900%, 01/15/23 | | | 1,932 | | | 1,985 |
FHLMC CMO, Ser 3035, Cl PA | | | | | | |
5.500%, 09/15/35 | | | 1,197 | | | 1,274 |
FHLMC CMO, Ser 3076, Cl MP | | | | | | |
0.000%, 10/15/30 | | | 271 | | | 267 |
FHLMC CMO, Ser 3195, Cl PD | | | | | | |
6.500%, 07/15/36 | | | 2,500 | | | 2,708 |
FHLMC CMO, Ser 3202, Cl HI, IO | | | | | | |
6.306%, 06/15/09 (A) | | | 1,556 | | | 186 |
FHLMC CMO, Ser 3253, Cl A | | | | | | |
5.000%, 08/15/20 | | | 2,311 | | | 2,410 |
FHLMC CMO, Ser 3263, Cl WE | | | | | | |
0.427%, 07/15/09 (A) | | | 274 | | | 264 |
FHLMC CMO, Ser 3273, Cl TH | | | | | | |
7.500%, 07/15/09 (A) | | | 293 | | | 284 |
FHLMC CMO, Ser 3277, Cl Y | | | | | | |
0.000%, 07/15/09 (A) | | | 600 | | | 599 |
FHLMC CMO, Ser 3312, Cl BP | | | | | | |
5.500%, 01/15/31 | | | 300 | | | 309 |
FHLMC CMO, Ser 3372, Cl BD | | | | | | |
4.500%, 10/15/22 | | | 2,533 | | | 2,520 |
FHLMC CMO, Ser 3387, Cl SA, IO | | | | | | |
6.076%, 06/15/09 (A) | | | 1,593 | | | 145 |
FHLMC CMO, Ser 3455, Cl SE | | | | | | |
5.856%, 06/15/09 (A) | | | 6,217 | | | 602 |
FHLMC CMO, Ser 3455, Cl MB | | | | | | |
4.500%, 06/15/23 | | | 8,548 | | | 8,525 |
FHLMC CMO, Ser 3465, Cl HA | | | | | | |
4.000%, 07/15/17 | | | 5,778 | | | 5,966 |
FHLMC CMO, Ser 3498, Cl GB | | | | | | |
6.500%, 11/15/36 | | | 7,285 | | | 7,827 |
FHLMC TBA | | | | | | |
5.500%, 07/01/37 | | | 103,000 | | | 106,026 |
FNMA | | | | | | |
8.000%, 04/01/15 to
07/01/36 | | | 700 | | | 758 |
7.500%, 06/01/30 to
06/01/31 | | | 573 | | | 632 |
| | | | | | |
| Description | | Face Amount
($ Thousands) | | Market Value
($ Thousands) |
| | | | | | |
7.000%, 12/01/15 to
06/01/35 | | $ | 13,118 | | $ | 14,264 |
6.500%, 05/01/17 to
12/01/37 | | | 55,440 | | | 59,094 |
6.000%, 06/17/19 to
02/01/39 | | | 147,349 | | | 154,900 |
5.500%, 04/01/14 to
08/01/37 | | | 194,377 | | | 203,122 |
5.000%, 02/01/20 to
11/01/36 | | | 160,610 | | | 165,439 |
4.500%, 07/01/20 to
04/01/38 | | | 39,953 | | | 40,699 |
4.000%, 04/01/19 to
11/01/20 | | | 4,410 | | | 4,464 |
FNMA ARM (A) | | | | | | |
6.648%, 07/25/09 | | | 2,810 | | | 2,968 |
6.277%, 07/25/09 | | | 5,642 | | | 5,868 |
6.207%, 07/25/09 | | | 84 | | | 88 |
6.113%, 07/25/09 | | | 1,366 | | | 1,430 |
6.106%, 07/25/09 | | | 829 | | | 870 |
6.037%, 07/25/09 | | | 2,070 | | | 2,175 |
6.028%, 07/25/09 | | | 1,695 | | | 1,774 |
5.981%, 07/25/09 | | | 1,685 | | | 1,763 |
5.936%, 07/25/09 | | | 3,098 | | | 3,244 |
5.911%, 07/25/09 | | | 5,805 | | | 6,070 |
5.900%, 07/25/09 | | | 4,596 | | | 4,803 |
5.878%, 07/25/09 | | | 1,382 | | | 1,443 |
5.826%, 08/15/09 | | | 3,081 | | | 3,220 |
5.798%, 07/25/09 | | | 14,728 | | | 15,374 |
5.766%, 07/25/09 | | | 3,394 | | | 3,540 |
5.697%, 07/25/09 | | | 5,883 | | | 6,144 |
5.640%, 07/25/09 | | | 10,070 | | | 10,495 |
5.578%, 07/25/09 | | | 3,181 | | | 3,323 |
5.561%, 07/25/09 | | | 567 | | | 589 |
5.508%, 08/15/09 | | | 3,945 | | | 4,125 |
3.531%, 07/25/09 | | | 1,973 | | | 2,010 |
3.529%, 07/25/09 | | | 1,976 | | | 2,013 |
3.528%, 07/25/09 | | | 2,003 | | | 2,040 |
3.516%, 07/25/09 | | | 1,987 | | | 2,024 |
3.514%, 07/25/09 | | | 2,034 | | | 2,071 |
FNMA CMO, Ser 1992-69, Cl Z | | | | | | |
8.000%, 05/25/22 | | | 923 | | | 1,014 |
FNMA CMO, Ser 1993-149, Cl SH | | | | | | |
11.500%, 06/25/09 (A) | | | 437 | | | 506 |
FNMA CMO, Ser 1994-31, Cl ZC | | | | | | |
6.500%, 02/25/24 | | | 1,517 | | | 1,635 |
FNMA CMO, Ser 1994-63, Cl PK | | | | | | |
7.000%, 04/25/24 | | | 1,370 | | | 1,491 |
FNMA CMO, Ser 1997-32, Cl PG | | | | | | |
6.500%, 04/25/27 | | | 1,056 | | | 1,127 |
FNMA CMO, Ser 1999-11, Cl Z | | | | | | |
5.500%, 03/25/29 | | | 3,000 | | | 3,158 |
FNMA CMO, Ser 2001-81, Cl HE | | | | | | |
6.500%, 01/25/32 | | | 33,453 | | | 35,973 |
| | |
| 156 | | SEI Institutional Investments Trust / Annual Report / May 31, 2009 |
| | | | | | |
| Description | | Face Amount
($ Thousands) | | Market Value
($ Thousands) |
| | | | | | |
FNMA CMO, Ser 2002-10, Cl SB | | | | | | |
18.459%, 06/25/09 (A) | | $ | 255 | | $ | 302 |
FNMA CMO, Ser 2002-94, Cl HQ | | | | | | |
4.500%, 01/25/18 | | | 2,379 | | | 2,478 |
FNMA CMO, Ser 2003-108, Cl BE | | | | | | |
4.000%, 11/25/18 | | | 230 | | | 230 |
FNMA CMO, Ser 2003-125, Cl AY | | | | | | |
4.000%, 12/25/18 | | | 660 | | | 654 |
FNMA CMO, Ser 2003-15, Cl CH | | | | | | |
4.000%, 02/25/17 | | | 851 | | | 867 |
FNMA CMO, Ser 2003-16, Cl PN | | | | | | |
4.500%, 10/25/15 | | | 909 | | | 918 |
FNMA CMO, Ser 2003-24, Cl MV | | | | | | |
5.500%, 02/25/14 | | | 1,510 | | | 1,614 |
FNMA CMO, Ser 2003-3, Cl HJ | | | | | | |
5.000%, 02/25/18 | | | 1,000 | | | 1,057 |
FNMA CMO, Ser 2003-30, Cl HS, IO | | | | | | |
7.341%, 06/25/09 (A) | | | 2,395 | | | 200 |
FNMA CMO, Ser 2003-50, Cl QJ | | | | | | |
5.000%, 08/25/28 | | | 396 | | | 403 |
FNMA CMO, Ser 2004-101, Cl HD | | | | | | |
5.000%, 01/25/20 | | | 2,500 | | | 2,622 |
FNMA CMO, Ser 2004-60, Cl PA | | | | | | |
5.500%, 04/25/34 | | | 1,648 | | | 1,733 |
FNMA CMO, Ser 2005-58, Cl MA | | | | | | |
5.500%, 07/25/35 | | | 976 | | | 1,040 |
FNMA CMO, Ser 2005-69, Cl JM | | | | | | |
4.500%, 08/25/25 | | | 1,801 | | | 1,785 |
FNMA CMO, Ser 2005-74, Cl CS | | | | | | |
19.171%, 06/25/09 (A) | | | 809 | | | 978 |
FNMA CMO, Ser 2006-33, Cl LS | | | | | | |
28.761%, 06/25/09 (A) | | | 682 | | | 863 |
FNMA CMO, Ser 2006-46, Cl SW | | | | | | |
23.067%, 06/25/09 (A) | | | 717 | | | 910 |
FNMA CMO, Ser 2007-113, Cl DB | | | | | | |
4.500%, 12/25/22 | | | 3,664 | | | 3,614 |
FNMA CMO, Ser 2007-30, Cl MA | | | | | | |
4.250%, 02/25/37 | | | 1,492 | | | 1,535 |
FNMA CMO, Ser 2007-39, Cl NA | | | | | | |
4.250%, 01/25/37 | | | 216 | | | 223 |
FNMA CMO, Ser 2007-53, Cl SH | | | | | | |
5.791%, 06/25/09 (A) | | | 3,718 | | | 323 |
FNMA CMO, Ser 2007-92, Cl YS, IO | | | | | | |
5.471%, 06/25/09 (A) | | | 3,403 | | | 288 |
FNMA CMO, Ser 2008-1, Cl BI | | | | | | |
5.601%, 06/25/09 (A) | | | 4,311 | | | 341 |
FNMA CMO, Ser 2008-22, Cl SI | | | | | | |
6.121%, 06/25/09 (A) | | | 23,000 | | | 2,977 |
FNMA CMO, Ser 2008-24, Cl DY | | | | | | |
5.000%, 04/25/23 | | | 1,500 | | | 1,565 |
FNMA CMO, Ser 2008-53, Cl CA | | | | | | |
5.000%, 07/25/23 | | | 3,500 | | | 3,678 |
FNMA CMO, Ser 2008-66, Cl B | | | | | | |
5.000%, 08/25/23 | | | 669 | | | 680 |
| | | | | | |
| Description | | Face Amount
($ Thousands) | | Market Value
($ Thousands) |
| | | | | | |
FNMA TBA | | | | | | |
5.500%, 06/01/22 to
06/12/37 | | $ | 43,000 | | $ | 44,795 |
5.000%, 06/17/21 to
06/01/38 | | | 80,900 | | | 82,976 |
4.500%, 06/12/37 to
07/01/37 | | | 5,800 | | | 5,832 |
GNMA | | | | | | |
9.500%, 12/15/20 | | | 13 | | | 14 |
7.500%, 09/20/38 | | | 792 | | | 845 |
7.000%, 04/15/26 to
09/15/34 | | | 3,689 | | | 4,007 |
6.500%, 01/15/24 to
02/15/39 | | | 20,230 | | | 21,586 |
6.000%, 11/15/23 to
02/15/35 | | | 43,293 | | | 45,459 |
5.000%, 05/15/33 to
11/15/35 | | | 36,255 | | | 37,469 |
GNMA CMO, Ser 2001-18, Cl WH | | | | | | |
31.191%, 06/20/09 (A) | | | 173 | | | 241 |
GNMA CMO, Ser 2001-22, Cl PS | | | | | | |
20.137%, 06/17/09 (A) | | | 1,275 | | | 1,504 |
GNMA CMO, Ser 2002-51, Cl SG | | | | | | |
31.130%, 06/20/09 (A) | | | 164 | | | 234 |
GNMA CMO, Ser 2002-57, Cl SB | | | | | | |
107.475%, 08/16/32 | | | 117 | | | 320 |
GNMA CMO, Ser 2002-69, Cl SC | | | | | | |
15.804%, 06/20/09 (A) | | | 596 | | | 654 |
GNMA CMO, Ser 2003-60, Cl GS | | | | | | |
11.858%, 06/16/09 (A) | | | 238 | | | 234 |
GNMA CMO, Ser 2003-82, Cl IO, IO | | | | | | |
5.500%, 03/20/29 | | | 589 | �� | | 3 |
GNMA CMO, Ser 2003-86, Cl ZK | | | | | | |
5.000%, 10/20/33 | | | 11,495 | | | 11,455 |
GNMA CMO, Ser 2004-80, Cl IP, IO | | | | | | |
5.500%, 07/20/34 | | | 2,365 | | | 64 |
GNMA CMO, Ser 2004-87, Cl LI, IO | | | | | | |
5.000%, 12/20/28 | | | 1,867 | | | 36 |
GNMA CMO, Ser 2005-7, Cl JM | | | | | | |
15.983%, 06/18/09 (A) | | | 534 | | | 620 |
GNMA CMO, Ser 2006-37, Cl JG | | | | | | |
5.000%, 07/20/36 | | | 1,723 | | | 1,789 |
GNMA CMO, Ser 2006-38, Cl SW | | | | | | |
6.184%, 06/20/09 (A) | | | 3,596 | | | 266 |
GNMA CMO, Ser 2008-2, Cl MS | | | | | | |
6.825%, 06/16/09 (A) | | | 3,144 | | | 241 |
GNMA CMO, Ser 2009-14, Cl NI, IO | | | | | | |
6.500%, 03/20/39 | | | 96 | | | 11 |
GNMA CMO, Ser 2009-18, Cl PI | | | | | | |
5.500%, 11/16/37 | | | 1,955 | | | 266 |
GNMA CMO, Ser 2009-22, Cl SA | | | | | | |
5.954%, 06/20/09 (A) | | | 5,000 | | | 398 |
GNMA CMO, Ser 2009-31, Cl TS | | | | | | |
12.475%, 10/15/30 | | | 5,000 | | | 369 |
| | |
| SEI Institutional Investments Trust / Annual Report / May 31, 2009 | | 157 |
SCHEDULE OF INVESTMENTS
Core Fixed Income Fund (Continued)
May 31, 2009
| | | | | | |
| Description | | Face Amount
($ Thousands) | | Market Value
($ Thousands) |
| | | | | | |
GNMA CMO, Ser 2009-33, Cl TI, IO | | | | | | |
6.000%, 05/01/39 | | $ | 1,000 | | $ | 97 |
GNMA TBA | | | | | | |
6.500%, 06/19/33 | | | 9,600 | | | 10,152 |
6.000%, 05/01/34 | | | 34,500 | | | 36,031 |
5.500%, 06/20/37 | | | 25,500 | | | 26,440 |
4.500%, 07/01/35 to
07/15/39 | | | 20,000 | | | 20,108 |
| | | | | | |
| | | | | | 1,900,688 |
| | | | | | |
|
Non-Agency Mortgage-Backed Obligations — 15.8% |
Adjustable Rate Mortgage Trust,
Ser 2005-8, Cl 4A11 | | | | | | |
5.435%, 07/25/09 (A) | | | 11,089 | | | 7,528 |
American Home Mortgage Assets,
Ser 2006-5, Cl A1 | | | | | | |
2.359%, 07/25/09 (A) | | | 1,819 | | | 612 |
American Home Mortgage Assets,
Ser 2007-2, Cl A1 | | | | | | |
0.434%, 06/25/09 (A) | | | 15,195 | | | 5,749 |
American Tower Trust,
Ser 2007-1A, Cl AFX | | | | | | |
5.420%, 04/15/37 (B) | | | 3,409 | | | 3,034 |
Banc of America Alternative Loan Trust,
Ser 2003-7, Cl 1CB1 | | | | | | |
5.500%, 09/25/33 | | | 683 | | | 603 |
Banc of America Alternative Loan Trust,
Ser 2006-8, Cl 3A1 | | | | | | |
6.246%, 07/25/09 (A) | | | 352 | | | 256 |
Banc of America Alternative Loan Trust,
Ser 2007-1, Cl 2A1 | | | | | | |
6.476%, 07/25/09 (A) | | | 511 | | | 263 |
Banc of America Commercial Mortgage Securities, Ser 2000-1, Cl A2A | | | | | | |
7.333%, 07/15/09 (A) | | | 2,325 | | | 2,336 |
Banc of America Commercial Mortgage Securities, Ser 2002-PB2, Cl B | | | | | | |
6.309%, 06/11/35 | | | 1,075 | | | 1,022 |
Banc of America Commercial Mortgage Securities, Ser 2003-1, Cl A1 | | | | | | |
3.878%, 09/11/36 | | | 5,377 | | | 5,368 |
Banc of America Commercial Mortgage Securities, Ser 2003-1, Cl A2 | | | | | | |
4.648%, 09/11/36 | | | 2,397 | | | 2,226 |
Banc of America Commercial Mortgage Securities, Ser 2004-2, Cl A5 | | | | | | |
4.580%, 11/10/38 | | | 564 | | | 503 |
Banc of America Commercial Mortgage Securities, Ser 2005-3, Cl A4 | | | | | | |
4.668%, 07/10/43 | | | 8,860 | | | 7,812 |
Banc of America Commercial Mortgage Securities, Ser 2005-5, Cl A4 | | | | | | |
5.115%, 07/10/09 (A) | | | 1,190 | | | 1,016 |
| | | | | | |
| Description | | Face Amount
($ Thousands) | | Market Value
($ Thousands) |
| | | | | | |
Banc of America Commercial Mortgage Securities, Ser 2006-4, Cl A4 | | | | | | |
5.634%, 07/10/46 | | $ | 15,000 | | $ | 12,201 |
Banc of America Commercial Mortgage,
Ser 2004-2, Cl A3 | | | | | | |
4.050%, 11/10/38 | | | 1,299 | | | 1,246 |
Banc of America Commercial Mortgage,
Ser 2006-1, Cl A4 | | | | | | |
5.372%, 07/10/09 (A) | | | 500 | | | 418 |
Banc of America Commercial Mortgage,
Ser 2006-5, Cl A2 | | | | | | |
5.317%, 09/10/47 | | | 1,054 | | | 979 |
Banc of America Commercial Mortgage,
Ser 2007-2, Cl A2 | | | | | | |
5.634%, 07/10/09 (A) | | | 7,269 | | | 6,723 |
Banc of America Funding,
Ser 2004-2, Cl 1CB1 | | | | | | |
5.750%, 09/20/34 | | | 763 | | | 677 |
Banc of America Funding,
Ser 2005-B, Cl 2A1 | | | | | | |
5.087%, 07/20/09 (A) | | | 4,953 | | | 3,246 |
Bear Stearns Adjustable Rate Mortgage Trust, Ser 2004-2, Cl 24A | | | | | | |
5.294%, 07/25/09 (A) | | | 4,457 | | | 3,869 |
Bear Stearns Asset Backed Securities Trust, Ser 2006-AC1, Cl 1A1 | | | | | | |
5.750%, 02/25/36 | | | 2,519 | | | 1,441 |
Bear Stearns Commercial Mortgage Securities, Ser 2000-WF1, Cl A2 | | | | | | |
7.780%, 07/15/09 (A) | | | 4,557 | | | 4,600 |
Bear Stearns Commercial Mortgage Securities, Ser 2001-TOP4, Cl A3 | | | | | | |
5.610%, 11/15/33 | | | 1,709 | | | 1,709 |
Bear Stearns Commercial Mortgage Securities, Ser 2002-TOP8, Cl A2 | | | | | | |
4.830%, 08/15/38 | | | 3,071 | | | 2,924 |
Bear Stearns Commercial Mortgage Securities, Ser 2003-T-12, Cl A3 | | | | | | |
4.240%, 07/13/09 (A) | | | 1,021 | | | 994 |
Bear Stearns Commercial Mortgage Securities, Ser 2004-PWR6, Cl A6 | | | | | | |
4.825%, 11/11/41 | | | 637 | | | 566 |
Bear Stearns Commercial Mortgage Securities, Ser 2005-T20, Cl A4A | | | | | | |
5.150%, 07/12/09 (A) | | | 6,500 | | | 5,692 |
Bear Stearns Commercial Mortgage Securities, Ser 2007-PW10, Cl A4 | | | | | | |
5.405%, 07/11/09 (A) | | | 889 | | | 806 |
Bear Stearns Commercial Mortgage Securities, Ser 2007-PW16, Cl A2 | | | | | | |
5.667%, 07/11/09 (A) | | | 10,298 | | | 9,677 |
Bear Stearns Commercial Mortgage Securities, Ser 2007-PW17, Cl A3 | | | | | | |
5.736%, 06/11/50 | | | 2,500 | | | 2,193 |
| | |
| 158 | | SEI Institutional Investments Trust / Annual Report / May 31, 2009 |
| | | | | | |
| Description | | Face Amount
($ Thousands) | | Market Value
($ Thousands) |
| | | | | | |
Chase Mortgage Finance,
Ser 2005-A1, Cl 2A3 | | | | | | |
5.238%, 07/25/09 (A) | | $ | 13,166 | | $ | 7,891 |
Citigroup Commercial Mortgage Trust,
Ser 2006-C4, Cl A3 | | | | | | |
5.726%, 07/15/09 (A) | | | 3,525 | | | 2,957 |
Citigroup Mortgage Loan Trust,
Ser 2005-11, Cl A3 | | | | | | |
4.900%, 07/25/09 (A) | | | 6,691 | | | 5,443 |
Citigroup Mortgage Loan Trust,
Ser 2009-5, Cl 8A1 | | | | | | |
4.900%, 07/25/09 (A) | | | 1,525 | | | 1,386 |
Commercial Mortgage Asset Trust,
Ser 1999-C1, Cl A4 | | | | | | |
6.975%, 06/17/09 (A) | | | 2,593 | | | 2,687 |
Commercial Mortgage Asset Trust,
Ser 1999-C2, Cl A2 | | | | | | |
7.546%, 06/17/09 (A) | | | 175 | | | 177 |
Commercial Mortgage Loan Trust,
Ser 2008-LS1, Cl A4B | | | | | | |
6.019%, 07/10/09 (A) | | | 9,920 | | | 7,089 |
Commercial Mortgage Pass Through Certificates, Ser 2005-LP5, Cl A4 | | | | | | |
4.982%, 07/10/09 (A) | | | 600 | | | 526 |
Commercial Mortgage Pass-Through Certificates, Ser 2001-J2A, Cl A2 | | | | | | |
6.096%, 07/16/34 (B) | | | 5,564 | | | 5,574 |
Countrywide Alternative Loan Trust,
Ser 2003-20CB, Cl 1A1 | | | | | | |
5.500%, 10/25/33 | | | 3,043 | | | 2,537 |
Countrywide Alternative Loan Trust,
Ser 2004-27CB, Cl A1 | | | | | | |
6.000%, 12/25/34 | | | 2,631 | | | 2,228 |
Countrywide Alternative Loan Trust,
Ser 2004-32CB, Cl 2A3, IO | | | | | | |
4.791%, 06/25/09 (A) | | | 53,921 | | | 3,136 |
Countrywide Alternative Loan Trust,
Ser 2004-J1, Cl 1A1 | | | | | | |
6.000%, 02/25/34 | | | 559 | | | 484 |
Countrywide Alternative Loan Trust,
Ser 2004-J6, Cl 2A1 | | | | | | |
6.500%, 11/25/31 | | | 1,824 | | | 1,615 |
Countrywide Alternative Loan Trust,
Ser 2005-27, Cl 2A1 | | | | | | |
2.789%, 07/25/09 (A) | | | 4,388 | | | 1,903 |
Countrywide Alternative Loan Trust,
Ser 2005-27, Cl 3A2 | | | | | | |
2.539%, 07/25/09 (A) | | | 1,149 | | | 451 |
Countrywide Alternative Loan Trust,
Ser 2005-56, Cl 4A1 | | | | | | |
0.619%, 06/25/09 (A) | | | 8,481 | | | 3,625 |
Countrywide Alternative Loan Trust,
Ser 2005-59, Cl 1A1 | | | | | | |
0.639%, 06/22/09 (A) | | | 10,094 | | | 4,576 |
| | | | | | |
| Description | | Face Amount
($ Thousands) | | Market Value
($ Thousands) |
| | | | | | |
Countrywide Alternative Loan Trust,
Ser 2005-72, Cl A1 | | | | | | |
0.579%, 06/25/09 (A) | | $ | 3,327 | | $ | 1,408 |
Countrywide Alternative Loan Trust,
Ser 2006-0A9, Cl 2A1A | | | | | | |
0.526%, 06/22/09 (A) | | | 667 | | | 242 |
Countrywide Alternative Loan Trust,
Ser 2006-OA11, Cl A4 | | | | | | |
0.499%, 06/25/09 (A) | | | 10,832 | | | 3,907 |
Countrywide Alternative Loan Trust,
Ser 2006-OA14, Cl 1A2 | | | | | | |
2.319%, 07/25/09 (A) | | | 1,166 | | | 144 |
Countrywide Alternative Loan Trust,
Ser 2006-OA2, Cl X1P, IO | | | | | | |
4.220%, 07/20/09 (A) | | | 32,377 | | | 486 |
Countrywide Alternative Loan Trust,
Ser 2006-OC6, Cl 2A1 | | | | | | |
0.379%, 06/25/09 (A) | | | 1,740 | | | 1,471 |
Countrywide Home Loan Mortgage Pass Through Trust, Ser 2003-56, Cl 6A1 | | | | | | |
5.325%, 07/25/09 (A) | | | 743 | | | 584 |
Countrywide Home Loan Mortgage Pass Through Trust, Ser 2003-J7, Cl 4A3 | | | | | | |
9.374%, 06/25/09 (A) | | | 353 | | | 327 |
Countrywide Home Loan Mortgage Pass Through Trust, Ser 2004-8, Cl 2A1 | | | | | | |
4.500%, 06/25/19 | | | 1,468 | | | 1,429 |
Countrywide Home Loan Mortgage Pass-Through Trust,
Ser 2005-20, Cl A7 | | | | | | |
5.250%, 10/25/35 | | | 831 | | | 587 |
Countrywide Home Loan Mortgage Pass-Through Trust,
Ser 2005-R3, Cl AF | | | | | | |
0.709%, 06/25/09 (A) (B) | | | 8,574 | | | 5,515 |
Credit Suisse First Boston Mortgage Securities, Ser 2001-CK1, Cl A3 | | | | | | |
6.380%, 12/18/35 | | | 1,216 | | | 1,227 |
Credit Suisse First Boston Mortgage Securities, Ser 2002-CKS4, Cl A1 | | | | | | |
4.485%, 11/15/36 | | | 81 | | | 81 |
Credit Suisse First Boston Mortgage Securities, Ser 2005-C6, Cl A4 | | | | | | |
5.230%, 07/15/09 (A) | | | 22,220 | | | 19,391 |
Credit Suisse First Boston Mortgage Securities, Ser 2001-CF2, Cl A4 | | | | | | |
6.505%, 02/15/34 | | | 2,124 | | | 2,182 |
Credit Suisse First Boston Mortgage Securities, Ser 2001-CK3, Cl A4 | | | | | | |
6.530%, 06/15/34 | | | 6,068 | | | 6,136 |
Credit Suisse First Boston Mortgage Securities, Ser 2001-CKN5, Cl A4 | | | | | | |
5.435%, 09/15/34 | | | 3,354 | | | 3,358 |
| | |
| SEI Institutional Investments Trust / Annual Report / May 31, 2009 | | 159 |
SCHEDULE OF INVESTMENTS
Core Fixed Income Fund (Continued)
May 31, 2009
| | | | | | |
| Description | | Face Amount
($ Thousands) | | Market Value
($ Thousands) |
| | | | | | |
Credit Suisse First Boston Mortgage Securities, Ser 2002-CKS4, Cl A2 | | | | | | |
5.183%, 11/15/36 | | $ | 6,381 | | $ | 6,158 |
Credit Suisse First Boston Mortgage Securities, Ser 2002-CP5, Cl A2 | | | | | | |
4.940%, 12/15/35 | | | 955 | | | 910 |
Credit Suisse First Boston Mortgage Securities, Ser 2003-C5, Cl A4 | | | | | | |
4.900%, 07/15/09 (A) | | | 1,475 | | | 1,373 |
Credit Suisse First Boston Mortgage Securities, Ser 2003-CK2, Cl A4 | | | | | | |
4.801%, 03/15/36 | | | 1,215 | | | 1,168 |
Credit Suisse First Boston Mortgage Securities, Ser 2003-CPN1, Cl A2 | | | | | | |
4.597%, 03/15/35 | | | 851 | | | 789 |
Credit Suisse First Boston Mortgage Securities, Ser 2004-C2, Cl A1 | | | | | | |
3.819%, 05/15/36 | | | 7,766 | | | 7,447 |
CS First Boston Mortgage Securities,
Ser 2004-AR5, Cl 7A2 | | | | | | |
3.637%, 07/25/09 (A) | | | 1,064 | | | 889 |
CS First Boston Mortgage Securities,
Ser 2005-4, Cl 3A24 | | | | | | |
17.988%, 07/25/09 (A) | | | 453 | | | 465 |
CW Capital Cobalt, Ser 2006-C1, Cl A4 | | | | | | |
5.223%, 08/15/48 | | | 7,040 | | | 5,223 |
DLJ Commercial Mortgage,
Ser 2000-CKP1, Cl A1B | | | | | | |
7.180%, 11/10/33 | | | 180 | | | 184 |
DLJ Commercial Mortgage,
Ser CG3, Cl A1B | | | | | | |
7.340%, 09/10/09 | | | 1,040 | | | 1,041 |
DSLA Mortgage Loan Trust,
Ser 2004-AR2, Cl A2B | | | | | | |
0.728%, 06/19/09 (A) | | | 2,448 | | | 534 |
DSLA Mortgage Loan Trust,
Ser 2006-AR1, Cl 1A1A | | | | | | |
2.359%, 07/19/09 (A) | | | 474 | | | 176 |
First Horizon Alternative Mortgage Securities, Ser 2006-FA6, Cl 2A10 | | | | | | |
6.000%, 11/25/36 (I) | | | 1,372 | | | 1,191 |
First Union National Bank Commercial Mortgage, Ser 1999-C4, Cl A2 | | | | | | |
7.390%, 12/15/31 | | | 119 | | | 120 |
First Union National Bank Commercial Mortgage, Ser 2000-C2, Cl A2 | | | | | | |
7.202%, 10/15/32 | | | 1,686 | | | 1,715 |
First Union National Bank Commercial Mortgage, Ser 2001-C4, Cl B | | | | | | |
6.417%, 12/12/33 | | | 926 | | | 882 |
GE Capital Commercial Mortgage,
Ser 2001-2, Cl A3 | | | | | | |
6.030%, 08/11/33 | | | 666 | | | 670 |
| | | | | | |
| Description | | Face Amount
($ Thousands) | | Market Value
($ Thousands) |
| | | | | | |
Ge Capital Commercial Mortgage,
Ser 2002-1A, Cl A3 | | | | | | |
6.269%, 12/10/35 | | $ | 1,562 | | $ | 1,600 |
GE Capital Commercial Mortgage,
Ser 2005-C4, Cl A3A | | | | | | |
5.334%, 07/10/09 (A) | | | 14,500 | | | 13,353 |
GE Capital Commercial Mortgage,
Ser 2007-C1, Cl A4 | | | | | | |
5.543%, 02/10/17 | | | 5,060 | | | 3,514 |
GMAC Commercial Mortgage Securities,
Ser 2000-C1, Cl A2 | | | | | | |
7.724%, 07/15/09 (A) | | | 6,185 | | | 6,258 |
GMAC Commercial Mortgage Securities,
Ser 2000-C2, Cl A2 | | | | | | |
7.455%, 07/16/09 (A) | | | 7,826 | | | 7,941 |
GMAC Commercial Mortgage Securities,
Ser 2000-C3, Cl A2 | | | | | | |
6.957%, 09/15/35 | | | 8,695 | | | 8,943 |
GMAC Commercial Mortgage Securities,
Ser 2002-C3, Cl A2 | | | | | | |
4.930%, 07/10/39 | | | 3,009 | | | 2,889 |
GMAC Commercial Mortgage Securities,
Ser 2003-C2, Cl A2 | | | | | | |
5.485%, 07/10/09 (A) | | | 1,259 | | | 1,250 |
GMAC Commercial Mortgage Securities,
Ser 2003-C3, Cl A4 | | | | | | |
5.023%, 04/10/40 | | | 5,138 | | | 4,619 |
GMAC Commercial Mortgage Securities,
Ser 2004-C2, Cl A1 | | | | | | |
3.896%, 08/10/38 | | | 25 | | | 25 |
GMAC Mortgage Loan Trust,
Ser 2004-J4, Cl A1 | | | | | | |
5.500%, 09/25/34 | | | 607 | | | 608 |
GMAC Mortgage Loan Trust,
Ser 2005-AR6, Cl 2A1 | | | | | | |
5.219%, 07/19/09 (A) | | | 1,232 | | | 880 |
Greenpoint Mortgage Funding Trust,
Ser 2007-AR1, Cl 1A1A | | | | | | |
0.389%, 06/25/09 (A) | | | 16,309 | | | 8,019 |
Greenwich Capital Commercial Funding,
Ser 2005-GG5, Cl A5 | | | | | | |
5.224%, 07/10/09 (A) | | | 2,491 | | | 2,105 |
Greenwich Capital Commercial Funding,
Ser 2006-GG7, Cl A4 | | | | | | |
5.917%, 07/10/09 (A) | | | 10,875 | | | 8,934 |
GS Mortgage Securities II,
Ser 2001-GL3A, Cl A2 | | | | | | |
6.449%, 07/05/09 (A) (B) | | | 5,378 | | | 5,435 |
GS Mortgage Securities II,
Ser 2005-GG4, Cl AABA | | | | | | |
4.680%, 07/10/39 | | | 6,191 | | | 6,029 |
GS Mortgage Securities II,
Ser 2006-GG6, Cl A4 | | | | | | |
5.553%, 07/10/09 (A) | | | 1,000 | | | 832 |
| | |
| 160 | | SEI Institutional Investments Trust / Annual Report / May 31, 2009 |
| | | | | | |
| Description | | Face Amount
($ Thousands) | | Market Value
($ Thousands) |
| | | | | | |
GSMPS Mortgage Loan Trust,
Ser 1998-1, Cl A | | | | | | |
8.000%, 07/19/09 (A) (B) | | $ | 6 | | $ | 4 |
GSMPS Mortgage Loan Trust,
Ser 2005-RP3, Cl 1AF | | | | | | |
0.659%, 06/25/09 (A) (B) | | | 3,279 | | | 2,216 |
GSMPS Mortgage Loan Trust,
Ser 2006-RP2, Cl 1AF1 | | | | | | |
0.709%, 06/25/09 (A) (B) | | �� | 2,418 | | | 2,068 |
Harborview Mortgage Loan Trust,
Ser 2005-01, Cl X, IO | | | | | | |
2.950%, 03/19/35 | | | 11,887 | | | 167 |
Harborview Mortgage Loan Trust,
Ser 2005-12, Cl X2B, IO | | | | | | |
3.005%, 07/19/09 (A) | | | 23,328 | | | 284 |
Heller Financial Commercial Mortgage Asset, Ser 1999-PH1, Cl C | | | | | | |
7.099%, 07/15/09 (A) | | | 239 | | | 238 |
Impac Secured Assets CMN Owner Trust, Ser 2003-2, Cl A1 | | | | | | |
5.500%, 08/25/33 | | | 436 | | | 385 |
Impac Secured Assets CMN Owner Trust, Ser 2006-2, Cl 2A1 | | | | | | |
0.659%, 06/25/09 (A) | | | 849 | | | 471 |
Indymac INDA Mortgage Loan Trust,
Ser 2007-AR7, Cl 1A1 | | | | | | |
6.151%, 07/25/09 (A) | | | 2,459 | | | 1,537 |
Indymac INDX Mortgage Loan Trust,
Ser 2007-AR5, Cl 1A1 | | | | | | |
5.947%, 07/25/09 (A) | | | 3,861 | | | 1,709 |
JPMorgan Alternative Loan Trust,
Ser 2006-A7, Cl 2A6 | | | | | | |
5.750%, 07/25/09 (A) | | | 11,300 | | | 4,239 |
JPMorgan Chase Commercial Mortgage Securities, Ser 2000-C10, Cl A2 | | | | | | |
7.371%, 07/15/09 (A) | | | 1,775 | | | 1,788 |
JPMorgan Chase Commercial Mortgage Securities, Ser 2001-CIB3, Cl A3 | | | | | | |
6.465%, 11/15/35 | | | 5,615 | | | 5,727 |
JPMorgan Chase Commercial Mortgage Securities, Ser 2002-CIB5, Cl A2 | | | | | | |
5.161%, 10/12/37 | | | 1,137 | | | 1,108 |
JPMorgan Chase Commercial Mortgage Securities, Ser 2003-PM1A, Cl A4 | | | | | | |
5.326%, 07/12/09 (A) | | | 1,911 | | | 1,825 |
JPMorgan Chase Commercial Mortgage Securities, Ser 2004-C3, Cl A4 | | | | | | |
4.657%, 01/15/42 | | | 4,000 | | | 3,565 |
JPMorgan Chase Commercial Mortgage Securities, Ser 2004-C3, Cl A2 | | | | | | |
4.223%, 01/15/42 | | | 12,948 | | | 12,720 |
JPMorgan Chase Commercial Mortgage Securities, Ser 2005-CB13, Cl A4 | | | | | | |
5.280%, 07/12/09 (A) | | | 1,621 | | | 1,463 |
| | | | | | |
| Description | | Face Amount
($ Thousands) | | Market Value
($ Thousands) |
| | | | | | |
JPMorgan Chase Commercial Mortgage Securities, Ser 2005-LDP2, Cl A1 | | | | | | |
4.334%, 07/15/42 | | $ | 101 | | $ | 101 |
JPMorgan Chase Commercial Mortgage Securities, Ser 2005-LDP3, Cl A1 | | | | | | |
4.655%, 08/15/42 | | | 303 | | | 302 |
JPMorgan Chase Commercial Mortgage Securities, Ser 2005-LDP4, Cl A4 | | | | | | |
4.918%, 07/15/09 (A) | | | 1,200 | | | 1,038 |
JPMorgan Chase Commercial Mortgage Securities, Ser 2006-LDP7, Cl A2 | | | | | | |
5.861%, 07/15/09 (A) | | | 2,400 | | | 2,282 |
JPMorgan Chase Commercial Mortgage Securities, Ser 2006-LDP8, Cl A4 | | | | | | |
5.399%, 05/15/45 | | | 500 | | | 393 |
JPMorgan Chase Commercial Mortgage Securities, Ser 2007-CB19, Cl A2 | | | | | | |
5.746%, 07/12/09 (A) | | | 774 | | | 736 |
JPMorgan Chase Commercial Mortgage Securities, Ser 2007-LD12, Cl A4 | | | | | | |
5.882%, 07/15/09 (A) | | | 3,165 | | | 2,413 |
JPMorgan Chase Commercial Mortgage Securities, Ser 2007-LDPX, Cl A3 | | | | | | |
5.420%, 01/15/49 | | | 5,377 | | | 4,039 |
JPMorgan Mortgage Trust,
Ser 2004-A3, Cl SF3 | | | | | | |
4.587%, 07/25/09 (A) | | | 5,774 | | | 5,116 |
JPMorgan Mortgage Trust,
Ser 2004-A5, Cl 4A2 | | | | | | |
4.810%, 07/25/09 (A) | | | 4,591 | | | 4,020 |
JPMorgan Mortgage Trust,
Ser 2004-A5, Cl 4A4 | | | | | | |
4.812%, 07/25/09 (A) | | | 11,500 | | | 10,038 |
JPMorgan Mortgage Trust,
Ser 2005-A3, Cl 11A2 | | | | | | |
4.499%, 07/25/09 (A) | | | 13,065 | | | 7,810 |
JPMorgan Mortgage Trust,
Ser 2006-A2, Cl 2A2 | | | | | | |
5.756%, 07/25/09 (A) | | | 13,400 | | | 7,983 |
JPMorgan Mortgage Trust,
Ser 2006-A3, Cl 3A4 | | | | | | |
5.731%, 07/25/09 (A) | | | 14,500 | | | 8,122 |
LB Commercial Conduit Mortgage Trust,
Ser 1999-C2, Cl B | | | | | | |
7.425%, 10/15/32 | | | 371 | | | 373 |
LB-UBS Commercial Mortgage Trust,
Ser 2000-C4, Cl A2 | | | | | | |
7.370%, 08/15/26 | | | 2,391 | | | 2,444 |
LB-UBS Commercial Mortgage Trust,
Ser 2000-C5, Cl A2 | | | | | | |
6.510%, 12/15/26 | | | 2,969 | | | 3,025 |
LB-UBS Commercial Mortgage Trust,
Ser 2001-C2, Cl A2 | | | | | | |
6.653%, 11/15/27 | | | 702 | | | 709 |
| | |
| SEI Institutional Investments Trust / Annual Report / May 31, 2009 | | 161 |
SCHEDULE OF INVESTMENTS
Core Fixed Income Fund (Continued)
May 31, 2009
| | | | | | |
| Description | | Face Amount
($ Thousands) | | Market Value
($ Thousands) |
| | | | | | |
LB-UBS Commercial Mortgage Trust,
Ser 2002-C2, Cl A4 | | | | | | |
5.594%, 06/15/31 | | $ | 21,324 | | $ | 21,239 |
LB-UBS Commercial Mortgage Trust,
Ser 2002-C4, Cl A5 | | | | | | |
4.853%, 09/15/31 | | | 2,169 | | | 2,102 |
LB-UBS Commercial Mortgage Trust,
Ser 2003-C8, Cl A4 | | | | | | |
5.124%, 06/15/09 (A) | | | 17,485 | | | 16,460 |
LB-UBS Commercial Mortgage Trust,
Ser 2006-C1, Cl A2 | | | | | | |
5.084%, 02/15/31 | | | 4,840 | | | 4,720 |
LB-UBS Commercial Mortgage Trust,
Ser 2007-C1, Cl A2 | | | | | | |
5.318%, 02/15/40 | | | 1,916 | | | 1,850 |
LB-UBS Commercial Mortgage Trust,
Ser 2007-C1, Cl A3 | | | | | | |
5.398%, 02/15/40 | | | 1,841 | | | 1,560 |
Master Adjustable Rate Mortgages Trust,
Ser 2004-13, Cl 3A7A | | | | | | |
3.649%, 07/21/09 (A) | | | 11,650 | | | 8,459 |
Master Adjustable Rate Mortgages Trust,
Ser 2007-3, Cl 12A1 | | | | | | |
0.509%, 06/25/09 (A) | | | 20,154 | | | 7,639 |
Master Alternative Loans Trust,
Ser 2004-4, Cl 1A1 | | | | | | |
5.500%, 05/25/34 | | | 2,622 | | | 2,186 |
Master Reperforming Loan Trust,
Ser 2005-1, Cl 1A1 | | | | | | |
6.000%, 08/25/34 (B) | | | 4,031 | | | 4,149 |
Master Reperforming Loan Trust,
Ser 2006-1, Cl 1A1F | | | | | | |
0.669%, 06/25/09 (A) (B) | | | 1,766 | | | 1,479 |
MASTR Alternative Loans Trust,
Ser 2006-3, Cl AA3 | | | | | | |
6.250%, 07/25/36 | | | 802 | | | 447 |
MASTR Asset Securitization Trust,
Ser 2004-10, Cl SA1 | | | | | | |
0.709%, 06/25/09 (A) | | | 255 | | | 243 |
Merit Securities, Ser 2003-13, Cl A4 | | | | | | |
7.978%, 07/28/09 (A) | | | 3,717 | | | 2,964 |
Merrill Lynch | | | | | | |
7.430%, 09/01/22 | | | 4 | | | 4 |
Merrill Lynch Mortgage Investors,
Ser 2004-A1, Cl 4A | | | | | | |
5.273%, 07/25/09 (A) | | | 5,911 | | | 5,246 |
Merrill Lynch Mortgage Trust,
Ser 2006-1, Cl 1A | | | | | | |
4.941%, 02/25/36 (A) | | | 604 | | | 295 |
Merrill Lynch, Ser 2006-4, Cl A3 | | | | | | |
5.172%, 07/12/09 (A) | | | 9,600 | | | 6,833 |
Merrill Lynch/Countrywide Commercial Mortgage Trust, Ser 2007-6, Cl A4 | | | | | | |
5.485%, 07/12/09 (A) | | | 6,740 | | | 4,780 |
| | | | | | |
| Description | | Face Amount
($ Thousands) | | Market Value
($ Thousands) |
| | | | | | |
MLCC Mortgage Investors,
Ser 2004-B, Cl A3 | | | | | | |
3.454%, 07/25/09 (A) | | $ | 643 | | $ | 552 |
Morgan Stanley Capital I,
Ser 2003-IQ5, Cl A4 | | | | | | |
5.010%, 04/15/38 | | | 3,770 | | | 3,640 |
Morgan Stanley Capital I,
Ser 2003-T11, Cl A4 | | | | | | |
5.150%, 06/13/41 | | | 3,077 | | | 2,871 |
Morgan Stanley Capital I,
Ser 2004-HQ3, Cl A4 | | | | | | |
4.800%, 01/13/41 | | | 2,256 | | | 2,040 |
Morgan Stanley Capital I,
Ser 2005-HQ5, Cl A4 | | | | | | |
5.168%, 01/14/42 | | | 680 | | | 624 |
Morgan Stanley Capital I,
Ser 2005-HQ5, Cl AAB | | | | | | |
5.037%, 01/14/42 | | | 3,294 | | | 3,257 |
Morgan Stanley Capital I,
Ser 2005-HQ6, Cl A4A | | | | | | |
4.989%, 08/13/42 | | | 4,630 | | | 4,074 |
Morgan Stanley Capital I,
Ser 2005-HQ7, Cl AAB | | | | | | |
5.185%, 07/14/09 (A) | | | 4,083 | | | 4,025 |
Morgan Stanley Capital I,
Ser 2006-T21, Cl A4 | | | | | | |
5.162%, 07/12/09 (A) | | | 6,900 | | | 6,047 |
Morgan Stanley Capital I,
Ser 2007-IQ14, Cl A2 | | | | | | |
5.610%, 04/15/49 | | | 3,157 | | | 2,858 |
Morgan Stanley Dean Witter Capital I,
Ser 2000-LIFE, Cl A2 | | | | | | |
7.570%, 07/15/09 (A) | | | 2,220 | | | 2,236 |
Morgan Stanley Dean Witter Capital I,
Ser 2001-TOP1, Cl A4 | | | | | | |
6.660%, 02/15/33 | | | 2,277 | | | 2,314 |
Morgan Stanley Dean Witter Capital I,
Ser 2001-TOP5, Cl A4 | | | | | | |
6.390%, 10/15/35 | | | 6,533 | | | 6,655 |
Morgan Stanley Dean Witter Capital I,
Ser 2003-HQ2, Cl A2 | | | | | | |
4.920%, 03/12/35 | | | 7,164 | | | 6,897 |
Morgan Stanley Mortgage Loan Trust,
Ser 2007-6XS, Cl 2A1S | | | | | | |
0.419%, 06/25/09 (A) | | | 800 | | | 530 |
New York Mortgage Trust,
Ser 2006-1, Cl 2A2 | | | | | | |
5.655%, 07/25/09 (A) | | | 788 | | | 514 |
Nomura Asset Securities,
Ser 1998-D6, Cl A1C | | | | | | |
6.690%, 03/15/30 | | | 3,392 | | | 3,600 |
Prime Mortgage Trust,
Ser 2006-CL1, Cl A1 | | | | | | |
0.809%, 06/25/09 (A) | | | 78 | | | 44 |
| | |
| 162 | | SEI Institutional Investments Trust / Annual Report / May 31, 2009 |
| | | | | | |
| Description | | Face Amount
($ Thousands) | | Market Value
($ Thousands) |
| | | | | | |
Prime Mortgage Trust,
Ser 2006-DR1, Cl 2A1 | | | | | | |
5.500%, 05/25/35 (B) | | $ | 3,207 | | $ | 2,330 |
RBSGC Mortgage Pass Through Certificates, Ser 2007-B, Cl 1A4 | | | | | | |
0.759%, 06/25/09 (A) | | | 6,912 | | | 2,698 |
Residential Accredit Loans,
Ser 2005-Q02, Cl A1 | | | | | | |
2.799%, 07/25/09 (A) | | | 1,289 | | | 529 |
Residential Accredit Loans,
Ser 2006-QO8, Cl 1A1A | | | | | | |
0.399%, 06/25/09 (A) | | | 9,977 | | | 8,066 |
Residential Asset Mortgage Products,
Ser 2004-SL1, Cl A8 | | | | | | |
6.500%, 11/25/31 | | | 1,420 | | | 1,370 |
Residential Asset Mortgage Products,
Ser 2004-SL3, Cl A2 | | | | | | |
6.500%, 12/25/31 | | | 2,394 | | | 2,074 |
Residential Asset Securitization Trust,
Ser 2004-IP2, Cl 2A1 | | | | | | |
4.774%, 07/25/09 (A) | | | 2,239 | | | 1,501 |
Salomon Brothers Mortgage Securities VII, Ser 2000-C3, Cl A2 | | | | | | |
6.592%, 12/18/33 | | | 2,087 | | | 2,117 |
Salomon Brothers Mortgage Securities VII, Ser 2002-KEY2, Cl A2 | | | | | | |
4.467%, 03/18/36 | | | 1,880 | | | 1,869 |
Structured Adjustable Rate Mortgage Loan Trust, Ser 2005-18, Cl 1A1 | | | | | | |
5.628%, 07/25/09 (A) | | | 5,331 | | | 3,550 |
Structured Adjustable Rate Mortgage Loan Trust, Ser 2005-19XS, Cl 1A1 | | | | | | |
0.629%, 06/25/09 (A) | | | 6,540 | | | 2,807 |
Structured Asset Mortgage Investments,
Ser 2006-AR6, Cl 1A3 | | | | | | |
0.499%, 06/25/09 (A) | | | 230 | | | 76 |
Structured Asset Mortgage Investments,
Ser 2006-AR8, Cl A1A | | | | | | |
0.509%, 06/25/09 (A) | | | 7,352 | | | 2,837 |
Structured Asset Mortgage Investments,
Ser 2007-AR4, Cl GA4B | | | | | | |
0.489%, 06/25/09 (A) | | | 20,786 | | | 6,610 |
Structured Asset Securities,
Ser 2003-31A, Cl 2A7 | | | | | | |
4.100%, 07/25/09 (A) | | | 12,700 | | | 10,086 |
Thornburg Mortgage Securities Trust,
Ser 2007-4, Cl 3A1 | | | | | | |
6.190%, 07/25/09 (A) | | | 7,262 | | | 4,750 |
Thornburg Mortgage Securities Trust,
Ser 2007-4, Cl 2A1 | | | | | | |
6.208%, 07/25/09 (A) | | | 7,828 | | | 5,876 |
US Bank National Mortgage Association,
Ser 2007-1, Cl A | | | | | | |
5.920%, 05/25/12 | | | 7,246 | | | 7,628 |
| | | | | | |
| Description | | Face Amount
($ Thousands) | | Market Value
($ Thousands) |
| | | | | | |
Wachovia Bank Commercial Mortgage Trust, Ser 2002-C1, Cl A4 | | | | | | |
6.287%, 04/15/34 | | $ | 2,587 | | $ | 2,586 |
Wachovia Bank Commercial Mortgage Trust, Ser 2002-C2, Cl A4 | | | | | | |
4.980%, 11/15/34 | | | 2,228 | | | 2,189 |
Wachovia Bank Commercial Mortgage Trust, Ser 2003-C5, Cl A2 | | | | | | |
3.989%, 06/15/35 | | | 955 | | | 911 |
Wachovia Bank Commercial Mortgage Trust, Ser 2003-C6, Cl A3 | | | | | | |
4.957%, 07/15/09 (A) | | | 4,281 | | | 4,080 |
Wachovia Bank Commercial Mortgage Trust, Ser 2003-C7, Cl A1 | | | | | | |
4.241%, 10/15/35 (B) | | | 501 | | | 494 |
Wachovia Bank Commercial Mortgage Trust, Ser 2003-C8, Cl A3 | | | | | | |
4.445%, 11/15/35 | | | 1,021 | | | 984 |
Wachovia Bank Commercial Mortgage Trust, Ser 2005-C18, Cl A4 | | | | | | |
4.935%, 04/15/42 | | | 1,945 | | | 1,690 |
WaMu Mortgage Pass Through Certificates, Ser 2003-S11, Cl 2A5 | | | | | | |
16.201%, 06/25/09 (A) | | | 1,057 | | | 1,069 |
WaMu Mortgage Pass Through Certificates, Ser 2006-AR13, Cl 2A | | | | | | |
3.503%, 07/25/09 (A) | | | 1,743 | | | 713 |
WaMu Mortgage Pass Through Certificates, Ser 2007-HY3, Cl 4A1 | | | | | | |
5.331%, 07/25/09 (A) | | | 529 | | | 368 |
WaMu Mortgage Pass-Through Certificates, Ser 2002-AR18, Cl A | | | | | | |
4.546%, 07/25/09 (A) | | | 417 | | | 340 |
WaMu Mortgage Pass-Through Certificates, Ser 2003-MS1, Cl 1A | | | | | | |
5.000%, 02/25/18 | | | 803 | | | 798 |
WaMu Mortgage Pass-Through Certificates, Ser 2005-AR11, Cl A1A | | | | | | |
0.629%, 06/25/09 (A) | | | 185 | | | 102 |
WaMu Mortgage Pass-Through Certificates, Ser 2005-AR13, Cl A1A1 | | | | | | |
0.599%, 06/25/09 (A) | | | 4,666 | | | 2,194 |
WaMu Mortgage Pass-Through Certificates, Ser 2005-AR15, Cl A1A2 | | | | | | |
0.589%, 06/25/09 (A) | | | 7,224 | | | 2,338 |
WaMu Mortgage Pass-Through Certificates, Ser 2005-AR16, Cl 1A4A | | | | | | |
5.092%, 07/25/09 (A) | | | 13,585 | | | 8,091 |
WaMu Mortgage Pass-Through Certificates, Ser 2005-AR19, Cl A1A2 | | | | | | |
0.599%, 06/25/09 (A) | | | 7,084 | | | 3,323 |
WaMu Mortgage Pass-Through Certificates, Ser 2006-AR1, Cl 1A1B | | | | | | |
2.509%, 07/25/09 (A) | | | 3,582 | | | 716 |
| | |
| SEI Institutional Investments Trust / Annual Report / May 31, 2009 | | 163 |
SCHEDULE OF INVESTMENTS
Core Fixed Income Fund (Continued)
May 31, 2009
| | | | | | |
| Description | | Face Amount
($ Thousands) | | Market Value
($ Thousands) |
| | | | | | |
WaMu Mortgage Pass-Through Certificates, Ser 2006-AR12, Cl 1A1 | | | | | | |
6.051%, 07/25/09 (A) (I) | | $ | 1,468 | | $ | 1,094 |
WaMu Mortgage Pass-Through Certificates, Ser 2006-AR14, Cl 1A4 | | | | | | |
5.603%, 07/25/09 (A) | | | 576 | | | 358 |
WaMu Mortgage Pass-Through Certificates, Ser 2006-AR15, Cl 1A | | | | | | |
2.279%, 07/25/09 (A) | | | 3,553 | | | 1,290 |
WaMu Mortgage Pass-Through Certificates, Ser 2006-AR15, Cl 2A1B | | | | | | |
2.939%, 07/25/09 (A) | | | 2,271 | | | 500 |
WaMu Mortgage Pass-Through Certificates, Ser 2006-AR15, Cl 1A1B | | | | | | |
2.279%, 07/25/09 (A) | | | 2,050 | | | 511 |
WaMu Mortgage Pass-Through Certificates, Ser 2006-AR17, Cl 2A | | | | | | |
3.503%, 07/25/09 (A) | | | 788 | | | 334 |
WaMu Mortgage Pass-Through Certificates, Ser 2006-AR17, Cl 1A1B | | | | | | |
2.249%, 07/25/09 (A) | | | 691 | | | 138 |
WaMu Mortgage Pass-Through Certificates, Ser 2006-AR4, Cl DA | | | | | | |
2.409%, 07/25/09 (A) | | | 1,545 | | | 566 |
WaMu Mortgage Pass-Through Certificates, Ser 2006-AR7, Cl A1B | | | | | | |
2.359%, 07/25/09 (A) | | | 1,185 | | | 231 |
WaMu Mortgage Pass-Through Certificates, Ser 2007-HY1, Cl 4A1 | | | | | | |
5.400%, 07/25/09 (A) | | | 10,294 | | | 5,988 |
WaMu Mortgage Pass-Through Certificates, Ser 2007-HY1, Cl 1A1 | | | | | | |
5.693%, 07/25/09 (A) | | | 7,891 | | | 4,691 |
WaMu Mortgage Pass-Through Certificates, Ser 2007-HY3, Cl 1A1 | | | | | | |
5.594%, 07/25/09 (A) | | | 8,725 | | | 5,024 |
WaMu Mortgage Pass-Through Certificates, Ser 2007-OA5, Cl 1A | | | | | | |
2.189%, 07/25/09 (A) | | | 14,238 | | | 5,692 |
WaMu Mortgage Pass-Through Certificates, Ser 2007-OA5, Cl 1A1B | | | | | | |
2.189%, 07/25/09 (A) | | | 659 | | | 117 |
WaMu Mortgage Pass-Through Certificates, Ser 2007-OA5, Cl A1B | | | | | | |
2.279%, 07/25/09 (A) | | | 17,757 | | | 3,584 |
WaMu Mortgage Pass-Through Certificates, Ser 2007-OA6, Cl 1A1B | | | | | | |
2.249%, 07/25/09 (A) | | | 771 | | | 148 |
WaMu Mortgage Pass-Through Certificates, Ser 2007-OA6, Cl 1A | | | | | | |
2.249%, 07/25/09 (A) | | | 14,228 | | | 5,561 |
Washington Mutual Alternative Mortgage Pass-Through Certificates,
Ser 2005-3, Cl CX | | | | | | |
5.500%, 05/25/35 | | | 965 | | | 103 |
| | | | | | |
| Description | | Face Amount
($ Thousands) | | Market Value
($ Thousands) |
| | | | | | |
Washington Mutual MSC Mortgage Pass-Through CTFS,
Ser 2003-MS8, Cl 1P | | | | | | |
1.772%, 05/25/33 | | $ | 523 | | $ | 304 |
Washington Mutual MSC Mortgage Pass-Through CTFS,
Ser 2003-MS9, Cl 2P | | | | | | |
1.834%, 04/25/33 | | | 1,118 | | | 690 |
Wells Fargo Mortgage-Backed Securities Trust, Ser 2004-L, Cl A5 | | | | | | |
4.778%, 07/25/09 (A) | | | 881 | | | 798 |
Wells Fargo Mortgage-Backed Securities Trust, Ser 2004-L, Cl A6 | | | | | | |
4.778%, 07/25/09 (A) | | | 895 | | | 802 |
Wells Fargo Mortgage-Backed Securities Trust, Ser 2004-O, Cl A1 | | | | | | |
4.882%, 07/25/09 (A) | | | 980 | | | 887 |
Wells Fargo Mortgage-Backed Securities Trust, Ser 2005-AR14, Cl A1 | | | | | | |
5.386%, 07/25/09 (A) | | | 1,157 | | | 880 |
Wells Fargo Mortgage-Backed Securities Trust, Ser 2006-2, Cl 3A1 | | | | | | |
5.750%, 03/25/36 | | | 13,651 | | | 9,605 |
Wells Fargo Mortgage-Backed Securities Trust, Ser 2006-AR18, Cl 1A1 | | | | | | |
5.922%, 07/25/09 (A) | | | 1,411 | | | 967 |
Zuni Mortgage Loan Trust,
Ser 2006-OA1, Cl A1 | | | | | | |
0.439%, 06/25/09 (A) | | | 6,702 | | | 6,598 |
| | | | | | |
| | | | | | 720,330 |
| | | | | | |
Total Mortgage-Backed Securities
(Cost $2,772,821) ($ Thousands) | | | | | | 2,621,018 |
| | | | | | |
|
CORPORATE OBLIGATIONS — 28.8% |
| | |
Consumer Discretionary — 1.9% | | | | | | |
British Sky Broadcasting Group | | | | | | |
9.500%, 11/15/18 (B) (C) | | | 7,660 | | | 8,786 |
Comcast | | | | | | |
6.500%, 01/15/17 | | | 2,155 | | | 2,231 |
6.500%, 01/15/15 | | | 3,635 | | | 3,761 |
5.700%, 05/15/18 | | | 2,320 | | | 2,301 |
Comcast Cable Communications | | | | | | |
8.375%, 03/15/13 | | | 9,470 | | | 10,548 |
6.750%, 01/30/11 | | | 1,840 | | | 1,954 |
COX Communications | | | | | | |
7.875%, 08/15/09 | | | 440 | | | 445 |
CVS | | | | | | |
5.789%, 01/10/26 (B) | | | 2,019 | | | 1,811 |
CVS Lease Pass-Through | | | | | | |
6.036%, 12/10/28 (B) | | | 10,226 | | | 8,423 |
5.880%, 01/10/28 (B) | | | 181 | | | 148 |
| | |
| 164 | | SEI Institutional Investments Trust / Annual Report / May 31, 2009 |
| | | | | | |
| Description | | Face Amount
($ Thousands) | | Market Value
($ Thousands) |
| | | | | | |
DaimlerChrysler | | | | | | |
7.300%, 01/15/12 | | $ | 1,995 | | $ | 2,072 |
6.500%, 11/15/13 | | | 2,245 | | | 2,248 |
Eastman Kodak | | | | | | |
7.250%, 11/15/13 | | | 2,445 | | | 1,504 |
JetBlue Airways Private Trust,
Ser 2004-2, Cl G1 | | | | | | |
1.258%, 08/17/09 (A) | | | 4,002 | | | 2,521 |
McDonald’s MTN | | | | | | |
5.350%, 03/01/18 (C) | | | 6,930 | | | 7,202 |
Nordstrom | | | | | | |
6.750%, 06/01/14 | | | 3,065 | | | 3,085 |
Rogers Cable | | | | | | |
5.500%, 03/15/14 | | | 1,165 | | | 1,173 |
Target | | | | | | |
4.000%, 06/15/13 | | | 355 | | | 354 |
Thomson Reuters | | | | | | |
5.950%, 07/15/13 | | | 1,655 | | | 1,681 |
Time Warner | | | | | | |
7.700%, 05/01/32 | | | 1,385 | | | 1,270 |
6.875%, 05/01/12 | | | 130 | | | 137 |
Time Warner Cable | | | | | | |
8.750%, 02/14/19 (C) | | | 7,085 | | | 8,139 |
8.250%, 04/01/19 | | | 2,600 | | | 2,913 |
5.850%, 05/01/17 | | | 1,230 | | | 1,215 |
Time Warner Entertainment | | | | | | |
8.375%, 07/15/33 | | | 1,180 | | | 1,225 |
Wal-Mart Stores | | | | | | |
6.200%, 04/15/38 | | | 1,550 | | | 1,608 |
5.800%, 02/15/18 | | | 3,360 | | | 3,616 |
Yum! Brands | | | | | | |
6.875%, 11/15/37 | | | 2,055 | | | 1,828 |
| | | | | | |
| | | | | | 84,199 |
| | | | | | |
| | |
Consumer Staples — 1.2% | | | | | | |
Altria Group | | | | | | |
9.950%, 11/10/38 | | | 1,650 | | | 1,847 |
9.700%, 11/10/18 | | | 5,215 | | | 5,945 |
Anheuser-Busch InBev Worldwide | | | | | | |
7.750%, 01/15/19 (B) (C) | | | 3,550 | | | 3,818 |
6.875%, 11/15/19 (B) | | | 1,505 | | | 1,522 |
Bunge Finance | | | | | | |
5.900%, 04/01/17 | | | 107 | | | 94 |
CVS Caremark | | | | | | |
6.600%, 03/15/19 | | | 280 | | | 291 |
Diageo Capital | | | | | | |
7.375%, 01/15/14 | | | 9,625 | | | 10,697 |
GlaxoSmithKline Capital | | | | | | |
4.375%, 04/15/14 | | | 200 | | | 205 |
Kellogg | | | | | | |
4.450%, 05/30/16 | | | 1,360 | | | 1,349 |
Kraft Foods | | | | | | |
6.750%, 02/19/14 (C) | | | 1,320 | | | 1,436 |
6.125%, 02/01/18 | | | 6,560 | | | 6,694 |
| | | | | | |
| Description | | Face Amount
($ Thousands) | | Market Value
($ Thousands) |
| | | | | | |
PepsiCo | | | | | | |
7.900%, 11/01/18 | | $ | 4,000 | | $ | 4,798 |
Philip Morris Capital | | | | | | |
7.500%, 07/16/09 | | | 1,155 | | | 1,155 |
Roche Holdings | | | | | | |
6.000%, 03/01/19 (B) | | | 8,902 | | | 9,220 |
Safeway | | | | | | |
6.350%, 08/15/17 | | | 5,196 | | | 5,501 |
| | | | | | |
| | | | | | 54,572 |
| | | | | | |
| | |
Energy — 3.9% | | | | | | |
Anadarko Finance, Ser B | | | | | | |
7.500%, 05/01/31 | | | 5,363 | | | 4,858 |
Anadarko Petroleum | | | | | | |
8.700%, 03/15/19 (C) | | | 3,980 | | | 4,432 |
7.625%, 03/15/14 | | | 7,110 | | | 7,629 |
6.450%, 09/15/36 | | | 1,665 | | | 1,386 |
5.950%, 09/15/16 | | | 5,010 | | | 4,792 |
Apache | | | | | | |
6.000%, 09/15/13 | | | 3,300 | | | 3,564 |
5.625%, 01/15/17 | | | 390 | | | 406 |
Baker Hughes | | | | | | |
7.500%, 11/15/18 | | | 5,380 | | | 6,199 |
BP AMI Leasing | | | | | | |
5.523%, 05/08/19 (B) | | | 6,125 | | | 6,113 |
Conoco Funding | | | | | | |
7.250%, 10/15/31 (C) | | | 885 | | | 915 |
6.950%, 04/15/29 | | | 3,685 | | | 3,785 |
6.350%, 10/15/11 (C) | | | 430 | | | 472 |
ConocoPhillips | | | | | | |
5.900%, 05/15/38 (C) | | | 700 | | | 647 |
5.900%, 10/15/32 | | | 10 | | | 9 |
El Paso | | | | | | |
6.950%, 06/01/28 | | | 2,250 | | | 1,637 |
Energy Transfer Partners | | | | | | |
9.000%, 04/15/19 | | | 3,425 | | | 3,824 |
8.500%, 04/15/14 | | | 4,415 | | | 4,914 |
6.700%, 07/01/18 (C) | | | 4,900 | | | 4,716 |
Enterprise Products Operating LLC | | | | | | |
9.750%, 01/31/14 | | | 7,250 | | | 8,091 |
Gaz Capital for Gazprom | | | | | | |
6.510%, 03/07/22 (B) | | | 1,790 | | | 1,338 |
6.212%, 11/22/16 (B) | | | 4,887 | | | 4,135 |
Hess | | | | | | |
8.125%, 02/15/19 | | | 4,200 | | | 4,615 |
7.875%, 10/01/29 | | | 1,130 | | | 1,146 |
7.300%, 08/15/31 (C) | | | 4,595 | | | 4,386 |
Husky Energy | | | | | | |
7.250%, 12/15/19 | | | 3,190 | | | 3,329 |
6.800%, 09/15/37 | | | 1,850 | | | 1,663 |
5.900%, 06/15/14 | | | 1,095 | | | 1,119 |
KazMunaiGaz Finance MTN | | | | | | |
8.375%, 07/02/13 (B) | | | 4,540 | | | 4,131 |
| | |
| SEI Institutional Investments Trust / Annual Report / May 31, 2009 | | 165 |
SCHEDULE OF INVESTMENTS
Core Fixed Income Fund (Continued)
May 31, 2009
| | | | | | |
| Description | | Face Amount
($ Thousands) | | Market Value
($ Thousands) |
| | | | | | |
Kerr-McGee | | | | | | |
6.950%, 07/01/24 | | $ | 2,325 | | $ | 2,035 |
Kinder Morgan Energy Partners | | | | | | |
7.125%, 03/15/12 | | | 1,760 | | | 1,849 |
6.950%, 01/15/38 | | | 3,660 | | | 3,392 |
6.000%, 02/01/17 | | | 3,140 | | | 3,028 |
5.950%, 02/15/18 (C) | | | 2,570 | | | 2,457 |
5.000%, 12/15/13 | | | 1,190 | | | 1,173 |
Knight | | | | | | |
6.500%, 09/01/12 | | | 7,145 | | | 6,913 |
Mantis Reef | | | | | | |
4.799%, 11/03/09 (B) | | | 1,397 | | | 1,372 |
Occidental Petroleum | | | | | | |
7.000%, 11/01/13 (C) | | | 7,060 | | | 8,076 |
Pemex Project Funding Master Trust | | | | | | |
6.625%, 06/15/35 | | | 5,762 | | | 5,354 |
Petrobras International Finance | | | | | | |
7.875%, 03/15/19 (C) | | | 2,565 | | | 2,796 |
6.125%, 10/06/16 | | | 3,500 | | | 3,535 |
5.875%, 03/01/18 | | | 1,990 | | | 1,944 |
Plains All American Pipeline | | | | | | |
6.500%, 05/01/18 | | | 654 | | | 632 |
Ras Laffan Liquefied Natural Gas III | | | | | | |
6.332%, 09/30/27 (B) | | | 2,065 | | | 1,849 |
Shell International Finance BV | | | | | | |
6.375%, 12/15/38 (C) | | | 2,790 | | | 3,093 |
Sonat | | | | | | |
7.625%, 07/15/11 | | | 2,880 | | | 2,833 |
Spectra Energy Capital LLC | | | | | | |
7.500%, 09/15/38 | | | 1,695 | | | 1,527 |
StatoilHydro | | | | | | |
5.250%, 04/15/19 | | | 2,515 | | | 2,541 |
Talisman Energy | | | | | | |
7.750%, 06/01/19 | | | 50 | | | 52 |
TransCanada Pipelines | | | | | | |
7.625%, 01/15/39 | | | 2,260 | | | 2,483 |
Valero Energy | | | | | | |
9.375%, 03/15/19 (C) | | | 4,260 | | | 4,769 |
Weatherford International | | | | | | |
9.625%, 03/01/19 | | | 950 | | | 1,072 |
6.350%, 06/15/17 | | | 1,615 | | | 1,512 |
5.950%, 06/15/12 | | | 1,340 | | | 1,321 |
Williams | | | | | | |
8.750%, 01/15/20 (B) | | | 3,750 | | | 3,863 |
8.750%, 03/15/32 (C) | | | 2,170 | | | 2,083 |
7.750%, 06/15/31 | | | 740 | | | 640 |
Williams, Ser A | | | | | | |
7.500%, 01/15/31 | | | 20 | | | 17 |
XTO Energy | | | | | | |
7.500%, 04/15/12 | | | 1,320 | | | 1,384 |
6.750%, 08/01/37 | | | 390 | | | 387 |
5.750%, 12/15/13 | | | 2,145 | | | 2,240 |
5.650%, 04/01/16 | | | 390 | | | 390 |
5.500%, 06/15/18 (C) | | | 5,622 | | | 5,516 |
| | | | | | |
| | | | | | 178,379 |
| | | | | | |
| | | | | | |
| Description | | Face Amount
($ Thousands) | | Market Value
($ Thousands) |
| | | | | | |
| | |
Financials — 13.8% | | | | | | |
ABX Financing | | | | | | |
6.350%, 10/15/36 (B) | | $ | 5,200 | | $ | 4,599 |
Aegon, Ser CMS | | | | | | |
3.217%, 07/15/09 (A) | | | 2,180 | | | 703 |
Aiful | | | | | | |
5.000%, 08/10/10 (B) | | | 2,620 | | | 1,480 |
4.450%, 02/16/10 (B) | | | 1,377 | | | 985 |
Allied World Assurance Holdings | | | | | | |
7.500%, 08/01/16 | | | 2,000 | | | 1,561 |
American Express | | | | | | |
8.150%, 03/19/38 | | | 2,515 | | | 2,448 |
7.250%, 05/20/14 (C) | | | 2,270 | | | 2,318 |
6.800%, 09/01/66 (A) | | | 1,725 | | | 1,170 |
5.875%, 05/02/13 (C) | | | 2,100 | | | 2,038 |
American General Finance MTN | | | | | | |
6.900%, 12/15/17 (C) | | | 1,500 | | | 742 |
American International Group | | | | | | |
8.250%, 08/15/18(B) | | | 880 | | | 420 |
6.250%, 03/15/37 | | | 5,000 | | | 1,100 |
5.850%, 01/16/18 (C) | | | 2,620 | | | 1,110 |
ASIF Global Financing XIX | | | | | | |
4.900%, 01/17/13 (B) | | | 450 | | | 371 |
Australia & New Zealand Banking Group | | | | | | |
1.712%, 10/30/09 (A) | | | 1,400 | | | 743 |
BA Covered Bond Issuer | | | | | | |
5.500%, 06/14/12 (B) | | | 1,500 | | | 1,483 |
BAC Capital Trust XIV | | | | | | |
5.630%, 09/15/09 (A) | | | 180 | | | 83 |
BAC Capital Trust XV | | | | | | |
1.468%, 09/01/09 (A) | | | 2,735 | | | 1,103 |
Bank of America MTN | | | | | | |
8.000%, 12/29/49 (A) (C) | | | 2,603 | | | 2,037 |
7.625%, 06/01/19 | | | 5,740 | | | 5,806 |
7.375%, 05/15/14 | | | 3,030 | | | 3,189 |
5.750%, 12/01/17 (C) | | | 4,545 | | | 4,059 |
5.650%, 05/01/18 (C) | | | 2,686 | | | 2,404 |
5.420%, 03/15/17 | | | 2,500 | | | 2,094 |
5.375%, 06/15/14 | | | 1,150 | | | 1,110 |
3.125%, 06/15/12 (C) | | | 1,160 | | | 1,203 |
Bank of Ireland | | | | | | |
1.482%, 06/30/09 (A) | | | 1,030 | | | 256 |
Bank of Scotland | | | | | | |
1.500%, 11/30/09 (A) | | | 330 | | | 135 |
Bank One | | | | | | |
7.875%, 08/01/10 | | | 4,440 | | | 4,646 |
Banponce Trust I, Ser A | | | | | | |
8.327%, 02/01/27 | | | 2,590 | | | 1,491 |
Barclays Bank | | | | | | |
1.875%, 08/07/49 (A) | | | 380 | | | 232 |
Barnett Capital III | | | | | | |
1.653%, 08/01/09 (A) | | | 600 | | | 270 |
BB&T MTN | | | | | | |
6.850%, 04/30/19 | | | 150 | | | 151 |
| | |
| 166 | | SEI Institutional Investments Trust / Annual Report / May 31, 2009 |
| | | | | | |
| Description | | Face Amount
($ Thousands) | | Market Value
($ Thousands) |
| | | | | | |
Bear Stearns | | | | | | |
7.250%, 02/01/18 | | $ | 3,960 | | $ | 4,083 |
6.400%, 10/02/17 | | | 11,020 | | | 10,796 |
4.650%, 07/02/18 | | | 3,000 | | | 2,602 |
BNP Paribas | | | | | | |
1.928%, 09/30/09 (A) | | | 510 | | | 240 |
BP Capital Markets | | | | | | |
5.250%, 11/07/13 | | | 7,600 | | | 8,065 |
3.625%, 05/08/14 | | | 100 | | | 99 |
Capital One Financial MTN | | | | | | |
7.375%, 05/23/14 | | | 1,810 | | | 1,865 |
1.573%, 06/10/09 (A) (C) | | | 2,180 | | | 2,136 |
Caterpillar Financial Services MTN | | | | | | |
6.200%, 09/30/13 (C) | | | 5,640 | | | 5,791 |
Cedar Brakes II LLC | | | | | | |
9.875%, 09/01/13 (B) | | | 3,953 | | | 4,036 |
Chase Capital VI | | | | | | |
1.653%, 08/03/09 (A) | | | 2,000 | | | 923 |
Citigroup | | | | | | |
8.500%, 05/22/19 | | | 300 | | | 311 |
6.875%, 03/05/38 (C) | | | 12,160 | | | 10,701 |
6.500%, 08/19/13 | | | 12,715 | | | 12,612 |
6.125%, 08/25/36 | | | 2,000 | | | 1,481 |
6.125%, 05/15/18 (C) | | | 5,544 | | | 4,946 |
5.500%, 04/11/13 | | | 4,479 | | | 4,296 |
5.500%, 02/15/17 | | | 10,000 | | | 8,221 |
5.000%, 09/15/14 | | | 2,890 | | | 2,513 |
1.211%, 08/25/09 (A) | | | 2,289 | | | 1,008 |
Citigroup Capital III | | | | | | |
7.625%, 12/01/36 | | | 2,000 | | | 1,402 |
Citigroup Capital XXI | | | | | | |
8.300%, 12/21/57 (A) (C) | | | 2,050 | | | 1,825 |
Citigroup Funding | | | | | | |
2.000%, 03/30/12 (C) | | | 7,585 | | | 7,625 |
Corestates Capital I | | | | | | |
8.000%, 12/15/26 (B) | | | 629 | | | 411 |
Countrywide Financial MTN | | | | | | |
5.800%, 06/07/12 | | | 5,353 | | | 5,371 |
4.000%, 03/22/11 | | | 5,750 | | | 5,557 |
Credit Suisse NY | | | | | | |
6.000%, 02/15/18 | | | 10,280 | | | 9,554 |
5.500%, 05/01/14 | | | 5,755 | | | 5,813 |
5.000%, 05/15/13 | | | 8,075 | | | 8,035 |
Credit Suisse USA | | | | | | |
5.125%, 01/15/14 | | | 335 | | | 334 |
Delta Air Lines | | | | | | |
6.619%, 03/18/11 | | | 311 | | | 295 |
Depfa ACS Bank | | | | | | |
5.125%, 03/16/37 (B) | | | 4,200 | | | 2,304 |
Deutsche Bank Capital Funding Trust | | | | | | |
5.628%, 01/19/49 (A) (B) (C) | | | 4,789 | | | 3,092 |
Dresdner Funding Trust I | | | | | | |
8.151%, 06/30/31(B) | | | 365 | | | 156 |
| | | | | | |
| Description | | Face Amount
($ Thousands) | | Market Value
($ Thousands) |
| | | | | | |
Eksportfinans | | | | | | |
5.500%, 05/25/16 | | $ | 4,250 | | $ | 4,384 |
ERP Operating | | | | | | |
5.125%, 03/15/16‡ | | | 1,000 | | | 887 |
Export-Import Bank of Korea | | | | | | |
5.500%, 10/17/12 | | | 2,320 | | | 2,371 |
Farmers Exchange Capital | | | | | | |
7.200%, 07/15/48 (B) | | | 2,519 | | | 1,330 |
7.050%, 07/15/28 (B) | | | 1,063 | | | 680 |
Farmers Insurance Exchange | | | | | | |
8.625%, 05/01/24 (B) | | | 4,118 | | | 3,063 |
First Industrial MTN | | | | | | |
7.500%, 12/01/17 | | | 1,765 | | | 1,005 |
Fleet Capital Trust II | | | | | | |
7.920%, 12/11/26 | | | 1,600 | | | 1,215 |
Ford Motor Credit LLC | | | | | | |
7.875%, 06/15/10 | | | 7,200 | | | 6,853 |
7.375%, 10/28/09 (C) | | | 15,740 | | | 15,352 |
General Electric Capital | | | | | | |
6.875%, 01/10/39 (C) | | | 11,870 | | | 10,913 |
6.375%, 11/15/09 (A) | | | 8,380 | | | 5,916 |
5.900%, 05/13/14 | | | 5,010 | | | 5,048 |
5.625%, 05/01/18 (C) | | | 8,045 | | | 7,697 |
1.580%, 06/15/09 (A) | | | 6,550 | | | 5,466 |
1.396%, 08/05/09 (A) | | | 4,345 | | | 2,672 |
0.915%, 08/20/09 (A) | | | 2,000 | | | 1,624 |
Glen Meadow Pass-Through Trust | | | | | | |
6.505%, 02/12/67 (A) (B) | | | 2,900 | | | 1,433 |
Glitnir Banki | | | | | | |
7.451%, 09/14/16 (B) (D) | | | 500 | | | — |
6.693%, 06/15/16 (B) (D) | | | 4,480 | | | — |
6.375%, 09/25/12 (B) (D) | | | 3,100 | | | 434 |
6.330%, 07/28/11 (B) (D) | | | 2,440 | | | 342 |
GMAC LLC | | | | | | |
8.000%, 12/31/18 (B) | | | 305 | | | 221 |
7.750%, 01/19/10 (B) | | | 1,545 | | | 1,475 |
7.500%, 12/31/13 (B) | | | 2,110 | | | 1,762 |
7.250%, 03/02/11 (B) | | | 1,744 | | | 1,570 |
2.868%, 09/01/09 (A) (B) | | | 4,579 | | | 3,434 |
Goldman Sachs Capital II | | | | | | |
5.793%, 12/01/09 (A) | | | 22,285 | | | 12,929 |
Goldman Sachs Group | | | | | | |
7.500%, 02/15/19 (C) | | | 9,566 | | | 10,066 |
6.750%, 10/01/37 | | | 5,325 | | | 4,464 |
6.600%, 01/15/12 | | | 2,630 | | | 2,779 |
6.150%, 04/01/18 | | | 7,500 | | | 7,240 |
6.000%, 05/01/14 | | | 4,380 | | | 4,453 |
5.450%, 11/01/12 | | | 6,660 | | | 6,824 |
5.150%, 01/15/14 (C) | | | 2,385 | | | 2,340 |
5.125%, 01/15/15 | | | 2,035 | | | 1,981 |
4.500%, 06/15/10 | | | 450 | | | 458 |
2.150%, 03/15/12 | | | 9,545 | | | 9,673 |
1.639%, 07/13/09 (A) | | | 3,000 | | | 2,581 |
1.501%, 07/22/09 (A) | | | 1,000 | | | 840 |
| | |
| SEI Institutional Investments Trust / Annual Report / May 31, 2009 | | 167 |
SCHEDULE OF INVESTMENTS
Core Fixed Income Fund (Continued)
May 31, 2009
| | | | | | |
| Description | | Face Amount
($ Thousands) | | Market Value
($ Thousands) |
| | | | | | |
HBOS | | | | | | |
6.750%, 05/21/18 (B) | | $ | 5,100 | | $ | 3,616 |
HBOS Capital Funding | | | | | | |
6.071%, 06/30/49 (A) (B) | | | 1,920 | | | 762 |
HCP | | | | | | |
6.700%, 01/30/18‡ (C) | | | 960 | | | 824 |
6.300%, 09/15/16‡ (C) | | | 1,015 | | | 868 |
6.000%, 01/30/17‡ | | | 6,610 | | | 5,538 |
5.650%, 12/15/13‡ | | | 3,245 | | | 2,900 |
Highwoods Properties | | | | | | |
7.500%, 04/15/18‡ | | | 1,339 | | | 1,050 |
Hongkong & Shanghai Banking | | | | | | |
1.250%, 07/27/09 (A) | | | 195 | | | 87 |
HRPT Properties Trust | | | | | | |
6.650%, 01/15/18‡ | | | 150 | | | 120 |
HSBC Bank, Ser 3M | | | | | | |
1.913%, 06/29/49 (A) | | | 1,160 | | | 516 |
HSBC Finance | | | | | | |
8.000%, 07/15/10 | | | 2,330 | | | 2,388 |
7.000%, 05/15/12 | | | 1,975 | | | 2,017 |
6.375%, 11/27/12 | | | 365 | | | 362 |
4.750%, 07/15/13 | | | 36 | | | 33 |
1.381%, 07/15/09 (A) | | | 500 | | | 410 |
HSBC Holdings | | | | | | |
6.800%, 06/01/38 | | | 1,585 | | | 1,494 |
Hutchison Whampoa International | | | | | | |
7.625%, 04/09/19 (B) | | | 2,260 | | | 2,406 |
ILFC E-Capital Trust II | | | | | | |
6.250%, 12/21/65 (A) (B) (C) | | | ,200 | | | 456 |
Intergas Finance | | | | | | |
6.375%, 05/14/17 (B) | | | 3,516 | | | 2,602 |
Jefferies Group | | | | | | |
6.250%, 01/15/36 | | | 100 | | | 59 |
JPMorgan Chase | | | | | | |
7.900%, 10/30/09 (A) | | | 5,732 | | | 4,786 |
6.400%, 05/15/38 | | �� | 2,800 | | | 2,826 |
6.300%, 04/23/19 | | | 8,965 | | | 8,919 |
6.000%, 10/01/17 (C) | | | 3,720 | | | 3,574 |
5.750%, 01/02/13 | | | 3,670 | | | 3,756 |
5.375%, 10/01/12 | | | 4,410 | | | 4,607 |
5.150%, 10/01/15 (C) | | | 240 | | | 231 |
5.125%, 09/15/14 | | | 445 | | | 441 |
4.650%, 06/01/14 (C) | | | 3,630 | | | 3,606 |
2.125%, 06/22/12 (C) | | | 9,930 | | | 10,017 |
JPMorgan Chase Bank | | | | | | |
1.656%, 06/15/09 (A) | | | 4,250 | | | 3,459 |
JPMorgan Chase Capital XIII | | | | | | |
2.182%, 06/30/09 (A) | | | 1,440 | | | 628 |
JPMorgan Chase Capital XXV | | | | | | |
6.800%, 10/01/37 (C) | | | 3,135 | | | 2,658 |
Kaupthing Bank (B) (D) (J) | | | | | | |
7.625%, 02/28/15 | | | 8,130 | | | 325 |
7.125%, 05/19/16 | | | 12,000 | | | 1 |
5.750%, 10/04/11 | | | 1,120 | | | 101 |
| | | | | | |
| Description | | Face Amount
($ Thousands) | | Market Value
($ Thousands) |
| | | | | | |
KeyBank | | | | | | |
3.200%, 06/15/12 | | $ | 2,220 | | $ | 2,303 |
Landsbanki Islands | | | | | | |
6.100%, 08/25/11* (B) (D) | | | 6,520 | | | 32 |
Lazard Group | | | | | | |
7.125%, 05/15/15 | | | 4,420 | | | 3,857 |
6.850%, 06/15/17 | | | 3,595 | | | 3,110 |
Lehman Brothers Holdings* | | | | | | |
6.750%, 12/28/17 (D) | | | 10,370 | | | 1 |
6.500%, 07/19/17 (D) | | | 4,040 | | | — |
6.200%, 09/26/14 (D) | | | 1,560 | | | 230 |
5.250%, 02/06/12 (D) | | | 965 | | | 142 |
Lehman Brothers Holdings Capital Trust VII MTN | | | | | | |
5.857%, 11/29/49* (D) | | | 20,630 | | | 2 |
Liberty Mutual Group | | | | | | |
7.500%, 08/15/36 (I) | | | 2,028 | | | 1,300 |
Lloyds Banking Group | | | | | | |
5.920%, 10/01/09 (A) (B) | | | 8,400 | | | 3,192 |
MBNA Capital, Ser A | | | | | | |
8.278%, 12/01/26 | | | 2,465 | | | 1,966 |
Merna Reinsurance | | | | | | |
2.970%, 06/30/09 (A) (B) | | | 4,950 | | | 4,581 |
Merrill Lynch MTN | | | | | | |
8.950%, 11/18/09 (A) | | | 4,315 | | | 3,398 |
8.680%, 11/02/09 (A) | | | 4,160 | | | 3,474 |
6.150%, 04/25/13 | | | 210 | | | 202 |
5.450%, 02/05/13 | | | 900 | | | 839 |
MetLife | | | | | | |
7.717%, 02/15/19 | | | 3,500 | | | 3,720 |
6.400%, 12/15/36 | | | 10,010 | | | 7,107 |
MetLife Capital Trust X | | | | | | |
9.250%, 10/08/09 (A) (B) | | | 2,700 | | | 2,295 |
Morgan Stanley | | | | | | |
7.300%, 05/13/19 | | | 2,865 | | | 2,935 |
6.750%, 04/15/11 | | | 1,060 | | | 1,104 |
6.625%, 04/01/18 | | | 8,640 | | | 8,541 |
6.000%, 05/13/14 | | | 14,495 | | | 14,566 |
5.950%, 12/28/17 | | | 3,080 | | | 2,893 |
5.300%, 03/01/13 (C) | | | 4,135 | | | 4,147 |
5.050%, 01/21/11 | | | 525 | | | 531 |
4.750%, 04/01/14 | | | 2,270 | | | 2,077 |
3.250%, 12/01/11 (C) | | | 1,130 | | | 1,174 |
1.557%, 07/20/09 (A) | | | 7,725 | | | 5,690 |
1.411%, 07/15/09 (A) | | | 2,250 | | | 2,207 |
1.357%, 07/20/09 (A) | | | 525 | | | 500 |
Morgan Stanley, Ser G | | | | | | |
1.449%, 07/09/09 (A) | | | 950 | | | 786 |
MUFG Capital Finance | | | | | | |
6.346%, 07/25/49 (A) | | | 1,840 | | | 1,597 |
National Australia Bank | | | | | | |
5.350%, 06/12/13 (B) | | | 5,495 | | | 5,549 |
National Capital Trust II | | | | | | |
5.486%, 12/29/49 (A) (B) | | | 3,207 | | | 1,892 |
| | |
| 168 | | SEI Institutional Investments Trust / Annual Report / May 31, 2009 |
| | | | | | |
| Description | | Face Amount
($ Thousands) | | Market Value
($ Thousands) |
| | | | | | |
Nationwide Mutual Insurance | | | | | | |
6.600%, 04/15/34 (B) | | $ | 2,483 | | $ | 1,358 |
5.810%, 06/15/09 (A) (B) | | | 3,900 | | | 2,279 |
NB Capital Trust IV | | | | | | |
8.250%, 04/15/27 | | | 4,865 | | | 3,844 |
Northern Trust | | | | | | |
4.625%, 05/01/14 | | | 75 | | | 76 |
Pemex Finance | | | | | | |
9.690%, 08/15/09 | | | 125 | | | 127 |
Power Receivables Finance | | | | | | |
6.290%, 01/01/12 (B) | | | 688 | | | 674 |
6.290%, 01/01/12 | | | 2,179 | | | 2,135 |
Prime Property Fund | | | | | | |
5.600%, 06/15/11‡ (B) | | | 3,380 | | | 2,756 |
5.500%, 01/15/14‡ (B) | | | 5,000 | | | 3,383 |
Principal Life Global Funding I | | | | | | |
6.250%, 02/15/12 (B) | | | 600 | | | 605 |
5.050%, 03/15/15 (B) | | | 750 | | | 689 |
Rabobank Capital Funding II | | | | | | |
5.260%, 12/29/49 (A) (B) | | | 210 | | | 162 |
Rabobank Capital Funding Trust | | | | | | |
5.254%, 10/21/16 (A) (B) | | | 440 | | | 330 |
Rabobank Nederland | | | | | | |
11.000%, 12/31/09 (A) (B) | | | 1,950 | | | 1,950 |
Resona Preferred Global Securities Cayman | | | | | | |
7.191%, 07/30/49 (A) (B) | | | 2,590 | | | 1,813 |
Royal Bank of Canada | | | | | | |
1.419%, 06/30/09 (A) | | | 860 | | | 420 |
Royal Bank of Scotland Group | | | | | | |
7.640%, 09/30/09 (A) | | | 1,300 | | | 489 |
RSHB Capital | | | | | | |
6.299%, 05/15/17 (B) | | | 5,600 | | | 4,816 |
Security Benefit Life Insurance | | | | | | |
8.750%, 05/15/16 (B) | | | 5,200 | | | 780 |
Shinsei Finance Cayman | | | | | | |
6.418%, 01/29/49 (A) (B) (C) | | | 4,960 | | | 1,538 |
Simon Property Group | | | | | | |
6.750%, 05/15/14‡ | | | 65 | | | 65 |
SMFG Preferred Capital | | | | | | |
6.078%, 01/25/17 (A) (B) | | | 6,810 | | | 5,259 |
Societe Generale | | | | | | |
1.375%, 11/29/49 (A) | | | 680 | | | 444 |
1.375%, 11/30/09 (A) | | | 180 | | | 117 |
State Street | | | | | | |
4.300%, 05/30/14 | | | 60 | | | 60 |
Stingray Pass-Through Trust MTN | | | | | | |
5.902%, 01/12/15 (B) | | | 3,600 | | | 324 |
SunTrust Capital VIII | | | | | | |
6.100%, 12/15/36 (A) | | | 5,450 | | | 3,529 |
SunTrust Preferred Capital I | | | | | | |
5.853%, 12/15/11 (A) (C) | | | 15,720 | | | 9,589 |
TNK-BP Finance | | | | | | |
7.875%, 03/13/18 (B) | | | 2,140 | | | 1,765 |
| | | | | | |
| Description | | Face Amount
($ Thousands) | | Market Value
($ Thousands) |
| | | | | | |
7.500%, 07/18/16 | | $ | 140 | | $ | 118 |
7.500%, 07/18/16 (B) | | | 3,750 | | | 3,112 |
6.625%, 03/20/17 (B) | | | 1,750 | | | 1,361 |
Toll Road Investors Partnership II | | | | | | |
5.050%, 02/15/45 (B) (E) | | | 7,217 | | | 649 |
Travelers | | | | | | |
6.250%, 09/15/09 (A) | | | 5,890 | | | 4,178 |
5.900%, 06/02/19 | | | 145 | | | 149 |
UDR MTN | | | | | | |
5.000%, 01/15/12‡ | | | 2,000 | �� | | 1,826 |
Wachovia MTN | | | | | | |
5.500%, 05/01/13 | | | 600 | | | 612 |
5.250%, 08/01/14 | | | 250 | | | 241 |
Wachovia Bank | | | | | | |
6.000%, 11/15/17 | | | 6,800 | | | 6,387 |
Wachovia Capital Trust III | | | | | | |
5.800%, 09/15/09 (A) | | | 2,410 | | | 1,470 |
WEA Finance LLC | | | | | | |
7.500%, 06/02/14 (B) | | | 5,220 | | | 5,171 |
7.125%, 04/15/18 (B) | | | 9,210 | | | 8,634 |
Wells Fargo | | | | | | |
7.980%, 09/15/09 (A) | | | 395 | | | 308 |
5.000%, 11/15/14 | | | 1,145 | | | 1,106 |
Wells Fargo Capital X | | | | | | |
5.950%, 12/15/36 | | | 960 | | | 703 |
Wells Fargo Capital XV | | | | | | |
9.750%, 09/26/09 (A) (C) | | | 7,770 | | | 7,226 |
Westfield Capital | | | | | | |
4.375%, 11/15/10 (B) | | | 4,600 | | | 4,488 |
Westfield Group | | | | | | |
5.400%, 10/01/12 (B) (C) | | | 2,528 | | | 2,426 |
Woodbourne Capital Trust I | | | | | | |
1.495%, 04/08/49 (A) (B) | | | 625 | | | 219 |
Woodbourne Capital Trust II | | | | | | |
1.495%, 04/08/49 (A) (B) | | | 625 | | | 219 |
Woodbourne Capital Trust III | | | | | | |
1.495%, 04/08/49 (A) (B) | | | 625 | | | 219 |
Woodbourne Capital Trust IV | | | | | | |
1.495%, 04/08/49 (A) (B) | | | 625 | | | 219 |
ZFS Finance USA Trust I | | | | | | |
6.150%, 12/15/65 (A) (B) | | | 2,549 | | | 1,670 |
| | | | | | |
| | | | | | 626,284 |
| | | | | | |
| | |
Health Care — 0.9% | | | | | | |
Abbott Laboratories | | | | | | |
5.600%, 11/30/17 | | | 470 | | | 500 |
Amgen | | | | | | |
6.400%, 02/01/39 | | | 2,875 | | | 2,932 |
5.700%, 02/01/19 | | | 100 | | | 103 |
Cardinal Health | | | | | | |
5.850%, 12/15/17 | | | 4,875 | | | 4,455 |
Coventry Health Care | | | | | | |
5.950%, 03/15/17 | | | 3,205 | | | 2,436 |
| | |
| SEI Institutional Investments Trust / Annual Report / May 31, 2009 | | 169 |
SCHEDULE OF INVESTMENTS
Core Fixed Income Fund (Continued)
May 31, 2009
| | | | | | |
| Description | | Face Amount
($ Thousands) | | Market Value
($ Thousands) |
| | | | | | |
GlaxoSmithKline Capital | | | | | | |
6.375%, 05/15/38 (C) | | $ | 1,725 | | $ | 1,823 |
GlaxoSmithKline Capital | | | | | | |
5.650%, 05/15/18 | | | 7,510 | | | 7,804 |
HCA | | | | | | |
5.750%, 03/15/14 | | | 5,548 | | | 4,299 |
Hospira | | | | | | |
6.400%, 05/15/15 | | | 20 | | | 20 |
Humana | | | | | | |
7.200%, 06/15/18 | | | 1,270 | | | 1,067 |
Pfizer | | | | | | |
7.200%, 03/15/39 | | | 4,440 | | | 5,019 |
6.200%, 03/15/19 | | | 2,785 | | | 2,981 |
Schering-Plough | | | | | | |
6.550%, 09/15/37 | | | 3,205 | | | 3,264 |
Tenet Healthcare | | | | | | |
7.375%, 02/01/13 | | | 168 | | | 162 |
UnitedHealth Group | | | | | | |
6.875%, 02/15/38 | | | 2,040 | | | 1,808 |
WellPoint | | | | | | |
5.875%, 06/15/17 | | | 330 | | | 315 |
Wyeth | | | | | | |
5.950%, 04/01/37 | | | 3,610 | | | 3,669 |
| | | | | | |
| | | | | | 42,657 |
| | | | | | |
| | |
Industrials — 1.5% | | | | | | |
Air 2 US | | | | | | |
8.027%, 10/01/19 (B) | | | 2,816 | | | 1,689 |
America West Airlines, Ser 99-1 | | | | | | |
7.930%, 01/02/19 | | | 1,536 | | | 1,183 |
American Airlines Private Trust,
Ser 99-1 | | | | | | |
7.024%, 10/15/09 | | | 2,320 | | | 2,285 |
Cedar Brakes I LLC | | | | | | |
8.500%, 02/15/14 (B) | | | 1,135 | | | 1,098 |
Continental Airlines | | | | | | |
5.983%, 04/19/22 (C) | | | 3,329 | | | 2,730 |
Continental Airlines, Ser 971A | | | | | | |
7.461%, 04/01/15 | | | 1,397 | | | 1,048 |
Continental Airlines, Ser 99-2 | | | | | | |
7.256%, 03/15/20 | | | 1,262 | | | 1,066 |
Continental Airlines, Ser AMBC | | | | | | |
6.236%, 03/15/20 | | | 2,045 | | | 1,329 |
CSX | | | | | | |
6.300%, 03/15/12 | | | 110 | | | 114 |
Delta Air Lines | | | | | | |
7.379%, 05/18/10 | | | 1,139 | | | 1,110 |
6.821%, 08/10/22 | | | 2,360 | | | 1,900 |
Delta Air Lines, Ser 2001-1 | | | | | | |
7.111%, 09/18/11 | | | 14,850 | | | 13,810 |
General Electric | | | | | | |
5.250%, 12/06/17 | | | 250 | | | 248 |
Northrop Grumman Systems | | | | | | |
7.750%, 03/01/16 | | | 200 | | | 226 |
| | | | | | |
| Description | | Face Amount
($ Thousands) | | Market Value
($ Thousands) |
| | | | | | |
Northwest Airlines, Ser 1A-2 | | | | | | |
6.841%, 04/01/11 | | $ | 4,500 | | $ | 4,005 |
Tyco International Group | | | | | | |
7.000%, 12/15/19 (C) | | | 1,875 | | | 1,755 |
6.875%, 01/15/29 | | | 6,490 | | | 6,161 |
6.750%, 02/15/11 | | | 1,170 | | | 1,220 |
6.375%, 10/15/11 | | | 5,490 | | | 5,766 |
6.000%, 11/15/13 | | | 1,945 | | | 1,950 |
Union Pacific Railroad 2003 Pass Through Trust | | | | | | |
4.698%, 01/02/24 | | | 185 | | | 170 |
United Air Lines | | | | | | |
6.602%, 09/01/13 | | | 108 | | | 106 |
United Parcel Service | | | | | | |
4.500%, 01/15/13 (C) | | | 6,720 | | | 7,137 |
United Technologies | | | | | | |
6.500%, 06/01/09 | | | 1,670 | | | 1,670 |
5.400%, 05/01/35 | | | 670 | | | 595 |
Waste Management | | | | | | |
7.375%, 05/15/29 | | | 5 | | | 5 |
7.125%, 12/15/17 | | | 4,840 | | | 4,841 |
7.100%, 08/01/26 | | | 1,375 | | | 1,233 |
| | | | | | |
| | | | | | 66,450 |
| | | | | | |
| | |
Information Technology — 0.3% | | | | | | |
Cisco Systems | | | | | | |
5.900%, 02/15/39 (C) | | | 1,900 | | | 1,840 |
Hewlett-Packard | | | | | | |
4.750%, 06/02/14 | | | 6,007 | | | 6,292 |
2.950%, 08/15/12 | | | 80 | | | 81 |
International Business Machines | | | | | | |
7.625%, 10/15/18 | | | 1,220 | | | 1,440 |
Xerox | | | | | | |
8.250%, 05/15/14 (C) | | | 910 | | | 923 |
6.350%, 05/15/18 | | | 1,055 | | | 918 |
| | | | | | |
| | | | | | 11,494 |
| | | | | | |
| | |
Materials — 0.8% | | | | | | |
Alcoa | | | | | | |
6.000%, 07/15/13 (C) | | | 4,180 | | | 4,032 |
Barrick | | | | | | |
6.950%, 04/01/19 (C) | | | 2,185 | | | 2,379 |
Codelco | | | | | | |
4.750%, 10/15/14 (B) | | | 900 | | | 914 |
Dow Chemical | | | | | | |
8.550%, 05/15/19 | | | 3,535 | | | 3,535 |
7.600%, 05/15/14 | | | 6,660 | | | 6,741 |
Freeport-McMoRan Copper & Gold | | | | | | |
8.375%, 04/01/17 (C) | | | 7,725 | | | 7,667 |
PPG Industries | | | | | | |
6.650%, 03/15/18 | | | 615 | | | 614 |
5.750%, 03/15/13 | | | 615 | | | 623 |
| | |
| 170 | | SEI Institutional Investments Trust / Annual Report / May 31, 2009 |
| | | | | | |
| Description | | Face Amount
($ Thousands) | | Market Value
($ Thousands) |
| | | | | | |
Rio Tinto Finance USA | | | | | | |
6.500%, 07/15/18 | | $ | 5,080 | | $ | 5,002 |
5.875%, 07/15/13 | | | 1,915 | | | 1,870 |
Stauffer Chemical | | | | | | |
5.775%, 04/15/18 (E) (J) | | | 860 | | | 184 |
5.648%, 04/15/17 (E) (J) | | | 350 | | | 84 |
5.143%, 04/15/10 (E) (J) | | | 300 | | | 169 |
Vale Overseas | | | | | | |
6.875%, 11/21/36 | | | 3,368 | | | 3,045 |
Weyerhaeuser | | | | | | |
6.750%, 03/15/12 | | | 410 | | | 408 |
| | | | | | |
| | | | | | 37,267 |
| | | | | | |
| | |
Sovereign — 0.5% | | | | | | |
Canadian Government Bond | | | | | | |
4.000%, 12/01/31 | | | 1,210 | | | 1,480 |
Deutsche Bundesrepublik | | | | | | |
3.750%, 01/04/15 | | | 6,750 | | | 9,992 |
Republic of Korea | | | | | | |
7.125%, 04/16/19 | | | 5,480 | | | 5,842 |
Republic of South Africa | | | | | | |
6.875%, 05/27/19 | | | 2,265 | | | 2,276 |
Russian Federation Registered | | | | | | |
7.500%, 03/31/30 | | | 1,034 | | | 1,031 |
United Mexican States MTN | | | | | | |
7.500%, 04/08/33 | | | 218 | | | 242 |
5.625%, 01/15/17 | | | 84 | | | 86 |
United Mexican States, Ser A MTN | | | | | | |
6.750%, 09/27/34 | | | 1,268 | | | 1,303 |
| | | | | | |
| | | | | | 22,252 |
| | | | | | |
|
Telecommunication Services — 2.2% |
America Movil | | | | | | |
5.625%, 11/15/17 | | | 2,350 | | | 2,275 |
AT&T | | | | | | |
6.550%, 02/15/39 (C) | | | 8,320 | | | 8,125 |
5.600%, 05/15/18 | | | 400 | | | 405 |
5.100%, 09/15/14 | | | 2,410 | | | 2,497 |
BellSouth | | | | | | |
4.750%, 11/15/12 (C) | | | 190 | | | 198 |
British Telecommunications | | | | | | |
9.625%, 06/15/09 (F) | | | 2,825 | | | 2,967 |
9.125%, 06/15/09 (F) | | | 1,460 | | | 1,549 |
5.950%, 01/15/18 (C) | | | 1,011 | | | 896 |
Deutsche Telekom International Finance | | | | | | |
5.750%, 03/23/16 (C) | | | 2,175 | | | 2,173 |
France Telecom | | | | | | |
7.750%, 03/01/11 (C) | | | 1,905 | | | 2,072 |
New Cingular Wireless Services | | | | | | |
8.125%, 05/01/12 | | | 1,255 | | | 1,396 |
News America | | | | | | |
6.650%, 11/15/37 | | | 260 | | | 220 |
6.200%, 12/15/34 (C) | | | 315 | | | 257 |
| | | | | | |
| Description | | Face Amount
($ Thousands) | | Market Value
($ Thousands) |
| | | | | | |
News America Holdings | | | | | | |
8.875%, 04/26/23 | | $ | 200 | | $ | 193 |
Qwest | | | | | | |
7.500%, 10/01/14 (C) | | | 3,310 | | | 3,161 |
Reed Elsevier Capital | | | | | | |
8.625%, 01/15/19 | | | 2,460 | | | 2,643 |
Rogers Communications | | | | | | |
6.375%, 03/01/14 | | | 6,155 | | | 6,395 |
Royal | | | | | | |
8.000%, 10/01/10 | | | 5,100 | | | 5,379 |
Sprint Capital | | | | | | |
8.750%, 03/15/32 | | | 390 | | | 308 |
8.375%, 03/15/12 (C) | | | 5,300 | | | 5,247 |
6.900%, 05/01/19 (C) | | | 120 | | | 97 |
Telecom Italia Capital | | | | | | |
6.999%, 06/04/18 (C) | | | 3,980 | | | 3,885 |
5.250%, 11/15/13 | | | 580 | | | 564 |
5.250%, 10/01/15 (C) | | | 370 | | | 339 |
4.950%, 09/30/14 | | | 1,320 | | | 1,253 |
Telefonica Emisiones | | | | | | |
5.984%, 06/20/11 | | | 2,225 | | | 2,350 |
Verizon Communications | | | | | | |
8.950%, 03/01/39 | | | 5,410 | | | 6,636 |
7.350%, 04/01/39 | | | 920 | | | 968 |
6.400%, 02/15/38 (C) | | | 660 | | | 638 |
6.350%, 04/01/19 | | | 905 | | | 951 |
6.100%, 04/15/18 | | | 1,580 | | | 1,644 |
5.500%, 02/15/18 | | | 2,810 | | | 2,816 |
Verizon Global Funding | | | | | | |
7.375%, 09/01/12 | | | 1,730 | | | 1,945 |
6.875%, 06/15/12 | | | 465 | | | 512 |
Verizon Maryland | | | | | | |
7.150%, 05/01/23 | | | 600 | | | 574 |
Verizon Wireless Capital LLC | | | | | | |
8.500%, 11/15/18 (B) (C) | | | 3,015 | | | 3,658 |
7.375%, 05/21/28 (B) | | | 7,140 | | | 8,012 |
5.550%, 02/01/14 (B) | | | 9,245 | | | 9,776 |
3.750%, 05/20/11 (B) | | | 7,135 | | | 7,280 |
| | | | | | |
| | | | | | 102,254 |
| | | | | | |
| | |
Utilities — 1.8% | | | | | | |
Allegheny Energy Supply | | | | | | |
8.250%, 04/15/12 (A) (C) (H) (I) | | | 1,955 | | | 2,032 |
Arizona Public Services | | | | | | |
8.000%, 12/30/15 | | | 632 | | | 619 |
Commonwealth Edison | | | | | | |
6.150%, 09/15/17 | | | 1,410 | | | 1,431 |
Consolidated Edison of New York | | | | | | |
7.125%, 12/01/18 | | | 1,600 | | | 1,795 |
5.850%, 04/01/18 | | | 2,848 | | | 2,974 |
Dominion Resources | | | | | | |
8.875%, 01/15/19 | | | 9,215 | | | 10,785 |
5.700%, 09/17/12 | | | 3,560 | | | 3,680 |
4.750%, 12/15/10 | | | 740 | | | 759 |
| | |
| SEI Institutional Investments Trust / Annual Report / May 31, 2009 | | 171 |
SCHEDULE OF INVESTMENTS
Core Fixed Income Fund (Continued)
May 31, 2009
| | | | | | |
| Description | | Face Amount
($ Thousands) | | Market Value
($ Thousands) |
| | | | | | |
Dominion Resources, Ser D | | | | | | |
5.125%, 12/15/09 | | $ | 850 | | $ | 864 |
DPL | | | | | | |
6.875%, 09/01/11 | | | 3,620 | | | 3,830 |
Duke Energy | | | | | | |
6.300%, 02/01/14 | | | 2,810 | | | 2,981 |
5.625%, 11/30/12 | | | 425 | | | 455 |
Exelon | | | | | | |
5.625%, 06/15/35 | | | 2,605 | | | 2,005 |
FirstEnergy, Ser B | | | | | | |
6.450%, 11/15/11 | | | 420 | | | 440 |
FirstEnergy, Ser C | | | | | | |
7.375%, 11/15/31 | | | 5,825 | | | 5,052 |
FPL Group Capital | | | | | | |
6.000%, 03/01/19 | | | 2,770 | | | 2,880 |
Hydro Quebec, Ser JL | | | | | | |
6.300%, 05/11/11 (C) | | | 1,050 | | | 1,139 |
Intergas Finance | | | | | | |
6.375%, 05/14/17 | | | 370 | | | 276 |
KCP&L Greater Missouri Operations | | | | | | |
11.875%, 07/01/12 | | | 2,525 | | | 2,705 |
8.270%, 11/15/21 | | | 2,894 | | | 2,593 |
Nevada Power | | | | | | |
8.250%, 06/01/11 | | | 4,515 | | | 4,765 |
Nisource Finance | | | | | | |
6.800%, 01/15/19 | | | 3,547 | | | 3,178 |
Oncor Electric Delivery | | | | | | |
6.800%, 09/01/18 (B) | | | 4,135 | | | 4,200 |
Pacific Gas & Electric | | | | | | |
8.250%, 10/15/18 | | | 1,130 | | | 1,344 |
6.050%, 03/01/34 (C) | | | 3,275 | | | 3,303 |
5.800%, 03/01/37 | | | 840 | | | 819 |
Pacificorp | | | | | | |
6.250%, 10/15/37 | | | 2,310 | | | 2,410 |
5.500%, 01/15/19 | | | 400 | | | 415 |
Power Contract Financing | | | | | | |
6.256%, 02/01/10 (B) | | | 1,272 | | | 1,248 |
Progress Energy | | | | | | |
6.850%, 04/15/12 | | | 1,715 | | | 1,831 |
Public Service of Colorado | | | | | | |
5.125%, 06/01/19 | | | 705 | | | 722 |
Public Service of New Mexico | | | | | | |
7.950%, 05/15/18 | | | 3,000 | | | 2,997 |
San Diego Gas & Electric | | | | | | |
6.000%, 06/01/39 | | | 635 | | | 646 |
Sempra Energy | | | | | | |
6.500%, 06/01/16 | | | 135 | | | 138 |
Southern | | | | | | |
4.150%, 05/15/14 | | | 995 | | | 996 |
TXU | | | | | | |
6.500%, 11/15/24 | | | 410 | | | 168 |
TXU, Ser P | | | | | | |
5.550%, 11/15/14 (C) | | | 370 | | | 198 |
| | | | | | |
| Description | | Face Amount
($ Thousands) | | Market Value
($ Thousands) |
| | | | | | |
TXU, Ser R | | | | | | |
6.550%, 11/15/34 | | $ | 4,385 | | $ | 1,723 |
Virginia Electric and Power | | | | | | |
5.400%, 04/30/18 | | | 300 | | | 307 |
| | | | | | |
| | | | | | 80,703 |
| | | | | | |
Total Corporate Obligations
(Cost $1,453,841) ($ Thousands) | | | | | | 1,306,511 |
| | | | | | |
| |
U.S. TREASURY OBLIGATIONS — 10.0% | | | |
FICO STRIPS, PO | | | | | | |
0.000%, 02/08/18 to
09/26/19 (E) | | | 21,400 | | | 13,851 |
U.S. Treasury Bills | | | | | | |
0.160%, 08/20/09 (E) (K) | | | 1,250 | | | 1,250 |
U.S. Treasury Bonds | | | | | | |
7.500%, 11/15/16 | | | 5,300 | | | 6,805 |
8.750%, 05/15/17 | | | 2,400 | | | 3,310 |
8.875%, 08/15/17 | | | 2,500 | | | 3,485 |
8.875%, 02/15/19 | | | 7,358 | | | 10,522 |
8.750%, 08/15/20 | | | 3,050 | | | 4,375 |
7.125%, 02/15/23 (C) | | | 3,742 | | | 4,874 |
6.250%, 08/15/23 (C) | | | 9,565 | | | 11,602 |
5.375%, 02/15/31 (C) | | | 21,419 | | | 24,448 |
5.000%, 05/15/37 | | | 1,079 | | | 1,192 |
4.375%, 02/15/38 (C) | | | 6,591 | | | 6,623 |
4.500%, 05/15/38 | | | 6,583 | | | 6,760 |
3.500%, 02/15/39 (C) | | | 34,266 | | | 29,528 |
4.250%, 05/15/39 (C) | | | 16,020 | | | 15,787 |
U.S. Treasury Inflation-Protected Securities | | | | | | |
1.875%, 07/15/15 (C) | | | 16,260 | | | 18,165 |
2.000%, 01/15/16 | | | 11,126 | | | 12,203 |
2.500%, 07/15/16 | | | 6,380 | | | 7,115 |
2.375%, 01/15/25 | | | 15,920 | | | 18,195 |
2.000%, 01/15/26 (C) | | | 5,620 | | | 5,782 |
2.375%, 01/15/27 | | | 11,979 | | | 12,781 |
1.750%, 01/15/28 | | | 25,844 | | | 24,190 |
3.625%, 04/15/28 (K) | | | 23,200 | | | 36,403 |
3.875%, 04/15/29 | | | 1,540 | | | 2,472 |
U.S. Treasury Notes | | | | | | |
1.250%, 11/30/10 | | | 643 | | | 648 |
0.875%, 04/30/11 | | | 812 | | | 812 |
2.750%, 02/28/13 | | | 12 | | | 12 |
3.125%, 08/31/13 | | | 846 | | | 885 |
2.750%, 10/31/13 | | | 1,365 | | | 1,403 |
2.000%, 11/30/13 | | | 1,664 | | | 1,654 |
1.500%, 12/31/13 | | | 2,139 | | | 2,077 |
1.750%, 03/31/14 (C) | | | 60 | | | 59 |
1.875%, 04/30/14 (C) | | | 6,634 | | | 6,495 |
| | |
| 172 | | SEI Institutional Investments Trust / Annual Report / May 31, 2009 |
| | | | | | |
| Description | | Face Amount
($ Thousands) | | Market Value
($ Thousands) |
| | | | | | |
2.250%, 05/31/14 | | $ | 60 | | $ | 60 |
2.375%, 03/31/16 (C) | | | 29,020 | | | 27,861 |
3.500%, 02/15/18 | | | 497 | | | 503 |
4.000%, 08/15/18 (C) | | | 1,554 | | | 1,622 |
3.750%, 11/15/18 (C) | | | 42,905 | | | 43,864 |
2.750%, 02/15/19 | | | 343 | | | 322 |
3.125%, 05/15/19 (C) | | | 55,595 | | | 54,006 |
4.750%, 02/15/37 | | | 2,197 | | | 2,336 |
U.S. Treasury STRIPS (E) | | | | | | |
2.147%, 02/15/14 | | | 1,550 | | | 1,374 |
3.134%, 08/15/16 | | | 5,100 | | | 3,981 |
6.450%, 02/15/17 | | | 3,600 | | | 2,728 |
3.249%, 11/15/17 | | | 1,500 | | | 1,091 |
3.429%, 05/15/18 (C) | | | 4,360 | | | 3,137 |
3.853%, 08/15/20 | | | 3,800 | | | 2,340 |
4.177%, 11/15/20 | | | 250 | | | 152 |
4.618%, 11/15/21 | | | 13,050 | | | 7,481 |
4.520%, 05/15/24 | | | 400 | | | 200 |
3.798%, 05/15/30 | | | 9,150 | | | 3,527 |
| | | | | | |
Total U.S. Treasury Obligations
(Cost $452,209) ($ Thousands) | | | | | | 452,348 |
| | | | | | |
| |
ASSET-BACKED SECURITIES — 4.8% | | | |
| | |
Automotive — 0.5% | | | | | | |
Americredit Prime Automobile Receivable,
Ser 2007-1, Cl A3 | | | | | | |
5.270%, 11/08/11 | | | 2,335 | | | 2,357 |
Daimler Chrysler Auto Trust,
Ser 2007-A, Cl A4 | | | | | | |
5.280%, 03/08/13 | | | 3,777 | | | 3,409 |
Harley-Davidson Motorcycle Trust,
Ser 2006-3, Cl A4 | | | | | | |
5.220%, 06/15/13 | | | 1,148 | | | 1,160 |
Harley-Davidson Motorcycle Trust,
Ser 2009-1, Cl A4 | | | | | | |
4.550%, 01/15/17 | | | 1,839 | | | 1,860 |
Honda Auto Receivables Owner Trust,
Ser 2009-2, Cl A4 | | | | | | |
4.430%, 07/15/15 | | | 3,338 | | | 3,378 |
Nissan Auto Receivables Owner Trust,
Ser 2009-A, Cl A4 | | | | | | |
4.740%, 08/17/15 | | | 1,896 | | | 1,937 |
Triad Auto Receivables Owner Trust,
Ser 2006-C, Cl A3 | | | | | | |
5.410%, 08/12/11 | | | 2,005 | | | 2,015 |
5.260%, 11/14/11 | | | 1,043 | | | 1,050 |
Volkswagen Auto Loan Enhanced Trust,
Ser 2008-1, Cl A3 | | | | | | |
4.500%, 07/20/12 | | | 2,724 | | | 2,769 |
| | | | | | |
| Description | | Face Amount
($ Thousands) | | Market Value
($ Thousands) |
| | | | | | |
World Omni Auto Receivables Trust,
Ser 2009-A, Cl A4 | | | | | | |
5.120%, 05/15/14 | | $ | 1,970 | | $ | 2,000 |
| | | | | | |
| | | | | | 21,935 |
| | | | | | |
| | |
Credit Cards — 0.8% | | | | | | |
BA Credit Card Trust,
Ser 2006-A7, Cl A7 | | | | | | |
0.384%, 06/15/09 (A) | | | 1,986 | | | 1,804 |
BA Credit Card Trust,
Ser 2006-A8, Cl A8 | | | | | | |
0.374%, 06/15/09 (A) | | | 1,559 | | | 1,439 |
Capital One Multi-Asset Execution Trust,
Ser 2006-A11, Cl A11 | | | | | | |
0.434%, 06/15/09 (A) | | | 7,991 | | | 6,834 |
Capital One Multi-Asset Execution Trust,
Ser 2008-A3, Cl A3 | | | | | | |
5.050%, 02/15/16 | | | 13,763 | | | 14,211 |
Chase Issuance Trust,
Ser 2007-A17, Cl A | | | | | | |
5.120%, 10/15/14 | | | 2,550 | | | 2,693 |
Discover Card Master Trust I,
Ser 2006-2, Cl A3 | | | | | | |
0.424%, 06/15/09 (A) | | | 7,008 | | | 6,241 |
MBNA Master Credit Card Trust,
Ser 1997-B, Cl A | | | | | | |
0.504%, 06/15/09 (A) | | | 5,302 | | | 5,125 |
| | | | | | |
| | | | | | 38,347 |
| | | | | | |
| | |
Mortgage Related Securities — 0.9% | | | | | | |
ABS Home Equity, Ser 2001-HE3, Cl A1 | | | | | | |
0.884%, 06/15/09 (A) | | | 264 | | | 183 |
ACE Securities, Ser 2006-SL3, Cl A1 | | | | | | |
0.409%, 06/25/09 (A) | | | 7,105 | | | 986 |
AFC Home Equity Loan Trust,
Ser 2000-1, Cl 2A | | | | | | |
0.549%, 06/25/09 (A) | | | 2,623 | | | 894 |
Citigroup Mortgage Loan Trust,
Ser 2007-AHL1, Cl A2A | | | | | | |
0.349%, 06/25/09 (A) | | | 940 | | | 725 |
Conseco Finance Home Loan Trust,
Ser 2001-D, Cl A5 | | | | | | |
6.190%, 06/15/09 (A) | | | 5,945 | | | 5,160 |
Contimortgage Home Equity Trust,
Ser 1997-2, Cl A9 | | | | | | |
7.090%, 04/15/28 | | | 13 | | | 11 |
Countrywide Asset-Backed Certificates,
Ser 2006-S1, Cl A2 | | | | | | |
5.549%, 08/25/21 | | | 2,031 | | | 1,471 |
Delta Funding Home Equity Loan Trust,
Ser 1999-3, Cl A1A | | | | | | |
1.164%, 06/15/09 (A) | | | 310 | | | 110 |
| | |
| SEI Institutional Investments Trust / Annual Report / May 31, 2009 | | 173 |
SCHEDULE OF INVESTMENTS
Core Fixed Income Fund (Continued)
May 31, 2009
| | | | | | |
| Description | | Face Amount
($ Thousands) | | Market Value
($ Thousands) |
| | | | | | |
EMC Mortgage Loan Trust,
Ser 2002-AA, Cl A1 | | | | | | |
0.779%, 06/25/09 (A) (B) | | $ | 1,029 | | $ | 772 |
Equivantage Home Equity Loan Trust, Ser 1997-2, Cl A3 | | | | | | |
7.775%, 07/25/28 | | | 196 | | | 120 |
FNIONP | | | | | | |
8.000%, 05/14/39 | | | 4,000 | | | 4,353 |
GMAC Mortgage Loan Trust,
Ser 2007-HE2, Cl A6 | | | | | | |
6.249%, 12/25/37 | | | 964 | | | 235 |
GSAA Trust, Ser 2005-6, Cl A3 | | | | | | |
0.679%, 06/25/09 (A) | | | 4,100 | | | 1,885 |
Home Equity Asset Trust,
Ser 2007-2, Cl 2A1 | | | | | | |
0.419%, 06/25/09 (A) | | | 4,320 | | | 3,987 |
Morgan Stanley Capital I,
Ser 2007-HE2, Cl A2A | | | | | | |
0.349%, 06/25/09 (A) | | | 554 | | | 450 |
Morgan Stanley Home Equity Loans , Ser 2007-1, Cl A1 | | | | | | |
0.359%, 06/25/09 (A) | | | 532 | | | 467 |
Morgan Stanley Mortgage Loan Trust,
Ser 2007-3XS, Cl 2A3S | | | | | | |
5.858%, 01/25/47 | | | 31 | | | 13 |
Nationstar Home Equity Loan Trust,
Ser 2006-B, Cl AV3 | | | | | | |
0.479%, 06/25/09 (A) | | | 6,400 | | | 3,101 |
Option One Mortgage Loan Trust,
Ser 2001-4, Cl A | | | | | | |
0.909%, 06/25/09 (A) | | | 281 | | | 197 |
Option One Mortgage Loan Trust,
Ser 2007-14, Cl 2A3 | | | | | | |
0.449%, 06/25/09 (A) | | | 17,000 | | | 3,006 |
Option One Mortgage Loan Trust,
Ser 2007-5, Cl 2A4 | | | | | | |
0.609%, 06/25/09 (A) | | | 10,000 | | | 1,818 |
PRLM, Ser BA-3832, Cl SA | | | | | | |
5.760%, 06/20/39 | | | 2,000 | | | 131 |
Residential Funding Mortgage Securities II, Ser 2000-HI1, Cl AI7 | | | | | | |
8.290%, 02/25/25 | | | 1,221 | | | 980 |
Residential Funding Mortgage Securities II, Ser 2007-HSA3, Cl AI2 | | | | | | |
5.980%, 07/25/09 (A) | | | 922 | | | 712 |
Security National Mortgage Loan Trust,
Ser 2007-1A, Cl 2A | | | | | | |
0.659%, 06/25/09 (A) (B) (J) | | | 1,196 | | | 360 |
Soundview Home Equity Loan Trust,
Ser 2007-OPT1, Cl 2A1 | | | | | | |
0.389%, 06/25/09 (A) | | | 5,930 | | | 4,817 |
Terwin Mortgage Trust,
Ser 2005-9HGS, Cl A1 | | | | | | |
4.000%, 07/25/09 (A) (B) | | | 817 | | | 732 |
| | | | | | |
| Description | | Face Amount
($ Thousands) | | Market Value
($ Thousands) |
| | | | | | |
Terwin Mortgage Trust,
Ser 2006-6, Cl 1A2 | | | | | | |
4.750%, 07/25/09 (A) | | $ | 10,000 | | $ | 1,002 |
| | | | | | |
| | | | | | 38,678 |
| | | | | | |
| | |
Other Asset-Backed Securities — 2.6% | | | | | | |
Amortizing Residential Collateral Trust CMO, Ser 2002-BC1, Cl A | | | | | | |
0.649%, 06/25/09 (A) | | | 504 | | | 381 |
ASG Resecuritization Trust,
Ser 2009-3, Cl A65 | | | | | | |
5.593%, 03/26/37 | | | 2,000 | | | 1,847 |
CenterPoint Energy Transition Bond LLC, Ser 2008-A, Cl A1 | | | | | | |
4.192%, 02/01/20 | | | 1,857 | | | 1,901 |
Chase Funding Mortgage Loan Asset-Backed Certificates,
Ser 2002-1, Cl 2A2 | | | | | | |
0.809%, 06/25/09 (A) | | | 1,088 | | | 615 |
Chase Funding Mortgage Loan Asset-Backed Certificates,
Ser 2003-6, Cl 1A7 | | | | | | |
4.277%, 09/25/33 | | | 1,269 | | | 1,085 |
Citicorp Residential Mortgage Securities,
Ser 2006-1, Cl A2 | | | | | | |
5.682%, 07/25/36 | | | 1,359 | | | 1,322 |
Citicorp Residential Mortgage Securities,
Ser 2006-2, Cl A5 | | | | | | |
6.036%, 09/25/36 | | | 6,340 | | | 3,921 |
Citicorp Residential Mortgage Securities,
Ser 2006-2, Cl A2 | | | | | | |
5.557%, 09/25/36 | | | 908 | | | 902 |
Citigroup Mortgage Loan Trust,
Ser 2007-SHL1, Cl A | | | | | | |
0.709%, 06/25/09 (A) (B) | | | 1,365 | | | 452 |
CNH Equipment Trust,
Ser 2009-B, Cl A3 | | | | | | |
2.970%, 03/15/13 | | | 215 | | | 215 |
Conseco Finance Home Loan Trust,
Ser 2000-E, Cl M1 | | | | | | |
8.130%, 06/15/09 (A) | | | 2,454 | | | 2,375 |
Conseco Finance Securitizations,
Ser 2000-4, Cl A6 | | | | | | |
8.310%, 07/01/09 (A) | | | 805 | | | 461 |
Countrywide Asset-Backed Certificates,
Ser 2001-BC3, Cl A | | | | | | |
0.789%, 06/25/09 (A) | | | 54 | | | 23 |
Countrywide Asset-Backed Certificates,
Ser 2003-BC2, Cl 2A1 | | | | | | |
0.909%, 06/25/09 (A) | | | 115 | | | 34 |
Countrywide Asset-Backed Certificates,
Ser 2005-17, Cl 1AF3 | | | | | | |
5.711%, 07/25/09 (A) | | | 10,000 | | | 3,690 |
| | |
| 174 | | SEI Institutional Investments Trust / Annual Report / May 31, 2009 |
| | | | | | |
| Description | | Face Amount
($ Thousands) | | Market Value
($ Thousands) |
| | | | | | |
Countrywide Asset-Backed Certificates,
Ser 2006-15, Cl A3 | | | | | | |
5.689%, 07/25/09 (A) | | $ | 208 | | $ | 89 |
Countrywide Asset-Backed Certificates,
Ser 2007-7, Cl 2A2 | | | | | | |
0.469%, 06/25/09 (A) | | | 7,500 | | | 4,399 |
Countrywide Asset-Backed Certificates,
Ser 2007-QH1, Cl A1 | | | | | | |
0.509%, 06/25/09 (A) (B) | | | 1,504 | | | 1,147 |
Countrywide Asset-Backed Certificates,
Ser 2007-SD1, Cl A1 | | | | | | |
0.759%, 06/25/09 (A) (B) | | | 1,033 | | | 368 |
Countrywide Home Equity Loan Trust,
Ser 2004-K, Cl 2A | | | | | | |
0.644%, 06/15/09 (A) | | | 1,020 | | | 379 |
Countrywide Home Equity Loan Trust,
Ser 2005-F, Cl 2A | | | | | | |
0.584%, 06/15/09 (A) | | | 2,357 | | | 821 |
Credit Suisse First Boston Mortgage Securities, Ser 2001-MH29, Cl A | | | | | | |
5.600%, 09/25/31 | | | 570 | | | 470 |
Credit-Based Asset Servicing and Securitization LLC,
Ser 2006-CB2, Cl AF2 | | | | | | |
5.501%, 12/25/36 | | | 1,110 | | | 833 |
Credit-Based Asset Servicing and Securitization LLC,
Ser 2006-CB2, Cl AF4 | | | | | | |
5.704%, 12/25/36 | | | 1,736 | | | 912 |
Credit-Based Asset Servicing and Securitization LLC,
Ser 2007-CB4, Cl A1A | | | | | | |
0.399%, 06/25/09 (A) | | | 5,708 | | | 3,754 |
Credit-Based Asset Servicing and Securitization LLC,
Ser 2007-RP1, Cl A | | | | | | |
0.619%, 06/25/09 (A) (B) | | | 15,330 | | | 8,288 |
Daimler Chrysler Master Owner Trust,
Ser 2006-A, Cl A | | | | | | |
0.374%, 06/15/09 (A) (I) | | | 3,128 | | | 2,418 |
Diamond Investment Grade CDO,
Ser 1X, Cl A1 | | | | | | |
4.775%, 10/11/14 (J) | | | 4,692 | | | 4,190 |
Dominos Pizza Master Issuer LLC,
Ser 2007-1, Cl A2 | | | | | | |
5.261%, 04/25/37 (I) | | | 3,452 | | | 2,195 |
Embarcadero Aircraft Securitization Trust, Ser 2000-A, Cl A1 | | | | | | |
0.824%, 06/15/09 (A) (B) | | | 4,046 | | | 1,254 |
Equity One, Ser 2003-2, Cl M1 | | | | | | |
5.050%, 07/25/09 (A) | | | 750 | | | 528 |
Fieldstone Mortgage Investment,
Ser 2007-A, Cl 2A2 | | | | | | |
0.579%, 06/25/09 (A) | | | 2,000 | | | 512 |
| | | | | | |
| Description | | Face Amount
($ Thousands) | | Market Value
($ Thousands) |
| | | | | | |
First Horizon Asset Back Trust,
Ser 2004-HE2, Cl A | | | | | | |
0.529%, 06/25/09 (A) | | $ | 1,305 | | $ | 982 |
First Horizon Asset Back Trust,
Ser 2006-HE2, Cl A | | | | | | |
0.439%, 06/25/09 (A) | | | 693 | | | 293 |
Ford Credit Floorplan Master Owner Trust, Ser 2006-4, Cl A | | | | | | |
0.594%, 06/15/09 (A) (I) | | | 5,007 | | | 4,087 |
GMAC Mortgage Loan Trust,
Ser 2005-HE3, Cl A1VN | | | | | | |
0.569%, 06/25/09 (A) | | | 7,618 | | | 1,983 |
Great America Leasing Receivables,
Ser 2006-1, Cl A3 | | | | | | |
5.340%, 01/15/10 (B) | | | 225 | | | 226 |
Green Tree Financial, Ser 1996-5, Cl A6 | | | | | | |
7.750%, 07/15/27 | | | 591 | | | 512 |
GSAMP Trust, Ser 2003-SEA, Cl A1 | | | | | | |
0.709%, 06/25/09 (A) | | | 2,096 | | | 1,162 |
GSAMP Trust, Ser 2006-SD2, Cl A1 | | | | | | |
0.419%, 06/25/09 (A) (B) | | | 4,694 | | | 4,521 |
JPMorgan Mortgage Acquisition,
Ser 2007-CH1, Cl AF6 | | | | | | |
5.501%, 11/25/36 | | | 9,605 | | | 5,359 |
Lehman XS Trust, Ser 2005-5N, Cl 1A1 | | | | | | |
0.609%, 06/25/09 (A) | | | 5,385 | | | 2,186 |
Lehman XS Trust,
Ser 2005-7N, Cl 1A1B | | | | | | |
0.609%, 06/25/09 (A) | | | 3,999 | | | 846 |
Lehman XS Trust,
Ser 2006-GP1, Cl A4A | | | | | | |
0.639%, 06/25/09 (A) | | | 8,113 | | | 844 |
Lone Star CDO Funding, Ser IX, Cl A | | | | | | |
2.802%, 12/15/12 (J) | | | 5,892 | | | 5,334 |
Merrill Lynch Mortgage Investors,
Ser 2006-WMC2, Cl A2D | | | | | | |
5.895%, 03/25/37 | | | 5,723 | | | 1,860 |
Merrill Lynch Mortgage Investors,
Ser 2006-WMC2, Cl A2B | | | | | | |
5.609%, 03/25/37 | | | 283 | | | 129 |
Mid-State Trust, Ser 2003-11, Cl A1 | | | | | | |
4.864%, 07/15/38 | | | 2,895 | | | 1,566 |
Mid-State Trust, Ser 2006-1, Cl A | | | | | | |
5.787%, 10/15/40 (B) | | | 7,051 | | | 4,674 |
MSCC Heloc Trust, Ser 2005-1, Cl A | | | | | | |
0.499%, 06/25/09 (A) | | | 539 | | | 224 |
Nelnet Student Loan Trust,
Ser 2008-4, Cl A4 | | | | | | |
2.572%, 07/27/09 (A) | | | 4,370 | | | 4,286 |
Oakwood Mortgage Investors,
Ser 2002-C, Cl AIO, IO | | | | | | |
6.000%, 08/15/10 | | | 4,961 | | | 284 |
Oncor Electric Delivery Transition Bond,
Ser 2003-1, Cl A2 | | | | | | |
4.030%, 02/15/12 | | | 787 | | | 797 |
| | |
| SEI Institutional Investments Trust / Annual Report / May 31, 2009 | | 175 |
SCHEDULE OF INVESTMENTS
Core Fixed Income Fund (Continued)
May 31, 2009
| | | | |
| Description | | Face Amount ($ Thousands)/
Shares | | Market Value
($ Thousands) |
| | | | |
| | | | | | |
Origen Manufactured Housing,
Ser 2002-A, Cl A1 | | | | | | |
0.584%, 06/15/09 (A) | | $ | 44 | | $ | 40 |
Popular ABS Mortgage Pass-Through Trust, Ser 2007-A, Cl A3 | | | | | | |
0.619%, 06/25/09 (A) | | | 10,380 | | | 2,759 |
RAAC Series, Ser 2007-RP4, Cl A | | | | | | |
0.659%, 06/25/09 (A) (B) (J) | | | 17,204 | | | 7,537 |
RAAC Series, Ser 2007-SP3, Cl A1 | | | | | | |
1.509%, 06/25/09 (A) | | | 498 | | | 309 |
SLM Student Loan Trust,
Ser 2005-6, Cl A5B | | | | | | |
2.292%, 07/27/09 (A) | | | 7,973 | | | 6,378 |
SLM Student Loan Trust,
Ser 2008-6, Cl A4 | | | | | | |
2.192%, 07/27/09 (A) | | | 3,928 | | | 3,722 |
Structured Asset Receivables Trust,
Ser 2003-1, Cl CTFS | | | | | | |
1.602%, 07/21/09 (A) (B) (J) | | | 1,232 | | | 1,096 |
Swift Master Auto Receivables Trust,
Ser 2007-1, Cl A | | | | | | |
0.444%, 06/15/09 (A) (I) (J) | | | 1,249 | | | 1,137 |
Wells Fargo Home Equity Trust,
Ser 2007-2, Cl A1 | | | | | | |
0.399%, 06/25/09 (A) | | | 3,615 | | | 3,046 |
| | | | | | |
| | | | | | 119,960 |
| | | | | | |
Total Asset-Backed Securities
(Cost $305,967) ($ Thousands) | | | | | | 218,920 |
| | | | | | |
|
U.S. GOVERNMENT AGENCY OBLIGATIONS — 1.1% |
FHLB | | | | | | |
5.500%, 08/13/14 | | | 8,500 | | | 9,517 |
5.000%, 11/17/17 | | | 5,000 | | | 5,328 |
0.140%, 06/12/09 (E) | | | 20,155 | | | 20,154 |
FHLMC | | | | | | |
5.625%, 11/23/35 | | | 1,620 | | | 1,636 |
5.500%, 07/18/16 | | | 4,000 | | | 4,431 |
1.750%, 06/15/12 | | | 2,850 | | | 2,846 |
FNMA | | | | | | |
5.250%, 08/01/12 | | | 2,800 | | | 2,923 |
5.000%, 02/13/17 | | | 5,000 | | | 5,423 |
| | | | | | |
Total U.S. Government Agency Obligations
(Cost $52,073) ($ Thousands) | | | | | | 52,258 |
| | | | | | |
| |
PREFERRED STOCK — 0.0% | | | |
GMAC Preferred Blocker* | | | 1 | | | 271 |
Zurich RegCaPS Funding Trust | | | — | | | 295 |
| | | | | | |
Total Preferred Stock
(Cost $309) ($ Thousands) | | | | | | 566 |
| | | | | | |
| | | | |
| Description | | Shares/Contracts | | Market Value
($ Thousands) |
| | | | |
| | | | | | | |
| |
CASH EQUIVALENTS — 6.3% | | | | | |
Evergreen Institutional Money Market Fund, Cl I, 0.340%** | | 76,959,078 | | | $ | 76,959 | |
SEI Daily Income Trust, Prime Obligation Fund, Cl A, 0.260%**† | | 207,123,549 | | | | 207,124 | |
| | | | | | | |
Total Cash Equivalents
(Cost $284,083) ($ Thousands) | | | | | | 284,083 | |
| | | | | | | |
| |
AFFILIATED PARTNERSHIP — 7.7% | | | | | |
SEI Liquidity Fund, L.P., 0.820%**† (G) | | 358,232,785 | | | | 348,176 | |
| | | | | | | |
Total Affiliated Partnership
(Cost $358,233) ($ Thousands) | | | | | | 348,176 | |
| | | | | | | |
| |
PURCHASED OPTION — 0.0% | | | | | |
June 2009 90Day EURO Future Put, Expires 06/16/09,
Strike Price $98.75* | | 3 | | | | — | |
| | | | | | | |
Total Purchased Option
(Cost $0) ($ Thousands) | | | | | | — | |
| | | | | | | |
Total Investments — 116.4%
(Cost $5,679,536) ($ Thousands) | | | | | $ | 5,283,880 | |
| | | | | | | |
| | |
WRITTEN OPTIONS — 0.0% | | | | | | | |
July 2009 U.S. Ten Year Treasury Call, Expires 06/29/09,
Strike Price $121.00* | | (205 | ) | | | (45 | ) |
July 2009 U.S. Ten Year Treasury Call, Expires 06/29/09,
Strike Price $120.00* | | (95 | ) | | | (34 | ) |
July 2009 U.S. Ten Year Treasury Put, Expires 06/29/09,
Strike Price $115.00* | | (110 | ) | | | (70 | ) |
June 2009 90Day EURO Future Put, Expires 06/16/09,
Strike Price $97.25* | | (183 | ) | | | (1 | ) |
June 2009 EURO$ One Year Mid Curve Put, Expires 06/15/09,
Strike Price $98.38* | | (93 | ) | | | (5 | ) |
Sept 2009 EURO Future Call,
Expires 09/17/09,
Strike Price $99.25* | | (118 | ) | | | (38 | ) |
Sept 2009 U.S. Ten Year Treasury Call, Expires 08/24/09,
Strike Price $124.00* | | (94 | ) | | | (31 | ) |
Sept 2009 U.S. Ten Year Treasury Put, Expires 08/24/09,
Strike Price $116.00* | | (94 | ) | | | (175 | ) |
| | | | | | | |
Total Written Options
(Premiums Received $609) ($ Thousands) | | | | (399 | ) |
| | | | | | | |
| | |
| 176 | | SEI Institutional Investments Trust / Annual Report / May 31, 2009 |
A summary of outstanding swap agreements held by the Fund at May 31, 2009, is as follows:
| | | | | | | | | | | | | | | | | |
| Credit Default Swaps | |
| Counterparty | | Reference Entity/Obligation | | Buy/Sell Protection | | (Pays)/
Receives Rate | | | Termination Date | | Notional Amount
(Thousands) | | | Net Unrealized
Appreciation
(Depreciation)
($Thousands) | |
| Bank of America | | CMBX-NA-AJ 1 Index | | BUY | | (0.84 | )% | | 10/12/52 | | $ | 3,850 | | | $ | (786 | ) |
| Bank of America | | CMBX-NA-AJ 1 Index | | BUY | | (0.84 | ) | | 10/12/52 | | | 5,500 | | | | (1,173 | ) |
| Barclays Bank PLC | | ABX.HE.AAA 07-1 Index | | SELL | | 0.09 | | | 08/25/37 | | | (4,680 | ) | | | (2,618 | ) |
| Barclays Bank PLC | | ABX.HE.PENAAA 07-2 Index | | SELL | | 0.76 | | | 01/25/38 | | | (4,600 | ) | | | (285 | ) |
| Barclays Bank PLC | | ABX-HE-PENAAA 07-2 Index | | SELL | | 0.76 | | | 01/25/38 | | | (4,000 | ) | | | (210 | ) |
| Barclays Bank PLC | | CMBX-NA-AJ 1 Index | | BUY | | (0.84 | ) | | 10/12/52 | | | 16,235 | | | | (3,551 | ) |
| Barclays Bank PLC | | CMBX-NA-AJ 1 Index | | BUY | | (0.84 | ) | | 10/12/52 | | | 2,000 | | | | 617 | |
| Barclays Bank PLC | | CMBX-NA-AJ 1 Index | | BUY | | (0.84 | ) | | 10/12/52 | | | 2,000 | | | | 595 | |
| Citigroup | | ABX.HE.AAA 06-2 Index | | SELL | | 0.11 | | | 05/25/46 | | | (2,100 | ) | | | (608 | ) |
| Citigroup | | ABX.HE.AAA 07-1 Index | | SELL | | 0.09 | | | 08/25/37 | | | (3,545 | ) | | | (1,973 | ) |
| Citigroup | | ABX.HE.PENAAA 07-2 Index | | SELL | | 0.76 | | | 01/25/38 | | | (8,100 | ) | | | (13 | ) |
| Citigroup | | ABX.HE.PENAAA 07-2 Index | | SELL | | 0.76 | | | 01/25/38 | | | (5,500 | ) | | | (119 | ) |
| Citigroup | | Arrow Electric, 6.875% 06/01/18 | | BUY | | (0.82 | ) | | 03/20/14 | | | 1,485 | | | | (4 | ) |
| Citigroup | | CMBX-NA-AJ 1 Index | | BUY | | (0.84 | ) | | 10/12/52 | | | 2,110 | | | | (442 | ) |
| Citigroup | | Darden Restaurants Inc., 6.000% 08/15/35 | | BUY | | (2.73 | ) | | 03/20/14 | | | 1,435 | | | | (106 | ) |
| Citigroup | | Darden Restaurants Inc., 7.125% 02/01/16 | | BUY | | (2.40 | ) | | 03/20/15 | | | 1,200 | | | | (86 | ) |
| Citigroup | | Hewlett Packard, 5.400% 03/01/17 | | BUY | | (0.72 | ) | | 03/20/14 | | | 1,485 | | | | (16 | ) |
| Citigroup | | Home Depot, 5.875% 12/16/36 | | BUY | | (2.67 | ) | | 03/20/14 | | | 5,100 | | | | (418 | ) |
| Citigroup | | Lowes Cos. Inc., 8.250% 06/01/10 | | BUY | | (1.20 | ) | | 03/20/14 | | | 5,320 | | | | (110 | ) |
| Citigroup | | Nordstrom Inc., 6.950%, 03/15/28 | | BUY | | (3.15 | ) | | 03/20/14 | | | 1,135 | | | | (72 | ) |
| Citigroup | | Pulte Homes Inc., 5.250% 01/15/14 | | BUY | | (3.91 | ) | | 12/20/12 | | | 1,600 | | | | 71 | |
Citigroup | | Pulte Homes Inc., 5.250% 01/15/14 | | BUY | | (3.88 | ) | | 12/20/12 | | | 3,050 | | | | 135 | |
| Citigroup | | Toll Brothers, 6.875% 11/15/12 | | BUY | | (2.83 | ) | | 12/20/12 | | | 1,400 | | | | 24 | |
| Credit Suisse | | ABX.HE.AA 06-2 Index | | SELL | | 0.17 | | | 05/25/46 | | | (5,000 | ) | | | (596 | ) |
| Credit Suisse | | ABX.HE.AA 06-2 Index | | SELL | | 0.17 | | | 05/25/46 | | | (5,300 | ) | | | (670 | ) |
| Credit Suisse | | ABX.HE.AAA 07-1 Index | | SELL | | 0.09 | | | 08/25/37 | | | (4,000 | ) | | | (695 | ) |
| Credit Suisse | | CMBX-NA-AJ 1 Index | | BUY | | (0.84 | ) | | 10/12/52 | | | 390 | | | | (84 | ) |
| Credit Suisse | | General Electric Capital Corp., 5.625% 09/15/17 | | SELL | | 6.55 | | | 12/20/10 | | | (2,570 | ) | | | 121 | |
| Deutsche Bank | | Centex Corporation, 5.250% 06/15/15 | | BUY | | (4.40 | ) | | 12/20/13 | | | 600 | | | | (84 | ) |
| Deutsche Bank | | Darden Restaurants Inc., 6.000% 08/15/35 | | BUY | | (2.25 | ) | | 03/20/14 | | | 1,650 | | | | (85 | ) |
| Deutsche Bank | | Darden Restaurants Inc., 7.125% 02/01/16 | | BUY | | (2.25 | ) | | 03/20/13 | | | 600 | | | | (27 | ) |
| Deutsche Bank | | Nordstrom Inc., 6.950%, 03/15/28 | | BUY | | (2.10 | ) | | 03/20/14 | | | 4,350 | | | | (67 | ) |
| Deutsche Bank | | Pulte Homes Inc., 5.250% 01/15/14 | | BUY | | (4.00 | ) | | 03/20/15 | | | 2,250 | | | | (229 | ) |
| Deutsche Bank | | Pulte Homes Inc., 5.250% 01/15/14 | | BUY | | (4.62 | ) | | 03/20/13 | | | 2,250 | | | | (204 | ) |
| Goldman Sachs | | ABX.HE.AA 06-2 Index | | SELL | | 0.17 | | | 05/25/46 | | | (3,800 | ) | | | (462 | ) |
| Goldman Sachs | | ABX.HE.AAA 07-1 Index | | SELL | | 0.09 | | | 08/25/37 | | | (5,420 | ) | | | (1,215 | ) |
| JPMorgan Chase Bank | | Morgan Stanley, 6.600% 04/01/12 | | BUY | | (0.91 | ) | | 12/20/12 | | | 3,525 | | | | 259 | |
| Merrill Lynch | | Centex Corporation, 5.250% 06/15/15 | | BUY | | (3.56 | ) | | 12/20/12 | | | 1,970 | | | | 14 | |
| Merrill Lynch | | Centex Corporation, 5.250% 06/15/15 | | BUY | | (3.65 | ) | | 12/20/12 | | | 1,375 | | | | 9 | |
| Merrill Lynch | | Toll Brothers, 6.875% 11/15/12 | | BUY | | (2.78 | ) | | 12/20/12 | | | 3,300 | | | | 57 | |
| Merrill Lynch | | Toll Brothers, 6.875% 11/15/12 | | BUY | | (2.83 | ) | | 12/20/12 | | | 2,000 | | | | 34 | |
| Morgan Stanley | | ABX.HE.AAA 07-1 Index | | SELL | | 0.09 | | | 08/25/37 | | | (2,100 | ) | | | (489 | ) |
| Morgan Stanley | | ABX.HE.AAA 07-1 Index | | SELL | | 0.09 | | | 08/25/37 | | | (5,200 | ) | | | (1,166 | ) |
| Morgan Stanley | | CDX.IG HVOL.12 Index | | SELL | | 5.00 | | | 06/20/14 | | | (6,300 | ) | | | 358 | |
| Morgan Stanley | | Darden Restaurants Inc., 7.125% 02/01/16 | | BUY | | (2.25 | ) | | 03/20/13 | | | 600 | | | | (27 | ) |
| Morgan Stanley | | Berkshire Hathaway, 4.625% 10/15/13 | | SELL | | 4.00 | | | 03/20/11 | | | (5,400 | ) | | | 128 | |
| Royal Bank of Scotland | | ABX.HE.AA 06-2 Index | | SELL | | 0.17 | | | 05/25/46 | | | (3,000 | ) | | | (357 | ) |
| | | | | | | | | | | | | | | | | |
| | | | | | | | | | | | | | | $ | (16,625 | ) |
| | | | | | | | | | | | | | | | | |
| | |
| SEI Institutional Investments Trust / Annual Report / May 31, 2009 | | 177 |
SCHEDULE OF INVESTMENTS
Core Fixed Income Fund (Concluded)
May 31, 2009
A summary of the outstanding forward foreign currency contracts held by the Fund at May 31, 2009, is as follows:
| | | | | | | | | | | | |
| Maturity Date | | Currency
to Deliver
(Thousands) | | Currency
to Receive
(Thousands) | | Unrealized
Appreciation
(Depreciation)
($ Thousands) | |
8/19/09 | | EUR | | 8,689 | | USD | | 11,308 | | $ | (981 | ) |
8/19/09 | | GBP | | 9,109 | | USD | | 13,394 | | | (1,288 | ) |
8/19/09 | | USD | | 11,633 | | GBP | | 7,980 | | | 1,229 | |
| | | | | | | | | | | | |
| | | | | | | | | | $ | (1,040 | ) |
| | | | | | | | | | | | |
A summary of the open futures contracts held by the Fund at May 31, 2009, is as follows:
| | | | | | | | | |
| Type of Contract | | Number of
Contracts
Long (Short) | | | Expiration
Date | | Unrealized
Appreciation
(Depreciation)
($ Thousands) | |
90-Day Euro$ | | 513 | | | Sep-2009 | | $ | 1,565 | |
90-Day Euro$ | | (26 | ) | | Sep-2009 | | | (195 | ) |
90-Day Euro$ | | 37 | | | Dec-2009 | | | 40 | |
90-Day Euro$ | | (26 | ) | | Dec-2009 | | | (200 | ) |
90-Day Euro$ | | 469 | | | Mar-2010 | | | 351 | |
90-Day Euro$ | | (26 | ) | | Mar-2010 | | | (203 | ) |
90-Day Euro$ | | 116 | | | Jun-2010 | | | (43 | ) |
90-Day Euro$ | | (26 | ) | | Jun-2010 | | | (197 | ) |
90-Day Euro$ | | 196 | | | Sep-2010 | | | 53 | |
90-Day Euro$ | | (26 | ) | | Sep-2010 | | | (189 | ) |
90-Day Euro$ | | (26 | ) | | Dec-2010 | | | (174 | ) |
90-Day Euro$ | | (26 | ) | | Mar-2011 | | | (156 | ) |
90-Day Euro$ | | (26 | ) | | Jun-2011 | | | (138 | ) |
U.S. 10-Year Treasury Note | | 261 | | | Sep-2009 | | | (521 | ) |
U.S. 10-Year Treasury Note | | (1,631 | ) | | Sep-2009 | | | 2,859 | |
U.S. 2-Year Treasury Note | | 478 | | | Oct-2009 | | | 7 | |
U.S. 5-Year Treasury Note | | 4,053 | | | Sep-2009 | | | (3,648 | ) |
U.S. Long Treasury Bond | | (1 | ) | | Sep-2009 | | | — | |
| | | | | | | | | |
| | | | | | | $ | (789 | ) |
| | | | | | | | | |
Percentages are based on a Net Assets of $4,540,593 ($ Thousands).
| * | | Non-income producing security. |
| ** | | Rate shown is the 7-day effective yield as of May 31, 2009. |
| † | | Investment in Affiliated Security (See Note 4). |
| ‡ | | Real Estate Investment Trust |
| (A) | | Variable Rate Security—The rate reported is the rate in effect as of May 31, 2009. The date reported is the next reset date. |
| (B) | | Securities sold within terms of a private placement memorandum, exempt from registration under Section 144A of the Securities Act of 1933, as amended, and may be sold only to dealers in that program or other “accredited investors.” These securities have been determined to be liquid under guidelines established by the board of Trustees. |
| (C) | | This security or a partial position of this security is on loan at May 31, 2009. The total value of securities on loan at May 31, 2009 was $350,045 ($ Thousands). |
| (D) | | Security in default on interest payments. |
| (E) | | Zero coupon security. The rate reported is the effective yield at time of purchase. |
| (F) | | Step Bonds—The rate reflected is the effective yield on May 31, 2009. The coupon on a step bond changes on a specified date. |
| (G) | | This security was purchased with cash collateral held from securities on loan. The total value of this security as of May 31, 2009 was $348,176 ($ Thousands). |
| (H) | | Securities considered restricted. The total value of such securities as of May 31, 2009 was $2,032 ($ Thousands) and represented 0.04% of net assets. |
| (I) | | Securities considered illiquid. The total value of such securities as of May 31, 2009 was $15,455 ($ Thousands) and represented 0.34% of net assets. |
| (J) | | Security fair valued using methods determined in good faith by the Valuation Committee of the Board of Trustees. The total value of such securities as of May 31, 2009 was $20,518 ($ Thousands) and represented 0.45% of net assets. |
| (K) | | Security, or portion thereof, has been pledged as collateral on open futures contracts. |
ABS — Asset-Based Security
ARM — Adjustable Rate Mortgage
CDO — Collateralized Debt Obligation
Cl — Class
CMO — Collateralized Mortgage Obligation
EUR — Euro
FHLB — Federal Home Loan Bank
FHLMC — Federal Home Loan Mortgage Corporation
FNMA — Federal National Mortgage Association
GBP — British Pound Sterling
GNMA — Government National Mortgage Association
IO — Interest Only—face amount represents notional amount
L.P. — Limited Partnership
LLC — Limited Liability Company
MTN — Medium Term Note
PO — Principal Only
Ser — Series
STRIPS — Separately Traded Registered Interest and Principal Securities
TBA — To Be Announced
USD — United States Dollar
Amounts designated as “—” are $0 or have been rounded to $0
The accompanying notes are an integral part of the financial statements.
| | |
| 178 | | SEI Institutional Investments Trust / Annual Report / May 31, 2009 |
SCHEDULE OF INVESTMENTS
High Yield Bond Fund
May 31, 2009
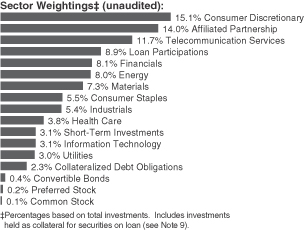
| | | | | | |
| Description | | Face Amount
($ Thousands) | | Market Value
($ Thousands) |
| | | | | | |
| |
CORPORATE OBLIGATIONS — 83.6% | | | |
|
Consumer Discretionary — 17.7% |
Adelphia Communications
(escrow security) | | | | | | |
10.250%, 06/15/11 | | $ | 125 | | $ | 2 |
7.875%, 05/01/09 | | | 75 | | | 1 |
7.750%, 01/15/09 | | | 250 | | | 4 |
Adelphia Communications, Ser B (escrow security) | | | | | | |
9.500%, 02/15/04 | | | 25 | | | — |
America West Airlines LLC | | | | | | |
8.057%, 07/02/20 | | | 1,760 | | | 1,337 |
American Greetings | | | | | | |
7.375%, 06/01/16 | | | 800 | | | 504 |
AmeriGas Partners | | | | | | |
7.125%, 05/20/16 | | | 1,190 | | | 1,102 |
Ameristar Casinos | | | | | | |
9.250%, 06/01/14 (A) | | | 2,100 | | | 2,121 |
Amscan Holdings | | | | | | |
8.750%, 05/01/14 | | | 2,205 | | | 1,869 |
Aramark Services | | | | | | |
8.500%, 02/01/15 (B) | | | 3,815 | | | 3,638 |
4.528%, 08/03/09 (C) | | | 325 | | | 262 |
Asbury Automotive Group | | | | | | |
7.625%, 03/15/17 | | | 225 | | | 155 |
Ashtead Capital | | | | | | |
9.000%, 08/15/16 (A) (B) | | | 2,849 | | | 2,108 |
Beazer Homes USA | | | | | | |
8.625%, 05/15/11 | | | 360 | | | 236 |
8.125%, 06/15/16 | | | 685 | | | 322 |
6.875%, 07/15/15 (B) | | | 610 | | | 276 |
6.500%, 11/15/13 (B) | | | 1,985 | | | 923 |
Blockbuster | | | | | | |
9.000%, 09/01/12 | | | 1,250 | | | 638 |
| | | | | | |
| Description | | Face Amount
($ Thousands) | | Market Value
($ Thousands) |
| | | | | | |
Bonten Media Acquisition | | | | | | |
9.000%, 06/01/15 (A) | | $ | 1,400 | | $ | 238 |
Boyd Gaming | | | | | | |
7.125%, 02/01/16 | | | 1,915 | | | 1,360 |
Brands | | | | | | |
6.900%, 07/15/17 | | | 680 | | | 578 |
Broder Brothers, Ser B | | | | | | |
11.250%, 10/15/10 | | | 1,200 | | | 378 |
Burlington Coat Factory Warehouse | | | | | | |
11.125%, 04/15/14 (B) | | | 3,845 | | | 2,788 |
Cablevision Systems, Ser B | | | | | | |
8.000%, 04/15/12 | | | 350 | | | 344 |
Caesars Entertainment | | | | | | |
8.125%, 05/15/11 | | | 265 | | | 238 |
7.875%, 03/15/10 | | | 1,282 | | | 1,176 |
Carrols | | | | | | |
9.000%, 01/15/13 | | | 700 | | | 656 |
CCH II LLC | | | | | | |
10.250%, 09/15/10 (D) | | | 325 | | | 322 |
CCH II LLC, Ser B | | | | | | |
10.250%, 09/15/10 (D) | | | 200 | | | 196 |
CCO Holdings LLC | | | | | | |
8.750%, 11/15/13 (B) (D) | | | 3,535 | | | 3,235 |
Charter Communications Operating LLC | | | | | | |
10.875%, 09/15/14 (A) (D) | | | 3,345 | | | 3,445 |
Charter Communications Operating LLC | | | | | | |
10.000%, 04/30/12 (A) (B) (D) | | | 4,845 | | | 4,651 |
Claire’s Stores | | | | | | |
9.625%, 06/01/15 (B) | | | 2,041 | | | 551 |
9.250%, 06/01/15 | | | 260 | | | 100 |
Cooper-Standard Automotive | | | | | | |
8.375%, 12/15/14 | | | 450 | | | 45 |
Couche-Tard US | | | | | | |
7.500%, 12/15/13 | | | 5,073 | | | 5,010 |
COX Communications | | | | | | |
7.875%, 08/15/09 | | | 560 | | | 566 |
Dana (escrow security) | | | | | | |
7.000%, 03/01/09 | | | 175 | | | 4 |
7.000%, 03/15/28 | | | 200 | | | 5 |
6.500%, 03/15/08 | | | 100 | | | 3 |
6.500%, 03/01/29 | | | 1,100 | | | 28 |
Dave & Buster’s | | | | | | |
11.250%, 03/15/14 | | | 616 | | | 517 |
Delta Air Lines | | | | | | |
7.920%, 11/18/10 | | | 170 | | | 150 |
Denny’s Holdings | | | | | | |
10.000%, 10/01/12 | | | 380 | | | 367 |
Dex Media | | | | | | |
9.000%, 11/15/13 (B) (D) | | | 4,260 | | | 682 |
Dex Media West, Ser B | | | | | | |
9.875%, 08/15/13 (D) | | | 2,710 | | | 583 |
8.500%, 08/15/10 (D) | | | 1,500 | | | 1,118 |
DirecTV Holdings LLC | | | | | | |
6.375%, 06/15/15 | | | 3,175 | | | 2,889 |
| | |
| SEI Institutional Investments Trust / Annual Report / May 31, 2009 | | 179 |
SCHEDULE OF INVESTMENTS
High Yield Bond Fund (Continued)
May 31, 2009
| | | | | | |
| Description | | Face Amount
($ Thousands) | | Market Value
($ Thousands) |
| | | | | | |
DISH DBS | | | | | | |
7.125%, 02/01/16 (B) | | $ | 3,915 | | $ | 3,602 |
6.625%, 10/01/14 | | | 1,890 | | | 1,715 |
Dollar General | | | | | | |
11.875%, 07/15/17 | | | 275 | | | 290 |
10.625%, 07/15/15 (B) | | | 2,765 | | | 2,924 |
DR Horton | | | | | | |
6.500%, 04/15/16 | | | 475 | | | 406 |
6.000%, 04/15/11 | | | 1,095 | | | 1,054 |
5.875%, 07/01/13 | | | 660 | | | 587 |
5.625%, 01/15/16 | | | 600 | | | 492 |
Duane Reade | | | | | | |
5.820%, 06/15/09 (C) | | | 2,701 | | | 2,458 |
El Dorado Casino Shreveport PIK | | | | | | |
10.000%, 08/01/12 | | | 1,102 | | | 915 |
El Pollo Loco | | | | | | |
11.750%, 12/01/12 (A) | | | 2,250 | | | 2,289 |
Expedia | | | | | | |
8.500%, 07/01/16 (A) | | | 1,845 | | | 1,753 |
Eye Care Centers of America | | | | | | |
10.750%, 02/15/15 | | | 600 | | | 600 |
Ferrellgas Partners | | | | | | |
6.750%, 05/01/14 (A) | | | 1,500 | | | 1,365 |
Fontainebleau Las Vegas | | | | | | |
11.000%, 06/15/15 (A) | | | 3,500 | | | 157 |
Galaxy Entertainment Finance | | | | | | |
9.875%, 12/15/12 (A) | | | 1,235 | | | 1,025 |
Gaylord Entertainment | | | | | | |
8.000%, 11/15/13 | | | 1,215 | | | 1,001 |
6.750%, 11/15/14 | | | 260 | | | 197 |
General Motors | | | | | | |
8.375%, 07/15/33 (B) (D) | | | 2,650 | | | 239 |
7.700%, 04/15/16 (B) (D) | | | 1,601 | | | 160 |
General Nutrition Centers PIK | | | | | | |
6.404%, 09/15/09 (C) | | | 1,280 | | | 1,059 |
Goodyear Tire & Rubber | | | | | | |
10.500%, 05/15/16 | | | 1,070 | | | 1,065 |
9.000%, 07/01/15 (B) | | | 1,496 | | | 1,429 |
8.625%, 12/01/11 (B) | | | 831 | | | 808 |
Group 1 Automotive | | | | | | |
8.250%, 08/15/13 | | | 100 | | | 82 |
Hanesbrands, Ser B | | | | | | |
5.698%, 12/15/14 (C) | | | 3,700 | | | 2,978 |
Harrah’s Operating | | | | | | |
10.000%, 12/15/18 (A) (B) | | | 5,516 | | | 3,682 |
5.500%, 07/01/10 | | | 248 | | | 218 |
Harrahs Operating Escrow LLC | | | | | | |
11.250%, 06/01/17 (A) | | | 7,306 | | | 7,087 |
Hertz | | | | | | |
10.500%, 01/01/16 (B) | | | 490 | | | 426 |
8.875%, 01/01/14 (B) | | | 3,495 | | | 3,180 |
HSN | | | | | | |
11.250%, 08/01/16 (A) | | | 1,520 | | | 1,332 |
| | | | | | |
| Description | | Face Amount
($ Thousands) | | Market Value
($ Thousands) |
| | | | | | |
Inergy | | | | | | |
8.750%, 03/01/15 (A) | | $ | 985 | | $ | 975 |
6.875%, 12/15/14 (B) | | | 1,175 | | | 1,075 |
Interpublic Group | | | | | | |
6.250%, 11/15/14 | | | 680 | | | 580 |
2.883%, 08/15/09 (C) | | | 415 | | | 382 |
Invista | | | | | | |
9.250%, 05/01/12 (A) | | | 1,010 | | | 944 |
Jarden | | | | | | |
8.000%, 05/01/16 | | | 1,225 | | | 1,185 |
7.500%, 05/01/17 (B) | | | 3,145 | | | 2,721 |
JC Penney | | | | | | |
7.400%, 04/01/37 | | | 1,860 | | | 1,518 |
K. Hovnanian Enterprises | | | | | | |
8.625%, 01/15/17 | | | 1,825 | | | 739 |
KAR Holdings | | | | | | |
10.000%, 05/01/15 | | | 1,125 | | | 906 |
8.750%, 05/01/14 | | | 2,400 | | | 2,052 |
5.028%, 08/03/09 (C) | | | 800 | | | 600 |
Lamar Media | | | | | | |
7.250%, 01/01/13 (B) | | | 900 | | | 824 |
6.625%, 08/15/15 (B) | | | 2,285 | | | 1,942 |
Lamar Media, Ser B | | | | | | |
6.625%, 08/15/15 | | | 350 | | | 287 |
Landry’s Restaurants | | | | | | |
14.000%, 08/15/11 (A) | | | 610 | | | 567 |
Levi Strauss | | | | | | |
9.750%, 01/15/15 (B) | | | 1,913 | | | 1,846 |
M/I Homes | | | | | | |
6.875%, 04/01/12 | | | 400 | | | 320 |
Macy’s Retail Holdings | | | | | | |
10.625%, 11/01/10 | | | 400 | | | 409 |
8.875%, 07/15/15 | | | 2,840 | | | 2,736 |
5.900%, 12/01/16 | | | 1,155 | | | 972 |
Mediacom LLC | | | | | | |
9.500%, 01/15/13 (B) | | | 2,243 | | | 2,142 |
MediMedia USA | | | | | | |
11.375%, 11/15/14 (A) | | | 725 | | | 471 |
Meritage Homes | | | | | | |
7.000%, 05/01/14 | | | 860 | | | 671 |
6.250%, 03/15/15 | | | 205 | | | 154 |
MGM Mirage | | | | | | |
13.000%, 11/15/13 (A) | | | 3,060 | | | 3,343 |
11.125%, 11/15/17 (A) (B) | | | 1,830 | | | 1,917 |
10.375%, 05/15/14 (A) | | | 1,740 | | | 1,792 |
8.500%, 09/15/10 | | | 150 | | | 141 |
7.500%, 06/01/16 (B) | | | 4,525 | | | 2,941 |
6.875%, 04/01/16 (B) | | | 2,270 | | | 1,456 |
6.750%, 09/01/12 | | | 1,070 | | | 736 |
6.750%, 04/01/13 (B) | | | 3,185 | | | 2,118 |
5.875%, 02/27/14 (B) | | | 3,085 | | | 1,959 |
Michaels Stores | | | | | | |
11.375%, 11/01/16 (B) | | | 21 | | | 11 |
| | |
| 180 | | SEI Institutional Investments Trust / Annual Report / May 31, 2009 |
| | | | | | |
| Description | | Face Amount
($ Thousands) | | Market Value
($ Thousands) |
| | | | | | |
Mohegan Tribal Gaming Authority | | | | | | |
6.875%, 02/15/15 | | $ | 975 | | $ | 643 |
6.125%, 02/15/13 | | | 325 | | | 270 |
MTR Gaming Group | | | | | | |
9.000%, 06/01/12 | | | 580 | | | 360 |
Neiman-Marcus Group PIK | | | | | | |
9.000%, 10/15/15 | | | 2,446 | | | 1,309 |
New Albertsons | | | | | | |
7.250%, 05/01/13 | | | 375 | | | 360 |
Newell Rubbermaid | | | | | | |
10.600%, 04/15/19 (B) | | | 1,755 | | | 1,964 |
OSI Restaurant Partners | | | | | | |
10.000%, 06/15/15 | | | 1,360 | | | 884 |
Penn National Gaming | | | | | | |
6.750%, 03/01/15 | | | 3,490 | | | 3,228 |
Penske Auto Group | | | | | | |
7.750%, 12/15/16 | | | 1,700 | | | 1,309 |
Perry Ellis International, Ser B | | | | | | |
8.875%, 09/15/13 | | | 1,544 | | | 1,204 |
Phillips-Van Heusen | | | | | | |
8.125%, 05/01/13 | | | 825 | | | 809 |
7.250%, 02/15/11 | | | 100 | | | 99 |
Pinnacle Entertainment | | | | | | |
8.750%, 10/01/13 | | | 675 | | | 665 |
8.250%, 03/15/12 | | | 345 | | | 336 |
7.500%, 06/15/15 | | | 725 | | | 605 |
Pokagon Gaming Authority | | | | | | |
10.375%, 06/15/14 (A) | | | 1,646 | | | 1,588 |
Quiksilver | | | | | | |
6.875%, 04/15/15 | | | 430 | | | 286 |
Rent-A-Center, Ser B | | | | | | |
7.500%, 05/01/10 (B) | | | 2,258 | | | 2,247 |
RJ Tower | | | | | | |
12.000%, 06/01/13 (D) | | | 212 | | | 1 |
Royal Caribbean Cruises | | | | | | |
7.250%, 06/15/16 (B) | | | 1,970 | | | 1,458 |
7.000%, 06/15/13 (B) | | | 925 | | | 770 |
6.875%, 12/01/13 | | | 2,189 | | | 1,817 |
RSC Equipment Rental | | | | | | |
9.500%, 12/01/14 (B) | | | 6,305 | | | 4,918 |
Ryland Group | | | | | | |
8.400%, 05/15/17 | | | 830 | | | 805 |
6.875%, 06/15/13 | | | 835 | | | 798 |
5.375%, 05/15/12 | | | 165 | | | 154 |
Sally Holdings LLC | | | | | | |
10.500%, 11/15/16 (B) | | | 1,805 | | | 1,810 |
9.250%, 11/15/14 (B) | | | 2,135 | | | 2,151 |
Sbarro | | | | | | |
10.375%, 02/01/15 | | | 1,866 | | | 1,040 |
Sealy Mattress | | | | | | |
10.875%, 04/15/16 (A) | | | 385 | | | 395 |
8.250%, 06/15/14 (B) | | | 4,670 | | | 3,689 |
Service International | | | | | | |
7.375%, 10/01/14 | | | 1,555 | | | 1,496 |
| | | | | | |
| Description | | Face Amount
($ Thousands) | | Market Value
($ Thousands) |
| | | | | | |
7.000%, 06/15/17 | | $ | 975 | | $ | 890 |
6.750%, 04/01/16 | | | 1,725 | | | 1,587 |
6.750%, 04/01/15 | | | 1,330 | | | 1,227 |
Shingle Springs Tribal Group | | | | | | |
9.375%, 06/15/15 (A) | | | 795 | | | 461 |
Simmons | | | | | | |
10.000%, 12/15/14 (B) | | | 6,595 | | | 132 |
Simmons Bedding | | | | | | |
7.875%, 01/15/14 | | | 4,195 | | | 1,468 |
Sinclair Broadcast Group | | | | | | |
8.000%, 03/15/12 (B) | | | 3,000 | | | 1,957 |
Six Flags | | | | | | |
9.625%, 06/01/14 | | | 550 | | | 85 |
Speedway Motorsports | | | | | | |
8.750%, 06/01/16 (A) | | | 1,750 | | | 1,746 |
Stanadyne Holdings | | | | | | |
12.000%, 02/15/15 (E) | | | 1,500 | | | 735 |
Stanadyne Holdings, Ser 1 | | | | | | |
10.000%, 08/15/14 | | | 475 | | | 391 |
Starwood Hotels & Resorts Worldwide | | | | | | |
7.875%, 05/01/12 | | | 640 | | | 622 |
6.750%, 05/15/18 (B) | | | 2,535 | | | 2,155 |
Station Casinos | | | | | | |
6.875%, 03/01/16 | | | 960 | | | 29 |
6.625%, 03/15/18 | | | 2,090 | | | 63 |
Steinway Musical Instruments | | | | | | |
7.000%, 03/01/14 (A) | | | 5,645 | | | 4,403 |
Stewart Enterprises | | | | | | |
6.250%, 02/15/13 | | | 560 | | | 507 |
Sun Media | | | | | | |
7.625%, 02/15/13 | | | 835 | | | 539 |
Tenneco | | | | | | |
8.625%, 11/15/14 | | | 260 | | | 160 |
8.125%, 11/15/15 (B) | | | 2,705 | | | 1,988 |
Time Warner Cable | | | | | | |
8.250%, 04/01/19 | | | 25 | | | 28 |
7.500%, 04/01/14 | | | 75 | | | 81 |
Toll | | | | | | |
8.250%, 12/01/11 | | | 404 | | | 404 |
Toys R US | | | | | | |
7.625%, 08/01/11 | | | 635 | | | 483 |
Travelport LLC | | | | | | |
11.875%, 09/01/16 (B) | | | 7,085 | | | 3,684 |
9.875%, 09/01/14 | | | 415 | | | 261 |
6.828%, 09/01/09 (C) | | | 2,044 | | | 1,022 |
TRW Automotive | | | | | | |
7.250%, 03/15/17 (A) (B) | | | 1,140 | | | 798 |
7.000%, 03/15/14 (A) (B) | | | 2,985 | | | 2,194 |
UAL 1995 Pass Through Trust A | | | | | | |
9.020%, 04/19/12 | | | 564 | | | 141 |
UAL Pass Through Trust Ser 2000-2 | | | | | | |
7.811%, 10/01/09 | | | 1,424 | | | 1,538 |
United Components | | | | | | |
9.375%, 06/15/13 | | | 1,460 | | | 993 |
| | |
| SEI Institutional Investments Trust / Annual Report / May 31, 2009 | | 181 |
SCHEDULE OF INVESTMENTS
High Yield Bond Fund (Continued)
May 31, 2009
| | | | | | |
| Description | | Face Amount
($ Thousands) | | Market Value
($ Thousands) |
| | | | | | |
Univision Communications | | | | | | |
9.750%, 03/15/15 (A) | | $ | 1,575 | | $ | 488 |
Vail Resorts | | | | | | |
6.750%, 02/15/14 (B) | | | 2,675 | | | 2,548 |
Videotron | | | | | | |
6.875%, 01/15/14 | | | 2,779 | | | 2,626 |
Virgin Media | | | | | | |
6.500%, 11/15/16 (A) | | | 1,480 | | | 1,145 |
WMG Acquisition | | | | | | |
9.500%, 06/15/16 (A) | | | 2,355 | | | 2,352 |
7.375%, 04/15/14 | | | 550 | | | 465 |
| | | | | | |
| | | | | | 219,592 |
| | | | | | |
| | |
Consumer Staples — 6.5% | | | | | | |
Alliance One International | | | | | | |
11.000%, 05/15/12 | | | 280 | | | 282 |
8.500%, 05/15/12 | | | 190 | | | 177 |
Anheuser-Busch InBev Worldwide | | | | | | |
6.875%, 11/15/19 (A) | | | 2,190 | | | 2,215 |
Bausch & Lomb | | | | | | |
9.875%, 11/01/15 (B) | | | 3,675 | | | 3,353 |
Biomet | | | | | | |
11.625%, 10/15/17 (B) | | | 2,935 | | | 2,891 |
Central Garden and Pet | | | | | | |
9.125%, 02/01/13 (B) | | | 1,445 | | | 1,369 |
Chiquita Brands International | | | | | | |
8.875%, 12/01/15 (B) | | | 1,495 | | | 1,270 |
Constellation Brands | | | | | | |
8.375%, 12/15/14 (B) | | | 1,600 | | | 1,600 |
8.125%, 01/15/12 | | | 285 | | | 283 |
7.250%, 05/15/17 (B) | | | 1,250 | | | 1,166 |
7.250%, 09/01/16 (B) | | | 2,595 | | | 2,420 |
Cott Beverages USA | | | | | | |
8.000%, 12/15/11 | | | 830 | | | 714 |
Del Monte | | | | | | |
8.625%, 12/15/12 | | | 605 | | | 608 |
DJO Finance LLC | | | | | | |
10.875%, 11/15/14 | | | 4,205 | | | 3,448 |
Dole Food | | | | | | |
13.875%, 03/15/14 (A) (B) | | | 2,045 | | | 2,188 |
7.250%, 06/15/10 | | | 225 | | | 220 |
Education Management LLC | | | | | | |
10.250%, 06/01/16 | | | 775 | | | 756 |
Elan Finance | | | | | | |
8.875%, 12/01/13 | | | 665 | | | 572 |
7.750%, 11/15/11 (B) | | | 300 | | | 270 |
Elizabeth Arden | | | | | | |
7.750%, 01/15/14 | | | 1,425 | | | 1,197 |
Erac USA Finance | | | | | | |
6.375%, 10/15/17 (A) | | | 585 | | | 491 |
Fleming | | | | | | |
10.125%, 04/01/08 (D) (F) | | | 943 | | | — |
Global Cash Access LLC | | | | | | |
8.750%, 03/15/12 | | | 1,060 | | | 1,039 |
| | | | | | |
| Description | | Face Amount
($ Thousands) | | Market Value
($ Thousands) |
| | | | | | |
HCA | | | | | | |
9.875%, 02/15/17 (A) | | $ | 345 | | $ | 345 |
9.625%, 11/15/16 | | | 12,023 | | | 11,512 |
9.250%, 11/15/16 (B) | | | 6,873 | | | 6,770 |
8.500%, 04/15/19 (A) | | | 3,375 | | | 3,299 |
6.500%, 02/15/16 | | | 1,425 | | | 1,090 |
Ingles Markets | | | | | | |
8.875%, 05/15/17 (A) | | | 680 | | | 671 |
JBS USA LLC | | | | | | |
11.625%, 05/01/14 (A) | | | 1,050 | | | 1,008 |
Johnsondiversey Holdings | | | | | | |
10.670%, 05/15/13 | | | 935 | | | 734 |
Laureate Education | | | | | | |
11.750%, 08/15/17 (A) | | | 400 | | | 300 |
10.000%, 08/15/15 (A) | | | 525 | | | 420 |
Michael Foods | | | | | | |
8.000%, 11/15/13 | | | 3,150 | | | 3,024 |
National Beef Packing | | | | | | |
10.500%, 08/01/11 | | | 697 | | | 693 |
Pantry | | | | | | |
7.750%, 02/15/14 (B) | | | 2,575 | | | 2,279 |
Quebecor World Capital | | | | | | |
8.750%, 03/15/16 (A) (D) | | | 2,175 | | | 196 |
6.125%, 11/15/13 (B) (D) | | | 1,800 | | | 151 |
Rite Aid | | | | | | |
10.375%, 07/15/16 | | | 760 | | | 678 |
9.500%, 06/15/17 | | | 4,185 | | | 2,720 |
9.375%, 12/15/11 | | | 155 | | | 105 |
7.700%, 02/15/27 | | | 150 | | | 60 |
7.500%, 03/01/17 (B) | | | 1,270 | | | 997 |
6.875%, 12/15/28 (A) | | | 350 | | | 140 |
Seminole Indian Tribe of Florida | | | | | | |
7.804%, 10/01/20 (A) | | | 950 | | | 796 |
5.798%, 10/01/13 (A) | | | 2,600 | | | 2,356 |
ServiceMaster | | | | | | |
10.750%, 07/15/15 (A) | | | 1,010 | | | 767 |
7.450%, 08/15/27 | | | 220 | | | 116 |
7.250%, 03/01/38 | | | 655 | | | 339 |
7.100%, 03/01/18 | | | 45 | | | 24 |
Smithfield Foods | | | | | | |
7.750%, 05/15/13 | | | 1,375 | | | 1,038 |
7.750%, 07/01/17 | | | 125 | | | 87 |
7.000%, 08/01/11 | | | 600 | | | 516 |
Southern States Cooperative | | | | | | |
11.000%, 11/01/10 (A) | | | 1,250 | | | 1,150 |
Spectrum Brands | | | | | | |
7.375%, 02/01/15 (B) (D) | | | 1,960 | | | 995 |
SuperValu | | | | | | |
7.500%, 11/15/14 | | | 1,400 | | | 1,355 |
8.000%, 05/01/16 | | | 2,927 | | | 2,868 |
Tyson Foods | | | | | | |
10.500%, 03/01/14 (A) (B) | | | 680 | | | 721 |
Universal Hospital Services | | | | | | |
8.500%, 06/01/15 | | | 960 | | | 922 |
| | |
| 182 | | SEI Institutional Investments Trust / Annual Report / May 31, 2009 |
| | | | | | |
| Description | | Face Amount
($ Thousands) | | Market Value
($ Thousands) |
| | | | | | |
US Oncology Holdings | | | | | | |
6.904%, 09/15/09 (C) | | $ | 470 | | $ | 319 |
VWR Funding | | | | | | |
10.250%, 07/15/15 | | | 1,025 | | | 769 |
| | | | | | |
| | | | | | 80,859 |
| | | | | | |
| | |
Energy — 9.5% | | | | | | |
Allis-Chalmers Energy | | | | | | |
9.000%, 01/15/14 | | | 3,161 | | | 2,023 |
Anadarko Petroleum | | | | | | |
8.700%, 03/15/19 | | | 1,590 | | | 1,770 |
Atlas Energy Resources LLC | | | | | | |
10.750%, 02/01/18 (A) | | | 1,420 | | | 1,264 |
Aventine Renewable Energy | | | | | | |
10.000%, 04/01/17 (D) | | | 2,600 | | | 572 |
Berry Petroleum | | | | | | |
10.250%, 06/01/14 | | | 2,300 | | | 2,257 |
Boardwalk Pipelines | | | | | | |
5.200%, 06/01/18 | | | 2,000 | | | 1,589 |
Brigham Exploration | | | | | | |
9.625%, 05/01/14 | | | 875 | | | 569 |
Calfrac Holdings | | | | | | |
7.750%, 02/15/15 (A) | | | 3,000 | | | 2,400 |
Chaparral Energy | | | | | | |
8.875%, 02/01/17 | | | 425 | | | 245 |
8.500%, 12/01/15 | | | 575 | | | 331 |
Chesapeake Energy | | | | | | |
9.500%, 02/15/15 | | | 2,155 | | | 2,128 |
7.500%, 06/15/14 (B) | | | 219 | | | 203 |
7.250%, 12/15/18 (B) | | | 1,490 | | | 1,244 |
7.000%, 08/15/14 (B) | | | 1,010 | | | 917 |
6.875%, 01/15/16 | | | 1,020 | | | 880 |
6.500%, 08/15/17 | | | 2,035 | | | 1,684 |
6.375%, 06/15/15 | | | 370 | | | 317 |
Cimarex Energy | | | | | | |
7.125%, 05/01/17 (B) | | | 1,020 | | | 885 |
Complete Production Services | | | | | | |
8.000%, 12/15/16 | | | 635 | | | 514 |
Compton Petroleum Finance | | | | | | |
7.625%, 12/01/13 | | | 350 | | | 175 |
Connacher Oil and Gas | | | | | | |
10.250%, 12/15/15 (A) | | | 675 | | | 429 |
Copano Energy LLC | | | | | | |
7.750%, 06/01/18 | | | 2,930 | | | 2,593 |
Denbury Resources | | | | | | |
9.750%, 03/01/16 | | | 1,085 | | | 1,107 |
7.500%, 04/01/13 | | | 2,290 | | | 2,198 |
7.500%, 12/15/15 (B) | | | 1,175 | | | 1,110 |
Dynegy Holdings | | | | | | |
8.375%, 05/01/16 | | | 2,450 | | | 1,972 |
7.750%, 06/01/19 | | | 2,255 | | | 1,641 |
7.500%, 06/01/15 (B) | | | 3,925 | | | 3,160 |
6.875%, 04/01/11 | | | 200 | | | 190 |
| | | | | | |
| Description | | Face Amount
($ Thousands) | | Market Value
($ Thousands) |
| | | | | | |
El Paso | | | | | | |
8.250%, 02/15/16 | | $ | 835 | | $ | 829 |
8.050%, 10/15/30 | | | 150 | | | 122 |
7.875%, 06/15/12 (B) | | | 1,425 | | | 1,397 |
7.800%, 08/01/31 | | | 1,175 | | | 935 |
7.420%, 02/15/37 | | | 1,300 | | | 942 |
7.250%, 06/01/18 (B) | | | 3,190 | | | 2,938 |
7.000%, 06/15/17 (B) | | | 1,070 | | | 1,002 |
6.875%, 06/15/14 | | | 775 | | | 734 |
El Paso Performance-Linked Trust | | | | | | |
7.750%, 07/15/11 (A) | | | 450 | | | 445 |
Forbes Energy Services LLC | | | | | | |
11.000%, 02/15/15 | | | 1,145 | | | 790 |
Forest Oil | | | | | | |
8.500%, 02/15/14 (A) | | | 50 | | | 48 |
8.000%, 12/15/11 | | | 800 | | | 796 |
7.750%, 05/01/14 | | | 505 | | | 472 |
7.250%, 06/15/19 (B) | | | 1,460 | | | 1,256 |
Helix Energy Solutions Group | | | | | | |
9.500%, 01/15/16 (A) | | | 2,955 | | | 2,438 |
Hillcorp Energy | | | | | | |
9.000%, 06/01/16 (A) | | | 930 | | | 818 |
7.750%, 11/01/15 (A) | | | 3,995 | | | 3,436 |
International Coal Group | | | | | | |
10.250%, 07/15/14 | | | 985 | | | 680 |
KCS Energy | | | | | | |
7.125%, 04/01/12 | | | 600 | | | 559 |
Key Energy Services | | | | | | |
8.375%, 12/01/14 | | | 1,360 | | | 1,197 |
Linn Energy LLC | | | | | | |
11.750%, 05/15/17 (A) | | | 1,370 | | | 1,308 |
Mariner Energy | | | | | | |
8.000%, 05/15/17 | | | 1,480 | | | 1,169 |
MarkWest Energy Partners | | | | | | |
8.750%, 04/15/18 | | | 3,285 | | | 2,727 |
MarkWest Energy Partners, Ser B | | | | | | |
8.500%, 07/15/16 | | | 250 | | | 211 |
6.875%, 11/01/14 | | | 1,125 | | | 922 |
Massey Energy | | | | | | |
6.875%, 12/15/13 | | | 2,090 | | | 1,850 |
Nabors Industries | | | | | | |
9.250%, 01/15/19 (A) | | | 2,000 | | | 2,128 |
Newfield Exploration | | | | | | |
7.125%, 05/15/18 | | | 1,525 | | | 1,372 |
6.625%, 04/15/16 | | | 1,270 | | | 1,149 |
Nustar Logistics | | | | | | |
7.650%, 04/15/18 | | | 925 | | | 865 |
OPTI Canada | | | | | | |
8.250%, 12/15/14 | | | 1,045 | | | 721 |
7.875%, 12/15/14 | | | 2,055 | | | 1,387 |
Pacific Energy Partners | | | | | | |
7.125%, 06/15/14 | | | 200 | | | 200 |
6.250%, 09/15/15 | | | 100 | | | 90 |
Parker Drilling | | | | | | |
9.625%, 10/01/13 | | | 639 | | | 559 |
| | |
| SEI Institutional Investments Trust / Annual Report / May 31, 2009 | | 183 |
SCHEDULE OF INVESTMENTS
High Yield Bond Fund (Continued)
May 31, 2009
| | | | | | |
| Description | | Face Amount
($ Thousands) | | Market Value
($ Thousands) |
| | | | | | |
Peabody Energy, Ser B | | | | | | |
6.875%, 03/15/13 | | $ | 3,100 | | $ | 2,991 |
PetroHawk Energy | | | | | | |
10.500%, 08/01/14 (A) | | | 2,500 | | | 2,563 |
9.125%, 07/15/13 | | | 2,847 | | | 2,797 |
7.875%, 06/01/15 | | | 1,795 | | | 1,665 |
Petroleum Development | | | | | | |
12.000%, 02/15/18 | | | 2,675 | | | 1,993 |
PHI | | | | | | |
7.125%, 04/15/13 | | | 125 | | | 102 |
Plains Exploration & Production | | | | | | |
10.000%, 03/01/16 | | | 650 | | | 648 |
7.750%, 06/15/15 | | | 75 | | | 70 |
7.625%, 06/01/18 | | | 350 | | | 309 |
7.000%, 03/15/17 | | | 1,035 | | | 900 |
Pride International | | | | | | |
8.500%, 06/15/19 | | | 1,670 | | | 1,683 |
Quicksilver Resources | | | | | | |
8.250%, 08/01/15 (B) | | | 1,605 | | | 1,340 |
7.125%, 04/01/16 | | | 1,075 | | | 785 |
Range Resources | | | | | | |
7.250%, 05/01/18 (B) | | | 450 | | | 421 |
6.375%, 03/15/15 | | | 925 | | | 853 |
Regency Energy Partners | | | | | | |
8.375%, 12/15/13 | | | 1,050 | | | 998 |
Sabine Pass LNG LP | | | | | | |
7.500%, 11/30/16 (A) | | | 625 | | | 506 |
7.250%, 11/30/13 (B) | | | 1,550 | | | 1,317 |
SandRidge Energy | | | | | | |
9.875%, 05/15/16 (A) | | | 480 | | | 457 |
8.625%, 04/01/15 | | | 750 | | | 639 |
8.000%, 06/01/18 (A) | | | 200 | | | 169 |
SESI LLC | | | | | | |
6.875%, 06/01/14 | | | 950 | | | 855 |
Sonat | | | | | | |
7.625%, 07/15/11 | | | 750 | | | 738 |
Southwestern Energy | | | | | | |
7.500%, 02/01/18 (A) | | | 2,000 | | | 1,905 |
Swift Energy | | | | | | |
7.625%, 07/15/11 (B) | | | 3,769 | | | 3,185 |
Targa Resources Partners | | | | | | |
8.500%, 11/01/13 | | | 375 | | | 268 |
8.250%, 07/01/16 (A) | | | 925 | | | 768 |
Tennessee Gas Pipeline | | | | | | |
8.000%, 02/01/16 (A) | | | 300 | | | 305 |
Tesoro | | | | | | |
6.625%, 11/01/15 | | | 1,655 | | | 1,409 |
United Refining | | | | | | |
10.500%, 08/15/12 | | | 850 | | | 638 |
Valero Energy | | | | | | |
9.375%, 03/15/19 | | | 375 | | | 420 |
Venoco | | | | | | |
8.750%, 12/15/11 | | | 2,940 | | | 2,352 |
| | | | | | |
| Description | | Face Amount
($ Thousands) | | Market Value
($ Thousands) |
| | | | | | |
Whiting Petroleum | | | | | | |
7.250%, 05/01/12 | | $ | 1,692 | | $ | 1,578 |
7.250%, 05/01/13 | | | 715 | | | 654 |
Williams | | | | | | |
8.750%, 01/15/20 (A) | | | 150 | | | 154 |
8.125%, 03/15/12 | | | 150 | | | 153 |
7.875%, 09/01/21 | | | 410 | | | 398 |
7.750%, 06/15/31 | | | 475 | | | 411 |
Williams Partners | | | | | | |
7.250%, 02/01/17 (B) | | | 2,905 | | | 2,614 |
Williams, Ser A | | | | | | |
7.500%, 01/15/31 | | | 375 | | | 317 |
| | | | | | |
| | | | | | 117,187 |
| | | | | | |
| | |
Financials — 9.5% | | | | | | |
ACE Cash Express | | | | | | |
10.250%, 10/01/14 (A) | | | 675 | | | 277 |
ALH Finance LLC | | | | | | |
8.500%, 01/15/13 | | | 3,675 | | | 3,252 |
American Achievement Group Holding | | | | | | |
14.750%, 10/01/12 | | | 1,108 | | | 233 |
BAC Capital Trust XIV | | | | | | |
5.630%, 09/15/09 (C) | | | 1,280 | | | 590 |
Bank of America | | | | | | |
6.100%, 06/15/17 | | | 2,025 | | | 1,778 |
5.750%, 08/15/16 | | | 465 | | | 394 |
BB&T Capital Trust I | | | | | | |
5.850%, 08/18/35 | | | 180 | | | 127 |
BB&T Capital Trust II, Ser 2006- | | | | | | |
6.750%, 06/07/36 (B) | | | 195 | | | 141 |
Capital One Financial | | | | | | |
6.150%, 09/01/16 | | | 320 | | | 269 |
Cardtronics | | | | | | |
9.250%, 08/15/13 | | | 1,370 | | | 1,206 |
9.250%, 08/15/13 | | | 1,110 | | | 977 |
CIT Group | | | | | | |
12.000%, 12/18/18 (A) | | | 1,035 | | | 568 |
5.850%, 09/15/16 | | | 2,150 | | | 1,419 |
5.650%, 02/13/17 (B) | | | 3,200 | | | 2,117 |
5.400%, 01/30/16 | | | 290 | | | 191 |
5.000%, 02/13/14 | | | 3,900 | | | 2,628 |
4.750%, 12/15/10 | | | 260 | | | 221 |
1.451%, 06/12/09 (C) | | | 270 | | | 243 |
1.353%, 07/28/09 (C) | | | 1,250 | | | 920 |
1.306%, 08/03/09 (C) | | | 450 | | | 360 |
CIT Group Funding of Canada | | | | | | |
4.650%, 07/01/10 | | | 135 | | | 120 |
Citigroup | | | | | | |
6.125%, 08/25/36 | | | 495 | | | 366 |
5.000%, 09/15/14 | | | 3,250 | | | 2,826 |
Deluxe | | | | | | |
7.375%, 06/01/15 | | | 200 | | | 158 |
FireKeepers Development Authority | | | | | | |
13.875%, 05/01/15 (A) | | | 1,235 | | | 1,111 |
| | |
| 184 | | SEI Institutional Investments Trust / Annual Report / May 31, 2009 |
| | | | | | |
| Description | | Face Amount
($ Thousands) | | Market Value
($ Thousands) |
| | | | | | |
Ford Motor Credit LLC | | | | | | |
12.000%, 05/15/15 | | $ | 1,950 | | $ | 1,793 |
9.875%, 08/10/11 | | | 2,660 | | | 2,428 |
9.750%, 09/15/10 | | | 200 | | | 189 |
8.000%, 06/01/14 | | | 3,755 | | | 3,046 |
8.000%, 12/15/16 (B) | | | 2,645 | | | 2,124 |
7.800%, 06/01/12 | | | 6,650 | | | 5,679 |
7.375%, 10/28/09 | | | 1,965 | | | 1,917 |
7.250%, 10/25/11 (B) | | | 2,615 | | | 2,257 |
7.000%, 10/01/13 (B) | | | 3,862 | | | 3,116 |
3.889%, 07/13/09 (C) | | | 635 | | | 502 |
2.701%, 07/15/09 (C) | | | 680 | | | 646 |
Fresenius US Finance II | | | | | | |
9.000%, 07/15/15 (A) | | | 800 | | | 828 |
FTI Consulting | | | | | | |
7.625%, 06/15/13 | | | 660 | | | 647 |
Genworth Financial | | | | | | |
5.750%, 06/15/14 | | | 350 | | | 220 |
5.650%, 06/15/12 | | | 1,120 | | | 776 |
Genworth Global Funding Trusts | | | | | | |
1.480%, 06/15/09 (C) | | | 970 | | | 846 |
1.023%, 08/17/09 (C) | | | 1,380 | | | 1,061 |
GMAC LLC | | | | | | |
8.000%, 11/01/31 (A) (B) | | | 4,918 | | | 3,689 |
7.250%, 03/02/11 (A) | | | 807 | | | 726 |
7.000%, 02/01/12 (A) | | | 63 | | | 55 |
6.875%, 09/15/11 (A) (B) | | | 4,984 | | | 4,461 |
6.875%, 08/28/12 (A) (B) | | | 6,341 | | | 5,485 |
6.750%, 12/01/14 (B) | | | 4,157 | | | 3,471 |
6.625%, 05/15/12 (A) (B) | | | 1,526 | | | 1,320 |
6.000%, 12/15/11 (A) | | | 1,078 | | | 938 |
GrafTech Finance | | | | | | |
10.250%, 02/15/12 | | | 78 | | | 73 |
Hawker Beechcraft Acquisition LLC | | | | | | |
9.750%, 04/01/17 (A) | | | 200 | | | 62 |
HCP MTN | | | | | | |
6.700%, 01/30/18‡ | | | 1,470 | | | 1,262 |
Hellas II | | | | | | |
6.881%, 07/15/09 (A) (C) | | | 2,100 | | | 399 |
Host Hotels & Resorts | | | | | | |
3.250%, 04/15/24‡ (A) | | | 555 | | | 543 |
Host Hotels & Resorts LP | | | | | | |
6.875%, 11/01/14‡ (B) | | | 935 | | | 846 |
Host Marriott LP | | | | | | |
7.125%, 11/01/13‡ | | | 770 | | | 716 |
Host Marriott LP, Ser M | | | | | | |
7.000%, 08/15/12‡ | | | 175 | | | 168 |
Host Marriott LP, Ser O | | | | | | |
6.375%, 03/15/15‡ (B) | | | 1,750 | | | 1,496 |
Host Marriott LP, Ser Q | | | | | | |
6.750%, 06/01/16‡ (B) | | | 2,750 | | | 2,365 |
HUB International Holdings | | | | | | |
10.250%, 06/15/15 (A) | | | 410 | | | 254 |
9.000%, 12/15/14 (A) | | | 1,750 | | | 1,313 |
| | | | | | |
| Description | | Face Amount
($ Thousands) | | Market Value
($ Thousands) |
| | | | | | |
Icahn Enterprises | | | | | | |
7.125%, 02/15/13 (B) | | $ | 4,725 | | $ | 4,040 |
International Lease Finance MTN | | | | | | |
5.625%, 09/20/13 | | | 645 | | | 503 |
5.550%, 09/05/12 | | | 430 | | | 339 |
5.350%, 03/01/12 | | | 125 | | | 94 |
5.250%, 01/10/13 | | | 350 | | | 272 |
iPayment | | | | | | |
9.750%, 05/15/14 | | | 1,100 | | | 597 |
Janus Capital Group | | | | | | |
6.700%, 06/15/17 | | | 1,510 | | | 1,190 |
6.500%, 06/15/12 | | | 2,200 | | | 1,814 |
5.875%, 09/15/11 | | | 1,127 | | | 1,008 |
JPMorgan Chase | | | | | | |
7.900%, 10/30/09 (C) | | | 505 | | | 422 |
JPMorgan Chase Capital XXV | | | | | | |
6.800%, 10/01/37 | | | 90 | | | 76 |
LaBranche | | | | | | |
11.000%, 05/15/12 | | | 1,090 | | | 1,000 |
Lehman Brothers Holdings MTN | | | | | | |
6.875%, 05/02/18 (D) | | | 3,500 | | | 578 |
5.625%, 01/24/13 (D) | | | 1,000 | | | 157 |
Leucadia National | | | | | | |
8.125%, 09/15/15 | | | 638 | | | 566 |
7.125%, 03/15/17 | | | 3,000 | | | 2,314 |
Liberty Mutual Group | | | | | | |
10.750%, 06/15/58 (A) (C) | | | 1,340 | | | 831 |
Marlin Water Trust II | | | | | | |
6.310%, 07/15/03 (A) (D) | | | 4,000 | | | 2 |
MetLife | | | | | | |
6.400%, 12/15/36 | | | 610 | | | 433 |
MetLife Capital Trust X | | | | | | |
9.250%, 10/08/09 (A) (C) | | | 1,350 | | | 1,148 |
Nuveen Investments | | | | | | |
10.500%, 11/15/15 (A) | | | 4,130 | | | 2,210 |
Omega Healthcare Investors | | | | | | |
7.000%, 01/15/16‡ | | | 825 | | | 742 |
Petroplus Finance | | | | | | |
7.000%, 05/01/17 (A) | | | 1,600 | | | 1,304 |
6.750%, 05/01/14 (A) | | | 125 | | | 104 |
Pinnacle Foods Finance LLC | | | | | | |
10.625%, 04/01/17 | | | 1,675 | | | 1,378 |
PNC Financial Services Group | | | | | | |
8.250%, 11/21/09 (B) (C) | | | 680 | | | 580 |
Popular North America Capital Trust I | | | | | | |
6.564%, 09/15/34 | | | 800 | | | 265 |
PXRE Capital Trust I | | | | | | |
8.850%, 02/01/27 | | | 1,600 | | | 800 |
Rabobank Nederland | | | | | | |
11.000%, 12/31/09 (A) (C) | | | 610 | | | 610 |
Realogy | | | | | | |
10.500%, 04/15/14 | | | 475 | | | 175 |
Senior Housing Properties Trust | | | | | | |
7.875%, 04/15/15‡ | | | 645 | | | 574 |
| | |
| SEI Institutional Investments Trust / Annual Report / May 31, 2009 | | 185 |
SCHEDULE OF INVESTMENTS
High Yield Bond Fund (Continued)
May 31, 2009
| | | | | | |
| Description | | Face Amount
($ Thousands) | | Market Value
($ Thousands) |
| | | | | | |
Silicon Valley Bank | | | | | | |
5.700%, 06/01/12 | | $ | 675 | | $ | 638 |
Snoqualmie Entertainment Authority | | | | | | |
9.125%, 02/01/15 (A) | | | 1,275 | | | 682 |
5.384%, 02/01/14 (A) (C) | | | 275 | | | 144 |
UCI Holdco | | | | | | |
9.320%, 06/15/09 (C) | | | 1,145 | | | 195 |
Universal City Development Partners | | | | | | |
11.750%, 04/01/10 | | | 640 | | | 614 |
Universal City Florida Holding | | | | | | |
5.778%, 08/01/09 (C) | | | 2,823 | | | 2,018 |
USB Capital IX | | | | | | |
6.189%, 10/15/09 (C) | | | 1,015 | | | 662 |
Ventas Realty | | | | | | |
6.500%, 06/01/16‡ | | | 635 | | | 578 |
Ventas Realty LP | | | | | | |
7.125%, 06/01/15‡ | | | 1,026 | | | 972 |
6.750%, 04/01/17‡ | | | 775 | | | 715 |
Wells Fargo Capital XIII MTN | | | | | | |
7.700%, 09/26/09 (C) | | | 1,700 | | | 1,326 |
Willis North America | | | | | | |
6.200%, 03/28/17 | | | 1,256 | | | 990 |
5.125%, 07/15/10 | | | 400 | | | 376 |
Zions Bancorporation | | | | | | |
6.000%, 09/15/15 | | | 1,305 | | | 914 |
5.500%, 11/16/15 | | | 500 | | | 341 |
| | | | | | |
| | | | | | 117,500 |
| | | | | | |
| | |
Health Care — 4.4% | | | | | | |
Alliance Imaging, Ser B | | | | | | |
7.250%, 12/15/12 | | | 550 | | | 539 |
Biomet | | | | | | |
10.375%, 10/15/17 | | | 9,000 | | | 8,550 |
10.000%, 10/15/17 (B) | | | 2,185 | | | 2,234 |
Bio-Rad Laboratories | | | | | | |
8.000%, 09/15/16 (A) | | | 870 | | | 872 |
6.125%, 12/15/14 | | | 900 | | | 828 |
Community Health Systems | | | | | | |
8.875%, 07/15/15 (B) | | | 4,430 | | | 4,380 |
Cooper | | | | | | |
7.125%, 02/15/15 | | | 1,590 | | | 1,531 |
CRC Health | | | | | | |
10.750%, 02/01/16 | | | 1,925 | | | 1,386 |
DaVita | | | | | | |
6.625%, 03/15/13 | | | 2,600 | | | 2,438 |
Health Management Associates | | | | | | |
6.125%, 04/15/16 | | | 1,765 | | | 1,500 |
Health Net | | | | | | |
6.375%, 06/01/17 | | | 1,741 | | | 1,306 |
Healthsouth | | | | | | |
8.323%, 06/15/14 (C) | | | 1,255 | | | 1,155 |
Inverness Medical Innovations | | | | | | |
9.000%, 05/15/16 (B) | | | 3,370 | | | 3,235 |
| | | | | | |
| Description | | Face Amount
($ Thousands) | | Market Value
($ Thousands) |
| | | | | | |
NMH Holdings | | | | | | |
8.445%, 06/15/09 (A) (C) | | $ | 781 | | $ | 461 |
Psychiatric Solutions | | | | | | |
7.750%, 07/15/15 (A) | | | 315 | | | 280 |
7.750%, 07/15/15 (B) | | | 3,300 | | | 2,970 |
Res-Care | | | | | | |
7.750%, 10/15/13 | | | 625 | | | 561 |
Select Medical | | | | | | |
7.625%, 02/01/15 | | | 5,676 | | | 4,484 |
Spheris | | | | | | |
11.000%, 12/15/12 | | | 750 | | | 281 |
Surgical Care Affiliates | | | | | | |
8.875%, 07/15/15 (A) | | | 1,580 | | | 1,264 |
Tenet Healthcare | | | | | | |
10.000%, 05/01/18 (A) | | | 632 | | | 661 |
9.875%, 07/01/14 | | | 1,125 | | | 1,125 |
9.250%, 02/01/15 (B) | | | 5,370 | | | 4,967 |
9.000%, 05/01/15 (A) | | | 587 | | | 599 |
7.375%, 02/01/13 | | | 1,030 | | | 991 |
United Surgical Partners International | | | | | | |
8.875%, 05/01/17 | | | 1,435 | | | 1,223 |
United Surgical Partners International PIK | | | | | | |
9.250%, 05/01/17 | | | 3,190 | | | 2,472 |
US Oncology | | | | | | |
10.750%, 08/15/14 | | | 1,275 | | | 1,214 |
9.000%, 08/15/12 (B) | | | 610 | | | 610 |
Vanguard Health Holding I | | | | | | |
11.250%, 10/01/15 (E) | | | 600 | | | 560 |
Vanguard Health Holding II | | | | | | |
9.000%, 10/01/14 | | | 325 | | | 319 |
| | | | | | |
| | | | | | 54,996 |
| | | | | | |
| | |
Industrials — 6.4% | | | | | | |
ACCO Brands | | | | | | |
7.625%, 08/15/15 | | | 6,810 | | | 3,031 |
Actuant | | | | | | |
6.875%, 06/15/17 | | | 2,575 | | | 2,305 |
AGY Holding | | | | | | |
11.000%, 11/15/14 | | | 800 | | | 572 |
Aleris International | | | | | | |
10.000%, 12/15/16 (D) | | | 1,675 | | | 6 |
Aleris International PIK | | | | | | |
9.000%, 12/15/14 (D) | | | 950 | | | 4 |
Allied Waste North America | | | | | | |
7.875%, 04/15/13 | | | 600 | | | 610 |
Allied Waste North America, Ser B | | | | | | |
7.125%, 05/15/16 | | | 415 | | | 406 |
Allison Transmission | | | | | | |
11.000%, 11/01/15 (A) (B) | | | 1,050 | | | 819 |
American Airlines, Ser 01-1 | | | | | | |
7.379%, 05/23/16 | | | 85 | | | 42 |
American Railcar Industries | | | | | | |
7.500%, 03/01/14 | | | 325 | | | 281 |
| | |
| 186 | | SEI Institutional Investments Trust / Annual Report / May 31, 2009 |
| | | | | | |
| Description | | Face Amount
($ Thousands) | | Market Value
($ Thousands) |
| | | | | | |
Ames True Temper | | | | | | |
10.000%, 07/15/12 (B) | | $ | 1,135 | | $ | 857 |
5.131%, 07/15/09 (C) | | | 1,480 | | | 1,251 |
Anixter | | | | | | |
10.000%, 03/15/14 | | | 1,745 | | | 1,728 |
Associated Materials | | | | | | |
9.750%, 04/15/12 (B) | | | 795 | | | 672 |
Atrium | | | | | | |
15.000%, 12/15/12 (A) (B) | | | 1,378 | | | 28 |
Baker & Taylor | | | | | | |
11.500%, 07/01/13 (A) | | | 925 | | | 232 |
Baldor Electric | | | | | | |
8.625%, 02/15/17 (B) | | | 1,820 | | | 1,656 |
BE Aerospace | | | | | | |
8.500%, 07/01/18 (B) | | | 650 | | | 614 |
Bombardier | | | | | | |
8.000%, 11/15/14 (A) (B) | | | 400 | | | 369 |
Buffalo Thunder Development Authority | | | | | | |
9.375%, 12/15/14 (A) | | | 2,050 | | | 287 |
Building Materials Corp of America | | | | | | |
7.750%, 08/01/14 | | | 820 | | | 717 |
BWAY | | | | | | |
10.000%, 04/15/14 (A) | | | 5,145 | | | 5,139 |
Casella Waste Systems | | | | | | |
9.750%, 02/01/13 | | | 1,385 | | | 1,150 |
Chart Industries | | | | | | |
9.125%, 10/15/15 | | | 2,325 | | | 2,104 |
Continental Airlines | | | | | | |
7.339%, 04/19/14 | | | 1,490 | | | 969 |
Cornell | | | | | | |
10.750%, 07/01/12 | | | 280 | | | 276 |
Corrections Corp of America | | | | | | |
7.750%, 06/01/17 | | | 130 | | | 128 |
7.500%, 05/01/11 | | | 1,300 | | | 1,287 |
6.750%, 01/31/14 | | | 320 | | | 307 |
6.250%, 03/15/13 (B) | | | 1,883 | | | 1,784 |
Crown Americas LLC | | | | | | |
7.625%, 11/15/13 | | | 450 | | | 439 |
7.625%, 05/15/17 (A) | | | 590 | | | 578 |
Delta Air Lines, Ser 2002-1, Cl C | | | | | | |
7.779%, 01/02/12 | | | 561 | | | 505 |
DigitalGlobe | | | | | | |
10.500%, 05/01/14 (A) | | | 545 | | | 560 |
Douglas Dynamics LLC | | | | | | |
7.750%, 01/15/12 (A) | | | 855 | | | 598 |
ESCO | | | | | | |
5.195%, 06/15/09 (A) (C) | | | 125 | | | 90 |
General Cable | | | | | | |
7.125%, 04/01/17 (B) | | | 685 | | | 627 |
Graphic Packaging International | | | | | | |
9.500%, 08/15/13 (B) | | | 2,025 | | | 1,893 |
8.500%, 08/15/11 (B) | | | 310 | | | 307 |
Gulfmark Offshore | | | | | | |
7.750%, 07/15/14 | | | 1,304 | | | 1,167 |
| | | | | | |
| Description | | Face Amount
($ Thousands) | | Market Value
($ Thousands) |
| | | | | | |
Harland Clarke Holdings | | | | | | |
9.500%, 05/15/15 | | $ | 1,070 | | $ | 797 |
Hawker Beechcraft Acquisition LLC PIK | | | | | | |
8.875%, 04/01/15 | | | 2,955 | | | 916 |
Indalex Holding, Ser B | | | | | | |
11.500%, 02/01/14 (D) | | | 401 | | | 20 |
Iron Mountain | | | | | | |
8.750%, 07/15/18 | | | 1,560 | | | 1,517 |
8.625%, 04/01/13 | | | 875 | | | 875 |
8.000%, 06/15/20 | | | 1,235 | | | 1,142 |
J.B. Poindexter | | | | | | |
8.750%, 03/15/14 | | | 325 | | | 224 |
Kansas City Southern de Mexico | | | | | | |
12.500%, 04/01/16 (A) | | | 445 | | | 418 |
9.375%, 05/01/12 | | | 460 | | | 413 |
L-3 Communications | | | | | | |
7.625%, 06/15/12 | | | 1,000 | | | 999 |
5.875%, 01/15/15 | | | 2,587 | | | 2,302 |
L-3 Communications, Ser B | | | | | | |
6.375%, 10/15/15 | | | 2,911 | | | 2,649 |
Language Line | | | | | | |
11.125%, 06/15/12 | | | 1,875 | | | 1,744 |
Mobile Mini | | | | | | |
6.875%, 05/01/15 | | | 1,215 | | | 993 |
Mobile Services Group | | | | | | |
9.750%, 08/01/14 | | | 425 | | | 396 |
Moog | | | | | | |
7.250%, 06/15/18 (A) | | | 420 | | | 395 |
Nebraska Book | | | | | | |
8.625%, 03/15/12 | | | 250 | | | 180 |
Noble Group | | | | | | |
6.625%, 03/17/15 (A) | | | 475 | | | 404 |
NXP BV | | | | | | |
10.000%, 07/15/13 (A) | | | 598 | | | 425 |
Owens-Brockway Glass Container | | | | | | |
7.375%, 05/15/16 (A) | | | 240 | | | 232 |
Park-Ohio Industries | | | | | | |
8.375%, 11/15/14 | | | 775 | | | 342 |
Penhall International | | | | | | |
12.000%, 08/01/14 (A) | | | 750 | | | 262 |
Plastipak Holdings | | | | | | |
8.500%, 12/15/15 (A) | | | 435 | | | 372 |
Pregis | | | | | | |
12.375%, 10/15/13 | | | 170 | | | 108 |
Quality Distribution LLC | | | | | | |
9.000%, 11/15/10 | | | 800 | | | 400 |
RBS Global | | | | | | |
9.500%, 08/01/14 (A) | | | 2,627 | | | 2,194 |
RBS Global & Rexnord | | | | | | |
11.750%, 08/01/16 (B) | | | 960 | | | 605 |
8.875%, 09/01/16 | | | 450 | | | 326 |
Saint Acquisition | | | | | | |
12.500%, 05/15/17 (A) | | | 50 | | | 23 |
Sequa | | | | | | |
11.750%, 12/01/15 (A) | | | 1,050 | | | 467 |
| | |
| SEI Institutional Investments Trust / Annual Report / May 31, 2009 | | 187 |
SCHEDULE OF INVESTMENTS
High Yield Bond Fund (Continued)
May 31, 2009
| | | | | | |
| Description | | Face Amount
($ Thousands) | | Market Value
($ Thousands) |
| | | | | | |
SPX | | | | | | |
7.625%, 12/15/14 | | $ | 1,330 | | $ | 1,290 |
Stallion Oilfield Services | | | | | | |
9.750%, 02/01/15 (A) | | | 1,144 | | | 269 |
Terex | | | | | | |
10.875%, 06/01/16 | | | 1,000 | | | 976 |
8.000%, 11/15/17 (B) | | | 8,990 | | | 7,282 |
Thermadyne Holdings | | | | | | |
9.250%, 02/01/14 | | | 1,040 | | | 686 |
Titan International | | | | | | |
8.000%, 01/15/12 | | | 3,360 | | | 2,890 |
TransDigm | | | | | | |
7.750%, 07/15/14 | | | 1,475 | | | 1,423 |
Tyco Electronics Group | | | | | | |
6.000%, 10/01/12 | | | 3,191 | | | 3,119 |
United Air Lines | | | | | | |
9.125%, 01/15/12 (D) (F) | | | 625 | | | — |
United Air Lines, Ser A | | | | | | |
10.670%, 05/01/04 (D) (F) | | | 325 | | | — |
USG | | | | | | |
9.250%, 01/15/18 | | | 850 | | | 669 |
Vought Aircraft Industries | | | | | | |
8.000%, 07/15/11 | | | 3,000 | | | 1,470 |
| | | | | | |
| | | | | | 78,609 |
| | | | | | |
| | |
Information Technology — 3.7% | | | | | | |
Activant Solutions | | | | | | |
9.500%, 05/01/16 | | | 1,900 | | | 1,392 |
Advanced Micro Devices | | | | | | |
7.750%, 11/01/12 (B) | | | 2,415 | | | 1,606 |
Amkor Technology | | | | | | |
9.250%, 06/01/16 (B) | | | 1,000 | | | 892 |
7.750%, 05/15/13 | | | 1,695 | | | 1,517 |
7.125%, 03/15/11 | | | 2,000 | | | 1,950 |
Avago Technologies Finance Pte | | | | | | |
10.125%, 12/01/13 | | | 670 | | | 644 |
Celestica | | | | | | |
7.875%, 07/01/11 | | | 470 | | | 471 |
7.625%, 07/01/13 | | | 825 | | | 804 |
Compagnie Generale de Geophysique | | | | | | |
7.750%, 05/15/17 | | | 1,010 | | | 889 |
7.500%, 05/15/15 | | | 1,339 | | | 1,225 |
Compucom Systems | | | | | | |
12.500%, 10/01/15 (A) | | | 1,610 | | | 1,240 |
First Data | | | | | | |
9.875%, 09/24/15 (B) | | | 6,033 | | | 4,102 |
Flextronics International | | | | | | |
6.250%, 11/15/14 (B) | | | 3,785 | | | 3,388 |
Freescale Semiconductor PIK | | | | | | |
9.125%, 12/15/14 | | | 2,125 | | | 584 |
Freescale Semiconductor | | | | | | |
8.875%, 12/15/14 | | | 2,025 | | | 911 |
Lender Processing Services | | | | | | |
8.125%, 07/01/16 | | | 650 | | | 640 |
| | | | | | |
| Description | | Face Amount
($ Thousands) | | Market Value
($ Thousands) |
| | | | | | |
National Semiconductor | | | | | | |
6.600%, 06/15/17 | | $ | 485 | | $ | 410 |
NXP Funding LLC | | | | | | |
7.875%, 10/15/14 (B) | | | 2,415 | | | 857 |
Open Solutions | | | | | | |
9.750%, 02/01/15 (A) | | | 4,820 | | | 1,253 |
Sanmina-SCI | | | | | | |
8.125%, 03/01/16 | | | 930 | | | 521 |
4.070%, 06/15/09 (A) (B) (C) | | | 1,250 | | | 944 |
4.070%, 06/15/09 (A) (C) | | | 2,380 | | | 2,273 |
Seitel | | | | | | |
9.750%, 02/15/14 | | | 2,200 | | | 1,095 |
Sensata Technologies | | | | | | |
8.000%, 05/01/14 | | | 1,725 | | | 794 |
Smart Modular | | | | | | |
6.708%, 07/01/09 (C) | | | 4,960 | | | 4,315 |
Spansion | | | | | | |
5.935%, 06/01/13 (A) (D) | | | 550 | | | 347 |
Sungard Data Systems | | | | | | |
10.625%, 05/15/15 (A) | | | 1,350 | | | 1,306 |
10.250%, 08/15/15 (B) | | | 7,602 | | | 6,899 |
9.125%, 08/15/13 | | | 2,687 | | | 2,586 |
| | | | | | |
| | | | | | 45,855 |
| | | | | | |
| | |
Materials — 8.6% | | | | | | |
AK Steel | | | | | | |
7.750%, 06/15/12 (B) | | | 3,900 | | | 3,666 |
Appleton Papers, Ser B | | | | | | |
9.750%, 06/15/14 | | | 650 | | | 221 |
ArcelorMittal | | | | | | |
9.850%, 06/01/19 | | | 210 | | | 216 |
9.000%, 02/15/15 (B) | | | 1,050 | | | 1,094 |
Arch Western Finance LLC | | | | | | |
6.750%, 07/01/13 | | | 6,960 | | | 6,334 |
Ashland | | | | | | |
9.125%, 06/01/17 (A) | | | 2,230 | | | 2,263 |
California Steel Industries | | | | | | |
6.125%, 03/15/14 | | | 275 | | | 223 |
Catalyst Paper | | | | | | |
7.375%, 03/01/14 | | | 338 | | | 145 |
Catalyst Paper, Ser D | | | | | | |
8.625%, 06/15/11 | | | 1,545 | | | 900 |
Crown Americas | | | | | | |
7.750%, 11/15/15 (B) | | | 960 | | | 936 |
Domtar | | | | | | |
9.500%, 08/01/16 | | | 250 | | | 210 |
7.875%, 10/15/11 | | | 18 | | | 16 |
7.125%, 08/15/15 (B) | | | 1,075 | | | 892 |
5.375%, 12/01/13 | | | 1,000 | | | 825 |
Dow Chemical | | | | | | |
8.550%, 05/15/19 | | | 3,205 | | | 3,205 |
Evraz Group | | | | | | |
9.500%, 04/24/18 (A) | | | 700 | | | 508 |
8.875%, 04/24/13 (A) | | | 525 | | | 417 |
| | |
| 188 | | SEI Institutional Investments Trust / Annual Report / May 31, 2009 |
| | | | | | |
| Description | | Face Amount
($ Thousands) | | Market Value
($ Thousands) |
| | | | | | |
FMG Finance | | | | | | |
10.625%, 09/01/16 (A) (B) | | $ | 2,075 | | $ | 1,842 |
Freeport-McMoRan Copper & Gold | | | | | | |
8.375%, 04/01/17 (B) | | | 8,955 | | | 8,888 |
8.250%, 04/01/15 | | | 1,740 | | | 1,740 |
4.995%, 10/01/09 (C) | | | 1,200 | | | 1,080 |
Georgia-Pacific | | | | | | |
8.125%, 05/15/11 | | | 650 | | | 653 |
8.000%, 01/15/24 | | | 1,850 | | | 1,573 |
7.700%, 06/15/15 | | | 1,575 | | | 1,469 |
7.125%, 01/15/17 (A) (B) | | | 2,070 | | | 1,946 |
7.000%, 01/15/15 (A) (B) | | | 3,280 | | | 3,100 |
Georgia-Pacific LLC | | | | | | |
9.500%, 12/01/11 | | | 135 | | | 139 |
8.250%, 05/01/16 (A) | | | 2,283 | | | 2,249 |
Graham Packaging | | | | | | |
9.875%, 10/15/14 (B) | | | 4,725 | | | 4,205 |
Hexion US Fin/Nova Scotia | | | | | | |
9.750%, 11/15/14 | | | 4,100 | | | 1,763 |
5.383%, 08/15/09 (B) (C) | | | 750 | | | 270 |
Huntsman International LLC | | | | | | |
7.875%, 11/15/14 (B) | | | 1,875 | | | 1,284 |
7.375%, 01/01/15 | | | 1,140 | | | 765 |
Huntsman LLC | | | | | | |
11.625%, 10/15/10 | | | 255 | | | 259 |
11.500%, 07/15/12 | | | 2,535 | | | 2,408 |
INEOS Group Holdings PLC | | | | | | |
8.500%, 02/15/16 (A) | | | 1,895 | | | 587 |
Innophos | | | | | | |
8.875%, 08/15/14 | | | 1,535 | | | 1,378 |
Innophos Holdings | | | | | | |
9.500%, 04/15/12 (A) | | | 700 | | | 581 |
International Paper | | | | | | |
7.950%, 06/15/18 | | | 2,138 | | | 2,013 |
Intertape Polymer | | | | | | |
8.500%, 08/01/14 | | | 935 | | | 416 |
MacDermid | | | | | | |
9.500%, 04/15/17 (A) | | | 2,340 | | | 1,427 |
Methanex | | | | | | |
6.000%, 08/15/15 | | | 175 | | | 126 |
Millennium America | | | | | | |
7.625%, 11/15/26 (D) | | | 200 | | | 13 |
Mosaic | | | | | | |
7.625%, 12/01/16 (A) | | | 2,750 | | | 2,736 |
Nalco | | | | | | |
8.875%, 11/15/13 | | | 1,205 | | | 1,211 |
8.250%, 05/15/17 (A) | | | 2,665 | | | 2,678 |
Neenah | | | | | | |
9.500%, 01/01/17 | | | 500 | | | 155 |
Newark Group | | | | | | |
9.750%, 03/15/14 | | | 800 | | | 8 |
NewPage | | | | | | |
10.000%, 05/01/12 | | | 775 | | | 434 |
Noranda Aluminium Acquisition | | | | | | |
5.413%, 11/15/09 (C) | | | 3,201 | | | 1,696 |
| | | | | | |
| Description | | Face Amount
($ Thousands) | | Market Value
($ Thousands) |
| | | | | | |
Noranda Aluminium Holding | | | | | | |
7.163%, 11/16/09 (C) | | $ | 30 | | $ | 11 |
Novelis | | | | | | |
7.250%, 02/15/15 | | | 1,400 | | | 921 |
Owens-Brockway Glass Container | | | | | | |
6.750%, 12/01/14 | | | 605 | | | 573 |
P.H. Glatfelter | | | | | | |
7.125%, 05/01/16 | | | 1,075 | | | 984 |
Packaging Dynamics Finance | | | | | | |
10.000%, 05/01/16 (A) | | | 2,565 | | | 859 |
PolyOne | | | | | | |
8.875%, 05/01/12 (B) | | | 3,580 | | | 2,408 |
Reichhold Industries | | | | | | |
9.000%, 08/15/14 (A) | | | 2,716 | | | 788 |
Rio Tinto Finance USA | | | | | | |
9.000%, 05/01/19 | | | 400 | | | 429 |
8.950%, 05/01/14 | | | 800 | | | 860 |
Rock-Tenn | | | | | | |
9.250%, 03/15/16 (A) | | | 160 | | | 162 |
9.250%, 03/15/16 (B) | | | 665 | | | 675 |
5.625%, 03/15/13 | | | 2,200 | | | 1,936 |
Rockwood Specialties Group | | | | | | |
7.500%, 11/15/14 | | | 750 | | | 712 |
Ryerson | | | | | | |
12.000%, 11/01/15 | | | 1,105 | | | 751 |
8.403%, 08/01/09 (C) | | | 150 | | | 83 |
Sappi Papier Holding | | | | | | |
6.750%, 06/15/12 (A) | | | 1,020 | | | 634 |
Solo Cup | | | | | | |
8.500%, 02/15/14 | | | 615 | | | 492 |
Solutia | | | | | | |
7.501%, 12/31/99 (B) | | | 455 | | | 1 |
Steel Capital for OAO Severstal | | | | | | |
9.750%, 07/29/13 (A) | | | 380 | | | 310 |
Steel Dynamics | | | | | | |
7.750%, 04/15/16 (A) (B) | | | 3,035 | | | 2,587 |
7.375%, 11/01/12 (B) | | | 1,500 | | | 1,380 |
6.750%, 04/01/15 | | | 500 | | | 426 |
Stone Container | | | | | | |
8.375%, 07/01/12 (D) | | | 2,800 | | | 882 |
Teck Resources | | | | | | |
10.750%, 05/15/19 (A) (B) | | | 2,540 | | | 2,613 |
10.250%, 05/15/16 (A) | | | 2,715 | | | 2,749 |
Terra Capital, Ser B | | | | | | |
7.000%, 02/01/17 | | | 1,265 | | | 1,183 |
U.S. Steel | | | | | | |
7.000%, 02/01/18 (B) | | | 1,480 | | | 1,231 |
6.650%, 06/01/37 | | | 640 | | | 467 |
6.050%, 06/01/17 | | | 1,040 | | | 790 |
Vedanta Resources | | | | | | |
9.500%, 07/18/18 (A) | | | 2,470 | | | 2,149 |
Verso Paper Holdings LLC | | | | | | |
11.500%, 07/01/14 (A) | | | 1,460 | | | 1,343 |
9.125%, 08/01/14 | | | 1,820 | | | 1,083 |
| | |
| SEI Institutional Investments Trust / Annual Report / May 31, 2009 | | 189 |
SCHEDULE OF INVESTMENTS
High Yield Bond Fund (Continued)
May 31, 2009
| | | | | | |
| Description | | Face Amount
($ Thousands) | | Market Value
($ Thousands) |
| | | | | | |
Verso Paper Holdings LLC, Ser B | | | | | | |
11.375%, 08/01/16 | | $ | 325 | | $ | 133 |
Vitro | | | | | | |
9.125%, 02/01/17 (D) | | | 3,915 | | | 1,297 |
| | | | | | |
| | | | | | 107,065 |
| | | | | | |
|
Telecommunication Services — 13.8% |
Affinion Group | | | | | | |
10.125%, 10/15/13 | | | 1,500 | | | 1,410 |
American Tower | | | | | | |
7.125%, 10/15/12 (B) | | | 970 | | | 977 |
CC Holdings GS V LLC | | | | | | |
7.750%, 05/01/17 (A) | | | 1,250 | | | 1,231 |
CCH II LLC | | | | | | |
10.250%, 10/01/13 (A) (D) | | | 1,251 | | | 1,157 |
Cengage Learning Acquisitions | | | | | | |
10.500%, 01/15/15 (A) | | | 220 | | | 172 |
Centennial Communications | | | | | | |
8.125%, 02/01/14 | | | 175 | | | 180 |
Charter Communications Operating LLC | | | | | | |
10.375%, 04/30/14 (A) (D) | | | 845 | | | 803 |
Cincinnati Bell | | | | | | |
7.250%, 07/15/13 (B) | | | 2,100 | | | 1,990 |
7.000%, 02/15/15 | | | 970 | | | 890 |
Citizens Communications | | | | | | |
7.125%, 03/15/19 | | | 2,085 | | | 1,840 |
Cleveland Unlimited | | | | | | |
11.500%, 06/15/09 (A) (C) | | | 3,460 | | | 3,252 |
Cricket Communications | | | | | | |
10.000%, 07/15/15 (A) | | | 825 | | | 833 |
7.750%, 05/15/16 (A) | | | 565 | | | 546 |
Cricket Communications I | | | | | | |
9.375%, 11/01/14 (B) | | | 7,892 | | | 7,853 |
Crown Castle International | | | | | | |
9.000%, 01/15/15 (B) | | | 3,630 | | | 3,666 |
CSC Holdings | | | | | | |
8.625%, 02/15/19 (A) | | | 2,890 | | | 2,836 |
8.500%, 04/15/14 (A) (B) | | | 2,343 | | | 2,331 |
8.500%, 06/15/15 (A) (B) | | | 899 | | | 886 |
6.750%, 04/15/12 (B) | | | 245 | | | 236 |
Dex Media West LLC | | | | | | |
8.500%, 08/15/10 (D) | | | 100 | | | 74 |
Digicel Group | | | | | | |
9.250%, 09/01/12 (A) | | | 1,885 | | | 1,800 |
9.125%, 01/15/15 (A) (B) | | | 819 | | | 631 |
8.875%, 01/15/15 (A) (B) | | | 4,875 | | | 3,900 |
DirecTV Holdings LLC | | | | | | |
7.625%, 05/15/16 | | | 2,760 | | | 2,670 |
DISH DBS | | | | | | |
7.750%, 05/31/15 | | | 4,680 | | | 4,423 |
6.375%, 10/01/11 | | | 1,235 | | | 1,193 |
Fairpoint Communications | | | | | | |
13.125%, 04/01/18 | | | 2,155 | | | 738 |
| | | | | | |
| Description | | Face Amount
($ Thousands) | | Market Value
($ Thousands) |
| | | | | | |
Frontier Communications | | | | | | |
9.250%, 05/15/11 | | $ | 150 | | $ | 156 |
8.250%, 05/01/14 | | | 50 | | | 49 |
6.625%, 03/15/15 | | | 1,175 | | | 1,072 |
6.250%, 01/15/13 | | | 545 | | | 510 |
GC Impsat Holdings I | | | | | | |
9.875%, 02/15/17 (A) | | | 2,442 | | | 2,076 |
GCI | | | | | | |
7.250%, 02/15/14 | | | 1,450 | | | 1,314 |
Hughes Network Systems LLC | | | | | | |
9.500%, 04/15/14 | | | 1,315 | | | 1,269 |
Inmarsat Finance II | | | | | | |
10.375%, 11/15/12 | | | 1,370 | | | 1,415 |
Intelsat | | | | | | |
9.250%, 08/15/14 (A) | | | 375 | | | 362 |
9.250%, 06/15/16 (A) | | | 850 | | | 816 |
Intelsat Bermuda | | | | | | |
11.250%, 06/15/16 (B) | | | 5,290 | | | 5,422 |
Intelsat Jackson Holdings | | | | | | |
9.500%, 06/15/16 (A) (B) | | | 2,100 | | | 2,089 |
Intelsat Subsidiary Holding | | | | | | |
8.875%, 01/15/15 (A) | | | 6,275 | | | 6,170 |
8.500%, 01/15/13 (A) | | | 2,450 | | | 2,401 |
iPCS | | | | | | |
3.153%, 08/03/09 (C) | | | 1,180 | | | 977 |
iPCS PIK | | | | | | |
5.028%, 08/01/09 (C) | | | 2,890 | | | 2,095 |
Lamar Media | | | | | | |
9.750%, 04/01/14 (A) | | | 500 | | | 515 |
6.625%, 08/15/15 | | | 475 | | | 385 |
LBI Media | | | | | | |
11.000%, 10/15/13 | | | 500 | | | 156 |
Level 3 Financing | | | | | | |
12.250%, 03/15/13 | | | 965 | | | 883 |
8.750%, 02/15/17 | | | 1,225 | | | 862 |
5.474%, 02/15/15 (C) | | | 100 | | | 62 |
Liberty Media LLC | | | | | | |
8.250%, 02/01/30 | | | 2,100 | | | 1,407 |
Lucent Technologies | | | | | | |
6.450%, 03/15/29 | | | 1,280 | | | 730 |
MetroPCS Wireless | | | | | | |
9.250%, 11/01/14 (B) | | | 7,145 | | | 7,172 |
9.250%, 11/01/14 (A) | | | 1,150 | | | 1,150 |
Nextel Communications | | | | | | |
7.375%, 08/01/15 | | | 1,535 | | | 1,216 |
6.875%, 10/31/13 | | | 600 | | | 500 |
Nielsen Finance LLC | | | | | | |
12.500%, 08/01/16 (E) | | | 1,650 | | | 1,056 |
11.625%, 02/01/14 (A) | | | 1,125 | | | 1,114 |
11.500%, 05/01/16 (A) | | | 40 | | | 38 |
10.000%, 08/01/14 | | | 1,765 | | | 1,681 |
Nordic Telephone Holdings | | | | | | |
8.875%, 05/01/16 (A) | | | 5,150 | | | 5,150 |
| | |
| 190 | | SEI Institutional Investments Trust / Annual Report / May 31, 2009 |
| | | | | | |
| Description | | Face Amount
($ Thousands) | | Market Value
($ Thousands) |
| | | | | | |
Nortel Networks | | | | | | |
10.750%, 07/15/16 (A) (D) | | $ | 725 | | $ | 228 |
10.125%, 07/15/13 (D) | | | 625 | | | 194 |
9.002%, 07/15/11 (D) | | | 475 | | | 142 |
Orascom Telecom Finance | | | | | | |
7.875%, 02/08/14 (A) (B) | | | 2,000 | | | 1,640 |
PAETEC Holding | | | | | | |
9.500%, 07/15/15 (B) | | | 2,831 | | | 2,562 |
Quebecor Media | | | | | | |
7.750%, 03/15/16 | | | 5,650 | | | 5,014 |
Qwest | | | | | | |
8.375%, 05/01/16 (A) | | | 770 | | | 757 |
7.875%, 09/01/11 | | | 3,296 | | | 3,284 |
7.500%, 10/01/14 | | | 1,360 | | | 1,299 |
7.250%, 09/15/25 | | | 375 | | | 285 |
7.250%, 10/15/35 | | | 1,200 | | | 852 |
6.875%, 09/15/33 | | | 275 | | | 193 |
Qwest Communications International | | | | | | |
7.250%, 02/15/11 | | | 2,265 | | | 2,208 |
Qwest Communications International, Ser B | | | | | | |
7.500%, 02/15/14 (B) | | | 1,125 | | | 1,035 |
Rainbow National Services LLC | | | | | | |
10.375%, 09/01/14 (A) | | | 505 | | | 521 |
8.750%, 09/01/12 (A) | | | 1,025 | | | 1,037 |
RH Donnelley | | | | | | |
11.750%, 05/15/15 (A) (B) (D) | | | 1,235 | | | 565 |
Sprint Capital | | | | | | |
8.750%, 03/15/32 | | | 950 | | | 750 |
8.375%, 03/15/12 | | | 495 | | | 490 |
6.900%, 05/01/19 (B) | | | 5,710 | | | 4,625 |
Sprint Nextel | | | | | | |
6.000%, 12/01/16 (B) | | | 3,225 | | | 2,621 |
Telcordia Technologies | | | | | | |
10.000%, 03/15/13 (A) | | | 1,745 | | | 1,099 |
4.881%, 07/15/09 (A) (C) | | | 2,750 | | | 2,062 |
Telesat Canada | | | | | | |
12.500%, 11/01/17 (A) | | | 810 | | | 713 |
11.000%, 11/01/15 (A) | | | 745 | | | 723 |
Time Warner Telecom Holdings | | | | | | |
9.250%, 02/15/14 | | | 1,220 | | | 1,223 |
UPC Holding BV | | | | | | |
9.875%, 04/15/18 (A) | | | 2,085 | | | 2,012 |
Videotron Ltee | | | | | | |
9.125%, 04/15/18 | | | 1,245 | | | 1,289 |
6.375%, 12/15/15 | | | 860 | | | 778 |
VIP Finance Ireland for Vimpel Communications | | | | | | |
9.125%, 04/30/18 (A) | | | 1,455 | | | 1,211 |
Virgin Media Finance | | | | | | |
9.500%, 08/15/16 | | | 1,460 | | | 1,395 |
8.750%, 04/15/14 | | | 1,890 | | | 1,824 |
Visant Holding | | | | | | |
10.250%, 12/01/13 | | | 5,780 | | | 5,693 |
| | | | | | |
| Description | | Face Amount
($ Thousands) | | Market Value
($ Thousands) |
| | | | | | |
8.750%, 12/01/13 | | $ | 1,525 | | $ | 1,475 |
Vitamin Shoppe Industries | | | | | | |
8.383%, 08/15/09 (C) | | | 3,025 | | | 2,806 |
West | | | | | | |
11.000%, 10/15/16 | | | 950 | | | 807 |
9.500%, 10/15/14 (B) | | | 2,859 | | | 2,573 |
Wind Acquisition Finance | | | | | | |
10.750%, 12/01/15 (A) | | | 4,090 | | | 4,294 |
Windstream | | | | | | |
8.625%, 08/01/16 | | | 4,700 | | | 4,641 |
8.125%, 08/01/13 | | | 2,905 | | | 2,858 |
| | | | | | |
| | | | | | 170,566 |
| | | | | | |
| | |
Utilities — 3.5% | | | | | | |
AES | | | | | | |
9.750%, 04/15/16 (A) | | | 2,125 | | | 2,135 |
8.750%, 05/15/13 (A) | | | 141 | | | 143 |
8.000%, 10/15/17 (B) | | | 1,885 | | | 1,762 |
8.000%, 06/01/20 | | | 1,660 | | | 1,461 |
Calpine Construction Finance and CCFC Finance | | | | | | |
8.000%, 06/01/16 (A) | | | 965 | | | 918 |
Calpine Generating LLC | | | | | | |
14.320%, 04/01/11 (C) (D) | | | 1,500 | | | 128 |
CMS Energy | | | | | | |
8.500%, 04/15/11 | | | 675 | | | 682 |
Edison Mission Energy | | | | | | |
7.500%, 06/15/13 | | | 2,525 | | | 2,127 |
7.200%, 05/15/19 | | | 550 | | | 372 |
7.000%, 05/15/17 (B) | | | 3,230 | | | 2,342 |
Elwood Energy LLC | | | | | | |
8.159%, 07/05/26 | | | 1,041 | | | 846 |
Energy Future Holdings | | | | | | |
11.250%, 11/01/17 | | | 1,002 | | | 523 |
10.875%, 11/01/17 (B) | | | 4,100 | | | 2,911 |
Ipalco Enterprises | | | | | | |
8.625%, 11/14/11 | | | 450 | | | 452 |
7.250%, 04/01/16 (A) | | | 275 | | | 264 |
KCP&L Greater Missouri Operations | | | | | | |
11.875%, 07/01/12 | | | 450 | | | 482 |
Mirant Americas Generation LLC | | | | | | |
8.500%, 10/01/21 | | | 2,883 | | | 2,393 |
Mirant Mid Atlantic Pass Through Trust A | | | | | | |
8.625%, 06/30/12 | | | 535 | | | 525 |
Mirant North America LLC | | | | | | |
7.375%, 12/31/13 (B) | | | 2,910 | | | 2,786 |
NRG Energy | | | | | | |
7.375%, 02/01/16 (B) | | | 2,540 | | | 2,391 |
7.375%, 01/15/17 | | | 3,720 | | | 3,497 |
7.250%, 02/01/14 (B) | | | 3,560 | | | 3,408 |
Orion Power Holdings | | | | | | |
12.000%, 05/01/10 (B) | | | 930 | | | 960 |
| | |
| SEI Institutional Investments Trust / Annual Report / May 31, 2009 | | 191 |
SCHEDULE OF INVESTMENTS
High Yield Bond Fund (Continued)
May 31, 2009
| | | | | | |
| Description | | Face Amount
($ Thousands) | | Market Value
($ Thousands) |
| | | | | | |
Public Service of New Mexico | | | | | | |
7.950%, 05/15/18 | | $ | 2,800 | | $ | 2,797 |
RRI Energy | | | | | | |
6.750%, 12/15/14 | | | 730 | | | 703 |
Sierra Pacific Resources | | | | | | |
7.803%, 06/15/12 | | | 975 | | | 974 |
Tenaska Alabama Partners | | | | | | |
7.000%, 06/30/21 (A) | | | 282 | | | 229 |
Texas Competitive Electric Holdings LLC | | | | | | |
10.250%, 11/01/15 (B) | | | 6,875 | | | 4,073 |
10.250%, 11/01/15 | | | 1,855 | | | 1,099 |
TXU | | | | | | |
6.500%, 11/15/24 | | | 310 | | | 127 |
TXU, Ser R | | | | | | |
6.550%, 11/15/34 | | | 310 | | | 122 |
| | | | | | |
| | | | | | 43,632 |
| | | | | | |
Total Corporate Obligations
(Cost $1,136,666) ($ Thousands) | | | | | | 1,035,861 |
| | | | | | |
| |
LOAN PARTICIPATIONS — 10.5% | | | |
Advanstar Communicaitons, 2nd Lien | | | | | | |
6.220%, 11/30/14 | | | 1,250 | | | 169 |
Aeroflex, Ser B-1 | | | | | | |
4.101%, 08/16/14 | | | 2,389 | | | 1,636 |
Affinion Group Holdings | | | | | | |
8.522%, 03/01/12 (C) | | | 500 | | | 225 |
Affinion Holding PIK | | | | | | |
8.522%, 03/01/12 (C) | | | 3,200 | | | 1,440 |
Affinion Holding | | | | | | |
8.522%, 03/01/12 (C) | | | 1,000 | | | 450 |
2.809%, 10/17/12 | | | 2,476 | | | 2,278 |
Alliant Insurance Services, Ser B | | | | | | |
4.232%, 08/21/14 | | | 1,231 | | | 1,047 |
Allison Transmission | | | | | | |
3.148%, 08/07/14 (C) | | | 600 | | | 464 |
Aspect Software, Ser A-1 | | | | | | |
4.250%, 07/11/11 | | | 1,309 | | | 943 |
Asurion | | | | | | |
6.882%, 07/02/15 (C) | | | 1,200 | | | 978 |
Asurion, 2nd Lien | | | | | | |
6.882%, 07/07/15 (C) | | | 2,250 | | | 1,833 |
Asurion, Ser B | | | | | | |
3.699%, 07/03/14 | | | 1,000 | | | 900 |
3.653%, 07/03/14 (C) | | | 1,200 | | | 1,080 |
3.536%, 07/03/14 (C) | | | 650 | | | 585 |
BOC Edwards, 1st Lien | | | | | | |
2.518%, 05/31/14 | | | 816 | | | 505 |
Boise Paper | | | | | | |
9.250%, 02/22/15 | | | 900 | | | 571 |
Boston Generating, 1st Lien | | | | | | |
7.518%, 12/20/16 | | | 163 | | | 6 |
Boston Generating, 2nd Lien | | | | | | |
4.569%, 06/20/14 | | | 650 | | | 119 |
| | | | | | |
| Description | | Face Amount
($ Thousands) | | Market Value
($ Thousands) |
| | | | | | |
Burlington Coat Factory, Ser B | | | | | | |
8.859%, 05/28/13 | | $ | 3,150 | | $ | 2,196 |
Calpine | | | | | | |
4.095%, 03/29/14 (C) | | | 1,995 | | | 1,734 |
Calpine, Ser T-1 | | | | | | |
7.562%, 03/29/14 | | | 645 | | | 561 |
Cebridge, 2nd Lien | | | | | | |
6.411%, 05/05/14 | | | 1,544 | | | 1,291 |
Cengage Learning Holdco | | | | | | |
0.000%, 06/28/14 | | | 1,000 | | | 777 |
Central Parking | | | | | | |
2.563%, 05/22/14 (C) | | | 1,723 | | | 1,173 |
0.410%, 05/22/14 (C) | | | 114 | | | 80 |
Central Parking Line of Credit (Synthetic) | | | | | | |
0.410%, 05/22/14 (C) | | | 503 | | | 355 |
Century Cable Bank, Ser B | | | | | | |
10.250%, 06/30/09 (F) | | | 3 | | | — |
Charter, Ser B | | | | | | |
4.022%, 03/06/14 | | | 1,739 | | | 1,496 |
CHS | | | | | | |
4.438%, 07/02/14 (C) | | | 34 | | | 30 |
2.923%, 07/02/14 (C) | | | 2 | | | 2 |
Claire’s Stores | | | | | | |
22.226%, 05/27/14 | | | 1,775 | | | 1,012 |
Cooper Standard | | | | | | |
3.750%, 02/28/10 | | | 2,661 | | | 1,157 |
DAE Aviation Holdings, Ser B | | | | | | |
4.920%, 09/27/14 (C) | | | 272 | | | 192 |
4.644%, 09/27/14 | | | 277 | | | 195 |
Delta, 2nd Lien | | | | | | |
3.664%, 04/30/14 | | | 221 | | | 142 |
Dex Media, Ser B | | | | | | |
7.000%, 10/24/14 (C) (D) | | | 2,100 | | | 1,714 |
Dresser Rand, 2nd Lien | | | | | | |
6.085%, 05/04/15 | | | 2,390 | | | 1,458 |
Femo, Ser B | | | | | | |
12.246%, 12/28/15 | | | 2,582 | | | 1,596 |
Femo, Ser C | | | | | | |
12.289%, 12/27/15 | | | 1,318 | | | 814 |
First Data, Ser B-1 | | | | | | |
3.069%, 09/24/14 | | | 111 | | | 82 |
3.059%, 09/24/14 | | | 4,505 | | | 3,332 |
First Data, Ser B-3 | | | | | | |
3.059%, 09/24/14 | | | 266 | | | 196 |
Flextronics International | | | | | | |
3.458%, 10/01/12 | | | 1,496 | | | 1,287 |
Flextronics International, Ser A | | | | | | |
2.569%, 10/01/14 | | | 1,200 | | | 957 |
Flextronics International, Ser A-2 | | | | | | |
2.569%, 10/01/14 | | | 490 | | | 391 |
Flextronics International, Ser A-3 | | | | | | |
2.569%, 10/01/14 | | | 572 | | | 456 |
Ford Motor | | | | | | |
14.572%, 12/14/11 | | | 1,250 | | | 834 |
| | |
| 192 | | SEI Institutional Investments Trust / Annual Report / May 31, 2009 |
| | | | | | |
| Description | | Face Amount
($ Thousands) | | Market Value
($ Thousands) |
| | | | | | |
14.184%, 12/15/13 | | $ | 600 | | $ | 429 |
3.680%, 12/16/13 (C) | | | 2,558 | | | 1,828 |
3.646%, 12/16/13 (C) | | | 580 | | | 414 |
Freescale Semiconductor Incremental | | | | | | |
20.191%, 12/15/14 | | | 334 | | | 239 |
12.500%, 12/15/14 | | | 1,842 | | | 1,315 |
6.621%, 12/15/14 | | | 900 | | | 671 |
6.207%, 12/15/14 | | | 330 | | | 236 |
General Motors | | | | | | |
8.000%, 12/15/13 (C) (D) | | | 3,793 | | | 3,592 |
Georgia Pacific | | | | | | |
2.653%, 02/14/13 | | | 306 | | | 283 |
2.521%, 12/20/10 | | | 62 | | | 59 |
Greektown Casino | | | | | | |
7.750%, 12/03/12 | | | 475 | | | 180 |
7.000%, 12/03/12 | | | 250 | | | 95 |
Green Valley Ranch Gaming, 2nd Lien | | | | | | |
3.599%, 08/06/14 | | | 2,000 | | | 220 |
Guitar Center | | | | | | |
8.156%, 10/09/13 | | | 579 | | | 402 |
7.377%, 10/09/13 | | | 583 | | | 405 |
Harrah’s Operating | | | | | | |
3.823%, 01/28/15 | | | 1,990 | | | 1,521 |
HCA | | | | | | |
3.470%, 11/18/13 (C) | | | 1,712 | | | 1,526 |
Hexion Specialty Chemicals, Ser C1 | | | | | | |
3.500%, 05/05/13 (C) | | | 1,066 | | | 633 |
Hexion Specialty Chemicals, Ser C2 | | | | | | |
3.500%, 05/05/13 (C) | | | 120 | | | 71 |
HUB International Holdings, Ser B | | | | | | |
3.720%, 06/13/14 (C) | | | 2,711 | | | 2,249 |
HUB International Holdings, Delayed Draw | | | | | | |
3.720%, 06/13/14 (C) | | | 609 | | | 506 |
Iasis Healthcare | | | | | | |
6.289%, 06/13/14 | | | 2,364 | | | 1,726 |
INEOS Group Holdings PLC | | | | | | |
8.001%, 12/13/14 | | | 1,985 | | | 1,266 |
7.501%, 12/14/13 | | | 1,985 | | | 1,262 |
Ineos Holdings, Ser B | | | | | | |
10.292%, 12/16/13 (C) | | | 288 | | | 183 |
10.105%, 12/16/13 | | | 250 | | | 159 |
9.551%, 12/16/13 (C) | | | 350 | | | 223 |
8.312%, 12/16/13 (C) | | | 900 | | | 572 |
Ineos Holdings, Ser C | | | | | | |
8.308%, 12/16/14 (C) | | | 288 | | | 184 |
8.157%, 12/16/14 | | | 250 | | | 160 |
7.712%, 12/16/14 (C) | | | 350 | | | 223 |
6.715%, 12/16/14 (C) | | | 900 | | | 574 |
Infor Global Solutions, Ser B | | | | | | |
11.748%, 07/30/12 | | | 336 | | | 252 |
10.770%, 07/30/12 | | | 293 | | | 220 |
10.057%, 07/30/12 | | | 1,250 | | | 937 |
Intelsat Bermuda | | | | | | |
2.901%, 02/01/14 (C) | | | 2,400 | | | 1,800 |
| | | | | | |
| Description | | Face Amount
($ Thousands) | | Market Value
($ Thousands) |
| | | | | | |
JG Wentworth, 1st Lien | | | | | | |
3.470%, 04/04/14 | | $ | 975 | | $ | 84 |
KAR Holding | | | | | | |
3.220%, 10/21/13 | | | 1,172 | | | 1,007 |
La Paloma | | | | | | |
8.020%, 08/16/12 | | | 379 | | | 308 |
Landry’s, Ser B | | | | | | |
9.500%, 05/13/11 | | | 848 | | | 831 |
Language Line, Ser B | | | | | | |
4.470%, 05/14/11 (C) | | | 450 | | | 396 |
Las Vegas Sands LLC, Ser B | | | | | | |
0.000%, 05/17/14 (C) | | | 1,010 | | | 728 |
Lyondell Bank | | | | | | |
13.000%, 12/15/09 | | | 1,673 | | | 1,717 |
Lyondell Chemical | | | | | | |
5.940%, 12/15/09 | | | 3,359 | | | 1,989 |
5.750%, 04/30/14 (C) (D) | | | 423 | | | 177 |
Lyondell Chemical, Ser A | | | | | | |
5.750%, 12/20/13 (C) (D) | | | 824 | | | 344 |
Lyondell Chemical, Ser B-1 | | | | | | |
7.000%, 12/20/14 | | | 1,406 | | | 589 |
Lyondell Chemical, Ser B-2 | | | | | | |
7.000%, 12/22/13 (C) (D) | | | 1,406 | | | 589 |
Lyondell Chemical, Ser B-3 | | | | | | |
7.000%, 12/20/14 (C) (D) | | | 1,406 | | | 589 |
Lyondell Dutch Revolving Credit | | | | | | |
5.750%, 12/20/13 (C) (D) | | | 95 | | | 40 |
Lyondell Dutch, Ser A | | | | | | |
5.750%, 12/20/13 (C) (D) | | | 266 | | | 111 |
Lyondell German Holdings, Ser B1 | | | | | | |
6.000%, 12/22/14 | | | 324 | | | 136 |
Lyondell German Holdings, Ser B2 | | | | | | |
6.000%, 12/22/14 | | | 324 | | | 136 |
Lyondell German Holdings, Ser B3 | | | | | | |
6.000%, 12/22/14 (C) (D) | | | 324 | | | 136 |
McKechnie Aerospace | | | | | | |
5.520%, 05/11/15 | | | 700 | | | 339 |
2.520%, 05/11/14 | | | 224 | | | 185 |
McKechnie Aerospace, 1st Lien | | | | | | |
2.520%, 05/11/14 | | | 375 | | | 310 |
Metroflag, 2nd Lien | | | | | | |
14.000%, 01/06/09 | | | 325 | | | 16 |
Murray Bank, 2nd Lien | | | | | | |
8.875%, 01/31/11 | | | 1,877 | | | 1,652 |
NEFF | | | | | | |
4.820%, 05/31/13 | | | 810 | | | 243 |
Neiman-Marcus Group | | | | | | |
2.945%, 04/26/13 | | | 1,630 | | | 1,173 |
New World Gaming | | | | | | |
6.935%, 05/18/15 | | | 1,300 | | | 197 |
News Day | | | | | | |
9.750%, 08/01/13 | | | 975 | | | 936 |
Northwest Airlines | | | | | | |
2.570%, 08/21/13 (C) | | | 610 | | | 567 |
| | |
| SEI Institutional Investments Trust / Annual Report / May 31, 2009 | | 193 |
SCHEDULE OF INVESTMENTS
High Yield Bond Fund (Continued)
May 31, 2009
| | | | | | |
| Description | | Face Amount
($ Thousands) | | Market Value
($ Thousands) |
| | | | | | |
NRG Energy, Ser B | | | | | | |
2.720%, 06/02/13 (C) | | $ | 2,477 | | $ | 2,289 |
Nuveen Investments | | | | | | |
10.492%, 11/09/14 | | | 1,410 | | | 1,005 |
Orbitz Worldwide | | | | | | |
6.572%, 07/01/14 (C) | | | 18 | | | 11 |
4.220%, 07/01/14 (C) | | | 19 | | | 12 |
4.077%, 07/01/14 | | | 59 | | | 36 |
3.965%, 07/01/14 (C) | | | 134 | | | 82 |
3.964%, 07/01/14 (C) | | | 50 | | | 31 |
3.146%, 07/01/14 (C) | | | 9 | | | 6 |
OSI Restaurant | | | | | | |
6.877%, 06/14/14 | | | 423 | | | 314 |
Penhall | | | | | | |
9.995%, 04/01/12 | | | 760 | | | 152 |
Proquest, 2nd Lien | | | | | | |
6.073%, 02/09/15 | | | 1,200 | | | 1,008 |
Quicksilver Resources | | | | | | |
5.146%, 08/08/13 (C) | | | 1,400 | | | 1,368 |
Rent Center, Ser B | | | | | | |
4.809%, 06/30/12 | | | 1,491 | | | 1,401 |
Rexnord | | | | | | |
8.261%, 03/01/13 | | | 1,919 | | | 480 |
Reynolds & Reynolds | | | | | | |
2.319%, 10/26/12 (C) | | | 1,982 | | | 1,381 |
Reynolds & Reynolds, 3rd Lien | | | | | | |
7.819%, 04/01/14 (C) | | | 3,750 | | | 1,067 |
7.819%, 04/26/14 (C) | | | 800 | | | 227 |
RH Donnelley, Ser D | | | | | | |
6.750%, 06/30/11 (C) (D) | | | 1,596 | | | 1,300 |
Royalty Pharma | | | | | | |
7.750%, 05/15/15 | | | 1,250 | | | 1,044 |
Sabre Holding, Ser B | | | | | | |
8.739%, 09/29/14 | | | 2,000 | | | 1,379 |
Sbarro | | | | | | |
4.928%, 01/29/14 | | | 500 | | | 372 |
0.000%, 01/29/14 | | | 925 | | | 689 |
Sensata Technologies | | | | | | |
2.803%, 04/27/13 | | | 3,685 | | | 2,562 |
Servicemaster | | | | | | |
3.090%, 10/17/14 | | | 1,500 | | | 1,151 |
Shexion, Ser C1 | | | | �� | | |
3.500%, 05/05/13 | | | 1,820 | | | 1,080 |
Shexion, Ser C2 | | | | | | |
3.500%, 05/05/13 | | | 400 | | | 237 |
Simmons Bedding | | | | | | |
10.500%, 12/19/11 | | | 1,155 | | | 976 |
Simmons Holdco | | | | | | |
8.224%, 02/15/12 | | | 2,403 | | | 25 |
Simmons Holdco, Unsecured | | | | | | |
8.224%, 02/15/12 | | | 419 | | | 4 |
Sorenson Communications, 2nd Lien | | | | | | |
7.427%, 02/16/14 (C) | | | 4,450 | | | 3,701 |
Stallion Oilfield Service | | | | | | |
16.065%, 06/12/13 | | | 1,081 | | | 670 |
| | | | | | |
| Description | | Face Amount
($ Thousands) | | Market Value
($ Thousands) |
| | | | | | |
Talecris Biotherapeutics | | | | | | |
7.740%, 12/06/14 (C) | | $ | 1,325 | | $ | 1,149 |
TD Ameritrade Holding, Ser A | | | | | | |
1.590%, 12/31/11 | | | 1,700 | | | 1,555 |
Texas Competitive Electric Holdings | | | | | | |
3.969%, 10/10/14 | | | 2,456 | | | 1,696 |
3.882%, 10/10/14 (C) | | | 2,520 | | | 1,733 |
3.881%, 10/10/14 (C) | | | 1,110 | | | 766 |
3.646%, 10/10/14 (C) | | | 1,995 | | | 1,377 |
Texas Competitive Electric Holdings, Ser B | | | | | | |
3.927%, 10/10/14 | | | 11 | | | 8 |
Texas Competitive Electric Holdings, Ser B-2 | | | | | | |
3.881%, 10/10/14 (C) | | | 473 | | | 326 |
Texas Competitive Electric Holdings, Ser B3 | | | | | | |
3.970%, 10/10/14 | | | 273 | | | 187 |
3.970%, 10/27/14 | | | 510 | | | 349 |
Town Sports International | | | | | | |
2.250%, 02/27/14 | | | 271 | | | 181 |
Toys R US - Delaware, Ser B | | | | | | |
4.566%, 07/19/12 (C) | | | 1,615 | | | 1,320 |
Tribune | | | | | | |
6.500%, 06/04/14 | | | 945 | | | 286 |
5.250%, 06/04/14 | | | 200 | | | 61 |
Univision Communications, Ser B | | | | | | |
2.678%, 09/29/14 (C) | | | 1,640 | | | 1,130 |
Venoco | | | | | | |
4.375%, 05/07/14 | | | 396 | | | 276 |
Verint Systems, Ser T-1 | | | | | | |
3.590%, 05/25/14 (C) | | | 2,510 | | | 1,908 |
Vsterwire | | | | | | |
9.328%, 07/03/12 | | | 1,500 | | | 1,093 |
Western Refining | | | | | | |
8.250%, 05/30/14 | | | 2,945 | | | 2,741 |
Wind Acquisition Holdings | | | | | | |
8.357%, 12/12/11 | | | 2,916 | | | 2,474 |
8.357%, 12/21/11 | | | 1,260 | | | 1,069 |
| | | | | | |
Total Loan Participations
(Cost $153,376) ($ Thousands) | | | | | | 130,624 |
| | | | | | |
|
COLLATERALIZED DEBT OBLIGATION — 2.7% |
|
Other Asset-Backed Securities — 2.7% |
ACAS Business Loan Trust,
Ser 2007-2A, Cl A | | | | | | |
1.254%, 11/18/09 (A) (C) | | | 6,586 | | | 3,886 |
ACAS CLO, Ser 2007-1A, Cl A1J | | | | | | |
1.417%, 07/20/09 (A) (C) | | | 3,800 | | | 1,064 |
Ares IIIR CLO, Ser 2007-3RA, Cl SUB | | | | | | |
0.000%, 04/16/21 (A) | | | 5,000 | | | 100 |
Ares VR CLO, Ser 2006-5RA, Cl SUB | | | | | | |
0.000%, 02/24/18 (A) | | | 3,500 | | | 9 |
| | |
| 194 | | SEI Institutional Investments Trust / Annual Report / May 31, 2009 |
| | | | | | |
| Description | | Face Amount
($ Thousands) | | Market Value
($ Thousands) |
| | | | | | |
Ares XI CLO, Ser 2007-11A, Cl SUB | | | | | | |
0.000%, 10/11/21 (A) | | $ | 3 | | $ | 78 |
Babson CLO, Ser 2004-II, Cl SUB | | | | | | |
0.000%, 11/15/16 (A) | | | 18 | | | 18 |
Babson CLO, Ser 2007-2A, Cl A1 | | | | | | |
1.351%, 07/15/09 (A) (C) | | | 4,000 | | | 2,798 |
Babson CLO, Ser 2007-2A, Cl D | | | | | | |
2.831%, 07/15/09 (A) (C) | | | 1,057 | | | 11 |
Babson CLO, Ser 2007-2A, Cl INC | | | | | | |
0.000%, 07/15/09 (A) (C) | | | 2,700 | | | 34 |
Babson CLO, Ser 2007-2A, Cl A2B | | | | | | |
1.431%, 07/15/09 (A) (C) | | | 1,700 | | | 646 |
Ballyrock CDO, Ser 2005-3A, Cl B | | | | | | |
1.472%, 07/27/09 (A) (C) | | | 1,375 | | | 289 |
Battalion CLO, Ser 2007-1, Cl 1A | | | | | | |
0.000%, 07/14/22 (A) | | | 18 | | | 35 |
Battalion CLO, Ser 2007-1A, Cl E | | | | | | |
5.389%, 07/14/09 (A) (C) | | | 2,550 | | | 153 |
Capitalsource Advisors CLO, Ser 2006-1A, Cl SUB | | | | | | |
0.000%, 08/27/20 (A) | | | 2,900 | | | — |
Carlyle High Yield Partners CLO, Ser 2006-8A, Cl N | | | | | | |
0.000%, 05/21/21 | | | 3,000 | | | — |
Cent CDO, Ser 2007-14A, Cl B | | | | | | |
1.491%, 07/15/09 (A) (C) | | | 4,410 | | | 1,877 |
CIFC Funding , Ser 2007-IV | | | | | | |
0.000%, 12/19/07 | | | 3,900 | | | 468 |
CIFC Funding, Ser 2006-1BA, Cl A3L | | | | | | |
2.057%, 06/22/09 (A) (C) | | | 3,525 | | | 276 |
CIFC Funding, Ser 2006-1BA, Cl A2L | | | | | | |
1.647%, 06/22/09 (A) (C) | | | 6,000 | | | 1,003 |
CIFC Funding, Ser 2006-I | | | | | | |
0.000%, 10/20/20 (A) (C) | | | 2,000 | | | 40 |
CIFC Funding, Ser 2006-II | | | | | | |
0.000%, 03/01/21 (A) (C) | | | 3,000 | | | 60 |
CIFC Funding, Ser 2007-1A, Cl A1LB | | | | | | |
1.296%, 08/10/09 (A) (C) | | | 3,250 | | | 578 |
CIFC Funding, Ser 2007-2A, Cl SUB | | | | | | |
0.000%, 04/15/21 (A) | | | 2,500 | | | 100 |
CIFC Funding, Ser 2007-3A, Cl B | | | | | | |
2.342%, 07/27/09 (A) (C) | | | 2,700 | | | 239 |
CIT CLO, Ser 2007-1A, Cl D | | | | | | |
3.288%, 06/22/09 (A) (C) | | | 3,000 | | | 240 |
CIT CLO, Ser 2007-1A, Cl E | | | | | | |
6.288%, 06/22/09 (C) | | | 2,200 | | | 154 |
Commercial Industrial Finance, Ser 2006-2A, Cl A1L | | | | | | |
1.521%, 03/01/21 (A) (C) | | | 8,500 | | | 5,100 |
Connecticut Valley Structured Credit CDO, Ser 2006-3A | | | | | | |
0.000%, 03/23/23 (A) | | | 1,200 | | | 3 |
Copper River CLO, Ser 2006-1A, Cl INC | | | | | | |
0.000%, 07/20/09 (A) (C) | | | 3,000 | | | 165 |
| | | | | | |
| Description | | Face Amount
($ Thousands) | | Market Value
($ Thousands) |
| | | | | | |
De Meer Middle Market CLO, Ser 2006-1A, Cl INC | | | | | | |
0.000%, 10/20/18 (A) | | $ | 3,167 | | $ | 190 |
De Meer Middle Market CLO, Ser 2006-1A, Cl B | | | | | | |
1.507%, 07/20/09 (A) (C) | | | 1,200 | | | 450 |
Denali Capital CLO VII,
Ser 2007-1A, Cl INC | | | | | | |
0.000%, 01/22/22 (A) | | | 4,500 | | | 225 |
Duane Street CLO, Ser 2007-5A, Cl SN | | | | | | |
0.000%, 10/14/21 (A) | | | 3,500 | | | 35 |
Gale Force CLO, Ser 2005-1A, Cl COM1 | | | | | | |
1.010%, 11/15/17 (A) | | | 6,573 | | | 460 |
Gale Force CLO, Ser 2007-4A, Cl INC | | | | | | |
0.785%, 08/20/09 (C) | | | 60 | | | 420 |
Gale Force CLO, Ser 2007-4A, Cl E | | | | | | |
7.185%, 08/20/09 (C) | | | 4,200 | | | 273 |
Gleneagles CLO, Ser AI | | | | | | |
0.000%, 08/01/09 (C) | | | 6 | | | 60 |
GoldenTree Loan Opportunities III, Ser 2007-3A, Cl SUB | | | | | | |
0.000%, 05/01/22 (A) | | | 3,100 | | | 248 |
Greenbriar CLO, Ser 2007-1A, Cl D | | | | | | |
3.778%, 08/03/09 (A) (C) | | | 4,644 | | | 46 |
GSC Partners CDO Fund,
Ser 2004-5A, Cl A2 | | | | | | |
1.435%, 08/20/09 (A) (C) | | | 3,300 | | | 858 |
Hamlet, Ser 2005-2A, Cl A2B | | | | | | |
1.286%, 08/11/09 (A) (C) | | | 2,800 | | | 896 |
Harch CLO, Ser 2005-2A, Cl C | | | | | | |
1.901%, 07/22/09 (A) (C) | | | 1,650 | | | 83 |
Harch CLO, Ser 2007-1A, Cl C | | | | | | |
1.804%, 07/29/09 (A) (C) | | | 2,750 | | | 138 |
ING Investment Management I CLO | | | | | | |
0.000%, 12/01/17 (A) (C) | | | 2 | | | 20 |
ING Investment Management II CLO | | | | | | |
0.000%, 08/01/20 (A) (C) | | | 5 | | | 48 |
Lafayette Square CDO,
Ser 2005-1A, Cl A2 | | | | | | |
1.283%, 08/17/09 (A) (C) | | | 3,575 | | | 1,108 |
Landmark CDO, Ser 2002-2A, Cl A | | | | | | |
1.741%, 09/01/09 (A) (C) | | | 3,392 | | | 2,849 |
Lightpoint CLO, Ser 2006-4A, Cl INC | | | | | | |
0.000%, 04/15/18 (A) | | | 2,000 | | | 40 |
Marathon CLO, Ser 2005-2A, Cl B | | | | | | |
2.088%, 06/22/09 (A) (C) | | | 1,300 | | | 39 |
Marathon CLO, Ser 2005-2A, Cl INC | | | | | | |
0.000%, 12/20/19 (A) | | | 1,500 | | | — |
Marlborough Street CLO,
Ser 2007-1A, Cl INC | | | | | | |
0.000%, 04/18/19 (A) | | | 2,300 | | | 23 |
Marlborough Street CLO,
Ser 2007-1A, Cl A2B | | | | | | |
1.457%, 07/20/09 (A) (C) | | | 5,250 | | | 2,153 |
| | |
| SEI Institutional Investments Trust / Annual Report / May 31, 2009 | | 195 |
SCHEDULE OF INVESTMENTS
High Yield Bond Fund (Continued)
May 31, 2009
| | | | | | |
| Description | | Face Amount
($ Thousands) | | Market Value
($ Thousands) |
| | | | | | |
NOB Hill CLO, Ser 2007-1A, Cl C | | | | | | |
2.177%, 06/22/09 (A) (C) | | $ | 2,767 | | $ | 55 |
Peritus I CDO | | | | | | |
0.000%, 12/19/07 | | | 3,000 | | | 30 |
Peritus I CDO, Ser 2005-1A, Cl C | | | | | | |
9.000%, 05/24/15 (A) | | | 10,361 | | | 311 |
Rockwall Investors CDO | | | | | | |
0.000%, 08/01/21 (A) (C) | | | 3,000 | | | — |
Sands Point Funding, Ser 2006-1A, Cl C | | | | | | |
1.907%, 07/20/09 (A) (C) | | | 2,580 | | | 310 |
Stanfield Daytona CLO | | | | | | |
0.000%, 04/27/21 | | | 36 | | | 144 |
Stanfield Veyron CLO, Ser 2006-1A, Cl SUB | | | | | | |
0.000%, 07/15/18 | | | 2,000 | | | 40 |
Tralee CDO, Ser 2007-1A, Cl SUB | | | | | | |
0.000%, 04/16/22 (A) | | | 2,500 | | | — |
Waterfront CLO, Ser 2007-1A, Cl A2 | | | | | | |
1.531%, 07/15/09 (A) (C) | | | 6,600 | | | 2,640 |
Whitehorse CLO II | | | | | | |
0.000%, 03/15/13 (A) (C) | | | 35 | | | 70 |
| | | | | | |
Total Collateralized Debt Obligation
(Cost $130,959) ($ Thousands) | | | | | | 33,686 |
| | | | | | |
| | |
CONVERTIBLE BONDS — 0.5% | | | | | | |
ADC Telecommunications | | | | | | |
3.500%, 07/15/15 | | | 870 | | | 548 |
Adelphia Recovery Trust, Ser ACE-1 (escrow security) | | | | | | |
0.000%, 02/15/09 | | | 466 | | | — |
Advanced Micro Devices | | | | | | |
5.750%, 08/15/12 | | | 700 | | | 435 |
Alcatel-Lucent USA | | | | | | |
2.875%, 06/15/25 | | | 700 | | | 453 |
Flextronics CV to 64.4122 | | | | | | |
1.000%, 08/01/10 | | | 78 | | | 73 |
Ford CV to 108.6957 | | | | | | |
4.250%, 12/15/36 | | | 250 | | | 201 |
International Game Technology CV to 16.1875 | | | | | | |
2.600%, 12/15/36 | | | 1,728 | | | 1,746 |
Mirant CV to 14.7167 | | | | | | |
0.000%, 06/15/21 | | | 1,950 | | | 4 |
NII Holdings CV to 8.4517 | | | | | | |
3.125%, 06/15/12 | | | 525 | | | 393 |
Prologis CV to 13.1614 | | | | | | |
2.250%, 04/01/37 | | | 1,435 | | | 1,116 |
SanDisk | | | | | | |
1.000%, 05/15/13 | | | 1,260 | | | 819 |
| | | | | | |
Total Convertible Bonds
(Cost $5,627) ($ Thousands) | | | | | | 5,788 |
| | | | | | |
| | | | | |
| Description | | Shares/Face Amount
($ Thousands) | | Market Value
($ Thousands) |
| | | | | |
| | |
PREFERRED STOCK — 0.2% | | | | | |
Crown Castle International | | 18,175 | | $ | 885 |
Dana, Ser B* | | 575 | | | 363 |
GMAC Preferred Blocker* | | 3 | | | 1,267 |
| | | | | |
Total Preferred Stock
(Cost $1,511) ($ Thousands) | | | | | 2,515 |
| | | | | |
| | |
GLOBAL BONDS — 0.1% | | | | | |
Mohawk Industries | | | | | |
6.625%, 01/15/16 | | $ 790 | | | 682 |
Wyndham Worldwide | | | | | |
6.000%, 12/01/16 | | 870 | | | 652 |
| | | | | |
Total Global Bonds
(Cost $1,206) ($ Thousands) | | | | | 1,334 |
| | | | | |
| | |
COMMON STOCK — 0.1% | | | | | |
Armstrong World Industries* | | 6,237 | | | 112 |
Core-Mark Holding* | | 12,992 | | | 339 |
Dana Holdings* | | 67,821 | | | 89 |
Owens Corning* | | 9,946 | | | 139 |
Federal Mogul, Cl A* | | 32,619 | | | 326 |
| | | | | |
Total Common Stock
(Cost $2,844) ($ Thousands) | | | | | 1,005 |
| | | | | |
| | | Number of
Warrants | | |
| | |
WARRANT — 0.0% | | | | | |
Atrium, Expires 10/14/08* (B) (F) | | 691 | | | — |
| | | | | |
Total Warrant
(Cost $0) ($ Thousands) | | | | | — |
| | | | | |
| |
AFFILIATED PARTNERSHIP — 16.5% | | | |
SEI Liquidity Fund, L.P., 0.820%**† (G) | | 208,078,978 | | | 204,720 |
| | | | | |
Total Affiliated Partnership
(Cost $208,079) ($ Thousands) | | | | | 204,720 |
| | | | | |
| | |
CASH EQUIVALENT — 3.7% | | | | | |
SEI Daily Income Trust, Prime Obligation Fund, Cl A, 0.260%**† | | 45,516,018 | | | 45,516 |
| | | | | |
Total Cash Equivalent
(Cost $45,516) ($ Thousands) | | | | | 45,516 |
| | | | | |
Total Investments — 117.9%
(Cost $1,685,784)($ Thousands) | | | | $ | 1,461,049 |
| | | | | |
| Percentages | | are based on a Net Assets of $1,239,271 ($ Thousands) |
| * | | Non-income producing security. |
| ** | | The rate reported is the 7-day effective yield as of May 31, 2009 |
| † | | Investment in Affiliated Security (See Note 4). |
| ‡ | | Real Estate Investment Trust |
| (A) | | Securities sold within terms of a private placement memorandum, exempt from registration under Section 144A of the Securities Act of 1933, as amended, and may |
| | |
| 196 | | SEI Institutional Investments Trust / Annual Report / May 31, 2009 |
| | be sold only to dealers in that program or other “accredited investors.” These securities have been determined to be liquid under guidelines established by the board of Trustees. |
| (B) | | This security or a partial position of this security is on loan at May 31, 2009. The total value of securities on loan at May 31, 2009 was $196,431 ($ Thousands). |
| (C) | | Variable Rate Security — The rate reported is the rate in effect as of May 31, 2009. The date reported is the next reset date. |
| (D) | | Security in default on interest payments. Security is non-income producing. |
| (E) | | Step Bonds — The rate reflected is the effective yield on May 31, 2009. The coupon on a step bond changes on a specified date. |
| (F) | | Securities considered illiquid. The total value of such securities as of May 31, 2009 was $0 ($ Thousands) and represented 0.00% of Net Assets. |
| (G) | | This security was purchased with cash collateral held from securities on loan (See Note 9). The total value of such securities as of May 31, 2009 was $204,720 ($ Thousands). |
CDO — Collateralized Debt Obligation
Cl — Class
CLO — Collateralized Loan Obligation
CV — Convertible Security
LLC — Limited Liability Company
L.P. — Limited Partnership
MTN — Medium Term Note
PIK — Payment-in-Kind
PLC — Public Limited Company
Ser — Series
Amounts designated as “—” are $0 or have been rounded to $O
The accompanying notes are an integral part of the financial statements.
| | |
| SEI Institutional Investments Trust / Annual Report / May 31, 2009 | | 197 |
SCHEDULE OF INVESTMENTS
Long Duration Fund
May 31, 2009
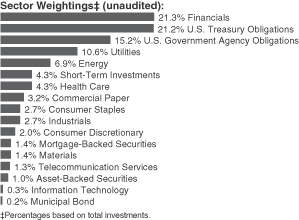
| | | | | | |
| Description | | Face Amount
($ Thousands) | | Market Value
($ Thousands) |
| | | | | | |
|
CORPORATE OBLIGATIONS — 52.9% |
| |
Consumer Discretionary — 2.0% | | | |
COX Communications | | | | | | |
8.375%, 03/01/39 (A) | | $ | 5,975 | | $ | 6,275 |
Time Warner Cable | | | | | | |
8.750%, 02/14/19 | | | 9,070 | | | 10,419 |
8.250%, 04/01/19 | | | 6,000 | | | 6,722 |
Time Warner Entertainment | | | | | | |
8.375%, 07/15/33 | | | 5,700 | | | 5,919 |
| | | | | | |
| | | | | | 29,335 |
| | | | | | |
| |
Consumer Staples — 2.7% | | | |
Altria Group | | | | | | |
10.200%, 02/06/39 | | | 10,950 | | | 12,515 |
9.250%, 08/06/19 | | | 6,000 | | | 6,638 |
Anheuser-Busch InBev Worldwide | | | | | | |
6.875%, 11/15/19 (A) | | | 17,800 | | | 18,004 |
General Mills | | | | | | |
5.650%, 02/15/19 | | | 2,750 | | | 2,814 |
| | | | | | |
| | | | | | 39,971 |
| | | | | | |
| | |
Energy — 6.8% | | | | | | |
CenterPoint Energy Resources | | | | | | |
7.875%, 04/01/13 | | | 1,000 | | | 1,050 |
6.625%, 11/01/37 | | | 7,665 | | | 5,327 |
6.000%, 05/15/18 | | | 3,500 | | | 3,086 |
ConocoPhillips | | | | | | |
6.500%, 02/01/39 | | | 8,375 | | | 8,655 |
5.750%, 02/01/19 | | | 8,233 | | | 8,466 |
Husky Energy | | | | | | |
7.250%, 12/15/19 | | | 11,200 | | | 11,688 |
Marathon Oil | | | | | | |
7.500%, 02/15/19 | | | 12,040 | | | 12,700 |
Talisman Energy | | | | | | |
7.750%, 06/01/19 | | | 3,075 | | | 3,224 |
| | | | | | |
| Description | | Face Amount
($ Thousands) | | Market Value
($ Thousands) |
| | | | | | |
Valero Energy | | | | | | |
9.375%, 03/15/19 | | $ | 4,000 | | $ | 4,478 |
6.625%, 06/15/37 | | | 17,205 | | | 14,119 |
Williams | | | | | | |
8.750%, 01/15/20 (A) | | | 14,810 | | | 15,254 |
7.875%, 09/01/21 | | | 2,150 | | | 2,085 |
Williams, Ser A | | | | | | |
7.500%, 01/15/31 | | | 2,000 | | | 1,690 |
XTO Energy | | | | | | |
6.100%, 04/01/36 | | | 11,315 | | | 9,929 |
| | | | | | |
| | | | | | 101,751 |
| | | | | | |
| | |
Financials — 21.1% | | | | | | |
American Express | | | | | | |
8.125%, 05/20/19 | | | 8,860 | | | 8,887 |
BAC Capital Trust XV | | | | | | |
1.468%, 09/01/09 (B) | | | 8,000 | | | 3,227 |
Bank of America | | | | | | |
8.000%, 12/29/49 (B) | | | 2,700 | | | 2,113 |
7.625%, 06/01/19 | | | 5,000 | | | 5,057 |
5.750%, 12/01/17 | | | 5,750 | | | 5,136 |
5.650%, 05/01/18 | | | 19,650 | | | 17,584 |
Bank of America, Ser A | | | | | | |
8.070%, 12/31/26 (A) | | | 5,095 | | | 3,922 |
Bear Stearns | | | | | | |
7.250%, 02/01/18 | | | 8,768 | | | 9,039 |
6.400%, 10/02/17 | | | 9,175 | | | 8,989 |
1.392%, 07/16/09 (B) | | | 700 | | | 701 |
BRE Properties‡ | | | | | | |
5.500%, 03/15/17 | | | 750 | | | 598 |
Capital One Financial MTN | | | | | | |
1.573%, 06/10/09 (B) | | | 2,000 | | | 1,960 |
Cedar Brakes II LLC | | | | | | |
9.875%, 09/01/13 (A) | | | 1,325 | | | 1,353 |
Chase Capital II | | | | | | |
1.528%, 08/03/09 (B) | | | 4,984 | | | 2,419 |
Citigroup | | | | | | |
8.500%, 05/22/19 | | | 7,600 | | | 7,869 |
6.875%, 03/05/38 | | | 13,090 | | | 11,519 |
6.125%, 05/15/18 | | | 6,500 | | | 5,799 |
5.875%, 05/29/37 | | | 4,761 | | | 3,821 |
4.125%, 02/22/10 | | | 4,494 | | | 4,492 |
Citigroup Capital XXI | | | | | | |
8.300%, 12/21/57 (B) | | | 2,515 | | | 2,239 |
Corestates Capital I | | | | | | |
8.000%, 12/15/26 (A) | | | 1,000 | | | 654 |
Credit Suisse NY | | | | | | |
6.000%, 02/15/18 | | | 13,600 | | | 12,639 |
Deutsche Bank Capital Funding Trust | | | | | | |
5.628%, 01/19/49 (A) (B) | | | 3,195 | | | 2,063 |
ERP Operating‡ | | | | | | |
5.750%, 06/15/17 | | | 6,250 | | | 5,570 |
5.200%, 04/01/13 | | | 900 | | | 866 |
| | |
| 198 | | SEI Institutional Investments Trust / Annual Report / May 31, 2009 |
| | | | | | |
| Description | | Face Amount
($ Thousands) | | Market Value
($ Thousands) |
| | | | | | |
Farmers Exchange Capital | | | | | | |
7.050%, 07/15/28 (A) | | $ | 17,350 | | $ | 11,106 |
Farmers Insurance Exchange | | | | | | |
8.625%, 05/01/24 (A) | | | 3,735 | | | 2,778 |
First Union Institutional Capital I | | | | | | |
8.040%, 12/01/26 | | | 1,250 | | | 979 |
General Electric Capital | | | | | | |
6.875%, 01/10/39 | | | 28,745 | | | 26,427 |
5.625%, 05/01/18 | | | 2,600 | | | 2,487 |
1.357%, 07/08/09 (B) | | | 4,000 | | | 3,143 |
1.156%, 08/11/09 (B) | | | 2,000 | | | 1,553 |
Goldman Sachs Group | | | | | | |
7.500%, 02/15/19 | | | 21,940 | | | 23,086 |
6.150%, 04/01/18 | | | 1,400 | | | 1,352 |
1.187%, 08/06/09 (B) | | | 5,000 | | | 4,724 |
HBOS | | | | | | |
6.750%, 05/21/18 (A) | | | 7,700 | | | 5,460 |
HCP MTN‡ | | | | | | |
6.700%, 01/30/18 | | | 1,500 | | | 1,288 |
Health Care‡ | | | | | | |
5.875%, 05/15/15 | | | 7,725 | | | 6,572 |
JPMorgan Chase | | | | | | |
6.300%, 04/23/19 | | | 7,740 | | | 7,701 |
6.000%, 01/15/18 | | | 4,000 | | | 3,981 |
Lloyds Banking Group | | | | | | |
5.920%, 10/01/09 (A) (B) | | | 2,800 | | | 1,064 |
MBNA Capital, Ser B | | | | | | |
1.828%, 08/01/09 (B) | | | 2,151 | | | 970 |
Merrill Lynch MTN | | | | | | |
8.950%, 11/18/09 (B) | | | 1,340 | | | 1,055 |
8.680%, 11/02/09 (B) | | | 1,305 | | | 1,090 |
MetLife | | | | | | |
7.717%, 02/15/19 | | | 11,200 | | | 11,903 |
Morgan Stanley MTN | | | | | | |
7.300%, 05/13/19 | | | 3,300 | | | 3,380 |
6.625%, 04/01/18 | | | 5,735 | | | 5,669 |
1.611%, 10/15/15 (B) | | | 17,575 | | | 14,245 |
1.557%, 07/20/09 (B) | | | 1,500 | | | 1,105 |
1.411%, 07/15/09 (B) | | | 2,225 | | | 2,183 |
Nationwide Mutual Insurance | | | | | | |
7.875%, 04/01/33 (A) | | | 1,643 | | | 1,064 |
6.600%, 04/15/34 (A) | | | 12,040 | | | 6,584 |
Power Receivables Finance | | | | | | |
6.290%, 01/01/12 (A) | | | 977 | | | 957 |
Sempra Energy ESOP & Trust | | | | | | |
5.781%, 11/01/14 (A) | | | 2,000 | | | 1,980 |
Security Benefit Life | | | | | | |
7.450%, 10/01/33 (A) | | | 4,000 | | | 300 |
Simon Property Group‡ | | | | | | |
7.000%, 07/15/09 | | | 2,000 | | | 2,000 |
5.750%, 05/01/12 | | | 1,670 | | | 1,627 |
Travelers | | | | | | |
5.900%, 06/02/19 | | | 1,500 | | | 1,536 |
Wachovia Bank | | | | | | |
6.000%, 11/15/17 | | | 3,748 | | | 3,520 |
| | | | | | |
| Description | | Face Amount
($ Thousands) | | Market Value
($ Thousands) |
| | | | | | |
Wachovia Capital Trust I | | | | | | |
7.640%, 01/15/27 (A) | | $ | 3,685 | | $ | 2,415 |
WEA Finance LLC | | | | | | |
7.125%, 04/15/18 (A) | | | 5,280 | | | 4,950 |
Weingarten Realty Investors MTN‡ | | | | | | |
8.250%, 01/22/10 | | | 4,075 | | | 4,082 |
Wells Fargo | | | | | | |
7.980%, 09/15/09 (B) | | | 465 | | | 363 |
ZFS Finance USA Trust I | | | | | | |
6.500%, 11/09/09 (A) (B) | | | 1,325 | | | 875 |
6.150%, 12/15/65 (A) (B) | | | 13,606 | | | 8,912 |
| | | | | | |
| | | | | | 314,982 |
| | | | | | |
| | |
Health Care — 4.2% | | | | | | |
Abbott Laboratories | | | | | | |
6.000%, 04/01/39 | | | 1,850 | | | 1,894 |
Amgen | | | | | | |
6.400%, 02/01/39 | | | 2,500 | | | 2,550 |
CIGNA | | | | | | |
8.500%, 05/01/19 | | | 5,825 | | | 5,720 |
Eli Lilly | | | | | | |
5.950%, 11/15/37 | | | 3,000 | | | 2,949 |
Novartis Securities Investment | | | | | | |
5.125%, 02/10/19 | | | 4,000 | | | 4,054 |
Pfizer | | | | | | |
7.200%, 03/15/39 | | | 13,800 | | | 15,602 |
Roche Holdings | | | | | | |
7.000%, 03/01/39 (A) | | | 7,395 | | | 7,898 |
UnitedHealth Group | | | | | | |
6.875%, 02/15/38 | | | 3,260 | | | 2,889 |
6.625%, 11/15/37 | | | 7,975 | | | 6,502 |
5.800%, 03/15/36 | | | 5,000 | | | 3,757 |
WellPoint | | | | | | |
7.000%, 02/15/19 | | | 9,506 | | | 9,435 |
| | | | | | |
| | | | | | 63,250 |
| | | | | | |
| | |
Industrials — 2.7% | | | | | | |
America West Airlines, Ser 01-1 | | | | | | |
7.100%, 04/02/21 | | | 312 | | | 240 |
American Airlines Pass Through Trust,
Ser 2003-01 | | | | | | |
3.857%, 07/09/10 | | | 5,510 | | | 5,086 |
American Airlines Private Trust, Ser 99-1 | | | | | | |
7.024%, 10/15/09 | | | 1,300 | | | 1,281 |
Canadian National Railway | | | | | | |
5.550%, 03/01/19 | | | 3,900 | | | 3,983 |
Continental Airlines | | | | | | |
5.983%, 04/19/22 | | | 7,175 | | | 5,884 |
Continental Airlines, Ser 99-2 | | | | | | |
7.056%, 09/15/09 | | | 3,045 | | | 2,999 |
Continental Airlines, Ser AMBC | | | | | | |
6.236%, 03/15/20 | | | 191 | | | 124 |
Delta Air Lines | | | | | | |
6.619%, 03/18/11 | | | 452 | | | 430 |
| | |
| SEI Institutional Investments Trust / Annual Report / May 31, 2009 | | 199 |
SCHEDULE OF INVESTMENTS
Long Duration Fund (Continued)
May 31, 2009
| | | | | | |
| Description | | Face Amount
($ Thousands) | | Market Value
($ Thousands) |
| | | | | | |
Delta Air Lines, Ser 2001-1 | | | | | | |
7.111%, 09/18/11 | | $ | 6,700 | | $ | 6,231 |
Norfolk Southern | | | | | | |
5.900%, 06/15/19 | | | 4,395 | | | 4,482 |
5.750%, 01/15/16 (A) | | | 1,500 | | | 1,449 |
Northwest Airlines, Ser 1A-2 | | | | | | |
6.841%, 04/01/11 | | | 2,610 | | | 2,323 |
Union Pacific | | | | | | |
6.125%, 02/15/20 | | | 5,125 | | | 5,090 |
United Air Lines, Ser 2001-1 | | | | | | |
6.201%, 03/29/49 | | | 63 | | | 62 |
United Air Lines, Ser 2001-1, Cl A-1 | | | | | | |
6.071%, 03/01/13 | | | 196 | | | 193 |
| | | | | | |
| | | | | | 39,857 |
| | | | | | |
| |
Information Technology — 0.3% | | | |
Cisco Systems | | | | | | |
4.950%, 02/15/19 | | | 3,800 | | | 3,823 |
| | | | | | |
| | |
Materials — 1.4% | | | | | | |
Barrick Gold | | | | | | |
6.950%, 04/01/19 | | | 7,800 | | | 8,490 |
Barrick Gold Finance | | | | | | |
5.800%, 11/15/34 | | | 2,160 | | | 1,641 |
Barrick North America Finance LLC | | | | | | |
7.500%, 09/15/38 | | | 6,435 | | | 6,568 |
BHP Billiton Finance USA | | | | | | |
6.500%, 04/01/19 | | | 3,720 | | | 4,052 |
| | | | | | |
| | | | | | 20,751 |
| | | | | | |
| |
Telecommunication Services — 1.2% | | | |
AT&T | | | | | | |
5.800%, 02/15/19 | | | 4,775 | | | 4,900 |
Verizon Communications | | | | | | |
7.350%, 04/01/39 | | | 5,660 | | | 5,956 |
6.400%, 02/15/38 | | | 4,750 | | | 4,594 |
6.350%, 04/01/19 | | | 828 | | | 870 |
Verizon Wireless Capital LLC | | | | | | |
8.500%, 11/15/18 (A) | | | 1,875 | | | 2,275 |
| | | | | | |
| | | | | | 18,595 |
| | | | | | |
| | |
Utilities — 10.5% | | | | | | |
Alabama Power | | | | | | |
6.000%, 03/01/39 | | | 1,850 | | | 1,881 |
Appalachian Power | | | | | | |
7.950%, 01/15/20 | | | 4,160 | | | 4,528 |
Arizona Public Service | | | | | | |
8.750%, 03/01/19 | | | 5,025 | | | 5,305 |
Carolina Power & Light | | | | | | |
5.300%, 01/15/19 | | | 2,000 | | | 2,050 |
Connecticut Light & Power | | | | | | |
5.500%, 02/01/19 | | | 1,700 | | | 1,736 |
Consolidated Edison of New York | | | | | | |
6.650%, 04/01/19 | | | 14,200 | | | 15,576 |
| | | | | | |
| Description | | Face Amount
($ Thousands) | | Market Value
($ Thousands) |
| | | | | | |
EDF | | | | | | |
6.950%, 01/26/39 (A) | | $ | 7,190 | | $ | 7,883 |
Entergy Gulf States | | | | | | |
1.068%, 09/01/09 (B) | | | 1,085 | | | 1,070 |
Entergy Louisiana LLC | | | | | | |
5.830%, 11/01/10 | | | 2,000 | | | 2,002 |
Entergy Texas | | | | | | |
7.125%, 02/01/19 | | | 2,000 | | | 2,021 |
EQT | | | | | | |
8.125%, 06/01/19 | | | 14,125 | | | 14,571 |
Florida Gas Transmission LLC | | | | | | |
7.900%, 05/15/19 (A) | | | 6,000 | | | 6,243 |
Florida Power & Light | | | | | | |
5.960%, 04/01/39 | | | 3,225 | | | 3,283 |
FPL Group Capital | | | | | | |
6.000%, 03/01/19 | | | 4,000 | | | 4,159 |
Georgia Power | | | | | | |
5.950%, 02/01/39 | | | 3,850 | | | 3,886 |
Kansas City Power & Light | | | | | | |
7.150%, 04/01/19 | | | 8,250 | | | 8,533 |
KCP&L Greater Missouri Operations | | | | | | |
8.270%, 11/15/21 | | | 5,100 | | | 4,570 |
Metropolitan Edison | | | | | | |
7.700%, 01/15/19 | | | 2,500 | | | 2,600 |
Nisource Finance | | | | | | |
10.750%, 03/15/16 | | | 5,575 | | | 6,074 |
Oncor Electric Delivery | | | | | | |
7.500%, 09/01/38 (A) | | | 3,200 | | | 3,187 |
6.800%, 09/01/18 | | | 4,330 | | | 4,399 |
6.800%, 09/01/18 (A) | | | 2,350 | | | 2,387 |
Pacific Gas & Electric | | | | | | |
6.250%, 03/01/39 | | | 4,500 | | | 4,634 |
Panhandle Eastern Pipeline | | | | | | |
8.125%, 06/01/19 | | | 6,900 | | | 6,927 |
Portland General Electric | | | | | | |
6.100%, 04/15/19 | | | 3,500 | | | 3,613 |
Power Contract Financing | | | | | | |
6.256%, 02/01/10 (A) | | | 712 | | | 699 |
Progress Energy | | | | | | |
7.050%, 03/15/19 | | | 4,500 | | | 4,822 |
San Diego Gas & Electric | | | | | | |
6.000%, 06/01/39 | | | 4,000 | | | 4,066 |
Southwestern Electric Power | | | | | | |
6.450%, 01/15/19 | | | 6,000 | | | 5,971 |
Texas-New Mexico Power | | | | | | |
9.500%, 04/01/19 (A) | | | 8,560 | | | 9,441 |
Union Electric | | | | | | |
8.450%, 03/15/39 | | | 7,000 | | | 7,757 |
| | | | | | |
| | | | | | 155,874 |
| | | | | | |
Total Corporate Obligations
(Cost $755,658) ($ Thousands ) | | | | | | 788,189 |
| | | | | | |
| | |
| 200 | | SEI Institutional Investments Trust / Annual Report / May 31, 2009 |
| | | | | | |
| Description | | Face Amount
($ Thousands) | | Market Value
($ Thousands) |
| | | | | | |
|
U.S. TREASURY OBLIGATIONS — 21.1% |
U.S. Treasury Bills | | | | | | |
0.160%, 08/20/09 (C) (D) | | $ | 12,605 | | $ | 12,601 |
U.S. Treasury Bonds | | | | | | |
6.250%, 08/15/23 | | | 11,502 | | | 13,952 |
5.375%, 02/15/31 | | | 146,621 | | | 167,354 |
4.500%, 05/15/38 | | | 55,080 | | | 56,560 |
4.250%, 05/15/39 | | | 58,719 | | | 57,866 |
U.S. Treasury Inflation-Protected Securities | | | | | | |
1.750%, 01/15/28 | | | 6,000 | | | 5,616 |
| | | | | | |
Total U.S. Treasury Obligations
(Cost $333,331) ($ Thousands) | | | | | | 313,949 |
| | | | | | |
|
U.S. GOVERNMENT AGENCY OBLIGATIONS — 15.1% |
FFCB | | | | | | |
5.750%, 12/07/28 | | | 5,275 | | | 5,314 |
FHLB DN | | | | | | |
0.070%, 06/01/09 (C) | | | 5,595 | | | 5,595 |
0.163%, 06/03/09 (C) | | | 101,017 | | | 101,016 |
FNMA | | | | | | |
7.250%, 05/15/30 | | | 10,130 | | | 13,132 |
5.625%, 07/15/37 | | | 5,975 | | | 6,256 |
6.210%, 08/06/38 | | | 16,745 | | | 18,378 |
FNMA STRIPS, PO (C) | | | | | | |
5.067%, 07/15/26 | | | 14,510 | | | 5,510 |
5.032%, 01/15/27 | | | 13,908 | | | 5,437 |
5.079%, 10/08/27 | | | 13,966 | | | 5,111 |
5.210%, 10/08/27 | | | 30,920 | | | 11,316 |
Tennessee Valley Authority | | | | | | |
7.125%, 05/01/30 | | | 16,030 | | | 19,070 |
5.880%, 04/01/36 | | | 16,790 | | | 17,758 |
5.500%, 06/15/38 | | | 2,120 | | | 2,115 |
4.875%, 01/15/48 | | | 10,505 | | | 9,325 |
| | | | | | |
Total U.S. Government Agency Obligations
(Cost $235,830) ($ Thousands) | | | | | | 225,333 |
| | | | | | |
|
MORTGAGE-BACKED SECURITIES — 1.4% |
|
Agency Mortgage-Backed Obligations — 0.1% |
FHLMC CMO, Ser 2748, Cl ZT | | | | | | |
5.500%, 02/15/24 | | | 503 | | | 501 |
FNMA CMO, Ser 2004-12, Cl ZX | | | | | | |
6.000%, 03/25/34 | | | 657 | | | 670 |
FNMA CMO, Ser 2004-80, Cl XZ | | | | | | |
5.000%, 11/25/34 | | | 389 | | | 367 |
GNMA ARM | | | | | | |
5.375%, 06/20/32 (B) | | | 245 | | | 251 |
| | | | | | |
| | | | | | 1,789 |
| | | | | | |
|
Non-Agency Mortgage-Backed Obligations — 1.3% |
American Home Mortgage Investment Trust, Ser 2007-2, Cl 11A1 | | | | | | |
0.539%, 06/25/09 (B) | | | 1,925 | | | 776 |
| | | | | | |
| Description | | Face Amount
($ Thousands) | | Market Value
($ Thousands) |
| | | | | | |
Bayview Commercial Asset Trust,
Ser 2007-3, Cl A1 | | | | | | |
0.549%, 06/25/09 (A) (B) | | $ | 2,349 | | $ | 1,285 |
Commercial Mortgage Loan Trust,
Ser 2008-LS1, Cl A4B | | | | | | |
6.019%, 07/10/09 (B) | | | 1,775 | | | 1,268 |
Countrywide Alternative Loan Trust,
Ser 2005-16, Cl A5 | | | | | | |
0.589%, 06/25/09 (B) | | | 483 | | | 83 |
Countrywide Home Loans,
Ser 2006-2, Cl 1A1 | | | | | | |
0.629%, 06/25/09 (B) | | | 233 | | | 95 |
Credit Suisse Mortgage Capital Certificates, Ser 2006-C5, Cl A3 | | | | | | |
5.311%, 12/15/39 | | | 6,560 | | | 4,852 |
DSLA Mortgage Loan Trust,
Ser 2005-AR2, Cl 2A1A | | | | | | |
0.538%, 06/19/09 (B) | | | 368 | | | 153 |
Greenwich Capital Commercial Funding,
Ser 2005-GG5, Cl AM | | | | | | |
5.277%, 07/10/09 (B) | | | 1,960 | | | 1,273 |
GS Mortgage Securities II,
Ser 2006-GG8, Cl A4 | | | | | | |
5.560%, 11/10/39 | | | 9,115 | | | 7,404 |
Harborview Mortgage Loan Trust,
Ser 2004-8, Cl 2A4A | | | | | | |
0.728%, 06/19/09 (B) | | | 439 | | | 219 |
Harborview Mortgage Loan Trust,
Ser 2005-11, Cl 2A1A | | | | | | |
0.638%, 06/19/09 (B) | | | 653 | | | 287 |
Indymac Index Mortgage Loan Trust,
Ser 2004-AR12, Cl A1 | | | | | | |
0.699%, 06/25/09 (B) | | | 220 | | | 114 |
Indymac Index Mortgage Loan Trust,
Ser 2004-AR5, Cl 2A1B | | | | | | |
0.709%, 06/25/09 (B) | | | 141 | | | 62 |
Indymac Index Mortgage Loan Trust,
Ser 2004-AR7, Cl A2 | | | | | | |
0.739%, 06/25/09 (B) | | | 57 | | | 30 |
Indymac Index Mortgage Loan Trust,
Ser 2005-AR18, Cl 2A1A | | | | | | |
0.619%, 06/25/09 (B) | | | 27 | | | 11 |
JPMorgan Chase Commercial Mortgage Securities, Ser 2006-LDP7, Cl A4 | | | | | | |
5.875%, 07/15/09 (B) | | | 535 | | | 447 |
Structured Asset Mortgage Investments,
Ser 2006-AR1, Cl 3A1 | | | | | | |
0.539%, 06/25/09 (B) | | | 569 | | | 208 |
Washington Mutual Mortgage Pass Through Certificates,
Ser 2000-1, Cl M2 | | | | | | |
1.609%, 06/25/09 (B) | | | 241 | | | 231 |
| | |
| SEI Institutional Investments Trust / Annual Report / May 31, 2009 | | 201 |
SCHEDULE OF INVESTMENTS
Long Duration Fund (Continued)
May 31, 2009
| | | | | | |
| Description | | Face Amount
($ Thousands) | | Market Value
($ Thousands) |
| | | | | | |
Washington Mutual Mortgage Pass Through Certificates,
Ser 2005-AR2, Cl 2A21 | | | | | | |
0.639%, 06/25/09 (B) | | $ | 353 | | $ | 159 |
Washington Mutual Mortgage Pass Through Certificates,
Ser 2007-OA3, Cl 4A1 | | | | | | |
2.209%, 07/25/09 (B) | | | 268 | | | 101 |
| | | | | | |
| | | | | | 19,058 |
| | | | | | |
Total Mortgage-Backed Securities
(Cost $24,808) ($ Thousands) | | | | | | 20,847 |
| | | | | | |
|
ASSET-BACKED SECURITIES — 1.0% |
|
Mortgage Related Securities — 1.0% |
Bayview Financial Acquisition Trust,
Ser 2004-B, Cl A1 | | | | | | |
1.316%, 06/29/09 (A) (B) | | | 4,964 | | | 2,867 |
Bayview Financial Acquisition Trust,
Ser 2005-A, Cl A1 | | | | | | |
1.316%, 06/29/09 (A) (B) | | | 5,978 | | | 2,485 |
Bayview Financial Revolving Mortgage Loan Trust, Ser 2005-E, Cl A1 | | | | | | |
0.816%, 06/29/09 (A) (B) | | | 5,600 | | | 1,539 |
Citigroup Mortgage Loan Trust,
Ser 2006-AMC1, Cl A2B | | | | | | |
0.469%, 06/25/09 (B) | | | 11,050 | | | 4,447 |
Continental Airlines, Ser 2002-1, Cl G1 | | | | | | |
1.333%, 08/17/09 (B) | | | 240 | | | 212 |
Home Equity Asset Trust,
Ser 2007-3, Cl 2A2 | | | | | | |
0.489%, 06/25/09 (B) | | | 2,300 | | | 1,200 |
Indymac Home Equity Loan Asset-Backed Trust, Ser 2002-A, Cl M1 | | | | | | |
1.434%, 06/25/09 (B) | | | 569 | | | 267 |
| | | | | |
| Description | | Face Amount
($ Thousands)/Shares | | Market Value
($ Thousands) |
| | | | | |
JPMorgan Mortgage Acquisition,
Ser 2007-HE1, Cl AV1 | | | | | |
0.369%, 06/25/09 (B) | | $ 637 | | $ | 421 |
Nationstar Home Equity Loan Trust,
Ser 2006-B, Cl AV3 | | | | | |
0.479%, 06/25/09 (B) | | 2,565 | | | 1,243 |
| | | | | |
Total Asset-Backed Securities
(Cost $24,982) ($ Thousands) | | | | | 14,681 |
| | | | | |
|
MUNICIPAL BOND — 0.2% |
California State, Building Authority, GO | | | | | |
7.550%, 04/01/39 | | 3,000 | | | 2,900 |
| | | | | |
Total Municipal Bonds
(Cost $3,174) ($ Thousands) | | | | | 2,900 |
| | | | | |
|
COMMERCIAL PAPER (C) — 3.2% |
BNP Paribas Finance | | | | | |
0.591%, 06/02/09 | | 10,600 | | | 10,600 |
0.465%, 06/29/09 | | 11,575 | | | 11,571 |
Rabobank USA Financial | | | | | |
0.691%, 06/01/09 | | 15,535 | | | 15,535 |
0.350%, 08/11/09 | | 9,505 | | | 9,498 |
| | | | | |
Total Commercial Paper
(Cost $47,204) ($ Thousands) | | | | | 47,204 |
| | | | | |
|
CASH EQUIVALENT — 4.3% |
SEI Daily Income Trust, Prime Obligation Fund, Cl A, 0.260%*† | | 63,576,279 | | | 63,576 |
| | | | | |
Total Cash Equivalent
(Cost $63,576) ($ Thousands) | | | | | 63,576 |
| | | | | |
Total Investments — 99.2%
(Cost $1,488,563) ($ Thousands) | | | | $ | 1,476,679 |
| | | | | |
A summary of outstanding swap agreements held by the Fund at May 31, 2009, is as follows (See Note 2 in Notes to Financial Statements):
| | | | | | | | | | | | | | | | |
| Credit Default Swap | |
| Counterparty | | Reference Entity/Obligation | | Buy/Sell Protection | | Receives Rate | | Termination Date | | Notional Amount
(Thousands) | | | Net Unrealized
Depreciation
($Thousands) | |
| Credit Suisse | | ABX.HE.AAA 07-1 Index | | SELL | | 0.09 | | 08/25/37 | | $ | (1,225 | ) | | $ | (675 | ) |
| | | | | | | | | | | | | | | | |
| | |
| 202 | | SEI Institutional Investments Trust / Annual Report / May 31, 2009 |
A summary of the open futures contracts held by the Fund at May 31, 2009, is as follows:
| | | | | | | | |
Type of
Contract | | Number of
Contracts
Long (Short) | | Expiration
Date | | Unrealized
Appreciation
(Depreciation)
($ Thousands) | |
U.S. Long Treasury Bond | | 3,806 | | Sep-2009 | | $ | (10,158 | ) |
| | | | | | | | |
Percentages are based on a Net Assets of $1,489,047 ($ Thousands)
| * | | The rate reported is the 7-day effective yield as of May 31, 2009. |
| † | | Investment in Affiliated Security (See Note 4). |
| ‡ | | Real Estate Investment Trust |
| (A) | | Securities sold within terms of a private placement memorandum, exempt from registration under Section 144A of the Securities Act of 1933, as amended, and may be sold only to dealers in that program or other “accredited investors.” These securities have been determined to be liquid under guidelines established by the board of Trustees. |
| (B) | | Variable Rate Security — The rate reported is the rate in effect as of May 31, 2009. The date reported is the next reset date. |
| (C) | | The rate reported is the effective yield at time of purchase. |
| (D) | | Security, or portion thereof, has been pledged as collateral on open futures contracts. |
ARM — Adjustable Rate Mortgage
Cl — Class
CMO — Collateralized Mortgage Obligation
DN — Discount Note
FFCB — Federal Farm Credit Bank
FHLB — Federal Home Loan Bank
FHLMC — Federal Home Loan Mortgage Corporation
FNMA — Federal National Mortgage Association
GNMA — Government National Mortgage Association
GO — General Obligation
LLC — Limited Liability Company
MTN — Medium Term Note
PO — Principal Only Security
Ser — Series
STRIPS — Separately Traded Registered Interest and Principal Securities
Amounts designated as “—” are $0 or have been rounded to $0
The accompanying notes are an integral part of the financial statements.
| | |
| SEI Institutional Investments Trust / Annual Report / May 31, 2009 | | 203 |
SCHEDULE OF INVESTMENTS
Emerging Markets Debt Fund
May 31, 2009
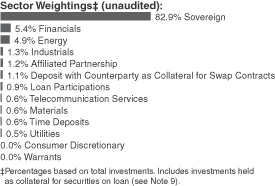
| | | | | | |
| Description | | Face Amount (1)
(Thousands) | | Market Value
($ Thousands) |
| | | | | | |
| | |
GLOBAL BONDS — 96.4% | | | | | | |
| | |
Argentina — 5.3% | | | | | | |
Alto Parana | | | | | | |
6.375%, 06/09/17 (C) | | | 370 | | $ | 334 |
Province Del Neuquen | | | | | | |
8.656%, 10/18/14 (C) | | | 187 | | | 169 |
Province of Buenos Aires | | | | | | |
9.625%, 04/18/28 (C) | | | 1,460 | | | 453 |
Province of Buenos Aires Registered | | | | | | |
9.625%, 04/18/28 | | | 1,335 | | | 414 |
9.375%, 09/14/18 | | | 440 | | | 136 |
9.375%, 09/14/18 | | | 1,000 | | | 312 |
4.000%, 05/15/35 (D) | | | 1,100 | | | 231 |
Province of Mendoza Registered | | | | | | |
5.500%, 09/04/18 | | | 334 | | | 144 |
Republic of Argentina | | | | | | |
15.500%, 12/19/08 (E) | | | 9,900 | | | 1,444 |
10.500%, 11/14/49 (E) | | | 400 | | | 35 |
10.250%, 01/26/07 (E) | | EUR | 850 | | | 144 |
10.250%, 02/06/49 (E) | | | 1,400 | | | 122 |
9.750%, 09/19/27 (E) | | EUR | 1,550 | | | 230 |
9.000%, 11/19/08 | | | 1,000 | | | 87 |
9.000%, 05/29/49 (E) | | EUR | 1,595 | | | 246 |
8.500%, 02/23/05 (E) | | | 245 | | | 21 |
8.500%, 07/01/49 (E) | | EUR | 4,500 | | | 764 |
8.375%, 12/20/49 (E) | | | 1,000 | | | 140 |
8.280%, 12/31/33 (F) | | | 3,861 | | | 1,670 |
8.125%, 04/21/49 (E) | | EUR | 2,818 | | | 447 |
7.875%, 07/29/05 (E) | | | 275 | | | 24 |
7.820%, 12/31/33 | | EUR | 1,492 | | | 714 |
7.000%, 03/18/49 (E) | | | 555 | | | 48 |
7.000%, 10/03/15 | | | 52,255 | | | 18,995 |
7.000%, 09/12/13 | | | 1,480 | | | 681 |
6.000%, 03/31/23 (E) | | | 172 | | | 77 |
3.750%, 12/31/38 (D) | | | 23,970 | | | 5,453 |
2.280%, 12/15/35 (G) | | | 11,725 | | | 378 |
1.683%, 08/03/12 (G) | | | 35,240 | | | 11,382 |
0.000%, 03/31/23 (E) (G) | | | 1,680 | | | 756 |
0.000%, 12/15/35 (G) | | | 2,905 | | | 89 |
| | | | | | |
| Description | | Face Amount (1)
(Thousands) | | Market Value
($ Thousands) |
| | | | | | |
Republic of Argentina, Ser E MTN | | | | | | |
10.000%, 01/07/05 (E) | | EUR | 1,650 | | $ | 280 |
9.250%, 07/20/04 (E) | | EUR | 2,100 | | | 357 |
8.750%, 02/04/49 (E) | | EUR | 4,835 | | | 582 |
7.000%, 03/18/49 (E) | | EUR | 2,554 | | | 361 |
Transportadora Gas Norte | | | | | | |
7.500%, 12/31/12 (E) | | | 350 | | | 87 |
7.500%, 12/31/12 (C) (D) | | | 210 | | | 54 |
7.500%, 12/31/12 (D) | | | 100 | | | 25 |
6.500%, 12/31/12 (C) (D) | | | 30 | | | 8 |
6.500%, 12/31/12 (D) | | | 60 | | | 15 |
6.500%, 12/31/12 (D) | | | 60 | | | 15 |
| | | | | | |
| | | | | | 47,924 |
| | | | | | |
| | |
Bahamas — 0.1% | | | | | | |
Banco Votorantim Nassau MTN | | | | | | |
10.625%, 04/10/14 (C) | | BRL | 2,300 | | | 1,104 |
| | | | | | |
| | |
Belize — 0.0% | | | | | | |
Government of Belize Registered | | | | | | |
4.250%, 02/20/29 | | | 330 | | | 132 |
| | | | | | |
| | |
Bosnia and Herzegovina — 0.1% | | | | | | |
Republic of Bosnia & Herzegovina | | | | | | |
10.039%, 12/11/17 (H) | | EUR | 2,000 | | | 651 |
| | | | | | |
| | |
Brazil — 12.1% | | | | | | |
Banco Safra MTN | | | | | | |
10.875%, 04/03/17 (C) | | BRL | 2,250 | | | 916 |
Brazil Notas do Tesouro Nacional, Ser F | | | | | | |
10.000%, 01/01/17 | | BRL | 32,980 | | | 15,182 |
Cesp-Comp Ener Sao Paulo MTN | | | | | | |
9.750%, 01/15/15 (C) | | BRL | 1,050 | | | 566 |
Federal Republic of Brazil | | | | | | |
12.250%, 03/06/30 | | | 195 | | | 311 |
11.000%, 08/17/40 (F) | | | 26,655 | | | 34,785 |
10.125%, 05/15/27 | | | 4,470 | | | 6,079 |
8.875%, 04/15/24 | | | 2,975 | | | 3,652 |
8.875%, 10/14/19 | | | 200 | | | 246 |
8.750%, 02/04/25 | | | 4,088 | | | 4,946 |
8.500%, 09/24/12 | | EUR | 2,855 | | | 4,566 |
8.250%, 01/20/34 | | | 4,145 | | | 4,870 |
8.000%, 01/15/18 | | | 11,515 | | | 12,897 |
7.875%, 03/07/15 | | | 900 | | | 1,017 |
7.125%, 01/20/37 | | | 9,235 | | | 9,881 |
6.000%, 01/17/17 | | | 4,240 | | | 4,374 |
5.875%, 01/15/19 | | | 2,600 | | | 2,620 |
Petrobras International Finance | | | | | | |
7.875%, 03/15/19 | | | 1,095 | | | 1,194 |
5.875%, 03/01/18 | | | 310 | | | 303 |
Vale Overseas | | | | | | |
6.875%, 11/21/36 | | | 215 | | | 194 |
| | | | | | |
| | | | | | 108,599 |
| | | | | | |
| | |
| 204 | | SEI Institutional Investments Trust / Annual Report / May 31, 2009 |
| | | | | | |
| Description | | Face Amount (1)
(Thousands) | | Market Value
($ Thousands) |
| | | | | | |
| | |
Chile — 0.1% | | | | | | |
Nacional del Cobre de Chile - CODELCO | | | | | | |
7.500%, 01/15/19 | | | 800 | | $ | 901 |
| | | | | | |
| | |
Colombia — 5.7% | | | | | | |
Bogota District Capital | | | | | | |
9.750%, 07/26/28 (C) | | COP | 12,895,000 | | | 5,479 |
Republic of Colombia | | | | | | |
11.750%, 02/25/20 | | | 3,658 | | | 4,975 |
10.375%, 01/28/33 | | | 450 | | | 585 |
9.850%, 06/28/27 | | COP | 1,276,000 | | | 636 |
8.375%, 02/15/27 (F) | | | 3,100 | | | 3,332 |
8.250%, 12/22/14 | | | 3,700 | | | 4,218 |
8.125%, 05/21/24 | | | 3,530 | | | 3,856 |
7.375%, 01/27/17 | | | 8,535 | | | 9,231 |
7.375%, 03/18/19 | | | 9,165 | | | 9,715 |
7.375%, 09/18/37 | | | 9,135 | | | 9,258 |
2.654%, 11/16/15 (G) | | | 225 | | | 217 |
| | | | | | |
| | | | | | 51,502 |
| | | | | | |
| | |
Dominican Republic — 0.2% | | | | | | |
Republic of Dominican Republic | | | | | | |
9.040%, 01/23/18 | | | 410 | | | 365 |
8.625%, 04/20/27 | | | 430 | | | 316 |
Standard Bank | | | | | | |
15.000%, 03/12/12 (C) | | | 446 | | | 320 |
Standard Bank, Ser E MTN | | | | | | |
15.000%, 07/20/09 (G) | | | 509 | | | 468 |
| | | | | | |
| | | | | | 1,469 |
| | | | | | |
| | |
Ecuador — 0.1% | | | | | | |
Republic of Ecuador Registered | | | | | | |
9.375%, 12/15/15 | | | 1,800 | | | 1,044 |
| | | | | | |
| | |
El Salvador — 0.9% | | | | | | |
Republic of El Salvador | | | | | | |
8.250%, 04/10/32 | | | 4,335 | | | 3,945 |
7.650%, 06/15/35 | | | 4,974 | | | 4,218 |
| | | | | | |
| | | | | | 8,163 |
| | | | | | |
| | |
Gabon — 0.2% | | | | | | |
Gabonese Republic | | | | | | |
8.200%, 12/12/17 (C) | | | 2,100 | | | 1,859 |
| | | | | | |
| | |
Georgia — 0.2% | | | | | | |
Republic of Georgia | | | | | | |
7.500%, 04/15/13 | | | 2,250 | | | 1,730 |
| | | | | | |
| | |
Ghana — 0.2% | | | | | | |
Republic of Ghana | | | | | | |
8.500%, 10/04/17 (C) | | | 600 | | | 483 |
8.500%, 10/04/17 | | | 1,250 | | | 1,006 |
| | | | | | |
| | | | | | 1,489 |
| | | | | | |
| | | | | |
| Description | | Face Amount (1)
(Thousands) | | Market Value
($ Thousands) |
| | | | | |
| | |
India — 0.4% | | | | | |
Vedanta Resources | | | | | |
9.500%, 07/18/18 (C) | | 4,025 | | $ | 3,502 |
| | | | | |
| | |
Indonesia — 8.3% | | | | | |
Majapahit Holding | | | | | |
7.875%, 06/29/37 (C) | | 415 | | | 330 |
7.750%, 10/17/16 | | 200 | | | 180 |
7.750%, 10/17/16 (C) | | 1,200 | | | 1,074 |
7.250%, 10/17/11 (C) | | 885 | | | 881 |
Republic of Indonesia | | | | | |
11.625%, 03/04/19 (C) | | 11,660 | | | 14,633 |
10.375%, 05/04/14 (C) | | 300 | | | 344 |
8.500%, 10/12/35 | | 6,675 | | | 6,809 |
7.750%, 01/17/38 | | 24,370 | | | 23,165 |
7.500%, 01/15/16 | | 4,540 | | | 4,562 |
7.250%, 04/20/15 | | 6,170 | | | 6,160 |
7.250%, 04/20/15 (C) | | 350 | | | 349 |
6.875%, 03/09/17 | | 920 | | | 895 |
6.875%, 01/17/18 | | 8,615 | | | 8,206 |
6.750%, 03/10/14 | | 3,550 | | | 3,518 |
6.750%, 03/10/14 (C) | | 1,400 | | | 1,390 |
6.625%, 02/17/37 | | 2,100 | | | 1,771 |
6.625%, 02/17/37 (C) | | 225 | | | 188 |
| | | | | |
| | | | | 74,455 |
| | | | | |
| | |
Iraq — 2.1% | | | | | |
Republic of Iraq | | | | | |
5.800%, 01/15/28 | | 29,665 | | | 18,615 |
| | | | | |
| | |
Israel — 0.2% | | | | | |
Republic of Israel | | | | | |
5.125%, 03/26/19 | | 2,150 | | | 2,099 |
| | | | | |
| | |
Ivory Coast — 0.0% | | | | | |
Republic of Ivory Coast | | | | | |
4.000%, 03/30/18 (E) | | 7,000 | | | 363 |
| | | | | |
| | |
Jamaica — 0.0% | | | | | |
Digicel Group | | | | | |
8.875%, 01/15/15 (C) | | 450 | | | 360 |
| | | | | |
| | |
Kazakhstan — 2.2% | | | | | |
Citigroup Global Markets for JSC Kazkommertsbank | | | | | |
7.375%, 10/07/09 (G) | | 2,000 | | | 795 |
HSBK Europe | | | | | |
9.250%, 10/16/13 (C) | | 800 | | | 536 |
7.250%, 05/03/17 (C) | | 300 | | | 174 |
7.250%, 05/03/17 | | 200 | | | 114 |
Kazkommerts International MTN | | | | | |
8.000%, 11/03/15 | | 2,400 | | | 1,320 |
7.500%, 11/29/16 | | 4,300 | | | 2,344 |
| | |
| SEI Institutional Investments Trust / Annual Report / May 31, 2009 | | 205 |
SCHEDULE OF INVESTMENTS
Emerging Markets Debt Fund (Continued)
May 31, 2009
| | | | | | |
| Description | | Face Amount (1)
(Thousands) | | Market Value
($ Thousands) |
| | | | | | |
Kazkommerts International | | | | | | |
8.500%, 04/16/13 | | | 850 | | $ | 467 |
7.875%, 04/07/14 | | | 500 | | | 275 |
6.875%, 02/13/17 | | | 600 | | | 407 |
KazMunaiGaz Finance MTN | | | | | | |
9.125%, 07/02/18 | | | 3,350 | | | 3,049 |
9.125%, 07/02/18 (C) | | | 6,350 | | | 5,810 |
8.375%, 07/02/13 (C) | | | 3,735 | | | 3,399 |
KazMunaiGaz Finance Sub MTN | | | | | | |
8.375%, 07/02/13 | | | 350 | | | 323 |
Tengizchevroil Finance | | | | | | |
6.124%, 11/15/14 | | | 503 | | | 420 |
| | | | | | |
| | | | | | 19,433 |
| | | | | | |
| | |
Lebanon — 0.1% | | | | | | |
Lebanese Republic Registered MTN | | | | | | |
8.250%, 04/12/21 | | | 460 | | | 448 |
| | | | | | |
| | |
Malaysia — 1.5% | | | | | | |
Petroliam Nasional | | | | | | |
7.750%, 08/15/15 | | | 1,460 | | | 1,677 |
7.625%, 10/15/26 | | | 430 | | | 457 |
Petronas Capital | | | | | | |
7.875%, 05/22/22 | | | 650 | | | 755 |
7.000%, 05/22/12 | | | 4,090 | | | 4,522 |
Petronas Capital Registered | | | | | | |
7.875%, 05/22/22 | | | 5,665 | | | 6,459 |
| | | | | | |
| | | | | | 13,870 |
| | | | | | |
| | |
Mexico — 7.4% | | | | | | |
Grupo Televisa | | | | | | |
6.000%, 05/15/18 (C) | | | 350 | | | 336 |
Mexican Bonos | | | | | | |
7.750%, 12/14/17 | | MXP | 122,780 | | | 9,238 |
Pemex Project Funding Master Trust MTN | | | | | | |
6.625%, 06/15/35 | | | 400 | | | 372 |
5.750%, 03/01/18 | | | 1,165 | | | 1,095 |
5.750%, 03/01/18 (C) | | | 505 | | | 475 |
Petroleos Mexicanos | | | | | | |
8.000%, 05/03/19 (C) | | | 465 | | | 508 |
United Mexican States | | | | | | |
11.375%, 09/15/16 | | | 540 | | | 737 |
8.375%, 01/14/11 | | | 3,050 | | | 3,355 |
8.300%, 08/15/31 | | | 6,450 | | | 7,772 |
7.500%, 01/14/12 | | | 3,200 | | | 3,528 |
7.500%, 04/08/33 | | | 375 | | | 416 |
6.625%, 03/03/15 | | | 3,750 | | | 4,069 |
6.375%, 01/16/13 | | | 3,700 | | | 3,981 |
6.050%, 01/11/40 | | | 740 | | | 696 |
5.950%, 03/19/19 (F) | | | 9,194 | | | 9,387 |
5.875%, 02/17/14 | | | 2,000 | | | 2,108 |
5.625%, 01/15/17 (F) | | | 4,328 | | | 4,414 |
| | | | | |
| Description | | Face Amount (1)
(Thousands) | | Market Value
($ Thousands) |
| | | | | |
United Mexican States, Ser A MTN | | | | | |
6.750%, 09/27/34 | | 9,993 | | $ | 10,268 |
5.875%, 01/15/14 | | 3,750 | | | 3,952 |
| | | | | |
| | | | | 66,707 |
| | | | | |
|
Netherlands — 0.0% |
GTB Finance B.V. | | | | | |
8.500%, 01/29/12 | | 450 | | | 366 |
| | | | | |
| | |
Nigeria — 0.1% | | | | | |
UBS | | | | | |
0.000%, 09/04/17 (C) (G) | | 800 | | | 723 |
| | | | | |
| | |
Oman — 0.0% | | | | | |
Blue City Investments | | | | | |
13.750%, 11/07/13 (B) | | 500 | | | 75 |
| | | | | |
| | |
Pakistan — 0.7% | | | | | |
Pakistan Mobile Communications | | | | | |
8.625%, 11/13/13 (C) | | 330 | | | 231 |
Republic of Pakistan | | | | | |
7.125%, 03/31/16 | | 5,110 | | | 3,172 |
6.875%, 06/01/17 | | 5,680 | | | 3,351 |
| | | | | |
| | | | | 6,754 |
| | | | | |
| | |
Panama — 2.8% | | | | | |
Republic of Panama | | | | | |
9.375%, 04/01/29 | | 6,640 | | | 8,201 |
9.375%, 01/16/23 | | 595 | | | 705 |
8.875%, 09/30/27 | | 4,400 | | | 5,192 |
8.125%, 04/28/34 | | 940 | | | 1,015 |
7.250%, 03/15/15 | | 7,850 | | | 8,419 |
6.700%, 01/26/36 | | 1,665 | | | 1,598 |
| | | | | |
| | | | | 25,130 |
| | | | | |
| | |
Peru — 3.3% | | | | | |
Interoceanica IV Finance | | | | | |
3.915%, 11/30/25 (C) (H) | | 775 | | | 267 |
3.791%, 11/30/18 (C) (H) | | 370 | | | 200 |
Peru Enhanced Pass-Through Finance | | | | | |
6.272%, 05/31/25 (C) (H) | | 250 | | | 78 |
4.117%, 05/31/18 (H) | | 482 | | | 330 |
4.040%, 05/31/18 (C) (H) | | 1,438 | | | 985 |
Republic of Peru | | | | | |
8.750%, 11/21/33 | | 1,530 | | | 1,851 |
8.375%, 05/03/16 | | 2,425 | | | 2,796 |
7.350%, 07/21/25 | | 14,360 | | | 15,387 |
7.125%, 03/30/19 | | 2,505 | | | 2,680 |
6.550%, 03/14/37 | | 5,730 | | | 5,567 |
| | | | | |
| | | | | 30,141 |
| | | | | |
| | |
Philippines — 6.9% | | | | | |
National Power | | | | | |
9.625%, 05/15/28 | | 1,100 | | | 1,166 |
| | |
| 206 | | SEI Institutional Investments Trust / Annual Report / May 31, 2009 |
| | | | | |
| Description | | Face Amount (1)
(Thousands) | | Market Value
($ Thousands) |
| | | | | |
Power Sector | | | | | |
7.250%, 05/27/19 | | 1,260 | | $ | 1,282 |
Republic of Philippines | | | | | |
10.625%, 03/16/25 | | 3,626 | | | 4,832 |
9.875%, 01/15/19 | | 800 | | | 992 |
9.500%, 10/21/24 | | 200 | | | 243 |
9.500%, 02/02/30 | | 4,580 | | | 5,719 |
9.375%, 01/18/17 | | 10,240 | | | 12,288 |
9.000%, 02/15/13 | | 500 | | | 573 |
8.875%, 03/17/15 | | 700 | | | 810 |
8.375%, 06/17/19 | | 3,275 | | | 3,791 |
8.250%, 01/15/14 | | 3,575 | | | 4,026 |
8.000%, 01/15/16 | | 8,650 | | | 9,666 |
7.750%, 01/14/31 | | 4,974 | | | 5,384 |
7.500%, 09/25/24 | | 10,509 | | | 11,061 |
| | | | | |
| | | | | 61,833 |
| | | | | |
| | |
Qatar — 0.1% | | | | | |
Government of Qatar | | | | | |
5.150%, 04/09/14 (C) | | 650 | | | 663 |
| | | | | |
| | |
Russia — 10.2% | | | | | |
ABN Amro Bank | | | | | |
9.625%, 03/01/13 | | 1,300 | | | 1,331 |
Alfa Dividend Payment Rights Finance MTN | | | | | |
3.220%, 12/15/11 (C) (G) | | 259 | | | 196 |
Alfa Invest MTN | | | | | |
9.250%, 06/24/13 (C) | | 1,200 | | | 1,020 |
Gaz Capital MTN | | | | | |
6.510%, 03/07/22 | | 220 | | | 166 |
6.212%, 11/22/16 | | 2,000 | | | 1,685 |
Gaz Capital for Gazprom Registered MTN | | | | | |
8.625%, 04/28/34 | | 2,950 | | | 2,891 |
GPB Eurobond Finance for Gazprombank | | | | | |
6.500%, 09/23/15 | | 800 | | | 642 |
Kazan Orgsintez | | | | | |
9.250%, 10/30/11 | | 330 | | | 99 |
Kuznetski (Bank of Moscow) | | | | | |
7.500%, 11/25/15 (G) | | 1,300 | | | 1,001 |
RSHB Capital MTN | | | | | |
7.175%, 05/16/13 | | 250 | | | 238 |
RSHB Capital for Russian Agricultural Bank | | | | | |
7.750%, 05/29/18 | | 400 | | | 361 |
7.750%, 05/29/18 (C) | | 950 | | | 856 |
7.125%, 01/14/14 (C) | | 530 | | | 500 |
Russian Federation Registered | | | | | |
12.750%, 06/24/28 | | 7,220 | | | 10,433 |
7.500%, 03/31/30 | | 55,934 | | | 55,794 |
Teorema Holding | | | | | |
11.000%, 10/27/09 (B) | | 2,000 | | | 300 |
| | | | | | |
| Description | | Face Amount (1)
(Thousands) | | Market Value
($ Thousands) |
| | | | | | |
TransCapital (Transneft) | | | | | | |
8.700%, 08/07/18 (C) | | | 1,065 | | $ | 1,023 |
7.700%, 08/07/13 (C) | | | 150 | | | 143 |
6.103%, 06/27/12 (C) | | | 600 | | | 567 |
UBS (Vimpelcom) | | | | | | |
8.250%, 05/23/16 | | | 190 | | | 158 |
VIP Finance Ireland for Vimpel Communications | | | | | | |
9.125%, 04/30/18 (C) | | | 1,560 | | | 1,299 |
9.125%, 04/30/18 | | | 1,200 | | | 1,005 |
8.375%, 04/30/13 (C) | | | 1,265 | | | 1,151 |
VTB Capital | | | | | | |
6.875%, 05/29/18 | | | 6,450 | | | 5,644 |
6.609%, 10/31/12 (C) | | | 3,500 | | | 3,246 |
| | | | | | |
| | | | | | 91,749 |
| | | | | | |
| | |
Singapore — 0.5% | | | | | | |
Sea Production | | | | | | |
5.484%, 02/14/12 | | | 8,800 | | | 4,928 |
| | | | | | |
| | |
South Africa — 1.0% | | | | | | |
Republic of South Africa | | | | | | |
8.500%, 06/23/17 | | | 815 | | | 905 |
6.875%, 05/27/19 | | | 1,595 | | | 1,603 |
6.500%, 06/02/14 | | | 3,905 | | | 4,042 |
5.875%, 05/30/22 | | | 2,745 | | | 2,484 |
| | | | | | |
| | | | | | 9,034 |
| | | | | | |
| | |
South Korea — 1.2% | | | | | | |
Export-Import Bank of Korea | | | | | | |
8.125%, 01/21/14 | | | 5,530 | | | 6,081 |
Hana Bank MTN | | | | | | |
6.500%, 04/09/12 (C) | | | 1,000 | | | 1,039 |
Korea Development Bank | | | | | | |
8.000%, 01/23/14 | | | 3,350 | | | 3,627 |
POSCO | | | | | | |
8.750%, 03/26/14 (C) | | | 360 | | | 398 |
| | | | | | |
| | | | | | 11,145 |
| | | | | | |
| | |
Supra-National — 0.3% | | | | | | |
Andina de Fomento | | | | | | |
8.125%, 06/04/19 | | | 565 | | | 564 |
European Investment Bank MTN | | | | | | |
10.000%, 01/28/11 | | TRY | 3,630 | | | 2,330 |
| | | | | | |
| | | | | | 2,894 |
| | | | | | |
| | |
Thailand — 0.1% | | | | | | |
True Move | | | | | | |
10.750%, 12/16/13 (C) | | | 850 | | | 629 |
10.375%, 08/01/14 (C) | | | 850 | | | 578 |
| | | | | | |
| | | | | | 1,207 |
| | | | | | |
| | |
| SEI Institutional Investments Trust / Annual Report / May 31, 2009 | | 207 |
SCHEDULE OF INVESTMENTS
Emerging Markets Debt Fund (Continued)
May 31, 2009
| | | | | |
| Description | | Face Amount (1)
(Thousands) | | Market Value
($ Thousands) |
| | | | | |
| | |
Trinidad & Tobago — 0.4% | | | | | |
Petroleum of Trinidad & Tobago | | | | | |
6.000%, 05/08/22 | | 4,075 | | $ | 3,145 |
6.000%, 05/08/22 (C) | | 900 | | | 695 |
| | | | | |
| | | | | 3,840 |
| | | | | |
| | |
Tunisia — 0.2% | | | | | |
Banque Centrale de Tunisie | | | | | |
7.375%, 04/25/12 | | 1,910 | | | 2,034 |
| | | | | |
| | |
Turkey — 5.6% | | | | | |
Republic of Turkey | | | | | |
11.875%, 01/15/30 | | 375 | | | 556 |
9.500%, 01/15/14 | | 700 | | | 784 |
8.000%, 02/14/34 | | 1,300 | | | 1,336 |
7.500%, 11/07/19 | | 2,035 | | | 2,081 |
7.500%, 07/14/17 | | 850 | | | 883 |
7.375%, 02/05/25 | | 7,125 | | | 7,086 |
7.250%, 03/05/38 | | 7,715 | | | 7,204 |
7.250%, 03/15/15 | | 8,995 | | | 9,197 |
7.000%, 03/11/19 | | 2,650 | | | 2,603 |
7.000%, 09/26/16 | | 2,585 | | | 2,611 |
6.875%, 03/17/36 | | 9,405 | | | 8,511 |
6.750%, 04/03/18 | | 7,680 | | | 7,517 |
| | | | | |
| | | | | 50,369 |
| | | | | |
| | |
Ukraine — 2.4% | | | | | |
Credit Suisse First Boston for City of Kiev | | | | | |
8.000%, 11/06/15 | | 750 | | | 360 |
Credit Suisse First Boston International (Export/Import -Ukraine) | | | | | |
7.650%, 09/07/11 | | 500 | | | 390 |
6.800%, 10/04/12 | | 550 | | | 401 |
Government of Ukraine | | | | | |
6.385%, 06/26/12 | | 1,300 | | | 988 |
5.151%, 08/05/09 (G) | | 1,485 | | | 1,422 |
3.500%, 09/15/18 | | 2,300 | | | 2,006 |
Government of Ukraine Registered | | | | | |
7.650%, 06/11/13 | | 5,395 | | | 4,181 |
6.875%, 03/04/11 | | 400 | | | 328 |
6.875%, 03/04/11 (C) | | 3,825 | | | 3,098 |
6.750%, 11/14/17 | | 800 | | | 540 |
6.580%, 11/21/16 | | 10,190 | | | 6,624 |
HSBC Bank (Ukrsibbank) | | | | | |
7.750%, 12/21/11 | | 170 | | | 129 |
Naftogaz Ukrainy | | | | | |
8.125%, 09/30/09 | | 600 | | | 540 |
Springvale Holdings | | | | | |
9.181%, 09/07/09 (B) (G) | | 1,000 | | | 150 |
UK Private Bank | | | | | |
8.000%, 02/06/12 (C) | | 800 | | | 360 |
| | | | | |
| | | | | 21,517 |
| | | | | |
| | | | | | |
| Description | | Face Amount (1)
(Thousands) | | Market Value
($ Thousands) |
| | | | | | |
| | |
United Arab Emirates — 2.6% | | | | | | |
Emirate of Abu Dhabi | | | | | | |
6.750%, 04/08/19 (C) | | | 1,420 | | $ | 1,474 |
5.500%, 04/08/14 (C) | | | 1,550 | | | 1,590 |
HSBC Bank Middle East MTN | | | | | | |
3.594%, 04/30/13 (G) | | AED | 16,500 | | | 4,043 |
Jafz Sukuk | | | | | | |
4.169%, 11/27/12 (G) | | AED | 33,500 | | | 6,877 |
MDC-GMTN B.V. | | | | | | |
5.750%, 05/06/14 (C) | | | 800 | | | 804 |
Nakheel Development | | | | | | |
3.173%, 12/14/09 | | | 8,950 | | | 7,854 |
Nakheel Development 2 | | | | | | |
2.750%, 01/16/11 | | | 750 | | | 480 |
| | | | | | |
| | | | | | 23,122 |
| | | | | | |
| | |
Uruguay — 3.6% | | | | | | |
Republic of Uruguay | | | | | | |
9.250%, 05/17/17 | | | 7,670 | | | 8,667 |
8.000%, 11/18/22 | | | 14,037 | | | 14,669 |
7.625%, 03/21/36 | | | 3,061 | | | 3,000 |
Republic of Uruguay PIK | | | | | | |
7.875%, 01/15/33 | | | 6,106 | | | 6,045 |
| | | | | | |
| | | | | | 32,381 |
| | | | | | |
| | |
Venezuela — 6.7% | | | | | | |
Government of Venezuela | | | | | | |
13.625%, 08/15/18 | | | 1,200 | | | 1,014 |
10.750%, 09/19/13 | | | 4,180 | | | 3,302 |
9.375%, 01/13/34 | | | 3,820 | | | 2,216 |
9.250%, 05/07/28 | | | 17,090 | | | 9,699 |
9.250%, 09/15/27 | | | 3,075 | | | 1,937 |
9.000%, 05/07/23 | | | 11,440 | | | 6,549 |
8.500%, 10/08/14 | | | 2,820 | | | 1,889 |
7.650%, 04/21/25 (F) | | | 12,725 | | | 6,490 |
7.000%, 03/31/38 | | | 200 | | | 95 |
7.000%, 12/01/18 | | | 765 | | | 423 |
6.000%, 12/09/20 | | | 2,950 | | | 1,394 |
5.750%, 02/26/16 | | | 4,185 | | | 2,312 |
2.122%, 04/20/11 (G) | | | 26,615 | | | 20,693 |
Petroleos de Venezuela | | | | | | |
5.375%, 04/12/27 | | | 4,605 | | | 1,655 |
5.250%, 04/12/17 | | | 800 | | | 340 |
| | | | | | |
| | | | | | 60,008 |
| | | | | | |
| | |
Vietnam — 0.2% | | | | | | |
Socialist Republic of Vietnam | | | | | | |
6.875%, 01/15/16 | | | 1,585 | | | 1,559 |
| | | | | | |
| | |
| 208 | | SEI Institutional Investments Trust / Annual Report / May 31, 2009 |
| | | | | | |
| Description | | Face Amount (1)
(Thousands) | | Market Value
($ Thousands) |
| | | | | | |
| | |
Yemen — 0.1% | | | | | | |
Pemberley SPV Finance 2008
Yemen MTN | | | | | | |
11.500%, 02/22/14 (B) (C) | | | 1,100 | | $ | 660 |
0.000%, 02/25/20 (B) (C) (G) | | | 1,100 | | | — |
| | | | | | |
| | | | | | 660 |
| | | | | | |
Total Global Bonds
(Cost $888,522) ($ Thousands) | | | | | | 868,551 |
| | | | | | |
|
DEPOSIT WITH COUNTERPARTY AS COLLATERAL FOR SWAP CONTRACTS (J) — 1.2% |
| | |
United States — 1.2% | | | | | | |
Deposits with Credit Suisse First Boston as Collateral for Swap Contract Outstanding | | | 600 | | | 600 |
Deposits with Credit Suisse First Boston as Collateral for Swap Contract Outstanding | | | 600 | | | 600 |
Deposits with Credit Suisse First Boston as Collateral for Swap Contract Outstanding | | | 2,400 | | | 2,400 |
Deposits with Deutsche Bank as Collateral for Swap Contract Outstanding | | BRL | 7,115 | | | 3,612 |
Deposits with Merrill Lynch as Collateral for Swap Contract Outstanding | | | 1,200 | | | 1,200 |
Deposits with Merrill Lynch as Collateral for Swap Contract Outstanding | | NGN | 285,300 | | | 1,928 |
| | | | | | |
Total Deposit with Counterparty as Collateral for Swap Contracts
(Cost $11,474) ($ Thousands) | | | | | | 10,340 |
| | | | | | |
| | |
LOAN PARTICIPATIONS — 1.2% | | | | | | |
| | |
Angola — 0.1% | | | | | | |
Republic of Angola | | | | | | |
7.132%, 04/30/16 (A) (B) | | | 1,300 | | | 1,269 |
| | | | | | |
| | |
Georgia — 0.0% | | | | | | |
Ashmore Cayman SPC No. 2 Limited | | | | | | |
0.000%, 04/16/14 (A) (B) (H) | | | 221 | | | 119 |
| | | | | | |
| | |
Nigeria — 0.2% | | | | | | |
Oando | | | | | | |
13.900%, 02/23/10 (A) (B) | | NGN | 229,710 | | | 1,065 |
13.900%, 03/02/10 (A) (B) | | NGN | 229,710 | | | 1,064 |
| | | | | | |
| | | | | | 2,129 |
| | | | | | |
| | | | | |
| Description | | Face Amount (1)
(Thousands) | | Market Value
($ Thousands) |
| | | | | |
| | |
Russia — 0.2% | | | | | |
Snegri Overseas | | | | | |
10.500%, 04/21/10 (A) (B) | | 2,600 | | $ | 2,080 |
| | | | | |
|
Singapore — 0.4% |
Morton Bay Senior | | | | | |
6.428%, 06/30/09 (A) (B) | | 3,054 | | | 3,054 |
| | | | | |
| | |
Turkey — 0.3% | | | | | |
Cukurova, Ser B | | | | | |
9.170%, 05/01/12 (A) (B) | | 3,439 | | | 2,510 |
| | | | | |
Total Loan Participations
(Cost $14,956) ($ Thousands) | | | | | 11,161 |
| | | | | |
| | | Number of
Warrants | | |
| | |
WARRANTS — 0.0% | | | | | |
| | |
Russia — 0.0% | | | | | |
Teorema Holding A, Expires 10/27/11* (B) | | 136 | | | — |
Teorema Holding B, Expires 10/27/11* (B) | | 272 | | | — |
| | | | | |
Total Warrants
(Cost $47) ($ Thousands) | | | | | — |
| | | | | |
| |
AFFILIATED PARTNERSHIP — 1.2% | | | |
| | |
United States — 1.2% | | | | | |
SEI Liquidity Fund, L.P., 0.820%†** (I) | | 10,947,513 | | | 10,665 |
| | | | | |
Total Affiliated Partnership
(Cost $10,948) ($ Thousands) | | | | | 10,665 |
| | | | | |
| | |
TIME DEPOSIT — 0.6% | | | | | |
| | |
United States — 0.6% | | | | | |
Brown Brothers Harriman
0.060%, 06/01/09 | | 5,566 | | | 5,566 |
| | | | | |
Total Time Deposit
(Cost $5,566) ($ Thousands) | | | | | 5,566 |
| | | | | |
Total Investments — 100.6%
(Cost $931,513) ($ Thousands) | | | | $ | 906,283 |
| | | | | |
| | |
| SEI Institutional Investments Trust / Annual Report / May 31, 2009 | | 209 |
SCHEDULE OF INVESTMENTS
Emerging Markets Debt Fund (Continued)
May 31, 2009
A summary of outstanding swap agreements help by the Fund at May 31, 2009, is as follows:
| | | | | | | | | | | | | | | | |
| Total Return Swaps | |
| Counterparty | | Reference Entity/Obligation | | Fund Pays | | Fund Receives | | Termination Date | | Notional Amount
(Thousands) | | Net Unrealized
Appreciation
(Depreciation)
($ Thousands) | |
| Merrill Lynch | | Solar Gardens Ltd. Term Loan Credit Facility ‡ | | Cash Deposit Of Notional Amount | | Price Return | | 12/30/09 | | NGN | | 285,300 | | $ | (499 | ) |
| Deutsche Bank | | Federative Republic of Brazil, 6.000%, 05/15/17 | | Cash Deposit Of Notional Amount | | Price Return | | 08/15/10 | | BRL | | 4,411 | | | 345 | |
| Merrill Lynch | | Zaporozh Term Loan, 9.784% 12/31/10 | | Cash Deposit Of Notional Amount | | Price Return | | 12/31/10 | | | | 1,200 | | | (476 | ) |
| | | | | | | | | | | | | | | | |
| | | | | | | | | | | | | | $ | (630 | ) |
| | | | | | | | | | | | | | | | |
| | | | | | | | | | | | | | | |
| Credit Default Swaps | |
| Counterparty | | Reference Entity/Obligation | | Buy/Sell Protection | | (Pays)/
Receives Rate | | Termination Date | | Notional Amount
(Thousands) | | | Net Unrealized
Appreciation
(Depreciation)
($ Thousands) | |
| Credit Suisse | | JSC Gazprom, 8.625% 04/28/34 | | SELL | | 1.37 | | 08/20/16 | | (600 | ) | | $ | (95 | ) |
| Credit Suisse | | Naftogaz Ukrainy, 8.125% 09/30/09 | | SELL | | 5.20 | | 12/20/11 | | (600 | ) | | | (321 | ) |
| Credit Suisse | | Naftogaz Ukrainy, 8.125% 09/30/09 | | SELL | | 5.75 | | 12/20/09 | | (2,400 | ) | | | (488 | ) |
| Credit Suisse | | Republic of Kazakhstan | | SELL | | 14.25 | | 02/20/10 | | (900 | ) | | | 102 | |
| Credit Suisse | | Republic of Turkey, 1 1.875% 01/15/30 | | BUY | | 3.90 | | 04/20/14 | | 1,000 | | | | (67 | ) |
| HSBC | | Ukraine Government, 7.650% 06/11/13 | | SELL | | 5.00 | | 06/20/09 | | (2,000 | ) | | | 246 | |
| HSBC | | Ukraine Government, 7.650% 06/11/13 | | SELL | | 5.00 | | 06/20/09 | | (1,000 | ) | | | 133 | |
| | | | | | | | | | | | | | | |
| | | | | | | | | | | | | $ | (490 | ) |
| | | | | | | | | | | | | | | |
A summary of the open futures contracts held by the Fund at May 31, 2009, is as follows:
| | | | | | | | |
Type of
Contract | | Number of
Contracts
Long (Short) | | Expiration
Date | | Unrealized
Appreciation
(Depreciation)
($ Thousands) | |
U.S. 5-Year Treasury Note | | 34 | | Sep-2009 | | $ | (1 | ) |
U.S. Long Treasury Bond | | 31 | | Sep-2009 | | | 35 | |
| | | | | | | | |
| | | | | | $ | 34 | |
| | | | | | | | |
A summary of the outstanding forward foreign currency contracts held by the Fund at May 31, 2009, is as follows:
| | | | | | | | | | | | |
| Maturity Date | | Currency
to Deliver
(Thousands) | | Currency
to Receive
(Thousands) | | Unrealized
Appreciation
(Depreciation)
($ Thousands) | |
6/2/09-6/8/09 | | BRL | | 12,154 | | USD | | 5,411 | | $ | (758 | ) |
6/2/09-7/2/09 | | USD | | 19,137 | | BRL | | 40,193 | | | 1,217 | |
6/8/09-8/21/09 | | MXP | | 119,220 | | USD | | 9,016 | | | (10 | ) |
6/8/09-8/21/09 | | USD | | 8,940 | | MXP | | 119,220 | | | 85 | |
6/9/09 | | USD | | 4,330 | | KRW | | 5,477,450 | | | 41 | |
6/18/09 | | COP | | 1,300,000 | | USD | | 575 | | | (32 | ) |
6/22/09 | | TRY | | 10,593 | | USD | | 6,642 | | | (185 | ) |
6/22/09-6/26/09 | | CHF | | 15,542 | | USD | | 14,099 | | | (481 | ) |
6/22/09-6/26/09 | | EUR | | 8,135 | | USD | | 11,179 | | | (334 | ) |
6/22/09-7/20/09 | | USD | | 10,734 | | TRY | | 16,905 | | | 125 | |
8/21/09 | | USD | | 6,600 | | RUB | | 213,428 | | | 196 | |
| | | | | | | | | | | | |
| | | | | | | | | | $ | (136 | ) |
| | | | | | | | | | | | |
| | |
| 210 | | SEI Institutional Investments Trust / Annual Report / May 31, 2009 |
| Percentages | | are based on a Net Assets of $901,226 ($ Thousands) |
| * | | Non-income producing security. |
| ** | | The rate reported is the 7-day effective yield as of May 31, 2009. |
| † | | Investment in Affiliated Security (see Note 4). |
| ‡ | | This swap was fair valued on May 31, 2009. |
| (1) | | In U.S. dollars unless otherwise indicated. |
| (A) | | Securities considered illiquid. The total value of such securities as of May 31, 2009 was $11,161 ($ Thousands) and represented 1.2% of Net Assets. |
| (B) | | Security fair valued using methods determined in good faith by the Valuation Committee of the Board of Trustees. The total market value of such securities as of May 31, 2009 was $12,346 and represented 1.4% of Net Assets. |
| (C) | | Securities sold within terms of a private placement memorandum, exempt from registration under Section 144A of the Securities Act of 1933, as amended, and may be sold only to dealers in that program or other “accredited investors.” These securities have been determined to be liquid under guidelines established by the board of Trustees. |
| (D) | | Step Bonds — The rate reflected is the effective yield on May 31, 2009. The coupon on a step bond changes on a specified date. |
| (E) | | Security in default on interest payments. Security is non-income producing. |
| (F) | | This security or a partial position of this security is on loan at May 31, 2009 (See Note 9). The total value of securities on loan at May 31, 2009 was $10,529 ($ Thousands). |
| (G) | | Variable Rate Security — The rate reported is the rate in effect as of May 31, 2009. The date reported is the next reset date. |
| (H) | | Zero coupon security. The rate reported is the effective yield at time of purchase. |
| (I) | | This security was purchased with cash collateral held from securities on loan (see Note 9). The total value of such securities as of May 31, 2009 was $10,665 ($ Thousands) |
| (J) | | Cash on loan to swap counterparty as collateral for outstanding swap contracts. |
AED — United Arab Emirates Dirham
BRL — Brazilian Real
CHF — Swiss Franc
COP — Colombian Peso
DEM — German Mark
EUR — Euro
KRW — Korean Won
L.P. — Limited Partnership
MTN — Medium Term Note
MXP — Mexican Peso
NGN — Nigerian Naira
PIK — Payment-in-Kind
RUB — Russian Ruble
Ser — Series
SPC — Segregated Portfolio Company
TRY — New Turkish Lira
USD — U.S. Dollar
Amounts designated as “—” are $O or have been rounded to $O.
The accompanying notes are an integral part of the financial statements.
| | |
| SEI Institutional Investments Trust / Annual Report / May 31, 2009 | | 211 |
SCHEDULE OF INVESTMENTS
Real Return Fund
May 31, 2009
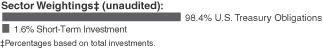
| | | | | | |
| Description | | Face Amount
($ Thousands)/Shares | | Market Value
($ Thousands) |
| |
U.S. TREASURY OBLIGATIONS — 98.3% | | | |
U.S. Treasury Inflation-Protected Securities | | | | | | |
3.500%, 01/15/11 | | $ | 4,474 | | $ | 5,712 |
3.375%, 01/15/12 | | | 9,283 | | | 11,868 |
3.000%, 07/15/12 | | | 12,738 | | | 16,049 |
2.625%, 07/15/17 | | | 2,557 | | | 2,821 |
2.500%, 07/15/16 | | | 16,217 | | | 18,084 |
2.375%, 04/15/11 | | | 16,328 | | | 17,990 |
2.375%, 01/15/17 | | | 15,674 | | | 17,375 |
2.125%, 01/15/19 | | | 7,087 | | | 7,322 |
2.000%, 04/15/12 | | | 8,171 | | | 8,870 |
2.000%, 01/15/14 | | | 26,224 | | | 31,104 |
2.000%, 07/15/14 | | | 15,814 | | | 18,420 |
2.000%, 01/15/16 | | | 16,432 | | | 18,023 |
1.875%, 07/15/13 | | | 22,945 | | | 27,412 |
1.875%, 07/15/15 | | | 805 | | | 899 |
1.625%, 01/15/15 | | | 15,661 | | | 17,560 |
1.625%, 01/15/18 | | | 6,672 | | | 6,755 |
1.375%, 07/15/18 | | | 21,007 | | | 20,262 |
1.250%, 04/15/14 | | | 8,633 | | | 8,796 |
0.625%, 04/15/13 | | | 670 | | | 673 |
| | | | | | |
Total U.S. Treasury Obligations
(Cost $245,123) ($ Thousands) | | | | | | 255,995 |
| | | | | | |
| | |
CASH EQUIVALENT — 1.6% | | | | | | |
SEI Daily Income Trust, Prime Obligation Fund, Cl A, 0.260%*† | | | 4,157,028 | | | 4,157 |
| | | | | | |
Total Cash Equivalent
(Cost $4,157) ($ Thousands) | | | | | | 4,157 |
| | | | | | |
Total Investments — 99.9%
(Cost $249,280) ($ Thousands) | | | | | $ | 260,152 |
| | | | | | |
| Percentages | | are based on a Net Assets of $260,477 ($ Thousands) |
| * | | The rate reported is the 7-day effective yield as of May 31, 2009 |
| † | | Investment in Affiliated Security (See Note 4). |
| | |
| 212 | | SEI Institutional Investments Trust / Annual Report / May 31, 2009 |
[THIS PAGE INTENTIONALLY LEFT BLANK]
| | |
| SEI Institutional Investments Trust / Annual Report / May 31, 2009 | | 213 |
Statements of Assets and Liabilities ($ Thousands)
May 31, 2009
| | | | | | | | | | | | |
| | | Large Cap
Fund | | | Large Cap
Diversified
Alpha Fund | | | Large Cap
Disciplined
Equity Fund | |
ASSETS: | | | | | | | | | | | | |
Investments at value† | | $ | 499,367 | * | | $ | 259,878 | | | $ | 5,179,518 | * |
Affiliated investment, at value†† | | | 51,711 | | | | 49,110 | | | | 1,442,663 | |
Cash | | | 10 | | | | 6 | | | | 17 | |
Foreign currency, at value††† | | | — | | | | 8 | | | | — | |
Cash held as collateral for forward foreign currency contracts | | | — | | | | — | | | | 787 | |
Receivable for fund shares sold | | | 17,336 | | | | 22,483 | | | | 148,403 | |
Receivable for investment securities sold | | | 4,857 | | | | 4,647 | | | | 53,201 | |
Dividends and interest receivable | | | 1,009 | | | | 591 | | | | 12,905 | |
Receivable for variation margin | | | 105 | | | | 794 | | | | 12,606 | |
Foreign tax reclaim receivable | | | 5 | | | | 3 | | | | — | |
Unrealized gain on foreign spot currency contracts | | | — | | | | — | | | | — | |
Unrealized gain on forward foreign currency contracts | | | — | | | | — | | | | 1,461 | |
Swap contracts at value†††† | | | — | | | | — | | | | — | |
Prepaid expenses | | | 1 | | | | 3 | | | | 49 | |
Total Assets | | | 574,401 | | | | 337,523 | | | | 6,851,610 | |
LIABILITIES: | | | | | | | | | | | | |
Payable upon return on securities loaned | | | 26,682 | | | | — | | | | 720,493 | |
Payable for investment securities purchased | | | 18,577 | | | | 4,820 | | | | 53,570 | |
Payable for fund shares redeemed | | | 2,604 | | | | 1,595 | | | | 30,931 | |
Margin call | | | — | | | | — | | | | — | |
Payable for variation margin | | | — | | | | — | | | | — | |
Unrealized loss on foreign spot currency contracts | | | — | | | | — | | | | — | |
Unrealized loss on forward foreign currency contracts | | | — | | | | — | | | | 2,264 | |
Investment advisory fees payable | | | 86 | | | | 83 | | | | 838 | |
CCO fees payable | | | 1 | | | | 1 | | | | 13 | |
Trustees fees payable | | | — | | | | — | | | | 3 | |
Accrued expense payable | | | 30 | | | | 22 | | | | 379 | |
Total Liabilities | | | 47,980 | | | | 6,521 | | | | 808,491 | |
Net Assets | | $ | 526,421 | | | $ | 331,002 | | | $ | 6,043,119 | |
† Cost of investments | | | 489,400 | | | | 272,061 | | | | 5,073,029 | |
†† Cost of affiliated investments | | | 52,157 | | | | 67,481 | | | | 1,785,008 | |
††† Cost of foreign currency | | | — | | | | 9 | | | | — | |
†††† Premiums received | | | — | | | | — | | | | — | |
* Includes market value of securities on loan | | | 26,438 | | | | — | | | | 712,934 | |
NET ASSETS: | | | | | | | | | | | | |
Paid-in Capital — (unlimited authorization — no par value) | | $ | 678,998 | | | $ | 569,865 | | | $ | 9,473,810 | |
Undistributed net investment income | | | 1,586 | | | | — | | | | 217 | |
Accumulated net realized loss on investments, futures, securities sold short, swap contracts and foreign currency | | | (165,203 | ) | | | (219,667 | ) | | | (3,399,453 | ) |
Net unrealized appreciation (depreciation) on investments | | | 9,521 | | | | (30,554 | ) | | | (235,856 | ) |
Net unrealized appreciation on futures contracts | | | 1,519 | | | | 11,359 | | | | 205,203 | |
Net unrealized appreciation on swap contracts | | | — | | | | — | | | | — | |
Net unrealized appreciation (depreciation) on forward foreign currency contracts, foreign currencies and translation of other assets and liabilities denominated in foreign currencies | | | — | | | | (1 | ) | | | (802 | ) |
Net Assets | | $ | 526,421 | | | $ | 331,002 | | | $ | 6,043,119 | |
Net Asset Value, Offering and Redemption Price Per Share — Class A | | | $12.55 | | | | $6.35 | | | | $7.36 | |
| | |
| ($526,421,000 ÷
41,935,498 shares |
) | |
| ($331,001,649 ÷
52,106,083 shares |
) | |
| ($6,043,119,438 ÷
820,898,926 shares |
) |
Amounts designated as “—” are $0 or have been rounded to $0.
The accompanying notes are an integral part of the financial statements.
| | |
| 214 | | SEI Institutional Investments Trust / Annual Report / May 31, 2009 |
| | | | | | | | | | | | | | | | | | |
Large Cap Index Fund | | | Small Cap Fund | | | Small/Mid Cap Equity Fund | | | U.S.
Managed Volatility Fund | | | International Equity Fund | |
| | | | | | | | | | | | | | | | | | |
| $ | 347,407 | * | | $ | 952,471 | * | | $ | 1,647,342 | * | | $ | 229,775 | | | $ | 693,240 | * |
| | 42,465 | | | | 187,882 | | | | 262,151 | | | | 8,584 | | | | 56,682 | |
| | 3 | | | | 3 | | | | 190 | | | | 11 | | | | 1,826 | |
| | — | | | | 1 | | | | 183 | | | | — | | | | 1,729 | |
| | — | | | | — | | | | — | | | | — | | | | — | |
| | 5,312 | | | | 15,035 | | | | 33,000 | | | | 1,149 | | | | 10,739 | |
| | 1,648 | | | | 9,482 | | | | 16,185 | | | | 1,032 | | | | 18,432 | |
| | 850 | | | | 1,051 | | | | 2,149 | | | | 478 | | | | 4,207 | |
| | 76 | | | | 389 | | | | 959 | | | | — | | | | 129 | |
| | — | | | | — | | | | — | | | | — | | | | 1,150 | |
| | — | | | | — | | | | — | | | | — | | | | 32 | |
| | — | | | | — | | | | — | | | | — | | | | 4,161 | |
| | — | | | | — | | | | — | | | | — | | | | 6,134 | |
| | 2 | | | | 9 | | | | 14 | | | | — | | | | 7 | |
| | 397,763 | | | | 1,166,323 | | | | 1,962,173 | | | | 241,029 | | | | 798,468 | |
| | | | | | | | | | | | | | | | | | |
| | 39,140 | | | | 162,201 | | | | 204,858 | | | | — | | | | 47,802 | |
| | 4,521 | | | | 11,198 | | | | 18,792 | | | | 845 | | | | 27,739 | |
| | 180 | | | | 6,573 | | | | 12,911 | | | | 2,256 | | | | 8,421 | |
| | — | | | | — | | | | — | | | | — | | | | 6,160 | |
| | — | | | | — | | | | — | | | | — | | | | 248 | |
| | — | | | | 1 | | | | — | | | | — | | | | 9 | |
| | — | | | | — | | | | — | | | | — | | | | 2,873 | |
| | 3 | | | | 425 | | | | 671 | | | | 47 | | | | 236 | |
| | 1 | | | | 2 | | | | 4 | | | | 1 | | | | 1 | |
| | — | | | | — | | | | 1 | | | | — | | | | — | |
| | 26 | | | | 63 | | | | 112 | | | | 20 | | | | 103 | |
| | 43,871 | | | | 180,463 | | | | 237,349 | | | | 3,169 | | | | 93,592 | |
| $ | 353,892 | | | $ | 985,860 | | | $ | 1,724,824 | | | $ | 237,860 | | | $ | 704,876 | |
| | 349,271 | | | | 1,022,423 | | | | 1,771,106 | | | | 217,161 | | | | 680,471 | |
| | 43,236 | | | | 194,125 | | | | 269,478 | | | | 8,584 | | | | 57,709 | |
| | — | | | | — | | | | 182 | | | | — | | | | 1,694 | |
| | — | | | | — | | | | — | | | | — | | | | — | |
| | 38,438 | | | | 160,061 | | | | 201,700 | | | | — | | | | 46,501 | |
| | | | | | | | | | | | | | | | | | |
| $ | 387,381 | | | $ | 1,631,883 | | | $ | 2,652,156 | | | $ | 227,002 | | | $ | 1,226,589 | |
| | 1,350 | | | | 918 | | | | 7,462 | | | | 733 | | | | 3,350 | |
|
(33,281 |
) | | | (574,940 | ) | | | (804,508 | ) | | | (3,011 | ) | | | (545,180 | ) |
| | (2,635 | ) | | | (76,195 | ) | | | (131,091 | ) | | | 12,614 | | | | 11,742 | |
| | 1,077 | | | | 4,193 | | | | 804 | | | | 522 | | | | 930 | |
| | — | | | | — | | | | — | | | | — | | | | 6,134 | |
|
— |
| | | 1 | | | | 1 | | | | — | | | | 1,311 | |
| $ | 353,892 | | | $ | 985,860 | | | $ | 1,724,824 | | | $ | 237,860 | | | $ | 704,876 | |
| | $78.92 | | | | $7.97 | | | | $7.85 | | | | $9.55 | | | | $6.08 | |
| ($353,891,640 ÷
4,484,269 shares |
) | |
| ($985,860,003 ÷
123,720,641 shares |
) | |
| ($1,724,824,301 ÷
219,593,360 shares |
) | |
| ($237,859,529 ÷
24,909,917 shares |
) | |
| ($704,875,912 ÷
115,968,242 shares |
) |
| | |
| SEI Institutional Investments Trust / Annual Report / May 31, 2009 | | 215 |
Statements of Assets and Liabilities ($ Thousands)
May 31, 2009
| | | | | | | | | | | | |
| | | World Equity Ex-US Fund | | | Screened World Equity Ex-US Fund | | | Enhanced LIBOR Opportunities Fund | |
ASSETS: | | | | | | | | | | | | |
Investments at value† | | $ | 2,705,420 | * | | $ | 49,554 | | | $ | 68,589 | |
Affiliated investment, at value†† | | | 202,244 | | | | 1,709 | | | | 83,244 | |
Repurchase agreements | | | — | | | | — | | | | 11,500 | |
Cash | | | 16,056 | | | | 60 | | | | 23 | |
Foreign currency, at value††† | | | 11,975 | | | | — | | | | — | |
Cash held as collateral for forward foreign currency contracts, future contracts and swap contracts | | | — | | | | — | | | | 200 | |
Receivable for fund shares sold | | | 48,317 | | | | 759 | | | | 173 | |
Receivable for investment securities sold | | | 28,834 | | | | 1,106 | | | | 5,862 | |
Dividends and interest receivable | | | 16,359 | | | | 257 | | | | 409 | |
Receivable for variation margin | | | 453 | | | | 10 | | | | — | |
Foreign tax reclaim receivable | | | 1,886 | | | | 36 | | | | 1 | |
Unrealized gain on foreign spot currency contracts | | | 71 | | | | 1 | | | | — | |
Unrealized gain on forward foreign currency contracts | | | 11,633 | | | | — | | | | 1,975 | |
Swap contracts at value†††† | | | 9,553 | | | | — | | | | — | |
Reimbursement of investment advisory fees | | | — | | | | 27 | | | | — | |
Prepaid expenses | | | 16 | | | | — | | | | 1 | |
Total Assets | | | 3,052,817 | | | | 53,519 | | | | 171,977 | |
LIABILITIES: | | | | | | | | | | | | |
Payable upon return on securities loaned | | | 191,730 | | | | — | | | | — | |
Payable for investment securities purchased | | | 65,567 | | | | 1,284 | | | | 4,281 | |
Payable for fund shares redeemed | | | 60,708 | | | | 25 | | | | 428 | |
Income distribution payable | | | — | | | | — | | | | — | |
Swap contracts at value†††† | | | — | | | | — | | | | — | |
Options written, at value††††† | | | — | | | | — | | | | — | |
Payable to custodian | | | — | | | | — | | | | — | |
Margin call | | | 5,305 | | | | — | | | | — | |
Payable for variation margin | | | 299 | | | | 4 | | | | 25 | |
Overdraft of foreign currency, at value††† | | | — | | | | 46 | | | | — | |
Unrealized loss on foreign spot currency contracts | | | 28 | | | | 1 | | | | — | |
Unrealized loss on forward foreign currency contracts | | | 5,528 | | | | — | | | | 2,054 | |
Investment advisory fees payable | | | 885 | | | | — | | | | 55 | |
CCO fees payable | | | 6 | | | | — | | | | — | |
Trustees fees payable | | | 1 | | | | — | | | | — | |
Accrued expense payable | | | 305 | | | | 52 | | | | 21 | |
Accrued foreign capital gains tax on appreciated securities | | | 698 | | | | — | | | | — | |
Total Liabilities | | | 331,060 | | | | 1,412 | | | | 6,864 | |
Net Assets | | $ | 2,721,757 | | | $ | 52,107 | | | $ | 165,113 | |
† Cost of investments and repurchase agreements | | | 2,610,070 | | | | 53,004 | | | | 100,364 | |
†† Cost of affiliated investments | | | 204,887 | | | | 1,709 | | | | 123,097 | |
††† Cost of foreign currency | | | 11,516 | | | | (50 | ) | | | — | |
†††† Premiums received | | | — | | | | — | | | | — | |
††††† Premiums received | | | — | | | | — | | | | — | |
* Includes market value of securities on loan | | | 189,573 | | | | — | | | | — | |
NET ASSETS: | | | | | | | | | | | | |
Paid-in Capital — (unlimited authorization — no par value) | | $ | 3,905,537 | | | $ | 83,932 | | | $ | 231,814 | |
Undistributed (distributions in excess of) net investment income | | | 28,028 | | | | 493 | | | | 4 | |
Accumulated net realized loss on investments, option contracts, swaptions, futures, swap contracts and foreign currency | | | (1,329,306 | ) | | | (29,082 | ) | |
| (6,477
| )
|
Net unrealized appreciation (depreciation) on investments and option contracts | | | 92,707 | | | | (3,450 | ) | | | (60,128 | ) |
Net unrealized appreciation (depreciation) on futures contracts | | | 8,750 | | | | 200 | | | | (21 | ) |
Net unrealized appreciation (depreciation) on swap contracts | | | 9,553 | | | | — | | | | — | |
Net unrealized appreciation (depreciation) on forward foreign currency contracts, foreign currencies and translation of other assets and liabilities denominated in foreign currencies | | | 7,186 | | | | 14 | | | | (79 | ) |
Accumulated foreign capital gains tax on appreciated securities | | | (698 | ) | | | — | | | | — | |
Net Assets | | $ | 2,721,757 | | | $ | 52,107 | | | $ | 165,113 | |
Net Asset Value, Offering and Redemption Price Per Share — Class A | | | $8.39 | | | | $6.42 | | | | $6.95 | |
| | |
| ($2,721,756,939 ÷
324,226,971 shares |
) | |
| ($52,107,392 ÷
8,111,972 shares |
) | |
| ($165,113,022 ÷
23,741,658 shares |
) |
Amounts designated as “—” are $0 or have been rounded to $0.
The accompanying notes are an integral part of the financial statements.
| | |
| 216 | | SEI Institutional Investments Trust / Annual Report / May 31, 2009 |
| | | | | | | | | | | | | | | | | | |
Core Fixed Income Fund | | | High Yield Bond Fund | | | Long Duration Fund | | | Emerging Markets Debt Fund | | | Real Return Fund | |
| | | | | | | | | | | | | | | | | | |
| $ | 4,728,580 | * | | $ | 1,210,813 | * | | $ | 1,413,103 | | | $ | 895,618 | * | | $ | 255,995 | |
| | 555,300 | | | | 250,236 | | | | 63,576 | | | | 10,665 | | | | 4,157 | |
| | — | | | | — | | | | — | | | | — | | | | — | |
| | 333 | | | | — | | | | 5 | | | | 13,451 | | | | — | |
| | 480 | | | | — | | | | — | | | | 14,293 | | | | — | |
|
44,026 |
| | | — | | | | 960 | | | | 4,393 | | | | — | |
| | 53,934 | | | | 9,984 | | | | 15,904 | | | | 1,298 | | | | 3,677 | |
| | 567,502 | | | | 37,708 | | | | 3,797 | | | | 24,154 | | | | 2,969 | |
| | 36,998 | | | | 26,706 | | | | 15,930 | | | | 18,515 | | | | 1,839 | |
| | 3,066 | | | | — | | | | 7,434 | | | | 79 | | | | — | |
| | 178 | | | | 13 | | | | — | | | | — | | | | — | |
| | — | | | | — | | | | — | | | | — | | | | — | |
| | 1,229 | | | | — | | | | — | | | | 1,664 | | | | — | |
| | — | | | | — | | | | — | | | | — | | | | — | |
| | — | | | | — | | | | — | | | | — | | | | — | |
| | 40 | | | | 9 | | | | 2 | | | | 5 | | | | 2 | |
| | 5,991,666 | | | | 1,535,469 | | | | 1,520,711 | | | | 984,135 | | | | 268,639 | |
| | | | | | | | | | | | | | | | | | |
| | 358,233 | | | | 208,079 | | | | — | | | | 10,948 | | | | — | |
| | 880,204 | | | | 57,092 | | | | 30,477 | | | | 6,269 | | | | — | |
| | 166,243 | | | | 29,512 | | | | — | | | | 61,674 | | | | 8,057 | |
| | 2,157 | | | | 263 | | | | 21 | | | | — | | | | — | |
| | 38,735 | | | | — | | | | 891 | | | | 1,505 | | | | — | |
| | 399 | | | | — | | | | — | | | | — | | | | — | |
| | — | | | | — | | | | — | | | | — | | | | 10 | |
| | — | | | | — | | | | — | | | | — | | | | — | |
| | 1,904 | | | | — | | | | — | | | | — | | | | — | |
| | — | | | | 850 | | | | — | | | | — | | | | — | |
| | — | | | | — | | | | — | | | | 213 | | | | — | |
| | 2,269 | | | | — | | | | — | | | | 1,800 | | | | — | |
| | 590 | | | | 277 | | | | 170 | | | | 424 | | | | 76 | |
| | 10 | | | | 3 | | | | 3 | | | | 2 | | | | 1 | |
| | 2 | | | | 1 | | | | 1 | | | | — | | | | — | |
| | 327 | | | | 121 | | | | 101 | | | | 74 | | | | 18 | |
| | — | | | | — | | | | — | | | | — | | | | — | |
| | 1,451,073 | | | | 296,198 | | | | 31,664 | | | | 82,909 | | | | 8,162 | |
| $ | 4,540,593 | | | $ | 1,239,271 | | | $ | 1,489,047 | | | $ | 901,226 | | | $ | 260,477 | |
| | 5,114,179 | | | | 1,432,189 | | | | 1,424,987 | | | | 920,565 | | | | 245,123 | |
| | 565,357 | | | | 253,595 | | | | 63,576 | | | | 10,948 | | | | 4,157 | |
| | 479 | | | | — | | | | — | | | | 14,293 | | | | — | |
| | (22,110 | ) | | | — | | | | (216 | ) | | | (385 | ) | | | — | |
| | (609 | ) | | | — | | | | — | | | | — | | | | — | |
| | 350,045 | | | | 196,431 | | | | — | | | | 10,529 | | | | — | |
| | | | | | | | | | | | | | | | | | |
| $ | 5,006,593 | | | $ | 1,694,438 | | | $ | 1,558,802 | | | $ | 1,027,424 | | | $ | 256,028 | |
| | 9,037 | | | | 1,899 | | | | (18 | ) | | | 7,588 | | | | (345 | ) |
|
(61,774 |
) | | | (232,331 | ) | | | (47,020 | ) | | | (107,266 | ) | | | (6,078 | ) |
|
(395,446 |
) | | | (224,735 | ) | | | (11,884 | ) | | | (25,230 | ) | | | 10,872 | |
| | (789 | ) | | | — | | | | (10,158 | ) | | | 34 | | | | — | |
| | (16,625 | ) | | | — | | | | (675 | ) | | | (1,120 | ) | | | ��� | |
|
(403 |
) | | | — | | | | — | | | | (204 | ) | | | — | |
| | — | | | | — | | | | — | | | | — | | | | — | |
| $ | 4,540,593 | | | $ | 1,239,271 | | | $ | 1,489,047 | | | $ | 901,226 | | | $ | 260,477 | |
| | $9.42 | | | | $7.00 | | | | $7.77 | | | | $9.27 | | | | $10.11 | |
| ($4,540,592,886 ÷
482,175,848 shares |
) | |
| ($1,239,270,513 ÷
177,155,172 shares |
) | |
| ($1,489,047,443 ÷
191,528,060 shares |
) | |
| ($901,225,689 ÷
97,209,012 shares |
) | |
| ($260,477,297 ÷
25,751,802 shares |
) |
| | |
| SEI Institutional Investments Trust / Annual Report / May 31, 2009 | | 217 |
Statements of Operations ($ Thousands)
For the year or period ended May 31, 2009
| | | | | | | | | | | | |
| | | Large Cap
Fund | | | Large Cap
Diversified
Alpha
Fund | | | Large Cap
Disciplined
Equity
Fund | |
Investment Income | | | | | | | | | | | | |
Dividends | | $ | 7,793 | | | $ | 7,035 | | | $ | 129,864 | |
Dividends from Affiliated Registered Investment Company (1) | | | 193 | | | | 274 | | | | 5,353 | |
Interest Income | | | 29 | | | | 80 | | | | 1,224 | |
Security Lending Income — Net | | | 218 | | | | — | | | | 2,237 | |
Less: Foreign Taxes Withheld | | | (16 | ) | | | (14 | ) | | | — | |
| | | | 8,217 | | | | 7,375 | | | | 138,678 | |
Expenses: | | | | | | | | | | | | |
Investment Advisory Fees | | | 1,361 | | | | 1,560 | | | | 25,641 | |
Administration Fees | | | 170 | | | | 195 | | | | 3,205 | |
Trustee Fees | | | 6 | | | | 8 | | | | 127 | |
Chief Compliance Officer Fees | | | 2 | | | | 2 | | | | 31 | |
Custodian/Wire Agent Fees | | | 26 | | | | 28 | | | | 470 | |
Professional Fees | | | 23 | | | | 23 | | | | 399 | |
Printing Fees | | | 8 | | | | 7 | | | | 118 | |
Registration Fees | | | 5 | | | | 4 | | | | 86 | |
Interest Expense on Reverse Repurchase Agreements | | | — | | | | — | | | | — | |
Dividend Expense on Short Sales | | | — | | | | 364 | | | | — | |
Interest Expense on Short Sales | | | — | | | | 282 | | | | — | |
Overdraft Fees | | | — | | | | — | | | | — | |
Other Expenses | | | 20 | | | | 23 | | | | 192 | |
Total Expenses | | | 1,621 | | | | 2,496 | | | | 30,269 | |
Less: | | | | | | | | | | | | |
Waiver of Investment Advisory Fees | | | (566 | ) | | | (429 | ) | | | (15,172 | ) |
Waiver of Administration Fees | | | (170 | ) | | | (195 | ) | | | (3,205 | ) |
Fees Paid Indirectly (1) | | | (31 | ) | | | — | | | | (8 | ) |
Net Expenses | | | 854 | | | | 1,872 | | | | 11,884 | |
Net Investment Income | | | 7,363 | | | | 5,503 | | | | 126,794 | |
Net Realized and Unrealized Gain (Loss) on Investments: | | | | | | | | | | | | |
Investments | | | (56,265 | ) | | | (174,479 | ) | | | (1,890,849 | ) |
Affiliated Investments | | | — | | | | (8,787 | ) | | | (208,188 | ) |
Securities Sold Short | | | — | | | | 39,328 | | | | — | |
Futures Contracts | | | (6,532 | ) | | | (42,422 | ) | | | (811,095 | ) |
Swap Contracts | | | — | | | | — | | | | — | |
Foreign Currency Transactions | | | — | | | | — | | | | (1,882 | ) |
Net Change in Unrealized Appreciation (Depreciation) on: | | | | | | | | | | | | |
Investments | | | (39,919 | ) | | | (38,634 | ) | | | (482,063 | ) |
Affiliated Investments | | | (446 | ) | | | (12,957 | ) | | | (235,143 | ) |
Securities Sold Short | | | — | | | | (55 | ) | | | — | |
Futures Contracts | | | 122 | | | | 3,441 | | | | 49,053 | |
Swap Contracts | | | — | | | | — | | | | — | |
Foreign Currency and Translation of Other Assets and Liabilities Denominated in Foreign Currencies | | | — | | | | (1 | ) | | | (451 | ) |
Net Increase (Decrease) in Net Assets Resulting from Operations | | $ | (95,677 | ) | | $ | (229,063 | ) | | $ | (3,453,824 | ) |
| (1) | | See Note 4 in the Notes to the Financial Statements. |
| (2) | | Commenced operations on January 2, 2009. |
Amounts designated as “—” are zero or have been rounded to zero.
The accompanying notes are an integral part of the financial statements.
| | |
| 218 | | SEI Institutional Investments Trust / Annual Report / May 31, 2009 |
| | | | | | | | | | | | | | | | | | |
Large Cap
Index
Fund | | | Small Cap
Fund | | | Small/Mid
Cap
Fund | | | U.S.
Managed
Volatility
Fund(a) | | | International
Equity
Fund | |
| | | | | | | | | | | | | | | | | | |
| $ | 8,269 | | | $ | 15,448 | | | $ | 26,953 | | | $ | 1,480 | | | $ | 27,257 | |
| | 77 | | | | 860 | | | | 1,329 | | | | 12 | | | | 535 | |
| | 4 | | | | 654 | | | | 727 | | | | 1 | | | | 2,575 | |
| | 294 | | | | 3,557 | | | | 4,118 | | | | — | | | | 1,688 | |
| | — | | | | (11 | ) | | | (35 | ) | | | (9 | ) | | | (2,022 | ) |
| | 8,644 | | | | 20,508 | | | | 33,092 | | | | 1,484 | | | | 30,033 | |
| | | | | | | | | | | | | | | | | | |
| | 561 | | | | 7,458 | | | | 11,440 | | | | 365 | | | | 4,424 | |
| | 165 | | | | 574 | | | | 880 | | | | 28 | | | | 438 | |
| | 6 | | | | 24 | | | | 34 | | | | — | | | | 18 | |
| | 2 | | | | 5 | | | | 9 | | | | 1 | | | | 4 | |
| | 26 | | | | 75 | | | | 130 | | | | 7 | | | | 259 | |
| | 21 | | | | 73 | | | | 111 | | | | 6 | | | | 53 | |
| | 6 | | | | 20 | | | | 34 | | | | 3 | | | | 13 | |
| | 4 | | | | 11 | | | | 26 | | | | 3 | | | | 9 | |
| | — | | | | — | | | | — | | | | — | | | | 15 | |
| | — | | | | — | | | | — | | | | — | | | | — | |
| | — | | | | — | | | | — | | | | — | | | | — | |
| | — | | | | — | | | | — | | | | — | | | | 31 | |
| | 22 | | | | 52 | | | | 67 | | | | 5 | | | | 96 | |
| | 813 | | | | 8,292 | | | | 12,731 | | | | 418 | | | | 5,360 | |
| | | | | | | | | | | | | | | | | | |
| | (450 | ) | | | (1,504 | ) | | | (3,030 | ) | | | (194 | ) | | | (1,467 | ) |
| | (165 | ) | | | (574 | ) | | | (880 | ) | | | (28 | ) | | | (438 | ) |
| | — | | | | (239 | ) | | | (407 | ) | | | — | | | | (49 | ) |
| | 198 | | | | 5,975 | | | | 8,414 | | | | 196 | | | | 3,406 | |
| | 8,446 | | | | 14,533 | | | | 24,678 | | | | 1,288 | | | | 26,627 | |
| | | | | | | | | | | | | | | | | | |
| | (26,739 | ) | | | (461,591 | ) | | | (624,341 | ) | | | (2,271 | ) | | | (419,577 | ) |
| | — | | | | — | | | | — | | | | — | | | | — | |
| | — | | | | — | | | | — | | | | — | | | | — | |
| | (2,702 | ) | | | (10,993 | ) | | | (30,550 | ) | | | (740 | ) | | | (71,808 | ) |
| | — | | | | — | | | | — | | | | — | | | | (38,277 | ) |
| | — | | | | (114 | ) | | | (404 | ) | | | — | | | | (19,516 | ) |
| | | | | | | | | | | | | | | | | | |
| | (109,469 | ) | | | (132,246 | ) | | | (216,030 | ) | | | 12,614 | | | | (151,132 | ) |
| | (792 | ) | | | (6,244 | ) | | | — | | | | — | | | | (1,027 | ) |
| | — | | | | — | | | | — | | | | — | | | | — | |
| | 553 | | | | (1,037 | ) | | | (4,349 | ) | | | 522 | | | | (6,218 | ) |
| | — | | | | — | | | | — | | | | — | | | | 107 | |
| | | | | | | | | | | | | | | | | | |
| | — | | | | 10 | | | | 9 | | | | — | | | | 2,112 | |
| $ | (130,703 | ) | | $ | (597,682 | ) | | $ | (850,987 | ) | | $ | 11,413 | | | $ | (678,709 | ) |
| | |
| SEI Institutional Investments Trust / Annual Report / May 31, 2009 | | 219 |
Statements of Operations ($ Thousands)
For the year or period ended May 31, 2009
| | | | | | | | | | | | |
| | | World Equity
Ex-US
Fund | | | Screened
World Equity
Ex-US
Fund(2) | | | Enhanced
LIBOR
Opportunities
Fund | |
Investment Income | | | | | | | | | | | | |
Dividends | | $ | 81,533 | | | $ | 1,721 | | | $ | 2 | |
Dividends from Affiliated Registered Investment Company (1) | | | 2,250 | | | | 29 | | | | 273 | |
Interest Income | | | 5,380 | | | | 23 | | | | 6,149 | |
Security Lending Income — Net | | | 2,296 | | | | — | | | | — | |
Less: Foreign Taxes Withheld | | | (7,082 | ) | | | (156 | ) | | | — | |
| | | | 84,377 | | | | 1,617 | | | | 6,424 | |
Expenses: | | | | | | | | | | | | |
Investment Advisory Fees | | | 13,304 | | | | 330 | | | | 868 | |
Administration Fees | | | 1,209 | | | | 25 | | | | 96 | |
Trustee Fees | | | 47 | | | | 1 | | | | 4 | |
Chief Compliance Officer Fees | | | 12 | | | | — | | | | 1 | |
Custodian/Wire Agent Fees | | | 833 | | | | 176 | | | | 14 | |
Professional Fees | | | 156 | | | | 3 | | | | 12 | |
Printing Fees | | | 46 | | | | 1 | | | | 4 | |
Registration Fees | | | 51 | | | | 3 | | | | 2 | |
Interest Expense on Reverse Repurchase Agreements | | | 26 | | | | — | | | | — | |
Overdraft Fees | | | 65 | | | | — | | | | — | |
Other Expenses | | | 177 | | | | 21 | | | | 47 | |
Total Expenses | | | 15,926 | | | | 560 | | | | 1,048 | |
Less: | | | | | | | | | | | | |
Waiver of Investment Advisory Fees | | | (3,747 | ) | | | (129 | ) | | | (154 | ) |
Waiver of Administration Fees | | | (1,209 | ) | | | (25 | ) | | | (96 | ) |
Fees Paid Indirectly (1) | | | (88 | ) | | | — | | | | — | |
Net Expenses | | | 10,882 | | | | 406 | | | | 798 | |
Net Investment Income | | | 73,495 | | | | 1,211 | | | | 5,626 | |
Net Realized and Unrealized Gain (Loss) on Investments: | | | | | | | | | | | | |
Investments | | | (980,785 | ) | | | (27,406 | ) | | | (12,538 | ) |
Futures Contracts | | | (156,885 | ) | | | (1,659 | ) | | | (1,289 | ) |
Written Options | | | — | | | | — | | | | — | |
Written Swaptions | | | — | | | | — | | | | — | |
Swap Contracts | | | (94,972 | ) | | | — | | | | 272 | |
Foreign Currency Transactions | | | (43,428 | ) | | | (174 | ) | | | (1,934 | ) |
Net Change in Unrealized Appreciation (Depreciation) on: | | | | | | | | | | | | |
Investments | | | (166,705 | ) | | | (3,450 | ) | | | (9,547 | ) |
Affiliated Investments | | | (2,643 | ) | | | — | | | | (34,093 | ) |
Futures Contracts | | | (19,704 | ) | | | 200 | | | | (23 | ) |
Written Options | | | — | | | | — | | | | — | |
Written Swaptions | | | — | | | | — | | | | — | |
Swap Contracts | | | (1,118 | ) | | | — | | | | (85 | ) |
Foreign Capital Gains Tax | | | (343 | ) | | | — | | | | — | |
Foreign Currency and Translation of Other Assets and Liabilities Denominated in Foreign Currencies | | | 7,784 | | | | 14 | | | | 235 | |
Net Increase (Decrease) in Net Assets Resulting from Operations | | $ | (1,385,304 | ) | | $ | (31,264 | ) | | $ | (53,376 | ) |
| (1) | | See Note 4 in the Notes to the Financial Statements. |
| (2) | | Commenced operations on June 30, 2008. |
Amounts designated as “—” are zero or have been rounded to zero.
The accompanying notes are an integral part of the financial statements.
| | |
| 220 | | SEI Institutional Investments Trust / Annual Report / May 31, 2009 |
| | | | | | | | | | | | | | | | | | |
Core Fixed
Income
Fund | | | High Yield
Bond
Fund | | | Long
Duration
Fund | | | Emerging
Markets
Debt Fund | | | Real Return
Fund | |
| | | | | | | | | | | | | | | | | | |
| $ | 214 | | | $ | 8,887 | | | $ | — | | | $ | — | | | $ | — | |
| | 2,253 | | | | 803 | | | | 88 | | | | — | | | | 89 | |
| | 296,821 | | | | 125,349 | | | | 23,597 | | | | 86,100 | | | | 7,074 | |
| | 4,987 | | | | 1,315 | | | | — | | | | 177 | | | | — | |
| | (48 | ) | | | (93 | ) | | | — | | | | (3 | ) | | | — | |
| | 304,227 | | | | 136,261 | | | | 23,685 | | | | 86,274 | | | | 7,163 | |
| | | | | | | | | | | | | | | | | | |
| | 15,971 | | | | 5,671 | | | | 1,399 | | | | 8,036 | | | | 2,114 | |
| | 2,663 | | | | 582 | | | | 233 | | | | 473 | | | | 151 | |
| | 105 | | | | 23 | | | | 6 | | | | 18 | | | | 6 | |
| | 28 | | | | 6 | | | | 4 | | | | 5 | | | | 2 | |
| | 417 | | | | 87 | | | | 36 | | | | 117 | | | | 30 | |
| | 317 | | | | 74 | | | | 44 | | | | 59 | | | | 18 | |
| | 98 | | | | 24 | | | | 21 | | | | 19 | | | | 5 | |
| | 30 | | | | 14 | | | | 16 | | | | 8 | | | | 2 | |
| | — | | | | — | | | | — | | | | — | | | | — | |
| | — | | | | — | | | | — | | | | 39 | | | | 11 | |
| | 196 | | | | 94 | | | | 46 | | | | 89 | | | | 24 | |
| | 19,825 | | | | 6,575 | | | | 1,805 | | | | 8,863 | | | | 2,363 | |
| | | | | | | | | | | | | | | | | | |
| | (9,708 | ) | | | (1,920 | ) | | | (639 | ) | | | (3,148 | ) | | | (1,113 | ) |
| | (2,663 | ) | | | (582 | ) | | | (233 | ) | | | (473 | ) | | | (151 | ) |
| | — | | | | — | | | | — | | | | — | | | | — | |
| | 7,454 | | | | 4,073 | | | | 933 | | | | 5,242 | | | | 1,099 | |
| | 296,773 | | | | 132,188 | | | | 22,752 | | | | 81,032 | | | | 6,064 | |
| | | | | | | | | | | | | | | | | | |
| | (40,630 | ) | | | (189,876 | ) | | | (43,619 | ) | | | (95,661 | ) | | | (4,634 | ) |
| | 8,285 | | | | — | | | | (17,437 | ) | | | 2,172 | | | | 194 | |
| | 12,139 | | | | — | | | | — | | | | 264 | | | | — | |
| | (2,086 | ) | | | — | | | | — | | | | — | | | | — | |
| | (31,271 | ) | | | — | | | | 22,422 | | | | (3,607 | ) | | | — | |
| | 12,443 | | | | — | | | | — | | | | (11,390 | ) | | | 3,101 | |
| | | | | | | | | | | | | | | | | | |
| | (232,225 | ) | | | (131,655 | ) | | | 5,205 | | | | (25,295 | ) | | | (3,472 | ) |
| | (10,056 | ) | | | (3,358 | ) | | | — | | | | (283 | ) | | | — | |
| | 3,172 | | | | — | | | | (10,174 | ) | | | (35 | ) | | | (2,034 | ) |
| | (107 | ) | | | — | | | | — | | | | (7 | ) | | | — | |
| | 1,076 | | | | — | | | | — | | | | — | | | | — | |
| | 22,935 | | | | — | | | | (1,624 | ) | | | 791 | | | | — | |
| | — | | | | — | | | | — | | | | — | | | | — | |
| (1,392 | ) | | | — | | | | — | | | | 756 | | | | (610 | ) |
| $ | 39,056 | | | $ | (192,701 | ) | | $ | (22,475 | ) | | $ | (51,263 | ) | | $ | (1,391 | ) |
| | |
| SEI Institutional Investments Trust / Annual Report / May 31, 2009 | | 221 |
Statements of Changes in Net Assets ($ Thousands)
For the years ended May 31,
| | | | | | | | | | | | | | | | |
| | | Large Cap
Fund | | | Large Cap
Diversified Alpha Fund | |
| | | 2009 | | | 2008 | | | 2009 | | | 2008 | |
Operations: | | | | | | | | | | | | | | | | |
Net Investment Income | | $ | 7,363 | | | $ | 7,508 | | | $ | 5,503 | | | $ | 5,612 | |
Net Realized Gain (Loss) from Investments, Affiliated Investments, Securities Sold Short, Written Options, Written Swaptions, Futures Contracts and Swap Contracts | | | (62,797 | ) | | | 69,587 | | | | (186,360 | ) | | | (26,707 | )(4) |
Net Realized Loss on Foreign Currency Transactions | | | — | | | | — | | | | — | | | | — | |
Net Change in Unrealized Depreciation on Investments, Affiliated Investments and Future Contracts | | | (40,243 | ) | | | (100,408 | ) | | | (48,205 | ) | | | (22,430 | ) |
Net Change in Unrealized Appreciation (Depreciation) on Foreign Currency Transactions | | | — | | | | — | | | | (1 | ) | | | — | |
Net Decrease in Net Assets Resulting from Operations | | | (95,677 | ) | | | (23,313 | ) | | | (229,063 | ) | | | (43,525 | ) |
Dividends and Distributions From: | | | | | | | | | | | | | | | | |
Net Investment Income: | | | | | | | | | | | | | | | | |
Class A | | | (6,781 | ) | | | (8,626 | ) | | | (772 | ) | | | (7,084 | ) |
Net Realized Gains: | | | | | | | | | | | | | | | | |
Class A | | | — | | | | — | | | | — | | | | (21,162 | ) |
Return of Capital | | | | | | | | | | | | | | | | |
Class A | | | — | | | | — | | | | (2,889 | ) | | | — | |
Total Dividends and Distributions | | | (6,781 | ) | | | (8,626 | ) | | | (3,661 | ) | | | (28,246 | ) |
Capital Share Transactions:(1) | | | | | | | | | | | | | | | | |
Class A: | | | | | | | | | | | | | | | | |
Proceeds from Shares Issued | | | 331,341 | | | | 24,208 | | | | 188,769 | | | | 262,224 | |
Reinvestment of Dividends & Distributions | | | 6,761 | | | | 8,602 | | | | 3,328 | | | | 25,898 | |
Cost of Shares Redeemed | | | (70,379 | ) | | | (333,709 | ) | | | (180,732 | ) | | | (117,944 | )(3) |
Increase (Decrease) in Net Assets Derived from Capital Share Transactions | | | 267,723 | | | | (300,899 | ) | | | 11,365 | | | | 170,178 | |
Net Increase (Decrease) in Net Assets | | | 165,265 | | | | (332,838 | ) | | | (221,359 | ) | | | 98,407 | |
Net Assets: | | | | | | | | | | | | | | | | |
Beginning of Year | | | 361,156 | | | | 693,994 | | | | 552,361 | | | | 453,954 | |
End of Year | | $ | 526,421 | | | $ | 361,156 | | | $ | 331,002 | | | $ | 552,361 | |
Undistributed (Distributions in Excess of) Net Investment Income Included in Net Assets at Period End | | $ | 1,586 | | | $ | 968 | | | $ | — | | | $ | (861 | ) |
| (1) | | See Note 5 in the Notes to Financial Statements for additional information. |
| (2) | | Includes subscriptions as a result of an in-kind transfers of securities (see Note 8). |
| (3) | | Includes redemptions as a result of an in-kind transfers of securities (see Note 8). |
| (4) | | Includes realized loss of $(2,669) ($ Thousands) due to in-kind redemptions (see Note 8). |
| (5) | | Includes realized loss of $(63,427) ($ Thousands) due to in-kind redemptions (see Note 8). |
Amounts designated as “—” are zero or have been rounded to zero.
The accompanying notes are an integral part of the financial statements.
| | |
| 222 | | SEI Institutional Investments Trust / Annual Report / May 31, 2009 |
| | | | | | | | | | | | | | | | | | | | | | |
Large Cap
Disciplined Equity Fund | | | Large Cap
Index Fund | | | Small Cap
Fund | |
| 2009 | | | 2008 | | | 2009 | | | 2008 | | | 2009 | | | 2008 | |
| | | | | | | | | | | | | | | | | | | | | | |
| $ | 126,794 | | | $ | 140,806 | | | $ | 8,446 | | | $ | 7,641 | | | $ | 14,533 | | | $ | 14,958 | |
|
(2,910,132 |
) | | | (412,975 | )(5) | | | (29,441 | ) | | | 6,603 | | | | (472,584 | ) | | | 27,641 | |
| | (1,882 | ) | | | (2,160 | ) | | | — | | | | — | | | | (114 | ) | | | (186 | ) |
|
(668,153 |
) | | | (532,973 | ) | | | (109,708 | ) | | | (38,727 | ) | | | (139,527 | ) | | | (321,896 | ) |
| | (451 | ) | | | (1,384 | ) | | | — | | | | — | | | | 10 | | | | (9 | ) |
| | (3,453,824 | ) | | | (808,686 | ) | | | (130,703 | ) | | | (24,483 | ) | | | (597,682 | ) | | | (279,492 | ) |
| | | | | | | | | | | | | | | | | | | | | | |
| | | | | | | | | | | | | | | | | | | | | | |
| | (10,906 | ) | | | (154,202 | ) | | | (8,380 | ) | | | (7,735 | ) | | | (23,822 | ) | | | (15,664 | ) |
| | | | | | | | | | | | | | | | | | | | | | |
| | — | | | | (470,491 | ) | | | (620 | ) | | | (10,331 | ) | | | — | | | | (219,331 | ) |
| | | | | | | | | | | | | | | | | | | | | | |
| | (79,835 | ) | | | — | | | | — | | | | — | | | | — | | | | — | |
| | (90,741 | ) | | | (624,693 | ) | | | (9,000 | ) | | | (18,066 | ) | | | (23,822 | ) | | | (234,995 | ) |
| | | | | | | | | | | | | | | | | | | | | | |
| | | | | | | | | | | | | | | | | | | | | | |
| | 2,154,108 | (2) | | | 3,092,387 | (2) | | | 156,678 | | | | 48,887 | | | | 174,015 | | | | 162,821 | |
| | 89,812 | | | | 618,766 | | | | 8,560 | | | | 16,951 | | | | 22,561 | | | | 223,813 | |
| | (1,423,578 | ) | | | (1,343,644 | )(3) | | | (58,516 | ) | | | (53,349 | ) | | | (408,912 | ) | | | (189,304 | ) |
| | 820,342 | | | | 2,367,509 | | | | 106,722 | | | | 12,489 | | | | (212,336 | ) | | | 197,330 | |
| | (2,724,223 | ) | | | 934,130 | | | | (32,981 | ) | | | (30,060 | ) | | | (833,840 | ) | | | (317,157 | ) |
| | | | | | | | | | | | | | | | | | | | | | |
| | 8,767,342 | | | | 7,833,212 | | | | 386,873 | | | | 416,933 | | | | 1,819,700 | | | | 2,136,857 | |
| $ | 6,043,119 | | | $ | 8,767,342 | | | $ | 353,892 | | | $ | 386,873 | | | $ | 985,860 | | | $ | 1,819,700 | |
$ |
217 |
| | $ | (14,517 | ) | | $ | 1,350 | | | $ | 1,244 | | | $ | 918 | | | $ | 11,553 | |
| | |
| SEI Institutional Investments Trust / Annual Report / May 31, 2009 | | 223 |
Statements of Changes in Net Assets ($ Thousands)
For the years or period ended May 31,
| | | | | | | | | | | | |
| | |
Small/Mid Cap
Equity Fund | | | U.S. Managed
Volatility Fund(3) | |
| | | 2009 | | | 2008 | | | 2009 | |
Operations: | | | | | | | | | | | | |
Net Investment Income | | $ | 24,678 | | | $ | 20,390 | | | $ | 1,288 | |
Net Realized Gain (Loss) from Investments, Affiliated Investments, Securities Sold Short, Written Options, Written Swaptions, Futures Contracts and Swap Contracts | | | (654,891 | ) | | | (84,527 | ) | | | (3,011 | ) |
Net Realized Gain (Loss) on Foreign Currency Transactions | | | (404 | ) | | | (187 | ) | | | — | |
Net Change in Unrealized Appreciation (Depreciation) on Investments, Affiliated Investments, Written Options, Written Swaptions, Future Contracts and Swap Contracts | | | (220,379 | ) | | | (204,402 | ) | | | 13,136 | |
Net Change in Unrealized Appreciation (Depreciation) on Foreign Cap Gains Tax | | | — | | | | — | | | | — | |
Net Change in Unrealized Appreciation (Depreciation) on Foreign Currency Transactions | | | 9 | | | | (9 | ) | | | — | |
Net Increase (Decrease) in Net Assets Resulting from Operations | | | (850,987 | ) | | | (268,735 | ) | | | 11,413 | |
Dividends and Distributions From: | | | | | | | | | | | | |
Net Investment Income: | | | | | | | | | | | | |
Class A | | | (27,726 | ) | | | (20,152 | ) | | | (555 | ) |
Net Realized Gains: | | | | | | | | | | | | |
Class A | | | — | | | | (138,055 | ) | | | — | |
Return of Capital | | | | | | | | | | | | |
Class A | | | — | | | | — | | | | — | |
Total Dividends and Distributions | | | (27,726 | ) | | | (158,207 | ) | | | (555 | ) |
Capital Share Transactions:(1) | | | | | | | | | | | | |
Class A: | | | | | | | | | | | | |
Proceeds from Shares Issued | | | 556,902 | | | | 1,097,100 | (2) | | | 232,207 | |
Reinvestment of Dividends & Distributions | | | 27,474 | | | | 157,300 | | | | 555 | |
Cost of Shares Redeemed | | | (353,895 | ) | | | (320,148 | ) | | | (5,760 | ) |
Increase (Decrease) in Net Assets Derived from Capital Share Transactions | | | 230,481 | | | | 934,252 | | | | 227,002 | |
Net Increase (Decrease) in Net Assets | | | (648,232 | ) | | | 507,310 | | | | 237,860 | |
Net Assets: | | | | | | | | | | | | |
Beginning of Period | | | 2,373,056 | | | | 1,865,746 | | | | — | |
End of Period | | $ | 1,724,824 | | | $ | 2,373,056 | | | $ | 237,860 | |
Undistributed (Distributions in Excess of) Net Investment Income Included in Net Assets at Period End | | $ | 7,462 | | | $ | 11,316 | | | $ | 733 | |
| (1) | | See Note 5 in the Notes to Financial Statements for additional information. |
| (2) | | Includes subscriptions as a result of an in-kind transfers of securities (see Note 8). |
| (3) | | Commenced operations on December 30, 2008. |
| (4) | | Commenced operations on June 30, 2008. |
Amounts designated as “—” are zero or have been rounded to zero.
The accompanying notes are an integral part of the financial statements.
| | |
| 224 | | SEI Institutional Investments Trust / Annual Report / May 31, 2009 |
| | | | | | | | | | | | | | | | | | | | | | | | | | |
International
Equity Fund | | | World Equity
Ex-US Fund | | | Screened
World Equity
Ex-US Fund(4) | | | Enhanced
LIBOR
Opportunities Fund | |
| 2009 | | | 2008 | | | 2009 | | | 2008 | | | 2009 | | | 2009 | | | 2008 | |
| | | | | | | | | | | | | | | | | | | | | | | | | | |
| $ | 26,627 | | | $ | 46,649 | | | $ | 73,495 | | | $ | 69,836 | | | $ | 1,211 | | | $ | 5,626 | | | $ | 9,046 | |
|
(529,662 |
) | | | 36,393 | | | | (1,232,642 | ) | | | (104,063 | ) | | | (29,065 | ) | | | (13,555 | ) | | | (4,750 | ) |
| | (19,516 | ) | | | 14,358 | | | | (43,428 | ) | | | 27,205 | | | | (174 | ) | | | (1,934 | ) | | | (576 | ) |
|
(158,270 |
) | | | (187,680 | ) | | | (190,170 | ) | | | (24,409 | ) | | | (3,250 | ) | | | (43,748 | ) | | | (16,236 | ) |
| | — | | | | 31 | | | | (343 | ) | | | 7 | | | | — | | | | — | | | | — | |
| | 2,112 | | | | (1,243 | ) | | | 7,784 | | | | (2,194 | ) | | | 14 | | | | 235 | | | | (634 | ) |
| | (678,709 | ) | | | (91,492 | ) | | | (1,385,304 | ) | | | (33,618 | ) | | | (31,264 | ) | | | (53,376 | ) | | | (13,150 | ) |
| | | | | | | | | | | | | | | | | | | | | | | | | | |
| | | | | | | | | | | | | | | | | | | | | | | | | | |
| | (10,879 | ) | | | (56,937 | ) | | | — | | | | (73,619 | ) | | | (561 | ) | | | (3,100 | ) | | | (8,559 | ) |
| | | | | | | | | | | | | | | | | | | | | | | | | | |
| | (2,062 | ) | | | (230,342 | ) | | | — | | | | (156,358 | ) | | | — | | | | — | | | | (268 | ) |
| | | | | | | | | | | | | | | | | | | | | | | | | | |
| | — | | | | — | | | | — | | | | — | | | | — | | | | (929 | ) | | | — | |
| | (12,941 | ) | | | (287,279 | ) | | | — | | | | (229,977 | ) | | | (561 | ) | | | (4,029 | ) | | | (8,827 | ) |
| | | | | | | | | | | | | | | | | | | | | | | | | | |
| | | | | | | | | | | | | | | | | | | | | | | | | | |
| | 315,996 | | | | 173,293 | | | | 1,523,949 | | | | 1,644,345 | | | | 97,244 | | | | 30,159 | | | | 179,865 | |
| | 12,425 | | | | 279,171 | | | | — | | | | 229,316 | | | | 507 | | | | 3,943 | | | | 8,806 | |
| | (384,857 | ) | | | (411,365 | ) | | | (718,008 | ) | | | (361,960 | ) | | | (13,819 | ) | | | (55,964 | ) | | | (45,744 | ) |
| | (56,436 | ) | | | 41,099 | | | | 805,941 | | | | 1,511,701 | | | | 83,932 | | | | (21,862 | ) | | | 142,927 | |
| | (748,086 | ) | | | (337,672 | ) | | | (579,363 | ) | | | 1,248,106 | | | | 52,107 | | | | (79,267 | ) | | | 120,950 | |
| | | | | | | | | | | | | | | | | | | | | | | | | | |
| | 1,452,962 | | | | 1,790,634 | | | | 3,301,120 | | | | 2,053,014 | | | | — | | | | 244,380 | | | | 123,430 | |
| $ | 704,876 | | | $ | 1,452,962 | | | $ | 2,721,757 | | | $ | 3,301,120 | | | $ | 52,107 | | | $ | 165,113 | | | $ | 244,380 | |
$ |
3,350 |
| | $ | 6,492 | | | $ | 28,028 | | | $ | (635 | ) | | $ | 493 | | | $ | 4 | | | $ | 1,087 | |
| | |
| SEI Institutional Investments Trust / Annual Report / May 31, 2009 | | 225 |
Statements of Changes in Net Assets ($ Thousands)
For the years ended May 31,
| | | | | | | | | | | | | | | | |
| | | Core Fixed
Income Fund | | | High Yield
Bond Fund | |
| | | 2009 | | | 2008 | | | 2009 | | | 2008 | |
Operations: | | | | | | | | | | | | | | | | |
Net Investment Income | | $ | 296,773 | | | $ | 335,088 | | | $ | 132,188 | | | $ | 114,672 | |
Net Realized Gain (Loss) from Investments, Affiliated Investments, Securities Sold Short, Written Options, Written Swaptions, Futures Contracts and Swap Contracts | | | (53,563 | ) | | | 134,777 | | | | (189,876 | ) | | | (29,320 | ) |
Net Realized Gain (Loss) on Foreign Currency Transactions | | | 12,443 | | | | (3,150 | ) | | | — | | | | — | |
Net Change in Unrealized Appreciation (Depreciation) on Investments, Affiliated Investments, Securities Sold Short Written Options, Written Swaptions, Futures Contracts and Swap Contracts | | | (215,205 | ) | | | (150,272 | ) | | | (135,013 | ) | | | (117,173 | ) |
Net Change in Unrealized Appreciation (Depreciation) on Foreign Currency Transactions | | | (1,392 | ) | | | 1,196 | | | | — | | | | — | |
Net Increase (Decrease) in Net Assets Resulting from Operations | | | 39,056 | | | | 317,639 | | | | (192,701 | ) | | | (31,821 | ) |
Dividends and Distributions From: | | | | | | | | | | | | | | | | |
Net Investment Income: | | | | | | | | | | | | | | | | |
Class A | | | (298,149 | ) | | | (336,849 | ) | | | (125,601 | ) | | | (114,928 | ) |
Net Realized Gains: | | | | | | | | | | | | | | | | |
Class A | | | (90,124 | ) | | | — | | | | (10,261 | ) | | | (12,235 | ) |
Return of Capital | | | | | | | | | | | | | | | | |
Class A | | | — | | | | — | | | | — | | | | — | |
Total Dividends and Distributions | | | (388,273 | ) | | | (336,849 | ) | | | (135,862 | ) | | | (127,163 | ) |
Capital Share Transactions:(1) | | | | | | | | | | | | | | | | |
Class A: | | | | | | | | | | | | | | | | |
Proceeds from Shares Issued | | | 1,865,234 | | | | 1,887,634 | | | | 340,770 | | | | 389,605 | |
Reinvestment of Dividends & Distributions | | | 374,113 | | | | 329,184 | | | | 133,130 | | | | 125,115 | |
Cost of Shares Redeemed | | | (3,498,985 | ) | | | (1,942,287 | ) | | | (305,925 | ) | | | (197,801 | ) |
Increase (Decrease) in Net Assets Derived from Capital Share Transactions | | | (1,259,638 | ) | | | 274,531 | | | | 167,975 | | | | 316,919 | |
Net Increase (Decrease) in Net Assets | | | (1,608,855 | ) | | | 255,321 | | | | (160,588 | ) | | | 157,935 | |
Net Assets: | | | | | | | | | | | | | | | | |
Beginning of Year | | | 6,149,448 | | | | 5,894,127 | | | | 1,399,859 | | | | 1,241,924 | |
End of Year | | $ | 4,540,593 | | | $ | 6,149,448 | | | $ | 1,239,271 | | | $ | 1,399,859 | |
Undistributed (Distributions in Excess of) Net Investment Income Included in Net Assets at Period End | | $ | 9,037 | | | $ | (2,489 | ) | | $ | 1,899 | | | $ | (6,220 | ) |
| (1) | | See Note 5 in the Notes to Financial Statements for additional information. |
Amounts designated as “—” are zero or have been rounded to zero.
The accompanying notes are an integral part of the financial statements.
| | |
| 226 | | SEI Institutional Investments Trust / Annual Report / May 31, 2009 |
| | | | | | | | | | | | | | | | | | | | | | |
Long Duration
Fund | | | Emerging Markets
Debt Fund | | | Real Return
Fund | |
| 2009 | | | 2008 | | | 2009 | | | 2008 | | | 2009 | | | 2008 | |
| | | | | | | | | | | | | | | | | | | | | | |
| $ | 22,752 | | | $ | 8,849 | | | $ | 81,032 | | | $ | 63,558 | | | $ | 6,064 | | | $ | 16,546 | |
|
(38,634 |
) | | | 273 | | | | (96,832 | ) | | | (3,876 | ) | | | (4,440 | ) | | | 694 | |
| | — | | | | — | | | | (11,390 | ) | | | 5,991 | | | | 3,101 | | | | 646 | |
|
(6,593 |
) | | | (10,883 | ) | | | (24,829 | ) | | | (31,513 | ) | | | (5,506 | ) | | | 19,222 | |
|
— |
| | | — | | | | 756 | | | | (1,535 | ) | | | (610 | ) | | | (368 | ) |
| | (22,475 | ) | | | (1,761 | ) | | | (51,263 | ) | | | 32,625 | | | | (1,391 | ) | | | 36,740 | |
| | | | | | | | | | | | | | | | | | | | | | |
| | | | | | | | | | | | | | | | | | | | | | |
| | (24,618 | ) | | | (9,372 | ) | | | (76,229 | ) | | | (67,527 | ) | | | (19,450 | ) | | | (9,863 | ) |
| | | | | | | | | | | | | | | | | | | | | | |
| | — | | | | — | | | | — | | | | (10,109 | ) | | | (63 | ) | | | (2,775 | ) |
| | | | | | | | | | | | | | | | | | | | | | |
| | — | | | | — | | | | — | | | | — | | | | (1,496 | ) | | | — | |
| | (24,618 | ) | | | (9,372 | ) | | | (76,229 | ) | | | (77,636 | ) | | | (21,009 | ) | | | (12,638 | ) |
| | | | | | | | | | | | | | | | | | | | | | |
| | | | | | | | | | | | | | | | | | | | | | |
| | 1,468,293 | | | | 16,563 | | | | 238,272 | | | | 345,931 | | | | 70,945 | | | | 232,500 | |
| | 24,542 | | | | 9,335 | | | | 74,453 | | | | 76,551 | | | | 20,190 | | | | 12,638 | |
| | (72,449 | ) | | | (83,627 | ) | | | (346,498 | ) | | | (119,016 | ) | | | (170,387 | ) | | | (128,642 | ) |
| | 1,420,386 | | | | (57,729 | ) | | | (33,773 | ) | | | 303,466 | | | | (79,252 | ) | | | 116,496 | |
| | 1,373,293 | | | | (68,862 | ) | | | (161,265 | ) | | | 258,455 | | | | (101,652 | ) | | | 140,598 | |
| | | | | | | | | | | | | | | | | | | | | | |
| | 115,754 | | | | 184,616 | | | | 1,062,491 | | | | 804,036 | | | | 362,129 | | | | 221,531 | |
| $ | 1,489,047 | | | $ | 115,754 | | | $ | 901,226 | | | $ | 1,062,491 | | | $ | 260,477 | | | $ | 362,129 | |
$ |
(18 |
) | | $ | (959 | ) | | $ | 7,588 | | | $ | 13,782 | | | $ | (345 | ) | | $ | 9,457 | |
| | |
| SEI Institutional Investments Trust / Annual Report / May 31, 2009 | | 227 |
Financial Highlights
For the years or periods ended May 31,
For a share outstanding throughout each period
| | | | | | | | | | | | | | | | | | | | | | | | | | |
| | | Net Asset Value,
Beginning of Period | | Net
Investment
Income(2) | | Net Realized
and Unrealized
Gains (Losses)
on Securities | | | Total from
Operations | | | Dividends from
Net Investment
Income | | | Distributions from
Realized
Capital Gains | | | Total Dividends
and Distributions | |
Large Cap Fund | | | | | | | | | | | | | | | | | | | | | | | | | | |
Class A | | | | | | | | | | | | | | | | | | | | | | | | | | |
2009 | | $ | 18.75 | | $ | 0.28 | | $ | (6.22 | ) | | $ | (5.94 | ) | | $ | (0.26 | ) | | $ | — | | | $ | (0.26 | ) |
2008 | | | 20.31 | | | 0.32 | | | (1.52 | ) | | | (1.20 | ) | | | (0.36 | ) | | | — | | | | (0.36 | ) |
2007 | | | 16.93 | | | 0.28 | | | 3.40 | | | | 3.68 | | | | (0.30 | ) | | | — | | | | (0.30 | ) |
2006 | | | 15.53 | | | 0.24 | | | 1.44 | | | | 1.68 | | | | (0.28 | ) | | | — | | | | (0.28 | ) |
2005 | | | 14.47 | | | 0.25 | | | 1.05 | | | | 1.30 | | | | (0.24 | ) | | | — | | | | (0.24 | ) |
Large Cap Diversified Alpha Fund | | | | | | | | | | | | | | | | | | | | |
Class A | | | | | | | | | | | | | | | | | | | | | | | | | | |
2009 | | $ | 10.23 | | $ | 0.10 | | $ | (3.91 | ) | | $ | (3.81 | ) | | $ | (0.07 | )** | | $ | — | | | $ | (0.07 | ) |
2008 | | | 11.94 | | | 0.13 | | | (1.15 | ) | | | (1.02 | ) | | | (0.17 | ) | | | (0.52 | ) | | | (0.69 | ) |
2007 | | | 9.94 | | | 0.19 | | | 2.04 | | | | 2.23 | | | | (0.16 | ) | | | (0.07 | ) | | | (0.23 | ) |
2006(1) | | | 10.00 | | | 0.04 | | | (0.09 | ) | | | (0.05 | ) | | | (0.01 | ) | | | — | | | | (0.01 | ) |
Large Cap Disciplined Equity Fund | | | | | | | | | | | | | | | | | | | | |
Class A | | | | | | | | | | | | | | | | | | | | | | | | | | |
2009 | | $ | 12.07 | | $ | 0.16 | | $ | (4.75 | ) | | $ | (4.59 | ) | | $ | (0.12 | )*** | | $ | — | | | $ | (0.12 | ) |
2008 | | | 14.38 | | | 0.22 | | | (1.54 | ) | | | (1.32 | ) | | | (0.25 | ) | | | (0.74 | ) | | | (0.99 | ) |
2007†† | | | 12.36 | | | 0.51 | | | 2.27 | | | | 2.78 | | | | (0.30 | ) | | | (0.46 | ) | | | (0.76 | ) |
2006†† | | | 12.05 | | | 0.26 | | | 0.85 | | | | 1.11 | | | | (0.22 | ) | | | (0.58 | ) | | | (0.80 | ) |
2005†† | | | 11.18 | | | 0.20 | | | 0.94 | | | | 1.14 | | | | (0.18 | ) | | | (0.09 | ) | | | (0.27 | ) |
Large Cap Index Fund | | | | | | | | | | | | | | | | | | | | |
Class A | | | | | | | | | | | | | | | | | | | | | | | | | | |
2009 | | $ | 121.02 | | $ | 2.13 | | $ | (41.96 | ) | | $ | (39.83 | ) | | $ | (2.13 | ) | | $ | (0.14 | ) | | $ | (2.27 | ) |
2008 | | | 135.30 | | | 2.47 | | | (10.72 | ) | | | (8.25 | ) | | | (2.52 | ) | | | (3.51 | ) | | | (6.03 | ) |
2007 | | | 113.02 | | | 2.29 | | | 23.15 | | | | 25.44 | | | | (2.33 | ) | | | (0.83 | ) | | | (3.16 | ) |
2006 | | | 106.24 | | | 2.06 | | | 7.77 | | | | 9.83 | | | | (1.94 | ) | | | (1.11 | ) | | | (3.05 | ) |
2005 | | | 99.12 | | | 1.93 | | | 7.20 | | | | 9.13 | | | | (1.82 | ) | | | (0.19 | ) | | | (2.01 | ) |
Small Cap Fund | | | | | | | | | | | | | | | | | | | | |
Class A | | | | | | | | | | | | | | | | | | | | | | | | | | |
2009 | | $ | 12.42 | | $ | 0.11 | | $ | (4.37 | ) | | $ | (4.26 | ) | | $ | (0.19 | ) | | $ | — | | | $ | (0.19 | ) |
2008 | | | 16.44 | | | 0.11 | | | (2.26 | ) | | | (2.15 | ) | | | (0.12 | ) | | | (1.75 | ) | | | (1.87 | ) |
2007 | | | 15.52 | | | 0.10 | | | 2.85 | | | | 2.95 | | | | (0.12 | ) | | | (1.91 | ) | | | (2.03 | ) |
2006 | | | 14.27 | | | 0.07 | | | 2.55 | | | | 2.62 | | | | (0.06 | ) | | | (1.31 | ) | | | (1.37 | ) |
2005 | | | 14.70 | | | 0.07 | | | 1.38 | | | | 1.45 | | | | (0.05 | ) | | | (1.83 | ) | | | (1.88 | ) |
| * | | The expense ratio includes dividend and interest expenses on short sales. Had these expenses been excluded, the ratios would have been 0.31% for the period ended May 31, 2009 and 0.32%, 0.35% and 0.34% for 2008, 2007 and 2006, respectively. |
| ** | | Includes a return of capital of $0.05 per share. See Note 7 in Notes to Financial Statements. |
| *** | | Includes a return of capital of $0.10 per share. See Note 7 in Notes to Financial Statements. |
| † | | Returns and portfolio turnover rates are for the period indicated and have not been annualized. Returns do not reflect the deduction of taxes the shareholder would pay on fund distributions or redemption of Fund shares. |
| †† | | Per share amounts have been adjusted for a 10 to 1 stock split paid to shareholders of record on November 16, 2006. |
| (1) | | Commenced operations on February 28, 2006. All ratios for the period have been annualized. |
| (2) | | Per share net investment income and net realized and unrealized gains (losses) calculated using average shares. |
| (3) | | The expense ratio includes interest expense on reverse repurchase agreements. Had this expense been excluded, the ratios would have been 0.22%, 0.22%, and 0.47%, respectively. |
Amounts designated as “—” are zero or have been rounded to zero.
The accompanying notes are an integral part of the financial statements.
| | |
| 228 | | SEI Institutional Investments Trust / Annual Report / May 31, 2009 |
| | | | | | | | | | | | | | | | | | | | | | |
Net Asset Value,
End of Period | | Total Return† | | | Net Assets
End of Period
($ Thousands) | | Ratio of Net
Expenses
to Average
Net Assets | | | Ratio of Expenses
to Average
Net Assets
(Excluding Fees
Paid Indirectly
and Including
Waivers) | | | Ratio of Expenses
to Average
Net Assets
(Excluding Fees
Paid Indirectly
and Waivers) | | | Ratio of Net
Investment
Income to
Average
Net Assets | | | Portfolio
Turnover
Rate† | |
| | | | | | | | | | | | | | | | | | | | | | |
| | | | | | | | | | | | | | | | | | | | | | |
| $ | 12.55 | | (31.73 | )% | | $ | 526,421 | | 0.25 | % | | 0.26 | % | | 0.48 | % | | 2.16 | % | | 81 | % |
| | 18.75 | | (5.95 | ) | | | 361,156 | | 0.26 | | | 0.26 | | | 0.47 | | | 1.66 | | | 57 | |
| | 20.31 | | 21.97 | | | | 693,994 | | 0.26 | | | 0.26 | | | 0.46 | | | 1.57 | | | 47 | |
| | 16.93 | | 10.87 | | | | 801,217 | | 0.25 | | | 0.26 | | | 0.48 | | | 1.47 | | | 103 | |
| | 15.53 | | 9.02 | | | | 1,751,751 | | 0.26 | | | 0.26 | | | 0.47 | | | 1.67 | | | 43 | |
| | | | | | | | | | | | | | | | | | | | | | |
| | | | | | | | | | | | | | | | | | | | | | |
| $ | 6.35 | | (37.33 | )% | | $ | 331,002 | | 0.48 | %* | | 0.48 | %* | | 0.64 | % | | 1.41 | % | | 132 | % |
| | 10.23 | | (8.80 | ) | | | 552,361 | | 0.64 | * | | 0.64 | * | | 0.79 | | | 1.17 | | | 77 | |
| | 11.94 | | 22.64 | | | | 453,954 | | 0.62 | * | | 0.62 | * | | 0.74 | | | 1.77 | | | 132 | |
| | 9.94 | | (0.49 | ) | | | 139,046 | | 0.45 | * | | 0.45 | * | | 0.66 | | | 1.70 | | | 47 | |
| | | | | | | | | | | | | | | | | | | | | | |
| | | | | | | | | | | | | | | | | | | | | | |
| $ | 7.36 | | (38.18 | )% | | $ | 6,043,119 | | 0.19 | % | | 0.19 | % | | 0.47 | % | | 1.97 | % | | 108 | % |
| | 12.07 | | (9.57 | ) | | | 8,767,342 | | 0.19 | | | 0.19 | | | 0.47 | | | 1.70 | | | 111 | |
| | 14.38 | | 23.15 | | | | 7,833,212 | | 0.23 | (3) | | 0.23 | (3) | | 0.47 | (3) | | 2.43 | | | 135 | |
| | 12.36 | | 9.33 | | | | 4,938,416 | | 0.24 | | | 0.24 | | | 0.47 | | | 2.10 | | | 140 | |
| | 12.05 | | 10.26 | | | | 3,531,361 | | 0.31 | | | 0.31 | | | 0.47 | | | 1.69 | | | 71 | |
| | | | | | | | | | | | | | | | | | | | | | |
| | | | | | | | | | | | | | | | | | | | | | |
| $ | 78.92 | | (32.99 | )% | | $ | 353,892 | | 0.06 | % | | 0.06 | % | | 0.25 | % | | 2.56 | % | | 18 | % |
| | 121.02 | | (6.25 | ) | | | 386,873 | | 0.06 | | | 0.06 | | | 0.24 | | | 1.97 | | | 14 | |
| | 135.30 | | 22.87 | | | | 416,933 | | 0.06 | | | 0.06 | | | 0.24 | | | 1.88 | | | 10 | |
| | 113.02 | | 9.34 | | | | 367,084 | | 0.08 | | | 0.08 | | | 0.24 | | | 1.84 | | | 20 | |
| | 106.24 | | 9.29 | | | | 320,703 | | 0.13 | | | 0.13 | | | 0.24 | | | 1.89 | | | 8 | |
| | | | | | | | | | | | | | | | | | | | | | |
| | | | | | | | | | | | | | | | | | | | | | |
| $ | 7.97 | | (34.27 | )% | | $ | 985,860 | | 0.52 | % | | 0.54 | % | | 0.72 | % | | 1.26 | % | | 122 | % |
| | 12.42 | | (13.58 | ) | | | 1,819,700 | | 0.52 | | | 0.54 | | | 0.72 | | | 0.80 | | | 99 | |
| | 16.44 | | 20.32 | | | | 2,136,857 | | 0.52 | | | 0.54 | | | 0.72 | | | 0.67 | | | 92 | |
| | 15.52 | | 18.93 | | | | 1,951,138 | | 0.52 | | | 0.54 | | | 0.72 | | | 0.44 | | | 119 | |
| | 14.27 | | 9.81 | | | | 1,610,876 | | 0.54 | | | 0.54 | | | 0.72 | | | 0.46 | | | 94 | |
| | |
| SEI Institutional Investments Trust / Annual Report / May 31, 2009 | | 229 |
Financial Highlights
For the years or periods ended May 31,
For a share outstanding throughout each period
| | | | | | | | | | | | | | | | | | | | | | | | | | |
| | | Net Asset Value,
Beginning of Period | | Net
Investment
Income(3) | | Net Realized
and Unrealized
Gains (Losses)
on Securities | | | Total from
Operations | | | Dividends from
Net Investment
Income | | | Distributions from
Realized
Capital Gains | | | Total Dividends
and Distributions | |
Small/Mid Cap Equity Fund | | | | | | | | | | | | | | | | | | | | | | | |
Class A | | | | | | | | | | | | | | | | | | | | | | | | | | |
2009 | | $ | 12.22 | | $ | 0.12 | | $ | (4.36 | ) | | $ | (4.24 | ) | | $ | (0.13 | ) | | $ | — | | | $ | (0.13 | ) |
2008 | | | 14.95 | | | 0.12 | | | (1.91 | ) | | | (1.79 | ) | | | (0.12 | ) | | | (0.82 | ) | | | (0.94 | ) |
2007†† | | | 13.38 | | | 0.19 | | | 2.57 | | | | 2.76 | | | | (0.13 | ) | | | (1.06 | ) | | | (1.19 | ) |
2006†† | | | 11.96 | | | 0.09 | | | 1.97 | | | | 2.06 | | | | (0.08 | ) | | | (0.56 | ) | | | (0.64 | ) |
2005†† | | | 10.70 | | | 0.05 | | | 1.38 | | | | 1.43 | | | | (0.05 | ) | | | (0.12 | ) | | | (0.17 | ) |
U.S. Managed Volatility Fund | | | | | | | | | | | | | | | | | | | | | | | |
Class A | | | | | | | | | | | | | | | | | | | | | | | | | | |
2009(2) | | $ | 10.00 | | $ | 0.09 | | $ | (0.51 | ) | | $ | (0.42 | ) | | $ | (0.03 | ) | | $ | — | | | $ | (0.03 | ) |
International Equity Fund | | | | | | | | | | | | | | | | | | | | | | | | | | |
Class A | | | | | | | | | | | | | | | | | | | | | | | | | | |
2009 | | $ | 11.12 | | $ | 0.21 | | $ | (5.15 | ) | | $ | (4.94 | ) | | $ | (0.09 | ) | | $ | (0.01 | ) | | $ | (0.10 | ) |
2008 | | | 14.27 | | | 0.37 | | | (1.05 | ) | | | (0.68 | ) | | | (0.44 | ) | | | (2.03 | ) | | | (2.47 | ) |
2007 | | | 14.05 | | | 0.37 | | | 3.12 | | | | 3.49 | | | | (0.50 | ) | | | (2.77 | ) | | | (3.27 | ) |
2006 | | | 11.15 | | | 0.29 | | | 3.09 | | | | 3.38 | | | | (0.37 | ) | | | (0.11 | ) | | | (0.48 | ) |
2005 | | | 10.06 | | | 0.23 | | | 1.16 | | | | 1.39 | | | | (0.30 | ) | | | — | | | | (0.30 | ) |
World Equity Ex-US Fund | | | | | | | | | | | | | | | | | | | | | | | | | | |
Class A | | | | | | | | | | | | | | | | | | | | | | | | | | |
2009 | | $ | 14.56 | | $ | 0.26 | | $ | (6.43 | ) | | $ | (6.17 | ) | | $ | — | | | $ | — | | | $ | — | |
2008 | | | 15.96 | | | 0.38 | | | (0.51 | ) | | | (0.13 | ) | | | (0.39 | ) | | | (0.88 | ) | | | (1.27 | ) |
2007 | | | 12.99 | | | 0.35 | | | 3.47 | | | | 3.82 | | | | (0.33 | ) | | | (0.52 | ) | | | (0.85 | ) |
2006 | | | 9.81 | | | 0.27 | | | 3.01 | | | | 3.28 | | | | (0.09 | ) | | | (0.01 | ) | | | (0.10 | ) |
2005(4) | | | 10.00 | | | 0.07 | | | (0.26 | ) | | | (0.19 | ) | | | — | | | | — | | | | — | |
Screened World Equity Ex-US Fund | | | | | | | | | | | | | | | | | | | | | | | |
Class A | | | | | | | | | | | | | | | | | | | | | | | | | | |
2009(1) | | $ | 10.00 | | $ | 0.14 | | $ | (3.66 | ) | | $ | (3.52 | ) | | $ | (0.06 | ) | | $ | — | | | $ | (0.06 | ) |
Enhanced LIBOR Opportunities Fund | | | | | | | | | | | | | | | | | | | | | | | |
Class A | | | | | | | | | | | | | | | | | | | | | | | | | | |
2009 | | $ | 9.11 | | $ | 0.22 | | $ | (2.22 | ) | | $ | (2.00 | ) | | $ | (0.16 | )* | | $ | — | | | $ | (0.16 | ) |
2008 | | | 10.14 | | | 0.42 | | | (1.00 | ) | | | (0.58 | ) | | | (0.44 | ) | | | (0.01 | ) | | | (0.45 | ) |
2007(7) | | | 10.00 | | | 0.27 | | | 0.03 | | | | 0.30 | | | | (0.16 | ) | | | — | | | | (0.16 | ) |
Core Fixed Income Fund | | | | | | | | | | | | | | | | | | | | | | | | | | |
Class A | | | | | | | | | | | | | | | | | | | | | | | | | | |
2009 | | $ | 9.95 | | $ | 0.52 | | $ | (0.38 | ) | | $ | 0.14 | | | $ | (0.52 | ) | | $ | (0.15 | ) | | $ | (0.67 | ) |
2008 | | | 9.99 | | | 0.54 | | | (0.04 | ) | | | 0.50 | | | | (0.54 | ) | | | — | | | | (0.54 | ) |
2007 | | | 9.84 | | | 0.53 | | | 0.14 | | | | 0.67 | | | | (0.52 | ) | | | — | | | | (0.52 | ) |
2006 | | | 10.34 | | | 0.47 | | | (0.48 | ) | | | (0.01 | ) | | | (0.48 | ) | | | (0.01 | ) | | | (0.49 | ) |
2005 | | | 10.19 | | | 0.41 | | | 0.27 | | | | 0.68 | | | | (0.42 | ) | | | (0.11 | ) | | | (0.53 | ) |
| * | | Includes a return of capital of $0.04 per share. See Note 7 in Notes to Financial Statements. |
| † | | Returns and portfolio turnover rates are for the period indicated and have not been annualized. Returns do not reflect the deduction of taxes the shareholder would pay on fund distributions or redemption of Fund shares. |
| †† | | Per share amounts have been adjusted for a 10 to 1 stock split paid to shareholders of record on November 16, 2006. |
| (1) | | Commenced operations on June 30, 2008. All ratios for the period have been annualized. |
| (2) | | Commenced operations on December 30, 2008. All ratios for the period have been annualized. |
| (3) | | Per share net investment income and net realized and unrealized gains (losses) calculated using average shares. |
| (4) | | Commenced operations on March 28, 2005. All ratios for the period have been annualized. |
| (5) | | The expense ratio includes interest expense on reverse repurchase agreements. Had this expense been excluded, the ratios would have been 0.37%, 0.37%, and 0.59%, respectively. |
| (6) | | The expense ratio includes interest expense on reverse repurchase agreements. Had this expense been excluded, the ratios would have been 0.60%, 0.60%, and 0.67%, respectively. |
| (7) | | Commenced operations on December 14, 2006. All ratios for the period have been annualized. |
| (8) | | The expense ratio includes interest expense on reverse repurchase agreements. Had this expense been excluded, the ratio would have been 0.39%, 0.40%, and 0.61%, respectively. |
| (9) | | The expense ratio includes interest expense on reverse repurchase agreements. Had this expense been excluded, the ratio would have been 0.39%, 0.39%, and 0.61%, respectively. |
| (10) | | The expense ratio includes interest expense on reverse repurchase agreements. Had this expense been excluded, the ratio would have been 0.45%, 0.45%, and 0.66%, respectively. |
Amounts designated as “—” are zero or have been rounded to zero.
The accompanying notes are an integral part of the financial statements.
| | |
| 230 | | SEI Institutional Investments Trust / Annual Report / May 31, 2009 |
| | | | | | | | | | | | | | | | | | | | | | |
Net Asset Value,
End of Period | | Total Return† | | | Net Assets
End of Period
($ Thousands) | | Ratio of Net
Expenses
to Average
Net Assets | | | Ratio of Expenses
to Average
Net Assets
(Excluding Fees
Paid Indirectly
and Including
Waivers) | | | Ratio of Expenses
to Average
Net Assets
(Excluding Fees
Paid Indirectly
and Waivers) | | | Ratio of Net
Investment
Income to
Average
Net Assets | | | Portfolio
Turnover
Rate† | |
| | | | | | | | | | | | | | | | | | | | | | |
| | | | | | | | | | | | | | | | | | | | | | |
| $ | 7.85 | | (34.70 | )% | | $ | 1,724,824 | | 0.48 | % | | 0.50 | % | | 0.72 | % | | 1.40 | % | | 125 | % |
| | 12.22 | | (12.14 | ) | | | 2,373,056 | | 0.49 | | | 0.50 | | | 0.72 | | | 0.97 | | | 95 | |
| | 14.95 | | 21.60 | | | | 1,865,746 | | 0.48 | | | 0.50 | | | 0.72 | | | 0.85 | | | 104 | |
| | 13.38 | | 17.51 | | | | 1,216,640 | | 0.50 | | | 0.53 | | | 0.72 | | | 0.69 | | | 123 | |
| | 11.96 | | 13.38 | | | | 768,897 | | 0.62 | | | 0.62 | | | 0.72 | | | 0.47 | | | 98 | |
| | | | | | | | | | | | | | | | | | | | | | |
| | | | | | | | | | | | | | | | | | | | | | |
| $ | 9.55 | | (4.16 | )% | | $ | 237,860 | | 0.35 | % | | 0.35 | % | | 0.75 | % | | 2.31 | % | | 31 | % |
| | | | | | | | | | | | | | | | | | | | | | |
| | | | | | | | | | | | | | | | | | | | | | |
| $ | 6.08 | | (44.32 | )% | | $ | 704,876 | | 0.39 | %(9) | | 0.39 | %(9) | | 0.61 | %(9) | | 3.03 | % | | 200 | % |
| | 11.12 | | (5.52 | ) | | | 1,452,962 | | 0.40 | (8) | | 0.41 | (8) | | 0.62 | (8) | | 2.99 | | | 145 | |
| | 14.27 | | 28.00 | | | | 1,790,634 | | 0.50 | (5) | | 0.50 | (5) | | 0.71 | (5) | | 2.69 | | | 153 | |
| | 14.05 | | 30.77 | | | | 1,656,985 | | 0.36 | | | 0.36 | | | 0.63 | | | 2.30 | | | 116 | |
| | 11.15 | | 13.73 | | | | 1,677,254 | | 0.43 | | | 0.43 | | | 0.58 | | | 2.12 | | | 48 | |
| | | | | | | | | | | | | | | | | | | | | | |
| | | | | | | | | | | | | | | | | | | | | | |
| $ | 8.39 | | (42.38 | )% | | $ | 2,721,757 | | 0.45 | %(10) | | 0.45 | %(10) | | 0.66 | %(10) | | 3.03 | % | | 171 | % |
| | 14.56 | | (1.14 | ) | | | 3,301,120 | | 0.57 | | | 0.57 | | | 0.67 | | | 2.58 | | | 153 | |
| | 15.96 | | 30.29 | | | | 2,053,014 | | 0.71 | (6) | | 0.71 | (6) | | 0.77 | (6) | | 2.45 | | | 154 | |
| | 12.99 | | 33.52 | | | | 908,582 | | 0.60 | | | 0.61 | | | 0.76 | | | 2.22 | | | 104 | |
| | 9.81 | | (1.90 | ) | | | 234,396 | | 0.60 | | | 0.60 | | | 0.70 | | | 4.35 | | | 15 | |
| | | | | | | | | | | | | | | | | | | | | | |
| | | | | | | | | | | | | | | | | | | | | | |
| $ | 6.42 | | (35.12 | )% | | $ | 52,107 | | 0.80 | % | | 0.80 | % | | 1.10 | % | | 2.38 | % | | 101 | % |
| | | | | | | | | | | | | | | | | | | | | | |
| | | | | | | | | | | | | | | | | | | | | | |
| $ | 6.95 | | (22.20 | )% | | $ | 165,113 | | 0.41 | % | | 0.41 | % | | 0.54 | % | | 2.91 | % | | 27 | % |
| | 9.11 | | (5.88 | ) | | | 244,380 | | 0.42 | | | 0.42 | | | 0.55 | | | 4.45 | | | 25 | |
| | 10.14 | | 3.02 | | | | 123,430 | | 0.44 | | | 0.44 | | | 0.54 | | | 5.84 | | | 53 | |
| | | | | | | | | | | | | | | | | | | | | | |
| | | | | | | | | | | | | | | | | | | | | | |
| $ | 9.42 | | 1.85 | % | | $ | 4,540,593 | | 0.14 | % | | 0.14 | % | | 0.37 | % | | 5.56 | % | | 411 | % |
| | 9.95 | | 5.10 | | | | 6,149,448 | | 0.14 | | | 0.14 | | | 0.37 | | | 5.35 | | | 432 | |
| | 9.99 | | 6.95 | | | | 5,894,127 | | 0.14 | | | 0.14 | | | 0.37 | | | 5.23 | | | 428 | |
| | 9.84 | | (0.09 | ) | | | 4,646,403 | | 0.14 | | | 0.14 | | | 0.37 | | | 4.62 | | | 545 | |
| | 10.34 | | 6.77 | | | | 4,265,249 | | 0.15 | | | 0.15 | | | 0.37 | | | 3.94 | | | 615 | |
| | |
| SEI Institutional Investments Trust / Annual Report / May 31, 2009 | | 231 |
Financial Highlights
For the years or periods ended May 31,
For a share outstanding throughout each period
| | | | | | | | | | | | | | | | | | | | | | | | | | |
| | | Net Asset Value,
Beginning of Period | | Net
Investment
Income(3) | | Net Realized
and Unrealized
Gains (Losses)
on Securities | | | Total from
Operations | | | Dividends from
Net Investment
Income | | | Distributions from
Realized Capital
Gains | | | Total Dividends
and Distributions | |
High Yield Bond Fund | | | | | | | | | | | | | | | | | | | | | | | | | | |
Class A | | | | | | | | | | | | | | | | | | | | | | | | | | |
2009 | | $ | 9.17 | | $ | 0.80 | | $ | (2.14 | ) | | $ | (1.34 | ) | | $ | (0.77 | ) | | $ | (0.06 | ) | | $ | (0.83 | ) |
2008 | | | 10.33 | | | 0.82 | | | (1.07 | ) | | | (0.25 | ) | | | (0.82 | ) | | | (0.09 | ) | | | (0.91 | ) |
2007 | | | 10.08 | | | 0.84 | | | 0.30 | | | | 1.14 | | | | (0.84 | ) | | | (0.05 | ) | | | (0.89 | ) |
2006(2) | | | 10.00 | | | 0.40 | | | 0.08 | | | | 0.48 | | | | (0.40 | ) | | | — | | | | (0.40 | ) |
Long Duration Fund | | | | | | | | | | | | | | | | | | | | | | | | | | |
Class A | | | | | | | | | | | | | | | | | | | | | | | | | | |
2009 | | $ | 8.57 | | $ | 0.39 | | $ | (0.72 | ) | | $ | (0.33 | ) | | $ | (0.47 | ) | | $ | — | | | $ | (0.47 | ) |
2008 | | | 9.52 | | | 0.51 | | | (0.91 | ) | | | (0.40 | ) | | | (0.55 | ) | | | — | | | | (0.55 | ) |
2007 | | | 9.31 | | | 0.53 | | | 0.18 | | | | 0.71 | | | | (0.50 | ) | | | — | | | | (0.50 | ) |
2006 | | | 10.56 | | | 0.46 | | | (1.07 | ) | | | (0.61 | ) | | | (0.54 | ) | | | (0.10 | ) | | | (0.64 | ) |
2005 | | | 9.77 | | | 0.42 | | | 1.03 | | | | 1.45 | | | | (0.54 | ) | | | (0.12 | ) | | | (0.66 | ) |
Emerging Markets Debt Fund | | | | | | | | | | | | | | | | | | | | | | | |
Class A | | | | | | | | | | | | | | | | | | | | | | | | | | |
2009 | | $ | 10.42 | | $ | 0.75 | | $ | (1.19 | ) | | $ | (0.44 | ) | | $ | (0.71 | ) | | $ | — | | | $ | (0.71 | ) |
2008 | | | 10.95 | | | 0.70 | | | (0.37 | ) | | | 0.33 | | | | (0.75 | ) | | | (0.11 | ) | | | (0.86 | ) |
2007 | | | 9.97 | | | 0.65 | | | 1.03 | | | | 1.68 | | | | (0.62 | ) | | | (0.08 | ) | | | (0.70 | ) |
2006(2) | | | 10.00 | | | 0.27 | | | (0.17 | ) | | | 0.10 | | | | (0.13 | ) | | | — | | | | (0.13 | ) |
Real Return Fund | | | | | | | | | | | | | | | | | | | | | | | | | | |
Class A | | | | | | | | | | | | | | | | | | | | | | | | | | |
2009 | | $ | 10.99 | | $ | 0.21 | | $ | (0.27 | ) | | $ | (0.06 | ) | | $ | (0.82 | )* | | $ | — | | | $ | (0.82 | ) |
2008 | | | 10.10 | | | 0.58 | | | 0.75 | | | | 1.33 | | | | (0.34 | ) | | | (0.10 | ) | | | (0.44 | ) |
2007(1) | | | 10.00 | | | 0.26 | | | (0.03 | ) | | | 0.23 | | | | (0.13 | ) | | | — | | | | (0.13 | ) |
| * | | Includes a return of capital of $0.06 per share. See Note 7 in Notes to Financial Statements. |
| † | | Returns and portfolio turnover rates are for the period indicated and have not been annualized. Returns do not reflect the deduction of taxes the shareholder would pay on fund distributions or redemption of Fund shares. |
| (1) | | Commenced operations on December 14, 2006. All ratios for the period have been annualized. |
| (2) | | Commenced operations on December 5, 2005. All ratios for the period have been annualized. |
| (3) | | Per share net investment income and net realized and unrealized gains (losses) calculated using average shares. |
Amounts designated as “—” are zero or have been rounded to zero.
The accompanying notes are an integral part of the financial statements.
| | |
| 232 | | SEI Institutional Investments Trust / Annual Report / May 31, 2009 |
| | | | | | | | | | | | | | | | | | | | | | |
Net Asset Value,
End of Period | | Total Return† | | | Net Assets
End of Period
($Thousands) | | Ratio of Net
Expenses
to Average Net Assets | | | Ratio of Expenses
to Average Net Assets
(Excluding Fees
Paid Indirectly
and Including
Waivers) | | | Ratio of Expenses
to Average Net Assets
(Excluding Fees
Paid Indirectly
and Waivers) | | | Ratio of Net
Investment
Income
to Average
Net Assets | | | Portfolio
Turnover
Rate† | |
| | | | | | | | | | | | | | | | | | | | | | |
| | | | | | | | | | | | | | | | | | | | | | |
| $ | 7.00 | | (13.79 | )% | | $ | 1,239,271 | | 0.35 | % | | 0.35 | % | | 0.56 | % | | 11.34 | % | | 79 | % |
| | 9.17 | | (2.36 | ) | | | 1,399,859 | | 0.35 | | | 0.35 | | | 0.55 | | | 8.63 | | | 59 | |
| | 10.33 | | 11.81 | | | | 1,241,924 | | 0.35 | | | 0.35 | | | 0.56 | | | 8.25 | | | 98 | |
| | 10.08 | | 4.85 | | | | 862,371 | | 0.35 | | | 0.35 | | | 0.57 | | | 8.15 | | | 58 | |
| | | | | | | | | | | | | | | | | | | | | | |
| | | | | | | | | | | | | | | | | | | | | | |
| $ | 7.77 | | (3.89 | )% | | $ | 1,489,047 | | 0.20 | % | | 0.20 | % | | 0.39 | % | | 4.88 | % | | 95 | % |
| | 8.57 | | (4.52 | ) | | | 115,754 | | 0.20 | | | 0.20 | | | 0.39 | | | 5.47 | | | 58 | |
| | 9.52 | | 7.67 | | | | 184,616 | | 0.20 | | | 0.20 | | | 0.38 | | | 5.49 | | | 97 | |
| | 9.31 | | (6.08 | ) | | | 165,324 | | 0.20 | | | 0.20 | | | 0.39 | | | 4.69 | | | 113 | |
| | 10.56 | | 15.26 | | | | 76,054 | | 0.20 | | | 0.20 | | | 0.41 | | | 4.05 | | | 449 | |
| | | | | | | | | | | | | | | | | | | | | | |
| | | | | | | | | | | | | | | | | | | | | | |
| $ | 9.27 | | (3.55 | )% | | $ | 901,226 | | 0.55 | % | | 0.55 | % | | 0.94 | % | | 8.56 | % | | 78 | % |
| | 10.42 | | 3.24 | | | | 1,062,491 | | 0.55 | | | 0.55 | | | 0.93 | | | 6.65 | | | 66 | |
| | 10.95 | | 17.40 | | | | 804,036 | | 0.55 | | | 0.55 | | | 0.94 | | | 6.16 | | | 89 | |
| | 9.97 | | 1.00 | | | | 479,808 | | 0.55 | | | 0.55 | | | 0.95 | | | 5.43 | | | 51 | |
| | | | | | | | | | | | | | �� | | | | | | | | |
| | | | | | | | | | | | | | | | | | | | | | |
| $ | 10.11 | | (0.17 | )% | | $ | 260,477 | | 0.36 | % | | 0.36 | % | | 0.78 | % | | 2.01 | % | | 148 | % |
| | 10.99 | | 13.30 | | | | 362,129 | | 0.43 | | | 0.43 | | | 0.77 | | | 5.36 | | | 47 | |
| | 10.10 | | 2.29 | | | | 221,531 | | 0.44 | | | 0.44 | | | 0.78 | | | 5.67 | | | 18 | |
| | |
| SEI Institutional Investments Trust / Annual Report / May 31, 2009 | | 233 |
Notes to Financial Statements
May 31, 2009
1. ORGANIZATION
SEI Institutional Investments Trust (the “Trust”) was organized as a Massachusetts business trust under a Declaration of Trust dated March 1, 1995. The Trust commenced operations on June 14, 1996.
The Trust is registered under the Investment Company Act of 1940, as amended, as an open-end investment company currently offering 16 Funds: The Large Cap, Large Cap Diversified Alpha, Large Cap Disciplined Equity, Large Cap Index, Small Cap, Small/Mid Cap Equity, U.S. Managed Volatility, International Equity, World Equity Ex-US, Screened World Equity Ex-US, Enhanced LIBOR Opportunities, Core Fixed Income, High Yield Bond, Long Duration, Emerging Markets Debt and Real Return Funds (each a “Fund,” collectively, the “Funds”) each of which are diversified Funds with the exception of the Emerging Markets Debt Fund. The Trust is registered to offer Class A shares of all Funds. The assets of each Fund are segregated, and a shareholder’s interest is limited to the Fund in which shares are held. The Trust’s prospectus provides a description of each Fund’s investment objectives, policies, and strategies.
On May 13, 2009, the Board of Trustees approved the name change of the Real Return Plus Fund to the Real Return Fund.
2. SIGNIFICANT ACCOUNTING POLICIES
The following is a summary of the significant accounting policies followed by the Funds.
Use of Estimates — The preparation of financial statements, in conformity with U.S. generally accepted accounting principles, requires management to make estimates and assumptions that affect the reported amount of assets and liabilities and disclosure of contingent assets and liabilities at the date of the financial statements and the reported amounts of increases and decreases in net assets from operations during the reporting period. Actual results could differ from those estimates.
Security Valuation — Securities listed on a securities exchange, market or automated quotation system for which quotations are readily available (except for securities traded on NASDAQ) are valued at the last quoted sale price on the primary exchange or market (foreign or domestic) on which they are traded, or, if there is no such reported sale, at the most recent quoted bid price. For securities traded on NASDAQ, the NASDAQ Official Closing Price will be used. Debt securities are priced based upon valuations provided by independent, third-party pricing agents, if available. Such values generally reflect the last reported sales price if the security is actively traded. The third-party pricing agents may also value debt securities at an evaluated bid price by employing methodologies that utilize actual market transactions, broker-supplied valuations, or other methodologies designed to identify the market value for such securities. Debt obligations acquired with remaining maturities of sixty days or less may be valued at their amortized cost, which approximates market value. The prices for foreign securities are reported in local currency and converted to
U.S. dollars using currency exchange rates. Prices for most securities held in the Funds are provided daily by recognized independent pricing agents. If a security price cannot be obtained from an independent, third-party pricing agent, the Funds seek to obtain a bid price from at least one independent broker.
Securities for which market prices are not “readily available” are valued in accordance with Fair Value Procedures established by the Trust’s Board of Trustees. The Trust’s Fair Value Procedures are implemented through a Fair Value Committee (the “Committee”) designated by the Trust’s Board of Trustees. Some of the more common reasons that may necessitate that a security be valued using Fair Value Procedures include: the security’s trading has been halted or suspended; the security has been de-listed from a national exchange; the security’s primary trading market is temporarily closed at a time when under normal conditions it would be open; or the security’s primary pricing source is not able or willing to provide a price. When a security is valued in accordance with the Fair Value Procedures, the Committee will determine the value after taking into consideration relevant information reasonably available to the Committee.
For securities that principally trade on a foreign market or exchange, a significant gap in time can exist between the time of a particular security’s last trade and the time at which a Fund calculates its net asset value. The closing prices of such securities may no longer reflect their market value at the time a Fund calculates net asset value if an event that could materially affect the value of those securities (a “Significant Event”) has occurred between the time of the security’s last close and the time that a Fund calculates net asset value. A Significant Event may relate to a single issuer or to an entire market sector. If the adviser or sub-adviser of a Fund becomes aware of a Significant Event that has occurred with respect to a security or group of securities after the closing of the exchange or market on which the security or securities principally trade, but before the time at which a Fund calculates net asset value, the adviser or sub-adviser may request that a Fair Value Committee Meeting be called. In addition, the Trust’s administrator monitors price movements among certain selected indices, securities and/or baskets of securities that may be an indicator that the closing prices received earlier from foreign exchanges or markets may not reflect market value at the time a Fund calculates net asset value. If price movements in a monitored index or security exceed levels established by the administrator, the administrator notifies the adviser or sub-adviser for any Fund holding the relevant securities that such limits have been exceeded. In such event, the adviser or sub-adviser makes the determination whether a Fair Value Committee Meeting should be called based on the information provided.
The International Equity, World Equity Ex-US and Screened World Equity Ex-US Funds that hold international securities also use a third-party fair valuation vendor. The vendor provides a fair value for foreign securities held by these funds based on certain factors and methodologies (involving, generally, tracking valuation correlations between
| | |
| 234 | | SEI Institutional Investments Trust / Annual Report / May 31, 2009 |
the U.S. market and each non-U.S. security). Values from the fair value vendor are applied in the event that there is a movement in the U.S. market that exceeds a specific threshold that has been established by the Committee. The Committee has also established a “confidence interval” which is used to determine the level of historical correlation between the value of a specific foreign security and movements in the U.S. market before a particular security will be fair valued when the threshold is exceeded. In the event that the threshold established by the Committee is exceeded on a specific day, these funds that hold international securities will value the non-U.S. securities within that fund that exceed the applicable “confidence interval” based upon the adjusted prices provided by the fair valuation vendor.
Options and warrants for which the primary market is a national securities exchange are valued at the last sale price on the exchange on which they are traded, or, in the absence of any sale, at the closing bid price. Options and warrants not traded on a national securities exchange are valued at the last quoted bid price.
Financial Accounting Standards Board Statement of Financial Accounting Standards No. 157, Fair Value Measurements (“FAS 157”), was adopted by the Trust effective June 1, 2008. In accordance with FAS 157, fair value is defined as the price that a Fund would receive upon selling an investment in a timely transaction to an independent buyer in the principal or most advantageous market of the investment. FAS 157 established a three-tier hierarchy to max-
imize the use of the observable market data and minimize the use of unobservable inputs and to establish classification of the fair value measurements for disclosure purposes. Inputs refer broadly to the assumptions that market participants would use in pricing an asset. Inputs may be observable or unobservable. Observable inputs are inputs that reflect the assumptions market participants would use in pricing the asset or liability developed based on market data obtained from sources independent of the reporting entity. Unobservable inputs are inputs that reflect the reporting entity’s own assumptions about the assumptions market participants would use in pricing the asset or liability developed based on the best information available in the circumstances.
The three-tier hierarchy of inputs is summarized in the three broad Levels listed below:
| Level 1 — | quoted prices in active markets for identical investments |
| Level 2 — | other significant observable inputs (including quoted prices for similar investments, interest rates, prepayment speeds, credit risks, etc.) |
| Level 3 — | significant unobservable inputs (including a Fund’s own assumptions in determining the fair value of investments) |
The valuation techniques used by a Fund to measure fair value in accordance with FAS 157 during the year ended May 31, 2009 maximized the use of observable inputs and minimized the use of unobservable inputs.
The following is a summary of the inputs used as of May 31, 2009 in valuing the Fund’s investments in accordance with FAS 157 carried at value ($ Thousands):
| | | | | | | | | | | | | | | |
| Investments in Securities* | | Level 1 | | | Level 2 | | | Level 3 | | Total | |
| Large Cap Fund | | $ | 521,642 | | | $ | 29,436 | | | $ | — | | $ | 551,078 | |
| Large Cap Diversified Alpha Fund | | | 301,989 | | | | 6,999 | | | | — | | | 308,988 | |
| Large Cap Disciplined Equity Fund | | | 5,759,556 | | | | 862,625 | | | | — | | | 6,622,181 | |
| Large Cap Index Fund | | | 350,865 | | | | 39,007 | | | | — | | | 389,872 | |
| Small Cap Fund | | | 972,633 | | | | 167,399 | | | | 321 | | | 1,140,353 | |
| Small/Mid Cap Equity Fund | | | 1,693,405 | | | | 215,704 | | | | 384 | | | 1,909,493 | |
| U.S. Managed Volatility Fund | | | 237,159 | | | | 1,200 | | | | — | | | 238,359 | |
| International Equity Fund | | | 44,194 | | | | 705,728 | | | | — | | | 749,922 | |
| World Equity Ex-US Fund | | | 387,401 | | | | 2,520,263 | | | | — | | | 2,907,664 | |
| Screened World Equity Ex-US Fund | | | 10,156 | | | | 41,107 | | | | — | | | 51,263 | |
| Enhanced LIBOR Opportunities Fund | | | 83,244 | | | | 80,001 | | | | 88 | | | 163,333 | |
| Core Fixed Income Fund | | | 284,083 | | | | 4,986,407 | | | | 13,390 | | | 5,283,880 | |
| High Yield Bond Fund | | | 46,521 | | | | 1,367,373 | | | | 47,155 | | | 1,461,049 | |
| Long Duration Fund | | | 63,576 | | | | 1,413,103 | | | | — | | | 1,476,679 | |
| Emerging Markets Debt Fund | | | — | | | | 895,122 | | | | 11,161 | | | 906,283 | |
| Real Return Plus Fund | | | 4,157 | | | | 255,995 | | | | — | | | 260,152 | |
| | | | |
| Liabilities** | | Level 1 | | | Level 2 | | | Level 3 | | Total | |
| Core Fixed Income Fund | | $ | (399 | ) | | $ | — | | | $ | — | | $ | (399 | ) |
| | | | |
| Other Financial Instruments*** | | Level 1 | | | Level 2 | | | Level 3 | | Total | |
| Large Cap Fund | | $ | 1,519 | | | $ | — | | | $ | — | | $ | 1,519 | |
| Large Cap Diversified Alpha Fund | | | 11,359 | | | | — | | | | — | | | 11,359 | |
| Large Cap Disciplined Equity Fund | | | 205,203 | | | | (803 | ) | | | — | | | 204,400 | |
| Large Cap Index Fund | | | 1,077 | | | | — | | | | — | | | 1,077 | |
| | |
| SEI Institutional Investments Trust / Annual Report / May 31, 2009 | | 235 |
Notes to Financial Statements (Continued)
May 31, 2009
| | | | | | | | | | | | |
| Other Financial Instruments*** | | Level 1 | | | Level 2 | | | Level 3 | | | Total | |
| Small Cap Fund | | 4,193 | | | — | | | — | | | 4,193 | |
| Small/Mid Cap Equity Fund | | 804 | | | — | | | — | | | 804 | |
| U.S. Managed Volatility Fund | | 522 | | | | | | | | | 522 | |
| International Equity Fund | | 930 | | | 7,749 | | | — | | | 8,679 | |
| World Equity Ex-US Fund | | 8,750 | | | 15,658 | | | — | | | 24,408 | |
| Screened World Ex-US Fund | | 200 | | | — | | | | | | 200 | |
| Enhanced LIBOR Opportunities Fund | | (21 | ) | | (79 | ) | | — | | | (100 | ) |
| Core Fixed Income Fund | | (789 | ) | | (17,665 | ) | | — | | | (18,454 | ) |
| Long Duration Fund | | (10,158 | ) | | (675 | ) | | — | | | (10,833 | ) |
| Emerging Markets Debt Fund | | 34 | | | (281 | ) | | (975 | ) | | (1,222 | ) |
| * | | Includes collateral for securities on loan. |
| ** | | Includes liabilities for written options contracts. |
| *** | | Other financial instruments are derivative instruments not reflected in the Schedule of Investments, such as futures, forwards and swap contracts, which are valued at the unrealized appreciation/depreciation on the instrument. |
The following is a reconciliation of investments in which significant unobservable inputs (Level 3) were used in determining value ($ Thousands):
| | | | | | | | | | | | |
| Investment in Securities | | Small Cap
Fund | | | Small/Mid Cap
Equity Fund | | | Enhanced LIBOR
Opportunities Fund | |
| Beginning balance as of June 1, 2008 | | $ | 428 | | | $ | 512 | | | $ | 14,365 | |
| Accrued discounts/premiums | | | — | | | | — | | | | (48 | ) |
| Realized gain/(loss) | | | — | | | | — | | | | (2,475 | ) |
| Change in unrealized appreciation/(depreciation) | | | (107 | ) | | | (128 | ) | | | 1,002 | |
| Net purchase/sales | | | — | | | | — | | | | (7,059 | ) |
| Net transfer in and/or out Level 3 | | | — | | | | — | | | | (5,697 | ) |
| Ending balance as of May 31, 2009 | | $ | 321 | | | $ | 384 | | | $ | 88 | |
| | | | | | | | | | | | |
| Investment in Securities and Other Financial Instruments | | Core Fixed
Income Fund | | | High Yield
Bond Fund | | | Emerging Markets
Debt Fund | |
| Beginning balance as of June 1, 2008 | | $ | 316 | | | $ | 145,793 | | | $ | 22,120 | |
| Accrued discounts/premiums | | | 113 | | | | 325 | | | | (132 | ) |
| Realized gain/(loss) | | | (9 | ) | | | (3,889 | ) | | | (360 | ) |
| Change in unrealized appreciation/(depreciation) | | | (4,367 | ) | | | (45,663 | ) | | | (4,099 | ) |
| Net purchase/sales | | | 10,547 | | | | 384 | | | | (7,343 | ) |
| Net transfer in and/or out Level 3 | | | 6,790 | | | | (49,795 | ) | | | — | |
| Ending balance as of May 31, 2009 | | $ | 13,390 | | | $ | 47,155 | | | $ | 10,186 | |
Security Transactions and Investment Income — Security transactions are recorded on the trade date. Cost used in determining net realized capital gains and losses on the sale of securities is determined on the basis of specific identification. Dividend income and expense is recognized on the ex-dividend date, and interest income or expense is recognized using the accrual basis of accounting.
Amortization and accretion is calculated using the scientific interest method, which approximates the effective interest method over the holding period of the security. Amortization of premiums and discounts is included in interest income.
Repurchase Agreements — A Fund may agree to purchase securities from financial institutions subject to the seller’s agreement to repurchase them at a mutually agreed upon date and price. It is the Fund’s policy that repurchase agreements are fully collateralized by U.S. Treasury and Government Agency securities. All collateral is held by the Fund’s custodian bank or a bank with which the custodian bank has entered into a subcustodian agreement, or is segregated in the Federal Reserve Book Entry System. In connection with trans-
actions in repurchase agreements, if the seller defaults and the value of the collateral declines, or if the seller enters an insolvency proceeding, realization of the collateral by the Fund may be delayed or limited.
Reverse Repurchase Agreements — The Large Cap Diversified Alpha, Large Cap Disciplined Equity, International Equity, World Equity Ex-US, Screened World Equity Ex-US Enhanced LIBOR Opportunities and Real Return Funds may issue reverse repurchase agreements. A reverse repurchase agreement involves the sale of portfolio assets together with an agreement to repurchase the same assets later at a fixed price. Additional assets are maintained in an account with the broker. The segregated assets may consist of cash, U.S. Government securities, or other liquid securities at least equal in value to the obligations under the reverse repurchase agreements. In the event the buyer of securities under a reverse repurchase agreement files for bankruptcy or becomes insolvent, those Funds use of the proceeds under the reverse repurchase agreement may be restricted pending a determination by the other party, or its trustee or receiver, whether to enforce the obligation to repurchase the securities. There were no outstanding reverse repurchase agreements as of May 31, 2009.
| | |
| 236 | | SEI Institutional Investments Trust / Annual Report / May 31, 2009 |
Compensating Balances — Funds that use U.S. Bank NA as its custodian with cash overdrafts in excess of $100,000 is required to leave 112% in compensating balances with U.S. Bank NA on the following day. Funds with positive cash balances in excess of $100,000 is allowed to overdraw 90% of the balance with U.S. Bank NA on the following day. Funds that use Brown Brothers Harriman & Co. as their custodian (International Equity, World Equity Ex-US, Screened World Equity Ex-US, Emerging Markets Debt and Real Return Funds) do not have a compensating balance program.
Expenses — Expenses that are directly related to a Fund are charged directly to that Fund. Other operating expenses of the Funds are prorated to the Funds on the basis of relative net assets.
Foreign Currency Translation — The books and records of the Funds investing in international securities are maintained in U.S. dollars on the following basis:
(I) market value of investment securities, assets and liabilities at the current rate of exchange; and
(II) purchases and sales of investment securities, income and expenses at the relevant rates of exchange prevailing on the respective dates of such transactions.
The Funds do not isolate that portion of gains and losses on investments in equity securities that is due to changes in the foreign exchange rates from that which is due to changes in market prices of equity securities.
The Funds report certain foreign-currency-related transactions as components of realized gains for financial reporting purposes, whereas such components are treated as ordinary income for Federal income tax purposes.
Forward Foreign Currency Contracts — The Funds may enter into forward foreign currency contracts as hedges against either specific transactions, fund positions or anticipated fund positions. All commitments are “marked-to-market” daily at the applicable foreign exchange rate, and any resulting unrealized gains or losses are recorded currently. The Large Cap Disciplined Equity, International Equity, World Equity Ex-US, Enhanced LIBOR Opportunities, Core Fixed Income and Emerging Markets Debt Funds realized gains and losses at the time forward contracts were extinguished. Unrealized gains or losses on outstanding positions in forward foreign currency contracts held at the close of the period are recognized as ordinary income or loss for Federal income tax purposes. These funds could be exposed to risk if the counterparties to the contracts are unable to meet the terms of the contract and from unanticipated movements in the value of a foreign currency relative to the U.S. dollar.
Finally, the risk exists that losses could exceed amounts disclosed on the Schedule of Investments or the Statement of Assets and Liabilities.
Futures Contracts — Each of the Funds with the exception of the High Yield Bond Fund utilized futures contracts during the year ended
May 31, 2009. The Funds may purchase future contracts to gain exposure to market changes, which may be more efficient or cost effective than actually buying the securities. The Funds’ investments in futures contracts are for tactical hedging purposes as well as to enhance the Funds’ returns. Upon entering into such a contract, a Fund is required to deposit and maintain as collateral such initial margin as required by the exchange on which the contract is held. The contracts are marked to market daily and the resulting changes in value are accounted for as unrealized gains and losses. Variation margin payments are paid or received, depending upon whether unrealized losses or gains are incurred. When the contract is closed, the Funds record a realized gain or loss equal to the difference between the proceeds from (or cost of) the closing transaction and the amount invested in the contract.
Risks of entering into futures contracts include the possibility that there will be an imperfect price correlation between the futures and the underlying securities. Second, it is possible that a lack of liquidity for futures contracts could exist in the secondary market, resulting in an inability to close a position prior to its maturity date. Third, the futures contract involves the risk that a Fund could lose more than the original margin deposit required to initiate a futures transaction.
Finally, the risk exists that losses could exceed amounts disclosed on the Schedule of Investments or Statement of Assets and Liabilities.
Options/Swaptions Written/Purchased — A Fund may invest in financial options/swaptions contracts primarily for the purpose of hedging its existing portfolio securities, or securities that a Fund intends to purchase, against fluctuations in fair market value caused by changes in prevailing market interest rates. The Funds invest in financial option/swaption contracts to enhance their returns. When a Fund writes or purchases an option/swaption, an amount equal to the premium received or paid by a Fund is recorded as a liability or an asset and is subsequently adjusted to the current market value of the option/swaption written or purchased. Premiums received or paid from writing or purchasing options/ swaptions which expire unexercised are treated by a Fund on the expiration date as realized gains or losses. The difference between the premium and the amount paid or received on effecting a closing purchase or sale transaction, including brokerage commissions, is also treated as a realized gain or loss. If an option/swaption is exercised, the premium paid or received is added to the cost of the purchase or proceeds from the sale in determining whether a Fund has realized a gain or a loss. The Core Fixed Income had option contracts as of May 31, 2009, as disclosed in the Fund’s Schedule of Investments.
The risk in writing a call option/swaption is a Fund may give up the opportunity for profit if the market price of the security increases. The risk in writing a put option/swaption is a Fund may incur a loss if the market price of the security decreases and the option/swaption is exercised. The risk in purchasing an option/swaption is a Fund may pay a premium whether or not the option/swaption is exercised. The Funds also have the additional risk of being unable to enter into a
| | |
| SEI Institutional Investments Trust / Annual Report / May 31, 2009 | | 237 |
Notes to Financial Statements (Continued)
May 31, 2009
closing transaction at an acceptable price if a liquid secondary market does not exist. Option/swaption contracts also involve the risk that they may not work as intended due to unanticipated developments in market conditions or other causes.
Finally, the risk exists that losses could exceed amounts disclosed on the Schedule of Investments or Statement of Assets and Liabilities.
Securities Sold Short — As consistent with each Fund’s investment objectives, a Fund may engage in short sales. Short sales are transactions under which a Fund sells a security it does not own. To complete such a transaction, a Fund must borrow the security to make delivery to the buyer. That Fund then is obligated to replace the security borrowed by purchasing the security at the market price at the time of the replacement. The price at such time may be more or less than the price at which the security was sold by a Fund. Until the security is replaced, a Fund is required to pay the lender amounts equal to any dividends or interest that accrue during the period of the loan. Dividends and interest are shown as an expense for financial reporting purposes. To borrow the security, a Fund also may be required to pay a premium, which would decrease proceeds of the security sold. The proceeds of the short sale are retained by the broker, to the extent necessary to meet margin requirements, until the short position is closed out. A gain, limited to the price at which a Fund sold the security short, or a loss, unlimited in size, will be recognized upon the close of a short sale.
Until a Fund closes its short position or replaces the borrowed security, that Fund will: (a) maintain a segregated account containing cash or liquid securities at such a level that (i) the amount deposited in the account plus the amount deposited with the broker as collateral will equal the current value of the security sold short; and (ii) the amount deposited in the segregated account plus the amount deposited with the broker as collateral will not be less than the market value of the security at the time the security was sold short, or (b) otherwise cover a Fund’s short positions. At May 31, 2009, none of the Funds held any short positions.
Swap Agreements — A Fund may enter into swap contracts to manage interest rate risk and credit risk. A Fund’s investments in swap contracts is mainly for tactical hedging purposes rather than leveraging. A swap agreement is a two-party contract under which an agreement is made to exchange returns from predetermined investments or instruments, including a particular interest rate, foreign currency, or “basket” of securities representing a particular index. Credit default swaps involve the periodic payment by a Fund or counterparty of interest based on a specified rate multiplied by a notional amount assigned to an underlying debt instrument or group of debt instruments in exchange for the assumption of credit risk on the same instruments. In the event of a credit event, usually in the form of a credit rating downgrade, the party receiving periodic payments (i.e. floating rate payer) must pay the other party (i.e. fixed rate payer) an amount equal to the outstanding principal of the downgraded debt instrument. Total return swaps allow an investor to benefit from the
cash flow without ever actually owning the underlying security. The receiver must pay any decline in value to the payer at the end of the total return swap. However, the investor does not need to make a payment if there is no decline in price. Payments can be made on various indices, bonds (i.e. mortgage backed securities, bank debt and corporate), loans or commodities. The value of a total return swap is equal to the change in value of the underlying asset versus the accrued income payment based on LIBOR (London Interbank Offered Rate) or some other form of index on the notional amount. Interest rate swaps involve the exchange by a Fund with another party of their respective commitments to pay or receive interest (e.g., an exchange of floating rate payments for fixed rate payments) with respect to a notional amount of principal to manage a Fund’s exposure to interest rates. Payments received or made are recorded as realized gains or losses. A Fund could be exposed to credit or market risk due to unfavorable changes in the fluctuation of interest rates or if the counterparty defaults on its obligation to perform. Risk of loss may exceed amounts recognized on the statement of assets and liabilities. In connection with swap agreements, securities/cash may be set aside as collateral by a Fund’s custodian. A Fund may enter into swap agreements in order to, among other things, change the maturity or duration of the investment portfolio; protect a Fund’s value from changes in interest rates; or expose a Fund to a different security or market.
Swaps are marked-to-market daily based upon quotations from market makers and the resulting changes in market values, if any, are recorded as unrealized gains or losses in the Statement of Operations. Net payments of interest are recorded as realized gains or losses. Entering into swap agreements involves, to varying degrees, elements of credit and market risk in excess of the amounts recognized on the Schedule of Investments or the Statement of Assets and Liabilities. Such risks involve the possibility that there will be no liquid market for these agreements, that the counterparty to the agreement may default on its obligation to perform and that there may be unfavorable changes in the fluctuation of interest rates. Risks also arise from potential losses from adverse market movements.
This risk is mitigated by having a master netting arrangement between a Fund and the counterparty and by having the counterparty post collateral to cover a Fund’s exposure to the counterparty.
Forward Treasury Commitments — A Fund may invest in commitments to purchase U.S. Treasury securities on an extended settlement basis. Such transactions involve the commitment to purchase a security with payment and delivery taking place in the future, sometimes a month or more after the transaction date. The Funds account for such transactions as purchases and sales and record an unrealized gain or loss each day equal to the difference between the cost of the purchase commitment and the current market value. Realized gains or losses are recorded upon closure or settlement of such commitments. No interest is earned prior to settlement of the transaction. These instruments are subject to market fluctuation due to changes in interest rates and the market value at the time of settlement could be
| | |
| 238 | | SEI Institutional Investments Trust / Annual Report / May 31, 2009 |
higher or lower than the purchase price. A Fund may incur losses due to changes in the value of the underlying treasury securities from interest rate fluctuations or as a result of counterparty nonperformance.
Delayed Delivery Transactions — The Large Cap Disciplined Equity, Large Cap Diversified Alpha, Core Fixed Income, International Equity and World Equity Ex-US Funds may purchase or sell securities on a when-issued or delayed delivery basis. These transactions involve a commitment by those funds to purchase or sell securities for a predetermined price or yield, with payment and delivery taking place beyond the customary settlement period. When purchasing a security on a delayed delivery basis, that fund assumes the rights and risks of ownership of the security, including the risk of price and yield fluctuations, and takes such fluctuations into account when determining its net asset value. Those funds may dispose of or renegotiate a delayed delivery transaction after it is entered into, and may sell when-issued securities before they are delivered, which may result in a capital gain or loss. When those Funds have sold a security on a delayed delivery basis, that Fund does not participate in future gains and losses with respect to the security.
Collateralized Debt Obligations — A Fund may invest in collateralized debt obligations (“CDOs”), which include collateralized loan obligations (“CLOs”) and other similarly structured securities. CLOs are a type of asset-backed securities. A CLO is a trust typically collateralized by a pool of loans, which may include, among others, domestic and foreign senior secured loans, senior unsecured loans, and subordinate corporate loans, including loans that may be rated below investment grade or equivalent unrated loans. CDOs may charge management fees and administrative expenses.
For CDOs, the cashflows from the trust are split into two or more portions, called tranches, varying in risk and yield. The riskiest portion is the “equity” tranche which bears the bulk of defaults from the bonds or loans in the trust and serves to protect the other, more senior tranches from default in all but the most severe circumstances. Since it is partially protected from defaults, a senior tranche from a CDO trust typically has a higher rating and lower yield than their underlying securities, and can be rated investment grade. Despite the protection
from the equity tranche, CDO tranches can experience substantial losses due to actual defaults, increased sensitivity to defaults due to collateral default and disappearance of protecting tranches, market anticipation of defaults, as well as aversion to CDO securities as a class.
The risks of an investment in a CDO depend largely on the type of the collateral securities and the class of the CDO in which a Fund invests. Normally, CLOs and other CDOs are privately offered and sold, and thus, are not registered under the securities laws. As a result, investments in CDOs may be characterized by a Fund as illiquid securities; however, an active dealer market may exist for CDOs allowing a CDO to qualify for Rule 144A transactions. In addition to the normal risks associated with fixed income securities (e.g., interest rate risk and default risk), CDOs carry additional risks including, but not limited to: (i) the possibility that distributions from collateral securities will not be adequate to make interest or other payments; (ii) the quality of the collateral may decline in value or default; (iii) a Fund may invest in CDOs that are subordinate to other classes; and (iv) the complex structure of the security may not be fully understood at the time of investment and may produce disputes with the issuer or unexpected investment results.
Dividends and Distributions to Shareholders — Dividends from net investment income are declared and paid to shareholders quarterly for the Large Cap, Large Cap Diversified Alpha, Large Cap Disciplined Equity, Large Cap Index, Small Cap, Small/Mid Cap Equity, U.S. Managed Volatility, Enhanced LIBOR Opportunities and Emerging Markets Debt Funds; declared daily and paid monthly for the Core Fixed Income, Long Duration and High Yield Bond Funds; and declared and paid at least annually for the International Equity, World Equity Ex-US, Screened World Equity Ex-US and Real Return Funds. Dividends and distributions are recorded on the ex-dividend date. Any net realized capital gains will be distributed at least annually by the Funds.
Illiquid Securities — A security is considered illiquid if it cannot be sold or disposed of in the ordinary course of business within seven days or less for its approximate carrying value on the books of a Fund. Valuations of illiquid securities may differ significantly from the values that would have been used had an active market value for these securities existed.
| | |
| SEI Institutional Investments Trust / Annual Report / May 31, 2009 | | 239 |
Notes to Financial Statements (Continued)
May 31, 2009
Restricted Securities — At May 31, 2009, the following Funds owned private placement investments that were purchased through private offerings or acquired through initial public offerings and cannot be sold without prior registration under the Securities Act of 1933 or pursuant to an exemption therefrom. In addition, these Funds have generally agreed to further restrictions on the disposition of certain holdings as set forth in various agreements entered into in connection with the purchase of these private placement investments. The acquisition dates of these investments, the enforceable right to acquire these private placement investments, along with the cost and values at May 31, 2009, were as follows:
| | | | | | | | | | | | | | | |
| | | Number of Shares/
Face Amount ($ Thousands) | | Acquisition
Date | | Right to
Acquire
Date | | Cost
($ Thousands) | | Market Value
($ Thousands) | | % of Net
Assets | |
| | | | | | |
| Small Cap Fund | | | | | | | | | | | | | | | |
Rentech | | 16,100 | | 4/20/07 | | 4/20/07 | | $ | — | | $ | 1 | | 0.00 | % |
Scorpio Mining | | 425 | | 5/5/08 | | 5/5/08 | | | 417 | | | 321 | | 0.03 | % |
Value Creation | | 119,600 | | 2/29/08 | | 2/29/08 | | | 1,225 | | | 549 | | 0.06 | % |
| | | | | | | | | | | | | | | |
| | | | | | | | $ | 1,642 | | $ | 871 | | 0.09 | % |
| | | | | | | | | | | | | | | |
| | | | | | |
| Small/Mid Cap Equity Fund | | | | | | | | | | | | | | | |
Rentech | | 13,800 | | 4/20/07 | | 4/20/07 | | $ | — | | $ | — | | 0.00 | % |
Scorpio Mining | | 509 | | 5/5/08 | | 5/5/08 | | | 499 | | | 384 | | 0.02 | % |
Value Creation | | 85,600 | | 2/29/08 | | 2/29/08 | | | 871 | | | 393 | | 0.03 | % |
| | | | | | | | | | | | | | | |
| | | | | | | | $ | 1,370 | | $ | 777 | | 0.05 | % |
| | | | | | | | | | | | | | | |
| | | | | | |
| Core Fixed Income Fund | | | | | | | | | | | | | | | |
Allegheny Energy Supply | | 1,955 | | 4/19/06 | | 4/19/06 | | $ | 2,046 | | $ | 2,032 | | 0.04 | % |
| | | | | | | | | | | | | | | |
Investments in Real Estate Investment Trusts (“REITs”) — Dividend income is recorded based on the income included in distributions received from the REIT investments using published REIT reclassifications including some management estimates when actual amounts are not available. Distributions received in excess of this estimated amount are recorded as a reduction of the cost of investments or reclassified to capital gains. The actual amounts of income, return of capital, and capital gains are only determined by each REIT after its fiscal year-end, and may differ from the estimated amounts.
3. DERIVATIVE TRANSACTIONS
In March 2008, the FASB issued SFAS No. 161, Disclosures about Derivative Instruments and Hedging Activities. SFAS No. 161 is effective for fiscal years and interim periods beginning after November 15, 2008 and was adopted by the Trust effective November 30, 2008. SFAS No. 161 requires enhanced disclosures about a Fund’s derivative and hedging activities, including how such activities are accounted for and their effect on a Fund’s financial position, performance, and cash flows.
On September 12, 2008, the FASB issued FASB Staff Position (“FSP”) No. FAS 133-1 and FASB Interpretation Number (“FIN”) 45-4 (“FSP 133-1”), Disclosures about Credit Derivatives and Certain Guarantees: An Amendment of FASB Statement No. 133 and FASB Interpretation No. 45; and Clarification of the Effective Date of FASB Statement No. 161. The FSP is intended to improve disclosures about credit derivatives by requiring more information about the potential adverse effects of changes in credit risk on the financial position, financial performance, and cash flows of the sellers of credit derivatives. It amends FASB Statement No. 133, Accounting for Derivative Instruments and Hedging Activities, to require disclosures by sellers of credit derivatives, including credit derivatives embedded in hybrid instruments. The FSP also amends FIN 45, Guarantor’s Accounting and Disclosure Requirements for Guarantees, Including Indirect Guarantees of Indebtedness to Others, to require an
additional disclosure about the current status of the payment/performance risk of a guarantee. FSP 133-1 and FIN 45-4 is effective for reporting periods (annual or interim) ending after November 15, 2008 and was adopted by the Trust effective November 30, 2008.
A Fund enters into credit default swaps to simulate long and short bond positions that are either unavailable or considered to be less attractively priced in the bond market. A Fund uses these swaps to reduce risk where a Fund has exposure to the issuer, or to take an active long or short position with respect to the likelihood of an event of default. The reference obligation of the swap can be a single issuer, a “basket” of issuers, or an index. The underlying referenced assets are corporate debt, sovereign debt and asset backed securities.
The buyer of a credit default swap is generally obligated to pay the seller a periodic stream of payments over the term of the contract in return for a contingent payment upon the occurrence of a credit event with respect to an underlying reference obligation. Generally, a credit event for corporate or sovereign reference obligations means bankruptcy, failure to pay, obligation acceleration, repudiation/moratorium or restructuring. For credit default swaps on asset-backed securities, a credit event may be triggered by events such as failure to pay principal, maturity extension, rating downgrade or write-down.
If a Fund is a seller of protection, and a credit event occurs, as defined under the terms of that particular swap agreement, a Fund will generally either (i) pay to the buyer an amount equal to the notional amount of the swap and take delivery of the referenced obligation, other deliverable obligations, or underlying securities comprising a referenced index or (ii) pay a net settlement amount in the form of cash or securities equal to the notional amount of the swap less the recovery value of the referenced obligation or underlying securities comprising a referenced index.
If a Fund is a buyer of protection and a credit event occurs, as defined under the terms of that particular swap agreement, a Fund
| | |
| 240 | | SEI Institutional Investments Trust / Annual Report / May 31, 2009 |
will either (i) receive from the seller of protection an amount equal to the notional amount of the swap and deliver the referenced obligation, other deliverable obligations or underlying securities comprising the referenced index or (ii) receive a net settlement amount in the form of cash or securities equal to the notional amount of the swap less the recovery value of the referenced obligation or underlying securities comprising the referenced index. Recovery values are assumed by market makers considering either industry standard recovery rates or entity specific factors and considerations until a credit event occurs. If a credit event has occurred, the recovery value is determined by a facilitated auction whereby a minimum number of allowable broker bids, together with a specified valuation method, are used to calculate the settlement value.
Certain Funds are party to International Swap Dealers Association, Inc. Master Agreements (“ISDA Master Agreements”). These agreements are with select counterparties and they govern transactions, including certain over-the counter derivative and foreign exchange contracts, entered into by the Funds and the counterparty. The ISDA Master Agreements maintain provisions for general obligations, representations, agreements, collateral, and events of default or termination. The occurrence of a specified event of termination may give a counterparty the right to terminate all of its contracts and affect settlement of all outstanding transactions under the applicable ISDA Master Agreement.
As of May 31, 2009, the Core Fixed, Long Duration, Emerging Markets Debt Funds are the buyers (“receiving protection”) on a total notional amount of $79.8 million, $0.0 million and $1.0 million, respectively) and are the sellers (“providing protection”) on a total notional amount of $80.6 million, $1.2 million and $7.5 million, respectively. The notional amounts of the swaps are not recorded in the financial statements; however the notional amount does approximate the maximum potential amount of future payments that the Funds could be required to make if the Funds were the sellers of protection and a credit event were to occur. Those credit default swaps (“CDS”) for which the Funds are providing protection at balance sheet date are summarized as follows:
| | | | | | | | | | | | | | | |
CORE FIXED INCOME FUND WRITTEN CREDIT DERIVATIVE CONTRACTS | | SINGLE NAME CDS | | CDS ON AN INDEX | | | |
| REFERENCE ASSET | | CORP
US$ | | SOVEREIGN
US$ | | ABS
US$ | | | CORP
US$ | | Total | |
Fair value of written credit derivatives | | $ | 249,304 | | — | | $ | (50,747,424 | ) | | — | | $ | (50,498,120 | ) |
Maximum potential amount of future payments | | $ | 7,970,000 | | — | | $ | 72,645,000 | | | — | | $ | 80,615,000 | |
Recourse provisions with third parties to recover any amounts paid under the credit derivative (including any purchased credit protection)1 | | | — | | — | | | — | | | — | | | — | |
Collateral held by the fund can obtain upon occurrence of triggering event | | | — | | — | | | — | | | — | | | — | |
| 1 | | Potential recoveries would include purchased credit derivatives to the extent they offset written credit derivatives which have an identical underlying, or a netting arrangement or credit support annex with the counterparty. There may be other potential recoveries from recourse provisions where agreements cover multiple derivative arrangements but those amounts have not been included. |
| | | | | | | | | | | | | | | | |
| MAXIMUM POTENTIAL AMOUNT OF FUTURE PAYMENTS BY CONTRACT TERM |
| CORE FIXED INCOME FUND | | 0-6 MONTHS | | 6-12 MONTHS | | 1-5 YEARS | | 5-10 YEARS | | > 10 YEARS | | Total |
Current credit spread* on underlying (in basis points)1 | | | | | | | | | | | | | | | | |
0-1,000 | | — | | — | | $ | 7,970,000 | | $ | 6,300,000 | | | — | | $ | 14,270,000 |
1,001-3,000 | | — | | — | | | — | | | — | | | — | | | — |
3,001-5,000 | | — | | — | | | — | | | — | | $ | 27,045,000 | | $ | 27,045,000 |
5,001-7,000 | | — | | — | | | — | | | — | | $ | 22,200,000 | | $ | 22,200,000 |
> than 7,000 | | — | | — | | | — | | | — | | $ | 17,100,000 | | $ | 17,100,000 |
Total | | — | | — | | $ | 7,970,000 | | $ | 6,300,000 | | $ | 66,345,000 | | $ | 80,615,000 |
| * | | The credit spread on the underlying asset is generally indicative of the current status of the underlying risk of the Fund having to perform. The spread also reflects the cost of buying/selling protection and may include upfront payments required to be made to enter into a contract. Higher credit spreads with a shorter contract term is indicative of a higher likelihood of performance by the Fund. |
The credit spread disclosed above for each reference obligation where the Fund is the seller of protection is a representation of the current payment/performance risk of the swap.
| | | | | | | | | | | | | | |
LONG DURATION FUND WRITTEN CREDIT DERIVATIVE CONTRACTS | | SINGLE NAME CDS | | CDS ON AN INDEX | | | |
| REFERENCE ASSET | | CORP
US$ | | SOVEREIGN
US$ | | ABS
US$ | | | CORP
US$ | | Total | |
Fair value of written credit derivatives | | — | | — | | $ | (890,575 | ) | | — | | $ | (890,575 | ) |
Maximum potential amount of future payments | | — | | — | | $ | 1,225,000 | | | — | | $ | 1,225,000 | |
Recourse provisions with third parties to recover any amounts paid under the credit derivative (including any purchased credit protection)1 | | — | | — | | | — | | | — | | | — | |
Collateral held by the fund can obtain upon occurrence of triggering event | | — | | — | | | — | | | — | | | — | |
| 1 | | Potential recoveries would include purchased credit derivatives to the extent they offset written credit derivatives which have an identical underlying, or a netting arrangement or credit support annex with the counterparty. There may be other potential recoveries from recourse provisions where agreements cover multiple derivative arrangements but those amounts have not been included. |
| | |
| SEI Institutional Investments Trust / Annual Report / May 31, 2009 | | 241 |
Notes to Financial Statements (Continued)
May 31, 2009
| | | | | | | | | | | | | | |
| MAXIMUM POTENTIAL AMOUNT OF FUTURE PAYMENTS BY CONTRACT TERM |
| LONG DURATION FUND | | 0-6 MONTHS | | 6-12 MONTHS | | 1-5 YEARS | | 5-10 YEARS | | > 10 YEARS | | Total |
Current credit spread* on underlying (in basis points)1 | | | | | | | | | | | | | | |
0-1,000 | | — | | — | | — | | — | | | — | | | — |
1,001-2,000 | | — | | — | | — | | — | | | — | | | — |
2,001-3,000 | | — | | — | | — | | — | | | — | | | — |
3,001-4000 | | — | | — | | — | | — | | $ | 1,225,000 | | $ | 1,225,000 |
> than 4,000 | | — | | — | | — | | — | | | — | | | — |
Total | | — | | — | | — | | — | | $ | 1,225,000 | | $ | 1,225,000 |
| * | | The credit spread on the underlying asset is generally indicative of the current status of the underlying risk of the Fund having to perform. The spread also reflects the cost of buying/selling protection and may include upfront payments required to be made to enter into a contract. Higher credit spreads with a shorter contract term is indicative of a higher likelihood of performance by the Fund. |
The credit spread disclosed above for each reference obligation where the Fund is the seller of protection is a representation of the current payment/performance risk of the swap.
| | | | | | | | | | | | | | |
EMERGING MARKETS DEBT FUND WRITTEN CREDIT DERIVATIVE CONTRACTS | | SINGLE NAME CDS | | CDS on an INDEX | | | |
| REFERENCE ASSET | | CORP
US$ | | SOVEREIGN
US$ | | ABS US$ | | | CORP
US$ | | Total | |
Fair value of written credit derivatives | | — | | — | | $ | (807,451 | ) | | — | | $ | (807,451 | ) |
Maximum potential amount of future payments | | — | | — | | $ | 7,500,000 | | | — | | $ | 7,500,000 | |
Recourse provisions with third parties to recover any amounts paid under the credit derivative (including any purchased credit protection)1 | | — | | — | | | — | | | — | | | — | |
Collateral held by the fund can obtain upon occurrence of triggering event | | — | | — | | $ | 3,600,000 | | | — | | $ | 3,600,000 | |
| 1 | | Potential recoveries would include purchased credit derivatives to the extent they offset written credit derivatives which have an identical underlying, or a netting arrangement or credit support annex with the counterparty. There may be other potential recoveries from recourse provisions where agreements cover multiple derivative arrangements but those amounts have not been included. |
| | | | | | | | | | | | | | | | | |
| MAXIMUM POTENTIAL AMOUNT OF FUTURE PAYMENTS BY CONTRACT TERM |
| EMERGING MARKETS DEBT FUND | | 0-6 MONTHS | | 6-12 MONTHS | | 1-5 YEARS | | 5-10 YEARS | | > 10 YEARS | | Total |
Current credit spread* on underlying (in basis points)1 | | | | | | | | | | | | | | | | | |
0-1,000 | | | — | | $ | 900,000 | | | — | | $ | 600,000 | | — | | $ | 1,500,000 |
1,001-2,500 | | $ | 3,000,000 | | | — | | | — | | | — | | — | | $ | 3,000,000 |
2,501-4,000 | | | — | | | — | | | — | | | — | | — | | | — |
4,001-5,500 | | | — | | $ | 2,400,000 | | $ | 600,000 | | | — | | — | | $ | 3,000,000 |
> than 5,500 | | | — | | | — | | | — | | | — | | — | | | — |
Total | | $ | 3,000,000 | | $ | 3,300,000 | | $ | 600,000 | | $ | 600,000 | | — | | $ | 7,500,000 |
| * | | The credit spread on the underlying asset is generally indicative of the current status of the underlying risk of the Fund having to perform. The spread also reflects the cost of buying/selling protection and may include upfront payments required to be made to enter into a contract. Higher credit spreads with a shorter contract term is indicative of a higher likelihood of performance by the Fund. |
The credit spread disclosed above for each reference obligation where the Fund is the seller of protection is a representation of the current payment/performance risk of the swap.
The fair value of derivative instruments as of May 31, 2009 was as follows:
| | | | | | | | | | | |
| | | Asset Derivatives | | | Liability Derivatives |
| | | Year ended May 31, 2009
($ Thousands) | | | Year ended May 31, 2009
($ Thousands) |
| Contract Type | | Statements of Assets & Liabilities Location | | Fair Value | | | Statements of Assets & Liabilities Location | | Fair Value |
Derivatives not accounted for as hedging instruments under Statement 133: | | | | | | | | | |
Large Cap Disciplined Equity | | | | | | | | | | | |
Foreign exchange contracts | | Unrealized gain on forward foreign currency contracts | | $ | 1,461 | | | Unrealized loss on forward foreign currency contracts | | $ | 2,264 |
Equity contracts | | Net Assets — Unrealized appreciation on futures contracts | | | 205,203 | * | | Net Assets — Unrealized depreciation on futures contracts | | | — |
| | | | | | | | | | | |
Total Derivatives not accounted for as hedging instruments under Statement 133 | | $ | 206,664 | | | | | $ | 2,264 |
| | | | | | | | | |
| | |
| 242 | | SEI Institutional Investments Trust / Annual Report / May 31, 2009 |
| | | | | | | | | | | | |
| | | Asset Derivatives | | | Liability Derivatives | |
| | | Year ended May 31, 2009
($ Thousands) | | | Year ended May 31, 2009
($ Thousands) | |
| Contract Type | | Statements of Assets & Liabilities Location | | Fair Value | | | Statements of Assets & Liabilities Location | | Fair Value | |
International Equity | | | | | | | | | | | | |
Foreign exchange contracts | | Unrealized gain on forward foreign currency contracts | | $ | 4,161 | | | Unrealized loss on forward foreign currency contracts | | $ | 2,873 | |
Credit contracts | | Net Assets — Unrealized appreciation on swap contracts | | $ | 689 | † | | Net Assets — Unrealized depreciation on swap contracts | | | — | |
Equity contracts | | Net Assets — Unrealized appreciation on futures contracts | | | 3,969 | * | | Net Assets — Unrealized depreciation on futures contracts | | $ | 3,039 | * |
| | Net Assets — Unrealized appreciation on swap contracts | | | 5,445 | † | | Net Assets — Unrealized depreciation on swap contracts | | | — | |
| | | | | | | | | | | | |
Total Derivatives not accounted for as hedging instruments under Statement 133 | | $ | 14,264 | | | | | $ | 5,912 | |
| | | | | | | | | | |
| | | | |
World Equity Ex-US | | | | | | | | | | | | |
Interest rate contracts | | Net Assets — Unrealized appreciation on futures contracts | | | — | | | Net Assets — Unrealized depreciation on futures contracts | | $ | 45 | |
Foreign exchange contracts | | Unrealized gain on forward foreign currency contracts | | $ | 11,633 | | | Unrealized loss on forward foreign currency contracts | | | 5,528 | |
Credit contracts | | Net Assets — Unrealized appreciation on swap contracts | | | 920 | † | | Net Assets — Unrealized depreciation on swap contracts | | | — | |
Equity contracts | | Net Assets — Unrealized appreciation on futures contracts | | | 11,838 | * | | Net Assets — Unrealized depreciation on futures contracts | | | 3,043 | * |
| | Net Assets — Unrealized appreciation on swap contracts | | | 8,633 | † | | Net Assets — Unrealized depreciation on swap contracts | | | — | |
| | | | | | | | | | | | |
Total Derivatives not accounted for as hedging instruments under Statement 133 | | $ | 33,024 | | | | | $ | 8,616 | |
| | | | | | | | | | |
| | | | |
Enhanced LIBOR Opportunities | | | | | | | | | | | | |
Interest rate contracts | | Net Assets — Unrealized appreciation on futures contracts | | | — | | | Net Assets — Unrealized depreciation on futures contracts | | $ | 21 | * |
Foreign exchange contracts | | Unrealized gain on forward foreign currency contracts | | $ | 1,975 | | | Unrealized loss on forward foreign currency contracts | | | 2,054 | |
| | | | | | | | | | | | |
Total Derivatives not accounted for as hedging instruments under Statement 133 | | $ | 1,975 | | | | | $ | 2,075 | |
| | | | | | | | | | |
| | | | |
Core Fixed Income | | | | | | | | | | | | |
Interest rate contracts | | Net Assets — Unrealized appreciation on futures contracts | | $ | 4,875 | * | | Net Assets — Unrealized depreciation on futures contracts | | $ | 5,664 | * |
| | Investments, at value | | | — | | | Options written, at value | | | 399 | |
Foreign exchange contracts | | Unrealized gain on forward foreign currency contracts | | | 1,229 | | | Unrealized loss on forward foreign currency contracts | | | 2,269 | |
Credit contracts | | Net Assets — Unrealized appreciation on swap contracts | | | 2,422 | † | | Net Assets — Unrealized depreciation on swap contracts | | | 19,047 | † |
| | | | | | | | | | | | |
Total Derivatives not accounted for as hedging instruments under Statement 133 | | $ | 8,526 | | | | | $ | 27,379 | |
| | | | | | | | | | |
| | | | |
Long Duration | | | | | | | | | | | | |
Interest rate contracts | | Net Assets — Unrealized appreciation on futures contracts | | | — | | | Net Assets — Unrealized depreciation on futures contracts | | $ | 10,158 | * |
Credit contracts | | Net Assets — Unrealized depreciation on swap contracts | | | — | | | Net Assets — Unrealized depreciation on swap contracts | | | 675 | † |
| | | | | | | | | | | | |
Total Derivatives not accounted for as hedging instruments under Statement 133 | | | — | | | | | $ | 10,833 | |
| | | | | | | | | | |
| | | | |
Emerging Markets Debt | | | | | | | | | | | | |
Interest rate contracts | | Net Assets — Unrealized appreciation on futures contracts | | $ | 35 | * | | Net Assets — Unrealized depreciation on futures contracts | | $ | 1 | * |
Foreign exchange contracts | | Unrealized gain on forward foreign currency contracts | | | 1,664 | | | Unrealized loss on forward foreign currency contracts | | | 1,800 | |
Credit contracts | | Net Assets — Unrealized depreciation on swap contracts | | | 481 | † | | Net Assets — Unrealized depreciation on swap contracts | | | 971 | † |
Equity contracts | | Net Assets — Unrealized depreciation on swap contracts | | | 345 | † | | Net Assets — Unrealized depreciation on swap contracts | | | 975 | † |
| | | | | | | | | | | | |
Total Derivatives not accounted for as hedging instruments under Statement 133 | | $ | 2,525 | | | | | $ | 3,747 | |
| | | | | | | | | | |
| * | | Includes cumulative appreciation/depreciation of futures contracts as reported in the Schedules of Investments. Only current day's variation margin is reported within the Statements of Assets & Liabilities. |
| † | | Includes cumulative appreciation/depreciation of swap contracts as reported in the Schedules of Investments. Market Value is reported within the |
Statements of Assets & Liabilities for swap contracts that have paid premiums.
| | |
| SEI Institutional Investments Trust / Annual Report / May 31, 2009 | | 243 |
Notes to Financial Statements (Continued)
May 31, 2009
The effect of derivative instruments on the Statements of Operations for the year ended May 31, 2009.
Amount of realized Gain or (Loss) on Derivatives Recognized in Income ($ Thousands):
| | | | | | | | | | | | | | | | | | | | |
Derivatives Not Accounted for as Hedging
Instruments under Statement 133 | | Options/
Swaptions | | | Futures | | | Forward
Currency
Contracts | | | Swaps | | | Total | |
Large Cap Disciplined Equity | | | | | | | | | | | | | | | | | | | | |
Interest rate contracts | | $ | — | | | $ | 2,468 | | | $ | — | | | $ | — | | | $ | 2,468 | |
Foreign exchange contracts | | | — | | | | — | | | | (1,246 | ) | | | — | | | | (1,246 | ) |
Equity contracts | | | — | | | | (813,563 | ) | | | — | | | | — | | | | (813,563 | ) |
Total | | $ | — | | | $ | (811,095 | ) | | $ | (1,246 | ) | | $ | — | | | $ | (812,341 | ) |
International Equity | | | | | | | | | | | | | | | | | | | | |
Interest rate contracts | | $ | (12 | ) | | $ | (1,604 | ) | | $ | — | | | $ | (27,789 | ) | | $ | (29,405 | ) |
Foreign exchange contracts | | | — | | | | — | | | | (15,906 | ) | | | — | | | | (15,906 | ) |
Credit contracts | | | — | | | | — | | | | — | | | | 4,911 | | | | 4,911 | |
Equity contracts | | | — | | | | (70,204 | ) | | | — | | | | (15,399 | ) | | | (85,603 | ) |
Total | | $ | (12 | ) | | $ | (71,808 | ) | | $ | (15,906 | ) | | $ | (38,277 | ) | | $ | (126,003 | ) |
World Equity Ex-US | | | | | | | | | | | | | | | | | | | | |
Interest rate contracts | | $ | (21 | ) | | $ | (3,150 | ) | | $ | — | | | $ | (61,106 | ) | | $ | (64,277 | ) |
Foreign exchange contracts | | | — | | | | — | | | | (35,991 | ) | | | — | | | | (35,991 | ) |
Credit contracts | | | — | | | | — | | | | — | | | | 9,832 | | | | 9,832 | |
Equity contracts | | | — | | | | (153,735 | ) | | | — | | | | (43,698 | ) | | | (197,433 | ) |
Total | | $ | (21 | ) | | $ | (156,885 | ) | | $ | (35,991 | ) | | $ | (94,972 | ) | | $ | (287,869 | ) |
Enhanced LIBOR Opportunities | | | | | | | | | | | | | | | | | | | | |
Interest rate contracts | | $ | — | | | $ | (1,289 | ) | | $ | — | | | $ | 64 | | | $ | (1,225 | ) |
Foreign exchange contracts | | | — | | | | — | | | | (1,933 | ) | | | — | | | | (1,933 | ) |
Credit contracts | | | — | | | | — | | | | — | | | | 208 | | | | 208 | |
Total | | $ | — | | | $ | (1,289 | ) | | $ | (1,933 | ) | | $ | 272 | | | $ | (2,950 | ) |
Core Fixed Income | | | | | | | | | | | | | | | | | | | | |
Interest rate contracts | | $ | 14,883 | | | $ | 8,285 | | | $ | — | | | $ | 8,504 | | | $ | 32,198 | |
Foreign exchange contracts | | | — | | | | — | | | | 11,896 | | | | — | | | | 11,896 | |
Credit contracts | | | — | | | | — | | | | — | | | | (39,775 | ) | | | (39,775 | ) |
Total | | $ | 14,883 | | | $ | 8,285 | | | $ | 11,896 | | | $ | (31,271 | ) | | $ | 4,319 | |
Long Duration | | | | | | | | | | | | | | | | | | | | |
Interest rate contracts | | $ | — | | | $ | (17,437 | ) | | $ | — | | | $ | 27,192 | | | $ | 9,755 | |
Credit contracts | | | — | | | | — | | | | — | | | | (4,770 | ) | | | (4,770 | ) |
Total | | $ | — | | | $ | (17,437 | ) | | $ | — | | | $ | 22,422 | | | $ | 4,985 | |
Emerging Markets Debt | | | | | | | | | | | | | | | | | | | | |
Interest rate contracts | | $ | 830 | | | $ | 2,172 | | | $ | — | | | $ | (3,533 | ) | | $ | (531 | ) |
Foreign exchange contracts | | | (439 | ) | | | — | | | | (719 | ) | | | — | | | | (1,158 | ) |
Credit contracts | | | — | | | | — | | | | — | | | | (74 | ) | | | (74 | ) |
Total | | $ | 391 | | | $ | 2,172 | | | $ | (719 | ) | | $ | (3,607 | ) | | $ | (1,763 | ) |
Real Return | | | | | | | | | | | | | | | | | | | | |
Interest rate contracts | | $ | — | | | $ | 1,395 | | | $ | — | | | $ | — | | | $ | 1,395 | |
Foreign exchange contracts | | | — | | | | — | | | | 2,593 | | | | — | | | | 2,593 | |
Equity contracts | | | — | | | | (1,201 | ) | | | — | | | | — | | | | (1,201 | ) |
Total | | $ | — | | | $ | 194 | | | $ | 2,593 | | | $ | — | | | $ | 2,787 | |
| | |
| 244 | | SEI Institutional Investments Trust / Annual Report / May 31, 2009 |
Change in Unrealized Appreciation or (Depreciation) on Derivatives Recognized in Income ($ Thousands):
| | | | | | | | | | | | | | | | | | | | |
Derivatives Not Accounted for as Hedging Instruments under Statement 133 | | Options/
Swaptions* | | | Futures | | | Forward
Currency
Contracts | | | Swaps | | | Total | |
Large Cap Disciplined Equity | | | | | | | | | | | | | | | | | | | | |
Interest rate contracts | | $ | — | | | $ | (220 | ) | | $ | — | | | $ | — | | | $ | (220 | ) |
Foreign exchange contracts | | | — | | | | — | | | | (450 | ) | | | — | | | | (450 | ) |
Equity contracts | | | — | | | | 49,273 | | | | — | | | | — | | | | 49,273 | |
Total | | $ | — | | | $ | 49,053 | | | $ | (450 | ) | | $ | — | | | $ | 48,603 | |
International Equity | | | | | | | | | | | | | | | | | | | | |
Interest rate contracts | | $ | (149 | ) | | $ | 533 | | | $ | — | | | $ | — | | | $ | 384 | |
Foreign exchange contracts | | | — | | | | — | | | | 1,761 | | | | — | | | | 1,761 | |
Credit contracts | | | — | | | | — | | | | — | | | | (773 | ) | | | (773 | ) |
Equity contracts | | | — | | | | (6,751 | ) | | | — | | | | 880 | | | | (5,871 | ) |
Total | | $ | (149 | ) | | $ | (6,218 | ) | | $ | 1,761 | | | $ | 107 | | | $ | (4,499 | ) |
World Equity Ex-US | | | | | | | | | | | | | | | | | | | | |
Interest rate contracts | | $ | (260 | ) | | $ | (51 | ) | | $ | — | | | $ | — | | | $ | (311 | ) |
Foreign exchange contracts | | | — | | | | — | | | | 6,508 | | | | — | | | | 6,508 | |
Credit contracts | | | — | | | | — | | | | — | | | | (802 | ) | | | (802 | ) |
Equity contracts | | | — | | | | (19,653 | ) | | | — | | | | (316 | ) | | | (19,969 | ) |
Total | | $ | (260 | ) | | $ | (19,704 | ) | | $ | 6,508 | | | $ | (1,118 | ) | | $ | (14,574 | ) |
Enhanced LIBOR Opportunities | | | | | | | | | | | | | | | | | | | | |
Interest rate contracts | | $ | — | | | $ | (23 | ) | | $ | — | | | $ | (85 | ) | | $ | (108 | ) |
Foreign exchange contracts | | | — | | | | — | | | | 235 | | | | — | | | | 235 | |
Total | | $ | — | | | $ | (23 | ) | | $ | 235 | | | $ | (85 | ) | | $ | 127 | |
Core Fixed Income | | | | | | | | | | | | | | | | | | | | |
Interest rate contracts | | $ | (247 | ) | | $ | 3,172 | | | $ | — | | | $ | (55 | ) | | $ | 2,870 | |
Foreign exchange contracts | | | — | | | | — | | | | (1,367 | ) | | | — | | | | (1,367 | ) |
Credit contracts | | | — | | | | — | | | | — | | | | 22,990 | | | | 22,990 | |
Total | | $ | (247 | ) | | $ | 3,172 | | | $ | (1,367 | ) | | $ | 22,935 | | | $ | 24,493 | |
Long Duration | | | | | | | | | | | | | | | | | | | | |
Interest rate contracts | | $ | — | | | $ | (10,174 | ) | | $ | — | | | $ | (5,623 | ) | | $ | (15,797 | ) |
Credit contracts | | | — | | | | — | | | | — | | | | 3,999 | | | | 3,999 | |
Total | | $ | — | | | $ | (10,174 | ) | | $ | — | | | $ | (1,624 | ) | | $ | (11,798 | ) |
Emerging Markets Debt | | | | | | | | | | | | | | | | | | | | |
Interest rate contracts | | $ | — | | | $ | (35 | ) | | $ | — | | | $ | 2,758 | | | $ | 2,723 | |
Foreign exchange contracts | | | (105 | ) | | | — | | | | 1,448 | | | | — | | | | 1,343 | |
Credit contracts | | | — | | | | — | | | | — | | | | (446 | ) | | | (446 | ) |
Equity contracts | | | — | | | | — | | | | — | | | | (1,521 | ) | | | (1,521 | ) |
Total | | $ | (105 | ) | | $ | (35 | ) | | $ | 1,448 | | | $ | 791 | | | $ | 2,099 | |
Real Return | | | | | | | | | | | | | | | | | | | | |
Interest rate contracts | | $ | — | | | $ | (690 | ) | | $ | — | | | $ | — | | | $ | (690 | ) |
Foreign exchange contracts | | | — | | | | — | | | | (608 | ) | | | — | | | | (608 | ) |
Equity contracts | | | — | | | | (1,344 | ) | | | — | | | | — | | | | (1,344 | ) |
Total | | $ | — | | | $ | (2,034 | ) | | $ | (608 | ) | | $ | — | | | $ | (2,642 | ) |
| * | | Includes purchased and written options/Swaptions. |
Written options transactions entered into during the year ended May 31, 2009 are summarized as follows:
| | | | | | | | | | | | | | |
| | | Core Fixed
Income Fund | | | Emerging Markets
Debt Fund | |
| | | Number of
Contracts | | | Premium
($ Thousands) | | | Number of
Contracts | | | Premium
($ Thousands) | |
| Balance at the beginning of period | | 2,672 | | | $ | 1,913 | | | 40,770,600 | * | | $ | 264 | |
| Written | | 19,568 | | | | 14,928 | | | — | | | | — | |
| Expired | | (15,491 | ) | | | (11,613 | ) | | (40,770,600 | )* | | | (264 | ) |
| Closing buys | | (5,757 | ) | | | (4,619 | ) | | — | | | | — | |
| Balance at the end of period | | 992 | | | $ | 609 | | | — | | | $ | — | |
| * | | Shown in Brazilian Real. |
Written swaptions transactions entered into during the year ended May 31, 2009 are summarized as follows:
| | | | | | | |
| | | Core Fixed
Income Fund | |
| | | Notional Amount
(Thousands) | | | Premium
($ Thousands) | |
| Balance at the beginning of period | | 44,000 | | | $ | 959 | |
| Written | | — | | | | — | |
| Expired | | — | | | | — | |
| Closing buys | | (44,000 | ) | | | (959 | ) |
| Balance at the end of period | | — | | | $ | — | |
At May 31, 2009 the Funds had cash and/or securities at least equal to the value of written options.
| | |
| SEI Institutional Investments Trust / Annual Report / May 31, 2009 | | 245 |
Notes to Financial Statements (Continued)
May 31, 2009
4. AGREEMENTS AND OTHER TRANSACTIONS WITH AFFILIATES
Administration and Transfer Agency Agreements —The Trust and SEI Investments Global Funds Services (the “Administrator”) are parties to an Amended and Restated Administration and Transfer Agency Agreement dated December 10, 2003 under which the Administrator provides administrative and shareholder servicing for an annual fee of 0.05% of the average daily net assets of each Fund. For the year ended May 31, 2009, and until further notice, the Administrator has voluntarily agreed to waive all of its fee.
Investment Advisory Agreement — SEI Investments Management Corporation (“SIMC”) serves as investment adviser (the “Adviser”) to each Fund. In connection with serving as investment adviser, SIMC is entitled to a fee that is calculated daily and paid monthly based on the average daily net assets of each Fund. SIMC has voluntarily agreed to waive a portion of its fee so that the total annual expenses of each Fund, exclusive of acquired fund fees expenses, will not exceed certain voluntary expense limitations adopted by SIMC. These waivers may be terminated at any time. The advisory fee and voluntary expense limitations for Class A of each Fund for the period indicated are as follows:
| | | | | | |
| | | Advisory
Fees | | | Voluntary
Expense
Limitations | |
Large Cap Fund | | 0.400 | % | | 0.260 | % |
Large Cap Diversified Alpha Fund | | 0.400 | | | 0.350 | |
Large Cap Disciplined Equity Fund | | 0.400 | | | 0.220 | |
Large Cap Index Fund | | 0.170 | | | 0.060 | |
Small Cap Fund | | 0.650 | | | 0.540 | |
Small/Mid Cap Equity Fund | | 0.650 | | | 0.500 | |
U.S. Managed Volatility Fund | | 0.650 | | | 0.350 | |
International Equity Fund | | 0.505 | | | 0.390 | |
World Equity Ex-US Fund | | 0.550 | | | 0.450 | |
Screened World Equity Ex-US Fund | | 0.650 | | | 0.800 | |
Enhanced LIBOR Opportunities Fund | | 0.450 | | | 0.440 | |
Core Fixed Income Fund | | 0.300 | | | 0.140 | |
High Yield Bond Fund | | 0.4875 | | | 0.350 | |
Long Duration Fund | | 0.300 | | | 0.200 | |
Emerging Markets Debt Fund | | 0.850 | | | 0.550 | |
Real Return Fund | | 0.700 | | | 0.360 | |
As of May 31, 2009, SIMC has entered into investment sub-advisory agreements with the following parties and pays the sub-advisers out of the fee that it receives from the Funds:
|
| Investment Sub-Adviser |
Large Cap Fund |
Aronson + Johnson + Ortiz, L.P. |
Delaware Management Company |
INTECH Investment Management, LLC |
Goldman Sachs Asset Management, L.P. |
Legg Mason Capital Management, Inc. |
LSV Asset Management |
Montag & Caldwell, Inc. |
Quantitative Management Associates, LLC |
|
| Investment Sub-Adviser |
Large Cap Diversified Alpha Fund |
Analytic Investors, LLC |
Aronson + Johnson + Ortiz, L.P. |
Delaware Management Company |
INTECH Investment Management, LLC |
Legg Mason Capital Management, Inc. |
Quantitative Management Associates, LLC |
Large Cap Disciplined Equity Fund |
Analytic Investors, Inc. |
INTECH Investment Management, LLC |
Legg Mason Capital Management, Inc. |
Massachusetts Financial Services Company |
Quantitative Management Associates, LLC |
Large Cap Index Fund |
SSgA Funds Management, Inc. |
Small Cap Fund |
Artisan Partners Limited Partnership |
BlackRock Capital Management, Inc. |
Integrity Asset Management, LLC |
Janus Capital Management, Inc. |
Lee Munder Investments, Ltd. |
Los Angeles Capital Management and Equity Research, Inc. |
LSV Asset Management |
Martingale Asset Management, L.P. |
McKinley Capital Management, Inc. |
Neuberger Berman Management, LLC |
Oppenheimer Capital, LLC |
PanAgora Asset Management, Inc. |
Robeco Investment Management, Inc. |
Security Capital Research and Management, Inc. |
Wellington Management Company, LLP |
Small/Mid Cap Equity Fund |
BlackRock Capital Management, Inc. |
Integrity Asset Management, LLC |
Janus Capital Management, Inc. |
Lee Munder Investments, Ltd. |
Los Angeles Capital Management and Equity Research, Inc. |
LSV Asset Management |
Martingale Asset Management, L.P. |
PanAgora Asset Management, Inc. |
Security Capital Research and Management Incorporated |
Wellington Management Company, LLP |
Wells Capital Management, Inc. |
U.S. Managed Volatility Fund |
Analytic Investors, LLC |
Aronson + Johnson + Ortiz, LP |
International Equity Fund |
Acadian Asset Management, Inc. |
AXA Rosenberg Investment Management, LLC |
Declaration Management + Research, LLC |
INTECH Investment Management, LLC |
McKinley Capital Management, Inc. |
Principal Global Investors, LLC |
Quantitative Management Associates, LLC |
Record Currency Management Limited |
UBS Global Asset Management (Americas), Inc.* |
Wellington Management Company, LLC |
| | |
| 246 | | SEI Institutional Investments Trust / Annual Report / May 31, 2009 |
|
| Investment Sub-Adviser |
World Equity Ex-US Fund |
Acadian Asset Management, Inc. |
Artisan Partners Limited Partnership |
AXA Rosenberg Investment Management, LLC |
Declaration Management + Research, LLC |
INTECH Investment Management, LLC |
McKinley Capital Management, Inc. |
Principal Global Investors, LLC |
Quantitative Management Associates, LLC |
Record Currency Management Limited |
Rexiter Capital Management Limited |
UBS Global Asset Management (Americas), Inc.* |
Wellington Management Company, LLC |
Screened World Equity Ex-US Fund |
AXA Rosenberg Investment Management, LLC |
McKinley Capital Management, Inc. |
Principal Global Investors, LLC |
Quantitative Management Associates, LLC |
Enhanced LIBOR Opportunities Fund |
Ares Management, LLC |
Declaration Management + Research, LLC* |
UBS Global Asset Management (Americas), Inc.* |
Wellington Management Company, LLP |
Core Fixed Income Fund |
J.P. Morgan Investment Management, Inc. |
Metropolitan West Asset Management, LLC |
Wells Capital Management, Inc. |
Western Asset Management Company |
Western Asset Management Company Limited |
High Yield Bond Fund |
Ares Management, LLC |
Brigade Capital Management, LLC |
Delaware Management Company |
Guggenheim Partners, LLC |
J.P. Morgan Investment Management, Inc. |
Long Duration Fund |
Metropolitan West Asset Management, LLC |
Emerging Markets Debt Fund |
Ashmore Investment Management Limited |
ING Investment Management Advisors, B.V. |
Stone Harbor Investment Partners, L.P. |
Real Return Fund |
Deutsche Investment Management Americas, Inc. |
* Not funded. As of May 31, 2009, this manager has not been allocated assets to manage.
Other —The Distribution Agreement between SEI Investments Distribution Co. (the “Distributor”) and the Trust provides that the Distributor may receive compensation on fund transactions effected for the Trust in accordance with Securities and Exchange Commission
(“SEC”) rules. Accordingly, it is expected that fund transactions may result in brokerage commissions being paid to the Distributor. The SEC rules require that such commissions not exceed usual and customary commissions.
Such commissions for the year ended May 31, 2009 were as follows ($ Thousands):
| | | |
| Large Cap Fund | | $ | 9 |
| Large Cap Diversified Alpha Fund | | | 2 |
| Small Cap Fund | | | 43 |
| Small/Mid Cap Equity Fund | | | 75 |
| International Equity Fund | | | 21 |
| World Equity Ex-US Fund | | | 43 |
Certain officers and/or trustees of the Trust are also officers of the Administrator or the Adviser. The Trust pays each unaffiliated Trustee an annual fee for attendance at quarterly, interim and committee meetings. Compensation of officers and affiliated Trustees of the Trust is paid by the Adviser or Administrator.
A portion of the services provided by the Chief Compliance Officer (“CCO”) and his staff, whom are employees of the Administrator, are paid for by the Trust as incurred. The services include regulatory oversight of the Trust’s Adviser, sub-advisers and service providers as required by SEC regulations. The CCO’s services have been approved by and are reviewed by the Board.
LSV Asset Management (partially-owned subsidiary of SIMC) serves as a sub-adviser to the Large Cap, Small Cap and Small/Mid Cap Equity Funds. For this service LSV Asset Management is entitled to receive a fee from SIMC. Such fees for the year ended May 31, 2009 were as follows ($ Thousands):
| | | |
| Large Cap Fund | | $ | 54 |
| Small Cap Fund | | | 361 |
| Small/Mid Cap Equity Fund | | | 618 |
Fees Paid Indirectly — The Funds may direct certain fund trades to the Distributor who pays a portion of the Fund’s expenses. Accordingly, the expenses reduced, which were used to pay third party expenses, can be found on the Statement of Operations and the effect on the Fund’s expense ratio, as a percentage of the Fund’s average daily net assets for the year ended May 31, 2009, can be found on the Financial Highlights.
Investment in Affiliated Companies — The Funds may purchase securities of certain companies with which it is affiliated to the extent these companies are represented in its Index. The Funds may invest the cash collateral from the securities lending program in the SEI Liquidity Fund LP.
| | |
| SEI Institutional Investments Trust / Annual Report / May 31, 2009 | | 247 |
Notes to Financial Statements (Continued)
May 31, 2009
5. CAPITAL SHARE TRANSACTIONS
Capital Share Transactions for the Funds were as follows (Thousands):
| | | | | | | | | | | | | | | | | | |
| | | Large Cap Fund | | | Large Cap
Diversified
Alpha | | | Large Cap
Disciplined
Equity Fund | |
| | | 2009 | | | 2008 | | | 2009 | | | 2008 | | | 2009 | | | 2008 | |
Class A: | | | | | | | | | | | | | | | | | | |
Shares Issued | | 27,740 | | | 1,264 | | | 23,513 | | | 24,295 | | | 263,121 | (1) | | 238,005 | (1) |
Shares Issued In Lieu of Dividends and Distributions | | 533 | | | 439 | | | 471 | | | 2,371 | | | 10,546 | | | 47,757 | |
Shares Redeemed | | (5,596 | ) | | (16,621 | ) | | (25,871 | ) | | (10,704 | )(2) | | (178,882 | ) | | (104,554 | )(2) |
Increase (Decrease) in Net Assets
Derived from Class A Transactions | | 22,677 | | | (14,918 | ) | | (1,887 | ) | | 15,962 | | | 94,785 | | | 181,208 | |
| | | | | | | | | | | | | | | | | | |
| | | Large Cap
Index Fund | | | Small Cap Fund | | | Small/Mid
Cap Fund | |
| | | 2009 | | | 2008 | | | 2009 | | | 2008 | | | 2009 | | | 2008 | |
Class A: | | | | | | | | | | | | | | | | | | |
Shares Issued | | 1,929 | | | 402 | | | 22,882 | | | 12,562 | | | 64,980 | | | 82,115 | (1) |
Shares Issued In Lieu of Dividends and Distributions | | 106 | | | 133 | | | 2,879 | | | 17,151 | | | 3,467 | | | 12,383 | |
Shares Redeemed | | (748 | ) | | (420 | ) | | (48,524 | ) | | (13,187 | ) | | (43,013 | ) | | (25,125 | ) |
Increase (Decrease) in Net Assets
Derived from Class A Transactions | | 1,287 | | | 115 | | | (22,763 | ) | | 16,526 | | | 25,434 | | | 69,373 | |
| | | | | | | | | | | | | | | | | | |
| | | U.S. Managed
Volatility Fund(3) | | | International
Equity Fund | | | World Equity
Ex-US Fund | |
| | | 2009 | | | 2009 | | | 2008 | | | 2009 | | | 2008 | |
Class A: | | | | | | | | | | | | | | | |
Shares Issued | | 25,465 | | | 44,814 | | | 14,402 | | | 180,222 | | | 106,952 | |
Shares Issued In Lieu of Dividends and Distributions | | 64 | | | 2,178 | | | 23,314 | | | — | | | 14,951 | |
Shares Redeemed | | (619) | | | (61,714 | ) | | (32,472 | ) | | (82,715 | ) | | (23,847 | ) |
Increase (Decrease) in Net Assets
Derived from Class A Transactions | | 24,910 | | | (14,722 | ) | | 5,244 | | | 97,507 | | | 98,056 | |
| | | | | | | | | | | | | | | | | | |
| | | | | | | | | | | | | | | |
| | | Screened World Equity
Ex-US Fund(4) | | | Enhanced LIBOR
Opportunities Fund | | | Core Fixed
Income Fund | |
| | | 2009 | | | 2009 | | | 2008 | | | 2009 | | | 2008 | |
Class A: | | | | | | | | | | | | | | | |
Shares Issued | | 10,439 | | | 3,618 | | | 18,586 | | | 193,251 | | | 187,314 | |
Shares Issued In Lieu of Dividends and Distributions | | 87 | | | 488 | | | 922 | | | 40,439 | | | 32,620 | |
Shares Redeemed | | (2,414 | ) | | (7,198 | ) | | (4,850 | ) | | (369,431 | ) | | (191,923 | ) |
Increase (Decrease) in Net Assets
Derived from Class A Transactions | | 8,112 | | | (3,092 | ) | | 14,658 | | | (135,741 | ) | | 28,011 | |
| | | | | | | | | | | | | | | |
| | | | | | High Yield
Bond Fund | | | Long
Duration Fund | |
| | | | | | 2009 | | | 2008 | | | 2009 | | | 2008 | |
Class A: | | | | | | | | | | | | | | | |
Shares Issued | | | | | 48,241 | | | 40,343 | | | 183,981 | | | 1,748 | |
Shares Issued In Lieu of Dividends and Distributions | | | | | 19,620 | | | 13,246 | | | 3,116 | | | 994 | |
Shares Redeemed | | | | | (43,406 | ) | | (21,064 | ) | | (9,083 | ) | | (8,614 | ) |
Increase (Decrease) in Net Assets
Derived from Class A Transactions | | | | | 24,455 | | | 32,525 | | | 178,014 | | | (5,872 | ) |
| | | | | | | | | | | | | | | |
| | | | | | Emerging
Markets Debt | | | Real Return
Fund | |
| | | | | | 2009 | | | 2008 | | | 2009 | | | 2008 | |
Class A: | | | | | | | | | | | | | | | |
Shares Issued | | | | | 26,254 | | | 32,634 | | | 6,992 | | | 21,809 | |
Shares Issued In Lieu of Dividends and Distributions | | | | | 8,541 | | | 7,298 | | | 2,090 | | | 1,192 | |
Shares Redeemed | | | | | (39,588 | ) | | (11,353 | ) | | (16,281 | ) | | (11,993 | ) |
Increase (Decrease) in Net Assets
Derived from Class A Transactions | | | | | (4,793 | ) | | 28,579 | | | (7,199 | ) | | 11,008 | |
| (1) | | Includes subscriptions as a result of in-kind transfers of securities (See Note 8). |
| (2) | | Includes redemptions as a result of in-kind transfers of securities (See Note 8). |
| (3) | | Fund commenced operations on January 2, 2009. |
| (4) | | Fund commenced operations on June 30, 2008. |
Amounts designated as “—” are zero or have been rounded to zero.
| | |
| 248 | | SEI Institutional Investments Trust / Annual Report / May 31, 2009 |
6. INVESTMENT TRANSACTIONS
The cost of security purchases and proceeds from the sale and maturities of securities other than temporary cash investments, during the year ended May 31, 2009, were as follows:
| | | | | | | | | |
| | | U.S. Gov’t
($ Thousands) | | Other
($ Thousands) | | Total
($ Thousands) |
Large Cap Fund | | | | | | | | | |
Purchases | | $ | — | | $ | 522,177 | | $ | 522,177 |
Sales | | | — | | | 269,842 | | | 269,842 |
Large Cap Diversified Alpha Fund | | | | | | | | | |
Purchases | | | — | | | 515,353 | | | 515,353 |
Sales | | | — | | | 596,980 | | | 596,980 |
Large Cap Disciplined Equity Fund | | | | | | | | | |
Purchases | | | — | | | 6,865,798 | | | 6,865,798 |
Sales | | | — | | | 6,534,827 | | | 6,534,827 |
Large Cap Index Fund | | | | | | | | | |
Purchases | | | — | | | 162,946 | | | 162,946 |
Sales | | | — | | | 59,886 | | | 59,886 |
Small Cap Fund | | | | | | | | | |
Purchases | | | — | | | 1,353,449 | | | 1,353,449 |
Sales | | | — | | | 1,530,855 | | | 1,530,855 |
Small/Mid Cap Fund | | | | | | | | | |
Purchases | | | — | | | 2,338,432 | | | 2,338,432 |
Sales | | | — | | | 2,142,709 | | | 2,142,709 |
U.S. Managed Volatility Fund | | | | | | | | | |
Purchases | | | — | | | 262,457 | | | 262,457 |
Sales | | | — | | | 44,226 | | | 44,226 |
| | | | | | | | | |
| | | U.S. Gov’t
($ Thousands) | | Other
($ Thousands) | | Total
($ Thousands) |
International Equity Fund | | | | | | | | | |
Purchases | | $ | 543,847 | | $ | 1,155,672 | | $ | 1,699,519 |
Sales | | | 645,818 | | | 1,267,041 | | | 1,912,859 |
World Equity Ex-US Fund | | | | | | | | | |
Purchases | | | 1,206,425 | | | 3,442,324 | | | 4,648,749 |
Sales | | | 1,411,453 | | | 2,535,061 | | | 3,946,514 |
Screened World Equity
Ex-US Fund | | | | | | | | | |
Purchases | | | — | | | 131,776 | | | 131,776 |
Sales | | | — | | | 52,617 | | | 52,617 |
Enhanced LIBOR Opportunities Fund | | | | | | | | | |
Purchases | | | 4,076 | | | 21,867 | | | 25,943 |
Sales | | | 10,905 | | | 16,061 | | | 26,966 |
Core Fixed Income Fund | | | | | | | | | |
Purchases | | | 20,130,961 | | | 1,832,256 | | | 21,963,217 |
Sales | | | 21,607,577 | | | 1,946,119 | | | 23,553,696 |
High Yield Bond Fund | | | | | | | | | |
Purchases | | | 268 | | | 865,387 | | | 865,655 |
Sales | | | — | | | 746,436 | | | 746,436 |
Long Duration Bond Fund | | | | | | | | | |
Purchases | | | 711,958 | | | 754,410 | | | 1,466,368 |
Sales | | | 294,479 | | | 37,913 | | | 332,392 |
Emerging Markets Debt Fund | | | | | | | | | |
Purchases | | | — | | | 675,804 | | | 675,804 |
Sales | | | — | | | 643,926 | | | 643,926 |
Real Return Fund | | | | | | | | | |
Purchases | | | 415,790 | | | 8,778 | | | 424,568 |
Sales | | | 507,070 | | | 9,221 | | | 516,291 |
7. FEDERAL TAX INFORMATION
It is each Fund’s intention to continue to qualify as a regulated investment company under Subchapter M of the Internal Revenue Code and distribute all of its taxable income (including net capital gains). Accordingly, no provision for Federal income taxes is required.
Dividends from net investment income and distributions from net realized capital gains are determined in accordance with U.S. Federal income tax regulations, which may differ from those amounts determined under accounting principles generally accepted in the United States of America. These book/tax differences are either temporary or permanent in nature. To the extent these differences are permanent, they are charged or credited to paid-in capital, undistributed net investment income or accumulated net realized gain, as appropriate, in the period that the differences arise.
Accordingly, the following permanent differences, primarily attributable to different treatment for gains and losses on paydowns of mortgage and asset-backed securities for tax purposes, defaulted bond basis adjustments, reclassification of long term capital gain distributions on Real Estate Investment Trust securities, reclassification of income and expense from swap transactions, gains and losses on passive foreign investment companies, foreign currency related transactions, return of capital, net investment losses, investments in partnerships and short sale of investments have been reclassified to/from the following accounts as of May 31, 2009:
| | | | | | | | | | | | |
| | | Undistributed
Net Investment
Income (Loss)
($ Thousands) | | | Accumulated
Realized
Gain (Loss)
($ Thousands) | | | Paid-in Capital
($ Thousands) | |
Large Cap Fund | | $ | 36 | | | $ | (36 | ) | | $ | — | |
Large Cap Diversified Alpha Fund | | | (981 | ) | | | 4,612 | | | | (3,631 | ) |
Large Cap Disciplined Equity Fund | | | (21,319 | ) | | | 101,154 | | | | (79,835 | ) |
Large Cap Index Fund | | | 40 | | | | (40 | ) | | | — | |
Small Cap Fund | | | (1,346 | ) | | | (1,399 | ) | | | 2,745 | |
Small/Mid Cap Equity Fund | | | (806 | ) | | | (1,394 | ) | | | 2,200 | |
International Equity Fund | | | (18,890 | ) | | | 18,890 | | | | — | |
World Equity Ex-US Fund | | | (44,832 | ) | | | 44,311 | | | | 521 | |
Screened World Equity Ex-US Fund | | | (157 | ) | | | 157 | | | | — | |
Enhanced LIBOR Opportunities Fund | | | (2,680 | ) | | | 13,677 | | | | (10,997 | ) |
Core Fixed Income Fund | | | 12,902 | | | | (13,318 | ) | | | 416 | |
| | |
| SEI Institutional Investments Trust / Annual Report / May 31, 2009 | | 249 |
Notes to Financial Statements (Continued)
May 31, 2009
| | | | | | | | | | | | |
| | | Undistributed
Net Investment
Income (Loss)
($ Thousands) | | | Accumulated
Realized
Gain (Loss)
($ Thousands) | | | Paid-in Capital
($ Thousands) | |
High Yield Bond Fund | | $ | 1,532 | | | $ | (1,532 | ) | | $ | — | |
Long Duration Fund | | | 2,807 | | | | (2,807 | ) | | | — | |
Emerging Markets Debt Fund | | | (10,997 | ) | | | 10,997 | | | | — | |
Real Return Fund | | | 5,080 | | | | (3,583 | ) | | | (1,497 | ) |
These reclassifications have no impact on net assets or net asset value per share.
The tax character of dividends and distributions paid during the last two years or periods ended May 31, 2009 were as follows:
| | | | | | | | | | | | | | |
| | | | | Ordinary Income
($ Thousands) | | Long-Term Capital Gain
($ Thousands) | | Return of Capital
($ Thousands) | | Total
($ Thousands) |
Large Cap Fund | | 2009 | | $ | 6,781 | | $ | — | | $ | — | | $ | 6,781 |
| | 2008 | | | 8,626 | | | — | | | — | | | 8,626 |
Large Cap Diversified Alpha Fund | | 2009 | | | 772 | | | — | | | 2,889 | | | 3,661 |
| | 2008 | | | 18,510 | | | 9,736 | | | — | | | 28,246 |
Large Cap Disciplined Equity Fund | | 2009 | | | 10,906 | | | — | | | 79,835 | | | 90,741 |
| | 2008 | | | 386,110 | | | 238,583 | | | — | | | 624,693 |
Large Cap Index Fund | | 2009 | | | 8,392 | | | 608 | | | — | | | 9,000 |
| | 2008 | | | 8,808 | | | 9,258 | | | — | | | 18,066 |
Small Cap Fund | | 2009 | | | 23,822 | | | — | | | — | | | 23,822 |
| | 2008 | | | 69,762 | | | 157,685 | | | 7,548 | | | 234,995 |
Small/Mid Cap Equity Fund | | 2009 | | | 27,726 | | | — | | | — | | | 27,726 |
| | 2008 | | | 74,475 | | | 76,784 | | | 6,948 | | | 158,207 |
U.S. Managed Volatility Fund | | 2009 | | | 555 | | | — | | | — | | | 555 |
International Equity Fund | | 2009 | | | 11,818 | | | 1,123 | | | — | | | 12,941 |
| | 2008 | | | 153,474 | | | 133,805 | | | — | | | 287,279 |
World Equity Ex-US Fund | | 2009 | | | — | | | — | | | — | | | — |
| | 2008 | | | 157,238 | | | 71,654 | | | 1,085 | | | 229,977 |
Screened World Equity Ex-US Fund | | 2009 | | | 561 | | | — | | | — | | | 561 |
Enhanced LIBOR Opportunities Fund | | 2009 | | | 3,100 | | | — | | | 929 | | | 4,029 |
| | 2008 | | | 8,666 | | | 161 | | | — | | | 8,827 |
Core Fixed Income Fund | | 2009 | | | 360,778 | | | 27,495 | | | — | | | 388,273 |
| | 2008 | | | 336,849 | | | — | | | — | | | 336,849 |
High Yield Bond Fund | | 2009 | | | 135,862 | | | — | | | — | | | 135,862 |
| | 2008 | | | 125,710 | | | 1,453 | | | — | | | 127,163 |
Long Duration Bond Fund | | 2009 | | | 24,618 | | | — | | | — | | | 24,618 |
| | 2008 | | | 9,372 | | | — | | | — | | | 9,372 |
Emerging Markets Debt Fund | | 2009 | | | 76,229 | | | — | | | — | | | 76,229 |
| | 2008 | | | 74,765 | | | 2,871 | | | — | | | 77,636 |
Real Return Fund | | 2009 | | | 19,513 | | | — | | | 1,496 | | | 21,009 |
| | 2008 | | | 11,228 | | | 1,410 | | | — | | | 12,638 |
As of May 31, 2009, the components of Distributable Earnings/(Accumulated Losses) were as follows:
| | | | | | | | | | | | | | | | | | | | | | | | | | | |
| | | Undistributed
Ordinary
Income
($ Thousands) | | Capital Loss
Carryforwards
($ Thousands) | | | Post October
Losses
($ Thousands) | | | Post October
Currency
Losses
($ Thousands) | | | Unrealized
Appreciation
(Depreciation)
($ Thousands) | | | Other
Temporary
Differences
($ Thousands) | | | Total Distributable
Earnings
(Accumulated Losses)
($ Thousands) | |
Large Cap Fund | | $ | 1,555 | | $ | (97,300 | ) | | $ | (33,608 | ) | | $ | — | | | $ | (23,255 | ) | | $ | 31 | | | $ | (152,577 | ) |
Large Cap Diversified Alpha Fund | | | — | | | (80,326 | ) | | | (106,256 | ) | | | — | | | | (52,281 | ) | | | — | | | | (238,863 | ) |
Large Cap Disciplined Equity Fund | | | — | | | (1,493,918 | ) | | | (1,507,113 | ) | | | (586 | ) | | | (429,877 | ) | | | 803 | | | | (3,430,691 | ) |
Large Cap Index Fund | | | 1,310 | | | (6,369 | ) | | | (11,670 | ) | | | — | | | | (16,800 | ) | | | 40 | | | | (33,489 | ) |
Small Cap Fund | | | 1,125 | | | (154,582 | ) | | | (310,129 | ) | | | (43 | ) | | | (182,386 | ) | | | (8 | ) | | | (646,023 | ) |
Small/Mid Cap Equity Fund | | | 8,142 | | | (208,795 | ) | | | (477,906 | ) | | | (365 | ) | | | (248,400 | ) | | | (8 | ) | | | (927,332 | ) |
U.S. Managed Volatility Fund | | | 733 | | | — | | | | (1,283 | ) | | | — | | | | 11,408 | | | | — | | | | 10,858 | |
International Equity Fund | | | 5,769 | | | (163,564 | ) | | | (323,425 | ) | | | — | | | | (39,175 | ) | | | (1,318 | ) | | | (521,713 | ) |
World Equity Ex-US Fund | | | 38,288 | | | (438,658 | ) | | | (693,343 | ) | | | — | | | | (83,816 | ) | | | (6,251 | ) | | | (1,183,780 | ) |
| | |
| 250 | | SEI Institutional Investments Trust / Annual Report / May 31, 2009 |
| | | | | | | | | | | | | | | | | | | | | | | | | | | |
| | | Undistributed
Ordinary
Income
($ Thousands) | | Capital Loss
Carryforwards
($ Thousands) | | | Post October
Losses
($ Thousands) | | | Post October
Currency
Losses
($ Thousands) | | | Unrealized
Appreciation
(Depreciation)
($ Thousands) | | | Other
Temporary
Differences
($ Thousands) | | | Total Distributable
Earnings
(Accumulated Losses)
($ Thousands) | |
Screened World Equity Ex-US Fund | | $ | 666 | | $ | (6,491 | ) | | $ | (18,690 | ) | | $ | — | | | $ | (7,153 | ) | | $ | (157 | ) | | $ | (31,825 | ) |
Enhanced LIBOR Opportunities Fund | | | — | | | (11,891 | ) | | | (13,958 | ) | | | (78 | ) | | | (40,855 | ) | | | 81 | | | | (66,701 | ) |
Core Fixed Income Fund | | | 31,853 | | | (32,495 | ) | | | (19,190 | ) | | | — | | | | (425,494 | ) | | | (20,674 | ) | | | (466,000 | ) |
High Yield Bond Fund | | | 7,957 | | | (63,110 | ) | | | (140,658 | ) | | | — | | | | (253,299 | ) | | | (6,057 | ) | | | (455,167 | ) |
Long Duration Fund | | | 6,671 | | | (9,572 | ) | | | (43,672 | ) | | | — | | | | (16,494 | ) | | | (6,688 | ) | | | (69,755 | ) |
Emerging Markets Debt Fund | | | 25,892 | | | (26,548 | ) | | | (66,219 | ) | | | (2,412 | ) | | | (40,935 | ) | | | (15,976 | ) | | | (126,198 | ) |
Real Return Plus Fund | | | — | | | (2,963 | ) | | | (3,068 | ) | | | — | | | | 10,480 | | | | — | | | | 4,449 | |
Post-October losses represent losses realized on investment transactions from November 1, 2008 through May 31, 2009 that, in accordance with Federal income tax regulations, the Funds may elect to defer and treat as having arisen in the following fiscal year. For Federal income tax purposes, capital loss carryforwards may be carried forward and applied against future capital gains as follows:
| | | | | | | | | | | | | | | |
| | | Expires 2011
($ Thousands) | | Expires 2015
($ Thousands) | | Expires 2016
($ Thousands) | | Expires 2017
($ Thousands) | | Total
Capital Loss
Carryforwards
05/31/09
($ Thousands) |
Large Cap Fund | | $ | 89,413 | | $ | — | | $ | — | | $ | 7,887 | | $ | 97,300 |
Large Cap Diversified Alpha Fund | | | — | | | — | | | — | | | 80,326 | | | 80,326 |
Large Cap Disciplined Equity Fund | | | — | | | — | | | — | | | 1,493,918 | | | 1,493,918 |
Large Cap Index Fund | | | — | | | — | | | — | | | 6,369 | | | 6,369 |
Small Cap Fund | | | — | | | — | | | — | | | 154,582 | | | 154,582 |
Small/Mid Cap Equity Fund | | | — | | | — | | | — | | | 208,795 | | | 208,795 |
International Equity Fund | | | — | | | — | | | — | | | 163,564 | | | 163,564 |
World Equity Ex-US Fund | | | — | | | — | | | — | | | 438,658 | | | 438,658 |
Screened World Equity Ex-US Fund | | | — | | | — | | | — | | | 6,491 | | | 6,491 |
Enhanced LIBOR Opportunities Fund | | | — | | | — | | | 1,487 | | | 10,404 | | | 11,891 |
Core Fixed Income Fund | | | — | | | — | | | — | | | 32,495 | | | 32,495 |
High Yield Bond Fund | | | — | | | — | | | 1,148 | | | 61,962 | | | 63,110 |
Long Duration Fund | | | — | | | 2,250 | | | 796 | | | 6,526 | | | 9,572 |
Emerging Markets Debt Fund | | | — | | | — | | | — | | | 26,548 | | | 26,548 |
Real Return Fund | | | — | | | — | | | — | | | 2,963 | | | 2,963 |
For Federal income tax purposes, the cost of securities owned at May 31, 2009, and the net realized gains or losses on securities sold for the period were not materially different from amounts reported for financial reporting purposes. These differences are primarily due to investments in partnerships and wash sales which cannot be used for Federal income tax purposes in the current year and have been deferred for use in future years. The aggregate gross unrealized appreciation and depreciation on total investments held by the Funds at May 31, 2009, was as follows:
| | | | | | | | | | | | | | |
| | | Federal Tax Cost
($ Thousands) | | Appreciated
Securities
($
Thousands) | | Depreciated
Securities
($ Thousands) | | | Net Unrealized
Appreciation
(Depreciation)
($
Thousands) | |
Large Cap Fund | | $ | 574,333 | | $ | 63,998 | | $ | (87,253 | ) | | $ | (23,255 | ) |
Large Cap Diversified Alpha Fund | | | 361,269 | | | 49,747 | | | (102,028 | ) | | | (52,281 | ) |
Large Cap Disciplined Equity Fund | | | 7,051,255 | | | 772,382 | | | (1,201,456 | ) | | | (429,074 | ) |
Large Cap Index Fund | | | 406,672 | | | 64,680 | | | (81,480 | ) | | | (16,800 | ) |
| | | | | | | | | | | | | | |
| | | Federal Tax Cost
($ Thousands) | | Appreciated
Securities
($
Thousands) | | Depreciated
Securities
($ Thousands) | | | Net Unrealized
Appreciation
(Depreciation)
($ Thousands) | |
Small Cap Fund | | $ | 1,322,739 | | $ | 98,107 | | $ | (280,493 | ) | | $ | (182,386 | ) |
Small/Mid Cap Equity Fund | | | 2,157,893 | | | 147,305 | | | (395,705 | ) | | | (248,400 | ) |
U.S. Managed Volatility Fund | | | 226,951 | | | 17,682 | | | (6,274 | ) | | | 11,408 | |
International Equity Fund | | | 800,333 | | | 60,884 | | | (111,295 | ) | | | (50,411 | ) |
World Equity Ex-US Fund | | | 3,013,191 | | | 258,594 | | | (364,121 | ) | | | (105,527 | ) |
Screened World Equity Ex-US Fund | | | 58,617 | | | 3,485 | | | (10,839 | ) | | | (7,354 | ) |
Enhanced LIBOR Opportunities Fund | | | 204,129 | | | 19,644 | | | (60,440 | ) | | | (40,796 | ) |
Core Fixed Income Fund | | | 5,691,834 | | | 139,105 | | | (547,059 | ) | | | (407,954 | ) |
High Yield Bond Fund | | | 1,714,348 | | | 58,304 | | | (311,603 | ) | | | (253,299 | ) |
Long Duration Fund | | | 1,492,498 | | | 41,040 | | | (56,859 | ) | | | (15,819 | ) |
Emerging Markets Debt Fund | | | 945,979 | | | 36,120 | | | (75,816 | ) | | | (39,696 | ) |
Real Return Fund | | | 249,672 | | | 10,872 | | | (392 | ) | | | 10,480 | |
| | |
| SEI Institutional Investments Trust / Annual Report / May 31, 2009 | | 251 |
Notes to Financial Statements (Continued)
May 31, 2009
Management has analyzed the Fund’s tax position taken on federal income tax returns for all open tax years and has concluded that as of May 31, 2009, no provision for income tax would be required in the Fund’s financial statements. The Fund’s federal and state income and federal excise tax returns for tax years for which the applicable statutes of limitations have not expired are subject to examination by the Internal Revenue Service and state departments of revenue.
8. CONCENTRATION/RISKS
In the normal course of business, the Funds enter into contracts that provide general indemnifications by the Fund to the counterparty to the contract. The Funds’ maximum exposure under these arrangements is dependent on future claims that may be made against the Funds and, therefore, cannot be estimated; however, based on experience, the risk of loss from such claims is considered remote.
The market values of the Core Fixed Income, Long Duration and High Yield Bond Funds’ investments may change in response to interest rate changes and other factors. During periods of falling interest rates, the values of fixed income securities generally rise. Conversely, during periods of rising interest rates, the values of such securities generally decline. Changes by recognized rating agencies in the ratings of any fixed income security and in the ability of an issuer to make payments of interest and principal may also affect the value of these investments.
The International Equity, World Equity Ex-US, Screened World Equity Ex-US and Emerging Markets Debt Funds concentrate their investments in securities of foreign issuers in various countries. These investments may involve certain considerations and risks not typically associated with investments in the United States, as a result of, among other factors, the possibility of future political and economic developments and the level of governmental supervision and regulation of securities markets in the respective countries.
9. IN-KIND TRANSFERS OF SECURITIES
During the year ended May 31, 2009, the Large Cap Disciplined Equity Fund issued shares of beneficial interest in exchange for securities. These securities were transferred at their current value on the date of such transactions.
| | | | | |
| | | Shares Issued | | Value ($ Thousands) |
Large Cap Disciplined Equity Fund | | | | | |
09/30/08 | | 7,801,537 | | $ | 76,845 |
During the year ended May 31, 2008, the Large Cap Diversified Alpha, Large Cap Disciplined Equity, and Small/Mid Cap Equity Funds issued (redeemed) shares of beneficial interest in exchange for securities. The securities were transferred at their current value on the date of such transactions.
| | | | | | | | | | | |
| | | Shares Issued (Redeemed) | | | Value ($ Thousands) | | | Gain (Loss) ($ Thousands) | |
Large Cap Diversified | | | | | | | | | | | |
Alpha Fund | | | | | | | | | | | |
08/31/07 | | (4,392,890 | ) | | $ | (43,929 | ) | | $ | (2,669 | ) |
Large Cap Disciplined | | | | | | | | | | | |
Equity Fund | | | | | | | | | | | |
06/29/07 | | 478,248 | | | | 6,739 | | | | — | |
08/31/07 | | (90,947,378 | ) | | | (909,474 | ) | | | (63,427 | ) |
10/31/07 | | 1,513,388 | | | | 21,505 | | | | — | |
01/16/08 | | 1,060,716 | | | | 12,580 | | | | — | |
Small/Mid Cap | | | | | | | | | | | |
Equity Fund | | | | | | | | | | | |
10/26/07 | | 1,208,695 | | | | 17,357 | | | | — | |
10. SECURITIES LENDING
A Fund may lend portfolio securities to brokers, dealers and other financial organizations that meet capital and other credit requirements or other criteria established by the Trust’s Board of Trustees. These loans may not exceed 33 1/3% of the total asset value of a Fund (including the loan collateral). No Fund will lend portfolio securities to its Adviser, sub-adviser or their affiliates unless it has applied for and received specific authority to do so from the SEC. Loans of portfolio securities will be fully collateralized by cash. Collateral will be maintained in an amount equal to at least 100% of the current market value of the loaned securities by marking to market daily, although the borrower will be required to deliver collateral between 102% and 105% of the market value of borrowed securities for domestic and foreign securities, respectively. However, due to market fluctuations during the day, the value of securities loaned on a particular day may, during the course of the day, exceed the value of collateral. On each business day, the amount of collateral is adjusted based on the prior day’s market fluctuations and the current day’s lending activity. Income from lending activity is determined by the amount of interest earned on collateral, less any amounts payable to the borrowers of the securities and the lending agent. Lending securities involves certain risks, including the risk that a Fund may be delayed or prevented from recovering the collateral if the borrower fails to return the securities.
| | |
| 252 | | SEI Institutional Investments Trust / Annual Report / May 31, 2009 |
Cash collateral received in connection with securities lending is invested in short-term investments by the lending agent. These investments may include the SEI Liquidity Fund L.P., repurchase agreements, which are collateralized by United States Treasury and Government Agency securities, and high-quality, short-term instruments, such as floating rate corporate obligations, commercial paper, and private placements with an average weighted maturity not to exceed 60 days and a maturity not to exceed 397 days. Cash collateral is invested on behalf of a Fund in a manner similar to the Fund’s investments of its cash reserves and the Fund bears all of the gains and losses on such investment. There is no guarantee that these investments will not lose value.
11. RECENT ACCOUNTING PRONOUNCEMENTS
In October 2008, the FASB issued Staff Position 157-3, Determining the Fair Value of a Financial Asset in a Market That Is Not Active (“FSP 157-3”), which clarifies the application of SFAS 157 in an inactive market and provides an illustrative example to demonstrate how the fair value of a financial asset is determined when the market for that financial asset is not active. The guidance provided by FSP 157-3 did not have a material impact on the Fund’s approach to valuing financial assets.
In April 2009, FASB Staff Position No. 157-4 — Determining Fair Value when the Volume and Level of Activity for the Asset or Liability Have Significantly Decreased and Identifying Transactions That Are Not Orderly (“FSP 157-4”) was issued. FSP 157-4 clarifies the process for measuring the fair value of financial instruments when the markets become inactive and quoted prices may reflect distressed transactions. FSP 157-4 provides a non-exclusive list of factors a reporting entity should consider when determining whether there has been a significant decrease in the volume and level of activity for an asset or liability when compared with normal market activity. Under FSP 157-4, if a reporting entity concludes there has been a significant decrease in volume and level of activity for the asset or liability (or similar assets or liabilities), transactions or quoted prices may not be determinative of fair value. Further analysis of the transactions or
quoted prices is needed, and a significant adjustment to the transactions or quoted prices may be necessary to estimate fair value in accordance with FASB Statement No. 157 — Fair Value Measurement. FSP 157-4 also requires entities to describe the inputs used in valuation techniques used to measure fair value changes and changes in inputs over the period. FSP 157-4 expands the three level hierarchy disclosure and level three roll-forward disclosure for each major security type as described in paragraph 19 of FAS No. 115, Accounting for Certain Investments in Debt and Equity Securities. FSP 157-4 is effective for interim and annual reporting periods ending after June 15, 2009, and shall be applied prospectively. At this time, management is evaluating the impact of FSP 157-4 on the Fund’s financial statements.
In May 2009, the FASB issued SFAS No. 165, SUBSEQUENT EVENTS ("SFAS 165"). SFAS 165 provides authoritative accounting literature related to evaluating subsequent events that was previously addressed only in the auditing literature, and is largely similar to the current guidance in the auditing literature with some exceptions that are not intended to result in significant changes in practice. SFAS 165 defines subsequent events and also requires the disclosure of the date through which an entity has evaluated subsequent events and the basis for that date. SFAS 165 is effective on a prospective basis for interim or annual financial periods ending after June 15, 2009. At this time, management is evaluating the impact of SFAS 165 on the Fund’s financial statements.
12. OTHER MATTERS (Unaudited)
Due to volatility in the fixed income and equity markets, the market value of a Fund’s holdings may be materially different than shown in the Schedules of Investments (“SOI”). The values shown in the SOI’s were the market values as of May 31, 2009 and do not reflect any market events after May 31, 2009.
| | |
| SEI Institutional Investments Trust / Annual Report / May 31, 2009 | | 253 |
Report of Independent Registered Public Accounting Firm
To the Board of Trustees and Shareholders
SEI Institutional Investments Trust:
We have audited the accompanying statements of assets and liabilities, including the schedules of investments of SEI Institutional Investments Trust, comprising the Large Cap Fund, Large Cap Diversified Alpha Fund, Large Cap Disciplined Equity Fund, Large Cap Index Fund, Small Cap Fund, Small/ Mid Cap Equity Fund, U.S. Managed Volatility Fund, International Equity Fund, World Equity Ex-US Fund, Screened World Equity Ex-US Fund, Enhanced LIBOR Opportunities Fund, Core Fixed Income Fund, High Yield Bond Fund, Long Duration Fund, Emerging Markets Debt Fund, and Real Return Fund (formerly Real Return Plus Fund), (collectively, the “Funds”), as of May 31, 2009, and the related statements of operations for the year or period then ended, the statements of changes in net assets for each of the years or periods in the two-year period then ended, and the financial highlights for each of the years or periods in the four-year period then ended. These financial statements and financial highlights are the responsibility of the Funds’ management. Our responsibility is to express an opinion on these financial statements and financial highlights based on our audits. The financial highlights for the year or period presented through May 31, 2005, were audited by other auditors, whose report dated July 27, 2005 expressed an unqualified opinion thereon.
We conducted our audits in accordance with the Standards of the Public Company Accounting Oversight Board (United States). Those standards require that we plan and perform the audit to obtain reasonable assurance about whether the financial statements and financial highlights are free of material misstatement. An audit includes examining, on a test basis, evidence supporting the amounts and disclosures in the financial statements. Our procedures included confirmation of securities owned as of May 31, 2009, by correspondence with the custodian and brokers or other appropriate auditing procedures. An audit also includes assessing the accounting principles used and significant estimates made by management, as well as evaluating the overall financial statement presentation. We believe that our audits provide a reasonable basis for our opinion.
In our opinion, the financial statements and financial highlights referred to above present fairly, in all material respects, the financial position of each of the funds comprising SEI Institutional Investments Trust as of May 31, 2009, the results of their operations for the year or period then ended, the changes in their net assets for the years or periods in the two-year period then ended, and the financial highlights for each of the years or periods in the four-year period then ended, in conformity with U.S. generally accepted accounting principles.

Philadelphia, Pennsylvania
July 30, 2009
| | |
| 254 | | SEI Institutional Investments Trust / Annual Report / May 31, 2009 |
Trustees and Officers of the Trust (Unaudited)
The following information is current as of May 31, 2009.
Set forth below are the names, addresses, ages, position with the Trust, Term of Office and Length of Time Served, the principal occupations for the last five years, number of portfolios in fund complex overseen by trustee, and other directorships outside the fund complex of each of the persons currently serving as Trustees and Officers of the Trust. The Trust’s Statement of Additional Information (“SAI”) includes additional information about the Trustees and Officers. The SAI may be obtained without charge by calling 1-800-342-5734.
| | | | | | | | | | |
Name Address, and Age | | Position(s)
Held with
Trusts | | Term of
Office and
Length of
Time Served1 | | Principal Occupation(s) During Past Five Years | | Number of
Portfolios in
Fund Complex
Overseen by Trustee2 | | Other Directorships Held by Trustee |
| INTERESTED TRUSTEES | | | | | | | | |
Robert A. Nesher One Freedom Valley Drive Oaks, PA 19456 62 yrs. old | | Chairman of the Board of Trustees* | | since 1982 | | Currently performs various services on behalf of SEI Investments for which Mr. Nesher is compensated. | | 80 | | Trustee of The Advisors’ Inner Circle Fund, The Advisors’ Inner Circle Fund II, Bishop Street Funds, Director of SEI Global Master Fund, plc, SEI Global Assets Fund, plc, SEI Global Investments Fund, plc, SEI Investments Global, Limited, SEI Investments — Global Fund Services, Limited, SEI Investments (Europe), Limited, SEI Investments — Unit Trust Management (UK), Limited, SEI Global Nominee Ltd., SEI Opportunity Fund, L.P., SEI Structured Credit Fund, L.P., and SEI Multi-Strategy Funds plc. |
William M. Doran 1701 Market Street Philadelphia, PA 19103 69 yrs. old | | Trustee* | | since 1982 | | Self-employed consultant since 2003. Partner, Morgan, Lewis & Bockius LLP (law firm) from 1976 to 2003, counsel to the Trust, SEI, SIMC, the Administrator and the Distributor. Secretary of SEI since 1978. | | 80 | | Trustee of The Advisors’ Inner Circle Fund, The Advisors’ Inner Circle Fund II, Bishop Street Funds, Director of SEI since 1974. Director of the Distributor since 2003. Director of SEI Investments — Global Fund Services, Limited, SEI Investments Global, Limited, SEI Investments (Europe), Limited, SEI Investments (Asia), Limited and SEI Asset Korea Co., Ltd. |
| TRUSTEES | | | | | | | | | | |
James M. Storey One Freedom Valley Drive Oaks, PA 19456 78 yrs. old | | Trustee | | since 1995 | | Attorney, sole practitioner since 1994. Partner, Dechert Price & Rhoads, September 1987- December 1993. | | 80 | | Trustee of The Advisors’ Inner Circle Fund, The Advisors’ Inner Circle Fund II, Bishop Street Funds, and U.S. Charitable Gift Trust. |
| | *Messrs. | Nesher and Doran are Trustees who may be deemed as “interested” persons of the Trust as that term is defined in the 1940 Act by virtue of their affiliation with SIMC and the Trust’s Distributor. |
| | 1Each | trustee shall hold office during the lifetime of this Trust until the election and qualification of his or her successor, or until he or she sooner dies, resigns or is removed in accordance with the Trust’s Declaration of Trust. |
| | 2The | Fund Complex includes the following Trusts: SEI Asset Allocation Trust, SEI Daily Income Trust, SEI Institutional Investments Trust, SEI Institutional International Trust, SEI Institutional Managed Trust, SEI Liquid Asset Trust, SEI Tax Exempt Trust and SEI Alpha Strategy Portfolios, L.P. |
| | |
| SEI Institutional Investments Trust / Annual Report / May 31, 2009 | | 255 |
Trustees and Officers of the Trust (Unaudited) (continued)
| | | | | | | | | | |
Name Address, and Age | | Position(s)
Held with
Trusts | | Term of
Office and
Length of
Time Served1 | | Principal Occupation(s) During Past Five Years | | Number of
Portfolios in
Fund Complex
Overseen by Trustee2 | | Other Directorships Held by Trustee |
| TRUSTEES (continued) | | | | | | | | | | |
George J. Sullivan, Jr. One Freedom
Valley Drive
Oaks, PA 19456
66 yrs. old | | Trustee | | since 1996 | | Self-Employed Consultant, Newfound Consultants Inc. since April 1997. | | 80 | | Trustee of The Advisors’ Inner Circle Fund, The Advisors’ Inner Circle Fund II, Bishop Street Funds, State Street Navigator Securities Lending Trust, SEI Opportunity Fund, L.P., and SEI Structured Credit Fund, L.P., member of the independent review committee for SEI’s Canadian-registered mutual funds since 2009 |
Rosemarie B. Greco One Freedom
Valley Drive
Oaks, PA 19456
63 yrs. old | | Trustee | | since 1999 | | Director, Governor’s Office of Health Care Reform, Commonwealth of Pennsylvania since 2003. Founder and Principal, Grecoventures Ltd. from 1999 to 2002. | | 80 | | Director, Sonoco, Inc.; Director, Exelon Corporation; Trustee, Pennsylvania Real Estate Investment Trust. |
Nina Lesavoy
One Freedom
Valley Drive
Oaks, PA 19456
52 yrs. old | | Trustee | | since 2003 | | Founder and Managing Director, Avec Capital since 2008, Managing Director, Cue Capital from March 2002-March 2008. | | 80 | | Director of SEI Opportunity Fund, L.P., and SEI Structured Credit Fund, L.P. |
James M. Williams
One Freedom
Valley Drive
Oaks, PA 19456
61 yrs. old | | Trustee | | since 2004 | | Vice President and Chief Investment Officer, J. Paul Getty Trust, Non-Profit Foundation for Visual Arts, since December 2002. President, Harbor Capital Advisors and Harbor Mutual Funds, 2000-2002. | | 80 | | Trustee/Director of Ariel Mutual Funds, SEI Opportunity Fund, L.P., and SEI Structured Credit Fund, L.P. |
Mitchell A. Johnson
One Freedom
Valley Drive
Oaks, PA 19456
67 yrs. old | | Trustee | | since 2007 | | Private Investor since 1994. | | 80 | | Trustee of the Advisors’ Inner Circle Fund, The Advisor’s Inner Circle Fund II, and Bishop Street Funds. |
Hubert L. Harris, Jr. One Freedom
Valley Drive
Oaks, PA 19456
66 yrs. old | | Trustee | | since 2008 | | Retired since December 2005. Chief Executive Officer and Chair of the Board of Directors, AMVESCAP Retirement, Inc., 1997-December 2005. Chief Executive Officer, INVESCO North America, September 2003-December 2005. | | 80 | | Director of Colonial BancGroup, Inc. and Chair of the Board of Trustees, Georgia Tech Foundation, Inc. (nonprofit corporation). |
| OFFICERS | | | | | | | | | | |
Robert A. Nesher
One Freedom
Valley Drive
Oaks, PA 19456
62 yrs. old | | President & CEO | | since 2005 | | Currently performs various services on behalf of SEI for which Mr. Nesher is compensated. | | N/A | | N/A |
Stephen F. Panner
One Freedom
Valley Drive
Oaks, PA 19456
39 yrs. old | | Controller and Chief Financial Officer | | since 2005 | | Fund Accounting Director of the Administrator since 2005. Fund Administration Manager, Old Mutual Fund Services, 2000-2005. Chief Financial Officer, Controller and Treasurer, PBHG Funds and PBHG Insurance Series Fund, 2004-2005. Assistant Treasurer, PBHG Funds and PBHG Insurance Series Fund, 2000-2004. Assistant Treasurer, Old Mutual Advisors Fund, 2004-2005. | | N/A | | N/A |
| | 1 | Each trustee shall hold office during the lifetime of this Trust until the election and qualification of his or her successor, or until he or she sooner dies, resigns or is removed in accordance with the Trust’s Declaration of Trust. |
| | 2 | The Fund Complex includes the following Trusts: SEI Asset Allocation Trust, SEI Daily Income Trust, SEI Institutional Investments Trust, SEI Institutional International Trust, SEI Institutional Managed Trust, SEI Liquid Asset Trust, SEI Tax Exempt Trust and SEI Alpha Strategy Portfolios, L.P. |
| | |
| 256 | | SEI Institutional Investments Trust / Annual Report / May 31, 2009 |
| | | | | | | | | | |
Name
Address,
and Age | | Position(s)
Held with
Trusts | | Term of
Office and
Length of
Time Served1 | | Principal Occupation(s)
During Past Five Years | | Number of
Portfolios in
Fund Complex
Overseen by
Trustee2 | | Other Directorships
Held by Trustee |
| OFFICERS (continued) | | | | | | | | |
Russell Emery One Freedom Valley Drive Oaks, PA 19456 46 yrs. old | | Chief Compliance Officer | | since 2006 | | Chief Compliance Officer of SEI Opportunity Fund, L.P., SEI Institutional Managed Trust, SEI Asset Allocation Trust, SEI Institutional International Trust, SEI Liquid Asset Trust, SEI Daily Income Trust, SEI Tax Exempt Trust, SEI Institutional Investments Trust, The Advisors’ Inner Circle Fund, The Advisors’ Inner Circle Fund II, and Bishop Street Funds, since March 2006. Chief Compliance Officer of SEI Structural Credit Fund, LP and SEI Alpha Strategy Portfolio, LP since June 2007. Director of Investment Product Management and Development of SIMC, February 2003-March 2006. | | N/A | | N/A |
Timothy D. Barto One Freedom Valley Drive Oaks, PA 19456 41 yrs. old | | Vice President and Secretary | | since 2002 | | General Counsel, Vice President and Secretary of SIMC and the Administrator since 2004. Vice President and Assistant Secretary of SEI since 2001. Vice President of SIMC and the Administrator since 1999. Assistant Secretary of SIMC, the Administrator and the Distributor and Vice President of the Distributor, 1999-2003. | | N/A | | N/A |
James Ndiaye One Freedom Valley Drive Oaks, PA 19456 40 yrs. old | | Vice President and Assistant Secretary | | since 2005 | | Vice President and Assistant Secretary of SIMC since 2005. Vice President, Deutsche Asset Management (2003-2004). Associate, Morgan, Lewis & Bockius LLP (2000-2003). | | N/A | | N/A |
Michael T. Pang One Freedom Valley Drive Oaks, PA 19456 37 yrs. old | | Vice President and Assistant Secretary | | since 2005 | | Vice President and Assistant Secretary of SIMC since 2005. Counsel, Caledonian Bank & Trust’s Mutual Funds Group (2004). Counsel, Permal Asset Management (2001-2004). | | N/A | | N/A |
Aaron Buser One Freedom Valley Drive Oaks, PA 19456 38 yrs. old | | Vice President and Assistant Secretary | | since 2008 | | Vice President and Assistant Secretary of SIMC since 2007. Associate at Stark & Stark (2004-2007). Associate at Flaster/Greenberg, P.C. (2000-2004). | | N/A | | N/A |
David F. McCann One Freedom Valley Drive Oaks, PA 19456 33 yrs. old | | Vice President and Assistant Secretary | | since 2009 | | Vice President and Assistant Secretary of SIMC since 2008. Attorney, Drinker Biddle & Reath, LLP (law firm), May 2005-October 2008. Attorney, Pepper Hamilton, LLP (law firm), September 2001-May 2005. | | N/A | | N/A |
John J. McCue
One Freedom Valley Drive
Oaks, PA 19456
46 yrs. old | | Vice President | | since 2004 | | Director of Portfolio Implementations for SIMC since 1995. Managing Director of Money Market Investments for SIMC since 2003. | | N/A | | N/A |
Andrew S. Decker
One Freedom Valley Drive
Oaks, PA 19456
45 yrs. old | | Anti-Money Laundering Compliance Officer | | since 2008 | | Compliance Officer and Product Manager, SEI 2005-2008. Vice President, Old Mutual Capital, 2000-2005. | | N/A | | N/A |
| | 1 | Each trustee shall hold office during the lifetime of this Trust until the election and qualification of his or her successor, or until he or she sooner dies, resigns or is removed in accordance with the Trust’s Declaration of Trust. |
| | 2 | The Fund Complex includes the following Trusts: SEI Asset Allocation Trust, SEI Daily Income Trust, SEI Institutional Investments Trust, SEI Institutional International Trust, SEI Institutional Managed Trust, SEI Liquid Asset Trust, SEI Tax Exempt Trust and SEI Alpha Strategy Portfolios, L.P. |
| | |
| SEI Institutional Investments Trust / Annual Report / May 31, 2009 | | 257 |
Disclosure of Fund Expenses (Unaudited)
MAY 31, 2009
All mutual funds have operating expenses. As a shareholder of a fund, your investment is affected by these ongoing costs, which include (among others) costs for portfolio management, administrative services, and shareholder reports like this one. It is important for you to understand the impact of these costs on your investment returns.
Operating expenses such as these are deducted from the fund’s gross income and directly reduce your final investment return. These expenses are expressed as a percentage of the fund’s average net assets; this percentage is known as the fund’s expense ratio.
The following examples use the expense ratio and are intended to help you understand the ongoing costs (in dollars) of investing in your Fund and to compare these costs with those of other mutual funds. The examples are based on an investment of $1,000 made at the beginning of the period shown and held for the entire period.
The table on the next page illustrates your Fund’s costs in two ways:
• Actual fund return. This section helps you to estimate the actual expenses after fee waivers that your Fund incurred over the period. The “Expenses Paid During Period” column shows the actual dollar expense cost incurred by a $1,000 investment in the Fund, and the “Ending Account Value” number is derived from deducting that expense cost from the Fund’s gross investment return.
You can use this information, together with the actual amount you invested in the Fund, to estimate the expenses you paid over that period. Simply divide your actual starting account value by $1,000 to arrive at a ratio (for example, an $8,600 account value divided by $1,000 = 8.6), then multiply that ratio by the number shown for your Fund under “Expenses Paid During Period.”
• Hypothetical 5% return. This section helps you compare your Fund’s costs with those of other mutual funds. It assumes that the Fund had an annual 5% return before expenses during the year, but that the expense ratio (Column 3) is unchanged. This example is useful in making comparisons because the Securities and Exchange Commission requires all mutual funds to make this 5% calculation. You can assess your Fund’s comparative cost by comparing the hypothetical result for your Fund in the “Expense Paid During Period” column with those that appear in the same charts in the shareholder reports for other funds.
NOTE: Because the return is set at 5% for comparison purposes — NOT your Fund’s actual return — the account values shown do not apply to your specific investment.
| | |
| 258 | | SEI Institutional Investments Trust / Annual Report / May 31, 2009 |
| | | | | | | | | | | | |
| | | Beginning
Account
Value
12/1/08 | | Ending
Account
Value
5/31/09 | | Annualized
Expense
Ratios | | | Expense
Paid
During
Period* |
Large Cap Fund | | | | | | | | | |
Actual Fund Return | | | | | | | | | |
Class A Shares | | $ | 1,000.00 | | $ | 1,086.40 | | 0.25 | % | | $ | 1.29 |
Hypothetical 5% Return | | | | | | |
Class A Shares | | $ | 1,000.00 | | $ | 1,023.69 | | 0.25 | % | | $ | 1.26 |
Large Cap Diversified Alpha Fund | | | | | | | | | |
Actual Fund Return | | | | | | | | | |
Class A Shares | | $ | 1,000.00 | | $ | 1,068.30 | | 0.31 | % | | $ | 1.62 |
Hypothetical 5% Return | | | | | | |
Class A Shares | | $ | 1,000.00 | | $ | 1,023.37 | | 0.31 | % | | $ | 1.58 |
Large Cap Disciplined Equity Fund | | | | | | | | | |
Actual Fund Return | | | | | | | | | |
Class A Shares | | $ | 1,000.00 | | $ | 1,031.80 | | 0.18 | % | | $ | 0.94 |
Hypothetical 5% Return | | | | | | |
Class A Shares | | $ | 1,000.00 | | $ | 1,024.01 | | 0.18 | % | | $ | 0.93 |
Large Cap Index Fund | | | | | | | | | |
Actual Fund Return | | | | | | | | | |
Class A Shares | | $ | 1,000.00 | | $ | 1,056.80 | | 0.06 | % | | $ | 0.31 |
Hypothetical 5% Return | | | | | | |
Class A Shares | | $ | 1,000.00 | | $ | 1,024.63 | | 0.06 | % | | $ | 0.30 |
Small Cap Fund | | | | | | | | | |
Actual Fund Return | | | | | | | | | |
Class A Shares | | $ | 1,000.00 | | $ | 1,143.60 | | 0.52 | % | | $ | 2.78 |
Hypothetical 5% Return | | | | | | |
Class A Shares | | $ | 1,000.00 | | $ | 1,022.34 | | 0.52 | % | | $ | 2.62 |
Small/Mid Cap Fund | | | | | | | | | |
Actual Fund Return | | | | | | | | | |
Class A Shares | | $ | 1,000.00 | | $ | 1,144.30 | | 0.47 | % | | $ | 2.50 |
Hypothetical 5% Return | | | | | | |
Class A Shares | | $ | 1,000.00 | | $ | 1,022.60 | | 0.47 | % | | $ | 2.36 |
International Equity Fund | | | | | | | | | |
Actual Fund Return | | | | | | | | | |
Class A Shares | | $ | 1,000.00 | | $ | 1,113.60 | | 0.39 | % | | $ | 2.06 |
Hypothetical 5% Return | | | | | | |
Class A Shares | | $ | 1,000.00 | | $ | 1,022.98 | | 0.39 | % | | $ | 1.97 |
World Equity Ex-US Fund | | | | | | | | | |
Actual Fund Return | | | | | | | | | |
Class A Shares | | $ | 1,000.00 | | $ | 1,181.70 | | 0.45 | % | | $ | 2.46 |
Hypothetical 5% Return | | | | | | |
Class A Shares | | $ | 1,000.00 | | $ | 1,022.68 | | 0.45 | % | | $ | 2.28 |
Screened World Equity Ex-US Fund | | | | | | | | | |
Actual Fund Return | | | | | | | | | |
Class A Shares | | $ | 1,000.00 | | $ | 1,171.10 | | 0.80 | % | | $ | 4.33 |
Hypothetical 5% Return | | | | | | |
Class A Shares | | $ | 1,000.00 | | $ | 1,020.94 | | 0.80 | % | | $ | 4.03 |
Enhanced LIBOR Opportunities Fund | | | | | | |
Actual Fund Return | | | | | | | | | |
Class A Shares | | $ | 1,000.00 | | $ | 1,043.40 | | 0.41 | % | | $ | 2.10 |
Hypothetical 5% Return | | | | | | |
Class A Shares | | $ | 1,000.00 | | $ | 1,022.88 | | 0.41 | % | | $ | 2.08 |
Core Fixed Income Fund |
Actual Fund Return | | | | | | | | | |
Class A Shares | | $ | 1,000.00 | | $ | 1,085.40 | | 0.14 | % | | $ | 0.72 |
Hypothetical 5% Return | | | | | | |
Class A Shares | | $ | 1,000.00 | | $ | 1,024.24 | | 0.14 | % | | $ | 0.70 |
High Yield Bond Fund | | | | | | | | | |
Actual Fund Return | | | | | | | | | |
Class A Shares | | $ | 1,000.00 | | $ | 1,257.30 | | 0.35 | % | | $ | 1.97 |
Hypothetical 5% Return | | | | | | |
Class A Shares | | $ | 1,000.00 | | $ | 1,023.19 | | 0.35 | % | | $ | 1.76 |
| | | | | | | | | | | | |
| | | Beginning
Account
Value
12/1/08 | | Ending
Account
Value
5/31/09 | | Annualized
Expense
Ratios | | | Expense
Paid
During
Period* |
Long Duration Fund | | | | | | | | | |
Actual Fund Return | | | | | | | | | |
Class A Shares | | $ | 1,000.00 | | $ | 971.90 | | 0.20 | % | | $ | 0.98 |
Hypothetical 5% Return | | | | | | |
Class A Shares | | $ | 1,000.00 | | $ | 1,023.93 | | 0.20 | % | | $ | 1.01 |
Emerging Markets Debt Fund | | | | | | | | | |
Actual Fund Return | | | | | | | | | |
Class A Shares | | $ | 1,000.00 | | $ | 1,276.70 | | 0.56 | % | | $ | 3.17 |
Hypothetical 5% Return | | | | | | |
Class A Shares | | $ | 1,000.00 | | $ | 1,022.14 | | 0.56 | % | | $ | 2.82 |
Real Return Fund | | | | | | | | | |
Actual Fund Return | | | | | | | | | |
Class A Shares | | $ | 1,000.00 | | $ | 1,098.20 | | 0.37 | % | | $ | 1.92 |
Hypothetical 5% Return | | | | | | |
Class A Shares | | $ | 1,000.00 | | $ | 1,023.10 | | 0.37 | % | | $ | 1.85 |
| * | Expenses are equal to the Fund’s annualized expense ratio multiplied by the average account value over the period, multiplied by 182/365 (to reflect one-half year period shown). |
| | | | | | | | | | | | |
| | | Beginning
Account
Value
12/30/08 | | Ending
Account
Value
5/31/09 | | Annualized
Expense
Ratios | | | Expense
Paid
During
Period** |
U.S. Managed Volatility Fund | | | | | | | | | |
Actual Fund Return | | | | | | | | | |
Class A Shares | | $ | 1,000.00 | | $ | 958.40 | | 0.35 | % | | $ | 1.43 |
Hypothetical 5% Return | | | | | | |
Class A Shares | | $ | 1,000.00 | | $ | 1,023.17 | | 0.35 | % | | $ | 1.78 |
| ** | Expenses are equal to the Fund’s annualized expense ratio multiplied by the average account value over the period, multiplied by 151/365 (to reflect the period since commencement of operations). |
| | |
| SEI Institutional Investments Trust / Annual Report / May 31, 2009 | | 259 |
Board of Trustees Considerations in Approving the Advisory and Sub-Advisory Agreements (Unaudited)
SEI Institutional Investments Trust (the “Trust”) and SEI Investments Management Corporation (“SIMC”) have entered into an investment advisory agreement (the “Advisory Agreement”). Pursuant to the Advisory Agreement, SIMC oversees the investment advisory services provided to the series of the Trust (the “Funds”) and may manage the cash portion of the Funds’ assets. Pursuant to separate sub-advisory agreements (the “Sub-Advisory Agreements” and, together with the Advisory Agreement, the “Investment Advisory Agreements”) with SIMC, and under the supervision of SIMC and the Trust’s Board of Trustees (the “Board”), the Sub-Advisers are responsible for the day-to-day investment management of all or a discrete portion of the assets of the Funds. The Sub-Advisers also are responsible for managing their employees who provide services to these Funds. The Sub-Advisers are selected based primarily upon the research and recommendations of SIMC, which evaluates quantitatively and qualitatively the Sub-Advisers’ skills and investment results in managing assets for specific asset classes, investment styles and strategies.
The Investment Company Act of 1940, as amended (the “1940 Act”) requires that the initial approval of, as well as the continuation of, the Funds’ Investment Advisory Agreements must be specifically approved: (i) by the vote of the Board of Trustees or by a vote of the shareholders of the Funds; and (ii) by the vote of a majority of the Trustees who are not parties to the Investment Advisory Agreements or “interested persons” of any party (the “Independent Trustees”), cast in person at a meeting called for the purpose of voting on such approval. In connection with their consideration of such approvals, the Funds’ Trustees must request and evaluate, and SIMC and the Sub-Advisers are required to furnish, such information as may be reasonably necessary to evaluate the terms of the Investment Advisory Agreements. In addition, the Securities and Exchange Commission (“SEC”) takes the position that, as part of their fiduciary duties with respect to a mutual fund’s fees, mutual fund boards are required to evaluate the material factors applicable to a decision to approve an Investment Advisory Agreement.
Consistent with these responsibilities, the Trust’s Board of Trustees calls and holds meetings each year that are dedicated to considering whether to renew the Investment Advisory Agreements between the Trust and SIMC and SIMC and the Sub-Advisers with respect to the Funds of the Trust. In preparation for these meetings, the Board requests and reviews a wide variety of materials provided by SIMC and the Sub-Advisers, including information about SIMC’s and the Sub-Advisers’ affiliates, personnel and operations. The Board also receives extensive data provided by third parties. This information is in addition to the detailed information about the Funds that the Board reviews during the course of each year, including information that relates to Fund operations and Fund performance. The Trustees also receive a memorandum from Fund counsel and independent counsel to the Independent Trustees regarding the responsibilities of Trustees in connection with their consideration of whether to approve the Trust’s Investment Advisory Agreements. Finally, the Independent Trustees receive advice from independent counsel to the Independent Trustees, meet in executive session outside the presence of Fund management and participate in question and answer sessions with representatives of SIMC and the Sub-Advisers.
Specifically, the Board requested and received written materials from SIMC and the Sub-Advisers regarding: (a) the quality of SIMC’s and the Sub-Advisers’ investment management and other services; (b) SIMC’s and the Sub-Advisers’ investment management personnel; (c) SIMC’s and the Sub-Advisers’ operations and financial condition; (d) SIMC’s and the Sub-Advisers’ brokerage practices (including any soft dollar arrangements) and investment strategies; (e) the level of the advisory fees that SIMC and the Sub-Advisers charge the Funds compared with the fees each charge to comparable mutual funds; (f) the Funds’ overall fees and operating expenses compared with similar mutual funds; (g) the level of SIMC’s and the Sub-Advisers’ profitability from their Fund-related operations; (h) SIMC’s and the Sub-Advisers’ compliance systems; (i) SIMC’s and the Sub-Advisers’ policies on and compliance procedures for personal securities transactions; (j) SIMC’s and the Sub-Advisers’ reputation, expertise and resources in domestic and/or international financial markets; and (k) the Funds’ performance compared with similar mutual funds.
| | |
| 260 | | SEI Institutional Investments Trust / Annual Report / May 31, 2009 |
Board of Trustees Considerations in Approving the Advisory and Sub-Advisory Agreements (Unaudited) (Continued)
At the December 2-3, 2008, March 25-26, 2009 and May 19, 2009 meetings of the Board of Trustees, the Trustees, including a majority of the Independent Trustees, approved the Investment Advisory Agreements and approved the selection of SIMC and the Sub-Advisers to act in their respective capacities for the Funds. The Board’s approval was based on its consideration and evaluation of a variety of specific factors discussed at the meetings and at prior meetings, including:
| • | | the nature, extent and quality of the services provided to the Funds under the Investment Advisory Agreements, including the resources of SIMC and the Sub-Advisers and their affiliates dedicated to the Funds; |
| • | | the Funds’ investment performance and how it compared to that of other comparable mutual funds; |
| • | | the Funds’ expenses under each Investment Advisory Agreement and how those expenses compared to those of other comparable mutual funds; |
| • | | the profitability of SIMC and the Sub-Advisers and their affiliates with respect to the Funds, including both direct and indirect benefits accruing to SIMC and the Sub-Advisers and their affiliates; and |
| • | | the extent to which economies of scale would be realized as the Funds grow and whether fee levels in the Investment Advisory Agreements reflect those economies of scale for the benefit of Fund investors. |
Nature, Extent and Quality of Services. The Board of Trustees considered the nature, extent and quality of the services provided by SIMC and the Sub-Advisers to the Funds and the resources of SIMC and the Sub-Advisers and their affiliates dedicated to the Funds. In this regard, the Trustees evaluated, among other things, SIMC’s and the Sub-Advisers’ personnel, experience, track record and compliance program. The Trustees found the level of SIMC’s professional staff and culture of compliance satisfactory. Following evaluation, the Board concluded that, within the context of its full deliberations, the nature, extent and quality of services provided by SIMC and the Sub-Advisers to the Funds and the resources of SIMC and the Sub-Advisers and their affiliates dedicated to the Funds supported renewal of the Investment Advisory Agreements.
Fund Performance. The Board of Trustees considered Fund performance in determining whether to renew the Investment Advisory Agreements. Specifically, the Trustees considered the Funds’ performance relative to their peer groups and appropriate indices/benchmarks, in light of total return, yield and market trends. As part of this review, the Trustees considered the composition of each peer group and selection criteria. In evaluating performance, the Trustees considered both market risk and shareholder risk expectations for the Funds. The Trustees found Fund performance satisfactory, and where performance was below the benchmark, the Trustees were satisfied that appropriate steps were being taken. Following evaluation, the Board concluded that, within the context of its full deliberations, the performance of the Funds supported renewal of the Investment Advisory Agreements.
Fund Expenses. With respect to the Funds’ expenses under the Investment Advisory Agreements, the Trustees considered the rate of compensation called for by the Investment Advisory Agreements and the Funds’ net operating expense ratio in comparison to those of other comparable mutual funds. The Trustees also considered information about average expense ratios of comparable mutual funds in the Funds’ respective peer groups. The Trustees further considered the fact that the comparative fee analysis either showed that the various fees were below average or that there was a reasonable basis for the fee level. Finally, the Trustees considered the effects of SIMC’s voluntary waiver of management and other fees and the Sub-Advisers’ fees to prevent total Fund expenses from exceeding a specified cap and that SIMC and the Sub-Advisers, through waivers, have maintained the Funds’ net operating expenses at competitive levels for their respective distribution channels. Following evaluation, the Board concluded that, within the context of its full deliberations, the expenses of the Funds are reasonable and supported renewal of the Investment Advisory Agreements.
| | |
| SEI Institutional Investments Trust / Annual Report / May 31, 2009 | | 261 |
Profitability. With regard to profitability, the Trustees considered all compensation flowing to SIMC and the Sub-Adviser and their affiliates, directly or indirectly. The Trustees considered whether the varied levels of compensation and profitability under the Investment Advisory Agreements and other service agreements were reasonable and justified in light of the quality of all services rendered to the Funds by SIMC and the Sub-Advisers and their affiliates. The Trustees found that profitability was reasonable and that the margin was not increasing despite growth in assets. When considering the profitability of the Sub-Advisers, the Board took into account the fact that the Sub-Advisers are compensated by SIMC, and not by the Funds directly, and such compensation with respect to any Sub-Adviser reflects an arms-length negotiation between the Sub-Adviser and SIMC. Based on this evaluation, the Board concluded that, within the context of its full deliberations, the profitability of SIMC and the Sub-Advisers are reasonable and supported renewal of the Investment Advisory Agreements.
Economies of Scale. The Trustees considered the existence of any economies of scale and whether those were passed along to the Funds’ shareholders through a graduated investment advisory fee schedule or other means, including any fee waivers by SIMC and its affiliates. Based on this evaluation, the Board concluded that, within the context of its full deliberations, the Funds obtain reasonable benefit from economies of scale.
Based on the Trustees’ deliberation and their evaluation of the information described above, the Board, including all of the Independent Trustees, unanimously approved the continuation of the Investment Advisory Agreements and concluded that the compensation under the Investment Advisory Agreements is fair and reasonable in light of such services and expenses and such other matters as the Trustees considered to be relevant in the exercise of their reasonable judgment. In the course of their deliberations, the Trustees did not identify any particular information that was all-important or controlling.
| | |
| 262 | | SEI Institutional Investments Trust / Annual Report / May 31, 2009 |
Notice to Shareholders (Unaudited)
For shareholders who do not have a May 31, 2009, taxable year end, this notice is for informational purposes only. For shareholders with a May 31, 2009, taxable year end, please consult your tax adviser as to the pertinence of this notice.
For the fiscal year ended May 31, 2009, the Funds are designating long term and qualifying dividend income with regard to distributions paid during the year as follows:
| | | | | | | | | | | | |
| | | (A)
Long Term
Capital Gains
Distributions
(Tax Basis) | | | (B)
Ordinary
Income
Distributions
(Tax Basis) | | | Return of
Capital | | | Total
Distributions
(Tax Basis) | |
| Large Cap Fund | | 0 | % | | 100 | % | | 0 | % | | 100 | % |
| Large Cap Diversified Alpha Fund | | 0 | % | | 21 | % | | 79 | % | | 100 | % |
| Large Cap Disciplined Equity Fund | | 0 | % | | 12 | % | | 88 | % | | 100 | % |
| Large Cap Index Fund | | 7 | % | | 93 | % | | 0 | % | | 100 | % |
| Small Cap Fund | | 0 | % | | 100 | % | | 0 | % | | 100 | % |
| Small/Mid Cap Equity Fund | | 0 | % | | 100 | % | | 0 | % | | 100 | % |
| U.S. Managed Volatility Fund | | 0 | % | | 100 | % | | 0 | % | | 100 | % |
| International Equity Fund (6) | | 8 | % | | 92 | % | | 0 | % | | 100 | % |
| World Equity Ex-US Fund (7) | | 0 | % | | 100 | % | | 0 | % | | 100 | % |
| Screened World Equity Ex-US Fund (8) | | 0 | % | | 100 | % | | 0 | % | | 100 | % |
| Enhanced LIBOR Opportunities Fund | | 0 | % | | 77 | % | | 23 | % | | 100 | % |
| Core Fixed Income Fund | | 7 | % | | 93 | % | | 0 | % | | 100 | % |
| High Yield Bond Fund | | 0 | % | | 100 | % | | 0 | % | | 100 | % |
| Long Duration Fund | | 0 | % | | 100 | % | | 0 | % | | 100 | % |
| Emerging Markets Debt Fund | | 0 | % | | 100 | % | | 0 | % | | 100 | % |
| Real Return Plus Fund | | 0 | % | | 93 | % | | 7 | % | | 100 | % |
| | | | | | | | | | | | | | | |
| | | (C)
Dividends
Qualifying
for Corporate
Dividends Rec.
Deduction (1) | | | (D)
Qualifying
Dividend Income
(15% Tax Rate
for QDI) (2) | | | (E)
U.S. Government
Interest (3) | | | Interest
Related
Dividends (4) | | | Short-Term
Capital Gain
Dividends (5) | |
| Large Cap Fund | | 85 | % | | 82 | % | | 0 | % | | 0 | % | | 0 | % |
| Large Cap Diversified Alpha Fund | | 38 | % | | 67 | % | | 1 | % | | 2 | % | | 0 | % |
| Large Cap Disciplined Equity Fund | | 76 | % | | 74 | % | | 0 | % | | 13 | % | | 0 | % |
| Large Cap Index Fund | | 72 | % | | 71 | % | | 0 | % | | 0 | % | | 0 | % |
| Small Cap Fund | | 26 | % | | 24 | % | | 0 | % | | 3 | % | | 0 | % |
| Small/Mid Cap Equity Fund | | 34 | % | | 33 | % | | 0 | % | | 0 | % | | 0 | % |
| U.S. Managed Volatility Fund | | 100 | % | | 100 | % | | 0 | % | | 0 | % | | 0 | % |
| International Equity Fund (6) | | 0 | % | | 46 | % | | 3 | % | | 2 | % | | 100 | % |
| World Equity Ex-US Fund (7) | | 0 | % | | 61 | % | | 1 | % | | 10 | % | | 0 | % |
| Screened World Equity Ex-US Fund (8) | | 0 | % | | 84 | % | | 0 | % | | 1 | % | | 0 | % |
| Enhanced LIBOR Opportunities Fund | | 0 | % | | 0 | % | | 0 | % | | 0 | % | | 0 | % |
| Core Fixed Income Fund | | 0 | % | | 0 | % | | 4 | % | | 86 | % | | 100 | % |
| High Yield Bond Fund | | 0 | % | | 0 | % | | 0 | % | | 88 | % | | 0 | % |
| Long Duration Fund | | 0 | % | | 0 | % | | 18 | % | | 21 | % | | 0 | % |
| Emerging Markets Debt Fund | | 0 | % | | 0 | % | | 0 | % | | 0 | % | | 0 | % |
| Real Return Plus Fund | | 0 | % | | 0 | % | | 66 | % | | 49 | % | | 100 | % |
| (1) | Qualifying dividends represent dividends which qualify for the corporate dividends received deduction. |
| (2) | The percentage in this column represents the amount of “Qualifying Dividend Income” is reflected as a percentage of “Ordinary Income Distributions.” It is the intention of each of the aforementioned funds to designate the maximum amount permitted by the law. |
| | The information reported herein may differ from the information and distributions taxable to the shareholders for the calendar year ending December 31, 2009. Complete information will be computed and reported in conjunction with your 2009 Form 1099-DIV. |
| (3) | “U.S. Government Interest” represents the amount of interest that was derived from direct U.S. Government obligations and distributed during the fiscal year. This amount is reflected as a percentage of total ordinary income distributions (the total of short term capital gain and net investment income distributions). Generally, interest from direct U.S. Government obligations is exempt from state income tax. However, for shareholders who are residents of California, Connecticut and New York, the statutory threshold requirements were not satisfied to permit exemption of these amounts from state income. |
| (4) | The percentage in this column represents the amount of “Interest Related Dividend” is reflected as a percentage of net investment income distributions that is exempt from U.S. withholding tax when paid to foreign investors. This provision of the IRC will be expiring for years beginning after January 1, 2010. |
| (5) | The percentage in this column represents the amount of “Short-Term Capital Gain” is reflected as a percentage of short-term capital gain distributions that is exempt from U.S. withholding tax when paid to foreign investors. This provision of the IRC will be expiring for years beginning after January 1, 2010. |
| (6) | The Fund intends to pass through a foreign tax credit to shareholders. For fiscal year ended 2009, the total amount of gross foreign source income is $20,880,167. The total amount of foreign tax to be paid is $1,287,224. Your allocable share of the gross foreign tax credit will be reported on Form 1099 DIV. |
| (7) | The Fund intends to pass through a foreign tax credit to shareholders. For fiscal year ended 2009, the total amount of foreign source income is $62,940,338. The total amount of foreign tax to be paid is $4,781,157. Your allocable share of the foreign tax credit will be reported on Form 1099 DIV. |
| (8) | The Fund intends to pass through a foreign tax credit to shareholders. For fiscal year ended 2009, the total amount of gross foreign source income is $1,286,773. The total amount of foreign tax paid is $155,898. Your allocable share of the foreign tax credit will be reported on Form 1099 DIV. |
Items (A) and (B) are based on the percentage of each fund’s total distribution.
Items (C) and (D) are based on the percentage of ordinary income distributions of each fund. Item (E) is based on the percentage of gross income of each fund.
Please consult your tax adviser for proper treatment of this information. This notification should be kept with your permanent tax records.
| | |
| SEI Institutional Investments Trust / Annual Report / May 31, 2009 | | 263 |
SEI INSTITUTIONAL INVESTMENTS TRUST ANNUAL REPORT MAY 31, 2009
Robert A. Nesher, Chairman
Trustees
William M. Doran
James M. Storey
George J. Sullivan, Jr.
Rosemarie B. Greco
Nina Lesavoy
James M. Williams
Mitchell A. Johnson
Hubert L. Harris, Jr.
Officers
Robert A. Nesher
President and Chief Executive Officer
Stephen F. Panner
Controller and Chief Financial Officer
Russell Emery
Chief Compliance Officer
Timothy D. Barto
Vice President, Secretary
James Ndiaye
Vice President, Assistant Secretary
Michael T. Pang
Vice President, Assistant Secretary
Aaron Buser
Vice President, Assistant Secretary
David F. McCann
Vice President, Assistant Secretary
John J. McCue
Vice President
Andrew S. Decker
Anti-Money Laundering Compliance Officer
Investment Adviser
SEI Investments Management Corporation
Administrator
SEI Investments Global Funds Services
Distributor
SEI Investments Distribution Co.
Legal Counsel
Morgan, Lewis & Bockius LLP
Independent Registered Public Accounting Firm
KPMG LLP
This report and the financial statements contained herein are submitted for the general information of the shareholders of the Trust and must be preceded or accompanied by a current prospectus. Shares of the Funds are not deposits or obligations of, or guaranteed or endorsed by, any bank. The shares are not federally insured by the Federal Deposit Insurance Corporation (FDIC), the Federal Reserve Board, or any other government agency. Investment in the shares involves risk, including the possible loss of principal.
For more information call
1 800 DIAL SEI
(1 800 342 5734)
SEI Investments Distribution Co.
Oaks, PA 19456 1.800.DIAL.SEI (1.800.342.5734)
SEI-F-140 (05/09)
The Registrant has adopted a code of ethics that applies to the Registrant’s principal executive officer, principal financial officer, comptroller or principal accounting officer, and any person who performs a similar function.
| Item 3. | Audit Committee Financial Expert. |
(a)(1) The Registrant���s Board of Trustees has determined that the Registrant has at least two audit committee financial expert serving on the audit committee.
(a)(2) The audit committee financial experts are George J. Sullivan, Jr. and Hubert L. Harris, Jr. Mrrs. Sullivan and Harris are independent as defined in Form N-CSR Item 3 (a) (2).
| Item 4. | Principal Accountant Fees and Services. |
Fees billed by KPMG LLP (“KPMG”) related to the Registrant.
KPMG billed the Registrant aggregate fees for services rendered to the Registrant for the fiscal years 2009 and 2008 as follows:
| | | | | | | | | | | | | | | | | | |
| | | Fiscal 2009 | | Fiscal 2008 |
| | | All fees and
services to the
Registrant
that were
pre-approved | | All fees and
services to
service
affiliates that
were
pre-approved | | All other fees
and services to
service
affiliates that
did not require
pre-approval | | All fees and
services to the
Registrant that
were
pre-approved | | All fees and
services to
service
affiliates that
were
pre-approved | | All other fees
and services to
service
affiliates that
did not require
pre-approval |
(a) Audit Fees(1) | | $ | 435,000 | | | N/A | | $ | 0 | | $ | 449,000 | | | N/A | | $ | 0 |
(b) Audit-Related Fees | | $ | 0 | | $ | 0 | | $ | 0 | | $ | 0 | | $ | 0 | | $ | 0 |
(c) Tax Fees (Tax return review services) | | $ | 84,000 | | $ | 0 | | $ | 0 | | $ | 87,800 | | $ | 0 | | $ | 0 |
(d) All Other Fees | | $ | 0 | | $ | 234,500 | | $ | 0 | | $ | 15,300 | | $ | 226,000 | | $ | 0 |
Notes:
| | (1) | Audit fees include amounts related to the audit of the Registrant’s annual financial statements and services normally provided by the accountant in connection with statutory and regulatory filings. |
(e)(1) The Registrant’s Audit Committee has adopted and the Board of Trustees has ratified an Audit and Non-Audit Services Pre-Approval Policy (the “Policy”), which sets forth the procedures and the conditions pursuant to which services proposed to be performed by the independent auditor of the Registrant may be pre-approved.
The Policy provides that all requests or applications for proposed services to be provided by the independent auditor must be submitted to the Registrant’s Chief Financial Officer (“CFO”) and must include a detailed description of the services proposed to be rendered. The CFO will determine whether such services: (1) require specific pre-approval; (2) are included within the list of services that have received the general pre-approval of the Audit Committee pursuant to the Policy; or (3) have been previously pre-approved in connection with the independent auditor’s annual engagement letter for the applicable year or otherwise. In any instance where services require pre-approval, the Audit Committee will consider whether such services are consistent with SEC’s rules and whether the provision of such services would impair the auditor’s independence.
Requests or applications to provide services that require specific pre-approval by the Audit Committee will be submitted to the Audit Committee by the CFO. The Audit Committee will be informed by the CFO on a quarterly basis of all services rendered by the independent auditor. The Audit Committee has delegated specific pre-approval authority to either the Audit Committee Chair or financial experts, provided that the estimated fee for any such proposed pre-approved service does not exceed $100,000 and any pre-approval decisions are reported to the Audit Committee at its next regularly scheduled meeting.
Services that have received the general pre-approval of the Audit Committee are identified and described in the Policy. In addition, the Policy sets forth a maximum fee per engagement with respect to each identified service that has received general pre-approval.
All services to be provided by the independent auditor shall be provided pursuant to a signed written engagement letter with the Registrant, the investment advisor or applicable control affiliate (except that matters as to which an engagement letter would be impractical because of timing issues or because the matter is small may not be the subject of an engagement letter) that sets forth both the services to be provided by the independent auditor and the total fees to be paid to the independent auditor for those services.
In addition, the Audit Committee has determined to take additional measures on an annual basis to meet its responsibility to oversee the work of the independent auditor and to assure the auditor’s independence from the Registrant, such as reviewing a formal written statement from the independent auditor delineating all relationships between the independent auditor and the Registrant, and discussing with the independent auditor its methods and procedures for ensuring independence.
(e)(2) Percentage of fees billed applicable to non-audit services pursuant to waiver of pre-approval requirement were as follows:
| | | | | | |
| | | Fiscal 2009 | | | Fiscal 2008 | |
Audit-Related Fees | | 0 | % | | 0 | % |
Tax Fees | | 0 | % | | 0 | % |
All Other Fees | | 0 | % | | 0 | % |
(f) Not Applicable.
(g) The aggregate non-audit fees and services billed by KPMG for the fiscal years 2009 and 2008 were $234,500 and $241,300, respectively. Non-audit fees consist of SAS No. 70 review of fund accounting and administration operations, attestation report in accordance with Rule 17Ad-13, agreed upon procedures report over certain internal controls related to compliance with federal securities laws and regulations and tax consulting services for various service affiliates of the registrant.
(h) During the past fiscal year, Registrant’s principal accountant provided certain non-audit services to Registrant’s investment adviser or to entities controlling, controlled by, or under common control with Registrant’s investment adviser that provide ongoing services to Registrant that were not subject to pre-approval pursuant to paragraph (c)(7)(ii) of Rule 2-01 of Regulation S-X. The Audit Committee of Registrant’s Board of Trustees reviewed and considered these non-audit services provided by Registrant’s principal accountant to Registrant’s affiliates, including whether the provision of these non-audit services is compatible with maintaining the principal accountant’s independence.
| Item 5. | Audit Committee of Listed Registrants. |
Not applicable.
| Item 6. | Schedule of Investments |
Not applicable.
| Item 7. | Disclosure of Proxy Voting Policies and Procedures for Closed-End Management Investment Companies. |
Not applicable.
| Item 8. | Portfolio Managers of Closed-End Management Investment Companies |
Not applicable.
| Item 9. | Purchases of Equity Securities by Closed-End Management Company and Affiliated Purchasers. |
Not applicable.
| Item 10. | Submission of Matters to a Vote of Security Holders. |
The Registrant has a standing Nominating Committee (the “Committee”) currently consisting of the Independent Trustees. The Committee is responsible for evaluating and recommending nominees for election to the Trust’s Board of Trustees (the “Board”). Pursuant to the Committee’s Charter, adopted on June 18th 2004, as amended, the Committee will review all shareholder recommendations for nominations to fill vacancies on the Board if such recommendations are submitted in writing and addressed to the Committee at the Registrant’s office.
| Item 11. | Controls and Procedures. |
(a) The certifying officers, whose certifications are included herewith, have evaluated the Registrant’s disclosure controls and procedures within 90 days of the filing date of this report. Based on their evaluation, the certifying officers have concluded that the Registrant’s disclosure controls and procedures are adequately designed, and are operating effectively to ensure, that information required to be disclosed
by the Registrant in the reports it files or submits under the Securities Exchange Act of 1934 is recorded, processed, summarized and reported within the time periods specified in the Securities and Exchange Commission’s rules and forms.
(b) There were no significant changes in the Registrant’s internal control over financial reporting that occurred during the Registrant’s last fiscal half-year that have materially affected, or are reasonably likely to materially affect, the Registrant’s internal control over financial reporting.
(a)(1) Code of Ethics attached hereto.
(a)(2) A separate certification for the principal executive officer and the principal financial officer of the Registrant as required by Rule 30a-2(a) under the Investment Company Act of 1940, as amended (17 CFR 270.30a-2(a)), are filed herewith.
(b) Officer certifications as required by Rule 30a-2(b) under the Investment Company Act of 1940, as amended (17 CFR 270.30a-2(b)) also accompany this filing as an exhibit.
SIGNATURES
Pursuant to the requirements of the Securities Exchange Act of 1934 and the Investment Company Act of 1940, the Registrant has duly caused this report to be signed on its behalf by the undersigned, thereunto duly authorized.
| | | | | | | | |
| (Registrant) | | | | SEI Institutional Investments Trust |
| | |
| By (Signature and Title) | | | | /s/ Robert A. Nesher |
| | | | | | Robert A. Nesher |
| | | | | | President & CEO |
| | |
| Date: August 6, 2009 | | | | |
Pursuant to the requirements of the Securities Exchange Act of 1934 and the Investment Company Act of 1940, this report has been signed below by the following persons on behalf of the Registrant and in the capacities and on the dates indicated.
| | | | | | | | |
| | |
| By (Signature and Title) | | | | /s/ Robert A. Nesher |
| | | | | | Robert A. Nesher |
| | | | | | President & CEO |
| | |
| Date: August 6, 2009 | | | | |
| | |
| By (Signature and Title) | | | | /s/ Stephen F. Panner |
| | | | | | Stephen F. Panner |
| | | | | | Controller & CFO |
| | |
| Date: August 6, 2009 | | | | |