UNITED STATES
SECURITIES AND EXCHANGE COMMISSION
Washington, D.C. 20549
FORM N-CSR
CERTIFIED SHAREHOLDER REPORT OF REGISTERED MANAGEMENT
INVESTMENT COMPANIES
Investment Company Act file number 811-07257
SEI Institutional Investments Trust
(Exact name of registrant as specified in charter)
SEI Investments
One Freedom Valley Drive
Oaks, PA 19456
(Address of principal executive offices) (Zip code)
CT Corporation
101 Federal Street
Boston, MA 02110
(Name and address of agent for service)
Registrant’s telephone number, including area code: 1-800-342-5734
Date of fiscal year end: May 31, 2010
Date of reporting period: May 31, 2010
Item 1. Reports to Stockholders.

SEI Institutional Investments Trust
Annual Report as of May 31, 2010
Large Cap Fund
Large Cap Diversified Alpha Fund
Large Cap Disciplined Equity Fund
Large Cap Index Fund
Small Cap Fund
Small/Mid Cap Equity Fund
U.S. Managed Volatility Fund
International Equity Fund
World Equity Ex-US Fund
Screened World Equity Ex-US Fund
Enhanced LIBOR Opportunities Fund
Core Fixed Income Fund
High Yield Bond Fund
Long Duration Fund
Emerging Markets Debt Fund
Real Return Fund
TABLE OF CONTENTS
The Trust files its complete schedule of portfolio holdings with the Securities and Exchange Commission for the first and third quarters of each fiscal year on Form N-Q within sixty days after the end of the period. The Trust’s Forms N-Q are available on the Commission’s website at http://www.sec.gov, and may be reviewed and copied at the Commission’s Public Reference Room in Washington, DC. Information on the operation of the Public Reference Room may be obtained by calling 1-800-SEC-0330.
A description of the policies and procedures that the Trust uses to determine how to vote proxies relating to portfolio securities, as well as information relating to how a Fund voted proxies relating to portfolio securities during the most recent 12-month period ended June 30, is available (i) without charge, upon request, by calling 1-800-DIAL-SEI; and (ii) on the Commission’s website at http://www.sec.gov.
MANAGEMENT’S DISCUSSION AND ANALYSIS OF FUND PERFORMANCE
SEI INSTITUTIONAL INVESTMENTS TRUST — MAY 31, 2010 (Unaudited)
Large Cap Fund
I. Objective:
The Large Cap Fund (the “Fund) seeks to provide long-term growth of capital and income.
II. Multi-Manager Approach Statement:
The Fund uses a multi-manager approach, relying on a number of sub-advisors with differing investment approaches to manage portions of the Fund’s portfolio under the general supervision of SEI Investments Management Corp. (SIMC). The Fund utilized the following sub-advisers as of May 31, 2010: Quantitative Management Associates, LLC, Legg Mason Capital Management Inc., Delaware Investments Company, Neuberger Berman Management LLC, Aronson + Johnson + Ortiz L.P. and LSV Asset Management. For the fiscal year ended May 31, 2010, Neuberger Berman Management LLC was added to the Fund, while Intech Investment Management, LLC and Goldman Sachs Asset Management were terminated.
III. Market Commentary:
The U.S. equity market, as measured by the Russell 1000 Index, gained 22.33% during the fiscal year ended May 31, 2010. After a historic fall in 2008, equity markets staged a strong rebound in 2009 off the heels of unprecedented global intervention by governments and central banks. Stocks and sectors that suffered the steepest declines in the year prior drove market returns in 2009. More specifically, smaller-cap and lower-quality names, most of which were assumed to be insolvent, posted significant gains.
For the fiscal year, value stocks outperformed their growth counterparts in the large-cap universe. All ten Global Industry Classification Standard (GICS) sectors posted positive performance during the period. A renewed confidence in economic recovery revived investors’ willingness for risk taking. The Consumer Discretionary sector was the best-performing sector, up 44%, followed by Industrials and Information Technology. Conversely, more defensive sectors, which performed well during the year before, lagged the broad market. Utilities, Consumer Staples and Healthcare names failed to keep pace with the market, as investors sought higher returns in riskier assets. Energy shares were a surprise during the fiscal year. Widely thought of as a cyclical sector, Energy was the worst-performing sector during the period. Exxon Mobil and Chevron, both significant constituents of the sector, trailed the benchmark. From a factor perspective, small-size and value factors, both traditional and relative, were the best-performing factors. Earnings and price momentum factors performed worst.
IV. Return vs. Benchmark:
For the fiscal year ended May 31, 2010, the Fund underperformed the Russell 1000 Index, returning 20.05% versus the index return of 22.33%.
V. Fund Attribution:
Although it posted a strong absolute return, the Fund lagged its benchmark, mostly due to an underweight to Financials and poor stock selection in Information Technology. The sudden rebound in banks and real estate caught managers short-handed, as many had been focusing instead on the less risky industry of diversified financials, as these names were more insulated from the recent credit crisis. On the Technology side, many software and hardware names that did well in the early part of 2009 had a reversal during the subsequent rally and continued to lag in 2010. In general, the Fund’s managers hold higher-quality names and thus did not participate in the rebound experienced by stocks that were priced for bankruptcy. The Fund benefited from an underweight to one of the defensive sectors, Consumer Staples, which lagged during the fiscal year ended May 31, 2010. A similar story can be told for the Energy sector, which the Fund also underweighted and which has come down in valuation over the past year.
Large Cap Fund
AVERAGE ANNUAL TOTAL RETURN1
| | | | | | | | | | |
| | | One Year
Return | | Annualized
3 Year
Return | | Annualized
5 Year
Return | | Annualized
10 Year
Return | | Annualized
Inception
to Date |
| Large Cap Fund, Class A | | 20.05% | | (8.31)% | | 0.84% | | (0.75)% | | 5.34% |
Comparison of Change in the Value of a $100,000 Investment in the Large Cap Fund, versus the Russell 1000 Index
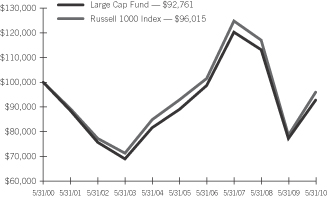
| | 1 | | For the period ended May 31, 2010. Past performance is not an indication of future performance. Class A shares were offered beginning 6/14/96. Returns shown do not reflect the deduction of taxes that a shareholder would pay on fund distributions or the redemption of fund shares. The returns for certain periods reflect fee waivers and/or reimbursements in effect for that period; absent fee waivers and reimbursements, performance would have been lower. |
| | |
| SEI Institutional Investments Trust / Annual Report / May 31, 2010 | | 1 |
MANAGEMENT’S DISCUSSION AND ANALYSIS OF FUND PERFORMANCE
SEI INSTITUTIONAL INVESTMENTS TRUST — MAY 31, 2010 (Unaudited)
Large Cap Diversified Alpha Fund
I. Objective:
The Large Cap Diversified Alpha Fund (the “Fund”) seeks to provide long-term growth of capital and income.
II. Multi-Manager Approach Statement:
The Fund uses a multi-manager approach, relying on a number of sub-advisors with differing investment approaches to manage portions of the Fund’s portfolio under the general supervision of SEI Investments Management Corp. (SIMC). The Fund utilized the following sub-advisers as of May 31, 2010: Quantitative Management Associates, LLC, Analytic Investors, LLC, Intech Investment Management, LLC, Legg Mason Capital Management, Inc., Delaware Management Company and Aronson + Johnson + Ortiz L.P. There were no changes to the portfolio in the fiscal year.
III. Market Commentary:
The U.S. equity market, as measured by the Russell 1000 Index, gained 22.33% during the fiscal year ended May 31, 2010. After a historic fall in 2008, equity markets staged a strong rebound in 2009 off the heels of unprecedented global intervention by governments and central banks. Stocks and sectors that suffered the steepest declines in the year prior drove market returns in 2009. More specifically, smaller-cap and lower-quality names, most of which were assumed to be insolvent, posted significant gains.
For the fiscal year, value stocks outperformed their growth counterparts in the large-cap universe. All ten Global Industry Classification Standard (GICS) sectors posted positive performance during the period. A renewed confidence in economic recovery revived investors’ willingness for risk taking. The Consumer Discretionary sector was the best-performing sector, up 44%, followed by Industrials and Information Technology. Conversely, more defensive sectors, which performed well during the year before, lagged the broad market. Utilities, Consumer Staples and Healthcare names failed to keep pace with the market, as investors sought higher returns in riskier assets. Energy shares were a surprise during the fiscal year. Widely thought of as a cyclical sector, Energy was the worst-performing sector during the period. Exxon Mobil and Chevron, both significant constituents of the sector, trailed the benchmark. From a factor perspective, small-size and value factors, both traditional and relative, were the best-performing factors. Earnings and price momentum factors performed worst.
IV. Return vs. Benchmark:
For the fiscal year ended May 31, 2010, the Fund outperformed the Russell 1000 Index, returning 22.61% versus the index return of 22.33%.
V. Fund Attribution:
The Fund delivered strong performance, with the LIBOR Plus portfolio and an allocation to Consumer Staples as major contributors. On the Technology side, many software and hardware names that did well in the early part of 2009 had a reversal during the subsequent rally and continued to lag in 2010. In general, the Fund’s managers hold higher-quality names and thus did not participate in the bounce experienced by many stocks that were priced for bankruptcy. Positioning in Financials also detracted from performance. The sudden rebound in real estate caught managers short-handed, as many had instead been focusing on the less risky industry of diversified financials, where companies were more insulated from the recent credit crisis. On the bright side, strong stock selection in the Healthcare sector boosted returns, especially once investors came back to the sector after decisions were finalized surrounding potential government regulation. In addition, the Fund benefited from an underweight to the Energy sector, which had come down in valuation over the past year.
Large Cap Diversified Alpha Fund
AVERAGE ANNUAL TOTAL RETURN1
| | | | | | |
| | | One Year
Return | | Annualized
3 Year
Return | | Annualized
Inception
to Date |
| Large Cap Diversified Alpha Fund, Class A | | 22.61% | | (11.18)% | | (3.61)% |
Comparison of Change in the Value of a $100,000 Investment in the Large Cap Diversified Alpha Fund, versus the Russell 1000 Index
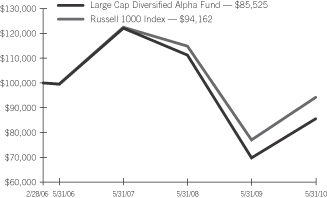
| | 1 | | For the period ended May 31, 2010. Past performance is no indication of future performance. Class A shares were offered beginning 2/28/06. Returns shown do not reflect the deduction of taxes that a shareholder would pay on fund distributions or the redemption of fund shares. The returns for certain periods reflect fee waivers and/or reimbursements in effect for that period; absent fee waivers and reimbursements, performance would have been lower. |
| | |
| 2 | | SEI Institutional Investments Trust / Annual Report / May 31, 2010 |
MANAGEMENT’S DISCUSSION AND ANALYSIS OF FUND PERFORMANCE
SEI INSTITUTIONAL INVESTMENTS TRUST — MAY 31, 2010 (Unaudited)
Large Cap Disciplined Equity Fund
I. Objective:
The Large Cap Disciplined Equity Fund (the “Fund”) seeks to provide capital appreciation.
II. Multi-Manager Approach Statement:
The Fund uses a multi-manager approach, relying on a number of sub-advisors with differing investment approaches to manage portions of the Fund’s portfolio under the general supervision of SEI Investments Management Corp. (SIMC). The Fund utilized the following sub-advisers as of May 31, 2010: Quantitative Management Associates, LLC, Analytic Investors, Inc., INTECH Investment Management, LLC, Massachusetts Financial Services Company and Lazard Asset Management LLC. For the one-year period ending May 31,2010, Lazard Asset Management LLC was added to the Fund.
III. Market Commentary:
The U.S. equity market, as measured by the Russell 1000 Index, gained 22.33% during the fiscal year ending May 31, 2010. After a historic fall in 2008, equity markets staged a strong rebound in 2009 off the heels of unprecedented global intervention by governments and central banks. Stocks and sectors that suffered the steepest declines in the year prior drove market returns in 2009. More specifically, smaller-cap and lower-quality names, most of which were assumed to be insolvent, posted significant gains.
For the fiscal year, value stocks outperformed their growth counterparts in the large-cap universe. All ten Global Industry Classification Standard (GICS) sectors posted positive performance during the period. A renewed confidence in economic recovery revived investors’ willingness for risk taking. The Consumer Discretionary sector was the best-performing sector, up 44%, followed by Industrials and Information Technology. Conversely, more defensive sectors, which performed well during the year before, lagged the broad market. Telecommunications, Healthcare and Materials names failed to keep pace with the market, as investors sought higher returns in riskier assets. Energy shares were a surprise during the fiscal year. Widely thought of as a cyclical sector, Energy was the worst-performing sector during the period. Exxon Mobil and Chevron, both significant constituents of the sector, trailed the benchmark. From a factor perspective, small size and expected growth were the best-performing factors. Momentum factors for both earnings and prices were negative.
IV. Return vs. Benchmark:
For the fiscal year ended May 31, 2010, the Fund outperformed the S&P 500 Index, returning 22.32% versus the index return of 20.99%.
V. Fund Attribution:
After a difficult time for quantitative managers, the tide turned during the past year for all but the factor rotation manager. The latter manager had a difficult time during the choppy markets, as its process relies on a trending market with a clear direction to add value. A decrease in the Chicago Board Options Exchange Volatility Index (VIX), a measure of implied volatility in S&P 500 Index options that is also known as the “fear index,” benefited the volatility capture manager for most of the period, as did the out-performance of smaller stocks, which the manager is typically biased towards. Investors began rewarding value factors once more—a boon to the traditional quantitative managers in the Fund—although this was dampened by the headwind from lower-quality names (usually underweighted by quantitative managers) outperforming during the market rally. The Fund’s hybrid manager did especially well, namely due to holdings in the Consumer Discretionary sector. The Libor Plus portfolio added significant alpha to the Fund as well, as credit spreads have continued to narrow.
Large Cap Disciplined Equity Fund
AVERAGE ANNUAL TOTAL RETURN1
| | | | | | | | |
| | | One Year
Return | | Annualized
3 Year
Return | | Annualized
5 Year
Return | | Annualized
Inception
to Date |
Large Cap Disciplined
Equity Fund, Class A | | 22.32% | | (11.90)% | | (1.64)% | | 2.08% |
Comparison of Change in the Value of a $100,000 Investment in the Large Cap Disciplined Equity Fund, versus the S&P 500 Index
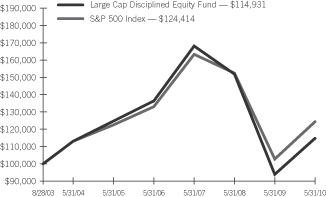
| | 1 | | For the period ended May 31, 2010. Past performance is not an indication of future performance. Class A shares were offered beginning 8/28/03. Returns shown do not reflect the deduction of taxes that a shareholder would pay on fund distributions or the redemption of fund shares. The returns for certain periods reflect fee waivers and/or reimbursements in effect for that period; absent fee waivers and reimbursements, performance would have been lower. |
| | |
| SEI Institutional Investments Trust / Annual Report / May 31, 2010 | | 3 |
MANAGEMENT’S DISCUSSION AND ANALYSIS OF FUND PERFORMANCE
SEI INSTITUTIONAL INVESTMENTS TRUST — MAY 31, 2010 (Unaudited)
Large Cap Index Fund
I. Objective:
The Large Cap Index Fund (the “Fund”) seeks to provide investment results that correspond to the aggregate price and dividend performance of the securities in the Russell 1000 Index.
II. Manager Approach Statement:
The Fund uses a sub-advisor to manage the Fund under the supervision of SEI Investments Management Corporation (SIMC). Currently, the sub-advisor is State Street Global Advisors. There were no manager changes during the period.
III. Market Commentary:
The U.S. equity market, as measured by the Russell 1000 Index, gained 22.33% during the fiscal year ended May 31, 2010. After a historic fall in 2008, equity markets staged a strong rebound in 2009 off the heels of unprecedented global intervention by governments and central banks. Stocks and sectors that suffered the steepest declines in the year prior drove market returns in 2009. More specifically, smaller-cap and lower-quality names, most of which were assumed to be insolvent, posted significant gains.
For the fiscal year, value stocks outperformed their growth counterparts in the large-cap universe. All ten Global Industry Classification Standard (GICS) sectors posted positive performance during the period. A renewed confidence in economic recovery revived investors’ willingness for risk taking. The Consumer Discretionary sector was the best-performing sector, up 44%, followed by Industrials and Information Technology. Conversely, more defensive sectors, which performed well during the year before, lagged the broad market. Utilities, Consumer Staples and Healthcare names failed to keep pace with the market, as investors sought higher returns in riskier assets. Energy shares were a surprise during the fiscal year. Widely thought of as a cyclical sector, Energy was the worst-performing sector during the period. Exxon Mobil and Chevron, both significant constituents of the sector, trailed the benchmark. From a factor perspective, small-size and value factors, both traditional and relative, were the best-performing factors. Earnings and price momentum factors performed worst.
IV. Return vs. Benchmark:
For the fiscal year ended May 31, 2010, the Fund outperformed the Russell 1000 Index, returning 22.34% versus the benchmark return of 22.33%.
V. Fund Attribution:
Incremental excess return was generated due to cash flows. As an index fund, performance is designed to track that of the index.
Large Cap Index Fund
AVERAGE ANNUAL TOTAL RETURN1
| | | | | | | | |
| | | One Year
Return | | Annualized
3 Year
Return | | Annualized
5 Year
Return | | Annualized
Inception
to Date |
| Large Cap Index Fund, Class A | | 22.34% | | (8.40)% | | 0.64% | | 1.77% |
Comparison of Change in the Value of a $100,000 Investment in the Large Cap Index Fund, versus the Russell 1000 Index
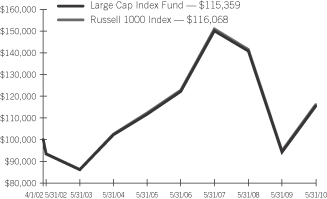
| | 1 | | For the period ended May 31, 2010. Past performance is not an indication of future performance. Class A shares were offered beginning 4/1/02. Returns shown do not reflect the deduction of taxes that a shareholder would pay on fund distributions or the redemption of fund shares. The returns for certain periods reflect fee waivers and/or reimbursements in effect for that period; absent fee waivers and reimbursements, performance would have been lower. |
| | |
| 4 | | SEI Institutional Investments Trust / Annual Report / May 31, 2010 |
MANAGEMENT’S DISCUSSION AND ANALYSIS OF FUND PERFORMANCE
SEI INSTITUTIONAL INVESTMENTS TRUST — MAY 31, 2010 (Unaudited)
Small Cap Fund
I. Objective:
The Small Cap Fund (the “Fund”) seeks to provide capital appreciation.
II. Multi-Manager Approach Statement:
The Fund uses a multi-manager approach, relying upon a number of sub-advisers with differing investment philosophies to manage portions of the Fund’s portfolio under the general supervision of SEI Investments Management Corporation (“SIMC”). The Fund utilized the following sub-advisers as of May 31, 2010: AQR Capital Management, LLC, Artisan Partners Limited Partnership, Janus Capital Management, Inc., Lee Munder Capital Group LLC, Los Angeles Capital Management & Equity Research, Inc., LSV Asset Management, Oppenheimer Capital, LC, Robeco Investment Management, Inc., Security Capital Research and Management, Inc. and Wellington Management Company, LLP.
For the fiscal year ended May 31, 2010, BlackRock Capital Management, Inc., McKinley Capital Management, Inc., Neuberger Berman Management, LLC, PanAgora Asset Management, Inc and Martingale Asset Management, L.P. were removed from the Fund. AQR Capital Management, LLC was added during the period.
III. Market Commentary:
The U.S. small-cap equity market, as measured by the Russell 2000 Index, gained over 33% during the fiscal year ended May 31, 2010. After small-cap stocks lost nearly half of their value in 2008 and early 2009, U.S. Small Cap stocks turned decisively positive in March 2009 as the extreme fear over the state of the U.S. and world financial systems subsided. An extended rally followed as investors discounted government intervention and became hopeful of an economic recovery, albeit a moderate one. From a factor perspective, price and earnings momentum performed very poorly for the fiscal year. Value, small market cap and low price were the best factors as the companies investors believed to be the most likely bankruptcy candidates during the downturn tended to lead the market during the rebound.
IV. Return vs. Benchmark:
For the fiscal year ended May 31, 2010, the Fund outperformed the Russell 2000 Index, returning 35.32% versus the index return of 33.62%.
V. Fund Attribution:
The majority of out-performance occurred in the third quarter of 2009, as the initial rally from the March 2009 low extended, and an underweight to the lagging banking industry added to performance. The Fund posted solid performance on a relative basis, principally due to stock selection within the Financials sector, particularly the real estate investment trust (REIT) industry. Strong stock selection in the Industrials sector contributed meaningfully as well. The core quantitative managers outperformed for the period, as factor returns began to trend and value factors saw positive returns. The value managers also contributed to performance, with a majority of them outperforming the Russell 2000 Value Index.
Small Cap Fund
AVERAGE ANNUAL TOTAL RETURN1
| | | | | | | | | | |
| | | One Year
Return | | Annualized
3 Year
Return | | Annualized
5 Year
Return | | Annualized
10 Year
Return | | Annualized
Inception
to Date |
| Small Cap Fund, Class A | | 35.32% | | (8.39)% | | 1.93% | | 4.54% | | 6.66% |
Comparison of Change in the Value of a $100,000 Investment in the Small Cap Fund, versus the Russell 2000 Index

| | 1 | | For the period ended May 31, 2010. Past performance is not an indication of future performance. Class A shares were offered beginning 6/14/96. Returns shown do not reflect the deduction of taxes that a shareholder would pay on fund distributions or the redemption of fund shares. The returns for certain periods reflect fee waivers and/or reimbursements in effect for that period; absent fee waivers and reimbursements, performance would have been lower. |
| | |
| SEI Institutional Investments Trust / Annual Report / May 31, 2010 | | 5 |
MANAGEMENT’S DISCUSSION AND ANALYSIS OF FUND PERFORMANCE
SEI INSTITUTIONAL INVESTMENTS TRUST — MAY 31, 2010 (Unaudited)
Small/Mid Cap Equity Fund
I. Objective:
The Small/Mid Cap Equity Fund (the “Fund”) seeks to provide long-term capital appreciation.
II. Multi-Manager Approach Statement:
The Fund uses a multi-manager approach, relying upon a number of sub-advisers with differing investment philosophies to manage portions of the Fund’s portfolio under the general supervision of SEI Investments Management Corporation (“SIMC”). The Fund utilized the following sub-advisers as of May 31, 2010: Integrity Asset Management, LLC, Janus Capital Management, Inc., Lee Munder Capital Group LLC, Los Angeles Capital Management & Equity Research, Inc., LSV Asset Management, PanAgora Asset Management, Inc., Security Capital Research and Management, Inc., Wellington Management Company, LLP and Wells Capital Management, Inc.
For the fiscal year ended May 31, 2010, BlackRock Capital Management, Inc. and Martingale Asset Management, L.P. were removed from the Fund. Wellington’s Small Cap Growth product was added during the period.
III. Market Commentary:
The U.S. small/mid cap equity market, as measured by the Russell 2500 Index, gained over 35% during the fiscal year ended May 31, 2010. After small- and mid-cap stocks lost nearly half of their value in 2008 and early 2009, these markets turned decisively positive in March 2009 as the extreme fear over the state of the U.S. and world financial systems subsided. An extended rally followed as investors discounted government intervention and became hopeful of an economic recovery, albeit a moderate one. From a factor perspective, price and earnings momentum performed very poorly for the fiscal year. Value, small market cap and low price were the best factors as the companies investors believed to be the most likely bankruptcy candidates during the downturn tended to lead the market during the rebound.
IV. Return vs. Benchmark:
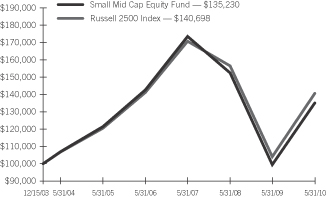
For the fiscal year ended May 31, 2010, the Fund outperformed the Russell 2500 Index, returning 35.79% versus the index return of 35.07%.
V. Fund Attribution:
The majority of out-performance occurred in the third quarter of 2009 as markets continued to rally off of March lows. The Fund posted solid performance on a relative basis, largely due to stock selection within the Financials sector, particularly the REIT industry. Strong stock selection in the Materials sector was also beneficial. From a style perspective, the Fund’s value managers contributed to performance, with each outperforming the Russell 2000 Value Index, and Wells Capital, added in 2008, contributed to performance as the best-performing growth manager over the period.
Small/Mid Cap Equity Fund
AVERAGE ANNUAL TOTAL RETURN1
| | | | | | | | |
| | | One Year
Return | | Annualized
3 Year
Return | | Annualized
5 Year
Return | | Annualized
Inception
to Date |
| Small/Mid Cap Equity Fund, Class A | | 35.79% | | (7.99)% | | 2.17% | | 4.78% |
Comparison of Change in the Value of a $100,000 Investment in the Small Mid Cap Equity Fund, versus the Russell 2500 Index
| | 1 | | For the period ended May 31, 2010. Past performance is not an indication of future performance. Class A shares were offered beginning 12/15/03. Returns shown do not reflect the deduction of taxes that a shareholder would pay on fund distributions or the redemption of fund shares. The returns for certain periods reflect fee waivers and/or reimbursements in effect for that period; absent fee waivers and reimbursements, performance would have been lower. |
| | |
| 6 | | SEI Institutional Investments Trust / Annual Report / May 31, 2010 |
MANAGEMENT’S DISCUSSION AND ANALYSIS OF FUND PERFORMANCE
SEI INSTITUTIONAL INVESTMENTS TRUST — MAY 31, 2010 (Unaudited)
U.S. Managed Volatility Fund
I. Objective:
The U.S. Managed Volatility Fund (the “Fund”) seeks to provide capital appreciation with less volatility than the broad U.S. equity markets.
II. Multi-Manager Approach Statement:
The Fund uses a multi-manager approach, relying on a number of Sub-Advisers with differing investment approaches to manage portions of the Fund’s portfolio under the general supervision of SIMC. The Fund utilized the following sub-advisors as of May 31, 2010: Aronson + Johnson + Ortiz, LP and Analytic Investors LLC. No manager changes were made during the period.
III. Market Commentary:
Economic recovery and excess liquidity prompted a sharp market rebound. Cyclical sectors, which previously experienced the heaviest declines, led the rally. Consumer Discretionary and Industrials posted the best returns, with the defensive Utilities and Telecommunications sectors lagging the broader market.
Companies that seemed to have a questionable chance for survival in 2008 were rewarded the most. These stocks generally had high levels of debt and a high beta, or more sensitivity to the movements in the broader market. High-beta names outperformed the low-beta ones overall.
May 2010 saw an increase in risk aversion compared to the last 12 months. Concerns over Southern European sovereign debt, an overheating Chinese property market and possibly the economy, as well as consequences of BP’s oil spill for the entire industry caused investors to seek refuge in the safer Consumer Staples, Telecommunications and Utilities sectors.
IV. Return vs. Benchmark:
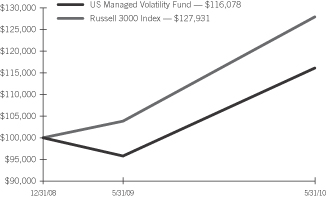
For the fiscal year ended May 31, 2010, the Fund underperformed the Russell 3000 Index, returning 21.12% versus the index return of 23.20%.
V. Fund Attribution:
The Fund’s underperformance was primarily driven by its defensive stance, which is required to achieve the primary objective of lowering volatility and providing downside protection to investors. In fact, the volatility reduction goal was comfortably achieved. For the fiscal year ended May 31, 2010, the Fund realized an annualized standard deviation of 14% (daily frequency) as compared to the benchmark’s results of 19%.
To achieve its intended low risk profile, the managers target lower-beta, lower-risk names with stable earnings streams and lower leverage ratios. In the early stages of market recovery, such positioning prevented the Fund from fully participating in the rally. As low-beta stocks lagged their high-beta counterparts by over 18%, this has had a major negative allocation effect. After adjusting for the beta positioning, stock selection was strong. From a more traditional sector perspective, the Fund’s overweight to the defensive Consumer Staples, Utilities, and Healthcare sectors detracted significantly.
U.S. Managed Volatility Fund
AVERAGE ANNUAL TOTAL RETURN1
| | | | |
| | | One Year
Return | | Annualized
Inception
to Date |
| U.S. Managed Volatility Fund | | 21.12% | | 11.08% |
Comparison of Change in the Value of a $100,000 Investment in the US Managed Volatility Fund, versus the Russell 3000 Index
| | 1 | | For the period ended May 31, 2010. Past performance is not an indication of future performance. Class A shares were offered beginning 12/31/08. Returns shown do not reflect the deduction of taxes that a shareholder would pay on fund distributions or the redemption of fund shares. The returns for certain periods reflect fee waivers and/or reimbursements in effect for that period; absent fee waivers and reimbursements, performance would have been lower. |
| | |
| SEI Institutional Investments Trust / Annual Report / May 31, 2010 | | 7 |
MANAGEMENT’S DISCUSSION AND ANALYSIS OF FUND PERFORMANCE
SEI INSTITUTIONAL INVESTMENTS TRUST — MAY 31, 2010 (Unaudited)
International Equity Fund
I. Objective:
The International Equity Fund (the “Fund”) seeks to provide capital appreciation.
II. Multi-Manager Approach Statement:
The Fund uses a multi-manager approach, relying upon a number of sub-advisors with differing investment philosophies to manage portions of the Fund’s portfolio under the general supervision of SEI Investments Management Corporation (“SIMC”). The Fund utilizes the following sub-advisers as of May 31, 2010: Acadian Asset Management, LLC, AXA Rosenberg Investment Management, LLC, Declaration Management and Research, LLC, INTECH Investment Management, LLC, Neuberger Berman Management, LLC, Quantitative Management Associates, LLC, and Schroder Investment Management North America, Inc.
For the fiscal year ended May 31, 2010, Neuberger Berman Management and Schroder Investment Management were added to the Fund; McKinley Capital Management, Principal Global Investors, and Wellington Management Company were terminated.
III. Market Commentary:
Global equity markets continued their tumble from 2008 well into the first quarter of 2009. However, hopeful signs emerged in March 2009 as global stimulus efforts began to take effect. Investors started to feel more confident about a global economic recovery and their appetite for risk returned, fueling a strong rally through the end of the year. Starting in March, stocks that had suffered the most during the credit crisis led the rally. This was reflected in the leadership by the cheapest stocks, particularly as measured by prices relative to book values (assets minus liabilities). Companies that had the highest levels of debt also outperformed the index. In the third quarter, earnings releases for many companies were better than expected, pushing prices higher. However, as the rally matured, investors began to favor companies with higher-quality balance sheets and opportunities to gain market share. In the first five months of 2010, global equity markets were down overall as macroeconomic events, which included the European sovereign debt crisis, a slowdown in Chinese growth, and the oil spill in the Gulf of Mexico, took center stage.
IV. Return vs. Benchmark:
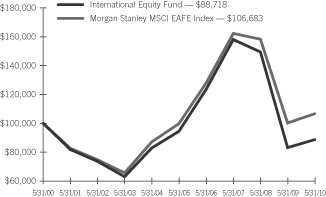
For the fiscal year ended May 31, 2010, the Fund outperformed the MSCI EAFE Index, returning 6.68% versus the index return of 6.38%.
V. Fund Attribution:
The Fund outperformed the benchmark, driven primarily by positive stock selection by the sub-advisors; however, allocation also contributed to performance. From a regional perspective, in addition to positive stock selection, the Fund’s underweight allocation to Europe ex-UK was beneficial as the region struggled with mounting
sovereign debt issues and fears of contagion. On the other hand, the Fund’s underweight allocation and stock selection in Pacific ex-Japan detracted from performance. Australia, the largest constituent in Pacific ex-Japan, was one of the hottest markets during the period and the Fund’s underweight allocation detracted. From a sector perspective, performance was diverse, favoring neither cyclical nor defensive sectors. Consumer Discretionary stocks performed the best, with automobile companies dominating positive performance. Industrial and Health Care detracted due to weak stock selection for the time period.
International Equity Fund
AVERAGE ANNUAL TOTAL RETURN1
| | | | | | | | | | |
| | | One Year
Return | | Annualized
3 Year
Return | | Annualized
5 Year
Return | | Annualized
10 Year
Return | | Annualized
Inception
to Date |
| International Equity Fund, Class A | | 6.68% | | (17.51)% | | (1.24)% | | (1.19)% | | 2.35% |
Comparison of Change in the Value of a $100,000 Investment in the International Equity Fund, versus the Morgan Stanley MSCI EAFE Index
| | 1 | | For the period ended May 31, 2010. Past performance is not an indication of future performance. Class A shares were offered beginning 6/14/96. Returns shown do not reflect the deduction of taxes that a shareholder would pay on fund distributions or the redemption of fund shares. The returns for certain periods reflect fee waivers and/or reimbursements in effect for that period; absent fee waivers and reimbursements, performance would have been lower. |
| | |
| 8 | | SEI Institutional Investments Trust / Annual Report / May 31, 2010 |
MANAGEMENT’S DISCUSSION AND ANALYSIS OF FUND PERFORMANCE
SEI INSTITUTIONAL INVESTMENTS TRUST — MAY 31, 2010 (Unaudited)
World Equity Ex-US Fund
I. Objective:
The objective of the World Equity Ex-US Fund (the “Fund”) is to provide capital appreciation.
II. Multi-Manager Approach Statement:
The Fund uses a multi-manager approach, relying upon a number of sub-advisors with differing investment philosophies to manage portions of the Fund’s portfolio under the general supervision of SEI Investments Management Corporation (“SIMC”). The Fund utilizes the following sub-advisors as of May 31, 2010: Acadian Asset Management, Inc., Artisan Partners Limited Partnership, Declaration Management & Research LLC, McKinley Capital Management, LLC, NFJ Investment Group LLC, Principal Global Investors, LLC, Quantitative Management Associates, LLC and Thornburg Investment Management LLC.
For the fiscal year ended May 31, 2010, NFJ Investment Group LLC and Thornburg Investment Management LLC were added to the Fund; Wellington Management Company, LLC, AXA Rosenberg Investment Management, LLC, INTECH Investment Management, LLC and Rexiter Capital Management Limited were terminated.
III. Market Commentary:
Global equity markets continued their tumble from 2008 well into the first quarter of 2009. However, hopeful signs emerged in March 2009 as global stimulus efforts began to take effect. Investors started to feel more confident about a global economic recovery and their appetite for risk returned, fueling a strong rally through the end of the year. Starting in March, stocks that had suffered the most during the credit crisis led the rally. This was reflected in the leadership by the cheapest stocks, particularly as measured by prices relative to book values (assets minus liabilities). Companies that had the highest levels of debt also outperformed the index. In the third quarter, earnings releases for many companies were better than expected, pushing prices higher. However, as the rally matured, investors began to favor companies with higher-quality balance sheets and opportunities to gain market share.
In the first five months of 2010, global equity markets were down overall as macroeconomic events, which included the European sovereign debt crisis, a slowdown in Chinese growth and the oil spill in the Gulf of Mexico, took center stage. For the time period, emerging markets outperformed developed markets and sector performance was mixed.
IV. Return vs. Benchmark:
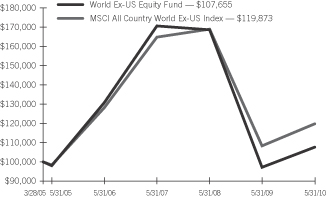
For the fiscal year ended May 31, 2010, the Fund outperformed the MSCI All Country World Ex-U.S. Index, returning 10.74% versus the index return of 10.63%.
V. Fund Attribution:
The Fund outperformed the benchmark, driven primarily by positive stock selection by the sub-advisors; however, allocation also contributed to performance. From a regional perspective, emerging markets outperformed developed markets, so the Fund’s overweight allocation to emerging markets benefitted performance. Brazilian and Mexican stocks were especially strong. The Fund’s underweight allocation to Europe Ex-U.K. was beneficial, as the region struggled with mounting sovereign debt issues and fears of contagion. On the other hand, the Fund’s underweight allocation and stock selection in Pacific Ex-Japan detracted from performance. Australia, the largest constituent in Pacific Ex-Japan, was one of the hottest performers among the developed markets, and the Fund’s underweight positioning detracted from performance.
From a sector perspective, performance was diverse, favoring neither cyclical nor defensive sectors. Consumer Discretionary stocks performed the best, with automobile companies dominating positive performance. Telecommunication Services was the largest detractor with wireless services stocks down the most.
World Equity Ex-US Fund
AVERAGE ANNUAL TOTAL RETURN1
| | | | | | | | |
| | | One Year
Return | | Annualized
3 Year
Return | | Annualized
5 Year
Return | | Annualized
Inception
to Date |
| World Equity Ex-US Fund, Class A | | 10.74% | | (14.24)% | | 1.88% | | 1.44% |
Comparison of Change in the Value of a $100,000 Investment in the World Ex-US Equity Fund, versus the MSCI All Country World Ex-US Index
| | 1 | | For the period ended May 31, 2010. Past performance is not an indication of future performance. Class A shares were offered beginning 3/28/05. Returns shown do not reflect the deduction of taxes that a shareholder would pay on fund distributions or the redemption of fund shares. The returns for certain periods reflect fee waivers and/or reimbursements in effect for that period; absent fee waivers and reimbursements, performance would have been lower. |
| | |
| SEI Institutional Investments Trust / Annual Report / May 31, 2010 | | 9 |
MANAGEMENT’S DISCUSSION AND ANALYSIS OF FUND PERFORMANCE
SEI INSTITUTIONAL INVESTMENTS TRUST — MAY 31, 2010 (Unaudited)
Screened World Equity Ex-US Fund
I. Objective:
The Screened World Equity Ex-US Fund (the “Fund”) seeks to provide capital appreciation.
II. Multi-Manager Approach Statement:
The Fund uses a multi-manager approach, relying upon a number of sub-advisors with differing investment philosophies to manage portions of the Fund’s portfolio under the general supervision of SEI Investments Management Corporation (“SIMC”). The Fund utilizes the following sub-advisers as of May 31, 2010: Acadian Asset Management LLC, McKinley Capital Management, LLC, Principal Global Investors, LLC, Quantitative Management Associates, LLC, and Thornburg Investment Management LLC.
For the fiscal year ended May 31, 2010, Acadian Asset Management and Thornburg Investment Management LLC were added to the Fund; AXA Rosenberg Investment Management, LLC was terminated.
III. Market Commentary:
Global equity markets continued their tumble from 2008 well into the first quarter of 2009. However, hopeful signs emerged in March 2009 as global stimulus efforts began to take effect. Investors started to feel more confident about a global economic recovery and their appetite for risk returned, fueling a strong rally through the end of the year. Starting in March, stocks that had suffered the most during the credit crisis led the rally. This was reflected by the leadership of the cheapest stocks, particularly as measured by prices relative to book values (assets minus liabilities). Companies that had the highest levels of debt also outperformed the index. In the third quarter, earnings releases for many companies were better than expected, pushing prices higher. However, as the rally matured, investors began to favor companies with higher-quality balance sheets and opportunities to gain market share.
In the first five months of 2010, global equity markets were down overall as macroeconomic events, which included the European sovereign debt crisis, a slowdown in Chinese growth, and the oil spill in the Gulf of Mexico, took center stage. For the time period, emerging markets outperformed developed markets and sector performance was diverse.
IV. Return vs. Benchmark:
For the fiscal year ended May 31, 2010, the Fund outperformed the MSCI All Country World Ex-U.S. Index, returning 11.00% versus the index return of 10.63%.
V. Fund Attribution:
The Fund outperformed the benchmark, driven primarily by positive stock selection by the sub-advisors; however, allocation was slightly beneficial. From a regional perspective, stock selection was especially strong in Europe Ex-U.K. despite the region’s sovereign debt crisis. Stock selection in emerging markets was also positive, with Latin American stocks posting the largest returns. On the other hand, the Fund’s underweight allocation and stock selection in Pacific Ex-Japan detracted from performance. Australia, the largest constituent in Pacific Ex-Japan, was one of the hottest performers among the developed markets, and the Fund’s underweight positioning and stock selection detracted. From a sector perspective, performance was diverse across cyclical and defensive sectors. Industrials, Information Technology and Energy were the best performers, while Telecommunication Services and Materials lagged the index the most.
Screened World Equity Ex-US Fund
AVERAGE ANNUAL TOTAL RETURN1
| | | | |
| | | One Year
Return | | Annualized
Inception
to Date |
| Screened World Equity Ex-US Fund, Class A | | 11.00% | | (15.74)% |
Comparison of Change in the Value of a $100,000 Investment in the Screened World Ex-US Equity Fund, versus the MSCI All Country World Ex-US Index
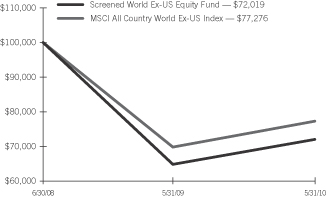
| | 1 | | For the period ended May 31, 2010. Past performance is not an indication of future performance. Class A shares were offered beginning 6/30/08. Returns shown do not reflect the deduction of taxes that a shareholder would pay on fund distributions or the redemption of fund shares. The returns for certain periods reflect fee waivers and/or reimbursements in effect for that period; absent fee waivers and reimbursements, performance would have been lower. |
| | |
| 10 | | SEI Institutional Investments Trust / Annual Report / May 31, 2010 |
MANAGEMENT’S DISCUSSION AND ANALYSIS OF FUND PERFORMANCE
SEI INSTITUTIONAL INVESTMENTS TRUST — MAY 31, 2010 (Unaudited)
Enhanced LIBOR Opportunities Fund
I. Objective:
The Enhanced LIBOR Opportunities Fund (the “Fund”) seeks to provide capital appreciation and income.
II. Multi-Manager Approach Statement:
The Fund uses a multi-manager approach, relying on a number of sub-advisors with differing investment approaches to manage portions of the Fund’s portfolio under the general supervision of SEI Investments Management Corp. (SIMC). The Fund utilizes the following sub-advisors as of May 31, 2010: Declaration Management & Research LLC, UBS Global Asset Management (Americas), Inc., Wellington Management Company, LLP and Ares Management LLC. No changes were made to the Fund during the period.
III. Market Commentary:
Fixed-income market conditions for the fiscal year ended May 31, 2010 reflected a dramatic recovery from the crisis conditions of 2008, including the bankruptcy of Lehman Brothers. The period was characterized by an increased investor appetite for risk that drove powerful rallies in most of the non-Treasury sectors in the market. The catalyst for the market recovery was a series of government programs designed to improve credit availability, which included the Term Asset-Backed Securities Lending Facility (TALF), the Public-Private Investment Program (PPIP) and a $1.25 trillion purchase program of agency mortgage-backed securities (MBS) by the U.S. Federal Reserve (Fed). The Fed’s purchase program brought MBS spreads and mortgage rates to historic lows. The TALF and PPIP programs helped drive strong performance in the non-agency MBS market, including commercial MBS, and the asset-backed securities market. The corporate bond market was supported by stabilizing economic conditions, lower default rates and improved market liquidity. The senior bank loan market also saw stellar returns, as fundamental credit conditions continued to improve and the technical environment remained supportive of higher loan prices, with demand outpacing supply. The strong market recovery was interrupted in the spring of 2010, as the European sovereign credit crisis triggered a modest flight to quality that served to bring Treasury yields back to the lower end of their trading range. Despite the more recent caution displayed by market participants, the rallies in the non-Treasury sectors provided very strong performance for the fixed income markets for the twelve-month period.
IV. Return vs. Benchmark:
For the fiscal year ended May 31, 2010, the Fund outperformed the Bank of America (“BofA”) Merrill Lynch 3-Month London Interbank Offered Rate (LIBOR) Constant Maturity Index, returning 12.66% versus the index return of 0.39%.
V. Fund Attribution:
During the fiscal year ended May 31, 2010, the Fund’s large allocation to non-Treasury sectors outperformed—particularly the portfolio’s allocations to non-agency mortgage-backed securities, commercial mortgage-backed securities and senior bank loans.
Enhanced LIBOR Opportunities Fund
AVERAGE ANNUAL TOTAL RETURN1
| | | | | | |
| | | One Year
Return | | Annualized
3 Year
Return | | Annualized
Inception
to Date |
| Enhanced LIBOR Opportunities Fund, Class A | | 12.66% | | (6.21)% | | (4.59)% |
Comparison of Change in the Value of a $100,000 Investment in the Enhanced LIBOR Opportunities Fund, versus the BofA Merrill Lynch 3-Month LIBOR Constant-Maturity Index
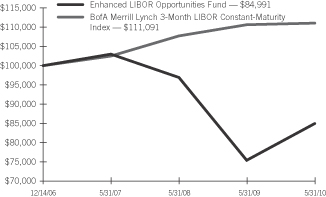
| | 1 | | For the period ended May 31, 2010. Past performance is not an indication of future performance. Class A shares were offered beginning 12/14/06. Returns shown do not reflect the deduction of taxes that a shareholder would pay on fund distributions or the redemption of fund shares. The returns for certain periods reflect fee waivers and/or reimbursements in effect for that period; absent fee waivers and reimbursements, performance would have been lower. |
| | |
| SEI Institutional Investments Trust / Annual Report / May 31, 2010 | | 11 |
MANAGEMENT’S DISCUSSION AND ANALYSIS OF FUND PERFORMANCE
SEI INSTITUTIONAL INVESTMENTS TRUST — MAY 31, 2010 (Unaudited)
Core Fixed Income Fund
I. Objective:
The Core Fixed Income Fund (the “Fund”) seeks to provide current income consistent with the preservation of capital.
II. Multi-Manager Approach Statement:
The Fund uses a multi-manager approach, relying on a number of sub-advisors with differing investment approaches to manage portions of the Fund’s portfolio, under the general supervision of SEI Investments Management Corp. (SIMC). The Fund utilized the following sub-advisors as of May 31, 2010: Trust Company of the West (formerly Metropolitan West Asset Management), J.P. Morgan Investment Management, Inc., Western Asset Management Company, Wells Capital Management, Inc. and Jennison Associates LLC. During the fiscal year ended May 31, 2010, Jennison Associates LLC was added to the Fund.
III. Market Commentary:
Fixed-income market conditions for the fiscal year ended May 31, 2010 reflected a dramatic recovery from the crisis conditions of 2008 and the post-Lehman bankruptcy. The period was characterized by an increased investor appetite for risk that drove powerful rallies in most of the non-Treasury sectors of the market. The catalyst for the market recovery was a series of government programs designed to improve credit availability. These programs included the Term Asset-Backed Securities Loan Facility (TALF), the Public-Private Investment Program (PPIP) and a $1.25 trillion purchase program of agency mortgage-backed securities (MBS) by the U.S. Federal Reserve (Fed). The Fed’s purchase program brought MBS spreads and mortgage rates to historic lows. The TALF and PPIP programs helped drive strong performance in the non-agency MBS market (including commercial MBS) and the asset-backed securities market. The corporate market was supported by stabilizing economic conditions, lower default rates and improved market liquidity. The strong market recovery was interrupted in the spring of 2010, as the European sovereign credit crisis triggered a modest flight to quality that served to bring Treasury yields back to the lower end of their trading range. Despite this more recent market caution, the rallies in the non-Treasury sectors provided very strong performance for fixed-income markets during the twelve-month period.
IV. Return vs. Benchmark:
For the fiscal year ended May 31, 2010, the Fund outperformed the Barclays Capital U.S. Aggregate Bond Index, returning 15.34% versus the index return of 8.42%.
V. Fund Attribution:
The Fund’s overweight positions in corporate bonds, non-agency MBS and commercial MBS were the key drivers of performance. In addition, the Fund entered the year with a positive bias towards agency MBS due to the Federal Reserve’s purchase program, but as
prices relative to Treasuries continued to climb, managers moved to an increasingly underweight position. As the Fed discontinued these purchases, prices relative to Treasuries weakened modestly, and the Fund gradually added exposure toward the end of the measurement period. Duration exposure did not have a meaningful impact on performance, as managers chose to utilize their risk budgets on securities within the non-Treasury sectors.
Specifically, an overweight to corporate bonds, especially those issued by large-cap financial firms, generated significant out-performance relative to Treasuries. The steep yield curve combined with improved access to the capital markets allowed the largest of the U.S. banking institutions to repair their balance sheets and return to profitability throughout the year. Non-agency mortgages recovered dramatically as the forced selling resulting from ratings downgrades and the unwinding of large levered positions abated. The announcement and implementation of PPIP and TALF during the year restored confidence in the market, thereby allowing private capital to flow back into the securitized markets. Finally, the Fund’s overweight to commercial MBS contributed to performance, as these securities posted the largest out-performance versus Treasuries of any sector within the Barclays Capital U.S. Aggregate Bond Index.
Core Fixed Income Fund
AVERAGE ANNUAL TOTAL RETURN1
| | | | | | | | | | |
| | | One Year
Return | | Annualized
3 Year
Return | | Annualized
5 Year
Return | | Annualized
10 Year
Return | | Annualized
Inception
to Date |
| Core Fixed Income Fund, Class A | | 15.34% | | 7.28% | | 5.70% | | 6.73% | | 6.67% |
Comparison of Change in the Value of a $100,000 Investment in the Core Fixed Income Fund, versus the Barclays Capital U.S. Aggregate Bond Index
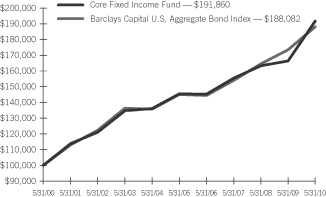
| | 1 | | For the period ended May 31, 2010. Past performance is not an indication of future performance. Class A shares were offered beginning 6/14/96. Returns shown do not reflect the deduction of taxes that a shareholder would pay on fund distributions or the redemption of fund shares. The returns for certain periods reflect fee waivers and/or reimbursements in effect for that period; absent fee waivers and reimbursements, performance would have been lower. |
| | |
| 12 | | SEI Institutional Investments Trust / Annual Report / May 31, 2010 |
MANAGEMENT’S DISCUSSION AND ANALYSIS OF FUND PERFORMANCE
SEI INSTITUTIONAL INVESTMENTS TRUST — MAY 31, 2010 (Unaudited)
High Yield Bond Fund
I. Objective:
The High Yield Bond Fund (the “Fund”) seeks to maximize total return.
II. Multi-Manager Approach Statement:
The Fund uses a multi-manager approach, relying on a number of sub-advisors with differing investment approaches to manage portions of the Fund’s portfolio under the general supervision of SEI Investments Management Corp. (SIMC). The Fund utilizes the following sub-advisers as of May 31, 2010: Ares Management, LLC, Brigade Capital Management, LLC, Delaware Management Company, Guggenheim Partners, LLC, J.P. Morgan Investment Management, Inc., and SEI Structured Credit. During the one-year period ended May 31, 2010, the Fund did not make any manager changes.
III. Market Commentary:
For the fiscal year ended May 31, 2010, the high-yield market, as measured by the Bank of America Merrill Lynch U.S. High Yield Master II Constrained Index, returned 29.91%. Credit quality spreads tightened 473 basis points (bps) to finish the period at 698 bps, down significantly from the peak of 2,168 basis points reached in December 2008. The Moody’s U.S. issuer-default rate fell from 10.86% to 7.91% over the fiscal year, after peaking at an all-time high of 14.51% in November 2009. Default rates are projected to continue their descent to 2.7% by the end of 2010. The significant amount of new issuance over the past 12 months, particularly for refinancing purposes, has improved the creditworthiness of many high-yield companies. Also putting downward pressure on the default rate is the fact that a large number of defaults occurred in the first half of 2009, therefore moving out of the 12-month window. Issuance in the primary market has been extremely robust over the period, with $247.5 billion coming to market, the second largest 12-month stretch on record (12 months ended April 30, 2010 saw the highest volume). The technical condition of the market was positive, as high-yield mutual funds saw $18.1 billion of inflows during the period, although May 2010 was a weak month due to European sovereign debt concerns; $3.5 billion exited funds, which reversed most of the YTD inflows. For the fiscal year, an increase in investor risk appetites and improved market
liquidity led to strong returns across all quality segments, but lower- quality credits outperformed, with CCCs up 60.72%, followed by Bs up 23.21%, and BBs up 23.15%.
The best-performing sectors were the higher-beta segments of the market, such as the Financial-related and Technology sectors. Insurance, Real Estate, Financial Services and Banking all outperformed the market, with the first three mentioned generating returns greater than twice the index gain. AIG, which has subsidiaries that operate in the Insurance and Financial Services sectors, had the largest impact on returns, while Realogy and iStar Financial boosted the performance in the Real Estate space. AIG was up on optimism about the insurer’s success in raising capital by selling off business units. AIG was scheduled to sell its Asian Life Unit to Prudential for $35.5B (Prudential pulled out of this deal in June, 2010), and to sell American Life Insurance Company (Alico) to MetLife for $15.5B, as they work to repay TARP money to the U.S. government. Technology companies did well over the year also, as investors moved into these high-growth companies as confidence in the economic recovery increased. Semiconductor firms were particularly strong, as many of these firms cut staff in 2008/2009, which has resulted in better earnings as chip sales for personal computers and cell phones, the biggest market drivers, are projected to grow in the low-to-mid-teens in 2010.
The Utilities and Telecommunications sectors lagged the overall high-yield market over the year, producing the lowest total returns among the sectors in the index. These sectors are both considered to be more defensive in nature and thus would be expected to under-perform in an environment where high-risk securities rally sharply. More specifically, electric generation companies within the Utilities sector were negatively impacted by numerous issues. Weak demand for power and natural gas hurt this sector, as well as unimpressive earnings results that reflected a poor operating environment and bleak future outlook for the sector. Uncertainty surrounding future environmental regulations and commodity prices remains. Within telecom, wireless companies have suffered from increased competition within the industry, which has created both pricing pressures and subscriber losses, two factors that have led to weaker earnings across many companies in the sector.
| | |
| SEI Institutional Investments Trust / Annual Report / May 31, 2010 | | 13 |
MANAGEMENT’S DISCUSSION AND ANALYSIS OF FUND PERFORMANCE
SEI INSTITUTIONAL INVESTMENTS TRUST — MAY 31, 2010 (Unaudited)
High Yield Bond Fund (Concluded)
IV. Return vs. Benchmark:
For the fiscal year ended May 31, 2010, the Fund outperformed the Bank of America (“BofA”) Merrill Lynch U.S. High Yield Master II Constrained Index, returning 37.60% versus the index return of 29.91%.
V. Fund Attribution:
The Fund’s allocation to CLOs and other structured investments outperformed the high-yield market, enhancing relative performance. The fundamental picture of the CLO marketplace has improved drastically due to the continued upturn in the high-yield loan and bond markets, the slowing pace of defaults/downgrades, and the ability of borrowers to successfully amend their credit agreements. Additionally, the technical picture has been a large driver of the rally, with the prospects for new issuance dim and a significant amount of money on the sidelines waiting to invest.
Another contributor to out-performance was the Fund’s underweight to and strong security selection within the Energy sector. An underweight to gas distribution companies’ debt boosted returns, since these firms were negatively impacted by low natural gas prices and a poor outlook for the industry. Security selection was strong within the integrated energy industry due to an overweight to ethanol producer Aventine Renewable Energy. Aventine emerged from Chapter 11 bankruptcy during the year and has also benefited from rumors that the EPA will boost the limit for blending ethanol with gasoline from 10% to 12-15%, which would increase demand for ethanol.
Security selection in the Media and Insurance sectors detracted from performance during the period. Poor security selection in the Media sector was largely impacted by an underweight to Clear Channel Communications, as the broadcasting company’s bonds benefited from improving financial results, the successful execution of several exchange offers for existing debt, and several new issues. These actions were taken to address immediate liquidity concerns and they dramatically improved the financial health of the company. Within the Insurance sector, an underweight to AIG hampered returns, as the company’s bonds rallied after it was able to raise a substantial amount of capital through both the new-issue market and asset sales, as mentioned above in the Market Commentary section.
High Yield Bond Fund
AVERAGE ANNUAL TOTAL RETURN1
| | | | | | |
| | | One Year
Return | | Annualized
3 Year
Return | | Annualized
Inception
to Date |
| High Yield Bond Fund, Class A | | 37.60% | | 5.02% | | 7.06% |
Comparison of Change in the Value of a $100,000 Investment in the High Yield Bond Fund, versus the BofA Merrill Lynch US High Yield Master II Constrained Index
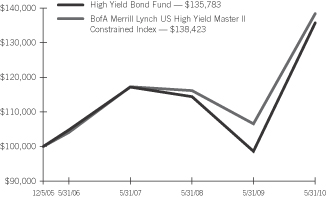
| | 1 | | For the period ended May 31, 2010. Past performance is not an indication of future performance. Class A shares were offered beginning 12/05/05. Returns shown do not reflect the deduction of taxes that a shareholder would pay on fund distributions or the redemption of fund shares. The returns for certain periods reflect fee waivers and/or reimbursements in effect for that period; absent fee waivers and reimbursements, performance would have been lower. |
| | |
| 14 | | SEI Institutional Investments Trust / Annual Report / May 31, 2010 |
MANAGEMENT’S DISCUSSION AND ANALYSIS OF FUND PERFORMANCE
SEI INSTITUTIONAL INVESTMENTS TRUST — MAY 31, 2010 (Unaudited)
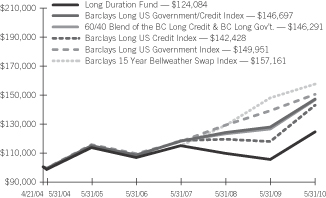
Long Duration Fund
I. Objective:
The Long Duration Fund (the “Fund”) seeks to provide return characteristics similar to those of high-quality corporate bonds with a duration range of 9 to 14 years.
II. Multi-Manager Approach Statement:
The Fund uses a multi-manager approach, relying on a number of sub-advisors with differing investment approaches to manage portions of the Fund’s portfolio under the general supervision of SEI Investments Management Corp. (SIMC). The Fund utilizes the following sub-advisors as of May 31, 2010: Trust Company of the West (formerly Metropolitan West Asset Management LLC), Jennison Associates LLC and Income Research & Management. For the fiscal year ended May 31, 2010, Jennison Associates LLC and Income Research & Management were added to the Fund.
III. Market Commentary:
Fixed-income market conditions for the fiscal year ended May 31, 2010 reflected a dramatic recovery from the crisis conditions of 2008, including the bankruptcy of Lehman Brothers. The period was characterized by an increased investor appetite for risk that drove powerful rallies in most of the non-Treasury sectors in the market. The catalyst for the market recovery was a series of government programs designed to improve credit availability, which included the Term Asset-Backed Securities Lending Facility (TALF), the Public-Private Investment Program (PPIP) and a $1.25 trillion purchase program of agency mortgage-backed securities (MBS) by the U.S. Federal Reserve (Fed). The Fed’s purchase program brought MBS spreads and mortgage rates to historic lows. The TALF and PPIP programs helped drive strong performance in the non-agency MBS market, including commercial MBS, and the asset-backed securities market. The corporate bond market was supported by stabilizing economic conditions, lower default rates and improved market liquidity. The strong market recovery was interrupted in the spring of 2010, as the European sovereign credit crisis triggered a modest flight to quality that served to bring Treasury yields back to the lower end of their trading range. Despite this more recent market caution, the rallies in the non-Treasury sectors provided very strong performance for the fixed-income markets for the one-year period.
IV. Return vs. Benchmark:
For the fiscal year ended May 31, 2010, the SIIT Long Duration Fund returned 18.11% compared to 15.11% for its benchmark, the Barclays Long U.S. Government/Credit Index.
V. Fund Attribution:
The Fund’s out-performance came from its overweight exposure to the corporate bond sector. The corporate overweight was focused on the Financials sector, which led the strong rally in the corporate market. The modest drop in intermediate- and longer-term Treasury yields served to support the very strong absolute return of the Fund.
Long Duration Fund
AVERAGE ANNUAL TOTAL RETURN1
| | | | | | | | |
| | | One Year
Return | | Annualized
3 Year
Return | | Annualized
5 Year
Return | | Annualized
Inception
to Date |
| Long Duration Fund, Class A | | 18.11% | | 2.72% | | 1.85% | | 3.60% |
Comparison of Change in the Value of a $100,000 Investment in the Long Duration Fund, versus the Barclays Long US Government/Credit Index2, the Barclays 15 Year Bellwether Swap Index2, 60/40 Blend of the Barclays Long Credit Index & Barclays Long Government Index, the Barclays Long US Credit Index, and the Barclays Long US Government Index
| | 1 | | For the period ended May 31, 2010. Past performance is not an indication of future performance. Class A shares were offered beginning 4/21/04. Returns shown do not reflect the deduction of taxes that a shareholder would pay on fund distributions or the redemption of fund shares. The returns for certain periods reflect fee waivers and/or reimbursements in effect for that period; absent fee waivers and reimbursements, performance would have been lower. |
| | 2 | | This table compares the Fund’s average annual total returns for Class A Shares to those of the Barclays Long U.S. Government/Credit Index. In prior years, the Fund’s return had been compared to the Barclays 15 Year Bellwether Swap Index. The Fund’s adviser believes that the Barclays Long U.S. Government/Credit Index better represents the Fund’s investment opportunities. |
| | |
| SEI Institutional Investments Trust / Annual Report / May 31, 2010 | | 15 |
MANAGEMENT’S DISCUSSION AND ANALYSIS OF FUND PERFORMANCE
SEI INSTITUTIONAL INVESTMENTS TRUST — MAY 31, 2010 (Unaudited)
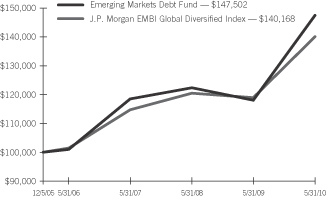
Emerging Markets Debt Fund
I. Objective:
The Emerging Markets Debt Fund (the “Fund”) seeks to maximize total return.
II. Multi-Manager Approach Statement:
The Fund uses a multi-manager approach, relying on a number of sub-advisors with differing investment approaches to manage portions of the Fund’s portfolio under the general supervision of SEI Investments Management Corp. (SIMC). The Fund utilized the following sub-advisors as of May 31, 2010: Ashmore Investment Management Limited, ING Investment Management Advisors, B.V. and Stone Harbor Investment Partners L.P. For the fiscal year ended May 31, 2010, no sub-advisor changes were made in the Fund.
III. Market Commentary:
The credit crisis abated and risk appetite amongst investors returned very quickly, which led to emerging markets debt posting its strongest annual performance since 1996. The market returned 29% in 2009 and carried the momentum into 2010 with a 3.55% return through the end of May. Spreads began the fiscal year at 478 basis points and tightened by as much as 222 basis points over U.S. Treasuries before widening in April and May to 338 basis points on broader risk aversion emanating from the Greek and eurozone sovereign debt crisis.
The fundamentals of emerging-markets debt remain strong and are supported by various factors. Stable and rising commodity prices, rising foreign currency reserves, declining debt levels and less political turbulence all contribute to a favorable outlook for the asset class. These factors have contributed to a substantial increase in credit-rating upgrades, with only a handful of downgrades during the last 12 months. Positive surprises to economic growth across the broader emerging markets universe have been supportive, while election results and unorthodox policy changes (which have rattled emerging markets in the past) have been conducted in more democratic ways with less violence and protest.
In addition to solid fundamentals, technical factors greatly contributed to performance for the period. The ability of emerging markets to weather the credit crisis of 2008 better than other spread sectors caught the attention of both new and existing investors. As a result, inflows into the asset class amounted to $54 billion for the period. Inflows are rising and becoming increasingly diversified, especially with more instrument selection coming from the growing local and corporate sectors of the market. As investors poured historically high amounts of money into emerging-markets debt, emerging-market issuers took advantage of lower financing rates and issued record amounts of bonds to meet the rising demand for emerging-market debt assets. In 2009 alone, emerging-market issuers raised $210 billion via new external debt issuance and have sold $105 billion through the first five months of 2010. With another $90 billion still in the pipeline for the remainder of the year, technicals are still expected to remain a key driver of performance going forward. The proceeds of these sales will be used for deficit funding, refinancing and infrastructure & development projects.
Central banks and local governments have done their part to improve confidence amongst investors and market participants. Fiscal policy continues to improve, and although monetary policy has been accommodative and successful in implementing counter-cyclical measures during the last 12 months, policymakers will be challenged going forward as inflationary pressures, stimulus unwinding, financial reforms and the fiscal crisis in Europe pose potential risks that could hinder growth. The outlook for emerging markets is positive, and fundamentals have not yet been threatened by any potential risks. Emerging countries are expected to grow approximately 6.2% in 2010, while the developed world is expected to grow by less than 3%. Problems in Europe and the rest of the developed world should only benefit the asset class as investors look for alternative opportunities.
IV. Return vs. Benchmark:
For the fiscal year ended May 31, 2010, the Fund outperformed the J.P. Morgan Emerging Markets Bond Index (EMBI) Global Diversified Index, returning 24.93% versus the index return of 17.85%.
| | |
| 16 | | SEI Institutional Investments Trust / Annual Report / May 31, 2010 |
MANAGEMENT’S DISCUSSION AND ANALYSIS OF FUND PERFORMANCE
SEI INSTITUTIONAL INVESTMENTS TRUST — MAY 31, 2010 (Unaudited)
Emerging Markets Debt Fund (Concluded)
V. Fund Attribution:
Security selection in Argentina contributed to positive relative performance for the period. The country had been plagued by political problems and fiscal concerns prior to and during the credit crisis that nearly led to a default. Fortunately, rising commodity prices led to strong export revenues, and the country’s endless commitment to comforting creditors and servicing debt was fulfilled via multiple debt swaps and an eventual decision to proceed with what the country hopes to be the final restructuring of past defaulted debt. Markets reacted favorably to the news and Argentina finished the period returning 69%, one of the top-performing countries in emerging-markets debt universe. An overweight to Russia added to out-performance, as rising oil prices helped support a country with one of the worst primary fiscal balances in emerging markets. Additionally, the government increased support to the struggling banking sector while inflation continued to slow, allowing rate cuts to follow and help revive the economy. Russia is better positioned to service its debt than its emerging-markets peers, and its rising level of foreign currency reserves has improved its financial flexibility. Allocations to local currency debt in Brazil also added to relative performance, as the country was marginally impacted by the credit crisis. The country’s diversified export base benefited from rising commodities, foreign currency reserves continued to rise, and loan growth and consumption helped drive its first-quarter 2010 gross domestic product growth to an annualized rate of 11.25%, one of the highest in the world.
The Fund’s underweight in Belize detracted from relative performance, as bonds returned 100% for the period. Belize makes up a very small portion of the index and generates most of its growth from agriculture and tourism. The country is a low-quality credit and rallied with other risky assets. An underweight in Ghana also detracted from performance. Similar to Belize, Ghana is a lower-quality country and also one of the smallest countries in the index. The country carries a higher beta than the index and outperformed the market on improved sentiment and a rally in commodity prices. Fund managers chose not to allocate to Belize or Ghana because the risk/reward opportunities were more attractive in more fiscally sound countries.
Emerging Markets Debt Fund
AVERAGE ANNUAL TOTAL RETURN1
| | | | | | |
| | | One Year
Return | | Annualized
3 Year
Return | | Annualized
Inception
to Date |
| Emerging Markets Debt Fund, Class A | | 24.93% | | 7.55% | | 9.05% |
Comparison of Change in the Value of a $100,000 Investment in the Emerging Markets Debt Fund, versus the J.P. Morgan EMBI Global Diversified Index
| | 1 | | For the period ended May 31, 2010. Past performance is not an indication of future performance. Class A shares were offered beginning 12/05/05. Returns shown do not reflect the deduction of taxes that a shareholder would pay on fund distributions or the redemption of fund shares. The returns for certain periods reflect fee waivers and/or reimbursements in effect for that period; absent fee waivers and reimbursements, performance would have been lower. |
| | |
| SEI Institutional Investments Trust / Annual Report / May 31, 2010 | | 17 |
MANAGEMENT’S DISCUSSION AND ANALYSIS OF FUND PERFORMANCE
SEI INSTITUTIONAL INVESTMENTS TRUST — MAY 31, 2010 (Unaudited)
Real Return Fund
I. Objective:
The Real Return Fund (the “Fund”) seeks to provide total return exceeding the rate of inflation.
II. Multi-Manager Approach Statement:
The Fund uses a sub-adviser to manage the Fund under the supervision of SEI Investments Management Corporation (SIMC). Currently, the sub-advisor is Wellington Management Company, LLC. There were no manager changes during the period.
III. Market Commentary:
Fixed-income market conditions for the fiscal year ended May 31, 2010 reflected a dramatic recovery from the crisis conditions of 2008, including the bankruptcy of Lehman Brothers. The period was characterized by an increased investor appetite for risk that drove powerful rallies in most of the non-Treasury sectors in the market. The catalyst for the market recovery was a series of government programs designed to improve credit availability, which included the Term Asset-Backed Securities Lending Facility (TALF), the Public-Private Investment Program (PPIP) and a $1.25 trillion purchase program of agency mortgage-backed securities (MBS) by the U.S. Federal Reserve (Fed). The Fed’s purchase program brought MBS spreads and mortgage rates to historic lows. The TALF and PPIP programs helped drive strong performance in the non-agency MBS market, including commercial MBS, and the asset-backed securities market. These actions helped stabilize economic conditions, which in turn supported the Treasury Inflation-Protected Securities (TIPS) market, as there were higher inflation expectations among investors and improved market liquidity. The strong market recovery was interrupted in the spring of 2010, as the European sovereign credit crisis triggered a modest flight to quality that served to bring Treasury yields back to the lower end of their trading range. Despite the more recent caution displayed by market participants, the rally in TIPS provided strong performance for the for the twelve month period.
IV. Return vs. Benchmark:
For the fiscal year ended May 31, 2010, the Fund returned 5.70% compared to 5.63% for its benchmark. The Fund’s adviser believes the Barclays 1-5 Year U.S. TIPS Index better represents the Fund’s investment opportunities.
V. Fund Attribution:
The Fund’s out-performance was a result of its tactical and timely allocation to nominal Treasuries. As Treasuries were the main beneficiaries of the recent flight to quality, this allocation helped the Fund outperform its benchmark. In addition, the modest drop in TIPS yields served to support the absolute return of the Fund.
Real Return Fund
AVERAGE ANNUAL TOTAL RETURN1
| | | | | | |
| | | One Year
Return | | Annualized
3 Year
Return | | Annualized
Inception
to Date |
| Real Return Fund, Class A | | 5.70% | | 6.14% | | 5.99% |
Comparison of Change in the Value of a $100,000 Investment in the Real Return Fund, versus the Barclays 1-5 Year US TIPS Index2, and the Barclays 1-10 Year US TIPS Index2
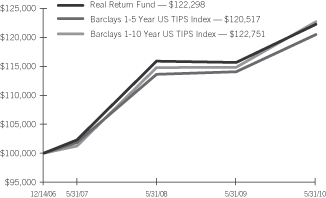
| | 1 | | For the period ended May 31, 2010. Past performance is not an indication of future performance. Class A shares were offered beginning 12/14/06. Returns shown do not reflect the deduction of taxes that a shareholder would pay on fund distributions or the redemption of fund shares. The returns for certain periods reflect fee waivers and/or reimbursements in effect for that period; absent fee waivers and reimbursements, performance would have been lower. |
| | 2 | | As of July 1, 2009, the Real Return Fund changed its benchmark from the Barclays Capital 1-10 Year U.S. TIPS Index to the Barclays Capital 1-5 Year U.S. TIPS Index. |
| | |
| 18 | | SEI Institutional Investments Trust / Annual Report / May 31, 2010 |
SUMMARY SCHEDULE OF INVESTMENTS
Large Cap Fund
May 31, 2010
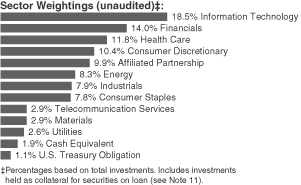
| | | | | | | | |
| Description | | Percentage of
Net Assets (%) | | | Shares | | Market Value
($ Thousands) |
| | | | | | | | |
| |
COMMON STOCK — 95.2% | | | |
| |
Consumer Discretionary — 11.4% | | | |
Amazon.com* | | 0.9 | % | | 83,899 | | $ | 10,526 |
Comcast, Cl A | | 0.5 | | | 340,900 | | | 6,167 |
DIRECTV, Cl A* | | 0.5 | | | 175,401 | | | 6,611 |
Lowe’s | | 0.5 | | | 267,523 | | | 6,621 |
NIKE, Cl B (A) | | 0.6 | | | 102,550 | | | 7,423 |
Time Warner | | 0.6 | | | 254,140 | | | 7,876 |
Other Securities | | 7.8 | | | | | | 94,721 |
| | | | | | | | |
| | | | | | | | 139,945 |
| | | | | | | | |
| |
Consumer Staples — 8.6% | | | |
Coca-Cola | | 0.7 | | | 165,661 | | | 8,515 |
PepsiCo | | 0.9 | | | 173,822 | | | 10,932 |
Procter & Gamble | | 1.8 | | | 360,398 | | | 22,017 |
Other Securities | | 5.2 | | | | | | 63,800 |
| | | | | | | | |
| | | | | | | | 105,264 |
| | | | | | | | |
| |
Energy — 9.1% | | | |
Chevron | | 1.4 | | | 239,596 | | | 17,699 |
ConocoPhillips | | 1.0 | | | 227,871 | | | 11,817 |
EOG Resources (A) | | 0.5 | | | 55,600 | | | 5,829 |
Exxon Mobil | | 2.0 | | | 414,201 | | | 25,043 |
Other Securities | | 4.2 | | | | | | 51,421 |
| | | | | | | | |
| | | | | | | | 111,809 |
| | | | | | | | |
| |
Financials — 15.3% | | | |
American Express | | 0.8 | | | 235,300 | | | 9,381 |
Bank of America | | 1.5 | | | 1,168,802 | | | 18,397 |
Citigroup* | | 0.8 | | | 2,492,800 | | | 9,871 |
Goldman Sachs Group | | 0.9 | | | 73,409 | | | 10,590 |
JPMorgan Chase | | 1.7 | | | 539,201 | | | 21,341 |
Wells Fargo | | 1.5 | | | 619,912 | | | 17,785 |
Other Securities | | 8.1 | | | | | | 100,855 |
| | | | | | | | |
| | | | | | | | 188,220 |
| | | | | | | | |
| |
Health Care — 12.9% | | | |
Aetna | | 0.6 | | | 238,369 | | | 6,951 |
Allergan | | 1.1 | | | 221,939 | | | 13,359 |
| | | | | | | | |
| Description | | Percentage of
Net Assets (%) | | | Shares | | Market Value
($ Thousands) |
| | | | | | | | |
Amgen* | | 0.6 | % | | 153,538 | | $ | 7,950 |
Genzyme* | | 0.6 | | | 145,650 | | | 7,086 |
Johnson & Johnson | | 1.4 | | | 294,565 | | | 17,173 |
Medco Health Solutions* | | 0.6 | | | 125,700 | | | 7,246 |
Medtronic | | 0.6 | | | 191,200 | | | 7,491 |
Merck | | 0.5 | | | 174,490 | | | 5,879 |
Pfizer | | 1.2 | | | 980,103 | | | 14,927 |
UnitedHealth Group | | 1.1 | | | 478,105 | | | 13,898 |
Other Securities | | 4.6 | | | | | | 57,170 |
| | | | | | | | |
| | | | | | | | 159,130 |
| | | | | | | | |
| |
Industrials — 8.7% | | | |
Expeditors International Washington | | 0.5 | | | 164,300 | | | 6,275 |
General Electric | | 1.3 | | | 988,703 | | | 16,165 |
Raytheon | | 0.5 | | | 113,329 | | | 5,939 |
United Technologies | | 0.7 | | | 129,319 | | | 8,713 |
Other Securities | | 5.7 | | | | | | 69,500 |
| | | | | | | | |
| | | | | | | | 106,592 |
| | | | | | | | |
| |
Information Technology — 20.2% | | | |
Apple* | | 2.5 | | | 117,753 | | | 30,281 |
Cisco Systems* | | 1.3 | | | 687,033 | | | 15,912 |
EMC* | | 0.8 | | | 569,745 | | | 10,609 |
Google, Cl A* | | 1.3 | | | 32,170 | | | 15,608 |
Hewlett-Packard | | 1.2 | | | 311,910 | | | 14,351 |
Intel | | 0.7 | | | 418,448 | | | 8,963 |
International Business Machines | | 0.6 | | | 65,157 | | | 8,162 |
Intuit* | | 0.5 | | | 177,100 | | | 6,330 |
Microsoft | | 1.6 | | | 758,430 | | | 19,568 |
Paychex (A) | | 0.5 | | | 203,200 | | | 5,799 |
Qualcomm | | 1.0 | | | 356,900 | | | 12,691 |
Texas Instruments | | 0.5 | | | 252,632 | | | 6,169 |
Visa, Cl A | | 0.9 | | | 152,701 | | | 11,065 |
Other Securities | | 6.8 | | | | | | 83,692 |
| | | | | | | | |
| | | | | | | | 249,200 |
| | | | | | | | |
| |
Materials — 3.1% | | | |
Other Securities | | 3.1 | | | | | | 38,161 |
| | | | | | | | |
| |
Telecommunication Services — 3.1% | | | |
AT&T | | 1.2 | | | 623,046 | | | 15,140 |
Verizon Communications | | 0.8 | | | 345,072 | | | 9,496 |
Other Securities | | 1.1 | | | | | | 14,030 |
| | | | | | | | |
| | | | | | | | 38,666 |
| | | | | | | | |
| |
Utilities — 2.8% | | | |
AES* | | 0.5 | | | 677,787 | | | 6,961 |
Other Securities | | 2.3 | | | | | | 27,891 |
| | | | | | | | |
| | | | | | | | 34,852 |
| | | | | | | | |
Total Common Stock
(Cost $1,106,713) ($ Thousands) | | | 1,171,839 |
| | | | | | | | |
| | |
| SEI Institutional Investments Trust / Annual Report / May 31, 2010 | | 19 |
SUMMARY SCHEDULE OF INVESTMENTS
Large Cap Fund (Concluded)
May 31, 2010
| | | | | | | | | |
| Description | | Percentage of
Net Assets (%) | | | Shares/Face Amount
($ Thousands) | | Market Value
($ Thousands) |
| | | | | | | | | |
| |
AFFILIATED PARTNERSHIP — 10.8% | | | |
SEI Liquidity Fund, L.P. 0.240% (B)**† | | 10.8 | % | | | 133,363,080 | | $ | 132,534 |
| | | | | | | | | |
Total Affiliated Partnership
(Cost $133,363) ($ Thousands) | | | 132,534 |
| | | | | | | | | |
| |
CASH EQUIVALENT — 2.1% | | | |
SEI Daily Income Trust, Prime Obligation Fund,
Cl A 0.090%**† | | 2.1 | | | | 25,945,718 | | | 25,946 |
| | | | | | | | | |
Total Cash Equivalent
(Cost $25,946) ($ Thousands) | | | 25,946 |
| | | | | | | | | |
|
U.S. TREASURY OBLIGATION (C) (D) — 1.2% |
U.S. Treasury Bill
0.134%, 06/03/10 | | 1.2 | | | $ | 14,608 | | | 14,608 |
| | | | | | | | | |
Total U.S. Treasury Obligation
(Cost $14,608) ($ Thousands) | | | 14,608 |
| | | | | | | | | |
Total Investments — 109.3%
(Cost $1,280,630) ($ Thousands) | | $ | 1,344,927 |
| | | | | | | | | |
A summary of the open futures contracts held by the Fund at May 31, 2010, is as follows:
| | | | | | | | |
Type of
Contract | | Number of
Contracts
Long (Short) | | Expiration
Date | | Unrealized
Depreciation
($ Thousands) | |
S&P 500 Composite Index | | 174 | | Jun-2010 | | $ | (1,472 | ) |
S&P Mid 400 E-Mini | | 87 | | Jun-2010 | | | (111 | ) |
| | | | | | | | |
| | | | | | $ | (1,583 | ) |
| | | | | | | | |
For the year ended May 31, 2010, the total amount of all open futures contracts, as presented in the table above, are representative of the volume of activity for this derivative type during the period.
Percentages are based on Net Assets of $1,230,382 ($ Thousands)
| * | | Non-income producing security. |
| ** | | The rate reported is the 7-day effective yield as of May 31, 2010. |
| † | | Investment in Affiliated Security (see Note 5). |
| (A) | | This security or a partial position of this security is on loan at May 31, 2010. The total value of securities on loan at May 31, 2010 was $128,195 ($ Thousands). |
| (B) | | This security was purchased with cash collateral held from securities on loan. The total value of such securities as of May 31, 2010 was $132,534 ($ Thousands). |
| (C) | | Security, or a portion thereof, has been pledged as collateral on open futures contracts. |
| (D) | | The rate reported is the effective yield at time of purchase. |
Cl — Class
L.P. — Limited Partnership
S&P — Standard & Poor’s
The Summary Schedule of Investments does not reflect the complete portfolio holdings. It includes the Fund’s 50 largest unaffiliated holdings and each investment of any issuer that exceeds 1% of the Fund’s net assets. “Other Securities” represent all issues not required to be disclosed under the rules adopted by the U.S. Securities and Exchange Commission (“SEC”). In certain instances, securities for which footnotes listed above may otherwise apply are included in the Other Securities caption. The complete schedule of portfolio holdings is available (i) without charge, upon request, by calling (800) 342-5734; and (ii) on the SEC’s website at http://www.sec.gov.
The following is a summary of the inputs used as of May 31, 2010 in valuing the Fund’s investments carried at value ($ Thousands):
| | | | | | | | | | | | |
| Investments in Securities | | Level 1 | | Level 2 | | Level 3 | | Total |
Common Stock | | $ | 1,171,839 | | $ | — | | $ | — | | $ | 1,171,839 |
Affiliated Partnership | | | — | | | 132,534 | | | — | | | 132,534 |
Cash Equivalent | | | 25,946 | | | — | | | — | | | 25,946 |
U.S. Treasury Obligation | | | — | | | 14,608 | | | — | | | 14,608 |
| | | | | | | | | | | | |
Total Investments in Securities | | $ | 1,197,785 | | $ | 147,142 | | $ | — | | $ | 1,344,927 |
| | | | | | | | | | | | |
| | | | | | | | | | | | | | |
| Other Financial Instruments | | Level 1 | | | Level 2 | | Level 3 | | Total | |
Futures Contracts* | | $ | (1,583 | ) | | $ | — | | $ | — | | $ | (1,583 | ) |
| | | | | | | | | | | | | | |
Total Other Financial Instruments | | $ | (1,583 | ) | | $ | — | | $ | — | | $ | (1,583 | ) |
| | | | | | | | | | | | | | |
| * | | Futures contracts are valued at the unrealized depreciation on the instrument. |
For more information on valuation inputs, see Note 2 — Significant Accounting Policies in Notes to Financial Statements.
The accompanying notes are an integral part of the financial statements.
| | |
| 20 | | SEI Institutional Investments Trust / Annual Report / May 31, 2010 |
SUMMARY SCHEDULE OF INVESTMENTS
Large Cap Diversified Alpha Fund
May 31, 2010
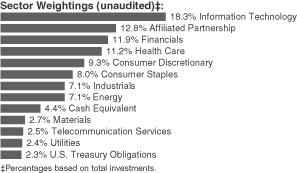
| | | | | | | | |
| Description | | Percentage of
Net Assets (%) | | | Shares | | Market Value
($ Thousands) |
| | | | | | | | |
| |
COMMON STOCK — 80.5% | | | |
| |
Consumer Discretionary — 9.3% | | | |
DIRECTV, Cl A* | | 0.4 | % | | 36,600 | | $ | 1,379 |
Ford Motor* | | 0.4 | | | 114,145 | | | 1,339 |
Time Warner | | 0.9 | | | 102,435 | | | 3,174 |
Other Securities | | 7.6 | | | | | | 26,865 |
| | | | | | | | |
| | | | | | | | 32,757 |
| | | | | | | | |
| |
Consumer Staples — 8.0% | | | |
Coca-Cola | | 0.4 | | | 26,200 | | | 1,347 |
PepsiCo | | 0.5 | | | 25,115 | | | 1,579 |
Philip Morris International | | 0.8 | | | 64,834 | | | 2,861 |
Procter & Gamble | | 1.3 | | | 73,200 | | | 4,472 |
Sysco | | 0.5 | | | 63,788 | | | 1,902 |
Walgreen | | 0.7 | | | 77,364 | | | 2,479 |
Wal-Mart Stores | | 0.6 | | | 43,000 | | | 2,174 |
Other Securities | | 3.2 | | | | | | 11,251 |
| | | | | | | | |
| | | | | | | | 28,065 |
| | | | | | | | |
| |
Energy — 7.1% | | | |
Chevron | | 1.6 | | | 75,687 | | | 5,591 |
ConocoPhillips | | 1.1 | | | 76,046 | | | 3,944 |
Exxon Mobil | | 1.7 | | | 100,300 | | | 6,064 |
Murphy Oil | | 0.5 | | | 34,981 | | | 1,867 |
Other Securities | | 2.2 | | | | | | 7,563 |
| | | | | | | | |
| | | | | | | | 25,029 |
| | | | | | | | |
| |
Financials — 11.9% | | | |
American Express | | 0.6 | | | 55,598 | | | 2,217 |
Bank of America | | 0.6 | | | 137,454 | | | 2,164 |
Franklin Resources | | 0.5 | | | 16,486 | | | 1,617 |
Goldman Sachs Group | | 0.8 | | | 20,213 | | | 2,916 |
JPMorgan Chase | | 0.9 | | | 76,789 | | | 3,039 |
Wells Fargo | | 1.4 | | | 169,223 | | | 4,855 |
Other Securities | | 7.1 | | | | | | 25,185 |
| | | | | | | | |
| | | | | | | | 41,993 |
| | | | | | | | |
| | | | | | | | |
| Description | | Percentage of
Net Assets (%) | | | Shares | | Market Value
($ Thousands) |
| | | | | | | | |
| |
Health Care — 11.2% | | | |
Allergan | | 0.6 | % | | 31,900 | | $ | 1,920 |
AmerisourceBergen | | 0.4 | | | 45,238 | | | 1,415 |
Amgen* | | 0.9 | | | 61,513 | | | 3,185 |
Cardinal Health | | 0.6 | | | 54,603 | | | 1,883 |
Johnson & Johnson | | 1.4 | | | 85,190 | | | 4,967 |
McKesson | | 0.6 | | | 30,785 | | | 2,155 |
Medco Health Solutions* | | 0.5 | | | 30,900 | | | 1,781 |
Medtronic | | 0.5 | | | 40,075 | | | 1,570 |
Pfizer | | 0.4 | | | 99,595 | | | 1,517 |
UnitedHealth Group | | 0.7 | | | 85,300 | | | 2,480 |
WellPoint* | | 0.4 | | | 27,562 | | | 1,414 |
Other Securities | | 4.2 | | | | | | 15,042 |
| | | | | | | | |
| | | | | | | | 39,329 |
| | | | | | | | |
| |
Industrials — 7.1% | | | |
General Electric | | 0.6 | | | 119,100 | | | 1,947 |
Lockheed Martin | | 0.4 | | | 17,859 | | | 1,427 |
Other Securities | | 6.1 | | | | | | 21,797 |
| | | | | | | | |
| | | | | | | | 25,171 |
| | | | | | | | |
| |
Information Technology — 18.3% | | | |
Apple* | | 1.3 | | | 17,964 | | | 4,620 |
Cisco Systems* | | 0.8 | | | 115,900 | | | 2,684 |
Google, Cl A* | | 1.1 | | | 7,812 | | | 3,790 |
Hewlett-Packard | | 0.8 | | | 60,316 | | | 2,775 |
Intel | | 0.8 | | | 128,300 | | | 2,748 |
International Business Machines | | 1.8 | | | 51,446 | | | 6,444 |
Intuit* | | 0.4 | | | 36,900 | | | 1,319 |
Microsoft | | 2.0 | | | 275,427 | | | 7,106 |
Qualcomm | | 0.6 | | | 63,725 | | | 2,266 |
Texas Instruments | | 1.0 | | | 136,008 | | | 3,321 |
Visa, Cl A | | 0.6 | | | 30,400 | | | 2,203 |
Other Securities | | 7.1 | | | | | | 25,221 |
| | | | | | | | |
| | | | | | | | 64,497 |
| | | | | | | | |
| |
Materials — 2.7% | | | |
E.I. Du Pont de Nemours | | 0.4 | | | 40,355 | | | 1,460 |
Other Securities | | 2.3 | | | | | | 8,118 |
| | | | | | | | |
| | | | | | | | 9,578 |
| | | | | | | | |
| |
Telecommunication Services — 2.5% | | | |
AT&T | | 1.0 | | | 152,913 | | | 3,716 |
Crown Castle International* | | 0.4 | | | 35,000 | | | 1,296 |
Other Securities | | 1.1 | | | | | | 3,936 |
| | | | | | | | |
| | | | | | | | 8,948 |
| | | | | | | | |
| |
Utilities — 2.4% | | | |
AES* | | 0.4 | | | 146,131 | | | 1,501 |
Exelon | | 0.5 | | | 45,064 | | | 1,739 |
Other Securities | | 1.5 | | | | | | 5,189 |
| | | | | | | | |
| | | | | | | | 8,429 |
| | | | | | | | |
Total Common Stock
(Cost $266,331) ($ Thousands) | | | 283,796 |
| | | | | | | | |
| | |
| SEI Institutional Investments Trust / Annual Report / May 31, 2010 | | 21 |
SUMMARY SCHEDULE OF INVESTMENTS
Large Cap Diversified Alpha Fund (Concluded)
May 31, 2010
| | | | | | | | | |
| Description | | Percentage of
Net Assets (%) | | | Shares/Face Amount
($ Thousands) | | Market Value
($ Thousands) |
| | | | | | | | | |
| |
AFFILIATED PARTNERSHIP — 12.8% | | | |
SEI LIBOR Plus Portfolio† | | 12.8 | % | | | 6,723,909 | | $ | 44,983 |
| | | | | | | | | |
Total Affiliated Partnership
(Cost $58,111) ($ Thousands) | | | 44,983 |
| | | | | | | | | |
| |
CASH EQUIVALENT — 4.4% | | | |
SEI Daily Income Trust, Prime Obligation Fund,
Cl A 0.090%**† | | 4.4 | | | | 15,628,672 | | | 15,629 |
| | | | | | | | | |
Total Cash Equivalent
(Cost $15,629) ($ Thousands) | | | 15,629 |
| | | | | | | | | |
|
U.S. TREASURY OBLIGATIONS (A) (B) — 2.3% |
U.S. Treasury Bills | | | | | | | | | |
0.122%, 06/03/10 | | 2.2 | | | $ | 7,698 | | | 7,698 |
0.326%, 02/10/11 | | 0.1 | | | | 300 | | | 299 |
| | | | | | | | | |
Total U.S. Treasury Obligations
(Cost $7,997) ($ Thousands) | | | 7,997 |
| | | | | | | | | |
Total Investments — 100.0%
(Cost $348,068) ($ Thousands) | | $ | 352,405 |
| | | | | | | | | |
A summary of the open futures contracts held by the Fund at May 31, 2010, is as follows:
| | | | | | | | |
Type of
Contract | | Number of
Contracts
Long (Short) | | Expiration
Date | | Unrealized
Depreciation
($ Thousands) | |
S&P 500 Composite Index | | 242 | | Jun-2010 | | $ | (2,097 | ) |
S&P 500 E-Mini | | 10 | | Jun-2010 | | | (29 | ) |
| | | | | | | | |
| | | | | | $ | (2,126 | ) |
| | | | | | | | |
For the year ended May 31, 2010, the total amount of all open futures contracts, as presented in the table above, are representative of the volume of activity for this derivative type during the period.
Percentages are based on Net Assets of $352,500 ($ Thousands)
| * | | Non-income producing security. |
| ** | | Rate shown is the 7-day effective yield as of May 31, 2010. |
| † | | Investment in Affiliated Security (see Note 5). |
| (A) | | The rate reported is the effective yield at time of purchase. |
| (B) | | Security, or a portion thereof, has been pledged as collateral on open futures contracts. |
Cl — Class
LIBOR — London Interbank Offered Rate
S&P — Standard & Poor’s
The Summary Schedule of Investments does not reflect the complete portfolio holdings. It includes the Fund’s 50 largest unaffiliated holdings and each investment of any issuer that exceeds 1% of the Fund’s net assets. “Other Securities” represent all issues not required to be disclosed under the rules adopted by the U.S. Securities and Exchange Commission (“SEC”). In certain instances, securities for which footnotes listed above may otherwise apply are included in the Other Securities caption. The complete schedule of portfolio holdings is available (i) without charge, upon request, by calling (800) 342-5734; and (ii) on the SEC’s website at http://www.sec.gov.
The following is a summary of the inputs used as of May 31, 2010 in valuing the Fund’s investments carried at value ($ Thousands):
| | | | | | | | | | | | |
| Investments in Securities | | Level 1 | | Level 2 | | Level 3 | | Total |
Common Stock | | $ | 283,796 | | $ | — | | $ | — | | $ | 283,796 |
Affiliated Partnership | | | 44,983 | | | — | | | — | | | 44,983 |
Cash Equivalent | | | 15,629 | | | — | | | — | | | 15,629 |
U.S. Treasury Obligations | | | — | | | 7,997 | | | — | | | 7,997 |
| | | | | | | | | | | | |
Total Investments in Securities | | $ | 344,408 | | $ | 7,997 | | $ | — | | $ | 352,405 |
| | | | | | | | | | | | |
| | | | | | | | | | | | | | |
| Other Financial Instruments | | Level 1 | | | Level 2 | | Level 3 | | Total | |
Futures Contracts* | | $ | (2,126 | ) | | $ | — | | $ | — | | $ | (2,126 | ) |
| | | | | | | | | | | | | | |
Total Other Financial Instruments | | $ | (2,126 | ) | | $ | — | | $ | — | | $ | (2,126 | ) |
| | | | | | | | | | | | | | |
| * | | Futures contracts are valued at the unrealized depreciation on the instrument. |
For more information on valuation inputs, see Note 2 — Significant Accounting Policies in Notes to Financial Statements.
The accompanying notes are an integral part of the financial statements.
| | |
| 22 | | SEI Institutional Investments Trust / Annual Report / May 31, 2010 |
SUMMARY SCHEDULE OF INVESTMENTS
Large Cap Disciplined Equity Fund
May 31, 2010
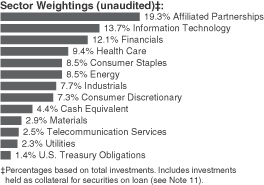
| | | | | | | | |
| Description | | Percentage of
Net Assets (%) | | | Shares | | Market Value
($ Thousands) |
| | | | | | | | |
| |
COMMON STOCK — 84.2% | | | |
| |
Consumer Discretionary — 8.2% | | | |
Ford Motor* (A) | | 0.6 | % | | 3,418,609 | | $ | 40,101 |
Time Warner (A) | | 0.6 | | | 1,354,150 | | | 41,965 |
Viacom, Cl B | | 0.5 | | | 993,208 | | | 33,382 |
Other Securities | | 6.5 | | | | | | 457,845 |
| | | | | | | | |
| | | | | | | | 573,293 |
| | | | | | | | |
| |
Consumer Staples — 9.6% | | | |
Coca-Cola | | 0.7 | | | 926,633 | | | 47,629 |
Kimberly-Clark | | 0.5 | | | 585,508 | | | 35,540 |
PepsiCo | | 0.6 | | | 670,081 | | | 42,142 |
Philip Morris International | | 0.9 | | | 1,414,864 | | | 62,424 |
Procter & Gamble | | 1.2 | | | 1,373,110 | | | 83,883 |
Walgreen | | 0.5 | | | 989,061 | | | 31,690 |
Wal-Mart Stores | | 1.4 | | | 1,922,558 | | | 97,205 |
Other Securities | | 3.8 | | | | | | 268,237 |
| | | | | | | | |
| | | | | | | | 668,750 |
| | | | | | | | |
| |
Energy — 9.6% | | | |
Chevron | | 2.0 | | | 1,891,023 | | | 139,690 |
ConocoPhillips | | 1.1 | | | 1,403,847 | | | 72,804 |
Exxon Mobil (A) | | 2.8 | | | 3,251,158 | | | 196,565 |
Other Securities | | 3.7 | | | | | | 259,191 |
| | | | | | | | |
| | | | | | | | 668,250 |
| | | | | | | | |
| |
Financials — 13.6% | | | |
American Express | | 0.7 | | | 1,187,264 | | | 47,336 |
Bank of America | | 1.4 | | | 6,271,682 | | | 98,716 |
Franklin Resources (A) | | 0.5 | | | 353,978 | | | 34,722 |
Goldman Sachs Group | | 1.0 | | | 490,601 | | | 70,774 |
JPMorgan Chase | | 1.6 | | | 2,745,164 | | | 108,654 |
MetLife | | 0.4 | | | 737,986 | | | 29,881 |
PNC Financial Services Group | | 0.5 | | | 520,612 | | | 32,668 |
Wells Fargo | | 1.4 | | | 3,470,846 | | | 99,579 |
Other Securities | | 6.1 | | | | | | 427,118 |
| | | | | | | | |
| | | | | | | | 949,448 |
| | | | | | | | |
| | | | | | | | |
| Description | | Percentage of
Net Assets (%) | | | Shares | | Market Value
($ Thousands) |
| | | | | | | | |
| |
Health Care — 10.6% | | | |
Abbott Laboratories | | 0.4 | % | | 626,229 | | $ | 29,783 |
Amgen* | | 0.8 | | | 1,096,084 | | | 56,755 |
Johnson & Johnson | | 1.6 | | | 1,872,488 | | | 109,166 |
McKesson (A) | | 0.6 | | | 585,903 | | | 41,013 |
Medtronic | | 0.5 | | | 936,832 | | | 36,705 |
Merck | | 0.5 | | | 1,068,677 | | | 36,004 |
Pfizer | | 1.1 | | | 5,095,311 | | | 77,602 |
WellPoint* | | 0.7 | | | 1,005,893 | | | 51,602 |
Other Securities | | 4.4 | | | | | | 296,491 |
| | | | | | | | |
| | | | | | | | 735,121 |
| | | | | | | | |
| |
Industrials — 8.7% | | | |
3M | | 0.5 | | | 464,992 | | | 36,878 |
General Dynamics | | 0.6 | | | 599,255 | | | 40,689 |
General Electric | | 1.3 | | | 5,419,488 | | | 88,609 |
Lockheed Martin | | 0.7 | | | 583,492 | | | 46,633 |
United Parcel Service, Cl B | | 0.5 | | | 564,342 | | | 35,418 |
United Technologies | | 1.0 | | | 987,722 | | | 66,553 |
Other Securities | | 4.1 | | | | | | 288,476 |
| | | | | | | | |
| | | | | | | | 603,256 |
| | | | | | | | |
| |
Information Technology — 15.4% | | | |
Apple* | | 1.4 | | | 375,328 | | | 96,519 |
Cisco Systems* | | 0.8 | | | 2,353,994 | | | 54,518 |
Google, Cl A* | | 1.3 | | | 177,710 | | | 86,221 |
Hewlett-Packard | | 1.0 | | | 1,549,342 | | | 71,285 |
Intel | | 1.0 | | | 3,308,904 | | | 70,877 |
International Business Machines | | 1.7 | | | 938,255 | | | 117,526 |
Microsoft | | 1.9 | | | 5,012,069 | | | 129,311 |
Oracle | | 0.6 | | | 1,719,529 | | | 38,810 |
Texas Instruments (A) | | 0.6 | | | 1,789,272 | | | 43,694 |
Other Securities | | 5.1 | | | | | | 363,417 |
| | | | | | | | |
| | | | | | | | 1,072,178 |
| | | | | | | | |
| |
Materials — 3.0% | | | |
E.I. Du Pont de Nemours (A) | | 0.6 | | | 1,049,712 | | | 37,968 |
Other Securities | | 2.4 | | | | | | 170,769 |
| | | | | | | | |
| | | | | | | | 208,737 |
| | | | | | | | |
| |
Telecommunication Services — 2.8% | | | |
AT&T | | 2.0 | | | 5,518,434 | | | 134,098 |
Verizon Communications | | 0.5 | | | 1,215,398 | | | 33,448 |
Other Securities | | 0.3 | | | | | | 27,621 |
| | | | | | | | |
| | | | | | | | 195,167 |
| | | | | | | | |
| |
Utilities — 2.7% | | | |
Constellation Energy Group (A) | | 0.5 | | | 1,019,657 | | | 36,075 |
Exelon | | 0.5 | | | 956,995 | | | 36,940 |
Other Securities | | 1.7 | | | | | | 112,286 |
| | | | | | | | |
| | | | | | | | 185,301 |
| | | | | | | | |
Total Common Stock
(Cost $5,357,245) ($ Thousands) | | | 5,859,501 |
| | | | | | | | |
| | |
| SEI Institutional Investments Trust / Annual Report / May 31, 2010 | | 23 |
SUMMARY SCHEDULE OF INVESTMENTS
Large Cap Disciplined Equity Fund (Concluded)
May 31, 2010
| | | | | | | | | |
| Description | | Percentage of
Net Assets (%) | | | Shares/Face Amount
($ Thousands) | | Market Value
($ Thousands) |
| | | | | | | | | |
| |
AFFILIATED PARTNERSHIPS — 21.7% | | | |
SEI Liquidity Fund, L.P.
0.240%**† (B) | | 11.0 | % | | | 775,044,706 | | $ | 766,164 |
SEI LIBOR Plus Portfolio† | | 10.7 | | | | 111,582,526 | | | 746,487 |
| | | | | | | | | |
Total Affiliated Partnerships
(Cost $1,707,198) ($ Thousands) | | | 1,512,651 |
| | | | | | | | | |
| |
CASH EQUIVALENT — 4.9% | | | |
SEI Daily Income Trust,
Prime Obligation Fund,
Cl A 0.090%**† | | 4.9 | | | | 342,669,118 | | | 342,669 |
| | | | | | | | | |
Total Cash Equivalent
(Cost $342,669) ($ Thousands) | | | 342,669 |
| | | | | | | | | |
|
U.S. TREASURY OBLIGATIONS (C) (D) — 1.6% |
U.S. Treasury Bills | | | | | | | | | |
0.118%, 06/03/10 | | 1.4 | | | $ | 98,566 | | | 98,565 |
0.180%, 06/10/10 | | 0.1 | | | | 4,277 | | | 4,277 |
0.139%, 06/17/10 | | 0.0 | | | | 2,150 | | | 2,150 |
0.330%, 02/10/11 | | 0.1 | | | | 3,645 | | | 3,639 |
| | | | | | | | | |
Total U.S. Treasury Obligations
(Cost $108,628) ($ Thousands) | | | 108,631 |
| | | | | | | | | |
Total Investments — 112.4%
(Cost $7,515,740) ($ Thousands) | | $ | 7,823,452 |
| | | | | | | | | |
A summary of the open futures contracts held by the Fund at May 31, 2010, is as follows:
| | | | | | | | |
Type of
Contract | | Number of
Contracts
Long (Short) | | Expiration
Date | | Unrealized
Depreciation
($ Thousands) | |
S&P 500 Composite Index | | 3,978 | | Jun-2010 | | $ | (32,209 | ) |
S&P 500 E-Mini | | 647 | | Jun-2010 | | | (1,882 | ) |
| | | | | | | | |
| | | | | | $ | (34,091 | ) |
| | | | | | | | |
For the year ended May 31, 2010, the total amount of all open futures contracts, as presented in the table above, are representative of the volume of activity for this derivative type during the period.
Percentages are based on Net Assets of $6,960,762 ($ Thousands)
| * | | Non-income producing security. |
| ** | | Rate shown is the 7-day effective yield as of May 31, 2010. |
| † | | Investment in Affiliated Security (see Note 5). |
| (A) | | This security or a partial position of this security is on loan at May 31, 2010. The total value of securities on loan at May 31, 2010 was $743,579 ($ Thousands). |
| (B) | | This security was purchased with cash collateral held from securities on loan. The total value of such securities on May 31, 2010 was $766,164 ($ Thousands). |
| (C) | | The rate reported is the effective yield at time of purchase. |
| (D) | | Security, or a portion thereof, has been pledged as collateral on open futures contracts. |
Cl — Class
LIBOR — London Interbank Offered Rate
L.P. — Limited Partnership
S&P — Standard & Poor’s
The Summary Schedule of Investments does not reflect the complete portfolio holdings. It includes the Fund’s 50 largest unaffiliated holdings and each investment of any issuer that exceeds 1% of the Fund’s net assets. “Other Securities” represent all issues not required to be disclosed under the rules adopted by the U.S. Securities and Exchange Commission (“SEC”). In certain instances, securities for which footnotes listed above may otherwise apply are included in the Other Securities caption. The complete schedule of portfolio holdings is available (i) without charge, upon request, by calling (800) 342-5734; and (ii) on the SEC’s website at http://www.sec.gov.
The following is a summary of the inputs used as of May 31, 2010 in valuing the Fund’s investments carried at value ($ Thousands):
| | | | | | | | | | | | |
| Investments in Securities | | Level 1 | | Level 2 | | Level 3 | | Total |
Common Stock | | $ | 5,859,501 | | $ | — | | $ | — | | $ | 5,859,501 |
Affiliated Partnerships | | | 746,487 | | | 766,164 | | | — | | | 1,512,651 |
Cash Equivalent | | | 342,669 | | | — | | | — | | | 342,669 |
U.S. Treasury Obligations | | | — | | | 108,631 | | | — | | | 108,631 |
| | | | | | | | | | | | |
Total Investments in Securities | | $ | 6,948,657 | | $ | 874,795 | | $ | — | | $ | 7,823,452 |
| | | | | | | | | | | | |
| | | | | | | | | | | | | | |
| Other Financial Instruments | | Level 1 | | | Level 2 | | Level 3 | | Total | |
Futures Contracts* | | $ | (34,091 | ) | | $ | — | | $ | — | | $ | (34,091 | ) |
| | | | | | | | | | | | | | |
Total Other Financial Instruments | | $ | (34,091 | ) | | $ | — | | $ | — | | $ | (34,091 | ) |
| | | | | | | | | | | | | | |
| * | | Futures contracts are valued at the unrealized depreciation on the instrument. |
For more information on valuation inputs, see Note 2 — Significant Accounting Policies in Notes to Financial Statements.
The accompanying notes are an integral part of the financial statements.
| | |
| 24 | | SEI Institutional Investments Trust / Annual Report / May 31, 2010 |
SUMMARY SCHEDULE OF INVESTMENTS
Large Cap Index Fund
May 31, 2010
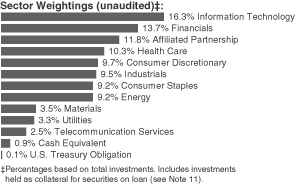
| | | | | | | | |
| Description | | Percentage of
Net Assets (%) | | | Shares | | Market Value
($ Thousands) |
| | | | | | | | |
| |
COMMON STOCK — 98.9% | | | |
| |
Consumer Discretionary — 11.1% | | | |
Amazon.com* | | 0.4 | % | | 15,089 | | $ | 1,893 |
Comcast, Cl A | | 0.5 | | | 132,125 | | | 2,390 |
Home Depot | | 0.5 | | | 78,015 | | | 2,642 |
McDonald’s | | 0.7 | | | 50,880 | | | 3,402 |
Target | | 0.4 | | | 34,485 | | | 1,881 |
Walt Disney | | 0.6 | | | 87,172 | | | 2,913 |
Other Securities | | 8.0 | | | | | | 41,111 |
| | | | | | | | |
| | | | | | | | 56,232 |
| | | | | | | | |
| |
Consumer Staples — 10.5% | | | |
Altria Group (A) | | 0.4 | | | 94,868 | | | 1,925 |
Coca-Cola | | 1.1 | | | 106,820 | | | 5,491 |
Colgate-Palmolive | | 0.4 | | | 22,875 | | | 1,786 |
CVS Caremark | | 0.4 | | | 62,552 | | | 2,166 |
Kraft Foods, Cl A | | 0.5 | | | 79,415 | | | 2,271 |
PepsiCo | | 0.9 | | | 74,552 | | | 4,689 |
Philip Morris International | | 0.7 | | | 85,368 | | | 3,766 |
Procter & Gamble | | 1.6 | | | 134,674 | | | 8,227 |
Wal-Mart Stores | | 1.0 | | | 102,079 | | | 5,161 |
Other Securities | | 3.5 | | | | | | 17,934 |
| | | | | | | | |
| | | | | | | | 53,416 |
| | | | | | | | |
| |
Energy — 10.5% | | | |
Chevron | | 1.4 | | | 92,602 | | | 6,841 |
ConocoPhillips | | 0.7 | | | 68,276 | | | 3,541 |
Exxon Mobil (A) | | 2.7 | | | 225,712 | | | 13,647 |
Occidental Petroleum | | 0.6 | | | 37,354 | | | 3,082 |
Schlumberger (A) | | 0.6 | | | 55,100 | | | 3,094 |
Other Securities | | 4.5 | | | | | | 23,152 |
| | | | | | | | |
| | | | | | | | 53,357 |
| | | | | | | | |
| |
Financials — 15.5% | | | |
American Express | | 0.4 | | | 46,534 | | | 1,855 |
Bank of America | | 1.4 | | | 459,518 | | | 7,233 |
Citigroup* | | 0.7 | | | 871,245 | | | 3,450 |
Goldman Sachs Group | | 0.7 | | | 23,175 | | | 3,343 |
| | | | | | | | |
| Description | | Percentage of
Net Assets (%) | | | Shares | | Market Value
($ Thousands) |
| | | | | | | | |
JPMorgan Chase | | 1.4 | % | | 183,534 | | $ | 7,264 |
SEI (C) | | 0.0 | | | 5,642 | | | 119 |
US Bancorp | | 0.4 | | | 87,143 | | | 2,088 |
Wells Fargo | | 1.4 | | | 239,166 | | | 6,862 |
Other Securities | | 9.1 | | | | | | 46,776 |
| | | | | | | | |
| | | | | | | | 78,990 |
| | | | | | | | |
| |
Health Care — 11.7% | | | |
Abbott Laboratories | | 0.7 | | | 71,176 | | | 3,385 |
Amgen* | | 0.5 | | | 44,067 | | | 2,282 |
Bristol-Myers Squibb | | 0.4 | | | 78,461 | | | 1,821 |
Johnson & Johnson | | 1.5 | | | 127,309 | | | 7,422 |
Medtronic | | 0.4 | | | 51,385 | | | 2,013 |
Merck | | 0.9 | | | 140,743 | | | 4,742 |
Pfizer | | 1.1 | | | 372,180 | | | 5,668 |
Other Securities | | 6.2 | | | | | | 32,146 |
| | | | | | | | |
| | | | | | | | 59,479 |
| | | | | | | | |
| |
Industrials — 10.7% | | | |
3M | | 0.5 | | | 31,946 | | | 2,534 |
Boeing (A) | | 0.4 | | | 33,391 | | | 2,143 |
General Electric | | 1.6 | | | 489,423 | | | 8,002 |
United Parcel Service, Cl B | | 0.4 | | | 31,741 | | | 1,992 |
United Technologies | | 0.5 | | | 38,466 | | | 2,592 |
Other Securities | | 7.3 | | | | | | 37,404 |
| | | | | | | | |
| | | | | | | | 54,667 |
| | | | | | | | |
| |
Information Technology — 18.5% | | | |
Apple* | | 2.1 | | | 41,223 | | | 10,601 |
Cisco Systems* (A) | | 1.2 | | | 266,427 | | | 6,170 |
Google, Cl A* | | 1.1 | | | 11,044 | | | 5,358 |
Hewlett-Packard | | 1.0 | | | 110,401 | | | 5,080 |
Intel | | 1.1 | | | 257,858 | | | 5,523 |
International Business Machines | | 1.5 | | | 61,098 | | | 7,653 |
Microsoft | | 1.8 | | | 356,300 | | | 9,193 |
Oracle | | 0.8 | | | 176,267 | | | 3,978 |
Qualcomm | | 0.5 | | | 76,150 | | | 2,708 |
Other Securities | | 7.4 | | | | | | 38,103 |
| | | | | | | | |
| | | | | | | | 94,367 |
| | | | | | | | |
| |
Materials — 3.9% | | | |
Other Securities | | 3.9 | | | | | | 19,956 |
| | | | | | | | |
| |
Telecommunication Services — 2.8% | | | |
AT&T | | 1.3 | | | 272,533 | | | 6,623 |
Verizon Communications | | 0.7 | | | 130,915 | | | 3,603 |
Other Securities | | 0.8 | | | | | | 4,145 |
| | | | | | | | |
| | | | | | | | 14,371 |
| | | | | | | | |
| |
Utilities — 3.7% | | | |
Other Securities | | 3.7 | | | | | | 18,954 |
| | | | | | | | |
Total Common Stock
(Cost $412,459) ($ Thousands) | | | 503,789 |
| | | | | | | | |
| | |
| SEI Institutional Investments Trust / Annual Report / May 31, 2010 | | 25 |
SUMMARY SCHEDULE OF INVESTMENTS
Large Cap Index Fund (Concluded)
May 31, 2010
| | | | | | | | |
| Description | | Percentage of
Net Assets (%) | | | Shares | | Market Value
($ Thousands) |
| | | | | | | | |
| |
AFFILIATED PARTNERSHIP — 13.4% | | | |
SEI Liquidity Fund, L.P.
0.240% (B)**† | | 13.4 | % | | 69,016,757 | | $ | 68,233 |
| | | | | | | | |
Total Affiliated Partnership
(Cost $69,017) ($ Thousands) | | | 68,233 |
| | | | | | | | |
| |
CASH EQUIVALENT — 1.1% | | | |
SEI Daily Income Trust,
Prime Obligation Fund,
Cl A 0.090%**† | | 1.1 | | | 5,427,614 | | | 5,428 |
| | | | | | | | |
Total Cash Equivalent
(Cost $5,428) ($ Thousands) | | | 5,428 |
| | | | | | | | |
| |
U.S. TREASURY OBLIGATION (D) — 0.2% | | | |
Other Securities | | 0.2 | | | | | | 828 |
| | | | | | | | |
Total U.S. Treasury Obligation
(Cost $828) ($ Thousands) | | | 828 |
| | | | | | | | |
Total Investments — 113.6%
(Cost $487,732) ($ Thousands) | | $ | 578,278 |
| | | | | | | | |
A summary of the open futures contracts held by the Fund at May 31, 2010, is as follows:
| | | | | | | | |
Type of
Contract | | Number of
Contracts
Long (Short) | | Expiration
Date | | Unrealized
Depreciation
($ Thousands) | |
S&P 500 E-Mini | | 137 | | Jun-2010 | | $ | (394 | ) |
S&P Mid 400 E-Mini | | 6 | | Jun-2010 | | | (12 | ) |
| | | | | | | | |
| | | | | | $ | (406 | ) |
| | | | | | | | |
For the year ended May 31, 2010, the total amount of all open futures contracts, as presented in the table above, are representative of the volume of activity for this derivative type during the period.
Percentages are based on Net Assets of $509,120 ($ Thousands)
| * | | Non-income producing security. |
| ** | | The rate reported is the 7-day effective yield as of May 31, 2010. |
| † | | Investment in Affiliated Security (see Note 5). |
| (A) | | This security or a partial position of this security is on loan at May 31, 2010. The total value of securities on loan at May 31, 2010 was $66,147 ($ Thousands). |
| (B) | | This security was purchased with cash collateral held from securities on loan. The total value of such securities on May 31, 2010 was $68,233 ($ Thousands). |
| (C) | | The Fund may purchase securities of certain companies with which it is affiliated to the extent these companies are represented in its benchmark index. |
| (D) | | Security, or a portion thereof, has been pledged as collateral on open futures contracts. |
Cl — Class
L.P. — Limited Partnership
S&P — Standard & Poor’s
The Summary Schedule of Investments does not reflect the complete portfolio holdings. It includes the Fund’s 50 largest unaffiliated holdings and each investment of any issuer that exceeds 1% of the Fund’s net assets. “Other Securities” represent all issues not required to be disclosed under the rules adopted by the U.S. Securities and Exchange Commission (“SEC”). In certain instances, securities for which footnotes listed above may otherwise apply are included in the Other Securities caption. The complete schedule of portfolio holdings is available (i) without charge, upon request, by calling (800) 342-5734; and (ii) on the SEC’s website at http://www.sec.gov.
The following is a summary of the inputs used as of May 31, 2010 in valuing the Fund’s investments carried at value ($ Thousands):
| | | | | | | | | | | | |
| Investments in Securities | | Level 1 | | Level 2 | | Level 3 | | Total |
Common Stock | | $ | 503,789 | | $ | — | | $ | — | | $ | 503,789 |
Affiliated Partnership | | | — | | | 68,233 | | | — | | | 68,233 |
Cash Equivalent | | | 5,428 | | | — | | | — | | | 5,428 |
U.S. Treasury Obligation | | | — | | | 828 | | | — | | | 828 |
| | | | | | | | | | | | |
Total Investments in Securities | | $ | 509,217 | | $ | 69,061 | | $ | — | | $ | 578,278 |
| | | | | | | | | | | | |
| | | | | | | | | | | | | | |
| Other Financial Instruments | | Level 1 | | | Level 2 | | Level 3 | | Total | |
Futures Contracts* | | $ | (406 | ) | | $ | — | | $ | — | | $ | (406 | ) |
| | | | | | | | | | | | | | |
Total Other Financial Instruments | | $ | (406 | ) | | $ | — | | $ | — | | $ | (406 | ) |
| | | | | | | | | | | | | | |
| * | | Futures contracts are valued at the unrealized depreciation on the instrument. |
For more information on valuation inputs, see Note 2 — Significant Accounting Policies in Notes to Financial Statements.
The accompanying notes are an integral part of the financial statements.
| | |
| 26 | | SEI Institutional Investments Trust / Annual Report / May 31, 2010 |
SUMMARY SCHEDULE OF INVESTMENTS
Small Cap Fund
May 31, 2010
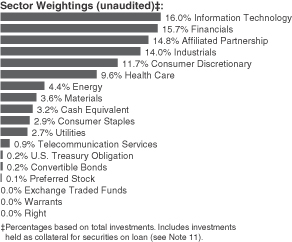
| | | | | | | | |
| Description | | Percentage of
Net Assets (%) | | | Shares | | Market Value
($ Thousands) |
| | | | | | | | |
| |
COMMON STOCK — 96.8% | | | |
| |
Consumer Discretionary — 13.8% | | | |
American Public Education* | | 0.4 | % | | 116,228 | | $ | 4,753 |
Cato, Cl A (A) | | 0.3 | | | 172,237 | | | 4,087 |
Eastman Kodak* (A) | | 0.2 | | | 586,500 | | | 3,308 |
Iconix Brand Group* | | 0.2 | | | 207,835 | | | 3,377 |
Life Time Fitness* (A) | | 0.3 | | | 117,361 | | | 4,355 |
MDC Partners, Cl A | | 0.3 | | | 288,400 | | | 3,513 |
Rent-A-Center, Cl A* (A) | | 0.2 | | | 137,000 | | | 3,318 |
Talbots* | | 0.3 | | | 236,340 | | | 3,555 |
Other Securities | | 11.6 | | | | | | 155,214 |
| | | | | | | | |
| | | | | | | | 185,480 |
| | | | | | | | |
| |
Consumer Staples — 3.5% | | | |
Del Monte Foods | | 0.4 | | | 332,300 | | | 4,845 |
Other Securities | | 3.1 | | | | | | 41,662 |
| | | | | | | | |
| | | | | | | | 46,507 |
| | | | | | | | |
| |
Energy — 5.3% | | | |
Comstock Resources* | | 0.4 | | | 186,118 | | | 5,554 |
Goodrich Petroleum* (A) | | 0.3 | | | 302,672 | | | 3,705 |
PetroHawk Energy* | | 0.3 | | | 215,057 | | | 4,136 |
Scorpio Tankers* | | 0.3 | | | 289,637 | | | 3,308 |
World Fuel Services | | 0.3 | | | 129,971 | | | 3,383 |
Other Securities | | 3.7 | | | | | | 50,408 |
| | | | | | | | |
| | | | | | | | 70,494 |
| | | | | | | | |
| |
Financials — 18.6% | | | |
Affiliated Managers Group* (A) | | 0.2 | | | 47,117 | | | 3,376 |
Equity Residential‡ | | 0.3 | | | 78,250 | | | 3,531 |
MarketAxess Holdings | | 0.2 | | | 230,376 | | | 3,400 |
MGIC Investment* | | 0.3 | | | 371,705 | | | 3,479 |
| | | | | | | | |
| Description | | Percentage of
Net Assets (%) | | | Shares | | Market Value
($ Thousands) |
| | | | | | | | |
Platinum Underwriters Holdings (A) | | 0.4 | % | | 143,296 | | $ | 5,275 |
Simon Property Group‡ (A) | | 0.3 | | | 40,847 | | | 3,473 |
Other Securities | | 16.9 | | | | | | 227,119 |
| | | | | | | | |
| | | | | | | | 249,653 |
| | | | | | | | |
| |
Health Care — 11.4% | | | |
AMAG Pharmaceuticals* | | 0.3 | | | 113,424 | | | 3,611 |
ICU Medical* | | 0.3 | | | 108,500 | | | 3,452 |
LHC Group* (A) | | 0.3 | | | 111,456 | | | 3,433 |
NuVasive* (A) | | 0.3 | | | 102,687 | | | 4,033 |
Par Pharmaceutical* | | 0.3 | | | 142,320 | | | 3,951 |
Other Securities | | 9.9 | | | | | | 134,517 |
| | | | | | | | |
| | | | | | | | 152,997 |
| | | | | | | | |
| |
Industrials — 16.6% | | | |
Acuity Brands (A) | | 0.2 | | | 78,280 | | | 3,220 |
Aegean Marine Petroleum Network (A) | | 0.3 | | | 199,149 | | | 4,588 |
Airtran Holdings* | | 0.4 | | | 1,028,886 | | | 5,803 |
CoStar Group* (A) | | 0.3 | | | 98,973 | | | 4,035 |
EMCOR Group* | | 0.4 | | | 216,618 | | | 5,409 |
FTI Consulting* (A) | | 0.3 | | | 89,700 | | | 3,836 |
Innerworkings* (A) | | 0.3 | | | 563,463 | | | 3,905 |
WESCO International* (A) | | 0.3 | | | 111,065 | | | 4,154 |
Other Securities | | 14.1 | | | | | | 187,130 |
| | | | | | | | |
| | | | | | | | 222,080 |
| | | | | | | | |
| |
Information Technology — 19.0% | | | |
Advanced Energy Industries* (A) | | 0.2 | | | 259,929 | | | 3,213 |
Atheros Communications* | | 0.3 | | | 131,939 | | | 4,486 |
DTS* | | 0.3 | | | 120,962 | | | 3,995 |
Earthlink (A) | | 0.2 | | | 371,100 | | | 3,188 |
Imation* (A) | | 0.3 | | | 379,866 | | | 3,905 |
Mantech International, Cl A* (A) | | 0.3 | | | 79,332 | | | 3,668 |
Netlogic Microsystems* | | 0.3 | | | 120,985 | | | 3,481 |
Quest Software* | | 0.3 | | | 178,118 | | | 3,447 |
SS&C Technologies Holdings* | | 0.2 | | | 201,131 | | | 3,282 |
VistaPrint* (A) | | 0.4 | | | 128,244 | | | 5,988 |
Other Securities | | 16.2 | | | | | | 216,238 |
| | | | | | | | |
| | | | | | | | 254,891 |
| | | | | | | | |
| |
Materials — 4.3% | | | |
NewMarket | | 0.3 | | | 36,475 | | | 3,756 |
WR Grace* (A) | | 0.3 | | | 129,971 | | | 3,331 |
Other Securities | | 3.7 | | | | | | 50,501 |
| | | | | | | | |
| | | | | | | | 57,588 |
| | | | | | | | |
| | |
| SEI Institutional Investments Trust / Annual Report / May 31, 2010 | | 27 |
SUMMARY SCHEDULE OF INVESTMENTS
Small Cap Fund (Concluded)
May 31, 2010
| | | | | | | | |
| Description | | Percentage of
Net Assets (%) | | | Shares | | Market Value
($ Thousands) |
| | | | | | | | |
| |
Telecommunication Services — 1.0% | | | |
SBA Communications, Cl A* (A) | | 0.3 | % | | 127,562 | | $ | 4,213 |
Other Securities | | 0.7 | | | | | | 9,200 |
| | | | | | | | |
| | | | | | | | 13,413 |
| | | | | | | | |
| |
Utilities — 3.3% | | | |
El Paso Electric* | | 0.3 | | | 184,300 | | | 3,653 |
NorthWestern (A) | | 0.4 | | | 216,881 | | | 5,712 |
Portland General Electric | | 0.5 | | | 311,775 | | | 5,896 |
Other Securities | | 2.1 | | | | | | 28,341 |
| | | | | | | | |
| | | | | | | | 43,602 |
| | | | | | | | |
Total Common Stock
(Cost $1,138,707) ($ Thousands) | | | 1,296,705 |
| | | | | | | | |
| |
PREFERRED STOCK — 0.2% | | | |
| |
Consumer Discretionary — 0.1% | | | |
Other Securities | | 0.1 | | | | | | 1,483 |
| | | | | | | | |
| |
Financials — 0.1% | | | |
Other Securities | | 0.1 | | | | | | 673 |
| | | | | | | | |
Total Preferred Stock
(Cost $1,755) ($ Thousands) | | | 2,156 |
| | | | | | | | |
| |
CONVERTIBLE BONDS — 0.2% | | | |
| |
Consumer Discretionary — 0.0% | | | |
Other Securities | | 0.0 | | | | | | 252 |
| | | | | | | | |
| | | |
Energy — 0.2% | | | | | | | | |
Other Securities | | 0.2 | | | | | | 2,070 |
| | | | | | | | |
Total Convertible Bonds
(Cost $3,725) ($ Thousands) | | | 2,322 |
| | | | | | | | |
| | | |
WARRANTS — 0.0% | | | | | | | | |
Other Securities | | 0.0 | | | | | | 56 |
| | | | | | | | |
Total Warrants
(Cost $53) ($ Thousands) | | | 56 |
| | | | | | | | |
| |
RIGHT — 0.0% | | | |
| |
United States — 0.0% | | | |
Other Securities | | 0.0 | | | | | | — |
| | | | | | | | |
Total Right
(Cost $0) ($ Thousands) | | | — |
| | | | | | | | |
| |
EXCHANGE TRADED FUNDS — 0.0% | | | |
Other Securities | | 0.0 | | | | | | 342 |
| | | | | | | | |
Total Exchange Traded Funds
(Cost $374) ($ Thousands) | | | 342 |
| | | | | | | | |
| | | | | | | | | |
| Description | | Percentage of
Net Assets (%) | | | Shares/Face Amount
($ Thousands) | | Market Value
($ Thousands) |
| | | | | | | | | |
| |
AFFILIATED PARTNERSHIP — 17.6% | | | |
SEI Liquidity Fund, L.P.
0.240%**† (B) | | 17.6 | % | | | 241,968,446 | | $ | 235,812 |
| | | | | | | | | |
Total Affiliated Partnership
(Cost $241,968) ($ Thousands) | | | 235,812 |
| | | | | | | | | |
| |
CASH EQUIVALENT — 3.8% | | | |
SEI Daily Income Trust, Prime Obligation Fund, Cl A 0.090%**† | | 3.8 | | | | 50,578,993 | | | 50,579 |
| | | | | | | | | |
Total Cash Equivalent
(Cost $50,579) ($ Thousands) | | | 50,579 |
| | | | | | | | | |
|
U.S. TREASURY OBLIGATION (C) (D) — 0.2% |
U.S. Treasury Bill
0.102%, 06/03/10 | | 0.2 | | | $ | 3,329 | | | 3,329 |
| | | | | | | | | |
Total U.S. Treasury Obligation
(Cost $3,329) ($ Thousands) | | | 3,329 |
| | | | | | | | | |
Total Investments — 118.8%
(Cost $1,440,490)($ Thousands) | | $ | 1,591,301 |
| | | | | | | | | |
A summary of the open futures contracts held by the Fund at May 31, 2010, is as follows:
| | | | | | | |
Type of
Contract | | Number of
Contracts
Long (Short) | | Expiration
Date | | Unrealized
Appreciation
($ Thousands) |
Russell 2000 Index E-Mini | | 513 | | Jun-2010 | | $ | 160 |
| | | | | | | |
For the year ended May 31, 2010, the total amount of all open futures contracts, as presented in the table above, are representative of the volume of activity for this derivative type during the period.
Percentages are based on Net Assets of $1,339,748 ($ Thousands)
| * | | Non-income producing security. |
| ** | | The rate reported is the 7-day effective yield as of May 31, 2010. |
| † | | Investment in Affiliated Security (see Note 5). |
| ‡ | | Real Estate Investment Trust |
| (A) | | This security or a partial position of this security is on loan at May 31, 2010. The total value of securities on loan at May 31, 2010 was $231,332 ($ Thousands). |
| (B) | | This security was purchased with cash collateral held from securities on loan. The total value of such securities as of May 31, 2010 was $235,812 ($ Thousands). |
| (C) | | Security, or a portion thereof, has been pledged as collateral on open futures contracts. |
| (D) | | The rate reported is the effective yield at time of purchase. |
Cl — Class
L.P. — Limited Partnership
The Summary Schedule of Investments does not reflect the complete portfolio holdings. It includes the Fund’s 50 largest unaffiliated holdings and each investment of any issuer that exceeds 1% of the Fund’s net assets. “Other Securities” represent all issues not required to be disclosed under the rules adopted by the U.S. Securities and Exchange Commission (“SEC”). In certain instances, securities for which footnotes listed above may otherwise apply are included in the Other Securities caption. The complete schedule of portfolio holdings is available (i) without charge, upon request, by calling (800) 342-5734; and (ii) on the SEC’s website at http://www.sec.gov.
| | |
| 28 | | SEI Institutional Investments Trust / Annual Report / May 31, 2010 |
The following is a summary of the inputs used as of May 31, 2010 in valuing the Fund’s investments carried at value ($ Thousands):
| | | | | | | | | | | | |
| Investments in Securities | | Level 1 | | Level 2 | | Level 3 | | Total |
Common Stock | | $ | 1,296,103 | | $ | 244 | | $ | 358 | | $ | 1,296,705 |
Preferred Stock | | | — | | | 2,156 | | | — | | | 2,156 |
Convertible Bonds | | | — | | | 1,291 | | | 1,031 | | | 2,322 |
Warrants | | | 5 | | | 51 | | | — | | | 56 |
Right | | | — | | | — | | | — | | | — |
Exchange Traded Funds | | | 342 | | | — | | | — | | | 342 |
Affiliated Partnership | | | — | | | 235,812 | | | — | | | 235,812 |
Cash Equivalent | | | 50,579 | | | — | | | — | | | 50,579 |
U.S. Treasury Obligation | | | — | | | 3,329 | | | — | | | 3,329 |
| | | | | | | | | | | | |
Total Investments in Securities | | $ | 1,347,029 | | $ | 242,883 | | $ | 1,389 | | $ | 1,591,301 |
| | | | | | | | | | | | |
| | | | | | | | | | | | |
| Other Financial Instruments | | Level 1 | | Level 2 | | Level 3 | | Total |
Futures Contracts* | | $ | 160 | | $ | — | | $ | — | | $ | 160 |
| | | | | | | | | | | | |
Total Other Financial Instruments | | $ | 160 | | $ | — | | $ | — | | $ | 160 |
| | | | | | | | | | | | |
The following is a reconciliation of investments in which significant unobservable inputs (Level 3) were used in determining value ($ Thousands):
| | | | | | |
| | | Investments in
Common Stock | | Investments in
Convertible Bonds |
Beginning balance as of June 1, 2009 | | $ | — | | $ | 321 |
Accrued discounts/premiums | | | — | | | 31 |
Realized gain/(loss) | | | — | | | — |
Change in unrealized appreciation/(depreciation) | | | — | | | 80 |
Net purchases/sales | | | — | | | 347 |
Net transfer in and/or out of Level 3 | | | 358 | | | 252 |
| | | | | | |
Ending balance as of May 31, 2010 | | $ | 358 | | $ | 1,031 |
| | | | | | |
Changes in unrealized gains/(losses) included in earnings related to securities still held at reporting date | | $ | — | | $ | 80 |
| | | | | | |
| * | | Futures contracts are valued at the unrealized appreciation on the instrument. |
For more information on valuation inputs, see Note 2 — Significant Accounting Policies in Notes to Financial Statements.
Amounts designated as “—” are either $0 or have been rounded to $0.
The accompanying notes are an integral part of the financial statements.
| | |
| SEI Institutional Investments Trust / Annual Report / May 31, 2010 | | 29 |
SUMMARY SCHEDULE OF INVESTMENTS
Small/Mid Cap Equity Fund
May 31, 2010
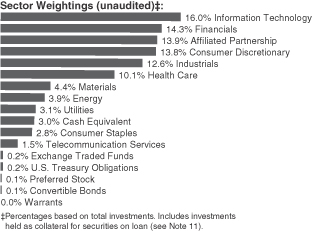
| | | | | | | | |
| Description | | Percentage of
Net Assets (%) | | | Shares | | Market Value
($ Thousands) |
| | | | | | | | |
| |
COMMON STOCK — 97.4% | | | |
| |
Consumer Discretionary — 16.3% | | | |
Carter’s* | | 0.3 | % | | 164,600 | | $ | 5,030 |
Cooper Tire & Rubber | | 0.2 | | | 249,752 | | | 4,723 |
Dick’s Sporting Goods* (A) | | 0.4 | | | 299,188 | | | 8,530 |
Jarden | | 0.3 | | | 198,225 | | | 5,770 |
Live Nation* | | 0.3 | | | 556,375 | | | 6,805 |
National CineMedia | | 0.3 | | | 311,775 | | | 5,453 |
Penn National Gaming* | | 0.3 | | | 218,402 | | | 5,591 |
PetSmart (A) | | 0.4 | | | 254,739 | | | 8,090 |
Scientific Games, Cl A* | | 0.3 | | | 526,749 | | | 5,383 |
Other Securities | | 13.5 | | | | | | 280,251 |
| | | | | | | | |
| | | | | | | | 335,626 |
| | | | | | | | |
| |
Consumer Staples — 3.4% | | | |
Other Securities | | 3.4 | | | | | | 67,921 |
| | | | | | | | |
| |
Energy — 4.6% | | | |
Dresser-Rand Group* (A) | | 0.4 | | | 245,774 | | | 7,823 |
Key Energy Services* (A) | | 0.3 | | | 535,164 | | | 5,116 |
World Fuel Services | | 0.2 | | | 180,500 | | | 4,698 |
Other Securities | | 3.7 | | | | | | 77,415 |
| | | | | | | | |
| | | | | | | | 95,052 |
| | | | | | | | |
| |
Financials — 16.9% | | | |
Affiliated Managers Group* (A) | | 0.2 | | | 66,610 | | | 4,773 |
Boston Properties‡ (A) | | 0.3 | | | 82,333 | | | 6,313 |
Jones Lang LaSalle | | 0.3 | | | 67,157 | | | 5,011 |
Reinsurance Group of America, Cl A | | 0.2 | | | 100,054 | | | 4,700 |
Zions Bancorporation (A) | | 0.3 | | | 273,430 | | | 6,549 |
Other Securities | | 15.6 | | | | | | 321,544 |
| | | | | | | | |
| | | | | | | | 348,890 |
| | | | | | | | |
| | | | | | | | |
| Description | | Percentage of
Net Assets (%) | | | Shares | | Market Value
($ Thousands) |
| | | | | | | | |
| |
Health Care — 11.8% | | | |
Incyte* (A) | | 0.3 | % | | 408,640 | | $ | 5,267 |
Pharmaceutical Product Development | | 0.3 | | | 188,070 | | | 5,048 |
SXC Health Solutions* | | 0.2 | | | 72,390 | | | 5,325 |
Other Securities | | 11.0 | | | | | | 229,719 |
| | | | | | | | |
| | | | | | | | 245,359 |
| | | | | | | | |
| |
Industrials — 14.9% | | | |
Acuity Brands (A) | | 0.2 | | | 116,962 | | | 4,810 |
CoStar Group* (A) | | 0.2 | | | 130,898 | | | 5,337 |
Gardner Denver | | 0.5 | | | 210,061 | | | 9,566 |
IHS, Cl A* | | 0.4 | | | 149,224 | | | 7,724 |
JB Hunt Transport Services (A) | | 0.3 | | | 159,617 | | | 5,512 |
SYKES Enterprises* (A) | | 0.4 | | | 439,033 | | | 7,578 |
Tetra Tech* | | 0.2 | | | 219,610 | | | 4,978 |
WESCO International* | | 0.4 | | | 218,319 | | | 8,165 |
Other Securities | | 12.3 | | | | | | 253,296 |
| | | | | | | | |
| | | | | | | | 306,966 |
| | | | | | | | |
| |
Information Technology — 18.9% | | | |
Alliance Data Systems* | | 0.3 | | | 83,600 | | | 5,907 |
Brocade Communications Systems* | | 0.2 | | | 909,305 | | | 4,956 |
Diebold | | 0.3 | | | 178,298 | | | 5,167 |
Equinix* (A) | | 0.3 | | | 65,495 | | | 6,026 |
Fairchild Semiconductor International, Cl A* (A) | | 0.3 | | | 564,834 | | | 5,648 |
Gartner* | | 0.5 | | | 392,853 | | | 9,723 |
GSI Commerce* (A) | | 0.7 | | | 530,024 | | | 14,925 |
Microsemi* (A) | | 0.3 | | | 432,213 | | | 6,691 |
PMC — Sierra* | | 0.3 | | | 759,400 | | | 6,151 |
Power Integrations (A) | | 0.2 | | | 142,139 | | | 4,830 |
Sanmina-SCI* | | 0.2 | | | 326,387 | | | 4,977 |
Sapient (A) | | 0.2 | | | 478,300 | | | 4,855 |
Trimble Navigation* (A) | | 0.2 | | | 172,824 | | | 4,965 |
VistaPrint* (A) | | 0.5 | | | 243,044 | | | 11,348 |
Other Securities | | 14.4 | | | | | | 295,095 |
| | | | | | | | |
| | | | | | | | 391,264 |
| | | | | | | | |
| |
Materials — 5.2% | | | |
Ashland (A) | | 0.2 | | | 88,799 | | | 4,761 |
Silgan Holdings | | 0.2 | | | 166,735 | | | 4,757 |
Other Securities | | 4.8 | | | | | | 99,147 |
| | | | | | | | |
| | | | | | | | 108,665 |
| | | | | | | | |
| |
Telecommunication Services — 1.8% | | | |
NII Holdings* | | 0.3 | | | 175,395 | | | 6,397 |
SBA Communications, Cl A* (A) | | 0.5 | | | 285,982 | | | 9,446 |
Other Securities | | 1.0 | | | | | | 21,124 |
| | | | | | | | |
| | | | | | | | 36,967 |
| | | | | | | | |
| | |
| 30 | | SEI Institutional Investments Trust / Annual Report / May 31, 2010 |
| | | | | | | | |
| Description | | Percentage of
Net Assets (%) | | | Shares | | Market Value
($ Thousands) |
| | | | | | | | |
| |
Utilities — 3.6% | | | |
AGL Resources | | 0.3 | % | | 158,311 | | $ | 5,778 |
Great Plains Energy | | 0.2 | | | 285,578 | | | 5,012 |
Portland General Electric | | 0.3 | | | 348,763 | | | 6,595 |
Other Securities | | 2.8 | | | | | | 57,886 |
| | | | | | | | |
| | | | | | | | 75,271 |
| | | | | | | | |
Total Common Stock
(Cost $1,715,523) ($ Thousands) | | | 2,011,981 |
| | | | | | | | |
| |
PREFERRED STOCK — 0.2% | | | |
| |
Consumer Discretionary — 0.1% | | | |
Other Securities | | 0.1 | | | | | | 1,870 |
| | | | | | | | |
| |
Financials — 0.1% | | | |
Other Securities | | 0.1 | | | | | | 1,469 |
| | | | | | | | |
Total Preferred Stock
(Cost $2,830) ($ Thousands) | | | 3,339 |
| | | | | | | | |
| |
CONVERTIBLE BONDS — 0.1% | | | |
| |
Consumer Discretionary — 0.0% | | | |
Other Securities | | 0.0 | | | | | | 252 |
| | | | | | | | |
| |
Energy — 0.1% | | | |
Other Securities | | 0.1 | | | | | | 1,940 |
| | | | | | | | |
Total Convertible Bonds
(Cost $3,809) ($ Thousands) | | | 2,192 |
| | | | | | | | |
| |
EXCHANGE TRADED FUNDS — 0.3% | | | |
iShares Russell 2000 Growth Index Fund (A) | | 0.3 | | | 79 | | | 5,626 |
Other Securities | | 0.0 | | | | | | 406 |
| | | | | | | | |
Total Exchange Traded Funds
(Cost $6,252) ($ Thousands) | | | 6,032 |
| | | | | | | | |
| |
WARRANTS — 0.0% | | | |
Other Securities | | 0.0 | | | | | | 71 |
| | | | | | | | |
Total Warrants
(Cost $196) ($ Thousands) | | | 71 |
| | | | | | | | |
| |
AFFILIATED PARTNERSHIP — 16.4% | | | |
SEI Liquidity Fund, L.P. 0.240%**† (B) | | 16.4 | | | 345,579,629 | | | 338,195 |
| | | | | | | | |
Total Affiliated Partnership
(Cost $345,580) ($ Thousands) | | | 338,195 |
| | | | | | | | |
| | | | | | | | |
| Description | | Percentage of
Net Assets (%) | | | Shares | | Market Value
($ Thousands) |
| |
CASH EQUIVALENT — 3.6% | | | |
SEI Daily Income Trust, Prime Obligation Fund, Cl A 0.090%**† | | 3.6 | % | | 73,966,794 | | $ | 73,967 |
| | | | | | | | |
Total Cash Equivalent
(Cost $73,967) ($ Thousands) | | | 73,967 |
| | | | | | | | |
| |
U.S. TREASURY OBLIGATIONS (C) — 0.2% | | | |
Other Securities | | 0.2 | | | | | | 4,533 |
| | | | | | | | |
Total U.S. Treasury Obligations
(Cost $4,533) ($ Thousands) | | | 4,533 |
| | | | | | | | |
Total Investments — 118.2%
(Cost $2,152,690)($ Thousands) | | $ | 2,440,310 |
| | | | | | | | |
A summary of the open futures contracts held by the Fund at May 31, 2010, is as follows:
| | | | | | | |
Type of
Contract | | Number of
Contracts
Long (Short) | | Expiration
Date | | Unrealized
Appreciation
($ Thousands) |
Russell 2000 Index E-Mini | | 163 | | Jun-2010 | | $ | 313 |
S&P Mid 400 Index E-Mini | | 110 | | Jun-2010 | | | 228 |
| | | | | | | |
| | | | | | $ | 541 |
| | | | | | | |
For the year ended May 31, 2010, the total amount of all open futures contracts, as presented in the table above, are representative of the volume of activity for this derivative type during the period.
Percentages are based on Net Assets of $2,064,443 ($ Thousands)
| * | | Non-income producing security. |
| ** | | The rate reported is the 7-day effective yield as of May 31, 2010. |
| † | | Investment in Affiliated Security (see Note 5). |
| ‡ | | Real Estate Investment Trust |
| (A) | | This security or a partial position of this security is on loan at May 31, 2010. The total value of securities on loan at May 31, 2010 was $331,075 ($ Thousands). |
| (B) | | This security was purchased with cash collateral held from securities on loan. The total value of such securities as of May 31, 2010 was $338,195 ($ Thousands). |
| (C) | | Security, or a portion thereof, has been pledged as collateral on open futures contracts. |
Cl — Class
L.P. — Limited Partnership
S&P — Standard & Poor’s
The Summary Schedule of Investments does not reflect the complete portfolio holdings. It includes the Fund’s 50 largest unaffiliated holdings and each investment of any issuer that exceeds 1% of the Fund’s net assets. “Other Securities” represent all issues not required to be disclosed under the rules adopted by the U.S. Securities and Exchange Commission (“SEC”). In certain instances, securities for which footnotes listed above may otherwise apply are included in the Other Securities caption. The complete schedule of portfolio holdings is available (i) without charge, upon request, by calling (800) 342-5734; and (ii) on the SEC’s website at http://www.sec.gov.
| | |
| SEI Institutional Investments Trust / Annual Report / May 31, 2010 | | 31 |
SUMMARY SCHEDULE OF INVESTMENTS
Small/Mid Cap Equity Fund (Concluded)
May 31, 2010
The following is a summary of the inputs used as of May 31, 2010 in valuing the Fund’s investments carried at value ($ Thousands):
| | | | | | | | | | | | |
| Investments in Securities | | Level 1 | | Level 2 | | Level 3 | | Total |
Common Stock | | $ | 2,011,010 | | $ | 663 | | $ | 308 | | $ | 2,011,981 |
Preferred Stock | | | — | | | 3,339 | | | — | | | 3,339 |
Convertible Bonds | | | — | | | 1,493 | | | 699 | | | 2,192 |
Exchange Traded Funds | | | 6,032 | | | — | | | — | | | 6,032 |
Warrants | | | 4 | | | 67 | | | — | | | 71 |
Affiliated Partnership | | | — | | | 338,195 | | | — | | | 338,195 |
Cash Equivalent | | | 73,967 | | | — | | | — | | | 73,967 |
U.S. Treasury Obligations | | | — | | | 4,533 | | | — | | | 4,533 |
| | | | | | | | | | | | |
Total Investments in Securities | | $ | 2,091,013 | | $ | 348,290 | | $ | 1,007 | | $ | 2,440,310 |
| | | | | | | | | | | | |
| | | | | | | | | | | | |
| Other Financial Instruments | | Level 1 | | Level 2 | | Level 3 | | Total |
Futures Contracts* | | $ | 541 | | $ | — | | $ | — | | $ | 541 |
| | | | | | | | | | | | |
Total Other Financial Instruments | | $ | 541 | | $ | — | | $ | — | | $ | 541 |
| | | | | | | | | | | | |
| * | | Futures contracts are valued at the unrealized appreciation on the instrument. |
The following is a reconciliation of investments in which significant unobservable inputs (Level 3) were used in determining value ($ Thousands):
| | | | | | |
| | | Investments in
Convertible Bonds | | Investments in
Common Stock |
Beginning balance as of June 1, 2009 | | $ | 384 | | $ | — |
Accrued discounts/premiums | | | — | | | — |
Realized gain/(loss) | | | — | | | — |
Change in unrealized appreciation/(depreciation) | | | 63 | | | — |
Net purchases/sales | | | — | | | — |
Net transfer in and/or out of Level 3 | | | 252 | | | 308 |
| | | | | | |
Ending balance as of May 31, 2010 | | $ | 699 | | $ | 308 |
| | | | | | |
Changes in unrealized gains/(losses) included in earnings related to securities still held at reporting date | | $ | 63 | | $ | — |
| | | | | | |
For more information on valuation inputs, see Note 2 — Significant Accounting Policies in Notes to Financial Statements.
Amounts designated as “—” are either $0 or have been rounded to $0.
The accompanying notes are an integral part of the financial statements.
| | |
| 32 | | SEI Institutional Investments Trust / Annual Report / May 31, 2010 |
SUMMARY SCHEDULE OF INVESTMENTS
U.S. Managed Volatility Fund
May 31, 2010
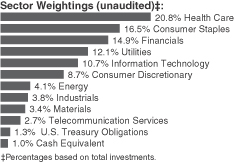
| | | | | | | | |
| Description | | Percentage of
Net Assets (%) | | | Shares | | Market Value
($ Thousands) |
| | | | | | | | |
| |
COMMON STOCK — 97.7% | | | |
| |
Consumer Discretionary — 8.7% | | | |
Amazon.com* | | 1.1 | % | | 22,953 | | $ | 2,880 |
priceline.com* | | 0.8 | | | 10,041 | | | 1,919 |
Strayer Education | | 0.8 | | | 8,204 | | | 1,969 |
Other Securities | | 6.0 | | | | | | 15,479 |
| | | | | | | | |
| | | | | | | | 22,247 |
| | | | | | | | |
| |
Consumer Staples — 16.5% | | | |
Altria Group | | 1.2 | | | 149,435 | | | 3,032 |
Brown-Forman, Cl B | | 1.2 | | | 54,460 | | | 3,020 |
Campbell Soup | | 0.8 | | | 55,513 | | | 1,988 |
Hershey | | 1.1 | | | 58,981 | | | 2,760 |
Hormel Foods | | 1.6 | | | 104,380 | | | 4,154 |
Kellogg | | 1.5 | | | 72,251 | | | 3,860 |
Kimberly-Clark | | 0.7 | | | 28,141 | | | 1,708 |
Lorillard | | 1.2 | | | 40,707 | | | 2,910 |
Philip Morris International | | 1.1 | | | 65,399 | | | 2,885 |
Reynolds American | | 1.2 | | | 59,465 | | | 3,101 |
Sysco | | 1.2 | | | 105,412 | | | 3,142 |
Other Securities | | 3.7 | | | | | | 9,599 |
| | | | | | | | |
| | | | | | | | 42,159 |
| | | | | | | | |
| |
Energy — 4.1% | | | |
Chevron | | 0.8 | | | 27,607 | | | 2,039 |
Other Securities | | 3.3 | | | | | | 8,519 |
| | | | | | | | |
| | | | | | | | 10,558 |
| | | | | | | | |
| |
Financials — 14.9% | | | |
Bank of Hawaii | | 1.1 | | | 58,591 | | | 2,814 |
Capitol Federal Financial | | 0.6 | | | 47,636 | | | 1,524 |
Commerce Bancshares | | 1.4 | | | 97,076 | | | 3,608 |
Cullen/Frost Bankers | | 1.2 | | | 54,888 | | | 3,012 |
TFS Financial | | 0.9 | | | 180,662 | | | 2,392 |
Other Securities | | 9.7 | | | | | | 24,559 |
| | | | | | | | |
| | | | | | | | 37,909 |
| | | | | | | | |
| |
Health Care — 20.8% | | | |
Abbott Laboratories | | 1.4 | | | 75,445 | | | 3,588 |
AmerisourceBergen | | 1.7 | | | 140,920 | | | 4,408 |
| | | | | | | | |
| Description | | Percentage of
Net Assets (%) | | | Shares | | Market Value
($ Thousands) |
| | | | | | | | |
Amgen* | | 1.2 | % | | 56,964 | | $ | 2,950 |
Baxter International | | 0.7 | | | 39,470 | | | 1,667 |
Becton Dickinson | | 1.1 | | | 40,042 | | | 2,855 |
Biogen Idec* | | 1.0 | | | 55,744 | | | 2,644 |
C.R. Bard | | 1.4 | | | 43,690 | | | 3,538 |
Cardinal Health | | 1.0 | | | 72,112 | | | 2,487 |
Forest Laboratories* | | 0.9 | | | 88,533 | | | 2,291 |
Genzyme* | | 0.6 | | | 32,371 | | | 1,575 |
Johnson & Johnson | | 1.1 | | | 49,001 | | | 2,857 |
McKesson | | 1.8 | | | 65,981 | | | 4,619 |
Millipore* | | 1.1 | | | 25,495 | | | 2,708 |
Techne | | 1.1 | | | 48,170 | | | 2,917 |
Other Securities | | 4.7 | | | | | | 12,077 |
| | | | | | | | |
| | | | | | | | 53,181 |
| | | | | | | | |
| |
Industrials — 3.8% | | | |
Other Securities | | 3.8 | | | | | | 9,610 |
| | | | | | | | |
| |
Information Technology — 10.7% | | | |
Analog Devices | | 1.1 | | | 95,180 | | | 2,777 |
Google, Cl A* | | 1.1 | | | 5,685 | | | 2,758 |
International Business Machines | | 1.4 | | | 28,454 | | | 3,564 |
Tech Data* | | 1.1 | | | 67,553 | | | 2,746 |
Texas Instruments | | 1.2 | | | 125,486 | | | 3,064 |
Other Securities | | 4.8 | | | | | | 12,359 |
| | | | | | | | |
| | | | | | | | 27,268 |
| | | | | | | | |
| |
Materials — 3.4% | | | |
Newmont Mining | | 1.2 | | | 57,997 | | | 3,122 |
Other Securities | | 2.2 | | | | | | 5,542 |
| | | | | | | | |
| | | | | | | | 8,664 |
| | | | | | | | |
| |
Telecommunication Services — 2.7% | | | |
AT&T | | 0.6 | | | 59,600 | | | 1,448 |
Verizon Communications | | 0.6 | | | 50,894 | | | 1,401 |
Other Securities | | 1.5 | | | | | | 4,059 |
| | | | | | | | |
| | | | | | | | 6,908 |
| | | | | | | | |
| |
Utilities — 12.1% | | | |
AGL Resources | | 0.8 | | | 57,898 | | | 2,113 |
Atmos Energy | | 0.9 | | | 82,948 | | | 2,250 |
Nicor | | 1.1 | | | 66,816 | | | 2,700 |
NSTAR | | 1.1 | | | 82,384 | | | 2,893 |
UGI | | 0.6 | | | 62,796 | | | 1,642 |
Vectren | | 0.7 | | | 82,749 | | | 1,907 |
Wisconsin Energy | | 1.3 | | | 66,796 | | | 3,273 |
Other Securities | | 5.6 | | | | | | 14,115 |
| | | | | | | | |
| | | | | | | | 30,893 |
| | | | | | | | |
Total Common Stock
(Cost $211,505) ($ Thousands) | | | | | | | | 249,397 |
| | | | | | | | |
| | |
| SEI Institutional Investments Trust / Annual Report / May 31, 2010 | | 33 |
SUMMARY SCHEDULE OF INVESTMENTS
U.S. Managed Volatility Fund (Concluded)
May 31, 2010
| | | | | | | | | |
| Description | | Percentage of
Net Assets (%) | | | Face Amount
(000)/Shares | | Market Value
($ Thousands) |
| | | | | | | | | |
| |
U.S. TREASURY OBLIGATION — 1.3% | | | |
U.S. Treasury Bill
0.134%, 06/03/10 (A) (B) | | 1.3 | % | | $ | 3,248 | | $ | 3,248 |
| | | | | | | | | |
Total U.S. Treasury Obligation
(Cost $3,248) ($ Thousands) | | | | | | | | | 3,248 |
| | | | | | | | | |
| |
CASH EQUIVALENT — 1.0% | | | |
SEI Daily Income Trust,
Prime Obligation Fund,
Cl A, 0.090%**† | | 1.0 | | | | 2,452,491 | | | 2,452 |
| | | | | | | | | |
Total Cash Equivalent
(Cost $2,452) ($ Thousands) | | | | | | | | | 2,452 |
| | | | | | | | | |
Total Investments — 100.0%
(Cost $217,205)($ Thousands) | | | | | | | | $ | 255,097 |
| | | | | | | | | |
A summary of the open futures contracts held by the Fund at May 31, 2010, is as follows:
| | | | | | | | |
Type of
Contract | | Number of
Contracts
Long (Short) | | Expiration
Date | | Unrealized
Depreciation
($ Thousands) | |
S&P 500 Index E-MINI | | 58 | | Jun-2010 | | $ | (140 | ) |
| | | | | | | | |
| | | | | | $ | (140 | ) |
| | | | | | | | |
For the year ended May 31, 2010, the total amount of all open futures contracts, as presented in the table above, are representative of the volume of activity for this derivative type during the period.
Percentages are based on Net Assets of $255,094 ($ Thousands)
| * | | Non-income producing security. |
| ** | | The rate reported is the 7-day effective yield as of May 31, 2010. |
| † | | Investment in Affiliated Security (see Note 5). |
| (A) | | The rate reported is the effective yield at time of purchase. |
| (B) | | Security, or a portion thereof, has been pledged as collateral on open futures contracts. |
Cl — Class
S&P — Standard & Poor’s
The Summary Schedule of Investments does not reflect the complete portfolio holdings. It includes the Fund’s 50 largest holdings and each investment of any issuer that exceeds 1% of the Fund’s net assets. “Other Securities” represent all issues not required to be disclosed under the rules adopted by the U.S. Securities and Exchange Commission (“SEC”). In certain instances, securities for which footnotes listed above may otherwise apply are included in the Other Securities caption. The complete schedule of portfolio holdings is available (i) without charge, upon request, by calling (800) 342-5734; and (ii) on the SEC’s website at http://www.sec.gov.
The following is a summary of the inputs used as of May 31, 2010 in valuing the Fund’s investments carried at value ($ Thousands):
| | | | | | | | | | | | |
| Investments in Securities | | Level 1 | | Level 2 | | Level 3 | | Total |
Common Stock | | $ | 249,397 | | $ | — | | $ | — | | $ | 249,397 |
U.S. Treasury Obligations | | | — | | | 3,248 | | | — | | | 3,248 |
Cash Equivalent | | | 2,452 | | | — | | | — | | | 2,452 |
| | | | | | | | | | | | |
Total Investments in Securities | | $ | 251,849 | | $ | 3,248 | | $ | — | | $ | 255,097 |
| | | | | | | | | | | | |
| | | | | | | | | | | | | | |
| Other Financial Instruments | | Level 1 | | | Level 2 | | Level 3 | | Total | |
Futures Contracts* | | $ | (140 | ) | | $ | — | | $ | — | | $ | (140 | ) |
| | | | | | | | | | | | | | |
Total Other Financial Instruments | | $ | (140 | ) | | $ | — | | $ | — | | $ | (140 | ) |
| | | | | | | | | | | | | | |
| * | | Future contracts are valued at the unrealized appreciation on the instrument. |
For more information on valuation inputs, see Note 2 — Significant Accounting Policies in Notes to Financial Statements.
The accompanying notes are an integral part of the financial statements.
| | |
| 34 | | SEI Institutional Investments Trust / Annual Report / May 31, 2010 |
SUMMARY SCHEDULE OF INVESTMENTS
International Equity Fund
May 31, 2010
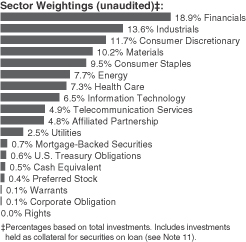
| | | | | | | | |
| Description | | Percentage of
Net Assets (%) | | | Shares | | Market Value
($ Thousands) |
| | | | | | | | |
| |
COMMON STOCK — 93.6% | | | |
| |
Argentina — 0.2% | | | |
Other Securities | | 0.2 | % | | | | $ | 873 |
| | | | | | | | |
| |
Australia — 5.6% | | | |
Australia & New Zealand Banking Group | | 0.6 | | | 191,848 | | | 3,628 |
BHP Billiton | | 0.9 | | | 159,934 | | | 5,185 |
BHP Billiton ADR | | 0.2 | | | 22,300 | | | 1,446 |
Commonwealth Bank of Australia | | 0.4 | | | 60,231 | | | 2,623 |
Rio Tinto | | 0.5 | | | 49,848 | | | 2,837 |
Other Securities | | 3.0 | | | | | | 18,153 |
| | | | | | | | |
| | | | | | | | 33,872 |
| | | | | | | | |
| |
Austria — 0.2% | | | |
Other Securities | | 0.2 | | | | | | 1,201 |
| | | | | | | | |
| |
Belgium — 1.1% | | | |
Other Securities | | 1.1 | | | | | | 6,891 |
| | | | | | | | |
| |
Bermuda — 0.0% | | | |
Other Securities | | 0.0 | | | | | | 144 |
| | | | | | | | |
| |
Brazil — 1.7% | | | |
Other Securities | | 1.7 | | | | | | 10,174 |
| | | | | | | | |
| |
Canada — 2.7% | | | |
Other Securities | | 2.7 | | | | | | 16,208 |
| | | | | | | | |
| |
Chile — 0.6% | | | |
Other Securities | | 0.6 | | | | | | 3,330 |
| | | | | | | | |
| |
China — 1.5% | | | |
Other Securities | | 1.5 | | | | | | 9,310 |
| | | | | | | | |
| | | | | | | | |
| Description | | Percentage of
Net Assets (%) | | | Shares | | Market Value
($ Thousands) |
| | | | | | | | |
| |
Denmark — 1.1% | | | |
Novo-Nordisk, Cl B | | 0.5 | % | | 41,762 | | $ | 3,236 |
Other Securities | | 0.6 | | | | | | 3,497 |
| | | | | | | | |
| | | | | | | | 6,733 |
| | | | | | | | |
| |
Finland — 0.8% | | | |
Other Securities | | 0.8 | | | | | | 4,754 |
| | | | | | | | |
| |
France — 7.6% | | | |
BNP Paribas | | 0.7 | | | 74,281 | | | 4,241 |
Gaz de France | | 0.5 | | | 95,538 | | | 2,976 |
Sanofi-Aventis (A) | | 0.7 | | | 73,819 | | | 4,501 |
Schneider Electric | | 0.7 | | | 44,727 | | | 4,522 |
Vivendi | | 0.6 | | | 148,235 | | | 3,224 |
Other Securities | | 4.4 | | | | | | 26,594 |
| | | | | | | | |
| | | | | | | | 46,058 |
| | | | | | | | |
| |
Germany — 7.2% | | | |
BASF | | 0.6 | | | 76,083 | | | 4,046 |
DaimlerChrysler | | 0.6 | | | 66,637 | | | 3,362 |
Linde | | 0.7 | | | 38,312 | | | 3,957 |
Siemens | | 1.0 | | | 66,215 | | | 6,041 |
Other Securities | | 4.3 | | | | | | 26,172 |
| | | | | | | | |
| | | | | | | | 43,578 |
| | | | | | | | |
| |
Greece — 0.2% | | | |
Other Securities | | 0.2 | | | | | | 1,365 |
| | | | | | | | |
| |
Hong Kong — 2.9% | | | |
Swire Pacific, Cl A | | 0.5 | | | 261,944 | | | 2,892 |
Other Securities | | 2.4 | | | | | | 14,313 |
| | | | | | | | |
| | | | | | | | 17,205 |
| | | | | | | | |
| |
India — 0.2% | | | |
Other Securities | | 0.2 | | | | | | 930 |
| | | | | | | | |
| |
Ireland — 0.8% | | | |
Experian | | 0.5 | | | 302,008 | | | 2,684 |
Other Securities | | 0.3 | | | | | | 2,006 |
| | | | | | | | |
| | | | | | | | 4,690 |
| | | | | | | | |
| |
Israel — 0.4% | | | |
Other Securities | | 0.4 | | | | | | 2,359 |
| | | | | | | | |
| |
Italy — 1.4% | | | |
Other Securities | | 1.4 | | | | | | 8,557 |
| | | | | | | | |
| |
Japan — 17.1% | | | |
Bridgestone | | 0.4 | | | 160,700 | | | 2,608 |
Canon | | 0.5 | | | 78,700 | | | 3,241 |
Fujitsu | | 0.5 | | | 446,000 | | | 2,869 |
Hitachi | | 0.4 | | | 634,000 | | | 2,593 |
Honda Motor | | 0.6 | | | 111,200 | | | 3,387 |
| | |
| SEI Institutional Investments Trust / Annual Report / May 31, 2010 | | 35 |
SUMMARY SCHEDULE OF INVESTMENTS
International Equity Fund (Continued)
May 31, 2010
| | | | | | | | |
| Description | | Percentage of
Net Assets (%) | | | Shares | | Market Value
($ Thousands) |
| | | | | | | | |
Mitsubishi | | 0.6 | % | | 170,500 | | $ | 3,847 |
Unicharm | | 0.4 | | | 26,200 | | | 2,650 |
Other Securities | | 13.7 | | | | | | 82,587 |
| | | | | | | | |
| | | | | | | | 103,782 |
| | | | | | | | |
| |
Macau — 0.1% | | | |
Other Securities | | 0.1 | | | | | | 387 |
| | | | | | | | |
| |
Mauritius — 0.0% | | | |
Other Securities | | 0.0 | | | | | | 44 |
| | | | | | | | |
| |
Netherlands — 6.5% | | | |
Koninklijke Ahold | | 0.5 | | | 222,083 | | | 2,804 |
Koninklijke Philips Electronics | | 0.6 | | | 114,787 | | | 3,453 |
Royal Dutch Shell, Cl A | | 0.5 | | | 107,571 | | | 2,811 |
Royal Dutch Shell, Cl A (GBP) | | 0.4 | | | 84,844 | | | 2,225 |
Royal Dutch Shell, Cl B | | 0.2 | | | 54,298 | | | 1,366 |
Unilever | | 1.2 | | | 256,012 | | | 7,056 |
Other Securities | | 3.1 | | | | | | 19,628 |
| | | | | | | | |
| | | | | | | | 39,343 |
| | | | | | | | |
| |
New Zealand — 0.1% | | | |
Other Securities | | 0.1 | | | | | | 664 |
| | | | | | | | |
| |
Norway — 1.2% | | | |
DnB | | 0.7 | | | 439,489 | | | 4,383 |
Other Securities | | 0.5 | | | | | | 2,669 |
| | | | | | | | |
| | | | | | | | 7,052 |
| | | | | | | | |
| |
Portugal — 0.2% | | | |
Other Securities | | 0.2 | | | | | | 1,459 |
| | | | | | | | |
| |
Singapore — 1.5% | | | |
Other Securities | | 1.5 | | | | | | 8,964 |
| | | | | | | | |
| |
South Africa — 0.3% | | | |
Other Securities | | 0.3 | | | | | | 1,601 |
| | | | | | | | |
| |
South Korea — 1.1% | | | |
Other Securities | | 1.1 | | | | | | 6,815 |
| | | | | | | | |
| |
Spain — 1.3% | | | |
Banco Santander Central Hispano | | 0.5 | | | 261,347 | | | 2,683 |
Other Securities | | 0.8 | | | | | | 5,140 |
| | | | | | | | |
| | | | | | | | 7,823 |
| | | | | | | | |
| |
Sweden — 2.1% | | | |
Svenska Handelsbanken, Cl A | | 0.4 | | | 109,213 | | | 2,658 |
Other Securities | | 1.7 | | | | | | 10,061 |
| | | | | | | | |
| | | | | | | | 12,719 |
| | | | | | | | |
| | | | | | | | |
| Description | | Percentage of
Net Assets (%) | | | Shares | | Market Value
($ Thousands) |
| | | | | | | | |
| |
Switzerland — 8.3% | | | |
Credit Suisse Group | | 0.6 | % | | 99,124 | | $ | 3,845 |
Nestle | | 1.3 | | | 172,223 | | | 7,797 |
Novartis | | 1.3 | | | 177,941 | | | 8,071 |
Roche Holding | | 0.8 | | | 35,580 | | | 4,878 |
SGS | | 0.7 | | | 3,497 | | | 4,381 |
Other Securities | | 3.6 | | | | | | 21,265 |
| | | | | | | | |
| | | | | | | | 50,237 |
| | | | | | | | |
| |
Taiwan — 0.1% | | | |
Other Securities | | 0.1 | | | | | | 801 |
| | | | | | | | |
| |
Thailand — 0.3% | | | |
Other Securities | | 0.3 | | | | | | 1,896 |
| | | | | | | | |
| |
United Kingdom — 16.7% | | | |
AstraZeneca | | 0.8 | | | 105,860 | | | 4,449 |
BAE Systems | | 0.6 | | | 776,789 | | | 3,601 |
Barclays | | 0.5 | | | 699,822 | | | 3,052 |
BG Group | | 0.6 | | | 250,260 | | | 3,809 |
BHP Billiton | | 0.2 | | | 45,791 | | | 1,252 |
BP | | 1.1 | | | 918,446 | | | 6,547 |
Cairn Energy* | | 0.7 | | | 696,575 | | | 4,026 |
GlaxoSmithKline | | 0.5 | | | 191,684 | | | 3,187 |
HSBC Holdings | | 1.1 | | | 705,633 | | | 6,383 |
Imperial Tobacco Group | | 0.4 | | | 100,554 | | | 2,604 |
Kingfisher | | 0.6 | | | 1,169,987 | | | 3,757 |
Rio Tinto | | 0.7 | | | 89,727 | | | 4,117 |
Sage Group | | 0.6 | | | 944,549 | | | 3,227 |
Tesco | | 0.7 | | | 729,509 | | | 4,324 |
Unilever | | 0.2 | | | 44,426 | | | 1,193 |
Vodafone Group | | 1.4 | | | 4,307,906 | | | 8,531 |
Other Securities | | 6.1 | | | | | | 37,751 |
| | | | | | | | |
| | | | | | | | 101,810 |
| | | | | | | | |
| |
United States — 0.5% | | | |
Other Securities | | 0.5 | | | | | | 2,724 |
| | | | | | | | |
Total Common Stock
(Cost $595,230) ($ Thousands) | | | 566,353 |
| | | | | | | | |
| |
MORTGAGE-BACKED SECURITIES — 0.7% | | | |
| |
Non-Agency Mortgage-Backed Obligations — 0.7% | | | |
Other Securities | | 0.7 | | | | | | 4,280 |
| | | | | | | | |
Total Mortgage-Backed Securities
(Cost $4,325) ($ Thousands) | | | 4,280 |
| | | | | | | | |
| |
PREFERRED STOCK — 0.4% | | | |
| |
Germany — 0.4% | | | |
Other Securities | | 0.4 | | | | | | 2,632 |
| | | | | | | | |
Total Preferred Stock
(Cost $2,702) ($ Thousands) | | | 2,632 |
| | | | | | | | |
| | |
| 36 | | SEI Institutional Investments Trust / Annual Report / May 31, 2010 |
| | | | | | | | | |
| Description | | Percentage of
Net Assets (%) | | | Shares/
Face Amount
($ Thousands) | | Market Value
($ Thousands) |
| | | | | | | | | |
|
CORPORATE OBLIGATION — 0.1% |
|
Financials — 0.1% |
Other Securities | | 0.1 | % | | | | | $ | 310 |
| | | | | | | | | |
Total Corporate Obligation
(Cost $490) ($ Thousands) | | | 310 |
| | | | | | | | | |
|
WARRANTS — 0.1% |
|
Hong Kong — 0.1% |
Henderson Land Development, Expires 12/31/49* | | 0.0 | | | | 3 | | | — |
Other Securities | | 0.1 | | | | | | | 774 |
| | | | | | | | | |
Total Warrants
(Cost $839) ($ Thousands) | | | | | | | | | 774 |
| | | | | | | | | |
| | | |
RIGHTS — 0.0% | | | | | | | | | |
| | | |
Australia — 0.0% | | | | | | | | | |
Other Securities | | 0.0 | | | | | | | — |
| | | | | | | | | |
|
United Kingdom — 0.0% |
Other Securities | | 0.0 | | | | | | | 39 |
| | | | | | | | | |
Total Rights
(Cost $—) ($ Thousands) | | | 39 |
| | | | | | | | | |
|
AFFILIATED PARTNERSHIP — 4.8% |
SEI Liquidity Fund, L.P. 0.240%**† (B) | | 4.8 | | | | 30,032,225 | | | 29,209 |
| | | | | | | | | |
Total Affiliated Partnership
(Cost $30,032) ($ Thousands) | | | 29,209 |
| | | | | | | | | |
|
U.S. TREASURY OBLIGATIONS — 0.6% |
U.S. Treasury Bills
0.134%, 06/03/10 (C) (D) | | 0.5 | | | $ | 2,967 | | | 2,967 |
Other Securities | | 0.1 | | | | | | | 482 |
| | | | | | | | | |
Total U.S. Treasury Obligations
(Cost $3,449) ($ Thousands) | | | 3,449 |
| | | | | | | | | |
|
CASH EQUIVALENT — 0.5% |
|
United States — 0.5% |
SEI Daily Income Trust,
Prime Obligation Fund,
Cl A, 0.090**† | | 0.5 | | | | 3,212,787 | | | 3,213 |
| | | | | | | | | |
Total Cash Equivalent
(Cost $3,213) ($ Thousands) | | | 3,213 |
| | | | | | | | | |
| | | | | | | |
| Description | | Face Amount
($ Thousands) | | Market Value
($ Thousands) |
| | | | | | | |
|
TIME DEPOSITS — 4.4% |
|
United States — 4.4% |
Brown Brothers Harriman | | | | | | | |
5.450%, 06/01/10 | | ZAR | | 5 | | $ | 1 |
3.410%, 06/01/10 | | AUD | | 86 | | | 73 |
1.700%, 06/01/10 | | NZD | | 9 | | | 6 |
0.080%, 06/01/10 | | GBP | | 124 | | | 180 |
0.070%, 06/01/10 | | CAD | | 1 | | | 1 |
0.070%, 06/01/10 | | NOK | | 106 | | | 16 |
0.050%, 06/01/10 | | DKK | | 281 | | | 46 |
0.050%, 06/01/10 | | EUR | | 179 | | | 221 |
0.030%, 06/01/10 | | | | 25,971 | | | 25,971 |
0.010%, 06/01/10 | | CHF | | 9 | | | 8 |
0.010%, 06/01/10 | | HKD | | 882 | | | 113 |
0.010%, 06/01/10 | | JPY | | 5,875 | | | 65 |
0.010%, 06/01/10 | | SEK | | 1,277 | | | 163 |
0.010%, 06/01/10 | | SGD | | 36 | | | 25 |
| | | | | | | |
Total Time Deposits
(Cost $26,889) ($ Thousands) | | | 26,889 |
| | | | | | | |
Total Investments — 105.2%
(Cost $667,169) ($ Thousands) | | $ | 637,148 |
| | | | | | | |
A summary of the open futures contracts held by the Fund at May 31, 2010, is as follows:
| | | | | | | | |
Type of
Contract | | Number of
Contracts
Long (Short) | | Expiration
Date | | Unrealized
Appreciation
(Depreciation)
($ Thousands) | |
DJ Euro Stoxx 50 Index | | 75 | | Jun-2010 | | $ | (1 | ) |
FTSE Index | | 22 | | Jun-2010 | | | (15 | ) |
Hang Seng Index | | 1 | | Jun-2010 | | | — | |
MSCI EAFE Index E-MINI | | 15 | | Jun-2010 | | | (148 | ) |
Nikkei 225 Index | | 13 | | Jun-2010 | | | (34 | ) |
SPI 200 Index | | 6 | | Jun-2010 | | | (5 | ) |
Topix Index | | 12 | | Jun-2010 | | | 3 | |
| | | | | | | | |
| | | | | | $ | (200 | ) |
| | | | | | | | |
For the year ended May 31, 2010, the total amount of all open futures contracts, as presented in the table above, are representative of the volume of activity for this derivative type during the period.
| | |
| SEI Institutional Investments Trust / Annual Report / May 31, 2010 | | 37 |
SUMMARY SCHEDULE OF INVESTMENTS
International Equity Fund (Concluded)
May 31, 2010
A summary of outstanding swap agreements held by the Fund at May 31, 2010, is as follows:
| | | | | | | | | | | | | | | |
| Total Return Swap | |
| Counterparty | | Reference Entity/Obligation | | Fund Pays | | Fund Receives | | Termination
Date | | Notional Amount
(Thousands) | | | Net Unrealized
Appreciation (Depreciation) ($Thousands) | |
| JPMorgan Chase Bank | | MSCI Daily TR NET EAFE USD MARKET Index | | 3-Month LIBOR Minus 25 Bps | | Price Return | | 10/12/10 | | (28,388 | ) | | $ | (4,287 | ) |
| | | | | | | | | | | | | | | |
Percentages are based on Net Assets of $605,479 ($ Thousands)
| ** | | The rate reported is the 7-day effective yield as of May 31, 2010. |
| † | | Investment is Affiliated Security (see Note 5). |
| (A) | | This security or a partial position of this security is on loan at May 31, 2010. The total value of securities on loan at May 31, 2010 was $27,726 ($ Thousands). |
| (B) | | This security was purchased with cash collateral held from securities on loan. The total value of such securities on May 31, 2010 was $29,209 ($Thousands). |
| (C) | | The rate reported is the effective yield at time of purchase. |
| (D) | | Security, or a portion thereof, has been pledged as collateral on open futures contracts. |
The Summary Schedule of Investments does not reflect the complete portfolio holdings. It includes the Fund’s 50 largest holdings and each investment of any issuer that exceeds 1% of the Fund’s net assets. “Other Securities” represent all issues not required to be disclosed under the rules adopted by the U.S. Securities and Exchange Commission (“SEC”). In certain instances, securities for which footnotes listed above may otherwise apply are included in the Other Securities caption. The complete schedule of portfolio holdings is available (i) without charge, upon request, by calling (800) 342-5734; and (ii) on the SEC’s website at http://www.sec.gov.
AUD —Australian Dollar
ADR — American Depositary Receipt
CAD — Canadian Dollar
CHF — Swiss Franc
Cl — Class
DJ — Dow Jones
DKK — Danish Krone
EUR — Euro
FTSE — Financial Times and the London Stock Exchange
GBP — British Pound Sterling
HKD — Hong Kong Dollar
JPY — Japanese Yen
L.P. — Limited Partnership
LIBOR — London Interbank Offered Rate
MSCI EAFE — Morgan Stanley Capital International Europe, Australia, and the Far East
NOK — Norwegian Krone
NZD — New Zealand Dollar
SEK — Swedish Krone
SGD —Singapore Dollar
SPI — Share Price Index
ZAR — South African Rand
The following is a summary of the inputs used as of May 31, 2010 in valuing the Fund’s investments carried at value ($ Thousands):
| | | | | | | | | | | | |
| Investments in Securities | | Level 1 | | Level 2 | | Level 3 | | Total |
Common Stock | | $ | 457,261 | | $ | 109,092 | | $ | — | | $ | 566,353 |
Mortgage-Backed Securities | | | — | | | 4,280 | | | — | | | 4,280 |
Preferred Stock | | | 2,632 | | | — | | | — | | | 2,632 |
Warrants | | | — | | | 774 | | | — | | | 774 |
Corporate Obligation | | | — | | | 310 | | | — | | | 310 |
Rights | | | 39 | | | — | | | — | | | 39 |
Affiliated Partnership | | | — | | | 29,209 | | | — | | | 29,209 |
U.S. Treasury Obligations | | | — | | | 3,449 | | | — | | | 3,449 |
Cash Equivalent | | | 3,213 | | | — | | | — | | | 3,213 |
Time Deposits | | | — | | | 26,889 | | | — | | | 26,889 |
| | | | | | | | | | | | |
Total Investments in Securities | | $ | 463,145 | | $ | 174,003 | | $ | — | | $ | 637,148 |
| | | | | | | | | | | | |
| | | | | | | | | | | | | | | |
| Other Financial Instruments | | Level 1 | | | Level 2 | | | Level 3 | | Total | |
Futures Contracts* | | $ | (200 | ) | | $ | — | | | $ | — | | $ | (200 | ) |
Total Return Swap | | | — | | | | (4,287 | ) | | | — | | | (4,287 | ) |
| | | | | | | | | | | | | | | |
Total Other Financial Instruments | | $ | (200 | ) | | $ | (4,287 | ) | | $ | — | | $ | (4,487 | ) |
| | | | | | | | | | | | | | | |
| * | | Futures contracts are valued at the unrealized appreciation on the instrument. |
For more information on valuation inputs, see Note 2 — Significant Accounting Policies in Notes to Financial Statements.
The accompanying notes are an integral part of the financial statements.
| | |
| 38 | | SEI Institutional Investments Trust / Annual Report / May 31, 2010 |
SUMMARY SCHEDULE OF INVESTMENTS
World Equity Ex-US Fund
May 31, 2010
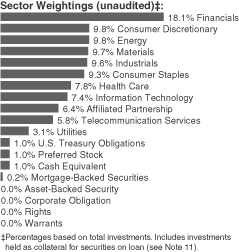
| | | | | | | | |
| Description | | Percentage of
Net Assets (%) | | | Shares | | Market Value
($ Thousands) |
| | | | | | | | |
| |
COMMON STOCK — 89.4% | | | |
| | | |
Argentina — 0.0% | | | | | | | | |
Other Securities | | 0.0 | % | | | | $ | 1,151 |
| | | | | | | | |
| | | |
Australia — 3.4% | | | | | | | | |
BHP Billiton | | 0.7 | | | 741,685 | | | 24,042 |
Rio Tinto | | 0.5 | | | 290,198 | | | 16,516 |
Other Securities | | 2.2 | | | | | | 86,907 |
| | | | | | | | |
| | | | | | | | 127,465 |
| | | | | | | | |
| | | |
Austria — 0.1% | | | | | | | | |
Other Securities | | 0.1 | | | | | | 2,884 |
| | | | | | | | |
| | | |
Belgium — 1.0% | | | | | | | | |
Delhaize Group ADR (A) | | 0.5 | | | 265,300 | | | 20,781 |
Other Securities | | 0.5 | | | | | | 16,263 |
| | | | | | | | |
| | | | | | | | 37,044 |
| | | | | | | | |
| | | |
Brazil — 3.5% | | | | | | | | |
Cia de Saneamento Basico do Estado de Sao Paulo ADR (A) | | 0.8 | | | 753,700 | | | 28,505 |
Cia Paranaense de Energia ADR (A) | | 0.5 | | | 1,025,600 | | | 19,025 |
Petroleo Brasileiro ADR (A) | | 0.7 | | | 664,200 | | | 23,659 |
Other Securities | | 1.5 | | | | | | 58,346 |
| | | | | | | | |
| | | | | | | | 129,535 |
| | | | | | | | |
| | | |
Canada — 6.7% | | | | | | | | |
Canadian National Railway | | 0.6 | | | 387,260 | | | 22,685 |
Canadian Natural Resources | | 0.6 | | | 669,100 | | | 23,701 |
Other Securities | | 5.5 | | | | | | 202,820 |
| | | | | | | | |
| | | | | | | | 249,206 |
| | | | | | | | |
| | | | | | | | |
| Description | | Percentage of
Net Assets (%) | | | Shares | | Market Value
($ Thousands) |
| | | | | | | | |
| | | |
Chile — 0.2% | | | | | | | | |
Other Securities | | 0.2 | % | | | | $ | 5,821 |
| | | | | | | | |
| | | |
China — 1.8% | | | | | | | | |
Industrial & Commercial Bank of China | | 0.5 | | | 25,872,000 | | | 19,173 |
Other Securities | | 1.3 | | | | | | 49,493 |
| | | | | | | | |
| | | | | | | | 68,666 |
| | | | | | | | |
| | | |
Colombia — 0.4% | | | | | | | | |
BanColombia ADR | | 0.4 | | | 340,900 | | | 16,302 |
| | | | | | | | |
| | | |
Cyprus — 0.0% | | | | | | | | |
Other Securities | | 0.0 | | | | | | 1,356 |
| | | | | | | | |
| | | |
Czech Republic — 0.1% | | | | | | | | |
Other Securities | | 0.1 | | | | | | 3,535 |
| | | | | | | | |
| | |
Denmark — 1.3% | | | | | | |
Novo-Nordisk, Cl B | | 0.8 | | | 379,442 | | | 29,401 |
Other Securities | | 0.5 | | | | | | 18,138 |
| | | | | | | | |
| | | | | | | | 47,539 |
| | | | | | | | |
| | | |
Egypt — 0.1% | | | | | | | | |
Other Securities | | 0.1 | | | | | | 3,370 |
| | | | | | | | |
| | | |
Finland — 0.8% | | | | | | | | |
Other Securities | | 0.8 | | | | | | 31,102 |
| | | | | | | | |
| | | |
France — 5.6% | | | | | | | | |
Air Liquide | | 0.5 | | | 173,876 | | | 17,112 |
BNP Paribas | | 0.5 | | | 355,284 | | | 20,283 |
France Telecom ADR (A) | | 0.5 | | | 929,900 | | | 17,752 |
LVMH Moet Hennessy Louis Vuitton (A) | | 0.5 | | | 177,336 | | | 18,855 |
Sanofi-Aventis (A) | | 0.5 | | | 310,108 | | | 18,910 |
Other Securities | | 3.1 | | | | | | 113,080 |
| | | | | | | | |
| | | | | | | | 205,992 |
| | | | | | | | |
| | | |
Germany — 4.8% | | | | | | | | |
BASF | | 0.7 | | | 472,150 | | | 25,106 |
Deutsche Bank (A) | | 0.7 | | | 433,455 | | | 25,951 |
SAP (A) | | 0.5 | | | 417,229 | | | 18,116 |
Other Securities | | 2.9 | | | | | | 109,865 |
| | | | | | | | |
| | | | | | | | 179,038 |
| | | | | | | | |
| | | |
Greece — 0.1% | | | | | | | | |
Other Securities | | 0.1 | | | | | | 1,948 |
| | | | | | | | |
| | | |
Guernsey — 0.3% | | | | | | | | |
Other Securities | | 0.3 | | | | | | 10,123 |
| | | | | | | | |
| | | |
Hong Kong — 2.8% | | | | | | | | |
China Mobile | | 0.5 | | | 2,016,000 | | | 19,083 |
| | |
| SEI Institutional Investments Trust / Annual Report / May 31, 2010 | | 39 |
SUMMARY SCHEDULE OF INVESTMENTS
World Equity Ex-US Fund (Continued)
May 31, 2010
| | | | | | | | |
| Description | | Percentage of
Net Assets (%) | | | Shares | | Market Value
($ Thousands) |
| | | | | | | | |
CNOOC | | 0.5 | % | | 11,306,000 | | $ | 18,093 |
Other Securities | | 1.8 | | | | | | 67,294 |
| | | | | | | | |
| | | | | | | | 104,470 |
| | | | | | | | |
| | | |
Hungary — 0.2% | | | | | | | | |
Other Securities | | 0.2 | | | | | | 6,758 |
| | | | | | | | |
| | | |
India — 1.2% | | | | | | | | |
Other Securities | | 1.2 | | | | | | 45,288 |
| | | | | | | | |
| | | |
Indonesia — 0.4% | | | | | | | | |
Other Securities | | 0.4 | | | | | | 16,612 |
| | | | | | | | |
| | | |
Ireland — 1.0% | | | | | | | | |
Covidien | | 0.5 | | | 464,200 | | | 19,678 |
Other Securities | | 0.5 | | | | | | 18,949 |
| | | | | | | | |
| | | | | | | | 38,627 |
| | | | | | | | |
| | | |
Israel — 1.3% | | | | | | | | |
Teva Pharmaceutical Industries ADR | | 1.0 | | | 660,620 | | | 36,215 |
Other Securities | | 0.3 | | | | | | 10,247 |
| | | | | | | | |
| | | | | | | | 46,462 |
| | | | | | | | |
| | | |
Italy — 1.3% | | | | | | | | |
Other Securities | | 1.3 | | | | | | 49,092 |
| | | | | | | | |
| | | |
Japan — 11.0% | | | | | | | | |
Fanuc | | 0.5 | | | 182,300 | | | 19,265 |
Hitachi | | 0.6 | | | 5,098,000 | | | 20,854 |
Mitsubishi UFJ Financial Group | | 0.5 | | | 3,574,186 | | | 17,333 |
Other Securities | | 9.4 | | | | | | 352,433 |
| | | | | | | | |
| | | | | | | | 409,885 |
| | | | | | | | |
| | | |
Kazakhstan — 0.1% | | | | | | | | |
Other Securities | | 0.1 | | | | | | 2,258 |
| | | | | | | | |
| | | |
Macau — 0.0% | | | | | | | | |
Other Securities | | 0.0 | | | | | | 860 |
| | | | | | | | |
| | | |
Malaysia — 0.4% | | | | | | | | |
Other Securities | | 0.4 | | | | | | 16,338 |
| | | | | | | | |
| | | |
Mauritius — 0.0% | | | | | | | | |
Other Securities | | 0.0 | | | | | | 353 |
| | | | | | | | |
| | | |
Mexico — 1.9% | | | | | | | | |
Coca-Cola Femsa ADR | | 0.6 | | | 338,300 | | | 22,504 |
Other Securities | | 1.3 | | | | | | 49,148 |
| | | | | | | | |
| | | | | | | | 71,652 |
| | | | | | | | |
| | | | | | | | |
| Description | | Percentage of
Net Assets (%) | | | Shares | | Market Value
($ Thousands) |
| | | | | | | | |
| | | |
Netherlands — 3.5% | | | | | | | | |
Koninklijke Philips Electronics | | 0.5 | % | | 625,325 | | $ | 18,808 |
Royal Dutch Shell, Cl A (GBP) | | 0.3 | | | 392,096 | | | 10,285 |
Royal Dutch Shell, Cl A | | 0.4 | | | 586,457 | | | 15,324 |
Royal Dutch Shell, Cl B | | 0.2 | | | 285,139 | | | 7,173 |
Royal Dutch Shell ADR, Cl A | | 0.5 | | | 368,600 | | | 19,315 |
Other Securities | | 1.6 | | | | | | 60,491 |
| | | | | | | | |
| | | | | | | | 131,396 |
| | | | | | | | |
| | | |
Netherlands Antilles — 0.3% | | | | | | | | |
Other Securities | | 0.3 | | | | | | 12,086 |
| | | | | | | | |
| | | |
New Zealand — 0.0% | | | | | | | | |
Other Securities | | 0.0 | | | | | | 1,476 |
| | | | | | | | |
| | | |
Norway — 1.1% | | | | | | | | |
Statoil ADR (A) | | 0.5 | | | 890,600 | | | 17,901 |
Other Securities | | 0.6 | | | | | | 21,753 |
| | | | | | | | |
| | | | | | | | 39,654 |
| | | | | | | | |
| | | |
Pakistan — 0.0% | | | | | | | | |
Other Securities | | 0.0 | | | | | | 331 |
| | | | | | | | |
| | | |
Panama — 0.2% | | | | | | | | |
Other Securities | | 0.2 | | | | | | 6,360 |
| | | | | | | | |
| | | |
Poland — 0.1% | | | | | | | | |
Other Securities | | 0.1 | | | | | | 4,886 |
| | | | | | | | |
| | | |
Portugal — 0.2% | | | | | | | | |
Other Securities | | 0.2 | | | | | | 6,935 |
| | | | | | | | |
| | | |
Russia — 0.4% | | | | | | | | |
Other Securities | | 0.4 | | | | | | 16,296 |
| | | | | | | | |
| | | |
Singapore — 0.9% | | | | | | | | |
Other Securities | | 0.9 | | | | | | 26,351 |
| | | | | | | | |
| | | |
South Africa — 1.1% | | | | | | | | |
Sasol ADR | | 0.5 | | | 535,800 | | | 19,289 |
Other Securities | | 0.6 | | | | | | 20,277 |
| | | | | | | | |
| | | | | | | | 39,566 |
| | | | | | | | |
| | | |
South Korea — 3.4% | | | | | | | | |
Samsung Electronics | | 0.8 | | | 45,079 | | | 29,282 |
Other Securities | | 2.6 | | | | | | 98,401 |
| | | | | | | | |
| | | | | | | | 127,683 |
| | | | | | | | |
| | | |
Spain — 1.0% | | | | | | | | |
Other Securities | | 1.0 | | | | | | 35,207 |
| | | | | | | | |
| | | |
Sweden — 1.6% | | | | | | | | |
Hennes & Mauritz, Cl B (A) | | 0.5 | | | 317,642 | | | 18,005 |
| | |
| 40 | | SEI Institutional Investments Trust / Annual Report / May 31, 2010 |
| | | | | | | | |
| Description | | Percentage of
Net Assets (%) | | | Shares | | Market Value
($ Thousands) |
| | | | | | | | |
Other Securities | | 1.1 | % | | | | $ | 43,084 |
| | | | | | | | |
| | | | | | | | 61,089 |
| | | | | | | | |
| | | |
Switzerland — 4.6% | | | | | | | | |
Nestle | | 0.9 | | | 730,279 | | | 33,061 |
Novartis | | 0.9 | | | 745,057 | | | 33,794 |
Roche Holding | | 0.6 | | | 153,713 | | | 21,076 |
Other Securities | | 2.2 | | | | | | 81,471 |
| | | | | | | | |
| | | | | | | | 169,402 |
| | | | | | | | |
| | | |
Taiwan — 1.7% | | | | | | | | |
Other Securities | | 1.7 | | | | | | 61,808 |
| | | | | | | | |
| | | |
Thailand — 0.6% | | | | | | | | |
Other Securities | | 0.6 | | | | | | 20,968 |
| | | | | | | | |
| | | |
Turkey — 0.9% | | | | | | | | |
Other Securities | | 0.9 | | | | | | 33,894 |
| | | | | | | | |
| |
United Kingdom — 14.6% | | | |
AstraZeneca | | 0.6 | | | 527,646 | | | 22,176 |
AstraZeneca ADR(A) | | 0.5 | | | 471,800 | | | 19,934 |
BHP Billiton | | 0.5 | | | 594,815 | | | 16,260 |
BP | | 0.8 | | | 3,917,534 | | | 27,921 |
British American Tobacco | | 0.8 | | | 989,976 | | | 29,061 |
British American Tobacco ADR | | 0.4 | | | 222,600 | | | 13,033 |
Carnival | | 0.5 | | | 521,607 | | | 19,606 |
GlaxoSmithKline ADR(A) | | 0.5 | | | 560,300 | | | 18,748 |
Pearson ADR | | 0.5 | | | 1,384,300 | | | 19,048 |
Prudential ADR | | 0.5 | | | 1,079,900 | | | 16,857 |
Reckitt Benckiser Group | | 0.5 | | | 430,379 | | | 20,030 |
SABMiller | | 0.4 | | | 583,464 | | | 16,386 |
Standard Chartered | | 0.6 | | | 1,003,230 | | | 23,597 |
Tesco | | 0.5 | | | 3,051,651 | | | 18,087 |
Other Securities | | 7.0 | | | | | | 262,614 |
| | | | | | | | |
| | | | | | | | 543,358 |
| | | | | | | | |
| |
United States — 1.4% | | | |
Other Securities | | 1.4 | | | | | | 50,937 |
| | | | | | | | |
Total Common Stock
(Cost $3,422,768) ($ Thousands) | | | 3,320,415 |
| | | | | | | | |
| |
MORTGAGE-BACKED SECURITIES — 0.2% | | | |
| |
Non-Agency Mortgage-Backed Obligations — 0.2% | | | |
Other Securities | | 0.2 | | | | | | 8,947 |
| | | | | | | | |
Total Mortgage-Backed Securities
(Cost $8,995) ($ Thousands) | | | 8,947 |
| | | | | | | | |
| |
PREFERRED STOCK — 1.0% | | | |
| |
Brazil — 0.3% | | | |
Other Securities | | 0.3 | | | | | | 11,550 |
| | | | | | | | |
| | | | | | | | |
| Description | | Percentage of
Net Assets (%) | | | Shares | | Market Value
($ Thousands) |
| | | | | | | | |
| |
Germany — 0.7% | | | |
Other Securities | | 0.7 | % | | | | $ | 25,338 |
| | | | | | | | |
Total Preferred Stock
(Cost $36,232) ($ Thousands) | | | 36,888 |
| | | | | | | | |
| |
ASSET-BACKED SECURITIES — 0.1% | | | |
| |
Mortgage Related Securities — 0.1% | | | |
Other Securities | | 0.1 | | | | | | 1,590 |
| | | | | | | | |
Total Asset-Backed Securities
(Cost $1,837) ($ Thousands) | | | 1,590 |
| | | | | | | | |
| |
WARRANTS — 0.0% | | | |
| |
Hong Kong — 0.0% | | | |
Henderson Land Development,
Expires 12/31/49** | | 0.0 | | | 43 | | | — |
Other Securities | | 0.0 | | | | | | 44 |
| | | | | | | | |
Total Warrants
(Cost $0) ($ Thousands) | | | 44 |
| | | | | | | | |
|
CORPORATE OBLIGATION — 0.0% |
|
Financials — 0.0% |
Other Securities | | 0.0 | | | | | | 345 |
| | | | | | | | |
Total Corporate Obligation
(Cost $545) ($ Thousands) | | | 345 |
| | | | | | | | |
|
RIGHTS — 0.0% |
|
United Kingdom — 0.0% |
Other Securities | | 0.0 | | | | | | 170 |
| | | | | | | | |
Total Rights
(Cost $0) ($ Thousands) | | | 170 |
| | | | | | | | |
|
AFFILIATED PARTNERSHIP — 6.3% |
SEI Liquidity Fund, L.P.
0.240%*† (B) | | 6.3 | | | 235,887,837 | | | 233,575 |
| | | | | | | | |
Total Affiliated Partnership
(Cost $235,888) ($ Thousands) | | | 233,575 |
| | | | | | | | |
|
CASH EQUIVALENT — 1.0% |
|
United States — 1.0% |
SEI Daily Income Trust,
Prime Obligation Fund,
Cl A, 0.090*† | | 1.0 | | | 36,630,196 | | | 36,630 |
| | | | | | | | |
Total Cash Equivalent
(Cost $36,630) ($ Thousands) | | | 36,630 |
| | | | | | | | |
| | |
| SEI Institutional Investments Trust / Annual Report / May 31, 2010 | | 41 |
SUMMARY SCHEDULE OF INVESTMENTS
World Equity Ex-US Fund (Concluded)
May 31, 2010
| | | | | | | | | | |
| Description | | Percentage of
Net Assets (%) | | | Face Amount ($ Thousands) | | Market Value
($ Thousands) |
| |
U.S. TREASURY OBLIGATIONS — 1.0% | | | |
U.S. Treasury Bills (C) (D) | | | | | | | | | | |
0.134%, 06/03/10 | | 0.9 | %$ | | | | 34,059 | | $ | 34,058 |
0.140%, 06/17/10 | | 0.0 | | | | | 750 | | | 750 |
0.155%, 08/26/10 | | 0.1 | | | | | 2,750 | | | 2,749 |
| | | | | | | | | | |
Total U.S. Treasury Obligations
(Cost $37,557) ($ Thousands) | | | 37,557 |
| | | | | | | | | | |
| |
TIME DEPOSITS — 2.0% | | | |
| |
United States — 2.0% | | | |
Brown Brothers Harriman | | | | | | | | | | |
3.410%, 06/01/10 | | | | | AUD | | 1,602 | | | 1,358 |
0.080%, 06/01/10 | | | | | GBP | | 453 | | | 655 |
0.070%, 06/01/10 | | | | | CAD | | 18 | | | 17 |
0.070%, 06/01/10 | | | | | NOK | | 34 | | | 5 |
0.050%, 06/01/10 | | | | | DKK | | 10 | | | 2 |
0.050%, 06/01/10 | | | | | EUR | | 1,702 | | | 2,098 |
0.030%, 06/01/10 | | | | | | | 67,216 | | | 67,216 |
0.010%, 06/01/10 | | | | | CHF | | 1,870 | | | 1,616 |
0.010%, 06/01/10 | | | | | HKD | | 2,757 | | | 354 |
0.010%, 06/01/10 | | | | | JPY | | 180,625 | | | 1,986 |
0.010%, 06/01/10 | | | | | SEK | | 110 | | | 14 |
0.010%, 06/01/10 | | | | | SGD | | 78 | | | 56 |
| | | | | | | | | | |
Total Time Deposits
(Cost $75,377) ($ Thousands) | | | 75,377 |
| | | | | | | | | | |
Total Investments — 101.0%
(Cost $3,855,829) ($ Thousands) | | $ | 3,751,538 |
| | | | | | | | | | |
A summary of the open futures contracts held by the Fund at May 31, 2010, is as follows:
| | | | | | | | | |
Type of Contract | | Number of
Contracts
Long (Short) | | | Expiration
Date | | Unrealized
Appreciation
(Depreciation)
($ Thousands) | |
DJ Euro Stoxx 50 Index | | 2,148 | | | Jun-2010 | | $ | 181 | |
FTSE Index | | 638 | | | Jun-2010 | | | (82 | ) |
Hang Seng Index | | 41 | | | Jun-2010 | | | 101 | |
MSCI EAFE Index E-MINI | | (9 | ) | | Jun-2010 | | | 42 | |
MSCI Emerging Markets E-MINI | | 316 | | | Jun-2010 | | | (1,357 | ) |
Nikkei 225 Index | | 47 | | | Jun-2010 | | | (156 | ) |
S&P TSE 60 Index | | 221 | | | Jun-2010 | | | (219 | ) |
SPI 200 Index | | 190 | | | Jun-2010 | | | 2 | |
Topix Index | | 469 | | | Jun-2010 | | | (694 | ) |
| | | | | | | | | |
| | | | | | | $ | (2,182 | ) |
| | | | | | | | | |
For the year ended May 31, 2010, the total amount of all open futures contracts, as presented in the table above, are representative of the volume of activity for this derivative type during the period.
A summary of the outstanding forward foreign currency contracts held by the Fund at May 31, 2010, is as follows:
| | | | | | | | | | | | |
Maturity
Date | | Currency
to Deliver
(Thousands) | | Currency
to Receive
(Thousands) | | Unrealized
Appreciation
($ Thousands) |
6/10/10 | | USD | | | 4,764 | | CAD | | 5,050 | | $ | 38 |
| | | | | | | | | | | | |
| | |
| 42 | | SEI Institutional Investments Trust / Annual Report / May 31, 2010 |
| | | | | | | | | | | | | | | |
| Total Return Swaps | |
| Counterparty | | Reference Entity/Obligation | | Fund Pays | | Fund
Receives | | Termination
Date | | Notional
Amount
(Thousands) | | | Net Unrealized
Appreciation
(Depreciation)
($ Thousands) | |
| Morgan Stanley | | MSCI Daily TR NET EAFE USD MARKET Index | | 1-Month LIBOR | | Price Return | | 08/03/10 | | (9,307 | ) | | $ | (1,001 | ) |
| Morgan Stanley | | MSCI Daily TR NET EAFE USD MARKET Index | | 3-Month LIBOR Minus 24 Bps | | Price Return | | 01/13/11 | | (40,262 | ) | | | (5,884 | ) |
| | | | | | | | | | | | | | | |
| | | | | | | | | | | | | $ | (6,885 | ) |
| | | | | | | | | | | | | | | |
Percentages are based on Net Assets of $3,712,614 ($ Thousands)
| * | | The rate reported is the 7-day effective yield as of May 31, 2010. |
| † | | Investment in Affiliated Security (see Note 5). |
| (A) | | This security or a partial position of this security is on loan at May 31, 2010. The total value of securities on loan at May 31, 2010 was $224,904 ($ Thousands). |
| (B) | | This security was purchased with cash collateral held from securities on loan. The total value of such securities as of May 31, 2010 was $233,575 ($ Thousands). |
| (C) | | The rate reported is the effective yield at time of purchase. |
| (D) | | Security, or a portion thereof, has been pledged as collateral on open futures contracts. |
The Summary Schedule of Investments does not reflect the complete portfolio holdings. It includes the Fund’s 50 largest holdings and each investment of any issuer that exceeds 1% of the Fund’s net assets. “Other Securities” represent all issues not required to be disclosed under the rules adopted by the U.S. Securities and Exchange Commission (“SEC”). In certain instances, securities for which footnotes listed above may otherwise apply are included in the Other Securities caption. The complete schedule of portfolio holdings is available (i) without charge, upon request, by calling (800) 342-5734; and (ii) on the SEC’s website at http://www.sec.gov.
ADR — American Depositary Receipt
AUD —Australian Dollar
CAD — Canadian Dollar
CHF — Swiss Franc
Cl — Class
DJ — Dow Jones
DKK — Danish Krone
EUR — Euro
FTSE — Financial Times and the London Stock Exchange
GBP — British Pound Sterling
HKD — Hong Kong Dollar
JPY — Japanese Yen
LIBOR — London Interbank Offered Rate
L.P. — Limited Partnership
MSCI EAFE — Morgan Stanley Capital International Europe, Australia, and the Far East
NOK — Norwegian Krone
S&P — Standard & Poor’s
SEK — Swedish Krone
Ser — Series
SGD —Singapore Dollar
SPI — Share Price Index
TSE — Toronto Stock Exchange
USD — U.S. Dollar
The following is a summary of the inputs used as of May 31, 2010 in valuing the Fund’s investments carried at value ($ Thousands):
| | | | | | | | | | | | |
| Investments in Securities | | Level 1 | | Level 2 | | Level 3 | | Total |
Common Stock | | $ | 2,909,249 | | $ | 411,166 | | $ | — | | $ | 3,320,415 |
Preferred Stock | | | 36,888 | | | — | | | — | | | 36,888 |
Mortgage-Backed Securities | | | — | | | 8,947 | | | — | | | 8,947 |
Asset-Backed Securities | | | — | | | 1,590 | | | — | | | 1,590 |
Corporate Obligation | | | — | | | 345 | | | — | | | 345 |
Right | | | 170 | | | — | | | — | | | 170 |
Warrants | | | 3 | | | 41 | | | — | | | 44 |
Affiliated Partnership | | | — | | | 233,575 | | | — | | | 233,575 |
U.S. Treasury Obligations | | | — | | | 37,557 | | | — | | | 37,557 |
Cash Equivalent | | | 36,630 | | | — | | | — | | | 36,630 |
Time Deposits | | | 75,377 | | | — | | | — | | | 75,377 |
| | | | | | | | | | | | |
Total Investments in Securities | | $ | 3,058,317 | | $ | 693,221 | | $ | — | | $ | 3,751,538 |
| | | | | | | | | | | | |
| | | | | | | | | | | | | | | |
| Other Financial Instruments | | | Level 1 | | | | Level 2 | | | | Level 3 | | | Total | |
Futures Contracts* | | $ | (2,182 | ) | | $ | — | | | $ | — | | $ | (2,182 | ) |
Total Return Swaps | | | — | | | | (6,885 | ) | | | — | | | (6,885 | ) |
| | | | | | | | | | | | | | | |
Total Other Financial Instruments | | $ | (2,182 | ) | | $ | (6,885 | ) | | $ | — | | $ | (9,067 | ) |
| | | | | | | | | | | | | | | |
| * | | Futures contracts are valued at the unrealized appreciation on the instrument. |
For more information on valuation inputs, see Note 2 — Significant Accounting Policies in Notes to Financial Statements.
Amounts designated as “—” are either $0 or have been rounded to $0.
The accompanying notes are an integral part of the financial statements.
| | |
| SEI Institutional Investments Trust / Annual Report / May 31, 2010 | | 43 |
SUMMARY SCHEDULE OF INVESTMENTS
Screened World Equity Ex-US Fund
May 31, 2010
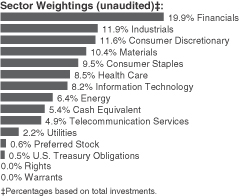
| | | | | | | | |
| Description | | Percentage of
Net Assets (%) | | | Shares | | Market Value
($ Thousands) |
| | | | | | | | |
| |
COMMON STOCK — 91.0% | | | |
| |
Australia — 3.4% | | | |
BHP Billiton | | 1.2 | % | | 25,289 | | $ | 820 |
Rio Tinto | | 0.7 | | | 7,871 | | | 448 |
Other Securities | | 1.5 | | | | | | 1,101 |
| | | | | | | | |
| | | | | | | | 2,369 |
| | | | | | | | |
| |
Austria — 0.1% | | | |
Other Securities | | 0.1 | | | | | | 59 |
| | | | | | | | |
| |
Belgium — 0.7% | | | |
Other Securities | | 0.7 | | | | | | 513 |
| | | | | | | | |
| |
Brazil — 1.1% | | | |
Other Securities | | 1.1 | | | | | | 748 |
| | | | | | | | |
| |
Canada — 7.6% | | | |
Canadian National Railway | | 0.8 | | | 9,100 | | | 533 |
Canadian Natural Resources | | 0.8 | | | 15,200 | | | 538 |
EnCana | | 0.6 | | | 13,169 | | | 416 |
Toronto-Dominion Bank | | 0.6 | | | 5,750 | | | 392 |
Other Securities | | 4.8 | | | | | | 3,344 |
| | | | | | | | |
| | | | | | | | 5,223 |
| | | | | | | | |
| |
Chile — 0.0% | | | |
Other Securities | | 0.0 | | | | | | 13 |
| | | | | | | | |
| |
China — 2.1% | | | |
China Merchants Bank, Cl H | | 0.5 | | | 147,500 | | | 350 |
Industrial & Commercial Bank of China | | 0.8 | | | 701,000 | | | 519 |
Other Securities | | 0.8 | | | | | | 579 |
| | | | | | | | |
| | | | | | | | 1,448 |
| | | | | | | | |
| | | | | | | | |
| |
Denmark — 1.7% | | | |
Novo-Nordisk, Cl B | | 1.0 | | | 9,080 | | | 704 |
Other Securities | | 0.7 | | | | | | 429 |
| | | | | | | | |
| | | | | | | | 1,133 |
| | | | | | | | |
| | | | | | | | |
| Description | | Percentage of
Net Assets (%) | | | Shares | | Market Value
($ Thousands) |
| |
Finland — 0.9% | | | |
Other Securities | | 0.9 | % | | | | $ | 632 |
| | | | | | | | |
| |
France — 6.1% | | | |
Air Liquide | | 0.6 | | | 4,117 | | | 405 |
BNP Paribas | | 0.8 | | | 9,099 | | | 520 |
LVMH Moet Hennessy Louis Vuitton | | 0.6 | | | 4,120 | | | 438 |
Safran | | 0.5 | | | 11,717 | | | 321 |
Sanofi-Aventis | | 0.8 | | | 9,232 | | | 563 |
Other Securities | | 2.8 | | | | | | 1,914 |
| | | | | | | | |
| | | | | | | | 4,161 |
| | | | | | | | |
| | | |
Germany — 5.1% | | | | | | | | |
Allianz | | 0.6 | | | 4,040 | | | 406 |
BASF | | 1.1 | | | 14,171 | | | 754 |
Deutsche Bank | | 0.6 | | | 6,747 | | | 404 |
Fresenius Medical Care | | 0.5 | | | 6,393 | | | 324 |
SAP | | 0.5 | | | 7,867 | | | 342 |
Other Securities | | 1.8 | | | | | | 1,287 |
| | | | | | | | |
| | | | | | | | 3,517 |
| | | | | | | | |
| | | |
Greece — 0.1% | | | | | | | | |
Other Securities | | 0.1 | | | | | | 77 |
| | | | | | | | |
| | | |
Guernsey — 0.3% | | | | | | | | |
Other Securities | | 0.3 | | | | | | 222 |
| | | | | | | | |
| | | |
Hong Kong — 3.1% | | | | | | | | |
China Mobile | | 0.4 | | | 32,500 | | | 308 |
Other Securities | | 2.7 | | | | | | 1,839 |
| | | | | | | | |
| | | | | | | | 2,147 |
| | | | | | | | |
| | | |
Hungary — 0.2% | | | | | | | | |
Other Securities | | 0.2 | | | | | | 115 |
| | | | | | | | |
| | | |
India — 0.4% | | | | | | | | |
Other Securities | | 0.4 | | | | | | 307 |
| | | | | | | | |
| | | |
Indonesia — 0.3% | | | | | | | | |
Other Securities | | 0.3 | | | | | | 191 |
| | | | | | | | |
| | | |
Ireland — 0.2% | | | | | | | | |
Other Securities | | 0.2 | | | | | | 165 |
| | | | | | | | |
| | | |
Israel — 1.4% | | | | | | | | |
Teva Pharmaceutical Industries | | | | | | | | |
ADR | | 1.0 | | | 12,530 | | | 687 |
Other Securities | | 0.4 | | | | | | 280 |
| | | | | | | | |
| | | | | | | | 967 |
| | | | | | | | |
| | | | | | | | |
| | | |
Italy — 1.5% | | | | | | | | |
Enel | | 0.7 | | | 99,357 | | | 458 |
Other Securities | | 0.8 | | | | | | 538 |
| | | | | | | | |
| | | | | | | | 996 |
| | | | | | | | |
| | |
| 44 | | SEI Institutional Investments Trust / Annual Report / May 31, 2010 |
| | | | | | | | |
| Description | | Percentage of
Net Assets (%) | | | Shares | | Market Value
($ Thousands) |
| | | |
Japan — 15.6% | | | | | | | | |
Chugai Pharmaceutical | | 0.1 | % | | 2,200 | | $ | 39 |
Fanuc | | 0.6 | | | 3,700 | | | 391 |
Hitachi | | 0.8 | | | 140,000 | | | 573 |
Komatsu | | 0.5 | | | 17,300 | | | 325 |
Mitsubishi UFJ Financial Group | | 0.5 | | | 71,100 | | | 345 |
Nippon Telegraph & Telephone | | 0.5 | | | 9,100 | | | 369 |
Nissan Motor | | 0.5 | | | 43,700 | | | 319 |
Sumitomo | | 0.5 | | | 29,400 | | | 319 |
Toyota Motor | | 0.5 | | | 10,233 | | | 369 |
Other Securities | | 11.1 | | | | | | 7,679 |
| | | | | | | | |
| | | | | | | | 10,728 |
| | | | | | | | |
| |
Macau — 0.1% | | | |
Other Securities | | 0.1 | | | | | | 50 |
| | | | | | | | |
| |
Malaysia — 0.6% | | | |
Other Securities | | 0.6 | | | | | | 390 |
| | | | | | | | |
| |
Mexico — 1.4% | | | |
Other Securities | | 1.4 | | | | | | 941 |
| | | | | | | | |
| |
Netherlands — 3.2% | | | |
Koninklijke Philips Electronics | | 0.9 | | | 20,643 | | | 621 |
Unilever | | 0.7 | | | 16,958 | | | 467 |
Other Securities | | 1.6 | | | | | | 1,098 |
| | | | | | | | |
| | | | | | | | 2,186 |
| | | | | | | | |
| |
Netherlands Antilles — 0.5% | | | |
Schlumberger | | 0.5 | | | 6,100 | | | 343 |
| | | | | | | | |
| |
New Zealand — 0.1% | | | |
Other Securities | | 0.1 | | | | | | 48 |
| | | | | | | | |
| |
Norway — 0.7% | | | |
Other Securities | | 0.7 | | | | | | 456 |
| | | | | | | | |
| |
Poland — 0.1% | | | |
Other Securities | | 0.1 | | | | | | 71 |
| | | | | | | | |
| |
Portugal — 0.3% | | | |
Other Securities | | 0.3 | | | | | | 216 |
| | | | | | | | |
| |
Russia — 0.1% | | | |
Other Securities | | 0.1 | | | | | | 88 |
| | | | | | | | |
| |
Singapore — 1.0% | | | |
Other Securities | | 1.0 | | | | | | 699 |
| | | | | | | | |
| | | | | | | | |
| |
South Africa — 0.2% | | | |
Other Securities | | 0.2 | | | | | | 160 |
| | | | | | | | |
| | | | | | | | |
| Description | | Percentage of
Net Assets (%) | | | Shares | | Market Value
($ Thousands) |
| |
South Korea — 2.5% | | | |
Samsung Electronics | | 0.7 | % | | 705 | | $ | 458 |
Other Securities | | 1.8 | | | | | | 1,287 |
| | | | | | | | |
| | | | | | | | 1,745 |
| | | | | | | | |
| |
Spain — 1.0% | | | |
Telefonica | | 0.6 | | | 20,697 | | | 397 |
Other Securities | | 0.4 | | | | | | 288 |
| | | | | | | | |
| | | | | | | | 685 |
| | | | | | | | |
| |
Sweden — 1.9% | | | |
Hennes & Mauritz, Cl B | | 0.6 | | | 6,939 | | | 393 |
Other Securities | | 1.3 | | | | | | 904 |
| | | | | | | | |
| | | | | | | | 1,297 |
| | | | | | | | |
| |
Switzerland — 6.2% | | | |
Nestle | | 1.4 | | | 21,673 | | | 981 |
Novartis | | 1.2 | | | 18,161 | | | 824 |
Roche Holding | | 0.9 | | | 4,314 | | | 591 |
Other Securities | | 2.7 | | | | | | 1,892 |
| | | | | | | | |
| | | | | | | | 4,288 |
| | | | | | | | |
| |
Taiwan — 1.1% | | | |
Other Securities | | 1.1 | | | | | | 748 |
| | | | | | | | |
| |
Thailand — 0.4% | | | |
Other Securities | | 0.4 | | | | | | 282 |
| | | | | | | | |
| |
Turkey — 0.7% | | | |
Other Securities | | 0.7 | | | | | | 491 |
| | | | | | | | |
| |
United Kingdom — 15.9% | | | |
AstraZeneca | | 0.9 | | | 14,616 | | | 614 |
BHP Billiton | | 0.7 | | | 17,598 | | | 481 |
BP | | 1.0 | | | 92,296 | | | 658 |
British American Tobacco | | 1.1 | | | 26,816 | | | 787 |
Carnival | | 0.7 | | | 13,376 | | | 503 |
Reckitt Benckiser Group | | 0.6 | | | 8,402 | | | 391 |
Rio Tinto | | 0.5 | | | 8,098 | | | 372 |
SABMiller | | 0.6 | | | 15,729 | | | 442 |
Standard Chartered | | 0.9 | | | 26,037 | | | 612 |
Tesco | | 0.6 | | | 72,310 | | | 429 |
Other Securities | | 8.3 | | | | | | 5,608 |
| | | | | | | | |
| | | | | | | | 10,897 |
| | | | | | | | |
| |
United States — 1.1% | | | |
Other Securities | | 1.1 | | | | | | 762 |
| | | | | | | | |
Total Common Stock
(Cost $65,654) ($ Thousands) | | | 62,574 |
| | | | | | | | |
| | |
| SEI Institutional Investments Trust / Annual Report / May 31, 2010 | | 45 |
SUMMARY SCHEDULE OF INVESTMENTS
Screened World Equity Ex-US Fund (Concluded)
May 31, 2010
| | | | | | | | | | | |
| Description | | Percentage of
Net Assets (%) | | | | | Shares/
Face Amount
($ Thousands) | | Market Value
($ Thousands) |
| | | | | | | | | | | |
| |
PREFERRED STOCK — 0.6% | | | |
| |
Germany — 0.6% | | | |
Other Securities | | 0.6 | % | | | | | | | $ | 431 |
| | |
South Korea — 0.0% | | | | | |
Other Securities | | 0.0 | % | | | | | | | | 7 |
| | | | | | | | | | | |
Total Preferred Stock
(Cost $444) ($ Thousands) | | | 438 |
| | | | | | | | | | | |
| |
WARRANTS — 0.0% | | | |
Other Securities | | 0.0 | | | | | | | | | 1 |
| | | | | | | | | | | |
Total Warrants
(Cost $—) ($ Thousands) | | | 1 |
| | | | | | | | | | | |
| |
RIGHT — 0.0% | | | |
| |
United Kingdom — 0.0% | | | |
Other Securities | | 0.0 | | | | | | | | | 3 |
| | | | | | | | | | | |
Total Right
(Cost $—) ($ Thousands) | | | 3 |
| | | | | | | | | | | |
| |
CASH EQUIVALENT — 5.2% | | | |
| |
United States — 5.2% | | | |
SEI Daily Income Trust,
Prime Obligation Fund,
Cl A, 0.090%*† | | 5.2 | | | | | | 3,595,702 | | | 3,596 |
| | | | | | | | | | | |
Total Cash Equivalent
(Cost $3,596) ($ Thousands) | | | 3,596 |
| | | | | | | | | | | |
| |
U.S. TREASURY OBLIGATIONS — 0.5% | | | |
U.S. Treasury Bill
0.134%, 06/03/10 (A) (B) | | 0.5 | | | $ | | | 308 | | | 308 |
Other Securities | | 0.0 | | | | | | | | | 10 |
| | | | | | | | | | | |
Total U.S. Treasury Obligations
(Cost $318) ($ Thousands) | | | 318 |
| | | | | | | | | | | |
| |
TIME DEPOSITS — 1.3% | | | |
| | | | |
United States — 1.3% | | | | | | | | | | | |
Brown Brothers Harriman | | | | | | | | | | | |
3.410%, 06/01/10 | | | | | | AUD | | 49 | | | 41 |
1.700%, 06/01/10 | | | | | | NZD | | 1 | | | 1 |
0.080%, 06/01/10 | | | | | | GBP | | 38 | | | 56 |
0.070%, 06/01/10 | | | | | | CAD | | 100 | | | 95 |
0.070%, 06/01/10 | | | | | | NOK | | 44 | | | 7 |
0.050%, 06/01/10 | | | | | | DKK | | 72 | | | 12 |
0.050%, 06/01/10 | | | | | | EUR | | 131 | | | 162 |
0.030%, 06/01/10 | | | | | | | | 351 | | | 351 |
0.010%, 06/01/10 | | | | | | CHF | | 33 | | | 29 |
0.010%, 06/01/10 | | | | | | HKD | | 105 | | | 13 |
0.010%, 06/01/10 | | | | | | JPY | | 7,548 | | | 83 |
0.010%, 06/01/10 | | | | | | SEK | | 131 | | | 17 |
| | | | | | | |
| Description | | | | Shares | | Market Value
($ Thousands) |
0.010%, 06/01/10 | | SGD | | 15 | | $ | 10 |
| | | | | | | |
Total Time Deposits
(Cost $877) ($ Thousands) | | | | | 877 |
| | | | | | | |
Total Investments — 98.6%
(Cost $70,889) ($ Thousands) | | $ | 67,807 |
| | | | | | | |
A summary of the open futures contracts held by the Fund at May 31, 2010, is as follows:
| | | | | | | | |
Type of
Contract | | Number of
Contracts
Long (Short) | | Expiration
Date | | Unrealized
Appreciation
(Depreciation)
($ Thousands) | |
DJ Euro Stoxx 50 Index | | 43 | | Jun-2010 | | $ | (71 | ) |
FTSE Index | | 12 | | Jun-2010 | | | (53 | ) |
Hang Seng Index | | 1 | | Jun-2010 | | | 4 | |
S&P TSE 60 Index | | 4 | | Jun-2010 | | | (7 | ) |
SPI 200 Index | | 3 | | Jun-2010 | | | (26 | ) |
Topix Index | | 10 | | Jun-2010 | | | (36 | ) |
| | | | | | | | |
| | | | | | $ | (189 | ) |
| | | | | | | | |
For the year ended May 31, 2010, the total amount of all open futures contracts, as presented in the table above, are representative of the volume of activity for this derivative type during the period.
| Percentages | | are based on Net Assets of $68,743 ($ Thousands) |
| * | | The rate reported is the 7-day effective yield as of May 31, 2010. |
| † | | Investment in Affiliated Security (see Note 5). |
| (A) | | The rate reported on the Schedule of Investments is the effective yield at time of purchase. |
| (B) | | Security, or a portion thereof, has been pledged as collateral on open futures contracts. |
The Summary Schedule of Investments does not reflect the complete portfolio holdings. It includes the Fund’s 50 largest holdings and each investment of any issuer that exceeds 1% of the Fund’s net assets. “Other Securities” represent all issues not required to be disclosed under the rules adopted by the U.S. Securities and Exchange Commission (“SEC”). In certain instances, securities for which footnotes listed above may otherwise apply are included in the Other Securities caption. The complete schedule of portfolio holdings is available (i) without charge, upon request, by calling (800) 342-5734; and (ii) on the SEC’s website at http://www.sec.gov.
ADR — American Depositary Receipt
AUD — Australian Dollar
CAD — Canadian Dollar
CHF — Swiss Franc
Cl — Class
DJ — Dow Jones
DKK — Danish Krone
EUR — Euro
FTSE — Financial Times and London Stock Exchange
GBP — British Pound Sterling
HKD — Hong Kong Dollar
JPY — Japanese Yen
NOK — Norwegian Krone
NZD — New Zealand Dollar
S&P — Standard & Poor’s
SEK — Swedish Krone
Ser — Series
SGD — Singapore Dollar
SPI — Stock Price Index
TSE — Toronto Stock Exchange
| | |
| 46 | | SEI Institutional Investments Trust / Annual Report / May 31, 2010 |
The following is a summary of the inputs used as of May 31, 2010 in valuing the Fund’s investments carried at value ($ Thousands):
| | | | | | | | | | | | |
| Investments in Securities | | Level 1 | | Level 2 | | Level 3 | | Total |
Common Stock | | $ | 51,632 | | $ | 10,942 | | $ | — | | $ | 62,574 |
Preferred Stock | | | 438 | | | — | | | — | | | 438 |
Right | | | 3 | | | — | | | — | | | 3 |
Warrants | | | — | | | 1 | | | — | | | 1 |
U.S. Treasury Obligations | | | — | | | 318 | | | — | | | 318 |
Cash Equivalent | | | 3,596 | | | — | | | — | | | 3,596 |
Time Deposits | | | 877 | | | — | | | — | | | 877 |
| | | | | | | | | | | | |
Total Investments in Securities | | $ | 56,546 | | $ | 11,261 | | $ | — | | $ | 67,807 |
| | | | | | | | | | | | |
| | | | | | | | | | | | | | |
| Other Financial Instruments | | | Level 1 | | | | Level 2 | | | Level 3 | | | Total | |
Futures Contracts* | | $ | (189 | ) | | $ | — | | $ | — | | $ | (189 | ) |
| | | | | | | | | | | | | | |
Total Other Financial Instruments | | $ | (189 | ) | | $ | — | | $ | — | | $ | (189 | ) |
| | | | | | | | | | | | | | |
| * | | Futures contracts are valued at the unrealized appreciation on the instrument. |
For more information on valuation inputs, see Note 2 — Significant Accounting Policies in Notes to Financial Statements.
| Amounts | | designated as “—” are either $0 or have been rounded to $0. |
The accompanying notes are an integral part of the financial statements.
| | |
| SEI Institutional Investments Trust / Annual Report / May 31, 2010 | | 47 |
SCHEDULE OF INVESTMENTS
Enhanced LIBOR Opportunities Fund
May 31, 2010
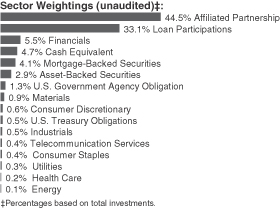
| | | | | | |
| Description | | Face Amount
($ Thousands) | | Market Value
($ Thousands) |
| | | | | | |
|
LOAN PARTICIPATIONS — 32.8% |
Aeroflex, Ser B-1 | | | | | | |
3.500%, 08/15/14 | | $ | 595 | | $ | 578 |
Affinion Group Holdings | | | | | | |
5.000%, 10/08/16 | | | 500 | | | 480 |
Alliant Insurance Service Term Loan | | | | | | |
3.290%, 08/21/14 | | | 698 | | | 649 |
Allison Transmission | | | | | | |
3.100%, 08/07/14 | | | 363 | | | 330 |
3.050%, 08/07/14 | | | 124 | | | 113 |
3.010%, 08/07/14 | | | 199 | | | 181 |
Aramark Facility | | | | | | |
2.126%, 01/26/14 | | | 27 | | | 26 |
Aramark US Term Loan | | | | | | |
2.165%, 01/26/14 | | | 418 | | | 398 |
Asurion 1st Lien Term Loan | | | | | | |
3.421%, 07/03/14 | | | 75 | | | 72 |
3.349%, 07/03/14 | | | 241 | | | 231 |
3.278%, 07/03/14 | | | 207 | | | 199 |
Asurion 2nd Lien | | | | | | |
6.849%, 07/03/15 | | | 500 | | | 488 |
BBN Acquisitions | | | | | | |
5.000%, 09/14/15 | | | 394 | | | 392 |
Biomet Dollar Term Loan | | | | | | |
3.284%, 03/25/15 | | | 414 | | | 403 |
3.273%, 03/25/15 | | | 21 | | | 21 |
Booz Allen Hamilton Tranche B Term Loan | | | | | | |
7.500%, 07/31/15 | | | 111 | | | 111 |
Burlington Coat Factory | | | | | | |
4.500%, 05/28/13 | | | 2 | | | 2 |
2.570%, 05/28/13 | | | 291 | | | 267 |
2.510%, 05/28/13 | | | 292 | | | 268 |
Calpine | | | | | | |
3.165%, 03/29/14 | | | 698 | | | 652 |
Cedar Fair | | | | | | |
4.273%, 08/30/14 | | | 522 | | | 518 |
2.273%, 08/30/12 | | | 120 | | | 119 |
| | | | | | |
| Description | | Face Amount
($ Thousands) | | Market Value
($ Thousands) |
| | | | | | |
Celanese US Holdings LLC Term Loan | | | | | | |
2.041%, 04/02/14 | | $ | 456 | | $ | 434 |
Cengage Learning Holdco | | | | | | |
2.790%, 06/28/14 | | | 594 | | | 513 |
CF Industries Term Loan B1 | | | | | | |
5.750%, 04/05/15 | | | 270 | | | 270 |
Charter Communications Term Loan C | | | | | | |
3.550%, 09/06/16 | | | 529 | | | 492 |
Charter Term Loan B | | | | | | |
2.300%, 03/15/14 | | | 65 | | | 60 |
Cinemark USA | | | | | | |
2.180%, 10/05/13 | | | 53 | | | 51 |
2.090%, 10/05/13 | | | 74 | | | 71 |
2.060%, 10/05/13 | | | 215 | | | 207 |
2.050%, 10/05/13 | | | 36 | | | 35 |
2.010%, 10/05/13 | | | 79 | | | 76 |
Clear Channel | | | | | | |
3.923%, 01/29/16 | | | 927 | | | 711 |
Community Health Systems Delayed Draw Term Loan | | | | | | |
2.502%, 07/25/14 | | | 44 | | | 41 |
Community Health Systems Funded Term Loan | | | | | | |
2.502%, 07/25/14 | | | 853 | | | 798 |
Dana Holding | | | | | | |
4.600%, 01/31/15 | | | 119 | | | 115 |
4.580%, 01/31/15 | | | 57 | | | 54 |
4.550%, 01/31/15 | | | 78 | | | 75 |
4.530%, 01/31/15 | | | 60 | | | 57 |
4.510%, 01/31/15 | | | 58 | | | 56 |
Dex Media West LLC | | | | | | |
7.500%, 10/24/14 | | | 374 | | | 341 |
Discovery Communications | | | | | | |
5.250%, 05/14/14 | | | 520 | | | 519 |
2.290%, 05/14/14 | | | 499 | | | 496 |
Dollar General Term Loan B-2 | | | | | | |
3.023%, 07/07/14 | | | 250 | | | 238 |
3.006%, 07/07/14 | | | 604 | | | 575 |
Dynegy Holdings | | | | | | |
4.030%, 04/02/13 | | | 685 | | | 650 |
Education Media Term Loan A | | | | | | |
5.535%, 06/12/14 | | | 498 | | | 456 |
Enterprise GP Holdings | | | | | | |
2.545%, 11/10/14 | | | 208 | | | 204 |
2.501%, 11/10/14 | | | 139 | | | 136 |
Federal Mogul | | | | | | |
2.278%, 12/29/14 | | | 72 | | | 63 |
2.278%, 12/28/15 | | | 234 | | | 205 |
2.217%, 12/29/14 | | | 387 | | | 337 |
Flextronics International Term A-2 | | | | | | |
2.540%, 10/01/14 | | | 263 | | | 245 |
Flextronics International Term A-3 | | | | | | |
2.523%, 10/01/14 | | | 306 | | | 285 |
| | |
| 48 | | SEI Institutional Investments Trust / Annual Report / May 31, 2010 |
| | | | | | |
| Description | | Face Amount
($ Thousands) | | Market Value
($ Thousands) |
| | | | | | |
Ford Motor Company | | | | | | |
3.263%, 11/08/14 | | $ | 500 | | $ | 458 |
Freescale Semiconductor | | | | | | |
4.528%, 12/01/16 | | | 566 | | | 498 |
Graphic Packaging International Incremental Term Loan | | | | | | |
3.050%, 05/16/14 | | | 48 | | | 46 |
3.044%, 05/16/14 | | | 123 | | | 118 |
3.041%, 05/16/14 | | | 221 | | | 212 |
Hanesbrands Term Loan B | | | | | | |
5.250%, 12/10/15 | | | 182 | | | 182 |
Harrah’s Operating, Ser B-2 | | | | | | |
3.316%, 01/28/15 | | | 668 | | | 558 |
HCA Tranche B Term Loan | | | | | | |
2.540%, 11/18/13 | | | 858 | | | 812 |
Hertz | | | | | | |
2.090%, 12/21/12 | | | 360 | | | 344 |
2.021%, 12/21/12 | | | 116 | | | 111 |
Hertz, Ser B | | | | | | |
2.020%, 12/21/12 | | | 150 | | | 143 |
2.010%, 12/21/12 | | | 120 | | | 114 |
Hexion Specialty Chemical, Ser C-1 | | | | | | |
2.563%, 05/05/13 | | | 359 | | | 330 |
Hexion Specialty Chemical, Ser C-2 | | | | | | |
2.563%, 05/05/13 | | | 159 | | | 146 |
Hub International | | | | | | |
6.750%, 06/13/14 | | | 348 | | | 338 |
Hub International Delayed Draw Term Loan | | | | | | |
2.790%, 06/13/14 | | | 91 | | | 83 |
Hub International Initial Term Loan | | | | | | |
2.790%, 06/13/14 | | | 407 | | | 370 |
Iasis Healthcare LLC Delayed Draw Term Loan | | | | | | |
2.273%, 03/15/14 | | | 229 | | | 215 |
Iasis Healthcare LLC Synthetic Letter of Credit | | | | | | |
2.252%, 03/15/14 | | | 62 | | | 58 |
Iasis Healthcare LLC Term Loan B | | | | | | |
2.273%, 03/15/14 | | | 663 | | | 622 |
IMS Health Term Loan B | | | | | | |
5.250%, 02/26/16 | | | 198 | | | 196 |
Infor Enterprise Solutions Holdings | | | | | | |
6.030%, 07/28/12 | | | 221 | | | 208 |
4.030%, 07/28/12 | | | 346 | | | 325 |
Infor Enterprise Solutions Holdings Tranche 1 | | | | | | |
4.030%, 07/28/12 | | | 77 | | | 73 |
Infor Global Enterprise Solutions | | | | | | |
6.604%, 03/02/14 | | | 27 | | | 21 |
Infor Global Enterprise Solutions Tranche 1 | | | | | | |
6.604%, 03/02/14 | | | 138 | | | 105 |
| | | | | | |
| Description | | Face Amount
($ Thousands) | | Market Value
($ Thousands) |
| | | | | | |
Infor Global Solutions Intermediate Holdings | | | | | | |
6.604%, 03/02/14 | | $ | 305 | | $ | 232 |
Integra Telecom | | | | | | |
9.250%, 04/07/15 | | | 570 | | | 566 |
Intelsat | | | | | | |
3.292%, 02/01/14 | | | 1,050 | | | 961 |
Intersil Term Loan B | | | | | | |
5.500%, 04/26/16 | | | 1 | | | 1 |
4.750%, 04/26/16 | | | 249 | | | 248 |
Inverness Medical Innovations | | | | | | |
4.502%, 06/26/15 | | | 440 | | | 430 |
Jetro Holdings Tranche 1 | | | | | | |
2.510%, 07/02/14 | | | 409 | | | 394 |
Lamar Media | | | | | | |
4.250%, 10/01/16 | | | 450 | | | 450 |
Las Vegas Sands LLC | | | | | | |
2.050%, 05/17/14 | | | 500 | | | 444 |
Live Nation Entertainment | | | | | | |
4.500%, 10/20/16 | | | 250 | | | 250 |
Meg Energy | | | | | | |
6.000%, 04/03/16 | | | 436 | | | 423 |
Metroflag, 2nd Lien | | | | | | |
11.250%, 01/06/09 (C) (D) | | | 1,500 | | | — |
Mylan Laboratories Term Loan B | | | | | | |
3.562%, 10/02/14 | | | 668 | | | 663 |
Nalco Term Loan B | | | | | | |
6.500%, 05/06/16 | | | 437 | | | 436 |
Nielsen Finance New Facility | | | | | | |
2.297%, 12/31/17 | | | 608 | | | 566 |
NRG Holdings Letter of Credit | | | | | | |
0.190%, 02/01/13 | | | 153 | | | 146 |
NRG Holdings Term Loan B | | | | | | |
2.040%, 02/01/13 | | | 182 | | | 174 |
2.023%, 02/01/13 | | | 50 | | | 48 |
Oshkosh Term Loan B | | | | | | |
6.260%, 12/06/13 | | | 213 | | | 213 |
re/max International | | | | | | |
5.500%, 03/11/16 | | | 500 | | | 496 |
Reable Therapeutics (DJO Finance) Term Loan B | | | | | | |
3.273%, 05/20/14 | | | 392 | | | 376 |
Realogy | | | | | | |
3.294%, 10/10/13 | | | 338 | | | 285 |
3.292%, 10/10/13 | | | 360 | | | 303 |
Regal Cinemas | | | | | | |
3.790%, 10/27/13 | | | 351 | | | 349 |
Reynold | | | | | | |
6.250%, 11/05/15 | | | 835 | | | 830 |
Reynolds Group | | | | | | |
5.750%, 05/13/16 | | | 499 | | | 497 |
Sensata Technology | | | | | | |
2.078%, 04/27/13 | | | 436 | | | 405 |
2.047%, 04/27/13 | | | 1 | | | 1 |
| | |
| SEI Institutional Investments Trust / Annual Report / May 31, 2010 | | 49 |
SCHEDULE OF INVESTMENTS
Enhanced LIBOR Opportunities Fund (Continued)
May 31, 2010
| | | | | | |
| Description | | Face Amount
($ Thousands) | | Market Value
($ Thousands) |
| | | | | | |
Sirva Revolving Credit Loan | | | | | | |
13.000%, 05/12/12 | | $ | 28 | | $ | 19 |
9.500%, 05/12/12 | | | 53 | | | 36 |
Sirva Worldwide (Unfunded) | | | | | | |
0.500%, 05/12/12 | | | 200 | | | 66 |
Solutia 1st Lien Term Loan | | | | | | |
4.750%, 03/02/17 | | | 170 | | | 169 |
Sungard Data Systems | | | | | | |
3.999%, 02/28/16 | | | 424 | | | 408 |
3.895%, 02/28/16 | | | 32 | | | 31 |
Texas Competitive Electric | | | | | | |
4.066%, 10/10/14 | | | 533 | | | 410 |
3.874%, 10/10/14 | | | 373 | | | 286 |
3.797%, 10/10/14 | | | 84 | | | 64 |
3.790%, 10/10/14 | | | 8 | | | 6 |
Travelport LLC Letter of Credit | | | | | | |
2.790%, 08/23/13 | | | 45 | | | 43 |
Travelport LLC Term Loan B | | | | | | |
2.790%, 08/23/13 | | | 393 | | | 371 |
Travelport LLC Term Loan C-1 | | | | | | |
10.500%, 08/23/13 | | | 158 | | | 158 |
United Surgical Partners International | | | | | | |
2.320%, 04/19/14 | | | 174 | | | 162 |
2.270%, 04/19/14 | | | 189 | | | 176 |
2.270%, 04/21/14 | | | 83 | | | 77 |
Univision Communications | | | | | | |
2.540%, 09/29/14 | | | 624 | | | 534 |
Vanguard Health Term Loan | | | | | | |
5.000%, 01/15/16 | | | 400 | | | 395 |
Verint Systems | | | | | | |
3.520%, 05/25/14 | | | 1,025 | | | 951 |
VWR International Term Loan B | | | | | | |
2.773%, 06/30/14 | | | 466 | | | 432 |
Warner Chilcott PLC, Ser A | | | | | | |
5.500%, 10/30/14 | | | 165 | | | 165 |
Warner Chilcott PLC, Ser B | | | | | | |
5.750%, 04/30/15 | | | 76 | | | 76 |
Warner Chilcott PLC, Ser B2 | | | | | | |
5.750%, 04/30/15 | | | 127 | | | 126 |
Wide Open West Finance 1st Lien | | | | | | |
2.874%, 06/30/14 | | | 183 | | | 169 |
2.795%, 06/30/14 | | | 179 | | | 165 |
2.752%, 06/30/14 | | | 175 | | | 161 |
| | | | | | |
Total Loan Participations
(Cost $39,053) ($ Thousands) | | | 37,893 |
| | | | | | |
|
CORPORATE OBLIGATIONS — 8.8% |
|
Consumer Discretionary — 0.6% |
Ferrellgas | | | | | | |
9.125%, 10/01/17 | | | 450 | | | 466 |
| | | | | | |
| Description | | Face Amount
($ Thousands) | | Market Value
($ Thousands) |
| | | | | | |
Macy’s Retail Holdings | | | | | | |
5.350%, 03/15/12 | | $ | 100 | | $ | 102 |
Sirius XM Radio | | | | | | |
9.750%, 09/01/15 (A) | | | 90 | | | 95 |
| | | | | | |
| | | | | | 663 |
| | | | | | |
|
Consumer Staples — 0.4% |
Seminole Indian Tribe of Florida | | | | | | |
6.535%, 10/01/20 (A) | | | 450 | | | 402 |
| | | | | | |
|
Energy — 0.1% |
Canadian Natural Resources | | | | | | |
5.700%, 05/15/17 | | | 150 | | | 164 |
| | | | | | |
|
Financials — 5.4% |
Ameriprise Financial | | | | | | |
5.350%, 11/15/10 | | | 300 | | | 305 |
Bank of America MTN | | | | | | |
0.638%, 04/30/12 (B) | | | 200 | | | 202 |
0.471%, 06/22/12 (B) | | | 500 | | | 503 |
Capital One Financial MTN | | | | | | |
5.700%, 09/15/11 | | | 150 | | | 156 |
Citigroup | | | | | | |
0.807%, 06/09/16 (B) | | | 150 | | | 126 |
Citigroup Funding | | | | | | |
0.668%, 04/30/12 (B) | | | 125 | | | 126 |
0.486%, 06/03/11 (B) | | | 135 | | | 135 |
General Electric Capital | | | | | | |
0.414%, 04/28/11 (B) | | | 140 | | | 139 |
Genworth Global Funding Trusts MTN | | | | | | |
5.200%, 10/08/10 | | | 400 | | | 404 |
GMAC | | | | | | |
0.266%, 12/19/12 (B) | | | 350 | | | 350 |
Hartford Financial Services Group | | | | | | |
7.900%, 06/15/10 | | | 250 | | | 251 |
JPMorgan Chase | | | | | | |
0.487%, 06/15/12 (B) | | | 500 | | | 503 |
JPMorgan Chase Capital XXI, Ser U | | | | | | |
1.294%, 02/02/37 (B) | | | 250 | | | 174 |
Liberty Property L.P. | | | | | | |
7.250%, 03/15/11‡ | | | 300 | | | 311 |
Monumental Global Funding | | | | | | |
0.503%, 01/15/14 (A) (B) | | | 230 | | | 219 |
Morgan Stanley | | | | | | |
0.654%, 02/10/12 (B) | | | 350 | | | 352 |
0.595%, 01/09/14 (B) | | | 200 | | | 184 |
0.457%, 03/13/12 (B) | | | 200 | | | 201 |
Prudential Financial MTN | | | | | | |
5.100%, 12/14/11 | | | 150 | | | 156 |
Reinsurance Group of America | | | | | | |
5.625%, 03/15/17 | | | 200 | | | 205 |
State Street | | | | | | |
0.438%, 04/30/12 (B) | | | 135 | | | 134 |
| | |
| 50 | | SEI Institutional Investments Trust / Annual Report / May 31, 2010 |
| | | | | | |
| Description | | Face Amount
($ Thousands) | | Market Value
($ Thousands) |
| | | | | | |
State Street Bank and Trust | | | | | | |
0.457%, 09/15/11 (B) | | $ | 295 | | $ | 296 |
Unitrin | | | | | | |
6.000%, 05/15/17 | | | 110 | | | 108 |
4.875%, 11/01/10 | | | 300 | | | 302 |
Wachovia | | | | | | |
0.377%, 03/15/11 (B) | | | 425 | | | 424 |
| | | | | | |
| | | | | | 6,266 |
| | | | | | |
|
Health Care — 0.2% |
UnitedHealth Group | | | | | | |
1.660%, 02/07/11 (B) | | | 250 | | | 251 |
| | | | | | |
|
Industrials — 0.5% |
Berry Plastics | | | | | | |
5.053%, 02/15/15 (B) | | | 460 | | | 431 |
Continental Airlines, Ser 061G | | | | | | |
0.886%, 06/02/13 (B) | | | 142 | | | 120 |
| | | | | | |
| | | | | | 551 |
| | | | | | |
|
Materials — 0.9% |
NewPage | | | | | | |
11.375%, 12/31/14 | | | 380 | | | 355 |
Verso Paper Holdings LLC | | | | | | |
11.500%, 07/01/14 (A) | | | 675 | | | 721 |
| | | | | | |
| | | | | | 1,076 |
| | | | | | |
|
Telecommunication Services — 0.4% |
Corning | | | | | | |
6.050%, 06/15/15 | | | 150 | | | 152 |
Telecom Italia Capital | | | | | | |
0.914%, 07/18/11 (B) | | | 150 | | | 149 |
Vodafone Group PLC | | | | | | |
0.816%, 02/27/12 (B) | | | 150 | | | 150 |
| | | | | | |
| | | | | | 451 |
| | | | | | |
|
Utilities — 0.3% |
KeySpan | | | | | | |
7.625%, 11/15/10 | | | 300 | | | 309 |
| | | | | | |
Total Corporate Obligations
(Cost $10,081) ($ Thousands) | | | 10,133 |
| | | | | | |
|
MORTGAGE-BACKED SECURITIES — 4.1% |
|
Non-Agency Mortgage-Backed Obligations — 4.1% |
American Tower Trust, Ser 2007-1A, Cl D | | | | | | |
5.957%, 04/15/37 | | | 125 | | | 131 |
Banc of America Funding, Ser 2005-F,
Cl 4A1 | | | |
5.193%, 09/20/35 (B) | | | 419 | | | 313 |
Banc of America Funding, Ser 2006-D, Cl 3A1 | | | | | | |
5.448%, 05/20/36 (B) | | | 341 | | | 276 |
| | | | | | |
| Description | | Face Amount
($ Thousands) | | Market Value
($ Thousands) |
| | | | | | |
Banc of America Large Loan,
Ser 2007-BMB1, Cl A1 | | | | | | |
0.847%, 08/15/29 (B) | | $ | 166 | | $ | 150 |
Banc of America Mortgage Securities, Ser 2005-A, Cl 2A1 | | | | | | |
3.180%, 02/25/35 (B) | | | 186 | | | 158 |
Bear Stearns Adjustable Rate Mortgage Trust, Ser 2006-1, Cl A1 | | | | | | |
4.625%, 02/25/36 (B) | | | 347 | | | 315 |
Bear Stearns Commercial Mortgage Securities, Ser 2001-TOP2, Cl A2 | | | | | | |
6.480%, 02/15/35 | | | 439 | | | 449 |
Crusade Global Trust, Ser 2007-1, Cl A1 | | | | | | |
0.364%, 04/19/38 (B) | | | 167 | | | 146 |
GMAC Mortgage Loan Trust,
Ser 2006-AR1, Cl 1A1 | | | | | | |
5.294%, 04/19/36 (B) | | | 374 | | | 295 |
JPMorgan Mortgage Trust, Ser 2007-A4, Cl 1A1 | | | | | | |
5.373%, 06/25/37 (B) | | | 332 | | | 273 |
Master Adjustable Rate Mortgages Trust, Ser 2005-6, Cl 5A1 | | | | | | |
4.003%, 07/25/35 (B) | | | 371 | | | 297 |
Merrill Lynch Mortgage Backed Securities Trust, Ser 2007-2, Cl 1A1 | | | | | | |
5.800%, 08/25/36 (B) | | | 374 | | | 299 |
Merrill Lynch Mortgage Investors,
Ser 2005-A1, Cl 2A1 | | | | | | |
3.070%, 12/25/34 (B) | | | 317 | | | 305 |
MortgageIT Trust, Ser 2005-4, Cl A1 | | | | | | |
0.623%, 10/25/35 (B) | | | 352 | | | 238 |
Residential Funding Mortgage Securities, Ser 2005-SA5, Cl 2A | | | | | | |
5.293%, 11/25/35 (B) | | | 140 | | | 115 |
Washington Mutual Mortgage Pass-Through Certificate,
Ser 2005-AR14, Cl 1A4 | | | | | | |
5.048%, 12/25/35 (B) | | | 363 | | | 306 |
Wells Fargo Mortgage-Backed Securities Trust, Ser 2004-Z, Cl 2A1 | | | | | | |
2.971%, 12/25/34 (B) | | | 315 | | | 310 |
Wells Fargo Mortgage-Backed Securities Trust, Ser 2005-AR16, Cl 6A3 | | | | | | |
3.981%, 10/25/35 (B) | | | 124 | | | 119 |
Wells Fargo Mortgage-Backed Securities Trust, Ser 2005-AR16, Cl 3A2 | | | | | | |
2.941%, 10/25/35 (B) | | | 82 | | | 72 |
Wells Fargo Mortgage-Backed Securities Trust, Ser 2006-AR2, Cl 2A3 | | | | | | |
4.896%, 03/25/36 (B) | | | 132 | | | 112 |
| | | | | | |
Total Mortgage-Backed Securities
(Cost $5,450) ($ Thousands) | | | 4,679 |
| | | | | | |
| | |
| SEI Institutional Investments Trust / Annual Report / May 31, 2010 | | 51 |
SCHEDULE OF INVESTMENTS
Enhanced LIBOR Opportunities Fund (Concluded)
May 31, 2010
| | | | | | |
| Description | | Face Amount
($ Thousands) | | Market Value
($ Thousands) |
| | | | | | |
|
ASSET-BACKED SECURITIES — 2.9% |
|
Automotive — 1.2% |
AmeriCredit Automobile Receivables Trust, Ser 2007-CM, Cl A4A | | | | | | |
5.550%, 04/07/14 | | $ | 250 | | $ | 262 |
Americredit Prime Automobile Receivable, Ser 2007-2M, Cl A3 | | | | | | |
5.220%, 06/08/12 | | | 136 | | | 137 |
Capital Auto Receivables Asset Trust,
Ser 2007-3, Cl A3A | | | | | | |
5.020%, 09/15/11 | | | 30 | | | 30 |
Capital One Auto Finance Trust,
Ser 2007-C, Cl A3A | | | | | | |
5.130%, 04/16/12 | | | 141 | | | 143 |
CarMax Auto Owner Trust, Ser 2007-1, Cl C | | | | | | |
5.530%, 07/15/13 | | | 50 | | | 51 |
Daimler Chrysler Auto Trust,
Ser 2007-A, Cl A3A | | | | | | |
5.000%, 02/08/12 | | | 139 | | | 140 |
Ford Credit Auto Owner Trust,
Ser 2007-B, Cl A3A | | | | | | |
5.150%, 11/15/11 | | | 91 | | | 92 |
Harley-Davidson Motorcycle Trust,
Ser 2007-1, Cl C | | | | | | |
5.540%, 04/15/15 | | | 105 | | | 109 |
Hyundai Auto Receivables Trust,
Ser 2007-A, Cl A3B | | | | | | |
0.737%, 01/17/12 (B) | | | 28 | | | 28 |
Merrill Auto Trust Securitization,
Ser 2007-1, Cl C | | | | | | |
5.960%, 12/15/13 | | | 101 | | | 102 |
Nissan Auto Receivables Owner Trust, Ser 2007-B, Cl A3 | | | | | | |
5.030%, 05/16/11 | | | 8 | | | 8 |
Swift Master Auto Receivables Trust,
Ser 2007-2, Cl A | | | | | | |
0.987%, 10/15/12 (B) | | | 200 | | | 199 |
USAA Auto Owner Trust, Ser 2007-2, Cl A3 | | | | | | |
4.900%, 02/15/12 | | | 28 | | | 29 |
| | | | | | |
| | | | | | 1,330 |
| | | | | | |
|
Credit Cards — 0.7% |
American Express Credit Account Master Trust, Ser 2007-2, Cl B | | | | | | |
0.517%, 09/15/16 (B) | | | 145 | | | 141 |
Chase Issuance Trust, Ser 2005-C2, Cl C2 | | | | | | |
0.777%, 01/15/15 (B) | | | 200 | | | 195 |
| | | | | | |
| Description | | Face Amount
($ Thousands)/Shares | | Market Value
($ Thousands) |
| | | | | | |
Citibank Credit Card Issuance Trust,
Ser 2007-B5, Cl B5 | | | | | | |
0.971%, 11/07/14 (B) | | $ | 250 | | $ | 249 |
GE Capital Credit Card Master Note Trust,
Ser 2007-3, Cl C | | | | | | |
0.637%, 06/15/13 (B) | | | 250 | | | 250 |
| | | | | | |
| | | | | | 835 |
| | | | | | |
|
Mortgage Related Securities — 0.7% |
Morgan Stanley Home Equity Loan Trust, Ser 2005-3, Cl M1 | | | | | | |
0.793%, 08/25/35 (B) | | | 350 | | | 272 |
Morgan Stanley Home Equity Loan Trust, Ser 2005-4, Cl M1 | | | | | | |
0.753%, 09/25/35 (B) | | | 370 | | | 180 |
Option One Mortgage Loan Trust,
Ser 2005-5, Cl M1 | | | | | | |
0.733%, 12/25/35 (B) | | | 470 | | | 242 |
Residential Asset Securities,
Ser 2005-KS12, Cl M1 | | | | | | |
0.783%, 01/25/36 (B) | | | 375 | | | 136 |
| | | | | | |
| | | | | | 830 |
| | | | | | |
|
Other Asset-Backed Securities — 0.3% |
Dominos Pizza Master Issuer LLC,
Ser 2007-1, Cl A2 | | | | | | |
5.261%, 04/25/37 | | | 400 | | | 373 |
| | | | | | |
Total Asset-Backed Securities
(Cost $4,126) ($ Thousands) | | | | | | 3,368 |
| | | | | | |
|
U.S. GOVERNMENT AGENCY OBLIGATION — 1.3% |
FHLB | | | | | | |
1.375%, 05/16/11 | | | 1,500 | | | 1,511 |
| | | | | | |
Total U.S. Government Agency Obligation
(Cost $1,499) ($ Thousands) | | | | | | 1,511 |
| | | | | | |
|
U.S. TREASURY OBLIGATION — 0.5% |
U.S. Treasury Notes | | | | | | |
0.875%, 01/31/11 | | | 600 | | | 602 |
| | | | | | |
Total U.S. Treasury Obligation
(Cost $601) ($ Thousands) | | | | | | 602 |
| | | | | | |
|
CASH EQUIVALENT — 4.6% |
SEI Daily Income Trust, Prime Obligation Fund, Cl A, 0.090%*† | | | 5,337,012 | | | 5,337 |
| | | | | | |
Total Cash Equivalent
(Cost $5,337) ($ Thousands) | | | | | | 5,337 |
| | | | | | |
| | |
| 52 | | SEI Institutional Investments Trust / Annual Report / May 31, 2010 |
| | | | | |
| Description | | Shares | | Market Value
($ Thousands) |
| | | | | |
|
AFFILIATED PARTNERSHIP — 44.1% |
SEI LIBOR Plus Portfolio† | | 7,611,979 | | $ | 50,924 |
| | | | | |
Total Affiliated Partnership
(Cost $72,725) ($ Thousands) | | | | | 50,924 |
| | | | | |
Total Investments — 99.1%
(Cost $138,872) ($ Thousands) | | | | $ | 114,447 |
| | | | | |
A summary of the open futures contracts held by the Fund at May 31, 2010, is as follows:
| | | | | | | | | |
Type of
Contract | | Number of
Contracts
Long (Short) | | | Expiration
Date | | Unrealized
Appreciation
(Depreciation)
($ Thousands) | |
U.S. 10-Year Treasury Note | | (10 | ) | | Sep-2010 | | $ | 5 | |
U.S. 2-Year Treasury Note | | (14 | ) | | Oct-2010 | | | (5 | ) |
U.S. 5-Year Treasury Note | | 10 | | | Oct-2010 | | | (4 | ) |
U.S. Long Treasury Bond | | (2 | ) | | Oct-2010 | | | 2 | |
| | | | | | | | | |
| | | | | | | $ | (2 | ) |
| | | | | | | | | |
For the year ended May 31, 2010, the total amount of all open futures contracts, as presented in the table above, are representative of the volume of activity for this derivative type during the period.
Percentages are based on Net Assets of $115,519 ($ Thousands).
| * | | Rate shown is the 7-day effective yield as of May 31, 2010. |
| † | | Investment in Affiliated Security (See Note 5). |
| ‡ | | Real Estate Investment Trust |
| (A) | | Securities sold within terms of a private placement memorandum, exempt from registration under Section 144A of the Securities Act of 1933, as amended, and may be sold only to dealers in that program or other “accredited investors.” These securities have been determined to be liquid under guidelines established by the board of Trustees. |
| (B) | | Variable Rate Security. The rate reported is the rate in effect as of May 31, 2010. The date reported is the final maturity date. |
| (C) | | Security in default on interest payments. |
| (D) | | Securities considered illiquid and restricted. The total value of such securities as of May 31, 2010 was $0 ($ Thousands) and represented 0.0% of net assets. (Unaudited in regards to illiquid status) |
Cl — Class
FHLB — Federal Home Loan Bank
LIBOR — London Interbank Offered Rate
LLC — Limited Liability Company
L.P. — Limited Partnership
MTN — Medium Term Note
PLC — Public Limited Company
Ser — Series
Amounts designated as “—” are $O or have been rounded to $O.
The following is a summary of the inputs used as of May 31, 2010 in valuing the Fund’s investments carried at value ($ Thousands):
| | | | | | | | | | | | |
| Investments in Securities | | Level 1 | | Level 2 | | Level 3 | | Total |
Loan Participations | | $ | — | | $ | 37,893 | | $ | — | | $ | 37,893 |
Corporate Obligations | | | — | | | 10,133 | | | — | | | 10,133 |
Mortgage-Backed Securities | | | — | | | 4,679 | | | — | | | 4,679 |
Asset-Backed Securities | | | — | | | 3,368 | | | — | | | 3,368 |
U.S. Government Agency | | | | | | | | | | | | |
Obligation | | | — | | | 1,511 | | | — | | | 1,511 |
U.S. Treasury Obligation | | | — | | | 602 | | | — | | | 602 |
Cash Equivalent | | | 5,337 | | | — | | | — | | | 5,337 |
Affiliated Partnership | | | 50,924 | | | — | | | — | | | 50,924 |
| | | | | | | | | | | | |
Total Investments in Securities | | $ | 56,261 | | $ | 58,186 | | $ | — | | $ | 114,447 |
| | | | | | | | | | | | |
| | | | | | | | | | | | | | |
| Other Financial Instruments | | Level 1 | | | Level 2 | | Level 3 | | Total | |
Futures Contracts* | | $ | (2 | ) | | $ | — | | $ | — | | $ | (2 | ) |
| | | | | | | | | | | | | | |
Total Other Financial Instruments | | $ | (2 | ) | | $ | — | | $ | — | | $ | (2 | ) |
| | | | | | | | | | | | | | |
The following is a reconciliation of investments in which significant unobservable inputs (Level 3) were used in determining value ($ Thousands):
| | | | |
| | | Investments in
Common Stock | |
Beginning balance as of June 1, 2009 | | $ | 88 | |
Accrued discounts/premiums | | | — | |
Realized gain/(loss) | | | 22 | |
Change in unrealized appreciation/depreciation | | | (88 | ) |
Net purchases/sales | | | (22 | ) |
Net transfer in and/or out of Level 3 | | | — | |
| | | | |
Ending balance as of May 31, 2010 | | $ | — | |
| | | | |
Changes in unrealized gains/(losses) included in earnings related to securities still held at reporting date | | | — | |
| | | | |
| * | | Futures contracts are valued at the unrealized depreciation on the instrument. |
For more information on valuation inputs, see Note 2 — Significant Accounting Policies in Notes to Financial Statements.
The accompanying notes are an integral part of the financial statements.
| | |
| SEI Institutional Investments Trust / Annual Report / May 31, 2010 | | 53 |
SCHEDULE OF INVESTMENTS
Core Fixed Income Fund
May 31, 2010
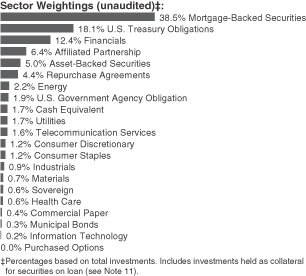
| | | | | | |
| Description | | Face Amount
($ Thousands) | | Market Value
($ Thousands) |
| | | | | | |
|
MORTGAGE-BACKED SECURITIES — 45.8% |
|
Agency Mortgage-Backed Obligations — 32.1% |
Federal Home Loan Banks CMO, Cl 1 |
5.300%, 06/15/12 | | $ | 684 | | $ | 728 |
FHLMC |
11.000%, 02/17/21 | | | 2,152 | | | 2,379 |
10.000%, 03/17/26 to 10/01/30 | | | 3,897 | | | 4,556 |
7.500%, 08/01/30 to 09/20/38 | | | 3,652 | | | 4,105 |
7.000%, 11/01/15 to 09/01/25 | | | 155 | | | 173 |
6.500%, 06/01/17 to 09/01/38 | | | 34,548 | | | 37,813 |
6.000%, 03/01/20 to 08/01/38 | | | 39,287 | | | 42,460 |
5.500%, 12/01/13 to 12/01/37 | | | 73,895 | | | 79,315 |
5.000%, 04/18/17 to 12/01/34 | | | 38,933 | | | 41,721 |
4.000%, 10/01/33 | | | 1,649 | | | 1,637 |
2.875%, 02/09/15 | | | 3,390 | | | 3,468 |
1.125%, 07/27/12 | | | 7,814 | | | 7,820 |
0.469%, 02/03/12 (A) | | | 14,170 | | | 14,177 |
FHLMC ARM (A) |
6.697%, 08/01/36 | | | 1,939 | | | 2,042 |
6.604%, 08/01/36 | | | 792 | | | 837 |
6.597%, 07/01/36 | | | 1,196 | | | 1,257 |
6.455%, 02/01/37 | | | 794 | | | 858 |
6.410%, 12/01/36 | | | 1,239 | | | 1,335 |
6.409%, 11/01/37 | | | 382 | | | 410 |
6.364%, 12/01/36 | | | 1,765 | | | 1,870 |
6.355%, 10/01/36 | | | 480 | | | 508 |
6.306%, 09/01/36 to 10/01/36 | | | 9,338 | | | 9,840 |
6.274%, 09/01/37 | | | 5,948 | | | 6,340 |
6.261%, 09/01/36 | | | 737 | | | 775 |
6.203%, 02/01/37 | | | 1,900 | | | 2,022 |
6.195%, 06/01/36 to 03/01/37 | | | 2,570 | | | 2,716 |
6.183%, 12/01/36 | | | 1,092 | | | 1,158 |
6.179%, 09/01/36 | | | 459 | | | 493 |
| | | | | | |
| Description | | Face Amount
($ Thousands) | | Market Value
($ Thousands) |
| | | | | | |
6.150%, 12/01/36 | | $ | 557 | | $ | 588 |
6.143%, 06/01/37 | | | 469 | | | 504 |
6.132%, 05/01/37 | | | 1,096 | | | 1,170 |
6.106%, 11/01/37 | | | 1,603 | | | 1,701 |
6.085%, 01/01/37 | | | 3,058 | | | 3,254 |
6.040%, 10/01/37 | | | 2,402 | | | 2,554 |
6.032%, 10/01/36 | | | 1,217 | | | 1,279 |
6.013%, 12/01/36 | | | 2,143 | | | 2,279 |
5.965%, 11/01/36 to 09/01/37 | | | 729 | | | 775 |
5.956%, 03/01/37 | | | 1,475 | | | 1,565 |
5.952%, 01/01/37 | | | 546 | | | 585 |
5.910%, 04/01/37 | | | 1,848 | | | 1,957 |
5.889%, 02/01/37 | | | 451 | | | 477 |
5.888%, 07/01/37 | | | 795 | | | 856 |
5.874%, 11/01/36 | | | 953 | | | 1,012 |
5.841%, 05/01/36 | | | 1,112 | | | 1,176 |
5.838%, 05/01/37 | | | 5,593 | | | 5,931 |
5.816%, 05/01/37 | | | 379 | | | 400 |
5.791%, 11/01/38 | | | 748 | | | 802 |
5.765%, 05/01/37 | | | 2,349 | | | 2,475 |
5.739%, 05/01/37 | | | 1,004 | | | 1,060 |
5.717%, 03/01/36 | | | 945 | | | 1,010 |
5.693%, 04/01/37 | | | 1,134 | | | 1,200 |
5.688%, 03/01/36 | | | 1,857 | | | 1,981 |
5.686%, 06/01/37 | | | 1,251 | | | 1,339 |
5.652%, 04/01/38 | | | 400 | | | 421 |
5.642%, 10/01/38 | | | 930 | | | 989 |
5.641%, 04/01/37 | | | 360 | | | 380 |
5.610%, 05/01/37 | | | 802 | | | 846 |
5.551%, 05/01/36 | | | 810 | | | 854 |
5.547%, 05/01/36 | | | 2,008 | | | 2,130 |
5.465%, 08/01/37 | | | 3,704 | | | 3,927 |
5.322%, 05/01/38 | | | 1,182 | | | 1,245 |
5.134%, 01/01/36 | | | 3,782 | | | 4,004 |
FHLMC CMO, Ser 1, Cl Z | | | | | | |
9.300%, 04/15/19 | | | 25 | | | 27 |
FHLMC CMO, Ser 1142, Cl IA | | | | | | |
7.000%, 10/15/21 | | | 393 | | | 428 |
FHLMC CMO, Ser 1611, Cl Z | | | | | | |
6.500%, 11/15/23 | | | 12,104 | | | 12,955 |
FHLMC CMO, Ser 2043, Cl CJ | | | | | | |
6.500%, 04/15/28 | | | 1,553 | | | 1,646 |
FHLMC CMO, Ser 2075, Cl D | | | | | | |
6.500%, 08/15/28 | | | 1,765 | | | 1,910 |
FHLMC CMO, Ser 2138, Cl KS, IO | | | | | | |
7.363%, 02/15/29 (A) | | | 1,929 | | | 191 |
FHLMC CMO, Ser 2293, Cl ZA | | | | | | |
6.000%, 03/15/31 | | | 1,939 | | | 2,109 |
FHLMC CMO, Ser 2312, Cl Z | | | | | | |
6.500%, 05/15/31 | | | 1,198 | | | 1,305 |
FHLMC CMO, Ser 2357, Cl ZJ | | | | | | |
6.500%, 09/15/31 | | | 291 | | | 320 |
FHLMC CMO, Ser 2434, Cl ZA | | | | | | |
6.500%, 04/15/32 | | | 3,151 | | | 3,480 |
| | |
| 54 | | SEI Institutional Investments Trust / Annual Report / May 31, 2010 |
| | | | | | |
| Description | | Face Amount
($ Thousands) | | Market Value
($ Thousands) |
| | | | | | |
FHLMC CMO, Ser 2456, Cl CJ | | | | | | |
6.500%, 06/15/32 | | $ | 934 | | $ | 1,034 |
FHLMC CMO, Ser 2458, Cl ZM | | | | | | |
6.500%, 06/15/32 | | | 1,711 | | | 1,896 |
FHLMC CMO, Ser 2542, Cl ES | | | | | | |
5.000%, 12/15/17 | | | 1,228 | | | 1,317 |
FHLMC CMO, Ser 2558, Cl BD | | | | | | |
5.000%, 01/15/18 | | | 4,137 | | | 4,479 |
FHLMC CMO, Ser 2587, Cl CO, PO | | | | | | |
0.000%, 03/15/32 | | | 1,155 | | | 1,078 |
FHLMC CMO, Ser 2590, Cl BY | | | | | | |
5.000%, 03/15/18 | | | 1,346 | | | 1,457 |
FHLMC CMO, Ser 2590, Cl NU | | | | | | |
5.000%, 06/15/17 | | | 908 | | | 943 |
FHLMC CMO, Ser 2591, Cl QO | | | | | | |
4.500%, 03/15/18 | | | 1,000 | | | 1,065 |
FHLMC CMO, Ser 2631, Cl SA | | | | | | |
14.232%, 06/15/33 (A) | | | 876 | | | 1,044 |
FHLMC CMO, Ser 2671, Cl S | | | | | | |
14.141%, 09/15/33 (A) | | | 815 | | | 963 |
FHLMC CMO, Ser 2676, Cl CY | | | | | | |
4.000%, 09/15/18 | | | 2,291 | | | 2,394 |
FHLMC CMO, Ser 2684, Cl SN | | | | | | |
26.566%, 10/15/33 (A) | | | 200 | | | 239 |
FHLMC CMO, Ser 2690, Cl TV | | | | | | |
4.500%, 11/15/25 | | | 1,800 | | | 1,910 |
FHLMC CMO, Ser 2690, Cl SJ | | | | | | |
8.645%, 10/15/33 (A) | | | 692 | | | 643 |
FHLMC CMO, Ser 2691, Cl SE | | | | | | |
9.081%, 12/15/28 (A) | | | 556 | | | 589 |
FHLMC CMO, Ser 2694, Cl QG | | | | | | |
4.500%, 01/15/29 | | | 270 | | | 283 |
FHLMC CMO, Ser 2695, Cl SX | | | | | | |
15.665%, 10/15/33 (A) | | | 256 | | | 272 |
FHLMC CMO, Ser 2695, Cl OB, PO | | | | | | |
0.000%, 10/15/33 | | | 307 | | | 239 |
FHLMC CMO, Ser 2698, Cl SV | | | | | | |
8.495%, 11/15/33 (A) | | | 353 | | | 332 |
FHLMC CMO, Ser 2725, Cl SC | | | | | | |
8.544%, 11/15/33 (A) | | | 322 | | | 287 |
FHLMC CMO, Ser 2727, Cl PW | | | | | | |
3.570%, 06/15/29 | | | 383 | | | 391 |
FHLMC CMO, Ser 2754, Cl JG | | | | | | |
4.500%, 03/15/33 | | | 780 | | | 786 |
FHLMC CMO, Ser 2765, Cl CT | | | | | | |
4.000%, 03/15/19 | | | 1,557 | | | 1,606 |
FHLMC CMO, Ser 2778, Cl JD | | | | | | |
5.000%, 12/15/32 | | | 1,974 | | | 2,116 |
FHLMC CMO, Ser 2812, Cl NO, PO | | | | | | |
0.000%, 10/15/33 | | | 459 | | | 334 |
FHLMC CMO, Ser 2827, Cl CS | | | | | | |
15.574%, 04/15/32 (A) | | | 137 | | | 143 |
FHLMC CMO, Ser 2833, Cl KO, PO | | | | | | |
0.000%, 08/15/34 | | | 250 | | | 210 |
| | | | | | |
| Description | | Face Amount
($ Thousands) | | Market Value
($ Thousands) |
| | | | | | |
FHLMC CMO, Ser 2843, Cl BC | | | | | | |
5.000%, 08/15/19 | | $ | 1,740 | | $ | 1,882 |
FHLMC CMO, Ser 2864, Cl NB | | | | | | |
5.500%, 07/15/33 | | | 2,000 | | | 2,194 |
FHLMC CMO, Ser 2865, Cl GO, PO | | | | | | |
0.000%, 10/15/33 | | | 463 | | | 346 |
FHLMC CMO, Ser 2875, Cl HB | | | | | | |
4.000%, 10/15/19 | | | 954 | | | 978 |
FHLMC CMO, Ser 2897, Cl EO, PO | | | | | | |
0.000%, 10/15/31 | | | 557 | | | 512 |
FHLMC CMO, Ser 2903, Cl UZ | | | | | | |
5.500%, 07/15/31 | | | 522 | | | 546 |
FHLMC CMO, Ser 2934, Cl CI | | | | | | |
5.000%, 01/15/34 | | | 9,978 | | | 10,733 |
FHLMC CMO, Ser 2945, Cl SA | | | | | | |
11.688%, 03/15/20 (A) | | | 3,168 | | | 3,615 |
FHLMC CMO, Ser 2950, Cl JO, PO | | | | | | |
0.000%, 03/15/20 | | | 556 | | | 502 |
FHLMC CMO, Ser 2957, Cl PT | | | | | | |
5.500%, 11/15/33 | | | 6,333 | | | 6,806 |
FHLMC CMO, Ser 2981, Cl FA | | | | | | |
0.737%, 05/15/35 (A) | | | 952 | | | 928 |
FHLMC CMO, Ser 2982, Cl CI | | | | | | |
5.500%, 02/15/34 | | | 7,882 | | | 8,459 |
FHLMC CMO, Ser 2990, Cl LK | | | | | | |
0.707%, 10/15/34 (A) | | | 890 | | | 886 |
FHLMC CMO, Ser 3001, Cl HP | | | | | | |
20.652%, 05/15/35 (A) | | | 148 | | | 166 |
FHLMC CMO, Ser 3006, Cl QS | | | | | | |
19.209%, 07/15/35 (A) | | | 888 | | | 1,044 |
FHLMC CMO, Ser 3012, Cl GK | | | | | | |
23.234%, 06/15/35 (A) | | | 138 | | | 172 |
FHLMC CMO, Ser 3028, Cl PG | | | | | | |
5.500%, 09/15/35 | | | 412 | | | 452 |
FHLMC CMO, Ser 3035, Cl PA | | | | | | |
5.500%, 09/15/35 | | | 996 | | | 1,094 |
FHLMC CMO, Ser 3049, Cl XF | | | | | | |
0.687%, 05/15/33 (A) | | | 1,144 | | | 1,137 |
FHLMC CMO, Ser 3052, Cl MH | | | | | | |
5.250%, 10/15/34 | | | 2,980 | | | 3,166 |
FHLMC CMO, Ser 3076, Cl MP | | | | | | |
0.000%, 10/15/30 | | | 48 | | | 48 |
FHLMC CMO, Ser 3137, Cl XP | | | | | | |
6.000%, 04/15/36 | | | 1,214 | | | 1,344 |
FHLMC CMO, Ser 3195, Cl PD | | | | | | |
6.500%, 07/15/36 | | | 2,500 | | | 2,790 |
FHLMC CMO, Ser 3202, Cl HI, IO | | | | | | |
6.313%, 08/15/36 (A) | | | 1,347 | | | 178 |
FHLMC CMO, Ser 3217, Cl CX, IO | | | | | | |
6.253%, 09/15/36 (A) | | | 1,113 | | | 144 |
FHLMC CMO, Ser 3234, Cl MC | | | | | | |
4.500%, 10/15/36 | | | 166 | | | 172 |
FHLMC CMO, Ser 3262, Cl SG, IO | | | | | | |
6.063%, 01/15/37 (A) | | | 1,600 | | | 173 |
| | |
| SEI Institutional Investments Trust / Annual Report / May 31, 2010 | | 55 |
SCHEDULE OF INVESTMENTS
Core Fixed Income Fund (Continued)
May 31, 2010
| | | | | | |
| Description | | Face Amount
($ Thousands) | | Market Value
($ Thousands) |
| | | | | | |
FHLMC CMO, Ser 3263, Cl WE | | | | | | |
0.438%, 08/15/35 (A) | | $ | 148 | | $ | 145 |
FHLMC CMO, Ser 3312, Cl BP | | | | | | |
5.500%, 01/15/31 | | | 300 | | | 318 |
FHLMC CMO, Ser 3336, Cl FA | | | | | | |
0.567%, 02/15/19 (A) | | | 17,450 | | | 17,433 |
FHLMC CMO, Ser 3342, Cl VG | | | | | | |
6.000%, 11/15/23 | | | 1,000 | | | 1,111 |
FHLMC CMO, Ser 3372, Cl BD | | | | | | |
4.500%, 10/15/22 | | | 2,533 | | | 2,674 |
FHLMC CMO, Ser 3373, Cl TO, PO | | | | | | |
0.000%, 04/15/37 | | | 387 | | | 333 |
FHLMC CMO, Ser 3383, Cl SA, IO | | | | | | |
6.113%, 11/15/37 (A) | | | 1,471 | | | 186 |
FHLMC CMO, Ser 3387, Cl SA, IO | | | | | | |
6.083%, 11/15/37 (A) | | | 1,108 | | | 95 |
FHLMC CMO, Ser 3422, Cl SE | | | | | | |
16.608%, 02/15/38 (A) | | | 296 | | | 363 |
FHLMC CMO, Ser 3437, Cl AI, IO | | | | | | |
1.335%, 09/15/11 | | | 2,272 | | | 26 |
FHLMC CMO, Ser 3455, Cl SE, IO | | | | | | |
5.863%, 06/15/38 (A) | | | 4,420 | | | 440 |
FHLMC CMO, Ser 3461, Cl LZ | | | | | | |
6.000%, 06/15/38 | | | 561 | | | 613 |
FHLMC CMO, Ser 3465, Cl HA | | | | | | |
4.000%, 07/15/17 | | | 4,841 | | | 5,054 |
FHLMC CMO, Ser 3515, Cl PIM15, IO | | | | | | |
5.500%, 07/15/37 | | | 1,301 | | | 187 |
FHLMC CMO, Ser 3546, Cl A | | | | | | |
6.017%, 02/15/39 (A) | | | 700 | | | 743 |
FHLMC CMO, Ser 3607, Cl BOPO, PO | | | | | | |
0.000%, 04/15/36 | | | 500 | | | 352 |
FHLMC CMO, Ser 3611, Cl PO, PO | | | | | | |
0.000%, 07/15/34 | | | 878 | | | 759 |
FHLMC CMO, Ser 3626, Cl MA | | | | | | |
5.000%, 02/15/30 | | | 13,676 | | | 14,625 |
FHLMC CMO, Ser 3631, Cl PA | | | | | | |
4.000%, 02/15/40 | | | 5,261 | | | 5,503 |
FHLMC CMO, Ser 3632, Cl BS | | | | | | |
16.377%, 02/15/40 (A) | | | 400 | | | 526 |
FHLMC CMO, Ser 3652, Cl AP | | | | | | |
4.500%, 03/15/40 | | | 10,451 | | | 11,122 |
FHLMC CMO, Ser T-41, Cl 2A | | | | | | |
6.968%, 07/25/32 (A) | | | 881 | | | 980 |
FHLMC CMO, Ser T-42, Cl A5 | | | | | | |
7.500%, 02/25/42 | | | 1,206 | | | 1,367 |
FHLMC CMO, Ser T-54, Cl 3A | | | | | | |
7.000%, 02/25/43 | | | 803 | | | 898 |
FHLMC CMO, Ser T-54, Cl 2A | | | | | | |
6.500%, 02/25/43 | | | 644 | | | 708 |
FHLMC CMO, Ser T-57, Cl 1A1 | | | | | | |
6.500%, 07/25/43 | | | 761 | | | 836 |
| | | | | | |
| Description | | Face Amount
($ Thousands) | | Market Value
($ Thousands) |
| | | | | | |
FHLMC CMO, Ser T-58, Cl 4A | | | | | | |
7.500%, 09/25/43 | | $ | 990 | | $ | 1,122 |
FHLMC CMO, Ser T-60, Cl 1A2 | | | | | | |
7.000%, 03/25/44 | | | 741 | | | 830 |
FHLMC CMO, Ser T-76, Cl 2A | | | | | | |
4.811%, 10/25/37 (A) | | | 1,578 | | | 1,618 |
FHLMC Multifamily Structured Pass Through Certificates,
Ser K003, Cl AAB | | | | | | |
4.768%, 05/25/18 | | | 2,824 | | | 3,035 |
FHLMC Multifamily Structured Pass Through Certificates,
Ser K005, Cl A2 | | | | | | |
4.317%, 11/25/19 | | | 2,945 | | | 3,000 |
FHLMC Reference REMIC CMO,
Ser R007, Cl ZA | | | | | | |
6.000%, 05/15/36 | | | 1,143 | | | 1,244 |
FHLMC STRIP CMO, Ser 239, Cl S30, IO | | | | | | |
7.363%, 08/15/36 (A) | | | 1,990 | | | 280 |
FHLMC TBA | | | | | | |
5.500%, 06/01/33 | | | 24,000 | | | 25,560 |
5.000%, 06/12/37 | | | 2,000 | | | 2,094 |
FHLMC-GNMA CMO, Ser 21, Cl L | | | | | | |
6.250%, 10/25/23 | | | 934 | | | 986 |
FNMA | | | | | | |
8.000%, 04/01/15 to 11/01/37 | | | 1,601 | | | 1,768 |
7.500%, 06/01/30 to 04/01/39 | | | 4,593 | | | 5,132 |
7.000%, 12/01/15 to 01/01/39 | | | 10,117 | | | 11,265 |
6.500%, 05/01/17 to 10/01/38 | | | 39,841 | | | 43,638 |
6.000%, 03/01/19 to 08/01/37 | | | 102,289 | | | 110,890 |
5.500%, 04/01/14 to 08/01/37 | | | 174,852 | | | 188,143 |
5.000%, 02/01/20 to 09/01/35 | | | 59,048 | | | 62,411 |
4.500%, 07/01/20 to 02/01/40 | | | 39,266 | | | 41,016 |
4.000%, 04/01/19 to 11/01/20 | | | 3,462 | | | 3,613 |
FNMA TBA | | | | | | |
6.500%, 06/01/37 | | | 9,200 | | | 10,008 |
6.000%, 06/01/37 | | | 300 | | | 323 |
5.000%, 07/15/38 | | | 31,800 | | | 33,156 |
4.500%, 06/14/40 | | | 31,150 | | | 31,783 |
FNMA ARM (A) | | | | | | |
6.526%, 09/01/36 | | | 512 | | | 542 |
6.478%, 01/01/37 | | | 1,321 | | | 1,423 |
6.257%, 10/01/36 | | | 668 | | | 717 |
6.237%, 09/01/36 | | | 462 | | | 488 |
6.180%, 10/01/36 | | | 980 | | | 1,038 |
6.178%, 08/01/36 | | | 475 | | | 509 |
6.150%, 02/01/37 | | | 974 | | | 1,036 |
6.138%, 07/01/37 | | | 637 | | | 678 |
6.110%, 09/01/36 | | | 1,825 | | | 1,955 |
6.080%, 09/01/37 | | | 324 | | | 349 |
6.056%, 09/01/36 | | | 1,623 | | | 1,716 |
| | |
| 56 | | SEI Institutional Investments Trust / Annual Report / May 31, 2010 |
| | | | | | |
| Description | | Face Amount
($ Thousands) | | Market Value
($ Thousands) |
| | | | | | |
6.035%, 12/01/36 | | $ | 775 | | $ | 831 |
6.021%, 09/01/37 | | | 1,295 | | | 1,379 |
6.020%, 10/01/37 | | | 544 | | | 585 |
6.007%, 08/01/36 | | | 774 | | | 822 |
5.996%, 11/01/37 | | | 799 | | | 858 |
5.993%, 05/01/36 | | | 739 | | | 780 |
5.962%, 10/01/37 | | | 1,451 | | | 1,561 |
5.961%, 07/01/37 | | | 1,006 | | | 1,082 |
5.953%, 04/01/37 | | | 439 | | | 469 |
5.939%, 07/01/36 | | | 1,702 | | | 1,809 |
5.929%, 10/01/37 | | | 1,915 | | | 2,052 |
5.926%, 01/01/37 | | | 1,156 | | | 1,239 |
5.921%, 07/01/37 | | | 1,516 | | | 1,604 |
5.919%, 10/01/36 | | | 555 | | | 589 |
5.910%, 03/01/37 | | | 1,049 | | | 1,126 |
5.908%, 04/01/37 | | | 1,334 | | | 1,433 |
5.904%, 06/01/36 | | | 934 | | | 988 |
5.902%, 03/01/37 to 07/01/37 | | | 2,572 | | | 2,765 |
5.898%, 07/01/37 | | | 1,660 | | | 1,786 |
5.896%, 01/01/37 | | | 1,909 | | | 2,049 |
5.895%, 09/01/37 | | | 838 | | | 905 |
5.882%, 11/01/36 | | | 1,441 | | | 1,531 |
5.871%, 07/01/37 to 12/01/37 | | | 4,053 | | | 4,353 |
5.857%, 02/01/37 | | | 994 | | | 1,067 |
5.855%, 04/01/37 | | | 1,752 | | | 1,870 |
5.847%, 11/01/37 | | | 11 | | | 12 |
5.845%, 12/01/36 | | | 2,368 | | | 2,507 |
5.831%, 03/01/37 | | | 696 | | | 742 |
5.817%, 10/01/36 | | | 2,864 | | | 3,029 |
5.804%, 04/01/37 | | | 1,299 | | | 1,385 |
5.796%, 11/01/37 | | | 1,426 | | | 1,522 |
5.795%, 02/01/37 | | | 397 | | | 424 |
5.794%, 05/01/37 | | | 365 | | | 386 |
5.781%, 03/01/37 | | | 1,598 | | | 1,706 |
5.772%, 08/01/37 | | | 1,376 | | | 1,461 |
5.756%, 02/01/37 | | | 1,310 | | | 1,382 |
5.750%, 05/01/37 | | | 670 | | | 716 |
5.720%, 03/01/37 | | | 10,141 | | | 10,799 |
5.718%, 03/01/37 | | | 1,774 | | | 1,893 |
5.703%, 10/01/37 | | | 960 | | | 1,025 |
5.686%, 01/01/23 | | | 1,170 | | | 1,241 |
5.684%, 04/01/37 | | | 1,651 | | | 1,743 |
5.679%, 11/01/36 | | | 1,201 | | | 1,265 |
5.620%, 05/01/37 | | | 3,916 | | | 4,131 |
5.610%, 02/01/39 | | | 2,444 | | | 2,607 |
5.601%, 11/01/37 | | | 881 | | | 933 |
5.599%, 06/01/36 | | | 2,103 | | | 2,218 |
5.556%, 01/01/37 | | | 1,947 | | | 2,055 |
5.516%, 10/01/36 | | | 2,745 | | | 2,892 |
5.501%, 07/01/37 | | | 798 | | | 846 |
FNMA CMO, Cl IO, IO | | | | | | |
6.087%, 03/25/37 (A) | | | 22,045 | | | 3,111 |
FNMA CMO, Ser 1991-113, Cl ZE | | | | | | |
7.500%, 09/25/21 | | | 345 | | | 382 |
| | | | | | |
| Description | | Face Amount
($ Thousands) | | Market Value
($ Thousands) |
| | | | | | |
FNMA CMO, Ser 1992-143, Cl M | | | | | | |
8.000%, 09/25/22 | | $ | 921 | | $ | 1,030 |
FNMA CMO, Ser 1992-69, Cl Z | | | | | | |
8.000%, 05/25/22 | | | 795 | | | 889 |
FNMA CMO, Ser 1992-96, Cl B, PO | | | | | | |
0.000%, 05/25/22 | | | 1 | | | 1 |
FNMA CMO, Ser 1993-149, Cl SH | | | | | | |
11.500%, 08/25/23 (A) | | | 350 | | | 445 |
FNMA CMO, Ser 1993-75, Cl ZQ | | | | | | |
6.500%, 05/25/23 | | | 1,451 | | | 1,579 |
FNMA CMO, Ser 1993-99, Cl Z | | | | | | |
7.000%, 07/25/23 | | | 1,903 | | | 2,104 |
FNMA CMO, Ser 1994-31, Cl ZC | | | | | | |
6.500%, 02/25/24 | | | 1,243 | | | 1,368 |
FNMA CMO, Ser 1994-63, Cl PK | | | | | | |
7.000%, 04/25/24 | | | 1,121 | | | 1,256 |
FNMA CMO, Ser 1997-32, Cl PG | | | | | | |
6.500%, 04/25/27 | | | 847 | | | 923 |
FNMA CMO, Ser 1999-11, Cl Z | | | | | | |
5.500%, 03/25/29 | | | 2,210 | | | 2,396 |
FNMA CMO, Ser 2001-50, Cl BA | | | | | | |
7.000%, 10/25/41 | | | 999 | | | 1,117 |
FNMA CMO, Ser 2001-71, Cl QE | | | | | | |
6.000%, 12/25/16 | | | 1,618 | | | 1,749 |
FNMA CMO, Ser 2001-79, Cl BA | | | | | | |
7.000%, 03/25/45 | | | 679 | | | 758 |
FNMA CMO, Ser 2001-81, Cl HE | | | | | | |
6.500%, 01/25/32 | | | 14,537 | | | 15,813 |
FNMA CMO, Ser 2002-10, Cl SB | | | | | | |
18.377%, 03/25/17 (A) | | | 187 | | | 225 |
FNMA CMO, Ser 2002-81, Cl JO, PO | | | | | | |
0.000%, 04/25/32 | | | 477 | | | 436 |
FNMA CMO, Ser 2002-90, Cl A1 | | | | | | |
6.500%, 06/25/42 | | | 875 | | | 963 |
FNMA CMO, Ser 2002-94, Cl HQ | | | | | | |
4.500%, 01/25/18 | | | 2,400 | | | 2,547 |
FNMA CMO, Ser 2003-108, Cl BE | | | | | | |
4.000%, 11/25/18 | | | 241 | | | 251 |
FNMA CMO, Ser 2003-125, Cl AY | | | | | | |
4.000%, 12/25/18 | | | 667 | | | 692 |
FNMA CMO, Ser 2003-131, Cl SK | | | | | | |
15.514%, 01/25/34 (A) | | | 942 | | | 1,153 |
FNMA CMO, Ser 2003-24, Cl MV | | | | | | |
5.500%, 02/25/14 | | | 1,218 | | | 1,305 |
FNMA CMO, Ser 2003-3, Cl HJ | | | | | | |
5.000%, 02/25/18 | | | 1,018 | | | 1,094 |
FNMA CMO, Ser 2003-30, Cl HS, IO | | | | | | |
7.307%, 07/25/17 (A) | | | 1,607 | | | 110 |
FNMA CMO, Ser 2003-35, Cl EA, PO | | | | | | |
0.000%, 05/25/33 | | | 761 | | | 582 |
FNMA CMO, Ser 2003-49, Cl YD | | | | | | |
5.500%, 06/25/23 | | | 1,243 | | | 1,353 |
FNMA CMO, Ser 2003-50, Cl QJ | | | | | | |
5.000%, 08/25/28 | | | 163 | | | 164 |
| | |
| SEI Institutional Investments Trust / Annual Report / May 31, 2010 | | 57 |
SCHEDULE OF INVESTMENTS
Core Fixed Income Fund (Continued)
May 31, 2010
| | | | | | |
| Description | | Face Amount
($ Thousands) | | Market Value
($ Thousands) |
| | | | | | |
FNMA CMO, Ser 2003-91, Cl XT | | | | | | |
4.500%, 12/25/17 | | $ | 1,321 | | $ | 1,354 |
FNMA CMO, Ser 2004-101, Cl HD | | | | | | |
5.000%, 01/25/20 | | | 2,500 | | | 2,701 |
FNMA CMO, Ser 2004-3, Cl HT | | | | | | |
4.000%, 02/25/19 | | | 10 | | | 10 |
FNMA CMO, Ser 2004-52, Cl PX, PO | | | | | | |
0.000%, 09/25/32 | | | 379 | | | 353 |
FNMA CMO, Ser 2004-60, Cl PA | | | | | | |
5.500%, 04/25/34 | | | 1,362 | | | 1,467 |
FNMA CMO, Ser 2004-61,
Cl CO, PO | | | | | | |
0.000%, 10/25/31 | | | 416 | | | 395 |
FNMA CMO, Ser 2005-106, Cl US | | | | | | |
23.310%, 11/25/35 (A) | | | 1,339 | | | 2,023 |
FNMA CMO, Ser 2005-123, Cl FG | | | | | | |
0.793%, 07/25/34 (A) | | | 905 | | | 891 |
FNMA CMO, Ser 2005-14, Cl BA | | | | | | |
4.500%, 04/25/19 | | | 1,786 | | | 1,871 |
FNMA CMO, Ser 2005-30, Cl UE | | | | | | |
5.000%, 01/25/34 | | | 2,419 | | | 2,597 |
FNMA CMO, Ser 2005-45, Cl BG | | | | | | |
4.500%, 06/25/25 | | | 634 | | | 632 |
FNMA CMO, Ser 2005-58, Cl MA | | | | | | |
5.500%, 07/25/35 | | | 789 | | | 867 |
FNMA CMO, Ser 2005-72, Cl SB | | | | | | |
16.018%, 08/25/35 (A) | | | 813 | | | 974 |
FNMA CMO, Ser 2005-74, Cl CS | | | | | | |
19.077%, 05/25/35 (A) | | | 695 | | | 934 |
FNMA CMO, Ser 2005-88,
Cl QO, PO | | | | | | |
0.000%, 11/25/33 | | | 484 | | | 418 |
FNMA CMO, Ser 2005-90,
Cl PO, PO | | | | | | |
0.000%, 09/25/35 | | | 485 | | | 443 |
FNMA CMO, Ser 2005-90, Cl ES | | | | | | |
16.018%, 10/25/35 (A) | | | 528 | | | 652 |
FNMA CMO, Ser 2005-96, Cl BP | | | | | | |
5.900%, 02/25/15 | | | 848 | | | 834 |
FNMA CMO, Ser 2006-118, Cl A2 | | | | | | |
0.403%, 12/25/36 (A) | | | 1,992 | | | 1,964 |
FNMA CMO, Ser 2006-15,
Cl OP, PO | | | | | | |
0.000%, 03/25/36 | | | 531 | | | 444 |
FNMA CMO, Ser 2006-23, Cl FK | | | | | | |
0.593%, 04/25/36 (A) | | | 630 | | | 625 |
FNMA CMO, Ser 2006-27,
Cl OH, PO | | | | | | |
0.000%, 04/25/36 | | | 702 | | | 623 |
FNMA CMO, Ser 2006-3, Cl D0, PO | | | | | | |
0.000%, 03/25/36 | | | 735 | | | 647 |
FNMA CMO, Ser 2006-33, Cl LS | | | | | | |
28.607%, 05/25/36 (A) | | | 528 | | | 830 |
| | | | | | |
| Description | | Face Amount
($ Thousands) | | Market Value
($ Thousands) |
| | | | | | |
FNMA CMO, Ser 2006-43, Cl VB | | | | | | |
6.500%, 10/25/17 | | $ | 726 | | $ | 787 |
FNMA CMO, Ser 2006-44, Cl FP | | | | | | |
0.743%, 06/25/36 (A) | | | 907 | | | 903 |
FNMA CMO, Ser 2006-44, Cl P, PO | | | | | | |
0.000%, 12/25/33 | | | 464 | | | 395 |
FNMA CMO, Ser 2006-46, Cl SW | | | | | | |
22.942%, 06/25/36 (A) | | | 631 | | | 923 |
FNMA CMO, Ser 2006-60,
Cl UO, PO | | | | | | |
0.000%, 07/25/36 | | | 1,211 | | | 1,048 |
FNMA CMO, Ser 2006-63, Cl ZH | | | | | | |
6.500%, 07/25/36 | | | 838 | | | 926 |
FNMA CMO, Ser 2006-75, Cl VD | | | | | | |
6.500%, 05/25/17 | | | 1,437 | | | 1,529 |
FNMA CMO, Ser 2006-78, Cl BZ | | | | | | |
6.500%, 08/25/36 | | | 641 | | | 712 |
FNMA CMO, Ser 2007-100,
Cl SM, IO | | | | | | |
6.107%, 10/25/37 (A) | | | 3,518 | | | 430 |
FNMA CMO, Ser 2007-112,
Cl SA, IO | | | | | | |
6.107%, 12/25/37 (A) | | | 2,021 | | | 272 |
FNMA CMO, Ser 2007-113, Cl DB | | | | | | |
4.500%, 12/25/22 | | | 3,696 | | | 3,895 |
FNMA CMO, Ser 2007-114, Cl A6 | | | | | | |
0.543%, 10/27/37 (A) | | | 2,000 | | | 1,996 |
FNMA CMO, Ser 2007-116,
Cl HI, IO | | | | | | |
6.289%, 01/25/38 (A) | | | 3,395 | | | 254 |
FNMA CMO, Ser 2007-30, Cl MA | | | | | | |
4.250%, 02/25/37 | | | 1,206 | | | 1,267 |
FNMA CMO, Ser 2007-39, Cl NA | | | | | | |
4.250%, 01/25/37 | | | 201 | | | 210 |
FNMA CMO, Ser 2007-43, Cl FL | | | | | | |
0.643%, 05/25/37 (A) | | | 550 | | | 543 |
FNMA CMO, Ser 2007-53, Cl SH, IO | | | | | | |
5.757%, 06/25/37 (A) | | | 2,694 | | | 261 |
FNMA CMO, Ser 2007-54, Cl FA | | | | | | |
0.743%, 06/25/37 (A) | | | 2,480 | | | 2,474 |
FNMA CMO, Ser 2007-60, Cl AX, IO | | | | | | |
6.807%, 07/25/37 (A) | | | 3,109 | | | 482 |
FNMA CMO, Ser 2007-74, Cl A | | | | | | |
5.000%, 04/25/34 | | | 1,539 | | | 1,617 |
FNMA CMO, Ser 2007-75,
Cl EO, PO | | | | | | |
0.000%, 01/25/36 | | | 1,257 | | | 1,163 |
FNMA CMO, Ser 2007-79, Cl SB | | | | | | |
22.760%, 08/25/37 (A) | | | 260 | | | 340 |
FNMA CMO, Ser 2007-92, Cl YS, IO | | | | | | |
5.437%, 06/25/37 (A) | | | 2,622 | | | 298 |
FNMA CMO, Ser 2008-1, Cl BI, IO | | | | | | |
5.567%, 02/25/38 (A) | | | 3,039 | | | 313 |
| | |
| 58 | | SEI Institutional Investments Trust / Annual Report / May 31, 2010 |
| | | | | | |
| Description | | Face Amount
($ Thousands) | | Market Value
($ Thousands) |
| | | | | | |
FNMA CMO, Ser 2008-20, Cl SA, IO | | | | | | |
6.647%, 03/25/38 (A) | | $ | 1,641 | | $ | 218 |
FNMA CMO, Ser 2008-24, Cl DY | | | | | | |
5.000%, 04/25/23 | | | 1,500 | | | 1,620 |
FNMA CMO, Ser 2008-32, Cl SA, IO | | | | | | |
6.507%, 04/25/38 (A) | | | 1,391 | | | 124 |
FNMA CMO, Ser 2008-35, Cl IM, IO | | | | | | |
0.642%, 10/25/16 (A) | | | 3,673 | | | 48 |
FNMA CMO, Ser 2008-4, Cl SD, IO | | | | | | |
5.657%, 02/25/38 (A) | | | 4,599 | | | 511 |
FNMA CMO, Ser 2008-53, Cl CA | | | | | | |
5.000%, 07/25/23 | | | 3,500 | | | 3,774 |
FNMA CMO, Ser 2008-66, Cl B | | | | | | |
5.000%, 08/25/23 | | | 676 | | | 731 |
FNMA CMO, Ser 2008-95, Cl BA | | | | | | |
5.000%, 01/25/24 | | | 643 | | | 696 |
FNMA CMO, Ser 2009-103, Cl MB | | | | | | |
4.000%, 12/25/39 | | | 2,000 | | | 2,099 |
FNMA CMO, Ser 2009-31, Cl A2 | | | | | | |
4.287%, 07/25/19 | | | 3,868 | | | 3,990 |
FNMA CMO, Ser 2009-52, Cl PI, IO | | | | | | |
5.000%, 07/25/39 | | | 1,726 | | | 268 |
FNMA CMO, Ser 2009-71, Cl JT | | | | | | |
6.000%, 06/25/36 | | | 3,087 | | | 3,355 |
FNMA CMO, Ser 2009-78, Cl J | | | | | | |
5.000%, 09/25/19 | | | 5,564 | | | 5,912 |
FNMA CMO, Ser 2009-84, Cl WS, IO | | | | | | |
5.557%, 10/25/39 (A) | | | 2,275 | | | 213 |
FNMA CMO, Ser 2009-86,
Cl BO, PO | | | | | | |
0.000%, 03/25/37 | | | 12,763 | | | 11,076 |
FNMA CMO, Ser 2009-99, Cl SC, IO | | | | | | |
5.837%, 12/25/39 (A) | | | 2,679 | | | 157 |
FNMA CMO, Ser 2010-1, Cl WA | | | | | | |
6.127%, 02/25/40 (A) | | | 965 | | | 1,066 |
FNMA CMO, Ser 2010-16, Cl WA | | | | | | |
6.428%, 03/25/40 | | | 974 | | | 1,061 |
FNMA CMO, Ser 2010-23, Cl KS, IO | | | | | | |
6.757%, 02/25/40 (A) | | | 2,401 | | | 402 |
FNMA CMO, Ser 2010-54, Cl EA | | | | | | |
4.500%, 06/25/40 | | | 7,732 | | | 8,262 |
FNMA CMO, Ser 2010-64, Cl DM | | | | | | |
5.000%, 06/25/40 | | | 2,000 | | | 2,114 |
FNMA CMO, Ser 2010-M1, Cl A2 | | | | | | |
4.450%, 09/25/19 | | | 1,374 | | | 1,402 |
FNMA CMO, Ser 2010-M3, Cl A3 | | | | | | |
4.332%, 03/25/20 (A) | | | 8,896 | | | 9,007 |
FNMA CMO, Ser ACES, Cl A3 | | | | | | |
4.001%, 01/25/19 | | | 4,134 | | | 4,191 |
FNMA CMO, Ser G92-41, Cl MA | | | | | | |
8.000%, 08/25/22 | | | 1,094 | | | 1,224 |
FNMA Grantor Trust CMO,
Ser 2000-86, Cl A1 | | | | | | |
7.500%, 06/25/30 | | | 1,189 | | | 1,352 |
| | | | | | |
| Description | | Face Amount
($ Thousands) | | Market Value
($ Thousands) |
| | | | | | |
FNMA Grantor Trust CMO,
Ser 2001-T10, Cl A2 | | | | | | |
7.500%, 12/25/41 | | $ | 2,675 | | $ | 3,041 |
FNMA Grantor Trust CMO,
Ser 2002-T19, Cl A2 | | | | | | |
7.000%, 07/25/42 | | | 786 | | | 872 |
FNMA Grantor Trust CMO,
Ser 2002-T3, Cl B | | | | | | |
5.763%, 12/25/11 | | | 727 | | | 773 |
FNMA Grantor Trust CMO,
Ser 2004-T3, Cl 1A3 | | | | | | |
7.000%, 02/25/44 | | | 1,010 | | | 1,131 |
FNMA Interest STRIP CMO,
Ser 323, Cl 16, IO | | | | | | |
7.000%, 01/01/32 | | | 1,003 | | | 233 |
FNMA Interest STRIP CMO,
Ser 334, Cl 16, IO | | | | | | |
6.500%, 02/01/33 | | | 1,653 | | | 343 |
FNMA TBA | | | | | | |
5.500%, 06/01/22 to 07/01/37 | | | 68,620 | | | 73,207 |
5.000%, 06/17/21 to 08/01/38 | | | 21,800 | | | 22,758 |
4.500%, 06/17/19 to 07/01/37 | | | 74,420 | | | 76,019 |
FNMA Whole Loan CMO,
Ser 2003-W1, Cl 2A | | | | | | |
7.500%, 12/25/42 | | | 1,067 | | | 1,212 |
FNMA Whole Loan CMO,
Ser 2003-W2, Cl 2A9 | | | | | | |
5.900%, 07/25/42 | | | 1,813 | | | 1,980 |
FNMA Whole Loan CMO,
Ser 2003-W6, Cl 3A | | | | | | |
6.500%, 09/25/42 | | | 891 | | | 969 |
FNMA Whole Loan CMO,
Ser 2003-W8, Cl 2A | | | | | | |
7.000%, 10/25/42 | | | 722 | | | 802 |
FNMA Whole Loan CMO,
Ser 2004-W1, Cl 2A2 | | | | | | |
7.000%, 12/25/33 | | | 1,127 | | | 1,266 |
FNMA Whole Loan CMO,
Ser 2004-W2, Cl 2A2 | | | | | | |
7.000%, 02/25/44 | | | 1,290 | | | 1,452 |
FNMA Whole Loan CMO,
Ser 2004-W9, Cl 2A1 | | | | | | |
6.500%, 02/25/44 | | | 1,022 | | | 1,125 |
FNMA Whole Loan CMO,
Ser 2005-W3, Cl 2AF | | | | | | |
0.563%, 03/25/45 (A) | | | 1,917 | | | 1,824 |
FNMA Whole Loan CMO,
Ser 2006-W1, Cl 1A3 | | | | | | |
7.500%, 12/25/45 | | | 447 | | | 508 |
FNMA Whole Loan CMO,
Ser 2006-W2, Cl 1AF1 | | | | | | |
0.563%, 02/25/36 (A) | | | 965 | | | 933 |
| | |
| SEI Institutional Investments Trust / Annual Report / May 31, 2010 | | 59 |
SCHEDULE OF INVESTMENTS
Core Fixed Income Fund (Continued)
May 31, 2010
| | | | | | |
| Description | | Face Amount
($ Thousands) | | Market Value
($ Thousands) |
| | | | | | |
FNMA Whole Loan CMO,
Ser 2007-W1, Cl 1AF1 | | | | | | |
0.603%, 11/25/46 (A) | | $ | 2,320 | | $ | 2,343 |
FNMA Whole Loan CMO,
Ser 2007-W7, Cl 1A4 | | | | | | |
37.123%, 07/25/37 (A) | | | 134 | | | 224 |
GNMA TBA | | | | | | |
5.500%, 06/19/33 | | | 3,800 | | | 4,075 |
5.000%, 08/01/33 to 06/15/40 | | | 16,600 | | | 17,426 |
4.500%, 06/01/39 to 06/15/40 | | | 159,680 | | | 163,808 |
GNMA | | | | | | |
9.500%, 12/15/20 | | | 10 | | | 12 |
7.500%, 10/15/37 | | | 3,203 | | | 3,533 |
7.000%, 04/15/26 to 06/15/35 | | | 5,203 | | | 5,839 |
6.500%, 01/15/24 to 02/15/39 | | | 16,498 | | | 18,220 |
6.000%, 11/15/23 to 09/15/34 | | | 20,937 | | | 23,002 |
5.500%, 11/01/18 | | | 2,116 | | | 2,289 |
5.000%, 05/15/33 to 02/15/35 | | | 24,736 | | | 26,285 |
GNMA CMO, Ser 2001-18, Cl WH | | | | | | |
31.081%, 04/20/31 (A) | | | 140 | | | 221 |
GNMA CMO, Ser 2001-22, Cl PS | | | | | | |
20.132%, 03/17/31 (A) | | | 1,040 | | | 1,319 |
GNMA CMO, Ser 2001-61, Cl Z | | | | | | |
6.500%, 12/20/31 | | | 1,869 | | | 2,078 |
GNMA CMO, Ser 2002-23, Cl SD | | | | | | |
20.054%, 04/16/32 (A) | | | 1,561 | | | 1,913 |
GNMA CMO, Ser 2002-51, Cl SG | | | | | | |
31.028%, 04/20/31 (A) | | | 131 | | | 207 |
GNMA CMO, Ser 2002-57, Cl SB | | | | | | |
107.447%, 08/16/32 | | | 102 | | | 296 |
GNMA CMO, Ser 2002-69, Cl SC | | | | | | |
15.753%, 02/20/32 (A) | | | 404 | | | 461 |
GNMA CMO, Ser 2003-60, Cl GS | | | | | | |
11.855%, 05/16/33 (A) | | | 231 | | | 256 |
GNMA CMO, Ser 2003-97, Cl SA, IO | | | | | | |
6.213%, 11/16/33 (A) | | | 784 | | | 127 |
GNMA CMO, Ser 2004-28, Cl SV | | | | | | |
8.660%, 04/20/34 (A) | | | 1,691 | | | 1,740 |
GNMA CMO, Ser 2004-34, Cl CS | | | | | | |
18.879%, 02/20/34 (A) | | | 96 | | | 116 |
GNMA CMO, Ser 2004-34,
Cl JO, PO | | | | | | |
0.000%, 02/20/34 | | | 288 | | | 273 |
GNMA CMO, Ser 2004-71, Cl ST | | | | | | |
7.000%, 09/20/34 (A) | | | 505 | | | 539 |
GNMA CMO, Ser 2004-85,
Cl PO, PO | | | | | | |
0.000%, 01/17/33 | | | 223 | | | 211 |
GNMA CMO, Ser 2004-87, Cl SB | | | | | | |
7.284%, 03/17/33 (A) | | | 407 | | | 410 |
GNMA CMO, Ser 2005-3, Cl SB, IO | | | | | | |
5.760%, 01/20/35 (A) | | | 2,150 | | | 250 |
GNMA CMO, Ser 2005-7, Cl JM | | | | | | |
15.977%, 05/18/34 (A) | | | 432 | | | 522 |
| | | | | | |
| Description | | Face Amount
($ Thousands) | | Market Value
($ Thousands) |
| | | | | | |
GNMA CMO, Ser 2005-92, Cl PB | | | | | | |
6.000%, 12/20/35 | | $ | 1,000 | | $ | 1,127 |
GNMA CMO, Ser 2006-34,
Cl PO, PO | | | | | | |
0.000%, 07/20/36 | | | 274 | | | 247 |
GNMA CMO, Ser 2006-37, Cl JG | | | | | | |
5.000%, 07/20/36 | | | 1,723 | | | 1,857 |
GNMA CMO, Ser 2006-38,
Cl SW, IO | | | | | | |
6.160%, 06/20/36 (A) | | | 2,251 | | | 224 |
GNMA CMO, Ser 2007-17, Cl AF | | | | | | |
0.537%, 04/16/37 (A) | | | 1,033 | | | 1,025 |
GNMA CMO, Ser 2007-27, Cl SD, IO | | | | | | |
5.860%, 05/20/37 (A) | | | 1,445 | | | 151 |
GNMA CMO, Ser 2007-42, Cl SB, IO | | | | | | |
6.410%, 07/20/37 (A) | | | 2,087 | | | 222 |
GNMA CMO, Ser 2007-45, Cl QA, IO | | | | | | |
6.300%, 07/20/37 (A) | | | 1,377 | | | 120 |
GNMA CMO, Ser 2007-72,
Cl USIO, IO | | | | | | |
6.210%, 11/20/37 (A) | | | 1,680 | | | 145 |
GNMA CMO, Ser 2007-78, Cl SA, IO | | | | | | |
6.193%, 12/16/37 (A) | | | 18,694 | | | 2,169 |
GNMA CMO, Ser 2007-81, Cl SP, IO | | | | | | |
6.310%, 12/20/37 (A) | | | 2,075 | | | 192 |
GNMA CMO, Ser 2007-82, Cl SA, IO | | | | | | |
6.190%, 12/20/37 (A) | | | 1,356 | | | 112 |
GNMA CMO, Ser 2007-9, Cl CI, IO | | | | | | |
5.860%, 03/20/37 (A) | | | 1,773 | | | 184 |
GNMA CMO, Ser 2008-10, Cl S, IO | | | | | | |
5.490%, 02/20/38 (A) | | | 2,473 | | | 212 |
GNMA CMO, Ser 2008-2, Cl MS, IO | | | | | | |
6.823%, 01/16/38 (A) | | | 1,803 | | | 181 |
GNMA CMO, Ser 2008-29,
Cl PO, PO | | | | | | |
0.000%, 02/17/33 | | | 598 | | | 539 |
GNMA CMO, Ser 2008-33, Cl XS, IO | | | | | | |
7.363%, 04/16/38 (A) | | | 1,000 | | | 127 |
GNMA CMO, Ser 2008-55, Cl SA, IO | | | | | | |
5.860%, 06/20/38 (A) | | | 2,425 | | | 202 |
GNMA CMO, Ser 2009-106,
Cl AS, IO | | | | | | |
6.063%, 11/16/39 (A) | | | 3,894 | | | 418 |
GNMA CMO, Ser 2009-14, Cl NI, IO | | | | | | |
6.500%, 03/20/39 | | | 65 | | | 10 |
GNMA CMO, Ser 2009-14, Cl KI, IO | | | | | | |
6.500%, 03/20/39 | | | 1,326 | | | 188 |
GNMA CMO, Ser 2009-18, Cl PI, IO | | | | | | |
5.500%, 11/16/37 | | | 1,698 | | | 256 |
GNMA CMO, Ser 2009-22, Cl SA, IO | | | | | | |
5.930%, 04/20/39 (A) | | | 3,645 | | | 374 |
GNMA CMO, Ser 2009-24, Cl DS, IO | | | | | | |
5.960%, 03/20/39 (A) | | | 2,274 | | | 232 |
| | |
| 60 | | SEI Institutional Investments Trust / Annual Report / May 31, 2010 |
| | | | | | |
| Description | | Face Amount
($ Thousands) | | Market Value
($ Thousands) |
| | | | | | |
GNMA CMO, Ser 2009-25, Cl SE, IO | | | | | | |
7.260%, 09/20/38 (A) | | $ | 1,398 | | $ | 167 |
GNMA CMO, Ser 2009-31, Cl TS, IO | | | | | | |
5.960%, 03/20/39 (A) | | | 3,677 | | | 376 |
GNMA CMO, Ser 2009-33, Cl TI, IO | | | | | | |
6.000%, 05/20/39 | | | 599 | | | 96 |
GNMA CMO, Ser 2009-42, Cl SC, IO | | | | | | |
5.740%, 06/20/39 (A) | | | 1,284 | | | 140 |
GNMA CMO, Ser 2009-42, Cl IY, IO | | | | | | |
1.000%, 06/16/37 (A) | | | 3,073 | | | 82 |
GNMA CMO, Ser 2009-43, Cl SA, IO | | | | | | |
5.610%, 06/20/39 (A) | | | 3,265 | | | 281 |
GNMA CMO, Ser 2009-44, Cl MV | | | | | | |
6.000%, 04/20/20 | | | 1,407 | | | 1,575 |
GNMA CMO, Ser 2009-6, Cl SH, IO | | | | | | |
5.700%, 02/20/39 (A) | | | 2,725 | | | 290 |
GNMA CMO, Ser 2009-65, Cl TS, IO | | | | | | |
6.060%, 12/20/38 (A) | | | 4,908 | | | 508 |
GNMA CMO, Ser 2009-65, Cl IQ, IO | | | | | | |
6.000%, 12/20/38 | | | 1,636 | | | 187 |
GNMA CMO, Ser 2009-66, Cl LC | | | | | | |
6.000%, 08/16/39 | | | 2,245 | | | 2,521 |
GNMA CMO, Ser 2009-67, Cl SA, IO | | | | | | |
5.713%, 08/16/39 (A) | | | 3,436 | | | 352 |
GNMA CMO, Ser 2009-79,
Cl OK, PO | | | | | | |
0.000%, 11/16/37 | | | 1,897 | | | 1,711 |
GNMA CMO, Ser 2010-14,
Cl CO, PO | | | | | | |
0.000%, 08/20/35 | | | 425 | | | 268 |
GNMA CMO, Ser 2010-59, Cl LB | | | | | | |
4.500%, 10/20/39 | | | 2,900 | | | 3,008 |
GNMA CMO, Ser 2010-H08, Cl FC | | | | | | |
1.264%, 06/30/60 (G) | | | 5,530 | | | 5,680 |
GNMA TBA | | | | | | |
6.000%, 06/01/34 | | | 2,200 | | | 2,385 |
| | | | | | |
| | | | | | 1,830,483 |
| | | | | | |
|
Non-Agency Mortgage-Backed Obligations — 13.7% |
American General Mortgage Loan Trust, Ser 2010-1A, Cl A1 | | | | | | |
5.150%, 03/25/58 (A) (B) | | | 864 | | | 863 |
American Home Mortgage Assets, Ser 2006-5, Cl A1 | | | | | | |
1.341%, 11/25/46 (A) | | | 1,594 | | | 776 |
American Home Mortgage Assets, Ser 2007-2, Cl A1 | | | | | | |
0.468%, 03/25/47 (A) | | | 13,431 | | | 7,536 |
ASG Resecuritization Trust,
Ser 2009-2, Cl A55 | | | | | | |
5.755%, 05/24/36 (A) (B) | | | 1,025 | | | 1,030 |
ASG Resecuritization Trust,
Ser 2009-3, Cl A65 | | | | | | |
5.595%, 03/26/37 (A) (B) | | | 2,247 | | | 2,248 |
| | | | | | |
| Description | | Face Amount
($ Thousands) | | Market Value
($ Thousands) |
| | | | | | |
ASG Resecuritization Trust,
Ser 2009-4, Cl A60 | | | | | | |
6.000%, 06/28/37 (B) | | $ | 1,706 | | $ | 1,714 |
Asset Securitization,
Ser 1996-D3, Cl A2 | | | | | | |
7.558%, 10/13/26 (A) | | | 2,159 | | | 2,254 |
Banc of America Alternative Loan Trust, Ser 2003-11, Cl 1A1 | | | | | | |
6.000%, 01/25/34 | | | 412 | | | 410 |
Banc of America Alternative Loan Trust, Ser 2003-11, Cl 2A1 | | | | | | |
6.000%, 01/25/34 | | | 820 | | | 817 |
Banc of America Alternative Loan Trust, Ser 2003-7, Cl 1CB1 | | | | | | |
5.500%, 09/25/33 | | | 608 | | | 625 |
Banc of America Alternative Loan Trust, Ser 2003-7, Cl 2A4 | | | | | | |
5.000%, 09/25/18 | | | 1,095 | | | 1,110 |
Banc of America Alternative Loan Trust, Ser 2003-9, Cl 1CB2 | | | | | | |
5.500%, 11/25/33 | | | 953 | | | 963 |
Banc of America Alternative Loan Trust, Ser 2004-1, Cl 5A1 | | | | | | |
5.500%, 02/25/19 | | | 670 | | | 669 |
Banc of America Alternative Loan Trust, Ser 2004-8, Cl 3A1 | | | | | | |
5.500%, 09/25/19 | | | 590 | | | 597 |
Banc of America Alternative Loan Trust, Ser 2006-8, Cl 3A1 | | | | | | |
6.168%, 11/25/21 (A) | | | 289 | | | 257 |
Banc of America Alternative Loan Trust, Ser 2007-1, Cl 2A1 | | | | | | |
6.145%, 04/25/37 (A) | | | 480 | | | 302 |
Banc of America Commercial Mortgage Securities,
Ser 2002-PB2, Cl A4 | | | | | | |
6.186%, 06/11/35 | | | 5,062 | | | 5,335 |
Banc of America Commercial Mortgage Securities,
Ser 2002-PB2, Cl B | | | | | | |
6.309%, 06/11/35 | | | 916 | | | 963 |
Banc of America Commercial Mortgage Securities,
Ser 2003-1, Cl A1 | | | | | | |
3.878%, 09/11/36 | | | 2,277 | | | 2,305 |
Banc of America Commercial Mortgage Securities,
Ser 2004-6, Cl A3 | | | | | | |
4.512%, 12/10/42 | | | 895 | | | 912 |
Banc of America Commercial Mortgage Securities,
Ser 2005-3, Cl A4 | | | | | | |
4.668%, 07/10/43 | | | 4,794 | | | 4,811 |
| | |
| SEI Institutional Investments Trust / Annual Report / May 31, 2010 | | 61 |
SCHEDULE OF INVESTMENTS
Core Fixed Income Fund (Continued)
May 31, 2010
| | | | | | |
| Description | | Face Amount
($ Thousands) | | Market Value
($ Thousands) |
| | | | | | |
Banc of America Commercial Mortgage Securities,
Ser 2005-4, Cl A5A | | | | | | |
4.930%, 07/10/45 | | $ | 2,943 | | $ | 2,914 |
Banc of America Commercial Mortgage Securities,
Ser 2005-5, Cl A4 | | | | | | |
5.115%, 10/10/45 (A) | | | 300 | | | 310 |
Banc of America Commercial Mortgage Securities,
Ser 2006-4, Cl A4 | | | | | | |
5.634%, 07/10/46 | | | 800 | | | 809 |
Banc of America Commercial Mortgage, Ser 2002-2, Cl E | | | | | | |
7.634%, 09/15/32 (A) | | | 767 | | | 765 |
Banc of America Commercial Mortgage, Ser 2005-3, Cl AM | | | | | | |
4.727%, 07/10/43 | | | 500 | | | 453 |
Banc of America Commercial Mortgage, Ser 2006-1, Cl A4 | | | | | | |
5.372%, 09/10/45 (A) | | | 500 | | | 510 |
Banc of America Commercial Mortgage, Ser 2006-3, Cl A4 | | | | | | |
5.889%, 07/10/44 (A) | | | 3,863 | | | 3,880 |
Banc of America Commercial Mortgage, Ser 2006-5, Cl A4 | | | | | | |
5.414%, 09/10/47 | | | 5,751 | | | 5,773 |
Banc of America Funding,
Ser 2004-2, Cl 1CB1 | | | | | | |
5.750%, 09/20/34 | | | 675 | | | 648 |
Banc of America Funding,
Ser 2004-3, Cl 1A7 | | | | | | |
5.500%, 10/25/34 | | | 1,120 | | | 1,116 |
Banc of America Funding,
Ser 2004-C, Cl 1A1 | | | | | | |
5.052%, 12/20/34 (A) | | | 516 | | | 512 |
Banc of America Funding,
Ser 2005-B, Cl 2A1 | | | | | | |
3.018%, 04/20/35 (A) | | | 4,513 | | | 3,279 |
Banc of America Funding,
Ser 2010-R5, Cl 5A6 | | | | | | |
0.643%, 05/26/37 (A) (B) (G) | | | 1,945 | | | 1,894 |
Banc of America Mortgage Securities, Ser 2003-3, Cl 2A1 | | | | | | |
0.893%, 05/25/18 (A) | | | 457 | | | 434 |
Banc of America Mortgage Securities, Ser 2003-6, Cl 2A1 | | | | | | |
0.793%, 08/25/18 (A) | | | 488 | | | 471 |
Banc of America Mortgage Securities, Ser 2003-E, Cl 2A2 | | | | | | |
3.335%, 06/25/33 (A) | | | 435 | | | 411 |
Banc of America Mortgage Securities, Ser 2004-3, Cl 3A1 | | | | | | |
5.000%, 04/25/19 | | | 476 | | | 479 |
| | | | | | |
| Description | | Face Amount
($ Thousands) | | Market Value
($ Thousands) |
| | | | | | |
Banc of America Mortgage Securities, Ser 2004-3, Cl 1A23 | | | | | | |
4.500%, 04/25/34 | | $ | 779 | | $ | 781 |
Banc of America Mortgage Securities, Ser 2004-5, Cl 4A1 | | | | | | |
4.750%, 06/25/19 | | | 434 | | | 433 |
Banc of America Mortgage Securities, Ser 2004-9, Cl 3A1 | | | | | | |
6.500%, 09/25/32 | | | 286 | | | 284 |
BCAP LLC Trust, Ser 2009-RR10, Cl 17A1 | | | | | | |
5.750%, 06/26/37 (B) | | | 2,129 | | | 2,129 |
BCAP LLC Trust, Ser 2009-RR13, Cl 11A1 | | | | | | |
5.250%, 05/26/37 (A) (B) | | | 696 | | | 696 |
BCAP LLC Trust, Ser 2009-RR5, Cl 8A1 | | | | | | |
5.500%, 11/26/34 (B) | | | 1,399 | | | 1,399 |
BCAP LLC Trust, Ser 2010-RR5, Cl 2A5 | | | | | | |
5.180%, 04/26/37 (A) (B) | | | 1,100 | | | 1,096 |
BCAP LLC Trust, Ser 2010-RR6, Cl 5A1 | | | | | | |
5.500%, 11/26/37 (A) (B) | �� | | 1,000 | | | 1,002 |
Bear Stearns Adjustable Rate Mortgage Trust, Ser 2004-2, Cl 14A | | | | | | |
5.151%, 05/25/34 (A) | | | 534 | | | 550 |
Bear Stearns Adjustable Rate Mortgage Trust, Ser 2004-2, Cl 24A | | | | | | |
5.267%, 05/25/34 (A) | | | 2,878 | | | 2,893 |
Bear Stearns Adjustable Rate Mortgage Trust, Ser 2005-5, Cl A1 | | | | | | |
2.530%, 08/25/35 (A) | | | 646 | | | 617 |
Bear Stearns Alt-A Trust,
Ser 2005-2, Cl 2A4 | | | | | | |
3.044%, 04/25/35 (A) | | | 264 | | | 198 |
Bear Stearns Asset Backed Securities Trust, Ser 2006-AC1, Cl 1A1 | | | | | | |
5.750%, 02/25/36 | | | 2,290 | | | 1,612 |
Bear Stearns Commercial Mortgage Securities, Ser 2001-TOP2, Cl A2 | | | | | | |
6.480%, 02/15/35 | | | 243 | | | 249 |
Bear Stearns Commercial Mortgage Securities, Ser 2001-TOP4, Cl A3 | | | | | | |
5.610%, 11/15/33 | | | 1,457 | | | 1,504 |
Bear Stearns Commercial Mortgage Securities, Ser 2002-TOP8, Cl A2 | | | | | | |
4.830%, 08/15/38 | | | 454 | | | 474 |
Bear Stearns Commercial Mortgage Securities, Ser 2003-T-12, Cl A3 | | | | | | |
4.240%, 08/13/39 (A) | | | 598 | | | 613 |
| | |
| 62 | | SEI Institutional Investments Trust / Annual Report / May 31, 2010 |
| | | | | | |
| Description | | Face Amount
($ Thousands) | | Market Value
($ Thousands) |
| | | | | | |
Bear Stearns Commercial Mortgage Securities, Ser 2004-PWR4, Cl A3 | | | | | | |
5.468%, 06/11/41 (A) | | $ | 691 | | $ | 726 |
Bear Stearns Commercial Mortgage Securities, Ser 2005-PWR7, Cl A2 | | | | | | |
4.945%, 02/11/41 | | | 1,110 | | | 1,133 |
Bear Stearns Commercial Mortgage Securities, Ser 2005-T20, Cl A4A | | | | | | |
5.149%, 10/12/42 (A) | | | 6,500 | | | 6,815 |
Bear Stearns Commercial Mortgage Securities, Ser 2006-PW11, Cl A4 | | | | | | |
5.456%, 03/11/39 (A) | | | 300 | | | 310 |
Bear Stearns Commercial Mortgage Securities, Ser 2006-T24, Cl A4 | | | | | | |
5.537%, 10/12/41 | | | 300 | | | 312 |
Bear Stearns Commercial Mortgage Securities, Ser 2007-PW10, Cl A4 | | | | | | |
5.405%, 12/11/40 (A) | | | 2,143 | | | 2,200 |
Bear Stearns Commercial Mortgage Securities, Ser 2007-PW17, Cl A3 | | | | | | |
5.736%, 06/11/50 | | | 2,640 | | | 2,685 |
Chase Mortgage Finance,
Ser 2003-S15, Cl 2A10 | | | | | | |
0.793%, 01/25/34 (A) | | | 522 | | | 514 |
Chase Mortgage Finance,
Ser 2003-S9, Cl AP, PO | | | | | | |
0.000%, 10/25/18 | | | 325 | | | 261 |
Chase Mortgage Finance,
Ser 2005-A1, Cl 2A3 | | | | | | |
5.229%, 12/25/35 (A) | | | 13,166 | | | 11,182 |
Chase Mortgage Finance,
Ser 2007-A1, Cl 9A1 | | | | | | |
4.549%, 02/25/37 (A) | | | 429 | | | 433 |
Chase Mortgage Finance,
Ser 2007-A1, Cl 2A1 | | | | | | |
3.815%, 02/25/37 (A) | | | 472 | | | 462 |
Chase Mortgage Finance,
Ser 2007-A2, Cl 1A1 | | | | | | |
3.253%, 07/25/37 (A) | | | 723 | | | 698 |
Citicorp Mortgage Securities,
Ser 2003-6, Cl 1A2 | | | | | | |
4.500%, 05/25/33 | | | 217 | | | 219 |
Citicorp Mortgage Securities,
Ser 2004-3, Cl A8 | | | | | | |
5.250%, 05/25/34 | | | 404 | | | 404 |
Citigroup Deutsche Bank Commercial Mortgage,
Ser 2007-CD4, Cl A4 | | | | | | |
5.322%, 12/11/49 | | | 6,855 | | | 6,489 |
Citigroup Mortgage Loan Trust,
Ser 2004-UST1, Cl A6 | | | | | | |
5.073%, 08/25/34 (A) | | | 800 | | | 829 |
| | | | | | |
| Description | | Face Amount
($ Thousands) | | Market Value
($ Thousands) |
| | | | | | |
Citigroup Mortgage Loan Trust,
Ser 2005-11, Cl A3 | | | | | | |
4.900%, 12/25/35 (A) | | $ | 6,218 | | $ | 5,197 |
Citigroup Mortgage Loan Trust,
Ser 2009-5, Cl 8A1 | | | | | | |
6.000%, 06/25/36 (B) (G) | | | 1,508 | | | 1,393 |
Commercial Mortgage Asset Trust, Ser 1999-C1, Cl A4 | | | | | | |
6.975%, 01/17/32 (A) | | | 4,560 | | | 4,983 |
Commercial Mortgage Asset Trust, Ser 1999-C2, Cl A2 | | | | | | |
7.546%, 11/17/32 (A) | | | 20 | | | 20 |
Commercial Mortgage Loan Trust, Ser 2008-LS1, Cl AJ | | | | | | |
6.019%, 12/10/49 (A) | | | 1,210 | | | 618 |
Commercial Mortgage Loan Trust, Ser 2008-LS1, Cl A4B | | | | | | |
6.019%, 12/10/49 (A) | | | 6,930 | | | 6,673 |
Commercial Mortgage Pass Through Certificates, Ser 2004-LB2A, Cl A4 | | | | | | |
4.715%, 03/10/39 | | | 1,421 | | | 1,453 |
Commercial Mortgage Pass Through Certificates, Ser 2005-LP5, Cl A4 | | | | | | |
4.982%, 05/10/43 (A) | | | 600 | | | 618 |
Commercial Mortgage Pass-Through Certificates, Ser 2001-J2A, Cl A2 | | | | | | |
6.096%, 07/16/34 (B) | | | 239 | | | 250 |
Countrywide Alternative Loan Trust, Ser 2003-20CB, Cl 1A1 | | | | | | |
5.500%, 10/25/33 | | | 2,662 | | | 2,692 |
Countrywide Alternative Loan Trust, Ser 2004-27CB, Cl A1 | | | | | | |
6.000%, 12/25/34 | | | 2,333 | | | 2,372 |
Countrywide Alternative Loan Trust, Ser 2004-32CB, Cl 2A3, IO | | | | | | |
4.757%, 02/25/35 (A) | | | 42,735 | | | 4,387 |
Countrywide Alternative Loan Trust, Ser 2004-J1, Cl 1A1 | | | | | | |
6.000%, 02/25/34 | | | 421 | | | 426 |
Countrywide Alternative Loan Trust, Ser 2004-J6, Cl PO, PO | | | | | | |
0.000%, 11/25/31 | | | 376 | | | 271 |
Countrywide Alternative Loan Trust, Ser 2004-J6, Cl 2A1 | | | | | | |
6.500%, 11/25/31 | | | 1,345 | | | 1,374 |
Countrywide Alternative Loan Trust, Ser 2005-27, Cl 3A2 | | | | | | |
1.521%, 08/25/35 (A) | | | 1,051 | | | 543 |
Countrywide Alternative Loan Trust, Ser 2005-27, Cl 2A1 | | | | | | |
1.791%, 08/25/35 (A) | | | 4,133 | | | 1,940 |
| | |
| SEI Institutional Investments Trust / Annual Report / May 31, 2010 | | 63 |
SCHEDULE OF INVESTMENTS
Core Fixed Income Fund (Continued)
May 31, 2010
| | | | | | |
| Description | | Face Amount
($ Thousands) | | Market Value
($ Thousands) |
| | | | | | |
Countrywide Alternative Loan Trust, Ser 2005-56, Cl 4A1 | | | | | | |
0.653%, 11/25/35 (A) | | $ | 7,852 | | $ | 4,270 |
Countrywide Alternative Loan Trust, Ser 2005-59, Cl 1A1 | | | | | | |
0.586%, 11/20/35 (A) | | | 5,522 | | | 3,213 |
Countrywide Alternative Loan Trust, Ser 2005-72, Cl A1 | | | | | | |
0.613%, 01/25/36 (A) | | | 2,946 | | | 1,788 |
Countrywide Alternative Loan Trust, Ser 2006-0A9, Cl 2A1A | | | | | | |
0.550%, 07/20/46 (A) | | | 633 | | | 250 |
Countrywide Home Loan Mortgage Pass Through Trust,
Ser 2003-39, Cl A6 | | | | | | |
5.000%, 10/25/33 | | | 840 | | | 807 |
Countrywide Home Loan Mortgage Pass Through Trust,
Ser 2003-56, Cl 6A1 | | | | | | |
3.476%, 12/25/33 (A) | | | 594 | | | 516 |
Countrywide Home Loan Mortgage Pass Through Trust,
Ser 2003-J1, Cl A6 | | | | | | |
5.250%, 09/25/33 | | | 1,000 | | | 1,023 |
Countrywide Home Loan Mortgage Pass Through Trust,
Ser 2003-J13, Cl 1A7 | | | | | | |
5.250%, 01/25/34 | | | 1,406 | | | 1,375 |
Countrywide Home Loan Mortgage Pass Through Trust,
Ser 2003-J7, Cl 4A3 | | | | | | |
9.331%, 08/25/18 (A) | | | 232 | | | 224 |
Countrywide Home Loan Mortgage Pass Through Trust,
Ser 2004-20, Cl 2A1 | | | | | | |
2.964%, 09/25/34 (A) | | | 93 | | | 39 |
Countrywide Home Loan Mortgage Pass Through Trust,
Ser 2004-8, Cl 2A1 | | | | | | |
4.500%, 06/25/19 | | | 1,748 | | | 1,759 |
Countrywide Home Loan Mortgage Pass-Through Trust,
Ser 2005-20, Cl A7 | | | | | | |
5.250%, 12/25/27 | | | 804 | | | 745 |
Countrywide Home Loan Mortgage Pass-Through Trust,
Ser 2005-R3, Cl AF | | | | | | |
0.743%, 09/25/35 (A) (B) | | | 6,972 | | | 5,601 |
Credit Suisse First Boston Mortgage Securities, Ser 2001-CKN5, Cl A4 | | | | | | |
5.435%, 09/15/34 | | | 427 | | | 441 |
Credit Suisse First Boston Mortgage Securities, Ser 2002-CKS4, Cl A1 | | | | | | |
4.485%, 11/15/36 | | | 35 | | | 35 |
| | | | | | |
| Description | | Face Amount
($ Thousands) | | Market Value
($ Thousands) |
| | | | | | |
Credit Suisse First Boston Mortgage Securities, Ser 2002-CKS4, Cl A2 | | | | | | |
5.183%, 11/15/36 | | $ | 3,030 | | $ | 3,168 |
Credit Suisse First Boston Mortgage Securities, Ser 2002-CP5, Cl A2 | | | | | | |
4.940%, 12/15/35 | | | 841 | | | 881 |
Credit Suisse First Boston Mortgage Securities, Ser 2003-27, Cl 5A3 | | | | | | |
5.250%, 11/25/33 | | | 1,125 | | | 1,096 |
Credit Suisse First Boston Mortgage Securities, Ser 2003-29, Cl 5A1 | | | | | | |
7.000%, 12/25/33 | | | 332 | | | 334 |
Credit Suisse First Boston Mortgage Securities, Ser 2003-29, Cl 8A1 | | | | | | |
6.000%, 11/25/18 | | | 659 | | | 665 |
Credit Suisse First Boston Mortgage Securities, Ser 2003-CPN1, Cl A2 | | | | | | |
4.597%, 03/15/35 | | | 1,452 | | | 1,513 |
Credit Suisse First Boston Mortgage Securities, Ser 2004-AR5, Cl 7A2 | | | | | | |
2.708%, 06/25/34 (A) | | | 888 | | | 867 |
Credit Suisse First Boston Mortgage Securities, Ser 2005-4, Cl 3A24 | | | | | | |
18.160%, 06/25/35 (A) | | | 357 | | | 370 |
Credit Suisse First Boston Mortgage Securities, Ser 2005-C1, Cl A3 | | | | | | |
4.813%, 02/15/38 | | | 332 | | | 336 |
Credit Suisse First Boston Mortgage Securities, Ser 2005-C2, Cl A4 | | | | | | |
4.832%, 04/15/37 | | | 1,987 | | | 1,974 |
Credit Suisse First Boston Mortgage Securities, Ser 2005-C6, Cl A4 | | | | | | |
5.230%, 12/15/40 (A) | | | 13,000 | | | 13,379 |
Credit Suisse Mortgage Capital Certificates, Ser 2006-C2, Cl A3 | | | | | | |
5.657%, 03/15/39 (A) | | | 825 | | | 825 |
Credit Suisse Mortgage Capital Certificates, Ser 2006-C5, Cl A3 | | | | | | |
5.311%, 12/15/39 | | | 10,517 | | | 10,179 |
Credit Suisse Mortgage Capital Certificates, Ser 2007-C5, Cl A3 | | | | | | |
5.694%, 09/15/40 (A) | | | 1,960 | | | 1,945 |
Credit Suisse Mortgage Capital Certificates, Ser 2009-12R, Cl 7A1 | | | | | | |
5.500%, 10/27/35 (B) | | | 951 | | | 955 |
Credit Suisse Mortgage Capital Certificates, Ser 2010-11R, Cl A1 | | | | | | |
1.354%, 06/28/47 (A) (B) | | | 1,775 | | | 1,773 |
CW Capital Cobalt, Ser 2006-C1, Cl A4 | | | | | | |
5.223%, 08/15/48 | | | 7,865 | | | 7,542 |
Deutsche ALT-A Securities Alternate Loan Trust, Ser 2005-1, Cl 2A1 | | | | | | |
5.590%, 02/25/20 (A) | | | 420 | | | 422 |
| | |
| 64 | | SEI Institutional Investments Trust / Annual Report / May 31, 2010 |
| | | | | | |
| Description | | Face Amount
($ Thousands) | | Market Value
($ Thousands) |
| | | | | | |
Developers Diversified Realty, Ser 2009-DDR1, Cl A | | | | | | |
3.807%, 10/14/22 (B) | | $ | 2,736 | | $ | 2,818 |
DSLA Mortgage Loan Trust, Ser 2004-AR2, Cl A2B | | | | | | |
0.739%, 11/19/44 (A) | | | 2,209 | | | 813 |
DSLA Mortgage Loan Trust, Ser 2006-AR1, Cl 1A1A | | | | | | |
1.341%, 03/19/46 (A) | | | 412 | | | 180 |
FDIC Structured Sale Guaranteed Notes, Ser 2010-S1, Cl 1A | | | | | | |
0.823%, 02/25/48 (A) (B) | | | 7,516 | | | 7,544 |
FHLMC Multifamily Structured Pass Through Certificates,
Ser FHMS, Cl A1 | | | | | | |
3.398%, 07/25/19 | | | 9 | | | 9 |
First Horizon Asset Securities,
Ser 2003-8, Cl 2A1 | | | | | | |
4.500%, 09/25/18 | | | 1,478 | | | 1,504 |
First Union National Bank Commercial Mortgage,
Ser 2000-C2, Cl B | | | | | | |
7.281%, 10/15/32 (A) | | | 500 | | | 506 |
First Union National Bank Commercial Mortgage,
Ser 2001-C4, Cl B | | | | | | |
6.417%, 12/12/33 | | | 789 | | | 823 |
First Union National Bank Commercial Mortgage,
Ser 2002-C1, Cl A2 | | | | | | |
6.141%, 02/12/34 | | | 794 | | | 830 |
GE Capital Commercial Mortgage, Ser 2001-3, Cl A1 | | | | | | |
5.560%, 06/10/38 | | | 180 | | | 182 |
GE Capital Commercial Mortgage, Ser 2002-1A, Cl A3 | | | | | | |
6.269%, 12/10/35 | | | 1,562 | | | 1,648 |
GE Capital Commercial Mortgage, Ser 2005-C4, Cl A4 | | | | | | |
5.334%, 11/10/45 (A) | | | 3,518 | | | 3,669 |
GE Capital Commercial Mortgage, Ser 2007-C1, Cl A4 | | | | | | |
5.543%, 12/10/49 | | | 1,000 | | | 916 |
GMAC Commercial Mortgage Securities, Ser 2000-C2, Cl A2 | | | | | | |
7.455%, 08/16/33 (A) (G) | | | 8 | | | 8 |
GMAC Commercial Mortgage Securities, Ser 2001-C2, Cl B | | | | | | |
6.790%, 04/15/34 | | | 404 | | | 420 |
GMAC Commercial Mortgage Securities, Ser 2002-C3, Cl A2 | | | | | | |
4.930%, 07/10/39 | | | 3,009 | | | 3,155 |
| | | | | | |
| Description | | Face Amount
($ Thousands) | | Market Value
($ Thousands) |
| | | | | | |
GMAC Commercial Mortgage Securities, Ser 2003-C2, Cl D | | | | | | |
5.501%, 05/10/40 (A) | | $ | 654 | | $ | 668 |
GMAC Commercial Mortgage Securities, Ser 2003-C2, Cl A2 | | | | | | |
5.485%, 05/10/40 (A) | | | 1,073 | | | 1,153 |
GMAC Commercial Mortgage Securities, Ser 2003-C3, Cl A4 | | | | | | |
5.023%, 04/10/40 | | | 760 | | | 800 |
GMAC Commercial Mortgage Securities, Ser 2004-C2, Cl A4 | | | | | | |
5.301%, 08/10/38 (A) | | | 1,299 | | | 1,321 |
GMAC Commercial Mortgage Securities, Ser 2006-C1, Cl A4 | | | | | | |
5.238%, 11/10/45 (A) | | | 700 | | | 716 |
GMAC Mortgage Loan Trust, Ser 2003-AR1, Cl A4 | | | | | | |
4.067%, 10/19/33 (A) | | | 2,317 | | | 2,278 |
GMAC Mortgage Loan Trust,
Ser 2003-GH2, Cl A4 | | | | | | |
5.000%, 10/25/33 | | | 746 | | | 732 |
GMAC Mortgage Loan Trust,
Ser 2003-J7, Cl A7 | | | | | | |
5.000%, 11/25/33 | | | 1,106 | | | 1,001 |
GMAC Mortgage Loan Trust,
Ser 2004-J4, Cl A1 | | | | | | |
5.500%, 09/25/34 | | | 270 | | | 268 |
GMAC Mortgage Loan Trust,
Ser 2004-J5, Cl A7 | | | | | | |
6.500%, 01/25/35 | | | 1,056 | | | 1,094 |
GMAC Mortgage Loan Trust,
Ser 2004-J6, Cl 1A1 | | | | | | |
5.000%, 01/25/20 | | | 683 | | | 697 |
GMAC Mortgage Loan Trust,
Ser 2005-AR5 , Cl 3A1 | | | | | | |
4.852%, 09/19/35 (A) | | | 222 | | | 209 |
GMAC Mortgage Loan Trust,
Ser 2005-AR6, Cl 2A1 | | | | | | |
5.145%, 11/19/35 (A) | | | 1,004 | | | 757 |
Greenpoint Mortgage Funding Trust,
Ser 2007-AR1, Cl 1A1A | | | | | | |
0.423%, 02/25/47 (A) | | | 12,021 | | | 8,491 |
Greenwich Capital Commercial Funding, Ser 2004-GG1,
Cl A6 | | | | | | |
5.135%, 06/10/36 (A) | | | 1,622 | | | 1,700 |
Greenwich Capital Commercial Funding, Ser 2005-GG5,
Cl A5 | | | | | | |
5.224%, 04/10/37 (A) | | | 4,580 | | | 4,605 |
Greenwich Capital Commercial Funding, Ser 2005-GG5,
Cl AAB | | | | | | |
5.190%, 04/10/37 (A) | | | 286 | | | 301 |
| | |
| SEI Institutional Investments Trust / Annual Report / May 31, 2010 | | 65 |
SCHEDULE OF INVESTMENTS
Core Fixed Income Fund (Continued)
May 31, 2010
| | | | | | |
| Description | | Face Amount
($ Thousands) | | Market Value
($ Thousands) |
| | | | | | |
Greenwich Capital Commercial Funding, Ser 2006-GG7, Cl A4 | | | | | | |
5.888%, 07/10/38 (A) | | $ | 12,222 | | $ | 12,398 |
Greenwich Capital Commercial Funding, Ser 2007-GG9, Cl A4 | | | | | | |
5.444%, 03/10/39 | | | 7,000 | | | 6,764 |
GS Mortgage Securities II,
Ser 2001-GL3A, Cl A2 | | | | | | |
6.449%, 08/05/18 (A) (B) | | | 6,987 | | | 7,331 |
GS Mortgage Securities II,
Ser 2004-C1, Cl A2 | | | | | | |
4.319%, 10/10/28 | | | 1,869 | | | 1,880 |
GS Mortgage Securities II,
Ser 2005-GG4, Cl AABA | | | | | | |
4.680%, 07/10/39 | | | 5,745 | | | 5,935 |
GS Mortgage Securities II,
Ser 2006-GG6, Cl A4 | | | | | | |
5.553%, 04/10/38 (A) | | | 1,000 | | | 995 |
GSMPS Mortgage Loan Trust,
Ser 1998-1, Cl A | | | | | | |
8.000%, 09/19/27 (A) (B) | | | 5 | | | 5 |
GSMPS Mortgage Loan Trust,
Ser 2005-RP3, Cl 1AF | | | | | | |
0.693%, 09/25/35 (A) (B) | | | 2,973 | | | 2,234 |
GSMPS Mortgage Loan Trust,
Ser 2006-RP2, Cl 1AF1 | | | | | | |
0.743%, 04/25/36 (A) (B) | | | 2,162 | | | 1,831 |
GSR Mortgage Loan Trust,
Ser 2004-8F, Cl 2A3 | | | | | | |
6.000%, 09/25/34 | | | 694 | | | 709 |
GSR Mortgage Loan Trust,
Ser 2005-5F, Cl 2A3 | | | | | | |
5.500%, 06/25/35 | | | 557 | | | 565 |
GSR Mortgage Loan Trust,
Ser 2005-5F, Cl 8A3 | | | | | | |
0.843%, 06/25/35 (A) | | | 825 | | | 742 |
GSR Mortgage Loan Trust,
Ser 2007-1F, Cl 2A4 | | | | | | |
5.500%, 01/25/37 | | | 125 | | | 101 |
Impac Secured Assets CMN Owner Trust, Ser 2003-2, Cl A1 | | | | | | |
5.500%, 08/25/33 | | | 948 | | | 961 |
Impac Secured Assets CMN Owner Trust, Ser 2006-2, Cl 2A1 | | | | | | |
0.693%, 08/25/36 (A) | | | 1,590 | | | 1,286 |
Indymac INDA Mortgage Loan Trust, Ser 2007-AR7, Cl 1A1 | | | | | | |
6.127%, 11/25/37 (A) | | | 1,940 | | | 1,538 |
JP Morgan Chase Commercial Mortgage Securities, Ser 2002- C2, Cl B | | | | | | |
5.211%, 12/12/34 (A) | | | 403 | | | 416 |
| | | | | | |
| Description | | Face Amount
($ Thousands) | | Market Value
($ Thousands) |
| | | | | | |
JP Morgan Chase Commercial Mortgage Securities,
Ser 2005-LDP2, Cl A3A | | | | | | |
4.678%, 07/15/42 | | $ | 4,619 | | $ | 4,740 |
JP Morgan Chase Commercial Mortgage Securities,
Ser 2006-CB16, Cl A4 | | | | | | |
5.552%, 05/12/45 | | | 1,371 | | | 1,383 |
JP Morgan Chase Commercial Mortgage Securities,
Ser 2007-LD12, Cl A3 | | | | | | |
5.962%, 02/15/51 (A) | | | 2,209 | | | 2,226 |
JP Morgan Mortgage Trust | | | | | | |
4.478%, 02/25/35 (A) | | | 688 | | | 690 |
JP Morgan Mortgage Trust,
Ser 2005-A1, Cl 3A4 | | | | | | |
5.016%, 02/25/35 (A) | | | 1,000 | | | 996 |
JPMorgan Alternative Loan Trust,
Ser 2006-A7, Cl 2A6 | | | | | | |
5.750%, 12/25/36 (A) | | | 11,300 | | | 4,291 |
JPMorgan Chase Commercial Mortgage Securities,
Ser 2001-CIB3, Cl A3 | | | | | | |
6.465%, 11/15/35 | | | 1,955 | | | 2,046 |
JPMorgan Chase Commercial Mortgage Securities,
Ser 2002-CIB5, Cl A2 | | | | | | |
5.161%, 10/12/37 | | | 969 | | | 1,020 |
JPMorgan Chase Commercial Mortgage Securities,
Ser 2003-CB7, Cl A4 | | | | | | |
4.879%, 01/12/38 (A) | | | 2,490 | | | 2,589 |
JPMorgan Chase Commercial Mortgage Securities,
Ser 2003-PM1A, Cl A4 | | | | | | |
5.326%, 08/12/40 (A) | | | 1,629 | | | 1,733 |
JPMorgan Chase Commercial Mortgage Securities,
Ser 2004-CB9, Cl A4 | | | | | | |
5.371%, 06/12/41 (A) | | | 651 | | | 676 |
JPMorgan Chase Commercial Mortgage Securities,
Ser 2005-LDP4, Cl A4 | | | | | | |
4.918%, 10/15/42 (A) | | | 500 | | | 511 |
JPMorgan Chase Commercial Mortgage Securities,
Ser 2006-LDP8, Cl A4 | | | | | | |
5.399%, 05/15/45 | | | 500 | | | 505 |
JPMorgan Chase Commercial Mortgage Securities,
Ser 2006-LDP9, Cl A3 | | | | | | |
5.336%, 05/15/47 | | | 3,588 | | | 3,448 |
| | |
| 66 | | SEI Institutional Investments Trust / Annual Report / May 31, 2010 |
| | | | | | |
| Description | | Face Amount
($ Thousands) | | Market Value
($ Thousands) |
| | | | | | |
JPMorgan Chase Commercial Mortgage Securities, Ser 2007-C1, Cl A4 | | | | | | |
5.716%, 02/15/51 | | $ | 2,465 | | $ | 2,397 |
JPMorgan Chase Commercial Mortgage Securities,
Ser 2007-LD12, Cl A4 | | | | | | |
5.882%, 02/15/51 (A) | | | 7,877 | | | 7,695 |
JPMorgan Chase Commercial Mortgage Securities,
Ser 2007-LDPX, Cl A2S | | | | | | |
5.305%, 01/15/49 | | | 6,589 | | | 6,533 |
JPMorgan Chase Commercial Mortgage Securities, Ser 2008-C2, Cl A1 | | | | | | |
5.017%, 02/12/51 | | | 115 | | | 118 |
JPMorgan Chase Commercial Mortgage Securities,
Ser 2009- IWST, Cl A2 | | | | | | |
5.633%, 12/05/27 (B) | | | 4,593 | | | 4,891 |
JPMorgan Commercial Mortgage Finance, Ser 2000-C10, Cl C | | | | | | |
7.639%, 08/15/32 (A) | | | 903 | | | 903 |
JPMorgan Mortgage Trust,
Ser 2004-A3, Cl 4A1 | | | | | | |
4.280%, 07/25/34 (A) | | | 310 | | | 314 |
JPMorgan Mortgage Trust,
Ser 2004-A3, Cl SF3 | | | | | | |
4.556%, 06/25/34 (A) | | | 3,957 | | | 3,987 |
JPMorgan Mortgage Trust,
Ser 2004-A4, Cl 1A1 | | | | | | |
4.609%, 09/25/34 (A) | | | 361 | | | 369 |
JPMorgan Mortgage Trust,
Ser 2004-A5, Cl 4A2 | | | | | | |
4.817%, 12/25/34 (A) | | | 2,620 | | | 2,663 |
JPMorgan Mortgage Trust,
Ser 2004-A5, Cl 4A4 | | | | | | |
4.817%, 12/25/34 (A) | | | 11,500 | | | 11,127 |
JPMorgan Mortgage Trust,
Ser 2005-A2, Cl 5A2 | | | | | | |
4.310%, 04/25/35 (A) | | | 360 | | | 355 |
JPMorgan Mortgage Trust,
Ser 2005-A3, Cl 11A2 | | | | | | |
4.504%, 06/25/35 (A) | | | 13,065 | | | 10,811 |
JPMorgan Mortgage Trust,
Ser 2006-A2, Cl 4A1 | | | | | | |
3.900%, 08/25/34 (A) | | | 2,299 | | | 2,243 |
JPMorgan Mortgage Trust,
Ser 2006-A2, Cl 2A2 | | | | | | |
5.754%, 04/25/36 (A) | | | 13,400 | | | 11,003 |
JPMorgan Mortgage Trust,
Ser 2006-A3, Cl 3A4 | | | | | | |
5.733%, 05/25/36 (A) | | | 14,500 | | | 12,035 |
JPMorgan Mortgage Trust,
Ser 2006-A3, Cl 6A1 | | | | | | |
3.894%, 08/25/34 (A) | | | 1,024 | | | 925 |
| | | | | | |
| Description | | Face Amount
($ Thousands) | | Market Value
($ Thousands) |
| | | | | | |
LB Commercial Conduit Mortgage Trust, Ser 2007-C3, Cl A3 | | | | | | |
5.940%, 07/15/44 (A) | | $ | 844 | | $ | 861 |
LB-UBS Commercial Mortgage Trust, Ser 2000-C5, Cl A2 | | | | | | |
5.594%, 06/15/31 | | | 12,470 | | | 13,160 |
LB-UBS Commercial Mortgage Trust, Ser 2001-C2, Cl A2 | | | | | | |
6.653%, 11/15/27 | | | 930 | | | 956 |
LB-UBS Commercial Mortgage Trust, Ser 2002-C4, Cl A4 | | | | | | |
4.563%, 09/15/26 | | | 707 | | | 725 |
LB-UBS Commercial Mortgage Trust, Ser 2002-C4, Cl A5 | | | | | | |
4.853%, 09/15/31 | | | 1,848 | | | 1,929 |
LB-UBS Commercial Mortgage Trust, Ser 2003-C3, Cl A4 | | | | | | |
4.166%, 05/15/32 | | | 752 | | | 777 |
LB-UBS Commercial Mortgage Trust, Ser 2003-C8, Cl A4 | | | | | | |
5.124%, 11/15/32 (A) | | | 18,003 | | | 19,119 |
LB-UBS Commercial Mortgage Trust, Ser 2004-C2, Cl A4 | | | | | | |
4.367%, 03/15/36 | | | 1,699 | | | 1,697 |
LB-UBS Commercial Mortgage Trust, Ser 2004-C7, Cl A5 | | | | | | |
4.628%, 10/15/29 | | | 853 | | | 874 |
LB-UBS Commercial Mortgage Trust, Ser 2006-C1, Cl A4 | | | | | | |
5.156%, 02/15/31 | | | 350 | | | 355 |
LB-UBS Commercial Mortgage Trust, Ser 2006-C4, Cl A2 | | | | | | |
5.868%, 06/15/32 (A) | | | 395 | | | 405 |
LB-UBS Commercial Mortgage Trust, Ser 2006-C4, Cl A4 | | | | | | |
5.882%, 06/15/38 (A) | | | 4,560 | | | 4,706 |
LB-UBS Commercial Mortgage Trust, Ser 2006-C6, Cl A4 | | | | | | |
5.372%, 09/15/39 | | | 1,247 | | | 1,249 |
LB-UBS Commercial Mortgage Trust, Ser 2007-C1, Cl A3 | | | | | | |
5.398%, 02/15/40 | | | 272 | | | 281 |
LB-UBS Commercial Mortgage Trust, Ser 2007-C1, Cl AAB | | | | | | |
5.403%, 02/15/40 | | | 352 | | | 360 |
LB-UBS Commercial Mortgage Trust, Ser 2008-C1, Cl A2 | | | | | | |
6.155%, 04/15/41 (A) | | | 5,813 | | | 5,955 |
LVII Resecuritization Trust,
Ser 2009-2, Cl A3 | | | | | | |
3.000%, 09/27/37 (A) (B) | | | 1,000 | | | 997 |
Master Adjustable Rate Mortgages Trust, Ser 2004-13, Cl 3A7 | | | | | | |
3.075%, 11/21/34 (A) | | | 1,585 | | | 1,372 |
| | |
| SEI Institutional Investments Trust / Annual Report / May 31, 2010 | | 67 |
SCHEDULE OF INVESTMENTS
Core Fixed Income Fund (Continued)
May 31, 2010
| | | | | | |
| Description | | Face Amount
($ Thousands) | | Market Value
($ Thousands) |
| | | | | | |
Master Adjustable Rate Mortgages Trust, Ser 2004-13, Cl 3A6 | | | | | | |
3.075%, 11/21/34 (A) | | $ | 1,076 | | $ | 1,075 |
Master Adjustable Rate Mortgages Trust, Ser 2004-13, Cl 3A7A | | | | | | |
3.075%, 11/21/34 (A) | | | 11,650 | | | 10,944 |
Master Adjustable Rate Mortgages Trust, Ser 2007-3, Cl 12A1 | | | | | | |
0.543%, 05/25/47 (A) | | | 17,130 | | | 8,676 |
Master Alternative Loans Trust, Ser 2004-4, Cl 1A1 | | | | | | |
5.500%, 05/25/34 | | | 2,311 | | | 2,372 |
Master Reperforming Loan Trust, Ser 2005-1, Cl 1A1 | | | | | | |
6.000%, 08/25/34 (B) | | | 3,655 | | | 3,412 |
Master Reperforming Loan Trust, Ser 2005-2, Cl 1A1F | | | | | | |
0.693%, 05/25/35 (A) (B) | | | 702 | | | 569 |
Master Reperforming Loan Trust, Ser 2006-1, Cl 1A1F | | | | | | |
0.703%, 07/25/35 (A) (B) | | | 1,596 | | | 1,319 |
Master Resecuritization Trust, Ser 2005-PO, Cl 3PO, PO | | | | | | |
0.000%, 05/28/35 (B) | | | 608 | | | 365 |
MASTR Alternative Loans Trust, Ser 2003-9, Cl 2A1 | | | | | | |
6.000%, 12/25/33 | | | 600 | | | 596 |
MASTR Alternative Loans Trust, Ser 2006-3, Cl AA3 | | | | | | |
6.250%, 07/25/36 | | | 802 | | | 592 |
MASTR Asset Securitization Trust, Ser 2003-2, Cl 1A1 | | | | | | |
5.000%, 03/25/18 | | | 205 | | | 212 |
MASTR Asset Securitization Trust, Ser 2003-3, Cl 3A18 | | | | | | |
5.500%, 04/25/33 | | | 695 | | | 714 |
MASTR Asset Securitization Trust, Ser 2004-10, Cl SA1 | | | | | | |
0.743%, 11/25/34 (A) | | | 117 | | | 112 |
Merrill Lynch Mortgage Investors, Ser 2003-A4, Cl 2A | | | | | | |
3.227%, 07/25/33 (A) | | | 242 | | | 244 |
Merrill Lynch Mortgage Investors, Ser 2004-A1, Cl 2A1 | | | | | | |
2.811%, 02/25/34 (A) | | | 248 | | | 231 |
Merrill Lynch Mortgage Investors, Ser 2004-A1, Cl 4A | | | | | | |
5.261%, 02/25/34 (A) | | | 4,735 | | | 4,840 |
Merrill Lynch Mortgage Investors, Ser 2004-A4, Cl A2 | | | | | | |
2.892%, 08/25/34 (A) | | | 484 | | | 483 |
Merrill Lynch Mortgage Investors, Ser 2005-A2, Cl A2 | | | | | | |
2.800%, 02/25/35 (A) | | | 227 | | | 222 |
| | | | | | |
| Description | | Face Amount
($ Thousands) | | Market Value
($ Thousands) |
| | | | | | |
Merrill Lynch Mortgage Trust | | | | | | |
5.047%, 07/12/38 (A) | | $ | 1,762 | | $ | 1,810 |
Merrill Lynch Mortgage Trust, Ser 2003-KEY1, Cl A4 | | | | | | |
5.236%, 11/12/35 (A) | | | 2,392 | | | 2,513 |
Merrill Lynch Mortgage Trust, Ser 2004-KEY2, Cl A4 | | | | | | |
4.864%, 08/12/39 (A) | | | 1,031 | | | 1,050 |
Merrill Lynch Mortgage Trust, Ser 2005-CIP1, Cl A3A | | | | | | |
4.949%, 07/12/38 (A) | | | 1,069 | | | 1,091 |
Merrill Lynch Mortgage Trust,
Ser 2006-1, Cl 1A | | | | | | |
2.686%, 02/25/36 (A) | | | 466 | | | 374 |
Merrill Lynch Mortgage Trust,
Ser 2006-C1 | | | | | | |
5.655%, 05/12/39 (A) | | | 505 | | | 516 |
Merrill Lynch Mortgage Trust, Ser 2007-C1, Cl A3 | | | | | | |
5.826%, 06/12/50 (A) | | | 2,256 | | | 2,267 |
Merrill Lynch, Ser 2006-4, Cl A3 | | | | | | |
5.172%, 12/12/49 (A) | | | 16,900 | | | 16,187 |
Merrill Lynch/Countrywide Commercial Mortgage Trust,
Ser 2007-6, Cl A4 | | | | | | |
5.485%, 03/12/51 (A) | | | 3,700 | | | 3,421 |
Merrill Lynch/Countrywide Commercial Mortgage Trust,
Ser 2007-7, Cl A4 | | | | | | |
5.747%, 06/12/50 (A) | | | 6,740 | | | 6,439 |
MLCC Mortgage Investors,
Ser 2004-A, Cl A2 | | | | | | |
0.684%, 04/25/29 (A) | | | 431 | | | 386 |
MLCC Mortgage Investors,
Ser 2004-B, Cl A3 | | | | | | |
2.010%, 05/25/29 (A) | | | 595 | | | 562 |
MLCC Mortgage Investors,
Ser 2004-D, Cl A2 | | | | | | |
0.754%, 08/25/29 (A) | | | 521 | | | 472 |
MLCC Mortgage Investors,
Ser 2005-1, Cl 2A2 | | | | | | |
2.361%, 04/25/35 (A) | | | 274 | | | 253 |
MLCC Mortgage Investors,
Ser 2005-1, Cl 2A1 | | | | | | |
2.361%, 04/25/35 (A) | | | 88 | | | 83 |
Morgan Stanley Capital I,
Ser 2003-IQ5, Cl A4 | | | | | | |
5.010%, 04/15/38 | | | 9 | | | 10 |
Morgan Stanley Capital I,
Ser 2004-HQ3, Cl A4 | | | | | | |
4.800%, 01/13/41 | | | 1,923 | | | 1,982 |
Morgan Stanley Capital I,
Ser 2004-HQ4, Cl A7 | | | | | | |
4.970%, 04/14/40 | | | 6,639 | | | 6,665 |
| | |
| 68 | | SEI Institutional Investments Trust / Annual Report / May 31, 2010 |
| | | | | | |
| Description | | Face Amount
($ Thousands) | | Market Value
($ Thousands) |
| | | | | | |
Morgan Stanley Capital I,
Ser 2004-IQ7, Cl A4 | | | | | | |
5.401%, 06/15/38 (A) | | $ | 2,922 | | $ | 3,039 |
Morgan Stanley Capital I,
Ser 2004-IQ8, Cl A4 | | | | | | |
4.900%, 06/15/40 | | | 2,536 | | | 2,614 |
Morgan Stanley Capital I,
Ser 2004-T15, Cl A4 | | | | | | |
5.270%, 06/13/41 (A) | | | 1,073 | | | 1,113 |
Morgan Stanley Capital I,
Ser 2004-T15, Cl A2 | | | | | | |
4.690%, 06/13/41 | | | 473 | | | 475 |
Morgan Stanley Capital I,
Ser 2005-HQ5, Cl AAB | | | | | | |
5.037%, 01/14/42 | | | 3,786 | | | 3,949 |
Morgan Stanley Capital I,
Ser 2005-HQ6, Cl A4A | | | | | | |
4.989%, 08/13/42 | | | 3,780 | | | 3,880 |
Morgan Stanley Capital I,
Ser 2005-HQ7, Cl AAB | | | | | | |
5.185%, 11/14/42 (A) | | | 418 | | | 436 |
Morgan Stanley Capital I,
Ser 2005-T17, Cl A4 | | | | | | |
4.520%, 12/13/41 | | | 178 | | | 182 |
Morgan Stanley Capital I,
Ser 2006-T21, Cl A4 | | | | | | |
5.162%, 10/12/52 (A) | | | 7,300 | | | 7,390 |
Morgan Stanley Capital I,
Ser 2007-T27, Cl A4 | | | | | | |
5.649%, 06/11/42 (A) | | | 300 | | | 308 |
Morgan Stanley Dean Witter Capital I, Ser 2001-TOP3, Cl B | | | | | | |
6.550%, 07/15/33 | | | 815 | | | 851 |
Morgan Stanley Dean Witter Capital I, Ser 2002-HQ, Cl A3 | | | | | | |
6.510%, 04/15/34 | | | 532 | | | 556 |
Morgan Stanley Dean Witter Capital I, Ser 2002-IQ2, Cl A4 | | | | | | |
5.740%, 12/15/35 | | | 453 | | | 475 |
Morgan Stanley Dean Witter Capital I, Ser 2003-HQ2, Cl A2 | | | | | | |
4.920%, 03/12/35 | | | 3,133 | | | 3,296 |
Morgan Stanley Dean Witter Capital I, Ser 2003-TOP9, Cl A2 | | | | | | |
4.740%, 11/13/36 | | | 1,132 | | | 1,188 |
Morgan Stanley Mortgage Loan Trust, Ser 2007-6XS, Cl 2A1S | | | | | | |
0.453%, 02/25/47 (A) | | | 529 | | | 411 |
New York Mortgage Trust,
Ser 2006-1, Cl 2A2 | | | | | | |
5.548%, 05/25/36 (A) | | | 788 | | | 685 |
Nomura Asset Securities,
Ser 1998-D6, Cl A2 | | | | | | |
7.070%, 03/15/30 (A) | | | 476 | | | 533 |
| | | | | | |
| Description | | Face Amount
($ Thousands) | | Market Value
($ Thousands) |
| | | | | | |
Prime Mortgage Trust,
Ser 2004-CL1, Cl 1PO, PO | | | | | | |
0.000%, 02/25/34 | | $ | 153 | | $ | 90 |
Prime Mortgage Trust,
Ser 2004-CL1, Cl 1A1 | | | | | | |
6.000%, 02/25/34 | | | 430 | | | 442 |
Prime Mortgage Trust,
Ser 2006-DR1, Cl 2A1 | | | | | | |
5.500%, 05/25/35 (B) | | | 2,940 | | | 2,594 |
Prudential Mortgage Capital Funding LLC, Ser 2001-ROCK, Cl B | | | | | | |
6.760%, 05/10/34 | | | 867 | | | 902 |
RBSGC Mortgage Pass Through Certificates, Ser 2007-B, Cl 1A4 | | | | | | |
0.793%, 01/25/37 (A) | | | 6,260 | | | 3,509 |
RBSSP Resecuritization Trust,
Ser 2010-4, Cl 12A1 | | | | | | |
4.500%, 03/26/21 (B) | | | 1,200 | | | 1,223 |
Residential Accredit Loans, Ser 2003-QS18, Cl A1 | | | | | | |
5.000%, 09/25/18 | | | 593 | | | 595 |
Residential Accredit Loans, Ser 2003-QS19, Cl A1 | | | | | | |
5.750%, 10/25/33 | | | 584 | | | 563 |
Residential Accredit Loans, Ser 2004-QS7, Cl A4 | | | | | | |
5.500%, 05/25/34 | | | 1,390 | | | 1,103 |
Residential Accredit Loans,
Ser 2005-Q02, Cl A1 | | | | | | |
1.781%, 09/25/45 (A) | | | 1,162 | | | 659 |
Residential Accredit Loans, Ser 2006-QO8, Cl 1A1A | | | | | | |
0.433%, 10/25/46 (A) | | | 4,311 | | | 4,132 |
Residential Asset Mortgage Products, Ser 2004-SL1, Cl A8 | | | | | | |
6.500%, 11/25/31 | | | 1,040 | | | 1,014 |
Residential Asset Mortgage Products, Ser 2004-SL3, Cl A2 | | | | | | |
6.500%, 12/25/31 | | | 1,974 | | | 1,932 |
Residential Asset Securitization Trust, Ser 2003-A5, Cl A1 | | | | | | |
5.500%, 06/25/33 | | | 664 | | | 644 |
Residential Asset Securitization Trust, Ser 2004-IP2, Cl 2A1 | | | | | | |
2.897%, 12/25/34 (A) | | | 1,914 | | | 1,755 |
Salomon Brothers Mortgage Securities VII, Ser 2000-C2 C, Cl C | | | | | | |
7.727%, 07/18/33 (A) | | | 1,398 | | | 1,394 |
Salomon Brothers Mortgage Securities VII, Ser 2002-KEY2, Cl A2 | | | | | | |
4.467%, 03/18/36 | | | 1,577 | | | 1,623 |
| | |
| SEI Institutional Investments Trust / Annual Report / May 31, 2010 | | 69 |
SCHEDULE OF INVESTMENTS
Core Fixed Income Fund (Continued)
May 31, 2010
| | | | | | |
| Description | | Face Amount
($ Thousands) | | Market Value
($ Thousands) |
| | | | | | |
Salomon Brothers Mortgage Securities VII, Ser 2003-HYB1, Cl A | | | | | | |
3.690%, 09/25/33 (A) | | $ | 974 | | $ | 958 |
Sequoia Mortgage Trust,
Ser 2010-H1, Cl A1 | | | | | | |
3.750%, 02/25/40 (A) | | | 1,570 | | | 1,586 |
Station Place Securitization Trust, Ser 2009-1, Cl A | | | | | | |
1.843%, 01/25/40 (A) (B) (G) | | | 1,000 | | | 1,002 |
Structured Adjustable Rate Mortgage Loan Trust, Ser 2005-18, Cl 1A1 | | | | | | |
5.534%, 09/25/35 (A) | | | 4,694 | | | 3,642 |
Structured Adjustable Rate Mortgage Loan Trust, Ser 2005-19XS, Cl 1A1 | | | | | | |
0.663%, 10/25/35 (A) | | | 5,680 | | | 3,434 |
Structured Asset Mortgage Investments, Ser 2004-AR8, Cl A1 | | | | | | |
0.679%, 05/19/35 (A) | | | 236 | | | 168 |
Structured Asset Mortgage Investments, Ser 2006-AR6, Cl 1A3 | | | | | | |
0.533%, 07/25/46 (A) | | | 214 | | | 110 |
Structured Asset Mortgage Investments, Ser 2006-AR8, Cl A1A | | | | | | |
0.543%, 10/25/36 (A) | | | 6,597 | | | 3,628 |
Structured Asset Mortgage Investments, Ser 2007-AR4, Cl GA4B | | | | | | |
0.523%, 09/25/47 (A) | | | 18,561 | | | 9,768 |
Structured Asset Securities,
Ser 2003-16, Cl A3 | | | | | | |
0.843%, 06/25/33 (A) | | | 1,310 | | | 1,197 |
Structured Asset Securities,
Ser 2003-31A, Cl 2A7 | | | | | | |
2.495%, 10/25/33 (A) | | | 11,211 | | | 10,650 |
Structured Asset Securities,
Ser 2003-32, Cl 1A1 | | | | | | |
5.145%, 11/25/33 (A) | | | 328 | | | 335 |
Structured Asset Securities,
Ser 2003-33H, Cl 1A1 | | | | | | |
5.500%, 10/25/33 | | | 1,144 | | | 1,085 |
Structured Asset Securities,
Ser 2003-37A, Cl 2A | | | | | | |
4.997%, 12/25/33 (A) | | | 452 | | | 458 |
Structured Asset Securities,
Ser 2004-5H, Cl A4 | | | | | | |
5.540%, 12/25/33 | | | 1,000 | | | 967 |
Structured Asset Securities,
Ser 2005-6, Cl 5A8 | | | | | | |
13.214%, 05/25/35 (A) | | | 178 | | | 171 |
| | | | | | |
| Description | | Face Amount
($ Thousands) | | Market Value
($ Thousands) |
| | | | | | |
Thornburg Mortgage Securities Trust, Ser 2003-4, Cl A1 | | | | | | |
0.663%, 09/25/43 (A) | | $ | 232 | | $ | 210 |
Thornburg Mortgage Securities Trust, Ser 2007-4, Cl 2A1 | | | | | | |
6.201%, 09/25/37 (A) | | | 6,213 | | | 5,840 |
Thornburg Mortgage Securities Trust, Ser 2007-4, Cl 3A1 | | | | | | |
6.205%, 09/25/37 (A) | | | 6,283 | | | 6,011 |
TIAA Seasoned Commercial Mortgage Trust, Ser 2007-C4, Cl A3 | | | | | | |
6.071%, 08/15/39 (A) | | | 2,500 | | | 2,694 |
US Bank National Mortgage Association, Ser 2007-1, Cl A | | | | | | |
5.920%, 05/25/12 | | | 4,729 | | | 4,957 |
Vendee Mortgage Trust CMO,
Ser 1993-1, Cl ZB | | | | | | |
7.250%, 02/15/23 | | | 2,989 | | | 3,345 |
Virginia Housing Development Authority, Ser 2006-2, Cl CTFS | | | | | | |
6.000%, 06/25/34 | | | 614 | | | 616 |
Wachovia Bank Commercial Mortgage Trust, Ser 2002-C1, Cl A4 | | | | | | |
6.287%, 04/15/34 | | | 2,587 | | | 2,741 |
Wachovia Bank Commercial Mortgage Trust, Ser 2003-C7, Cl A1 | | | | | | |
4.241%, 10/15/35 (B) | | | 358 | | | 361 |
Wachovia Bank Commercial Mortgage Trust, Ser 2003-C8, Cl A3 | | | | | | |
4.445%, 11/15/35 | | | 870 | | | 887 |
Wachovia Bank Commercial Mortgage Trust, Ser 2005-C18, Cl A4 | | | | | | |
4.935%, 04/15/42 | | | 1,658 | | | 1,708 |
WaMu Mortgage Pass Through Certificates, Ser 2004-S1, Cl 1A3 | | | | | | |
0.743%, 03/25/34 (A) | | | 548 | | | 535 |
WaMu Mortgage Pass Through Certificates, Ser 2004-S2, Cl 2A4 | | | | | | |
5.500%, 06/25/34 | | | 695 | | | 677 |
WaMu Mortgage Pass Through Certificates, Ser 2006-AR7, Cl 2A | | | | | | |
1.401%, 07/25/46 (A) | | | 1,268 | | | 797 |
WaMu Mortgage Pass-Through Certificates, Ser 2002-AR18, Cl A | | | | | | |
2.771%, 01/25/33 (A) | | | 380 | | | 366 |
WaMu Mortgage Pass-Through Certificates, Ser 2003-AR10, Cl A7 | | | | | | |
2.825%, 10/25/33 (A) | | | 670 | | | 633 |
| | |
| 70 | | SEI Institutional Investments Trust / Annual Report / May 31, 2010 |
| | | | | | |
| Description | | Face Amount
($ Thousands) | | Market Value
($ Thousands) |
| | | | | | |
WaMu Mortgage Pass-Through Certificates, Ser 2003-AR6, Cl A1 | | | | | | |
3.019%, 06/25/33 (A) | | $ | 657 | | $ | 636 |
WaMu Mortgage Pass-Through Certificates, Ser 2003-AR7, Cl A7 | | | | | | |
2.831%, 08/25/33 (A) | | | 595 | | | 583 |
WaMu Mortgage Pass-Through Certificates, Ser 2003-AR8, Cl A | | | | | | |
2.847%, 08/25/33 (A) | | | 355 | | | 351 |
WaMu Mortgage Pass-Through Certificates, Ser 2003-AR9, Cl 2A | | | | | | |
2.882%, 09/25/33 (A) | | | 411 | | | 411 |
WaMu Mortgage Pass-Through Certificates,
Ser 2003-AR9, Cl 1A6 | | | | | | |
2.833%, 09/25/33 (A) | | | 1,265 | | | 1,241 |
WaMu Mortgage Pass-Through Certificates, Ser 2003-MS1, Cl 1A | | | | | | |
5.000%, 02/25/18 | | | 536 | | | 543 |
WaMu Mortgage Pass-Through Certificates, Ser 2003-S11, Cl 2A5 | | | | | | |
16.107%, 11/25/33 (A) | | | 975 | | | 1,020 |
WaMu Mortgage Pass-Through Certificates,
Ser 2003-S13, Cl 21A1 | | | | | | |
4.500%, 12/25/18 | | | 680 | | | 697 |
WaMu Mortgage Pass-Through Certificates, Ser 2003-S4, Cl 2A10 | | | | | | |
16.520%, 06/25/33 (A) | | | 192 | | | 192 |
WaMu Mortgage Pass-Through Certificates, Ser 2003-S9, Cl A8 | | | | | | |
5.250%, 10/25/33 | | | 2,127 | | | 1,966 |
WaMu Mortgage Pass-Through Certificates, Ser 2004-AR11, Cl A | | | | | | |
2.890%, 10/25/34 (A) | | | 49 | | | 47 |
WaMu Mortgage Pass-Through Certificates,
Ser 2004-AR14, Cl A1 | | | | | | |
2.740%, 01/25/35 (A) | | | 1,734 | | | 1,698 |
WaMu Mortgage Pass-Through Certificates, Ser 2004-AR3, Cl A1 | | | | | | |
2.712%, 06/25/34 (A) | | | 344 | | | 329 |
WaMu Mortgage Pass-Through Certificates, Ser 2004-CB2, Cl 7A | | | | | | |
5.500%, 08/25/19 | | | 777 | | | 793 |
WaMu Mortgage Pass-Through Certificates,
Ser 2005-AR11, Cl A1A | | | | | | |
0.663%, 08/25/45 (A) | | | 165 | | | 128 |
WaMu Mortgage Pass-Through Certificates,
Ser 2005-AR13, Cl A1A1 | | | | | | |
0.633%, 10/25/45 (A) | | | 4,144 | | | 3,171 |
| | | | | | |
| Description | | Face Amount
($ Thousands) | | Market Value
($ Thousands) |
| | | | | | |
WaMu Mortgage Pass-Through Certificates, Ser 2005-AR15, Cl A1A2 | | | | | | |
0.623%, 11/25/45 (A) | | $ | 6,514 | | $ | 4,311 |
WaMu Mortgage Pass-Through Certificates, Ser 2005-AR16, Cl 1A4A | | | | | | |
5.070%, 12/25/35 (A) | | | 13,585 | | | 11,087 |
WaMu Mortgage Pass-Through Certificates, Ser 2005-AR19, Cl A1A2 | | | | | | |
0.633%, 12/25/45 (A) | | | 6,168 | | | 4,168 |
WaMu Mortgage Pass-Through Certificates, Ser 2006-AR1, Cl 1A1B | | | | | | |
1.491%, 01/25/46 (A) | | | 3,349 | | | 887 |
WaMu Mortgage Pass-Through Certificates, Ser 2006-AR13, Cl 2A | | | | | | |
3.359%, 10/25/46 (A) | | | 1,608 | | | 1,046 |
WaMu Mortgage Pass-Through Certificates, Ser 2006-AR14, Cl 1A4 | | | | | | |
5.570%, 11/25/36 (A) | | | 510 | | | 390 |
WaMu Mortgage Pass-Through Certificates, Ser 2006-AR15, Cl 2A1B | | | | | | |
3.359%, 11/25/46 (A) | | | 2,112 | | | 697 |
WaMu Mortgage Pass-Through Certificates, Ser 2006-AR15, Cl 1A1B | | | | | | |
1.261%, 11/25/46 (A) | | | 1,832 | | | 410 |
WaMu Mortgage Pass-Through Certificates, Ser 2006-AR15, Cl 1A | | | | | | |
1.261%, 11/25/46 (A) | | | 3,175 | | | 1,935 |
WaMu Mortgage Pass-Through Certificates, Ser 2006-AR17, Cl 1A1B | | | | | | |
1.231%, 12/25/46 (A) | | | 636 | | | 194 |
WaMu Mortgage Pass-Through Certificates, Ser 2006-AR17, Cl 2A | | | | | | |
3.359%, 12/25/46 (A) | | | 728 | | | 409 |
WaMu Mortgage Pass-Through Certificates, Ser 2006-AR4, Cl DA | | | | | | |
1.411%, 06/25/46 (A) | | | 1,359 | | | 593 |
WaMu Mortgage Pass-Through Certificates, Ser 2006-AR7, Cl A1B | | | | | | |
1.361%, 09/25/46 (A) | | | 1,070 | | | 120 |
WaMu Mortgage Pass-Through Certificates, Ser 2007-HY1, Cl 1A1 | | | | | | |
5.610%, 02/25/37 (A) | | | 6,636 | | | 4,867 |
| | |
| SEI Institutional Investments Trust / Annual Report / May 31, 2010 | | 71 |
SCHEDULE OF INVESTMENTS
Core Fixed Income Fund (Continued)
May 31, 2010
| | | | | | |
| Description | | Face Amount
($ Thousands) | | Market Value
($ Thousands) |
| | | | | | |
WaMu Mortgage Pass-Through Certificates,
Ser 2007-HY1, Cl 4A1 | | | | | | |
5.370%, 02/25/37 (A) | | $ | 9,138 | | $ | 6,686 |
WaMu Mortgage Pass-Through Certificates,
Ser 2007-HY3, Cl 4A1 | | | | | | |
5.348%, 03/25/37 (A) | | | 437 | | | 382 |
WaMu Mortgage Pass-Through Certificates,
Ser 2007-HY3, Cl 1A1 | | | | | | |
5.520%, 03/25/37 (A) | | | 7,723 | | | 5,630 |
WaMu Mortgage Pass-Through Certificates,
Ser 2007-OA5, Cl A1B | | | | | | |
1.281%, 05/25/47 (A) | | | 16,266 | | | 3,577 |
WaMu Mortgage Pass-Through Certificates, Ser 2007-OA5, Cl 1A | | | | | | |
1.191%, 06/25/47 (A) | | | 13,072 | | | 7,738 |
WaMu Mortgage Pass-Through Certificates, Ser 2007-OA6, Cl 1A | | | | | | |
1.251%, 07/25/47 (A) | | | 13,165 | | | 7,593 |
Washington Mutual Alternative Mortgage Pass-Through Certificates, Ser 2005-3, Cl CX, IO | | | | | | |
5.500%, 05/25/35 | | | 850 | | | 126 |
Washington Mutual Mortgage Pass Through Certificates,
Ser 2004-AR3, Cl A2 | | | | | | |
2.712%, 06/25/34 (A) | | | 451 | | | 441 |
Washington Mutual MSC Mortgage Pass-Through CTFS,
Ser 2003-MS8, Cl 1P, PO | | | | | | |
1.656%, 05/25/33 | | | 417 | | | 266 |
Washington Mutual MSC Mortgage Pass-Through CTFS,
Ser 2003-MS9, Cl 2P, PO | | | | | | |
1.655%, 04/25/33 | | | 845 | | | 593 |
Wells Fargo Mortgage Backed Securities Trust,
Ser 2003-15, Cl 1A1 | | | | | | |
4.750%, 12/25/18 | | | 2,473 | | | 2,532 |
Wells Fargo Mortgage Backed Securities Trust,
Ser 2003-C, Cl A6 | | | | | | |
3.292%, 02/25/33 (A) | | | 747 | | | 754 |
Wells Fargo Mortgage Backed Securities Trust,
Ser 2003-J, Cl 2A5 | | | | | | |
4.438%, 10/25/33 (A) | | | 343 | | | 348 |
Wells Fargo Mortgage Backed Securities Trust,
Ser 2003-K, Cl 1A1 | | | | | | |
4.472%, 11/25/33 (A) | | | 1,533 | | | 1,556 |
| | | | | | |
| Description | | Face Amount
($ Thousands) | | Market Value
($ Thousands) |
| | | | | | |
Wells Fargo Mortgage Backed Securities Trust,
Ser 2004-0, Cl A1 | | | | | | |
4.862%, 08/25/34 (A) | | $ | 681 | | $ | 689 |
Wells Fargo Mortgage Backed Securities Trust,
Ser 2004-B, Cl A1 | | | | | | |
4.896%, 02/25/34 (A) | | | 1,091 | | | 1,108 |
Wells Fargo Mortgage Backed Securities Trust,
Ser 2004-E, Cl A2 | | | | | | |
4.500%, 05/25/34 (A) | | | 265 | | | 264 |
Wells Fargo Mortgage Backed Securities Trust,
Ser 2004-E, Cl A8 | | | | | | |
4.858%, 05/25/34 (A) | | | 1,000 | | | 1,003 |
Wells Fargo Mortgage Backed Securities Trust,
Ser 2004-EE, Cl 3A2 | | | | | | |
3.596%, 12/25/34 (A) | | | 504 | | | 515 |
Wells Fargo Mortgage Backed Securities Trust,
Ser 2004-EE, Cl 2A1 | | | | | | |
3.050%, 12/25/34 (A) | | | 1,052 | | | 1,049 |
Wells Fargo Mortgage Backed Securities Trust,
Ser 2004-EE, Cl 3A1 | | | | | | |
3.596%, 12/25/34 (A) | | | 336 | | | 338 |
Wells Fargo Mortgage Backed Securities Trust,
Ser 2004-I, Cl 1A1 | | | | | | |
3.322%, 07/25/34 (A) | | | 1,021 | | | 998 |
Wells Fargo Mortgage Backed Securities Trust,
Ser 2004-L, Cl A5 | | | | | | |
4.756%, 07/25/34 (A) | | | 571 | | | 575 |
Wells Fargo Mortgage Backed Securities Trust,
Ser 2004-L, Cl A6 | | | | | | |
4.756%, 07/25/34 (A) | | | 895 | | | 915 |
Wells Fargo Mortgage Backed Securities Trust,
Ser 2004-P, Cl 2A1 | | | | | | |
3.060%, 09/25/34 (A) | | | 679 | | | 665 |
Wells Fargo Mortgage Backed Securities Trust,
Ser 2004-V, Cl 1A1 | | | | | | |
3.143%, 10/25/34 (A) | | | 910 | | | 926 |
Wells Fargo Mortgage Backed Securities Trust,
Ser 2004-V, Cl 1A2 | | | | | | |
3.143%, 10/25/34 (A) | | | 728 | | | 723 |
| | |
| 72 | | SEI Institutional Investments Trust / Annual Report / May 31, 2010 |
| | | | | | |
| Description | | Face Amount
($ Thousands) | | Market Value
($ Thousands) |
| | | | | | |
Wells Fargo Mortgage Backed Securities Trust,
Ser 2005-13, Cl A1 | | | | | | |
5.000%, 11/25/20 | | $ | 672 | | $ | 681 |
Wells Fargo Mortgage Backed Securities Trust, Ser 2005- AR14, Cl A1 | | | | | | |
5.368%, 08/25/35 (A) | | | 936 | | | 903 |
Wells Fargo Mortgage Backed Securities Trust, Ser 2005-AR8, Cl 2A1 | | | | | | |
3.098%, 06/25/35 (A) | | | 1,254 | | | 1,242 |
Wells Fargo Mortgage Backed Securities Trust, Ser 2006- AR18, Cl 1A1 | | | | | | |
5.795%, 11/25/36 (A) | | | 1,101 | | | 978 |
Wells Fargo Mortgage-Backed Securities Trust, Ser 2004-EE, Cl 2A2 | | | | | | |
3.050%, 12/25/34 (A) | | | 702 | | | 695 |
| | | | | | |
| | | | | | 784,945 |
| | | | | | |
Total Mortgage-Backed Securities
(Cost $2,612,579) ($ Thousands) | | | 2,615,428 |
| | | | | | |
|
CORPORATE OBLIGATIONS — 26.8% |
|
Consumer Discretionary — 1.4% |
British Sky Broadcasting Group | | | | | | |
9.500%, 11/15/18 (B) | | | 1,895 | | | 2,434 |
CBS | | | | | | |
7.875%, 07/30/30 | | | 160 | | | 175 |
5.750%, 04/15/20 | | | 92 | | | 94 |
Comcast | | | | | | |
6.500%, 01/15/17 (C) | | | 7,925 | | | 8,869 |
6.500%, 01/15/15 (C) | | | 3,635 | | | 4,121 |
6.400%, 03/01/40 (C) | | | 1,900 | | | 1,999 |
5.150%, 03/01/20 | | | 2,984 | | | 3,068 |
4.950%, 06/15/16 | | | 4,125 | | | 4,350 |
Comcast Cable Communications | | | | | | |
8.375%, 03/15/13 | | | 3,307 | | | 3,832 |
6.750%, 01/30/11 (C) | | | 1,840 | | | 1,905 |
COX Communications | | | | | | |
5.450%, 12/15/14 | | | 235 | | | 257 |
CVS | | | | | | |
5.789%, 01/10/26 (B) | | | 1,942 | | | 1,912 |
| | | | | | |
CVS Caremark | | | | | | |
6.600%, 03/15/19 | | | 280 | | | 318 |
CVS Lease Pass-Through | | | | | | |
6.036%, 12/10/28 (B) | | | 6,065 | | | 6,138 |
5.880%, 01/10/28 (B) | | | 176 | | | 178 |
DaimlerChrysler | | | | | | |
7.300%, 01/15/12 | | | 2,515 | | | 2,725 |
6.500%, 11/15/13 (C) | | | 460 | | | 512 |
| | | | | | |
| Description | | Face Amount
($ Thousands) | | Market Value
($ Thousands) |
Eastman Kodak | | | | | | |
7.250%, 11/15/13 | | $ | 2,445 | | $ | 2,360 |
Grupo Televisa | | | | | | |
6.625%, 01/15/40 | | | 2,445 | | | 2,448 |
Historic TW | | | | | | |
9.150%, 02/01/23 | | | 500 | | | 655 |
Kohl’s | | | | | | |
6.250%, 12/15/17 (C) | | | 255 | | | 289 |
Lowe’s MTN | | | | | | |
7.110%, 05/15/37 | | | 400 | | | 475 |
McDonald’s MTN | | | | | | |
5.350%, 03/01/18 (C) | | | 2,350 | | | 2,617 |
News America | | | | | | |
6.650%, 11/15/37 | | | 260 | | | 281 |
Staples | | | | | | |
9.750%, 01/15/14 (C) | | | 305 | | | 374 |
Target | | | | | | |
4.000%, 06/15/13 | | | 355 | | | 377 |
Thomson Reuters | | | | | | |
5.950%, 07/15/13 | | | 1,350 | | | 1,498 |
4.700%, 10/15/19 | | | 250 | | | 257 |
Time Warner | | | | | | |
7.625%, 04/15/31 | | | 4,680 | | | 5,381 |
6.875%, 05/01/12 | | | 130 | | | 142 |
Time Warner Cable | | | | | | |
8.750%, 02/14/19 | | | 3,320 | | | 4,141 |
8.250%, 04/01/19 | | | 3,235 | | | 3,938 |
7.300%, 07/01/38 (C) | | | 400 | | | 457 |
6.750%, 07/01/18 (C) | | | 120 | | | 135 |
6.550%, 05/01/37 | | | 5,050 | | | 5,265 |
5.850%, 05/01/17 | | | 1,230 | | | 1,336 |
Viacom | | | | | | |
6.250%, 04/30/16 | | | 300 | | | 337 |
Wal-Mart Stores | | | | | | |
5.800%, 02/15/18 | | | 1,990 | | | 2,288 |
| | | | | | |
| | | | | | 77,938 |
| | | | | | |
| | |
Consumer Staples — 1.3% | | | | | | |
Altria Group | | | | | | |
10.200%, 02/06/39 | | | 855 | | | 1,104 |
9.700%, 11/10/18 (C) | | | 3,450 | | | 4,190 |
9.250%, 08/06/19 | | | 1,690 | | | 2,005 |
Anheuser-Busch InBev Worldwide | | | | | | |
7.750%, 01/15/19 (B) | | | 7,240 | | | 8,580 |
7.200%, 01/15/14 (B) | | | 100 | | | 114 |
5.375%, 01/15/20 | | | 4,550 | | | 4,745 |
| | | | | | |
5.375%, 11/15/14 (B) | | | 4,885 | | | 5,299 |
5.000%, 04/15/20 (B) | | | 910 | | | 923 |
4.125%, 01/15/15 | | | 5,305 | | | 5,475 |
Bunge Finance | | | | | | |
8.500%, 06/15/19 | | | 350 | | | 408 |
5.900%, 04/01/17 | | | 107 | | | 113 |
Cargill | | | | | | |
7.350%, 03/06/19 (B) | | | 400 | | | 483 |
| | |
| SEI Institutional Investments Trust / Annual Report / May 31, 2010 | | 73 |
SCHEDULE OF INVESTMENTS
Core Fixed Income Fund (Continued)
May 31, 2010
| | | | | | |
| Description | | Face Amount
($ Thousands) | | Market Value
($ Thousands) |
Diageo Capital | | | | | | |
4.828%, 07/15/20 | | $ | 300 | | $ | 306 |
Diageo Finance BV | | | | | | |
5.500%, 04/01/13 | | | 300 | | | 330 |
Dr Pepper Snapple Group | | | | | | |
6.820%, 05/01/18 | | | 2,870 | | | 3,354 |
2.350%, 12/21/12 | | | 2,735 | | | 2,756 |
Kraft Foods | | | | | | |
6.750%, 02/19/14 (C) | | | 200 | | | 228 |
6.500%, 02/09/40 | | | 7,440 | | | 7,898 |
6.500%, 08/11/17 | | | 100 | | | 113 |
6.125%, 08/23/18 | | | 700 | | | 771 |
5.375%, 02/10/20 | | | 10,910 | | | 11,331 |
PepsiCo | | | | | | |
7.900%, 11/01/18 (C) | | | 1,580 | | | 2,027 |
5.500%, 01/15/40 | | | 1,915 | | | 1,970 |
Reynolds American | | | | | | |
7.250%, 06/01/12 | | | 2,090 | | | 2,256 |
SABMiller | | | | | | |
5.500%, 08/15/13 (B) | | | 320 | | | 350 |
Safeway | | | | | | |
6.350%, 08/15/17 | | | 2,726 | | | 3,111 |
Wal-Mart Stores | | | | | | |
5.625%, 04/01/40 | | | 5,430 | | | 5,659 |
5.250%, 09/01/35 | | | 1,035 | | | 1,025 |
| | | | | | |
| | | | | | 76,924 |
| | | | | | |
| | |
Energy — 2.5% | | | | | | |
Anadarko Finance | | | | | | |
7.500%, 05/01/31 | | | 273 | | | 284 |
Anadarko Petroleum | | | | | | |
8.700%, 03/15/19 | | | 150 | | | 176 |
7.625%, 03/15/14 | | | 450 | | | 501 |
6.950%, 06/15/19 | | | 90 | | | 97 |
6.450%, 09/15/36 | | | 2,258 | | | 2,138 |
5.950%, 09/15/16 | | | 5,010 | | | 5,337 |
ANR Pipeline | | | | | | |
9.625%, 11/01/21 | | | 100 | | | 137 |
Apache | | | | | | |
6.000%, 09/15/13 | | | 3,300 | | | 3,701 |
5.625%, 01/15/17 | | | 390 | | | 438 |
Baker Hughes | | | | | | |
7.500%, 11/15/18 | | | 2,290 | | | 2,769 |
Cenovus Energy | | | | | | |
5.700%, 10/15/19 (B) | | | 150 | | | 158 |
| | | | | | |
CenterPoint Energy Resources | | | | | | |
7.875%, 04/01/13 | | | 170 | | | 195 |
Conoco Funding | | | | | | |
7.250%, 10/15/31 | | | 885 | | | 1,077 |
6.950%, 04/15/29 (C) | | | 2,515 | | | 2,999 |
6.350%, 10/15/11 | | | 430 | | | 460 |
ConocoPhillips | | | | | | |
6.000%, 01/15/20 (C) | | | 460 | | | 524 |
5.900%, 05/15/38 | | | 3,845 | | | 4,156 |
| | | | | | |
| Description | | Face Amount
($ Thousands) | | Market Value
($ Thousands) |
5.900%, 10/15/32 | | $ | 10 | | $ | 11 |
Duke Capital LLC | | | | | | |
8.000%, 10/01/19 | | | 702 | | | 842 |
El Paso | | | | | | |
6.950%, 06/01/28 | | | 2,250 | | | 1,948 |
EnCana | | | | | | |
6.500%, 05/15/19 | | | 565 | | | 629 |
6.500%, 02/01/38 | | | 3,735 | | | 3,948 |
Energy Transfer Partners | | | | | | |
9.000%, 04/15/19 | | | 2,605 | | | 3,067 |
8.500%, 04/15/14 | | | 1,060 | | | 1,237 |
6.700%, 07/01/18 | | | 4,030 | | | 4,315 |
Enterprise Products Operating LLC | | | | | | |
9.750%, 01/31/14 (C) | | | 3,610 | | | 4,356 |
Gaz Capital for Gazprom | | | | | | |
6.212%, 11/22/16 (B) | | | 427 | | | 417 |
Halliburton | | | | | | |
6.150%, 09/15/19 | | | 300 | | | 328 |
Hess | | | | | | |
8.125%, 02/15/19 | | | 4,200 | | | 5,183 |
7.300%, 08/15/31 | | | 1,445 | | | 1,680 |
Husky Energy | | | | | | |
5.900%, 06/15/14 | | | 1,625 | | | 1,787 |
Kerr-McGee | | | | | | |
6.950%, 07/01/24 | | | 2,325 | | | 2,453 |
Kinder Morgan Energy Partners | | | | | | |
7.125%, 03/15/12 | | | 1,760 | | | 1,901 |
6.550%, 09/15/40 | | | 2,110 | | | 2,077 |
6.000%, 02/01/17 | | | 610 | | | 656 |
5.000%, 12/15/13 | | | 1,190 | | | 1,263 |
Marathon Oil | | | | | | |
7.500%, 02/15/19 (C) | | | 300 | | | 349 |
Motiva Enterprises LLC | | | | | | |
6.850%, 01/15/40 (B) | | | 3,050 | | | 3,375 |
Occidental Petroleum | | | | | | |
7.000%, 11/01/13 | | | 4,440 | | | 5,157 |
Pemex Project Funding Master Trust | | | | | | |
6.625%, 06/15/35 | | | 5,602 | | | 5,490 |
1.136%, 12/03/12 (A) (B) | | | 201 | | | 199 |
Petrobras International Finance | | | | | | |
7.875%, 03/15/19 (C) | | | 1,585 | | | 1,793 |
6.875%, 01/20/40 | | | 1,490 | | | 1,495 |
6.125%, 10/06/16 | | | 1,300 | | | 1,384 |
5.750%, 01/20/20 | | | 1,127 | | | 1,118 |
| | | | | | |
Petro-Canada | | | | | | |
6.800%, 05/15/38 (C) | | | 4,610 | | | 4,980 |
6.050%, 05/15/18 | | | 260 | | | 284 |
Ras Laffan Liquefied Natural Gas III | | | | | | |
5.500%, 09/30/14 (B) | | | 2,900 | | | 3,099 |
4.500%, 09/30/12 (B) | | | 1,995 | | | 2,058 |
Rockies Express Pipeline LLC | | | | | | |
5.625%, 04/15/20 (B) | | | 1,965 | | | 1,939 |
3.900%, 04/15/15 (B) | | | 4,445 | | | 4,373 |
| | |
| 74 | | SEI Institutional Investments Trust / Annual Report / May 31, 2010 |
| | | | | | |
| Description | | Face Amount
($ Thousands) | | Market Value
($ Thousands) |
Shell International Finance BV | | | | | | |
6.375%, 12/15/38 | | $ | 2,790 | | $ | 3,185 |
4.375%, 03/25/20 | | | 90 | | | 91 |
4.300%, 09/22/19 | | | 1,000 | | | 1,009 |
Sonat | | | | | | |
7.625%, 07/15/11 | | | 2,880 | | | 2,975 |
Suncor Energy | | | | | | |
6.500%, 06/15/38 | | | 2,120 | | | 2,212 |
Talisman Energy | | | | | | |
7.750%, 06/01/19 (C) | | | 390 | | | 470 |
Tosco | | | | | | |
7.800%, 01/01/27 | | | 210 | | | 254 |
Total Capital | | | | | | |
3.125%, 10/02/15 | | | 2,390 | | | 2,423 |
TransCanada Pipelines | | | | | | |
6.200%, 10/15/37 | | | 3,240 | | | 3,252 |
TransCanada PipeLines | | | | | | |
6.500%, 08/15/18 (C) | | | 425 | | | 480 |
Union Pacific Resources Group | | | | | | |
7.150%, 05/15/28 | | | 150 | | | 160 |
Valero Energy | | | | | | |
9.375%, 03/15/19 | | | 8,370 | | | 9,912 |
Williams | | | | | | |
8.750%, 03/15/32 (C) | | | 1,606 | | | 1,913 |
7.875%, 09/01/21 | | | 2,862 | | | 3,308 |
7.750%, 06/15/31 | | | 548 | | | 598 |
Williams Partners | | | | | | |
5.250%, 03/15/20 (B) (C) | | | 1,140 | | | 1,140 |
Williams, Ser A | | | | | | |
7.500%, 01/15/31 | | | 2,265 | | | 2,407 |
XTO Energy | | | | | | |
7.500%, 04/15/12 | | | 1,320 | | | 1,468 |
6.750%, 08/01/37 | | | 1,075 | | | 1,277 |
6.250%, 08/01/17 | | | 380 | | | 440 |
5.650%, 04/01/16 | | | 390 | | | 442 |
5.500%, 06/15/18 | | | 2,692 | | | 2,965 |
4.625%, 06/15/13 | | | 100 | | | 107 |
| | | | | | |
| | | | | | 142,826 |
| | | | | | |
| | |
Financials — 14.4% | | | | | | |
Achmea Hypotheekbank | | | | | | |
3.200%, 11/03/14 (B) | | | 7,010 | | | 7,105 |
Aegon, Ser CMS | | | | | | |
3.891%, 07/29/49 (A) | | | 2,180 | | | 1,304 |
| | | | | | |
AEP Texas Central Transition Funding LLC | | | | | | |
5.090%, 07/01/15 | | | 8,975 | | | 9,908 |
4.980%, 07/01/13 | | | 949 | | | 1,000 |
Aiful | | | | | | |
5.000%, 08/10/10 (B) | | | 1,800 | | | 1,674 |
Allstate | | | | | | |
6.200%, 05/16/14 | | | 4,765 | | | 5,360 |
5.000%, 08/15/14 (C) | | | 300 | | | 325 |
| | | | | | |
| Description | | Face Amount
($ Thousands) | | Market Value
($ Thousands) |
American Express | | | | | | |
7.250%, 05/20/14 | | $ | 2,450 | | $ | 2,780 |
7.000%, 03/19/18 (C) | | | 500 | | | 569 |
6.800%, 09/01/66 (A) | | | 2,545 | | | 2,405 |
5.875%, 05/02/13 | | | 2,100 | | | 2,282 |
American Express Credit MTN | | | | | | |
7.300%, 08/20/13 | | | 500 | | | 562 |
5.125%, 08/25/14 | | | 5,900 | | | 6,313 |
American General Finance MTN | | | | | | |
6.900%, 12/15/17 | | | 1,500 | | | 1,193 |
American Honda Finance | | | | | | |
2.375%, 03/18/13 (B) | | | 150 | | | 151 |
American International Group | | | | | | |
8.250%, 08/15/18 | | | 980 | | | 956 |
6.250%, 03/15/37 | | | 5,000 | | | 3,125 |
5.850%, 01/16/18 | | | 2,670 | | | 2,256 |
ANZ National Int’l | | | | | | |
2.375%, 12/21/12 (B) | | | 190 | | | 191 |
ASIF Global Financing XIX | | | | | | |
4.900%, 01/17/13 (B) | | | 450 | | | 423 |
Associates Corp of North America | | | | | | |
6.950%, 11/01/18 | | | 450 | | | 466 |
Australia & New Zealand Banking Group | | | | | | |
3.700%, 01/13/15 (B) | | | 4,000 | | | 4,039 |
0.681%, 10/29/49 (A) | | | 1,400 | | | 959 |
BA Covered Bond Issuer | | | | | | |
5.500%, 06/14/12 (B) | | | 1,500 | | | 1,598 |
BAC Capital Trust XIV | | | | | | |
5.630%, 03/15/12 (A) | | | 180 | | | 124 |
BAC Capital Trust XV | | | | | | |
1.338%, 06/01/56 (A) | | | 9,235 | | | 5,593 |
Bank of America | | | | | | |
7.625%, 06/01/19 | | | 1,015 | | | 1,152 |
7.400%, 01/15/11 | | | 2,500 | | | 2,587 |
7.375%, 05/15/14 | | | 3,905 | | | 4,312 |
6.500%, 08/01/16 | | | 8,755 | | | 9,325 |
6.000%, 09/01/17 | | | 2,115 | | | 2,167 |
5.750%, 12/01/17 | | | 3,190 | | | 3,231 |
5.650%, 05/01/18 | | | 240 | | | 241 |
5.420%, 03/15/17 | | | 4,730 | | | 4,615 |
4.500%, 04/01/15 | | | 9,492 | | | 9,435 |
Bank of Ireland | | | | | | |
0.886%, 12/29/49 (A) | | | 1,030 | | | 417 |
| | | | | | |
Bank of New York Mellon MTN | | | | | | |
4.600%, 01/15/20 | | | 160 | | | 163 |
Bank of Nova Scotia | | | | | | |
3.400%, 01/22/15 | | | 328 | | | 334 |
Bank of Scotland | | | | | | |
0.687%, 11/29/49 (A) | | | 330 | | | 153 |
Bank of Tokyo-Mitsubishi UFJ | | | | | | |
3.850%, 01/22/15 (B) (C) | | | 2,227 | | | 2,312 |
Bank One | | | | | | |
7.875%, 08/01/10 | | | 4,440 | | | 4,486 |
| | |
| SEI Institutional Investments Trust / Annual Report / May 31, 2010 | | 75 |
SCHEDULE OF INVESTMENTS
Core Fixed Income Fund (Continued)
May 31, 2010
| | | | | | |
| Description | | Face Amount
($ Thousands) | | Market Value
($ Thousands) |
Barclays Bank MTN | | | | | | |
6.050%, 12/04/17 (B) | | $ | 2,490 | | $ | 2,432 |
5.200%, 07/10/14 | | | 1,430 | | | 1,480 |
5.125%, 01/08/20 | | | 4,330 | | | 4,117 |
5.000%, 09/22/16 | | | 5,635 | | | 5,568 |
2.500%, 01/23/13 | | | 500 | | | 491 |
0.500%, 08/07/49 (A) | | | 380 | | | 231 |
Barnett Capital III | | | | | | |
0.969%, 02/01/27 (A) | | | 600 | | | 402 |
BB&T | | | | | | |
6.850%, 04/30/19 | | | 115 | | | 131 |
4.900%, 06/30/17 | | | 400 | | | 406 |
3.950%, 04/29/16 | | | 555 | | | 558 |
3.850%, 07/27/12 | | | 150 | | | 155 |
3.375%, 09/25/13 (C) | | | 620 | | | 635 |
Bear Stearns | | | | | | |
7.250%, 02/01/18 | | | 2,930 | | | 3,340 |
6.950%, 08/10/12 (C) | | | 1,670 | | | 1,834 |
6.400%, 10/02/17 | | | 3,910 | | | 4,297 |
4.650%, 07/02/18 | | | 3,000 | | | 2,892 |
Bear Stearns LLC | | | | | | |
5.700%, 11/15/14 | | | 1,320 | | | 1,442 |
Berkshire Hathaway | | | | | | |
3.200%, 02/11/15 | | | 3,400 | | | 3,478 |
Berkshire Hathaway Finance | | | | | | |
5.400%, 05/15/18 (C) | | | 400 | | | 436 |
BlackRock | | | | | | |
6.250%, 09/15/17 | | | 280 | | | 317 |
Boeing Capital | | | | | | |
4.700%, 10/27/19 | | | 920 | | | 961 |
BP Capital Markets | | | | | | |
3.875%, 03/10/15 (C) | | | 430 | | | 435 |
3.625%, 05/08/14 (C) | | | 100 | | | 101 |
Branch Banking & Trust | | | | | | |
5.625%, 09/15/16 (C) | | | 325 | | | 355 |
Capital One Bank USA | | | | | | |
8.800%, 07/15/19 | | | 2,115 | | | 2,522 |
Capital One Financial | | | | | | |
7.375%, 05/23/14 (C) | | | 450 | | | 511 |
6.750%, 09/15/17 (C) | | | 590 | | | 664 |
Caterpillar Financial Services MTN | | | | | | |
7.150%, 02/15/19 | | | 250 | | | 302 |
6.200%, 09/30/13 | | | 5,640 | | | 6,373 |
5.850%, 09/01/17 | | | 580 | | | 638 |
| | | | | | |
CDP Financial | | | | | | |
3.000%, 11/25/14 (B) | | | 6,800 | | | 6,753 |
Cedar Brakes I LLC | | | | | | |
8.500%, 02/15/14 (B) | | | 941 | | | 943 |
Chase Capital VI | | | | | | |
0.969%, 08/01/28 (A) | | | 2,000 | | | 1,573 |
Citigroup | | | | | | |
8.500%, 05/22/19 (C) | | | 4,390 | | | 5,144 |
8.125%, 07/15/39 | | | 400 | | | 457 |
6.875%, 03/05/38 | | | 6,660 | | | 6,746 |
| | | | | | |
| Description | | Face Amount
($ Thousands) | | Market Value
($ Thousands) |
6.500%, 08/19/13 | | $ | 2,920 | | $ | 3,078 |
6.375%, 08/12/14 (C) | | | 4,896 | | | 5,173 |
6.125%, 05/15/18 (C) | | | 1,429 | | | 1,462 |
6.125%, 08/25/36 | | | 1,500 | | | 1,300 |
6.010%, 01/15/15 | | | 1,330 | | | 1,384 |
6.000%, 08/15/17 (C) | | | 6,175 | | | 6,240 |
5.875%, 02/22/33 | | | 6,150 | | | 5,174 |
5.500%, 04/11/13 | | | 3,699 | | | 3,810 |
5.500%, 10/15/14 (C) | | | 1,000 | | | 1,010 |
5.500%, 02/15/17 | | | 6,880 | | | 6,655 |
5.000%, 09/15/14 | | | 2,890 | | | 2,857 |
4.750%, 05/19/15 | | | 2,110 | | | 2,084 |
1.047%, 08/25/36 (A) | | | 2,839 | | | 1,976 |
Citigroup Capital III | | | | | | |
7.625%, 12/01/36 | | | 2,000 | | | 1,730 |
Citigroup Funding MTN | | | | | | |
1.875%, 10/22/12 (C) | | | 6,280 | | | 6,362 |
0.668%, 04/30/12 (A) | | | 4,900 | | | 4,941 |
City National Capital Trust I | | | | | | |
9.625%, 02/01/40 | | | 5,010 | | | 5,103 |
Comerica Capital Trust II | | | | | | |
6.576%, 02/20/37 (A) | | | 220 | | | 183 |
Commonwealth Bank of Australia | | | | | | |
5.000%, 03/19/20 (B) (C) | | | 2,180 | | | 2,171 |
5.000%, 10/15/19 (B) | | | 3,370 | | | 3,417 |
3.750%, 10/15/14 (B) | | | 4,580 | | | 4,668 |
Corestates Capital I | | | | | | |
8.000%, 12/15/26 (B) | | | 629 | | | 635 |
Countrywide Financial MTN | | | | | | |
5.800%, 06/07/12 | | | 8,783 | | | 9,258 |
4.000%, 03/22/11 | | | 2,250 | | | 2,291 |
Credit Agricole | | | | | | |
8.375%, 12/31/49 (A) (B) | | | 4,740 | | | 4,479 |
Credit Suisse NY MTN | | | | | | |
6.000%, 02/15/18 (C) | | | 9,040 | | | 9,227 |
5.500%, 05/01/14 | | | 125 | | | 135 |
5.400%, 01/14/20 | | | 2,065 | | | 2,019 |
5.300%, 08/13/19 | | | 600 | | | 616 |
5.000%, 05/15/13 | | | 5,300 | | | 5,638 |
3.450%, 07/02/12 (C) | | | 300 | | | 310 |
Credit Suisse USA | | | | | | |
5.125%, 01/15/14 (C) | | | 335 | | | 356 |
5.125%, 08/15/15 | | | 310 | | | 333 |
| | | | | | |
Depfa ACS Bank | | | | | | |
5.125%, 03/16/37 (B) | | | 4,200 | | | 2,955 |
Deutsche Bank | | | | | | |
3.875%, 08/18/14 (C) | | | 295 | | | 303 |
2.375%, 01/11/13 | | | 2,500 | | | 2,484 |
Deutsche Bank Capital Funding Trust | | | | | | |
5.628%, 01/19/49 (A) (B) | | | 4,789 | | | 3,544 |
Dexia Credit Local | | | | | | |
2.750%, 04/29/14 (B) | | | 13,575 | | | 13,735 |
| | |
| 76 | | SEI Institutional Investments Trust / Annual Report / May 31, 2010 |
| | | | | | |
| Description | | Face Amount
($ Thousands) | | Market Value
($ Thousands) |
Discover Financial Services | | | | | | |
0.786%, 06/11/10 (A) | | $ | 3,547 | | $ | 3,546 |
Dresdner Funding Trust I | | | | | | |
8.151%, 06/30/31 (B) | | | 365 | | | 267 |
ERP Operating | | | | | | |
5.750%, 06/15/17‡ (C) | | | 500 | | | 529 |
5.125%, 03/15/16‡ | | | 1,000 | | | 1,052 |
Export-Import Bank of Korea | | | | | | |
5.875%, 01/14/15 | | | 2,545 | | | 2,720 |
5.500%, 10/17/12 | | | 1,510 | | | 1,603 |
Farmers Exchange Capital | | | | | | |
7.200%, 07/15/48 (B) | | | 2,519 | | | 2,301 |
7.050%, 07/15/28 (B) | | | 1,063 | | | 1,019 |
Farmers Insurance Exchange | | | | | | |
8.625%, 05/01/24 (B) | | | 4,118 | | | 4,470 |
First Chicago NBD Institutional Capital I | | | | | | |
0.894%, 02/01/27 (A) | | | 3,750 | | | 2,946 |
First Industrial MTN | | | | | | |
7.500%, 12/01/17 | | | 1,765 | | | 1,585 |
Fleet Capital Trust II | | | | | | |
7.920%, 12/11/26 | | | 1,600 | | | 1,544 |
FMR LLC | | | | | | |
6.450%, 11/15/39 (B) (C) | | | 250 | | | 254 |
General Electric Capital MTN | | | | | | |
6.875%, 01/10/39 (C) | | | 5,361 | | | 5,700 |
6.375%, 11/15/67 (A) | | | 8,925 | | | 8,256 |
6.000%, 08/07/19 | | | 920 | | | 975 |
5.900%, 05/13/14 (C) | | | 5,010 | | | 5,474 |
5.875%, 01/14/38 | | | 6,875 | | | 6,435 |
5.625%, 09/15/17 | | | 800 | | | 848 |
5.625%, 05/01/18 (C) | | | 6,775 | | | 7,045 |
5.500%, 01/08/20 (C) | | | 480 | | | 492 |
5.450%, 01/15/13 (C) | | | 180 | | | 193 |
5.400%, 02/15/17 | | | 1,800 | | | 1,880 |
0.727%, 05/05/26 (A) | | | 4,345 | | | 3,490 |
0.595%, 03/20/14 (A) | | | 2,000 | | | 1,868 |
0.517%, 09/15/14 (A) | | | 6,550 | | | 6,152 |
0.414%, 04/10/12 (A) | | | 500 | | | 492 |
Glitnir Banki | | | | | | |
7.451%, 09/14/16 (B) (D) | | | 500 | | | 1 |
6.693%, 06/15/16 (B) (D) | | | 4,480 | | | 6 |
6.375%, 09/25/12 (B) (D) | | | 3,100 | | | 860 |
6.330%, 07/28/11 (B) (D) | | | 2,440 | | | 677 |
| | | | | | |
GMAC | | | | | | |
7.250%, 03/02/11 | | | 1,744 | | | 1,751 |
2.738%, 12/01/14 (A) | | | 4,579 | | | 3,762 |
1.750%, 10/30/12 | | | 3,960 | | | 4,001 |
Goldman Sachs Capital II | | | | | | |
5.793%, 12/29/49 (A) (C) | | | 18,565 | | | 14,202 |
Goldman Sachs Group | | | | | | |
7.500%, 02/15/19 | | | 8,855 | | | 9,776 |
6.750%, 10/01/37 | | | 7,096 | | | 6,644 |
6.600%, 01/15/12 (C) | | | 2,960 | | | 3,107 |
| | | | | | |
| Description | | Face Amount
($ Thousands) | | Market Value
($ Thousands) |
6.250%, 09/01/17 | | $ | 1,400 | | $ | 1,451 |
6.150%, 04/01/18 | | | 7,800 | | | 7,968 |
6.000%, 06/15/20 | | | 2,310 | | | 2,336 |
5.950%, 01/18/18 (C) | | | 500 | | | 507 |
5.450%, 11/01/12 | | | 750 | | | 780 |
5.375%, 03/15/20 (C) | | | 540 | | | 521 |
5.300%, 02/14/12 | | | 150 | | | 156 |
5.250%, 10/15/13 | | | 680 | | | 708 |
5.150%, 01/15/14 | | | 470 | | | 486 |
4.750%, 07/15/13 | | | 230 | | | 234 |
4.500%, 06/15/10 | | | 450 | | | 451 |
3.625%, 08/01/12 (C) | | | 770 | | | 774 |
0.794%, 01/12/15 (A) | | | 3,000 | | | 2,773 |
0.707%, 07/22/15 (A) | | | 1,000 | | | 912 |
Hartford Financial Services Group | | | | | | |
5.500%, 03/30/20 | | | 2,975 | | | 2,829 |
HBOS | | | | | | |
6.750%, 05/21/18 (B) | | | 5,100 | | | 4,814 |
HBOS Capital Funding | | | | | | |
6.071%, 06/30/49 (A) (B) | | | 1,920 | | | 1,373 |
HCP MTN | | | | | | |
6.700%, 01/30/18‡ | | | 5,383 | | | 5,629 |
6.300%, 09/15/16‡ | | | 780 | | | 818 |
6.000%, 01/30/17‡ | | | 6,550 | | | 6,720 |
5.650%, 12/15/13‡ | | | 2,765 | | | 2,906 |
Highwoods Properties | | | | | | |
7.500%, 04/15/18‡ | | | 1,339 | | | 1,446 |
Hongkong & Shanghai Banking | | | | | | |
0.500%, 07/22/49 (A) | | | 195 | | | 122 |
HRPT Properties Trust | | | | | | |
6.650%, 01/15/18‡ | | | 255 | | | 263 |
6.250%, 08/15/16‡ | | | 300 | | | 309 |
HSBC Bank | | | | | | |
0.538%, 06/29/49 (A) | | | 1,160 | | | 754 |
HSBC Bank USA NY | | | | | | |
4.625%, 04/01/14 | | | 300 | | | 315 |
HSBC Finance | | | | | | |
8.000%, 07/15/10 | | | 2,330 | | | 2,347 |
7.000%, 05/15/12 | | | 1,975 | | | 2,132 |
6.375%, 11/27/12 (C) | | | 365 | | | 394 |
5.500%, 01/19/16 (C) | | | 600 | | | 640 |
4.750%, 07/15/13 | | | 166 | | | 172 |
0.553%, 01/15/14 (A) | | | 500 | | | 477 |
| | | | | | |
HSBC Holdings | | | | | | |
6.800%, 06/01/38 | | | 1,755 | | | 1,843 |
Hutchison Whampoa International | | | | | | |
4.625%, 09/11/15 (B) | | | 6,120 | | | 6,266 |
ILFC E-Capital Trust II | | | | | | |
6.250%, 12/21/65 (A) (B) (C) | | | 1,200 | | | 732 |
International Lease Finance MTN | | | | | | |
5.250%, 01/10/13 (C) | | | 400 | | | 358 |
Itau Unibanco Holding MTN | | | | | | |
6.200%, 04/15/20 (B) (C) | | | 2,670 | | | 2,675 |
| | |
| SEI Institutional Investments Trust / Annual Report / May 31, 2010 | | 77 |
SCHEDULE OF INVESTMENTS
Core Fixed Income Fund (Continued)
May 31, 2010
| | | | | | |
| Description | | Face Amount
($ Thousands) | | Market Value
($ Thousands) |
Jackson National Life Global Funding MTN | | | | | | |
5.375%, 05/08/13 (B) | | $ | 610 | | $ | 653 |
Jefferies Group | | | | | | |
6.450%, 06/08/27 | | | 590 | | | 545 |
6.250%, 01/15/36 | | | 400 | | | 344 |
John Deere Capital MTN | | | | | | |
5.750%, 09/10/18 | | | 300 | | | 337 |
JPMorgan Chase | | | | | | |
6.400%, 05/15/38 | | | 3 | | | 3 |
6.000%, 10/01/17 | | | 4,185 | | | 4,471 |
5.750%, 01/02/13 | | | 810 | | | 869 |
5.150%, 10/01/15 | | | 240 | | | 253 |
5.125%, 09/15/14 | | | 756 | | | 805 |
4.950%, 03/25/20 | | | 1,690 | | | 1,690 |
3.700%, 01/20/15 | | | 370 | | | 373 |
JPMorgan Chase Bank | | | | | | |
6.000%, 07/05/17 | | | 2,300 | | | 2,450 |
0.587%, 06/13/16 (A) | | | 4,250 | | | 3,996 |
JPMorgan Chase Capital XIII | | | | | | |
1.239%, 09/30/34 (A) | | | 1,440 | | | 1,116 |
JPMorgan Chase Capital XXII | | | | | | |
6.450%, 02/02/37 | | | 500 | | | 463 |
JPMorgan Chase Capital XXIII | | | | | | |
1.436%, 05/15/47 (A) | | | 4,000 | | | 2,952 |
JPMorgan Chase Capital XXV | | | | | | |
6.800%, 10/01/37 | | | 2,665 | | | 2,585 |
Kaupthing Bank | | | | | | |
7.625%, 02/28/15 (B) (D) | | | 8,130 | | | 1,870 |
7.125%, 05/19/16 (B) (D) | | | 12,000 | | | 1 |
5.750%, 10/04/11 (B) (D) | | | 1,120 | | | 258 |
KeyBank | | | | | | |
5.800%, 07/01/14 | | | 600 | | | 637 |
Kilroy Realty | | | | | | |
6.625%, 06/01/20‡ (B) | | | 1,260 | | | 1,258 |
Korea Development Bank | | | | | | |
4.375%, 08/10/15 (C) | | | 2,375 | | | 2,365 |
Kreditanstalt fuer Wiederaufbau | | | | | | |
3.500%, 03/10/14 | | | 3,080 | | | 3,234 |
Landsbanki Islands | | | | | | |
6.100%, 08/25/11 (B) (D) | | | 6,520 | | | 668 |
Lazard Group | | | | | | |
7.125%, 05/15/15 | | | 3,890 | | | 4,119 |
6.850%, 06/15/17 | | | 3,825 | | | 3,939 |
| | | | | | |
LBG Capital No 1 MTN | | | | | | |
8.000%, 12/15/49 (A) | | | 8,400 | | | 6,720 |
Lehman Brothers Holdings MTN | | | | | | |
6.750%, 12/28/17 (D) | | | 10,370 | | | 13 |
6.500%, 07/19/17 (D) | | | 4,040 | | | 15 |
6.200%, 09/26/14 (D) | | | 1,560 | | | 324 |
5.250%, 02/06/12 (D) | | | 965 | | | 200 |
Lehman Brothers Holdings Capital Trust VII MTN | | | | | | |
5.857%, 11/29/49 (D) | | | 20,630 | | | 2 |
| | | | | | |
| Description | | Face Amount
($ Thousands) | | Market Value
($ Thousands) |
Liberty Mutual Group | | | | | | |
7.500%, 08/15/36 (B) | | $ | 1,678 | | $ | 1,540 |
Lloyds TSB Bank MTN | | | | | | |
5.800%, 01/13/20 (B) (C) | | | 3,040 | | | 2,856 |
4.375%, 01/12/15 (B) | | | 3,050 | | | 2,915 |
M&T Bank | | | | | | |
5.375%, 05/24/12 | | | 325 | | | 343 |
Mack-Cali Realty | | | | | | |
7.750%, 08/15/19‡ | | | 895 | | | 1,035 |
Massachusetts Mutual Life Insurance | | | | | | |
8.875%, 06/01/39 (B) | | | 3,010 | | | 3,952 |
MassMutual Global Funding II | | | | | | |
3.625%, 07/16/12 (B) | | | 150 | | | 155 |
2.875%, 04/21/14 (B) | | | 122 | | | 124 |
MBNA Capital, Ser A | | | | | | |
8.278%, 12/01/26 | | | 2,465 | | | 2,403 |
Merna Reinsurance | | | | | | |
2.040%, 07/07/10 (A) (B) | | | 4,950 | | | 4,932 |
Merrill Lynch | | | | | | |
7.430%, 09/01/22 (G) | | | 4 | | | 4 |
6.875%, 04/25/18 | | | 980 | | | 1,011 |
6.400%, 08/28/17 | | | 900 | | | 923 |
6.150%, 04/25/13 | | | 210 | | | 222 |
5.700%, 05/02/17 | | | 600 | | | 594 |
MetLife | | | | | | |
7.717%, 02/15/19 | | | 3,500 | | | 4,050 |
6.750%, 06/01/16 | | | 2,950 | | | 3,306 |
6.400%, 12/15/36 | | | 10,020 | | | 8,667 |
MetLife Capital Trust X | | | | | | |
9.250%, 04/08/38 (A) (B) | | | 2,700 | | | 2,943 |
MetLife Global Funding I | | | | | | |
2.875%, 09/17/12 (B) | | | 600 | | | 613 |
Metropolitan Life Global Funding I | | | | | | |
5.125%, 04/10/13 (B) | | | 200 | | | 216 |
5.125%, 06/10/14 (B) | | | 1,575 | | | 1,690 |
2.500%, 01/11/13 (B) | | | 325 | | | 327 |
Monumental Global Funding | | | | | | |
5.500%, 04/22/13 (B) | | | 235 | | | 248 |
Morgan Stanley MTN | | | | | | |
7.250%, 04/01/32 | | | 215 | | | 236 |
6.625%, 04/01/18 (C) | | | 5,190 | | | 5,329 |
6.250%, 08/28/17 | | | 550 | | | 551 |
6.000%, 05/13/14 | | | 5,135 | | | 5,323 |
| | | | | | |
5.950%, 12/28/17 (C) | | | 1,688 | | | 1,683 |
5.625%, 09/23/19 | | | 725 | | | 693 |
5.550%, 04/27/17 | | | 7,214 | | | 7,116 |
5.500%, 01/26/20 | | | 5,259 | | | 4,980 |
5.300%, 03/01/13 (C) | | | 400 | | | 413 |
4.750%, 04/01/14 | | | 2,270 | | | 2,253 |
4.200%, 11/20/14 (C) | | | 1,836 | | | 1,778 |
0.754%, 10/18/16 (A) | | | 7,725 | | | 6,629 |
0.621%, 06/20/12 (A) | | | 7,510 | | | 7,577 |
0.595%, 01/09/14 (A) | | | 1,475 | | | 1,355 |
| | |
| 78 | | SEI Institutional Investments Trust / Annual Report / May 31, 2010 |
| | | | | | |
| Description | | Face Amount
($ Thousands) | | Market Value
($ Thousands) |
0.554%, 01/18/11 (A) | | $ | 215 | | $ | 214 |
MUFG Capital Finance 1 | | | | | | |
6.346%, 07/25/49 (A) | | | 1,840 | | | 1,628 |
6.346%, 07/25/49 (A) | | | 378 | | | 342 |
National Australia Bank | | | | | | |
5.350%, 06/12/13 (B) | | | 5,495 | | | 5,950 |
3.750%, 03/02/15 (B) | | | 455 | | | 459 |
2.500%, 01/08/13 (B) (C) | | | 550 | | | 550 |
National Capital Trust II | | | | | | |
5.486%, 12/29/49 (A) (B) | | | 3,207 | | | 2,822 |
National City | | | | | | |
4.900%, 01/15/15 (C) | | | 400 | | | 427 |
National City Bank | | | | | | |
5.800%, 06/07/17 | | | 250 | | | 266 |
0.908%, 06/07/17 (A) | | | 3,000 | | | 2,681 |
National Rural Utilities Cooperative Finance | | | | | | |
2.625%, 09/16/12 | | | 95 | | | 97 |
Nationwide Mutual Insurance | | | | | | |
6.600%, 04/15/34 (B) | | | 2,483 | | | 2,122 |
5.810%, 12/15/24 (A) (B) | | | 3,900 | | | 3,392 |
NB Capital Trust IV | | | | | | |
8.250%, 04/15/27 | | | 2,305 | | | 2,236 |
New Communications Holdings | | | | | | |
8.500%, 04/15/20 (B) | | | 1,475 | | | 1,453 |
8.250%, 04/15/17 (B) | | | 1,700 | | | 1,683 |
New York Life Global Funding | | | | | | |
4.650%, 05/09/13 (B) | | | 300 | | | 320 |
3.000%, 05/04/15 (B) | | | 4,980 | | | 4,965 |
NIBC Bank MTN | | | | | | |
2.800%, 12/02/14 (B) | | | 4,220 | | | 4,236 |
Nomura Holdings | | | | | | |
6.700%, 03/04/20 | | | 429 | | | 442 |
Nordea Bank | | | | | | |
4.875%, 01/27/20 (B) | | | 1,780 | | | 1,769 |
3.700%, 11/13/14 (B) (C) | | | 5,780 | | | 5,811 |
2.500%, 11/13/12 (B) | | | 2,430 | | | 2,467 |
Northern Trust | | | | | | |
5.500%, 08/15/13 | | | 85 | | | 94 |
Northwestern Mutual Life Insurance | | | | | | |
6.063%, 03/30/40 (B) | | | 2,655 | | | 2,688 |
Pacific Life Global Funding MTN | | | | | | |
5.150%, 04/15/13 (B) | | | 370 | | | 388 |
5.000%, 05/15/17 (B) | | | 170 | | | 172 |
| | | | | | |
PNC Funding | | | | | | |
5.125%, 02/08/20 | | | 340 | | | 345 |
Power Receivables Finance | | | | | | |
6.290%, 01/01/12 (B) | | | 452 | | | 462 |
6.290%, 01/01/12 | | | 1,431 | | | 1,462 |
PPF Funding | | | | | | |
5.500%, 01/15/14‡ (B) | | | 5,000 | | | 4,942 |
Pricoa Global Funding I | | | | | | |
5.450%, 06/11/14 (B) | | | 300 | | | 323 |
| | | | | | |
| Description | | Face Amount
($ Thousands) | | Market Value
($ Thousands) |
Prime Property Funding II | | | | | | |
5.600%, 06/15/11 (B) | | $ | 3,380 | | $ | 3,469 |
Principal Life Global Funding I | | | | | | |
6.250%, 02/15/12 (B) | | | 600 | | | 641 |
5.050%, 03/15/15 (B) | | | 750 | | | 763 |
Principal Life Income Funding Trusts MTN | | | | | | |
5.100%, 04/15/14 | | | 600 | | | 639 |
Private Export Funding | | | | | | |
3.050%, 10/15/14 | | | 1,010 | | | 1,044 |
Prudential Holdings LLC | | | | | | |
8.695%, 12/18/23 (B) | | | 2,500 | | | 2,949 |
1.136%, 12/18/17 (A) (B) | | | 3,725 | | | 3,169 |
Rabobank Nederland | | | | | | |
11.000%, 12/31/49 (A) (B) | | | 2,823 | | | 3,425 |
3.200%, 03/11/15 (B) | | | 700 | | | 703 |
Reckson Operating Partnership | | | | | | |
7.750%, 03/15/20‡ (B) | | | 3,175 | | | 3,259 |
Resona Preferred Global Securities Cayman | | | | | | |
7.191%, 07/30/49 (A) (B) | | | 3,240 | | | 2,749 |
Royal Bank of Canada | | | | | | |
0.500%, 06/29/85 (A) | | | 860 | | | 516 |
Royal Bank of Scotland | | | | | | |
4.875%, 03/16/15 | | | 800 | | | 791 |
Royal Bank of Scotland Group MTN | | | | | | |
7.640%, 09/29/17 | | | 1,300 | | | 734 |
6.400%, 10/21/19 | | | 4,330 | | | 4,290 |
RSHB Capital | | | | | | |
6.299%, 05/15/17 (B) | | | 1,190 | | | 1,160 |
Santander US Debt Unipersonal | | | | | | |
3.724%, 01/20/15 (B) | | | 3,100 | | | 2,961 |
Security Benefit Life Insurance | | | | | | |
8.750%, 05/15/16 (B) | | | 5,200 | | | 4,335 |
Shinsei Finance Cayman | | | | | | |
6.418%, 01/29/49 (A) (B) | | | 5,605 | | | 3,552 |
Simon Property Group | | | | | | |
10.350%, 04/01/19‡ (C) | | | 520 | | | 675 |
6.750%, 05/15/14‡ (C) | | | 165 | | | 184 |
5.650%, 02/01/20‡ (C) | | | 133 | | | 137 |
SLM MTN | | | | | | |
8.450%, 06/15/18 | | | 550 | | | 500 |
Societe Generale | | | | | | |
0.844%, 11/29/49 (A) | | | 180 | | | 104 |
0.844%, 11/29/49 (A) | | | 680 | | | 392 |
| | | | | | |
Standard Chartered | | | | | | |
3.850%, 04/27/15 (B) (C) | | | 1,785 | | | 1,742 |
State Street | | | | | | |
4.300%, 05/30/14 | | | 60 | | | 63 |
SunTrust Capital VIII | | | | | | |
6.100%, 12/15/36 (A) | | | 5,570 | | | 4,233 |
SunTrust Preferred Capital I | | | | | | |
5.853%, 12/15/11 (A) (C) | | | 2,643 | | | 1,797 |
| | |
| SEI Institutional Investments Trust / Annual Report / May 31, 2010 | | 79 |
SCHEDULE OF INVESTMENTS
Core Fixed Income Fund (Continued)
May 31, 2010
| | | | | | |
| Description | | Face Amount
($ Thousands) | | Market Value
($ Thousands) |
Teachers Insurance & Annuity Association of America | | | | | | |
6.850%, 12/16/39 (B) | | $ | 4,870 | | $ | 5,353 |
TNK-BP Finance | | | | | | |
7.500%, 07/18/16 (B) | | | 1,800 | | | 1,858 |
6.625%, 03/20/17 (B) | | | 1,070 | | | 1,027 |
Toll Road Investors Partnership II | | | | | | |
5.667%, 02/15/45 (B) (E) | | | 7,178 | | | 1,073 |
Travelers | | | | | | |
6.250%, 03/15/37 (A) | | | 6,250 | | | 5,826 |
5.900%, 06/02/19 | | | 145 | | | 159 |
Travelers Property Casualty | | | | | | |
7.750%, 04/15/26 | | | 300 | | | 355 |
Triton Container Finance LLC, Ser 2007-1A, Cl NOTE | | | | | | |
0.485%, 02/26/19 (A) (B) | | | 2,969 | | | 2,730 |
UBS MTN | | | | | | |
5.875%, 12/20/17 (C) | | | 520 | | | 535 |
3.875%, 01/15/15 | | | 2,690 | | | 2,677 |
UDR MTN | | | | | | |
5.000%, 01/15/12‡ | | | 2,000 | | | 2,039 |
US Bancorp MTN | | | | | | |
2.875%, 11/20/14 | | | 415 | | | 414 |
Wachovia | | | | | | |
5.750%, 06/15/17 (C) | | | 690 | | | 734 |
5.500%, 05/01/13 (C) | | | 600 | | | 650 |
5.250%, 08/01/14 | | | 650 | | | 690 |
0.678%, 10/28/15 (A) | | | 3,760 | | | 3,491 |
Wachovia Bank | | | | | | |
6.600%, 01/15/38 | | | 2,875 | | | 2,997 |
6.000%, 11/15/17 | | | 3,650 | | | 3,952 |
0.587%, 03/15/16 (A) | | | 1,200 | | | 1,086 |
Wachovia Capital Trust III | | | | | | |
5.800%, 03/15/11 (A) | | | 3,252 | | | 2,569 |
WEA Finance LLC | | | | | | |
7.500%, 06/02/14 (B) | | | 1,700 | | | 1,930 |
7.125%, 04/15/18 (B) | | | 4,578 | | | 5,077 |
6.750%, 09/02/19 (B) | | | 136 | | | 150 |
Wells Fargo | | | | | | |
5.625%, 12/11/17 | | | 350 | | | 375 |
5.000%, 11/15/14 | | | 1,145 | | | 1,202 |
3.750%, 10/01/14 (C) | | | 1,830 | | | 1,861 |
Wells Fargo Capital X | | | | | | |
5.950%, 12/15/36 | | | 1,630 | | | 1,353 |
Wells Fargo Capital XV | | | | | | |
9.750%, 12/31/49 (A) | | | 7,770 | | | 8,314 |
| | | | | | |
Westfield Capital | | | | | | |
4.375%, 11/15/10 (B) | | | 4,600 | | | 4,665 |
Westfield Group | | | | | | |
5.400%, 10/01/12 (B) | | | 2,093 | | | 2,219 |
Westpac Banking | | | | | | |
4.875%, 11/19/19 (C) | | | 2,734 | | | 2,724 |
2.250%, 11/19/12 | | | 4,895 | | | 4,918 |
| | | | | | |
| Description | | Face Amount
($ Thousands) | | Market Value
($ Thousands) |
Woodbourne Capital Trust I | | | | | | |
3.824%, 04/08/49 (A) (B) | | $ | 625 | | $ | 269 |
Woodbourne Capital Trust II | | | | | | |
3.824%, 04/08/49 (A) (B) | | | 625 | | | 269 |
Woodbourne Capital Trust III | | | | | | |
3.824%, 04/08/49 (A) (B) | | | 625 | | | 269 |
ZFS Finance USA Trust I | | | | | | |
6.150%, 12/15/65 (A) (B) | | | 4,049 | | | 3,806 |
ZFS Finance USA Trust II | | | | | | |
6.450%, 12/15/65 (A) (B) | | | 2,700 | | | 2,457 |
ZFS Finance USA Trust III | | | | | | |
1.407%, 12/15/65 (A) (B) | | | 620 | | | 560 |
| | | | | | |
| | | | | | 821,451 |
| | | | | | |
| | |
Health Care — 0.7% | | | | | | |
Abbott Laboratories | | | | | | |
5.600%, 11/30/17 | | | 470 | | | 530 |
5.300%, 05/27/40 | | | 3,190 | | | 3,134 |
Amgen | | | | | | |
5.750%, 03/15/40 | | | 1,627 | | | 1,682 |
5.700%, 02/01/19 (C) | | | 100 | | | 113 |
4.500%, 03/15/20 | | | 84 | | | 87 |
CareFusion | | | | | | |
4.125%, 08/01/12 | | | 1,595 | | | 1,663 |
Coventry Health Care | | | | | | |
5.950%, 03/15/17 | | | 2,680 | | | 2,647 |
GlaxoSmithKline Capital | | | | | | |
4.375%, 04/15/14 | | | 200 | | | 215 |
GlaxoSmithKline Capital | | | | | | |
5.650%, 05/15/18 | | | 2,250 | | | 2,505 |
HCA | | | | | | |
5.750%, 03/15/14 | | | 5,548 | | | 5,118 |
Hospira | | | | | | |
6.400%, 05/15/15 | | | 20 | | | 23 |
5.550%, 03/30/12 | | | 200 | | | 213 |
Humana | | | | | | |
7.200%, 06/15/18 | | | 2,210 | | | 2,451 |
Life Technologies | | | | | | |
6.000%, 03/01/20 | | | 2,430 | | | 2,573 |
4.400%, 03/01/15 | | | 1,870 | | | 1,932 |
Medtronic | | | | | | |
4.450%, 03/15/20 | | | 1,370 | | | 1,413 |
Pfizer | | | | | | |
5.350%, 03/15/15 | | | 1,739 | | | 1,947 |
Pharmacia | | | | | | |
6.500%, 12/01/18 (C) | | | 430 | | | 505 |
| | | | | | |
Roche Holdings | | | | | | |
6.000%, 03/01/19 (B) | | | 2,310 | | | 2,612 |
Tenet Healthcare | | | | | | |
7.375%, 02/01/13 | | | 168 | | | 168 |
UnitedHealth Group | | | | | | |
6.875%, 02/15/38 | | | 3,400 | | | 3,716 |
WellPoint | | | | | | |
5.875%, 06/15/17 | | | 350 | | | 381 |
| | |
| 80 | | SEI Institutional Investments Trust / Annual Report / May 31, 2010 |
| | | | | | |
| Description | | Face Amount
($ Thousands) | | Market Value
($ Thousands) |
Wyeth | | | | | | |
5.950%, 04/01/37 | | $ | 3,610 | | $ | 3,889 |
| | | | | | |
| | | | | | 39,517 |
| | | | | | |
| | |
Industrials — 1.0% | | | | | | |
Air 2 US | | | | | | |
8.027%, 10/01/19 (B) | | | 2,242 | | | 1,995 |
Allied Waste North America | | | | | | |
6.875%, 06/01/17 | | | 115 | | | 125 |
Boeing | | | | | | |
4.875%, 02/15/20 | | | 2,760 | | | 2,925 |
Browning-Ferris Industries | | | | | | |
9.250%, 05/01/21 | | | 65 | | | 78 |
Burlington Northern Santa Fe | | | | | | |
7.290%, 06/01/36 | | | 200 | | | 232 |
4.700%, 10/01/19 | | | 375 | | | 385 |
Burlington Northern Santa Fe LLC | | | | | | |
5.750%, 05/01/40 | | | 2,110 | | | 2,119 |
Canadian National Railway | | | | | | |
5.850%, 11/15/17 | | | 150 | | | 169 |
Continental Airlines | | | | | | |
7.256%, 03/15/20 | | | 1,242 | | | 1,254 |
6.545%, 02/02/19 | | | 144 | | | 147 |
6.236%, 03/15/20 | | | 2,014 | | | 1,853 |
5.983%, 04/19/22 (C) | | | 3,270 | | | 3,254 |
Continental Airlines 2000-1 Class A-1 Pass Through Trust | | | | | | |
8.048%, 11/01/20 | | | 2,400 | | | 2,400 |
CSX | | | | | | |
9.780%, 02/14/11 | | | 100 | | | 104 |
7.375%, 02/01/19 | | | 460 | | | 552 |
6.300%, 03/15/12 | | | 110 | | | 118 |
Delta Air Lines | | | | | | |
6.821%, 08/10/22 (C) | | | 2,191 | | | 2,136 |
6.619%, 03/18/11 | | | 197 | | | 199 |
Delta Air Lines, Ser 2001-1, Cl A- 2 | | | | | | |
7.111%, 09/18/11 (C) | | | 14,850 | | | 15,258 |
General Electric | | | | | | |
5.250%, 12/06/17 (C) | | | 250 | | | 268 |
JetBlue Airways Private Trust,
Ser 2004-2, Cl G1 | | | | | | |
0.811%, 08/15/16 (A) | | | 5,626 | | | 4,642 |
Lockheed Martin | | | | | | |
5.720%, 06/01/40 (B) | | | 405 | | | 423 |
Northrop Grumman Systems | | | | | | |
7.750%, 03/01/16 | | | 200 | | | 244 |
| | | | | | |
Northwest Airlines, Ser 1A-2 | | | | | | |
6.841%, 04/01/11 | | | 4,500 | | | 4,534 |
Systems 2001 Asset Trust LLC | | | | | | |
6.664%, 09/15/13 (B) | | | 180 | | | 189 |
Tyco International Finance | | | | | | |
8.500%, 01/15/19 | | | 170 | | | 217 |
Tyco International Group | | | | | | |
6.750%, 02/15/11 | | | 1,170 | | | 1,214 |
| | | | | | |
| Description | | Face Amount
($ Thousands) | | Market Value
($ Thousands) |
6.000%, 11/15/13 | | $ | 1,945 | | $ | 2,166 |
Union Pacific | | | | | | |
7.000%, 02/01/16 | | | 500 | | | 583 |
Union Pacific Railroad 2003
Pass Through Trust | | | | | | |
4.698%, 01/02/24 | | | 177 | | | 189 |
United Parcel Service | | | | | | |
4.500%, 01/15/13 (C) | | | 3,820 | | | 4,110 |
United Parcel Service of America | | | | | | |
8.375%, 04/01/20 | | | 140 | | | 187 |
United Technologies | | | | | | |
8.875%, 11/15/19 | | | 400 | | | 535 |
5.400%, 05/01/35 | | | 670 | | | 677 |
Waste Management | | | | | | |
7.125%, 12/15/17 | | | 1,720 | | | 2,033 |
| | | | | | |
| | | | | | 57,514 |
| | | | | | |
| | |
Information Technology — 0.2% | | | | | | |
Adobe Systems | | | | | | |
4.750%, 02/01/20 | | | 2,025 | | | 2,032 |
3.250%, 02/01/15 | | | 775 | | | 788 |
Arrow Electronics | | | | | | |
6.875%, 07/01/13 | | | 100 | | | 110 |
6.875%, 06/01/18 | | | 270 | | | 293 |
Cisco Systems | | | | | | |
5.900%, 02/15/39 | | | 250 | | | 265 |
5.500%, 01/15/40 | | | 2,620 | | | 2,628 |
4.450%, 01/15/20 | | | 4,295 | | | 4,410 |
Dell | | | | | | |
5.650%, 04/15/18 | | | 415 | | | 452 |
Hewlett-Packard | | | | | | |
2.950%, 08/15/12 | | | 80 | | | 83 |
International Business Machines | | | | | | |
8.000%, 10/15/38 | | | 100 | | | 136 |
7.625%, 10/15/18 (C) | | | 365 | | | 459 |
Intuit | | | | | | |
5.750%, 03/15/17 (C) | | | 255 | | | 279 |
National Semiconductor | | | | | | |
6.600%, 06/15/17 | | | 300 | | | 332 |
Oracle | | | | | | |
5.000%, 07/08/19 | | | 450 | | | 484 |
Xerox | | | | | | |
8.250%, 05/15/14 | | | 320 | | | 373 |
| | | | | | |
| | | | | | 13,124 |
| | | | | | |
| | | | | | |
| | |
Materials — 0.8% | | | | | | |
Alcoa | | | | | | |
6.000%, 07/15/13 (C) | | | 270 | | | 286 |
Barrick Gold | | | | | | |
6.950%, 04/01/19 (C) | | | 1,760 | | | 2,050 |
BHP Billiton Finance USA | | | | | | |
6.500%, 04/01/19 | | | 445 | | | 518 |
Codelco | | | | | | |
4.750%, 10/15/14 (B) | | | 900 | | | 952 |
| | |
| SEI Institutional Investments Trust / Annual Report / May 31, 2010 | | 81 |
SCHEDULE OF INVESTMENTS
Core Fixed Income Fund (Continued)
May 31, 2010
| | | | | | |
| Description | | Face Amount
($ Thousands) | | Market Value
($ Thousands) |
Dow Chemical | | | | | | |
8.550%, 05/15/19 | | $ | 8,215 | | $ | 9,743 |
5.900%, 02/15/15 | | | 1,785 | | | 1,923 |
4.850%, 08/15/12 | | | 3,765 | | | 3,956 |
Freeport-McMoRan Copper & Gold | | | | | | |
8.375%, 04/01/17 | | | 3,005 | | | 3,268 |
PPG Industries | | | | | | |
9.000%, 05/01/21 | | | 515 | | | 645 |
6.650%, 03/15/18 | | | 615 | | | 714 |
5.750%, 03/15/13 | | | 615 | | | 670 |
Praxair | | | | | | |
5.200%, 03/15/17 | | | 215 | | | 232 |
4.375%, 03/31/14 | | | 250 | | | 268 |
Rio Tinto Finance USA | | | | | | |
9.000%, 05/01/19 | | | 2,050 | | | 2,591 |
8.950%, 05/01/14 | | | 265 | | | 318 |
6.500%, 07/15/18 | | | 5,080 | | | 5,618 |
5.875%, 07/15/13 | | | 2,315 | | | 2,527 |
Southern Copper | | | | | | |
6.750%, 04/16/40 (C) | | | 2,531 | | | 2,513 |
Stauffer Chemical | | | | | | |
6.117%, 04/15/18 (E) (G) (H) | | | 860 | | | 179 |
5.975%, 04/15/17 (E) (G) (H) | | | 350 | | | 82 |
Vale Overseas | | | | | | |
8.250%, 01/17/34 | | | 365 | | | 410 |
6.875%, 11/10/39 | | | 1,720 | | | 1,713 |
6.875%, 11/21/36 | | | 2,958 | | | 2,948 |
| | | | | | |
| | | | | | 44,124 |
| | | | | | |
|
Sovereign — 0.7% |
Banco Nacional de Desenvolvimento Economico e Social | | | | | | |
5.500%, 07/12/20 (B) | | | 3,380 | | | 3,279 |
International Bank for Reconstruction & Development | | | | | | |
2.375%, 05/26/15 | | | 9,340 | | | 9,343 |
Kommunalbanken | | | | | | |
2.750%, 05/05/15 (B) | | | 3,692 | | | 3,718 |
Province of Manitoba Canada | | | | | | |
2.125%, 04/22/13 | | | 162 | | | 165 |
Province of Ontario Canada | | | | | | |
4.400%, 04/14/20 | | | 2,330 | | | 2,393 |
4.100%, 06/16/14 | | | 5,355 | | | 5,705 |
2.950%, 02/05/15 | | | 850 | | | 862 |
| | | | | | |
Qatar Government International Bond | | | | | | |
4.000%, 01/20/15 (B) | | | 895 | | | 917 |
Russian Federation | | | | | | |
7.500%, 03/31/30 (I) | | | 991 | | | 1,107 |
Russian Foreign Bond - Eurobond | | | | | | |
3.625%, 04/29/15 (B) (C) | | | 1,800 | | | 1,722 |
Societe Financement de l’Economie Francaise | | | | | | |
2.875%, 09/22/14 (B) | | | 1,010 | | | 1,031 |
| | | | | | |
| Description | | Face Amount
($ Thousands) | | Market Value
($ Thousands) |
State of Qatar | | | | | | |
6.400%, 01/20/40 (B) | | $ | 2,550 | | $ | 2,639 |
Svensk Exportkredit | | | | | | |
3.250%, 09/16/14 | | | 5,729 | | | 5,930 |
United Mexican States MTN | | | | | | |
7.500%, 04/08/33 | | | 218 | | | 259 |
6.375%, 01/16/13 | | | 350 | | | 382 |
5.625%, 01/15/17 | | | 84 | | | 90 |
United Mexican States, Ser A MTN | | | | | | |
6.750%, 09/27/34 | | | 798 | | | 876 |
| | | | | | |
| | | | | | 40,418 |
| | | | | | |
|
Telecommunication Services — 1.9% |
America Movil | | | | | | |
6.125%, 03/30/40 (B) (C) | | | 2,090 | | | 2,009 |
5.625%, 11/15/17 | | | 1,450 | | | 1,543 |
5.000%, 10/16/19 (B) | | | 2,415 | | | 2,414 |
5.000%, 03/30/20 (B) | | | 740 | | | 737 |
AT&T | | | | | | |
8.000%, 11/15/31 | | | 1,250 | | | 1,542 |
6.700%, 11/15/13 (C) | | | 500 | | | 572 |
6.550%, 02/15/39 | | | 3,870 | | | 4,192 |
6.300%, 01/15/38 | | | 8,590 | | | 8,944 |
5.875%, 02/01/12 | | | 500 | | | 536 |
5.600%, 05/15/18 | | | 400 | | | 436 |
5.500%, 02/01/18 (C) | | | 150 | | | 163 |
5.100%, 09/15/14 (C) | | | 2,410 | | | 2,641 |
BellSouth | | | | | | |
4.750%, 11/15/12 (C) | | | 190 | | | 203 |
BellSouth Telecommunications | | | | | | |
6.300%, 12/15/15 | | | 262 | | | 278 |
British Telecommunications | | | | | | |
9.625%, 12/15/30 (I) | | | 1,060 | | | 1,325 |
9.125%, 12/15/10 (I) | | | 1,460 | | | 1,521 |
5.950%, 01/15/18 (I) | | | 1,711 | | | 1,769 |
Cellco Partnership | | | | | | |
8.500%, 11/15/18 (C) | | | 2,310 | | | 2,888 |
7.375%, 11/15/13 | | | 810 | | | 944 |
Comcast Cable Holdings LLC | | | | | | |
10.125%, 04/15/22 | | | 190 | | | 261 |
COX Enterprises | | | | | | |
7.375%, 07/15/27 (B) | | | 170 | | | 189 |
| | | | | | |
Deutsche Telekom International Finance | | | | | | |
6.000%, 07/08/19 | | | 600 | | | 646 |
5.750%, 03/23/16 | | | 2,175 | | | 2,345 |
Discovery Communications LLC | | | | | | |
6.350%, 06/01/40 | | | 2,610 | | | 2,628 |
5.050%, 06/01/20 | | | 1,370 | | | 1,369 |
France Telecom | | | | | | |
8.500%, 03/01/31 | | | 170 | | | 227 |
7.750%, 03/01/11 | | | 1,610 | | | 1,688 |
Frontier Communications | | | | | | |
8.125%, 10/01/18 | | | 1,130 | | | 1,107 |
| | |
| 82 | | SEI Institutional Investments Trust / Annual Report / May 31, 2010 |
| | | | | | |
| Description | | Face Amount
($ Thousands) | | Market Value
($ Thousands) |
| | | | | | |
GTE | | | | | | |
8.750%, 11/01/21 | | $ | 600 | | $ | 775 |
New Cingular Wireless Services | | | | | | |
8.125%, 05/01/12 | | | 1,255 | | | 1,410 |
News America | | | | | | |
7.300%, 04/30/28 | | | 350 | | | 384 |
6.200%, 12/15/34 | | | 315 | | | 323 |
6.150%, 03/01/37 | | | 3,365 | | | 3,409 |
News America Holdings | | | | | | |
8.875%, 04/26/23 | | | 200 | | | 262 |
Qwest | | | | | | |
7.875%, 09/01/11 | | | 1,560 | | | 1,634 |
7.500%, 10/01/14 | | | 2,160 | | | 2,273 |
Reed Elsevier Capital | | | | | | |
8.625%, 01/15/19 | | | 2,460 | | | 3,088 |
Rogers Communications | | | | | | |
6.375%, 03/01/14 | | | 4,340 | | | 4,879 |
5.500%, 03/15/14 | | | 590 | | | 645 |
Royal | | | | | | |
8.000%, 10/01/10 (C) | | | 5,100 | | | 5,215 |
Sprint Capital | | | | | | |
8.750%, 03/15/32 | | | 390 | | | 372 |
8.375%, 03/15/12 | | | 5,300 | | | 5,486 |
6.900%, 05/01/19 | | | 120 | | | 108 |
TCI Communications | | | | | | |
8.750%, 08/01/15 | | | 701 | | | 855 |
7.125%, 02/15/28 | | | 400 | | | 432 |
Telecom Italia Capital | | | | | | |
6.999%, 06/04/18 | | | 4,480 | | | 4,717 |
5.250%, 11/15/13 | | | 580 | | | 603 |
5.250%, 10/01/15 | | | 370 | | | 370 |
4.950%, 09/30/14 | | | 1,320 | | | 1,309 |
Telefonica Emisiones | | | | | | |
5.984%, 06/20/11 | | | 2,320 | | | 2,421 |
5.877%, 07/15/19 (C) | | | 115 | | | 119 |
Telefonica Emisiones SAU | | | | | | |
6.221%, 07/03/17 | | | 190 | | | 205 |
5.134%, 04/27/20 | | | 7,725 | | | 7,452 |
2.582%, 04/26/13 | | | 680 | | | 672 |
Verizon Communications | | | | | | |
8.750%, 11/01/18 (C) | | | 194 | | | 247 |
7.350%, 04/01/39 | | | 2,885 | | | 3,428 |
6.400%, 02/15/38 | | | 2,800 | | | 2,975 |
6.100%, 04/15/18 | | | 630 | | | 702 |
5.850%, 09/15/35 | | | 150 | | | 148 |
5.500%, 02/15/18 | | | 2,810 | | | 3,025 |
Verizon Global Funding | | | | | | |
7.750%, 12/01/30 | | | 500 | | | 601 |
7.375%, 09/01/12 | | | 1,730 | | | 1,945 |
6.875%, 06/15/12 | | | 465 | | | 513 |
Verizon Maryland | | | | | | |
7.150%, 05/01/23 | | | 600 | | | 640 |
| | | | | | |
| Description | | Face Amount
($ Thousands) | | Market Value
($ Thousands) |
| | | | | | |
Vodafone Group | | | | | | |
5.450%, 06/10/19 (C) | | $ | 226 | | $ | 237 |
| | | | | | |
| | | | | | 108,996 |
| | | | | | |
|
Utilities — 1.9% |
AGL Capital | | | | | | |
5.250%, 08/15/19 | | | 170 | | | 176 |
4.450%, 04/15/13 | | | 400 | | | 418 |
Appalachian Power | | | | | | |
5.950%, 05/15/33 | | | 200 | | | 201 |
Arizona Public Services | | | | | | |
8.000%, 12/30/15 | | | 553 | | | 593 |
Atmos Energy | | | | | | |
4.950%, 10/15/14 | | | 260 | | | 279 |
Carolina Power & Light | | | | | | |
5.300%, 01/15/19 | | | 400 | | | 433 |
Cedar Brakes II LLC | | | | | | |
9.875%, 09/01/13 (B) | | | 3,188 | | | 3,269 |
CenterPoint Energy Houston Electric LLC | | | | | | |
7.000%, 03/01/14 | | | 150 | | | 171 |
Cleveland Electric Illuminating | | | | | | |
7.880%, 11/01/17 | | | 310 | | | 375 |
Consumers Energy | | | | | | |
6.700%, 09/15/19 | | | 400 | | | 464 |
Dominion Resources | | | | | | |
8.875%, 01/15/19 | | | 4,645 | | | 5,948 |
6.400%, 06/15/18 | | | 300 | | | 339 |
5.700%, 09/17/12 | | | 3,560 | | | 3,840 |
4.750%, 12/15/10 | | | 740 | | | 755 |
DPL | | | | | | |
6.875%, 09/01/11 | | | 3,220 | | | 3,422 |
Duke Energy | | | | | | |
6.300%, 02/01/14 | | | 2,805 | | | 3,148 |
5.625%, 11/30/12 | | | 425 | | | 466 |
Enel Finance International | | | | | | |
6.000%, 10/07/39 (B) | | | 5,980 | | | 5,574 |
5.125%, 10/07/19 (B) | | | 500 | | | 490 |
3.875%, 10/07/14 (B) | | | 2,700 | | | 2,680 |
Exelon | | | | | | |
5.625%, 06/15/35 | | | 2,605 | | | 2,440 |
Exelon Generation LLC | | | | | | |
6.250%, 10/01/39 | | | 900 | | | 922 |
5.200%, 10/01/19 | | | 125 | | | 129 |
FirstEnergy Solutions | | | | | | |
6.800%, 08/15/39 | | | 770 | | | 740 |
6.050%, 08/15/21 | | | 3,180 | | | 3,153 |
4.800%, 02/15/15 | | | 885 | | | 913 |
FirstEnergy, Ser B | | | | | | |
6.450%, 11/15/11 | | | 14 | | | 15 |
FirstEnergy, Ser C | | | | | | |
7.375%, 11/15/31 | | | 5,315 | | | 5,491 |
Hydro Quebec, Ser JL | | | | | | |
6.300%, 05/11/11 | | | 1,050 | | | 1,103 |
| | |
| SEI Institutional Investments Trust / Annual Report / May 31, 2010 | | 83 |
SCHEDULE OF INVESTMENTS
Core Fixed Income Fund (Continued)
May 31, 2010
| | | | | | |
| Description | | Face Amount
($ Thousands) | | Market Value
($ Thousands) |
| | | | | | |
Jersey Central Power & Light | | | | | | |
7.350%, 02/01/19 | | $ | 500 | | $ | 591 |
KCP&L Greater Missouri Operations | | | | | | |
11.875%, 07/01/12 | | | 3,360 | | | 3,871 |
8.270%, 11/15/21 | | | 2,894 | | | 3,240 |
Massachusetts Electric | | | | | | |
5.900%, 11/15/39 (B) | | | 210 | | | 219 |
MidAmerican Energy | | | | | | |
5.300%, 03/15/18 | | | 750 | | | 817 |
Midamerican Energy Holdings | | | | | | |
6.500%, 09/15/37 | | | 3,155 | | | 3,445 |
Nevada Power | | | | | | |
8.250%, 06/01/11 | | | 4,765 | | | 5,069 |
7.125%, 03/15/19 | | | 400 | | | 464 |
Niagara Mohawk Power | | | | | | |
4.881%, 08/15/19 (B) (C) | | | 180 | | | 183 |
Nisource Finance | | | | | | |
10.750%, 03/15/16 (C) | | | 500 | | | 641 |
6.800%, 01/15/19 | | | 3,547 | | | 3,922 |
6.125%, 03/01/22 | | | 2,400 | | | 2,501 |
Northern States Power | | | | | | |
6.250%, 06/01/36 | | | 350 | | | 395 |
5.350%, 11/01/39 | | | 56 | | | 56 |
Oncor Electric Delivery | | | | | | |
6.800%, 09/01/18 (C) | | | 4,535 | | | 5,229 |
Pacific Gas & Electric | | | | | | |
8.250%, 10/15/18 | | | 1,320 | | | 1,635 |
6.050%, 03/01/34 | | | 1,615 | | | 1,683 |
5.800%, 03/01/37 | | | 840 | | | 855 |
5.400%, 01/15/40 | | | 156 | | | 149 |
PacifiCorp | | | | | | |
6.250%, 10/15/37 | | | 310 | | | 344 |
5.650%, 07/15/18 | | | 100 | | | 111 |
5.500%, 01/15/19 (C) | | | 400 | | | 440 |
Progress Energy | | | | | | |
6.850%, 04/15/12 | | | 1,710 | | | 1,863 |
6.000%, 12/01/39 | | | 200 | | | 200 |
PSEG Power LLC | | | | | | |
5.500%, 12/01/15 | | | 445 | | | 486 |
5.320%, 09/15/16 (B) | | | 126 | | | 133 |
5.125%, 04/15/20 (B) | | | 120 | | | 123 |
Public Service Electric & Gas MTN | | | | | | |
5.375%, 11/01/39 | | | 97 | | | 97 |
2.700%, 05/01/15 | | | 135 | | | 134 |
Public Service of New Mexico | | | | | | |
7.950%, 05/15/18 | | | 3,000 | | | 3,134 |
Public Service of Oklahoma | | | | | | |
5.150%, 12/01/19 | | | 170 | | | 174 |
Sempra Energy | | | | | | |
8.900%, 11/15/13 | | | 400 | | | 476 |
6.500%, 06/01/16 | | | 135 | | | 154 |
6.000%, 10/15/39 | | | 170 | | | 173 |
Southern | | | | | | |
4.150%, 05/15/14 | | | 85 | | | 89 |
| | | | | | |
| Description | | Face Amount
($ Thousands) | | Market Value
($ Thousands) |
| | | | | | |
Southern California Edison | | | | | | |
5.500%, 03/15/40 | | $ | 170 | | $ | 173 |
4.650%, 04/01/15 | | | 200 | | | 217 |
Southern Union | | | | | | |
8.250%, 11/15/29 | | | 5,018 | | | 5,724 |
Southwestern Public Service | | | | | | |
8.750%, 12/01/18 | | | 300 | | | 383 |
Tennessee Valley Authority | | | | | | |
5.250%, 09/15/39 | | | 8,248 | | | 8,620 |
Texas-New Mexico Power | | | | | | |
9.500%, 04/01/19 (B) | | | 875 | | | 1,096 |
TXU | | | | | | |
6.500%, 11/15/24 | | | 410 | | | 187 |
TXU, Ser P | | | | | | |
5.550%, 11/15/14 | | | 370 | | | 260 |
TXU, Ser R | | | | | | |
6.550%, 11/15/34 | | | 4,385 | | | 1,940 |
Virginia Electric and Power | | | | | | |
5.400%, 04/30/18 | | | 300 | | | 323 |
| | | | | | |
| | | | | | 109,966 |
| | | | | | |
Total Corporate Obligations
(Cost $1,560,717)
($ Thousands) | | | | | | 1,532,798 |
| | | | | | |
|
U.S. TREASURY OBLIGATIONS — 21.3% |
U.S. Treasury Bills | | | | | | |
0.151%, 06/10/10 | | | 7,905 | | | 7,905 |
0.149%, 08/12/10 (E) | | | 380 | | | 380 |
0.140%, 06/17/10 (E) | | | 17,115 | | | 17,114 |
| | | | | | |
| | | | | | 25,399 |
| | | | | | |
U.S. Treasury Bonds | | | | | | |
9.250%, 02/15/16 (E) | | | 750 | | | 900 |
9.000%, 11/15/18 | | | 900 | | | 1,302 |
8.875%, 08/15/17 (C) | | | 26,200 | | | 36,655 |
8.875%, 02/15/19 | | | 13,870 | | | 19,961 |
8.750%, 05/15/17 (C) | | | 21,675 | | | 30,006 |
8.750%, 08/15/20 | | | 4,250 | | | 6,205 |
8.000%, 11/15/21 | | | 11,355 | | | 16,060 |
7.500%, 11/15/16 (C) | | | 20,700 | | | 26,703 |
7.125%, 02/15/23 (C) | | | 11,185 | | | 15,014 |
6.750%, 08/15/26 | | | 250 | | | 335 |
6.500%, 11/15/26 | | | 100 | | | 131 |
6.375%, 08/15/27 (E) | | | 650 | | | 474 |
6.250%, 08/15/23 | | | 11,405 | | | 14,328 |
6.125%, 11/15/27 (E) | | | 750 | | | 552 |
6.000%, 02/15/26 | | | 100 | | | 125 |
5.500%, 08/15/28 | | | 200 | | | 238 |
5.375%, 02/15/31 (C) | | | 20,883 | | | 24,668 |
4.786%, 05/15/26 (E) | | | 500 | | | 253 |
4.748%, 08/15/25 (E) | | | 400 | | | 210 |
4.745%, 05/15/28 (E) | | | 100 | | | 46 |
4.718%, 02/15/27 (E) | | | 200 | | | 98 |
4.718%, 11/15/31 (E) | | | 200 | | | 78 |
4.625%, 02/15/17 (C) | | | 30,500 | | | 34,208 |
| | |
| 84 | | SEI Institutional Investments Trust / Annual Report / May 31, 2010 |
| | | | | | |
| Description | | Face Amount
($ Thousands) | | Market Value
($ Thousands) |
| | | | | | |
4.625%, 02/15/40 | | $ | 10,415 | | $ | 11,121 |
4.375%, 11/15/39 (C) | | | 25,177 | | | 25,806 |
4.375%, 05/15/40 | | | 233 | | | 239 |
4.250%, 05/15/39 (C) | | | 24,429 | | | 24,528 |
3.991%, 08/15/19 (E) | | | 2,325 | | | 1,682 |
3.625%, 02/15/20 (C) | | | 17,977 | | | 18,843 |
3.500%, 02/15/39 | | | 19,900 | | | 17,506 |
3.375%, 11/15/19 | | | 26,740 | | | 26,905 |
3.250%, 12/31/16 | | | 2,220 | | | 2,292 |
3.202%, 01/15/16 (E) | | | 7,570 | | | 6,436 |
2.625%, 12/31/14 (C) | | | 6,500 | | | 6,685 |
| | | | | | |
| | | | | | 370,593 |
| | | | | | |
U.S. Treasury Inflation-Protected Securities | | | | | | |
6.450%, 02/15/17 (E) | | | 17,420 | | | 14,396 |
5.294%, 02/15/21 (E) | | | 200 | | | 133 |
4.726%, 11/15/24 (E) | | | 200 | �� | | 109 |
4.637%, 02/15/24 (E) | | | 75 | | | 42 |
4.622%, 11/15/27 (E) | | | 31,090 | | | 14,802 |
4.601%, 02/15/25 (E) | | | 21,110 | | | 11,431 |
4.593%, 05/15/36 (E) | | | 300 | | | 94 |
4.583%, 08/15/24 (E) | | | 200 | | | 111 |
4.532%, 05/15/29 (E) | | | 100 | | | 44 |
4.520%, 05/15/24 (E) | | | 800 | | | 448 |
4.459%, 02/15/32 (E) | | | 200 | | | 77 |
4.316%, 11/15/20 (E) | | | 1,000 | | | 673 |
4.233%, 05/15/20 (E) | | | 2,900 | | | 2,006 |
4.130%, 02/15/22 (E) | | | 300 | | | 189 |
4.097%, 08/15/20 (E) | | | 4,550 | | | 3,102 |
3.947%, 05/15/30 (E) | | | 9,150 | | | 3,879 |
3.931%, 05/15/19 (E) | | | 2,450 | | | 1,799 |
3.875%, 04/15/29 (C) | | | 430 | | | 754 |
3.845%, 08/15/17 (E) | | | 4,000 | | | 3,226 |
3.691%, 08/15/18 (E) | | | 800 | | | 616 |
3.626%, 11/15/17 (E) | | | 6,150 | | | 4,902 |
3.625%, 04/15/28 | | | 8,180 | | | 14,018 |
3.572%, 02/15/18 (E) | | | 1,350 | | | 1,065 |
3.234%, 08/15/16 (E) | | | 5,100 | | | 4,310 |
2.875%, 02/15/14 (E) | | | 8,550 | | | 8,034 |
2.733%, 05/15/14 (E) | | | 2,150 | | | 2,004 |
2.695%, 02/15/15 (E) | | | 200 | | | 181 |
2.375%, 01/15/25 | | | 160 | | | 202 |
2.375%, 01/15/27 | | | 10,019 | | | 11,782 |
2.180%, 02/15/13 (E) | | | 1,000 | | | 970 |
2.000%, 01/15/16 (C) | | | 11,126 | | | 13,040 |
1.750%, 01/15/28 | | | 24,854 | | | 25,710 |
| | | | | | |
| | | | | | 144,149 |
| | | | | | |
U.S. Treasury Notes | | | | | | |
4.750%, 08/15/17 (C) | | | 6,000 | | | 6,794 |
4.500%, 11/30/11 | | | 1,000 | | | 1,058 |
4.500%, 05/15/17 | | | 1,600 | | | 1,786 |
| | | | | | |
| Description | | Face Amount
($ Thousands) | | Market Value
($ Thousands) |
| | | | | | |
3.750%, 11/15/18 | | $ | 8,400 | | $ | 8,798 |
3.625%, 08/15/19 (C) | | | 19,225 | | | 19,749 |
3.500%, 05/15/20 | | | 7,000 | | | 7,116 |
3.125%, 10/31/16 | | | 4,400 | | | 4,519 |
3.125%, 04/30/17 | | | 20,733 | | | 21,238 |
3.000%, 09/30/16 | | | 8,790 | | | 8,971 |
2.750%, 11/30/16 | | | 2,437 | | | 2,446 |
2.750%, 05/31/17 | | | 17,620 | | | 17,612 |
2.750%, 02/15/19 (C) | | | 5,710 | | | 5,524 |
2.625%, 07/31/14 | | | 2,800 | | | 2,889 |
2.500%, 03/31/15 (C) | | | 28,805 | | | 29,417 |
2.500%, 04/30/15 | | | 6,060 | | | 6,182 |
2.375%, 10/31/14 | | | 39,845 | | | 40,580 |
2.375%, 02/28/15 (C) | | | 135,875 | | | 138,061 |
2.375%, 03/31/16 | | | 2,000 | | | 1,988 |
2.125%, 05/31/15 | | | 50,805 | | | 50,869 |
1.875%, 02/28/14 | | | 19,243 | | | 19,386 |
1.750%, 04/15/13 | | | 2,069 | | | 2,100 |
1.375%, 02/15/13 | | | 149,216 | | | 150,032 |
1.375%, 03/15/13 (C) | | | 7,202 | | | 7,240 |
1.375%, 05/15/13 | | | 67,058 | | | 67,315 |
1.000%, 04/30/12 | | | 45,795 | | | 46,004 |
0.750%, 05/31/12 | | | 6,533 | | | 6,529 |
| | | | | | |
| | | | | | 674,203 |
| | | | | | |
Total U.S. Treasury Obligations
(Cost $1,184,277) ($ Thousands) | | | | | | 1,214,344 |
| | | | | | |
|
ASSET-BACKED SECURITIES — 5.9% |
|
Automotive — 0.5% |
Ally Auto Receivables Trust,
Ser 2009-1, Cl A3 | | | | | | |
2.330%, 06/17/13 (B) | | | 500 | | | 507 |
Ally Auto Receivables Trust,
Ser 2010-1, Cl A3 | | | | | | |
1.450%, 05/15/14 | | | 285 | | | 285 |
AmeriCredit Automobile Receivables Trust, Ser 2010-1, Cl A3 | | | | | | |
1.660%, 03/17/14 | | | 115 | | | 115 |
AmeriCredit Automobile Receivables Trust, Ser 2010-1, Cl A2 | | | | | | |
0.980%, 01/15/13 | | | 165 | | | 165 |
Avis Budget Rental Car Funding AESOP LLC, Ser 2010-3A,
Cl A | | | | | | |
4.640%, 05/20/16 (B) | | | 1,490 | | | 1,519 |
Bank of America Auto Trust,
Ser 2009-14, Cl A3 | | | | | | |
2.670%, 07/15/13 (B) | | | 600 | | | 610 |
Bank of America Auto Trust,
Ser 2009-1A, Cl A4 | | | | | | |
3.520%, 06/15/16 (B) | | | 200 | | | 208 |
| | |
| SEI Institutional Investments Trust / Annual Report / May 31, 2010 | | 85 |
SCHEDULE OF INVESTMENTS
Core Fixed Income Fund (Continued)
May 31, 2010
| | | | | | |
| Description | | Face Amount
($ Thousands) | | Market Value
($ Thousands) |
Bank of America Auto Trust,
Ser 2009-2A, Cl A3 | | | | | | |
2.130%, 09/15/13 (B) | | $ | 650 | | $ | 658 |
Bank of America Auto Trust,
Ser 2009-3A, Cl A3 | | | | | | |
1.670%, 12/15/13 (B) | | | 350 | | | 352 |
Bank of America Auto Trust,
Ser 2010-1A, Cl A3 | | | | | | |
1.390%, 03/15/14 (B) | | | 430 | | | 430 |
Bank of America Auto Trust,
Ser 2010-1A, Cl A4 | | | | | | |
2.180%, 02/15/17 (B) | | | 310 | | | 312 |
CarMax Auto Owner Trust,
Ser 2010-1, Cl A3 | | | | | | |
1.560%, 07/15/14 | | | 300 | | | 300 |
Chrysler Financial Auto Securitization Trust,
Ser 2009- A, Cl A3 | | | | | | |
2.820%, 01/15/16 | | | 250 | | | 255 |
CitiFinancial Auto Issuance Trust,
Ser 2009-1, Cl A3 | | | | | | |
2.590%, 10/15/13 (B) | | | 695 | | | 702 |
Ford Credit Auto Owner Trust,
Ser 2007-A, Cl A4A | | | | | | |
5.470%, 06/15/12 | | | 800 | | | 827 |
Ford Credit Auto Owner Trust,
Ser 2009-B, Cl A3 | | | | | | |
2.790%, 08/15/13 | | | 350 | | | 356 |
Ford Credit Auto Owner Trust,
Ser 2009-B, Cl A4 | | | | | | |
4.500%, 07/15/14 | | | 300 | | | 319 |
Harley-Davidson Motorcycle Trust,
Ser 2006-3, Cl A4 | | | | | | |
5.220%, 06/15/13 | | | 865 | | | 887 |
Harley-Davidson Motorcycle Trust,
Ser 2009-1, Cl A4 | | | | | | |
4.550%, 01/15/17 | | | 1,211 | | | 1,280 |
Harley-Davidson Motorcycle Trust,
Ser 2009-2, Cl A4 | | | | | | |
3.320%, 02/15/17 | | | 278 | | | 287 |
Harley-Davidson Motorcycle Trust,
Ser 2009-3, Cl A4 | | | | | | |
2.540%, 04/15/17 | | | 209 | | | 211 |
Harley-Davidson Motorcycle Trust,
Ser 2009-4, Cl A4 | | | | | | |
2.400%, 07/15/14 | | | 592 | | | 596 |
| | | | | | |
Hertz Vehicle Financing LLC,
Ser 2009-2A, Cl A2 | | | | | | |
5.290%, 03/25/16 (B) | | | 2,910 | | | 3,103 |
Honda Auto Receivables Owner Trust, Ser 2009-3, Cl A4 | | | | | | |
3.300%, 09/15/15 | | | 250 | | | 259 |
| | | | | | |
| Description | | Face Amount
($ Thousands) | | Market Value
($ Thousands) |
Honda Auto Receivables Owner Trust, Ser 2009-S1, Cl A3 | | | | | | |
2.310%, 05/15/13 | | $ | 2,480 | | $ | 2,516 |
Huntington Auto Trust,
Ser 2009- 1A, Cl A4 | | | | | | |
5.730%, 01/15/14 (B) | | | 3,653 | | | 3,916 |
Nissan Auto Receivables Owner Trust, Ser 2009-1, Cl A3 | | | | | | |
5.000%, 09/15/14 | | | 5,774 | | | 5,978 |
USAA Auto Owner Trust,
Ser 2009-2, Cl A4 | | | | | | |
2.530%, 07/15/15 | | | 365 | | | 372 |
USAA Auto Owner Trust,
Ser 2009-2, Cl A3 | | | | | | |
1.540%, 02/18/14 | | | 470 | | | 472 |
World Omni Auto Receivables Trust,
Ser 2010-A, Cl A4 | | | | | | |
2.210%, 05/15/15 | | | 550 | | | 554 |
| | | | | | |
| | | | | | 28,351 |
| | | | | | |
|
Credit Cards — 1.4% |
American Express Credit Account Master Trust, Ser 2010-1, Cl A | | | | | | |
0.530%, 11/16/15 (A) | | | 4,208 | | | 4,208 |
BA Credit Card Trust,
Ser 2010- A1, Cl A1 | | | | | | |
0.640%, 09/15/15 (A) | | | 2,131 | | | 2,131 |
Bank of America Credit Card Trust,
Ser 2008-A1, Cl A1 | | | | | | |
0.917%, 04/15/13 (A) | | | 34,573 | | | 34,639 |
Capital One Multi-Asset Execution Trust, Ser 2008-A5, Cl A5 | | | | | | |
4.850%, 02/18/14 | | | 2,244 | | | 2,319 |
Chase Issuance Trust,
Ser 2007- A17, Cl A | | | | | | |
5.120%, 10/15/14 | | | 6,980 | | | 7,552 |
Chase Issuance Trust,
Ser 2009- A2, Cl A2 | | | | | | |
1.887%, 04/15/14 (A) | | | 2,150 | | | 2,201 |
Citibank Credit Card Issuance Trust,
Ser 2006-A3, Cl A3 | | | | | | |
5.300%, 03/15/18 | | | 654 | | | 728 |
Citibank Credit Card Issuance Trust,
Ser 2009-A1, Cl A1 | | | | | | |
2.087%, 03/17/14 (A) | | | 3,038 | | | 3,120 |
Citibank Credit Card Issuance Trust,
Ser 2009-A5, Cl A5 | | | | | | |
2.250%, 12/23/14 | | | 5,310 | | | 5,372 |
| | | | | | |
Discover Card Master Trust,
Ser 2009-A1, Cl A1 | | | | | | |
1.637%, 12/15/14 (A) | | | 2,512 | | | 2,535 |
Discover Card Master Trust,
Ser 2009-A2, Cl A2 | | | | | | |
1.637%, 02/17/15 (A) | | | 12,592 | | | 12,874 |
| | |
| 86 | | SEI Institutional Investments Trust / Annual Report / May 31, 2010 |
| | | | | | |
| Description | | Face Amount
($ Thousands) | | Market Value
($ Thousands) |
Nordstrom Private Label Credit Card Master Note Trust,
Ser 2007-2A, Cl A | | | | | | |
0.397%, 05/15/15 (A) (B) | | $ | 2,115 | | $ | 2,074 |
| | | | | | |
| | | | | | 79,753 |
| | | | | | |
| |
Mortgage Related Securities — 0.9% | | | |
ABFS Mortgage Loan Trust, Ser 2002-3, Cl A | | | | | | |
4.763%, 09/15/33 | | | 8 | | | 8 |
ABS Home Equity, Ser 2001-HE3, Cl A1 | | | | | | |
0.877%, 11/15/31 (A) | | | 232 | | | 197 |
ACE Securities, Ser 2006-SL3, Cl A1 | | | | | | |
0.443%, 06/25/36 (A) | | | 6,595 | | | 998 |
AFC Home Equity Loan Trust, Ser 2000-1, Cl 2A | | | | | | |
0.583%, 03/25/30 (A) | | | 2,447 | | | 683 |
Citigroup Mortgage Loan Trust,
Ser 2007-AHL1, Cl A2A | | | | | | |
0.383%, 12/25/36 (A) | | | 557 | | | 518 |
Conseco Finance Home Loan Trust,
Ser 2001-D, Cl A5 | | | | | | |
6.190%, 11/15/32 (A) | | | 4,575 | | | 4,598 |
Contimortgage Home Equity Trust,
Ser 1997-2, Cl A9 | | | | | | |
7.090%, 04/15/28 | | | 6 | | | 6 |
Delta Funding Home Equity Loan Trust, Ser 1999-3, Cl A1A | | | | | | |
1.157%, 09/15/29 (A) | | | 310 | | | 164 |
EMC Mortgage Loan Trust,
Ser 2002-AA, Cl A1 | | | | | | |
0.813%, 05/25/39 (A) (B) | | | 933 | | | 708 |
GMAC Mortgage Loan Trust,
Ser 2007-HE2, Cl A6 | | | | | | |
6.249%, 12/25/37 | | | 863 | | | 439 |
GSAA Trust, Ser 2005-6, Cl A3 | | | | | | |
0.713%, 06/25/35 (A) | | | 4,100 | | | 2,445 |
HFC Home Equity Loan Asset Backed Certificates, Ser 2006- 2, Cl A1 | | | | | | |
0.490%, 03/20/36 (A) | | | 418 | | | 382 |
Home Equity Asset Trust,
Ser 2007-2, Cl 2A1 | | | | | | |
0.453%, 07/25/37 (A) | | | 2,775 | | | 2,653 |
HSBC Home Equity Loan Trust,
Ser 2005-2, Cl M2 | | | | | | |
0.830%, 01/20/35 (A) | | | 572 | | | 496 |
| | | | | | |
HSBC Home Equity Loan Trust,
Ser 2005-2, Cl A1 | | | | | | |
0.610%, 01/20/35 (A) | | | 5,139 | | | 4,558 |
HSBC Home Equity Loan Trust,
Ser 2006-1, Cl A1 | | | | | | |
0.500%, 01/20/36 (A) | | | 614 | | | 570 |
| | | | | | |
| Description | | Face Amount
($ Thousands) | | Market Value
($ Thousands) |
HSBC Home Equity Loan Trust,
Ser 2007-1, Cl A2F | | | | | | |
5.600%, 03/20/36 | | $ | 750 | | $ | 767 |
HSBC Home Equity Loan Trust,
Ser 2007-1, Cl AS | | | | | | |
0.540%, 03/20/36 (A) | | | 328 | | | 300 |
HSBC Home Equity Loan Trust,
Ser 2007-3, Cl APT | | | | | | |
1.540%, 11/20/36 (A) | | | 959 | | | 807 |
Indymac Home Equity Loan Asset-Backed Trust, Ser 2001- A, Cl AV | | | | | | |
0.603%, 03/25/31 (A) | | | 37 | | | 18 |
Morgan Stanley ABS Capital I,
Ser 2004-WMC3, Cl M1 | | | | | | |
1.093%, 01/25/35 (A) | | | 289 | | | 281 |
Morgan Stanley Capital I,
Ser 2007-HE2, Cl A2A | | | | | | |
0.383%, 01/25/37 (A) | | | 260 | | | 252 |
Morgan Stanley Home Equity Loans ,
Ser 2007-1, Cl A1 | | | | | | |
0.393%, 12/25/36 (A) | | | 243 | | | 234 |
Morgan Stanley Mortgage Loan Trust, Ser 2007-3XS, Cl 2A3S | | | | | | |
5.858%, 01/25/47 | | | 31 | | | 19 |
MSDWCC Heloc Trust, Ser 2003- 1, Cl A | | | | | | |
0.883%, 11/25/15 (A) | | | 75 | | | 61 |
Nationstar Home Equity Loan Trust,
Ser 2006-B, Cl AV3 | | | | | | |
0.513%, 09/25/36 (A) | | | 6,400 | | | 4,480 |
Option One Mortgage Loan Trust, Ser 2001-4, Cl A | | | | | | |
0.943%, 01/25/32 (A) | | | 242 | | | 200 |
Option One Mortgage Loan Trust,
Ser 2007-14, Cl 2A3 | | | | | | |
0.483%, 01/25/37 (A) | | | 17,000 | | | 6,667 |
Option One Mortgage Loan Trust,
Ser 2007-5, Cl 2A4 | | | | | | |
0.643%, 05/25/37 (A) | | | 10,000 | | | 3,493 |
Renaissance Home Equity Loan Trust, Ser 2005-2, Cl AF3R | | | | | | |
4.499%, 08/25/35 | | | 1,357 | | | 1,297 |
Residential Funding Mortgage Securities II, Ser 2000-HI1, Cl AI7 | | | | | | |
8.790%, 02/25/25 | | | 897 | | | 763 |
Salomon Brothers Mortgage Securities VII, Ser 2003-UP1, Cl A | | | | | | |
3.450%, 04/25/32 (B) | | | 369 | | | 308 |
| | | | | | |
Security National Mortgage Loan Trust, Ser 2007-1A, Cl 2A | | | | | | |
0.693%, 04/25/37 (A) (B) (G) (H) | | | 972 | | | 439 |
Soundview Home Equity Loan Trust, Ser 2007-OPT1, Cl 2A1 | | | | | | |
0.423%, 06/25/37 (A) | | | 5,012 | | | 4,427 |
| | |
| SEI Institutional Investments Trust / Annual Report / May 31, 2010 | | 87 |
SCHEDULE OF INVESTMENTS
Core Fixed Income Fund (Continued)
May 31, 2010
| | | | | | |
| Description | | Face Amount
($ Thousands) | | Market Value
($ Thousands) |
Structured Asset Securities,
Ser 2002-AL1, Cl A2 | | | | | | |
3.450%, 02/25/32 | | $ | 372 | | $ | 335 |
Terwin Mortgage Trust,
Ser 2005- 9HGS, Cl A1 | | | | | | |
4.000%, 08/25/35 (A) (B) | | | 468 | | | 438 |
Triton Container Finance LLC,
Ser 2006-1A, Cl NOTE | | | | | | |
0.515%, 11/26/21 (A) (B) | | | 4,452 | | | 3,983 |
UCFC Home Equity Loan,
Ser 1998-D, Cl MF1 | | | | | | |
6.905%, 04/15/30 | | | 36 | | | 33 |
| | | | | | |
| | | | | | 49,025 |
| | | | | | |
| |
Other Asset-Backed Securities — 3.1% | | | |
Aircastle Aircraft Lease Backed Trust,
Ser 2007-1A, CI GI | | | | | | |
0.557%, 06/14/37 (A) (B) | | | 3,477 | | | 2,817 |
Ally Master Owner Trust,
Ser 2010-3, Cl A | | | | | | |
2.880%, 04/15/15 (B) | | | 5,651 | | | 5,673 |
Amortizing Residential Collateral Trust CMO, Ser 2002-BC1, Cl A | | | | | | |
1.023%, 01/25/32 (A) | | | 422 | | | 326 |
Babcock & Brown Air Funding I,
Ser 2007-1A, Cl G1 | | | | | | |
0.638%, 10/14/33 (A) (B) | | | 3,009 | | | 2,280 |
CenterPoint Energy Transition Bond LLC, Ser 2008-A, Cl A1 | | | | | | |
4.192%, 02/01/20 | | | 1,665 | | | 1,779 |
Chase Funding Mortgage Loan Asset-Backed Certificates,
Ser 2002-1, Cl 2A2 | | | | | | |
0.843%, 03/25/32 (A) | | | 966 | | | 630 |
Chase Funding Mortgage Loan Asset-Backed Certificates,
Ser 2003-6, Cl 1A4 | | | | | | |
4.499%, 11/25/34 | | | 641 | | | 622 |
Chase Funding Mortgage Loan Asset-Backed Certificates,
Ser 2003-6, Cl 1A7 | | | | | | |
4.277%, 11/25/34 | | | 1,090 | | | 987 |
Citicorp Residential Mortgage Securities, Ser 2006-2, Cl A5 | | | | | | |
6.036%, 09/25/36 | | | 6,340 | | | 5,507 |
Citigroup Mortgage Loan Trust,
Ser 2007-SHL1, Cl A | | | | | | |
0.743%, 11/25/46 (A) (B) | | | 1,186 | | | 536 |
CNH Equipment Trust,
Ser 2009- B, Cl A3 | | | | | | |
2.970%, 03/15/13 | | | 131 | | | 132 |
| | | | | | |
CNH Equipment Trust,
Ser 2009- C, Cl A3 | | | | | | |
1.850%, 12/16/13 | | | 130 | | | 131 |
| | | | | | |
| Description | | Face Amount
($ Thousands) | | Market Value
($ Thousands) |
CNH Equipment Trust,
Ser 2010- A, Cl A3 | | | | | | |
1.540%, 07/15/14 | | $ | 725 | | $ | 725 |
Conseco Finance Home Loan Trust, Ser 2000-E, Cl M1 | | | | | | |
8.130%, 08/15/31 (A) | | | 1,849 | | | 1,765 |
Conseco Finance Securitizations,
Ser 2000-4, Cl A6 | | | | | | |
8.310%, 05/01/32 (A) | | | 759 | | | 593 |
Consumer Funding LLC,
Ser 2001-1, Cl A5 | | | | | | |
5.430%, 04/20/15 | | | 440 | | | 467 |
Countrywide Asset-Backed Certificates, Cl A | | | | | | |
1.003%, 04/25/32 (A) | | | 63 | | | 35 |
Countrywide Asset-Backed Certificates, Cl A1 | | | | | | |
0.673%, 07/25/36 (A) (B) | | | 460 | | | 244 |
Countrywide Asset-Backed Certificates, Ser 2001-BC3, Cl A | | | | | | |
0.823%, 12/25/31 (A) | | | 51 | | | 25 |
Countrywide Asset-Backed Certificates, Ser 2003-BC2, Cl 2A1 | | | | | | |
0.943%, 06/25/33 (A) | | | 115 | | | 105 |
Countrywide Asset-Backed Certificates, Ser 2005-17, Cl 1AF3 | | | | | | |
5.711%, 05/25/36 (A) | | | 10,000 | | | 3,609 |
Countrywide Asset-Backed Certificates, Ser 2005-6, Cl M1 | | | | | | |
0.833%, 12/25/35 (A) | | | 320 | | | 288 |
Countrywide Asset-Backed Certificates, Ser 2006-15, Cl A3 | | | | | | |
5.689%, 10/25/46 (A) | | | 208 | | | 130 |
Countrywide Asset-Backed Certificates, Ser 2007-7, Cl 2A2 | | | | | | |
0.503%, 10/25/47 (A) | | | 7,500 | | | 5,843 |
Countrywide Asset-Backed Certificates, Ser 2007-QH1, Cl A1 | | | | | | |
0.543%, 02/25/37 (A) (B) | | | 1,239 | | | 783 |
Countrywide Asset-Backed Certificates, Ser 2007-SD1, Cl A1 | | | | | | |
0.793%, 03/25/47 (A) (B) | | | 936 | | | 383 |
Countrywide Home Equity Loan Trust, Ser 2004-K, Cl 2A | | | | | | |
0.637%, 02/15/34 (A) | | | 888 | | | 411 |
Countrywide Home Equity Loan Trust, Ser 2005-F, Cl 2A | | | | | | |
0.577%, 12/15/35 (A) | | | 2,052 | | | 803 |
Credit Suisse First Boston Mortgage Securities, Ser 2001- MH29, Cl A | | | | | | |
5.600%, 09/25/31 | | | 451 | | | 457 |
| | | | | | |
Credit-Based Asset Servicing and Securitization LLC, Ser 2006- CB2, Cl AF2 | | | | | | |
5.501%, 12/25/36 | | | 764 | | | 550 |
| | |
| 88 | | SEI Institutional Investments Trust / Annual Report / May 31, 2010 |
| | | | | | |
| Description | | Face Amount
($ Thousands) | | Market Value
($ Thousands) |
Credit-Based Asset Servicing and Securitization LLC, Ser 2006- CB2, Cl AF4 | | | | | | |
5.704%, 12/25/36 | | $ | 1,584 | | $ | 1,238 |
Credit-Based Asset Servicing and Securitization LLC, Ser 2007- CB4, Cl A1A | | | | | | |
0.433%, 04/25/37 (A) | | | 4,119 | | | 3,506 |
Credit-Based Asset Servicing and Securitization LLC, Ser 2007- RP1, Cl A | | | | | | |
0.653%, 05/25/46 (A) (B) | | | 13,043 | | | 7,905 |
Diamond Investment Grade CDO, Ser 1X, Cl A1 | | | | | | |
0.853%, 10/11/14 (G) | | | 2,040 | | | 1,938 |
Embarcadero Aircraft Securitization Trust, Ser 2000- A, Cl A1 | | | | | | |
0.817%, 08/15/25 (A) (B) | | | 3,248 | | | 1,656 |
Equity One, Ser 2003-2, Cl M1 | | | | | | |
5.050%, 09/25/33 (A) | | | 558 | | | 498 |
Fieldstone Mortgage Investment, Ser 2007-A, Cl 2A2 | | | | | | |
0.613%, 04/25/47 (A) | | | 2,000 | | | 689 |
First Horizon Asset Back Trust, Ser 2004-HE2, Cl A | | | | | | |
0.563%, 02/25/34 (A) | | | 1,009 | | | 562 |
First Horizon Asset Back Trust, Ser 2006-HE2, Cl A | | | | | | |
0.473%, 10/25/26 (A) | | | 631 | | | 468 |
Ford Credit Floorplan Master Owner Trust, Ser 2010-3, Cl A1 | | | | | | |
4.200%, 02/15/17 (B) | | | 2,963 | | | 3,067 |
GE Seaco Finance Srl,
Ser 2005- 1A, Cl A | | | | | | |
0.587%, 11/17/20 (A) (B) | | | 3,493 | | | 3,152 |
GMAC Mortgage Loan Trust, Ser 2005-HE3, Cl A1VN | | | | | | |
0.603%, 02/25/36 (A) | | | 6,404 | | | 2,496 |
Green Tree Financial,
Ser 1996-5, Cl A6 | | | | | | |
7.750%, 07/15/27 | | | 452 | | | 460 |
GSAMP Trust, Ser 2003-SEA, Cl A1 | | | | | | |
0.743%, 02/25/33 (A) | | | 1,885 | | | 1,410 |
GSAMP Trust, Ser 2006-SD2, Cl A1 | | | | | | |
0.453%, 05/25/46 (A) (B) | | | 2,249 | | | 2,142 |
John Deere Owner Trust, Ser 2009-A, Cl A3 | | | | | | |
2.590%, 10/15/13 | | | 276 | | | 279 |
John Deere Owner Trust, Ser 2009-B, Cl A3 | | | | | | |
1.570%, 10/15/13 | | | 535 | | | 537 |
| | | | | | |
JPMorgan Mortgage Acquisition,
Ser 2007-CH1, Cl AF6 | | | | | | |
5.501%, 11/25/36 | | | 9,494 | | | 7,592 |
| | | | | | |
| Description | | Face Amount
($ Thousands) | | Market Value
($ Thousands) |
Lehman XS Trust,
Ser 2005-5N, Cl 1A1 | | | | | | |
0.643%, 11/25/35 (A) | | $ | 4,318 | | $ | 2,918 |
Lehman XS Trust,
Ser 2005-7N, Cl 1A1B | | | | | | |
0.643%, 12/25/35 (A) | | | 3,327 | | | 1,064 |
Lehman XS Trust,
Ser 2006-GP1, Cl A4A | | | | | | |
0.673%, 05/25/46 (A) | | | 8,114 | | | 2,294 |
Lone Star CDO Funding, Ser IX, Cl A | | | | | | |
0.936%, 12/15/12 (G) | | | 2,985 | | | 2,895 |
Merrill Lynch Mortgage Investors, Ser 2006-WMC2, Cl A2D | | | | | | |
5.895%, 03/25/37 | | | 5,520 | | | 2,444 |
Merit Securities,
Ser 2003-13, CI A4 | | | | | | |
7.950%, 12/28/33 (A) | | | 3,252 | | | 3,264 |
Mid-State Trust, Ser 2003-11, Cl A1 | | | | | | |
4.864%, 07/15/38 | | | 2,729 | | | 2,608 |
Mid-State Trust, Ser 2006-1, Cl A | | | | | | |
5.787%, 10/15/40 (B) | | | 6,556 | | | 6,640 |
MSCC Heloc Trust, Ser 2005-1, Cl A | | | | | | |
0.533%, 07/25/17 (A) | | | 495 | | | 322 |
Nelnet Student Loan Trust, Ser 2008-3, Cl A4 | | | | | | |
2.147%, 11/25/24 (A) | | | 8,152 | | | 8,446 |
Nelnet Student Loan Trust,
Ser 2008-4, Cl A4 | | | | | | |
1.796%, 04/25/24 (A) | | | 4,540 | | | 4,677 |
Oakwood Mortgage Investors,
Ser 2002-C, Cl AIO, IO | | | | | | |
6.000%, 08/15/10 | | | 4,436 | | | 50 |
Origen Manufactured Housing, Ser 2002-A, Cl A1 | | | | | | |
0.577%, 05/15/32 (A) | | | 34 | | | 31 |
Park Place Securities,
Ser 2004-MHQ1, Cl M1 | | | | | | |
1.043%, 12/25/34 (A) | | | 7,391 | | | 7,198 |
Popular ABS Mortgage Pass- Through Trust, Ser 2007-A, Cl A3 | | | | | | |
0.653%, 06/25/47 (A) | | | 10,380 | | | 3,895 |
RAAC Series, Ser 2007-RP4, Cl A | | | | | | |
0.693%, 11/25/46 (A) (B) | | | 14,437 | | | 7,028 |
RAAC Series, Ser 2007-SP3, Cl A1 | | | | | | |
1.543%, 09/25/47 (A) | | | 389 | | | 268 |
SLC Student Loan Trust,
Ser 2008-1, Cl A4A | | | | | | |
1.857%, 12/15/32 (A) | | | 12,024 | | | 12,487 |
SLM Student Loan Trust,
Ser 2005-9, Cl A4 | | | | | | |
0.416%, 01/25/23 (A) | | | 2,491 | | | 2,474 |
SLM Student Loan Trust,
Ser 2006-5, Cl A5 | | | | | | |
0.426%, 01/25/27 (A) | | | 2,830 | | | 2,665 |
| | |
| SEI Institutional Investments Trust / Annual Report / May 31, 2010 | | 89 |
SCHEDULE OF INVESTMENTS
Core Fixed Income Fund (Continued)
May 31, 2010
| | | | | | |
| Description | | Face Amount
($ Thousands) | | Market Value
($ Thousands) |
| | | | | | |
SLM Student Loan Trust,
Ser 2008-5, Cl A4 | | | | | | |
2.016%, 07/25/23 (A) | | $ | 7,930 | | $ | 8,361 |
SLM Student Loan Trust,
Ser 2008-8, Cl A4 | | | | | | |
1.966%, 07/25/22 (A) | | | 1,784 | | | 1,872 |
SLM Student Loan Trust,
Ser 2010-1, Cl A | | | | | | |
0.743%, 03/25/25 (A) | | | 9,210 | | | 9,202 |
Swift Master Auto Receivables
Trust, Ser 2007-1, Cl A | | | | | | |
0.437%, 06/15/12 (A) | | | 1,249 | | | 1,249 |
Textainer Marine Containers,
Ser 2005-1A, Cl A | | | | | | |
0.587%, 05/15/20 (A) (B) | | | 3,450 | | | 3,133 |
Wells Fargo Home Equity Trust,
Ser 2007-2, Cl A1 | | | | | | |
0.433%, 04/25/37 (A) | | | 3,416 | | | 3,269 |
| | | | | | |
| | | | | | 178,985 |
| | | | | | |
Total Asset-Backed Securities
(Cost $374,654) ($ Thousands) | | | | | | 336,114 |
| | | | | | |
|
U.S. GOVERNMENT AGENCY OBLIGATIONS — 1.1% |
FHLB | | | | | | |
5.500%, 08/13/14 (C) | | | 5,000 | | | 5,712 |
5.000%, 11/17/17 | | | 5,000 | | | 5,601 |
1.500%, 01/16/13 (C) | | | 2,010 | | | 2,018 |
FHLMC | | | | | | |
5.625%, 11/23/35 | | | 1,620 | | | 1,685 |
5.500%, 07/18/16 | | | 4,000 | | | 4,600 |
FICO STRIPS, PO (E) | | | | | | |
4.840%, 09/26/19 | | | 180 | | | 123 |
4.790%, 06/06/19 | | | 470 | | | 327 |
4.750%, 03/07/19 | | | 1,450 | | | 1,024 |
4.650%, 11/02/18 | | | 3,410 | | | 2,471 |
4.580%, 08/03/18 | | | 9,280 | | | 6,834 |
4.520%, 05/11/18 | | | 3,620 | | | 2,704 |
4.510%, 04/06/18 | | | 2,920 | | | 2,191 |
4.480%, 02/08/18 | | | 960 | | | 726 |
0.000%, 09/26/19 | | | 1,655 | | | 1,129 |
FNMA | | | | | | |
7.735%, 10/09/19 (E) | | | 670 | | | 408 |
FNMA | | | | | | |
7.125%, 01/15/30 | | | 4,090 | | | 5,383 |
6.250%, 05/15/29 | | | 3,730 | | | 4,468 |
5.375%, 06/12/17 | | | 250 | | | 286 |
5.250%, 08/01/12 | | | 2,800 | | | 3,019 |
5.000%, 02/13/17 | | | 5,000 | | | 5,605 |
1.250%, 06/22/12 | | | 5,500 | | | 5,524 |
| | | | | | |
Total U.S. Government Agency Obligations
(Cost $59,382) ($ Thousands) | | | | | | 61,838 |
| | | | | | |
| | | | | | |
| Description | | Face Amount
($ Thousands)/Shares | | Market Value
($ Thousands) |
| | | | | | |
|
MUNICIPAL BONDS — 0.3% |
County of Clark Nevada, RB | | | | | | |
6.820%, 07/01/45 | | $ | 2,120 | | $ | 2,392 |
Los Angeles Unified School
District, GO | | | | | | |
6.758%, 07/01/34 | | | 1,930 | | | 2,098 |
Louisiana Public Facilities
Authority, RB | | | | | | |
4.500%, 02/01/14 | | | 722 | | | 733 |
North Texas Tollway
Authority, RB | | | | | | |
6.718%, 01/01/49 | | | 1,035 | | | 1,122 |
State of California, Build America
Project, GO | | | | | | |
7.550%, 04/01/39 | | | 1,760 | | | 1,864 |
7.300%, 10/01/39 | | | 6,815 | | | 7,003 |
State of California, GO | | | | | | |
7.625%, 03/01/40 | | | 660 | | | 711 |
6.650%, 03/01/22 | | | 1,700 | | | 1,781 |
State of Illinois, GO | | | | | | |
5.100%, 06/01/33 | | | 270 | | | 233 |
| | | | | | |
Total Municipal Bonds
(Cost $17,170) ($ Thousands) | | | | | | 17,937 |
| | | | | | |
|
PURCHASED OPTIONS — 0.0% |
July 2010 90Day EURO$ Future
Call, Expires 06/28/2010, Strike Price $121.00* | | | 348 | | | 234 |
September 2010 90Day EURO$
Future Call,
Expires 08/30/2010,
Strike Price $119.50* | | | 94 | | | 192 |
| | | | | | |
Total Purchased Options
(Cost $285) ($ Thousands) | | | | | | 426 |
| | | | | | |
|
CASH EQUIVALENTS — 2.0% |
Evergreen Institutional Money
Market Fund, Cl I, 0.090%** | | | 3,318,666 | | | 3,319 |
SEI Daily Income Trust,
Prime Obligation Fund, Cl A, 0.090%**† | | | 110,080,882 | | | 110,081 |
| | | | | | |
Total Cash Equivalents
(Cost $113,400) ($ Thousands) | | | | | | 113,400 |
| | | | | | |
|
COMMERCIAL PAPER — 0.4% |
BNP Paribas Finance
0.230%, 06/03/10 | | | 23,320 | | | 23,319 |
| | | | | | |
Total Commercial Paper
(Cost $23,320) ($ Thousands) | | | | | | 23,319 |
| | | | | | |
|
AFFILIATED PARTNERSHIP — 7.4% |
SEI Liquidity Fund, L.P. 0.240%**† | | | 431,338,806 | | | 421,924 |
| | | | | | |
Total Affiliated Partnership
(Cost $431,339) ($ Thousands) | | | | | | 421,924 |
| | | | | | |
| | |
| 90 | | SEI Institutional Investments Trust / Annual Report / May 31, 2010 |
| | | | | | | | |
| Description | | Face Amount
($ Thousands)/Contracts | | | Market Value
($ Thousands) | |
| | | | | | | | |
|
REPURCHASE AGREEMENTS — 5.1% | |
Barclays 0.160%, dated 05/28/10, to be repurchased on 06/01/10, repurchase price $140,702,501 (collateralized by U.S. Government obligations, par value $142,623,000, 0.875%, 01/31/12 with total market value $143,514,000) | | $ | 140,700 | | | $ | 140,700 | |
Deutsche 0.180%, dated 05/28/10, to be repurchased on 06/01/10, repurchase price $147,602,952 (collateralized by U.S. Government Agency obligations, par value $150,894,000, 0.00%, 01/24/11; with total market value $150,552,000) | | | 147,600 | | | | 147,600 | |
| | | | | | | | |
Total Repurchase Agreements
(Cost $288,300)
($ Thousands) | | | | | | | 288,300 | |
| | | | | | | | |
Total Investments — 116.1%
(Cost $6,665,423)
($ Thousands) | | | | | | $ | 6,625,828 | |
| | | | | | | | |
|
WRITTEN OPTIONS — 0.0% | |
September 2010 90Day EURO$
Future Call, Expires 09/14/10,
Strike Price $99.25* | | | (75 | ) | | $ | (23 | ) |
September 2010 90Day EURO$
Future Call, Expires 08/30/2010,
Strike Price $121.00* | | | (136 | ) | | | (183 | ) |
September 2010 90Day EURO$
Future Put, Expires 08/30/2010,
Strike Price $115.00* | | | (136 | ) | | | (58 | ) |
| | | | | | | | |
Total Written Options
(Premiums Received $234) ($ Thousands) | | | | (264 | ) |
| | | | | | | | |
A summary of the open futures contracts held by the Fund at May 31, 2010, is as follows:
| | | | | | | | | |
Type of
Contract | | Number of
Contracts
Long (Short) | | | Expiration
Date | | Unrealized
Appreciation
(Depreciation)
($ Thousands) | |
90-Day Euro$ | | (26 | ) | | Dec-2010 | | $ | (240 | ) |
90-Day Euro$ | | (26 | ) | | Jun-2011 | | | (227 | ) |
90-Day Euro$ | | (26 | ) | | Mar-2011 | | | (234 | ) |
90-Day Euro$ | | 241 | | | Sep-2010 | | | 18 | |
90-Day Euro$ | | (26 | ) | | Sep-2010 | | | (241 | ) |
U.S. 10-Year Treasury Note | | 33 | | | Sep-2010 | | | 5 | |
U.S. 10-Year Treasury Note | | (9 | ) | | Sep-2010 | | | 7 | |
U.S. 2-Year Treasury Note | | 1 | | | Jul-2010 | | | 2 | |
U.S. 2-Year Treasury Note | | 85 | | | Oct-2010 | | | 20 | |
U.S. 5-Year Treasury Note | | 2,175 | | | Oct-2010 | | | (221 | ) |
U.S. Long Treasury Bond | | 208 | | | Oct-2010 | | | (379 | ) |
U.S. Long Treasury Bond | | (389 | ) | | Oct-2010 | | | 954 | |
U.S. Ultra Long Treasury Bond | | 233 | | | Oct-2010 | | | (663 | ) |
| | | | | | | | | |
| | | | | | | $ | (1,199 | ) |
| | | | | | | | | |
For the year ended May 31, 2010, the total amount of all open futures contracts, as presented in the table above, are representative of the volume of activity for this derivative type during the period.
A summary of the outstanding forward foreign currency contracts held by the Fund at May 31, 2010, is as follows:
| | | | | | | | | | | | |
Maturity
Date | | Currency
to Deliver
(Thousands) | | Currency
to Receive
(Thousands) | | Unrealized
Appreciation
(Depreciation)
($ Thousands) | |
8/17/10 | | EUR | | 6,938 | | USD | | 8,945 | | $ | 385 | |
8/17/10 | | USD | | 8,451 | | EUR | | 6,649 | | | (247 | ) |
| | | | | | | | | | | | |
| | | | | | | | | | $ | 138 | |
| | | | | | | | | | | | |
Percentages are based on Net Assets of $5,705,708 ($ Thousands)
| * | | Non-income producing security. |
| ** | | The rate reported is the 7-day effective yield as of May 31, 2010. |
| ‡ | | Real Estate Investment Trust. |
| † | | Investment in Affiliated Security. |
| (A) | | Variable Rate Security—The rate reported is the rate in effect as of May 31, 2010. The date reported is the final maturity date. |
| (B) | | Securities sold within terms of a private placement memorandum, exempt from registration under Section 144A of the Securities Act of 1933, as amended, and may be sold only to dealers in that program or other “accredited investors.” These securities have been determined to be liquid under guidelines established by the board of Trustees. |
| (C) | | This security or a partial position of this security is on loan at May 31, 2010. The total value of securities on loan at May 31, 2010 was $419,251 ($ Thousands). |
| (D) | | Security in default on interest payments. |
| (E) | | Zero coupon security. The rate reported is the effective yield at time of purchase. |
| (F) | | This security was purchased with cash collateral held from securities on loan. The total value of this security as of May 31, 2010 was $421,924 ($ Thousands). |
| (G) | | Security fair valued using methods determined in good faith by the Valuation Committee of the Board of Trustees. The total value of such securities as of May 31, 2010 was $15,513 ($ Thousands) and represented 0.27% of net assets. |
| (H) | | Securities considered illiquid. The total value of such securities as of May 31, 2010 was $700 ($ Thousands) and represented 0.01% of net assets. (Unaudited in regards to illiquid status) |
| (I) | | Step Bond—The rate reported is the effective yield on May 31, 2010. The coupon on a step bond changes on a specific date. |
ABS — Asset-Backed Security
ARM — Adjustable Rate Mortgage
CDO — Collateralized Debt Obligation
Cl — Class
CMO — Collateralized Mortgage Obligation
EUR — Euro
FHLB — Federal Home Loan Bank
FHLMC — Federal Home Loan Mortgage Corporation
FICO — Fair Isaac Corporation
FNMA — Federal National Mortgage Association
GNMA — Government National Mortgage Association
GO — General Obligation
IO — Interest Only—face amount represents notional amount
LLC — Limited Liability Company
L.P. — Limited Partnership
MTN — Medium Term Note
PO — Principal Only
REMIC — Real Estate Mortgage Investment Conduit
RB — Revenue Bond
Ser — Series
STRIPS — Separately Traded Registered Interest and Principal Securities
TBA — To Be Announced
USD — United States Dollar
Amounts designated as “—” are $O or have been rounded to $O.
| | |
| SEI Institutional Investments Trust / Annual Report / May 31, 2010 | | 91 |
SCHEDULE OF INVESTMENTS
Core Fixed Income Fund (Concluded)
May 31, 2010
A summary of outstanding swap agreements held by the Fund at May 31, 2010, is as follows:
| | | | | | | | | | | | | | | | |
| Credit Default Swaps | |
| Counterparty | | Reference Entity/Obligation | | Buy/Sell
Protection | | (Pays)/
Receives Rate | | | Termination Date | | Notional Amount
(Thousands) | | | Net Unrealized
Appreciation
(Depreciation)
($ Thousands) | |
| Bank of America | | Cmbx-Na-Aj 1 Index | | BUY | | (0.84 | ) | | 10/12/52 | | 3,850 | | | $ | (1,450 | ) |
| Bank of America | | Cmbx-Na-Aj 1 Index | | BUY | | (0.84 | ) | | 10/12/52 | | 5,500 | | | | (2,121 | ) |
| Bank of America | | Cmbx-Na-Aj 1 Index | | BUY | | (0.84 | ) | | 10/12/52 | | 4,445 | | | | (160 | ) |
| Barclays Bank PLC | | ABX.HE.AAA 07-1 Index | | SELL | | 0.09 | | | 08/25/37 | | (4,680 | ) | | | (1,988 | ) |
| Barclays Bank PLC | | ABX.HE.PENAAA 07-2 Index | | SELL | | 0.76 | | | 01/25/38 | | (4,581 | ) | | | 268 | |
| Barclays Bank PLC | | ABX.HE.PENAAA 07-2 Index | | SELL | | 0.76 | | | 01/25/38 | | (3,984 | ) | | | 269 | |
| Barclays Bank PLC | | Cmbx-Na-Aj 1 Index | | BUY | | (0.84 | ) | | 10/12/52 | | 4,880 | | | | (1,908 | ) |
| Barclays Bank PLC | | Cmbx-Na-Aj 1 Index | | BUY | | (0.84 | ) | | 10/12/52 | | 2,000 | | | | 248 | |
| Barclays Bank PLC | | Cmbx-Na-Aj 1 Index | | BUY | | (0.84 | ) | | 10/12/52 | | 2,000 | | | | 227 | |
| Citigroup | | ABX.HE.AAA 06-2 Index | | SELL | | 0.11 | | | 05/25/46 | | (2,067 | ) | | | (226 | ) |
| Citigroup | | ABX.HE.AAA 07-1 Index | | SELL | | 0.09 | | | 08/25/37 | | (3,545 | ) | | | (1,495 | ) |
| Citigroup | | ABX.HE.PENAAA 07-2 Index | | SELL | | 0.76 | | | 01/25/38 | | (4,083 | ) | | | 476 | |
| Citigroup | | ABX.HE.PENAAA 07-2 Index | | SELL | | 0.76 | | | 01/25/38 | | (5,478 | ) | | | 533 | |
| Citigroup | | Darden Restaurants Inc., 6.000% 08/15/35 | | BUY | | (2.73 | ) | | 03/20/14 | | 1,435 | | | | (104 | ) |
| Citigroup | | Darden Restaurants Inc., 7.125% 02/01/16 | | BUY | | (2.40 | ) | | 03/20/15 | | 1,200 | | | | (79 | ) |
| Citigroup | | DR Horton, Inc., 5.375% 6/15/12 | | BUY | | (1.00 | ) | | 09/20/16 | | 1,020 | | | | 32 | |
| Citigroup | | Home Depot, 5.875% 12/16/36 | | BUY | | (2.67 | ) | | 03/20/14 | | 5,100 | | | | (437 | ) |
| Citigroup | | Lowes Cos. Inc., 8.250% 06/01/10 | | BUY | | (1.20 | ) | | 03/20/14 | | 5,320 | | | | (144 | ) |
| Credit Suisse | | ABX.HE.AA 06-2 Index | | SELL | | 0.17 | | | 05/25/46 | | (4,612 | ) | | | (261 | ) |
| Credit Suisse | | ABX.HE.AA 06-2 Index | | SELL | | 0.17 | | | 05/25/46 | | (4,889 | ) | | | (311 | ) |
| Credit Suisse | | ABX.HE.AAA 06-1 Index | | SELL | | 0.09 | | | 08/25/37 | | (4,000 | ) | | | (211 | ) |
| Credit Suisse | | Cmbx-Na-Aj 1 Index | | BUY | | (0.84 | ) | | 10/12/52 | | 390 | | | | (151 | ) |
| Credit Suisse | | General Electric Corp., 5.625% 09/15/17 | | SELL | | 6.55 | | | 12/20/10 | | (2,570 | ) | | | 102 | |
| Credit Suisse | | Pulte Homes, Inc., 5.250% 1/15/14 | | BUY | | (1.00 | ) | | 09/20/16 | | 2,250 | | | | 80 | |
| Credit Suisse | | Target Corporation, 4.000% 6/15/13 | | BUY | | (1.00 | ) | | 12/20/14 | | 1,280 | | | | (13 | ) |
| Credit Suisse | | Toll Brothers Inc., 5.150% 05/15/15 | | BUY | | (1.00 | ) | | 09/20/16 | | 6,700 | | | | 307 | |
| Deutsche Bank | | Centex Corporation, 5.250% 06/15/15 | | BUY | | (4.40 | ) | | 12/20/13 | | 600 | | | | (73 | ) |
| Deutsche Bank | | Darden Restaurants Inc., 6.000% 08/15/35 | | BUY | | (2.25 | ) | | 03/20/14 | | 1,650 | | | | (89 | ) |
| Deutsche Bank | | Darden Restaurants Inc., 7.125% 02/01/16 | | BUY | | (2.25 | ) | | 03/20/13 | | 600 | | | | (28 | ) |
| Deutsche Bank | | DR Horton, Inc., 5.375% 6/15/12 | | BUY | | (1.00 | ) | | 09/20/16 | | 800 | | | | 13 | |
| Deutsche Bank | | Pulte Homes, Inc., 5.250% 1/15/14 | | BUY | | (1.00 | ) | | 09/20/16 | | 3,050 | | | | 114 | |
| Deutsche Bank | | Pulte Homes, Inc., 5.250% 1/15/14 | | BUY | | (1.00 | ) | | 09/20/16 | | 2,250 | | | | 119 | |
| Deutsche Bank | | Target Corporation, 4.000% 6/15/13 | | BUY | | (1.00 | ) | | 12/20/14 | | 1,280 | | | | (13 | ) |
| Goldman Sachs | | ABX.HE.AA 06-2 Index | | SELL | | 0.17 | | | 05/25/46 | | (3,505 | ) | | | (207 | ) |
| Goldman Sachs | | ABX.HE.AAA 07-1 Index | | SELL | | 0.09 | | | 08/25/37 | | (5,420 | ) | | | (549 | ) |
| Goldman Sachs | | DR Horton, Inc., 5.375% 6/15/12 | | BUY | | (1.00 | ) | | 09/20/16 | | 795 | | | | 13 | |
| Goldman Sachs | | Pulte Homes, Inc., 5.250% 1/15/14 | | BUY | | (1.00 | ) | | 09/20/16 | | 1,600 | | | | 64 | |
| Merrill Lynch | | Centex Corporation, 5.250% 06/15/15 | | BUY | | (3.56 | ) | | 12/20/12 | | 1,970 | | | | (144 | ) |
| Merrill Lynch | | Centex Corporation, 5.250% 06/15/15 | | BUY | | (3.56 | ) | | 12/20/12 | | 1,375 | | | | (104 | ) |
| Morgan Stanley | | ABX.HE.AAA 07-1 Index | | SELL | | 0.09 | | | 08/25/37 | | (2,100 | ) | | | (230 | ) |
| Morgan Stanley | | ABX.HE.AAA 07-1 Index | | SELL | | 0.09 | | | 08/25/37 | | (5,200 | ) | | | (527 | ) |
| Morgan Stanley | | Berkshire Hathaway Inc., 4.625% 10/15/13 | | SELL | | 4.00 | | | 03/20/11 | | (5,400 | ) | | | 165 | |
| Morgan Stanley | | CDX.IG HVOL.12 Index | | SELL | | 5.00 | | | 06/20/14 | | (6,090 | ) | | | 738 | |
| Morgan Stanley | | Darden Restaurants Inc., 7.125% 02/01/16 | | BUY | | (2.25 | ) | | 03/20/13 | | 600 | | | | (28 | ) |
| Royal Bank of Scotland | | ABX.HE.AA 06-2 Index | | SELL | | 0.17 | | | 05/25/46 | | (2,767 | ) | | | (156 | ) |
| | | | | | | | | | | | | | | | |
| | | | | | | | | | | | | | $ | (9,439 | ) |
| | | | | | | | | | | | | | | | |
| | | | | | | | | | | | |
| Interest Rate Swaps | |
| Counterparty | | Fund Pays | | Fund Receives | | Termination Date | | Notional Amount
(Thousands) | | Net Unrealized
(Depreciation)
($ Thousands) | |
| Deutsche Bank | | 2.90% | | 3-Month LIBOR | | 02/28/14 | | 87,200,000 | | $ | (3,625 | ) |
| Morgan Stanley | | 0.00% | | 3MLIBOR (PAYMENT AT MATURITY) | | 11/15/27 | | 29,630,000 | | | (1,373 | ) |
| Morgan Stanley | | 0.00% | | 3MLIBOR (PAYMENT AT MATURITY) | | 02/15/25 | | 19,470,000 | | | (949 | ) |
| | | | | | | | | | | | |
| | | | | | | | | | $ | (5,947 | ) |
| | | | | | | | | | | | |
| | |
| 92 | | SEI Institutional Investments Trust / Annual Report / May 31, 2010 |
The following is a summary of the inputs used as of May 31, 2010 in valuing the Fund’s investments carried at value ($ Thousands):
| | | | | | | | | | | | |
| Investments in Securities | | Level 1 | | Level 2 | | Level 3 | | Total |
Mortgage-Backed Securities | | $ | — | | $ | 2,602,155 | | $ | 13,273 | | $ | 2,615,428 |
Corporate Obligations | | | — | | | 1,532,533 | | | 265 | | | 1,532,798 |
U.S. Treasury Obligations | | | — | | | 1,214,344 | | | — | | | 1,214,344 |
Affiliated Partnership | | | — | | | 421,924 | | | — | | | 421,924 |
Asset-Backed Securities | | | — | | | 332,780 | | | 3,334 | | | 336,114 |
U.S. Government Agency Obligations | | | — | | | 61,838 | | | — | | | 61,838 |
Municipal Bonds | | | — | | | 17,937 | | | — | | | 17,937 |
Cash Equivalents | | | 113,400 | | | — | | | — | | | 113,400 |
Commercial Paper | | | — | | | 23,319 | | | — | | | 23,319 |
Purchased Options | | | 426 | | | — | | | — | | | 426 |
Repurchase Agreements | | | — | | | 288,300 | | | — | | | 288,300 |
| | | | | | | | | | | | |
Total Investments in Securities | | $ | 113,826 | | $ | 6,495,130 | | $ | 16,872 | | $ | 6,625,828 |
| | | | | | | | | | | | |
| | | | | | | | | | | | | | |
| Liabilities | | Level 1 | | | Level 2 | | Level 3 | | Total | |
Written Options | | $ | (264 | ) | | $ | — | | $ | — | | $ | (264 | ) |
| | | | | | | | | | | | | | |
Total Liabilities | | $ | (264 | ) | | $ | — | | $ | — | | $ | (264 | ) |
| | | | | | | | | | | | | | |
| | | | | | | | | | | | | | | |
| Other Financial Instruments | | Level 1 | | | Level 2 | | | Level 3 | | Total | |
Future Contracts* | | $ | (1,199 | ) | | $ | — | | | $ | — | | $ | (1,199 | ) |
Credit Default Swaps | | | — | | | | (9,439 | ) | | | — | | | (9,439 | ) |
Interest Rate Swaps | | | — | | | | (5,947 | ) | | | — | | | (5,947 | ) |
Forwards Contracts | | | — | | | | 138 | | | | — | | | 138 | |
| | | | | | | | | | | | | | | |
Total Other Financial Instruments | | $ | (1,199 | ) | | $ | (15,248 | ) | | $ | — | | $ | (16,447 | ) |
| | | | | | | | | | | | | | | |
| | | | | | | | | | | |
| | | Investments in
Corporate
Obligations | | | Investments in
Mortgage-Backed
Securities | | Investments in
Asset-Backed
Securities | |
Beginning balance as of
June 1, 2009 | | $ | 442 | | | $ | 6,160 | | $ | 6,790 | |
Accrued discounts/premiums | | | 43 | | | | 108 | | | 9 | |
Realized gain/(loss) | | | — | | | | 361 | | | 39 | |
Change in unrealized appreciation/ (depreciation) | | | 66 | | | | 2,614 | | | 836 | |
Net purchases/sales | | | (286 | ) | | | 4,030 | | | (4,340 | ) |
Net transfer in and/or out of Level 3 | | | — | | | | — | | | — | |
| | | | | | | | | | | |
Ending balance as of May 31, 2010 | | $ | 265 | | | $ | 13,273 | | $ | 3,334 | |
| | | | | | | | | | | |
Changes in unrealized gains/(losses) included in earnings related to securities still held at reporting date. | | $ | (52 | ) | | $ | 2,620 | | $ | 701 | |
| | | | | | | | | | | |
| * | | Futures contracts are valued at the unrealized appreciation on the instrument. |
For more information on valuation inputs, see Note 2 — Significant Accounting Policies in Notes to Financial Statements.
The accompanying notes are an integral part of the financial statements.
| | |
| SEI Institutional Investments Trust / Annual Report / May 31, 2010 | | 93 |
SCHEDULE OF INVESTMENTS
High Yield Bond Fund
May 31, 2010
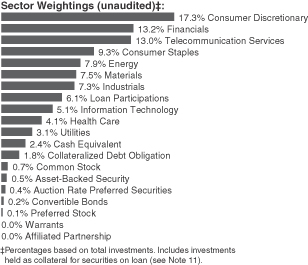
| | | | | | |
| Description | | Face Amount
($ Thousands) | | Market Value
($ Thousands) |
| | | | | | |
|
CORPORATE OBLIGATIONS — 84.4% |
|
Consumer Discretionary — 16.6% |
Adelphia Communications (escrow security) | | | | | | |
10.250%, 06/15/11 (B) | | $ | 125 | | $ | 2 |
7.875%, 01/15/09 (B) | | | 250 | | | 3 |
7.750%, 05/01/09 (B) | | | 75 | | | 1 |
Adelphia Communications,
Ser B (escrow security) | | | | | | |
9.500%, 02/15/04 | | | 25 | | | — |
America West Airlines LLC | | | | | | |
8.057%, 07/02/20 | | | 2,094 | | | 2,099 |
American Airlines | | | | | | |
13.000%, 08/01/16 | | | 2,544 | | | 2,817 |
American Tire Distributors | | | | | | |
9.750%, 06/01/17 (A) | | | 775 | | | 765 |
Ameristar Casinos | | | | | | |
9.250%, 06/01/14 | | | 1,050 | | | 1,076 |
Amscan Holdings | | | | | | |
8.750%, 05/01/14 | | | 2,811 | | | 2,762 |
ArvinMeritor | | | | | | |
8.125%, 09/15/15 | | | 1,295 | | | 1,201 |
Ashtead Capital | | | | | | |
9.000%, 08/15/16 (A) | | | 2,324 | | | 2,312 |
Avis Budget Car Rental LLC | | | | | | |
7.750%, 05/15/16 | | | 705 | | | 656 |
Beazer Homes USA | | | | | | |
12.000%, 10/15/17 | | | 1,290 | | | 1,432 |
9.125%, 06/15/18 | | | 460 | | | 432 |
8.125%, 06/15/16 | | | 810 | | | 741 |
Belo | | | | | | |
8.000%, 11/15/16 | | | 2,575 | | | 2,581 |
7.750%, 06/01/27 | | | 2,025 | | | 1,721 |
| | | | | | |
| Description | | Face Amount
($ Thousands) | | Market Value
($ Thousands) |
| | | | | | |
Bon-Ton Department Stores | | | | | | |
10.250%, 03/15/14 | | $ | 715 | | $ | 711 |
Boyd Gaming | | | | | | |
7.125%, 02/01/16 | | | 1,375 | | | 1,176 |
Brunswick | | | | | | |
11.250%, 11/01/16 (A) | | | 1,440 | | | 1,613 |
Burlington Coat Factory Investment Holdings | | | | | | |
14.500%, 10/15/14 | | | 4,480 | | | 4,704 |
Burlington Coat Factory Warehouse | | | | | | |
11.125%, 04/15/14 | | | 1,435 | | | 1,482 |
Cablevision Systems | | | | | | |
8.625%, 09/15/17 (A) | | | 1,170 | | | 1,176 |
8.000%, 04/15/20 | | | 535 | | | 527 |
7.750%, 04/15/18 | | | 900 | | | 880 |
Charter Communications Operating LLC | | | | | | |
10.875%, 09/15/14 (A) | | | 530 | | | 579 |
Continental Airlines 2000-1 Class B Pass Through Trust | | | | | | |
8.388%, 11/01/20 | | | 1,168 | | | 1,110 |
Couche-Tard US | | | | | | |
7.500%, 12/15/13 | | | 330 | | | 329 |
Dana (escrow security) (B) | | | | | | |
7.000%, 03/01/09 | | | 175 | | | 4 |
7.000%, 03/15/28 | | | 200 | | | 5 |
6.500%, 03/15/08 | | | 100 | | | 2 |
6.500%, 03/01/29 | | | 1,100 | | | 28 |
Dave & Buster’s | | | | | | |
11.250%, 03/15/14 | | | 2,081 | | | 2,201 |
Delta Air Lines | | | | | | |
7.711%, 09/18/11 | | | 1,900 | | | 1,881 |
Dex One | | | | | | |
12.000%, 01/29/17 | | | 724 | | | 702 |
Dillard’s | | | | | | |
7.875%, 01/01/23 | | | 50 | | | 45 |
7.750%, 07/15/26 | | | 99 | | | 85 |
7.750%, 05/15/27 | | | 540 | | | 470 |
7.000%, 12/01/28 | | | 150 | | | 128 |
6.625%, 01/15/18 | | | 351 | | | 328 |
DISH DBS | | | | | | |
7.125%, 02/01/16 | | | 3,200 | | | 3,136 |
Dollar General | | | | | | |
11.875%, 07/15/17 | | | 1,520 | | | 1,733 |
Eastman Kodak | | | | | | |
9.750%, 03/01/18 (A) | | | 1,700 | | | 1,687 |
7.250%, 11/15/13 | | | 2,930 | | | 2,827 |
Easton-Bell Sports | | | | | | |
9.750%, 12/01/16 (A) | | | 2,310 | | | 2,385 |
El Dorado Casino Shreveport PIK | | | | | | |
10.000%, 08/01/12 | | | 1,102 | | | 937 |
El Pollo Loco | | | | | | |
11.750%, 12/01/12 | | | 2,250 | | | 2,273 |
| | |
| 94 | | SEI Institutional Investments Trust / Annual Report / May 31, 2010 |
| | | | | | |
| Description | | Face Amount
($ Thousands) | | Market Value
($ Thousands) |
| | | | | | |
Equinox Holdings | | | | | | |
9.500%, 02/01/16 (A) | | $ | 1,240 | | $ | 1,215 |
Ferrellgas | | | | | | |
9.125%, 10/01/17 (A) | | | 2,500 | | | 2,588 |
Fontainebleau Las Vegas | | | | | | |
11.000%, 06/15/15 (A) (B) | | | 3,500 | | | 39 |
Ford Motor | | | | | | |
7.450%, 07/16/31 | | | 1,975 | | | 1,758 |
Ford Motor, Ser 1999- | | | | | | |
6.375%, 02/01/29 | | | 1,080 | | | 837 |
Games Merger | | | | | | |
11.000%, 06/01/18 (A) | | | 9,045 | | | 8,909 |
Gaylord Entertainment | | | | | | |
6.750%, 11/15/14 | | | 310 | | | 287 |
Goodyear Tire & Rubber | | | | | | |
10.500%, 05/15/16 | | | 325 | | | 345 |
9.000%, 07/01/15 | | | 51 | | | 52 |
8.750%, 08/15/20 | | | 110 | | | 110 |
8.625%, 12/01/11 | | | 831 | | | 854 |
Gray Television | | | | | | |
10.500%, 06/29/15 (A) | | | 1,298 | | | 1,227 |
GWR Operating Partnership LLP | | | | | | |
10.875%, 04/01/17 (A) | | | 835 | | | 819 |
Hanesbrands | | | | | | |
8.000%, 12/15/16 | | | 2,730 | | | 2,771 |
Hanesbrands, Ser B | | | | | | |
3.831%, 12/15/14 (C) | | | 985 | | | 921 |
Harrah’s Operating | | | | | | |
12.750%, 04/15/18 (A) | | | 400 | | | 370 |
11.250%, 06/01/17 | | | 9,245 | | | 9,684 |
10.000%, 12/15/18 | | | 5,706 | | | 4,508 |
5.750%, 10/01/17 | | | 1,000 | | | 591 |
Hertz | | | | | | |
8.875%, 01/01/14 | | | 1,480 | | | 1,487 |
Hillman Group | | | | | | |
10.875%, 06/01/18 (A) | | | 560 | | | 556 |
HSN | | | | | | |
11.250%, 08/01/16 | | | 1,700 | | | 1,879 |
Inergy | | | | | | |
8.750%, 03/01/15 | | | 850 | | | 867 |
8.250%, 03/01/16 | | | 515 | | | 520 |
6.875%, 12/15/14 | | | 245 | | | 240 |
Intcomex | | | | | | |
13.250%, 12/15/14 (A) | | | 3,315 | | | 3,398 |
Isle of Capri Casinos | | | | | | |
7.000%, 03/01/14 | | | 590 | | | 510 |
Jarden | | | | | | |
8.000%, 05/01/16 | | | 640 | | | 654 |
7.500%, 05/01/17 | | | 1,610 | | | 1,578 |
JC Penney | | | | | | |
7.400%, 04/01/37 | | | 1,860 | | | 1,911 |
K Hovnanian Enterprises | | | | | | |
7.500%, 05/15/16 | | | 685 | | | 514 |
6.250%, 01/15/15 | | | 835 | | | 655 |
| | | | | | |
| Description | | Face Amount
($ Thousands) | | Market Value
($ Thousands) |
| | | | | | |
Landry’s Restaurants | | | | | | |
11.625%, 12/01/15 (A) | | $ | 2,514 | | $ | 2,621 |
11.625%, 12/01/15 (A) | | | 936 | | | 976 |
Lear | | | | | | |
8.125%, 03/15/20 | | | 980 | | | 958 |
7.875%, 03/15/18 | | | 965 | | | 941 |
Levi Strauss | | | | | | |
7.625%, 05/15/20 (A) | | | 990 | | | 965 |
Libbey Glass | | | | | | |
10.000%, 02/15/15 (A) | | | 885 | | | 918 |
Lions Gate Entertainment | | | | | | |
10.250%, 11/01/16 (A) | | | 3,465 | | | 3,491 |
Live Nation Entertainment | | | | | | |
8.125%, 05/15/18 (A) | | | 1,585 | | | 1,569 |
M/I Homes | | | | | | |
6.875%, 04/01/12 | | | 640 | | | 622 |
MCE Finance | | | | | | |
10.250%, 05/15/18 (A) | | | 1,430 | | | 1,423 |
McJunkin Red Man | | | | | | |
9.500%, 12/15/16 (A) | | | 1,050 | | | 1,019 |
MDC Partners | | | | | | |
11.000%, 11/01/16 (A) | | | 3,400 | | | 3,638 |
MGM Mirage | | | | | | |
11.375%, 03/01/18 (A) | | | 5,995 | | | 5,545 |
11.125%, 11/15/17 (A) | | | 595 | | | 644 |
10.375%, 05/15/14 (A) | | | 775 | | | 823 |
9.000%, 03/15/20 (A) | | | 3,985 | | | 3,995 |
7.500%, 06/01/16 | | | 2,375 | | | 1,900 |
6.875%, 04/01/16 | | | 250 | | | 191 |
6.750%, 04/01/13 | | | 1,235 | | | 1,081 |
5.875%, 02/27/14 | | | 3,085 | | | 2,491 |
Michaels Stores | | | | | | |
11.375%, 11/01/16 (A) | | | 21 | | | 22 |
Mohegan Tribal Gaming Authority | | | | | | |
7.125%, 08/15/14 | | | 905 | | | 670 |
6.875%, 02/15/15 | | | 250 | | | 182 |
MTR Gaming Group | | | | | | |
12.625%, 07/15/14 | | | 1,055 | | | 1,055 |
NCL | | | | | | |
11.750%, 11/15/16 (A) | | | 1,210 | | | 1,295 |
Neiman-Marcus Group PIK | | | | | | |
9.000%, 10/15/15 | | | 1,868 | | | 1,824 |
Niska Gas Storage US LLC | | | | | | |
8.875%, 03/15/18 (A) | | | 1,845 | | | 1,854 |
Norcraft | | | | | | |
10.500%, 12/15/15 (A) | | | 625 | | | 656 |
Norcraft Holdings | | | | | | |
9.750%, 09/01/12 | | | 671 | | | 611 |
OSI Restaurant Partners | | | | | | |
10.000%, 06/15/15 | | | 3,533 | | | 3,462 |
Peninsula Gaming LLC | | | | | | |
10.750%, 08/15/17 (A) | | | 1,740 | | | 1,714 |
8.375%, 08/15/15 (A) | | | 3,150 | | | 3,166 |
| | |
| SEI Institutional Investments Trust / Annual Report / May 31, 2010 | | 95 |
SCHEDULE OF INVESTMENTS
High Yield Bond Fund (Continued)
May 31, 2010
| | | | | | |
| Description | | Face Amount
($ Thousands) | | Market Value
($ Thousands) |
| | | | | | |
Penn National Gaming | | | | | | |
6.750%, 03/01/15 | | $ | 3,490 | | $ | 3,446 |
Penske Auto Group | | | | | | |
7.750%, 12/15/16 | | | 1,700 | | | 1,602 |
Phillips-Van Heusen | | | | | | |
7.375%, 05/15/20 | | | 5,540 | | | 5,568 |
Pinnacle Entertainment | | | | | | |
8.750%, 05/15/20 (A) | | | 6,370 | | | 5,892 |
Quiksilver | | | | | | |
6.875%, 04/15/15 | | | 1,755 | | | 1,535 |
QVC | | | | | | |
7.500%, 10/01/19 (A) | | | 4,215 | | | 4,110 |
7.375%, 10/15/20 (A) | | | 470 | | | 456 |
River Rock Entertainment Authority | | | | | | |
9.750%, 11/01/11 | | | 4,717 | | | 4,399 |
RJ Tower | | | | | | |
12.000%, 06/01/13 (B) | | | 210 | | | 1 |
Royal Caribbean Cruises | | | | | | |
11.875%, 07/15/15 | | | 900 | | | 1,021 |
7.250%, 06/15/16 | | | 640 | | | 616 |
7.000%, 06/15/13 | | | 925 | | | 910 |
RSC Equipment Rental | | | | | | |
9.500%, 12/01/14 | | | 3,505 | | | 3,330 |
Sabre Holdings | | | | | | |
8.350%, 03/15/16 | | | 2,100 | | | 1,932 |
Salem Communications | | | | | | |
9.625%, 12/15/16 | | | 1,152 | | | 1,166 |
Sally Holdings LLC | | | | | | |
9.250%, 11/15/14 | | | 1,615 | | | 1,655 |
San Pasqual Casino | | | | | | |
8.000%, 09/15/13 (A) | | | 1,530 | | | 1,453 |
Sbarro | | | | | | |
10.375%, 02/01/15 | | | 1,866 | | | 1,437 |
Sealy Mattress | | | | | | |
8.250%, 06/15/14 | | | 3,690 | | | 3,672 |
Service International | | | | | | |
7.375%, 10/01/14 | | | 1,035 | | | 1,045 |
6.750%, 04/01/15 | | | 1,895 | | | 1,876 |
Shingle Springs Tribal Group | | | | | | |
9.375%, 06/15/15 (A) | | | 1,685 | | | 1,314 |
Simmons Bedding | | | | | | |
11.250%, 07/15/15 (A) | | | 4,710 | | | 5,004 |
Sinclair Broadcast Group | | | | | | |
8.000%, 03/15/12 | | | 2,025 | | | 2,000 |
Sirius XM Radio | | | | | | |
9.750%, 09/01/15 (A) | | | 1,380 | | | 1,463 |
8.750%, 04/01/15 (A) | | | 2,000 | | | 1,940 |
Speedway Motorsports | | | | | | |
8.750%, 06/01/16 | | | 1,750 | | | 1,829 |
Stanadyne Holdings | | | | | | |
12.000%, 02/15/15 | | | 1,500 | | | 1,080 |
Stanadyne Holdings, Ser 1 | | | | | | |
10.000%, 08/15/14 | | | 475 | | | 423 |
| | | | | | |
| Description | | Face Amount
($ Thousands) | | Market Value
($ Thousands) |
| | | | | | |
Standard Pacific Escrow LLC | | | | | | |
10.750%, 09/15/16 | | $ | 2,275 | | $ | 2,468 |
8.375%, 05/15/18 | | | 1,049 | | | 1,005 |
Starwood Hotels & Resorts Worldwide | | | | | | |
6.750%, 05/15/18 | | | 1,390 | | | 1,373 |
Station Casinos | | | | | | |
6.875%, 03/01/16 (B) | | | 960 | | | 8 |
6.625%, 03/15/18 (B) | | | 2,090 | | | 16 |
Steinway Musical Instruments | | | | | | |
7.000%, 03/01/14 (A) | | | 5,070 | | | 4,893 |
Suburban Propane Partners | | | | | | |
7.375%, 03/15/20 | | | 2,500 | | | 2,488 |
Sun Media | | | | | | |
7.625%, 02/15/13 | | | 505 | | | 501 |
Tenneco | | | | | | |
8.625%, 11/15/14 | | | 585 | | | 579 |
Travelport LLC | | | | | | |
11.875%, 09/01/16 | | | 7,455 | | | 7,511 |
9.875%, 09/01/14 | | | 690 | | | 688 |
4.877%, 09/01/14 (C) | | | 1,444 | | | 1,343 |
TRW Automotive (A) | | | | | | |
7.250%, 03/15/17 | | | 575 | | | 558 |
7.000%, 03/15/14 | | | 840 | | | 825 |
Turning Stone Resort Casino Enterprise | | | | | | |
9.125%, 09/15/14 (A) | | | 1,970 | | | 1,960 |
UAL Pass Through Trust
Series 2000-1 | | | | | | |
8.030%, 07/01/11 | | | 540 | | | 804 |
United Air Lines | | | | | | |
12.000%, 11/01/13 (A) | | | 1,735 | | | 1,774 |
10.400%, 11/01/16 | | | 1,662 | | | 1,803 |
9.875%, 08/01/13 (A) | | | 1,370 | | | 1,401 |
9.750%, 01/15/17 | | | 1,415 | | | 1,521 |
United Air Lines, Ser 95A1 | | | | | | |
9.020%, 04/19/12 (B) | | | 530 | | | 132 |
United Components | | | | | | |
9.375%, 06/15/13 | | | 1,030 | | | 1,025 |
Univision Communications | | | | | | |
9.750%, 03/15/15 (A) | | | 4,329 | | | 3,674 |
Vail Resorts | | | | | | |
6.750%, 02/15/14 | | | 1,970 | | | 1,960 |
Videotron | | | | | | |
6.875%, 01/15/14 | | | 1,234 | | | 1,228 |
VWR Funding | | | | | | |
10.250%, 07/15/15 | | | 3,777 | | | 3,815 |
WMG Acquisition | | | | | | |
9.500%, 06/15/16 (A) | | | 2,600 | | | 2,691 |
Wynn Las Vegas LLC | | | | | | |
7.875%, 05/01/20 (A) | | | 620 | | | 611 |
7.875%, 11/01/17 (A) | | | 155 | | | 153 |
| | | | | | |
| | | | | | 271,704 |
| | | | | | |
| | |
| 96 | | SEI Institutional Investments Trust / Annual Report / May 31, 2010 |
| | | | | | |
| Description | | Face Amount
($ Thousands) | | Market Value
($ Thousands) |
| | | | | | |
|
Consumer Staples — 8.9% |
Accellent | | | | | | |
10.500%, 12/01/13 | | $ | 915 | | $ | 883 |
8.375%, 02/01/17 (A) | | | 1,705 | | | 1,645 |
Alion Science and Technology | | | | | | |
12.000%, 11/01/14 (A) | | | 8 | | | 8 |
12.000%, 11/01/14 (A) | | | 3,590 | | | 3,572 |
Alliance One International | | | | | | |
10.000%, 07/15/16 (A) | | | 220 | | | 225 |
10.000%, 07/15/16 (A) | | | 715 | | | 729 |
American Renal Holdings | | | | | | |
8.375%, 05/15/18 (A) | | | 3,830 | | | 3,725 |
Apria Healthcare Group | | | | | | |
12.375%, 11/01/14 (A) | | | 5,120 | | | 5,478 |
Avis Budget Car Rental LLC | | | | | | |
9.625%, 03/15/18 (A) | | | 1,745 | | | 1,745 |
B&G Foods | | | | | | |
7.625%, 01/15/18 | | | 2,920 | | | 2,913 |
Bausch & Lomb | | | | | | |
9.875%, 11/01/15 | | | 2,190 | | | 2,234 |
Biomet | | | | | | |
11.625%, 10/15/17 | | | 7,300 | | | 7,793 |
Bumble Bee Foods LLC | | | | | | |
7.750%, 12/15/15 (A) | | | 630 | | | 627 |
C&S Group Enterprises LLC | | | | | | |
8.375%, 05/01/17 (A) | | | 4,225 | | | 4,035 |
Catalent Pharma Solutions | | | | | | |
9.500%, 04/15/15 | | | 5,314 | | | 5,168 |
Central Garden and Pet | | | | | | |
8.250%, 03/01/18 | | | 940 | | | 931 |
Chiquita Brands International | | | | | | |
8.875%, 12/01/15 | | | 1,495 | | | 1,454 |
Constellation Brands | | | | | | |
8.375%, 12/15/14 | | | 2,000 | | | 2,080 |
7.250%, 05/15/17 | | | 1,250 | | | 1,237 |
7.250%, 09/01/16 | | | 2,190 | | | 2,179 |
Cott Beverages | | | | | | |
8.375%, 11/15/17 (A) | | | 2,325 | | | 2,348 |
Dean Foods | | | | | | |
7.000%, 06/01/16 | | | 690 | | | 634 |
DJO Finance LLC | | | | | | |
10.875%, 11/15/14 (A) | | | 825 | | | 858 |
10.875%, 11/15/14 | | | 1,905 | | | 1,981 |
Dole Food | | | | | | |
13.875%, 03/15/14 | | | 517 | | | 597 |
8.000%, 10/01/16 (A) | | | 405 | | | 406 |
Fleming | | | | | | |
10.125%, 04/01/08 (B) (F) | | | 943 | | | — |
HCA | | | | | | |
9.875%, 02/15/17 (A) | | | 170 | | | 179 |
9.625%, 11/15/16 | | | 9,111 | | | 9,589 |
9.250%, 11/15/16 | | | 4,820 | | | 5,061 |
8.500%, 04/15/19 (A) | | | 2,640 | | | 2,759 |
7.875%, 02/15/20 (A) | | | 4,010 | | | 4,080 |
| | | | | | |
| Description | | Face Amount
($ Thousands) | | Market Value
($ Thousands) |
| | | | | | |
JBS USA LLC | | | | | | |
11.625%, 05/01/14 | | $ | 560 | | $ | 615 |
JohnsonDiversey | | | | | | |
8.250%, 11/15/19 (A) | | | 1,410 | | | 1,445 |
Johnsondiversey Holdings | | | | | | |
10.500%, 05/15/20 (A) | | | 2,595 | | | 2,790 |
Lantheus Medical Imaging | | | | | | |
9.750%, 05/15/17 (A) | | | 2,965 | | | 2,846 |
Laureate Education | | | | | | |
11.750%, 08/15/17 (A) | | | 1,100 | | | 1,133 |
10.000%, 08/15/15 (A) | | | 525 | | | 530 |
Novasep Holding SAS | | | | | | |
9.750%, 12/15/16 (A) | | | 870 | | | 844 |
Pantry | | | | | | |
7.750%, 02/15/14 | | | 3,785 | | | 3,634 |
PharmaNet Development Group | | | | | | |
10.875%, 04/15/17 (A) | | | 2,775 | | | 2,720 |
Radiation Therapy Services | | | | | | |
9.875%, 04/15/17 (A) | | | 1,815 | | | 1,761 |
Rite Aid | | | | | | |
10.375%, 07/15/16 | | | 3,455 | | | 3,524 |
10.250%, 10/15/19 | | | 1,170 | | | 1,191 |
9.750%, 06/12/16 | | | 2,340 | | | 2,483 |
9.500%, 06/15/17 | | | 3,720 | | | 2,985 |
9.375%, 12/15/15 | | | 705 | | | 580 |
7.500%, 03/01/17 | | | 1,080 | | | 972 |
RSC Equipment Rental | | | | | | |
10.000%, 07/15/17 (A) | | | 2,000 | | | 2,153 |
Seminole Indian Tribe of Florida | | | | | | |
6.535%, 10/01/20 (A) | | | 1,000 | | | 892 |
ServiceMaster | | | | | | |
10.750%, 07/15/15 (A) | | | 5,675 | | | 5,675 |
7.450%, 08/15/27 | | | 1,500 | | | 1,125 |
7.250%, 03/01/38 | | | 1,145 | | | 790 |
7.100%, 03/01/18 | | | 1,155 | | | 970 |
Smithfield Foods | | | | | | |
7.750%, 07/01/17 | | | 580 | | | 545 |
Spectrum Brands | | | | | | |
12.000%, 08/28/19 | | | 2,005 | | | 2,125 |
SuperValu | | | | | | |
8.000%, 05/01/16 | | | 3,725 | | | 3,669 |
Ticketmaster Entertainment LLC | | | | | | |
10.750%, 08/01/16 | | | 5,495 | | | 5,962 |
Tops Markets LLC | | | | | | |
10.125%, 10/15/15 (A) | | | 1,330 | | | 1,373 |
United Rentals North America | | | | | | |
10.875%, 06/15/16 | | | 3,000 | | | 3,195 |
9.250%, 12/15/19 | | | 1,085 | | | 1,089 |
Universal Hospital Services | | | | | | |
8.500%, 06/01/15 | | | 960 | | | 922 |
US Oncology | | | | | | |
9.125%, 08/15/17 | | | 1,620 | | | 1,634 |
US Oncology Holdings | | | | | | |
6.427%, 03/15/12 (C) | | | 1,270 | | | 1,165 |
| | |
| SEI Institutional Investments Trust / Annual Report / May 31, 2010 | | 97 |
\
SCHEDULE OF INVESTMENTS
High Yield Bond Fund (Continued)
May 31, 2010
| | | | | | |
| Description | | Face Amount
($ Thousands) | | Market Value
($ Thousands) |
| | | | | | |
Vanguard Health Holding II LLC | | | | | | |
8.000%, 02/01/18 | | $ | 2,965 | | $ | 2,817 |
Yankee Acquisition, Ser B | | | | | | |
9.750%, 02/15/17 | | | 2,320 | | | 2,337 |
| | | | | | |
| | | | | | 145,644 |
| | | | | | |
| | |
Energy — 7.6% | | | | | | |
American Petroleum Tankers LLC | | | | | | |
10.250%, 05/01/15 (A) | | | 585 | | | 579 |
Antero Resources Finance | | | | | | |
9.375%, 12/01/17 (A) | | | 990 | | | 970 |
Aquilex Holdings LLC | | | | | | |
11.125%, 12/15/16 (A) | | | 2,220 | | | 2,220 |
Arch Coal | | | | | | |
8.750%, 08/01/16 (A) | | | 2,390 | | | 2,438 |
Atlas Energy Operating LLC | | | | | | |
12.125%, 08/01/17 | | | 190 | | | 211 |
10.750%, 02/01/18 | | | 1,845 | | | 1,956 |
Aventine Renewable Energy Holdings | | | | | | |
13.000%, 03/15/15 (A) (F) (I) | | | 932 | | | 979 |
Basic Energy Services | | | | | | |
11.625%, 08/01/14 | | | 1,300 | | | 1,411 |
Bill Barrett | | | | | | |
9.875%, 07/15/16 | | | 1,000 | | | 1,035 |
Calfrac Holdings | | | | | | |
7.750%, 02/15/15 (A) | | | 3,000 | | | 2,910 |
Chesapeake Energy | | | | | | |
9.500%, 02/15/15 | | | 2,545 | | | 2,755 |
7.500%, 06/15/14 | | | 219 | | | 224 |
6.875%, 01/15/16 | | | 560 | | | 573 |
6.500%, 08/15/17 | | | 875 | | | 851 |
Cloud Peak Energy Resources LLC | | | | | | |
8.250%, 12/15/17 (A) | | | 1,205 | | | 1,190 |
Complete Production Services | | | | | | |
8.000%, 12/15/16 | | | 760 | | | 749 |
Compton Petroleum Finance | | | | | | |
7.625%, 12/01/13 | | | 350 | | | 273 |
Consol Energy | | | | | | |
8.250%, 04/01/20 (A) | | | 2,090 | | | 2,134 |
8.000%, 04/01/17 (A) | | | 2,200 | | | 2,236 |
Continental Resources | | | | | | |
7.375%, 10/01/20 (A) | | | 2,500 | | | 2,438 |
Copano Energy LLC | | | | | | |
7.750%, 06/01/18 | | | 2,930 | | | 2,784 |
Crosstex Energy | | | | | | |
8.875%, 02/15/18 (A) | | | 2,175 | | | 2,142 |
Denbury Resources | | | | | | |
9.750%, 03/01/16 | | | 675 | | | 721 |
7.500%, 04/01/13 | | | 375 | | | 377 |
Drummond | | | | | | |
9.000%, 10/15/14 (A) | | | 1,220 | | | 1,214 |
Dynegy Holdings | | | | | | |
8.375%, 05/01/16 | | | 1,000 | | | 825 |
7.750%, 06/01/19 | | | 3,930 | | | 2,839 |
| | | | | | |
| Description | | Face Amount
($ Thousands) | | Market Value
($ Thousands) |
| | | | | | |
7.625%, 10/15/26 | | $ | 1,230 | | $ | 799 |
7.500%, 06/01/15 | | | 1,900 | | | 1,558 |
El Paso | | | | | | |
8.250%, 02/15/16 | | | 470 | | | 486 |
7.420%, 02/15/37 | | | 1,000 | | | 858 |
7.250%, 06/01/18 | | | 2,425 | | | 2,375 |
7.000%, 06/15/17 | | | 270 | | | 264 |
Forbes Energy Services LLC | | | | | | |
11.000%, 02/15/15 | | | 806 | | | 746 |
Forest Oil | | | | | | |
8.500%, 02/15/14 | | | 385 | | | 396 |
8.000%, 12/15/11 | | | 800 | | | 832 |
7.250%, 06/15/19 | | | 2,490 | | | 2,344 |
General Maritime | | | | | | |
12.000%, 11/15/17 (A) | | | 1,215 | | | 1,245 |
Global Geophysical Services | | | | | | |
10.500%, 05/01/17 (A) | | | 540 | | | 518 |
Helix Energy Solutions Group | | | | | | |
9.500%, 01/15/16 (A) | | | 3,290 | | | 3,224 |
Hercules Offshore | | | | | | |
10.500%, 10/15/17 (A) | | | 1,260 | | | 1,172 |
Hilcorp Energy I | | | | | | |
8.000%, 02/15/20 (A) | | | 1,280 | | | 1,242 |
Holly | | | | | | |
9.875%, 06/15/17 (A) | | | 3,135 | | | 3,166 |
International Coal Group | | | | | | |
9.125%, 04/01/18 | | | 1,165 | | | 1,165 |
Key Energy Services | | | | | | |
8.375%, 12/01/14 | | | 960 | | | 955 |
Linn Energy LLC | | | | | | |
11.750%, 05/15/17 (A) | | | 260 | | | 287 |
8.625%, 04/15/20 (A) | | | 3,900 | | | 3,861 |
MarkWest Energy Partners | | | | | | |
8.750%, 04/15/18 | | | 1,045 | | | 1,055 |
MarkWest Energy Partners, Ser B | | | | | | |
8.500%, 07/15/16 | | | 250 | | | 251 |
Murray Energy | | | | | | |
10.250%, 10/15/15 (A) | | | 1,150 | | | 1,144 |
Newfield Exploration | | | | | | |
7.125%, 05/15/18 | | | 5,635 | | | 5,565 |
6.875%, 02/01/20 | | | 2,075 | | | 2,002 |
NFR Energy LLC | | | | | | |
9.750%, 02/15/17 (A) | | | 1,900 | | | 1,777 |
OPTI Canada | | | | | | |
9.000%, 12/15/12 (A) | | | 275 | | | 276 |
8.250%, 12/15/14 | | | 3,445 | | | 2,945 |
7.875%, 12/15/14 | | | 1,605 | | | 1,364 |
Parker Drilling | | | | | | |
9.125%, 04/01/18 (A) | | | 3,010 | | | 2,860 |
Penn Virginia | | | | | | |
10.375%, 06/15/16 | | | 400 | | | 426 |
Petrohawk Energy | | | | | | |
10.500%, 08/01/14 | | | 2,185 | | | 2,311 |
| | |
| 98 | | SEI Institutional Investments Trust / Annual Report / May 31, 2010 |
| | | | | | |
| Description | | Face Amount
($ Thousands) | | Market Value
($ Thousands) |
| | | | | | |
9.125%, 07/15/13 | | $ | 1,335 | | $ | 1,368 |
7.875%, 06/01/15 | | | 1,895 | | | 1,836 |
Petroleum Development | | | | | | |
12.000%, 02/15/18 | | | 2,325 | | | 2,395 |
Pioneer Drilling | | | | | | |
9.875%, 03/15/18 (A) | | | 1,060 | | | 1,049 |
Plains Exploration & Production | | | | | | |
10.000%, 03/01/16 | | | 1,140 | | | 1,183 |
7.750%, 06/15/15 | | | 75 | | | 73 |
7.625%, 06/01/18 | | | 350 | | | 327 |
7.625%, 04/01/20 | | | 725 | | | 671 |
7.000%, 03/15/17 | | | 600 | | | 549 |
Quicksilver Resources | | | | | | |
11.750%, 01/01/16 | | | 2,200 | | | 2,398 |
9.125%, 08/15/19 | | | 180 | | | 180 |
7.125%, 04/01/16 | | | 2,970 | | | 2,680 |
Range Resources | | | | | | |
8.000%, 05/15/19 | | | 4,575 | | | 4,712 |
7.500%, 05/15/16 | | | 350 | | | 351 |
SandRidge Energy | | | | | | |
9.875%, 05/15/16 (A) | | | 1,595 | | | 1,571 |
8.750%, 01/15/20 (A) | | | 2,280 | | | 2,063 |
8.625%, 04/01/15 | | | 2,290 | | | 2,130 |
Southwestern Energy | | | | | | |
7.500%, 02/01/18 | | | 1,125 | | | 1,181 |
Targa Resources Partners | | | | | | |
11.250%, 07/15/17 (A) | | | 4,435 | | | 4,768 |
Tesoro | | | | | | |
9.750%, 06/01/19 | | | 2,800 | | | 2,863 |
Thermon Industries | | | | | | |
9.500%, 05/01/17 (A) | | | 1,790 | | | 1,772 |
| | | | | | |
| | | | | | 124,623 |
| | | | | | |
|
Financials — 12.7% |
Algoma Acquisition | | | | | | |
9.875%, 06/15/15 (A) | | | 1,400 | | | 1,302 |
ALH Finance LLC | | | | | | |
8.500%, 01/15/13 | | | 2,365 | | | 2,306 |
Alliant Holdings | | | | | | |
11.000%, 05/01/15 (A) | | | 3,350 | | | 3,337 |
Allied Capital | | | | | | |
6.625%, 07/15/11 | | | 1,525 | | | 1,530 |
6.000%, 04/01/12 | | | 1,345 | | | 1,347 |
Ally Financial | | | | | | |
8.000%, 11/01/31 | | | 3,883 | | | 3,534 |
8.000%, 12/31/18 | | | 1,250 | | | 1,175 |
6.875%, 08/28/12 | | | 2,925 | | | 2,888 |
6.750%, 12/01/14 | | | 2,506 | | | 2,387 |
6.625%, 05/15/12 | | | 354 | | | 349 |
American General Finance MTN | | | | | | |
5.375%, 10/01/12 | | | 100 | | | 90 |
4.875%, 07/15/12 | | | 360 | | | 324 |
American International Group | | | | | | |
8.175%, 05/15/58 (C) | | | 2,100 | | | 1,638 |
| | | | | | |
| Description | | Face Amount
($ Thousands) | | Market Value
($ Thousands) |
| | | | | | |
Bank of America | | | | | | |
8.000%, 12/29/49 (C) | | $ | 635 | | $ | 610 |
Capital One Capital V | | | | | | |
10.250%, 08/15/39 | | | 1,545 | | | 1,661 |
Cardtronics | | | | | | |
9.250%, 08/15/13 | | | 2,040 | | | 2,040 |
Cemex Finance LLC | | | | | | |
9.500%, 12/14/16 (A) | | | 6,720 | | | 6,132 |
CEVA Group | | | | | | |
11.625%, 10/01/16 (A) | | | 3,155 | | | 3,289 |
11.500%, 04/01/18 (A) | | | 2,500 | | | 2,575 |
Chukchansi Economic Development Authority | | | | | | |
4.123%, 11/15/12 (A) (C) | | | 2,185 | | | 1,486 |
CIT Group | | | | | | |
7.000%, 05/01/13 | | | 483 | | | 465 |
7.000%, 05/01/14 | | | 4,709 | | | 4,427 |
7.000%, 05/01/15 | | | 824 | | | 760 |
7.000%, 05/01/16 | | | 5,392 | | | 4,893 |
7.000%, 05/01/17 | | | 4,040 | | | 3,646 |
Citigroup Capital XXI | | | | | | |
8.300%, 12/21/57 (C) | | | 635 | | | 606 |
City National Bank | | | | | | |
9.000%, 08/12/19 | | | 4,062 | | | 4,062 |
City National Capital Trust I | | | | | | |
9.625%, 02/01/40 | | | 1,975 | | | 2,012 |
Credit Acceptance | | | | | | |
9.125%, 02/01/17 (A) | | | 2,600 | | | 2,626 |
Delphi Financial Group | | | | | | |
7.875%, 01/31/20 | | | 4,050 | | | 4,384 |
DuPont Fabros Technology | | | | | | |
8.500%, 12/15/17‡ (A) | | | 450 | | | 454 |
E*Trade Financial | | | | | | |
7.875%, 12/01/15 | | | 825 | | | 759 |
E*Trade Financial PIK | | | | | | |
12.500%, 11/30/17 | | | 2,010 | | | 2,231 |
Express LLC | | | | | | |
8.750%, 03/01/18 (A) | | | 790 | | | 796 |
Felcor Lodging | | | | | | |
10.000%, 10/01/14‡ | | | 1,320 | | | 1,320 |
FireKeepers Development Authority | | | | | | |
13.875%, 05/01/15 (A) | | | 3,420 | | | 3,916 |
Ford Motor Credit LLC | | | | | | |
12.000%, 05/15/15 | | | 1,070 | | | 1,247 |
8.700%, 10/01/14 | | | 3,235 | | | 3,327 |
8.000%, 06/01/14 | | | 2,000 | | | 2,022 |
8.000%, 12/15/16 | | | 2,100 | | | 2,104 |
7.000%, 10/01/13 | | | 8,445 | | | 8,518 |
7.000%, 04/15/15 | | | 2,965 | | | 2,935 |
Fresenius US Finance II | | | | | | |
9.000%, 07/15/15 (A) | | | 800 | | | 872 |
Genworth Financial | | | | | | |
6.500%, 06/15/34 | | | 1,045 | | | 916 |
| | |
| SEI Institutional Investments Trust / Annual Report / May 31, 2010 | | 99 |
SCHEDULE OF INVESTMENTS
High Yield Bond Fund (Continued)
May 31, 2010
| | | | | | |
| Description | | Face Amount
($ Thousands) | | Market Value
($ Thousands) |
| | | | | | |
6.150%, 11/15/66 (C) | | $ | 5,472 | | $ | 3,803 |
HBOS Capital Funding | | | | | | |
6.071%, 06/30/49 (A) (C) | | | 4,200 | | | 3,003 |
Hellas II | | | | | | |
6.881%, 01/15/15 (A) (B) (C) | | | 2,100 | | | 63 |
Host Hotels & Resorts | | | | | | |
9.000%, 05/15/17‡ | | | 470 | | | 498 |
Host Hotels & Resorts L.P. | | | | | | |
6.875%, 11/01/14‡ | | | 545 | | | 541 |
Host Marriott LP, Ser Q | | | | | | |
6.750%, 06/01/16‡ | | | 1,600 | | | 1,568 |
HUB International Holdings | | | | | | |
10.250%, 06/15/15 (A) | | | 410 | | | 375 |
9.000%, 12/15/14 (A) | | | 2,270 | | | 2,134 |
Icahn Enterprises | | | | | | |
8.000%, 01/15/18 (A) | | | 3,400 | | | 3,196 |
7.750%, 01/15/16 (A) | | | 4,800 | | | 4,512 |
ILFC E-Capital Trust II | | | | | | |
6.250%, 12/21/65 (A) (C) | | | 1,770 | | | 1,080 |
International Lease Finance | | | | | | |
8.750%, 03/15/17 (A) | | | 4,955 | | | 4,534 |
8.625%, 09/15/15 (A) | | | 4,430 | | | 4,076 |
6.375%, 03/25/13 | | | 2,630 | | | 2,393 |
5.650%, 06/01/14 | | | 790 | | | 679 |
Ironshore Holdings US | | | | | | |
8.500%, 05/15/20 (A) | | | 5,000 | | | 4,975 |
LBG Capital No.1 | | | | | | |
7.875%, 11/01/20 | | | 1,005 | | | 789 |
Lehman Brothers Holdings MTN | | | | | | |
6.875%, 05/02/18 (B) | | | 3,500 | | | 752 |
5.625%, 01/24/13 (B) | | | 1,000 | | | 217 |
Liberty Mutual Group | | | | | | |
7.000%, 03/15/37 (A) (C) | | | 1,530 | | | 1,188 |
Lincoln National | | | | | | |
6.050%, 04/20/67 (C) | | | 370 | | | 285 |
Lloyds Banking Group | | | | | | |
6.267%, 11/14/16 (A) | | | 310 | | | 164 |
5.920%, 09/29/49 (A) (C) | | | 470 | | | 249 |
Marlin Water Trust II | | | | | | |
6.310%, 07/15/03 (A) (B) | | | 4,000 | | | — |
MBIA | | | | | | |
5.700%, 12/01/34 | | | 2,390 | | | 1,283 |
MetLife Capital Trust X | | | | | | |
9.250%, 04/08/38 (A) (C) | | | 3,135 | | | 3,417 |
National Life Insurance | | | | | | |
10.500%, 09/15/39 (A) | | | 1,100 | | | 1,239 |
Nuveen Investments | | | | | | |
10.500%, 11/15/15 | | | 11,010 | | | 9,909 |
5.500%, 09/15/15 | | | 765 | | | 581 |
Ohio Casualty | | | | | | |
7.300%, 06/15/14 | | | 1,050 | | | 1,136 |
Omega Healthcare Investors | | | | | | |
7.500%, 02/15/20‡ (A) | | | 3,505 | | | 3,470 |
| | | | | | |
| Description | | Face Amount
($ Thousands) | | Market Value
($ Thousands) |
| | | | | | |
Penson Worldwide | | | | | | |
12.500%, 05/15/17 (A) | | $ | 1,270 | | $ | 1,259 |
Pinnacle Foods Finance LLC | | | | | | |
10.625%, 04/01/17 | | | 1,675 | | | 1,721 |
9.250%, 04/01/15 | | | 170 | | | 170 |
9.250%, 04/01/15 (A) | | | 1,745 | | | 1,741 |
PNC Preferred Funding Trust II | | | | | | |
6.113%, 03/29/49 (A) (C) | | | 2,640 | | | 1,901 |
Protective Life | | | | | | |
8.450%, 10/15/39 | | | 3,140 | | | 3,272 |
Rabobank Nederland | | | | | | |
11.000%, 12/31/49 (A) (C) | | | 1,465 | | | 1,777 |
Realogy | | | | | | |
12.375%, 04/15/15 | | | 950 | | | 712 |
10.500%, 04/15/14 | | | 1,660 | | | 1,411 |
Regions Financing Trust II | | | | | | |
6.625%, 05/15/47 (C) | | | 470 | | | 341 |
Reynolds Group Issuer | | | | | | |
8.500%, 05/15/18 (A) | | | 2,345 | | | 2,228 |
7.750%, 10/15/16 (A) | | | 6,650 | | | 6,583 |
Snoqualmie Entertainment Authority | | | | | | |
9.125%, 02/01/15 (A) | | | 3,070 | | | 2,579 |
4.136%, 02/01/14 (A) (C) | | | 445 | | | 356 |
SSI Investments II | | | | | | |
11.125%, 06/01/18 (A) | | | 780 | | | 768 |
Susquehanna Capital II | | | | | | |
11.000%, 03/23/40 | | | 1,300 | | | 1,362 |
Susser Holdings LLC | | | | | | |
8.500%, 05/15/16 (A) | | | 4,015 | | | 3,965 |
Symetra Financial | | | | | | |
6.125%, 04/01/16 (A) | | | 565 | | | 559 |
UCI Holdco | | | | | | |
8.257%, 12/15/13 (C) | | | 1,255 | | | 1,193 |
Unitrin | | | | | | |
6.000%, 05/15/17 | | | 1,140 | | | 1,117 |
Universal City Development Partners | | | | | | |
10.875%, 11/15/16 (A) | | | 2,470 | | | 2,495 |
8.875%, 11/15/15 (A) | | | 1,515 | | | 1,500 |
USI Holdings | | | | | | |
9.750%, 05/15/15 (A) | | | 3,687 | | | 3,355 |
Ventas Realty LP | | | | | | |
7.125%, 06/01/15‡ | | | 1,026 | | | 1,065 |
6.750%, 04/01/17‡ | | | 775 | | | 777 |
XL Capital | | | | | | |
6.500%, 12/31/49 (C) | | | 750 | | | 525 |
Yankee Acquisition, Ser B | | | | | | |
8.500%, 02/15/15 | | | 1,705 | | | 1,709 |
Zions Bancorporation | | | | | | |
5.650%, 05/15/14 | | | 160 | | | 150 |
| | | | | | |
| | | | | | 207,998 |
| | | | | | |
|
Health Care — 3.9% |
Biomet | | | | | | |
10.375%, 10/15/17 | | | 6,935 | | | 7,377 |
| | |
| 100 | | SEI Institutional Investments Trust / Annual Report / May 31, 2010 |
| | | | | | |
| Description | | Face Amount
($ Thousands) | | Market Value
($ Thousands) |
| | | | | | |
10.000%, 10/15/17 | | $ | 4,220 | | $ | 4,463 |
BioScrip | | | | | | |
10.250%, 10/01/15 (A) | | | 4,780 | | | 4,660 |
Community Health Systems | | | | | | |
8.875%, 07/15/15 | | | 2,075 | | | 2,124 |
Cooper | | | | | | |
7.125%, 02/15/15 | | | 1,185 | | | 1,179 |
Health Management Associates | | | | | | |
6.125%, 04/15/16 | | | 2,140 | | | 2,009 |
Healthsouth | | | | | | |
8.125%, 02/15/20 | | | 3,210 | | | 3,114 |
Inverness Medical Innovations | | | | | | |
9.000%, 05/15/16 | | | 5,650 | | | 5,565 |
Mylan | | | | | | |
7.875%, 07/15/20 (A) | | | 1,495 | | | 1,497 |
7.625%, 07/15/17 (A) | | | 5,815 | | | 5,859 |
Omnicare | | | | | | |
7.750%, 06/01/20 | | | 6,340 | | | 6,356 |
Phibro Animal Health | | | | | | |
13.000%, 08/01/14 (A) | | | 1,000 | | | 1,015 |
Psychiatric Solutions | | | | | | |
7.750%, 07/15/15 | | | 1,000 | | | 1,025 |
ReAble Therapeutics Finance LLC | | | | | | |
11.750%, 11/15/14 | | | 3,127 | | | 3,197 |
Select Medical | | | | | | |
7.625%, 02/01/15 | | | 4,970 | | | 4,672 |
Surgical Care Affiliates | | | | | | |
8.875%, 07/15/15 (A) | | | 1,736 | | | 1,701 |
Talecris Biotherapeutics Holdings | | | | | | |
7.750%, 11/15/16 (A) | | | 1,990 | | | 1,940 |
Tenet Healthcare | | | | | | |
10.000%, 05/01/18 (A) | | | 45 | | | 49 |
9.250%, 02/01/15 | | | 1,990 | | | 2,045 |
8.875%, 07/01/19 (A) | | | 495 | | | 519 |
United Surgical Partners International | | | | | | |
8.875%, 05/01/17 | | | 105 | | | 105 |
United Surgical Partners International PIK | | | | | | |
9.250%, 05/01/17 | | | 3,190 | | | 3,166 |
| | | | | | |
| | | | | | 63,637 |
| | | | | | |
|
Industrials — 7.0% |
ACCO Brands | | | | | | |
10.625%, 03/15/15 | | | 3,605 | | | 3,902 |
7.625%, 08/15/15 | | | 905 | | | 842 |
Actuant | | | | | | |
6.875%, 06/15/17 | | | 2,575 | | | 2,433 |
Aleris International PIK | | | | | | |
9.000%, 12/15/14 (B) | | | 950 | | | 5 |
Aleris International | | | | | | |
10.000%, 12/15/16 (B) | | | 1,675 | | | 11 |
Alliant Techsystems | | | | | | |
6.750%, 04/01/16 | | | 3,300 | | | 3,250 |
| | | | | | |
| Description | | Face Amount
($ Thousands) | | Market Value
($ Thousands) |
| | | | | | |
Allison Transmission | | | | | | |
11.000%, 11/01/15 (A) | | $ | 1,558 | | $ | 1,628 |
American Axle & Manufacturing | | | | | | |
7.875%, 03/01/17 | | | 1,705 | | | 1,509 |
Ames True Temper | | | | | | |
10.000%, 07/15/12 | | | 1,115 | | | 1,076 |
4.303%, 01/15/12 (C) | | | 1,730 | | | 1,631 |
Amsted Industries | | | | | | |
8.125%, 03/15/18 (A) | | | 3,730 | | | 3,693 |
ArvinMeritor | | | | | | |
10.625%, 03/15/18 | | | 610 | | | 625 |
Associated Materials | | | | | | |
11.250%, 03/01/14 (D) | | | 910 | | | 905 |
Associated Materials LLC | | | | | | |
9.875%, 11/15/16 | | | 630 | | | 677 |
Atrium | | | | | | |
15.000%, 12/15/12 (A) (B) (E) | | | 1,593 | | | 24 |
Baker & Taylor | | | | | | |
11.500%, 07/01/13 (A) | | | 925 | | | 686 |
Baldor Electric | | | | | | |
8.625%, 02/15/17 | | | 990 | | | 1,007 |
BE Aerospace | | | | | | |
8.500%, 07/01/18 | | | 650 | | | 673 |
Belden | | | | | | |
9.250%, 06/15/19 (A) | | | 655 | | | 685 |
Berry Plastics | | | | | | |
10.250%, 03/01/16 | | | 2,400 | | | 2,136 |
9.500%, 05/15/18 (A) | | | 3,076 | | | 2,753 |
Buffalo Thunder Development Authority | | | | | | |
9.375%, 12/15/14 (A) (B) | | | 2,050 | | | 369 |
Case New Holland | | | | | | |
7.750%, 09/01/13 (A) | | | 1,210 | | | 1,231 |
Casella Waste Systems | | | | | | |
11.000%, 07/15/14 (A) | | | 30 | | | 32 |
9.750%, 02/01/13 | | | 1,335 | | | 1,308 |
Cemex Espana Luxembourg | | | | | | |
9.250%, 05/12/20 (A) | | | 808 | | | 691 |
Chart Industries | | | | | | |
9.125%, 10/15/15 | | | 2,000 | | | 1,995 |
Clean Harbors | | | | | | |
7.625%, 08/15/16 | | | 575 | | | 589 |
Coleman Cable | | | | | | |
9.000%, 02/15/18 (A) | | | 3,845 | | | 3,759 |
Corrections Corp of America | | | | | | |
7.750%, 06/01/17 | | | 1,650 | | | 1,704 |
CPM Holdings | | | | | | |
10.625%, 09/01/14 (A) | | | 735 | | | 784 |
Crown Americas LLC | | | | | | |
7.625%, 05/15/17 (A) | | | 590 | | | 593 |
DAE Aviation Holdings | | | | | | |
11.250%, 08/01/15 (A) | | | 1,070 | | | 1,073 |
Delta Air Lines | | | | | | |
12.250%, 03/15/15 (A) | | | 4,355 | | | 4,518 |
| | |
| SEI Institutional Investments Trust / Annual Report / May 31, 2010 | | 101 |
SCHEDULE OF INVESTMENTS
High Yield Bond Fund (Continued)
May 31, 2010
| | | | | | |
| Description | | Face Amount
($ Thousands) | | Market Value
($ Thousands) |
| | | | | | |
Douglas Dynamics LLC | | | | | | |
7.750%, 01/15/12 (A) | | $ | 2,584 | | $ | 2,634 |
ESCO | | | | | | |
4.132%, 12/15/13 (A) (C) | | | 400 | | | 369 |
ESCO | | | | | | |
8.625%, 12/15/13 (A) | | | 105 | | | 107 |
General Cable | | | | | | |
7.125%, 04/01/17 | | | 1,120 | | | 1,100 |
Geo Group | | | | | | |
7.750%, 10/15/17 (A) | | | 585 | | | 583 |
Global Aviation Holdings | | | | | | |
14.000%, 08/15/13 (A) | | | 2,850 | | | 2,879 |
Goodman Global Group | | | | | | |
12.795%, 12/15/14 (A) | | | 4,800 | | | 2,856 |
Graham Packaging | | | | | | |
8.250%, 01/01/17 (A) | | | 65 | | | 63 |
Graphic Packaging International | | | | | | |
9.500%, 06/15/17 | | | 1,245 | | | 1,295 |
Harland Clarke Holdings | | | | | | |
9.500%, 05/15/15 | | | 3,950 | | | 3,525 |
6.000%, 05/15/15 (C) | | | 545 | | | 435 |
Interface | | | | | | |
11.375%, 11/01/13 | | | 475 | | | 531 |
9.500%, 02/01/14 | | | 146 | | | 149 |
Interline Brands | | | | | | |
8.125%, 06/15/14 | | | 810 | | | 818 |
International Wire Group | | | | | | |
9.750%, 04/15/15 (A) | | | 1,105 | | | 1,095 |
Iron Mountain | | | | | | |
8.750%, 07/15/18 | | | 1,265 | | | 1,297 |
8.375%, 08/15/21 | | | 1,115 | | | 1,132 |
Kansas City Southern de Mexico | | | | | | |
12.500%, 04/01/16 | | | 345 | | | 398 |
8.000%, 02/01/18 (A) | | | 1,530 | | | 1,528 |
KAR Holdings | | | | | | |
10.000%, 05/01/15 | | | 28 | | | 28 |
Koppers | | | | | | |
7.875%, 12/01/19 (A) | | | 1,245 | | | 1,251 |
Kratos Defense & Security Solutions | | | | | | |
10.000%, 06/01/17 (A) | | | 2,250 | | | 2,227 |
L-3 Communications, Ser B | | | | | | |
6.375%, 10/15/15 | | | 315 | | | 315 |
Manitowoc | | | | | | |
9.500%, 02/15/18 | | | 1,610 | | | 1,582 |
Masco | | | | | | |
7.125%, 03/15/20 | | | 825 | | | 799 |
Millar Western Forest | | | | | | |
7.750%, 11/15/13 | | | 650 | | | 572 |
NXP BV | | | | | | |
10.000%, 07/15/13 (A) | | | 598 | | | 635 |
Oshkosh | | | | | | |
8.500%, 03/01/20 | | | 1,200 | | | 1,242 |
8.250%, 03/01/17 | | | 1,380 | | | 1,422 |
| | | | | | |
| Description | | Face Amount
($ Thousands) | | Market Value
($ Thousands) |
| | | | | | |
Plastipak Holdings | | | | | | |
10.625%, 08/15/19 (A) | | $ | 665 | | $ | 725 |
Ply Gem Industries | | | | | | |
13.125%, 07/15/14 (A) | | | 1,290 | | | 1,303 |
Pregis | | | | | | |
12.375%, 10/15/13 | | | 2,436 | | | 2,399 |
Quality Distribution LLC | | | | | | |
11.750%, 11/01/13 | | | 812 | | | 763 |
Quebecore | | | | | | |
0.000%, 11/15/13 (B) (F) | | | 1,800 | | | — |
0.000%, 03/15/16 (F) (I) | | | 2,175 | | | 141 |
Radnet Management | | | | | | |
10.375%, 04/01/18 (A) | | | 1,205 | | | 1,102 |
RailAmerica | | | | | | |
9.250%, 07/01/17 | | | 1,085 | | | 1,129 |
RBS Global | | | | | | |
8.500%, 05/01/18 (A) | | | 4,090 | | | 3,885 |
RBS Global & Rexnord | | | | | | |
11.750%, 08/01/16 | | | 1,395 | | | 1,458 |
Sequa | | | | | | |
11.750%, 12/01/15 (A) | | | 1,925 | | | 1,925 |
Solo Cup | | | | | | |
10.500%, 11/01/13 | | | 990 | | | 1,007 |
Spirit Aerosystems | | | | | | |
7.500%, 10/01/17 | | | 800 | | | 788 |
SPX | | | | | | |
7.625%, 12/15/14 | | | 1,330 | | | 1,353 |
Syncreon Global Ireland | | | | | | |
9.500%, 05/01/18 (A) | | | 2,187 | | | 2,100 |
Terex | | | | | | |
10.875%, 06/01/16 | | | 1,000 | | | 1,075 |
8.000%, 11/15/17 | | | 5,690 | | | 5,278 |
Thermadyne Holdings | | | | | | |
9.500%, 02/01/14 | | | 1,040 | | | 1,067 |
Trimas | | | | | | |
9.750%, 12/15/17 (A) | | | 620 | | | 629 |
Triumph Group | | | | | | |
8.000%, 11/15/17 | | | 135 | | | 130 |
United Air Lines | | | | | | |
9.125%, 01/15/12 (B) (F) | | | 625 | | | — |
United Air Lines, Ser A | | | | | | |
10.670%, 05/01/04 (B) (F) | | | 325 | | | — |
USG | | | | | | |
9.750%, 08/01/14 (A) | | | 265 | | | 278 |
Vought Aircraft Industries | | | | | | |
8.000%, 07/15/11 | | | 2,900 | | | 2,893 |
Wyle Services | | | | | | |
10.500%, 04/01/18 (A) | | | 1,800 | | | 1,764 |
| | | | | | |
| | | | | | 114,856 |
| | | | | | |
|
Information Technology — 5.0% |
Activant Solutions | | | | | | |
9.500%, 05/01/16 | | | 1,975 | | | 1,876 |
| | |
| 102 | | SEI Institutional Investments Trust / Annual Report / May 31, 2010 |
| | | | | | |
| Description | | Face Amount
($ Thousands) | | Market Value
($��Thousands) |
| | | | | | |
Amkor Technology | | | | | | |
9.250%, 06/01/16 | | $ | 3,015 | | $ | 3,162 |
7.750%, 05/15/13 | | | 1,335 | | | 1,348 |
7.375%, 05/01/18 (A) | | | 2,345 | | | 2,263 |
Aspect Software | | | | | | |
10.625%, 05/15/17 (A) | | | 2,715 | | | 2,691 |
Brocade Communications Systems | | | | | | |
6.875%, 01/15/20 (A) | | | 480 | | | 473 |
6.625%, 01/15/18 (A) | | | 480 | | | 473 |
Compucom Systems | | | | | | |
12.500%, 10/01/15 (A) | | | 3,515 | | | 3,730 |
Equinix | | | | | | |
8.125%, 03/01/18 | | | 3,150 | | | 3,197 |
First Data | | | | | | |
9.875%, 09/24/15 | | | 9,463 | | | 7,712 |
1.755%, 09/24/15 | | | 1,958 | | | 1,513 |
Freescale Semiconductor | | | | | | |
10.125%, 03/15/18 (A) | | | 200 | | | 207 |
10.125%, 12/15/16 | | | 2,455 | | | 1,976 |
9.250%, 04/15/18 (A) | | | 7,845 | | | 7,786 |
JDA Software Group | | | | | | |
8.000%, 12/15/14 (A) | | | 1,010 | | | 1,023 |
MagnaChip Semiconductor | | | | | | |
10.500%, 04/15/18 (A) | | | 4,755 | | | 4,880 |
NXP Funding LLC | | | | | | |
9.500%, 10/15/15 | | | 1,500 | | | 1,292 |
7.875%, 10/15/14 | | | 4,095 | | | 3,778 |
Open Solutions | | | | | | |
9.750%, 02/01/15 (A) | | | 5,090 | | | 3,970 |
Sanmina-SCI | | | | | | |
8.125%, 03/01/16 | | | 960 | | | 915 |
Sensata Technologies | | | | | | |
8.000%, 05/01/14 | | | 206 | | | 211 |
Smart Modular | | | | | | |
5.791%, 04/01/12 (C) | | | 760 | | | 737 |
Stratus Technologies | | | | | | |
12.000%, 03/29/15 (A) | | | 2,575 | | | 2,372 |
Sungard Data Systems | | | | | | |
10.250%, 08/15/15 | | | 5,745 | | | 5,810 |
9.125%, 08/15/13 | | | 3,465 | | | 3,500 |
Terremark Worldwide | | | | | | |
12.000%, 06/15/17 (A) | | | 3,090 | | | 3,507 |
Unisys | | | | | | |
14.250%, 09/15/15 (A) | | | 1,660 | | | 1,942 |
12.750%, 10/15/14 (A) | | | 6,695 | | | 7,666 |
Viasat | | | | | | |
8.875%, 09/15/16 | | | 665 | | | 671 |
| | | | | | |
| | | | | | 80,681 |
| | | | | | |
|
Materials — 7.2% |
AK Steel | | | | | | |
7.625%, 05/15/20 | | | 1,992 | | | 1,967 |
Appleton Papers | | | | | | |
10.500%, 06/15/15 (A) | | | 1,040 | | | 946 |
| | | | | | |
| Description | | Face Amount
($ Thousands) | | Market Value
($ Thousands) |
| | | | | | |
Arch Western Finance LLC | | | | | | |
6.750%, 07/01/13 | | $ | 1,050 | | $ | 1,037 |
Ashland | | | | | | |
9.125%, 06/01/17 (A) | | | 3,005 | | | 3,291 |
Boise Paper Holdings LLC | | | | | | |
9.000%, 11/01/17 (A) | | | 2,670 | | | 2,820 |
Cascades | | | | | | |
7.875%, 01/15/20 (A) | | | 1,440 | | | 1,426 |
Century Aluminum | | | | | | |
8.000%, 05/15/14 | | | 1,071 | | | 1,034 |
CF Industries | | | | | | |
7.125%, 05/01/20 | | | 1,884 | | | 1,900 |
6.875%, 05/01/18 | | | 4,225 | | | 4,230 |
Clearwater Paper | | | | | | |
10.625%, 06/15/16 (A) | | | 855 | | | 938 |
CPG International I | | | | �� | | |
10.500%, 07/01/13 | | | 2,100 | | | 2,121 |
Crown Americas | | | | | | |
7.750%, 11/15/15 | | | 695 | | | 707 |
Domtar | | | | | | |
10.750%, 06/01/17 | | | 3,500 | | | 4,095 |
9.500%, 08/01/16 | | | 250 | | | 284 |
Essar Steel Algoma | | | | | | |
9.375%, 03/15/15 (A) | | | 125 | | | 128 |
FMG Finance | | | | | | |
10.625%, 09/01/16 (A) | | | 4,070 | | | 4,477 |
Georgia-Pacific | | | | | | |
8.000%, 01/15/24 | | | 3,070 | | | 3,200 |
7.125%, 01/15/17 (A) | | | 5,480 | | | 5,453 |
7.000%, 01/15/15 (A) | | | 2,010 | | | 2,010 |
Georgia-Pacific LLC | | | | | | |
8.250%, 05/01/16 (A) | | | 2,220 | | | 2,309 |
Glatfelter | | | | | | |
7.125%, 05/01/16 (A) | | | 175 | | | 166 |
Graham Packaging | | | | | | |
9.875%, 10/15/14 | | | 3,535 | | | 3,561 |
Headwaters | | | | | | |
11.375%, 11/01/14 | | | 1,335 | | | 1,345 |
Hexion Finance Escrow LLC | | | | | | |
8.875%, 02/01/18 (A) | | | 1,895 | | | 1,753 |
Hexion US Fin/Nova Scotia | | | | | | |
9.750%, 11/15/14 | | | 3,384 | | | 3,232 |
4.750%, 11/15/14 (C) | | | 750 | | | 637 |
Huntsman International LLC | | | | | | |
8.625%, 03/15/20 (A) | | | 1,965 | | | 1,852 |
7.875%, 11/15/14 | | | 2,140 | | | 2,044 |
7.375%, 01/01/15 | | | 505 | | | 477 |
5.500%, 06/30/16 (A) | | | 755 | | | 657 |
Ineos Finance | | | | | | |
9.000%, 05/15/15 (A) | | | 3,140 | | | 3,124 |
Innophos | | | | | | |
8.875%, 08/15/14 | | | 2,745 | | | 2,814 |
Intertape Polymer | | | | | | |
8.500%, 08/01/14 | | | 835 | | | 680 |
| | |
| SEI Institutional Investments Trust / Annual Report / May 31, 2010 | | 103 |
SCHEDULE OF INVESTMENTS
High Yield Bond Fund (Continued)
May 31, 2010
| | | | | | |
| Description | | Face Amount
($ Thousands) | | Market Value
($ Thousands) |
| | | | | | |
LBI Escrow | | | | | | |
8.000%, 11/01/17 (A) | | $ | 6,105 | | $ | 6,212 |
Lyondell Chemical | | | | | | |
11.000%, 05/01/18 | | | 3,607 | | | 3,824 |
MacDermid | | | | | | |
9.500%, 04/15/17 (A) | | | 2,325 | | | 2,331 |
Neenah Foundry | | | | | | |
9.500%, 01/01/17 (B) | | | 500 | | | 246 |
NewPage | | | | | | |
11.375%, 12/31/14 | | | 4,740 | | | 4,432 |
Noranda Aluminium Acquisition | | | | | | |
5.370%, 05/15/15 (C) | | | 2,976 | | | 2,418 |
Novelis | | | | | | |
11.500%, 02/15/15 | | | 675 | | | 732 |
7.250%, 02/15/15 (D) | | | 2,570 | | | 2,409 |
P.H. Glatfelter | | | | | | |
7.125%, 05/01/16 | | | 1,115 | | | 1,059 |
Packaging Dynamics Finance | | | | | | |
10.000%, 05/01/16 (A) | | | 1,165 | | | 998 |
PE Paper Escrow GmbH | | | | | | |
12.000%, 08/01/14 (A) | | | 590 | | | 646 |
PolyOne | | | | | | |
8.875%, 05/01/12 | | | 1,325 | | | 1,388 |
Reichhold Industries | | | | | | |
9.000%, 08/15/14 (A) | | | 2,716 | | | 2,472 |
Ryerson | | | | | | |
12.000%, 11/01/15 | | | 1,725 | | | 1,764 |
Scotts Miracle-Gro | | | | | | |
7.250%, 01/15/18 | | | 385 | | | 383 |
Sealed Air | | | | | | |
7.875%, 06/15/17 (A) | | | 1,320 | | | 1,395 |
Solo Cup | | | | | | |
8.500%, 02/15/14 | | | 905 | | | 835 |
Solutia | | | | | | |
8.750%, 11/01/17 | | | 2,095 | | | 2,147 |
7.875%, 03/15/20 | | | 1,000 | | | 995 |
Standard Steel LLC | | | | | | |
12.000%, 05/01/15 (A) | | | 3,270 | | | 3,290 |
Steel Dynamics | | | | | | |
7.750%, 04/15/16 | | | 1,500 | | | 1,493 |
7.625%, 03/15/20 (A) | | | 905 | | | 896 |
Teck Resources | | | | | | |
10.750%, 05/15/19 | | | 760 | | | 916 |
10.250%, 05/15/16 | | | 70 | | | 82 |
Verso Paper Holdings LLC | | | | | | |
11.500%, 07/01/14 (A) | | | 1,460 | | | 1,559 |
9.125%, 08/01/14 | | | 3,200 | | | 3,024 |
Verso Paper Holdings LLC, Ser B | | | | | | |
11.375%, 08/01/16 | | | 1,080 | | | 937 |
Viskase | | | | | | |
9.875%, 01/15/18 (A) | | | 1,300 | | | 1,313 |
| | | | | | |
| Description | | Face Amount
($ Thousands) | | Market Value
($ Thousands) |
| | | | | | |
Vitro | | | | | | |
9.125%, 02/01/17 (B) | | $ | 2,305 | | $ | 1,026 |
| | | | | | |
| | | | | | 117,937 |
| | | | | | |
| |
Telecommunication Services — 12.5% | | | |
Aeroflex | | | | | | |
11.750%, 02/15/15 | | | 1,650 | | | 1,753 |
Affinion Group | | | | | | |
11.500%, 10/15/15 | | | 1,640 | | | 1,693 |
10.125%, 10/15/13 | | | 4,025 | | | 4,095 |
Avaya | | | | | | |
10.125%, 11/01/15 | | | 786 | | | 770 |
9.750%, 11/01/15 | | | 860 | | | 830 |
CCH II LLC | | | | | | |
13.500%, 11/30/16 | | | 4,005 | | | 4,591 |
CCO Holdings LLC | | | | | | |
8.125%, 04/30/20 (A) | | | 1,941 | | | 1,922 |
7.875%, 04/30/18 (A) | | | 2,135 | | | 2,095 |
Cengage Learning Acquisitions | | | | | | |
10.500%, 01/15/15 (A) | | | 1,420 | | | 1,289 |
Cequel Communications Holdings I LLC and Cequel Capital | | | | | | |
8.625%, 11/15/17 (A) | | | 5,520 | | | 5,327 |
Clear Channel Communications | | | | | | |
10.750%, 08/01/16 | | | 1,185 | | | 877 |
Clear Channel Worldwide Holdings | | | | | | |
9.250%, 12/15/17 (A) | | | 2,650 | | | 2,694 |
Clearwire Communications LLC | | | | | | |
12.000%, 12/01/15 (A) | | | 7,840 | | | 7,629 |
Cleveland Unlimited | | | | | | |
13.500%, 12/15/10 (A) (C) | | | 4,260 | | | 4,090 |
Columbus International | | | | | | |
11.500%, 11/20/14 (A) | | | 1,465 | | | 1,553 |
Cricket Communications | | | | | | |
10.000%, 07/15/15 | | | 2,000 | | | 2,050 |
Cricket Communications I | | | | | | |
9.375%, 11/01/14 | | | 3,002 | | | 3,024 |
Crown Castle International | | | | | | |
9.000%, 01/15/15 | | | 2,815 | | | 2,959 |
CSC Holdings | | | | | | |
8.625%, 02/15/19 (A) | | | 2,650 | | | 2,763 |
Digicel Group | | | | | | |
12.000%, 04/01/14 (A) | | | 600 | | | 666 |
10.500%, 04/15/18 (A) | | | 1,340 | | | 1,357 |
9.125%, 01/15/15 (A) | | | 300 | | | 292 |
8.875%, 01/15/15 (A) | | | 900 | | | 871 |
8.250%, 09/01/17 (A) | | | 1,520 | | | 1,490 |
DISH DBS | | | | | | |
7.875%, 09/01/19 | | | 1,200 | | | 1,212 |
7.750%, 05/31/15 | | | 4,740 | | | 4,764 |
| | |
| 104 | | SEI Institutional Investments Trust / Annual Report / May 31, 2010 |
| | | | | | |
| Description | | Face Amount
($ Thousands) | | Market Value
($ Thousands) |
| | | | | | |
Frontier Communications | | | | | | |
6.625%, 03/15/15 | | $ | 1,100 | | $ | 1,044 |
GCI | | | | | | |
8.625%, 11/15/19 (A) | | | 2,605 | | | 2,527 |
Global Crossing | | | | | | |
12.000%, 09/15/15 (A) | | | 1,615 | | | 1,760 |
GXS Worldwide | | | | | | |
9.750%, 06/15/15 (A) | | | 11,655 | | | 10,926 |
Inmarsat Finance | | | | | | |
7.375%, 12/01/17 (A) | | | 2,450 | | | 2,444 |
Integra Telecom Holdings | | | | | | |
10.750%, 04/15/16 (A) | | | 1,000 | | | 965 |
Intelsat | | | | | | |
9.250%, 06/15/16 | | | 275 | | | 282 |
Intelsat Bermuda | | | | | | |
11.250%, 06/15/16 | | | 3,300 | | | 3,481 |
Intelsat Jackson Holdings | | | | | | |
9.500%, 06/15/16 | | | 1,300 | | | 1,339 |
8.500%, 11/01/19 (A) | | | 1,830 | | | 1,821 |
Intelsat Luxembourg | | | | | | |
11.500%, 02/04/17 | | | 4,453 | | | 4,375 |
11.250%, 02/04/17 | | | 3,780 | | | 3,723 |
Intelsat Subsidiary Holding | | | | | | |
8.875%, 01/15/15 (A) | | | 2,250 | | | 2,261 |
8.875%, 01/15/15 | | | 2,025 | | | 2,045 |
iPCS PIK | | | | | | |
3.594%, 05/01/14 (C) | | | 2,800 | | | 2,520 |
ITC Deltacom | | | | | | |
10.500%, 04/01/16 (A) | | | 750 | | | 720 |
Lamar Media | | | | | | |
7.875%, 04/15/18 (A) | | | 2,470 | | | 2,433 |
Level 3 Financing | | | | | | |
10.000%, 02/01/18 (A) | | | 3,305 | | | 2,908 |
4.140%, 02/15/15 (C) | | | 100 | | | 77 |
Liberty Media LLC | | | | | | |
8.250%, 02/01/30 | | | 2,240 | | | 2,072 |
MetroPCS Wireless | | | | | | |
9.250%, 11/01/14 | | | 375 | | | 382 |
9.250%, 11/01/14 | | | 3,390 | | | 3,492 |
Nexstar Broadcasting | | | | | | |
8.875%, 04/15/17 (A) | | | 1,840 | | | 1,822 |
Nextel Communications | | | | | | |
6.875%, 10/31/13 | | | 1,991 | | | 1,906 |
Nielsen Finance LLC | | | | | | |
11.500%, 05/01/16 | | | 275 | | | 291 |
10.000%, 08/01/14 | | | 940 | | | 955 |
1.606%, 08/01/11 (D) | | | 4,325 | | | 4,001 |
NII Capital | | | | | | |
10.000%, 08/15/16 | | | 3,150 | | | 3,370 |
Nordic Telephone Holdings | | | | | | |
8.875%, 05/01/16 (A) | | | 1,795 | | | 1,840 |
Orascom Telecom Finance | | | | | | |
7.875%, 02/08/14 (A) | | | 1,000 | | | 900 |
| | | | | | |
| Description | | Face Amount
($ Thousands) | | Market Value
($ Thousands) |
| | | | | | |
PAETEC Holding | | | | | | |
9.500%, 07/15/15 | | $ | 2,691 | | $ | 2,617 |
8.875%, 06/30/17 | | | 1,960 | | | 1,935 |
Primus Telecommunications Holding | | | | | | |
13.000%, 12/15/16 (A) | | | 705 | | | 705 |
Quebecor Media | | | | | | |
7.750%, 03/15/16 | | | 4,360 | | | 4,196 |
Qwest | | | | | | |
7.500%, 06/15/23 | | | 710 | | | 689 |
7.250%, 09/15/25 | | | 375 | | | 367 |
7.250%, 10/15/35 | | | 1,200 | | | 1,116 |
6.875%, 09/15/33 | | | 275 | | | 252 |
Qwest Communications International | | | | | | |
7.500%, 02/15/14 | | | 295 | | | 291 |
7.125%, 04/01/18 (A) | | | 810 | | | 790 |
Qwest Communications International, Ser B | | | | | | |
7.500%, 02/15/14 | | | 1,970 | | | 1,940 |
Sable International Finance | | | | | | |
7.750%, 02/15/17 (A) | | | 1,180 | | | 1,204 |
SBA Telecommunications | | | | | | |
8.250%, 08/15/19 (A) | | | 435 | | | 453 |
8.000%, 08/15/16 (A) | | | 435 | | | 448 |
Sinclair Television Group | | | | | | |
9.250%, 11/01/17 (A) | | | 1,005 | | | 995 |
Sitel LLC | | | | | | |
11.500%, 04/01/18 (A) | | | 1,180 | | | 1,121 |
Sprint Capital | | | | | | |
8.750%, 03/15/32 | | | 3,585 | | | 3,415 |
6.900%, 05/01/19 | | | 4,150 | | | 3,750 |
Telcordia Technologies | | | | | | |
11.000%, 05/01/18 (A) | | | 5,765 | | | 5,585 |
Telesat Canada | | | | | | |
12.500%, 11/01/17 | | | 935 | | | 1,056 |
11.000%, 11/01/15 | | | 795 | | | 863 |
tw telecom holdings inc | | | | | | |
8.000%, 03/01/18 (A) | | | 2,455 | | | 2,461 |
Univision Communications | | | | | | |
12.000%, 07/01/14 (A) | | | 608 | | | 654 |
UPC Holding BV | | | | | | |
9.875%, 04/15/18 (A) | | | 3,085 | | | 3,116 |
Videotron Ltee | | | | | | |
9.125%, 04/15/18 | | | 1,045 | | | 1,118 |
Virgin Media Finance | | | | | | |
9.500%, 08/15/16 | | | 3,680 | | | 3,772 |
8.375%, 10/15/19 | | | 2,050 | | | 2,045 |
Visant Holding | | | | | | |
10.250%, 12/01/13 (D) | | | 4,330 | | | 4,417 |
West | | | | | | |
11.000%, 10/15/16 | | | 1,905 | | | 1,924 |
9.500%, 10/15/14 | | | 1,539 | | | 1,531 |
Wind Acquisition Finance | | | | | | |
11.750%, 07/15/17 (A) | | | 2,188 | | | 2,231 |
10.750%, 12/01/15 (A) | | | 3,015 | | | 3,105 |
| | |
| SEI Institutional Investments Trust / Annual Report / May 31, 2010 | | 105 |
SCHEDULE OF INVESTMENTS
High Yield Bond Fund (Continued)
May 31, 2010
| | | | | | |
| Description | | Face Amount
($ Thousands) | | Market Value
($ Thousands) |
| | | | | | |
Wind Acquisition Holdings Finance | | | | | | |
12.250%, 07/15/17 (A) | | $ | 1,550 | | $ | 1,457 |
Windstream | | | | | | |
8.625%, 08/01/16 | | | 2,160 | | | 2,149 |
XM Satellite Radio | | | | | | |
11.250%, 06/15/13 (A) | | | 2,210 | | | 2,365 |
XM Satellite Radio Holdings | | | | | | |
13.000%, 08/01/13 (A) | | | 4,820 | | | 5,278 |
Zayo Group LLC | | | | | | |
10.250%, 03/15/17 (A) | | | 1,085 | | | 1,096 |
| | | | | | |
| | | | | | 203,845 |
| | | | | | |
| | |
Utilities — 3.0% | | | | | | |
AES | | | | | | |
9.750%, 04/15/16 (A) | | | 2,320 | | | 2,465 |
8.000%, 06/01/20 | | | 575 | | | 558 |
8.000%, 10/15/17 | | | 280 | | | 277 |
Calpine Construction Finance and CCFC Finance | | | | | | |
8.000%, 06/01/16 (A) | | | 450 | | | 454 |
Calpine Generating LLC | | | | | | |
14.320%, 04/01/11 (B) (C) | | | 1,500 | | | 191 |
Edison Mission Energy | | | | | | |
7.625%, 05/15/27 | | | 1,400 | | | 882 |
7.500%, 06/15/13 | | | 600 | | | 532 |
7.200%, 05/15/19 | | | 3,700 | | | 2,405 |
Elwood Energy LLC | | | | | | |
8.159%, 07/05/26 | | | 957 | | | 907 |
Energy Future Holdings | | | | | | |
10.875%, 11/01/17 | | | 3,775 | | | 2,775 |
10.000%, 01/15/20 (A) | | | 2,080 | | | 2,070 |
Ferrellgas Partners | | | | | | |
6.750%, 05/01/14 | | | 1,500 | | | 1,463 |
Mirant Americas Generation LLC | | | | | | |
8.500%, 10/01/21 | | | 1,750 | | | 1,601 |
Mirant North America LLC | | | | | | |
7.375%, 12/31/13 | | | 3,555 | | | 3,564 |
North American Energy Alliance LLC | | | | | | |
10.875%, 06/01/16 (A) | | | 1,300 | | | 1,329 |
NRG Energy | | | | | | |
8.500%, 06/15/19 | | | 1,895 | | | 1,833 |
7.375%, 02/01/16 | | | 4,440 | | | 4,296 |
7.375%, 01/15/17 | | | 1,210 | | | 1,150 |
7.250%, 02/01/14 | | | 1,800 | | | 1,777 |
Public Service of New Mexico | | | | | | |
7.950%, 05/15/18 | | | 2,800 | | | 2,925 |
Puget Sound Energy | | | | | | |
6.974%, 06/01/67 (C) | | | 1,035 | | | 946 |
Sabine Pass LNG LP | | | | | | |
7.500%, 11/30/16 (A) | | | 620 | | | 515 |
7.500%, 11/30/16 | | | 6,070 | | | 5,038 |
Texas Competitive Electric Holdings LLC | | | | | | |
10.250%, 11/01/15 | | | 3,275 | | | 2,194 |
| | | | | | |
| Description | | Face Amount
($ Thousands) | | Market Value
($ Thousands) |
| | | | | | |
TXU | | | | | | |
6.500%, 11/15/24 | | $ | 1,010 | | $ | 459 |
TXU, Ser P | | | | | | |
5.550%, 11/15/14 | | | 1,215 | | | 853 |
TXU, Ser R | | | | | | |
6.550%, 11/15/34 | | | 2,105 | | | 931 |
United Maritime Group LLC | | | | | | |
11.750%, 06/15/15 (A) | | | 4,100 | | | 4,018 |
| | | | | | |
| | | | | | 48,408 |
| | | | | | |
Total Corporate Obligations
(Cost $1,356,031) ($ Thousands) | | | 1,379,333 |
| | | | | | |
|
LOAN PARTICIPATIONS — 5.8% |
Advantage Sales | | | | | | |
8.500%, 04/15/17 | | | 1,800 | | | 1,776 |
Affinion Group Holdings | | | | | | |
7.641%, 03/01/12 | | | 5,127 | | | 4,819 |
Allison Transmission | | | | | | |
3.100%, 08/07/14 | | | 348 | | | 316 |
3.050%, 08/07/14 | | | 141 | | | 129 |
3.010%, 08/07/14 | | | 99 | | | 90 |
American General Finance | | | | | | |
7.250%, 04/08/15 | | | 2,170 | | | 2,098 |
Asurion 2nd Lien | | | | | | |
6.849%, 07/03/15 | | | 3,450 | | | 3,367 |
Aventi | | | | | | |
0.000%, 10/15/49 (B) (F) (H) (I) | | | 2,600 | | | 456 |
Boston Generating | | | | | | |
7.290%, 12/20/16 | | | 173 | | | 4 |
4.540%, 06/20/14 | | | 650 | | | 157 |
BWAY | | | | | | |
0.000%, 07/20/13 (H) | | | 2,510 | | | 2,504 |
CDW | | | | | | |
4.234%, 10/12/14 | | | 995 | | | 877 |
Central Parking | | | | | | |
2.563%, 05/22/14 (C) | | | 616 | | | 540 |
Central Parking 1st Lien Term Loan | | | | | | |
2.813%, 05/22/14 | | | 1,723 | | | 1,510 |
CF Industries | | | | | | |
10.000%, 12/02/16 | | | 1,870 | | | 1,868 |
Chester Downs | | | | | | |
12.375%, 12/31/49 | | | 650 | | | 645 |
CIT Group | | | | | | |
9.500%, 01/20/12 | | | 2,635 | | | 2,681 |
0.000%, 01/20/12 (H) | | | 2,748 | | | 2,796 |
Claire’s Stores | | | | | | |
3.040%, 05/27/14 | | | 1,784 | | | 1,500 |
DAE Aviation Holdings Tranche B-1 Loan | | | | | | |
4.090%, 07/31/14 | | | 277 | | | 251 |
DAE Aviation Holdings Tranche B-2 Loan | | | | | | |
4.090%, 09/27/14 | | | 269 | | | 245 |
| | |
| 106 | | SEI Institutional Investments Trust / Annual Report / May 31, 2010 |
| | | | | | |
| Description | | Face Amount
($ Thousands) | | Market Value
($ Thousands) |
| | | | | | |
Dana | | | | | | |
0.000%, 01/31/15 (H) | | $ | 755 | | $ | 726 |
Dex Media West LLC | | | | | | |
9.250%, 06/30/11 | | | 1,200 | | | 1,109 |
7.500%, 10/24/14 | | | 1,483 | | | 1,348 |
Federal Mogul | | | | | | |
2.278%, 12/28/15 | | | 706 | | | 616 |
2.278%, 12/29/14 | | | 217 | | | 189 |
2.217%, 12/29/14 | | | 1,167 | | | 1,018 |
First Data | | | | | | |
3.091%, 09/24/14 | | | 2,113 | | | 1,780 |
3.040%, 09/24/14 | | | 129 | | | 109 |
3.032%, 09/24/14 | | | 241 | | | 203 |
Gambro Aktiebolag | | | | | | |
7.054%, 11/24/16 | | | 1,014 | | | 869 |
5.186%, 12/05/15 | | | 922 | | | 832 |
Georgia Pacific | | | | | | |
2.538%, 12/20/12 | | | 199 | | | 194 |
2.290%, 12/23/10 | | | 26 | | | 25 |
2.290%, 12/20/12 | | | 26 | | | 25 |
Greektown Casino (B) (H) | | | | | | |
0.000%, 09/30/10 | | | 1,100 | | | 1,006 |
0.000%, 12/03/12 | | | 725 | | | 781 |
Green Valley Ranch Gaming | | | | | | |
3.507%, 08/06/14 | | | 2,000 | | | 104 |
Guitar Center | | | | | | |
3.850%, 10/09/13 | | | 2,086 | | | 1,850 |
Harrah’s Operating | | | | | | |
9.500%, 01/28/15 | | | 2,993 | | | 2,991 |
3.316%, 01/28/15 | | | 1,575 | | | 1,313 |
3.290%, 01/28/15 | | | 17 | | | 14 |
Hexion Specialty Chemical, Ser C-1 | | | | | | |
2.563%, 05/05/13 (C) | | | 1,401 | | | 1,290 |
Hexion Specialty Chemical, Ser C-2 | | | | | | |
2.563%, 05/05/13 (C) | | | 514 | | | 474 |
Iasis Healthcare | | | | | | |
5.588%, 06/13/14 | | | 3,357 | | | 3,016 |
Ineos US Finance LLC | | | | | | |
8.000%, 12/16/14 | | | 1,665 | | | 1,615 |
7.500%, 12/16/13 | | | 1,456 | | | 1,403 |
Infor Enterprise Solution | | | | | | |
0.000%, 03/02/14 (H) | | | 1,094 | | | 832 |
Infor Global Enterprise Solutions Tranche 1 | | | |
6.604%, 03/02/14 | | | 2,217 | | | 1,686 |
Infor Global Solutions | | | | | | |
8.240%, 08/29/14 | | | 3,873 | | | 1,840 |
6.479%, 03/02/14 | | | 1,283 | | | 976 |
0.000%, 08/29/14 (H) | | | 210 | | | 100 |
0.000%, 07/28/12 (H) | | | 1,203 | | | 1,131 |
Integra Telecom | | | | | | |
9.250%, 04/07/15 | | | 270 | | | 268 |
| | | | | | |
Intelsat Jackson Holdings | | | | | | |
2.804%, 02/01/14 (C) | | | 2,400 | | | 2,118 |
| | | | | | |
| Description | | Face Amount
($ Thousands) | | Market Value
($ Thousands) |
Jacuzzi Brands | | | | | | |
| | | | | | |
2.574%, 02/14/14 | | $ | 1,005 | | $ | 821 |
2.543%, 02/14/14 | | | 2 | | | 2 |
2.540%, 02/07/14 | | | 52 | | | 42 |
Metroflag, 2nd Lien | | | | | | |
14.000%, 01/06/09 (B) (F) | | | 325 | | | — |
Millennium | | | | | | |
7.625%, 11/15/26 (B) | | | 200 | | | — |
Nuveen Investments | | | | | | |
12.500%, 11/09/14 | | | 810 | | | 835 |
12.500%, 07/31/15 | | | 725 | | | 747 |
Open Link Financial | | | | | | |
10.250%, 11/06/15 | | | 2,750 | | | 2,860 |
OSI Restaurant Partners LLC | | | | | | |
2.563%, 06/14/13 | | | 76 | | | 66 |
2.563%, 06/14/14 | | | 3,987 | | | 3,451 |
0.074%, 06/14/13 | | | 205 | | | 178 |
PQ | | | | | | |
6.740%, 06/14/14 | | | 1,450 | | | 1,316 |
Proquest | | | | | | |
6.110%, 02/09/15 | | | 1,100 | | | 990 |
6.090%, 02/09/15 | | | 100 | | | 90 |
Realogy | | | | | | |
3.294%, 10/13/13 | | | 594 | | | 500 |
3.292%, 10/13/13 | | | 632 | | | 531 |
Rexnord | | | | | | |
7.252%, 03/01/13 | | | 2,072 | | | 1,347 |
Reynold | | | | | | |
6.250%, 11/05/15 | | | 1,441 | | | 1,433 |
Rite Aid | | | | | | |
9.500%, 06/01/15 | | | 1,036 | | | 1,056 |
Sabre | | | | | | |
2.494%, 09/30/14 | | | 848 | | | 760 |
2.479%, 09/30/14 | | | 480 | | | 431 |
Simmons Holdco, Unsecured | | | | | | |
0.000%, 02/15/12 (H) | | | 1,635 | | | — |
Targa Resources | | | | | | |
5.337%, 02/09/15 | | | 1,544 | | | 1,309 |
0.000%, 02/09/16 (H) | | | 400 | | | 339 |
Texas Competitive Electric | | | | | | |
4.066%, 10/10/14 | | | 5,033 | | | 3,864 |
3.874%, 10/10/14 | | | 1,831 | | | 1,406 |
3.797%, 10/10/14 | | | 4,134 | | | 3,172 |
3.790%, 10/10/14 | | | 85 | | | 66 |
Tronox | | | | | | |
9.000%, 09/20/10 | | | 805 | | | 809 |
Wide Open West Finance | | | | | | |
7.256%, 06/27/15 | | | 1,513 | | | 1,279 |
6.624%, 06/27/15 | | | 785 | | | 663 |
0.000%, 06/27/15 (H) | | | 525 | | | 444 |
| | | | | | |
Zuffa | | | | | | |
7.500%, 06/18/15 | | | 1,791 | | | 1,795 |
| | | | | | |
Total Loan Participations
(Cost $92,467) ($ Thousands) | | | | | | 95,082 |
| | | | | | |
| | |
| SEI Institutional Investments Trust / Annual Report / May 31, 2010 | | 107 |
SCHEDULE OF INVESTMENTS
High Yield Bond Fund (Continued)
May 31, 2010
| | | | | | |
| Description | | Face Amount
($ Thousands)/
Shares | | Market Value
($ Thousands) |
COLLATERALIZED DEBT OBLIGATION — 1.7% |
| | | | | | |
| |
Other Asset-Backed Securities — 1.7% | | | |
ACAS, Ser 2007-1A, Cl A1J | | | | | | |
0.615%, 04/20/21 (C) | | $ | 3,800 | | $ | 2,888 |
Ares IIIR CLO, Ser 2007-3RA, Cl SUB | | | | | | |
0.000%, 04/16/21 | | | 5,000 | | | 1,500 |
CIFC Funding, Ser 2007-3A, Cl B | | | | | | |
1.566%, 07/26/21 (C) | | | 2,700 | | | 1,423 |
CIT CLO, Ser 2007-1A, Cl E | | | | | | |
5.271%, 06/20/21 (C) | | | 926 | | | 370 |
CIT CLO, Ser 2007-1A, Cl D | | | | | | |
2.271%, 06/20/21 (C) | | | 3,000 | | | 1,410 |
Connecticut Valley Structured Credit CDO, Ser 2006-3A | | | | | | |
0.000%, 03/23/23 | | | 1,200 | | | 6 |
De Meer Middle Market CLO,
Ser 2006-1A, Cl INC | | | | | | |
0.000%, 10/20/18 | | | 3,167 | | | 1,267 |
De Meer Middle Market CLO,
Ser 2006-1A, Cl B | | | | | | |
0.705%, 10/20/18 (C) | | | 1,200 | | | 948 |
Duane Street CLO, Ser 2007-5A, Cl SN | | | | | | |
0.000%, 10/14/21 | | | 3,500 | | | 1,050 |
Emporia Preferred Funding, Cl C | | | | | | |
1.213%, 04/23/21 (C) | | | 2,024 | | | 1,255 |
Gleneagles CLO, Ser AI | | | | | | |
0.000%, 11/01/17 (C) | | | 6 | | | 720 |
Peritus I CDO, Ser 2005-1A, Cl C | | | | | | |
9.000%, 05/24/15 (A) | | | 10,013 | | | 6,208 |
Peritus I CDO, | | | | | | |
0.000%, 12/19/07 | | | 3,000 | | | 600 |
Rockwall CDO, Cl A1LA | | | | | | |
0.644%, 08/01/21 (A) (C) | | | 6,878 | | | 4,815 |
Rockwall Investors CDO, | | | | | | |
0.000%, 08/01/21 (A) (C) | | | 3,000 | | | 270 |
Stone Tower CDO, Cl A1LA | | | | | | |
0.828%, 01/29/20 (C) | | | 1,950 | | | 1,658 |
Waterfront CLO, Ser 2007-1A, Cl A2 | | | | | | |
0.703%, 08/02/20 (C) | | | 1,444 | | | 1,083 |
| | | | | | |
Total Collateralized Debt Obligation
(Cost $40,454) ($ Thousands) | | | | | | 27,471 |
| | | | | | |
| | |
COMMON STOCK — 0.7% | | | | | | |
Aventine Renewable Energy Holdings* (F) (I) | | | 57,685 | | | 2,488 |
| | | | | | |
Core-Mark Holding* | | | 812 | | | 22 |
Dana Holdings* | | | 67,821 | | | 736 |
Dex One* | | | 43,745 | | | 896 |
LyondellBasell Industries, Cl B* | | | 136,954 | | | 2,424 |
LyondellBasell Industries, Cl A* | | | 149,388 | | | 2,655 |
Solutia* | | | 368 | | | 5 |
| | | | | | |
| Description | | Face Amount
($ Thousands)/
Shares | | Market Value
($ Thousands) |
Spectrum Brands* | | | 17,187 | | $ | 477 |
| | | | | | |
VSS AHC, Cl A*(F) (I) (J) | | | 43,496 | | | 519 |
World Color Press* | | | 14,266 | | | 160 |
| | | | | | |
Total Common Stock
(Cost $11,549) ($ Thousands) | | | | | | 10,382 |
| | | | | | |
|
ASSET-BACKED SECURITIES — 0.5% |
|
Other Asset-Backed Securities — 0.5% |
ACAS Business Loan Trust,
Ser 2007-2A, Cl
A 0.836%, 11/18/19 (C) | | $ | 1,212 | | | 1,066 |
Applebee’s Enterprises LLC
6.427%, 12/20/37 (A) | | | 3,937 | | | 3,642 |
Dominos Pizza Master Issuer LLC,
Ser 2007-1, Cl A2
5.261%, 04/25/37 | | | 1,403 | | | 1,308 |
Grayson CLO, Cl A1B
0.704%, 11/01/21 (C) | | | 3,684 | | | 2,579 |
| | | | | | |
Total Asset-Backed Securities
(Cost $4,520) ($ Thousands) | | | 8,595 |
| | | | | | |
|
AUCTION RATE PREFERRED SECURITIES — 0.4% |
BlackRock Insured Municipal Income Trust | | | 14,500 | | | 1,247 |
BlackRock Municipal Income Trust | | | 27 | | | 2,322 |
BlackRock MuniVest Fund II | | | 9,250 | | | 796 |
BlackRock MuniYield Fund | | | 11,750 | | | 1,010 |
BlackRock MuniYield New Jersey Fund | | | 14,500 | | | 1,247 |
| | | | | | |
Total Auction Rate Preferred Securities
(Cost $6,459) ($ Thousands) | | | 6,622 |
| | | | | | |
|
CONVERTIBLE BONDS — 0.2% |
Hologic | | | | | | |
2.000%, 12/15/37 | | | 535 | | | 457 |
Leap Wireless International | | | | | | |
4.500%, 07/15/14 | | | 703 | | | 590 |
Liberty Media LLC | | | | | | |
4.000%, 11/15/29 | | | 375 | | | 196 |
3.750%, 02/15/30 | | | 565 | | | 282 |
Lions Gate Entertainment | | | | | | |
2.938%, 10/15/24 | | | 1,555 | | | 1,524 |
Live Nation Entertainment | | | | | | |
2.875%, 07/15/27 | | | 268 | | | 232 |
Mirant CV to 131.9888 | | | | | | |
0.000%, 07/15/49 (B) (F) | | | 750 | | | — |
| | | | | | |
Mirant CV to 14.7167 | | | | | | |
0.000%, 06/15/21 (B) | | | 1,950 | | | 4 |
Vector Group | | | | | | |
5.750%, 06/15/26 (C) | | | 410 | | | 439 |
| | | | | | |
Total Convertible Bonds
(Cost $3,453) ($ Thousands) | | | 3,724 |
| | | | | | |
| | |
| 108 | | SEI Institutional Investments Trust / Annual Report / May 31, 2010 |
| | | | | |
| Description | | Shares | | Market Value
($ Thousands) |
PREFERRED STOCK — 0.1% |
Ally Financial (A) | | 923 | | $ | 694 |
Axis Capital Holdings (C) | | 12,600 | | | 1,140 |
Dana* | | 5,754 | | | 362 |
| | | | | |
Total Preferred Stock
(Cost $1,268) ($ Thousands) | | | 2,196 |
| | | | | |
| | | Number of
Warrants | | |
|
WARRANTS — 0.0% |
Atrium, Expires 10/14/08* (E) (F) | | 691 | | | — |
World Color Press, Expires
07/20/14* | | 15,736 | | | 31 |
World Color Press, Expires
07/20/14* | | 15,736 | | | 83 |
| | | | | |
Total Warrants
(Cost $499) ($ Thousands) | | | 114 |
| | | | | |
|
AFFILIATED PARTNERSHIP — 0.0% |
SEI Liquidity Fund, L.P.
0.240%**† (G) | | 6,416 | | | 6 |
| | | | | |
Total Affiliated Partnership
(Cost $6) ($ Thousands) | | | 6 |
| | | | | |
| | | | | |
|
CASH EQUIVALENT — 2.3% |
SEI Daily Income Trust, Prime Obligation Fund, Cl A 0.090%**† | | 37,795,477 | | | 37,795 |
| | | | | |
Total Cash Equivalent
(Cost $37,795) ($ Thousands) | | | 37,795 |
| | | | | |
Total Investments — 96.1%
(Cost $1,554,501) ($ Thousands) | | $ | 1,571,320 |
| | | | | |
Percentages are based on Net Assets of $1,634,608 ($ Thousands)
| * | | Non-income producing security. |
| ** | | The rate reported is the 7-day effective yield as of May 31, 2010. |
| † | | Investment in Affiliated Security (see Note 5). |
| ‡ | | Real Estate Investment Trust |
| (A) | | Securities sold within terms of a private placement memorandum, exempt from registration under Section 144A of the Securities Act of 1933, as amended, and may be sold only to dealers in that program or other “accredited investors.” These securities have been determined to be liquid under guidelines established by the board of Trustees. |
| (B) | | Security in default on interest payments. |
| (C) | | Variable Rate Security — The rate reported is the rate in effect as of May 31, 2010. The date reported is the final maturity date. |
| (D) | | Step Bonds — The rate reflected is the effective yield on May 31, 2010. The coupon on a step bond changes on a specified date. |
| (E) | | This security or a partial position of this security is on loan at May 31, 2010. The total value of securities on loan at May 31, 2010 was $5 ($ Thousands). |
| (F) | | Securities considered illiquid. The total value of such securities as of May 31, 2010 was $4,582 ($ Thousands) and represented 0.28% of Net Assets. (Unaudited in regards to illiquid status) |
| (G) | | This security was purchased with cash collateral held from securities on loan. The total value of such securities as of May 31, 2010 was $6 ($ Thousands). |
| (H) | | Unsettled Loan Participation. Interest rate not available. |
| (I) | | Security fair valued using methods determined in good faith by the Valuation Committee of the Board of Trustees. The total value of such securities as of May 31, 2010 was $4,582 ($ Thousands) and represents 0.28% of net assets. |
| (J) | | Securities considered restricted. The total value of such securities as of May 31, 2010 was $519 ($ Thousands) and represented 0.03% of Net Assets. |
CDO — Collateralized Debt Obligation
Cl — Class
CLO — Collateralized Loan Obligation
CV — Convertible Security
LLC — Limited Liability Company
LLP — Limited Liability Partnership
L.P. — Limited Partnership
MTN — Medium Term Note
PIK — Payment-in-Kind
Ser — Series
Amounts designated as “—” are $O or have been rounded to $O.
A summary of outstanding swap agreements held by the Fund at May 31, 2010, is as follows:
| | | | | | | | | | | | | | | | |
| Credit Default Swap | |
| Counterparty | | Reference Entity/Obligation | | Buy/Sell Protection | | (Pays)/
Receives Rate | | | Termination Date | | Notional Amount
(Thousands) | | Net Unrealized
Depreciation
($Thousands) | |
| Barclays Bank PLC | | CDX.NA.HY.13-V2 Index | | BUY | | 5.00 | % | | 12/20/14 | | $ | 14,058 | | $ | (723 | ) |
| | | | | | | | | | | | | | | | |
| | |
| SEI Institutional Investments Trust / Annual Report / May 31, 2010 | | 109 |
SCHEDULE OF INVESTMENTS
High Yield Bond Fund (Concluded)
May 31, 2010
The following is a summary of the inputs used as of May 31, 2010 in valuing the Fund’s investments carried at value ($ Thousands):
| | | | | | | | | | | | |
| Investments in Securities | | Level 1 | | Level 2 | | Level 3 | | Total |
Corporate Obligations | | $ | — | | $ | 1,362,885 | | $ | 16,448 | | $ | 1,379,333 |
Loan Participations | | | — | | | 78,713 | | | 16,369 | | | 95,082 |
Collateralized Debt Obligations | | | — | | | — | | | 27,471 | | | 27,471 |
Convertible Bonds | | | — | | | 3,720 | | | 4 | | | 3,724 |
Asset-Backed Securities | | | — | | | 1,308 | | | 7,287 | | | 8,595 |
Auction Rate Preferred Securities | | | — | | | — | | | 6,622 | | | 6,622 |
Common Stock | | | 7,375 | | | — | | | 3,007 | | | 10,382 |
Preferred Stock | | | — | | | 2,196 | | | — | | | 2,196 |
Warrants | | | — | | | 114 | | | — | | | 114 |
Affiliated Partnerships | | | — | | | 6 | | | — | | | 6 |
Cash Equivalent | | | 37,795 | | | — | | | — | | | 37,795 |
| | | | | | | | | | | | |
Total Investments in Securities | | $ | 45,170 | | $ | 1,448,942 | | $ | 77,208 | | $ | 1,571,320 |
| | | | | | | | | | | | |
| | | | | | | | | | | | | | |
| Other Financial Instruments | | Level 1 | | Level 2 | | | Level 3 | | Total | |
Credit Default Swaps | | $ | — | | $ | (723 | ) | | $ | — | | $ | (723 | ) |
| | | | | | | | | | | | | | |
Total Other Financial Instruments | | $ | — | | $ | (723 | ) | | $ | — | | $ | (723 | ) |
| | | | | | | | | | | | | | |
The following is a reconciliation of investments in which significant unobservable inputs (Level 3) were used in determining value ($ Thousands):
| | | | | | | | | | | | |
| | | Investments in
Corporate
Obligations | | | Investments in
Collateralized
Debt Obligations | | | Investments in
Convertible
Bonds | |
Beginning balance as of
June 1, 2009 | | $ | 3,656 | | | $ | 28,879 | | | $ | 4 | |
Accrued discounts/premiums | | | (44 | ) | | | (563 | ) | | | — | |
Realized gain/(loss) | | | 205 | | | | (6,974 | ) | | | 17 | |
Change in unrealized appreciation/(depreciation) | | | 69 | | | | 73,133 | | | | — | |
Net purchases/sales | | | 63 | | | | (74,467 | ) | | | (17 | ) |
Net transfer in and/or out of Level 3 | | | 12,499 | | | | 7,463 | | | | — | |
| | | | | | | | | | | | |
Ending balance as of
May 31, 2010 | | $ | 16,448 | | | $ | 27,471 | | | $ | 4 | |
| | | | | | | | | | | | |
Changes in unrealized gains/(losses) included in earnings related to securities still held at reporting date. | | $ | (181 | ) | | $ | 11,102 | | | $ | — | |
| | | | | | | | | | | | |
| | | | | | | | | | |
| | | Investments in Asset-Backed Securities | | Investments in Common Stock | | Investments in Loan Participation | |
Beginning balance as of
June 1, 2009 | | $ | 3,886 | | $ | — | | $ | 10,731 | |
Accrued discounts/premiums | | | 37 | | | — | | | 117 | |
Realized gain/(loss) | | | 230 | | | — | | | (2,505 | ) |
Change in unrealized
appreciation/(depreciation) | | | 1,273 | | | — | | | 8,208 | |
Net purchases/sales | | | 1,861 | | | — | | | (11,354 | ) |
Net transfer in and/or out of Level 3 | | | — | | | 3,007 | | | 11,172 | |
| | | | | | | | | | |
Ending balance as of
May 31, 2010 | | $ | 7,287 | | $ | 3,007 | | $ | 16,369 | |
| | | | | | | | | | |
Changes in unrealized gains/(losses) included in earnings related to securities still held at reporting date. | | $ | 1,110 | | $ | — | | $ | 2,397 | |
| | | | | | | | | | |
| | | |
| ` | | Investments in Auction Rate Preferred Securities |
Beginning balance as of June 1, 2009 | | $ | — |
Accrued discounts/premiums | | | — |
Realized gain/(loss) | | | — |
Change in unrealized appreciation/ (depreciation) | | | 13 |
Net purchases/sales | | | 2,309 |
Net transfer in and/or out of Level 3 | | | 4,300 |
| | | |
Ending balance as of May 31, 2010 | | $ | 6,622 |
| | | |
Changes in unrealized gains/(losses) included in earnings related
to securities still held at reporting date. | | $ | — |
| | | |
For more information on valuation inputs, see Note 2 — Significant Accounting Policies in Notes to Financial Statements.
Amounts designated as “—” are either $0 or have been rounded to $0.
The accompanying notes are an integral part of the financial statements.
| | |
| 110 | | SEI Institutional Investments Trust / Annual Report / May 31, 2010 |
SCHEDULE OF INVESTMENTS
Long Duration Fund
May 31, 2010
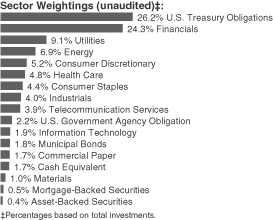
| | | | | | |
| Description | | Face Amount
($ Thousands) | | Market Value
($ Thousands) |
| | | | | | |
|
CORPORATE OBLIGATIONS — 65.4% |
|
Consumer Discretionary — 5.6% |
Comcast | | | | | | |
6.450%, 03/15/37 | | $ | 13,705 | | $ | 14,366 |
6.400%, 05/15/38 | | | 700 | | | 734 |
6.400%, 03/01/40 | | | 4,389 | | | 4,617 |
Comcast Cable Communications Holdings | | | | | | |
9.455%, 11/15/22 | | | 3,750 | | | 5,040 |
COX Communications | | | | | | |
8.375%, 03/01/39 (A) | | | 5,975 | | | 7,787 |
6.950%, 06/01/38 | | | 4,883 | | | 5,388 |
Discovery Communications LLC | | | | | | |
6.350%, 06/01/40 (F) | | | 3,095 | | | 3,116 |
Historic TW | | | | | | |
6.625%, 05/15/29 | | | 3,995 | | | 4,232 |
Lowe’s | | | | | | |
7.110%, 05/15/37 | | | 1,402 | | | 1,665 |
5.800%, 04/15/40 | | | 4,000 | | | 4,217 |
McDonald’s MTN | | | | | | |
6.300%, 03/01/38 | | | 5,430 | | | 6,188 |
NBC Universal | | | | | | |
6.400%, 04/30/40 | | | 5,169 | | | 5,366 |
News America | | | | | | |
7.850%, 03/01/39 (A) | | | 6,275 | | | 7,685 |
6.900%, 08/15/39 | | | 2,775 | | | 3,085 |
6.750%, 01/09/38 | | | 2,260 | | | 2,431 |
6.650%, 11/15/37 (A) | | | 4,855 | | | 5,253 |
6.150%, 03/01/37 | | | 1,945 | | | 1,970 |
Target | | | | | | |
7.000%, 01/15/38 | | | 3,560 | | | 4,243 |
Time Warner | | | | | | |
7.700%, 05/01/32 | | | 425 | | | 492 |
7.625%, 04/15/31 | | | 14,455 | | | 16,620 |
7.570%, 02/01/24 | | | 295 | | | 347 |
Time Warner Cable | | | | | | |
8.750%, 02/14/19 | | | 6,730 | | | 8,395 |
| | | | | | |
| Description | | Face Amount
($ Thousands) | | Market Value
($ Thousands) |
| | | | | | |
8.250%, 04/01/19 | | $ | 3,075 | | $ | 3,743 |
7.300%, 07/01/38 | | | 925 | | | 1,057 |
6.750%, 06/15/39 | | | 6,690 | | | 7,190 |
5.000%, 02/01/20 | | | 4,390 | | | 4,382 |
Time Warner Entertainment | | | | | | |
8.375%, 07/15/33 | | | 5,700 | | | 6,912 |
Wal-Mart Stores | | | | | | |
6.200%, 04/15/38 | | | 8,250 | | | 9,220 |
Yum! Brands | | | | | | |
6.875%, 11/15/37 | | | 5,620 | | | 6,302 |
| | | | | | |
| | | | | | 152,043 |
| | | | | | |
| | |
Consumer Staples — 4.4% | | | | | | |
Altria Group | | | | | | |
10.200%, 02/06/39 | | | 10,950 | | | 14,142 |
Anheuser-Busch | | | | | | |
6.450%, 09/01/37 | | | 945 | | | 1,033 |
Anheuser-Busch InBev Worldwide | | | | | | |
8.200%, 01/15/39 (A) | | | 4,430 | | | 5,792 |
6.875%, 11/15/19 (A) | | | 6,000 | | | 6,922 |
6.375%, 01/15/40 | | | 6,295 | | | 6,898 |
CVS Caremark | | | | | | |
6.125%, 09/15/39 | | | 14,825 | | | 15,244 |
Diageo Capital | | | | | | |
5.875%, 09/30/36 | | | 4,508 | | | 4,735 |
Dr Pepper Snapple Group | | | | | | |
6.820%, 05/01/18 | | | 2,000 | | | 2,337 |
General Mills | | | | | | |
5.400%, 06/15/40 (F) | | | 3,040 | | | 2,987 |
HJ Heinz Finance | | | | | | |
7.125%, 08/01/39 (A) | | | 8,060 | | | 9,643 |
Kraft Foods | | | | | | |
6.875%, 02/01/38 | | | 11,385 | | | 12,638 |
6.500%, 02/09/40 | | | 7,600 | | | 8,068 |
Mead Johnson Nutrition | | | | | | |
5.900%, 11/01/39 (A) | | | 5,350 | | | 5,478 |
PepsiCo | | | | | | |
5.500%, 01/15/40 | | | 4,215 | | | 4,336 |
Philip Morris International | | | | | | |
6.375%, 05/16/38 | | | 3,500 | | | 3,943 |
President and Fellows of Harvard College | | | | | | |
5.625%, 10/01/38 | | | 2,430 | | | 2,571 |
Ralcorp Holdings | | | | | | |
6.625%, 08/15/39 (A) | | | 5,000 | | | 5,167 |
Wal-Mart Stores | | | | | | |
5.625%, 04/01/40 | | | 7,517 | | | 7,834 |
| | | | | | |
| | | | | | 119,768 |
| | | | | | |
| | |
Energy — 6.9% | | | | | | |
Anadarko Petroleum | | | | | | |
6.200%, 03/15/40 | | | 2,160 | | | 1,995 |
Canadian Natural Resources | | | | | | |
6.250%, 03/15/38 | | | 3,000 | | | 3,104 |
| | |
| SEI Institutional Investments Trust / Annual Report / May 31, 2010 | | 111 |
SCHEDULE OF INVESTMENTS
Long Duration Fund (Continued)
May 31, 2010
| | | | | | |
| Description | | Face Amount
($ Thousands) | | Market Value
($ Thousands) |
| | | | | | |
Cenovus Energy | | | | | | |
6.750%, 11/15/39 (A) | | $ | 6,515 | | $ | 7,070 |
CenterPoint Energy Resources | | | | | | |
6.625%, 11/01/37 | | | 3,862 | | | 4,200 |
ConocoPhillips | | | | | | |
6.500%, 02/01/39 | | | 18,055 | | | 20,729 |
5.900%, 05/15/38 | | | 6,380 | | | 6,895 |
Diamond Offshore Drilling | | | | | | |
5.700%, 10/15/39 | | | 828 | | | 781 |
EnCana | | | | | | |
6.500%, 02/01/38 | | | 3,625 | | | 3,831 |
EQT | | | | | | |
8.125%, 06/01/19 | | | 9,365 | | | 11,199 |
Husky Energy | | | | | | |
7.250%, 12/15/19 | | | 11,200 | | | 13,136 |
Marathon Oil | | | | | | |
7.500%, 02/15/19 | | | 2,441 | | | 2,842 |
6.600%, 10/01/37 | | | 5,700 | | | 6,002 |
Motiva Enterprises LLC | | | | | | |
6.850%, 01/15/40 (A) | | | 10,380 | | | 11,486 |
Panhandle Eastern Pipeline | | | | | | |
8.125%, 06/01/19 | | | 2,900 | | | 3,312 |
7.000%, 06/15/18 | | | 700 | | | 777 |
Petrobras International Finance | | | | | | |
6.875%, 01/20/40 | | | 4,600 | | | 4,616 |
Petro-Canada | | | | | | |
6.800%, 05/15/38 | | | 3,725 | | | 4,024 |
Shell International Finance BV | | | | | | |
6.375%, 12/15/38 | | | 920 | | | 1,050 |
5.500%, 03/25/40 | | | 16,871 | | | 16,939 |
Spectra Energy Capital LLC | | | | | | |
7.500%, 09/15/38 | | | 1,913 | | | 2,105 |
Suncor Energy | | | | | | |
6.850%, 06/01/39 | | | 3,675 | | | 3,967 |
Talisman Energy | | | | | | |
7.750%, 06/01/19 | | | 3,075 | | | 3,706 |
6.250%, 02/01/38 | | | 2,060 | | | 2,117 |
TransCanada Pipelines | | | | | | |
7.625%, 01/15/39 | | | 2,500 | | | 2,974 |
7.250%, 08/15/38 | | | 3,100 | | | 3,594 |
6.100%, 06/01/40 (F) | | | 18,440 | | | 18,284 |
Valero Energy | | | | | | |
6.625%, 06/15/37 | | | 7,205 | | | 6,879 |
6.125%, 02/01/20 | | | 3,007 | | | 3,043 |
Williams | | | | | | |
7.875%, 09/01/21 | | | 1,592 | | | 1,840 |
7.750%, 06/15/31 | | | 1,394 | | | 1,521 |
Williams, Ser A | | | | | | |
7.500%, 01/15/31 | | | 1,000 | | | 1,063 |
XTO Energy | | | | | | |
6.750%, 08/01/37 | | | 4,465 | | | 5,304 |
6.100%, 04/01/36 | | | 8,315 | | | 9,269 |
| | | | | | |
| | | | | | 189,654 |
| | | | | | |
| | | | | | |
| Description | | Face Amount
($ Thousands) | | Market Value
($ Thousands) |
| | | | | | |
| | |
Financials — 24.3% | | | | | | |
ACE INA Holdings | | | | | | |
6.700%, 05/15/36 | | $ | 4,677 | | $ | 5,279 |
American Express | | | | | | |
8.150%, 03/19/38 | | | 3,910 | | | 5,121 |
8.125%, 05/20/19 | | | 7,475 | | | 9,104 |
7.000%, 03/19/18 | | | 1,840 | | | 2,095 |
BAC Capital Trust VI | | | | | | |
5.625%, 03/08/35 | | | 2,700 | | | 2,177 |
BAC Capital Trust XV | | | | | | |
1.338%, 06/01/56 (B) | | | 8,000 | | | 4,845 |
Bank of America | | | | | | |
6.500%, 09/15/37 | | | 2,700 | | | 2,646 |
5.750%, 12/01/17 | | | 5,750 | | | 5,823 |
5.650%, 05/01/18 | | | 22,040 | | | 22,167 |
Bank of America, Ser A | | | | | | |
8.070%, 12/31/26 (A) | | | 5,095 | | | 4,942 |
Barclays Bank | | | | | | |
5.125%, 01/08/20 | | | 5,150 | | | 4,896 |
Bear Stearns | | | | | | |
7.250%, 02/01/18 | | | 8,768 | | | 9,995 |
6.400%, 10/02/17 | | | 9,175 | | | 10,084 |
Blackstone Holdings Finance LLC | | | | | | |
6.625%, 08/15/19 (A) | | | 5,523 | | | 5,764 |
BRE Properties | | | | | | |
5.500%, 03/15/17‡ | | | 750 | | | 743 |
Capital One Capital VI | | | | | | |
8.875%, 05/15/40 | | | 4,000 | | | 4,123 |
CDP Financial | | | | | | |
5.600%, 11/25/39 (A) | | | 15,585 | | | 16,155 |
Chase Capital II | | | | | | |
0.844%, 02/01/27 (B) | | | 4,984 | | | 4,024 |
Chubb | | | | | | |
6.500%, 05/15/38 | | | 8,725 | | | 9,767 |
Citigroup | | | | | | |
8.500%, 05/22/19 | | | 7,600 | | | 8,905 |
8.125%, 07/15/39 | | | 5,410 | | | 6,176 |
6.875%, 02/15/98 | | | 1,400 | | | 1,261 |
6.875%, 03/05/38 | | | 29,020 | | | 29,395 |
5.875%, 05/29/37 | | | 6,551 | | | 5,914 |
City National Capital Trust I | | | | | | |
9.625%, 02/01/40 | | | 4,500 | | | 4,583 |
Commonwealth Bank of Australia | | | | | | |
5.000%, 10/15/19 (A) | | | 4,250 | | | 4,309 |
Coso Geothermal Power Holdings | | | | | | |
7.000%, 07/15/26 (A) | | | 3,963 | | | 3,842 |
Credit Suisse NY MTN | | | | | | |
6.000%, 02/15/18 | | | 7,600 | | | 7,757 |
5.300%, 08/13/19 | | | 6,250 | | | 6,421 |
Deutsche Bank Capital Funding Trust | | | | | | |
5.628%, 01/19/49 (A) (B) | | | 3,195 | | | 2,364 |
Discover Bank | | | | | | |
8.700%, 11/18/19 | | | 5,200 | | | 5,689 |
| | |
| 112 | | SEI Institutional Investments Trust / Annual Report / May 31, 2010 |
| | | | | | |
| Description | | Face Amount
($ Thousands) | | Market Value
($ Thousands) |
| | | | | | |
ERP Operating | | | | | | |
5.750%, 06/15/17‡ | | $ | 6,250 | | $ | 6,611 |
Farmers Exchange Capital | | | | | | |
7.050%, 07/15/28 (A) | | | 17,515 | | | 16,788 |
First Union Institutional Capital I | | | | | | |
8.040%, 12/01/26 | | | 1,250 | | | 1,255 |
FleetBoston Financial | | | | | | |
6.875%, 01/15/28 | | | 3,250 | | | 3,252 |
General Electric Capital MTN | | | | | | |
6.875%, 01/10/39 | | | 31,445 | | | 33,434 |
6.150%, 08/07/37 | | | 8,775 | | | 8,471 |
5.875%, 01/14/38 | | | 16,152 | | | 15,118 |
Goldman Sachs Group | | | | | | |
7.500%, 02/15/19 | | | 4,174 | | | 4,608 |
6.750%, 10/01/37 | | | 34,125 | | | 31,950 |
6.150%, 04/01/18 | | | 1,400 | | | 1,430 |
5.375%, 03/15/20 | | | 2,560 | | | 2,470 |
0.533%, 02/06/12 (B) | | | 5,000 | | | 4,857 |
Guardian Life Insurance of America | | | | | | |
7.375%, 09/30/39 (A) | | | 13,635 | | | 14,963 |
HBOS | | | | | | |
6.750%, 05/21/18 (A) | | | 3,700 | | | 3,493 |
HCP MTN | | | | | | |
6.700%, 01/30/18‡ | | | 2,295 | | | 2,400 |
6.300%, 09/15/16‡ | | | 2,255 | | | 2,365 |
Health Care REIT | | | | | | |
6.125%, 04/15/20‡ | | | 3,050 | | | 3,134 |
5.875%, 05/15/15‡ | | | 7,725 | | | 8,253 |
HSBC Holdings | | | | | | |
6.500%, 09/15/37 | | | 8,275 | | | 8,401 |
JPMorgan Chase | | | | | | |
6.400%, 05/15/38 | | | 6,577 | | | 7,266 |
6.300%, 04/23/19 | | | 5,555 | | | 6,047 |
6.000%, 01/15/18 | | | 2,671 | | | 2,884 |
6.000%, 10/01/17 | | | 4,170 | | | 4,455 |
JPMorgan Chase Capital XXVII | | | | | | |
7.000%, 11/01/39 | | | 5,250 | | | 5,140 |
LBG Capital No.. 1 MTN | | | | | | |
8.000%, 12/15/49 (B) | | | 2,800 | | | 2,240 |
Lloyds TSB Bank MTN | | | | | | |
5.800%, 01/13/20 (A) | | | 2,610 | | | 2,452 |
Macquarie Group | | | | | | |
6.000%, 01/14/20 (A) | | | 6,380 | | | 6,201 |
Massachusetts Mutual Life Insurance | | | | | | |
8.875%, 06/01/39 (A) | | | 16,445 | | | 21,593 |
MBNA Capital, Ser B | | | | | | |
1.144%, 02/01/27 (B) | | | 2,151 | | | 1,453 |
Merrill Lynch | | | | | | |
8.950%, 05/18/17 (B) | | | 1,340 | | | 1,414 |
8.680%, 05/02/17 (B) | | | 1,305 | | | 1,377 |
6.110%, 01/29/37 | | | 9,680 | | | 8,358 |
MetLife | | | | | | |
7.717%, 02/15/19 | | | 8,100 | | | 9,373 |
| | | | | | |
| Description | | Face Amount
($ Thousands) | | Market Value
($ Thousands) |
| | | | | | |
Metropolitan Life Insurance | | | | | | |
7.800%, 11/01/25 | | $ | 4,700 | | $ | 5,293 |
Morgan Stanley | | | | | | |
7.300%, 05/13/19 | | | 6,445 | | | 6,770 |
6.625%, 04/01/18 | | | 10,760 | | | 11,049 |
5.625%, 09/23/19 | | | 15,625 | | | 14,933 |
5.500%, 01/26/20 | | | 4,218 | | | 3,994 |
NASDAQ OMX Group | | | | | | |
5.550%, 01/15/20 | | | 1,442 | | | 1,442 |
Nationwide Mutual Insurance | | | | | | |
6.600%, 04/15/34 (A) | | | 12,040 | | | 10,289 |
New York Life Insurance | | | | | | |
6.750%, 11/15/39 (A) | | | 18,475 | | | 20,288 |
Northwestern Mutual Life Insurance | | | | | | |
6.063%, 03/30/40 (A) | | | 8,790 | | | 8,900 |
Pacific Life Insurance | | | | | | |
9.250%, 06/15/39 (A) | | | 4,245 | | | 5,286 |
PNC Funding | | | | | | |
6.700%, 06/10/19 | | | 3,235 | | | 3,650 |
5.125%, 02/08/20 | | | 8,475 | | | 8,602 |
Power Receivables Finance | | | | | | |
6.290%, 01/01/12 (A) | | | 641 | | | 655 |
Prudential Financial MTN | | | | | | |
5.700%, 12/14/36 | | | 4,845 | | | 4,520 |
Prudential Holdings LLC | | | | | | |
8.695%, 12/18/23 (A) | | | 7,700 | | | 9,082 |
Prudential Insurance of America | | | | | | |
8.300%, 07/01/25 (A) | | | 5,500 | | | 6,589 |
Raymond James Financial | | | | | | |
8.600%, 08/15/19 | | | 1,655 | | | 1,908 |
Security Benefit Life | | | | | | |
7.450%, 10/01/33 (A) | | | 4,000 | | | 3,240 |
Sempra Energy ESOP & Trust | | | | | | |
5.781%, 11/01/14 | | | 2,000 | | | 2,000 |
Simon Property Group | | | | | | |
10.350%, 04/01/19‡ | | | 1,995 | | | 2,589 |
6.750%, 02/01/40‡ | | | 5,791 | | | 6,130 |
6.125%, 05/30/18‡ | | | 1,965 | | | 2,109 |
Teachers Insurance & Annuity Association of America | | | | | | |
6.850%, 12/16/39 (A) | | | 9,430 | | | 10,365 |
Wachovia | | | | | | |
6.605%, 10/01/25 | | | 3,100 | | | 3,162 |
0.678%, 10/28/15 (B) | | | 1,590 | | | 1,476 |
Wachovia Bank | | | | | | |
6.600%, 01/15/38 | | | 12,400 | | | 12,928 |
5.850%, 02/01/37 | | | 6,545 | | | 6,188 |
WEA Finance LLC | | | | | | |
7.125%, 04/15/18 | | | 4,513 | | | 5,005 |
6.750%, 09/02/19 | | | 2,780 | | | 3,075 |
Westpac Banking | | | | | | |
4.875%, 11/19/19 | | | 5,035 | | | 5,017 |
ZFS Finance USA Trust I | | | | | | |
5.875%, 05/09/32 (A) (B) | | | 5,000 | | | 4,387 |
| | |
| SEI Institutional Investments Trust / Annual Report / May 31, 2010 | | 113 |
SCHEDULE OF INVESTMENTS
Long Duration Fund (Continued)
May 31, 2010
| | | | | | |
| Description | | Face Amount
($ Thousands) | | Market Value
($ Thousands) |
| | | | | | |
ZFS Finance USA Trust II | | | | | | |
6.450%, 12/15/65 (A) (B) | | $ | 3,650 | | $ | 3,322 |
| | | | | | |
| | | | | | 664,115 |
| | | | | | |
|
Health Care — 4.8% |
Abbott Laboratories | | | | | | |
6.000%, 04/01/39 | | | 2,820 | | | 3,048 |
5.300%, 05/27/40 | | | 9,487 | | | 9,319 |
Aetna | | | | | | |
6.750%, 12/15/37 | | | 3,400 | | | 3,788 |
Amgen | | | | | | |
6.400%, 02/01/39 | | | 3,685 | | | 4,149 |
5.750%, 03/15/40 | | | 9,280 | | | 9,589 |
AstraZeneca | | | | | | |
6.450%, 09/15/37 | | | 6,625 | | | 7,486 |
Boston Scientific | | | | | | |
7.375%, 01/15/40 | | | 1,425 | | | 1,400 |
6.000%, 01/15/20 | | | 3,760 | | | 3,640 |
Bristol-Myers Squibb | | | | | | |
6.125%, 05/01/38 | | | 6,775 | | | 7,531 |
CIGNA | | | | | | |
8.500%, 05/01/19 | | | 5,825 | | | 7,184 |
Eli Lilly | | | | | | |
5.950%, 11/15/37 | | | 3,000 | | | 3,246 |
Merck | | | | | | |
5.850%, 06/30/39 | | | 7,370 | | | 8,166 |
Pfizer | | | | | | |
7.200%, 03/15/39 | | | 17,205 | | | 21,289 |
Roche Holdings | | | | | | |
7.000%, 03/01/39 | | | 13,150 | | | 16,225 |
UnitedHealth Group | | | | | | |
6.875%, 02/15/38 | | | 3,260 | | | 3,563 |
6.625%, 11/15/37 | | | 8,855 | | | 9,396 |
6.500%, 06/15/37 | | | 4,100 | | | 4,282 |
5.800%, 03/15/36 | | | 5,000 | | | 4,825 |
Wyeth | | | | | | |
5.950%, 04/01/37 | | | 3,300 | | | 3,555 |
Zimmer Holdings | | | | | | |
5.750%, 11/30/39 | | | 397 | | | 405 |
| | | | | | |
| | | | | | 132,086 |
| | | | | | |
| | |
Industrials — 4.0% | | | | | | |
American Airlines Pass-Through Trust, Ser 2003-01 | | | | | | |
3.857%, 07/09/10 | | | 4,756 | | | 4,750 |
American Airlines Pass-Through Trust, Ser 2009-1A | | | | | | |
10.375%, 07/02/19 | | | 576 | | | 660 |
Boeing | | | | | | |
6.875%, 03/15/39 | | | 5,400 | | | 6,538 |
5.875%, 02/15/40 | | | 4,975 | | | 5,299 |
Burlington Northern Santa Fe LLC | | | | | | |
6.200%, 08/15/36 | | | 5,100 | | | 5,430 |
5.750%, 05/01/40 | | | 2,460 | | | 2,470 |
5.650%, 05/01/17 | | | 2,830 | | | 3,098 |
| | | | | | |
| Description | | Face Amount
($ Thousands) | | Market Value
($ Thousands) |
| | | | | | |
Canadian National Railway | | | | | | |
6.900%, 07/15/28 | | $ | 1,000 | | $ | 1,187 |
5.550%, 03/01/19 | | | 3,900 | | | 4,287 |
Caterpillar | | | | | | |
6.050%, 08/15/36 | | | 3,430 | | | 3,781 |
Continental Airlines | | | | | | |
9.000%, 07/08/16 | | | 6,393 | | | 6,745 |
5.983%, 04/19/22 | | | 7,048 | | | 7,013 |
Delta Air Lines | | | | | | |
7.750%, 12/17/19 | | | 5,200 | | | 5,590 |
Delta Air Lines,
Ser 2001-1, Cl A-2 | | | | | | |
7.111%, 09/18/11 | | | 6,700 | | | 6,884 |
Lockheed Martin | | | | | | |
5.500%, 11/15/39 | | | 5,850 | | | 5,962 |
Meccanica Holdings USA | | | | | | |
7.375%, 07/15/39 (A) | | | 5,570 | | | 6,016 |
6.250%, 01/15/40 | | | 4,315 | | | 3,912 |
Norfolk Southern | | | | | | |
5.900%, 06/15/19 | | | 4,395 | | | 4,900 |
5.750%, 01/15/16 | | | 1,500 | | | 1,680 |
Union Pacific | | | | | | |
6.625%, 02/01/29 | | | 1,941 | | | 2,179 |
6.125%, 02/15/20 | | | 2,000 | | | 2,256 |
United Parcel Service | | | | | | |
6.200%, 01/15/38 | | | 2,085 | | | 2,355 |
United Technologies | | | | | | |
5.700%, 04/15/40 | | | 11,110 | | | 11,755 |
Waste Management | | | | | | |
6.125%, 11/30/39 | | | 4,240 | | | 4,434 |
| | | | | | |
| | | | | | 109,181 |
| | | | | | |
| | |
Information Technology — 1.9% | | | | | | |
Cisco Systems | | | | | | |
5.900%, 02/15/39 | | | 2,450 | | | 2,598 |
5.500%, 01/15/40 | | | 18,275 | | | 18,327 |
International Business Machines | | | | | | |
5.600%, 11/30/39 | | | 9,775 | | | 10,255 |
Oracle | | | | | | |
6.500%, 04/15/38 | | | 6,200 | | | 7,147 |
6.125%, 07/08/39 | | | 11,710 | | | 13,003 |
| | | | | | |
| | | | | | 51,330 |
| | | | | | |
| | |
Materials — 0.9% | | | | | | |
ArcelorMittal | | | | | | |
7.000%, 10/15/39 | | | 3,275 | | | 3,156 |
Barrick North America Finance LLC | | | | | | |
7.500%, 09/15/38 | | | 6,435 | | | 7,697 |
Dow Chemical | | | | | | |
9.400%, 05/15/39 | | | 5,265 | | | 6,888 |
8.550%, 05/15/19 | | | 2,605 | | | 3,090 |
Southern Copper | | | | | | |
7.500%, 07/27/35 | | | 4,999 | | | 5,170 |
| | | | | | |
| | | | | | 26,001 |
| | | | | | |
| | |
| 114 | | SEI Institutional Investments Trust / Annual Report / May 31, 2010 |
| | | | | | |
| Description | | Face Amount
($ Thousands) | | Market Value
($ Thousands) |
| | | | | | |
|
Telecommunication Services — 3.5% |
AT&T | | | | | | |
6.550%, 02/15/39 | | $ | 11,760 | | $ | 12,738 |
6.300%, 01/15/38 | | | 15,000 | | | 15,619 |
Bellsouth Capital Funding | | | | | | |
7.120%, 07/15/97 | | | 3,485 | | | 3,746 |
BellSouth Telecommunications | | | | | | |
7.000%, 12/01/95 | | | 1,709 | | | 1,820 |
British Telecommunications | | | | | | |
9.625%, 12/15/30 (E) | | | 3,170 | | | 3,962 |
Telecom Italia Capital | | | | | | |
7.721%, 06/04/38 | | | 7,275 | | | 7,443 |
7.175%, 06/18/19 | | | 5,375 | | | 5,694 |
Telefonica Emisiones | | | | | | |
7.045%, 06/20/36 | | | 1,815 | | | 1,933 |
Verizon Communications | | | | | | |
8.950%, 03/01/39 | | | 2,650 | | | 3,646 |
7.350%, 04/01/39 | | | 16,900 | | | 20,082 |
6.400%, 02/15/38 | | | 9,502 | | | 10,095 |
6.350%, 04/01/19 | | | 828 | | | 938 |
Vodafone Group | | | | | | |
6.150%, 02/27/37 | | | 6,840 | | | 6,964 |
| | | | | | |
| | | | | | 94,680 |
| | | | | | |
| | |
Utilities — 9.1% | | | | | | |
Alabama Power | | | | | | |
6.000%, 03/01/39 | | | 1,850 | | | 1,977 |
Appalachian Power | | | | | | |
7.950%, 01/15/20 | | | 4,160 | | | 5,104 |
Arizona Public Service | | | | | | |
8.750%, 03/01/19 | | | 5,025 | | | 6,304 |
Cedar Brakes II LLC | | | | | | |
9.875%, 09/01/13 (A) | | | 1,068 | | | 1,095 |
Consolidated Edison of New York | | | | | | |
6.750%, 04/01/38 | | | 3,845 | | | 4,451 |
6.650%, 04/01/19 | | | 2,310 | | | 2,714 |
6.200%, 06/15/36 | | | 2,225 | | | 2,400 |
5.500%, 12/01/39 | | | 4,130 | | | 4,058 |
Duke Energy Carolinas LLC | | | | | | |
6.100%, 06/01/37 | | | 5,000 | | | 5,440 |
5.300%, 02/15/40 | | | 5,585 | | | 5,558 |
EDF | | | | | | |
5.600%, 01/27/40 (A) | | | 8,575 | | | 8,486 |
Enel Finance International | | | | | | |
6.000%, 10/07/39 (A) | | | 8,035 | | | 7,489 |
Entergy Texas | | | | | | |
7.125%, 02/01/19 | | | 11,750 | | | 13,619 |
Exelon Generation LLC | | | | | | |
6.250%, 10/01/39 | | | 4,480 | | | 4,588 |
Florida Gas Transmission LLC | | | | | | |
7.900%, 05/15/19 (A) | | | 6,000 | | | 7,219 |
Florida Power & Light | | | | | | |
5.960%, 04/01/39 | | | 3,225 | | | 3,486 |
| | | | | | |
| Description | | Face Amount
($ Thousands) | | Market Value
($ Thousands) |
| | | | | | |
5.400%, 09/01/35 | | $ | 710 | | $ | 714 |
FPL Group Capital | | | | | | |
6.000%, 03/01/19 | | | 4,000 | | | 4,413 |
Georgia Power | | | | | | |
5.950%, 02/01/39 | | | 3,850 | | | 4,057 |
5.400%, 06/01/40 (F) | | | 13,530 | | | 13,193 |
Iberdrola Finance Ireland | | | | | | |
5.000%, 09/11/19 (A) | | | 3,700 | | | 3,553 |
Kansas City Power & Light | | | | | | |
7.150%, 04/01/19 | | | 10,930 | | | 13,017 |
KCP&L Greater Missouri Operations | | | | | | |
8.270%, 11/15/21 | | | 5,100 | | | 5,710 |
Metropolitan Edison | | | | | | |
7.700%, 01/15/19 | | | 2,500 | | | 2,957 |
Midamerican Energy Holdings | | | | | | |
6.500%, 09/15/37 | | | 19,440 | | | 21,229 |
Nisource Finance | | | | | | |
10.750%, 03/15/16 | | | 5,575 | | | 7,150 |
6.125%, 03/01/22 | | | 1,767 | | | 1,841 |
Northern States Power | | | | | | |
5.350%, 11/01/39 | | | 4,625 | | | 4,644 |
Oncor Electric Delivery | | | | | | |
7.500%, 09/01/38 | | | 3,200 | | | 3,863 |
6.800%, 09/01/18 | | | 6,680 | | | 7,702 |
Pacific Gas & Electric | | | | | | |
6.250%, 03/01/39 | | | 4,500 | | | 4,833 |
6.050%, 03/01/34 | | | 4,100 | | | 4,273 |
5.800%, 03/01/37 | | | 648 | | | 659 |
PacifiCorp | | | | | | |
5.750%, 04/01/37 | | | 615 | | | 643 |
Pennsylvania Electric | | | | | | |
6.150%, 10/01/38 | | | 3,680 | | | 3,693 |
Progress Energy | | | | | | |
7.050%, 03/15/19 | | | 4,500 | | | 5,182 |
San Diego Gas & Electric | | | | | | |
5.350%, 05/15/40 | | | 1,350 | | | 1,370 |
Southern California Edison | | | | | | |
6.050%, 03/15/39 | | | 7,050 | | | 7,746 |
Southern Union | | | | | | |
8.250%, 11/15/29 | | | 6,375 | | | 7,272 |
Southwestern Electric Power | | | | | | |
6.450%, 01/15/19 | | | 6,000 | | | 6,601 |
6.200%, 03/15/40 | | | 6,680 | | | 6,705 |
Texas-New Mexico Power | | | | | | |
9.500%, 04/01/19 | | | 8,560 | | | 10,721 |
Union Electric | | | | | | |
8.450%, 03/15/39 | | | 3,000 | | | 4,015 |
Virginia Electric and Power | | | | | | |
8.875%, 11/15/38 | | | 5,500 | | | 7,624 |
| | | | | | |
| | | | | | 249,368 |
| | | | | | |
Total Corporate Obligations
(Cost $1,666,027) ($ Thousands) | | | | | | 1,788,226 |
| | | | | | |
| | |
| SEI Institutional Investments Trust / Annual Report / May 31, 2010 | | 115 |
SCHEDULE OF INVESTMENTS
Long Duration Fund (Continued)
May 31, 2010
| | | | | | |
| Description | | Face Amount
($ Thousands) | | Market Value
($ Thousands) |
| | | | | | |
|
U.S. TREASURY OBLIGATIONS (C) — 26.2% |
U.S. Treasury Bills | | | | | | |
0.151%, 06/10/10 | | $ | 43,890 | | $ | 43,889 |
0.140%, 06/17/10 | | | 87,535 | | | 87,529 |
0.149%, 08/12/10 (D) | | | 5,825 | | | 5,823 |
| | | | | | |
| | | | | | 137,241 |
| | | | | | |
U.S. Treasury Bonds | | | | | | |
3.625%, 02/15/20 | | | 23,971 | | | 24,587 |
6.250%, 08/15/23 | | | 67,180 | | | 84,395 |
7.625%, 02/15/25 | | | 23,880 | | | 33,984 |
4.250%, 05/15/39 | | | 204,236 | | | 205,066 |
4.375%, 11/15/39 (D) | | | 91,525 | | | 93,813 |
4.625%, 02/15/40 | | | 38,328 | | | 40,927 |
| | | | | | |
| | | | | | 482,772 |
| | | | | | |
U.S. Treasury STRIPS | | | | | | |
4.101%, 11/15/21 | | | 120,165 | | | 76,914 |
4.485%, 02/15/23 | | | 35,235 | | | 21,092 |
| | | | | | |
| | | | | | 98,006 |
| | | | | | |
Total U.S. Treasury Obligations
(Cost $686,432) ($ Thousands) | | | | | | 718,019 |
| | | | | | |
|
U.S. GOVERNMENT AGENCY OBLIGATIONS — 2.2% |
FICO STRIPS, PO | | | | | | |
0.000%, 08/03/18 to 03/07/19 (G) | | | 34,625 | | | 25,224 |
FICO STRIPS | | | | | | |
4.471%, 03/26/19 (C) | | | 12,000 | | | 8,437 |
4.928%, 09/26/19 (C) | | | 12,145 | | | 8,282 |
FNMA | | | | | | |
2.625%, 07/22/10 (D) | | | 14,200 | | | 14,204 |
Resolution Funding STRIPS | | | | | | |
3.794%, 10/15/17 (C) | | | 6,445 | | | 5,014 |
| | | | | | |
Total U.S. Government Agency Obligations
(Cost $58,403) ($ Thousands) | | | | | | 61,161 |
| | | | | | |
|
MUNICIPAL BONDS — 1.8% |
Bay Area, Toll Authority, Build America Project, RB | | | | | | |
6.263%, 04/01/49 | | | 5,000 | | | 5,320 |
Dallas County Hospital District, | | | | | | |
Ser C, GO | | | | | | |
5.621%, 08/15/44 | | | 4,993 | | | 5,374 |
Indianapolis Local Public Improvement Bond Bank, RB | | | | | | |
6.116%, 01/15/40 | | | 440 | | | 474 |
Los Angeles, Department of Water & Power, RB | | | | | | |
6.008%, 07/01/39 | | | 5,000 | | | 5,087 |
New York City Municipal Water Finance Authority, RB Callable 06/15/20 @ 100 | | | | | | |
6.491%, 06/15/42 | | | 6,630 | | | 6,948 |
| | | | | | |
| Description | | Face Amount
($ Thousands) | | Market Value
($ Thousands) |
| | | | | | |
North Texas Tollway Authority, RB | | | | | | |
6.718%, 01/01/49 | | $ | 4,247 | | $ | 4,605 |
State of California, Build America Project, GO | | | | | | |
7.550%, 04/01/39 | | | 8,000 | | | 8,471 |
7.300%, 10/01/39 | | | 1,500 | | | 1,541 |
State of Illinois, GO | | | | | | |
6.630%, 02/01/35 | | | 3,275 | | | 3,371 |
5.100%, 06/01/33 | | | 6,810 | | | 5,870 |
State of Washington, Ser D, GO | | | | | | |
5.481%, 08/01/39 | | | 2,455 | | | 2,598 |
| | | | | | |
Total Municipal Bonds
(Cost $47,745) ($ Thousands) | | | | | | 49,659 |
| | | | | | |
|
MORTGAGE-BACKED SECURITIES — 0.6% |
|
Agency Mortgage-Backed Obligations — 0.1% |
FHLMC CMO, Ser 2748, Cl ZT | | | | | | |
5.500%, 02/15/24 | | | 531 | | | 577 |
FNMA CMO, Ser 2004-12, Cl ZX | | | | | | |
6.000%, 03/25/34 | | | 698 | | | 807 |
FNMA CMO, Ser 2004-80, Cl XZ | | | | | | |
5.000%, 11/25/34 | | | 409 | | | 419 |
GNMA ARM | | | | | | |
4.375%, 06/20/32 (B) | | | 179 | | | 186 |
| | | | | | |
| | | | | | 1,989 |
| | | | | | |
|
Non-Agency Mortgage-Backed Obligations — 0.5% |
American Home Mortgage
Investment Trust, Ser 2007-2,
Cl 11A1 | | | | | | |
0.573%, 03/25/47 (B) | | | 1,744 | | | 914 |
Bayview Commercial Asset Trust,
Ser 2007-3, Cl A1 | | | | | | |
0.583%, 07/25/37 (B) | | | 2,150 | | | 1,621 |
Commercial Mortgage Loan Trust,
Ser 2008-LS1, Cl A4B | | | | | | |
6.019%, 12/10/49 (B) | | | 1,775 | | | 1,709 |
Countrywide Alternative Loan Trust,
Ser 2005-16, Cl A5 | | | | | | |
0.623%, 06/25/35 (B) (E) | | | 451 | | | 159 |
Countrywide Home Loans,
Ser 2006-2, Cl 1A1 | | | | | | |
0.663%, 03/25/35 (B) | | | 214 | | | 117 |
Credit Suisse Mortgage Capital Certificates, Ser 2006-C5, Cl A3 | | | | | | |
5.311%, 12/15/39 | | | 6,560 | | | 6,349 |
DSLA Mortgage Loan Trust,
Ser 2005-AR2, Cl 2A1A | | | | | | |
0.549%, 03/19/45 (B) (E) | | | 319 | | | 187 |
Harborview Mortgage Loan Trust,
Ser 2004-8, Cl 2A4A | | | | | | |
0.739%, 11/19/34 (B) | | | 397 | | | 242 |
| | |
| 116 | | SEI Institutional Investments Trust / Annual Report / May 31, 2010 |
| | | | | | |
| Description | | Face Amount
($ Thousands) | | Market Value
($ Thousands) |
| | | | | | |
Harborview Mortgage Loan Trust,
Ser 2005-11, Cl 2A1A | | | | | | |
0.649%, 08/19/45 (B) (E) | | $ | 560 | | $ | 353 |
Indymac Index Mortgage Loan Trust, Ser 2004-AR12, Cl A1 | | | | | | |
0.733%, 12/25/34 (B) | | | 190 | | | 101 |
Indymac Index Mortgage Loan Trust, Ser 2004-AR5, Cl 2A1B | | | | | | |
1.143%, 08/25/34 (B) | | | 119 | | | 72 |
Indymac Index Mortgage Loan Trust, Ser 2004-AR7, Cl A2 | | | | | | |
1.203%, 09/25/34 (B) | | | 48 | | | 27 |
Indymac Index Mortgage Loan
Trust, Ser 2005-AR18,
Cl 2A1A | | | | | | |
0.653%, 10/25/36 (A) (B) | | | 23 | | | 14 |
JPMorgan Chase Commercial Mortgage Securities,
Ser 2006-LDP7, Cl A4 | | | | | | |
5.874%, 04/15/45 (B) | | | 535 | | | 557 |
Washington Mutual Mortgage Pass-Through Certificates,
Ser 2000-1, Cl M2 | | | | | | |
1.643%, 01/25/40 (B) | | | 104 | | | 99 |
Washington Mutual Mortgage Pass-Through Certificates,
Ser 2005-AR2, Cl 2A21 | | | | | | |
0.673%, 01/25/45 (B) | | | 305 | | | 206 |
Washington Mutual Mortgage Pass-Through Certificates,
Ser 2007-OA3, Cl 4A1 | | | | | | |
1.211%, 04/25/47 (B) | | | 243 | | | 129 |
| | | | | | |
| | | | | | 12,856 |
| | | | | | |
Total Mortgage-Backed Securities
(Cost $14,470) ($ Thousands) | | | | | | 14,845 |
| | | | | | |
|
ASSET-BACKED SECURITIES — 0.4% |
|
Mortgage Related Securities — 0.4% |
Bayview Financial Acquisition Trust, Ser 2005-A, Cl A1 | | | | | | |
1.354%, 02/28/40 (B) | | | 3,818 | | | 2,100 |
Citigroup Mortgage Loan Trust,
Ser 2006-AMC1, Cl A2B | | | | | | |
0.160%, 09/25/36 (B) | | | 9,567 | | | 4,298 |
Indymac Home Equity Loan Asset-Backed Trust,
Ser 2002- A, Cl M1 | | | | | | |
1.468%, 05/25/33 (B) | | | 494 | | | 289 |
JPMorgan Mortgage Acquisition,
Ser 2007-HE1, Cl AV1 | | | | | | |
0.403%, 03/25/47 (B) | | | 453 | | | 314 |
Nationstar Home Equity Loan Trust, Ser 2006-B, Cl AV3 | | | | | | |
0.513%, 09/25/36 (B) | | | 2,565 | | | 1,796 |
| | | | | | |
| Description | | Face Amount
($ Thousands)/
Shares | | Market Value
($ Thousands) |
| | | | | | |
Triton Container Finance LLC,
Ser 2006-1A, Cl NOTE | | | | | | |
0.515%, 11/26/21 (B) | | $ | 1,365 | | $ | 1,221 |
| | | | | | |
Total Asset-Backed Securities
(Cost $12,165) ($ Thousands) | | | | | | 10,018 |
| | | | | | |
|
COMMERCIAL PAPER (C) — 1.7% |
BNP Paribas Finance | | | | | | |
0.230%, 06/03/10 | | | 16,655 | | | 16,654 |
Lloyds TSB Bank | | | | | | |
0.245%, 06/17/10 | | | 12,245 | | | 12,243 |
Moody’s | | | | | | |
0.280%, 06/10/10 | | | 18,770 | | | 18,768 |
| | | | | | |
Total Commercial Paper
(Cost $47,667) ($ Thousands) | | | | | | 47,665 |
| | | | | | |
|
CASH EQUIVALENT — 1.7% |
SEI Daily Income Trust, Prime Obligation Fund, Cl A, | | | | | | |
0.090%*† | | | 46,555,386 | | | 46,555 |
| | | | | | |
Total Cash Equivalent
(Cost $46,555) ($ Thousands) | | | | | | 46,555 |
| | | | | | |
Total Investments — 100.0%
(Cost $2,579,464) ($ Thousands) | | | | | $ | 2,736,148 |
| | | | | | |
A summary of the open futures contracts held by the Fund at May 31, 2010, is as follows:
| | | | | | | | | |
Type of
Contract | | Number of
Contracts
Long (Short) | | | Expiration
Date | | Unrealized
Appreciation
(Depreciation)
($ Thousands) | |
U.S. 10-Year Treasury Note | | (250 | ) | | Sept-2010 | | $ | 188 | |
U.S. Long Treasury Bond | | 688 | | | Oct-2010 | | | (1,147 | ) |
U.S. Ultra Long Treasury Bond | | 1,272 | | | Oct-2010 | | | (2,721 | ) |
| | | | | | | | | |
| | | | | | | $ | (3,680 | ) |
| | | | | | | | | |
For the year ended May 31, 2010, the total amount of all open futures contracts, as presented in the table above, are representative of the volume of activity for this derivative type during the period.
| | |
| SEI Institutional Investments Trust / Annual Report / May 31, 2010 | | 117 |
SCHEDULE OF INVESTMENTS
Long Duration Fund (Concluded)
May 31, 2010
A summary of outstanding swap agreements held by the Fund at May 31, 2010, is as follows:
| | | | | | | | | | | | | | | | | |
| Credit Default Swap | |
| Counterparty | | Reference Entity/Obligation | | Buy/Sell Protection | | (Pays)/
Receives Rate | | | Termination Date | | Notional Amount
(Thousands) | | | Net Unrealized
Depreciation
($ Thousands) | |
| Credit Suisse | | ABX.HE.AAA 07-1 Index | | SELL | | 0.09 | % | | 08/25/37 | | $ | (1,225 | ) | | $ | (511 | ) |
| | | | | | | | | | | | | | | | | |
Percentages are based on Net Assets of $2,736,187 ($ Thousands).
| * | | The rate reported is the 7-day effective yield as of May 31, 2010. |
| † | | Investment in Affiliated Security (See Note 5). |
| ‡ | | Real Estate Investment Trust |
| (A) | | Securities sold within terms of a private placement memorandum, exempt from registration under Section 144A of the Securities Act of 1933, as amended, and may be sold only to dealers in that program or other “accredited investors.” These securities have been determined to be liquid under guidelines established by the Board of Trustees. |
| (B) | | Variable Rate Security—The rate reported is the rate in effect as of May 31, 2010. The date reported is the final maturity date. |
| (C) | | The rate reported is the effective yield at time of purchase. |
| (D) | | Security, or a portion thereof, has been pledged as collateral on open futures contracts. |
| (E) | | Step Bonds—The rate reported is the effective yield as of May 31, 2010. The coupon on a step bond changes on a specific date. |
| (F) | | Security is when issued. |
| (G) | | Zero Coupon Security. The rate reported is the effective yield at time of purchase. |
ARM — Adjustable Rate Mortgage
Cl — Class
CMO — Collateralized Mortgage Obligation
FHLMC — Federal Home Loan Mortgage Corporation
FICO — Fair Isaac Corporation
FNMA — Federal National Mortgage Association
GNMA — Government National Mortgage Association
GO — General Obligation
LLC — Limited Liability Company
MTN — Medium Term Note
NY — New York
PO — Principal Only
RB — Revenue Bond
REIT — Real Estate Investment Trust
Ser — Series
STRIPS — Separately Traded Registered Interest and Principal Securities
Amounts designated as “—” are $0 or have been rounded to $0.
The following is a summary of the inputs used as of May 31, 2010 in valuing the Fund’s investments carried at value ($ Thousands):
| | | | | | | | | | | | |
| Investments in Securities | | Level 1 | | Level 2 | | Level 3 | | Total |
Corporate Obligations | | $ | — | | $ | 1,788,226 | | $ | — | | $ | 1,788,226 |
U.S. Treasury Obligations | | | — | | | 718,019 | | | — | | | 718,019 |
U.S. Government Agency Obligations | | | — | | | 61,161 | | | — | | | 61,161 |
Municipal Bonds | | | — | | | 49,659 | | | — | | | 49,659 |
Mortgage-Backed Securities | | | — | | | 14,845 | | | — | | | 14,845 |
Asset-Backed Securities | | | — | | | 10,018 | | | — | | | 10,018 |
Commercial Paper | | | — | | | 47,665 | | | — | | | 47,665 |
Cash Equivalent | | | 46,555 | | | — | | | — | | | 46,555 |
| | | | | | | | | | | | |
Total Investments in Securities | | $ | 46,555 | | $ | 2,689,593 | | $ | — | | $ | 2,736,148 |
| | | | | | | | | | | | |
| | | | | | | | | | | | | | | |
| Other Financial Instruments | | Level 1 | | | Level 2 | | | Level 3 | | Total | |
Futures Contracts* | | $ | (3,680 | ) | | $ | — | | | $ | — | | $ | (3,680 | ) |
Credit Default Swap | | | — | | | | (511 | ) | | | — | | | (511 | ) |
| | | | | | | | | | | | | | | |
Total Other Financial Instruments | | $ | (3,680 | ) | | $ | (511 | ) | | $ | — | | $ | (4,191 | ) |
| | | | | | | | | | | | | | | |
| * | | Futures contracts are valued at the unrealized depreciation on the instrument. |
For more information on valuation inputs, see Note 2 — Significant Accounting Policies in Notes to Financial Statements.
The accompanying notes are an integral part of the financial statements.
| | |
| 118 | | SEI Institutional Investments Trust / Annual Report / May 31, 2010 |
SCHEDULE OF INVESTMENTS
Emerging Markets Debt Fund
May 31, 2010
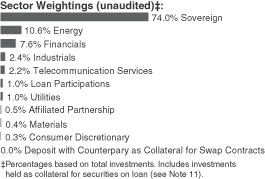
| | | | | | | |
| Description | | | | Face Amount
(Thousands) (1) | | Market Value
($ Thousands) |
| | | | | | | |
| | | |
GLOBAL BONDS — 91.8% | | | | | | | |
| | | |
Argentina — 3.2% | | | | | | | |
Provincia de Buenos Aires | | | | | | | |
9.625%, 04/18/28 (A) | | | | 1,460 | | $ | 1,029 |
9.625%, 04/18/28 | | | | 1,335 | | | 941 |
9.375%, 09/14/18 | | | | 440 | | | 319 |
9.375%, 09/14/18 | | | | 1,000 | | | 728 |
4.000%, 05/15/35 | | | | 439 | | | 158 |
Provincia de Mendoza Argentina | | | | | | | |
5.500%, 09/04/18 | | | | 307 | | | 234 |
Provincia de Neuquen Argentina | | | | | | | |
8.656%, 10/18/14 (A) | | | | 153 | | | 158 |
Republic of Argentina | | | | | | | |
10.250%, 02/06/03 (B) | | | | 1,400 | | | 351 |
10.250%, 01/26/07 (B) | | EUR | | 850 | | | 425 |
9.000%, 11/19/08 | | | | 1,000 | | | 230 |
9.000%, 05/26/09 (B) | | EUR | | 1,595 | | | 634 |
8.500%, 07/01/04 (B) | | EUR | | 4,500 | | | 2,109 |
8.280%, 12/31/33 | | | | 10,813 | | | 6,975 |
8.125%, 04/21/08 (B) | | EUR | | 2,818 | | | 1,181 |
7.875%, 07/29/05 (B) | | | | 275 | | | 65 |
7.000%, 10/03/15 | | | | 5,800 | | | 4,230 |
6.000%, 03/31/23 (B) | | | | 172 | | | 96 |
3.169%, 12/15/35 (C) | | | | 11,725 | | | 797 |
2.500%, 03/31/19 (D) | | | | 7,920 | | | 2,851 |
0.389%, 08/03/12 (C) | | | | 14,560 | | | 4,732 |
0.000%, 03/31/23 (B) (C) | | | | 1,680 | | | 924 |
0.000%,12/15/35 (C) | | | | 2,905 | | | 196 |
Republic of Argentina,
Ser E MTN | | | | | | | |
9.250%, 07/20/04 (B) | | EUR | | 2,100 | | | 984 |
7.000%, 03/18/04 (B) | | EUR | | 2,554 | | | 1,030 |
Transportadora Gas Norte (B) | | | | | | | |
7.500%, 12/31/12 (D) | | | | 100 | | | 48 |
7.500%, 12/31/12 (A) (D) | | | | 210 | | | 101 |
7.500%, 12/31/12 | | | | 350 | | | 168 |
6.500%, 12/31/12 (A) (D) | | | | 30 | | | 15 |
6.500%, 12/31/12 (D) | | | | 60 | | | 29 |
6.500%, 12/31/12 (D) | | | | 60 | | | 29 |
| | | | | | | |
| | | | | | | 31,767 |
| | | | | | | |
| | | | | | | |
| Description | | | | Face Amount
(Thousands) (1) | | Market Value
($ Thousands) |
| | | | | | | |
| | | |
Bahrain — 0.1% | | | | | | | |
Kingdom of Bahrain | | | | | | | |
5.500%, 03/31/20 (A) | | | | 1,444 | | $ | 1,415 |
| | | | | | | |
| | | |
Barbados — 0.2% | | | | | | | |
Columbus International | | | | | | | |
11.500%, 11/20/14 (A) | | | | 1,900 | | | 2,014 |
| | | | | | | |
| |
Belize — 0.0% | | | |
Government of Belize | | | | | | | |
6.000%, 02/20/29 | | | | 330 | | | 238 |
| | | | | | | |
| | | |
Bosnia and Herzegovina — 0.1% | | | | | | | |
Republic of Bosnia & Herzegovina | | | | | | | |
10.039%, 12/11/21 (C) | | EUR | | 2,000 | | | 908 |
| | | | | | | |
| | | |
Brazil — 9.3% | | | | | | | |
Banco Nacional de Desenvolvimento Economico e Social | | | | | | | |
6.500%, 06/10/19 (A) | | | | 2,605 | | | 2,683 |
5.500%, 07/12/20 (A) | | | | 700 | | | 679 |
Banco Votorantim | | | | | | | |
7.375%, 01/21/20 (A) | | | | 840 | | | 857 |
Brazil Notas do Tesouro Nacional, Ser F | | | | | | | |
10.000%, 01/01/17 | | BRL | | 9,250 | | | 4,743 |
10.000%, 01/01/21 | | | | 48,255 | | | 23,746 |
Federal Republic of Brazil | | | | | | | |
12.250%, 03/06/30 | | | | 195 | | | 341 |
11.000%, 08/17/40 | | | | 5,795 | | | 7,685 |
10.125%, 05/15/27 | | | | 2,695 | | | 4,009 |
8.875%, 04/15/24 | | | | 3,710 | | | 4,916 |
8.875%, 10/14/19 | | | | 1,355 | | | 1,748 |
8.750%, 02/04/25 | | | | 3,568 | | | 4,754 |
8.250%, 01/20/34 | | | | 6,495 | | | 8,395 |
8.000%, 01/15/18 | | | | 1,973 | | | 2,251 |
7.125%, 01/20/37 | | | | 2,625 | | | 3,019 |
6.000%, 01/17/17 | | | | 5,270 | | | 5,710 |
5.875%, 01/15/19 | | | | 6,110 | | | 6,538 |
5.625%, 01/07/41 | | | | 950 | | | 915 |
4.875%, 01/22/21 | | | | 3,990 | | | 3,900 |
Fibria Overseas Finance | | | | | | | |
7.500%, 05/04/20 (A) | | | | 1,597 | | | 1,565 |
Petrobras International Finance | | | | | | | |
7.875%, 03/15/19 | | | | 740 | | | 837 |
Rearden G Holdings | | | | | | | |
7.875%, 03/30/20 (A) | | | | 207 | | | 202 |
Voto-Votorantim | | | | | | | |
6.750%, 04/05/21 (A) (E) | | | | 2,170 | | | 2,132 |
| | |
| SEI Institutional Investments Trust / Annual Report / May 31, 2010 | | 119 |
SCHEDULE OF INVESTMENTS
Emerging Markets Debt Fund (Continued)
May 31, 2010
| | | | | | | |
| Description | | | | Face Amount
(Thousands) (1) | | Market Value
($ Thousands) |
| | | | | | | |
Voto-Votorantim Overseas Trading Operations | | | | | | | |
6.625%, 09/25/19 (A) | | | | 600 | | $ | 589 |
| | | | | | | |
| | | | | | | 92,214 |
| | | | | | | |
| | | |
Chile — 0.3% | | | | | | | |
Empresa Nacional del Petroleo | | | | | | | |
6.250%, 07/08/19 (A) | | | | 1,300 | | | 1,302 |
Nacional del Cobre de Chile | | | | | | | |
7.500%, 01/15/19 | | | | 450 | | | 530 |
6.150%, 10/24/36 | | | | 200 | | | 206 |
6.150%, 10/24/36 (A) | | | | 905 | | | 929 |
| | | | | | | |
| | | | | | | 2,967 |
| | | | | | | |
| | | |
China — 0.1% | | | | | | | |
Evergrande | | | | | | | |
13.000%, 01/27/15 | | | | 800 | | | 752 |
| | | | | | | |
| | | |
Colombia — 4.5% | | | | | | | |
Ecopetrol | | | | | | | |
7.625%, 07/23/19 (A) | | | | 750 | | | 834 |
Republic of Colombia | | | | | | | |
11.750%, 02/25/20 | | | | 2,258 | | | 3,291 |
10.375%, 01/28/33 | | | | 450 | | | 642 |
9.850%, 06/28/27 | | COP | | 1,572,000 | | | 990 |
8.375%, 02/15/27 | | | | 3,100 | | | 3,550 |
8.125%, 05/21/24 | | | | 3,180 | | | 3,768 |
7.375%, 09/18/37 | | | | 9,080 | | | 10,033 |
7.375%, 01/27/17 | | | | 5,285 | | | 6,065 |
7.375%, 03/18/19 | | | | 5,545 | | | 6,391 |
6.125%, 01/18/41 | | | | 1,375 | | | 1,306 |
Santa Fe de Bogota | | | | | | | |
9.750%, 07/26/28 (A) | | COP | | 13,095,000 | | | 7,457 |
| | | | | | | |
| | | | | | | 44,327 |
| | | | | | | |
| | | |
Croatia — 0.2% | | | | | | | |
Republic of Croatia | | | | | | | |
6.750%, 11/05/19 (A) | | | | 200 | | | 209 |
6.750%, 11/05/19 | | | | 300 | | | 311 |
Zagrebacki Holding D.O.O. | | | | | | | |
5.500%, 07/10/17 | | | | 1,500 | | | 1,480 |
| | | | | | | |
| | | | | | | 2,000 |
| | | | | | | |
| | | |
Czech Republic — 0.1% | | | | | | | |
Central European Media Enterprises | | | | | | | |
11.625%, 09/15/16 (A) | | | | 600 | | | 721 |
| | | | | | | |
| | | |
Dominican Republic — 0.1% | | | | | | | |
Republic of Dominican Republic | | | | | | | |
9.040%, 01/23/18 | | | | 27 | | | 30 |
7.500%, 05/06/21 (A) | | | | 1,130 | | | 1,115 |
| | | | | | | |
| | | | | | | 1,145 |
| | | | | | | |
| | | | | | | |
| Description | | | | Face Amount
(Thousands) (1) | | Market Value
($ Thousands) |
| | | | | | | |
| | | |
Ecuador — 0.1% | | | | | | | |
Republic of Ecuador | | | | | | | |
9.375%, 12/15/15 | | | | 1,150 | | $ | 1,090 |
| | | | | | | |
| | | |
Egypt — 0.2% | | | | | | | |
Arab Republic of Egypt | | | | | | | |
5.750%, 04/29/20 (A) | | | | 1,783 | | | 1,796 |
| | | | | | | |
| | | |
El Salvador — 0.9% | | | | | | | |
Republic of El Salvador | | | | | | | |
8.250%, 04/10/32 | | | | 100 | | | 107 |
8.250%, 04/10/32 | | | | 3,710 | | | 4,044 |
7.650%, 06/15/35 | | | | 3,744 | | | 3,875 |
7.375%, 12/01/19 | | | | 200 | | | 214 |
7.375%, 12/01/19 (A) | | | | 500 | | | 536 |
| | | | | | | |
| | | | | | | 8,776 |
| | | | | | | |
| | | |
Georgia — 0.5% | | | | | | | |
BG Finance for JSC Bank of Georgia | | | | | | | |
9.000%, 02/08/12 | | | | 2,500 | | | 2,375 |
Republic of Georgia | | | | | | | |
7.500%, 04/15/13 | | | | 2,800 | | | 2,891 |
| | | | | | | |
| | | | | | | 5,266 |
| | | | | | | |
| | | |
Ghana — 0.2% | | | | | | | |
Republic of Ghana | | | | | | | |
8.500%, 10/04/17 (A) | | | | 600 | | | 618 |
8.500%, 10/04/17 | | | | 1,250 | | | 1,287 |
| | | | | | | |
| | | | | | | 1,905 |
| | | | | | | |
| | | |
Hong Kong — 0.2% | | | | | | | |
Bank of China Hong Kong | | | | | | | |
5.550%, 02/11/20 (A) | | | | 2,450 | | | 2,433 |
| | | | | | | |
| | | |
Hungary — 0.4% | | | | | | | |
Republic of Hungary | | | | | | | |
6.250%, 01/29/20 | | | | 3,720 | | | 3,700 |
| | | | | | | |
| | | |
India — 0.4% | | | | | | | |
Indian Oil | | | | | | | |
4.750%, 01/22/15 | | | | 550 | | | 558 |
State Bank of India MTN | | | | | | | |
4.500%, 10/23/14 | | | | 850 | | | 869 |
Vedanta Resources | | | | | | | |
9.500%, 07/18/18 (A) | | | | 2,295 | | | 2,341 |
| | | | | | | |
| | | | | | | 3,768 |
| | | | | | | |
| | | |
Indonesia — 7.4% | | | | | | | |
Adaro Indonesia | | | | | | | |
7.625%, 10/22/19 | | | | 1,965 | | | 1,994 |
Majapahit Holding | | | | | | | |
8.000%, 08/07/19 (A) | | | | 1,415 | | | 1,514 |
| | |
| 120 | | SEI Institutional Investments Trust / Annual Report / May 31, 2010 |
| | | | | | | |
| Description | | | | Face Amount
(Thousands) (1) | | Market Value
($ Thousands) |
| | | | | | | |
7.875%, 06/29/37 (A) | | | | 415 | | $ | 407 |
7.750%, 10/17/16 (A) | | | | 150 | | | 162 |
7.750%, 10/17/16 | | | | 1,250 | | | 1,327 |
7.750%, 01/20/20 (A) | | | | 2,295 | | | 2,415 |
7.250%, 10/17/11 (A) | | | | 885 | | | 931 |
Republic of Indonesia | | | | | | | |
11.625%, 03/04/19 (A) | | | | 5,610 | | | 8,008 |
11.625%, 03/04/19 | | | | 1,700 | | | 2,427 |
11.500%, 09/15/19 | | | | 7,300,000 | | | 909 |
11.000%, 11/15/20 | | | | 17,100,000 | | | 2,081 |
10.375%, 05/04/14 (A) | | | | 300 | | | 369 |
10.375%, 05/04/14 | | | | 1,000 | | | 1,230 |
10.000%, 06/17/21 | | | | 46,100,000 | | | 6,221 |
8.500%, 10/12/35 | | | | 4,612 | | | 5,719 |
7.750%, 01/17/38 | | | | 650 | | | 743 |
7.750%, 01/17/38 | | | | 16,415 | | | 18,754 |
7.500%, 01/15/16 | | | | 3,390 | | | 3,858 |
7.250%, 04/20/15 | | | | 1,390 | | | 1,570 |
6.875%, 01/17/18 (A) | | | | 1,500 | | | 1,680 |
6.875%, 01/17/18 | | | | 3,630 | | | 4,066 |
6.750%, 03/10/14 | | | | 1,450 | | | 1,581 |
6.750%, 03/10/14 (A) | | | | 500 | | | 549 |
6.625%, 02/17/37 | | | | 2,500 | | | 2,512 |
5.875%, 03/13/20 (A) | | | | 1,800 | | | 1,863 |
Star Energy | | | | | | | |
11.500%, 02/12/15 | | | | 500 | | | 513 |
| | | | | | | |
| | | | | | | 73,403 |
| | | | | | | |
| |
Iraq — 1.2% | | |
Republic of Iraq | | | | | | | |
5.800%, 01/15/28 | | | | 14,165 | | | 11,651 |
| | | | | | | |
| |
Ivory Coast — 0.2% | | |
Government of Ivory Coast | | | | | | | |
2.450%, 12/31/32 | | | | 3,437 | | | 1,718 |
| | | | | | | |
| |
Jamaica — 0.0% | | |
Digicel Group | | | | | | | |
8.875%, 01/15/15 (A) | | | | 450 | | | 435 |
| | | | | | | |
| |
Kazakhstan — 3.6% | | |
CenterCredit International | | | | | | | |
8.625%, 01/30/14 | | | | 2,249 | | | 2,142 |
Citigroup Global Markets for JSC Kazkommertsbank | | | | | | | |
8.700%, 04/07/14 (C) | | | | 1,550 | | | 1,325 |
Halyk Savings Bank of Kazakhstan | | | | | | | |
9.250%, 10/16/13 | | | | 875 | | | 884 |
7.750%, 05/13/13 | | | | 100 | | | 100 |
7.250%, 05/03/17 | | | | 650 | | | 586 |
Kazatomprom | | | | | | | |
6.250%, 05/20/15 | | | | 1,050 | | | 1,037 |
| | | | | | | |
| Description | | | | Face Amount
(Thousands) (1) | | Market Value
($ Thousands) |
| | | | | | | |
Kazkommertsbank | | | | | | | |
8.500%, 04/16/13 | | | | 1,350 | | $ | 1,239 |
8.000%, 11/03/15 | | | | 1,650 | | | 1,485 |
7.875%, 04/07/14 | | | | 900 | | | 812 |
7.500%, 11/29/16 | | | | 2,350 | | | 2,056 |
6.875%, 02/13/17 | | | | 500 | | | 547 |
KazMunaiGaz Finance MTN | | | | | | | |
11.750%, 01/23/15 (A) | | | | 3,910 | | | 4,653 |
9.125%, 07/02/18 (A) | | | | 3,125 | | | 3,437 |
9.125%, 07/02/18 | | | | 4,323 | | | 4,764 |
8.375%, 07/02/13 | | | | 4,450 | | | 4,717 |
7.000%, 05/05/20 (A) | | | | 5,655 | | | 5,443 |
Tengizchevroil Finance | | | | | | | |
6.124%, 11/15/14 | | | | 412 | | | 416 |
| | | | | | | |
| | | | | | | 35,643 |
| | | | | | | |
| | | |
Lithuania — 0.5% | | | | | | | |
Republic of Lithuania | | | | | | | |
7.375%, 02/11/20 (A) | | | | 2,150 | | | 2,220 |
7.375%, 02/11/20 | | | | 1,700 | | | 1,779 |
6.750%, 01/15/15 (A) | | | | 1,405 | | | 1,442 |
| | | | | | | |
| | | | | | | 5,441 |
| | | | | | | |
| |
Malaysia — 3.2% | | |
Government of Malaysia | | | | | | | |
4.378%, 11/29/19 | | | | 12,720 | | | 3,961 |
3.741%, 02/27/15 | | | | 12,440 | | | 3,798 |
Malaysia Sukuk Global Berhad | | | | | | | |
3.928%, 06/04/15 (A) | | | | 450 | | | 450 |
Petroliam Nasional | | | | | | | |
7.750%, 08/15/15 | | | | 1,460 | | | 1,758 |
7.625%, 10/15/26 | | | | 430 | | | 512 |
Petronas Capital | | | | | | | |
7.875%, 05/22/22 | | | | 4,930 | | | 5,921 |
7.875%, 05/22/22 (A) | | | | 450 | | | 543 |
7.000%, 05/22/12 | | | | 3,055 | | | 3,334 |
5.250%, 08/12/19 (A) | | | | 11,115 | | | 11,350 |
5.250%, 08/12/19 | | | | 500 | | | 513 |
| | | | | | | |
| | | | | | | 32,140 |
| | | | | | | |
|
Mexico — 8.9% |
BBVA Bancomer | | | | | | | |
6.008%, 05/17/22 (C) | | | | 780 | | | 703 |
Cemex Espana Luxembourg | | | | | | | |
9.250%, 05/12/20 (A) | | | | 1,739 | | | 1,487 |
Grupo Senda | | | | | | | |
10.500%, 10/03/15 | | | | 4,590 | | | 4,177 |
Mexican Bonos | | | | | | | |
9.500%, 12/18/14 | | | | 12,283 | | | 1,076 |
8.500%, 05/31/29 | | | | 24,800 | | | 2,040 |
8.000%, 12/17/15 | | | | 33,430 | | | 2,776 |
8.000%, 06/11/20 | | | | 30,860 | | | 2,516 |
7.500%, 06/03/27 | | | | 50,230 | | | 3,785 |
| | |
| SEI Institutional Investments Trust / Annual Report / May 31, 2010 | | 121 |
SCHEDULE OF INVESTMENTS
Emerging Markets Debt Fund (Continued)
May 31, 2010
| | | | | | | |
| Description | | | | Face Amount
(Thousands) (1) | | Market Value
($ Thousands) |
| | | | | | | |
Mexican Bonos, Ser M10 | | | | | | | |
7.250%, 12/15/16 | | MXP | | 13,000 | | $ | 1,035 |
NII Capital | | | | | | | |
10.000%, 08/15/16 | | | | 4,900 | | | 5,243 |
Oceanografia | | | | | | | |
11.250%, 07/15/15 | | | | 1,286 | | | 797 |
Pemex Finance | | | | | | | |
9.150%, 11/15/18 | | | | 1,895 | | | 2,402 |
Pemex Project Funding Master Trust | | | | | | | |
6.625%, 06/15/35 | | | | 400 | | | 392 |
5.750%, 03/01/18 | | | | 1,670 | | | 1,696 |
Petroleos Mexicanos | | | | | | | |
8.000%, 05/03/19 (A) | | | | 465 | | | 536 |
8.000%, 05/03/19 | | | | 1,150 | | | 1,325 |
6.000%, 03/05/20 (A) | | | | 500 | | | 506 |
United Mexican States | | | | | | | |
11.375%, 09/15/16 | | | | 540 | | | 748 |
8.300%, 08/15/31 | | | | 13,060 | | | 16,847 |
8.125%, 12/30/19 | | | | 1,290 | | | 1,583 |
7.500%, 04/08/33 | | | | 1,430 | | | 1,702 |
6.625%, 03/03/15 | | | | 2,650 | | | 2,975 |
6.050%, 01/11/40 | | | | 10,274 | | | 10,325 |
5.950%, 03/19/19 | | | | 4,890 | | | 5,269 |
5.625%, 01/15/17 | | | | 4,550 | | | 4,880 |
5.125%, 01/15/20 | | | | 3,662 | | | 3,726 |
United Mexican States,
Ser A MTN | | | | | | | |
6.750%, 09/27/34 | | | | 6,568 | | | 7,208 |
| | | | | | | |
| | | | | | | 87,755 |
| | | | | | | |
|
Nigeria — 0.1% |
GTB Finance | | | | | | | |
8.500%, 01/29/12 | | | | 500 | | | 507 |
UBS | | | | | | | |
0.000%, | | | | | | | |
09/04/17 (A) (C) | | | | 800 | | | 787 |
| | | | | | | |
| | | | | | | 1,294 |
| | | | | | | |
| | | |
Oman — 0.0% | | | | | | | |
Blue City Investments | | | | | | | |
13.750%, 11/07/13 | | | | 2,750 | | | 275 |
4.174%, 11/07/13 (C) | | | | 500 | | | 175 |
| | | | | | | |
| | | | | | | 450 |
| | | | | | | |
| | | |
Pakistan — 0.6% | | | | | | | |
Pakistan Mobile Communications | | | | | | | |
8.625%, 11/13/13 (A) | | | | 330 | | | 297 |
Republic of Pakistan | | | | | | | |
7.125%, 03/31/16 | | | | 3,650 | | | 3,368 |
6.875%, 06/01/17 | | | | 2,850 | | | 2,565 |
| | | | | | | |
| | | | | | | 6,230 |
| | | | | | | |
| | | | | | | |
| Description | | | | Face Amount
(Thousands) (1) | | Market Value
($ Thousands) |
| | | | | | | |
| | | |
Panama — 2.1% | | | | | | | |
Republic of Panama | | | | | | | |
9.375%, 04/01/29 | | | | 7,540 | | $ | 10,443 |
9.375%, 01/16/23 | | | | 595 | | | 777 |
8.875%, 09/30/27 | | | | 3,400 | | | 4,556 |
8.125%, 04/28/34 | | | | 940 | | | 1,180 |
7.250%, 03/15/15 | | | | 2,150 | | | 2,483 |
6.700%, 01/26/36 | | | | 1,650 | | | 1,819 |
| | | | | | | |
| | | | | | | 21,258 |
| | | | | | | |
| | | |
Peru — 2.7% | | | | | | | |
Interoceanica IV Finance | | | | | | | |
3.966%, 11/30/25 (A) (F) | | | | 749 | | | 333 |
3.899%, 11/30/18 (A) (F) | | | | 358 | | | 257 |
3.230%, 11/30/18 | | | | 656 | | | 470 |
Peru Enhanced Pass-Through Finance | | | | | | | |
7.295%, 06/02/25 (A) (F) | | | | 500 | | | 224 |
4.417%, 05/31/18 (F) | | | | 1,623 | | | 1,299 |
3.998%, 05/31/18 (A) (F) | | | | 507 | | | 405 |
Republic of Peru | | | | | | | |
8.750%, 11/21/33 | | | | 2,661 | | | 3,519 |
8.375%, 05/03/16 | | | | 350 | | | 425 |
7.350%, 07/21/25 | | | | 11,720 | | | 13,712 |
6.550%, 03/14/37 | | | | 5,675 | | | 6,118 |
| | | | | | | |
| | | | | | | 26,762 |
| | | | | | | |
| | | |
Philippines — 5.7% | | | | | | | |
National Power | | | | | | | |
9.625%, 05/15/28 | | | | 1,100 | | | 1,342 |
Power Sector | | | | | | | |
7.390%, 12/02/24 | | | | 1,465 | | | 1,586 |
7.250%, 05/27/19 | | | | 760 | | | 830 |
Republic of Philippines | | | | | | | |
10.625%, 03/16/25 | | | | 4,661 | | | 6,712 |
9.500%, 02/02/30 | | | | 2,730 | | | 3,668 |
9.500%, 10/21/24 | | | | 200 | | | 264 |
9.375%, 01/18/17 | | | | 10,040 | | | 12,763 |
8.875%, 03/17/15 | | | | 500 | | | 613 |
8.375%, 06/17/19 | | | | 650 | | | 803 |
8.250%, 01/15/14 | | | | 2,575 | | | 3,000 |
8.000%, 01/15/16 | | | | 4,650 | | | 5,592 |
7.750%, 01/14/31 | | | | 3,624 | | | 4,199 |
7.500%, 09/25/24 | | | | 7,964 | | | 9,298 |
6.500%, 01/20/20 | | | | 500 | | | 544 |
6.375%, 10/23/34 | | | | 4,290 | | | 4,279 |
6.375%, 01/15/32 | | | | 890 | | | 890 |
| | | | | | | |
| | | | | | | 56,383 |
| | | | | | | |
| | | |
Poland — 1.6% | | | | | | | |
Republic of Poland | | | | | | | |
6.375%, 07/15/19 | | | | 13,105 | | | 14,271 |
| | |
| 122 | | SEI Institutional Investments Trust / Annual Report / May 31, 2010 |
| | | | | | | |
| Description | | | | Face Amount
(Thousands) (1) | | Market Value
($ Thousands) |
| | | | | | | |
TVN Finance II | | | | | | | |
10.750%, 11/15/17 (A) | | | | 1,000 | | $ | 1,301 |
| | | | | | | |
| | | | | | | 15,572 |
| | | | | | | |
| | | |
Qatar — 1.2% | | | | | | | |
Qtel International Finance | | | | | | | |
7.875%, 06/10/19 | | | | 3,050 | | | 3,424 |
6.500%, 06/10/14 (A) | | | | 600 | | | 649 |
State of Qatar | | | | | | | |
9.750%, 06/15/30 | | | | 535 | | | 754 |
6.400%, 01/20/40 (A) | | | | 705 | | | 730 |
5.250%, 01/20/20 (A) | | | | 6,240 | | | 6,412 |
| | | | | | | |
| | | | | | | 11,969 |
| | | | | | | |
| | | |
Russia — 8.7% | | | | | | | |
Alfa Dividend Payment Rights Finance MTN | | | | | | | |
2.157%, 12/15/11 (A) (C) | | | | 165 | | | 151 |
Alfa Invest MTN | | | | | | | |
9.250%, 06/24/13 (A) | | | | 1,200 | | | 1,229 |
Alfa Issuance MTN | | | | | | | |
8.000%, 03/18/15 | | | | 208 | | | 202 |
Edel Capital for Sinek Capital SA | | | | | | | |
7.700%, 08/03/15 | | | | 600 | | | 600 |
Gaz Capital MTN | | | | | | | |
8.625%, 04/28/34 | | | | 1,850 | | | 2,037 |
6.510%, 03/07/22 | | | | 220 | | | 207 |
6.510%, 03/07/22 (A) | | | | 1,250 | | | 1,181 |
6.212%, 11/22/16 | | | | 600 | | | 585 |
Kuznetski (Bank of Moscow) | | | | | | | |
7.500%, 11/25/15 (C) | | | | 1,300 | | | 1,297 |
Morgan Stanley Bank for GAZPROM | | | | | | | |
9.625%, 03/01/13 | | | | 700 | | | 769 |
RSHB Capital for Russian Agricultural Bank | | | | | | | |
9.000%, 06/11/14 | | | | 750 | | | 830 |
7.750%, 05/29/18 | | | | 1,250 | | | 1,313 |
6.299%, 05/15/17 | | | | 400 | | | 389 |
Russian Federation | | | | | | | |
12.750%, 06/24/28 | | | | 4,270 | | | 7,131 |
11.200%, 12/17/14 | | | | 49,200 | | | 1,868 |
7.500%, 03/31/30 | | | | 40,567 | | | 45,334 |
Russian Foreign Bond - Eurobond | | | | | | | |
5.000%, 04/29/20 (A) (E) | | | | 3,300 | | | 3,143 |
Teorema Holding | | | | | | | |
11.000%, 10/27/08 (B) | | | | 2,000 | | | 200 |
TNK-BP Finance | | | | | | | |
7.875%, 03/13/18 (A) | | | | 325 | | | 328 |
7.500%, 07/18/16 (A) | | | | 415 | | | 429 |
7.250%, 02/02/20 (A) | | | | 1,098 | | | 1,068 |
6.250%, 02/02/15 (A) | | | | 598 | | | 592 |
TransCapitalInvest (Transneft) | | | | | | | |
8.700%, 08/07/18 (A) | | | | 465 | | | 519 |
| | | | | | | |
| Description | | | | Face Amount
(Thousands) (1) | | Market Value
($ Thousands) |
| | | | | | | |
UBS (Vimpelcom) | | | | | | | |
8.250%, 05/23/16 | | | | 190 | | $ | 195 |
VIP Finance Ireland for Vimpel Communications | | | | | | | |
9.125%, 04/30/18 (A) | | | | 1,460 | | | 1,544 |
9.125%, 04/30/18 | | | | 1,200 | | | 1,269 |
8.375%, 04/30/13 | | | | 800 | | | 835 |
8.375%, 04/30/13 (A) | | | | 1,050 | | | 1,095 |
VTB Capital | | | | | | | |
6.875%, 05/29/18 | | | | 7,550 | | | 7,710 |
6.609%, 10/31/12 (A) | | | | 1,500 | | | 1,535 |
6.250%, 06/30/35 | | | | 498 | | | 492 |
| | | | | | | |
| | | | | | | 86,077 |
| | | | | | | |
| | | |
Saudi Arabia — 0.1% | | | | | | | |
Dar Al-Arkan International Sukuk | | | | | | | |
10.750%, 02/18/15 (A) | | | | 900 | | | 895 |
| | | | | | | |
| | | |
Singapore — 0.4% | | | | | | | |
Sea Production | | | | | | | |
4.500%, 02/14/12 | | | | 8,800 | | | 3,960 |
| | | | | | | |
| | | |
South Africa — 1.7% | | | | | | | |
Consol Glass MTN | | | | | | | |
7.625%, 04/15/14 | | | | 285 | | | 327 |
Edcon Proprietary | | | | | | | |
3.900%, 06/15/14 (C) | | | | 2,350 | | | 2,115 |
Republic of South Africa | | | | | | | |
13.500%, 09/15/15 | | | | 5,840 | | | 946 |
8.500%, 06/23/17 | | | | 815 | | | 974 |
7.500%, 01/15/14 | | | | 7,420 | | | 963 |
6.875%, 05/27/19 | | | | 3,095 | | | 3,455 |
6.500%, 06/02/14 | | | | 2,905 | | | 3,206 |
5.875%, 05/30/22 | | | | 2,445 | | | 2,506 |
5.500%, 03/09/20 | | | | 1,950 | | | 1,965 |
| | | | | | | |
| | | | | | | 16,457 |
| | | | | | | |
| | | |
South Korea — 0.4% | | | | | | | |
Export-Import Bank of Korea | | | | | | | |
8.125%, 01/21/14 | | | | 2,105 | | | 2,398 |
5.875%, 01/14/15 | | | | 1,125 | | | 1,203 |
| | | | | | | |
| | | | | | | 3,601 |
| | | | | | | |
| | | |
Sri Lanka — 0.1% | | | | | | | |
Democratic Socialist Republic of Sri Lanka | | | | | | | |
7.400%, 01/22/15 (A) | | | | 500 | | | 510 |
| | | | | | | |
| | | |
Supra-National — 0.1% | | | | | | | |
Andina de Fomento | | | | | | | |
8.125%, 06/04/19 | | | | 565 | | | 685 |
Central American Bank for Economic Integration | | | | | | | |
5.375%, 09/24/14 (A) | | | | 350 | | | 364 |
| | |
| SEI Institutional Investments Trust / Annual Report / May 31, 2010 | | 123 |
SCHEDULE OF INVESTMENTS
Emerging Markets Debt Fund (Continued)
May 31, 2010
| | | | | | | |
| Description | | | | Face Amount
(Thousands) (1) | | Market Value
($ Thousands) |
| | | | | | | |
Eurasian Development Bank MTN | | | | | | | |
7.375%, 09/29/14 (A) | | | | 350 | | $ | 357 |
| | | | | | | |
| | | | | | | 1,406 |
| | | | | | | |
| | | |
Thailand — 0.2% | | | | | | | |
True Move | | | | | | | |
10.750%, 12/16/13 (A) | | | | 850 | | | 833 |
10.375%, 08/01/14 (A) | | | | 850 | | | 829 |
| | | | | | | |
| | | | | | | 1,662 |
| | | | | | | |
| | | |
Trinidad & Tobago — 0.4% | | | | | | | |
Petroleum of Trinidad & Tobago | | | | | | | |
9.750%, 08/14/19 (A) | | | | 653 | | | 715 |
6.000%, 05/08/22 | | | | 2,375 | | | 2,155 |
6.000%, 05/08/22 (A) | | | | 900 | | | 817 |
| | | | | | | |
| | | | | | | 3,687 |
| | | | | | | |
| | | |
Tunisia — 0.3% | | | | | | | |
Banque Centrale de Tunisie | | | | | | | |
7.375%, 04/25/12 | | | | 2,210 | | | 2,398 |
6.250%, 02/20/13 | | | | 430 | | | 570 |
| | | | | | | |
| | | | | | | 2,968 |
| | | | | | | |
| | | |
Turkey — 4.2% | | | | | | | |
Globus Capital Finance | | | | | | | |
8.500%, 03/05/12 | | | | 700 | | | 616 |
Republic of Turkey | | | | | | | |
11.875%, 01/15/30 | | | | 625 | | | 1,008 |
9.500%, 01/15/14 | | | | 300 | | | 356 |
8.000%, 02/14/34 | | | | 2,150 | | | 2,489 |
7.500%, 11/07/19 | | | | 2,535 | | | 2,890 |
7.500%, 07/14/17 | | | | 2,975 | | | 3,391 |
7.375%, 02/05/25 | | | | 5,975 | | | 6,676 |
7.250%, 03/05/38 | | | | 640 | | | 674 |
7.250%, 03/15/15 | | | | 1,200 | | | 1,350 |
7.000%, 06/05/20 | | | | 550 | | | 605 |
7.000%, 09/26/16 | | | | 1,450 | | | 1,613 |
7.000%, 03/11/19 | | | | 800 | | | 884 |
6.875%, 03/17/36 | | | | 6,895 | | | 7,016 |
6.750%, 05/30/40 | | | | 4,927 | | | 4,890 |
6.750%, 04/03/18 | | | | 6,230 | | | 6,806 |
| | | | | | | |
| | | | | | | 41,264 |
| | | | | | | |
| | | |
Ukraine — 3.9% | | | | | | | |
Biz Finance for Ukreximbank | | | | | | | |
8.375%, 04/27/15 | | | | 1,450 | | | 1,373 |
Credit Suisse First Boston for City of Kiev | | | | | | | |
8.000%, 11/06/15 | | | | 750 | | | 630 |
Credit Suisse First Boston International (Export/Import -Ukraine) | | | | | | | |
7.650%, 09/07/11 | | | | 1,000 | | | 990 |
| | | | | | | |
| Description | | | | Face Amount
(Thousands) (1) | | Market Value
($ Thousands) |
| | | | | | | |
6.800%, 10/04/12 | | | | 800 | | $ | 740 |
Government of Ukraine | | | | | | | |
7.650%, 06/11/13 | | | | 3,625 | | | 3,661 |
7.650%, 06/11/13 | | | | 250 | | | 253 |
6.875%, 03/04/11 | | | | 500 | | | 499 |
6.750%, 11/14/17 | | | | 2,200 | | | 2,009 |
6.580%, 11/21/16 | | | | 3,948 | | | 3,643 |
6.385%, 06/26/12 | | | | 1,445 | | | 1,423 |
3.200%, 12/19/10 | | | | 760,000 | | | 8,172 |
MHP | | | | | | | |
10.250%, 04/29/15 | | | | 1,965 | | | 1,739 |
NAK Naftogaz Ukraine | | | | | | | |
9.500%, 09/30/14 | | | | 8,373 | | | 8,582 |
9.500%, 09/30/14 | | | | 2,050 | | | 2,108 |
Springvale Holdings | | | | | | | |
9.181%, 09/07/09 (B) (C) (H) | | | | 1,000 | | | 75 |
UK Private Bank | | | | | | | |
8.000%, 02/06/12 | | | | 3,000 | | | 2,760 |
| | | | | | | |
| | | | | | | 38,657 |
| | | | | | | |
| |
United Arab Emirates — 1.9% | | | |
Dolphin Energy | | | | | | | |
5.888%, 06/15/19 (A) | | | | 446 | | | 454 |
5.888%, 06/15/19 | | | | 1,832 | | | 1,868 |
Dubai DOF Sukuk MTN | | | | | | | |
6.396%, 11/03/14 | | | | 1,200 | | | 1,142 |
Dubai Electricity & Water Authority | | | | | | | |
8.500%, 04/22/15 (A) | | | | 2,050 | | | 2,057 |
Dubai Holding Commercial Operations MTN | | | | | | | |
4.750%, 01/30/14 | | | | 1,850 | | | 1,631 |
0.719%, 02/01/12 (C) | | | | 200 | | | 154 |
Dubai Sukuk Centre | | | | | | | |
0.632%, 06/13/12 (C) | | | | 750 | | | 533 |
Emirate of Abu Dhabi | | | | | | | |
6.750%, 04/08/19 (A) | | | | 670 | | | 757 |
Jafz Sukuk | | | | | | | |
3.446%, 11/27/12 (C) | | AED | | 33,500 | | | 7,502 |
Nakheel Development 2 | | | | | | | |
2.750%, 01/16/11 | | | | 2,900 | | | 3,045 |
| | | | | | | |
| | | | | | | 19,143 |
| | | | | | | |
| | | |
Uruguay — 3.0% | | | | | | | |
Republic of Uruguay | | | | | | | |
9.250%, 05/17/17 | | | | 5,670 | | | 7,045 |
8.000%, 11/18/22 | | | | 12,047 | | | 14,155 |
7.625%, 03/21/36 | | | | 2,086 | | | 2,347 |
6.875%, 09/28/25 | | | | 761 | | | 818 |
Republic of Uruguay PIK | | | | | | | |
7.875%, 01/15/33 | | | | 4,220 | | | 4,853 |
| | | | | | | |
| | | | | | | 29,218 |
| | | | | | | |
| | |
| 124 | | SEI Institutional Investments Trust / Annual Report / May 31, 2010 |
| | | | | | | |
| Description | | | | Face Amount
(Thousands) (1) | | Market Value
($ Thousands) |
| | | | | | | |
| | | |
Venezuela — 6.1% | | | | | | | |
Bolivarian Republic of Venezuela | | | | | | | |
8.250%, 10/13/24 | | | | 4,315 | | $ | 2,395 |
Government of Venezuela | | | |
13.625%, 08/15/18 | | | | 2,435 | | | 2,058 |
10.750%, 09/19/13 | | | | 700 | | | 604 |
9.375%, 01/13/34 | | | | 2,370 | | | 1,434 |
9.250%, 05/07/28 | | | | 7,065 | | | 4,186 |
9.250%, 09/15/27 | | | | 4,025 | | | 2,636 |
9.000%, 05/07/23 | | | | 8,545 | | | 5,106 |
8.500%, 10/08/14 | | | | 3,675 | | | 2,756 |
7.750%, 10/13/19 | | | | 400 | | | 238 |
7.650%, 04/21/25 | | | | 5,065 | | | 2,786 |
7.000%, 12/01/18 | | | | 255 | | | 152 |
7.000%, 03/31/38 | | | | 200 | | | 103 |
6.000%, 12/09/20 | | | | 2,300 | | | 1,219 |
5.750%, 02/26/16 | | | | 2,250 | | | 1,372 |
1.307%, 04/20/11 (C) | | | | 22,615 | | | 20,014 |
Petroleos de Venezuela | | | | | | | |
5.500%, 04/12/37 | | | | 2,650 | | | 1,186 |
5.375%, 04/12/27 | | | | 5,305 | | | 2,427 |
5.250%, 04/12/17 | | | | 12,890 | | | 7,089 |
5.000%, 10/28/15 | | | | 1,700 | | | 939 |
4.900%, 10/28/14 | | | | 2,175 | | | 1,316 |
| | | | | | | |
| | | | | | | 60,016 |
| | | | | | | |
| | | |
Vietnam — 0.2% | | | | | | | |
Socialist Republic of Vietnam | | | |
6.875%, 01/15/16 | | | | 450 | | | 475 |
6.750%, 01/29/20 (A) | | | | 1,052 | | | 1,065 |
| | | | | | | |
| | | | | | | 1,540 |
| | | | | | | |
Total Global Bonds
(Cost $846,080) ($ Thousands) | | | 908,367 |
| | | | | | | |
| |
LOAN PARTICIPATIONS — 0.9% | | | |
| | | |
Angola — 0.1% | | | | | | | |
Republic of Angola (H) (I) | | | | | | | |
2.998%, 04/30/16 | | | | 1,300 | | | 1,326 |
| | | | | | | |
| | | |
Cambodia — 0.3% | | | | | | | |
CAMGSM PIK | | | | | | | |
12.854%, 05/25/11 | | | | 2,480 | | | 2,480 |
| | | | | | | |
| | | |
Georgia — 0.0% | | | | | | | |
Ashmore Cayman | | | | | | | |
0.000%, 04/16/14 (F) (H) (I) | | | | 221 | | | 227 |
| | | | | | | |
| | | |
Russia — 0.2% | | | | | | | |
Snegri Overseas | | | | | | | |
10.500%, 10/26/10 (H) (I) | | | | 2,560 | | | 2,048 |
| | | | | | | |
| | | | | | | |
| Description | | | | Face Amount
(Thousands) (1)/
Shares | | Market Value
($ Thousands) |
| | | | | | | |
| | | |
Singapore — 0.3% | | | | | | | |
Morton Bay Senior | | | | | | | |
6.250%, 06/30/11 (H) (I) | | | | 3,054 | | $ | 3,054 |
| | | | | | | |
Total Loan Participations
(Cost $10,070) ($ Thousands) | | | 9,135 |
| | | | | | | |
| |
CONVERTIBLE BONDS — 0.7% | | | |
FirstSource Solutions | | | | | | | |
6.214%, 12/04/12 (F) | | | | 2,300 | | | 2,340 |
Reliance Communications | | | | | | | |
0.000%, 03/01/12 (F) | | | | 1,400 | | | 1,512 |
Suzlon Energy | | | | | | | |
1.307%, 06/12/12 | | | | 2,484 | | | 2,637 |
2.468%, 07/25/14 | | | | 500 | | | 422 |
| | | | | | | |
Total Convertible Bonds
(Cost $6,261) ($ Thousands) | | | 6,911 |
| | | | | | | |
| |
AFFILIATED PARTNERSHIP (G) — 0.4% | | | |
SEI Liquidity Fund, L.P. | | | | | | | |
0.240%**† | | | | 4,439,163 | | | 4,213 |
| | | | | | | |
Total Affiliated Partnership
(Cost $4,439) ($ Thousands) | | | 4,213 |
| | | | | | | |
| | | |
WARRANTS — 0.0% | | | | | | | |
| | | |
Russia — 0.0% | | | | | | | |
Teorema Holding A, | | | | | | | |
Expires 10/27/11* (H) | | | | 136 | | | — |
Teorema Holding B, | | | | | | | |
Expires 10/27/11* (H) | | | | 272 | | | — |
| | | | | | | |
Total Warrants
(Cost $47) ($ Thousands) | | | — |
| | | | | | | |
| | | |
TIME DEPOSIT — 3.4% | | | | | | | |
| | | |
United States — 3.4% | | | | | | | |
Brown Brothers Harriman | | | | | | | |
0.030%, 06/01/10 | | | | 33,396 | | | 33,396 |
| | | | | | | |
Total Time Deposit
(Cost $33,396) ($ Thousands) | | | | | | | 33,396 |
| | | | | | | |
|
DEPOSIT WITH COUNTERPARTY AS COLLATERAL FOR SWAP CONTRACTS — 0.0% |
| | | |
United States — 0.0% | | | | | | | |
Deposits with Merrill Lynch as Collateral for Swap Contracts Outstanding | | | | 400 | | | 400 |
| | | | | | | |
Total Deposit with Counterparty as Collateral for Swap Contracts
(Cost $400) ($ Thousands) | | | | | 400 |
| | | | | | | |
Total Investments — 97.2%
(Cost $900,693) ($ Thousands) | | $ | 962,422 |
| | | | | | | |
| | |
| SEI Institutional Investments Trust / Annual Report / May 31, 2010 | | 125 |
SCHEDULE OF INVESTMENTS
Emerging Markets Debt Fund (Concluded)
May 31, 2010
A summary of the open futures contracts held by the Fund at May 31, 2010, is as follows:
| | | | | | | | |
| Type of Contract | | Number of
Contracts
Long (Short) | | Expiration
Date | | Unrealized
Depreciation
($ Thousands) | |
U.S. Ultra Long Treasury Bond | | 4 | | Oct-2010 | | $ | (8 | ) |
| | | | | | | | |
| | | | | | $ | (8 | ) |
| | | | | | | | |
For the year ended May 31, 2010, the total amount of all open future contracts, as presented in the table above, are representative of the volume of activity for this derivative type during the period.
A summary of the outstanding forward foreign currency contracts held by the Fund at May 31, 2010, is as follows:
| | | | | | | | | | | | |
Maturity
Date | | Currency
to Deliver
(Thousands) | | Currency to
Receive
(Thousands) | | Unrealized
Appreciation
(Depreciation)
($ Thousands) | |
6/2/10 | | BRL | | 7,970 | | USD | | 4,450 | | $ | 82 | |
6/2/10-7/2/10 | | USD | | 18,429 | | BRL | | 33,889 | | | 103 | |
6/8/10 | | KRW | | 247,544 | | USD | | 216 | | | 9 | |
6/8/10-7/12/10 | | USD | | 9,182 | | KRW | | 10,297,799 | | | (547 | ) |
6/11/10-7/12/10 | | USD | | 13,138 | | INR | | 590,470 | | | (430 | ) |
6/11/10-7/19/10 | | USD | | 8,751 | | RUB | | 265,683 | | | (106 | ) |
6/14/10-7/26/10 | | MXP | | 30,323 | | USD | | 2,295 | | | (48 | ) |
6/14/10-7/26/10 | | USD | | 8,598 | | MXP | | 109,447 | | | (127 | ) |
6/21/10-7/26/10 | | PLN | | 16,183 | | USD | | 4,809 | | | (78 | ) |
6/24/10 | | RUB | | 72,477 | | USD | | 2,320 | | | (37 | ) |
6/24/10-7/26/10 | | USD | | 4,802 | | PLN | | 16,183 | | | 85 | |
6/28/10-6/30/10 | | EUR | | 14,549 | | USD | | 18,014 | | | 71 | |
6/30/10 | | JPY | | 748,763 | | USD | | 8,274 | | | 35 | |
7/16/10 | | SGD | | 6,194 | | USD | | 4,362 | | | (53 | ) |
7/16/10 | | USD | | 4,500 | | SGD | | 6,194 | | | (85 | ) |
11/23/10-5/20/11 | | USD | | 5,840 | | CNY | | 39,069 | | | (73 | ) |
| | | | | | | | | | | | |
| | | | | | | | | | $ | (1,199 | ) |
| | | | | | | | | | | | |
A summary of outstanding swap agreements help by the Fund at May 31, 2010, is as follows:
| | | | | | | | | | | | | | |
| Total Return Swaps | |
| Counterparty | | Reference Entity/Obligation | | Fund Pays | | Fund Receives | | Termination
Date | | Notional
Amount
(Thousands) | | Net Unrealized
Appreciation
(Depreciation)
($Thousands) | |
| Merrill Lynch | | ZAPOROZH TERM LOAN 9.784% 12/31/10 | | Cash Deposit Of Notional Amount | | Price Return | | 12/31/10 | | 400 | | $ | 5 | |
| HSBC | | CITY OF MOSCOW 16% 06/08/14 | | Cash Deposit Of Notional Amount | | Price Return | | 06/08/14 | | RUB 5,160 | | | (7 | ) |
| HSBC | | CITY OF MOSCOW 16% 06/08/14 | | Cash Deposit Of Notional Amount | | Price Return | | 06/08/14 | | RUB 4,944 | | | (8 | ) |
| HSBC | | RUSSIA FEDERAL LOAN BOND 12% 08/20/14 | | Cash Deposit Of Notional Amount | | Price Return | | 08/20/14 | | RUB 2,207 | | | (3 | ) |
| HSBC | | RUSSIA FEDERAL LOAN BOND 12% 08/20/14 | | Cash Deposit Of Notional Amount | | Price Return | | 08/20/14 | | RUB 9,390 | | | (13 | ) |
| HSBC | | RUSSIA FEDERAL LOAN BOND 8.1% 11/26/14 | | Cash Deposit Of Notional Amount | | Price Return | | 11/26/14 | | RUB 3,504 | | | (3 | ) |
| HSBC | | RUSSIA FEDERAL LOAN BOND 11.2% 12/17/14 | | Cash Deposit Of Notional Amount | | Price Return | | 12/17/14 | | RUB 7,385 | | | (12 | ) |
| HSBC | | RUSSIA FEDERAL LOAN BOND 11.2% 12/17/14 | | Cash Deposit Of Notional Amount | | Price Return | | 12/17/14 | | RUB 9,025 | | | (16 | ) |
| HSBC | | RUSSIAN RAILWAYS 9% 01/16/25 | | Cash Deposit Of Notional Amount | | Price Return | | 01/16/25 | | RUB 6,080 | | | (7 | ) |
| HSBC | | RUSSIAN RAILWAYS 9% 01/16/25 | | Cash Deposit Of Notional Amount | | Price Return | | 01/16/25 | | RUB 5,719 | | | (7 | ) |
| HSBC | | RUSSIAN RAILWAYS 9% 01/16/25 | | Cash Deposit Of Notional Amount | | Price Return | | 01/16/25 | | RUB 4,579 | | | (6 | ) |
| | | | | | | | | | | | | | |
| | | | | | | | | | | | $ | (77 | ) |
| | | | | | | | | | | | | | |
| | |
| 126 | | SEI Institutional Investments Trust / Annual Report / May 31, 2010 |
Percentages are based on Net Assets of $989,598 ($ Thousands)
| (1) | | In U.S. dollars unless otherwise indicated. |
| * | | Non-income producing security. |
| ** | | The rate reported is the 7-day effective yield as of May 31, 2010. |
| † | | Investment in Affiliated Security (See Note 5). |
| (A) | | Securities sold within terms of a private placement memorandum, exempt from registration under Section 144A of the Securities Act of 1933, as amended, and may be sold only to dealers in that program or other “accredited investors.” These securities have been determined to be liquid under guidelines established by the board of Trustees. |
| (B) | | Security in default on interest payments. |
| (C) | | Variable Rate Security — The rate reported is the rate in effect as of May 31, 2010. The date reported is the next reset date. |
| (D) | | Step Bonds — The rate reflected is the effective yield on May 31, 2010. The coupon on a step bond changes on a specified date. |
| (E) | | This security or a partial position of this security is on loan at May 31, 2010. The total value of securities on loan at May 31, 2010 was $4,235 ($ Thousands). |
| (F) | | Zero coupon security. The rate reported is the effective yield at time of purchase. |
| (G) | | This security was purchased with cash collateral held from securities on loan. The total value of such securities as of May 31, 2010 was $4,213 ($ Thousands). |
| (H) | | Security fair valued using methods determined in good faith by the Valuation Committee of the Board of Trustees. The total market value of such securities as of May 31, 2010 was $6,730 ($ Thousands) and represented 0.7% of Net Assets. |
| (I) | | Securities considered illiquid. The total value of such securities as of May 31, 2010 was $6,655 ($ Thousands) and represented 0.7% of Net Assets. (Unaudited in regards to illiquid status) |
AED — United Arab Emirates Dirham
BRL — Brazilian Real
CNY — Chinese Yuan Renminbi
COP — Colombian Peso
EUR — Euro
INR — India Rupee
JPY — Japanese Yen
KRW — South Korean Won
L.P. — Limited Partnership
MTN — Medium Term Note
MXP — Mexican Peso
PIK — Payment-in-Kind
PLN — Polish Zloty
RUB — Russian Ruble
Ser — Series
SGD — Singapore Dollar
USD — U.S. Dollar
Amounts designated as “—” are $0 or have been rounded to $0.
The following is a summary of the inputs used as of May 31, 2010 in valuing the Fund’s investments carried at value ($ Thousands):
| | | | | | | | | | | | |
| Investments in Securities | | Level 1 | | Level 2 | | Level 3 | | Total |
Global Bonds | | $ | — | | $ | 908,367 | | $ | — | | $ | 908,367 |
Convertible Bonds | | | — | | | 6,911 | | | — | | | 6,911 |
Loan Participations | | | — | | | — | | | 9,135 | | | 9,135 |
Affiliated Partnership | | | — | | | 4,213 | | | — | | | 4,213 |
Warrants | | | — | | | — | | | — | | | — |
Deposit with Counterparty as Collateral for Swap Contracts | | | — | | | 400 | | | — | | | 400 |
Time Deposit | | | 33,396 | | | — | | | — | | | 33,396 |
| | | | | | | | | | | | |
Total Investments in Securities | | $ | 33,396 | | $ | 919,891 | | $ | 9,135 | | $ | 962,422 |
| | | | | | | | | | | | |
| | | | | | | | | | | | | | | | |
| Other Financial Instruments | | Level 1 | | | Level 2 | | | Level 3 | | | Total | |
Future Contracts* | | $ | (8 | ) | | $ | — | | | $ | — | | | $ | (8 | ) |
Forwards | | | (1,199 | ) | | | — | | | | — | | | | (1,199 | ) |
Total Return Swaps | | | — | | | | (73 | ) | | | (4 | ) | | | (77 | ) |
| | | | | | | | | | | | | | | | |
Total Other Financial Instruments | | $ | (1,207 | ) | | $ | (73 | ) | | $ | (4 | ) | | $ | (1,284 | ) |
| | | | | | | | | | | | | | | | |
The following is a reconciliation of investments in which significant unobservable inputs (Level 3) were used in determining value ($ Thousands):
| | | | | | | | |
| | | Investments in
Loan Participations | | | Investments in Total
Return Swaps | |
Beginning balance as of June 1, 2009 | | $ | 11,161 | | | $ | (975 | ) |
Accrued discounts/premiums | | | 26 | | | | 9 | |
Realized gain/(loss) | | | (869 | ) | | | 25 | |
Change in unrealized appreciation/(depreciation) | | | 2,860 | | | | 971 | |
Net purchases/sales | | | (4,043 | ) | | | (25 | ) |
Net transfer in and/or out of | | | | | | | | |
Level 3 | | | — | | | | — | |
| | | | | | | | |
Ending balance as of May 31, 2010 | | $ | 9,135 | | | $ | 5 | |
| | | | | | | | |
Changes in unrealized gain/(loss) included in earnings related to securities still held at reporting date | | $ | 147 | | | $ | 479 | |
| | | | | | | | |
| * | | Future contracts are valued at the unrealized depreciation on the instrument. |
For more information on valuation inputs, see Note 2 — Significant Accounting Policies in Notes to Financial Statements.
The accompanying notes are an integral part of the financial statements.
| | |
| SEI Institutional Investments Trust / Annual Report / May 31, 2010 | | 127 |
SCHEDULE OF INVESTMENTS
Real Return Fund
May 31, 2010
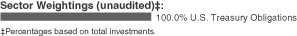
| | | | | | |
| Description | | Face Amount
($ Thousands) | | Market Value
($ Thousands) |
| | | | | | |
|
U.S. TREASURY OBLIGATIONS — 99.8% |
U.S. Treasury Inflation-Protected Securities | | | | | | |
3.500%, 01/15/11 | | $ | 3,850 | | $ | 4,902 |
2.375%, 04/15/11 | | | 4,450 | | | 4,964 |
2.000%, 04/15/12 | | | 37,921 | | | 42,065 |
3.000%, 07/15/12 | | | 15,225 | | | 19,567 |
0.625%, 04/15/13 | | | 40,095 | | | 41,974 |
1.875%, 07/15/13 | | | 21,670 | | | 27,020 |
2.000%, 01/15/14 | | | 36,024 | | | 44,943 |
1.250%, 04/15/14 | | | 26,250 | | | 28,029 |
2.000%, 07/15/14 | | | 34,536 | | | 42,528 |
1.625%, 01/15/15 | | | 45,425 | | | 54,241 |
0.500%, 04/15/15 | | | 3,300 | | | 3,332 |
2.000%, 01/15/16 | | | 10,625 | | | 12,453 |
| | | | | | |
Total U.S. Treasury Obligations
(Cost $320,285) ($ Thousands) | | | | | | 326,018 |
| | | | | | |
Total Investments — 99.8%
(Cost $320,285) ($ Thousands) | | | | | $ | 326,018 |
| | | | | | |
Percentages are based on a Net Assets of $326,758 ($ Thousands).
The following is a summary of the inputs used as of May 31, 2010 in valuing the Fund’s investments carried at value ($ Thousands):
| | | | | | | | |
| Investments in Securities | | Level 1 | | Level 2 | | Level 3 | | Total |
U.S. Treasury Obligations | | $— | | $326,018 | | $— | | $326,018 |
| | | | | | | | |
Total Investments in Securities | | $— | | $326,018 | | $��� | | $326,018 |
| | | | | | | | |
Amounts designated as “—” are either $0 or have been rounded to $0.
For more information on valuation inputs, see Note 2 — Significant Accounting Policies in Notes to Financial Statements.
The accompanying notes are an integral part of the financial statements.
| | |
| 128 | | SEI Institutional Investments Trust / Annual Report / May 31, 2010 |
This page intentionally left blank.
Statements of Assets and Liabilities ($ Thousands)
May 31, 2010
| | | | | | | | | | | | |
| | | Large Cap
Fund | | | Large Cap
Diversified
Alpha
Fund | | | Large Cap
Disciplined
Equity
Fund | |
ASSETS: | | | | | | | | | | | | |
Investments at value† | | $ | 1,186,447 | * | | $ | 291,793 | | | $ | 5,968,132 | * |
Affiliated investment, at value†† | | | 158,480 | | | | 60,612 | | | | 1,855,320 | |
Cash | | | 78 | | | | 8 | | | | 52 | |
Foreign currency, at value††† | | | — | | | | — | | | | — | |
Restricted cash held for forwards and swaps | | | — | | | | — | | | | — | |
Receivable for fund shares sold | | | 24,150 | | | | 430 | | | | 52,081 | |
Receivable for investment securities sold | | | 3,454 | | | | 1,465 | | | | 89,236 | |
Dividends and interest receivable | | | 2,327 | | | | 649 | | | | 15,345 | |
Receivable for variation margin | | | — | | | | 1 | | | | 2 | |
Foreign tax reclaim receivable | | | 25 | | | | 6 | | | | — | |
Unrealized gain on foreign spot currency contracts | | | — | | | | — | | | | — | |
Swap contracts at value†††† | | | — | | | | — | | | | — | |
Prepaid expenses | | | 6 | | | | 2 | | | | 46 | |
Total Assets | | | 1,374,967 | | | | 354,966 | | | | 7,980,214 | |
LIABILITIES: | | | | | | | | | | | | |
Payable upon return on securities loaned | | | 133,363 | | | | — | | | | 775,045 | |
Payable for investment securities purchased | | | 6,330 | | | | 1,575 | | | | 91,217 | |
Payable for fund shares redeemed | | | 4,236 | | | | 12 | | | | 138,174 | |
Swap contracts at value†††† | | | — | | | | — | | | | — | |
Payable to custodian | | | — | | | | — | | | | — | |
Payable for variation margin | | | 347 | | | | 769 | | | | 13,659 | |
Unrealized loss on foreign spot currency contracts | | | — | | | | — | | | | — | |
Investment advisory fees payable | | | 226 | | | | 92 | | | | 1,064 | |
CCO fees payable | | | 1 | | | | — | | | | 8 | |
Accrued expense payable | | | 82 | | | | 18 | | | | 285 | |
Total Liabilities | | | 144,585 | | | | 2,466 | | | | 1,019,452 | |
Net Assets | | $ | 1,230,382 | | | $ | 352,500 | | | $ | 6,960,762 | |
† Cost of investments and repurchase agreements | | | 1,121,321 | | | | 274,328 | | | | 5,465,873 | |
†† Cost of affiliated investments | | | 159,309 | | | | 73,740 | | | | 2,049,867 | |
††† Cost of foreign currency | | | — | | | | — | | | | — | |
†††† Premiums received | | | — | | | | — | | | | — | |
* Includes market value of securities on loan | | | 128,195 | | | | — | | | | 743,579 | |
NET ASSETS: | | | | | | | | | | | | |
Paid-in Capital — (unlimited authorization — no par value) | | $ | 1,277,446 | | | $ | 524,860 | | | $ | 9,146,511 | |
Undistributed net investment income | | | 3,321 | | | | 1,390 | | | | 32,919 | |
Accumulated net realized gain (loss) on investments, option contracts, swaptions, futures, swap contracts and foreign currency | | | (113,099 | ) | | | (175,961 | ) | | | (2,492,289 | ) |
Net unrealized appreciation (depreciation) on investments and option contracts | | | 64,297 | | | | 4,337 | | | | 307,712 | |
Net unrealized appreciation (depreciation) on futures contracts | | | (1,583 | ) | | | (2,126 | ) | | | (34,091 | ) |
Net unrealized depreciation on swap contracts | | | — | | | | — | | | | — | |
Net unrealized depreciation on forward foreign currency contracts, foreign currencies and translation of other assets and liabilities denominated in foreign currencies | | | — | | | | — | | | | — | |
Net Assets | | $ | 1,230,382 | | | $ | 352,500 | | | $ | 6,960,762 | |
Net Asset Value, Offering and Redemption Price Per Share — Class A | | | $14.84 | | | | $7.69 | | | | $8.86 | |
| | |
| ($1,230,381,718 ÷
82,904,747 shares |
) | |
| ($352,500,474 ÷
45,841,863 shares |
) | |
| ($6,960,761,883 ÷
785,479,184 shares |
) |
Amounts designated as “—” are either $0, or have been rounded to $0.
The accompanying notes are an integral part of the financial statements.
| | |
| 130 | | SEI Institutional Investments Trust / Annual Report / May 31, 2010 |
| | | | | | | | | | | | | |
Large Cap
Index
Fund | | | Small Cap
Fund | | | Smalll/Mid
Cap Equity
Fund | | | U.S.
Managed
Volatility
Fund | | | International
Equity
Fund | |
| | | | | | | | | | | | | |
| $504,498 | * | | $1,304,910 | * | | $2,028,148 | * | | $252,645 | * | | $ 604,726 | * |
| 73,780 | | | 286,391 | | | 412,162 | | | 2,452 | | | 32,422 | |
| 3 | | | 29 | | | — | | | 1 | | | 1,935 | |
| — | | | 1 | | | 5 | | | — | | | 578 | |
| — | | | — | | | — | | | — | | | 4,420 | |
| 212 | | | 3,124 | | | 7,568 | | | — | | | 13,667 | |
| 13,483 | | | 7,666 | | | 13,379 | | | — | | | 5,947 | |
| 1,144 | | | 1,370 | | | 1,834 | | | 524 | | | 3,045 | |
| — | | | — | | | — | | | — | | | 83 | |
| — | | | — | | | — | | | — | | | 1,340 | |
| — | | | — | | | — | | | — | | | 3 | |
| — | | | — | | | — | | | — | | | 24,110 | |
| 3 | | | 7 | | | 14 | | | 1 | | | 5 | |
| 593,123 | | | 1,603,498 | | | 2,463,110 | | | 255,623 | | | 692,281 | |
| | | | | | | | | | | | | |
| 69,017 | | | 241,968 | | | 345,580 | | | — | | | 30,032 | |
| — | | | 9,116 | | | 12,739 | | | — | | | 4,154 | |
| 14,834 | | | 11,548 | | | 38,099 | | | 402 | | | 23,853 | |
| — | | | — | | | — | | | — | | | 28,397 | |
| — | | | — | | | 659 | | | — | | | — | |
| 105 | | | 450 | | | 604 | | | 39 | | | 41 | |
| — | | | — | | | — | | | — | | | 2 | |
| 17 | | | 605 | | | 893 | | | 77 | | | 127 | |
| 1 | | | 2 | | | 3 | | | — | | | 1 | |
| 29 | | | 61 | | | 90 | | | 11 | | | 195 | |
| 84,003 | | | 263,750 | | | 398,667 | | | 529 | | | 86,802 | |
| $509,120 | | | $1,339,748 | | | $2,064,443 | | | $255,094 | | | $ 605,479 | |
| 413,190 | | | 1,147,943 | | | 1,733,143 | | | 214,753 | | | 633,924 | |
| 74,542 | | | 292,547 | | | 419,547 | | | 2,452 | | | 33,245 | |
| — | | | 1 | | | 5 | | | — | | | 573 | |
| — | | | — | | | — | | | — | | | — | |
| 66,147 | | | 231,332 | | | 331,075 | | | — | | | 27,726 | |
| | | | | | | | | | | | | |
| $460,724 | | | $1,647,609 | | | $2,391,502 | | | $202,702 | | | $1,084,636 | |
| 1,848 | | | 1,670 | | | 1,454 | | | 823 | | | 21,951 | |
(43,592 | ) | | (460,501 | ) | | (616,671 | ) | | 13,817 | | | (466,288 | ) |
90,546 |
| | 150,811 | | | 287,620 | | | 37,892 | | | (30,021 | ) |
| (406 | ) | | 160 | | | 541 | | | (140 | ) | | (200 | ) |
| — | | | — | | | — | | | — | | | (4,287 | ) |
— |
| | (1 | ) | | (3 | ) | | — | | | (312 | ) |
| $509,120 | | | $1,339,748 | | | $2,064,443 | | | $255,094 | | | $ 605,479 | |
| $94.53 | | | $10.69 | | | $10.53 | | | $11.16 | | | $6.37 | |
($509,119,961 ÷
5,385,779 shares |
) | | ($1,339,748,399 ÷
125,307,764 shares |
) | | ($2,064,442,640 ÷
196,009,908 shares |
) | | ($255,093,669 ÷
22,860,421 shares |
) | | ($605,478,845 ÷
95,124,605 shares |
) |
| | |
| SEI Institutional Investments Trust / Annual Report / May 31, 2010 | | 131 |
Statements of Assets and Liabilities ($ Thousands)
May 31, 2010
| | | | | | | | | | | | |
| | | World Equity
Ex-US
Fund | | | Screened
World Equity
Ex-US
Fund | | | Enhanced
LIBOR
Opportunity
Fund | |
ASSETS: | | | | | | | | | | | | |
Investments at value† | | $ | 3,481,333 | * | | $ | 64,211 | | | $ | 58,186 | |
Affiliated investment, at value†† | | | 270,205 | | | | 3,596 | | | | 56,261 | |
Cash | | | 75,761 | | | | 70 | | | | 261 | |
Foreign currency, at value††† | | | 7,313 | | | | 33 | | | | — | |
Cash pledged as collateral for forward foreign currency contracts, future contracts and swap contracts | | | 7,001 | | | | — | | | | 200 | |
Receivable for fund shares sold | | | 120,591 | | | | 299 | | | | 24 | |
Receivable for investment securities sold | | | 36,461 | | | | 1,052 | | | | 524 | |
Dividends and interest receivable | | | 14,308 | | | | 212 | | | | 292 | |
Receivable for variation margin | | | 851 | | | | 20 | | | | 5 | |
Foreign tax reclaim receivable | | | 2,655 | | | | 64 | | | | 1 | |
Unrealized gain on foreign spot currency contracts | | | 527 | | | | 1 | | | | — | |
Unrealized gain on forward foreign currency contracts | | | 38 | | | | — | | | | — | |
Swap contracts at value†††† | | | 42,703 | | | | — | | | | — | |
Prepaid expenses | | | 23 | | | | — | | | | 1 | |
Total Assets | | | 4,059,770 | | | | 69,558 | | | | 115,755 | |
LIABILITIES: | | | | | | | | | | | | |
Payable upon return on securities loaned | | | 235,888 | | | | — | | | | — | |
Payable for investment securities purchased | | | 44,437 | | | | 658 | | | | 123 | |
Payable for fund shares redeemed | | | 14,976 | | | | 22 | | | | 46 | |
Payable for loss on securities lending | | | — | | | | — | | | | — | |
Income distribution payable | | | — | | | | — | | | | — | |
Swap contracts at value†††† | | | 49,588 | | | | — | | | | — | |
Options written, at value††††† | | | — | | | | — | | | | — | |
Payable to custodian | | | — | | | | — | | | | — | |
Payable for variation margin | | | 256 | | | | 7 | | | | 10 | |
Unrealized loss on foreign spot currency contracts | | | 94 | | | | 2 | | | | — | |
Unrealized loss on forward foreign currency contracts | | | — | | | | — | | | | — | |
Investment advisory fees payable | | | 1,226 | | | | 33 | | | | 43 | |
CCO fees payable | | | 4 | | | | — | | | | — | |
Accrued expense payable | | | 575 | | | | 93 | | | | 14 | |
Accrued foreign capital gains tax on appreciated securities | | | 112 | | | | — | | | | — | |
Total Liabilities | | | 347,156 | | | | 815 | | | | 236 | |
Net Assets | | $ | 3,712,614 | | | $ | 68,743 | | | $ | 115,519 | |
† Cost of investments and repurchase agreements | | | 3,583,311 | | | | 67,293 | | | | 60,810 | |
†† Cost of affiliated investments | | | 272,518 | | | | 3,596 | | | | 78,062 | |
††† Cost of foreign currency | | | 7,212 | | | | 529 | | | | — | |
†††† Premiums received | | | — | | | | — | | | | — | |
††††† Premiums received | | | — | | | | — | | | | — | |
* Includes market value of securities on loan | | | 224,904 | | | | — | | | | — | |
NET ASSETS: | | | | | | | | | | | | |
Paid-in Capital — (unlimited authorization — no par value) | | $ | 4,717,651 | | | $ | 95,696 | | | $ | 165,894 | |
Undistributed (Distributions in excess of) net investment income | | | 53,729 | | | | 821 | | | | 2,587 | |
Accumulated net realized gain (loss) on investments, option contracts, swaptions, futures, swap contracts and foreign currency | | | (945,231 | ) | | | (24,500 | ) | | | (28,535 | ) |
Net unrealized appreciation (depreciation) on investments and option contracts | | | (104,291 | ) | | | (3,082 | ) | | | (24,425 | ) |
Net unrealized depreciation on futures contracts | | | (2,182 | ) | | | (189 | ) | | | (2 | ) |
Net unrealized depreciation on swap contracts | | | (6,885 | ) | | | — | | | | — | |
Net unrealized appreciation (depreciation) on forward foreign currency contracts, foreign currencies and translation of other assets and liabilities denominated in foreign currencies | | | (65 | ) | | | (3 | ) | | | — | |
Accumulated foreign capital gains tax on appreciated securities | | | (112 | ) | | | — | | | | — | |
Net Assets | | $ | 3,712,614 | | | $ | 68,743 | | | $ | 115,519 | |
Net Asset Value, Offering and Redemption Price Per Share — Class A | | | $9.09 | | | | $7.04 | | | | $7.69 | |
| | |
| ($3,712,613,737 ÷
408,505,323 shares |
) | |
| ($68,742,935 ÷
9,761,926 shares |
) | |
| ($115,519,217 ÷
15,020,650 shares |
) |
Amounts designated as “—” are either $0, or have been rounded to $0.
The accompanying notes are an integral part of the financial statements.
| | |
| 132 | | SEI Institutional Investments Trust / Annual Report / May 31, 2010 |
| | | | | | | | | | | | | |
Core
Fixed Income
Fund | | | High Yield
Bond
Fund | | | Long
Duration
Fund | | | Emerging
Markets
Debt
Fund | | | Real Return
Fund | |
| | | | | | | | | | | | | |
| $6,093,823 | * | | $1,533,519 | * | | $2,689,593 | | | $ 958,209 | * | | $326,018 | |
| 532,005 | | | 37,801 | | | 46,555 | | | 4,213 | | | — | |
| — | | | 557 | | | 678 | | | — | | | 4,095 | |
| — | | | — | | | — | | | 94 | | | — | |
42,403 | | | 1,571 | | | 960 | | | 3,312 | | | — | |
| 33,491 | | | 57,243 | | | 7,000 | | | 28,326 | | | 584 | |
| 746,933 | | | 18,534 | | | 4,132 | �� | | 11,305 | | | — | |
| 40,087 | | | 32,490 | | | 31,121 | | | 17,356 | | | 1,682 | |
| 1,398 | | | — | | | 820 | | | 5 | | | — | |
| 27 | | | 65 | | | 58 | | | — | | | — | |
| — | | | — | | | — | | | — | | | — | |
| 385 | | | — | | | — | | | 385 | | | — | |
| 24,469 | | | 211 | | | — | | | 2,202 | | | — | |
| 34 | | | 10 | | | 14 | | | 4 | | | 2 | |
| 7,515,055 | | | 1,682,001 | | | 2,780,931 | | | 1,025,411 | | | 332,381 | |
| | | | | | | | | | | | | |
| 431,339 | | | 6 | | | — | | | 4,439 | | | — | |
| 1,150,925 | | | 20,489 | | | 38,426 | | | 13,832 | | | — | |
| 156,832 | | | 23,967 | | | 4,975 | | | 14,314 | | | 5,554 | |
| — | | | 1,912 | | | — | | | — | | | — | |
| 1,166 | | | 455 | | | — | | | — | | | — | |
| 63,842 | | | — | | | 718 | | | — | | | — | |
| 264 | | | — | | | — | | | — | | | — | |
| 2,682 | | | — | | | — | | | 1,067 | | | — | |
| 1,056 | | | — | | | 94 | | | — | | | — | |
| — | | | — | | | — | | | 52 | | | — | |
| 247 | | | — | | | — | | | 1,584 | | | — | |
| 692 | | | 464 | | | 359 | | | 444 | | | 54 | |
| 7 | | | 2 | | | 3 | | | 1 | | | — | |
| 295 | | | 98 | | | 169 | | | 80 | | | 15 | |
| — | | | — | | | — | | | — | | | — | |
| 1,809,347 | | | 47,393 | | | 44,744 | | | 35,813 | | | 5,623 | |
| $5,705,708 | | | $1,634,608 | | | $2,736,187 | | | $ 989,598 | | | $326,758 | |
| 6,124,003 | | | 1,516,700 | | | 2,532,909 | | | 896,254 | | | 320,285 | |
| 541,420 | | | 37,801 | | | 46,555 | | | 4,439 | | | — | |
| — | | | — | | | — | | | 94 | | | — | |
| (23,987 | ) | | 934 | | | (207 | ) | | 2,279 | | | — | |
| (234 | ) | | — | | | — | | | — | | | — | |
| 419,251 | | | 5 | | | — | | | 4,235 | | | — | |
| | | | | | | | | | | | | |
| $5,690,425 | | | $1,781,429 | | | $2,600,113 | | | $1,000,469 | | | $314,370 | |
| 8,929 | | | 49 | | | (3,008 | ) | | (5,095 | ) | | 1,919 | |
62,426 | | | (162,966 | ) | | (13,411 | ) | | (66,112 | ) | | 4,736 | |
(39,625 | ) | | 16,819 | | | 156,684 | | | 61,729 | | | 5,733 | |
| (1,199 | ) | | — | | | (3,680 | ) | | (8 | ) | | — | |
| (15,386 | ) | | (723 | ) | | (511 | ) | | (77 | ) | | — | |
138 | | | — | | | — | | | (1,308 | ) | | — | |
| — | | | — | | | — | | | — | | | — | |
| $5,705,708 | | | $1,634,608 | | | $2,736,187 | | | $ 989,598 | | | $326,758 | |
| $10.35 | | | $8.74 | | | $8.69 | | | $10.47 | | | $10.41 | |
($5,705,708,019 ÷
551,082,245 shares |
) | | ($1,634,608,066 ÷
186,991,591 shares |
) | | ($2,736,186,746 ÷
314,718,012 shares |
) | | ($989,597,880 ÷
94,481,965 shares |
) | | ($326,758,153 ÷
31,394,920 shares |
) |
| | |
| SEI Institutional Investments Trust / Annual Report / May 31, 2010 | | 133 |
Statements of Operations ($ Thousands)
For the year ended May 31, 2010
| | | | | | | | | | | | |
| | | Large Cap
Fund | | | Large Cap
Diversified
Alpha
Fund | | | Large Cap
Disciplined
Equity
Fund | |
Investment Income | | | | | | | | | | | | |
Dividends | | $ | 16,107 | | | $ | 5,624 | | | $ | 133,262 | |
Dividends from Affiliated Registered Investment Company(1) | | | 35 | | | | 20 | | | | 360 | |
Interest Income | | | 13 | | | | 15 | | | | 260 | |
Security Lending Income — Net | | | 378 | | | | — | | | | 2,046 | |
Less: Foreign Taxes Withheld | | | (46 | ) | | | (11 | ) | | | — | |
| | | | 16,487 | | | | 5,648 | | | | 135,928 | |
Expenses: | | | | | | | | | | | | |
Investment Advisory Fees | | | 3,630 | | | | 1,437 | | | | 28,296 | |
Administration Fees | | | 454 | | | | 180 | | | | 3,537 | |
Trustee Fees | | | 14 | | | | 7 | | | | 135 | |
Chief Compliance Officer Fees | | | 6 | | | | 2 | | | | 43 | |
Custodian/Wire Agent Fees | | | 49 | | | | 19 | | | | 369 | |
Professional Fees | | | 44 | | | | 16 | | | | 311 | |
Registration Fees | | | 38 | | | | 2 | | | | 39 | |
Printing Fees | | | 12 | | | | 3 | | | | 61 | |
Overdraft Fees | | | — | | | | — | | | | — | |
Other Expenses | | | 32 | | | | 23 | | | | 168 | |
Total Expenses | | | 4,279 | | | | 1,689 | | | | 32,959 | |
Less: | | | | | | | | | | | | |
Waiver of Investment Advisory Fees | | | (1,465 | ) | | | (381 | ) | | | (16,335 | ) |
Waiver of Administration Fees | | | (454 | ) | | | (180 | ) | | | (3,537 | ) |
Fees Paid Indirectly(1) | | | (19 | ) | | | — | | | | (1 | ) |
Net Expenses | | | 2,341 | | | | 1,128 | | | | 13,086 | |
Net Investment Income | | | 14,146 | | | | 4,520 | | | | 122,842 | |
Net Realized and Unrealized Gain (Loss) on Investments: | | | | | | | | | | | | |
Investments | | | 43,985 | | | | 19,858 | | | | 541,637 | |
Affiliated Investments | | | — | | | | — | | | | (54,358 | ) |
Futures Contracts | | | 8,212 | | | | 25,183 | | | | 444,246 | |
Swap Contracts | | | — | | | | — | | | | — | |
Foreign Currency Transactions | | | — | | | | (9 | ) | | | (795 | ) |
Net Change in Unrealized Appreciation (Depreciation) on: | | | | | | | | | | | | |
Investments | | | 55,158 | | | | 29,650 | | | | 395,770 | |
Affiliated Investments | | | (382 | ) | | | 5,241 | | | | 147,798 | |
Futures Contracts | | | (3,102 | ) | | | (13,485 | ) | | | (239,294 | ) |
Swap Contracts | | | — | | | | — | | | | — | |
Foreign Currency and Translation of Other Assets and Liabilities Denominated in Foreign Currencies | | | — | | | | 1 | | | | 802 | |
Net Increase in Net Assets Resulting from Operations | | $ | 118,017 | | | $ | 70,959 | | | $ | 1,358,648 | |
| (1) | | See Note 5 in the Notes to Financial Statements. |
Amounts designated as “—” are zero or have been rounded to zero.
The accompanying notes are an integral part of the financial statements.
| | |
| 134 | | SEI Institutional Investments Trust / Annual Report / May 31, 2010 |
| | | | | | | | | | | | | | | | | | |
Large Cap
Index
Fund | | | Small Cap
Fund | | | Small/Mid
Cap Equity Fund | | | U.S.
Managed
Volatility
Fund | | | International
Equity
Fund | |
| | | | | | | | | | | | | | | | | | |
| $ | 10,625 | | | $ | 15,770 | | | $ | 25,366 | | | $ | 6,558 | | | $ | 19,205 | |
| | 10 | | | | 60 | | | | 86 | | | | 14 | | | | 16 | |
| | 7 | | | | 606 | | | | 730 | | | | 3 | | | | 908 | |
| | 278 | | | | 728 | | | | 808 | | | | — | | | | 642 | |
| | — | | | | (25 | ) | | | (32 | ) | | | (38 | ) | | | (1,525 | ) |
| | 10,920 | | | | 17,139 | | | | 26,958 | | | | 6,537 | | | | 19,246 | |
| | | | | | | | | | | | | | | | | | |
| | 833 | | | | 7,980 | | | | 13,640 | | | | 1,781 | | | | 3,686 | |
| | 245 | | | | 614 | | | | 1,049 | | | | 137 | | | | 365 | |
| | 9 | | | | 23 | | | | 40 | | | | 5 | | | | 15 | |
| | 3 | | | | 8 | | | | 12 | | | | 2 | | | | 4 | |
| | 26 | | | | 65 | | | | 111 | | | | 13 | | | | 429 | |
| | 23 | | | | 56 | | | | 92 | | | | 11 | | | | 31 | |
| | 7 | | | | 8 | | | | 11 | | | | 3 | | | | 5 | |
| | 5 | | | | 12 | | | | 18 | | | | 2 | | | | 5 | |
| | — | | | | — | | | | — | | | | — | | | | 7 | |
| | 26 | | | | 59 | | | | 68 | | | | 8 | | | | 110 | |
| | 1,177 | | | | 8,825 | | | | 15,041 | | | | 1,962 | | | | 4,657 | |
| | | | | | | | | | | | | | | | | | |
| | (638 | ) | | | (1,578 | ) | | | (3,497 | ) | | | (865 | ) | | | (1,440 | ) |
| | (245 | ) | | | (614 | ) | | | (1,049 | ) | | | (137 | ) | | | (365 | ) |
| | — | | | | (64 | ) | | | (159 | ) | | | — | | | | (23 | ) |
| | 294 | | | | 6,569 | | | | 10,336 | | | | 960 | | | | 2,829 | |
| | 10,626 | | | | 10,570 | | | | 16,622 | | | | 5,577 | | | | 16,417 | |
| | | | | | | | | | | | | | | | | | |
| | (13,183 | ) | | | 101,908 | | | | 174,538 | | | | 19,411 | | | | 73,050 | |
| | — | | | | — | | | | — | | | | — | | | | — | |
| | 2,982 | | | | 13,510 | | | | 14,322 | | | | 1,962 | | | | 2,042 | �� |
| | — | | | | — | | | | — | | | | — | | | | 14,931 | |
| | — | | | | (39 | ) | | | (215 | ) | | | — | | | | 4,439 | �� |
| | | | | | | | | | | | | | | | | | |
| | 93,149 | | | | 226,919 | | | | 418,769 | | | | 25,278 | | | | (41,967 | ) |
| | 32 | | | | 87 | | | | (58 | ) | | | — | | | | 204 | |
| | (1,483 | ) | | | (4,033 | ) | | | (263 | ) | | | (662 | ) | | | (1,130 | ) |
| | — | | | | — | | | | — | | | | — | | | | (10,421 | ) |
| — | | | | (2 | ) | | | (4 | ) | | | — | | | | (1,623 | ) |
| $ | 92,123 | | | $ | 348,920 | | | $ | 623,711 | | | $ | 51,566 | | | $ | 55,942 | |
| | |
| SEI Institutional Investments Trust / Annual Report / May 31, 2010 | | 135 |
Statements of Operations ($ Thousands)
For the year ended May 31, 2010
| | | | | | | | | | | | |
| | | World Equity
Ex-US
Fund | | | Screened
World Equity
Ex-US
Fund | | | Enhanced
LIBOR
Opportunities
Fund | |
Investment Income | | | | | | | | | | | | |
Dividends | | $ | 89,076 | | | $ | 1,846 | | | $ | — | |
Dividends from Affiliated Registered Investment Company(1) | | | 134 | | | | 2 | | | | 15 | |
Interest Income | | | 2,550 | | | | 15 | | | | 4,963 | |
Security Lending Income — Net | | | 2,172 | | | | — | | | | — | |
Less: Foreign Taxes Withheld | | | (7,817 | ) | | | (161 | ) | | | — | |
| | | | 86,115 | | | | 1,702 | | | | 4,978 | |
Expenses: | | | | | | | | | | | | |
Investment Advisory Fees | | | 18,540 | | | | 444 | | | | 687 | |
Administration Fees | | | 1,685 | | | | 34 | | | | 76 | |
Trustee Fees | | | 63 | | | | 1 | | | | 3 | |
Chief Compliance Officer Fees | | | 21 | | | | — | | | | 1 | |
Custodian/Wire Agent Fees | | | 1,079 | | | | 176 | | | | 7 | |
Professional Fees | | | 152 | | | | 3 | | | | 6 | |
Registration Fees | | | 50 | | | | — | | | | 1 | |
Printing Fees | | | 33 | | | | 1 | | | | 1 | |
Overdraft Fees | | | 36 | | | | 2 | | | | — | |
Other Expenses | | | 215 | | | | 64 | | | | 38 | |
Total Expenses | | | 21,874 | | | | 725 | | | | 820 | |
Less: | | | | | | | | | | | | |
Waiver of Investment Advisory Fees | | | (4,991 | ) | | | (145 | ) | | | (114 | ) |
Waiver of Administration Fees | | | (1,685 | ) | | | (34 | ) | | | (76 | ) |
Fees Paid Indirectly(1) | | | (73 | ) | | | — | | | | — | |
Net Expenses | | | 15,125 | | | | 546 | | | | 630 | |
Net Investment Income | | | 70,990 | | | | 1,156 | | | | 4,348 | |
Net Realized and Unrealized Gain (Loss) on Investments: | | | | | | | | | | | | |
Investments | | | 378,235 | | | | 4,109 | | | | (10,614 | ) |
Affiliated Investments | | | — | | | | — | | | | (10,003 | ) |
Futures Contracts | | | 2,591 | | | | 606 | | | | (318 | ) |
Written Options | | | — | | | | — | | | | — | |
Written Swaptions | | | — | | | | — | | | | — | |
Swap Contracts | | | 19,419 | | | | — | | | | — | |
Foreign Currency Transactions | | | 13,721 | | | | (49 | ) | | | (78 | ) |
Net Change in Unrealized Appreciation (Depreciation) on: | | | | | | | | | | | | |
Investments | | | (197,328 | ) | | | 368 | | | | 17,651 | |
Affiliated Investments | | | 330 | | | | — | | | | 18,052 | |
Futures Contracts | | | (10,932 | ) | | | (389 | ) | | | 19 | |
Written Options | | | — | | | | — | | | | — | |
Swap Contracts | | | (16,438 | ) | | | — | | | | — | |
Foreign Capital Gains Tax | | | 586 | | | | — | | | | — | |
Foreign Currency and Translation of Other Assets and Liabilities Denominated in Foreign Currencies | | | (7,251 | ) | | | (17 | ) | | | 79 | |
Net Increase in Net Assets Resulting from Operations | | $ | 253,923 | | | $ | 5,784 | | | $ | 19,136 | |
| (1) | | See Note 5 in the Notes to Financial Statements. |
Amounts designated as “—” are zero or have been rounded to zero.
The accompanying notes are an integral part of the financial statements.
| | |
| 136 | | SEI Institutional Investments Trust / Annual Report / May 31, 2010 |
| | | | | | | | | | | | | | | | | | |
Core Fixed
Income
Fund | | | High Yield
Bond
Fund | | | Long
Duration
Fund | | | Emerging
Markets
Debt Fund | | | Real Return
Fund | |
| | | | | | | | | | | | | | | | | | |
| $ | 35 | | | $ | 673 | | | $ | — | | | $ | — | | | $ | — | |
| | 248 | | | | 55 | | | | 72 | | | | — | | | | 1 | |
| | 256,390 | | | | 152,666 | | | | 116,143 | | | | 83,134 | | | | 9,743 | |
| | 979 | | | | 182 | | | | — | | | | 31 | | | | — | |
| | (23 | ) | | | (37 | ) | | | — | | | | — | | | | — | |
| | 257,629 | | | | 153,539 | | | | 116,215 | | | | 83,165 | | | | 9,744 | |
| | | | | | | | | | | | | | | | | | |
| | 15,913 | | | | 7,209 | | | | 6,191 | | | | 8,153 | | | | 1,365 | |
| | 2,652 | | | | 739 | | | | 1,032 | | | | 480 | | | | 141 | |
| | 104 | | | | 28 | | | | 36 | | | | 19 | | | | 6 | |
| | 33 | | | | 9 | | | | 13 | | | | 6 | | | | 2 | |
| | 264 | | | | 77 | | | | 120 | | | | 86 | | | | 4 | |
| | 245 | | | | 67 | | | | 99 | | | | 43 | | | | 13 | |
| | 70 | | | | 7 | | | | 71 | | | | 5 | | | | 5 | |
| | 47 | | | | 14 | | | | 23 | | | | 7 | | | | 2 | |
| | — | | | | — | | | | — | | | | 14 | | | | 2 | |
| | 184 | | | | 173 | | | | 104 | | | | 89 | | | | 7 | |
| | 19,512 | | | | 8,323 | | | | 7,689 | | | | 8,902 | | | | 1,547 | |
| | | | | | | | | | | | | | | | | | |
| | (9,449 | ) | | | (2,408 | ) | | | (2,530 | ) | | | (3,134 | ) | | | (593 | ) |
| | (2,637 | ) | | | (739 | ) | | | (1,032 | ) | | | (480 | ) | | | (141 | ) |
| | — | | | | — | | | | — | | | | — | | | | — | |
| | 7,426 | | | | 5,176 | | | | 4,127 | | | | 5,288 | | | | 813 | |
| | 250,203 | | | | 148,363 | | | | 112,088 | | | | 77,877 | | | | 8,931 | |
| | | | | | | | | | | | | | | | | | |
| | 110,405 | | | | 64,687 | | | | 18,166 | | | | 38,786 | | | | 11,256 | |
| | — | | | | — | | | | — | | | | — | | | | — | |
| | 21,284 | | | | — | | | | 14,124 | | | | 456 | | | | (168 | ) |
| | 3,024 | | | | — | | | | — | | | | — | | | | — | |
| | 900 | | | | — | | | | — | | | | — | | | | — | |
| | (4,835 | ) | | | (367 | ) | | | 11 | | | | 687 | | | | — | |
| | 416 | | | | — | | | | — | | | | 5,771 | | | | 44 | |
| | | | | | | | | | | | | | | | | | |
| | 355,419 | | | | 238,195 | | | | 168,568 | | | | 86,902 | | | | (5,139 | ) |
| | 642 | | | | 3,359 | | | | — | | | | 57 | | | | — | |
| | (410 | ) | | | — | | | | 6,478 | | | | (42 | ) | | | — | |
| | (240 | ) | | | — | | | | — | | | | — | | | | — | |
| | 1,239 | | | | (723 | ) | | | 164 | | | | 1,043 | | | | — | |
| | — | | | | — | | | | — | | | | — | | | | — | |
| 541 | | | | — | | | | — | | | | (1,104 | ) | | | — | |
| $ | 738,588 | | | $ | 453,514 | | | $ | 319,599 | | | $ | 210,433 | | | $ | 14,924 | |
| | |
| SEI Institutional Investments Trust / Annual Report / May 31, 2010 | | 137 |
Statements of Changes in Net Assets ($ Thousands)
For the years ended May 31,
| | | | | | | | | | | | | | | | |
| | | Large Cap
Fund | | | Large Cap
Diversified Alpha Fund | |
| | | 2010 | | | 2009 | | | 2010 | | | 2009 | |
Operations: | | | | | | | | | | | | | | | | |
Net Investment Income | | $ | 14,146 | | | $ | 7,363 | | | $ | 4,520 | | | $ | 5,503 | |
Net Realized Gain (Loss) from Investments, Affiliated Investments, Futures Contracts and Swap Contracts | | | 52,197 | | | | (62,797 | ) | | | 45,041 | | | | (186,360 | ) |
Net Realized Loss on Foreign Currency Transactions | | | — | | | | — | | | | (9 | ) | | | — | |
Net Change in Unrealized Appreciation (Depreciation) on Investments, Affiliated Investments and Future Contracts | | | 51,674 | | | | (40,243 | ) | | | 21,406 | | | | (48,205 | ) |
Net Change in Unrealized Appreciation (Depreciation) on Foreign Currency Transactions | | | — | | | | — | | | | 1 | | | | (1 | ) |
Net Increase (Decrease) in Net Assets Resulting from Operations | | | 118,017 | | | | (95,677 | ) | | | 70,959 | | | | (229,063 | ) |
Dividends and Distributions From: | | | | | | | | | | | | | | | | |
Net Investment Income: | | | | | | | | | | | | | | | | |
Class A | | | (12,504 | ) | | | (6,781 | ) | | | (4,456 | ) | | | (772 | ) |
Net Realized Gains: | | | | | | | | | | | | | | | | |
Class A | | | — | | | | — | | | | — | | | | — | |
Return of Capital | | | | | | | | | | | | | | | | |
Class A | | | — | | | | — | | | | — | | | | (2,889 | ) |
Total Dividends and Distributions | | | (12,504 | ) | | | (6,781 | ) | | | (4,456 | ) | | | (3,661 | ) |
Capital Share Transactions:(1) | | | | | | | | | | | | | | | | |
Class A: | | | | | | | | | | | | | | | | |
Proceeds from Shares Issued | | | 780,894 | (2) | | | 331,341 | | | | 53,221 | | | | 188,769 | |
Reinvestment of Dividends & Distributions | | | 11,980 | | | | 6,761 | | | | 3,677 | | | | 3,328 | |
Cost of Shares Redeemed | | | (194,426 | ) | | | (70,379 | ) | | | (101,903 | ) | | | (180,732 | ) |
Increase (Decrease) in Net Assets Derived from Capital Share Transactions | | | 598,448 | | | | 267,723 | | | | (45,005 | ) | | | 11,365 | |
Net Increase (Decrease) in Net Assets | | | 703,961 | | | | 165,265 | | | | 21,498 | | | | (221,359 | ) |
Net Assets: | | | | | | | | | | | | | | | | |
Beginning of Year | | | 526,421 | | | | 361,156 | | | | 331,002 | | | | 552,361 | |
End of Year | | $ | 1,230,382 | | | $ | 526,421 | | | $ | 352,500 | | | $ | 331,002 | |
Undistributed Net Investment Income Included in Net Assets at Period End | | $ | 3,321 | | | $ | 1,586 | | | $ | 1,390 | | | $ | — | |
| (1) | | See Note 6 in the Notes to Financial Statements for additional information. |
| (2) | | Includes subscriptions as a result of an in-kind transfers of securities (see Note 10). |
Amounts designated as “—” are zero or have been rounded to zero.
The accompanying notes are an integral part of the financial statements.
| | |
| 138 | | SEI Institutional Investments Trust / Annual Report / May 31, 2010 |
| | | | | | | | | | | | | | | | | | | | | | |
Large Cap
Disciplined Equity Fund | | | Large Cap
Index Fund | | | Small Cap
Fund | |
| 2010 | | | 2009 | | | 2010 | | | 2009 | | | 2010 | | | 2009 | |
| | | | | | | | | | | | | | | | | | | | | | |
| $ | 122,842 | | | $ | 126,794 | | | $ | 10,626 | | | $ | 8,446 | | | $ | 10,570 | | | $ | 14,533 | |
|
931,525 |
| | | (2,910,132 | ) | | | (10,201 | ) | | | (29,441 | ) | | | 115,418 | | | | (472,584 | ) |
| | (795 | ) | | | (1,882 | ) | | | — | | | | — | | | | (39 | ) | | | (114 | ) |
|
304,274 |
| | | (668,153 | ) | | | 91,698 | | | | (109,708 | ) | | | 222,973 | | | | (139,527 | ) |
| | 802 | | | | (451 | ) | | | — | | | | — | | | | (2 | ) | | | 10 | |
| | 1,358,648 | | | | (3,453,824 | ) | | | 92,123 | | | | (130,703 | ) | | | 348,920 | | | | (597,682 | ) |
| | | | | | | | | | | | | | | | | | | | | | |
| | | | | | | | | | | | | | | | | | | | | | |
| | (113,630 | ) | | | (10,906 | ) | | | (10,238 | ) | | | (8,380 | ) | | | (10,767 | ) | | | (23,822 | ) |
| | | | | | | | | | | | | | | | | | | | | | |
| | — | | | | — | | | | — | | | | (620 | ) | | | — | | | | — | |
| | | | | | | | | | | | | | | | | | | | | | |
| | — | | | | (79,835 | ) | | | — | | | | — | | | | — | | | | — | |
| | (113,630 | ) | | | (90,741 | ) | | | (10,238 | ) | | | (9,000 | ) | | | (10,767 | ) | | | (23,822 | ) |
| | | | | | | | | | | | | | | | | | | | | | |
| | | | | | | | | | | | | | | | | | | | | | |
| | 1,258,268 | (2) | | | 2,154,108 | (2) | | | 142,340 | | | | 156,678 | | | | 229,238 | (2) | | | 174,015 | |
| | 110,682 | | | | 89,812 | | | | 9,924 | | | | 8,560 | | | | 9,886 | | | | 22,561 | |
| | (1,696,325 | ) | | | (1,423,578 | ) | | | (78,921 | ) | | | (58,516 | ) | | | (223,389 | ) | | | (408,912 | ) |
| | (327,375 | ) | | | 820,342 | | | | 73,343 | | | | 106,722 | | | | 15,735 | | | | (212,336 | ) |
| | 917,643 | | | | (2,724,223 | ) | | | 155,228 | | | | (32,981 | ) | | | 353,888 | | | | (833,840 | ) |
| | | | | | | | | | | | | | | | | | | | | | |
| | 6,043,119 | | | | 8,767,342 | | | | 353,892 | | | | 386,873 | | | | 985,860 | | | | 1,819,700 | |
| $ | 6,960,762 | | | $ | 6,043,119 | | | $ | 509,120 | | | $ | 353,892 | | | $ | 1,339,748 | | | $ | 985,860 | |
| $ | 32,919 | | | $ | 217 | | | $ | 1,848 | | | $ | 1,350 | | | $ | 1,670 | | | $ | 918 | |
| | |
| SEI Institutional Investments Trust / Annual Report / May 31, 2010 | | 139 |
Statements of Changes in Net Assets ($ Thousands)
For the years or period ended May 31,
| | | | | | | | | | | | | | | | |
| | |
Small/Mid Cap
Equity Fund | | | U.S. Managed
Volatility Fund(2) | |
| | | 2010 | | | 2009 | | | 2010 | | | 2009 | |
Operations: | | | | | | | | | | | | | | | | |
Net Investment Income | | $ | 16,622 | | | $ | 24,678 | | | $ | 5,577 | | | $ | 1,288 | |
Net Realized Gain (Loss) from Investments, Affiliated Investments, Written Options, Written Swaptions, Futures Contracts and Swap Contracts | | | 188,860 | | | | (654,891 | ) | | | 21,373 | | | | (3,011 | ) |
Net Realized Gain (Loss) on Foreign Currency Transactions | | | (215 | ) | | | (404 | ) | | | — | | | | — | |
Net Change in Unrealized Appreciation (Depreciation) on Investments, Affiliated Investments, Written Options, Future Contracts and Swap Contracts | | | 418,448 | | | | (220,379 | ) | | | 24,616 | | | | 13,136 | |
Net Change in Unrealized Appreciation (Depreciation) on Foreign Cap Gains Tax | | | — | | | | — | | | | — | | | | — | |
Net Change in Unrealized Appreciation (Depreciation) on Foreign Currency Transactions | | | (4 | ) | | | 9 | | | | — | | | | — | |
Net Increase (Decrease) in Net Assets Resulting from Operations | | | 623,711 | | | | (850,987 | ) | | | 51,566 | | | | 11,413 | |
Dividends and Distributions From: | | | | | | | | | | | | | | | | |
Net Investment Income: | | | | | | | | | | | | | | | | |
Class A | | | (23,438 | ) | | | (27,726 | ) | | | (5,539 | ) | | | (555 | ) |
Net Realized Gains: | | | | | | | | | | | | | | | | |
Class A | | | — | | | | — | | | | (4,493 | ) | | | — | |
Return of Capital: | | | | | | | | | | | | | | | | |
Class A | | | — | | | | — | | | | — | | | | — | |
Total Dividends and Distributions | | | (23,438 | ) | | | (27,726 | ) | | | (10,032 | ) | | | (555 | ) |
Capital Share Transactions:(1) | | | | | | | | | | | | | | | | |
Class A: | | | | | | | | | | | | | | | | |
Proceeds from Shares Issued | | | 390,769 | | | | 556,902 | | | | 45,965 | | | | 232,207 | |
Reinvestment of Dividends & Distributions | | | 22,917 | | | | 27,474 | | | | 10,025 | | | | 555 | |
Cost of Shares Redeemed | | | (674,340 | ) | | | (353,895 | ) | | | (80,290 | ) | | | (5,760 | ) |
Increase (Decrease) in Net Assets Derived from Capital Share Transactions | | | (260,654 | ) | | | 230,481 | | | | (24,300 | ) | | | 227,002 | |
Net Increase (Decrease) in Net Assets | | | 339,619 | | | | (648,232 | ) | | | 17,234 | | | | 237,860 | |
Net Assets: | | | | | | | | | | | | | | | | |
Beginning of Period | | | 1,724,824 | | | | 2,373,056 | | | | 237,860 | | | | — | |
End of Period | | $ | 2,064,443 | | | $ | 1,724,824 | | | $ | 255,094 | | | $ | 237,860 | |
Undistributed Net Investment Income Included in Net Assets at Period End | | $ | 1,454 | | | $ | 7,462 | | | $ | 823 | | | $ | 733 | |
| (1) | | See Note 6 in the Notes to Financial Statements for additional information. |
| (2) | | Commenced operations on December 30, 2008. |
| (3) | | Commenced operations on June 30, 2008. |
Amounts designated as “—” are zero or have been rounded to zero.
The accompanying notes are an integral part of the financial statements.
| | |
| 140 | | SEI Institutional Investments Trust / Annual Report / May 31, 2010 |
| | | | | | | | | | | | | | | | | | | | | | | | | | | | | | |
International
Equity Fund | | | World Equity
Ex-US Fund | | | Screened
World Equity
Ex-US Fund(3) | | | Enhanced
LIBOR
Opportunities Fund | |
| 2010 | | | 2009 | | | 2010 | | | 2009 | | | 2010 | | | 2009 | | | 2010 | | | 2009 | |
| | | | | | | | | | | | | | | | | | | | | | | | | | | | | | |
| $ | 16,417 | | | $ | 26,627 | | | $ | 70,990 | | | $ | 73,495 | | | $ | 1,156 | | | $ | 1,211 | | | $ | 4,348 | | | $ | 5,626 | |
| 90,023 | | | | (529,662 | ) | | | 400,245 | | | | (1,232,642 | ) | | | 4,715 | | | | (29,065 | ) | | | (20,935 | ) | | | (13,555 | ) |
| | 4,439 | | | | (19,516 | ) | | | 13,721 | | | | (43,428 | ) | | | (49 | ) | | | (174 | ) | | | (78 | ) | | | (1,934 | ) |
| (53,314 | ) | | | (158,270 | ) | | | (224,368 | ) | | | (190,170 | ) | | | (21 | ) | | | (3,250 | ) | | | 35,722 | | | | (43,748 | ) |
| | — | | | | — | | | | 586 | | | | (343 | ) | | | — | | | | — | | | | — | | | | — | |
| | (1,623 | ) | | | 2,112 | | | | (7,251 | ) | | | 7,784 | | | | (17 | ) | | | 14 | | | | 79 | | | | 235 | |
| | 55,942 | | | | (678,709 | ) | | | 253,923 | | | | (1,385,304 | ) | | | 5,784 | | | | (31,264 | ) | | | 19,136 | | | | (53,376 | ) |
| | | | | | | | | | | | | | | | | | | | | | | | | | | | | | |
| | | | | | | | | | | | | | | | | | | | | | | | | | | | | | |
| | (13,386 | ) | | | (10,879 | ) | | | (75,180 | ) | | | — | | | | (912 | ) | | | (561 | ) | | | (2,810 | ) | | | (3,100 | ) |
| | | | | | | | | | | | | | | | | | | | | | | | | | | | | | |
| | — | | | | (2,062 | ) | | | — | | | | — | | | | — | | | | — | | | | — | | | | — | |
| | | | | | | | | | | | | | | | | | | | | | | | | | | | | | |
| | — | | | | — | | | | — | | | | — | | | | — | | | | — | | | | — | | | | (929 | ) |
| | (13,386 | ) | | | (12,941 | ) | | | (75,180 | ) | | | — | | | | (912 | ) | | | (561 | ) | | | (2,810 | ) | | | (4,029 | ) |
| | | | | | | | | | | | | | | | | | | | | | | | | | | | | | |
| | | | | | | | | | | | | | | | | | | | | | | | | | | | | | |
| | 168,088 | | | | 315,996 | | | | 1,300,345 | | | | 1,523,949 | | | | 25,764 | | | | 97,244 | | | | 6,304 | | | | 30,159 | |
| | 11,628 | | | | 12,425 | | | | 73,000 | | | | — | | | | 785 | | | | 507 | | | | 1,051 | | | | 3,943 | |
| | (321,669 | ) | | | (384,857 | ) | | | (561,231 | ) | | | (718,008 | ) | | | (14,785 | ) | | | (13,819 | ) | | | (73,275 | ) | | | (55,964 | ) |
| | (141,953 | ) | | | (56,436 | ) | | | 812,114 | | | | 805,941 | | | | 11,764 | | | | 83,932 | | | | (65,920 | ) | | | (21,862 | ) |
| | (99,397 | ) | | | (748,086 | ) | | | 990,857 | | | | (579,363 | ) | | | 16,636 | | | | 52,107 | | | | (49,594 | ) | | | (79,267 | ) |
| | | | | | | | | | | | | | | | | | | | | | | | | | | | | | |
| | 704,876 | | | | 1,452,962 | | | | 2,721,757 | | | | 3,301,120 | | | | 52,107 | | | | — | | | | 165,113 | | | | 244,380 | |
| $ | 605,479 | | | $ | 704,876 | | | $ | 3,712,614 | | | $ | 2,721,757 | | | $ | 68,743 | | | $ | 52,107 | | | $ | 115,519 | | | $ | 165,113 | |
| $ | 21,951 | | | $ | 3,350 | | | $ | 53,729 | | | $ | 28,028 | | | $ | 821 | | | $ | 493 | | | $ | 2,587 | | | $ | 4 | |
| | |
| SEI Institutional Investments Trust / Annual Report / May 31, 2010 | | 141 |
Statements of Changes in Net Assets ($ Thousands)
For the years ended May 31,
| | | | | | | | | | | | | | | | |
| | | Core Fixed
Income Fund | | | High Yield
Bond Fund | |
| | | 2010 | | | 2009 | | | 2010 | | | 2009 | |
Operations: | | | | | | | | | | | | | | | | |
Net Investment Income | | $ | 250,203 | | | $ | 296,773 | | | $ | 148,363 | | | $ | 132,188 | |
Net Realized Gain (Loss) from Investments, Affiliated Investments, Written Options, Written Swaptions, Futures Contracts and Swap Contracts | | | 130,778 | | | | (53,563 | ) | | | 64,320 | | | | (189,876 | ) |
Net Realized Gain (Loss) on Foreign Currency Transactions | | | 416 | | | | 12,443 | | | | — | | | | — | |
Net Change in Unrealized Appreciation (Depreciation) on Investments, Affiliated Investments, Written Options, Futures Contracts and Swap Contracts | | | 356,650 | | | | (215,205 | ) | | | 240,831 | | | | (135,013 | ) |
Net Change in Unrealized Appreciation (Depreciation) on Foreign Currency Transactions | | | 541 | | | | (1,392 | ) | | | — | | | | — | |
Net Increase (Decrease) in Net Assets Resulting from Operations | | | 738,588 | | | | 39,056 | | | | 453,514 | | | | (192,701 | ) |
Dividends and Distributions From: | | | | | | | | | | | | | | | | |
Net Investment Income: | | | | | | | | | | | | | | | | |
Class A | | | (257,305 | ) | | | (298,149 | ) | | | (141,645 | ) | | | (125,601 | ) |
Net Realized Gains: | | | | | | | | | | | | | | | | |
Class A | | | — | | | | (90,124 | ) | | | (3,523 | ) | | | (10,261 | ) |
Return of Capital: | | | | | | | | | | | | | | | | |
Class A | | | — | | | | — | | | | — | | | | — | |
Total Dividends and Distributions | | | (257,305 | ) | | | (388,273 | ) | | | (145,168 | ) | | | (135,862 | ) |
Capital Share Transactions:(1) | | | | | | | | | | | | | | | | |
Class A: | | | | | | | | | | | | | | | | |
Proceeds from Shares Issued | | | 2,283,474 | | | | 1,865,234 | | | | 483,963 | | | | 340,770 | |
Reinvestment of Dividends & Distributions | | | 235,877 | | | | 374,113 | | | | 138,393 | | | | 133,130 | |
Cost of Shares Redeemed | | | (1,835,519 | ) | | | (3,498,985 | ) | | | (535,365 | ) | | | (305,925 | ) |
Increase (Decrease) in Net Assets Derived from Capital Share Transactions | | | 683,832 | | | | (1,259,638 | ) | | | 86,991 | | | | 167,975 | |
Net Increase (Decrease) in Net Assets | | | 1,165,115 | | | | (1,608,855 | ) | | | 395,337 | | | | (160,588 | ) |
Net Assets: | | | | | | | | | | | | | | | | |
Beginning of Year | | | 4,540,593 | | | | 6,149,448 | | | | 1,239,271 | | | | 1,399,859 | |
End of Year | | $ | 5,705,708 | | | $ | 4,540,593 | | | $ | 1,634,608 | | | $ | 1,239,271 | |
Undistributed (Distributions in Excess of) Net Investment Income Included in
Net Assets at Year End | | $ | 8,929 | | | $ | 9,037 | | | $ | 49 | | | $ | 1,899 | |
| (1) | | See Note 6 in the Notes to Financial Statements for additional information. |
Amounts designated as “—” are zero or have been rounded to zero.
The accompanying notes are an integral part of the financial statements.
| | |
| 142 | | SEI Institutional Investments Trust / Annual Report / May 31, 2010 |
| | | | | | | | | | | | | | | | | | | | | | |
Long Duration
Fund | | | Emerging Markets
Debt Fund | | | Real Return
Fund | |
| 2010 | | | 2009 | | | 2010 | | | 2009 | | | 2010 | | | 2009 | |
| | | | | | | | | | | | | | | | | | | | | | |
| $ | 112,088 | | | $ | 22,752 | | | $ | 77,877 | | | $ | 81,032 | | | $ | 8,931 | | | $ | 6,064 | |
| 32,301 | | | | (38,634 | ) | | | 39,929 | | | | (96,832 | ) | | | 11,088 | | | | (4,440 | ) |
| | — | | | | — | | | | 5,771 | | | | (11,390 | ) | | | 44 | | | | 3,101 | |
| 175,210 | | | | (6,593 | ) | | | 87,960 | | | | (24,829 | ) | | | (5,139 | ) | | | (5,506 | ) |
| — | | | | — | | | | (1,104 | ) | | | 756 | | | | — | | | | (610 | ) |
| | 319,599 | | | | (22,475 | ) | | | 210,433 | | | | (51,263 | ) | | | 14,924 | | | | (1,391 | ) |
| | | | | | | | | | | | | | | | | | | | | | |
| | | | | | | | | | | | | | | | | | | | | | |
| | (113,770 | ) | | | (24,618 | ) | | | (95,106 | ) | | | (76,229 | ) | | | (6,985 | ) | | | (19,450 | ) |
| | | | | | | | | | | | | | | | | | | | | | |
| | — | | | | — | | | | — | | | | — | | | | — | | | | (63 | ) |
| | | | | | | | | | | | | | | | | | | | | | |
| | — | | | | — | | | | — | | | | — | | | | — | | | | (1,496 | ) |
| | (113,770 | ) | | | (24,618 | ) | | | (95,106 | ) | | | (76,229 | ) | | | (6,985 | ) | | | (21,009 | ) |
| | | | | | | | | | | | | | | | | | | | | | |
| | | | | | | | | | | | | | | | | | | | | | |
| | 1,092,791 | | | | 1,468,293 | | | | 257,845 | | | | 238,272 | | | | 162,256 | | | | 70,945 | |
| | 113,670 | | | | 24,542 | | | | 90,608 | | | | 74,453 | | | | 4,464 | | | | 20,190 | |
| | (165,150 | ) | | | (72,449 | ) | | | (375,408 | ) | | | (346,498 | ) | | | (108,378 | ) | | | (170,387 | ) |
| | 1,041,311 | | | | 1,420,386 | | | | (26,955 | ) | | | (33,773 | ) | | | 58,342 | | | | (79,252 | ) |
| | 1,247,140 | | | | 1,373,293 | | | | 88,372 | | | | (161,265 | ) | | | 66,281 | | | | (101,652 | ) |
| | | | | | | | | | | | | | | | | | | | | | |
| | 1,489,047 | | | | 115,754 | | | | 901,226 | | | | 1,062,491 | | | | 260,477 | | | | 362,129 | |
| $ | 2,736,187 | | | $ | 1,489,047 | | | $ | 989,598 | | | $ | 901,226 | | | $ | 326,758 | | | $ | 260,477 | |
$ | (3,008 | ) | | $ | (18 | ) | | $ | (5,095 | ) | | $ | 7,588 | | | $ | 1,919 | | | $ | (345 | ) |
| | |
| SEI Institutional Investments Trust / Annual Report / May 31, 2010 | | 143 |
Financial Highlights
For the years or periods ended May 31,
For a share outstanding throughout each period
| | | | | | | | | | | | | | | | | | | | | | | | | | | | | | | | | | | | | | | | | | | | | | | | | | |
| | | Net Asset
Value,
Beginning
of Period | | Net
Investment
Income(2) | | Net
Realized
and
Unrealized
Gains
(Losses) on
Securities | | | Total from
Operations | | | Dividends
from Net
Investment
Income | | | Distributions
from
Realized
Capital
Gains | | | Total
Dividends
and
Distributions | | | Net Asset
Value,
End of
Period | | Total
Return† | | | Net Assets
End of Period
($ Thousands) | | Ratio of
Net
Expenses
to Average
Net Assets | | | Ratio of
Expenses
to Average
Net Assets
(Excluding
Fees Paid
Indirectly
and
Including
Waivers) | | | Ratio of
Expenses
to Average
Net Assets
(Excluding
Fees Paid
Indirectly
and
Waivers) | | | Ratio of
Net
Investment
Income
to Average
Net Assets | | | Portfolio
Turnover
Rate† | |
Large Cap Fund | | | | | | | | | | | | | | | | | | | | | | | | | | | | | | | | | | | | | | | | | | | | | | | |
Class A | | | | | | | | | | | | | | | | | | | | | | | | | | | | | | | | | | | | | | | | | | | | | | | |
2010 | | $ | 12.55 | | $ | 0.23 | | $ | 2.28 | | | $ | 2.51 | | | $ | (0.22 | ) | | $ | — | | | $ | (0.22 | ) | | $ | 14.84 | | 20.05 | % | | $ | 1,230,382 | | 0.26 | % | | 0.26 | % | | 0.47 | % | | 1.56 | % | | 72 | % |
2009 | | | 18.75 | | | 0.28 | | | (6.22 | ) | | | (5.94 | ) | | | (0.26 | ) | | | — | | | | (0.26 | ) | | | 12.55 | | (31.73 | ) | | | 526,421 | | 0.25 | | | 0.26 | | | 0.48 | | | 2.16 | | | 81 | |
2008 | | | 20.31 | | | 0.32 | | | (1.52 | ) | | | (1.20 | ) | | | (0.36 | ) | | | — | | | | (0.36 | ) | | | 18.75 | | (5.95 | ) | | | 361,156 | | 0.26 | | | 0.26 | | | 0.47 | | | 1.66 | | | 57 | |
2007 | | | 16.93 | | | 0.28 | | | 3.40 | | | | 3.68 | | | | (0.30 | ) | | | — | | | | (0.30 | ) | | | 20.31 | | 21.97 | | | | 693,994 | | 0.26 | | | 0.26 | | | 0.46 | | | 1.57 | | | 47 | |
2006 | | | 15.53 | | | 0.24 | | | 1.44 | | | | 1.68 | | | | (0.28 | ) | | | — | | | | (0.28 | ) | | | 16.93 | | 10.87 | | | | 801,217 | | 0.25 | | | 0.26 | | | 0.48 | | | 1.47 | | | 103 | |
Large Cap Diversified Alpha Fund | | | | | | | | | | | | | | | | | | | | | | | | | | | | | | | | | | | | | | | | | |
Class A | | | | | | | | | | | | | | | | | | | | | | | | | | | | | | | | | | | | | | | | | | | | | | | |
2010 | | $ | 6.35 | | $ | 0.09 | | $ | 1.34 | | | $ | 1.43 | | | $ | (0.09 | ) | | $ | — | | | $ | (0.09 | ) | | $ | 7.69 | | 22.61 | % | | $ | 352,500 | | 0.31 | % | | 0.31 | % | | 0.47 | % | | 1.26 | % | | 95 | % |
2009 | | | 10.23 | | | 0.10 | | | (3.91 | ) | | | (3.81 | ) | | | (0.07 | )** | | | — | | | | (0.07 | ) | | | 6.35 | | (37.33 | ) | | | 331,002 | | 0.48 | * | | 0.48 | * | | 0.64 | | | 1.41 | | | 132 | |
2008 | | | 11.94 | | | 0.13 | | | (1.15 | ) | | | (1.02 | ) | | | (0.17 | ) | | | (0.52 | ) | | | (0.69 | ) | | | 10.23 | | (8.80 | ) | | | 552,361 | | 0.64 | * | | 0.64 | * | | 0.79 | | | 1.17 | | | 77 | |
2007 | | | 9.94 | | | 0.19 | | | 2.04 | | | | 2.23 | | | | (0.16 | ) | | | (0.07 | ) | | | (0.23 | ) | | | 11.94 | | 22.64 | | | | 453,954 | | 0.62 | * | | 0.62 | * | | 0.74 | | | 1.77 | | | 132 | |
2006(1) | | | 10.00 | | | 0.04 | | | (0.09 | ) | | | (0.05 | ) | | | (0.01 | ) | | | — | | | | (0.01 | ) | | | 9.94 | | (0.49 | ) | | | 139,046 | | 0.45 | * | | 0.45 | * | | 0.66 | | | 1.70 | | | 47 | |
Large Cap Disciplined Equity Fund | | | | | | | | | | | | | | | | | | | | | | | | | | | | | | | | | | | | | | | | | |
Class A | | | | | | | | | | | | | | | | | | | | | | | | | | | | | | | | | | | | | | | | | | | | | | | |
2010 | | $ | 7.36 | | $ | 0.15 | | $ | 1.49 | | | $ | 1.64 | | | $ | (0.14 | ) | | $ | — | | | $ | (0.14 | ) | | $ | 8.86 | | 22.32 | % | | $ | 6,960,762 | | 0.18 | % | | 0.18 | % | | 0.47 | % | | 1.74 | % | | 104 | % |
2009 | | | 12.07 | | | 0.16 | | | (4.75 | ) | | | (4.59 | ) | | | (0.12 | )*** | | | — | | | | (0.12 | ) | | | 7.36 | | (38.18 | ) | | | 6,043,119 | | 0.19 | | | 0.19 | | | 0.47 | | | 1.97 | | | 108 | |
2008 | | | 14.38 | | | 0.22 | | | (1.54 | ) | | | (1.32 | ) | | | (0.25 | ) | | | (0.74 | ) | | | (0.99 | ) | | | 12.07 | | (9.57 | ) | | | 8,767,342 | | 0.19 | | | 0.19 | | | 0.47 | | | 1.70 | | | 111 | |
2007†† | | | 12.36 | | | 0.51 | | | 2.27 | | | | 2.78 | | | | (0.30 | ) | | | (0.46 | ) | | | (0.76 | ) | | | 14.38 | | 23.15 | | | | 7,833,212 | | 0.23 | (3) | | 0.23 | (3) | | 0.47 | (3) | | 2.43 | | | 135 | |
2006†† | | | 12.05 | | | 0.26 | | | 0.85 | | | | 1.11 | | | | (0.22 | ) | | | (0.58 | ) | | | (0.80 | ) | | | 12.36 | | 9.33 | | | | 4,938,416 | | 0.24 | | | 0.24 | | | 0.47 | | | 2.10 | | | 140 | |
Large Cap Index Fund | | | | | | | | | | | | | | | | | | | | | | | | | | | | | | | | | | | | | | | | | |
Class A | | | | | | | | | | | | | | | | | | | | | | | | | | | | | | | | | | | | | | | | | | | | | | | |
2010 | | $ | 78.92 | | $ | 2.01 | | $ | 15.53 | | | $ | 17.54 | | | $ | (1.93 | ) | | $ | — | | | $ | (1.93 | ) | | $ | 94.53 | | 22.34 | % | | $ | 509,120 | | 0.06 | % | | 0.06 | % | | 0.24 | % | | 2.17 | % | | 11 | % |
2009 | | | 121.02 | | | 2.13 | | | (41.96 | ) | | | (39.83 | ) | | | (2.13 | ) | | | (0.14 | ) | | | (2.27 | ) | | | 78.92 | | (32.99 | ) | | | 353,892 | | 0.06 | | | 0.06 | | | 0.25 | | | 2.56 | | | 18 | |
2008 | | | 135.30 | | | 2.47 | | | (10.72 | ) | | | (8.25 | ) | | | (2.52 | ) | | | (3.51 | ) | | | (6.03 | ) | | | 121.02 | | (6.25 | ) | | | 386,873 | | 0.06 | | | 0.06 | | | 0.24 | | | 1.97 | | | 14 | |
2007 | | | 113.02 | | | 2.29 | | | 23.15 | | | | 25.44 | | | | (2.33 | ) | | | (0.83 | ) | | | (3.16 | ) | | | 135.30 | | 22.87 | | | | 416,933 | | 0.06 | | | 0.06 | | | 0.24 | | | 1.88 | | | 10 | |
2006 | | | 106.24 | | | 2.06 | | | 7.77 | | | | 9.83 | | | | (1.94 | ) | | | (1.11 | ) | | | (3.05 | ) | | | 113.02 | | 9.34 | | | | 367,084 | | 0.08 | | | 0.08 | | | 0.24 | | | 1.84 | | | 20 | |
Small Cap Fund | | | | | | | | | | | | | | | | | | | | | | | | | | | | | | | | | | | | | | | | | |
Class A | | | | | | | | | | | | | | | | | | | | | | | | | | | | | | | | | | | | | | | | | | | | | | | |
2010 | | $ | 7.97 | | $ | 0.08 | | $ | 2.73 | | | $ | 2.81 | | | $ | (0.09 | ) | | $ | — | | | $ | (0.09 | ) | | $ | 10.69 | | 35.32 | % | | $ | 1,339,748 | | 0.53 | % | | 0.54 | % | | 0.72 | % | | 0.86 | % | | 106 | % |
2009 | | | 12.42 | | | 0.11 | | | (4.37 | ) | | | (4.26 | ) | | | (0.19 | ) | | | — | | | | (0.19 | ) | | | 7.97 | | (34.27 | ) | | | 985,860 | | 0.52 | | | 0.54 | | | 0.72 | | | 1.26 | | | 122 | |
2008 | | | 16.44 | | | 0.11 | | | (2.26 | ) | | | (2.15 | ) | | | (0.12 | ) | | | (1.75 | ) | | | (1.87 | ) | | | 12.42 | | (13.58 | ) | | | 1,819,700 | | 0.52 | | | 0.54 | | | 0.72 | | | 0.80 | | | 99 | |
2007 | | | 15.52 | | | 0.10 | | | 2.85 | | | | 2.95 | | | | (0.12 | ) | | | (1.91 | ) | | | (2.03 | ) | | | 16.44 | | 20.32 | | | | 2,136,857 | | 0.52 | | | 0.54 | | | 0.72 | | | 0.67 | | | 92 | |
2006 | | | 14.27 | | | 0.07 | | | 2.55 | | | | 2.62 | | | | (0.06 | ) | | | (1.31 | ) | | | (1.37 | ) | | | 15.52 | | 18.93 | | | | 1,951,138 | | 0.52 | | | 0.54 | | | 0.72 | | | 0.44 | | | 119 | |
| * | | The expense ratio includes dividend and interest expenses on short sales. Had these expenses been excluded, the ratios would have been 0.31% for the period ended May 31, 2009 and 0.32%, 0.35% and 0.34% for 2008, 2007 and 2006, respectively. |
| ** | | Includes a return of capital of $0.05 per share. See Note 8 in Notes to Financial Statements. |
| *** | | Includes a return of capital of $0.10 per share. See Note 8 in Notes to Financial Statements. |
| † | | Returns and portfolio turnover rates are for the period indicated and have not been annualized. Returns do not reflect the deduction of taxes the shareholder would pay on fund distributions or redemption of Fund shares. |
| †† | | Per share amounts have been adjusted for a 10 to 1 stock split paid to shareholders of record on November 16, 2006. |
| (1) | | Commenced operations on February 28, 2006. All ratios for the period have been annualized. |
| (2) | | Per share net investment income and net realized and unrealized gains (losses) calculated using average shares. |
| (3) | | The expense ratio includes interest expense on reverse repurchase agreements. Had this expense been excluded, the ratios would have been 0.22%, 0.22%, and 0.47%, respectively. |
Amounts designated as “—” are zero or have been rounded to zero.
The accompanying notes are an integral part of the financial statements.
| | |
| 144 | | SEI Institutional Investments Trust / Annual Report / May 31, 2010 |
Financial Highlights
For the years or periods ended May 31,
For a share outstanding throughout each period
| | | | | | | | | | | | | | | | | | | | | | | | | | | | | | | | | | | | | | | | | | | | | | | | | | |
| | | Net Asset
Value,
Beginning
of Period | | Net
Investment
Income(3) | | Net
Realized
and
Unrealized
Gains
(Losses) on
Securities | | | Total from
Operations | | | Dividends
from Net
Investment
Income | | | Distributions
from
Realized
Capital
Gains | | | Total
Dividends
and
Distributions | | | Net Asset
Value,
End of
Period | | Total
Return† | | | Net Assets
End of Period
($ Thousands) | | Ratio of
Net
Expenses
to Average
Net Assets | | | Ratio of
Expenses
to Average
Net Assets
(Excluding
Fees Paid
Indirectly
and
Including
Waivers) | | | Ratio of
Expenses
to Average
Net Assets
(Excluding
Fees Paid
Indirectly
and
Waivers) | | | Ratio of
Net
Investment
Income to
Average
Net Assets | | | Portfolio
Turnover
Rate† | |
Small/Mid Cap Equity Fund | | | | | | | | | | | | | | | | | | | | | | | | | | | | | | | | | | | | | | | | | |
Class A | | | | | | | | | | | | | | | | | | | | | | | | | | | | | | | | | | | | | | | | | | | | | | | |
2010 | | $ | 7.85 | | $ | 0.08 | | $ | 2.71 | | | $ | 2.79 | | | $ | (0.11 | ) | | $ | — | | | $ | (0.11 | ) | | $ | 10.53 | | 35.79 | % | | $ | 2,064,443 | | 0.49 | % | | 0.50 | % | | 0.72 | % | | 0.79 | % | | 97 | % |
2009 | | | 12.22 | | | 0.12 | | | (4.36 | ) | | | (4.24 | ) | | | (0.13 | ) | | | — | | | | (0.13 | ) | | | 7.85 | | (34.70 | ) | | | 1,724,824 | | 0.48 | | | 0.50 | | | 0.72 | | | 1.40 | | | 125 | |
2008 | | | 14.95 | | | 0.12 | | | (1.91 | ) | | | (1.79 | ) | | | (0.12 | ) | | | (0.82 | ) | | | (0.94 | ) | | | 12.22 | | (12.14 | ) | | | 2,373,056 | | 0.49 | | | 0.50 | | | 0.72 | | | 0.97 | | | 95 | |
2007†† | | | 13.38 | | | 0.19 | | | 2.57 | | | | 2.76 | | | | (0.13 | ) | | | (1.06 | ) | | | (1.19 | ) | | | 14.95 | | 21.60 | | | | 1,865,746 | | 0.48 | | | 0.50 | | | 0.72 | | | 0.85 | | | 104 | |
2006†† | | | 11.96 | | | 0.09 | | | 1.97 | | | | 2.06 | | | | (0.08 | ) | | | (0.56 | ) | | | (0.64 | ) | | | 13.38 | | 17.51 | | | | 1,216,640 | | 0.50 | | | 0.53 | | | 0.72 | | | 0.69 | | | 123 | |
U.S. Managed Volatility Fund | | | | | | | | | | | | | | | | | | | | | | | | | | | | | | | | | | | | | | | | | |
Class A | | | | | | | | | | | | | | | | | | | | | | | | | | | | | | | | | | | | | | | | | | | | | | | |
2010 | | $ | 9.55 | | $ | 0.22 | | $ | 1.78 | | | $ | 2.00 | | | $ | (0.22 | ) | | $ | (0.17 | ) | | $ | (0.39 | ) | | $ | 11.16 | | 21.12 | % | | $ | 255,094 | | 0.35 | % | | 0.35 | % | | 0.72 | % | | 2.04 | % | | 58 | % |
2009(2) | | | 10.00 | | | 0.09 | | | (0.51 | ) | | | (0.42 | ) | | | (0.03 | ) | | | — | | | | (0.03 | ) | | | 9.55 | | (4.16 | ) | | | 237,860 | | 0.35 | | | 0.35 | | | 0.75 | | | 2.31 | | | 31 | |
International Equity Fund | | | | | | | | | | | | | | | | | | | | | | | | | | | | | | | | | | | | | | | | | | | | |
Class A | | | | | | | | | | | | | | | | | | | | | | | | | | | | | | | | | | | | | | | | | | | | | | | |
2010 | | $ | 6.08 | | $ | 0.15 | | $ | 0.27 | | | $ | 0.42 | | | $ | (0.13 | ) | | $ | — | | | $ | (0.13 | ) | | $ | 6.37 | | 6.68 | % | | $ | 605,479 | | 0.39 | % | | 0.39 | % | | 0.64 | % | | 2.25 | % | | 153 | % |
2009 | | | 11.12 | | | 0.21 | | | (5.15 | ) | | | (4.94 | ) | | | (0.09 | ) | | | (0.01 | ) | | | (0.10 | ) | | | 6.08 | | (44.32 | ) | | | 704,876 | | 0.39 | (8) | | 0.39 | (8) | | 0.61 | (8) | | 3.03 | | | 200 | |
2008 | | | 14.27 | | | 0.37 | | | (1.05 | ) | | | (0.68 | ) | | | (0.44 | ) | | | (2.03 | ) | | | (2.47 | ) | | | 11.12 | | (5.52 | ) | | | 1,452,962 | | 0.40 | (7) | | 0.41 | (7) | | 0.62 | (7) | | 2.99 | | | 145 | |
2007 | | | 14.05 | | | 0.37 | | | 3.12 | | | | 3.49 | | | | (0.50 | ) | | | (2.77 | ) | | | (3.27 | ) | | | 14.27 | | 28.00 | | | | 1,790,634 | | 0.50 | (4) | | 0.50 | (4) | | 0.71 | (4) | | 2.69 | | | 153 | |
2006 | | | 11.15 | | | 0.29 | | | 3.09 | | | | 3.38 | | | | (0.37 | ) | | | (0.11 | ) | | | (0.48 | ) | | | 14.05 | | 30.77 | | | | 1,656,985 | | 0.36 | | | 0.36 | | | 0.63 | | | 2.30 | | | 116 | |
World Equity Ex-US Fund | | | | | | | | | | | | | | | | | | | | | | | | | | | | | | | | | | | | | | | | | | | | |
Class A | | | | | | | | | | | | | | | | | | | | | | | | | | | | | | | | | | | | | | | | | | | | | | | |
2010 | | $ | 8.39 | | $ | 0.20 | | $ | 0.72 | | | $ | 0.92 | | | $ | (0.22 | ) | | $ | — | | | $ | (0.22 | ) | | $ | 9.09 | | 10.74 | % | | $ | 3,712,614 | | 0.45 | % | | 0.45 | % | | 0.65 | % | | 2.10 | % | | 149 | % |
2009 | | | 14.56 | | | 0.26 | | | (6.43 | ) | | | (6.17 | ) | | | — | | | | — | | | | — | | | | 8.39 | | (42.38 | ) | | | 2,721,757 | | 0.45 | (9) | | 0.45 | (9) | | 0.66 | (9) | | 3.03 | | | 171 | |
2008 | | | 15.96 | | | 0.38 | | | (0.51 | ) | | | (0.13 | ) | | | (0.39 | ) | | | (0.88 | ) | | | (1.27 | ) | | | 14.56 | | (1.14 | ) | | | 3,301,120 | | 0.57 | | | 0.57 | | | 0.67 | | | 2.58 | | | 153 | |
2007 | | | 12.99 | | | 0.35 | | | 3.47 | | | | 3.82 | | | | (0.33 | ) | | | (0.52 | ) | | | (0.85 | ) | | | 15.96 | | 30.29 | | | | 2,053,014 | | 0.71 | (5) | | 0.71 | (5) | | 0.77 | (5) | | 2.45 | | | 154 | |
2006 | | | 9.81 | | | 0.27 | | | 3.01 | | | | 3.28 | | | | (0.09 | ) | | | (0.01 | ) | | | (0.10 | ) | | | 12.99 | | 33.52 | | | | 908,582 | | 0.60 | | | 0.61 | | | 0.76 | | | 2.22 | | | 104 | |
Screened World Equity Ex-US Fund | | | | | | | | | | | | | | | | | | | | | | | | | | | | | | | | | | | | | | | | | |
Class A | | | | | | | | | | | | | | | | | | | | | | | | | | | | | | | | | | | | | | | | | | | | | | | |
2010 | | $ | 6.42 | | $ | 0.13 | | $ | 0.58 | | | $ | 0.71 | | | $ | (0.09 | ) | | $ | — | | | $ | (0.09 | ) | | $ | 7.04 | | 11.00 | % | | $ | 68,743 | | 0.80 | % | | 0.80 | % | | 1.06 | % | | 1.69 | % | | 161 | % |
2009(1) | | | 10.00 | | | 0.14 | | | (3.66 | ) | | | (3.52 | ) | | | (0.06 | ) | | | — | | | | (0.06 | ) | | | 6.42 | | (35.12 | ) | | | 52,107 | | 0.80 | | | 0.80 | | | 1.10 | | | 2.38 | | | 101 | |
Enhanced LIBOR Opportunities Fund | | | | | | | | | | | | | | | | | | | | | | | | | | | | | | | | | | | | | |
Class A | | | | | | | | | | | | | | | | | | | | | | | | | | | | | | | | | | | | | | | | | | | | | | | |
2010 | | $ | 6.95 | | $ | 0.21 | | $ | 0.67 | | | $ | 0.88 | | | $ | (0.14 | ) | | $ | — | | | $ | (0.14 | ) | | $ | 7.69 | | 12.66 | % | | $ | 115,519 | | 0.41 | % | | 0.41 | % | | 0.54 | % | | 2.85 | % | | 12 | % |
2009 | | | 9.11 | | | 0.22 | | | (2.22 | ) | | | (2.00 | ) | | | (0.16 | )* | | | — | | | | (0.16 | ) | | | 6.95 | | (22.20 | ) | | | 165,113 | | 0.41 | | | 0.41 | | | 0.54 | | | 2.91 | | | 27 | |
2008 | | | 10.14 | | | 0.42 | | | (1.00 | ) | | | (0.58 | ) | | | (0.44 | ) | | | (0.01 | ) | | | (0.45 | ) | | | 9.11 | | (5.88 | ) | | | 244,380 | | 0.42 | | | 0.42 | | | 0.55 | | | 4.45 | | | 25 | |
2007(6) | | | 10.00 | | | 0.27 | | | 0.03 | | | | 0.30 | | | | (0.16 | ) | | | — | | | | (0.16 | ) | | | 10.14 | | 3.02 | | | | 123,430 | | 0.44 | | | 0.44 | | | 0.54 | | | 5.84 | | | 53 | |
Core Fixed Income Fund | | | | | | | | | | | | | | | | | | | | | | | | | | | | | | | | | | | | | | | | | | | | |
Class A | | | | | | | | | | | | | | | | | | | | | | | | | | | | | | | | | | | | | | | | | | | | | | | |
2010 | | $ | 9.42 | | $ | 0.47 | | $ | 0.95 | | | $ | 1.42 | | | $ | (0.49 | ) | | $ | — | | | $ | (0.49 | ) | | $ | 10.35 | | 15.34 | % | | $ | 5,705,708 | | 0.14 | % | | 0.14 | % | | 0.37 | % | | 4.71 | % | | 242 | % |
2009 | | | 9.95 | | | 0.52 | | | (0.38 | ) | | | 0.14 | | | | (0.52 | ) | | | (0.15 | ) | | | (0.67 | ) | | | 9.42 | | 1.85 | | | | 4,540,593 | | 0.14 | | | 0.14 | | | 0.37 | | | 5.56 | | | 411 | |
2008 | | | 9.99 | | | 0.54 | | | (0.04 | ) | | | 0.50 | | | | (0.54 | ) | | | — | | | | (0.54 | ) | | | 9.95 | | 5.10 | | | | 6,149,448 | | 0.14 | | | 0.14 | | | 0.37 | | | 5.35 | | | 432 | |
2007 | | | 9.84 | | | 0.53 | | | 0.14 | | | | 0.67 | | | | (0.52 | ) | | | — | | | | (0.52 | ) | | | 9.99 | | 6.95 | | | | 5,894,127 | | 0.14 | | | 0.14 | | | 0.37 | | | 5.23 | | | 428 | |
2006 | | | 10.34 | | | 0.47 | | | (0.48 | ) | | | (0.01 | ) | | | (0.48 | ) | | | (0.01 | ) | | | (0.49 | ) | | | 9.84 | | (0.09 | ) | | | 4,646,403 | | 0.14 | | | 0.14 | | | 0.37 | | | 4.62 | | | 545 | |
| * | | Includes a return of capital of $0.04 per share. See Note 8 in Notes to Financial Statements. |
| † | | Returns and portfolio turnover rates are for the period indicated and have not been annualized. Returns do not reflect the deduction of taxes the shareholder would pay on fund distributions or redemption of Fund shares. |
| †† | | Per share amounts have been adjusted for a 10 to 1 stock split paid to shareholders of record on November 16, 2006. |
| (1) | | Commenced operations on June 30, 2008. All ratios for the period have been annualized. |
| (2) | | Commenced operations on December 30, 2008. All ratios for the period have been annualized. |
| (3) | | Per share net investment income and net realized and unrealized gains (losses) calculated using average shares. |
| (4) | | The expense ratio includes interest expense on reverse repurchase agreements. Had this expense been excluded, the ratios would have been 0.37%, 0.37%, and 0.59%, respectively. |
| (5) | | The expense ratio includes interest expense on reverse repurchase agreements. Had this expense been excluded, the ratios would have been 0.60%, 0.60%, and 0.67%, respectively. |
| (6) | | Commenced operations on December 14, 2006. All ratios for the period have been annualized. |
| (7) | | The expense ratio includes interest expense on reverse repurchase agreements. Had this expense been excluded, the ratio would have been 0.39%, 0.40%, and 0.61%, respectively. |
| (8) | | The expense ratio includes interest expense on reverse repurchase agreements. Had this expense been excluded, the ratio would have been 0.39%, 0.39%, and 0.61%, respectively. |
| (9) | | The expense ratio includes interest expense on reverse repurchase agreements. Had this expense been excluded, the ratio would have been 0.45%, 0.45%, and 0.66%, respectively. |
Amounts designated as “—” are zero or have been rounded to zero.
The accompanying notes are an integral part of the financial statements.
| | |
| SEI Institutional Investments Trust / Annual Report / May 31, 2010 | | 145 |
Financial Highlights
For the years or periods ended May 31,
For a share outstanding throughout each period
| | | | | | | | | | | | | | | | | | | | | | | | | | | | | | | | | | | | | | | | | | | | | | | | | | |
| | | Net Asset
Value,
Beginning
of Period | | Net
Investment
Income(3) | | Net
Realized
and
Unrealized
Gains
(Losses) on
Securities | | | Total from
Operations | | | Dividends
from Net
Investment
Income | | | Distributions
from
Realized
Capital
Gains | | | Total
Dividends
and
Distributions | | | Net Asset
Value,
End of
Period | | Total
Return† | | | Net Assets
End of Period
($Thousands) | | Ratio of
Net
Expenses
to Average Net Assets | | | Ratio of
Expenses
to Average Net Assets
(Excluding
Fees Paid
Indirectly
and
Including
Waivers) | | | Ratio of
Expenses
to Average Net Assets
(Excluding
Fees Paid
Indirectly
and
Waivers) | | | Ratio of
Net
Investment
Income to
Average
Net Assets | | | Portfolio
Turnover
Rate† | |
High Yield Bond Fund | | | | | | | | | | | | | | | | | | | | | | | | | | | | | | | | | | | | | |
Class A | | | | | | | | | | | | | | | | | | | | | | | | | | | | | | | | | | | | | | | | | | | | | | | | | | |
2010 | | $ | 7.00 | | $ | 0.84 | | $ | 1.72 | | | $ | 2.56 | | | $ | (0.80 | ) | | $ | (0.02 | ) | | $ | (0.82 | ) | | $ | 8.74 | | 37.60 | % | | $ | 1,634,608 | | 0.35 | % | | 0.35 | % | | 0.56 | % | | 10.03 | % | | 110 | % |
2009 | | | 9.17 | | | 0.80 | | | (2.14 | ) | | | (1.34 | ) | | | (0.77 | ) | | | (0.06 | ) | | | (0.83 | ) | | | 7.00 | | (13.79 | ) | | | 1,239,271 | | 0.35 | | | 0.35 | | | 0.56 | | | 11.34 | | | 79 | |
2008 | | | 10.33 | | | 0.82 | | | (1.07 | ) | | | (0.25 | ) | | | (0.82 | ) | | | (0.09 | ) | | | (0.91 | ) | | | 9.17 | | (2.36 | ) | | | 1,399,859 | | 0.35 | | | 0.35 | | | 0.55 | | | 8.63 | | | 59 | |
2007 | | | 10.08 | | | 0.84 | | | 0.30 | | | | 1.14 | | | | (0.84 | ) | | | (0.05 | ) | | | (0.89 | ) | | | 10.33 | | 11.81 | | | | 1,241,924 | | 0.35 | | | 0.35 | | | 0.56 | | | 8.25 | | | 98 | |
2006(2) | | | 10.00 | | | 0.40 | | | 0.08 | | | | 0.48 | | | | (0.40 | ) | | | — | | | | (0.40 | ) | | | 10.08 | | 4.85 | | | | 862,371 | | 0.35 | | | 0.35 | | | 0.57 | | | 8.15 | | | 58 | |
Long Duration Fund | | | | | | | | | | | | | | | | | | | | | | | | | | | | | | | | | | | | | |
Class A | | | | | | | | | | | | | | | | | | | | | | | | | | | | | | | | | | | | | | | | | | | | | | | | | | |
2010 | | $ | 7.77 | | $ | 0.45 | | $ | 0.93 | | | $ | 1.38 | | | $ | (0.46 | ) | | $ | — | | | $ | (0.46 | ) | | $ | 8.69 | | 18.11 | % | | $ | 2,736,187 | | 0.20 | % | | 0.20 | % | | 0.37 | % | | 5.42 | % | | 113 | % |
2009 | | | 8.57 | | | 0.39 | | | (0.72 | ) | | | (0.33 | ) | | | (0.47 | ) | | | — | | | | (0.47 | ) | | | 7.77 | | (3.89 | ) | | | 1,489,047 | | 0.20 | | | 0.20 | | | 0.39 | | | 4.88 | | | 95 | |
2008 | | | 9.52 | | | 0.51 | | | (0.91 | ) | | | (0.40 | ) | | | (0.55 | ) | | | — | | | | (0.55 | ) | | | 8.57 | | (4.52 | ) | | | 115,754 | | 0.20 | | | 0.20 | | | 0.39 | | | 5.47 | | | 58 | |
2007 | | | 9.31 | | | 0.53 | | | 0.18 | | | | 0.71 | | | | (0.50 | ) | | | — | | | | (0.50 | ) | | | 9.52 | | 7.67 | | | | 184,616 | | 0.20 | | | 0.20 | | | 0.38 | | | 5.49 | | | 97 | |
2006 | | | 10.56 | | | 0.46 | | | (1.07 | ) | | | (0.61 | ) | | | (0.54 | ) | | | (0.10 | ) | | | (0.64 | ) | | | 9.31 | | (6.08 | ) | | | 165,324 | | 0.20 | | | 0.20 | | | 0.39 | | | 4.69 | | | 113 | |
Emerging Markets Debt Fund | | | | | | | | | | | | | | | | | | | | | | | | | | | | | | | | | | | | | |
Class A | | | | | | | | | | | | | | | | | | | | | | | | | | | | | | | | | | | | | | | | | | | | | | | | | | |
2010 | | $ | 9.27 | | $ | 0.84 | | $ | 1.40 | | | $ | 2.24 | | | $ | (1.04 | ) | | $ | — | | | $ | (1.04 | ) | | $ | 10.47 | | 24.93 | % | | $ | 989,598 | | 0.55 | % | | 0.55 | % | | 0.93 | % | | 8.12 | % | | 66 | % |
2009 | | | 10.42 | | | 0.75 | | | (1.19 | ) | | | (0.44 | ) | | | (0.71 | ) | | | — | | | | (0.71 | ) | | | 9.27 | | (3.55 | ) | | | 901,226 | | 0.55 | | | 0.55 | | | 0.94 | | | 8.56 | | | 78 | |
2008 | | | 10.95 | | | 0.70 | | | (0.37 | ) | | | 0.33 | | | | (0.75 | ) | | | (0.11 | ) | | | (0.86 | ) | | | 10.42 | | 3.24 | | | | 1,062,491 | | 0.55 | | | 0.55 | | | 0.93 | | | 6.65 | | | 66 | |
2007 | | | 9.97 | | | 0.65 | | | 1.03 | | | | 1.68 | | | | (0.62 | ) | | | (0.08 | ) | | | (0.70 | ) | | | 10.95 | | 17.40 | | | | 804,036 | | 0.55 | | | 0.55 | | | 0.94 | | | 6.16 | | | 89 | |
2006(2) | | | 10.00 | | | 0.27 | | | (0.17 | ) | | | 0.10 | | | | (0.13 | ) | | | — | | | | (0.13 | ) | | | 9.97 | | 1.00 | | | | 479,808 | | 0.55 | | | 0.55 | | | 0.95 | | | 5.43 | | | 51 | |
Real Return Fund | | | | | | | | | | | | | | | | | | | | | | | | | | | | | | | | | | | | | |
Class A | | | | | | | | | | | | | | | | | | | | | | | | | | | | | | | | | | | | | | | | | | | | | | | | | | |
2010 | | $ | 10.11 | | $ | 0.33 | | $ | 0.24 | | | $ | 0.57 | | | $ | (0.27 | ) | | $ | — | | | $ | (0.27 | ) | | $ | 10.41 | | 5.70 | % | | $ | 326,758 | | 0.29 | % | | 0.29 | % | | 0.55 | % | | 3.18 | % | | 205 | % |
2009 | | | 10.99 | | | 0.21 | | | (0.27 | ) | | | (0.06 | ) | | | (0.82 | )* | | | — | | | | (0.82 | ) | | | 10.11 | | (0.17 | ) | | | 260,477 | | 0.36 | | | 0.36 | | | 0.78 | | | 2.01 | | | 148 | |
2008 | | | 10.10 | | | 0.58 | | | 0.75 | | | | 1.33 | | | | (0.34 | ) | | | (0.10 | ) | | | (0.44 | ) | | | 10.99 | | 13.30 | | | | 362,129 | | 0.43 | | | 0.43 | | | 0.77 | | | 5.36 | | | 47 | |
2007(1) | | | 10.00 | | | 0.26 | | | (0.03 | ) | | | 0.23 | | | | (0.13 | ) | | | — | | | | (0.13 | ) | | | 10.10 | | 2.29 | | | | 221,531 | | 0.44 | | | 0.44 | | | 0.78 | | | 5.67 | | | 18 | |
| * | | Includes a return of capital of $0.06 per share. See Note 8 in Notes to Financial Statements. |
| † | | Returns and portfolio turnover rates are for the period indicated and have not been annualized. Returns do not reflect the deduction of taxes the shareholder would pay on fund distributions or redemption of Fund shares. |
| (1) | | Commenced operations on December 14, 2006. All ratios for the period have been annualized. |
| (2) | | Commenced operations on December 5, 2005. All ratios for the period have been annualized. |
| (3) | | Per share net investment income and net realized and unrealized gains (losses) calculated using average shares. |
Amounts designated as “—” are zero or have been rounded to zero.
The accompanying notes are an integral part of the financial statements.
| | |
| 146 | | SEI Institutional Investments Trust / Annual Report / May 31, 2010 |
Notes to Financial Statements
May 31, 2010
1. ORGANIZATION
SEI Institutional Investments Trust (the “Trust”) was organized as a Massachusetts business trust under a Declaration of Trust dated March 1, 1995. The Trust commenced operations on June 14, 1996.
The Trust is registered under the Investment Company Act of 1940, as amended, as an open-end investment company with 20 registered funds: Large Cap, Large Cap Diversified Alpha, Large Cap Disciplined Equity, Large Cap Index, Strategic U.S. Large Cap Equity, Small Cap, Small/Mid Cap Equity, U.S. Managed Volatility, International Equity, World Equity Ex-US, Screened World Equity Ex-US, Emerging Markets Equity, Global Equity, Enhanced LIBOR Opportunities, Core Fixed Income, High Yield Bond, Long Duration, Emerging Markets Debt, Real Return and Dynamic Asset Allocation Funds (each a “Fund,” collectively, the “Funds”) each of which are diversified Funds with the exception of the Emerging Markets Debt Fund. The Trust is registered to offer Class A shares of all Funds. The assets of each Fund are segregated, and a shareholder’s interest is limited to the Fund in which shares are held. The Trust’s prospectus provides a description of each Fund’s investment objectives, policies, and strategies.
As of May 31, 2010, the Dynamic Asset Allocation, Strategic U.S. Large Cap Equity, Emerging Markets Equity and Global Equity Funds have not yet commenced operations.
2. SIGNIFICANT ACCOUNTING POLICIES
The following is a summary of the significant accounting policies followed by the Funds.
Use of Estimates — The preparation of financial statements, in conformity with U.S. generally accepted accounting principles (“GAAP”), requires management to make estimates and assumptions that affect the reported amount of assets and liabilities and disclosure of contingent assets and liabilities as of the date of the financial statements and the reported amounts of increases and decreases in net assets from operations during the reporting period. Actual results could differ from those estimates.
Security Valuation — Securities listed on a securities exchange, market or automated quotation system for which quotations are readily available (except for securities traded on NASDAQ) are valued at the last quoted sale price on the primary exchange or market (foreign or domestic) on which they are traded, or, if there is no such reported sale, at the most recent quoted bid price. For securities traded on NASDAQ, the NASDAQ Official Closing Price will be used. Debt securities are priced based upon valuations provided by independent, third-party pricing agents, if available. Such values generally reflect the last reported sales price if the security is actively traded. The third-party pricing agents may also value debt securities at an evaluated bid price by employing methodologies that utilize actual market transactions, broker-supplied valuations, or other methodologies designed to identify the market value for such securities. Debt obligations acquired with remaining maturities of sixty days or less may be valued
at their amortized cost, which approximates market value. The prices for foreign securities are reported in local currency and converted to U.S. dollars using currency exchange rates. Prices for most securities held in the Funds are provided daily by recognized independent pricing agents. If a security price cannot be obtained from an independent, third-party pricing agent, the Funds seek to obtain a bid price from at least one independent broker.
Securities for which market prices are not “readily available” are valued in accordance with Fair Value Procedures established by the Trust’s Board of Trustees. The Trust’s Fair Value Procedures are implemented through a Fair Value Committee (the “Committee”) designated by the Trust’s Board of Trustees. Some of the more common reasons that may necessitate that a security be valued using Fair Value Procedures include: the security’s trading has been halted or suspended; the security has been de-listed from a national exchange; the security’s primary trading market is temporarily closed at a time when under normal conditions it would be open; or the security’s primary pricing source is not able or willing to provide a price. When a security is valued in accordance with the Fair Value Procedures, the Committee will determine the value after taking into consideration relevant information reasonably available to the Committee.
For securities that principally trade on a foreign market or exchange, a significant gap in time can exist between the time of a particular security’s last trade and the time at which a Fund calculates its net asset value. The closing prices of such securities may no longer reflect their market value at the time a Fund calculates net asset value if an event that could materially affect the value of those securities (a “Significant Event”) has occurred between the time of the security’s last close and the time that a Fund calculates net asset value. A Significant Event may relate to a single issuer or to an entire market sector. If the adviser or sub-adviser of a Fund becomes aware of a Significant Event that has occurred with respect to a security or group of securities after the closing of the exchange or market on which the security or securities principally trade, but before the time at which a Fund calculates net asset value, the adviser or sub-adviser may request that a Fair Value Committee Meeting be called. In addition, the Trust’s administrator monitors price movements among certain selected indices, securities and/or baskets of securities that may be an indicator that the closing prices received earlier from foreign exchanges or markets may not reflect market value at the time a Fund calculates net asset value. If price movements in a monitored index or security exceed levels established by the administrator, the administrator notifies the adviser or sub-adviser for any Fund holding the relevant securities that such limits have been exceeded. In such event, the adviser or sub-adviser makes the determination whether a Fair Value Committee Meeting should be called based on the information provided.
The International Equity, World Equity Ex-US and Screened World Equity Ex-US Funds that hold international securities also use a third-party fair valuation vendor. The vendor provides a fair value for foreign securities held by these funds based on certain factors and method-
| | |
| SEI Institutional Investments Trust / Annual Report / May 31, 2010 | | 147 |
Notes to Financial Statements (Continued)
May 31, 2010
ologies (involving, generally, tracking valuation correlations between the U.S. market and each non-U.S. security). Values from the fair value vendor are applied in the event that there is a movement in the U.S. market that exceeds a specific threshold that has been established by the Committee. The Committee has also established a “confidence interval” which is used to determine the level of historical correlation between the value of a specific foreign security and movements in the U.S. market before a particular security will be fair valued when the threshold is exceeded. In the event that the threshold established by the Committee is exceeded on a specific day, these funds that hold international securities will value the non-U.S. securities within that fund that exceed the applicable “confidence interval” based upon the adjusted prices provided by the fair valuation vendor.
Options and warrants for which the primary market is a national securities exchange are valued at the last sale price on the exchange on which they are traded, or, in the absence of any sale, at the closing bid price. Options and warrants not traded on a national securities exchange are valued at the last quoted bid price.
In accordance with GAAP, Fair Value is defined as the price that a Fund would receive upon selling an investment in a timely transaction to an independent buyer in the principal or most advantageous market of the investment. A three tier hierarchy has been established to maximize the use of observable and minimize the use of unobservable inputs and to establish classification of fair value measurements for disclosure purposes. Inputs refer broadly to the assumptions that market participants would use in pricing an asset. Inputs may be observable or unobservable. Observable inputs are inputs that reflect the assumptions market participants would use in pricing the asset or liability based on market data obtained from sources independent of the reporting entity. Unobservable inputs are inputs that reflect the reporting entity’s own assumptions about the assumptions market participants would use in pricing the asset or liability based on the best information available in the circumstances.
The three-tier hierarchy of inputs is summarized in the three broad Levels listed below:
| Level 1 — | quoted prices in active markets for identical investments |
| Level 2 — | other significant observable inputs (including quoted prices for similar investments, interest rates, prepayment speeds, credit risks, etc.) |
| Level 3 — | significant unobservable inputs (including the Fund’s own assumptions in determining the fair value of investments) |
The valuation techniques used by the Funds to measure fair value during the fiscal year ended May 31, 2010 maximized the use of observable inputs and minimized the use of unobservable inputs.
For the fiscal year ended May 31, 2010, there have been no significant changes to the Trust’s fair valuation methodologies.
Security Transactions and Investment Income — Security transactions are recorded on the trade date. Cost used in determining net
realized capital gains and losses on the sale of securities is determined on the basis of specific identification. Dividend income and expense is recognized on the ex-dividend date, and interest income or expense is recognized using the accrual basis of accounting.
Distributions received on securities that represent a return of capital or capital gain are recorded as a reduction of cost of investments and/or as a realized gain. The Trust estimates the components of distributions received that may be considered nontaxable distributions or capital gain distributions.
Amortization and accretion is calculated using the scientific interest method, which approximates the effective interest method over the holding period of the security. Amortization of premiums and discounts is included in interest income.
Repurchase Agreements — A Fund may agree to purchase securities from financial institutions subject to the seller’s agreement to repurchase them at a mutually agreed upon date and price. It is the Fund’s policy that repurchase agreements are fully collateralized by U.S. Treasury and Government Agency securities. All collateral is held by the Fund’s custodian bank or a bank with which the custodian bank has entered into a subcustodian agreement, or is segregated in the Federal Reserve Book Entry System. In connection with transactions in repurchase agreements, if the seller defaults and the value of the collateral declines, or if the seller enters an insolvency proceeding, realization of the collateral by the Fund may be delayed or limited.
Reverse Repurchase Agreements — To the extent consistent with its Investment Objective and Strategies, a Fund may issue reverse repurchase agreements. A reverse repurchase agreement involves the sale of portfolio assets together with an agreement to repurchase the same assets later at a fixed price. Additional assets are maintained in an account with the broker. The segregated assets may consist of cash, U.S. Government securities, or other liquid securities at least equal in value to the obligations under the reverse repurchase agreements. In the event the buyer of securities under a reverse repurchase agreement files for bankruptcy or becomes insolvent, those Funds use of the proceeds under the reverse repurchase agreement may be restricted pending a determination by the other party, or its trustee or receiver, whether to enforce the obligation to repurchase the securities. There were no outstanding reverse repurchase agreements as of May 31, 2010.
Expenses — Expenses that are directly related to a Fund are charged directly to that Fund. Other operating expenses of the Funds are prorated to the Funds on the basis of relative net assets.
Foreign Currency Translation — The books and records of the Funds investing in international securities are maintained in U.S. dollars on the following basis:
(I) market value of investment securities, assets and liabilities at the current rate of exchange; and
| | |
| 148 | | SEI Institutional Investments Trust / Annual Report / May 31, 2010 |
(II) purchases and sales of investment securities, income and expenses at the relevant rates of exchange prevailing on the respective dates of such transactions.
The Funds do not isolate that portion of gains and losses on investments in equity securities that is due to changes in the foreign exchange rates from that which is due to changes in market prices of equity securities.
The Funds report certain foreign-currency-related transactions as components of realized gains for financial reporting purposes, whereas such components are treated as ordinary income for Federal income tax purposes.
Forward Foreign Currency Contracts — To the extent consistent with its Investment Objective and Strategies, a Fund may enter into forward foreign currency contracts as hedges against either specific transactions, fund positions or anticipated fund positions. All commitments are marked-to-market daily at the applicable foreign exchange rate, and any resulting unrealized gains or losses are recorded currently. The Fund realizes gains and losses at the time forward contracts are extinguished. Unrealized gains or losses on outstanding positions in forward foreign currency contracts held at the close of the period are recognized as ordinary income or loss for Federal income tax purposes. A Fund could be exposed to risk if the counterparties to the contracts are unable to meet the terms of the contract and from unanticipated movements in the value of a foreign currency relative to the U.S. dollar.
Finally, the risk exists that losses could exceed amounts disclosed on the Summary Schedule of Investments/Schedule of Investments or the Statement of Assets and Liabilities.
Futures Contracts — All Funds, with the exception of the High Yield Bond and Real Return Funds, utilized futures contracts during the fiscal year ended May 31, 2010. These Funds’ investments in futures contracts are designed to enable the Funds to more closely approximate the performance of their benchmark indices. To the extent consistent with its Investment Objective and Strategies, a Fund may use futures contracts for tactical hedging purposes as well as to enhance the Fund’s returns. Initial margin deposits of cash or securities are made upon entering into futures contracts. The contracts are marked to market daily and the resulting changes in value are accounted for as unrealized gains and losses. Variation margin payments are paid or received, depending upon whether unrealized gains or losses are incurred. When the contract is closed, the Funds record a realized gain or loss equal to the difference between the proceeds from (or cost of) the closing transaction and the amount invested in the contract.
Risks of entering into futures contracts include the possibility that there will be an imperfect price correlation between the futures and the underlying securities. Second, it is possible that a lack of liquidity for futures contracts could exist in the secondary market, resulting in
an inability to close a position prior to its maturity date. Third, the futures contract involves the risk that a Fund could lose more than the original margin deposit required to initiate a futures transaction.
Finally, the risk exists that losses could exceed amounts disclosed on the Summary Schedule of Investments/Schedule of Investments or the Statement of Assets and Liabilities.
Options/Swaptions Writing/Purchasing — To the extent consistent with its Investment Objective and Strategies, a Fund may invest in financial options/swaptions contracts for the purpose of hedging its existing portfolio securities, or securities that a Fund intends to purchase, against fluctuations in fair market value caused by changes in prevailing market interest rates. A Fund may also invest in financial option/swaption contracts to enhance its returns. When the Fund writes or purchases an option/swaption, an amount equal to the premium received or paid by the Fund is recorded as a liability or an asset and is subsequently adjusted to the current market value of the option/swaption written or purchased. Premiums received or paid from writing or purchasing options/ swaptions which expire unexercised are treated by the Fund on the expiration date as realized gains or losses. The difference between the premium and the amount paid or received on effecting a closing purchase or sale transaction, including brokerage commissions, is also treated as a realized gain or loss. If an option/swaption is exercised, the premium paid or received is added to the cost of the purchase or proceeds from the sale in determining whether the Fund has realized a gain or a loss. The Core Fixed Income Fund had options contracts as of May 31, 2010, as disclosed in the Fund’s Schedule of Investments.
The risk in writing a call option/swaption is a Fund may give up the opportunity for profit if the market price of the security increases. The risk in writing a put option/swaption is a Fund may incur a loss if the market price of the security decreases and the option/swaption is exercised. The risk in purchasing an option/swaption is a Fund may pay a premium whether or not the option/swaption is exercised. The Funds also have the additional risk of being unable to enter into a closing transaction at an acceptable price if a liquid secondary market does not exist. Option/swaption contracts also involve the risk that they may not work as intended due to unanticipated developments in market conditions or other causes.
Finally, the risk exists that losses could exceed amounts disclosed on the Summary Schedule of Investments/Schedule of Investments or the Statement of Assets and Liabilities.
Securities Sold Short — As consistent with each Fund’s investment objectives, a Fund may engage in short sales. Short sales are transactions under which a Fund sells a security it does not own. To complete such a transaction, a Fund must borrow the security to make delivery to the buyer. That Fund then is obligated to replace the security borrowed by purchasing the security at the market price at the time of the replacement. The price at such time may be more or less than the price at which the security was sold by a Fund. Until the
| | |
| SEI Institutional Investments Trust / Annual Report / May 31, 2010 | | 149 |
Notes to Financial Statements (Continued)
May 31, 2010
security is replaced, a Fund is required to pay the lender amounts equal to any dividends or interest that accrue during the period of the loan. Dividends and interest are shown as an expense for financial reporting purposes. To borrow the security, a Fund also may be required to pay a premium, which would decrease proceeds of the security sold. The proceeds of the short sale are retained by the broker, to the extent necessary to meet margin requirements, until the short position is closed out. A gain, limited to the price at which a Fund sold the security short, or a loss, unlimited in size, will be recognized upon the close of a short sale.
Until a Fund closes its short position or replaces the borrowed security, that Fund will: (a) maintain a segregated account containing cash or liquid securities at such a level that (i) the amount deposited in the account plus the amount deposited with the broker as collateral will equal the current value of the security sold short; and (ii) the amount deposited in the segregated account plus the amount deposited with the broker as collateral will not be less than the market value of the security at the time the security was sold short, or (b) otherwise cover a Fund’s short positions. As of May 31, 2010, none of the Funds held any short positions.
Swap Agreements — A Fund’s investments in swap contracts is mainly used as an efficient means to take and manage risk in the portfolio, including interest rate risk, credit risk and overall yield sensitivity. A swap agreement is a two-party contract under which an agreement is made to exchange returns from predetermined investments or instruments, including a particular interest rate, foreign currency, or “basket” of securities representing a particular index. Credit default swaps involve the periodic payment by a Fund or counterparty of interest based on a specified rate multiplied by a notional amount assigned to an underlying debt instrument or group of debt instruments in exchange for the assumption of credit risk on the same instruments. In the event of a credit event, usually in the form of a credit rating downgrade, the party receiving periodic payments (i.e. floating rate payer) must pay the other party (i.e. fixed rate payer) an amount equal to the outstanding principal of the downgraded debt instrument. Total return swaps allow an investor to benefit from the cash flow without ever actually owning the underlying security. The receiver must pay any decline in value to the payer at the end of the total return swap. However, the investor does not need to make a payment if there is no decline in price. Payments can be made on various indices, bonds (i.e. mortgage-backed securities, bank debt and corporate), loans or commodities. The value of a total return swap is equal to the change in value of the underlying asset versus the accrued income payment based on LIBOR (London Interbank Offered Rate) or some other form of index on the notional amount. Interest rate swaps involve the exchange by a Fund with another party of their respective commitments to pay or receive interest (e.g., an exchange of floating rate payments for fixed rate payments) with respect to a notional amount of principal to manage a Fund’s exposure to interest rates. Payments received or made are recorded as realized gains or losses. A Fund
could be exposed to credit or market risk due to unfavorable changes in the fluctuation of interest rates or if the counterparty defaults on its obligation to perform. Risk of loss may exceed amounts recognized on the statement of assets and liabilities. In connection with swap agreements, securities/cash may be set aside as collateral by a Fund’s custodian. A Fund may enter into swap agreements in order to, among other things, change the maturity or duration of the investment portfolio; protect a Fund’s value from changes in interest rates; or expose a Fund to a different security or market.
Swaps are marked-to-market daily based upon quotations from market makers and the resulting changes in market values, if any, are recorded as unrealized gains or losses in the Statement of Operations. Net payments of interest are recorded as realized gains or losses.
Entering into swap agreements involves, to varying degrees, elements of credit and market risk in excess of the amounts recognized on the Statement of Assets and Liabilities. Such risks involve the possibility that there will be no liquid market for these agreements, that the counterparty to the agreement may default on its obligation to perform and that there may be unfavorable changes in the fluctuation of interest rates. Risks also arise from potential losses from adverse market movements.
This risk is mitigated by having a master netting arrangement between a Fund and the counterparty and by having the counterparty post collateral to cover a Fund’s exposure to the counterparty. See Note 3 for further details.
Forward Treasury Commitments — A Fund may invest in commitments to purchase U.S. Treasury securities on an extended settlement basis. Such transactions involve the commitment to purchase a security with payment and delivery taking place in the future, sometimes a month or more after the transaction date. The Funds account for such transactions as purchases and sales and record an unrealized gain or loss each day equal to the difference between the cost of the purchase commitment and the current market value. Realized gains or losses are recorded upon closure or settlement of such commitments. No interest is earned prior to settlement of the transaction. These instruments are subject to market fluctuation due to changes in interest rates and the market value at the time of settlement could be higher or lower than the purchase price. A Fund may incur losses due to changes in the value of the underlying treasury securities from interest rate fluctuations or as a result of counterparty nonperformance.
Delayed Delivery Transactions — To the extent consistent with its Investment Objective and Strategies, a Fund may purchase or sell securities on a when-issued or delayed delivery basis. These transactions involve a commitment by those Funds to purchase or sell securities for a predetermined price or yield, with payment and delivery taking place beyond the customary settlement period. When purchasing a security on a delayed delivery basis, that fund assumes the rights and risks of ownership of the security, including the risk of price and yield fluctuations, and takes such fluctuations into account when
| | |
| 150 | | SEI Institutional Investments Trust / Annual Report / May 31, 2010 |
determining its net asset value. Those Funds may dispose of or renegotiate a delayed delivery transaction after it is entered into, and may sell when-issued securities before they are delivered, which may result in a capital gain or loss. When those Funds have sold a security on a delayed delivery basis, that Fund does not participate in future gains and losses with respect to the security.
Loan Participations and Brady Bonds — To the extent consistent with its Investment Objective and Strategies, a Fund may invest in U.S. dollar-denominated fixed- and floating-rate loans (“Loans”) arranged through private negotiations between a foreign sovereign entity and one or more financial institutions (“Lenders”). The Fund invests in such Loans in the form of participations in Loans (“Participations”) or assignments of all or a portion of Loans from third parties. Participations typically result in this Fund having a contractual relationship only with the Lenders, not with the sovereign borrowers. This Fund has the right to receive payments of principal, interest and any fees to which it is entitled from the Lender selling the Participation and only upon receipt by the Lender of the payments from the borrower. In connection with purchasing Participations, the Fund generally has no right to enforce compliance by the borrower with the terms of the loan agreement relating to the Loan, nor any rights of set-off against the borrower, and the Fund will not benefit directly from any collateral supporting the Loan in which it has purchased the Participation. As a result, the Fund assumes the credit risk of both the borrower and the Lender that is selling the Participation.
Certain debt obligations, customarily referred to as “Brady Bonds,” are created through the exchange of existing commercial bank loans to foreign entities for new obligations in connection with debt restructuring under a plan introduced by former U.S. Secretary of the Treasury Nicholas F. Brady. Brady Bonds have only been issued since 1989, and, accordingly, do not have a long payment history. They are issued by governments that may have previously defaulted on the loans being restructured by the Brady Bonds, so they are subject to the risk of default by the issuer. They may be fully or partially collateralized or uncollateralized and issued in various currencies.
Collateralized Debt Obligations — A Fund may invest in collateralized debt obligations (“CDOs”), which include collateralized loan obligations (“CLOs”) and other similarly structured securities. CLOs are a type of asset-backed security. A CLO is a trust, typically collateralized by a pool of loans, which may include, among others, domestic and foreign senior secured loans, senior unsecured loans and subordinate corporate loans, including loans that may be rated below investment grade or equivalent unrated loans. CDOs may charge management fees and administrative expenses.
For CDOs, the cashflows from the trust are split into two or more portions, called tranches, varying in risk and yield. The riskiest portion is the “equity” tranche which bears the bulk of defaults from the bonds or loans in the trust and serves to protect the other, more senior tranches from default in all but the most severe circumstances. Since it is partially protected from defaults, a senior tranche from a CDO trust typically has a higher rating and lower yield than their underlying securities, and can be rated investment grade. Despite the protection from the equity tranche, CDO tranches can experience substantial losses due to actual defaults, increased sensitivity to defaults due to collateral default and disappearance of protecting tranches, market anticipation of defaults, as well as aversion to CDO securities as a class.
The risks of an investment in a CDO depend largely on the type of the collateral securities and the class of the CDO in which a Fund invests. Normally, CLOs and other CDOs are privately offered and sold, and thus, are not registered under the securities laws. As a result, investments in CDOs may be characterized by a Fund as illiquid securities; however, an active dealer market may exist for CDOs allowing a CDO to qualify for Rule 144A transactions. In addition to the normal risks associated with fixed income securities (e.g., interest rate risk and default risk), CDOs carry additional risks including, but not limited to: (i) the possibility that distributions from collateral securities will not be adequate to make interest or other payments; (ii) the quality of the collateral may decline in value or default; (iii) a Fund may invest in CDOs that are subordinate to other classes; and (iv) the complex structure of the security may not be fully understood at the time of investment and may produce disputes with the issuer or unexpected investment results.
Dividends and Distributions to Shareholders — Dividends from net investment income are declared and paid to shareholders quarterly for the Large Cap, Large Cap Diversified Alpha, Large Cap Disciplined Equity, Large Cap Index, Small Cap, Small/Mid Cap Equity, U.S. Managed Volatility, Enhanced LIBOR Opportunities and Emerging Markets Debt Funds; declared daily and paid monthly for the Core Fixed Income, Long Duration and High Yield Bond Funds; and declared and paid at least annually for the International Equity, World Equity Ex-US, Screened World Equity Ex-US and Real Return Funds. Dividends and distributions are recorded on the ex-dividend date. Any net realized capital gains will be distributed at least annually by the Funds.
Illiquid Securities — A security is considered illiquid if it cannot be sold or disposed of in the ordinary course of business within seven days or less for its approximate carrying value on the books of a Fund. Valuations of illiquid securities may differ significantly from the values that would have been used had an active market value for these securities existed.
| | |
| SEI Institutional Investments Trust / Annual Report / May 31, 2010 | | 151 |
Notes to Financial Statements (Continued)
May 31, 2010
Restricted Securities — As of May 31, 2010, the following Funds owned private placement investments that were purchased through private offerings or acquired through initial public offerings and cannot be sold without prior registration under the Securities Act of 1933 or pursuant to an exemption therefrom. In addition, these Funds have generally agreed to further restrictions on the disposition of certain holdings as set forth in various agreements entered into in connection with the purchase of these private placement investments. The acquisition dates of these investments, the enforceable right to acquire these private placement investments, along with the cost and values at May 31, 2010, were as follows:
| | | | | | | | | | | | | | | |
| | | Number of Shares/
Face Amount ($ Thousands) | | Acquisition
Date | | Right to
Acquire Date | | Cost
($ Thousands) | | Market Value
($ Thousands) | | % of Net
Assets | |
| | | | | | |
| Small Cap Fund | | | | | | | | | | | | | | | |
Rentech | | 16,100 | | 4/20/07 | | 4/20/07 | | $ | — | | $ | 2 | | 0.00 | % |
Scorpio Mining | | 887 | | 5/5/08 | | 5/5/08 | | | 795 | | | 779 | | 0.06 | |
Titanium Asset PP | | 122,200 | | 8/6/07 | | 8/6/07 | | | 729 | | | 358 | | 0.03 | |
Titanium Asset | | 122,000 | | 6/14/07 | | 6/14/07 | | | — | | | — | | 0.00 | |
Value Creation | | 119,600 | | 2/29/08 | | 2/29/08 | | | 1,225 | | | 114 | | 0.01 | |
| | | | | | | | | | | | | | | |
| | | | | | | | $ | 2,749 | | $ | 1,253 | | 0.10 | % |
| | | | | | | | | | | | | | | |
| | | | | | |
| Small/Mid Cap Equity Fund | | | | | | | | | | | | | | | |
Rentech | | 13,800 | | 4/20/07 | | 4/20/07 | | $ | — | | $ | 1 | | 0.00 | % |
Scorpio Mining | | 509 | | 5/5/08 | | 5/5/08 | | | 499 | | | 447 | | 0.02 | |
Titanium Asset PP | | 105,000 | | 8/6/07 | | 8/6/07 | | | 625 | | | 308 | | 0.02 | |
Titanium Asset | | 105,000 | | 6/14/07 | | 6/14/07 | | | — | | | — | | 0.00 | |
Value Creation | | 85,600 | | 2/29/08 | | 2/29/08 | | | 871 | | | 81 | | 0.00 | |
| | | | | | | | | | | | | | | |
| | | | | | | | $ | 1,995 | | $ | 837 | | 0.04 | % |
| | | | | | | | | | | | | | | |
| | | | | | |
| Enhanced LIBOR Opportunities Fund | | | | | | | | | | | | | | | |
Metroflag | | 1,500 | | 1/10/08 | | 1/10/08 | | $ | 1,500 | | $ | — | | 0.00 | % |
| | | | | | | | | | | | | | | |
| | | | | | |
| High Yield Bond Fund | | | | | | | | | | | | | | | |
VSS, AHC | | 43,496 | | 9/25/09 | | 9/25/09 | | $ | 551 | | $ | 519 | | 0.03 | % |
| | | | | | | | | | | | | | | |
Investments in Real Estate Investment Trusts (“REITs”) — Dividend income is recorded based on the income included in distributions received from the REIT investments using published REIT reclassifications including some management estimates when actual amounts are not available. Distributions received in excess of this estimated amount are recorded as a reduction of the cost of investments or reclassified to capital gains. The actual amounts of income, return of capital, and capital gains are only determined by each REIT after its fiscal year-end, and may differ from the estimated amounts.
3. CREDIT DERIVATIVES
A Fund enters into credit default swaps to simulate long and short bond positions that are either unavailable or considered to be less attractively priced in the bond market. A Fund uses these swaps to reduce risk where a Fund has exposure to the issuer, or to take an active long or short position with respect to the likelihood of an event of default. The reference obligation of the swap can be a single issuer, a “basket” of issuers, or an index. The underlying referenced assets are corporate debt, sovereign debt and asset-backed securities.
The buyer of a credit default swap is generally obligated to pay the seller a periodic stream of payments over the term of the contract in return for a contingent payment upon the occurrence of a credit event with respect to an underlying reference obligation. Generally, a credit event for corporate or sovereign reference obligations means bankruptcy, failure to pay, obligation acceleration, repudiation/moratorium or restructuring. For credit default swaps on asset-backed securities, a
credit event may be triggered by events such as failure to pay principal, maturity extension, rating downgrade or write-down.
If a Fund is a seller of protection, and a credit event occurs, as defined under the terms of that particular swap agreement, a Fund will generally either (i) pay to the buyer an amount equal to the notional amount of the swap and take delivery of the referenced obligation, other deliverable obligations, or underlying securities comprising a referenced index or (ii) pay a net settlement amount in the form of cash or securities equal to the notional amount of the swap less the recovery value of the referenced obligation or underlying securities comprising a referenced index.
If a Fund is a buyer of protection and a credit event occurs, as defined under the terms of that particular swap agreement, a Fund will either (i) receive from the seller of protection an amount equal to the notional amount of the swap and deliver the referenced obligation, other deliverable obligations or underlying securities comprising the referenced index or (ii) receive a net settlement amount in the form of cash or securities equal to the notional amount of the swap less the recovery value of the referenced obligation or underlying securities comprising the referenced index. Recovery values are assumed by market makers considering either industry standard recovery rates or entity specific factors and considerations until a credit event occurs. If a credit event has occurred, the recovery value is determined by a facilitated auction whereby a minimum number of allowable broker bids, together with a specified valuation method, are used to calculate the settlement value.
| | |
| 152 | | SEI Institutional Investments Trust / Annual Report / May 31, 2010 |
Certain Funds are party to International Swap Dealers Association, Inc. Master Agreements (“ISDA Master Agreements”). These agreements are with select counterparties and they govern transactions,
including certain over-the-counter derivative and foreign exchange contracts, entered into by the Funds and the counterparty.
As of May 31, 2010, the Core Fixed Fund is the buyer (“receiving protection”) on a total notional amount of $63.9 million, and the Core Fixed and Long Duration Funds are the sellers (“providing protection”) on a total notional amount of $75.0 million and $1.2 million, respectively. The notional amounts of the swaps are not recorded in the financial statements; however the notional amounts approximate the maximum potential amount of future payments that the Fund could be required to make if the Fund was the sellers of protection and a credit event were to occur. Those credit default swaps (“CDS”) for which the Fund is providing protection at balance sheet date are summarized as follows:
| | | | | | | | | | | | | | | | | | |
CORE FIXED INCOME FUND WRITTEN CREDIT DERIVATIVE CONTRACTS | | SINGLE NAME CDS | | CDS ON AN INDEX | | | | |
| REFERENCE ASSET | | CORP
US$ | | | SOVEREIGN
US$ | | ABS
US$ | | | CORP
US$ | | | Total | |
Fair value of written credit derivatives | | $ | 266,086 | | | — | | $ | (39,285,738 | ) | | $ | 892,333 | | | $ | (38,127,319 | ) |
Maximum potential amount of future payments | | $ | (7,970,000 | ) | | — | | $ | (60,910,730 | ) | | $ | (6,089,958 | ) | | $ | (74,970,688 | ) |
Recourse provisions with third parties to recover any amounts paid under the credit derivative (including any purchased credit protection)1 | | | — | | | — | | | — | | | | — | | | | — | |
Collateral held by the fund can obtain upon occurrence of triggering event | | | — | | | — | | | — | | | | — | | | | — | |
| 1 | | Potential recoveries would include purchased credit derivatives to the extent they offset written credit derivatives which have an identical underlying, or a netting arrangement or credit support annex with the counterparty. There may be other potential recoveries from recourse provisions where agreements cover multiple derivative arrangements but those amounts have not been included. |
| | | | | | | | | | | | | | | | | | | | | |
| MAXIMUM POTENTIAL AMOUNT OF FUTURE PAYMENTS BY CONTRACT TERM | |
| CORE FIXED INCOME FUND | | 0-6 MONTHS | | 6-12 MONTHS | | | 1-5 YEARS | | | 5-10 YEARS | | > 10 YEARS | | | Total | |
Current credit spread* on underlying (in basis points) | | | | | | | | | | | | | | | | | | | | | |
0-2,000 | | — | | $ | (7,970,000 | ) | | $ | (6,089,958 | ) | | $ | — | | | — | | | $ | (14,059,958 | ) |
2,001-4,000 | | — | | | — | | | | — | | | | — | | $ | (45,138,082 | ) | | $ | (45,138,082 | ) |
4,001-6,000 | | — | | | — | | | | — | | | | — | | $ | (15,772,648 | ) | | $ | (15,772,648 | ) |
Total | | — | | $ | (7,970,000 | ) | | $ | (6,089,958 | ) | | $ | — | | $ | (60,910,730 | ) | | $ | (74,970,688 | ) |
| * | | The credit spread on the underlying asset is generally indicative of the current status of the underlying risk of the Fund having to perform. The spread also reflects the cost of buying/selling protection and may include upfront payments required to be made to enter into a contract. Higher credit spreads with a shorter contract term is indicative of a higher likelihood of performance by the Fund. |
| | | | | | | | | | | | | | |
LONG DURATION FUND
WRITTEN CREDIT DERIVATIVE CONTRACTS | | SINGLE NAME CDS | | CREDIT DEFAULT
SWAP INDEX | | | |
| REFERENCE ASSET | | CORP
US$ | | SOVEREIGN
US$ | | ABS
US$ | | | CORP
US$ | | Total | |
Fair value written credit derivatives | | — | | — | | $ | (708,328 | ) | | — | | $ | (708,328 | ) |
Maximum potential amount of future payments | | — | | — | | $ | 1,225,000 | | | — | | $ | 1,225,000 | |
Recourse provisions with third parties to recover any amounts paid under the credit derivative (including any purchased credit protection)1 | | — | | — | | | — | | | — | | | — | |
Collateral held by the fund can obtain upon occurrence of triggering event | | | | | | | | | | | | | | |
| 1 | | Potential recoveries would include purchased credit derivatives to the extent they offset written credit derivatives which have an identical underlying, or a netting arrangement or credit support annex with the counterparty. There may be other potential recoveries from recourse provisions where agreements cover multiple derivative arrangements but those amounts have not been included. |
| | | | | | | | | | | | | | |
| MAXIMUM POTENTIAL AMOUNT OF FUTURE PAYMENTS BY CONTRACT TERM |
| LONG DURATION FUND | | 0-6 MONTHS | | 6-12 MONTHS | | 1-5 YEARS | | 5-10 YEARS | | > 10 YEARS | | Total |
Current credit spread* on underlying (in basis points) | | | | | | | | | | | | | | |
0-1,000 | | — | | — | | — | | — | | | — | | | — |
1,001-2,000 | | — | | — | | — | | — | | | — | | | — |
2,001-3,000 | | — | | — | | — | | — | | $ | 1,225,000 | | $ | 1,225,000 |
3,001-4000 | | — | | — | | — | | — | | | — | | | — |
> than 4,000 | | — | | — | | — | | — | | | — | | | — |
Total | | — | | — | | — | | — | | $ | 1,225,000 | | $ | 1,225,000 |
| * | | The credit spread on the underlying asset is generally indicative of the current status of the underlying risk of the Fund having to perform. The spread also reflects the cost of buying/selling protection and may include upfront payments required to be made to enter into a contract. Higher credit spreads with a shorter contract term is indicative of a higher likelihood of performance by the Fund. |
| | |
| SEI Institutional Investments Trust / Annual Report / May 31, 2010 | | 153 |
Notes to Financial Statements (Continued)
May 31, 2010
The credit spread disclosed above for each reference obligation where the Fund is the seller of protection is a representation of the current payment/performance risk of the swap.
4. DERIVATIVE TRANSACTIONS
The fair value of derivative instruments as of May 31, 2010 was as follows:
| | | | | | | | | | | | |
| | | Asset Derivatives | | | Liability Derivatives | |
| | | Year ended May 31, 2010
($ Thousands) | | | Year ended May 31, 2010
($ Thousands) | |
| | | Statement of Assets and Liabilities Location | | Fair Value | | | Statement of Assets and Liabilities Location | | Fair Value | |
Derivatives not accounted for as hedging instruments: | | | | | | | | | | |
| | | | |
| International Equity | | | | | | | | | | | | |
Equity contracts | | Net Assets — Unrealized appreciation on futures contracts | | $ | 3 | * | | Net Assets — Unrealized depreciation on futures contracts | | $ | 203 | * |
| | Net Assets — Unrealized appreciation on swap contracts | | | 24,110 | † | | Net Assets — Unrealized depreciation on swap contracts | | | 28,397 | † |
| | | | | | | | | | | | |
Total Derivatives not accounted for as hedging instruments | | $ | 24,113 | | | | | $ | 28,600 | |
| | | | | | | | | | | | |
| | | | |
| World Equity Ex-US | | | | | | | | | | | | |
Foreign exchange contracts | | Unrealized gain on forward foreign currency contracts | | $ | 38 | | | Unrealized loss on forward foreign currency contracts | | $ | — | |
Equity contracts | | Net Assets — Unrealized appreciation on futures contracts | | | 326 | * | | Net Assets — Unrealized depreciation on futures contracts | | | 2,508 | * |
| | Net Assets — Unrealized appreciation on swap contracts | | | 42,703 | † | | Net Assets — Unrealized depreciation on swap contracts | | | 49,588 | † |
| | | | | | | | | | | | |
Total Derivatives not accounted for as hedging instruments | | $ | 43,067 | | | | | $ | 52,096 | |
| | | | | | | | | | | | |
| | | | |
| Core Fixed Income | | | | | | | | | | | | |
Foreign exchange contracts | | Unrealized gain on forward foreign currency contracts | | $ | 385 | | | Unrealized loss on forward foreign currency contracts | | $ | 247 | |
Interest rate contracts | | Net Assets — Unrealized appreciation on futures contracts | | | 1,006 | * | | Net Assets — Unrealized depreciation on futures contracts | | | 2,205 | * |
| | Net Assets — Unrealized appreciation on swap contracts | | | — | | | Net Assets — Unrealized depreciation on swap contracts | | | 5,947 | † |
| | Investments, at value | | | — | | | Options written, at value | | | 264 | |
Credit contracts | | Net Assets — Unrealized appreciation on swap contracts | | | 3,768 | † | | Net Assets — Unrealized depreciation on swap contracts | | | 13,207 | † |
| | | | | | | | | | | | |
Total Derivatives not accounted for as hedging instruments | | $ | 5,159 | | | | | $ | 21,870 | |
| | | | | | | | | | | | |
| | | | |
| Long Duration | | | | | | | | | | | | |
Interest rate contracts | | Net Assets — Unrealized appreciation on futures contracts | | $ | 188 | * | | Net Assets — Unrealized depreciation on futures contracts | | $ | 3,868 | * |
Credit contracts | | Net Assets — Unrealized appreciation on swap contracts | | | — | | | Net Assets — Unrealized depreciation on swap contracts | | | 511 | † |
| | | | | | | | | | | | |
Total Derivatives not accounted for as hedging instruments | | $ | 188 | | | | | $ | 4,379 | |
| | | | | | | | | | | | |
| | | | |
| Emerging Markets Debt | | | | | | | | | | | | |
Interest rate contracts | | Net Assets — Unrealized appreciation on futures contracts | | $ | — | | | Net Assets — Unrealized depreciation on futures contracts | | $ | 8 | * |
Foreign exchange contracts | | Unrealized gain on forward foreign currency contracts | | | 385 | | | Unrealized loss on forward foreign currency contracts | | | 1,584 | |
Equity contracts | | Net Assets — Unrealized appreciation on swap contracts | | | 5 | † | | Net Assets — Unrealized depreciation on swap contracts | | | 82 | † |
| | | | | | | | | | | | |
Total Derivatives not accounted for as hedging instruments | | $ | 390 | | | | | $ | 1,674 | |
| | | | | | | | | | | | |
| * | | Includes cumulative appreciation or depreciation of futures contracts as reported in the Schedules of Investments. Only current day’s variation margin is reported within the Statements of Assets & Liabilities. |
| † | | Includes cumulative appreciation or depreciation of swap contracts as reported in the Schedules of Investments. Market Value is reported within the Statements of Assets & Liabilities for swap contracts that have paid premiums. |
| | |
| 154 | | SEI Institutional Investments Trust / Annual Report / May 31, 2010 |
The effect of derivative instruments on the Statements of Operations for the year ended May 31, 2010.
Amount of realized Gain or (Loss) on Derivatives Recognized in Income ($ Thousands):
| | | | | | | | | | | | | | | | | | | | | | |
| Derivatives Not Accounted for as Hedging Instruments | | Options | | Swaptions | | Futures | | | Forward
Currency
Contracts | | | Swaps | | | Total | |
International Equity | | | | | | | | | | | | | | | | | | | | | | |
Foreign exchange contracts | | $ | — | | $ | — | | $ | — | | | $ | 3,910 | | | $ | — | | | $ | 3,910 | |
Credit contracts | | | — | | | — | | | — | | | | — | | | | 645 | | | | 645 | |
Equity contracts | | | — | | | — | | | 2,042 | | | | — | | | | 14,286 | | | | 16,328 | |
Total | | $ | — | | $ | — | | $ | 2,042 | | | $ | 3,910 | | | $ | 14,931 | | | $ | 20,883 | |
World Equity Ex-US | | | | | | | | | | | | | | | | | | | | | | |
Interest rate contracts | | $ | — | | $ | — | | $ | (180 | ) | | $ | — | | | $ | — | | | $ | (180 | ) |
Foreign exchange contracts | | | — | | | — | | | — | | | | 14,037 | | | | — | | | | 14,037 | |
Credit contracts | | | — | | | — | | | — | | | | — | | | | 860 | | | | 860 | |
Equity contracts | | | — | | | — | | | 2,771 | | | | — | | | | 18,559 | | | | 21,330 | |
Total | | $ | — | | $ | — | | $ | 2,591 | | | $ | 14,037 | | | $ | 19,419 | | | $ | 36,047 | |
Core Fixed Income | | | | | | | | | | | | | | | | | | | | | | |
Interest rate contracts | | $ | 3,024 | | $ | 900 | | $ | 21,284 | | | $ | — | | | $ | 55 | | | $ | 25,263 | |
Foreign exchange contracts | | | — | | | — | | | — | | | | (542 | ) | | | — | | | | (542 | ) |
Credit contracts | | | — | | | — | | | — | | | | — | | | | (4,890 | ) | | | (4,890 | ) |
Total | | $ | 3,024 | | $ | 900 | | $ | 21,284 | | | $ | (542 | ) | | $ | (4,835 | ) | | $ | 19,831 | |
Long Duration | | | | | | | | | | | | | | | | | | | | | | |
Interest rate contracts | | $ | — | | $ | — | | $ | 14,124 | | | $ | — | | | $ | — | | | $ | 14,124 | |
Credit contracts | | | — | | | — | | | — | | | | — | | | | 11 | | | | 11 | |
Total | | $ | — | | $ | — | | $ | 14,124 | | | $ | — | | | $ | 11 | | | $ | 14,135 | |
Emerging Markets Debt | | | | | | | | | | | | | | | | | | | | | | |
Interest rate contracts | | $ | — | | $ | — | | $ | 456 | | | $ | — | | | $ | — | | | $ | 456 | |
Foreign exchange contracts | | | 375 | | | — | | | — | | | | 3,464 | | | | — | | | | 3,839 | |
Credit contracts | | | — | | | — | | | — | | | | — | | | | 661 | | | | 661 | |
Equity contracts | | | — | | | — | | | — | | | | — | | | | 26 | | | | 26 | |
Total | | $ | 375 | | $ | — | | $ | 456 | | | $ | 3,464 | | | $ | 687 | | | $ | 4,982 | |
Change in Unrealized Appreciation or (Depreciation) on Derivatives Recognized in Income ($ Thousands):
| | | | | | | | | | | | | | | | | | | | |
| Derivatives Not Accounted for as Hedging Instruments | | Options | | | Futures | | | Forward
Currency
Contracts | | | Swaps | | | Total | |
International Equity | | | | | | | | | | | | | | | | | | | | |
Foreign exchange contracts | | $ | — | | | $ | — | | | $ | (1,288 | ) | | $ | — | | | $ | (1,288 | ) |
Credit contracts | | | — | | | | — | | | | — | | | | (689 | ) | | | (689 | ) |
Equity contracts | | | — | | | | (1,130 | ) | | | — | | | | (9,732 | ) | | | (10,862 | ) |
Total | | $ | — | | | $ | (1,130 | ) | | $ | (1,288 | ) | | $ | (10,421 | ) | | $ | (12,839 | ) |
World Equity Ex-US | | | | | | | | | | | | | | | | | | | | |
Interest rate contracts | | $ | — | | | $ | 45 | | | $ | — | | | $ | — | | | $ | 45 | |
Foreign exchange contracts | | | — | | | | — | | | | (6,067 | ) | | | — | | | | (6,067 | ) |
Credit contracts | | | — | | | | — | | | | — | | | | (920 | ) | | | (920 | ) |
Equity contracts | | | — | | | | (10,977 | ) | | | — | | | | (15,518 | ) | | | (26,495 | ) |
Total | | $ | — | | | $ | (10,932 | ) | | $ | (6,067 | ) | | $ | (16,438 | ) | | $ | (33,437 | ) |
Enhanced LIBOR Opportunities | | | | | | | | | | | | | | | | | | | | |
Interest rate contracts | | $ | — | | | $ | 19 | | | $ | — | | | $ | — | | | $ | 19 | |
Foreign exchange contracts | | | — | | | | — | | | | 79 | | | | — | | | | 79 | |
Total | | $ | — | | | $ | 19 | | | $ | 79 | | | $ | — | | | $ | 98 | |
Core Fixed Income | | | | | | | | | | | | | | | | | | | | |
Interest rate contracts | | $ | (240 | ) | | $ | (410 | ) | | $ | — | | | $ | (5,947 | ) | | $ | (6,597 | ) |
Foreign exchange contracts | | | — | | | | — | | | | 1,178 | | | | — | | | | 1,178 | |
Credit contracts | | | — | | | | — | | | | — | | | | 7,186 | | | | 7,186 | |
Total | | $ | (240 | ) | | $ | (410 | ) | | $ | 1,178 | | | $ | 1,239 | | | $ | 1,767 | |
Long Duration | | | | | | | | | | | | | | | | | | | | |
Interest rate contracts | | $ | — | | | $ | 6,478 | | | $ | — | | | $ | — | | | $ | 6,478 | |
Credit contracts | | | — | | | | — | | | | — | | | | 164 | | | | 164 | |
Total | | $ | — | | | $ | 6,478 | | | $ | — | | | $ | 164 | | | $ | 6,642 | |
Emerging Markets Debt | | | | | | | | | | | | | | | | | | | | |
Interest rate contracts | | $ | — | | | $ | (42 | ) | | $ | — | | | $ | — | | | $ | (42 | ) |
Foreign exchange contracts | | | — | | | | — | | | | (1,063 | ) | | | — | | | | (1,063 | ) |
Credit contracts | | | — | | | | — | | | | — | | | | 490 | | | | 490 | |
Equity contracts | | | — | | | | — | | | | — | | | | 553 | | | | 553 | |
Total | | $ | — | | | $ | (42 | ) | | $ | (1,063 | ) | | $ | 1,043 | | | $ | (62 | ) |
| | |
| SEI Institutional Investments Trust / Annual Report / May 31, 2010 | | 155 |
Notes to Financial Statements (Continued)
May 31, 2010
The ISDA Master Agreements maintain provisions for general obligations, representations, agreements, collateral, and events of default or termination. The occurrence of a specified event of termination may give a counterparty the right to terminate all of its contracts and affect settlement of all outstanding transactions under the applicable ISDA Master Agreement.
Written options transactions entered into during the fiscal year ended May 31, 2010 are summarized as follows:
| | | | | | | |
| | | Core Fixed
Income Fund | |
| | | Number of
Contracts | | | Premium
($ Thousands) | |
| Balance at the beginning of period | | 992 | | | $ | 609 | |
| Written | | 7,593 | | | | 5,056 | |
| Expired | | (3,639 | ) | | | (2,030 | ) |
| Closing buys | | (4,599 | ) | | | (3,401 | ) |
| Balance at the end of period | | 347 | | | $ | 234 | |
Written swaptions transactions entered into during the fiscal year ended May 31, 2010 are summarized as follows:
| | | | | | | |
| | | Core Fixed
Income Fund | |
| | | Number of
Contracts | | | Premium
($ Thousands) | |
| Balance at the beginning of period | | — | | | $ | — | |
| Written | | 48,340 | | | | 1,013 | |
| Expired | | (24,170 | ) | | | (465 | ) |
| Closing buys | | (24,170 | ) | | | (548 | ) |
| Balance at the end of period | | — | | | $ | — | |
As of May 31, 2010 the Funds had cash and/or securities at least equal to the value of written options.
5. AGREEMENTS AND OTHER TRANSACTIONS WITH AFFILIATES
Administration and Transfer Agency Agreement — The Trust and SEI Investments Global Funds Services (the “Administrator”) are parties to an Amended and Restated Administration and Transfer Agency Agreement dated December 10, 2003 under which the Administrator provides administrative and shareholder servicing for an annual fee of 0.05% of the average daily net assets of each Fund. For the fiscal year ended May 31, 2010, and until further notice, the Administrator has voluntarily agreed to waive all of its fee.
Investment Advisory Agreement — SEI Investments Management Corporation (“SIMC”) serves as investment adviser (the “Adviser”) to each Fund. In connection with serving as Adviser, SIMC is entitled to a fee that is calculated daily and paid monthly, based on the average daily net assets of each Fund. SIMC has voluntarily agreed to waive a portion of its fee so that the total annual expenses of each Fund, exclusive of acquired fund fees expenses, will not exceed certain voluntary expense limitations adopted by SIMC. These waivers may be
terminated at any time. Accordingly, the advisory fee and voluntary expense limitations for each Fund are as follows:
| | | | | | |
| | | Advisory
Fees | | | Voluntary
Expense
Limitations | |
Large Cap Fund | | 0.400 | % | | 0.260 | % |
Large Cap Diversified Alpha Fund | | 0.400 | | | 0.350 | |
Large Cap Disciplined Equity Fund | | 0.400 | | | 0.220 | |
Large Cap Index Fund | | 0.170 | | | 0.060 | |
Small Cap Fund | | 0.650 | | | 0.540 | |
Small/Mid Cap Equity Fund | | 0.650 | | | 0.500 | |
U.S. Managed Volatility Fund | | 0.650 | | | 0.350 | |
International Equity Fund | | 0.505 | | | 0.390 | |
World Equity Ex-US Fund | | 0.550 | | | 0.450 | |
Screened World Equity Ex-US Fund | | 0.650 | | | 0.800 | |
Enhanced LIBOR Opportunities Fund | | 0.450 | | | 0.440 | |
Core Fixed Income Fund | | 0.300 | | | 0.140 | |
High Yield Bond Fund | | 0.4875 | | | 0.350 | |
Long Duration Fund | | 0.300 | | | 0.200 | |
Emerging Markets Debt Fund | | 0.850 | | | 0.550 | |
Real Return Fund | | 0.220 | * | | 0.200 | * |
| * | | The Advisory Fee and Voluntary Expense Limitation for the Real Return Fund changed from 0.700% and 0.360%, respectively, as of January 1, 2010. |
As of May 31, 2010, SIMC has entered into investment sub-advisory agreements with the following parties and pays the sub-advisers out of the fee that it receives from the Funds:
|
| Investment Sub-Adviser |
Large Cap Fund |
Aronson + Johnson + Ortiz, L.P. |
Delaware Management Company |
Legg Mason Capital Management, Inc. |
LSV Asset Management |
Neuberger Berman Management LLC |
Quantitative Management Associates, LLC |
Large Cap Diversified Alpha Fund |
Analytic Investors, LLC |
Aronson + Johnson + Ortiz, L.P. |
Delaware Management Company |
INTECH Investment Management, LLC |
Legg Mason Capital Management, Inc. |
Quantitative Management Associates, LLC |
Large Cap Disciplined Equity Fund |
Analytic Investors, Inc. |
INTECH Investment Management, LLC |
Lazard Asset Management LLC |
Massachusetts Financial Services Company |
Quantitative Management Associates, LLC |
Large Cap Index Fund |
SSgA Funds Management, Inc. |
Small Cap Fund |
AQR Capital Management, LLC |
Artisan Partners Limited Partnership |
Janus Capital Management, Inc. |
Lee Munder Capital Group LLC |
| | |
| 156 | | SEI Institutional Investments Trust / Annual Report / May 31, 2010 |
|
| Investment Sub-Adviser |
Los Angeles Capital Management and Equity Research, Inc. |
LSV Asset Management |
Oppenheimer Capital, LLC |
Robeco Investment Management, Inc. |
Security Capital Research and Management, Inc. |
Wellington Management Company, LLP |
Small/Mid Cap Equity Fund |
Integrity Asset Management, LLC |
Janus Capital Management, Inc. |
Lee Munder Capital Group LLC |
Los Angeles Capital Management and Equity Research, Inc. |
LSV Asset Management |
PanAgora Asset Management, Inc. |
Security Capital Research and Management Incorporated |
Wellington Management Company, LLP |
Wells Capital Management, Inc. |
U.S. Managed Volatility Fund |
Analytic Investors, LLC |
Aronson + Johnson + Ortiz, LP |
International Equity Fund |
Acadian Asset Management, LLC |
AXA Rosenberg Investment Management, LLC |
Declaration Management & Research, LLC |
INTECH Investment Management, LLC |
Neuberger Berman Management LLC |
Quantitative Management Associates, LLC |
Schroder Investment Management North America, Inc. |
World Equity Ex-US Fund |
Acadian Asset Management, Inc. |
Artisan Partners Limited Partnership |
Declaration Management & Research, LLC |
McKinley Capital Management, LLC |
NFJ Investment Group LLC |
Principal Global Investors, LLC |
Quantitative Management Associates, LLC |
Thornburg Investment Management LLC |
Screened World Equity Ex-US Fund |
Acadian Asset Management LLC |
McKinley Capital Management, LLC |
Principal Global Investors, LLC |
Quantitative Management Associates, LLC |
Thornburg Investment Management LLC |
Enhanced LIBOR Opportunities Fund |
Ares Management, LLC |
Declaration Management & Research, LLC* |
UBS Global Asset Management (Americas), Inc. |
Wellington Management Company, LLP |
Core Fixed Income Fund |
J.P. Morgan Investment Management, Inc. |
Jennison Associates LLC |
Metropolitan West Asset Management, LLC |
Wells Capital Management, Inc. |
Western Asset Management Company |
Western Asset Management Company Limited |
|
| Investment Sub-Adviser |
High Yield Bond Fund |
Ares Management, LLC |
Brigade Capital Management, LLC |
Delaware Management Company |
Guggenheim Partners, LLC |
J.P. Morgan Investment Management, Inc. |
Long Duration Fund |
Income Research & Management |
Jennison Associates LLC |
Trust Company of the West (formerly Metropolitan West Asset Management, LLC) |
Emerging Markets Debt Fund |
Ashmore Investment Management Limited |
ING Investment Management Advisors, B.V. |
Stone Harbor Investment Partners, L.P. |
Real Return Fund |
Wellington Management Company, LLC |
* As of May 31, 2010, this manager has not been allocated assets to manage.
Distribution Agreement — SEI Investments Distribution Co. (the “Distributor”), a wholly owned subsidiary of SEI Investments Company (“SEI”), serves as each Fund’s Distributor pursuant to a Distribution Agreement with the Trust.
Other —The Distribution Agreement between the Distributor and the Trust provides that the Distributor may receive compensation on fund transactions effected for the Trust in accordance with Securities and Exchange Commission (“SEC”) rules. Accordingly, it is expected that fund transactions may result in brokerage commissions being paid to the Distributor. The SEC rules require that such commissions not exceed usual and customary commissions.
Such commissions for the year ended May 31, 2010 were as follows ($ Thousands):
| | | |
| Large Cap Fund | | $ | 78 |
| Large Cap Diversified Alpha Fund | | | 1 |
| Large Cap Disciplined Equity Fund | | | 118 |
| Small Cap Fund | | | 355 |
| Small/Mid Cap Equity Fund | | | 300 |
| International Equity Fund | | | 182 |
| World Equity Ex-US Fund | | | 1,093 |
Screened World Equity Ex-US Fund | | | 16 |
Payments to Affiliates — Certain officers and/or trustees of the Trust are also officers of the Distributor or the Adviser. The Trust pays each unaffiliated Trustee an annual fee for attendance at quarterly, interim and committee meetings. Compensation of officers and affiliated Trustees of the Trust is paid by the Adviser or Administrator.
A portion of the services provided by the Chief Compliance Officer (“CCO”) and his staff, whom are employees of the Administrator, are paid for by the Trust as incurred. The services include regulatory oversight of the Trust’s Adviser, sub-advisers and service providers as required by SEC regulations. The CCO’s services have been approved by and are reviewed annually by the Board.
| | |
| SEI Institutional Investments Trust / Annual Report / May 31, 2010 | | 157 |
Notes to Financial Statements (Continued)
May 31, 2010
LSV Asset Management (partially-owned subsidiary of SIMC) serves as a sub-adviser to the Large Cap, Small Cap and Small/Mid Cap Equity Funds. For this service LSV Asset Management is entitled to receive a fee from SIMC. Such fees for the year ended May 31, 2010 were as follows ($ Thousands):
| | | |
| Large Cap Fund | | $ | 198 |
| Small Cap Fund | | | 411 |
| Small/Mid Cap Equity Fund | | | 807 |
Fees Paid Indirectly — The Funds may direct certain fund trades to the Distributor who pays a portion of the Fund’s expenses. Accord-
ingly, the expenses reduced, which were used to pay third party expenses, can be found on the Statement of Operations and the effect on the Fund’s expense ratio, as a percentage of the Fund’s average daily net assets for the fiscal year ended May 31, 2010, can be found on the Financial Highlights.
Investment in Affiliated Security — The funds may invest excess cash in the SEI Daily Income Trust Prime Obligation Fund, an affiliated money market fund. Additionally, the Funds may invest the cash collateral from the securities lending program in the SEI Liquidity Fund L.P.
6. CAPITAL SHARE TRANSACTIONS
Capital Share Transactions for the Funds were as follows (Thousands):
| | | | | | | | | | | | | | | | | | |
| | | Large Cap Fund | | | Large Cap
Diversified
Alpha | | | Large Cap
Disciplined
Equity Fund | |
| | | 2010 | | | 2009 | | | 2010 | | | 2009 | | | 2010 | | | 2009 | |
Class A: | | | | | | | | | | | | | | | | | | |
Shares Issued | | 53,265 | (1) | | 27,740 | | | 7,083 | | | 23,513 | | | 147,091 | (1) | | 263,121 | (1) |
Shares Issued In Lieu of Dividends and Distributions | | 824 | | | 533 | | | 486 | | | 471 | | | 12,742 | | | 10,546 | |
Shares Redeemed | | (13,119 | ) | | (5,596 | ) | | (13,833 | ) | | (25,871 | ) | | (195,253 | ) | | (178,882 | ) |
Increase (Decrease) in Net Assets
Derived from Class A Transactions | | 40,970 | | | 22,677 | | | (6,264 | ) | | (1,887 | ) | | (35,420 | ) | | 94,785 | |
| | | | | | | | | | | | | | | | | | |
| | | Large Cap
Index Fund | | | Small Cap Fund | | | Small/Mid
Cap Fund | |
| | | 2010 | | | 2009 | | | 2010 | | | 2009 | | | 2010 | | | 2009 | |
Class A: | | | | | | | | | | | | | | | | | | |
Shares Issued | | 1,650 | | | 1,929 | | | 23,333 | (1) | | 22,882 | | | 42,363 | | | 64,980 | |
Shares Issued In Lieu of Dividends and Distributions | | 109 | | | 106 | | | 1,012 | | | 2,879 | | | 2,587 | | | 3,467 | |
Shares Redeemed | | (858 | ) | | (748 | ) | | (22,758 | ) | | (48,524 | ) | | (68,534 | ) | | (43,013 | ) |
Increase (Decrease) in Net Assets
Derived from Class A Transactions | | 901 | | | 1,287 | | | 1,587 | | | (22,763 | ) | | (23,584 | ) | | 25,434 | |
| | | | | | | | | | | | | | | | | | |
| | | U.S. Managed
Volatility Fund(2) | | | International
Equity Fund | | | World Equtiy
Ex-US Fund | |
| | | 2010 | | | 2009 | | | 2010 | | | 2009 | | | 2010 | | | 2009 | |
Class A: | | | | | | | | | | | | | | | | | | |
Shares Issued | | 4,280 | | | 25,465 | | | 24,574 | | | 44,814 | | | 135,855 | | | 180,222 | |
Shares Issued In Lieu of Dividends and Distributions | | 926 | | | 64 | | | 1,647 | | | 2,178 | | | 7,381 | | | — | |
Shares Redeemed | | (7,255 | ) | | (619 | ) | | (47,065 | ) | | (61,714 | ) | | (58,958 | ) | | (82,715 | ) |
Increase (Decrease) in Net Assets
Derived from Class A Transactions | | (2,049 | ) | | 24,910 | | | (20,844 | ) | | (14,722 | ) | | 84,278 | | | 97,507 | |
| | | | | | | | | | | | | | | | | | |
| | | Screened World Equtiy
Ex-US Fund(3) | | | Enhanced LIBOR
Opportunities Fund | | | Core Fixed
Income Fund | |
| | | 2010 | | | 2009 | | | 2010 | | | 2009 | | | 2010 | | | 2009 | |
Class A: | | | | | | | | | | | | | | | | | | |
Shares Issued | | 3,524 | | | 10,439 | | | 842 | | | 3,618 | | | 206,708 | | | 193,251 | |
Shares Issued In Lieu of Dividends and Distributions | | 102 | | | 87 | | | 140 | | | 488 | | | 23,466 | | | 40,439 | |
Shares Redeemed | | (1,976 | ) | | (2,414 | ) | | (9,703 | ) | | (7,198 | ) | | (161,268 | ) | | (369,431 | ) |
Increase (Decrease) in Net Assets
Derived from Class A Transactions | | 1,650 | | | 8,112 | | | (8,721 | ) | | (3,092 | ) | | 68,906 | | | (135,741 | ) |
| | |
| 158 | | SEI Institutional Investments Trust / Annual Report / May 31, 2010 |
| | | | | | | | | | | | | | | | |
| | | | | High Yield
Bond Fund | | | Long
Duration Fund | |
| | | | | | | 2010 | | | 2009 | | | 2010 | | | 2009 | |
Class A: | | | | | | | | | | | | | | | | |
Shares Issued | | | | | | 57,698 | | | 48,241 | | | 129,684 | | | 183,981 | |
Shares Issued In Lieu of Dividends and Distributions | | | | | | 16,487 | | | 19,620 | | | 13,437 | | | 3,116 | |
Shares Redeemed | | | | | | (64,348 | ) | | (43,406 | ) | | (19,931 | ) | | (9,083 | ) |
Increase (Decrease) in Net Assets
Derived from Class A Transactions | | | | | | 9,837 | | | 24,455 | | | 123,190 | | | 178,014 | |
| | | | | | | | | | | | | | | | |
| | | | | Emerging
Markets Debt | | | Real Return
Fund | |
| | | | | | | 2010 | | | 2009 | | | 2010 | | | 2009 | |
Class A: | | | | | | | | | | | | | | | | |
Shares Issued | | | | | | 24,976 | | | 26,254 | | | 15,668 | | | 6,992 | |
Shares Issued In Lieu of Dividends and Distributions | | | | | | 8,914 | | | 8,541 | | | 433 | | | 2,090 | |
Shares Redeemed | | | | | | (36,617 | ) | | (39,588 | ) | | (10,458 | ) | | (16,281 | ) |
Increase (Decrease) in Net Assets
Derived from Class A Transactions | | | | | | (2,727 | ) | | (4,793 | ) | | 5,643 | | | (7,199 | ) |
| (1) | | Includes subscriptions as a result of in-kind transfers of securities (See Note 10). |
| (2) | | Fund commenced operations on December 30, 2008. |
| (3) | | Fund commenced operations on June 30, 2008. |
Amounts designated as “—” are zero or have been rounded to zero.
7. INVESTMENT TRANSACTIONS
The cost of security purchases and proceeds from the sale and maturities of securities other than temporary cash investments, during the fiscal year ended May 31, 2010, were as follows:
| | | | | | | | | |
| | | U.S. Gov’t
($ Thousands) | | Other
($ Thousands) | | Total
($ Thousands) |
Large Cap Fund | | | | | | | | | |
Purchases | | $ | — | | $ | 1,195,012 | | $ | 1,195,012 |
Sales | | | — | | | 617,352 | | | 617,352 |
Large Cap Diversified Alpha Fund | | | | | | | | | |
Purchases | | | — | | | 311,253 | | | 311,253 |
Sales | | | — | | | 325,802 | | | 325,802 |
Large Cap Disciplined Equity Fund | | | | | | | | | |
Purchases | | | — | | | 6,785,463 | | | 6,785,463 |
Sales | | | — | | | 6,809,591 | | | 6,809,591 |
Large Cap Index Fund | | | | | | | | | |
Purchases | | | — | | | 128,797 | | | 128,797 |
Sales | | | — | | | 51,772 | | | 51,772 |
Small Cap Fund | | | | | | | | | |
Purchases | | | — | | | 1,251,129 | | | 1,251,129 |
Sales | | | — | | | 1,223,737 | | | 1,223,737 |
Small/Mid Cap Fund | | | | | | | | | |
Purchases | | | — | | | 1,930,183 | | | 1,930,183 |
Sales | | | — | | | 2,136,773 | | | 2,136,773 |
U.S. Managed Volatility Fund | | | | | | | | | |
Purchases | | | — | | | 149,633 | | | 149,633 |
Sales | | | — | | | 173,448 | | | 173,448 |
International Equity Fund | | | | | | | | | |
Purchases | | | 36,695 | | | 993,422 | | | 1,030,117 |
Sales | | | 43,657 | | | 1,083,407 | | | 1,127,064 |
World Equity Ex-US Fund | | | | | | | | | |
Purchases | | | 121,511 | | | 5,062,615 | | | 5,184,126 |
Sales | | | 145,303 | | | 4,470,821 | | | 4,616,124 |
Screened World Equity Ex-US Fund | | | | | | | | | |
Purchases | | | — | | | 113,051 | | | 113,051 |
Sales | | | — | | | 102,788 | | | 102,788 |
| | | | | | | | | |
| | | U.S. Gov’t
($ Thousands) | | Other
($ Thousands) | | Total
($ Thousands) |
Enhanced LIBOR Opportunities Fund | | | | | | | | | |
Purchases | | $ | 3,032 | | $ | 7,870 | | $ | 10,902 |
Sales | | | 6,085 | | | 34,729 | | | 40,814 |
Core Fixed Income Fund | | | | | | | | | |
Purchases | | | 9,716,032 | | | 2,608,618 | | | 12,324,650 |
Sales | | | 9,146,201 | | | 2,611,087 | | | 11,757,288 |
High Yield Bond Fund | | | | | | | | | |
Purchases | | | 353 | | | 1,513,678 | | | 1,514,031 |
Sales | | | 716 | | | 1,370,186 | | | 1,370,902 |
Long Duration Bond Fund | | | | | | | | | |
Purchases | | | 1,672,961 | | | 1,469,802 | | | 3,142,763 |
Sales | | | 1,496,563 | | | 541,787 | | | 2,038,350 |
Emerging Markets Debt Fund | | | | | | | | | |
Purchases | | | — | | | 555,613 | | | 555,613 |
Sales | | | — | | | 637,338 | | | 637,338 |
Real Return Fund | | | | | | | | | |
Purchases | | | 601,890 | | | 10 | | | 601,900 |
Sales | | | 552,252 | | | 10 | | | 552,262 |
8. FEDERAL TAX INFORMATION
It is each Fund’s intention to continue to qualify as a regulated investment company under Subchapter M of the Internal Revenue Code and distribute all of its taxable income (including net capital gains). Accordingly, no provision for Federal income taxes is required.
Dividends from net investment income and distributions from net realized capital gains are determined in accordance with U.S. Federal income tax regulations, which may differ from those amounts determined under GAAP. These book/tax differences are either temporary or permanent in nature. To the extent these differences are permanent, they are charged or credited to paid-in capital, undistributed net investment income or accumulated net realized gain, as appropriate, in the period that the differences arise.
| | |
| SEI Institutional Investments Trust / Annual Report / May 31, 2010 | | 159 |
Notes to Financial Statements (Continued)
May 31, 2010
Accordingly, the following permanent differences, primarily attributable to different treatment for gains and losses on paydowns of mortgage and asset-backed securities for tax purposes, defaulted bond basis adjustments, reclassification of long term capital gain distributions on Real Estate Investment Trust securities, reclassification of income and expense from swap transactions, and gains and losses on passive foreign investment companies, investments in partnerships and certain foreign currency related transactions, have been reclassified to/from the following accounts as of May 31, 2010:
| | | | | | | | | | | | |
| | | Undistributed
Net Investment
Income (Loss)
($ Thousands) | | | Accumulated
Realized
Gain (Loss)
($ Thousands) | | | Paid-in Capital
($ Thousands) | |
Large Cap Fund | | $ | 93 | | | $ | (93 | ) | | $ | — | |
Large Cap Diversified Alpha Fund | | | 1,326 | | | | (1,326 | ) | | | — | |
Large Cap Disciplined Equity Fund | | | 23,490 | | | | (23,566 | ) | | | 76 | |
Large Cap Index Fund | | | 110 | | | | (110 | ) | | | — | |
Small Cap Fund | | | 949 | | | | (940 | ) | | | (9 | ) |
Small/Mid Cap Equity Fund | | | 808 | | | | (808 | ) | | | — | |
U.S. Managed Volatility Fund | | | 52 | | | | (52 | ) | | | — | |
International Equity Fund | | | 15,570 | | | | (15,570 | ) | | | — | |
World Equity Ex-US Fund | | | 29,891 | | | | (29,891 | ) | | | — | |
Screened World Equity Ex-US Fund | | | 84 | | | | (84 | ) | | | — | |
Enhanced LIBOR Opportunities Fund | | | 1,045 | | | | (1,045 | ) | | | — | |
Core Fixed Income Fund | | | 6,994 | | | | (6,994 | ) | | | — | |
High Yield Bond Fund | | | (8,568 | ) | | | 8,568 | | | | — | |
Long Duration Fund | | | (1,308 | ) | | | 1,308 | | | | — | |
Emerging Markets Debt Fund | | | 4,546 | | | | (4,546 | ) | | | — | |
Real Return Fund | | | 318 | | | | (318 | ) | | | — | |
These reclassifications have no impact on net assets or net asset value per share.
The tax character of dividends and distributions paid during the last two years or periods ended May 31, 2010 were as follows:
| | | | | | | | | | | | | | |
| | | | | Ordinary Income
($ Thousands) | | Long-Term Capital Gain
($ Thousands) | | Return of Capital
($ Thousands) | | Total
($ Thousands) |
Large Cap Fund | | 2010 | | $ | 12,504 | | $ | — | | $ | — | | $ | 12,504 |
| | 2009 | | | 6,781 | | | — | | | — | | | 6,781 |
Large Cap Diversified Alpha Fund | | 2010 | | | 4,456 | | | — | | | — | | | 4,456 |
| | 2009 | | | 772 | | | — | | | 2,889 | | | 3,661 |
Large Cap Disciplined Equity Fund | | 2010 | | | 113,630 | | | — | | | — | | | 113,630 |
| | 2009 | | | 10,906 | | | — | | | 79,835 | | | 90,741 |
Large Cap Index Fund | | 2010 | | | 10,238 | | | — | | | — | | | 10,238 |
| | 2009 | | | 8,392 | | | 608 | | | — | | | 9,000 |
Small Cap Fund | | 2010 | | | 10,767 | | | — | | | — | | | 10,767 |
| | 2009 | | | 23,822 | | | — | | | — | | | 23,822 |
Small/Mid Cap Equity Fund | | 2010 | | | 23,438 | | | — | | | — | | | 23,438 |
| | 2009 | | | 27,726 | | | — | | | — | | | 27,726 |
U.S. Managed Volatility Fund | | 2010 | | | 9,780 | | | 252 | | | — | | | 10,032 |
| | 2009 | | | 555 | | | — | | | — | | | 555 |
International Equity Fund | | 2010 | | | 13,386 | | | — | | | — | | | 13,386 |
| | 2009 | | | 11,818 | | | 1,123 | | | — | | | 12,941 |
World Equity Ex-US Fund | | 2010 | | | 75,180 | | | — | | | — | | | 75,180 |
| | 2009 | | | — | | | — | | | — | | | — |
Screened World Equity Ex-US Fund | | 2010 | | | 912 | | | — | | | — | | | 912 |
| | 2009 | | | 561 | | | — | | | — | | | 561 |
Enhanced LIBOR Opportunities Fund | | 2010 | | | 2,810 | | | — | | | — | | | 2,810 |
| | 2009 | | | 3,100 | | | — | | | 929 | | | 4,029 |
Core Fixed Income Fund | | 2010 | | | 257,305 | | | — | | | — | | | 257,305 |
| | 2009 | | | 360,778 | | | 27,495 | | | — | | | 388,273 |
High Yield Bond Fund | | 2010 | | | 145,168 | | | — | | | — | | | 145,168 |
| | 2009 | | | 135,862 | | | — | | | — | | | 135,862 |
Long Duration Bond Fund | | 2010 | | | 113,770 | | | — | | | — | | | 113,770 |
| | 2009 | | | 24,618 | | | — | | | — | | | 24,618 |
Emerging Markets Debt Fund | | 2010 | | | 95,106 | | | — | | | — | | | 95,106 |
| | 2009 | | | 76,229 | | | — | | | — | | | 76,229 |
Real Return Fund | | 2010 | | | 6,985 | | | — | | | — | | | 6,985 |
| | 2009 | | | 19,513 | | | — | | | 1,496 | | | 21,009 |
| | |
| 160 | | SEI Institutional Investments Trust / Annual Report / May 31, 2010 |
As of May 31, 2010, the components of Distributable Earnings/(Accumulated Losses) were as follows:
| | | | | | | | | | | | | | | | | | | | | | | | | | | | | | |
| | | Undistributed
Ordinary
Income
($ Thousands) | | Undistributed
Long-Term
Capital Gain
($ Thousands) | | Capital Loss
Carryforwards
($ Thousands) | | | Post October
Losses
($ Thousands) | | | Post October
Currency
Losses
($ Thousands) | | | Unrealized
Appreciation
(Depreciation)
($ Thousands) | | | Other
Temporary
Differences
($ Thousands) | | | Total Distributable
Earnings
(Accumulated Losses)
($ Thousands) | |
Large Cap Fund | | $ | 3,345 | | $ | — | | $ | (89,778 | ) | | $ | — | | | $ | — | | | $ | 39,369 | | | $ | — | | | $ | (47,064 | ) |
Large Cap Diversified Alpha Fund | | | 1,399 | | | — | | | (175,790 | ) | | | (864 | ) | | | (9 | ) | | | 2,904 | | | | — | | | | (172,360 | ) |
Large Cap Disciplined Equity Fund | | | 32,995 | | | — | | | (2,597,114 | ) | | | — | | | | (8 | ) | | | 378,378 | | | | — | | | | (2,185,749 | ) |
Large Cap Index Fund | | | 1,839 | | | — | | | (23,438 | ) | | | (3,295 | ) | | | — | | | | 73,290 | | | | — | | | | 48,396 | |
Small Cap Fund | | | 1,865 | | | — | | | (404,837 | ) | | | — | | | | — | | | | 95,174 | | | | (63 | ) | | | (307,861 | ) |
Small/Mid Cap Equity Fund | | | 2,092 | | | — | | | (533,984 | ) | | | — | | | | (116 | ) | | | 204,952 | | | | (3 | ) | | | (327,059 | ) |
U.S. Managed Volatility Fund | | | 11,693 | | | 3,283 | | | — | | | | — | | | | — | | | | 37,416 | | | �� | — | | | | 52,392 | |
International Equity Fund | | | 22,354 | | | — | | | (441,761 | ) | | | (1,960 | ) | | | — | | | | (57,790 | ) | | | — | | | | (479,157 | ) |
World Equity Ex-US Fund | | | 56,247 | | | — | | | (880,613 | ) | | | — | | | | — | | | | (179,528 | ) | | | (1,143 | ) | | | (1,005,037 | ) |
Screened World Equity Ex-US Fund | | | 846 | | | — | | | (22,911 | ) | | | — | | | | — | | | | (4,889 | ) | | | 1 | | | | (26,953 | ) |
Enhanced LIBOR Opportunities Fund | | | 2,586 | | | — | | | (35,404 | ) | | | (17,470 | ) | | | — | | | | (87 | ) | | | — | | | | (50,375 | ) |
Core Fixed Income Fund | | | 115,817 | | | — | | | — | | | | — | | | | — | | | | (81,296 | ) | | | (19,238 | ) | | | 15,283 | |
High Yield Bond Fund | | | 12,977 | | | — | | | (124,856 | ) | | | (28,042 | ) | | | — | | | | 6,098 | | | | (12,998 | ) | | | (146,821 | ) |
Long Duration Fund | | | 9,037 | | | — | | | (8,733 | ) | | | — | | | | — | | | | 147,817 | | | | (12,047 | ) | | | 136,074 | |
Emerging Markets Debt Fund | | | 12,658 | | | — | | | (59,232 | ) | | | — | | | | — | | | | 54,074 | | | | (18,371 | ) | | | (10,871 | ) |
Real Return Fund | | | 3,134 | | | 4,038 | | | — | | | | — | | | | (1 | ) | | | 5,217 | | | | — | | | | 12,388 | |
Post-October losses represent losses realized on investment transactions from November 1, 2009 through May 31, 2010 that, in accordance with Federal income tax regulations, the Funds may elect to defer and treat as having arisen in the following fiscal year. For Federal income tax purposes, capital loss carryforwards may be carried forward and applied against future capital gains as follows:
| | | | | | | | | | | | | | | | | | |
| | | Expires 2011
($ Thousands) | | Expires 2015
($ Thousands) | | Expires 2016
($ Thousands) | | Expires 2017
($ Thousands) | | Expires 2018
($ Thousands) | | Total Capital
Loss
Carryforwards
05/31/09
($ Thousands) |
Large Cap Fund | | $ | 81,891 | | $ | — | | $ | — | | $ | 7,887 | | $ | — | | $ | 89,778 |
Large Cap Diversified Alpha Fund | | | — | | | — | | | — | | | 80,326 | | | 95,464 | | | 175,790 |
Large Cap Disciplined Equity Fund | | | — | | | — | | | — | | | 1,493,918 | | | 1,103,196 | | | 2,597,114 |
Large Cap Index Fund | | | — | | | — | | | — | | | 6,369 | | | 17,069 | | | 23,438 |
Small Cap Fund | | | — | | | — | | | — | | | 154,582 | | | 250,255 | | | 404,837 |
Small/Mid Cap Equity Fund | | | — | | | — | | | — | | | 208,795 | | | 325,189 | | | 533,984 |
International Equity Fund | | | — | | | — | | | — | | | 163,564 | | | 278,197 | | | 441,761 |
World Equity Ex-US Fund | | | — | | | — | | | — | | | 438,657 | | | 441,956 | | | 880,613 |
Screened World Equity Ex-US Fund | | | — | | | — | | | — | | | 6,490 | | | 16,421 | | | 22,911 |
Enhanced LIBOR Opportunities Fund | | | — | | | — | | | 1,488 | | | 10,404 | | | 23,512 | | | 35,404 |
High Yield Bond Fund | | | — | | | — | | | 1,148 | | | 61,962 | | | 61,746 | | | 124,856 |
Long Duration Fund | | | — | | | 1,412 | | | 796 | | | 6,525 | | | — | | | 8,733 |
Emerging Markets Debt Fund | | | — | | | — | | | — | | | 26,548 | | | 32,684 | | | 59,232 |
During the fiscal year ended May 31, 2010, the Large Cap, U.S. Managed Volatility, Core Fixed Income, Long Duration and Real Return Funds utilized $7,522,945, $1,283,308, $31,257,517, $837,977 and $2,962,680, respectively, of capital loss carryforwards, to offset capital gains.
For Federal income tax purposes, the cost of securities owned at May 31, 2010, and the net realized gains or losses on securities sold for the period were not materially different from amounts reported for financial reporting purposes. These differences are primarily due to investments in partnerships and wash sales which cannot be used for Federal income tax purposes in the current year and have been deferred for use in future years. The aggregate gross unrealized appreciation and depreciation on total investments held by the Funds at May 31, 2010, was as follows:
| | | | | | | | | | | | | |
| | | Federal Tax Cost
($ Thousands) | | Appreciated
Securities
($ Thousands) | | Depreciated
Securities
($ Thousands) | | | Net
Unrealized
Appreciation
(Depreciation)
($ Thousands) |
Large Cap Fund | | $ | 1,305,558 | | $ | 134,498 | | $ | (95,129 | ) | | $ | 39,369 |
Large Cap Diversified Alpha Fund | | | 349,501 | | | 55,015 | | | (52,111 | ) | | | 2,904 |
Large Cap Disciplined Equity Fund | | | 7,445,074 | | | 1,208,407 | | | (830,029 | ) | | | 378,378 |
Large Cap Index Fund | | | 504,988 | | | 127,740 | | | (54,450 | ) | | | 73,290 |
Small Cap Fund | | | 1,496,127 | | | 220,615 | | | (125,441 | ) | | | 95,174 |
Small/Mid Cap Equity Fund | | | 2,235,358 | | | 382,039 | | | (177,087 | ) | | | 204,952 |
U.S. Managed Volatility Fund | | | 217,681 | | | 43,046 | | | (5,630 | ) | | | 37,416 |
| | |
| SEI Institutional Investments Trust / Annual Report / May 31, 2010 | | 161 |
Notes to Financial Statements (Concluded)
May 31, 2010
| | | | | | | | | | |
| | | Federal Tax Cost
($ Thousands) | | Appreciated
Securities
($ Thousands) | | Depreciated
Securities
($ Thousands) | | | Net
Unrealized
Appreciation
(Depreciation)
($ Thousands) | |
International Equity Fund | | 690,320 | | 20,483 | | (73,655 | ) | | (53,172 | ) |
World Equity Ex-US Fund | | 3,923,548 | | 134,504 | | (306,514 | ) | | (172,010 | ) |
Screened World Equity Ex-US Fund | | 72,511 | | 2,246 | | (6,950 | ) | | (4,704 | ) |
Enhanced LIBOR Opportunities Fund | | 114,532 | | 25,500 | | (25,585 | ) | | (85 | ) |
Core Fixed Income Fund | | 6,691,597 | | 231,050 | | (296,819 | ) | | (65,769 | ) |
High Yield Bond Fund | | 1,564,500 | | 78,672 | | (71,852 | ) | | 6,820 | |
Long Duration Fund | | 2,587,820 | | 172,506 | | (24,178 | ) | | 148,328 | |
Emerging Markets Debt Fund | | 907,646 | | 85,877 | | (31,101 | ) | | 54,776 | |
Real Return Fund | | 320,801 | | 6,851 | | (1,634 | ) | | 5,217 | |
Management has analyzed the Fund’s tax position taken on federal income tax returns for all open tax years and has concluded that as of May 31, 2010, no provision for income tax would be required in the Fund’s financial statements. The Fund’s federal and state income and federal excise tax returns for tax years for which the applicable statutes of limitations have not expired are subject to examination by the Internal Revenue Service and state departments of revenue.
9. CONCENTRATION/RISKS
In the normal course of business, the Trust enters into contracts that provide general indemnifications by the Trust to the counterparty to the contract. The Trust’s maximum exposure under these arrangements is dependent on future claims that may be made against the Trust and, therefore, cannot be estimated; however, management believes that, based on experience, the risk of loss from such claims is considered remote.
The market values of the Core Fixed Income, Long Duration and High Yield Bond Funds’ investments may change in response to interest rate changes and other factors. During periods of falling interest rates, the values of fixed income securities generally rise. Conversely, during periods of rising interest rates, the values of such securities generally decline. Changes by recognized rating agencies in the ratings of any fixed income security and in the ability of an issuer to make payments of interest and principal may also affect the value of these investments.
The International Equity, World Equity Ex-US, Screened World Equity Ex-US and Emerging Markets Debt Funds concentrate their investments in securities of foreign issuers in various countries. These investments may involve certain considerations and risks not typically associated with investments in the United States, as a result of, among other factors, the possibility of future political and economic developments and the level of governmental supervision and regulation of securities markets in the respective countries.
10. IN-KIND TRANSFERS OF SECURITIES
During the fiscal year ended May 31, 2010, the Large Cap Fund, Large Cap Disciplined Equity Fund and Small Cap Fund issued shares of beneficial interest in exchange for securities. These securities were transferred at their current value on the date of such transactions.
| | | | | |
| | | Shares Issued | | Value
($ Thousands) |
Large Cap Fund | | | | | |
03/31/10 | | 2,998,170 | | $ | 47,731 |
Large Cap Disciplined Equity Fund | | | | | |
08/31/09 | | 7,632,084 | | $ | 62,736 |
Small Cap Fund | | | | | |
03/31/10 | | 562,704 | | $ | 6,162 |
During the fiscal year ended May 31, 2009, the Large Cap Disciplined Equity Fund issued shares of beneficial interest in exchange for securities. These securities were transferred at their current value on the date of such transactions.
| | | | | |
| | | Shares Issued | | Value ($ Thousands) |
Large Cap Disciplined Equity Fund | | | | | |
09/30/08 | | 7,801,537 | | $ | 76,845 |
11. SECURITIES LENDING
Each Fund may lend portfolio securities to brokers, dealers and other financial organizations that meet capital and other credit requirements or other criteria established by the Trust’s Board of Trustees. These loans may not exceed 33 1/3% of the total asset value of the Fund (including the loan collateral). No Fund will lend portfolio securities to its Adviser, sub-adviser or their affiliates unless it has applied for and received specific authority to do so from the SEC. Loans of portfolio securities will be fully collateralized by cash. Collateral will be maintained in an amount equal to at least 100% of the current market value of the loaned securities by marking to market daily, although the borrower will be required to deliver collateral between 102% and 105% of the market value of borrowed securities for domestic and foreign securities, respectively. However, due to market fluctuations during the day, the value of securities loaned on a particular day may, during the course of the day, exceed the value of collateral. On each business day, the amount of collateral is adjusted based on the prior day’s market fluctuations and the current day’s lending activity.
Income from lending activity is determined by the amount of interest earned on collateral, less any amounts payable to the borrowers of the securities and the lending agent. Lending securities involves certain risks, including the risk that the Fund may be delayed or prevented from recovering the collateral if the borrower fails to return the securities.
Cash collateral received in connection with securities lending is invested in short-term investments by the lending agent. These investments may include the SEI Liquidity Fund L.P., and the Fund bears all of the gains and losses on such investment. There is no guarantee that these investments will not lose value.
12. SUBSEQUENT EVENTS
Management has evaluated the need for disclosures and/or adjustments resulting from subsequent events through the date the financial statements were issued. Based on this evaluation, no adjustments were required to the financial statements as of May 31, 2010.
13. OTHER MATTERS
Due to volatility in the fixed income and equity markets, the market value of a Fund��s holdings may be materially different than shown in the Summary Schedule of Investments/Schedule of Investments (“SOI”). The values shown in the SOIs were the market values as of May 31, 2010 and do not reflect any market events after May 31, 2010.
| | |
| 162 | | SEI Institutional Investments Trust / Annual Report / May 31, 2010 |
Report of Independent Registered Public Accounting Firm
To the Board of Trustees and Shareholders
SEI Institutional Investments Trust:
We have audited the accompanying statements of assets and liabilities, including the schedules of investments of SEI Institutional Investments Trust, comprising the Large Cap Fund, Large Cap Diversified Alpha Fund, Large Cap Disciplined Equity Fund, Large Cap Index Fund, Small Cap Fund, Small/Mid Cap Equity Fund, U.S. Managed Volatility Fund, International Equity Fund, World Equity Ex-US Fund, Screened World Equity Ex-US Fund, Enhanced LIBOR Opportunities Fund, Core Fixed Income Fund, High Yield Bond Fund, Long Duration Fund, Emerging Markets Debt Fund, and Real Return Fund, (collectively, the “Funds”), as of May 31, 2010, and the related statements of operations for the year then ended, the statements of changes in net assets for each of the years in the two-year period then ended, and the financial highlights for each of the years or periods in the five-year period then ended. These financial statements and financial highlights are the responsibility of the Funds’ management. Our responsibility is to express an opinion on these financial statements and financial highlights based on our audits.
We conducted our audits in accordance with the Standards of the Public Company Accounting Oversight Board (United States). Those standards require that we plan and perform the audit to obtain reasonable assurance about whether the financial statements and financial highlights are free of material misstatement. An audit includes examining, on a test basis, evidence supporting the amounts and disclosures in the financial statements. Our procedures included confirmation of securities owned as of May 31, 2010, by correspondence with the custodian and brokers or other appropriate auditing procedures. An audit also includes assessing the accounting principles used and significant estimates made by management, as well as evaluating the overall financial statement presentation. We believe that our audits provide a reasonable basis for our opinion.
In our opinion, the financial statements and financial highlights referred to above present fairly, in all material respects, the financial position of each of the funds comprising SEI Institutional Investments Trust as of May 31, 2010, the results of their operations for the year then ended, the changes in their net assets for each of the years in the two-year period then ended, and the financial highlights for each of the years or periods in the five-year period then ended, in conformity with U.S. generally accepted accounting principles.

Philadelphia, Pennsylvania
July 30, 2010
| | |
| SEI Institutional Investments Trust / Annual Report / May 31, 2010 | | 163 |
TRUSTEES AND OFFICERS OF THE TRUST (Unaudited)
The following chart lists Trustees and Officers as of May 31, 2010.
Set forth below are the names, addresses, ages, position with the Trust, Term of Office and Length of Time Served, the principal occupations for the last five years, number of portfolios in fund complex overseen by trustee, and other directorships outside the fund complex of each of the persons currently serving as Trustees and Officers of the Trust. The Trust’s Statement of Additional Information (“SAI”) includes additional information about the Trustees and Officers. The SAI may be obtained without charge by calling 1-800-342-5734.
| | | | | | | | | | |
Name
Address,
and Age | | Position(s)
Held with
Trusts | | Term of
Office and
Length of
Time Served1 | | Principal Occupation(s)
During Past Five Years | | Number of
Portfolios in
Fund Complex
Overseen
by Trustee2 | | Other Directorships
Held by Trustee |
| INTERESTED TRUSTEES |
Robert A. Nesher
One Freedom
Valley Drive,
Oaks, PA 19456
63 yrs. old | | Chairman of the Board of Trustees* | | since 1982 | | Currently performs various services on behalf of SEI for which Mr. Nesher is compensated. | | 81 | | Trustee of The Advisors’ Inner Circle Fund, The Advisors’ Inner Circle Fund II, Bishop Street Funds, Director of SEI Global Master Fund, plc, SEI Global Assets Fund, plc, SEI Global Investments Fund, plc, SEI Investments Global, Limited, SEI Investments — Global Fund Services, Limited, SEI Investments (Europe), Limited, SEI Investments — Unit Trust Management (UK), Limited, SEI Global Nominee Ltd., SEI Structured Credit Fund, L.P. |
William M. Doran
One Freedom
Valley Drive,
Oaks, PA 19456
69 yrs. old | | Trustee* | | since 1982 | | Self-employed consultant since 2003. Partner, Morgan, Lewis & Bockius LLP (law firm) from 1976 to 2003, counsel to the Trust, SEI, SIMC, the Administrator and the Distributor. Secretary of SEI since 1978. | | 81 | | Trustee of The Advisors’ Inner Circle Fund, The Advisors’ Inner Circle Fund II, Bishop Street Funds, Director of SEI since 1974. Director of the Distributor since 2003. Director of SEI Investments — Global Fund Services, Limited, SEI Investments Global, Limited, SEI Investments (Europe), Limited, SEI Investments (Asia) Limited, SEI Global Nominee Ltd., Limited, SEI — Unit Trust Management (UK) Limited and SEI Asset Korea Co., Ltd. |
| TRUSTEES |
James M. Storey
One Freedom
Valley Drive,
Oaks, PA 19456
78 yrs. old | | Trustee | | since 1995 | | Attorney, sole practitioner since 1994. Partner, Dechert Price & Rhoads, September 1987- December 1993. | | 81 | | Trustee of The Advisors’ Inner Circle Fund, The Advisors’ Inner Circle Fund II, Bishop Street Funds, and U.S. Charitable Gift Trust. |
George J. Sullivan, Jr. One Freedom Valley Drive
Oaks, PA 19456
66 yrs. old | | Trustee | | since 1996 | | Self-Employed Consultant, Newfound Consultants Inc. since April 1997. | | 81 | | Trustee of The Advisors’ Inner Circle Fund, The Advisors’ Inner Circle Fund II, Bishop Street Funds, State Street Navigator Securities Lending Trust, and SEI Structured Credit Fund, L.P., member of the independent review committee for SEI’s Canadian registered mutual funds. |
| | *Messrs. | Nesher and Doran are Trustees who may be deemed as “interested” persons of the Trust as that term is defined in the 1940 Act by virtue of their affiliation with SIMC and the Trust’s Distributor. |
| | 1Each | trustee shall hold office during the lifetime of this Trust until the election and qualification of his or her successor, or until he or she sooner dies, resigns or is removed in accordance with the Trust’s Declaration of Trust. |
| | 2The | Fund Complex includes the following Trusts: SEI Asset Allocation Trust, SEI Daily Income Trust, SEI Institutional Investments Trust, SEI Institutional International Trust, SEI Institutional Managed Trust, SEI Liquid Asset Trust, SEI Tax Exempt Trust and SEI Alpha Strategy Portfolios, L.P. |
| | |
| 164 | | SEI Institutional Investments Trust / Annual Report / May 31, 2010 |
| | | | | | | | | | |
Name
Address,
and Age | | Position(s)
Held with
Trusts | | Term of
Office and
Length of
Time Served1 | | Principal Occupation(s)
During Past Five Years | | Number of
Portfolios in
Fund Complex
Overseen
by Trustee2 | | Other Directorships
Held by Trustee |
| TRUSTEES (continued) |
Rosemarie B. Greco One Freedom
Valley Drive
Oaks, PA 19456
63 yrs. old | | Trustee | | since 1999 | | Director, Governor’s Office of Health Care Reform, Commonwealth of Pennsylvania since 2003. | | 81 | | Director, Sonoco, Inc.; Director, Exelon Corporation; Trustee, Pennsylvania Real Estate Investment Trust. |
Nina Lesavoy
One Freedom
Valley Drive,
Oaks, PA 19456
52 yrs. old | | Trustee | | since 2003 | | Founder and Managing Director, Avec Capital since 2008. Managing Director, Cue Capital from March 2002-March 2008. | | 81 | | Director of SEI Structured Credit Fund, L.P. |
James M. Williams One Freedom
Valley Drive, Oaks, PA 19456
62 yrs. old | | Trustee | | since 2004 | | Vice President and Chief Investment Officer, J. Paul Getty Trust, Non-Profit Foundation for Visual Arts, since December 2002. | | 81 | | Trustee/Director of Ariel Mutual Funds, and SEI Structured Credit Fund, L.P. |
Mitchell A. Johnson One Freedom Valley Drive,
Oaks, PA 19456
67 yrs. old | | Trustee | | since 2007 | | Private Investor since 1994. | | 81 | | Trustee of the Advisors’ Inner Circle Fund, The Advisor’s Inner Circle Fund II, and Bishop Street Funds. |
Hubert L. Harris, Jr. One Freedom
Valley Drive,
Oaks, PA 19456 66 yrs. old | | Trustee | | since 2008 | | Retired since December 2005. Chief Executive Officer, INVESCO North America, August 2003-December 2005. Director, Colonial BancGroup, Inc., 2003-2009. Chair of the Board of Trustees, Georgia Tech Foundation, Inc. (nonprofit corporation), 2007-2009. | | 81 | | Director of St. Joseph’s Translational Research Institute; Board of Councilors of the Charter Center. |
| OFFICERS |
Robert A. Nesher
One Freedom
Valley Drive,
Oaks, PA 19456
63 yrs. old | | President & CEO | | since 2005 | | Currently performs various services on behalf of SEI for which Mr. Nesher is compensated. | | N/A | | N/A |
Stephen F. Panner One Freedom
Valley Drive,
Oaks, PA 19456 39 yrs. old | | Controller and Chief Financial Officer | | since 2005 | | Fund Accounting Director of the Administrator since 2005. Fund Administration Manager, Old Mutual Fund Services, 2000-2005. | | N/A | | N/A |
Russell Emery
One Freedom
Valley Drive
Oaks, PA 19456
47 yrs. old | | Chief Compliance Officer | | since 2006 | | Chief Compliance Officer of the Trust, SEI Institutional Managed Trust, SEI Asset Allocation Trust, SEI Institutional International Trust, SEI Liquid Asset Trust, SEI Tax Exempt Trust, SEI Daily Income Trust, The Advisors’ Inner Circle Fund, The Advisors’ Inner Circle Fund II, and Bishop Street Funds, since March 2006. Chief Compliance Officer of SEI Structured Credit Fund, LP and SEI Alpha Strategy Portfolio, LP since June 2007. Director of Investment Product Management and Development of SIMC, February 2003-March 2006. | | N/A | | N/A |
Timothy D. Barto
One Freedom
Valley Drive
Oaks, PA 19456
42 yrs. old | | Vice President and Secretary | | since 2002 | | General Counsel, Vice President and Secretary of SIMC and the Administrator since 2004. Vice President and Assistant Secretary of SEI since 2001. Vice President of SIMC and the Administrator since 1999. | | N/A | | N/A |
| | |
| SEI Institutional Investments Trust / Annual Report / May 31, 2010 | | 165 |
TRUSTEES AND OFFICERS OF THE TRUST (Unaudited) (Continued)
| | | | | | | | | | |
Name
Address, and Age | | Position(s)
Held with
Trusts | | Term of
Office and
Length of
Time Served1 | | Principal Occupation(s)
During Past Five Years | | Number of
Portfolios in
Fund Complex
Overseen
by Trustee2 | | Other Directorships
Held by Trustee |
| OFFICERS (continued) |
James Ndiaye
One Freedom
Valley Drive
Oaks, PA 19456
41 yrs. old | | Vice President and Assistant Secretary | | since 2005 | | Vice President and Assistant Secretary of SIMC since 2005. | | N/A | | N/A |
Aaron Buser
One Freedom
Valley Drive
Oaks, PA 19456
39 yrs. old | | Vice President and Assistant Secretary | | since 2007 | | Vice President and Assistant Secretary of SIMC since 2007. Associate at Stark & Stark (2004-2007). | | N/A | | N/A |
David F. McCann
One Freedom
Valley Drive
Oaks, PA 19456
33 yrs. old | | Vice President and Assistant Secretary | | since 2008 | | Vice President and Assistant Secretary of SIMC since 2008. Attorney, Drinker Biddle & Reath, LLP, May 2005-October 2008. | | N/A | | N/A |
John J. McCue
One Freedom
Valley Drive
Oaks, PA 19456
46 yrs. old | | Vice President | | since 2004 | | Director of Portfolio Implementations for SIMC since 1995. Managing Director of Money Market Investments for SIMC since 2003. | | N/A | | N/A |
Andrew S. Decker One Freedom
Valley Drive
Oaks, PA 19456
46 yrs. old | | Anti-Money Laundering Compliance Officer | | since 2008 | | Compliance Officer and Product Manager, SEI 2005-2008. Vice President, Old Mutual Capital, 2000-2005. | | N/A | | N/A |
Keri E. Rohn
One Freedom
Valley Drive
Oaks, PA 19456
29 yrs. old | | Privacy Officer | | since 2009 | | Compliance Officer of SEI Investments Company, since 2003. | | N/A | | N/A |
| | 1Each | trustee shall hold office during the lifetime of this Trust until the election and qualification of his or her successor, or until he or she sooner dies, resigns or is removed in accordance with the Trust’s Declaration of Trust. |
| | 2The | Fund Complex includes the following Trusts: SEI Asset Allocation Trust, SEI Daily Income Trust, SEI Institutional Investments Trust, SEI Institutional International Trust, SEI Institutional Managed Trust, SEI Liquid Asset Trust, SEI Tax Exempt Trust and SEI Alpha Strategy Portfolios, L.P. |
| | |
| 166 | | SEI Institutional Investments Trust / Annual Report / May 31, 2010 |
Disclosure of Fund Expenses (Unaudited)
May 31, 2010
All mutual funds have operating expenses. As a shareholder of a fund, your investment is affected by these ongoing costs, which include (among others) costs for portfolio management, administrative services, and shareholder reports like this one. It is important for you to understand the impact of these costs on your investment returns.
Operating expenses such as these are deducted from the fund’s gross income and directly reduce your final investment return. These expenses are expressed as a percentage of the fund’s average net assets; this percentage is known as the fund’s expense ratio.
The following examples use the expense ratio and are intended to help you understand the ongoing costs (in dollars) of investing in your Fund and to compare these costs with those of other mutual funds. The examples are based on an investment of $1,000 made at the beginning of the period shown and held for the entire period.
The table on the next page illustrates your Fund’s costs in two ways:
• Actual fund return. This section helps you to estimate the actual expenses after fee waivers that your Fund incurred over the period. The “Expenses Paid During Period” column shows the actual dollar expense cost incurred by a $1,000 investment in the Fund, and the “Ending Account Value” number is derived from deducting that expense cost from the Fund’s gross investment return.
You can use this information, together with the actual amount you invested in the Fund, to estimate the expenses you paid over that period. Simply divide your actual starting account value by $1,000 to arrive at a ratio (for example, an $8,600 account value divided by $1,000 = 8.6), then multiply that ratio by the number shown for your Fund under “Expenses Paid During Period.”
• Hypothetical 5% return. This section helps you compare your Fund’s costs with those of other mutual funds. It assumes that the Fund had an annual 5% return before expenses during the year, but that the expense ratio (Column 3) is unchanged. This example is useful in making comparisons because the Securities and Exchange Commission requires all mutual funds to make this 5% calculation. You can assess your Fund’s comparative cost by comparing the hypothetical result for your Fund in the “Expense Paid During Period” column with those that appear in the same charts in the shareholder reports for other funds.
NOTE: Because the return is set at 5% for comparison purposes — NOT your Fund’s actual return — the account values shown do not apply to your specific investment.
| | |
| SEI Institutional Investments Trust / Annual Report / May 31, 2010 | | 167 |
Disclosure of Fund Expenses (Unaudited) (Continued)
May 31, 2010
| | | | | | | | | | | | |
| | | Beginning
Account
Value
12/1/2009 | | Ending
Account
Value
5/31/2010 | | Annualized
Expense
Ratios | | | Expense Paid
During
Period* |
Large Cap Fund | | | | | | | | | |
Actual Fund Return | | | | | | | | | |
Class A Shares | | $ | 1,000.00 | | $ | 1,004.50 | | 0.26 | % | | $ | 1.30 |
Hypothetical 5% Return | | | | | | | | | |
Class A Shares | | $ | 1,000.00 | | $ | 1,023.64 | | 0.26 | % | | $ | 1.31 |
Large Cap Diversified Alpha Fund | | | | | | | | | |
Actual Fund Return | | | | | | | | | |
Class A Shares | | $ | 1,000.00 | | $ | 1,013.70 | | 0.31 | % | | $ | 1.56 |
Hypothetical 5% Return | | | | | | | | | |
Class A Shares | | $ | 1,000.00 | | $ | 1,023.39 | | 0.31 | % | | $ | 1.56 |
Large Cap Disciplined Equity Fund | | | | | | |
Actual Fund Return | | | | | | | | | |
Class A Shares | | $ | 1,000.00 | | $ | 1,011.60 | | 0.18 | % | | $ | 0.90 |
Hypothetical 5% Return | | | | | | | | | |
Class A Shares | | $ | 1,000.00 | | $ | 1,024.03 | | 0.18 | % | | $ | 0.91 |
Large Cap Index Fund | | | | | | | | | |
Actual Fund Return | | | | | | | | | |
Class A Shares | | $ | 1,000.00 | | $ | 1,014.90 | | 0.06 | % | | $ | 0.30 |
Hypothetical 5% Return | | | | | | | | | |
Class A Shares | | $ | 1,000.00 | | $ | 1,024.63 | | 0.06 | % | | $ | 0.30 |
Small Cap Fund | | | | | | | | | |
Actual Fund Return | | | | | | | | | |
Class A Shares | | $ | 1,000.00 | | $ | 1,134.40 | | 0.54 | % | | $ | 2.87 |
Hypothetical 5% Return | | | | | | | | | |
Class A Shares | | $ | 1,000.00 | | $ | 1,022.24 | | 0.54 | % | | $ | 2.72 |
Small/Mid Cap Fund | | | | | | | | | |
Actual Fund Return | | | | | | | | | |
Class A Shares | | $ | 1,000.00 | | $ | 1,127.70 | | 0.49 | % | | $ | 2.60 |
Hypothetical 5% Return | | | | | | | | | |
Class A Shares | | $ | 1,000.00 | | $ | 1,022.49 | | 0.49 | % | | $ | 2.47 |
U.S. Managed Volatility Fund | | | | | | | | | |
Actual Fund Return | | | | | | | | | |
Class A Shares | | $ | 1,000.00 | | $ | 1,046.30 | | 0.35 | % | | $ | 1.79 |
Hypothetical 5% Return | | | | | | | | | |
Class A Shares | | $ | 1,000.00 | | $ | 1,023.19 | | 0.35 | % | | $ | 1.77 |
International Equity Fund | | | | | | | | | |
Actual Fund Return | | | | | | | | | |
Class A Shares | | $ | 1,000.00 | | $ | 910.40 | | 0.39 | % | | $ | 1.86 |
Hypothetical 5% Return | | | | | | | | | |
Class A Shares | | $ | 1,000.00 | | $ | 1,022.99 | | 0.39 | % | | $ | 1.97 |
World Equity Ex-US Fund | | | | | | | | | |
Actual Fund Return | | | | | | | | | |
Class A Shares | | $ | 1,000.00 | | $ | 934.30 | | 0.45 | % | | $ | 2.17 |
Hypothetical 5% Return | | | | | | | | | |
Class A Shares | | $ | 1,000.00 | | $ | 1,022.69 | | 0.45 | % | | $ | 2.27 |
Screened World Equity Ex-US Fund | | | | | | |
Actual Fund Return | | | | | | | | | |
Class A Shares | | $ | 1,000.00 | | $ | 929.90 | | 0.80 | % | | $ | 3.85 |
Hypothetical 5% Return | | | | | | | | | |
Class A Shares | | $ | 1,000.00 | | $ | 1,020.94 | | 0.80 | % | | $ | 4.03 |
Enhanced LIBOR Opportunities Fund | | | | | | |
Actual Fund Return | | | | | | | | | |
Class A Shares | | $ | 1,000.00 | | $ | 1,039.20 | | 0.41 | % | | $ | 2.08 |
Hypothetical 5% Return | | | | | | | | | |
Class A Shares | | $ | 1,000.00 | | $ | 1,022.89 | | 0.41 | % | | $ | 2.07 |
Core Fixed Income Fund | | | | | | | | | |
Actual Fund Return | | | | | | | | | |
Class A Shares | | $ | 1,000.00 | | $ | 1,042.80 | | 0.14 | % | | $ | 0.71 |
Hypothetical 5% Return | | | | | | | | | |
Class A Shares | | $ | 1,000.00 | | $ | 1,024.23 | | 0.14 | % | | $ | 0.71 |
| | | | | | | | | | | | |
| | | Beginning
Account
Value
12/1/2009 | | Ending
Account
Value
5/31/2010 | | Annualized
Expense
Ratios | | | Expense Paid
During
Period* |
HighYield Bond Fund | | | | | | | | | |
Actual Fund Return | | | | | | | | | |
Class A Shares | | $ | 1,000.00 | | $ | 1,081.50 | | 0.35 | % | | $ | 1.82 |
Hypothetical 5% Return | | | | | | | | | |
Class A Shares | | $ | 1,000.00 | | $ | 1,023.19 | | 0.35 | % | | $ | 1.77 |
Long Duration Fund | | | | | | | | | |
Actual Fund Return | | | | | | | | | |
Class A Shares | | $ | 1,000.00 | | $ | 1,035.90 | | 0.20 | % | | $ | 1.02 |
Hypothetical 5% Return | | | | | | | | | |
Class A Shares | | $ | 1,000.00 | | $ | 1,023.93 | | 0.20 | % | | $ | 1.01 |
Emerging Markets Debt Fund | | | | | | | | | |
Actual Fund Return | | | | | | | | | |
Class A Shares | | $ | 1,000.00 | | $ | 1,062.50 | | 0.57 | % | | $ | 2.93 |
Hypothetical 5% Return | | | | | | | | | |
Class A Shares | | $ | 1,000.00 | | $ | 1,022.09 | | 0.57 | % | | $ | 2.87 |
Real Return Fund | | | | | | | | | |
Actual Fund Return | | | | | | | | | |
Class A Shares | | $ | 1,000.00 | | $ | 1,007.20 | | 0.22 | % | | $ | 1.10 |
Hypothetical 5% Return | | | | | | | | | |
Class A Shares | | $ | 1,000.00 | | $ | 1,023.83 | | 0.22 | % | | $ | 1.11 |
| * | Expenses are equal to the Fund’s annualized expense ratio multiplied by the average account value over the period, multiplied by 182/365 (to reflect one-half year period shown). |
| | |
| 168 | | SEI Institutional Investments Trust / Annual Report / May 31, 2010 |
Board of Trustees Considerations in Approving the Advisory and Sub-Advisory Agreements (Unaudited)
SEI Institutional Investments Trust (the “Trust”) and SEI Investments Management Corporation (“SIMC”) have entered into an investment advisory agreement (the “Advisory Agreement”). Pursuant to the Advisory Agreement, SIMC oversees the investment advisory services provided to the series of the Trust (the “Funds”) and may manage the cash portion of the Funds’ assets. Pursuant to separate sub-advisory agreements (the “Sub-Advisory Agreements” and, together with the Advisory Agreement, the “Investment Advisory Agreements”) with SIMC, and under the supervision of SIMC and the Trust’s Board of Trustees (the “Board”), the Sub-Advisers are responsible for the day-to-day investment management of all or a discrete portion of the assets of the Funds. The Sub-Advisers also are responsible for managing their employees who provide services to these Funds. The Sub-Advisers are selected based primarily upon the research and recommendations of SIMC, which evaluates quantitatively and qualitatively the Sub-Advisers’ skills and investment results in managing assets for specific asset classes, investment styles and strategies.
The Investment Company Act of 1940, as amended (the “1940 Act”) requires that the initial approval of, as well as the continuation of, the Funds’ Investment Advisory Agreements must be specifically approved: (i) by the vote of the Board of Trustees or by a vote of the shareholders of the Funds; and (ii) by the vote of a majority of the Trustees who are not parties to the Investment Advisory Agreements or “interested persons” of any party (the “Independent Trustees”), cast in person at a meeting called for the purpose of voting on such approval. In connection with their consideration of such approvals, the Funds’ Trustees must request and evaluate, and SIMC and the Sub-Advisers are required to furnish, such information as may be reasonably necessary to evaluate the terms of the Investment Advisory Agreements. In addition, the Securities and Exchange Commission (“SEC”) takes the position that, as part of their fiduciary duties with respect to a mutual fund’s fees, mutual fund boards are required to evaluate the material factors applicable to a decision to approve an Investment Advisory Agreement.
Consistent with these responsibilities, the Trust’s Board of Trustees calls and holds meetings each year that are dedicated to considering whether to renew the Investment Advisory Agreements between the Trust and SIMC and SIMC and the Sub-Advisers with respect to the Funds of the Trust. In preparation for these meetings, the Board requests and reviews a wide variety of materials provided by SIMC and the Sub-Advisers, including information about SIMC’s and the Sub-Advisers’ affiliates, personnel and operations. The Board also receives extensive data provided by third parties. This information is in addition to the detailed information about the Funds that the Board reviews during the course of each year, including information that relates to Fund operations and Fund performance. The Trustees also receive a memorandum from Fund counsel and independent counsel to the Independent Trustees regarding the responsibilities of Trustees in connection with their consideration of whether to approve the Trust’s Investment Advisory Agreements. Finally, the Independent Trustees receive advice from independent counsel to the Independent Trustees, meet in executive session outside the presence of Fund management and participate in question and answer sessions with representatives of SIMC and the Sub-Advisers.
Specifically, the Board requested and received written materials from SIMC and the Sub-Advisers regarding: (a) the quality of SIMC’s and the Sub-Advisers’ investment management and other services; (b) SIMC’s and the Sub-Advisers’ investment management personnel; (c) SIMC’s and the Sub-Advisers’ operations and financial condition; (d) SIMC’s and the Sub-Advisers’ brokerage practices (including any soft dollar arrangements) and investment strategies; (e) the level of the advisory fees that SIMC and the Sub-Advisers charge the Funds compared with the fees each charge to comparable mutual funds; (f) the Funds’ overall fees and operating expenses compared with similar mutual funds; (g) the level of SIMC’s and the Sub-Advisers’ profitability from their Fund-related operations; (h) SIMC’s and the Sub-Advisers’ compliance systems; (i) SIMC’s and the Sub-Advisers’ policies on and compliance procedures for personal securities transactions; (j) SIMC’s and the Sub-Advisers’ reputation, expertise and resources in domestic and/or international financial markets; and (k) the Funds’ performance compared with similar mutual funds.
At the December 9-10, 2009 and March 24-25, 2010 meetings of the Board of Trustees, the Trustees, including a majority of the Independent Trustees, approved the Investment Advisory Agreements and approved the selection of SIMC and the Sub-Advisers to act in their respective capacities for the Funds. The Board’s approval was based on its consideration and evaluation of a variety of specific factors discussed at the meetings and at prior meetings, including:
| • | | the nature, extent and quality of the services provided to the Funds under the Investment Advisory Agreements, including the resources of SIMC and the Sub-Advisers and their affiliates dedicated to the Funds; |
| | |
| SEI Institutional Investments Trust / Annual Report / May 31, 2010 | | 169 |
Board of Trustees Considerations in Approving the Advisory and Sub-Advisory Agreements (Unaudited) (Continued)
| • | | the Funds’ investment performance and how it compared to that of other comparable mutual funds; |
| • | | the Funds’ expenses under each Investment Advisory Agreement and how those expenses compared to those of other comparable mutual funds; |
| • | | the profitability of SIMC and the Sub-Advisers and their affiliates with respect to the Funds, including both direct and indirect benefits accruing to SIMC and the Sub-Advisers and their affiliates; and |
| • | | the extent to which economies of scale would be realized as the Funds grow and whether fee levels in the Investment Advisory Agreements reflect those economies of scale for the benefit of Fund investors. |
Nature, Extent and Quality of Services. The Board of Trustees considered the nature, extent and quality of the services provided by SIMC and the Sub-Advisers to the Funds and the resources of SIMC and the Sub-Advisers and their affiliates dedicated to the Funds. In this regard, the Trustees evaluated, among other things, SIMC’s and the Sub-Advisers’ personnel, experience, track record and compliance program. The Trustees found the level of SIMC’s professional staff and culture of compliance satisfactory. Following evaluation, the Board concluded that, within the context of its full deliberations, the nature, extent and quality of services provided by SIMC and the Sub-Advisers to the Funds and the resources of SIMC and the Sub-Advisers and their affiliates dedicated to the Funds supported renewal of the Investment Advisory Agreements.
Fund Performance. The Board of Trustees considered Fund performance in determining whether to renew the Investment Advisory Agreements. Specifically, the Trustees considered the Funds’ performance relative to their peer groups and appropriate indices/benchmarks, in light of total return, yield and market trends. As part of this review, the Trustees considered the composition of each peer group and selection criteria. In evaluating performance, the Trustees considered both market risk and shareholder risk expectations for the Funds. The Trustees found Fund performance satisfactory, and where performance was below the benchmark, the Trustees were satisfied that appropriate steps were being taken. Following evaluation, the Board concluded that, within the context of its full deliberations, the performance of the Funds supported renewal of the Investment Advisory Agreements.
Fund Expenses. With respect to the Funds’ expenses under the Investment Advisory Agreements, the Trustees considered the rate of compensation called for by the Investment Advisory Agreements and the Funds’ net operating expense ratio in comparison to those of other comparable mutual funds. The Trustees also considered information about average expense ratios of comparable mutual funds in the Funds’ respective peer groups. The Trustees further considered the fact that the comparative fee analysis either showed that the various fees were below average or that there was a reasonable basis for the fee level. Finally, the Trustees considered the effects of SIMC’s voluntary waiver of management and other fees and the Sub-Advisers’ fees to prevent total Fund expenses from exceeding a specified cap and that SIMC and the Sub-Advisers, through waivers, have maintained the Funds’ net operating expenses at competitive levels for their respective distribution channels. Following evaluation, the Board concluded that, within the context of its full deliberations, the expenses of the Funds are reasonable and supported renewal of the Investment Advisory Agreements.
Profitability. With regard to profitability, the Trustees considered all compensation flowing to SIMC and the Sub-Advisers and their affiliates, directly or indirectly. The Trustees considered whether the varied levels of compensation and profitability under the Investment Advisory Agreements and other service agreements were reasonable and justified in light of the quality of all services rendered to the Funds by SIMC and the Sub-Advisers and their affiliates. The Trustees found that profitability was reasonable and that the margin was not increasing despite growth in assets. When considering the profitability of the Sub-Advisers, the Board took into account the fact that the Sub-Advisers are compensated by SIMC, and not by the Funds directly, and such compensation with respect to any Sub-Adviser reflects an arms-length negotiation between the Sub-Adviser and SIMC. Based on this evaluation, the Board concluded that, within the context of its full deliberations, the profitability of SIMC and the Sub-Advisers is reasonable and supported renewal of the Investment Advisory Agreements.
| | |
| 170 | | SEI Institutional Investments Trust / Annual Report / May 31, 2010 |
Economies of Scale. The Trustees considered the existence of any economies of scale and whether those were passed along to the Funds’ shareholders through a graduated investment advisory fee schedule or other means, including any fee waivers by SIMC and its affiliates. Based on this evaluation, the Board concluded that, within the context of its full deliberations, the Funds obtain reasonable benefit from economies of scale.
Based on the Trustees’ deliberation and their evaluation of the information described above, the Board, including all of the Independent Trustees, unanimously approved the continuation of the Investment Advisory Agreements and concluded that the compensation under the Investment Advisory Agreements is fair and reasonable in light of such services and expenses and such other matters as the Trustees considered to be relevant in the exercise of their reasonable judgment. In the course of their deliberations, the Trustees did not identify any particular information that was all-important or controlling.
| | |
| SEI Institutional Investments Trust / Annual Report / May 31, 2010 | | 171 |
Notice to Shareholders (Unaudited)
For shareholders who do not have a May 31, 2010, taxable year end, this notice is for informational purposes only. For shareholders with a May 31, 2010, taxable year end, please consult your tax adviser as to the pertinence of this notice.
For the fiscal year ended May 31, 2010, the Funds are designating long term and qualifying dividend income with regard to distributions paid during the year as follows:
| | | | | | | | | | | | |
| | | (A)
Long Term
Capital Gains
Distributions
(Tax Basis) | | | (B)
Ordinary
Income
Distributions
(Tax Basis) | | | Total
Distributions
(Tax Basis) | | | (C)
Dividends
Qualifying
for Corporate
Dividends Rec.
Deduction (1) | |
| Large Cap Fund | | 0 | % | | 100 | % | | 100 | % | | 93 | % |
| Large Cap Diversified Alpha Fund | | 0 | % | | 100 | % | | 100 | % | | 90 | % |
| Large Cap Disciplined Equity Fund | | 0 | % | | 100 | % | | 100 | % | | 69 | % |
| Large Cap Index Fund | | 0 | % | | 100 | % | | 100 | % | | 71 | % |
| Small Cap Fund | | 0 | % | | 100 | % | | 100 | % | | 68 | % |
| Small/Mid Cap Equity Fund | | 0 | % | | 100 | % | | 100 | % | | 61 | % |
| U.S. Managed Volatility Fund | | 3 | % | | 97 | % | | 100 | % | | 35 | % |
| International Equity Fund (6) | | 0 | % | | 100 | % | | 100 | % | | 0 | % |
| World Equity Ex-US Fund (7) | | 0 | % | | 100 | % | | 100 | % | | 0 | % |
| Screened World Equity Ex-US Fund (8) | | 0 | % | | 100 | % | | 100 | % | | 0 | % |
| Enhanced LIBOR Opportunities Fund | | 0 | % | | 100 | % | | 100 | % | | 0 | % |
| Core Fixed Income Fund | | 0 | % | | 100 | % | | 100 | % | | 0 | % |
| High Yield Bond Fund | | 0 | % | | 100 | % | | 100 | % | | 0 | % |
| Long Duration Fund | | 0 | % | | 100 | % | | 100 | % | | 0 | % |
| Emerging Markets Debt Fund | | 0 | % | | 100 | % | | 100 | % | | 0 | % |
| Real Return Fund | | 0 | % | | 100 | % | | 100 | % | | 0 | % |
| | | | | | | | | | | | |
| | | (D)
Qualifying
Dividend Income
(15% Tax Rate
for QDI) (2) | | | (E)
U.S. Government
Interest (3) | | | Interest
Related
Dividends (4) | | | Short-Term
Capital Gain
Dividends (5) | |
| Large Cap Fund | | 96 | % | | 0 | % | | 1 | % | | 0 | % |
| Large Cap Diversified Alpha Fund | | 89 | % | | 0 | % | | 0 | % | | 0 | % |
| Large Cap Disciplined Equity Fund | | 72 | % | | 0 | % | | 16 | % | | 0 | % |
| Large Cap Index Fund | | 79 | % | | 0 | % | | 0 | % | | 0 | % |
| Small Cap Fund | | 66 | % | | 0 | % | | 5 | % | | 0 | % |
| Small/Mid Cap Equity Fund | | 65 | % | | 0 | % | | 2 | % | | 0 | % |
| U.S. Managed Volatility Fund | | 35 | % | | 0 | % | | 0 | % | | 100 | % |
| International Equity Fund (6) | | 66 | % | | 0 | % | | 12 | % | | 0 | % |
| World Equity Ex-US Fund (7) | | 64 | % | | 0 | % | | 6 | % | | 0 | % |
| Screened World Equity Ex-US Fund (8) | | 90 | % | | 0 | % | | 1 | % | | 0 | % |
| Enhanced LIBOR Opportunities Fund | | 0 | % | | 1 | % | | 100 | % | | 0 | % |
| Core Fixed Income Fund | | 0 | % | | 7 | % | | 78 | % | | 0 | % |
| High Yield Bond Fund | | 0 | % | | 0 | % | | 98 | % | | 0 | % |
| Long Duration Fund | | 0 | % | | 18 | % | | 98 | % | | 0 | % |
| Emerging Markets Debt Fund | | 0 | % | | 0 | % | | 0 | % | | 0 | % |
| Real Return Fund | | 0 | % | | 89 | % | | 0 | % | | 0 | % |
| (1) | Qualifying dividends represent dividends which qualify for the corporate dividends received deduction. |
| (2) | The percentage in this column represents the amount of “Qualifying Dividend Income” is reflected as a percentage of “Ordinary Income Distributions.” It is the intention of each of the aforementioned funds to designate the maximum amount permitted by the law. The information reported herein may differ from the information and distributions taxable to the shareholders for the calendar year ending December 31, 2010. Complete information will be computed and reported in conjunction with your 2010 Form 1099-DIV. |
| (3) | “U.S. Government Interest” represents the amount of interest that was derived from direct U.S. Government obligations and distributed during the fiscal year. This amount is reflected as a percentage of total ordinary income distributions (the total of short term capital gain and net investment income distributions). Generally, interest from direct U.S. Government obligations is exempt from state income tax. However, for shareholders who are residents of California, Connecticut and New York, the statutory threshold requirements were not satisfied to permit exemption of these amounts from state income. |
| (4) | The percentage in this column represents the amount of “Interest Related Dividend” is reflected as a percentage of net investment income distributions that is exempt from U.S. withholding tax when paid to foreign investors. This provision of the IRC will be expiring for years beginning after January 1, 2010. |
| (5) | The percentage in this column represents the amount of “Short-Term Capital Gain” is reflected as a percentage of short-term capital gain distributions that is exempt from U.S. withholding tax when paid to foreign investors. This provision of the IRC will be expiring for years beginning after January 1, 2010. |
| (6) | The Fund intends to pass through a foreign tax credit to shareholders. For fiscal year ended 2010, the total amount of foreign source income is $16,119,406. The total amount of foreign tax to be paid is $868,801. Your allocable share of the foreign tax credit will be reported on Form 1099 DIV. |
| (7) | The Fund intends to pass through a foreign tax credit to shareholders. For fiscal year ended 2010, the total amount of foreign source income is $64,990,675. The total amount of foreign tax to be paid is $5,155,143. Your allocable share of the foreign tax credit will be reported on Form 1099 DIV. |
| (8) | The Fund intends to pass through a foreign tax credit to shareholders. For fiscal year ended 2010, the total amount of foreign source income is $1,307,705. The total amount of foreign tax paid is $159,084. Your allocable share of the foreign tax credit will be reported on Form 1099 DIV. |
Items (A) and (B) are based on the percentage of each fund’s total distribution.
Items (C) and (D) are based on the percentage of ordinary income distributions of each fund. Item (E) is based on the percentage of gross income of each fund.
Please consult your tax adviser for proper treatment of this information. This notification should be kept with your permanent tax records.
| | |
| 172 | | SEI Institutional Investments Trust / Annual Report / May 31, 2010 |
SEI INSTITUTIONAL INVESTMENTS TRUST ANNUAL REPORT MAY 31, 2010
Robert A. Nesher, Chairman
Trustees
William M. Doran
James M. Storey
George J. Sullivan, Jr.
Rosemarie B. Greco
Nina Lesavoy
James M. Williams
Mitchell A. Johnson
Hubert L. Harris, Jr.
Officers
Robert A. Nesher
President and Chief Executive Officer
Stephen F. Panner
Controller and Chief Financial Officer
Russell Emery
Chief Compliance Officer
Timothy D. Barto
Vice President, Secretary
James Ndiaye
Vice President, Assistant Secretary
Aaron Buser
Vice President, Assistant Secretary
David F. McCann
Vice President, Assistant Secretary
John J. McCue
Vice President
Andrew S. Decker
Anti-Money Laundering Compliance Officer
Keri E. Rohn
Privacy Officer
Investment Adviser
SEI Investments Management Corporation
Administrator
SEI Investments Global Funds Services
Distributor
SEI Investments Distribution Co.
Legal Counsel
Morgan, Lewis & Bockius LLP
Independent Registered Public Accounting Firm
KPMG LLP
This report and the financial statements contained herein are submitted for the general information of the shareholders of the Trust and must be preceded or accompanied by a current prospectus. Shares of the Funds are not deposits or obligations of, or guaranteed or endorsed by, any bank. The shares are not federally insured by the Federal Deposit Insurance Corporation (FDIC), the Federal Reserve Board, or any other government agency. Investment in the shares involves risk, including the possible loss of principal.
For more information call
1 800 DIAL SEI
(1 800 342 5734)
SEI Investments Distribution Co.
Oaks, PA 19456 1.800.DIAL.SEI (1.800.342.5734)
SEI-F-140 (05/10)
The Registrant has adopted a code of ethics that applies to the Registrant’s principal executive officer, principal financial officer, comptroller or principal accounting officer, and any person who performs a similar function.
| Item 3. | Audit Committee Financial Expert. |
(a)(1) The Registrant’s Board of Trustees has determined that the Registrant has at least two audit committee financial experts serving on the audit committee.
(a) (2) The audit committee financial experts are George J. Sullivan, Jr. and Hubert L. Harris, Jr. Mrrs. Sullivan and Harris are independent as defined in Form N-CSR Item 3 (a) (2).
| Item 4. | Principal Accountant Fees and Services. |
Fees billed by KPMG LLP (“KPMG”) related to the Registrant.
KPMG billed the Registrant aggregate fees for services rendered to the Registrant for the fiscal years 2010 and 2009 as follows:
| | | | | | | | | | | | | | |
| | | Fiscal 2010 | | Fiscal 2009 |
| | | | All fees and
services to the
Registrant that
were pre-
approved | | All fees and
services to
service
affiliates that
were pre-
approved | | All other fees
and services to
service
affiliates that
did not require
pre-approval | | All fees and
services to the
Registrant that
were pre-
approved | | All fees and
services to
service
affiliates that
were pre-
approved | | All other fees
and services to
service
affiliates that
did not require
pre-approval |
| | | | | | | |
| (a) | | Audit Fees(1) | | $455,000 | | N/A | | $0 | | $435,000 | | N/A | | $0 |
| | | | | | | |
| (b) | | Audit-Related Fees | | $0 | | $0 | | $0 | | $0 | | $0 | | $0 |
| | | | | | | |
| (c) | | Tax Fees (Tax return review services | | $89,500 | | $0 | | $0 | | $84,000 | | $0 | | $0 |
| | | | | | | |
| (d) | | All Other Fees | | $0 | | $244,500 | | $0 | | $0 | | $234,500 | | $0 |
Notes:
| (1) | Audit fees include amounts related to the audit of the Registrant’s annual financial statements and services normally provided by the accountant in connection with statutory and regulatory filings. |
1
(e)(1) The Registrant’s Audit Committee has adopted and the Board of Trustees has ratified an Audit and Non-Audit Services Pre-Approval Policy (the “Policy”), which sets forth the procedures and the conditions pursuant to which services proposed to be performed by the independent auditor of the Registrant may be pre-approved.
The Policy provides that all requests or applications for proposed services to be provided by the independent auditor must be submitted to the Registrant’s Chief Financial Officer (“CFO”) and must include a detailed description of the services proposed to be rendered. The CFO will determine whether such services: (1) require specific pre-approval; (2) are included within the list of services that have received the general pre-approval of the Audit Committee pursuant to the Policy; or (3) have been previously pre-approved in connection with the independent auditor’s annual engagement letter for the applicable year or otherwise. In any instance where services require pre-approval, the Audit Committee will consider whether such services are consistent with SEC’s rules and whether the provision of such services would impair the auditor’s independence.
Requests or applications to provide services that require specific pre-approval by the Audit Committee will be submitted to the Audit Committee by the CFO. The Audit Committee will be informed by the CFO on a quarterly basis of all services rendered by the independent auditor. The Audit Committee has delegated specific pre-approval authority to either the Audit Committee Chair or financial experts, provided that the estimated fee for any such proposed pre-approved service does not exceed $100,000 and any pre-approval decisions are reported to the Audit Committee at its next regularly scheduled meeting.
Services that have received the general pre-approval of the Audit Committee are identified and described in the Policy. In addition, the Policy sets forth a maximum fee per engagement with respect to each identified service that has received general pre-approval.
All services to be provided by the independent auditor shall be provided pursuant to a signed written engagement letter with the Registrant, the investment advisor or applicable control affiliate (except that matters as to which an engagement letter would be impractical because of timing issues or because the matter is small may not be the subject of an engagement letter) that sets forth both the services to be provided by the independent auditor and the total fees to be paid to the independent auditor for those services.
In addition, the Audit Committee has determined to take additional measures on an annual basis to meet its responsibility to oversee the work of the independent auditor and to assure the auditor’s independence from the Registrant, such as reviewing a formal written statement from the independent auditor delineating all relationships between the independent auditor and the Registrant, and discussing with the independent auditor its methods and procedures for ensuring independence.
(e)(2) Percentage of fees billed applicable to non-audit services pursuant to waiver of pre-approval requirement were as follows:
| | | | |
| | | Fiscal 2010 | | Fiscal 2009 |
Audit-Related Fees | | 0% | | 0% |
| | |
Tax Fees | | 0% | | 0% |
| | |
All Other Fees | | 0% | | 0% |
(f) Not Applicable.
(g) The aggregate non-audit fees and services billed by KPMG for the fiscal years 2010 and 2009 were $244,500 and $234,500, respectively. Non-audit fees consist of SAS No. 70 review of fund accounting and administration operations, attestation report in accordance with Rule 17Ad-13, agreed upon procedures report over certain internal controls related to compliance with federal securities laws and regulations and tax consulting services for various service affiliates of the registrant.
(h) During the past fiscal year, Registrant’s principal accountant provided certain non-audit services to Registrant’s investment adviser or to entities controlling, controlled by, or under common control with Registrant’s investment adviser that provide ongoing services to Registrant that were not subject to pre-approval pursuant to paragraph (c)(7)(ii) of Rule 2-01 of Regulation S-X. The Audit Committee of Registrant’s Board of Trustees reviewed and considered these non-audit services provided by Registrant’s principal accountant to Registrant’s affiliates, including whether the provision of these non-audit services is compatible with maintaining the principal accountant’s independence.
Item 5. Audit Committee of Listed Registrants.
Not applicable.
Item 6. Schedule of Investments
(a) The Schedules of Investments in securities of unaffiliated issuers as of the close of the reporting period for the Large Cap Fund, Large Cap Diversified Alpha Fund, Large Cap Disciplined Equity Fund, Large Cap Index Fund, Small Cap Fund, Small/Mid Cap Equity Fund, U.S. Managed Volatility Fund, International Equity Fund, World Equity Ex-US Fund and Screened World Equity Ex-US Fund are listed below. The Schedule of Investments in securities of unaffiliated issuers as of the close of the reporting period for the Enhanced LIBOR Opportunities Fund, Core Fixed Income Fund, High Yield Bond Fund, Long Duration Bond Fund, Emerging Markets Debt Fund and Real Return Fund are included as part of the report to shareholders filed under Item 1 of this form.
SCHEDULE OF INVESTMENTS
Large Cap Fund
May 31, 2010
| | | | | |
Description | | Shares | | Market Value
($ Thousands) |
COMMON STOCK — 95.2% | | | | | |
Consumer Discretionary —11.4% | | | | | |
99 Cents Only Stores * | | 12,500 | | $ | 191 |
Aeropostale * | | 6,450 | | | 179 |
Amazon.com * | | 83,899 | | | 10,526 |
American Greetings, Cl A | | 5,600 | | | 132 |
Apollo Group, Cl A * (A) | | 52,100 | | | 2,770 |
Autoliv (A) | | 17,100 | | | 812 |
Best Buy | | 27,600 | | | 1,166 |
Big 5 Sporting Goods | | 2,900 | | | 43 |
Big Lots * | | 17,400 | | | 615 |
Brinker International (A) | | 46,000 | | | 818 |
Career Education * (A) | | 1,700 | | | 48 |
Carnival | | 52,500 | | | 1,902 |
Carter’s * | | 1,100 | | | 34 |
CBS, Cl B (A) | | 66,700 | | | 971 |
Chico’s FAS | | 77,400 | | | 947 |
Coach (A) | | 118,929 | | | 4,889 |
Comcast, Cl A | | 340,900 | | | 6,167 |
Cooper Tire & Rubber | | 61,600 | | | 1,165 |
Core-Mark Holding * | | 4,700 | | | 127 |
Darden Restaurants (A) | | 13,300 | | | 571 |
Deckers Outdoor * | | 3,300 | | | 478 |
DeVry | | 600 | | | 34 |
DIRECTV, Cl A * | | 175,401 | | | 6,611 |
DISH Network, Cl A | | 22,600 | | | 471 |
Dollar Tree * | | 13,100 | | | 820 |
Eastman Kodak * (A) | | 453,300 | | | 2,556 |
Education Management * (A) | | 19,100 | | | 403 |
Ford Motor * (A) | | 362,900 | | | 4,257 |
Fossil * | | 7,400 | | | 277 |
Gannett (A) | | 50,300 | | | 782 |
Gap | | 70,200 | | | 1,530 |
Gentex | | 6,000 | | | 118 |
Hasbro | | 26,700 | | | 1,072 |
Helen of Troy * | | 10,000 | | | 258 |
Home Depot | | 72,200 | | | 2,445 |
ITT Educational Services * (A) | | 9,300 | | | 939 |
J.C. Penney (A) | | 76,700 | | | 2,109 |
Johnson Controls | | 129,295 | | | 3,689 |
Jones Apparel Group | | 8,700 | | | 171 |
Leggett & Platt | | 25,800 | | | 601 |
Liberty Global, Cl A * (A) | | 23,200 | | | 598 |
LKQ * | | 32,000 | | | 590 |
Lowe’s | | 267,523 | | | 6,621 |
Macy’s | | 107,400 | | | 2,385 |
Magna International, Cl A | | 1,800 | | | 121 |
Mattel | | 20,300 | | | 440 |
McDonald’s | | 64,031 | | | 4,282 |
McGraw-Hill | | 18,100 | | | 503 |
Newell Rubbermaid (A) | | 14,500 | | | 241 |
News, Cl A | | 93,400 | | | 1,233 |
NIKE, Cl B (A) | | 102,550 | | | 7,423 |
Omnicom Group (A) | | 19,800 | | | 751 |
Oxford Industries | | 4,300 | | | 90 |
PetSmart | | 20,600 | | | 654 |
Pre-Paid Legal Services * (A) | | 1,100 | | | 51 |
priceline.com * (A) | | 21,400 | | | 4,091 |
RadioShack | | 27,400 | | | 560 |
Ross Stores (A) | | 35,300 | | | 1,850 |
Scholastic | | 6,600 | | | 173 |
Sears Holdings * (A) | | 46,200 | | | 4,068 |
| | | | | |
Description | | Shares | | Market Value
($ Thousands) |
Staples (A) | | 199,900 | | $ | 4,302 |
Starbucks (A) | | 116,890 | | | 3,026 |
Superior Industries International | | 3,600 | | | 53 |
Target | | 87,731 | | | 4,784 |
Tempur-Pedic International * | | 17,000 | | | 564 |
Thor Industries (A) | | 11,700 | | | 341 |
Timberland, Cl A * | | 3,300 | | | 63 |
Time Warner | | 254,140 | | | 7,876 |
Time Warner Cable, Cl A | | 63,607 | | | 3,481 |
TJX | | 45,000 | | | 2,046 |
TRW Automotive Holdings * | | 58,900 | | | 1,772 |
Tupperware Brands | | 2,700 | | | 115 |
Ulta Salon Cosmetics & Fragrance * | | 7,600 | | | 194 |
Universal Technical Institute * | | 7,500 | | | 184 |
VF (A) | | 28,770 | | | 2,225 |
Viacom, Cl B | | 45,100 | | | 1,516 |
Walt Disney | | 76,300 | | | 2,550 |
Whirlpool (A) | | 24,000 | | | 2,506 |
Winnebago Industries * | | 6,600 | | | 80 |
Wolverine World Wide | | 4,200 | | | 120 |
Yum! Brands | | 42,200 | | | 1,728 |
| | | | | |
| | | | | 139,945 |
| | | | | |
Consumer Staples — 8.6% | | | | | |
Archer-Daniels-Midland | | 94,000 | | | 2,375 |
BJ’s Wholesale Club * (A) | | 26,400 | | | 1,058 |
Brown-Forman, Cl B (A) | | 25,600 | | | 1,420 |
Bunge | | 22,400 | | | 1,092 |
Campbell Soup (A) | | 18,500 | | | 663 |
Coca-Cola | | 165,661 | | | 8,515 |
Colgate-Palmolive (A) | | 48,173 | | | 3,762 |
ConAgra Foods (A) | | 211,700 | | | 5,119 |
Corn Products International | | 14,000 | | | 467 |
Costco Wholesale (A) | | 43,650 | | | 2,543 |
CVS Caremark | | 124,100 | | | 4,297 |
Dean Foods * | | 17,600 | | | 187 |
Del Monte Foods | | 41,000 | | | 598 |
Diageo ADR | | 59,800 | | | 3,664 |
Dole Food * (A) | | 24,400 | | | 223 |
Dr. Pepper Snapple Group | | 18,200 | | | 689 |
General Mills | | 14,300 | | | 1,019 |
Herbalife | | 13,600 | | | 614 |
HJ Heinz (A) | | 5,000 | | | 221 |
Kellogg | | 51,900 | | | 2,773 |
Kimberly-Clark | | 76,840 | | | 4,664 |
Kroger | | 26,700 | | | 537 |
Lorillard | | 4,100 | | | 293 |
Mead Johnson Nutrition, Cl A | | 54,245 | | | 2,675 |
Medifast * (A) | | 21,300 | | | 669 |
PepsiCo | | 173,822 | | | 10,932 |
Philip Morris International | | 112,996 | | | 4,986 |
Prestige Brands Holdings * | | 17,500 | | | 135 |
Procter & Gamble | | 360,398 | | | 22,017 |
Ralcorp Holdings * | | 11,400 | | | 685 |
Reynolds American (A) | | 36,884 | | | 1,923 |
Safeway | | 76,100 | | | 1,685 |
Sanderson Farms (A) | | 10,400 | | | 570 |
Sara Lee | | 39,500 | | | 560 |
Supervalu | | 37,800 | | | 509 |
Sysco | | 5,300 | | | 158 |
Tyson Foods, Cl A | | 62,300 | | | 1,095 |
USANA Health Sciences * (A) | | 1,500 | | | 56 |
| | |
1 | | SEI Institutional Investments Trust /Annual Report/May 31, 2010 |
SCHEDULE OF INVESTMENTS
Large Cap Fund
May 31, 2010
| | | | | |
Description | | Shares | | Market Value
($ Thousands) |
Walgreen | | 178,062 | | $ | 5,705 |
Wal-Mart Stores | | 81,304 | | | 4,111 |
| | | | | |
| | | | | 105,264 |
| | | | | |
Energy — 9.1% | | | | | |
Apache (A) | | 49,300 | | | 4,414 |
Canadian Natural Resources | | 43,302 | | | 3,008 |
Chesapeake Energy (A) | | 104,300 | | | 2,330 |
Chevron | | 239,596 | | | 17,699 |
Cimarex Energy (A) | | 8,300 | | | 610 |
ConocoPhillips | | 227,871 | | | 11,817 |
Continental Resources * (A) | | 2,900 | | | 137 |
Denbury Resources * | | 64,528 | | | 1,061 |
Devon Energy | | 27,600 | | | 1,762 |
Diamond Offshore Drilling (A) | | 5,700 | | | 360 |
El Paso | | 37,000 | | | 420 |
EOG Resources (A) | | 55,600 | | | 5,829 |
Exxon Mobil | | 414,201 | | | 25,043 |
FMC Technologies * (A) | | 12,300 | | | 715 |
Halliburton | | 118,800 | | | 2,950 |
Hess | | 69,400 | | | 3,692 |
Marathon Oil | | 138,600 | | | 4,309 |
Murphy Oil | | 66,900 | | | 3,571 |
National Oilwell Varco | | 64,700 | | | 2,467 |
Noble | | 16,300 | | | 474 |
Occidental Petroleum | | 43,100 | | | 3,556 |
Oil States International * | | 19,400 | | | 757 |
Overseas Shipholding Group (A) | | 6,300 | | | 244 |
Patterson-UTI Energy (A) | | 40,000 | | | 561 |
Peabody Energy | | 7,900 | | | 308 |
Range Resources (A) | | 43,748 | | | 1,966 |
Schlumberger | | 45,299 | | | 2,544 |
Southern Union | | 56,500 | | | 1,230 |
Southwestern Energy * | | 50,934 | | | 1,916 |
Stone Energy * | | 31,500 | | | 422 |
Sunoco | | 17,900 | | | 535 |
Tidewater | | 9,100 | | | 380 |
Transocean * | | 37,400 | | | 2,123 |
Unit * | | 28,800 | | | 1,178 |
Valero Energy | | 23,800 | | | 445 |
Williams | | 49,400 | | | 976 |
| | | | | |
| | | | | 111,809 |
| | | | | |
Financials — 15.3% | | | | | |
ACE | | 4,200 | | | 206 |
Aflac | | 99,200 | | | 4,395 |
Allied World Assurance Holdings | | 11,900 | | | 534 |
Allstate | | 128,100 | | | 3,924 |
Alterra Capital Holdings | | 1,100 | | | 21 |
American Equity Investment Life Holding | | 12,100 | | | 114 |
American Express | | 235,300 | | | 9,381 |
American Financial Group | | 7,700 | | | 215 |
Ameriprise Financial | | 63,500 | | | 2,527 |
Annaly Capital Management ‡ (A) | | 104,600 | | | 1,774 |
Apartment Investment & | | | | | |
Management, Cl A ‡ (A) | | 40,300 | | | 832 |
Assurant | | 61,200 | | | 2,124 |
Axis Capital Holdings (A) | | 17,100 | | | 520 |
Bank of America | | 1,168,802 | | | 18,397 |
Bank of Hawaii | | 31,000 | | | 1,489 |
Bank of New York Mellon | | 159,800 | | | 4,347 |
BOK Financial (A) | | 12,300 | | | 622 |
| | | | | |
Description | | Shares | | Market Value
($ Thousands) |
Brandywine Realty Trust ‡ | | 87,500 | | $ | 1,014 |
Brookfield Asset Management, Cl A | | 32,100 | | | 764 |
Capital One Financial | | 119,600 | | | 4,940 |
Cardinal Financial | | 7,700 | | | 81 |
Cathay General Bancorp (A) | | 23,000 | | | 253 |
Chimera Investment ‡ (A) | | 232,500 | | | 916 |
Chubb (A) | | 79,700 | | | 4,004 |
Cincinnati Financial (A) | | 10,500 | | | 286 |
Citigroup * | | 2,492,800 | | | 9,871 |
CME Group, Cl A | | 18,300 | | | 5,795 |
CNA Financial * | | 30,300 | | | 790 |
Colony Financial ‡ | | 7,100 | | | 129 |
Comerica | | 9,700 | | | 370 |
Cowen Group, Cl A * | | 5,500 | | | 26 |
Credicorp | | 2,700 | | | 238 |
Endurance Specialty Holdings (A) | | 15,700 | | | 582 |
Equity Residential ‡ | | 21,900 | | | 988 |
Everest Re Group | | 14,000 | | | 1,018 |
First Citizens BancShares, Cl A | | 800 | | | 160 |
First Community Bancshares (A) | | 5,700 | | | 91 |
First Financial Holdings | | 3,600 | | | 51 |
Flagstone Reinsurance Holdings | | 8,100 | | | 96 |
Franklin Resources | | 20,900 | | | 2,050 |
Fulton Financial | | 27,900 | | | 278 |
Goldman Sachs Group | | 73,409 | | | 10,590 |
Hartford Financial Services Group | | 14,800 | | | 371 |
HCP ‡ (A) | | 7,700 | | | 245 |
Hospitality Properties Trust ‡ | | 17,000 | | | 383 |
HRPT Properties Trust ‡ | | 124,100 | | | 833 |
Hudson City Bancorp | | 132,700 | | | 1,673 |
Huntington Bancshares | | 108,000 | | | 665 |
IntercontinentalExchange * (A) | | 45,500 | | | 5,284 |
Invesco Mortgage Capital ‡ | | 10,400 | | | 214 |
Jones Lang LaSalle | | 14,900 | | | 1,112 |
JPMorgan Chase | | 539,201 | | | 21,341 |
Keycorp (A) | | 13,300 | | | 107 |
Lakeland Bancorp | | 4,600 | | | 46 |
Lincoln National | | 11,400 | | | 302 |
MBIA * (A) | | 2,200 | | | 16 |
MetLife | | 109,170 | | | 4,420 |
MFA Mortgage Investments ‡ (A) | | 72,000 | | | 528 |
Montpelier Re Holdings | | 48,500 | | | 757 |
Moody’s (A) | | 41,000 | | | 840 |
Morgan Stanley | | 97,417 | | | 2,641 |
Nelnet, Cl A | | 10,600 | | | 210 |
NewStar Financial * | | 5,000 | | | 35 |
NYSE Euronext | | 129,600 | | | 3,716 |
OceanFirst Financial (A) | | 2,800 | | | 34 |
Parkway Properties ‡ | | 9,500 | | | 160 |
PHH * (A) | | 24,400 | | | 538 |
Phoenix * (A) | | 15,300 | | | 43 |
Piedmont Office Realty Trust, Cl A ‡ (A) | | 1,400 | | | 27 |
Piper Jaffray * | | 2,100 | | | 69 |
Platinum Underwriters Holdings | | 13,200 | | | 486 |
PNC Financial Services Group | | 47,500 | | | 2,981 |
Presidential Life | | 7,100 | | | 74 |
Principal Financial Group | | 6,600 | | | 179 |
Progressive | | 8,500 | | | 167 |
Prosperity Bancshares | | 4,200 | | | 151 |
Prudential Financial | | 57,350 | | | 3,310 |
Regions Financial | | 42,755 | | | 326 |
| | |
2 | | SEI Institutional Investments Trust /Annual Report/May 31, 2010 |
SCHEDULE OF INVESTMENTS
Large Cap Fund
May 31, 2010
| | | | | |
Description | | Shares | | Market Value
($ Thousands) |
RenaissanceRe Holdings | | 3,700 | | $ | 200 |
Resource Capital ‡ | | 61,200 | | | 343 |
SLM * | | 55,300 | | | 614 |
State Street | | 73,900 | | | 2,821 |
Stewart Information Services (A) | | 13,900 | | | 147 |
SunTrust Banks | | 12,500 | | | 337 |
SWS Group | | 5,200 | | | 52 |
T. Rowe Price Group (A) | | 21,100 | | | 1,045 |
Taubman Centers ‡ (A) | | 29,100 | | | 1,178 |
Torchmark | | 20,300 | | | 1,046 |
Travelers | | 95,505 | | | 4,725 |
Trustco Bank (A) | | 22,200 | | | 138 |
Unitrin | | 4,800 | | | 128 |
Unum Group | | 73,400 | | | 1,696 |
US Bancorp | | 125,200 | | | 3,000 |
Vornado Realty Trust ‡ | | 1,700 | | | 132 |
Webster Financial (A) | | 13,300 | | | 255 |
Wells Fargo | | 619,912 | | | 17,785 |
World Acceptance * (A) | | 5,000 | | | 179 |
WR Berkley | | 5,700 | | | 155 |
XL Capital, Cl A | | 63,000 | | | 1,109 |
Zions Bancorporation (A) | | 2,000 | | | 48 |
| | | | | |
| | | | | 188,220 |
| | | | | |
Health Care — 12.9% | | | | | |
Abbott Laboratories | | 41,400 | | | 1,969 |
Aetna | | 238,369 | | | 6,951 |
Allergan | | 221,939 | | | 13,359 |
Allscripts-Misys Healthcare Solutions * (A) | | 27,700 | | | 521 |
AmerisourceBergen | | 28,800 | | | 901 |
Amgen * | | 153,538 | | | 7,950 |
Becton Dickinson | | 20,300 | | | 1,447 |
Biogen Idec * | | 23,000 | | | 1,091 |
Bristol-Myers Squibb | | 193,900 | | | 4,500 |
Bruker * | | 23,000 | | | 293 |
C.R. Bard | | 1,900 | | | 154 |
Cardinal Health | | 5,000 | | | 172 |
Celgene * | | 59,105 | | | 3,118 |
CIGNA | | 19,000 | | | 636 |
Coventry Health Care * | | 12,300 | | | 255 |
Covidien | | 80,789 | | | 3,425 |
Eli Lilly (A) | | 78,900 | | | 2,587 |
Endo Pharmaceuticals Holdings * | | 14,300 | | | 299 |
Forest Laboratories * | | 70,800 | | | 1,832 |
Genzyme * | | 145,650 | | | 7,086 |
Gilead Sciences * | | 126,300 | | | 4,537 |
Health Net * | | 21,000 | | | 518 |
Humana * | | 33,700 | | | 1,552 |
Idexx Laboratories * (A) | | 10,300 | | | 651 |
Impax Laboratories * | | 7,600 | | | 160 |
Intuitive Surgical * (A) | | 5,300 | | | 1,711 |
Invacare (A) | | 8,700 | | | 208 |
Johnson & Johnson | | 294,565 | | | 17,173 |
Kinetic Concepts * | | 13,100 | | | 542 |
King Pharmaceuticals * (A) | | 34,000 | | | 295 |
Laboratory Corp of America Holdings * | | 41,900 | | | 3,168 |
Life Technologies * | | 5,100 | | | 256 |
McKesson (A) | | 13,800 | | | 966 |
Medco Health Solutions * | | 125,700 | | | 7,246 |
Medtronic | | 191,200 | | | 7,491 |
Merck | | 174,490 | | | 5,879 |
| | | | | |
Description | | Shares | | Market Value
($ Thousands) |
Mettler Toledo International * | | 500 | | $ | 57 |
Novo Nordisk ADR (A) | | 66,500 | | | 5,109 |
Par Pharmaceutical * | | 15,100 | | | 419 |
Pfizer | | 980,103 | | | 14,927 |
Quidel * (A) | | 2,600 | | | 30 |
St. Jude Medical * | | 68,039 | | | 2,541 |
Teva Pharmaceutical Industries ADR (A) | | 35,825 | | | 1,964 |
Thermo Fisher Scientific * | | 31,700 | | | 1,650 |
UnitedHealth Group | | 478,105 | | | 13,898 |
Universal Health Services, Cl B | | 13,000 | | | 551 |
Valeant Pharmaceuticals International * (A) | | 18,600 | | | 865 |
Watson Pharmaceuticals * | | 18,800 | | | 830 |
WellPoint * | | 75,400 | | | 3,868 |
West Pharmaceutical Services | | 1,300 | | | 51 |
Zimmer Holdings * | | 26,300 | | | 1,471 |
| | | | | |
| | | | | 159,130 |
| | | | | |
Industrials — 8.7% | | | | | |
3M | | 47,508 | | | 3,768 |
Alliant Techsystems * (A) | | 7,200 | | | 495 |
ArvinMeritor * (A) | | 8,800 | | | 128 |
Boeing | | 54,500 | | | 3,498 |
Canadian National Railway | | 12,700 | | | 729 |
Crane | | 14,300 | | | 465 |
CSX | | 9,100 | | | 475 |
Cummins | | 45,040 | | | 3,062 |
Danaher | | 28,368 | | | 2,252 |
Deere | | 8,500 | | | 490 |
Delta Air Lines * (A) | | 44,500 | | | 604 |
Dover | | 10,900 | | | 489 |
Eaton | | 34,700 | | | 2,427 |
Emerson Electric | | 49,666 | | | 2,306 |
Ennis | | 5,800 | | | 102 |
Expeditors International Washington | | 164,300 | | | 6,275 |
FedEx | | 24,400 | | | 2,037 |
Gardner Denver | | 18,700 | | | 852 |
General Dynamics | | 51,000 | | | 3,463 |
General Electric | | 988,703 | | | 16,165 |
Goodrich | | 33,500 | | | 2,325 |
Graco | | 38,600 | | | 1,223 |
Harsco | | 22,900 | | | 623 |
Honeywell International | | 8,600 | | | 368 |
Hubbell, Cl B | | 3,900 | | | 166 |
IDEX | | 12,800 | | | 391 |
Illinois Tool Works | | 39,000 | | | 1,811 |
Interline Brands * | | 1,400 | | | 28 |
ITT | | 9,800 | | | 473 |
Joy Global | | 8,900 | | | 454 |
Kansas City Southern * | | 8,800 | | | 336 |
KBR (A) | | 32,200 | | | 708 |
Kennametal | | 8,300 | | | 234 |
L-3 Communications Holdings, Cl 3 | | 49,700 | | | 4,107 |
Lennox International | | 2,300 | | | 103 |
Lockheed Martin | | 18,747 | | | 1,498 |
NACCO Industries, CI A | | 1,600 | | | 135 |
Nordson | | 600 | | | 40 |
Norfolk Southern | | 5,400 | | | 305 |
Northrop Grumman | | 77,859 | | | 4,710 |
Oshkosh Truck * | | 24,100 | | | 856 |
| | |
3 | | SEI Institutional Investments Trust /Annual Report/May 31, 2010 |
SCHEDULE OF INVESTMENTS
Large Cap Fund
May 31, 2010
| | | | | |
Description | | Shares | | Market Value
($ Thousands) |
Owens Corning * | | 10,700 | | $ | 357 |
Parker Hannifin | | 23,300 | | | 1,432 |
Polypore International * | | 2,300 | | | 47 |
Quanta Services * (A) | | 127,500 | | | 2,643 |
Raytheon | | 113,329 | | | 5,939 |
Republic Services, Cl A | | 13,600 | | | 396 |
Rockwell Automation | | 16,200 | | | 866 |
Rockwell Collins | | 65,267 | | | 3,808 |
RR Donnelley & Sons | | 83,300 | | | 1,596 |
Timken | | 1,400 | | | 41 |
Toro (A) | | 9,700 | | | 519 |
Towers Watson, Cl A | | 6,800 | | | 313 |
Tyco International | | 34,800 | | | 1,260 |
UAL * (A) | | 41,000 | | | 821 |
Union Pacific | | 9,500 | | | 679 |
United Parcel Service, Cl B | | 53,307 | | | 3,345 |
United Technologies | | 129,319 | | | 8,713 |
WABCO Holdings * | | 17,800 | | | 541 |
Waste Management | | 11,200 | | | 364 |
Werner Enterprises | | 2,400 | | | 54 |
WW Grainger (A) | | 18,500 | | | 1,882 |
| | | | | |
| | | | | 106,592 |
| | | | | |
Information Technology — 20.2% | | | |
Activision Blizzard | | 53,800 | | | 578 |
Adobe Systems * | | 172,921 | | | 5,547 |
Amdocs * | | 33,800 | | | 963 |
Apple * | | 117,753 | | | 30,281 |
Autodesk * (A) | | 79,700 | | | 2,332 |
Avnet * (A) | | 29,500 | | | 847 |
AVX | | 2,500 | | | 35 |
BMC Software * | | 1,900 | | | 70 |
Brightpoint * | | 11,000 | | | 82 |
Broadcom, Cl A (A) | | 27,400 | | | 946 |
CA | | 147,000 | | | 2,977 |
Cisco Systems * | | 687,033 | | | 15,912 |
Citrix Systems * (A) | | 84,813 | | | 3,699 |
Computer Sciences | | 20,300 | | | 1,015 |
Corning | | 201,900 | | | 3,519 |
eBay * | | 172,000 | | | 3,683 |
EMC * | | 569,745 | | | 10,609 |
Fairchild Semiconductor International, Cl A * (A) | | 18,900 | | | 189 |
Flextronics International * | | 110,600 | | | 726 |
Google, Cl A * | | 32,170 | | | 15,608 |
Harris | | 26,300 | | | 1,234 |
Hewitt Associates, Cl A * | | 5,000 | | | 186 |
Hewlett-Packard | | 311,910 | | | 14,351 |
IAC * | | 11,300 | | | 265 |
Ingram Micro, Cl A * | | 46,400 | | | 787 |
Intel | | 418,448 | | | 8,963 |
International Business Machines | | 65,157 | | | 8,162 |
Intersil, Cl A | | 16,000 | | | 213 |
Intuit * | | 177,100 | | | 6,330 |
Jabil Circuit | | 22,000 | | | 301 |
Juniper Networks * (A) | | 34,800 | | | 926 |
Lam Research * | | 7,900 | | | 299 |
Lender Processing Services | | 3,000 | | | 102 |
Linear Technology | | 1,700 | | | 48 |
Loral Space & Communications * | | 1,200 | | | 48 |
Marvell Technology Group * | | 67,400 | | | 1,279 |
Mastercard, CI A (A) | | 24,000 | | | 4,842 |
McAfee * | | 11,600 | | | 369 |
| | | | | |
Description | | Shares | | Market Value
($ Thousands) |
Micron Technology * (A) | | 145,900 | | $ | 1,326 |
Microsoft | | 758,430 | | | 19,568 |
National Instruments | | 800 | | | 26 |
National Semiconductor | | 14,600 | | | 205 |
NCR * | | 28,000 | | | 372 |
NeuStar, Cl A * | | 6,600 | | | 141 |
Nokia ADR (A) | | 181,000 | | | 1,832 |
Nortel Networks * | | 5 | | | — |
Novellus Systems * (A) | | 3,500 | | | 90 |
Nuance Communications * | | 148,400 | | | 2,528 |
Oracle | | 245,544 | | | 5,542 |
Paychex (A) | | 203,200 | | | 5,799 |
PMC—Sierra * | | 35,100 | | | 284 |
Qualcomm | | 356,900 | | | 12,691 |
Rackspace Hosting * (A) | | 160,500 | | | 2,825 |
Red Hat * | | 78,700 | | | 2,307 |
Rovi * | | 8 | | | — |
SAIC * | | 31,400 | | | 540 |
Salesforce.com * | | 24,800 | | | 2,146 |
SanDisk * | | 25,900 | | | 1,207 |
Seagate Technology * (A) | | 119,400 | | | 1,834 |
Symantec * | | 308,500 | | | 4,371 |
Tech Data * | | 12,200 | | | 496 |
Teradata * | | 124,900 | | | 3,989 |
Texas Instruments | | 252,632 | | | 6,169 |
Tyco Electronics | | 28,700 | | | 827 |
VeriSign * (A) | | 196,000 | | | 5,470 |
Visa, Cl A | | 152,701 | | | 11,065 |
Vishay Intertechnology * | | 62,800 | | | 568 |
Western Digital * | | 49,000 | | | 1,706 |
Western Union | | 34,700 | | | 554 |
Xerox | | 147,500 | | | 1,373 |
Xilinx | | 3,700 | | | 91 |
Yahoo! * | | 159,400 | | | 2,445 |
Zebra Technologies, Cl A * | | 17,800 | | | 490 |
| | | | | |
| | | | | 249,200 |
| | | | | |
Materials — 3.1% | | | | | |
Air Products & Chemicals | | 2,400 | | | 166 |
Alcoa (A) | | 108,500 | | | 1,263 |
Allegheny Technologies | | 69,830 | | | 3,818 |
Ashland (A) | | 48,000 | | | 2,573 |
Ball | | 17,800 | | | 877 |
Boise * (A) | | 25,000 | | | 153 |
Celanese, Cl A | | 28,900 | | | 829 |
Cytec Industries | | 28,900 | | | 1,235 |
E.I. Du Pont de Nemours | | 27,600 | | | 998 |
Eastman Chemical (A) | | 24,300 | | | 1,467 |
Freeport-McMoRan Copper &
Gold, Cl B | | 36,600 | | | 2,564 |
H.B. Fuller | | 2,200 | | | 47 |
International Paper | | 51,200 | | | 1,189 |
Lubrizol | | 21,300 | | | 1,887 |
Monsanto | | 69,745 | | | 3,548 |
Mosaic | | 9,200 | | | 425 |
Nalco Holding (A) | | 130,700 | | | 2,962 |
Nucor (A) | | 16,400 | | | 706 |
Omnova Solutions * | | 7,100 | | | 57 |
Owens-Illinois * | | 16,800 | | | 510 |
Pactiv * | | 33,100 | | | 946 |
Rock-Tenn, CI A | | 18,050 | | | 929 |
Schnitzer Steel Industries, CI A | | 10,900 | | | 546 |
Sealed Air | | 48,000 | | | 1,000 |
| | |
4 | | SEI Institutional Investments Trust /Annual Report/May 31, 2010 |
SCHEDULE OF INVESTMENTS
Large Cap Fund
May 31, 2010
| | | | | |
Description | | Shares | | Market Value
($ Thousands) |
Sherwin-Williams (A) | | 16,500 | | $ | 1,264 |
Solutia * | | 9,500 | | | 144 |
Sonoco Products | | 24,500 | | | 757 |
Southern Copper (A) | | 61,100 | | | 1,801 |
Spartech * | | 4,600 | | | 61 |
Syngenta ADR (A) | | 71,900 | | | 3,169 |
Walter Industries (A) | | 3,400 | | | 270 |
| | | | | |
| | | | | 38,161 |
| | | | | |
Telecommunication Services — 3.1% | | | |
American Tower, Cl A * | | 77,595 | | | 3,145 |
AT&T | | 623,046 | | | 15,140 |
BCE | | 39,100 | | | 1,142 |
CenturyLink (A) | | 12,700 | | | 436 |
Crown Castle International * | | 155,300 | | | 5,751 |
NII Holdings * | | 18,600 | | | 678 |
Sprint Nextel * | | 385,400 | | | 1,977 |
Telephone & Data Systems | | 27,400 | | | 901 |
Verizon Communications | | 345,072 | | | 9,496 |
| | | | | |
| | | | | 38,666 |
| | | | | |
Utilities — 2.8% | | | | | |
AES * | | 677,787 | | | 6,961 |
AGL Resources | | 7,400 | | | 270 |
Allegheny Energy | | 2,300 | | | 47 |
Alliant Energy | | 17,200 | | | 552 |
Ameren | | 18,200 | | | 449 |
American Electric Power | | 38,200 | | | 1,221 |
American Water Works | | 13,800 | | | 281 |
Aqua America (A) | | 12,900 | | | 225 |
Atmos Energy | | 11,200 | | | 304 |
CMS Energy (A) | | 25,200 | | | 370 |
DPL | | 35,700 | | | 894 |
DTE Energy | | 35,000 | | | 1,593 |
Duke Energy | | 9,100 | | | 145 |
Edison International | | 121,900 | | | 3,945 |
Energen | | 23,600 | | | 1,045 |
Entergy (A) | | 29,400 | | | 2,207 |
Exelon | | 99,500 | | | 3,841 |
FirstEnergy (A) | | 35,000 | | | 1,232 |
FPL Group | | 4,400 | | | 220 |
Mirant * | | 72,100 | | | 895 |
NV Energy | | 22,700 | | | 268 |
OGE Energy | | 39,000 | | | 1,421 |
Pepco Holdings | | 13,800 | | | 222 |
PG&E (A) | | 32,700 | | | 1,357 |
Pinnacle West Capital | | 17,300 | | | 607 |
Public Service Enterprise Group | | 115,700 | | | 3,544 |
Sempra Energy | | 16,000 | | | 736 |
| | | | | |
| | | | | 34,852 |
| | | | | |
Total Common Stock (Cost $1,106,713) ($ Thousands) | | | | | 1,171,839 |
| | | | | |
| | | | | | |
Description | | Shares | | Market Value
($ Thousands) |
AFFILIATED PARTNERSHIP — 10.8% | | | |
SEI Liquidity Fund, L.P. 0.240% (B)**† | | | 133,363,080 | | $ | 132,534 |
| | | | | | |
Total Affiliated Partnership | | | | | | |
(Cost $133,363)
($ Thousands) | | | | | | 132,534 |
| | | | | | |
CASH EQUIVALENT — 2.1% | | | |
SEI Daily Income Trust, Prime Obligation Fund, Cl A 0.090%**† | | | 25,945,718 | | | 25,946 |
| | | | | | |
Total Cash Equivalent | | | | | | |
(Cost $25,946)
($ Thousands) | | | | | | 25,946 |
| | | | | | |
U.S. TREASURY OBLIGATION (C) (D) — 1.2% |
U.S. Treasury Bill 0.134%, 06/03/10 | | $ | 14,608 | | | 14,608 |
| | | | | | |
Total U.S. Treasury Obligation | | | | | | |
(Cost $14,608)
($ Thousands) | | | | | | 14,608 |
| | | | | | |
Total Investments — 109.3% | | | |
(Cost $1,280,630)
($ Thousands) | | | | | $ | 1,344,927 |
| | | | | | |
|
| A summary of the open futures contracts held by the Fund at May 31, 2010, is as follows: |
| | | | | | | | |
Type of Contract | | Number of
Contracts
Long (Short) | | Expiration
Date | | Unrealized
Depreciation
($ Thousands) | |
S&P 500 Composite Index | | 174 | | Jun-2010 | | $ | (1,472 | ) |
S&P Mid 400 E-Mini | | 87 | | Jun-2010 | | | (111 | ) |
| | | | | | | | |
| | | | | | $ | (1,583 | ) |
| | | | | | | | |
For the year ended May 31, 2010, the total amount of all open futures contracts, as presented in the table above, are representative of the volume of activity for this derivative type during the period.
Percentages are based on Net Assets of $1,230,382 ($ Thousands).
| (A) | This security or a partial position of this security is on loan at May 31, 2010. The total value of securities on loan at May 31, 2010 was $128,195 ($ Thousands). |
| (B) | This security was purchased with cash collateral held from securities on loan. The total value of such securities as of May 31, 2010 was $132,534 ($ Thousands). |
| (C) | Security, or a portion thereof, has been pledged as collateral on open futures contracts. |
| (D) | The rate reported is the effective yield at time of purchase. |
| * | Non-income producing security. |
| ** | The rate reported is the 7-day effective yield as of May 31, 2010. |
| † | Investment in Affiliated Security. |
| ‡ | Real Estate Investment Trust. |
| | |
5 | | SEI Institutional Investments Trust /Annual Report/May 31, 2010 |
SCHEDULE OF INVESTMENTS
Large Cap Fund
May 31, 2010
ADR — American Depositary Receipt
Cl — Class
L.P. — Limited Partnership
S&P — Standard & Poor’s
| | |
6 | | SEI Institutional Investments Trust /Annual Report/May 31, 2010 |
SCHEDULE OF INVESTMENTS
Large Cap Diversified Alpha Fund
May 31, 2010
| | | | | |
Description | | Shares | | Market Value
($ Thousands) |
COMMON STOCK — 80.5% |
|
Consumer Discretionary — 9.3% |
99 Cents Only Stores * | | 5,000 | | $ | 76 |
Abercrombie & Fitch, Cl A | | 200 | | | 7 |
Amazon.com * | | 9,200 | | | 1,154 |
American Eagle Outfitters | | 1,200 | | | 16 |
American Greetings, Cl A | | 500 | | | 12 |
Apollo Group, Cl A * | | 18,375 | | | 977 |
Autoliv | | 3,100 | | | 147 |
Bed Bath & Beyond * | | 600 | | | 27 |
Best Buy | | 1,400 | | | 59 |
Big 5 Sporting Goods | | 1,000 | | | 15 |
Cablevision Systems, Cl A | | 19,582 | | | 486 |
Carmax * | | 5,800 | | | 126 |
Chico’s FAS | | 20,900 | | | 256 |
Coach | | 29,600 | | | 1,217 |
Comcast, Cl A | | 57,500 | | | 1,040 |
Cooper Tire & Rubber | | 2,400 | | | 46 |
Core-Mark Holding * | | 600 | | | 16 |
Darden Restaurants | | 200 | | | 8 |
Deckers Outdoor * | | 800 | | | 116 |
DeVry | | 1,500 | | | 86 |
DIRECTV, Cl A * | | 36,600 | | | 1,379 |
Discovery Communications,
Cl C * | | 2,800 | | | 89 |
DISH Network, Cl A | | 15,507 | | | 323 |
Dollar Tree * | | 8,400 | | | 526 |
DreamWorks Animation SKG,
Cl A * | | 3,400 | | | 101 |
Eastman Kodak * | | 87,400 | | | 493 |
Education Management * | | 5,500 | | | 116 |
Expedia | | 4,300 | | | 93 |
Family Dollar Stores | | 400 | | | 16 |
Ford Motor * | | 114,145 | | | 1,339 |
Fossil * | | 11,500 | | | 431 |
Gannett | | 5,200 | | | 81 |
Gap | | 35,600 | | | 776 |
Garmin | | 1,800 | | | 60 |
Gentex | | 2,300 | | | 45 |
Guess | | 600 | | | 23 |
H&R Block | | 2,500 | | | 40 |
Hanesbrands * | | 400 | | | 11 |
Harley-Davidson | | 700 | | | 21 |
Harman International Industries * | | 3,100 | | | 100 |
Hasbro | | 300 | | | 12 |
Helen of Troy * | | 3,200 | | | 82 |
Home Depot | | 7,400 | | | 250 |
Interactive Data | | 172 | | | 6 |
International Game Technology | | 700 | | | 14 |
ITT Educational Services * | | 4,600 | | | 465 |
J.C. Penney | | 13,875 | | | 381 |
Jarden | | 1,600 | | | 47 |
John Wiley & Sons, Cl A | | 300 | | | 12 |
Johnson Controls | | 16,200 | | | 462 |
Jones Apparel Group | | 1,700 | | | 33 |
Kohl’s * | | 2,200 | | | 112 |
Lamar Advertising, Cl A * | | 100 | | | 3 |
Leggett & Platt | | 9,800 | | | 228 |
Liberty Global, Cl A * | | 2,000 | | | 52 |
Liberty Media—Capital, Ser A * | | 1,300 | | | 55 |
Liberty Media—Interactive, Cl A * | | 7,200 | | | 93 |
Liberty Media—Starz * | | 1,910 | | | 100 |
Limited Brands | | 18,900 | | | 470 |
| | | | | |
Description | | Shares | | Market Value
($ Thousands) |
LKQ * | | 8,000 | | $ | 148 |
Lowe’s | | 30,600 | | | 757 |
Macy’s | | 17,400 | | | 387 |
Madison Square Garden, Cl A* | | 2,325 | | | 49 |
Marriott International, Cl A | | 415 | | | 14 |
Mattel | | 4,400 | | | 95 |
McDonald’s | | 11,700 | | | 782 |
McGraw-Hill | | 7,500 | | | 208 |
MGM Mirage * | | 700 | | | 9 |
NetFlix * | | 5,700 | | | 634 |
New York Times, Cl A * | | 1,100 | | | 10 |
Newell Rubbermaid | | 8,200 | | | 137 |
News, Cl A | | 13,600 | | | 180 |
NIKE, Cl B | | 17,800 | | | 1,288 |
Nordstrom | | 300 | | | 12 |
NVR * | | 335 | | | 230 |
Omnicom Group | | 1,100 | | | 42 |
Oxford Industries | | 2,000 | | | 42 |
Panera Bread, Cl A * | | 100 | | | 8 |
PetSmart | | 9,700 | | | 308 |
Phillips-Van Heusen | | 400 | | | 22 |
Polo Ralph Lauren, Cl A | | 1,600 | | | 139 |
Pre-Paid Legal Services * | | 300 | | | 14 |
priceline.com * | | 5,100 | | | 975 |
RadioShack | | 700 | | | 14 |
Ross Stores | | 8,900 | | | 466 |
Royal Caribbean Cruises * | | 11,400 | | | 331 |
Scholastic | | 1,400 | | | 37 |
Scripps Networks Interactive, Cl A | | 3,300 | | | 149 |
Sears Holdings * | | 7,800 | | | 687 |
Service International | | 9,900 | | | 85 |
Signet Jewelers * | | 1,300 | | | 40 |
Stanley Black & Decker | | 1,282 | | | 71 |
Staples | | 40,800 | | | 878 |
Starbucks | | 7,900 | | | 204 |
Starwood Hotels & Resorts Worldwide | | 500 | | | 23 |
Superior Industries International | | 1,100 | | | 16 |
Target | | 16,600 | | | 905 |
Tempur-Pedic International * | | 5,700 | | | 189 |
Thor Industries | | 3,300 | | | 96 |
Tiffany | | 2,400 | | | 109 |
Timberland, Cl A * | | 1,100 | | | 21 |
Time Warner | | 102,435 | | | 3,174 |
Time Warner Cable, Cl A | | 8,026 | | | 439 |
TJX | | 11,700 | | | 532 |
TRW Automotive Holdings * | | 10,100 | | | 304 |
Tupperware Brands | | 500 | | | 21 |
Ulta Salon Cosmetics &
Fragrance * | | 1,900 | | | 49 |
Universal Technical Institute * | | 1,600 | | | 39 |
Urban Outfitters * | | 3,800 | | | 138 |
VF | | 4,600 | | | 356 |
Viacom, Cl B | | 19,060 | | | 641 |
Virgin Media | | 8,300 | | | 134 |
Walt Disney | | 11,562 | | | 386 |
Whirlpool | | 4,000 | | | 418 |
Williams-Sonoma | | 1,200 | | | 36 |
Winnebago Industries * | | 1,800 | | | 22 |
WMS Industries * | | 600 | | | 28 |
Wolverine World Wide | | 1,200 | | | 35 |
Wyndham Worldwide | | 1,400 | | | 33 |
| | |
1 | | SEI Institutional Investments Trust /Annual Report/May 31, 2010 |
SCHEDULE OF INVESTMENTS
Large Cap Diversified Alpha Fund
May 31, 2010
| | | | | |
Description | | Shares | | Market Value
($ Thousands) |
Yum! Brands | | 8,150 | | $ | 334 |
| | | | | |
| | | | | 32,757 |
| | | | | |
Consumer Staples — 8.0% | | | | | |
Altria Group | | 3,000 | | | 61 |
Archer-Daniels-Midland | | 20,200 | | | 510 |
Avon Products | | 4,100 | | | 109 |
BJ’s Wholesale Club * | | 6,700 | | | 268 |
Brown-Forman, Cl B | | 300 | | | 17 |
Bunge | | 4,600 | | | 224 |
Campbell Soup | | 1,700 | | | 61 |
Coca-Cola | | 26,200 | | | 1,347 |
Coca-Cola Enterprises | | 4,900 | | | 128 |
Colgate-Palmolive | | 4,300 | | | 336 |
ConAgra Foods | | 23,500 | | | 568 |
Constellation Brands, Cl A * | | 4,900 | | | 81 |
Corn Products International | | 10,000 | | | 333 |
Costco Wholesale | | 5,500 | | | 320 |
CVS Caremark | | 9,204 | | | 319 |
Dean Foods * | | 4,600 | | | 49 |
Del Monte Foods | | 7,100 | | | 103 |
Diageo ADR | | 6,200 | | | 380 |
Dole Food * | | 5,400 | | | 49 |
Dr. Pepper Snapple Group | | 7,600 | | | 288 |
Estee Lauder, Cl A | | 1,500 | | | 87 |
General Mills | | 3,000 | | | 214 |
Green Mountain Coffee Roasters * | | 1,600 | | | 38 |
Hansen Natural * | | 8,700 | | | 340 |
Herbalife | | 13,800 | | | 623 |
Hershey | | 300 | | | 14 |
HJ Heinz | | 2,900 | | | 128 |
Hormel Foods | | 300 | | | 12 |
JM Smucker | | 2,800 | | | 155 |
Kellogg | | 8,200 | | | 438 |
Kimberly-Clark | | 900 | | | 54 |
Kraft Foods, Cl A | | 3,660 | | | 105 |
Kroger | | 24,900 | | | 501 |
Lorillard | | 1,900 | | | 136 |
McCormick | | 300 | | | 12 |
Mead Johnson Nutrition, Cl A | | 3,600 | | | 178 |
Medifast * | | 6,300 | | | 198 |
Molson Coors Brewing, Cl B | | 500 | | | 20 |
NBTY * | | 2,500 | | | 86 |
PepsiCo | | 25,115 | | | 1,579 |
Philip Morris International | | 64,834 | | | 2,861 |
Prestige Brands Holdings * | | 2,700 | | | 21 |
Procter & Gamble | | 73,200 | | | 4,472 |
Reynolds American | | 7,100 | | | 370 |
Safeway | | 10,600 | | | 235 |
Sanderson Farms | | 2,600 | | | 143 |
Sara Lee | | 87,371 | | | 1,238 |
Smithfield Foods * | | 2,200 | | | 38 |
Supervalu | | 72,640 | | | 978 |
Sysco | | 63,788 | | | 1,902 |
Tyson Foods, Cl A | | 34,025 | | | 598 |
USANA Health Sciences * | | 600 | | | 22 |
Walgreen | | 77,364 | | | 2,479 |
Wal-Mart Stores | | 43,000 | | | 2,174 |
Whole Foods Market * | | 1,600 | | | 65 |
| | | | | |
| | | | | 28,065 |
| | | | | |
Energy — 7.1% | | | | | |
Alpha Natural Resources * | | 833 | | | 32 |
| | | | | |
Description | | Shares | | Market Value
($ Thousands) |
Anadarko Petroleum | | 2,200 | | $ | 115 |
Apache | | 4,100 | | | 367 |
Atwood Oceanics * | | 700 | | | 19 |
Baker Hughes | | 2,761 | | | 105 |
Cabot Oil & Gas | | 500 | | | 17 |
Cameron International * | | 1,700 | | | 62 |
Chesapeake Energy | | 8,500 | | | 190 |
Chevron | | 75,687 | | | 5,591 |
Cimarex Energy | | 2,500 | | | 184 |
Concho Resources * | | 400 | | | 21 |
ConocoPhillips | | 76,046 | | | 3,944 |
Continental Resources * | | 600 | | | 28 |
Devon Energy | | 5,900 | | | 377 |
Diamond Offshore Drilling | | 700 | | | 44 |
Dresser-Rand Group * | | 600 | | | 19 |
El Paso | | 4,400 | | | 50 |
EOG Resources | | 11,500 | | | 1,206 |
Exxon Mobil | | 100,300 | | | 6,064 |
FMC Technologies * | | 500 | | | 29 |
Frontline | | 400 | | | 13 |
Halliburton | | 17,400 | | | 432 |
Hess | | 13,100 | | | 697 |
Marathon Oil | | 35,914 | | | 1,117 |
Mariner Energy * | | 482 | | | 10 |
Massey Energy | | 1,200 | | | 40 |
Murphy Oil | | 34,981 | | | 1,867 |
Nabors Industries * | | 300 | | | 6 |
National Oilwell Varco | | 2,089 | | | 80 |
Newfield Exploration * | | 200 | | | 10 |
Occidental Petroleum | | 3,800 | | | 313 |
Oil States International * | | 7,500 | | | 293 |
Patterson-UTI Energy | | 600 | | | 8 |
Peabody Energy | | 2,600 | | | 101 |
Pioneer Natural Resources | | 900 | | | 57 |
Pride International * | | 300 | | | 7 |
Range Resources | | 200 | | | 9 |
Rowan * | | 400 | | | 10 |
Schlumberger | | 8,600 | | | 483 |
Smith International | | 1,167 | | | 44 |
Southern Union | | 3,700 | | | 81 |
Southwestern Energy * | | 1,600 | | | 60 |
Spectra Energy | | 3,000 | | | 60 |
St. Mary Land & Exploration | | 200 | | | 9 |
Stone Energy * | | 8,300 | | | 111 |
Tidewater | | 400 | | | 17 |
Transocean * | | 3,300 | | | 187 |
Unit * | | 2,500 | | | 102 |
Whiting Petroleum * | | 300 | | | 25 |
Williams | | 9,500 | | | 188 |
XTO Energy | | 2,985 | | | 128 |
| | | | | |
| | | | | 25,029 |
| | | | | |
Financials — 11.9% | | | | | |
Aflac | | 28,700 | | | 1,271 |
Alexandria Real Estate Equities ‡ | | 1,200 | | | 79 |
Allied World Assurance Holdings | | 3,400 | | | 153 |
Allstate | | 10,800 | | | 331 |
Alterra Capital Holdings | | 300 | | | 6 |
American Equity Investment Life Holding | | 1,500 | | | 14 |
American Express | | 55,598 | | | 2,217 |
American Financial Group | | 10,900 | | | 304 |
| | |
2 | | SEI Institutional Investments Trust /Annual Report/May 31, 2010 |
SCHEDULE OF INVESTMENTS
Large Cap Diversified Alpha Fund
May 31, 2010
| | | | | |
Description | | Shares | | Market Value
($ Thousands) |
American International Group * | | 800 | | $ | 28 |
AmeriCredit * | | 3,300 | | | 71 |
Ameriprise Financial | | 5,100 | | | 203 |
Annaly Capital Management ‡ | | 25,400 | | | 431 |
Apartment Investment & | | | | | |
Management, CI A ‡ | | 1,800 | | | 37 |
Arch Capital Group * | | 400 | | | 29 |
Assurant | | 9,000 | | | 312 |
AvalonBay Communities ‡ | | 103 | | | 10 |
Bank of America | | 137,454 | | | 2,164 |
Bank of Hawaii | | 1,500 | | | 72 |
Bank of New York Mellon | | 33,050 | | | 899 |
BB&T | | 2,600 | | | 79 |
BlackRock, CI A | | 700 | | | 118 |
Boston Properties ‡ | | 300 | | | 23 |
Brandywine Realty Trust ‡ | | 13,300 | | | 154 |
BRE Properties ‡ | | 600 | | | 24 |
Camden Property Trust ‡ | | 800 | | | 36 |
Capital One Financial | | 26,700 | | | 1,103 |
Cathay General Bancorp | | 7,800 | | | 86 |
CB Richard Ellis Group, CI A * | | 900 | | | 14 |
Charles Schwab | | 600 | | | 10 |
Chimera Investment ‡ | | 136,047 | | | 536 |
Chubb | | 16,800 | | | 844 |
Citigroup * | | 281,238 | | | 1,114 |
City National | | 200 | | | 11 |
CME Group, CI A | | 3,300 | | | 1,045 |
Colony Financial ‡ | | 1,200 | | | 22 |
Comerica | | 3,100 | | | 118 |
Commerce Bancshares | | 1,000 | | | 37 |
Compass Diversified Holdings | | 700 | | | 10 |
Credicorp | | 6,700 | | | 592 |
Digital Realty Trust ‡ | | 200 | | | 11 |
Discover Financial Services | | 9,400 | | | 127 |
Douglas Emmett ‡ | | 2,500 | | | 39 |
Eaton Vance | | 100 | | | 3 |
Endurance Specialty Holdings | | 10,500 | | | 390 |
Equity Residential ‡ | | 400 | | | 18 |
Essex Property Trust ‡ | | 100 | | | 10 |
Everest Re Group | | 200 | | | 15 |
Federated Investors, CI B | | 2,412 | | | 54 |
Fifth Third Bancorp | | 11,400 | | | 148 |
First American | | 1,600 | | | 55 |
First Citizens BancShares, CI A | | 200 | | | 40 |
First Commonwealth Financial | | 5,500 | | | 29 |
First Community Bancshares | | 800 | | | 13 |
Flagstone Reinsurance Holdings | | 1,900 | | | 23 |
Franklin Resources | | 16,486 | | | 1,617 |
Fulton Financial | | 14,000 | | | 139 |
Genworth Financial, CI A* | | 7,400 | | | 115 |
Goldman Sachs Group | | 20,213 | | | 2,916 |
Hanover Insurance Group | | 700 | | | 31 |
Hartford Financial Services Group | | 200 | | | 5 |
HCP * | | 500 | | | 16 |
| | 600 | | | 26 |
Hospitality Properties Trust ‡ | | 1,100 | | | 25 |
Host Hotels & Resorts ‡ | | 826 | | | 12 |
HRPT Properties Trust ‡ | | 10,100 | | | 68 |
Hudson City Bancorp | | 50,100 | | | 632 |
Huntington Bancshares | | 13,200 | | | 81 |
IntercontinentalExchange * | | 9,100 | | | 1,057 |
Invesco | | 1,100 | | | 20 |
Invesco Mortgage Capital ‡ | | 3,100 | | | 64 |
| | | | | |
Description | | Shares | | Market Value
($ Thousands) |
Jefferies Group | | 1,700 | | $ | 40 |
Jones Lang LaSalle | | 7,600 | | | 567 |
JPMorgan Chase | | 76,789 | | | 3,039 |
Keycorp | | 1,600 | | | 13 |
Lazard, CI A | | 1,400 | | | 44 |
Legg Mason | | 100 | | | 3 |
Liberty Property Trust ‡ | | 800 | | | 25 |
Lincoln National | | 500 | | | 13 |
Loews | | 7,800 | | | 254 |
M&T Bank | | 14,144 | | | 1,121 |
Macerich ‡ | | 313 | | | 13 |
Mack-Cali Realty ‡ | | 100 | | | 3 |
Marsh & McLennan | | 1,300 | | | 28 |
Marshall & Ilsley | | 2,200 | | | 18 |
MetLife | | 700 | | | 28 |
MFA Mortgage Investments ‡ | | 18,400 | | | 135 |
Montpelier Re Holdings | | 6,400 | | | 100 |
Moody’s | | 7,624 | | | 156 |
Morgan Stanley | | 11,700 | | | 317 |
MSCI, CI A * | | 2,900 | | | 86 |
Nationwide Health Properties ‡ | | 1,000 | | | 35 |
Nelnet, CI A | | 1,500 | | | 30 |
New York Community Bancorp | | 63,984 | | | 1,027 |
NewStar Financial * | | 1,000 | | | 7 |
NYSE Euronext | | 35,000 | | | 1,003 |
Parkway Properties ‡ | | 2,000 | | | 34 |
PHH * | | 6,200 | | | 137 |
Phoenix * | | 3,600 | | | 10 |
Piper Jaffray * | | 400 | | | 13 |
PNC Financial Services Group | | 4,033 | | | 253 |
Presidential Life | | 2,000 | | | 21 |
Principal Financial Group | | 600 | | | 16 |
ProAssurance * | | 7,500 | | | 442 |
Progressive | | 600 | | | 12 |
Prosperity Bancshares | | 1,200 | | | 43 |
Protective Life | | 2,000 | | | 43 |
Prudential Financial | | 7,625 | | | 440 |
Public Storage ‡ | | 200 | | | 18 |
Raymond James Financial | | 2,200 | | | 62 |
Regions Financial | | 12,350 | | | 94 |
RenaissanceRe Holdings | | 6,100 | | | 330 |
Resource Capital ‡ | | 18,600 | | | 104 |
SCBT Financial | | 200 | | | 7 |
Senior Housing Properties Trust ‡ | | 1,200 | | | 25 |
Simon Property Group ‡ | | 717 | | | 61 |
SL Green Realty ‡ | | 1,200 | | | 75 |
SLM * | | 21,900 | | | 243 |
StanCorp Financial Group | | 1,400 | | | 60 |
State Street | | 15,800 | | | 603 |
Stewart Information Services | | 3,800 | | | 40 |
SunTrust Banks | | 2,300 | | | 62 |
T. Rowe Price Group | | 14,500 | | | 718 |
Taubman Centers ‡ | | 700 | | | 28 |
TD Ameritrade Holding * | | 1,200 | | | 21 |
Torchmark | | 200 | | | 10 |
Transatlantic Holdings | | 900 | | | 42 |
Travelers | | 21,900 | | | 1,083 |
Trustco Bank | | 4,500 | | | 28 |
UDR ‡ | | 4,700 | | | 96 |
United America Indemnity, Cl A * | | 1,100 | | | 9 |
Unitrin | | 1,700 | | | 45 |
US Bancorp | | 29,908 | | | 717 |
Ventas ‡ | | 700 | | | 33 |
| | |
3 | | SEI Institutional Investments Trust /Annual Report/May 31, 2010 |
SCHEDULE OF INVESTMENTS
Large Cap Diversified Alpha Fund
May 31, 2010
| | | | | |
Description | | Shares | | Market Value
($ Thousands) |
Vornado Realty Trust ‡ | | 500 | | $ | 39 |
Waddell & Reed Financial, CI A | | 500 | | | 13 |
Washington Federal | | 3,500 | | | 60 |
Webster Financial | | 1,300 | | | 25 |
Wells Fargo | | 169,223 | | | 4,855 |
WesBanco | | 1,200 | | | 23 |
White Mountains Insurance Group | | 300 | | | 98 |
World Acceptance * | | 1,800 | | | 64 |
XL Capital, CI A | | 9,500 | | | 167 |
Zions Bancorporation | | 2,500 | | | 60 |
| | | | | |
| | | | | 41,993 |
| | |
Health Care — 11.2% | | | | | |
Abbott Laboratories | | 10,000 | | | 476 |
Aetna | | 40,500 | | | 1,181 |
Alexion Pharmaceuticals * | | 1,200 | | | 60 |
Allergan | | 31,900 | | | 1,920 |
Allscripts-Misys Healthcare
Solutions * | | 9,400 | | | 177 |
AmerisourceBergen | | 45,238 | | | 1,415 |
Amgen * | | 61,513 | | | 3,185 |
Amylin Pharmaceuticals * | | 3,000 | | | 50 |
Baxter International | | 1,500 | | | 63 |
Beckman Coulter | | 1,500 | | | 86 |
Becton Dickinson | | 5,200 | | | 371 |
Biogen Idec * | | 10,100 | | | 479 |
BioMarin Pharmaceutical * | | 1,200 | | | 24 |
Bio-Rad Laboratories, CI A * | | 500 | | | 47 |
Boston Scientific * | | 2,300 | | | 14 |
Bristol-Myers Squibb | | 31,100 | | | 722 |
Bruker * | | 5,300 | | | 67 |
C.R. Bard | | 400 | | | 32 |
Cardinal Health | | 54,603 | | | 1,883 |
CareFusion * | | 2,300 | | | 59 |
Celgene * | | 3,400 | | | 179 |
Cephalon * | | 6,625 | | | 390 |
Cerner * | | 1,400 | | | 117 |
Charles River Laboratories
International * | | 2,200 | | | 74 |
CIGNA | | 6,500 | | | 218 |
Community Health Systems * | | 700 | | | 27 |
Cooper | | 400 | | | 15 |
Covance * | | 2,500 | | | 132 |
Coventry Health Care * | | 5,700 | | | 118 |
DaVita * | | 1,200 | | | 76 |
Dendreon * | | 1,200 | | | 52 |
Dentsply International | | 300 | | | 10 |
Edwards Lifesciences * | | 1,400 | | | 71 |
Eli Lilly | | 2,700 | | | 88 |
Endo Pharmaceuticals Holdings * | | 500 | | | 10 |
Express Scripts * | | 1,200 | | | 121 |
Forest Laboratories * | | 4,800 | | | 124 |
Genzyme * | | 18,950 | | | 922 |
Gilead Sciences * | | 33,500 | | | 1,203 |
Health Net * | | 25,700 | | | 633 |
Henry Schein * | | 400 | | | 23 |
Hill-Rom Holdings | | 2,500 | | | 70 |
Hospira * | | 3,500 | | | 182 |
Humana * | | 11,500 | | | 530 |
Idexx Laboratories * | | 3,100 | | | 196 |
Impax Laboratories * | | 2,000 | | | 42 |
Intuitive Surgical * | | 1,800 | | | 581 |
| | | | | |
Description | | Shares | | Market Value
($ Thousands) |
Invacare | | 1,900 | | $ | 45 |
Inverness Medical Innovations * | | 2,100 | | | 73 |
Johnson & Johnson | | 85,190 | | | 4,967 |
Kinetic Concepts * | | 2,100 | | | 87 |
King Pharmaceuticals * | | 9,800 | | | 85 |
Laboratory Corp of America Holdings * | | 800 | | | 60 |
Life Technologies * | | 3,700 | | | 185 |
Lincare Holdings | | 2,300 | | | 108 |
McKesson | | 30,785 | | | 2,155 |
Medco Health Solutions * | | 30,900 | | | 1,781 |
Mednax * | | 1,600 | | | 90 |
Medtronic | | 40,075 | | | 1,570 |
Merck | | 34,163 | | | 1,151 |
Mettler Toledo International * | | 1,100 | | | 126 |
Millipore * | | 297 | | | 31 |
Mylan Laboratories * | | 3,900 | | | 76 |
Novo Nordisk ADR | | 13,400 | | | 1,029 |
OSI Pharmaceuticals * | | 311 | | | 18 |
Par Pharmaceutical * | | 3,800 | | | 105 |
Patterson | | 2,600 | | | 77 |
PerkinElmer | | 3,200 | | | 73 |
Perrigo | | 2,100 | | | 125 |
Pfizer | | 99,595 | | | 1,517 |
Quest Diagnostics | | 1,300 | | | 69 |
Quidel * | | 600 | | | 7 |
ResMed * | | 400 | | | 25 |
Somanetics * | | 400 | | | 7 |
Stryker | | 2,200 | | | 117 |
Teleflex | | 1,100 | | | 62 |
Tenet Healthcare * | | 15,500 | | | 89 |
Thermo Fisher Scientific * | | 8,900 | | | 463 |
United Therapeutics * | | 1,800 | | | 92 |
UnitedHealth Group | | 85,300 | | | 2,480 |
Universal Health Services, CI B | | 900 | | | 38 |
ValeantPharmaceuticals International * | | 2,300 | | | 107 |
Varian Medical Systems * | | 1,200 | | | 60 |
Vertex Pharmaceuticals * | | 1,100 | | | 38 |
Waters * | | 1,400 | | | 96 |
Watson Pharmaceuticals * | | 200 | | | 9 |
WellPoint * | | 27,562 | | | 1,414 |
West Pharmaceutical Services | | 300 | | | 12 |
Zimmer Holdings * | | 1,700 | | | 95 |
| | | | | |
| | | | | 39,329 |
Industrials — 7.1% | | | | | |
3M | | 12,700 | | | 1,007 |
Alexander & Baldwin | | 1,300 | | | 42 |
Alliant Techsystems * | | 1,400 | | | 96 |
ArvinMeritor * | | 1,600 | | | 23 |
Avery Dennison | | 2,700 | | | 92 |
BE Aerospace * | | 900 | | | 24 |
Boeing | | 3,897 | | | 250 |
Bucyrus International, CI A | | 800 | | | 43 |
C.H. Robinson Worldwide | | 200 | | | 12 |
Carlisle | | 9,200 | | | 358 |
Caterpillar | | 3,300 | | | 200 |
Continental Airlines, Cl B * | | 1,950 | | | 41 |
Con-way | | 700 | | | 24 |
Copa Holdings, Cl A | | 1,000 | | | 51 |
Corrections of America * | | 4,000 | | | 80 |
Crane | | 4,800 | | | 156 |
| | |
4 | | SEI Institutional Investments Trust /Annual Report/May 31, 2010 |
SCHEDULE OF INVESTMENTS
Large Cap Diversified Alpha Fund
May 31, 2010
| | | | | |
Description | | Shares | | Market Value
($ Thousands) |
CSX | | 4,900 | | $ | 256 |
Cummins | | 100 | | | 7 |
Deere | | 2,400 | | | 138 |
Delta Air Lines * | | 56,403 | | | 766 |
Dover | | 4,100 | | | 184 |
Eaton | | 5,700 | | | 399 |
Emerson Electric | | 200 | | | 9 |
Ennis | | 1,700 | | | 30 |
Expeditors International Washington | | 26,800 | | | 1,024 |
FedEx | | 7,000 | | | 584 |
Flowserve | | 300 | | | 28 |
Fluor | | 10,773 | | | 505 |
Gardner Denver | | 8,600 | | | 392 |
General Dynamics | | 16,710 | | | 1,135 |
General Electric | | 119,100 | | | 1,947 |
Goodrich | | 6,400 | | | 444 |
Graco | | 400 | | | 13 |
Honeywell International | | 1,100 | | | 47 |
Hubbell, Cl B | | 4,861 | | | 207 |
IDEX | | 3,300 | | | 101 |
Illinois Tool Works | | 5,100 | | | 237 |
ITT | | 3,500 | | | 169 |
Joy Global | | 2,500 | | | 127 |
Kansas City Southern * | | 4,700 | | | 179 |
KBR | | 24,300 | | | 534 |
Kennametal | | 2,200 | | | 62 |
L-3 Communications Holdings, Cl 3 | | 9,300 | | | 769 |
Lennox International | | 1,000 | | | 45 |
Lockheed Martin | | 17,859 | | | 1,427 |
Manitowoc | | 1,100 | | | 13 |
Manpower | | 1,500 | | | 68 |
Masco | | 700 | | | 9 |
NACCO Industries, CI A | | 400 | | | 34 |
Norfolk Southern | | 2,500 | | | 141 |
Northrop Grumman | | 18,300 | | | 1,107 |
Oshkosh Truck * | | 22,200 | | | 789 |
Owens Corning * | | 24,068 | | | 802 |
Pall | | 300 | | | 10 |
Parker Hannifin | | 5,300 | | | 326 |
Polypore International * | | 900 | | | 18 |
Precision Castparts | | 1,300 | | | 152 |
Quanta Services * | | 13,200 | | | 274 |
Raytheon | | 16,500 | | | 865 |
Republic Services, CI A | | 41,264 | | | 1,202 |
Rockwell Automation | | 6,600 | | | 353 |
Rockwell Collins | | 1,800 | | | 105 |
RR Donnelley & Sons | | 16,600 | | | 318 |
Ryder System | | 8,600 | | | 387 |
Snap-On | | 300 | | | 13 |
Southwest Airlines | | 13,200 | | | 164 |
Spirit Aerosystems Holdings, ClA * | | 1,900 | | | 37 |
Textron | | 3,500 | | | 72 |
Thomas & Betts * | | 200 | | | 8 |
Timken | | 300 | | | 8 |
Toro | | 2,200 | | | 118 |
Towers Watson, Cl A | | 2,500 | | | 115 |
TransDigm Group | | 1,200 | | | 63 |
Tyco International | | 12,390 | | | 449 |
Union Pacific | | 9,400 | | | 672 |
United Parcel Service, Cl B | | 4,800 | | | 301 |
| | | | | |
Description | | Shares | | Market Value
($ Thousands) |
United Technologies | | 15,550 | | $ | 1,048 |
Valmont Industries | | 100 | | | 8 |
Verisk Analytics, CI A * | | 500 | | | 15 |
WABCO Holdings * | | 6,700 | | | 204 |
Waste Connections * | | 1,400 | | | 49 |
Waste Management | | 6,551 | | | 213 |
WW Grainger | | 3,700 | | | 377 |
| | | | | |
| | | | | 25,171 |
| | | | | |
Information Technology — 18.3% |
Activision Blizzard | | 13,900 | | | 150 |
Adobe Systems * | | 25,200 | | | 808 |
Advanced Micro Devices * | | 4,000 | | | 34 |
Agilent Technologies * | | 8,400 | | | 272 |
Alliance Data Systems * | | 1,000 | | | 71 |
Altera | | 1,800 | | | 42 |
Amdocs * | | 1,300 | | | 37 |
Amphenol, CI A | | 400 | | | 17 |
Analog Devices | | 3,500 | | | 102 |
Ansys * | | 1,700 | | | 74 |
AOL * | | 2,193 | | | 45 |
Apple * | | 17,964 | | | 4,620 |
Autodesk * | | 9,200 | | | 269 |
Automatic Data Processing | | 400 | | | 16 |
Avnet * | | 18,300 | | | 525 |
AVX | | 1,500 | | | 21 |
BMC Software * | | 200 | | | 7 |
Brightpoint * | | 3,800 | | | 28 |
Broadcom, CI A | | 8,500 | | | 293 |
Broadridge Financial Solutions | | 200 | | | 4 |
Brocade Communications Systems * | | 3,700 | | | 20 |
CA | | 28,928 | | | 586 |
Cisco Systems * | | 115,900 | | | 2,684 |
Citrix Systems * | | 1,500 | | | 65 |
Cognizant Technology Solutions, CI A * | | 4,800 | | | 240 |
Computer Sciences | | 17,691 | | | 884 |
Corning | | 9,500 | | | 166 |
Cree * | | 2,000 | | | 133 |
Dell * | | 75,882 | | | 1,011 |
Diebold | | 1,200 | | | 35 |
eBay * | | 37,500 | | | 803 |
EMC * | | 66,200 | | | 1,233 |
Equinix * | | 300 | | | 27 |
F5 Networks * | | 2,600 | | | 183 |
Factset Research Systems | | 800 | | | 55 |
Fairchild Semiconductor International, CI A * | | 3,000 | | | 30 |
Fidelity National Information Services | | 5,759 | | | 158 |
Fiserv * | | 200 | | | 10 |
Flextronics International * | | 67,700 | | | 444 |
FLIR Systems * | | 2,100 | | | 60 |
Global Payments | | 2,300 | | | 97 |
Google, CI A * | | 7,812 | | | 3,790 |
Harris | | 15,500 | | | 727 |
Hewlett-Packard | | 60,316 | | | 2,775 |
IAC * | | 2,600 | | | 61 |
Ingram Micro, Cl A * | | 38,241 | | | 648 |
Intel | | 128,300 | | | 2,748 |
International Business Machines | | 51,446 | | | 6,444 |
Intersil, Cl A | | 3,700 | | | 49 |
| | |
5 | | SEI Institutional Investments Trust /Annual Report/May 31, 2010 |
SCHEDULE OF INVESTMENTS
Large Cap Diversified Alpha Fund
May 31, 2010
| | | | | |
Description | | Shares | | Market Value
($ Thousands) |
Intuit * | | 36,900 | | $ | 1,319 |
Jabil Circuit | | 63,889 | | | 875 |
JDS Uniphase * | | 1,200 | | | 14 |
Juniper Networks * | | 9,500 | | | 253 |
Kla-Tencor | | 1,700 | | | 52 |
Lam Research * | | 3,500 | | | 133 |
Lender Processing Services | | 7,162 | | | 243 |
Lexmark International, Cl A * | | 9,800 | | | 368 |
Linear Technology | | 2,700 | | | 76 |
Loral Space & Communications * | | 400 | | | 16 |
LSI * | | 2,100 | | | 11 |
Marvell Technology Group * | | 22,500 | | | 427 |
Mastercard, Cl A | | 5,400 | | | 1,090 |
Maxim Integrated Products | | 2,400 | | | 43 |
McAfee * | | 3,000 | | | 95 |
Microchip Technology | | 1,600 | | | 45 |
Micron Technology * | | 80,308 | | | 730 |
Micros Systems * | | 100 | | | 4 |
Microsoft | | 275,427 | | | 7,106 |
Molex | | 800 | | | 17 |
Monster Worldwide * | | 400 | | | 6 |
Motorola * | | 17,500 | | | 120 |
National Instruments | | 2,300 | | | 74 |
National Semiconductor | | 5,100 | | | 72 |
NCR * | | 1,200 | | | 16 |
NetApp * | | 5,900 | | | 222 |
NeuStar, Cl A * | | 16,900 | | | 362 |
Nokia ADR | | 18,800 | | | 190 |
Novellus Systems * | | 1,700 | | | 44 |
Nuance Communications * | | 15,400 | | | 262 |
Nvidia * | | 600 | | | 8 |
ON Semiconductor * | | 1,100 | | | 8 |
Oracle | | 29,800 | | | 673 |
Paychex | | 10,900 | | | 311 |
PMC—Sierra * | | 10,900 | | | 88 |
QLogic * | | 20,200 | | | 366 |
Qualcomm | | 63,725 | | | 2,266 |
Rackspace Hosting * | | 16,700 | | | 294 |
Rambus * | | 2,600 | | | 61 |
Red Hat * | | 11,200 | | | 328 |
Research In Motion * | | 6,800 | | | 413 |
Rovi * | | 2,800 | | | 105 |
Salesforce.com * | | 1,300 | | | 113 |
SanDisk * | | 700 | | | 33 |
Seagate Technology * | | 30,883 | | | 474 |
Silicon Laboratories * | | 700 | | | 32 |
Sybase * | | 393 | | | 25 |
Symantec * | | 86,900 | | | 1,231 |
Tech Data * | | 2,931 | | | 119 |
Tellabs | | 600 | | | 5 |
Teradata * | | 31,400 | | | 1,003 |
Texas Instruments | | 136,008 | | | 3,321 |
Total System Services | | 3,800 | | | 55 |
Trimble Navigation * | | 600 | | | 17 |
Tyco Electronics | | 9,600 | | | 277 |
Varian Semiconductor Equipment Associates * | | 100 | | | 3 |
VeriSign * | | 39,600 | | | 1,105 |
Visa, Cl A | | 30,400 | | | 2,203 |
Vishay Intertechnology * | | 7,800 | | | 71 |
VMware, Cl A * | | 500 | | | 33 |
WebMD Health, Cl A * | | 2,188 | | | 100 |
Western Digital * | | 19,900 | | | 693 |
| | | | | |
Description | | Shares | | Market Value
($ Thousands) |
Western Union | | 10,600 | | $ | 169 |
Xerox | | 7,435 | | | 69 |
Xilinx | | 600 | | | 15 |
Yahoo! * | | 30,900 | | | 474 |
Zebra Technologies, Cl A * | | 1,800 | | | 50 |
| | | | | |
| | | | | 64,497 |
| | | | | |
Materials — 2.7% | | | | | |
Air Products & Chemicals | | 2,500 | | | 173 |
Airgas | | 440 | | | 27 |
Albemarle | | 300 | | | 13 |
Alcoa | | 26,000 | | | 303 |
Allegheny Technologies | | 300 | | | 17 |
Aptargroup | | 6,600 | | | 263 |
Ashland | | 1,800 | | | 96 |
Ball | | 1,400 | | | 69 |
Boise * | | 4,500 | | | 28 |
Cabot | | 12,000 | | | 336 |
Celanese, Cl A | | 8,200 | | | 235 |
CF Industries Holdings | | 285 | | | 20 |
Cliffs Natural Resources | | 500 | | | 28 |
Compass Minerals International | | 200 | | | 15 |
Crown Holdings * | | 600 | | | 14 |
Cytec Industries | | 6,600 | | | 282 |
Dow Chemical | | 7,358 | | | 198 |
E.I. Du Pont de Nemours | | 40,355 | | | 1,460 |
Eastman Chemical | | 6,000 | | | 362 |
Freeport-McMoRan Copper & Gold, Cl B | | 6,100 | | | 427 |
H.B. Fuller | | 700 | | | 15 |
Huntsman | | 87,252 | | | 871 |
International Flavors & Fragrances | | 400 | | | 18 |
International Paper | | 2,800 | | | 65 |
Lubrizol | | 10,300 | | | 912 |
MeadWestvaco | | 6,900 | | | 165 |
Monsanto | | 4,400 | | | 224 |
Mosaic | | 2,100 | | | 97 |
Nalco Holding | | 18,800 | | | 426 |
Newmont Mining | | 1,248 | | | 67 |
Owens-Illinois * | | 800 | | | 24 |
Packaging of America | | 1,200 | | | 27 |
PPG Industries | | 3,000 | | | 192 |
Rock-Tenn, Cl A | | 1,600 | | | 82 |
RPM International | | 3,400 | | | 67 |
Schnitzer Steel Industries, Cl A | | 3,000 | | | 150 |
Sealed Air | | 600 | | | 13 |
Solutia * | | 1,500 | | | 23 |
Southern Copper | | 31,100 | | | 917 |
Spartech * | | 1,500 | | | 20 |
Syngenta ADR | | 14,400 | | | 635 |
Temple-Inland | | 1,200 | | | 25 |
Valspar | | 100 | | | 3 |
Walter Industries | | 2,200 | | | 174 |
| | | | | |
| | | | | 9,578 |
| | | | | |
Telecommunication Services — 2.5% | | | |
American Tower, Cl A * | | 300 | | | 12 |
AT&T | | 152,913 | | | 3,716 |
BCE | | 9,700 | | | 283 |
CenturyLink | | 6,273 | | | 215 |
Crown Castle International * | | 35,000 | | | 1,296 |
| | |
6 | | SEI Institutional Investments Trust /Annual Report/May 31, 2010 |
SCHEDULE OF INVESTMENTS
Large Cap Diversified Alpha Fund
May 31, 2010
| | | | | |
`Description | | Shares | | Market Value
($ Thousands) |
Frontier Communications | | 2,000 | | $ | 16 |
NII Holdings * | | 34,907 | | | 1,273 |
Qwest Communications International | | 10,329 | | | 54 |
Rogers Communications, Cl B | | 7,900 | | | 269 |
SBA Communications, Cl A * | | 500 | | | 17 |
Sprint Nextel * | | 141,561 | | | 726 |
tw telecom , Cl A * | | 100 | | | 2 |
Verizon Communications | | 38,400 | | | 1,057 |
Windstream | | 1,100 | | | 12 |
| | | | | |
| | | | | 8,948 |
| | | | | |
Utilities — 2.4% | | | |
AES * | | 146,131 | | | 1,501 |
Allegheny Energy | | 1,715 | | | 35 |
Alliant Energy | | 1,600 | | | 51 |
Ameren | | 1,900 | | | 47 |
American Electric Power | | 1,400 | | | 45 |
American Water Works | | 6,800 | | | 138 |
Aqua America | | 4,700 | | | 82 |
Calpine * | | 1,700 | | | 23 |
Centerpoint Energy | | 6,100 | | | 83 |
Chesapeake Utilities | | 300 | | | 9 |
Consolidated Edison | | 300 | | | 13 |
Constellation Energy Group | | 14,276 | | | 505 |
Dominion Resources | | 300 | | | 12 |
DPL | | 2,700 | | | 68 |
DTE Energy | | 3,100 | | | 141 |
Duke Energy | | 1,500 | | | 24 |
Edison International | | 25,800 | | | 835 |
Energen | | 9,000 | | | 398 |
Entergy | | 600 | | | 45 |
Equities | | 1,200 | | | 47 |
Exelon | | 45,064 | | | 1,739 |
FirstEnergy | | 2,900 | | | 102 |
FPL Group | | 500 | | | 25 |
Great Plains Energy | | 2,600 | | | 46 |
Hawaiian Electric Industries | | 1,900 | | | 42 |
Integrys Energy Group | | 2,600 | | | 118 |
MDU Resources Group | | 1,200 | | | 22 |
Mirant * | | 35,984 | | | 447 |
National Fuel Gas | | 2,500 | | | 122 |
NiSource | | 4,100 | | | 61 |
Northeast Utilities | | 600 | | | 15 |
NRG Energy * | | 1,300 | | | 31 |
NV Energy | | 24,700 | | | 291 |
OGE Energy | | 2,100 | | | 76 |
Oneok | | 2,700 | | | 120 |
Pepco Holdings | | 5,200 | | | 84 |
PG&E | | 4,300 | | | 178 |
Pinnacle West Capital | | 1,400 | | | 49 |
PPL | | 400 | | | 10 |
Public Service Enterprise Group | | 19,200 | | | 588 |
Questar | | 500 | | | 23 |
Sempra Energy | | 800 | | | 37 |
TECO Energy | | 5,500 | | | 86 |
Wisconsin Energy | | 300 | | | 15 |
| | | | | |
| | | | | 8,429 |
| | | | | |
Total Common Stock (Cost $266,331)
($ Thousands) | | | 283,796 |
| | | | | |
| | | | | | |
Description | | Shares/Face
Amount
($ Thousands) | | Market Value
($ Thousands) |
AFFILIATED PARTNERSHIP — 12.8% | | | |
SEI LIBOR Plus Portfolio† | | | 6,723,909 | | $ | 44,983 |
| | | | | | |
Total Affiliated Partnership | | | |
(Cost $58,111) ($ Thousands) | | | | | | 44,983 |
| | | | | | |
CASH EQUIVALENT — 4.4% | | | |
SEI Daily Income Trust, Prime Obligation Fund, Cl A 0.090%**† | | | 15,628,672 | | | 15,629 |
| | | | | | |
Total Cash Equivalent | | | | | | |
(Cost $15,629) ($ Thousands) | | | | | | 15,629 |
| | | | | | |
U.S. TREASURY OBLIGATIONS (A) (B) — 2.3% |
U.S. Treasury Bills 0.122%, 06/03/10 | | $ | 7,698 | | | 7,698 |
0.326%, 02/10/11 | | | 300 | | | 299 |
| | | | | | |
Total U.S. Treasury Obligations | | | | | | |
(Cost $7,997) ($ Thousands) | | | | | | 7,997 |
| | | | | | |
Total Investments — 100.0% | | | | | | |
(Cost $348,068)
($ Thousands) | | | | | $ | 352,405 |
| | | | | | |
A summary of the open futures contracts held by the Fund at May 31, 2010, is as follows:
| | | | | | | | |
Type of Contract | | Number of
Contracts
Long (Short) | | Expiration
Date | | Unrealized
Depreciation
($ Thousands) | |
S&P 500 Composite Index | | 242 | | Jun-2010 | | $ | (2,097 | ) |
S&P 500 E-Mini | | 10 | | Jun-2010 | | | (29 | ) |
| | | | | | | | |
| | | | | | $ | (2,126 | ) |
| | | | | | | | |
For the year ended May 31, 2010, the total amount of all open futures contracts, as presented in the table above, are representative of the volume of activity for this derivative type during the period.
Percentages are based on Net Assets of $352,500 ($ Thousands).
| (A) | The rate reported is the effective yield at time of purchase. |
| (B) | Security, or a portion thereof, has been pledged as collateral on open futures contracts. |
| * | Non-income producing security. |
| ** | Rate shown is the 7-day effective yield as of May 31, 2010. |
| † | Investment in Affiliated Security. |
| ‡ | Real Estate Investment Trust. |
ADR — American Depositary Receipt
Cl — Class
LIBOR — London Interbank Offered Rate
S&P — Standard & Poor’s
| | |
7 | | SEI Institutional Investments Trust /Annual Report/May 31, 2010 |
SCHEDULE OF INVESTMENTS
Large Cap Disciplined Equity Fund
May 31, 2010
| | | | | |
Description | | Shares | | Market Value
($ Thousands) |
COMMON STOCK — 84.2% | | | |
| |
Consumer Discretionary — 8.2% | | | |
99 Cents Only Stores * | | 22,500 | | $ | 344 |
Abercrombie & Fitch, Cl A | | 14,200 | | | 509 |
Amazon.com * (A) | | 60,300 | | | 7,565 |
Apollo Group, Cl A * | | 197,380 | | | 10,493 |
AutoNation * (A) | | 35,900 | | | 719 |
AutoZone * (A) | | 17,300 | | | 3,302 |
Bed Bath & Beyond * (A) | | 16,200 | | | 727 |
Best Buy | | 79,835 | | | 3,373 |
Big Lots * | | 9,700 | | | 343 |
Cablevision Systems, Cl A | | 36,058 | | | 895 |
Carnival | | 20,200 | | | 732 |
CBS, Cl B (A) | | 719,149 | | | 10,471 |
Cheesecake Factory * (A) | | 22,500 | | | 574 |
Chico’s FAS (A) | | 362,400 | | | 4,432 |
Chipotle Mexican Grill, Cl A * (A) | | 5,600 | | | 797 |
Coach (A) | | 397,300 | | | 16,333 |
Comcast, Cl A | | 1,620,752 | | | 28,899 |
Darden Restaurants (A) | | 360,298 | | | 15,457 |
Deckers Outdoor * | | 11,500 | | | 1,664 |
DeVry | | 32,300 | | | 1,857 |
DIRECTV, Cl A * | | 347,620 | | | 13,102 |
Discovery Communications, Cl A * (A) | | 43,200 | | | 1,627 |
DISH Network, Cl A | | 182,785 | | | 3,811 |
Dollar Tree * (A) | | 37,300 | | | 2,334 |
Eastman Kodak * (A) | | 179,800 | | | 1,014 |
Education Management * (A) | | 17,900 | | | 378 |
Expedia (A) | | 105,300 | | | 2,271 |
Family Dollar Stores (A) | | 4,600 | | | 187 |
Ford Motor * (A) | | 3,418,609 | | | 40,101 |
Fossil * (A) | | 10,100 | | | 379 |
Gannett (A) | | 228,100 | | | 3,545 |
Gap (A) | | 208,300 | | | 4,541 |
Goodyear Tire & Rubber * | | 9,100 | | | 108 |
H&R Block | | 46,800 | | | 752 |
Harley-Davidson (A) | | 19,100 | | | 577 |
Harman International Industries * | | 76,700 | | | 2,477 |
Hasbro (A) | | 85,558 | | | 3,435 |
Helen of Troy * | | 7,700 | | | 198 |
Home Depot | | 655,647 | | | 22,200 |
International Game Technology | | 17,100 | | | 335 |
J.C. Penney (A) | | 12,000 | | | 330 |
Johnson Controls | | 807,468 | | | 23,037 |
Jones Apparel Group | | 18,200 | | | 357 |
Kohl’s * | | 28,000 | | | 1,421 |
Las Vegas Sands * (A) | | 137,536 | | | 3,229 |
Leggett & Platt | | 208,600 | | | 4,856 |
Lennar, Cl A (A) | | 32,000 | | | 554 |
Limited Brands (A) | | 691,370 | | | 17,187 |
LKQ * | | 37,800 | | | 696 |
Lowe’s | | 110,200 | | | 2,727 |
Macy’s | | 558,650 | | | 12,408 |
Marriott International, Cl A (A) | | 15,219 | | | 509 |
Mattel | | 167,000 | | | 3,617 |
McDonald’s | | 354,992 | | | 23,738 |
McGraw-Hill (A) | | 152,900 | | | 4,251 |
New York Times, Cl A * (A) | | 93,700 | | | 869 |
Newell Rubbermaid (A) | | 589,900 | | | 9,828 |
News, Cl A | | 734,000 | | | 9,689 |
NIKE, Cl B (A) | | 47,000 | | | 3,402 |
| | | | | |
Description | | Shares | | Market Value
($ Thousands) |
Nordstrom (A) | | 16,426 | | $ | 652 |
NVR * (A) | | 10,135 | | | 6,945 |
Office Depot * | | 37,300 | | | 216 |
Omnicom Group | | 44,300 | | | 1,681 |
PetSmart | | 42,747 | | | 1,358 |
Polo Ralph Lauren, Cl A (A) | | 50,200 | | | 4,360 |
priceline.com * (A) | | 19,900 | | | 3,804 |
RadioShack (A) | | 50,400 | | | 1,030 |
Ross Stores (A) | | 86,700 | | | 4,543 |
Royal Caribbean Cruises * (A) | | 295,660 | | | 8,574 |
Scholastic | | 7,700 | | | 201 |
Scripps Networks Interactive, Cl A (A) | | 74,200 | | | 3,352 |
Sears Holdings * (A) | | 10,300 | | | 907 |
Stanley Black & Decker (A) | | 26,860 | | | 1,499 |
Staples | | 8,200 | | | 177 |
Starbucks (A) | | 645,340 | | | 16,708 |
Starwood Hotels & Resorts Worldwide | | 13,200 | | | 610 |
Target | | 393,362 | | | 21,450 |
Tempur-Pedic International * (A) | | 123,600 | | | 4,104 |
Thor Industries (A) | | 23,600 | | | 688 |
Tiffany (A) | | 64,400 | | | 2,926 |
Time Warner (A) | | 1,354,150 | | | 41,965 |
Time Warner Cable, Cl A (A) | | 457,872 | | | 25,059 |
TJX | | 304,900 | | | 13,861 |
TRW Automotive Holdings * | | 116,400 | | | 3,502 |
Tupperware Brands | | 25,500 | | | 1,083 |
Ulta Salon Cosmetics & Fragrance * | | 17,300 | | | 443 |
Universal Technical Institute * | | 11,000 | | | 270 |
Urban Outfitters * (A) | | 76,500 | | | 2,777 |
VF (A) | | 49,200 | | | 3,806 |
Viacom, Cl B | | 993,208 | | | 33,382 |
Walt Disney | | 557,250 | | | 18,623 |
Washington Post, Cl B | | 1,200 | | | 559 |
Whirlpool (A) | | 47,200 | | | 4,930 |
Wyndham Worldwide | | 65,700 | | | 1,551 |
Wynn Resorts (A) | | 1,600 | | | 134 |
| | | | | |
| | | | | 573,293 |
| | | | | |
Consumer Staples — 9.6% | | | | | |
Altria Group | | 977,441 | | | 19,832 |
Andersons | | 5,300 | | | 173 |
Archer-Daniels-Midland | | 620,796 | | | 15,687 |
Avon Products | | 87,200 | | | 2,310 |
Brown-Forman, Cl B | | 5,300 | | | 294 |
Bunge (A) | | 55,300 | | | 2,696 |
Campbell Soup (A) | | 32,700 | | | 1,171 |
Coca-Cola | | 926,633 | | | 47,629 |
Coca-Cola Enterprises | | 172,000 | | | 4,489 |
Colgate-Palmolive | | 162,800 | | | 12,713 |
Constellation Brands, Cl A * | | 108,100 | | | 1,801 |
Costco Wholesale (A) | | 50,800 | | | 2,959 |
CVS Caremark | | 473,808 | | | 16,408 |
Dean Foods * | | 327,600 | | | 3,489 |
Dole Food * (A) | | 43,900 | | | 402 |
Dr. Pepper Snapple Group | | 279,190 | | | 10,570 |
Energizer Holdings * (A) | | 79,700 | | | 4,479 |
Estee Lauder, Cl A | | 44,600 | | | 2,599 |
General Mills | | 250,771 | | | 17,862 |
Hershey | | 3,900 | | | 183 |
HJ Heinz (A) | | 50,400 | | | 2,227 |
| | |
1 | | SEI Institutional Investments Trust /Annual Report/May 31, 2010 |
SCHEDULE OF INVESTMENTS
Large Cap Disciplined Equity Fund
May 31, 2010
| | | | | |
Description | | Shares | | Market Value
($ Thousands) |
Hormel Foods | | 18,100 | | $ | 720 |
JM Smucker | | 54,300 | | | 2,998 |
Kellogg | | 52,000 | | | 2,778 |
Kimberly-Clark | | 585,508 | | | 35,540 |
Kraft Foods, Cl A | | 145,383 | | | 4,158 |
Kroger | | 315,060 | | | 6,342 |
Lorillard | | 66,020 | | | 4,720 |
McCormick | | 7,900 | | | 305 |
Mead Johnson Nutrition, Cl A | | 79,500 | | | 3,921 |
Medifast * (A) | | 39,500 | | | 1,239 |
Molson Coors Brewing, Cl B | | 10,400 | | | 427 |
Nu Skin Enterprises, Cl A | | 40,200 | | | 1,156 |
PepsiCo | | 670,081 | | | 42,142 |
Philip Morris International | | 1,414,864 | | | 62,424 |
Procter & Gamble | | 1,373,110 | | | 83,883 |
Ralcorp Holdings * | | 56,000 | | | 3,364 |
Reynolds American (A) | | 214,700 | | | 11,194 |
Sanderson Farms (A) | | 41,700 | | | 2,287 |
Sara Lee (A) | | 1,900,477 | | | 26,930 |
Smithfield Foods * | | 21,500 | | | 371 |
Supervalu (A) | | 1,553,377 | | | 20,924 |
Sysco | | 866,432 | | | 25,828 |
Tyson Foods, Cl A (A) | | 1,396,854 | | | 24,557 |
Walgreen | | 989,061 | | | 31,690 |
Wal-Mart Stores | | 1,922,558 | | | 97,205 |
Whole Foods Market * (A) | | 41,400 | | | 1,674 |
| | | | | |
| | | | | 668,750 |
| | | | | |
Energy — 9.6% | | | | | |
Anadarko Petroleum | | 142,700 | | | 7,468 |
Apache (A) | | 227,552 | | | 20,375 |
Baker Hughes (A) | | 293,685 | | | 11,201 |
Cabot Oil & Gas (A) | | 17,100 | | | 593 |
Cal Dive International * | | 61,000 | | | 337 |
Cameron International * | | 65,300 | | | 2,364 |
Chesapeake Energy (A) | | 318,900 | | | 7,124 |
Chevron | | 1,891,023 | | | 139,690 |
ConocoPhillips | | 1,403,847 | | | 72,804 |
Devon Energy | | 329,900 | | | 21,064 |
Diamond Offshore Drilling (A) | | 19,700 | | | 1,243 |
El Paso | | 53,400 | | | 606 |
EOG Resources (A) | | 15,000 | | | 1,573 |
Exxon Mobil (A) | | 3,251,158 | | | 196,565 |
FMC Technologies * (A) | | 21,900 | | | 1,273 |
Halliburton (A) | | 660,943 | | | 16,411 |
Helmerich & Payne (A) | | 43,400 | | | 1,635 |
Hess | | 413,178 | | | 21,981 |
Marathon Oil | | 805,522 | | | 25,044 |
Massey Energy (A) | | 35,300 | | | 1,169 |
Murphy Oil (A) | | 373,175 | | | 19,920 |
Nabors Industries * (A) | | 19,200 | | | 365 |
National Oilwell Varco | | 422,595 | | | 16,114 |
Noble Energy | | 52,200 | | | 3,105 |
Occidental Petroleum | | 322,298 | | | 26,593 |
Peabody Energy | | 39,200 | | | 1,527 |
Pioneer Natural Resources (A) | | 34,100 | | | 2,172 |
Range Resources | | 5,900 | | | 265 |
Rowan * (A) | | 18,000 | | | 446 |
Schlumberger (A) | | 347,268 | | | 19,499 |
Smith International | | 49,664 | | | 1,865 |
Spectra Energy | | 61,300 | | | 1,227 |
Stone Energy * (A) | | 50,800 | | | 681 |
Transocean * | | 34,800 | | | 1,976 |
| | | | | |
Description | | Shares | | Market Value
($ Thousands) |
Unit * (A) | | 43,700 | | $ | 1,787 |
Williams | | 666,097 | | | 13,155 |
XTO Energy | | 164,552 | | | 7,033 |
| | | | | |
| | | | | 668,250 |
| | | | | |
Financials — 13.6% | | | | | |
ACE | | 124,700 | | | 6,130 |
Affiliated Managers Group * (A) | | 49,293 | | | 3,532 |
Aflac | | 185,200 | | | 8,204 |
Allied World Assurance Holdings | | 43,100 | | | 1,936 |
Allstate | | 252,894 | | | 7,746 |
Alterra Capital Holdings | | 7,300 | | | 136 |
American Express | | 1,187,264 | | | 47,336 |
American International Group * (A) | | 28,300 | | | 1,001 |
Ameriprise Financial (A) | | 142,836 | | | 5,684 |
Annaly Capital Management ‡ (A) | | 825,248 | | | 13,996 |
AON | | 84,700 | | | 3,343 |
Apartment Investment & Management, Cl A ‡ (A) | | 40,600 | | | 838 |
Assurant | | 141,000 | | | 4,893 |
AvalonBay Communities ‡ (A) | | 7,300 | | | 716 |
Bank of America | | 6,271,682 | | | 98,716 |
Bank of New York Mellon | | 806,712 | | | 21,943 |
BB&T (A) | | 56,800 | | | 1,718 |
Berkshire Hathaway, Cl B * | | 342,804 | | | 24,185 |
Boston Properties ‡ (A) | | 26,500 | | | 2,032 |
Capital One Financial (A) | | 181,900 | | | 7,513 |
CB Richard Ellis Group, Cl A * (A) | | 64,900 | | | 1,027 |
Charles Schwab (A) | | 17,100 | | | 279 |
Chimera Investment ‡ (A) | | 2,627,109 | | | 10,351 |
Chubb (A) | | 97,680 | | | 4,907 |
Citigroup * (A) | | 7,164,406 | | | 28,371 |
CME Group, Cl A | | 11,900 | | | 3,768 |
Comerica | | 89,500 | | | 3,410 |
Discover Financial Services | | 240,100 | | | 3,229 |
Equity Residential ‡ | | 20,300 | | | 916 |
Everest Re Group | | 182,576 | | | 13,270 |
Federated Investors, Cl B (A) | | 91,026 | | | 2,022 |
Fifth Third Bancorp | | 571,027 | | | 7,418 |
Franklin Resources (A) | | 353,978 | | | 34,722 |
Fulton Financial | | 33,200 | | | 330 |
Genworth Financial, Cl A * | | 196,900 | | | 3,070 |
Goldman Sachs Group | | 490,601 | | | 70,774 |
Hartford Financial Services Group | | 32,064 | | | 804 |
HCP ‡ (A) | | 30,400 | | | 969 |
Health Care REIT ‡ | | 7,600 | | | 327 |
Host Hotels & Resorts ‡ (A) | | 57,962 | | | 826 |
Hudson City Bancorp | | 241,400 | | | 3,044 |
Huntington Bancshares (A) | | 1,105,000 | | | 6,807 |
IntercontinentalExchange * | | 6,400 | | | 743 |
Invesco | | 49,700 | | | 922 |
JPMorgan Chase | | 2,745,164 | | | 108,654 |
Keycorp (A) | | 684,000 | | | 5,486 |
Legg Mason (A) | | 7,100 | | | 211 |
Leucadia National * | | 13,000 | | | 285 |
Lincoln National | | 223,500 | | | 5,914 |
Loews (A) | | 126,600 | | | 4,116 |
M&T Bank (A) | | 151,165 | | | 11,978 |
Marsh & McLennan | | 34,800 | | | 759 |
Marshall & Ilsley | | 156,300 | | | 1,274 |
Medical Properties Trust ‡ | | 15,800 | | | 151 |
MetLife | | 737,986 | | | 29,881 |
| | |
2 | | SEI Institutional Investments Trust /Annual Report/May 31, 2010 |
SCHEDULE OF INVESTMENTS
Large Cap Disciplined Equity Fund
May 31, 2010
| | | | | |
Description | | Shares | | Market Value
($ Thousands) |
MFA Mortgage Investments ‡ (A) | | 496,600 | | $ | 3,640 |
Montpelier Re Holdings | | 9,200 | | | 143 |
Moody’s (A) | | 577,154 | | | 11,832 |
Morgan Stanley | | 391,716 | | | 10,619 |
New York Community Bancorp (A) | | 1,057,626 | | | 16,975 |
NYSE Euronext (A) | | 414,855 | | | 11,894 |
PartnerRe | | 43,246 | | | 3,155 |
PHH * (A) | | 96,500 | | | 2,128 |
Platinum Underwriters Holdings | | 16,100 | | | 593 |
PNC Financial Services Group | | 520,612 | | | 32,668 |
Principal Financial Group (A) | | 34,200 | | | 930 |
Progressive | | 17,300 | | | 339 |
ProLogis ‡ (A) | | 23,700 | | | 270 |
Prosperity Bancshares | | 16,800 | | | 605 |
Prudential Financial | | 354,421 | | | 20,454 |
Public Storage ‡ (A) | | 3,300 | | | 306 |
Regions Financial (A) | | 737,500 | | | 5,627 |
RenaissanceRe Holdings (A) | | 66,900 | | | 3,616 |
Resource Capital ‡ | | 80,700 | | | 453 |
Simon Property Group ‡ (A) | | 49,989 | | | 4,251 |
SLM * | | 607,400 | | | 6,748 |
State Street | | 64,400 | | | 2,458 |
SunTrust Banks (A) | | 83,400 | | | 2,248 |
T. Rowe Price Group (A) | | 40,128 | | | 1,987 |
Torchmark | | 8,500 | | | 438 |
Travelers (A) | | 564,972 | | | 27,949 |
Unitrin | | 6,500 | | | 173 |
Unum Group | | 65,400 | | | 1,511 |
US Bancorp (A) | | 1,000,644 | | | 23,975 |
Ventas ‡ (A) | | 32,300 | | | 1,516 |
Vornado Realty Trust ‡ (A) | | 49,541 | | | 3,848 |
Wells Fargo | | 3,470,846 | | | 99,579 |
White Mountains Insurance Group | | 1,939 | | | 634 |
Willis Group Holdings | | 93,200 | | | 2,854 |
XL Capital, Cl A (A) | | 434,600 | | | 7,653 |
Zions Bancorporation (A) | | 115,500 | | | 2,766 |
| | | | | |
| | | | | 949,448 |
| | | | | |
Health Care — 10.6% | | | | | |
Abbott Laboratories | | 626,229 | | | 29,783 |
Aetna | | 147,200 | | | 4,292 |
Allergan | | 155,500 | | | 9,360 |
Allscripts-Misys Healthcare Solutions * (A) | | 21,800 | | | 410 |
AmerisourceBergen (A) | | 760,258 | | | 23,781 |
Amgen * | | 1,096,084 | | | 56,755 |
Baxter International | | 151,500 | | | 6,398 |
Becton Dickinson | | 169,637 | | | 12,095 |
Biogen Idec * | | 140,199 | | | 6,650 |
Boston Scientific * (A) | | 82,500 | | | 499 |
Bristol-Myers Squibb | | 904,547 | | | 20,995 |
Bruker * | | 39,900 | | | 508 |
C.R. Bard | | 14,200 | | | 1,150 |
Cardinal Health | | 653,706 | | | 22,546 |
CareFusion * | | 67,000 | | | 1,703 |
Celgene * | | 188,400 | | | 9,940 |
Cephalon * (A) | | 135,858 | | | 7,997 |
Cerner * (A) | | 18,500 | | | 1,549 |
CIGNA | | 147,500 | | | 4,937 |
Coventry Health Care * (A) | | 198,500 | | | 4,109 |
Covidien | | 94,100 | | | 3,989 |
| | | | | |
Description | | Shares | | Market Value
($ Thousands) |
DaVita * | | 29,800 | | $ | 1,890 |
Dentsply International (A) | | 9,100 | | | 295 |
Eli Lilly (A) | | 436,676 | | | 14,319 |
Express Scripts * | | 43,300 | | | 4,356 |
Forest Laboratories * | | 49,600 | | | 1,284 |
Gilead Sciences * | | 200,600 | | | 7,205 |
Health Net * | | 19,600 | | | 483 |
Hill-Rom Holdings | | 73,307 | | | 2,044 |
Hospira * | | 74,200 | | | 3,863 |
Humana * | | 77,800 | | | 3,583 |
Idexx Laboratories * (A) | | 17,400 | | | 1,100 |
Impax Laboratories * | | 14,900 | | | 314 |
Intuitive Surgical * (A) | | 41,800 | | | 13,492 |
Invacare (A) | | 23,500 | | | 561 |
Johnson & Johnson | | 1,872,488 | | | 109,166 |
King Pharmaceuticals * (A) | | 271,100 | | | 2,350 |
Laboratory Corp of America Holdings * (A) | | 5,700 | | | 431 |
Life Technologies * (A) | | 146,700 | | | 7,344 |
Lincare Holdings (A) | | 212,530 | | | 9,951 |
McKesson (A) | | 585,903 | | | 41,013 |
Medco Health Solutions * | | 303,948 | | | 17,523 |
Medtronic | | 936,832 | | | 36,705 |
Merck | | 1,068,677 | | | 36,004 |
Millipore * | | 9,068 | | | 963 |
Mylan Laboratories * (A) | | 92,100 | | | 1,790 |
Par Pharmaceutical * | | 57,500 | | | 1,596 |
Patterson | | 55,300 | | | 1,643 |
PerkinElmer | | 101,900 | | | 2,312 |
Pfizer | | 5,095,311 | | | 77,602 |
Quest Diagnostics | | 5,900 | | | 311 |
Stryker (A) | | 23,300 | | | 1,236 |
Talecris Biotherapeutics Holdings * | | 190,000 | | | 3,150 |
Tenet Healthcare * | | 431,700 | | | 2,469 |
Thermo Fisher Scientific * | | 313,117 | | | 16,301 |
UnitedHealth Group | | 644,500 | | | 18,736 |
Varian Medical Systems * | | 24,300 | | | 1,217 |
Waters * | | 79,843 | | | 5,464 |
Watson Pharmaceuticals * | | 35,900 | | | 1,585 |
WellPoint * | | 1,005,893 | | | 51,602 |
Zimmer Holdings * | | 43,300 | | | 2,422 |
| | | | | |
| | | | | 735,121 |
| | | | | |
Industrials — 8.7% | | | | | |
3M | | 464,992 | | | 36,878 |
Alaska Air Group * | | 5,400 | | | 252 |
Avery Dennison | | 63,700 | | | 2,177 |
Boeing (A) | | 139,118 | | | 8,929 |
Caterpillar (A) | | 140,728 | | | 8,551 |
Crane | | 7,500 | | | 244 |
CSX | | 112,700 | | | 5,889 |
Cummins | | 6,040 | | | 411 |
Deere | | 96,400 | | | 5,560 |
Delta Air Lines * (A) | | 734,507 | | | 9,975 |
Dover (A) | | 133,200 | | | 5,979 |
Eaton (A) | | 119,900 | | | 8,387 |
Emerson Electric (A) | | 205,030 | | | 9,522 |
FedEx (A) | | 138,222 | | | 11,540 |
Flowserve | | 46,700 | | | 4,441 |
Fluor (A) | | 209,626 | | | 9,836 |
Foster Wheeler * | | 200,400 | | | 4,811 |
General Dynamics | | 599,255 | | | 40,689 |
| | |
3 | | SEI Institutional Investments Trust /Annual Report/May 31, 2010 |
SCHEDULE OF INVESTMENTS
Large Cap Disciplined Equity Fund
May 31, 2010
| | | | | |
Description | | Shares | | Market Value
($ Thousands) |
General Electric | | 5,419,488 | | $ | 88,609 |
Goodrich | | 58,200 | | | 4,039 |
Honeywell International | | 191,953 | | | 8,210 |
Hubbell, Cl B | | 15,423 | | | 658 |
IDEX (A) | | 25,000 | | | 763 |
Illinois Tool Works | | 16,700 | | | 775 |
ITT | | 78,700 | | | 3,800 |
Joy Global | | 43,523 | | | 2,220 |
Kansas City Southern * (A) | | 19,300 | | | 737 |
Kennametal | | 18,000 | | | 508 |
L-3 Communications Holdings, Cl 3 | | 40,800 | | | 3,371 |
Lennox International | | 6,300 | | | 282 |
Lockheed Martin | | 583,492 | | | 46,633 |
Masco | | 32,800 | | | 438 |
Norfolk Southern | | 62,700 | | | 3,540 |
Northrop Grumman | | 401,399 | | | 24,281 |
Oshkosh Truck * | | 111,700 | | | 3,969 |
Owens Corning * (A) | | 243,592 | | | 8,119 |
Paccar (A) | | 6,369 | | | 261 |
Pall | | 8,800 | | | 300 |
Parker Hannifin | | 114,600 | | | 7,043 |
Pitney Bowes | | 357,460 | | | 8,093 |
Precision Castparts | | 19,300 | | | 2,252 |
Raytheon | | 309,700 | | | 16,231 |
Republic Services, Cl A | | 890,305 | | | 25,926 |
Rockwell Automation (A) | | 209,810 | | | 11,210 |
Rockwell Collins | | 23,400 | | | 1,365 |
Roper Industries (A) | | 27,500 | | | 1,595 |
RR Donnelley & Sons | | 159,700 | | | 3,060 |
Ryder System | | 16,900 | | | 759 |
Snap-On | | 7,500 | | | 331 |
Southwest Airlines | | 264,200 | | | 3,287 |
SPX (A) | | 45,800 | | | 2,707 |
Textron (A) | | 106,200 | | | 2,195 |
Toro (A) | | 13,900 | | | 743 |
UAL * (A) | | 245,652 | | | 4,915 |
Union Pacific | | 167,945 | | | 11,996 |
United Parcel Service, Cl B | | 564,342 | | | 35,418 |
United Technologies | | 987,722 | | | 66,553 |
WABCO Holdings * | | 34,300 | | | 1,043 |
Waste Management | | 123,927 | | | 4,029 |
WESCO International * (A) | | 127,585 | | | 4,772 |
WW Grainger (A) | | 119,400 | | | 12,149 |
| | | | | |
| | | | | 603,256 |
| | | | | |
Information Technology — 15.4% | | | |
Activision Blizzard (A) | | 840,773 | | | 9,038 |
Adobe Systems * | | 416,647 | | | 13,366 |
Advanced Micro Devices * (A) | | 425,621 | | | 3,648 |
Agilent Technologies * (A) | | 175,900 | | | 5,692 |
Akamai Technologies * (A) | | 329,292 | | | 13,080 |
Altera (A) | | 78,400 | | | 1,848 |
Amphenol, Cl A | | 16,900 | | | 717 |
Analog Devices (A) | | 128,400 | | | 3,745 |
Apple * | | 375,328 | | | 96,519 |
Applied Materials | | 3,200 | | | 41 |
Autodesk * (A) | | 33,100 | | | 969 |
Automatic Data Processing | | 12,053 | | | 493 |
Avnet * | | 28,700 | | | 824 |
BMC Software * | | 124,600 | | | 4,612 |
Broadcom, Cl A (A) | | 233,800 | | | 8,071 |
CA | | 395,626 | | | 8,011 |
| | | | | |
Description | | Shares | | Market Value
($ Thousands) |
Cisco Systems * | | 2,353,994 | | $ | 54,518 |
Citrix Systems * | | 29,200 | | | 1,273 |
Cognizant Technology Solutions, Cl A * | | 90,500 | | | 4,529 |
Computer Sciences | | 242,130 | | | 12,104 |
Corning | | 423,500 | | | 7,382 |
Dell * | | 2,012,994 | | | 26,833 |
Dolby Laboratories, Cl A * | | 9,800 | | | 647 |
eBay * | | 353,200 | | | 7,562 |
Electronic Arts * | | 22,400 | | | 370 |
EMC * | | 904,500 | | | 16,842 |
Fidelity National Information Services | | 79,700 | | | 2,193 |
Fiserv * | | 5,300 | | | 252 |
FLIR Systems * | | 35,000 | | | 997 |
Google, Cl A * | | 177,710 | | | 86,221 |
Harris | | 78,429 | | | 3,679 |
Hewlett-Packard | | 1,549,342 | | | 71,285 |
IAC * | | 75,300 | | | 1,766 |
Ingram Micro, Cl A * | | 623,321 | | | 10,572 |
Intel | | 3,308,904 | | | 70,877 |
International Business Machines | | 938,255 | | | 117,526 |
Intersil, Cl A | | 37,300 | | | 496 |
Intuit * | | 195,400 | | | 6,984 |
Jabil Circuit | | 1,254,995 | | | 17,181 |
JDS Uniphase * | | 38,700 | | | 445 |
Juniper Networks * (A) | | 220,500 | | | 5,870 |
Kla-Tencor (A) | | 73,500 | | | 2,262 |
Lender Processing Services | | 197,690 | | | 6,710 |
Lexmark International, Cl A * | | 80,500 | | | 3,023 |
Linear Technology (A) | | 64,200 | | | 1,795 |
LSI * | | 48,800 | | | 260 |
Marvell Technology Group * | | 55,700 | | | 1,057 |
Mastercard, Cl A (A) | | 35,965 | | | 7,257 |
McAfee * | | 179,100 | | | 5,695 |
Microchip Technology (A) | | 102,000 | | | 2,841 |
Micron Technology * (A) | | 1,445,149 | | | 13,136 |
Microsoft | | 5,012,069 | | | 129,311 |
Molex (A) | | 18,600 | | | 394 |
Monster Worldwide * (A) | | 13,500 | | | 200 |
Motorola * | | 374,790 | | | 2,567 |
National Instruments | | 5,000 | | | 161 |
National Semiconductor (A) | | 120,200 | | | 1,689 |
NetApp * | | 130,600 | | | 4,921 |
Novell * | | 68,500 | | | 399 |
Novellus Systems * (A) | | 76,700 | | | 1,980 |
Nvidia * (A) | | 54,650 | | | 718 |
Oracle | | 1,719,529 | | | 38,810 |
Paychex | | 24,400 | | | 696 |
QLogic * | | 35,500 | | | 643 |
Qualcomm | | 332,300 | | | 11,817 |
Red Hat * | | 60,400 | | | 1,770 |
SAIC * | | 12,294 | | | 211 |
Salesforce.com * (A) | | 29,300 | | | 2,535 |
SanDisk * | | 24,700 | | | 1,152 |
Seagate Technology * (A) | | 1,274,416 | | | 19,575 |
Symantec * | | 515,840 | | | 7,310 |
Tech Data * | | 87,797 | | | 3,569 |
Tellabs | | 48,300 | | | 435 |
Teradata * | | 143,400 | | | 4,580 |
Teradyne * (A) | | 45,600 | | | 501 |
Texas Instruments (A) | | 1,789,272 | | | 43,694 |
Total System Services (A) | | 137,900 | | | 2,013 |
| | |
4 | | SEI Institutional Investments Trust /Annual Report/May 31, 2010 |
SCHEDULE OF INVESTMENTS
Large Cap Disciplined Equity Fund
May 31, 2010
| | | | | |
Description | | Shares | | Market Value
($ Thousands) |
Tyco Electronics | | 135,115 | | $ | 3,894 |
Visa, Cl A | | 334,526 | | | 24,240 |
Vishay Intertechnology * | | 36,400 | | | 329 |
Western Digital * | | 256,700 | | | 8,936 |
Western Union | | 135,600 | | | 2,164 |
Xerox | | 531,625 | | | 4,949 |
Xilinx (A) | | 94,800 | | | 2,318 |
Yahoo! * | | 38,000 | | | 583 |
| | | | | |
| | | | | 1,072,178 |
| | | | | |
Materials — 3.0% | | | |
Air Products & Chemicals (A) | | 131,200 | | | 9,061 |
Airgas | | 17,981 | | | 1,123 |
Alcoa (A) | | 453,500 | | | 5,279 |
Allegheny Technologies | | 7,900 | | | 432 |
Ashland (A) | | 28,400 | | | 1,522 |
Ball | | 171,700 | | | 8,456 |
Boise * (A) | | 185,100 | | | 1,136 |
Celanese, Cl A | | 478,924 | | | 13,731 |
CF Industries Holdings | | 13,300 | | | 912 |
Cliffs Natural Resources | | 14,700 | | | 821 |
Dow Chemical (A) | | 1,048,999 | | | 28,229 |
E.I. Du Pont de Nemours (A) | | 1,049,712 | | | 37,968 |
Eastman Chemical (A) | | 72,600 | | | 4,384 |
Freeport-McMoRan Copper & Gold, Cl B (A) | | 329,658 | | | 23,093 |
H.B. Fuller | | 10,800 | | | 230 |
Huntsman | | 1,052,257 | | | 10,502 |
International Flavors & | | | | | |
Fragrances | | 10,300 | | | 458 |
International Paper | | 43,800 | | | 1,018 |
MeadWestvaco (A) | | 180,100 | | | 4,304 |
Monsanto | | 60,120 | | | 3,058 |
Mosaic | | 57,500 | | | 2,655 |
Nalco Holding (A) | | 139,100 | | | 3,152 |
NewMarket | | 7,500 | | | 772 |
Newmont Mining | | 30,923 | | | 1,664 |
Nucor | | 79,300 | | | 3,414 |
Owens-Illinois * | | 309,100 | | | 9,375 |
Pactiv * | | 162,200 | | | 4,636 |
PPG Industries | | 132,554 | | | 8,493 |
Praxair (A) | | 43,100 | | | 3,345 |
Schnitzer Steel Industries, Cl A | | 30,200 | | | 1,511 |
Sealed Air | | 31,700 | | | 661 |
Sherwin-Williams | | 1,800 | | | 138 |
Solutia * | | 105,400 | | | 1,597 |
Southern Copper (A) | | 42,300 | | | 1,247 |
United States Steel | | 219,450 | | | 10,360 |
| | | | | |
| | | | | 208,737 |
| | | | | |
Telecommunication Services — 2.8% |
American Tower, Cl A * | | 8,300 | | | 336 |
AT&T | | 5,518,434 | | | 134,098 |
CenturyLink (A) | | 443,257 | | | 15,217 |
Frontier Communications (A) | | 36,400 | | | 289 |
NII Holdings * | | 147,654 | | | 5,385 |
Qwest Communications International (A) | | 312,198 | | | 1,636 |
Sprint Nextel * (A) | | 787,317 | | | 4,039 |
Verizon Communications | | 1,215,398 | | | 33,448 |
Windstream | | 67,413 | | | 719 |
| | | | | |
| | | | | 195,167 |
| | | | | |
| | | | | | |
Description | | Shares/Face Amount
($ Thousands) | | Market Value
($ Thousands) |
Utilities — 2.7% | | | |
AES * | | | 418,378 | | $ | 4,297 |
AGL Resources | | | 11,100 | | | 405 |
Allegheny Energy (A) | | | 52,331 | | | 1,071 |
Ameren | | | 46,400 | | | 1,144 |
American Electric Power | | | 291,900 | | | 9,329 |
American Water Works | | | 55,700 | | | 1,133 |
Centerpoint Energy | | | 85,100 | | | 1,159 |
CMS Energy (A) | | | 6,800 | | | 100 |
Consolidated Edison | | | 10,100 | | | 430 |
Constellation Energy Group (A) | | | 1,019,657 | | | 36,075 |
Dominion Resources | | | 17,300 | | | 674 |
DPL | | | 265,808 | | | 6,656 |
DTE Energy | | | 75,100 | | | 3,418 |
Duke Energy | | | 21,200 | | | 338 |
Edison International | | | 206,400 | | | 6,679 |
Energen | | | 83,983 | | | 3,718 |
Entergy (A) | | | 71,600 | | | 5,375 |
Equities | | | 66,500 | | | 2,606 |
Exelon | | | 956,995 | | | 36,940 |
FirstEnergy (A) | | | 96,037 | | | 3,381 |
FPL Group | | | 34,600 | | | 1,728 |
Integrys Energy Group | | | 65,000 | | | 2,939 |
Nicor | | | 24,300 | | | 982 |
NiSource (A) | | | 550,400 | | | 8,234 |
Northeast Utilities | | | 15,000 | | | 389 |
NRG Energy * (A) | | | 30,800 | | | 719 |
Oneok | | | 65,000 | | | 2,891 |
Pepco Holdings | | | 174,800 | | | 2,820 |
PG&E (A) | | | 494,712 | | | 20,531 |
Pinnacle West Capital | | | 25,000 | | | 878 |
PPL | | | 125,500 | | | 3,239 |
Public Service Enterprise Group | | | 315,206 | | | 9,655 |
Questar (A) | | | 17,100 | | | 767 |
SCANA | | | 6,100 | | | 221 |
Sempra Energy | | | 17,300 | | | 796 |
Southern | | | 9,200 | | | 301 |
TECO Energy (A) | | | 133,900 | | | 2,082 |
Wisconsin Energy | | | 6,200 | | | 304 |
Xcel Energy | | | 43,800 | | | 897 |
| | | | | | |
| | | | | | 185,301 |
| | | | | | |
Total Common Stock | | | | | | |
(Cost $5,357,245) ($ Thousands) | | | 5,859,501 |
| | | | | | |
AFFILIATED PARTNERSHIPS — 21.7% |
SEI Liquidity Fund, L.P. 0.240%**† (B) | | | 775,044,706 | | | 766,164 |
SEI LIBOR Plus Portfolio† | | | 111,582,526 | | | 746,487 |
| | | | | | |
Total Affiliated Partnerships | | | | | | |
(Cost $1,707,198) ($ Thousands) | | | 1,512,651 |
| | | | | | |
CASH EQUIVALENT — 4.9% |
SEI Daily Income Trust, Prime Obligation Fund, Cl A 0.090%**† | | | 342,669,118 | | | 342,669 |
| | | | | | |
Total Cash Equivalent | | | | | | |
(Cost $342,669) ($ Thousands) | | | 342,669 |
| | | | | | |
U.S. TREASURY OBLIGATIONS (C) (D) — 1.6% |
U.S. Treasury Bills 0.118%, 06/03/10 | | $ | 98,566 | | | 98,565 |
| | |
5 | | SEI Institutional Investments Trust /Annual Report/May 31, 2010 |
SCHEDULE OF INVESTMENTS
Large Cap Disciplined Equity Fund
May 31, 2010
| | | | | | |
Description | | Face Amount
($ Thousands) | | Market Value
($ Thousands) |
0.180%, 06/10/10 | | $ | 4,277 | | $ | 4,277 |
0.139%, 06/17/10 | | | 2,150 | | | 2,150 |
0.330%, 02/10/11 | | | 3,645 | | | 3,639 |
| | | | | | |
Total U.S. Treasury Obligations
(Cost $108,628) ($ Thousands) | | | | | | 108,631 |
| | | | | | |
Total Investments — 112.4%
(Cost $7,515,740)($ Thousands) | | | | | $ | 7,823,452 |
| | | | | | |
A summary of the open futures contracts held by the Fund at May 31, 2010, is as follows:
| | | | | | | | |
Type of Contract | | Number of
Contracts
Long (Short) | | Expiration
Date | | Unrealized
Depreciation
($ Thousands) | |
S&P 500 Composite Index | | 3,978 | | Jun-2010 | | $ | (32,209 | ) |
S&P 500 E-Mini | | 647 | | Jun-2010 | | | (1,882 | ) |
| | | | | | | | |
| | | | | | $ | (34,091 | ) |
| | | | | | | | |
For the year ended May 31, 2010, the total amount of all open futures contracts, as presented in the table above, are representative of the volume of activity for this derivative type during the period.
Percentages are based on Net Assets of $6,960,762 ($ Thousands)
| (A) | This security or a partial position of this security is on loan at May 31, 2010. The total value of securities on loan at May 31, 2010 was $743,579 ($ Thousands). |
| (B) | This security was purchased with cash collateral held from securities on loan. The total value of such securities on May 31, 2010 was $766,164 ($ Thousands). |
| (C) | The rate reported is the effective yield at time of purchase. |
| (D) | Security, or a portion thereof, has been pledged as collateral on open futures contracts. |
| * | Non-income producing security. |
| ** | Rate shown is the 7-day effective yield as of May 31, 2010. |
| † | Investment in Affiliated Security. |
| ‡ | Real Estate Investment Trust. |
Cl — Class
LIBOR — London Interbank Offered Rate
L.P. — Limited Partnership
S&P — Standard & Poor’s
| | |
6 | | SEI Institutional Investments Trust /Annual Report/May 31, 2010 |
SCHEDULE OF INVESTMENTS
Large Cap Index Fund
May 31, 2010
| | | | | |
Description | | Shares | | Market Value
($ Thousands) |
COMMON STOCK — 98.9% | | | | | |
| |
Consumer Discretionary — 11.1% | | | |
Aaron’s (A) | | 2,700 | | $ | 54 |
Abercrombie & Fitch, Cl A | | 4,302 | | | 154 |
Advance Auto Parts (A) | | 4,408 | | | 228 |
Aeropostale * | | 4,800 | | | 133 |
Amazon.com * | | 15,089 | | | 1,893 |
American Eagle Outfitters | | 8,871 | | | 116 |
Apollo Group, Cl A * | | 5,464 | | | 290 |
Autoliv | | 3,918 | | | 186 |
AutoNation * (A) | | 2,832 | | | 57 |
AutoZone * (A) | | 1,407 | | | 269 |
Barnes & Noble (A) | | 1,238 | | | 25 |
Bed Bath & Beyond * | | 12,415 | | | 557 |
Best Buy | | 16,047 | | | 678 |
Big Lots * | | 3,300 | | | 117 |
BorgWarner * | | 5,382 | | | 200 |
Boyd Gaming * (A) | | 1,651 | | | 22 |
Brinker International | | 4,483 | | | 80 |
Burger King Holdings | | 5,000 | | | 95 |
Cablevision Systems, Cl A | | 11,442 | | | 284 |
Career Education * (A) | | 3,259 | | | 91 |
Carmax * (A) | | 10,360 | | | 225 |
Carnival | | 20,800 | | | 754 |
CBS, Cl B (A) | | 29,269 | | | 426 |
Central European Media Enterprises, Cl A * (A) | | 1,800 | | | 45 |
Chico’s FAS | | 8,600 | | | 105 |
Chipotle Mexican Grill, Cl A * (A) | | 1,500 | | | 213 |
Choice Hotels International | | 1,484 | | | 49 |
Clear Channel Outdoor Holdings, Cl A * | | 700 | | | 6 |
Coach (A) | | 15,067 | | | 619 |
Comcast, Cl A | | 132,125 | | | 2,390 |
CTC Media | | 1,100 | | | 16 |
Darden Restaurants | | 6,322 | | | 271 |
DeVry (A) | | 2,900 | | | 167 |
Dick’s Sporting Goods * | | 4,258 | | | 121 |
DIRECTV, Cl A * | | 42,229 | | | 1,591 |
Discovery Communications, Cl C * | | 13,521 | | | 429 |
DISH Network, Cl A | | 9,862 | | | 206 |
Dollar General * | | 2,000 | | | 60 |
Dollar Tree * | | 4,153 | | | 260 |
DR Horton (A) | | 12,868 | | | 157 |
DreamWorks Animation SKG, Cl A * | | 3,434 | | | 102 |
Education Management * | | 1,500 | | | 32 |
Expedia | | 8,134 | | | 175 |
Family Dollar Stores (A) | | 6,462 | | | 263 |
Federal Mogul, Cl A * | | 1,500 | | | 26 |
Foot Locker | | 6,869 | | | 103 |
Ford Motor * (A) | | 151,884 | | | 1,782 |
Fortune Brands | | 7,320 | | | 347 |
GameStop, Cl A * (A) | | 7,700 | | | 176 |
Gannett (A) | | 11,259 | | | 175 |
Gap | | 22,859 | | | 498 |
Garmin (A) | | 5,300 | | | 178 |
Gentex | | 6,132 | | | 121 |
Genuine Parts | | 7,771 | | | 315 |
Goodyear Tire & Rubber * | | 11,052 | | | 131 |
Guess? (A) | | 2,900 | | | 110 |
| | | | | |
Description | | Shares | | Market Value
($ Thousands) |
H&R Block | | 16,425 | | $ | 264 |
Hanesbrands * | | 4,143 | | | 113 |
Harley-Davidson (A) | | 10,803 | | | 326 |
Harman International Industries * | | 3,568 | | | 115 |
Hasbro | | 5,867 | | | 235 |
Hillenbrand | | 2,824 | | | 69 |
Home Depot | | 78,015 | | | 2,642 |
Hyatt Hotels, Cl A * (A) | | 2,300 | | | 93 |
Interactive Data | | 1,900 | | | 62 |
International Game Technology | | 13,643 | | | 267 |
International Speedway, Cl A (A) | | 1,512 | | | 42 |
Interpublic Group * (A) | | 22,775 | | | 190 |
ITT Educational Services * (A) | | 1,621 | | | 164 |
J.C. Penney (A ) | | 10,851 | | | 298 |
Jarden | | 4,300 | | | 125 |
John Wiley & Sons, Cl A | | 1,842 | | | 73 |
Johnson Controls | | 30,445 | | | 869 |
KB Home | | 3,380 | | | 49 |
Kohl’s * | | 13,719 | | | 696 |
Lamar Advertising, Cl A * | | 2,540 | | | 75 |
Las Vegas Sands * (A) | | 13,793 | | | 324 |
Leggett & Platt | | 6,119 | | | 142 |
Lennar, Cl A (A) | | 7,230 | | | 125 |
Liberty Global, Cl A * (A) | | 12,971 | | | 335 |
Liberty Media—Capital, Ser A * | | 3,492 | | | 147 |
Liberty Media—Interactive, Cl A * | | 26,247 | | | 340 |
Liberty Media—Starz * | | 2,436 | | | 127 |
Limited Brands (A) | | 11,557 | | | 287 |
LKQ * | | 7,100 | | | 131 |
Lowe’s | | 67,510 | | | 1,671 |
Macy’s | | 18,630 | | | 414 |
Madison Square Garden, Cl A * | | 2,860 | | | 60 |
Marriott International, Cl A (A) | | 14,287 | | | 478 |
Mattel | | 17,342 | | | 376 |
McDonald’s | | 50,880 | | | 3,402 |
McGraw-Hill | | 15,039 | | | 418 |
MDC Holdings | | 1,516 | | | 48 |
Meredith (A) | | 1,358 | | | 46 |
MGM Mirage * (A) | | 8,439 | | | 105 |
Mohawk Industries * (A) | | 2,866 | | | 161 |
Morningstar * (A) | | 900 | | | 44 |
NetFlix * (A) | | 1,800 | | | 200 |
New York Times, Cl A * (A) | | 4,824 | | | 45 |
Newell Rubbermaid (A) | | 13,065 | | | 218 |
News, Cl A | | 104,085 | | | 1,374 |
NIKE, Cl B (A) | | 16,448 | | | 1,191 |
Nordstrom | | 8,112 | | | 322 |
NVR * (A) | | 224 | | | 154 |
Office Depot * | | 14,189 | | | 82 |
Omnicom Group (A) | | 13,944 | | | 529 |
O’Reilly Automotive * (A) | | 6,240 | | | 318 |
Panera Bread, Cl A * (A) | | 1,162 | | | 94 |
Penn National Gaming * | | 2,989 | | | 77 |
Penske Auto Group * | | 1,200 | | | 16 |
PetSmart | | 4,873 | | | 155 |
Phillips-Van Heusen | | 2,300 | | | 126 |
Polo Ralph Lauren, Cl A (A) | | 2,680 | | | 233 |
priceline.com * (A) | | 2,100 | | | 402 |
Pulte Homes * (A) | | 15,545 | | | 173 |
RadioShack | | 5,571 | | | 114 |
Regal Entertainment Group, Cl A | | 4,188 | | | 64 |
Ross Stores | | 5,771 | | | 302 |
Royal Caribbean Cruises * (A) | | 5,900 | | | 171 |
| | |
1 | | SEI Institutional Investments Trust /Annual Report/May 31, 2010 |
SCHEDULE OF INVESTMENTS
Large Cap Index Fund
May 31, 2010
| | | | | |
Description | | Shares | | Market Value
($ Thousands) |
Scientific Games, Cl A * (A) | | 2,366 | | $ | 24 |
Scripps Networks Interactive, Cl A | | 4,072 | | | 184 |
Sears Holdings * (A) | | 2,328 | | | 205 |
Service International | | 11,194 | | | 96 |
Signet Jewelers * | | 3,800 | | | 118 |
Stanley Black & Decker | | 7,493 | | | 418 |
Staples | | 33,964 | | | 731 |
Starbucks | | 33,406 | | | 865 |
Starwood Hotels & Resorts Worldwide | | 8,684 | | | 402 |
Strayer Education (A) | | 700 | | | 168 |
Target | | 34,485 | | | 1,881 |
Thor Industries | | 1,900 | | | 55 |
Tiffany | | 6,025 | | | 274 |
Time Warner | | 54,879 | | | 1,701 |
Time Warner Cable, Cl A | | 15,984 | | | 875 |
TJX | | 18,754 | | | 853 |
Toll Brothers * (A) | | 6,051 | | | 128 |
TRW Automotive Holdings * | | 2,793 | | | 84 |
Urban Outfitters * (A) | | 5,920 | | | 215 |
VF (A) | | 4,317 | | | 334 |
Viacom, Cl B | | 24,569 | | | 826 |
Virgin Media (A) | | 13,620 | | | 220 |
Walt Disney | | 87,172 | | | 2,913 |
Warner Music Group * | | 662 | | | 4 |
Washington Post, Cl B | | 257 | | | 120 |
Weight Watchers International (A) | | 1,662 | | | 45 |
Wendy’s, Cl A | | 19,400 | | | 87 |
Whirlpool (A) | | 3,287 | | | 343 |
Williams-Sonoma (A) | | 4,662 | | | 139 |
WMS Industries * (A) | | 2,600 | | | 120 |
Wyndham Worldwide | | 8,668 | | | 205 |
Wynn Resorts | | 3,096 | | | 260 |
Yum! Brands | | 20,948 | | | 858 |
| | | | | |
| | | | | 56,232 |
| | | | | |
Consumer Staples — 10.5% | | | | | |
Alberto-Culver, Cl B | | 3,687 | | | 102 |
Altria Group (A) | | 94,868 | | | 1,925 |
Archer-Daniels-Midland | | 29,079 | | | 735 |
Avon Products | | 20,306 | | | 538 |
BJ’s Wholesale Club * | | 2,672 | | | 107 |
Brown-Forman, Cl B | | 4,418 | | | 245 |
Bunge (A) | | 6,500 | | | 317 |
Campbell Soup (A) | | 9,578 | | | 343 |
Central European Distribution * | | 3,100 | | | 79 |
Church & Dwight | | 3,132 | | | 206 |
Clorox | | 6,603 | | | 415 |
Coca-Cola | | 106,820 | | | 5,491 |
Coca-Cola Enterprises | | 14,215 | | | 371 |
Colgate-Palmolive | | 22,875 | | | 1,786 |
ConAgra Foods | | 21,186 | | | 512 |
Constellation Brands, Cl A * | | 9,131 | | | 152 |
Corn Products International | | 3,900 | | | 130 |
Costco Wholesale (A) | | 19,781 | | | 1,152 |
CVS Caremark | | 62,552 | | | 2,166 |
Dean Foods * | | 8,087 | | | 86 |
Del Monte Foods | | 8,458 | | | 123 |
Dr. Pepper Snapple Group | | 11,300 | | | 428 |
Energizer Holdings * | | 3,341 | | | 188 |
Estee Lauder, Cl A | | 5,454 | | | 318 |
Flowers Foods (A) | | 4,100 | | | 101 |
| | | | | |
Description | | Shares | | Market Value
($ Thousands) |
General Mills | | 14,996 | | $ | 1,068 |
Green Mountain Coffee Roasters * (A) | | 5,100 | | | 121 |
Hansen Natural * | | 2,700 | | | 105 |
Herbalife | | 3,000 | | | 135 |
Hershey | | 7,498 | | | 351 |
HJ Heinz (A) | | 14,837 | | | 656 |
Hormel Foods | | 3,339 | | | 133 |
JM Smucker | | 5,711 | | | 315 |
Kellogg | | 12,103 | | | 647 |
Kimberly-Clark | | 18,918 | | | 1,148 |
Kraft Foods, Cl A | | 79,415 | | | 2,271 |
Kroger | | 31,073 | | | 626 |
Lorillard | | 7,250 | | | 518 |
McCormick | | 5,593 | | | 216 |
Mead Johnson Nutrition, Cl A | | 9,586 | | | 473 |
Molson Coors Brewing, Cl B | | 6,262 | | | 257 |
NBTY * | | 2,600 | | | 89 |
PepsiCo | | 74,552 | | | 4,689 |
Philip Morris International | | 85,368 | | | 3,766 |
Procter & Gamble | | 134,674 | | | 8,227 |
Ralcorp Holdings * | | 2,600 | | | 156 |
Reynolds American (A) | | 8,010 | | | 418 |
Rite Aid * (A) | | 19,101 | | | 22 |
Safeway | | 17,220 | | | 381 |
Sara Lee (A) | | 33,251 | | | 471 |
Smithfield Foods * (A) | | 5,975 | | | 103 |
Supervalu | | 10,789 | | | 145 |
Sysco (A) | | 26,748 | | | 797 |
Tyson Foods, Cl A | | 13,965 | | | 246 |
Walgreen | | 45,425 | | | 1,456 |
Wal-Mart Stores | | 102,079 | | | 5,161 |
Whole Foods Market * (A) | | 5,752 | | | 233 |
| | | | | |
| | | | | 53,416 |
| | | | | |
Energy — 10.5% | | | | | |
Alpha Natural Resources * | | 5,868 | | | 225 |
Anadarko Petroleum | | 22,840 | | | 1,195 |
Apache (A) | | 15,359 | | | 1,375 |
Arch Coal | | 7,712 | | | 166 |
Atwood Oceanics * | | 2,800 | | | 76 |
Baker Hughes (A) | | 19,940 | | | 761 |
Cabot Oil & Gas | | 5,100 | | | 177 |
Cameron International * | | 11,444 | | | 414 |
Chesapeake Energy (A) | | 28,166 | | | 629 |
Chevron | | 92,602 | | | 6,841 |
Cimarex Energy | | 4,000 | | | 294 |
CNX Gas * | | 800 | | | 31 |
Cobalt International Energy * | | 4,300 | | | 30 |
Comstock Resources * | | 2,400 | | | 72 |
Concho Resources * | | 3,700 | | | 193 |
ConocoPhillips | | 68,276 | | | 3,541 |
Consol Energy | | 8,744 | | | 319 |
Continental Resources * (A) | | 1,600 | | | 75 |
Denbury Resources * | | 18,124 | | | 298 |
Devon Energy | | 20,313 | | | 1,297 |
Diamond Offshore Drilling (A) | | 3,309 | | | 209 |
Dresser-Rand Group * | | 3,934 | | | 125 |
El Paso | | 33,503 | | | 380 |
EOG Resources (A) | | 11,445 | | | 1,200 |
EXCO Resources | | 6,800 | | | 117 |
Exterran Holdings * (A) | | 2,900 | | | 74 |
Exxon Mobil (A) | | 225,712 | | | 13,647 |
| | |
2 | | SEI Institutional Investments Trust /Annual Report/May 31, 2010 |
SCHEDULE OF INVESTMENTS
Large Cap Index Fund
May 31, 2010
| | | | | |
Description | | Shares | | Market Value
($ Thousands) |
FMC Technologies * (A) | | 5,660 | | $ | 329 |
Forest Oil * | | 4,914 | | | 131 |
Frontier Oil | | 4,600 | | | 64 |
Frontline | | 2,200 | | | 72 |
Halliburton | | 40,897 | | | 1,015 |
Helix Energy Solutions Group * | | 5,300 | | | 58 |
Helmerich & Payne (A) | | 5,150 | | | 194 |
Hess | | 13,112 | | | 698 |
Holly | | 2,000 | | | 52 |
Marathon Oil | | 32,176 | | | 1,000 |
Mariner Energy * (A) | | 5,200 | | | 111 |
Massey Energy | | 4,861 | | | 161 |
Murphy Oil | | 9,054 | | | 483 |
Nabors Industries * (A) | | 13,100 | | | 249 |
National Oilwell Varco | | 18,880 | | | 720 |
Newfield Exploration * | | 6,099 | | | 318 |
Noble Energy | | 8,262 | | | 492 |
Occidental Petroleum | | 37,354 | | | 3,082 |
Oceaneering International * | | 2,600 | | | 120 |
Oil States International * | | 2,600 | | | 102 |
Overseas Shipholding Group (A) | | 1,327 | | | 51 |
Patterson-UTI Energy (A) | | 8,032 | | | 113 |
Peabody Energy | | 12,674 | | | 494 |
PetroHawk Energy * | | 13,800 | | | 265 |
Pioneer Natural Resources | | 5,544 | | | 353 |
Plains Exploration & Production * | | 6,491 | | | 143 |
Pride International * | | 8,029 | | | 199 |
Quicksilver Resources * | | 5,102 | | | 62 |
Range Resources | | 7,439 | | | 334 |
Rowan * (A) | | 5,386 | | | 133 |
SandRidge Energy * (A) | | 6,400 | | | 41 |
Schlumberger (A) | | 55,100 | | | 3,094 |
SEACOR Holdings * | | 900 | | | 66 |
Seahawk Drilling * | | 535 | | | 6 |
Smith International | | 11,631 | | | 437 |
Southern Union | | 5,368 | | | 117 |
Southwestern Energy * | | 16,376 | | | 616 |
Spectra Energy (A) | | 30,509 | | | 610 |
St. Mary Land & Exploration | | 2,700 | | | 117 |
Sunoco | | 5,556 | | | 166 |
Superior Energy Services * | | 3,500 | | | 76 |
Teekay | | 2,100 | | | 53 |
Tesoro (A) | | 6,846 | | | 80 |
Tidewater | | 2,170 | | | 91 |
Unit * | | 2,127 | | | 87 |
Valero Energy | | 25,136 | | | 470 |
Whiting Petroleum * (A) | | 2,400 | | | 201 |
Williams | | 27,446 | | | 542 |
XTO Energy | | 26,388 | | | 1,128 |
| | | | | |
| | | | | 53,357 |
| | | | | |
Financials — 15.5% | | | | | |
Affiliated Managers Group * (A) | | 2,133 | | | 153 |
Aflac | | 21,256 | | | 942 |
Alexandria Real Estate Equities ‡ (A) | | 2,000 | | | 131 |
Alleghany * | | 242 | | | 71 |
Allied World Assurance Holdings | | 2,600 | | | 117 |
Allstate | | 24,225 | | | 742 |
AMB Property ‡ | | 6,644 | | | 172 |
American Express | | 46,534 | | | 1,855 |
American Financial Group | | 4,214 | | | 118 |
| | | | | |
Description | | Shares | | Market Value
($ Thousands) |
American International Group * (A) | | 6,023 | | $ | 213 |
American National Insurance | | 722 | | | 75 |
AmeriCredit * (A) | | 4,672 | | | 101 |
Ameriprise Financial | | 12,200 | | | 485 |
Annaly Capital Management ‡ | | 25,811 | | | 438 |
AON | | 13,150 | | | 519 |
Apartment Investment & Management, Cl A ‡ (A) | | 6,199 | | | 128 |
Arch Capital Group * | | 1,900 | | | 140 |
Arthur J Gallagher | | 4,804 | | | 119 |
Aspen Insurance Holdings | | 3,700 | | | 93 |
Associated Banc (A) | | 8,984 | | | 121 |
Assurant | | 5,193 | | | 180 |
AvalonBay Communities ‡ (A) | | 3,541 | | | 347 |
Axis Capital Holdings | | 6,400 | | | 195 |
Bancorpsouth (A) | | 3,600 | | | 70 |
Bank of America | | 459,518 | | | 7,233 |
Bank of Hawaii | | 1,982 | | | 95 |
Bank of New York Mellon | | 54,709 | | | 1,488 |
BB&T (A) | | 31,206 | | | 944 |
BlackRock, Cl A | | 1,485 | | | 249 |
BOK Financial (A) | | 775 | | | 39 |
Boston Properties ‡ (A) | | 6,184 | | | 474 |
Brandywine Realty Trust ‡ | | 6,600 | | | 77 |
BRE Properties ‡ (A) | | 2,920 | | | 119 |
Brown & Brown (A) | | 6,124 | | | 120 |
Camden Property Trust ‡ | | 3,247 | | | 148 |
Capital One Financial | | 20,525 | | | 848 |
CapitalSource | | 11,382 | | | 52 |
Capitol Federal Financial (A) | | 1,027 | | | 33 |
CB Richard Ellis Group, Cl A * | | 13,317 | | | 211 |
Charles Schwab (A) | | 45,085 | | | 737 |
Chimera Investment ‡ (A) | | 32,100 | | | 126 |
Chubb (A) | | 15,518 | | | 780 |
Cincinnati Financial (A) | | 6,786 | | | 185 |
Citigroup * | | 871,245 | | | 3,450 |
City National (A) | | 1,638 | | | 94 |
CME Group, Cl A | | 2,974 | | | 942 |
CNA Financial * | | 1,700 | | | 44 |
Comerica | | 8,653 | | | 330 |
Commerce Bancshares | | 3,218 | | | 120 |
Corporate Office Properties Trust ‡ | | 2,800 | | | 106 |
Cullen/Frost Bankers | | 2,368 | | | 130 |
Digital Realty Trust ‡ (A) | | 3,600 | | | 205 |
Discover Financial Services | | 26,189 | | | 352 |
Douglas Emmett ‡ (A) | | 5,400 | | | 84 |
Duke Realty ‡ | | 10,909 | | | 130 |
Eaton Vance (A) | | 5,310 | | | 159 |
Endurance Specialty Holdings (A) | | 2,200 | | | 82 |
Equity Residential ‡ | | 13,087 | | | 591 |
Erie Indemnity, Cl A | | 1,119 | | | 51 |
Essex Property Trust ‡ (A) | | 1,469 | | | 155 |
Everest Re Group | | 3,000 | | | 218 |
Federal Realty Investment Trust ‡ (A) | | 2,796 | | | 206 |
Federated Investors, Cl B (A) | | 3,658 | | | 81 |
Fidelity National Financial, Cl A | | 10,604 | | | 153 |
Fifth Third Bancorp | | 37,982 | | | 493 |
First American | | 4,584 | | | 156 |
First Citizens BancShares, Cl A | | 300 | | | 60 |
First Horizon National * | | 11,177 | | | 139 |
| | |
3 | | SEI Institutional Investments Trust /Annual Report/May 31, 2010 |
SCHEDULE OF INVESTMENTS
Large Cap Index Fund
May 31, 2010
| | | | | |
Description | | Shares | | Market Value
($ Thousands) |
First Niagara Financial Group | | 9,400 | | $ | 124 |
Forest City Enterprises, Cl A * (A) | | 5,142 | | | 68 |
Franklin Resources | | 6,803 | | | 667 |
Fulton Financial | | 8,095 | | | 80 |
Genworth Financial, Cl A * | | 23,292 | | | 363 |
GLG Partners * (A) | | 10,000 | | | 43 |
Goldman Sachs Group | | 23,175 | | | 3,343 |
Greenhill (A) | | 800 | | | 55 |
Hanover Insurance Group | | 2,193 | | | 95 |
Hartford Financial Services Group | | 20,610 | | | 517 |
HCC Insurance Holdings | | 5,641 | | | 141 |
HCP ‡ (A) | | 13,074 | | | 417 |
Health Care REIT ‡ (A) | | 5,783 | | | 249 |
Hospitality Properties Trust ‡ | | 5,966 | | | 134 |
Host Hotels & Resorts ‡ (A) | | 29,040 | | | 414 |
HRPT Properties Trust ‡ | | 11,302 | | | 76 |
Hudson City Bancorp | | 21,328 | | | 269 |
Huntington Bancshares | | 34,934 | | | 215 |
Interactive Brokers Group, Cl A * (A) | | 2,200 | | | 37 |
IntercontinentalExchange * | | 3,500 | | | 406 |
Invesco | | 19,800 | | | 368 |
Investment Technology Group * | | 1,500 | | | 25 |
Janus Capital Group | | 9,365 | | | 100 |
Jefferies Group (A) | | 5,414 | | | 126 |
Jones Lang LaSalle | | 2,100 | | | 157 |
JPMorgan Chase | | 183,534 | | | 7,264 |
Keycorp (A) | | 40,695 | | | 326 |
Kimco Realty ‡ | | 20,044 | | | 287 |
Lazard, Cl A | | 3,800 | | | 120 |
Legg Mason | | 7,681 | | | 228 |
Leucadia National * | | 8,420 | | | 185 |
Liberty Property Trust ‡ | | 5,006 | | | 154 |
Lincoln National | | 13,388 | | | 354 |
Loews | | 15,536 | | | 505 |
M&T Bank (A) | | 3,583 | | | 284 |
Macerich ‡ (A) | | 4,911 | | | 203 |
Mack-Cali Realty ‡ | | 3,798 | | | 125 |
Markel * (A) | | 450 | | | 155 |
Marsh & McLennan | | 24,665 | | | 538 |
Marshall & Ilsley | | 25,860 | | | 211 |
MBIA * (A) | | 4,859 | | | 36 |
Mercury General | | 1,196 | | | 52 |
MetLife | | 26,309 | | | 1,065 |
Moody’s (A) | | 8,627 | | | 177 |
Morgan Stanley | | 62,278 | | | 1,688 |
MSCI, Cl A * | | 4,700 | | | 139 |
NASDAQ OMX Group * | | 6,700 | | | 125 |
Nationwide Health Properties ‡ | | 5,700 | | | 202 |
New York Community Bancorp (A) | | 19,972 | | | 321 |
Northern Trust (A) | | 11,405 | | | 580 |
NYSE Euronext | | 12,700 | | | 364 |
Old Republic International (A) | | 11,490 | | | 159 |
OneBeacon Insurance Group, Cl A | | 1,100 | | | 16 |
PartnerRe | | 3,400 | | | 248 |
People’s United Financial | | 16,934 | | | 237 |
Plum Creek Timber ‡ (A) | | 7,921 | | | 277 |
PNC Financial Services Group | | 23,622 | | | 1,482 |
Popular | | 29,530 | | | 89 |
Principal Financial Group | | 14,818 | | | 403 |
Progressive | | 32,280 | | | 632 |
| | | | | |
Description | | Shares | | Market Value
($ Thousands) |
ProLogis ‡ (A) | | 22,388 | | $ | 255 |
Protective Life | | 3,509 | | | 76 |
Prudential Financial | | 21,063 | | | 1,216 |
Public Storage ‡ | | 6,368 | | | 590 |
Raymond James Financial (A) | | 4,221 | | | 119 |
Rayonier ‡ (A) | | 3,503 | | | 157 |
Realty Income ‡ (A) | | 4,600 | | | 143 |
Regency Centers ‡ (A) | | 3,308 | | | 122 |
Regions Financial | | 55,687 | | | 425 |
Reinsurance Group of America, Cl A | | 3,199 | | | 150 |
RenaissanceRe Holdings | | 2,900 | | | 157 |
SEI (C) | | 5,642 | | | 119 |
Senior Housing Properties Trust ‡ | | 5,400 | | | 113 |
Simon Property Group ‡ | | 10,981 | | | 934 |
SL Green Realty ‡ (A) | | 3,668 | | | 228 |
SLM * | | 23,114 | | | 257 |
St. Joe * (A) | | 4,761 | | | 131 |
StanCorp Financial Group | | 2,042 | | | 87 |
State Street | | 22,394 | | | 855 |
Student Loan | | 102 | | | 3 |
SunTrust Banks | | 23,646 | | | 637 |
Symetra Financial | | 2,500 | | | 33 |
Synovus Financial (A) | | 19,972 | | | 59 |
T. Rowe Price Group (A) | | 11,480 | | | 569 |
Taubman Centers ‡ (A) | | 2,200 | | | 89 |
TCF Financial (A) | | 6,301 | | | 102 |
TD Ameritrade Holding * (A) | | 13,045 | | | 231 |
TFS Financial | | 3,700 | | | 49 |
Torchmark | | 3,750 | | | 193 |
Transatlantic Holdings | | 1,355 | | | 64 |
Travelers | | 23,444 | | | 1,160 |
UDR ‡ (A) | | 7,393 | | | 150 |
Unitrin | | 2,460 | | | 66 |
Unum Group | | 16,105 | | | 372 |
US Bancorp | | 87,143 | | | 2,088 |
Validus Holdings | | 4,600 | | | 113 |
Valley National Bancorp (A) | | 8,011 | | | 116 |
Ventas ‡ (A) | | 7,644 | | | 359 |
Vornado Realty Trust ‡ | | 7,336 | | | 570 |
Waddell & Reed Financial, Cl A | | 4,100 | | | 110 |
Washington Federal | | 6,163 | | | 106 |
Weingarten Realty Investors ‡ (A) | | 4,467 | | | 93 |
Wells Fargo | | 239,166 | | | 6,862 |
Wesco Financial | | 41 | | | 14 |
White Mountains Insurance Group | | 347 | | | 113 |
Whitney Holding (A) | | 5,557 | | | 66 |
Wilmington Trust | | 4,892 | | | 74 |
WR Berkley | | 6,714 | | | 183 |
XL Capital, Cl A | | 16,800 | | | 296 |
Zions Bancorporation (A) | | 7,602 | | | 182 |
| | | | | |
| | | | | 78,990 |
| | | | | |
Health Care — 11.7% | | | |
Abbott Laboratories | | 71,176 | | | 3,385 |
Abraxis Bioscience * | | 340 | | | 15 |
Aetna | | 21,234 | | | 619 |
Alexion Pharmaceuticals * | | 4,400 | | | 220 |
Allergan | | 13,796 | | | 830 |
Allscripts-Misys Healthcare Solutions * (A) | | 2,400 | | | 45 |
AmerisourceBergen | | 13,124 | | | 411 |
| | |
4 | | SEI Institutional Investments Trust /Annual Report/May 31, 2010 |
SCHEDULE OF INVESTMENTS
Large Cap Index Fund
May 31, 2010
| | | | | |
Description | | Shares | | Market Value
($ Thousands) |
Amgen * | | 44,067 | | $ | 2,282 |
Amylin Pharmaceuticals * | | 7,200 | | | 119 |
Baxter International | | 27,575 | | | 1,164 |
Beckman Coulter | | 3,212 | | | 184 |
Becton Dickinson | | 11,344 | | | 809 |
Biogen Idec * | | 12,600 | | | 598 |
BioMarin Pharmaceutical * (A) | | 5,200 | | | 101 |
Bio-Rad Laboratories, Cl A * | | 1,000 | | | 94 |
Boston Scientific * (A) | | 70,939 | | | 429 |
Bristol-Myers Squibb | | 78,461 | | | 1,821 |
Brookdale Senior Living * (A) | | 2,500 | | | 44 |
C.R. Bard | | 4,785 | | | 387 |
Cardinal Health | | 17,229 | | | 594 |
CareFusion * | | 8,864 | | | 225 |
Celgene * | | 20,992 | | | 1,108 |
Cephalon * (A) | | 3,348 | | | 197 |
Cerner * (A) | | 3,074 | | | 258 |
Charles River Laboratories International * (A) | | 2,843 | | | 95 |
CIGNA | | 12,055 | | | 404 |
Community Health Systems * | | 4,062 | | | 158 |
Cooper (A) | | 2,304 | | | 85 |
Covance * | | 3,036 | | | 160 |
Coventry Health Care * | | 7,462 | | | 154 |
DaVita * | | 4,708 | | | 299 |
Dendreon * (A) | | 6,600 | | | 286 |
Dentsply International | | 6,898 | | | 224 |
Edwards Lifesciences * | | 5,214 | | | 263 |
Eli Lilly (A) | | 46,361 | | | 1,520 |
Emdeon, Cl A * | | 1,900 | | | 26 |
Endo Pharmaceuticals Holdings * | | 6,197 | | | 130 |
Express Scripts * | | 12,522 | | | 1,260 |
Forest Laboratories * | | 14,373 | | | 372 |
Gen-Probe * | | 2,227 | | | 98 |
Genzyme * | | 12,853 | | | 625 |
Gilead Sciences * | | 41,450 | | | 1,489 |
Health Management Associates, Cl A * (A) | | 12,422 | | | 116 |
Health Net * | | 4,702 | | | 116 |
Henry Schein * | | 4,184 | | | 236 |
Hill-Rom Holdings | | 2,724 | | | 76 |
Hologic * | | 12,000 | | | 179 |
Hospira * (A) | | 7,681 | | | 400 |
Humana * | | 8,175 | | | 376 |
Idexx Laboratories * (A) | | 2,952 | | | 187 |
Illumina * (A) | | 5,700 | | | 240 |
Intuitive Surgical * (A) | | 1,800 | | | 581 |
Inverness Medical Innovations * (A) | | 3,600 | | | 125 |
Johnson & Johnson | | 127,309 | | | 7,422 |
Kinetic Concepts * | | 3,113 | | | 129 |
King Pharmaceuticals * (A) | | 12,426 | | | 108 |
Laboratory Corp of America Holdings * | | 5,211 | | | 394 |
Life Technologies * | | 8,370 | | | 419 |
LifePoint Hospitals * | | 2,376 | | | 84 |
Lincare Holdings (A) | | 3,027 | | | 142 |
McKesson (A) | | 12,366 | | | 866 |
Medco Health Solutions * | | 20,820 | | | 1,200 |
Mednax * | | 2,000 | | | 113 |
Medtronic | | 51,385 | | | 2,013 |
Merck | | 140,743 | | | 4,742 |
Mettler Toledo International * | | 1,536 | | | 176 |
| | | | | |
Description | | Shares | | Market Value
($ Thousands) |
Millipore * | | 2,586 | | $ | 275 |
Mylan Laboratories * (A) | | 14,119 | | | 275 |
Myriad Genetics * | | 4,500 | | | 82 |
Omnicare | | 5,431 | | | 136 |
OSI Pharmaceuticals * | | 2,600 | | | 149 |
Patterson (A) | | 4,783 | | | 142 |
PerkinElmer | | 6,034 | | | 137 |
Perrigo (A) | | 3,800 | | | 226 |
Pfizer | | 372,180 | | | 5,668 |
Pharmaceutical Product Development | | 5,384 | | | 145 |
Quest Diagnostics | | 7,444 | | | 393 |
ResMed * | | 3,555 | | | 224 |
St. Jude Medical * | | 15,146 | | | 566 |
Stryker (A) | | 15,304 | | | 812 |
Talecris Biotherapeutics Holdings * | | 2,700 | | | 45 |
Techne | | 1,541 | | | 93 |
Teleflex | | 2,040 | | | 114 |
Tenet Healthcare * | | 23,094 | | | 132 |
Thermo Fisher Scientific * | | 19,025 | | | 990 |
United Therapeutics * | | 2,200 | | | 113 |
UnitedHealth Group | | 54,529 | | | 1,585 |
Universal Health Services,
Cl B | | 4,376 | | | 185 |
Valeant Pharmaceuticals International * (A) | | 3,400 | | | 158 |
Varian Medical Systems * | | 6,130 | | | 307 |
VCA Antech * | | 3,539 | | | 92 |
Vertex Pharmaceuticals * (A) | | 9,100 | | | 315 |
Waters * | | 4,472 | | | 306 |
Watson Pharmaceuticals * | | 4,918 | | | 217 |
WellPoint * | | 20,331 | | | 1,043 |
Zimmer Holdings * | | 9,425 | | | 527 |
| | | | | |
| | | | | 59,479 |
| | | | | |
Industrials — 10.7% | | | | | |
3M | | 31,946 | | | 2,534 |
A123 Systems * (A) | | 1,800 | | | 16 |
Aecom Technology * | | 4,800 | | | 122 |
AGCO * | | 4,700 | | | 135 |
Alexander & Baldwin (A) | | 1,782 | | | 57 |
Alliant Techsystems * (A) | | 1,636 | | | 113 |
Ametek | | 5,047 | | | 205 |
AMR * (A) | | 17,086 | | | 131 |
Armstrong World
Industries * | | 700 | | | 26 |
Avery Dennison | | 5,310 | | | 182 |
BE Aerospace * | | 4,800 | | | 130 |
Boeing (A) | | 33,391 | | | 2,143 |
Brink’s | | 1,800 | | | 41 |
Bucyrus International, Cl A | | 4,000 | | | 214 |
C.H. Robinson Worldwide (A) | | 8,086 | | | 470 |
Carlisle | | 2,666 | | | 104 |
Caterpillar (A) | | 27,588 | | | 1,676 |
Cintas (A) | | 6,157 | | | 160 |
Continental Airlines, Cl B * (A) | | 6,800 | | | 143 |
Con-way (A) | | 2,223 | | | 75 |
Copa Holdings, Cl A (A) | | 1,600 | | | 82 |
Copart * | | 3,213 | | | 115 |
Corrections of America * | | 5,600 | | | 112 |
Covanta Holding * | | 6,200 | | | 96 |
Crane | | 2,400 | | | 78 |
CSX | | 17,832 | | | 932 |
Cummins | | 9,612 | | | 653 |
| | |
5 | | SEI Institutional Investments Trust /Annual Report/May 31, 2010 |
SCHEDULE OF INVESTMENTS
Large Cap Index Fund
May 31, 2010
| | | | | |
Description | | Shares | | Market Value
($ Thousands) |
Danaher | | 11,751 | | $ | 933 |
Deere | | 19,318 | | | 1,114 |
Delta Air Lines * (A) | | 34,500 | | | 469 |
Donaldson | | 3,772 | | | 163 |
Dover | | 8,957 | | | 402 |
Dun & Bradstreet | | 2,456 | | | 179 |
Eaton | | 7,826 | | | 547 |
Emerson Electric | | 34,420 | | | 1,598 |
Equifax | | 6,156 | | | 186 |
Expeditors International Washington | | 10,148 | | | 388 |
Fastenal (A) | | 6,462 | | | 326 |
FedEx | | 14,244 | | | 1,189 |
First Solar * (A) | | 2,500 | | | 281 |
Flowserve | | 2,600 | | | 247 |
Fluor (A) | | 8,508 | | | 399 |
FTI Consulting * (A) | | 2,400 | | | 103 |
Gardner Denver | | 2,300 | | | 105 |
GATX (A) | | 2,100 | | | 61 |
General Cable * | | 2,500 | | | 78 |
General Dynamics | | 15,772 | | | 1,071 |
General Electric | | 489,423 | | | 8,002 |
Goodrich | | 5,992 | | | 416 |
Graco | | 2,624 | | | 83 |
Harsco | | 3,470 | | | 94 |
Hertz Global Holdings * (A) | | 9,400 | | | 107 |
Honeywell International | | 34,090 | | | 1,458 |
Hubbell, Cl B | | 2,892 | | | 123 |
IDEX | | 3,593 | | | 110 |
IHS, Cl A * | | 2,200 | | | 114 |
Illinois Tool Works | | 20,380 | | | 946 |
Iron Mountain | | 8,963 | | | 220 |
ITT | | 8,602 | | | 415 |
Jacobs Engineering Group * (A) | | 6,102 | | | 255 |
JB Hunt Transport Services (A) | | 3,972 | | | 137 |
Joy Global | | 4,633 | | | 236 |
Kansas City Southern * | | 4,500 | | | 172 |
KAR Auction Services * | | 2,100 | | | 29 |
KBR (A) | | 7,284 | | | 160 |
Kennametal | | 4,200 | | | 119 |
Kirby * | | 2,300 | | | 91 |
L-3 Communications Holdings, Cl 3 | | 5,577 | | | 461 |
Landstar System | | 2,165 | | | 91 |
Lennox International | | 2,300 | | | 103 |
Lincoln Electric Holdings | | 2,200 | | | 123 |
Lockheed Martin | | 13,729 | | | 1,097 |
Manitowoc | | 5,700 | | | 68 |
Manpower | | 3,684 | | | 168 |
Masco | | 17,809 | | | 238 |
McDermott International * | | 11,300 | | | 251 |
MSC Industrial Direct, Cl A (A) | | 2,120 | | | 109 |
Navistar International * (A) | | 3,000 | | | 163 |
Norfolk Southern | | 16,733 | | | 945 |
Northrop Grumman | | 13,778 | | | 833 |
Oshkosh Truck * | | 4,259 | | | 151 |
Owens Corning * | | 4,200 | | | 140 |
Paccar (A) | | 17,270 | | | 708 |
Pall | | 5,545 | | | 189 |
Parker Hannifin | | 7,604 | | | 467 |
Pentair | | 4,961 | | | 171 |
Pitney Bowes | | 10,285 | | | 233 |
Precision Castparts | | 6,346 | | | 741 |
| | | | | |
Description | | Shares | | Market Value
($ Thousands) |
Quanta Services * | | 9,200 | | $ | 191 |
Raytheon | | 17,868 | | | 936 |
Republic Services, Cl A | | 15,342 | | | 447 |
Robert Half International (A) | | 6,876 | | | 174 |
Rockwell Automation | | 6,504 | | | 348 |
Rockwell Collins | | 7,562 | | | 441 |
Roper Industries | | 4,200 | | | 244 |
RR Donnelley & Sons | | 9,677 | | | 185 |
Ryder System | | 2,106 | | | 94 |
Shaw Group * | | 4,300 | | | 146 |
Snap-On | | 2,991 | | | 132 |
Southwest Airlines | | 35,620 | | | 443 |
Spirit Aerosystems Holdings, Cl A * | | 4,700 | | | 92 |
SPX | | 2,211 | | | 131 |
Stericycle * | | 3,826 | | | 224 |
SunPower, Cl A * (A) | | 4,400 | | | 58 |
Terex * | | 5,648 | | | 123 |
Textron (A) | | 13,222 | | | 273 |
Thomas & Betts * | | 2,867 | | | 110 |
Timken | | 4,260 | | | 123 |
Toro (A) | | 1,560 | | | 84 |
TransDigm Group | | 2,000 | | | 105 |
Trinity Industries (A) | | 3,500 | | | 77 |
Tyco International | | 100 | | | 3 |
Union Pacific | | 23,116 | | | 1,651 |
United Parcel Service, Cl B | | 31,741 | | | 1,992 |
United Technologies | | 38,466 | | | 2,592 |
URS * | | 4,100 | | | 183 |
USG * (A) | | 2,298 | | | 40 |
UTi Worldwide | | 5,100 | | | 74 |
Valmont Industries | | 1,000 | | | 79 |
Verisk Analytics, Cl A * | | 4,500 | | | 136 |
WABCO Holdings * | | 3,424 | | | 104 |
Wabtec (A) | | 2,400 | | | 104 |
Waste Connections * | | 3,900 | | | 137 |
Waste Management | | 22,194 | | | 722 |
WESCO International * | | 2,000 | | | 75 |
WW Grainger | | 2,681 | | | 273 |
| | | | | |
| | | | | 54,667 |
| | | | | |
Information Technology — 18.5% |
Activision Blizzard | | 26,756 | | | 288 |
Adobe Systems * | | 23,702 | | | 760 |
Advanced Micro Devices * (A) | | 26,734 | | | 229 |
Agilent Technologies * | | 16,264 | | | 526 |
Akamai Technologies * (A) | | 8,118 | | | 323 |
Alliance Data Systems * (A) | | 2,612 | | | 185 |
Altera (A) | | 14,273 | | | 336 |
Amdocs * (A) | | 8,900 | | | 254 |
Amphenol, Cl A | | 7,892 | | | 335 |
Analog Devices (A) | | 13,912 | | | 406 |
Ansys * | | 4,100 | | | 179 |
AOL * (A) | | 5,034 | | | 104 |
Apple * | | 41,223 | | | 10,601 |
Applied Materials | | 60,155 | | | 777 |
Arrow Electronics * | | 6,089 | | | 166 |
Atmel * | | 18,900 | | | 97 |
Autodesk * | | 9,937 | | | 291 |
Automatic Data Processing | | 22,792 | | | 932 |
Avnet * | | 7,410 | | | 213 |
AVX | | 1,424 | | | 20 |
BMC Software * | | 8,989 | | | 333 |
| | |
6 | | SEI Institutional Investments Trust /Annual Report/May 31, 2010 |
SCHEDULE OF INVESTMENTS
Large Cap Index Fund
May 31, 2010
| | | | | |
Description | | Shares | | Market Value
($ Thousands) |
Broadcom, Cl A (A) | | 22,268 | | $ | 769 |
Broadridge Financial Solutions | | 7,073 | | | 135 |
Brocade Communications Systems * | | 22,200 | | | 121 |
CA | | 18,738 | | | 379 |
Cadence Design Systems * | | 13,063 | | | 87 |
Ciena * (A) | | 4,114 | | | 64 |
Cisco Systems * (A) | | 266,427 | | | 6,170 |
Citrix Systems * (A) | | 8,687 | | | 379 |
Cognizant Technology Solutions,
Cl A * | | 13,788 | | | 690 |
CommScope * | | 3,700 | | | 104 |
Computer Sciences | | 7,264 | | | 363 |
Compuware * | | 11,951 | | | 98 |
Convergys * | | 5,569 | | | 61 |
Corning | | 70,958 | | | 1,237 |
Cree * | | 5,022 | | | 333 |
Cypress Semiconductor * | | 7,200 | | | 82 |
Dell * | | 78,043 | | | 1,040 |
Diebold | | 2,729 | | | 79 |
Dolby Laboratories, Cl A * (A) | | 2,643 | | | 174 |
DST Systems | | 1,695 | | | 65 |
eBay * | | 51,011 | | | 1,092 |
EchoStar, Cl A * | | 2,132 | | | 45 |
Electronic Arts * | | 15,865 | | | 262 |
EMC * | | 92,264 | | | 1,718 |
Equinix * (A) | | 1,700 | | | 156 |
F5 Networks * | | 3,738 | | | 263 |
Factset Research Systems (A) | | 1,800 | | | 122 |
Fairchild Semiconductor International, Cl A * (A) | | 6,600 | | | 66 |
Fidelity National Information Services | | 15,690 | | | 432 |
Fiserv * | | 7,469 | | | 355 |
FLIR Systems * | | 6,800 | | | 194 |
Genpact * | | 3,100 | | | 52 |
Global Payments (A) | | 3,734 | | | 158 |
Google, Cl A * | | 11,044 | | | 5,358 |
Harris | | 6,189 | | | 290 |
Hewitt Associates, Cl A * | | 3,863 | | | 144 |
Hewlett-Packard | | 110,401 | | | 5,080 |
IAC * | | 3,532 | | | 83 |
Ingram Micro, Cl A * | | 7,023 | | | 119 |
Integrated Device Technology * | | 5,600 | | | 33 |
Intel | | 257,858 | | | 5,523 |
International Business Machines | | 61,098 | | | 7,653 |
International Rectifier * | | 3,355 | | | 70 |
Intersil, Cl A (A) | | 5,361 | | | 71 |
Intuit * | | 15,386 | | | 550 |
Itron * | | 1,900 | | | 127 |
Jabil Circuit | | 9,174 | | | 125 |
JDS Uniphase * | | 10,640 | | | 122 |
Juniper Networks * (A) | | 24,925 | | | 664 |
Kla-Tencor | | 7,809 | | | 240 |
Lam Research * | | 5,891 | | | 223 |
Lender Processing Services | | 4,714 | | | 160 |
Lexmark International, Cl A * | | 3,986 | | | 150 |
Linear Technology (A) | | 10,857 | | | 304 |
LSI * | | 31,948 | | | 170 |
Marvell Technology Group * | | 24,500 | | | 465 |
Mastercard, Cl A (A) | | 4,000 | | | 807 |
Maxim Integrated Products (A) | | 15,100 | | | 268 |
McAfee * | | 7,573 | | | 241 |
| | | | | |
Description | | Shares | | Market Value
($ Thousands) |
MEMC Electronic Materials * (A) | | 10,338 | | $ | 117 |
Microchip Technology (A) | | 8,422 | | | 235 |
Micron Technology * (A) | | 41,116 | | | 374 |
Micros Systems * | | 3,600 | | | 123 |
Microsoft | | 356,300 | | | 9,193 |
Molex (A) | | 6,370 | | | 135 |
Monster Worldwide * | | 5,218 | | | 77 |
Motorola * (A) | | 108,934 | | | 746 |
National Instruments | | 2,536 | | | 82 |
National Semiconductor | | 11,556 | | | 162 |
NCR * | | 6,689 | | | 89 |
NetApp * | | 15,555 | | | 586 |
NeuStar, Cl A * | | 3,900 | | | 83 |
Novell * | | 15,326 | | | 89 |
Novellus Systems * (A) | | 4,377 | | | 113 |
Nuance Communications * | | 11,600 | | | 198 |
Nvidia * (A) | | 26,056 | | | 342 |
ON Semiconductor * (A) | | 19,200 | | | 140 |
Oracle | | 176,267 | | | 3,978 |
Paychex (A) | | 15,307 | | | 437 |
PMC—Sierra * | | 12,100 | | | 98 |
QLogic * (A) | | 5,980 | | | 108 |
Qualcomm | | 76,150 | | | 2,708 |
Rambus * (A) | | 4,500 | | | 106 |
Red Hat * | | 8,527 | | | 250 |
Rovi * (A) | | 4,800 | | | 179 |
SAIC * | | 18,100 | | | 311 |
Salesforce.com * (A) | | 4,838 | | | 419 |
SanDisk * | | 10,543 | | | 491 |
Seagate Technology * (A) | | 21,600 | | | 332 |
Silicon Laboratories * (A) | | 2,200 | | | 100 |
Sohu.com * | | 1,400 | | | 62 |
Sybase * | | 3,900 | | | 251 |
Symantec * | | 39,048 | | | 553 |
Synopsys * | | 6,882 | | | 147 |
Tech Data * | | 2,250 | | | 91 |
Tellabs | | 17,289 | | | 156 |
Teradata * | | 7,989 | | | 255 |
Teradyne * (A) | | 8,863 | | | 97 |
Texas Instruments | | 58,308 | | | 1,424 |
Total System Services (A) | | 8,391 | | | 122 |
Trimble Navigation * (A) | | 6,114 | | | 176 |
Varian Semiconductor Equipment Associates * | | 3,200 | | | 100 |
VeriSign * (A) | | 8,985 | | | 251 |
Visa, Cl A | | 20,600 | | | 1,493 |
Vishay Intertechnology * | | 9,550 | | | 86 |
VMware, Cl A * (A) | | 2,500 | | | 166 |
WebMD Health, Cl A * | | 2,422 | | | 110 |
Western Digital * | | 10,630 | | | 370 |
Western Union | | 33,128 | | | 529 |
Xerox | | 58,996 | | | 550 |
Xilinx (A) | | 13,357 | | | 327 |
Yahoo! * | | 53,881 | | | 827 |
Zebra Technologies, Cl A * | | 3,025 | | | 83 |
| | | | | |
| | | | | 94,367 |
| | | | | |
Materials — 3.9% | | | | | |
Air Products & Chemicals | | 9,494 | | | 656 |
Airgas | | 4,015 | | | 251 |
AK Steel Holding | | 5,300 | | | 79 |
Albemarle | | 4,444 | | | 191 |
Alcoa | | 46,402 | | | 540 |
| | |
7 | | SEI Institutional Investments Trust /Annual Report/May 31, 2010 |
SCHEDULE OF INVESTMENTS
Large Cap Index Fund
May 31, 2010
| | | | | |
Description | | Shares | | Market Value
($ Thousands) |
Allegheny Technologies (A) | | 4,697 | | $ | 257 |
Aptargroup | | 3,500 | | | 139 |
Ashland | | 3,476 | | | 186 |
Ball | | 4,575 | | | 225 |
Bemis | | 4,774 | | | 137 |
Cabot | | 3,373 | | | 95 |
Carpenter Technology | | 2,300 | | | 90 |
Celanese, Cl A | | 7,783 | | | 223 |
CF Industries Holdings (A) | | 2,866 | | | 197 |
Cliffs Natural Resources | | 5,800 | | | 324 |
Commercial Metals | | 4,900 | | | 76 |
Compass Minerals International | | 1,600 | | | 122 |
Crown Holdings * | | 7,451 | | | 175 |
Cytec Industries | | 2,381 | | | 102 |
Dow Chemical | | 50,870 | | | 1,369 |
E.I. Du Pont de Nemours | | 41,392 | | | 1,497 |
Eagle Materials (A) | | 2,000 | | | 61 |
Eastman Chemical (A) | | 3,642 | | | 220 |
Ecolab | | 10,591 | | | 500 |
FMC | | 3,460 | | | 210 |
Freeport-McMoRan Copper & Gold, Cl B (A) | | 19,712 | | | 1,381 |
Greif, Cl A | | 1,500 | | | 82 |
Huntsman | | 8,329 | | | 83 |
International Flavors & Fragrances | | 3,991 | | | 178 |
International Paper | | 20,655 | | | 480 |
Intrepid Potash * (A) | | 1,500 | | | 37 |
Lubrizol | | 3,234 | | | 286 |
Martin Marietta Materials (A) | | 1,963 | | | 183 |
MeadWestvaco | | 8,258 | | | 197 |
Monsanto | | 24,950 | | | 1,269 |
Mosaic | | 7,578 | | | 350 |
Nalco Holding | | 7,017 | | | 159 |
Newmont Mining | | 21,833 | | | 1,175 |
Nucor | | 14,790 | | | 637 |
Owens-Illinois * | | 7,791 | | | 236 |
Packaging of America | | 4,599 | | | 102 |
Pactiv * | | 6,183 | | | 177 |
PPG Industries | | 7,823 | | | 501 |
Praxair (A) | | 14,025 | | | 1,088 |
Reliance Steel & Aluminum | | 2,900 | | | 133 |
Royal Gold (A) | | 2,200 | | | 110 |
RPM International | | 6,269 | | | 124 |
Schnitzer Steel Industries, Cl A | | 1,000 | | | 50 |
Scotts Miracle-Gro, Cl A | | 2,406 | | | 107 |
Sealed Air | | 7,768 | | | 162 |
Sherwin-Williams (A) | | 4,237 | | | 325 |
Sigma-Aldrich (A) | | 5,948 | | | 317 |
Sonoco Products | | 5,046 | | | 156 |
Southern Copper (A) | | 8,748 | | | 258 |
Steel Dynamics | | 10,100 | | | 148 |
Temple-Inland | | 5,375 | | | 114 |
Titanium Metals * | | 3,358 | | | 59 |
United States Steel (A) | | 6,583 | | | 311 |
Valspar | | 4,764 | | | 149 |
Vulcan Materials (A) | | 5,757 | | | 291 |
Walter Industries | | 2,400 | | | 190 |
Weyerhaeuser | | 10,078 | | | 429 |
| | | | | |
| | | | | 19,956 |
| | | | | |
| | | | | |
Description | | Shares | | Market Value
($ Thousands) |
Telecommunication Services — 2.8% | | | |
American Tower, Cl A * | | 18,022 | | $ | 730 |
AT&T | | 272,533 | | | 6,623 |
CenturyLink (A) | | 14,175 | | | 487 |
Clearwire, Cl A * (A) | | 2,500 | | | 20 |
Crown Castle International * | | 13,796 | | | 511 |
Frontier Communications (A) | | 12,955 | | | 103 |
Leap Wireless International * (A) | | 2,900 | | | 47 |
Level 3 Communications * (A) | | 84,300 | | | 113 |
MetroPCS Communications * | | 11,800 | | | 106 |
NII Holdings * | | 7,720 | | | 282 |
Qwest Communications International | | 71,796 | | | 376 |
SBA Communications, Cl A * (A) | | 5,300 | | | 175 |
Sprint Nextel * | | 132,344 | | | 679 |
Telephone & Data Systems | | 4,102 | | | 135 |
tw telecom , Cl A * | | 7,400 | | | 129 |
US Cellular * | | 831 | | | 35 |
Verizon Communications | | 130,915 | | | 3,603 |
Windstream | | 20,347 | | | 217 |
| | | | | |
| | | | | 14,371 |
| | | | | |
Utilities — 3.7% | | | | | |
AES * | | 31,624 | | | 325 |
AGL Resources | | 3,947 | | | 144 |
Allegheny Energy | | 7,566 | | | 155 |
Alliant Energy | | 5,176 | | | 166 |
Ameren | | 11,290 | | | 278 |
American Electric Power | | 22,650 | | | 724 |
American Water Works | | 2,900 | | | 59 |
Aqua America (A) | | 6,977 | | | 122 |
Atmos Energy | | 4,691 | | | 127 |
Calpine * | | 14,900 | | | 204 |
Centerpoint Energy | | 18,715 | | | 255 |
CMS Energy (A) | | 11,342 | | | 167 |
Consolidated Edison (A) | | 12,816 | | | 546 |
Constellation Energy Group | | 8,358 | | | 296 |
Dominion Resources | | 26,912 | | | 1,049 |
DPL | | 5,446 | | | 136 |
DTE Energy | | 7,964 | | | 362 |
Duke Energy (A) | | 58,519 | | | 934 |
Dynegy, Cl A * (A) | | 4,503 | | | 24 |
Edison International | | 15,479 | | | 501 |
Energen | | 3,537 | | | 157 |
Entergy | | 9,198 | | | 690 |
Equities | | 7,066 | | | 277 |
Exelon | | 30,029 | | | 1,159 |
FirstEnergy | | 14,181 | | | 499 |
FPL Group | | 18,673 | | | 932 |
Great Plains Energy | | 6,471 | | | 114 |
Hawaiian Electric Industries (A) | | 3,746 | | | 82 |
Integrys Energy Group (A) | | 3,702 | | | 167 |
ITC Holdings | | 2,400 | | | 127 |
MDU Resources Group | | 8,621 | | | 161 |
Mirant * | | 6,461 | | | 80 |
National Fuel Gas | | 3,289 | | | 160 |
NiSource | | 12,821 | | | 192 |
Northeast Utilities | | 7,907 | | | 205 |
NRG Energy * (A) | | 12,700 | | | 296 |
NSTAR | | 5,028 | | | 177 |
NV Energy | | 10,800 | | | 127 |
| | |
8 | | SEI Institutional Investments Trust /Annual Report/May 31, 2010 |
SCHEDULE OF INVESTMENTS
Large Cap Index Fund
May 31, 2010
| | | | | | |
Description | | Shares/Face Amount
($ Thousands) | | Market Value
($ Thousands) |
OGE Energy | | | 4,568 | | $ | 166 |
Oneok | | | 4,929 | | | 219 |
Ormat Technologies (A) | | | 1,000 | | | 28 |
Pepco Holdings | | | 10,044 | | | 162 |
PG&E (A) | | | 17,518 | | | 727 |
Pinnacle West Capital | | | 4,792 | | | 168 |
PPL | | | 18,126 | | | 468 |
Progress Energy | | | 13,261 | | | 512 |
Public Service Enterprise Group | | | 24,052 | | | 737 |
Questar (A) | | | 8,346 | | | 374 |
RRI Energy * | | | 14,659 | | | 65 |
SCANA | | | 5,420 | | | 197 |
Sempra Energy | | | 11,523 | | | 530 |
Southern | | | 37,003 | | | 1,210 |
TECO Energy (A) | | | 10,600 | | | 165 |
UGI | | | 4,850 | | | 127 |
Vectren | | | 3,491 | | | 80 |
Westar Energy | | | 5,300 | | | 117 |
Wisconsin Energy | | | 5,749 | | | 282 |
Xcel Energy (A) | | | 21,681 | | | 444 |
| | | | | | |
| | | | | | 18,954 |
| | | | | | |
Total Common Stock (Cost $412,460)
($ Thousands) | | | 503,789 |
| | | | | | |
AFFILIATED PARTNERSHIP — 13.4% |
SEI Liquidity Fund, L.P. 0.240%(B)**† | | | 69,016,757 | | | 68,233 |
| | | | | | |
Total Affiliated Partnership | | | | | | |
(Cost $69,016) ($ Thousands) | | | 68,233 |
| | | | | | |
CASH EQUIVALENT — 1.1% | | | |
SEI Daily Income Trust, Prime Obligation Fund, Cl A 0.090%**† | | | 5,427,614 | | | 5,428 |
| | | | | | |
Total Cash Equivalent | | | | | | |
(Cost $5,428) ($ Thousands) | | | 5,428 |
| | | | | | |
U.S. TREASURY OBLIGATION (D) (E) — 0.2% |
U.S. Treasury Bill 0.140%, 06/17/10 | | $ | 828 | | | 828 |
| | | | | | |
Total U.S. Treasury Obligation | | | |
(Cost $828) ($ Thousands) | | | 828 |
| | | | | | |
Total Investments — 113.6% | | | |
(Cost $487,732)($ Thousands) | | $ | 578,278 |
| | | | | | |
A summary of the open futures contracts held by the Fund at May 31, 2010, is as follows:
| | | | | | | | |
Type of Contracts | | Number of
Contract
Long (Short) | | Expiration
Date | | Unrealized
Depreciation
($ Thousands) | |
S&P 500 E-Mini | | 137 | | Jun-2010 | | $ | (394 | ) |
S&P Mid 400 E-Mini | | 6 | | Jun-2010 | | | (12 | ) |
| | | | | | | | |
| | | | | | $ | (406 | ) |
| | | | | | | | |
For the year ended May 31, 2010, the total amount of all open futures contracts, as presented in the table above, are representative of the volume of activity for this derivative type during the period.
Percentages are based on Net Assets of $509,120 ($ Thousands).
| (A) | This security or a partial position of this security is on loan at May 31, 2010. The total value of securities on loan at May 31, 2010 was $66,147 ($ Thousands). |
| (B) | This security was purchased with cash collateral held from securities on loan. The total value of such securities on May 31, 2010 was $68,233 ($ Thousands). |
| (C) | The Fund may purchase securities of certain companies with which it is affiliated to the extent these companies are represented in its benchmark index. |
| (D) | Security, or a portion thereof, has been pledged as collateral on open futures contracts. |
| (E) | The rate reported is the effective yield at time of purchase. |
| * | Non-income producing security. |
| ** | The rate reported is the 7-day effective yield as of May 31, 2010. |
| † | Investment in Affiliated Security. |
| ‡ | Real Estate Investment Trust. |
Cl — Class
L.P. — Limited Partnership
S&P — Standard & Poor’s
| | |
9 | | SEI Institutional Investments Trust /Annual Report/May 31, 2010 |
SCHEDULE OF INVESTMENTS
Small Cap Fund
May 31, 2010
| | | | | |
Description | | Shares | | Market Value
($ Thousands) |
COMMON STOCK — 96.8% | | | | | |
Consumer Discretionary — 13.8% | | | |
Aaron’s | | 29,600 | | $ | 591 |
Abercrombie & Fitch, Cl A | | 14,628 | | | 524 |
American Axle & Manufacturing Holdings * | | 34,100 | | | 306 |
American Eagle Outfitters | | 52,900 | | | 693 |
American Greetings,
Cl A (A) | | 90,100 | | | 2,125 |
American Public Education * | | 116,228 | | | 4,753 |
America’s Car-Mart * | | 28,900 | | | 700 |
Amerigon * (A) | | 63,619 | | | 561 |
Ameristar Casinos (A) | | 42,500 | | | 766 |
AnnTaylor Stores * | | 38,000 | | | 823 |
Arctic Cat * | | 54,500 | | | 625 |
Ascent Media, Cl A * | | 2,100 | | | 56 |
Barnes & Noble | | 41,500 | | | 840 |
Beazer Homes USA * | | 88,400 | | | 439 |
Bebe Stores | | 21,823 | | | 149 |
Belo, Cl A | | 126,757 | | | 922 |
Big Lots * (A) | | 37,000 | | | 1,307 |
Bluegreen * | | 7,325 | | | 35 |
Blyth | | 11,331 | | | 563 |
Bob Evans Farms | | 24,900 | | | 723 |
Boyd Gaming * (A) | | 2,000 | | | 26 |
Brinker International | | 20,200 | | | 359 |
Brown Shoe | | 81,200 | | | 1,354 |
Brunswick (A) | | 105,400 | | | 1,841 |
Buckle | | 10,200 | | | 363 |
Buffalo Wild Wings * | | 29,878 | | | 1,102 |
Cabela’s * (A) | | 97,950 | | | 1,686 |
California Pizza Kitchen * (A) | | 62,484 | | | 1,139 |
Callaway Golf (A) | | 95,399 | | | 803 |
Capella Education * (A) | | 23,523 | | | 2,021 |
Career Education * (A) | | 7,600 | | | 213 |
Carter’s * | | 47,200 | | | 1,442 |
Casual Male Retail Group * | | 173,800 | | | 652 |
Cato, Cl A (A) | | 172,237 | | | 4,087 |
Century Casinos * | | 65,685 | | | 150 |
Charming Shoppes * | | 78,400 | | | 357 |
Cheesecake Factory * (A) | | 1,700 | | | 43 |
Chico’s FAS | | 7,800 | | | 95 |
Childrens Place Retail Stores * (A) | | 5,600 | | | 264 |
Christopher & Banks | | 69,729 | | | 639 |
Citi Trends * | | 1,400 | | | 48 |
CKE Restaurants | | 17,100 | | | 211 |
Collective Brands * | | 34,400 | | | 770 |
Cooper Tire & Rubber | | 123,381 | | | 2,333 |
Corinthian Colleges * (A) | | 96,300 | | | 1,289 |
Cracker Barrel Old Country Store (A) | | 48,424 | | | 2,413 |
CSS Industries | | 17,600 | | | 333 |
Dana Holdings * | | 33,001 | | | 358 |
Deckers Outdoor * | | 3,400 | | | 492 |
Dick’s Sporting Goods * (A) | | 85,691 | | | 2,443 |
Dillard’s, Cl A (A) | | 36,200 | | | 1,039 |
DineEquity * | | 9,600 | | | 324 |
Domino’s Pizza * | | 33,800 | | | 439 |
Dress Barn * | | 11,800 | | | 323 |
Drew Industries * | | 4,000 | | | 88 |
DSW, Cl A * (A) | | 98,300 | | | 2,839 |
Eastman Kodak * (A) | | 586,500 | | | 3,308 |
| | | | | |
Description | | Shares | | Market Value
($ Thousands) |
Ethan Allen Interiors (A) | | 40,493 | | $ | 818 |
EW Scripps, Cl A * | | 22,600 | | | 200 |
Exide Technologies * (A) | | 74,400 | | | 317 |
Finish Line, Cl A | | 185,297 | | | 3,085 |
Foot Locker | | 92,300 | | | 1,376 |
Fossil * (A) | | 28,900 | | | 1,084 |
Fred’s, Cl A (A) | | 81,900 | | | 1,121 |
Furniture Brands International * | | 70,808 | | | 554 |
Gaylord Entertainment * (A) | | 9,100 | | | 242 |
Genesco * (A) | | 3,700 | | | 115 |
Grand Canyon Education
* (A) | | 50,955 | | | 1,251 |
Group 1 Automotive * (A) | | 20,300 | | | 577 |
Gymboree * (A) | | 4,900 | | | 218 |
Harte-Hanks | | 42,400 | | | 579 |
Helen of Troy * | | 29,500 | | | 760 |
hhgregg * | | 21,741 | | | 652 |
Hibbett Sports * (A) | | 46,377 | | | 1,195 |
Hillenbrand | | 64,635 | | | 1,570 |
HOT Topic | | 250,800 | | | 1,394 |
HSN * | | 19,500 | | | 525 |
Iconix Brand Group * | | 207,835 | | | 3,377 |
International Speedway,
Cl A (A) | | 56,485 | | | 1,575 |
J Crew Group * | | 49,730 | | | 2,270 |
Jack in the Box * (A) | | 61,800 | | | 1,387 |
Jackson Hewitt Tax Service
* (A) | | 138,000 | | | 262 |
Jakks Pacific * (A) | | 40,500 | | | 600 |
Jarden | | 98,921 | | | 2,880 |
Jo-Ann Stores * (A) | | 33,804 | | | 1,544 |
Jones Apparel Group (A) | | 115,400 | | | 2,266 |
Jos. A. Bank Clothiers * (A) | | 11,800 | | | 716 |
Journal Communications, Cl A * | | 152,400 | | | 768 |
K12 * (A) | | 66,988 | | | 1,676 |
Kirkland’s * | | 71,400 | | | 1,537 |
Lakeland Industries * | | 85,300 | | | 882 |
Las Vegas Sands * | | 30,400 | | | 714 |
Leggett & Platt | | 14,300 | | | 333 |
Lennar, Cl A | | 35,400 | | | 612 |
Life Time Fitness * (A) | | 117,361 | | | 4,355 |
Lifetime Brands * | | 38,200 | | | 534 |
Lincoln Educational Services * | | 56,800 | | | 1,354 |
Lions Gate Entertainment * | | 56,633 | | | 385 |
Live Nation * | | 225,842 | | | 2,762 |
Liz Claiborne * (A) | | 71,400 | | | 438 |
LodgeNet Interactive * | | 51,505 | | | 274 |
Matthews International, Cl A | | 51,400 | | | 1,664 |
MDC Partners, Cl A | | 288,400 | | | 3,513 |
Men’s Wearhouse (A) | | 30,666 | | | 667 |
Meredith (A) | | 63,600 | | | 2,136 |
Meritage Homes * (A) | | 77,340 | | | 1,654 |
Morningstar * | | 6,600 | | | 322 |
Movado Group * | | 8,600 | | | 106 |
National CineMedia | | 101,147 | | | 1,769 |
New Frontier Media * | | 208,088 | | | 379 |
NutriSystem (A) | | 27,100 | | | 603 |
NVR * | | 1,985 | | | 1,360 |
O’Charleys * | | 27,900 | | | 208 |
Office Depot * | | 117,985 | | | 684 |
OfficeMax * | | 19,260 | | | 343 |
Oxford Industries | | 17,500 | | | 365 |
Papa John’s International * | | 12,600 | | | 313 |
Peet’s Coffee & Tea * (A) | | 31,085 | | | 1,208 |
Penske Auto Group * | | 22,900 | | | 299 |
| | |
1 | | SEI Institutional Investments Trust /Annual Report/May 31, 2010 |
SCHEDULE OF INVESTMENTS
Small Cap Fund
May 31, 2010
| | | | | |
Description | | Shares | | Market Value
($ Thousands) |
PetSmart (A) | | 70,170 | | $ | 2,229 |
PF Chang’s China Bistro (A) | | 35,142 | | | 1,528 |
Pinnacle Entertainment * (A) | | 198,392 | | | 2,401 |
Polaris Industries (A) | | 17,200 | | | 1,010 |
Pool | | 25,300 | | | 607 |
Pre-Paid Legal Services * (A) | | 18,700 | | | 866 |
Princeton Review * | | 163,671 | | | 393 |
Pulte Homes * | | 72,725 | | | 810 |
RadioShack | | 80,800 | | | 1,652 |
Red Robin Gourmet Burgers * (A) | | 44,100 | | | 909 |
Regal Entertainment Group, Cl A | | 16,400 | | | 250 |
Regis (A) | | 116,451 | | | 2,142 |
Rent-A-Center, Cl A * (A) | | 137,000 | | | 3,318 |
Ruby Tuesday * | | 73,100 | | | 787 |
Ryland Group (A) | | 110,998 | | | 2,065 |
Saks * | | 325,340 | | | 2,987 |
Scholastic | | 97,641 | | | 2,553 |
Scientific Games, Cl A * (A) | | 29,059 | | | 297 |
Sealy * | | 84,400 | | | 274 |
Service International | | 42,999 | | | 367 |
Shutterfly * (A) | | 51,800 | | | 1,197 |
Signet Jewelers * | | 6,400 | | | 199 |
Sinclair Broadcast Group, Cl A * | | 39,677 | | | 263 |
Sonic Automotive, Cl A * | | 34,200 | | | 338 |
Sotheby’s | | 34,193 | | | 1,111 |
Spartan Motors | | 22,600 | | | 109 |
Spectrum Group International * | | 9,759 | | | 19 |
Stage Stores | | 151,900 | | | 2,152 |
Standard Pacific * | | 47,415 | | | 239 |
Steiner Leisure * (A) | | 56,000 | | | 2,324 |
Stewart Enterprises, Cl A | | 90,604 | | | 550 |
Stoneridge * | | 23,600 | | | 228 |
Sturm Ruger (A) | | 117,000 | | | 1,841 |
Superior Industries International | | 15,100 | | | 224 |
Systemax | | 14,700 | | | 284 |
Talbots * | | 236,340 | | | 3,555 |
Tempur-Pedic International * | | 52,889 | | | 1,756 |
Tenneco * | | 121,893 | | | 2,701 |
Texas Roadhouse, Cl A * | | 21,700 | | | 317 |
Timberland, Cl A * | | 72,300 | | | 1,389 |
Tractor Supply (A) | | 34,189 | | | 2,317 |
True Religion Apparel * | | 48,370 | | | 1,335 |
Tupperware Brands | | 8,100 | | | 344 |
Ulta Salon Cosmetics & Fragrance * | | 65,868 | | | 1,685 |
Under Armour, Cl A * | | 41,650 | | | 1,403 |
Unifirst | | 5,800 | | | 261 |
Universal Electronics * (A) | | 1,800 | | | 35 |
Universal Technical Institute * | | 6,300 | | | 155 |
Volcom * | | 14,300 | | | 285 |
Warnaco Group * | | 1,800 | | | 77 |
Wendy’s, Cl A | | 187,717 | | | 847 |
Williams-Sonoma (A) | | 37,100 | | | 1,109 |
Wolverine World Wide | | 29,400 | | | 844 |
World Wrestling Entertainment, | | | | | |
Cl A | | 32,900 | | | 545 |
Zumiez * | | 121,655 | | | 2,083 |
| | | | | |
| | | | | 185,480 |
| | | | | |
Consumer Staples — 3.5% | | | | | |
Alliance One International * | | 266,600 | | | 1,112 |
American Italian Pasta, Cl A * | | 12,000 | | | 467 |
| | | | | |
Description | | Shares | | Market Value
($ Thousands) |
American Oriental Bioengineering * (A) | | 104,300 | | $ | 323 |
Andersons (A) | | 56,700 | | | 1,856 |
BJ’s Wholesale Club * (A) | | 14,846 | | | 595 |
Cal-Maine Foods | | 38,700 | | | 1,253 |
Casey’s General Stores (A) | | 40,329 | | | 1,487 |
Central Garden and Pet * | | 35,415 | | | 356 |
Central Garden and Pet, Cl A * | | 31,766 | | | 301 |
China-Biotics * (A) | | 91,500 | | | 1,310 |
Chiquita Brands International * (A) | | 179,296 | | | 2,214 |
Corn Products International | | 19,797 | | | 660 |
Cosan Industria e Comercio (Brazil) * | | 111,700 | | | 1,270 |
Darling International * | | 32,400 | | | 259 |
Dean Foods * | | 85,474 | | | 910 |
Del Monte Foods | | 332,300 | | | 4,845 |
Dole Food * (A) | | 32,164 | | | 294 |
Elizabeth Arden * | | 12,500 | | | 213 |
Flowers Foods | | 15,100 | | | 373 |
Fresh Del Monte Produce * (A) | | 70,200 | | | 1,404 |
Great Atlantic & Pacific Tea * | | 94,684 | | | 510 |
Herbalife | | 20,529 | | | 927 |
Ingles Markets, Cl A | | 25,700 | | | 390 |
Kulim Malaysia | | 584,500 | | | 1,298 |
Lancaster Colony (A) | | 18,900 | | | 1,033 |
Lance | | 78,914 | | | 1,523 |
Mead Johnson Nutrition, Cl A | | 4,400 | | | 217 |
Medifast * (A) | | 11,400 | | | 358 |
Nash Finch (A) | | 16,900 | | | 610 |
NBTY * | | 62,000 | | | 2,123 |
Nu Skin Enterprises, Cl A | | 17,600 | | | 506 |
Pantry * | | 118,879 | | | 1,818 |
Prestige Brands Holdings * | | 129,805 | | | 1,002 |
Pricesmart | | 8,900 | | | 214 |
Ruddick (A) | | 66,896 | | | 2,209 |
Sanderson Farms (A) | | 29,236 | | | 1,604 |
Saskatchewan Wheat Pool, Cl Common Subscription Recei * | | 163,300 | | | 1,187 |
Smart Balance * | | 348,758 | | | 2,086 |
United Natural Foods * | | 18,200 | | | 565 |
Universal | | 59,500 | | | 2,432 |
USANA Health Sciences * | | 1,900 | | | 71 |
Vector Group | | 31,881 | | | 500 |
Village Super Market, Cl A | | 6,600 | | | 177 |
Weis Markets (A) | | 13,300 | | | 449 |
Winn-Dixie Stores * (A) | | 106,762 | | | 1,196 |
| | | | | |
| | | | | 46,507 |
| | | | | |
Energy — 5.3% | | | | | |
Allis-Chalmers Energy * (A) | | 113,088 | | | 326 |
Alon USA Energy (A) | | 26,200 | | | 177 |
Approach Resources * | | 125,600 | | | 901 |
Arena Resources * (A) | | 14,051 | | | 462 |
Atwood Oceanics * | | 3,500 | | | 95 |
Basic Energy Services * | | 22,800 | | | 186 |
Berry Petroleum, Cl A (A) | | 31,181 | | | 958 |
BPZ Resources * (A) | | 286,100 | | | 1,465 |
Cal Dive International * | | 403,037 | | | 2,225 |
Clayton Williams Energy * | | 30,100 | | | 1,366 |
Complete Production Services * | | 49,300 | | | 641 |
| | |
2 | | SEI Institutional Investments Trust /Annual Report/May 31, 2010 |
SCHEDULE OF INVESTMENTS
Small Cap Fund
May 31, 2010
| | | | | |
Description | | Shares | | Market Value
($ Thousands) |
Comstock Resources * | | 186,118 | | $ | 5,554 |
CVR Energy * | | 215,173 | | | 1,627 |
Delek US Holdings | | 19,634 | | | 130 |
DHT Maritime (A) | | 51,300 | | | 213 |
Dresser-Rand Group * | | 75,040 | | | 2,389 |
Energy Partners * | | 11,600 | | | 147 |
Exterran Holdings * | | 27,557 | | | 703 |
Forest Oil * (A) | | 69,500 | | | 1,851 |
Frontier Oil | | 43,602 | | | 606 |
GeoMet * | | 214,366 | | | 270 |
Global Geophysical Services * | | 7,100 | | | 66 |
Global Industries * (A) | | 27,500 | | | 144 |
GMX Resources * | | 58,800 | | | 401 |
Goodrich Petroleum * (A) | | 302,672 | | | 3,705 |
Gulfmark Offshore, Cl A * | | 11,600 | | | 303 |
Hercules Offshore * | | 128,900 | | | 402 |
Holly (A) | | 75,900 | | | 1,966 |
Hornbeck Offshore Services * | | 27,600 | | | 422 |
International Coal Group * | | 198,825 | | | 861 |
InterOil * | | 6,600 | | | 325 |
Key Energy Services * | | 97,585 | | | 933 |
Kinder Morgan Escrow * | | 57,191 | | | — |
Knightsbridge Tankers | | 53,600 | | | 926 |
Matrix Service * | | 71,800 | | | 706 |
Newpark Resources * | | 76,400 | | | 490 |
Northern Oil And Gas * (A) | | 88,500 | | | 1,277 |
Oil States International * | | 12,300 | | | 480 |
Oilsands Quest * (A) | | 1,590,400 | | | 1,144 |
Oilsands Quest Private Placement * | | 144,700 | | | 104 |
Overseas Shipholding Group (A) | | 28,200 | | | 1,091 |
Parker Drilling * (A) | | 217,900 | | | 1,048 |
Patterson-UTI Energy (A) | | 133,700 | | | 1,876 |
PetroHawk Energy * | | 215,057 | | | 4,136 |
Petroquest Energy * (A) | | 88,427 | | | 555 |
Quicksilver Resources * | | 110,809 | | | 1,353 |
Rosetta Resources * | | 48,100 | | | 1,055 |
RPC (A) | | 33,200 | | | 375 |
SandRidge Energy * | | 217,575 | | | 1,401 |
Scorpio Tankers * | | 289,637 | | | 3,308 |
SEACOR Holdings * | | 9,400 | | | 686 |
Seahawk Drilling * (A) | | 36,100 | | | 436 |
Ship Finance International (A) | | 42,500 | | | 768 |
StealthGas * | | 112,100 | | | 572 |
Stone Energy * | | 58,700 | | | 787 |
Superior Energy Services * | | 60,000 | | | 1,306 |
Swift Energy * (A) | | 83,210 | | | 2,301 |
Teekay | | 37,600 | | | 949 |
Tesoro (A) | | 75,100 | | | 879 |
Tidewater | | 7,816 | | | 327 |
USEC * (A) | | 334,400 | | | 1,766 |
Vaalco Energy (A) | | 148,000 | | | 790 |
W&T Offshore (A) | | 163,900 | | | 1,596 |
Willbros Group * (A) | | 86,444 | | | 803 |
World Fuel Services | | 129,971 | | | 3,383 |
| | | | | |
| | | | | 70,494 |
| | | | | |
Financials — 18.6% | | | | | |
Acadia Realty Trust ‡ | | 8,600 | | | 154 |
Advance America Cash Advance Centers | | 91,500 | | | 442 |
Affiliated Managers Group * (A) | | 47,117 | | | 3,376 |
| | | | | |
Description | | Shares | | Market Value
($ Thousands) |
Alexander’s ‡ | | 500 | | $ | 162 |
Allied World Assurance Holdings | | 27,100 | | | 1,217 |
Alterra Capital Holdings (A) | | 128,300 | | | 2,400 |
AMB Property ‡ (A) | | 69,250 | | | 1,796 |
American Campus Communities ‡ (A) | | 35,300 | | | 945 |
American Capital Agency ‡ (A) | | 10,600 | | | 278 |
American Equity Investment Life Holding | | 36,900 | | | 347 |
American Physicians Capital (A) | | 37,499 | | | 1,163 |
Amtrust Financial Services | | 64,700 | | | 852 |
Anworth Mortgage Asset ‡ (A) | | 275,509 | | | 1,868 |
Apartment Investment & Management, Cl A ‡ (A) | | 79,264 | | | 1,635 |
Apollo Investments * | | 77,138 | | | 805 |
Ares Capital | | 12,025 | | | 163 |
Argo Group International Holdings | | 24,900 | | | 752 |
Ashford Hospitality Trust ‡ * | | 36,500 | | | 290 |
Aspen Insurance Holdings | | 71,900 | | | 1,816 |
Associated Banc (A) | | 91,700 | | | 1,232 |
Assured Guaranty | | 47,100 | | | 791 |
Astoria Financial (A) | | 53,318 | | | 793 |
AvalonBay Communities ‡ (A) | | 24,733 | | | 2,425 |
Axis Capital Holdings | | 11,400 | | | 347 |
Banco Latinoamericano de Comercio Exterior, Cl E | | 74,200 | | | 959 |
Bancorp Rhode Island | | 35,399 | | | 1,012 |
Bancorpsouth (A) | | 25,930 | | | 503 |
Bank Mutual | | 44,500 | | | 286 |
Bank of Hawaii | | 22,800 | | | 1,095 |
Bank of the Ozarks (A) | | 14,800 | | | 522 |
BioMed Realty Trust ‡ (A) | | 54,300 | | | 924 |
Boston Private Financial Holdings (A) | | 195,758 | | | 1,433 |
Boston Properties ‡ (A) | | 36,350 | | | 2,787 |
Brandywine Realty Trust ‡ | | 76,100 | | | 882 |
Brasil Brokers Participacoes | | 291,100 | | | 951 |
Brookline Bancorp | | 9,400 | | | 94 |
Calamos Asset Management, Cl A | | 20,522 | | | 226 |
Camden National | | 10,600 | | | 333 |
CapitalSource | | 639,381 | | | 2,903 |
Capstead Mortgage ‡ (A) | | 153,700 | | | 1,755 |
Cardinal Financial | | 40,784 | | | 428 |
Cardtronics * | | 140,318 | | | 1,817 |
Cathay General Bancorp (A) | | 100,100 | | | 1,103 |
CBL & Associates Properties ‡ (A) | | 140,597 | | | 2,009 |
Central Pacific Financial * (A) | | 29,400 | | | 71 |
Chatham Lodging Trust ‡ * | | 37,500 | | | 675 |
Chemical Financial | | 24,548 | | | 595 |
Chimera Investment ‡ | | 210,300 | | | 829 |
Cincinnati Financial | | 13,900 | | | 378 |
Citizens Republic Bancorp * (A) | | 444,300 | | | 489 |
City Holding | | 8,200 | | | 263 |
CNA Surety * | | 26,160 | | | 430 |
CNO Financial Group * (A) | | 285,000 | | | 1,599 |
Cohen & Steers | | 14,800 | | | 358 |
Colonial Properties Trust ‡ | | 15,600 | | | 235 |
Community Bank System (A) | | 46,788 | | | 1,069 |
Corporate Office Properties Trust ‡ (A) | | 27,250 | | | 1,033 |
Cousins Properties ‡ | | 16,179 | | | 125 |
| | |
3 | | SEI Institutional Investments Trust /Annual Report/May 31, 2010 |
SCHEDULE OF INVESTMENTS
Small Cap Fund
May 31, 2010
| | | | | |
Description | | Shares | | Market Value
($ Thousands) |
Cowen Group, Cl A * | | 305,400 | | $ | 1,448 |
Crawford, Cl B * | | 15,924 | | | 53 |
CreXus Investment ‡ | | 44,500 | | | 580 |
DCT Industrial Trust ‡ (A) | | 44,100 | | | 213 |
Delphi Financial Group, Cl A (A) | | 84,100 | | | 2,184 |
Developers Diversified Realty ‡ (A) | | 82,500 | | | 944 |
DiamondRock Hospitality ‡ (A) | | 25,692 | | | 235 |
Dime Community Bancshares (A) | | 33,400 | | | 426 |
Dollar Financial * (A) | | 59,600 | | | 1,204 |
Douglas Emmett ‡ (A) | | 45,150 | | | 699 |
Duff & Phelps, Cl A | | 61,634 | | | 831 |
DuPont Fabros Technology ‡ | | 46,500 | | | 1,188 |
Dynex Capital ‡ (A) | | 26,500 | | | 250 |
E*Trade Financial * | | 474,600 | | | 702 |
EastGroup Properties ‡ (A) | | 5,600 | | | 207 |
Education Realty Trust ‡ | | 78,576 | | | 500 |
EMC Insurance Group | | 3,271 | | | 73 |
Employers Holdings | | 90,398 | | | 1,442 |
Encore Bancshares * | | 39,100 | | | 407 |
Encore Capital Group * | | 30,600 | | | 640 |
Endurance Specialty Holdings (A) | | 55,053 | | | 2,042 |
Entertainment Properties Trust ‡ (A) | | 9,300 | | | 381 |
Equity Lifestyle Properties ‡ | | 5,600 | | | 290 |
Equity One ‡ (A) | | 86,386 | | | 1,483 |
Equity Residential ‡ | | 78,250 | | | 3,531 |
ESSA Bancorp | | 36,900 | | | 463 |
Essex Property Trust ‡ (A) | | 20,400 | | | 2,147 |
Extra Space Storage ‡ (A) | | 56,750 | | | 854 |
FBL Financial Group, Cl A (A) | | 32,400 | | | 792 |
FBR Capital Markets * | | 334,000 | | | 1,353 |
Federal Realty Investment Trust ‡ (A) | | 24,300 | | | 1,791 |
Federated Investors, Cl B (A) | | 25,322 | | | 562 |
FelCor Lodging Trust ‡ * | | 13,600 | | | 92 |
Financial Engines * | | 56,535 | | | 862 |
First Bancorp | | 270,047 | | | 359 |
First Commonwealth Financial | | 37,304 | | | 195 |
First Financial Bancorp (A) | | 113,203 | | | 1,799 |
First Financial Bankshares (A) | | 700 | | | 35 |
First Financial Holdings | | 18,800 | | | 263 |
First Horizon National * (A) | | 37,497 | | | 467 |
First Industrial Realty Trust ‡ * | | 61,100 | | | 409 |
First Merchants (A) | | 9,500 | | | 82 |
First Potomac Realty Trust ‡ | | 9,000 | | | 132 |
FirstMerit (A) | | 26,910 | | | 502 |
Flushing Financial | | 135,000 | | | 1,828 |
FNB (Pennsylvania) | | 50,942 | | | 417 |
FPIC Insurance Group * | | 17,400 | | | 475 |
Franklin Street Properties ‡ (A) | | 14,800 | | | 183 |
GAMCO Investors, Cl A | | 1,500 | | | 59 |
General Shopping Brasil (Brazil) * | | 173,100 | | | 664 |
Getty Realty ‡ | | 4,100 | | | 92 |
GFI Group (A) | | 132,300 | | | 800 |
Gluskin Sheff + Associates | | 37,100 | | | 623 |
Great American Group * | | 234,582 | | �� | 422 |
Greenhill | | 20,754 | | | 1,438 |
Grubb & Ellis * (A) | | 524,460 | | | 761 |
Hancock Holding (A) | | 39,483 | | | 1,509 |
Harleysville Group | | 8,700 | | | 284 |
Hatteras Financial ‡ (A) | | 21,800 | | | 604 |
HCP ‡ (A) | | 88,550 | | | 2,821 |
| | | | | |
Description | | Shares | | Market Value
($ Thousands) |
Healthcare Realty Trust ‡ (A) | | 45,150 | | $ | 1,035 |
Hercules Technology Growth Capital | | 105,365 | | | 928 |
Highwoods Properties ‡ (A) | | 51,700 | | | 1,523 |
Home Bancshares | | 48,600 | | | 1,146 |
Home Federal Bancorp | | 37,800 | | | 579 |
Home Properties ‡ (A) | | 7,300 | | | 355 |
Horace Mann Educators | | 161,578 | | | 2,483 |
Horizon Financial * (A) | | 400 | | | — |
Hospitality Properties Trust ‡ | | 19,100 | | | 430 |
Host Hotels & Resorts ‡ (A) | | 132,562 | | | 1,890 |
HRPT Properties Trust ‡ | | 172,600 | | | 1,158 |
Hudson Valley Holding | | 45,710 | | | 1,093 |
Iberiabank (A) | | 11,541 | | | 634 |
Infinity Property & Casualty (A) | | 53,786 | | | 2,517 |
Inland Real Estate ‡ (A) | | 65,100 | | | 542 |
International Bancshares (A) | | 110,300 | | | 2,178 |
Investors Real Estate Trust ‡ (A) | | 141,400 | | | 1,234 |
iStar Financial ‡ * | | 122,300 | | | 742 |
Jones Lang LaSalle | | 33,440 | | | 2,495 |
Kennedy-Wilson Holdings * | | 42,710 | | | 471 |
Kilroy Realty ‡ (A) | | 9,300 | | | 306 |
Knight Capital Group, Cl A * | | 65,500 | | | 957 |
LaSalle Hotel Properties ‡ (A) | | 13,900 | | | 313 |
Lexington Realty Trust ‡ (A) | | 22,672 | | | 141 |
Life Partners Holdings (A) | | 9,600 | | | 194 |
LTC Properties ‡ | | 65,093 | | | 1,672 |
Macerich ‡ (A) | | 45,196 | | | 1,869 |
Mack-Cali Realty ‡ | | 55,750 | | | 1,839 |
MainSource Financial Group (A) | | 22,500 | | | 187 |
MarketAxess Holdings | | 230,376 | | | 3,400 |
MB Financial | | 55,400 | | | 1,211 |
Meadowbrook Insurance Group | | 327,868 | | | 2,849 |
Medical Properties Trust ‡ | | 273,600 | | | 2,613 |
MF Global Holdings * | | 234,450 | | | 1,805 |
MFA Mortgage Investments ‡ (A) | | 414,111 | | | 3,035 |
MGIC Investment * | | 371,705 | | | 3,479 |
Mid-America Apartment Communities ‡ (A) | | 19,834 | | | 1,084 |
Montpelier Re Holdings | | 131,013 | | | 2,045 |
MSCI, Cl A * | | 45,412 | | | 1,347 |
National Health Investors ‡ | | 5,900 | | | 243 |
National Penn Bancshares (A) | | 129,595 | | | 906 |
National Retail Properties ‡ (A) | | 18,100 | | | 398 |
Nationwide Health Properties ‡ | | 8,213 | | | 292 |
Navios Maritime Acquisition * | | 117,200 | | | 769 |
NBT Bancorp | | 3,700 | | | 81 |
Nelnet, Cl A | | 149,800 | | | 2,966 |
Northwest Bancshares | | 57,900 | | | 673 |
NYSE Euronext | | 14,100 | | | 404 |
OceanFirst Financial (A) | | 13,950 | | | 170 |
Old National Bancorp | | 64,300 | | | 738 |
Omega Healthcare Investors ‡ (A) | | 18,100 | | | 359 |
Oriental Financial Group (A) | | 33,900 | | | 464 |
PacWest Bancorp (A) | | 36,961 | | | 770 |
Park National (A) | | 12,200 | | | 789 |
Parkway Properties ‡ (A) | | 32,800 | | | 553 |
Pebblebrook Hotel Trust ‡ * | | 25,700 | | | 527 |
Pennsylvania Real Estate Investment Trust ‡ | | 32,300 | | | 445 |
PHH * (A) | | 82,933 | | | 1,829 |
Phoenix * (A) | | 332,500 | | | 938 |
| | |
4 | | SEI Institutional Investments Trust /Annual Report/May 31, 2010 |
SCHEDULE OF INVESTMENTS
Small Cap Fund
May 31, 2010
| | | | | |
Description | | Shares | | Market Value
($ Thousands) |
Pico Holdings * | | 41,758 | | $ | 1,390 |
Piedmont Office Realty Trust, | | | | | |
Cl A ‡ | | 21,245 | | | 403 |
Piper Jaffray * | | 4,500 | | | 149 |
Platinum Underwriters Holdings (A) | | 143,296 | | | 5,275 |
PMA Capital, Cl A * | | 83,953 | | | 567 |
Post Properties ‡ | | 9,900 | | | 248 |
Potlatch ‡ (A) | | 18,500 | | | 645 |
Presidential Life | | 13,709 | | | 144 |
PrivateBancorp, Cl A | | 34,300 | | | 455 |
ProAssurance * (A) | | 25,199 | | | 1,483 |
ProLogis ‡ (A) | | 36,100 | | | 411 |
Prosperity Bancshares (A) | | 59,400 | | | 2,141 |
Protective Life (A) | | 11,300 | | | 243 |
Provident Financial Services (A) | | 88,100 | | | 1,089 |
PS Business Parks ‡ | | 3,900 | | | 210 |
Public Storage ‡ | | 32,374 | | | 3,001 |
Radian Group | | 182,500 | | | 1,876 |
RAIT Financial Trust ‡ * (A) | | 234,200 | | | 588 |
Redwood Trust ‡ (A) | | 61,200 | | | 930 |
Regency Centers ‡ (A) | | 15,300 | | | 562 |
Reinsurance Group of America, Cl A | | 16,412 | | | 771 |
Renasant | | 47,800 | | | 686 |
Republic Bancorp, Cl A (A) | | 53,900 | | | 1,248 |
S&T Bancorp (A) | | 23,700 | | | 511 |
Safeguard Scientifics * | | 28,600 | | | 323 |
Safety Insurance Group | | 45,600 | | | 1,648 |
SCBT Financial | | 26,160 | | | 936 |
SeaBright Insurance Holdings | | 52,900 | | | 545 |
Selective Insurance Group | | 44,600 | | | 696 |
Senior Housing Properties Trust ‡ | | 71,850 | | | 1,497 |
Signature Bank NY * | | 22,597 | | | 855 |
Simmons First National, Cl A | | 21,780 | | | 574 |
Simon Property Group ‡ (A) | | 40,847 | | | 3,473 |
SL Green Realty ‡ (A) | | 12,600 | | | 785 |
South Financial Group (A) | | 401,300 | | | 109 |
Sovran Self Storage ‡ (A) | | 22,203 | | | 800 |
Starwood Property Trust ‡ | | 72,800 | | | 1,327 |
Sterling Bancshares | | 137,500 | | | 736 |
Sterling Financial * (A) | | 69,700 | | | 59 |
Stewart Information Services (A) | | 55,100 | | | 584 |
Student Loan | | 17,800 | | | 522 |
Sun Communities ‡ (A) | | 3,600 | | | 107 |
Sunstone Hotel Investors ‡ * | | 97,750 | | | 1,078 |
Susquehanna Bancshares (A) | | 210,255 | | | 1,844 |
SVB Financial Group * (A) | | 42,220 | | | 1,894 |
SWS Group | | 54,169 | | | 544 |
Synovus Financial (A) | | 787,322 | | | 2,330 |
Tanger Factory Outlet Centers ‡ (A) | | 8,900 | | | 370 |
Taubman Centers ‡ (A) | | 46,450 | | | 1,881 |
TD Ameritrade Holding * | | 43,531 | | | 772 |
Texas Capital Bancshares * | | 34,100 | | | 623 |
THL Credit * | | 60,200 | | | 712 |
Thomas Weisel Partners Group * | | 74,000 | | | 508 |
Titanium Asset Management * (G) | | 122,200 | | | 358 |
Titanium Asset Management * | | 10,500 | | | 26 |
Tompkins Financial | | 5,200 | | | 207 |
Tower Group | | 13,900 | | | 305 |
TradeStation Group * | | 61,000 | | | 434 |
| | | | | |
Description | | Shares | | Market Value
($ Thousands) |
Trustco Bank (A) | | 191,167 | | $ | 1,191 |
Trustmark (A) | | 19,600 | | | 438 |
Umpqua Holdings | | 129,588 | | | 1,628 |
United Bankshares (A) | | 54,900 | | | 1,478 |
United Community Banks * (A) | | 69,539 | | | 322 |
United Financial Bancorp | | 30,700 | | | 416 |
United Fire & Casualty | | 5,800 | | | 124 |
Unitrin | | 7,300 | | | 195 |
Universal Health Realty Income Trust ‡ | | 3,000 | | | 98 |
Uranium Participation * | | 206,900 | | | 1,115 |
Urstadt Biddle Properties, Cl A ‡ | | 4,600 | | | 77 |
U-Store-It Trust ‡ | | 17,500 | | | 144 |
Validus Holdings | | 68,347 | | | 1,679 |
Value Creation * (G) | | 119,600 | | | 114 |
Ventas ‡ (A) | | 29,800 | | | 1,399 |
ViewPoint Financial Group | | 42,300 | | | 672 |
Vornado Realty Trust ‡ (A) | | 12,137 | | | 943 |
Walter Investment Management ‡ | | 4,500 | | | 73 |
Washington Federal | | 23,300 | | | 403 |
Washington Real Estate Investment Trust ‡ (A) | | 43,200 | | | 1,269 |
Webster Financial (A) | | 16,000 | | | 306 |
WesBanco (A) | | 30,100 | | | 567 |
Westamerica Bancorporation (A) | | 31,800 | | | 1,770 |
Whitney Holding (A) | | 84,267 | | | 999 |
Willis Group Holdings | | 14,562 | | | 446 |
Wilmington Trust | | 28,500 | | | 430 |
Wilshire Bancorp | | 14,100 | | | 144 |
Wintrust Financial (A) | | 8,400 | | | 300 |
World Acceptance * (A) | | 70,000 | | | 2,501 |
WSFS Financial | | 26,200 | | | 1,057 |
Zions Bancorporation (A) | | 19,295 | | | 462 |
| | | | | |
| | | | | 249,653 |
| | | | | |
Health Care — 11.4% | | | | | |
Abaxis * (A) | | 132,345 | | | 2,979 |
Acadia Pharmaceuticals * (A) | | 249,100 | | | 334 |
Achillion Pharmaceuticals * | | 168,545 | | | 374 |
Acorda Therapeutics * | | 76,525 | | | 2,631 |
Affymetrix * (A) | | 68,700 | | | 450 |
Air Methods * | | 22,700 | | | 747 |
Albany Molecular Research * | | 58,119 | | | 373 |
Alexion Pharmaceuticals * | | 16,792 | | | 840 |
Align Technology * (A) | | 139,458 | | | 2,081 |
Allscripts-Misys Healthcare | | | | | |
Solutions * | | 45,100 | | | 848 |
Alnylam Pharmaceuticals * (A) | | 26,170 | | | 414 |
AMAG Pharmaceuticals * | | 113,424 | | | 3,611 |
Amedisys * (A) | | 10,476 | | | 521 |
American Medical Systems Holdings * (A) | | 22,700 | | | 512 |
AMERIGROUP * | | 14,901 | | | 535 |
AMN Healthcare Services * (A) | | 211,200 | | | 1,757 |
Amsurg, Cl A * | | 130,396 | | | 2,582 |
Analogic | | 9,256 | | | 400 |
Angiodynamics * | | 23,114 | | | 341 |
Arena Pharmaceuticals * (A) | | 321,302 | | | 990 |
Assisted Living Concepts, Cl A * | | 32,970 | | | 1,093 |
athenahealth * | | 79,450 | | | 1,967 |
BioMarin Pharmaceutical * | | 132,119 | | | 2,579 |
Biovail | | 94,600 | | | 1,420 |
| | |
5 | | SEI Institutional Investments Trust /Annual Report/May 31, 2010 |
SCHEDULE OF INVESTMENTS
Small Cap Fund
May 31, 2010
| | | | | |
Description | | Shares | | Market Value
($ Thousands) |
Cambrex * | | 110,300 | | $ | 460 |
Cardiome Pharma * | | 241,241 | | | 2,039 |
Catalyst Health Solutions * | | 74,010 | | | 2,834 |
Cepheid * (A) | | 41,727 | | | 746 |
Chemed (A) | | 52,795 | | | 3,005 |
Conceptus * (A) | | 151,634 | | | 2,531 |
Conmed * | | 89,115 | | | 1,732 |
Cooper (A) | | 14,334 | | | 528 |
Covance * | | 12,500 | | | 660 |
Cross Country Healthcare * | | 100,300 | | | 854 |
CryoLife * | | 29,700 | | | 154 |
Cubist Pharmaceuticals * | | 115,091 | | | 2,474 |
Cyberonics * | | 8,300 | | | 146 |
Cypress Bioscience * (A) | | 14,100 | | | 58 |
Durect * | | 478,253 | | | 1,215 |
Emergency Medical Services, Cl A * | | 10,800 | | | 579 |
Emergent Biosolutions * | | 6,800 | | | 107 |
Ensign Group (A) | | 42,433 | | | 774 |
Enzo Biochem * | | 25,556 | | | 136 |
eResearch Technology * | | 73,463 | | | 583 |
Exactech * | | 52,314 | | | 907 |
Exelixis * (A) | | 104,062 | | | 539 |
Genoptix * | | 44,024 | | | 1,174 |
Gen-Probe * | | 32,796 | | | 1,442 |
Genta * | | 126 | | | — |
Gentiva Health Services * | | 25,400 | | | 702 |
GTx * (A) | | 7,400 | | | 15 |
Haemonetics * | | 8,500 | | | 459 |
Hanger Orthopedic Group * (A) | | 9,500 | | | 162 |
Healthsouth * (A) | | 122,377 | | | 2,430 |
Healthspring * | | 39,500 | | | 686 |
HealthTronics * | | 320,200 | | | 1,543 |
HeartWare International * | | 28,123 | | | 1,663 |
Hill-Rom Holdings | | 36,000 | | | 1,004 |
Human Genome Sciences * (A) | | 68,898 | | | 1,706 |
ICU Medical * | | 108,500 | | | 3,452 |
Idexx Laboratories * | | 12,400 | | | 784 |
Immucor * | | 13,100 | | | 257 |
Incyte * (A) | | 243,380 | �� | | 3,137 |
Inspire Pharmaceuticals * | | 118,300 | | | 673 |
Integra LifeSciences Holdings * (A) | | 14,129 | | | 557 |
Invacare (A) | | 17,300 | | | 413 |
inVentiv Health * | | 1,300 | | | 32 |
Inverness Medical Innovations * | | 4,600 | | | 160 |
IPC The Hospitalist * | | 60,817 | | | 1,780 |
Kendle International * (A) | | 65,917 | | | 929 |
Kensey Nash * (A) | | 28,041 | | | 648 |
Kindred Healthcare * | | 121,550 | | | 1,885 |
Kinetic Concepts * (A) | | 21,300 | | | 882 |
King Pharmaceuticals * (A) | | 132,400 | | | 1,148 |
LCA-Vision * (A) | | 24,100 | | | 181 |
LHC Group * (A) | | 111,456 | | | 3,433 |
Lincare Holdings (A) | | 13,600 | | | 637 |
Luminex * (A) | | 62,560 | | | 1,072 |
Magellan Health Services * | | 15,700 | | | 639 |
Martek Biosciences * (A) | | 43,976 | | | 818 |
Masimo | | 82,060 | | | 1,817 |
Matrixx Initiatives * | | 12,300 | | | 58 |
MedAssets * | | 71,155 | | | 1,615 |
| | | | | |
Description | | Shares | | Market Value
($ Thousands) |
Medical Staffing Network | | | | | |
Holdings * | | 88,000 | | $ | 4 |
Medicines * | | 223,000 | | | 1,874 |
Medicis Pharmaceutical, Cl A (A) | | 98,800 | | | 2,291 |
Medivation * | | 19,000 | | | 223 |
Mednax * | | 53,678 | | | 3,035 |
Meridian Bioscience | | 46,800 | | | 818 |
Merit Medical Systems * | | 5,250 | | | 80 |
Molina Healthcare * (A) | | 29,600 | | | 815 |
MWI Veterinary Supply * | | 29,348 | | | 1,438 |
Myriad Genetics * | | 59,145 | | | 1,079 |
Neogen * (A) | | 28,491 | | | 733 |
Nighthawk Radiology Holdings * | | 40,281 | | | 128 |
NuVasive * (A) | | 102,687 | | | 4,033 |
Obagi Medical Products * | | 59,105 | | | 751 |
Odyssey HealthCare * (A) | | 26,300 | | | 698 |
Omnicell * | | 148,999 | | | 1,952 |
Orthofix International * | | 2,900 | | | 93 |
Owens & Minor | | 8,900 | | | 266 |
Par Pharmaceutical * | | 142,320 | | | 3,951 |
Parexel International * | | 33,100 | | | 738 |
Patterson (A) | | 15,459 | | | 459 |
PDL BioPharma (A) | | 576,794 | | | 3,097 |
Perrigo | | 6,100 | | | 362 |
Pharmaceutical Product Development | | 24,893 | | | 668 |
PharMerica * | | 38,000 | | | 623 |
Pozen * | | 205,133 | | | 1,575 |
Providence Service * | | 41,000 | | | 672 |
PSS World Medical * (A) | | 109,236 | | | 2,503 |
Psychiatric Solutions * | | 10,500 | | | 340 |
Quality Systems | | 18,675 | | | 1,103 |
Questcor Pharmaceuticals * (A) | | 153,300 | | | 1,452 |
Quidel * (A) | | 148,823 | | | 1,741 |
Res-Care * | | 117,600 | | | 1,323 |
Rigel Pharmaceuticals * (A) | | 217,600 | | | 1,419 |
Savient Pharmaceuticals * (A) | | 5,400 | | | 65 |
Seattle Genetics * (A) | | 54,506 | | | 721 |
Sirona Dental Systems * | | 2,700 | | | 96 |
Skilled Healthcare Group, Cl A * | | 50,800 | | | 418 |
Somanetics * | | 3,300 | | | 59 |
STERIS | | 75,600 | | | 2,406 |
Sun Healthcare Group * (A) | | 60,000 | | | 547 |
Symmetry Medical * | | 27,400 | | | 298 |
Techne | | 39,055 | | | 2,365 |
Teleflex | | 23,766 | | | 1,333 |
Theravance * (A) | | 104,426 | | | 1,327 |
Thoratec * | | 17,810 | | | 781 |
United Therapeutics * (A) | | 20,720 | | | 1,061 |
Universal American Financial * | | 91,100 | | | 1,332 |
Universal Health Services, Cl B | | 27,200 | | | 1,153 |
Viropharma * (A) | | 74,464 | | | 906 |
Volcano * (A) | | 30,770 | | | 683 |
WellCare Health Plans * | | 47,109 | | | 1,284 |
Zoll Medical * | | 13,500 | | | 392 |
| | | | | |
| | | | | 152,997 |
| | | | | |
Industrials — 16.6% | | | | | |
AAR * (A) | | 24,600 | | | 484 |
ACCO Brands * | | 123,800 | | | 874 |
Acuity Brands (A) | | 78,280 | | | 3,220 |
Administaff | | 5,900 | | | 142 |
| | |
6 | | SEI Institutional Investments Trust /Annual Report/May 31, 2010 |
SCHEDULE OF INVESTMENTS
Small Cap Fund
May 31, 2010
| | | | | |
Description | | Shares | | Market Value
($ Thousands) |
Advisory Board * (A) | | 22,372 | | $ | 830 |
Aegean Marine Petroleum Network (A) | | 199,149 | | | 4,588 |
AerCap Holdings * | | 236,176 | | | 2,832 |
Aerovironment * | | 84,028 | | | 2,104 |
Air Transport Services Group * | | 39,500 | | | 222 |
Aircastle | | 79,000 | | | 778 |
Airtran Holdings * | | 1,028,886 | | | 5,803 |
Alamo Group | | 21,600 | | | 502 |
Alaska Air Group * (A) | | 41,500 | | | 1,938 |
Alliant Techsystems * | | 16,005 | | | 1,101 |
Ameron International | | 1,400 | | | 91 |
Ampco-Pittsburgh | | 23,100 | | | 535 |
AMR * | | 39,000 | | | 299 |
AO Smith | | 25,200 | | | 1,175 |
APAC Customer Services * (A) | | 90,700 | | | 587 |
Apogee Enterprises (A) | | 126,900 | | | 1,733 |
Applied Industrial Technologies | | 59,100 | | | 1,630 |
Arkansas Best (A) | | 60,600 | | | 1,418 |
Armstrong World Industries * | | 21,900 | | | 821 |
ArvinMeritor * | | 66,900 | | | 973 |
Astec Industries * (A) | | 47,500 | | | 1,419 |
ATC Technology * (A) | | 65,193 | | | 1,219 |
Atlas Air Worldwide Holdings * | | 17,300 | | | 904 |
Avis Budget Group * (A) | | 66,400 | | | 787 |
AZZ | | 11,300 | | | 417 |
Barnes Group | | 75,425 | | | 1,412 |
BE Aerospace * | | 44,578 | | | 1,209 |
Beacon Roofing Supply * | | 61,085 | | | 1,283 |
Belden (A) | | 36,215 | | | 938 |
Brady, Cl A | | 20,981 | | | 610 |
Briggs & Stratton | | 61,215 | | | 1,263 |
Brink’s | | 13,300 | | | 301 |
Carlisle | | 64,625 | | | 2,513 |
Cascade | | 12,200 | | | 406 |
CDI | | 3,400 | | | 54 |
Celadon Group * | | 132,098 | | | 1,799 |
Cenveo * | | 110,611 | | | 816 |
Ceradyne * | | 36,400 | | | 784 |
Chart Industries * | | 21,300 | | | 392 |
Clean Harbors * | | 14,037 | | | 890 |
Columbus McKinnon * | | 84,066 | | | 1,377 |
Comfort Systems USA (A) | | 167,100 | | | 1,841 |
Continental Airlines, Cl B * | | 44,800 | | | 945 |
Copa Holdings, Cl A | | 28,170 | | | 1,437 |
Copart * | | 80,817 | | | 2,901 |
Cornell * | | 104,000 | | | 2,812 |
Corporate Executive Board | | 60,327 | | | 1,954 |
CoStar Group * (A) | | 98,973 | | | 4,035 |
Courier | | 15,336 | | | 243 |
CRA International * | | 103,200 | | | 2,293 |
Crane | | 4,500 | | | 146 |
Cubic | | 60,000 | | | 2,183 |
Deluxe | | 81,000 | | | 1,739 |
Diamond Management & Technology Consultants, Cl A | | 5,200 | | | 52 |
Douglas Dynamics * | | 123,000 | | | 1,458 |
DXP Enterprises * | | 2,500 | | | 39 |
Dycom Industries * | | 108,292 | | | 1,070 |
DynCorp International, Cl A * | | 57,000 | | | 975 |
EMCOR Group * | | 216,618 | | | 5,409 |
Encore Wire | | 26,300 | | | 519 |
| | | | | |
Description | | Shares | | Market Value
($ Thousands) |
EnerNOC * (A) | | 99,209 | | $ | 2,788 |
EnerSys * (A) | | 34,900 | | | 785 |
Ennis | | 30,721 | | | 540 |
EnPro Industries * (A) | | 41,400 | | | 1,307 |
Esterline Technologies * (A) | | 25,500 | | | 1,368 |
Fastenal | | 14,200 | | | 716 |
Force Protection * | | 302,300 | | | 1,344 |
Franklin Electric | | 3,900 | | | 114 |
FTI Consulting * (A) | | 89,700 | | | 3,836 |
G&K Services, Cl A | | 50,915 | | | 1,232 |
Gardner Denver | | 60,934 | | | 2,775 |
Genco Shipping & Trading * (A) | | 42,500 | | | 809 |
Generac Holdings * | | 92,420 | | | 1,016 |
General Cable * (A) | | 16,705 | | | 521 |
Genesee & Wyoming, Cl A * | | 7,000 | | | 252 |
Geo Group * | | 60,700 | | | 1,281 |
GeoEye * (A) | | 96,071 | | | 3,052 |
Gibraltar Industries * | | 46,500 | | | 610 |
GrafTech International * | | 34,300 | | | 570 |
Graham | | 43,919 | | | 733 |
Granite Construction (A) | | 91,300 | | | 2,707 |
Great Lakes Dredge & Dock | | 199,400 | | | 1,162 |
Griffon * | | 42,500 | | | 516 |
GT Solar International * (A) | | 24,500 | | | 134 |
H&E Equipment Services * (A) | | 92,700 | | | 926 |
Harsco | | 300 | | | 8 |
Hawaiian Holdings * (A) | | 114,900 | | | 818 |
Healthcare Services Group | | 69,096 | | | 1,390 |
Heico, Cl A | | 27,913 | | | 838 |
Hexcel * (A) | | 9,000 | | | 144 |
Hill International * | | 18,300 | | | 86 |
HNI (A) | | 41,700 | | | 1,279 |
Horizon Lines, Cl A | | 253,678 | | | 1,035 |
Hubbell, Cl B | | 8,200 | | | 350 |
Hudson Highland Group * | | 62,800 | | | 322 |
ICF International * | | 61,264 | | | 1,374 |
IDEX (A) | | 50,707 | | | 1,549 |
IHS, Cl A * | | 34,885 | | | 1,806 |
II-VI * | | 33,872 | | | 1,135 |
Innerworkings * (A) | | 563,463 | | | 3,905 |
Insteel Industries (A) | | 14,900 | | | 189 |
Interface, Cl A | | 193,862 | | | 2,285 |
Interline Brands * | | 10,200 | | | 203 |
John Bean Technologies | | 7,600 | | | 131 |
Kadant * | | 31,055 | | | 607 |
Kaman | | 16,467 | | | 403 |
Kaydon (A) | | 60,627 | | | 2,276 |
KBR | | 26,900 | | | 591 |
Kelly Services, Cl A * (A) | | 29,600 | | | 432 |
Kirby * | | 46,100 | | | 1,817 |
Knight Transportation (A) | | 43,376 | | | 862 |
Knoll | | 15,500 | | | 229 |
Kratos Defense & Security Solutions * | | 108,700 | | | 1,333 |
Ladish * | | 14,400 | | | 364 |
Landstar System | | 55,375 | | | 2,322 |
LB Foster, Cl A * | | 13,200 | | | 371 |
LECG * | | 221,001 | | | 734 |
Lincoln Electric Holdings (A) | | 3,000 | | | 167 |
Lindsay Manufacturing (A) | | 2,300 | | | 79 |
LS Starrett, Cl A | | 1,700 | | | 16 |
Lydall * | | 15,060 | | | 121 |
| | |
7 | | SEI Institutional Investments Trust /Annual Report/May 31, 2010 |
SCHEDULE OF INVESTMENTS
Small Cap Fund
May 31, 2010
| | | | | |
Description | | Shares | | Market Value
($ Thousands) |
Marten Transport * (A) | | 16,800 | | $ | 374 |
Mcgrath Rentcorp | | 5,576 | | | 130 |
Michael Baker * | | 51,500 | | | 1,867 |
Middleby * | | 23,390 | | | 1,317 |
Mine Safety Appliances | | 34,528 | | | 945 |
Mueller Industries | | 81,300 | | | 2,155 |
Mueller Water Products, Cl A | | 20,500 | | | 89 |
MYR Group * (A) | | 45,111 | | | 744 |
NACCO Industries, Cl A (A) | | 12,100 | | | 1,023 |
Navistar International * | | 17,300 | | | 937 |
Northwest Pipe * | | 5,100 | | | 105 |
Old Dominion Freight Line * | | 44,600 | | | 1,590 |
Orbital Sciences * (A) | | 37,000 | | | 587 |
Owens Corning * | | 14,101 | | | 470 |
Pacer International * (A) | | 101,700 | | | 828 |
Powell Industries * | | 17,900 | | | 526 |
Quanex Building Products | | 87,875 | | | 1,751 |
Raven Industries | | 22,400 | | | 794 |
RBC Bearings * | | 7,925 | | | 222 |
Republic Airways Holdings * (A) | | 58,800 | | | 344 |
Resources Connection * | | 143,737 | | | 2,320 |
Ritchie Bros Auctioneers | | 88,560 | | | 1,805 |
RSC Holdings * (A) | | 159,500 | | | 1,166 |
Rush Enterprises, Cl A * | | 93,643 | | | 1,422 |
Ryder System (A) | | 45,400 | | | 2,040 |
Sauer-Danfoss * | | 14,200 | | | 203 |
School Specialty * (A) | | 103,399 | | | 2,222 |
Skywest | | 57,264 | | | 840 |
Spirit Aerosystems Holdings, Cl A * | | 50,600 | | | 986 |
Standard Parking * | | 133,304 | | | 2,068 |
Standard Register | | 35,194 | | | 140 |
Standex International | | 18,500 | | | 481 |
SYKES Enterprises * | | 106,600 | | | 1,840 |
TAL International Group (A) | | 59,600 | | | 1,430 |
Teledyne Technologies * | | 47,002 | | | 1,848 |
Tennant | | 73,732 | | | 2,469 |
Terex * | | 57,224 | | | 1,245 |
Tetra Tech * | | 105,450 | | | 2,390 |
Textainer Group Holdings (A) | | 65,500 | | | 1,608 |
Titan Machinery * | | 82,626 | | | 1,071 |
Towers Watson, Cl A (A) | | 62,163 | | | 2,860 |
TransDigm Group | | 45,940 | | | 2,424 |
Tredegar | | 51,705 | | | 852 |
Trex * (A) | | 1,400 | | | 32 |
Triumph Group (A) | | 10,018 | | | 695 |
TrueBlue * | | 85,700 | | | 1,139 |
Tutor Perini * | | 79,606 | | | 1,775 |
UAL * (A) | | 80,211 | | | 1,605 |
United Rentals * (A) | | 31,900 | | | 388 |
United Stationers * | | 4,900 | | | 286 |
Universal Forest Products (A) | | 12,300 | | | 456 |
US Airways Group * | | 172,700 | | | 1,525 |
US Ecology | | 14,377 | | | 203 |
Vitran, Cl A * | | 77,660 | | | 1,097 |
Wabash National * | | 147,500 | | | 1,056 |
Wabtec | | 53,465 | | | 2,318 |
Watts Water Technologies, Cl A (A) | | 31,550 | | | 1,022 |
WESCO International * (A) | | 111,065 | | | 4,154 |
Woodward Governor (A) | | 55,800 | | | 1,601 |
| | | | | |
Description | | Shares | | Market Value
($ Thousands) |
YRC Worldwide * | | 31,300 | | $ | 11 |
| | | | | |
| | | | | 222,080 |
| | | | | |
Information Technology — 19.0% | | | | | |
ACI Worldwide * | | 5,000 | | | 96 |
Acme Packet * | | 59,275 | | | 1,737 |
Actel * | | 99,900 | | | 1,410 |
Acxiom * | | 21,400 | | | 373 |
ADC Telecommunications * (A) | | 54,700 | | | 452 |
Advanced Energy Industries * (A) | | 259,929 | | | 3,213 |
Advent Software * (A) | | 57,059 | | | 2,467 |
Amkor Technology * | | 114,900 | | | 782 |
Ancestry.com * (A) | | 86,040 | | | 1,451 |
Anixter International * (A) | | 37,017 | | | 1,758 |
Ansys * | | 19,196 | | | 839 |
AOL * | | 56,835 | | | 1,172 |
Applied Micro Circuits * | | 41,800 | | | 461 |
Archipelago Learning * | | 85,219 | | | 1,237 |
Arris Group * | | 232,400 | | | 2,549 |
Arrow Electronics * | | 45,200 | | | 1,233 |
Art Technology Group * (A) | | 647,782 | | | 2,423 |
AsiaInfo Holdings * | | 35,000 | | | 750 |
Atheros Communications * | | 131,939 | | | 4,486 |
Atmel * | | 425,105 | | | 2,170 |
ATMI * | | 98,554 | | | 1,596 |
Benchmark Electronics * | | 170,500 | | | 3,151 |
Black Box | | 17,200 | | | 507 |
Blackbaud | | 8,100 | | | 183 |
Blackboard * (A) | | 56,261 | | | 2,253 |
Blue Coat Systems * | | 13,900 | | | 298 |
Brightpoint * | | 137,400 | | | 1,021 |
Brocade Communications Systems * | | 293,667 | | | 1,601 |
Cabot Microelectronics * | | 39,200 | | | 1,439 |
CACI International, Cl A * | | 47,756 | | | 2,208 |
CDC Software ADR * | | 192,612 | | | 1,645 |
Ceva * | | 179,990 | | | 2,091 |
Checkpoint Systems * | | 37,986 | | | 756 |
Ciber * | | 367,050 | | | 1,094 |
Cirrus Logic * | | 2,300 | | | 33 |
Cognex | | 47,092 | | | 899 |
Cogo Group * | | 44,900 | | | 304 |
Coherent * | | 36,774 | | | 1,298 |
CommScope * | | 60,890 | | | 1,717 |
CommVault Systems * | | 73,352 | | | 1,653 |
Compuware * | | 133,600 | | | 1,094 |
Comtech Telecommunications * | | 50,264 | | | 1,448 |
Comverse Technology * (A) | | 155,600 | | | 1,329 |
Concur Technologies * (A) | | 21,486 | | | 909 |
Convergys * | | 83,600 | | | 913 |
CSG Systems International * | | 147,593 | | | 3,029 |
CTS | | 110,657 | | | 1,165 |
Cymer * | | 38,000 | | | 1,150 |
Cypress Semiconductor * | | 43,100 | | | 491 |
Daktronics | | 27,600 | | | 232 |
DealerTrack Holdings * (A) | | 61,024 | | | 978 |
DG FastChannel * | | 49,682 | | | 2,110 |
Diebold (A) | | 63,575 | | | 1,842 |
Digi International * | | 164,700 | | | 1,522 |
Digital River * | | 105,212 | | | 2,898 |
DSP Group * | | 48,301 | | | 327 |
DTS * | | 120,962 | | | 3,995 |
| | |
8 | | SEI Institutional Investments Trust /Annual Report/May 31, 2010 |
SCHEDULE OF INVESTMENTS
Small Cap Fund
May 31, 2010
| | | | | |
Description | | Shares | | Market Value
($ Thousands) |
Earthlink (A) | | 371,100 | | $ | 3,188 |
Echo Global Logistics * | | 41,398 | | | 543 |
EF Johnson Technologies * | | 73,200 | | | 73 |
Electro Rent | | 13,171 | | | 179 |
Electronics for Imaging * | | 33,857 | | | 377 |
EMS Technologies * | | 4,000 | | | 62 |
Emulex * | | 144,682 | | | 1,516 |
Entegris * | | 44,800 | | | 242 |
Entropic Communications * | | 170,849 | | | 912 |
Epicor Software * | | 3,600 | | | 34 |
EPIQ Systems | | 7,200 | | | 82 |
Euronet Worldwide * | | 100,840 | | | 1,326 |
Fair Isaac (A) | | 67,500 | | | 1,566 |
Forrester Research * | | 14,300 | | | 449 |
Gartner * | | 118,590 | | | 2,935 |
GSI Commerce * (A) | | 74,411 | | | 2,095 |
Hackett Group * | | 197,801 | | | 669 |
Heartland Payment Systems | | 108,652 | | | 1,785 |
Hittite Microwave * | | 13,100 | | | 599 |
IAC * | | 40,300 | | | 945 |
Imation * (A) | | 379,866 | | | 3,905 |
Insight Enterprises * | | 78,800 | | | 1,146 |
Integral Systems * | | 90,800 | | | 621 |
Integrated Device Technology * | | 108,149 | | | 632 |
InterDigital * (A) | | 7,000 | | | 183 |
Intermec * (A) | | 191,710 | | | 2,117 |
Internet Capital Group * | | 137,141 | | | 1,141 |
Intersil, Cl A | | 51,400 | | | 684 |
IXYS * | | 24,600 | | | 229 |
Jack Henry & Associates | | 47,800 | | | 1,149 |
JDA Software Group * | | 83,106 | | | 2,221 |
KIT Digital * (A) | | 114,705 | | | 1,265 |
Knot * (A) | | 263,719 | | | 1,973 |
Lawson Software * | | 346,738 | | | 2,859 |
LeCroy * | | 71,700 | | | 358 |
Lexmark International, Cl A * | | 32,500 | | | 1,220 |
Littelfuse * (A) | | 17,830 | | | 645 |
LivePerson * | | 19,800 | | | 128 |
LTX-Credence * | | 194,200 | | | 672 |
Manhattan Associates * (A) | | 105,800 | | | 3,063 |
Mantech International, Cl A * (A) | | 79,332 | | | 3,668 |
MAXIMUS | | 27,900 | | | 1,671 |
Meru Networks * (A) | | 71,264 | | | 934 |
Methode Electronics (A) | | 159,792 | | | 1,622 |
Micrel | | 41,100 | | | 456 |
Microsemi * (A) | | 120,562 | | | 1,866 |
MicroStrategy, Cl A * | | 36,600 | | | 2,820 |
Mitel Networks * (A) | | 137,100 | | | 1,522 |
MKS Instruments * | | 56,125 | | | 1,115 |
ModusLink Global Solutions * | | 33,317 | | | 255 |
MoneyGram International * | | 126,800 | | | 333 |
Monotype Imaging Holdings * | | 79,107 | | | 781 |
Monster Worldwide * (A) | | 90,200 | | | 1,334 |
Move * | | 152,603 | | | 320 |
MTS Systems | | 19,099 | | | 559 |
Multi-Fineline Electronix * | | 20,550 | | | 543 |
NCR * | | 70,
400 | | | 935 |
Net 1 UEPS Technologies * | | 114,046 | | | 1,633 |
Netgear * | | 78,400 | | | 1,781 |
Netlogic Microsystems * | | 120,985 | | | 3,481 |
NetSuite * | | 125,261 | | | 1,764 |
Novatel Wireless * (A) | | 252,400 | | | 1,552 |
| | | | | |
Description | | Shares | | Market Value
($ Thousands) |
Novell * | | 200,045 | | $ | 1,166 |
Nuance Communications * (A) | | 57,708 | | | 983 |
Omnivision Technologies * (A) | | 99,300 | | | 1,915 |
Openwave Systems * | | 73,400 | | | 158 |
Orbotech * | | 109,800 | | | 1,239 |
OSI Systems * | | 42,200 | | | 1,109 |
Palm * | | 69,600 | | | 397 |
Parametric Technology * | | 42,984 | | | 708 |
Park Electrochemical | | 77,300 | | | 2,000 |
Parkervision * (A) | | 376,271 | | | 662 |
Plantronics (A) | | 34,900 | | | 1,045 |
PMC - Sierra * | | 160,500 | | | 1,300 |
Power Integrations | | 64,252 | | | 2,183 |
Progress Software * | | 74,400 | | | 2,376 |
PROS Holdings * | | 76,632 | | | 507 |
Quantum * | | 766,424 | | | 1,801 |
Quest Software * | | 178,118 | | | 3,447 |
Radisys * (A) | | 71,700 | | | 673 |
RealNetworks * | | 60,300 | | | 217 |
Richardson Electronics | | 25,765 | | | 251 |
RightNow Technologies * | | 25,541 | | | 372 |
Rogers * | | 11,936 | | | 341 |
Rosetta Stone * | | 84,898 | | | 2,229 |
Rubicon Technology * (A) | | 58,057 | | | 1,578 |
Rudolph Technologies * (A) | | 96,300 | | | 855 |
Sapient | | 249,200 | | | 2,529 |
SAVVIS * | | 85,097 | | | 1,596 |
Scansource * (A) | | 32,400 | | | 835 |
Seachange International * | | 183,800 | | | 1,535 |
Sigma Designs * (A) | | 15,700 | | | 164 |
Silicon Image * | | 94,000 | | | 343 |
Smith Micro Software * | | 91,615 | | | 902 |
Solera Holdings | | 39,293 | | | 1,363 |
Sonic Solutions * (A) | | 85,631 | | | 1,018 |
Sourcefire * (A) | | 26,908 | | | 555 |
SRA International, Cl A * (A) | | 87,827 | | | 1,894 |
SS&C Technologies Holdings * | | 201,131 | | | 3,282 |
Stamps.com * | | 15,225 | | | 160 |
Standard Microsystems * | | 26,671 | | | 610 |
SuccessFactors * | | 51,550 | | | 1,148 |
Synaptics * | | 11,900 | | | 356 |
Synchronoss Technologies * | | 53,654 | | | 1,097 |
SYNNEX * (A) | | 36,500 | | | 976 |
Synopsys * | | 27,232 | | | 583 |
Syntel | | 38,650 | | | 1,292 |
Take-Two Interactive Software * | | 38,800 | | | 449 |
Taleo, Cl A * | | 58,280 | | | 1,460 |
Tech Data * | | 40,900 | | | 1,663 |
Technitrol (A) | | 53,500 | | | 206 |
Tekelec * | | 31,114 | | | 446 |
TeleNav * | | 10,600 | | | 89 |
TeleTech Holdings * | | 43,300 | | | 560 |
Teradyne * | | 289,524 | | | 3,179 |
Tessera Technologies * (A) | | 24,900 | | | 433 |
THQ * | | 56,211 | | | 337 |
TIBCO Software * | | 100,700 | | | 1,149 |
TiVo * (A) | | 17,200 | | | 156 |
TNS * (A) | | 32,397 | | | 623 |
Trimble Navigation * | | 79,165 | | | 2,274 |
TriQuint Semiconductor * | | 92,700 | | | 651 |
TTM T echnologies * (A) | | 191,400 | | | 2,214 |
Ultra Clean Holdings * | | 71,300 | | | 636 |
| | |
9 | | SEI Institutional Investments Trust /Annual Report/May 31, 2010 |
SCHEDULE OF INVESTMENTS
Small Cap Fund
May 31, 2010
| | | | | |
Description | | Shares | | Market Value
($ Thousands) |
Ultratech * | | 78,600 | | $ | 1,096 |
Unisys * | | 57,280 | | | 1,329 |
United Online (A) | | 265,300 | | | 1,808 |
Valueclick * | | 102,700 | | | 1,194 |
VanceInfo Technologies ADR * | | 97,399 | | | 2,107 |
Varian Semiconductor Equipment | | | | | |
Associates * | | 23,600 | | | 734 |
Vasco Data Security International * | | 15,300 | | | 97 |
Veeco Instruments * (A) | | 51,038 | | | 1,948 |
VeriFone Holdings * | | 74,225 | | | 1,498 |
Verigy * | | 146,827 | | | 1,492 |
Vishay Intertechnology * (A) | | 31,700 | | | 287 |
VistaPrint * (A) | | 128,244 | | | 5,988 |
Vocus * | | 112,111 | | | 1,756 |
Volterra Semiconductor * | | 13,800 | | | 324 |
Web.com Group * | | 51,800 | | | 196 |
Websense * (A) | | 79,700 | | | 1,667 |
Xyratex * | | 63,974 | | | 1,038 |
Zebra Technologies, Cl A * | | 31,575 | | | 869 |
Zoran * | | 229,501 | | | 2,217 |
| | | | | |
| | | | | 254,891 |
| | | | | |
Materials — 4.3% | | | | | |
A. Schulman | | 60,482 | | | 1,344 |
AEP Industries * | | 5,300 | | | 133 |
AK Steel Holding | | 35,375 | | | 529 |
Allied Nevada Gold * (A) | | 83,800 | | | 1,604 |
AM Castle * | | 33,269 | | | 495 |
Aptargroup | | 43,790 | | | 1,745 |
Arch Chemicals | | 26,418 | | | 905 |
Buckeye Technologies * | | 109,200 | | | 1,323 |
Bway Holding * | | 5,300 | | | 106 |
Cabot | | 14,429 | | | 404 |
Carpenter Technology (A) | | 34,000 | | | 1,323 |
Century Aluminum * | | 29,000 | | | 305 |
Coeur d’Alene Mines * (A) | | 17,600 | | | 266 |
Commercial Metals (A) | | 85,715 | | | 1,334 |
Crown Holdings * | | 57,930 | | | 1,362 |
Cytec Industries | | 19,131 | | | 818 |
Domtar | | 9,700 | | | 594 |
Eagle Materials (A) | | 15,000 | | | 460 |
Ferro * | | 28,606 | | | 258 |
Gammon Gold * | | 174,700 | | | 1,282 |
General Steel Holdings * | | 78,857 | | | 217 |
Glatfelter (A) | | 41,800 | | | 485 |
Globe Specialty Metals * | | 110,000 | | | 1,284 |
Graham Packaging * | | 22,000 | | | 276 |
H.B. Fuller | | 128,258 | | | 2,736 |
Haynes International | | 29,000 | | | 921 |
Headwaters * | | 73,275 | | | 290 |
Hecla Mining * (A) | | 43,500 | | | 234 |
Huntsman | | 38,278 | | | 382 |
Innophos Holdings | | 44,300 | | | 1,264 |
Jaguar Mining * (A) | | 148,200 | | | 1,338 |
Kaiser Aluminum (A) | | 27,000 | | | 1,010 |
Koppers Holdings | | 71,322 | | | 1,932 |
Landec * | | 13,462 | | | 83 |
LSB Industries * (A) | | 6,000 | | | 98 |
Minerals Technologies | | 11,300 | | | 604 |
Myers Industries | | 71,593 | | | 643 |
Nalco Holding | | 74,360 | | | 1,685 |
| | | | | |
Description | | Shares | | Market Value
($ Thousands) |
New Gold * (A) | | 231,900 | | $ | 1,408 |
NewMarket | | 36,475 | | | 3,756 |
Olin (A) | | 64,054 | | | 1,228 |
Olympic Steel | | 23,000 | | | 634 |
OM Group * (A) | | 54,706 | | | 1,633 |
PolyOne * | | 102,148 | | | 1,020 |
Quaker Chemical | | 28,200 | | | 779 |
Rock-Tenn, Cl A | | 21,100 | | | 1,086 |
Rockwood Holdings * | | 16,900 | | | 438 |
RTI International Metals * | | 52,683 | | | 1,397 |
Schweitzer-Mauduit International | | 37,092 | | | 2,047 |
Sensient Technologies (A) | | 76,100 | | | 2,107 |
Silgan Holdings | | 22,076 | | | 630 |
Spartech * | | 20,790 | | | 277 |
Stepan (A) | | 14,000 | | | 1,010 |
Universal Stainless & Alloy * | | 63,000 | | | 1,298 |
US Gold * (A) | | 70,900 | | | 280 |
Wausau Paper * | | 25,400 | | | 222 |
Worthington Industries (A) | | 63,500 | | | 935 |
WR Grace * (A) | | 129,971 | | | 3,331 |
| | | | | |
| | | | | 57,588 |
| | | | | |
Telecommunication Services — 1.0% | | | |
Alaska Communications Systems Group | | 33,364 | | | 276 |
Atlantic Telegraph-Network (A) | | 12,100 | | | 506 |
Cbeyond * (A) | | 40,310 | | | 630 |
Cincinnati Bell * | | 269,300 | | | 856 |
Consolidated Communications Holdings | | 27,286 | | | 471 |
Frontier Communications | | 115,100 | | | 915 |
Global Crossing * | | 36,200 | | | 493 |
Leap Wireless International * (A) | | 70,000 | | | 1,143 |
Neutral Tandem * (A) | | 158,966 | | | 2,137 |
Premiere Global Services * | | 59,300 | | | 473 |
SBA Communications, Cl A * (A) | | 127,562 | | | 4,213 |
USA Mobility (A) | | 92,300 | | | 1,300 |
| | | | | |
| | | | | 13,413 |
| | | | | |
Utilities — 3.3% | | | | | |
AGL Resources | | 28,212 | | | 1,030 |
Allete (A) | | 72,440 | | | 2,501 |
Avista (A) | | 51,300 | | | 990 |
California Water Service Group | | 14,000 | | | 502 |
Central Vermont Public Service | | 17,800 | | | 357 |
CH Energy Group | | 2,100 | | | 82 |
Cia de Saneamento de Minas Gerais-COPASA (Brazil) | | 87,400 | | | 1,143 |
Cleco | | 69,000 | | | 1,826 |
El Paso Electric * | | 184,300 | | | 3,653 |
Empire District Electric (A) | | 93,192 | | | 1,700 |
Great Plains Energy | | 79,067 | | | 1,388 |
IDACORP | | 53,656 | | | 1,773 |
ITC Holdings | | 29,878 | | | 1,575 |
Laclede Group | | 6,900 | | | 228 |
Mirant * | | 32,000 | | | 397 |
New Jersey Resources | | 2,400 | | | 85 |
Nicor (A) | | 45,200 | | | 1,826 |
Northwest Natural Gas (A) | | 13,500 | | | 594 |
NorthWestern (A) | | 216,881 | | | 5,712 |
Portland General Electric | | 311,775 | | | 5,896 |
| | |
10 | | SEI Institutional Investments Trust /Annual Report/May 31, 2010 |
SCHEDULE OF INVESTMENTS
Small Cap Fund
May 31, 2010
| | | | | | |
Description | | Shares/Face Amount
($ Thousands) | | Market Value
($ Thousands) |
RRI Energy * | | | 55,200 | | $ | 244 |
South Jersey Industries | | | 12,954 | | | 569 |
UGI | | | 60,000 | | | 1,568 |
UIL Holdings | | | 39,800 | | | 1,006 |
Unisource Energy (A) | | | 98,058 | | | 3,028 |
Vectren | | | 81,300 | | | 1,874 |
Westar Energy | | | 80,626 | | | 1,774 |
WGL Holdings (A) | | | 8,300 | | | 281 |
| | | | | | |
| | | | | | 43,602 |
| | | | | | |
Total Common Stock
(Cost $1,138,707)
($ Thousands) | | | | | | 1,296,705 |
| | | | | | |
PREFERRED STOCK — 0.2% | | | |
Consumer Discretionary — 0.1% | | | |
Callaway Golf (B) | | | 11,100 | | | 1,483 |
| | | | | | |
Financials — 0.1% | | | | | | |
Grubb & Ellis * | | | 6,600 | | | 673 |
| | | | | | |
Total Preferred Stock
(Cost $1,755)
($ Thousands) | | | | | | 2,156 |
| | | | | | |
CONVERTIBLE BONDS — 0.2% |
Consumer Discretionary — 0.0% |
Eddie Bauer Holdings 5.250%, 04/01/14 (E) | | $ | 3,147 | | | 252 |
| | | | | | |
Energy — 0.2% | | | | | | |
Nova Biosource Fuels 10.000%, 09/30/12 (E) | | | 3,332 | | | 8 |
Rentech
4.000%, 04/15/13 | | | 1,915 | | | 1,283 |
Scorpio Mining
7.000%, 05/05/11 (G) | | | 887 | | | 779 |
| | | | | | |
| | | | | | 2,070 |
| | | | | | |
Total Convertible Bonds (Cost $3,725)
($ Thousands) | | | | | | 2,322 |
| | | | | | |
WARRANTS — 0.0% | | | | | | |
Oilsands Quest,
Expires 05/12/11 * | | | 247,050 | | | 49 |
| | | | | | |
Rentech, Expires 04/25/12 * (G) | | | 16,100 | | | 2 |
| | | | | | |
Titanium Asset Management, Expires 06/21/11 * (G) | | | 122,200 | | | — |
| | | | | | |
Washington Mutual (F) | | | 17,435 | | | 5 |
| | | | | | |
Total Warrants
(Cost $53)
($ Thousands) | | | | | | 56 |
| | | | | | |
| | | | | | |
Description | | Shares/Face Amount
($ Thousands) | | Market Value
($ Thousands) |
| | | Number Of
Rights | | |
RIGHT — 0.0% | | | | | | |
United States — 0.0% | | | | | | |
Ligand Pharma, Expires 01/05/12 | | | 64,529 | | $ | — |
| | | | | | |
Total Right
(Cost $0)
($ Thousands) | | | | | | — |
| | | | | | |
EXCHANGE TRADED FUNDS — 0.0% |
Powershares QQQ | | | 7,485 | | | 342 |
| | | | | | |
Total Exchange Traded Funds
(Cost $374)
($ Thousands) | | | | | | 342 |
| | | | | | |
AFFILIATED PARTNERSHIP — 17.6% |
SEI Liquidity Fund, L.P. 0.240%**†(B) | | | 241,968,446 | | | 235,812 |
| | | | | | |
Total Affiliated Partnership (Cost $241,968)
($ Thousands) | | | | | | 235,812 |
| | | | | | |
CASH EQUIVALENT — 3.8% | | | |
SEI Daily Income Trust, Prime Obligation Fund, Cl A 0.090%**† | | | 50,578,993 | | | 50,579 |
| | | | | | |
Total Cash Equivalent
(Cost $50,579)
($ Thousands) | | | | | | 50,579 |
| | | | | | |
U.S. TREASURY OBLIGATION (C) (D) — 0.2% |
U.S. Treasury Bill
0.102%, 06/03/10 | | $ | 3,329 | | | 3,329 |
| | | | | | |
Total U.S. Treasury Obligation
(Cost $3,329)
($ Thousands) | | | | | | 3,329 |
| | | | | | |
Total Investments — 118.8% (Cost $1,440,490)
($ Thousands) | | | | | $ | 1,591,301 |
| | | | | | |
A summary of the open futures contracts held by the Fund at May 31, 2010,
is as follows:
| | | | | | | |
Type of Contract | | Number of
Contracts
Long (Short) | | Expiration
Date | | Unrealized
Appreciation
($ Thousands) |
Russell 2000 Index E-Mini | | 513 | | Jun-2010
| | $ | 160 |
| | | | | | | |
For the year ended May 31, 2010, the total amount of all open futures contracts, as presented in the table above, are representative of the volume of activity for this derivative type during the period.
| | |
11 | | SEI Institutional Investments Trust /Annual Report/May 31, 2010 |
SCHEDULE OF INVESTMENTS
Small Cap Fund
May 31, 2010
Percentages are based on Net Assets of $1,339,748 ($ Thousands).
| (A) | This security or a partial position of this security is on loan at May 31, 2010. The total value of securities on loan at May 31, 2010 was $231,332 ($ Thousands). |
| (B) | This security was purchased with cash collateral held from securities on loan. The total value of such securities as of May 31, 2010 was $235,812 ($ Thousands). |
| (C) | Security, or a portion thereof, has been pledged as collateral on open futures contracts. |
| (D) | The rate reported is the effective yield at time of purchase. |
| (E) | Security in default on interest payments. |
| (F) | This warrant represents a potential distribution settlement in a legal claim and does not have a strike price or expiration date. |
| (G) | Securities considered restricted. The total value of such securities as of May 31, 2010 was $1,253 ($ Thousands) and represented 0.10% of Net Assets. |
| * | Non-income producing security. |
| ** | The rate reported is the 7-day effective yield as of May 31, 2010. |
| † | Investment in Affiliated Security. |
| ‡ | Real Estate Investment Trust. |
ADR — American Depositary Receipt
CL — Class
L.P. — Limited Partnership
Amounts designated as “—” are either $0 or have been rounded to $0.
| | |
12 | | SEI Institutional Investments Trust /Annual Report/May 31, 2010 |
SCHEDULE OF INVESTMENTS
Small/Mid Cap Equity Fund
May 31, 2010
| | | | | |
Description | | Shares | | Market Value
($ Thousands) |
COMMON STOCK — 97.4% | | | | | |
Consumer Discretionary — 16.3% | | | | | |
Aaron’s | | 64,902 | | $ | 1,297 |
Abercrombie & Fitch, Cl A | | 37,683 | | | 1,350 |
Advance Auto Parts | | 9,880 | | | 511 |
Aeropostale * | | 71,200 | | | 1,973 |
AFC Enterprises * | | 62,235 | | | 651 |
American Eagle Outfitters | | 308,162 | | | 4,037 |
American Greetings, Cl A (A) | | 33,400 | | | 788 |
AnnTaylor Stores * | | 27,800 | | | 602 |
Apollo Group, Cl A * | | 28,800 | | | 1,531 |
Arctic Cat * | | 68,000 | | | 780 |
Autoliv (A) | | 46,400 | | | 2,204 |
Barnes & Noble | | 23,071 | | | 467 |
Bebe Stores | | 45,936 | | | 315 |
Belo, Cl A | | 147,440 | | | 1,072 |
Big 5 Sporting Goods (A) | | 29,244 | | | 432 |
Big Lots * (A) | | 57,066 | | | 2,016 |
Blyth | | 5,589 | | | 277 |
Bob Evans Farms (A) | | 41,100 | | | 1,194 |
BorgWarner * | | 54,527 | | | 2,032 |
Bridgepoint Education * | | 178,500 | | | 3,850 |
Brinker International (A) | | 56,300 | | | 1,001 |
Brown Shoe | | 105,516 | | | 1,760 |
Brunswick (A) | | 122,100 | | | 2,133 |
Buckle | | 11,900 | | | 423 |
Cabela’s * (A) | | 74,000 | | | 1,273 |
Cablevision Systems, Cl A | | 26,300 | | | 653 |
California Pizza Kitchen * | | 4,175 | | | 76 |
Callaway Golf (A) | | 275,759 | | | 2,322 |
Capella Education * (A) | | 28,269 | | | 2,429 |
Career Education * | | 86,106 | | | 2,411 |
Carmike Cinemas * | | 14,421 | | | 160 |
Carter’s * | | 164,600 | | | 5,030 |
Cato, Cl A | | 166,805 | | | 3,958 |
CBS, Cl B | | 62,000 | | | 903 |
CEC Entertainment * (A) | | 59,421 | | | 2,403 |
Central European Media Enterprises, Cl A * | | 6,100 | | | 155 |
Century Casinos * | | 85,331 | | | 195 |
Charm Communications ADR * (A) | | 38,600 | | | 315 |
Charming Shoppes * | | 43,317 | | | 197 |
Cheesecake Factory * (A) | | 102,546 | | | 2,615 |
Childrens Place Retail Stores * | | 20,000 | | | 943 |
Chipotle Mexican Grill, Cl A * | | 2,900 | | | 413 |
Christopher & Banks | | 78,897 | | | 723 |
Citi Trends * (A) | | 43,920 | | | 1,497 |
Coinstar * | | 55,600 | | | 2,983 |
Collective Brands * | | 37,248 | | | 834 |
Cooper Tire & Rubber | | 249,752 | | | 4,723 |
Corinthian Colleges * | | 18,600 | | | 249 |
CPI | | 3,874 | | | 109 |
Cracker Barrel Old Country | | | | | |
Store (A) | | 76,924 | | | 3,833 |
CROCS * | | 206,100 | | | 2,133 |
Dana Holdings * | | 40,202 | | | 436 |
Darden Restaurants | | 32,954 | | | 1,414 |
DeVry | | 1,939 | | | 111 |
Dick’s Sporting Goods * (A) | | 299,188 | | | 8,530 |
Dillard’s, Cl A (A) | | 129,380 | | | 3,712 |
DineEquity * | | 5,066 | | | 171 |
Domino’s Pizza * | | 44,698 | | | 581 |
| | | | | |
Description | | Shares | | Market Value
($ Thousands) |
DR Horton (A) | | 142,390 | | $ | 1,736 |
DreamWorks Animation SKG, Cl A * | | 56,200 | | | 1,669 |
DSW, Cl A * (A) | | 55,800 | | | 1,611 |
Eastman Kodak * (A) | | 759,819 | | | 4,285 |
Entercom Communications, Cl A * | | 89,929 | | | 1,124 |
Ethan Allen Interiors | | 56,801 | | | 1,147 |
Expedia | | 119,400 | | | 2,574 |
Express * | | 74,300 | | | 1,062 |
Family Dollar Stores (A) | | 51,500 | | | 2,098 |
Focus Media Holding ADR * (A) | | 160,160 | | | 2,513 |
Foot Locker | | 274,511 | | | 4,093 |
Fossil * | | 21,178 | | | 794 |
GameStop, Cl A * | | 163,139 | | | 3,718 |
Gannett (A) | | 249,457 | | | 3,877 |
Gaylord Entertainment * | | 72,000 | | | 1,914 |
Genesco * | | 93,060 | | | 2,896 |
Gentex (A) | | 229,017 | | | 4,507 |
Goodyear Tire & Rubber * | | 48,115 | | | 572 |
Grand Canyon Education * (A) | | 182,699 | | | 4,487 |
Group 1 Automotive * (A) | | 63,810 | | | 1,815 |
H&R Block | | 147,622 | | | 2,374 |
Hanesbrands * | | 139,440 | | | 3,804 |
Harley-Davidson | | 62,260 | | | 1,881 |
hhgregg * | | 45,749 | | | 1,373 |
Hibbett Sports * (A) | | 63,662 | | | 1,641 |
Hillenbrand | | 39,800 | | | 967 |
Home Inns & Hotels Management ADR * | | 37,400 | | | 1,424 |
HOT Topic | | 280,000 | | | 1,557 |
HSN * | | 40,297 | | | 1,086 |
Hyatt Hotels, Cl A * | | 62,550 | | | 2,531 |
Iconix Brand Group * | | 32,000 | | | 520 |
Interactive Data | | 11,000 | | | 358 |
International Game Technology | | 89,112 | | | 1,744 |
International Speedway, Cl A | | 33,006 | | | 920 |
Interpublic Group * | | 511,239 | | | 4,269 |
J Crew Group * | | 64,610 | | | 2,949 |
Jakks Pacific * | | 42,270 | | | 626 |
Jarden | | 198,225 | | | 5,770 |
Jo-Ann Stores * | | 32,601 | | | 1,489 |
John Wiley & Sons, Cl A | | 6,900 | | | 273 |
Jones Apparel Group | | 183,150 | | | 3,597 |
Journal Communications, Cl A * | | 29,166 | | | 147 |
Las Vegas Sands * | | 55,700 | | | 1,308 |
La-Z-Boy, Cl Z * | | 18,470 | | | 219 |
Leggett & Platt | | 152,000 | | | 3,539 |
Lennar, Cl A | | 46,900 | | | 811 |
Liberty Global * | | 7,689 | | | 197 |
Life Time Fitness * (A) | | 55,022 | | | 2,042 |
Limited Brands | | 13,068 | | | 325 |
Lin TV, Cl A * | | 11,300 | | | 74 |
Lincoln Educational Services * | | 67,100 | | | 1,599 |
Live Nation * | | 556,375 | | | 6,805 |
Liz Claiborne * | | 123,625 | | | 758 |
LKQ * | | 86,100 | | | 1,586 |
Maidenform Brands * | | 8,383 | | | 194 |
MarineMax * | | 32,457 | | | 328 |
Marriott International, Cl A | | 36,200 | | | 1,211 |
Men’s Wearhouse | | 37,804 | | | 822 |
Meredith | | 14,000 | | | 470 |
Meritage Homes * | | 99,055 | | | 2,118 |
National American University Holdings | | 170,684 | | | 1,365 |
National CineMedia | | 311,775 | | | 5,453 |
| | |
1 | | SEI Institutional Investments Trust /Annual Report/May 31, 2010 |
SCHEDULE OF INVESTMENTS
Small/Mid Cap Equity Fund
May 31, 2010
| | | | | |
Description | | Shares | | Market Value
($ Thousands) |
Navitas | | 301,047 | | $ | 1,222 |
NetFlix * | | 17,300 | | | 1,923 |
New York Times, Cl A * | | 35,500 | | | 329 |
NutriSystem | | 19,400 | | | 432 |
NVR * | | 2,721 | | | 1,865 |
O’Charleys * | | 16,994 | | | 127 |
Office Depot * | | 215,470 | | | 1,250 |
OfficeMax * (A) | | 96,320 | | | 1,717 |
Oxford Industries | | 17,934 | | | 374 |
Penn National Gaming * | | 218,402 | | | 5,591 |
Penske Auto Group * | | 62,900 | | | 821 |
Perry Ellis International * | | 7,652 | | | 184 |
PetSmart (A) | | 254,739 | | | 8,090 |
PF Chang’s China Bistro | | 6,264 | | | 272 |
Phillips-Van Heusen | | 76,662 | | | 4,196 |
Polaris Industries | | 61,425 | | | 3,606 |
Pool (A) | | 66,900 | | | 1,605 |
Pre-Paid Legal Services * (A) | | 9,200 | | | 426 |
priceline.com * | | 2,865 | | | 548 |
Pulte Homes * | | 269,675 | | | 3,004 |
RadioShack | | 116,200 | | | 2,375 |
RC2 * | | 165,730 | | | 3,082 |
Red Robin Gourmet Burgers * (A) | | 50,328 | | | 1,037 |
Regal Entertainment Group, Cl A | | 130,597 | | | 1,990 |
Regis (A) | | 148,269 | | | 2,727 |
Rent-A-Center, Cl A * | | 81,865 | | | 1,983 |
Retail Ventures * | | 9,884 | | | 100 |
Ross Stores | | 12,436 | | | 652 |
Royal Caribbean Cruises * | | 11,100 | | | 322 |
Ruby Tuesday * | | 79,800 | | | 859 |
Ryland Group (A) | | 144,280 | | | 2,684 |
Saks * | | 422,705 | | | 3,880 |
Scholastic | | 83,038 | | | 2,171 |
Scientific Games, Cl A * | | 526,749 | | | 5,383 |
Scripps Networks Interactive, Cl A | | 13,900 | | | 628 |
Service International | | 66,200 | | | 565 |
Shutterfly * | | 63,298 | | | 1,462 |
Signet Jewelers * | | 4,677 | | | 145 |
Sinclair Broadcast Group, Cl A * (A) | | 93,100 | | | 618 |
Sonic * (A) | | 128,160 | | | 1,352 |
Sonic Automotive, Cl A * | | 20,500 | | | 203 |
Sotheby’s (A) | | 59,810 | | | 1,944 |
Spectrum Group International * | | 3,929 | | | 8 |
Stage Stores | | 95,604 | | | 1,355 |
Starwood Hotels & Resorts | | | | | |
Worldwide | | 77,852 | | | 3,601 |
Stein Mart * | | 16,724 | | | 133 |
Steiner Leisure * | | 54,100 | | | 2,245 |
Strayer Education | | 14,000 | | | 3,360 |
Systemax | | 13,442 | | | 259 |
Talbots * | | 170,160 | | | 2,559 |
Tempur-Pedic International * (A) | | 94,069 | | | 3,123 |
Tenneco * | | 129,137 | | | 2,862 |
Texas Roadhouse, Cl A * (A) | | 33,100 | | | 483 |
Tractor Supply (A) | | 45,336 | | | 3,072 |
True Religion Apparel * | | 62,837 | | | 1,735 |
TRW Automotive Holdings * | | 82,852 | | | 2,492 |
Tupperware Brands | | 33,122 | | | 1,407 |
Warnaco Group * | | 11,380 | | | 484 |
Wendy’s, Cl A | | 154,400 | | | 696 |
Westport Innovations * | | 118,255 | | | 1,929 |
Whirlpool (A) | | 27,400 | | | 2,862 |
Williams-Sonoma (A) | | 111,030 | | | 3,318 |
| | | | | |
Description | | Shares | | Market Value
($ Thousands) |
Winnebago Industries * (A) | | 125,390 | | $ | 1,521 |
WMS Industries * | | 90,186 | | | 4,178 |
Wyndham Worldwide (A) | | 102,440 | | | 2,418 |
Zumiez * (A) | | 209,141 | | | 3,580 |
| | | | | |
| | | | | 335,626 |
| | | | | |
Consumer Staples — 3.4% | | | | | |
Alliance One International * | | 65,400 | | | 273 |
American Italian Pasta, Cl A * | | 14,603 | | | 568 |
Andersons | | 8,200 | | | 268 |
Avon Products | | 38,469 | | | 1,019 |
BJ’s Wholesale Club * | | 91,155 | | | 3,653 |
Brown-Forman, Cl B | | 37,784 | | | 2,095 |
Cal-Maine Foods (A) | | 31,900 | | | 1,033 |
Casey’s General Stores | | 39,738 | | | 1,465 |
Central European Distribution * (A) | | 40,310 | | | 1,030 |
Central Garden and Pet, Cl A * | | 66,227 | | | 626 |
Central Garden and Pet * | | 73,524 | | | 739 |
China-Biotics * (A) | | 106,500 | | | 1,525 |
Chiquita Brands International * (A) | | 91,010 | | | 1,124 |
Constellation Brands, Cl A * | | 99,916 | | | 1,665 |
Corn Products International | | 46,890 | | | 1,564 |
Cosan Industria e Comercio | | | | | |
(Brazil) * | | 135,100 | | | 1,537 |
Cullen Agricultural Holding * | | 38,000 | | | 257 |
Dean Foods * | | 388,936 | | | 4,142 |
Del Monte Foods | | 290,830 | | | 4,240 |
Diamond Foods | | 12,211 | | | 506 |
Dole Food * | | 67,698 | | | 619 |
Elizabeth Arden * | | 7,862 | | | 134 |
Estee Lauder, Cl A | | 12,156 | | | 708 |
Flowers Foods | | 18,800 | | | 465 |
Fresh Del Monte Produce * | | 48,300 | | | 966 |
Great Atlantic & Pacific Tea * | | 55,300 | | | 298 |
Green Mountain Coffee Roasters * (A) | | 119,900 | | | 2,836 |
Hansen Natural * | | 15,600 | | | 609 |
Herbalife | | 68,940 | | | 3,113 |
Hormel Foods | | 20,700 | | | 824 |
Kulim Malaysia | | 690,700 | | | 1,534 |
Lance (A) | | 91,700 | | | 1,770 |
McCormick | | 48,014 | | | 1,852 |
Mead Johnson Nutrition, Cl A | | 27,600 | | | 1,361 |
Molson Coors Brewing, Cl B | | 50,238 | | | 2,062 |
Nash Finch | | 10,552 | | | 381 |
NBTY * | | 55,200 | | | 1,890 |
Nu Skin Enterprises, Cl A | | 6,446 | | | 186 |
Nutraceutical International * | | 8,408 | | | 119 |
Pantry * | | 115,051 | | | 1,759 |
Prestige Brands Holdings * | | 193,033 | | | 1,490 |
Rite Aid * | | 457,179 | | | 526 |
Ruddick | | 35,200 | | | 1,162 |
Sanderson Farms | | 56,371 | | | 3,092 |
Sara Lee (A) | | 171,300 | | | 2,427 |
Saskatchewan Wheat Pool, Cl Common Subscription Recei * | | 188,800 | | | 1,372 |
Supervalu | | 94,000 | | | 1,266 |
TreeHouse Foods * (A) | | 47,573 | | | 2,193 |
Village Super Market, Cl A | | 3,068 | | | 83 |
Weis Markets | | 17,700 | | | 598 |
Whole Foods Market * | | 10,918 | | | 441 |
| | |
2 | | SEI Institutional Investments Trust /Annual Report/May 31, 2010 |
SCHEDULE OF INVESTMENTS
Small/Mid Cap Equity Fund
May 31, 2010
| | | | | |
Description | | Shares | | Market Value
($ Thousands) |
Winn-Dixie Stores * | | 40,735 | | $ | 456 |
| | | | | |
| | | | | 67,921 |
| | | | | |
Energy — 4.4% | | | | | |
Atwood Oceanics * | | 32,900 | | | 893 |
Berry Petroleum, Cl A (A) | | 108,437 | | | 3,333 |
BPZ Resources * (A) | | 332,500 | | | 1,702 |
Brigham Exploration * | | 88,200 | | | 1,515 |
Cal Dive International * | | 14,264 | | | 79 |
Carrizo Oil & Gas * (A) | | 48,624 | | | 863 |
Cimarex Energy | | 1,736 | | | 128 |
Clayton Williams Energy * | | 33,842 | | | 1,536 |
Complete Production Services * | | 8,551 | | | 111 |
Concho Resources * (A) | | 24,153 | | | 1,257 |
Contango Oil & Gas * | | 2,433 | | | 122 |
CVR Energy * | | 238,700 | | | 1,805 |
Dresser-Rand Group * (A) | | 245,774 | | | 7,823 |
Ensco International ADR | | 9,422 | | | 352 |
Exterran Holdings * | | 113,606 | | | 2,897 |
Frontier Oil | | 91,748 | | | 1,276 |
Goodrich Petroleum * | | 134,227 | | | 1,643 |
Gulfmark Offshore, Cl A * | | 6,177 | | | 161 |
Gulfport Energy * | | 100,874 | | | 1,325 |
Helix Energy Solutions Group * (A) | | 205,369 | | | 2,237 |
Hornbeck Offshore Services * | | 85,756 | | | 1,310 |
Key Energy Services * (A) | | 535,164 | | | 5,116 |
Kinder Morgan Escrow * | | 24,428 | | | — |
Lufkin Industries | | 28,832 | | | 2,299 |
Murphy Oil | | 39,509 | | | 2,109 |
Nabors Industries * | | 111,739 | | | 2,126 |
Newfield Exploration * | | 35,270 | | | 1,836 |
Newpark Resources * | | 47,280 | | | 304 |
Nordic American Tanker | | | | | |
Shipping | | 34,900 | | | 991 |
Northern Oil And Gas * (A) | | 93,500 | | | 1,349 |
Oil States International * | | 5,737 | | | 224 |
Oilsands Quest * (A) | | 1,723,200 | | | 1,239 |
Oilsands Quest Private Placement * | | 304,800 | | | 219 |
Overseas Shipholding Group (A) | | 110,330 | | | 4,269 |
Patterson-UTI Energy | | 31,400 | | | 441 |
PetroHawk Energy * | | 78,364 | | | 1,507 |
Petroleum Development * | | 9,488 | | | 195 |
Pioneer Natural Resources | | 34,269 | | | 2,183 |
Quicksilver Resources * | | 7,503 | | | 92 |
Range Resources (A) | | 72,823 | | | 3,273 |
Rosetta Resources * | | 49,600 | | | 1,088 |
SEACOR Holdings * | | 13,912 | | | 1,015 |
Ship Finance International | | 13,100 | | | 237 |
Southern Union | | 4,786 | | | 104 |
Southwestern Energy * | | 26,498 | | | 997 |
Spectra Energy | | 103,920 | | | 2,079 |
Stone Energy * | | 18,726 | | | 251 |
Sunoco | | 89,145 | | | 2,663 |
Swift Energy * (A) | | 126,461 | | | 3,497 |
T-3 Energy Services, Cl 3 * (A) | | 51,915 | | | 1,385 |
Teekay | | 48,412 | | | 1,222 |
Tesoro (A) | | 125,913 | | | 1,473 |
Tetra Technologies * | | 28,850 | | | 290 |
Tidewater (A) | | 57,124 | | | 2,388 |
Unit * | | 13,118 | | | 536 |
USEC * (A) | | 61,099 | | | 323 |
Venoco * | | 72,946 | | | 1,056 |
W&T Offshore (A) | | 199,400 | | | 1,942 |
| | | | | |
Description | | Shares | | Market Value
($ Thousands) |
Western Refining * (A) | | 88,000 | | $ | 463 |
Whiting Petroleum * (A) | | 54,267 | | | 4,543 |
Willbros Group * (A) | | 71,241 | | | 662 |
World Fuel Services | | 180,500 | | | 4,698 |
| | | | | |
| | | | | 95,052 |
| | | | | |
Financials — 17.0% | | | | | |
1st Source | | 800 | | | 15 |
Advance America Cash Advance Centers | | 104,300 | | | 504 |
Affiliated Managers Group * (A) | | 66,610 | | | 4,773 |
Alexander’s ‡ | | 1,037 | | | 336 |
Alexandria Real Estate Equities ‡ | | 5,406 | | | 355 |
Allied World Assurance Holdings | | 40,600 | | | 1,823 |
AMB Property ‡ (A) | | 91,650 | | | 2,377 |
American Capital Agency ‡ | | 18,267 | | | 480 |
American Financial Group | | 164,635 | | | 4,593 |
AmeriCredit * | | 10,954 | | | 237 |
Ameriprise Financial | | 85,057 | | | 3,384 |
Annaly Capital Management ‡ | | 65,700 | | | 1,114 |
Anworth Mortgage Asset ‡ (A) | | 248,000 | | | 1,681 |
Apartment Investment & Management, Cl A ‡ (A) | | 83,458 | | | 1,722 |
Apollo Investments * | | 18,133 | | | 189 |
Arch Capital Group * (A) | | 40,816 | | | 3,001 |
Ares Capital | | 8,677 | | | 117 |
Aspen Insurance Holdings | | 42,000 | | | 1,061 |
Associated Banc (A) | | 126,200 | | | 1,695 |
Assured Guaranty (A) | | 109,990 | | | 1,848 |
AvalonBay Communities ‡ (A) | | 32,763 | | | 3,213 |
Axis Capital Holdings | | 8,700 | | | 265 |
Banco Latinoamericano de Comercio Exterior, Cl E | | 80,200 | | | 1,036 |
Bancorpsouth | | 54,565 | | | 1,058 |
Bank Mutual | | 25,400 | | | 163 |
BGC Partners, Cl A | | 146,161 | | | 910 |
BioMed Realty Trust ‡ (A) | | 65,700 | | | 1,118 |
BlackRock, Cl A | | 1,859 | | | 312 |
Boston Private Financial Holdings | | 54,938 | | | 402 |
Boston Properties ‡ (A) | | 82,333 | | | 6,313 |
Brandywine Realty Trust ‡ | | 64,775 | | | 751 |
Brasil Brokers Participacoes | | 337,600 | | | 1,103 |
Calamos Asset Management, Cl A | | 9,636 | | | 106 |
CapitalSource | | 486,090 | | | 2,207 |
Capstead Mortgage ‡ (A) | | 172,100 | | | 1,965 |
Cardinal Financial | | 239,884 | | | 2,519 |
Cardtronics * | | 182,314 | | | 2,361 |
CB Richard Ellis Group, Cl A * | | 173,908 | | | 2,753 |
CBL & Associates Properties ‡ | | 74,039 | | | 1,058 |
Cedar Shopping Centers ‡ | | 145,000 | | | 996 |
Chemical Financial | | 20,942 | | | 507 |
Cincinnati Financial (A) | | 31,800 | | | 865 |
City National | | 3,800 | | | 219 |
CNA Financial * (A) | | 90,700 | | | 2,365 |
CNA Surety * | | 8,258 | | | 136 |
Colonial Properties Trust ‡ (A) | | 102,050 | | | 1,539 |
Comerica | | 67,761 | | | 2,582 |
Commerce Bancshares | | 1 | | | — |
Community Bank System | | 11,393 | | | 260 |
Corporate Office Properties | | | | | |
Trust ‡ (A) | | 36,100 | | | 1,369 |
Cowen Group, Cl A * | | 354,700 | | | 1,681 |
CreXus Investment ‡ | | 62,200 | | | 810 |
CVB Financial | | 53,000 | | | 526 |
Delphi Financial Group, Cl A | | 15,500 | | | 403 |
| | |
3 | | SEI Institutional Investments Trust /Annual Report/May 31, 2010 |
SCHEDULE OF INVESTMENTS
Small/Mid Cap Equity Fund
May 31, 2010
| | | | | |
Description | | Shares | | Market Value
($ Thousands) |
Developers Diversified Realty ‡ (A) | | 163,703 | | $ | 1,873 |
DiamondRock Hospitality ‡ | | 207,394 | | | 1,896 |
Digital Realty Trust ‡ (A) | | 27,650 | | | 1,574 |
Dime Community Bancshares | | 16,322 | | | 208 |
Dollar Financial * (A) | | 63,000 | | | 1,273 |
Douglas Emmett ‡ (A) | | 59,850 | | | 927 |
Duff & Phelps, Cl A | | 78,655 | | | 1,061 |
DuPont Fabros Technology ‡ | | 11,595 | | | 296 |
E*Trade Financial * | | 345,100 | | | 511 |
Eaton Vance | | 41,747 | | | 1,248 |
Education Realty Trust ‡ | | 404,739 | | | 2,574 |
EMC Insurance Group | | 13,767 | | | 307 |
Employers Holdings | | 190,224 | | | 3,034 |
Endurance Specialty Holdings | | 108,045 | | | 4,008 |
Equity Lifestyle Properties ‡ | | 5,222 | | | 271 |
Equity One ‡ | | 108,824 | | | 1,869 |
Equity Residential ‡ | | 103,700 | | | 4,680 |
Essex Property Trust ‡ (A) | | 27,050 | | | 2,846 |
Evercore Partners, Cl A | | 7,133 | | | 232 |
Everest Re Group | | 22,700 | | | 1,650 |
Extra Space Storage ‡ | | 49,750 | | | 748 |
Ezcorp, Cl A * | | 39,572 | | | 724 |
FBL Financial Group, Cl A | | 4,420 | | | 108 |
Federal Realty Investment Trust ‡ (A) | | 47,440 | | | 3,496 |
Federated Investors, Cl B | | 148,479 | | | 3,298 |
Fifth Third Bancorp | | 165,808 | | | 2,154 |
Financial Engines * | | 74,186 | | | 1,131 |
First Bancorp | | 164,748 | | | 219 |
First Community Bancshares | | 4,459 | | | 72 |
First Financial Bancorp (A) | | 233,460 | | | 3,711 |
First Horizon National * | | 183,451 | | | 2,284 |
First Mercury Financial | | 10,642 | | | 130 |
First Niagara Financial Group | | 24,200 | | | 320 |
First Potomac Realty Trust ‡ | | 73,700 | | | 1,083 |
FirstMerit | | 56,627 | | | 1,056 |
Flushing Financial | | 193,600 | | | 2,621 |
Forestar Group * | | 8,902 | | | 163 |
General Shopping Brasil (Brazil) * | | 201,300 | | | 772 |
Genworth Financial, Cl A * | | 98,169 | | | 1,530 |
Getty Realty ‡ | | 8,920 | | | 199 |
GFI Group | | 157,800 | | | 955 |
Glimcher Realty Trust ‡ | | 21,001 | | | 146 |
Gluskin Sheff + Associates | | 41,800 | | | 702 |
Gramercy Capital ‡ * | | 15,800 | | | 25 |
Greenlight Capital Re, Cl A * | | 7,685 | | | 186 |
Grubb & Ellis * (A) | | 308,560 | | | 448 |
Hancock Holding (A) | | 93,409 | | | 3,571 |
Hanover Insurance Group (A) | | 99,808 | | | 4,342 |
Hatteras Financial ‡ | | 24,100 | | | 668 |
HCP ‡ (A) | | 117,200 | | | 3,734 |
Health Care REIT ‡ (A) | | 54,217 | | | 2,336 |
Healthcare Realty Trust ‡ | | 42,150 | | | 967 |
Hercules Technology Growth Capital | | 94,618 | | | 834 |
Highwoods Properties ‡ (A) | | 62,000 | | | 1,827 |
Horace Mann Educators | | 135,085 | | | 2,076 |
Hospitality Properties Trust ‡ | | 101,300 | | | 2,279 |
Host Hotels & Resorts ‡ (A) | | 291,214 | | | 4,153 |
HRPT Properties Trust ‡ | | 434,071 | | | 2,913 |
Hudson City Bancorp | | 107,858 | | | 1,360 |
Hudson Valley Holding | | 44,960 | | | 1,075 |
Huntington Bancshares (A) | | 371,600 | | | 2,289 |
Iberiabank | | 24,289 | | | 1,334 |
Independent Bank | | 8,829 | | | 214 |
| | | | | |
Description | | Shares | | Market Value
($ Thousands) |
Infinity Property & Casualty | | 59,390 | | $ | 2,779 |
Inland Real Estate ‡ | | 123,251 | | | 1,027 |
International Bancshares (A) | | 71,865 | | | 1,419 |
Investors Bancorp * | | 10,312 | | | 141 |
Investors Real Estate Trust ‡ (A) | | 133,500 | | | 1,165 |
Jefferies Group | | 13,200 | | | 308 |
Jones Lang LaSalle | | 67,157 | | | 5,011 |
Keycorp | | 253,750 | | | 2,035 |
Kilroy Realty ‡ | | 17,400 | | | 572 |
Kimco Realty ‡ | | 21,900 | | | 313 |
Kite Realty Group Trust ‡ | | 22,941 | | | 112 |
Knight Capital Group, Cl A * | | 87,740 | | | 1,282 |
Lazard, Cl A | | 39,400 | | | 1,243 |
Lexington Realty Trust ‡ (A) | | 231,662 | | | 1,439 |
Liberty Property Trust ‡ | | 74,012 | | | 2,280 |
LTC Properties ‡ | | 22,000 | | | 565 |
M&T Bank | | 2,300 | | | 182 |
Macerich ‡ (A) | | 101,069 | | | 4,180 |
Mack-Cali Realty ‡ | | 77,875 | | | 2,568 |
MarketAxess Holdings | | 314,941 | | | 4,649 |
MB Financial | | 42,000 | | | 918 |
Meadowbrook Insurance Group | | 184,100 | | | 1,600 |
Medical Properties Trust ‡ | | 319,300 | | | 3,049 |
MFA Mortgage Investments ‡ | | 630,994 | | | 4,625 |
MGIC Investment * (A) | | 254,256 | | | 2,380 |
Mid-America Apartment Communities ‡ | | 28,281 | | | 1,545 |
Montpelier Re Holdings | | 75,900 | | | 1,185 |
MSCI, Cl A * | | 75,497 | | | 2,239 |
National Health Investors ‡ | | 6,806 | | | 280 |
National Penn Bancshares (A) | | 436,406 | | | 3,050 |
National Retail Properties ‡ (A) | | 68,493 | | | 1,505 |
Nationwide Health Properties ‡ | | 75,374 | | | 2,675 |
Nelnet, Cl A | | 78,800 | | | 1,560 |
New York Community Bancorp | | 31,399 | | | 504 |
NewAlliance Bancshares | | 56,848 | | | 669 |
NorthStar Realty Finance ‡ | | 81,624 | | | 257 |
NYSE Euronext | | 9,425 | | | 270 |
Old National Bancorp | | 20,000 | | | 230 |
Old Republic International | | 12,078 | | | 167 |
Omega Healthcare Investors ‡ | | 14,088 | | | 280 |
Oriental Financial Group (A) | | 50,000 | | | 684 |
PacWest Bancorp | | 77,775 | | | 1,621 |
PartnerRe | | 41,771 | | | 3,047 |
Pennsylvania Real Estate Investment Trust ‡ (A) | | 80,672 | | | 1,112 |
People’s United Financial | | 170,108 | | | 2,376 |
PHH * | | 71,398 | | | 1,574 |
Platinum Underwriters Holdings (A) | | 90,235 | | | 3,322 |
Plum Creek Timber ‡ | | 7,900 | | | 277 |
Popular | | 80,693 | | | 245 |
Post Properties ‡ | | 54,958 | | | 1,378 |
PrivateBancorp, Cl A (A) | | 64,640 | | | 856 |
ProAssurance * | | 75,653 | | | 4,453 |
ProLogis ‡ (A) | | 47,750 | | | 543 |
Prosperity Bancshares | | 14,976 | | | 540 |
Protective Life | | 29,479 | | | 634 |
PS Business Parks ‡ | | 11,237 | | | 606 |
Public Storage ‡ (A) | | 42,854 | | | 3,972 |
Radian Group (A) | | 306,912 | | | 3,155 |
RAIT Financial Trust ‡ * (A) | | 69,000 | | | 173 |
Raymond James Financial | | 66,500 | | | 1,880 |
Rayonier ‡ | | 8,107 | | | 364 |
Redwood Trust ‡ | | 103,030 | | | 1,565 |
| | |
4 | | SEI Institutional Investments Trust /Annual Report/May 31, 2010 |
SCHEDULE OF INVESTMENTS
Small/Mid Cap Equity Fund
May 31, 2010
| | | | | |
Description | | Shares | | Market Value
($ Thousands) |
Regency Centers ‡ (A) | | 43,550 | | $ | 1,600 |
Regions Financial (A) | | 118,700 | | | 906 |
Reinsurance Group of America, Cl A | | 100,054 | | | 4,700 |
Republic Bancorp, Cl A (A) | | 25,594 | | | 592 |
S&T Bancorp | | 23,500 | | | 507 |
Selective Insurance Group | | 43,800 | | | 683 |
Senior Housing Properties Trust ‡ (A) | | 102,785 | | | 2,142 |
Signature Bank NY * | | 47,564 | | | 1,800 |
Simmons First National, Cl A | | 5,214 | | | 137 |
Simon Property Group ‡ (A) | | 54,129 | | | 4,603 |
SL Green Realty ‡ | | 32,250 | | | 2,009 |
Sovran Self Storage ‡ | | 19,100 | | | 688 |
StanCorp Financial Group (A) | | 43,804 | | | 1,874 |
Stewart Information Services | | 6,200 | | | 66 |
Stifel Financial * (A) | | 38,491 | | | 1,950 |
Sun Communities ‡ | | 5,473 | | | 162 |
Sunstone Hotel Investors ‡ * (A) | | 355,123 | | | 3,917 |
Susquehanna Bancshares (A) | | 239,204 | | | 2,098 |
SVB Financial Group * | | 46,280 | | | 2,076 |
SWS Group | | 41,300 | | | 415 |
Synovus Financial | | 978,570 | | | 2,897 |
Tanger Factory Outlet Centers ‡ | | 3,405 | | | 142 |
Taubman Centers ‡ (A) | | 35,150 | | | 1,423 |
TD Ameritrade Holding * | | 98,724 | | | 1,750 |
TFS Financial | | 16,800 | | | 223 |
Titanium Asset Management * (F) | | 105,000 | | | 308 |
Titanium Asset Management * | | 42,000 | | | 105 |
Tower Group | | 45,411 | | | 995 |
Transatlantic Holdings | | 16,056 | | | 755 |
Trustco Bank | | 112,300 | | | 700 |
Trustmark (A) | | 74,778 | | | 1,673 |
Umpqua Holdings | | 41,308 | | | 519 |
Unitrin | | 78,100 | | | 2,085 |
Unum Group | | 176,363 | | | 4,074 |
Uranium Participation * | | 259,700 | | | 1,400 |
U-Store-It Trust ‡ (A) | | 199,365 | | | 1,639 |
Validus Holdings | | 44,312 | | | 1,089 |
Value Creation * (F) | | 85,600 | | | 81 |
Ventas ‡ (A) | | 50,840 | | | 2,387 |
Vornado Realty Trust ‡ (A) | | 16,091 | | | 1,250 |
Waddell & Reed Financial, Cl A | | 9,848 | | | 264 |
Washington Federal | | 48,800 | | | 843 |
Weingarten Realty Investors ‡ | | 42,856 | | | 894 |
Westamerica Bancorporation | | 8,200 | | | 456 |
Western Alliance Bancorp * (A) | | 246,785 | | | 1,987 |
White Mountains Insurance Group | | 2,900 | | | 948 |
Whitney Holding (A) | | 266,158 | | | 3,154 |
Willis Group Holdings | | 69,814 | | | 2,138 |
Winthrop Realty Trust ‡ | | 11,191 | | | 143 |
World Acceptance * (A) | | 91,977 | | | 3,286 |
WR Berkley | | 39,600 | | | 1,080 |
XL Capital, Cl A | | 18,500 | | | 326 |
Zions Bancorporation (A) | | 273,430 | | | 6,549 |
| | | | | |
| | | | | 348,890 |
| | | | | |
Health Care — 11.8% | | | | | |
Abaxis * | | 40,218 | | | 905 |
Acadia Pharmaceuticals * | | 377,800 | | | 506 |
Accretive Health * | | 39,200 | | | 508 |
Achillion Pharmaceuticals * | | 245,072 | | | 544 |
Acorda Therapeutics * | | 123,911 | | | 4,260 |
Affymax * | | 56,200 | | | 1,237 |
| | | | | |
Description | | Shares | | Market Value
($ Thousands) |
Albany Molecular Research * | | 26,300 | | $ | 169 |
Alexion Pharmaceuticals * | | 45,625 | | | 2,283 |
Align Technology * (A) | | 204,706 | | | 3,054 |
Alkermes * (A) | | 123,931 | | | 1,407 |
Allergan | | 8,500 | | | 512 |
Allscripts-Misys Healthcare Solutions * | | 63,100 | | | 1,187 |
AMAG Pharmaceuticals * (A) | | 25,500 | | | 812 |
American Medical Systems Holdings * (A) | | 119,499 | | | 2,696 |
AMERIGROUP * (A) | | 73,865 | | | 2,653 |
AmerisourceBergen (A) | | 131,977 | | | 4,128 |
AMN Healthcare Services * | | 20,430 | | | 170 |
Amsurg, Cl A * (A) | | 167,086 | | | 3,308 |
Analogic | | 5,005 | | | 216 |
Angiodynamics * | | 23,129 | | | 342 |
Arena Pharmaceuticals * (A) | | 374,145 | | | 1,152 |
Arqule * | | 31,612 | | | 193 |
athenahealth * | | 103,230 | | | 2,556 |
Auxilium Pharmaceuticals * (A) | | 128,540 | | | 3,699 |
Beckman Coulter | | 24,853 | | | 1,428 |
BioMarin Pharmaceutical * (A) | | 80,057 | | | 1,563 |
Biovail | | 277,710 | | | 4,168 |
Brookdale Senior Living * | | 96,700 | | | 1,701 |
Bruker * | | 18,900 | | | 241 |
Cadence Pharmaceuticals * (A) | | 123,560 | | | 980 |
Catalyst Health Solutions * | | 96,155 | | | 3,682 |
Celera * | | 26,849 | | | 190 |
Cephalon * (A) | | 16,800 | | | 989 |
Cepheid * (A) | | 60,251 | | | 1,077 |
Charles River Laboratories International * | | 33,851 | | | 1,135 |
Chemed | | 21,077 | | | 1,199 |
Codexis * (A) | | 42,300 | | | 437 |
Community Health Systems * | | 17,579 | | | 685 |
Conceptus * (A) | | 216,960 | | | 3,621 |
Conmed * | | 29,892 | | | 581 |
Cooper | | 71,166 | | | 2,623 |
Corvel * | | 1,462 | | | 52 |
Covance * | | 53,325 | | | 2,814 |
Coventry Health Care * | | 80,270 | | | 1,662 |
Cubist Pharmaceuticals * (A) | | 79,254 | | | 1,704 |
Cyberonics * | | 83,290 | | | 1,463 |
Dendreon * (A) | | 48,501 | | | 2,105 |
Dentsply International | | 63,300 | | | 2,053 |
Eclipsys * | | 5,279 | | | 101 |
Emergency Medical Services, Cl A * | | 23,595 | | | 1,264 |
Emergent Biosolutions * | | 10,534 | | | 166 |
Endo Pharmaceuticals Holdings * | | 93,357 | | | 1,955 |
Ensign Group (A) | | 54,254 | | | 989 |
eResearch Technology * | | 22,144 | | | 176 |
ev3 * | | 205,000 | | | 3,879 |
Exelixis * | | 25,137 | | | 130 |
Forest Laboratories * | | 56,400 | | | 1,460 |
Genomic Health * | | 5,555 | | | 83 |
Genoptix * | | 44,525 | | | 1,187 |
Gen-Probe * | | 89,195 | | | 3,921 |
Health Management Associates, Cl A * (A) | | 222,189 | | | 2,066 |
Health Net * | | 149,735 | | | 3,691 |
Healthsouth * (A) | | 88,250 | | | 1,753 |
HeartWare International * | | 36,537 | | | 2,161 |
Henry Schein * | | 27,859 | | | 1,572 |
Hill-Rom Holdings | | 97,639 | | | 2,722 |
| | |
5 | | SEI Institutional Investments Trust /Annual Report/May 31, 2010 |
SCHEDULE OF INVESTMENTS
Small/Mid Cap Equity Fund
May 31, 2010
| | | | | |
Description | | Shares | | Market Value
($ Thousands) |
Hologic * | | 33,590 | | $ | 500 |
Hospira * | | 1,551 | | | 81 |
Human Genome Sciences * (A) | | 69,995 | | | 1,733 |
Humana * | | 40,759 | | | 1,877 |
ICON ADR * | | 66,560 | | | 1,851 |
ICU Medical * | | 36,755 | | | 1,169 |
Idexx Laboratories * | | 25,300 | | | 1,600 |
Impax Laboratories * | | 19,401 | | | 409 |
Incyte * (A) | | 408,640 | | | 5,267 |
Inspire Pharmaceuticals * | | 125,800 | | | 715 |
Integra LifeSciences Holdings * | | 3,708 | | | 146 |
Intuitive Surgical * | | 2,585 | | | 834 |
inVentiv Health * | | 14,909 | | | 372 |
Inverness Medical Innovations * | | 54,083 | | | 1,883 |
Kendle International * | | 22,698 | | | 320 |
Kensey Nash * | | 19,313 | | | 446 |
Kindred Healthcare * | | 36,998 | | | 574 |
Kinetic Concepts * (A) | | 67,622 | | | 2,799 |
King Pharmaceuticals * (A) | | 496,238 | | | 4,302 |
LHC Group * (A) | | 136,303 | | | 4,198 |
LifePoint Hospitals * | | 53,200 | | | 1,888 |
Lincare Holdings (A) | | 87,610 | | | 4,102 |
Magellan Health Services * | | 49,425 | | | 2,011 |
Martek Biosciences * | | 10,296 | | | 192 |
MedAssets * | | 147,321 | | | 3,343 |
Medicines * | | 271,600 | | | 2,283 |
Medicis Pharmaceutical, Cl A | | 15,856 | | | 368 |
Mednax * | | 73,735 | | | 4,170 |
Meridian Bioscience | | 35,400 | | | 619 |
Millipore * | | 2,836 | | | 301 |
MWI Veterinary Supply * | | 53,845 | | | 2,639 |
Mylan Laboratories * | | 136,529 | | | 2,654 |
Myriad Genetics * | | 86,245 | | | 1,574 |
Nabi Biopharmaceuticals * | | 32,675 | | | 179 |
Nektar Therapeutics * | | 10,180 | | | 124 |
Neogen * (A) | | 35,115 | | | 903 |
NPS Pharmaceuticals * | | 32,967 | | | 217 |
NuVasive * (A) | | 104,985 | | | 4,123 |
Omnicell * | | 152,864 | | | 2,003 |
Onyx Pharmaceuticals * | | 184,650 | | | 4,116 |
OraSure Technologies * | | 12,396 | | | 56 |
Osiris Therapeutics * | | 11,698 | | | 72 |
Owens & Minor (A) | | 107,615 | | | 3,214 |
Par Pharmaceutical * | | 60,402 | | | 1,677 |
Parexel International * (A) | | 149,750 | | | 3,340 |
Patterson | | 33,012 | | | 981 |
PDL BioPharma (A) | | 301,287 | | | 1,618 |
PerkinElmer | | 195,291 | | | 4,431 |
Perrigo | | 36,400 | | | 2,163 |
Pharmaceutical Product | | | | | |
Development | | 188,070 | | | 5,048 |
Pharmasset * | | 36,600 | | | 1,078 |
PSS World Medical * | | 82,720 | | | 1,895 |
Quality Systems | | 48,320 | | | 2,853 |
Questcor Pharmaceuticals * | | 19,051 | | | 180 |
Quidel * (A) | | 122,300 | | | 1,431 |
Regeneron Pharmaceuticals * (A) | | 84,500 | | | 2,414 |
RehabCare Group * | | 82,840 | | | 2,410 |
Res-Care * | | 112,500 | | | 1,266 |
ResMed * | | 10,825 | | | 681 |
Rigel Pharmaceuticals * (A) | | 376,400 | | | 2,454 |
Salix Pharmaceuticals * | | 50,965 | | | 1,831 |
Sciclone Pharmaceuticals * | | 36,589 | | | 127 |
Seattle Genetics * (A) | | 111,940 | | | 1,481 |
Sirona Dental Systems * | | 38,840 | | | 1,374 |
| | | | | |
Description | | Shares | | Market Value
($ Thousands) |
STERIS | | 3,578 | | $ | 114 |
SXC Health Solutions * | | 72,390 | | | 5,325 |
Symmetry Medical * | | 26,048 | | | 284 |
Synta Pharmaceuticals * | | 33,562 | | | 105 |
Team Health Holdings * (A) | | 85,530 | | | 1,096 |
Techne | | 53,395 | | | 3,233 |
Teleflex | | 42,475 | | | 2,382 |
Theravance * | | 56,890 | | | 723 |
Thoratec * (A) | | 39,031 | | | 1,712 |
United Therapeutics * (A) | | 35,317 | | | 1,809 |
Universal Health Services, Cl B (A) | | 74,004 | | | 3,136 |
Valeant Pharmaceuticals | | | | | |
International * | | 15,989 | | | 743 |
Vertex Pharmaceuticals * | | 31,900 | | | 1,104 |
Vical * | | 39,649 | | | 132 |
Viropharma * | | 28,500 | | | 347 |
Virtual Radiologic * | | 6,438 | | | 109 |
Vital Images * | | 50,904 | | | 698 |
Volcano * (A) | | 123,980 | | | 2,751 |
Waters * | | 8,025 | | | 549 |
Zymogenetics * | | 26,102 | | | 121 |
| | | | | |
| | | | | 245,359 |
| | | | | |
Industrials — 15.0% | | | | | |
AAR * | | 24,607 | | | 485 |
ABM Industries (A) | | 54,489 | | | 1,170 |
ACCO Brands * | | 96,500 | | | 681 |
Actuant, Cl A (A) | | 76,212 | | | 1,541 |
Acuity Brands (A) | | 116,962 | | | 4,810 |
Advisory Board * | | 59,700 | | | 2,216 |
Aecom Technology * | | 64,066 | | | 1,626 |
Aegean Marine Petroleum | | | | | |
Network (A) | | 63,258 | | | 1,457 |
AerCap Holdings * | | 88,100 | | | 1,056 |
Aircastle | | 24,100 | | | 237 |
Alaska Air Group * | | 44,498 | | | 2,078 |
Alexander & Baldwin | | 14,037 | | | 452 |
Allegiant Travel, Cl A (A) | | 47,943 | | | 2,651 |
Alliant Techsystems * | | 23,363 | | | 1,607 |
Ametek | | 43,957 | | | 1,785 |
AO Smith (A) | | 30,900 | | | 1,440 |
Apogee Enterprises | | 49,100 | | | 671 |
Applied Industrial Technologies | | 52,100 | | | 1,437 |
Arkansas Best | | 8,900 | | | 208 |
ArvinMeritor * (A) | | 316,583 | | | 4,603 |
ATC Technology * | | 61,850 | | | 1,157 |
Atlas Air Worldwide Holdings * | | 63,217 | | | 3,305 |
Avery Dennison | | 60,360 | | | 2,063 |
Avis Budget Group * | | 22,750 | | | 270 |
Baldor Electric | | 52,623 | | | 1,891 |
Barnes Group | | 98,000 | | | 1,835 |
BE Aerospace * | | 148,311 | | | 4,022 |
Beacon Roofing Supply * (A) | | 187,700 | | | 3,942 |
Belden | | 65,474 | | | 1,696 |
Brady, Cl A | | 44,151 | | | 1,284 |
Briggs & Stratton | | 97,215 | | | 2,006 |
Bucyrus International, Cl A | | 55,000 | | | 2,946 |
C.H. Robinson Worldwide | | 22,616 | | | 1,314 |
Carlisle | | 100,240 | | | 3,898 |
Cenveo * | | 41,900 | | | 309 |
Cintas | | 99,361 | | | 2,583 |
Clean Harbors * | | 54,439 | | | 3,451 |
Columbus McKinnon * | | 21,815 | | | 357 |
Consolidated Graphics * (A) | | 63,023 | | | 2,895 |
| | |
6 | | SEI Institutional Investments Trust /Annual Report/May 31, 2010 |
SCHEDULE OF INVESTMENTS
Small/Mid Cap Equity Fund
May 31, 2010
| | | | | |
Description | | Shares | | Market Value
($ Thousands) |
Continental Airlines, Cl B * (A) | | 194,139 | | $ | 4,096 |
Con-way | | 3,242 | | | 110 |
Copa Holdings, Cl A | | 43,790 | | | 2,234 |
Copart * | | 114,876 | | | 4,124 |
Corporate Executive Board | | 76,500 | | | 2,478 |
Corrections of America * (A) | | 231,280 | | | 4,603 |
CoStar Group * (A) | | 130,898 | | | 5,337 |
Courier | | 32,275 | | | 511 |
CRA International * | | 78,700 | | | 1,749 |
Crane | | 69,787 | | | 2,270 |
Cubic | | 25,888 | | | 942 |
Deluxe (A) | | 93,202 | | | 2,001 |
Douglas Dynamics * | | 144,100 | | | 1,708 |
Dover | | 48,774 | | | 2,189 |
Dycom Industries * | | 258,951 | | | 2,558 |
EMCOR Group * | | 185,797 | | | 4,639 |
EnerSys * | | 6,435 | | | 145 |
Ennis | | 17,942 | | | 316 |
EnPro Industries * (A) | | 43,700 | | | 1,380 |
Esterline Technologies * | | 32,918 | | | 1,766 |
Fastenal | | 31,527 | | | 1,590 |
Fluor | | 39,607 | | | 1,858 |
Force Protection * | | 350,100 | | | 1,556 |
Franklin Electric | | 4,473 | | | 130 |
G&K Services, Cl A | | 55,150 | | | 1,334 |
Gardner Denver | | 210,061 | | | 9,566 |
GATX | | 10,600 | | | 306 |
GenCorp * | | 22,000 | | | 114 |
GeoEye * (A) | | 99,713 | | | 3,168 |
Graham | | 50,077 | | | 836 |
Great Lakes Dredge & Dock | | 489,275 | | | 2,850 |
H&E Equipment Services * | | 113,200 | | | 1,131 |
Hertz Global Holdings * | | 133,600 | | | 1,518 |
Hexcel * | | 53,041 | | | 847 |
HNI | | 15,311 | | | 469 |
Horizon Lines, Cl A | | 296,784 | | | 1,211 |
Hubbell, Cl B | | 14,991 | | | 639 |
ICF International * (A) | | 83,872 | | | 1,881 |
IDEX | | 33,912 | | | 1,036 |
IHS, Cl A * | | 149,224 | | | 7,724 |
Interface, Cl A | | 288,206 | | | 3,397 |
Interline Brands * | | 11,978 | | | 238 |
ITT | | 11,329 | | | 547 |
Jacobs Engineering Group * | | 9,944 | | | 415 |
JB Hunt Transport Services (A) | | 159,617 | | | 5,512 |
Joy Global | | 42,900 | | | 2,188 |
Kadant * | | 65,361 | | | 1,276 |
Kaman | | 13,404 | | | 328 |
Kaydon | | 52,617 | | | 1,975 |
KBR | | 17,500 | | | 385 |
Kirby * (A) | | 36,400 | | | 1,435 |
Knoll | | 153,810 | | | 2,275 |
Kratos Defense & Security Solutions * | | 132,526 | | | 1,625 |
Landstar System | | 71,945 | | | 3,017 |
Lincoln Electric Holdings | | 12,959 | | | 723 |
Localiza Rent a Car | | 179,000 | | | 1,858 |
Manitowoc (A) | | 183,429 | | | 2,188 |
Manpower | | 45,900 | | | 2,098 |
Mcgrath Rentcorp | | 4,824 | | | 113 |
Michael Baker * | | 43,400 | | | 1,574 |
Mine Safety Appliances | | 28,000 | | | 766 |
Mueller Industries | | 39,900 | | | 1,058 |
Mueller Water Products, Cl A (A) | | 432,112 | | | 1,871 |
MYR Group * (A) | | 60,630 | | | 1,000 |
| | | | | |
Description | | Shares | | Market Value
($ Thousands) |
Navistar International * | | 43,487 | | $ | 2,356 |
NN * | | 85,100 | | | 527 |
Old Dominion Freight Line * | | 116,706 | | | 4,159 |
Orbital Sciences * | | 5,449 | | | 87 |
Oshkosh Truck * | | 65,131 | | | 2,314 |
Owens Corning * | | 42,100 | | | 1,403 |
Paccar | | 50,767 | | | 2,081 |
Pitney Bowes | | 91,764 | | | 2,078 |
PowerSecure International * (A) | | 126,541 | | | 1,196 |
Quanta Services * | | 48,530 | | | 1,006 |
Regal-Beloit | | 50,420 | | | 3,040 |
Resources Connection * | | 276,598 | | | 4,464 |
Ritchie Bros Auctioneers | | 165,165 | | | 3,366 |
Rockwell Collins | | 25,745 | | | 1,502 |
RR Donnelley & Sons | | 115,510 | | | 2,213 |
RSC Holdings * (A) | | 176,200 | | | 1,288 |
Rush Enterprises, Cl A * (A) | | 249,682 | | | 3,793 |
Ryder System | | 17,100 | | | 768 |
School Specialty * | | 56,401 | | | 1,212 |
SFN Group * | | 37,513 | | | 287 |
Shaw Group * | | 19,843 | | | 677 |
Skywest | | 49,700 | | | 729 |
Spirit Aerosystems Holdings, Cl A * | | 199,976 | | | 3,896 |
Standard Parking * | | 173,195 | | | 2,686 |
Standard Register | | 28,668 | | | 114 |
Standex International | | 6,106 | | | 159 |
Stericycle * (A) | | 13,469 | | | 790 |
SYKES Enterprises * (A) | | 439,033 | | | 7,578 |
TAL International Group (A) | | 69,300 | | | 1,663 |
Teledyne Technologies * | | 46,087 | | | 1,812 |
Terex * | | 74,903 | | | 1,630 |
Tetra Tech * | | 219,610 | | | 4,978 |
Textainer Group Holdings (A) | | 76,400 | | | 1,875 |
Thomas & Betts * | | 54,970 | | | 2,107 |
Timken | | 110,254 | | | 3,174 |
Toro | | 3,508 | | | 188 |
Towers Watson, Cl A | | 51,265 | | | 2,358 |
TransDigm Group | | 59,690 | | | 3,149 |
Trex * (A) | | 119,570 | | | 2,719 |
Trinity Industries (A) | | 70,830 | | | 1,548 |
Triumph Group | | 21,080 | | | 1,463 |
Tutor Perini * | | 15,100 | | | 337 |
Twin Disc | | 6,858 | | | 88 |
UAL * | | 89,392 | | | 1,789 |
United Rentals * | | 17,858 | | | 217 |
United Stationers * | | 30,557 | | | 1,785 |
URS * | | 37,183 | | | 1,658 |
US Airways Group * | | 185,030 | | | 1,634 |
US Ecology | | 6,595 | | | 93 |
UTi Worldwide | | 81,900 | | | 1,184 |
Vitran, Cl A * | | 134,810 | | | 1,903 |
Wabash National * (A) | | 187,980 | | | 1,346 |
Wabtec | | 69,475 | | | 3,012 |
Watsco | | 13,800 | | | 808 |
Watts Water Technologies, Cl A | | 37,566 | | | 1,217 |
Werner Enterprises | | 38,800 | | | 875 |
WESCO International * | | 218,319 | | | 8,165 |
WW Grainger | | 2,015 | | | 205 |
| | | | | |
| | | | | 306,966 |
| | | | | |
Information Technology — 18.9% | | | | | |
ADC Telecommunications * (A) | | 187,719 | | | 1,550 |
Advanced Analogic Technologies * | | 435,832 | | | 1,508 |
| | |
7 | | SEI Institutional Investments Trust/Annual Report/May 31, 2010 |
SCHEDULE OF INVESTMENTS
Small/Mid Cap Equity Fund
May 31, 2010
| | | | | |
Description | | Shares | | Market Value
($ Thousands) |
Advent Software * | | 42,682 | | $ | 1,846 |
Agilysys | | 9,293 | | | 63 |
Akamai Technologies * (A) | | 80,260 | | | 3,188 |
Alliance Data Systems * | | 83,600 | | | 5,907 |
Amkor Technology * | | 75,300 | | | 513 |
Analog Devices | | 77,781 | | | 2,269 |
Ancestry.com * (A) | | 117,343 | | | 1,980 |
Ansys * | | 40,400 | | | 1,767 |
AOL * | | 73,845 | | | 1,523 |
Applied Micro Circuits * (A) | | 240,960 | | | 2,657 |
Arris Group * | | 151,452 | | | 1,661 |
Arrow Electronics * | | 26,299 | | | 717 |
Art Technology Group * | | 797,543 | | | 2,983 |
AsiaInfo Holdings * | | 44,100 | | | 945 |
Atheros Communications * (A) | | 73,251 | | | 2,491 |
Atmel * | | 771,362 | | | 3,938 |
ATMI * (A) | | 119,947 | | | 1,943 |
Avnet * | | 63,031 | | | 1,810 |
Baidu ADR * (A) | | 16,149 | | | 1,182 |
Benchmark Electronics * (A) | | 141,000 | | | 2,606 |
Black Box | | 24,000 | | | 708 |
Blackboard * | | 71,390 | | | 2,858 |
Blue Coat Systems * | | 64,100 | | | 1,376 |
Bottomline Technologies * | | 15,997 | | | 262 |
Brightpoint * | | 250,872 | | | 1,864 |
Broadridge Financial Solutions | | 15,556 | | | 297 |
Brocade Communications Systems * | | 909,305 | | | 4,956 |
Cabot Microelectronics * (A) | | 48,000 | | | 1,762 |
CACI International, Cl A * | | 29,368 | | | 1,358 |
Celestica * | | 149,720 | | | 1,394 |
Ceragon Networks * | | 101,834 | | | 850 |
Ceva * | | 233,850 | | | 2,717 |
Checkpoint Systems * | | 49,404 | | | 984 |
Ciber * | | 148,735 | | | 443 |
Cognex | | 21,800 | | | 416 |
Cogo Group * | | 28,800 | | | 195 |
Coherent * | | 57,813 | | | 2,041 |
CommScope * | | 121,370 | | | 3,423 |
Computer Sciences | | 45,014 | | | 2,250 |
Compuware * | | 11,899 | | | 97 |
Comtech Telecommunications * | | 124,288 | | | 3,581 |
Comverse Technology * | | 177,900 | | | 1,519 |
Concur Technologies * (A) | | 81,729 | | | 3,457 |
Convergys * | | 118,100 | | | 1,290 |
Cree * | | 9,664 | | | 641 |
CSG Systems International * | | 32,324 | | | 663 |
CTS | | 127,190 | | | 1,339 |
Cymer * | | 52,015 | | | 1,575 |
Cypress Semiconductor * (A) | | 165,900 | | | 1,890 |
Daktronics | | 22,500 | | | 189 |
DealerTrack Holdings * (A) | | 83,165 | | | 1,333 |
DG FastChannel * | | 46,231 | | | 1,963 |
Diebold | | 178,298 | | | 5,167 |
Digital River * | | 81,464 | | | 2,244 |
Diodes * (A) | | 84,429 | | | 1,668 |
Dolby Laboratories, Cl A * (A) | | 40,946 | | | 2,703 |
DSP Group * | | 45,099 | | | 305 |
DST Systems | | 14,600 | | | 560 |
DTS * | | 110,220 | | | 3,641 |
Earthlink | | 61,800 | | | 531 |
EF Johnson Technologies * | | 85,200 | | | 85 |
Electronics for Imaging * | | 27,753 | | | 309 |
Emulex * | | 212,177 | | | 2,224 |
Entegris * | | 317,995 | | | 1,717 |
| | | | | |
Description | | Shares | | Market Value
($ Thousands) |
Entropic Communications * | | 238,682 | | $ | 1,275 |
Equinix * (A) | | 65,495 | | | 6,026 |
Euronet Worldwide * | | 229,320 | | | 3,016 |
F5 Networks * | | 5,500 | | | 387 |
Factset Research Systems (A) | | 18,189 | | | 1,238 |
Fairchild Semiconductor International, Cl A * (A) | | 564,834 | | | 5,648 |
Finisar * (A) | | 156,130 | | | 2,373 |
FLIR Systems * | | 24,080 | | | 686 |
Gartner * | | 392,853 | | | 9,723 |
Gerber Scientific * | | 112,900 | | | 681 |
Global Payments | | 16,978 | | | 716 |
GSI Commerce * (A) | | 530,024 | | | 14,925 |
Harris | | 52,191 | | | 2,448 |
Heartland Payment Systems | | 91,331 | | | 1,501 |
Hewitt Associates, Cl A * | | 16,248 | | | 605 |
Hollysys Automation Technologies * | | 99,800 | | | 946 |
Hutchinson Technology * | | 16,084 | | | 88 |
IAC * | | 53,437 | | | 1,253 |
Imation * (A) | | 234,500 | | | 2,411 |
Informatica * (A) | | 129,950 | | | 3,353 |
Infospace * | | 216,880 | | | 1,785 |
Ingram Micro, Cl A * | | 146,683 | | | 2,488 |
Insight Enterprises * | | 105,575 | | | 1,535 |
Integral Systems * | | 100,100 | | | 685 |
Integrated Device Technology * | | 373,866 | | | 2,183 |
InterDigital * | | 19,503 | | | 509 |
Intermec * | | 118,932 | | | 1,313 |
Internap Network Services * | | 17,229 | | | 88 |
Internet Brands, Cl A * (A) | | 200,257 | | | 2,081 |
Intersil, Cl A | | 37,900 | | | 505 |
Ixia * (A) | | 114,000 | | | 1,140 |
Jabil Circuit | | 52,138 | | | 714 |
Jack Henry & Associates | | 12,376 | | | 298 |
JDA Software Group * | | 136,754 | | | 3,654 |
KIT Digital * | | 132,631 | | | 1,463 |
Knot * (A) | | 323,048 | | | 2,416 |
Lawson Software * | | 369,632 | | | 3,048 |
Lexmark International, Cl A * (A) | | 116,180 | | | 4,362 |
Linear Technology | | 18,000 | | | 503 |
Littelfuse * | | 37,519 | | | 1,356 |
LSI * | | 84,100 | | | 448 |
Mantech International, Cl A * (A) | | 25,824 | | | 1,194 |
MAXIMUS | | 6,279 | | | 376 |
Methode Electronics (A) | | 92,951 | | | 943 |
Micrel | | 32,366 | | | 359 |
Micros Systems * | | 49,000 | | | 1,676 |
Microsemi * (A) | | 432,213 | | | 6,691 |
Microtune * | | 28,250 | | | 67 |
Mitel Networks * (A) | | 158,900 | | | 1,764 |
MKS Instruments * | | 151,096 | | | 3,001 |
Molex | | 140,750 | | | 2,981 |
Monolithic Power Systems * | | 25,686 | | | 493 |
Monotype Imaging Holdings * | | 100,798 | | | 995 |
Move * | | 222,716 | | | 468 |
MTS Systems | | 10,255 | | | 300 |
Multi-Fineline Electronix * | | 47,300 | | | 1,250 |
National Semiconductor | | 15,900 | | | 223 |
NCR * | | 66,725 | | | 886 |
Ness Technologies * | | 19,170 | | | 100 |
Net 1 UEPS Technologies * | | 147,206 | | | 2,108 |
Netezza * (A) | | 173,130 | | | 2,256 |
Netgear * | | 95,031 | | | 2,158 |
Netlogic Microsystems * (A) | | 82,670 | | | 2,378 |
| | |
8 | | SEI Institutional Investments Trust /Annual Report/May 31, 2010 |
SCHEDULE OF INVESTMENTS
Small/Mid Cap Equity Fund
May 31, 2010
| | | | | |
Description | | Shares | | Market Value
($ Thousands) |
Netscout Systems * | | 23,868 | | $ | 323 |
NeuStar, Cl A * | | 32,813 | | | 702 |
Novatel Wireless * (A) | | 296,400 | | | 1,823 |
Novell * | | 105,744 | | | 616 |
Nuance Communications * (A) | | 78,213 | | | 1,332 |
OSI Systems * | | 54,500 | | | 1,432 |
Parametric Technology * (A) | | 215,402 | | | 3,550 |
Park Electrochemical | | 58,300 | | | 1,509 |
Parkervision * (A) | | 435,485 | | | 766 |
Pericom Semiconductor * | | 178,708 | | | 1,769 |
Plantronics | | 6,132 | | | 184 |
Plexus * (A) | | 81,752 | | | 2,784 |
PMC—Sierra * | | 759,400 | | | 6,151 |
Polycom * | | 66,720 | | | 2,004 |
Power Integrations (A) | | 142,139 | | | 4,830 |
Progress Software * | | 98,764 | | | 3,155 |
PROS Holdings * | | 99,557 | | | 658 |
QLogic * (A) | | 122,590 | | | 2,221 |
Quantum * | | 719,300 | | | 1,690 |
Quest Software * | | 132,803 | | | 2,570 |
QuinStreet * (A) | | 119,139 | | | 1,655 |
RF Micro Devices * (A) | | 196,530 | | | 943 |
Richardson Electronics | | 57,494 | | | 560 |
Riverbed Technology * (A) | | 64,520 | | | 1,725 |
Rovi * (A) | | 49,730 | | | 1,857 |
Rubicon Technology * (A) | | 79,072 | | | 2,149 |
SAIC * | | 17,881 | | | 307 |
Sanmina-SCI * | | 326,387 | | | 4,977 |
Sapient (A) | | 478,300 | | | 4,855 |
SAVVIS * | | 110,563 | | | 2,074 |
Scansource * | | 17,700 | | | 456 |
Seachange International * (A) | | 190,500 | | | 1,591 |
Silicon Laboratories * | | 16,597 | | | 754 |
Skyworks Solutions * (A) | | 218,508 | | | 3,481 |
Sohu.com * | | 5,053 | | | 224 |
Solera Holdings | | 78,669 | | | 2,728 |
Sonic Solutions * (A) | | 117,345 | | | 1,395 |
SPS Commerce * | | 62,576 | | | 756 |
SS&C Technologies Holdings * | | 268,196 | | | 4,377 |
Stamps.com * | | 8,756 | | | 92 |
Stratasys * (A) | | 21,574 | | | 502 |
SuccessFactors * (A) | | 104,590 | | | 2,328 |
Sybase * | | 25,982 | | | 1,671 |
Symyx Technologies * | | 34,513 | | | 221 |
Synaptics * | | 13,800 | | | 413 |
Synchronoss Technologies * | | 74,121 | | | 1,515 |
SYNNEX * | | 10,478 | | | 280 |
Synopsys * | | 172,089 | | | 3,686 |
Take-Two Interactive Software * | | 53,900 | | | 624 |
Taleo, Cl A * | | 111,421 | | | 2,791 |
Tech Data * | | 50,863 | | | 2,068 |
Technitrol (A) | | 43,000 | | | 165 |
TeleNav * | | 12,300 | | | 103 |
TeleTech Holdings * | | 2,890 | | | 37 |
Teradata * | | 49,333 | | | 1,576 |
Teradyne * | | 125,011 | | | 1,373 |
TIBCO Software * | | 28,846 | | | 329 |
TiVo * (A) | | 348,130 | | | 3,147 |
TNS * | | 68,174 | | | 1,311 |
Trimble Navigation * (A) | | 172,824 | | | 4,965 |
TriQuint Semiconductor * | | 315,277 | | | 2,213 |
TTM Technologies * (A) | | 281,510 | | | 3,257 |
Unisys * | | 62,108 | | | 1,441 |
United Online | | 301,460 | | | 2,054 |
Valueclick * | | 81,400 | | | 947 |
| | | | | |
Description | | Shares | | Market Value
($ Thousands) |
Varian Semiconductor Equipment Associates * | | 23,625 | | $ | 735 |
Veeco Instruments * (A) | | 69,902 | | | 2,668 |
VeriFone Holdings * | | 28,435 | | | 574 |
Vishay Intertechnology * | | 202,631 | | | 1,834 |
VistaPrint * (A) | | 243,044 | | | 11,348 |
Vocus * (A) | | 246,726 | | | 3,864 |
Volterra Semiconductor * | | 8,243 | | | 193 |
WebMD Health, Cl A * | | 22,357 | | | 1,018 |
Websense * (A) | | 147,871 | | | 3,093 |
Western Digital * | | 56,100 | | | 1,953 |
Wright Express * | | 67,392 | | | 2,116 |
Xyratex * | | 97,166 | | | 1,577 |
Zebra Technologies, Cl A * | | 66,441 | | | 1,827 |
Zoran * | | 205,996 | | | 1,990 |
| | | | | |
| | | | | 391,264 |
| | | | | |
Materials — 5.2% | | | | | |
A. Schulman | | 40,799 | | | 907 |
AK Steel Holding (A) | | 115,409 | | | 1,727 |
Albemarle | | 49,876 | | | 2,148 |
Allegheny Technologies | | 42,280 | | | 2,312 |
Allied Nevada Gold * (A) | | 79,600 | | | 1,524 |
AM Castle * | | 44,957 | | | 669 |
Aptargroup | | 70,473 | | | 2,809 |
Ashland (A) | | 88,799 | | | 4,761 |
Bemis | | 6,128 | | | 176 |
Buckeye Technologies * | | 71,300 | | | 864 |
Cabot | | 54,137 | | | 1,516 |
Carpenter Technology (A) | | 104,942 | | | 4,083 |
Celanese, Cl A | | 121,946 | | | 3,496 |
Century Aluminum * | | 39,242 | | | 412 |
Cliffs Natural Resources | | 26,506 | | | 1,481 |
Commercial Metals | | 66,977 | | | 1,043 |
Crown Holdings * | | 80,778 | | | 1,899 |
Cytec Industries | | 73,180 | | | 3,127 |
Domtar | | 23,000 | | | 1,408 |
Eastman Chemical | | 33,100 | | | 1,999 |
Gammon Gold * | | 212,300 | | | 1,558 |
General Steel Holdings * | | 91,227 | | | 251 |
Greif, Cl A | | 6,500 | | | 356 |
H.B. Fuller | | 50,700 | | | 1,081 |
Hawkins | | 3,530 | | | 95 |
Headwaters * | | 70,221 | | | 277 |
Huntsman | | 297,256 | | | 2,967 |
Innophos Holdings | | 110,860 | | | 3,164 |
Innospec | | 17,342 | | | 216 |
International Paper | | 12,393 | | | 288 |
Jaguar Mining * (A) | | 172,000 | | | 1,553 |
Kaiser Aluminum | | 16,300 | | | 610 |
KapStone Paper and Packaging * | | 21,376 | | | 236 |
Koppers Holdings | | 30,173 | | | 817 |
LSB Industries * (A) | | 89,145 | | | 1,458 |
Lubrizol | | 30,918 | | | 2,738 |
Minerals Technologies | | 13,641 | | | 729 |
Nalco Holding | | 189,726 | | | 4,299 |
Neenah Paper | | 33,822 | | | 641 |
New Gold * | | 263,300 | | | 1,598 |
NewMarket | | 26,936 | | | 2,773 |
Nucor | | 47,115 | | | 2,028 |
Olin | | 17,100 | | | 328 |
OM Group * | | 31,796 | | | 949 |
Owens-Illinois * | | 107,998 | | | 3,276 |
Packaging of America | | 99,743 | | | 2,208 |
Pactiv * | | 63,337 | | | 1,810 |
| | |
9 | | SEI Institutional Investments Trust /Annual Report/May 31, 2010 |
SCHEDULE OF INVESTMENTS
Small/Mid Cap Equity Fund
May 31, 2010
| | | | | |
Description | | Shares | | Market Value
($ Thousands) |
PolyOne * | | 337,777 | | $ | 3,374 |
Reliance Steel & Aluminum (A) | | 41,088 | | | 1,886 |
Rockwood Holdings * | | 138,522 | | | 3,593 |
RPM International | | 11,721 | | | 232 |
RTI International Metals * (A) | | 91,423 | | | 2,424 |
Schnitzer Steel Industries, Cl A | | 45,099 | | | 2,257 |
Schweitzer-Mauduit International | | 18,715 | | | 1,033 |
Sensient Technologies | | 24,400 | | | 676 |
Silgan Holdings | | 166,735 | | | 4,757 |
Solutia * | | 110,555 | | | 1,675 |
Sonoco Products | | 32,600 | | | 1,008 |
Spartech * | | 16,233 | | | 216 |
Steel Dynamics | | 107,860 | | | 1,582 |
Stepan | | 5,278 | | | 381 |
Temple-Inland | | 88,139 | | | 1,862 |
Titanium Metals * | | 33,300 | | | 588 |
Universal Stainless & Alloy * | | 74,500 | | | 1,535 |
Walter Industries | | 4,814 | | | 382 |
Westlake Chemical | | 11,130 | | | 236 |
Worthington Industries | | 44,300 | | | 652 |
WR Grace * | | 64,421 | | | 1,651 |
| | | | | |
| | | | | 108,665 |
| | | | | |
Telecommunication Services — 1.8% | | | | | |
AboveNet * (A) | | 17,659 | | | 810 |
Alaska Communications Systems Group | | 104,525 | | | 864 |
Cbeyond * (A) | | 90,264 | | | 1,411 |
CenturyLink (A) | | 63,900 | | | 2,194 |
Cincinnati Bell * (A) | | 926,961 | | | 2,948 |
Consolidated Communications Holdings | | 17,836 | | | 308 |
Frontier Communications | | 326,500 | | | 2,596 |
Global Crossing * | | 2,700 | | | 37 |
Leap Wireless International * (A) | | 71,700 | | | 1,171 |
Level 3 Communications * | | 221,900 | | | 297 |
MetroPCS Communications * | | 290,600 | | | 2,612 |
Neutral Tandem * (A) | | 162,097 | | | 2,179 |
NII Holdings * | | 175,395 | | | 6,397 |
NTELOS Holdings | | 66,400 | | | 1,192 |
Qwest Communications International | | 76,400 | | | 400 |
SBA Communications, Cl A * (A) | | 285,982 | | | 9,446 |
Telephone & Data Systems, Cl L | | 7,129 | | | 206 |
tw telecom , Cl A * | | 33,457 | | | 585 |
US Cellular * | | 4,757 | | | 197 |
USA Mobility | | 72,471 | | | 1,020 |
Windstream | | 9,095 | | | 97 |
| | | | | |
| | | | | 36,967 |
| | | | | |
Utilities — 3.6% | | | | | |
AGL Resources | | 158,311 | | | 5,778 |
Alliant Energy | | 43,300 | | | 1,392 |
Ameren | | 42,000 | | | 1,036 |
American Water Works | | 26,800 | | | 545 |
Atmos Energy | | 16,697 | | | 453 |
Avista | | 16,800 | | | 324 |
Black Hills | | 13,417 | | | 385 |
Centerpoint Energy | | 66,000 | | | 899 |
Cia de Saneamento de Minas | | | | | |
Gerais-COPASA (Brazil) | | 105,700 | | | 1,382 |
Cleco (A) | | 56,172 | | | 1,487 |
CMS Energy (A) | | 135,800 | | | 1,994 |
Consolidated Edison | | 31,009 | | | 1,321 |
| | | | | | |
Description | | Shares/Face Amount
($ Thousands) | | Market Value
($ Thousands) |
Dynegy, Cl A * | | | 62,300 | | $ | 326 |
Edison International | | | 50,675 | | | 1,640 |
El Paso Electric * | | | 11,953 | | | 237 |
Empire District Electric | | | 40,548 | | | 740 |
Energen | | | 13,012 | | | 576 |
Great Plains Energy | | | 285,578 | | | 5,012 |
Hawaiian Electric Industries | | | 45,000 | | | 988 |
IDACORP | | | 17,450 | | | 577 |
ITC Holdings | | | 41,532 | | | 2,189 |
Laclede Group | | | 9,825 | | | 325 |
MDU Resources Group | | | 109,493 | | | 2,047 |
Mirant * | | | 50,600 | | | 628 |
New Jersey Resources (A) | | | 48,670 | | | 1,725 |
NiSource | | | 93,500 | | | 1,399 |
Northeast Utilities | | | 122,474 | | | 3,178 |
NorthWestern (A) | | | 134,625 | | | 3,546 |
NV Energy | | | 25,822 | | | 304 |
OGE Energy | | | 36,771 | | | 1,340 |
Pepco Holdings | | | 32,000 | | | 516 |
Pinnacle West Capital | | | 86,285 | | | 3,030 |
PNM Resources (A) | | | 122,380 | | | 1,510 |
Portland General Electric | | | 348,763 | | | 6,595 |
RRI Energy * | | | 591,085 | | | 2,613 |
SCANA | | | 73,497 | | | 2,667 |
South Jersey Industries | | | 27,262 | | | 1,197 |
UGI | | | 147,323 | | | 3,851 |
Unisource Energy | | | 51,169 | | | 1,580 |
Vectren | | | 56,834 | | | 1,310 |
Westar Energy | | | 89,909 | | | 1,978 |
Wisconsin Energy | | | 55,062 | | | 2,698 |
Xcel Energy | | | 95,329 | | | 1,953 |
| | | | | | |
| | | | | | 75,271 |
| | | | | | |
Total Common Stock | | | | | | |
(Cost $1,715,523) ($ Thousands) | | | | | | 2,011,981 |
| | | | | | |
PREFERRED STOCK — 0.2% | | | | | | |
Consumer Discretionary — 0.1% | | | | | | |
Callaway Golf (B) | | | 14,000 | | | 1,870 |
| | | | | | |
Financials — 0.1% | | | | | | |
Grubb & Ellis * | | | 14,400 | | | 1,469 |
| | | | | | |
Total Preferred Stock (Cost $2,830) ($ Thousands) | | | 3,339 |
| | | | | | |
CONVERTIBLE BONDS — 0.1% | | | | | | |
Consumer Discretionary — 0.0% | | | | | | |
Eddie Bauer Holdings | | | | | | |
5.250%, 04/01/14 (D) | | $ | 3,146 | | | 252 |
| | | | | | |
Energy — 0.1% | | | | | | |
Nova Biosource Fuels | | | | | | |
10.000%, 09/30/12 (D) | | | 1,679 | | | 4 |
Rentech | | | | | | |
4.000%, 04/15/13 | | | 2,222 | | | 1,489 |
Scorpio Mining | | | | | | |
7.000%, 05/05/11 (F) | | | 509 | | | 447 |
| | | | | | |
| | | | | | 1,940 |
| | | | | | |
Total Convertible Bonds (Cost $3,809) ($ Thousands) | | | 2,192 |
| | | | | | |
| | |
10 | | SEI Institutional Investments Trust /Annual Report/May 31, 2010 |
SCHEDULE OF INVESTMENTS
Small/Mid Cap Equity Fund
May 31, 2010
| | | | | | |
Description | | Shares/Face
Amount ($
Thousands) | | Market Value
($ Thousands) |
EXCHANGE TRADED FUNDS — 0.3% | | | | | | |
iShares Russell 2000 Growth Index Fund (A) | | | 78,800 | | $ | 5,626 |
iShares Russell 2000 Index Fund | | | 3,062 | | | 203 |
SPDR S&P MidCap 400 ETF Trust | | | 1,467 | | | 203 |
| | | | | | |
Total Exchange Traded Funds (Cost $6,252) ($ Thousands) | | | | | | 6,032 |
| | | | | | |
WARRANTS — 0.0% Cullen Agricultural Holding, Expires 2013 | | | 222,701 | | | 4 |
| | | | | | |
Oilsands Quest, Expires 05/12/11 * | | | 330,350 | | | 66 |
| | | | | | |
Rentech, Expires 04/25/12 * (F) | | | 13,800 | | | 1 |
| | | | | | |
Titanium Asset Management, Expires 06/21/11 * (F) | | | 105,000 | | | — |
| | | | | | |
Total Warrants (Cost $196) ($ Thousands) | | | | | | 71 |
| | | | | | |
AFFILIATED PARTNERSHIP — 16.4% SEI Liquidity Fund, L.P. 0.240%**†(B) | | | 345,579,629 | | | 338,195 |
| | | | | | |
Total Affiliated Partnership (Cost $345,580) ($ Thousands) | | | | | | 338,195 |
| | | | | | |
CASH EQUIVALENT — 3.6% SEI Daily Income Trust, Prime Obligation Fund, Cl A 0.090%**† | | | 73,966,794 | | | 73,967 |
| | | | | | |
Total Cash Equivalent (Cost $73,967) ($ Thousands) | | | | | | 73,967 |
| | | | | | |
U.S. TREASURY OBLIGATIONS (C) (E) — 0.2% | | | | | | |
U.S. Treasury Bills 0.165%, 06/10/10 | | $ | 70 | | | 70 |
0.078%, 06/03/10 | | | 4,463 | | | 4,463 |
| | | | | | |
Total U.S. Treasury Obligations (Cost $4,533) ($ Thousands) | | | | | | 4,533 |
| | | | | | |
Total Investments — 118.2% (Cost $2,152,690)($ Thousands) | | | | | $ | 2,440,310 |
| | | | | | |
A summary of the open futures contracts held by the Fund at May 31, 2010, is as follows:
| | | | | | | |
Type of Contract | | Number of
Contracts
Long (Short) | | Expiration
Date | | Unrealized
Appreciation
($ Thousands) |
Russell 2000 Index E-Mini | | 163 | | Jun-2010 | | $ | 313 |
S&P Mid 400 Index E-Mini | | 110 | | Jun-2010 | | | 228 |
| | | | | | | |
| | | | | | $ | 541 |
| | | | | | | |
For the year ended May 31, 2010, the total amount of all open futures contracts, as presented in the table above, are representative of the volume of activity for this derivative type during the period.
Percentages are based on Net Assets of $2,064,443 ($ Thousands).
| (A) | This security or a partial position of this security is on loan at May 31, 2010. The total value of securities on loan at May 31, 2010 was $331,075 ($ Thousands). |
| (B) | This security was purchased with cash collateral held from securities on loan. The total value of such securities as of May 31, 2010 was $338,195 ($ Thousands). |
| (C) | Security, or a portion thereof, has been pledged as collateral on open futures contracts. |
| (D) | Security in default on interest payments. |
(E) The rate reported is the effective yield at time of purchase.
(F) Securities considered restricted. The total value of such securities as of May 31, 2010 was $837 ($ Thousands) and represented 0.04% of Net Assets.
| * | Non-income producing security. |
| ** | The rate reported is the 7-day effective yield as of May 31, 2010. |
| † | Investment in Affiliated Security. |
| ‡ | Real Estate Investment Trust. |
CL — Class
L.P. — Limited Partnership
S&P — Standard & Poor’s
Amounts designated as “—” are either $0 or have been rounded to $0.
| | |
11 | | SEI Institutional Investments Trust /Annual Report/May 31, 2010 |
SCHEDULE OF INVESTMENTS
U.S. Managed Volatility Fund
May 31, 2010
| | | | | |
Description | | Shares | | Market
Value ($
Thousands) |
COMMON STOCK — 97.7% | | | |
Consumer Discretionary — 8.7% | | | |
Aaron’s | | 43,950 | | $ | 878 |
Amazon.com * | | 22,953 | | | 2,880 |
Autoliv | | 11,600 | | | 551 |
Buckle | | 15,000 | | | 533 |
Burger King Holdings | | 51,000 | | | 970 |
Career Education * | | 32,300 | | | 904 |
Carter’s * | | 29,900 | | | 914 |
Choice Hotels International | | 30,000 | | | 999 |
Cinemark Holdings | | 56,300 | | | 900 |
DIRECTV, Cl A * | | 29,400 | | | 1,108 |
Discovery Communications, Cl A * | | 33,200 | | | 1,251 |
DreamWorks Animation SKG, Cl A * | | 25,200 | | | 748 |
GameStop, Cl A * | | 33,700 | | | 768 |
Genuine Parts | | 23,200 | | | 942 |
Gildan Activewear, Cl A * | | 15,400 | | | 445 |
H&R Block | | 27,600 | | | 444 |
ITT Educational Services * | | 10,500 | | | 1,060 |
Panera Bread, Cl A * | | 5,200 | | | 420 |
priceline.com * | | 10,041 | | | 1,919 |
Regal Entertainment Group, Cl A | | 30,700 | | | 468 |
Shaw Communications, Cl B | | 29,500 | | | 539 |
Strayer Education | | 8,204 | | | 1,969 |
Tractor Supply | | 9,400 | | | 637 |
| | | | | |
| | | | | 22,247 |
| | | | | |
Consumer Staples — 16.5% | | | |
Altria Group | | 149,435 | | | 3,032 |
Brown-Forman, Cl B | | 54,460 | | | 3,020 |
Campbell Soup | | 55,513 | | | 1,988 |
Church & Dwight | | 16,900 | | | 1,113 |
Dean Foods * | | 64,700 | | | 689 |
Flowers Foods | | 27,700 | | | 685 |
General Mills | | 16,600 | | | 1,183 |
Hansen Natural * | | 11,600 | | | 453 |
Hershey | | 58,981 | | | 2,760 |
Hormel Foods | | 104,380 | | | 4,154 |
Kellogg | | 72,251 | | | 3,860 |
Kimberly-Clark | | 28,141 | | | 1,708 |
Lorillard | | 40,707 | | | 2,910 |
McCormick | | 27,485 | | | 1,060 |
PepsiCo | | 16,357 | | | 1,029 |
Philip Morris International | | 65,399 | | | 2,885 |
Ralcorp Holdings * | | 15,600 | | | 937 |
Reynolds American | | 59,465 | | | 3,101 |
Ruddick | | 23,500 | | | 776 |
Sara Lee | | 50,858 | | | 721 |
Sysco | | 105,412 | | | 3,142 |
Tyson Foods, Cl A | | 54,203 | | | 953 |
| | | | | |
| | | | | 42,159 |
| | | | | |
Energy — 4.1% | | | | | |
Chevron | | 27,607 | | | 2,039 |
CNX Gas * | | 24,000 | | | 918 |
Dresser-Rand Group * | | 22,800 | | | 726 |
Enbridge | | 26,400 | | | 1,184 |
Exxon Mobil | | 21,935 | | | 1,326 |
FMC Technologies * | | 16,700 | | | 971 |
| | | | | |
Description | | Shares | | Market
Value ($
Thousands) |
Murphy Oil | | 15,400 | | $ | 822 |
PetroHawk Energy * | | 31,300 | | | 602 |
SEACOR Holdings * | | 5,800 | | | 423 |
Teekay | | 17,400 | | | 439 |
TransCanada | | 33,400 | | | 1,108 |
| | | | | |
| | | | | 10,558 |
| | | | | |
Financials — 14.9% | | | |
Alleghany * | | 2,900 | | | 847 |
Allied World Assurance Holdings | | 22,700 | | | 1,020 |
Bancorpsouth | | 40,700 | | | 789 |
Bank of Hawaii | | 58,591 | | | 2,814 |
BOK Financial | | 14,677 | | | 742 |
Capitol Federal Financial | | 47,636 | | | 1,524 |
Commerce Bancshares | | 97,076 | | | 3,608 |
Corporate Office Properties Trust ‡ | | 28,600 | | | 1,084 |
Cullen/Frost Bankers | | 54,888 | | | 3,012 |
Endurance Specialty Holdings | | 25,500 | | | 946 |
Erie Indemnity, Cl A | | 24,900 | | | 1,142 |
Essex Property Trust ‡ | | 11,700 | | | 1,231 |
Federated Investors, Cl B | | 37,600 | | | 835 |
First Citizens BancShares, Cl A | | 6,708 | | | 1,342 |
First Niagara Financial Group | | 37,898 | | | 501 |
Health Care REIT ‡ | | 29,800 | | | 1,284 |
Hudson City Bancorp | | 75,700 | | | 955 |
MFA Mortgage Investments ‡ | | 68,200 | | | 500 |
NASDAQ OMX Group * | | 30,000 | | | 558 |
National Retail Properties ‡ | | 38,700 | | | 850 |
Nationwide Health Properties ‡ | | 12,900 | | | 458 |
PartnerRe | | 9,859 | | | 719 |
People’s United Financial | | 95,024 | | | 1,327 |
Platinum Underwriters Holdings | | 21,800 | | | 803 |
ProAssurance * | | 20,700 | | | 1,218 |
Prosperity Bancshares | | 29,300 | | | 1,056 |
Realty Income ‡ | | 33,100 | | | 1,031 |
RenaissanceRe Holdings | | 19,000 | | | 1,027 |
TFS Financial | | 180,662 | | | 2,392 |
UMB Financial | | 26,000 | | | 1,013 |
Washington Real Estate Investment Trust ‡ | | 38,200 | | | 1,122 |
Wesco Financial | | 449 | | | 159 |
| | | | | |
| | | | | 37,909 |
| | | | | |
Health Care — 20.8% | | | |
Abbott Laboratories | | 75,445 | | | 3,588 |
Alexion Pharmaceuticals * | | 8,757 | | | 438 |
Allscripts-Misys Healthcare | | | | | |
Solutions * | | 5,648 | | | 106 |
AmerisourceBergen | | 140,920 | | | 4,408 |
Amgen * | | 56,964 | | | 2,950 |
Baxter International | | 39,470 | | | 1,667 |
Becton Dickinson | | 40,042 | | | 2,855 |
Biogen Idec * | | 55,744 | | | 2,644 |
C.R. Bard | | 43,690 | | | 3,538 |
Cardinal Health | | 72,112 | | | 2,487 |
Celgene * | | 6,200 | | | 327 |
Cephalon * | | 3,571 | | | 210 |
Edwards Lifesciences * | | 16,000 | | | 808 |
Eli Lilly | | 30,072 | | | 986 |
Endo Pharmaceuticals Holdings * | | 52,700 | | | 1,104 |
Forest Laboratories * | | 88,533 | | | 2,291 |
| | |
1 | | SEI Institutional Investments Trust /Annual Report/May 31, 2010 |
SCHEDULE OF INVESTMENTS
U.S. Managed Volatility Fund
May 31, 2010
| | | | | |
Description | | Shares | | Market Value
($ Thousands) |
Genzyme * | | 32,371 | | $ | 1,575 |
Henry Schein * | | 18,912 | | | 1,067 |
InterMune * | | 8,700 | | | 79 |
Johnson & Johnson | | 49,001 | | | 2,857 |
Kinetic Concepts * | | 19,700 | | | 816 |
Laboratory Corp of America | | | | | |
Holdings * | | 8,100 | | | 612 |
LifePoint Hospitals * | | 14,500 | | | 514 |
McKesson | | 65,981 | | | 4,619 |
Medco Health Solutions * | | 5,687 | | | 328 |
Mettler Toledo International * | | 3,600 | | | 412 |
Millipore * | | 25,495 | | | 2,708 |
Myriad Genetics * | | 33,300 | | | 608 |
Owens & Minor | | 36,150 | | | 1,080 |
Patterson | | 34,500 | | | 1,025 |
Perrigo | | 7,600 | | | 451 |
Techne | | 48,170 | | | 2,917 |
United Therapeutics * | | 21,600 | | | 1,106 |
| | | | | |
| | | | | 53,181 |
| | | | | |
Industrials — 3.8% | | | | | |
Alliant Techsystems * | | 13,500 | | | 929 |
C.H. Robinson Worldwide | | 19,000 | | | 1,104 |
Copa Holdings, Cl A | | 9,639 | | | 492 |
FTI Consulting * | | 21,800 | | | 932 |
Gardner Denver | | 11,200 | | | 510 |
KBR | | 48,700 | | | 1,070 |
Landstar System | | 24,800 | | | 1,040 |
Lennox International | | 22,600 | | | 1,011 |
Nordson | | 6,400 | | | 427 |
Raytheon | | 9,200 | | | 482 |
Rollins | | 47,200 | | | 1,003 |
Stericycle * | | 10,400 | | | 610 |
| | | | | |
| | | | | 9,610 |
| | | | | |
Information Technology — 10.7% | | | | | |
ADTRAN | | 35,900 | | | 985 |
Analog Devices | | 95,180 | | | 2,777 |
AVX | | 38,600 | | | 539 |
Diebold | | 17,400 | | | 504 |
FLIR Systems * | | 19,100 | | | 544 |
Google, Cl A * | | 5,685 | | | 2,758 |
Harris | | 22,900 | | | 1,074 |
Hewitt Associates, Cl A * | | 32,900 | | | 1,226 |
Ingram Micro, Cl A * | | 76,912 | | | 1,305 |
Intel | | 15,948 | | | 342 |
International Business Machines | | 28,454 | | | 3,564 |
Lender Processing Services | | 4,395 | | | 149 |
Mantech International, Cl A * | | 22,300 | | | 1,031 |
Microchip Technology | | 23,448 | | | 653 |
Micros Systems * | | 13,600 | | | 465 |
NeuStar, Cl A * | | 16,300 | | | 349 |
SAIC * | | 1,135 | | | 19 |
Sybase * | | 17,300 | | | 1,113 |
Tech Data * | | 67,553 | | | 2,746 |
Texas Instruments | | 125,486 | | | 3,064 |
WebMD Health, Cl A * | | 1,124 | | | 51 |
Xilinx | | 46,916 | | | 1,147 |
Zebra Technologies, Cl A * | | 31,383 | | | 863 |
| | | | | |
| | | | | 27,268 |
| | | | | |
| | | | | |
Description | | Shares | | Market Value
($ Thousands) |
Materials — 3.4% | | | | | |
Aptargroup | | 27,600 | | $ | 1,100 |
Compass Minerals International | | 13,200 | | | 1,001 |
Greif, Cl A | | 18,700 | | | 1,025 |
Intrepid Potash * | | 32,400 | | | 799 |
Newmont Mining | | 57,997 | | | 3,122 |
Sensient Technologies | | 23,800 | | | 659 |
Silgan Holdings | | 33,600 | | | 958 |
| | | | | |
| | | | | 8,664 |
| | | | | |
Telecommunication Services —2.7% | | | | | |
AT&T | | 59,600 | | | 1,448 |
BCE | | 29,600 | | | 865 |
MetroPCS Communications * | | 118,100 | | | 1,062 |
Rogers Communications, Cl B | | 36,400 | | | 1,239 |
SBA Communications, Cl A * | | 15,800 | | | 522 |
Telephone & Data Systems | | 11,300 | | | 371 |
Verizon Communications | | 50,894 | | | 1,401 |
| | | | | |
| | | | | 6,908 |
| | | | | |
Utilities — 12.1% | | | | | |
AGL Resources | | 57,898 | | | 2,113 |
Alliant Energy | | 31,800 | | | 1,022 |
Aqua America | | 13,497 | | | 235 |
Atmos Energy | | 82,948 | | | 2,250 |
Consolidated Edison | | 28,700 | | | 1,222 |
DPL | | 8,027 | | | 201 |
DTE Energy | | 24,600 | | | 1,120 |
Edison International | | 34,300 | | | 1,110 |
Energen | | 11,800 | | | 522 |
Hawaiian Electric Industries | | 39,300 | | | 863 |
IDACORP | | 25,500 | | | 843 |
Nicor | | 66,816 | | | 2,700 |
NSTAR | | 82,384 | | | 2,893 |
OGE Energy | | 27,700 | | | 1,009 |
Pepco Holdings | | 26,000 | | | 419 |
PG&E | | 20,300 | | | 842 |
Piedmont Natural Gas | | 37,600 | | | 956 |
PPL | | 34,926 | | | 902 |
SCANA | | 24,800 | | | 900 |
TECO Energy | | 24,800 | | | 386 |
UGI | | 62,796 | | | 1,642 |
Vectren | | 82,749 | | | 1,907 |
Westar Energy | | 30,200 | | | 664 |
WGL Holdings | | 26,600 | | | 900 |
Wisconsin Energy | | 66,796 | | | 3,273 |
| | | | | |
| | | | | 30,894 |
| | | | | |
Total Common Stock (Cost $211,505) ($ Thousands) | | | 249,398 |
| | | | | |
CASH EQUIVALENT — 1.0% SEI Daily Income Trust, Prime Obligation Fund, Cl A, 0.090%**† | | 2,452,491 | |
| 2,452
|
| | | | | |
Total Cash Equivalent
(Cost $2,452) ($ Thousands) | | | | | 2,452 |
| | | | | |
| | |
2 | | SEI Institutional Investments Trust /Annual Report/May 31, 2010 |
SCHEDULE OF INVESTMENTS
U.S. Managed Volatility Fund
May 31, 2010
| | | | | | |
Description | | Shares | | Market Value
($ Thousands) |
U.S. TREASURY OBLIGATION — 1.3% | | | |
U.S. Treasury Bill | | | | | | |
0.103%, 06/03/10 (A)(B) | | $ | 3,248 | | $ | 3,248 |
| | | | | | |
Total U.S. Treasury Obligation | | | | | | |
(Cost $3,248) ($ Thousands) | | | | | | 3,248 |
| | | | | | |
Total Investments — 100.0% | | | |
(Cost $217,205)($ Thousands) | | | | | $ | 255,098 |
| | | | | | |
A summary of the open futures contracts held by the Fund at May 31, 2010, is as follows:
| | | | | | | | |
Type of Contract | | Number of
Contracts
Long (Short) | | Expiration
Date | | Unrealized
(Depreciation)
($ Thousands) | |
S&P 500 Index EMINI | | 58 | | Jun-2010 | | $ | (140 | ) |
| | | | | | | | |
| | | | | | $ | (140 | ) |
| | | | | | | | |
For the year ended May 31, 2010, the total amount of all open futures contracts, as presented in the table above, are representative of the volume of activity for this derivative type during the period.
Percentages are based on a Net Assets of $255,094($ Thousands).
| * | Non-income producing security. |
| ** | Rate shown is the 7-day effective yield as of May 31, 2010. |
| † | Investment in Affiliated Security. |
| ‡ | Real Estate Investment Trust. |
| (A) | Zero coupon security. The rate reportedis the effective yield at time of purchase. |
| (B) | Security, or a portion thereof, has been pledged as collateral on open futures contracts. |
Cl — Class
REIT — Real Estate Investment Trust
S&P — Standard & Poor’s
| | |
3 | | SEI Institutional Investments Trust /Annual Report/May 31, 2010 |
SCHEDULE OF INVESTMENTS
International Equity Fund
May 31, 2010
| | | | | |
Description | | Shares | | Market Value
($ Thousands) |
COMMON STOCK — 93.6% | | | | | |
Argentina — 0.2% | | | | | |
Banco Macro ADR | | 10,000 | | $ | 272 |
BBVA Banco Frances ADR | | 22,659 | | | 134 |
Telecom Argentina ADR | | 8,200 | | | 134 |
Tenaris | | 17,645 | | | 333 |
| | | | | |
| | | | | 873 |
| | | | | |
Australia — 5.6% | | | | | |
AGL Energy | | 1,303 | | | 15 |
Amcor | | 101,988 | | | 531 |
AMP | | 41,174 | | | 195 |
Arrow Energy* | | 7,177 | | | 30 |
Asciano Group | | 171,031 | | | 232 |
Australia & New Zealand Banking Group | | 191,848 | | | 3,628 |
AXA Asia Pacific Holdings | | 76,189 | | | 376 |
Bendigo Bank | | 30,119 | | | 217 |
BGP Holdings* | | 39,545 | | | — |
BHP Billiton ADR | | 22,300 | | | 1,446 |
BHP Billiton | | 159,934 | | | 5,185 |
Billabong International | | 8,977 | | | 76 |
Boral | | 6,705 | | | 32 |
Brambles | | 19,010 | | | 107 |
Caltex Australia | | 61,209 | | | 564 |
CFS Retail Property Trust‡ | | 100,643 | | | 165 |
Coca-Cola Amatil | | 100,703 | | | 929 |
Cochlear | | 4,217 | | | 260 |
Commonwealth Bank of Australia | | 60,231 | | | 2,623 |
Computershare | | 45,806 | | | 420 |
CSL | | 3,723 | | | 100 |
Dexus Property Group‡ | | 113,523 | | | 75 |
Downer EDI | | 1,864 | | | 10 |
Fairfax Media(A) | | 355,873 | | | 456 |
Flight Centre | | 1,700 | | | 24 |
Fortescue Metals Group* | | 28,934 | | | 99 |
Goodman Fielder | | 58,884 | | | 67 |
Goodman Group‡ | | 464,953 | | | 248 |
GPT Group‡ | | 9,128 | | | 20 |
Harvey Norman Holdings | | 57,147 | | | 167 |
Hillgrove Resources | | 53,200 | | | 13 |
Incitec Pivot | | 25,197 | | | 65 |
Leighton Holdings(A) | | 15,707 | | | 434 |
Lend Lease Group | | 41,392 | | | 270 |
Macquarie Group | | 12,329 | | | 453 |
National Australia Bank | | 85,885 | | | 1,793 |
OneSteel | | 252,041 | | | 684 |
Orica | | 23,503 | | | 511 |
Origin Energy | | 4,195 | | | 53 |
OZ Minerals | | 99,199 | | | 90 |
Qantas Airways | | 106,172 | | | 225 |
QBE Insurance Group | | 500 | | | 8 |
Rio Tinto | | 49,848 | | | 2,837 |
Santos | | 130,960 | | | 1,379 |
Sonic Healthcare | | 31,535 | | | 273 |
Stockland‡ | | 238,516 | | | 787 |
Suncorp-Metway | | 74,311 | | | 513 |
TABCORP Holdings | | 61,384 | | | 344 |
Telstra | | 51,800 | | | 129 |
Toll Holdings | | 9,202 | | | 48 |
Transurban Group | | 94,817 | | | 345 |
| | | | | |
Description | | Shares | | Market Value
($ Thousands) |
Wesfarmers | | 59,303 | | $ | 1,463 |
Westfield Group‡ | | 22,899 | | | 247 |
Westpac Banking | | 97,120 | | | 1,889 |
WHK Group | | 22,891 | | | 19 |
Woodside Petroleum | | 600 | | | 22 |
Woolworths | | 18,186 | | | 411 |
WorleyParsons | | 12,910 | | | 270 |
| | | | | |
| | | | | 33,872 |
| | | | | |
Austria — 0.2% | | | | | |
IMMOFINANZ | | 135,520 | | | 421 |
OMV(A) | | 9,600 | | | 307 |
RHI* | | 2,647 | | | 72 |
Strabag | | 2,354 | | | 56 |
Vienna Insurance Group | | 2,800 | | | 119 |
Voestalpine | | 8,160 | | | 226 |
| | | | | |
| | | | | 1,201 |
| | | | | |
Belgium — 1.1% | | | | | |
Ageas | | 232,475 | | | 595 |
Belgacom | | 15,613 | | | 481 |
Colruyt | | 7,166 | | | 1,637 |
Delhaize Group(A) | | 10,818 | | | 859 |
D’ieteren | | 170 | | | 76 |
Fortis (Netherlands Line)* (A) | | — | | | — |
InBev | | 39,274 | | | 1,902 |
KBC Groep | | 13,912 | | | 547 |
Solvay | | 2,933 | | | 258 |
UCB | | 12,785 | | | 424 |
Umicore | | 3,674 | | | 112 |
| | | | | |
| | | | | 6,891 |
| | | | | |
Bermuda — 0.0% | | | | | |
Montpelier Re Holdings | | 9,224 | | | 144 |
| | | | | |
Brazil — 1.7% | | | | | |
Amil Participacoes | | 197,413 | | | 1,488 |
Anhanguera Educacional Participacoes | | 40,792 | | | 586 |
Banco Santander Brasil ADR | | 116,800 | | | 1,217 |
Centrais Eletricas Brasileiras ADR | | 38,243 | | | 477 |
Cia Vale do Rio Doce ADR, Cl B | | 3,400 | | | 93 |
Itau Unibanco Holding ADR | | 95,300 | | | 1,755 |
NET Servicos de Comunicacao ADR* | | 79,200 | | | 809 |
Petroleo Brasileiro ADR(A) | | 30,100 | | | 1,072 |
Porto Seguro | | 96,900 | | | 998 |
Totvs | | 23,597 | | | 1,679 |
| | | | | |
| | | | | 10,174 |
| | | | | |
Canada — 2.7% | | | | | |
Bankers Petroleum* | | 159,300 | | | 1,156 |
Canadian Natural Resources | | 41,800 | | | 1,481 |
Celestica* | | 27,600 | | | 254 |
Cenovus Energy | | 45,600 | | | 1,260 |
CI Financial | | 13,200 | | | 232 |
Domtar | | 7,495 | | | 465 |
Dundee, Cl A* | | 6,000 | | | 76 |
Eldorado Gold | | 101,100 | | | 1,737 |
Fairfax Financial Holdings | | 700 | | | 262 |
Magna International, Cl A | | 4,200 | | | 288 |
| | |
1 | | SEI Institutional Investments Trust /Annual Report/May 31, 2010 |
SCHEDULE OF INVESTMENTS
International Equity Fund
May 31, 2010
| | | | | |
Description | | Shares | | Market Value
($ Thousands) |
Niko Resources | | 25,100 | | $ | 2,494 |
Pacific Rubiales Energy* | | 72,500 | | | 1,527 |
Research In Motion* | | 18,300 | | | 1,106 |
Silver Wheaton* | | 83,400 | | | 1,574 |
Suncor Energy | | 73,100 | | | 2,259 |
West Fraser Timber | | 900 | | | 37 |
| | | | | |
| | | | | 16,208 |
| | | | | |
Chile — 0.6% | | | | | |
Banco Santander Chile ADR | | 12,737 | | | 790 |
Enersis ADR | | 55,153 | | | 1,040 |
Sociedad Quimica y Minera de Chile ADR(A) | | 44,700 | | | 1,500 |
| | | | | |
| | | | | 3,330 |
| | | | | |
China — 1.5% | | | | | |
Bank of China, Cl H | | 2,650,000 | | | 1,321 |
Baoye Group, Cl H | | 44,000 | | | 26 |
China Minsheng Banking, Cl H* | | 227,000 | | | 228 |
Ctrip.com International ADR* | | 37,041 | | | 1,459 |
Industrial & Commercial Bank of China | | 1,998,000 | | | 1,481 |
Ping An Insurance Group of China, Cl H | | 236,500 | | | 1,903 |
Want Want China Holdings | | 2,383,000 | | | 1,879 |
Xinao Gas Holdings | | 382,000 | | | 1,013 |
| | | | | |
| | | | | 9,310 |
| | | | | |
Denmark — 1.1% | | | | | |
A P Moeller - Maersk, Cl A | | 3 | | | 22 |
A P Moeller - Maersk, Cl B | | 3 | | | 23 |
Carlsberg, Cl B | | 14,933 | | | 1,143 |
Coloplast, Cl B | | 4,736 | | | 493 |
Danske Bank | | 19,231 | | | 391 |
Novo-Nordisk, Cl B | | 41,762 | | | 3,236 |
Novozymes, Cl B | | 1,901 | | | 205 |
PER Aarsleff, Cl B | | 416 | | | 34 |
Sydbank | | 1,730 | | | 41 |
TrygVesta | | 20,032 | | | 1,094 |
William Demant Holding* | | 716 | | | 51 |
| | | | | |
| | | | | 6,733 |
| | | | | |
Finland — 0.8% | | | | | |
Elisa, Cl A | | 10,777 | | | 182 |
Fortum | | 33,472 | | | 751 |
Kesko, Cl B | | 5,499 | | | 177 |
Kone, Cl B | | 25,447 | | | 996 |
Metso | | 10,666 | | | 339 |
Nokia | | 7,808 | | | 81 |
Orion, Cl B | | 20,760 | | | 365 |
Pohjola Bank, Cl A | | 19,457 | | | 191 |
Sampo, Cl A | | 9,973 | | | 212 |
Sanoma | | 3,155 | | | 57 |
Stora Enso, Cl R | | 129,603 | | | 972 |
UPM-Kymmene | | 21,567 | | | 278 |
Wartsila, Cl B | | 3,543 | | | 153 |
| | | | | |
| | | | | 4,754 |
| | | | | |
France — 7.6% | | | | | |
Alcatel-Lucent | | 313,584 | | | 812 |
Alstom | | 44,772 | | | 2,160 |
Arkema(A) | | 2,929 | | | 107 |
| | | | | |
Description | | Shares | | Market Value
($ Thousands) |
Assystem | | 1,449 | | $ | 21 |
Atos Origin | | 3,608 | | | 161 |
AXA | | 18,675 | | | 310 |
BioMerieux | | 441 | | | 46 |
BNP Paribas | | 74,281 | | | 4,241 |
Bouygues | | 23,761 | | | 1,021 |
Casino Guichard Perrachon | | 6,503 | | | 500 |
Cegid Group | | 1,081 | | | 27 |
Christian Dior | | 6,076 | | | 589 |
Cie Generale de Geophysique-Veritas* | | 5,091 | | | 114 |
Cie Generale d’Optique Essilor International(A) | | 1,278 | | | 73 |
CNP Assurances(A) | | 17,080 | | | 1,207 |
Compagnie de St.-Gobain(A) | | 9,748 | | | 377 |
Credit Agricole(A) | | 22,812 | | | 250 |
Danone | | 49,320 | | | 2,556 |
Dassault Systemes | | 1,574 | | | 92 |
Eurazeo(A) | | 2,392 | | | 146 |
Eutelsat Communications | | 41,462 | | | 1,363 |
Fonciere Des Regions‡ | | 1,211 | | | 112 |
France Telecom | | 65,359 | | | 1,249 |
Gaz de France | | 95,538 | | | 2,976 |
Gecina‡ | | 2,705 | | | 226 |
Groupe Eurotunnel | | 37,463 | | | 291 |
Havas | | 9,594 | | | 44 |
Ipsen(A) | | 55,046 | | | 2,346 |
JC Decaux | | 5,573 | | | 134 |
Klepierre‡ | | 6,461 | | | 174 |
Legrand(A) | | 5,847 | | | 174 |
L’Oreal | | 4,284 | | | 403 |
LVMH Moet Hennessy Louis Vuitton | | 2,640 | | | 280 |
Metropole Television | | 2,232 | | | 46 |
Natixis | | 266,431 | | | 1,186 |
Neopost | | 2,429 | | | 178 |
NetGem | | 7,913 | | | 32 |
Nexity | | 2,253 | | | 65 |
Pernod-Ricard | | 1,490 | | | 114 |
Peugeot | | 28,819 | | | 694 |
PPR | | 958 | | | 116 |
Publicis Groupe(A) | | 4,551 | | | 191 |
Renault | | 15,481 | | | 561 |
Safran(A) | | 29,517 | | | 809 |
Sanofi-Aventis(A) | | 73,819 | | | 4,501 |
Schneider Electric | | 44,727 | | | 4,522 |
SEB | | 281 | | | 19 |
Sequana Capital | | 6,313 | | | 81 |
SES Global | | 2,159 | | | 45 |
Societe BIC | | 1,108 | | | 79 |
Societe Des Autoroutes Paris-Rhin-Rhone | | 812 | | | 50 |
Societe Generale | | 16,795 | | | 726 |
Societe Television Francaise 1 | | 10,809 | | | 155 |
Sodexo | | 34,110 | | | 1,938 |
Suez Environnement | | 737 | | | 13 |
Technip | | 3,373 | | | 220 |
Total(A) | | 31,030 | | | 1,444 |
Unibail-Rodamco‡ | | 682 | | | 107 |
Valeo | | 813 | | | 23 |
Vallourec(A) | | 1,056 | | | 198 |
Video Futur Entertainment Group* | | 7,913 | | | 2 |
| | |
2 | | SEI Institutional Investments Trust /Annual Report/May 31, 2010 |
SCHEDULE OF INVESTMENTS
International Equity Fund
May 31, 2010
| | | | | |
Description | | Shares | | Market Value
($ Thousands) |
Vinci | | 3,014 | | $ | 137 |
Vivendi | | 148,235 | | | 3,224 |
| | | | | |
| | | | | 46,058 |
| | | | | |
Germany — 7.2% | | | | | |
Adidas | | 24,833 | | | 1,254 |
Allianz | | 22,702 | | | 2,282 |
BASF | | 76,083 | | | 4,046 |
Bayer | | 15,072 | | | 849 |
Bayerische Motoren Werke | | 287 | | | 13 |
Beiersdorf | | 2,218 | | | 121 |
Celesio | | 4,949 | | | 125 |
Continental | | 400 | | | 19 |
DaimlerChrysler | | 66,637 | | | 3,362 |
Deutsche Bank(A) | | 39,633 | | | 2,373 |
Deutsche Boerse(A) | | 32,341 | | | 1,991 |
Deutsche Lufthansa | | 12,648 | | | 169 |
Deutsche Post | | 25,145 | | | 376 |
Deutsche Telekom | | 131,705 | | | 1,477 |
E.ON | | 46,412 | | | 1,418 |
Fresenius | | 2,182 | | | 138 |
Fresenius Medical Care | | 30,403 | | | 1,542 |
GAGFAH | | 13,000 | | | 88 |
GEA Group | | 1,327 | | | 27 |
Hannover Rueckversicherung | | 19,169 | | | 819 |
HeidelbergCement | | 1,142 | | | 62 |
Henkel | | 12,066 | | | 486 |
Hochtief | | 1,384 | | | 89 |
Infineon Technologies* | | 361,384 | | | 2,081 |
Linde | | 38,312 | | | 3,957 |
MAN | | 487 | | | 42 |
MTU Aero Engines Holding | | 2,600 | | | 143 |
Norddeutsche Affinerie | | 2,100 | | | 97 |
Puma Rudolf Dassler Sport | | 26 | | | 7 |
Rheinmetall | | 110 | | | 6 |
RWE | | 9,793 | | | 706 |
Salzgitter | | 1,112 | | | 72 |
SAP | | 1,737 | | | 76 |
SAP ADR(A) | | 33,500 | | | 1,421 |
Siemens | | 66,215 | | | 6,041 |
Suedzucker(A) | | 17,166 | | | 315 |
ThyssenKrupp | | 76,906 | | | 2,089 |
Tognum(A) | | 87,663 | | | 1,620 |
TUI | | 55,942 | | | 512 |
United Internet | | 2,213 | | | 28 |
Volkswagen | | 276 | | | 24 |
Wincor Nixdorf | | 20,325 | | | 1,215 |
| | | | | |
| | | | | 43,578 |
| | | | | |
Greece — 0.2% | | | | | |
Coca Cola Hellenic Bottling | | 16,093 | | | 361 |
OPAP | | 35,787 | | | 572 |
Public Power | | 27,806 | | | 432 |
| | | | | |
| | | | | 1,365 |
| | | | | |
Hong Kong — 2.8% | | | | | |
ASM Pacific Technology | | 34,000 | | | 259 |
BOC Hong Kong Holdings | | 133,000 | | | 300 |
Cathay Pacific Airways | | 122,000 | | | 242 |
Champion REIT‡ | | 66,000 | | | 30 |
Champion Technology Holdings | | 564,000 | | | 15 |
Cheung Kong Holdings | | 42,009 | | | 479 |
| | | | | |
Description | | Shares | | Market Value
($ Thousands) |
China Merchants Holdings International | | 398,000 | | $ | 1,242 |
China Mobile ADR(A) | | 34,400 | | | 1,602 |
China Mobile | | 115,500 | | | 1,093 |
Esprit Holdings | | 12,000 | | | 71 |
Fairwood | | 19,500 | | | 19 |
First Pacific | | 133,000 | | | 86 |
Great Eagle Holdings | | 2,000 | | | 5 |
Guoco Group | | 9,000 | | | 92 |
Hang Lung Group | | 10,000 | | | 48 |
Hang Lung Properties | | 2,000 | | | 7 |
Hongkong & Shanghai Hotels | | 47,500 | | | 75 |
Hongkong Land Holdings | | 69,000 | | | 328 |
Hopewell Holdings | | 42,000 | | | 115 |
Hutchison Telecommunications Hong Kong Holdings | | 228,000 | | | 46 |
Hutchison Whampoa | | 138,000 | | | 859 |
Hysan Development(A) | | 23,635 | | | 61 |
Jardine Matheson Holdings | | 5,600 | | | 194 |
Jardine Strategic Holdings | | 109,453 | | | 2,143 |
Kerry Properties | | 211,000 | | | 881 |
Lai Sun Development* | | 1,739,000 | | | 29 |
Li & Fung | | 106,000 | | | 460 |
Link REIT‡ | | 58,000 | | | 140 |
New World Development | | 381,000 | | | 609 |
Noble Group | | 1,000 | | | 1 |
NWS Holdings | | 17,000 | | | 30 |
Orient Overseas International | | 55,500 | | | 370 |
Pacific Century Premium Developments | | 45,000 | | | 8 |
Pico Far East Holdings | | 202,000 | | | 37 |
Qingling Motors, Cl H | | 298,000 | | | 70 |
RCG Holdings* | | 28,708 | | | 23 |
Sun Hung Kai Properties | | 30,000 | | | 396 |
Swire Pacific, Cl A | | 261,944 | | | 2,892 |
Television Broadcasts | | 18,000 | | | 80 |
Vedan International Holdings | | 220,000 | | | 24 |
VTech Holdings | | 12,754 | | | 126 |
Wharf Holdings | | 139,000 | | | 693 |
Wheelock | | 255,383 | | | 684 |
Yue Yuen Industrial Holdings | | 77,894 | | | 241 |
| | | | | |
| | | | | 17,205 |
| | | | | |
India — 0.2% | | | | | |
State Bank of India GDR | | 9,800 | | | 930 |
| | | | | |
Ireland — 0.8% | | | | | |
DCC | | 4,200 | | | 97 |
Experian | | 302,008 | | | 2,684 |
Kerry Group, Cl A | | 6,851 | | | 191 |
Willis Group Holdings | | 56,100 | | | 1,718 |
| | | | | |
| | | | | 4,690 |
| | | | | |
Israel — 0.4% | | | | | |
Bank Hapoalim* | | 7,093 | | | 27 |
Bezeq Israeli Telecommunication | | 12,377 | | | 27 |
Israel Chemicals | | 3,172 | | | 35 |
Makhteshim-Agan Industries | | 318,882 | | | 1,113 |
NICE Systems* | | 519 | | | 15 |
Teva Pharmaceutical Industries | | 6,646 | | | 358 |
| | |
3 | | SEI Institutional Investments Trust /Annual Report/May 31, 2010 |
SCHEDULE OF INVESTMENTS
International Equity Fund
May 31, 2010
| | | | | |
Description | | Shares | | Market Value
($ Thousands) |
Teva Pharmaceutical Industries ADR | | 14,300 | | $ | 784 |
| | | | | |
| | | | | 2,359 |
| | | | | |
Italy — 1.4% | | | | | |
Atlantia(A) | | 8,370 | | | 156 |
Autogrill | | 851 | | | 10 |
Banca Popolare di Milano | | 15,955 | | | 68 |
Credito Emiliano | | 1,302 | | | 7 |
Edison | | 35,904 | | | 42 |
Enel | | 478,921 | | | 2,207 |
ENI | | 27,249 | | | 511 |
Fiat | | 34,191 | | | 376 |
Finmeccanica(A) | | 23,818 | | | 255 |
Italcementi | | 5,000 | | | 42 |
Mediaset(A) | | 189,642 | | | 1,180 |
Saipem | | 5,412 | | | 171 |
Servizi Italia | | 2,512 | | | 15 |
Snam Rete Gas(A) | | 27,713 | | | 113 |
Societa Iniziative Autostradali e Servizi | | 2,297 | | | 19 |
Telecom Italia(A) | | 2,061,995 | | | 2,373 |
Terna Rete Elettrica Nazionale | | 29,285 | | | 111 |
UniCredito Italiano | | 419,773 | | | 901 |
| | | | | |
| | | | | 8,557 |
| | | | | |
Japan — 17.1% | | | | | |
77 Bank | | 82,000 | | | 423 |
ABC-Mart | | 1,900 | | | 67 |
Able | | 1,500 | | | 12 |
Advantest | | 1,200 | | | 27 |
Aeon(A) | | 72,800 | | | 761 |
Aeon Fantasy | | 200 | | | 2 |
Aichi Bank | | 400 | | | 25 |
Aichi Machine Industry | | 3,000 | | | 9 |
Aisin Seiki | | 19,600 | | | 547 |
Ajinomoto | | 49,000 | | | 417 |
Alfresa Holdings | | 2,400 | | | 115 |
Amada | | 10,000 | | | 73 |
Amano | | 1,400 | | | 12 |
AOKI Holdings | | 900 | | | 13 |
Aoyama Trading | | 1,800 | | | 31 |
Aozora Bank | | 136,000 | | | 167 |
Arakawa Chemical Industries | | 1,700 | | | 18 |
Asahi Breweries | | 22,900 | | | 387 |
Asahi Glass | | 107,000 | | | 1,135 |
Asahi Kasei | | 65,000 | | | 342 |
Astellas Pharma | | 50,800 | | | 1,640 |
Bando Chemical Industries | | 16,000 | | | 52 |
Bank of Nagoya | | 6,000 | | | 20 |
Belluna | | 1,150 | | | 6 |
Bridgestone | | 160,700 | | | 2,608 |
Brother Industries | | 134,800 | | | 1,494 |
Canon | | 78,700 | | | 3,241 |
Cawachi | | 3,700 | | | 76 |
Central Japan Railway | | 142 | | | 1,160 |
Chiba Bank | | 22,000 | | | 134 |
Chiba Kogyo Bank* | | 600 | | | 4 |
Chiyoda | | 6,000 | | | 47 |
Chubu Electric Power | | 24,300 | | | 564 |
Chubu Shiryo | | 3,000 | | | 20 |
Chuetsu Pulp & Paper | | 8,000 | | | 14 |
| | | | | |
Description | | Shares | | Market Value
($ Thousands) |
Citizen Holdings | | 14,400 | | $ | 86 |
Cleanup | | 100 | | | 1 |
Corona | | 200 | | | 2 |
Create SD Holdings | | 300 | | | 6 |
Credit Saison | | 8,400 | | | 99 |
Dai Nippon Printing | | 58,000 | | | 711 |
Daicel Chemical Industries | | 119,000 | | | 834 |
Daihatsu Motor | | 11,000 | | | 100 |
Daiichi Jitsugyo | | 5,000 | | | 16 |
Dai-ichi Life Insurance | | 66 | | | 109 |
Daiichikosho | | 5,100 | | | 63 |
Daikoku Denki | | 2,800 | | | 38 |
Daikyo | | 225,000 | | | 450 |
Dainippon Ink and Chemicals(A) | | 7,000 | | | 12 |
Daito Trust Construction | | 2,500 | | | 126 |
Daiwa House Industry | | 67,000 | | | 641 |
Daiwa Securities Group | | 6,000 | | | 27 |
Dena | | 34,200 | | | 1,034 |
Denki Kagaku Kogyo | | 52,000 | | | 245 |
Denso | | 7,900 | | | 213 |
Dentsu(A) | | 5,600 | | | 143 |
East Japan Railway | | 8,600 | | | 556 |
Eighteenth Bank | | 12,000 | | | 32 |
Eizo Nanao | | 500 | | | 11 |
Electric Power Development | | 5,100 | | | 153 |
Elpida Memory* | | 14,400 | | | 262 |
Fanuc | | 8,700 | | | 919 |
Fast Retailing | | 2,600 | | | 366 |
Fields | | 3 | | | 3 |
Fuji Electric Holdings | | 8,000 | | | 23 |
Fuji Heavy Industries | | 136,000 | | | 784 |
Fuji Media Holdings | | 636 | | | 941 |
FUJI SOFT INC | | 2,400 | | | 43 |
FUJIFILM Holdings | | 60,000 | | | 1,788 |
Fujikura | | 9,000 | | | 44 |
Fujitec | | 1,000 | | | 6 |
Fujitsu | | 446,000 | | | 2,869 |
FuKoKu | | 2,800 | | | 24 |
Fukuda Denshi | | 400 | | | 9 |
Fukuoka Financial Group | | 155,000 | | | 653 |
Funai Electric | | 6,100 | | | 246 |
Furukawa-Sky Aluminum | | 41,000 | | | 117 |
Furuno Electric | | 700 | | | 4 |
Gunma Bank | | 10,000 | | | 52 |
Hakuhodo DY Holdings | | 1,310 | | | 67 |
Hankyu Hanshin Holdings | | 18,000 | | | 80 |
Heiwado | | 1,200 | | | 15 |
Higashi-Nippon Bank | | 7,000 | | | 13 |
HI-LEX | | 1,100 | | | 13 |
Hitachi | | 634,000 | | | 2,593 |
Hitachi Chemical | | 2,200 | | | 43 |
Hitachi Construction Machinery | | 9,800 | | | 200 |
Hitachi High-Technologies | | 300 | | | 6 |
Honda Motor | | 111,200 | | | 3,387 |
H-One | | 1,900 | | | 17 |
Hosiden | | 1,900 | | | 21 |
Hoya | | 12,800 | | | 300 |
Idemitsu Kosan | | 4,000 | | | 300 |
IHI | | 23,000 | | | 40 |
Iida Home Max | | 10,500 | | | 88 |
Imasen Electric Industrial | | 4,600 | | | 62 |
Inaba Denki Sangyo | | 400 | | | 10 |
| | |
4 | | SEI Institutional Investments Trust /Annual Report/May 31, 2010 |
SCHEDULE OF INVESTMENTS
International Equity Fund
May 31, 2010
| | | | | |
Description | | Shares | | Market Value
($ Thousands) |
Inabata | | 36,200 | | $ | 177 |
Inpex | | 147 | | | 925 |
Isuzu Motors | | 49,000 | | | 152 |
Itochu | | 88,200 | | | 732 |
Itochu-Shokuhin | | 400 | | | 12 |
J Front Retailing | | 12,000 | | | 62 |
Japan Digital Laboratory | | 900 | | | 10 |
Japan Tobacco | | 192 | | | 603 |
JBCC Holdings | | 700 | | | 4 |
JFE Holdings | | 20,800 | | | 701 |
JFE Shoji Holdings | | 6,000 | | | 29 |
JS Group | | 21,800 | | | 420 |
JSP | | 6,900 | | | 67 |
JSR | | 39,800 | | | 727 |
JTEKT | | 4,900 | | | 50 |
Jupiter Telecommunications | | 2,348 | | | 2,324 |
JX Holdings* | | 107,270 | | | 586 |
Kaneka | | 9,000 | | | 55 |
Kansai Paint | | 2,000 | | | 17 |
Kao | | 800 | | | 18 |
Kasumi | | 600 | | | 3 |
Kato Sangyo | | 600 | | | 9 |
Kawasaki Heavy Industries | | 6,000 | | | 17 |
Kawasumi Laboratories | | 3,000 | | | 21 |
KDDI | | 428 | | | 1,939 |
Keio | | 5,000 | | | 31 |
Keisei Electric Railway | | 10,000 | | | 55 |
Keyence | | 300 | | | 67 |
Kirin Holdings | | 26,000 | | | 351 |
Kobe Steel | | 38,000 | | | 80 |
Kohnan Shoji | | 1,000 | | | 11 |
Komatsu | | 12,900 | | | 242 |
Konaka | | 5,000 | | | 16 |
Konica Minolta Holdings | | 19,500 | | | 220 |
Konishi | | 2,300 | | | 24 |
Kuraray | | 44,000 | | | 547 |
Kyocera | | 3,300 | | | 288 |
Kyoei Steel | | 1,500 | | | 22 |
Kyudenko | | 5,000 | | | 27 |
Lawson | | 2,500 | | | 106 |
Mabuchi Motor | | 2,100 | | | 107 |
Maeda | | 5,000 | | | 14 |
Maeda Road Construction | | 1,000 | | | 8 |
Maezawa Kasei Industries | | 800 | | | 7 |
Makita | | 50,100 | | | 1,402 |
Mars Engineering | | 100 | | | 2 |
Marubeni | | 450,000 | | | 2,509 |
Maruichi Steel Tube | | 5,000 | | | 91 |
Maruzen Showa Unyu | | 5,000 | | | 16 |
Maxvalu Nishinihon | | 300 | | | 4 |
Mazda Motor | | 52,000 | | | 136 |
Mediceo Paltac Holdings | | 42,600 | | | 500 |
MEIJI Holdings | | 2,200 | | | 80 |
Mie Bank | | 4,000 | | | 11 |
Mikuni Coca-Cola Bottling | | 1,600 | | | 13 |
Minebea | | 18,000 | | | 104 |
Mitsubishi | | 170,500 | | | 3,847 |
Mitsubishi Chemical Holdings | | 112,500 | | | 523 |
Mitsubishi Electric | | 105,000 | | | 862 |
Mitsubishi Heavy Industries | | 78,000 | | | 290 |
Mitsubishi Materials | | 8,000 | | | 22 |
Mitsubishi UFJ Financial Group | | 185,000 | | | 897 |
| | | | | |
Description | | Shares | | Market Value
($ Thousands) |
Mitsubishi UFJ Lease & Finance | | 1,170 | | $ | 44 |
Mitsui | | 18,200 | | | 259 |
Mitsui Chemicals | | 107,000 | | | 324 |
Mitsui Engineering & | | | | | |
Shipbuilding(A) | | 98,000 | | | 224 |
Mitsui Home | | 1,000 | | | 5 |
Mitsui OSK Lines | | 37,000 | | | 264 |
Mitsui Sumitomo Insurance Group Holdings | | 10,900 | | | 269 |
Mizuho Financial Group | | 84,900 | | | 153 |
Mizuho Securities | | 82,000 | | | 205 |
Murata Manufacturing | | 4,100 | | | 199 |
Nafco | | 1,000 | | | 17 |
Namco Bandai Holdings | | 8,800 | | | 80 |
NEC | | 73,000 | | | 206 |
NEC Mobiling | | 400 | | | 10 |
NEC Networks & System Integration | | 13,300 | | | 165 |
NGK Spark Plug | | 7,000 | | | 88 |
NHK Spring | | 27,000 | | | 255 |
Nichireki | | 10,000 | | | 47 |
Nidec | | 16,000 | | | 1,459 |
Nihon Shokuhin Kako | | 3,000 | | | 17 |
Nihon Yamamura Glass | | 1,000 | | | 3 |
Nikon | | 10,100 | | | 195 |
Nintendo | | 800 | | | 236 |
Nippo | | 4,000 | | | 31 |
Nippon Beet Sugar Manufacturing | | 3,000 | | | 6 |
Nippon Electric Glass | | 166,100 | | | 2,183 |
Nippon Express | | 9,000 | | | 40 |
Nippon Meat Packers | | 31,000 | | | 388 |
Nippon Steel | | 123,000 | | | 431 |
Nippon Steel Trading | | 1,000 | | | 3 |
Nippon Telegraph & Telephone | | 48,400 | | | 1,961 |
Nishi-Nippon City Bank | | 72,000 | | | 200 |
Nishio Rent All | | 2,900 | | | 20 |
Nissan Chemical Industries | | 2,000 | | | 24 |
Nissan Motor | | 320,400 | | | 2,339 |
Nissan Shatai | | 5,000 | | | 34 |
Nisshin Fudosan | | 8,300 | | | 56 |
Nissin Food Products | | 1,100 | | | 36 |
Nissin Healthcare Food Service | | 1,500 | | | 18 |
Nissin Sugar Manufacturing | | 11,000 | | | 22 |
Nitori | | 2,250 | | | 180 |
Nittetsu Mining | | 4,000 | | | 15 |
Nitto Denko | | 8,400 | | | 300 |
Nojima | | 729 | | | 6 |
NOK | | 5,100 | | | 82 |
NSK | | 49,000 | | | 359 |
NTN | | 4,000 | | | 17 |
NTT Data | | 21 | | | 78 |
Obic | | 1,110 | | | 214 |
Ohsho Food Service | | 800 | | | 21 |
Olympus | | 8,000 | | | 209 |
Omron | | 16,500 | | | 347 |
Oracle Japan | | 3,300 | | | 155 |
Oriental Land | | 2,400 | | | 183 |
Oriental Yeast | | 3,000 | | | 13 |
ORIX | | 2,710 | | | 207 |
Osaka Steel | | 1,300 | | | 17 |
Panasonic | | 36,600 | | | 467 |
Panasonic Electric Works | | 27,000 | | | 277 |
| | |
5 | | SEI Institutional Investments Trust /Annual Report/May 31, 2010 |
SCHEDULE OF INVESTMENTS
International Equity Fund
May 31, 2010
| | | | | |
Description | | Shares | | Market Value
($ Thousands) |
Penta-Ocean Construction | | 45,500 | | $ | 69 |
Piolax | | 1,000 | | | 19 |
Rakuten | | 433 | | | 302 |
Rengo | | 3,000 | | | 18 |
Resona Holdings | | 11,900 | | | 151 |
Ricoh | | 24,000 | | | 344 |
Rinnai | | 900 | | | 45 |
Rohm | | 400 | | | 26 |
Roland | | 600 | | | 6 |
Ryoden Trading | | 7,000 | | | 37 |
S Foods | | 5,500 | | | 45 |
Sammy NetWorks | | 6 | | | 18 |
San-Ai Oil | | 19,000 | | | 75 |
San-In Godo Bank | | 4,000 | | | 29 |
Sankyo | | 33,700 | | | 1,460 |
Sanshin Electronics | | 8,000 | | | 67 |
Sapporo Hokuyo Holdings | | 249,500 | | | 922 |
Sazaby League | | 600 | | | 10 |
Secom | | 500 | | | 22 |
Seiko Epson | | 7,000 | | | 95 |
Seino Holdings | | 24,000 | | | 170 |
Seiren | | 400 | | | 2 |
Sekisui Chemical | | 396,000 | | | 2,447 |
Sharp | | 138,000 | | | 1,506 |
Shimamura | | 200 | | | 18 |
Shimano | | 2,500 | | | 103 |
Shinsei Bank(A) | | 174,000 | | | 172 |
Shiseido | | 33,600 | | | 652 |
Showa Denko | | 31,000 | | | 62 |
Sinanen | | 6,000 | | | 24 |
Sintokogio | | 1,600 | | | 12 |
SKY Perfect JSAT Holdings | | 43 | | | 15 |
SMC | | 1,500 | | | 195 |
Softbank | | 2,500 | | | 60 |
Sojitz | | 176,400 | | | 301 |
Sony | | 73,800 | | | 2,285 |
Sony Financial Holdings | | 61 | | | 212 |
SRI Sports | | 8 | | | 8 |
Sumco | | 2,000 | | | 36 |
Sumikin Bussan | | 4,000 | | | 10 |
Sumitomo | | 174,900 | | | 1,898 |
Sumitomo Chemical | | 49,000 | | | 201 |
Sumitomo Electric Industries | | 35,000 | | | 414 |
Sumitomo Heavy Industries | | 8,000 | | | 46 |
Sumitomo Metal Mining | | 47,000 | | | 669 |
Sumitomo Mitsui Financial Group | | 20,600 | | | 612 |
Sumitomo Trust & Banking | | 6,000 | | | 32 |
Suncall | | 4,000 | | | 15 |
Suzuken | | 9,900 | | | 352 |
Suzuki Motor | | 10,300 | | | 207 |
Sysmex | | 2,600 | | | 150 |
SysproCatena | | 22 | | | 14 |
T&D Holdings | | 4,450 | | | 105 |
T&K Toka | | 2,100 | | | 23 |
Tachi-S, Cl S | | 4,200 | | | 40 |
Tact Home | | 36 | | | 29 |
Takagi Securities | | 10,000 | | | 17 |
Takara Leben(A) | | 6,700 | | | 27 |
Takata | | 100 | | | 2 |
Takeda Pharmaceutical | | 14,600 | | | 609 |
Tanabe Seiyaku | | 17,000 | | | 221 |
TDK | | 4,000 | | | 233 |
| | | | | |
Description | | Shares | | Market Value
($ Thousands) |
Teijin | | 37,000 | | $ | 105 |
Terumo | | 2,300 | | | 110 |
THK | | 3,700 | | | 76 |
TKC | | 1,100 | | | 19 |
Toho Gas | | 38,000 | | | 189 |
Toho Holdings | | 3,100 | | | 48 |
Tohokushinsha Film | | 1,300 | | | 7 |
Token | | 50 | | | 1 |
Tokuyama | | 7,000 | | | 36 |
Tokyo Broadcasting System HD | | 6,100 | | | 90 |
Tokyo Electron | | 3,600 | | | 209 |
Tokyo Gas | | 35,000 | | | 153 |
Tokyo Style | | 2,000 | | | 16 |
Tokyo Tekko | | 11,000 | | | 27 |
Tomoku | | 11,000 | | | 30 |
Toppan Printing | | 22,000 | | | 188 |
Topre | | 200 | | | 1 |
Torii Pharmaceutical | | 200 | | | 3 |
Tosei | | 112 | | | 47 |
Toshiba | | 21,000 | | | 108 |
Toshiba TEC | | 48,000 | | | 176 |
Tosoh | | 7,000 | | | 19 |
Totetsu Kogyo | | 13,000 | | | 84 |
Toyo Kohan | | 1,000 | | | 5 |
Toyo Seikan Kaisha | | 5,200 | | | 81 |
Toyo Suisan Kaisha | | 3,000 | | | 67 |
Toyoda Gosei | | 2,300 | | | 59 |
Toyota Auto Body | | 2,700 | | | 37 |
Toyota Industries | | 4,900 | | | 126 |
Toyota Motor | | 22,700 | | | 819 |
Toyota Tsusho | | 36,300 | | | 516 |
Trusco Nakayama | | 100 | | | 1 |
TS Tech | | 900 | | | 15 |
TV Asahi | | 32 | | | 48 |
Unicharm | | 26,200 | | | 2,650 |
Universe | | 3,600 | | | 49 |
UNY | | 2,700 | | | 21 |
USS | | 1,120 | | | 75 |
Valor | | 1,600 | | | 12 |
VITAL KSK HOLDINGS | | 300 | | | 1 |
West Japan Railway | | 56 | | | 200 |
Yahoo! Japan | | 5,725 | | | 2,015 |
Yakult Honsha | | 8,000 | | | 196 |
Yamada Denki | | 830 | | | 57 |
Yamaha | | 2,500 | | | 26 |
Yamaha Motor | | 10,900 | | | 158 |
Yaskawa Electric | | 18,000 | | | 142 |
Yokogawa Electric | | 7,200 | | | 50 |
Yokohama Rubber | | 3,000 | | | 14 |
| | | | | |
| | | | | 103,782 |
| | | | | |
Macau — 0.1% | | | | | |
Wynn Macau* | | 13,100 | | | 21 |
Sands China* | | 247,200 | | | 366 |
| | | | | |
| | | | | 387 |
| | | | | |
Mauritius — 0.0% | | | | | |
Golden Agri-Resources | | 120,560 | | | 44 |
| | | | | |
| | |
6 | | SEI Institutional Investments Trust /Annual Report/May 31, 2010 |
SCHEDULE OF INVESTMENTS
International Equity Fund
May 31, 2010
| | | | | |
Description | | Shares | | Market Value
($ Thousands) |
Netherlands — 6.5% | | | | | |
Akzo Nobel | | 35,027 | | $ | 1,803 |
ArcelorMittal | | 8,078 | | | 248 |
ASML Holding | | 32,985 | | | 958 |
Boskalis Westminster | | 3,333 | | | 127 |
European Aeronautic Defense and Space(A) | | 62,702 | | | 1,260 |
Fugro | | 37,779 | | | 1,956 |
Heineken | | 31,314 | | | 1,354 |
Heineken Holding | | 10,321 | | | 388 |
Imtech | | 2,800 | | | 75 |
ING Groep | | 315,120 | | | 2,520 |
James Hardie Industries | | 33,183 | | | 208 |
Koninklijke Ahold | | 222,083 | | | 2,804 |
Koninklijke DSM(A) | | 63,910 | | | 2,567 |
Koninklijke Philips Electronics | | 114,787 | | | 3,453 |
Koninklijke Vopak | | 5,180 | | | 198 |
Nutreco Holding | | 2,000 | | | 110 |
Randstad Holding | | 8,125 | | | 345 |
Reed Elsevier | | 1,543 | | | 16 |
Royal Dutch Shell, Cl A | | 107,571 | | | 2,811 |
Royal Dutch Shell, Cl A (GBP) | | 84,844 | | | 2,225 |
Royal Dutch Shell, Cl B | | 54,298 | | | 1,366 |
Royal KPN | | 178,322 | | | 2,328 |
SBM Offshore | | 51,463 | | | 819 |
Teleplan International | | 9,136 | | | 24 |
TNT | | 93,105 | | | 2,324 |
Unilever | | 256,012 | | | 7,056 |
| | | | | |
| | | | | 39,343 |
| | | | | |
New Zealand — 0.1% | | | | | |
Air New Zealand | | 45,100 | | | 36 |
Fletcher Building | | 32,059 | | | 179 |
Telecom of New Zealand | | 348,411 | | | 449 |
| | | | | |
| | | | | 664 |
| | | | | |
Norway — 1.2% | | | | | |
Aker Kvaerner | | 1,400 | | | 19 |
Atea | | 11,500 | | | 81 |
DnB | | 439,489 | | | 4,383 |
Norsk Hydro | | 800 | | | 5 |
Seadrill | | 16,950 | | | 327 |
Statoil(A) | | 70,341 | | | 1,391 |
Telenor(A) | | 62,600 | | | 769 |
TGS Nopec Geophysical* | | 1,300 | | | 18 |
Yara International | | 2,000 | | | 59 |
| | | | | |
| | | | | 7,052 |
| | | | | |
Portugal — 0.2% | | | | | |
Banco Comercial Portugues, Cl R | | 170,000 | | | 135 |
Energias de Portugal | | 245,756 | | | 762 |
Jeronimo Martins | | 58,810 | | | 547 |
Portugal Telecom | | 1,411 | | | 15 |
| | | | | |
| | | | | 1,459 |
| | | | | |
Singapore — 1.5% | | | | | |
CapitaMalls Asia | | 11,400 | | | 17 |
DBS Group Holdings | | 192,000 | | | 1,916 |
Fortune Real Estate Investment Trust‡ | | 13,000 | | | 6 |
Fraser and Neave | | 70,000 | | | 244 |
GP Batteries International* | | 16,000 | | | 21 |
Ho Bee Investment | | 98,000 | | | 101 |
| | | | | |
Description | | Shares | | Market Value
($ Thousands) |
Jardine Cycle & Carriage | | 15,000 | | $ | 295 |
Keppel | | 9,000 | | | 57 |
Keppel Land | | 6,000 | | | 15 |
K-REIT Asia‡ | | 7,000 | | | 5 |
Oversea-Chinese Banking | | 288,000 | | | 1,710 |
SembCorp Industries | | 97,000 | | | 276 |
SembCorp Marine | | 15,000 | | | 42 |
SIA Engineering | | 18,000 | | | 48 |
Singapore Airlines | | 121,000 | | | 1,243 |
Singapore Airport Terminal Services | | 33,000 | | | 62 |
Singapore Press Holdings(A) | | 48,000 | | | 127 |
Singapore Technologies Engineering | | 115,000 | | | 256 |
Starhill Global REIT, Cl REIT‡ | | 40,000 | | | 15 |
Suntec Real Estate Investment Trust, Cl REIT‡ | | 22,000 | | | 20 |
Transpac Industrial Holdings | | 15,000 | | | 15 |
United Overseas Bank | | 20,000 | | | 258 |
UOL Group | | 160,000 | | | 432 |
Venture | | 6,000 | | | 37 |
Wheelock Properties Singapore | | 35,370 | | | 44 |
Wilmar International | | 209,000 | | | 868 |
Yangzijiang Shipbuilding Holdings | | 929,000 | | | 834 |
| | | | | |
| | | | | 8,964 |
| | | | | |
South Africa — 0.3% | | | | | |
Group | | 112,660 | | | 1,601 |
| | | | | |
South Korea — 1.1% | | | | | |
Hyundai Mobis | | 15,415 | | | 2,568 |
Samsung Electronics | | 2,642 | | | 1,716 |
Samsung SDI | | 6,988 | | | 956 |
Shinhan Financial Group | | 43,340 | | | 1,575 |
| | | | | |
| | | | | 6,815 |
| | | | | |
Spain — 1.3% | | | | | |
Banco Bilbao Vizcaya Argentaria(A) | | 97,947 | | | 1,029 |
Banco Popular Espanol(A) | | 13,219 | | | 68 |
Banco Santander Central Hispano | | 261,347 | | | 2,683 |
Bankinter | | 16,434 | | | 95 |
Caja de Ahorros del Mediterraneo | | 3,673 | | | 27 |
Construcciones y Auxiliar de Ferrocarriles | | 165 | | | 70 |
Enagas | | 4,167 | | | 67 |
Ferrovial | | 5,354 | | | 36 |
Fomento de Construcciones y Contratas(A) | | 3,343 | | | 83 |
Gamesa Tecnologica | | 133,654 | | | 1,323 |
Gas Natural | | 45,149 | | | 663 |
Gestevision Telecinco | | 7,873 | | | 79 |
Inditex | | 10,940 | | | 613 |
Mapfre(A) | | 7,677 | | | 22 |
Telefonica | | 50,291 | | | 965 |
| | | | | |
| | | | | 7,823 |
| | | | | |
Sweden — 2.1% | | | | | |
Alfa Laval | | 28,666 | | | 363 |
Assa Abloy, Cl B | | 18,443 | | | 372 |
Atlas Copco, Cl A | | 21,766 | | | 310 |
| | |
7 | | SEI Institutional Investments Trust /Annual Report/May 31, 2010 |
SCHEDULE OF INVESTMENTS
International Equity Fund
May 31, 2010
| | | | | |
Description | | Shares | | Market Value
($ Thousands) |
Atlas Copco, Cl B | | 12,809 | | $ | 166 |
Bilia, Cl A | | 6,483 | | | 76 |
Boliden | | 16,454 | | | 198 |
Electrolux, Cl B | | 68,380 | | | 1,541 |
Getinge, Cl B | | 16,896 | | | 335 |
Hennes & Mauritz, Cl B | | 14,980 | | | 849 |
Industrivarden, Cl C | | 36,045 | | | 402 |
Investor, Cl A | | 12,815 | | | 200 |
Kinnevik Investment, Cl B | | 18,215 | | | 284 |
Millicom International Cellular | | 246 | | | 19 |
Modern Times Group, Cl B | | 400 | | | 21 |
Nordea Bank | | 130,000 | | | 1,067 |
Ratos, Cl B | | 9,307 | | | 235 |
Saab, Cl B | | 5,381 | | | 71 |
Sandvik | | 8,942 | | | 106 |
Scania, Cl B | | 37,761 | | | 556 |
Securitas, Cl B | | 31,948 | | | 285 |
Skanska, Cl B | | 25,888 | | | 380 |
SKF, Cl B | | 1,909 | | | 33 |
SSAB, Cl A | | 1,174 | | | 17 |
Svenska Cellulosa, Cl B | | 74,681 | | | 869 |
Svenska Cellulosa, Cl A | | 555 | | | 6 |
Svenska Handelsbanken, Cl A | | 109,213 | | | 2,658 |
Swedbank | | 47,082 | | | 423 |
Swedish Match | | 11,671 | | | 244 |
Tele2, Cl B | | 22,718 | | | 329 |
Telefonaktiebolaget LM Ericsson, Cl B | | 1,336 | | | 14 |
TeliaSonera | | 37,100 | | | 222 |
Volvo, Cl B | | 6,507 | | | 68 |
| | | | | |
| | | | | 12,719 |
| | | | | |
Switzerland — 8.3% | | | | | |
Actelion* | | 2,197 | | | 79 |
Adecco(A) | | 3,989 | | | 193 |
Aryzta | | 1,309 | | | 43 |
Baloise Holding | | 3,400 | | | 241 |
Banque Cantonale Vaudoise | | 189 | | | 73 |
Clariant | | 18,838 | | | 219 |
Coltene Holding | | 472 | | | 23 |
Compagnie Financiere Richemont | | 20,524 | | | 679 |
Credit Suisse Group | | 99,124 | | | 3,845 |
Emmi | | 200 | | | 28 |
Flughafen Zuerich* | | 28 | | | 8 |
Geberit | | 3,316 | | | 501 |
Givaudan | | 2,901 | | | 2,275 |
Helvetia Holding | | 500 | | | 134 |
Holcim | | 17,415 | | | 1,104 |
Informa | | 281,592 | | | 1,530 |
Kuehne + Nagel International | | 363 | | | 34 |
Micronas Semiconductor Holding* | | 6,888 | | | 31 |
Nestle | | 172,223 | | | 7,797 |
Nobel Biocare Holding | | 52,435 | | | 986 |
Novartis | | 177,941 | | | 8,071 |
PSP Swiss Property | | 428 | | | 24 |
Roche Holding | | 35,580 | | | 4,878 |
Schindler Holding | | 13,853 | | | 1,072 |
SGS | | 3,497 | | | 4,381 |
Sonova Holding | | 4,916 | | | 532 |
STMicroelectronics | | 33,574 | | | 266 |
Straumann Holding | | 218 | | | 46 |
| | | | | |
Description | | Shares | | Market Value
($ Thousands) |
Sulzer | | 21,758 | | $ | 1,809 |
Swatch Group | | 10,635 | | | 515 |
Swatch Group, Cl B | | 2,608 | | | 684 |
Swiss Life Holding | | 5,581 | | | 600 |
Swiss Reinsurance | | 8,031 | | | 328 |
Swisscom | | 3,867 | | | 1,230 |
Syngenta | | 7,173 | | | 1,591 |
Synthes | | 2,472 | | | 261 |
UBS | | 72,989 | | | 980 |
Xstrata | | 98,771 | | | 1,434 |
Zurich Financial Services | | 8,368 | | | 1,712 |
| | | | | |
| | | | | 50,237 |
| | | | | |
Taiwan — 0.1% | | | | | |
United Microelectronics ADR(A) | | 241,944 | | | 801 |
| | | | | |
Thailand — 0.3% | | | | | |
Kasikornbank | | 686,700 | | | 1,896 |
| | | | | |
| | | | | 1,896 |
| | | | | |
United Kingdom — 16.8% | | | | | |
3i Group | | 188,762 | | | 773 |
Admiral Group | | 11,881 | | | 220 |
Aggreko | | 1,900 | | | 34 |
Amec | | 135,189 | | | 1,544 |
Amlin | | 360,181 | | | 1,943 |
Anglo American* | | 47,592 | | | 1,816 |
Antofagasta | | 119,897 | | | 1,522 |
ARM Holdings | | 9,400 | | | 33 |
Associated British Foods | | 49,085 | | | 676 |
AstraZeneca | | 105,860 | | | 4,449 |
Autonomy* | | 3,103 | | | 78 |
Aviva | | 78,243 | | | 359 |
BAE Systems | | 776,789 | | | 3,601 |
Balfour Beatty | | 11,760 | | | 43 |
Barclays | | 699,822 | | | 3,052 |
BG Group | | 250,260 | | | 3,809 |
BHP Billiton | | 45,791 | | | 1,252 |
BP | | 918,446 | | | 6,546 |
British Airways | | 2,993 | | | 9 |
British American Tobacco | | 68,090 | | | 1,999 |
BT Group, Cl A | | 378,254 | | | 692 |
Bunzl | | 15,500 | | | 159 |
Burberry Group | | 35,768 | | | 355 |
Cairn Energy* | | 696,575 | | | 4,026 |
Cape* | | 36,691 | | | 110 |
Carnival | | 7,515 | | | 283 |
Centrica | | 26,756 | | | 106 |
Cobham | | 61,854 | | | 205 |
Compass Group | | 170,492 | | | 1,312 |
Computacenter | | 4,925 | | | 22 |
Davis Service Group PLC | | 60,400 | | | 338 |
Diageo | | 64,458 | | | 983 |
DS Smith | | 8,312 | | | 14 |
easyJet* | | 28,355 | | | 163 |
Education Development International | | 15,291 | | | 24 |
Eurasian Natural Resources | | 103,231 | | | 1,483 |
Firstgroup | | 40,872 | | | 221 |
GlaxoSmithKline | | 191,684 | | | 3,187 |
Halfords Group | | 4,744 | | | 33 |
| | |
8 | | SEI Institutional Investments Trust /Annual Report/May 31, 2010 |
SCHEDULE OF INVESTMENTS
International Equity Fund
May 31, 2010
| | | | | |
Description | | Shares | | Market Value
($ Thousands) |
Healthcare Locums | | 18,106 | | $ | 59 |
Hogg Robinson Group | | 38,599 | | | 16 |
Home Retail Group | | 148,071 | | | 534 |
HSBC Holdings | | 705,633 | | | 6,383 |
ICAP | | 117,695 | | | 655 |
Imperial Tobacco Group | | 100,554 | | | 2,604 |
Inchcape | | 17,576 | | | 73 |
Inmarsat | | 21,128 | | | 229 |
Intercontinental Hotels Group | | 21,329 | | | 335 |
International Power | | 205,314 | | | 853 |
Invensys | | 22,624 | | | 90 |
Investec | | 45,032 | | | 317 |
ITV | | 31,000 | | | 25 |
Kazakhmys | | 20,760 | | | 352 |
Kingfisher | | 1,169,987 | | | 3,757 |
Legal & General Group | | 405,422 | | | 461 |
Lloyds Banking Group | | 880,094 | | | 712 |
Meggitt | | 1,927 | | | 8 |
Millennium & Copthorne Hotels | | 18,390 | | | 109 |
Mondi | | 4,227 | | | 25 |
Morgan Sindall | | 3,027 | | | 24 |
National Grid | | 49,328 | | | 356 |
Next | | 23,557 | | | 704 |
Old Mutual | | 229,674 | | | 376 |
Pearson | | 52,390 | | | 716 |
Petrofac | | 13,148 | | | 213 |
Prudential | | 3,222 | | | 25 |
Reckitt Benckiser Group | | 16,654 | | | 775 |
Reed Elsevier | | 217,344 | | | 1,505 |
Rexam | | 24,541 | | | 111 |
Rio Tinto | | 89,727 | | | 4,117 |
Rolls-Royce Group | | 79,110 | | | 670 |
Royal Bank of Scotland Group | | 1,424,371 | | | 949 |
SABMiller | | 27,076 | | | 761 |
Sage Group | | 944,549 | | | 3,227 |
Schroders | | 5,274 | | | 101 |
Serco Group | | 23,977 | | | 211 |
Shire | | 39,741 | | | 809 |
Smith & Nephew | | 151,080 | | | 1,360 |
Smiths Group | | 23,932 | | | 355 |
Standard Chartered | | 3,076 | | | 72 |
Standard Life | | 106,485 | | | 278 |
Tesco | | 729,509 | | | 4,324 |
Thomas Cook Group | | 52,000 | | | 155 |
Travis Perkins | | 55,257 | | | 626 |
Tullett Prebon | | 39,004 | | | 180 |
Tullow Oil | | 93,601 | | | 1,503 |
Unilever | | 44,426 | | | 1,193 |
Vedanta Resources | | 11,132 | | | 369 |
Vodafone Group | | 4,307,906 | | | 8,531 |
Whitbread | | 13,045 | | | 259 |
WM Morrison Supermarkets | | 164,071 | | | 624 |
WPP | | 134,438 | | | 1,259 |
| | | | | |
| | | | | 101,809 |
| | | | | |
United States — 0.5% | | | | | |
AmeriCredit* (A) | | 5,135 | | | 111 |
BGC Partners, Cl A | | 8,210 | | | 51 |
Buckeye Technologies* | | 3,802 | | | 46 |
Central Garden and Pet* | | 4,700 | | | 47 |
Clearwater Paper* | | 1,900 | | | 116 |
Gladstone Capital | | 3,886 | | | 44 |
| | | | | |
Description | | Shares | | Market Value
($ Thousands) |
Hill-Rom Holdings | | 4,729 | | $ | 132 |
Horace Mann Educators | | 7,560 | | | 116 |
John B. Sanfilippo & Son* | | 2,700 | | | 39 |
JPMorgan Chase | | 4,574 | | | 181 |
Kemet* | | 11,358 | | | 24 |
KKR Financial Holdings LLC(A) | | 20,380 | | | 169 |
M&F Worldwide* | | 1,500 | | | 47 |
NGP Capital Resources | | 2,500 | | | 18 |
Och-Ziff Capital Management Group LLC, Cl A | | 15,920 | | | 229 |
Omnova Solutions* | | 5,400 | | | 43 |
Pre-Paid Legal Services* (A) | | 1,600 | | | 74 |
RAIT Financial Trust‡ * (A) | | 64,752 | | | 163 |
Seagate Technology* | | 45,828 | | | 704 |
TICC Capital | | 12,600 | | | 104 |
Valueclick* | | 3,593 | | | 42 |
Western Digital* | | 6,428 | | | 224 |
| | | | | |
| | | | | 2,724 |
| | | | | |
Total Common Stock (Cost $595,230) ($ Thousands) | | | 566,353 |
| | | | | |
MORTGAGE-BACKED SECURITIES — 0.7% | | | |
Non-Agency Mortgage-Backed Obligations —0.7% | | | |
Banc of America Funding, Ser 2004-5, Cl 1A19 | | | | | |
5.250%, 12/20/34 | | 265 | | | 265 |
Banc of America Funding, Ser 2005-2, Cl 1A2 | | | | | |
5.500%, 04/25/35 | | 258 | | | 254 |
Banc of America Mortgage Securities, Ser 2003-9, Cl 1A12 | | | | | |
0.793%, 12/25/33 (B) | | 58 | | | 56 |
Banc of America Mortgage Securities, Ser 2004-10, Cl 2A1 | | | | | |
5.000%, 12/25/19 | | 344 | | | 349 |
Bear Stearns Commercial Mortgage Securities, Ser 2005- PWR9, Cl A2 | | | | | |
4.735%, 09/11/42 | | 2 | | | 2 |
Countrywide Home Loan Mortgage Pass Through Trust, Ser 2003-34, Cl A3 | | | | | |
5.000%, 09/25/33 | | 72 | | | 72 |
Countrywide Home Loan Mortgage Pass-Through Trust, Ser 2003-14, Cl A16 | | | | | |
5.500%, 06/25/33 | | 151 | | | 154 |
Countrywide Home Loan Mortgage Pass-Through Trust, Ser 2003-2, Cl A18 | | | | | |
8.000%, 03/25/33 | | 57 | | | 61 |
Countrywide Home Loan Mortgage Pass-Through Trust, Ser 2003-24, Cl A2 | | | | | |
4.500%, 07/25/33 | | 275 | | | 278 |
Countrywide Home Loan Mortgage Pass-Through Trust, Ser 2004-13, Cl 2A17 | | | | | |
5.750%, 08/25/34 | | 52 | | | 52 |
Countrywide Home Loan Mortgage Pass-Through Trust, Ser 2004-5, Cl 2A14 | | | | | |
5.000%, 05/25/34 | | 63 | | | 62 |
| | |
9 | | SEI Institutional Investments Trust /Annual Report/May 31, 2010 |
SCHEDULE OF INVESTMENTS
International Equity Fund
May 31, 2010
| | | | | | |
Description | | Shares | | Market Value
($Thousands) |
Credit Suisse First Boston Mortgage Securities, Ser 2003-C3 | | | | | | |
3.382%, 05/15/38 | | $ | 6 | | $ | 6 |
DLJ Commercial Mortgage,
Ser 2000-CKP1, Cl A1B | | | | | | |
7.180%, 11/10/33 | | | 138 | | | 138 |
First Horizon Asset Securities,
Ser 2003-9, Cl 1A3 | | | | | | |
5.500%, 11/25/33 | | | 255 | | | 254 |
GMAC Mortgage Loan Trust,
Ser 2004-J1, Cl A2 | | | | | | |
5.250%, 04/25/34 | | | 202 | | | 201 |
GMAC Mortgage Loan Trust,
Ser 2004-J4, Cl A1 | | | | | | |
5.500%, 09/25/34 | | | 134 | | | 134 |
Greenwich Capital Commercial Funding,
Ser 2003-C2, Cl A2 | | | | | | |
4.022%, 01/05/36 | | | 2 | | | 2 |
JPMorgan Mortgage Trust,
Ser 2004-A5, Cl 4A2 | | | | | | |
4.817%, 12/25/34 (B) | | | 151 | | | 154 |
LB-UBS Commercial Mortgage Trust, Ser 2000-C4, Cl A2 | | | | | | |
7.370%, 08/15/26 | | | 29 | | | 29 |
Master Adjustable Rate Mortgages Trust, Ser 2004-6, Cl 2A1 | | | | | | |
3.915%, 07/25/34 (B) | | | 382 | | | 348 |
PNC Mortgage Acceptance, Ser 2000-C2, Cl A2 | | | | | | |
7.300%, 10/12/33 | | | 37 | | | 37 |
Residential Funding Mortgage Securities I, Ser 2004-S1, Cl A2 | | | | | | |
0.743%, 02/25/34 (B) | | | 44 | | | 43 |
Residential Funding Mortgage Securities I, Ser 2006-S5, Cl A4 | | | | | | |
5.500%, 03/25/34 | | | 143 | | | 144 |
Thornburg Mortgage Securities Trust, Ser 2006-5, Cl A1 | | | | | | |
0.463%, 09/25/46 (B) | | | 467 | | | 455 |
Wachovia Bank Commercial Mortgage Trust, Ser 2005-C17, Cl A2 | | | | | | |
4.782%, 03/15/42 | | | 176 | | | 176 |
WaMu Mortgage Pass Through Certificates, Ser 2004-AR9, Cl A6 | | | | | | |
2.950%, 08/25/34 (B) | | | 2 | | | 2 |
WaMu Mortgage Pass Through Certificates, Ser 2005-AR10, Cl 1A1 | | | | | | |
4.750%, 09/25/35 (B) | | | 252 | | | 253 |
Washington Mutual Mortgage Pass-Through Certificates, Ser 2003-S4, Cl 2A5 | | | | | | |
4.500%, 06/25/33 | | | 28 | | | 28 |
Washington Mutual Mortgage Pass-Through Certificates, Ser 2004-S2, Cl 2A1 | | | | | | |
5.500%, 06/25/34 | | | 146 | | | 146 |
| | | | | |
Description | | Shares/Face
Amount ($ Thousands) | | Market Value
($ Thousands) |
Wells Fargo Mortgage Backed Securities Trust, Ser 2004-I, Cl B1 | | | | | |
3.220%, 07/25/34 (B) | | $ | 45 $ | | 15 |
Wells Fargo Mortgage Backed Securities Trust, Ser 2004-N, Cl A13 | | | | | |
0.793%, 06/25/34 (B) | | | 76 | | 74 |
Wells Fargo Mortgage Backed Securities Trust, Ser 2005- AR12, Cl 2A4 | | | | | |
2.933%, 07/25/35 (B) | | | 36 | | 36 |
| | | | | |
Total Mortgage-Backed Securities
(Cost $4,325) ($ Thousands) | | 4,280 |
| | | | | |
PREFERRED STOCK— 0.4% | | |
Germany — 0.4% | | | | | |
Draegerwerk | | | 1,189 | | 71 |
Fresenius | | | 3,718 | | 237 |
Henkel | | | 38,382 | | 1,811 |
Jungheinrich | | | 1,164 | | 27 |
KSB | | | 173 | | 100 |
ProSiebenSat.1 Media | | | 3,727 | | 57 |
STO | | | 300 | | 27 |
Volkswagen | | | 3,420 | | 302 |
| | | | | |
Total Preferred Stock (Cost $2,702) ($ Thousands) | | 2,632 |
| | | | | |
WARRANTS �� 0.1% | | | | | |
| | |
| | | Number Of
Warrants | | |
India — 0.1% | | | | | |
Shriram Transport Finance, Expires 2014 * (C) | | | 64,656 | | 774 |
Hong Kong — 0.0% | | | | | |
Henderson Land Development, Expires 12/31/49 * | | | 2,780 | | — |
| | | | | |
Total Warrants (Cost $839) ($ Thousands) | | 774 |
| | | | | |
CORPORATE OBLIGATION — 0.1% | | | | | |
Financials — 0.1% | | | | | |
Shinsei Finance Cayman | | | | | |
6.418%, 01/29/49 (B) (C) | | $ | 490 | | 310 |
| | | | | |
Total Corporate Obligation
(Cost $490) ($ Thousands) | | | | | 310 |
| | | | | |
| | |
| | | Number Of
Rights | | |
RIGHTS — 0.0% | | | | | |
Australia — 0.0% | | | | | |
Transurban Group, Expires 06/21/10 | | | 8,619 | | — |
| | | | | |
| | |
10 | | SEI Institutional Investments Trust /Annual Report/May 31, 2010 |
SCHEDULE OF INVESTMENTS
International Equity Fund
May 31, 2010
| | | | | | | | |
Description | | Shares/Face
Amount ($ Thousands) | | Market Value
($ Thousands) |
United Kingdom — 0.0% | | | |
National Grid, PLC, Expires 06/13/10 | | | 19,731 | | $ | 39 |
| | | | | | | | |
Total Rights (Cost $0) ($ Thousands) | | | | | | 39 |
| | | | | | | | |
CASH EQUIVALENT — 0.5% | | | |
SEI Daily Income Trust, Prime Obligation Fund, Cl A, 0.090%**† | | | 3,212,787 | | | 3,213 |
| | | | | | | | |
Total Cash Equivalent
(Cost $3,213) ($ Thousands) | | | | | | 3,213 |
| | | | | | | | |
U.S. TREASURY OBLIGATIONS — 0.6% |
U.S. Treasury Bills (C)(D) | | | | | | |
0.134%,
06/03/10 | | $ | 2,967 | | | 2,967 |
0.140%,
06/17/10 | | | 308 | | | 308 |
0.150%,
07/15/10 | | | 106 | | | 106 |
0.140%,
08/19/10 | | | 68 | | | 68 |
| | | | | | | | |
Total U.S. Treasury Obligations
(Cost $3,449) ($ Thousands) | | | 3,449 |
| | | | | | | | |
United States — 4.4% | | | |
Brown Brothers Harriman | | | | | | | | |
5.450%,
06/01/10 | | ZAR | | | 5 | | | 1 |
3.410%,
06/01/10 | | AUD | | | 86 | | | 73 |
1.700%,
06/01/10 | | NZD | | | 9 | | | 6 |
0.080%,
06/01/10 | | GBP | | | 124 | | | 180 |
0.070%,
06/01/10 | | CAD | | | 1 | | | 1 |
0.070%,
06/01/10 | | NOK | | | 106 | | | 16 |
0.050%,
06/01/10 | | DKK | | | 281 | | | 46 |
0.050%,
06/01/10 | | EUR | | | 179 | | | 221 |
0.030%,
06/01/10 | | | | | 25,971 | | | 25,971 |
0.010%,
06/01/10 | | CHF | | | 9 | | | 8 |
0.010%,
06/01/10 | | HKD | | | 882 | | | 113 |
0.010%,
06/01/10 | | JPY | | | 5,875 | | | 65 |
0.010%,
06/01/10 | | SEK | | | 1,277 | | | 163 |
0.010%,
06/01/10 | | SGD | | | 36 | | | 25 |
| | | | | | | | |
Total Time Deposits (Cost $26,889) ($ Thousands) | | | | | | 26,889 |
| | | | | | | | |
AFFILIATED PARTNERSHIP — 4.9% |
SEI Liquidity Fund, L.P. 0.240% *†(F) | | $ | 30,032 | | $ | 29,209 |
| | | | | | | | |
Total Affiliated Partnership (Cost $30,032) ($ Thousands) | | | | | | 29,209 |
| | | | | | | | |
Total Investments — 100.8% (Cost $667,169)($ Thousands) | | | | | $ | 637,148 |
| | | | | | | | |
| | |
11 | | SEI Institutional Investments Trust /Annual Report/May 31, 2010 |
SCHEDULE OF INVESTMENTS
International Equity Fund
May 31, 2010
A summary of the open futures contracts held by the Fund at May 31, 2010, is as follows:
| | | | | | | | |
Type of Contract
| | Number of
Contracts
Long
(Short) | | Expiration
Date | | Unrealized
Appreciation
(Depreciation)
($ Thousands) | |
DJ Euro Stoxx 50 Index | | 75 | | Jun-2010 | | $ | (1 | ) |
FTSE Index | | 22 | | Jun-2010 | | | (15 | ) |
Hang Seng Index | | 1 | | Jun-2010 | | | — | |
MSCI EAFE Index
E-MINI | | 15 | | Jun-2010 | | | (148 | ) |
Nikkei 225 Index | | 13 | | Jun-2010 | | | (34 | ) |
SPI 200 Index | | 6 | | Jun-2010 | | | (5 | ) |
Topix Index | | 12 | | Jun-2010 | | | 3 | |
| | | | | | | | |
| | | | | | $ | (200 | ) |
| | | | | | | | |
A summary of outstanding swap agreements held by the Fund at May 31, 2010, is as follows:
| | | | | | | | | | | | | | | |
Total Return Swaps | |
Counterparty | | Reference Entity/Obligation | | Fund Pays | | Fund Receives | | Termination
Date | | Notional Amount
(Thousands) | | | Net Unrealized
Appreciation
(Depreciation)
($Thousands) | |
JPMorgan Chase Bank | | MSCI Daily TR NET EAFE USD MARKET Index | | 3-Month LIBOR Minus 25 Bps | | Price Return | | 10/12/10 | | (28,388 | ) | | $ | (4,287 | ) |
| | | | | | | | | | | | | | | |
Percentages are based on a Net Assets of $605,479 ($ Thousands).
| * | Non-income producing security. |
| ** | The rate reported is the 7-day effective yield as of May 31, 2010. |
| † | Investment in Affiliated Security. |
| ‡ | Real Estate Investment Trust. |
| (A) | This security or a partial position of this security is on loan at May 31, 2010. The total value of securities on loan at May 31, 2010 was $27,726 ($ Thousands). |
| (B) | Securities sold within terms of a private placement memorandum, exempt from registration under Section 144A of the Securities Act of 1933, as amended, and may be sold only to dealers in that program or other “accredited investors.” These securities have been determined to be liquid under guidelines established by the Board of Trustees. |
| (C) | Variable Rate Security. The rate is the rate in effect as of May 31, 2010. The date reported is the final maturity date. |
| (D) | Security, or portion thereof, has been pledged as collateral on open futures contracts. |
| (E) | Zero coupon security. The rate reported is the effective yield at time of purchase. |
| (F) | This security was purchased with cash collateral held from securities on loan. The total value of such securities as of May 31, 2010 was $29,209 ($ Thousands). |
ADR — American Depositary Receipt
ARM — Adjustable Rate Mortgage
AUD — Australian Dollar
Cl — Class
DKK — Danish Krone
EUR — Euro
FHLMC — Federal Home Loan Mortgage Corporation
FNMA — Federal National Mortgage Association
GBP — British Pound Sterling
GDR — Global Depositary Receipt
HKD — Hong Kong Dollar
JPY — Japanese Yen
LLC — Limited Liability Company
L.P. — Limited Partnership
Ser — Series
SGD — Singapore Dollar
USD — U.S. Dollar
Amounts designated as “—” are $O or have been rounded to $O.
| | |
12 | | SEI Institutional Investments Trust /Annual Report/May 31, 2010 |
SCHEDULE OF INVESTMENTS
World Equity Ex-US Fund
May 31, 2010
| | | | | |
Description | | Shares | | Market Value
($ Thousands) |
COMMON STOCK — 89.4% | | | | | |
Argentina — 0.0% | | | | | |
Tenaris ADR | | 30,999 | | $ | 1,151 |
| | | | | |
Australia — 3.4% | | | | | |
Aditya Birla Minerals* | | 166,691 | | | 107 |
Amcor ADR | | 77,200 | | | 1,604 |
Australia & New Zealand Banking Group ADR | | 741,400 | | | 14,139 |
Australia & New Zealand Banking Group | | 194,986 | | | 3,688 |
Beach Energy | | 1,020,311 | | | 653 |
Bendigo Bank | | 46,055 | | | 331 |
BGP Holdings* | | 239,898 | | | — |
BHP Billiton | | 741,685 | | | 24,042 |
Caltex Australia | | 643,282 | | | 5,933 |
CFS Retail Property Trust‡ | | 78,167 | | | 128 |
Coal & Allied Industries | | 5,259 | | | 401 |
Coca-Cola Amatil | | 197,438 | | | 1,821 |
Commonwealth Bank of Australia | | 213,729 | | | 9,307 |
Fairfax Media(A) | | 377,445 | | | 483 |
Fortescue Metals Group* | | 21,855 | | | 75 |
Incitec Pivot | | 553,668 | | | 1,417 |
Macquarie Group | | 54,620 | | | 2,006 |
National Australia Bank | | 211,258 | | | 4,411 |
New Hope | | 252,430 | | | 954 |
OneSteel | | 1,407,347 | | | 3,818 |
Origin Energy | | 219,141 | | | 2,787 |
OZ Minerals | | 1,822,194 | | | 1,653 |
Rio Tinto | | 290,198 | | | 16,516 |
Santos | | 859,596 | | | 9,050 |
SP AusNet, Cl Miscellaneous | | 657,720 | | | 468 |
Stockland‡ | | 905,928 | | | 2,987 |
TABCORP Holdings | | 110,768 | | | 621 |
Telstra ADR | | 998,300 | | | 12,339 |
Wesfarmers | | 134,206 | | | 3,311 |
Westpac Banking | | 75,223 | | | 1,463 |
Woolworths | | 42,138 | | | 952 |
| | | | | |
| | | | | 127,465 |
| | | | | |
Austria — 0.1% | | | | | |
Erste Group Bank | | 2,449 | | | 89 |
IMMOFINANZ | | 288,780 | | | 897 |
OMV | | 25,031 | | | 801 |
RHI* | | 2,622 | | | 72 |
Voestalpine | | 36,969 | | | 1,025 |
| | | | | |
| | | | | 2,884 |
| | | | | |
Belgium — 1.0% | | | | | |
Belgacom | | 27,762 | | | 856 |
Delhaize Group ADR(A) | | 265,300 | | | 20,781 |
Delhaize Group(A) | | 35,137 | | | 2,791 |
D’ieteren | | 1,877 | | | 835 |
Groupe Bruxelles Lambert | | 6,282 | | | 456 |
InBev | | 141,063 | | | 6,834 |
KBC Groep | | 68,415 | | | 2,690 |
Nyrstar(A) | | 46,722 | | | 494 |
Telenet Group Holding | | 36,613 | | | 957 |
| | | | | |
Description | | Shares | | Market Value
($ Thousands) |
Umicore | | 11,503 | | $ | 350 |
| | | | | |
| | | | | 37,044 |
| | | | | |
Brazil — 3.5% | | | | | |
BM&F Bovespa SA | | 2,033,200 | | | 13,517 |
Centrais Eletricas Brasileiras ADR | | 53,971 | | | 673 |
Cia de Saneamento Basico do Estado de Sao Paulo ADR(A) | | 753,700 | | | 28,505 |
Cia Paranaense de Energia ADR(A) | | 1,025,600 | | | 19,025 |
Cia Vale do Rio Doce | | 268,300 | | | 7,353 |
Empresa Brasileira de Aeronautica | | 247,200 | | | 1,321 |
Empresa Brasileira de Aeronautica ADR | | 263,500 | | | 5,739 |
Fleury* | | 206,200 | | | 2,012 |
Hypermarcas* | | 130,500 | | | 1,760 |
Iguatemi Empresa de Shopping Centers | | 119,200 | | | 1,958 |
Julio Simoes Logistica* | | 270,600 | | | 1,172 |
Natura Cosmeticos | | 453,300 | | | 9,416 |
Petroleo Brasileiro | | 428,600 | | | 8,006 |
Petroleo Brasileiro ADR(A) | | 664,200 | | | 23,659 |
Rodobens Negocios Imobiliarios | | 176,500 | | | 1,151 |
SLC Agricola | | 201,367 | | | 1,544 |
Telegraph Norte Leste Participacoes | | 75,000 | | | 1,471 |
Wilson Sons, Cl BDR | | 110,980 | | | 1,253 |
| | | | | |
| | | | | 129,535 |
| | | | | |
Canada — 6.7% | | | | | |
Agrium | | 234,500 | | | 12,888 |
Alimentation Couche Tard, Cl B | | 31,930 | | | 587 |
Bank of Montreal(A) | | 136,425 | | | 8,063 |
Bank of Nova Scotia | | 77,800 | | | 3,570 |
BCE | | 137,300 | | | 4,008 |
Brookfield Asset Management, Cl A(A) | | 116,258 | | | 2,952 |
Canadian Imperial Bank of Commerce(A) | | 65,300 | | | 4,456 |
Canadian National Railway | | 387,260 | | | 22,685 |
Canadian Natural Resources | | 669,100 | | | 23,701 |
Canadian Pacific Railway | | 39,300 | | | 2,200 |
Canadian Utilities, Cl A | | 18,506 | | | 787 |
Cascades | | 32,900 | | | 215 |
Celestica* | | 85,800 | | | 791 |
Cenovus Energy | | 182,919 | | | 5,055 |
Centerra Gold* | | 69,900 | | | 852 |
CGI Group, Cl A* | | 338,909 | | | 5,237 |
Domtar | | 12,500 | | | 765 |
Dorel Industries, Cl B | | 33,200 | | | 1,201 |
Empire, Cl A | | 7,600 | | | 377 |
EnCana | | 448,013 | | | 14,161 |
Fairfax Financial Holdings | | 4,300 | | | 1,607 |
First Quantum Minerals | | 11,600 | | | 622 |
Flint Energy Services (Canada)* | | 9,700 | | | 113 |
Gildan Activewear* | | 53,047 | | | 1,580 |
Grande Cache Coal* | | 38,500 | | | 213 |
Groupe Aeroplan | | 26,800 | | | 243 |
IAMGOLD | | 96,832 | | | 1,687 |
IESI-BFC | | 28,500 | | | 574 |
IGM Financial | | 4,500 | | | 167 |
| | |
1 | | SEI Institutional Investments Trust /Annual Report/May 31, 2010 |
SCHEDULE OF INVESTMENTS
World Equity Ex-US Fund
May 31, 2010
| | | | | |
Description | | Shares | | Market Value
($ Thousands) |
Lundin Mining* | | 471,200 | | $ | 1,833 |
Manulife Financial | | 12,200 | | | 209 |
MDS* | | 47 | | | — |
Metro, Cl A(A) | | 71,907 | | | 2,975 |
National Bank of Canada | | 26,400 | | | 1,455 |
Nexen | | 606,343 | | | 13,269 |
Norbord* | | 48,403 | | | 684 |
Northgate Minerals* | | 241,700 | | | 720 |
Onex | | 58,200 | | | 1,480 |
Pacific Rubiales Energy* | | 65,158 | | | 1,372 |
Petrobank Energy & Resources* | | 43,300 | | | 1,854 |
Potash Corp of Saskatchewan | | 80,750 | | | 8,009 |
Potash Saskatchewan | | 16,700 | | | 1,701 |
Provident Energy Trust | | 10,100 | | | 73 |
Quebecor, Cl B | | 24,700 | | | 819 |
Research In Motion* | | 154,985 | | | 9,404 |
Rogers Communications, Cl B | | 181,400 | | | 6,224 |
Royal Bank of Canada | | 133,810 | | | 7,014 |
Saputo | | 72,000 | | | 2,013 |
SEMAFO* | | 97,100 | | | 640 |
Sherritt International | | 152,000 | | | 966 |
Sino-Forest, Cl A* | | 71,063 | | | 1,229 |
Teck Cominco, Cl B | | 136,503 | | | 4,743 |
Tesco ADR | | 23,996 | | | 270 |
TMX Group | | 7,400 | | | 192 |
Toronto-Dominion Bank | | 422,400 | | | 28,870 |
Transat AT, Cl B* | | 15,700 | | | 164 |
TransCanada | | 417,900 | | | 13,892 |
West Fraser Timber | | 12,000 | | | 496 |
Western Coal* | | 69,438 | | | 347 |
Yamana Gold | | 1,277,500 | | | 13,752 |
Yellow Pages Income Fund(A) | | 193,840 | | | 1,180 |
| | | | | |
| | | | | 249,206 |
| | | | | |
Chile — 0.2% | | | | | |
Banco Santander Chile ADR | | 7,648 | | | 475 |
Cia Cervecerias Unidas | | 179,986 | | | 1,498 |
Enersis ADR | | 109,089 | | | 2,056 |
ENTEL Chile | | 133,628 | | | 1,792 |
| | | | | |
| | | | | 5,821 |
| | | | | |
China — 1.8% | | | | | |
AirMedia Group ADR* | | 202,106 | | | 817 |
Ajisen China Holdings | | 1,731,909 | | | 1,795 |
China Construction Bank, Cl H | | 2,917,000 | | | 2,361 |
China Life Insurance, Cl H | | 667,000 | | | 2,938 |
China Merchants Bank, Cl H(A) | | 6,666,150 | | | 15,822 |
China Petroleum & Chemical, | | | | | |
Cl H | | 8,260,000 | | | 6,567 |
China Railway Construction, Cl H | | 1,035,000 | | | 1,232 |
China Telecom, Cl H | | 1,214,000 | | | 563 |
Dongfeng Motor Group, Cl H | | 1,846,000 | | | 2,245 |
Industrial & Commercial Bank of | | | | | |
China | | 25,872,000 | | | 19,173 |
Luthai Textile* | | 142,800 | | | 110 |
Mindray Medical International | | | | | |
ADR | | 77,667 | | | 2,310 |
Shanghai Friendship Group, Cl B | | 241,620 | | | 311 |
Sinopharm Group, Cl H | | 1,940,800 | | | 7,690 |
Tingyi Cayman Islands Holding | | 1,132,000 | | | 2,603 |
| | | | | |
Description | | Shares | | Market Value
($ Thousands) |
Zhuzhou CSR Times Electric, Cl H | | 1,057,000 | | $ | 2,129 |
| | | | | |
| | | | | 68,666 |
| | | | | |
Colombia — 0.4% | | | | | |
BanColombia ADR | | 340,900 | | | 16,302 |
| | | | | |
Cyprus — 0.0% | | | | | |
Eurasia Drilling GDR(B) | | 57,349 | | | 1,061 |
Songa Offshore* | | 85,490 | | | 295 |
| | | | | |
| | | | | 1,356 |
| | | | | |
Czech Republic — 0.1% | | | | | |
CEZ | | 49,926 | | | 2,121 |
Komercni Banka | | 8,077 | | | 1,414 |
| | | | | |
| | | | | 3,535 |
| | | | | |
Denmark — 1.3% | | | | | |
Carlsberg, Cl B | | 39,481 | | | 3,023 |
Coloplast, Cl B | | 24,872 | | | 2,589 |
Danisco | | 18,580 | | | 1,117 |
Danske Bank | | 67,935 | | | 1,384 |
FLSmidth | | 28,162 | | | 1,774 |
Novo-Nordisk, Cl B | | 379,442 | | | 29,401 |
Vestas Wind Systems* | | 171,901 | | | 8,251 |
| | | | | |
| | | | | 47,539 |
| | | | | |
Egypt — 0.1% | | | | | |
Egyptian Financial Group-Hermes | | | | | |
Holding | | 459,865 | | | 2,472 |
Orascom Construction Industries | | 20,858 | | | 898 |
| | | | | |
| | | | | 3,370 |
| | | | | |
Finland — 0.8% | | | | | |
Fortum | | 151,783 | | | 3,405 |
Kone, Cl B | | 95,384 | | | 3,734 |
Metso | | 39,901 | | | 1,267 |
Nokia ADR(A) | | 551,100 | | | 5,577 |
Orion, Cl B | | 67,301 | | | 1,184 |
Pohjola Bank, Cl A | | 4,789 | | | 47 |
Sampo, Cl A | | 185,113 | | | 3,940 |
Stora Enso, Cl R | | 972,381 | | | 7,291 |
UPM-Kymmene | | 349,291 | | | 4,501 |
Wartsila, Cl B(A) | | 3,604 | | | 156 |
| | | | | |
| | | | | 31,102 |
| | | | | |
France — 5.6% | | | | | |
Air Liquide | | 173,876 | | | 17,112 |
Alstom | | 32,846 | | | 1,585 |
Arkema(A) | | 42,082 | | | 1,545 |
AXA | | 34,904 | | | 579 |
BNP Paribas | | 355,284 | | | 20,283 |
Bouygues | | 14,872 | | | 639 |
Casino Guichard Perrachon | | 6,131 | | | 472 |
CNP Assurances(A) | | 12,194 | | | 862 |
Compagnie de St.-Gobain(A) | | 26,809 | | | 1,038 |
Credit Agricole(A) | | 13,815 | | | 151 |
Dassault Systemes(A) | | 34,959 | | | 2,045 |
Eutelsat Communications | | 29,895 | | | 982 |
Fonciere Des Regions‡ | | 1,158 | | | 107 |
| | |
2 | | SEI Institutional Investments Trust /Annual Report/May 31, 2010 |
SCHEDULE OF INVESTMENTS
World Equity Ex-US Fund
May 31, 2010
| | | | | |
Description | | Shares | | Market Value
($ Thousands) |
France Telecom | | 69,456 | | $ | 1,327 |
France Telecom ADR(A) | | 929,900 | | | 17,752 |
Gecina‡ | | 1,777 | | | 149 |
Havas | | 410,200 | | | 1,883 |
Klepierre‡ | | 29,416 | | | 794 |
Lafarge | | 175,873 | | | 10,218 |
Lagardere S.C.A. | | 29,160 | | | 942 |
Legrand(A) | | 1,256 | | | 37 |
LVMH Moet Hennessy Louis Vuitton(A) | | 177,336 | | | 18,855 |
Natixis | | 570,850 | | | 2,542 |
Neopost | | 3,579 | | | 263 |
Peugeot | | 199,125 | | | 4,798 |
PPR | | 17,605 | | | 2,129 |
Publicis Groupe | | 40,888 | | | 1,718 |
Renault | | 117,475 | | | 4,257 |
Rhodia | | 260,926 | | | 4,484 |
Safran(A) | | 281,740 | | | 7,718 |
Sanofi-Aventis(A) | | 310,108 | | | 18,910 |
Schneider Electric | | 70,929 | | | 7,172 |
SEB | | 8,776 | | | 594 |
Sequana Capital | | 7,402 | | | 94 |
Societe BIC | | 1,505 | | | 108 |
Societe Des Autoroutes Paris- Rhin-Rhone | | 3,319 | | | 202 |
Societe Generale | | 78,315 | | | 3,385 |
Societe Television Francaise 1 | | 64,219 | | | 924 |
Technip | | 100,740 | | | 6,574 |
Technip ADR | | 189,300 | | | 12,305 |
Total(A) | | 154,158 | | | 7,172 |
Valeo | | 106,264 | | | 2,963 |
Vallourec(A) | | 8,009 | | | 1,503 |
Vinci | | 61,724 | | | 2,808 |
Vivendi | | 644,352 | | | 14,012 |
| | | | | |
| | | | | 205,992 |
| | | | | |
Germany — 4.8% | | | | | |
Adidas | | 81,832 | | | 4,131 |
ADVA Optical Networking* | | 49,708 | | | 249 |
Aixtron(A) | | 105,282 | | | 2,869 |
Allianz | | 148,269 | | | 14,901 |
BASF | | 472,150 | | | 25,106 |
Bayer | | 44,834 | | | 2,526 |
Bilfinger Berger | | 24,216 | | | 1,361 |
DaimlerChrysler | | 157,840 | | | 7,963 |
Deutsche Bank(A) | | 433,455 | | | 25,951 |
Deutsche Post | | 176,007 | | | 2,633 |
Deutsche Telekom | | 500,444 | | | 5,613 |
E.ON | | 198,353 | | | 6,062 |
Fresenius Medical Care | | 237,246 | | | 12,037 |
Hannover Rueckversicherung(A) | | 79,639 | | | 3,403 |
Henkel | | 4,430 | | | 178 |
Hochtief | | 17,232 | | | 1,109 |
Infineon Technologies* | | 429,526 | | | 2,473 |
Linde | | 8,663 | | | 895 |
MAN | | 5,220 | | | 449 |
Metro | | 12,492 | | | 658 |
MTU Aero Engines Holding | | 23,500 | | | 1,291 |
Norddeutsche Affinerie | | 23,244 | | | 1,066 |
RWE | | 57,957 | | | 4,176 |
SAP ADR(A) | | 152,300 | | | 6,462 |
SAP(A) | | 417,229 | | | 18,116 |
| | | | | |
Description | | Shares | | Market Value
($ Thousands) |
Siemens ADR(A) | | 151,800 | | $ | 13,591 |
Siemens | | 109,430 | | | 9,983 |
Suedzucker(A) | | 107,306 | | | 1,970 |
TUI | | 113,187 | | | 1,035 |
United Internet(A) | | 54,274 | | | 695 |
Volkswagen | | 998 | | | 86 |
| | | | | |
| | | | | 179,038 |
| | | | | |
Greece — 0.1% | | | | | |
OPAP | | 65,863 | | | 1,052 |
Public Power | | 57,700 | | | 896 |
| | | | | |
| | | | | 1,948 |
| | | | | |
Guernsey — 0.3% | | | | | |
Amdocs* | | 355,200 | | | 10,123 |
| | | | | |
Hong Kong — 2.8% | | | | | |
ASM Pacific Technology | | 109,200 | | | 830 |
BOC Hong Kong Holdings | | 1,411,794 | | | 3,188 |
Chaoda Modern Agriculture | | 3,298,000 | | | 3,151 |
Cheung Kong Holdings | | 185,000 | | | 2,108 |
China Dongxiang Group | | 4,322,000 | | | 2,903 |
China Mobile | | 2,016,000 | | | 19,083 |
Chinese Estates Holdings | | 26,500 | | | 44 |
CLP Holdings | | 1,171,000 | | | 8,249 |
CNOOC | | 11,306,000 | | | 18,093 |
First Pacific | | 1,406,000 | | | 912 |
GOME Electrical Appliances Holdings | | 9,925,300 | | | 3,047 |
Henderson Land Development | | 19,000 | | | 113 |
Hong Kong Exchanges and Clearing | | 859,100 | | | 13,197 |
Hongkong Land Holdings | | 302,007 | | | 1,437 |
Hopewell Holdings | | 96,000 | | | 261 |
Huabao International Holdings | | 3,391,000 | | | 4,181 |
Hutchison Telecommunications Hong Kong Holdings | | 1,170,000 | | | 236 |
Hutchison Whampoa | | 301,450 | | | 1,876 |
Hysan Development(A) | | 43,000 | | | 112 |
Jardine Matheson Holdings | | 20,000 | | | 695 |
Jardine Strategic Holdings | | 29,000 | | | 568 |
Link REIT‡ | | 179,500 | | | 433 |
Midland Holdings | | 720,000 | | | 518 |
New World Development | | 1,410,000 | | | 2,253 |
Noble Group | | 1,676,816 | | | 2,163 |
Orient Overseas International | | 97,500 | | | 651 |
Polytec Asset Holdings | | 1,560,000 | | | 258 |
RCG Holdings* | | 137,229 | | | 108 |
Sun Hung Kai Properties | | 338,000 | | | 4,458 |
Swire Pacific, Cl A | | 106,000 | | | 1,170 |
TPV Technology | | 1,266,000 | | | 777 |
Wharf Holdings | | 805,342 | | | 4,013 |
Wheelock | | 393,270 | | | 1,053 |
Yue Yuen Industrial Holdings | | 753,000 | | | 2,331 |
| | | | | |
| | | | | 104,470 |
| | | | | |
Hungary — 0.2% | | | | | |
MOL Hungarian Oil and Gas | | 17,193 | | | 1,411 |
| | |
3 | | SEI Institutional Investments Trust /Annual Report/May 31, 2010 |
SCHEDULE OF INVESTMENTS
World Equity Ex-US Fund
May 31, 2010
| | | | | |
Description | | Shares | | Market Value
($ Thousands) |
OTP Bank | | 206,777 | | $ | 5,347 |
| | | | | |
| | | | | 6,758 |
| | | | | |
India — 1.2% | | | | | |
Allahabad Bank | | 275,829 | | | 983 |
Andhra Bank | | 400,782 | | | 1,180 |
Cairn India* | | 412,130 | | | 2,669 |
Dena Bank | | 255,022 | | | 493 |
HDFC Bank | | 152,520 | | | 6,215 |
IDBI Bank | | 593,756 | | | 1,458 |
India Cements | | 623,293 | | | 1,450 |
Indian Bank | | 87,100 | | | 432 |
Indian Overseas Bank | | 118,213 | | | 232 |
Infosys Technologies | | 93,410 | | | 5,357 |
LIC Housing Finance | | 72,396 | | | 1,468 |
Nagarjuna Construction | | 395,189 | | | 1,479 |
Oil & Natural Gas | | 34,441 | | | 841 |
Oriental Bank of Commerce | | 135,995 | | | 985 |
Patni Computer Systems ADR | | 7,700 | | | 203 |
Power Finance | | 377,475 | | | 2,412 |
Sesa Goa* (C) | | 460,242 | | | 3,793 |
Sonata Software | | 73,006 | | | 75 |
State Bank of India GDR | | 4,006 | | | 380 |
State Bank of India | | 182,515 | | | 8,935 |
Syndicate Bank | | 86,740 | | | 172 |
UCO Bank | | 323,974 | | | 551 |
Union Bank of India | | 140,619 | | | 889 |
Vijaya Bank | | 396,817 | | | 505 |
Welspun | | 418,305 | | | 2,003 |
Zuari Industries | | 8,087 | | | 128 |
| | | | | |
| | | | | 45,288 |
| | | | | |
Indonesia — 0.4% | | | | | |
Astra International | | 1,047,500 | | | 4,881 |
Bank Mandiri | | 5,352,000 | | | 3,092 |
Bank Negara Indonesia Persero | | 3,295,000 | | | 890 |
Bank Rakyat Indonesia | | 2,082,000 | | | 1,933 |
Gudang Garam | | 153,500 | | | 558 |
HM Sampoerna | | 17,500 | | | 28 |
Indocement Tunggal Prakarsa | | 1,578,420 | | | 2,557 |
Telekomunikasi Indonesia | | 3,194,500 | | | 2,673 |
| | | | | |
| | | | | 16,612 |
| | | | | |
Ireland — 1.0% | | | | | |
Accenture, Cl A | | 158,500 | | | 5,947 |
Covidien | | 464,200 | | | 19,678 |
CRH ADR | | 573,800 | | | 13,002 |
| | | | | |
| | | | | 38,627 |
| | | | | |
Israel — 1.3% | | | | | |
Bank Hapoalim* | | 1,516,308 | | | 5,754 |
Check Point Software Technologies* (A) | | 83,780 | | | 2,570 |
Israel Discount Bank, Cl A* | | 1,137,803 | | | 1,923 |
Teva Pharmaceutical Industries ADR | | 660,620 | | | 36,215 |
| | | | | |
| | | | | 46,462 |
| | | | | |
Italy — 1.3% | | | | | |
Atlantia(A) | | 74,661 | | | 1,395 |
Banca Intesa(A) | | 2,182,792 | | | 5,848 |
Danieli & C Officine Meccaniche | | 12,488 | | | 244 |
| | | | | |
Description | | Shares | | Market Value
($ Thousands) |
Enel | | 3,141,714 | | $ | 14,480 |
ENI | | 164,634 | | | 3,086 |
Finmeccanica(A) | | 257,683 | | | 2,761 |
Indesit | | 34,599 | | | 371 |
Mediaset(A) | | 588,863 | | | 3,663 |
Parmalat | | 3,676,250 | | | 8,931 |
Prysmian | | 11,787 | | | 183 |
Saipem | | 53,916 | | | 1,699 |
Snam Rete Gas(A) | | 116,189 | | | 472 |
Telecom Italia(A) | | 4,861,815 | | | 5,381 |
Terna Rete Elettrica Nazionale | | 152,888 | | | 578 |
| | | | | |
| | | | | 49,092 |
| | | | | |
Japan — 11.0% | | | | | |
77 Bank | | 224,359 | | | 1,157 |
Aeon(A) | | 216,900 | | | 2,268 |
Aeon Fantasy | | 5,800 | | | 64 |
Aisin Seiki | | 42,400 | | | 1,183 |
Ajinomoto | | 14,000 | | | 119 |
Alfresa Holdings | | 22,000 | | | 1,051 |
Alpine Electronics | | 23,000 | | | 279 |
Alps Electric | | 124,828 | | | 1,120 |
Arnest One | | 58,500 | | | 608 |
Asahi Glass | | 890,866 | | | 9,444 |
Asahi Kasei | | 400,000 | | | 2,107 |
Astellas Pharma | | 220,500 | | | 7,117 |
Bank of Yokohama | | 287,796 | | | 1,377 |
Brother Industries | | 189,000 | | | 2,095 |
Canon | | 293,695 | | | 12,095 |
Chiba Bank | | 219,574 | | | 1,340 |
Chubu Electric Power | | 67,200 | | | 1,558 |
Chugai Pharmaceutical | | 56,904 | | | 1,009 |
Dai Nippon Printing | | 10,000 | | | 123 |
Daicel Chemical Industries | | 564,219 | | | 3,952 |
Dai-ichi Life Insurance | | 5,940 | | | 9,798 |
Daiichikosho | | 23,200 | | | 286 |
Daikyo | | 963,000 | | | 1,927 |
Daito Trust Construction | | 58,100 | | | 2,935 |
Daiwa House Industry | | 377,000 | | | 3,607 |
Dena | | 186,000 | | | 5,621 |
Denki Kagaku Kogyo | | 170,000 | | | 802 |
Denso | | 71,200 | | | 1,922 |
Disco | | 20,906 | | | 1,407 |
EDION(A) | | 60,200 | | | 531 |
Elpida Memory* | | 6,100 | | | 111 |
Fanuc | | 182,300 | | | 19,265 |
Fuji Electric Holdings | | 625,000 | | | 1,759 |
Fuji Heavy Industries | | 553,000 | | | 3,186 |
FUJIFILM Holdings | | 178,155 | | | 5,309 |
Fujitsu | | 1,219,000 | | | 7,842 |
Fujitsu ADR(A) | | 221,700 | | | 7,141 |
Fukuoka Financial Group | | 389,000 | | | 1,638 |
Fukuyama Transporting | | 13,000 | | | 62 |
Furukawa Electric | | 289,000 | | | 1,246 |
Futaba Industrial | | 31,800 | | | 248 |
Gunma Bank | | 18,000 | | | 94 |
Hanwa | | 90,000 | | | 362 |
Hitachi | | 5,098,000 | | | 20,854 |
Honda Motor | | 401,570 | | | 12,232 |
Hosiden | | 34,100 | | | 381 |
Idemitsu Kosan | | 23,200 | | | 1,740 |
IHI | | 277,000 | | | 475 |
| | |
4 | | SEI Institutional Investments Trust /Annual Report/May 31, 2010 |
SCHEDULE OF INVESTMENTS
World Equity Ex-US Fund
May 31, 2010
| | | | | |
Description | | Shares | | Market Value
($ Thousands) |
Inpex | | 207 | | $ | 1,302 |
Isuzu Motors | | 109,000 | | | 338 |
IT Holdings | | 29,900 | | | 358 |
Itochu | | 283,600 | | | 2,355 |
J Front Retailing | | 124,000 | | | 642 |
Japan Retail Fund Investment, Cl A‡ | | 156 | | | 187 |
JFE Holdings | | 103,406 | | | 3,485 |
JGC | | 5,000 | | | 80 |
JSR | | 105,400 | | | 1,925 |
JX Holdings* | | 1,012,550 | | | 5,534 |
Kaken Pharmaceutical | | 62,000 | | | 530 |
KDDI | | 223 | | | 1,010 |
Kobe Steel | | 541,000 | | | 1,136 |
Komatsu | | 781,600 | | | 14,688 |
K’s Holdings | | 50,200 | | | 1,173 |
Kuraray | | 159,000 | | | 1,976 |
Kyocera | | 34,400 | | | 3,000 |
Lintec | | 5,600 | | | 100 |
Maeda Road Construction | | 71,000 | | | 566 |
Marubeni | | 2,437,819 | | | 13,591 |
Maruichi Steel Tube | | 5,400 | | | 98 |
Mediceo Paltac Holdings | | 159,500 | | | 1,871 |
Millea Holdings | | 55,300 | | | 1,550 |
Minebea | | 134,000 | | | 771 |
Miraca Holdings | | 50,400 | | | 1,511 |
Mitsubishi | | 468,366 | | | 10,568 |
Mitsubishi Chemical Holdings | | 153,000 | | | 712 |
Mitsubishi Electric | | 215,000 | | | 1,766 |
Mitsubishi Heavy Industries | | 142,000 | | | 528 |
Mitsubishi UFJ Financial Group | | 3,574,186 | | | 17,333 |
Mitsui ADR | | 46,000 | | | 13,294 |
Mitsui | | 183,000 | | | 2,604 |
Mitsui Chemicals | | 802,000 | | | 2,425 |
Mitsui Engineering & Shipbuilding(A) | | 481,000 | | | 1,100 |
Mitsui OSK Lines | | 930,000 | | | 6,627 |
Murata Manufacturing | | 3,500 | | | 170 |
Nagase | | 53,000 | | | 573 |
NEC Networks & System Integration | | 39,800 | | | 493 |
NHK Spring | | 131,000 | | | 1,239 |
Nichii Gakkan | | 33,900 | | | 315 |
Nidec | | 61,500 | | | 5,606 |
Nippo | | 62,000 | | | 487 |
Nippon Electric Glass | | 240,517 | | | 3,161 |
Nippon Express | | 47,000 | | | 208 |
Nippon Flour Mills | | 78,000 | | | 369 |
Nippon Light Metal | | 524,000 | | | 761 |
Nippon Meat Packers | | 117,000 | | | 1,463 |
Nippon Paper Group | | 51,200 | | | 1,475 |
Nippon Steel | | 73,000 | | | 256 |
Nippon Telegraph & Telephone | | 359,000 | | | 14,547 |
Nishi-Nippon City Bank | | 131,000 | | | 364 |
Nissan Motor | | 1,715,080 | | | 12,523 |
Nitori | | 6,200 | | | 496 |
Nitto Denko | | 88,400 | | | 3,159 |
Nojima | | 3,545 | | | 31 |
Noritsu Koki | | 8,200 | | | 60 |
NSK | | 276,000 | | | 2,024 |
NTT Data | | 163 | | | 607 |
NTT DoCoMo | | 1,870 | | | 2,782 |
| | | | | |
Description | | Shares | | Market Value
($ Thousands) |
Obic | | 2,890 | | $ | 557 |
Omron | | 88,400 | | | 1,861 |
Onward Holdings | | 60,000 | | | 451 |
ORIX | | 14,418 | | | 1,100 |
Rohm | | 6,000 | | | 382 |
Saizeriya | | 56,700 | | | 1,112 |
Sapporo Hokuyo Holdings | | 317,700 | | | 1,174 |
Secom | | 8,700 | | | 373 |
Seika | | 23,000 | | | 48 |
Seino Holdings | | 134,000 | | | 950 |
Shimamura | | 900 | | | 82 |
Shinsei Bank(A) | | 265,000 | | | 262 |
Shiseido | | 124,800 | | | 2,421 |
SMC | | 4,800 | | | 623 |
Sojitz | | 1,141,600 | | | 1,946 |
Sony | | 375,800 | | | 11,637 |
Sony Financial Holdings | | 32 | | | 111 |
Sumitomo | | 387,711 | | | 4,208 |
Sumitomo Electric Industries | | 343,633 | | | 4,062 |
Sumitomo Heavy Industries | | 307,760 | | | 1,773 |
Sumitomo Metal Mining | | 62,000 | | | 883 |
Sumitomo Mitsui Financial Group | | 94,909 | | | 2,821 |
Sumitomo Trust & Banking | | 311,000 | | | 1,662 |
Suzuken | | 30,900 | | | 1,099 |
Tachi-S, Cl S | | 4,700 | | | 45 |
Takefuji(A) | | 337,950 | | | 996 |
Tanabe Seiyaku | | 18,000 | | | 234 |
TDK | | 24,916 | | | 1,452 |
Toagosei | | 190,000 | | | 831 |
Tokyo Electron | | 30,778 | | | 1,790 |
Tokyo Energy & Systems | | 14,000 | | | 89 |
Tokyo Gas | | 551,000 | | | 2,405 |
Tokyo Tekko | | 30,000 | | | 73 |
Toshiba TEC | | 168,000 | | | 617 |
Toyo Seikan Kaisha | | 90,300 | | | 1,411 |
Toyo Suisan Kaisha | | 54,540 | | | 1,208 |
Toyoda Gosei | | 41,200 | | | 1,050 |
Toyota Industries | | 24,600 | | | 632 |
Toyota Motor | | 425,506 | | | 15,347 |
Unicharm | | 24,600 | | | 2,489 |
Warabeya Nichiyo | | 6,500 | | | 74 |
Watabe Wedding | | 9,200 | | | 104 |
Yahoo! Japan | | 7,835 | | | 2,757 |
Yamada Denki | | 16,410 | | | 1,130 |
Zeon | | 137,000 | | | 803 |
| | | | | |
| | | | | 409,885 |
| | | | | |
Kazakhstan — 0.1% | | | | | |
KazMunaiGas Exploration | | | | | |
Production GDR | | 105,284 | | | 2,258 |
| | | | | |
Macau — 0.0% | | | | | |
Sands China* | | 580,400 | | | 860 |
| | | | | |
Malaysia — 0.4% | | | | | |
Affin Holdings | | 236,400 | | | 208 |
Axiata Group* | | 572,700 | | | 655 |
CIMB Group Holdings | | 4,309,400 | | | 8,865 |
EON Capital | | 119,600 | | | 254 |
Hong Leong Bank | | 293,133 | | | 760 |
| | |
5 | | SEI Institutional Investments Trust /Annual Report/May 31, 2010 |
SCHEDULE OF INVESTMENTS
World Equity Ex-US Fund
May 31, 2010
| | | | | |
Description | | Shares | | Market Value
($ Thousands) |
Hong Leong Financial Group | | 94,700 | | $ | 236 |
KLCC Property Holdings | | 103,700 | | | 91 |
Malayan Banking | | 341,000 | | | 739 |
Proton Holdings* | | 131,700 | | | 188 |
Public Bank | | 256,864 | | | 892 |
RHB Capital | | 764,700 | | | 1,334 |
Telekom Malaysia | | 2,081,500 | | | 2,116 |
| | | | | |
| | | | | 16,338 |
| | | | | |
Mauritius — 0.0% | | | | | |
Golden Agri-Resources | | 970,840 | | | 353 |
| | | | | |
Mexico — 1.9% | | | | | |
Alfa, Cl A | | 150,804 | | | 1,071 |
America Movil, Ser L | | 6,391,874 | | | 15,711 |
America Movil ADR, Ser L(A) | | 251,150 | | | 11,890 |
Bolsa Mexicana de Valores* | | 859,517 | | | 1,288 |
Coca-Cola Femsa ADR | | 338,300 | | | 22,504 |
Grupo Financiero Banorte, Ser O | | 548,493 | | | 2,152 |
Grupo Lamosa* | | 17,900 | | | 18 |
Grupo Televisa | | 493,921 | | | 1,916 |
Telefonos de Mexico | | 436,600 | | | 329 |
Urbi Desarrollos Urbanos* | | 867,461 | | | 1,706 |
Wal-Mart de Mexico | | 5,848,500 | | | 13,067 |
| | | | | |
| | | | | 71,652 |
| | | | | |
Netherlands — 3.5% | | | | | |
ArcelorMittal | | 82,462 | | | 2,531 |
ASML Holding | | 75,192 | | | 2,185 |
CSM | | 81,000 | | | 2,433 |
European Aeronautic Defense and Space(A) | | 254,525 | | | 5,113 |
Heineken | | 50,744 | | | 2,194 |
Heineken Holding | | 7,473 | | | 281 |
ING Groep | | 1,522,474 | | | 12,175 |
Koninklijke Ahold | | 433,395 | | | 5,473 |
Koninklijke DSM(A) | | 205,258 | | | 8,244 |
Koninklijke Philips Electronics | | 625,325 | | | 18,808 |
Koninklijke Vopak | | 43,370 | | | 1,657 |
Nutreco Holding | | 18,690 | | | 1,032 |
Plaza Centers | | 403,855 | | | 617 |
Royal Dutch Shell, Cl B | | 285,139 | | | 7,173 |
Royal Dutch Shell ADR, Cl A | | 368,600 | | | 19,315 |
Royal Dutch Shell, Cl A (GBP) | | 392,096 | | | 10,285 |
Royal Dutch Shell, Cl A | | 586,457 | | | 15,324 |
Royal KPN | | 500,690 | | | 6,535 |
SBM Offshore | | 4,153 | | | 66 |
TNT | | 25,678 | | | 641 |
Unilever | | 337,931 | | | 9,314 |
| | | | | |
| | | | | 131,396 |
| | | | | |
Netherlands Antilles — 0.3% | | | | | |
Schlumberger(A) | | 215,250 | | | 12,086 |
| | | | | |
New Zealand — 0.0% | | | | | |
Telecom of New Zealand | | 1,145,450 | | | 1,476 |
| | | | | |
Norway — 1.1% | | | | | |
DnB | | 827,680 | | | 8,255 |
| | | | | |
Description | | Shares | | Market Value
($ Thousands) |
Marine Harvest(A) | | 5,142,521 | | $ | 4,151 |
Seadrill | | 16,450 | | | 317 |
Statoil ADR(A) | | 890,600 | | | 17,901 |
Statoil(A) | | 314,539 | | | 6,220 |
Telenor(A) | | 206,656 | | | 2,537 |
TGS Nopec Geophysical* | | 20,000 | | | 273 |
| | | | | |
| | | | | 39,654 |
| | | | | |
Pakistan — 0.0% | | | | | |
Pakistan Telecommunication | | 1,439,600 | | | 331 |
| | | | | |
Panama — 0.2% | | | | | |
Copa Holdings, Cl A | | 124,700 | | | 6,360 |
| | | | | |
Poland — 0.1% | | | | | |
Bank Zachodni WBK | | 13,272 | | | 827 |
Getin Holding* | | 185,131 | | | 573 |
Netia* | | 107,362 | | | 160 |
Polski Koncern Naftowy Orlen | | 285,565 | | | 3,326 |
| | | | | |
| | | | | 4,886 |
| | | | | |
Portugal — 0.2% | | | | | |
Banco Espirito Santo | | 51,355 | | | 199 |
Cimpor Cimentos de Portugal | | 9,503 | | | 51 |
Energias de Portugal | | 1,118,123 | | | 3,469 |
Inapa-Invest Particip Gesta* | | 122,900 | | | 76 |
Jeronimo Martins | | 203,901 | | | 1,896 |
Portugal Telecom | | 120,865 | | | 1,244 |
| | | | | |
| | | | | 6,935 |
| | | | | |
Russia — 0.4% | | | | | |
Alliance Oil* | | 123,363 | | | 1,635 |
Globaltrans Investment GDR | | 179,595 | | | 2,299 |
LSR Group GDR* | | 140,513 | | | 1,124 |
Lukoil ADR | | 65,287 | | | 3,124 |
Magnit GDR | | 82,818 | | | 1,325 |
Magnitogorsk Iron & Steel Works | | | | | |
GDR | | 187,433 | | | 1,972 |
Mechel ADR(A) | | 97,390 | | | 2,112 |
Mobile Telesystems ADR | | 140,661 | | | 2,705 |
| | | | | |
| | | | | 16,296 |
| | | | | |
Singapore — 0.9% | | | | | |
CapitaCommercial Trust‡ | | 1,227,527 | | | 997 |
CapitaMall Trust‡ | | 735,217 | | | 954 |
DBS Group Holdings | | 435,261 | | | 4,343 |
Fraser and Neave | | 180,000 | | | 627 |
Hong Leong Asia | | 116,000 | | | 261 |
Jardine Cycle & Carriage | | 44,144 | | | 868 |
SembCorp Industries | | 231,000 | | | 659 |
SembCorp Marine | | 27,000 | | | 75 |
Singapore Airlines | | 344,027 | | | 3,536 |
United Overseas Bank ADR | | 239,100 | | | 6,226 |
UOB-Kay Hian Holdings | | 82,000 | | | 86 |
UOL Group | | 383,000 | | | 1,034 |
Wilmar International | | 355,000 | | | 1,475 |
Yangzijiang Shipbuilding Holdings | | 5,802,000 | | | 5,210 |
| | | | | |
| | | | | 26,351 |
| | | | | |
South Africa — 1.1% | | | | | |
| | |
6 | | SEI Institutional Investments Trust /Annual Report/May 31, 2010 |
SCHEDULE OF INVESTMENTS
World Equity Ex-US Fund
May 31, 2010
| | | | | |
Description | | Shares | | Market Value
($ Thousands) |
ABSA Group | | 135,603 | | $ | 2,286 |
African Bank Investments | | 385,496 | | | 1,596 |
Barloworld | | 200,937 | | | 1,223 |
Grindrod | | 778,517 | | | 1,548 |
Group | | 220,871 | | | 3,139 |
Harmony Gold Mining | | 191,888 | | | 1,948 |
Impala Platinum Holdings | | 169,371 | | | 4,271 |
Mondi | | 358,609 | | | 2,219 |
Mr Price Group | | 252,166 | | | 1,487 |
Sasol ADR | | 535,800 | | | 19,289 |
Telkom | | 114,662 | | | 560 |
| | | | | |
| | | | | 39,566 |
| | | | | |
South Korea — 3.4% | | | | | |
Daewoo Shipbuilding & Marine | | | | | |
Engineering | | 82,690 | | | 1,256 |
Hana Financial Group | | 282,130 | | | 7,380 |
Hyundai Development | | 51,500 | | | 1,056 |
Hyundai Motor | | 137,572 | | | 16,122 |
Hyundai Steel | | 55,239 | | | 4,078 |
Kia Motors | | 259,190 | | | 6,791 |
KISCO Holdings | | 4,036 | | | 151 |
KT | | 250,290 | | | 9,491 |
LG | | 123,552 | | | 6,950 |
LG Hausys | | 1,304 | | | 103 |
LG.Philips LCD | | 179,270 | | | 6,693 |
MegaStudy | | 8,276 | | | 1,129 |
POSCO ADR(A) | | 118,100 | | | 11,381 |
Samsung Electronics | | 45,079 | | | 29,282 |
Shinhan Financial Group | | 76,740 | | | 2,788 |
Shinsegae | | 5,517 | | | 2,230 |
SK Holdings | | 44,026 | | | 3,117 |
SK Telecom ADR | | 857,600 | | | 13,336 |
Woori Finance Holdings | | 347,520 | | | 4,349 |
| | | | | |
| | | | | 127,683 |
| | | | | |
Spain — 1.0% | | | | | |
Banco Bilbao Vizcaya Argentaria ADR(A) | | 1,100,100 | | | 11,441 |
Banco Bilbao Vizcaya Argentaria(A) | | 213,519 | | | 2,243 |
Banco Pastor | | 160 | | | 1 |
Banco Santander Central Hispano | | 469,461 | | | 4,820 |
Gas Natural | | 88,514 | | | 1,299 |
Mapfre(A) | | 159,198 | | | 449 |
Red Electrica | | 6,535 | | | 260 |
Repsol | | 17,167 | | | 351 |
Telefonica | | 747,270 | | | 14,343 |
| | | | | |
| | | | | 35,207 |
| | | | | |
Sweden — 1.6% | | | | | |
Alfa Laval | | 122,590 | | | 1,551 |
Assa Abloy, Cl B | | 17,102 | | | 345 |
Atlas Copco, Cl A(A) | | 88,395 | | | 1,260 |
Billerud | | 58,221 | | | 375 |
Electrolux, Cl B | | 379,854 | | | 8,560 |
Hennes & Mauritz, Cl B(A) | | 317,642 | | | 18,005 |
Nordea Bank | | 230,777 | | | 1,894 |
Saab, Cl B | | 16,300 | | | 215 |
Scania, Cl B | | 4,577 | | | 67 |
Securitas, Cl B | | 84,383 | | | 753 |
SKF, Cl B | | 60,502 | | | 1,063 |
| | | | | |
Description | | Shares | | Market Value
($ Thousands) |
Svenska Cellulosa, Cl B | | 154,809 | | $ | 1,801 |
Svenska Cellulosa ADR | | 946,500 | | | 11,074 |
Svenska Handelsbanken, Cl A | | 43,685 | | | 1,063 |
Tele2, Cl B(A) | | 182,530 | | | 2,641 |
Telefonaktiebolaget LM Ericsson, Cl B | | 231,857 | | | 2,373 |
TeliaSonera | | 701,005 | | | 4,199 |
Volvo, Cl B | | 369,273 | | | 3,850 |
| | | | | |
| | | | | 61,089 |
| | | | | |
Switzerland — 4.6% | | | | | |
Actelion* | | 4,000 | | | 145 |
Adecco(A) | | 120,552 | | | 5,838 |
Baloise Holding | | 13,550 | | | 959 |
Clariant | | 186,400 | | | 2,171 |
Compagnie Financiere Richemont | | 48,769 | | | 1,614 |
Credit Suisse Group | | 72,648 | | | 2,818 |
EGL | | 83 | | | 54 |
Holcim | | 23,096 | | | 1,464 |
Julius Baer Group | | 153,233 | | | 4,448 |
Logitech International* (A) | | 387,449 | | | 5,553 |
Nestle | | 730,279 | | | 33,061 |
Novartis | | 745,057 | | | 33,794 |
Roche Holding | | 153,713 | | | 21,076 |
Schindler Holding | | 29,913 | | | 2,314 |
Sonova Holding | | 7,313 | | | 792 |
STMicroelectronics (EUR) | | 190,403 | | | 1,515 |
STMicroelectronics | | 518,513 | | | 4,111 |
Swatch Group | | 25,128 | | | 1,217 |
Swatch Group, Cl B | | 24,485 | | | 6,418 |
Swiss Life Holding | | 8,454 | | | 909 |
Swisscom | | 725 | | | 231 |
Syngenta | | 6,804 | | | 1,510 |
Temenos Group* (A) | | 28,143 | | | 655 |
UBS | | 342,745 | | | 4,599 |
Xstrata | | 592,482 | | | 8,600 |
Zurich Financial Services ADR | | 586,700 | | | 11,857 |
Zurich Financial Services | | 57,083 | | | 11,679 |
| | | | | |
| | | | | 169,402 |
| | | | | |
Taiwan — 1.7% | | | | | |
Acer | | 637,990 | | | 1,599 |
Asia Polymer | | 443,000 | | | 378 |
Cathay Financial Holding | | 1,138,000 | | | 1,689 |
Chinatrust Financial Holding | | 2,585,345 | | | 1,347 |
Chunghwa Telecom | | 724,000 | | | 1,389 |
CMC Magnetics* | | 1,730,000 | | | 438 |
Elitegroup Computer Systems | | 704,000 | | | 249 |
Far Eastern Textile | | 1,404,720 | | | 1,391 |
Fubon Financial Holding | | 4,198,000 | | | 4,820 |
High Tech Computer | | 544,650 | | | 7,412 |
HON HAI Precision Industry | | 911,500 | | | 3,550 |
Hwa Fong Rubber* | | 616,000 | | | 229 |
Jean* | | 177,000 | | | 63 |
Long Bon International | | 488,000 | | | 202 |
MediaTek | | 186,248 | | | 3,048 |
Prime View International | | 1,409,000 | | | 2,145 |
Siliconware Precision Industries ADR | | 1,074,900 | | | 5,847 |
Taishin Financial Holding | | 743,000 | | | 261 |
Taiwan Fertilizer | | 720,000 | | | 2,005 |
| | |
7 | | SEI Institutional Investments Trust /Annual Report/May 31, 2010 |
SCHEDULE OF INVESTMENTS
World Equity Ex-US Fund
May 31, 2010
| | | | | |
Description | | Shares | | Market Value
($ Thousands) |
Taiwan Semiconductor | | | | | |
Manufacturing ADR | | 785,250 | | $ | 7,656 |
Taiwan Semiconductor | | | | | |
Manufacturing | | 4,911,925 | | | 9,251 |
United Microelectronics ADR(A) | | 1,211,600 | | | 4,010 |
United Microelectronics | | 4,159,000 | | | 1,965 |
Yageo | | 1,423,000 | | | 630 |
Yosun Industrial | | 155,000 | | | 234 |
| | | | | |
| | | | | 61,808 |
| | | | | |
Thailand — 0.6% | | | | | |
Bangkok Bank | | 1,324,700 | | | 4,761 |
Bangkok Bank NVDR | | 410,400 | | | 1,475 |
Bank of Ayudhya | | 4,743,100 | | | 2,710 |
Bumrungrad Hospital | | 1,198,400 | | | 1,132 |
Glow Energy | | 1,276,155 | | | 1,372 |
Kasikornbank | | 1,703,900 | | | 4,619 |
Krung Thai Bank | | 6,025,900 | | | 2,203 |
Siam Commercial Bank | | 744,000 | | | 1,862 |
Thai Airways International | | 451,200 | | | 326 |
Thanachart Capital | | 695,600 | | | 508 |
| | | | | |
| | | | | 20,968 |
| | | | | |
Turkey — 0.9% | | | | | |
Arcelik | | 553,608 | | | 2,332 |
Cimsa Cimento Sanayi VE Tica | | 245,301 | | | 1,174 |
Ford Otomotiv Sanayi | | 181,031 | | | 1,150 |
Haci Omer Sabanci Holding | | 990,068 | | | 4,044 |
KOC Holding | | 568,981 | | | 1,979 |
Tekfen Holding | | 315,674 | | | 943 |
Tupras Turkiye Petrol Rafine | | 62,493 | | | 1,147 |
Turkcell Iletisim Hizmet ADR | | 430,100 | | | 5,798 |
Turkcell Iletisim Hizmet | | 454,230 | | | 2,464 |
Turkiye Garanti Bankasi | | 1,993,106 | | | 8,587 |
Turkiye Sinai Kalkinma Bankasi | | 1,046,412 | | | 1,175 |
Turkiye Vakiflar Bankasi Tao, Cl D | | 1,472,480 | | | 3,101 |
| | | | | |
| | | | | 33,894 |
| | | | | |
United Kingdom — 14.6% | | | | | |
3i Group | | 578,688 | | | 2,369 |
Acergy | | 116,978 | | | 1,704 |
Aggreko | | 81,391 | | | 1,479 |
Amlin | | 144,920 | | | 782 |
Anglo American* | | 123,692 | | | 4,719 |
Antofagasta | | 80,653 | | | 1,024 |
ARM Holdings | | 2,319,176 | | | 8,229 |
Associated British Foods | | 184,689 | | | 2,542 |
AstraZeneca | | 527,646 | | | 22,176 |
AstraZeneca ADR(A) | | 471,800 | | | 19,934 |
Autonomy* | | 50,262 | | | 1,265 |
Aviva | | 633,934 | | | 2,908 |
BAE Systems ADR | | 643,600 | | | 11,958 |
Barclays | | 815,686 | | | 3,557 |
BG Group | | 343,567 | | | 5,229 |
BHP Billiton | | 594,815 | | | 16,260 |
BP | | 3,917,534 | | | 27,921 |
British American Tobacco ADR | | 222,600 | | | 13,033 |
British American Tobacco | | 989,976 | | | 29,061 |
British Sky Broadcasting Group | | 1,325,323 | | | 10,979 |
BT Group, Cl A | | 2,259,865 | | | 4,133 |
Cairn Energy* | | 972,386 | | | 5,620 |
Cape* | | 112,128 | | | 335 |
| | | | | |
Description | | Shares | | Market Value
($ Thousands) |
Carnival | | 521,607 | | $ | 19,606 |
Catlin Group | | 193,684 | | | 911 |
Compass Group | | 783,922 | | | 6,033 |
Compass Group ADR(A) | | 1,731,900 | | | 13,422 |
Cookson Group | | 147,334 | | | 1,006 |
Diageo ADR | | 215,600 | | | 13,212 |
Diageo | | 298,662 | | | 4,556 |
Dimension Data Holdings | | 726,115 | | | 1,062 |
DS Smith | | 173,654 | | | 290 |
EnQuest* | | 6,688 | | | 9 |
GlaxoSmithKline | | 469,043 | | | 7,799 |
GlaxoSmithKline ADR(A) | | 560,300 | | | 18,748 |
Hamworthy | | 22,253 | | | 89 |
Healthcare Locums | | 55,412 | | | 181 |
HSBC Holdings | | 672,264 | | | 6,059 |
Imperial Tobacco Group | | 470,431 | | | 12,183 |
International Power ADR | | 144,500 | | | 6,170 |
International Power | | 217,241 | | | 903 |
Invensys | | 242,406 | | | 964 |
Investec | | 447,774 | | | 3,137 |
ITV | | 1,487,310 | | | 1,195 |
Kingfisher | | 4,437,149 | | | 14,247 |
Legal & General Group | | 1,661,367 | | | 1,887 |
Lloyds Banking Group | | 6,111,370 | | | 4,943 |
Marks & Spencer Group ADR | | 649,100 | | | 6,511 |
National Grid | | 213,529 | | | 1,542 |
Next | | 43,980 | | | 1,314 |
Pearson | | 755,456 | | | 10,328 |
Pearson ADR | | 1,384,300 | | | 19,048 |
Persimmon | | 154,248 | | | 903 |
Petrofac | | 104,438 | | | 1,688 |
Prudential ADR | | 1,079,900 | | | 16,857 |
Reckitt Benckiser Group | | 430,379 | | | 20,030 |
Rexam | | 91,890 | | | 416 |
Rio Tinto | | 289,224 | | | 13,271 |
Rolls-Royce Group | | 510,757 | | | 4,324 |
SABMiller | | 583,464 | | | 16,386 |
Severn Trent | | 51,828 | | | 892 |
Shire | | 256,796 | | | 5,225 |
Smith & Nephew | | 872,645 | | | 7,858 |
Standard Chartered | | 1,003,230 | | | 23,597 |
Tesco | | 3,051,651 | | | 18,087 |
Tomkins | | 333,212 | | | 1,169 |
Unilever | | 155,595 | | | 4,178 |
Unilever ADR | | 485,700 | | | 13,133 |
United Utilities Group | | 168,601 | | | 1,309 |
Vedanta Resources | | 10,386 | | | 345 |
Vodafone Group | | 3,150,080 | | | 6,238 |
WM Morrison Supermarkets | | 292,454 | | | 1,112 |
Wolseley | | 138,400 | | | 3,263 |
WPP | | 908,029 | | | 8,505 |
| | | | | |
| | | | | 543,358 |
| | | | | |
United States — 1.4% | | | | | |
Advance America Cash Advance | | | | | |
Centers | | 57,164 | | | 276 |
ATC Technology* | | 22,541 | | | 421 |
Avis Budget Group* | | 79,462 | | | 942 |
Axis Capital Holdings | | 255,900 | | | 7,779 |
Boise* (A) | | 348,844 | | | 2,142 |
Bon-Ton Stores | | 17,707 | | | 230 |
Buckeye Technologies* | | 20,509 | | | 249 |
| | |
8 | | SEI Institutional Investments Trust /Annual Report/May 31, 2010 |
SCHEDULE OF INVESTMENTS
World Equity Ex-US Fund
May 31, 2010
| | | | | |
Description | | Shares/
Face Amount
($ Thousands) | | Market Value
($ Thousands) |
Calamos Asset Management, Cl A | | 36,343 | | $ | 400 |
Central Garden and Pet* | | 45,888 | | | 461 |
Clearwater Paper* | | 5,300 | | | 324 |
ConocoPhillips | | 7,204 | | | 374 |
Consolidated Graphics* | | 5,500 | | | 253 |
Gladstone Capital | | 20,956 | | | 236 |
Golden Star Resources* (A) | | 108,400 | | | 458 |
Golden Star Resources* | | 213,629 | | | 908 |
Healthspring* | | 42,987 | | | 747 |
Hercules Technology Growth Capital | | 23,506 | | | 207 |
KKR Financial Holdings LLC(A) | | 43,227 | | | 358 |
Lubrizol | | 6,854 | | | 607 |
Medifast* (A) | | 40,285 | | | 1,264 |
Omnova Solutions* | | 37,500 | | | 301 |
Par Pharmaceutical* | | 4,745 | | | 132 |
PHH* | | 83,149 | | | 1,833 |
PolyOne* | | 47,243 | | | 472 |
Questcor Pharmaceuticals* | | 34,949 | | | 331 |
RAIT Financial Trust‡ * (A) | | 139,296 | | | 350 |
RenaissanceRe Holdings | | 159,400 | | | 8,617 |
Sanderson Farms | | 4,200 | | | 230 |
Seagate Technology* | | 304,384 | | | 4,675 |
Southern Copper(A) | | 228,100 | | | 6,724 |
Spartech* | | 10,300 | | | 137 |
Thomson Reuters (CAD)(A) | | 146,300 | | | 5,181 |
USA Mobility | | 17,647 | | | 248 |
Western Digital* | | 74,127 | | | 2,581 |
World Acceptance* (A) | | 13,676 | | | 489 |
| | | | | |
| | | | | 50,937 |
| | | | | |
Total Common Stock (Cost $3,422,768) ($ Thousands) | | | | | 3,320,415 |
| | | | | |
PREFERRED STOCK — 1.0% | | | | | |
Brazil — 0.3% | | | | | |
Banco Bradesco | | 228,100 | | | 3,801 |
Cia de Bebidas das Americas | | 23,400 | | | 2,224 |
Cia Energetica de Minas Gerais | | 115,310 | | | 1,643 |
Randon Participacoes | | 330,700 | | | 1,731 |
Tekno Industria e Comercio | | 1 | | | — |
Tim Participacoes | | 796,200 | | | 2,151 |
| | | | | |
| | | | | 11,550 |
| | | | | |
Germany — 0.7% | | | | | |
Draegerwerk | | 3,838 | | | 231 |
Henkel | | 217,135 | | | 10,243 |
KSB | | 304 | | | 176 |
ProSiebenSat.1 Media(A) | | 162,055 | | | 2,484 |
RWE | | 1,075 | | | 73 |
Volkswagen | | 137,241 | | | 12,131 |
| | | | | |
| | | | | 25,338 |
| | | | | |
Total Preferred Stock (Cost $36,232) ($ Thousands) | | | 36,888 |
| | | | | |
MORTGAGE-BACKED SECURITIES — 0.2% | | | | | |
Non-Agency Mortgage-Backed Obligations — 0.2% | | | | | |
Banc of America Funding, Ser 2004-5, Cl 1A19 5.250%, 12/20/34 | | 664 | | | 663 |
Banc of America Funding, Ser 2005-2, Cl 1A2 5.500%, 04/25/35 | | 345 | | | 340 |
| | | | | | |
Description | | Face Amount
($ Thousands) | | Market Value
($ Thousands) |
Banc of America Mortgage Securities, Ser 2003-9, Cl 1A12 | | | | | | |
0.793%, 12/25/33 (D) | | $ | 144 | | $ | 141 |
Bear Stearns Commercial Mortgage Securities, Ser 2005- PWR9, Cl A2 | | | | | | |
4.735%, 09/11/42 | | | 4 | | | 4 |
Countrywide Home Loan Mortgage Pass Through Trust, Ser 2003-34, Cl A3 | | | | | | |
5.000%, 09/25/33 | | | 153 | | | 153 |
Countrywide Home Loan Mortgage Pass Through Trust, Ser 2004-5, Cl 2A14 | | | | | | |
5.000%, 05/25/34 | | | 136 | | | 134 |
Countrywide Home Loan Mortgage Pass-Through Trust, Ser 2003-14, Cl A16 | | | | | | |
5.500%, 06/25/33 | | | 272 | | | 277 |
Countrywide Home Loan Mortgage Pass-Through Trust, Ser 2003-2, Cl A18 | | | | | | |
8.000%, 03/25/33 | | | 164 | | | 175 |
Countrywide Home Loan Mortgage Pass-Through Trust, Ser 2003-24, Cl A2 | | | | | | |
4.500%, 07/25/33 | | | 550 | | | 556 |
Countrywide Home Loan Mortgage Pass-Through Trust, Ser 2004-13, Cl 2A17 | | | | | | |
5.750%, 08/25/34 | | | 123 | | | 122 |
Credit Suisse First Boston Mortgage Securities, Ser 2003- C3 | | | | | | |
3.382%, 05/15/38 | | | 8 | | | 8 |
DLJ Commercial Mortgage, Ser 2000-CKP1, Cl A1B | | | | | | |
7.180%, 11/10/33 | | | 326 | | | 326 |
First Horizon Asset Securities, Ser 2003-9, Cl 1A3 | | | | | | |
5.500%, 11/25/33 | | | 622 | | | 620 |
GMAC Mortgage Loan Trust, Ser 2004-J1, Cl A2 | | | | | | |
5.250%, 04/25/34 | | | 447 | | | 445 |
GMAC Mortgage Loan Trust, Ser 2004-J4, Cl A1 | | | | | | |
5.500%, 09/25/34 | | | 321 | | | 319 |
Greenwich Capital Commercial Funding, Ser 2003-C2, Cl A2 | | | | | | |
4.022%, 01/05/36 | | | 6 | | | 6 |
JPMorgan Mortgage Trust, Ser 2004-A5, Cl 4A2 | | | | | | |
4.817%, 12/25/34 (D) | | | 328 | | | 333 |
LB-UBS Commercial Mortgage Trust, Ser 2000-C4, Cl A2 | | | | | | |
7.370%, 08/15/26 | | | 44 | | | 44 |
Master Adjustable Rate Mortgages Trust, Ser 2004-6, Cl 2A1 | | | | | | |
3.915%, 07/25/34 (D) | | | 478 | | | 435 |
PNC Mortgage Acceptance, Ser 2000-C2, Cl A2 | | | | | | |
7.300%, 10/12/33 | | | 87 | | | 88 |
| | |
9 | | SEI Institutional Investments Trust /Annual Report/May 31, 2010 |
SCHEDULE OF INVESTMENTS
World Equity Ex-US Fund
May 31, 2010
| | | | | | |
Description | |
Face Amount
($ Thousands) | | Market Value
($ Thousands) |
Residential Funding Mortgage Securities I, Ser 2004-S1, Cl A2 | | | | | | |
0.743%, 02/25/34 (D) | | $ | 124 | | $ | 123 |
Residential Funding Mortgage Securities I, Ser 2006-S5, Cl A4 | | | | | | |
5.500%, 03/25/34 | | | 651 | | | 655 |
Thornburg Mortgage Securities Trust, Ser 2006-5, Cl A1 | | | | | | |
0.463%, 09/25/46 (D) | | | 1,346 | | | 1,311 |
Wachovia Bank Commercial Mortgage Trust, Ser 2005-C17, Cl A2 | | | | | | |
4.782%, 03/15/42 | | | 347 | | | 347 |
WaMu Mortgage Pass Through Certificates, Ser 2004-AR9, Cl A6 | | | | | | |
2.950%, 08/25/34 (D) | | | 31 | | | 31 |
WaMu Mortgage Pass Through Certificates, Ser 2005-AR10, Cl 1A1 | | | | | | |
4.750%, 09/25/35 (D) | | | 643 | | | 645 |
Washington Mutual Mortgage Pass-Through Certificates, Ser 2003-S4, Cl 2A5 | | | | | | |
4.500%, 06/25/33 | | | 62 | | | 61 |
Washington Mutual Mortgage Pass-Through Certificates, Ser 2004-S2, Cl 2A1 | | | | | | |
5.500%, 06/25/34 | | | 372 | | | 373 |
Wells Fargo Mortgage Backed Securities Trust, Ser 2004-I, Cl B1 | | | | | | |
3.220%, 07/25/34 (D) | | | 45 | | | 15 |
Wells Fargo Mortgage Backed Securities Trust, Ser 2004-N, Cl A13 | | | | | | |
0.793%, 06/25/34 (D) | | | 185 | | | 179 |
Wells Fargo Mortgage Backed Securities Trust, Ser 2005- AR12, Cl 2A4 | | | | | | |
2.933%, 07/25/35 (D) | | | 18 | | | 18 |
| | | | | | |
| | | | | | 8,947 |
| | | | | | |
Total Mortgage-Backed Securities | | | | | | |
(Cost $8,995) ($ Thousands) | | | | | | 8,947 |
| | | | | | |
ASSET-BACKED SECURITIES — 0.1% | | | |
Mortgage Related Securities — 0.1% | | | | | | |
First Franklin Mortgage Loan Asset Backed Certificates, Ser 2005-FF9, Cl A3 | | | | | | |
0.623%, 10/25/35 (D) | | | 437 | | | 420 |
Structured Asset Securities, Ser 2007-GEL2, Cl A1 | | | | | | |
0.493%, 05/25/37 (B) (D) | | | 1,419 | | | 1,170 |
| | | | | | |
| | | | | | 1,590 |
| | | | | | |
Total Asset-Backed Securities | | | | | | |
(Cost $1,837) ($ Thousands) | | | | | | 1,590 |
| | | | | | |
| | | | | | | | |
Description | | | | Face Amount
($ Thousands)/
Number of
Contracts | | Market Value
($ Thousands) |
WARRANTS — 0.0% | | | | | | |
| | |
Singapore — 0.0% | | | | | | |
Golden Agri-Resources, Expires 05/29/12 * | | | 176,797 | | $ | 41 |
| | | | | | | | |
Hong Kong — 0.0% | | | | | | |
Henderson Land Development, Expires 12/31/49 * | | | 43,200 | | | — |
| | | | | | | | |
Italy — 0.0% | | | | | | | | |
Mediobanca, Expires 2011 | | | 51,652 | | | 3 |
| | | | | | | | |
Total Warrants | | | | | | | | |
(Cost $0) ($ Thousands) | | | | | | 44 |
| | | | | | | | |
| | | | | Number Of
Rights | | |
| | | | | | | | |
RIGHT — 0.0% | | | | | | | | |
United Kingdom — 0.0% | | | | | | | | |
National Grid, PLC, Expires | | | | | | | | |
06/13/10 | | | | | 85,411 | | | 170 |
| | | | | | | | |
Total Right (Cost $0) ($ Thousands) | | | 170 |
| | | | | | | | |
CORPORATE OBLIGATION — 0.0% | | | | | | | | |
Financials — 0.0% | | | | | | | | |
Shinsei Finance Cayman | | | | | | |
6.418%, 01/29/49 (B) (D) | | $ | 545 | | | 345 |
| | | | | | | | |
Total Corporate Obligation | | | | | | |
(Cost $545) ($ Thousands) | | | | | | 345 |
| | | | | | | | |
U.S. TREASURY OBLIGATIONS — 1.0% |
U.S. Treasury Bills (C)(D) | | | | | | |
0.134%, 06/03/10 | | | 34,059 | | | 34,058 |
0.140%, 06/17/10 | | | 750 | | | 750 |
0.155%, 08/26/10 | | | 2,750 | | | 2,749 |
| | | | | | | | |
Total U.S. Treasury Obligations | | | | | | |
(Cost $37,557) ($ Thousands) | | | 37,557 |
| | | | | | | | |
TIME DEPOSITS— 2.0% | | | |
United States — 2.0% | | | |
Brown Brothers Harriman | | | | | | | | |
3.410%, 06/01/10 | | AUD | | | 1,602 | | | 1,358 |
0.080%, 06/01/10 | | GBP | | | 453 | | | 655 |
0.070%, 06/01/10 | | CAD | | | 18 | | | 17 |
0.070%, 06/01/10 | | NOK | | | 34 | | | 5 |
0.050%, 06/01/10 | | DKK | | | 10 | | | 2 |
0.050%, 06/01/10 | | EUR | | | 1,702 | | | 2,098 |
0.030%, 06/01/10 | | | | | 67,216 | | | 67,216 |
0.010%, 06/01/10 | | CHF | | | 1,870 | | | 1,616 |
0.010%, 06/01/10 | | HKD | | | 2,757 | | | 354 |
0.010%, 06/01/10 | | JPY | | | 180,625 | | | 1,986 |
0.010%, 06/01/10 | | SEK | | | 110 | | | 14 |
0.010%, 06/01/10 | | SGD | | | 78 | | | 56 |
| | | | | | | | |
| | |
10 | | SEI Institutional Investments Trust /Annual Report/May 31, 2010 |
SCHEDULE OF INVESTMENTS
World Equity Ex-US Fund
May 31, 2010
| | | | | |
Description | | Shares | | Market Value
($ Thousands) |
Total Time Deposits (Cost $75,377) ($ Thousands) | | | | $ | 75,377 |
| | | | | |
CASH EQUIVALENT — 1.0% | | | | | |
United States — 1.0% | | | | | |
SEI Daily Income Trust, Prime Obligation Fund, Cl A, | | | | | |
0.090%**† | | 36,630,196 | | $ | 36,630 |
| | | | | |
Total Cash Equivalent (Cost $36,630) ($ Thousands) | | | | | 36,630 |
| | | | | |
AFFILIATED PARTNERSHIP — 6.3% | | | | | |
SEI Liquidity Fund, L.P. | | | | | |
0.240%*†(F) | | 235,888 | | | 233,575 |
| | | | | |
Total Affiliated Partnership (Cost $235,888) ($ Thousands) | | | | | 233,575 |
| | | | | |
Total Investments — 101.0% (Cost $3,855,829)($ Thousands) | | | | $ | 3,751,538 |
| | | | | |
A summary of the open futures contracts held by the Fund at May 31, 2010, is as follows:
| | | | | | | | | |
Type of Contract | | Number of
Contracts
Long (Short) | | | Expiration
Date | | Unrealized
Appreciation
(Depreciation)
($ Thousands) | |
DJ Euro Stoxx 50 Index | | 2,148 | | | Jun-2010 | | $ | 181 | |
FTSE Index | | 638 | | | Jun-2010 | | | (82 | ) |
Hang Seng Index | | 41 | | | Jun-2010 | | | 101 | |
MSCI EAFE Index E-MINI | | (9 | ) | | Jun-2010 | | | 42 | |
MSCI Emerging Markets E-MINI | | 316 | | | Jun-2010 | | | (1,357 | ) |
Nikkei 225 Index | | 47 | | | Jun-2010 | | | (156 | ) |
S&P TSE 60 Index | | 221 | | | Jun-2010 | | | (219 | ) |
SPI 200 Index | | 190 | | | Jun-2010 | | | 2 | |
Topix Index | | 469 | | | Jun-2010 | | | (694 | ) |
| | | | | | | | | |
| | | | | | | $ | (2,182 | ) |
| | | | | | | | | |
For the year ended May 31, 2010, the total amount of all open futures contracts, as presented in the table above, are representative of the volume of activity for this derivative type during the period.
A summary of the outstanding forward foreign currency contracts held by the Fund at May 31, 2010, is as follows:
| | | | | | | | | | | |
Maturity Date | | Currency to Deliver
(Thousands) | | Currency to Receive
(Thousands) | | Unrealized
Appreciation
($ Thousands) |
6/10/10 | | USD | | 4,764 | | CAD | | 5,050 | | $ | 38 |
| | | | | | | | | | | |
A summary of outstanding swap agreements held by the Fund at May 31, 2010, is as follows:
| | | | | | | | | | | | | | | |
Total Return Swaps | |
Counterparty | | Reference Entity/
Obligation | | Fund Pays | | Fund Receives | | Termination
Date | | Notional Amount
(Thousands) | | | Net Unrealized
Appreciation (Depreciation)
($Thousands) | |
Morgan Stanley | | MSCI Daily TR
NET EAFE USD
MARKET Index | | 1-Month LIBOR | | Price Return | | 08/03/10 | | (9,307 | ) | | $ | (1,001 | ) |
Morgan Stanley | | MSCI Daily TR NET EAFE USD MARKET Index | | 3-Month LIBOR Minus 24 Bps | | Price Return | | 01/13/11 | | (40,262 | ) | | | (5,884 | ) |
| | | | | | | | | | | | | | | |
| | | | | | | | | | | | | $ | (6,885 | ) |
| | | | | | | | | | | | | | | |
| | |
11 | | SEI Institutional Investments Trust /Annual Report/May 31, 2010 |
SCHEDULE OF INVESTMENTS
World Equity Ex-US Fund
May 31, 2010
Percentages are based on a Net Assets of $3,712,614 ($ Thousands).
| * | Non-income producing security. |
| ** | The rate reported is the 7-day effective yield as of May 31, 2010. |
| † | Investment in Affiliated Security. |
| ‡ | Real Estate Investment Trust. |
| (A) | This security or a partial position of this security is on loan at May 31, 2010. The total value of securities on loan at May 31, 2010 was $224,904 ($ Thousands). |
| (B) | Securities sold within terms of a private placement memorandum, exempt from registration under Section 144A of the Securities Act of 1933, as amended, and may be sold only to dealers in that program or other “accredited investors.” These securities have been determined to be liquid under guidelines established by the Board of Trustees. |
| (C) | Zero coupon security. The rate reported is the effective yield at time of purchase. |
| (D) | Security, or portion thereof, has been pledged as collateral on open future contracts. |
| (E) | Variable Rate Security. The rate reported is the rate in effect as of May 31, 2010. The date reported is the final maturity date. |
| (F) | This security was purchased with cash collateral held from securities on loan. The total value of such securities as of May 31, 2010 was $233,575 ($ Thousands). |
ABS — Asset-Backed Security
ADR — American Depositary Receipt
ARM — Adjustable Rate Mortgage
AUD — Australian Dollar
CAD — Canadian Dollar
CHF — Swiss Franc
Cl — Class
CMO — Collateralized Mortgage Obligation
DKK — Danish Krone
EUR — Euro
FHLMC — Federal Home Loan Mortgage Corporation
FNMA — Federal National Mortgage Association
GBP — British Pound Sterling
GDR — Global Depositary Receipt
HKD — Hong Kong Dollar
JPY — Japanese Yen
LLC — Limited Liability Company
L.P. — Limited Partnership
NOK — Norwegian Krone
NVDR — Non-Voting Depositary Receipt
S&P — Standard & Poor’s
SEK — Swedish Krone
Ser — Series
SGP — Singapore Dollar
USD — U.S. Dollar
Amounts designated as “—” are $0 or have been rounded to $0.
| | |
12 | | SEI Institutional Investments Trust /Annual Report/May 31, 2010 |
SCHEDULE OF INVESTMENTS
Screened World Equity Ex-US Fund
May 31, 2010
| | | | | |
Description | | Shares | | Market Value
($ Thousands) |
COMMON STOCK — 91.1% | | | | | |
Australia — 3.4% | | | | | |
Australia & New Zealand Banking Group | | 10,798 | | $ | 204 |
Bendigo Bank | | 1,851 | | | 13 |
BGP Holdings* | | 4,500 | | | — |
BHP Billiton | | 25,289 | | | 820 |
Caltex Australia | | 14,432 | | | 133 |
Coca-Cola Amatil | | 1,323 | | | 12 |
Commonwealth Bank of Australia | | 5,404 | | | 235 |
Fairfax Media | | 16,318 | | | 21 |
Fortescue Metals Group* | | 7,389 | | | 25 |
Incitec Pivot | | 15,230 | | | 39 |
Minara Resources | | 15,406 | | | 9 |
National Australia Bank | | 4,705 | | | 98 |
OneSteel | | 11,654 | | | 32 |
Rio Tinto | | 7,871 | | | 448 |
Stockland‡ | | 13,954 | | | 46 |
Thorn Group | | 18,819 | | | 18 |
Wesfarmers | | 3,710 | | | 92 |
Westpac Banking | | 4,413 | | | 86 |
Woodside Petroleum | | 891 | | | 33 |
Woolworths | | 238 | | | 5 |
| | | | | |
| | | | | 2,369 |
| | | | | |
Austria — 0.1% | | | | | |
IMMOFINANZ | | 5,265 | | | 16 |
OMV | | 419 | | | 13 |
Voestalpine | | 1,070 | | | 30 |
| | | | | |
| | | | | 59 |
| | | | | |
Belgium — 0.7% | | | | | |
Delhaize Group | | 942 | | | 75 |
D’ieteren | | 75 | | | 33 |
InBev | | 3,865 | | | 187 |
KBC Groep | | 2,233 | | | 88 |
Recticel | | 5,843 | | | 58 |
Telenet Group Holding | | 1,528 | | | 40 |
Umicore | | 1,051 | | | 32 |
| | | | | |
| | | | | 513 |
| | | | | |
Brazil — 1.1% | | | | | |
Banco Bradesco ADR | | 6,011 | | | 98 |
Banco do Brasil | | 4,700 | | | 67 |
BM&F Bovespa SA | | 35,800 | | | 238 |
Empresa Brasileira de Aeronautica ADR | | 6,200 | | | 135 |
Natura Cosmeticos | | 10,100 | | | 210 |
| | | | | |
| | | | | 748 |
| | | | | |
Canada — 7.6% | | | | | |
Agrium | | 100 | | | 6 |
ARC Energy Trust | | 1,300 | | | 26 |
Bank of Montreal | | 3,500 | | | 207 |
Bank of Nova Scotia | | 1,800 | | | 83 |
Baytex Energy Trust | | 3,200 | | | 100 |
BCE | | 1,200 | | | 35 |
Brookfield Asset Management, Cl A | | 4,700 | | | 119 |
| | | | | |
Description | | Shares | | Market Value
($ Thousands) |
Canadian Imperial Bank of Commerce | | 1,600 | | $ | 109 |
Canadian National Railway | | 9,100 | | | 533 |
Canadian Natural Resources | | 15,200 | | | 538 |
Canadian Oil Sands Trust | | 2,800 | | | 76 |
Canadian Pacific Railway | | 500 | | | 28 |
Canadian Utilities, Cl A | | 500 | | | 21 |
Cardiome Pharma* | | 3,600 | | | 30 |
Celestica* | | 1,800 | | | 17 |
Cenovus Energy | | 8,169 | | | 226 |
CGI Group, Cl A* | | 8,500 | | | 131 |
Cott* | | 14,400 | | | 108 |
Domtar | | 200 | | | 12 |
Dorel Industries, Cl B | | 1,100 | | | 40 |
Enbridge | | 1,500 | | | 68 |
EnCana | | 13,169 | | | 416 |
Flint Energy Services (Canada)* | | 8,100 | | | 95 |
Gildan Activewear* | | 1,800 | | | 54 |
IAMGOLD | | 5,238 | | | 91 |
Imperial Oil | | 100 | | | 4 |
MDS* | | 3 | | | — |
Metro, Cl A | | 1,200 | | | 50 |
National Bank of Canada | | 1,100 | | | 61 |
Nexen | | 1,607 | | | 36 |
Northgate Minerals* | | 8,100 | | | 24 |
Onex | | 1,000 | | | 25 |
Pacific Rubiales Energy* | | 7,600 | | | 160 |
PetroBakken Energy, Cl A | | 2,589 | | | 59 |
Petrobank Energy & Resources* | | 2,100 | | | 90 |
Potash Corp of Saskatchewan | | 2,200 | | | 218 |
Provident Energy Trust | | 8,400 | | | 61 |
Research In Motion* | | 4,500 | | | 273 |
Rogers Communications, Cl B | | 6,000 | | | 206 |
Royal Bank of Canada | | 3,400 | | | 178 |
Sino-Forest, Cl A* | | 3,400 | | | 59 |
Talisman Energy | | 300 | | | 5 |
Teck Cominco, Cl B | | 4,400 | | | 153 |
Toronto-Dominion Bank | | 5,750 | | | 392 |
| | | | | |
| | | | | 5,223 |
| | | | | |
Chile — 0.0% | | | | | |
CorpBanca ADR | | 300 | | | 13 |
| | | | | |
China — 2.1% | | | | | |
Bank of China, Cl H | | 36,000 | | | 18 |
China Construction Bank, Cl H | | 280,000 | | | 227 |
China Life Insurance, Cl H | | 14,000 | | | 62 |
China Merchants Bank, Cl H | | 147,500 | | | 350 |
Dongfeng Motor Group, Cl H | | 44,000 | | | 53 |
Industrial & Commercial Bank of China | | 701,000 | | | 519 |
Pacific Textile Holdings | | 75,000 | | | 40 |
Sinopharm Group, Cl H | | 45,200 | | | 179 |
| | | | | |
| | | | | 1,448 |
| | | | | |
Denmark — 1.7% | | | | | |
Carlsberg, Cl B | | 1,078 | | | 82 |
Coloplast, Cl B | | 554 | | | 58 |
Danisco | | 386 | | | 23 |
FLSmidth | | 800 | | | 50 |
Novo-Nordisk, Cl B | | 9,080 | | | 704 |
| | |
1 | | SEI Institutional Investments Trust /Annual Report/May 31, 2010 |
SCHEDULE OF INVESTMENTS
Screened World Equity Ex-US Fund
May 31, 2010
| | | | | |
Description | | Shares | | Market Value
($ Thousands) |
Vestas Wind Systems* | | 4,501 | | $ | 216 |
| | | | | |
| | | | | 1,133 |
| | | | | |
Finland — 0.9% | | | | | |
Fortum | | 2,567 | | | 58 |
Kone, Cl B | | 3,841 | | | 150 |
Metso | | 1,552 | | | 49 |
Norvestia, Cl B | | 934 | | | 9 |
Sampo, Cl A | | 4,329 | | | 92 |
Stora Enso, Cl R | | 20,451 | | | 153 |
UPM-Kymmene | | 9,347 | | | 121 |
| | | | | |
| | | | | 632 |
| | | | | |
France — 6.1% | | | | | |
Air Liquide | | 4,117 | | | 405 |
Arkema | | 611 | | | 23 |
BNP Paribas | | 9,099 | | | 520 |
Bouygues | | 1,037 | | | 45 |
Carrefour | | 310 | | | 13 |
Casino Guichard Perrachon | | 872 | | | 67 |
Christian Dior | | 219 | | | 21 |
CNP Assurances | | 479 | | | 34 |
Compagnie de St.-Gobain | | 2,043 | | | 79 |
Dassault Systemes | | 1,010 | | | 59 |
Eutelsat Communications | | 2,200 | | | 72 |
France Telecom | | 1,576 | | | 30 |
Klepierre‡ | | 1,155 | | | 31 |
Lafarge | | 3,816 | | | 222 |
Legrand | | 170 | | | 5 |
LVMH Moet Hennessy Louis Vuitton | | 4,120 | | | 438 |
Natixis | | 18,682 | | | 83 |
Peugeot | | 4,199 | | | 101 |
PPR | | 1,167 | | | 141 |
Publicis Groupe | | 1,224 | | | 51 |
Renault | | 486 | | | 18 |
Rhodia | | 6,174 | | | 106 |
Safran | | 11,717 | | | 321 |
Sanofi-Aventis | | 9,232 | | | 563 |
Societe Generale | | 418 | | | 18 |
Societe Television Francaise 1 | | 2,457 | | | 35 |
Valeo | | 6,575 | | | 183 |
Vallourec | | 313 | | | 59 |
Vinci | | 2,876 | | | 131 |
Vivendi | | 13,196 | | | 287 |
| | | | | |
| | | | | 4,161 |
| | | | | |
Germany — 5.1% | | | | | |
ADVA Optical Networking* | | 1,667 | | | 8 |
Aixtron | | 3,312 | | | 90 |
Allianz | | 4,040 | | | 406 |
BASF | | 14,171 | | | 754 |
Bayer | | 420 | | | 24 |
Bilfinger Berger | | 944 | | | 53 |
DaimlerChrysler | | 5,032 | | | 254 |
Deutsche Bank | | 6,747 | | | 404 |
Deutsche Post | | 6,024 | | | 90 |
Deutsche Telekom | | 3,899 | | | 44 |
E.ON | | 8,188 | | | 250 |
Fresenius Medical Care | | 6,393 | | | 324 |
Hannover Rueckversicherung | | 2,694 | | | 115 |
Henkel | | 143 | | | 6 |
| | | | | |
Description | | Shares | | Market Value
($ Thousands) |
Hochtief | | 670 | | $ | 43 |
Infineon Technologies* | | 13,101 | | | 75 |
Leifheit | | 675 | | | 15 |
Linde | | 184 | | | 19 |
Metro | | 948 | | | 50 |
MTU Aero Engines Holding | | 918 | | | 50 |
RWE | | 324 | | | 23 |
SAP | | 7,867 | | | 342 |
Siemens | | 168 | | | 15 |
Suedzucker | | 1,420 | | | 26 |
TUI | | 3,373 | | | 31 |
Volkswagen | | 67 | | | 6 |
| | | | | |
| | | | | 3,517 |
| | | | | |
Greece — 0.1% | | | | | |
OPAP | | 2,017 | | | 32 |
Public Power | | 2,900 | | | 45 |
| | | | | |
| | | | | 77 |
| | | | | |
Guernsey — 0.3% | | | | | |
Amdocs* | | 7,800 | | | 222 |
| | | | | |
Hong Kong — 3.1% | | | | | |
Alco Holdings | | 54,000 | | | 17 |
ASM Pacific Technology | | 1,900 | | | 14 |
BOC Hong Kong Holdings | | 47,000 | | | 106 |
Cheung Kong Holdings | | 6,000 | | | 68 |
China Mobile | | 32,500 | | | 308 |
CLP Holdings | | 25,000 | | | 176 |
First Pacific | | 56,000 | | | 36 |
Hong Kong Exchanges and Clearing | | 18,700 | | | 287 |
Hong Kong Ferry Holdings | | 10,000 | | | 9 |
Hongkong Land Holdings | | 16,000 | | | 76 |
Hutchison Whampoa | | 20,000 | | | 124 |
Jardine Matheson Holdings | | 800 | | | 28 |
Jardine Strategic Holdings | | 2,342 | | | 46 |
Link REIT‡ | | 6,000 | | | 14 |
New World Development | | 28,000 | | | 45 |
Noble Group | | 97,364 | | | 126 |
Orient Overseas International | | 500 | | | 3 |
Pacific Basin Shipping | | 59,000 | | | 41 |
Paliburg Holdings | | 64,000 | | | 20 |
Polytec Asset Holdings | | 70,000 | | | 12 |
Sun Hung Kai Properties | | 9,000 | | | 119 |
Swire Pacific, Cl A | | 20,000 | | | 221 |
Wharf Holdings | | 16,000 | | | 80 |
Wheelock | | 19,000 | | | 51 |
Wing On International | | 30,111 | | | 46 |
Yue Yuen Industrial Holdings | | 24,000 | | | 74 |
| | | | | |
| | | | | 2,147 |
| | | | | |
Hungary — 0.2% | | | | | |
OTP Bank | | 4,436 | | | 115 |
| | | | | |
India — 0.4% | | | | | |
HDFC Bank ADR | | 1,170 | | | 163 |
| | |
2 | | SEI Institutional Investments Trust /Annual Report/May 31, 2010 |
SCHEDULE OF INVESTMENTS
Screened World Equity Ex-US Fund
May 31, 2010
| | | | | |
Description | | Shares | | Market Value
($ Thousands) |
Infosys Technologies ADR | | 2,500 | | $ | 144 |
| | | | | 307 |
| | | | | |
Indonesia — 0.3% | | | | | |
Astra International | | 16,500 | | | 77 |
Bank Mandiri | | 159,500 | | | 92 |
Charoen Pokphand Indonesia | | 54,000 | | | 16 |
Titan Kimia Nusantara* | | 396,000 | | | 6 |
| | | | | |
| | | | | 191 |
| | | | | |
Ireland — 0.2% | | | | | |
Covidien | | 3,900 | | | 165 |
| | | | | |
Israel — 1.4% | | | | | |
Bank Hapoalim* | | 41,053 | | | 156 |
Check Point Software | | | | | |
Technologies* | | 2,300 | | | 71 |
Israel Discount Bank, Cl A* | | 31,634 | | | 53 |
Teva Pharmaceutical Industries ADR | | 12,530 | | | 687 |
| | | | | |
| | | | | 967 |
| | | | | |
Italy — 1.5% | | | | | |
Amplifon | | 2,223 | | | 10 |
Atlantia | | 2,426 | | | 45 |
Azimut Holding | | 3,519 | | | 31 |
Banca Intesa | | 48,182 | | | 129 |
Danieli & C Officine Meccaniche | | 620 | | | 12 |
Enel | | 99,357 | | | 458 |
Mediaset | | 17,764 | | | 111 |
Saipem | | 1,874 | | | 59 |
Snam Rete Gas | | 11,653 | | | 47 |
Telecom Italia | | 56,838 | | | 64 |
Terna Rete Elettrica Nazionale | | 8,007 | | | 30 |
| | | | | |
| | | | | 996 |
| | | | | |
Japan — 15.6% | | | | | |
Adores | | 9,000 | | | 8 |
Aeon | | 7,800 | | | 82 |
Aisin Seiki | | 1,600 | | | 45 |
Alps Electric | | 4,900 | | | 44 |
Arc Land Sakamoto | | 4,500 | | | 56 |
Arnest One | | 1,300 | | | 13 |
Asahi Glass | | 24,000 | | | 254 |
Asahi Kasei | | 4,000 | | | 21 |
Astellas Pharma | | 4,100 | | | 132 |
Bank of Yokohama | | 11,000 | | | 53 |
Belluna | | 5,450 | | | 27 |
Best Denki | | 14,000 | | | 36 |
Brother Industries | | 500 | | | 6 |
Canon | | 7,400 | | | 305 |
Chiba Bank | | 15,000 | | | 92 |
Chubu Electric Power | | 2,000 | | | 46 |
Chugai Pharmaceutical | | 2,200 | | | 39 |
Chuo Spring | | 3,000 | | | 11 |
Combi | | 2,000 | | | 14 |
Daicel Chemical Industries | | 12,000 | | | 84 |
Dai-ichi Life Insurance | | 125 | | | 206 |
Dainichi | | 1,700 | | | 10 |
Daito Trust Construction | | 600 | | | 30 |
Daiwa House Industry | | 5,000 | | | 48 |
| | | | | |
Description | | Shares | | Market Value
($ Thousands) |
Dena | | 3,000 | | $ | 91 |
Denso | | 2,600 | | | 70 |
Disco | | 800 | | | 54 |
Fanuc | | 3,700 | | | 391 |
First Juken | | 2,600 | | | 19 |
Fuji Electric Holdings | | 54,000 | | | 152 |
Fuji Heavy Industries | | 13,000 | | | 75 |
FUJIFILM Holdings | | 5,200 | | | 155 |
Fujitsu | | 35,000 | | | 225 |
Fukuoka Financial Group | | 4,000 | | | 17 |
Furukawa Electric | | 12,000 | | | 52 |
Gunma Bank | | 8,000 | | | 42 |
Hanwa | | 29,000 | | | 117 |
Happinet | | 600 | | | 7 |
Hitachi | | 140,000 | | | 573 |
Hokuriku Gas | | 1,000 | | | 3 |
Honda Motor | | 9,635 | | | 293 |
Idemitsu Kosan | | 700 | | | 52 |
Inabata | | 3,500 | | | 17 |
Inpex | | 13 | | | 82 |
IT Holdings | | 200 | | | 2 |
Itochu | | 9,700 | | | 81 |
Itochu Enex | | 3,400 | | | 18 |
Itochu-Shokuhin | | 800 | | | 25 |
J Front Retailing | | 6,000 | | | 31 |
Japan Retail Fund Investment, Cl A‡ | | 23 | | | 28 |
Japan Wool Textile | | 5,000 | | | 34 |
JFE Holdings | | 4,800 | | | 162 |
JFE Shoji Holdings | | 4,000 | | | 19 |
JSR | | 1,700 | | | 31 |
JX Holdings* | | 16,100 | | | 88 |
Kamei | | 4,000 | | | 18 |
Kanaden | | 2,000 | | | 9 |
KDDI | | 10 | | | 45 |
Keiyo Gas | | 1,000 | | | 4 |
Kikuchi | | 600 | | | 10 |
Kobe Steel | | 20,000 | | | 42 |
Komatsu | | 17,300 | | | 325 |
K’s Holdings | | 7,800 | | | 182 |
Kuraray | | 5,000 | | | 62 |
Kyocera | | 1,200 | | | 105 |
Maruichi Steel Tube | | 500 | | | 9 |
Maruzen -General Commercial Kitchen Appliances & Equipment | | 1,000 | | | 5 |
Millea Holdings | | 2,600 | | | 73 |
Minebea | | 6,000 | | | 34 |
Mitani | | 3,100 | | | 19 |
Mitsubishi Chemical Holdings | | 6,000 | | | 28 |
Mitsubishi Electric | | 10,000 | | | 82 |
Mitsubishi UFJ Financial Group | | 71,100 | | | 345 |
Mitsui | | 1,400 | | | 20 |
Mitsui Chemicals | | 42,000 | | | 127 |
Mitsui OSK Lines | | 27,000 | | | 192 |
Murakami | | 1,000 | | | 11 |
NHK Spring | | 7,000 | | | 66 |
Nichireki | | 8,000 | | | 38 |
Nidec | | 1,600 | | | 146 |
Nippon Electric Glass | | 7,000 | | | 92 |
Nippon Game Card* | | 10 | | | 11 |
Nippon Light Metal | | 18,000 | | | 26 |
| | |
3 | | SEI Institutional Investments Trust /Annual Report/May 31, 2010 |
SCHEDULE OF INVESTMENTS
Screened World Equity Ex-US Fund
May 31, 2010
| | | | | |
Description | | Shares | | Market Value
($ Thousands) |
Nippon Telegraph & Telephone | | 9,100 | | $ | 369 |
Nishi-Nippon City Bank | | 12,000 | | | 33 |
Nissan Motor | | 43,700 | | | 319 |
Nisshin Fudosan | | 4,800 | | | 32 |
Nisshin Steel | | 7,000 | | | 13 |
Nissin Sugar Manufacturing | | 10,000 | | | 20 |
Nitto Denko | | 2,900 | | | 104 |
Noevir | | 1,100 | | | 12 |
NSK | | 9,000 | | | 66 |
NTT DoCoMo | | 77 | | | 115 |
Obayashi Road | | 14,000 | | | 30 |
OJI Paper | | 2,000 | | | 10 |
Omron | | 3,500 | | | 74 |
Onoken | | 3,300 | | | 29 |
ORIX | | 810 | | | 62 |
Raysum | | 59 | | | 18 |
Saison Information Systems | | 2,600 | | | 19 |
San-Ai Oil | | 3,000 | | | 12 |
Sanei Architecture Planning | | 200 | | | 5 |
Sanyo Housing Nagoya | | 20 | | | 17 |
Seino Holdings | | 21,000 | | | 149 |
Senshu Electric | | 1,600 | | | 15 |
Shidax | | 6,700 | | | 22 |
Shinsei Bank | | 15,000 | | | 15 |
Shiseido | | 5,700 | | | 111 |
Shoei Foods | | 1,000 | | | 5 |
SMC | | 1,200 | | | 156 |
Soken Chemical & Engineering | | 700 | | | 11 |
Sony | | 9,500 | | | 294 |
Starts | | 1,500 | | | 5 |
Sugimoto | | 700 | | | 6 |
Sumikin Bussan | | 6,000 | | | 14 |
Sumitomo | | 29,400 | | | 319 |
Sumitomo Electric Industries | | 12,200 | | | 144 |
Sumitomo Heavy Industries | | 9,000 | | | 52 |
Sumitomo Trust & Banking | | 25,000 | | | 134 |
Suzuken | | 1,600 | | | 57 |
Takagi Securities | | 12,000 | | | 21 |
Takamatsu Construction Group | | 1,600 | | | 18 |
Takeda Pharmaceutical | | 300 | | | 13 |
Takefuji | | 10,680 | | | 31 |
TDK | | 1,000 | | | 58 |
Tokai | | 1,200 | | | 16 |
Tokyo Electron | | 1,000 | | | 58 |
Tokyo Gas | | 22,000 | | | 96 |
Tomoe Engineering | | 1,000 | | | 13 |
Toyo Seikan Kaisha | | 2,100 | | | 33 |
Toyo Suisan Kaisha | | 2,000 | | | 44 |
Toyoda Gosei | | 1,600 | | | 41 |
Toyota Industries | | 400 | | | 10 |
Toyota Motor | | 10,233 | | | 369 |
Toyota Tsusho | | 1,200 | | | 17 |
Unicharm | | 700 | | | 71 |
Yagi | | 300 | | | 3 |
Yahoo! Japan | | 211 | | | 74 |
Yamada Denki | | 660 | | | 45 |
Zeon | | 6,000 | | | 35 |
| | | | | |
| | | | | 10,728 |
| | | | | |
Macau — 0.1% | | | | | |
| | | | | |
Description | | Shares | | Market Value
($ Thousands) |
Sands China* | | 34,000 | | $ | 50 |
| | | | | |
Malaysia — 0.6% | | | | | |
CIMB Group Holdings | | 147,800 | | | 304 |
EON Capital | | 9,500 | | | 20 |
HAP Seng Consolidated | | 11,800 | | | 10 |
Hong Leong Financial Group | | 7,200 | | | 18 |
Public Bank | | 10,800 | | | 38 |
| | | | | |
| | | | | 390 |
| | | | | |
Mexico — 1.4% | | | | | |
Alfa, Cl A | | 4,500 | | | 32 |
America Movil, Ser L | | 116,500 | | | 286 |
America Movil ADR, Ser L | | 5,500 | | | 261 |
Telefonos de Mexico | | 99,400 | | | 75 |
Wal-Mart de Mexico | | 128,600 | | | 287 |
| | | | | |
| | | | | 941 |
| | | | | |
Netherlands — 3.2% | | | | | |
ArcelorMittal | | 2,109 | | | 65 |
ASML Holding | | 3,455 | | | 100 |
CSM | | 2,132 | | | 64 |
European Aeronautic Defense and Space | | 7,162 | | | 144 |
Heineken | | 1,792 | | | 78 |
ING Groep | | 20,970 | | | 168 |
Koninklijke Ahold | | 15,361 | | | 194 |
Koninklijke Philips Electronics | | 20,643 | | | 621 |
Koninklijke Vopak | | 1,840 | | | 70 |
Royal KPN | | 16,462 | | | 215 |
Unilever | | 16,958 | | | 467 |
| | | | | |
| | | | | 2,186 |
| | | | | |
Netherlands Antilles — 0.5% | | | |
Schlumberger | | 6,100 | | | 343 |
| | | | | |
New Zealand — 0.1% | | | | | |
Telecom of New Zealand | | 37,529 | | | 48 |
| | | | | |
Norway — 0.7% | | | | | |
DnB | | 28,108 | | | 280 |
Marine Harvest | | 86,000 | | | 70 |
Seadrill | | 390 | | | 8 |
Telenor | | 8,000 | | | 98 |
| | | | | |
| | | | | 456 |
| | | | | |
Poland — 0.1% | | | | | |
Bank Zachodni WBK | | 313 | | | 20 |
Getin Holding* | | 3,605 | | | 11 |
KGHM Polska Miedz | | 287 | | | 9 |
Polish Oil & Gas | | 6,989 | | | 7 |
Polski Koncern Naftowy Orlen | | 2,076 | | | 24 |
| | | | | |
| | | | | 71 |
| | | | | |
Portugal — 0.3% | | | | | |
Energias de Portugal | | 25,911 | | | 80 |
Jeronimo Martins | | 9,331 | | | 87 |
| | |
4 | | SEI Institutional Investments Trust /Annual Report/May 31, 2010 |
SCHEDULE OF INVESTMENTS
Screened World Equity Ex-US Fund
May 31, 2010
| | | | | |
Description | | Shares | | Market Value
($ Thousands) |
Portugal Telecom | | 4,718 | | $ | 49 |
| | | | | |
| | | | | 216 |
| | | | | |
Russia — 0.1% | | | | | |
Mechel ADR | | 2,670 | | | 58 |
Surgutneftegaz ADR | | 3,407 | | | 30 |
| | | | | |
| | | | | 88 |
| | | | | |
Singapore — 1.0% | | | | | |
CapitaCommercial Trust‡ | | 47,000 | | | 38 |
CapitaMall Trust‡ | | 28,000 | | | 36 |
DBS Group Holdings | | 11,000 | | | 110 |
GP Batteries International* | | 40,000 | | | 52 |
Hiap Seng Engineering | | 81,000 | | | 36 |
Ho Bee Investment | | 55,000 | | | 56 |
Jardine Cycle & Carriage | | 3,000 | | | 59 |
MCL Land | | 12,000 | | | 15 |
Oversea-Chinese Banking | | 1,000 | | | 6 |
SembCorp Marine | | 2,000 | | | 6 |
Singapore Airlines | | 5,633 | | | 58 |
United Overseas Bank | | 1,000 | | | 13 |
UOL Group | | 23,000 | | | 62 |
Wilmar International | | 12,000 | | | 50 |
Yangzijiang Shipbuilding Holdings | | 114,000 | | | 102 |
| | | | | |
| | | | | 699 |
| | | | | |
South Africa — 0.2% | | | | | |
Group | | 11,277 | | | 160 |
| | | | | |
South Korea — 2.5% | | | | | |
Hana Financial Group | | 5,850 | | | 153 |
Hyundai Steel | | 1,530 | | | 113 |
Kia Motors | | 7,260 | | | 190 |
Kolon Industries | | 4,900 | | | 104 |
KT | | 4,080 | | | 155 |
LG | | 2,459 | | | 138 |
LG Electronics | | 777 | | | 68 |
LG.Philips LCD | | 4,110 | | | 153 |
Samsung Electronics | | 705 | | | 458 |
Shinhan Financial Group | | 600 | | | 22 |
Taekwang Industrial | | 129 | | | 78 |
Woori Finance Holdings | | 9,050 | | | 113 |
| | | | | |
| | | | | 1,745 |
| | | | | |
Spain — 1.0% | | | | | |
Banco Bilbao Vizcaya Argentaria | | 5,419 | | | 57 |
Banco Pastor | | 23 | | | — |
Banco Santander Central Hispano | | 19,241 | | | 197 |
Enagas | | 290 | | | 5 |
Inditex | | 512 | | | 29 |
Telefonica | | 20,697 | | | 397 |
| | | | | |
| | | | | 685 |
| | | | | |
Sweden — 1.9% | | | | | |
Alfa Laval | | 3,350 | | | 42 |
Assa Abloy, Cl B | | 6,670 | | | 134 |
Atlas Copco, Cl A | | 2,208 | | | 31 |
Billerud | | 1,324 | | | 9 |
Electrolux, Cl B | | 4,327 | | | 98 |
Hennes & Mauritz, Cl B | | 6,939 | | | 393 |
Investor, Cl B | | 412 | | | 7 |
| | | | | |
Description | | Shares | | Market Value
($ Thousands) |
Kabe Husvagnar, Cl B | | 400 | | $ | 5 |
Nordea Bank | | 11,909 | | | 98 |
SKF, Cl B | | 2,337 | | | 41 |
Svenska Cellulosa, Cl B | | 7,329 | | | 85 |
Svenska Handelsbanken, Cl A | | 4,506 | | | 110 |
Telefonaktiebolaget LM Ericsson, | | | | | |
Cl B | | 8,018 | | | 82 |
TeliaSonera | | 9,422 | | | 56 |
Volvo, Cl B | | 10,180 | | | 106 |
| | | | | |
| | | | | 1,297 |
| | | | | |
Switzerland — 6.2% | | | | | |
Adecco | | 3,734 | | | 181 |
Baloise Holding | | 523 | | | 37 |
Clariant | | 2,237 | | | 26 |
Compagnie Financiere Richemont | | 1,915 | | | 63 |
Credit Suisse Group | | 1,464 | | | 57 |
Holcim | | 897 | | | 57 |
Julius Baer Group | | 3,601 | | | 104 |
Logitech International* | | 8,789 | | | 126 |
Nestle | | 21,673 | | | 981 |
Novartis | | 18,161 | | | 824 |
Roche Holding | | 4,314 | | | 591 |
Schindler Holding | | 1,029 | | | 80 |
Sonova Holding | | 508 | | | 55 |
STMicroelectronics | | 12,305 | | | 98 |
Swatch Group, Cl B | | 734 | | | 192 |
Swatch Group | | 920 | | | 45 |
Swiss Life Holding | | 650 | | | 70 |
Swisscom | | 86 | | | 27 |
Syngenta | | 348 | | | 77 |
Temenos Group* | | 1,087 | | | 25 |
UBS | | 4,885 | | | 66 |
Xstrata | | 16,719 | | | 243 |
Zurich Financial Services | | 1,285 | | | 263 |
| | | | | |
| | | | | 4,288 |
| | | | | |
Taiwan — 1.1% | | | | | |
Asia Polymer | | 25,000 | | | 21 |
Asustek Computer | | 1,350 | | | 9 |
CMC Magnetics* | | 78,000 | | | 20 |
Elitegroup Computer Systems | | 52,000 | | | 18 |
Formosa Chemicals & Fibre | | 5,000 | | | 11 |
Formosa Petrochemical* | | 7,000 | | | 17 |
High Tech Computer | | 9,000 | | | 122 |
HON HAI Precision Industry | | 6,000 | | | 23 |
Nan Ya Plastics | | 6,000 | | | 10 |
Pegatron* | | 3,634 | | | 5 |
Quanta Computer | | 8,000 | | | 15 |
Taiwan Semiconductor Manufacturing | | 63,258 | | | 119 |
Taiwan Semiconductor Manufacturing ADR | | 18,000 | | | 176 |
United Microelectronics ADR | | 41,062 | | | 136 |
Yageo | | 72,000 | | | 32 |
Zenitron* | | 23,000 | | | 14 |
| | | | | |
| | | | | 748 |
| | | | | |
Thailand — 0.4% | | | | | |
Bangchak Petroleum | | 7,700 | | | 3 |
Bangkok Bank | | 34,600 | | | 124 |
Bank of Ayudhya | | 134,200 | | | 77 |
| | |
5 | | SEI Institutional Investments Trust /Annual Report/May 31, 2010 |
SCHEDULE OF INVESTMENTS
Screened World Equity Ex-US Fund
May 31, 2010
| | | | | |
Description | | Shares | | Market Value
($ Thousands) |
Thai Airways International | | 108,300 | | $ | 78 |
| | | | | |
| | | | | 282 |
| | | | | |
Turkey — 0.7% | | | | | |
Akbank | | 2,399 | | | 12 |
Cimsa Cimento Sanayi VE Tica | | 2,750 | | | 13 |
KOC Holding | | 23,986 | | | 83 |
Tupras Turkiye Petrol Rafine | | 868 | | | 16 |
Turkiye Garanti Bankasi | | 53,581 | | | 231 |
Turkiye Halk Bankasi | | 1,638 | | | 11 |
Turkiye Is Bankasi, Cl C | | 5,107 | | | 16 |
Turkiye Vakiflar Bankasi Tao, Cl D | | 47,351 | | | 100 |
Yapi ve Kredi Bankasi* | | 3,676 | | | 9 |
| | | | | |
| | | | | 491 |
| | | | | |
United Kingdom — 15.9% | | | | | |
3i Group | | 29,419 | | | 120 |
Acergy | | 4,500 | | | 66 |
Aggreko | | 2,230 | | | 41 |
Amlin | | 5,703 | | | 31 |
Anglo American* | | 6,832 | | | 261 |
ARM Holdings | | 53,023 | | | 188 |
Associated British Foods | | 5,689 | | | 78 |
AstraZeneca | | 14,616 | | | 614 |
Autonomy* | | 1,938 | | | 49 |
Aviva | | 24,035 | | | 110 |
BAE Systems | | 5,883 | | | 27 |
Barclays | | 46,217 | | | 202 |
BG Group | | 12,302 | | | 187 |
BHP Billiton | | 17,598 | | | 481 |
BP | | 92,296 | | | 658 |
British American Tobacco | | 26,816 | | | 787 |
British Sky Broadcasting Group | | 31,433 | | | 260 |
BT Group, Cl A | | 38,242 | | | 70 |
Cairn Energy* | | 45,006 | | | 260 |
Carnival | | 13,376 | | | 503 |
Catlin Group | | 9,629 | | | 45 |
Compass Group | | 26,124 | | | 201 |
Cookson Group | | 5,674 | | | 39 |
Diageo | | 5,466 | | | 83 |
Dimension Data Holdings | | 28,354 | | | 42 |
Firstgroup | | 2,249 | | | 12 |
GlaxoSmithKline | | 14,956 | | | 249 |
HSBC Holdings | | 8,266 | | | 75 |
Imperial Tobacco Group | | 10,653 | | | 276 |
International Power | | 8,492 | | | 35 |
Invensys | | 9,299 | | | 37 |
Investec | | 20,656 | | | 145 |
ITV | | 57,850 | | | 47 |
Kingfisher | | 95,082 | | | 305 |
Legal & General Group | | 75,646 | | | 86 |
Lloyds Banking Group | | 202,026 | | | 163 |
Meggitt | | 23,260 | | | 100 |
National Grid | | 3,462 | | | 25 |
Next | | 1,109 | | | 33 |
Pearson | | 19,215 | | | 263 |
Persimmon | | 6,030 | | | 35 |
Reckitt Benckiser Group | | 8,402 | | | 391 |
Rio Tinto | | 8,098 | | | 372 |
Rolls-Royce Group | | 14,090 | | | 119 |
Royal Bank of Scotland Group | | 189,740 | | | 126 |
SABMiller | | 15,729 | | | 442 |
| | | | | |
Description | | Shares | | Market Value
($ Thousands) |
Severn Trent | | 2,020 | | $ | 35 |
Shire | | 8,124 | | | 165 |
Smith & Nephew | | 19,355 | | | 174 |
Standard Chartered | | 26,037 | | | 612 |
Tesco | | 72,310 | | | 429 |
Tomkins | | 12,809 | | | 45 |
Unilever | | 3,271 | | | 88 |
United Utilities Group | | 6,613 | | | 51 |
Vedanta Resources | | 248 | | | 8 |
Vodafone Group | | 80,472 | | | 159 |
WM Morrison Supermarkets | | 10,667 | | | 41 |
Wolseley | | 4,000 | | | 94 |
WPP | | 27,397 | | | 257 |
| | | | | |
| | | | | 10,897 |
| | | | | |
United States — 1.1% | | | | | |
Boise* | | 9,225 | | | 57 |
Calamos Asset Management, Cl A | | 900 | | | 10 |
Capital One Financial | | 341 | | | 14 |
ConocoPhillips | | 2,900 | | | 150 |
Exxon Mobil | | 100 | | | 6 |
Johnson & Johnson | | 163 | | | 10 |
PHH* | | 2,400 | | | 53 |
Sanderson Farms | | 441 | | | 24 |
Seagate Technology* | | 6,000 | | | 92 |
South Financial Group | | 72,147 | | | 20 |
Southern Copper | | 5,100 | | | 150 |
Thomson Reuters (CAD) | | 3,100 | | | 110 |
Western Digital* | | 1,900 | | | 66 |
| | | | | |
| | | | | 762 |
| | | | | |
Total Common Stock (Cost $65,654) ($ Thousands) | | | | | 62,581 |
| | | | | |
PREFERRED STOCK — 0.6% | | | | | |
Germany — 0.6% | | | | | |
Henkel | | 1,920 | | | 91 |
ProSiebenSat.1 Media | | 6,263 | | | 96 |
RWE | | 88 | | | 6 |
Volkswagen | | 2,698 | | | 238 |
| | | | | |
| | | | | 431 |
South Korea — 0.0% | | | | | |
LG | | 280 | | | 7 |
| | | | | |
Total Preferred Stock (Cost $444) ($ Thousands) | | | | | 438 |
| | | | | |
| | |
| | | Number Of
Rights | | |
RIGHT — 0.0% | | | | | |
United Kingdom — 0.0% | | | | | |
National Grid, PLC, Expires 06/13/10 | | 1,384 | | | 3 |
| | | | | |
Total Right (Cost $0) ($ Thousands) | | | | | 3 |
| | | | | |
| | |
| | | Number of
Contracts | | |
WARRANTS — 0.0% | | | | | |
Hong Kong — 0.0% | | | | | |
Henderson Land Development, Expires 12/31/49 * | | 2,600 | | | — |
| | |
6 | | SEI Institutional Investments Trust /Annual Report/May 31, 2010 |
SCHEDULE OF INVESTMENTS
Screened World Equity Ex-US Fund
May 31, 2010
| | | | | | | | | |
Description | | | | Number of
Contracts/
Face Amount
($ Thousands) | | | | Market Value
($ Thousands) |
Singapore — 0.0% | | | | | |
Golden Agri-Resources, Expires 05/29/12 * | | 5,951 | | | | $ | 1 |
| | | | | | | | | |
Total Warrants (Cost $0) ($ Thousands) | | | | | 1 |
| | | | | | | | | |
U.S. TREASURY OBLIGATIONS — 0.5% | | | |
U.S. Treasury Bills (A) (B) | | | | | |
0.140%, 06/17/10 | | | | 10 | | | | | 10 |
0.134%, 06/03/10 | | | | 308 | | | | | 308 |
| | | | | | | | | |
| | | | | | | | | 318 |
| | | | | | | | | |
Total U.S. Treasury Obligations (Cost $318) ($ Thousands) | | | | | 318 |
| | | | | | | | | |
TIME DEPOSITS — 1.3% | | | | | |
United States — 1.3% | | | | | |
Brown Brothers Harriman | | | | | |
3.410%, 06/01/10 | | AUD | | 49 | | | | | 41 |
1.700%, 06/01/10 | | NZD | | 1 | | | | | 1 |
0.080%, 06/01/10 | | GBP | | 38 | | | | | 56 |
0.070%, 06/01/10 | | CAD | | 100 | | | | | 95 |
0.070%, 06/01/10 | | NOK | | 44 | | | | | 7 |
0.050%, 06/01/10 | | DKK | | 72 | | | | | 12 |
0.050%, 06/01/10 | | EUR | | 131 | | | | | 162 |
0.030%, 06/01/10 | | | | 351 | | | | | 351 |
0.010%, 06/01/10 | | CHF | | 33 | | | | | 29 |
0.010%, 06/01/10 | | HKD | | 105 | | | | | 13 |
0.010%, 06/01/10 | | JPY | | 7,548 | | | | | 83 |
0.010%, 06/01/10 | | SEK | | 131 | | | | | 17 |
0.010%, 06/01/10 | | SGD | | 15 | | | | | 10 |
| | | | | | | | | |
Total Time Deposits (Cost $877) ($ Thousands) | | | | | 877 |
| | | | | | | | | |
CASH EQUIVALENT — 5.2% | | | | | |
United States — 5.2% | | | | | |
SEI Daily Income Trust, Prime Obligation Fund, Cl A, 0.090%**† | | 3,595,702 | | | 3,596 |
| | | | | | | | | |
Total Cash Equivalent (Cost $3,596) ($ Thousands) | | | | | 3,596 |
| | | | | | | | | |
Total Investments — 98.6% (Cost $70,889)($ Thousands) | | | | $ | 67,807 |
| | | | | | | | | |
Percentages are based on a Net Assets of $68,743 ($ Thousands). |
| * | Non-income producing security. |
| ** | The rate reported is the 7-day effective yield as of May 31, 2010. |
| † | Investment in Affiliated Security. |
(A) The rate reported on the Schedule of Investments is the effective yield at time of purchase.
(B) Security, or a portion thereof, has been pledged as collateral on open futures contracts.
ADR — American Depositary Receipt
AUD — Australian Dollar
CAD — Canadian Dollar
CHF — Swiss Franc
Cl — Class
DKK — Danish Krone
EUR — Euro
GBP — British Pound Sterling
GDR — Global Depositary Receipt
HKD — Hong Kong Dollar
JPY — Japanese Yen
NOK — Norwegian Krone
NVDR — Non-Voting Depositary Receipt
NZD — New Zealand Dollar
REIT — Real Estate Investment Trust
S&P — Standard & Poor’s
SEK — Swedish Krone
Ser — Series
SGP — Singapore Dollar
Amounts designated as “—” are $O or have been rounded to $O.
A summary of the open futures contracts held by the Fund at May 31, 2010, is as follows:
| | | | | | | | |
Type of Contract | | Number of
Contracts
Long (Short) | | Expiration
Date | | Unrealized
Appreciation
(Depreciation)
($ Thousands) | |
DJ Euro Stoxx 50 Index | | 43 | | Jun-2010 | | $ | (71 | ) |
FTSE Index | | 12 | | Jun-2010 | | | (53 | ) |
Hang Seng Index | | 1 | | Jun-2010 | | | 4 | |
S&P TSE 60 Index | | 4 | | Jun-2010 | | | (7 | ) |
SPI 200 Index | | 3 | | Jun-2010 | | | (26 | ) |
Topix Index | | 10 | | Jun-2010 | | | (36 | ) |
| | | | | | | | |
| | | | | | $ | (189 | ) |
| | | | | | | | |
For the year ended May 31, 2010, the total amount of all open futures contracts, as presented in the table above, are representative of the volume of activity for this derivative type during the period.
| | |
7 | | SEI Institutional Investments Trust /Annual Report/May 31, 2010 |
(b) In accordance with Section 13(c) of the Investment Company Act of 1940 the Screened World Equity Ex-US Fund divested itself of the following security during the fiscal year ended May 31, 2010:
| (1) | Issuer Name: STATOIL ASA |
| (4) | Number of Shares divested: 4,950 |
| (5) | Date security was divested: January 8, 2010 |
| (6) | The Registrant no longer holds any shares of the divested security. |
Item 7. Disclosure of Proxy Voting Policies and Procedures for Closed-End Management Investment Companies.
Not applicable.
Item 8. Portfolio Managers of Closed-End Management Investment Companies
Not applicable.
Item 9. Purchases of Equity Securities by Closed-End Management Company and Affiliated Purchasers.
Not applicable.
Item 10. Submission of Matters to a Vote of Security Holders.
The Registrant has a standing Nominating Committee (the “Committee”) currently consisting of the Independent Trustees. The Committee is responsible for evaluating and recommending nominees for election to the Registrant’s Board of Trustees (the “Board”). Pursuant to the Committee’s Charter, adopted on June 18, 2004, as amended, the Committee will review all shareholder recommendations for nominations to fill vacancies on the Board if such recommendations are submitted in writing and addressed to the Committee at the Registrant’s office.
| Item 11. | Controls and Procedures. |
(a) The Registrant’s principal executive and principal financial officers, or persons performing similar functions, have concluded that the Registrant’s disclosure controls and procedures (as defined in Rule 30a-3(c) under the Investment Company Act of 1940 (the “1940 Act”)) are effective (except as noted below), based on the evaluation of these controls and procedures required by Rule 30a-3(b) under the 1940 Act and Rules 13a-15(b) or 15d-15(b) under the Securities Exchange Act of 1934 as of a date within 90 days of the filing date of this report.
In connection with its audit of the Registrant’s financial statements for the period ended May 31, 2010, KPMG has advised management that management did not maintain effective internal controls related to changes to security terms recorded in the accounting system which have not been authorized by management, including security interest yields in the SEI Institutional Investments Trust Emerging Markets Debt Fund. KPMG’s internal control report, which discussed this matter, is filed as an Exhibit to the Registrant’s most recent Form N-SAR.
(b) There were no significant changes in the Registrant’s internal control over financial reporting (as defined in Rule 30a-3(d) under the 1940 Act) that occurred during the last fiscal year that have materially affected, or are reasonably likely to materially affect, the Registrants internal control over financial reporting. Subsequent to the registrant’s last fiscal half-year a new control has been implemented to ensure the timely detection of changes to fixed income securities that materially impact a security’s interest yield.
(a)(1) Code of Ethics attached hereto.
(a)(2) A separate certification for the principal executive officer and the principal financial officer of the Registrant as required by Rule 30a-2(a) under the Investment Company Act of 1940, as amended (17 CFR 270.30a-2(a)), are filed herewith.
(b) Officer certifications as required by Rule 30a-2(b) under the Investment Company Act of 1940, as amended (17 CFR 270.30a-2(b)) also accompany this filing as an exhibit.
SIGNATURES
Pursuant to the requirements of the Securities Exchange Act of 1934 and the Investment Company Act of 1940, the Registrant has duly caused this report to be signed on its behalf by the undersigned, thereunto duly authorized.
| | |
| SEI Institutional Investments Trust |
| |
By | | /s/ Robert A. Nesher |
| | Robert A. Nesher |
| | President & CEO |
Date: July 30, 2010
Pursuant to the requirements of the Securities Exchange Act of 1934 and the Investment Company Act of 1940, this report has been signed below by the following persons on behalf of the Registrant and in the capacities and on the dates indicated.
| | |
By | | /s/ Robert A. Nesher |
| | Robert A. Nesher |
| | President & CEO |
Date: July 30, 2010
| | |
By | | /s/ Stephen F. Panner |
| | Stephen F. Panner |
| | Controller & CFO |
Date: July 30, 2010