UNITED STATES
SECURITIES AND EXCHANGE COMMISSION
Washington, D.C. 20549
FORM N-CSR
CERTIFIED SHAREHOLDER REPORT OF REGISTERED
MANAGEMENT INVESTMENT COMPANIES
Investment Company Act file number | 811-07261 |
|
CREDIT SUISSE TRUST |
(Exact name of registrant as specified in charter) |
|
One Madison Avenue, New York, New York | | 10010 |
(Address of principal executive offices) | | (Zip code) |
|
John G. Popp Credit Suisse Trust One Madison Avenue New York, New York 10010 |
(Name and address of agent for service) |
|
Registrant’s telephone number, including area code: | (212) 325-2000 | |
|
Date of fiscal year end: | December 31st | |
|
Date of reporting period: | January 1, 2016 to December 31, 2016 | |
| | | | | | | | | |
Item 1. Reports to Stockholders.

CREDIT SUISSE FUNDS
Annual Report
December 31, 2016
n CREDIT SUISSE TRUST
COMMODITY RETURN STRATEGY
PORTFOLIO
Credit Suisse Trust — Commodity Return Strategy Portfolio (the "Portfolio") shares are not available directly to individual investors, but may be offered only through certain insurance products and pension and retirement plans.
The Portfolio's investment objective, risks, charges and expenses (which should be considered carefully before investing), and more complete information about the Trust, are provided in the Prospectus, which should be read carefully before investing. You may obtain additional copies by calling 877-870-2874 or by visiting our website at www.credit-suisse.com/us/funds.
Credit Suisse Securities (USA) LLC, Distributor, is located at One Madison Avenue, New York, NY 10010. The Portfolio is advised by Credit Suisse Asset Management, LLC.
Portfolio shares are not deposits or other obligations of Credit Suisse Asset Management, LLC ("Credit Suisse") or any affiliate, are not FDIC-insured and are not guaranteed by Credit Suisse or any affiliate. Portfolio investments are subject to investment risks, including loss of your investment.
Credit Suisse Trust — Commodity Return Strategy Portfolio
Annual Investment Adviser's Report
December 31, 2016 (unaudited)
January 20, 2017
Dear Shareholder:
We are pleased to present this Annual Report covering the activities of the Credit Suisse Trust — Commodity Return Strategy Portfolio (the "Portfolio") for the 12 months ended December 31, 2016.
Performance Summary
01/01/16 – 12/31/16
Fund & Benchmark | | Performance | |
Credit Suisse Trust — Commodity Return
Strategy Portfolio1 | | | 12.02 | % | |
Bloomberg Commodity Index Total Return2 | | | 11.77 | % | |
Market and Strategy Review:
Commodities were higher for the 12 months ended December 31, 2016. The Bloomberg Commodity Index Total Return (the "Benchmark") increased 11.77%, with 16 out of 22 index constituents trading higher.
For the 12 months ended December 31, 2016, the Portfolio outperformed the Benchmark before fees and fund expenses. Commodity strategies and underlying cash management both positively contributed to relative performance. The Portfolio held futures contracts which expire on different dates than those held within the Benchmark; this forward curve positioning in the Energy and Agriculture sectors had a positive impact on performance relative to the Benchmark. The Portfolio also outperformed the Benchmark after fees and fund expenses.
Industrial Metals was the best performing sector, increasing 19.92%, led higher by Zinc. Zinc increased the most, returning 57.46%, amid a global supply deficit for the first 10 months of the year, as reported by the International Lead and Zinc Study Group. The sector was supported by increased demand out of China after stimulus measures helped to boost industrial production and manufacturing activity. The prospects for broader infrastructure spending in China and the U.S. in the coming year also supported base metals.
Energy ended the period 16.27% higher, as all components posted positive returns. The largest driver of returns in the sector was an acceleration of the market's expectation that oil supply and demand would come into balance sooner as low oil prices forced production cuts from U.S. shale while the Organization of the Petroleum Exporting Countries ("OPEC") and non-OPEC members, at the end of the year, coordinated output reductions. Ultra-Light
1
Credit Suisse Trust — Commodity Return Strategy Portfolio
Annual Investment Adviser's Report (continued)
December 31, 2016 (unaudited)
Sulfur Diesel (previously Heating Oil) gained 33.46% due to tightening supply conditions in the second quarter of the year as stronger-than-expected demand, refinery outages and increased exports helped to draw down record inventories. Brent Crude Oil rose 25.37% as, earlier in the year, increased geopolitical risks out of Nigeria, Libya and Venezuela reduced output while U.S. crude production fell as energy companies adapted to a lower price environment. In addition, major producers involved in the OPEC-led production cut agreement began preparing buyers in the last month of the year for reduced crude supplies in 2017. Natural Gas also increased after pipeline congestion in the U.S. Northeast, increased expectations for a colder-than-normal winter, and incremental demand from Liquefied Natural Gas and pipeline exports tightened the supply and demand outlook for the commodity.
Precious Metals increased 9.50%, with strong gains during the first half of the year, followed by smaller losses in the second half. 2016 began with uncertainty surrounding the health of the U.S. economy and continued with easy monetary policies from multiple major central banks, which fueled safe haven demand. During the fourth quarter, the sector lost ground due to the strengthening of the U.S. Dollar and higher Treasury yields as U.S. economic growth showed increasing strength.
Agriculture gained 2.10%. Kansas City Wheat and Chicago Wheat declined 25.25% and 24.05%, respectively, after favorable weather in the U.S. and Russia increased crop yield expectations amid already oversupplied stock conditions. A strong U.S. Dollar also incentivized exports out of Argentina and Europe rather than from the U.S. Corn decreased 9.75% also due to favorable growing conditions during the summer, which helped alleviate dryness in key growing areas in the U.S. Midwest, increasing production expectations. While grains generally detracted from performance, the sector was supported by softs, Soybeans and Soybean byproducts. Sugar was buoyed by reduced production expectations out of India, Brazil and Thailand due to unsuitable rain levels in each country. Soybeans and its derivatives also increased from strong Chinese demand for the U.S. product after flooding in Argentina harmed the quality of its crop.
Livestock declined 5.63%, led lower by Live Cattle, after the U.S. Department of Agriculture reported high feedlot placement and strong beef production earlier in the year, increasing supply expectations. Excess supply concerns also weighed on Lean Hogs as cheap grains lowered feed costs and helped lead to strong pork production.
2
Credit Suisse Trust — Commodity Return Strategy Portfolio
Annual Investment Adviser's Report (continued)
December 31, 2016 (unaudited)
Outlook:
Despite periodic financial market uncertainty throughout 2016 due to concerns around China and Europe as well as political surprises, including the "Brexit" referendum and the U.S. presidential election, the year ended strongly for commodities. The primary driver has been improving fundamentals for key commodities as cyclical over-supply resulting from the previous period of higher prices has further eroded, potentially setting up another period of cyclical under-supply. This was especially true for oil after OPEC and non-OPEC members agreed to reduce production, allowing prices to end the year in positive territory, something not seen since 2013. Over the course of 2017, market participants will be focused on whether these member countries comply with the agreed upon output quotas, as well as on monitoring the potential supply response from U.S. shale players as a result of higher prices. However, the price outlook has improved as the global oil supply and demand balance looks set to move into deficit in 2017 and as OPEC reasserts itself as a major player in the oil markets.
In the upcoming year, there could be significant variations in both monetary and fiscal policies across many key economies. In the past twelve months, the People's Bank of China, Bank of England, European Central Bank, and Bank of Japan all increased stimulus measures to support their respective economies. On the other hand, the U.S. Federal Reserve raised short-term interest rates in December and indicated the path for rate hikes in 2017 has accelerated. With China's manufacturing data reaching their highest level in December over the past five years, the Chinese government seemed to be indicating it may be looking to cool the pace of growth in order to avoid overheating its economy. Meanwhile, expectations have increased that growth may further accelerate in the U.S., with rising prospects for additional infrastructure spending and fiscal stimulus under the new administration. This divergence will continue to impact U.S. Dollar volatility and most likely commodity prices, in general, in the short term. If the present level of global differences in growth policies becomes the status quo, or U.S. interest rates are raised more slowly than currently anticipated, precious metals may regain some of their lost luster with investors. Additional fiscal stimulus measures in conjunction with continued loose monetary policy may potentially lead to more inflation risk. Amid this uncertainty, it may be more difficult to predict how markets will react, highlighting the benefits of holding commodities as a valuable asset class diversifier.
The Credit Suisse Commodities Management Team
Nelson Louie
Christopher Burton
3
Credit Suisse Trust — Commodity Return Strategy Portfolio
Annual Investment Adviser's Report (continued)
December 31, 2016 (unaudited)
This Portfolio is non-diversified, which means it may invest a greater proportion of its assets in the securities of a smaller number of issuers than a diversified mutual fund and may therefore be subject to greater volatility. The Portfolio's investment in commodity-linked derivative instruments may subject the Portfolio to greater volatility than investment in traditional securities, particularly in investments involving leverage.
The use of derivatives such as commodity-linked structured notes, swaps and futures entails substantial risks, including risk of loss of a significant portion of their principal value, commodity exposure risk, correlation risk, derivatives risk, exposure risk, fixed income risk, focus risk, futures contract risk, leveraging risk, liquidity risk, interest rate risk, market risk, portfolio turnover risk, structured note risk, subsidiary risk, swap agreements risk, U.S. government securities risk, credit risk and tax risk. Gains and losses from speculative positions in derivatives may be much greater than the derivative's cost. At any time, the risk of loss of any individual security held by the Portfolio could be significantly higher than 50% of the security's value. For a detailed discussion of these and other risks, please refer to the Portfolio's Prospectus, which should be read carefully before investing.
In addition to historical information, this report contains forward-looking statements, which may concern, among other things, domestic and foreign markets, industry and economic trends and developments, and government regulation and their potential impact on the Portfolio's investments. These statements are subject to risks and uncertainties and actual trends, developments and regulations in the future, and their impact on the Portfolio could be materially different from those projected, anticipated or implied. The Portfolio has no obligation to update or revise forward-looking statements.
The views of the Portfolio's management are as of the date of this letter and the Portfolio holdings described in this document are as of December 31, 2016; these views and Portfolio holdings may have changed subsequent to these dates. Nothing in this document is a recommendation to purchase or sell securities.
4
Credit Suisse Trust — Commodity Return Strategy Portfolio
Annual Investment Adviser's Report (continued)
December 31, 2016 (unaudited)
Comparison of Change in Value of $10,000 Investment in the
Credit Suisse Trust — Commodity Return Strategy Portfolio1, the Bloomberg Commodity Index Total Return2 and the
Standard & Poor's 500 Index3
For Ten Years
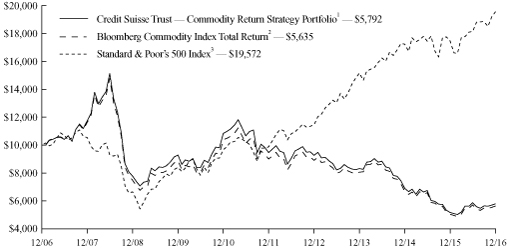
1 Fee waivers and/or expense reimbursements reduce expenses for the Portfolio, without which performance would be lower. The Portfolio entered into a written contract to limit expenses to 1.05% of the Portfolio's average daily net assets through at least May 1, 2018. This limit excludes certain expenses, as set forth in the Portfolio's Prospectus.
2 The Bloomberg Commodity Index Total Return is a broadly diversified futures index currently composed of futures contracts on 22 physical commodities. The Index does not have transaction costs and investors may not invest directly in the Index.
3 The Standard & Poor's 500 Index is an unmanaged index (with no defined investment objective) of common stocks, includes reinvestment of dividends, and is a registered trademark of The McGraw-Hill Companies, Inc. The Index does not have transaction costs and investors may not invest directly in the Index.
5
Credit Suisse Trust — Commodity Return Strategy Portfolio
Annual Investment Adviser's Report (continued)
December 31, 2016 (unaudited)
Average Annual Returns as of December 31, 20161 | |
| 1 Year | | 5 Years | | 10 Years | |
| | 12.02 | % | | | (9.36 | )% | | | (5.31 | )% | |
Returns represent past performance and include change in share price and reinvestment of dividends and capital gain distributions, if any. Past performance cannot guarantee future results. The current performance of the Portfolio may be lower or higher than the figures shown. Returns and share price will fluctuate, and redemption value may be more or less than original cost. The performance results do not reflect the deduction of taxes that a shareholder would pay on Portfolio distributions or the redemption of Portfolio shares. Performance information current to the most recent month end is available at www.credit-suisse.com/us/funds.
The annualized gross expense ratio is 1.07%. The annualized net expense ratio after fee waivers and/or expense reimbursements is 1.05%.
1 Fee waivers and/or expense reimbursements reduce expenses for the Portfolio, without which performance would be lower. The Portfolio entered into a written contract to limit expenses to 1.05% of the Portfolio's average daily net assets through at least May 1, 2018. This limit excludes certain expenses, as set forth in the Portfolio's Prospectus.
6
Credit Suisse Trust — Commodity Return Strategy Portfolio
Annual Investment Adviser's Report (continued)
December 31, 2016 (unaudited)
Information About Your Portfolio's Expenses
As an investor of the Portfolio, you incur two types of costs: ongoing expenses and transaction costs. Ongoing expenses include management fees, distribution and service (12b-1) fees and other Portfolio expenses. Examples of transaction costs include sales charges (loads), redemption fees and account maintenance fees, which are not shown in this section and which would result in higher total expenses. The following table is intended to help you understand your ongoing expenses of investing in the Portfolio and to help you compare these expenses with the ongoing expenses of investing in other mutual funds. The table is based on an investment of $1,000 made at the beginning of the six months ended December 31, 2016.
The table illustrates your Portfolio's expenses in two ways:
• Actual Portfolio Return. This helps you estimate the actual dollar amount of ongoing expenses paid on a $1,000 investment in the Portfolio using the Portfolio's actual return during the period. To estimate the expenses you paid over the period, simply divide your account value by $1,000 (for example, an $8,600 account value divided by $1,000 = 8.6), then multiply the result by the number in the "Expenses Paid per $1,000" line.
• Hypothetical 5% Portfolio Return. This helps you to compare the Portfolio's ongoing expenses with those of other mutual funds using the Portfolio's actual expense ratio and a hypothetical rate of return of 5% per year before expenses. Examples using a 5% hypothetical portfolio return may be found in the shareholder reports of other mutual funds. The hypothetical account values and expenses may not be used to estimate the actual ending account balance or expenses you paid for the period.
Please note that the expenses shown in these tables are meant to highlight your ongoing expenses only and do not reflect any transaction costs, such as sales charges (loads) or redemption fees. If these transaction costs had been included, your costs would have been higher. The "Expenses Paid per $1,000" line of the tables is useful in comparing ongoing expenses only and will not help you determine the relative total expenses of owning different funds.
7
Credit Suisse Trust — Commodity Return Strategy Portfolio
Annual Investment Adviser's Report (continued)
December 31, 2016 (unaudited)
Expenses and Value for a $1,000 Investment
for the six-month period ended December 31, 2016
Beginning Account Value 07/01/16 | | $ | 1,000.00 | | |
Ending Account Value 12/31/16 | | $ | 986.50 | | |
Expenses Paid per $1,000* | | $ | 5.24 | | |
Hypothetical 5% Portfolio Return | |
Beginning Account Value 07/01/16 | | $ | 1,000.00 | | |
Ending Account Value 12/31/16 | | $ | 1,019.86 | | |
Expenses Paid per $1,000* | | $ | 5.33 | | |
Annualized Expense Ratio* | | | 1.05 | % | |
* Expenses are equal to the Portfolio's annualized expense ratio multiplied by the average account value over the period, multiplied by 184/366 to reflect the one-half year period.
The "Expenses Paid per $1,000" and the "Annualized Expense Ratio" in the tables are based on actual expenses paid by the Portfolio during the period, net of fee waivers and/or actual expense reimbursements, if applicable. If those fee waivers and/or expense reimbursements had not been in effect, the Portfolio's actual expenses would have been higher. Expenses do not reflect additional charges and expenses that are, or may be, imposed under the variable contracts or plans. Such charges and expenses are described in the prospectus of the insurance company separate account or in the plan documents or other informational materials supplied by plan sponsors. The Portfolio's expenses should be considered with these charges and expenses in evaluating the overall cost of investing in the separate account.
For more information, please refer to the Portfolio's Prospectus.
Portfolio Breakdown*
United States Agency Obligations | | | 77.20 | % | |
United States Treasury Obligations | | | 19.25 | | |
Commodity Indexed Structured Notes | | | 2.16 | | |
Short-term Investment1 | | | 1.39 | | |
Total | | | 100.00 | % | |
* Expressed as a percentage of total investments (excluding securities lending collateral, if applicable) and may vary over time.
1 Primarily reflects cash invested in State Street Bank and Trust Co. Euro Time Deposit, for which the purchases of securities have been executed but not yet settled at December 31, 2016, if applicable.
8
Credit Suisse Trust — Commodity Return Strategy Portfolio
Consolidated Schedule of Investments
December 31, 2016
Par
(000) | |
| | Ratings†
(S&P/Moody's) | | Maturity | | Rate% | | Value | |
| COMMODITY INDEXED STRUCTURED NOTES (2.1%) | | | |
$ | 2,100 | | | BNP Paribas, Commodity Index Linked Senior
Unsecured Notes(1),(2),(3) | | (A, A1) | | 03/27/17 | | | 0.419 | | | $ | 3,182,510 | | |
| | 900 | | | Deutsche Bank AG London, Commodity Index
Linked Senior Unsecured Notes(1),(2),(3) | | (BBB+, A3) | | 02/14/17 | | | 0.567 | | | | 1,226,341 | | |
| | 2,000 | | | Deutsche Bank AG London, Commodity Index
Linked Senior Unsecured Notes(1),(2),(3) | | (BBB+, A3) | | 02/14/17 | | | 0.567 | | | | 2,846,192 | | |
| TOTAL COMMODITY INDEXED STRUCTURED NOTES (Cost $5,000,000) | | | 7,255,043 | | |
| UNITED STATES AGENCY OBLIGATIONS (74.6%) | | | |
| | 3,800 | | | Federal Farm Credit Banks(1) | | (AA+, Aaa) | | 04/05/18 | | | 0.900 | | | | 3,802,721 | | |
| | 3,800 | | | Federal Farm Credit Banks(1) | | (AA+, Aaa) | | 05/22/18 | | | 0.936 | | | | 3,813,517 | | |
| | 10,100 | | | Federal Farm Credit Banks(1) | | (AA+, Aaa) | | 06/12/18 | | | 0.970 | | | | 10,118,039 | | |
| | 2,500 | | | Federal Farm Credit Banks(1) | | (AA+, Aaa) | | 06/18/18 | | | 0.936 | | | | 2,506,522 | | |
| | 5,000 | | | Federal Farm Credit Banks(1) | | (AA+, Aaa) | | 06/22/18 | | | 1.046 | | | | 5,019,665 | | |
| | 4,700 | | | Federal Farm Credit Banks(1) | | (AA+, Aaa) | | 07/18/18 | | | 1.000 | | | | 4,711,012 | | |
| | 4,000 | | | Federal Farm Credit Banks(1) | | (AA+, Aaa) | | 08/01/18 | | | 0.911 | | | | 4,008,796 | | |
| | 4,000 | | | Federal Farm Credit Banks(1) | | (AA+, Aaa) | | 08/20/18 | | | 0.856 | | | | 4,009,424 | | |
| | 2,000 | | | Federal Farm Credit Banks(1) | | (AA+, Aaa) | | 10/19/18 | | | 0.868 | | | | 2,006,050 | | |
| | 10,987 | | | Federal Farm Credit Banks(1) | | (AA+, Aaa) | | 01/22/19 | | | 0.919 | | | | 11,008,260 | | |
| | 7,200 | | | Federal Farm Credit Banks(1) | | (AA+, Aaa) | | 02/25/19 | | | 0.931 | | | | 7,198,351 | | |
| | 10,400 | | | Federal Farm Credit Banks(1) | | (AA+, Aaa) | | 03/15/19 | | | 0.854 | | | | 10,421,705 | | |
| | 11,800 | | | Federal Farm Credit Banks(1) | | (AA+, Aaa) | | 08/19/19 | | | 0.926 | | | | 11,816,850 | | |
| | 3,600 | | | Federal Farm Credit Banks(1) | | (AA+, Aaa) | | 09/23/19 | | | 0.988 | | | | 3,605,969 | | |
| | 5,200 | | | Federal Farm Credit Banks(1) | | (AA+, Aaa) | | 10/24/19 | | | 0.936 | | | | 5,206,484 | | |
| | 7,900 | | | Federal Farm Credit Banks(1) | | (AA+, Aaa) | | 10/25/19 | | | 0.822 | | | | 7,900,229 | | |
| | 1,200 | | | Federal Farm Credit Banks | | (AA+, Aaa) | | 12/14/20 | | | 1.540 | | | | 1,186,742 | | |
| | 4,000 | | | Federal Farm Credit Banks(1) | | (AA+, Aaa) | | 02/05/21 | | | 0.985 | | | | 4,029,676 | | |
| | 1,800 | | | Federal Farm Credit Banks | | (AA+, Aaa) | | 02/17/21 | | | 1.470 | | | | 1,741,682 | | |
| | 1,700 | | | Federal Farm Credit Banks | | (AA+, Aaa) | | 02/17/21 | | | 1.580 | | | | 1,666,155 | | |
| | 8,000 | | | Federal Farm Credit Banks(1) | | (AA+, Aaa) | | 12/08/23 | | | 1.049 | | | | 8,007,984 | | |
| | 2,500 | | | Federal Home Loan Bank Discount Notes | | (AA+, Aaa) | | 02/28/17 | | | 0.510 | | | | 2,497,946 | | |
| | 5,500 | | | Federal Home Loan Bank Discount Notes | | (AA+, Aaa) | | 02/28/17 | | | 0.515 | | | | 5,495,436 | | |
| | 5,100 | | | Federal Home Loan Banks(1) | | (AA+, Aaa) | | 10/25/17 | | | 0.802 | | | | 5,109,889 | | |
| | 4,800 | | | Federal Home Loan Banks(1) | | (AA+, Aaa) | | 10/27/17 | | | 0.816 | | | | 4,809,763 | | |
| | 5,200 | | | Federal Home Loan Banks(1) | | (AA+, Aaa) | | 11/24/17 | | | 0.826 | | | | 5,209,537 | | |
| | 5,300 | | | Federal Home Loan Banks(1) | | (AA+, Aaa) | | 12/07/17 | | | 0.727 | | | | 5,305,634 | | |
| | 4,300 | | | Federal Home Loan Banks(1) | | (AA+, Aaa) | | 01/04/18 | | | 0.824 | | | | 4,309,873 | | |
| | 5,700 | | | Federal Home Loan Banks(1) | | (AA+, Aaa) | | 09/20/18 | | | 0.877 | | | | 5,702,901 | | |
| | 6,000 | | | Federal Home Loan Banks(1) | | (AA+, Aaa) | | 07/01/20 | | | 1.123 | | | | 6,032,976 | | |
| | 1,800 | | | Federal Home Loan Banks | | (AA+, Aaa) | | 07/13/21 | | | 1.480 | | | | 1,757,551 | | |
| | 5,800 | | | Federal Home Loan Mortgage Corp.(1) | | (AA+, Aaa) | | 01/08/18 | | | 0.842 | | | | 5,814,709 | | |
| | 4,600 | | | Federal Home Loan Mortgage Corp.(1) | | (AA+, Aaa) | | 03/08/18 | | | 0.971 | | | | 4,618,648 | | |
| | 7,450 | | | Federal Home Loan Mortgage Corp. | | (AA+, Aaa) | | 05/11/18 | | | 1.000 | | | | 7,434,780 | | |
| | 2,425 | | | Federal Home Loan Mortgage Corp. | | (AA+, Aaa) | | 05/25/18 | | | 1.050 | | | | 2,416,083 | | |
| | 6,400 | | | Federal Home Loan Mortgage Corp.(1) | | (AA+, Aaa) | | 07/17/18 | | | 0.650 | | | | 6,401,952 | | |
| | 12,000 | | | Federal Home Loan Mortgage Corp.(1) | | (AA+, Aaa) | | 07/24/18 | | | 0.632 | | | | 11,998,140 | | |
| | 5,500 | | | Federal Home Loan Mortgage Corp. | | (AA+, Aaa) | | 07/27/18 | | | 1.000 | | | | 5,460,268 | | |
See Accompanying Notes to Consolidated Financial Statements.
9
Credit Suisse Trust — Commodity Return Strategy Portfolio
Consolidated Schedule of Investments (continued)
December 31, 2016
Par
(000) | |
| | Ratings†
(S&P/Moody's) | | Maturity | | Rate% | | Value | |
| UNITED STATES AGENCY OBLIGATIONS (continued) | | | |
$ | 2,300 | | | Federal Home Loan Mortgage Corp. | | (AA+, Aaa) | | 09/21/18 | | | 1.000 | | | $ | 2,284,963 | | |
| | 6,900 | | | Federal Home Loan Mortgage Corp.(4) | | (AA+, Aaa) | | 02/01/19 | | | 0.750 | | | | 6,896,446 | | |
| | 6,700 | | | Federal National Mortgage Association(1) | | (AA+, Aaa) | | 01/11/18 | | | 0.846 | | | | 6,715,678 | | |
| | 5,200 | | | Federal National Mortgage Association | | (AA+, Aaa) | | 10/29/18 | | | 1.160 | | | | 5,193,235 | | |
| | 6,900 | | | Federal National Mortgage Association(4) | | (AA+, Aaa) | | 02/01/19 | | | 0.750 | | | | 6,898,993 | | |
| | 3,400 | | | Federal National Mortgage Association | | (AA+, Aaa) | | 02/26/19 | | | 1.250 | | | | 3,377,305 | | |
| | 14,000 | | | Federal National Mortgage Association(1) | | (AA+, Aaa) | | 02/28/19 | | | 0.756 | | | | 13,953,940 | | |
| | 5,200 | | | Federal National Mortgage Association(1) | | (AA+, Aaa) | | 03/08/19 | | | 0.649 | | | | 5,182,450 | | |
| | 2,200 | | | Federal National Mortgage Association | | (AA+, Aaa) | | 04/28/21 | | | 1.650 | | | | 2,150,469 | | |
| | 2,200 | | | Federal National Mortgage Association
Discount Notes | | (AA+, Aaa) | | 01/17/17 | | | 0.402 | | | | 2,199,607 | | |
| TOTAL UNITED STATES AGENCY OBLIGATIONS (Cost $259,036,622) | | | 259,015,005 | | |
| UNITED STATES TREASURY OBLIGATIONS (18.6%) | | | |
| | 1,200 | | | United States Treasury Bill | | (AA+, Aaa) | | 02/02/17 | | | 0.350 | | | | 1,199,627 | | |
| | 9,100 | | | United States Treasury Floating Rate Notes(1),(5) | | (AA+, Aaa) | | 10/31/17 | | | 0.724 | | | | 9,113,350 | | |
| | 8,000 | | | United States Treasury Floating Rate Notes(1),(5),(6) | | (AA+, Aaa) | | 01/31/18 | | | 0.828 | | | | 8,024,256 | | |
| | 7,000 | | | United States Treasury Floating Rate Notes(1),(5) | | (AA+, Aaa) | | 04/30/18 | | | 0.746 | | | | 7,013,671 | | |
| | 2,500 | | | United States Treasury Floating Rate Notes(1),(5) | | (AA+, Aaa) | | 07/31/18 | | | 0.730 | | | | 2,502,777 | | |
| | 23,000 | | | United States Treasury Floating Rate Notes(1) | | (AA+, Aaa) | | 10/31/18 | | | 0.686 | | | | 23,008,349 | | |
| | 1,000 | | | United States Treasury Notes | | (AA+, Aaa) | | 01/15/17 | | | 0.750 | | | | 1,000,091 | | |
| | 2,000 | | | United States Treasury Notes | | (AA+, Aaa) | | 01/31/17 | | | 0.875 | | | | 2,000,722 | | |
| | 3,000 | | | United States Treasury Notes | | (AA+, Aaa) | | 02/15/17 | | | 0.625 | | | | 3,000,508 | | |
| | 2,000 | | | United States Treasury Notes | | (AA+, Aaa) | | 02/28/17 | | | 0.875 | | | | 2,001,189 | | |
| | 1,500 | | | United States Treasury Notes | | (AA+, Aaa) | | 03/31/17 | | | 3.250 | | | | 1,509,960 | | |
| | 1,500 | | | United States Treasury Notes | | (AA+, Aaa) | | 11/30/17 | | | 2.250 | | | | 1,518,603 | | |
| | 2,700 | | | United States Treasury Notes(7) | | (AA+, Aaa) | | 11/30/18 | | | 1.000 | | | | 2,691,668 | | |
| TOTAL UNITED STATES TREASURY OBLIGATIONS (Cost $64,527,653) | | | 64,584,771 | | |
Number of
Shares | |
| |
| |
| |
| |
| |
| SHORT-TERM INVESTMENTS (2.1%) | | | |
| | 2,745,795 | | | State Street Navigator Securities Lending Government
Money Market Portfolio, 0.50%(8) | | | | | | | | | | | | | | | 2,745,795 | | |
Par
(000) | |
| |
| |
Maturity | |
Rate% | |
| |
$ | 4,662 | | | State Street Bank and Trust Co. Euro Time Deposit | | | | 01/03/17 | | | 0.010 | | | | 4,662,134 | | |
| TOTAL SHORT-TERM INVESTMENTS (Cost $7,407,929) | | | 7,407,929 | | |
| TOTAL INVESTMENTS AT VALUE (97.4%) (Cost $335,972,204) | | | 338,262,748 | | |
| OTHER ASSETS IN EXCESS OF LIABILITIES (2.6%) | | | 8,855,272 | | |
| NET ASSETS (100.0%) | | $ | 347,118,020 | | |
See Accompanying Notes to Consolidated Financial Statements.
10
Credit Suisse Trust — Commodity Return Strategy Portfolio
Consolidated Schedule of Investments (continued)
December 31, 2016
† Credit ratings given by the Standard & Poor's Division of The McGraw-Hill Companies, Inc. ("S&P") and Moody's Investors Service, Inc. (Moody's) are unaudited.
(1) Variable rate obligation — The interest rate shown is as of December 31, 2016.
(2) Return on security is linked to the Bloomberg Commodity Index Total Return. The Bloomberg Commodity Index Total Return is composed of futures contracts on 22 physical commodities.
(3) Security exempt from registration under Rule 144A of the Securities Act of 1933, as amended. These securities may be resold in transactions exempt from registration, normally to qualified institutional buyers. At December 31, 2016, these securities amounted to a value of $7,255,043 or 2.1% of net assets.
(4) Step Bond — The interest rate shown is as of December 31, 2016 and will reset at a future date.
(5) At December 31, 2016, $6,906,986 in the value of these securities has been pledged as collateral for open swap contracts.
(6) At December 31, 2016, $2,507,580 in the value of this security has been pledged to cover initial margin requirements for open futures contracts.
(7) Security or portion thereof is out on loan (See note 2-J).
(8) Represents security purchased with cash collateral received for securities on loan. The rate shown is the annualized one-day yield at December 31, 2016.
Futures Contracts | |
Contract Description | | Currency | | Expiration
Date | | Number of
Contracts | | Notional
Value | | Net Unrealized
Appreciation
(Depreciation) | |
Contracts to Purchase | | | | | | | | | | | |
Energy | | USD | | | | Mar 2017 | | | 61 | | | $ | 2,247,240 | | | $ | 403,791 | | |
| | | USD | | | | Oct 2017 | | | 58 | | | | 2,070,600 | | | | 163,613 | | |
| | | USD | | | | Apr 2018 | | | 22 | | | | 655,160 | | | | 9,674 | | |
| | | | | | | | | | | $ | 577,078 | | |
Contracts to Sell | | | | | | | | | | | | | | | | | | | |
Energy | | USD | | | | Apr 2017 | | | (119 | ) | | | (4,243,540 | ) | | $ | (626,789 | ) | |
| | | USD | | | | Mar 2018 | | | (22 | ) | | | (795,520 | ) | | | (25,193 | ) | |
| | | | | | | | | | | $ | (651,982 | ) | |
Net unrealized appreciation (depreciation) | | | | | | | | | | $ | (74,904 | ) | |
See Accompanying Notes to Consolidated Financial Statements.
11
Credit Suisse Trust — Commodity Return Strategy Portfolio
Consolidated Schedule of Investments (continued)
December 31, 2016
Commodity Index Swap Contracts | | | | | |
Currency | | Notional
Amount | | Expiration
Date | | Counterparty | | Receive | | Pay | | Net Unrealized
Appreciation
(Depreciation) | |
USD | | | | $ | 12,863,699 | | | 01/24/17 | | Bank of America | | Commodity Index
Return(1) | | 3-month T-Bill Rate
plus a negotiated
dealer rate | | $ | 156,438 | | |
USD | | | | | 27,312,882 | | | 01/24/17 | | Bank of America | | Commodity Index
Return(1) | | 3-month T-Bill Rate
plus a negotiated
dealer rate | | | 342,654 | | |
USD | | | | | 1,899,263 | | | 01/24/17 | | Bank of America | | Commodity Index
Return(1) | | 3-month T-Bill Rate
plus a negotiated
dealer rate | | | 24,366 | | |
USD | | | | | 17,550,387 | | | 01/24/17 | | CIBC | | Commodity Index
Return(1) | | 3-month T-Bill Rate
plus a negotiated
dealer rate | | | 225,202 | | |
USD | | | | | 13,214,367 | | | 01/24/17 | | CIBC | | Commodity Index
Return(1) | | 3-month T-Bill Rate
plus a negotiated
dealer rate | | | 160,669 | | |
USD | | | | | 13,495,902 | | | 01/24/17 | | Citigroup | | Commodity Index
Return(1) | | 3-month T-Bill Rate
plus a negotiated
dealer rate | | | 173,176 | | |
USD | | | | | 36,608,514 | | | 01/24/17 | | Citigroup | | Commodity Index
Return(1) | | 3-month T-Bill Rate
plus a negotiated
dealer rate | | | 444,841 | | |
USD | | | | | 8,829,224 | | | 01/24/17 | | JPMorgan Chase | | Commodity Index
Return(1) | | 3-month T-Bill Rate
plus a negotiated
dealer rate | | | 113,251 | | |
USD | | | | | 9,137,880 | | | 01/24/17 | | JPMorgan Chase | | Commodity Index
Return(1) | | 3-month T-Bill Rate
plus a negotiated
dealer rate | | | 111,060 | | |
USD | | | | | 4,158,895 | | | 01/24/17 | | Macquarie | | Commodity Index
Return(1) | | 3-month T-Bill Rate
plus a negotiated
dealer rate | | | 53,345 | | |
USD | | | | | 33,050,107 | | | 01/24/17 | | Macquarie | | Commodity Index
Return(1) | | 3-month T-Bill Rate
plus a negotiated
dealer rate | | | 418,664 | | |
USD | | | | | 18,317,318 | | | 01/24/17 | | Morgan Stanley | | Commodity Index
Return(1) | | 3-month T-Bill Rate
plus a negotiated
dealer rate | | | 234,952 | | |
USD | | | | | 20,274,514 | | | 01/24/17 | | Morgan Stanley | | Commodity Index
Return(1) | | 3-month T-Bill Rate
plus a negotiated
dealer rate | | | 246,362 | | |
USD | | | | | 21,015,299 | | | 01/24/17 | | Societe Generale | | Commodity Index
Return(1) | | 3-month T-Bill Rate
plus a negotiated
dealer rate | | | 269,559 | | |
USD | | | | | 25,275,178 | | | 01/24/17 | | Societe Generale | | Commodity Index
Return(1) | | 3-month T-Bill Rate
plus a negotiated
dealer rate | | | 307,126 | | |
USD | | | | | 28,977,377 | | | 01/24/17 | | Societe Generale | | Commodity Index
Return(1) | | 3-month T-Bill Rate
plus a negotiated
dealer rate | | | 347,002 | | |
See Accompanying Notes to Consolidated Financial Statements.
12
Credit Suisse Trust — Commodity Return Strategy Portfolio
Consolidated Schedule of Investments (continued)
December 31, 2016
| Commodity Index Swap Contracts (continued) | |
Currency | | Notional
Amount | | Expiration
Date | | Counterparty | | Receive | | Pay | | Net Unrealized
Appreciation
(Depreciation) | |
USD | | | | $ | 18,401,442 | | | 01/24/17 | | UBS | | Commodity Index
Return(1) | | 3-month T-Bill Rate
plus a negotiated
dealer rate | | $ | 236,031 | | |
USD | | | | | 13,804,793 | | | 01/24/17 | | UBS | | Commodity Index
Return(1) | | 3-month T-Bill Rate
plus a negotiated
dealer rate | | | 167,746 | | |
| | | $ | 4,032,444 | | |
(1) The Commodity Index Return is comprised of futures contracts on physical commodities.
See Accompanying Notes to Consolidated Financial Statements.
13
Credit Suisse Trust — Commodity Return Strategy Portfolio
Consolidated Statement of Assets and Liabilities
December 31, 2016
Assets | |
Investments at value, including collateral for securities on loan of $2,745,795
(Cost $335,972,204) (Note 2) | | $ | 338,262,7481 | | |
Cash | | | 50,000 | | |
Cash segregated at brokers for swap contracts (Note 2) | | | 7,380,020 | | |
Unrealized appreciation on open swap contracts (Note 2) | | | 4,032,444 | | |
Interest receivable | | | 433,582 | | |
Receivable for Portfolio shares sold | | | 232,289 | | |
Prepaid expenses and other assets | | | 2,479 | | |
Total assets | | | 350,393,562 | | |
Liabilities | |
Investment management fee payable (Note 3) | | | 148,879 | | |
Administrative services fee payable (Note 3) | | | 20,089 | | |
Shareholder servicing/Distribution fee payable (Note 3) | | | 72,892 | | |
Payable upon return of securities loaned (Note 2) | | | 2,745,795 | | |
Payable for Portfolio shares redeemed | | | 89,344 | | |
Trustees' fee payable | | | 5,158 | | |
Variation margin payable on futures contracts (Note 2) | | | 4,211 | | |
Accrued expenses | | | 189,174 | | |
Total liabilities | | | 3,275,542 | | |
Net Assets | |
Capital stock, $.001 par value (Note 6) | | | 79,205 | | |
Paid-in capital (Note 6) | | | 325,382,506 | | |
Undistributed net investment income | | | 33,847,009 | | |
Accumulated net realized loss on investments, futures contracts and swap contracts | | | (18,438,784 | ) | |
Net unrealized appreciation from investments, futures contracts and swap contracts | | | 6,248,084 | | |
Net assets | | $ | 347,118,020 | | |
Shares outstanding | | | 79,205,262 | | |
Net asset value, offering price and redemption price per share | | $ | 4.38 | | |
1 Includes $2,691,360 of securities on loan.
See Accompanying Notes to Consolidated Financial Statements.
14
Credit Suisse Trust — Commodity Return Strategy Portfolio
Consolidated Statement of Operations
For the Year Ended December 31, 2016
Investment Income | |
Interest | | $ | 2,185,422 | | |
Securities lending (net of rebates) | | | 1,836 | | |
Total investment income | | | 2,187,258 | | |
Expenses | |
Investment advisory fees (Note 3) | | | 1,601,886 | | |
Administrative services fees (Note 3) | | | 299,751 | | |
Shareholder servicing/Distribution fees (Note 3) | | | 781,712 | | |
Transfer agent fees (Note 3) | | | 352,376 | | |
Printing fees | | | 107,069 | | |
Legal fees | | | 64,734 | | |
Audit and tax fees | | | 60,513 | | |
Trustees' fees | | | 32,096 | | |
Custodian fees | | | 31,103 | | |
Commitment fees (Note 4) | | | 10,215 | | |
Insurance expense | | | 7,073 | | |
Miscellaneous expense | | | 7,556 | | |
Total expenses | | | 3,356,084 | | |
Less: fees waived (Note 3) | | | (72,895 | ) | |
Net expenses | | | 3,283,189 | | |
Net investment loss | | | (1,095,931 | ) | |
Net Realized and Unrealized Gain (Loss) from Investments, Futures Contracts and Swap Contracts | |
Net realized loss from investments | | | (1,337,844 | ) | |
Net realized gain from futures contracts | | | 275,477 | | |
Net realized gain from swap contracts | | | 32,011,058 | | |
Net change in unrealized appreciation (depreciation) from investments | | | 3,301,545 | | |
Net change in unrealized appreciation (depreciation) from futures contracts | | | 71,260 | | |
Net change in unrealized appreciation (depreciation) from swap contracts | | | 2,585,692 | | |
Net realized and unrealized gain from investments, futures contracts and swap contracts | | | 36,907,188 | | |
Net increase in net assets resulting from operations | | $ | 35,811,257 | | |
See Accompanying Notes to Consolidated Financial Statements.
15
Credit Suisse Trust — Commodity Return Strategy Portfolio
Consolidated Statement of Changes in Net Assets
| | | For the Year
Ended
December 31, 2016 | | For the Year
Ended
December 31, 2015 | |
From Operations | |
Net investment loss | | $ | (1,095,931 | ) | | $ | (2,092,524 | ) | |
Net realized gain (loss) from investments, futures contracts and
swap contracts | | | 30,948,691 | | | | (93,732,481 | ) | |
Net change in unrealized appreciation (depreciation)
from investments, futures contracts and swap contracts | | | 5,958,497 | | | | 13,716,079 | | |
Net increase (decrease) in net assets resulting from operations | | | 35,811,257 | | | | (82,108,926 | ) | |
| From Capital Share Transactions (Note 6) | |
Proceeds from sale of shares | | | 51,657,341 | | | | 95,802,741 | | |
Net asset value of shares redeemed | | | (15,185,554 | ) | | | (11,913,752 | ) | |
Net increase in net assets from capital share transactions | | | 36,471,787 | | | | 83,888,989 | | |
Net increase in net assets | | | 72,283,044 | | | | 1,780,063 | | |
Net Assets | |
Beginning of year | | | 274,834,976 | | | | 273,054,913 | | |
End of year | | $ | 347,118,020 | | | $ | 274,834,976 | | |
Undistributed net investment income | | $ | 33,847,009 | | | $ | — | | |
See Accompanying Notes to Consolidated Financial Statements.
16
Credit Suisse Trust — Commodity Return Strategy Portfolio
Consolidated Financial Highlights
(For a Share of the Portfolio Outstanding Throughout Each Year)
| | | For the Year Ended December 31, | |
| | | 2016 | | 2015 | | 2014 | | 2013 | | 2012 | |
Per share data | |
Net asset value, beginning of year | | $ | 3.91 | | | $ | 5.22 | | | $ | 6.29 | | | $ | 7.01 | | | $ | 7.16 | | |
INVESTMENT OPERATIONS | |
Net investment loss1 | | | (0.01 | ) | | | (0.03 | ) | | | (0.05 | ) | | | (0.05 | ) | | | (0.06 | ) | |
Net gain (loss) from investments, futures
contracts and swap contracts (both realized
and unrealized) | | | 0.48 | | | | (1.28 | ) | | | (1.02 | ) | | | (0.67 | ) | | | (0.09 | ) | |
Total from investment operations | | | 0.47 | | | | (1.31 | ) | | | (1.07 | ) | | | (0.72 | ) | | | (0.15 | ) | |
Net asset value, end of year | | $ | 4.38 | | | $ | 3.91 | | | $ | 5.22 | | | $ | 6.29 | | | $ | 7.01 | | |
Total return2 | | | 12.02 | % | | | (25.10 | )% | | | (17.01 | )% | | | (10.27 | )% | | | (2.09 | )% | |
RATIOS AND SUPPLEMENTAL DATA | |
Net assets, end of year (000s omitted) | | $ | 347,118 | | | $ | 274,835 | | | $ | 273,055 | | | $ | 257,040 | | | $ | 93,435 | | |
Ratio of net expenses to average net assets | | | 1.05 | % | | | 1.05 | % | | | 1.05 | % | | | 1.05 | % | | | 1.05 | % | |
Ratio of net investment loss to average net assets | | | (0.35 | )% | | | (0.73 | )% | | | (0.83 | )% | | | (0.83 | )% | | | (0.80 | )% | |
Decrease reflected in above operating expense
ratios due to waivers/reimbursements | | | 0.02 | % | | | 0.04 | % | | | 0.05 | % | | | 0.28 | % | | | 0.15 | % | |
Portfolio turnover rate | | | 113 | % | | | 113 | % | | | 96 | % | | | 41 | %3 | | | 84 | % | |
1 Per share information is calculated using the average shares outstanding method.
2 Total returns are historical and include change in share price and reinvestment of all dividends and distributions. Had certain expenses not been reduced during the years shown, total returns would have been lower. Total returns do not reflect charges and expenses attributable to any particular variable contract or plan.
3 Portfolio turnover calculation does not include $170,753,807 of in-kind subscription.
See Accompanying Notes to Consolidated Financial Statements.
17
Credit Suisse Trust — Commodity Return Strategy Portfolio
Notes to Consolidated Financial Statements
December 31, 2016
Credit Suisse Trust (the "Trust") is an open-end management investment company registered under the Investment Company Act of 1940, as amended (the "1940 Act"), which currently offers the Commodity Return Strategy Portfolio (the "Portfolio"). The Portfolio is a non-diversified, open-end management investment company that seeks total return that exceeds the return of its benchmark index, the Bloomberg Commodity Index Total Return (the "Benchmark"). Shares of the Portfolio are not available directly to individual investors but may be offered only through (a) variable annuity contracts and variable life insurance contracts offered by separate accounts of certain insurance companies and (b) tax qualified pension and retirement plans. The Portfolio may not be available in connection with a particular contract or plan. The Trust was organized under the laws of the Commonwealth of Massachusetts as a business trust on March 15, 1995.
Credit Suisse Asset Management, LLC ("Credit Suisse"), the investment adviser to the Portfolio, is registered as a Commodity Pool Operator with the Commodity Futures Trading Commission. The Portfolio intends to gain exposure to commodity derivatives through investing in a wholly-owned subsidiary, Credit Suisse Cayman Commodity Fund II, Ltd. (the "Subsidiary"), organized under the laws of the Cayman Islands. The Subsidiary invests in commodity-linked derivative instruments, such as swaps and futures. The Subsidiary may also invest in debt securities, some of which are intended to serve as margin or collateral for the Subsidiary's derivatives positions.
The Subsidiary is managed by the same portfolio managers that manage the Portfolio and the accompanying financial statements reflect the financial position of the Portfolio and the Subsidiary and the results of operations on a consolidated basis. The consolidated financial statements include portfolio holdings of the Portfolio and the Subsidiary and all intercompany transactions and balances have been eliminated. The Portfolio may invest up to 25% of its total assets in the Subsidiary. As of December 31, 2016, the Portfolio held $65,257,020 in the Subsidiary, representing 18.8% of the Portfolio's consolidated net assets. For the year ended December 31, 2016, the net realized gain on securities and other financial instruments held in the Subsidiary was $32,285,988.
Subsequent references to the Portfolio within the Notes to Consolidated Financial Statements collectively refer to the Portfolio and the Subsidiary.
Note 2. Significant Accounting Policies
The following is a summary of significant accounting policies followed by the Portfolio in the preparation of its consolidated financial statements. The policies
18
Credit Suisse Trust — Commodity Return Strategy Portfolio
Notes to Consolidated Financial Statements (continued)
December 31, 2016
Note 2. Significant Accounting Policies (continued)
are in accordance with accounting principles generally accepted in the United States of America ("GAAP"). The preparation of consolidated financial statements requires management to make estimates and assumptions that affect the reported amounts and disclosures in the consolidated financial statements. Actual results could differ from those estimates. The Portfolio is considered an investment company for financial reporting purposes under GAAP and follows Accounting Standard Codification ("ASC") Topic 946 — Financial Services — Investment Companies.
A) SECURITY VALUATION — The net asset value of the Portfolio is determined daily as of the close of regular trading on the New York Stock Exchange, Inc. (the "Exchange") on each day the Exchange is open for business. The valuations for fixed income securities (which may include, but are not limited to, corporate, government, municipal, mortgage-backed, collateralized mortgage obligations and asset-backed securities) and certain derivative instruments are typically the prices supplied by independent third party pricing services, which may use market prices or broker/dealer quotations or a variety of valuation techniques and methodologies. The independent third party pricing services use inputs that are observable such as issuer details, interest rates, yield curves, prepayment speeds, credit risks/spreads, default rates and quoted prices for similar securities. These pricing services generally price fixed income securities assuming orderly transactions of an institutional "round lot" size, but some trades occur in smaller "odd lot" sizes which may be effected at lower prices than institutional round lot trades. Structured note agreements are valued in accordance with a dealer-supplied valuation based on changes in the value of the underlying index. Futures contracts are valued daily at the settlement price established by the board of trade or exchange on which they are traded. Forward contracts are valued at the London closing spot rates and the London closing forward point rates on a daily basis. The currency forward contract pricing model derives the differential in point rates to the expiration date of the forward and calculates its present value. Equity securities for which market quotations are available are valued at the last reported sales price or official closing price on the primary market or exchange on which they trade. The Portfolio may utilize a service provided by an independent third party which has been approved by the Board of Trustees (the "Board") to fair value certain securities. When fair value pricing is employed, the prices of securities used by the Trust to calculate its net asset value may differ from quoted or published prices for the same securities. If independent third party pricing services are unable to supply prices for a portfolio investment, or if the prices supplied are deemed by the investment
19
Credit Suisse Trust — Commodity Return Strategy Portfolio
Notes to Consolidated Financial Statements (continued)
December 31, 2016
Note 2. Significant Accounting Policies (continued)
adviser to be unreliable, the market price may be determined by the investment adviser using quotations from one or more brokers/dealers or at the transaction price if the security has recently been purchased and no value has yet been obtained from a pricing service or pricing broker. When reliable prices are not readily available, such as when the value of a security has been significantly affected by events after the close of the exchange or market on which the security is principally traded, but before the Portfolio calculates its net asset value, the Portfolio values these securities as determined in accordance with procedures approved and established by the Board.
The Portfolio uses valuation techniques to measure fair value that are consistent with the market approach and/or income approach, depending on the type of security and the particular circumstance. The market approach uses prices and other relevant information generated by market transactions involving identical or comparable securities. The income approach uses valuation techniques to discount estimated future cash flows to present value.
GAAP established a disclosure hierarchy that categorizes the inputs to valuation techniques used to value assets and liabilities at each measurement date. These inputs are summarized in the three broad levels listed below:
• Level 1 – quoted prices in active markets for identical investments
• Level 2 – other significant observable inputs (including quoted prices for similar investments, interest rates, prepayment speeds, credit risk, etc.)
• Level 3 – significant unobservable inputs (including the Portfolio's own assumptions in determining the fair value of investments)
The inputs or methodologies used to value securities are not necessarily an indication of the risk associated with investing in those securities.
The following is a summary of the inputs used as of December 31, 2016 in valuing the Portfolio's assets and liabilities carried at fair value:
Assets | | Level 1 | | Level 2 | | Level 3 | | Total | |
Investments in Securities | |
Commodity Indexed Structured Notes | | $ | — | | | $ | 7,255,043 | | | $ | — | | | $ | 7,255,043 | | |
United States Agency Obligations | | | — | | | | 259,015,005 | | | | — | | | | 259,015,005 | | |
United States Treasury Obligations | | | — | | | | 64,584,771 | | | | — | | | | 64,584,771 | | |
Short-term Investments | | | — | | | | 7,407,929 | | | | — | | | | 7,407,929 | | |
| | | $ | — | | | $ | 338,262,748 | | | $ | — | | | $ | 338,262,748 | | |
Other Financial Instruments* | |
Futures Contracts | | $ | 577,078 | | | $ | — | | | $ | — | | | $ | 577,078 | | |
Swap Contracts** | | | — | | | | 4,032,444 | | | | — | | | | 4,032,444 | | |
20
Credit Suisse Trust — Commodity Return Strategy Portfolio
Notes to Consolidated Financial Statements (continued)
December 31, 2016
Note 2. Significant Accounting Policies (continued)
Liabilities | | Level 1 | | Level 2 | | Level 3 | | Total | |
Other Financial Instruments* | |
Futures Contracts | | $ | 651,982 | | | $ | — | | | $ | — | | | $ | 651,982 | | |
* Other financial instruments include unrealized appreciation (depreciation) on futures and swap contracts.
** Value includes any premium paid or received with respect to swap contracts, if applicable.
For the year ended December 31, 2016, there were no transfers among Level 1, Level 2 and Level 3. All transfers, if any, are assumed to occur at the end of the reporting period.
B) DERIVATIVE INSTRUMENTS AND HEDGING ACTIVITIES — The Portfolio adopted amendments to authoritative guidance on disclosures about derivative instruments and hedging activities which require that a portfolio disclose (a) how and why an entity uses derivative instruments, (b) how derivative instruments and hedging activities are accounted for and (c) how derivative instruments and related hedging activities affect a portfolio's financial position, financial performance and cash flows. For the year ended December 31, 2016, the Portfolio's derivatives did not qualify for hedge accounting as they are held at fair value.
Fair Value of Derivative Instruments as of December 31, 2016
| | | Asset Derivatives | | Liability Derivatives | |
| | | Balance Sheet
Location | | Fair Value | | Balance Sheet
Location | | Fair Value | |
Commodity Index
Return Contracts | | Unrealized appreciation
on futures contracts | | $ | 577,078 | * | | Unrealized depreciation
on futures contracts | | $ | 651,982 | * | |
| | | Unrealized appreciation
on swap contracts | | | 4,032,444 | | | Unrealized depreciation
on swap contracts | | | — | | |
| | | | | $ | 4,609,522 | | | | | $ | 651,982 | | |
*Reflects cumulative appreciation (depreciation) on futures contracts as reported in the Consolidated Statement of Assets and Liabilities and Notes to Consolidated Financial Statements. Only unsettled variation margin receivable (payable) is reported in the Consolidated Statement of Assets and Liabilities.
Effect of Derivative Instruments on the Consolidated Statement of Operations
| | | Location | | Realized
Gain (Loss) | | Location | | Net Unrealized
Appreciation
(Depreciation) | |
Commodity Index
Return Contracts | | Net realized gain
from futures
contracts | | $ | 275,477 | | | Net change in unrealized
appreciation (depreciation)
from futures contracts | | $ | 71,260 | | |
| | | Net realized gain
from swap
contracts | | | 32,011,058 | | | Net change in unrealized
appreciation (depreciation)
from swap contracts | | | 2,585,692 | | |
| | | | | | | $ | 32,286,535 | | | | | | | $ | 2,656,952 | | |
21
Credit Suisse Trust — Commodity Return Strategy Portfolio
Notes to Consolidated Financial Statements (continued)
December 31, 2016
Note 2. Significant Accounting Policies (continued)
For the year ended December 31, 2016, the Portfolio held average monthly notional values on a net basis of $3,768,712, $3,587,032 and $296,438,510 in long futures contracts, short futures contracts and swap contracts, respectively.
The Portfolio is a party to International Swap and Derivatives Association, Inc. ("ISDA") Master Agreements ("Master Agreements") with certain counterparties that govern over-the-counter derivative (including Total Return, Credit Default and Interest Rate Swaps) and foreign exchange contracts entered into by the Portfolio. The Master Agreements may contain provisions regarding, among other things, the parties' general obligations, representations, agreements, collateral requirements, events of default and early termination. Termination events applicable to the Portfolio may occur upon a decline in the Portfolio's net assets below a specified threshold over a certain period of time.
The following table presents by counterparty the Portfolio's derivative assets, net of related collateral held by the Portfolio, at December 31, 2016:
Counterparty | | Gross Amount of
Assets Presented in
the Consolidated
Statement of Assets
and Liabilities(a) | | Financial
Instruments
and Derivatives
Available for Offset | | Non-Cash
Collateral
Received | | Cash
Collateral
Received | | Net Amount
of Derivative
Assets(b) | |
Bank of America | | $ | 523,458 | | | $ | — | | | $ | — | | | $ | — | | | $ | 523,458 | | |
CIBC | | | 385,871 | | | | — | | | | — | | | | — | | | | 385,871 | | |
Citigroup | | | 618,017 | | | | — | | | | — | | | | — | | | | 618,017 | | |
JPMorgan Chase | | | 224,311 | | | | — | | | | — | | | | — | | | | 224,311 | | |
Macquarie | | | 472,009 | | | | — | | | | — | | | | — | | | | 472,009 | | |
Morgan Stanley | | | 481,314 | | | | — | | | | — | | | | — | | | | 481,314 | | |
Societe Generale | | | 923,687 | | | | — | | | | — | | | | — | | | | 923,687 | | |
UBS | | | 403,777 | | | | — | | | | — | | | | — | | | | 403,777 | | |
| | | $ | 4,032,444 | | | $ | — | | | $ | — | | | $ | — | | | $ | 4,032,444 | | |
(a) Swap contracts are included.
(a) In lieu of receiving cash collateral for its net exposure to the counterparty, the Portfolio's unrealized gains are used to satisfy the independent amount of collateral required by the counterparty for open contracts.
C) SECURITY TRANSACTIONS AND INVESTMENT INCOME/
EXPENSE — Security transactions are accounted for on a trade date basis. Interest income/expense is recorded on the accrual basis. The Portfolio amortizes premiums and accretes discounts using the effective interest method. Dividend income/expense is recorded on the ex-dividend date. The cost of investments sold is determined by use of the specific identification method for both financial reporting and income tax purposes. To the extent any issuer defaults or a credit event occurs that impacts the issuer, the Fund may halt any additional interest income accruals and consider the realizability of interest accrued up to the date of default or credit event.
22
Credit Suisse Trust — Commodity Return Strategy Portfolio
Notes to Consolidated Financial Statements (continued)
December 31, 2016
Note 2. Significant Accounting Policies (continued)
D) DIVIDENDS AND DISTRIBUTIONS TO SHAREHOLDERS — Dividends from net investment income, if any, are declared and paid quarterly. Distributions of net realized capital gains, if any, are declared and paid at least annually. However, to the extent that a net realized capital gain can be reduced by a capital loss carryforward, such gain will not be distributed. Dividends and distributions to shareholders of the Fund are recorded on the ex-dividend date and are determined in accordance with federal income tax regulations, which may differ from GAAP.
E) FEDERAL INCOME TAXES — No provision is made for federal taxes as it is the Portfolio's intention to continue to qualify as a regulated investment company ("RIC") under the Internal Revenue Code of 1986, as amended (the "Code"), and to make the requisite distributions to its shareholders, which will be sufficient to relieve it from federal income and excise taxes.
In order to qualify as a RIC under the Code, the Portfolio must meet certain requirements regarding the source of its income, the diversification of its assets and the distribution of its income. One of these requirements is that the Portfolio derive at least 90% of its gross income for each taxable year from dividends, interest, payments with respect to certain securities loans, gains from the sale or other disposition of stock, securities or foreign currencies, other income derived with respect to its business of investing in such stock, securities or currencies or net income derived from interests in certain publicly-traded partnerships ("Qualifying Income"). The Portfolio may seek to track the performance of the Benchmark through investing in structured notes designed to track the performance of the Benchmark. The Portfolio has received a private letter ruling from the Internal Revenue Service ("IRS") which confirms that the Portfolio's use of certain types of structured notes designed to track the performance of the Benchmark produces Qualifying Income. In addition, the Portfolio may, through its investment in the Subsidiary, seek to track the performance of the Benchmark by the Subsidiary's investments in commodity-linked swaps and/or futures contracts. The Portfolio has obtained a private letter ruling from the IRS which confirms that its investment in the Subsidiary produces Qualifying Income. If the Portfolio is unable to ensure continued qualification as a RIC, the Portfolio may be required to change its investment objective, policies or techniques, or may be liquidated. If the Portfolio fails to qualify as a RIC, the Portfolio will be subject to federal income tax on its net income and capital gains at regular corporate rates (without reduction for distributions to shareholders). If the Portfolio were to fail to qualify as a RIC and become subject to federal income tax, shareholders of the Portfolio would be subject to the risk of diminished returns.
23
Credit Suisse Trust — Commodity Return Strategy Portfolio
Notes to Consolidated Financial Statements (continued)
December 31, 2016
Note 2. Significant Accounting Policies (continued)
The Portfolio adopted the authoritative guidance for uncertainty in income taxes and recognizes a tax benefit or liability from an uncertain position only if it is more likely than not that the position is sustainable based solely on its technical merits and consideration of the relevant taxing authority's widely understood administrative practices and procedures. The Portfolio has reviewed its current tax positions and has determined that no provision for income tax is required in the Portfolio's financial statements. The Portfolio's federal and state income and federal excise tax returns for tax years for which the applicable statutes of limitations have not expired are subject to examination by the IRS and state departments of revenue.
F) SHORT-TERM INVESTMENTS — The Portfolio, together with other funds/portfolios advised by Credit Suisse, pools available cash into a short-term variable rate time deposit issued by State Street Bank and Trust Company ("SSB"), the Portfolio's custodian. The short-term time deposit issued by SSB is a variable rate account classified as a short-term investment.
G) FUTURES — The Portfolio may enter into futures contracts to the extent permitted by its investment policies and objectives. The Portfolio may use futures contracts to gain exposure to or hedge against changes in commodities. Upon entering into a futures contract, the Portfolio is required to deposit cash and/or pledge U.S. Government securities as initial margin with a Futures Commission Merchant ("FCM"). Subsequent payments, which are dependent on the daily fluctuations in the value of the underlying instrument, are made or received by the Portfolio each day (daily variation margin) and are recorded as unrealized gains or losses until the contracts are closed. When the contracts are closed, the Portfolio records a realized gain or loss equal to the difference between the proceeds from (or cost of) the closing transaction and the Portfolio's basis in the contract. Risks of entering into futures contracts for hedging purposes include the possibility that a change in the value of the contract may not correlate with the changes in the value of the underlying instruments. Futures have minimal counterparty credit risk because futures are exchange traded and the exchange's clearinghouse, as counterparty to all exchange-traded futures, guarantees the futures against default. In addition, the purchase of a futures contract involves the risk that the Portfolio could lose more than the original margin deposit and subsequent payments may be required for a futures transaction. The Portfolio's open futures contracts are disclosed in the Consolidated Schedule of Investments. At December 31, 2016, the amount of restricted cash held at brokers related to futures contracts was $0.
24
Credit Suisse Trust — Commodity Return Strategy Portfolio
Notes to Consolidated Financial Statements (continued)
December 31, 2016
Note 2. Significant Accounting Policies (continued)
The Commodity Exchange Act requires an FCM to segregate all customer transactions and assets from the FCM's proprietary activities. A customer's cash and other equity deposited with an FCM are considered commingled with all other customer funds subject to the FCM's segregation requirements. In the event of an FCM's insolvency, recovery may be limited to the Portfolio's pro rata share of segregated customer funds available. It is possible that the recovery amount could be less than the total of cash and other equity deposited.
H) SWAPS — The Portfolio may enter into commodity index swaps either for hedging purposes or to seek to increase total return. A swap contract is an agreement that obligates two parties to exchange a series of cash flows at specified intervals based upon or calculated by reference to changes in specified prices or rates for a specified amount of an underlying asset or notional principal amount. The Portfolio will enter into swap contracts only on a net basis, which means that the two payment streams are netted out, with the Portfolio receiving or paying, as the case may be, only the net amount of the two payments. Risks may arise as a result of the failure of the counterparty to the swap contract to comply with the terms of the swap contract. The extent of the Portfolio's exposure to credit and counterparty risks is the discounted net value of the cash flows to be received from the counterparty over the contract's remaining life, to the extent that the amount is positive. These risks are mitigated by having a master netting arrangement between the Portfolio and the counterparty and by the posting of collateral by the counterparty to the Portfolio to cover the Portfolio's exposure to the counterparty. Therefore, the Portfolio considers the creditworthiness of each counterparty as well as the amounts posted by the counterparty pursuant to the master netting agreement to a swap contract in evaluating potential credit risk. Additionally, risks may arise from unanticipated movements in interest rates or in the value of the underlying reference asset or index.
The Portfolio may enter into total return swap contracts, involving commitments to pay interest in exchange for a market-linked return, both based on notional amounts. The Portfolio may invest in total return swap contracts for hedging purposes or to seek to increase total return. To the extent the total return of the security or index underlying the transaction exceeds or falls short of the offsetting interest rate obligation, the Portfolio will receive a payment from or make a payment to the counterparty.
The Portfolio records unrealized gains or losses on a daily basis representing the value and the current net receivable or payable relating to open swap contracts. Net amounts received or paid on the swap contract are recorded as
25
Credit Suisse Trust — Commodity Return Strategy Portfolio
Notes to Consolidated Financial Statements (continued)
December 31, 2016
Note 2. Significant Accounting Policies (continued)
realized gains or losses. Fluctuations in the value of swap contracts are recorded for financial statement purposes as unrealized appreciation or depreciation from swap contracts. Realized gains and losses from terminated swaps are included in net realized gains/losses from swap contracts. The Portfolio's open swap contracts are disclosed in the Consolidated Schedule of Investments. At December 31, 2016, the amount of restricted cash held at brokers related to swap contracts was $7,380,020.
I) COMMODITY INDEXED STRUCTURED NOTES — The Portfolio may invest in structured notes whose value is based on the price movements of the Benchmark. The structured notes are often leveraged, increasing the volatility of each note's value relative to the change in the underlying linked financial instrument. The value of these notes will rise and fall in response to changes in the underlying commodity index. Structured notes may entail a greater degree of market risk than other types of debt securities because the investor bears the risk of the underlying commodity index. Structured notes may also be more volatile, less liquid, and more difficult to accurately price than less complex securities or more traditional debt securities. Fluctuations in the value of the structured notes are recorded as unrealized gains and losses in the Consolidated Statement of Operations. Payments received are recorded as interest income. These notes are subject to prepayment, credit and interest rate risks. The Portfolio has the option to request prepayment from the issuer. At maturity, or when a note is sold, the Portfolio records a realized gain or loss. At December 31, 2016, the value of these securities comprised 2.1% of the Portfolio's net assets and resulted in unrealized appreciation of $2,255,043.
J) SECURITIES LENDING — The initial collateral received by the Portfolio is required to have a value of at least 102% of the market value of domestic securities on loan (including any accrued interest thereon) and 105% of the market value of foreign securities on loan (including any accrued interest thereon). The collateral is maintained thereafter at a value equal to at least 102% of the current market value of the securities on loan. The market value of loaned securities is determined at the close of each business day of the Portfolio and any additional required collateral is delivered to the Portfolio, or excess collateral returned by the Portfolio, on the next business day. Cash collateral received by the Portfolio in connection with securities lending activity may be pooled together with cash collateral for other funds/portfolios advised by Credit Suisse and may be invested in a variety of investments, including funds advised by SSB, the Portfolio's securities lending agent, or money market instruments. However, in the event of default or bankruptcy by the other party
26
Credit Suisse Trust — Commodity Return Strategy Portfolio
Notes to Consolidated Financial Statements (continued)
December 31, 2016
Note 2. Significant Accounting Policies (continued)
to the agreement, realization and/or retention of the collateral may be subject to legal proceedings.
SSB has been engaged by the Portfolio to act as the Portfolio's securities lending agent. As of December 31, 2016, the Portfolio had investment securities on loan with a fair value of $2,691,360. Collateral received for securities loaned and a related liability of $2,745,795 are presented gross in the Consolidated Statement of Assets and Liabilities. The collateral for securities loaned is valued consistently to the other investments held by the Portfolio and is included in Level 2 of the fair value hierarchy. At December 31, 2016, the value of the related collateral exceeded the value of the securities loaned.
During the year ended December 31, 2016, total earnings from the Portfolio's investment in cash collateral received in connection with securities lending arrangements was $3,364, of which $752 was rebated to borrowers (brokers). The Portfolio retained $1,836 in income from the cash collateral investment, and SSB, as lending agent, was paid $776. Securities lending income is accrued as earned.
K) OTHER — In the normal course of business the Portfolio trades financial instruments and enters into financial transactions for which risk of potential loss exists due to changes in the market (market risk) or failure of the other party to a transaction to perform (credit risk). Similar to credit risk, the Portfolio may be exposed to counterparty risk, or the risk that an institution or other entity with which the Portfolio has unsettled or open transactions will default. The potential loss could exceed the value of the financial assets recorded in the consolidated financial statements. Financial assets, which potentially expose the Portfolio to credit risk, consist principally of cash due from counterparties and investments. The extent of the Portfolio's exposure to credit and counterparty risks in respect to these financial assets approximates their carrying value as recorded in the Portfolio's Consolidated Statement of Assets and Liabilities.
L) NEW ACCOUNTING PRONOUNCEMENTS — On August 26, 2016, Financial Accounting Standards Board ("FASB") issued Accounting Standards Update No. 2016-15, "Statement of Cash Flows (Topic 230), a consensus of the FASB's Emerging Issues Task Force" ("ASU 2016-15"). ASU 2016-15 is intended to reduce diversity in practice in how certain transactions are classified in the statement of cash flows. The issues addressed in ASU 2016-15 are: debt prepayment or debt extinguishment costs, settlement of zero-coupon debt instruments, contingent consideration payments made after a business
27
Credit Suisse Trust — Commodity Return Strategy Portfolio
Notes to Consolidated Financial Statements (continued)
December 31, 2016
Note 2. Significant Accounting Policies (continued)
combination, proceeds from the settlement of insurance claims, proceeds from the settlement of corporate-owned life insurance policies, including bank-owned life insurance policies, distributions received from equity method investments, beneficial interests in securitization transactions; and, separately identifiable cash flows and application of the predominance principle. ASU 2016-15 is effective for interim and annual reporting periods beginning after December 15, 2017. Management is currently evaluating the impact, if any, of applying this provision.
In November 2016, FASB issued Accounting Standards Update No. 2016-18, "Statement of Cash Flows (Topic 230), Restricted Cash, a consensus of the FASB's Emerging Issues Task Force" ("ASU 2016-18"). ASU 2016-18 requires that a statement of cash flows explains the change during the period in the total of cash, cash equivalents, and amounts generally described as restricted cash or restricted cash equivalents. Therefore, amounts generally described as restricted cash and restricted cash equivalents should be included with cash and cash equivalents when reconciling the beginning-of-period and end-of-period total amounts shown on the statement of cash flows. The amendments in ASU 2016-18 do not provide a definition of restricted cash or restricted cash equivalents. ASU 2016-18 is effective for interim and annual reporting periods beginning after December 15, 2017. Management is currently evaluating the impact, if any, of applying this provision.
In October 2016, the U.S. Securities and Exchange Commission adopted new rules and amended existing rules (together, "final rules") intended to modernize the reporting and disclosure of information by registered investment companies. In part, the final rules amend Regulation S-X and require standardized, enhanced disclosure about derivatives in investment company financial statements, as well as other amendments. The compliance date for the amendments to Regulation S-X is August 1, 2017. Management is currently evaluating the impact that the adoption of the amendments to Regulation S-X will have on the Fund's financial statements and related disclosures.
M) SUBSEQUENT EVENTS — In preparing the financial statements as of December 31, 2016, management considered the impact of subsequent events for potential recognition or disclosure in these financial statements through the date of release of this report. No such events requiring recognition or disclosure were identified through the date of the release of this report.
28
Credit Suisse Trust — Commodity Return Strategy Portfolio
Notes to Consolidated Financial Statements (continued)
December 31, 2016
Note 3. Transactions with Affiliates and Related Parties
Credit Suisse serves as investment manager for the Portfolio. For its investment management services, Credit Suisse is entitled to receive a fee from the Portfolio at an annual rate of 0.59% of the Portfolio's average daily net assets. Credit Suisse has contractually agreed to limit expenses so that the Portfolio's annual operating expenses do not exceed 1.05% of the Portfolio's average daily net assets. For the year ended December 31, 2016, investment management fees earned and fees waived were $1,601,886 and $72,895, respectively. Prior to November 15, 2016, the Portfolio paid advisory fees at the annual rate of 0.50% of average daily net assets. The Portfolio is authorized to reimburse Credit Suisse for management fees previously limited and/or for expenses previously reimbursed by Credit Suisse, provided, however, that any reimbursements must be paid at a date not more than three years after the end of the fiscal year during which such fees were limited or expenses were reimbursed by Credit Suisse and the reimbursements do not cause the Portfolio to exceed the expense limitation in the contract at the time the fees are recouped. This contract may not be terminated before May 1, 2018.
The amounts waived and reimbursed by Credit Suisse, which are available for potential future recoupment by Credit Suisse, and the expiration schedule at December 31, 2016 are as follows:
Fee waivers/ expense
reimbursements
subject to
repayment | | Expires
December 31,
2017 | | Expires
December 31,
2018 | | Expires
December 31,
2019 | |
| $ | 328,818 | | | $ | 153,655 | | | $ | 102,268 | | | $ | 72,895 | | |
Prior to November 15, 2016, Credit Suisse and SSB served as co-administrators to the Portfolio. For its co-administrative services, Credit Suisse received a fee calculated at an annual rate of 0.09% of the Portfolio's average daily net assets. On November 15, 2016, the Portfolio entered into an Investment Management Agreement with Credit Suisse which bundled the advisory and administration fees into a single fee. For the period from January 1, 2016 to November 14, 2016, co-administrative services fees earned by Credit Suisse were $242,954.
For its co-administrative services, SSB receives a fee, exclusive of out-of-pocket expenses, calculated in total for all the Credit Suisse funds/portfolios co-administered by SSB and allocated based upon the relative average net assets of each fund/portfolio, subject to an annual minimum fee. For the year ended December 31, 2016, co-administrative services fees earned by SSB (including out-of-pocket expenses) with respect to the Portfolio were $56,797.
29
Credit Suisse Trust — Commodity Return Strategy Portfolio
Notes to Consolidated Financial Statements (continued)
December 31, 2016
Note 3. Transactions with Affiliates and Related Parties (continued)
Credit Suisse Securities (USA) LLC ("CSSU"), an affiliate of Credit Suisse, serves as the distributor of the Portfolio's shares. Pursuant to a distribution plan adopted by the Portfolio pursuant to Rule 12b-1 under the 1940 Act, CSSU receives fees for its distribution services. These fees were calculated at an annual rate of 0.25% of the average daily net assets. For the year ended December 31, 2016, the Portfolio paid Rule 12b-1 distribution fees of $781,712.
Certain brokers, dealers and financial representatives provide transfer agent-related services to the Portfolio and receive compensation from the Portfolio. For the year ended December 31, 2016, the Portfolio paid $342,796, which is included within transfer agent fees in the Consolidated Statement of Operations.
Note 4. Line of Credit
The Portfolio, together with other funds/portfolios advised by Credit Suisse (collectively, the "Participating Funds"), participates in a committed, unsecured line of credit facility ("Credit Facility"), with SSB in an aggregated amount of $250 million for temporary or emergency purposes under a first-come, first-served basis. Under the terms of the Credit Facility, the Participating Funds pay an aggregate commitment fee on the average unused amount of the Credit Facility, which is allocated among the Participating Funds in such manner as is determined by the governing Boards of the Participating Funds. In addition, the Participating Funds pay interest on borrowings at either the Overnight Federal Funds rate or the Overnight LIBOR rate plus a spread. At December 31, 2016 and during the year ended December 31, 2016, the Portfolio had no borrowings outstanding under the Credit Facility.
Note 5. Purchases and Sales of Securities
For the year ended December 31, 2016, purchases and sales of investment securities (excluding short-term investments) and U.S. Government and Agency Obligations were as follows:
Investment Securities | | U.S. Government/
Agency Obligations | |
| Purchases | | Sales | | Purchases | | Sales | |
| $ | 2,100,000 | | | $ | 1,376,127 | | | $ | 390,767,877 | | | $ | 291,209,072 | | |
30
Credit Suisse Trust — Commodity Return Strategy Portfolio
Notes to Consolidated Financial Statements (continued)
December 31, 2016
Note 6. Capital Share Transactions
The Portfolio is authorized to issue an unlimited number of full and fractional shares of beneficial interest, $.001 par value per share. Transactions in capital shares of the Portfolio were as follows:
| | | For the Year Ended
December 31, 2016 | | For the Year Ended
December 31, 2015 | |
Shares sold | | | 12,607,444 | | | | 20,470,231 | | |
Shares redeemed | | | (3,621,694 | ) | | | (2,580,282 | ) | |
Net increase | | | 8,985,750 | | | | 17,889,949 | | |
On December 31, 2016, the number of shareholders that held 5% or more of the outstanding shares of the Portfolio was as follows:
Number of
Shareholders | | Approximate Percentage
of Outstanding Shares | |
| | 4 | | | | 97 | % | |
Some of the shareholders are omnibus accounts, which hold shares on behalf of individual shareholders.
Note 7. Federal Income Taxes
Income and capital gain distributions are determined in accordance with federal income tax regulations, which may differ from GAAP.
There were no distributions paid by the Fund to shareholders during the years ended December 31, 2016 and December 31, 2015.
The tax basis components of distributable earnings may differ from the amounts reflected in the Consolidated Statement of Assets and Liabilities by temporary book/tax differences. At December 31, 2016, the components of distributable earnings on a tax basis were as follows:
Undistributed net investment income | | $ | 33,847,009 | | |
Accumulated realized loss | | | (18,438,784 | ) | |
Unrealized appreciation | | | 6,248,084 | | |
| | $ | 21,656,309 | | |
At December 31, 2016, the Fund had $1,206,650 of short-term capital loss carryforwards which will expire in 2017, $10,320,091 of unlimited short-term capital loss carryforwards and $6,912,043 of unlimited long-term capital loss carryforwards available to offset possible future capital gains.
During the tax year ended December 31, 2016, the Fund did not utilize any capital loss carryforwards.
31
Credit Suisse Trust — Commodity Return Strategy Portfolio
Notes to Consolidated Financial Statements (continued)
December 31, 2016
Note 7. Federal Income Taxes (continued)
At December 31, 2016, the cost of investments (excluding foreign currency related transactions) and the net unrealized appreciation (depreciation) for income tax purposes were as follows:
Cost of Investments | | $ | 335,972,204 | | |
Unrealized appreciation | | $ | 2,657,493 | | |
Unrealized depreciation | | | (366,949 | ) | |
Net unrealized appreciation (depreciation) | | $ | 2,290,544 | | |
To adjust for current period permanent book/tax differences, paid-in capital was charged $2,656,952, accumulated net realized loss was charged $32,285,988 and undistributed net investment income was credited $34,942,940. These permanent differences are due to differing book/tax treatment of Subsidiary net income and net gain. Net assets were not affected by these reclassifications.
Note 8. Contingencies
In the normal course of business, the Portfolio may provide general indemnifications pursuant to certain contracts and organizational documents. The Portfolio's maximum exposure under these arrangements is dependent on future claims that may be made against the Portfolio and, therefore, cannot be estimated; however, based on experience, the risk of loss from such claims is considered remote.
32
Credit Suisse Trust — Commodity Return Strategy Portfolio
Report of Independent Registered Public Accounting Firm
The Board of Trustees and Shareholders
Credit Suisse Trust �� Commodity Return Strategy Portfolio:
We have audited the accompanying consolidated statement of assets and liabilities of Credit Suisse Trust — Commodity Return Strategy Portfolio (the "Portfolio") including the consolidated schedule of investments, as of December 31, 2016, and the related consolidated statement of operations for the year then ended and the consolidated statements of changes in net assets and consolidated financial highlights for each of the years in the two-year period then ended. These consolidated financial statements and consolidated financial highlights are the responsibility of the Portfolio's management. Our responsibility is to express an opinion on these consolidated financial statements and consolidated financial highlights based on our audits. The accompanying consolidated financial highlights for each of the years in the three-year period ended December 31, 2014 were audited by other independent registered public accountants whose report thereon dated February 23, 2015, expressed an unqualified opinion on those consolidated financial highlights.
We conducted our audits in accordance with the standards of the Public Company Accounting Oversight Board (United States). Those standards require that we plan and perform the audits to obtain reasonable assurance about whether the consolidated financial statements and consolidated financial highlights are free of material misstatement. An audit includes examining, on a test basis, evidence supporting the amounts and disclosures in the consolidated financial statements. Our procedures included confirmation of securities owned as of December 31, 2016, by correspondence with the custodian and broker or by other appropriate auditing procedures. An audit also includes assessing the accounting principles used and significant estimates made by management, as well as evaluating the overall consolidated financial statement presentation. We believe that our audits provide a reasonable basis for our opinion.
In our opinion, the consolidated financial statements and consolidated financial highlights referred to above present fairly, in all material respects, the financial position of Credit Suisse Trust — Commodity Return Strategy Portfolio as of December 31, 2016, the results of its operations for the year then ended and the changes in its net assets and financial highlights for each of the years in the two-year period then ended, in conformity with U.S. generally accepted accounting principles.
New York, New York
February 15, 2017
33
Credit Suisse Trust — Commodity Return Strategy Portfolio
Board Approval of Investment Management Agreement (unaudited)
In approving the amended and restated investment management agreement for the Commodity Return Strategy Portfolio (the "Portfolio"), a series of Credit Suisse Trust (the "Trust"), the Board of Trustees of the Trust (the "Board"), including all of the Trustees who are not "interested persons" of the Trust defined in the Investment Company Act of 1940 (the "Independent Trustees"), at a meeting held on November 14 and 15, 2016, considered the following factors:
Investment Management Fee Rates and Expenses
The Board reviewed and considered the contractual management fee rate of 0.59% for the Portfolio ("Contractual Management Fee") in light of the extent and quality of the management services provided by Credit Suisse Asset Management, LLC ("Credit Suisse"). The Board also considered that Credit Suisse entered into an expense limitation agreement ("Expense Limitation Agreement") limiting the Portfolio's total net expenses to 1.05% of the average daily net assets until May 1, 2018.
The Board considered that it had approved a proposal to bundle the Portfolio's advisory and co-administration services under a single new Investment Management Agreement between the Portfolio and Credit Suisse (the "Management Agreement"). The Board noted that the Management Agreement became effective November 15, 2016. The Board noted that the proposal bundled the advisory and administration fees into a single fee under the Management Agreement. The Board also noted that the bundling of the advisory and co-administration services and fees will not impact the aggregate services provided under the current arrangement and that the overall combined advisory and co-administration fees paid by shareholders would not increase.
Additionally, the Board received and considered information comparing the Portfolio's Contractual Management Fee, Contractual Management Fee less waivers and/or reimbursements ("Net Management Fee") and the Portfolio's overall expenses with those of funds in both the relevant expense group ("Expense Group") and universe of funds ("Expense Universe") provided by Broadridge, an independent provider of investment company data. The Board was provided with a description of the methodology used to arrive at the funds included in the Expense Group and the Expense Universe. The Board also received and considered information regarding the co-administration fees paid by the Portfolio.
34
Credit Suisse Trust — Commodity Return Strategy Portfolio
Board Approval of Investment Management Agreement (unaudited) (continued)
Nature, Extent and Quality of the Services under the Management Agreement
The Board received and considered information regarding the nature, extent and quality of services provided to the Portfolio by Credit Suisse under the advisory and co-administration agreements and to be provided under the Management Agreement. The Board also noted information received at regular meetings throughout the year related to the services rendered by Credit Suisse. The Board noted that the extensive investment management services provided by Credit Suisse included broad supervisory responsibility and oversight over other service providers to the Portfolio. The Board reviewed background information about Credit Suisse including its Form ADV Part 2 — Disclosure Brochure and Brochure Supplement. The Board considered the background and experience of Credit Suisse's senior management and the expertise of, and the amount of attention given to the Portfolio by, senior personnel of Credit Suisse. In addition, the Board reviewed the qualifications, backgrounds and responsibilities of the portfolio management team primarily responsible for the day-to-day portfolio management of the Portfolio and the extent of the resources devoted to research and analysis of actual and potential investments. The Board evaluated the ability of Credit Suisse, based on its resources, reputation and other attributes, to attract and retain qualified investment professionals including research, advisory, and supervisory personnel. The Board also received and considered information about the nature, extent and quality of services and fee rates offered to other Credit Suisse clients for comparable services.
Portfolio Performance
The Board received and considered performance results of the Portfolio over time, along with comparisons both to the relevant performance group ("Performance Group") and universe of funds ("Performance Universe") for the Portfolio. The Board was provided with a description of the methodology used to arrive at the funds included in the Performance Group and the Performance Universe. The Board considered the investment performance of the Portfolio relative to its stated objectives as well as the performance of the Portfolio relative to its peers.
Credit Suisse Profitability
The Board received and considered a profitability analysis of Credit Suisse based on the fees payable under the Management Agreement for the Portfolio, including any fee waivers, as well as other relationships between the Portfolio
35
Credit Suisse Trust — Commodity Return Strategy Portfolio
Board Approval of Investment Management Agreement (unaudited) (continued)
on the one hand and Credit Suisse affiliates on the other. The Board also considered Credit Suisse's methodology for allocating costs to the Portfolio, recognizing that cost allocation methodologies are inherently subjective. The Board also received profitability information for the other funds in the Credit Suisse family of funds.
Economies of Scale
The Board considered information regarding whether there have been economies of scale with respect to the management of the Portfolio, whether the Portfolio has appropriately benefited from any economies of scale, and whether there is potential for realization of any further economies of scale. The Board noted that as the Portfolio's asset levels grow, further economies of scale potentially could be realized.
Other Benefits to Credit Suisse
The Board considered other benefits received by Credit Suisse and its affiliates as a result of their relationship with the Portfolio. Such benefits include, among others, benefits potentially derived from an increase in Credit Suisse's businesses as a result of its relationship with the Portfolio (such as the ability to market to shareholders other financial products offered by Credit Suisse and its affiliates) and the fees paid to an affiliate of Credit Suisse for distribution services.
The Board considered the standards applied in seeking best execution and reviewed Credit Suisse's method for allocating portfolio investment opportunities among its advisory clients.
Other Factors and Broader Review
As discussed above, the Board reviews detailed materials received from Credit Suisse as part of the annual approval process. The Board also reviews and assesses the quality of the services that the Portfolio receives throughout the year. In this regard, the Board reviews reports of Credit Suisse at least quarterly, which include, among other things, detailed portfolio and market reviews, detailed fund performance reports and Credit Suisse's compliance procedures.
36
Credit Suisse Trust — Commodity Return Strategy Portfolio
Board Approval of Investment Management Agreement (unaudited) (continued)
Conclusions
In selecting Credit Suisse, and approving the Management Agreement and the investment management fee under such agreement, the Board concluded that:
• The Contractual Management Fee and Net Management Fee, reviewed along with information provided by Broadridge for the funds in the Portfolio's Expense Group and Expense Universe, were reasonable in relation to the services provided by Credit Suisse.
• The Board was satisfied with the nature, extent and quality of the investment management services provided to the Portfolio by Credit Suisse in a challenging commodities environment and that, based on dialogue with management and counsel, the services provided by Credit Suisse under the advisory and co-administration agreements and to be provided under the Management Agreement are typical of, and consistent with, those provided to similar mutual funds by other investment advisers.
• In light of the costs of providing investment management and other services to the Portfolio and Credit Suisse's ongoing commitment to the Portfolio and willingness to waive fees (by agreeing to an expense limitation), Credit Suisse's profitability based on fees payable under the advisory and co-administration agreements, as well as other ancillary benefits that Credit Suisse and its affiliates received, were considered reasonable.
• In light of the information received and considered by the Board, the Portfolio's current fee structure was considered reasonable.
No single factor reviewed by the Board was identified by the Board as the principal factor in determining whether to approve the Management Agreement. The Independent Trustees were advised by separate independent legal counsel throughout the process.
37
Credit Suisse Trust — Commodity Return Strategy Portfolio
Information Concerning Trustees and Officers (unaudited)
Name, Address
(Year of Birth) | | Position(s)
Held with
Portfolio | | Term
of Office1
and
Length
of Time
Served | | Principal
Occupation(s) During
Past Five Years | | Number of
Portfolios
in Portfolio
Complex
Overseen
by Trustee | | Other
Trusteeships
Held by Trustee | |
Independent Trustees | | | | | | | | | | | |
Enrique R. Arzac
c/o Credit Suisse Asset
Management, LLC
Attn: General Counsel
One Madison Avenue
New York, New York
10010
(1941) | | Trustee, Audit Committee Chairman and Nominating Committee Member | | Since Portfolio Inception | | Professor Emeritus of Finance and Economics from July 2015 to present; Professor of Finance and Economics, Graduate School of Business, Columbia University from 1971 to July 2015. | | | 11 | | | Director of Adams Diversified Equity Fund, Inc., Adams Natural Resources Fund, Inc., Aberdeen Chile Fund, Inc., Aberdeen Emerging Markets Smaller Company Opportunities Fund, Inc., Aberdeen Israel Fund, Inc., Aberdeen Indonesia Fund, Inc. and Aberdeen Latin America Equity Fund, Inc. (each a closed-end investment company); Director of Aberdeen Asia-Pacific Income Investment Company Limited (a Canadian closed-end fund); Trustee of Mirae Asset Discovery Funds (7 open-end portfolios); Director of Epoch Holding Corporation (an investment management and investment advisory services company) from August 2006 to March 2013. | |
1 Subject to the Trust's retirement policy, each Trustee may continue to serve as a Trustee until the last day of the calendar year in which the applicable Trustee attains age 75. Officer serves until his or her respective successor has been duly elected and qualified.
38
Credit Suisse Trust — Commodity Return Strategy Portfolio
Information Concerning Trustees and Officers (unaudited) (continued)
Name, Address
(Year of Birth) | | Position(s)
Held with
Portfolio | | Term
of Office1
and
Length
of Time
Served | | Principal
Occupation(s) During
Past Five Years | | Number of
Portfolios
in Portfolio
Complex
Overseen
by Trustee | | Other
Trusteeships
Held by Trustee | |
Independent Trustees | | | | | | | | | | | |
Jeffrey E. Garten
c/o Credit Suisse Asset
Management, LLC
Attn: General Counsel
One Madison Avenue
New York, New York
10010
(1946) | | Trustee, Audit and Nominating Committee Member | | Since Portfolio Inception | | Dean Emeritus of Yale School of Management from July 2015 to present; The Juan Trippe Professor in the Practice of International Trade, Finance and Business, Yale School of Management, from July 2005 to July 2015; Partner and Chairman of Garten Rothkopf (consulting firm) from October 2005 to present. | | | 9 | | | Director of Aetna, Inc. (insurance company); Director of CarMax Group (used car dealers); Director of Miller Buckfire & Co., LLC (financial restructuring); Member of Standard & Poor's Board of Managers (credit rating agency) from December 2011 to November 2014. | |
Steven N. Rappaport
Lehigh Court, LLC
555 Madison Avenue
29th Floor
New York, New York
10022
(1948) | | Chairman of the Board of Trustees, Audit Committee Member and Nominating Committee Chairman | | Trustee since Portfolio Inception and Chairman since 2005 | | Partner of Lehigh Court, LLC and RZ Capital (private investment firms) from July 2002 to present; Partner of Backstage Acquisition Holdings, LLC (publication job postings) from November 2013 to present. | | | 11 | | | Director of iCAD, Inc. (surgical and medical instruments and apparatus company); Director of Aberdeen Chile Fund, Inc., Aberdeen Emerging Markets Smaller Company Opportunities Fund, Inc., Aberdeen Israel Fund, Inc., Aberdeen Indonesia Fund, Inc. and Aberdeen Latin America Equity Fund, Inc. (each a closed-end investment company); Director of Aberdeen Funds (25 open end Portfolios); Director of Presstek, Inc. (digital imaging technologies company) from 2003 to 2012; Director of Wood Resources, LLC (plywood manufacturing company) from 2003 to October 2013. | |
1 Subject to the Trust's retirement policy, each Trustee may continue to serve as a Trustee until the last day of the calendar year in which the applicable Trustee attains age 75. Officer serves until his or her respective successor has been duly elected and qualified.
39
Credit Suisse Trust — Commodity Return Strategy Portfolio
Information Concerning Trustees and Officers (unaudited) (continued)
Name, Address
(Year of Birth) | | Position(s)
Held with
Portfolio | | Term of
Office1
and
Length of
Time
Served | | Principal Occupation(s) During Past Five Years | |
Officers* | | | | | | | |
John G. Popp
Credit Suisse Asset
Management, LLC
One Madison Avenue
New York, New York 10010
(1956) | | Chief Executive Officer and President | | Since 2010 | | Managing Director of Credit Suisse; Global Head and Chief Investment Officer of the Credit Investment Group; Associated with Credit Suisse or its predecessor since 1997; Officer of other Credit Suisse Funds; Trustee of Credit Suisse High Yield Bond Fund; Director of Credit Suisse Asset Management Income Fund, Inc. | |
Emidio Morizio
Credit Suisse Asset
Management, LLC
One Madison Avenue
New York, New York 10010
(1966) | | Chief Compliance Officer | | Since 2004 | | Managing Director and Global Head of Compliance of Credit Suisse since 2010; Associated with Credit Suisse since July 2000; Officer of other Credit Suisse Funds. | |
Lou Anne McInnis
Credit Suisse Asset Management, LLC
One Madison Avenue
New York, New York 10010
(1959) | | Chief Legal Officer | | Since 2015 | | Director of Credit Suisse; Associated with Credit Suisse since April 2015; Counsel at DLA Piper US LLP from 2011 to April 2015; Associated with Morgan Stanley Investment Management from 1997 to 2010; Officer of other Credit Suisse Funds. | |
Laurie Pecha
Credit Suisse Asset
Management, LLC
One Madison Avenue
New York, New York 10010
(1961) | | Chief Financial Officer | | Since 2016 | | Director of Credit Suisse since August 2016; Senior Consultant of Spectra Professional Services, LLC from January 2012 to July 2016; Vice President of Legg Mason & Co. from March 2007 to December 2011; Officer of other Credit Suisse Funds. | |
Esther Cheung
Credit Suisse Asset
Management, LLC
One Madison Avenue
New York, New York 10010
(1980) | | Treasurer | | Since 2016 | | Vice President of Credit Suisse since 2015; Associated with Reich & Tang Asset Management, LLC from June 2010 to August 2015; Officer of other Credit Suisse Funds. | |
1 Subject to the Trust's retirement policy, each Trustee may continue to serve as a Trustee until the last day of the calendar year in which the applicable Trustee attains age 75. Officer serves until his or her respective successor has been duly elected and qualified.
* The officers of the Fund shown are officers that make policy decisions.
40
Credit Suisse Trust — Commodity Return Strategy Portfolio
Information Concerning Trustees and Officers (unaudited) (continued)
Name, Address
(Year of Birth) | | Position(s)
Held with
Portfolio | | Term of
Office1
and
Length of
Time
Served | | Principal Occupation(s) During Past Five Years | |
Officers* | | | | | | | |
Karen Regan
Credit Suisse Asset
Management, LLC
One Madison Avenue
New York, New York 10010
(1963) | | Vice President and Secretary | | Since 2010 | | Vice President of Credit Suisse; Associated with Credit Suisse since December 2004; Officer of other Credit Suisse Funds. | |
1 Subject to the Trust's retirement policy, each Trustee may continue to serve as a Trustee until the last day of the calendar year in which the applicable Trustee attains age 75. Officer serves until his or her respective successor has been duly elected and qualified.
* The officers of the Fund shown are officers that make policy decisions.
The Statement of Additional Information includes additional information about the Trustees and is available, without charge, upon request, by calling 877-870-2874.
41
Credit Suisse Trust — Commodity Return Strategy Portfolio
Proxy Voting and Portfolio Holdings Information (unaudited)
Information regarding how the Portfolio voted proxies related to its portfolio securities during the 12-month period ended June 30 of each year, as well as the policies and procedures that the Portfolio uses to determine how to vote proxies relating to its portfolio securities are available:
• By calling 1-877-870-2874
• On the Portfolio's website, www.credit-suisse.com/us/funds
• On the website of the Securities and Exchange Commission, www.sec.gov.
The Portfolio files a complete schedule of its portfolio holdings for the first and third quarters of its fiscal year with the SEC on Form N-Q. The Portfolio's Forms N-Q are available on the SEC's website at www.sec.gov and may be reviewed and copied at the SEC's Public Reference Room in Washington, DC. Information on the operation of the SEC's Public Reference Room may be obtained by calling 1-202-551-8090.
42
This page intentionally left blank
This page intentionally left blank

P.O. BOX 55030, BOSTON, MA 02205-5030
877-870-2874 n www.credit-suisse.com/us/funds
CREDIT SUISSE SECURITIES (USA) LLC, DISTRIBUTOR. TRCOM-AR-1216
Item 2. Code of Ethics.
The registrant has adopted a code of ethics applicable to its Chief Executive Officer, President, Chief Financial Officer and Chief Accounting Officer, or persons performing similar functions. A copy of the code is filed as Exhibit 12(a)(1) to this Form. There were no amendments to the code during the fiscal year ended December 31, 2016. There were no waivers or implicit waivers from the code granted by the registrant during the fiscal year ended December 31, 2016.
Item 3. Audit Committee Financial Expert.
The registrant’s governing board has determined that it has one audit committee financial expert serving on its audit committee: Steven N. Rappaport. The audit committee financial expert is “independent” for purposes of this item.
Item 4. Principal Accountant Fees and Services.
(a) through (d). The information in the table below is provided for services rendered to the registrant by its independent registered public accounting firm, KPMG LLP (“KPMG”), for its fiscal years ended December 31, 2015 and December 31, 2016. The Fund’s former independent registered public accounting firm served the registrant for the fiscal year ended December 31, 2014 until their resignation on February 24, 2015.
| | 2015 | | 2016 | |
Audit Fees | | $ | 48,000 | | $ | 50,400 | |
Audit-Related Fees(1) | | $ | 4,000 | | $ | 4,773 | |
Tax Fees(2) | | $ | 3,100 | | $ | 3,255 | |
All Other Fees | | — | | — | |
Total | | $ | 55,100 | | $ | 58,428 | |
(1) Services include agreed-upon procedures in connection with the registrant’s semi-annual financial statements ($4,000 for 2015 and $4,773 for 2016).
(2) Tax services in connection with the registrant’s excise tax calculations and review of the registrant’s applicable tax returns.
The information in the table below is provided with respect to non-audit services that directly relate to the registrant’s operations and financial reporting and that were rendered by KPMG to the registrant’s investment adviser, Credit Suisse Asset Management, LLC (“Credit Suisse”), and any service provider to the registrant controlling, controlled by or under common control with Credit Suisse that provided ongoing services to the registrant (“Covered Services Provider”), for the registrant’s fiscal years ended December 31, 2015 and December 31, 2016.
2
| | 2015 | | 2016 | |
Audit-Related Fees | | N/A | | N/A | |
Tax Fees | | N/A | | N/A | |
All Other Fees | | N/A | | N/A | |
Total | | N/A | | N/A | |
(e)(1) Pre-Approval Policies and Procedures. The Audit Committee (“Committee”) of the registrant is responsible for pre-approving (i) all audit and permissible non-audit services to be provided by the independent registered public accounting firm to the registrant and (ii) all permissible non-audit services to be provided by the independent registered public accounting firm to Credit Suisse and any Covered Services Provider if the engagement relates directly to the operations and financial reporting of the registrant. The Committee may delegate its responsibility to pre-approve any such audit and permissible non-audit services to the Chairperson of the Committee, and the Chairperson shall report to the Committee, at its next regularly scheduled meeting after the Chairperson’s pre-approval of such services, his or her decision(s). The Committee may also establish detailed pre-approval policies and procedures for pre-approval of such services in accordance with applicable laws, including the delegation of some or all of the Committee’s pre-approval responsibilities to other persons (other than Credit Suisse or the registrant’s officers). Pre-approval by the Committee of any permissible non-audit services shall not be required so long as: (i) the aggregate amount of all such permissible non-audit services provided to the registrant, Credit Suisse and any Covered Services Provider constitutes not more than 5% of the total amount of revenues paid by the registrant to its independent registered public accounting firm during the fiscal year in which the permissible non-audit services are provided; (ii) the permissible non-audit services were not recognized by the registrant at the time of the engagement to be non-audit services; and (iii) such services are promptly brought to the attention of the Committee and approved by the Committee (or its delegate(s)) prior to the completion of the audit.
(e)(2) The information in the table below sets forth the percentages of fees for services (other than audit, review or attest services) rendered by KPMG to the registrant for which the pre-approval requirement was waived pursuant to Rule 2-01(c)(7)(i)(C) of Regulation S-X:
| | 2015 | | 2016 | |
Audit-Related Fees | | N/A | | N/A | |
Tax Fees | | N/A | | N/A | |
All Other Fees | | N/A | | N/A | |
Total | | N/A | | N/A | |
3
The information in the table below sets forth the percentages of fees for services (other than audit, review or attest services) rendered by KPMG to Credit Suisse and any Covered Services Provider required to be approved pursuant to Rule 2-01(c)(7)(ii) of Regulation S-X, for the registrant’s fiscal years ended December 31, 2015 and December 31, 2016:
| | 2015 | | 2016 | |
Audit-Related Fees | | N/A | | N/A | |
Tax Fees | | N/A | | N/A | |
All Other Fees | | N/A | | N/A | |
Total | | N/A | | N/A | |
(f) Not Applicable.
(g) The aggregate fees billed by KPMG for non-audit services rendered to the registrant, Credit Suisse and Covered Service Providers for the fiscal years ended December 31, 2015 and December 31, 2016 were $0 and $0, respectively.
(h) Not Applicable.
Item 5. Audit Committee of Listed Registrants.
Form N-CSR disclosure requirement is not applicable to the registrant.
Item 6. Schedule of Investments.
Included as part of the report to shareholders filed under Item 1 of this Form.
4
Item 7. Disclosure of Proxy Voting Policies and Procedures for Closed-End Management Investment Companies.
Form N-CSR disclosure requirement is not applicable to the registrant.
Item 8. Portfolio Managers of Closed-End Management Investment Companies.
Form N-CSR disclosure requirement is not applicable to the registrant.
Item 9. Purchases of Equity Securities by Closed-End Management Investment Company and Affiliated Purchasers.
Form N-CSR disclosure requirement is not applicable to the registrant.
Item 10. Submission of Matters to a Vote of Security Holders.
None
Item 11. Controls and Procedures.
(a) As of a date within 90 days from the filing date of this report, the principal executive officer and principal financial officer concluded that the registrant’s disclosure controls and procedures (as defined in Rule 30a-3(c) under the Investment Company Act of 1940 (the “Act”)) were effective based on their evaluation of the disclosure controls and procedures required by Rule 30a-3(b) under the Act and Rules 13a-15(b) or 15d-15(b) under the Securities Exchange Act of 1934.
(b) There were no changes in registrant’s internal control over financial reporting (as defined in Rule 30a-3(d) under the Act) that occurred during the second fiscal quarter of the period covered by this report that have materially affected, or are reasonably likely to materially affect, the registrant’s internal control over financial reporting.
Item 12. Exhibits.
(a)(1) Registrant’s Code of Ethics is an exhibit to this report.
(a)(2) The certifications of the registrant as required by Rule 30a-2(a) under the Act are exhibits to this report.
(a)(3) Not applicable.
(b) The certifications of the registrant as required by Rule 30a-2(b) under the Act are an exhibit to this report.
(other) Iran related activities disclosure requirement.
5
SIGNATURES
Pursuant to the requirements of the Securities Exchange Act of 1934 and the Investment Company Act of 1940, the registrant has duly caused this report to be signed on its behalf by the undersigned, thereunto duly authorized.
CREDIT SUISSE TRUST | |
| |
/s/ John G. Popp | |
Name: John G. Popp | |
Title: Chief Executive Officer and President | |
Date: March 6, 2017 | |
Pursuant to the requirements of the Securities Exchange Act of 1934 and the Investment Company Act of 1940, this report has been signed below by the following persons on behalf of the registrant and in the capacities and on the dates indicated.
/s/ John G. Popp | |
Name: John G. Popp | |
Title: Chief Executive Officer and President | |
Date: March 6, 2017 | |
| |
/s/ Laurie Pecha | |
Name: Laurie Pecha | |
Title: Chief Financial Officer | |
Date: March 6, 2017 | |
6