The CitySync segment loss before income taxes includes $817,000 of acquisition related expenses.
The following table sets forth, for the periods indicated, certain statements of income data as a percent of total revenue and gross margin on international sales and royalties as a percentage of international sales and royalties, respectively.
Gross margins for product sales decreased to 59.3% in 2010 from 65.6% in 2009. The decrease resulted mainly from the addition of the CitySync product line, which currently earns lower margins than Autoscope or RTMS, and increased warranty expense for RTMS, and to a lesser extent from increased pricing competition for Autoscope internationally. Gross margins on royalty income remained consistent at 100% in 2010 and 2009. We anticipate that gross margins for our product sales will be in the proximity of 60% in 2011, while we expect royalty gross margins will be 100% in 2011.
Selling, marketing and product support expense increased to $9.8 million or 31.0% of total revenue in 2010 from $7.2 million or 29.3% of total revenue in 2009. Our selling, marketing and product support expense increased in 2010 mostly as a result of the addition of the CitySync organization. Additionally, we invested in market expansion activities in Europe and Asia, including adding senior management. We anticipate that selling, marketing and product support expense will increase both in terms of dollar amount and as a percentage of revenue in 2011, as compared to 2010, as we realize the full year impact of CitySync related expense and continue to invest in market expansion activities.
General and administrative expense increased to $4.4 million or 13.8% of total revenue in 2010, from $3.8 million or 15.4% of total revenue in 2009. The general and administrative expenses increased in 2010 mainly as a result of the addition of the CitySync organization and to a lesser extent due to increased compensation and benefits. We anticipate that general and administrative expense will increase in terms of dollar amount in 2011 as compared to 2010.
Research and development expense increased to $3.6 million or 11.5% of total revenue in 2010, up from $3.3 million or 13.6% of total revenue in 2009. The increase was mainly related to the addition of the CitySync engineering organization. We anticipate that research and development expense will increase in terms of dollar amount in 2011 as compared to 2010.
Table of Contents
Amortization of intangibles expense was $1.2 million in 2010 and reflects the amortization of intangible assets acquired in both the EIS asset purchase and the CitySync acquisition. Assuming there are no changes to our intangible assets, we anticipate amortization expense will be approximately $1.6 million in 2011.
Other income (expense) was an expense of $123,000 in 2010, primarily consisting of interest expense, as opposed to income of $7,000 in 2009 mainly due to higher debt balances in 2010 including a portion related to CitySync.
Income before income taxes for the Autoscope segment decreased to $2.6 million in 2010 from $3.8 million in 2009, a decrease of 31.6%. The decrease was mainly due to increased competition. Income before income taxes for the RTMS segment increased to $1.8 million in 2010 from $1.4 million in 2009, an increase of 29.1%. The increase was due to higher revenues in the segment, which were partially offset by increased warranty expense.
Our income tax effective rate was 23.2% in 2010 compared to 25.9% in 2009. The 2010 effective rate was positively impacted by increased tax credits for research and development activities. We expect the effective rate in 2011 to be below 30%.
Year Ended December 31, 2009 Compared to Year Ended December 31, 2008. Total revenue decreased to $24.6 million in 2009 from $26.5 million in 2008, a decrease of 7.1%. Royalty income decreased to $12.1 million in 2009 from $13.3 million in 2008, a decrease of 9.1%. We attribute the decrease in royalties to the economic recession in North America and its negative impact on state and federal spending. Product sales decreased to $12.5 million in 2009 from $13.1 million in 2008, a decrease of 5.0%. The decrease was mainly due to weakness in the Asian market in the first half of 2009. Revenue for the Autoscope segment decreased to $16.2 million in 2009 from $18.7 million in 2008, a decrease of 13.2%. The decrease related to lower royalties and weakness in Asia as discussed above. Revenue for the RTMS segment increased to $8.4 million in 2009 from $7.8 million in 2008, an increase of 7.6%. The increase resulted mainly as a result of improved sales in North America.
Gross margins for product sales increased to 65.6% in 2009 from 62.4% in 2008. The increase resulted mainly from the increase in RTMS revenue, which typically earns higher margins than Autoscope, and to a lesser extent from fewer lower of cost or market adjustments to inventory in 2009 as compared to 2008. Gross margins on royalty income remained consistent at 100% in 2009 and 2008.
Selling, marketing and product support expense increased to $7.2 million or 29.3% of total revenue in 2009 from $6.7 million or 25.2% of total revenue in 2008. The selling, marketing and product support expense increased in 2009 as we invested in market expansion activities in Europe and Asia and realized the impact of headcount additions made late in 2008.
General and administrative expense decreased to $3.8 million or 15.4% of total revenue in 2009, down from $4.1 million or 15.4% of total revenue in 2008. The general and administrative expenses decrease in 2009 resulted mainly from lower incentive pay expense and higher foreign currency transaction gains, which were partially offset by increased professional services expense.
Research and development expense increased to $3.3 million or 13.6% of total revenue in 2009, up from $2.9 million or 11.0% of total revenue in 2008. The increase was directly related to our investment in video/radar hybrid solutions and tailored international offerings, development projects to reduce manufacturing costs, and the realization of the impact of headcount additions made late in 2008.
Amortization of intangibles expense was $768,000 in 2009 and reflects the amortization of intangible assets acquired in the EIS asset purchase.
Other income decreased to $7,000 in 2009 from $43,000 in 2008 mainly due to lower interest rates. In 2008, other income fell due to lower cash and investment balances, lower interest rates and interest expense on debt incurred for the EIS asset purchase.
Income before income taxes for the Autoscope segment decreased to $3.8 million in 2009 from $5.9 million in 2008, a decrease of 35.9%. The decrease was mainly due to lower gross margins and higher investments in market expansion activities in the segment. Income before income taxes for the RTMS segment increased to $1.4 million in 2009 from $1.2 million in 2008, an increase of 14.6%. The increase was due to higher revenues in the segment, which were partially offset by increased expenses, a majority of which were caused by the U.S. Dollar weakening over the course of 2009 against the Canadian Dollar.
Our income tax effective rate was 25.9% in 2009 compared to 30.8% in 2008. The 2009 effective rate was positively impacted by the realization of $236,000 in foreign tax credits whose status was uncertain prior to 2009.
Liquidity and Capital Resources
At December 31, 2010, we had $8.0 million in cash and cash equivalents and $4.0 million in short-term investments, compared to $14.1 million in cash and cash equivalents and $3.9 million in short-term investments at December 31, 2009.
24
Table of Contents
Net cash provided by operating activities was $33,000 in 2010, compared to $5.4 million and $5.2 million in 2009 and 2008, respectively. In 2010, as compared to 2009, we had increased accounts and other receivables outstanding, the majority of which related to CitySync activity. The primary reasons for the 2009 change compared to 2008 were lower net income and increased inventory balances that were offset by decreased accounts receivable outstanding. In 2010, investment balances were similar to those of 2009. We anticipate that average receivable collection days in 2011 will be similar to 2010 and that it will not have a material impact on our liquidity. Our planned additions of property and equipment are discretionary, and we do not expect them to exceed historical levels in 2011. We used $8.3 million of cash in 2010 to acquire CitySync including repaying seller loans. This was mostly offset by our 2010 secondary offering which provided $8.8 million in cash, net of offering expenses.
In December 2009, we entered into a term loan agreement for $4.0 million with Associated Bank, National Association, or Associated Bank, which we fully repaid in September 2010. We previously had a separate $4.0 million term note with Associated Bank that originated in May 2008 and was fully repaid in February 2009.
We also have a revolving line of credit agreement with Associated Bank. The revolving line of credit provides for up to $5.0 million at an annual interest rate equal to the greater of 4.5% or LIBOR plus 2.75%, as reset from time to time by the bank. Advances on the line of credit cannot exceed a borrowing base determined under a formula, which is a percentage of the amounts of eligible receivables. The line of credit currently has no borrowings outstanding and matures on May 1, 2012. We believe that on an ongoing basis, we will have regular availability to draw a minimum of $3.0 million on our line of credit based on our qualifying assets.
In conjunction with our acquisition of CitySync, the sellers have an earn-out arrangement over approximately 18 months from the June 2010 date of purchase. The earn-out is based on achieving certain revenue and minimum gross margins from the sale of CitySync ANPR systems and it is calculated in two separate periods, each ending on December 31. In each period there are two tiers and superior performance could lead to a total earn-out of $2 million or higher, as the earn-out is not capped. Earn-out payments are due within three months of the end of an earn-out period. Based on the 2010 results, the sellers are entitled to receive a $696,000 earn-out for the first period which ran from the June acquisition date to December 31, 2010. The payment is expected to be made in March 2011, and a liability has been recorded on our balance sheet as of December 31, 2010. As part of the recognition of the liability, we recorded an additional $205,000 in expense as the earn-out exceeded our initial estimate.
In conjunction with our EIS asset purchase, the sellers had an earn-out arrangement over approximately three years from the December 2007 date of purchase. The earn-out ended as of December 31, 2010. The earn-out was based on earnings before taxes from RTMS sales less related cost of revenue and operating expenses, excluding depreciation, amortization and interest expenses, and was calculated annually. For the first two earn-out periods, the sellers of the EIS assets received a total of $2.7 million in earn-out payments. Based on the 2010 results, the sellers are entitled to receive a $1.7 million earn-out for the third and final period. The payment is expected to be made in March 2011, and a liability has been recorded on our balance sheet as of December 31, 2010.
We believe that cash and cash equivalents on hand at December 31, 2010, along with the availability of funds under our $5.0 million revolving line of credit and cash provided by operating activities, will satisfy our projected working capital needs, payments under the EIS and CitySync earn-outs, investing activities, and other cash requirements for the foreseeable future.
Off-Balance Sheet Arrangements
We do not participate in transactions or have relationships or other arrangements with an unconsolidated entity, including special purpose and similar entities or other off-balance sheet arrangements.
Critical Accounting Policies
Goodwill and Intangible Assets. Goodwill is not amortized but is tested for impairment annually or whenever an impairment indicator arises. Our goodwill related to our Flow Traffic subsidiary is tested for impairment on December 31 of each year. EIS asset purchase (RTMS) related goodwill is tested on October 1 of each year. CitySync goodwill will be tested beginning in April 2011.
On an annual basis, we reconcile our market value to the estimated combined fair value of our business segments and reporting units as a separate measure to determine whether goodwill is impaired.
For Flow Traffic, we estimate the fair value by using a combination of the income approach, where fair value is dependent on the present value of future economic benefits to be derived from ownership of Flow Traffic, and the comparable market transactions method. The future economic benefits are significantly dependent on sustaining revenue levels for all product lines. For the RTMS reporting units, we estimate fair value by using a combination of the income approach, where fair value is dependent on the present value of future economic benefits to be derived from the RTMS product line, and the market valuation approach, where the business was compared to guideline public company price-earning multiples with a significant weighting to companies in the traffic detection business. The future economic benefits are mainly dependent on future revenue growth of the RTMS product line. No impairment of goodwill was recorded as of December 31, 2010, 2009 and 2008. If Flow Traffic and/or the RTMS reporting units do not provide the future economic benefits we project, the fair value of these assets may become impaired, and we would need to record an impairment loss.
25
Table of Contents
Intangible assets are stated at their estimated value at the time of acquisition. Amortization is computed by the straight-line method over a three- to nine-year period for financial reporting purposes based on their estimated useful lives.
Earn-outs related to the EIS asset purchase are recorded as additional goodwill in the year earned. Intangible assets related to the EIS asset purchase are for trade names and technology. Earn-outs for the CitySync acquisition were estimated at the time of the acquisition, based on projected sales and gross margins during the earn-out period, and recorded on our balance sheet as a liability with an offsetting increase in goodwill. Actual earn-outs that vary from the initial estimated liability result in operating expense or income in the applicable year. Intangible assets related to the CitySync acquisition are for customer relationships, trade names and technology.
Revenue Recognition. Royalty income is recognized based upon a monthly royalty report provided to us by Econolite. This report is prepared by Econolite based on its sales of products we developed and is based on sales shipped or delivered to its customers. We recognize revenue from North American and international sales at the time of shipment or delivery; the selling price is fixed or determinable; and collectability is reasonably assured. We record provisions against revenue for estimated returns and allowances in the period when the related revenue is recorded based upon historical sales returns and changes in end user demands. The allowance for doubtful accounts is estimated based on specific identification of delinquent receivables.
Income Taxes. Income taxes are accounted for under the liability method. Deferred income taxes reflect the effects of temporary differences between the carrying amounts of assets and liabilities for financial reporting purposes and amounts used for income tax purposes. Deferred tax assets are offset by a valuation allowance as deemed necessary based on our estimate of our future sources of taxable income and the expected timing of temporary difference reversals. Uncertain tax positions are recognized if the tax position is more likely than not of being sustained on audit based on the technical merits of the position.
Inventories. Inventories are stated at the lower of cost (first-in, first-out method) or market and allowances have been made for obsolete, excess or unmarketable inventories based on estimated future usage or actual or anticipated product line changes.
Warranties. We generally provide a standard two-year warranty on product sales. Reserves to honor warranty claims are estimated and recorded at the time of sale based on historical claim information and are analyzed and adjusted periodically based on claim trends.
New and Recently Adopted Accounting Pronouncements
In January 2010, the FASB issued Accounting Standards Update (“ASU”) No. 2010-06,Improving Disclosures about Fair Value Measurements (“ASU 2010-06”). ASU 2010-06 requires new disclosures regarding transfers in and out of Levels 1 and 2 and activity in Level 3 fair value measurements. It also clarifies existing disclosure requirements regarding the level of disaggregation in certain disclosures, inputs, and valuation techniques used in ASC 820,Fair Value Measurements and Disclosures. We adopted all of the requirements of this update on January 1, 2010, its effective date, except for the new requirement regarding activity in Level 3 fair value measurements which has a later effective date under the provisions of ASU 2010-6 and will become effective on January 1, 2011. Adoption of this pronouncement has not had, and is not expected to have, a significant effect on our consolidated financial statements disclosures.
In September 2010, the FASB issued ASU No. 2010-20,Disclosures about the Credit Quality of Financing Receivables and the Allowance for Credit Losses, to enhance the disclosures required for financing receivables (for example, loans, trade accounts receivable, notes receivable, and receivables relating to a lessor’s leveraged, direct financing, and sales-type leases) and allowances for credit losses. The amended disclosures are designed to provide more information to financial statement users regarding the credit quality of a creditor’s financing receivables and the adequacy of its allowance for credit losses. We adopted all of the requirements of the amended guidance on December 31, 2010, its effective date, except for the disclosures regarding the activity during a reporting period which will become effective January 1, 2011. Adoption of the pronouncement has not had, and is not expected to have, a significant effect on our consolidated financial statement disclosures.
| |
Item 7A. | Quantitative and Qualitative Disclosures About Market Risks |
Our foreign sales and results of operations are subject to the impact of foreign currency fluctuations. From time to time, we enter into currency hedges to attempt to lower our exposure to translation gains and losses as well as to limit the impact of foreign currency translation upon the consolidation of our foreign subsidiaries. A 10% adverse change in foreign currency rates, if we have not hedged, could have a material effect on our results of operations or financial position. Our current greatest exposure for a negative material impact to our operations is a rising Canadian Dollar versus the U.S. Dollar.
26
Table of Contents
| |
Item 8. | Financial Statements and Supplementary Data |
IMAGE SENSING SYSTEMS, INC.
CONSOLIDATED BALANCE SHEETS
(in thousands, except share data)
| | | | | | | |
| | December 31 | |
| |
| |
| | 2010 | | 2009 | |
| |
|
|
| |
ASSETS | | | | | | | |
Current assets: | | | | | | | |
Cash and cash equivalents | | $ | 8,021 | | $ | 14,084 | |
Investments | | | 3,954 | | | 3,935 | |
Accounts receivable, net of allowance for returns and doubtful accounts of $328 ($90 in 2009) | | | 10,137 | | | 5,660 | |
Inventories | | | 4,649 | | | 2,734 | |
Prepaid expenses and other receivables | | | 2,017 | | | 588 | |
Deferred income taxes | | | 230 | | | 137 | |
| |
|
| |
|
| |
Total current assets | | | 29,008 | | | 27,138 | |
| | | | | | | |
Property and equipment: | | | | | | | |
Furniture and fixtures | | | 380 | | | 274 | |
Leasehold improvements | | | 158 | | | 92 | |
Equipment | | | 2,714 | | | 2,288 | |
| |
|
| |
|
| |
| | | 3,252 | | | 2,654 | |
Accumulated depreciation | | | 2,130 | | | 1,656 | |
| |
|
| |
|
| |
| | | 1,122 | | | 998 | |
| | | | | | | |
Deferred income taxes | | | — | | | 1,676 | |
Intangible assets | | | 9,513 | | | 3,714 | |
Goodwill | | | 14,713 | | | 7,624 | |
| |
|
| |
|
| |
TOTAL ASSETS | | $ | 54,356 | | $ | 41,150 | |
| |
|
| |
|
| |
| | | | | | | |
LIABILITIES AND SHAREHOLDERS’ EQUITY | | | | | | | |
Current liabilities: | | | | | | | |
Accounts payable | | $ | 2,094 | | $ | 953 | |
Bank debt | | | — | | | 4,000 | |
Accrued compensation | | | 1,364 | | | 858 | |
Accrued warranty and other | | | 1,467 | | | 643 | |
Earn-outs payable | | | 2,928 | | | 1,541 | |
Income taxes payable | | | 17 | | | 234 | |
| |
|
| |
|
| |
Total current liabilities | | | 7,870 | | | 8,229 | |
| | | | | | | |
Deferred income taxes | | | 290 | | | — | |
Income taxes payable | | | 175 | | | 208 | |
| | | | | | | |
Shareholders’ equity: | | | | | | | |
Preferred stock, $.01 par value; 5,000,000 shares authorized, none issued or outstanding | | | — | | | — | |
Common stock, $.01 par value; 20,000,000 shares authorized, 4,878,519 issued and outstanding (3,985,819 in 2009) | | | 49 | | | 40 | |
Additional paid-in capital | | | 22,065 | | | 11,994 | |
Accumulated other comprehensive income (loss) | | | 52 | | | (171 | ) |
Retained earnings | | | 23,855 | | | 20,850 | |
| |
|
| |
|
| |
Total shareholders’ equity | | | 46,021 | | | 32,713 | |
| |
|
| |
|
| |
TOTAL LIABILITIES AND SHAREHOLDERS’ EQUITY | | $ | 54,356 | | $ | 41,150 | |
| |
|
| |
|
| |
See accompanying notes to the consolidated financial statements.
27
Table of Contents
IMAGE SENSING SYSTEMS, INC.
CONSOLIDATED STATEMENTS OF INCOME
(in thousands, except share data)
| | | | | | | | | | |
| | Years ended December 31 | |
| |
| |
| | 2010 | | 2009 | | 2008 | |
| |
| |
| |
| |
Revenue: | | | | | | | | | | |
Product sales | | $ | 19,162 | | $ | 12,483 | | $ | 13,144 | |
Royalties | | | 12,519 | | | 12,110 | | | 13,321 | |
| |
|
| |
|
| |
|
| |
| | | 31,681 | | | 24,593 | | | 26,465 | |
Cost of revenue (exclusive of amortization shown below): | | | | | | | | | | |
Product sales | | | 7,799 | | | 4,297 | | | 4,912 | |
| |
|
| |
|
| |
|
| |
Gross profit | | | 23,882 | | | 20,296 | | | 21,553 | |
| | | | | | | | | | |
Operating expenses: | | | | | | | | | | |
Selling, marketing and product support | | | 9,807 | | | 7,201 | | | 6,680 | |
General and administrative | | | 4,372 | | | 3,779 | | | 4,069 | |
Research and development | | | 3,630 | | | 3,336 | | | 2,908 | |
Amortization of intangible assets | | | 1,218 | | | 768 | | | 768 | |
Acquisition related expenses | | | 817 | | | — | | | — | |
| |
|
| |
|
| |
|
| |
| | | 19,844 | | | 15,084 | | | 14,425 | |
| |
|
| |
|
| |
|
| |
Income from operations | | | 4,038 | | | 5,212 | | | 7,128 | |
| | | | | | | | | | |
Other income (expense), net | | | (123 | ) | | 7 | | | 43 | |
| |
|
| |
|
| |
|
| |
Income before income taxes | | | 3,915 | | | 5,219 | | | 7,171 | |
Income tax expense | | | 910 | | | 1,354 | | | 2,207 | |
| |
|
| |
|
| |
|
| |
Net income | | $ | 3,005 | | $ | 3,865 | | $ | 4,964 | |
| |
|
| |
|
| |
|
| |
Net income per share: | | | | | | | | | | |
Basic | | $ | 0.66 | | $ | 0.97 | | $ | 1.26 | |
Diluted | | | 0.64 | | | 0.95 | | | 1.24 | |
| | | | | | | | | | |
Weighted average number of common shares outstanding: | | | | | | | | | | |
Basic | | | 4,555 | | | 3,985 | | | 3,943 | |
Diluted | | | 4,667 | | | 4,081 | | | 4,001 | |
See accompanying notes to the consolidated financial statements.
28
Table of Contents
|
IMAGE SENSING SYSTEMS, INC. |
CONSOLIDATED STATEMENTS OF CASH FLOW |
(in thousands) |
| | | | | | | | | | |
| | Years ended December 31 | |
| |
| |
| | 2010 | | 2009 | | 2008 | |
| |
| |
| |
| |
Operating activities: | | | | | | | | | | |
Net income | | $ | 3,005 | | $ | 3,865 | | $ | 4,964 | |
Adjustments to reconcile net income to net cash provided by operating activities: | | | | | | | | | | |
Depreciation | | | 498 | | | 424 | | | 357 | |
Amortization | | | 1,218 | | | 768 | | | 768 | |
Tax benefit from disqualifying disposition | | | 72 | | | — | | | 137 | |
Stock option expense | | | 342 | | | 341 | | | 339 | |
Deferred income taxes | | | 174 | | | 138 | | | (133 | ) |
Changes in operating assets and liabilities, net of acquisition: | | | | | | | | | | |
Accounts receivable | | | (3,711 | ) | | 960 | | | (1,623 | ) |
Inventories | | | (1,309 | ) | | (1,126 | ) | | (29 | ) |
Prepaid expenses and other receivables | | | (1,229 | ) | | (212 | ) | | (148 | ) |
Accounts payable | | | 391 | | | 702 | | | (565 | ) |
Accrued liabilities | | | 832 | | | (384 | ) | | 671 | |
Income taxes payable | | | (250 | ) | | (87 | ) | | 445 |
|
| |
|
| |
|
| |
|
| |
Net cash provided by operating activities | | | 33 | | | 5,389 | | | 5,183 | |
| | | | | | | | | | |
Investing activities: | | | | | | | | | | |
Cash paid to sellers of CitySync equity | | | (7,871 | ) | | — | | | — | |
Repayment of CitySync seller loans | | | (445 | ) | | — | | | — | |
EIS earn-out payment | | | (1,541 | ) | | (1,192 | ) | | — | |
Purchase of short-term investments | | | (8,882 | ) | | (6,640 | ) | | (7,400 | ) |
Sale of short-term investments | | | 8,863 | | | 6,705 | | | 3,400 | |
Purchases of property and equipment | | | (380 | ) | | (694 | ) | | (385 | ) |
| |
|
| |
|
| |
|
| |
Net cash used in investing activities | | | (10,256 | ) | | (1,821 | ) | | (4,385 | ) |
| | | | | | | | | | |
Financing activities: | | | | | | | | | | |
Net proceeds from common stock offering | | | 8,818 | | | — | | | — | |
Proceeds from exercise of stock options | | | 121 | | | 1 | | | 173 | |
Proceeds from bank debt | | | — | | | 4,000 | | | — | |
Repayment of bank debt | | | (4,556 | ) | | (3,750 | ) | | (1,250 | ) |
Cash released from restriction on bank debt | | | — |
| | — | | | 5,263 | |
| |
|
| |
|
| |
|
| |
Net cash provided by financing activities | | | 4,383 | | | 251 | | | 4,186 | |
| | | | | | | | | | |
Effect of exchange rate changes on cash | | | (223 | ) | | 24 | | | (308 | ) |
| |
|
| |
|
| |
|
| |
Increase (decrease) in cash and cash equivalents | | | (6,063 | ) | | 3,795 | | | 4,676 | |
| | | | | | | | | | |
Cash and cash equivalents at beginning of year | | | 14,084 | | | 10,289 | | | 5,613 | |
| |
|
| |
|
| |
|
| |
Cash and cash equivalents at end of year | | $ | 8,021 | | $ | 14,084 | | $ | 10,289 |
|
| |
|
| |
|
| |
|
| |
| | | | | | | | | | |
Supplemental disclosure: | | | | | | | | | | |
Income taxes paid | | $ | 1,571 | | $ | 1,488 | | $ | 1,680 | |
Interest expense paid | | $ | 155 | | $ | 33 | | $ | 278 | |
| | | | | | | | | | |
Supplemental non-cash disclosure: | | | | | | | | | | |
Common stock issued in connection with CitySync acquisition | | $ | 727 | | $ | — | | $ | — | |
EIS earn-out payable recorded as additional goodwill | | $ | 1,665 | | $ | 1,541 | | $ | 1,164 | |
| | | | | | | | | | |
See accompanying notes to the consolidated financial statements. | | | | | | | | | | |
29
Table of Contents
|
IMAGE SENSING SYSTEMS, INC. |
CONSOLIDATED STATEMENTS OF SHAREHOLDERS’ EQUITY AND COMPREHENSIVE INCOME |
(in thousands, except share data) |
| | | | | | | | | | | | | | | | | | | |
| | Shares
Issued | | Common
Stock | | Additional
Paid-In
Capital | | Accumulated
Other
Comprehensive
Income
(Loss) | | Retained
Earnings | | Total | |
| |
| |
| |
| |
| |
| |
| |
Balance at December 31, 2007 | | | 3,927,806 | | $ | 39 | | $ | 11,004 | | $ | 161 | | $ | 12,021 | | $ | 23,225 | |
| | | | | | | | | | | | | | | | | | | |
Tax benefit from disqualifying disposition | | | — | | | — | | | 137 | | | — | | | — | | | 137 | |
Common stock issued for options exercised | | | 59,000 | | | 1 | | | 194 | | | — | | | — | | | 195 | |
Common stock retired | | | (1,587 | ) | | — | | | (22 | ) | | — | | | — | | | (22 | ) |
Stock option expense | | | — | | | — | | | 339 | | | — | | | — | | | 339 | |
Foreign currency translation adjustment | | | — | | | — | | | — | | | (308 | ) | | — | | | (308 | ) |
Net income | | | — | | | — | | | — | | | — | | | 4,964 | | | 4,964 | |
| | | | | | | | | | | | | | | | |
|
| |
Comprehensive income | | | — | | | — | | | — | | | — | | | — | | | 4,656 | |
| |
|
| |
|
| |
|
| |
|
| |
|
| |
|
| |
Balance at December 31, 2008 | | | 3,985,219 | | | 40 | | | 11,652 | | | (147 | ) | | 16,985 | | | 28,530 | |
| | | | | | | | | | | | | | | | | | | |
Common stock issued for options exercised | | | 600 | | | — | | | 1 | | | — | | | — | | | 1 | |
Stock option expense | | | — | | | — | | | 341 | | | — | | | — | | | 341 | |
Foreign currency translation adjustment | | | — | | | — | | | — | | | (24 | ) | | — | | | (24 | ) |
Net income | | | — | | | — | | | — | | | — | | | 3,865 | | | 3,865 | |
| | | | | | | | | | | | | | | | |
|
| |
Comprehensive income | | | — | | | — | | | — | | | — | | | — | | | 3,841 | |
| |
|
| |
|
| |
|
| |
|
| |
|
| |
|
| |
Balance at December 31, 2009 | | | 3,985,819 | | | 40 | | | 11,994 | | | (171 | ) | | 20,850 | | | 32,713 | |
| | | | | | | | | | | | | | | | | | | |
Tax benefit from disqualifying disposition | | | — | | | — | | | 72 | | | — | | | — | | | 72 | |
Common stock issued for options exercised | | | 37,700 | | | — | | | 121 | | | — | | | — | | | 121 | |
Common stock issued in secondary offering, net | | | 798,000 | | | 8 | | | 8,810 | | | — | | | — | | | 8,818 | |
Common stock issued in CitySync acquisition | | | 57,000 | | | 1 | | | 726 | | | — | | | — | | | 727 | |
Stock option expense | | | — | | | — | | | 342 | | | — | | | — | | | 342 | |
Foreign currency translation adjustment | | | — | | | — | | | — | | | 223 | | | — | | | 223 | |
Net income | | | — | | | — | | | — | | | — | | | 3,005 | | | 3,005 | |
| | | | | | | | | | | | | | | | |
|
| |
Comprehensive income | | | — | | | — | | | — | | | — | | | — | | | 3,228 | |
| |
|
| |
|
| |
|
| |
|
| |
|
| |
|
| |
Balance at December 31, 2010 | | | 4,878,519 | | $ | 49 | | $ | 22,065 | | $ | 52 | | $ | 23,855 | | $ | 46,021 | |
| |
|
| |
|
| |
|
| |
|
| |
|
| |
|
| |
| | | | | | | | | | | | | | | | | | | |
See accompanying notes to the consolidated financial statements. | |
30
Table of Contents
Notes to Consolidated Financial Statements
December 31, 2010
| |
1. | DESCRIPTION OF BUSINESS AND SIGNIFICANT ACCOUNTING POLICIES |
DESCRIPTION OF BUSINESS
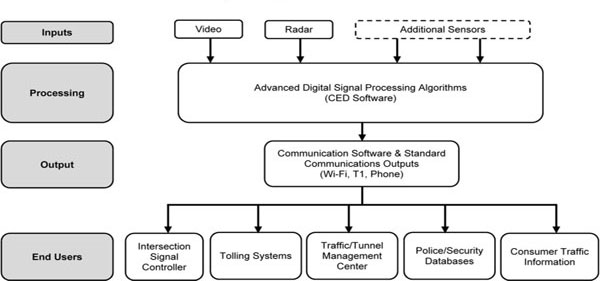
Image Sensing Systems, Inc. (referred to herein as “we,” the “Company,” “us” and “our”) develops and markets software-based computer enabled detection products for use in traffic, security, police and parking applications. We sell our products primarily to distributors and also receive royalties under a license agreement with a manufacturer/distributor for one of our product lines. Our products are used primarily by governmental entities.
PRINCIPLES OF CONSOLIDATION
The consolidated financial statements include the accounts of Image Sensing Systems, Inc. and its wholly-owned subsidiaries: Flow Traffic Ltd. (Flow Traffic) located in Hong Kong; Image Sensing Systems Holdings Limited (ISS/Holdings) and Image Sensing Systems Europe Ltd. (ISS/Europe), both located in the United Kingdom; Image Sensing Systems Europe Limited SP.Z.O.O. (ISS/Poland), located in Poland; ISS Image Sensing Systems Canada Ltd (ISS/Canada) and ISS Canada Sales Corp. (Canada Sales Corp.), both located in Ontario, Canada; and CitySync Limited (CitySync), located in the United Kingdom. All significant inter-company transactions and accounts have been eliminated in consolidation.
REVENUE RECOGNITION
Royalty income is recognized based upon a monthly royalty report provided to us by Econolite Control Products, Inc. (Econolite), a licensee that sells one of our products in North America, the Caribbean and Latin America. The royalty is calculated using a profit sharing model where we split evenly the gross profit on sales of our Autoscope product made by Econolite. The royalty report is prepared by Econolite based on its sales of licensed products shipped or delivered to its customers.
We recognize revenue from product sales at the time of shipment or delivery, the selling price is fixed or determinable and collection of payment is reasonably assured. We record provisions against sales revenue for estimated returns and allowances in the period when the related revenue is recorded based on historical sales returns and changes in end user demand.
CASH AND CASH EQUIVALENTS
We consider all highly liquid investments with an original maturity of three months or less to be cash equivalents. Cash equivalents consist of money market funds. Cash located in foreign banks was $3.3 million and $3.6 million at December 31, 2010 and 2009, respectively. We hold our cash and cash equivalents with financial institutions and, at times, the amounts of our balances may be in excess of insurance limits.
INVESTMENTS
Investments and marketable securities held at December 31, 2010 and 2009 that do not qualify as cash equivalents have been designated as “available for sale”.
ACCOUNTS RECEIVABLE
We grant credit to customers in the normal course of business and generally do not require collateral. Management performs on-going credit evaluations of customers. We have fixed payment terms with each of our customers that vary in length. Accounts receivable that are outstanding longer than the fixed payment term are considered past due. We determine an allowance for doubtful accounts by considering a number of factors, including any on-going technical problems with product in the field, the length of time trade accounts receivable are past due, our previous loss history with the customer and the customer’s current ability to pay. We write off accounts receivable when they become uncollectible, and payments subsequently received on such receivables are credited to the allowance for doubtful accounts.
31
Table of Contents
INVENTORIES
Inventories are primarily electronic components and finished goods and are valued at the lower of cost or market on the first-in, first-out (FIFO) method. Adjustments to record inventory at the lower of cost or market are charged to cost of revenue in the period incurred and totaled $23,000, $6,000 and $211,000 for the years ended December 31, 2010, 2009 and 2008, respectively.
PROPERTY AND EQUIPMENT
Property and equipment are stated at cost. Depreciation is computed by the straight-line method over a three- to seven-year period for financial reporting purposes and by accelerated methods for income tax purposes.
INCOME TAXES
Income taxes are accounted for under the liability method. Deferred income taxes are provided for temporary differences between the carrying amounts of assets and liabilities for financial reporting purposes and amounts used for income tax purposes. Deferred taxes are reduced by a valuation allowance when, in the opinion of management, it is more likely than not that some portion or the entire deferred tax asset will not be realized. Deferred tax assets and liabilities are adjusted for the effects of changes in tax laws and rates on the date of the enactment. We recognize tax benefits when we believe the benefit is more likely than not to be sustained upon review from the relevant authorities. We recognize penalties and interest expense related to unrecognized tax benefits in income tax expense.
FAIR VALUE MEASUREMENTS
Fair value is determined on the exchange price that would be received for an asset or paid to transfer a liability (an exit price) in the principal or most advantageous market for the asset or liability in an orderly transaction between market participants. Each major asset and liability category is measured at fair value on either a recurring or nonrecurring basis using a three-tier fair value hierarchy which prioritizes the inputs used in fair value measurements. The three-tier hierarchy for inputs used in measuring fair value is as follows:
| | |
| Level 1. | Observable inputs such as quoted prices in active markets; |
| | |
| Level 2. | Inputs, other than the quoted prices in active markets, that are observable either directly or indirectly; and |
| | |
| Level 3. | Unobservable inputs in which there is little or no market data, which require the reporting entity to develop its own assumptions. |
INTANGIBLE ASSETS
Intangible assets are stated at their estimated value at the time of acquisition. Amortization is computed by the straight-line method over a three- to nine-year period for financial reporting purposes based on their estimated useful lives.
GOODWILL
Goodwill is not amortized but is tested for impairment annually or whenever an impairment indicator arises. Our goodwill related to our Flow Traffic subsidiary is tested for impairment on December 31 of each year. EIS asset purchase related goodwill is tested on October 1 of each year. CitySync goodwill will be tested beginning in April 2011. There is a two-step process for impairment testing of goodwill. The first step, used to identify potential impairment, compares the fair value of a reporting unit with its carrying amount, including goodwill. The second step, if necessary, measures the amount of the impairment by comparing the estimated fair value of the goodwill and intangible assets to their respective carrying values. If an impairment is identified, the carrying value of the asset is adjusted to estimated fair value.
During our annual impairment testing, we reconcile our market value, based on the value of our common stock, to the estimated combined fair value of our reporting units, to ensure that goodwill is not impaired. For Flow Traffic, we estimate the fair value by using a combination of the income approach, where fair value is dependent on the present value of future economic benefits to be derived from ownership of Flow Traffic, and the comparable market transactions method. The future economic benefits are significantly dependent on sustaining revenue levels for all product lines. For the RTMS reporting unit, we estimate fair value by using a combination of the income approach, where fair value is dependent on the present value of future economic benefits to be derived from the RTMS product line, and the market valuation approach, where the business was compared to guideline public company price-earning multiples with a significant weighting to companies in the traffic detection business. The future economic benefits are mainly dependent on future revenue growth of the RTMS product line. At December 31, 2008, we performed a reconciliation, as our market capitalization was similar to our consolidated shareholders’ equity. We determined that no goodwill impairment existed at December 31, 2010, 2009 and 2008, as the fair value of each reporting unit exceeded its carrying value.
32
Table of Contents
IMPAIRMENT OF LONG-LIVED ASSETS
Long-lived assets are reviewed for impairment when indicators of impairment are present. Impairment is recognized when the undiscounted cash flows estimated to be generated by those assets are less than the assets’ carrying amount. No such losses were recorded during the years ended December 31, 2010, 2009 or 2008.
USE OF ESTIMATES
Preparing financial statements in conformity with accounting principles generally accepted in the United States of America requires management to make estimates and assumptions that affect the reported amounts of assets and liabilities and disclosure of contingent assets and liabilities at the date of the consolidated financial statements and reported amounts of revenues and expenses during the reporting periods. Actual results could differ from the estimates.
RESEARCH AND DEVELOPMENT
Research and development costs are charged to operations in the period incurred.
WARRANTIES
We generally provide a standard two-year warranty on product sales. Reserves to honor warranty claims are estimated and recorded at the time of sale based on historical claim information and are analyzed and adjusted periodically based on claim trends.
ADVERTISING
Advertising costs are charged to operations in the period incurred and totaled $153,000, $151,000 and $196,000 for the years ended December 31, 2010, 2009 and 2008, respectively.
FOREIGN CURRENCY
All assets and liabilities of Flow Traffic, ISS/Europe, ISS/Holdings, ISS/Poland, ISS/Canada, Canada Sales Corp. and CitySync are translated from their respective functional currency to United States dollars at period-end rates of exchange, while the statement of income is translated at the average exchange rates during the period. Accumulated translation adjustments are shown in equity under “Accumulated other comprehensive income (loss).”
NET INCOME PER SHARE
Our basic net income per share amounts have been computed by dividing net income by the weighted average number of outstanding common shares. Diluted net income per share amounts have been computed by dividing net income by the weighted average number of outstanding common shares and common share equivalents relating to stock options, when dilutive.
For the years ended December 31, 2010, 2009 and 2008, respectively, 112,000, 96,000 and 58,000 common share equivalents were included in the computation of diluted net income per share.
At December 31, 2010, 2009 and 2008, the exercise prices of 133,000, 36,000 and 253,500 outstanding options, respectively, were greater than the average market price of the common shares during the period and were excluded from the calculation of diluted net income per share.
STOCK OPTIONS
We recognize compensation expense for share-based awards using the fair value of the option at the time of the grant and amortizing the fair value over the estimated service period on the straight-line attribute method. Unrecognized compensation costs were $761,000 at December 31, 2010, with a weighted average remaining life of 2.4 years.
33
Table of Contents
NEW ACCOUNTING PRONOUNCEMENTS
In January 2010, the FASB issued Accounting Standards Update (“ASU”) No. 2010-06,Improving Disclosures about Fair Value Measurements (“ASU 2010-06”). ASU 2010-06 requires new disclosures regarding transfers in and out of Levels 1 and 2 and activity in Level 3 fair value measurements. It also clarifies existing disclosure requirements regarding the level of disaggregation in certain disclosures, inputs, and valuation techniques used in ASC 820,Fair Value Measurements and Disclosures. We adopted all of the requirements of this update on January 1, 2010, its effective date, except for the new requirement regarding activity in Level 3 fair value measurements which has a later effective date under the provisions of ASU 2010-6 and will become effective on January 1, 2011. Adoption of this pronouncement has not had, and is not expected to have, a significant effect on our consolidated financial statements disclosures.
In September 2010, the FASB issued ASU No. 2010-20,Disclosures about the Credit Quality of Financing Receivables and the Allowance for Credit Losses, to enhance the disclosures required for financing receivables (for example, loans, trade accounts receivable, notes receivable, and receivables relating to a lessor’s leveraged, direct financing, and sales-type leases) and allowances for credit losses. The amended disclosures are designed to provide more information to financial statement users regarding the credit quality of a creditor’s financing receivables and the adequacy of its allowance for credit losses. We adopted all of the requirements of the amended guidance on December 31, 2010, its effective date, except for the disclosures regarding the activity during a reporting period which will become effective January 1, 2011. Adoption of the pronouncement has not had, and is not expected to have, a significant effect on our consolidated financial statement disclosures.
RECLASSIFICATIONS
Certain prior year amounts have been reclassified to conform to the current year presentation.
Investments and marketable securities held at December 31, 2010 and 2009 that do not qualify as cash equivalents have been designated as “available for sale”. The estimated fair value of the investments held at December 31, 2010 and 2009 was determined using Level 1 measurements.
Our current portfolio is composed of high-grade municipal bonds, federal notes and commercial paper. The maximum term to maturity or time to next reset is six months.
Investments consisted of the following (in thousands):
| | | | | | | |
| | December 31, | |
| |
| |
| | 2010 | | 2009 | |
| |
| |
| |
Federal notes | | $ | 422 | | $ | — | |
Municipal bonds | | | 2,217 | | | 3,935 | |
Commercial paper | | | 1,315 | | | — | |
| |
|
| |
|
| |
| | | | | | | |
Total | | $ | 3,954 | | $ | 3,935 | |
| |
|
| |
|
| |
Proceeds from maturities and sales of investments totaled $8.9 million, $6.7 million and $3.4 million for the years ended December 31, 2010, 2009 and 2008, respectively. Realized gains or losses related to sales during the years ended December 31, 2010 and 2009 were immaterial and are included in interest income.
Inventories, net of reserves, consisted of the following (in thousands):
| | | | | | | |
| | December 31, | |
| |
| |
| | 2010 | | 2009 | |
| |
| |
| |
Electronic components | | $ | 2,114 | | $ | 1,733 | |
Finished goods | | | 2,535 | | | 1,001 | |
| |
|
| |
|
| |
Total | | $ | 4,649 | | $ | 2,734 | |
| |
|
| |
|
| |
34
Table of Contents
On June 21, 2010, we purchased all of the outstanding equity of CitySync Limited, a privately-held developer and marketer of automatic number plate recognition (ANPR) products. We believe the CitySync acquisition expands our addressable market, strengthens our selling presence in Europe and extends the opportunities for hybrid product developments. The purchase price was $7.9 million in cash plus 57,000 shares of our common stock, valued using the closing price on the day before the acquisition, totaling approximately $727,000. In conjunction with the purchase, we repaid seller loans, including accrued interest, of $601,000. Following the acquisition, CitySync became a wholly-owned subsidiary of ISS/Europe.
As part of the purchase agreement, the sellers are eligible to receive an earn-out based on the performance of the business for the next 18 months. Earn-outs will be calculated as of each calendar year end and paid within 90 days thereof. The earn-out is based on achieving certain revenue and minimum gross margins from the sale of CitySync ANPR systems, and it is calculated in two separate periods, each ending on December 31. In each period there are two tiers, and superior performance could lead to a total earn-out of $2 million or higher, as the earn-out is not capped. The 2010 earn-out achieved was $696,000. We had initially determined the fair value of the 2010 earn-out to be $491,000 as of June 30, 2010, and therefore we incurred an additional $205,000 that is recognized in the consolidated statements of income under the caption “Acquisition related expenses.” The estimate of the 2011 earn-out fair value of $519,000 is unchanged.
At June 30, 2010, we preliminarily estimated the value of goodwill from the CitySync acquisition at $3.3 million and revised our estimate to $5.3 million as of September 30, 2010. This estimate did not change as of December 31, 2010, and management has determined the goodwill is no longer subject to look-back adjustments.
The purchase price was allocated on the basis of estimated fair value at the date of the purchase. The final purchase price allocation is as follows (in thousands):
| | | | |
Consideration transferred: | | | | |
Cash | | $ | 7,871 | |
Fair value of common stock | | | 727 | |
Estimated fair value of earn-out | | | 1,010 | |
| |
|
| |
Total purchase price | | | 9,608 | |
| | | | |
Allocation: | | | | |
Net tangible current assets | | | (1,684 | ) |
Property and equipment | | | (242 | ) |
Liabilities | | | 2,450 | |
Deferred income taxes | | | 1,876 | |
Developed technology | | | (3,300 | ) |
Trade names | | | (1,900 | ) |
Other intangibles | | | (1,500 | ) |
| |
|
| |
Goodwill | | $ | 5,308 |
|
| |
|
| |
In conjunction with the acquisition, all of the shares of common stock issued in connection with the transaction were placed in escrow to secure potential indemnification obligations. Any shares remaining in escrow on December 31, 2012 will be released to the sellers.
The results of CitySync operations are included in the accompanying financial statements since the date of the acquisition. The following pro forma summary presents the results of operations as if the acquisition had occurred on January 1, 2009. The table below includes our results for the periods as shown and for CitySync based on a January fiscal year. The pro forma results are not necessarily indicative of the results that would have been achieved had the CitySync acquisition taken place on that date (in thousands, except per share amounts):
| | | | | | | |
| | Year Ended
December 31, | |
| |
| |
| | 2010 | | 2009 | |
| |
| |
| |
Total revenue | | $ | 34,088 | | $ | 32,034 | |
| | | | | | | |
Net income | | | 2,508 | | | 2,937 | |
|
Net income per share: | | | | | | | |
Basic | | $ | 0.55 | | $ | 0.73 | |
| |
|
| |
|
| |
Diluted | | $ | 0.53 | | $ | 0.71 | |
| |
|
| |
|
| |
35
Table of Contents
In 2007, we purchased certain assets of EIS Electronic Integrated Systems, Inc. (EIS), including its RTMS radar product line. As part of the purchase agreement, the sellers are eligible to receive an earn-out based on the performance of the EIS assets purchased for approximately three years after the December 2007 purchase date. Earn-outs were calculated annually for 2008, 2009 and 2010. Earn-out payments related to the EIS asset purchase were recorded as additional goodwill when earned. In 2009, the sellers were entitled to a $1.5 million earn-out for the second earn-out period, which was paid in March 2010. For 2010, the final earn-out period, the sellers are entitled to a $1.7 million earn-out, which is expected to be paid in March 2011.
| |
5. | GOODWILL AND INTANGIBLE ASSETS |
Goodwill consists of $1.1 million related to our acquisition of Flow Traffic (Autoscope segment), $8.2 million related to the EIS asset purchase (RTMS segment) and $5.4 million related to our acquisition of CitySync (CitySync segment). Because the goodwill and intangible assets related to the CitySync acquisition are accounted for in Great Britain Pounds, they are impacted by period-end rates of exchange to United States Dollars and therefore may vary in different reporting periods.
Intangible assets consisted of the following (dollars in thousands):
| | | | | | | |
| | December 31, | |
| |
| |
| | 2010 | | 2009 | |
| |
| |
| |
Developed technology (8 to 9 year life) | | $ | 7,364 | | $ | 3,900 | |
Trade names (5 to 8 year life) | | | 3,193 | | | 1,200 | |
Other intangibles (3 to 8 year life) | | | 1,774 | | | 200 | |
Less: Accumulated amortization | | | (2,818 | ) | | (1,586 | ) |
| |
|
| |
|
| |
Total identifiable intangible assets, net | | $ | 9,513 | | $ | 3,714 | |
| |
|
| |
|
| |
We expect to recognize amortization expense for the intangible assets in the above table in each of our years ending December 31 of $1.6 million in each of 2011 and 2012, and $1.3 million in each of 2013, 2014 and 2015. The weighted average amortization period remaining for intangible assets is 6.5 years. Goodwill and intangible assets related to the EIS asset purchase are deductible for tax purposes over 15 years.
We have a revolving line of credit and had term loans with our bank. These credit agreements were initially entered into on May 1, 2008 and replaced all prior bank agreements, including the repayment of loans under the previous agreements.
The revolving line of credit agreement with Associated Bank, National Association, or Associated Bank, provides up to $5.0 million in short-term borrowings at the bank’s prime rate expiring May 1, 2012. Any loans are secured by inventories, accounts receivable and equipment, and Associated Bank has the right of setoff against our checking, savings and other accounts. There was no outstanding balance under the line at December 31, 2010 and 2009.
In December 2009, we entered into a term loan agreement for $4.0 million with Associated Bank, which was fully repaid in September 2010. We previously had a separate $4.0 million term note with Associated Bank that originated in May 2008 and was fully repaid in February 2009.
Warranty liability and related activity consisted of the following (in thousands):
| | | | | | | | | | |
| | Years Ended December 31, | |
| |
| |
| | 2010 | | 2009 | | 2008 | |
| |
| |
| |
| |
Warranty liability at beginning of year | | $ | 289 | | $ | 217 | | $ | 157 | |
Provisions for estimated future warranty obligations | | | 484 | | | 175 | | | 153 | |
Costs incurred for warranties honored | | | (149 | ) | | (103 | ) | | (93 | ) |
| |
|
| |
|
| |
|
| |
Warranty liability at end of year | | $ | 624 | | $ | 289 | | $ | 217 | |
| |
|
| |
|
| |
|
| |
36
Table of Contents
We rent office space and equipment under operating lease agreements expiring at various dates through January 2015. Our leases currently provide for monthly payments of $90,000, which is inclusive of our proportionate share of operating expenses that exceed a base rent. Rent expense for office facilities was $777,000 in 2010, $585,000 in 2009 and $555,000 in 2008.
Future minimum annual lease payments under noncancelable operating leases for the years ending December 31, 2011, 2012, 2013, 2014 and 2015 are $556,000, $376,000, $353,000, $261,000 and $16,000, respectively.
Our deferred tax assets (liabilities) are as follows (in thousands):
| | | | | | | |
| | December 31, | |
| |
| |
| | 2010 | | 2009 | |
| |
| |
| |
Current deferred tax assets (liabilities): | | | | | | | |
Accrued compensation | | $ | 55 | | $ | 47 | |
Prepaid expenses | | | (67 | ) | | (48 | ) |
Bad debt reserves | | | 75 | | | 27 | |
Warranty reserves | | | 143 | | | 45 | |
Other | | | 24 | | | 66 | |
Foreign net operating loss carryforwards | | | — | | | 55 | |
Less valuation allowance | | | — | | | (55 | ) |
| |
|
| |
|
| |
| | | 230 | | | 137 | |
Non-current deferred tax assets (liabilities): | | | | | | | |
Intangible asset amortization - EIS | | | 1,369 | | | 1,525 | |
Intangible asset amortization - CitySync | | | (1,840 | ) | | — | |
Stock option expense (non-qualified) | | | 164 | | | 131 | |
Other | | | 17 | | | 20 | |
| |
|
| |
|
| |
| | | (290 | ) | | 1,676 | |
| |
|
| |
|
| |
Net deferred tax assets (liabilities) | | $ | (60 | ) | $ | 1,813 | |
| |
|
| |
|
| |
Deferred tax assets have been offset by a valuation allowance as deemed necessary based on our estimates of future sources of taxable income and the expected timing of temporary difference reversals.
There were $4.4 million, $3.3 million and $2.0 million in undistributed earnings of our wholly-owned foreign subsidiaries at December 31, 2010, 2009 and 2008, respectively. We have not provided any additional federal or state income taxes or foreign withholding taxes on the undistributed earnings, as such earnings have been indefinitely reinvested in the business.
We realize an income tax benefit from the exercise or early disposition of certain stock options. This benefit results in a decrease in current income taxes payable and an increase in additional paid-in capital.
37
Table of Contents
The components of income tax expense are as follows (in thousands):
| | | | | | | | | | |
| | Years Ended December 31, | |
| |
| |
| | 2010 | | 2009 | | 2008 | |
| |
| |
| |
| |
Current: | | | | | | | | | | |
Federal | | $ | 983 | | $ | 1,222 | | $ | 1,738 | |
State | | | (65 | ) | | 23 | | | 38 | |
Foreign | | | 25 | | | (29 | ) | | 564 | |
| |
|
| |
|
| |
|
| |
| | | 943 | | | 1,216 | | | 2,340 | |
| |
|
| |
|
| |
|
| |
Deferred: | | | | | | | | | | |
Federal | | | (32 | ) | | 82 | | | (59 | ) |
State | | | (1 | ) | | 5 | | | (23 | ) |
Foreign | | | — | | | 51 | | | (51 | ) |
| |
|
| |
|
| |
|
| |
| | | (33 | ) | | 138 | | | (133 | ) |
| |
|
| |
|
| |
|
| |
Total income tax expense | | $ | 910 | | $ | 1,354 | | $ | 2,207 | |
| |
|
| |
|
| |
|
| |
Income before taxes for the foreign operations was $1.1 million, $1.3 million and $1.7 million for the years ended December 31, 2010, 2009 and 2008.
A reconciliation of income taxes to the statutory federal rate is as follows (in thousands):
| | | | | | | | | | |
| | Years Ended December 31, | |
| |
| |
| | 2010 | | 2009 | | 2008 | |
| |
| |
| |
| |
Federal tax statutory rate | | $ | 1,331 | | $ | 1,774 | | $ | 2,438 | |
State taxes, net of federal benefit | | | (47 | ) | | 18 | | | 10 | |
Research and development tax credits | | | (454 | ) | | (301 | ) | | (120 | ) |
Non-deductible acquisition expenses and earn-out | | | 238 | | | — | | | — | |
Domestic production activity deduction | | | (111 | ) | | (62 | ) | | (83 | ) |
Effect of lower rates on foreign income | | | (43 | ) | | (58 | ) | | (125 | ) |
Reduction in valuation allowance | | | (55 | ) | | — | | | (77 | ) |
Stock option expense | | | 75 | | | 74 | | | 66 | |
Adjustment of prior year tax credits and refunds | | | (64 | ) | | (77 | ) | | (50 | ) |
Uncertain tax positions | | | (33 | ) | | (38 | ) | | 96 | |
Other | | | 73 | | | (46 | ) | | 52 | |
| |
|
| |
|
| |
|
| |
| | $ | 910 | | $ | 1,354 | | $ | 2,207 | |
| |
|
| |
|
| |
|
| |
A reconciliation of the beginning and ending amount of the tax liability for uncertain tax benefits is as follows (in thousands):
| | | | |
Balance at January 1, 2009 | | $ | 246 | |
Additions for current year tax positions | | | — | |
Reductions as a result of lapses in statute of limitations | | | (38 | ) |
| |
|
| |
Balance at December 31, 2009 | | | 208 | |
| | | | |
Additions for current year tax positions | | | — | |
Reductions as a result of lapses in statute of limitations | | | (33 | ) |
| |
|
| |
Balance at December 31, 2010 | | $ | 175 | |
| |
|
| |
We are subject to income taxes in the U.S. federal jurisdiction and various state and foreign jurisdictions. Tax regulations within each jurisdiction are subject to the interpretation of the related tax laws and require significant judgment to apply. Generally, we are subject to U.S. federal, state, local and foreign tax examinations by taxing authorities for years after the fiscal year ended December 31, 2006.
We have sublicensed the exclusive right to manufacture and market the Autoscope technology in North America, the Caribbean and Latin America to Econolite Control Products, Inc. (Econolite) and receive royalties from Econolite on sales of the Autoscope system in those territories as well as in non-exclusive territories as allowed from time to time. We may terminate our agreement with Econolite if a minimum annual sales level is not met or Econolite fails to make royalty payments as required by the agreement. The agreement’s term runs to 2028, unless terminated by either party upon three years’ notice.
38
Table of Contents
We recognized royalty income from this agreement of $12.5 million, $12.1 million and $13.3 million in 2010, 2009 and 2008, respectively.
We derived the following percentages of our net revenues from the following geographic regions:
| | | | | | | | | | |
| | 2010 | | 2009 | | 2008 | |
| |
| |
| |
| |
Asia Pacific | | | | 11 | % | | | | 10 | % | | | | 12 | % | |
Europe | | | | 26 | % | | | | 15 | % | | | | 16 | % | |
North America | | | | 63 | % | | | | 75 | % | | | | 72 | % | |
No country other than the United States had revenue in excess of 10% of our total revenue. The aggregate net book value of long-lived assets held outside of the United States, not including goodwill and intangible assets, was $401,000 and $288,000 at December 31, 2010 and 2009, respectively.
| |
12. | SIGNIFICANT CUSTOMERS AND CONCENTRATION OF CREDIT RISK |
Royalty income from Econolite comprised 40%, 49% and 50% of revenue in the years ended December 31, 2010, 2009 and 2008, respectively. Accounts receivable from Econolite were $2.6 million and $2.2 million at December 31, 2010 and 2009, respectively. Major disruptions in the manufacturing and distribution of our products by Econolite or the inability of Econolite to make payments on their accounts receivable with us could have a material adverse effect on our business, financial condition and results of operations. Not including Econolite, one international customer comprised 15% of accounts receivable at December 31, 2010 and a separate international customer comprised 10% of accounts receivable at December 31, 2009.
Substantially all of our employees in the United States are eligible to participate in a qualified defined contribution 401(k) plan in which participants may elect to have a specified portion of their salary contributed to the plan and we may make discretionary contributions to the plan. Flow Traffic and CitySync are obligated to contribute to certain employee pension plans. We made contributions totaling $131,000, $98,000 and $97,000 to the plans for 2010, 2009 and 2008, respectively.
| |
14. | EQUITY AND STOCK OPTIONS |
In April 2010, we sold 798,000 shares of our common stock to investors at $12.25 per share under a registration statement on Form S-3 declared effective by the Securities and Exchange Commission in December 2009. Net of underwriting fees and other offering expenses, we received $8.8 million in cash from the stock sale.
In February 1995 and April 2005, we adopted the 1995 Long-Term Incentive and Stock Option Plan (the 1995 Plan) and the 2005 Stock Incentive Plan (the 2005 Plan), respectively, which provide for the granting of incentive (ISO) and non-qualified (NQO) stock options, stock appreciation rights, restricted stock awards and performance awards to our officers, directors, employees, consultants and independent contractors. The 1995 Plan terminated in February 2005, although the options granted under the 1995 Plan remain outstanding according to their terms. Options granted under the Plans generally vest over three to five years based on service, and have a contractual term of six to ten years and are amortized to expense on a straight-line basis. The following table summarizes stock option activity for 2010, 2009 and 2008:
| | | | | | | | | | | | | | | | |
| | Plan
Options Available
For Grant | | Plan Options
Outstanding | | Non-Plan
Options Outstanding | | Weighted
Average
Exercise Price
Per Share | |
| |
|
|
|
|
|
|
|
|
| |
| | | | ISO | | NQO | | | | | |
| |
|
|
|
|
|
|
|
|
| |
Balance at December 31, 2007 | | | 122,200 | | | 119,615 | | | 175,618 | | | 42,000 | | $ | 8.47 | |
Granted | | | (95,500 | ) | | 48,130 | | | 47,370 | | | — | | | 13.58 | |
Exercised | | | — | | | (13,000 | ) | | (10,000 | ) | | (36,000 | ) | | 3.31 | |
Plan addition | | | 138,800 | | | — | | | — | | | — | | | | |
| |
|
|
|
|
|
|
|
|
|
|
|
|
|
| |
Balance at December 31, 2008 | | | 165,500 | | | 154,745 | | | 212,988 | | | 6,000 | | $ | 10.59 | |
Granted | | | (68,000 | ) | | 19,000 | | | 49,000 | | | — | | | 8.62 | |
Exercised | | | — | | | (600 | ) | | — | | | — | | | 1.30 | |
Plan addition | | | 10,000 | | | (10,000 | ) | | — | | | — | | | 9.22 | |
| |
|
|
|
|
|
|
|
|
|
|
|
|
|
| |
Balance at December 31, 2009 | | | 107,500 | | | 163,145 | | | 261,988 | | | 6,000 | | $ | 8.10 | |
Granted | | | (85,000 | ) | | 40,300 | | | 44,700 | | | — | | | 12.33 | |
Exercised | | | — | | | (20,200 | ) | | (11,500 | ) | | (6,000 | ) | | 3.31 | |
Plan addition | | | 135,000 | | | — | | | — | | | — | | | — | |
Forfeited | | | 15,000 | | | (7,000 | ) | | (8,000 | ) | | — | | | 6.69 | |
| |
|
|
|
|
|
|
|
|
|
|
|
|
|
| |
Balance at December 31, 2010 | | | 172,500 | | | 176,245 | | | 287,188 | | | — | | $ | 9.11 | |
| |
|
|
|
|
|
|
|
|
|
|
|
|
|
| |
39
Table of Contents
The following table summarizes information about the stock options outstanding at December 31, 2010:
| | | | | | | | | | | | | | | | | | | | | | |
| | Options Outstanding | | Options Exercisable | |
| |
| |
| |
Range of
Exercise Price | | Number
Outstanding | | Weighted
Average
Remaining
Contractual
Life | | Weighted
Average
Exercise
Price | | Aggregate
Intrinsic
Value | | Number
Exercisable | | Weighted
Average
Exercise
Price | | Aggregate
Intrinsic
Value | |
|
|
|
|
|
|
|
|
| |
|
|
|
|
| |
$1.30-1.99 | | | 46,000 | | | 1.5 years | | $ | 1.36 | | $ | 497,147 | | | 46,000 | | $ | 1.36 | | $ | 497,147 | |
3.00-3.99 | | | 38,933 | | | 1.8 years | | | 3.15 | | | 351,080 | | | 38,933 | | | 3.15 | | | 351,080 | |
8.00-8.99 | | | 48,000 | | | 5.9 years | | | 8.63 | | | 169,755 | | | 13,500 | | | 8.58 | | | 48,400 | |
9.00-9.99 | | | 172,500 | | | 4.4 years | | | 9.20 | | | 511,371 | | | 55,125 | | | 9.16 | | | 165,811 | |
11.00-11.99 | | | 15,000 | | | 5.8 years | | | 11.19 | | | — | | | — | | | — | | | — | |
12.00-12.99 | | | 115,000 | | | 4.9 years | | | 12.53 | | | — | | | 31,500 | | | 12.51 | | | — | |
15.00-15.99 | | | 28,000 | | | 1.0 years | | | 15.30 | | | — | | | 28,000 | | | 15.30 | | | — | |
| |
|
| | | | | | | |
|
| |
|
| | | | |
|
| |
| | | 463,433 | | | 4.0 years | | $ | 9.11 | | $ | 1,529,353 | | | 213,058 | | $ | 7.64 | | $ | 1,062,438 | |
| |
|
| | | | | | | |
|
| |
|
| | | | |
|
| |
The fair value of the 85,000, 68,000 and 95,500 options granted during 2010, 2009 and 2008, respectively, was $348,000, $279,000 and $388,000.
The total intrinsic value of options exercised during 2010, 2009 and 2008 was $352,000, $7,000 and $292,000, respectively. The total fair value of option shares vested during 2010, 2009 and 2008 was $716,000, $578,000 and $807,000, respectively. The fair value of each option granted is estimated on the date of grant using the Black-Scholes option-pricing model with the following weighted-average assumptions used during 2010, 2009 and 2008, respectively: zero dividend yield; expected volatility of 78%, 45% and 41%; risk-free interest rate of 2.84%, 3.19% and 3.68%; and expected life of 3.68, 3.0 and 3.5 years. The expected life of the options is based on evaluations of historical and expected future exercise behavior. The risk-free interest rate is based on the U.S. Treasury rates at the date of grant, with maturity dates approximately equal to the expected life at the grant date. Volatility is based on historical volatility of our stock over the past three years. We have not historically paid any dividends and do not expect to in the foreseeable future. We recognized stock option expense of $342,000, $341,000 and $339,000 in the years ended December 31, 2010, 2009 and 2008, respectively, and the expense is included within general and administrative expense on the consolidated statements of income.
There were 213,058, 181,383 and 183,633 options exercisable at December 31, 2010, 2009 and 2008, respectively. The weighted average exercise price of these options was $7.64, $6.39 and $2.94 at December 31, 2010, 2009 and 2008, respectively.
We currently operate in three reportable segments: Autoscope, RTMS and CitySync. Autoscope is our machine-vision product line, and revenue consists of royalties (all of which are received from Econolite), as well as a portion of international sales. RTMS is our radar product line acquired in the EIS asset purchase in December 2007. CitySync is our ANPR product line acquired in the CitySync purchase in June 2010. All segment revenues are derived from external customers.
Due to the CitySync acquisition and related changes in how we manage our business, we may reevaluate our segment definitions in the future.
The following tables set forth selected unaudited financial information for each of the Company’s reportable segments (in thousands):
| | | | | | | | | | | | | |
| | For the year ended December 31, 2010 | |
| |
| |
| | Autoscope | | RTMS | | CitySync | | Total | |
| |
| |
| |
| |
| |
Revenue | | $ | 16,659 | | $ | 9,819 | | $ | 5,203 | | $ | 31,681 | |
Depreciation | | | 293 | | | 173 | | | 32 | | | 498 | |
Amortization of intangible assets | | | — | | | 768 | | | 450 | | | 1,218 | |
Income (loss) before income taxes | | | 2,618 | | | 1,823 | | | (526 | ) | | 3,915 | |
Capital expenditures | | | 325 | | | 77 | | | 14 | | | 416 | |
Total assets | | | 26,915 | | | 13,202 | | | 14,239 | | | 54,356 | |
| | | | | | | | | | | | | |
40
Table of Contents
| | | | | | | | | | |
| | For the year ended December 31, 2009 | |
| |
| |
| | Autoscope | | RTMS | | Total | |
| |
| |
| |
| |
Revenue | | $ | 16,240 | | $ | 8,353 | | $ | 24,593 | |
Depreciation | | | 292 | | | 132 | | | 424 | |
Amortization of intangible assets | | | — | | | 768 | | | 768 | |
Income before income taxes | | | 3,807 | | | 1,412 | | | 5,219 | |
Capital expenditures | | | 555 | | | 139 | | | 694 | |
Total assets | | | 29,752 | | | 11,398 | | | 41,150 | |
| | | | | | | | | | |
| | For the year ended December 31, 2008 | |
| |
| |
| | Autoscope | | RTMS | | | Total | |
| |
| |
| | |
| |
Revenue | | $ | 18,705 | | $ | 7,760 | | $ | 26,465 | |
Depreciation | | | 242 | | | 115 | | | 357 | |
Amortization of intangible assets | | | — | | | 768 | | | 768 | |
Income before income taxes | | | 5,939 | | | 1,232 | | | 7,171 | |
Capital expenditures | | | 273 | | | 112 | | | 385 | |
Total assets | | | 24,135 | | | 11,973 | | | 36,108 | |
The CitySync segment loss before income taxes includes $817,000 of acquisition related expenses.
| |
16. | RELATED PARTY TRANSACTIONS |
Dan Manor, who was a named executive officer in 2010, is a beneficiary of the earn-out for the EIS asset purchase as further described in Note 4.
41
Table of Contents
Report of Independent Registered Public Accounting Firm
Board of Directors and Shareholders
Image Sensing Systems, Inc.
We have audited the accompanying consolidated balance sheets of Image Sensing Systems, Inc. (a Minnesota Corporation) and subsidiaries (the Company) as of December 31, 2010 and 2009, and the related consolidated statements of income, shareholders’ equity and comprehensive income, and cash flows for each of the three years in the period ended December 31, 2010. These consolidated financial statements are the responsibility of the Company’s management. Our responsibility is to express an opinion on these financial statements based on our audits.
We conducted our audits in accordance with the standards of the Public Company Accounting Oversight Board (United States). Those standards require that we plan and perform the audit to obtain reasonable assurance about whether the financial statements are free of material misstatement. The Company is not required to have, nor were we engaged to perform an audit of its internal control over financial reporting. Our audit included consideration of internal control over financial reporting as a basis for designing audit procedures that are appropriate in the circumstances, but not for the purpose of expressing an opinion on the effectiveness of the Company’s internal control over financial reporting. Accordingly, we express no such opinion. An audit also includes examining, on a test basis, evidence supporting the amounts and disclosures in the financial statements, assessing the accounting principles used and significant estimates made by management, as well as evaluating the overall financial statement presentation. We believe that our audits provide a reasonable basis for our opinion.
In our opinion, the consolidated financial statements referred to above present fairly, in all material respects, the financial position of Image Sensing Systems, Inc. and subsidiaries as of December 31, 2010 and 2009, and the results of their operations and their cash flows for each of the three years in the period ended December 31, 2010 in conformity with accounting principles generally accepted in the United States of America.
|
/s/ GRANT THORNTON LLP |
|
Minneapolis, Minnesota |
March 24, 2011 |
42
Table of Contents
| |
Item 9. | Changes in and Disagreements with Accountants on Accounting and Financial Disclosure |
None.
| |
Item 9A. | Controls and Procedures |
Evaluation of disclosure controls and procedures
We maintain disclosure controls and procedures (as defined in Rules 13a-15(e) and 15d-15(e) under the Securities Exchange Act of 1934, as amended (Exchange Act)), that are designed to reasonably ensure that information required to be disclosed by us in the reports we file or submit under the Exchange Act is recorded, processed, summarized and reported within the time periods specified in the SEC’s rules and forms and that such information is accumulated and communicated to our management, including our principal executive officer and principal financial officer, or persons performing similar functions, as appropriate to allow timely decisions regarding required disclosure. Under the supervision and with the participation of our management, including our Chief Executive Officer and Chief Financial Officer, we evaluated the effectiveness of the design and operation of our disclosure controls and procedures. Based upon that evaluation, the Chief Executive Officer and Chief Financial Officer concluded that, as of the end of the period covered by this report, our disclosure controls and procedures were effective.
Management’s report on internal control over financial reporting
Our management is responsible for establishing and maintaining adequate internal control over financial reporting. Our internal control over financial reporting is a process designed to provide reasonable assurance regarding the reliability of financial reporting and the preparation of financial statements for external purposes in accordance with generally accepted accounting principles in the United States of America. Our internal control over financial reporting includes those policies and procedures that (i) pertain to the maintenance of records that, in reasonable detail, accurately and fairly reflect our transactions and dispositions of our assets; (ii) provide reasonable assurance that transactions are recorded as necessary to permit preparation of the financial statements in accordance with generally accepted accounting principles in the United States of America, and that our receipts and expenditures are being made only in accordance with authorizations of our management and directors; and (iii) provide reasonable assurance regarding prevention or timely detection of unauthorized acquisition, use or disposition of our assets that could have a material effect on the financial statements.
Internal control over financial reporting cannot provide absolute assurance of achieving financial reporting objectives because of its inherent limitations. Internal control over financial reporting is a process that involves human diligence and is subject to lapses in judgment or breakdowns resulting from human failures. Internal control over financial reporting also can be circumvented by collusion or improper management override. Because of such limitations, there is a risk that material misstatements may not be prevented or detected on a timely basis by internal control over financial reporting. However, these inherent limitations are known features of the financial reporting process. Therefore, it is possible to design into the process safeguards to reduce, though not eliminate, this risk.
Because of its inherent limitations, internal control over financial reporting may not prevent or detect all misstatements. Further, projections of any evaluation of effectiveness to future periods are subject to the risk that controls may become inadequate because of changes in conditions, or that the degree of compliance with the policies or procedures may deteriorate.
Management assessed the effectiveness of our internal control over financial reporting as of December 31, 2010. In making this assessment, management used the criteria set forth by the Committee of Sponsoring Organizations of the Treadway Commission (COSO) in “Internal Control—Integrated Framework”. Based on this assessment, management has concluded that our internal control over financial reporting was effective as of December 31, 2010.
Changes in internal control over financial reporting
During the most recent fiscal quarter covered by this report, there has been no change in our internal control over financial reporting (as defined in Rule 13a-15(f) and 15d-15(f) under the Exchange Act) that has materially affected, or is reasonably likely to materially affect, our internal control over financial reporting.
| |
Item 9B. | Other Information |
None.
43
Table of Contents
PART III
| |
Item 10. | Directors, Executive Officers and Corporate Governance |
We have adopted a Code of Ethics which applies to our principal executive, accounting and financial officers. The Code of Ethics is published on our website at www.imagesensing.com. Any amendments to the Code of Ethics and waivers of the Code of Ethics for our principal executive, accounting and financial officers will be published on our website.
The sections entitled “Proposal I - Election of Directors,” “Audit Committee” and “Section 16(a) Beneficial Ownership Reporting Compliance” in our definitive proxy statement for our 2011 annual meeting of shareholders are incorporated into this Annual Report on Form 10-K by reference.
| |
Item 11. | Executive Compensation |
The sections entitled “Executive Compensation” and “Compensation of Directors” in our definitive proxy statement for the 2011 annual meeting of shareholders are incorporated into this Annual Report on Form 10-K by reference.
| |
Item 12. | Security Ownership of Certain Beneficial Owners and Management and Related Stockholder Matters |
Equity Compensation Plan Information
The following table provides information as of December 31, 2010 about our shares of common stock subject to outstanding awards or available for future awards under our equity compensation plans and arrangements.
| | | | | | | | | | |
Plan Category | | Number of securities to
be issued upon exercise
of outstanding options,
warrants and rights | | Weighted-average exercise
price of outstanding
options, warrants and
rights | | Number of securities remaining
available for future issuance
under equity compensation plans
(excluding securities reflected in
the first column)(2) | |
|
|
|
|
|
|
|
|
Equity compensation plans approved by shareholders(1) | | | 463,433 | | $ | 9.11 | | | 172,500 | |
|
|
(1) Includes shares underlying stock options granted under the Image Sensing Systems, Inc. 1995 Long-Term Incentive and Stock Option Plan (1995 Plan) and non-qualified stock options granted outside the 1995 Plan between 1996 and 2000 to current and former members of the Board of Directors. |
|
(2) The 172,500 shares available for grant under the 2005 Stock Incentive Plan may become the subject of future awards in the form of stock options, stock appreciation rights, restricted stock, performance awards or other stock-based awards. |
The section entitled “Security Ownership of Certain Beneficial Owners and Management” in our definitive proxy statement for the 2011 annual meeting of shareholders is incorporated into this Form Annual Report on 10-K by reference.
| |
Item 13. | Certain Relationships and Related Transactions, and Director Independence |
The section entitled “Certain Relationships and Related Transactions” in our definitive proxy statement for the 2011 annual meeting of shareholders is incorporated into this Annual Report on Form 10-K by reference.
| |
Item 14. | Principal Accounting Fees and Services |
The sections entitled “Audit Fees,” “Audit-Related Fees,” “Tax Fees,” “All Other Fees” and “Policy on Audit Committee Pre-Approval of Audit and Permissible Non-Audit Services Provided by Our Independent Registered Public Accounting Firm” in our definitive proxy statement for our 2011 annual meeting of shareholders are incorporated into this Annual Report on Form 10-K by reference.
44
Table of Contents
PART IV
| |
Item 15. | Exhibits and Financial Statement Schedules |
(a) Documents filed as part of this report:
| | |
| 1. | Financial statements |
| | |
| | The following consolidated financial statements are included in Part II, Item 8. “Financial Statements and Supplementary Data”: |
| | |
| | Consolidated Balance Sheets as of December 31, 2010 and 2009 |
| | Consolidated Statements of Income for the years ended December 31, 2010, 2009 and 2008 |
| | Consolidated Statements of Cash Flow for the years ended December 31, 2010, 2009 and 2008 |
| | Consolidated Statements of Shareholders’ Equity and Comprehensive Income for the years ended December 31, 2010, 2009 and 2008 |
| | Notes to Consolidated Financial Statements |
| | Report of Independent Registered Public Accounting Firm |
| | |
| 2. | Financial Statement Schedules: |
| | |
| | All financial statement schedules have been omitted because they are not required or not applicable, or the information is included in the Consolidated Financial Statements or Notes. |
| | |
| 3. | The following documents are filed as exhibits to this report: |
| | |
Exhibit No. | Description |
| |
| 1.1 | Underwriting Agreement by and among ISS, Wedbush Securities Inc. and Craig-Hallum Capital Group Inc. dated April 15, 2010, incorporated by reference to Exhibit 1.1 to ISS’ Current Report on Form 8-K dated April 15, 2010. |
| | |
| 2.1* | Asset Purchase Agreement dated December 6, 2007 by and among Image Sensing Systems, Inc. (ISS), EIS Electronic Integrated Systems Inc., Dan Manor and the other parties named therein, incorporated by reference to Exhibit 2.1 to ISS’ Annual Report on Form 10-K for the year ended December 31, 2007 (2007 Form 10-K). (Schedules to this Agreement have not been filed in reliance on Item 601(b)(2) of Regulation S-K of the Securities and Exchange Commission (SEC). ISS will furnish supplementally copies of such schedules to the SEC upon its request.) |
| | |
| 2.2 | Share Purchase Agreement dated June 21, 2010 by and among ISS, Image Sensing Systems Europe Limited, CitySync Limited and three shareholders of CitySync Limited, incorporated by reference to Exhibit 2.1 to ISS’ Quarterly Report on Form 10-Q for the quarter ended June 30, 2010. |
| | |
| 3.1 | Restated Articles of Incorporation of ISS, incorporated by reference to Exhibit 3.1 to ISS’ Registration Statement on Form SB-2 (Registration No. 33-90298C) filed on March 14, 1995, as amended (Registration Statement). |
| | |
| 3.2 | Articles of Amendment to Articles of Incorporation of ISS, incorporated by reference to Exhibit 3.2 to ISS’ Quarterly Report on Form 10-QSB for the quarter ended June 30, 2001. |
| | |
| 3.3 | Bylaws of ISS, incorporated by reference to Exhibit 3.3 to ISS’ Registration Statement. |
| | |
| 4.1 | Specimen form of ISS’ common stock certificate, incorporated by reference to Exhibit 4.1 to ISS’ Registration Statement. |
| | |
| 10.1 | Form of Distributor Agreement, incorporated by reference to Exhibit 10.1 to ISS’ Registration Statement. |
| | |
| 10.2** | 1995 Long-Term Incentive and Stock Option Plan, amended and restated through May 17, 2001, incorporated by reference to Exhibit 10.10 to ISS’ Annual Report on Form 10-KSB for the year ended December 31, 2001. |
45
Table of Contents
| | |
| 10.3** | Employment Agreement between ISS and Kenneth R. Aubrey, dated December 12, 2006, effective on or about January 15, 2007 (in capacity as President) and effective on or about June 1, 2007 (in capacity of President and Chief Executive Officer), incorporated by reference to Exhibit 10.1 to ISS’ Current Report on Form 8-K dated December 14, 2006. |
| | |
| 10.4** | Employment Agreement between ISS and Gregory R. L. Smith, dated December 8, 2006, incorporated by reference to Exhibit 10.1 to ISS’ Current Report on Form 8-K dated December 8, 2006. |
| | |
| 10.5 | Amendment VII to Office Lease Agreement dated April 26, 2007 by and between ISS and Spruce Tree Centre L.L.P., incorporated by reference to Exhibit 10.11 to ISS’ Annual Report on Form 10-K for the year ended December 31, 2007 (2007 Form 10-K). |
| | |
| 10.6 | Modification to Manufacturing, Distributing and Technology License Agreement dated September 1, 2000 by and between ISS and Econolite Control Products, Inc. (Econolite), incorporated by reference to Exhibit 10.12 to ISS’ 2007 Form 10-K. |
| | |
| 10.7** | Image Sensing Systems, Inc. 2005 Stock Incentive Plan, incorporated by reference to Appendix A to ISS’ proxy statement filed with the SEC on April 19, 2005. |
| | |
| 10.8 | Manufacturing, Distributing and Technology License Agreement dated June 11, 1991 by and between ISS and Econolite Control Products, Inc. (Econolite), incorporated by reference to Exhibit 10.1 to the Registration Statement. |
| | |
| 10.09 | Extension and Second Modification to License Agreement dated July 13, 2001 by and between ISS and Econolite, incorporated by reference to Exhibit 10.12 to ISS’ Annual Report on Form 10-KSB for the year ended December 31, 2001. |
| | |
| 10.10 | Office Lease Agreement dated November 24, 1998 by and between ISS and Spruce Tree Centre L.L.P., incorporated by reference to Exhibit 10.18 to ISS’ Annual Report on Form 10-KSB for the year ended December 31, 1998. |
| | |
| 10.11 | Production Agreement dated February 14, 2002 by and among ISS, Wireless Technology, Inc. and Econolite, incorporated by reference to Exhibit 10.20 to ISS’ Annual Report on Form 10-KSB for the year ended December 31, 2001. |
| | |
| 10.12 | Extension and Third Modification to Manufacturing Distributing and Technology License Agreement dated July 3, 2008 by and between ISS and Econolite, incorporated by reference to Exhibit 10.1 to ISS’ Current Report on Form 8-K dated July 3, 2008. |
| | |
| 10.13** | Employment Agreement dated December 6, 2007 by and between ISS Image Sensing Systems Canada Ltd. and Dan Manor, incorporated by reference to Exhibit 99.1 to ISS’ 2007 Form 10-K. |
| | |
| 10.14 | Loan Agreement dated May 1, 2008 by and between ISS and Associated Bank, National Association (Associated Bank), incorporated by reference to Exhibit 10.19 to ISS’ Registration Statement on Form S-1 filed on May 12, 2008 (Form S-1). |
| | |
| 10.15 | Security Agreement dated May 1, 2008 by and between ISS and Associated Bank, incorporated by reference to Exhibit 10.20 to ISS’ Form S-1. |
| | |
| 10.16 | Promissory Note (Line of Credit) dated May 1, 2008 in the original principal amount of $5,000,000 issued by ISS to Associated Bank, incorporated by reference to Exhibit 10.21 to ISS’ Form S-1. |
| | |
| 10.17 | Promissory Note (Loan) dated May 1, 2008 in the original principal amount of $3,000,000 issued by ISS to Associated Bank, incorporated by reference to Exhibit 10.22 to ISS’ Form S-1. |
| | |
| 10.18 | Modification Agreement dated December 28, 2009 by and between ISS and Associated Bank under which ISS and Associated Bank amended the Loan Agreement dated as of May 1, 2008 by and between ISS and Associated Bank, incorporated by reference to Exhibit 10.18 to ISS’ Annual Report on Form 10-K for the year ended December 31, 2009 (2009 Form 10-K). |
| | |
| 10.19 | Promissory Note (Loan) dated December 28, 2009 in the original principal amount of $4,000,000 issued by ISS to Associated Bank, incorporated by reference to Exhibit 10.19 to the 2009 Form 10-K. |
46
Table of Contents
| | |
| 10.20 | Lease dated February 1, 2010 between CitySync Limited and Nortrust Nominees Limited, incorporated by reference to Exhibit 10.1 to ISS’ Quarterly Report on Form 10-Q for the quarter ended June 30, 2010. |
| | |
| 10.21 | Third Modification Agreement dated December 28, 2010 by and between ISS and Associated Bank under which ISS and Associated Bank amended the Loan Agreement dated as of May 1, 2008 by and between ISS and Associated Bank (filed herewith). |
| | |
| 21 | List of Subsidiaries of ISS. |
| | |
| 23.1 | Consent of Independent Registered Public Accounting Firm. |
| | |
| 24 | Power of Attorney (included on signature page). |
| | |
| 31.1 | Certification of Chief Executive Officer Pursuant to Section 302 of the Sarbanes-Oxley Act of 2002. |
| | |
| 31.2 | Certification of Chief Financial Officer Pursuant to Section 302 of the Sarbanes-Oxley Act of 2002. |
| | |
| 32.1 | Certification of Chief Executive Officer Pursuant to Section 906 of the Sarbanes-Oxley Act of 2002. |
| | |
| 32.2 | Certification of Chief Financial Officer Pursuant to Section 906 of the Sarbanes-Oxley Act of 2002. |
| | |
| 99.1 | Extension of Modification to Manufacturing, Distributing and Technology License Agreement dated May 31, 2002 by and between ISS and Econolite, incorporated by reference to Exhibit 99.2 to ISS’ 2007 Form 10-K. |
| | |
| 99.2 | Letter agreement dated June 19, 1997 by and between ISS and Econolite, incorporated by reference to Exhibit 99.3 to ISS’ 2007 Form 10-K. |
| |
|
* | Portions of this exhibit are treated as confidential pursuant to a request for confidential treatment filed by ISS with the SEC. |
| |
** | Management contract or compensatory plan or arrangement. |
| |
| Copies of all exhibits not attached will be furnished without charge upon written request to the Company at the address set forth on the inside back cover page of this Annual Report. |
47
Table of Contents
Signatures
Pursuant to the requirements of Section 13 or 15(d) of the Securities Exchange Act of 1934, the registrant has duly caused this report to be signed on its behalf by the undersigned, thereunto duly authorized.
Image Sensing Systems, Inc.
| | |
/s/ Kenneth R. Aubrey | | Date: March 24, 2011 |
| | |
Kenneth R. Aubrey | | |
President and Chief Executive Officer | | |
(Principal Executive Officer) | | |
Each person whose signature to this Annual Report on Form 10-K appears below hereby constitutes and appoints Kenneth R. Aubrey and Gregory R. L. Smith, and each of them, as his or her true and lawful attorney-in-fact and agent, with full power of substitution, to sign on his or her behalf individually and in the capacity stated below and to perform any acts necessary to be done in order to file all amendments to this Annual Report on Form 10-K, and any and all instruments or documents filed as part of or in connection with this Annual Report on Form 10-K or any amendments hereto, and each of the undersigned does hereby ratify and confirm all that said attorney-in-fact and agent, or his substitutes, shall do or cause to be done by virtue hereof.
In accordance with the Exchange Act, this report has been signed below by the following persons on behalf of the registrant and in the capacities and on the dates indicated:
| | |
/s/ Kenneth R. Aubrey | | Date: March 24, 2011 |
| | |
Kenneth R. Aubrey | | |
President and Chief Executive Officer | | |
(Principal Executive Officer) | | |
| | |
/s/ Gregory R. L. Smith | | Date: March 24, 2011 |
| | |
Gregory R. L. Smith | | |
Chief Financial Officer | | |
(Principal Financial and Principal Accounting Officer) | | |
| | |
/s/ James Murdakes | | Date: March 24, 2011 |
| | |
James Murdakes | | |
Chairman of the Board of Directors | | |
| | |
/s/ James W. Bracke | | Date: March 24, 2011 |
| | |
James W. Bracke | | |
Director | | |
| | |
/s/ Michael G. Eleftheriou | | Date: March 24, 2011 |
| | |
Michael G. Eleftheriou | | |
Director | | |
| | |
/s/ Panos G. Michalopoulos | | Date: March 24, 2011 |
| | |
Panos G. Michalopoulos | | |
Director | | |
| | |
/s/ Sven A. Wehrwein | | Date: March 24, 2011 |
| | |
Sven A. Wehrwein | | |
Director | | |
48