The following table sets forth, for the periods indicated, certain statements of income data as a percent of total revenue and gross margin on international sales and royalties as a percentage of international sales and royalties, respectively.
Gross margins for product sales decreased to 46.6% in 2012 from 47.3% in 2011. Gross margins for the CitySync product line have historically been lower than gross margins for the Autoscope and RTMS product lines and therefore the mix of the product lines in any given period can result in varying margins. Generally, lower sales volumes of RTMS or CitySync products will reduce gross margins because of fixed manufacturing costs for these products. The decrease in gross margins for 2012 compared to 2011 is reflective of lower sales volume. Additionally, during 2012, we recorded a $200,000 lower of cost or market adjustment to inventory procured for a subsequently cancelled order. Gross margins on royalty income remained consistent at 100.0% in 2012 and 2011. We anticipate that gross margins for our product sales will be higher in 2013 as compared to 2012, while we expect royalty gross margins will be 100% in 2013.
Selling, marketing and product support expense decreased to $7.3 million or 29.2% of total revenue in 2012 from $10.6 million or 34.8% of total revenue in 2011. Our selling, marketing and product support expense decreased mainly due to the workforce reduction resulting from restructuring activities and the RTMS business model change. We anticipate that selling, marketing and product support expense will increase in terms of dollar amount and as a percentage of revenue in 2013 as compared to 2012.
General and administrative expense decreased to $5.2 million or 20.7% of total revenue in 2012, from $6.3 million or 20.7% of total revenue in 2011. General and administrative expenses decreased in 2012 mainly as a result of restructuring initiatives, partially offset by severance for the separation of our former President and Chief Executive Officer, and the RTMS business model change. We anticipate that general and administrative expenses will increase in 2013 in dollar amount and as a percentage of revenue compared to 2012, principally due to increased legal and other professional fees related to the investigation and remediation actions described in Note 15 of our Notes to Consolidated Financial Statements set forth elsewhere in this Annual Report on Form 10-K. The Company’s known costs related to the investigation to date were immaterial in 2012 and approximately $1.5 million through March 22, 2013. The Company is unable to determine the likely outcome or range of loss, if any, from the investigation, or predict with certainty the timeline for resolution of the investigation.
Table of Contents
Research and development expense decreased to $4.1 million or 16.6% of total revenue in 2012, down from $4.4 million or 14.5% of total revenue in 2012. The decrease was mainly related to decreased expenditures on our hybrid product development. We anticipate that research and development expense will increase in terms of dollar amount and as a percentage of revenue in 2013 as compared to 2012.
We recognized goodwill impairment charges in 2012 and 2011 of $3.2 million and $11.7 million, respectively, that were triggered by significant declines in our market capitalization.
As discussed above, beginning in January 2012, we changed our North American business model for the RTMS product line and undertook restructuring initiatives. In June 2012, we expanded the restructuring initiative to include aspects of our Europe-based CitySync business and our non-China Asian business. The majority of restructuring expense recognized in 2012 related to employee severance.
Amortization of intangibles expense was $1.6 million in both 2012 and 2011 and reflects the amortization of intangible assets acquired in acquisitions. Assuming there are no changes to our intangible assets, we anticipate amortization expense will be approximately $1.4 million in 2013.
Other income, net was $29,000 and $9,000 in 2012 and 2011, respectively, primarily consisting of interest income.
Income tax benefit of $180,000, or 5.4% of our pretax loss, was recorded for the year ended December 31, 2012, compared to income tax benefit of $3.0 million, or 23.2% of pretax loss, for the year ended December 31, 2011. The decrease in the effective rate resulted from the nondeductible goodwill impairment charge, nondeductible stock option expense and valuation for net operating losses in certain jurisdictions. We expect the effective rate in 2013 to be below 30%.
Year Ended December 31, 2011 Compared to Year Ended December 31, 2010. Total revenue decreased to $30.5 million in 2011 from $31.7 million in 2010, a decrease of 3.7%. Royalty income increased to $13.0 million in 2011 from $12.5 million in 2010, an increase of 4.2%. Product sales decreased to $17.5 million in 2011 from $19.2 million in 2010, a decrease of 8.8%. The decrease in product sales was mainly due to lower sales volume in Asia resulting, in part, from increased price and product competition and slower than planned management transitions. Revenue for the Autoscope segment increased to $17.4 million in 2011 from $16.7 million in 2010, an increase of 4.7%. Revenue for the RTMS segment decreased to $7.4 million in 2011 from $9.8 million in 2010, a decrease of 25.0%. The increase in Autoscope was due to higher volume mainly driven by two large project sales late in 2011. The decrease in RTMS was due mainly to lower sales volume in Asia and, to a lesser extent, in North America. Although the CitySync segment increased in 2011 over 2010, an annualized pro-forma comparison shows a decline. This is due to lower sales volume in 2011 and is reflective of a difficult environment for selling security applications to government customers in Europe and the United States that we believe was caused by constrained government budgets. As CitySync revenues were below the threshold required to achieve a second earn-out payment, in the 2011 fourth quarter, we took into income, as a reduction of overall operating expenses, $618,000 that was estimated and recorded as of the acquisition date.
Gross margins for product sales decreased to 47.3% in 2011 from 59.3% in 2010. Gross margins for the CitySync product line have historically been lower than gross margins for the Autoscope and RTMS product lines and therefore the mix of the product lines in any given period can result in varying margins. Generally, lower sales volumes of RTMS or CitySync products will reduce gross margins because of fixed manufacturing costs for these products. Additionally, gross margins were lower as a result of $448,000 in restructuring charges related to the RTMS business model change. Without these charges, product sale gross margins would have been 49.8%. The decrease in gross margins for 2011 compared to 2010 is reflective of lower sales volumes and unfavorable mix towards lower margin third party equipment. Gross margins on royalty income remained consistent at 100.0% in each of 2011 and 2010.
Selling, marketing and product support expense increased to $10.6 million or 34.8% of total revenue in 2011 from $9.8 million or 31.0% of total revenue in 2010. Our selling, marketing and product support expense increased mainly due to the addition of CitySync operations for a full year but also reflected investments in market expansion activities in Europe and Asia.
General and administrative expense increased to $6.3 million or 20.7% of total revenue in 2011, from $4.4 million or 13.8% of total revenue in 2010. General and administrative expenses increased in 2011 mainly as a result of the addition of the CitySync organization and to a lesser extent due to increased foreign currency exchange losses and bad debt reserves.
Research and development expense increased to $4.4 million or 14.5% of total revenue in 2011, up from $3.6 million or 11.5% of total revenue in 2010. The increase was mainly related to the addition of the CitySync engineering organization and increased expenditures on our hybrid product development
We recognized a goodwill impairment in 2011 of $11.7 million that was triggered by a significant decline in our market capitalization.
23
Table of Contents
As discussed above, in December 2011, we announced a change to our North American business model for the RTMS product line and certain restructuring initiatives. As a result, we recognized restructuring expense of $448,000 related to reserves for inventory and $287,000 related mainly to employee severance.
Amortization of intangibles expense was $1.7 million in 2011 compared to $1.2 million in 2010 and reflects the amortization of intangible assets acquired in acquisitions.
Other income (expense), net was income of $9,000 in 2011, primarily consisting of interest income, as opposed to expense of $123,000 in 2010 mainly due to higher debt balances in 2010, including a portion related to CitySync.
Income tax benefit of $3.0 million, or 23.2% of our pretax loss, was recorded for the year ended December 31, 2011, compared to income tax expense of $0.9 million, or 23.2% of pretax income, for the year ended December 31, 2010.
Liquidity and Capital Resources
At December 31, 2012, we had $8.3 million in cash and cash equivalents and $4.8 million in short-term investments, compared to $5.2 million in cash and cash equivalents and $2.1 million in short-term investments at December 31, 2011. Our investment objectives are to preserve principal, maintain liquidity, and achieve the best available return consistent with the primary objectives of safety and liquidity.
Net cash provided by operating activities was $5.9 million in 2012, compared to cash used of $1.3 million in 2011 and cash provided of $33,000 in 2010. The primary reasons for the increase in cash were collections of outstanding receivables and conversions of inventory, mostly driven by the RTMS model change, offset by reductions in payables and the generation of operating income after taking into account non-cash charges for goodwill impairment, depreciation and amortization. The primary reason for the 2011 change compared to 2010 was increased receivables outstanding in 2010 from 2009, the majority of which related to CitySync activity. We anticipate that average receivable collection days in 2013 will be similar to 2012 and that it will not have a material impact on our liquidity.
Net cash used in investing activities was $3.2 million in 2012, compared to cash used in investing activities of $1.4 million and $10.3 million in 2011 and 2010, respectively. Our planned additions of property and equipment are discretionary, and we do not expect them to exceed historical levels in 2013.
Net cash provided by financing activities was $121,000 in 2012, compared to cash provided of $105,000 and $4.4 million in 2011 and 2010, respectively. During 2010, we raised $8.8 million in cash, net of offering expenses, through a secondary offering, which was used to fund the purchase of CitySync. In December 2009, we entered into a term loan agreement for $4.0 million with Associated Bank, National Association (“Associated Bank”), which we fully repaid in September 2010.
We have a revolving line of credit and had term loans with Associated Bank that were initially entered into as of May 1, 2008. Our current revolving line of credit agreement (“Credit Agreement”) with Associated Bank provides up to $5.0 million of credit. The Credit Agreement expires in May 2014 and bears interest at an annual rate equal to the greater of (a) 4.5% or (b) LIBOR plus 2.75%. Any advances are secured by inventories, accounts receivable and equipment. We are subject to certain financial covenants under the Credit Agreement, including minimum debt service coverage ratios, minimum cash flow coverage ratios and financial measures. At December 31, 2012, we had no borrowings under the Credit Agreement, and we were in compliance with all financial covenants.
We believe that cash and cash equivalents on hand at December 31, 2012, along with the availability of funds under our revolving line of credit and cash provided by operating activities, will satisfy our projected working capital needs, investing activities, and other cash requirements for the foreseeable future.
Off-Balance Sheet Arrangements
We do not participate in transactions or have relationships or other arrangements with an unconsolidated entity, including special purpose and similar entities or other off-balance sheet arrangements.
Critical Accounting Policies
Our Consolidated Financial Statements included elsewhere in this Annual Report on Form 10-K are prepared in accordance with U.S. generally accepted accounting principles (“GAAP”), which require us to make estimates and assumptions in certain circumstances that affect amounts reported. In preparing these financial statements, management has made its best estimates and judgments of certain amounts, giving due consideration to materiality. We believe that of our significant accounting policies, the following are particularly important to the portrayal of our results of operations and financial position, may require the application of a higher level of judgment by our management, and as a result, are subject to an inherent degree of uncertainty. For further information see “Summary of Significant Accounting Policies” under Note 1 to the Consolidated Financial Statements included in Item 8 of this Annual Report on Form 10-K.
24
Table of Contents
Revenue Recognition and Allowance for Doubtful Accounts. We are required to comply with a variety of technical accounting requirements in order to achieve consistent and accurate revenue recognition. Royalty income is recognized based on sales shipped or delivered to our customers as reported to us by Econolite. Revenue is recognized when both product ownership and the risk of loss have transferred to the customer and we have no remaining obligations. Allowances for doubtful accounts are estimated by management based on an evaluation of potential losses related to customer receivable balances. We determine the allowance based on historical write-off experience in the industry, regional economic data, and an evaluation of specific customer accounts for risk of loss. We review our allowance for doubtful accounts monthly. Account balances are charged off against the allowance when we believe it is probable the receivable will not be recovered. We do not have any off-balance sheet credit exposure related to our customers. The establishment of this reserve requires the use of judgment and assumptions regarding the potential for losses on receivable balances. Although management considers these balances adequate and proper, changes in economic conditions in specific markets in which we operate could have an effect on reserve balances required.
Inventories. We maintain a material amount of inventory to support our engineering and manufacturing operations. This inventory is stated at the lower of cost or market. On a regular basis, we review our inventory and identify that which is excess, slow moving, and obsolete by considering factors such as inventory levels, expected product life, and forecasted sales demand. Any identified excess, slow moving, and obsolete inventory is written down to its market value through a charge to income from operations. It is possible that additional inventory write-down charges may be required in the future if there is a significant decline in demand for our products.
Impairment of Long-Lived Assets. We review the carrying value of long-lived assets or asset groups, such as property and equipment and intangibles subject to amortization, when events or changes in circumstances such as asset utilization, physical change, legal factors, or other matters indicate that the carrying value may not be recoverable. When this review indicates the carrying value of an asset or asset group exceeds the sum of the undiscounted cash flows expected to result from the use and eventual disposition of the asset or asset group, we recognize an asset impairment charge against operations. The amount of the impairment loss recorded is the amount by which the carrying value of the impaired asset or asset group exceeds its fair value.
Our impairment loss calculations contain uncertainties because they require management to make assumptions and to apply judgment to identify events or changes in circumstances indicating the carrying value of assets may not be recoverable, estimate future cash flows, estimate asset fair values, and select a discount rate that reflects the risk inherent in future cash flows. Expected cash flows may not be realized, which could cause long-lived assets to become impaired in future periods and could have a material adverse effect on future results of operations.
Warranty Liabilities. The estimated cost to service warranty and customer service claims is included in cost of sales. This estimate is based on historical trends of warranty claims. We regularly assess and adjust the estimate of accrued warranty claims by updating claims rates for actual trends and projected claim costs. Our warranty liability contains uncertainties because our warranty obligations cover an extended period of time. While these liability levels are based on historical warranty experience, they may not reflect the actual claims that will occur over the upcoming warranty period, and additional warranty reserves may be required. A revision of estimated claim rates or the projected cost of materials and freight associated with sending replacement parts to customers could have a material adverse effect on future results of operations.
Income Taxes. We record a tax provision for the anticipated tax consequences of the reported results of operations. Deferred tax assets and liabilities are measured using the currently enacted tax rates that apply to taxable income in effect for the years in which those deferred tax assets and liabilities are expected to be realized or settled. We record a valuation allowance to reduce deferred tax assets to the amount that is believed more likely than not to be realized. We believe it is more likely than not that forecasted income, including income that may be generated as a result of certain tax planning strategies, together with the tax effects of the deferred tax liabilities, will be sufficient to fully recover the remaining net realizable value of our deferred tax assets. In the event that all or part of the net deferred tax assets are determined not to be realizable in the future, an adjustment to the valuation allowance would be charged to earnings in the period such determination is made. In addition, the calculation of tax liabilities involves significant judgment in estimating the impact of uncertainties in the application of complex tax laws. Resolution of these uncertainties in a manner inconsistent with management’s expectations could have a material impact on our financial condition and operating results.
New and Recently Adopted Accounting Pronouncements
We do not anticipate that recently issued accounting guidance that has not yet been adopted will have a material impact on our consolidated financial statements.
25
Table of Contents
| |
Item 7A. | Quantitative and Qualitative Disclosures About Market Risk |
Foreign Currency Exchange Risk
Approximately 40% of our revenue has historically been derived from shipments to customers outside of the United States, and a large portion of this revenue is denominated in currencies other than the U.S. dollar. Our international subsidiaries have functional currencies other than our U.S. dollar reporting currency and, occasionally, transact business in currencies other than their functional currencies. These non-functional currency transactions expose us to market risk on assets, liabilities and cash flows recognized on these transactions.
The strengthening of the U.S. dollar relative to foreign currencies decreases the value of foreign currency-denominated revenue and earnings when translated into U.S. dollars. Conversely, a weakening of the U.S. dollar increases the value of foreign currency-denominated revenue and earnings. A 10% adverse change in foreign currency rates, if we have not properly hedged, could have a material effect on our results of operations or financial position.
26
Table of Contents
| |
Item 8. | Financial Statements and Supplementary Data |
IMAGE SENSING SYSTEMS, INC.
CONSOLIDATED BALANCE SHEETS
(in thousands, except share data)
| | | | | | | |
| | December 31 | |
| |
| |
| | 2012 | | 2011 | |
| |
| |
| |
ASSETS | | | | | | | |
Current assets: | | | | | | | |
Cash and cash equivalents | | $ | 8,334 | | $ | 5,224 | |
Marketable securities | | | 4,817 | | | 2,093 | |
Accounts receivable, net of allowance for doubtful accounts of $796 and $677, respectively | | | 6,722 | | | 10,148 | |
Inventories | | | 4,485 | | | 6,142 | |
Prepaid expenses and other current assets | | | 1,611 | | | 1,644 | |
Deferred income taxes | | | 186 | | | 429 | |
| |
|
| |
|
| |
Total current assets | | | 26,155 | | | 25,680 | |
| | | | | | | |
Property and equipment: | | | | | | | |
Furniture and fixtures | | | 461 | | | 444 | |
Leasehold improvements | | | 471 | | | 363 | |
Equipment | | | 4,427 | | | 3,364 | |
| |
|
| |
|
| |
| | | 5,359 | | | 4,171 | |
Accumulated depreciation | | | 3,484 | | | 2,736 | |
| |
|
| |
|
| |
| | | 1,875 | | | 1,435 | |
| | | | | | | |
Deferred income taxes | | | 4,017 | | | 3,131 | |
Intangible assets, net | | | 6,489 | | | 7,888 | |
Goodwill | | | — | | | 3,120 | |
| |
|
| |
|
| |
TOTAL ASSETS | | $ | 38,536 | | $ | 41,254 | |
| |
|
| |
|
| |
| | | | | | | |
LIABILITIES AND SHAREHOLDERS’ EQUITY | | | | | | | |
Current liabilities: | | | | | | | |
Accounts payable | | $ | 2,112 | | $ | 1,998 | |
Accrued compensation | | | 949 | | | 1,013 | |
Warranty and other current liabilities | | | 1,086 | | | 1,601 | |
| |
|
| |
|
| |
Total current liabilities | | | 4,147 | | | 4,612 | |
| | | | | | | |
Deferred income taxes | | | 241 | | | — | |
Other long-term liabilities | | | 168 | | | 316 | |
| | | | | | | |
Shareholders’ equity: | | | | | | | |
Preferred stock, $.01 par value; 5,000,000 shares authorized, none issued or outstanding | | | — | | | — | |
Common stock, $.01 par value; 20,000,000 shares authorized, 4,966,619 and 4,910,619 issued and outstanding, respectively | | | 49 | | | 49 | |
Additional paid-in capital | | | 23,055 | | | 22,619 | |
Accumulated other comprehensive income (loss) | | | 390 | | | (180 | ) |
Retained earnings | | | 10,486 | | | 13,838 | |
| |
|
| |
|
| |
Total shareholders’ equity | | | 33,980 | | | 36,326 | |
| |
|
| |
|
| |
TOTAL LIABILITIES AND SHAREHOLDERS’ EQUITY | | $ | 38,536 | | $ | 41,254 | |
| |
|
| |
|
| |
See accompanying notes to the consolidated financial statements.
27
Table of Contents
IMAGE SENSING SYSTEMS, INC.
CONSOLIDATED STATEMENTS OF OPERATIONS
(in thousands, except share data)
| | | | | | | | | | |
| | Years ended December 31 | |
| |
| |
| | 2012 | | 2011 | | 2010 | |
| |
| |
| |
| |
Revenue: | | | | | | | | | | |
Product sales | | $ | 12,564 | | $ | 17,475 | | $ | 19,162 | |
Royalties | | | 12,399 | | | 13,046 | | | 12,519 | |
| |
|
| |
|
| |
|
| |
| | | 24,963 | | | 30,521 | | | 31,681 | |
Cost of revenue (exclusive of amortization shown below): | | | | | | | | | | |
Product sales | | | 6,706 | | | 8,769 | | | 7,799 | |
Restructuring | | | — | | | 448 | | | — | |
| |
|
| |
|
| |
|
| |
| | | 6,706 | | | 9,217 | | | 7,799 | |
| |
|
| |
|
| |
|
| |
Gross profit | | | 18,257 | | | 21,304 | | | 23,882 | |
| | | | | | | | | | |
Operating expenses: | | | | | | | | | | |
Selling, marketing and product support | | | 7,289 | | | 10,609 | | | 9,807 | |
General and administrative | | | 5,167 | | | 6,315 | | | 4,372 | |
Research and development | | | 4,135 | | | 4,424 | | | 3,630 | |
Amortization of intangible assets | | | 1,622 | | | 1,650 | | | 1,218 | |
Restructuring | | | 430 | | | 287 | | | — | |
Goodwill impairment | | | 3,175 | | | 11,685 | | | — | |
Acquisition related expenses (income) | | | — | | | (618 | ) | | 817 | |
| |
|
| |
|
| |
|
| |
| | | 21,818 | | | 34,352 | | | 19,844 | |
| |
|
| |
|
| |
|
| |
Income (loss) from operations | | | (3,561 | ) | | (13,048 | ) | | 4,038 | |
| | | | | | | | | | |
Other income (expense), net | | | 29 | | | 9 | | | (123 | ) |
| |
|
| |
|
| |
|
| |
Income (loss) before income taxes | | | (3,532 | ) | | (13,039 | ) | | 3,915 | |
Income tax expense (benefit) | | | (180 | ) | | (3,022 | ) | | 910 | |
| |
|
| |
|
| |
|
| |
Net income (loss) | | $ | (3,352 | ) | $ | (10,017 | ) | $ | 3,005 | |
| |
|
| |
|
| |
|
| |
Net income (loss) per share: | | | | | | | | | | |
Basic | | $ | (0.69 | ) | $ | (2.07 | ) | $ | 0.66 | |
Diluted | | | (0.69 | ) | | (2.07 | ) | | 0.64 | |
| | | | | | | | | | |
Weighted average number of common shares outstanding: | | | | | | | | | | |
Basic | | | 4,886 | | | 4,834 | | | 4,555 | |
Diluted | | | 4,886 | | | 4,834 | | | 4,667 | |
See accompanying notes to the consolidated financial statements.
28
Table of Contents
IMAGE SENSING SYSTEMS, INC.
CONSOLIDATED STATEMENTS OF COMPREHENSIVE INCOME (LOSS)
(in thousands)
| | | | | | | | | | |
| | Years ended December 31 | |
| |
| |
| | 2012 | | 2011 | | 2010 | |
| |
| |
| |
| |
Net income (loss) | | $ | (3,352 | ) | $ | (10,017 | ) | $ | 3,005 | |
Other comprehensive income (loss): | | | | | | | | | | |
Foreign currency translation adjustment | | | 570 | | | (232 | ) | | 223 | |
| |
|
| |
|
| |
|
| |
Comprehensive income (loss) | | $ | (2,782 | ) | $ | (10,249 | ) | $ | 3,228 | |
See accompanying notes to the consolidated financial statements.
29
Table of Contents
IMAGE SENSING SYSTEMS, INC.
CONSOLIDATED STATEMENTS OF CASH FLOW
(in thousands)
| | | | | | | | | | |
| | Years ended December 31 | |
| |
| |
| | 2012 | | 2011 | | 2010 | |
| |
| |
| |
| |
Operating activities: | | | | | | | | | | |
Net income (loss) | | $ | (3,352 | ) | $ | (10,017 | ) | $ | 3,005 | |
Adjustments to reconcile net income (loss) to net cash provided by (used for) operating activities: | | | | | | | | | | |
Depreciation | | | 727 | | | 548 | | | 498 | |
Amortization | | | 1,622 | | | 1,650 | | | 1,218 | |
Tax benefit from disqualifying dispositions | | | 71 | | | 37 | | | 72 | |
Stock-based compensation | | | 244 | | | 412 | | | 342 | |
Goodwill impairment | | | 3,175 | | | 11,685 | | | — | |
Deferred income tax expense (benefit) | | | (402 | ) | | (3,620 | ) | | 174 | |
Earn-out income | | | — | | | (618 | ) | | — | |
Changes in operating assets and liabilities, net of acquisition: | | | | | | | | | | |
Accounts receivable, net | | | 2,777 | | | (11 | ) | | (3,711 | ) |
Inventories | | | 1,657 | | | (1,493 | ) | | (1,309 | ) |
Prepaid expenses and other receivables | | | 33 | | | 496 | | | (1,479 | ) |
Accounts payable | | | 114 | | | (96 | ) | | 391 | |
Accrued liabilities | | | (727 | ) | | (284 | ) | | 832 | |
| |
|
| |
|
| |
|
| |
Net cash provided by (used for) operating activities | | | 5,939 | | | (1,311 | ) | | 33 | |
| | | | | | | | | | |
Investing activities: | | | | | | | | | | |
Purchases of marketable securities | | | (10,027 | ) | | (7,340 | ) | | (8,882 | ) |
Sales and maturities of marketable securities | | | 7,303 | | | 9,201 | | | 8,863 | |
Purchases of property and equipment | | | (487 | ) | | (859 | ) | | (380 | ) |
Payment of earn-outs | | | — | | | (2,361 | ) | | (1,541 | ) |
Payments for acquisition | | | — | | | — | | | (8,316 | ) |
| |
|
| |
|
| |
|
| |
Net cash used for investing activities | | | (3,211 | ) | | (1,359 | ) | | (10,256 | ) |
| | | | | | | | | | |
Financing activities: | | | | | | | | | | |
Net proceeds from common stock offering | | | — | | | — | | | 8,818 | |
Proceeds from exercise of stock options | | | 121 | | | 105 | | | 121 | |
Repayment of bank debt | | | — | | | — | | | (4,556 | ) |
| |
|
| |
|
| |
|
| |
Net cash provided by financing activities | | | 121 | | | 105 | | | 4,383 | |
| | | | | | | | | | |
Effect of exchange rate changes on cash | | | 261 | | | (232 | ) | | (223 | ) |
| |
|
| |
|
| |
|
| |
Increase (decrease) in cash and cash equivalents | | | 3,110 | | | (2,797 | ) | | (6,063 | ) |
| | | | | | | | | | |
Cash and cash equivalents at beginning of year | | | 5,224 | | | 8,021 | | | 14,084 | |
| |
|
| |
|
| |
|
| |
Cash and cash equivalents at end of year | | $ | 8,334 | | $ | 5,224 | | $ | 8,021 | |
| |
|
| |
|
| |
|
| |
| | | | | | | | | | |
Supplemental disclosure: | | | | | | | | | | |
Income taxes paid, net of refunds | | $ | 75 | | $ | 57 | | $ | 1,571 | |
Interest paid | | | — | | | 6 | | | 155 | |
| | | | | | | | | | |
Supplemental non-cash disclosure: | | | | | | | | | | |
Property acquired in exchange for the fair value of an accounts receivable | | $ | 649 | | $ | — | | $ | — | |
Common stock issued in connection with CitySync acquisition | | | — | | | — | | | 727 | |
EIS earn-out payable recorded as additional goodwill | | | — | | | — | | | 1,665 | |
See accompanying notes to the consolidated financial statements.
30
Table of Contents
IMAGE SENSING SYSTEMS, INC.
CONSOLIDATED STATEMENTS OF SHAREHOLDERS’ EQUITY
(in thousands, except share data)
| | | | | | | | | | | | | | | | | | | |
| | Shares
Issued | | Common
Stock | | Additional
Paid-In
Capital | | Accumulated
Other
Comprehensive
Income
(Loss) | | Retained
Earnings | | Total | |
| |
| |
| |
| |
| |
| |
| |
| | | | | | | | | | | | | |
Balance at December 31, 2009 | | | 3,985,819 | | $ | 40 | | $ | 11,994 | | $ | (171 | ) | $ | 20,850 | | $ | 32,713 | |
| | | | | | | | | | | | | | | | | | | |
Tax benefit from disqualifying disposition | | | — | | | — | | | 72 | | | — | | | — | | | 72 | |
Common stock issued for options exercised | | | 37,700 | | | — | | | 121 | | | — | | | — | | | 121 | |
Common stock issued in secondary
offering, net | | | 798,000 | | | 8 | | | 8,810 | | | — | | | — | | | 8,818 | |
Common stock issued in CitySync
acquisition | | | 57,000 | | | 1 | | | 726 | | | — | | | — | | | 727 | |
Stock-based compensation | | | — | | | — | | | 342 | | | — | | | — | | | 342 | |
Comprehensive income (loss): | | | | | | | | | | | | | | | | | | | |
Foreign currency translation adjustment | | | — | | | — | | | — | | | 223 | | | — | | | 223 | |
Net income | | | — | | | — | | | — | | | — | | | 3,005 | | | 3,005 | |
| | | | | | | | | | | | | | | | |
|
| |
Total comprehensive income | | | — | | | — | | | — | | | — | | | — | | | 3,228 | |
| |
|
| |
|
| |
|
| |
|
| |
|
| |
|
| |
Balance at December 31, 2010 | | | 4,878,519 | | $ | 49 | | $ | 22,065 | | $ | 52 | | $ | 23,855 | | $ | 46,021 | |
| |
|
| |
|
| |
|
| |
|
| |
|
| |
|
| |
| | | | | | | | | | | | | | | | | | | |
Tax benefit from disqualifying disposition | | | — | | | — | | | 37 | | | — | | | — | | | 37 | |
Common stock issued for options exercised | | | 32,100 | | | — | | | 105 | | | — | | | — | | | 105 | |
Stock-based compensation | | | — | | | — | | | 412 | | | — | | | — | | | 412 | |
Comprehensive income (loss): | | | | | | | | | | | | | | | | | | | |
Foreign currency translation adjustment | | | — | | | — | | | — | | | (232 | ) | | — | | | (232 | ) |
Net loss | | | — | | | — | | | — | | | — | | | (10,017 | ) | | (10,017 | ) |
| | | | | | | | | | | | | | | | |
|
| |
Total comprehensive loss | | | — | | | — | | | — | | | — | | | — | | | (10,249 | ) |
| |
|
| |
|
| |
|
| |
|
| |
|
| |
|
| |
Balance at December 31, 2011 | | | 4,910,619 | | $ | 49 | | $ | 22,619 | | $ | (180 | ) | $ | 13,838 | | $ | 36,326 | |
| |
|
| |
|
| |
|
| |
|
| |
|
| |
|
| |
| | | | | | | | | | | | | | | | | | | |
Tax benefit from disqualifying disposition | | | — | | | — | | | 71 | | | — | | | — | | | 71 | |
Common stock issued for options exercised | | | 56,000 | | | — | | | 121 | | | — | | | — | | | 121 | |
Stock-based compensation | | | — | | | — | | | 244 | | | — | | | — | | | 244 | |
Comprehensive income (loss): | | | | | | | | | | | | | | | | | | | |
Foreign currency translation adjustment | | | — | | | — | | | — | | | 570 | | | — | | | 570 | |
Net loss | | | — | | | — | | | — | | | — | | | (3,352 | ) | | (3,352 | ) |
| | | | | | | | | | | | | | | | |
|
| |
Total comprehensive loss | | | — | | | — | | | — | | | — | | | — | | | (2,782 | ) |
| |
|
| |
|
| |
|
| |
|
| |
|
| |
|
| |
Balance at December 31, 2012 | | | 4,966,619 | | $ | 49 | | $ | 23,055 | | $ | 390 | | $ | 10,486 | | $ | 33,980 | |
| |
|
| |
|
| |
|
| |
|
| |
|
| |
|
| |
See accompanying notes to the consolidated financial statements.
31
Table of Contents
Notes to Consolidated Financial Statements
December 31, 2012
| |
1. | DESCRIPTION OF BUSINESS AND SIGNIFICANT ACCOUNTING POLICIES |
DESCRIPTION OF BUSINESS
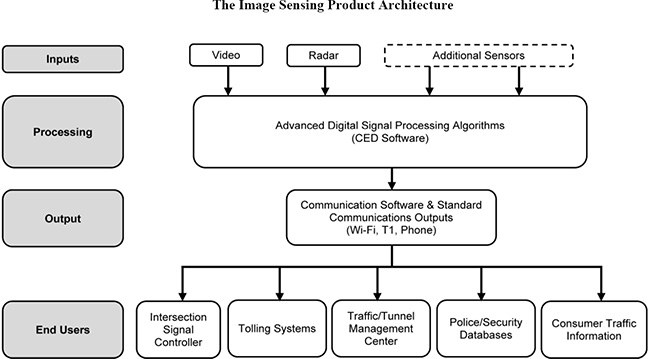
Image Sensing Systems, Inc. (referred to herein as “we,” the “Company,” “us” and “our”) develops and markets software-based computer enabled detection products for use in traffic, security, police and parking applications. We sell our products primarily to distributors and also receive royalties under a license agreement with a manufacturer/distributor for certain of our products. Our products are used primarily by governmental entities.
PRINCIPLES OF CONSOLIDATION
The Consolidated Financial Statements include the accounts of Image Sensing Systems, Inc. and its wholly-owned subsidiaries: Flow Traffic Ltd. (Flow Traffic) located in Hong Kong; Image Sensing Systems Holdings Limited (ISS/Holdings) and Image Sensing Systems Europe Ltd. (ISS/Europe), both located in the United Kingdom; Image Sensing Systems Europe Limited SP.Z.O.O. (ISS/Poland), located in Poland; ISS Image Sensing Systems Canada Ltd (ISS/Canada) and ISS Canada Sales Corp. (Canada Sales Corp.), both located in Ontario, Canada; and CitySync Limited (CitySync), located in the United Kingdom. All significant inter-company transactions and balances have been eliminated in consolidation.
REVENUE RECOGNITION
We recognize revenue on a sales arrangement when it is realized or realizable and earned, which occurs when all of the following criteria have been met: persuasive evidence of an arrangement exists; delivery and title transfer has occurred or services have been rendered; the sales price is fixed and determinable; collectability is reasonably assured; and all significant obligations to the customer have been fulfilled.
Certain sales may contain multiple elements for revenue recognition purposes. We consider each deliverable that provides value to the customer on a standalone basis as a separable element. Separable elements in these arrangements may include the hardware, software, installation services, training and support. We initially allocate consideration to each separable element using the relative selling price method. Selling prices are determined by us based on either vendor-specific objective evidence (“VSOE”) (the actual selling prices of similar products and services sold on a standalone basis) or, in the absence of VSOE, our best estimate of the selling price. Factors considered by us in determining estimated selling prices for applicable elements generally include overall economic conditions, customer demand, costs incurred by us to provide the deliverable, as well as our historical pricing practices. Under these arrangements, revenue associated with each delivered element is recognized in an amount equal to the lesser of the consideration initially allocated to the delivered element or the amount for which payment is not deemed contingent upon future delivery of other elements in the arrangement. Under arrangements where special acceptance protocols exist, installation services and training may not be considered separable. Under those circumstances, revenue for the entire arrangement is recognized upon the completion of installation, training and fulfillment of any other significant obligations specific to the terms of the arrangement. Arrangements that do not contain any separable elements are typically recognized when the products are shipped and title has transferred to the customer.
Revenue from arrangements for services such as maintenance, repair, consulting and technical support are recognized either as the service is performed or ratably over the defined contractual period for service maintenance contracts.
Econolite Control Products, Inc. (Econolite) is our licensee that sells certain of our products in North America, the Caribbean and Latin America. The royalty of approximately 50% of the gross profit on licensed products is recognized when the products are shipped or delivered by Econolite to its customers.
We record provisions against sales revenue for estimated returns and allowances in the period when the related revenue is recorded based on historical sales returns and changes in end user demand.
Revenue is recorded net of taxes collected from customers that are remitted to governmental authorities, with the collected taxes recorded as current liabilities until remitted to the relevant government authority.
SHIPPING AND HANDLING
Freight revenue billed to customers is reported within revenue on the Consolidated Statements of Operations, and expenses incurred for shipping products to customers are reported within cost of revenue on the Consolidated Statements of Operations.
32
Table of Contents
CASH AND CASH EQUIVALENTS
We consider all highly liquid investments with an original maturity of three months or less to be cash equivalents. Cash equivalents, both inside and outside the United States, are invested in money market funds and bank deposits in local currency denominations. Cash located in foreign banks was $2.6 million and $2.4 million at December 31, 2012 and 2011, respectively. We hold our cash and cash equivalents with financial institutions and, at times, the amounts of our balances may be in excess of insurance limits.
MARKETABLE SECURITIES
We classify marketable debt securities as available-for-sale investments and these securities are stated at their estimated fair value. The value of these securities is subject to market and credit volatility during the period these investments are held.
ACCOUNTS RECEIVABLE
We grant credit to customers in the normal course of business and generally do not require collateral from domestic customers. When deemed appropriate, receivables from customers outside the United States are supported by letters of credit from financial institutions. Management performs on-going credit evaluations of customers. The allowance for doubtful accounts is based on management’s assessment of the collectability of specific customer accounts and includes consideration of the credit worthiness and financial condition of those specific customers. We record an allowance to reduce receivables to the amount that is reasonably believed to be collectible and consider factors such as the financial condition of the customer and the aging of the receivables. If there is a deterioration of a customer’s financial condition, if we become aware of additional information related to the credit worthiness of a customer, or if future actual default rates on trade receivables in general differ from those currently anticipated, we may have to adjust our allowance for doubtful accounts, which would affect earnings in the period the adjustments were made.
INVENTORIES
Inventories are primarily electronic components and finished goods and are valued at the lower of cost or market determined under the first-in, first-out accounting method.
PROPERTY AND EQUIPMENT
Property and equipment is stated at cost. Additions, replacements, and improvements are capitalized at cost, while maintenance and repairs are charged to operations as incurred. Depreciation is recorded using the straight-line method over the estimated useful lives of the assets. Leasehold improvements are depreciated over the shorter of the estimated useful lives of the assets or the contractual term of the lease, with consideration of lease renewal options if renewal appears probable. Depreciation is recorded over a three- to seven-year period for financial reporting purposes and by accelerated methods for income tax purposes.
INCOME TAXES
We record a tax provision for the anticipated tax consequences of the reported results of operations. Deferred tax assets and liabilities are measured using the currently enacted tax rates that apply to taxable income in effect for the years in which those deferred tax assets and liabilities are expected to be realized or settled. We record a valuation allowance to reduce deferred tax assets to the amount that is believed more likely than not to be realized. We believe it is more likely than not that forecasted income, including income that may be generated as a result of certain tax planning strategies, together with the tax effects of the deferred tax liabilities, will be sufficient to fully recover the remaining net realizable value of its deferred tax assets. In the event that all or part of the net deferred tax assets are determined not to be realizable in the future, an adjustment to the valuation allowance would be charged to earnings in the period such determination is made. In addition, the calculation of tax liabilities involves significant judgment in estimating the impact of uncertainties in the application of complex tax laws. Resolution of these uncertainties in a manner inconsistent with management’s expectations could have a material impact on our financial condition and operating results. We recognize penalties and interest expense related to unrecognized tax benefits in income tax expense.
GOODWILL AND INTANGIBLE ASSETS
Goodwill represents the excess of acquisition costs over the fair value of the net assets of businesses acquired. Goodwill is not amortized, but instead tested at least annually for impairment. Goodwill is also tested for impairment as changes in circumstances occur indicating that the carrying value may not be recoverable.
Goodwill impairment testing first requires a comparison of the fair value of each reporting unit to the carrying value. If the carrying value of the reporting unit exceeds fair value, goodwill is considered impaired. Impairment testing for indefinite-lived intangible assets requires a comparison between the fair value and the carrying value of the asset. If the carrying value of the asset exceeds its fair value, the asset is reduced to fair value. See Note 5 to the Consolidated Financial Statements for additional information on goodwill.
33
Table of Contents
Intangible assets with finite lives are amortized on a straight-line basis over the expected period to be benefited by future cash flows and reviewed for impairment. Fair values of goodwill and intangible assets are primarily determined using discounted cash flow analyses. At both December 31, 2012 and 2011, we determined there was no impairment of intangible assets. At both December 31, 2012 and 2011, there were no indefinite-lived intangible assets.
IMPAIRMENT OF LONG-LIVED ASSETS
We review the carrying value of long-lived assets or asset groups, such as property and equipment and intangibles subject to amortization, when events or changes in circumstances such as asset utilization, physical change, legal factors, or other matters indicate that the carrying value may not be recoverable. When this review indicates the carrying value of an asset or asset group exceeds the sum of the undiscounted cash flows expected to result from the use and eventual disposition of the asset or asset group, we recognize an asset impairment charge against operations. The amount of the impairment loss recorded is the amount by which the carrying value of the impaired asset or asset group exceeds its fair value. No such impairment losses were recorded during the years ended December 31, 2012, 2011 or 2010.
RESEARCH AND DEVELOPMENT
Research and development costs associated with new products are charged to operations in the period incurred.
WARRANTIES
We generally provide a standard two-year warranty on product sales. We record estimated warranty costs at the time of sale and accrue for specific items at the time that their existence is known and the amounts are determinable. We estimate warranty costs using standard quantitative measures based on historical warranty claim experience and an evaluation of specific customer warranty issues.
ADVERTISING
Advertising costs are charged to operations in the period incurred and totaled $124,000, $157,000 and $153,000 for the years ended December 31, 2012, 2011 and 2010, respectively.
FOREIGN CURRENCY
The financial position and results of operations of our foreign subsidiaries are measured using local currency as the functional currency. Assets and liabilities are translated using fiscal period-end exchange rates, and statements of operations are translated using average exchange rates applicable to each period, with the resulting translation adjustments recorded as a separate component of shareholders’ equity under “Accumulated other comprehensive income (loss)”. Gains and losses from foreign currency transactions are recognized in the Consolidated Statements of Operations.
NET INCOME (LOSS) PER SHARE
Basic income (loss) per share excludes dilution and is computed by dividing net income (loss) attributable to common shareholders by the weighted-average number of common shares outstanding during the period. Diluted income (loss) per share includes potentially dilutive common shares consisting of stock options, restricted stock and warrants using the treasury stock method. Under the treasury stock method, shares associated with certain stock options have been excluded from the diluted weighted average shares outstanding calculation because the exercise of those options would lead to a net reduction in common shares outstanding. As a result, stock options to acquire 481,000, 404,000 and 133,000 weighted common shares have been excluded from the diluted weighted shares outstanding calculation for the years ended December 31, 2012, 2011 and 2010, respectively, because the exercise prices were greater than the average market price of the common shares during the period and were excluded from the calculation of diluted net income per share.
For the year ended December 31, 2010, 112,000 common share equivalents were included in the computation of diluted net income per share.
USE OF ESTIMATES
The preparation of financial statements in accordance with U.S. generally accepted accounting principles requires management to make estimates and assumptions that affect the reported amounts of assets and liabilities, disclosure of contingent assets and liabilities as of the date of the financial statements, and reported amounts of revenue and expense during the reporting period. Predicting future events is inherently an imprecise activity and, as such, requires the use of judgment. Ultimate results could differ from those estimates. Changes in these estimates will be reflected in the financial statements in future periods.
34
Table of Contents
STOCK-BASED COMPENSATION
We measure the cost of employee services received in exchange for the award of equity instruments based on the fair value of the award at the date of grant and recognize the cost over the period during which an employee is required to provide services in exchange for the award. Stock options are granted at exercise prices equal to the closing market price of our stock on the date of grant.
For purposes of determining estimated fair value of stock-based payment awards, we utilize a Black-Scholes option pricing model, which requires the input of certain assumptions requiring management judgment. Because our employee stock option awards have characteristics significantly different from those of traded options, and because changes in the input assumptions can materially affect fair value estimates, existing models may not provide a reliable single measure of the fair value of employee stock options. Management will continue to assess the assumptions and methodologies used to calculate estimated fair value of stock-based compensation. Circumstances may change and additional data may become available over time that could result in changes to these assumptions and methodologies and thereby materially impact the fair value determination of future grants of stock-based payment awards. If factors change and we employ different assumptions in future periods, the compensation expense recorded may differ significantly from the stock-based compensation expense recorded in the current period.
| |
2. | FAIR VALUE MEASUREMENTS AND MARKETABLE SECURITIES |
The guidance for fair value measurements establishes the authoritative definition of fair value, sets out a framework for measuring fair value and outlines the required disclosures regarding fair value measurements. Fair value is the price that would be received to sell an asset or paid to transfer a liability (an exit price) in the principal or most advantageous market for the asset or liability in an orderly transaction between market participants at the measurement date. We use a three-tier fair value hierarchy based upon observable and non-observable inputs as follows:
| |
• | Level 1 – observable inputs such as quoted prices in active markets; |
• | Level 2 – inputs, other than the quoted prices in active markets, that are observable either directly or indirectly; and |
• | Level 3 – unobservable inputs in which there is little or no market data, which require the reporting entity to develop its own assumptions. |
Assets and Liabilities that are Measured at Fair Value on a Recurring Basis
The fair value hierarchy requires the use of observable market data when available. In instances in which the inputs used to measure fair value fall into different levels of the fair value hierarchy, the fair value measurement has been determined based on the lowest level input that is significant to the fair value measurement in its entirety. Our assessment of the significance of a particular item to the fair value measurement in its entirety requires judgment, including the consideration of inputs specific to the asset or liability.
Investments are comprised of high-grade municipal bonds, U.S. government securities and commercial paper and are classified as Level 1 or Level 2, depending on trading frequency and volume and our ability to obtain pricing information on an ongoing basis.
The amortized cost and market value of our available-for-sale securities by major security type were as follows (in thousands):
| | | | | | | | | | | | | |
| | December 31, 2012 | |
| |
| |
| |
|
|
| |
| | Level 1 | | Level 2 | | Level 3 | | Total | |
| |
| |
| |
|
|
| |
Bank certificates of deposit | | $ | — | | $ | 2,524 | | $ | — | | $ | 2,524 | |
U.S. government obligations | | | 880 | | | 504 | | | — | | | 1,384 | |
Corporate obligations | | | 453 | | | — | | | — | | | 453 | |
State and municipal bonds | | | — | | | 456 | | | — | | | 456 | |
| |
|
| |
|
| |
|
| |
|
| |
| | $ | 1,333 | | $ | 3,484 | | $ | — | | $ | 4,817 | |
| |
|
| |
|
| |
|
| |
|
| |
| | | | | | | | | | | | | |
| | December 31, 2011 | |
| |
| |
| |
|
|
| |
| | Level 1 | | Level 2 | | Level 3 | | Total | |
| |
| |
| |
|
|
| |
Corporate obligations | | $ | 1,227 | | $ | — | | $ | — | | $ | 1,227 | |
State and municipal bonds | | | — | | | 866 | | | — | | | 866 | |
| |
|
| |
|
| |
|
| |
|
| |
| | $ | 1,227 | | $ | 866 | | $ | — | | $ | 2,093 | |
| |
|
| |
|
| |
|
| |
|
| |
35
Table of Contents
The Company evaluates impairment at each reporting period for securities where the fair value of the investment is less than its cost. Unrealized gains and losses on the Company’s available-for-sale investments are primarily attributable to general changes in interest rates and market conditions. We do not believe the unrealized losses represent other-than-temporary impairments based on our evaluation of available evidence as of December 31, 2012. The aggregate unrealized gain or loss on available-for-sale investments were immaterial as of December 31, 2012 and 2011.
Classification of available-for-sale investments as current or noncurrent is dependent upon our intended holding period, the security’s maturity date, or both. Contractual maturities were less than one year for all available-for-sale investments as of December 31, 2012. There were no available-for-sale investments with gross unrealized losses that have been in a continuous unrealized loss position for more than 12 months as of December 31, 2012 and 2011.
Proceeds from maturities or sales of available-for-sale securities were $7.3 million, $9.2 million and $8.9 million during the years ended December 31, 2012, 2011 and 2010, respectively. Realized gains and losses are determined on the specific identification method. Realized gains and losses related to sales of available-for-sale investments during the years ended December 31, 2012, 2011 and 2010 were immaterial and included in other income (expense).
Nonfinancial Assets Measured at Fair Value on a Nonrecurring Basis
Our goodwill, intangible assets and other long-lived assets are nonfinancial assets that were acquired either as part of a business combination, individually or with a group of other assets. These nonfinancial assets were initially, and have historically been, measured and recognized at amounts equal to the fair value determined as of the date of acquisition.
Periodically, these nonfinancial assets are tested for impairment by comparing their respective carrying values to the estimated fair value of the reporting unit or asset group in which they reside. In the quarters ended June 30, 2012 and September 30, 2011, certain of these nonfinancial assets were deemed to be impaired (see Note 5), and we recognized an impairment loss equal to the amount by which the carrying value of each reporting unit exceeded their estimated fair value. Fair value measurements of the reporting units were estimated using certain Level 3 inputs requiring management judgment, including projections of economic conditions and customer demand, revenue and margins, changes in competition, operating costs, working capital requirements, and new product introductions.
Financial Instruments not Measured at Fair Value
Certain of our financial instruments are not measured at fair value and are recorded at carrying amounts approximating fair value, based on their short-term nature or variable interest rate. These financial instruments include cash and cash equivalents, accounts receivable, accounts payable and other current assets and liabilities.
Inventories consisted of the following (in thousands):
| | | | | | | |
| | December 31, | |
| |
| |
| | 2012 | | 2011 | |
| |
| |
| |
Electronic components | | $ | 3,001 | | $ | 2,924 | |
Finished goods | | | 1,484 | | | 3,218 | |
| |
|
| |
|
| |
| | | | | | | |
Total | | $ | 4,485 | | $ | 6,142 | |
| |
|
| |
|
| |
On June 21, 2010, we purchased all of the outstanding equity of CitySync Limited (“CitySync”), a privately-held developer and marketer of automatic number plate recognition (ANPR) products. The total purchase price was $9.6 million, comprised of $7.9 million in cash plus 57,000 shares of our common stock.
36
Table of Contents
The results of CitySync operations are included in the accompanying Consolidated Financial Statements since the date of the acquisition and are reported in the CitySync segment. The following pro forma summary presents the results of operations as if the acquisition had occurred on January 1, 2010. The table below includes our results for the periods as shown and for CitySync based on a January fiscal year. The pro forma results are not necessarily indicative of the results that would have been achieved had the CitySync acquisition taken place on that date (in thousands, except per share amounts):
| | | | | | | | | | |
| | Year Ended
December 31, | |
| |
| |
| | 2012 | | 2011 | | 2010 | |
| |
|
|
|
|
| |
| | (Actual) | | (Actual) | | (Pro Forma) | |
| |
| |
| |
| |
Total revenue | | $ | 24,963 | | $ | 30,521 | | $ | 34,088 | |
Net income (loss) | | | (3,352 | ) | | (10,017 | ) | | 2,508 | |
| | | | | | | | | | |
Net income (loss) per share: | | | | | | | | | | |
Basic | | $ | (0.69 | ) | $ | (2.07 | ) | $ | 0.55 | |
| |
|
| |
|
| |
|
| |
Diluted | | $ | (0.69 | ) | $ | (2.07 | ) | $ | 0.53 | |
| |
|
| |
|
| |
|
| |
| |
5. | GOODWILL AND INTANGIBLE ASSETS |
Goodwill
Because the goodwill and intangible assets related to the CitySync acquisition are accounted for in Great Britain Pounds, they are impacted by period-end rates of exchange to United States Dollars and therefore varied in different reporting periods.
Goodwill consisted of the following reporting units (dollars in thousands):
| | | | | | | | | | | | | | | | |
| | December 31,
2011 | | Additions | | Impairments | | Foreign
Currency | | December 31,
2012 | |
| |
| |
| |
| |
| |
| |
RTMS: | | | | | | | | | | | | | | | | |
RTMS goodwill | | $ | 8,239 | | $ | — | | $ | — | | $ | — | | $ | 8,239 | |
Accumulated impairment losses | | | (6,867 | ) | | — | | | (1,372 | ) | | — | | | (8,239 | ) |
| |
|
| |
|
| |
|
| |
|
| |
|
| |
RTMS goodwill | | | 1,372 | | | — | | | (1,372 | ) | | — | | | — | |
| | | | | | | | | | | | | | | | |
CitySync: | | | | | | | | | | | | | | | | |
CitySync goodwill | | | 5,516 | | | — | | | — | | | 55 | | | 5,571 | |
Accumulated impairment losses | | | (3,768 | ) | | — | | | (1,803 | ) | | — | | | (5,571 | ) |
| |
|
| |
|
| |
|
| |
|
| |
|
| |
CitySync goodwill | | | 1,748 | | | — | | | (1,803 | ) | | 55 | | | — | |
| | | | | | | | | | | | | | | | |
| |
|
| |
|
| |
|
| |
|
| |
|
| |
Total goodwill | | $ | 3,120 | | $ | — | | $ | (3,175 | ) | $ | 55 | | $ | — | |
| |
|
| |
|
| |
|
| |
|
| |
|
| |
| | | | | | | | | | | | | | | | |
| | December 31,
2010 | | Additions | | Impairments | | Foreign
Currency | | December 31,
2011 | |
| |
| |
| |
| |
| |
| |
Flow Traffic: | | | | | | | | | | | | | | | | |
Flow Traffic goodwill | | $ | 1,050 | | $ | — | | $ | — | | $ | — | | $ | 1,050 | |
Accumulated impairment losses | | | — | | | — | | | (1,050 | ) | | — | | | (1,050 | ) |
| |
|
| |
|
| |
|
| |
|
| |
|
| |
Flow Traffic goodwill | | | 1,050 | | | — | | | (1,050 | ) | | — | | | — | |
| | | | | | | | | | | | | | | | |
RTMS: | | | | | | | | | | | | | | | | |
RTMS goodwill | | | 8,239 | | | — | | | — | | | — | | | 8,239 | |
Accumulated impairment losses | | | — | | | — | | | (6,867 | ) | | — | | | (6,867 | ) |
| |
|
| |
|
| |
|
| |
|
| |
|
| |
RTMS goodwill | | | 8,239 | | | — | | | (6,867 | ) | | — | | | 1,372 | |
| | | | | | | | | | | | | | | | |
CitySync: | | | | | | | | | | | | | | | | |
CitySync goodwill | | | 5,424 | | | — | | | — | | | 92 | | | 5,516 | |
Accumulated impairment losses | | | — | | | — | | | (3,768 | ) | | — | | | (3,768 | ) |
| |
|
| |
|
| |
|
| |
|
| |
|
| |
CitySync goodwill | | | 5,424 | | | — | | | (3,768 | ) | | 92 | | | 1,748 | |
| | | | | | | | | | | | | | | | |
| |
|
| |
|
| |
|
| |
|
| |
|
| |
Total goodwill | | $ | 14,713 | | $ | — | | $ | (11,685 | ) | $ | 92 | | $ | 3,120 | |
| |
|
| |
|
| |
|
| |
|
| |
|
| |
37
Table of Contents
We apply a fair value based impairment test to the carrying value of goodwill for each reporting unit on an annual basis and on an interim basis if certain events or circumstances indicate that an impairment loss may have occurred. In the second quarter of 2012 and the third quarter of 2011, we experienced a significant and sustained decline in our stock price. The decline resulted in our market capitalization falling significantly below the recorded value of our consolidated net assets. As a result, we concluded a triggering event had occurred and performed an impairment test of goodwill for each reporting unit at that time.
Based on the results of our initial assessment of impairment of our goodwill (step 1), we determined that the carrying value of each reporting unit exceeded its estimated fair value. Therefore, we performed the second step of the impairment assessment to determine the implied fair value of goodwill. In performing the goodwill assessment, we used current market capitalization, discounted cash flows and other factors as the best evidence of fair value.
We recorded goodwill impairment charges in the third quarter of 2011 of $1.1 million, $3.7 million, and $6.9 million for the Flow Traffic Ltd., CitySync and RTMS reporting units, respectively. We recorded goodwill impairment charges in the second quarter of 2012 of $1.8 million and $1.4 million for the CitySync and RTMS reporting units, respectively.
Intangible Assets
Intangible assets consisted of the following (dollars in thousands):
| | | | | | | | | | | | | |
| | December 31, 2012 | |
| |
| |
| | Gross Carrying
Amount | | Accumulated
Amortization | | Net Carrying
Value | | Weighted
Average
Useful Life
(in Years) | |
| |
| |
| |
| |
| |
Developed technology | | $ | 7,490 | | $ | (3,480 | ) | $ | 4,010 | | | 4.6 | |
Trade names | | | 3,267 | | | (1,853 | ) | | 1,414 | | | 5.8 | |
Other intangible assets | | | 1,840 | | | (775 | ) | | 1,065 | | | 5.2 | |
| |
|
| |
|
| |
|
| |
|
| |
Total | | $ | 12,597 | | $ | (6,108 | ) | $ | 6,489 | | | 4.9 | |
| |
|
| |
|
| |
|
| |
|
| |
| | | | | | | | | | | | | |
| | December 31, 2011 | |
| |
| |
| | Gross Carrying
Amount | | Accumulated
Amortization | | Net Carrying
Value | | Weighted
Average
Useful Life
(in Years) | |
| |
| |
| |
| |
| |
Developed technology | | $ | 7,352 | | $ | (2,570 | ) | $ | 4,782 | | | 5.5 | |
Trade names | | | 3,188 | | | (1,356 | ) | | 1,832 | | | 3.7 | |
Other intangible assets | | | 1,769 | | | (495 | ) | | 1,274 | | | 4.9 | |
| |
|
| |
|
| |
|
| |
|
| |
Total | | $ | 12,309 | | $ | (4,421 | ) | $ | 7,888 | | | 4.9 | |
| |
|
| |
|
| |
|
| |
|
| |
The estimated future amortization expense related to other intangible assets for the next five fiscal years is as follows (dollars in thousands):
| | | | |
| | Amortization
Expense | |
| |
2013 | | $ | 1,350 | |
2014 | | | 1,334 | |
2015 | | | 1,301 | |
2016 | | | 847 | |
2017 | | | 846 | |
Future amortization amounts presented above are estimates. Actual future amortization expense may be different due to future acquisitions, impairments, changes in amortization periods, or other factors.
In connection with the triggering events discussed above, during the second quarter of 2012 and the third quarter of 2011, we reviewed our long-lived assets and determined that none of the long-lived assets were impaired for our asset groups. The determination was based on reviewing estimated undiscounted cash flows for our asset groups, which were greater than their carrying values. As required under GAAP, this impairment analysis occurred before the goodwill impairment assessment.
The evaluation of the recoverability of long-lived assets requires us to make significant estimates and assumptions. These estimates and assumptions primarily include, but are not limited to, the identification of the asset group at the lowest level of independent cash flows and the primary asset of the group; and long-range forecasts of revenue, reflecting management’s assessment of general economic and industry conditions, operating income, depreciation and amortization and working capital requirements.
38
Table of Contents
We have a revolving line of credit and had term loans with Associated Bank, National Association (“Associated Bank”) that were initially entered into as of May 1, 2008. Our current revolving line of credit agreement (“Credit Agreement”) with Associated Bank provides up to $5.0 million of credit. The Credit Agreement expires in May 2014 and bears interest at an annual rate equal to the greater of (a) 4.5% or (b) LIBOR plus 2.75%. Any advances are secured by inventories, accounts receivable and equipment. We are subject to certain financial covenants under the Credit Agreement, including minimum debt service coverage ratios, minimum cash flow coverage ratios and financial measures. At December 31, 2012, we had no borrowings under the Credit Agreement, and we were in compliance with all financial covenants.
Warranty liability and related activity consisted of the following (in thousands):
| | | | | | | | | | |
| | Years Ended December 31, | |
| |
| |
| | 2012 | | 2011 | | 2010 | |
| |
| |
| |
| |
Beginning balance | | $ | 423 | | $ | 624 | | $ | 289 | |
Warranty provisions | | | 234 | | | 198 | | | 484 | |
Warranty claims | | | (233 | ) | | (318 | ) | | (149 | ) |
Adjustments to preexisting warranties | | | 96 | | | (81 | ) | | — | |
| |
|
| |
|
| |
|
| |
Ending balance | | $ | 520 | | $ | 423 | | $ | 624 | |
| |
|
| |
|
| |
|
| |
The components of income (loss) before income taxes were as follows (in thousands):
| | | | | | | | | | |
| | Years Ended December 31, | |
| |
| |
| | 2012 | | 2011 | | 2010 | |
| |
| |
| |
| |
Income (loss) before income taxes: | | | | | | | | | | |
Domestic | | $ | (136 | ) | $ | (6,761 | ) | $ | 2,789 | |
Foreign | | | (3,396 | ) | | (6,278 | ) | | 1,126 | |
| |
|
| |
|
| |
|
| |
Total | | $ | (3,532 | ) | $ | (13,039 | ) | $ | 3,915 | |
| |
|
| |
|
| |
|
| |
The components of income tax expense (benefit) are as follows (in thousands):
| | | | | | | | | | |
| | Years Ended December 31, | |
| |
| |
| | 2012 | | 2011 | | 2010 | |
| |
| |
| |
| |
Current: | | | | | | | | | | |
Federal | | $ | (48 | ) | $ | 279 | | $ | 983 | |
State | | | (1 | ) | | 4 | | | (65 | ) |
Foreign | | | 90 | | | 315 | | | 25 | |
| |
|
| |
|
| |
|
| |
| | | 41 | | | 598 | | | 943 | |
| |
|
| |
|
| |
|
| |
Deferred: | | | | | | | | | | |
Federal | | | (31 | ) | | (2,358 | ) | | (32 | ) |
State | | | — | | | (35 | ) | | (1 | ) |
Foreign | | | (190 | ) | | (1,227 | ) | | — | |
| |
|
| |
|
| |
|
| |
| | | (221 | ) | | (3,620 | ) | | (33 | ) |
| |
|
| |
|
| |
|
| |
Total income tax expense (benefit) | | $ | (180 | ) | $ | (3,022 | ) | $ | 910 | |
| |
|
| |
|
| |
|
| |
39
Table of Contents
A reconciliation from the federal statutory income tax provision to our effective tax expense (benefit) is as follows (in thousands):
| | | | | | | | | | |
| | Years Ended December 31, | |
| |
| |
| | 2012 | | 2011 | | 2010 | |
| |
| |
| |
| |
| | | | | | | | | | |
United States federal tax statutory rate | | $ | (1,201 | ) | $ | (4,433 | ) | $ | 1,331 | |
State taxes, net of federal benefit | | | 3 | | | (36 | ) | | (47 | ) |
Goodwill impairment | | | 417 | | | 1,299 | | | — | |
Research and development tax credits | | | (135 | ) | | (412 | ) | | (454 | ) |
Non-deductible acquisition expenses and earn-out | | | — | | | (155 | ) | | 238 | |
Domestic production activities deduction | | | (2 | ) | | (38 | ) | | (111 | ) |
Foreign provision different than U.S. tax rate | | | 545 | | | 641 | | | (43 | ) |
Valuation allowances against deferred tax assets | | | 90 | | | 121 | | | (55 | ) |
Stock option expense | | | (27 | ) | | 82 | | | 75 | |
Adjustment of prior year tax credits and refunds | | | 69 | | | 50 | | | (64 | ) |
Uncertain tax positions | | | (19 | ) | | (138 | ) | | (33 | ) |
Other | | | 80 | | | (3 | ) | | 73 | |
| |
|
| |
|
| |
|
| |
| | $ | (180 | ) | $ | (3,022 | ) | $ | 910 | |
| |
|
| |
|
| |
|
| |
A summary of the deferred tax assets and liabilities is as follows (in thousands):
| | | | | | | |
| | December 31, | |
| |
| |
| | 2012 | | 2011 | |
| |
| |
| |
Current deferred tax assets (liabilities): | | | | | | | |
Accrued compensation and benefits | | $ | 42 | | $ | 59 | |
Prepaid expenses and other | | | (31 | ) | | (22 | ) |
Inventory reserves | | | 21 | | | 169 | |
Allowance for doubtful accounts | | | 115 | | | 119 | |
Warranty reserves | | | 39 | | | 104 | |
| |
|
| |
|
| |
Total current deferred tax asset | | | 186 | | | 429 | |
| | | | | | | |
Non-current deferred tax assets (liabilities): | | | | | | | |
Intangible and other assets | | | 3,617 | | | 2,089 | |
Foreign net operating loss carryforwards | | | 280 | | | 991 | |
Non-qualified stock option expense | | | 63 | | | 192 | |
Property, equipment and other | | | 96 | | | 35 | |
| |
|
| |
|
| |
Non-current deferred tax asset (liability): | | | 4,056 | | | 3,307 | |
| |
|
| |
|
| |
Less: valuation allowance | | | (280 | ) | | (176 | ) |
| |
|
| |
|
| |
Non-current deferred tax asset (liability), net | | | 3,776 | | | 3,131 | |
| | | | | | | |
| |
|
| |
|
| |
Total net deferred tax asset (liability) | | $ | 3,962 | | $ | 3,560 | |
| |
|
| |
|
| |
As of December 31, 2012, certain subsidiaries in the United Kingdom and Hong Kong had net operating loss carryovers of $834,000 and $745,000, respectively. These net operating loss carryovers will not expire under local tax law. We determined that the benefit of these United Kingdom and Hong Kong subsidiaries’ net operating loss carryovers are uncertain. Accordingly, as of December 31, 2012, we had a full valuation allowance against those deferred tax assets in the amount of $280,000.
In accordance with Accounting Standards Codification (“ASC”) 740-30, we have not recognized a deferred tax liability for the undistributed earnings of certain of our foreign operations because those subsidiaries have invested or will invest the undistributed earnings indefinitely. At December 31, 2012, undistributed earnings were approximately $4,136,000. It is impractical for us to determine the amount of unrecognized deferred tax liabilities on these indefinitely reinvested earnings. Deferred taxes are recorded for earnings of foreign operations when we determine that such earnings are no longer indefinitely reinvested.
We realize an income tax benefit from the exercise or early disposition of certain stock options. This benefit results in a decrease in current income taxes payable and an increase in additional paid-in capital.
40
Table of Contents
A reconciliation of the beginning and ending amount of the tax liability for uncertain tax positions is as follows (in thousands):
| | | | |
Balance at December 31, 2010 | | $ | 175 | |
Additions for current year tax positions | | | — | |
Reductions as a result of lapses in statute of limitations | | | (139 | ) |
| |
|
| |
Balance at December 31, 2011 | | | 36 | |
| | | | |
Additions for current year tax positions | | | — | |
Reductions as a result of lapses in statute of limitations | | | (18 | ) |
| |
|
| |
Balance at December 31, 2012 | | $ | 18 | |
| |
|
| |
Included in the balance of uncertain tax positions at December 31, 2012 are immaterial potential benefits that, if recognized, would affect the effective tax rate. The amount of unrecognized tax benefits are not expected to change materially within the next 12 months. At December 31, 2012 and December 31, 2011, we had no accrued interest related to uncertain income tax positions. At December 31, 2012 and December 31, 2011, no accrual for penalties related to uncertain tax positions existed. Interest and penalties related to uncertain tax positions are included in interest expense and general and administrative expense, respectively, on the Consolidated Statements of Operations.
We are subject to income taxes in the U.S. federal jurisdiction and various state and foreign jurisdictions. Tax regulations within each jurisdiction are subject to the interpretation of the related tax laws and require significant judgment to apply. Generally, we are subject to U.S. federal, state, local and foreign tax examinations by taxing authorities for years after the fiscal year ended December 31, 2008.
At December 31, 2012 and December 31, 2011, certain of our foreign subsidiaries were expected to receive income tax refunds within the next fiscal year. As a result, at December 31, 2012 and December 31, 2011, we recognized a current income tax receivable of $452,000 and $488,000, respectively, which is included in Prepaid Expenses and Other Current Assets on the Consolidated Balance Sheets.
We have sublicensed the exclusive right to manufacture and market the Autoscope and RTMS technology in North America, the Caribbean and Latin America to Econolite, and we receive royalties from Econolite on sales of systems in those territories as well as in non-exclusive territories as allowed from time to time. We may terminate our agreement with Econolite if a minimum annual sales level is not met or if Econolite fails to make royalty payments as required by the agreement. The agreement’s term runs to 2031, unless terminated by either party upon three years’ notice.
We recognized royalty income from this agreement of $12.4 million, $13.0 million and $12.5 million in 2012, 2011 and 2010, respectively.
| |
10. | SIGNIFICANT CUSTOMERS AND CONCENTRATION OF CREDIT RISK |
Royalty income from Econolite comprised 50%, 43% and 40% of revenue in the years ended December 31, 2012, 2011 and 2010, respectively. Accounts receivable from Econolite were $2.6 million and $4.3 million at December 31, 2012 and 2011, respectively. Major disruptions in the manufacturing and distribution of our products by Econolite or the inability of Econolite to make payments on its accounts receivable with us could have a material adverse effect on our business, financial condition and results of operations. Econolite was the only customer that comprised more than 10% of accounts receivable as of December 31, 2012. During the period from April 2011 through August 2012, the Chief Executive Officer of the parent company of Econolite served on our Board of Directors.
| |
11. | RETIREMENT SAVINGS PLANS |
Substantially all of our employees in the United States are eligible to participate in a qualified defined contribution 401(k) plan. Participants may elect to have a specified portion of their salary contributed to the plan, and we may make discretionary contributions to the plan. Flow Traffic and CitySync are obligated to contribute to certain employee pension plans. We made contributions totaling $132,000, $170,000 and $131,000 to the plans for 2012, 2011 and 2010, respectively.
41
Table of Contents
Equity Financing
In April 2010, we sold 798,000 shares of our common stock to investors at $12.25 per share under a registration statement on Form S-3 declared effective by the Securities and Exchange Commission in December 2009. Net of underwriting fees and other offering expenses, we received $8.8 million in net proceeds from the offering.
Stock-Based Compensation
We compensate officers, directors, and employees with stock-based compensation under two stock plans approved by the Company’s shareholders in 2006 and 2011 and administered under the supervision of our Board of Directors. In February 1995 and April 2005, we adopted the 1995 Long-Term Incentive and Stock Option Plan (the 1995 Plan) and the 2005 Stock Incentive Plan (the 2005 Plan), respectively, which provide for the granting of incentive (ISO) and non-qualified (NQO) stock options, stock appreciation rights, restricted stock awards and performance awards to our officers, directors, employees, consultants and independent contractors. The 1995 Plan terminated in February 2005, although options granted under the 1995 Plan remain outstanding according to their terms. Options granted under the plans generally vest over three to five years and have a contractual term of six to ten years. At December 31, 2012, a total of 148,940 shares were available for future grant under the 2005 Plan. Shares will be available for issuance under the 2005 Plan until May 17, 2015.
The following table summarizes stock option activity for 2012, 2011 and 2010:
| | | | | | | | | | | | | | | | | | | |
| | 2012 | | 2011 | | 2010 | |
| |
| |
| |
| |
| | Shares | | WAEP* | | Shares | | WAEP* | | Shares | | WAEP* | |
| |
| |
| |
| |
| |
| |
| |
Options outstanding at beginning of year | | | 535,333 | | $ | 9.58 | | | 463,433 | | $ | 9.11 | | | 431,133 | | $ | 8.10 | |
Granted | | | 159,750 | | $ | 5.12 | | | 156,000 | | $ | 10.21 | | | 85,000 | | $ | 12.33 | |
Exercised | | | (56,000 | ) | $ | 2.17 | | | (32,100 | ) | $ | 3.29 | | | (37,700 | ) | $ | 3.31 | |
Forfeited or expired | | | (240,190 | ) | $ | 11.02 | | | (52,000 | ) | $ | 11.16 | | | (15,000 | ) | $ | 6.69 | |
| |
|
| |
|
| |
|
| |
|
| |
|
| |
|
| |
| | | | | | | | | | | | | | | | | | | |
Options outstanding at end of year | | | 398,893 | | $ | 7.95 | | | 535,333 | | $ | 9.58 | | | 463,433 | | $ | 9.11 | |
| |
|
| | | | |
|
| | | | |
|
| | | | |
Options eligible for exercise at year-end | | | 160,143 | | $ | 9.84 | | | 249,333 | | $ | 8.81 | | | 213,058 | | $ | 7.64 | |
| |
|
| | | | |
|
| | | | |
|
| | | | |
| |
| |
*Weighted Average Exercise Price |
Options outstanding at December 31, 2012 had a weighted average remaining contractual term of 5.6 years and an aggregate intrinsic value of approximately $13,000. Options eligible for exercise at December 31, 2012 had a weighted average remaining contractual term of 3.7 years and an aggregate intrinsic value of $3,000.
The total intrinsic value of stock options exercised during the fiscal years ended December 31, 2012, 2011, 2010 was $208,000, $211,000 and $352,000, respectively. The fair value of stock options granted under stock-based compensation programs has been estimated as of the date of each grant using the multiple option form of the Black-Scholes valuation model, based on the grant price and assumptions regarding the expected grant life, stock price volatility, dividends, and risk-free interest rates. Each vesting period of an option award is valued separately, with this value being recognized evenly over the vesting period. The weighted average per share grant date fair value of options to purchase 159,750, 156,000 and 85,000 shares granted for the years ended December 31, 2012, 2011 and 2010 was $1.82, $3.35 and $3.79, respectively. The weighted average assumptions used to determine the fair value of stock options granted during those fiscal years were as follows:
| | | | | | | | | | |
| | 2012 | | 2011 | | 2010 | |
| |
| |
| |
| |
Expected life (in years) | | | | 4.8 | | | | | 3.1 | | | | | 2.8 | | |
Risk-free interest rate | | | | 0.72 | % | | | | 1.47 | % | | | | 1.39 | % | |
Expected volatility | | | | 42 | % | | | | 44 | % | | | | 78 | % | |
Dividend yield | | | | 0 | % | | | | 0 | % | | | | 0 | % | |
42
Table of Contents
The expected life represents the period that the stock option awards are expected to be outstanding and was determined based on historical and anticipated future exercise and expiration patterns. The risk-free interest rate used is based on the yield of constant maturity U.S. Treasury bonds on the grant date with a remaining term equal to the expected life of the grant. We estimate stock price volatility based on a historical weekly price observation. The dividend yield assumption is based on the annualized current dividend divided by the share price on the grant date. We have not historically paid any dividends and do not expect to do so in the foreseeable future.
Other information pertaining to options for the years ended December 31, 2012, 2011 and 2010 is as follows:
| | | | | | | | | | |
| | 2012 | | 2011 | | 2010 | |
| |
| |
| |
| |
| | | | | | | | | | |
Cash received from the exercise of stock options | | $ | 121,000 | | $ | 105,000 | | $ | 121,000 | |
Stock-based compensation expense recognized within general and administrative expense on the consolidated statements of operations | | | 244,000 | | | 412,000 | | | 342,000 | |
Excess income tax benefits from exercise of stock options | | | 71,000 | | | 37,000 | | | 72,000 | |
At December 31, 2012, there was approximately $447,000 of total stock option compensation expense related to non-vested awards not yet recognized, which is expected to be recognized over a weighted-average period of 2.8 years.
In the fourth quarter of 2011 and second quarter of 2012, we implemented restructuring plans to improve our financial performance. As a result of these actions, we recorded restructuring charges within all reportable segments that were comprised of termination benefits, facility closure costs and inventory charges. In 2012, approximately $430,000 was recorded in operating expenses in the Consolidated Statement of Operations, and in 2011, approximately $448,000 was recorded in cost of revenue and $287,000 was recorded in operating expenses.
The following table shows the restructuring activity for 2012 (in thousands):
| | | | | | | | | | | | | |
| | Termination
Benefits | | Facility Costs and
Contract
Termination | | Inventory
Charges | | Total | |
| |
| |
| |
| |
| |
Balance at January 1, 2011 | | $ | — | | $ | — | | $ | — | | $ | — | |
Charges | | | 208 | | | 101 | | | 426 | | | 735 | |
Settlements | | | (45 | ) | | (36 | ) | | (42 | ) | | (123 | ) |
| |
|
| |
|
| |
|
| |
|
| |
Balance at December 31, 2011 | | $ | 163 | | $ | 65 | | $ | 384 | | $ | 612 | |
| |
|
| |
|
| |
|
| |
|
| |
Charges | | | 359 | | | 71 | | | — | | | 430 | |
Settlements | | | (522 | ) | | (136 | ) | | (384 | ) | | (1,042 | ) |
| |
|
| |
|
| |
|
| |
|
| |
Balance at December 31, 2012 | | $ | — | | $ | — | | $ | — | | $ | — | |
| |
|
| |
|
| |
|
| |
|
| |
We currently operate in three reportable segments: Autoscope, RTMS and CitySync. Autoscope is our machine-vision product line, and revenue consists of royalties (all of which are received from Econolite), as well as a portion of international product sales. RTMS is our radar product line acquired in the EIS asset purchase in December 2007. CitySync is our ANPR product line acquired in the CitySync purchase in June 2010. All segment revenues are derived from external customers.
Our presentation of segments has changed from 2010 as company-wide organizational changes completed in 2011 resulted in the chief operating decision-maker focusing on segment gross profit. The segment information below has been reclassified to reflect these changes. Operating expenses and total assets are not allocated to the segments for internal reporting purposes. Due to the amended manufacturing and distribution agreement with Econolite and the related changes in how we manage our business, we may reevaluate our segment definitions in the future.
43
Table of Contents
The following tables set forth selected unaudited financial information for each of our reportable segments (in thousands):
| | | | | | | | | | | | | |
| | For the year ended December 31, 2012 | |
| |
| |
| | Autoscope | | RTMS | | CitySync | | Total | |
| |
| |
| |
| |
| |
Revenue | | $ | 16,031 | | $ | 4,118 | | $ | 4,814 | | $ | 24,963 | |
Gross profit | | | 14,010 | | | 1,798 | | | 2,449 | | | 18,257 | |
Goodwill impairment | | | — | | | 1,372 | | | 1,803 | | | 3,175 | |
Amortization of intangible assets | | | — | | | 748 | | | 874 | | | 1,622 | |
Intangible assets | | | — | | | 1,430 | | | 5,059 | | | 6,489 | |
| | | | | | | | | | | | | |
| | For the year ended December 31, 2011 | |
| |
| |
| | Autoscope | | RTMS | | CitySync | | Total | |
| |
| |
| |
| |
| |
Revenue | | $ | 17,445 | | $ | 7,366 | | $ | 5,710 | | $ | 30,521 | |
Gross profit | | | 15,096 | | | 3,512 | | | 2,696 | | | 21,304 | |
Goodwill impairment | | | 525 | | | 7,392 | | | 3,768 | | | 11,685 | |
Amortization of intangible assets | | | — | | | 768 | | | 882 | | | 1,650 | |
Intangible assets and goodwill | | | — | | | 3,551 | | | 7,457 | | | 11,008 | |
| | | | | | | | | | | | | |
| | For the year ended December 31, 2010 | |
| |
| |
| | Autoscope | | RTMS | | CitySync | | Total | |
| |
| |
| |
| |
| |
Revenue | | $ | 16,659 | | $ | 9,819 | | $ | 5,203 | | $ | 31,681 | |
Gross profit | | | 15,054 | | | 6,104 | | | 2,724 | | | 23,882 | |
Amortization of intangible assets | | | — | | | 768 | | | 450 | | | 1,218 | |
Intangible assets and goodwill | | | 525 | | | 11,710 | | | 11,991 | | | 24,226 | |
We derived the following percentages of our net revenues from the following geographic regions:
| | | | | | | | | | |
| | 2012 | | 2011 | | 2010 | |
| |
| |
| |
| |
Asia Pacific | | 11 | % | | 4 | % | | 11 | % | |
Europe | | 35 | % | | 31 | % | | 26 | % | |
North America | | 54 | % | | 65 | % | | 63 | % | |
No countries other than the United States and the United Kingdom had revenue in excess of 10% of our total revenue during any periods presented. The aggregate net book value of long-lived assets held outside of the United States, not including goodwill and intangible assets, was $1.2 million and $651,000 at December 31, 2012 and 2011, respectively.
| |
15. | COMMITMENTS AND CONTINGENCIES |
Operating Leases
We rent office space and equipment under operating lease agreements expiring at various dates through January 2016. Rent expense for office facilities was $947,000 in 2012, $1.1 million in 2011 and $777,000 in 2010. Minimum annual rental commitments under noncancelable operating leases are as follows (in thousands):
| | | | |
| | Future Lease
Payments | |
|
|
|
|
2013 | | $ | 500 | |
2014 | | | 334 | |
2015 | | | 29 | |
Litigation
We are involved from time to time in various legal proceedings arising in the ordinary course of our business, including primarily commercial, product liability, employment and intellectual property claims. In accordance with generally accepted accounting principles in the United States, we record a liability in our Consolidated Financial Statements with respect to any of these matters when it is both probable that a liability has been incurred and the amount of the liability can be reasonably estimated. With respect to currently pending legal proceedings, we have not established an estimated range of reasonably possible additional losses either because we believe that we have valid defenses to claims asserted against us or the proceeding has not advanced to a stage of discovery that would enable us to establish an estimate. We currently do not expect the outcome of these matters to have a material effect on our consolidated results of operations, financial position or cash flows. Litigation, however, is inherently unpredictable, and it is possible that the ultimate outcome of one or more claims asserted against us could adversely impact our results of operations, financial position or cash flows. We expense legal costs as incurred.
44
Table of Contents
Investigation Matter
We learned that Polish authorities are conducting an investigation into violations of Polish law related to tenders in the City of Łodź, Poland. In December 2012, the regional prosecutor charged two employees of ISS Poland with, among other things, criminal violations of Polish tender and corruption law related to a project in Łodź. Neither the Company nor any of our subsidiaries has been charged with any offense. A Special Subcommittee of our Audit Committee comprised solely of independent directors has retained independent counsel and accounting advisors to conduct an investigation focusing on possible violations of Company policy, internal controls, and laws, including the Foreign Corrupt Practices Act, the U.K. Anti-Bribery Act and Polish law. This investigation is ongoing, and we are voluntarily disclosing this matter to the Securities and Exchange Commission and the Department of Justice.
We are cooperating with the Polish prosecutor and intend to cooperate with any other governmental investigation into these matters. We have taken remedial actions, including ending the employment of the two Polish employees, and we are assessing and implementing enhancements to our internal policies, procedures and controls. We cannot predict the outcome of this matter at this time or whether it will have a material adverse impact on our business prospects, financial condition, operating results or cash flows.
45
Table of Contents
Report of Independent Registered Public Accounting Firm
Board of Directors and Shareholders
Image Sensing Systems, Inc.
We have audited the accompanying consolidated balance sheets of Image Sensing Systems, Inc. (a Minnesota Corporation) and subsidiaries (the “Company”) as of December 31, 2012 and 2011, and the related consolidated statements of operations, comprehensive income (loss), shareholders’ equity, and cash flows for each of the three years in the period ended December 31, 2012. These financial statements are the responsibility of the Company’s management. Our responsibility is to express an opinion on these financial statements based on our audits.
We conducted our audits in accordance with the standards of the Public Company Accounting Oversight Board (United States). Those standards require that we plan and perform the audit to obtain reasonable assurance about whether the financial statements are free of material misstatement. The Company is not required to have, nor were we engaged to perform an audit of its internal control over financial reporting. Our audits included consideration of internal control over financial reporting as a basis for designing audit procedures that are appropriate in the circumstances, but not for the purpose of expressing an opinion on the effectiveness of the Company’s internal control over financial reporting. Accordingly, we express no such opinion. An audit also includes examining, on a test basis, evidence supporting the amounts and disclosures in the financial statements, assessing the accounting principles used and significant estimates made by management, as well as evaluating the overall financial statement presentation. We believe that our audits provide a reasonable basis for our opinion.
In our opinion, the consolidated financial statements referred to above present fairly, in all material respects, the financial position of Image Sensing Systems, Inc. and subsidiaries as of December 31, 2012 and 2011, and the results of their operations and their cash flows for each of the three years in the period ended December 31, 2012, in conformity with accounting principles generally accepted in the United States of America.
/s/ GRANT THORNTON LLP
Minneapolis, Minnesota
March 27, 2013
46
Table of Contents
| |
Item 9. | Changes in and Disagreements with Accountants on Accounting and Financial Disclosure |
None.
| |
Item 9A. | Controls and Procedures |
Evaluation of disclosure controls and procedures
We maintain disclosure controls and procedures (as defined in Rules 13a-15(e) and 15d-15(e) under the Securities Exchange Act of 1934, as amended (Exchange Act)), that are designed to reasonably ensure that information required to be disclosed by us in the reports we file or submit under the Exchange Act is recorded, processed, summarized and reported within the time periods specified in the rules and forms of the Securities and Exchange Commission and that such information is accumulated and communicated to our management, including our principal executive officer and principal financial officer, or persons performing similar functions, as appropriate to allow timely decisions regarding required disclosure. Under the supervision and with the participation of our management, including our Chief Executive Officer and Chief Financial Officer, we evaluated the effectiveness of the design and operation of our disclosure controls and procedures. Based upon that evaluation, the Chief Executive Officer and Chief Financial Officer concluded that, as of the end of the period covered by this Annual Report on Form 10-K, our disclosure controls and procedures were effective.
Management’s report on internal control over financial reporting
Our management is responsible for establishing and maintaining adequate internal control over financial reporting. Our internal control over financial reporting is a process designed to provide reasonable assurance regarding the reliability of financial reporting and the preparation of financial statements for external purposes in accordance with generally accepted accounting principles in the United States of America. Our internal control over financial reporting includes those policies and procedures that (i) pertain to the maintenance of records that, in reasonable detail, accurately and fairly reflect our transactions and dispositions of our assets; (ii) provide reasonable assurance that transactions are recorded as necessary to permit preparation of the financial statements in accordance with generally accepted accounting principles in the United States of America and that our receipts and expenditures are being made only in accordance with authorizations of our management and directors; and (iii) provide reasonable assurance regarding prevention or timely detection of unauthorized acquisition, use or disposition of our assets that could have a material effect on the financial statements.
Internal control over financial reporting cannot provide absolute assurance of achieving financial reporting objectives because of its inherent limitations. Internal control over financial reporting is a process that involves human diligence and is subject to lapses in judgment or breakdowns resulting from human failures. Internal control over financial reporting also can be circumvented by collusion or improper management override. Because of such limitations, there is a risk that material misstatements may not be prevented or detected on a timely basis by internal control over financial reporting. However, these inherent limitations are known features of the financial reporting process. Therefore, it is possible to design into the process safeguards to reduce, although not eliminate, these risks.
Because of its inherent limitations, internal control over financial reporting may not prevent or detect all misstatements. Further, projections of any evaluation of effectiveness to future periods are subject to the risk that controls may become inadequate because of changes in conditions or that the degree of compliance with the policies or procedures may deteriorate.
Management assessed the effectiveness of our internal control over financial reporting as of December 31, 2012. In making this assessment, management used the criteria set forth by the Committee of Sponsoring Organizations of the Treadway Commission (COSO) in “Internal Control—Integrated Framework”. Based on this assessment, management has concluded that our internal control over financial reporting was effective as of December 31, 2012.
Changes in internal control over financial reporting
During the most recent fiscal quarter covered by this Annual Report on Form 10-K, there has been no change in our internal control over financial reporting (as defined in Rule 13a-15(f) and 15d-15(f) under the Exchange Act) that has materially affected, or is reasonably likely to materially affect, our internal control over financial reporting.
| |
Item 9B. | Other Information |
None.
47
Table of Contents
PART III
| |
Item 10. | Directors, Executive Officers and Corporate Governance |
We have adopted a Code of Ethics which applies to our principal executive, accounting and financial officers. The Code of Ethics is published on our website at www.imagesensing.com. Any amendments to the Code of Ethics and waivers of the Code of Ethics for our principal executive, accounting and financial officers will be published on our website.
The sections entitled “Proposal I - Election of Directors,” “Audit Committee” and “Section 16(a) Beneficial Ownership Reporting Compliance” in our definitive proxy statement for our 2013 annual meeting of shareholders are incorporated into this Annual Report on Form 10-K by reference.
| |
Item 11. | Executive Compensation |
The sections entitled “Executive Compensation” and “Compensation of Directors” in our definitive proxy statement for the 2013 annual meeting of shareholders are incorporated into this Annual Report on Form 10-K by reference.
| |
Item 12. | Security Ownership of Certain Beneficial Owners and Management and Related Stockholder Matters |
Equity Compensation Plan Information
The following table provides information as of December 31, 2012 about our shares of common stock subject to outstanding awards or available for future awards under our equity compensation plans and arrangements.
| | | | | | | | | | |
Plan Category | | Number of securities to
be issued upon exercise
of outstanding options,
warrants and rights | | Weighted-average exercise
price of outstanding
options, warrants and
rights | | Number of securities remaining
available for future issuance
under equity compensation plans
(excluding securities reflected in
the first column)(2) | |
|
|
|
|
|
|
|
|
Equity compensation plans approved by shareholders(1) | | | 398,893 | | $ | 7.95 | | | 148,940 | |
(1) Includes shares underlying stock options granted under the Image Sensing Systems, Inc. 1995 Long-Term Incentive and Stock Option Plan (1995 Plan) and non-qualified stock options granted outside the 1995 Plan between 1996 and 2000 to current and former members of the Board of Directors.
(2) The 148,940 shares available for grant under the 2005 Stock Incentive Plan may become the subject of future awards in the form of stock options, stock appreciation rights, restricted stock, performance awards or other stock-based awards.
The section entitled “Security Ownership of Certain Beneficial Owners and Management” in our definitive proxy statement for the 2013 annual meeting of shareholders is incorporated into this Annual Report on Form 10-K by reference.
| |
Item 13. | Certain Relationships and Related Transactions, and Director Independence |
The section entitled “Certain Relationships and Related Transactions” in our definitive proxy statement for the 2013 annual meeting of shareholders is incorporated into this Annual Report on Form 10-K by reference.
| |
Item 14. | Principal Accounting Fees and Services |
The sections entitled “Audit Fees,” “Audit-Related Fees,” “Tax Fees,” “All Other Fees” and “Policy on Audit Committee Pre-Approval of Audit and Permissible Non-Audit Services Provided by Our Independent Registered Public Accounting Firm” in our definitive proxy statement for our 2013 annual meeting of shareholders are incorporated into this Annual Report on Form 10-K by reference.
48
Table of Contents
PART IV
| |
Item 15. | Exhibits and Financial Statement Schedules |
(a) Documents filed as part of this report:
| | |
| 1. | Financial statements |
| | |
| | The following Consolidated Financial Statements are included in Part II, Item 8. “Financial Statements and Supplementary Data”: |
| | |
| | Consolidated Balance Sheets as of December 31, 2012 and 2011 |
| | Consolidated Statements of Operations for the years ended December 31, 2012, 2011 and 2010 |
| | Consolidated Statements of Comprehensive Income (Loss) for the years ended December 31, 2012, 2011 and 2010 |
| | Consolidated Statements of Cash Flow for the years ended December 31, 2012, 2011 and 2010 |
| | Consolidated Statements of Shareholders’ Equity for the years ended December 31, 2012, 2011 and 2010 |
| | Notes to Consolidated Financial Statements |
| | Report of Independent Registered Public Accounting Firm |
| | |
| 2. | Financial Statement Schedules: |
| | |
| | All financial statement schedules have been omitted because they are not required. |
| | |
| 3. | The following documents are filed as exhibits to this report: |
| | |
Exhibit No. | Description |
|
| 1.1 | Underwriting Agreement by and among ISS, Wedbush Securities Inc. and Craig-Hallum Capital Group Inc. dated April 15, 2010, incorporated by reference to Exhibit 1.1 to ISS’ Current Report on Form 8-K dated April 15, 2010. |
| | |
| 2.1* | Asset Purchase Agreement dated December 6, 2007 by and among Image Sensing Systems, Inc. (ISS), EIS Electronic Integrated Systems Inc., Dan Manor and the other parties named therein, incorporated by reference to Exhibit 2.1 to ISS’ Annual Report on Form 10-K for the year ended December 31, 2007 (2007 Form 10-K). (Schedules to this Agreement have not been filed in reliance on Item 601(b)(2) of Regulation S-K of the Securities and Exchange Commission (SEC). ISS will furnish supplementally copies of such schedules to the SEC upon its request.) |
| | |
| 2.2 | Share Purchase Agreement dated June 21, 2010 by and among ISS, Image Sensing Systems Europe Limited, CitySync Limited and three shareholders of CitySync Limited, incorporated by reference to Exhibit 2.1 to ISS’ Quarterly Report on Form 10-Q for the quarter ended June 30, 2010. |
| | |
| 3(i).1 | Restated Articles of Incorporation of ISS, incorporated by reference to Exhibit 3.1 to ISS’ Registration Statement on Form SB-2 (Registration No. 33-90298C) filed on March 15, 1995, as amended (Registration Statement). |
| | |
| 3(i).2 | Articles of Amendment to Articles of Incorporation of ISS, incorporated by reference to Exhibit 3.2 to ISS’ Quarterly Report on Form 10-QSB for the quarter ended June 30, 2001. |
| | |
| 3(ii) | Bylaws of ISS, incorporated by reference to Exhibit 3(ii) to ISS’ Quarterly Report on Form 10-Q for the quarter ended September 30, 2011. |
| | |
| 4.1 | Specimen form of ISS’ common stock certificate, incorporated by reference to Exhibit 4.1 to ISS’ Registration Statement. |
| | |
| 10.1 | Form of Distributor Agreement, incorporated by reference to Exhibit 10.1 to ISS’ Registration Statement. |
49
Table of Contents
| | |
| 10.2** | 1995 Long-Term Incentive and Stock Option Plan, amended and restated through May 17, 2001, incorporated by reference to Exhibit 10.10 to ISS’ Annual Report on Form 10-KSB for the year ended December 31, 2001. |
| | |
| 10.3** | Employment Agreement between ISS and Kenneth R. Aubrey, dated December 12, 2006, effective on or about January 15, 2007 (in capacity as President) and effective on or about June 1, 2007 (in capacity of President and Chief Executive Officer), incorporated by reference to Exhibit 10.1 to ISS’ Current Report on Form 8-K dated December 14, 2006. |
| | |
| 10.4** | Employment Agreement between ISS and Gregory R. L. Smith, dated December 8, 2006, incorporated by reference to Exhibit 10.1 to ISS’ Current Report on Form 8-K dated December 8, 2006. |
| | |
| 10.5 | Amendment VII to Office Lease Agreement dated April 26, 2007 by and between ISS and Spruce Tree Centre L.L.P., incorporated by reference to Exhibit 10.11 to ISS’ Annual Report on Form 10-K for the year ended December 31, 2007 (2007 Form 10-K). |
| | |
| 10.6 | Modification to Manufacturing, Distributing and Technology License Agreement dated September 1, 2000 by and between ISS and Econolite Control Products, Inc. (Econolite), incorporated by reference to Exhibit 10.12 to ISS’ 2007 Form 10-K. |
| | |
| 10.7** | Image Sensing Systems, Inc. 2005 Stock Incentive Plan, incorporated by reference to Appendix A to ISS’ proxy statement filed with the SEC on April 19, 2005. |
| | |
| 10.8 | Manufacturing, Distributing and Technology License Agreement dated June 11, 1991 by and between ISS and Econolite Control Products, Inc. (Econolite), incorporated by reference to Exhibit 10.1 to the Registration Statement. |
| | |
| 10.09 | Extension and Second Modification to License Agreement dated July 13, 2001 by and between ISS and Econolite, incorporated by reference to Exhibit 10.12 to ISS’ Annual Report on Form 10-KSB for the year ended December 31, 2001. |
| | |
| 10.10 | Office Lease Agreement dated November 24, 1998 by and between ISS and Spruce Tree Centre L.L.P., incorporated by reference to Exhibit 10.18 to ISS’ Annual Report on Form 10-KSB for the year ended December 31, 1998. |
| | |
| 10.11 | Production Agreement dated February 14, 2002 by and among ISS, Wireless Technology, Inc. and Econolite, incorporated by reference to Exhibit 10.20 to ISS’ Annual Report on Form 10-KSB for the year ended December 31, 2001. |
| | |
| 10.12 | Extension and Third Modification to Manufacturing Distributing and Technology License Agreement dated July 3, 2008 by and between ISS and Econolite, incorporated by reference to Exhibit 10.1 to ISS’ Current Report on Form 8-K dated July 3, 2008. |
| | |
| 10.13 | Fourth Modification to Manufacturing, Distributing and Technology License Agreement dated as of December 15, 2011 by and between ISS and Econolite, incorporated by reference to Exhibit 10.1 to ISS’ Current Report on Form 8-K dated December 15, 2011. |
| | |
| 10.14 | Loan Agreement dated May 1, 2008 (2008 Loan Agreement) by and between ISS and Associated Bank, National Association (Associated Bank), incorporated by reference to Exhibit 10.19 to ISS’ Registration Statement on Form S-1 filed on May 12, 2008 (Form S-1). |
| | |
| 10.15 | Security Agreement dated May 1, 2008 by and between ISS and Associated Bank, incorporated by reference to Exhibit 10.20 to ISS’ Form S-1. |
| | |
| 10.16 | Promissory Note (Line of Credit) dated May 1, 2008 in the original principal amount of $5,000,000 issued by ISS to Associated Bank, incorporated by reference to Exhibit 10.21 to ISS’ Form S-1. |
| | |
| 10.17 | Promissory Note (Loan) dated May 1, 2008 in the original principal amount of $3,000,000 issued by ISS to Associated Bank, incorporated by reference to Exhibit 10.22 to ISS’ Form S-1. |
50
Table of Contents
| | |
| 10.18 | Modification Agreement dated December 28, 2009 by and between ISS and Associated Bank under which ISS and Associated Bank amended the 2008 Loan Agreement, incorporated by reference to Exhibit 10.18 to ISS’ Annual Report on Form 10-K for the year ended December 31, 2009 (2009 Form 10-K). |
| | |
| 10.19 | Promissory Note (Loan) dated December 28, 2009 in the original principal amount of $4,000,000 issued by ISS to Associated Bank, incorporated by reference to Exhibit 10.19 to the 2009 Form 10-K. |
| | |
| 10.20 | Lease dated February 1, 2010 between CitySync Limited and Nortrust Nominees Limited, incorporated by reference to Exhibit 10.1 to ISS’ Quarterly Report on Form 10-Q for the quarter ended June 30, 2010. |
| | |
| 10.21 | Third Modification Agreement dated December 28, 2010 by and between ISS and Associated Bank under which ISS and Associated Bank amended the 2008 Loan Agreement, incorporated by reference to Exhibit 10.21 to ISS’ Annual Report on Form 10-K for the year ended December 31, 2010. |
| | |
| 10.22 | Fourth Modification Agreement dated December 22, 2011 by and between ISS and Associated Bank under which ISS and Associated Bank amended the 2008 Loan Agreement, incorporated by reference to Exhibit 10.1 to ISS’ Current Report on Form 8-K dated December 22, 2011. |
| | |
| 10.23 | Fifth Modification Agreement dated December 24, 2012 by and between ISS and Associated Bank under which ISS and Associated Bank amended the 2008 Loan Agreement, incorporated by reference to Exhibit 10.1 to ISS’ Current Report on Form 8-K dated December 24, 2012. |
| | |
| 10.24** | Employment Agreement between ISS and Kris B. Tufto dated October 30, 2012, incorporated by reference to Exhibit 10.1 to ISS’ Quarterly Report on Form 10-Q for the quarter ended September 30, 2012. |
| | |
| 21 | List of Subsidiaries of ISS (filed herewith). |
| | |
| 23.1 | Consent of Independent Registered Public Accounting Firm (filed herewith). |
| | |
| 24 | Power of Attorney (included on signature page). |
| | |
| 31.1 | Certification of Chief Executive Officer Pursuant to Section 302 of the Sarbanes-Oxley Act of 2002 (filed herewith). |
| | |
| 31.2 | Certification of Chief Financial Officer Pursuant to Section 302 of the Sarbanes-Oxley Act of 2002 (filed herewith). |
| | |
| 32.1 | Certification of Chief Executive Officer Pursuant to Section 906 of the Sarbanes-Oxley Act of 2002 (filed herewith). |
| | |
| 32.2 | Certification of Chief Financial Officer Pursuant to Section 906 of the Sarbanes-Oxley Act of 2002 (filed herewith). |
| | |
| 99.1 | Extension of Modification to Manufacturing, Distributing and Technology License Agreement dated May 31, 2002 by and between ISS and Econolite, incorporated by reference to Exhibit 99.2 to ISS’ 2007 Form 10-K. |
| | |
| 99.2 | Letter agreement dated June 19, 1997 by and between ISS and Econolite, incorporated by reference to Exhibit 99.3 to ISS’ 2007 Form 10-K. |
| | |
| 99.3 | License and Distribution Agreement dated January 2, 2011 by and among ISS, Econolite and Econolite Canada Inc., incorporated by reference to Exhibit 99.3 to ISS’ Annual Report on Form 10-K for the year ended December 31, 2011. |
| | |
| |
| | |
* | Portions of this exhibit are treated as confidential pursuant to a request for confidential treatment filed by ISS with the SEC. |
| |
** | Management contract or compensatory plan or arrangement. |
| |
| Copies of all exhibits not attached will be furnished without charge upon written request to the Company at the address set forth on the inside back cover page of this Annual Report on Form 10-K. |
51
Table of Contents
Signatures
Pursuant to the requirements of Section 13 or 15(d) of the Securities Exchange Act of 1934, the registrant has duly caused this report to be signed on its behalf by the undersigned, thereunto duly authorized.
| | |
Image Sensing Systems, Inc. | | |
| | |
/s/ Kris B. Tufto | | Date: March 27, 2013 |
| | |
Kris B. Tufto | | |
President and Chief Executive Officer | | |
(Principal Executive Officer) | | |
Each person whose signature to this Annual Report on Form 10-K appears below hereby constitutes and appoints Kris B. Tufto and Gregory R. L. Smith, and each of them, as his or her true and lawful attorney-in-fact and agent, with full power of substitution, to sign on his or her behalf individually and in the capacity stated below and to perform any acts necessary to be done in order to file all amendments to this Annual Report on Form 10-K, and any and all instruments or documents filed as part of or in connection with this Annual Report on Form 10-K or any amendments hereto, and each of the undersigned does hereby ratify and confirm all that said attorney-in-fact and agent, or his substitutes, shall do or cause to be done by virtue hereof.
In accordance with the Exchange Act, this report has been signed below by the following persons on behalf of the registrant and in the capacities and on the dates indicated:
| | |
/s/ Kris B. Tufto | | Date: March 27, 2013 |
| | |
Kris B. Tufto | | |
President and Chief Executive Officer | | |
(Principal Executive Officer) | | |
| | |
/s/ Gregory R. L. Smith | | Date: March 27, 2013 |
| | |
Gregory R. L. Smith | | |
Chief Financial Officer | | |
(Principal Financial and Principal Accounting Officer) | | |
| | |
/s/ James W. Bracke | | Date: March 27, 2013 |
| | |
James W. Bracke | | |
Chairman of the Board of Directors | | |
| | |
/s/ Panos G. Michalopoulos | | Date: March 27, 2013 |
| | |
Panos G. Michalopoulos | | |
Director | | |
| | |
/s/ Dale E. Parker | | Date: March 27, 2013 |
| | |
Dale E. Parker | | |
Director | | |
52
Table of Contents
Exhibit Index
| | | |
Exhibit No. | | Description |
| | |
| 1.1 | | Underwriting Agreement by and among ISS, Wedbush Securities Inc. and Craig-Hallum Capital Group Inc. dated April 15, 2010, incorporated by reference to Exhibit 1.1 to ISS’ Current Report on Form 8-K dated April 15, 2010. |
| | | |
| 2.1* | | Asset Purchase Agreement dated December 6, 2007 by and among Image Sensing Systems, Inc. (ISS), EIS Electronic Integrated Systems Inc., Dan Manor and the other parties named therein, incorporated by reference to Exhibit 2.1 to ISS’ Annual Report on Form 10-K for the year ended December 31, 2007 (2007 Form 10-K). (Schedules to this Agreement have not been filed in reliance on Item 601(b)(2) of Regulation S-K of the Securities and Exchange Commission (SEC). ISS will furnish supplementally copies of such schedules to the SEC upon its request.) |
| | | |
| 2.2 | | Share Purchase Agreement dated June 21, 2010 by and among ISS, Image Sensing Systems Europe Limited, CitySync Limited and three shareholders of CitySync Limited, incorporated by reference to Exhibit 2.1 to ISS’ Quarterly Report on Form 10-Q for the quarter ended June 30, 2010. |
| | | |
| 3(i).1 | | Restated Articles of Incorporation of ISS, incorporated by reference to Exhibit 3.1 to ISS’ Registration Statement on Form SB-2 (Registration No. 33-90298C) filed on March 15, 1995, as amended (Registration Statement). |
| | | |
| 3(i).2 | | Articles of Amendment to Articles of Incorporation of ISS, incorporated by reference to Exhibit 3.2 to ISS’ Quarterly Report on Form 10-QSB for the quarter ended June 30, 2001. |
| | | |
| 3(ii) | | Bylaws of ISS, incorporated by reference to Exhibit 3(ii) to ISS’ Quarterly Report on Form 10-Q for the quarter ended September 30, 2011. |
| | | |
| 4.1 | | Specimen form of ISS’ common stock certificate, incorporated by reference to Exhibit 4.1 to ISS’ Registration Statement. |
| | | |
| 10.1 | | Form of Distributor Agreement, incorporated by reference to Exhibit 10.1 to ISS’ Registration Statement. |
| | | |
| 10.2** | | 1995 Long-Term Incentive and Stock Option Plan, amended and restated through May 17, 2001, incorporated by reference to Exhibit 10.10 to ISS’ Annual Report on Form 10-KSB for the year ended December 31, 2001. |
| | | |
| 10.3** | | Employment Agreement between ISS and Kenneth R. Aubrey, dated December 12, 2006, effective on or about January 15, 2007 (in capacity as President) and effective on or about June 1, 2007 (in capacity of President and Chief Executive Officer), incorporated by reference to Exhibit 10.1 to ISS’ Current Report on Form 8-K dated December 14, 2006. |
| | | |
| 10.4** | | Employment Agreement between ISS and Gregory R. L. Smith, dated December 8, 2006, incorporated by reference to Exhibit 10.1 to ISS’ Current Report on Form 8-K dated December 8, 2006. |
| | | |
| 10.5 | | Amendment VII to Office Lease Agreement dated April 26, 2007 by and between ISS and Spruce Tree Centre L.L.P., incorporated by reference to Exhibit 10.11 to ISS’ Annual Report on Form 10-K for the year ended December 31, 2007 (2007 Form 10-K). |
| | | |
| 10.6 | | Modification to Manufacturing, Distributing and Technology License Agreement dated September 1, 2000 by and between ISS and Econolite Control Products, Inc. (Econolite), incorporated by reference to Exhibit 10.12 to ISS’ 2007 Form 10-K. |
| | | |
| 10.7** | | Image Sensing Systems, Inc. 2005 Stock Incentive Plan, incorporated by reference to Appendix A to ISS’ proxy statement filed with the SEC on April 19, 2005. |
| | | |
| 10.8 | | Manufacturing, Distributing and Technology License Agreement dated June 11, 1991 by and between ISS and Econolite Control Products, Inc. (Econolite), incorporated by reference to Exhibit 10.1 to the Registration Statement. |
53
Table of Contents
| | | |
| 10.09 | | Extension and Second Modification to License Agreement dated July 13, 2001 by and between ISS and Econolite, incorporated by reference to Exhibit 10.12 to ISS’ Annual Report on Form 10-KSB for the year ended December 31, 2001. |
| | | |
| 10.10 | | Office Lease Agreement dated November 24, 1998 by and between ISS and Spruce Tree Centre L.L.P., incorporated by reference to Exhibit 10.18 to ISS’ Annual Report on Form 10-KSB for the year ended December 31, 1998. |
| | | |
| 10.11 | | Production Agreement dated February 14, 2002 by and among ISS, Wireless Technology, Inc. and Econolite, incorporated by reference to Exhibit 10.20 to ISS’ Annual Report on Form 10-KSB for the year ended December 31, 2001. |
| | | |
| 10.12 | | Extension and Third Modification to Manufacturing Distributing and Technology License Agreement dated July 3, 2008 by and between ISS and Econolite, incorporated by reference to Exhibit 10.1 to ISS’ Current Report on Form 8-K dated July 3, 2008. |
| | | |
| 10.13 | | Fourth Modification to Manufacturing, Distributing and Technology License Agreement dated as of December 15, 2011 by and between ISS and Econolite, incorporated by reference to Exhibit 10.1 to ISS’ Current Report on Form 8-K dated December 15, 2011. |
| | | |
| 10.14 | | Loan Agreement dated May 1, 2008 (2008 Loan Agreement) by and between ISS and Associated Bank, National Association (Associated Bank), incorporated by reference to Exhibit 10.19 to ISS’ Registration Statement on Form S-1 filed on May 12, 2008 (Form S-1). |
| | | |
| 10.15 | | Security Agreement dated May 1, 2008 by and between ISS and Associated Bank, incorporated by reference to Exhibit 10.20 to ISS’ Form S-1. |
| | | |
| 10.16 | | Promissory Note (Line of Credit) dated May 1, 2008 in the original principal amount of $5,000,000 issued by ISS to Associated Bank, incorporated by reference to Exhibit 10.21 to ISS’ Form S-1. |
| | | |
| 10.17 | | Promissory Note (Loan) dated May 1, 2008 in the original principal amount of $3,000,000 issued by ISS to Associated Bank, incorporated by reference to Exhibit 10.22 to ISS’ Form S-1. |
| | | |
| 10.18 | | Modification Agreement dated December 28, 2009 by and between ISS and Associated Bank under which ISS and Associated Bank amended the 2008 Loan Agreement, incorporated by reference to Exhibit 10.18 to ISS’ Annual Report on Form 10-K for the year ended December 31, 2009 (2009 Form 10-K). |
| | | |
| 10.19 | | Promissory Note (Loan) dated December 28, 2009 in the original principal amount of $4,000,000 issued by ISS to Associated Bank, incorporated by reference to Exhibit 10.19 to the 2009 Form 10-K. |
| | | |
| 10.20 | | Lease dated February 1, 2010 between CitySync Limited and Nortrust Nominees Limited, incorporated by reference to Exhibit 10.1 to ISS’ Quarterly Report on Form 10-Q for the quarter ended June 30, 2010. |
| | | |
| 10.21 | | Third Modification Agreement dated December 28, 2010 by and between ISS and Associated Bank under which ISS and Associated Bank amended the 2008 Loan Agreement, incorporated by reference to Exhibit 10.21 to ISS’ Annual Report on Form 10-K for the year ended December 31, 2010. |
| | | |
| 10.22 | | Fourth Modification Agreement dated December 22, 2011 by and between ISS and Associated Bank under which ISS and Associated Bank amended the 2008 Loan Agreement, incorporated by reference to Exhibit 10.1 to ISS’ Current Report on Form 8-K dated December 22, 2011. |
| | | |
| 10.23 | | Fifth Modification Agreement dated December 24, 2012 by and between ISS and Associated Bank under which ISS and Associated Bank amended the 2008 Loan Agreement, incorporated by reference to Exhibit 10.1 to ISS’ Current Report on Form 8-K dated December 24, 2012. |
| | | |
| 10.24** | | Employment Agreement between ISS and Kris B. Tufto dated October 30, 2012, incorporated by reference to Exhibit 10.1 to ISS’ Quarterly Report on Form 10-Q for the quarter ended September 30, 2012. |
| | | |
| 21 | | List of Subsidiaries of ISS (filed herewith). |
54
Table of Contents
| | | |
| 23.1 | | Consent of Independent Registered Public Accounting Firm (filed herewith). |
| | | |
| 24 | | Power of Attorney (included on signature page). |
| | | |
| 31.1 | | Certification of Chief Executive Officer Pursuant to Section 302 of the Sarbanes-Oxley Act of 2002 (filed herewith). |
| | | |
| 31.2 | | Certification of Chief Financial Officer Pursuant to Section 302 of the Sarbanes-Oxley Act of 2002 (filed herewith). |
| | | |
| 32.1 | | Certification of Chief Executive Officer Pursuant to Section 906 of the Sarbanes-Oxley Act of 2002 (filed herewith). |
| | | |
| 32.2 | | Certification of Chief Financial Officer Pursuant to Section 906 of the Sarbanes-Oxley Act of 2002 (filed herewith). |
| | | |
| 99.1 | | Extension of Modification to Manufacturing, Distributing and Technology License Agreement dated May 31, 2002 by and between ISS and Econolite, incorporated by reference to Exhibit 99.2 to ISS’ 2007 Form 10-K. |
| | | |
| 99.2 | | Letter agreement dated June 19, 1997 by and between ISS and Econolite, incorporated by reference to Exhibit 99.3 to ISS’ 2007 Form 10-K. |
| | | |
| 99.3 | | License and Distribution Agreement dated January 2, 2011 by and among ISS, Econolite and Econolite Canada Inc., incorporated by reference to Exhibit 99.3 to ISS’ Annual Report on Form 10-K for the year ended December 31, 2011. |
| | |
| |
| |
* | Portions of this exhibit are treated as confidential pursuant to a request for confidential treatment filed by ISS with the SEC. |
| |
** | Management contract or compensatory plan or arrangement. |
| |
| Copies of all exhibits not attached will be furnished without charge upon written request to the Company at the address set forth on the inside back cover page of this Annual Report on Form 10-K. |
55