QuickLinks -- Click here to rapidly navigate through this document
T E S M A
| | | EXHIBIT 99.6 |
| | | |
| | | REPORT TO SHAREHOLDERS |
| | | |
|
|
For the five-month period ended
December 31, 2002 |
Tesma at a Glance
| | 2002 STUB PERIOD OPERATING HIGHLIGHTS
| | PRODUCT OFFERINGS
| |
|
|---|
| Engine Technologies | | Increased customer base for existing product lines
Opened small assembly facility in Brazil
Expanded product line to include additional value-added assemblies and modules
Continued successful launch of new business
Intensified continuous improvement activities (Six Sigma, Process/Productivity, Waste Reduction, Quality & Delivery Performance Improvements)
Launched first water pump assembly for Honda
Shipped first balance shafts to Perkins and first oil pumps to the PSA Group | | Front End Accessory Drive Systems
Accessory and Timing Drive Tensioners
Steel, Phenolic and Aluminum Pulleys
Idler Assemblies
Front Cover Modules
Engine Oil Pumps
Water Pumps
Cooling Management Systems | | Overrunning Alternator Decouplers
Cam Covers
Variable Camshaft Phasing Systems
Engine Oil Pan Assemblies
Engine Balance Shaft Assemblies
Collapsible Drive Shaft Assemblies |
Transmission Technologies |
|
Launched various new products including continuously variable transmission (CVT) cylinders for ZF in Europe and aluminum clutch pistons for General Motors
Launched Six Sigma throughout our facilities which advocates continuous improvement, cost reduction and advancement in processes
Developed new generation clutch for transfer case applications
Launched complex new transmission oil pump assembly for Ford
Successfully awarded first clutch pack assembly |
|
Automatic Transmission Clutch Housings and Shaft Assemblies
Flow-Formed Clutch Housings
Cam Die-Formed Transmission Shells
Torque Converter Damper Assemblies
Oil Pump Assemblies
Die-Formed Oil Pan Assemblies
Aluminum Die Cast and Machined Case Extensions
Servo Piston and Accumulator Assemblies |
|
Roller Die-Formed Drive Hubs and Housings
Fineblanked Products, Separator Plates and Backing Plates
Flexplates
Reaction and Input Shells
CVT — Pistons, Plungers and Clutch Housings
Friction Clutch Pack Assemblies
Torque Converter Stator Shafts |
Fuel Technologies |
|
Focused Research and Development (R&D) initiatives, including the development of low permeation capless filler systems, filler pipes and fuel tank assemblies to meet Low Emission Vehicle legislation (LEV II) and Partial Zero Emission Vehicle legislation (PZEV)
Launched first fuel tank programs
Launched a variety of new filler pipe programs in North America and Europe
Expanded manufacturing and testing capabilities at a new Michigan facility to support North American business growth
Continued successful R&D in material and welding technologies for new fuel tank and filler pipe business |
|
Fuel Caps
Fuel Filler Inlets and Valves
Capless Filler Systems
Stainless Steel Fuel Filler Pipes
Stainless Steel Fuel Tank Assemblies
Vent, Fill and Spud Tubes |
|
|
| | MAJOR CUSTOMERS
| | STRATEGY
|
|---|
| Engine Technologies | | General Motors
(including Fiat, Saab, Isuzu)
Ford
(including Volvo, Mazda, Jaguar)
DaimlerChrysler
(including Mitsubishi, Hyundai)
Volkswagen Group
Honda
Toyota
Renault-Nissan Samsung | | Capitalize on Tesma's component manufacturing expertise/capabilities and further integrate to value-added assemblies and modules
Expand customer base in Europe and Asia, as well as North America, for front cover modules and cooling and lubrication systems
Continue to develop full-service capabilities by establishing appropriate design, development, testing and validation capabilities at both the component and systems level
Continue to enhance benchmarking capabilities for cooling, lubrication and engine system products
Continue to develop unique and innovative products, technologies and materials |
Transmission Technologies |
|
General Motors
Ford
(including Mazda)
DaimlerChrysler
Allison Transmission
ZF
Renault-Nissan Samsung |
|
Expand engineering and testing capabilities to include complete clutch pack assemblies
Continue to pursue and expand content in the precision aluminum transmission die-cast components area
Continue to pursue value-added sub-assemblies for CVT programs
Expand transmission oil pump assemblies to include unique variable flow technology for CVT applications
Continue to develop unique and innovative products, technologies and materials |
Fuel Technologies |
|
General Motors
(including Fiat)
Ford
(including Volvo)
DaimlerChrysler
Volkswagen Group
BMW |
|
Provide leadership in the development and market introduction of innovative fuel system solutions and material applications
Expand filler pipe and fuel tank business in Europe and North America
Provide customers with improved fuel system permeation and corrosion performance and reduced waste through improved recyclability
Continue to develop unique and innovative products, technologies and materials |
 | |  |
Five months ended December 31 |
Tesma Global Performance (Canadian dollars in millions, except facilities and employees)
OPERATING SEGMENT
| |
| |
| |
| |
| | Asia and South America
| |
|---|
| | North America
| | Europe
| |
|---|
Five months ended
Dec 31
| |
|---|
| | 2002
| | 2001
| | 2002
| | 2001
| | 2002
| | 2001
| |
|---|
| Sales | | $ | 490.4 | | $ | 410.0 | | $ | 124.7 | | $ | 95.1 | | $ | 22.0 | | $ | 15.4 | |
| Income before income taxes | | $ | 63.4 | | $ | 42.6 | | $ | (16.4 | )* | $ | 3.0 | | $ | 0.2 | | $ | (0.5 | ) |
| Capital assets | | $ | 310.2 | | $ | 285.3 | | $ | 77.0 | | $ | 71.8 | | $ | 41.1 | | $ | 35.8 | |
| Manufacturing facilities | | | 15 | | | 15 | | | 5 | | | 5 | | | 3 | | | 2 | |
| Employees | | | 3,500 | | | 3,400 | | | 1,200 | | | 1,080 | | | 200 | | | 180 | |
* includes an impairment loss on long-lived assets of $18.8 million
Tesma International Inc. (Tesma or the Company) designs, engineers, tests and manufactures technologically-advanced engine, transmission and fuel components, modules and systems for the global automotive industry. Tesma employs approximately 4,900 skilled and motivated people in 23 manufacturing facilities located in North and South America, Europe and Asia and three focused R&D centres within each of our Engine, Transmission and Fuel Technologies groups. Tesma's continued strategic focus on Product — People — Processes and Performance has established the Company as a leader in the automotive parts sector.
Tesma's Class A Subordinate Voting Shares trade on the Toronto Stock Exchange under the symbol TSM.A and the NASDAQ National Market under the symbol TSMA.
Forward-Looking Statements
This Report to Shareholders may contain "forward-looking statements" within the meaning of applicable securities legislation. Such statements involve certain risks, assumptions, uncertainties and other factors (as described in Tesma's Annual Information Form, Form 40-F and other public filings) which may cause Tesma's actual future results or performance to differ materially from those expressed or implied herein. Tesma expressly disclaims any intention and undertakes no obligation to update or revise any forward-looking statements to reflect subsequent information, events, results, circumstances or otherwise.
| "Solid financial and operating performance continued through the balance of calendar 2002 as the successful execution of our growth strategies is transforming Tesma into a recognized leading supplier of technologically-advanced powertrain modules and systems to the global automotive industry." | | |
| | | [PHOTO] |
|
|
Anthony E. Dobranowski
President and Chief Financial Officer
|
To Our Shareholders
Effective January 1, 2003, we will begin reporting our financial results on a calendar-year basis and in U.S. dollars. We have taken these steps to enable our shareholders and the investment community to more easily compare our strong track record of operating and financial performance with other companies in our industry. As a result of the fiscal year end change, this report provides details on our performance for the five months ended December 31, 2002.
Solid Performance Continues
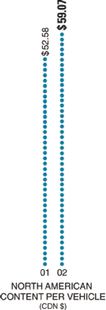
We experienced continued strong growth in sales through the remainder of calendar 2002. Sales for the five months rose 22% compared to the same period last year. This was in part due to a 3% increase in vehicle production in both North America and Europe, but, more importantly, our North American and European content per vehicle grew significantly in the period, rising by 12% and 16%, respectively, as we generated increased sales on many current customer programs and launched a number of new programs and products.
Our sales performance led to another period of solid growth in operating earnings, as margins expanded due to our increased volumes, higher content per vehicle and our ongoing efforts to maximize operating efficiencies. However, a non-cash charge to earnings amounting to $0.41 per share on a diluted basis was incurred in the period to write-down asset values at our Eralmetall die-casting facility in Germany due to its poor performance. While this action negatively impacted net income, future profitability will be positively impacted by reduced depreciation and other costs.
There were a number of important achievements in the period. We launched a complex oil pump assembly for a Ford truck transmission and a new water pump program in North America for the redesigned Honda Accord. Increased volumes were also realized on our key engine programs for General Motors and Ford. In Europe, new launches included fuel tank assembly programs for Volvo and the Volkswagen Group (VW) and fuel filler pipe programs for Ford, Volvo and VW, while increased volumes of axle and adaptor extension components were delivered to DaimlerChrysler and Opel.
A Bright Future
As we enter 2003, industry forecasts indicate a near-term reduction in production volumes, as vehicle manufacturers reduced their use of low-interest financing and other consumer incentives. We also believe that pressures for pricing concessions from our customers will continue over the short term. At Tesma, however, we view this outlook as yet another opportunity for growth and enhanced returns for our shareholders.
Our solid and stable relationships with the majority of the world's major vehicle manufacturers, combined with our efficient and world-class operations, will prove invaluable to our customers, as we work with them to reduce costs and help maintain their competitive positions. Our design, engineering, manufacturing and testing facilities are world class, with the right people and processes in place, supported by a strong financial position that provides us with the resources and flexibility to achieve our goals. Our high-value portfolio of advanced technologies, processes and products has positioned Tesma as a leading global supplier of engine, transmission
1
and fueling modules and systems, and we will continue to capitalize on our technology and product focus to meet the needs of our customers.
In addition, we are confident that our strong balance sheet and considerable cash reserves will enable us to win new business from potentially struggling competitors, while we generate solid internal growth from our expanding backlog of current business and new program launches. We are also in an excellent position to take advantage of potential acquisition opportunities that we anticipate will arise during the near-term.
Finally, our dedicated and motivated workforce, together with our long-standing culture of innovation and entrepreneurship, remain as our strongest assets. Our decentralized operating structure and employee profit participation and share ownership programs are key contributors to our past successes and will enable us to continue to grow and prosper going forward. The recent realignment of our group management structure, which places increased emphasis on engineering, testing, research and product development within each of our Engine, Transmission and Fuel Technologies product groups, will accelerate our ability to deliver advanced systems and modules to our customers. In addition, the adoption of Six Sigma procedures at the majority of our operations during 2002 will further enhance the already high quality level of Tesma's products and processes.
A Clear Focus
Going forward, our objectives remain the same, and our proven strategies to meet our goals and enhance shareholder value remain relevant and sound.
We will focus on continuous improvement opportunities in our operations that will allow us to remain competitive in the global marketplace. We will continue expanding our industry-leading capabilities and processes to ensure we can meet customer demands, now and well into the future. By maintaining our emphasis on the design, engineering, testing and manufacturing of value-added, highly-engineered and proprietary products, we are well positioned to meet the growing trend toward outsourcing complete powertrain modules and systems.
We will extend our presence in both current and new geographic markets to support our customers' global product mandates. Our focused sales and marketing programs will continue to broaden and extend our customer base, as we build on our solid reputation for providing high quality and cost competitive solutions. We made solid progress in Asia in the five-month period, as well as with the New Domestic vehicle manufacturers in North America, and we are developing and executing strategies to grow our presence in Europe, Mexico and South America.
We will also continue to identify and pursue unexploited opportunities within our specific areas of product expertise through our proven R&D efforts and developing or acquiring new and related products.
We will maintain a rigorous focus on our customers. Our success has been built on anticipating and meeting their needs efficiently and effectively, and we thank them for their valued and continued support.
In addition, we wish to thank all of our employees for their contributions to Tesma's success, as well as our shareholders for their continued support. Our strategies to enhance value are sound, and we are confident that continued growth will be realized over the long term.
Anthony E. Dobranowski (signed)
President and Chief Financial Officer
2
Tesma's Corporate Constitution
Tesma's Corporate Constitution includes the following principles:
Employee Equity and Profit Participation
Ten percent of Tesma's profit before tax will be allocated to employees. These funds will be used for the purchase of Tesma shares in trust for employees and for cash distributions to employees, recognizing length of service.
Shareholder Profit Participation
Tesma will distribute, on average, not less than 20% of its annual net profit after tax to shareholders.
Management Profit Participation
To obtain long-term contractual commitment from senior management, Tesma provides a compensation arrangement which, in addition to a base salary below industry standards, allows for the distribution of up to 6%of its profit before tax.
Research and Development
Tesma will allocate a minimum of 7%of its profit before tax for research and development to ensure its long-term viability.
Social Responsibility
Tesma will allocate a maximum of 2%of its profit before tax for charitable, cultural, educational and political purposes to support the basic fabric of society.
Minimum Profit Performance
Management has an obligation to produce a profit. If Tesma does not generate a minimum after-tax return of 4%on share capital for two consecutive years, Tesma's Class A shareholders, voting as a class, will have the right to elect additional directors.
Unrelated Investments
Tesma Class A and Class B shareholders, with each class voting separately, will have the right to approve any investment in an unrelated business in the event such investment, together with all other investments in unrelated businesses, exceeds 20% of Tesma's equity.
Board of Directors
Tesma believes that outside directors provide independent counsel and discipline. A majority of the members of Tesma's Board of Directors will be individuals who are not officers or employees of the corporation, at least two of which will be complete outsiders.
Constitutional Amendments
Any change to the Corporate Constitution will require the approval of Tesma's Class A and Class B shareholders, with each class voting separately.
3
Employee's Charter
Tesma is committed to an operating philosophy which is based on fairness and concern for people. This philosophy is part of Tesma's Fair Enterprise culture in which employees and management share in the responsibility to ensure the success of the Company. It includes these principles:
Job Security
Being competitive by making a better product for a better price is the best way to enhance job security. Tesma is committed to working together with its employees to help protect their job security. To assist employees, Tesma will provide:
- •
- Job Counselling
- •
- Training
- •
- Employee Assistance Programs
A Safe and Healthful Workplace
Tesma strives to provide employees with a working environment which is safe and healthful.
Fair Treatment
Tesma offers equal employment opportunities based on an individual's qualifications and performance, free from discrimination or favouritism.
Competitive Wages and Benefits
Tesma will provide employees with information which will enable them to compare their total compensation, including total wages and total benefits, with those earned by employees of competitors, as well as with other plants in the community. If total compensation is found not to be competitive, then wages will be adjusted.
Employee Equity and Profit Participation
Tesma believes that every employee should share in the financial success of the Company and provides a method for doing so through the Employee Equity Participation and Profit Sharing Program.
Communication and Information
Through regular monthly meetings between management and employees and through publications, Tesma will provide employees with information so they will know what is going on in the Company and within the industry.
The Hotline
Should an employee have a problem, or feel the above principles are not being met, Tesma encourages such employees to contact the Hotline to register their complaints. Employees do not have to give their name, but if they do, it will be held in strict confidence. Hotline Investigators will answer the call. The Hotline is committed to investigate and resolve all employee concerns or complaints and must report the outcome to Magna's Global Human Resources Department.
Employee Relations Advisory Board
The Employee Relations Advisory Board is a group of people who have proven recognition and credibility relating to humanitarian and social issues. This Board will monitor, advise and ensure that Tesma operates within the spirit of this Employee's Charter and the principles of Tesma's Corporate Constitution.
4
MANAGEMENT'S DISCUSSION AND ANALYSIS OF
RESULTS OF OPERATIONS AND FINANCIAL POSITION
FOR THE FIVE-MONTH PERIOD ENDED DECEMBER 31, 2002
Tesma International Inc. designs, engineers, tests and manufactures technologically-advanced powertrain (engine, transmission and fuel) components, modules and systems for the global automotive industry. We employ approximately 4,900 skilled and motivated people in 23 manufacturing facilities in North and South America, Europe and Asia and three focused research and development (R&D) centres within each of our Engine, Transmission and Fuel Technologies groups.
Effective December 31, 2002, we changed our fiscal year end from July to December. The change reflects the global nature of our business and will enable our financial performance to be compared more readily to that of our peer group in the automotive industry.
As a consequence, the following management's discussion and analysis (MD&A) of our consolidated operating results and financial position is for the five-month periods ended December 31, 2002 and 2001 and should be read in conjunction with the accompanying consolidated financial statements and notes thereto found on pages 17 through 46 of this report to shareholders. All amounts presented are in Canadian dollars unless otherwise noted.
OVERVIEW
Our strategic objective is to be recognized as the world's pre-eminent powertrain systems supplier. Our ability to develop and manufacture individual components and to assemble them as highly engineered modules and systems places us at the forefront of industry trends towards modularization and outsourcing. Our reputation for product quality and reliability, our strong customer relationships and our world-class development and manufacturing capabilities help position us to achieve this objective.
The five-month period ended December 31, 2002 was marked by many accomplishments, including significant growth in our content per vehicle in both the European and North American markets, successful launches of complex and technologically-advanced products in each of our Engine, Transmission and Fuel Technologies groups and the attainment of new business. Our strong operating performance was achieved despite the recognition of a significant write-down in assets at our Eralmetall die-casting facility in Germany, as discussed below. Our evaluation of Eralmetall's operations continues, and we are currently exploring various alternatives for this facility that meet our strategic and economic objectives.
Looking forward, industry observers continue to predict a slowdown in the global automotive industry, despite the use of aggressive incentive campaigns by North American Original Equipment Manufacturers (OEMs) in an effort to maintain market share and reduce inventory levels. Recent indications, however, suggest that various North American OEMs are attempting to reduce the costly use of incentive programs and, as a result, sales volumes of new vehicles may decline. We view any industry slowdown as an opportunity to win new business from, or possibly acquire, struggling competitors. In addition, our strong balance sheet and financial position provide us with the resources and flexibility to capitalize on opportunities as they occur. Finally, our focus in 2003 will be to further improve our cost structures, achieve additional operating efficiencies, continue to expand our product and technological capabilities and search for new opportunities to expand our global presence, especially in Europe, Mexico and South America.
IMPAIRMENT OF LONG-LIVED ASSETS
As announced on February 3, 2003, under new accounting standards adopted in Canada (which conform to similar guidance in the United States), we recorded an $18.8 million write-down to fair value in the carrying value of long-lived assets at our Eralmetall die-casting facility. As a result, we recognized this $18.8 million non-cash impairment loss ($13.2 million net of applicable taxes) as an operating expense in the five-month period ended December 31, 2002. The impact of this impairment loss on diluted earnings per share in the five-month period was approximately $0.41.
5
The new guidance, issued under the Canadian Institute of Chartered Accountants (CICA) Handbook Section 3063 "Impairment of Long-Lived Assets" (CICA 3063), establishes standards for the consideration and potential recognition, measurement and disclosure of an impairment in the carrying value of long-lived assets held for use. CICA 3063 requires us to consider whether factors exist that would indicate that there is a potential impairment in the carrying value of any of our consolidated long-lived assets. Among other factors, the projected future losses following the launch of new business at our Eralmetall die-casting facility, combined with current and historical operating losses, prompted the initiation and the completion of a review for impairment of the $32.2 million carrying value of Eralmetall's capital and other long-lived assets (asset group) at December 31, 2002. As prescribed by the guidance, the initial step in the review process is to group assets at the lowest level for which there are identifiable cash flows and then determine if the future undiscounted cash flows directly attributable to the asset group (in its current state and operating capacity) are in excess of the carrying value of the assets. If not, an impairment exists. As a result of the initial step of our review at Eralmetall, we determined that the estimated future undiscounted cash flows attributable to the asset group were less than the carrying value of the asset group and, therefore, an impairment existed.
The second step is to measure the impairment loss to be recognized, which is the excess of the carrying value of the asset group over the estimated fair value. The asset group to be valued in the second step of this exercise consisted mainly of the machinery, equipment, land and buildings at Eralmetall. The estimated fair value of the asset group was determined primarily using a market-based approach, which estimates value based on market prices in actual transactions and on asking prices for currently available assets that are in a similar state and condition. For the remaining assets not valued using the market approach, a cost approach was used, which estimates value based on what a prudent investor would pay to reproduce the assets with a similar application or utility. Utilizing these approaches, the fair value of the asset group was determined to be approximately $13.4 million, and as a result, we recorded an $18.8 million impairment loss.
This review is part of a larger evaluation of the viability of the entire operations of Eralmetall. The evaluation is ongoing and is expected to be concluded in the first half of 2003. Subsequent to the write-down, the net assets (excluding cash) at Eralmetall were approximately $16 million.
ACCOUNTING POLICY CHANGES
In addition to the new standard for long-lived assets discussed above, the following new accounting standards were applicable for the five-month period ended December 31, 2002:
Stock-Based Compensation
In November 2001, the CICA issued Handbook Section 3870 "Stock-Based Compensation and Other Stock-Based Payments" (CICA 3870) which was applicable for fiscal years beginning on or after January 1, 2002. CICA 3870 requires that all stock-based awards granted to non-employees (including those granted to directors not acting in their capacity as directors) must be accounted for at fair value. The new standard also encourages, but does not require, the use of the fair value method for valuing all stock-based compensation granted to employees and directors (acting in their capacities as directors). Specifically, the fair value method does not have to be applied to option plans where the only choice for the employee is to pay the exercise price and obtain stock. The new standard only applies to awards granted on or after the adoption date. We have prospectively adopted CICA 3870 effective August 1, 2002 and have elected to continue accounting for employee stock options using the intrinsic value method and to disclose proforma earnings as prescribed by the standard. The adoption of CICA 3870 had no effect on our reported earnings for the five-month period ended December 31, 2002.
Foreign Currency Translation
In December 2001, the CICA amended Handbook Section 1650 "Foreign Currency Translation" with the amendments effective for fiscal years beginning on or after January 1, 2002. The most significant change under the new recommendations is the elimination of the deferral and amortization method for unrealized translation gains and losses on long-term monetary assets and liabilities. Unrealized translation gains and losses on
6
long-term monetary assets and liabilities are now reflected in income. Effective August 1, 2002, we adopted these new recommendations on a retroactive basis, with restatement of prior periods.
The impact of retroactively applying the new rules to the comparative years ended July 31, 2002, 2001 and 2000 was to increase (decrease) net income by $0.3 million, ($0.4) million, and $nil, respectively, and increase (decrease) basic and diluted earnings per Class A Subordinate Voting or Class B Share by $0.01, ($0.01) and $nil, respectively.
RESULTS OF OPERATIONS
The Company's comparative consolidated operating results for the five-month periods ended December 31 are as follows:
| | 2002
| | 2001
|
|---|
[Canadian dollars in thousands, except per share and share figures]
| | (audited)
| | (unaudited)
|
|---|
| Sales | | $ | 627,018 | | $ | 515,227 |
| | |
| |
|
| Cost of goods sold | | | 486,631 | | | 406,874 |
| Selling, general and administrative | | | 38,225 | | | 32,318 |
| Depreciation and amortization | | | 28,240 | | | 23,279 |
| Impairment loss on long-lived assets | | | 18,811 | | | — |
| Affiliation fees and other charges | | | 7,428 | | | 6,286 |
| Interest, net | | | 493 | | | 1,389 |
| | |
| |
|
| Income before income taxes | | | 47,190 | | | 45,081 |
| Income taxes | | | 14,558 | | | 16,446 |
| | |
| |
|
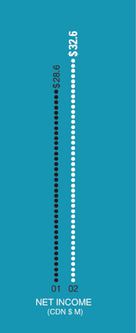
| Net income attributable to Class A Subordinate Voting Shares and Class B Shares | | $ | 32,632 | | $ | 28,635 |
| | |
| |
|
| Earnings per Class A Subordinate Voting Share or Class B Share | | | | | | |
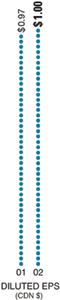
| | Basic | | $ | 1.01 | | $ | 0.98 |
| | Diluted | | $ | 1.00 | | $ | 0.97 |
| | |
| |
|
| Average number of Class A Subordinate Voting Shares and Class B Shares outstanding (in thousands) | | | | | | |
| | Basic | | | 32,300 | | | 29,269 |
| | Diluted | | | 32,513 | | | 29,601 |
| | |
| |
|
DISCUSSION OF THE RESULTS
The amounts presented and discussed in the following portion of the MD&A for the five-month periods ended December 31, 2002 and 2001 are in millions of Canadian dollars unless otherwise noted. We also refer to the five-month period ended December 31, 2002 as our "fiscal 2002 stub period."
Vehicle Volumes [in millions of units]
| |
| |
| | Change
|
|---|
Five-month period ended December 31
| |
| |
|
|---|
| | 2002
| | 2001
| | Units
| | %
|
|---|
| North America | | 6.8 | | 6.6 | | 0.2 | | +3% |
| Europe | | 6.3 | | 6.1 | | 0.2 | | +3% |
| | |
| |
| |
| |
|
North American vehicle production volumes for the fiscal 2002 stub period were 6.8 million units, a 3% increase over the 6.6 million units in the same period a year ago. In the five-month period, continued use of attractive financing rates and other consumer incentive campaigns by the "Big Three" OEMs (Ford, General Motors (GM) and DaimlerChrysler) spurred demand and helped keep volumes strong, especially for GM, our largest customer, where volumes were up 6% compared to a year ago. The European market experienced growth as
7
well, as vehicle production for the fiscal 2002 stub period was up 3% to 6.3 million units from 6.1 million units in the comparable period last year. However, many of our larger customers, including the Volkswagen Group (VW), DaimlerChrysler and Fiat, experienced declines ranging from 1% to 4% during this period.
Sales
| | 2002
| | 2001
| | Change
|
|---|
| North America | | $ | 490.4 | | $ | 410.0 | | +20% |
| Europe | | | 124.7 | | | 95.1 | | +31% |
| Asia | | | 22.0 | | | 15.4 | | +43% |
| Intersegment | | | (10.1 | ) | | (5.3 | ) | — |
| | |
| |
| |
|
| Total external sales | | $ | 627.0 | | $ | 515.2 | | +22% |
| | |
| |
| |
|
Our consolidated sales in the fiscal 2002 stub period increased by 22% to $627.0 million from $515.2 million in the same period ended December 31, 2001.
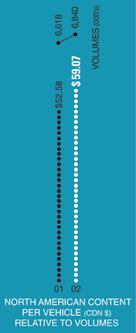
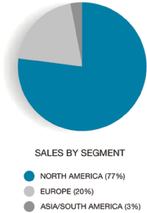
Our North American operations, consisting of 15 manufacturing facilities (13 in Canada and 2 in the U.S.) employing 3,500 employees, reported sales of $490.4 million for the fiscal 2002 stub period, up 20% from $410.0 million in the same five-month period a year ago. This sales increase was fueled by our increased content per vehicle, which grew by 12% to over $59 for the five-month period from approximately $53 a year ago, and was also spurred by the 3% increase in North American production volumes. The significant improvement in our North American content per vehicle reflects higher volumes of the GM L850 engine program, as GM added this engine to its J-Car vehicle platforms (which includes the Chevrolet Cavalier, Pontiac Sunfire and Saturn Ion models) for the 2003 model year. Also, significant new program launches, including production of a water pump assembly for Honda's redesigned Accord and a complex new oil pump assembly for Ford's 5R110 transmission (initially being used in the diesel engine application of Ford's heavier duty F-Series trucks), substantially increased sales. In addition, the sales increase also reflects increased volumes on the GM Gen III (used in the full-size pickup trucks and SUV families) and Line 6 (used in the popular mid-size SUV segment) engine programs, Ford's Modular V8 engine program, and various water management, tensioner, alternator decoupler and other product programs, as well as a higher proportionate share of sales from one of our jointly-controlled entities and higher exports, offset by givebacks to various OEM customers. North American sales represented 77% of our consolidated sales in the fiscal 2002 stub period, down from 79% for the same period a year ago.
8
Our 5 European operations, located in Germany and Austria, employ 1,200 employees. During the fiscal 2002 stub period, sales from our European operations increased by 31% to $124.7 million from $95.1 million a year ago, fueled by significant growth in our European content per vehicle (presented in euros to exclude the impact of foreign-exchange fluctuations) by 16% to over 16 compared to approximately 14 for the same period a year ago and further aided by the 3% increase in vehicle production volumes. The growth in sales and content per vehicle reflects the launch of new fuel tank assembly programs for Volvo and VW and new fuel filler pipe programs for Ford, Volvo and VW. The sales increase also reflects higher volumes on the rear-axle crossover component supplied to DaimlerChrysler and adaptor extensions supplied to GM (Opel) (launched in the latter half of fiscal 2002), stronger demand for service parts and a significant strengthening of the euro relative to the Canadian dollar, which caused translated sales to increase by approximately $11.6 million in the fiscal 2002 stub period compared to last year. European sales represented 20% of our consolidated sales in the fiscal 2002 stub period versus 18% a year ago.

Our 2 Asian manufacturing facilities in South Korea and a small assembly facility in Brazil employ 200 people. Sales for this segment in the fiscal 2002 stub period were up 43% to $22.0 million from $15.4 million a year ago and represented 3% of our consolidated sales for the fiscal 2002 stub period (consistent with the same period last year). This increase in the fiscal 2002 stub period is due primarily to newly-launched front cover and water pump programs for Renault-Nissan Samsung's new SM3 engine program, higher exports to Europe (including a
9
new oil pump for the PSA Group) and North America, a strengthening of the Korean won versus the Canadian dollar and the commencement of limited production runs in Brazil.
Overall tooling and other sales for the fiscal 2002 stub period increased significantly by 33% to $34.1 million compared to $25.6 million in the same period a year ago. This increase was realized primarily in North America on sales for upcoming programs in each of our Technologies groups and the preparation for a number of new program launches in our South Korean facilities.
For the fiscal 2002 stub period, the net impact of fluctuations in foreign currencies increased sales by approximately $15.2 million or 3% due primarily to a strengthening of the euro and Korean won and higher rates on our U.S. dollar hedges, all relative to the Canadian dollar. This increase, excluding the hedges, occurred primarily on the translation of self-sustaining foreign subsidiaries at higher average exchange rates in the fiscal 2002 stub period versus the same period a year ago.
Our focus on providing highly-engineered and proprietary products and full-service capabilities to OEMs is translating into growth in all geographic regions. Higher North American content, driven by new program launches and increased production volumes on certain key engine and transmission programs, resulted in sales to North American customers increasing by 19% to $425.3 million (68% of consolidated sales) for the fiscal 2002 stub period from $357.4 million (69% of consolidated sales) in the same period a year ago.
Sales to our European-based customers grew in the fiscal 2002 stub period by 28% to $176.8 million (28% of consolidated sales) compared to $137.6 million (27% of consolidated sales) in the five months ended December 31, 2001. The growth was driven by our increased content on new vehicle launches, higher demand for service parts, increased exports to Europe from our North American and Korean operations, the 3% increase in European production volumes and a 10% strengthening of the euro relative to the Canadian dollar versus the same period a year ago.
For the fiscal 2002 stub period, sales to Australasian customers grew by 10% to $16.0 million (3% of consolidated sales) compared to $14.6 million (3% of consolidated sales) a year ago on stronger domestic Korean demand and a stronger Korean won (up 6% in the period versus a year ago). Our exports to the South American market in the fiscal 2002 stub period increased by 59% from $5.6 million last year to $8.9 million (representing 1% of consolidated sales in both periods).
Sales to our four largest worldwide customers, GM, Ford, DaimlerChrysler and VW, were 76% of consolidated sales in the fiscal 2002 stub period, consistent with the prior year. Our sales to the global operations of GM, our largest customer group, increased to 43% of our consolidated sales in the fiscal 2002 stub period from 42% in the five months ended December 31, 2001, primarily due to stronger production volumes (6% higher than the five months ended December 31, 2001) on SUV and other truck platforms and their high-volume compact cars which now use engines with significant Tesma content. While no single product sold to any customer accounted for more than 10%of our consolidated sales in the five months ended December 31, 2002 or the full year in fiscal 2002, our largest engine or transmission dependence continues to be on the GM Gen III engine program.
On a product-line basis, Tesma Engine Technologies' sales grew by 22% to $433 million in the fiscal 2002 stub period, compared to $356 million in the same period a year ago, and accounted for 69% of consolidated sales compared to 70% last year. This growth was the result of increased content and volumes on our key engine programs for GM (L850, Gen III and Line 6), the launch of our first balance shaft programs for export to Europe, increased volumes and sales of tensioners, decouplers and plastic coolant management products in the North American market and an increase in service part sales in Europe.
Sales of Tesma Transmission Technologies' products rose 15% to $144 million from $125 million a year ago, and represented 23% of consolidated sales in the fiscal 2002 stub period, down from 24% in the prior year. This sales increase is primarily due to the launch of the transmission oil pump and other components for the Ford 5R110 transmission, higher volumes for GM's 4L60 transmission for which we supply 1/2 accumulators, stator shafts and other transmission components and higher tooling sales for upcoming program launches.
Tesma Fuel Technologies' sales increased by 46% to $50 million in the fiscal 2002 stub period, driven by the launches of stainless steel fuel tank assembly and filler tube programs for customers in Europe, full volumes of the filler tube for the Saturn VUE SUV which launched in the comparative period a year ago and a
10
strengthening euro relative to the Canadian dollar (which significantly impacts this group as the majority of its operations are located in Europe). Tesma Fuel Technologies' sales represented 8% of our consolidated sales in the fiscal 2002 stub period compared to 6% in the same period last year.
Gross Margin
| | 2002
| | 2001
| | Change
|
|---|
| Sales | | $ | 627.0 | | $ | 515.2 | | +22% |
| Cost of goods sold | | | 486.6 | | | 406.8 | | +20% |
| | |
| |
| |
|
| Gross margin | | $ | 140.4 | | $ | 108.4 | | +30% |
| | |
| |
| |
|
| Gross margin percentage | | | 22.4 | % | | 21.0 | % | +7% |
| | |
| |
| |
|
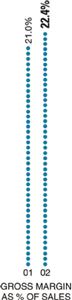
Our gross margin as a percentage of sales in the fiscal 2002 stub period increased to 22.4% from 21.0% in the comparable period a year ago.
This increase in gross margin was due to improved results at our North American die-casting facility (versus a difficult period in the prior year), improvements in capacity utilization and production efficiencies achieved at many facilities, significant growth in content per vehicle in both of our major markets, increased cost absorption due to higher inventory levels at the period end (in preparation for early January releases) and the positive impact of R&D investment tax credits realized this year. These positive impacts were offset somewhat by higher operating, development and engineering costs at certain North American divisions and at our European fuel facilities in the midst of, or preparing for, program launches, a provision booked in the first quarter for the expected cost to supply replacement parts to a customer at our cost, the costs related to an early retirement program, annual wage increases, recurring operating issues and losses at our German die-casting facility, higher utility costs and customer pricing concessions.
Gross expenditures on R&D for the fiscal 2002 stub period were $10.2 million. Customer and government funding and tax credits reduced our funding of these R&D expenses by $2.7 million in the period. Gross spending on R&D amounted to 22% of income before income taxes in the fiscal 2002 stub period, well in excess of the minimum 7% requirement in our Corporate Constitution.
11
Income Before Income Taxes
| | 2002
| | 2001
| | Change
|
|---|
| Gross margin | | $ | 140.4 | | $ | 108.4 | | +30% |
| less: | | | | | | | | |
| Selling, general and administrative | | | 38.2 | | | 32.3 | | +18% |
| Depreciation and amortization | | | 28.3 | | | 23.3 | | +21% |
| Impairment loss on long-lived assets | | | 18.8 | | | — | | — |
| Affiliation fees and other charges | | | 7.4 | | | 6.3 | | +17% |
| Interest, net | | | 0.5 | | | 1.4 | | –64% |
| | |
| |
| |
|
| Income before income taxes | | $ | 47.2 | | $ | 45.1 | | +5% |
| | |
| |
| |
|
Income before income taxes increased 5% to $47.2 million for the fiscal 2002 stub period from $45.1 million in the same period a year ago, despite the write-down of long-lived assets that was recorded at Eralmetall. More specifically, the $32.0 million increase in the fiscal 2002 stub period gross margin and lower net interest expense were partially offset by the $18.8 million impairment loss at Eralmetall, higher selling, general and administrative costs and increased depreciation charges and affiliation fees.
Fueled by the higher sales levels, income before income taxes at our North American operations for the fiscal 2002 stub period increased by 49% to $63.4 million from $42.6 million in the same period last year. Results of our European operations declined significantly from income before income taxes of $3.0 million in the five-month period a year ago, to a loss before income taxes of $16.4 million this year, entirely due to the $18.8 million impairment loss at Eralmetall. Excluding this write-down, income before income taxes for our European operations would have been $2.4 million. Our Asian and South American operations (which include our engineering and marketing offices in Brazil, Japan and Korea) generated income before income taxes of approximately $0.2 million in the fiscal 2002 stub period on higher sales levels, compared to a loss before income taxes of $0.5 million for the same period in the prior year.
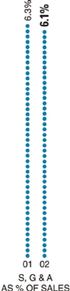
Selling, general and administrative costs for the fiscal 2002 stub period, as a percentage of sales, declined to 6.1% from 6.3% for the same period a year ago. Absolute costs increased from $32.3 million to $38.2 million due to higher incentive-based compensation amounts, a $1.6 million recovery of previously provided for accounts receivable booked in the prior year, a significantly strengthened euro versus the Canadian dollar causing translated amounts from our European operations to increase, additional personnel added to further develop our Group structure and support new and upcoming program launches, higher travel costs reflecting our growing global presence, and foreign-exchange losses (versus gains in the prior year). The increase was offset partially by a $1.3 million charge booked in the prior year for our estimated share of the costs pertaining to the abandoned merger between Tesma and Magna Steyr, as well as gains on disposals of capital assets recognized during the fiscal 2002 stub period.
12
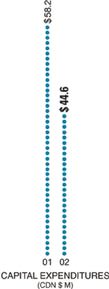
Depreciation and amortization expense for the fiscal 2002 stub period was $28.3 million compared to $23.3 million in the five months ended December 31, 2001. The increase in depreciation charges was the result of our continuing investment in capital assets (over $100 million over the past twelve months) — primarily for facility upgrades and equipment for new programs, many of which were put into service for launches occurring during the period. Capital expenditures for the fiscal 2002 stub period totaled $41.9 million, net of disposals, representing a significant decrease from the $57.8 million spent in the same period a year ago. These capital expenditures (see discussion under Investing Activities) will result in higher depreciation charges in the future.
Net interest expense decreased for the fiscal 2002 stub period to $0.5 million from $1.4 million in the same period last year. This decrease in net interest expense has resulted primarily from our higher levels of cash available for investment in short-term interest-bearing investments since the completion of our public offering of Class A Subordinate Voting Shares in July 2002.
Affiliation fees and other charges paid to Magna increased by 17% to $7.4 million in the fiscal 2002stub period from $6.3 million in the same period last year and included the following:
- •
- Under our affiliation agreement with Magna, we pay an affiliation fee calculated as 1% of our consolidated net sales, subject to certain exceptions for sales from acquired businesses (which are exempt from the calculation of the affiliation fee in the year of acquisition, 50% inclusion in the year after acquisition, and full inclusion in all subsequent years). The affiliation fee is paid to Magna in exchange for, among other things, a non-exclusive worldwide licence to use certain Magna trademarks, access to Magna management resources, and the collaboration and sharing of best practices in areas such as new management techniques, employee benefits and programs, marketing and technological initiatives. As a result of negotiations concluded during fiscal 2002, the affiliation agreement was extended for a period of seven years and five months from August 1, 2002 to December 31, 2009 (subject to annual renewals thereafter). In the fiscal 2002 stub period, Tesma paid $6.1 million under the affiliation agreement, an increase of 17% compared to $5.2 million in the same period last year, entirely as a result of our increased sales levels.
- •
- Under our social fee agreement with Magna (also extended during fiscal 2002 for the same duration as the affiliation agreement), we pay Magna a social fee of 1.5% of pretax profits as a contribution towards social and charitable programs coordinated by Magna on behalf of Magna and its affiliated companies, including us. In the fiscal 2002 stub period, we paid $0.7 million as a social fee, an amount consistent with the same period a year ago.
- •
- Other specific charges are negotiated annually and are based on the level of benefits or services provided to us by Magna Services Inc. (Serviceco), a wholly-owned subsidiary of Magna. These services include information technology (WAN infrastructure and support services), human resources services (including administration of our Employee Equity Participation and Profit Sharing Program), foreign marketing
13
services, finance, treasury and legal support, management and technical training and an allocated share of the facility and overhead costs dedicated to providing these services. In the fiscal 2002 stub period, we paid $0.6 million to Serviceco for specific charges, an increase of 20% over the $0.5 million paid in the same period a year ago.
Net Income and Earnings per Share
| | 2002
| | 2001
| | Change
|
|---|
| Income before income taxes | | $ | 47.2 | | $ | 45.1 | | +5% |
| Income taxes | | | 14.6 | | | 16.5 | | –12% |
| | |
| |
| |
|
| Net income attributable to Class A Subordinate Voting Shares and Class B Shares | | $ | 32.6 | | $ | 28.6 | | +14% |
| | |
| |
| |
|
| Earnings per Class A Subordinate Voting Share or Class B Share | | | | | | | | |
| | Basic | | $ | 1.01 | | $ | 0.98 | | +3% |
| | Diluted | | $ | 1.00 | | $ | 0.97 | | +3% |
| | |
| |
| |
|
| Average number of shares outstanding (in millions) | | | | | | | | |
| | Basic | | | 32.3 | | | 29.3 | | +10% |
| | Diluted | | | 32.5 | | | 29.6 | | +10% |
| | |
| |
| |
|
Our effective income tax rate for the fiscal 2002 stub period was 30.9%, significantly lower than the 36.5% in the same period a year ago. This decline in our effective tax rate is due mainly to $2.9 million in tax refunds realized by one of our foreign subsidiaries (as the final stage of prior year tax planning initiatives) and higher income earned in jurisdictions with tax rates lower than in Canada. Offsetting a portion of the decline were higher losses at one of our foreign operations and one of our North American joint ventures that have not been tax effected, and portions of the impairment loss at Eralmetall that were either not tax effected or were tax effected at lower rates expected to be in place when the amounts will be realized for tax purposes.
In spite of the impairment write-down at Eralmetall, our net income attributable to Class A Subordinate Voting Shares and Class B Shares for the fiscal 2002 stub period increased 14% to $32.6 million compared to $28.6 million in the same period a year ago.
Similarly, basic and diluted earnings per Class A Subordinate Voting Share or Class B Share for the fiscal 2002 stub period increased 3% to $1.01 and $1.00, respectively, from $0.98 and $0.97, respectively, for the same period last year. These figures reflect a 10% increase in the average number of basic and diluted shares outstanding for the fiscal 2002 stub period to 32.3 million and 32.5 million, respectively, (from 29.3 million and
14
29.6 million, respectively, a year ago) due primarily to the 2.85 million Class A Subordinate Voting Shares issued in our July 2002 public offering.
For the fiscal 2002 stub period, the $13.2 million after-tax write-down of Eralmetall's long-lived assets reduced basic and diluted earnings per share by$0.41 while the tax refunds positively impacted basic and diluted earnings per share by $0.09.
FINANCIAL CONDITION, LIQUIDITY AND CAPITAL RESOURCES
Our consolidated cash flows for the five-month periods ended December 31 are as follows:
| | 2002
| | 2001
| |
|---|
[Canadian dollars in thousands]
| | (audited)
| | (unaudited)
| |
|---|
| Cash provided from (used for): | | | | | | | |
| Operating Activities | | | | | | | |
| Net income | | $ | 32,632 | | $ | 28,635 | |
| Items not involving current cash flows | | | 40,828 | | | 24,376 | |
| | |
| |
| |
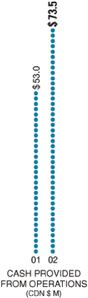
| | | | 73,460 | | | 53,011 | |
| Net change in non-cash working capital | | | (28,709 | ) | | (34,023 | ) |
| | |
| |
| |
| | | | 44,751 | | | 18,988 | |
| | |
| |
| |
| Investing Activities | | | | | | | |
| Capital asset additions | | | (44,562 | ) | | (58,236 | ) |
| Increase in other assets | | | (798 | ) | | (45 | ) |
| Increased investments in subsidiaries | | | (800 | ) | | (1 | ) |
| Proceeds on disposal of capital and other assets | | | 2,674 | | | 490 | |
| Cash and cash equivalents acquired on additional investment in subsidiary | | | — | | | 599 | |
| | |
| |
| |
| | | | (43,486 | ) | | (57,193 | ) |
| | |
| |
| |
| Financing Activities | | | | | | | |
| Increase(decrease) in bank indebtedness | | | 40,801 | | | (7,147 | ) |
| Issuance of Class A Subordinate Voting Shares | | | 400 | | | 335 | |
| Dividends on Class A Subordinate Voting Shares and Class B Shares | | | (5,168 | ) | | (4,683 | ) |
| Repayments of long-term debt | | | (2,643 | ) | | (2,145 | ) |
| Issues of long-term debt | | | — | | | 124 | |
| | |
| |
| |
| | | | 33,390 | | | (13,516 | ) |
| | |
| |
| |
| Effect of exchange rate changes on cash and cash equivalents | | | 445 | | | 1,414 | |
| | |
| |
| |
| Net increase (decrease) in cash and cash equivalents during the period | | | 35,100 | | | (50,307 | ) |
| Cash and cash equivalents, beginning of period | | | 176,759 | | | 95,703 | |
| | |
| |
| |
| Cash and cash equivalents, end of period | | $ | 211,859 | | $ | 45,396 | |
| | |
| |
| |
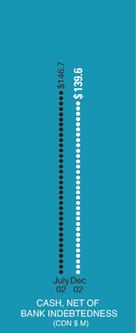
Our cash balances at December 31, 2002, net of bank indebtedness, were $139.6 million compared to $146.7 million at July 31, 2002. The decrease in net cash balances by $7.1 million in the fiscal 2002 stub period is due to cash provided from operating activities and stock option exercises offset by continued investments in capital and other assets (net of disposals), the payment of dividends and the scheduled repayments of long-term debt.
15
Operating Activities
Cash provided from operations, before the effect of changes in non-cash working capital, increased by 39% from $53.0 million in the five months ended December 31, 2001 to $73.5 million in the fiscal 2002 stub period due to higher non-cash charges, including the long-lived assets write-down and depreciation charges offset by future tax recoveries. Cash provided from operating activities increased due to incremental investments in non-cash working capital in the fiscal 2002 stub period of $28.7 million, compared to $34.0 million in the same period a year ago. This reduced investment versus a year ago resulted primarily from relatively larger increases in accounts payable (including accruals) and income taxes payable in the current five-month period.
Investing Activities
Our investment spending for the fiscal 2002 stub period, net of proceeds from dispositions, was $43.5 million, a decrease from $57.2 million for the same period a year ago. Cash spent on capital assets decreased to $44.6 million from $58.2 million for the same period last year, as new program spending was delayed. Our capital asset additions related primarily to facility upgrades and machinery and equipment purchased to support program launches and increased sales activities. The $0.8 million increased investment in subsidiaries relates to an earn out payment on the fiscal 1999 Sterling Heights acquisition and represents the final payment required under the earn out provisions for this acquisition.
16
Proceeds from disposal of capital and other assets were received on the disposal of some small-tonnage press equipment to a third party and the transfer of certain assets and activities of our non-product-related R&D operations to Magna (our controlling shareholder) at the beginning of the fiscal 2002 stub period.
Capital assets purchased for our North American operations accounted for 70% of the total capital spending in the fiscal 2002 stub period compared to 81% in the same period a year ago. Our European operations accounted for 17% compared to 16% a year ago and our Asian and other operations accounted for 13% compared to 3% in the same period a year ago.
Our target will be to maintain annual capital spending under a threshold of 50% of earnings before interest, taxes, depreciation and amortization (EBITDA). We may exceed this limit as the trend to outsourcing and modularization in the powertrain area may create significant opportunities for the award of new business which may require significant capital investments on an expedited basis.
Financing Activities
In the fiscal 2002 stub period, funds provided through operating lines of credit were $40.8 million compared to $7.1 million used in the same period a year ago. This increase resulted from higher borrowing levels in our Austrian subsidiary to finance capital investments required for new fuel tank and filler tube programs, combined with higher levels of outstanding cheques in our North American divisions.
The issuance of our Class A Subordinate Voting Shares and resulting proceeds received in the fiscal 2002 stub period are the direct result of periodic exercises of stock options during the period.
Our Corporate Constitution requires the payment of dividends of at least 20% of after-tax profits on a rolling three-year basis. Dividends of $10.3 million or $0.32 per share were declared ($5.2 million paid) on our Class A Subordinate Voting Shares and Class B Shares in the fiscal 2002 stub period compared to $9.4 million or $0.32 per share ($4.7 million paid) in the same period a year ago. The increase over the prior year is due to the increase in the number of shares outstanding as a result of our July 2002 public share offering and stock options exercised over the last twelve months.
Scheduled debt repayments of $2.6 million were made during the fiscal 2002 stub period compared to $2.1 million in the same period last year.
Financing Resources
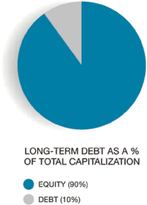
At December 31, 2002, we had cash and cash equivalents on hand (net of bank indebtedness) of $139.6 million. In addition, we had unused and available credit facilities (excluding facilities available for foreign-exchange purposes) approximating $105 million. Of our total long-term debt of $77.4 million, only 4% becomes due and payable in the next twelve months, while approximately 87% does not mature until 2006 or later. Our total debt to capitalization ratio at December 31, 2002 was 0.10:1, reflecting a slight improvement from the 0.11:1 ratio at July 31, 2002.
17
Shareholders' Equity
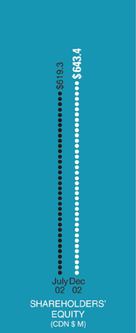
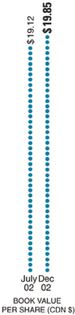
During the fiscal 2002 stub period, shareholders' equity increased by 4% or $24.2 million to $643.4 million due mainly to an increase in undistributed earnings, stock options exercised and an increase in the value of the currency translation account. As a result, the book value per Class A Subordinate Voting Share or Class B Share on a diluted basis increased by 4% to $19.85 as at December 31, 2002 from $19.12 at July 31, 2002.
The increase in the cumulative currency translation adjustment account represents the unrealized increase in the value of our net investment in foreign subsidiaries, resulting primarily from the significant strengthening of the euro and Swiss franc compared to the Canadian dollar since July 31, 2002 and a realized translation loss on the reduction in the net investment (due to dividend distributions) of certain foreign operations, offset by a reduction in the rates for the U.S. dollar and Korean won compared to the Canadian dollar versus the same rates at July 31, 2002.
FOREIGN CURRENCY ACTIVITIES
In our operations, we negotiate sales contracts and purchase materials, equipment and labour generally in the currency of the region in which the operation is located. Our foreign currency cash flows for the purchase of materials and capital equipment denominated in foreign currencies are naturally hedged when contracts to deliver certain products are also denominated in those same foreign currencies. In an effort to manage the remaining exposure, we employ hedging programs primarily through the use of foreign-exchange forward contracts that extend through the expected duration of the underlying production programs.
The amount and timing of forward contracts are dependent upon a number of factors, including anticipated production delivery schedules, anticipated customer payment dates and anticipated product costs which may be paid in foreign currencies. We are exposed to credit risk from the potential default by counterparties on our foreign-exchange forward contracts, but mitigate this risk by dealing with only those counterparties considered to be high quality credits. Despite these measures, significant long-term movements in relative currency values could affect our operating results. In particular, our results, including the business activities of self-sustaining foreign subsidiaries that are not hedged, may be adversely affected by movements of the Canadian dollar against the euro, the U.S. dollar, the Korean won or the Swiss franc. As we will be changing our financial reporting currency to the U.S. dollar commencing January 1, 2003, our future results could be significantly affected by future movements of the U.S. dollar against the Canadian dollar, the euro, the Korean won or the Swiss franc which, in combination, comprise the majority of the currencies in which we transact business.
18
CONTINGENCIES
From time to time, we may be contingently liable for litigation and other claims. Refer to Note 21 of our audited consolidated financial statements for the fiscal 2002 stub period.
OTHER MATTERS
Reporting Currency Change
The previously announced change in our reporting currency to the U.S. dollar becomes effective January 1, 2003, and we will commence reporting on this basis for our first quarter ending March 31, 2003.
Subsequent Event — Property Sale-Leaseback Transaction with Magna
Subsequent to the period end, on January 31, 2003, we completed a sale-leaseback transaction with MI Developments Inc. (MID), a wholly-owned subsidiary of Magna, for all of the land and buildings on our corporate campus, which includes our corporate office and the lead manufacturing facilities in each of our Engine and Transmission Technologies groups. This transaction was approved by our Board of Directors, upon recommendation by a special committee of independent directors established to review the transaction.
Under the terms of the purchase and sale agreement, the land and buildings comprising the corporate campus (with a carrying value of $36.0 million) were sold to MID for cash proceeds approximating their fair value of $38.2 million. The gain of $2.2 million resulting on the sale will be deferred and amortized on a straight-line basis over the term of the leases.
As part of the transaction, we entered into agreements to lease the properties back from MID for a term of twelve years (with an initial option to renew for three years, followed by two subsequent five-year renewal options) and to make lease payments of approximately $3.5 million per year. In addition, under the terms of the transaction, all construction management fees (including carrying charges) billed in fiscal 2002 by MID on account of this project were refunded.
19
OUTLOOK
During the two-month period ended December 31, 2002, North American OEM production volumes were 2.3 million units, down 5% from the prior year, and the "New Domestics" increased market share at the expense of the "Big Three" (especially Ford and DaimlerChrysler). The use of low interest rate financing and other consumer incentive campaigns by the "Big Three" has been waning, to the extent that in January 2003, there was a clear attempt by the largest North American OEMs to reduce the level of incentives. At the same time, dealer inventories have risen to levels well above those in the prior year, especially in the all-important truck and SUV segments for Ford and GM. Considering these higher inventory levels, the demonstrated efforts by the "Big Three" to reduce the use of incentives, and the moderately negative outlook expressed in many recent industry forecasts, we expect a weakening in North American vehicle production in the 2003 calendar year by 3% to approximately 16.0 million units. In Europe, we expect production levels to remain consistent with the prior year at approximately 16.2 million units. At these levels of production, we project sales for our 2003 calendar year to increase in the range of 10% over the 2002 calendar year. In addition, we anticipate capital spending for the 2003 calendar year to be in the range of $150 million as we continue to invest for new business growth.
RISKS AND UNCERTAINTIES (FORWARD-LOOKING STATEMENTS)
This MD&A contains statements which, to the extent that they are not recitations of historical fact, may constitute "forward-looking statements" within the meaning of the Private Securities Litigation Reform Act of 1995. Forward-looking statements may include financial and other projections, as well as statements regarding our future plans, objectives or performance, or our underlying assumptions. The words "estimate," "anticipate," "believe," "expect," "intend" and other similar expressions are intended to identify forward-looking statements. Persons reading this MD&A are cautioned that such statements are only predictions, and that our actual future results or performance may be materially different.
Forward-looking information involves certain risks, assumptions, uncertainties and other factors which may cause actual future results or anticipated events to differ materially from those expressed or implied in any forward-looking statements. In our case, these factors principally relate to the risks associated with the automotive industry and include, but are not limited to: our operating and/or financial performance, including the affect of new accounting standards (such as the ongoing requirement for impairment testing of long-lived assets) on our financial results; our ability to identify, negotiate, complete and integrate acquisitions; the ability to finance our business requirements, including raising required funding as necessary; global economic conditions and changes in the various economies in which we operate; our relationship with Magna International Inc.; fluctuations in interest rates; changes in consumer and business confidence levels; consumers' personal debt levels; vehicle prices; the extent and nature of purchasing or leasing incentive campaigns offered by automotive manufacturers; environmental emission and safety regulations; fuel prices and availability; the continuation and extent of outsourcing by automotive manufacturers; the extent and continued use of steel as a primary material for automotive parts versus alternative materials (such as aluminum and plastics); our ability to continue to meet customer specifications relating to product performance, cost, quality and service; industry cyclicality or seasonality; trade and/or labour issues or disruptions; customer pricing pressures, pricing concessions and cost absorptions; warranty, recall and product liability costs and risks; actual levels of program production volumes by our customers compared to original expectations, including program cancellations or delays and changes in product mix; new program launch risks; our dependence on certain engine and transmission programs and the market success and consumer acceptance of the vehicles into which such powertrain products are installed; our relationship with and dependence on certain customers; currency exposure; technological developments by our competitors; governmental, environmental and regulatory policies and our ability to anticipate or respond to changes therein; disruptions of terrorism or war; and other changes in the competitive environment in which we operate. For a more detailed discussion of some of these factors, reference is made to the disclosures regarding risks and uncertainties set forth in our Annual Information Form, Form 40-F and other public filings. In addition, our ongoing evaluation of the viability of the operations of Eralmetall (expected to be concluded in the first half of 2003) may have an impact on our actual future results or performance. We do not intend, nor do we undertake any obligation, to update or revise any forward-looking statements to reflect subsequent information, events, results, circumstances or otherwise.
20
MANAGEMENT'S RESPONSIBILITY FOR FINANCIAL REPORTING
Tesma's management is responsible for the preparation and presentation of the consolidated financial statements and all information in this report to shareholders. The consolidated financial statements were prepared by management in accordance with Canadian generally accepted accounting principles and, where appropriate, reflect estimates based upon the judgment of management. Where alternative accounting methods exist, management has selected those that it considered to be the most appropriate in the circumstances. Financial statements include certain amounts based on estimates and judgments. Management has determined such amounts on a reasonable basis designed to ensure that the consolidated financial statements are presented fairly, in all material respects. Financial information presented elsewhere in this report to shareholders has been prepared by management on a basis consistent with the consolidated financial statements. The consolidated financial statements have been reviewed by the Audit Committee and approved by the Board of Directors of Tesma.
Management is responsible for the development and maintenance of systems of internal accounting and administrative controls of high quality, consistent with reasonable cost. Such systems are designed to provide reasonable assurance that the financial information is accurate, relevant and reliable, and that Tesma's assets are appropriately accounted for and adequately safeguarded.
Tesma's Audit Committee is appointed by the Board of Directors annually and is completely comprised of outside directors. The Committee meets periodically with management, as well as with the independent auditors, to satisfy itself that each is properly discharging its responsibilities, to review the consolidated financial statements and the independent Auditors' Report and to discuss significant financial reporting issues and auditing matters. The Audit Committee reports its findings to the Board of Directors for consideration when approving the consolidated financial statements for issuance to the shareholders.
The consolidated financial statements have been audited by Ernst & Young LLP, the independent auditors, in accordance with Canadian and United States generally accepted auditing standards on behalf of the shareholders of Tesma. The Auditors' Report outlines the nature of their examination and their opinion on Tesma's consolidated financial statements. The independent auditors have full and unrestricted access to the Audit Committee.
Toronto, Canada
February 3, 2003 | | |
| | |
| Anthony E. Dobranowski (signed) | | James L. Moulds (signed) |
| President and Chief Financial Officer | | Vice President, Finance and Treasurer |
AUDITORS' REPORT
To the Shareholders of
Tesma International Inc.
We have audited the consolidated balance sheets of Tesma International Inc. as at December 31, 2002 and July 31, 2002 and the consolidated statements of income and retained earnings and cash flows for the five-month period ended December 31, 2002 and for each of the years in the three-year period ended July 31, 2002. These financial statements are the responsibility of the Company's management. Our responsibility is to express an opinion on these financial statements based on our audits.
We conducted our audits in accordance with Canadian and United States generally accepted auditing standards. Those standards require that we plan and perform an audit to obtain reasonable assurance whether the financial statements are free of material misstatement. An audit includes examining, on a test basis, evidence supporting the amounts and disclosures in the financial statements. An audit also includes assessing the accounting
21
principles used and significant estimates made by management, as well as evaluating the overall financial statement presentation.
In our opinion, these consolidated financial statements present fairly, in all material respects, the financial position of the Company as at December 31, 2002 and July 31, 2002 and the results of its operations and its cash flows for the five-month period ended December 31, 2002 and for each of the years in the three-year period ended July 31, 2002 in accordance with Canadian generally accepted accounting principles.
As described in Note 1 to these consolidated financial statements, the Company changed its accounting policies for long-lived assets and foreign currency translation.
| | |
| Toronto, Canada | | Ernst & Young LLP (signed) |
| February 3, 2003 | | Chartered Accountants |
CONSOLIDATED FINANCIAL STATEMENTS
SIGNIFICANT ACCOUNTING POLICIES
(a) Basis of Presentation
The consolidated financial statements of Tesma International Inc. and its subsidiary entities (the Company) have been prepared in Canadian dollars following Canadian generally accepted accounting principles (Canadian GAAP). These principles are also in conformity, in all material respects, with accounting principles generally accepted in the United States (U.S. GAAP), except as described in Note 22 to the consolidated financial statements.
(b) Principles of Consolidation
The consolidated financial statements include the accounts of the Company. The Company accounts for its interests in jointly-controlled entities using the proportionate consolidation method. All significant intercompany balances and transactions have been eliminated.
(c) Foreign Currency Translation
Assets and liabilities of foreign subsidiaries and investees, all of which are self-sustaining, are translated using the exchange rate in effect at the end of the year, and revenues and expenses are translated at the average rate during the year. Exchange gains or losses on translation of the Company's net equity investment in these foreign subsidiaries and investees are deferred as a separate component of shareholders' equity. The appropriate amounts of exchange gains or losses accumulated in the separate component of shareholders' equity are reflected in income when there is a reduction in the Company's investment in these subsidiaries and investees as a result of capital transactions.
Foreign-exchange gains and losses on transactions occurring in a currency different than an operation's functional currency are reflected in income, except for gains and losses on foreign-exchange forward contracts used to hedge specific future commitments in foreign currencies. Gains or losses on these contracts are accounted for as a component of the related hedged transaction.
In December 2001, the Canadian Institute of Chartered Accountants (CICA) amended Handbook Section 1650 "Foreign Currency Translation." The most significant change under the new recommendations is the elimination of the deferral and amortization method for unrealized translation gains and losses on long-term monetary assets and liabilities that are now required to be reflected in income. In accordance with the updated standard, the Company adopted the new recommendations on a retroactive basis with restatement of prior periods. The impact of retroactively applying the new rules to the comparative years ended July 31, 2002, 2001 and 2000 was to increase (decrease) net income attributable to Class A Subordinate Voting and Class B Shares by $0.3 million,
22
($0.4) million, and $nil respectively, and increase (decrease) basic and diluted earnings per Class A Subordinate Voting or Class B share by $0.01, ($0.01) and $nil respectively.
(d) Use of Estimates
The preparation of consolidated financial statements in conformity with Canadian GAAP requires management to make estimates and assumptions that affect the amounts reported in the consolidated financial statements and accompanying notes. Management believes that the estimates utilized in preparing its consolidated financial statements are reasonable and prudent; however, actual results could differ from these estimates.
(e) Cash and Cash Equivalents
Cash and cash equivalents include cash on account, bonds, demand deposits and short-term investments with original or remaining maturities of three months or less. Cost approximates fair value.
(f) Inventories
Inventories are valued at the lower of cost and net realizable value, with cost being determined substantially on a first-in, first-out basis. Cost includes the cost of materials plus direct labour applied to the product and the applicable share of manufacturing overhead.
(g) Capital Assets
Capital assets are recorded at historical cost, including interest capitalized on capital expenditures in progress, less related investment tax credits and government grants.
Depreciation is provided on a straight-line basis over the estimated useful lives of capital assets (including those under capital leases) at annual rates of 21/2% to 5% for buildings, 7% to 10% for general purpose equipment and 10% to 30% for special purpose equipment.
(h) Long-Lived Assets
Long-lived assets are assets that do not meet the definition of a current asset. In December 2002, the CICA approved and issued Handbook Section 3063, "Impairment of Long-Lived Assets" (CICA 3063), which establishes standards for the consideration and potential recognition, measurement and disclosure of an impairment in the carrying value of long-lived assets held for use. CICA 3063 is substantially harmonized with the Financial Accounting Standards Board (FASB) Standard FAS 144, which provides guidance for the same issues under U.S. GAAP.
Under CICA 3063, an impairment loss should be recognized when the carrying amount of a long-lived asset or asset group is not recoverable and exceeds its fair value. An asset is considered to be impaired if the estimated undiscounted future cash flows attributable to the asset are less than the associated carrying amount. When an asset is impaired in accordance with the above test, an impairment loss is measured and recognized as the excess, if any, of the carrying value of the asset over the respective fair value. The Company has elected to implement the new rules earlier than the date required under the standard and adopt them on a prospective basis effective August 1, 2002.
Upon application of the new rules during the current period, an impairment loss was recognized on a long-lived group of assets as fully described in Note 6.
(i) Goodwill
Goodwill represents the excess of the purchase price of the Company's interest in subsidiary entities over the fair value of the underlying net identifiable tangible and intangible assets arising on acquisition.
Effective August 1, 2001, the Company adopted the CICA new recommendations under Handbook Section 3062 "Goodwill and Other Intangible Assets" (CICA 3062) for goodwill and intangible assets. CICA 3062 requires non-amortization of existing and future goodwill and intangible assets that meet the criteria for indefinite life, and accordingly, the Company ceased recording goodwill amortization upon adoption of the new standard.
23
Instead, the Company must determine at least once annually whether the fair value of each reporting unit to which goodwill has been attributed is less than the carrying value of the reporting unit's net assets including goodwill, thus indicating impairment. Any impairments are then recorded as a separate charge against earnings and as a reduction of the carrying value of goodwill.
The Company prospectively applied these new rules, without restatement of any comparative periods. However, if retroactively applied, net income attributable to Class A Subordinate Voting and Class B Shares for the comparative years ended July 31, 2001 and July 31, 2000 would have been higher by $1.7 million and $1.6 million respectively. Similarly, basic and diluted earnings per Class A Subordinate Voting or Class B Share would each have been approximately $0.06 higher in each of these comparative years.
(j) Other Assets
Costs incurred in establishing new facilities which require substantial time to reach commercial production capability are capitalized as deferred preproduction costs. Amortization is provided over periods up to five years from the date commercial production is achieved. No amounts were capitalized during the five-month period ended December 31, 2002 and during the year ended July 31, 2002.
The Company accounts for its investments in which it has significant influence on the equity basis.
(k) Revenue Recognition
Revenue from the sale of manufactured products is recognized when measurable, upon shipment to (or receipt by customers depending on contractual terms), and acceptance by, customers. Revenues from separately priced engineering services and tooling contracts are recognized primarily on a percentage of completion basis, but in some cases, depending upon the terms of the contract, the completed contract basis may be applied.
Revenue and cost of sales are presented on a gross basis in the consolidated statements of income when the Company is acting as principal and is subject to the significant risks and rewards of the business. Otherwise, components of revenues and related costs are presented on a net basis.
(l) Preproduction Costs Related to Long-Term Supply Agreements
Costs incurred (net of customer subsidies) related to design and engineering, which are reimbursed as part of subsequent related parts production piece-price amounts, are expensed as incurred unless a contractual guarantee for reimbursement exists.
Costs incurred (net of customer subsidies) related to design and development costs for moulds, dies and other tools that the Company does not own (and that will be used in, and reimbursed as part of the piece-price amounts for, subsequent related parts production) are expensed as incurred, unless the supply agreement provides a contractual guarantee for reimbursement or the non-cancelable right to use the moulds, dies and other tools during the supply agreement.
(m) Government Financing
The Company makes periodic applications for financial assistance under available government assistance programs in the various jurisdictions in which the Company operates. Grants relating to capital expenditures are reflected as a reduction of the cost of the related assets. Grants and tax credits relating to current operating expenditures are recorded as a reduction of expense at the time the eligible expenses are incurred. The Company also receives loans which are recorded as liabilities in amounts equal to the cash received.
(n) Research and Development
The Company carries out various applied research and development (R&D) programs, certain of which are partially or fully funded by governments or by customers of the Company. Funding received is accounted for using the cost reduction approach. Research costs are expensed as incurred. Development costs are expensed as incurred, unless they meet the criteria under generally accepted accounting principles for deferral and amortization.
24
(o) Income Taxes
The Company uses the liability method of tax allocation for accounting for income taxes. Under the liability method of tax allocation, future tax assets and liabilities are determined based on differences between the financial reporting and tax bases of assets and liabilities and are measured using the substantively enacted tax rates and laws that will be in effect when the differences are expected to reverse.
(p) Stock-Based Compensation
The Company has two stock-based compensation plans which are described in Note 12. In November 2001,the CICA issued Handbook Section 3870 "Stock-Based Compensation and other Stock-Based Payments" (CICA 3870). CICA 3870 requires that all stock-based awards granted to non-employees (including those granted to directors not acting in their capacity as directors) must be accounted for at fair value. The new standard also encourages, but does not require, the use of the fair value method for valuing all stock-based compensation granted to employees and directors (acting in their capacities as directors). Specifically, the fair value method does not have to be applied to option plans where the only choice for the employee is to pay the exercise price and obtain stock. As prescribed by the new standard, the Company prospectively adopted CICA 3870 effective August 1, 2002 and applied the new rules to awards granted on or after the adoption date. The Company has elected to continue accounting for employee stock options using the intrinsic value method and to disclose proforma earnings as prescribed by the standard (see Note 12[b]). Under the intrinsic value method, compensation expense is recognized under the incentive stock option plan when stock options are granted to employees or directors and have intrinsic value at the time they are granted. Consideration paid by employees or directors on the exercise of stock options is credited to Class A Subordinate Voting Shares. The adoption of CICA 3870 had no effect on the Company's reported earnings for the five-month period ended December 31, 2002.
Compensation expense is recorded under the non-employee director share-based compensation plan as described in Note 12[c].
(q) Post-Retirement Medical Benefits
The Company provides a defined benefit post-retirement medical benefits plan covering eligible employees and retirees. The cost of post-retirement medical benefits is determined using the projected-benefit method prorated based on employment services and is expensed as employment services are rendered. Past service costs which arose upon introduction of the plan are being amortized to income over the employees' expected average remaining service lives.
(r) Earnings per Class A Subordinate Voting Share or Class B Share
Basic earnings per Class A Subordinate Voting Share or Class B Share are calculated using the weighted average number of Class A Subordinate Voting Shares outstanding during the year, plus the weighted average number of Class B Shares outstanding during the year.
Diluted earnings per Class A Subordinate Voting Share or Class B Share are calculated using the treasury stock method for the determination of the dilutive effect of outstanding options. Under this method:
- •
- the exercise of options is assumed at the beginning of the period (or at time of issuance, if later) and Class A Subordinate Voting Shares are assumed to be issued;
- •
- the proceeds from exercise are assumed to be used to purchase Class A Subordinate Voting Shares at the average market price during the period; and
- •
- the incremental number of Class A Subordinate Voting Shares (the difference between the number of Class A Subordinate Voting Shares assumed issued and assumed purchased) is included in the denominator of the diluted earnings per share computation.
25
CONSOLIDATED BALANCE SHEETS
INCORPORATED UNDER THE LAWS OF ONTARIO
As at
| | Note
| | December 31
2002
| | July 31
2002
|
|---|
(Canadian dollars in thousands)
| |
| |
| | (restated Note 1[c])
|
|---|
| ASSETS | | | | | | | | |
| Current | | | | | | | | |
| | Cash and cash equivalents | | | | $ | 211,859 | | $ | 176,759 |
| | Accounts receivable | | 20 | | | 229,288 | | | 198,383 |
| | Inventories | | 4 | | | 117,511 | | | 105,829 |
| | Future tax assets | | 9 | | | 298 | | | 7,263 |
| | Prepaid expenses and other | | | | | 12,873 | | | 12,302 |
| | | | |
| |
|
| | | | | | 571,829 | | | 500,536 |
| Capital assets | | 5,6,20,23 | | | 428,337 | | | 429,626 |
| Goodwill | | 7 | | | 21,345 | | | 20,774 |
| Other assets | | 6,8 | | | 7,864 | | | 8,603 |
| Future tax assets | | 9 | | | 705 | | | 1,003 |
| | | | |
| |
|
| | | | | $ | 1,030,080 | | $ | 960,542 |
| | | | |
| |
|
| LIABILITIES AND SHAREHOLDERS' EQUITY | | | | | | | | |
| Current | | | | | | | | |
| | Bank indebtedness | | | | $ | 72,281 | | $ | 30,053 |
| | Accounts payable | | 20 | | | 121,666 | | | 106,316 |
| | Accrued salaries and wages | | 11 | | | 32,961 | | | 42,128 |
| | Other accrued liabilities | | 12,20 | | | 37,883 | | | 36,098 |
| | Dividends payable | | | | | 5,099 | | | — |
| | Income taxes payable | | | | | 15,022 | | | 7,448 |
| | Future tax liabilities | | 9 | | | 1,028 | | | 19,368 |
| | Long-term debt due within one year | | 10 | | | 2,822 | | | 4,420 |
| | | | |
| |
|
| | | | | | 288,762 | | | 245,831 |
| | | | |
| |
|
| Long-term debt | | 10 | | | 74,602 | | | 75,172 |
| | | | |
| |
|
| Future tax liabilities | | 9 | | | 23,280 | | | 20,269 |
| | | | |
| |
|
| Shareholders' equity | | | | | | | | |
| | Class A Subordinate Voting Shares | | 12 | | | 287,427 | | | 287,027 |
| | Class B Shares | | 12 | | | 2,583 | | | 2,583 |
| | Retained earnings | | | | | 340,008 | | | 317,643 |
| | Currency translation adjustment | | 15 | | | 13,418 | | | 12,017 |
| | | | |
| |
|
| | | | | | 643,436 | | | 619,270 |
| | | | |
| |
|
| | | | | $ | 1,030,080 | | $ | 960,542 |
| | | | |
| |
|
Commitments and contingencies (Notes 10, 14 and 21)
See accompanying notes.
On behalf of the Board:
Belinda Stronach(Signed)
Director |
Judson D. Whiteside(Signed)
Director |
26
CONSOLIDATED STATEMENTS OF INCOME AND RETAINED EARNINGS
| |
| | Five-month period ended December 31 2002
| | Years ended July 31
| |
|---|
| | Note
| | 2002
| | 2001
| | 2000
| |
|---|
(Canadian dollars in thousands, except per share and share figures.)
| |
| |
| | (restated Note 1[c])
| |
|---|
| Sales | | 20 | | $ | 627,018 | | $ | 1,341,616 | | $ | 1,202,144 | | $ | 1,127,785 | |
| | | | |
| |
| |
| |
| |
| Cost of goods sold | | 11,20 | | | 486,631 | | | 1,047,294 | | | 931,896 | | | 857,757 | |
| Selling, general and administrative | | 15,16,20 | | | 38,225 | | | 85,018 | | | 77,798 | | | 76,291 | |
| Depreciation and amortization | | 7 | | | 28,240 | | | 58,663 | | | 51,646 | | | 43,513 | |
| Impairment loss on long-lived assets | | 6 | | | 18,811 | | | — | | | — | | | — | |
| Affiliation fees and other charges | | 20 | | | 7,428 | | | 18,251 | | | 15,271 | | | 13,343 | |
| Interest, net | | 10,20 | | | 493 | | | 4,013 | | | 1,697 | | | 3,271 | |
| | | | |
| |
| |
| |
| |
| Income before income taxes | | | | | 47,190 | | | 128,377 | | | 123,836 | | | 133,610 | |
| Income taxes | | 9 | | | 14,558 | | | 44,272 | | | 35,425 | | | 48,693 | |
| | | | |
| |
| |
| |
| |
| Net income attributable to Class A Subordinate Voting Shares and Class B Shares | | | | | 32,632 | | | 84,105 | | | 88,411 | | | 84,917 | |
| Retained earnings, beginning of period | | | | | 317,643 | | | 252,234 | | | 186,737 | | | 120,595 | |
| Dividends | | | | | (10,267 | ) | | (18,696 | ) | | (18,552 | ) | | (15,712 | ) |
| Cumulative adjustment for change in accounting policies | | 1, 9 | | | — | | | — | | | (3,945 | ) | | 160 | |
| Surrender of stock options | | 12 | | | — | | | — | | | (417 | ) | | (3,223 | ) |
| | | | |
| |
| |
| |
| |
| Retained earnings, end of period | | | | $ | 340,008 | | $ | 317,643 | | $ | 252,234 | | $ | 186,737 | |
| | | | |
| |
| |
| |
| |
| Earnings per Class A Subordinate Voting Share or Class B Share | | | | | | | | | | | | | | | |
| | Basic | | 13 | | $ | 1.01 | | $ | 2.86 | | $ | 3.03 | | $ | 2.95 | |
| | Diluted | | 13 | | $ | 1.00 | | $ | 2.82 | | $ | 2.99 | | $ | 2.90 | |
| | | | |
| |
| |
| |
| |
| Average number of Class A Subordinate Voting Shares and Class B Shares outstanding during the period (in thousands) | | | | | | | | | | | | | | | |
| | Basic | | 13 | | | 32,300 | | | 29,454 | | | 29,214 | | | 28,766 | |
| | Diluted | | 13 | | | 32,513 | | | 29,829 | | | 29,558 | | | 29,322 | |
| | | | |
| |
| |
| |
| |
See accompanying notes.
27
CONSOLIDATED STATEMENTS OF CASH FLOWS
| |
| | Five-month period ended December 31 2002
| | Years ended July 31
| |
|---|
| | Note
| | 2002
| | 2001
| | 2000
| |
|---|
(Canadian dollars in thousands)
| |
| |
| | (restated Note 1[c])
| |
|---|
| CASH PROVIDED FROM (USED FOR): | | | | | | | | | | | | | | | |
| OPERATING ACTIVITIES | | | | | | | | | | | | | | | |
| Net income | | | | $ | 32,632 | | $ | 84,105 | | $ | 88,411 | | $ | 84,917 | |
| Items not involving current cash flows | | 18 | | | 40,828 | | | 69,397 | | | 45,588 | | | 51,747 | |
| | | | |
| |
| |
| |
| |
| | | | | | 73,460 | | | 153,502 | | | 133,999 | | | 136,664 | |
| Net change in non-cash working capital | | 18 | | | (28,709 | ) | | (9,776 | ) | | (60,473 | ) | | 10,545 | |
| | | | |
| |
| |
| |
| |
| | | | | | 44,751 | | | 143,726 | | | 73,526 | | | 147,209 | |
| | | | |
| |
| |
| |
| |
| INVESTING ACTIVITIES | | | | | | | | | | | | | | | |
| Capital asset additions | | 20 | | | (44,562 | ) | | (122,033 | ) | | (97,625 | ) | | (81,947 | ) |
| Increase in other assets | | | | | (798 | ) | | (1,735 | ) | | (1,452 | ) | | (1,288 | ) |
| Increased investment in subsidiaries | | 3 | | | (800 | ) | | (801 | ) | | (800 | ) | | (800 | ) |
| Proceeds from disposal of capital and other assets | | 20 | | | 2,674 | | | 1,523 | | | 425 | | | 3,065 | |
| Cash and cash equivalents acquired on additional investment in subsidiary | | 3 | | | — | | | 599 | | | — | | | — | |
| | | | |
| |
| |
| |
| |
| | | | | | (43,486 | ) | | (122,447 | ) | | (99,452 | ) | | (80,970 | ) |
| | | | |
| |
| |
| |
| |
| FINANCING ACTIVITIES | | | | | | | | | | | | | | | |
| Increase (decrease) in bank indebtedness | | | | | 40,801 | | | (18,357 | ) | | (3,407 | ) | | 19,353 | |
| Issuance of Class A Subordinate Voting Shares, net of related costs | | 12 | | | 400 | | | 97,967 | | | 1,792 | | | 5,586 | |
| Dividends on Class A Subordinate Voting Shares and Class B Shares | | | | | (5,168 | ) | | (18,696 | ) | | (18,552 | ) | | (15,712 | ) |
| Repayments of long-term debt | | 10 | | | (2,643 | ) | | (5,083 | ) | | (9,750 | ) | | (7,617 | ) |
| Issues of long-term debt | | 10 | | | — | | | 124 | | | 8,753 | | | 1,377 | |
| Surrender of stock options | | 12 | | | — | | | — | | | (417 | ) | | (3,223 | ) |
| | | | |
| |
| |
| |
| |
| | | | | | 33,390 | | | 55,955 | | | (21,581 | ) | | (236 | ) |
| | | | |
| |
| |
| |
| |
| Effect of exchange rate changes on cash and cash equivalents | | | | | 445 | | | 3,822 | | | 106 | | | (1,481 | ) |
| | | | |
| |
| |
| |
| |
| Net increase (decrease) in cash and cash equivalents during the period | | | | | 35,100 | | | 81,056 | | | (47,401 | ) | | 64,522 | |
| Cash and cash equivalents, beginning of period | | | | | 176,759 | | | 95,703 | | | 143,104 | | | 78,582 | |
| | | | |
| |
| |
| |
| |
| Cash and cash equivalents, end of period | | | | $ | 211,859 | | $ | 176,759 | | $ | 95,703 | | $ | 143,104 | |
| | | | |
| |
| |
| |
| |
See accompanying notes.
28
NOTES TO CONSOLIDATED FINANCIAL STATEMENTS
1. SIGNIFICANT ACCOUNTING POLICIES
The significant accounting policies followed by the Company are set out under "Significant Accounting Policies" preceding these consolidated financial statements.
2. JOINTLY-CONTROLLED ENTITIES
The consolidated financial statements include the Company's proportionate share of the combined revenues, expenses, assets and liabilities of its jointly-controlled entities as follows:
| | Five-month period ended December 31 2002
| | Years ended July 31
|
|---|
Results of Operations
|
|---|
| | 2002
| | 2001
| | 2000
|
|---|
| | (Canadian dollars in thousands)
|
|---|
| Sales | | $ | 210,577 | | $ | 433,149 | | $ | 383,281 | | $ | 385,099 |
| Cost of goods sold, other expenses and income taxes (i) | | | 184,159 | | | 385,855 | | | 341,805 | | | 350,395 |
| | |
| |
| |
| |
|
| Net income, after tax allocation | | $ | 26,418 | | $ | 47,294 | | $ | 41,476 | | $ | 34,704 |
| | |
| |
| |
| |
|
Financial Position, as at
| | December 31 2002
| | July 31
2002
|
|---|
| | (Canadian dollars in thousands)
|
|---|
| ASSETS | | | | | | |
| Current assets | | $ | 165,098 | | $ | 143,831 |
| Long-term assets | | | 47,840 | | | 51,076 |
| | |
| |
|
| Total assets | | $ | 212,938 | | $ | 194,907 |
| | |
| |
|
| LIABILITIES AND EQUITY | | | | | | |
| Current liabilities | | $ | 78,356 | | $ | 60,770 |
| Other liabilities | | | — | | | 150 |
| Loans from partners and shareholders | | | 47,089 | | | 47,089 |
| Equity (ii) | | | 87,493 | | | 86,898 |
| | |
| |
|
| Total liabilities and equity | | $ | 212,938 | | $ | 194,907 |
| | |
| |
|
| |
| | Years ended July 31
| |
|---|
Statements of Cash Flows
| | Five-month period ended December 31 2002
| |
|---|
| | 2002
| | 2001
| | 2000
| |
|---|
| | (Canadian dollars in thousands)
| |
|---|
| Cash provided from (used for): | | | | | | | | | | | | | |
| | Operating activities | | $ | 41,734 | | $ | 62,669 | | $ | 43,290 | | $ | 51,676 | |
| | Investing activities | | | (6,832 | ) | | (21,473 | ) | | (7,920 | ) | | (8,671 | ) |
| | Financing activities (iii) | | | (35,102 | ) | | (48,469 | ) | | (19,694 | ) | | (38,504 | ) |
| | |
| |
| |
| |
| |
| | | $ | (200 | ) | $ | (7,273 | ) | $ | 15,676 | | $ | 4,501 | |
| | |
| |
| |
| |
| |
(i) The results of operations for the five-month period ended December 31, 2002 include the benefit of income tax refunds totaling $2.9 million, as outlined in Note 9(a)(i). For the year ended July 31, 2001, results of operations include the benefit of income tax refunds totaling $6.1 million.
(ii) Included in equity are undistributed earnings of $79.6 million at December 31, 2002 (July 31, 2002 — $79.0 million).
(iii) Included in cash flows from financing activities for the five-month period ended December 31, 2002 is a net cash distribution to the Company of $35.1 million (years ended July 31, 2002 — $51.5 million; 2001 — $19.7 million; 2000 — $38.5 million).
29
Pursuant to agreements amongst the partners of one of the jointly-controlled entities, net income is to be distributed annually to the partners and each partner is required to loan back to the entity approximately 35% of such distribution, unless otherwise determined by the management committee of the entity. No amounts were required to be loaned back during the five-month period ended December 31, 2002 or in the years ended July 31, 2002, 2001 or 2000. The management committee is responsible for overseeing and directing the operations and management of the entity and is comprised of four members of which the Company is entitled to appoint two. The repayment of this entity's partners' capital of $7.4 million at December 31, 2002 (July 31, 2002 — $7.4 million) and loans are subject to the approval of the management committee.
In another jointly-controlled entity, shareholders' loans total $31.0 million at December 31, 2002 (July 31, 2002 — $29.4 million). These loans are interest bearing at the rate of prime plus 2%, payable monthly, with principal repayment due on August 1, 2004.
3. BUSINESS ACQUISITIONS
Acquisitions in Prior Years
In December 2001, the Company completed the acquisition of an additional 30% interest in one of its jointly-controlled entities for nominal cash consideration, increasing the Company's ownership to 75%. The transaction was accounted for using the purchase method. The net effect on the Company's balance sheet was a net decrease in working capital of $4.9 million (including cash acquired of $0.6 million), an increase in capital assets of $4.7 million, additional long-term debt acquired of $0.4 million, and an increase in goodwill of $0.6 million. Pursuant to agreements executed on the purchase, the only other remaining shareholder of the jointly-controlled entity has the option to purchase an additional 25% equity ownership interest from the Company at any time prior to August 1, 2004 at a formula price. While the option is outstanding, the Company and the remaining shareholder each retain the right to nominate one of the two directors composing the board of directors of this jointly-controlled entity.
Under the terms of the acquisition of Triam Automotive Corporation (Sterling Heights) in October 1998, the Company agreed to pay an additional amount not to exceed $4.0 million in respect of the five-year period commencing February 1, 1998 if Sterling Heights achieves certain predetermined levels of earnings. The Company has recognized the full $4.0 million in additional purchase consideration to December 31, 2002 (July 31, 2002 — $3.2 million) as earnings have exceeded the predetermined levels in each of the five years.
Similarly, under the terms of the acquisition of Hanwha Automotive Components Corporation (HACC) in January 1999, the Company agreed to pay additional amounts, not to exceed US$2.0 million, in respect of the four-year period commencing January 1, 1999 equal to 50% of the amount that HACC's adjusted earnings exceed predetermined thresholds. No amounts have been paid or accrued throughout the four-year post-acquisition period which ended December 31, 2002.
4. INVENTORIES
Inventories consist of:
| | December 31 2002
| | July 31 2002
|
|---|
| | (Canadian dollars in thousands)
|
|---|
| Raw materials and supplies | | $ | 43,951 | | $ | 38,295 |
| Work-in-process | | | 18,013 | | | 16,887 |
| Finished goods | | | 28,760 | | | 24,943 |
| Tooling and engineering (i) | | | 26,787 | | | 25,704 |
| | |
| |
|
| | | $ | 117,511 | | $ | 105,829 |
| | |
| |
|
(i) Tooling and engineering inventory represents costs incurred on separately priced tooling and engineering service contracts in excess of billed and unbilled amounts included in accounts receivable.
30
5. CAPITAL ASSETS
Capital assets consist of:
| | December 31 2002
| | July 31 2002
|
|---|
| | (Canadian dollars in thousands)
|
|---|
| Land (i) | | $ | 30,420 | | $ | 30,450 |
| Buildings (i) | | | 105,622 | | | 104,415 |
| Machinery and equipment (i), (ii) | | | 509,518 | | | 510,346 |
| Capital expenditures in progress (iii) | | | 64,253 | | | 60,228 |
| | |
| |
|
| | | | 709,813 | | | 705,439 |
| | |
| |
|
| Accumulated depreciation (i), (ii), (iv) | | | 281,476 | | | 275,813 |
| | |
| |
|
| | | $ | 428,337 | | $ | 429,626 |
| | |
| |
|
(i) As fully described in Note 6, the Company recorded a write-down in the carrying value of long-lived assets at a foreign subsidiary consisting mainly of land, buildings, and machinery and equipment. As part of the write-down, the Company recorded reductions to both the cost and accumulated depreciation balances related to these assets.
(ii) Machinery and equipment at December 31, 2002 includes $19.3 million (July 31, 2002 — $19.6 million) for assets under capital leases and accumulated depreciation includes $8.8 million at December 31, 2002 (July 31, 2002 — $8.1 million) for assets under capital leases.
(iii) Capital expenditures in progress include costs incurred to date, including deposits, for machinery and equipment, assembly lines, and facility upgrades and expansions which are still in progress or are not yet in service as at the balance sheet date. Accordingly, depreciation on these assets will commence when the assets are put into use.
(iv) Accumulated depreciation at December 31, 2002 includes $18.2 million (July 31, 2002 — $18.3 million) for buildings and $263.3 million (July 31, 2002 — $257.5 million) for machinery and equipment.
6. LONG-LIVED ASSETS
In accordance with the new recommendations of CICA 3063 under Canadian GAAP, the Company is required to consider whether factors exist that would indicate that there is a potential impairment in the carrying value of any long-lived assets of the consolidated entity. Among other factors, current and historical operating losses and projected future losses following the launch of new business at the Company's German die-casting facility prompted the Company to initiate and complete a review for impairment of the approximate $32.2 million carrying value of capital and other long-lived assets (asset group) of this subsidiary. In the initial step of the review, the estimated future undiscounted cash flows attributable to the asset group were determined to be less than their carrying value, thus providing an indication of impairment. An impairment loss was then measured as the excess of the carrying value of the asset group over its estimated fair value.
The group of assets reviewed in this exercise consisted mainly of the machinery, equipment, land and buildings of this subsidiary. The estimated fair value of the asset group was determined primarily using a market-based approach which estimates value based on market prices in actual transactions and on asking prices for currently available assets that are in a similar state and condition. The remaining assets, for which the market approach was not possible, were valued using a cost approach which estimates value based on what a prudent investor would pay to reproduce the assets with a similar application or utility. Utilizing these approaches, the fair value of the asset group was determined to be approximately $13.4 million. As a result, the Company recorded $18.8 million as a write-down of the carrying value of the respective assets of this subsidiary to their estimated fair values and recorded an impairment loss in the five-month period ending December 31, 2002 totaling $13.2 million, net of applicable taxes. The results of this subsidiary and the associated impairment loss are included in the European Automotive segment of the Company's operations (Note 19).
31
7. GOODWILL
At December 31, 2002, the Company had consolidated goodwill, recorded at carrying value, totaling $21.3 million (July 31, 2002 — $20.8 million). In the year ending July 31, 2002, the Company prospectively adopted the CICA non-amortization and impairment rules for existing goodwill and, accordingly, ceased recording amortization of goodwill effective the start of this period. In fiscal 2001, $1.7 million (fiscal 2000 — $1.6 million) of goodwill amortization was recorded.
During the five-month period ended December 31, 2002, the Company recorded an additional $0.8 million of goodwill on earnout provisions associated with prior year acquisitions as described in Note 3.
During the five-month period ended December 31, 2002, the Company assessed the fair value of the reportable segments to which the underlying goodwill is attributable and determined that no charge for impairment of goodwill was required.
8. OTHER ASSETS
Other assets consist of:
| | December 31 2002
| | July 31 2002
|
|---|
| | (Canadian dollars in thousands)
|
|---|
| Deferred preproduction costs (net of accumulated amortization of $5,237 [July 31, 2002 — $4,680]) | | $ | 1,449 | | $ | 2,006 |
| Long-term receivables | | | 2,674 | | | 2,228 |
| Other | | | 3,741 | | | 4,369 |
| | |
| |
|
| | | $ | 7,864 | | $ | 8,603 |
| | |
| |
|
9. INCOME TAXES
(a) Rate Reconciliation
Effective August 1, 2000, the Company adopted the new recommendations of the CICA for the accounting and disclosure of income taxes. The Company adopted these recommendations prospectively without restating the financial statements of any prior periods. Accordingly, the fiscal 2000 comparative amounts presented were determined using the deferral method of accounting for income taxes.
The provision for income taxes differs from the expense that would be obtained by applying Canadian statutory rates as a result of the following:
| | Five-month period ended December 31 2002
| | Years ended July 31
| |
|---|
| | 2002
| | 2001
| | 2000
| |
|---|
| Canadian statutory income tax rate | | 39.0 | % | 40.0 | % | 42.9 | % | 44.5 | % |
| Manufacturing and processing profits deduction | | (5.4) | | (6.2) | | (8.2) | | (8.8) | |
| | |
| |
| |
| |
| |
| Expected income tax rate | | 33.6 | | 33.8 | | 34.7 | | 35.7 | |
| Tax refunds on profit distributions (i) | | (6.0) | | — | | (7.7) | | — | |
| Foreign rate differentials | | (0.8) | | (0.5) | | 0.7 | | 0.4 | |
| Losses not tax benefited in excess of (less than) losses utilized | | 2.0 | | 1.3 | | (0.1) | | 0.4 | |
| Other | | 2.1 | | (0.1) | | 1.0 | | (0.1) | |
| | |
| |
| |
| |
| |
| Effective income tax rate | | 30.9 | % | 34.5 | % | 28.6 | % | 36.4 | % |
| | |
| |
| |
| |
| |
(i) During the five-month period ending December 31, 2002, the Company recognized $2.9 million in tax refunds realized by one of the Company's foreign subsidiaries as the final stage of prior-year tax-planning initiatives. In 2001, the Company recognized the full benefit of tax refunds totaling $9.4 million on dividends paid, and to be paid, out of two German subsidiaries. The refunds represented the recovery of taxes paid at higher rates in prior years through the payment of dividends before the end of calendar year 2001.
32
(b) Provision
The details of the income tax provision are as follows:
| | Five-month period ended December 31 2002
| | Years ended July 31
|
|---|
| | 2002
| | 2001
| | 2000
|
|---|
| | (Canadian dollars in thousands)
|
|---|
| Current provision | | | | | | | | | | | | |
| | Canadian federal taxes | | $ | 18,117 | | $ | 17,329 | | $ | 21,744 | | $ | 20,940 |
| | Canadian provincial taxes | | | 9,673 | | | 10,750 | | | 11,926 | | | 12,528 |
| | Foreign taxes (i) | | | (5,599 | ) | | 7,872 | | | 12,666 | | | 10,521 |
| | |
| |
| |
| |
|
| | | $ | 22,191 | | $ | 35,951 | | $ | 46,336 | | $ | 43,989 |
| | |
| |
| |
| |
|
| Future provision (recovery) | | | | | | | | | | | | |
| | Canadian federal taxes | | $ | (6,579 | ) | $ | 4,645 | | $ | (3,153 | ) | $ | 2,805 |
| | Canadian provincial taxes | | | (3,466 | ) | | 2,445 | | | (735 | ) | | 1,715 |
| | Foreign taxes (ii) | | | 2,412 | | | 1,231 | | | (7,023 | ) | | 184 |
| | |
| |
| |
| |
|
| | | $ | (7,633 | ) | $ | 8,321 | | $ | (10,911 | ) | $ | 4,704 |
| | |
| |
| |
| |
|
| | | $ | 14,558 | | $ | 44,272 | | $ | 35,425 | | $ | 48,693 |
| | |
| |
| |
| |
|
(i) Included in the current foreign tax provision are tax refunds received totaling $2.9 million as referred to in Note 9(a)(i).
(ii) Included in the future tax provision for foreign entities for the five-month period ended December 31, 2002 is a $5.6 million recovery on temporary differences consisting of book depreciation in excess of tax depreciation recognized as part of the write-down of certain long-lived assets to their fair value for accounting purposes as described in Note 6.
[c] Future Provision (Recovery)
Future income taxes have been provided (recovered) on temporary differences which consist of the following:
| | Five-month period ended December 31 2002
| | Years ended July 31
| |
|---|
| | 2002
| | 2001
| | 2000
| |
|---|
| | (Canadian dollars in thousands)
| |
|---|
| Tax deferred income | | $ | (7,907 | ) | $ | 5,383 | | $ | (1,080 | ) | $ | 3,763 | |
| Tax refunds on profit distributions | | | 7,071 | | | 3,502 | | | (9,408 | ) | | — | |
| Book depreciation (in excess of) less than tax depreciation (Note 9[b][ii]) | | | (6,210 | ) | | (151 | ) | | 459 | | | 236 | |
| Reduction in enacted tax rates | | | (229 | ) | | (670 | ) | | — | | | — | |
| Book amortization of deferred preproduction costs in excess of tax basis | | | (188 | ) | | (455 | ) | | (464 | ) | | (477 | ) |
| Other | | | (170 | ) | | 712 | | | (418 | ) | | 1,182 | |
| | |
| |
| |
| |
| |
| | | $ | (7,633 | ) | $ | 8,321 | | $ | (10,911 | ) | $ | 4,704 | |
| | |
| |
| |
| |
| |
33
[d] Future Tax Assets and Liabilities
Future tax assets and liabilities consist of the following:
| | December 31 2002
| | July 31 2002
|
|---|
| | (Canadian dollars in thousands)
|
|---|
| Current future tax assets | | | | | | |
| | Share issue costs | | $ | 298 | | $ | 122 |
| | Tax refunds on profit distributions | | | — | | | 7,141 |
| | |
| |
|
| | | $ | 298 | | $ | 7,263 |
| | |
| |
|
| Long-term future tax assets | | | | | | |
| | Share issue costs | | $ | 705 | | $ | 1,003 |
| | |
| |
|
| | | $ | 705 | | $ | 1,003 |
| | |
| |
|
| Current future tax liabilities | | | | | | |
| | Tax deferred income (i) | | $ | — | | $ | 16,747 |
| | Tax depreciation in excess of book depreciation | | | 385 | | | 1,169 |
| | Net preproduction costs book value in excess of tax value | | | 452 | | | 455 |
| | Other | | | 191 | | | 997 |
| | |
| |
|
| | | $ | 1,028 | | $ | 19,368 |
| | |
| |
|
| Long-term future tax liabilities | | | | | | |
| | Tax depreciation in excess of book depreciation | | $ | 9,595 | | $ | 15,217 |
| | Tax deferred income | | | 8,741 | | | — |
| | Net preproduction costs book value in excess of tax value | | | 38 | | | 227 |
| | Other | | | 4,906 | | | 4,825 |
| | |
| |
|
| | | $ | 23,280 | | $ | 20,269 |
| | |
| |
|
| Net future income tax liabilities | | $ | 23,305 | | $ | 31,371 |
| | |
| |
|
(i) Due to the Company's change in its fiscal year end to December, a new effective tax year end for the Company was triggered for the five-month period ending December 31, 2002 (the stub period). As a result, certain temporary differences reversed during this period and the Company was required to include the amounts in its taxable income for the stub period. Accordingly, the future tax liabilities associated with these differences have now been reclassified to current income taxes payable at December 31, 2002.
(e) Taxes Paid
Income taxes paid in cash were $15.9 million for the five-month period ended December 31, 2002 [years ended July 31, 2002 — $38.8 million; 2001 — $46.5 million; 2000 — $31.9 million].
(f) Loss Carryforwards
At December 31, 2002, certain subsidiaries of the Company have tax loss carryforwards, in various jurisdictions, of approximately $32.9 million. Of these losses, $28.5 million have no expiry date and $4.4 million expire between 2004 and 2009. The tax benefits of the full $32.9 million of these losses have not been recognized in the consolidated financial statements. In addition to these losses, at December 31, 2002, there are temporary differences at one of our jointly-controlled entities, totaling $4.4 million, that have not been tax benefited.
34
10. DEBT
(a) Long-Term Debt
The Company's long-term debt consists of the following:
| | December 31 2002
| | July 31
2002
|
|---|
| | (Canadian dollars in thousands)
|
|---|
| 6.22% Senior Unsecured Notes (Note 10[b]) | | $ | 60,000 | | $ | 60,000 |
| Bank term debt (Note 10[c]) | | | 13,737 | | | 14,878 |
| Obligations under capital leases (Note 10[d]) | | | 2,580 | | | 3,585 |
| Other | | | 1,107 | | | 1,129 |
| | | | 77,424 | | | 79,592 |
| | |
| |
|
| Less amounts due within one year | | | 2,822 | | | 4,420 |
| | |
| |
|
| | | $ | 74,602 | | $ | 75,172 |
| | |
| |
|
(b) 6.22% Senior Unsecured Notes
The $60 million 6.22% Senior Unsecured Notes (the Notes) are due May 25, 2006. These Notes require the Company to maintain certain covenants.
(c) Bank Term Debt
Bank term debt consists of amounts originally denominated in the following currencies or legacy currencies:
| | Final maturity
| | Weighted average interest rate
| | December 31 2002
| | July 31
2002
|
|---|
| | (Canadian dollars in thousands)
|
|---|
| Austrian schillings (i) | | 2003 - 2009 | | 1.56% | | $ | 10,318 | | $ | 11,191 |
| German deutschmarks (ii) | | 2003 - 2007 | | 6.71% | | | 2,070 | | | 2,200 |
| Other | | 2008 | | 3.80% | | | 1,349 | | | 1,487 |
| | |
| |
| |
| |
|
| | | | | | | $ | 13,737 | | $ | 14,878 |
| | |
| |
| |
| |
|
(i) Austrian Schillings
At December 31, 2002, $0.2 million (AS 2.0 million) (July 31, 2002 — $0.4 million (AS 3.1 million)) is advanced under a total line of $0.2 million [July 31, 2002 — $0.4 million]. Interest is payable at a fixed rate of 4.38%. The loan is repayable in equal semi-annual installments and matures December 31, 2003.
Under a banking arrangement which was conditional on the attainment of certain employment and capital expenditure requirements, at December 31, 2002 long-term debt of $10.1 million (AS 85 million) [July 31, 2002 — $9.7 million (AS 85 million)] has been advanced under potential lines totaling $23.7 million (AS 200 million) as conditions required for further funds under this arrangement have not been satisfied. Interest is currently payable at a fixed rate of 1.5%. The loan is repayable in equal semi-annual installments beginning July 1, 2003 and matures January 1, 2009. Effective July 1, 2003 through to maturity, interest will be payable at a fixed rate of 2.95%. A portion of the loan is collateralized by land and buildings of certain subsidiaries.
(ii) German Deutschmarks
At December 31, 2002, bank term debt of $2.1 million (DM 2.5 million) [July 31, 2002 — $2.2 million (DM 2.7 million)] is advanced under total lines of $2.1 million [July 31, 2002 — $2.2 million]. Interest is currently payable at fixed rates ranging from 5.70% to 7.32%. The principal amounts are repayable at various intervals over the next five years. This debt is collateralized by land, building and specific assets of certain subsidiaries.
35
(d) Obligations Under Capital Leases
Obligations under capital leases consist of amounts originally denominated in the following currencies or legacy currencies:
| | Final maturity
| | Weighted average interest rate
| | December 31 2002
| | July 31 2002
|
|---|
| | (Canadian dollars in thousands)
|
|---|
| U.S. dollars (i) | | 2003-2004 | | 8.21% | | $ | 1,612 | | $ | 2,516 |
| German deutschmarks | | 2005 | | 5.75% | | | 947 | | | 1,029 |
| Korean won | | 2003 | | 12.80% | | | 21 | | | 40 |
| | |
| |
| |
| |
|
| | | | | | | $ | 2,580 | | $ | 3,585 |
| | |
| |
| |
| |
|
(i) Interest is payable at floating rates currently ranging from 3.05% to 8.50%.
(e) Principal Repayments
Future annual principal repayments on long-term debt are estimated to be as follows for the years ending December 31:
| |
|
|---|
| | (Canadian dollars in thousands)
|
|---|
| 2003 | | $ | 2,822 |
| 2004 | | | 4,109 |
| 2005 | | | 2,556 |
| 2006 | | | 62,256 |
| 2007 | | | 2,078 |
| Thereafter | | | 3,603 |
| | |
|
| | | $ | 77,424 |
| | |
|
(f) Bank Indebtedness
(i) The Company has an unsecured $50 million operating line of credit bearing interest at variable rates per annum not exceeding the bank's prime rate of interest. At December 31, 2002, the Company had outstanding letters of credit in the amount of $0.7 million drawn under this line of credit, and $49.3 million of this line was unused and available. The related credit agreement requires the Company to maintain certain covenants. The Company also has foreign-exchange facilities in the amount of $30 million (Note 14[a]).
(ii) One of the Company's jointly-controlled entities has an unsecured $15 million operating line of credit bearing interest at variable rates per annum not exceeding the bank's prime rate of interest, all of which was unused and available at December 31, 2002. The related credit agreement provides for the maintenance of certain financial ratios. This jointly-controlled entity also has a foreign-exchange facility in the amount of US$50 million (Note 14[a]), and one of its subsidiaries has unsecured demand lines of credit totaling $4.1 million (2.5 million), all of which were unused and available at December 31, 2002. Interest is payable at a negotiated interest rate based on the European Central Bank's (the ECB) leading interest rate.
(iii) The Company has various operating lines of credit for its European subsidiaries denominated in euros, German deutschmarks and Austrian schillings totaling $43.5 million. At December 31, 2002, $38.1 million was drawn on these lines, while $5.4 million remains unused and available. Interest on the euro-denominated operating lines of credit is currently payable at negotiated interest rates based on either the Austrian Control Bank Corporation's interest rate or the Euribor, as well as floating rates based on Euribor plus a margin ranging from 0.70% to 0.75%. Interest on German deutschmark-denominated operating lines of credit is payable at interest rates negotiated based on the Euribor and the leading interest rates of the ECB. Interest on the lines of credit denominated in Austrian schillings is payable at a fixed rate of 6.4%, floating rates based on Euribor plus 0.38% and a negotiated interest rate based on the Austrian National Bank interest rate for operating lines of
36
credit. Accounts receivable and certain assets of the related subsidiaries have been pledged as collateral under these lines of credit.
(iv) HACC has various operating lines of credit, denominated primarily in Korean won, of $41.0 million (31.4 billion won). At December 31, 2002, $35.4 million of these lines was unused and available. Interest is payable at negotiated variable rates based on prime and daily best lending rates, which are adjusted at periodic intervals, currently ranging from 6.4% to 9.4%. Certain assets of this subsidiary have been pledged as collateral under certain of these lines of credit.
(g) Interest, net
Net interest expense (income) includes:
| | Five-month period ended December 31 2002
| | Years ended July 31
| |
|---|
| | 2002
| | 2001
| | 2000
| |
|---|
| | (Canadian dollars in thousands)
| |
|---|
| Interest on long-term debt | | $ | 1,782 | | $ | 4,641 | | $ | 4,807 | | $ | 6,036 | |
| Other interest income, net — external | | | (1,302 | ) | | (656 | ) | | (3,223 | ) | | (2,765 | ) |
| Interest expense — Magna International Inc. (Magna) | | | 13 | | | 28 | | | 113 | | | — | |
| | |
| |
| |
| |
| |
| Interest, net | | $ | 493 | | $ | 4,013 | | $ | 1,697 | | $ | 3,271 | |
| | |
| |
| |
| |
| |
Net interest paid in cash was $1.0 million for the five-month period ended December 31, 2002 (years ended July 31, 2002 — $4.0 million; 2001 — $1.9 million; 2000 — $3.0 million).
11. POST-RETIREMENT MEDICAL BENEFITS
The Company provides a post-retirement medical benefits plan covering eligible employees and retirees. Retirees 60 years of age and older with ten or more years of service will be eligible for benefits. In addition, existing retirees, as at the date of plan implementation who meet the above criteria are also eligible for benefits. Benefits are capped, based on years of service.
The cost of benefits earned by employees is actuarially determined using the projected benefit method prorated based on service and management's best estimate of compensation increases, retirement ages of employees, future termination levels and expected returns on plan assets.
The significant actuarial assumptions adopted in measuring the Company's projected benefit obligations are as follows:
| |
| | Years ended July 31
|
|---|
| | Five-month period ended December 31 2002
|
|---|
| | 2002
| | 2001
|
|---|
| Discount rate | | 6.8% | | 6.8% | | 7.5% |
| Rate of compensation increase | | 4.0% | | 4.0% | | 4.0% |
| | |
| |
| |
|
37
(a) Projected Benefit Obligation
The projected benefit obligation and the net amount included in accrued salaries and wages in the consolidated balance sheets is calculated as follows:
| | December 31 2002
| | July 31 2002
| |
|---|
| | (Canadian dollars in thousands)
| |
|---|
| Balance, beginning of year | | $ | 2,607 | | $ | 1,973 | |
| Current service costs | | | 119 | | | 220 | |
| Interest costs on projected benefit obligation | | | 73 | | | 141 | |
| Actuarial (gains) losses and changes in actuarial assumptions | | | (114 | ) | | 283 | |
| Benefits paid | | | (4 | ) | | (10 | ) |
| | |
| |
| |
| Unfunded obligation | | | 2,681 | | | 2,607 | |
| Unrecognized past service costs | | | (1,854 | ) | | (1,902 | ) |
| Unrecognized actuarial gains | | | 308 | | | 192 | |
| | |
| |
| |
| Net amount recognized in the consolidated balance sheets | | $ | 1,135 | | $ | 897 | |
| | |
| |
| |
(b) Net Periodic Cost
The calculation of the net periodic cost is as follows:
| |
| | Years ended July 31
| |
|---|
| | Five-month period ended December 31 2002
| |
|---|
| | 2002
| | 2001
| |
|---|
| | (Canadian dollars in thousands)
| |
|---|
| Current service costs | | $ | 119 | | $ | 220 | | $ | 203 | |
| Interest costs on projected benefit obligation | | | 73 | | | 141 | | | 128 | |
| Amortization of past service costs | | | 48 | | | 117 | | | 118 | |
| Amortization of experience gains | | | — | | | (16 | ) | | (4 | ) |
| | |
| |
| |
| |
| | | $ | 240 | | $ | 462 | | $ | 445 | |
| | |
| |
| |
| |
12. CAPITAL STOCK
(a) Class A Subordinate Voting Shares and Class B Shares
Class A Subordinate Voting Shares without par value (unlimited amount authorized) have the following attributes:
- •
- Each share is entitled to one vote per share at all meetings of shareholders; and,
- •
- Each share shall participate equally as to cash dividends with each Class B Share.
Class B Shares without par value (unlimited amount authorized) have the following attributes:
- •
- Each share is entitled to 10 votes per share at all meetings of shareholders;
- •
- Each share shall participate equally as to cash dividends with each Class A Subordinate Voting Share; and,
- •
- Each share may be converted at any time into fully-paid Class A Subordinate Voting Shares on a one-for-one basis.
In the event that either the Class A Subordinate Voting Shares or the Class B Shares are subdivided or consolidated, the other class shall be similarly changed to preserve the relative position of each class.
38
Outstanding Class A Subordinate Voting Shares and Class B Shares included in shareholders' equity of the Company consist of:
| | Class A Subordinate Voting Shares
| | Class B Shares
|
|---|
| | Number of shares
| | Consideration
| | Number of shares
| | Consideration
|
|---|
| | (Canadian dollars in thousands, except number of shares)
|
|---|
| Balance, July 31, 2000 | | 14,899,779 | | $ | 185,851 | | 14,223,900 | | $ | 2,583 |
| Exercise of incentive stock options (Note 12[b]) | | 142,600 | | | 1,792 | | — | | | — |
| | |
| |
| |
| |
|
| Balance, July 31, 2001 | | 15,042,379 | | | 187,643 | | 14,223,900 | | | 2,583 |
| Issuance of Class A Subordinate Voting Shares through public offering (i) | | 2,850,000 | | | 97,190 | | — | | | — |
| Exercise of incentive stock options (Note 12[b]) | | 182,400 | | | 2,194 | | — | | | — |
| | |
| |
| |
| |
|
| Balance, July 31, 2002 | | 18,074,779 | | $ | 287,027 | | 14,223,900 | | $ | 2,583 |
| Exercise of incentive stock options (Note 12[b]) | | 35,650 | | | 400 | | — | | | — |
| | |
| |
| |
| |
|
| Balance, December 31, 2002 | | 18,110,429 | | $ | 287,427 | | 14,223,900 | | $ | 2,583 |
| | |
| |
| |
| |
|
(i) On July 18, 2002, the Company completed a public offering of Class A Subordinate Voting Shares. The details of the proceeds from the offering were as follows:
| |
| |
|---|
| | (Canadian dollars
in thousands,
except number
of shares)
| |
|---|
| Total proceeds on issue of 2,850,000 shares at $35.15 | | $ | 100,178 | |
| Underwriters' fee | | | (4,007 | ) |
| Other expenses of the issue | | | (398 | ) |
| Tax savings in respect of the above fee and expenses | | | 1,417 | |
| | |
| |
| Net proceeds | | $ | 97,190 | |
| | |
| |
(b) Incentive Stock Option Plan
Under the Company's amended and restated Incentive Stock Option Plan, the Company may grant options to purchase Class A Subordinate Voting Shares to present and future officers, directors, other full-time employees or consultants of the Company. The maximum number of shares reserved to be issued for options is 3,000,000, subject to certain adjustments. The number of unoptioned shares available to be reserved at December 31, 2002 was 10,000 (July 31, 2002 — 44,500).
All options granted are for a term not exceeding ten years from the date of grant. In general, management options vest 20% on the date of the grant and 20% on August 1 of each of the four calendar years following the grant date. However, 10,000 and 70,000 options granted to directors in the current five-month period and in fiscal 2000, respectively, vested 50% on the grant date with the remaining 50% vesting on August 1 of the following year, and 300,000 options granted to Stronach & Co. (S & Co) vested 162/3% on October 25, 2000 and 162/3% on each of the following five anniversaries of this date. All options allow the holder to purchase Class A Subordinate Voting Shares at a price equal to or greater than the market price of such shares at the date of the grant.
39
The following is a continuity schedule of the options outstanding:
| | Number of options
| | Range of exercise price
| | Weighted average exercise price
| | Options exercisable
| |
|---|
| Balance, July 31, 2000 | | 1,221,500 | | $ | 10.50-$26.00 | | $ | 18.56 | | 693,100 | |
| Granted (i) | | 432,500 | | $ | 26.45-$29.40 | | $ | 27.35 | | | |
| Exercised | | (142,600 | ) | $ | 10.50-$26.00 | | $ | 12.57 | | (142,600 | ) |
| Surrendered (iii) | | (73,000 | ) | $ | 10.50-$26.00 | | $ | 16.41 | | (73,000 | ) |
| Cancelled | | (5,000 | ) | $ | 26.00 | | $ | 26.00 | | (5,000 | ) |
| Vested | | | | | | | | | | 151,500 | |
| | |
| |
| |
| |
| |
| Balance, July 31, 2001 | | 1,433,400 | | $ | 10.50-$29.40 | | $ | 21.89 | | 624,000 | |
| Exercised | | (182,400 | ) | $ | 10.50-$26.00 | | $ | 12.03 | | (182,400 | ) |
| Vested | | | | | | | | | | 240,600 | |
| | |
| |
| |
| |
| |
| Balance, July 31, 2002 | | 1,251,000 | | $ | 10.50-$29.40 | | $ | 23.33 | | 682,200 | |
| Granted | | 44,500 | | $ | 31.74 | | $ | 31.74 | | | |
| Exercised | | (35,650 | ) | $ | 10.50-$26.00 | | $ | 11.22 | | (35,650 | ) |
| Expired | | (10,000 | ) | $ | 26.00 | | $ | 26.00 | | (10,000 | ) |
| Vested | | | | | | | | | | 201,000 | |
| | |
| |
| |
| |
| |
| Balance, December 31, 2002 | | 1,249,850 | | $ | 10.50-$31.74 | | $ | 23.96 | | 837,550 | |
| | |
| |
| |
| |
| |
(i) On August 31, 2000, a grant of 300,000 options to purchase Class A Subordinate Voting Shares was made to S & Co at an exercise price of $26.45 pursuant to a Consulting Services Agreement (CSA) as described in Note 20.
(ii) On June 15, 2000, 325,000 Stock Appreciation Rights (SARs) were issued to the then CEO of the Company for a cash payment equal to their intrinsic value in exchange for 325,000 stock options held by the CEO as an alternative to his stated plans to exercise these stock options and sell the acquired Class A Subordinate Voting Shares through the public markets. The SARs were issued in exchange for the underlying stock options and immediately exercised for proceeds of $5.0 million, resulting in a $3.2 million net charge to retained earnings.
(iii) On January 29, 2001, in connection with the resignation from the Company of a Vice President, the HRC Committee of the Company asked the Vice President to consider a proposal to surrender 73,000 vested stock options for the purchase of Class A Subordinate Voting Shares in exchange for a cash payment equal to their intrinsic value. This proposal was presented to the Vice President as an alternative to his stated plans to exercise 73,000 stock options and sell the acquired Class A Subordinate Voting Shares through the public markets. To effect this surrender, the HRC Committee granted 73,000 SARs in connection with the 73,000 previously issued stock options. The Vice President immediately exercised these SARs and surrendered the underlying stock options for proceeds of $0.6 million, resulting in a $0.4 million net charge to retained earnings. A portion of the proceeds on surrender was used to pay withholding taxes arising on the surrender of the stock options.
40
The following table summarizes the outstanding and exercisable options held by directors, officers and employees as at December 31, 2002:
| | Options outstanding
| |
|
|---|
| | Exercise price
| | Number of options
| | Remaining contractual life
| | Number of options exercisable
|
|---|
| | | $ | 10.50 | | | 80,000 | | 2.6 | | | 80,000 |
| | | $ | 10.50 | | | 60,000 | | 3.6 | | | 60,000 |
| | | $ | 17.25 | | | 65,500 | | 5.6 | | | 65,500 |
| | | $ | 19.00 | | | 57,000 | | 6.6 | | | 43,500 |
| | | $ | 21.70 | | | 10,000 | | 4.6 | | | 10,000 |
| | | $ | 22.50 | | | 60,000 | | 4.6 | | | 60,000 |
| | | $ | 26.00 | | | 440,350 | | 7.6 | | | 277,150 |
| | | $ | 26.45 | | | 300,000 | | 7.6 | | | 150,000 |
| | | $ | 29.40 | | | 132,500 | | 7.6 | | | 79,500 |
| | | $ | 31.74 | | | 44,500 | | 9.6 | | | 11,900 |
| | |
| |
| |
| |
|
| | | | | | | 1,249,850 | | | | | 837,550 |
| | |
| |
| |
| |
|
| Weighted average exercise price | | | | | $ | 23.96 | | | | $ | 22.54 |
| | |
| |
| |
| |
|
| Weighted average remaining contractual life | | | | | | 6.8 | | | | | 6.4 |
| | |
| |
| |
| |
|
The Company has elected to continue to measure the compensation cost related to awards of stock options using the intrinsic value-based method of accounting as permitted by CICA 3870. Under this standard, when stock options are issued to non-employees other than directors acting in their capacity as directors, the Company must record compensation expense. Options issued to directors for services provided outside of their role as directors are recorded as compensation expense by the Company.
As required under the new standard, for stock award plans not accounted for at fair-value, the Company is required to make proforma disclosures of net income attributable to Class A Subordinate Voting Shares and Class B Shares and basic and diluted earnings per Class A Subordinate Voting Share or Class B Share as if the fair-value method of accounting prescribed therein had been applied.
The Company estimates the fair value of stock options at the date of grant using the Black Scholes option pricing model. As prescribed in CICA 3870, the new recommendations are to be applied to awards granted on or after the date of adoption. Accordingly, the Company has estimated the fair value of the options granted in the five-month period ended December 31, 2002 using the following weighted average assumptions:
| Risk-free interest rate | | 4.5% |
| Expected dividend yield | | 2.0% |
| Expected volatility | | 24% |
| Expected life of options (years) | | 5 |
The Black Scholes option valuation model used by the Company to determine fair values, as well as other currently accepted option valuation models, was developed for use in estimating the fair value of freely traded options which are fully transferable and have no vesting restrictions. In addition, this model requires the input of highly subjective assumptions, including future stock price volatility and expected time until exercise. Since the Company's outstanding stock options have characteristics that are significantly different from those of traded options, and because changes in any of the assumptions can materially affect the fair value estimate, in management's opinion, the existing models do not necessarily provide a reliable single measure of the fair value of its stock options.
41
However, for purposes of proforma disclosures, the Company's net income attributable to Class A Subordinate Voting Shares and Class B Shares and basic and diluted earnings per Class A Subordinate Voting Share or Class B Share, after valuing all stock options issued on or after the date of adoption, would have been as follows:
Five-month period ended December 31, 2002
| | (Canadian dollars in thousands, except per share figures)
|
|---|
| Proforma net income attributable to Class A Subordinate Voting Shares and Class B Shares | | $ | 32,509 |
| Proforma earnings per Class A Subordinate Voting Share or Class B Share | | | |
| | Basic | | $ | 1.01 |
| | Diluted | | $ | 1.00 |
(c) Non-Employee Director Share-Based Compensation Plan
Under this plan, established during fiscal 2000, non-employee directors can elect to receive a portion of their annual retainers and other Board-related compensation in the form of deferred share units (DSUs) which are credited to the director's account, and the Company records a liability. The number of DSUs issued is based upon the market value of the Company's shares at each allocation date. One DSU has a cash value equal to the market price of one of the Company's Class A Subordinate Voting Shares. Within a specified time after retirement, non-employee directors receive a cash payment equal to the market value of their DSUs. During the five-month period ended December 31, 2002, no amounts were recorded as compensation expense (including revaluation of the DSUs to their fair values at December 31, 2002) under this plan (year ended July 31, 2002 — $0.3 million), and $0.2 million (year ended July 31, 2002 — $nil) was paid out under this plan. At December 31, 2002, there were 19,551 DSUs (July 31, 2002 — 23,185) having a total value of $0.5 million (July 31, 2002 — $0.7 million) that were issued and outstanding.
(d) Maximum Number of Shares
The following table presents the maximum number of shares that would be outstanding if all the outstanding options at December 31, 2002 were exercised:
| | Number of shares
|
|---|
| Class A Subordinate Voting Shares outstanding at December 31, 2002 | | 18,110,429 |
| Class B Shares outstanding at December 31, 2002 | | 14,223,900 |
| Options to purchase Class A Subordinate Voting Shares | | 1,249,850 |
| | |
|
| | | 33,584,179 |
| | |
|
42
13. EARNINGS PER CLASS A SUBORDINATE VOTING SHARE OR CLASS B SHARE
The following table presents the reconciliation from the weighted average number of Class A Subordinate Voting Shares and Class B Shares outstanding to the weighted average number of these shares outstanding on a diluted basis:
| | Five-month period ended December 31 2002
| | Years ended July 31
|
|---|
| | 2002
| | 2001
| | 2000
|
|---|
| | (Canadian dollars in thousands)
|
|---|
| Average number of Class A Subordinate Voting Shares and Class B Shares outstanding during the period | | 32,300 | | 29,454 | | 29,214 | | 28,766 |
Effect of dilutive securities:
Stock options to purchase Class A Subordinate Voting Shares | | 213 | | 375 | | 344 | | 556 |
| | |
| |
| |
| |
|
| Average number of Class A Subordinate Voting Shares and Class B Shares outstanding during the period on a diluted basis | | 32,513 | | 29,829 | | 29,558 | | 29,322 |
| | |
| |
| |
| |
|
At December 31, 2002, there were options to purchase 44,500 Class A Subordinate Voting Shares, at an exercise price of $31.74 per share, that were outstanding and not included in the computation of diluted earnings per Class A Subordinate Voting Share or Class B Share because their impact was antidilutive. All options to purchase Class A Subordinate Voting Shares outstanding at July 31, 2002 and July 31, 2001 have been considered in the computation of diluted earnings per Class A Subordinate Voting Share or Class B Share because their impact was dilutive. At July 31, 2000, there were options to purchase 478,000 Class A Subordinate Voting Shares, at an exercise price of $26.00 per share, that were outstanding and not included in the computation of diluted earnings per Class A Subordinate Voting Share or Class B Share because their impact was antidilutive.
14. FINANCIAL INSTRUMENTS
[a] Foreign-Exchange Contracts and Other Hedging Instruments
[i] Foreign Currency Hedges
The Company operates globally, which gives rise to a risk that its earnings and cash flows may be adversely impacted by fluctuations in foreign exchange. The Company utilizes foreign-exchange forward contracts to manage foreign-exchange risk from its underlying customer contracts. In particular, the Company uses foreign-exchange forward contracts for the sole purpose of hedging a significant portion of its projected foreign currency inflows and outflows, consisting primarily of U.S. dollar and euro-denominated contractual commitments to deliver products to the Company's customers or buy products from the Company's suppliers in addition to other anticipated transactions expected to be settled in foreign currencies. The Company does not enter into foreign-exchange contracts for speculative purposes.
As at December 31, 2002, the Company had outstanding foreign-exchange forward contracts representing a commitment to sell approximately US$102.6 million and €43.4 million, at weighted average rates of exchange of CDN$1.56 and CDN$1.57, respectively, and to buy approximately US$76.1 million and €19.5 million at weighted
43
average rates of exchange of CDN$1.47 and CDN$1.39, respectively. These contracts mature over the next five years as follows:
| | For Canadian dollars
| |
|
|---|
| | US dollar amount
| | Weighted average rate
| | Euros amount
| | Weighted average rate
|
|---|
| | (Amounts in millions, except rates)
|
|---|
| 2003 | | US$(41.6 | ) | 1.53 | | €(21.0 | ) | 1.55 |
| 2003 | | 34.9 | | 1.47 | | 4.2 | | 1.36 |
| 2004 | | (23.3 | ) | 1.55 | | (14.8 | ) | 1.57 |
| 2004 | | 24.7 | | 1.46 | | 6.9 | | 1.38 |
| 2005 | | (15.5 | ) | 1.59 | | (6.3 | ) | 1.59 |
| 2005 | | 11.6 | | 1.46 | | 5.7 | | 1.40 |
| 2006 | | (13.8 | ) | 1.60 | | (1.3 | ) | 1.62 |
| 2006 | | 4.9 | | 1.57 | | 2.7 | | 1.42 |
| 2007 | | (8.4 | ) | 1.60 | | — | | — |
| 2007 | | — | | — | | — | | — |
| | |
| |
| |
| |
|
| | | US$(26.5 | ) | | | €(23.9 | ) | |
| | |
| |
| |
| |
|
The fair values of foreign-exchange forward contracts represent an approximation of the amounts the Company would have paid to or received from counterparties to unwind its positions at December 31, 2002. The fair value of the Company's net benefit for all foreign-exchange forward contracts at December 31, 2002 was approximately $7.0 million (July 31, 2002 — $9.2 million). If these contracts ceased to be effective as hedges (i.e., if the related projected cash flows changed significantly), previously unrecognized gains or losses pertaining to the portion of the hedging transactions in excess of projected foreign-denominated cash flows would be recognized in income at the time this condition was identified.
(ii) Other Financial Instruments
The Company, through one of its jointly-controlled entities, has outstanding foreign-exchange options that require it to sell 4.6 million euros at a weighted average rate of US$0.92. The fair value of these options at December 31, 2002 is approximately $0.4 million lower than the carrying value (July 31, 2002 — $0.5 million lower). Due to the fact these options do not qualify as part of an effective hedging relationship, during the five-month period ended December 31, 2002, the Company recorded $0.4 million as a charge against earnings (year ended July 31, 2002 — $0.5 million).
To manage the electricity cost volatility that may arise since the Ontario, Canada hydroelectricity market was deregulated in May 2002, the Company entered into a contract to purchase approximately 131,000 megawatt hours (MWh) of electricity over a three-year period at a weighted average rate of $53.80 per MWh. The Company does not enter into electricity supply contracts for speculative purposes. On November 25, 2002, the Ontario government introduced proposed legislation under Bill 210, the "Electricity Pricing, Conservation and Supply Act" (The Bill) that includes a price freeze on electricity for low volume and certain designated consumers. The Bill also provides for other consumers to elect to have their electricity price determined by regulation provided they give proper notice and meet criteria prescribed by the proposed legislation. Until the regulations are formally approved and published, the Company will continue to be bound by the current supply contract that was entered into in May 2002. As a result of the recent developments and the consequential lack of liquidity in the wholesale marketplace, the mark-to-market fair value of this contract at December 31, 2002 could not be determined. At July 31, 2002, the mark-to-market fair value of this contact was not significant.
(b) Fair Value
The Company has determined the estimated values of its financial instruments based on appropriate valuation methodologies. However, considerable judgment is required to develop these estimates. Accordingly, these estimated values are not necessarily indicative of the amounts the Company could realize in a current market exchange. The estimated fair value amounts can be materially affected by the use of different assumptions or
44
methodologies. The methods and assumptions used to estimate the fair value of each class of financial instruments are discussed below.
Short-term financial assets and liabilities, including cash and cash equivalents, accounts receivable, bank indebtedness, accounts payable, accrued liabilities and income taxes payable, are valued at their carrying amounts as presented in the consolidated balance sheets. The carrying values of the amounts are reasonable estimates of fair value due to the short period to maturity of these financial instruments, except for the obligation for the post-retirement medical benefits plan for which the actuarially determined obligation exceeds the carrying value by $1.5 million as described in Note 11(a).
Fair value information is not readily available for the Company's long-term monetary assets included in other assets. However, management believes the market value of these assets approximates their carrying value.
Rates currently available to the Company for long-term debt with similar terms and remaining maturities have been used to estimate the fair value of the long-term debt which approximates the carrying value for all years, except for the $60 million 6.22% Senior Unsecured Notes which have a fair value of approximately $62.8 million at December 31, 2002 (July 31, 2002 — $60.0 million).
The Company enters into foreign-exchange forward contracts to manage foreign currency risk. If the Company did not use forward contracts, its exposure to financial risks would be higher. The Company does not enter into forward contracts for speculative purposes. The fair values of foreign-exchange forward contracts represent an approximation of the amounts that the Company would have paid to or received from counterparties to unwind its positions prior to maturity. The fair value of the Company's net benefit for all foreign-exchange forward contracts, none of which is recorded, is discussed in Note 14(a).
(c) Credit Risk
The Company's financial assets that are exposed to credit risk consist primarily of cash and cash equivalents, accounts receivable and foreign-exchange forward contracts with positive fair values.
The Company, in the normal course of business, is exposed to credit risk from its customers, substantially all of which are in the automotive industry. These accounts receivable are subject to normal industry credit risks.
Cash and cash equivalents consist of short-term investments, including bonds, commercial paper and certified deposits with original or remaining maturities of three months or less. The Company limits its exposure to credit risk by investing in bonds and commercial paper of governments and corporations with a minimum credit rating of R1 (low) by the Dominion Bond Rating Service (DBRS) or its equivalent in the United States, and further limits the amount to be invested at this minimum credit rating level to 15% or less of the total invested in these instruments at any time. In addition, the Company deals with banks or financial institutions with a Financial Strength Rating of B+ by Moody's Investors Service or its equivalent. Credit risk is further reduced by limiting the amount which is invested in any one government or corporation.
The Company is also exposed to credit risk from the potential default by any of its counterparties on its foreign-exchange forward contracts. The Company mitigates this credit risk by generally dealing only with counterparties which are banks with a minimum credit rating of A-1 by Moody's Investment Service, and which are included on an authorized list of counterparties maintained by the Company. The Company also monitors its relative positions with each counterparty. The maximum credit risk, based on the theoretical amount, term and exchange rates, amounts to approximately $14.4 million. This risk is divided amongst five financial institutions. The Company does not anticipate non-performance by any of the counterparties to their contractual obligations.
45
(d) Interest Rate Risk
The following table summarizes the Company's exposure to interest rate risk as at December 31, 2002:
| |
| | Fixed interest rate maturing in
| |
| |
| |
|---|
| | Floating rate
| | 1 year or less
| | 1 to 5 years
| | More than 5 years
| | Non-interest bearing
| | Total
| |
|---|
| | (Canadian dollars in thousands)
| |
|---|
| Financial assets | | | | | | | | | | | | | | | | | | | |
| | Cash | | $ | 211,859 | | | | | | | | | | | | | | $ | 211,859 | |
| | Accounts receivable | | | | | | | | | | | | | | $ | 229,288 | | | 229,288 | |
| | Other assets | | | 444 | | $ | 135 | | $ | 60 | | | | | | 3,550 | | | 4,189 | |
| Financial liabilities | | | | | | | | | | | | | | | | | | | |
| | Bank indebtedness | | | (72,281 | ) | | | | | | | | | | | | | | (72,281 | ) |
| | Accounts payable and all other accrued liabilities and payables | | | | | | | | | | | | | | | (213,659 | ) | | (213,659 | ) |
| | Long-term debt | | | (1,613 | ) | | (2,008 | ) | | (69,592 | ) | $ | (3,603 | ) | | (608 | ) | | (77,424 | ) |
| | |
| |
| |
| |
| |
| |
| |
| | | $ | 138,409 | | $ | (1,873 | ) | $ | (69,532 | ) | $ | (3,603 | ) | $ | 18,571 | | $ | 81,972 | |
| | |
| |
| |
| |
| |
| |
| |
| Average fixed rate of long-term debt | | | | | | 3.87% | | | 5.70% | | | 2.91% | | | | | | | |
| | | | | |
| |
| |
| | | | | | | |
15. CURRENCY TRANSLATION ADJUSTMENT
The following is a continuity schedule of the currency translation adjustment account included as a separate component of shareholders' equity:
| | December 31 2002
| | July 31
2002
| |
|---|
| | (Canadian dollars in thousands)
| |
|---|
| Balance, beginning of period | | $ | 12,017 | | $ | (8,436 | ) |
| Realized translation (gain) loss on the reduction of the net investment in foreign operations | | | 460 | | | (185 | ) |
| Unrealized translation adjustments | | | 941 | | | 20,638 | |
| | |
| |
| |
| Balance, end of period | | $ | 13,418 | | $ | 12,017 | |
| | |
| |
| |
Unrealized translation adjustments, which arise on the translation to Canadian dollars of assets and liabilities of the Company's self-sustaining foreign operations, resulted in an unrealized currency translation gain of $0.9 million for the five-month period ended December 31, 2002 (year ended July 31, 2002 — gain of $20.6 million) primarily from the strengthening of the euro and Korean won against the Canadian dollar, during the period.
The translation loss of $0.5 million for the five-month period ended December 31, 2002 (year ended July 31, 2002 — gain of $0.2 million) realized on the reduction of the net investment in foreign operations was the result of dividend distributions and was recorded in selling, general and administrative expenses.
46
16. FOREIGN EXCHANGE
Included as part of selling, general and administrative expenses are gains (losses) resulting from foreign exchange as follows:
| |
| | Years ended July 31
| |
|---|
| | Five-month period ended December 31
2002
| |
|---|
| | 2002
| | 2001
| | 2000
| |
|---|
| | (Canadian dollars in thousands)
| |
|---|
| Foreign exchange gains (losses) | | $ | (784 | ) | $ | 2,218 | | $ | 549 | | $ | (263 | ) |
17. RESEARCH AND DEVELOPMENT
Gross R&D expenditures for the five-month period ended December 31, 2002 were $10.2 million (years ended July 31, 2002 — $24.4 million; 2001 — $18.9 million). These expenditures were partially funded by governments or customers in the amount of $2.7 million (years ended July 31, 2002 — $6.2 million; 2001 — $6.5 million).
18. DETAILS OF CASH FROM OPERATING ACTIVITIES
(a) Items Not Involving Current Cash Flows
Items not involving current cash flows consist of:
| | Five-month period ended December 31 2002
| | Years ended July 31
|
|---|
| | 2002
| | 2001
| | 2000
|
|---|
| | (Canadian dollars in thousands)
|
|---|
| Depreciation and amortization | | $ | 28,240 | | $ | 58,663 | | $ | 51,646 | | $ | 43,513 |
| Impairment loss on long-lived assets (Note 6) | | | 18,811 | | | — | | | — | | | — |
| Future income taxes | | | (7,633 | ) | | 8,321 | | | (10,911 | ) | | 4,704 |
| Realized translation losses (gains) on the reduction of net investments in foreign operations | | | 460 | | | (185 | ) | | 3,372 | | | — |
| Net periodic cost on post-retirement medical benefits plan | | | 240 | | | 462 | | | 445 | | | — |
| Other | | | 710 | | | 2,136 | | | 1,036 | | | 3,530 |
| | |
| |
| |
| |
|
| | | $ | 40,828 | | $ | 69,397 | | $ | 45,588 | | $ | 51,747 |
| | |
| |
| |
| |
|
(b) Net Change in Non-Cash Working Capital
The net change in non-cash working capital, net of foreign-exchange fluctuations, consists of:
| | Five-month period ended December 31 2002
| | Years ended July 31
| |
|---|
| | 2002
| | 2001
| | 2000
| |
|---|
| | (Canadian dollars in thousands)
| |
|---|
| Accounts receivable | | $ | (30,382 | ) | $ | (24,017 | ) | $ | (35,906 | ) | $ | (14,385 | ) |
| Inventories | | | (11,278 | ) | | (9,403 | ) | | (12,357 | ) | | (12,239 | ) |
| Prepaid expenses and other | | | (565 | ) | | (1,292 | ) | | (272 | ) | | (301 | ) |
| Accounts payable and other accrued liabilities | | | 15,881 | | | 22,424 | | | (9,363 | ) | | 18,325 | |
| Accrued salaries and wages | | | (9,473 | ) | | 4,226 | | | 1,150 | | | 12,334 | |
| Income taxes payable | | | 7,108 | | | (1,714 | ) | | (3,725 | ) | | 6,811 | |
| | |
| |
| |
| |
| |
| | | $ | (28,709 | ) | $ | (9,776 | ) | $ | (60,473 | ) | $ | 10,545 | |
| | |
| |
| |
| |
| |
47
19. SEGMENTED INFORMATION
(a) Operating Segments
The Company currently operates in one industry segment, the automotive powertrain business, designing and manufacturing parts and assemblies primarily for the automotive OEMs or their Tier I and Tier II powertrain component manufacturers.
The Company operates internationally, and its manufacturing facilities are arranged geographically to match the requirements of the Company's customers in each market. Each manufacturing facility has the capability to offer many different powertrain parts and assemblies, as the technological processes employed can be used to make many different parts and assemblies. Additionally, specific marketing and distribution strategies are required in each geographic region.
The Company currently operates in four geographic segments of which only two are reportable segments. The accounting policies for the segments are the same as those described in Note 1 to the consolidated financial statements, and intersegment sales are accounted for at prices which approximate fair value.
Executive management assesses the performance of each segment based on income before income taxes, as the management of income tax expense is centralized.
The following tables show certain information with respect to operating segment disclosures:
Five-month period ended December 31, 2002
| | North American automotive
| | European automotive
| | Other automotive
| | Total
| |
|---|
| | (Canadian dollars in thousands)
| |
|---|
| Total sales | | $ | 490,392 | | $ | 124,707 | | $ | 21,984 | | $ | 637,083 | |
| Intersegment sales | | | (7,326 | ) | | (2,638 | ) | | (101 | ) | | (10,065 | ) |
| | |
| |
| |
| |
| |
| Sales to external customers | | $ | 483,066 | | $ | 122,069 | | $ | 21,883 | | $ | 627,018 | |
| | |
| |
| |
| |
| |
| Depreciation and amortization (Note 7) | | $ | 20,351 | | $ | 5,882 | | $ | 2,007 | | $ | 28,240 | |
| | |
| |
| |
| |
| |
| Interest, net | | $ | (491 | ) | $ | 390 | | $ | 594 | | $ | 493 | |
| | |
| |
| |
| |
| |
| Income before income taxes (Note 6) | | $ | 63,370 | | $ | (16,393 | ) | $ | 213 | | $ | 47,190 | |
| | |
| |
| |
| |
| |
| Capital assets, net (Notes 6, 20 and 23) | | $ | 310,180 | | $ | 77,012 | | $ | 41,145 | | $ | 428,337 | |
| | |
| |
| |
| |
| |
| Capital asset additions (Note 20) | | $ | 31,386 | | $ | 7,364 | | $ | 5,812 | | $ | 44,562 | |
| | |
| |
| |
| |
| |
| Goodwill, at carrying value (Note 7) | | $ | 20,399 | | $ | 946 | | $ | — | | $ | 21,345 | |
| | |
| |
| |
| |
| |
Year ended July 31, 2002
|
|
|
|
|
|
|
|
|
|
|---|
| Total sales | | $ | 1,058,852 | | $ | 253,614 | | $ | 46,421 | | $ | 1,358,887 | |
| Intersegment sales | | | (14,844 | ) | | (2,427 | ) | | — | | | (17,271 | ) |
| | |
| |
| |
| |
| |
| Sales to external customers | | $ | 1,044,008 | | $ | 251,187 | | $ | 46,421 | | $ | 1,341,616 | |
| | |
| |
| |
| |
| |
| Depreciation and amortization (Note 7) | | $ | 44,263 | | $ | 10,060 | | $ | 4,340 | | $ | 58,663 | |
| | |
| |
| |
| |
| |
| Interest, net | | $ | 1,475 | | $ | 840 | | $ | 1,698 | | $ | 4,013 | |
| | |
| |
| |
| |
| |
| Income before income taxes | | $ | 116,126 | | $ | 10,496 | | $ | 1,755 | | $ | 128,377 | |
| | |
| |
| |
| |
| |
| Capital assets, net (Note 20) | | $ | 301,037 | | $ | 90,101 | | $ | 38,488 | | $ | 429,626 | |
| | |
| |
| |
| |
| |
| Capital asset additions (Note 20) | | $ | 93,460 | | $ | 24,537 | | $ | 4,036 | | $ | 122,033 | |
| | |
| |
| |
| |
| |
| Goodwill, at carrying value (Note 7) | | $ | 19,828 | | $ | 946 | | $ | — | | $ | 20,774 | |
| | |
| |
| |
| |
| |
48
Year ended July 31, 2001
|
|
|
|
|
|
|
|
|
|
|---|
| Total sales | | $ | 948,336 | | $ | 219,744 | | $ | 45,564 | | $ | 1,213,644 | |
| Intersegment sales | | | (8,725 | ) | | (2,775 | ) | | — | | | (11,500 | ) |
| | |
| |
| |
| |
| |
| Sales to external customers | | $ | 939,611 | | $ | 216,969 | | $ | 45,564 | | $ | 1,202,144 | |
| | |
| |
| |
| |
| |
| Depreciation and amortization (Note 7) | | $ | 39,024 | | $ | 8,368 | | $ | 4,254 | | $ | 51,646 | |
| | |
| |
| |
| |
| |
| Interest, net | | $ | 454 | | $ | (510 | ) | $ | 1,753 | | $ | 1,697 | |
| | |
| |
| |
| |
| |
| Income before income taxes | | $ | 103,615 | | $ | 17,174 | | $ | 3,047 | | $ | 123,836 | |
| | |
| |
| |
| |
| |
| Capital assets, net | | $ | 250,250 | | $ | 63,921 | | $ | 34,837 | | $ | 349,008 | |
| | |
| |
| |
| |
| |
| Capital asset additions | | $ | 80,211 | | $ | 15,764 | | $ | 1,650 | | $ | 97,625 | |
| | |
| |
| |
| |
| |
| Goodwill, net (Note 7) | | $ | 17,870 | | $ | 1,361 | | $ | — | | $ | 19,231 | |
| | |
| |
| |
| |
| |
Year ended July 31, 2000
|
|
|
|
|
|
|
|
|
|
|
|
|
|
| Total sales | | $ | 883,295 | | $ | 208,830 | | $ | 42,748 | | $ | 1,134,873 | |
| Intersegment sales | | | (4,241 | ) | | (2,847 | ) | | — | | | (7,088 | ) |
| | |
| |
| |
| |
| |
| Sales to external customers | | $ | 879,054 | | $ | 205,983 | | $ | 42,748 | | $ | 1,127,785 | |
| | |
| |
| |
| |
| |
| Depreciation and amortization (Note 7) | | $ | 31,265 | | $ | 7,760 | | $ | 4,488 | | $ | 43,513 | |
| | |
| |
| |
| |
| |
| Interest, net | | $ | 1,042 | | $ | (808 | ) | $ | 3,037 | | $ | 3,271 | |
| | |
| |
| |
| |
| |
| Income before income taxes | | $ | 116,111 | | $ | 14,949 | | $ | 2,550 | | $ | 133,610 | |
| | |
| |
| |
| |
| |
| Capital assets, net | | $ | 208,393 | | $ | 55,977 | | $ | 41,687 | | $ | 306,057 | |
| | |
| |
| |
| |
| |
| Capital asset additions | | $ | 54,292 | | $ | 21,018 | | $ | 6,637 | | $ | 81,947 | |
| | |
| |
| |
| |
| |
| Goodwill, net (Note 7) | | $ | 17,788 | | $ | 1,704 | | $ | — | | $ | 19,492 | |
| | |
| |
| |
| |
| |
(b) Geographic and Customer Information
The final destination of the Company's sales to its external customers are as follows:
| | Five-month period ended December 31 2002
| | Years ended July 31
|
|---|
| | 2002
| | 2001
| | 2000
|
|---|
| | (Canadian dollars in thousands)
|
|---|
| United States | | $ | 361,294 | | $ | 773,967 | | $ | 696,959 | | $ | 660,471 |
| Canada | | | 48,249 | | | 121,895 | | | 109,775 | | | 97,247 |
| Europe | | | 176,777 | | | 365,219 | | | 321,445 | | | 301,838 |
| Other foreign countries | | | 40,698 | | | 80,535 | | | 73,965 | | | 68,229 |
| | |
| |
| |
| |
|
| | | $ | 627,018 | | $ | 1,341,616 | | $ | 1,202,144 | | $ | 1,127,785 |
| | |
| |
| |
| |
|
In the five-month period ended December 31, 2002, sales to the Company's four largest customers (including their global subsidiaries) amounted to 43%, 17%, 9% and 7% of total sales (years ended July 31, 2002 — 42%, 18%, 9%, and 7%; 2001 — 40%, 20%, 8% and 8%; 2000 — 38%, 20%, 9% and 8%).
49
20. RELATED PARTY TRANSACTIONS
The Company completed transactions with Magna, the Company's controlling shareholder, and other companies under Magna's control during the period as follows:
| | Five-month period ended December 31 2002
| | Years ended July 31
|
|---|
| | 2002
| | 2001
| | 2000
|
|---|
| | (Canadian dollars in thousands)
|
|---|
| Sales (i) | | $ | 5,744 | | $ | 21,702 | | $ | 15,316 | | $ | 18,901 |
| Purchases of materials (i) | | $ | 1,626 | | $ | 5,109 | | $ | 6,960 | | $ | 5,191 |
| Rental of manufacturing facilities | | $ | 535 | | $ | 1,328 | | $ | 976 | | $ | — |
| Affiliation fee (ii) | | $ | 6,144 | | $ | 13,416 | | $ | 12,022 | | $ | 11,278 |
| Social fee (iii) | | $ | 683 | | $ | 1,922 | | $ | 1,863 | | $ | 1,455 |
| Other specific charges (iv) | | $ | 600 | | $ | 2,913 | | $ | 1,386 | | $ | 610 |
| Interest | | $ | 13 | | $ | 28 | | $ | 113 | | $ | — |
| Construction management fees (v[a]) | | $ | — | | $ | 2,226 | | $ | — | | $ | — |
| | |
| |
| |
| |
|
The outstanding balances related to these transactions included in the consolidated financial statements at the end of the period are as follows:
| | December 31 2002
| | July 31 2002
|
|---|
| | (Canadian dollars in thousands)
|
|---|
| Accounts receivable (i) | | $ | 1,549 | | $ | 2,484 |
| Accounts payable and other accrued liabilities (i) | | $ | 4,878 | | $ | 6,560 |
| | |
| |
|
(i) Sales to and purchases from Magna and other companies under Magna's control and the resulting accounts receivable and payable balances are typically effected on normal commercial terms.
(ii) The Company is party to an affiliation agreement with Magna that provides for the payment by the Company of an affiliation fee in exchange for, among other things, Magna granting the Company a non-exclusive worldwide licence to use certain Magna trademarks, and Magna providing certain management resources and the collaboration and sharing of best practices such as new management techniques, employee benefits and programs, and marketing and technological initiatives. An extension of this agreement was negotiated with Magna, becoming effective August 1, 2002 for a term of seven years and five months, expiring on December 31, 2009. Under the terms of the negotiated extension, affiliation fees payable to Magna will continue to be calculated as 1% of the Company's consolidated net sales. However, the new agreement will provide for a limited moratorium on the sales from acquired businesses in that there will be no affiliation fee payable on net sales generated from acquired businesses in the fiscal year of the acquisition and only 50% of the normal affiliation fee will be payable on such net sales in the following fiscal year. The full affiliation fee will be payable on net sales from acquired businesses in all the subsequent years.
(iii) Under the terms of a social fee agreement, the Company pays Magna a social fee of 1.5% of pretax profits as a contribution to social and charitable programs coordinated by Magna, on behalf of Magna and its affiliated companies, including the Company. The Company agreed to renew the social fee agreement with Magna, on the same terms, for a period of seven years and five months, expiring December 31, 2009.
(iv) Other specific charges are negotiated annually and are based on the level of benefits or services provided by Magna Services Inc., a wholly-owned subsidiary of Magna, to the Company. The services that are provided include, but are not limited to: information technology (WAN infrastructure and support services), human resources services (including administration of the Employee Equity Participation Plan and Profit Sharing Plan), foreign marketing services, finance, treasury and legal support, management and technology training and an allocated share of the facility and overhead costs dedicated to providing these services.
50
(v) Other transactions
(a) During fiscal 2002, the Company embarked on or completed various real estate projects, including the construction of a new transmission components manufacturing facility, expansions at three other manufacturing facilities and the construction of a new corporate office, which were all sourced through a wholly-owned subsidiary of Magna. In fiscal 2002, total costs approximating $22.3 million were billed by this subsidiary for these projects, of which $20.1 million was billed on a cost recovery basis and $2.2 million was billed as construction management fees (including carrying charges). During the five-month period ended December 31, 2002, a further $0.1 million was billed by this subsidiary for these projects on a cost recovery basis. As fully described in Note 23, subsequent to December 31, 2002, the Company sold certain of these properties, including the applicable land, to Magna in a sale-leaseback transaction.
(b) Effective August 1, 2002, the Company transferred certain assets and activities of its non-product-related R&D operations to Magna for total proceeds approximating $2.1 million.
(c) During the five-month period ending December 31, 2002, the Company purchased $0.1 million (year ended July 31, 2002 — $0.9 million) of products and services, sold $0.2 million (year ended July 31, 2002 — $0.3 million) of products and services, and advanced $0.2 million to a company owned by the Vice Chairman and CEO of the Company. The purchase and sales transactions were effected on normal commercial terms. At December 31, 2002, $0.8 million (July 31, 2002 — $0.2 million) was recorded as a net receivable from this company.
(d) During the five-month period ending December 31, 2002, the Company purchased $nil (year ended July 31, 2002 — $0.1 million) of services from companies affiliated with certain members of the Company's Board of Directors.
(e) On October 25, 2000, the Company signed a Consulting Services Agreement (CSA) with S & Co. Under the terms of the CSA, S & Co will provide the Company with various consulting services in continental Europe and in other non-North American countries for a period of six years ending October 25, 2006. In consideration for the consulting services to be provided under the CSA, the Board of Directors granted to S & Co, options to purchase 300,000 Class A Subordinate Voting Shares at an exercise price of $26.45 per share (Note 12(b)(i)). The general partner of S & Co is the Chairman of Magna.
(f) Due to the abandoned merger between the Company and the Magna Steyr Group in December 2001, costs approximating $0.6 million (net of a $2.0 million recovery from Magna pursuant to the merger agreement between the Company and Magna) that had been incurred specifically for the merger transaction were expensed by the Company as part of selling, general and administrative costs in the year ended July 31, 2002.
21. COMMITMENTS AND CONTINGENCIES
(a) Operating Leases
The Company had commitments under operating leases requiring future minimum annual rental payments for the years ending December 31 as follows:
| | (Canadian dollars
in thousands)
|
|---|
| 2003 | | $ | 7,822 |
| 2004 | | | 5,726 |
| 2005 | | | 4,468 |
| 2006 | | | 3,607 |
| 2007 | | | 3,007 |
| Thereafter | | | 15,005 |
| | |
|
| | | $ | 39,635 |
| | |
|
51
Approximately 13% (July 31, 2002 — 18%) of these lease commitments represent the Company's share of commitments of its proportionately consolidated jointly-controlled entities. Approximately 54% (July 31, 2002 — 32%) of the lease commitments are with related parties.
For the five-month period ended December 31, 2002, payments under operating leases amounted to approximately $3.9 million (years ended July 31, 2002 — $8.0 million; 2001 — $6.3 million; 2000 — $5.8 million).
[b] Purchase Commitments
The Company has commitments to purchase capital assets of approximately $39.6 million as at December 31, 2002 (July 31, 2002 — $32.9 million).
In addition, as described in Note 14(a)(ii), in May 2002, the Company entered into a three-year contract to purchase specified levels of hydroelectricity supply during expected peak and non-peak time periods at specified fixed prices. The total commitment remaining under this contract at December 31, 2002 is approximately $5.6 million (July 31, 2002 — $6.5 million).
[c] Corporate Constitution
The Company's Corporate Constitution requires that a portion of the Company's profits be distributed or used for certain purposes, including, but not limited to the following:
- •
- allocation or distribution of 10% of pre-tax profits to employees and/or the Tesma Employee Equity Participation and Profit Sharing Program (including the Tesma International Inc. (Canadian) Deferred Profit Sharing Plan and the Tesma International of America, Inc. U.S. Employees' Deferred Profit Sharing Plan forming part thereof);
- •
- allocation of a minimum of 7% of pre-tax profits to R&D; and
- •
- payment of dividends to shareholders based on a formula of after-tax profits.
(d) General
In the ordinary course of business activities, the Company may be contingently liable for litigation and claims with customers, suppliers and former employees. Management believes that adequate provisions have been recorded in the accounts where required. Although it is not possible to estimate the extent of potential costs and losses, if any, management believes, but can provide no assurance, that the ultimate resolution of such contingencies would not have a materially adverse effect on the consolidated financial position of the Company.
22. UNITED STATES GENERALLY ACCEPTED ACCOUNTING PRINCIPLES
The Company's consolidated financial statements are prepared in accordance with Canadian GAAP which conform in all material respects with U.S. GAAP except for the following:
(a) Income Taxes
Prior to August 1, 2000, the income tax provision under Canadian GAAP was based on the deferral method and adjustments were not made for changes in income tax rates. Under U.S. GAAP, the income tax provision was calculated using the liability method and adjustments were made for enacted changes in income tax rates.
(b) Derivative Instruments and Hedging
The Company uses foreign-exchange forward contracts to manage foreign-exchange risk from its underlying customer contracts. As detailed in Note 14, the Company uses foreign-exchange forward contracts for the sole purpose of hedging certain of its future committed U.S. dollar and euro inflows and outflows. Under Canadian GAAP, gains and losses on these contracts are accounted for as a component of the related hedged transaction. For periods up to and including July 31, 2000, gains and losses on these contracts were also accounted for as a component of the related hedged transaction under U.S. GAAP.
52
Effective August 1, 2000, the Company adopted FASB Statement No. 133, "Accounting for Derivative Instruments and Hedging Activities," as amended by FASB Statement Nos.137 and 138 (collectively the Statement), which establishes accounting and reporting standards for derivative instruments, including certain derivatives embedded in other contracts and for hedging activities. The Statement requires a company to recognize all of its derivative instruments, whether designated in hedging relationships or not, on the balance sheet at fair value. The accounting for changes in fair value (i.e., gains or losses) of a derivative instrument depends on whether it has been designated and qualifies as part of a hedging relationship. The Statement establishes certain criteria to be met in order to designate a derivative instrument as a hedge and deem a hedge as effective.
The Company is currently working towards implementing a new treasury management system that complies with the new documentation requirements for hedge accounting under the Statement. For the five-month period ended December 31, 2002, the Company's derivative portfolio is not eligible for hedge accounting, despite the fact that management considers its portfolio to be an effective foreign currency risk management tool and an economic hedge of the Company's projected cash flows in the significant foreign currencies in which it transacts.
Accordingly, the Company has recorded a loss of $1.1 million for the five-month period ended December 31, 2002 in its reconciliation of net income under U.S. GAAP. In the year ended July 31, 2001, the Company recorded a cumulative gain of $2.5 million as a component of comprehensive income upon adoption of the Statement of which $1.6 million has now been realized through U.S. GAAP net income.
The Company has reviewed its other commercial contracts outstanding as at December 31, 2002 in relation to the Statement and has concluded that there are no freestanding derivatives having a significant impact on the consolidated financial statements. In addition, the Company has determined that there are no other embedded derivative instruments outstanding.
(c) Deferred Preproduction Costs
Under U.S. GAAP, the Company would have expensed all preproduction costs as incurred.
(d) Joint Ventures
The Company has certain interests in jointly-controlled entities, which have been proportionately consolidated in the Company's consolidated financial statements. Under U.S. GAAP, the Company would account for its interests in its jointly-controlled entities using the equity method. Net income, earnings per share and shareholders' equity under U.S. GAAP are not impacted by the proportionate consolidation of these interests in jointly-controlled entities.
(e) Gains and Losses on Translation of Long-Term Debt
Under U.S. GAAP, gains and losses arising on the translation of foreign-currency-denominated long-term debt, at exchange rates prevailing on the balance sheet date, are included in income. Effective August 1, 2002, the Company retroactively adopted new CICA rules for Foreign Currency Translation under Canadian GAAP as described in Note 1(c). As a result, the treatment under Canadian GAAP now conforms to U.S. GAAP, thus eliminating any impact to net income for all the periods presented.
(f) Accounting for Stock Options
The Company continues to measure compensation cost related to awards of stock options using the intrinsic value-based method of accounting as prescribed by APB Opinion No. 25, "Accounting for Stock Issued to Employees" (APB 25), as permitted by FASB Statement No. 123, "Accounting for Stock-Based Compensation" (FAS 123). Under APB 25, when a stock option is repurchased by the Company for a cash payment, the Company must record compensation expense. Under the new rules of CICA 3870, prospectively adopted by the Company for Canadian GAAP purposes as described in Note 1(p), the same treatment is now applicable for Canadian GAAP effective August 1, 2002. Prior to this date, for Canadian GAAP purposes, the payment was considered to be a capital transaction and recorded in retained earnings.
53
The new rules under CICA 3870 are substantially harmonized with the existing U.S. GAAP rules contained in APB 25 and FAS 123; however, in accordance with the transitional provisions, the new rules can be applied on a prospective basis to awards granted on or after the date of adoption. As such, the amount of compensation expense for proforma disclosures under U.S. GAAP will differ from that calculated for Canadian GAAP until all options granted prior to August 1, 2002 have fully vested and all related compensation expense has been recorded for U.S. GAAP purposes.
(g) Recognition of Translation Gains and Losses on Reduction of Net Investment in Foreign Subsidiaries
Under U.S. GAAP FASB Statement No. 52 (FAS 52), the Company would only realize a gain or loss on the portion of the currency translation adjustment included as a separate component of the net investment in a foreign operation upon a sale or complete, or substantially complete, liquidation of the related investment. Under FAS 52, no gains or losses are recognized as a result of capital transactions, including the payment of dividends. Under Canadian GAAP, the Company is required to realize a gain or loss equal to the appropriate portion of the cumulative translation adjustment account when there is a reduction in the Company's net investment in a foreign subsidiary which includes the payment of dividends.
(h) Statements of Income
The following table presents net income and earnings per share information following U.S. GAAP:
| | Five-month period ended December 31 2002
| | Years ended July 31
| |
|---|
| | 2002
| | 2001
| | 2000
| |
|---|
| | (Canadian dollars in thousands, except per share and share figures)
| |
|---|
| Net income attributable to Class A Subordinate Voting Shares and Class B shares under Canadian GAAP | | $ | 32,632 | | $ | 84,105 | | $ | 88,411 | | $ | 84,917 | |
| Adjustments | | | | | | | | | | | | | |
| Change in fair value of derivative instruments | | | (1,111 | ) | | 2,437 | | | 2,366 | | | — | |
| Amortization of deferred preproduction costs | | | 369 | | | 882 | | | 873 | | | 860 | |
| Stock-based compensation (expense) recovery on stock options issued for consulting services | | | 124 | | | (377 | ) | | (391 | ) | | — | |
| Translation (gains) losses realized on the reduction of the net investment inforeign subsidiaries | | | 460 | | | (185 | ) | | 3,372 | | | — | |
| Compensation expense on repurchase of stock options | | | — | | | — | | | (417 | ) | | (3,223 | ) |
| Income tax provision adjustment under the liability method | | | — | | | — | | | — | | | 1,644 | |
| | |
| |
| |
| |
| |
| Net income attributable to Class A Subordinate Voting Shares and Class B Shares under U.S. GAAP | | $ | 32,474 | | $ | 86,862 | | $ | 94,214 | | $ | 84,198 | |
| | |
| |
| |
| |
| |
| Earnings per Class A Subordinate Voting Share or Class B Share under U.S. GAAP | | | | | | | | | | | | | |
| | Basic | | $ | 1.01 | | $ | 2.95 | | $ | 3.22 | | $ | 2.93 | |
| | Diluted | | $ | 1.00 | | $ | 2.91 | | $ | 3.19 | | $ | 2.87 | |
| | |
| |
| |
| |
| |
| Weighted average number of Class A Subordinate Voting Shares and Class B Shares outstanding during the year (in thousands) | | | | | | | | | | | | | |
| | Basic | | | 32,300 | | | 29,454 | | | 29,214 | | | 28,766 | |
| | Diluted | | | 32,513 | | | 29,829 | | | 29,558 | | | 29,322 | |
54
(i) Comprehensive Income
| | Five-month period ended December 31 2002
| | Years ended July 31
| |
|---|
| | 2002
| | 2001
| | 2000
| |
|---|
| | (Canadian dollars in thousands)
| |
|---|
| Net income attributable to Class A Subordinate Voting Shares and Class B shares under U.S. GAAP | | $ | 32,474 | | $ | 86,862 | | $ | 94,214 | | $ | 84,198 | |
| Adjustments | | | | | | | | | | | | | |
| Unrealized foreign exchange gains(losses) on translation of self-sustaining foreign operations | | | 941 | | | 20,638 | | | (4,025 | ) | | (7,829 | ) |
| Adjustment for derivative instruments matured in the period, included in the cumulative adjustment at July 31, 2001 | | | (295 | ) | | (1,266 | ) | | — | | | — | |
| Cumulative adjustment to derivative instruments | | | — | | | — | | | 2,530 | | | — | |
| Comprehensive income attributable to Class A Subordinate Voting Shares and Class B Shares under U.S. GAAP | | $ | 33,120 | | $ | 106,234 | | $ | 92,719 | | $ | 76,369 | |
| | |
| |
| |
| |
| |
(j) Balance Sheet Items
The following table presents items in the consolidated balance sheets that would have been significantly affected had the consolidated financial statements been prepared under U.S. GAAP:
| | December 31 2002
| | July 31
2002
|
|---|
| | (Canadian dollars in thousands)
|
|---|
| Prepaid expenses and other | | $ | 19,985 | | $ | 21,440 |
| Long-term future tax liabilities | | $ | 29,938 | | $ | 40,860 |
| | |
| |
|
The following table presents shareholders' equity under U.S. GAAP:
| | December 31 2002
| | July 31
2002
|
|---|
| | (Canadian dollars in thousands)
|
|---|
| Class A Subordinate Voting Shares | | $ | 287,013 | | $ | 286,613 |
| Class B Shares | | | 2,583 | | | 2,583 |
| Retained earnings | | | 346,224 | | | 324,017 |
| Accumulated other comprehensive income | | | 10,741 | | | 10,095 |
| | |
| |
|
| | | $ | 646,561 | | $ | 623,308 |
| | |
| |
|
(k) Stock-Based Compensation
As described in Note 22(f), the new rules adopted for Canadian GAAP are applicable for awards granted on or after the date of adoption. As such, for U.S. GAAP, the proforma disclosure calculations will differ, as they include fair value calculations on all options granted under the plan and in accordance with the applicable vesting provisions therein.
As fully described in Note 12(b), despite the limitations in its effectiveness as a reliable single model for determining the fair value of the Company's stock options, the Company uses the Black Scholes option pricing model for estimating the fair value of stock options at the date of grant. The estimated fair value of options
55
granted in the five-month period ending December 31, 2002 and in the other comparative periods presented was determined using the following weighted average assumptions:
| |
| | Years ended July 31
|
|---|
| | Five-month period ended December 31 2002
|
|---|
| | 2002
| | 2001
|
|---|
| Risk-free interest rate | | 4.5% | | 5.7% | | 5.9% |
| Expected dividend yield | | 2.0% | | 2.4% | | 2.4% |
| Expected volatility | | 24% | | 32% | | 31% |
| Expected life of options (years) | | 5 | | 5 | | 5 |
| | |
| |
| |
|
(i) The Company did not grant any additional stock options during its fiscal year ended July 31, 2002.
Accordingly, for purposes of proforma disclosures, the Company's net income attributable to Class A Subordinate Voting Shares and Class B Shares and basic and diluted earnings per Class A Subordinate Voting Share or Class B Share would have been as follows:
| | Five-month period ended December 31 2002
| | Years ended July 31
|
|---|
| | 2002
| | 2001
| | 2000
|
|---|
| | (Canadian dollars in thousands, except per share figures)
|
|---|
| Proforma net income attributable to Class A Subordinate Voting Shares and Class B Shares under U.S. GAAP | | $ | 31,870 | | $ | 85,631 | | $ | 92,910 | | $ | 85,584 |
| Proforma earnings per Class A Subordinate Voting Share or Class B Share | | | | | | | | | | | | |
| | Basic | | $ | 0.99 | | $ | 2.91 | | $ | 3.18 | | $ | 2.98 |
| | Diluted | | $ | 0.98 | | $ | 2.87 | | $ | 3.14 | | $ | 2.92 |
| | |
| |
| |
| |
|
(l) Recently Issued Pronouncements
Under Staff Accounting Bulletin 74, the Company is required to disclose certain information related to new accounting standards which have not yet been adopted due to delayed effective dates.
Canadian GAAP standards and guidelines
In December 2001, the CICA issued Accounting Guideline ACG-13, "Hedging Relationships" (ACG-13). ACG-13 establishes certain conditions that must exist at the inception of a hedge in order to apply hedge accounting under Canadian GAAP and are consistent with the criteria that currently are required in order to apply hedge accounting under U.S. GAAP. The implementation of a new guideline was delayed and is now applicable to fiscal years beginning on or after July 1, 2003. The Company is currently working towards implementing a new treasury management system that complies with the new documentation requirements for hedge accounting and does not expect the implementation of the guideline to have any impact on the Company's consolidated financial statements.
In July 2002, the Emerging Issues Committee (EIC) of the CICA issued EIC-130 which establishes the method to be used for comparative financial statements presented when there is a change in reporting currency of the reporting entity. Under EIC-130, when there is a change in reporting currency, the financial statements of prior periods presented for comparative purposes should be translated as if the reporting currency used in the current period had been used for at least all periods presented. This treatment is consistent with the rules governing a change in reporting currency under U.S. GAAP. The Company will be utilizing this method in its adoption of the U.S. dollar as its reporting currency effective January 1, 2003.
56
In December 2002, the CICA amended Handbook Section 3475, "Disposal of Long-Lived Assets and Discontinued Operations" (CICA 3475). CICA 3475 provides guidance on differentiating between assets held for sale and held for disposal other than by sale and on the presentation of discontinued operations. CICA 3475 applies to disposal activities initiated on or after May 1, 2003. The Company is currently reviewing CICA 3475. The impact, if any, of this pronouncement on the Company's consolidated financial statements has not been determined.
U.S. GAAP standards
During the fiscal 2002 stub period, FASB issued Statement of Financial Accounting Standards No. 146, "Accounting for Costs Associated with Exit or Disposal Activities" (FAS 146). FAS 146 requires that costs associated with an exit or disposal activity be recognized and measured at fair value in the period in which the liability is incurred. FAS 146 is effective for exit or disposal activities that are initiated after December 31, 2002. Although the Company is currently reviewing FAS 146, the impact, if any, of this pronouncement on its consolidated financial statements has not been determined.
23. SUBSEQUENT EVENT
Sale-Leaseback Transaction with Magna
On January 31, 2003, Tesma completed a sale-leaseback transaction with MI Developments Inc. (MID), a wholly-owned subsidiary of Magna, for all the land and buildings on the Tesma corporate campus, which includes the Tesma corporate office and the lead manufacturing facilities in each of the Company's Engine and Transmission Technologies groups. This transaction was approved by the Company's Board of Directors, upon recommendation by a special committee of independent directors established to review the transaction.
Under the terms of the purchase and sale agreement, the land and buildings comprising the corporate campus (with a carrying value of $36.0 million) were sold to MID for cash proceeds approximating their fair value of $38.2 million. The gain of $2.2 million resulting on the sale will be deferred and amortized on a straight-line basis over the term of the leases.
As part of the transaction, Tesma entered into agreements to lease the properties back from MID for a term of twelve years (with an initial option to renew for three years followed by two subsequent five-year renewal options) and to make lease payments of approximately $3.5 million per year. In addition, under the terms of the transaction, all construction management fees (including carrying charges) billed in fiscal 2002 by MID to the Company on account of this project were refunded.
24. COMPARATIVE CONSOLIDATED FINANCIAL STATEMENTS
Certain other comparative figures have been reclassified to conform to the current year's method of presentation.
57
HISTORICAL FINANCIAL SUMMARY
RESULTS OF OPERATIONS
| |
| |
Years ended July 31
|
|---|
| | Five-month period ended December 31 2002
|
|---|
| | 2002
| | 2001
| | 2000
| | 1999
| | 1998
| | 1997
| | 1996
| | 1995
| | 1994
|
|---|
| | (Canadian dollars in millions, except per share amounts and ratios)
|
|---|
| Sales | | $ | 627.0 | | $ | 1,341.6 | | $ | 1,202.1 | | $ | 1,127.8 | | | 893.7 | | | 645.9 | | | 551.5 | | | 455.6 | | | 344.9 | | | 280.3 |
| | |
| |
| |
| |
| |
| |
| |
| |
| |
| |
|
| Income before litigation settlement, equity losses, income taxes and minority interest | | $ | 47.2 | | $ | 128.4 | | $ | 123.8 | | $ | 133.6 | | $ | 84.6 | | $ | 59.5 | | $ | 45.7 | | $ | 35.3 | | $ | 30.9 | | $ | 31.7 |
| | |
| |
| |
| |
| |
| |
| |
| |
| |
| |
|
| Net income | | $ | 32.6 | | $ | 84.1 | | $ | 88.4 | | $ | 84.9 | | $ | 52.5 | | $ | 29.7 | | $ | 26.5 | | $ | 19.5 | | $ | 14.8 | | $ | 19.5 |
| | |
| |
| |
| |
| |
| |
| |
| |
| |
| |
|
| Net income attributable to Class A Subordinate Voting Shares and Class B Shares | | $ | 32.6 | | $ | 84.1 | | $ | 88.4 | | $ | 84.9 | | $ | 52.5 | | $ | 26.8 | | $ | 24.6 | | $ | 18.5 | | $ | 14.8 | | $ | 19.5 |
| | |
| |
| |
| |
| |
| |
| |
| |
| |
| |
|
| Earnings per Class A SubordinateVoting Share or Class B Share | | | | | | | | | | | | | | | | | | | | | | | | | | | | | | |
| | Basic | | $ | 1.01 | | $ | 2.86 | | $ | 3.03 | | $ | 2.95 | | $ | 1.84 | | $ | 1.14 | | $ | 1.31 | | $ | 1.03 | | $ | 1.04 | | $ | 1.37 |
| | Diluted | | $ | 1.00 | | $ | 2.82 | | $ | 2.99 | | $ | 2.90 | | $ | 1.80 | | $ | 1.06 | | $ | 1.15 | | $ | 0.93 | | $ | 1.02 | | $ | 1.37 |
| | |
| |
| |
| |
| |
| |
| |
| |
| |
| |
|
| Average number of Class A Subordinate Voting Shares and Class B Shares outstanding (millions) | | | | | | | | | | | | | | | | | | | | | | | | | | | | | | |
| | Basic | | | 32.3 | | | 29.5 | | | 29.2 | | | 28.8 | | | 28.5 | | | 23.4 | | | 18.8 | | | 18.0 | | | 14.2 | | | 14.2 |
| | Diluted | | | 32.5 | | | 29.8 | | | 29.6 | | | 29.3 | | | 29.2 | | | 29.1 | | | 25.6 | | | 24.3 | | | 14.5 | | | 14.2 |
| | |
| |
| |
| |
| |
| |
| |
| |
| |
| |
|
| Cash flow from operating activities | | $ | 44.8 | | $ | 143.7 | | $ | 73.5 | | $ | 147.2 | | $ | 93.8 | | $ | 52.0 | | $ | 32.0 | | $ | 38.1 | | $ | 29.6 | | $ | 23.5 |
| | |
| |
| |
| |
| |
| |
| |
| |
| |
| |
|
| Cash dividends paid per Class A Subordinate Voting Share or Class B Share(1) | | $ | 0.16 | | $ | 0.64 | | $ | 0.64 | | $ | 0.545 | | $ | 0.31 | | $ | 0.22 | | $ | 0.20 | | $ | 0.15 | | $ | — | | $ | — |
| | |
| |
| |
| |
| |
| |
| |
| |
| |
| |
|
FINANCIAL POSITION
| |
| | July 31
| |
|---|
As at
| | December 31 2002
| |
|---|
| | 2002
| | 2001
| | 2000
| | 1999
| | 1998
| | 1997
| | 1996
| | 1995
| | 1994
| |
|---|
| | (Canadian dollars in millions, except per share amounts and ratios)
| |
|---|
| Cash (net of bank indebtedness) | | $ | 139.6 | | $ | 146.7 | | $ | 51.0 | | $ | 92.9 | | $ | 48.0 | | $ | 38.0 | | $ | 68.3 | | $ | 28.6 | | $ | 37.9 | | $ | (3.0 | ) |
| | |
| |
| |
| |
| |
| |
| |
| |
| |
| |
| |
| Total assets | | $ | 1,030.1 | | $ | 960.5 | | $ | 758.1 | | $ | 712.7 | | $ | 607.3 | | $ | 399.3 | | $ | 349.5 | | $ | 258.4 | | $ | 245.8 | | $ | 127.5 | |
| | |
| |
| |
| |
| |
| |
| |
| |
| |
| |
| |
| Capital expenditures | | $ | 44.6 | | $ | 122.0 | | $ | 97.6 | | $ | 81.9 | | $ | 69.7 | | $ | 65.0 | | $ | 48.1 | | $ | 29.2 | | $ | 28.3 | | $ | 15.8 | |
| | |
| |
| |
| |
| |
| |
| |
| |
| |
| |
| |
| Long-term debt (excluding current portion) | | $ | 74.6 | | $ | 75.2 | | $ | 77.2 | | $ | 75.0 | | $ | 82.3 | | $ | 14.0 | | $ | 13.4 | | $ | 15.9 | | $ | 20.2 | | $ | 34.5 | |
| | |
| |
| |
| |
| |
| |
| |
| |
| |
| |
| |
| Convertible Series Preferred Shares | | $ | — | | $ | — | | $ | — | | $ | — | | $ | — | | $ | — | | $ | 57.2 | | $ | 64.1 | | $ | 61.1 | | $ | — | |
| | |
| |
| |
| |
| |
| |
| |
| |
| |
| |
| |
| Shareholders' equity | | $ | 643.4 | | $ | 619.3 | | $ | 434.0 | | $ | 367.4 | | $ | 303.6 | | $ | 261.5 | | $ | 174.9 | | $ | 83.4 | | $ | 71.7 | | $ | 38.7 | |
| | |
| |
| |
| |
| |
| |
| |
| |
| |
| |
| |
| Book value per Class A Subordinate Voting Share or Class B Share(2) | | $ | 19.90 | | $ | 19.17 | | $ | 14.83 | | $ | 12.61 | | $ | 10.62 | | $ | 9.17 | | $ | 7.66 | | $ | 4.65 | | $ | 3.99 | | $ | — | |
| | |
| |
| |
| |
| |
| |
| |
| |
| |
| |
| |
| Long-term debt (excluding current portion) to total capitalization ratio(3) | | | 0.10:1 | | | 0.11:1 | | | 0.15:1 | | | 0.17:1 | | | 0.21:1 | | | 0.05:1 | | | 0.07:1 | | | 0.16:1 | | | 0.22:1 | | | 0.47:1 | |
| | |
| |
| |
| |
| |
| |
| |
| |
| |
| |
| |
(1) Excluding all dividends paid prior to the completion of the Company's initial public offering in July 1995.
(2) Numbers prior to the completion of the Company's initial public offering in July 1995 are not meaningful.
58
(3) Total capitalization is the sum of long-term debt (excluding current portion) and shareholders' equity.
59
SHAREHOLDER INFORMATION
Annual and Special Meeting of Shareholders
The Annual and Special Meeting of Shareholders will be held on Tuesday, May 6, 2003 at the Design Exchange, 234 Bay Street, Toronto, Ontario, Canada, commencing at 11:00 a.m.
Transfer Agents and Registrars
Canada — Class A: Computershare Trust Company of Canada
Telephone: 514 982-7270 / 1 800 564-6253
Mail: 9th Floor, 100 University Avenue, Toronto, Ontario M5J 2Y1
e-mail: caregistryinfo@computershare.com
U.S.A. — Class A: Computershare Trust Company, Inc.,
Telephone: 1 800 564-6253
Mail: 350 Indiana Street, Suite 800, Golden, Colorado 80401
email: caregistryinfo@computershare.com
For shareholder inquiries, (address changes, stock transfers, registered shareholdings, dividends and lost certificates), please contact the transfer agent directly.
Principal Bankers
Canadian Imperial Bank of Commerce, Toronto, Canada
Auditors
Ernst & Young LLP, Toronto, Canada
Dividends
The current quarterly dividend rate is set at $0.16 per share (two-month period ended December 31, 2002 — $0.11 per share). Commencing January 1, 2003, cash dividends will be paid quarterly on or about the 15th of March, June, September and December in each fiscal year with a record date on or about the last business day of February, May, August and November (subject to approval by the Board of Directors).
Payment of Dividends to Non-Residents
Shareholders with addresses of record in the United States receive dividends in U.S. funds. The dividend amount is converted at the Bank of Canada's noon rate of exchange on the record date. All other non-resident shareholders may elect to receive dividends in U.S. or Canadian funds. In all cases, the applicable Canadian withholding tax is deducted.
Annual Information Form (AIF)/Form 40-F
The Company files an AIF with Canadian Provincial Securities Regulators and a Report on Form 40-F with the U.S. Securities and Exchange Commission. The AIF is available on the Tesma website at www.tesma.com or upon written request to the Company.
Corporate Governance
The Company has adopted certain structures and procedures to assist in the implementation of effective corporate governance practices and permit the Board of Directors to function independently of management. A Statement of the Company's current corporate governance practices (relative to the Toronto Stock Exchange guidelines for effective corporate governance) is contained in the management information circular and proxy statement for the May 6, 2003 Annual and Special Meeting of Shareholders.
Investor Information
To make inquiries regarding the Company or to be placed on our supplementary mailing list, fax list or e-mail list to receive Tesma's annual and quarterly reports or press releases, please contact Lynn Riley, Manager, Investor Relations at: 1000 Tesma Way, Concord, Ontario L4K 5R8
Telephone: 905 417-2160 Fax: 905 417-2148 e-mail: lynn.riley@tesma.com
60
STOCK EXCHANGE LISTINGS
Tesma's Class A Subordinate Voting Shares trade on the Toronto Stock Exchange under the symbol TSM.A and on the NASDAQ National Market under the symbol TSMA.
ISSUED AND OUTSTANDING SHARES
As at December 31, 2002
| | Class A Subordinate Voting Shares (one vote per share) | | 18,110,429 |
| | Class B Shares (10 votes per share) | | 14,223,900 |
Magna International Inc. owns, directly and indirectly, all Class B Shares carrying approximately 88.7% of the total votes attaching to all outstanding voting shares of the Company.
CLASS A SUBORDINATE VOTING SHARE STOCK PERFORMANCE (CLOSING PRICES)
| |
| | January
| | February
| | March
| | April
| | May
| | June
| | July
| | August
| | September
| | October
| | November
| | December
|
|---|
| TSX (CDN$) | | | | | | | | | | | | | | | | | | | | | | | | |
| High | | 02 | | $31.80 | | $33.40 | | $36.90 | | $35.00 | | $36.74 | | $39.35 | | $35.05 | | $32.78 | | $33.75 | | $33.00 | | $26.00 | | $27.26 |
| | | 01 | | $25.60 | | $27.00 | | $31.00 | | $30.94 | | $34.01 | | $33.92 | | $31.00 | | $29.98 | | $27.50 | | $31.75 | | $30.45 | | $30.00 |
| Low | | 02 | | $29.50 | | $31.35 | | $31.75 | | $33.20 | | $35.00 | | $35.30 | | $31.27 | | $30.01 | | $29.50 | | $24.90 | | $22.50 | | $22.25 |
| | | 01 | | $21.60 | | $24.45 | | $24.50 | | $25.75 | | $28.80 | | $29.50 | | $28.50 | | $26.59 | | $24.05 | | $25.74 | | $28.00 | | $28.00 |
| Close | | 02 | | $31.80 | | $33.00 | | $32.55 | | $34.50 | | $36.10 | | $34.76 | | $32.75 | | $30.45 | | $32.45 | | $25.75 | | $23.25 | | $27.24 |
| | | 01 | | $24.30 | | $27.00 | | $26.50 | | $30.94 | | $31.00 | | $31.00 | | $28.60 | | $27.00 | | $25.57 | | $29.15 | | $28.90 | | $29.79 |
NASDAQ (US$) |
|
|
|
|
|
|
|
|
|
|
|
|
|
|
|
|
|
|
|
|
|
|
|
|
| High | | 02 | | $20.15 | | $21.10 | | $23.35 | | $22.10 | | $23.90 | | $25.68 | | $23.06 | | $20.59 | | $22.00 | | $20.62 | | $16.85 | | $17.14 |
| | | 01 | | $17.00 | | $16.86 | | $19.36 | | $19.85 | | $22.25 | | $22.00 | | $20.15 | | $19.00 | | $22.00 | | $20.75 | | $18.75 | | $17.37 |
| Low | | 02 | | $18.30 | | $19.75 | | $20.11 | | $20.62 | | $22.47 | | $22.83 | | $19.69 | | $19.27 | | $18.83 | | $15.50 | | $14.50 | | $14.25 |
| | | 01 | | $14.31 | | $15.13 | | $16.00 | | $16.00 | | $19.85 | | $18.93 | | $18.52 | | $17.25 | | $18.00 | | $18.69 | | $16.50 | | $13.69 |
| Close | | 02 | | $20.09 | | $20.30 | | $21.70 | | $21.77 | | $23.60 | | $22.90 | | $20.54 | | $19.27 | | $20.51 | | $16.35 | | $14.86 | | $16.90 |
| | | 01 | | $17.00 | | $16.88 | | $16.13 | | $19.85 | | $20.18 | | $18.93 | | $18.86 | | $18.00 | | $18.44 | | $20.25 | | $17.38 | | $16.13 |
CUMULATIVE TOTAL RETURNS TO DECEMBER 31, 2002
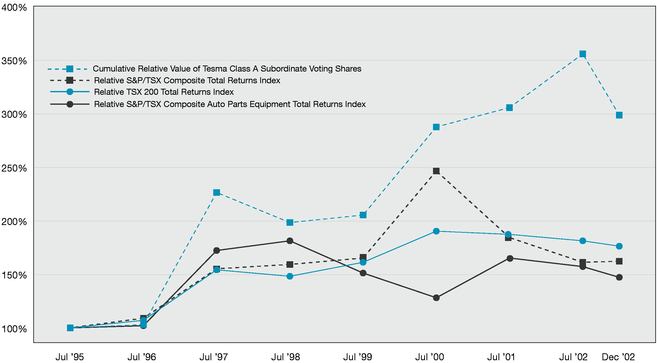
61
BOARD OF DIRECTORS
BELINDA STRONACH(1)
Director since December 12, 2001
Chairman of the Board (Non-Executive)
Tesma International Inc.
President and Chief Executive Officer
Magna International Inc. | | HON. DAVID R. PETERSON, P.C., Q.C.(4)(5)
Director since February 13, 2002
Chairman
Cassels Brock & Blackwell LLP | | |
MANFRED GINGL
Director since April 27, 1995
Vice Chairman and Chief Executive Officer
Tesma International Inc.
Executive Vice Chairman
Magna International Inc.
OSCAR B. MARX, III(4)
Director since July 31, 1995
Vice President
TMW Enterprises, Inc. |
|
JUDSON D. WHITESIDE(2)(6)
Director since July 31, 1995
Chairman and Chief Executive Officer
Miller Thomson LLP
SIEGFRIED WOLF
Director since June 6, 2002
Executive Vice Chairman
Magna International Inc.
HON. M. DOUGLAS YOUNG, P.C.(3)(5)
Director since July 31, 2002
Chairman
Summa Strategies Canada Inc. |
|
(1) Chairman of the Human Resources and
Compensation Committee
(2) Chairman of the Audit Committee
(3) Chairman of the Environmental, Health and
Safety Committee
(4) Member of the Audit Committee
(5) Member of the Human Resources and
Compensation Committee
(6) Member of the Environmental, Health and
Safety Committee |
OFFICERS
MANFRED GINGL
Vice Chairman and
Chief Executive Officer | | PAUL A. MANNERS
Executive Vice President and
Chief Operating Officer | | |
ANTHONY E. DOBRANOWSKI
President and
Chief Financial Officer |
|
JAMES L. MOULDS
Vice President, Finance and Treasurer |
|
|
PASQUALE CERULLO
Executive Vice President, Sales, Marketing and Corporate Development |
|
STEFAN T. PRONIUK
Vice President, Secretary and
General Counsel |
|
|
| | | THOMAS MORE
Controller | | |
62
CORPORATE INFORMATION
1000 Tesma Way, Concord, Ontario, Canada L4K 5R8 Telephone: 905 417-2100 Fax: 905 417-2101
Sales Office Locations
CANADA
Tesma International Inc.
1000 Tesma Way
Concord, Ontario
Canada L4K 5R8
Tel: 905 417-2191
Fax: 905 417-2136 | | GERMANY NORTH
Im Kleigarten 17
D-38162 Cremlingen
Germany
Tel: 011 49-5306-970473
Fax: 011 49-5306-970472 | | SOUTH AMERICA
Litens Automotive do Brasil Ltda.
Av. Tegula, 888
Predio D CEA, Atibaia – SP
Brazil, CEP 12940-000
Tel: 011 55-11-4414-5901
Fax: 011 55-11-4414-5919 |
UNITED STATES
Tesma Corporate Sales
23300 Haggerty Road
Suite 200
Farmington Hills, MI
U.S.A. 48335
Tel: 248 888-5550
Fax: 248 427-1458 |
|
GERMANY SOUTH
Marktplatz 10
D-86441 Zusmarshausen
Germany
Tel: 011 49-8291-790140
Fax: 011 49-8291-790150 |
|
SOUTH KOREA
HAC Corporation
4F Mosan Building, 14-4
Yangjae-dong, Seocho-Gu
Seoul, Korea
137-130
Tel: 011 82-2-571-9350
Fax: 011 82-2-571-9355 |
EUROPEAN UNION
Tesma Motoren-und Getriebetechnik
Ges.m.b.H.
Tesma Allee 1
A-8261 Sinabelkirchen
Austria
Tel: 011 43-3118-2055-140
Fax: 011 43-3118-2055-444 |
|
UNITED KINGDOM
Tesma International
Suite 2, Melville House
High Street, Great Dunmow
Essex, Great Britain, CM6 1AF
Tel: 011 44-1371-875333
Fax: 011 44-1371-875151 |
|
JAPAN
c/o Magna International Tokyo Office
Uchikanda ST Building, 2F
3-24-3 Uchikanda, Chiyoda-Ku
Tokyo, 101-0047, Japan
Tel: 011 81-3-5289-4000
Fax: 011 81-3-5289-4005 |
|
|
ITALY
Via Tavoloni (Loc: Caselle)
84099 S. Cipriano-Picentino (Salerno)
Italy
Tel/Fax: 011 39-89-862065 |
|
|
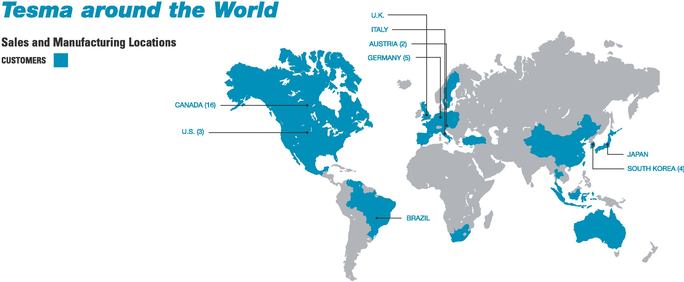
63
| |
|
|---|
 | | Tesma International Inc.
1000 Tesma Way, Concord, Ontario, Canada L4K 5R8 Telephone: 905 417-2100 Fax: 905 417-2101 |
QuickLinks
T E S M ATo Our ShareholdersTesma's Corporate ConstitutionEmployee's CharterMANAGEMENT'S DISCUSSION AND ANALYSIS OF RESULTS OF OPERATIONS AND FINANCIAL POSITION FOR THE FIVE-MONTH PERIOD ENDED DECEMBER 31, 2002FINANCIAL CONDITION, LIQUIDITY AND CAPITAL RESOURCESMANAGEMENT'S RESPONSIBILITY FOR FINANCIAL REPORTINGAUDITORS' REPORTCONSOLIDATED FINANCIAL STATEMENTSCONSOLIDATED BALANCE SHEETS INCORPORATED UNDER THE LAWS OF ONTARIOCONSOLIDATED STATEMENTS OF INCOME AND RETAINED EARNINGSCONSOLIDATED STATEMENTS OF CASH FLOWSNOTES TO CONSOLIDATED FINANCIAL STATEMENTSHISTORICAL FINANCIAL SUMMARYSHAREHOLDER INFORMATION