Exhibit 99.1
MEMC Electronic
Materials, Inc. 501 Pearl Drive (City of
O’Fallon) Post Office Box 8 St. Peters, Missouri
63376 USA Phone:636-474-5000 Fax: 636-474-5158 www.memc.com | 
For Immediate Release MEMC REPORTS SECOND QUARTER RESULTS |
St. Peters, MO, July 23, 2008 – MEMC Electronic Materials, Inc. (NYSE: WFR) today reported financial results for the quarter ended June 30, 2008.
Highlights:
| • | Net sales of $531.4 million |
| • | Gross margin of $282.8 million (53.2% of net sales) |
| • | Operating income of $242.5 million (45.6% of net sales) |
| • | Cash and investment balances grow to approximately $1.5 billion |
| • | MEMC amends Conergy agreement and signs new wafer agreement with Tainergy |
| • | Board authorizes $500 million increase in share repurchase program |
The company reported second quarter 2008 net sales of $531.4 million, which represents an increase of 6.0% from first quarter 2008 net sales of $501.4 million, and an increase of 12.4% from second quarter 2007 net sales of $472.7 million. The increase in net sales was primarily the result of higher product volumes.
Gross margin in the quarter was $282.8 million, or 53.2% of net sales, compared to $259.3 million, or 51.7% of sales, in the 2008 first quarter and $245.6 million, or 52.0% of sales, in the 2007 second quarter. Compared to the 2008 first quarter, gross margin improved by 9.1% in dollar terms, and 150 basis points as a percentage of net sales. Compared to the 2007 second quarter, gross margin improved by 15.1% in dollar terms, and 126 basis points as a percentage of net sales.
The company reported operating income during the quarter of $242.5 million, or 45.6% of net sales. This compares to $218.4 million, or 43.6% of net sales, for the 2008 first quarter and $207.3 million, or 43.9% of net sales, for the 2007 second quarter. Operating expenses were $40.3 million, or 7.6% of sales, compared to $40.9 million, or 8.2% of sales, in the 2008 first quarter, and $38.3 million, or 8.1% of sales, in the 2007 second quarter.
Using an estimated effective cash tax rate of 15%, non-GAAP net income for the second quarter of 2008, excluding the non-cash effects of the quarterly valuation of the Suntech warrants, was $212.0 million and non-GAAP diluted EPS, excluding warrants, was $0.92 per share. See non-GAAP reconciliation information at the end of this press release following the financial statement tables. GAAP net income for the second quarter, using a GAAP tax rate of 25.6%, was $176.1 million or $0.76 per share, which includes a $0.05 per share non-cash impact relating to a decrease in the valuation of the Suntech warrants.
-more-
MEMC ELECTRONIC MATERIALS
PAGE 2
During the second quarter, the company generated operating cash flow of $205.0 million, or 38.6% of sales, compared to $197.2 million, or 39.3% of sales, in the 2008 first quarter. Capital expenditures for the second quarter totaled $87.3 million, or 16.4% of sales. Free cash flow (operating cash flow minus capital expenditures) was $117.7 million or 22.1% of sales. MEMC ended the second quarter with cash and investments of $1.5 billion, compared to $1.4 billion at the end of the 2008 first quarter.
“MEMC grew sales by 6% sequentially, expanded gross and operating margins by 150 and 200 basis points, respectively, continued to generate industry-leading levels of free cash flow at 22% of sales, and further expanded our cash and investment balances to approximately $1.5 billion,” said Nabeel Gareeb, MEMC’s chief executive officer. “However, our financial results were a bit below the bottom end of our targeted range as the company encountered unanticipated events towards the tail end of the quarter.”
The premature failure of a relatively new heat-exchanger at the company’s Merano, Italy facility in June reduced the company’s second quarter polysilicon output by just under five percent. The output from the company’s Pasadena, Texas facility during the month of May and early part of June (shown on the attached silane and polysilicon output charts) had positioned the company on a trajectory to exceed the upper end of the company’s targeted second quarter revenue range. Unfortunately, a loose pipe fitting caused a fire at the company’s Pasadena facility that required a shut down of half the silane production commencing on Friday June 13. Even though the complications lasted for approximately a week, the Pasadena facility recovered and managed to produce enough silane and polysilicon during the remainder of the quarter to be in the middle of that facility’s targeted range for second quarter production, but there was not enough Pasadena production to completely offset the Merano shortfall.
Continued Gareeb, “While we are disappointed that we experienced an uncharacteristic event at our Merano facility, we are pleased that we were able to limit the impact to a few percent below the targeted revenue range. This was primarily a result of the accomplishments in the second quarter that helped to offset the Merano shortfall. Specifically, we:
| - | Achieved strong output from Unit 3 in Pasadena, overcoming most of the issues that held us back in the first quarter. While output was limited by the fire incident and its associated complications, the unit has recovered well. |
| - | Completed and ramped Unit 4 in Pasadena over a month prior to the end of the quarter, with the unit running at good rates save for the interruption of the fire incident. |
-more-
MEMC ELECTRONIC MATERIALS
PAGE 3
| - | Completed this technically and operationally challenging phase of silane expansion and established a high level of confidence in the longer-term performance of Units 3 and 4 based on actual output. We expect that this should eliminate silane production as a constraining element for polysilicon production. |
In addition, so far in the third quarter we have:
| - | Mechanically completed two additional poly reactors in Pasadena, with ramps scheduled to begin next week. As a result of these installations, the company is now at 7,500MT of annualized capacity and we have demonstrated good output in July as shown in the charts. |
| - | Replaced and restarted the Merano heat exchanger and commenced the Merano expansion several weeks ago, which will get the company to the targeted level of 8,000MT of annualized polysilicon capacity before the end of the third quarter.” |
“While the last six months of this expansion and ramp have been difficult, our accomplishments in the second quarter and early part of the third should allow us to demonstrate significant growth in the second half of the year compared to the first half, as mentioned in the April earnings call.”
Third Quarter 2008 Outlook
“Solar application demand continues to be strong, however, semiconductor application demand seems to be uncertain, primarily due to macroeconomic conditions. In addition, although we have made significant progress as a result of the accomplishments mentioned earlier, we did not achieve the targeted level of results for the second quarter, and that continues to warrant a degree of caution. Based on these considerations, we are targeting revenues of approximately $560 to $620 million for the third quarter. In addition, we are targeting gross margin of approximately 54%-55%, with operating expenses of approximately $41 million,” added Gareeb.
“Given the number of unanticipated events associated with our expansion and ramp during the last few quarters as well as our cautious view, we are planning on providing an interim update this quarter via a conference call on September 2. In this update call we intend to review the status of the company’s production rate and provide an update to the quarterly financial targets, if appropriate.”
Full Year 2008 Update
“For the full year 2008, based on market indicators, customer indications and our projected expansion plans, we are currently targeting:
| - | Revenue of approximately $2.25 to $2.35 billion. |
| - | Non-GAAP EPS of approximately $4-$4.30 based on a cash tax rate of approximately 15%, and excluding the non-cash effects of the Suntech warrant valuation. |
-more-
MEMC ELECTRONIC MATERIALS
PAGE 4
| - | Capital expenditures of approximately 15% of sales. |
| - | Operating expenses of approximately $163-$165 million. |
These targets would represent 2008 sales growth of 20%-25% and non-GAAP EPS growth (excluding the Suntech warrants) of 23%-33% compared to 2007,” concluded Gareeb.
Other Events
The company also announced that the Board of Directors today approved an increase to the company’s existing share repurchase plan. The Board has authorized the repurchase of up to an additional $500 million of the company’s common stock, bringing the total authorization to $1 billion. Since the initial $500 million authorization was approved in May 2007, the company has repurchased approximately 4 million shares for a total of $270 million through June 30, 2008.
On July 10, the company announced an amendment to the 10-year solar wafer agreement with Conergy, which amendment adjusts the sales volume to approximately $4 billion from $7-$8 billion, providing more financial flexibility for Conergy and allowing MEMC to reallocate solar wafer volumes to other customers. MEMC concurrently announced that it had signed a $3-$3.5 billion solar wafer agreement with Tainergy Tech Co. Ltd. Under the terms of the Tainergy agreement, MEMC will supply solar wafers to Tainergy over a 10-year period, on a take or pay basis, beginning in the third quarter of 2008. In total, MEMC has signed solar wafer contracts worth between $15-$18 billion in revenue to MEMC.
In association with these agreements, the company today announced that the first set of deposits due from Tainergy have been received. The company anticipates that the final deposits from both Conergy and Tainergy will be received in the current quarter, with wafer deliveries commencing subsequent to receipt.
Conference Call
MEMC will host a conference call today, July 23, 2008, at 5:30 p.m. ET to discuss the company’s second quarter results and related business matters. A live webcast will be available on the company’s web site at www.memc.com. Please go to the web site at least fifteen minutes prior to the call to register, download and install any necessary audio software.
A replay of the conference call will be available from 7:30 p.m. ET on July 23, 2008, until 11:59 p.m. ET on July 30, 2008. To access the replay, please dial (320) 365-3844 at any time during that period, using passcode 953714. A replay will also be available until 11:59 p.m. ET on July 30, 2008 on the company’s web site at www.memc.com.
-more-
MEMC ELECTRONIC MATERIALS
PAGE 5
About MEMC
MEMC is a global leader in the manufacture and sale of wafers and related intermediate products to the semiconductor and solar industries. MEMC has been a pioneer in the design and development of wafer technologies over the past four decades. With R&D and manufacturing facilities in the U.S., Europe and Asia, MEMC enables the next generation of high performance semiconductor devices and solar cells. MEMC’s common stock is listed on the New York Stock Exchange under the symbol ‘WFR’ and is included in the S&P 500 Index.
Contact:
Bill Michalek
Director, Investor Relations
MEMC Electronic Materials, Inc.
(636) 474-5443
Certain matters discussed in this news release are forward-looking statements, including that third quarter 2008 revenues are targeted to be approximately $560-$620 million, with gross margin of approximately 54%-55% and operating expenses of approximately $41 million; that the remaining polysilicon expansion at our Merano, Italy facility will be completed before the end of the third quarter getting us to 8,000MT of annualized capacity in total; that for the full year 2008 we are currently targeting revenue of approximately $2.25 to $2.35 billion, non-GAAP EPS of approximately $4-$4.30 based on a cash tax rate of approximately 15%, and excluding the non-cash effects of the Suntech warrant valuation; that for the full year we are targeting capital expenditures of approximately 15% of sales and operating expenses of approximately $163-$165 million; that the Conergy agreement will provide MEMC with approximately $4 billion in revenue; and that the Tainergy agreement will provide MEMC with $3-$3.5 billion in revenue; that final deposits from Conergy and Tainergy will be received in the current quarter; that solar wafer deliveries to these customers will commence subsequent to receipt of these deposits; and that MEMC’s solar wafer contracts will be worth between $15-$18 billion in revenue to MEMC. Such statements involve certain risks and uncertainties that could cause actual results to differ materially from those in the forward-looking statements. Potential risks and uncertainties include market demand for wafers and semiconductors as well as polysilicon; utilization of manufacturing capacity; good working order of our manufacturing facilities; our ability to reduce manufacturing and operating costs; inventory levels of our customers; changes in the pricing environment for both silicon wafers and polysilicon; supply chain difficulties or problems; interruption of production; delays in capacity expansion; customer acceptance of our new products; assumptions underlying management’s financial estimates; general economic conditions; actions by competitors, customers and suppliers;
-more-
MEMC ELECTRONIC MATERIALS
PAGE 6
changes in product specifications and manufacturing processes; changes in financial market conditions; changes in the composition of worldwide taxable income; the impact of competitive products and technologies; changes in interest and currency exchange rates and other risks described in the company’s filings with the Securities and Exchange Commission. These forward-looking statements represent the company’s judgment as of the date of this release. The company disclaims, however, any intent or obligation to update these forward-looking statements.
-tables to follow-
MEMC ELECTRONIC MATERIALS, INC. AND SUBSIDIARIES
CONSOLIDATED STATEMENTS OF OPERATIONS
(In millions, except per share data)
Unaudited
| Three Months Ended | | Six Months Ended | |
| | June 30
2008 | | | March 31,
2008 | | | June 30,
2007 | | | June 30,
2008 | | | June 30,
2007 | |
| | | | | | | | | | | | | | | |
Net sales | $ | 531.4 | | $ | 501.4 | | $ | 472.7 | | $ | 1,032.8 | | $ | 913.1 | |
Cost of goods sold | | 248.6 | | | 242.1 | | | 227.1 | | | 490.7 | | | 445.0 | |
Gross margin | | 282.8 | | | 259.3 | | | 245.6 | | | 542.1 | | | 468.1 | |
| | | | | | | | | | | | | | | |
Operating expenses: | | | | | | | | | | | | | | | |
Marketing and administration | | 30.3 | | | 30.6 | | | 28.9 | | | 60.9 | | | 54.2 | |
Research and development | | 10.0 | | | 10.3 | | | 9.4 | | | 20.3 | | | 18.9 | |
Operating income | | 242.5 | | | 218.4 | | | 207.3 | | | 460.9 | | | 395.0 | |
| | | | | | | | | | | | | | | |
Nonoperating (income) expense: | | | | | | | | | | | | | | | |
Interest expense | | 0.3 | | | 0.3 | | | 0.3 | | | 0.6 | | | 0.6 | |
Interest income | | (11.3 | ) | | (12.8 | ) | | (10.5 | ) | | (24.1 | ) | | (18.9 | ) |
Loss (gain) on fair value of warrant | | 12.3 | | | 209.4 | | | (7.9 | ) | | 221.7 | | | (6.8 | ) |
Other, net | | 2.5 | | | 1.5 | | | 1.6 | | | 4.0 | | | 1.4 | |
Total nonoperating (income) expense: | | 3.8 | | | 198.4 | | | (16.5 | ) | | 202.2 | | | (23.7 | ) |
Income before income tax expense and minority interests | | 238.7 | | | 20.0 | | | 223.8 | | | 258.7 | | | 418.7 | |
Income tax expense | | 61.2 | | | 60.7 | | | 58.9 | | | 121.9 | | | 117.7 | |
Income (loss) before minority interests | | 177.5 | | | (40.7 | ) | | 164.9 | | | 136.8 | | | 301.0 | |
Minority interests | | (1.4 | ) | | (1.1 | ) | | (1.3 | ) | | (2.5 | ) | | (2.7 | ) |
Net income (loss) | $ | 176.1 | | $ | (41.8 | ) | $ | 163.6 | | $ | 134.3 | | $ | 298.3 | |
| | | | | | | | | | | | | | | |
Basic income (loss) per share | $ | 0.77 | | $ | (0.18 | ) | $ | 0.73 | | $ | 0.59 | | $ | 1.33 | |
Diluted income (loss) per share | $ | 0.76 | | $ | (0.18 | ) | $ | 0.70 | | $ | 0.58 | | $ | 1.29 | |
| | | | | | | | | | | | | | | |
Weighted-average shares used in computing basic income (loss)
per share | | 228.3 | | | 228.5 | | | 225.0 | | | 228.4 | | | 224.5 | |
Weighted-average shares used in computing diluted income (loss)
per share | | 230.7 | | | 228.5 | | | 232.5 | | | 231.1 | | | 232.1 | |
MEMC ELECTRONIC MATERIALS, INC. AND SUBSIDIARIES
CONSOLIDATED BALANCE SHEETS
(In millions, except per share data)
| | June 30,
2008 | | | December 31,
2007 | |
| | (Unaudited) | | | | |
ASSETS | | | | | | |
Current assets: | | | | | | |
Cash and cash equivalents | $ | 1,110.9 | | $ | 859.3 | |
Short-term investments | | 276.1 | | | 457.1 | |
Accounts receivable, net | | 230.6 | | | 197.9 | |
Inventories | | 33.9 | | | 36.4 | |
Prepaid and other current assets | | 26.9 | | | 38.8 | |
Total current assets | | 1,678.4 | | | 1,589.5 | |
| | | | | | |
Long-term investments | | 109.7 | | | 12.7 | |
Property, plant and equipment, net | | 950.4 | | | 834.0 | |
Deferred tax assets, net | | 100.6 | | | 89.3 | |
Other assets | | 141.3 | | | 361.7 | |
Total assets | $ | 2,980.4 | | $ | 2,887.2 | |
| | | | | | |
LIABILITIES AND STOCKHOLDERS’ EQUITY | | | | | | |
Current liabilities: | | | | | | |
Current portion of long-term debt | $ | 5.6 | | $ | 5.3 | |
Accounts payable | | 147.7 | | | 168.3 | |
Accrued liabilities | | 53.8 | | | 40.8 | |
Accrued wages and salaries | | 32.7 | | | 31.9 | |
Customer deposits | | 168.0 | | | 122.0 | |
Income taxes payable | | 42.7 | | | 75.9 | |
Total current liabilities | | 450.5 | | | 444.2 | |
| | | | | | |
Long-term debt, less current portion | | 24.5 | | | 25.6 | |
Pension and post-employment liabilities | | 57.2 | | | 60.6 | |
Deferred revenue | | 86.1 | | | 81.4 | |
Other liabilities | | 238.4 | | | 204.6 | |
Total liabilities | | 856.7 | | | 816.4 | |
| | | | | | |
Minority interests | | 35.1 | | | 35.8 | |
Commitments and contingencies | | | | | | |
Stockholders’ equity: | | | | | | |
Preferred stock | | — | | | — | |
Common stock | | 2.3 | | | 2.3 | |
Additional paid-in capital | | 420.2 | | | 358.0 | |
Retained earnings | | 1,894.8 | | | 1,760.5 | |
Accumulated other comprehensive income | | 45.9 | | | 29.8 | |
Treasury stock | | (274.6 | ) | | (115.6 | ) |
Total stockholders’ equity | | 2,088.6 | | | 2,035.0 | |
Total liabilities and stockholders’ equity | $ | 2,980.4 | | $ | 2,887.2 | |
MEMC ELECTRONIC MATERIALS, INC. AND SUBSIDIARIES
CONSOLIDATED STATEMENTS OF CASH FLOWS
(In millions)
Unaudited
| Three Months Ended | | Six Months Ended | |
| | June 30,
2008 | | | March 31,
2008 | | | June 30,
2007 | | | June 30,
2008 | | | June 30,
2007 | |
| | | | | | | | | | | | | | | |
Cash flows from operating activities: | | | | | | | | | | | | | | | |
Net income (loss) | $ | 176.1 | | $ | (41.8 | ) | $ | 163.6 | | $ | 134.3 | | $ | 298.3 | |
Adjustments to reconcile net income (loss) to net cash provided by operating activities: | | | | | | | | | | | | | | | |
Depreciation and amortization | | 25.5 | | | 22.8 | | | 20.2 | | | 48.3 | | | 39.2 | |
Minority interests | | 1.4 | | | 1.1 | | | 1.3 | | | 2.5 | | | 2.7 | |
Stock-based compensation | | 9.6 | | | 12.6 | | | 7.8 | | | 22.2 | | | 15.2 | |
Loss (gain) on fair value of warrant | | 12.3 | | | 209.4 | | | (7.9 | ) | | 221.7 | | | (6.8 | ) |
Working capital and other | | (19.9 | ) | | (6.9 | ) | | 12.6 | | | (26.8 | ) | | 63.5 | |
Net cash provided by operating activities | | 205.0 | | | 197.2 | | | 197.6 | | | 402.2 | | | 412.1 | |
| | | | | | | | | | | | | | | |
Cash flows from investing activities: | | | | | | | | | | | | | | | |
Proceeds from sales and maturities of investments | | 111.3 | | | 201.6 | | | 29.3 | | | 312.9 | | | 43.5 | |
Purchases of investments | | (62.6 | ) | | (177.6 | ) | | (132.7 | ) | | (240.2 | ) | | (144.4 | ) |
Capital expenditures | | (87.3 | ) | | (81.9 | ) | | (53.9 | ) | | (169.2 | ) | | (101.8 | ) |
Net cash used in investing activities | | (38.6 | ) | | (57.9 | ) | | (157.3 | ) | | (96.5 | ) | | (202.7 | ) |
| | | | | | | | | | | | | | | |
Cash flows from financing activities: | | | | | | | | | | | | | | | |
Net proceeds from customer deposits related to long-term
supply agreements | | 31.0 | | | 17.5 | | | — | | | 48.5 | | | 63.7 | |
Principal payments on long-term debt | | (2.9 | ) | | — | | | (2.5 | ) | | (2.9 | ) | | (2.5 | ) |
Dividends to Minority Interest | | (3.2 | ) | | — | | | (6.2 | ) | | (3.2 | ) | | (6.2 | ) |
Excess tax benefits from stock-based payment arrangements | | 12.1 | | | 6.5 | | | 16.0 | | | 18.6 | | | 28.1 | |
Common stock repurchased | | (76.3 | ) | | (78.6 | ) | | (4.8 | ) | | (154.9 | ) | | (4.8 | ) |
Proceeds from issuance of common stock | | 9.3 | | | 9.3 | | | 8.2 | | | 18.6 | | | 18.4 | |
Net cash (used in) provided by financing activities | | (30.0 | ) | | (45.3 | ) | | 10.7 | | | (75.3 | ) | | 96.7 | |
| | | | | | | | | | | | | | | |
Effect of exchange rate changes on cash and cash equivalents | | (5.2 | ) | | 26.4 | | | 2.4 | | | 21.2 | | | 3.2 | |
| | | | | | | | | | | | | | | |
Net increase in cash and cash equivalents | | 131.2 | | | 120.4 | | | 53.4 | | | 251.6 | | | 309.3 | |
Cash and cash equivalents at beginning of period | | 979.7 | | | 859.3 | | | 783.4 | | | 859.3 | | | 527.5 | |
Cash and cash equivalents at end of period | $ | 1,110.9 | | $ | 979.7 | | $ | 836.8 | | $ | 1,110.9 | | $ | 836.8 | |
Reconciliation of GAAP Net Income (Loss) and Diluted EPS
to non-GAAP Net Income and Diluted EPS
(Unaudited; In millions, except per share data)
| | Three Months Ended |
| | June 30, 2008 | | March 31, 2008 | | December 31, 2007 |
| | Net income | | EPS | | Net Income | | EPS | | Net Income | | EPS |
GAAP Net Income (Loss) | | $ | 176.1 | | $ | 0.76 | | $ | (41.8 | ) | $ | (0.18 | ) | $ | 376.4 | | $ | 1.62 |
Cash Tax Difference* | | | 25.4 | | | 0.11 | | | 57.7 | | | 0.25 | | | 24.0 | | | 0.10 |
Non-GAAP | | | 201.5 | | | 0.87 | | | 15.9 | | | 0.07 | | | 400.4 | | | 1.72 |
Loss (Gain) on Warrants at Cash Tax Rate** | | | 10.5 | | | 0.05 | | | 178.0 | | | 0.77 | | | (174.0 | ) | | (0.75 |
Non-GAAP Income Excluding Warrants | | $ | 212.0 | | $ | 0.92 | | $ | 193.9 | | $ | 0.84 | | $ | 226.4 | | $ | 0.97 |
| | | | | | | | | | | | | | | | | | |
Estimated annual book tax rate | | 25% | | 25% | | 20% |
Estimated cash tax rate | | 15% | | 15% | | 15% |
*Our estimated cash tax rate is the estimated tax payable on our tax returns as a percentage of estimated annual pre-tax book income. The annual cash tax rate is estimated quarterly by reference to book taxable income and then taking into account temporary book/tax differences and any tax basis items reflected on our annual tax returns. The company uses an estimated cash tax rate to adjust for the historical variation in the effective book tax rate associated with the reversal of valuation allowances, foreign tax credits and loss carry-forwards that are not tied to actual operating results, because the company believes that the cash tax rate provides a more transparent view of the company’s operating results. Please note that the actual book rate used for the purposes of calculating actual book net income for the second quarter was 25.6%.
**Because the value of the Suntech warrant may vary significantly from quarter to quarter, the company believes excluding its effect for non-GAAP EPS comparisons provides a more transparent view of the company's operating results.
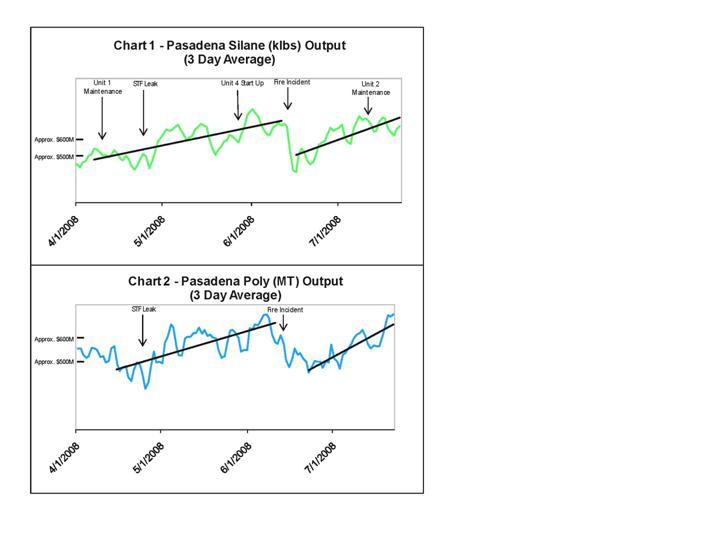
These two progress charts set forth a three day
average of daily silane and polysilicon
production output at our Pasadena, Texas
polysilicon facility over the course of the second
quarter and through July 22, 2008. The charts
also include an indication of what average level
of daily silane and/or polysilicon production
output would be required to achieve
approximately $500 million and approximately
$600 million of quarterly revenue, assuming the
second quarter projected (not actual) overall
product mix and projected (not actual) pricing for
that overall product mix. These production
output requirements to achieve the indicated
revenue levels are just approximations to
illustrate the production output-revenue
correlation described in the accompanying press
release. Moreover, the production output lines
do not correspond to a cumulative quarter to
date quantity – only production output quantities
based on a particular day’s production output,
and assume second quarter targeted (not actual)
output from our Merano, Italy polysilicon facility.
The solid lines included on the charts are simple
trend lines between the respective dates. The
charts also include indications of each of the
significant production related events at the
Pasadena facility from April 1 through July 22, 2008.