UNITED STATES
SECURITIES AND EXCHANGE COMMISSION
Washington, D.C. 20549
FORM N-CSR
CERTIFIED SHAREHOLDER REPORT OF REGISTERED
MANAGEMENT INVESTMENT COMPANIES
Investment Company Act file number 811-07319
Fidelity Covington Trust
(Exact name of registrant as specified in charter)
245 Summer St., Boston, MA 02210
(Address of principal executive offices) (Zip code)
Margaret Carey, Secretary
245 Summer St.
Boston, Massachusetts 02210
(Name and address of agent for service)
Registrant's telephone number, including area code:
617-563-7000
Date of fiscal year end: | August 31 |
Date of reporting period: | February 28, 2023 |
Item 1.
Reports to Stockholders


Contents
| Top Bond Issuers (% of Fund's net assets) | ||
(with maturities greater than one year) | ||
| TransDigm, Inc. | 3.7 | |
| Icahn Enterprises LP/Icahn Enterprises Finance Corp. | 2.2 | |
| Occidental Petroleum Corp. | 2.2 | |
| CCO Holdings LLC/CCO Holdings Capital Corp. | 2.1 | |
| Ford Motor Credit Co. LLC | 2.0 | |
| Royal Caribbean Cruises Ltd. | 1.9 | |
| New Fortress Energy, Inc. | 1.9 | |
| FMG Resources Pty Ltd. | 1.6 | |
| Performance Food Group, Inc. | 1.6 | |
| LPL Holdings, Inc. | 1.5 | |
| 20.7 | ||
| Market Sectors (% of Fund's net assets) | ||
| Energy | 17.2 | |
| Diversified Financial Services | 11.7 | |
| Technology | 4.6 | |
| Automotive & Auto Parts | 4.4 | |
| Aerospace | 4.3 | |
Quality Diversification (% of Fund's net assets) |
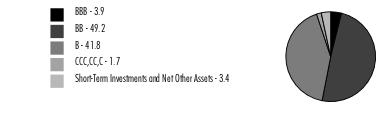 |
| We have used ratings from Moody's Investors Service, Inc. Where Moody's® ratings are not available, we have used S&P® ratings. All ratings are as of the date indicated and do not reflect subsequent changes. |
Asset Allocation (% of Fund's net assets) |
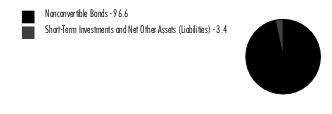 |
Foreign investments - 15.9% |
Geographic Diversification (% of Fund's net assets) |
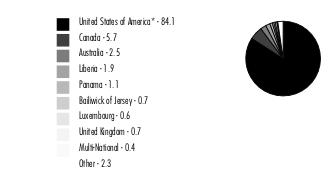 |
* Includes Short-Term investments and Net Other Assets (Liabilities). Percentages are based on country or territory of incorporation and are adjusted for the effect of derivatives, if applicable. |
| Nonconvertible Bonds - 96.6% | |||
Principal Amount (a) | Value ($) | ||
| Aerospace - 4.3% | |||
| Bombardier, Inc. 7.5% 2/1/29 (b) | 1,500,000 | 1,470,064 | |
| Hexcel Corp. 4.95% 8/15/25 | 269,000 | 262,376 | |
| TransDigm, Inc.: | |||
| 4.875% 5/1/29 | 4,029,000 | 3,455,003 | |
| 6.25% 3/15/26 (b) | 3,054,000 | 3,013,522 | |
| 6.75% 8/15/28 (b)(c) | 3,630,000 | 3,611,850 | |
| 8% 12/15/25 (b) | 133,000 | 135,926 | |
TOTAL AEROSPACE | 11,948,741 | ||
| Air Transportation - 2.3% | |||
| Air Canada 3.875% 8/15/26 (b) | 280,000 | 252,233 | |
| Allegiant Travel Co. 7.25% 8/15/27 (b) | 320,000 | 314,400 | |
| American Airlines, Inc.: | |||
| 7.25% 2/15/28 (b) | 215,000 | 210,313 | |
| 11.75% 7/15/25 (b) | 534,900 | 586,668 | |
| American Airlines, Inc. / AAdvantage Loyalty IP Ltd. 5.5% 4/20/26 (b) | 645,634 | 628,362 | |
| Bristow Group, Inc. 6.875% 3/1/28 (b) | 166,000 | 156,267 | |
| Rand Parent LLC 8.5% 2/15/30 (b) | 2,000,000 | 1,920,210 | |
| Spirit Loyalty Cayman Ltd. / Spirit IP Cayman Ltd. 8% 9/20/25 (b) | 1,115,000 | 1,120,296 | |
| United Airlines, Inc. 4.375% 4/15/26 (b) | 762,900 | 718,026 | |
| United Continental Holdings, Inc. 4.875% 1/15/25 | 369,000 | 358,557 | |
TOTAL AIR TRANSPORTATION | 6,265,332 | ||
| Automotive & Auto Parts - 4.4% | |||
| Adient Global Holdings Ltd. 8.25% 4/15/31 (b)(c) | 2,000,000 | 2,000,000 | |
| Allison Transmission, Inc. 3.75% 1/30/31 (b) | 4,455,000 | 3,697,650 | |
| Ford Motor Credit Co. LLC: | |||
| 3.37% 11/17/23 | 787,000 | 771,063 | |
| 4.687% 6/9/25 | 1,143,000 | 1,092,805 | |
| 4.95% 5/28/27 | 2,400,000 | 2,236,056 | |
| 6.95% 3/6/26 | 1,400,000 | 1,399,832 | |
| Gates Global LLC/Gates Global Co. 6.25% 1/15/26 (b) | 175,000 | 170,991 | |
| Jaguar Land Rover Automotive PLC 7.75% 10/15/25 (b) | 175,000 | 172,375 | |
| LCM Investments Holdings 4.875% 5/1/29 (b) | 276,000 | 224,331 | |
| Thor Industries, Inc. 4% 10/15/29 (b) | 443,000 | 356,910 | |
TOTAL AUTOMOTIVE & AUTO PARTS | 12,122,013 | ||
| Banks & Thrifts - 0.6% | |||
| AG TTMT Escrow Issuer LLC 8.625% 9/30/27 (b) | 500,000 | 506,158 | |
| PennyMac Financial Services, Inc. 5.75% 9/15/31 (b) | 600,000 | 478,046 | |
| UniCredit SpA 7.296% 4/2/34 (b)(d) | 289,693 | 272,986 | |
| VistaJet Malta Finance PLC / XO Management Holding, Inc. 7.875% 5/1/27 (b) | 450,000 | 429,194 | |
TOTAL BANKS & THRIFTS | 1,686,384 | ||
| Broadcasting - 2.3% | |||
| DISH Network Corp. 11.75% 11/15/27 (b) | 2,000,000 | 2,026,450 | |
| Nexstar Broadcasting, Inc. 4.75% 11/1/28 (b) | 2,147,000 | 1,877,058 | |
| Sirius XM Radio, Inc. 3.125% 9/1/26 (b) | 1,970,000 | 1,741,652 | |
| Univision Communications, Inc. 7.375% 6/30/30 (b) | 505,000 | 478,943 | |
| WMG Acquisition Corp. 3.75% 12/1/29 (b) | 300,000 | 253,250 | |
TOTAL BROADCASTING | 6,377,353 | ||
| Building Materials - 1.0% | |||
| Builders FirstSource, Inc. 4.25% 2/1/32 (b) | 1,880,000 | 1,578,307 | |
| Jeld-Wen, Inc. 4.625% 12/15/25 (b) | 471,000 | 423,268 | |
| Standard Industries, Inc./New Jersey 4.375% 7/15/30 (b) | 867,000 | 721,778 | |
TOTAL BUILDING MATERIALS | 2,723,353 | ||
| Cable/Satellite TV - 3.4% | |||
| CCO Holdings LLC/CCO Holdings Capital Corp.: | |||
| 4.25% 1/15/34 (b) | 3,045,000 | 2,279,342 | |
| 4.5% 5/1/32 | 2,005,000 | 1,586,857 | |
| 6.375% 9/1/29 (b) | 1,640,000 | 1,529,029 | |
| 7.375% 3/1/31 (b) | 500,000 | 485,053 | |
| CSC Holdings LLC 4.5% 11/15/31 (b) | 1,550,000 | 1,100,467 | |
| DIRECTV Financing LLC / DIRECTV Financing Co-Obligor, Inc. 5.875% 8/15/27 (b) | 613,000 | 548,033 | |
| DISH DBS Corp. 5.125% 6/1/29 | 2,100,000 | 1,240,859 | |
| Dolya Holdco 18 DAC 5% 7/15/28 (b) | 650,000 | 564,205 | |
TOTAL CABLE/SATELLITE TV | 9,333,845 | ||
| Capital Goods - 1.8% | |||
| ATS Automation Tooling System, Inc. 4.125% 12/15/28 (b) | 480,000 | 419,055 | |
| Chart Industries, Inc.: | |||
| 7.5% 1/1/30 (b) | 370,000 | 375,550 | |
| 9.5% 1/1/31 (b) | 1,000,000 | 1,045,000 | |
| EnerSys 4.375% 12/15/27 (b) | 1,247,000 | 1,132,092 | |
| Patrick Industries, Inc. 4.75% 5/1/29 (b) | 897,000 | 762,549 | |
| Resideo Funding, Inc. 4% 9/1/29 (b) | �� | 1,523,000 | 1,247,961 |
TOTAL CAPITAL GOODS | 4,982,207 | ||
| Chemicals - 3.5% | |||
| Avient Corp. 5.75% 5/15/25 (b) | 105,000 | 102,915 | |
| CVR Partners LP 6.125% 6/15/28 (b) | 320,000 | 284,248 | |
| INEOS Finance PLC 6.75% 5/15/28 (b) | 1,000,000 | 976,360 | |
| INEOS Quattro Finance 2 PLC 3.375% 1/15/26 (b) | 480,000 | 422,169 | |
| Koppers, Inc. 6% 2/15/25 (b) | 750,000 | 725,078 | |
| NOVA Chemicals Corp. 4.25% 5/15/29 (b) | 709,000 | 587,017 | |
| Nufarm Australia Ltd. 5% 1/27/30 (b) | 455,000 | 397,217 | |
| Olin Corp. 5% 2/1/30 | 2,170,300 | 1,974,874 | |
| The Chemours Co. LLC: | |||
| 4.625% 11/15/29 (b) | 2,280,000 | 1,850,379 | |
| 5.75% 11/15/28 (b) | 2,000,000 | 1,756,565 | |
| Trinseo Materials Operating SCA/Trinseo Materials Finance, Inc. 5.125% 4/1/29 (b) | 400,000 | 266,285 | |
| W.R. Grace Holding LLC 5.625% 8/15/29 (b) | 270,000 | 216,487 | |
TOTAL CHEMICALS | 9,559,594 | ||
| Consumer Products - 1.7% | |||
| BlueLinx Corp. 6% 11/15/29 (b) | 425,000 | 362,954 | |
| Evergreen AcqCo./TVI, Inc. 9.75% 4/26/28 (b) | 500,000 | 494,455 | |
| Ferrellgas LP/Ferrellgas Finance Corp. 5.375% 4/1/26 (b) | 556,000 | 500,531 | |
| Grubhub Holdings, Inc. 5.5% 7/1/27 (b) | 286,000 | 225,940 | |
| Prestige Brands, Inc. 3.75% 4/1/31 (b) | 401,000 | 325,813 | |
| Rakuten Group, Inc. 10.25% 11/30/24 (b) | 1,000,000 | 1,000,049 | |
| TripAdvisor, Inc. 7% 7/15/25 (b) | 1,403,000 | 1,404,883 | |
| Vista Outdoor, Inc. 4.5% 3/15/29 (b) | 510,000 | 413,738 | |
TOTAL CONSUMER PRODUCTS | 4,728,363 | ||
| Containers - 0.7% | |||
| Ball Corp. 5.25% 7/1/25 | 263,000 | 258,775 | |
| BWAY Holding Co. 7.875% 8/15/26 (b) | 600,000 | 603,750 | |
| Graphic Packaging International, Inc. 3.75% 2/1/30 (b) | 273,000 | 232,651 | |
| Sealed Air Corp.: | |||
| 5% 4/15/29 (b) | 400,000 | 365,273 | |
| 6.125% 2/1/28 (b) | 390,000 | 384,131 | |
TOTAL CONTAINERS | 1,844,580 | ||
| Diversified Financial Services - 11.7% | |||
| BrightSphere Investment Group, Inc. 4.8% 7/27/26 | 1,707,000 | 1,566,173 | |
| Burford Capital Global Finance LLC 6.25% 4/15/28 (b) | 600,000 | 523,136 | |
| Cargo Aircraft Management, Inc. 4.75% 2/1/28 (b) | 810,000 | 700,650 | |
| Castlelake Aviation Finance 5% 4/15/27 (b) | 414,000 | 373,225 | |
| Compass Group Diversified Holdings LLC 5% 1/15/32 (b) | 500,000 | 395,084 | |
| Credit Acceptance Corp. 6.625% 3/15/26 | 1,479,000 | 1,384,802 | |
| Enova International, Inc. 8.5% 9/15/25 (b) | 525,000 | 503,891 | |
| First Cash Financial Services, Inc. 5.625% 1/1/30 (b) | 3,060,000 | 2,706,690 | |
| goeasy Ltd. 4.375% 5/1/26 (b) | 2,962,000 | 2,622,168 | |
| Icahn Enterprises LP/Icahn Enterprises Finance Corp.: | |||
| 4.375% 2/1/29 | 2,300,000 | 1,986,516 | |
| 5.25% 5/15/27 | 4,520,000 | 4,203,600 | |
| Jefferies Finance LLC/JFIN Co-Issuer Corp. 5% 8/15/28 (b) | 345,000 | 291,356 | |
| Ladder Capital Finance Holdings LLLP/Ladder Capital Finance Corp. 4.75% 6/15/29 (b) | 598,000 | 486,278 | |
| LPL Holdings, Inc.: | |||
| 4% 3/15/29 (b) | 3,000,000 | 2,639,428 | |
| 4.375% 5/15/31 (b) | 1,599,000 | 1,383,184 | |
| MidCap Financial Issuer Trust 5.625% 1/15/30 (b) | 250,000 | 196,447 | |
| Nationstar Mortgage Holdings, Inc.: | |||
| 5.5% 8/15/28 (b) | 44,000 | 37,373 | |
| 6% 1/15/27 (b) | 500,000 | 460,000 | |
| Navient Corp. 4.875% 3/15/28 | 900,000 | 765,126 | |
| OneMain Finance Corp.: | |||
| 3.875% 9/15/28 | 4,014,000 | 3,191,130 | |
| 6.625% 1/15/28 | 371,000 | 345,478 | |
| Oxford Finance LLC / Oxford Finance Co. 6.375% 2/1/27 (b) | 639,000 | 602,253 | |
| PRA Group, Inc.: | |||
| 5% 10/1/29 (b) | 1,881,000 | 1,603,007 | |
| 7.375% 9/1/25 (b) | 1,171,000 | 1,167,143 | |
| 8.375% 2/1/28 (b) | 1,000,000 | 1,008,750 | |
| StoneX Group, Inc. 8.625% 6/15/25 (b) | 1,240,000 | 1,247,172 | |
TOTAL DIVERSIFIED FINANCIAL SERVICES | 32,390,060 | ||
| Diversified Media - 0.6% | |||
| Lamar Media Corp. 3.625% 1/15/31 | 2,069,000 | 1,704,090 | |
| Energy - 17.2% | |||
| Aethon United BR LP / Aethon United Finance Corp. 8.25% 2/15/26 (b) | 185,000 | 177,939 | |
| Altus Midstream LP 5.875% 6/15/30 (b) | 240,000 | 221,810 | |
| Antero Midstream Partners LP/Antero Midstream Finance Corp. 5.375% 6/15/29 (b) | 633,000 | 569,700 | |
| Antero Resources Corp. 8.375% 7/15/26 (b) | 275,000 | 284,297 | |
| Archrock Partners LP / Archrock Partners Finance Corp. 6.25% 4/1/28 (b) | 102,000 | 96,827 | |
| Baytex Energy Corp. 8.75% 4/1/27 (b) | 145,000 | 147,538 | |
| Buckeye Partners LP 4.5% 3/1/28 (b) | 330,000 | 289,776 | |
| California Resources Corp. 7.125% 2/1/26 (b) | 140,000 | 141,057 | |
| Chord Energy Corp. 6.375% 6/1/26 (b) | 508,000 | 489,885 | |
| Citgo Petroleum Corp.: | |||
| 6.375% 6/15/26 (b) | 715,000 | 690,322 | |
| 7% 6/15/25 (b) | 624,000 | 614,253 | |
| Civitas Resources, Inc. 5% 10/15/26 (b) | 1,088,000 | 1,005,849 | |
| CNX Midstream Partners LP 4.75% 4/15/30 (b) | 403,000 | 330,393 | |
| CNX Resources Corp. 6% 1/15/29 (b) | 105,000 | 95,196 | |
| Comstock Resources, Inc. 5.875% 1/15/30 (b) | 3,000,000 | 2,580,000 | |
| Coronado Finance Pty Ltd. 10.75% 5/15/26 (b) | 160,000 | 165,741 | |
| Crestwood Midstream Partners LP/Crestwood Midstream Finance Corp. 6% 2/1/29 (b) | 409,000 | 372,067 | |
| CVR Energy, Inc. 5.75% 2/15/28 (b) | 3,000,000 | 2,662,650 | |
| Delek Logistics Partners LP 7.125% 6/1/28 (b) | 2,263,000 | 1,991,440 | |
| DT Midstream, Inc. 4.125% 6/15/29 (b) | 800,000 | 686,000 | |
| Energy Ventures GoM LLC / EnVen Finance Corp. 11.75% 4/15/26 (b) | 210,000 | 216,883 | |
| Genesis Energy LP/Genesis Energy Finance Corp. 8.875% 4/15/30 | 600,000 | 602,947 | |
| Harvest Midstream I LP 7.5% 9/1/28 (b) | 250,000 | 241,090 | |
| Hess Midstream Partners LP: | |||
| 4.25% 2/15/30 (b) | 175,000 | 147,767 | |
| 5.5% 10/15/30 (b) | 125,000 | 112,500 | |
| Hilcorp Energy I LP/Hilcorp Finance Co. 6.25% 11/1/28 (b) | 500,000 | 464,544 | |
| Holly Energy Partners LP/Holly Energy Finance Corp. 5% 2/1/28 (b) | 460,000 | 417,445 | |
| Independence Energy Finance LLC 7.25% 5/1/26 (b) | 552,000 | 510,600 | |
| Leeward Renewable Energy LLC 4.25% 7/1/29 (b) | 537,000 | 456,923 | |
| Matador Resources Co. 5.875% 9/15/26 | 165,300 | 159,383 | |
| Moss Creek Resources Holdings, Inc. 7.5% 1/15/26 (b) | 310,000 | 278,644 | |
| Murphy Oil Corp.: | |||
| 5.75% 8/15/25 | 543,000 | 537,486 | |
| 6.375% 7/15/28 | 20,000 | 19,306 | |
| Nabors Industries, Inc. 7.375% 5/15/27 (b) | 200,000 | 192,756 | |
| New Fortress Energy, Inc. 6.5% 9/30/26 (b) | 5,873,000 | 5,373,783 | |
| Northern Oil & Gas, Inc. 8.125% 3/1/28 (b) | 306,000 | 295,290 | |
| NuStar Logistics LP 5.625% 4/28/27 | 160,000 | 148,941 | |
| Occidental Petroleum Corp.: | |||
| 6.125% 1/1/31 | 3,410,000 | 3,434,245 | |
| 6.625% 9/1/30 | 2,201,000 | 2,261,528 | |
| 7.5% 5/1/31 | 260,000 | 278,200 | |
| Oceaneering International, Inc. 4.65% 11/15/24 | 301,000 | 289,736 | |
| Patterson-UTI Energy, Inc. 5.15% 11/15/29 | 270,000 | 239,974 | |
| PBF Holding Co. LLC/PBF Finance Corp. 6% 2/15/28 | 465,000 | 433,766 | |
| PDC Energy, Inc. 6.125% 9/15/24 | 433,000 | 428,645 | |
| Perenti Finance Pty Ltd. 6.5% 10/7/25 (b) | 530,000 | 515,955 | |
| Range Resources Corp. 8.25% 1/15/29 | 799,000 | 819,974 | |
| Rockcliff Energy II LLC 5.5% 10/15/29 (b) | 480,000 | 440,352 | |
| Rockies Express Pipeline LLC 4.8% 5/15/30 (b) | 704,000 | 608,704 | |
| SM Energy Co. 6.75% 9/15/26 | 450,000 | 434,157 | |
| Summit Midstream Holdings LLC 8.5% (b)(e) | 300,000 | 284,849 | |
| Sunoco LP/Sunoco Finance Corp.: | |||
| 4.5% 5/15/29 | 1,728,000 | 1,516,517 | |
| 4.5% 4/30/30 | 1,600,000 | 1,386,400 | |
| Tallgrass Energy Partners LP / Tallgrass Energy Finance Corp.: | |||
| 6% 9/1/31 (b) | 500,000 | 427,267 | |
| 7.5% 10/1/25 (b) | 105,000 | 104,507 | |
| Talos Production, Inc. 12% 1/15/26 | 105,000 | 110,814 | |
| Tap Rock Resources LLC 7% 10/1/26 (b) | 240,000 | 219,600 | |
| Tervita Corp. 11% 12/1/25 (b) | 510,000 | 548,250 | |
| Transocean Titan Finance Ltd. 8.375% 2/1/28 (b) | 222,000 | 226,595 | |
| U.S.A. Compression Partners LP: | |||
| 6.875% 4/1/26 | 2,131,000 | 2,042,329 | |
| 6.875% 9/1/27 | 196,000 | 185,581 | |
| Venture Global Calcasieu Pass LLC: | |||
| 4.125% 8/15/31 (b) | 248,000 | 213,280 | |
| 6.25% 1/15/30 (b) | 2,000,000 | 1,972,500 | |
| Vital Energy, Inc.: | |||
| 7.75% 7/31/29 (b) | 114,000 | 98,725 | |
| 10.125% 1/15/28 | 76,000 | 74,688 | |
| W&T Offshore, Inc. 11.75% 2/1/26 (b) | 500,000 | 505,105 | |
| Weatherford International Ltd. 6.5% 9/15/28 (b) | 700,000 | 687,750 | |
| Western Gas Partners LP: | |||
| 3.35% 2/1/25 | 2,276,000 | 2,157,111 | |
| 4.3% 2/1/30 | 110,000 | 97,454 | |
| 4.5% 3/1/28 | 92,000 | 84,816 | |
| 5.5% 2/1/50 | 715,000 | 583,721 | |
TOTAL ENERGY | 47,502,123 | ||
| Entertainment/Film - 0.5% | |||
| Live Nation Entertainment, Inc. 4.875% 11/1/24 (b) | 1,364,000 | 1,323,080 | |
| Environmental - 1.0% | |||
| Clean Harbors, Inc. 6.375% 2/1/31 (b) | 120,000 | 119,146 | |
| Covanta Holding Corp. 4.875% 12/1/29 (b) | 630,000 | 532,134 | |
| GFL Environmental, Inc. 4% 8/1/28 (b) | 2,426,000 | 2,111,129 | |
TOTAL ENVIRONMENTAL | 2,762,409 | ||
| Food & Drug Retail - 0.6% | |||
| Albertsons Companies LLC/Safeway, Inc./New Albertson's, Inc./Albertson's LLC 6.5% 2/15/28 (b) | 1,000,000 | 994,350 | |
| Parkland Corp. 5.875% 7/15/27 (b) | 614,000 | 575,908 | |
TOTAL FOOD & DRUG RETAIL | 1,570,258 | ||
| Food/Beverage/Tobacco - 2.9% | |||
| Chobani LLC/Finance Corp., Inc. 7.5% 4/15/25 (b) | 82,000 | 79,890 | |
| Lamb Weston Holdings, Inc. 4.125% 1/31/30 (b) | 1,012,000 | 888,122 | |
| Performance Food Group, Inc. 4.25% 8/1/29 (b) | 5,160,000 | 4,505,351 | |
| Turning Point Brands, Inc. 5.625% 2/15/26 (b) | 1,420,000 | 1,285,196 | |
| Vector Group Ltd. 5.75% 2/1/29 (b) | 1,330,000 | 1,144,715 | |
TOTAL FOOD/BEVERAGE/TOBACCO | 7,903,274 | ||
| Gaming - 1.5% | |||
| Caesars Entertainment, Inc. 6.25% 7/1/25 (b) | 832,300 | 825,378 | |
| CDI Escrow Issuer, Inc. 5.75% 4/1/30 (b) | 1,721,000 | 1,598,379 | |
| Churchill Downs, Inc. 5.5% 4/1/27 (b) | 246,000 | 233,299 | |
| International Game Technology PLC 4.125% 4/15/26 (b) | 105,000 | 97,913 | |
| MGM Resorts International 6.75% 5/1/25 | 151,000 | 151,373 | |
| Raptor Acquisition Corp. / Raptor Co-Issuer LLC 4.875% 11/1/26 (b) | 677,000 | 626,225 | |
| Wynn Resorts Finance LLC / Wynn Resorts Capital Corp. 7.125% 2/15/31 (b) | 600,000 | 598,800 | |
TOTAL GAMING | 4,131,367 | ||
| Healthcare - 3.5% | |||
| AMN Healthcare 4% 4/15/29 (b) | 1,180,000 | 1,008,900 | |
| Avantor Funding, Inc. 3.875% 11/1/29 (b) | 1,394,000 | 1,205,810 | |
| Bausch Health Companies, Inc. 4.875% 6/1/28 (b) | 3,392,000 | 2,115,777 | |
| Community Health Systems, Inc. 4.75% 2/15/31 (b) | 2,000,000 | 1,545,000 | |
| CTR Partnership LP/CareTrust Capital Corp. 3.875% 6/30/28 (b) | 345,000 | 293,139 | |
| DaVita HealthCare Partners, Inc. 4.625% 6/1/30 (b) | 2,124,000 | 1,750,537 | |
| Hologic, Inc. 4.625% 2/1/28 (b) | 101,000 | 94,182 | |
| Modivcare, Inc. 5.875% 11/15/25 (b) | 895,000 | 845,220 | |
| Mozart Borrower LP 5.25% 10/1/29 (b) | 885,000 | 726,306 | |
| Tenet Healthcare Corp. 4.625% 7/15/24 | 204,000 | 200,685 | |
TOTAL HEALTHCARE | 9,785,556 | ||
| Homebuilders/Real Estate - 3.9% | |||
| American Finance Trust, Inc./American Finance Operating Partnership LP 4.5% 9/30/28 (b) | 1,015,000 | 801,109 | |
| Arcosa, Inc. 4.375% 4/15/29 (b) | 270,000 | 235,920 | |
| Brookfield Property REIT, Inc./BPR Nimbus LLC/BPR Cumulus LLC/GGSI Sellco LLC 4.5% 4/1/27 (b) | 1,093,000 | 936,450 | |
| HAT Holdings I LLC/HAT Holdings II LLC: | |||
| 3.375% 6/15/26 (b) | 1,667,000 | 1,446,123 | |
| 6% 4/15/25 (b) | 900,000 | 867,393 | |
| iStar Financial, Inc. 4.25% 8/1/25 | 365,000 | 363,160 | |
| Kennedy-Wilson, Inc.: | |||
| 4.75% 2/1/30 | 290,000 | 222,874 | |
| 5% 3/1/31 | 3,000,000 | 2,295,459 | |
| LGI Homes, Inc. 4% 7/15/29 (b) | 860,000 | 673,445 | |
| Office Properties Income Trust 2.65% 6/15/26 | 153,000 | 121,135 | |
| Service Properties Trust: | |||
| 4.65% 3/15/24 | 113,000 | 110,366 | |
| 4.75% 10/1/26 | 155,000 | 134,463 | |
| 5.25% 2/15/26 | 181,000 | 164,258 | |
| 7.5% 9/15/25 | 408,300 | 404,699 | |
| Starwood Property Trust, Inc.: | |||
| 3.75% 12/31/24 (b) | 977,000 | 919,496 | |
| 4.375% 1/15/27 (b) | 502,000 | 435,210 | |
| Uniti Group LP / Uniti Group Finance, Inc. 10.5% 2/15/28 (b) | 650,000 | 650,130 | |
TOTAL HOMEBUILDERS/REAL ESTATE | 10,781,690 | ||
| Hotels - 1.3% | |||
| Carnival Holdings (Bermuda) Ltd. 10.375% 5/1/28 (b) | 625,000 | 668,750 | |
| Hilton Domestic Operating Co., Inc. 3.75% 5/1/29 (b) | 2,050,000 | 1,777,452 | |
| Travel+Leisure Co. 6.625% 7/31/26 (b) | 370,000 | 362,691 | |
| Wyndham Hotels & Resorts, Inc. 4.375% 8/15/28 (b) | 933,000 | 845,031 | |
TOTAL HOTELS | 3,653,924 | ||
| Insurance - 0.5% | |||
| MGIC Investment Corp. 5.25% 8/15/28 | 645,000 | 603,075 | |
| NMI Holdings, Inc. 7.375% 6/1/25 (b) | 747,000 | 743,265 | |
TOTAL INSURANCE | 1,346,340 | ||
| Leisure - 3.3% | |||
| Carnival Corp.: | |||
| 4% 8/1/28 (b) | 2,520,000 | 2,128,972 | |
| 6% 5/1/29 (b) | 472,000 | 366,047 | |
| 7.625% 3/1/26 (b) | 102,000 | 91,863 | |
| 9.875% 8/1/27 (b) | 410,000 | 417,376 | |
| NCL Corp. Ltd. 8.375% 2/1/28 (b) | 500,000 | 509,395 | |
| Royal Caribbean Cruises Ltd.: | |||
| 5.5% 8/31/26 (b) | 1,300,000 | 1,194,466 | |
| 11.625% 8/15/27 (b) | 4,000,000 | 4,268,200 | |
| Viking Ocean Cruises Ship VII Ltd. 5.625% 2/15/29 (b) | 235,000 | 201,738 | |
TOTAL LEISURE | 9,178,057 | ||
| Metals/Mining - 3.0% | |||
| Cleveland-Cliffs, Inc. 5.875% 6/1/27 | 596,000 | 578,400 | |
| Eldorado Gold Corp. 6.25% 9/1/29 (b) | 300,000 | 263,796 | |
| ERO Copper Corp. 6.5% 2/15/30 (b) | 500,000 | 423,125 | |
| First Quantum Minerals Ltd. 6.875% 10/15/27 (b) | 390,000 | 364,894 | |
| FMG Resources Pty Ltd.: | |||
| 4.375% 4/1/31 (b) | 127,000 | 107,332 | |
| 5.875% 4/15/30 (b) | 4,740,000 | 4,461,666 | |
| HudBay Minerals, Inc. 4.5% 4/1/26 (b) | 859,000 | 771,245 | |
| Mineral Resources Ltd.: | |||
| 8% 11/1/27 (b) | 485,000 | 482,575 | |
| 8.125% 5/1/27 (b) | 883,000 | 881,465 | |
TOTAL METALS/MINING | 8,334,498 | ||
| Paper - 1.4% | |||
| Ardagh Metal Packaging Finance U.S.A. LLC/Ardagh Metal Packaging Finance PLC 6% 6/15/27 (b) | 360,000 | 348,386 | |
| Enviva Partners LP / Enviva Partners Finance Corp. 6.5% 1/15/26 (b) | 2,000,000 | 1,874,920 | |
| Louisiana-Pacific Corp. 3.625% 3/15/29 (b) | 700,000 | 584,871 | |
| Resolute Forest Products, Inc. 4.875% 3/1/26 (b) | 515,000 | 527,556 | |
| Sylvamo Corp. 7% 9/1/29 (b) | 600,000 | 593,990 | |
TOTAL PAPER | 3,929,723 | ||
| Restaurants - 1.8% | |||
| 1011778 BC Unlimited Liability Co./New Red Finance, Inc.: | |||
| 3.5% 2/15/29 (b) | 370,000 | 313,778 | |
| 4% 10/15/30 (b) | 3,015,000 | 2,490,149 | |
| Yum! Brands, Inc.: | |||
| 4.75% 1/15/30 (b) | 130,000 | 118,463 | |
| 5.375% 4/1/32 | 2,230,000 | 2,066,074 | |
| 6.875% 11/15/37 | 123,000 | 127,873 | |
TOTAL RESTAURANTS | 5,116,337 | ||
| Services - 3.9% | |||
| Allied Universal Holdco LLC / Allied Universal Finance Corp. 6.625% 7/15/26 (b) | 723,000 | 686,676 | |
| Aramark Services, Inc. 5% 4/1/25 (b) | 150,000 | 145,504 | |
| Avis Budget Car Rental LLC/Avis Budget Finance, Inc. 5.75% 7/15/27 (b) | 518,000 | 486,887 | |
| Booz Allen Hamilton, Inc. 4% 7/1/29 (b) | 502,000 | 440,390 | |
| CoreCivic, Inc. 8.25% 4/15/26 | 429,000 | 434,307 | |
| Fair Isaac Corp. 4% 6/15/28 (b) | 2,023,000 | 1,837,208 | |
| Fluor Corp. 4.25% 9/15/28 | 517,000 | 466,485 | |
| Iron Mountain, Inc.: | |||
| 5% 7/15/28 (b) | 2,507,000 | 2,272,395 | |
| 5.25% 7/15/30 (b) | 711,000 | 619,949 | |
| Neptune BidCo U.S., Inc. 9.29% 4/15/29 (b) | 900,000 | 850,860 | |
| TriNet Group, Inc. 3.5% 3/1/29 (b) | 2,691,000 | 2,246,993 | |
| WASH Multifamily Acquisition, Inc. 5.75% 4/15/26 (b) | 270,000 | 251,162 | |
TOTAL SERVICES | 10,738,816 | ||
| Steel - 0.5% | |||
| Carpenter Technology Corp.: | |||
| 6.375% 7/15/28 | 36,000 | 34,491 | |
| 7.625% 3/15/30 | 500,000 | 498,529 | |
| Commercial Metals Co. 4.125% 1/15/30 | 1,000,000 | 871,932 | |
TOTAL STEEL | 1,404,952 | ||
| Super Retail - 2.2% | |||
| Asbury Automotive Group, Inc.: | |||
| 4.75% 3/1/30 | 1,614,000 | 1,398,289 | |
| 5% 2/15/32 (b) | 680,000 | 579,498 | |
| Bath & Body Works, Inc. 9.375% 7/1/25 (b) | 980,000 | 1,036,350 | |
| Group 1 Automotive, Inc. 4% 8/15/28 (b) | 2,423,000 | 2,080,703 | |
| Sally Holdings LLC 5.625% 12/1/25 | 105,000 | 102,375 | |
| Sonic Automotive, Inc.: | |||
| 4.625% 11/15/29 (b) | 500,000 | 412,500 | |
| 4.875% 11/15/31 (b) | 450,000 | 358,058 | |
TOTAL SUPER RETAIL | 5,967,773 | ||
| Technology - 4.6% | |||
| Atkore, Inc. 4.25% 6/1/31 (b) | 892,000 | 776,540 | |
| Consensus Cloud Solutions, Inc. 6.5% 10/15/28 (b) | 988,000 | 862,030 | |
| Gen Digital, Inc.: | |||
| 5% 4/15/25 (b) | 193,000 | 187,472 | |
| 6.75% 9/30/27 (b) | 3,000,000 | 2,948,843 | |
| Go Daddy Operating Co. LLC / GD Finance Co., Inc. 3.5% 3/1/29 (b) | 480,000 | 402,134 | |
| Iron Mountain Information Management Services, Inc. 5% 7/15/32 (b) | 3,065,000 | 2,527,828 | |
| Match Group Holdings II LLC 5.625% 2/15/29 (b) | 170,000 | 156,619 | |
| MicroStrategy, Inc. 6.125% 6/15/28 (b) | 195,000 | 161,850 | |
| Open Text Holdings, Inc. 4.125% 12/1/31 (b) | 2,100,000 | 1,671,075 | |
| Picard Midco, Inc. 6.5% 3/31/29 (b) | 1,149,000 | 995,333 | |
| PTC, Inc. 3.625% 2/15/25 (b) | 440,000 | 418,365 | |
| Seagate HDD Cayman 3.125% 7/15/29 | 203 | 163 | |
| Uber Technologies, Inc. 7.5% 5/15/25 (b) | 1,387,000 | 1,401,060 | |
| Xerox Corp. 4.8% 3/1/35 | 250,000 | 163,846 | |
| Xerox Holdings Corp. 5% 8/15/25 (b) | 105,000 | 97,730 | |
TOTAL TECHNOLOGY | 12,770,888 | ||
| Telecommunications - 3.0% | |||
| Altice Financing SA 5.75% 8/15/29 (b) | 700,000 | 572,467 | |
| Altice France SA: | |||
| 5.125% 7/15/29 (b) | 1,390,000 | 1,072,553 | |
| 5.5% 10/15/29 (b) | 410,000 | 319,672 | |
| Cogent Communications Group, Inc. 7% 6/15/27 (b) | 2,055,000 | 1,988,213 | |
| Dycom Industries, Inc. 4.5% 4/15/29 (b) | 1,155,000 | 1,012,386 | |
| Frontier Communications Holdings LLC: | |||
| 5% 5/1/28 (b) | 1,163,000 | 1,020,533 | |
| 6% 1/15/30 (b) | 355,000 | 283,556 | |
| 8.75% 5/15/30 (b) | 305,000 | 308,431 | |
| Lumen Technologies, Inc. 4.5% 1/15/29 (b) | 755,000 | 399,018 | |
| Sabre GLBL, Inc. 9.25% 4/15/25 (b) | 254,900 | 250,909 | |
| Telecom Italia Capital SA 7.2% 7/18/36 | 1,031,000 | 905,610 | |
| Windstream Escrow LLC 7.75% 8/15/28 (b) | 251,000 | 205,117 | |
TOTAL TELECOMMUNICATIONS | 8,338,465 | ||
| Textiles/Apparel - 0.1% | |||
| Foot Locker, Inc. 4% 10/1/29 (b) | 127,000 | 104,407 | |
| Kontoor Brands, Inc. 4.125% 11/15/29 (b) | 250,000 | 211,875 | |
TOTAL TEXTILES/APPAREL | 316,282 | ||
| Transportation Ex Air/Rail - 0.7% | |||
| XPO Escrow Sub LLC 7.5% 11/15/27 (b) | 2,000,000 | 2,029,115 | |
| Utilities - 0.9% | |||
| Calpine Corp.: | |||
| 3.75% 3/1/31 (b) | 1,176,000 | 954,713 | |
| 5.25% 6/1/26 (b) | 105,000 | 100,638 | |
| Solaris Midstream Holdings LLC 7.625% 4/1/26 (b) | 346,000 | 341,728 | |
| TerraForm Power Operating LLC 5% 1/31/28 (b) | 153,000 | 140,760 | |
| Vistra Operations Co. LLC 5.625% 2/15/27 (b) | 1,148,000 | 1,087,868 | |
TOTAL UTILITIES | 2,625,707 | ||
| TOTAL NONCONVERTIBLE BONDS (Cost $287,955,146) | 267,176,549 | ||
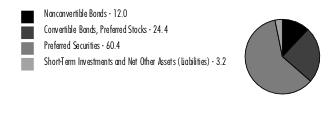
| Money Market Funds - 3.2% | |||
| Shares | Value ($) | ||
Fidelity Cash Central Fund 4.63% (f) (Cost $8,906,567) | 8,904,786 | 8,906,567 | |
| TOTAL INVESTMENT IN SECURITIES - 99.8% (Cost $296,861,713) | 276,083,116 |
NET OTHER ASSETS (LIABILITIES) - 0.2% | 610,262 |
| NET ASSETS - 100.0% | 276,693,378 |
| (a) | Amount is stated in United States dollars unless otherwise noted. |
| (b) | Security exempt from registration under Rule 144A of the Securities Act of 1933. These securities may be resold in transactions exempt from registration, normally to qualified institutional buyers. At the end of the period, the value of these securities amounted to $206,644,937 or 74.7% of net assets. |
| (c) | Security or a portion of the security purchased on a delayed delivery or when-issued basis. |
| (d) | Coupon rates for floating and adjustable rate securities reflect the rates in effect at period end. |
| (e) | Security is perpetual in nature with no stated maturity date. |
| (f) | Affiliated fund that is generally available only to investment companies and other accounts managed by Fidelity Investments. The rate quoted is the annualized seven-day yield of the fund at period end. A complete unaudited listing of the fund's holdings as of its most recent quarter end is available upon request. In addition, each Fidelity Central Fund's financial statements are available on the SEC's website or upon request. |
| Affiliate | Value, beginning of period ($) | Purchases ($) | Sales Proceeds ($) | Dividend Income ($) | Realized Gain (loss) ($) | Change in Unrealized appreciation (depreciation) ($) | Value, end of period ($) | % ownership, end of period |
| Fidelity Cash Central Fund 4.63% | 7,518,427 | 46,180,313 | 44,792,173 | 164,276 | - | - | 8,906,567 | 0.0% |
| Total | 7,518,427 | 46,180,313 | 44,792,173 | 164,276 | - | - | 8,906,567 | |
| Valuation Inputs at Reporting Date: | ||||
| Description | Total ($) | Level 1 ($) | Level 2 ($) | Level 3 ($) |
Investments in Securities: | ||||
| Corporate Bonds | 267,176,549 | - | 267,176,549 | - |
| Money Market Funds | 8,906,567 | 8,906,567 | - | - |
| Total Investments in Securities: | 276,083,116 | 8,906,567 | 267,176,549 | - |
| Statement of Assets and Liabilities | ||||
February 28, 2023 (Unaudited) | ||||
| Assets | ||||
| Investment in securities, at value - See accompanying schedule: | ||||
Unaffiliated issuers (cost $287,955,146) | $ | 267,176,549 | ||
Fidelity Central Funds (cost $8,906,567) | 8,906,567 | |||
| Total Investment in Securities (cost $296,861,713) | $ | 276,083,116 | ||
| Cash | 35,751 | |||
| Receivable for investments sold | 2,803,912 | |||
| Interest receivable | 4,197,745 | |||
| Distributions receivable from Fidelity Central Funds | 20,303 | |||
Total assets | 283,140,827 | |||
| Liabilities | ||||
| Payable for investments purchased on a delayed delivery basis | $ | 4,970,000 | ||
| Distributions payable | 1,374,000 | |||
| Accrued management fee | 103,449 | |||
| Total Liabilities | 6,447,449 | |||
| Net Assets | $ | 276,693,378 | ||
| Net Assets consist of: | ||||
| Paid in capital | $ | 320,307,369 | ||
| Total accumulated earnings (loss) | (43,613,991) | |||
| Net Assets | $ | 276,693,378 | ||
Net Asset Value , offering price and redemption price per share ($276,693,378 ÷ 6,000,000 shares) | $ | 46.12 | ||
| Statement of Operations | ||||
Six months ended February 28, 2023 (Unaudited) | ||||
| Investment Income | ||||
| Dividends | $ | 5,273 | ||
| Interest | 7,989,545 | |||
| Income from Fidelity Central Funds | 164,276 | |||
| Total Income | 8,159,094 | |||
| Expenses | ||||
| Management fee | $ | 600,477 | ||
| Independent trustees' fees and expenses | 409 | |||
| Total expenses before reductions | 600,886 | |||
| Expense reductions | (1,147) | |||
| Total expenses after reductions | 599,739 | |||
| Net Investment income (loss) | 7,559,355 | |||
| Realized and Unrealized Gain (Loss) | ||||
| Net realized gain (loss) on: | ||||
| Investment Securities: | ||||
| Unaffiliated issuers | (5,558,715) | |||
| Redemptions in-kind | (1,920,614) | |||
| Total net realized gain (loss) | (7,479,329) | |||
| Change in net unrealized appreciation (depreciation) on investment securities | 6,393,338 | |||
| Net gain (loss) | (1,085,991) | |||
| Net increase (decrease) in net assets resulting from operations | $ | 6,473,364 | ||
| Statement of Changes in Net Assets | ||||
Six months ended February 28, 2023 (Unaudited) | Year ended August 31, 2022 | |||
| Increase (Decrease) in Net Assets | ||||
| Operations | ||||
| Net investment income (loss) | $ | 7,559,355 | $ | 13,042,306 |
| Net realized gain (loss) | (7,479,329) | (16,010,975) | ||
| Change in net unrealized appreciation (depreciation) | 6,393,338 | (32,513,552) | ||
| Net increase (decrease) in net assets resulting from operations | 6,473,364 | (35,482,221) | ||
| Distributions to shareholders | (7,694,550) | (19,199,200) | ||
| Share transactions | ||||
| Proceeds from sales of shares | 22,996,706 | 122,215,264 | ||
| Cost of shares redeemed | (20,078,039) | (70,069,896) | ||
Net increase (decrease) in net assets resulting from share transactions | 2,918,667 | 52,145,368 | ||
| Total increase (decrease) in net assets | 1,697,481 | (2,536,053) | ||
| Net Assets | ||||
| Beginning of period | 274,995,897 | 277,531,950 | ||
| End of period | $ | 276,693,378 | $ | 274,995,897 |
| Other Information | ||||
| Shares | ||||
| Sold | 500,000 | 2,350,000 | ||
| Redeemed | (450,000) | (1,350,000) | ||
| Net increase (decrease) | 50,000 | 1,000,000 | ||
| Fidelity® High Yield Factor ETF |
Six months ended (Unaudited) February 28, 2023 | Years ended August 31, 2022 | 2021 | 2020 | 2019 | 2018 A | |||||||
Selected Per-Share Data | ||||||||||||
| Net asset value, beginning of period | $ | 46.22 | $ | 56.07 | $ | 54.49 | $ | 52.32 | $ | 50.21 | $ | 50.00 |
| Income from Investment Operations | ||||||||||||
Net investment income (loss) B,C | 1.305 | 2.383 | 2.250 | 2.518 | 2.589 | .578 | ||||||
| Net realized and unrealized gain (loss) | (.075) | (8.748) | 2.335 | 2.323 | 2.006 | .209 | ||||||
| Total from investment operations | 1.230 | (6.365) | 4.585 | 4.841 | 4.595 | .787 | ||||||
| Distributions from net investment income | (1.330) | (2.355) | (2.195) | (2.429) | (2.485) | (.577) | ||||||
| Distributions from net realized gain | - | (1.128) | (.808) | (.242) | - | - | ||||||
| Total distributions | (1.330) | (3.483) | (3.003) | (2.671) | (2.485) | (.577) | ||||||
| Net asset value, end of period | $ | 46.12 | $ | 46.22 | $ | 56.07 | $ | 54.49 | $ | 52.32 | $ | 50.21 |
Total Return D,E,F | 2.72% | (11.85)% | 8.66% | 9.61% | 9.48% | 1.59% | ||||||
Ratios to Average Net Assets C,G,H | ||||||||||||
| Expenses before reductions | .45% I | .45% | .45% | .45% | .44% J | .45% I | ||||||
| Expenses net of fee waivers, if any | .45% I | .45% | .45% | .45% | .44% J | .45% I | ||||||
| Expenses net of all reductions | .45% I | .45% | .45% | .45% | .44% J | .45% I | ||||||
| Net investment income (loss) | 5.72% I | 4.64% | 4.07% | 4.84% | 5.03% | 5.21% I | ||||||
| Supplemental Data | ||||||||||||
| Net assets, end of period (000 omitted) | $ | 276,693 | $ | 274,996 | $ | 277,532 | $ | 114,421 | $ | 68,016 | $ | 12,553 |
Portfolio turnover rate K | 54% I,L | 72% L | 177% L | 179% L | 76% | 8% M |
Top Holdings (% of Fund's net assets) | ||
| PNC Financial Services Group, Inc. 5% | 4.7 | |
| Wells Fargo & Co. 5.9% | 4.2 | |
| Truist Financial Corp. 5.125% 12/31/99 | 3.1 | |
| JPMorgan Chase & Co. 4.55% | 3.0 | |
| Bank of America Corp. 5.875% | 2.6 | |
| Goldman Sachs Group, Inc. 4.4% | 2.5 | |
| Morgan Stanley 5.3% | 2.4 | |
| Citigroup, Inc. 6.3% | 2.3 | |
| Charles Schwab Corp. 4% | 2.2 | |
| Goldman Sachs Group, Inc. 3 month U.S. LIBOR + 2.870% 7.7333% | 1.9 | |
| 28.9 | ||
| Market Sectors (% of Fund's net assets) | ||
| Financials | 71.8 | |
| Utilities | 10.1 | |
| Energy | 7.6 | |
| Communication Services | 3.4 | |
| Industrials | 1.6 | |
| Real Estate | 1.6 | |
| Consumer Discretionary | 0.7 | |
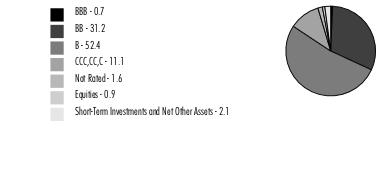
Quality Diversification (% of Fund's net assets) |
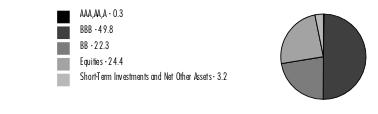 |
| We have used ratings from Moody's Investors Service, Inc. Where Moody's® ratings are not available, we have used S&P® ratings. All ratings are as of the date indicated and do not reflect subsequent changes. |
Asset Allocation (% of Fund's net assets) |
 |
Foreign investments - 7.5% |
| Nonconvertible Bonds - 12.0% | |||
Principal Amount (a) | Value ($) | ||
| COMMUNICATION SERVICES - 1.6% | |||
| Media - 0.4% | |||
| Paramount Global 6.25% 2/28/57 (b) | 153,000 | 126,225 | |
| Wireless Telecommunication Services - 1.2% | |||
| Vodafone Group PLC 7% 4/4/79 (b) | 400,000 | 392,119 | |
TOTAL COMMUNICATION SERVICES | 518,344 | ||
| ENERGY - 2.0% | |||
| Oil, Gas & Consumable Fuels - 2.0% | |||
| Enterprise Products Operating LP: | |||
| 3 month U.S. LIBOR + 2.980% 7.8576% 8/16/77 (b)(c) | 33,000 | 31,565 | |
| 5.25% 8/16/77 (b) | 126,000 | 112,505 | |
| 5.375% 2/15/78 (b) | 67,000 | 55,945 | |
| Transcanada Trust: | |||
| 5.3% 3/15/77 (b) | 161,000 | 142,083 | |
| 5.5% 9/15/79 (b) | 128,000 | 112,877 | |
| 5.625% 5/20/75 (b) | 95,000 | 90,497 | |
| 5.875% 8/15/76 (b) | 129,000 | 122,556 | |
| 668,028 | |||
| FINANCIALS - 6.2% | |||
| Diversified Financial Services - 0.9% | |||
| Apollo Management Holdings LP 4.95% 1/14/50 (b)(d) | 324,000 | 279,450 | |
| Insurance - 5.3% | |||
| American International Group, Inc. 5.75% 4/1/48 (b) | 129,000 | 124,485 | |
| Assurant, Inc. 7% 3/27/48 (b) | 61,000 | 60,441 | |
| Liberty Mutual Group, Inc.: | |||
| 4.125% 12/15/51 (b)(d) | 150,000 | 125,141 | |
| 4.3% 2/1/61 (d) | 125,000 | 75,927 | |
| MetLife, Inc.: | |||
| 6.4% 12/15/66 (b) | 319,000 | 320,158 | |
| 10.75% 8/1/69 (b) | 128,000 | 171,520 | |
| Nippon Life Insurance Co. 3.4% 1/23/50 (b)(d) | 100,000 | 86,959 | |
| PartnerRe Finance B LLC 4.5% 10/1/50 (b) | 67,000 | 59,821 | |
| Prudential Financial, Inc.: | |||
| 3.7% 10/1/50 (b) | 200,000 | 168,625 | |
| 5.125% 3/1/52 (b) | 150,000 | 137,078 | |
| 6% 9/1/52 (b) | 200,000 | 192,933 | |
| 6.75% 3/1/53 (b) | 200,000 | 201,000 | |
| 1,724,088 | |||
TOTAL FINANCIALS | 2,003,538 | ||
| UTILITIES - 2.2% | |||
| Electric Utilities - 1.3% | |||
| Emera, Inc. 6.75% 6/15/76 (b) | 125,000 | 119,934 | |
| NextEra Energy Capital Holdings, Inc. 5.65% 5/1/79 (b) | 329,000 | 304,325 | |
| 424,259 | |||
| Multi-Utilities - 0.9% | |||
| CMS Energy Corp. 3.75% 12/1/50 (b) | 359,000 | 285,407 | |
TOTAL UTILITIES | 709,666 | ||
| TOTAL NONCONVERTIBLE BONDS (Cost $4,365,475) | 3,899,576 | ||
| Nonconvertible Preferred Stocks - 24.4% | |||
| Shares | Value ($) | ||
| COMMUNICATION SERVICES - 1.8% | |||
| Diversified Telecommunication Services - 1.5% | |||
| AT&T, Inc. 4.75% | 25,000 | 498,750 | |
| Wireless Telecommunication Services - 0.3% | |||
| U.S. Cellular Corp. 5.50% | 6,000 | 98,940 | |
TOTAL COMMUNICATION SERVICES | 597,690 | ||
| ENERGY - 1.1% | |||
| Oil, Gas & Consumable Fuels - 1.1% | |||
| DCP Midstream Partners LP: | |||
| 7.95% (b) | 775 | 19,654 | |
| Series B, 7.875% (b) | 775 | 19,422 | |
| Energy Transfer LP: | |||
| 7.60% (b) | 6,755 | 164,147 | |
| 7.625% (b) | 2,960 | 71,810 | |
| Series C, 7.375% (b) | 2,623 | 63,896 | |
| 338,929 | |||
| FINANCIALS - 16.2% | |||
| Banks - 7.9% | |||
| Associated Banc-Corp. 6.625% (b)(e) | 1,000 | 25,400 | |
| Bank of America Corp.: | |||
| 4.25% | 4,750 | 88,398 | |
| 4.375% | 20,000 | 387,200 | |
| Cadence Bank 5.50% | 1,000 | 21,580 | |
| Cullen/Frost Bankers, Inc. Series B 4.45% | 3,000 | 59,640 | |
| Fifth Third Bancorp Series K 4.95% | 1,500 | 34,035 | |
| First Republic Bank: | |||
| 4.125% | 10,000 | 175,600 | |
| Series M, 4.00% | 10,000 | 171,100 | |
| Huntington Bancshares, Inc. Series H, 4.50% | 6,950 | 136,012 | |
| JPMorgan Chase & Co. 4.55% | 47,900 | 970,454 | |
| KeyCorp 5.625% | 1,738 | 41,243 | |
| Regions Financial Corp.: | |||
| 4.45% | 2,500 | 48,150 | |
| 5.75% (b) | 3,000 | 73,830 | |
| Truist Financial Corp. 4.75% | 3,025 | 63,011 | |
| U.S. Bancorp: | |||
| 4.50% | 3,000 | 60,960 | |
| Series L, 3.75% | 2,000 | 34,400 | |
| Series M, 4.00% | 5,000 | 91,250 | |
| Wells Fargo & Co. Series Z, 4.75% | 5,000 | 100,150 | |
| 2,582,413 | |||
| Capital Markets - 3.6% | |||
| Affiliated Managers Group, Inc. 4.75% | 3,000 | 58,740 | |
| Charles Schwab Corp. 4.45% | 27,500 | 571,175 | |
| Morgan Stanley: | |||
| Series K, 5.85% (b) | 11,275 | 282,439 | |
| Series O, 4.50% | 2,300 | 43,332 | |
| Northern Trust Corp. Series E, 4.70% | 1,000 | 21,420 | |
| Oaktree Capital Group LLC 6.55% | 2,000 | 47,580 | |
| SCE Trust III 5.75% (b) | 1,550 | 36,193 | |
| Stifel Financial Corp. Series D, 4.50% | 5,000 | 94,750 | |
| 1,155,629 | |||
| Consumer Finance - 0.1% | |||
| Navient Corp. 6.00% | 1,500 | 29,175 | |
| Diversified Financial Services - 1.1% | |||
| Equitable Holdings, Inc.: | |||
| 4.30% | 2,000 | 38,000 | |
| Series A 5.25% | 3,000 | 66,150 | |
| KKR Group Finance Co. IX LLC 4.625% | 10,000 | 188,000 | |
| Voya Financial, Inc. Series B, 5.35% (b) | 2,550 | 61,430 | |
| 353,580 | |||
| Insurance - 3.5% | |||
| Aegon Funding Co. LLC 5.10% | 3,950 | 81,844 | |
| Allstate Corp.: | |||
| 5.10% | 12,000 | 273,000 | |
| Series I, 4.75% | 2,000 | 44,480 | |
| American Financial Group, Inc.: | |||
| 4.50% | 2,000 | 38,800 | |
| 5.125% | 1,000 | 21,680 | |
| Athene Holding Ltd.: | |||
| Series C, 6.375% (b) | 4,000 | 100,840 | |
| Series D, 4.875% | 5,425 | 102,370 | |
| Series E, 7.75% (b) | 1,000 | 26,050 | |
| MetLife, Inc. Series F 4.75% | 4,000 | 87,000 | |
| PartnerRe Ltd. 4.875% | 3,150 | 66,710 | |
| Prudential Financial, Inc. 4.125% | 3,000 | 58,650 | |
| RenaissanceRe Holdings Ltd. Series G, 4.20% | 1,550 | 26,784 | |
| W.R. Berkley Corp. 4.25% | 11,000 | 212,850 | |
| 1,141,058 | |||
TOTAL FINANCIALS | 5,261,855 | ||
| REAL ESTATE - 1.6% | |||
| Equity Real Estate Investment Trusts (REITs) - 1.5% | |||
| Digital Realty Trust, Inc.: | |||
| 5.25% | 750 | 16,823 | |
| Series L, 5.20% | 3,000 | 66,930 | |
| Public Storage 4.00% | 20,000 | 368,600 | |
| Summit Hotel Properties, Inc. Series F, 5.875% | 775 | 14,795 | |
| 467,148 | |||
| Real Estate Management & Development - 0.1% | |||
| Brookfield Property Partners LP: | |||
| 5.75% | 1,550 | 27,141 | |
| 6.375% | 825 | 15,106 | |
| 42,247 | |||
TOTAL REAL ESTATE | 509,395 | ||
| UTILITIES - 3.7% | |||
| Electric Utilities - 2.3% | |||
| Pacific Gas & Electric Co. Series A | 8,000 | 177,600 | |
| SCE Trust II 5.10% | 705 | 14,678 | |
| SCE Trust V 5.45% (b) | 1,550 | 35,387 | |
| Southern Co.: | |||
| 4.20% | 13,000 | 253,240 | |
| Series A, 4.95% | 11,825 | 259,086 | |
| 739,991 | |||
| Independent Power and Renewable Electricity Producers - 0.1% | |||
| Brookfield Renewable Partners LP 5.25% | 2,395 | 48,523 | |
| Multi-Utilities - 1.3% | |||
| Algonquin Power & Utilities Corp. Series A, 6.20% (b) | 4,000 | 92,516 | |
| Brookfield Infrastructure Partners LP: | |||
| 5.125% | 825 | 15,551 | |
| Class A 5.00% | 825 | 15,205 | |
| CMS Energy Corp. 5.875% | 4,000 | 97,920 | |
| DTE Energy Co. 4.375% | 2,825 | 56,924 | |
| NiSource, Inc. 6.50% (b) | 4,000 | 100,400 | |
| SCE Trust VI | 2,375 | 47,666 | |
| 426,182 | |||
TOTAL UTILITIES | 1,214,696 | ||
| TOTAL NONCONVERTIBLE PREFERRED STOCKS (Cost $9,039,678) | 7,922,565 | ||
| Preferred Securities - 60.4% | |||
Principal Amount (a) | Value ($) | ||
| CONSUMER DISCRETIONARY - 0.7% | |||
| Automobiles - 0.7% | |||
| General Motors Financial Co., Inc. 5.7% 12/31/99 (b)(f) | 227,000 | 210,486 | |
| ENERGY - 4.5% | |||
| Oil, Gas & Consumable Fuels - 4.5% | |||
| BP Capital Markets PLC: | |||
| 4.375% (b)(f) | 125,000 | 121,591 | |
| 4.875% (b)(f) | 450,000 | 416,514 | |
| Enbridge, Inc.: | |||
| 5.5% 7/15/77 (b) | 126,000 | 117,224 | |
| 5.75% 7/15/80 (b) | 126,000 | 119,072 | |
| 6% 1/15/77 (b) | 68,000 | 65,363 | |
| 6.25% 3/1/78 (b) | 123,000 | 117,701 | |
| Energy Transfer LP: | |||
| 3 month U.S. LIBOR + 4.020% 8.8916% (b)(c)(f) | 125,000 | 118,870 | |
| 7.125% (b)(f) | 300,000 | 272,959 | |
| EnLink Midstream Partners LP 3 month U.S. LIBOR + 4.110% 8.879% 12/31/99 (b)(c)(f) | 31,000 | 27,551 | |
| Plains All American Pipeline LP 3 month U.S. LIBOR + 4.110% 8.9736% (b)(c)(f) | 95,000 | 87,727 | |
| 1,464,572 | |||
| FINANCIALS - 49.4% | |||
| Banks - 32.4% | |||
| Bank of America Corp.: | |||
| 5.875% (b)(f) | 863,000 | 829,389 | |
| 6.1% (b)(f) | 100,000 | 101,780 | |
| 6.125% (b)(f) | 100,000 | 98,041 | |
| Citigroup, Inc.: | |||
| 3.875% (b)(f) | 511,000 | 459,017 | |
| 4.15% (b)(f) | 89,000 | 76,574 | |
| 5.95% (b)(f) | 418,000 | 415,752 | |
| 6.3% (b)(f) | 745,000 | 741,050 | |
| Citizens Financial Group, Inc. 6% (b)(f) | 247,000 | 241,148 | |
| Fifth Third Bancorp 4.5% (b)(f) | 50,000 | 48,207 | |
| Huntington Bancshares, Inc.: | |||
| 4.45% 12/31/99 (b)(f) | 574,000 | 535,894 | |
| 5.625% (b)(f) | 351,000 | 335,393 | |
| 5.7% (b)(f) | 184,000 | 183,931 | |
| JPMorgan Chase & Co.: | |||
| 5% (b)(f) | 351,000 | 342,266 | |
| 6.1% (b)(f) | 321,000 | 327,317 | |
| KeyCorp 5% (b)(f) | 75,000 | 71,576 | |
| M&T Bank Corp.: | |||
| 3.5% (b)(f) | 30,000 | 24,301 | |
| 5.125% (b)(f) | 450,000 | 426,483 | |
| PNC Financial Services Group, Inc.: | |||
| 5% (b)(f) | 1,592,000 | 1,510,119 | |
| 6% (b)(f) | 225,000 | 218,106 | |
| Regions Financial Corp. 5.75% 12/31/99 (b) | 75,000 | 74,611 | |
| SVB Financial Group: | |||
| 4.25% 12/31/99 (b)(f) | 125,000 | 88,661 | |
| 4.7% 12/31/99 (b)(f) | 60,000 | 41,465 | |
| Truist Financial Corp.: | |||
| 4.95% (b)(f) | 50,000 | 49,503 | |
| 5.1% (b)(f) | 478,000 | 468,583 | |
| 5.125% 12/31/99 (b)(f) | 1,130,000 | 1,007,342 | |
| U.S. Bancorp: | |||
| 3.7% (b)(f) | 275,000 | 232,616 | |
| 5.3% (b)(f) | 100,000 | 92,169 | |
| Wells Fargo & Co.: | |||
| 3.9% (b)(f) | 141,000 | 127,268 | |
| 5.9% (b)(f) | 1,371,000 | 1,358,316 | |
| 10,526,878 | |||
| Capital Markets - 13.5% | |||
| Bank of New York Mellon Corp.: | |||
| 3.7% (b)(f) | 425,000 | 390,058 | |
| 3.75% (b)(f) | 96,000 | 80,870 | |
| 4.625% (b)(f) | 200,000 | 186,137 | |
| Charles Schwab Corp.: | |||
| 4% (b)(f) | 831,000 | 710,837 | |
| 5% (b)(f) | 75,000 | 71,438 | |
| Goldman Sachs Group, Inc.: | |||
| 3 month U.S. LIBOR + 2.870% 7.7333% (b)(c)(f) | 616,000 | 612,601 | |
| 4.125% (b)(f) | 29,000 | 25,271 | |
| 4.4% (b)(f) | 894,000 | 813,218 | |
| 5.3% (b)(f) | 279,000 | 275,973 | |
| Morgan Stanley: | |||
| 5.3% (b)(f) | 765,000 | 774,891 | |
| 5.875% (b)(f) | 125,000 | 126,832 | |
| Northern Trust Corp. 4.6% (b)(f) | 50,000 | 47,138 | |
| State Street Corp. 5.625% (b)(f) | 263,000 | 256,884 | |
| 4,372,148 | |||
| Consumer Finance - 2.5% | |||
| Ally Financial, Inc. 4.7% (b)(f) | 250,000 | 196,375 | |
| American Express Co. 3.55% (b)(f) | 232,000 | 198,684 | |
| Capital One Financial Corp. 3.95% (b)(f) | 400,000 | 341,510 | |
| Discover Financial Services 5.5% 12/31/99 (b)(f) | 100,000 | 87,095 | |
| 823,664 | |||
| Diversified Financial Services - 0.2% | |||
| Equitable Holdings, Inc. 4.95% (b)(f) | 75,000 | 73,024 | |
| Insurance - 0.8% | |||
| Markel Corp. 6% (b)(f) | 100,000 | 100,217 | |
| MetLife, Inc. 3.85% (b)(f) | 125,000 | 119,601 | |
| SBL Holdings, Inc. 6.5% 12/31/99 (b)(d)(f) | 34,000 | 26,238 | |
| 246,056 | |||
TOTAL FINANCIALS | 16,041,770 | ||
| INDUSTRIALS - 1.6% | |||
| Trading Companies & Distributors - 1.6% | |||
| AerCap Holdings NV 5.875% 10/10/79 (b) | 150,000 | 146,541 | |
| Air Lease Corp.: | |||
| 4.125% 12/31/99 (b)(f) | 56,000 | 43,906 | |
| 4.65% (b)(f) | 250,000 | 226,304 | |
| Aircastle Ltd. 5.25% 12/31/99 (b)(d)(f) | 126,000 | 105,120 | |
| 521,871 | |||
| UTILITIES - 4.2% | |||
| Electric Utilities - 1.4% | |||
| Duke Energy Corp. 4.875% (b)(f) | 225,000 | 222,717 | |
| Edison International: | |||
| 5% (b)(f) | 64,000 | 56,591 | |
| 5.375% (b)(f) | 191,000 | 178,609 | |
| 457,917 | |||
| Independent Power and Renewable Electricity Producers - 1.2% | |||
| Vistra Corp.: | |||
| 7% (b)(d)(f) | 295,000 | 280,234 | |
| 8% (b)(d)(f) | 90,000 | 89,110 | |
| 369,344 | |||
| Multi-Utilities - 1.6% | |||
| CenterPoint Energy, Inc. 6.125% 12/31/99 (b) | 96,000 | 97,182 | |
| Dominion Energy, Inc.: | |||
| 4.35% (b)(f) | 85,000 | 75,110 | |
| 4.65% (b)(f) | 75,000 | 69,916 | |
| Sempra Energy 4.875% (b)(f) | 301,000 | 289,253 | |
| 531,461 | |||
TOTAL UTILITIES | 1,358,722 | ||
| TOTAL PREFERRED SECURITIES (Cost $21,232,616) | 19,597,421 | ||
| Money Market Funds - 2.8% | |||
| Shares | Value ($) | ||
Fidelity Cash Central Fund 4.63% (g) (Cost $915,749) | 915,566 | 915,749 | |
| TOTAL INVESTMENT IN SECURITIES - 99.6% (Cost $35,553,518) | 32,335,311 |
NET OTHER ASSETS (LIABILITIES) - 0.4% | 125,337 |
| NET ASSETS - 100.0% | 32,460,648 |
| (a) | Amount is stated in United States dollars unless otherwise noted. |
| (b) | Coupon rates for floating and adjustable rate securities reflect the rates in effect at period end. |
| (c) | Coupon is indexed to a floating interest rate which may be multiplied by a specified factor and/or subject to caps or floors. |
| (d) | Security exempt from registration under Rule 144A of the Securities Act of 1933. These securities may be resold in transactions exempt from registration, normally to qualified institutional buyers. At the end of the period, the value of these securities amounted to $1,068,179 or 3.3% of net assets. |
| (e) | Non-income producing |
| (f) | Security is perpetual in nature with no stated maturity date. |
| (g) | Affiliated fund that is generally available only to investment companies and other accounts managed by Fidelity Investments. The rate quoted is the annualized seven-day yield of the fund at period end. A complete unaudited listing of the fund's holdings as of its most recent quarter end is available upon request. In addition, each Fidelity Central Fund's financial statements are available on the SEC's website or upon request. |
| Affiliate | Value, beginning of period ($) | Purchases ($) | Sales Proceeds ($) | Dividend Income ($) | Realized Gain (loss) ($) | Change in Unrealized appreciation (depreciation) ($) | Value, end of period ($) | % ownership, end of period |
| Fidelity Cash Central Fund 4.63% | 1,165,886 | 4,633,463 | 4,883,600 | 11,189 | - | - | 915,749 | 0.0% |
| Total | 1,165,886 | 4,633,463 | 4,883,600 | 11,189 | - | - | 915,749 | |
| Valuation Inputs at Reporting Date: | ||||
| Description | Total ($) | Level 1 ($) | Level 2 ($) | Level 3 ($) |
Investments in Securities: | ||||
| Equities: | ||||
Communication Services | 597,690 | 597,690 | - | - |
Energy | 338,929 | 338,929 | - | - |
Financials | 5,261,855 | 5,236,455 | 25,400 | - |
Real Estate | 509,395 | 509,395 | - | - |
Utilities | 1,214,696 | 1,214,696 | - | - |
| Corporate Bonds | 3,899,576 | - | 3,899,576 | - |
| Preferred Securities | 19,597,421 | - | 19,597,421 | - |
| Money Market Funds | 915,749 | 915,749 | - | - |
| Total Investments in Securities: | 32,335,311 | 8,812,914 | 23,522,397 | - |
| Statement of Assets and Liabilities | ||||
February 28, 2023 (Unaudited) | ||||
| Assets | ||||
| Investment in securities, at value - See accompanying schedule: | ||||
Unaffiliated issuers (cost $34,637,769) | $ | 31,419,562 | ||
Fidelity Central Funds (cost $915,749) | 915,749 | |||
| Total Investment in Securities (cost $35,553,518) | $ | 32,335,311 | ||
| Cash | 14,924 | |||
| Receivable for investments sold | 152,003 | |||
| Dividends receivable | 44,152 | |||
| Interest receivable | 58,727 | |||
| Distributions receivable from Fidelity Central Funds | 2,133 | |||
Total assets | 32,607,250 | |||
| Liabilities | ||||
| Distributions payable | $ | 130,200 | ||
| Accrued management fee | 16,402 | |||
| Total Liabilities | 146,602 | |||
| Net Assets | $ | 32,460,648 | ||
| Net Assets consist of: | ||||
| Paid in capital | $ | 38,340,205 | ||
| Total accumulated earnings (loss) | (5,879,557) | |||
| Net Assets | $ | 32,460,648 | ||
Net Asset Value , offering price and redemption price per share ($32,460,648 ÷ 1,550,000 shares) | $ | 20.94 | ||
| Statement of Operations | ||||
Six months ended February 28, 2023 (Unaudited) | ||||
| Investment Income | ||||
| Dividends | $ | 798,681 | ||
| Interest | 187,051 | |||
| Income from Fidelity Central Funds | 11,189 | |||
| Total Income | 996,921 | |||
| Expenses | ||||
| Management fee | $ | 93,193 | ||
| Independent trustees' fees and expenses | 48 | |||
| Total expenses before reductions | 93,241 | |||
| Expense reductions | (46) | |||
| Total expenses after reductions | 93,195 | |||
| Net Investment income (loss) | 903,726 | |||
| Realized and Unrealized Gain (Loss) | ||||
| Net realized gain (loss) on: | ||||
| Investment Securities: | ||||
| Unaffiliated issuers | (1,294,944) | |||
| Total net realized gain (loss) | (1,294,944) | |||
| Change in net unrealized appreciation (depreciation) on investment securities | 1,604,816 | |||
| Net gain (loss) | 309,872 | |||
| Net increase (decrease) in net assets resulting from operations | $ | 1,213,598 | ||
| Statement of Changes in Net Assets | ||||
Six months ended February 28, 2023 (Unaudited) | Year ended August 31, 2022 | |||
| Increase (Decrease) in Net Assets | ||||
| Operations | ||||
| Net investment income (loss) | $ | 903,726 | $ | 1,028,374 |
| Net realized gain (loss) | (1,294,944) | (1,304,286) | ||
| Change in net unrealized appreciation (depreciation) | 1,604,816 | (4,847,016) | ||
| Net increase (decrease) in net assets resulting from operations | 1,213,598 | (5,122,928) | ||
| Distributions to shareholders | (806,000) | (1,189,250) | ||
| Share transactions | ||||
| Proceeds from sales of shares | - | 34,118,167 | ||
| Cost of shares redeemed | (1,015,599) | (1,037,642) | ||
Net increase (decrease) in net assets resulting from share transactions | (1,015,599) | 33,080,525 | ||
| Total increase (decrease) in net assets | (608,001) | 26,768,347 | ||
| Net Assets | ||||
| Beginning of period | 33,068,649 | 6,300,302 | ||
| End of period | $ | 32,460,648 | $ | 33,068,649 |
| Other Information | ||||
| Shares | ||||
| Sold | - | 1,400,000 | ||
| Redeemed | (50,000) | (50,000) | ||
| Net increase (decrease) | (50,000) | 1,350,000 | ||
| Fidelity® Preferred Securities & Income ETF |
Six months ended (Unaudited) February 28, 2023 | Years ended August 31, 2022 | 2021 A | ||||
Selected Per-Share Data | ||||||
| Net asset value, beginning of period | $ | 20.67 | $ | 25.20 | $ | 25.00 |
| Income from Investment Operations | ||||||
Net investment income (loss) B,C | .581 | .886 | .170 | |||
| Net realized and unrealized gain (loss) | .209 | (4.485) | .187 | |||
| Total from investment operations | .790 | (3.599) | .357 | |||
| Distributions from net investment income | (.520) | (.931) | (.157) | |||
| Total distributions | (.520) | (.931) | (.157) | |||
| Net asset value, end of period | $ | 20.94 | $ | 20.67 | $ | 25.20 |
Total Return D,E,F | 3.97% | (14.50)% | 1.44% | |||
Ratios to Average Net Assets C,G,H | ||||||
| Expenses before reductions | .59% I | .59% | .59% I | |||
| Expenses net of fee waivers, if any | .59% I | .59% | .59% I | |||
| Expenses net of all reductions | .59% I | .59% | .59% I | |||
| Net investment income (loss) | 5.77% I | 3.98% | 3.16% I | |||
| Supplemental Data | ||||||
| Net assets, end of period (000 omitted) | $ | 32,461 | $ | 33,069 | $ | 6,300 |
Portfolio turnover rate J | 35% I | 21% | -% |
| Fidelity Central Fund | Investment Manager | Investment Objective | Investment Practices | Expense Ratio A |
| Fidelity Money Market Central Funds | Fidelity Management & Research Company LLC (FMR) | Each fund seeks to obtain a high level of current income consistent with the preservation of capital and liquidity. | Short-term Investments | Less than .005% |
| Tax cost | Gross unrealized appreciation | Gross unrealized depreciation | Net unrealized appreciation (depreciation) | |
| Fidelity High Yield Factor ETF | $296,869,145 | $1,109,350 | $(21,895,379) | $(20,786,029) |
Fidelity Preferred Securities & Income ETF | 35,575,241 | 296,988 | (3,536,918) | (3,239,930) |
| Short-term | Long-term | Total capital loss carryforward | |
| Fidelity High Yield Factor ETF | $- | $- | $- |
Fidelity Preferred Securities & Income ETF | (1,173,624) | (112,821) | (1,286,445) |
| Capital Losses | |
| Fidelity High Yield Factor ETF | $(15,325,843) |
| Purchases ($) | Sales ($) | |
| Fidelity High Yield Factor ETF | 69,580,284 | 67,384,202 |
| Fidelity Preferred Securities & Income ETF | 5,316,140 | 6,251,926 |
| In-Kind Subscriptions ($) | In-Kind Redemptions ($) | |
| Fidelity High Yield Factor ETF | 17,898,596 | 15,665,143 |
| Fee Rate | |
| Fidelity High Yield Factor ETF | .45% |
| Fidelity Preferred Securities & Income ETF | .59% |
| Amount | |
| Fidelity Preferred Securities & Income ETF | 15 |
| Custodian credits | |
| Fidelity High Yield Factor ETF | $1,147 |
Fidelity Preferred Securities & Income ETF | 46 |
| The Example is based on an investment of $1,000 invested at the beginning of the period and held for the entire period (September 1, 2022 to February 28, 2023). |
Annualized Expense Ratio- A | Beginning Account Value September 1, 2022 | Ending Account Value February 28, 2023 | Expenses Paid During Period- C September 1, 2022 to February 28, 2023 | |||||||
| Fidelity® High Yield Factor ETF | .45% | |||||||||
| Actual | $ 1,000 | $ 1,027.20 | $ 2.26 | |||||||
Hypothetical- B | $ 1,000 | $ 1,022.56 | $ 2.26 | |||||||
| Fidelity® Preferred Securities & Income ETF | .59% | |||||||||
| Actual | $ 1,000 | $ 1,039.70 | $ 2.98 | |||||||
Hypothetical- B | $ 1,000 | $ 1,021.87 | $ 2.96 | |||||||
- Highly liquid investments - cash or convertible to cash within three business days or less
- Moderately liquid investments - convertible to cash in three to seven calendar days
- Less liquid investments - can be sold or disposed of, but not settled, within seven calendar days
- Illiquid investments - cannot be sold or disposed of within seven calendar days
 |


Contents
| Top Bond Issuers (% of Fund's net assets) | ||
(with maturities greater than one year) | ||
| CCO Holdings LLC/CCO Holdings Capital Corp. | 2.8 | |
| Uber Technologies, Inc. | 2.5 | |
| New Fortress Energy, Inc. | 2.2 | |
| Community Health Systems, Inc. | 2.0 | |
| MPT Operating Partnership LP/MPT Finance Corp. | 1.9 | |
| Tenet Healthcare Corp. | 1.7 | |
| WASH Multifamily Acquisition Inc. | 1.6 | |
| OneMain Finance Corp. | 1.6 | |
| Stericycle, Inc. | 1.6 | |
| Go Daddy Operating Co. LLC / GD Finance Co., Inc. | 1.5 | |
| 19.4 | ||
| Market Sectors (% of Fund's net assets) | ||
| Energy | 14.8 | |
| Technology | 11.7 | |
| Services | 8.4 | |
| Healthcare | 8.0 | |
| Telecommunications | 5.9 | |
Quality Diversification (% of Fund's net assets) |
 |
| We have used ratings from Moody's Investors Service, Inc. Where Moody's® ratings are not available, we have used S&P® ratings. All ratings are as of the date indicated and do not reflect subsequent changes. |
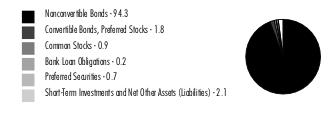
Asset Allocation (% of Fund's net assets) |
 |
Foreign investments - 21% |
Geographic Diversification (% of Fund's net assets) |
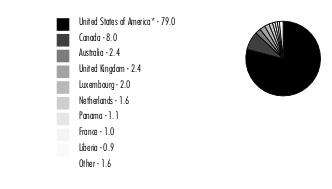 |
* Includes Short-Term investments and Net Other Assets (Liabilities). Percentages are based on country or territory of incorporation and are adjusted for the effect of derivatives, if applicable. |
| Corporate Bonds - 96.1% | |||
Principal Amount (a) | Value ($) | ||
| Convertible Bonds - 1.8% | |||
| Broadcasting - 1.0% | |||
| DISH Network Corp.: | |||
| 2.375% 3/15/24 | 20,000 | 18,370 | |
| 3.375% 8/15/26 | 120,000 | 76,690 | |
| 95,060 | |||
| Gaming - 0.1% | |||
| DraftKings, Inc. 0% 3/15/28 | 14,000 | 9,702 | |
| Homebuilders/Real Estate - 0.4% | |||
| Redfin Corp. 0.5% 4/1/27 | 61,000 | 36,685 | |
| Super Retail - 0.1% | |||
| Wayfair LLC 0.625% 10/1/25 | 12,000 | 8,905 | |
| Technology - 0.2% | |||
| MicroStrategy, Inc. 0% 2/15/27 | 18,000 | 8,424 | |
| Oak Street Health, Inc. 0% 3/15/26 | 8,000 | 7,401 | |
| 15,825 | |||
TOTAL CONVERTIBLE BONDS | 166,177 | ||
| Nonconvertible Bonds - 94.3% | |||
| Aerospace - 2.4% | |||
| ATI, Inc. 4.875% 10/1/29 | 50,000 | 44,768 | |
| Bombardier, Inc. 6% 2/15/28 (b) | 105,000 | 98,379 | |
| Howmet Aerospace, Inc. 3% 1/15/29 | 15,000 | 12,881 | |
| Triumph Group, Inc.: | |||
| 8.875% 6/1/24 (b) | 34,000 | 35,371 | |
| 9% 3/15/28 (b)(c) | 25,000 | 25,000 | |
| 216,399 | |||
| Air Transportation - 0.3% | |||
| Rand Parent LLC 8.5% 2/15/30 (b) | 30,000 | 28,803 | |
| Automotive & Auto Parts - 1.0% | |||
| McLaren Finance PLC 7.5% 8/1/26 (b) | 25,000 | 19,379 | |
| Rivian Holdco & Rivian LLC & Rivian Automotive LLC 6 month U.S. LIBOR + 5.620% 10.1636% 10/15/26 (b)(d)(e) | 70,000 | 68,250 | |
| 87,629 | |||
| Broadcasting - 0.6% | |||
| DISH Network Corp. 11.75% 11/15/27 (b) | 20,000 | 20,265 | |
| TEGNA, Inc. 4.75% 3/15/26 (b) | 30,000 | 28,500 | |
| 48,765 | |||
| Building Materials - 0.4% | |||
| Cornerstone Building Brands, Inc. 6.125% 1/15/29 (b) | 40,000 | 29,001 | |
| Eco Material Technologies, Inc. 7.875% 1/31/27 (b) | 10,000 | 9,543 | |
| 38,544 | |||
| Cable/Satellite TV - 3.6% | |||
| CCO Holdings LLC/CCO Holdings Capital Corp.: | |||
| 4.25% 1/15/34 (b) | 50,000 | 37,428 | |
| 4.75% 2/1/32 (b) | 265,000 | 214,645 | |
| DIRECTV Financing LLC / DIRECTV Financing Co-Obligor, Inc. 5.875% 8/15/27 (b) | 50,000 | 44,701 | |
| DISH DBS Corp. 5.75% 12/1/28 (b) | 5,000 | 3,994 | |
| UPC Broadband Finco BV 4.875% 7/15/31 (b) | 30,000 | 25,328 | |
| 326,096 | |||
| Capital Goods - 0.7% | |||
| Patrick Industries, Inc. 4.75% 5/1/29 (b) | 50,000 | 42,506 | |
| Regal Rexnord Corp.: | |||
| 6.05% 4/15/28 (b) | 5,000 | 4,889 | |
| 6.3% 2/15/30 (b) | 2,000 | 1,957 | |
| Vertical Holdco GmbH 7.625% 7/15/28 (b) | 14,000 | 12,851 | |
| 62,203 | |||
| Chemicals - 4.4% | |||
| Methanex Corp.: | |||
| 5.125% 10/15/27 | 70,000 | 65,795 | |
| 5.65% 12/1/44 | 75,000 | 61,125 | |
| NOVA Chemicals Corp.: | |||
| 4.25% 5/15/29 (b) | 30,000 | 24,839 | |
| 4.875% 6/1/24 (b) | 20,000 | 19,601 | |
| Nufarm Australia Ltd. 5% 1/27/30 (b) | 45,000 | 39,285 | |
| Olympus Water U.S. Holding Corp. 6.25% 10/1/29 (b) | 60,000 | 48,634 | |
| The Chemours Co. LLC 4.625% 11/15/29 (b) | 165,000 | 133,909 | |
| 393,188 | |||
| Consumer Products - 0.2% | |||
| Macy's Retail Holdings LLC 5.875% 4/1/29 (b) | 16,000 | 14,534 | |
| Containers - 0.5% | |||
| Crown Americas LLC/Crown Americas Capital Corp. IV 4.75% 2/1/26 | 50,000 | 47,750 | |
| Diversified Financial Services - 3.3% | |||
| Coinbase Global, Inc.: | |||
| 3.375% 10/1/28 (b) | 30,000 | 19,650 | |
| 3.625% 10/1/31 (b) | 20,000 | 12,062 | |
| Fortress Transportation & Infrastructure Investors LLC 5.5% 5/1/28 (b) | 40,000 | 35,722 | |
| Hightower Holding LLC 6.75% 4/15/29 (b) | 40,000 | 33,838 | |
| HTA Group Ltd. 7% 12/18/25 (b) | 30,000 | 28,356 | |
| OneMain Finance Corp. 3.875% 9/15/28 | 180,000 | 143,100 | |
| StoneX Group, Inc. 8.625% 6/15/25 (b) | 25,000 | 25,145 | |
| 297,873 | |||
| Energy - 14.5% | |||
| Altus Midstream LP 5.875% 6/15/30 (b) | 30,000 | 27,726 | |
| Archrock Partners LP / Archrock Partners Finance Corp. 6.25% 4/1/28 (b) | 30,000 | 28,478 | |
| Atlantica Sustainable Infrastructure PLC 4.125% 6/15/28 (b) | 105,000 | 92,671 | |
| California Resources Corp. 7.125% 2/1/26 (b) | 100,000 | 100,755 | |
| CGG SA 8.75% 4/1/27 (b) | 67,000 | 58,700 | |
| CNX Resources Corp.: | |||
| 6% 1/15/29 (b) | 40,000 | 36,265 | |
| 7.375% 1/15/31 (b) | 5,000 | 4,764 | |
| Crestwood Midstream Partners LP/Crestwood Midstream Finance Corp. 6% 2/1/29 (b) | 80,000 | 72,776 | |
| CVR Energy, Inc. 5.25% 2/15/25 (b) | 131,000 | 125,760 | |
| Energean PLC 6.5% 4/30/27 (b) | 40,000 | 36,800 | |
| Global Partners LP/GLP Finance Corp. 6.875% 1/15/29 | 35,000 | 32,376 | |
| Holly Energy Partners LP/Holly Energy Finance Corp. 5% 2/1/28 (b) | 40,000 | 36,300 | |
| MEG Energy Corp. 5.875% 2/1/29 (b) | 100,000 | 93,267 | |
| New Fortress Energy, Inc.: | |||
| 6.5% 9/30/26 (b) | 205,000 | 187,575 | |
| 6.75% 9/15/25 (b) | 5,000 | 4,688 | |
| Northern Oil & Gas, Inc. 8.125% 3/1/28 (b) | 30,000 | 28,950 | |
| Oceaneering International, Inc. 6% 2/1/28 | 50,000 | 47,431 | |
| SM Energy Co. 6.5% 7/15/28 | 30,000 | 27,675 | |
| Sunnova Energy Corp. 5.875% 9/1/26 (b) | 80,000 | 69,712 | |
| Sunoco LP/Sunoco Finance Corp. 4.5% 5/15/29 | 60,000 | 52,657 | |
| Tallgrass Energy Partners LP / Tallgrass Energy Finance Corp. 6% 3/1/27 (b) | 25,000 | 23,212 | |
| Teine Energy Ltd. 6.875% 4/15/29 (b) | 70,000 | 64,013 | |
| Transocean Titan Finance Ltd. 8.375% 2/1/28 (b) | 8,000 | 8,166 | |
| Transocean, Inc. 8.75% 2/15/30 (b) | 10,000 | 10,175 | |
| Weatherford International Ltd. 8.625% 4/30/30 (b) | 30,000 | 29,960 | |
| 1,300,852 | |||
| Environmental - 2.9% | |||
| Covanta Holding Corp. 4.875% 12/1/29 (b) | 136,000 | 114,873 | |
| Darling Ingredients, Inc. 6% 6/15/30 (b) | 5,000 | 4,831 | |
| Stericycle, Inc.: | |||
| 3.875% 1/15/29 (b) | 80,000 | 68,581 | |
| 5.375% 7/15/24 (b) | 70,000 | 68,972 | |
| 257,257 | |||
| Food & Drug Retail - 1.5% | |||
| Albertsons Companies LLC/Safeway, Inc./New Albertson's, Inc./Albertson's LLC: | |||
| 3.25% 3/15/26 (b) | 50,000 | 45,879 | |
| 4.875% 2/15/30 (b) | 25,000 | 22,433 | |
| Emergent BioSolutions, Inc. 3.875% 8/15/28 (b) | 35,000 | 21,175 | |
| Parkland Corp. 4.625% 5/1/30 (b) | 55,000 | 45,788 | |
| 135,275 | |||
| Food/Beverage/Tobacco - 1.3% | |||
| HLF Financing SARL LLC / Herbalife International, Inc. 4.875% 6/1/29 (b) | 5,000 | 3,874 | |
| Post Holdings, Inc. 4.5% 9/15/31 (b) | 30,000 | 25,262 | |
| TreeHouse Foods, Inc. 4% 9/1/28 | 30,000 | 25,730 | |
| Triton Water Holdings, Inc. 6.25% 4/1/29 (b) | 45,000 | 35,867 | |
| U.S. Foods, Inc. 4.625% 6/1/30 (b) | 30,000 | 26,203 | |
| 116,936 | |||
| Gaming - 1.3% | |||
| Wynn Las Vegas LLC/Wynn Las Vegas Capital Corp. 5.25% 5/15/27 (b) | 120,000 | 111,758 | |
| Healthcare - 8.0% | |||
| Akumin Escrow, Inc. 7.5% 8/1/28 (b) | 30,000 | 21,000 | |
| Cano Health, Inc. 6.25% 10/1/28 (b) | 59,000 | 38,350 | |
| Catalent Pharma Solutions 3.5% 4/1/30 (b) | 70,000 | 60,797 | |
| Charles River Laboratories International, Inc. 3.75% 3/15/29 (b) | 10,000 | 8,682 | |
| Community Health Systems, Inc.: | |||
| 4.75% 2/15/31 (b) | 104,000 | 80,340 | |
| 5.25% 5/15/30 (b) | 70,000 | 56,008 | |
| 6.875% 4/15/29 (b) | 35,000 | 24,479 | |
| 8% 3/15/26 (b) | 20,000 | 19,500 | |
| DaVita HealthCare Partners, Inc. 3.75% 2/15/31 (b) | 75,000 | 56,633 | |
| Encompass Health Corp. 4.625% 4/1/31 | 30,000 | 25,652 | |
| HealthEquity, Inc. 4.5% 10/1/29 (b) | 70,000 | 61,179 | |
| Horizon Pharma U.S.A., Inc. 5.5% 8/1/27 (b) | 30,000 | 30,484 | |
| Pediatrix Medical Group, Inc. 5.375% 2/15/30 (b) | 65,000 | 57,342 | |
| RegionalCare Hospital Partners Holdings, Inc. 5.375% 1/15/29 (b) | 50,000 | 32,817 | |
| Tenet Healthcare Corp. 6.125% 10/1/28 | 160,000 | 148,000 | |
| 721,263 | |||
| Homebuilders/Real Estate - 4.1% | |||
| Howard Hughes Corp. 4.375% 2/1/31 (b) | 65,000 | 52,962 | |
| MPT Operating Partnership LP/MPT Finance Corp.: | |||
| 4.625% 8/1/29 | 25,000 | 18,688 | |
| 5% 10/15/27 | 190,000 | 155,958 | |
| Railworks Holdings LP 8.25% 11/15/28 (b) | 30,000 | 28,071 | |
| Realogy Group LLC/Realogy Co.-Issuer Corp. 5.25% 4/15/30 (b) | 35,000 | 23,975 | |
| Rithm Capital Corp. 6.25% 10/15/25 (b) | 30,000 | 27,371 | |
| Taylor Morrison Communities, Inc./Monarch Communities, Inc. 5.125% 8/1/30 (b) | 50,000 | 44,125 | |
| Uniti Group LP / Uniti Group Finance, Inc. 10.5% 2/15/28 (b) | 20,000 | 20,004 | |
| 371,154 | |||
| Hotels - 0.9% | |||
| Hilton Domestic Operating Co., Inc. 3.625% 2/15/32 (b) | 100,000 | 82,099 | |
| Insurance - 0.3% | |||
| Radian Group, Inc. 6.625% 3/15/25 | 30,000 | 29,978 | |
| Leisure - 2.5% | |||
| Carnival Corp. 6% 5/1/29 (b) | 125,000 | 96,940 | |
| Constellation Merger Sub, Inc. 8.5% 9/15/25 (b) | 25,000 | 20,875 | |
| MajorDrive Holdings IV LLC 6.375% 6/1/29 (b) | 35,000 | 27,051 | |
| Royal Caribbean Cruises Ltd. 5.5% 4/1/28 (b) | 95,000 | 82,802 | |
| 227,668 | |||
| Metals/Mining - 3.4% | |||
| Coeur d'Alene Mines Corp. 5.125% 2/15/29 (b) | 30,000 | 22,704 | |
| Eldorado Gold Corp. 6.25% 9/1/29 (b) | 35,000 | 30,776 | |
| ERO Copper Corp. 6.5% 2/15/30 (b) | 75,000 | 63,469 | |
| First Quantum Minerals Ltd. 6.875% 10/15/27 (b) | 30,000 | 28,069 | |
| FMG Resources Pty Ltd. 6.125% 4/15/32 (b) | 60,000 | 56,700 | |
| IAMGOLD Corp. 5.75% 10/15/28 (b) | 40,000 | 29,900 | |
| Mineral Resources Ltd. 8.5% 5/1/30 (b) | 75,000 | 75,091 | |
| 306,709 | |||
| Paper - 2.5% | |||
| Berry Global, Inc. 5.625% 7/15/27 (b) | 70,000 | 67,375 | |
| Clydesdale Acquisition Holdings, Inc. 6.625% 4/15/29 (b) | 40,000 | 38,162 | |
| Domtar Corp. 6.75% 10/1/28 (b) | 30,000 | 27,000 | |
| Enviva Partners LP / Enviva Partners Finance Corp. 6.5% 1/15/26 (b) | 34,000 | 31,874 | |
| Mercer International, Inc. 5.125% 2/1/29 | 70,000 | 57,397 | |
| 221,808 | |||
| Restaurants - 1.7% | |||
| 1011778 BC Unlimited Liability Co./New Red Finance, Inc. 3.5% 2/15/29 (b) | 40,000 | 33,922 | |
| Yum! Brands, Inc. 4.625% 1/31/32 | 130,000 | 114,912 | |
| 148,834 | |||
| Services - 8.2% | |||
| Adtalem Global Education, Inc. 5.5% 3/1/28 (b) | 37,000 | 34,060 | |
| AECOM 5.125% 3/15/27 | 50,000 | 47,816 | |
| APX Group, Inc. 5.75% 7/15/29 (b) | 40,000 | 33,513 | |
| Brand Energy & Infrastructure Services, Inc. 8.5% 7/15/25 (b) | 55,000 | 46,020 | |
| Dun & Bradstreet Corp. 5% 12/15/29 (b) | 12,000 | 9,927 | |
| GEMS MENASA Cayman Ltd. 7.125% 7/31/26 (b) | 25,000 | 24,317 | |
| Hertz Corp. 4.625% 12/1/26 (b) | 50,000 | 44,527 | |
| KAR Auction Services, Inc. 5.125% 6/1/25 (b) | 18,000 | 17,545 | |
| Life Time, Inc. 8% 4/15/26 (b) | 30,000 | 28,907 | |
| Neptune BidCo U.S., Inc. 9.29% 4/15/29 (b) | 20,000 | 18,908 | |
| Sotheby's 7.375% 10/15/27 (b) | 30,000 | 28,301 | |
| StoneMor, Inc. 8.5% 5/15/29 (b) | 30,000 | 21,690 | |
| Tempo Acquisition LLC 5.75% 6/1/25 (b) | 30,000 | 29,700 | |
| Uber Technologies, Inc. 4.5% 8/15/29 (b) | 233,000 | 205,991 | |
| WASH Multifamily Acquisition, Inc. 5.75% 4/15/26 (b) | 155,000 | 144,186 | |
| 735,408 | |||
| Steel - 0.6% | |||
| Infrabuild Australia Pty Ltd. 12% 10/1/24 (b) | 50,000 | 48,375 | |
| Super Retail - 3.9% | |||
| At Home Group, Inc. 4.875% 7/15/28 (b) | 30,000 | 22,050 | |
| Bath & Body Works, Inc. 6.95% 3/1/33 | 30,000 | 26,100 | |
| Carvana Co. 4.875% 9/1/29 (b) | 130,000 | 61,493 | |
| EG Global Finance PLC 6.75% 2/7/25 (b) | 50,000 | 45,125 | |
| Hanesbrands, Inc. 4.625% 5/15/24 (b) | 45,000 | 44,969 | |
| LBM Acquisition LLC 6.25% 1/15/29 (b) | 40,000 | 28,498 | |
| Michaels Companies, Inc. 5.25% 5/1/28 (b) | 70,000 | 58,256 | |
| Nordstrom, Inc. 4.375% 4/1/30 | 25,000 | 19,719 | |
| Upbound Group, Inc. 6.375% 2/15/29 (b) | 50,000 | 42,894 | |
| 349,104 | |||
| Technology - 11.4% | |||
| Athenahealth Group, Inc. 6.5% 2/15/30 (b) | 30,000 | 23,728 | |
| Atkore, Inc. 4.25% 6/1/31 (b) | 30,000 | 26,117 | |
| Black Knight InfoServ LLC 3.625% 9/1/28 (b) | 30,000 | 25,950 | |
| Broadcom, Inc. 2.6% 2/15/33 (b) | 35,000 | 26,452 | |
| Coherent Corp. 5% 12/15/29 (b) | 35,000 | 30,664 | |
| CommScope, Inc. 4.75% 9/1/29 (b) | 45,000 | 36,675 | |
| Elastic NV 4.125% 7/15/29 (b) | 110,000 | 90,276 | |
| Entegris Escrow Corp. 5.95% 6/15/30 (b) | 76,000 | 70,687 | |
| Entegris, Inc. 3.625% 5/1/29 (b) | 110,000 | 91,212 | |
| Gen Digital, Inc. 5% 4/15/25 (b) | 55,000 | 53,425 | |
| Go Daddy Operating Co. LLC / GD Finance Co., Inc. 3.5% 3/1/29 (b) | 160,000 | 134,045 | |
| Match Group Holdings II LLC 4.625% 6/1/28 (b) | 50,000 | 44,413 | |
| MicroStrategy, Inc. 6.125% 6/15/28 (b) | 10,000 | 8,300 | |
| NCR Corp. 6.125% 9/1/29 (b) | 52,500 | 51,056 | |
| onsemi 3.875% 9/1/28 (b) | 15,000 | 13,183 | |
| Open Text Corp. 3.875% 12/1/29 (b) | 55,000 | 44,394 | |
| Open Text Holdings, Inc.: | |||
| 4.125% 2/15/30 (b) | 10,000 | 8,229 | |
| 4.125% 12/1/31 (b) | 3,000 | 2,387 | |
| Rackspace Hosting, Inc. 3.5% 2/15/28 (b) | 15,000 | 9,131 | |
| Sensata Technologies BV 4% 4/15/29 (b) | 30,000 | 26,459 | |
| Twilio, Inc. 3.625% 3/15/29 | 70,000 | 58,804 | |
| Uber Technologies, Inc. 8% 11/1/26 (b) | 20,000 | 20,305 | |
| Virtusa Corp. 7.125% 12/15/28 (b) | 40,000 | 33,219 | |
| VM Consolidated, Inc. 5.5% 4/15/29 (b) | 110,000 | 97,412 | |
| 1,026,523 | |||
| Telecommunications - 5.9% | |||
| Altice Financing SA 5.75% 8/15/29 (b) | 90,000 | 73,603 | |
| Altice France Holding SA 6% 2/15/28 (b) | 120,000 | 82,500 | |
| Altice France SA 5.125% 7/15/29 (b) | 35,000 | 27,007 | |
| Frontier Communications Holdings LLC 8.75% 5/15/30 (b) | 25,000 | 25,281 | |
| Level 3 Financing, Inc. 3.75% 7/15/29 (b) | 180,000 | 113,150 | |
| Millicom International Cellular SA 4.5% 4/27/31 (b) | 40,000 | 32,300 | |
| SBA Communications Corp. 3.125% 2/1/29 | 40,000 | 33,028 | |
| Uniti Group, Inc. 6% 1/15/30 (b) | 130,000 | 80,573 | |
| Virgin Media Finance PLC 5% 7/15/30 (b) | 30,000 | 24,450 | |
| Zayo Group Holdings, Inc. 6.125% 3/1/28 (b) | 55,000 | 34,647 | |
| 526,539 | |||
| Textiles/Apparel - 0.9% | |||
| Crocs, Inc. 4.125% 8/15/31 (b) | 70,000 | 57,400 | |
| Victoria's Secret & Co. 4.625% 7/15/29 (b) | 30,000 | 24,466 | |
| 81,866 | |||
| Transportation Ex Air/Rail - 0.3% | |||
| Seaspan Corp. 5.5% 8/1/29 (b) | 40,000 | 30,102 | |
| Utilities - 0.8% | |||
| PG&E Corp. 5% 7/1/28 | 35,000 | 31,957 | |
| Pike Corp. 5.5% 9/1/28 (b) | 15,000 | 13,017 | |
| TerraForm Power Operating LLC 4.75% 1/15/30 (b) | 30,000 | 25,933 | |
| 70,907 | |||
TOTAL NONCONVERTIBLE BONDS | 8,462,199 | ||
| TOTAL CORPORATE BONDS (Cost $9,329,233) | 8,628,376 | ||
| Common Stocks - 0.9% | |||
| Shares | Value ($) | ||
| Automotive & Auto Parts - 0.1% | |||
| Aptiv PLC (f) | 100 | 11,628 | |
| Cable/Satellite TV - 0.1% | |||
| Charter Communications, Inc. Class A (f) | 28 | 10,293 | |
| Capital Goods - 0.2% | |||
| Regal Rexnord Corp. | 80 | 12,611 | |
| Energy - 0.3% | |||
| Denbury, Inc. (f) | 150 | 12,506 | |
| New Fortress Energy, Inc. | 400 | 13,196 | |
TOTAL ENERGY | 25,702 | ||
| Healthcare - 0.0% | |||
| Cano Health, Inc. (f) | 1,400 | 2,310 | |
| Technology - 0.1% | |||
| Coherent Corp. (f) | 230 | 9,920 | |
| Utilities - 0.1% | |||
| EQT Corp. | 230 | 7,631 | |
| TOTAL COMMON STOCKS (Cost $75,370) | 80,095 | ||
| Bank Loan Obligations - 0.2% | |||
Principal Amount (a) | Value ($) | ||
| Services - 0.2% | |||
| Brand Energy & Infrastructure Services, Inc. Tranche B, term loan 3 month U.S. LIBOR + 4.250% 9.0646% 6/21/24 (d)(e)(g) | 990 | 933 | |
| Neptune BidCo U.S., Inc. Tranche B 1LN, term loan CME Term SOFR 1 Month Index + 5.000% 9.735% 4/11/29 (d)(e)(g) | 15,000 | 13,763 | |
| TOTAL BANK LOAN OBLIGATIONS (Cost $14,260) | 14,696 | ||
| Preferred Securities - 0.7% | |||
Principal Amount (a) | Value ($) | ||
| Banks & Thrifts - 0.7% | |||
Ally Financial, Inc. 4.7% (d)(h) (Cost $76,525) | 80,000 | 62,840 | |
| Money Market Funds - 1.4% | |||
| Shares | Value ($) | ||
Fidelity Cash Central Fund 4.63% (i) (Cost $128,398) | 128,372 | 128,398 | |
| TOTAL INVESTMENT IN SECURITIES - 99.3% (Cost $9,623,786) | 8,914,405 |
NET OTHER ASSETS (LIABILITIES) - 0.7% | 61,843 |
| NET ASSETS - 100.0% | 8,976,248 |
| (a) | Amount is stated in United States dollars unless otherwise noted. |
| (b) | Security exempt from registration under Rule 144A of the Securities Act of 1933. These securities may be resold in transactions exempt from registration, normally to qualified institutional buyers. At the end of the period, the value of these securities amounted to $7,132,902 or 79.5% of net assets. |
| (c) | Security or a portion of the security purchased on a delayed delivery or when-issued basis. |
| (d) | Coupon rates for floating and adjustable rate securities reflect the rates in effect at period end. |
| (e) | Coupon is indexed to a floating interest rate which may be multiplied by a specified factor and/or subject to caps or floors. |
| (f) | Non-income producing |
| (g) | Remaining maturities of bank loan obligations may be less than the stated maturities shown as a result of contractual or optional prepayments by the borrower. Such prepayments cannot be predicted with certainty. |
| (h) | Security is perpetual in nature with no stated maturity date. |
| (i) | Affiliated fund that is generally available only to investment companies and other accounts managed by Fidelity Investments. The rate quoted is the annualized seven-day yield of the fund at period end. A complete unaudited listing of the fund's holdings as of its most recent quarter end is available upon request. In addition, each Fidelity Central Fund's financial statements are available on the SEC's website or upon request. |
| Affiliate | Value, beginning of period ($) | Purchases ($) | Sales Proceeds ($) | Dividend Income ($) | Realized Gain (loss) ($) | Change in Unrealized appreciation (depreciation) ($) | Value, end of period ($) | % ownership, end of period |
| Fidelity Cash Central Fund 4.63% | 299,904 | 763,797 | 935,303 | 2,434 | - | - | 128,398 | 0.0% |
| Total | 299,904 | 763,797 | 935,303 | 2,434 | - | - | 128,398 | |
| Valuation Inputs at Reporting Date: | ||||
| Description | Total ($) | Level 1 ($) | Level 2 ($) | Level 3 ($) |
Investments in Securities: | ||||
| Equities: | ||||
Communication Services | 10,293 | 10,293 | - | - |
Consumer Discretionary | 11,628 | 11,628 | - | - |
Energy | 33,333 | 33,333 | - | - |
Health Care | 2,310 | 2,310 | - | - |
Industrials | 12,611 | 12,611 | - | - |
Information Technology | 9,920 | 9,920 | - | - |
| Corporate Bonds | 8,628,376 | - | 8,628,376 | - |
| Bank Loan Obligations | 14,696 | - | 14,696 | - |
| Preferred Securities | 62,840 | - | 62,840 | - |
| Money Market Funds | 128,398 | 128,398 | - | - |
| Total Investments in Securities: | 8,914,405 | 208,493 | 8,705,912 | - |
| Statement of Assets and Liabilities | ||||
February 28, 2023 (Unaudited) | ||||
| Assets | ||||
| Investment in securities, at value - See accompanying schedule: | ||||
Unaffiliated issuers (cost $9,495,388) | $ | 8,786,007 | ||
Fidelity Central Funds (cost $128,398) | 128,398 | |||
| Total Investment in Securities (cost $9,623,786) | $ | 8,914,405 | ||
| Dividends receivable | 35 | |||
| Interest receivable | 140,791 | |||
| Distributions receivable from Fidelity Central Funds | 268 | |||
Total assets | 9,055,499 | |||
| Liabilities | ||||
| Payable for investments purchased on a delayed delivery basis | $ | 25,000 | ||
| Distributions payable | 49,600 | |||
| Accrued management fee | 4,651 | |||
| Total Liabilities | 79,251 | |||
| Net Assets | $ | 8,976,248 | ||
| Net Assets consist of: | ||||
| Paid in capital | $ | 10,029,358 | ||
| Total accumulated earnings (loss) | (1,053,110) | |||
| Net Assets | $ | 8,976,248 | ||
Net Asset Value , offering price and redemption price per share ($8,976,248 ÷ 200,000 shares) | $ | 44.88 | ||
| Statement of Operations | ||||
Six months ended February 28, 2023 (Unaudited) | ||||
| Investment Income | ||||
| Dividends | $ | 3,219 | ||
| Interest | 310,291 | |||
| Income from Fidelity Central Funds | 2,434 | |||
| Total Income | 315,944 | |||
| Expenses | ||||
| Management fee | $ | 24,601 | ||
| Independent trustees' fees and expenses | 14 | |||
| Total expenses before reductions | 24,615 | |||
| Expense reductions | (66) | |||
| Total expenses after reductions | 24,549 | |||
| Net Investment income (loss) | 291,395 | |||
| Realized and Unrealized Gain (Loss) | ||||
| Net realized gain (loss) on: | ||||
| Investment Securities: | ||||
| Unaffiliated issuers | (183,548) | |||
| Total net realized gain (loss) | (183,548) | |||
| Change in net unrealized appreciation (depreciation) on investment securities | 102,896 | |||
| Net gain (loss) | (80,652) | |||
| Net increase (decrease) in net assets resulting from operations | $ | 210,743 | ||
| Statement of Changes in Net Assets | ||||
Six months ended February 28, 2023 (Unaudited) | For the period February 15, 2022 (commencement of operations) through August 31, 2022 | |||
| Increase (Decrease) in Net Assets | ||||
| Operations | ||||
| Net investment income (loss) | $ | 291,395 | $ | 280,716 |
| Net realized gain (loss) | (183,548) | (169,092) | ||
| Change in net unrealized appreciation (depreciation) | 102,896 | (812,277) | ||
| Net increase (decrease) in net assets resulting from operations | 210,743 | (700,653) | ||
| Distributions to shareholders | (286,000) | (277,200) | ||
| Share transactions | ||||
| Proceeds from sales of shares | - | 10,029,358 | ||
Net increase (decrease) in net assets resulting from share transactions | - | 10,029,358 | ||
| Total increase (decrease) in net assets | (75,257) | 9,051,505 | ||
| Net Assets | ||||
| Beginning of period | 9,051,505 | - | ||
| End of period | $ | 8,976,248 | $ | 9,051,505 |
| Other Information | ||||
| Shares | ||||
| Sold | - | 200,000 | ||
| Redeemed | - | - | ||
| Net increase (decrease) | - | 200,000 | ||
| Fidelity® Sustainable High Yield ETF |
Six months ended (Unaudited) February 28, 2023 | Years ended August 31, 2022 A | |||
Selected Per-Share Data | ||||
| Net asset value, beginning of period | $ | 45.26 | $ | 50.00 |
| Income from Investment Operations | ||||
Net investment income (loss) B,C | 1.457 | 1.404 | ||
| Net realized and unrealized gain (loss) | (.407) | (4.758) | ||
| Total from investment operations | 1.050 | (3.354) | ||
| Distributions from net investment income | (1.430) | (1.386) | ||
| Total distributions | (1.430) | (1.386) | ||
| Net asset value, end of period | $ | 44.88 | $ | 45.26 |
Total Return D,E,F | 2.41% | (6.78)% | ||
Ratios to Average Net Assets C,G,H | ||||
| Expenses before reductions | .55% I | .55% I | ||
| Expenses net of fee waivers, if any | .55% I | .55% I | ||
| Expenses net of all reductions | .55% I | .55% I | ||
| Net investment income (loss) | 6.57% I | 5.49% I | ||
| Supplemental Data | ||||
| Net assets, end of period (000 omitted) | $ | 8,976 | $ | 9,052 |
Portfolio turnover rate J | 47% I | 24% K |
| Fidelity Central Fund | Investment Manager | Investment Objective | Investment Practices | Expense Ratio A |
| Fidelity Money Market Central Funds | Fidelity Management & Research Company LLC (FMR) | Each fund seeks to obtain a high level of current income consistent with the preservation of capital and liquidity. | Short-term Investments | Less than .005% |
| Gross unrealized appreciation | $87,434 |
| Gross unrealized depreciation | (792,507) |
| Net unrealized appreciation (depreciation) | $(705,073) |
| Tax cost | $9,619,478 |
| Purchases ($) | Sales ($) | |
| Fidelity Sustainable High Yield ETF | 2,158,604 | 2,005,360 |
| Purchases ($) | Sales ($) | Realized Gain (Loss) ($) | |
| Fidelity Sustainable High Yield ETF | 9,020 | - | - |
| The Example is based on an investment of $1,000 invested at the beginning of the period and held for the entire period (September 1, 2022 to February 28, 2023). |
Annualized Expense Ratio- A | Beginning Account Value September 1, 2022 | Ending Account Value February 28, 2023 | Expenses Paid During Period- C September 1, 2022 to February 28, 2023 | |||||||
| Fidelity® Sustainable High Yield ETF | .55% | |||||||||
| Actual | $ 1,000 | $ 1,024.10 | $ 2.76 | |||||||
Hypothetical- B | $ 1,000 | $ 1,022.07 | $ 2.76 | |||||||
- Highly liquid investments - cash or convertible to cash within three business days or less
- Moderately liquid investments - convertible to cash in three to seven calendar days
- Less liquid investments - can be sold or disposed of, but not settled, within seven calendar days
- Illiquid investments - cannot be sold or disposed of within seven calendar days
 |
Item 2.
Code of Ethics
Not applicable.
Item 3.
Audit Committee Financial Expert
Not applicable.
Item 4.
Principal Accountant Fees and Services
Not applicable.
Item 5.
Audit Committee of Listed Registrants
Not applicable.
Item 6.
Investments
(a)
Not applicable.
(b)
Not applicable
Item 7.
Disclosure of Proxy Voting Policies and Procedures for Closed-End Management Investment Companies
Not applicable.
Item 8.
Portfolio Managers of Closed-End Management Investment Companies
Not applicable.
Item 9.
Purchase of Equity Securities by Closed-End Management Investment Company and Affiliated Purchasers
Not applicable.
Item 10.
Submission of Matters to a Vote of Security Holders
There were no material changes to the procedures by which shareholders may recommend nominees to the Fidelity Covington Trust’s Board of Trustees.
Item 11.
Controls and Procedures
(a)(i) The President and Treasurer and the Chief Financial Officer have concluded that the Fidelity Covington Trust’s (the “Trust”) disclosure controls and procedures (as
defined in Rule 30a-3(c) under the Investment Company Act) provide reasonable assurances that material information relating to the Trust is made known to them by the appropriate persons, based on their evaluation of these controls and procedures as of a date within 90 days of the filing date of this report.
(a)(ii) There was no change in the Trust’s internal control over financial reporting (as defined in Rule 30a-3(d) under the Investment Company Act) that occurred during the period covered by this report that has materially affected, or is reasonably likely to materially affect, the Trust’s internal control over financial reporting.
Item 12.
Disclosure of Securities Lending Activities for Closed-End Management
Investment Companies
Not applicable.
Item 13.
Exhibits
(a) | (1) | Not applicable. |
(a) | (2) | |
(a) | (3) | Not applicable. |
(b) |
SIGNATURES
Pursuant to the requirements of the Securities Exchange Act of 1934 and the Investment Company Act of 1940, the registrant has duly caused this report to be signed on its behalf by the undersigned, thereunto duly authorized.
Fidelity Covington Trust
By: | /s/Stacie M. Smith |
Stacie M. Smith | |
President and Treasurer | |
Date: | April 20, 2023 |
Pursuant to the requirements of the Securities Exchange Act of 1934 and the Investment Company Act of 1940, this report has been signed below by the following persons on behalf of the registrant and in the capacities and on the dates indicated.
By: | /s/Stacie M. Smith |
Stacie M. Smith | |
President and Treasurer | |
Date: | April 20, 2023 |
By: | /s/John J. Burke III |
John J. Burke III | |
Chief Financial Officer | |
Date: | April 20, 2023 |