UNITED STATES
SECURITIES AND EXCHANGE COMMISSION
Washington, D.C. 20549
FORM N-CSR
CERTIFIED SHAREHOLDER REPORT OF REGISTERED
MANAGEMENT INVESTMENT COMPANIES
Investment Company Act file number 811-07319
Fidelity Covington Trust
(Exact name of registrant as specified in charter)
245 Summer St., Boston, MA 02210
(Address of principal executive offices) (Zip code)
Margaret Carey, Secretary
245 Summer St.
Boston, Massachusetts 02210
(Name and address of agent for service)
Registrant's telephone number, including area code:
617-563-7000
Date of fiscal year end: | May 31 |
Date of reporting period: | November 30, 2023 |
Item 1.
Reports to Stockholders


Contents
Top Holdings (% of Fund's net assets) | ||
| Taiwan Semiconductor Manufacturing Co. Ltd. | 5.8 | |
| Keyence Corp. | 5.5 | |
| NVIDIA Corp. | 5.4 | |
| PTC, Inc. | 5.3 | |
| FANUC Corp. | 5.0 | |
| SMC Corp. | 4.1 | |
| HIWIN Technologies Corp. | 3.9 | |
| Misumi Group, Inc. | 3.8 | |
| Teradyne, Inc. | 3.6 | |
| Leader Harmonious Drive Systems Co. Ltd. (A Shares) | 3.5 | |
| 45.9 | ||
| Market Sectors (% of Fund's net assets) | ||
| Industrials | 49.6 | |
| Information Technology | 42.8 | |
| Consumer Discretionary | 3.5 | |
| Health Care | 1.8 | |
| Communication Services | 1.6 | |
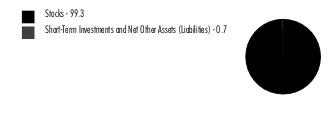
Asset Allocation (% of Fund's net assets) |
 |
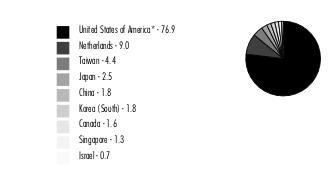
Geographic Diversification (% of Fund's net assets) |
 |
* Includes Short-Term investments and Net Other Assets (Liabilities). Percentages are adjusted for the effect of derivatives, if applicable. |
| Common Stocks - 99.3% | |||
| Shares | Value ($) | ||
| COMMUNICATION SERVICES - 1.6% | |||
| Interactive Media & Services - 1.6% | |||
| Alphabet, Inc. Class C (a) | 12,388 | 1,659,001 | |
| CONSUMER DISCRETIONARY - 3.5% | |||
| Automobile Components - 1.4% | |||
| Mobileye Global, Inc. (a)(b) | 34,525 | 1,417,251 | |
| Automobiles - 1.3% | |||
| Tesla, Inc. (a) | 5,424 | 1,302,194 | |
| Broadline Retail - 0.8% | |||
| Amazon.com, Inc. (a) | 6,018 | 879,170 | |
TOTAL CONSUMER DISCRETIONARY | 3,598,615 | ||
| HEALTH CARE - 1.8% | |||
| Health Care Equipment & Supplies - 1.8% | |||
| Intuitive Surgical, Inc. (a) | 5,835 | 1,813,751 | |
| INDUSTRIALS - 49.6% | |||
| Electrical Equipment - 3.9% | |||
| AMETEK, Inc. | 8,685 | 1,348,173 | |
| Rockwell Automation, Inc. | 6,786 | 1,869,136 | |
| Sensata Technologies, Inc. PLC | 22,552 | 733,166 | |
| 3,950,475 | |||
| Industrial Conglomerates - 3.5% | |||
| Honeywell International, Inc. | 6,664 | 1,305,611 | |
| Siemens AG | 13,523 | 2,266,847 | |
| 3,572,458 | |||
| Machinery - 40.0% | |||
| Airtac International Group | 34,187 | 1,181,453 | |
| ATS Corp. (a)(b) | 47,255 | 1,859,972 | |
| AutoStore Holdings Ltd. (a)(c) | 596,075 | 988,597 | |
| Daifuku Co. Ltd. | 121,606 | 2,282,676 | |
| Deere & Co. | 5,050 | 1,840,271 | |
| Dongguan Yiheda Automation Co. Ltd. | 474,944 | 1,877,481 | |
| Estun Automation Co. Ltd. (A Shares) | 867,836 | 2,331,255 | |
| FANUC Corp. | 184,706 | 5,125,324 | |
| HIWIN Technologies Corp. | 548,012 | 3,988,430 | |
| Kardex AG | 6,564 | 1,570,353 | |
| Leader Harmonious Drive Systems Co. Ltd. (A Shares) | 162,381 | 3,632,966 | |
| Misumi Group, Inc. | 239,757 | 3,881,133 | |
| Nabtesco Corp. | 29,141 | 543,961 | |
| Shenzhen Inovance Technology Co. Ltd. (A Shares) | 238,293 | 2,204,200 | |
| SMC Corp. | 8,335 | 4,185,490 | |
| Symbotic, Inc. (a)(b) | 34,046 | 1,800,352 | |
| THK Co. Ltd. | 88,514 | 1,763,295 | |
| 41,057,209 | |||
| Professional Services - 2.2% | |||
| Recruit Holdings Co. Ltd. | 60,981 | 2,264,268 | |
TOTAL INDUSTRIALS | 50,844,410 | ||
| INFORMATION TECHNOLOGY - 42.8% | |||
| Electronic Equipment, Instruments & Components - 10.1% | |||
| Keyence Corp. | 13,172 | 5,628,263 | |
| OPT Machine Vision Tech Co. Ltd. | 127,256 | 2,025,753 | |
| Renishaw PLC | 39,900 | 1,579,658 | |
| Teledyne Technologies, Inc. (a) | 2,665 | 1,073,888 | |
| 10,307,562 | |||
| IT Services - 2.1% | |||
| Accenture PLC Class A | 6,587 | 2,194,393 | |
| Semiconductors & Semiconductor Equipment - 14.8% | |||
| NVIDIA Corp. | 11,892 | 5,561,888 | |
| Taiwan Semiconductor Manufacturing Co. Ltd. | 323,363 | 5,942,807 | |
| Teradyne, Inc. | 40,263 | 3,713,456 | |
| 15,218,151 | |||
| Software - 15.8% | |||
| Altair Engineering, Inc. Class A (a) | 13,012 | 942,850 | |
| ANSYS, Inc. (a) | 3,201 | 939,045 | |
| Autodesk, Inc. (a) | 3,898 | 851,440 | |
| Dassault Systemes SA | 45,861 | 2,144,800 | |
| Manhattan Associates, Inc. (a) | 4,720 | 1,052,796 | |
| Microsoft Corp. | 3,064 | 1,160,980 | |
| Nemetschek SE | 10,214 | 889,880 | |
| PTC, Inc. (a) | 34,816 | 5,478,646 | |
| Synopsys, Inc. (a) | 4,257 | 2,312,530 | |
| Unity Software, Inc. (a)(b) | 15,600 | 460,356 | |
| 16,233,323 | |||
TOTAL INFORMATION TECHNOLOGY | 43,953,429 | ||
| TOTAL COMMON STOCKS (Cost $98,757,459) | 101,869,206 | ||
| Money Market Funds - 5.2% | |||
| Shares | Value ($) | ||
| Fidelity Cash Central Fund 5.40% (d) | 544,816 | 544,925 | |
| Fidelity Securities Lending Cash Central Fund 5.39% (d)(e) | 4,840,041 | 4,840,525 | |
| TOTAL MONEY MARKET FUNDS (Cost $5,385,450) | 5,385,450 | ||
| TOTAL INVESTMENT IN SECURITIES - 104.5% (Cost $104,142,909) | 107,254,656 |
NET OTHER ASSETS (LIABILITIES) - (4.5)% | (4,622,760) |
| NET ASSETS - 100.0% | 102,631,896 |
| (a) | Non-income producing |
| (b) | Security or a portion of the security is on loan at period end. |
| (c) | Security exempt from registration under Rule 144A of the Securities Act of 1933. These securities may be resold in transactions exempt from registration, normally to qualified institutional buyers. At the end of the period, the value of these securities amounted to $988,597 or 1.0% of net assets. |
| (d) | Affiliated fund that is generally available only to investment companies and other accounts managed by Fidelity Investments. The rate quoted is the annualized seven-day yield of the fund at period end. A complete unaudited listing of the fund's holdings as of its most recent quarter end is available upon request. In addition, each Fidelity Central Fund's financial statements are available on the SEC's website or upon request. |
| (e) | Investment made with cash collateral received from securities on loan. |
| Affiliate | Value, beginning of period ($) | Purchases ($) | Sales Proceeds ($) | Dividend Income ($) | Realized Gain (loss) ($) | Change in Unrealized appreciation (depreciation) ($) | Value, end of period ($) | % ownership, end of period |
| Fidelity Cash Central Fund 5.40% | 794,696 | 18,112,720 | 18,362,491 | 34,174 | - | - | 544,925 | 0.0% |
| Fidelity Securities Lending Cash Central Fund 5.39% | 2,079,750 | 28,075,568 | 25,314,793 | 62,582 | - | - | 4,840,525 | 0.0% |
| Total | 2,874,446 | 46,188,288 | 43,677,284 | 96,756 | - | - | 5,385,450 | |
| Valuation Inputs at Reporting Date: | ||||
| Description | Total ($) | Level 1 ($) | Level 2 ($) | Level 3 ($) |
Investments in Securities: | ||||
| Equities: | ||||
Communication Services | 1,659,001 | 1,659,001 | - | - |
Consumer Discretionary | 3,598,615 | 3,598,615 | - | - |
Health Care | 1,813,751 | 1,813,751 | - | - |
Industrials | 50,844,410 | 50,844,410 | - | - |
Information Technology | 43,953,429 | 43,953,429 | - | - |
| Money Market Funds | 5,385,450 | 5,385,450 | - | - |
| Total Investments in Securities: | 107,254,656 | 107,254,656 | - | - |
| Statement of Assets and Liabilities | ||||
November 30, 2023 (Unaudited) | ||||
| Assets | ||||
| Investment in securities, at value (including securities loaned of $4,611,062) - See accompanying schedule: | ||||
Unaffiliated issuers (cost $98,757,459) | $ | 101,869,206 | ||
Fidelity Central Funds (cost $5,385,450) | 5,385,450 | |||
| Total Investment in Securities (cost $104,142,909) | $ | 107,254,656 | ||
| Dividends receivable | 152,624 | |||
| Reclaims receivable | 95,554 | |||
| Distributions receivable from Fidelity Central Funds | 10,928 | |||
Total assets | 107,513,762 | |||
| Liabilities | ||||
| Accrued management fee | $ | 41,341 | ||
| Collateral on securities loaned | 4,840,525 | |||
| Total Liabilities | 4,881,866 | |||
| Net Assets | $ | 102,631,896 | ||
| Net Assets consist of: | ||||
| Paid in capital | $ | 106,879,549 | ||
| Total accumulated earnings (loss) | (4,247,653) | |||
| Net Assets | $ | 102,631,896 | ||
Net Asset Value, offering price and redemption price per share ($102,631,896 ÷ 4,305,492 shares) | �� | $ | 23.84 | |
| Statement of Operations | ||||
Six months ended November 30, 2023 (Unaudited) | ||||
| Investment Income | ||||
| Dividends | $ | 393,263 | ||
| Interest | 909 | |||
| Income from Fidelity Central Funds (including $62,582 from security lending) | 96,756 | |||
| Total Income | 490,928 | |||
| Expenses | ||||
| Management fee | $ | 266,979 | ||
| Independent trustees' fees and expenses | 287 | |||
| Interest | 814 | |||
| Total expenses before reductions | 268,080 | |||
| Expense reductions | (102) | |||
| Total expenses after reductions | 267,978 | |||
| Net Investment income (loss) | 222,950 | |||
| Realized and Unrealized Gain (Loss) | ||||
| Net realized gain (loss) on: | ||||
| Investment Securities: | ||||
| Unaffiliated issuers | (1,751,265) | |||
| Redemptions in-kind | 1,817,374 | |||
| Foreign currency transactions | (1,748) | |||
| Total net realized gain (loss) | 64,361 | |||
| Change in net unrealized appreciation (depreciation) on: | ||||
| Investment Securities: | ||||
| Unaffiliated issuers | (5,086,134) | |||
| Assets and liabilities in foreign currencies | 6,063 | |||
| Total change in net unrealized appreciation (depreciation) | (5,080,071) | |||
| Net gain (loss) | (5,015,710) | |||
| Net increase (decrease) in net assets resulting from operations | $ | (4,792,760) | ||
See Organization and Merger information note regarding reorganization from mutual fund to exchange traded fund.
| Statement of Changes in Net Assets | ||||
Six months ended November 30, 2023 (Unaudited) | Year ended May 31, 2023 | |||
| Increase (Decrease) in Net Assets | ||||
| Operations | ||||
| Net investment income (loss) | $ | 222,950 | $ | 478,333 |
| Net realized gain (loss) | 64,361 | (4,420,381) | ||
| Change in net unrealized appreciation (depreciation) | (5,080,071) | 12,045,246 | ||
| Net increase (decrease) in net assets resulting from operations | (4,792,760) | 8,103,198 | ||
| Distributions to shareholders | (397,501) | (182,874) | ||
| Share transactions - net increase (decrease) | - | (19,835,179) | ||
| Share transactions | ||||
| Proceeds from sales of shares | 6,340,894 | - | ||
| Reinvestment of distributions | 249,235 | - | ||
| Cost of shares redeemed | (10,493,526) | - | ||
Net increase (decrease) in net assets resulting from share transactions | (3,903,397) | (19,835,179) | ||
| Total increase (decrease) in net assets | (9,093,658) | (11,914,855) | ||
| Net Assets | ||||
| Beginning of period | 111,725,554 | 123,640,409 | ||
| End of period | $ | 102,631,896 | $ | 111,725,554 |
| Other Information | ||||
| Shares | ||||
| Sold | 323,637 | 5,260,948 | ||
| Issued in reinvestment of distributions | 9,878 | 8,292 | ||
| Redeemed | (534,365) | (6,297,436) | ||
| Net increase (decrease) | (200,850) | (1,028,196) | ||
| Fidelity® Disruptive Automation ETF |
Six months ended (Unaudited) November 30, 2023 A | Years ended May 31, 2023 A | 2022 A | 2021 A | 2020 A,B | ||||||
Selected Per-Share Data | ||||||||||
| Net asset value, beginning of period | $ | 24.80 | $ | 22.33 | $ | 27.34 | $ | 17.80 | $ | 14.96 |
| Income from Investment Operations | ||||||||||
Net investment income (loss) C,D | .05 | .05 | (.09) | .02 | (.02) | |||||
| Net realized and unrealized gain (loss) | (.92) | 2.42 | (4.37) | 9.60 | 2.86 | |||||
| Total from investment operations | (.87) | 2.47 | (4.46) | 9.62 | 2.84 | |||||
| Distributions from net investment income | (.09) | - | - | (.06) | - | |||||
| Distributions from net realized gain | - | - | (.55) | (.03) | - | |||||
| Total distributions | (.09) | - | (.55) | (.08) E | - | |||||
| Net asset value, end of period | $ | 23.84 | $ | 24.80 | $ | 22.33 | $ | 27.34 | $ | 17.80 |
Total Return F,G,H | (3.52)% | 11.05% | (16.75)% | 54.13% | 19.00% | |||||
Ratios to Average Net Assets D,I,J | ||||||||||
| Expenses before reductions | .50% K | .85% | 1.00% | 1.01% L | 1.01% K,L | |||||
| Expenses net of fee waivers, if any | .50% K | .85% | 1.00% | 1.01% L | 1.01% K,L | |||||
| Expenses net of all reductions | .50% K | .85% | 1.00% | 1.01% L | 1.01% K,L | |||||
| Net investment income (loss) | .42% K | .23% | (.33)% | .06% | (.47)% K | |||||
| Supplemental Data | ||||||||||
| Net assets, end of period (000 omitted) | $ | 102,632 | $ | 111,726 | $ | 36,333 | $ | 111,910 | $ | 5,308 |
Portfolio turnover rate M | 38% K,N | 26% | 22% | 14% | 6% O |
Top Holdings (% of Fund's net assets) | ||
| Snap, Inc. Class A | 6.2 | |
| Meta Platforms, Inc. Class A | 6.0 | |
| Netflix, Inc. | 5.9 | |
| American Tower Corp. | 5.3 | |
| Arista Networks, Inc. | 5.2 | |
| Liberty Broadband Corp. Class A | 5.2 | |
| Amazon.com, Inc. | 5.1 | |
| Alphabet, Inc. Class A | 5.1 | |
| NVIDIA Corp. | 4.8 | |
| PDD Holdings, Inc. ADR | 4.8 | |
| 53.6 | ||
| Market Sectors (% of Fund's net assets) | ||
| Communication Services | 48.4 | |
| Information Technology | 28.4 | |
| Consumer Discretionary | 11.5 | |
| Real Estate | 5.3 | |
| Industrials | 4.1 | |
| Energy | 2.1 | |
Asset Allocation (% of Fund's net assets) |
 |
Geographic Diversification (% of Fund's net assets) |
 |
* Includes Short-Term investments and Net Other Assets (Liabilities). Percentages are adjusted for the effect of derivatives, if applicable. |
| Common Stocks - 99.8% | |||
| Shares | Value ($) | ||
| COMMUNICATION SERVICES - 48.4% | |||
| Diversified Telecommunication Services - 4.3% | |||
| Cellnex Telecom SA (a) | 35,610 | 1,358,202 | |
| Liberty Latin America Ltd. Class C (b) | 49,208 | 336,091 | |
| 1,694,293 | |||
| Entertainment - 9.7% | |||
| Netflix, Inc. (b) | 4,804 | 2,276,952 | |
| Sea Ltd. ADR (b) | 41,108 | 1,488,932 | |
| 3,765,884 | |||
| Interactive Media & Services - 25.0% | |||
| Alphabet, Inc. Class A (b) | 14,964 | 1,983,179 | |
| Angi, Inc. (b) | 171,855 | 386,674 | |
| Bumble, Inc. (b) | 21,372 | 296,216 | |
| Match Group, Inc. (b) | 23,958 | 775,760 | |
| Meta Platforms, Inc. Class A (b) | 7,197 | 2,354,499 | |
| Pinterest, Inc. Class A (b) | 25,263 | 860,710 | |
| Snap, Inc. Class A (b) | 175,691 | 2,429,807 | |
| Tencent Holdings Ltd. | 16,159 | 676,455 | |
| 9,763,300 | |||
| Media - 5.6% | |||
| DISH Network Corp. Class A (b)(c) | 45,026 | 164,795 | |
| Liberty Broadband Corp. Class A (b) | 24,241 | 2,010,549 | |
| 2,175,344 | |||
| Wireless Telecommunication Services - 3.8% | |||
| T-Mobile U.S., Inc. | 9,763 | 1,468,843 | |
TOTAL COMMUNICATION SERVICES | 18,867,664 | ||
| CONSUMER DISCRETIONARY - 11.5% | |||
| Broadline Retail - 11.5% | |||
| Alibaba Group Holding Ltd. sponsored ADR (b) | 8,054 | 603,084 | |
| Amazon.com, Inc. (b) | 13,716 | 2,003,770 | |
| PDD Holdings, Inc. ADR (b) | 12,632 | 1,862,462 | |
| 4,469,316 | |||
| ENERGY - 2.1% | |||
| Oil, Gas & Consumable Fuels - 2.1% | |||
| Reliance Industries Ltd. GDR (a) | 14,117 | 808,904 | |
| INDUSTRIALS - 4.1% | |||
| Construction & Engineering - 0.9% | |||
| Dycom Industries, Inc. (b) | 3,574 | 371,231 | |
| Ground Transportation - 3.2% | |||
| Uber Technologies, Inc. (b) | 21,920 | 1,235,850 | |
TOTAL INDUSTRIALS | 1,607,081 | ||
| INFORMATION TECHNOLOGY - 28.4% | |||
| Communications Equipment - 5.2% | |||
| Arista Networks, Inc. (b) | 9,186 | 2,018,256 | |
| IT Services - 3.0% | |||
| Cloudflare, Inc. (b) | 5,626 | 434,046 | |
| Twilio, Inc. Class A (b) | 11,235 | 726,680 | |
| 1,160,726 | |||
| Semiconductors & Semiconductor Equipment - 12.2% | |||
| Impinj, Inc. (b) | 3,583 | 299,503 | |
| NVIDIA Corp. | 4,014 | 1,877,348 | |
| NXP Semiconductors NV | 2,731 | 557,342 | |
| ON Semiconductor Corp. (b) | 5,376 | 383,470 | |
| Renesas Electronics Corp. (b) | 33,749 | 592,645 | |
| Taiwan Semiconductor Manufacturing Co. Ltd. sponsored ADR | 10,764 | 1,047,445 | |
| 4,757,753 | |||
| Software - 8.0% | |||
| Cadence Design Systems, Inc. (b) | 3,915 | 1,069,852 | |
| Microsoft Corp. | 3,329 | 1,261,391 | |
| RingCentral, Inc. (b) | 9,146 | 260,295 | |
| Synopsys, Inc. (b) | 979 | 531,822 | |
| 3,123,360 | |||
TOTAL INFORMATION TECHNOLOGY | 11,060,095 | ||
| REAL ESTATE - 5.3% | |||
| Equity Real Estate Investment Trusts (REITs) - 5.3% | |||
| American Tower Corp. | 10,016 | 2,091,140 | |
| TOTAL COMMON STOCKS (Cost $35,337,120) | 38,904,200 | ||
| Money Market Funds - 0.7% | |||
| Shares | Value ($) | ||
| Fidelity Cash Central Fund 5.40% (d) | 239,978 | 240,026 | |
| Fidelity Securities Lending Cash Central Fund 5.39% (d)(e) | 47,620 | 47,625 | |
| TOTAL MONEY MARKET FUNDS (Cost $287,651) | 287,651 | ||
| TOTAL INVESTMENT IN SECURITIES - 100.5% (Cost $35,624,771) | 39,191,851 |
NET OTHER ASSETS (LIABILITIES) - (0.5)% | (205,405) |
| NET ASSETS - 100.0% | 38,986,446 |
| (a) | Security exempt from registration under Rule 144A of the Securities Act of 1933. These securities may be resold in transactions exempt from registration, normally to qualified institutional buyers. At the end of the period, the value of these securities amounted to $2,167,106 or 5.6% of net assets. |
| (b) | Non-income producing |
| (c) | Security or a portion of the security is on loan at period end. |
| (d) | Affiliated fund that is generally available only to investment companies and other accounts managed by Fidelity Investments. The rate quoted is the annualized seven-day yield of the fund at period end. A complete unaudited listing of the fund's holdings as of its most recent quarter end is available upon request. In addition, each Fidelity Central Fund's financial statements are available on the SEC's website or upon request. |
| (e) | Investment made with cash collateral received from securities on loan. |
| Affiliate | Value, beginning of period ($) | Purchases ($) | Sales Proceeds ($) | Dividend Income ($) | Realized Gain (loss) ($) | Change in Unrealized appreciation (depreciation) ($) | Value, end of period ($) | % ownership, end of period |
| Fidelity Cash Central Fund 5.40% | 149,758 | 1,943,974 | 1,853,706 | 5,647 | - | - | 240,026 | 0.0% |
| Fidelity Securities Lending Cash Central Fund 5.39% | - | 2,411,730 | 2,364,105 | 696 | - | - | 47,625 | 0.0% |
| Total | 149,758 | 4,355,704 | 4,217,811 | 6,343 | - | - | 287,651 | |
| Valuation Inputs at Reporting Date: | ||||
| Description | Total ($) | Level 1 ($) | Level 2 ($) | Level 3 ($) |
Investments in Securities: | ||||
| Equities: | ||||
Communication Services | 18,867,664 | 18,867,664 | - | - |
Consumer Discretionary | 4,469,316 | 4,469,316 | - | - |
Energy | 808,904 | 808,904 | - | - |
Industrials | 1,607,081 | 1,607,081 | - | - |
Information Technology | 11,060,095 | 11,060,095 | - | - |
Real Estate | 2,091,140 | 2,091,140 | - | - |
| Money Market Funds | 287,651 | 287,651 | - | - |
| Total Investments in Securities: | 39,191,851 | 39,191,851 | - | - |
| Statement of Assets and Liabilities | ||||
November 30, 2023 (Unaudited) | ||||
| Assets | ||||
| Investment in securities, at value (including securities loaned of $46,482) - See accompanying schedule: | ||||
Unaffiliated issuers (cost $35,337,120) | $ | 38,904,200 | ||
Fidelity Central Funds (cost $287,651) | 287,651 | |||
| Total Investment in Securities (cost $35,624,771) | $ | 39,191,851 | ||
| Cash | 1,604 | |||
| Foreign currency held at value (cost $109) | 109 | |||
| Receivable for investments sold | 96,204 | |||
| Dividends receivable | 9,582 | |||
| Interest receivable | 36 | |||
| Distributions receivable from Fidelity Central Funds | 961 | |||
Total assets | 39,300,347 | |||
| Liabilities | ||||
| Payable for investments purchased | $ | 250,207 | ||
| Accrued management fee | 16,069 | |||
| Collateral on securities loaned | 47,625 | |||
| Total Liabilities | 313,901 | |||
| Net Assets | $ | 38,986,446 | ||
| Net Assets consist of: | ||||
| Paid in capital | $ | 44,258,795 | ||
| Total accumulated earnings (loss) | (5,272,349) | |||
| Net Assets | $ | 38,986,446 | ||
Net Asset Value, offering price and redemption price per share ($38,986,446 ÷ 1,407,063 shares) | $ | 27.71 | ||
| Statement of Operations | ||||
Six months ended November 30, 2023 (Unaudited) | ||||
| Investment Income | ||||
| Dividends | $ | 51,007 | ||
| Interest | 147 | |||
| Income from Fidelity Central Funds (including $696 from security lending) | 6,343 | |||
| Total Income | 57,497 | |||
| Expenses | ||||
| Management fee | $ | 96,845 | ||
| Independent trustees' fees and expenses | 102 | |||
| Total expenses before reductions | 96,947 | |||
| Expense reductions | (110) | |||
| Total expenses after reductions | 96,837 | |||
| Net Investment income (loss) | (39,340) | |||
| Realized and Unrealized Gain (Loss) | ||||
| Net realized gain (loss) on: | ||||
| Investment Securities: | ||||
| Unaffiliated issuers | 826,831 | |||
| Redemptions in-kind | 641,168 | |||
| Foreign currency transactions | 594 | |||
| Total net realized gain (loss) | 1,468,593 | |||
| Change in net unrealized appreciation (depreciation) on: | ||||
| Investment Securities: | ||||
| Unaffiliated issuers | 3,405,713 | |||
| Assets and liabilities in foreign currencies | (40) | |||
| Total change in net unrealized appreciation (depreciation) | 3,405,673 | |||
| Net gain (loss) | 4,874,266 | |||
| Net increase (decrease) in net assets resulting from operations | $ | 4,834,926 | ||
See Organization and Merger information note regarding reorganization from mutual fund to exchange traded fund.
| Statement of Changes in Net Assets | ||||
Six months ended November 30, 2023 (Unaudited) | Year ended May 31, 2023 | |||
| Increase (Decrease) in Net Assets | ||||
| Operations | ||||
| Net investment income (loss) | $ | (39,340) | $ | (15,475) |
| Net realized gain (loss) | 1,468,593 | (5,754,830) | ||
| Change in net unrealized appreciation (depreciation) | 3,405,673 | 6,648,437 | ||
| Net increase (decrease) in net assets resulting from operations | 4,834,926 | 878,132 | ||
| Share transactions - net increase (decrease) | - | (9,971,399) | ||
| Share transactions | ||||
| Proceeds from sales of shares | 1,993,878 | - | ||
| Cost of shares redeemed | (5,823,373) | - | ||
Net increase (decrease) in net assets resulting from share transactions | (3,829,495) | (9,971,399) | ||
| Total increase (decrease) in net assets | 1,005,431 | (9,093,267) | ||
| Net Assets | ||||
| Beginning of period | 37,981,015 | 47,074,282 | ||
| End of period | $ | 38,986,446 | $ | 37,981,015 |
| Other Information | ||||
| Shares | ||||
| Sold | 103,661 | 1,803,846 | ||
| Redeemed | (251,280) | (2,265,568) | ||
| Net increase (decrease) | (147,619) | (461,722) | ||
| Fidelity® Disruptive Communications ETF |
Six months ended (Unaudited) November 30, 2023 A | Years ended May 31, 2023 A | 2022 A | 2021 A | 2020 A,B | ||||||
Selected Per-Share Data | ||||||||||
| Net asset value, beginning of period | $ | 24.44 | $ | 23.29 | $ | 34.12 | $ | 23.21 | $ | 20.05 |
| Income from Investment Operations | ||||||||||
Net investment income (loss) C,D | (.03) | (.10) | (.26) | (.26) | - E | |||||
| Net realized and unrealized gain (loss) | 3.30 | 1.25 | (8.93) | 11.59 | 3.16 | |||||
| Total from investment operations | 3.27 | 1.15 | (9.19) | 11.33 | 3.16 | |||||
| Distributions from net investment income | - | - | - | - E | - | |||||
| Distributions from net realized gain | - | - | (1.64) | (.41) | - | |||||
| Total distributions | - | - | (1.64) | (.42) F | - | |||||
| Net asset value, end of period | $ | 27.71 | $ | 24.44 | $ | 23.29 | $ | 34.12 | $ | 23.21 |
Total Return G,H,I | 13.39% | 4.91% | (28.39)% | 48.96% | 15.80% | |||||
Ratios to Average Net Assets D,J,K | ||||||||||
| Expenses before reductions | .50% L | .79% | .99% M | 1.01% M | 1.01% L,M | |||||
| Expenses net of fee waivers, if any | .50% L | .79% | .99% M | 1.01% M | 1.01% L,M | |||||
| Expenses net of all reductions | .50% L | .79% | .99% M | 1.01% M | 1.01% L,M | |||||
| Net investment income (loss) | (.20)% L | (.44)% | (.81)% | (.83)% | (.23)% L | |||||
| Supplemental Data | ||||||||||
| Net assets, end of period (000 omitted) | $ | 38,986 | $ | 37,981 | $ | 7,746 | $ | 36,731 | $ | 2,880 |
Portfolio turnover rate N | 17% L,O | 31% | 32% | 39% | -% P |
Top Holdings (% of Fund's net assets) | ||
| Visa, Inc. Class A | 6.4 | |
| Adyen BV | 6.1 | |
| MasterCard, Inc. Class A | 5.8 | |
| BlackRock, Inc. Class A | 5.5 | |
| Dlocal Ltd. | 5.2 | |
| Equifax, Inc. | 5.1 | |
| Aon PLC | 4.7 | |
| Capital One Financial Corp. | 4.4 | |
| Intercontinental Exchange, Inc. | 4.0 | |
| FinecoBank SpA | 3.4 | |
| 50.6 | ||
| Market Sectors (% of Fund's net assets) | ||
| Financials | 89.2 | |
| Industrials | 6.4 | |
| Consumer Discretionary | 1.4 | |
| Information Technology | 1.4 | |
| Real Estate | 1.2 | |
Asset Allocation (% of Fund's net assets) |
 |
Geographic Diversification (% of Fund's net assets) |
 |
* Includes Short-Term investments and Net Other Assets (Liabilities). Percentages are adjusted for the effect of derivatives, if applicable. |
| Common Stocks - 99.6% | |||
| Shares | Value ($) | ||
| CONSUMER DISCRETIONARY - 1.4% | |||
| Broadline Retail - 1.4% | |||
| MercadoLibre, Inc. (a) | 363 | 588,227 | |
| FINANCIALS - 89.2% | |||
| Banks - 10.4% | |||
| DBS Group Holdings Ltd. | 54,691 | 1,297,669 | |
| DNB Bank ASA | 62,473 | 1,189,995 | |
| FinecoBank SpA | 103,465 | 1,392,567 | |
| Pathward Financial, Inc. | 8,518 | 422,408 | |
| SVB Financial Group (a) | 3,427 | 69 | |
| 4,302,708 | |||
| Capital Markets - 20.5% | |||
| BlackRock, Inc. Class A | 3,060 | 2,298,764 | |
| Cboe Global Markets, Inc. | 4,976 | 906,577 | |
| Coinbase Global, Inc. (a) | 5,600 | 698,432 | |
| Intercontinental Exchange, Inc. | 14,738 | 1,677,774 | |
| London Stock Exchange Group PLC | 10,500 | 1,180,555 | |
| MSCI, Inc. | 1,036 | 539,601 | |
| Tradeweb Markets, Inc. Class A | 7,139 | 691,769 | |
| Virtu Financial, Inc. Class A | 29,962 | 538,717 | |
| 8,532,189 | |||
| Consumer Finance - 7.1% | |||
| Ally Financial, Inc. | 14,083 | 411,505 | |
| Capital One Financial Corp. | 16,419 | 1,833,346 | |
| NerdWallet, Inc. (a) | 61,676 | 724,693 | |
| 2,969,544 | |||
| Financial Services - 40.1% | |||
| Adyen BV (a)(b) | 2,184 | 2,546,071 | |
| Apollo Global Management, Inc. | 12,863 | 1,183,396 | |
| AvidXchange Holdings, Inc. (a) | 78,329 | 835,770 | |
| Block, Inc. Class A (a) | 9,857 | 625,230 | |
| Dlocal Ltd. (a) | 125,561 | 2,165,927 | |
| Fiserv, Inc. (a) | 5,200 | 679,172 | |
| Flywire Corp. (a) | 45,084 | 1,050,457 | |
| MasterCard, Inc. Class A | 5,808 | 2,403,525 | |
| PennyMac Financial Services, Inc. | 6,024 | 468,607 | |
| Remitly Global, Inc. (a) | 18,891 | 406,912 | |
| Repay Holdings Corp. (a) | 53,085 | 398,138 | |
| Shift4 Payments, Inc. (a)(c) | 5,354 | 352,400 | |
| Visa, Inc. Class A | 10,378 | 2,663,824 | |
| Wise PLC (a) | 93,544 | 922,083 | |
| 16,701,512 | |||
| Insurance - 11.1% | |||
| Aon PLC | 5,900 | 1,938,091 | |
| Beazley PLC | 66,013 | 446,692 | |
| BRP Group, Inc. (a) | 65,263 | 1,141,450 | |
| Hiscox Ltd. | 85,183 | 1,092,599 | |
| 4,618,832 | |||
TOTAL FINANCIALS | 37,124,785 | ||
| INDUSTRIALS - 6.4% | |||
| Professional Services - 6.4% | |||
| Equifax, Inc. | 9,672 | 2,105,691 | |
| Verisk Analytics, Inc. | 2,310 | 557,703 | |
| 2,663,394 | |||
| INFORMATION TECHNOLOGY - 1.4% | |||
| Software - 1.4% | |||
| Bill Holdings, Inc. (a) | 3,382 | 221,420 | |
| MicroStrategy, Inc. Class A (a)(c) | 700 | 348,810 | |
| 570,230 | |||
| REAL ESTATE - 1.2% | |||
| Equity Real Estate Investment Trusts (REITs) - 1.2% | |||
| American Homes 4 Rent Class A | 14,440 | 523,739 | |
| TOTAL COMMON STOCKS (Cost $39,158,821) | 41,470,375 | ||
| Money Market Funds - 1.4% | |||
| Shares | Value ($) | ||
| Fidelity Cash Central Fund 5.40% (d) | 144,426 | 144,455 | |
| Fidelity Securities Lending Cash Central Fund 5.39% (d)(e) | 445,805 | 445,850 | |
| TOTAL MONEY MARKET FUNDS (Cost $590,305) | 590,305 | ||
| TOTAL INVESTMENT IN SECURITIES - 101.0% (Cost $39,749,126) | 42,060,680 |
NET OTHER ASSETS (LIABILITIES) - (1.0)% | (434,996) |
| NET ASSETS - 100.0% | 41,625,684 |
| (a) | Non-income producing |
| (b) | Security exempt from registration under Rule 144A of the Securities Act of 1933. These securities may be resold in transactions exempt from registration, normally to qualified institutional buyers. At the end of the period, the value of these securities amounted to $2,546,071 or 6.1% of net assets. |
| (c) | Security or a portion of the security is on loan at period end. |
| (d) | Affiliated fund that is generally available only to investment companies and other accounts managed by Fidelity Investments. The rate quoted is the annualized seven-day yield of the fund at period end. A complete unaudited listing of the fund's holdings as of its most recent quarter end is available upon request. In addition, each Fidelity Central Fund's financial statements are available on the SEC's website or upon request. |
| (e) | Investment made with cash collateral received from securities on loan. |
| Affiliate | Value, beginning of period ($) | Purchases ($) | Sales Proceeds ($) | Dividend Income ($) | Realized Gain (loss) ($) | Change in Unrealized appreciation (depreciation) ($) | Value, end of period ($) | % ownership, end of period |
| Fidelity Cash Central Fund 5.40% | - | 4,637,471 | 4,493,016 | 11,580 | - | - | 144,455 | 0.0% |
| Fidelity Securities Lending Cash Central Fund 5.39% | 334,700 | 6,496,716 | 6,385,566 | 2,835 | - | - | 445,850 | 0.0% |
| Total | 334,700 | 11,134,187 | 10,878,582 | 14,415 | - | - | 590,305 | |
| Valuation Inputs at Reporting Date: | ||||
| Description | Total ($) | Level 1 ($) | Level 2 ($) | Level 3 ($) |
Investments in Securities: | ||||
| Equities: | ||||
Consumer Discretionary | 588,227 | 588,227 | - | - |
Financials | 37,124,785 | 37,124,785 | - | - |
Industrials | 2,663,394 | 2,663,394 | - | - |
Information Technology | 570,230 | 570,230 | - | - |
Real Estate | 523,739 | 523,739 | - | - |
| Money Market Funds | 590,305 | 590,305 | - | - |
| Total Investments in Securities: | 42,060,680 | 42,060,680 | - | - |
| Statement of Assets and Liabilities | ||||
November 30, 2023 (Unaudited) | ||||
| Assets | ||||
| Investment in securities, at value (including securities loaned of $430,620) - See accompanying schedule: | ||||
Unaffiliated issuers (cost $39,158,821) | $ | 41,470,375 | ||
Fidelity Central Funds (cost $590,305) | 590,305 | |||
| Total Investment in Securities (cost $39,749,126) | $ | 42,060,680 | ||
| Cash | 6,961 | |||
| Dividends receivable | 19,738 | |||
| Distributions receivable from Fidelity Central Funds | 718 | |||
Total assets | 42,088,097 | |||
| Liabilities | ||||
| Accrued management fee | $ | 16,563 | ||
| Collateral on securities loaned | 445,850 | |||
| Total Liabilities | 462,413 | |||
| Net Assets | $ | 41,625,684 | ||
| Net Assets consist of: | ||||
| Paid in capital | $ | 44,054,535 | ||
| Total accumulated earnings (loss) | (2,428,851) | |||
| Net Assets | $ | 41,625,684 | ||
Net Asset Value, offering price and redemption price per share ($41,625,684 ÷ 1,544,580 shares) | $ | 26.95 | ||
| Statement of Operations | ||||
Six months ended November 30, 2023 (Unaudited) | ||||
| Investment Income | ||||
| Dividends | $ | 208,966 | ||
| Income from Fidelity Central Funds (including $2,835 from security lending) | 14,415 | |||
| Total Income | 223,381 | |||
| Expenses | ||||
| Management fee | $ | 104,321 | ||
| Independent trustees' fees and expenses | 112 | |||
| Total expenses before reductions | 104,433 | |||
| Expense reductions | (103) | |||
| Total expenses after reductions | 104,330 | |||
| Net Investment income (loss) | 119,051 | |||
| Realized and Unrealized Gain (Loss) | ||||
| Net realized gain (loss) on: | ||||
| Investment Securities: | ||||
| Unaffiliated issuers | 317,834 | |||
| Redemptions in-kind | 1,835,433 | |||
| Foreign currency transactions | 3,399 | |||
| Total net realized gain (loss) | 2,156,666 | |||
| Change in net unrealized appreciation (depreciation) on: | ||||
| Investment Securities: | ||||
| Unaffiliated issuers | 2,195,612 | |||
| Assets and liabilities in foreign currencies | 317 | |||
| Total change in net unrealized appreciation (depreciation) | 2,195,929 | |||
| Net gain (loss) | 4,352,595 | |||
| Net increase (decrease) in net assets resulting from operations | $ | 4,471,646 | ||
See Organization and Merger information note regarding reorganization from mutual fund to exchange traded fund.
| Statement of Changes in Net Assets | ||||
Six months ended November 30, 2023 (Unaudited) | Year ended May 31, 2023 | |||
| Increase (Decrease) in Net Assets | ||||
| Operations | ||||
| Net investment income (loss) | $ | 119,051 | $ | 429,106 |
| Net realized gain (loss) | 2,156,666 | (5,165,409) | ||
| Change in net unrealized appreciation (depreciation) | 2,195,929 | (2,264,698) | ||
| Net increase (decrease) in net assets resulting from operations | 4,471,646 | (7,001,001) | ||
| Distributions to shareholders | (305,577) | (3,640,977) | ||
| Share transactions - net increase (decrease) | - | (13,799,786) | ||
| Share transactions | ||||
| Proceeds from sales of shares | 1,965,620 | - | ||
| Reinvestment of distributions | 224,111 | - | ||
| Cost of shares redeemed | (5,549,816) | - | ||
Net increase (decrease) in net assets resulting from share transactions | (3,360,085) | (13,799,786) | ||
| Total increase (decrease) in net assets | 805,984 | (24,441,764) | ||
| Net Assets | ||||
| Beginning of period | 40,819,700 | 65,261,464 | ||
| End of period | $ | 41,625,684 | $ | 40,819,700 |
| Other Information | ||||
| Shares | ||||
| Sold | 100,156 | 2,055,446 | ||
| Issued in reinvestment of distributions | 9,007 | 136,875 | ||
| Redeemed | (249,456) | (2,748,212) | ||
| Net increase (decrease) | (140,293) | (555,891) | ||
| Fidelity® Disruptive Finance ETF |
Six months ended (Unaudited) November 30, 2023 A | Years ended May 31, 2023 A | 2022 A | 2021 A | 2020 A,B | ||||||
Selected Per-Share Data | ||||||||||
| Net asset value, beginning of period | $ | 24.23 | $ | 29.04 | $ | 34.73 | $ | 22.63 | $ | 19.08 |
| Income from Investment Operations | ||||||||||
Net investment income (loss) C,D | .07 | .12 | .04 | .21 | .06 | |||||
| Net realized and unrealized gain (loss) | 2.83 | (3.38) | (5.10) | 12.24 | 3.49 | |||||
| Total from investment operations | 2.90 | (3.26) | (5.06) | 12.45 | 3.55 | |||||
| Distributions from net investment income | (.18) | - | (.08) | (.10) | - | |||||
| Distributions from net realized gain | - | (1.55) | (.55) | (.25) | - | |||||
| Total distributions | (.18) | (1.55) | (.63) | (.35) | - | |||||
| Net asset value, end of period | $ | 26.95 | $ | 24.23 | $ | 29.04 | $ | 34.73 | $ | 22.63 |
Total Return E,F,G | 12.02% | (11.46)% | (14.88)% | 55.31% | 18.60% | |||||
Ratios to Average Net Assets D,H,I | ||||||||||
| Expenses before reductions | .50% J | .86% | 1.00% | 1.01% K | 1.01% J,K | |||||
| Expenses net of fee waivers, if any | .50% J | .86% | 1.00% | 1.01% K | 1.01% J,K | |||||
| Expenses net of all reductions | .50% J | .86% | 1.00% | 1.01% K | 1.01% J,K | |||||
| Net investment income (loss) | .57% J | .48% | .12% | .72% | 1.99% J | |||||
| Supplemental Data | ||||||||||
| Net assets, end of period (000 omitted) | $ | 41,626 | $ | 40,820 | $ | 18,486 | $ | 48,219 | $ | 2,373 |
Portfolio turnover rate L | 20% J,M | 22% | 43% | 18% | -% N |
Top Holdings (% of Fund's net assets) | ||
| Boston Scientific Corp. | 5.5 | |
| UnitedHealth Group, Inc. | 5.2 | |
| Centene Corp. | 3.9 | |
| Danaher Corp. | 3.6 | |
| Vertex Pharmaceuticals, Inc. | 3.3 | |
| Penumbra, Inc. | 3.0 | |
| Bruker Corp. | 3.0 | |
| Argenx SE ADR | 3.0 | |
| Alnylam Pharmaceuticals, Inc. | 3.0 | |
| Royalty Pharma PLC | 3.0 | |
| 36.5 | ||
| Market Sectors (% of Fund's net assets) | ||
| Health Care | 98.4 | |
Asset Allocation (% of Fund's net assets) |
 |
| Common Stocks - 98.4% | |||
| Shares | Value ($) | ||
| HEALTH CARE - 98.4% | |||
| Biotechnology - 27.5% | |||
| Alnylam Pharmaceuticals, Inc. (a) | 8,061 | 1,356,263 | |
| ALX Oncology Holdings, Inc. (a) | 16,876 | 132,308 | |
| Arcellx, Inc. (a) | 9,164 | 481,385 | |
| Argenx SE ADR (a) | 3,016 | 1,359,040 | |
| Arrowhead Pharmaceuticals, Inc. (a) | 6,311 | 133,793 | |
| Ascendis Pharma A/S sponsored ADR (a) | 3,865 | 388,162 | |
| Beam Therapeutics, Inc. (a)(b) | 3,873 | 108,754 | |
| Cytokinetics, Inc. (a) | 15,335 | 513,416 | |
| Exact Sciences Corp. (a) | 9,330 | 597,120 | |
| Icosavax, Inc. (a) | 24,621 | 249,165 | |
| Intellia Therapeutics, Inc. (a) | 2,450 | 72,594 | |
| Janux Therapeutics, Inc. (a) | 14,042 | 122,587 | |
| Keros Therapeutics, Inc. (a) | 5,273 | 159,983 | |
| Legend Biotech Corp. ADR (a) | 11,059 | 672,608 | |
| Moonlake Immunotherapeutics (a)(b) | 3,889 | 170,766 | |
| Natera, Inc. (a) | 4,827 | 270,071 | |
| Oxford BioMedica PLC (a) | 105,735 | 222,653 | |
| RayzeBio, Inc. | 9,200 | 219,696 | |
| Regeneron Pharmaceuticals, Inc. (a) | 1,343 | 1,106,377 | |
| Repligen Corp. (a)(b) | 5,625 | 884,531 | |
| Sarepta Therapeutics, Inc. (a) | 5,031 | 408,920 | |
| Tyra Biosciences, Inc. (a) | 8,307 | 97,275 | |
| Vaxcyte, Inc. (a) | 8,985 | 465,153 | |
| Vertex Pharmaceuticals, Inc. (a) | 4,241 | 1,504,749 | |
| Verve Therapeutics, Inc. (a)(b) | 7,619 | 85,942 | |
| Xenon Pharmaceuticals, Inc. (a) | 6,169 | 225,662 | |
| Zai Lab Ltd. ADR (a)(b) | 18,315 | 499,816 | |
| Zentalis Pharmaceuticals, Inc. (a) | 7,282 | 81,923 | |
| 12,590,712 | |||
| Health Care Equipment & Supplies - 27.3% | |||
| Align Technology, Inc. (a) | 1,045 | 223,421 | |
| Boston Scientific Corp. (a) | 45,279 | 2,530,642 | |
| DexCom, Inc. (a) | 7,307 | 844,105 | |
| Glaukos Corp. (a) | 8,600 | 549,454 | |
| ICU Medical, Inc. (a) | 4,278 | 375,437 | |
| Inspire Medical Systems, Inc. (a) | 2,424 | 352,231 | |
| Insulet Corp. (a) | 6,434 | 1,216,605 | |
| Intuitive Surgical, Inc. (a) | 3,850 | 1,196,734 | |
| iRhythm Technologies, Inc. (a) | 4,403 | 375,488 | |
| Masimo Corp. (a) | 12,788 | 1,199,003 | |
| Nevro Corp. (a) | 11,624 | 201,328 | |
| Penumbra, Inc. (a) | 6,186 | 1,373,849 | |
| ResMed, Inc. | 4,344 | 685,179 | |
| Stryker Corp. | 3,887 | 1,151,835 | |
| Tandem Diabetes Care, Inc. (a) | 11,178 | 226,243 | |
| 12,501,554 | |||
| Health Care Providers & Services - 16.2% | |||
| agilon health, Inc. (a) | 49,094 | 521,378 | |
| Centene Corp. (a) | 24,261 | 1,787,550 | |
| Guardant Health, Inc. (a) | 12,326 | 310,245 | |
| Humana, Inc. | 2,276 | 1,103,541 | |
| LifeStance Health Group, Inc. (a) | 125,761 | 863,978 | |
| Privia Health Group, Inc. (a) | 21,746 | 449,272 | |
| UnitedHealth Group, Inc. | 4,288 | 2,371,135 | |
| 7,407,099 | |||
| Health Care Technology - 3.9% | |||
| Doximity, Inc. (a) | 8,273 | 192,347 | |
| Evolent Health, Inc. (a) | 15,428 | 428,898 | |
| Phreesia, Inc. (a) | 18,034 | 277,904 | |
| Veeva Systems, Inc. Class A (a) | 5,181 | 903,100 | |
| 1,802,249 | |||
| Life Sciences Tools & Services - 16.5% | |||
| 10X Genomics, Inc. (a) | 21,048 | 916,009 | |
| Bio-Techne Corp. | 12,588 | 791,785 | |
| Bruker Corp. | 21,063 | 1,370,991 | |
| Danaher Corp. | 7,509 | 1,676,835 | |
| Lonza Group AG | 613 | 236,884 | |
| Sartorius Stedim Biotech | 2,996 | 673,101 | |
| Thermo Fisher Scientific, Inc. | 1,907 | 945,414 | |
| West Pharmaceutical Services, Inc. | 2,720 | 954,067 | |
| 7,565,086 | |||
| Pharmaceuticals - 7.0% | |||
| Edgewise Therapeutics, Inc. (a)(b) | 23,957 | 145,659 | |
| Eli Lilly & Co. | 1,513 | 894,244 | |
| Novo Nordisk A/S Series B sponsored ADR | 4,100 | 417,544 | |
| Royalty Pharma PLC | 50,097 | 1,356,126 | |
| Structure Therapeutics, Inc. ADR | 6,800 | 378,692 | |
| 3,192,265 | |||
| TOTAL COMMON STOCKS (Cost $46,195,046) | 45,058,965 | ||
| Money Market Funds - 4.5% | |||
| Shares | Value ($) | ||
| Fidelity Cash Central Fund 5.40% (c) | 723,065 | 723,210 | |
| Fidelity Securities Lending Cash Central Fund 5.39% (c)(d) | 1,331,692 | 1,331,825 | |
| TOTAL MONEY MARKET FUNDS (Cost $2,055,035) | 2,055,035 | ||
| TOTAL INVESTMENT IN SECURITIES - 102.9% (Cost $48,250,081) | 47,114,000 |
NET OTHER ASSETS (LIABILITIES) - (2.9)% | (1,344,841) |
| NET ASSETS - 100.0% | 45,769,159 |
| (a) | Non-income producing |
| (b) | Security or a portion of the security is on loan at period end. |
| (c) | Affiliated fund that is generally available only to investment companies and other accounts managed by Fidelity Investments. The rate quoted is the annualized seven-day yield of the fund at period end. A complete unaudited listing of the fund's holdings as of its most recent quarter end is available upon request. In addition, each Fidelity Central Fund's financial statements are available on the SEC's website or upon request. |
| (d) | Investment made with cash collateral received from securities on loan. |
| Affiliate | Value, beginning of period ($) | Purchases ($) | Sales Proceeds ($) | Dividend Income ($) | Realized Gain (loss) ($) | Change in Unrealized appreciation (depreciation) ($) | Value, end of period ($) | % ownership, end of period |
| Fidelity Cash Central Fund 5.40% | - | 4,837,023 | 4,113,813 | 13,320 | - | - | 723,210 | 0.0% |
| Fidelity Securities Lending Cash Central Fund 5.39% | 461,500 | 8,702,827 | 7,832,502 | 1,602 | - | - | 1,331,825 | 0.0% |
| Total | 461,500 | 13,539,850 | 11,946,315 | 14,922 | - | - | 2,055,035 | |
| Valuation Inputs at Reporting Date: | ||||
| Description | Total ($) | Level 1 ($) | Level 2 ($) | Level 3 ($) |
Investments in Securities: | ||||
| Equities: | ||||
Health Care | 45,058,965 | 45,058,965 | - | - |
| Money Market Funds | 2,055,035 | 2,055,035 | - | - |
| Total Investments in Securities: | 47,114,000 | 47,114,000 | - | - |
| Statement of Assets and Liabilities | ||||
November 30, 2023 (Unaudited) | ||||
| Assets | ||||
| Investment in securities, at value (including securities loaned of $1,292,763) - See accompanying schedule: | ||||
Unaffiliated issuers (cost $46,195,046) | $ | 45,058,965 | ||
Fidelity Central Funds (cost $2,055,035) | 2,055,035 | |||
| Total Investment in Securities (cost $48,250,081) | $ | 47,114,000 | ||
| Dividends receivable | 32,342 | |||
| Distributions receivable from Fidelity Central Funds | 3,744 | |||
Total assets | 47,150,086 | |||
| Liabilities | ||||
| Payable for investments purchased | $ | 30,487 | ||
| Accrued management fee | 18,613 | |||
| Other payables and accrued expenses | 2 | |||
| Collateral on securities loaned | 1,331,825 | |||
| Total Liabilities | 1,380,927 | |||
| Net Assets | $ | 45,769,159 | ||
| Net Assets consist of: | ||||
| Paid in capital | $ | 58,069,873 | ||
| Total accumulated earnings (loss) | (12,300,714) | |||
| Net Assets | $ | 45,769,159 | ||
Net Asset Value, offering price and redemption price per share ($45,769,159 ÷ 2,123,806 shares) | $ | 21.55 | ||
| Statement of Operations | ||||
Six months ended November 30, 2023 (Unaudited) | ||||
| Investment Income | ||||
| Dividends | $ | 63,296 | ||
| Income from Fidelity Central Funds (including $1,602 from security lending) | 14,922 | |||
| Total Income | 78,218 | |||
| Expenses | ||||
| Management fee | $ | 108,709 | ||
| Independent trustees' fees and expenses | 115 | |||
| Total expenses before reductions | 108,824 | |||
| Expense reductions | (133) | |||
| Total expenses after reductions | 108,691 | |||
| Net Investment income (loss) | (30,473) | |||
| Realized and Unrealized Gain (Loss) | ||||
| Net realized gain (loss) on: | ||||
| Investment Securities: | ||||
| Unaffiliated issuers | (1,703,599) | |||
| Redemptions in-kind | 654,546 | |||
| Foreign currency transactions | (7,829) | |||
| Total net realized gain (loss) | (1,056,882) | |||
| Change in net unrealized appreciation (depreciation) on: | ||||
| Investment Securities: | ||||
| Unaffiliated issuers | (4,192,730) | |||
| Assets and liabilities in foreign currencies | 7,030 | |||
| Total change in net unrealized appreciation (depreciation) | (4,185,700) | |||
| Net gain (loss) | (5,242,582) | |||
| Net increase (decrease) in net assets resulting from operations | $ | (5,273,055) | ||
See Organization and Merger information note regarding reorganization from mutual fund to exchange traded fund.
| Statement of Changes in Net Assets | ||||
Six months ended November 30, 2023 (Unaudited) | Year ended May 31, 2023 | |||
| Increase (Decrease) in Net Assets | ||||
| Operations | ||||
| Net investment income (loss) | $ | (30,473) | $ | (65,769) |
| Net realized gain (loss) | (1,056,882) | (6,730,978) | ||
| Change in net unrealized appreciation (depreciation) | (4,185,700) | 11,521,551 | ||
| Net increase (decrease) in net assets resulting from operations | (5,273,055) | 4,724,804 | ||
| Share transactions - net increase (decrease) | - | (13,925,552) | ||
| Share transactions | ||||
| Proceeds from sales of shares | 10,797,368 | - | ||
| Cost of shares redeemed | (2,952,019) | - | ||
Net increase (decrease) in net assets resulting from share transactions | 7,845,349 | (13,925,552) | ||
| Total increase (decrease) in net assets | 2,572,294 | (9,200,748) | ||
| Net Assets | ||||
| Beginning of period | 43,196,865 | 52,397,613 | ||
| End of period | $ | 45,769,159 | $ | 43,196,865 |
| Other Information | ||||
| Shares | ||||
| Sold | 500,368 | 2,183,358 | ||
| Redeemed | (149,500) | (2,768,145) | ||
| Net increase (decrease) | 350,868 | (584,787) | ||
| Fidelity® Disruptive Medicine ETF |
Six months ended (Unaudited) November 30, 2023 A | Years ended May 31, 2023 A | 2022 A | 2021 A | 2020 A,B | ||||||
Selected Per-Share Data | ||||||||||
| Net asset value, beginning of period | $ | 24.36 | $ | 22.08 | $ | 28.82 | $ | 24.52 | $ | 22.17 |
| Income from Investment Operations | ||||||||||
Net investment income (loss) C,D | (.02) | (.11) | (.20) | (.16) | (.02) | |||||
| Net realized and unrealized gain (loss) | (2.79) | 2.39 | (6.25) | 4.66 | 2.37 | |||||
| Total from investment operations | (2.81) | 2.28 | (6.45) | 4.50 | 2.35 | |||||
| Distributions from net realized gain | - | - | (.29) | (.20) | - | |||||
| Total distributions | - | - | (.29) | (.20) | - | |||||
| Net asset value, end of period | $ | 21.55 | $ | 24.36 | $ | 22.08 | $ | 28.82 | $ | 24.52 |
Total Return E,F,G | (11.53)% | 10.34% | (22.68)% | 18.44% | 10.60% | |||||
Ratios to Average Net Assets D,H,I | ||||||||||
| Expenses before reductions | .50% J | .84% | 1.00% | 1.01% K | 1.01% J,K | |||||
| Expenses net of fee waivers, if any | .50% J | .84% | 1.00% | 1.01% K | 1.01% J,K | |||||
| Expenses net of all reductions | .50% J | .84% | 1.00% | 1.01% K | 1.01% J,K | |||||
| Net investment income (loss) | (.14)% J | (.51)% | (.70)% | (.58)% | (.75)% J | |||||
| Supplemental Data | ||||||||||
| Net assets, end of period (000 omitted) | $ | 45,769 | $ | 43,197 | $ | 11,027 | $ | 32,331 | $ | 5,666 |
Portfolio turnover rate L | 10% J,M | 39% | 47% | 44% | -% N,O |
Top Holdings (% of Fund's net assets) | ||
| Adobe, Inc. | 5.7 | |
| Salesforce, Inc. | 5.5 | |
| NVIDIA Corp. | 5.4 | |
| Microsoft Corp. | 5.4 | |
| MongoDB, Inc. Class A | 4.7 | |
| Taiwan Semiconductor Manufacturing Co. Ltd. sponsored ADR | 4.4 | |
| Amazon.com, Inc. | 3.8 | |
| Marvell Technology, Inc. | 3.8 | |
| Alphabet, Inc. Class C | 3.8 | |
| ASML Holding NV (Netherlands) | 3.7 | |
| 46.2 | ||
| Market Sectors (% of Fund's net assets) | ||
| Information Technology | 70.2 | |
| Communication Services | 17.1 | |
| Consumer Discretionary | 7.6 | |
| Financials | 3.5 | |
| Industrials | 1.2 | |
Asset Allocation (% of Fund's net assets) |
|
Geographic Diversification (% of Fund's net assets) |
 |
* Includes Short-Term investments and Net Other Assets (Liabilities). Percentages are adjusted for the effect of derivatives, if applicable. |
| Common Stocks - 99.6% | |||
| Shares | Value ($) | ||
| COMMUNICATION SERVICES - 17.1% | |||
| Entertainment - 6.9% | |||
| Netflix, Inc. (a) | 7,762 | 3,678,955 | |
| Sea Ltd. ADR (a) | 37,333 | 1,352,201 | |
| Spotify Technology SA (a) | 5,516 | 1,021,067 | |
| Universal Music Group NV | 38,091 | 1,005,040 | |
| 7,057,263 | |||
| Interactive Media & Services - 9.3% | |||
| Alphabet, Inc. Class C (a) | 28,618 | 3,832,523 | |
| Meta Platforms, Inc. Class A (a) | 10,819 | 3,539,436 | |
| Snap, Inc. Class A (a) | 146,752 | 2,029,580 | |
| 9,401,539 | |||
| Wireless Telecommunication Services - 0.9% | |||
| T-Mobile U.S., Inc. | 6,262 | 942,118 | |
TOTAL COMMUNICATION SERVICES | 17,400,920 | ||
| CONSUMER DISCRETIONARY - 7.6% | |||
| Broadline Retail - 6.3% | |||
| Amazon.com, Inc. (a) | 26,433 | 3,861,597 | |
| Global-e Online Ltd. (a)(b) | 19,546 | 669,451 | |
| PDD Holdings, Inc. ADR (a) | 12,600 | 1,857,744 | |
| 6,388,792 | |||
| Hotels, Restaurants & Leisure - 0.7% | |||
| Airbnb, Inc. Class A (a) | 5,381 | 679,836 | |
| Specialty Retail - 0.6% | |||
| ZOZO, Inc. | 30,364 | 640,007 | |
TOTAL CONSUMER DISCRETIONARY | 7,708,635 | ||
| FINANCIALS - 3.5% | |||
| Financial Services - 3.5% | |||
| Adyen BV (a)(c) | 2,130 | 2,483,119 | |
| Block, Inc. Class A (a) | 17,326 | 1,098,988 | |
| 3,582,107 | |||
| INDUSTRIALS - 1.2% | |||
| Ground Transportation - 1.2% | |||
| Uber Technologies, Inc. (a) | 21,050 | 1,186,799 | |
| INFORMATION TECHNOLOGY - 70.2% | |||
| Electronic Equipment, Instruments & Components - 0.7% | |||
| Samsung SDI Co. Ltd. | 1,960 | 711,713 | |
| IT Services - 9.0% | |||
| Accenture PLC Class A | 4,278 | 1,425,173 | |
| MongoDB, Inc. Class A (a) | 11,545 | 4,799,718 | |
| Shopify, Inc. Class A (a) | 22,028 | 1,604,079 | |
| Snowflake, Inc. (a) | 7,272 | 1,364,809 | |
| 9,193,779 | |||
| Semiconductors & Semiconductor Equipment - 23.0% | |||
| Advantest Corp. | 61,491 | 1,941,450 | |
| ASML Holding NV (Netherlands) | 5,536 | 3,754,158 | |
| BE Semiconductor Industries NV | 13,575 | 1,898,027 | |
| Marvell Technology, Inc. | 69,038 | 3,847,488 | |
| Micron Technology, Inc. | 16,600 | 1,263,592 | |
| NVIDIA Corp. | 11,873 | 5,553,002 | |
| SolarEdge Technologies, Inc. (a) | 8,877 | 704,656 | |
| Taiwan Semiconductor Manufacturing Co. Ltd. sponsored ADR | 45,576 | 4,435,001 | |
| 23,397,374 | |||
| Software - 35.0% | |||
| Adobe, Inc. (a) | 9,471 | 5,786,876 | |
| Atlassian Corp. PLC (a) | 6,933 | 1,323,856 | |
| Confluent, Inc. (a) | 56,358 | 1,195,917 | |
| Crowdstrike Holdings, Inc. (a) | 6,922 | 1,640,445 | |
| Datadog, Inc. Class A (a) | 16,763 | 1,954,063 | |
| HashiCorp, Inc. (a) | 45,634 | 977,480 | |
| HubSpot, Inc. (a) | 3,498 | 1,727,767 | |
| Intuit, Inc. | 4,190 | 2,394,417 | |
| Microsoft Corp. | 14,496 | 5,492,679 | |
| Palo Alto Networks, Inc. (a) | 8,024 | 2,367,802 | |
| Salesforce, Inc. (a) | 22,370 | 5,635,003 | |
| Synopsys, Inc. (a) | 4,700 | 2,553,181 | |
| Workday, Inc. Class A (a) | 9,376 | 2,538,271 | |
| 35,587,757 | |||
| Technology Hardware, Storage & Peripherals - 2.5% | |||
| Apple, Inc. | 7,672 | 1,457,296 | |
| Samsung Electronics Co. Ltd. | 20,450 | 1,145,332 | |
| 2,602,628 | |||
TOTAL INFORMATION TECHNOLOGY | 71,493,251 | ||
| TOTAL COMMON STOCKS (Cost $89,822,476) | 101,371,712 | ||
| Money Market Funds - 0.8% | |||
| Shares | Value ($) | ||
| Fidelity Cash Central Fund 5.40% (d) | 393,819 | 393,898 | |
| Fidelity Securities Lending Cash Central Fund 5.39% (d)(e) | 399,484 | 399,524 | |
| TOTAL MONEY MARKET FUNDS (Cost $793,422) | 793,422 | ||
| TOTAL INVESTMENT IN SECURITIES - 100.4% (Cost $90,615,898) | 102,165,134 |
NET OTHER ASSETS (LIABILITIES) - (0.4)% | (375,849) |
| NET ASSETS - 100.0% | 101,789,285 |
| (a) | Non-income producing |
| (b) | Security or a portion of the security is on loan at period end. |
| (c) | Security exempt from registration under Rule 144A of the Securities Act of 1933. These securities may be resold in transactions exempt from registration, normally to qualified institutional buyers. At the end of the period, the value of these securities amounted to $2,483,119 or 2.4% of net assets. |
| (d) | Affiliated fund that is generally available only to investment companies and other accounts managed by Fidelity Investments. The rate quoted is the annualized seven-day yield of the fund at period end. A complete unaudited listing of the fund's holdings as of its most recent quarter end is available upon request. In addition, each Fidelity Central Fund's financial statements are available on the SEC's website or upon request. |
| (e) | Investment made with cash collateral received from securities on loan. |
| Affiliate | Value, beginning of period ($) | Purchases ($) | Sales Proceeds ($) | Dividend Income ($) | Realized Gain (loss) ($) | Change in Unrealized appreciation (depreciation) ($) | Value, end of period ($) | % ownership, end of period |
| Fidelity Cash Central Fund 5.40% | 478,846 | 11,710,705 | 11,795,653 | 20,776 | - | - | 393,898 | 0.0% |
| Fidelity Securities Lending Cash Central Fund 5.39% | 3,121,750 | 7,343,557 | 10,065,783 | 1,150 | - | - | 399,524 | 0.0% |
| Total | 3,600,596 | 19,054,262 | 21,861,436 | 21,926 | - | - | 793,422 | |
| Valuation Inputs at Reporting Date: | ||||
| Description | Total ($) | Level 1 ($) | Level 2 ($) | Level 3 ($) |
Investments in Securities: | ||||
| Equities: | ||||
Communication Services | 17,400,920 | 17,400,920 | - | - |
Consumer Discretionary | 7,708,635 | 7,708,635 | - | - |
Financials | 3,582,107 | 3,582,107 | - | - |
Industrials | 1,186,799 | 1,186,799 | - | - |
Information Technology | 71,493,251 | 71,493,251 | - | - |
| Money Market Funds | 793,422 | 793,422 | - | - |
| Total Investments in Securities: | 102,165,134 | 102,165,134 | - | - |
| Statement of Assets and Liabilities | ||||
November 30, 2023 (Unaudited) | ||||
| Assets | ||||
| Investment in securities, at value (including securities loaned of $388,190) - See accompanying schedule: | ||||
Unaffiliated issuers (cost $89,822,476) | $ | 101,371,712 | ||
Fidelity Central Funds (cost $793,422) | 793,422 | |||
| Total Investment in Securities (cost $90,615,898) | $ | 102,165,134 | ||
| Cash | 27,937 | |||
| Dividends receivable | 33,977 | |||
| Distributions receivable from Fidelity Central Funds | 1,758 | |||
Total assets | 102,228,806 | |||
| Liabilities | ||||
| Accrued management fee | $ | 39,997 | ||
| Collateral on securities loaned | 399,524 | |||
| Total Liabilities | 439,521 | |||
| Net Assets | $ | 101,789,285 | ||
| Net Assets consist of: | ||||
| Paid in capital | $ | 119,553,287 | ||
| Total accumulated earnings (loss) | (17,764,002) | |||
| Net Assets | $ | 101,789,285 | ||
Net Asset Value, offering price and redemption price per share ($101,789,285 ÷ 3,788,469 shares) | $ | 26.87 | ||
| Statement of Operations | ||||
Six months ended November 30, 2023 (Unaudited) | ||||
| Investment Income | ||||
| Dividends | $ | 131,959 | ||
| Interest | 68 | |||
| Income from Fidelity Central Funds (including $1,150 from security lending) | 21,926 | |||
| Total Income | 153,953 | |||
| Expenses | ||||
| Management fee | $ | 246,261 | ||
| Independent trustees' fees and expenses | 259 | |||
| Total expenses before reductions | 246,520 | |||
| Expense reductions | (170) | |||
| Total expenses after reductions | 246,350 | |||
| Net Investment income (loss) | (92,397) | |||
| Realized and Unrealized Gain (Loss) | ||||
| Net realized gain (loss) on: | ||||
| Investment Securities: | ||||
| Unaffiliated issuers | (6,214,185) | |||
| Redemptions in-kind | 1,393,703 | |||
| Foreign currency transactions | 8,756 | |||
| Total net realized gain (loss) | (4,811,726) | |||
| Change in net unrealized appreciation (depreciation) on: | ||||
| Investment Securities: | ||||
| Unaffiliated issuers | 14,805,642 | |||
| Assets and liabilities in foreign currencies | 5,608 | |||
| Total change in net unrealized appreciation (depreciation) | 14,811,250 | |||
| Net gain (loss) | 9,999,524 | |||
| Net increase (decrease) in net assets resulting from operations | $ | 9,907,127 | ||
See Organization and Merger information note regarding reorganization from mutual fund to exchange traded fund.
| Statement of Changes in Net Assets | ||||
Six months ended November 30, 2023 (Unaudited) | Year ended May 31, 2023 | |||
| Increase (Decrease) in Net Assets | ||||
| Operations | ||||
| Net investment income (loss) | $ | (92,397) | $ | (164,342) |
| Net realized gain (loss) | (4,811,726) | (24,265,561) | ||
| Change in net unrealized appreciation (depreciation) | 14,811,250 | 33,937,798 | ||
| Net increase (decrease) in net assets resulting from operations | 9,907,127 | 9,507,895 | ||
| Distributions to shareholders | - | (1,210,975) | ||
| Share transactions - net increase (decrease) | - | (12,866,094) | ||
| Share transactions | ||||
| Proceeds from sales of shares | 1,190,118 | - | ||
| Cost of shares redeemed | (10,852,977) | - | ||
Net increase (decrease) in net assets resulting from share transactions | (9,662,859) | (12,866,094) | ||
| Total increase (decrease) in net assets | 244,268 | (4,569,174) | ||
| Net Assets | ||||
| Beginning of period | 101,545,017 | 106,114,191 | ||
| End of period | $ | 101,789,285 | $ | 101,545,017 |
| Other Information | ||||
| Shares | ||||
| Sold | 48,177 | 5,396,940 | ||
| Issued in reinvestment of distributions | - | 55,606 | ||
| Redeemed | (434,792) | (6,149,268) | ||
| Net increase (decrease) | (386,615) | (696,722) | ||
| Fidelity® Disruptive Technology ETF |
Six months ended (Unaudited) November 30, 2023 A | Years ended May 31, 2023 A | 2022 A | 2021 A | 2020 A,B | ||||||
Selected Per-Share Data | ||||||||||
| Net asset value, beginning of period | $ | 24.32 | $ | 21.70 | $ | 33.25 | $ | 21.11 | $ | 18.37 |
| Income from Investment Operations | ||||||||||
Net investment income (loss) C,D | (.02) | (.09) | (.26) | (.24) | (.02) | |||||
| Net realized and unrealized gain (loss) | 2.57 | 2.97 | (10.79) | 12.51 | 2.76 | |||||
| Total from investment operations | 2.55 | 2.88 | (11.05) | 12.27 | 2.74 | |||||
| Distributions from net realized gain | - | (.26) | (.50) E | (.13) | - | |||||
| Total distributions | - | (.26) | (.50) | (.13) | - | |||||
| Net asset value, end of period | $ | 26.87 | $ | 24.32 | $ | 21.70 | $ | 33.25 | $ | 21.11 |
Total Return F,G,H | 10.46% | 13.45% | (33.85)% | 58.13% | 14.90% | |||||
Ratios to Average Net Assets D,I,J | ||||||||||
| Expenses before reductions | .50% K | .87% | .99% | 1.01% E | 1.01% E,K | |||||
| Expenses net of fee waivers, if any | .50% K | .87% | .99% E | 1.01% E | 1.01% E,K | |||||
| Expenses net of all reductions | .50% K | .87% | .99% E | 1.01% E | 1.01% E,K | |||||
| Net investment income (loss) | (.19)% K | (.42)% | (.78)% | (.77)% | (.62)% K | |||||
| Supplemental Data | ||||||||||
| Net assets, end of period (000 omitted) | $ | 101,789 | $ | 101,545 | $ | 34,802 | $ | 130,244 | $ | 6,198 |
Portfolio turnover rate L | 19% K,M | 28% | 33% | 29% | -% N,O |
| Current ETFs | Former Mutual Funds (Predecessor Funds) |
| Fidelity Disruptive Automation ETF | Fidelity Disruptive Automation Fund |
| Fidelity Disruptive Communications ETF | Fidelity Disruptive Communications Fund |
| Fidelity Disruptive Finance ETF | Fidelity Disruptive Finance Fund |
| Fidelity Disruptive Medicine ETF | Fidelity Disruptive Medicine Fund |
| Fidelity Disruptive Technology ETF | Fidelity Disruptive Technology Fund |
| Fidelity Central Fund | Investment Manager | Investment Objective | Investment Practices | Expense RatioA |
| Fidelity Money Market Central Funds | Fidelity Management & Research Company LLC (FMR) | Each fund seeks to obtain a high level of current income consistent with the preservation of capital and liquidity. | Short-term Investments | Less than .005% |
| Tax cost | Gross unrealized appreciation | Gross unrealized depreciation | Net unrealized appreciation (depreciation) | |
| Fidelity Disruptive Automation ETF | $104,655,483 | $17,348,248 | $(14,749,075) | $2,599,173 |
Fidelity Disruptive Communications ETF | 36,873,006 | 10,987,284 | (8,668,439) | 2,318,845 |
| Fidelity Disruptive Finance ETF | 40,053,972 | 7,712,994 | (5,706,286) | 2,006,708 |
| Fidelity Disruptive Medicine ETF | 48,323,525 | 6,907,098 | (8,116,623) | (1,209,525) |
| Fidelity Disruptive Technology ETF | 92,111,225 | 25,321,900 | (15,267,991) | 10,053,909 |
| Short-term | Long-term | Total capital loss carryforward | |
| Fidelity Disruptive Automation Fund | $(2,580,613) | $(4,788,003) | $(7,368,616) |
Fidelity Disruptive Communications Fund | (4,856,673) | (4,392,633) | (9,249,306) |
| Fidelity Disruptive Finance Fund | (4,448,700) | (2,134,278) | (6,582,978) |
| Fidelity Disruptive Medicine Fund | (6,685,546) | (3,174,906) | (9,860,452) |
| Fidelity Disruptive Technology Fund | (3,935,299) | (18,903,217) | (22,838,516) |
| Purchases ($) | Sales ($) | |
| Fidelity Disruptive Automation ETF | 37,544,124 | 33,596,392 |
| Fidelity Disruptive Communications ETF | 6,843,293 | 5,445,911 |
| Fidelity Disruptive Finance ETF | 9,934,218 | 7,026,590 |
| Fidelity Disruptive Medicine ETF | 7,006,982 | 3,408,381 |
| Fidelity Disruptive Technology ETF | 15,500,992 | 15,267,380 |
| In-Kind Subscriptions ($) | In-Kind Redemptions ($) | |
| Fidelity Disruptive Automation ETF | 3,597,594 | 7,126,337 |
| Fidelity Disruptive Communications ETF | - | 3,895,711 |
| Fidelity Disruptive Finance ETF | - | 4,841,021 |
| Fidelity Disruptive Medicine ETF | 7,607,367 | 2,474,632 |
| Fidelity Disruptive Technology ETF | - | 4,587,682 |
| Shares | Total net realized gain or loss ($) | Total Proceeds ($) | |
| Fidelity Disruptive Automation Fund | 210,398 | 2,526,540 | 4,955,947 |
| Fee Rate | |
| Fidelity Disruptive Automation ETF | .50% |
| Fidelity Disruptive Communications ETF | .50% |
| Fidelity Disruptive Finance ETF | .50% |
| Fidelity Disruptive Medicine ETF | .50% |
| Fidelity Disruptive Technology ETF | .50% |
| Management Fee Annual % of Average Net Assets | Expense Contract Annual % of Average Net Assets | |
| Fidelity Disruptive Automation Fund | 1.00% | .50% |
| Fidelity Disruptive Communications Fund | 1.00% | .50% |
| Fidelity Disruptive Finance Fund | 1.00% | .50% |
| Fidelity Disruptive Medicine Fund | 1.00% | .50% |
| Fidelity Disruptive Technology Fund | 1.00% | .50% |
| Amount | |
| Fidelity Disruptive Automation ETF | $128 |
| Fidelity Disruptive Communications ETF | 71 |
| Fidelity Disruptive Finance ETF | 71 |
| Fidelity Disruptive Medicine ETF | 193 |
| Fidelity Disruptive Technology ETF | 81 |
| Borrower or Lender | Average Loan Balance | Weighted Average Interest Rate | Interest Expense | |
| Fidelity Disruptive Automation ETF | Borrower | $ 5,516,000 | 5.32% | $814 |
| Purchases ($) | Sales ($) | Realized Gain (Loss) ($) | |
| Fidelity Disruptive Automation ETF | 1,038,847 | 1,075,914 | 253,185 |
| Fidelity Disruptive Communications ETF | 11,648 | 474,253 | 175,908 |
| Fidelity Disruptive Finance ETF | 1,955,770 | 1,402,362 | 812,533 |
| Fidelity Disruptive Medicine ETF | 283,263 | 35,656 | (15,544) |
| Fidelity Disruptive Technology ETF | 1,335,652 | 166,170 | (563,289) |
| Total Security Lending Fees Paid to NFS | Security Lending Income From Securities Loaned to NFS | Value of Securities Loaned to NFS at Period End | |
| Fidelity Disruptive Automation ETF | $5,118 | $4,521 | $63,456 |
| Fidelity Disruptive Communications ETF | $26 | $- | $- |
| Fidelity Disruptive Finance ETF | $271 | $- | $- |
| Fidelity Disruptive Medicine ETF | $123 | $- | $- |
| Fidelity Disruptive Technology ETF | $80 | $- | $- |
| Custodian credits | |
| Fidelity Disruptive Automation ETF | $102 |
Fidelity Disruptive Communications ETF | 110 |
| Fidelity Disruptive Finance ETF | 103 |
| Fidelity Disruptive Medicine ETF | 133 |
| Fidelity Disruptive Technology ETF | 170 |
Year ended May 31, 2023 | |
| Fidelity Disruptive Automation Fund | |
| Distributions to shareholders | |
| Fidelity Disruptive Automation Fund | $- |
| Loyalty Class 1 | 70,285 |
| Loyalty Class 2 | 370 |
| Class F | 112,219 |
Total | $182,874 |
| Fidelity Disruptive Finance Fund | |
| Distributions to shareholders | |
| Fidelity Disruptive Finance Fund | $889,399 |
| Loyalty Class 1 | 1,176,792 |
| Loyalty Class 2 | 9,204 |
| Class F | 1,565,582 |
Total | $3,640,977 |
| Fidelity Disruptive Technology Fund | |
| Distributions to shareholders | |
| Fidelity Disruptive Technology Fund | $403,963 |
| Loyalty Class 1 | 534,280 |
| Loyalty Class 2 | 1,388 |
| Class F | 271,344 |
Total | $1,210,975 |
| Shares | Dollars | |
Year ended May 31, 2023 | Year ended May 31, 2023 | |
| Fidelity Disruptive Automation Fund | ||
| Fidelity Disruptive Automation Fund | ||
| Shares sold | 4,549,471 | $106,491,639 |
| Reinvestment of distributions | - | - |
| Shares redeemed | (1,670,230) | (35,221,801) |
| Net increase (decrease) | 2,879,241 | $71,269,838 |
| Loyalty Class 1 | ||
| Shares sold | 687,455 | $14,592,727 |
| Reinvestment of distributions | 3,054 | 65,051 |
| Shares redeemed | (3,399,293) | (78,288,179) |
| Net increase (decrease) | (2,708,784) | $(63,630,401) |
| Loyalty Class 2 | ||
| Shares sold | 831 | $17,906 |
| Reinvestment of distributions | 17 | 370 |
| Shares redeemed | (7,730) | (180,614) |
| Net increase (decrease) | (6,882) | $(162,338) |
| Class F | ||
| Shares sold | 23,191 | $512,114 |
| Reinvestment of distributions | 5,221 | 112,219 |
| Shares redeemed | (1,220,183) | (27,936,611) |
| Net increase (decrease) | (1,191,771) | $(27,312,278) |
| Fidelity Disruptive Communications Fund | ||
| Fidelity Disruptive Communications Fund | ||
| Shares sold | 1,574,930 | $36,001,186 |
| Reinvestment of distributions | - | - |
| Shares redeemed | (352,668) | (7,507,221) |
| Net increase (decrease) | 1,222,262 | $28,493,965 |
| Loyalty Class 1 | ||
| Shares sold | 118,546 | $2,583,699 |
| Reinvestment of distributions | - | - |
| Shares redeemed | (741,539) | (16,870,638) |
| Net increase (decrease) | (622,993) | $(14,286,939) |
| Loyalty Class 2 | ||
| Shares sold | 234 | $5,415 |
| Reinvestment of distributions | - | - |
| Shares redeemed | (5,580) | (129,686) |
| Net increase (decrease) | (5,346) | $(124,271) |
| Class F | ||
| Shares sold | 110,136 | $2,260,556 |
| Reinvestment of distributions | - | - |
| Shares redeemed | (1,165,781) | (26,314,710) |
| Net increase (decrease) | (1,055,645) | $(24,054,154) |
| Fidelity Disruptive Finance Fund | ||
| Fidelity Disruptive Finance Fund | ||
| Shares sold | 1,667,868 | $41,586,096 |
| Reinvestment of distributions | 33,977 | 860,296 |
| Shares redeemed | (653,573) | (16,387,983) |
| Net increase (decrease) | 1,048,272 | $26,058,409 |
| Loyalty Class 1 | ||
| Shares sold | 262,880 | $6,806,499 |
| Reinvestment of distributions | 41,011 | 1,037,086 |
| Shares redeemed | (1,019,650) | (25,336,391) |
| Net increase (decrease) | (715,759) | $(17,492,806) |
| Loyalty Class 2 | ||
| Shares sold | 653 | $17,290 |
| Reinvestment of distributions | 362 | 9,204 |
| Shares redeemed | (6,443) | (160,502) |
| Net increase (decrease) | (5,428) | $(134,008) |
| Class F | ||
| Shares sold | 124,045 | $3,122,008 |
| Reinvestment of distributions | 61,525 | 1,565,581 |
| Shares redeemed | (1,068,546) | (26,918,970) |
| Net increase (decrease) | (882,976) | $(22,231,381) |
| Fidelity Disruptive Medicine Fund | ||
| Fidelity Disruptive Medicine Fund | ||
| Shares sold | 1,872,264 | $47,165,060 |
| Reinvestment of distributions | - | - |
| Shares redeemed | (598,763) | (13,951,368) |
| Net increase (decrease) | 1,273,501 | $33,213,692 |
| Loyalty Class 1 | ||
| Shares sold | 219,552 | $5,140,188 |
| Reinvestment of distributions | - | - |
| Shares redeemed | (976,902) | (24,624,657) |
| Net increase (decrease) | (757,350) | $(19,484,469) |
| Loyalty Class 2 | ||
| Shares sold | 69 | $1,704 |
| Reinvestment of distributions | - | - |
| Shares redeemed | (4,672) | (120,139) |
| Net increase (decrease) | (4,603) | $(118,435) |
| Class F | ||
| Shares sold | 91,473 | $2,265,715 |
| Reinvestment of distributions | - | - |
| Shares redeemed | (1,187,808) | (29,802,055) |
| Net increase (decrease) | (1,096,335) | $(27,536,340) |
| Fidelity Disruptive Technology Fund | ||
| Fidelity Disruptive Technology Fund | ||
| Shares sold | 4,693,753 | $100,997,985 |
| Reinvestment of distributions | 18,804 | 392,082 |
| Shares redeemed | (2,141,414) | (42,810,625) |
| Net increase (decrease) | 2,571,143 | $58,579,442 |
| Loyalty Class 1 | ||
| Shares sold | 577,993 | $11,797,211 |
| Reinvestment of distributions | 23,915 | 499,555 |
| Shares redeemed | (2,750,511) | (59,530,327) |
| Net increase (decrease) | (2,148,603) | $(47,233,561) |
| Loyalty Class 2 | ||
| Shares sold | 62 | $1,295 |
| Reinvestment of distributions | 66 | 1,388 |
| Shares redeemed | (5,683) | (125,896) |
| Net increase (decrease) | (5,555) | $(123,213) |
| Class F | ||
| Shares sold | 125,132 | $2,389,168 |
| Reinvestment of distributions | 12,821 | 271,344 |
| Shares redeemed | (1,251,660) | (26,749,274) |
| Net increase (decrease) | (1,113,707) | $(24,088,762) |
| Predecessor Funds | New ETFs |
| Fidelity Disruptive Automation Fund | Fidelity Disruptive Automation ETF |
| Fidelity Disruptive Communications Fund | Fidelity Disruptive Communications ETF |
| Fidelity Disruptive Finance Fund | Fidelity Disruptive Finance ETF |
| Fidelity Disruptive Medicine Fund | Fidelity Disruptive Medicine ETF |
| Fidelity Disruptive Technology Fund | Fidelity Disruptive Technology ETF |
| Predecessor Fund/Accounting Survivor | Investments ($) | Unrealized appreciation (depreciation) ($) | Net Assets ($) | Shares Exchanged | Shares Exchanged Ratio |
| Fidelity Disruptive Automation Fund | 111,001,230 | 9,648,810 | 111,488,793 | 4,459,561 | .6686440000 |
| Fidelity Disruptive Communications Fund | 38,182,670 | 416,225 | 38,176,192 | 1,527,044 | .4988520000 |
| Fidelity Disruptive Finance Fund | 41,565,870 | 1,661,222 | 41,616,228 | 1,664,653 | .5240880000 |
| Fidelity Disruptive Medicine Fund | 43,523,861 | 4,291,008 | 43,537,456 | 1,741,504 | .4511440000 |
| Fidelity Disruptive Technology Fund | 102,251,358 | 1,677,809 | 102,438,029 | 4,097,527 | .5443240000 |
| Legal Acquiring ETF | Net Assets ($) | Total net assets after the acquisition ($) |
| Fidelity Disruptive Automation ETF | 25 | 111,488,818 |
| Fidelity Disruptive Communications ETF | 25 | 38,176,217 |
| Fidelity Disruptive Finance ETF | 25 | 41,616,253 |
| Fidelity Disruptive Medicine ETF | 25 | 43,537,481 |
| Fidelity Disruptive Technology ETF | 25 | 102,438,054 |
| ETF name | Net investment income (loss) | Total net realized gain (loss) | Total change in net unrealized appreciation (depreciation) | Net increase (decrease) in net assets resulting from operations |
| Fidelity Disruptive Automation ETF | 223,453 | 64,361 | (5,080,071) | (4,792,257) |
| Fidelity Disruptive Communications ETF | (39,233) | 1,468,593 | 3,405,673 | 4,835,033 |
| Fidelity Disruptive Finance ETF | 119,138 | 2,156,666 | 2,195,929 | 4,471,733 |
| Fidelity Disruptive Medicine ETF | (30,380) | (1,056,882) | (4,185,700) | (5,272,962) |
| Fidelity Disruptive Technology ETF | (91,919) | (4,811,726) | 14,811,250 | 9,907,605 |
| The Example is based on an investment of $1,000 invested at the beginning of the period and held for the entire period (June 1, 2023 to November 30, 2023). |
Annualized Expense Ratio- A | Beginning Account Value June 1, 2023 | Ending Account Value November 30, 2023 | Expenses Paid During Period- C June 1, 2023 to November 30, 2023 | |||||||
| Fidelity® Disruptive Automation ETF | .50% | |||||||||
| Actual | $ 1,000 | $ 964.80 | $ 2.35 | |||||||
Hypothetical-B | $ 1,000 | $ 1,022.50 | $ 2.53 | |||||||
| Fidelity® Disruptive Communications ETF | .50% | |||||||||
| Actual | $ 1,000 | $ 1,133.90 | $ 2.55 | |||||||
Hypothetical-B | $ 1,000 | $ 1,022.50 | $ 2.53 | |||||||
| Fidelity® Disruptive Finance ETF | .50% | |||||||||
| Actual | $ 1,000 | $ 1,120.20 | $ 2.53 | |||||||
Hypothetical-B | $ 1,000 | $ 1,022.50 | $ 2.53 | |||||||
| Fidelity® Disruptive Medicine ETF | .50% | |||||||||
| Actual | $ 1,000 | $ 884.70 | $ 2.25 | |||||||
Hypothetical-B | $ 1,000 | $ 1,022.50 | $ 2.53 | |||||||
| Fidelity® Disruptive Technology ETF | .50% | |||||||||
| Actual | $ 1,000 | $ 1,104.60 | $ 2.52 | |||||||
Hypothetical-B | $ 1,000 | $ 1,022.50 | $ 2.53 | |||||||
 |


Contents
Top Holdings (% of Fund's net assets) | ||
| Fidelity Disruptive Communications ETF | 21.3 | |
| Fidelity Disruptive Technology ETF | 21.1 | |
| Fidelity Disruptive Finance ETF | 21.0 | |
| Fidelity Disruptive Automation ETF | 18.4 | |
| Fidelity Disruptive Medicine ETF | 18.1 | |
| Fidelity Cash Central Fund 5.40% | 0.3 | |
| 100.2 | ||
Asset Allocation (% of Fund's net assets) |
 |
Net Other Assets (Liabilities) - (0.2)% |
| Domestic Equity Funds - 99.9% | |||
| Shares | Value ($) | ||
| Fidelity Disruptive Automation ETF (a) | 669,660 | 15,951,294 | |
| Fidelity Disruptive Communications ETF (a)(b) | 668,031 | 18,501,179 | |
| Fidelity Disruptive Finance ETF (a) | 676,449 | 18,230,305 | |
| Fidelity Disruptive Medicine ETF (a)(b) | 731,298 | 15,730,225 | |
| Fidelity Disruptive Technology ETF (a)(b) | 679,849 | 18,281,136 | |
| TOTAL DOMESTIC EQUITY FUNDS (Cost $80,564,106) | 86,694,139 | ||
| Short-Term Funds - 0.3% | |||
| Shares | Value ($) | ||
Fidelity Cash Central Fund 5.40% (c) (Cost $231,420) | 231,373 | 231,420 | |
| TOTAL INVESTMENT IN SECURITIES - 100.2% (Cost $80,795,526) | 86,925,559 |
NET OTHER ASSETS (LIABILITIES) - (0.2)% | (139,894) |
| NET ASSETS - 100.0% | 86,785,665 |
| ETF | - | EXCHANGE-TRADED FUND |
| (a) | Affiliated Fund |
| (b) | Non-income producing |
| (c) | Affiliated fund that is generally available only to investment companies and other accounts managed by Fidelity Investments. The rate quoted is the annualized seven-day yield of the fund at period end. A complete unaudited listing of the fund's holdings as of its most recent quarter end is available upon request. In addition, each Fidelity Central Fund's financial statements are available on the SEC's website or upon request. |
| Affiliate | Value, beginning of period ($) | Purchases ($) | Sales Proceeds ($) | Dividend Income ($) | Realized Gain (loss) ($) | Change in Unrealized appreciation (depreciation) ($) | Value, end of period ($) | % ownership, end of period |
| Fidelity Cash Central Fund 5.40% | - | 2,296,732 | 2,065,312 | 8,412 | - | - | 231,420 | 0.0% |
| Total | - | 2,296,732 | 2,065,312 | 8,412 | - | - | 231,420 | |
| Affiliate | Value, beginning of period ($) | Purchases ($) | Sales Proceeds ($) | Dividend Income ($) | Realized Gain (loss) ($) | Change in Unrealized appreciation (depreciation) ($) | Value, end of period ($) |
| Fidelity Disruptive Automation ETF | 19,063,965 | 14,473,427 | 2,419,039 | 65,754 | 528,276 | (1,267,849) | 15,951,294 |
| Fidelity Disruptive Communications ETF | 19,096,640 | 20,044,285 | 3,019,959 | - | 17,692 | 2,271,051 | 18,501,179 |
| Fidelity Disruptive Finance ETF | 18,203,265 | 18,836,171 | 2,885,515 | 136,437 | 259,479 | 1,649,410 | 18,230,305 |
| Fidelity Disruptive Medicine ETF | 18,733,959 | 20,500,945 | 2,391,640 | - | (76,990) | (2,022,916) | 15,730,225 |
| Fidelity Disruptive Techology ETF | 20,318,052 | 18,511,060 | 4,099,187 | - | (155,133) | 2,007,747 | 18,281,136 |
| 95,415,881 | 92,365,888 | 14,815,340 | 202,191 | 573,324 | 2,637,443 | 86,694,139 |
| Valuation Inputs at Reporting Date: | ||||
| Description | Total ($) | Level 1 ($) | Level 2 ($) | Level 3 ($) |
Investments in Securities: | ||||
| Domestic Equity Funds | 86,694,139 | 86,694,139 | - | - |
| Short-Term Funds | 231,420 | 231,420 | - | - |
| Total Investments in Securities: | 86,925,559 | 86,925,559 | - | - |
| Statement of Assets and Liabilities | ||||
November 30, 2023 (Unaudited) | ||||
| Assets | ||||
| Investment in securities, at value - See accompanying schedule: | ||||
Fidelity Central Funds (cost $231,420) | $ | 231,420 | ||
Other affiliated issuers (cost $80,564,106) | 86,694,139 | |||
| Total Investment in Securities (cost $80,795,526) | $ | 86,925,559 | ||
| Receivable for investments sold | 758,617 | |||
| Distributions receivable from Fidelity Central Funds | 1,025 | |||
Total assets | 87,685,201 | |||
| Liabilities | ||||
| Payable for investments purchased | $ | 899,536 | ||
| Total Liabilities | 899,536 | |||
| Net Assets | $ | 86,785,665 | ||
| Net Assets consist of: | ||||
| Paid in capital | $ | 94,998,406 | ||
| Total accumulated earnings (loss) | (8,212,741) | |||
| Net Assets | $ | 86,785,665 | ||
Net Asset Value, offering price and redemption price per share ($86,785,665 ÷ 3,525,062 shares) | $ | 24.62 | ||
| Statement of Operations | ||||
Six months ended November 30, 2023 (Unaudited) | ||||
| Investment Income | ||||
| Dividends: | ||||
| Affiliated issuers | $ | 202,191 | ||
| Income from Fidelity Central Funds | 8,412 | |||
| Total Income | 210,603 | |||
| Expenses | ||||
| Management fee | $ | 24,042 | ||
| Independent trustees' fees and expenses | 245 | |||
| Total expenses before reductions | 24,287 | |||
| Expense reductions | (24,033) | |||
| Total expenses after reductions | 254 | |||
| Net Investment income (loss) | 210,349 | |||
| Realized and Unrealized Gain (Loss) | ||||
| Net realized gain (loss) on: | ||||
| Investment Securities: | ||||
| Redemptions in-kind | 1,332,620 | |||
| Affiliated issuers | (759,296) | |||
| Total net realized gain (loss) | 573,324 | |||
| Change in net unrealized appreciation (depreciation) on: | ||||
| Investment Securities: | ||||
| Affiliated issuers | 2,637,443 | |||
| Total change in net unrealized appreciation (depreciation) | 2,637,443 | |||
| Net gain (loss) | 3,210,767 | |||
| Net increase (decrease) in net assets resulting from operations | $ | 3,421,116 | ||
See Organization and Merger information note regarding reorganization from mutual fund to exchange traded fund.
| Statement of Changes in Net Assets | ||||
Six months ended November 30, 2023 (Unaudited) | Year ended May 31, 2023 | |||
| Increase (Decrease) in Net Assets | ||||
| Operations | ||||
| Net investment income (loss) | $ | 210,349 | $ | (438,548) |
| Net realized gain (loss) | 573,324 | (11,203,876) | ||
| Change in net unrealized appreciation (depreciation) | 2,637,443 | 14,746,550 | ||
| Net increase (decrease) in net assets resulting from operations | 3,421,116 | 3,104,126 | ||
| Distributions to shareholders | (204,878) | - | ||
| Share transactions - net increase (decrease) | - | (33,405,540) | ||
| Share transactions | ||||
| Proceeds from sales of shares | 619,060 | - | ||
| Cost of shares redeemed | (12,458,404) | - | ||
Net increase (decrease) in net assets resulting from share transactions | (11,839,344) | (33,405,540) | ||
| Total increase (decrease) in net assets | (8,623,106) | (30,301,414) | ||
| Net Assets | ||||
| Beginning of period | 95,408,771 | 125,710,185 | ||
| End of period | $ | 86,785,665 | $ | 95,408,771 |
| Other Information | ||||
| Shares | ||||
| Sold | 25,397 | 4,434,170 | ||
| Redeemed | (527,857) | (6,032,531) | ||
| Net increase (decrease) | (502,460) | (1,598,361) | ||
| Fidelity® Disruptors ETF |
Six months ended (Unaudited) November 30, 2023 A | Years ended May 31, 2023 A | 2022 A | 2021 A | 2020 A,B | ||||||
Selected Per-Share Data | ||||||||||
| Net asset value, beginning of period | $ | 23.69 | $ | 22.31 | $ | 29.44 | $ | 20.17 | $ | 17.43 |
| Income from Investment Operations | ||||||||||
Net investment income (loss) C,D | .06 | (.10) | (.21) | (.21) | (.02) | |||||
| Net realized and unrealized gain (loss) | .93 | 1.48 | (6.54) | 9.67 | 2.76 | |||||
| Total from investment operations | .99 | 1.38 | (6.75) | 9.46 | 2.74 | |||||
| Distributions from net investment income | (.06) | - | - | - | - | |||||
| Distributions from net realized gain | - | - | (.38) | (.19) | - | |||||
| Total distributions | (.06) | - | (.38) | (.19) | - | |||||
| Net asset value, end of period | $ | 24.62 | $ | 23.69 | $ | 22.31 | $ | 29.44 | $ | 20.17 |
Total Return E,F,G | 4.17% | 6.17% | (23.29)% | 46.99% | 15.70% | |||||
Ratios to Average Net Assets D,H,I | ||||||||||
| Expenses before reductions | .05% J | .90% | 1.00% | 1.01% K | 1.01% J,K | |||||
| Expenses net of fee waivers, if any | -% J,L | .82% | 1.00% | 1.01% K | 1.01% J,K | |||||
| Expenses net of all reductions | -% J,L | .82% | 1.00% | 1.01% K | 1.01% J,K | |||||
| Net investment income (loss) | .47% J | (.50)% | (.69)% | (.77)% | (1.01)% J | |||||
| Supplemental Data | ||||||||||
| Net assets, end of period (000 omitted) | $ | 86,786 | $ | 95,409 | $ | 48,579 | $ | 141,385 | $ | 19,310 |
Portfolio turnover rate M | 4% J,N | 12% | 22% | 3% | -% O |
| Fidelity Central Fund | Investment Manager | Investment Objective | Investment Practices | Expense RatioA |
| Fidelity Money Market Central Funds | Fidelity Management & Research Company LLC (FMR) | Each fund seeks to obtain a high level of current income consistent with the preservation of capital and liquidity. | Short-term Investments | Less than .005% |
| Gross unrealized appreciation | $9,046,680 |
| Gross unrealized depreciation | (3,288,869) |
| Net unrealized appreciation (depreciation) | $5,757,811 |
| Tax cost | $81,167,748 |
Short-term | $(5,351,923) |
Long-term | (8,928,765) |
| Total capital loss carryforward | $(14,280,688) |
| Purchases ($) | Sales ($) | |
| Fidelity Disruptors ETF | 92,365,888 | 14,815,340 |
| In-Kind Subscriptions ($) | In-Kind Redemptions ($) | |
| Fidelity Disruptors ETF | - | 6,789,450 |
| Management Fee Annual % of Average Net Assets | Expense Contract Annual % of Average Net Assets | |
| Fidelity Disruptors Fund | 1.00% | .50% |
| Management Fee Waiver Annual % of Average Net Assets | Management Fee Waiver | |
| Fidelity Disruptors Fund | .50% | $24,025 |
| Shares | Dollars | |
Year ended May 31, 2023 | Year ended May 31, 2023 | |
| Fidelity Disruptors Fund | ||
| Fidelity Disruptors Fund | ||
| Shares sold | 3,703,937 | $84,461,331 |
| Reinvestment of distributions | - | - |
| Shares redeemed | (1,852,955) | (38,815,504) |
| Net increase (decrease) | 1,850,982 | $45,645,827 |
| Loyalty Class 1 | ||
| Shares sold | 730,233 | $15,839,358 |
| Reinvestment of distributions | - | - |
| Shares redeemed | (4,173,700) | (94,754,589) |
| Net increase (decrease) | (3,443,467) | $(78,915,231) |
| Loyalty Class 2 | ||
| Reinvestment of distributions | - | - |
| Shares redeemed | (5,876) | (136,136) |
| Net increase (decrease) | (5,876) | $(136,136) |
| Predecessor Fund/Accounting Survivor | Investments ($) | Unrealized appreciation (depreciation) ($) | Net Assets ($) | Shares Exchanged | Shares Exchanged Ratio |
| Fidelity Disruptors Fund | 98,438,042 | 8,954,987 | 98,615,698 | 3,944,631 | .5736680000 |
| Legal Acquiring ETF | Net Assets ($) | Total net assets after the acquisition ($) |
| Fidelity Disruptors ETF | 25 | 98,615,723 |
| Net investment income (loss) | $210,276 |
| Total net realized gain (loss) | 573,324 |
| Total change in net unrealized appreciation (depreciation) | 2,637,443 |
| Net increase (decrease) in net assets resulting from operations | $3,421,043 |
| The Example is based on an investment of $1,000 invested at the beginning of the period and held for the entire period (June 1, 2023 to November 30, 2023). |
Annualized Expense Ratio- A | Beginning Account Value June 1, 2023 | Ending Account Value November 30, 2023 | Expenses Paid During Period- C June 1, 2023 to November 30, 2023 | |||||||
| Fidelity® Disruptors ETF | -%-D | |||||||||
| Actual | $ 1,000 | $ 1,041.70 | $-E | |||||||
Hypothetical-B | $ 1,000 | $ 1,025.00 | $-E | |||||||
 |
Item 2.
Code of Ethics
Not applicable.
Item 3.
Audit Committee Financial Expert
Not applicable.
Item 4.
Principal Accountant Fees and Services
Not applicable.
Item 5.
Audit Committee of Listed Registrants
Not applicable.
Item 6.
Investments
(a)
Not applicable.
(b)
Not applicable
Item 7.
Disclosure of Proxy Voting Policies and Procedures for Closed-End Management Investment Companies
Not applicable.
Item 8.
Portfolio Managers of Closed-End Management Investment Companies
Not applicable.
Item 9.
Purchase of Equity Securities by Closed-End Management Investment Company and Affiliated Purchasers
Not applicable.
Item 10.
Submission of Matters to a Vote of Security Holders
There were no material changes to the procedures by which shareholders may recommend nominees to the Fidelity Covington Trust’s Board of Trustees.
Item 11.
Controls and Procedures
(a)(i) The President and Treasurer and the Chief Financial Officer have concluded that the Fidelity Covington Trust’s (the “Trust”) disclosure controls and procedures (as defined in Rule 30a-3(c) under the Investment Company Act) provide reasonable
assurances that material information relating to the Trust is made known to them by the appropriate persons, based on their evaluation of these controls and procedures as of a date within 90 days of the filing date of this report.
(a)(ii) There was no change in the Trust’s internal control over financial reporting (as defined in Rule 30a-3(d) under the Investment Company Act) that occurred during the period covered by this report that has materially affected, or is reasonably likely to materially affect, the Trust’s internal control over financial reporting.
Item 12.
Disclosure of Securities Lending Activities for Closed-End Management
Investment Companies
Not applicable.
Item 18.
Recovery of Erroneously Awarded Compensation
(a) Not applicable.
(b) Not applicable.
Item 19.
Exhibits
(a) | (1) | Not applicable. |
(a) | (2) | |
(a) | (3) | Not applicable. |
(b) |
SIGNATURES
Pursuant to the requirements of the Securities Exchange Act of 1934 and the Investment Company Act of 1940, the registrant has duly caused this report to be signed on its behalf by the undersigned, thereunto duly authorized.
Fidelity Covington Trust
By: | /s/Stacie M. Smith |
Stacie M. Smith | |
President and Treasurer | |
Date: | January 22, 2024 |
Pursuant to the requirements of the Securities Exchange Act of 1934 and the Investment Company Act of 1940, this report has been signed below by the following persons on behalf of the registrant and in the capacities and on the dates indicated.
By: | /s/Stacie M. Smith |
Stacie M. Smith | |
President and Treasurer | |
Date: | January 22, 2024 |
By: | /s/John J. Burke III |
John J. Burke III | |
Chief Financial Officer | |
Date: | January 22, 2024 |