UNITED STATES
SECURITIES AND EXCHANGE COMMISSION
Washington, D.C. 20549
FORM N-CSR
CERTIFIED SHAREHOLDER REPORT OF REGISTERED
MANAGEMENT INVESTMENT COMPANIES
Investment Company Act file number 811-07319
Fidelity Covington Trust
(Exact name of registrant as specified in charter)
245 Summer St., Boston, MA 02210
(Address of principal executive offices) (Zip code)
Margaret Carey, Secretary
245 Summer St.
Boston, Massachusetts 02210
(Name and address of agent for service)
Registrant's telephone number, including area code:
617-563-7000
Date of fiscal year end: | October 31 |
Date of reporting period: | April 30, 2023 |
Item 1.
Reports to Stockholders


Contents
Top Holdings (% of Fund's net assets) | ||
| Samsung Electronics Co. Ltd. | 3.2 | |
| Emaar Properties PJSC | 2.0 | |
| GAIL India Ltd. | 1.8 | |
| Beijing Enterprises Holdings Ltd. | 1.8 | |
| Alibaba Group Holding Ltd. sponsored ADR | 1.7 | |
| China Overseas Land and Investment Ltd. | 1.7 | |
| FIBRA Macquarie Mexican (REIT) | 1.6 | |
| NHPC Ltd. | 1.6 | |
| Companhia Energetica de Minas Gerais (CEMIG) (PN) | 1.6 | |
| C&D International Investment Group Ltd. | 1.5 | |
| 18.5 | ||
| Market Sectors (% of Fund's net assets) | ||
| Financials | 19.9 | |
| Communication Services | 14.6 | |
| Information Technology | 14.2 | |
| Consumer Staples | 10.0 | |
| Consumer Discretionary | 9.8 | |
| Energy | 9.3 | |
| Utilities | 8.5 | |
| Real Estate | 6.8 | |
| Materials | 4.1 | |
| Industrials | 2.3 | |
Asset Allocation (% of Fund's net assets) |
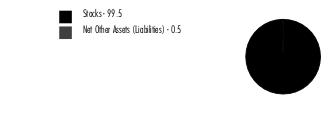 |
Futures - 0.4% |
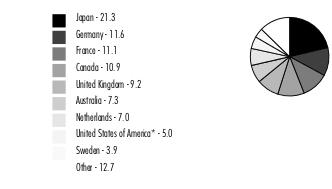
Geographic Diversification (% of Fund's net assets) |
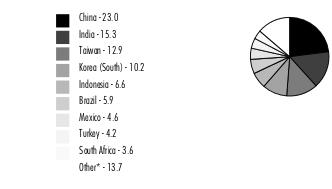 |
* Includes Short-Term investments and Net Other Assets (Liabilities). Percentages are adjusted for the effect of derivatives, if applicable. |
| Common Stocks - 97.2% | |||
| Shares | Value ($) | ||
| COMMUNICATION SERVICES - 14.6% | |||
| Diversified Telecommunication Services - 5.5% | |||
| China Tower Corp. Ltd. (H Shares) (a) | 1,454,000 | 185,225 | |
| Chunghwa Telecom Co. Ltd. | 53,000 | 218,948 | |
| LG Uplus Corp. | 18,324 | 150,875 | |
| PT Sarana Menara Nusantara Tbk | 2,110,200 | 147,441 | |
| PT Telkom Indonesia Persero Tbk | 744,500 | 215,687 | |
| Telekom Malaysia Bhd | 132,700 | 147,560 | |
| TIME dotCom Bhd | 127,200 | 156,558 | |
| 1,222,294 | |||
| Entertainment - 1.3% | |||
| International Games Systems Co. Ltd. | 9,000 | 156,624 | |
| Tencent Music Entertainment Group ADR (b) | 19,339 | 143,302 | |
| 299,926 | |||
| Interactive Media & Services - 1.9% | |||
| Autohome, Inc. ADR Class A | 4,347 | 128,889 | |
| Hello Group, Inc. ADR | 14,364 | 120,083 | |
| Info Edge India Ltd. | 3,716 | 171,469 | |
| 420,441 | |||
| Media - 1.3% | |||
| Cheil Worldwide, Inc. | 9,661 | 133,467 | |
| MultiChoice Group Ltd. | 25,681 | 160,810 | |
| 294,277 | |||
| Wireless Telecommunication Services - 4.6% | |||
| CelcomDigi Bhd | 163,200 | 160,986 | |
| Far EasTone Telecommunications Co. Ltd. | 73,000 | 187,353 | |
| Intouch Holdings PCL NVDR | 73,100 | 160,553 | |
| Maxis Bhd | 170,100 | 167,793 | |
| Mobile TeleSystems OJSC sponsored ADR (b)(c) | 15,647 | 15,584 | |
| TIM SA | 63,700 | 178,258 | |
| Turkcell Iletisim Hizmet A/S | 96,995 | 165,081 | |
| 1,035,608 | |||
TOTAL COMMUNICATION SERVICES | 3,272,546 | ||
| CONSUMER DISCRETIONARY - 9.8% | |||
| Automobile Components - 0.4% | |||
| Hankook Tire Co. Ltd. | 3,235 | 83,389 | |
| Automobiles - 1.8% | |||
| Bajaj Auto Ltd. | 2,027 | 109,775 | |
| Dongfeng Motor Group Co. Ltd. (H Shares) | 132,000 | 62,890 | |
| Eicher Motors Ltd. | 2,513 | 101,369 | |
| Li Auto, Inc. ADR (b) | 1,444 | 33,934 | |
| PT Astra International Tbk | 212,000 | 97,546 | |
| 405,514 | |||
| Broadline Retail - 3.0% | |||
| Alibaba Group Holding Ltd. sponsored ADR (b) | 4,494 | 380,597 | |
| Coupang, Inc. Class A (b) | 2,582 | 43,274 | |
| El Puerto de Liverpool S.A.B. Dcv Series C | 5,400 | 32,866 | |
| JD.com, Inc.: | |||
| Class A | 1,023 | 17,711 | |
| sponsored ADR | 2,279 | 81,406 | |
| MINISO Group Holding Ltd. ADR | 525 | 9,681 | |
| PDD Holdings, Inc. ADR (b) | 1,293 | 88,118 | |
| Vipshop Holdings Ltd. ADR (b) | 1,095 | 17,192 | |
| 670,845 | |||
| Diversified Consumer Services - 0.3% | |||
| China Education Group Holdings Ltd. | 53,000 | 46,992 | |
| New Oriental Education & Technology Group, Inc. sponsored ADR (b) | 438 | 19,968 | |
| TAL Education Group ADR (b) | 1,719 | 10,073 | |
| 77,033 | |||
| Hotels, Restaurants & Leisure - 1.7% | |||
| H World Group Ltd. ADR | 400 | 18,760 | |
| Jiumaojiu International Holdings Ltd. (a) | 33,000 | 73,484 | |
| MakeMyTrip Ltd. (b) | 255 | 5,977 | |
| Tongcheng Travel Holdings Ltd. (b) | 36,400 | 76,974 | |
| TravelSky Technology Ltd. (H Shares) | 49,000 | 97,502 | |
| Trip.com Group Ltd. ADR (b) | 1,336 | 47,441 | |
| Yum China Holdings, Inc. | 1,030 | 63,015 | |
| 383,153 | |||
| Household Durables - 0.4% | |||
| Haier Smart Home Co. Ltd. | 27,200 | 88,185 | |
| Specialty Retail - 1.2% | |||
| Abu Dhabi National Oil Co. for Distribution PJSC | 72,465 | 86,634 | |
| Jumbo SA | 4,672 | 107,800 | |
| Topsports International Holdings Ltd. (a) | 87,000 | 77,248 | |
| 271,682 | |||
| Textiles, Apparel & Luxury Goods - 1.0% | |||
| Bosideng International Holdings Ltd. | 144,000 | 70,809 | |
| Fila Holdings Corp. | 2,737 | 74,948 | |
| Pou Chen Corp. | 66,000 | 68,163 | |
| 213,920 | |||
TOTAL CONSUMER DISCRETIONARY | 2,193,721 | ||
| CONSUMER STAPLES - 10.0% | |||
| Beverages - 1.1% | |||
| Arca Continental S.A.B. de CV | 25,600 | 242,816 | |
| Consumer Staples Distribution & Retail - 1.3% | |||
| Bim Birlesik Magazalar A/S JSC | 36,807 | 295,618 | |
| Food Products - 2.6% | |||
| Indofood Sukses Makmur Tbk PT | 416,000 | 182,904 | |
| Orion Corp./Republic of Korea | 1,881 | 203,644 | |
| WH Group Ltd. (a) | 354,500 | 196,897 | |
| 583,445 | |||
| Household Products - 1.1% | |||
| Kimberly-Clark de Mexico SA de CV Series A | 109,300 | 247,090 | |
| Personal Care Products - 2.0% | |||
| Hengan International Group Co. Ltd. | 44,000 | 196,181 | |
| Hindustan Unilever Ltd. | 8,433 | 253,218 | |
| 449,399 | |||
| Tobacco - 1.9% | |||
| ITC Ltd. | 48,219 | 250,740 | |
| KT&G Corp. | 2,718 | 174,241 | |
| 424,981 | |||
TOTAL CONSUMER STAPLES | 2,243,349 | ||
| ENERGY - 9.3% | |||
| Oil, Gas & Consumable Fuels - 9.3% | |||
| China Shenhua Energy Co. Ltd. (H Shares) | 87,000 | 288,157 | |
| Coal India Ltd. | 92,241 | 262,737 | |
| Exxaro Resources Ltd. | 16,741 | 175,635 | |
| Gazprom OAO (c) | 14,450 | 1,754 | |
| Inner Mongolia Yitai Coal Co. Ltd. (B Shares) | 154,600 | 228,808 | |
| MOL Hungarian Oil and Gas PLC Series A (For. Reg.) | 28,428 | 230,637 | |
| PT Adaro Energy Indonesia Tbk | 1,217,600 | 259,788 | |
| PT United Tractors Tbk | 144,500 | 284,666 | |
| PTT Exploration and Production PCL NVDR | 48,200 | 208,905 | |
| Surgutneftegas OJSC (c) | 56,600 | 804 | |
| Thungela Resources Ltd. | 16,439 | 153,963 | |
| 2,095,854 | |||
| FINANCIALS - 19.4% | |||
| Banks - 14.7% | |||
| Abu Dhabi Islamic Bank | 40,328 | 124,762 | |
| Agricultural Bank of China Ltd. (H Shares) | 288,000 | 111,166 | |
| Akbank TAS | 124,833 | 103,021 | |
| Al Rajhi Bank | 7,555 | 154,698 | |
| Alinma Bank | 8,663 | 73,102 | |
| Banco de Chile | 740,373 | 79,323 | |
| Banco del Bajio SA (a) | 20,400 | 66,892 | |
| Banco do Brasil SA | 12,700 | 108,802 | |
| Bank Albilad | 5,683 | 62,653 | |
| Bank of Baroda | 27,772 | 63,715 | |
| Bank of China Ltd. (H Shares) | 382,000 | 152,315 | |
| China CITIC Bank Corp. Ltd. (H Shares) | 148,000 | 79,940 | |
| Far Eastern International Bank | 194,000 | 70,677 | |
| Federal Bank Ltd. | 33,067 | 54,528 | |
| Haci Omer Sabanci Holding A/S | 49,290 | 96,815 | |
| HDFC Bank Ltd. | 13,315 | 274,578 | |
| Hong Leong Bank Bhd | 16,200 | 73,146 | |
| ICICI Bank Ltd. | 18,133 | 203,330 | |
| Industrial & Commercial Bank of China Ltd. (H Shares) | 327,000 | 175,791 | |
| Krung Thai Bank PCL NVDR | 134,200 | 70,740 | |
| PT Bank Central Asia Tbk | 265,400 | 163,727 | |
| PT Bank Mandiri (Persero) Tbk | 324,200 | 114,365 | |
| Sberbank of Russia (c) | 38,410 | 274 | |
| Standard Bank Group Ltd. | 9,389 | 87,960 | |
| State Bank of India | 12,062 | 85,237 | |
| Taichung Commercial Bank Co. Ltd. | 173,466 | 79,560 | |
| Taiwan Business Bank | 180,000 | 81,678 | |
| Taiwan Cooperative Financial Holding Co. Ltd. | 108,000 | 93,974 | |
| TCS Group Holding PLC GDR (b)(c) | 789 | 7,069 | |
| The Shanghai Commercial & Savings Bank Ltd. | 58,885 | 88,972 | |
| Turkiye Is Bankasi A/S Series C | 188,928 | 105,207 | |
| VTB Bank OJSC (b)(c) | 91,900,000 | 4,074 | |
| Woori Financial Group, Inc. | 8,570 | 75,109 | |
| Yapi ve Kredi Bankasi A/S | 220,085 | 107,167 | |
| 3,294,367 | |||
| Capital Markets - 0.7% | |||
| China Cinda Asset Management Co. Ltd. (H Shares) | 426,000 | 50,469 | |
| HDFC Asset Management Co. Ltd. (a) | 2,300 | 49,585 | |
| Investec Ltd. | 10,179 | 56,006 | |
| 156,060 | |||
| Consumer Finance - 0.2% | |||
| Mahindra & Mahindra Financial Services Ltd. | 17,823 | 56,407 | |
| Financial Services - 0.6% | |||
| Kakao Pay Corp. (b) | 65 | 2,647 | |
| Power Finance Corp. Ltd. | 30,919 | 64,191 | |
| REC Ltd. | 36,038 | 58,195 | |
| 125,033 | |||
| Insurance - 3.2% | |||
| BB Seguridade Participacoes SA | 11,400 | 78,182 | |
| China Life Insurance Co. Ltd. (H Shares) | 56,000 | 107,150 | |
| China Taiping Insurance Group Ltd. | 49,800 | 56,969 | |
| Db Insurance Co. Ltd. | 1,461 | 91,695 | |
| Hyundai Fire & Marine Insurance Co. Ltd. | 3,009 | 84,420 | |
| Momentum Metropolitan Holdings | 59,035 | 59,733 | |
| New China Life Insurance Co. Ltd. (H Shares) | 25,700 | 73,336 | |
| People's Insurance Co. of China Group Ltd. (H Shares) | 201,000 | 78,865 | |
| PICC Property & Casualty Co. Ltd. (H Shares) | 82,000 | 98,924 | |
| 729,274 | |||
TOTAL FINANCIALS | 4,361,141 | ||
| INDUSTRIALS - 2.3% | |||
| Aerospace & Defense - 0.3% | |||
| Bharat Electronics Ltd. | 30,313 | 38,263 | |
| Hindustan Aeronautics Ltd. | 1,121 | 40,001 | |
| 78,264 | |||
| Construction & Engineering - 0.3% | |||
| China Railway Group Ltd. (H Shares) | 73,000 | 55,983 | |
| Industrial Conglomerates - 1.1% | |||
| CITIC Pacific Ltd. | 38,000 | 47,585 | |
| Enka Insaat ve Sanayi A/S | 39,252 | 55,180 | |
| Far Eastern New Century Corp. | 47,000 | 48,770 | |
| GS Holdings Corp. | 1,014 | 30,078 | |
| Hanwha Corp. | 1,462 | 29,603 | |
| LG Corp. | 627 | 40,944 | |
| 252,160 | |||
| Machinery - 0.2% | |||
| Yangzijiang Shipbuilding Holdings Ltd. | 50,100 | 46,564 | |
| Transportation Infrastructure - 0.4% | |||
| Grupo Aeroportuario Norte S.A.B. de CV | 4,300 | 47,112 | |
| Promotora y Operadora de Infraestructura S.A.B. de CV | 3,995 | 41,416 | |
| 88,528 | |||
TOTAL INDUSTRIALS | 521,499 | ||
| INFORMATION TECHNOLOGY - 14.2% | |||
| Electronic Equipment, Instruments & Components - 3.7% | |||
| Foxconn Technology Co. Ltd. | 41,000 | 71,884 | |
| Hon Hai Precision Industry Co. Ltd. (Foxconn) | 52,000 | 176,759 | |
| Kingboard Chemical Holdings Ltd. | 25,000 | 76,275 | |
| L&F Co. Ltd. | 60 | 11,880 | |
| Largan Precision Co. Ltd. | 1,000 | 65,382 | |
| LG Display Co. Ltd. | 578 | 6,409 | |
| LG Innotek Co. Ltd. | 36 | 7,114 | |
| Lotes Co. Ltd. | 3,077 | 87,879 | |
| Samsung Electro-Mechanics Co. Ltd. | 148 | 15,912 | |
| Samsung SDI Co. Ltd. | 140 | 72,280 | |
| Simplo Technology Co. Ltd. | 8,000 | 80,150 | |
| SINBON Electronics Co. Ltd. | 8,000 | 88,477 | |
| Zhen Ding Technology Holding Ltd. | 21,000 | 76,165 | |
| 836,566 | |||
| IT Services - 1.5% | |||
| HCL Technologies Ltd. | 3,372 | 43,845 | |
| Infosys Ltd. | 9,714 | 148,702 | |
| Samsung SDS Co. Ltd. | 110 | 9,641 | |
| Tata Consultancy Services Ltd. | 2,828 | 111,247 | |
| Tech Mahindra Ltd. | 2,399 | 30,009 | |
| 343,444 | |||
| Semiconductors & Semiconductor Equipment - 3.0% | |||
| ASE Technology Holding Co. Ltd. | 30,000 | 98,561 | |
| Chipbond Technology Corp. | 37,000 | 79,314 | |
| Daqo New Energy Corp. ADR (b) | 2,370 | 108,830 | |
| DB HiTek Co. Ltd. | 105 | 4,746 | |
| Global Unichip Corp. | 3,000 | 97,194 | |
| Leeno Industrial, Inc. | 24 | 2,396 | |
| Novatek Microelectronics Corp. | 7,000 | 95,292 | |
| Radiant Opto-Electronics Corp. | 22,000 | 80,865 | |
| SK Hynix, Inc. | 1,349 | 90,209 | |
| SK Square Co. Ltd. (b) | 257 | 8,151 | |
| 665,558 | |||
| Software - 0.1% | |||
| Tata Elxsi Ltd. | 212 | 17,211 | |
| Technology Hardware, Storage & Peripherals - 5.9% | |||
| ASUSTeK Computer, Inc. | 10,000 | 91,892 | |
| Catcher Technology Co. Ltd. | 14,000 | 82,427 | |
| Chicony Electronics Co. Ltd. | 26,000 | 82,036 | |
| Gigabyte Technology Co. Ltd. | 20,000 | 85,224 | |
| Lite-On Technology Corp. | 38,000 | 90,851 | |
| Micro-Star International Co. Ltd. | 18,000 | 85,192 | |
| Pegatron Corp. | 39,000 | 88,802 | |
| Samsung Electronics Co. Ltd. | 14,776 | 723,118 | |
| 1,329,542 | |||
TOTAL INFORMATION TECHNOLOGY | 3,192,321 | ||
| MATERIALS - 3.9% | |||
| Chemicals - 1.5% | |||
| Formosa Plastics Corp. | 22,000 | 67,197 | |
| Kumho Petro Chemical Co. Ltd. | 432 | 44,026 | |
| Mesaieed Petrochemical Holding Co. (b) | 96,438 | 52,458 | |
| Petronas Chemicals Group Bhd | 28,100 | 44,602 | |
| Pidilite Industries Ltd. | 1,868 | 55,222 | |
| Sabic Agriculture-Nutrients Co. | 1,844 | 65,683 | |
| 329,188 | |||
| Construction Materials - 0.2% | |||
| Ambuja Cements Ltd. | 11,556 | 55,989 | |
| Metals & Mining - 1.7% | |||
| African Rainbow Minerals Ltd. | 3,054 | 38,368 | |
| MMC Norilsk Nickel PJSC (c) | 188 | 1,451 | |
| NMDC Ltd. | 32,453 | 43,027 | |
| NMDC Steel Ltd. | 40,035 | 18,052 | |
| POSCO | 313 | 88,166 | |
| Shougang Fushan Resources Group Ltd. | 228,000 | 77,260 | |
| Vale SA | 7,800 | 112,880 | |
| 379,204 | |||
| Paper & Forest Products - 0.5% | |||
| Empresas CMPC SA | 16,603 | 26,181 | |
| PT Indah Kiat Pulp & Paper Tbk | 84,100 | 44,572 | |
| Sappi Ltd. | 16,081 | 36,562 | |
| 107,315 | |||
TOTAL MATERIALS | 871,696 | ||
| REAL ESTATE - 6.8% | |||
| Equity Real Estate Investment Trusts (REITs) - 1.6% | |||
| FIBRA Macquarie Mexican (REIT) (a) | 223,900 | 366,899 | |
| Real Estate Management & Development - 5.2% | |||
| C&D International Investment Group Ltd. | 112,000 | 343,138 | |
| China Overseas Land and Investment Ltd. | 146,000 | 369,003 | |
| Emaar Properties PJSC | 273,518 | 441,711 | |
| 1,153,852 | |||
TOTAL REAL ESTATE | 1,520,751 | ||
| UTILITIES - 6.9% | |||
| Electric Utilities - 1.7% | |||
| CPFL Energia SA | 48,900 | 323,925 | |
| Inter Rao Ues JSC (c) | 7,348,600 | 47,005 | |
| 370,930 | |||
| Gas Utilities - 3.6% | |||
| Beijing Enterprises Holdings Ltd. | 96,500 | 399,527 | |
| GAIL India Ltd. | 305,606 | 400,697 | |
| 800,224 | |||
| Independent Power and Renewable Electricity Producers - 1.6% | |||
| NHPC Ltd. | 675,422 | 365,210 | |
TOTAL UTILITIES | 1,536,364 | ||
| TOTAL COMMON STOCKS (Cost $22,505,532) | 21,809,242 | ||
| Nonconvertible Preferred Stocks - 2.3% | |||
| Shares | Value ($) | ||
| ENERGY - 0.0% | |||
| Oil, Gas & Consumable Fuels - 0.0% | |||
| AK Transneft OAO (c) | 12 | 4,040 | |
| FINANCIALS - 0.5% | |||
| Banks - 0.5% | |||
| Itausa-Investimentos Itau SA (PN) | 55,431 | 96,173 | |
| MATERIALS - 0.2% | |||
| Metals & Mining - 0.2% | |||
| Bradespar SA (PN) | 4,600 | 21,792 | |
| Metalurgica Gerdau SA (PN) | 10,600 | 24,705 | |
| 46,497 | |||
| UTILITIES - 1.6% | |||
| Electric Utilities - 1.6% | |||
| Companhia Energetica de Minas Gerais (CEMIG) (PN) | 144,100 | 355,724 | |
| TOTAL NONCONVERTIBLE PREFERRED STOCKS (Cost $470,433) | 502,434 | ||
| TOTAL INVESTMENT IN SECURITIES - 99.5% (Cost $22,975,965) | 22,311,676 |
NET OTHER ASSETS (LIABILITIES) - 0.5% | 118,786 |
| NET ASSETS - 100.0% | 22,430,462 |
| Futures Contracts | |||||
Number of contracts | Expiration Date | Notional Amount ($) | Value ($) | Unrealized Appreciation/ (Depreciation) ($) | |
| Purchased | |||||
| Equity Index Contracts | |||||
| ICE E-mini MSCI Emerging Markets Index Contracts (United States) | 2 | Jun 2023 | 98,420 | 1,671 | 1,671 |
| The notional amount of futures purchased as a percentage of Net Assets is 0.4% | |||||
| (a) | Security exempt from registration under Rule 144A of the Securities Act of 1933. These securities may be resold in transactions exempt from registration, normally to qualified institutional buyers. At the end of the period, the value of these securities amounted to $1,016,230 or 4.5% of net assets. |
| (b) | Non-income producing |
| (c) | Level 3 security |
| Affiliate | Value, beginning of period ($) | Purchases ($) | Sales Proceeds ($) | Dividend Income ($) | Realized Gain (loss) ($) | Change in Unrealized appreciation (depreciation) ($) | Value, end of period ($) | % ownership, end of period |
| Fidelity Cash Central Fund 4.88% | - | 227,397 | 227,397 | 137 | - | - | - | 0.0% |
| Total | - | 227,397 | 227,397 | 137 | - | - | - | |
| Valuation Inputs at Reporting Date: | ||||
| Description | Total ($) | Level 1 ($) | Level 2 ($) | Level 3 ($) |
Investments in Securities: | ||||
| Equities: | ||||
Communication Services | 3,272,546 | 896,423 | 2,360,539 | 15,584 |
Consumer Discretionary | 2,193,721 | 1,046,736 | 1,146,985 | - |
Consumer Staples | 2,243,349 | 785,524 | 1,457,825 | - |
Energy | 2,099,894 | 560,235 | 1,533,061 | 6,598 |
Financials | 4,457,314 | 1,460,496 | 2,985,401 | 11,417 |
Industrials | 521,499 | 143,708 | 377,791 | - |
Information Technology | 3,192,321 | 108,830 | 3,083,491 | - |
Materials | 918,193 | 396,681 | 520,061 | 1,451 |
Real Estate | 1,520,751 | 808,610 | 712,141 | - |
Utilities | 1,892,088 | 1,044,859 | 800,224 | 47,005 |
| Total Investments in Securities: | 22,311,676 | 7,252,102 | 14,977,519 | 82,055 |
Derivative Instruments: | ||||
| Assets | ||||
Futures Contracts | 1,671 | 1,671 | - | - |
| Total Assets | 1,671 | 1,671 | - | - |
| Total Derivative Instruments: | 1,671 | 1,671 | - | - |
Primary Risk Exposure / Derivative Type | Value | |
| Asset ($) | Liability ($) | |
| Equity Risk | ||
Futures Contracts (a) | 1,671 | 0 |
| Total Equity Risk | 1,671 | 0 |
| Total Value of Derivatives | 1,671 | 0 |
| Statement of Assets and Liabilities | ||||
April 30, 2023 (Unaudited) | ||||
| Assets | ||||
Investment in securities, at value - See accompanying schedule Unaffiliated issuers (cost $22,975,965): | $ | 22,311,676 | ||
| Segregated cash with brokers for derivative instruments | 3,065 | |||
| Cash | 47,552 | |||
| Foreign currency held at value (cost $114,943) | 106,647 | |||
| Receivable for investments sold | 218 | |||
| Dividends receivable | 109,070 | |||
| Receivable for daily variation margin on futures contracts | 173 | |||
| Other receivables | 473 | |||
Total assets | 22,578,874 | |||
| Liabilities | ||||
| Payable for investments purchased | $ | 78,269 | ||
| Accrued management fee | 8,367 | |||
| Other payables and accrued expenses | 61,776 | |||
| Total Liabilities | 148,412 | |||
| Net Assets | $ | 22,430,462 | ||
| Net Assets consist of: | ||||
| Paid in capital | $ | 25,651,703 | ||
| Total accumulated earnings (loss) | (3,221,241) | |||
| Net Assets | $ | 22,430,462 | ||
Net Asset Value , offering price and redemption price per share ($22,430,462 ÷ 1,000,000 shares) | $ | 22.43 | ||
| Statement of Operations | ||||
Six months ended April 30, 2023 (Unaudited) | ||||
| Investment Income | ||||
| Dividends | $ | 462,387 | ||
| Income from Fidelity Central Funds | 137 | |||
| Income before foreign taxes withheld | $ | 462,524 | ||
| Less foreign taxes withheld | (72,135) | |||
| Total Income | 390,389 | |||
| Expenses | ||||
| Management fee | $ | 48,991 | ||
| Independent trustees' fees and expenses | 68 | |||
| Total expenses before reductions | 49,059 | |||
| Expense reductions | (159) | |||
| Total expenses after reductions | 48,900 | |||
| Net Investment income (loss) | 341,489 | |||
| Realized and Unrealized Gain (Loss) | ||||
| Net realized gain (loss) on: | ||||
| Investment Securities: | ||||
| Unaffiliated issuers (net of foreign taxes of $828) | (374,467) | |||
| Foreign currency transactions | (10,710) | |||
| Futures contracts | 3,822 | |||
| Total net realized gain (loss) | (381,355) | |||
| Change in net unrealized appreciation (depreciation) on: | ||||
| Investment Securities: | ||||
| Unaffiliated issuers(net of increase in deferred foreign taxes of $18,017) | 3,206,794 | |||
| Assets and liabilities in foreign currencies | (6,793) | |||
| Futures contracts | 1,048 | |||
| Total change in net unrealized appreciation (depreciation) | 3,201,049 | |||
| Net gain (loss) | 2,819,694 | |||
| Net increase (decrease) in net assets resulting from operations | $ | 3,161,183 | ||
| Statement of Changes in Net Assets | ||||
Six months ended April 30, 2023 (Unaudited) | Year ended October 31, 2022 | |||
| Increase (Decrease) in Net Assets | ||||
| Operations | ||||
| Net investment income (loss) | $ | 341,489 | $ | 823,731 |
| Net realized gain (loss) | (381,355) | (1,875,585) | ||
| Change in net unrealized appreciation (depreciation) | 3,201,049 | (3,937,671) | ||
| Net increase (decrease) in net assets resulting from operations | 3,161,183 | (4,989,525) | ||
| Distributions to shareholders | (238,000) | (826,772) | ||
| Distributions to shareholders from tax return of capital | - | (29,228) | ||
| Total Distributions | (238,000) | (856,000) | ||
| Share transactions | ||||
| Proceeds from sales of shares | - | 4,649,878 | ||
Net increase (decrease) in net assets resulting from share transactions | - | 4,649,878 | ||
| Total increase (decrease) in net assets | 2,923,183 | (1,195,647) | ||
| Net Assets | ||||
| Beginning of period | 19,507,279 | 20,702,926 | ||
| End of period | $ | 22,430,462 | $ | 19,507,279 |
| Other Information | ||||
| Shares | ||||
| Sold | - | 200,000 | ||
| Redeemed | - | - | ||
| Net increase (decrease) | - | 200,000 | ||
| Fidelity® Emerging Markets Multifactor ETF |
Six months ended (Unaudited) April 30, 2023 | Years ended October 31, 2022 | 2021 | 2020 | 2019 A | ||||||
Selected Per-Share Data | ||||||||||
| Net asset value, beginning of period | $ | 19.51 | $ | 25.88 | $ | 23.12 | $ | 24.68 | $ | 25.00 |
| Income from Investment Operations | ||||||||||
Net investment income (loss) B,C | .34 | .89 | .72 | .55 | .50 | |||||
| Net realized and unrealized gain (loss) | 2.82 | (6.37) | 2.67 | (1.57) | (.34) | |||||
| Total from investment operations | 3.16 | (5.48) | 3.39 | (1.02) | .16 | |||||
| Distributions from net investment income | (.24) | (.86) | (.63) | (.54) | (.48) | |||||
| Tax return of capital | - | (.03) | - | - | - | |||||
| Total distributions | (.24) | (.89) | (.63) | (.54) | (.48) | |||||
| Net asset value, end of period | $ | 22.43 | $ | 19.51 | $ | 25.88 | $ | 23.12 | $ | 24.68 |
Total Return D,E,F | 16.27% | (21.56)% | 14.55% | (4.03)% | .66% | |||||
Ratios to Average Net Assets C,G,H | ||||||||||
| Expenses before reductions | .45% I | .45% | .45% | .45% | .45% I | |||||
| Expenses net of fee waivers, if any | .45% I | .45% | .45% | .45% | .45% I | |||||
| Expenses net of all reductions | .45% I | .45% | .45% | .45% | .45% I | |||||
| Net investment income (loss) | 3.14% I | 3.84% | 2.64% | 2.39% | 3.05% I | |||||
| Supplemental Data | ||||||||||
| Net assets, end of period (000 omitted) | $ | 22,430 | $ | 19,507 | $ | 20,703 | $ | 9,249 | $ | 9,872 |
Portfolio turnover rate J | 91% I | 91% K | 65% K | 66% | 34% K,L |
Top Holdings (% of Fund's net assets) | ||
| Enel SpA | 3.8 | |
| Terna - Rete Elettrica Nazionale | 3.3 | |
| Telefonica SA | 3.0 | |
| Daiwa House Industry Co. Ltd. | 2.9 | |
| Vodafone Group PLC | 2.7 | |
| Algonquin Power & Utilities Corp. | 2.7 | |
| Power Assets Holdings Ltd. | 2.5 | |
| Nintendo Co. Ltd. | 2.4 | |
| Barrick Gold Corp. (Canada) | 2.3 | |
| BCE, Inc. | 2.3 | |
| 27.9 | ||
| Market Sectors (% of Fund's net assets) | ||
| Financials | 27.0 | |
| Materials | 14.6 | |
| Communication Services | 12.7 | |
| Utilities | 12.3 | |
| Industrials | 9.8 | |
| Real Estate | 9.1 | |
| Health Care | 4.7 | |
| Consumer Discretionary | 4.3 | |
| Consumer Staples | 2.6 | |
| Information Technology | 1.7 | |
Asset Allocation (% of Fund's net assets) |
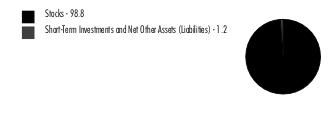 |
Futures - 1.2% |
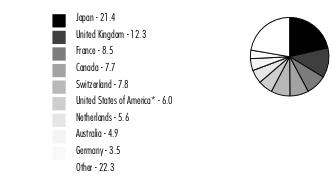
Geographic Diversification (% of Fund's net assets) |
 |
* Includes Short-Term investments and Net Other Assets (Liabilities). Percentages are adjusted for the effect of derivatives, if applicable. |
| Common Stocks - 98.8% | |||
| Shares | Value ($) | ||
| COMMUNICATION SERVICES - 12.7% | |||
| Diversified Telecommunication Services - 5.3% | |||
| BCE, Inc. | 41,670 | 2,000,701 | |
| Telefonica SA | 590,376 | 2,688,572 | |
| 4,689,273 | |||
| Entertainment - 2.4% | |||
| Nintendo Co. Ltd. | 48,900 | 2,054,543 | |
| Wireless Telecommunication Services - 5.0% | |||
| SoftBank Corp. | 177,000 | 1,990,787 | |
| Vodafone Group PLC | 1,996,669 | 2,406,719 | |
| 4,397,506 | |||
TOTAL COMMUNICATION SERVICES | 11,141,322 | ||
| CONSUMER DISCRETIONARY - 4.3% | |||
| Automobile Components - 0.5% | |||
| Bridgestone Corp. | 6,600 | 263,583 | |
| Compagnie Generale des Etablissements Michelin SCA Series B | 5,709 | 181,708 | |
| 445,291 | |||
| Automobiles - 2.4% | |||
| Bayerische Motoren Werke AG (BMW) | 3,222 | 360,831 | |
| Honda Motor Co. Ltd. | 11,400 | 300,394 | |
| Isuzu Motors Ltd. | 17,500 | 204,476 | |
| Mercedes-Benz Group AG (Germany) | 4,896 | 381,498 | |
| Stellantis NV (Italy) | 20,298 | 336,135 | |
| Toyota Motor Corp. | 37,435 | 510,534 | |
| 2,093,868 | |||
| Broadline Retail - 0.4% | |||
| Canadian Tire Ltd. Class A (non-vtg.) | 1,138 | 149,023 | |
| Wesfarmers Ltd. | 5,967 | 204,933 | |
| 353,956 | |||
| Household Durables - 0.3% | |||
| Persimmon PLC | 16,567 | 273,615 | |
| Textiles, Apparel & Luxury Goods - 0.7% | |||
| LVMH Moet Hennessy Louis Vuitton SE | 661 | 635,607 | |
TOTAL CONSUMER DISCRETIONARY | 3,802,337 | ||
| CONSUMER STAPLES - 2.6% | |||
| Consumer Staples Distribution & Retail - 0.6% | |||
| Coles Group Ltd. | 15,812 | 190,178 | |
| Kesko Oyj | 5,845 | 121,992 | |
| Koninklijke Ahold Delhaize NV | 5,595 | 192,842 | |
| 505,012 | |||
| Food Products - 0.9% | |||
| Danone SA | 3,122 | 206,767 | |
| Nestle SA (Reg. S) | 4,635 | 596,371 | |
| 803,138 | |||
| Personal Care Products - 0.3% | |||
| Unilever PLC | 5,359 | 298,831 | |
| Tobacco - 0.8% | |||
| British American Tobacco PLC (United Kingdom) | 5,472 | 201,312 | |
| Imperial Brands PLC | 5,177 | 128,025 | |
| Japan Tobacco, Inc. | 16,600 | 356,407 | |
| 685,744 | |||
TOTAL CONSUMER STAPLES | 2,292,725 | ||
| FINANCIALS - 27.0% | |||
| Banks - 18.7% | |||
| ANZ Group Holdings Ltd. | 76,081 | 1,224,272 | |
| Bank of Montreal | 12,355 | 1,112,524 | |
| Bank of Nova Scotia | 22,080 | 1,100,988 | |
| Barclays PLC | 505,313 | 1,015,443 | |
| BNP Paribas SA | 19,967 | 1,291,533 | |
| Canadian Imperial Bank of Commerce | 23,814 | 997,298 | |
| Credit Agricole SA | 86,185 | 1,054,623 | |
| ING Groep NV (Certificaten Van Aandelen) | 88,344 | 1,092,356 | |
| Intesa Sanpaolo SpA | 445,839 | 1,173,666 | |
| KBC Group NV | 14,524 | 1,038,715 | |
| Nordea Bank ABP | 97,931 | 1,086,695 | |
| Oversea-Chinese Banking Corp. Ltd. | 117,900 | 1,111,706 | |
| Societe Generale Series A | 36,195 | 880,103 | |
| United Overseas Bank Ltd. | 50,200 | 1,061,833 | |
| Westpac Banking Corp. | 82,903 | 1,231,051 | |
| 16,472,806 | |||
| Capital Markets - 3.0% | |||
| Daiwa Securities Group, Inc. | 292,700 | 1,352,097 | |
| SBI Holdings, Inc. Japan | 65,000 | 1,263,577 | |
| 2,615,674 | |||
| Financial Services - 1.2% | |||
| M&G PLC | 401,898 | 1,036,054 | |
| Insurance - 4.1% | |||
| Allianz SE | 6,007 | 1,508,387 | |
| Legal & General Group PLC | 343,424 | 1,010,492 | |
| Manulife Financial Corp. | 54,704 | 1,078,915 | |
| 3,597,794 | |||
TOTAL FINANCIALS | 23,722,328 | ||
| HEALTH CARE - 4.7% | |||
| Health Care Equipment & Supplies - 0.4% | |||
| Koninklijke Philips Electronics NV | 16,413 | 345,837 | |
| Health Care Providers & Services - 0.8% | |||
| Fresenius SE & Co. KGaA | 9,843 | 284,924 | |
| Galenica AG (a) | 1,117 | 100,336 | |
| Sonic Healthcare Ltd. | 12,692 | 297,253 | |
| 682,513 | |||
| Pharmaceuticals - 3.5% | |||
| Astellas Pharma, Inc. | 20,400 | 306,828 | |
| Bayer AG | 6,194 | 408,649 | |
| GSK PLC | 22,934 | 415,379 | |
| Novartis AG | 5,513 | 564,462 | |
| Roche Holding AG (participation certificate) | 1,673 | 526,965 | |
| Sanofi SA | 5,025 | 554,760 | |
| Takeda Pharmaceutical Co. Ltd. | 11,000 | 364,499 | |
| 3,141,542 | |||
TOTAL HEALTH CARE | 4,169,892 | ||
| INDUSTRIALS - 9.8% | |||
| Aerospace & Defense - 0.6% | |||
| BAE Systems PLC | 43,316 | 552,061 | |
| Air Freight & Logistics - 0.8% | |||
| Deutsche Post AG | 15,635 | 751,200 | |
| Construction & Engineering - 2.1% | |||
| ACS Actividades de Construccion y Servicios SA | 13,582 | 467,829 | |
| Bouygues SA | 16,219 | 594,472 | |
| VINCI SA | 6,155 | 762,412 | |
| 1,824,713 | |||
| Ground Transportation - 0.6% | |||
| Canadian National Railway Co. | 4,204 | 500,587 | |
| Industrial Conglomerates - 0.8% | |||
| DCC PLC (United Kingdom) | 6,267 | 389,439 | |
| Jardine Matheson Holdings Ltd. | 6,782 | 326,892 | |
| 716,331 | |||
| Machinery - 0.8% | |||
| Volvo AB (B Shares) | 32,899 | 676,118 | |
| Marine Transportation - 2.0% | |||
| A.P. Moller - Maersk A/S Series B | 190 | 343,201 | |
| Kawasaki Kisen Kaisha Ltd. | 21,600 | 511,585 | |
| Mitsui OSK Lines Ltd. | 18,800 | 463,908 | |
| Nippon Yusen KK | 19,800 | 465,754 | |
| 1,784,448 | |||
| Professional Services - 0.5% | |||
| Adecco SA (Reg.) | 11,725 | 402,184 | |
| Trading Companies & Distributors - 1.6% | |||
| Finning International, Inc. | 10,721 | 277,530 | |
| Mitsubishi Corp. | 17,800 | 655,972 | |
| Sumitomo Corp. | 29,200 | 520,460 | |
| 1,453,962 | |||
TOTAL INDUSTRIALS | 8,661,604 | ||
| INFORMATION TECHNOLOGY - 1.7% | |||
| Communications Equipment - 0.2% | |||
| Ericsson (B Shares) | 16,056 | 88,238 | |
| Nokia Corp. | 21,434 | 90,914 | |
| 179,152 | |||
| Electronic Equipment, Instruments & Components - 0.3% | |||
| Kyocera Corp. | 3,000 | 156,670 | |
| Venture Corp. Ltd. | 11,900 | 151,365 | |
| 308,035 | |||
| IT Services - 0.1% | |||
| TietoEVRY Oyj | 2,594 | 82,935 | |
| Semiconductors & Semiconductor Equipment - 0.6% | |||
| ASML Holding NV (Netherlands) | 510 | 322,903 | |
| Tokyo Electron Ltd. | 1,500 | 170,694 | |
| 493,597 | |||
| Software - 0.3% | |||
| SAP SE | 1,708 | 231,669 | |
| Technology Hardware, Storage & Peripherals - 0.2% | |||
| Canon, Inc. | 6,800 | 161,704 | |
TOTAL INFORMATION TECHNOLOGY | 1,457,092 | ||
| MATERIALS - 14.6% | |||
| Chemicals - 3.6% | |||
| BASF AG | 32,218 | 1,666,392 | |
| Covestro AG (a) | 35,109 | 1,542,274 | |
| 3,208,666 | |||
| Metals & Mining - 11.0% | |||
| Anglo American PLC (United Kingdom) | 45,682 | 1,403,863 | |
| Barrick Gold Corp. (Canada) | 105,619 | 2,006,006 | |
| BHP Group Ltd. | 60,211 | 1,766,696 | |
| JFE Holdings, Inc. | 137,500 | 1,617,706 | |
| Rio Tinto Ltd. | 15,655 | 1,161,294 | |
| Rio Tinto PLC | 27,098 | 1,719,663 | |
| 9,675,228 | |||
TOTAL MATERIALS | 12,883,894 | ||
| REAL ESTATE - 9.1% | |||
| Equity Real Estate Investment Trusts (REITs) - 2.2% | |||
| CapitaMall Trust | 1,249,000 | 1,900,438 | |
| Real Estate Management & Development - 6.9% | |||
| Daiwa House Industry Co. Ltd. | 99,900 | 2,536,293 | |
| New World Development Co. Ltd. | 704,000 | 1,869,884 | |
| Vonovia SE | 76,465 | 1,656,691 | |
| 6,062,868 | |||
TOTAL REAL ESTATE | 7,963,306 | ||
| UTILITIES - 12.3% | |||
| Electric Utilities - 9.6% | |||
| Enel SpA | 485,412 | 3,322,011 | |
| Power Assets Holdings Ltd. | 393,000 | 2,242,882 | |
| Terna - Rete Elettrica Nazionale | 329,761 | 2,861,481 | |
| 8,426,374 | |||
| Multi-Utilities - 2.7% | |||
| Algonquin Power & Utilities Corp. | 280,477 | 2,382,286 | |
TOTAL UTILITIES | 10,808,660 | ||
| TOTAL COMMON STOCKS (Cost $92,568,566) | 86,903,160 | ||
| Money Market Funds - 0.1% | |||
| Shares | Value ($) | ||
Fidelity Cash Central Fund 4.88% (b) (Cost $79,478) | 79,462 | 79,478 | |
| TOTAL INVESTMENT IN SECURITIES - 98.9% (Cost $92,648,044) | 86,982,638 |
NET OTHER ASSETS (LIABILITIES) - 1.1% | 1,008,121 |
| NET ASSETS - 100.0% | 87,990,759 |
| Futures Contracts | |||||
Number of contracts | Expiration Date | Notional Amount ($) | Value ($) | Unrealized Appreciation/ (Depreciation) ($) | |
| Purchased | |||||
| Equity Index Contracts | |||||
| ICE E-mini MSCI EAFE Index Contracts (United States) | 10 | Jun 2023 | 1,074,800 | 51,442 | 51,442 |
| The notional amount of futures purchased as a percentage of Net Assets is 1.2% | |||||
| (a) | Security exempt from registration under Rule 144A of the Securities Act of 1933. These securities may be resold in transactions exempt from registration, normally to qualified institutional buyers. At the end of the period, the value of these securities amounted to $1,642,610 or 1.9% of net assets. |
| (b) | Affiliated fund that is generally available only to investment companies and other accounts managed by Fidelity Investments. The rate quoted is the annualized seven-day yield of the fund at period end. A complete unaudited listing of the fund's holdings as of its most recent quarter end is available upon request. In addition, each Fidelity Central Fund's financial statements are available on the SEC's website or upon request. |
| Affiliate | Value, beginning of period ($) | Purchases ($) | Sales Proceeds ($) | Dividend Income ($) | Realized Gain (loss) ($) | Change in Unrealized appreciation (depreciation) ($) | Value, end of period ($) | % ownership, end of period |
| Fidelity Cash Central Fund 4.88% | 48,989 | 2,949,480 | 2,918,991 | 1,419 | - | - | 79,478 | 0.0% |
| Fidelity Securities Lending Cash Central Fund 4.88% | - | 2,333,247 | 2,333,247 | 3,998 | - | - | - | 0.0% |
| Total | 48,989 | 5,282,727 | 5,252,238 | 5,417 | - | - | 79,478 | |
| Valuation Inputs at Reporting Date: | ||||
| Description | Total ($) | Level 1 ($) | Level 2 ($) | Level 3 ($) |
Investments in Securities: | ||||
| Equities: | ||||
Communication Services | 11,141,322 | 2,000,701 | 9,140,621 | - |
Consumer Discretionary | 3,802,337 | 1,119,604 | 2,682,733 | - |
Consumer Staples | 2,292,725 | 314,834 | 1,977,891 | - |
Financials | 23,722,328 | 9,554,037 | 14,168,291 | - |
Health Care | 4,169,892 | 385,260 | 3,784,632 | - |
Industrials | 8,661,604 | 4,070,571 | 4,591,033 | - |
Information Technology | 1,457,092 | 405,838 | 1,051,254 | - |
Materials | 12,883,894 | 3,672,398 | 9,211,496 | - |
Real Estate | 7,963,306 | - | 7,963,306 | - |
Utilities | 10,808,660 | 5,243,767 | 5,564,893 | - |
| Money Market Funds | 79,478 | 79,478 | - | - |
| Total Investments in Securities: | 86,982,638 | 26,846,488 | 60,136,150 | - |
Derivative Instruments: | ||||
| Assets | ||||
Futures Contracts | 51,442 | 51,442 | - | - |
| Total Assets | 51,442 | 51,442 | - | - |
| Total Derivative Instruments: | 51,442 | 51,442 | - | - |
Primary Risk Exposure / Derivative Type | Value | |
| Asset ($) | Liability ($) | |
| Equity Risk | ||
Futures Contracts (a) | 51,442 | 0 |
| Total Equity Risk | 51,442 | 0 |
| Total Value of Derivatives | 51,442 | 0 |
| Statement of Assets and Liabilities | ||||
April 30, 2023 (Unaudited) | ||||
| Assets | ||||
| Investment in securities, at value - See accompanying schedule: | ||||
Unaffiliated issuers (cost $92,568,566) | $ | 86,903,160 | ||
Fidelity Central Funds (cost $79,478) | 79,478 | |||
| Total Investment in Securities (cost $92,648,044) | $ | 86,982,638 | ||
| Segregated cash with brokers for derivative instruments | 26,927 | |||
| Foreign currency held at value (cost $98,616) | 99,215 | |||
| Dividends receivable | 692,958 | |||
| Reclaims receivable | 217,812 | |||
| Distributions receivable from Fidelity Central Funds | 315 | |||
Total assets | 88,019,865 | |||
| Liabilities | ||||
| Accrued management fee | $ | 28,288 | ||
| Payable for daily variation margin on futures contracts | 818 | |||
| Total Liabilities | 29,106 | |||
| Net Assets | $ | 87,990,759 | ||
| Net Assets consist of: | ||||
| Paid in capital | $ | 102,886,011 | ||
| Total accumulated earnings (loss) | (14,895,252) | |||
| Net Assets | $ | 87,990,759 | ||
Net Asset Value , offering price and redemption price per share ($87,990,759 ÷ 4,500,000 shares) | $ | 19.55 | ||
| Statement of Operations | ||||
Six months ended April 30, 2023 (Unaudited) | ||||
| Investment Income | ||||
| Dividends | $ | 2,449,568 | ||
| Income from Fidelity Central Funds (including $3,998 from security lending) | 5,417 | |||
| Income before foreign taxes withheld | $ | 2,454,985 | ||
| Less foreign taxes withheld | (262,125) | |||
| Total Income | 2,192,860 | |||
| Expenses | ||||
| Management fee | $ | 172,984 | ||
| Independent trustees' fees and expenses | 281 | |||
| Total expenses before reductions | 173,265 | |||
| Expense reductions | (173) | |||
| Total expenses after reductions | 173,092 | |||
| Net Investment income (loss) | 2,019,768 | |||
| Realized and Unrealized Gain (Loss) | ||||
| Net realized gain (loss) on: | ||||
| Investment Securities: | ||||
| Unaffiliated issuers | (1,526,277) | |||
| Redemptions in-kind | (197,460) | |||
| Foreign currency transactions | (112,044) | |||
| Futures contracts | 83,537 | |||
| Total net realized gain (loss) | (1,752,244) | |||
| Change in net unrealized appreciation (depreciation) on: | ||||
| Investment Securities: | ||||
| Unaffiliated issuers | 14,398,071 | |||
| Assets and liabilities in foreign currencies | 192,473 | |||
| Futures contracts | 52,448 | |||
| Total change in net unrealized appreciation (depreciation) | 14,642,992 | |||
| Net gain (loss) | 12,890,748 | |||
| Net increase (decrease) in net assets resulting from operations | $ | 14,910,516 | ||
| Statement of Changes in Net Assets | ||||
Six months ended April 30, 2023 (Unaudited) | Year ended October 31, 2022 | |||
| Increase (Decrease) in Net Assets | ||||
| Operations | ||||
| Net investment income (loss) | $ | 2,019,768 | $ | 4,486,859 |
| Net realized gain (loss) | (1,752,244) | 5,237,224 | ||
| Change in net unrealized appreciation (depreciation) | 14,642,992 | (26,568,820) | ||
| Net increase (decrease) in net assets resulting from operations | 14,910,516 | (16,844,737) | ||
| Distributions to shareholders | (2,119,700) | (4,783,300) | ||
| Share transactions | ||||
| Proceeds from sales of shares | - | 55,975,704 | ||
| Cost of shares redeemed | (5,529,770) | (35,815,029) | ||
Net increase (decrease) in net assets resulting from share transactions | (5,529,770) | 20,160,675 | ||
| Total increase (decrease) in net assets | 7,261,046 | (1,467,362) | ||
| Net Assets | ||||
| Beginning of period | 80,729,713 | 82,197,075 | ||
| End of period | $ | 87,990,759 | $ | 80,729,713 |
| Other Information | ||||
| Shares | ||||
| Sold | - | 2,600,000 | ||
| Redeemed | (300,000) | (1,700,000) | ||
| Net increase (decrease) | (300,000) | 900,000 | ||
| Fidelity® International High Dividend ETF |
Six months ended (Unaudited) April 30, 2023 | Years ended October 31, 2022 | 2021 | 2020 | 2019 | 2018 A | |||||||
Selected Per-Share Data | ||||||||||||
| Net asset value, beginning of period | $ | 16.82 | $ | 21.08 | $ | 15.10 | $ | 20.96 | $ | 20.56 | $ | 25.08 |
| Income from Investment Operations | ||||||||||||
Net investment income (loss) B,C | .43 | .97 | .77 | .60 | 1.04 | .82 | ||||||
| Net realized and unrealized gain (loss) | 2.75 | (4.22) | 5.95 | (5.81) | .31 | (4.63) | ||||||
| Total from investment operations | 3.18 | (3.25) | 6.72 | (5.21) | 1.35 | (3.81) | ||||||
| Distributions from net investment income | (.45) | (1.01) | (.74) | (.65) | (.95) | (.71) | ||||||
| Total distributions | (.45) | (1.01) | (.74) | (.65) | (.95) | (.71) | ||||||
| Net asset value, end of period | $ | 19.55 | $ | 16.82 | $ | 21.08 | $ | 15.10 | $ | 20.96 | $ | 20.56 |
Total Return D,E,F | 19.17% | (15.83)% | 44.78% | (24.98)% | 6.84% | (15.44)% | ||||||
Ratios to Average Net Assets B,G,H | ||||||||||||
| Expenses before reductions | .39% I | .39% | .39% | .39% | .39% | .39% I | ||||||
| Expenses net of fee waivers, if any | .39% I | .39% | .39% | .39% | .39% | .39% I | ||||||
| Expenses net of all reductions | .39% I | .39% | .39% | .39% | .39% | .39% I | ||||||
| Net investment income (loss) | 4.56% I | 4.96% | 3.82% | 3.38% | 5.07% | 4.59% I | ||||||
| Supplemental Data | ||||||||||||
| Net assets, end of period (000 omitted) | $ | 87,991 | $ | 80,730 | $ | 82,197 | $ | 45,290 | $ | 44,022 | $ | 18,500 |
Portfolio turnover rate J,K | 124% I | 71% | 67% | 82% | 47% | 42% L |
Top Holdings (% of Fund's net assets) | ||
| Novo Nordisk A/S Series B | 1.9 | |
| Novartis AG | 1.6 | |
| AstraZeneca PLC (United Kingdom) | 1.6 | |
| Roche Holding AG (participation certificate) | 1.5 | |
| PSP Swiss Property AG | 1.5 | |
| Sino Land Ltd. | 1.5 | |
| Advance Residence Investment Corp. | 1.4 | |
| Engie SA | 1.4 | |
| L'Oreal SA | 1.3 | |
| SSE PLC | 1.3 | |
| 15.0 | ||
| Market Sectors (% of Fund's net assets) | ||
| Health Care | 16.5 | |
| Financials | 15.3 | |
| Consumer Staples | 14.9 | |
| Industrials | 12.2 | |
| Communication Services | 8.9 | |
| Utilities | 8.3 | |
| Consumer Discretionary | 6.8 | |
| Real Estate | 6.7 | |
| Materials | 3.9 | |
| Information Technology | 3.7 | |
| Energy | 1.6 | |
Asset Allocation (% of Fund's net assets) |
|
Futures - 1% |
Geographic Diversification (% of Fund's net assets) |
 |
* Includes Short-Term investments and Net Other Assets (Liabilities). Percentages are adjusted for the effect of derivatives, if applicable. |
| Common Stocks - 98.8% | |||
| Shares | Value ($) | ||
| COMMUNICATION SERVICES - 8.9% | |||
| Diversified Telecommunication Services - 4.2% | |||
| Koninklijke KPN NV | 57,048 | 208,404 | |
| Nippon Telegraph & Telephone Corp. | 7,300 | 222,434 | |
| Swisscom AG | 336 | 231,412 | |
| Telstra Group Ltd. | 78,828 | 227,649 | |
| 889,899 | |||
| Entertainment - 0.8% | |||
| Nexon Co. Ltd. | 7,800 | 175,860 | |
| Interactive Media & Services - 1.8% | |||
| Auto Trader Group PLC (a) | 24,308 | 194,193 | |
| Rightmove PLC | 25,104 | 181,179 | |
| 375,372 | |||
| Media - 1.0% | |||
| Publicis Groupe SA | 2,612 | 213,736 | |
| Wireless Telecommunication Services - 1.1% | |||
| KDDI Corp. | 7,500 | 233,981 | |
TOTAL COMMUNICATION SERVICES | 1,888,848 | ||
| CONSUMER DISCRETIONARY - 6.8% | |||
| Automobile Components - 0.3% | |||
| Niterra Co. Ltd. | 3,000 | 62,439 | |
| Automobiles - 0.3% | |||
| Ferrari NV (Italy) | 243 | 67,685 | |
| Broadline Retail - 0.9% | |||
| Dollarama, Inc. | 850 | 52,593 | |
| Prosus NV | 1,308 | 98,006 | |
| Wesfarmers Ltd. | 1,430 | 49,112 | |
| 199,711 | |||
| Distributors - 0.2% | |||
| D'ieteren Group | 229 | 43,105 | |
| Hotels, Restaurants & Leisure - 0.8% | |||
| Compass Group PLC | 2,850 | 75,118 | |
| InterContinental Hotel Group PLC | 657 | 45,088 | |
| La Francaise des Jeux SAEM (a) | 470 | 20,101 | |
| Sodexo SA | 230 | 24,681 | |
| 164,988 | |||
| Household Durables - 0.7% | |||
| Sekisui House Ltd. | 3,500 | 71,714 | |
| Sumitomo Forestry Co. Ltd. | 3,300 | 70,888 | |
| 142,602 | |||
| Leisure Products - 0.6% | |||
| Bandai Namco Holdings, Inc. | 3,000 | 67,815 | |
| SHIMANO, Inc. | 400 | 61,749 | |
| 129,564 | |||
| Specialty Retail - 1.2% | |||
| Fast Retailing Co. Ltd. | 400 | 94,033 | |
| Industria de Diseno Textil SA | 2,090 | 71,897 | |
| JB Hi-Fi Ltd. | 754 | 22,149 | |
| USS Co. Ltd. | 3,600 | 60,227 | |
| 248,306 | |||
| Textiles, Apparel & Luxury Goods - 1.8% | |||
| Hermes International SCA | 33 | 71,654 | |
| LVMH Moet Hennessy Louis Vuitton SE | 197 | 189,432 | |
| Moncler SpA | 796 | 59,019 | |
| Swatch Group AG (Bearer) | 142 | 48,596 | |
| 368,701 | |||
TOTAL CONSUMER DISCRETIONARY | 1,427,101 | ||
| CONSUMER STAPLES - 14.9% | |||
| Beverages - 3.8% | |||
| Coca-Cola HBC AG | 3,556 | 108,342 | |
| Diageo PLC | 4,423 | 201,357 | |
| Heineken Holding NV | 1,603 | 153,876 | |
| Heineken NV (Bearer) | 1,498 | 172,077 | |
| Suntory Beverage & Food Ltd. | 4,200 | 157,618 | |
| 793,270 | |||
| Consumer Staples Distribution & Retail - 3.0% | |||
| Jeronimo Martins SGPS SA | 6,128 | 154,926 | |
| Koninklijke Ahold Delhaize NV | 5,324 | 183,502 | |
| Loblaw Companies Ltd. | 1,614 | 151,642 | |
| Metro, Inc. | 2,650 | 150,876 | |
| 640,946 | |||
| Food Products - 2.0% | |||
| JDE Peet's BV | 4,222 | 128,646 | |
| Orkla ASA | 17,524 | 125,557 | |
| Toyo Suisan Kaisha Ltd. | 3,500 | 156,024 | |
| 410,227 | |||
| Household Products - 0.8% | |||
| Essity AB (B Shares) | 5,358 | 162,298 | |
| Personal Care Products - 3.2% | |||
| Beiersdorf AG | 1,126 | 157,377 | |
| L'Oreal SA | 579 | 276,621 | |
| Unilever PLC | 4,485 | 250,094 | |
| 684,092 | |||
| Tobacco - 2.1% | |||
| British American Tobacco PLC (United Kingdom) | 4,561 | 167,797 | |
| Imperial Brands PLC | 4,270 | 105,595 | |
| Japan Tobacco, Inc. | 7,900 | 169,615 | |
| 443,007 | |||
TOTAL CONSUMER STAPLES | 3,133,840 | ||
| ENERGY - 1.6% | |||
| Oil, Gas & Consumable Fuels - 1.6% | |||
| BP PLC | 5,975 | 40,133 | |
| Canadian Natural Resources Ltd. | 683 | 41,575 | |
| Crescent Point Energy Corp. | 3,079 | 22,747 | |
| Eni SpA | 917 | 13,916 | |
| Equinor ASA | 387 | 11,040 | |
| Galp Energia SGPS SA Class B | 285 | 3,458 | |
| INPEX Corp. | 3,100 | 33,535 | |
| Repsol SA | 573 | 8,442 | |
| Shell PLC (London) | 2,267 | 69,867 | |
| TotalEnergies SE | 793 | 50,725 | |
| Tourmaline Oil Corp. | 550 | 24,684 | |
| Whitecap Resources, Inc. | 2,788 | 21,954 | |
| 342,076 | |||
| FINANCIALS - 15.3% | |||
| Banks - 7.5% | |||
| Banco de Sabadell SA | 47,624 | 49,675 | |
| Bank Hapoalim BM (Reg.) | 7,069 | 60,203 | |
| Bank Leumi le-Israel BM | 7,395 | 57,916 | |
| Bank of Montreal | 925 | 83,293 | |
| Barclays PLC | 44,069 | 88,558 | |
| CaixaBank SA | 16,360 | 60,542 | |
| Commonwealth Bank of Australia | 1,984 | 130,274 | |
| DBS Group Holdings Ltd. | 3,300 | 81,180 | |
| Israel Discount Bank Ltd. (Class A) | 11,508 | 56,489 | |
| Mizrahi Tefahot Bank Ltd. | 1,675 | 54,352 | |
| Mizuho Financial Group, Inc. | 5,700 | 82,257 | |
| National Bank of Canada | 701 | 52,217 | |
| Oversea-Chinese Banking Corp. Ltd. | 8,181 | 77,140 | |
| Ringkjoebing Landbobank A/S | 398 | 55,975 | |
| Royal Bank of Canada | 1,526 | 151,340 | |
| Skandinaviska Enskilda Banken AB (A Shares) | 6,832 | 77,597 | |
| Standard Chartered PLC (United Kingdom) | 10,757 | 84,963 | |
| The Toronto-Dominion Bank | 2,040 | 123,441 | |
| United Overseas Bank Ltd. | 3,300 | 69,802 | |
| Westpac Banking Corp. | 5,381 | 79,904 | |
| 1,577,118 | |||
| Capital Markets - 2.0% | |||
| Deutsche Borse AG | 460 | 87,806 | |
| IG Group Holdings PLC | 7,512 | 69,256 | |
| Man Group PLC | 23,353 | 66,689 | |
| Singapore Exchange Ltd. | 7,200 | 51,646 | |
| TMX Group Ltd. | 357 | 36,119 | |
| UBS Group AG | 5,574 | 113,133 | |
| 424,649 | |||
| Financial Services - 1.2% | |||
| Challenger Ltd. | 8,035 | 32,019 | |
| Edenred SA | 731 | 47,550 | |
| Industrivarden AB (A Shares) | 2,554 | 72,906 | |
| Mitsubishi UFJ Lease & Finance Co. Ltd. | 11,200 | 57,906 | |
| Wise PLC (b) | 4,683 | 32,373 | |
| 242,754 | |||
| Insurance - 4.6% | |||
| Allianz SE | 584 | 146,645 | |
| Assicurazioni Generali SpA | 3,802 | 79,247 | |
| Baloise Holdings AG | 367 | 61,479 | |
| Beazley PLC | 9,341 | 69,916 | |
| Hannover Reuck SE | 331 | 70,746 | |
| Insurance Australia Group Ltd. | 13,407 | 44,123 | |
| Intact Financial Corp. | 365 | 55,152 | |
| Japan Post Holdings Co. Ltd. | 8,300 | 68,148 | |
| Manulife Financial Corp. | 3,188 | 62,876 | |
| Medibank Private Ltd. | 20,948 | 49,283 | |
| Sompo Holdings, Inc. | 1,600 | 66,425 | |
| Tokio Marine Holdings, Inc. | 4,300 | 85,896 | |
| Zurich Insurance Group Ltd. | 245 | 118,860 | |
| 978,796 | |||
TOTAL FINANCIALS | 3,223,317 | ||
| HEALTH CARE - 16.5% | |||
| Biotechnology - 0.8% | |||
| CSL Ltd. | 819 | 162,685 | |
| Health Care Equipment & Supplies - 1.2% | |||
| bioMerieux SA | 780 | 81,720 | |
| Sonova Holding AG | 281 | 88,968 | |
| Straumann Holding AG | 536 | 80,486 | |
| 251,174 | |||
| Health Care Providers & Services - 0.7% | |||
| Galenica AG (a) | 835 | 75,005 | |
| Sonic Healthcare Ltd. | 3,328 | 77,944 | |
| 152,949 | |||
| Life Sciences Tools & Services - 0.3% | |||
| Tecan Group AG | 153 | 66,663 | |
| Pharmaceuticals - 13.5% | |||
| Astellas Pharma, Inc. | 10,100 | 151,910 | |
| AstraZeneca PLC (United Kingdom) | 2,320 | 342,514 | |
| GSK PLC | 8,769 | 158,824 | |
| Indivior PLC (b) | 3,399 | 65,194 | |
| Ipsen SA | 763 | 92,659 | |
| Merck KGaA | 522 | 93,676 | |
| Novartis AG | 3,361 | 344,124 | |
| Novo Nordisk A/S Series B | 2,380 | 396,442 | |
| Ono Pharmaceutical Co. Ltd. | 5,900 | 118,897 | |
| Orion Oyj (B Shares) | 1,549 | 72,884 | |
| Otsuka Holdings Co. Ltd. | 4,300 | 145,297 | |
| Recordati SpA | 1,855 | 85,460 | |
| Roche Holding AG (participation certificate) | 1,012 | 318,762 | |
| Sanofi SA | 2,078 | 229,411 | |
| Shionogi & Co. Ltd. | 2,800 | 124,881 | |
| UCB SA | 1,091 | 101,681 | |
| 2,842,616 | |||
TOTAL HEALTH CARE | 3,476,087 | ||
| INDUSTRIALS - 12.2% | |||
| Aerospace & Defense - 1.1% | |||
| BAE Systems PLC | 6,709 | 85,506 | |
| Dassault Aviation SA | 355 | 69,487 | |
| Thales SA | 529 | 80,828 | |
| 235,821 | |||
| Air Freight & Logistics - 0.4% | |||
| Deutsche Post AG | 1,960 | 94,170 | |
| Commercial Services & Supplies - 1.9% | |||
| Dai Nippon Printing Co. Ltd. | 2,700 | 77,333 | |
| Secom Co. Ltd. | 1,100 | 70,266 | |
| Securitas AB (B Shares) | 5,024 | 44,964 | |
| SPIE SA | 2,126 | 66,376 | |
| Toppan, Inc. | 3,900 | 82,545 | |
| Waste Connections, Inc. (Canada) | 422 | 58,638 | |
| 400,122 | |||
| Construction & Engineering - 1.5% | |||
| Kajima Corp. | 5,300 | 69,867 | |
| Obayashi Corp. | 8,200 | 68,170 | |
| Taisei Corp. | 1,900 | 64,396 | |
| VINCI SA | 940 | 116,437 | |
| 318,870 | |||
| Ground Transportation - 0.8% | |||
| Canadian National Railway Co. | 728 | 86,686 | |
| Canadian Pacific Kansas City Ltd. | 1,110 | 87,405 | |
| 174,091 | |||
| Industrial Conglomerates - 0.5% | |||
| Jardine Matheson Holdings Ltd. | 1,977 | 95,291 | |
| Machinery - 2.0% | |||
| Atlas Copco AB (A Shares) | 6,829 | 98,601 | |
| Bucher Industries AG | 141 | 63,494 | |
| Epiroc AB (A Shares) | 3,046 | 60,877 | |
| GEA Group AG | 1,295 | 60,819 | |
| Knorr-Bremse AG | 829 | 58,061 | |
| Kone OYJ (B Shares) | 1,433 | 81,791 | |
| 423,643 | |||
| Marine Transportation - 0.3% | |||
| A.P. Moller - Maersk A/S Series B | 34 | 61,415 | |
| Professional Services - 1.9% | |||
| Bureau Veritas SA | 2,181 | 62,941 | |
| DKSH Holding AG | 754 | 60,105 | |
| Experian PLC | 1,862 | 65,764 | |
| RELX PLC (London Stock Exchange) | 2,985 | 99,274 | |
| Wolters Kluwer NV | 770 | 102,137 | |
| 390,221 | |||
| Trading Companies & Distributors - 1.8% | |||
| Itochu Corp. | 3,000 | 98,968 | |
| Mitsubishi Corp. | 2,900 | 106,872 | |
| Mitsui & Co. Ltd. | 3,300 | 102,491 | |
| Sojitz Corp. | 3,100 | 64,930 | |
| 373,261 | |||
TOTAL INDUSTRIALS | 2,566,905 | ||
| INFORMATION TECHNOLOGY - 3.7% | |||
| Communications Equipment - 0.2% | |||
| Ericsson (B Shares) | 6,972 | 38,316 | |
| IT Services - 1.1% | |||
| CGI, Inc. Class A (sub. vtg.) (b) | 491 | 49,781 | |
| OBIC Co. Ltd. | 300 | 46,069 | |
| Otsuka Corp. | 1,400 | 50,740 | |
| TietoEVRY Oyj | 1,070 | 34,210 | |
| TIS, Inc. | 1,800 | 49,176 | |
| 229,976 | |||
| Semiconductors & Semiconductor Equipment - 1.0% | |||
| ASML Holding NV (Netherlands) | 270 | 170,949 | |
| Tower Semiconductor Ltd. (b) | 832 | 36,516 | |
| 207,465 | |||
| Software - 1.1% | |||
| Constellation Software, Inc. | 29 | 56,700 | |
| NICE Ltd. (b) | 179 | 36,682 | |
| Sage Group PLC | 3,913 | 40,261 | |
| SimCorp A/S | 462 | 50,057 | |
| Trend Micro, Inc. | 1,100 | 53,479 | |
| 237,179 | |||
| Technology Hardware, Storage & Peripherals - 0.3% | |||
| Canon, Inc. | 2,700 | 64,206 | |
TOTAL INFORMATION TECHNOLOGY | 777,142 | ||
| MATERIALS - 3.9% | |||
| Chemicals - 1.0% | |||
| Incitec Pivot Ltd. | 8,718 | 18,379 | |
| Nissan Chemical Corp. | 1,200 | 53,053 | |
| Nutrien Ltd. | 693 | 48,024 | |
| Tosoh Corp. | 4,300 | 57,190 | |
| Yara International ASA | 876 | 35,135 | |
| 211,781 | |||
| Containers & Packaging - 0.2% | |||
| Verallia SA (a) | 979 | 39,796 | |
| Metals & Mining - 2.4% | |||
| Anglo American PLC (United Kingdom) | 1,611 | 49,508 | |
| Antofagasta PLC | 1,847 | 33,905 | |
| ArcelorMittal SA (Netherlands) | 1,456 | 41,327 | |
| BHP Group Ltd. | 3,441 | 100,965 | |
| Glencore PLC | 12,216 | 72,012 | |
| Rio Tinto Ltd. | 418 | 31,007 | |
| Rio Tinto PLC | 1,080 | 68,538 | |
| South32 Ltd. | 8,127 | 22,772 | |
| SSAB AB (B Shares) | 5,620 | 37,871 | |
| Teck Resources Ltd. Class B (sub. vtg.) | 1,036 | 48,206 | |
| 506,111 | |||
| Paper & Forest Products - 0.3% | |||
| UPM-Kymmene Corp. | 1,248 | 39,818 | |
| West Fraser Timber Co. Ltd. | 406 | 29,336 | |
| 69,154 | |||
TOTAL MATERIALS | 826,842 | ||
| REAL ESTATE - 6.7% | |||
| Equity Real Estate Investment Trusts (REITs) - 2.5% | |||
| Advance Residence Investment Corp. | 110 | 285,169 | |
| CapitaMall Trust | 163,000 | 248,016 | |
| 533,185 | |||
| Real Estate Management & Development - 4.2% | |||
| Daito Trust Construction Co. Ltd. | 2,800 | 264,650 | |
| PSP Swiss Property AG | 2,644 | 312,212 | |
| Sino Land Ltd. | 231,322 | 311,184 | |
| 888,046 | |||
TOTAL REAL ESTATE | 1,421,231 | ||
| UTILITIES - 8.3% | |||
| Electric Utilities - 3.4% | |||
| Elia Group SA/NV | 1,578 | 216,719 | |
| Red Electrica Corporacion SA | 12,782 | 232,907 | |
| SSE PLC | 11,468 | 264,860 | |
| 714,486 | |||
| Gas Utilities - 2.4% | |||
| Osaka Gas Co. Ltd. | 15,800 | 261,544 | |
| Snam SpA | 44,537 | 247,811 | |
| 509,355 | |||
| Multi-Utilities - 2.5% | |||
| Canadian Utilities Ltd. Class A (non-vtg.) | 8,212 | 237,163 | |
| Engie SA | 17,773 | 284,824 | |
| 521,987 | |||
TOTAL UTILITIES | 1,745,828 | ||
| TOTAL COMMON STOCKS (Cost $19,581,777) | 20,829,217 | ||
| Money Market Funds - 0.3% | |||
| Shares | Value ($) | ||
Fidelity Cash Central Fund 4.88% (c) (Cost $61,554) | 61,542 | 61,554 | |
| TOTAL INVESTMENT IN SECURITIES - 99.1% (Cost $19,643,331) | 20,890,771 |
NET OTHER ASSETS (LIABILITIES) - 0.9% | 189,285 |
| NET ASSETS - 100.0% | 21,080,056 |
| Futures Contracts | |||||
Number of contracts | Expiration Date | Notional Amount ($) | Value ($) | Unrealized Appreciation/ (Depreciation) ($) | |
| Purchased | |||||
| Equity Index Contracts | |||||
| ICE E-mini MSCI EAFE Index Contracts (United States) | 2 | Jun 2023 | 214,960 | 10,105 | 10,105 |
| The notional amount of futures purchased as a percentage of Net Assets is 1.0% | |||||
| (a) | Security exempt from registration under Rule 144A of the Securities Act of 1933. These securities may be resold in transactions exempt from registration, normally to qualified institutional buyers. At the end of the period, the value of these securities amounted to $329,095 or 1.6% of net assets. |
| (b) | Non-income producing |
| (c) | Affiliated fund that is generally available only to investment companies and other accounts managed by Fidelity Investments. The rate quoted is the annualized seven-day yield of the fund at period end. A complete unaudited listing of the fund's holdings as of its most recent quarter end is available upon request. In addition, each Fidelity Central Fund's financial statements are available on the SEC's website or upon request. |
| Affiliate | Value, beginning of period ($) | Purchases ($) | Sales Proceeds ($) | Dividend Income ($) | Realized Gain (loss) ($) | Change in Unrealized appreciation (depreciation) ($) | Value, end of period ($) | % ownership, end of period |
| Fidelity Cash Central Fund 4.88% | - | 533,645 | 472,091 | 866 | - | - | 61,554 | 0.0% |
| Total | - | 533,645 | 472,091 | 866 | - | - | 61,554 | |
| Valuation Inputs at Reporting Date: | ||||
| Description | Total ($) | Level 1 ($) | Level 2 ($) | Level 3 ($) |
Investments in Securities: | ||||
| Equities: | ||||
Communication Services | 1,888,848 | 412,591 | 1,476,257 | - |
Consumer Discretionary | 1,427,101 | 459,331 | 967,770 | - |
Consumer Staples | 3,133,840 | 1,925,740 | 1,208,100 | - |
Energy | 342,076 | 122,860 | 219,216 | - |
Financials | 3,223,317 | 1,863,763 | 1,359,554 | - |
Health Care | 3,476,087 | 823,910 | 2,652,177 | - |
Industrials | 2,566,905 | 1,298,044 | 1,268,861 | - |
Information Technology | 777,142 | 475,156 | 301,986 | - |
Materials | 826,842 | 353,418 | 473,424 | - |
Real Estate | 1,421,231 | 312,212 | 1,109,019 | - |
Utilities | 1,745,828 | 1,219,424 | 526,404 | - |
| Money Market Funds | 61,554 | 61,554 | - | - |
| Total Investments in Securities: | 20,890,771 | 9,328,003 | 11,562,768 | - |
Derivative Instruments: | ||||
| Assets | ||||
Futures Contracts | 10,105 | 10,105 | - | - |
| Total Assets | 10,105 | 10,105 | - | - |
| Total Derivative Instruments: | 10,105 | 10,105 | - | - |
Primary Risk Exposure / Derivative Type | Value | |
| Asset ($) | Liability ($) | |
| Equity Risk | ||
Futures Contracts (a) | 10,105 | 0 |
| Total Equity Risk | 10,105 | 0 |
| Total Value of Derivatives | 10,105 | 0 |
| Statement of Assets and Liabilities | ||||
April 30, 2023 (Unaudited) | ||||
| Assets | ||||
| Investment in securities, at value - See accompanying schedule: | ||||
Unaffiliated issuers (cost $19,581,777) | $ | 20,829,217 | ||
Fidelity Central Funds (cost $61,554) | 61,554 | |||
| Total Investment in Securities (cost $19,643,331) | $ | 20,890,771 | ||
| Segregated cash with brokers for derivative instruments | 6,684 | |||
| Cash | 21,385 | |||
| Foreign currency held at value (cost $37,182) | 37,142 | |||
| Dividends receivable | 99,569 | |||
| Reclaims receivable | 47,897 | |||
| Distributions receivable from Fidelity Central Funds | 172 | |||
| Other receivables | 21 | |||
Total assets | 21,103,641 | |||
| Liabilities | ||||
| Payable for investments purchased | $ | 16,606 | ||
| Accrued management fee | 6,769 | |||
| Payable for daily variation margin on futures contracts | 210 | |||
| Total Liabilities | 23,585 | |||
| Net Assets | $ | 21,080,056 | ||
| Net Assets consist of: | ||||
| Paid in capital | $ | 21,409,362 | ||
| Total accumulated earnings (loss) | (329,306) | |||
| Net Assets | $ | 21,080,056 | ||
Net Asset Value , offering price and redemption price per share ($21,080,056 ÷ 800,000 shares) | $ | 26.35 | ||
| Statement of Operations | ||||
Six months ended April 30, 2023 (Unaudited) | ||||
| Investment Income | ||||
| Dividends | $ | 371,803 | ||
| Income from Fidelity Central Funds | 866 | |||
| Income before foreign taxes withheld | $ | 372,669 | ||
| Less foreign taxes withheld | (41,640) | |||
| Total Income | 331,029 | |||
| Expenses | ||||
| Management fee | $ | 34,323 | ||
| Independent trustees' fees and expenses | 51 | |||
| Total expenses before reductions | 34,374 | |||
| Expense reductions | (129) | |||
| Total expenses after reductions | 34,245 | |||
| Net Investment income (loss) | 296,784 | |||
| Realized and Unrealized Gain (Loss) | ||||
| Net realized gain (loss) on: | ||||
| Investment Securities: | ||||
| Unaffiliated issuers | (52,356) | |||
| Foreign currency transactions | 3,164 | |||
| Futures contracts | 4,204 | |||
| Total net realized gain (loss) | (44,988) | |||
| Change in net unrealized appreciation (depreciation) on: | ||||
| Investment Securities: | ||||
| Unaffiliated issuers | 2,802,491 | |||
| Assets and liabilities in foreign currencies | 35,561 | |||
| Futures contracts | 14,833 | |||
| Total change in net unrealized appreciation (depreciation) | 2,852,885 | |||
| Net gain (loss) | 2,807,897 | |||
| Net increase (decrease) in net assets resulting from operations | $ | 3,104,681 | ||
| Statement of Changes in Net Assets | ||||
Six months ended April 30, 2023 (Unaudited) | Year ended October 31, 2022 | |||
| Increase (Decrease) in Net Assets | ||||
| Operations | ||||
| Net investment income (loss) | $ | 296,784 | $ | 389,711 |
| Net realized gain (loss) | (44,988) | (1,163,840) | ||
| Change in net unrealized appreciation (depreciation) | 2,852,885 | (3,143,159) | ||
| Net increase (decrease) in net assets resulting from operations | 3,104,681 | (3,917,288) | ||
| Distributions to shareholders | (202,400) | (524,400) | ||
| Share transactions | ||||
| Proceeds from sales of shares | 4,935,163 | 2,824,049 | ||
| Cost of shares redeemed | - | (2,787,735) | ||
Net increase (decrease) in net assets resulting from share transactions | 4,935,163 | 36,314 | ||
| Total increase (decrease) in net assets | 7,837,444 | (4,405,374) | ||
| Net Assets | ||||
| Beginning of period | 13,242,612 | 17,647,986 | ||
| End of period | $ | 21,080,056 | $ | 13,242,612 |
| Other Information | ||||
| Shares | ||||
| Sold | 200,000 | 100,000 | ||
| Redeemed | - | (100,000) | ||
| Net increase (decrease) | 200,000 | - | ||
| Fidelity® International Multifactor ETF |
Six months ended (Unaudited) April 30, 2023 | Years ended October 31, 2022 | 2021 | 2020 | 2019 A | ||||||
Selected Per-Share Data | ||||||||||
| Net asset value, beginning of period | $ | 22.07 | $ | 29.41 | $ | 24.01 | $ | 26.18 | $ | 25.05 |
| Income from Investment Operations | ||||||||||
Net investment income (loss) B,C | .42 | .65 | .65 | .57 | .55 | |||||
| Net realized and unrealized gain (loss) | 4.13 | (7.12) | 5.34 | (2.07) | 1.12 | |||||
| Total from investment operations | 4.55 | (6.47) | 5.99 | (1.50) | 1.67 | |||||
| Distributions from net investment income | (.27) | (.87) | (.59) | (.67) | (.54) | |||||
| Total distributions | (.27) | (.87) | (.59) | (.67) | (.54) | |||||
| Net asset value, end of period | $ | 26.35 | $ | 22.07 | $ | 29.41 | $ | 24.01 | $ | 26.18 |
Total Return D,E,F | 20.71% | (22.36)% | 25.08% | (5.73)% | 6.72% | |||||
Ratios to Average Net Assets C,G,H | ||||||||||
| Expenses before reductions | .39% I | .39% | .39% | .39% | .39% I | |||||
| Expenses net of fee waivers, if any | .39% I | .39% | .39% | .39% | .39% I | |||||
| Expenses net of all reductions | .39% I | .39% | .39% | .39% | .39% I | |||||
| Net investment income (loss) | 3.38% I | 2.51% | 2.28% | 2.29% | 3.18% I | |||||
| Supplemental Data | ||||||||||
| Net assets, end of period (000 omitted) | $ | 21,080 | $ | 13,243 | $ | 17,648 | $ | 7,202 | $ | 10,473 |
Portfolio turnover rate J,K | 50% I | 61% | 74% | 69% | 35% L |
Top Holdings (% of Fund's net assets) | ||
| ASML Holding NV (Netherlands) | 1.8 | |
| Sanofi SA | 1.7 | |
| Novartis AG | 1.6 | |
| Shell PLC (London) | 1.6 | |
| Roche Holding AG (participation certificate) | 1.5 | |
| Japan Tobacco, Inc. | 1.5 | |
| Deutsche Post AG | 1.4 | |
| Teck Resources Ltd. Class B (sub. vtg.) | 1.4 | |
| Sony Group Corp. | 1.4 | |
| Koninklijke Ahold Delhaize NV | 1.3 | |
| 15.2 | ||
| Market Sectors (% of Fund's net assets) | ||
| Financials | 19.4 | |
| Industrials | 16.0 | |
| Health Care | 11.8 | |
| Consumer Discretionary | 10.9 | |
| Consumer Staples | 9.8 | |
| Information Technology | 8.0 | |
| Materials | 7.8 | |
| Energy | 5.8 | |
| Communication Services | 4.2 | |
| Utilities | 3.4 | |
| Real Estate | 1.9 | |
Asset Allocation (% of Fund's net assets) |
 |
Futures - 0.9% |
Geographic Diversification (% of Fund's net assets) |
 |
* Includes Short-Term investments and Net Other Assets (Liabilities). Percentages are adjusted for the effect of derivatives, if applicable. |
| Common Stocks - 99.0% | |||
| Shares | Value ($) | ||
| COMMUNICATION SERVICES - 4.2% | |||
| Diversified Telecommunication Services - 2.5% | |||
| Deutsche Telekom AG | 23,302 | 562,872 | |
| Nippon Telegraph & Telephone Corp. | 11,100 | 338,221 | |
| Singapore Telecommunications Ltd. | 137,200 | 262,234 | |
| 1,163,327 | |||
| Wireless Telecommunication Services - 1.7% | |||
| KDDI Corp. | 11,700 | 365,010 | |
| Vodafone Group PLC | 348,325 | 419,860 | |
| 784,870 | |||
TOTAL COMMUNICATION SERVICES | 1,948,197 | ||
| CONSUMER DISCRETIONARY - 10.9% | |||
| Automobiles - 4.6% | |||
| Honda Motor Co. Ltd. | 17,300 | 455,862 | |
| Mazda Motor Corp. | 42,000 | 374,457 | |
| Mercedes-Benz Group AG (Germany) | 5,878 | 458,016 | |
| Renault SA | 11,989 | 445,122 | |
| Stellantis NV (Italy) | 24,043 | 398,152 | |
| 2,131,609 | |||
| Broadline Retail - 1.5% | |||
| Canadian Tire Ltd. Class A (non-vtg.) | 1,506 | 197,213 | |
| Prosus NV | 6,739 | 504,943 | |
| 702,156 | |||
| Hotels, Restaurants & Leisure - 1.8% | |||
| Aristocrat Leisure Ltd. | 11,129 | 278,813 | |
| Sodexo SA | 5,282 | 566,805 | |
| 845,618 | |||
| Household Durables - 2.2% | |||
| Sony Group Corp. | 6,800 | 640,723 | |
| Sumitomo Forestry Co. Ltd. | 18,000 | 386,663 | |
| 1,027,386 | |||
| Specialty Retail - 0.8% | |||
| Kingfisher PLC | 115,597 | 374,132 | |
TOTAL CONSUMER DISCRETIONARY | 5,080,901 | ||
| CONSUMER STAPLES - 9.8% | |||
| Beverages - 1.2% | |||
| Heineken Holding NV | 5,653 | 542,647 | |
| Consumer Staples Distribution & Retail - 3.4% | |||
| Alimentation Couche-Tard, Inc. Class A (multi-vtg.) | 8,715 | 434,497 | |
| Carrefour SA | 25,019 | 520,932 | |
| Koninklijke Ahold Delhaize NV | 17,750 | 611,787 | |
| 1,567,216 | |||
| Household Products - 1.2% | |||
| Essity AB (B Shares) | 18,544 | 561,712 | |
| Personal Care Products - 1.2% | |||
| Unilever PLC | 10,345 | 576,862 | |
| Tobacco - 2.8% | |||
| British American Tobacco PLC (United Kingdom) | 10,561 | 388,534 | |
| Imperial Brands PLC | 10,005 | 247,419 | |
| Japan Tobacco, Inc. | 31,700 | 680,608 | |
| 1,316,561 | |||
TOTAL CONSUMER STAPLES | 4,564,998 | ||
| ENERGY - 5.8% | |||
| Oil, Gas & Consumable Fuels - 5.8% | |||
| Eni SpA | 17,945 | 272,326 | |
| INPEX Corp. | 25,600 | 276,935 | |
| Shell PLC (London) | 23,901 | 736,609 | |
| Suncor Energy, Inc. | 14,408 | 450,628 | |
| TotalEnergies SE | 9,072 | 580,297 | |
| Tourmaline Oil Corp. | 8,908 | 399,786 | |
| 2,716,581 | |||
| FINANCIALS - 19.4% | |||
| Banks - 8.7% | |||
| Banco Santander SA (Spain) | 126,555 | 445,207 | |
| Bank of Nova Scotia | 7,746 | 386,243 | |
| Barclays PLC | 135,537 | 272,366 | |
| BNP Paribas SA | 7,554 | 488,618 | |
| HSBC Holdings PLC (United Kingdom) | 81,070 | 584,684 | |
| Mizuho Financial Group, Inc. | 35,600 | 513,744 | |
| Oversea-Chinese Banking Corp. Ltd. | 31,300 | 295,135 | |
| Societe Generale Series A | 12,545 | 305,039 | |
| Standard Chartered PLC (United Kingdom) | 33,557 | 265,045 | |
| The Toronto-Dominion Bank | 8,343 | 504,837 | |
| 4,060,918 | |||
| Capital Markets - 2.9% | |||
| Deutsche Bank AG | 30,532 | 335,152 | |
| Macquarie Group Ltd. | 4,267 | 514,904 | |
| UBS Group AG | 23,372 | 474,372 | |
| 1,324,428 | |||
| Financial Services - 1.0% | |||
| Investor AB (B Shares) | 21,244 | 455,232 | |
| Insurance - 6.8% | |||
| AIA Group Ltd. | 48,800 | 528,104 | |
| Allianz SE | 2,332 | 585,576 | |
| Japan Post Holdings Co. Ltd. | 58,300 | 478,680 | |
| Manulife Financial Corp. | 18,058 | 356,154 | |
| QBE Insurance Group Ltd. | 52,146 | 528,282 | |
| SCOR SE | 13,624 | 352,258 | |
| Sun Life Financial, Inc. | 6,687 | 327,669 | |
| 3,156,723 | |||
TOTAL FINANCIALS | 8,997,301 | ||
| HEALTH CARE - 11.8% | |||
| Health Care Equipment & Supplies - 1.1% | |||
| Koninklijke Philips Electronics NV | 24,145 | 508,758 | |
| Health Care Providers & Services - 3.1% | |||
| Fresenius Medical Care AG & Co. KGaA | 10,731 | 521,743 | |
| Fresenius SE & Co. KGaA | 14,469 | 418,832 | |
| Galenica AG (a) | 1,473 | 132,314 | |
| Sonic Healthcare Ltd. | 16,612 | 389,062 | |
| 1,461,951 | |||
| Pharmaceuticals - 7.6% | |||
| Merck KGaA | 2,312 | 414,900 | |
| Novartis AG | 7,233 | 740,569 | |
| Otsuka Holdings Co. Ltd. | 12,000 | 405,479 | |
| Roche Holding AG (participation certificate) | 2,184 | 687,921 | |
| Sanofi SA | 7,100 | 783,840 | |
| Takeda Pharmaceutical Co. Ltd. | 14,700 | 487,103 | |
| 3,519,812 | |||
TOTAL HEALTH CARE | 5,490,521 | ||
| INDUSTRIALS - 16.0% | |||
| Aerospace & Defense - 0.9% | |||
| BAE Systems PLC | 31,221 | 397,911 | |
| Air Freight & Logistics - 1.4% | |||
| Deutsche Post AG | 13,652 | 655,925 | |
| Building Products - 1.2% | |||
| Compagnie de Saint-Gobain | 9,573 | 554,006 | |
| Construction & Engineering - 1.2% | |||
| Bouygues SA | 15,308 | 561,081 | |
| Ground Transportation - 1.5% | |||
| Canadian National Railway Co. | 2,941 | 350,196 | |
| Canadian Pacific Kansas City Ltd. | 4,467 | 351,748 | |
| 701,944 | |||
| Industrial Conglomerates - 0.6% | |||
| Jardine Matheson Holdings Ltd. | 5,900 | 284,380 | |
| Machinery - 2.0% | |||
| CNH Industrial NV | 22,591 | 317,866 | |
| Volvo AB (B Shares) | 28,779 | 591,446 | |
| 909,312 | |||
| Marine Transportation - 2.2% | |||
| A.P. Moller - Maersk A/S Series B | 160 | 289,011 | |
| Mitsui OSK Lines Ltd. | 15,200 | 375,074 | |
| Nippon Yusen KK | 16,000 | 376,367 | |
| 1,040,452 | |||
| Professional Services - 1.7% | |||
| Adecco SA (Reg.) | 10,229 | 350,869 | |
| RELX PLC (London Stock Exchange) | 12,755 | 424,200 | |
| 775,069 | |||
| Trading Companies & Distributors - 3.3% | |||
| Itochu Corp. | 15,100 | 498,140 | |
| Mitsubishi Corp. | 14,500 | 534,359 | |
| Mitsui & Co. Ltd. | 16,200 | 503,138 | |
| 1,535,637 | |||
TOTAL INDUSTRIALS | 7,415,717 | ||
| INFORMATION TECHNOLOGY - 8.0% | |||
| Communications Equipment - 0.9% | |||
| Ericsson (B Shares) | 38,886 | 213,703 | |
| Nokia Corp. | 52,182 | 221,334 | |
| 435,037 | |||
| IT Services - 3.3% | |||
| Capgemini SA | 1,313 | 239,031 | |
| CGI, Inc. Class A (sub. vtg.) (b) | 4,850 | 491,723 | |
| Fujitsu Ltd. | 3,000 | 397,900 | |
| NEC Corp. | 10,600 | 405,581 | |
| 1,534,235 | |||
| Semiconductors & Semiconductor Equipment - 2.5% | |||
| ASML Holding NV (Netherlands) | 1,289 | 816,127 | |
| Sumco Corp. | 25,000 | 342,415 | |
| 1,158,542 | |||
| Software - 1.3% | |||
| SAP SE | 4,271 | 579,308 | |
TOTAL INFORMATION TECHNOLOGY | 3,707,122 | ||
| MATERIALS - 7.8% | |||
| Metals & Mining - 7.8% | |||
| Anglo American PLC (United Kingdom) | 12,149 | 373,353 | |
| ArcelorMittal SA (Netherlands) | 13,207 | 374,865 | |
| BHP Group Ltd. | 17,943 | 526,479 | |
| Glencore PLC | 84,901 | 500,480 | |
| Nippon Steel & Sumitomo Metal Corp. | 23,100 | 490,789 | |
| Rio Tinto Ltd. | 2,981 | 221,132 | |
| Rio Tinto PLC | 7,569 | 480,335 | |
| Teck Resources Ltd. Class B (sub. vtg.) | 14,070 | 654,691 | |
| 3,622,124 | |||
| REAL ESTATE - 1.9% | |||
| Real Estate Management & Development - 1.9% | |||
| CK Asset Holdings Ltd. | 32,500 | 191,690 | |
| Daiwa House Industry Co. Ltd. | 13,500 | 342,742 | |
| Hongkong Land Holdings Ltd. | 28,200 | 124,926 | |
| Vonovia SE | 10,047 | 217,678 | |
| 877,036 | |||
| UTILITIES - 3.4% | |||
| Electric Utilities - 0.6% | |||
| Kansai Electric Power Co., Inc. | 26,700 | 288,246 | |
| Independent Power and Renewable Electricity Producers - 1.5% | |||
| Northland Power, Inc. | 6,724 | 164,890 | |
| RWE AG | 11,846 | 556,468 | |
| 721,358 | |||
| Multi-Utilities - 1.3% | |||
| Engie SA | 36,778 | 589,392 | |
TOTAL UTILITIES | 1,598,996 | ||
| TOTAL COMMON STOCKS (Cost $45,220,058) | 46,019,494 | ||
| TOTAL INVESTMENT IN SECURITIES - 99.0% (Cost $45,220,058) | 46,019,494 |
NET OTHER ASSETS (LIABILITIES) - 1.0% | 484,166 |
| NET ASSETS - 100.0% | 46,503,660 |
| Futures Contracts | |||||
Number of contracts | Expiration Date | Notional Amount ($) | Value ($) | Unrealized Appreciation/ (Depreciation) ($) | |
| Purchased | |||||
| Equity Index Contracts | |||||
| ICE E-mini MSCI EAFE Index Contracts (United States) | 4 | Jun 2023 | 429,920 | 23,395 | 23,395 |
| The notional amount of futures purchased as a percentage of Net Assets is 0.9% | |||||
| (a) | Security exempt from registration under Rule 144A of the Securities Act of 1933. These securities may be resold in transactions exempt from registration, normally to qualified institutional buyers. At the end of the period, the value of these securities amounted to $132,314 or 0.3% of net assets. |
| (b) | Non-income producing |
| Affiliate | Value, beginning of period ($) | Purchases ($) | Sales Proceeds ($) | Dividend Income ($) | Realized Gain (loss) ($) | Change in Unrealized appreciation (depreciation) ($) | Value, end of period ($) | % ownership, end of period |
| Fidelity Cash Central Fund 4.88% | 34,107 | 1,103,898 | 1,138,005 | 830 | - | - | - | 0.0% |
| Total | 34,107 | 1,103,898 | 1,138,005 | 830 | - | - | - | |
| Valuation Inputs at Reporting Date: | ||||
| Description | Total ($) | Level 1 ($) | Level 2 ($) | Level 3 ($) |
Investments in Securities: | ||||
| Equities: | ||||
Communication Services | 1,948,197 | - | 1,948,197 | - |
Consumer Discretionary | 5,080,901 | 1,607,292 | 3,473,609 | - |
Consumer Staples | 4,564,998 | 2,150,643 | 2,414,355 | - |
Energy | 2,716,581 | 850,414 | 1,866,167 | - |
Financials | 8,997,301 | 3,902,169 | 5,095,132 | - |
Health Care | 5,490,521 | 966,046 | 4,524,475 | - |
Industrials | 7,415,717 | 2,947,406 | 4,468,311 | - |
Information Technology | 3,707,122 | 1,546,881 | 2,160,241 | - |
Materials | 3,622,124 | 1,029,556 | 2,592,568 | - |
Real Estate | 877,036 | - | 877,036 | - |
Utilities | 1,598,996 | 1,310,750 | 288,246 | - |
| Total Investments in Securities: | 46,019,494 | 16,311,157 | 29,708,337 | - |
Derivative Instruments: | ||||
| Assets | ||||
Futures Contracts | 23,395 | 23,395 | - | - |
| Total Assets | 23,395 | 23,395 | - | - |
| Total Derivative Instruments: | 23,395 | 23,395 | - | - |
Primary Risk Exposure / Derivative Type | Value | |
| Asset ($) | Liability ($) | |
| Equity Risk | ||
Futures Contracts (a) | 23,395 | 0 |
| Total Equity Risk | 23,395 | 0 |
| Total Value of Derivatives | 23,395 | 0 |
| Statement of Assets and Liabilities | ||||
April 30, 2023 (Unaudited) | ||||
| Assets | ||||
Investment in securities, at value - See accompanying schedule Unaffiliated issuers (cost $45,220,058): | $ | 46,019,494 | ||
| Segregated cash with brokers for derivative instruments | 13,464 | |||
| Cash | 31,626 | |||
| Foreign currency held at value (cost $49,451) | 49,742 | |||
| Receivable for investments sold | 18,555 | |||
| Dividends receivable | 309,239 | |||
| Reclaims receivable | 101,733 | |||
| Distributions receivable from Fidelity Central Funds | 137 | |||
| Other receivables | 49 | |||
Total assets | 46,544,039 | |||
| Liabilities | ||||
| Payable for investments purchased | $ | 24,982 | ||
| Accrued management fee | 14,977 | |||
| Payable for daily variation margin on futures contracts | 420 | |||
| Total Liabilities | 40,379 | |||
| Net Assets | $ | 46,503,660 | ||
| Net Assets consist of: | ||||
| Paid in capital | $ | 49,554,363 | ||
| Total accumulated earnings (loss) | (3,050,703) | |||
| Net Assets | $ | 46,503,660 | ||
Net Asset Value , offering price and redemption price per share ($46,503,660 ÷ 2,000,000 shares) | $ | 23.25 | ||
| Statement of Operations | ||||
Six months ended April 30, 2023 (Unaudited) | ||||
| Investment Income | ||||
| Dividends | $ | 996,110 | ||
| Income from Fidelity Central Funds | 830 | |||
| Income before foreign taxes withheld | $ | 996,940 | ||
| Less foreign taxes withheld | (96,942) | |||
| Total Income | 899,998 | |||
| Expenses | ||||
| Management fee | $ | 84,339 | ||
| Independent trustees' fees and expenses | 129 | |||
| Total expenses before reductions | 84,468 | |||
| Expense reductions | (136) | |||
| Total expenses after reductions | 84,332 | |||
| Net Investment income (loss) | 815,666 | |||
| Realized and Unrealized Gain (Loss) | ||||
| Net realized gain (loss) on: | ||||
| Investment Securities: | ||||
| Redemptions in-kind | 1,707,252 | |||
| Unaffiliated issuers | (382,215) | |||
| Foreign currency transactions | (34,519) | |||
| Futures contracts | 50,078 | |||
| Total net realized gain (loss) | 1,340,596 | |||
| Change in net unrealized appreciation (depreciation) on: | ||||
| Investment Securities: | ||||
| Unaffiliated issuers | 6,800,007 | |||
| Assets and liabilities in foreign currencies | 83,957 | |||
| Futures contracts | 10,219 | |||
| Total change in net unrealized appreciation (depreciation) | 6,894,183 | |||
| Net gain (loss) | 8,234,779 | |||
| Net increase (decrease) in net assets resulting from operations | $ | 9,050,445 | ||
| Statement of Changes in Net Assets | ||||
Six months ended April 30, 2023 (Unaudited) | Year ended October 31, 2022 | |||
| Increase (Decrease) in Net Assets | ||||
| Operations | ||||
| Net investment income (loss) | $ | 815,666 | $ | 1,515,077 |
| Net realized gain (loss) | 1,340,596 | (1,837,712) | ||
| Change in net unrealized appreciation (depreciation) | 6,894,183 | (8,191,270) | ||
| Net increase (decrease) in net assets resulting from operations | 9,050,445 | (8,513,905) | ||
| Distributions to shareholders | (593,800) | (1,749,900) | ||
| Share transactions | ||||
| Proceeds from sales of shares | 9,153,839 | 18,476,821 | ||
| Cost of shares redeemed | (8,989,408) | (11,779,865) | ||
Net increase (decrease) in net assets resulting from share transactions | 164,431 | 6,696,956 | ||
| Total increase (decrease) in net assets | 8,621,076 | (3,566,849) | ||
| Net Assets | ||||
| Beginning of period | 37,882,584 | 41,449,433 | ||
| End of period | $ | 46,503,660 | $ | 37,882,584 |
| Other Information | ||||
| Shares | ||||
| Sold | 400,000 | 800,000 | ||
| Redeemed | (400,000) | (500,000) | ||
| Net increase (decrease) | - | 300,000 | ||
| Fidelity® International Value Factor ETF |
Six months ended (Unaudited) April 30, 2023 | Years ended October 31, 2022 | 2021 | 2020 | 2019 | 2018 A | |||||||
Selected Per-Share Data | ||||||||||||
| Net asset value, beginning of period | $ | 18.94 | $ | 24.38 | $ | 17.82 | $ | 21.89 | $ | 20.89 | $ | 25.00 |
| Income from Investment Operations | ||||||||||||
Net investment income (loss) B,C | .42 | .83 | .79 | .51 | .80 | .62 | ||||||
| Net realized and unrealized gain (loss) | 4.19 | (5.32) | 6.54 | (4.09) | 1.05 | (4.18) | ||||||
| Total from investment operations | 4.61 | (4.49) | 7.33 | (3.58) | 1.85 | (3.56) | ||||||
| Distributions from net investment income | (.30) | (.95) | (.77) | (.49) | (.85) | (.55) | ||||||
| Total distributions | (.30) | (.95) | (.77) | (.49) | (.85) | (.55) | ||||||
| Net asset value, end of period | $ | 23.25 | $ | 18.94 | $ | 24.38 | $ | 17.82 | $ | 21.89 | $ | 20.89 |
Total Return D,E,F | 24.50% | (18.82)% | 41.36% | (16.32)% | 9.04% | (14.46)% | ||||||
Ratios to Average Net Assets C,G,H | ||||||||||||
| Expenses before reductions | .39% I | .39% | .39% | .39% | .39% | .39% I | ||||||
| Expenses net of fee waivers, if any | .39% I | .39% | .39% | .39% | .39% | .39% I | ||||||
| Expenses net of all reductions | .39% I | .39% | .39% | .39% | .39% | .39% I | ||||||
| Net investment income (loss) | 3.78% I | 3.79% | 3.32% | 2.60% | 3.74% | 3.38% I | ||||||
| Supplemental Data | ||||||||||||
| Net assets, end of period (000 omitted) | $ | 46,504 | $ | 37,883 | $ | 41,449 | $ | 14,254 | $ | 13,135 | $ | 12,532 |
Portfolio turnover rate J | 64% I,K | 69% K | 101% K | 76% K | 56% | 65% K,L |
| Fidelity Central Fund | Investment Manager | Investment Objective | Investment Practices | Expense Ratio A |
| Fidelity Money Market Central Funds | Fidelity Management & Research Company LLC (FMR) | Each fund seeks to obtain a high level of current income consistent with the preservation of capital and liquidity. | Short-term Investments | Less than .005% |
| Tax cost | Gross unrealized appreciation | Gross unrealized depreciation | Net unrealized appreciation (depreciation) | |
Fidelity Emerging Markets Multifactor ETF | $23,029,467 | $1,915,139 | $(2,631,259) | $(716,120) |
Fidelity International High Dividend ETF | 92,958,151 | 2,589,143 | (8,513,214) | (5,924,071) |
Fidelity International Multifactor ETF | 19,684,029 | 1,927,618 | (710,771) | 1,216,847 |
| Fidelity International Value Factor ETF | 45,361,629 | 3,601,794 | (2,920,534) | 681,260 |
| Equity Risk | Equity risk relates to the fluctuations in the value of financial instruments as a result of changes in market prices (other than those arising from interest rate risk or foreign exchange risk), whether caused by factors specific to an individual investment, its issuer, or all factors affecting all instruments traded in a market or market segment. |
| Purchases ($) | Sales ($) | |
| Fidelity Emerging Markets Multifactor ETF | 9,791,028 | 9,752,407 |
| Fidelity International High Dividend ETF | 53,627,026 | 54,246,984 |
| Fidelity International Multifactor ETF | 4,440,764 | 4,248,597 |
| Fidelity International Value Factor ETF | 13,424,863 | 13,097,613 |
| In-Kind Subscriptions ($) | In-Kind Redemptions ($) | |
| Fidelity International High Dividend ETF | - | 5,344,937 |
| Fidelity International Multifactor ETF | 4,715,595 | - |
| Fidelity International Value Factor ETF | 8,754,952 | 8,817,309 |
| Fee Rate | |
| Fidelity Emerging Markets Multifactor ETF | .45% |
| Fidelity International High Dividend ETF | .39% |
| Fidelity International Multifactor ETF | .39% |
| Fidelity International Value Factor ETF | .39% |
| Total Security Lending Fees Paid to NFS | Security Lending Income From Securities Loaned to NFS | Value of Securities Loaned to NFS at Period End | |
| Fidelity International High Dividend ETF | $434 | $- | $- |
| Custodian credits | |
Fidelity Emerging Markets Multifactor ETF | $159 |
Fidelity International High Dividend ETF | 173 |
Fidelity International Multifactor ETF | 129 |
Fidelity International Value Factor ETF | 136 |
| The Example is based on an investment of $1,000 invested at the beginning of the period and held for the entire period (November 1, 2022 to April 30, 2023). |
Annualized Expense Ratio- A | Beginning Account Value November 1, 2022 | Ending Account Value April 30, 2023 | Expenses Paid During Period- C November 1, 2022 to April 30, 2023 | |||||||
| Fidelity® Emerging Markets Multifactor ETF | .45% | |||||||||
| Actual | $ 1,000 | $ 1,162.70 | $ 2.41 | |||||||
Hypothetical- B | $ 1,000 | $ 1,022.56 | $ 2.26 | |||||||
| Fidelity® International High Dividend ETF | .39% | |||||||||
| Actual | $ 1,000 | $ 1,191.70 | $ 2.12 | |||||||
Hypothetical- B | $ 1,000 | $ 1,022.86 | $ 1.96 | |||||||
| Fidelity® International Multifactor ETF | .39% | |||||||||
| Actual | $ 1,000 | $ 1,207.10 | $ 2.13 | |||||||
Hypothetical- B | $ 1,000 | $ 1,022.86 | $ 1.96 | |||||||
| Fidelity® International Value Factor ETF | .39% | |||||||||
| Actual | $ 1,000 | $ 1,245.00 | $ 2.17 | |||||||
Hypothetical- B | $ 1,000 | $ 1,022.86 | $ 1.96 | |||||||
- Highly liquid investments - cash or convertible to cash within three business days or less
- Moderately liquid investments - convertible to cash in three to seven calendar days
- Less liquid investments - can be sold or disposed of, but not settled, within seven calendar days
- Illiquid investments - cannot be sold or disposed of within seven calendar days
 |
Item 2.
Code of Ethics
Not applicable.
Item 3.
Audit Committee Financial Expert
Not applicable.
Item 4.
Principal Accountant Fees and Services
Not applicable.
Item 5.
Audit Committee of Listed Registrants
Not applicable.
Item 6.
Investments
(a)
Not applicable.
(b)
Not applicable
Item 7.
Disclosure of Proxy Voting Policies and Procedures for Closed-End Management Investment Companies
Not applicable.
Item 8.
Portfolio Managers of Closed-End Management Investment Companies
Not applicable.
Item 9.
Purchase of Equity Securities by Closed-End Management Investment Company and Affiliated Purchasers
Not applicable.
Item 10.
Submission of Matters to a Vote of Security Holders
There were no material changes to the procedures by which shareholders may recommend nominees to the Fidelity Covington Trust’s Board of Trustees.
Item 11.
Controls and Procedures
(a)(i) The President and Treasurer and the Chief Financial Officer have concluded that the Fidelity Covington Trust’s (the “Trust”) disclosure controls and procedures (as
defined in Rule 30a-3(c) under the Investment Company Act) provide reasonable assurances that material information relating to the Trust is made known to them by the appropriate persons, based on their evaluation of these controls and procedures as of a date within 90 days of the filing date of this report.
(a)(ii) There was no change in the Trust’s internal control over financial reporting (as defined in Rule 30a-3(d) under the Investment Company Act) that occurred during the period covered by this report that has materially affected, or is reasonably likely to materially affect, the Trust’s internal control over financial reporting.
Item 12.
Disclosure of Securities Lending Activities for Closed-End Management
Investment Companies
Not applicable.
Item 13.
Exhibits
(a) | (1) | Not applicable. |
(a) | (2) | |
(a) | (3) | Not applicable. |
(b) |
SIGNATURES
Pursuant to the requirements of the Securities Exchange Act of 1934 and the Investment Company Act of 1940, the registrant has duly caused this report to be signed on its behalf by the undersigned, thereunto duly authorized.
Fidelity Covington Trust
By: | /s/Stacie M. Smith |
Stacie M. Smith | |
President and Treasurer | |
Date: | June 22, 2023 |
Pursuant to the requirements of the Securities Exchange Act of 1934 and the Investment Company Act of 1940, this report has been signed below by the following persons on behalf of the registrant and in the capacities and on the dates indicated.
By: | /s/Stacie M. Smith |
Stacie M. Smith | |
President and Treasurer | |
Date: | June 22, 2023 |
By: | /s/John J. Burke III |
John J. Burke III | |
Chief Financial Officer | |
Date: | June 22, 2023 |