UNITED STATES
SECURITIES AND EXCHANGE COMMISSION
Washington, D.C. 20549
FORM N-CSR
CERTIFIED SHAREHOLDER REPORT OF REGISTERED
MANAGEMENT INVESTMENT COMPANIES
Investment Company Act file number 811-07319
Fidelity Covington Trust
(Exact name of registrant as specified in charter)
245 Summer St., Boston, Massachusetts 02210
(Address of principal executive offices) (Zip code)
Margaret Carey, Secretary
245 Summer St.
Boston, Massachusetts 02210
(Name and address of agent for service)
Registrant's telephone number, including area code:
617-563-7000
| |
Date of fiscal year end: | June 30 |
|
|
Date of reporting period: | June 30, 2023 |
Item 1.
Reports to Stockholders
Fidelity® Clean Energy ETF
Fidelity® Cloud Computing ETF
Fidelity® Crypto Industry and Digital Payments ETF
Fidelity® Digital Health ETF
Fidelity® Electric Vehicles and Future Transportation ETF
Fidelity® Metaverse ETF
Annual Report
June 30, 2023
Contents
To view a fund's proxy voting guidelines and proxy voting record for the 12-month period ended June 30, visit http://www.fidelity.com/proxyvotingresults or visit the Securities and Exchange Commission's (SEC) web site at http://www.sec.gov.
You may also call 1-800-FIDELITY to request a free copy of the proxy voting guidelines.
The funds or securities referred to herein are not sponsored, endorsed, or promoted by Fidelity Product Services LLC (FPS), and FPS bears no liability with respect to any such funds or securities or any index on which such funds or securities are based. The prospectus contains a more detailed description of the relationship between FPS and any related funds.
Standard & Poor's, S&P and S&P 500 are registered service marks of The McGraw-Hill Companies, Inc. and have been licensed for use by Fidelity Distributors Corporation.
Other third-party marks appearing herein are the property of their respective owners.
All other marks appearing herein are registered or unregistered trademarks or service marks of FMR LLC or an affiliated company. © 2023 FMR LLC. All rights reserved.
This report and the financial statements contained herein are submitted for the general information of the shareholders of the Funds. This report is not authorized for distribution to prospective investors in the Funds unless preceded or accompanied by an effective prospectus.
A fund files its complete schedule of portfolio holdings with the SEC for the first and third quarters of each fiscal year on Form N-PORT. Forms N-PORT are available on the SEC's web site at http://www.sec.gov. A fund's Forms N-PORT may be reviewed and copied at the SEC's Public Reference Room in Washington, DC. Information regarding the operation of the SEC's Public Reference Room may be obtained by calling 1-800-SEC-0330.
For a complete list of a fund's portfolio holdings, view the most recent holdings listing, semiannual report, or annual report on Fidelity's web site at http://www.fidelity.com, http://www.institutional.fidelity.com, or http://www.401k.com, as applicable.
NOT FDIC INSURED •MAY LOSE VALUE •NO BANK GUARANTEE
Neither the Funds nor Fidelity Distributors Corporation is a bank.
NAV and closing market price average annual returns reflect the change in the value of an investment, assuming reinvestment of distributions from dividend income and capital gains (the profits earned upon the sale of securities that have grown in value, if any) at NAV and Market Price, respectively, and assumes a constant rate of performance each year. The hypothetical investment and the fund's returns do not reflect the deduction of taxes that a shareholder would pay on fund distributions or the redemption or selling of fund shares. How a fund did yesterday is no guarantee of how it will do tomorrow.
| Average Annual Total Returns |
| | | | |
Periods ended June 30, 2023 | Past 1 year | Life of Fund A |
| Fidelity® Clean Energy ETF - NAV | 0.10% | -9.59% |
Fidelity® Clean Energy ETF - Market Price B | -0.25% | -10.23% |
| Fidelity Clean Energy Index℠ | 0.36% | -8.71% |
| MSCI ACWI (All Country World Index) Index | 16.97% | -0.17% |
A From October 5, 2021
B From October 7, 2021, date initially listed on the CboeBZX Exchange, Inc.
| $10,000 Over Life of Fund |
| |
Let's say hypothetically that $10,000 was invested in Fidelity® Clean Energy ETF - NAV, on October 5, 2021, when the fund started. The chart shows how the value of your investment would have changed, and also shows how the Fidelity Clean Energy Index℠ and MSCI ACWI (All Country World Index) Index performed over the same period. |
|
|
Fidelity® Clean Energy ETF
Market Recap:
U.S. equities gained 19.59% for the 12 months ending June 30, 2023, according to the S&P 500 ® index, as continued global economic expansion, falling commodity prices and a slowing in the pace of inflation provided a favorable backdrop for risk assets. U.S. large-cap stocks spearheaded the rally, which was driven by the shares of a narrow set of mega-cap companies in the information technology and communication services sectors, largely due to exuberance related to artificial intelligence. Aggressive policy tightening by the U.S. Federal Reserve continued amid consistent pressure on core inflation, a measure that excludes food and energy. Since March 2022, the Fed has hiked its benchmark interest rate 10 times, while also shrinking its massive asset portfolio. The latest bump came in early May, a third consecutive raise of a stepped down 25 basis points. In June, the Fed held interest rates steady and signaled it was prepared to raise rates next month if the economy and inflation don't cool more. The S&P 500® gained 6.61% for the month, raising hopes for a "soft landing" of the economy and bringing the index's year-to-date result to 16.89%. June saw the return of market breadth and lower dispersion. Smaller-cap stocks had a particularly strong month, achieving the best result for the category since January. For the full 12 months, value (+20%) topped growth (+18%). By sector, tech (+42%), consumer discretionary and industrials (+25% each) led, while real estate and utilities (-4% each) lagged.
Comments from the Geode Capital Management, LLC, passive equity index team:
For the fiscal year ending June 30, 2023, the exchange-traded fund's (ETF) net asset value returned 0.10% and its market price returned -0.25%, compared with the 0.36% advance of the benchmark Fidelity Clean Energy Index NR. By region, the U.S. gained 14% and contributed most, followed by Asia Pacific ex Japan (+18%). By sector, information technology advanced about 37% and contributed most, driven by the semiconductors & semiconductor equipment industry (+37%). Industrials stocks also helped (+9%), benefiting from the capital goods industry (+9%). In contrast, by region, emerging markets returned -24% and detracted most, followed by Canada (-16%). From a sector standpoint, stocks in the utilities sector returned roughly -15% and detracted. Energy (-9%) also hurt. Turning to individual stocks, the biggest individual contributor was First Solar (+177%), from the semiconductors & semiconductor equipment industry. Also detracting overall were the fund's international holdings, in part due to a foreign exchange impact. SMA Solar Technology (+206%) and Maxeon Solar Technologies (+115%), from the semiconductors & semiconductor equipment group, helped. Other contributors from the capital goods segment were Array Technologies (+104%) and Vestas Wind Systems (+26%). In contrast, the biggest individual detractor was China Longyuan Power (-46%), from the utilities sector. In capital goods, Xinjiang Goldwind S&T (-63%) and Plug Power (-37%) hurt. Jinkosolar Holding, within the semiconductors & semiconductor equipment category, returned -36% and hindered the fund. Another detractor was Northland Power (-28%), a stock in the utilities sector.
The views expressed above reflect those of the portfolio manager(s) only through the end of the period as stated on the cover of this report and do not necessarily represent the views of Fidelity or any other person in the Fidelity organization, or Geode Capital Management, LLC, (the ETF's subadviser) or any other person in the Geode organization. Any such views are subject to change at any time based upon market or other conditions and Fidelity and Geode disclaim any responsibility to update such views. These views may not be relied on as investment advice and, because investment decisions for a Fidelity fund are based on numerous factors, may not be relied on as an indication of trading intent on behalf of any Fidelity fund.
Fidelity® Clean Energy ETF
Top Holdings (% of Fund's net assets) |
| |
| Vestas Wind Systems A/S | 4.1 | |
| ORSTED A/S | 4.0 | |
| Enphase Energy, Inc. | 4.0 | |
| First Solar, Inc. | 3.7 | |
| Plug Power, Inc. | 3.0 | |
| Xinyi Solar Holdings Ltd. | 2.8 | |
| Northland Power, Inc. | 2.5 | |
| Shoals Technologies Group, Inc. | 2.4 | |
| Acciona SA | 2.4 | |
| EDP Renovaveis SA | 2.4 | |
| | 31.3 | |
| |
| Market Sectors (% of Fund's net assets) |
| |
| Utilities | 48.2 | |
| Industrials | 29.2 | |
| Information Technology | 21.2 | |
| Energy | 1.2 | |
| |
Asset Allocation (% of Fund's net assets) |
|
|
Geographic Diversification (% of Fund's net assets) |
|
* Includes Short-Term investments and Net Other Assets (Liabilities). Percentages are adjusted for the effect of derivatives, if applicable. |
| |
Fidelity® Clean Energy ETF
Showing Percentage of Net Assets
| Common Stocks - 99.8% |
| | | Shares | Value ($) |
| ENERGY - 1.2% | | | |
| Oil, Gas & Consumable Fuels - 1.2% | | | |
| Enviva, Inc. | | 41,906 | 454,680 |
| INDUSTRIALS - 29.2% | | | |
| Commercial Services & Supplies - 1.6% | | | |
| China Everbright International Ltd. | | 1,618,000 | 637,983 |
| Construction & Engineering - 2.7% | | | |
| OX2 AB (a) | | 73,523 | 496,221 |
| Xinte Energy Co. Ltd. (H Shares) | | 249,200 | 527,872 |
| | | | 1,024,093 |
| Electrical Equipment - 24.9% | | | |
| Abalance Corp. | | 6,700 | 495,541 |
| Array Technologies, Inc. (a) | | 36,789 | 831,431 |
| Bloom Energy Corp. Class A (a) | | 55,556 | 908,341 |
| CS Wind Corp. | | 11,495 | 752,870 |
| Doosan Fuel Cell Co. Ltd. (a) | | 24,404 | 531,548 |
| Nordex SE (a) | | 53,006 | 643,354 |
| Plug Power, Inc. (a) | | 110,880 | 1,152,043 |
| Shoals Technologies Group, Inc. (a) | | 36,988 | 945,413 |
| Sunrun, Inc. (a) | | 48,776 | 871,139 |
| TPI Composites, Inc. (a) | | 40,589 | 420,908 |
| Vestas Wind Systems A/S (a) | | 59,171 | 1,573,245 |
| Xinjiang Goldwind Science & Technology Co. Ltd. (H Shares) | | 651,800 | 446,643 |
| | | | 9,572,476 |
TOTAL INDUSTRIALS | | | 11,234,552 |
| INFORMATION TECHNOLOGY - 21.2% | | | |
| Electronic Equipment, Instruments & Components - 1.8% | | | |
| Landis+Gyr Group AG | | 8,003 | 687,007 |
| Semiconductors & Semiconductor Equipment - 19.4% | | | |
| Canadian Solar, Inc. (a) | | 17,924 | 693,480 |
| Enphase Energy, Inc. (a) | | 9,157 | 1,533,614 |
| First Solar, Inc. (a) | | 7,508 | 1,427,196 |
| Flat Glass Group Co. Ltd. | | 211,000 | 720,242 |
| JinkoSolar Holdings Co. Ltd. ADR (a) | | 16,143 | 716,426 |
| Maxeon Solar Technologies Ltd. (a) | | 18,742 | 527,775 |
| SMA Solar Technology AG (a) | | 6,418 | 783,528 |
| Xinyi Solar Holdings Ltd. | | 938,000 | 1,083,238 |
| | | | 7,485,499 |
TOTAL INFORMATION TECHNOLOGY | | | 8,172,506 |
| UTILITIES - 48.2% | | | |
| Electric Utilities - 8.6% | | | |
| Acciona SA | | 5,503 | 932,986 |
| ORSTED A/S (b) | | 16,375 | 1,547,082 |
| Verbund AG | | 10,404 | 833,714 |
| | | | 3,313,782 |
| Independent Power and Renewable Electricity Producers - 39.6% | | | |
| Atlantica Sustainable Infrastructure PLC | | 27,202 | 637,615 |
| Boralex, Inc. Class A | | 27,551 | 751,003 |
| Brookfield Renewable Corp. | | 27,229 | 859,928 |
| China Datang Corp. Renewable Power Co. Ltd. | | 1,513,000 | 505,839 |
| China Longyuan Power Grid Corp. Ltd. (H Shares) | | 801,000 | 824,856 |
| Clearway Energy, Inc. Class C | | 26,255 | 749,843 |
| Corp. ACCIONA Energias Renovables SA | | 20,925 | 699,029 |
| Drax Group PLC | | 116,689 | 860,445 |
| EDP Renovaveis SA | | 45,770 | 913,562 |
| Encavis AG | | 43,698 | 716,310 |
| Enlight Renewable Energy Ltd. (a) | | 38,634 | 678,264 |
| ERG SpA | | 23,826 | 701,323 |
| Innergex Renewable Energy, Inc. | | 64,787 | 604,173 |
| Neoen SA (b) | | 24,121 | 763,164 |
| Northland Power, Inc. | | 45,879 | 957,972 |
| Ormat Technologies, Inc. | | 11,084 | 891,819 |
| ReNew Energy Global PLC (a) | | 81,174 | 444,834 |
| RENOVA, Inc. (a) | | 38,600 | 432,643 |
| Solaria Energia y Medio Ambiente SA (a) | | 43,303 | 663,536 |
| Sunnova Energy International, Inc. (a) | | 38,191 | 699,277 |
| TransAlta Renewables, Inc. | | 61,792 | 531,414 |
| West Holdings Corp. | | 21,600 | 372,715 |
| | | | 15,259,564 |
TOTAL UTILITIES | | | 18,573,346 |
| TOTAL COMMON STOCKS (Cost $43,100,424) | | | 38,435,084 |
| | | | |
| TOTAL INVESTMENT IN SECURITIES - 99.8% (Cost $43,100,424) | 38,435,084 |
NET OTHER ASSETS (LIABILITIES) - 0.2% | 68,784 |
| NET ASSETS - 100.0% | 38,503,868 |
| | |
Legend
| (b) | Security exempt from registration under Rule 144A of the Securities Act of 1933. These securities may be resold in transactions exempt from registration, normally to qualified institutional buyers. At the end of the period, the value of these securities amounted to $2,310,246 or 6.0% of net assets. |
Affiliated Central Funds
Fiscal year to date information regarding the Fund's investments in Fidelity Central Funds, including the ownership percentage, is presented below.
| Affiliate | Value, beginning of period ($) | Purchases ($) | Sales Proceeds ($) | Dividend Income ($) | Realized Gain (loss) ($) | Change in Unrealized appreciation (depreciation) ($) | Value, end of period ($) | % ownership, end of period |
| Fidelity Cash Central Fund 5.14% | - | 3,930,285 | 3,930,285 | 996 | - | - | - | 0.0% |
| Total | - | 3,930,285 | 3,930,285 | 996 | - | - | - | |
| | | | | | | | | |
Amounts in the dividend income column in the above table include any capital gain distributions from underlying funds, which are presented in the corresponding line item in the Statement of Operations, if applicable.
Amounts included in the purchases and sales proceeds columns may include in-kind transactions, if applicable.
Investment Valuation
The following is a summary of the inputs used, as of June 30, 2023, involving the Fund's assets and liabilities carried at fair value. The inputs or methodology used for valuing securities may not be an indication of the risk associated with investing in those securities. For more information on valuation inputs, and their aggregation into the levels used below, please refer to the Investment Valuation section in the accompanying Notes to Financial Statements.
| Valuation Inputs at Reporting Date: |
| Description | Total ($) | Level 1 ($) | Level 2 ($) | Level 3 ($) |
Investments in Securities: | | | | |
|
| Equities: | | | | |
Energy | 454,680 | 454,680 | - | - |
Industrials | 11,234,552 | 11,234,552 | - | - |
Information Technology | 8,172,506 | 8,172,506 | - | - |
Utilities | 18,573,346 | 18,573,346 | - | - |
| | | | | |
| Total Investments in Securities: | 38,435,084 | 38,435,084 | - | - |
Fidelity® Clean Energy ETF
| Statement of Assets and Liabilities |
| | | | June 30, 2023 |
| | | | | |
| Assets | | | | |
Investment in securities, at value - See accompanying schedule Unaffiliated issuers (cost $43,100,424): | | | $ | 38,435,084 |
| Foreign currency held at value (cost $23,697) | | | | 23,740 |
| Receivable for investments sold | | | | 10,770 |
| Dividends receivable | | | | 47,996 |
| Distributions receivable from Fidelity Central Funds | | | | 99 |
Total assets | | | | 38,517,689 |
| Liabilities | | | | |
| Payable to custodian bank | $ | 1,221 | | |
| Accrued management fee | | 12,600 | | |
| Total Liabilities | | | | 13,821 |
| Net Assets | | | $ | 38,503,868 |
| Net Assets consist of: | | | | |
| Paid in capital | | | $ | 46,237,086 |
| Total accumulated earnings (loss) | | | | (7,733,218) |
| Net Assets | | | $ | 38,503,868 |
Net Asset Value , offering price and redemption price per share ($38,503,868 ÷ 1,850,000 shares) | | | $ | 20.81 |
| Statement of Operations |
| | | | Year ended June 30, 2023 |
| Investment Income | | | | |
| Dividends | | | $ | 471,225 |
| Income from Fidelity Central Funds | | | | 996 |
| Income before foreign taxes withheld | | | $ | 472,221 |
| Less foreign taxes withheld | | | | (54,132) |
| Total Income | | | | 418,089 |
| Expenses | | | | |
| Management fee | $ | 150,620 | | |
| Independent trustees' fees and expenses | | 180 | | |
| Total expenses before reductions | | 150,800 | | |
| Expense reductions | | (127) | | |
| Total expenses after reductions | | | | 150,673 |
| Net Investment income (loss) | | | | 267,416 |
| Realized and Unrealized Gain (Loss) | | | | |
| Net realized gain (loss) on: | | | | |
| Investment Securities: | | | | |
| Redemptions in-kind | | 339,151 | | |
| Unaffiliated issuers | | (2,068,472) | | |
| Foreign currency transactions | | 407 | | |
| Total net realized gain (loss) | | | | (1,728,914) |
| Change in net unrealized appreciation (depreciation) on: | | | | |
| Investment Securities: | | | | |
| Unaffiliated issuers | | (194,650) | | |
| Assets and liabilities in foreign currencies | | 4,558 | | |
| Total change in net unrealized appreciation (depreciation) | | | | (190,092) |
| Net gain (loss) | | | | (1,919,006) |
| Net increase (decrease) in net assets resulting from operations | | | $ | (1,651,590) |
| Statement of Changes in Net Assets |
| |
| | Year ended June 30, 2023 | | For the period October 5, 2021 (commencement of operations) through June 30, 2022 |
| Increase (Decrease) in Net Assets | | | | |
| Operations | | | | |
| Net investment income (loss) | $ | 267,416 | $ | 144,270 |
| Net realized gain (loss) | | (1,728,914) | | (1,012,499) |
| Change in net unrealized appreciation (depreciation) | | (190,092) | | (4,471,106) |
| Net increase (decrease) in net assets resulting from operations | | (1,651,590) | | (5,339,335) |
| Distributions to shareholders | | (306,800) | | (145,750) |
| | | | | |
| Share transactions | | | | |
| Proceeds from sales of shares | | 14,295,218 | | 33,772,796 |
| Cost of shares redeemed | | (2,120,671) | | - |
| | | | | |
Net increase (decrease) in net assets resulting from share transactions | | 12,174,547 | | 33,772,796 |
| Total increase (decrease) in net assets | | 10,216,157 | | 28,287,711 |
| | | | | |
| Net Assets | | | | |
| Beginning of period | | 28,287,711 | | - |
| End of period | $ | 38,503,868 | $ | 28,287,711 |
| | | | | |
| Other Information | | | | |
| Shares | | | | |
| Sold | | 600,000 | | 1,350,000 |
| Redeemed | | (100,000) | | - |
| Net increase (decrease) | | 500,000 | | 1,350,000 |
| | | | | |
| Fidelity® Clean Energy ETF |
| |
| Years ended June 30, | | 2023 | | 2022 A |
Selected Per-Share Data | | | | |
| Net asset value, beginning of period | $ | 20.95 | $ | 25.12 |
| Income from Investment Operations | | | | |
Net investment income (loss) B,C | | .15 | | .15 |
| Net realized and unrealized gain (loss) | | (.12) | | (4.20) |
| Total from investment operations | | .03 | | (4.05) |
| Distributions from net investment income | | (.17) | | (.12) |
| Total distributions | | (.17) | | (.12) |
| Net asset value, end of period | $ | 20.81 | $ | 20.95 |
Total Return D,E,F | | .10% | | (16.12)% |
Ratios to Average Net Assets C,G,H | | | | |
| Expenses before reductions | | .39% | | .39% I |
| Expenses net of fee waivers, if any | | .39% | | .39% I |
| Expenses net of all reductions | | .39% | | .39% I |
| Net investment income (loss) | | .69% | | .90% I |
| Supplemental Data | | | | |
| Net assets, end of period (000 omitted) | $ | 38,504 | $ | 28,288 |
Portfolio turnover rate J,K | | 37% | | 30% L |
A For the period October 5, 2021 (commencement of operations) through June 30, 2022.
B Calculated based on average shares outstanding during the period.
C Net investment income (loss) is affected by the timing of the declaration of dividends by any underlying mutual funds or exchange-traded funds (ETFs). Net investment income (loss) of any mutual funds or ETFs is not included in the Fund's net investment income (loss) ratio.
D Total returns for periods of less than one year are not annualized.
E Based on net asset value.
F Total returns would have been lower if certain expenses had not been reduced during the applicable periods shown.
G Fees and expenses of any underlying mutual funds or exchange-traded funds (ETFs) are not included in the Fund's expense ratio. The Fund indirectly bears its proportionate share of these expenses. For additional expense information related to investments in Fidelity Central Funds, please refer to the "Investments in Fidelity Central Funds" note found in the Notes to Financial Statements section of the most recent Annual or Semi-Annual report.
H Expense ratios reflect operating expenses of the class. Expenses before reductions do not reflect amounts reimbursed, waived, or reduced through arrangements with the investment adviser, brokerage services, or other offset arrangements, if applicable, and do not represent the amount paid by the class during periods when reimbursements, waivers or reductions occur.
I Annualized.
J Portfolio turnover rate excludes securities received or delivered in-kind.
K Amount does not include the portfolio activity of any underlying mutual funds or exchange-traded funds (ETFs).
L Amount not annualized.
NAV and closing market price average annual returns reflect the change in the value of an investment, assuming reinvestment of distributions from dividend income and capital gains (the profits earned upon the sale of securities that have grown in value, if any) at NAV and Market Price, respectively, and assumes a constant rate of performance each year. The hypothetical investment and the fund's returns do not reflect the deduction of taxes that a shareholder would pay on fund distributions or the redemption or selling of fund shares. How a fund did yesterday is no guarantee of how it will do tomorrow.
| Average Annual Total Returns |
| | | | |
Periods ended June 30, 2023 | Past 1 year | Life of Fund A |
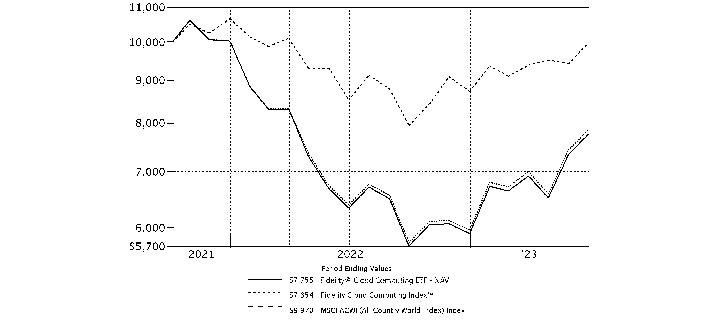
| Fidelity® Cloud Computing ETF - NAV | 22.51% | -13.63% |
Fidelity® Cloud Computing ETF - Market Price B | 23.12% | -14.34% |
| Fidelity Cloud Computing Index℠ | 23.00% | -13.00% |
| MSCI ACWI (All Country World Index) Index | 16.97% | -0.17% |
A From October 5, 2021
B From October 7, 2021, date initially listed on the CboeBZX Exchange, Inc.
| $10,000 Over Life of Fund |
| |
Let's say hypothetically that $10,000 was invested in Fidelity® Cloud Computing ETF - NAV, on October 5, 2021, when the fund started. The chart shows how the value of your investment would have changed, and also shows how the Fidelity Cloud Computing Index℠ and MSCI ACWI (All Country World Index) Index performed over the same period. |
|
|
Fidelity® Cloud Computing ETF
Market Recap:
U.S. equities gained 19.59% for the 12 months ending June 30, 2023, according to the S&P 500 ® index, as continued global economic expansion, falling commodity prices and a slowing in the pace of inflation provided a favorable backdrop for risk assets. U.S. large-cap stocks spearheaded the rally, which was driven by the shares of a narrow set of mega-cap companies in the information technology and communication services sectors, largely due to exuberance related to artificial intelligence. Aggressive policy tightening by the U.S. Federal Reserve continued amid consistent pressure on core inflation, a measure that excludes food and energy. Since March 2022, the Fed has hiked its benchmark interest rate 10 times, while also shrinking its massive asset portfolio. The latest bump came in early May, a third consecutive raise of a stepped down 25 basis points. In June, the Fed held interest rates steady and signaled it was prepared to raise rates next month if the economy and inflation don't cool more. The S&P 500® gained 6.61% for the month, raising hopes for a "soft landing" of the economy and bringing the index's year-to-date result to 16.89%. June saw the return of market breadth and lower dispersion. Smaller-cap stocks had a particularly strong month, achieving the best result for the category since January. For the full 12 months, value (+20%) topped growth (+18%). By sector, tech (+42%), consumer discretionary and industrials (+25% each) led, while real estate and utilities (-4% each) lagged.
Comments from the Geode Capital Management, LLC, passive equity index team:
For the fiscal year ending June 30, 2023, the exchange traded fund's (ETF) net asset value returned 22.51% and its market price returned 23.12%, roughly in line with the 23.00% advance of the benchmark Fidelity Cloud Computing Index NR. By region, the U.S. gained 23% and contributed most, followed by Europe ex U.K., primarily driven by Germany (+51%). By sector, information technology gained 24% and contributed most, driven by the software & services industry (+26%). Real estate stocks also helped (+8%), benefiting from the equity real estate investment trusts industry (+8%). The consumer discretionary sector rose roughly 19%, boosted by the consumer services industry (+19%). In contrast, emerging markets returned -35% and was a notable detractor. Also detracting overall were the fund's international holdings, in part due to a foreign exchange impact. Turning to individual stocks, the biggest individual contributor was SAP (+53%), from the software & services segment. Also in software & services, Mongodb (+58%), Hubspot (+77%), Workday (+62%), and Nutanix (+93%) all benefited the fund. In contrast, the biggest individual detractor was Zoom Video Communications (-37%), from the software & services industry. Also in software & services, Kingdee International Software Group (-42%), Twilio (-24%), Vnet (-46%), and Liveperson (-59%) all hurt the fund.
The views expressed above reflect those of the portfolio manager(s) only through the end of the period as stated on the cover of this report and do not necessarily represent the views of Fidelity or any other person in the Fidelity organization, or Geode Capital Management, LLC, (the ETF's subadviser) or any other person in the Geode organization. Any such views are subject to change at any time based upon market or other conditions and Fidelity and Geode disclaim any responsibility to update such views. These views may not be relied on as investment advice and, because investment decisions for a Fidelity fund are based on numerous factors, may not be relied on as an indication of trading intent on behalf of any Fidelity fund.
Fidelity® Cloud Computing ETF
Top Holdings (% of Fund's net assets) |
| |
| Oracle Corp. | 4.8 | |
| SAP SE | 4.5 | |
| Salesforce, Inc. | 4.3 | |
| ServiceNow, Inc. | 4.3 | |
| Equinix, Inc. | 3.7 | |
| Snowflake, Inc. | 3.3 | |
| MongoDB, Inc. Class A | 3.3 | |
| Workday, Inc. Class A | 3.2 | |
| Digital Realty Trust, Inc. | 2.9 | |
| VMware, Inc. Class A | 2.8 | |
| | 37.1 | |
| |
| Market Sectors (% of Fund's net assets) |
| |
| Information Technology | 93.3 | |
| Real Estate | 6.6 | |
| |
Asset Allocation (% of Fund's net assets) |
|
Futures - 0.1% |
|
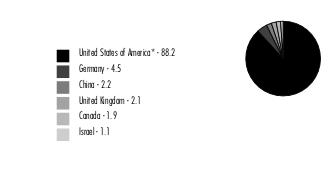
Geographic Diversification (% of Fund's net assets) |
|
* Includes Short-Term investments and Net Other Assets (Liabilities). Percentages are adjusted for the effect of derivatives, if applicable. |
| |
Fidelity® Cloud Computing ETF
Showing Percentage of Net Assets
| Common Stocks - 99.9% |
| | | Shares | Value ($) |
| INFORMATION TECHNOLOGY - 93.3% | | | |
| IT Services - 11.4% | | | |
| Digitalocean Holdings, Inc. (a) | | 10,696 | 429,337 |
| Fastly, Inc. Class A (a) | | 23,689 | 373,576 |
| Kingsoft Cloud Holdings Ltd. (a) | | 794,000 | 325,235 |
| MongoDB, Inc. Class A (a) | | 2,940 | 1,208,311 |
| Snowflake, Inc. (a) | | 6,871 | 1,209,159 |
| Twilio, Inc. Class A (a) | | 10,690 | 680,098 |
| | | | 4,225,716 |
| Software - 69.1% | | | |
| Alteryx, Inc. Class A (a) | | 10,179 | 462,127 |
| Atlassian Corp. PLC (a) | | 5,331 | 894,595 |
| Box, Inc. Class A (a) | | 17,794 | 522,788 |
| C3.ai, Inc. (a) | | 13,097 | 477,124 |
| CommVault Systems, Inc. (a) | | 6,627 | 481,253 |
| Confluent, Inc. (a) | | 16,680 | 588,971 |
| Datadog, Inc. Class A (a) | | 9,555 | 940,021 |
| Dropbox, Inc. Class A (a) | | 25,146 | 670,644 |
| Dynatrace, Inc. (a) | | 13,711 | 705,705 |
| Elastic NV (a) | | 7,820 | 501,418 |
| Five9, Inc. (a) | | 7,958 | 656,137 |
| GitLab, Inc. (a) | | 11,560 | 590,832 |
| HubSpot, Inc. (a) | | 1,791 | 952,973 |
| Informatica, Inc. (a) | | 15,676 | 290,006 |
| JFrog Ltd. (a) | | 14,931 | 413,589 |
| Kingdee International Software Group Co. Ltd. (a) | | 363,500 | 486,114 |
| LivePerson, Inc. (a) | | 55,755 | 252,013 |
| MicroStrategy, Inc. Class A (a) | | 1,500 | 513,630 |
| New Relic, Inc. (a) | | 7,282 | 476,534 |
| Nutanix, Inc. Class A (a) | | 20,147 | 565,123 |
| Open Text Corp. | | 17,098 | 711,959 |
| Oracle Corp. | | 15,014 | 1,788,015 |
| Pegasystems, Inc. | | 8,287 | 408,549 |
| Sage Group PLC | | 66,539 | 782,329 |
| Salesforce, Inc. (a) | | 7,474 | 1,578,957 |
| SAP SE | | 12,067 | 1,647,480 |
| ServiceNow, Inc. (a) | | 2,795 | 1,570,706 |
| SolarWinds, Inc. (a) | | 25,656 | 263,231 |
| Splunk, Inc. (a) | | 7,664 | 813,074 |
| Teradata Corp. (a) | | 11,361 | 606,791 |
| UiPath, Inc. Class A (a) | | 32,647 | 540,961 |
| Verint Systems, Inc. (a) | | 11,702 | 410,272 |
| VMware, Inc. Class A (a) | | 7,169 | 1,030,114 |
| Workday, Inc. Class A (a) | | 5,170 | 1,167,851 |
| Zoom Video Communications, Inc. Class A (a) | | 11,421 | 775,257 |
| | | | 25,537,143 |
| Technology Hardware, Storage & Peripherals - 12.8% | | | |
| Hewlett Packard Enterprise Co. | | 57,374 | 963,883 |
| NetApp, Inc. | | 10,970 | 838,108 |
| Pure Storage, Inc. Class A (a) | | 19,725 | 726,275 |
| Seagate Technology Holdings PLC | | 11,746 | 726,725 |
| Super Micro Computer, Inc. (a) | | 3,026 | 754,231 |
| Western Digital Corp. (a) | | 18,821 | 713,881 |
| | | | 4,723,103 |
TOTAL INFORMATION TECHNOLOGY | | | 34,485,962 |
| REAL ESTATE - 6.6% | | | |
| Equity Real Estate Investment Trusts (REITs) - 6.6% | | | |
| Digital Realty Trust, Inc. | | 9,399 | 1,070,264 |
| Equinix, Inc. | | 1,729 | 1,355,432 |
| | | | 2,425,696 |
| TOTAL COMMON STOCKS (Cost $37,125,287) | | | 36,911,658 |
| | | | |
| Money Market Funds - 0.1% |
| | | Shares | Value ($) |
Fidelity Cash Central Fund 5.14% (b) (Cost $13,981) | | 13,979 | 13,981 |
| | | | |
| TOTAL INVESTMENT IN SECURITIES - 100.0% (Cost $37,139,268) | 36,925,639 |
NET OTHER ASSETS (LIABILITIES) - 0.0% | 11,909 |
| NET ASSETS - 100.0% | 36,937,548 |
| | |
| Futures Contracts |
| | Number of contracts | Expiration Date | Notional Amount ($) | Value ($) | Unrealized Appreciation/ (Depreciation) ($) |
| Purchased | | | | | |
| | | | | | |
| Equity Index Contracts | | | | | |
| CME E-mini NASDAQ 100 Index Contracts (United States) | 1 | Sep 2023 | 30,674 | 1,196 | 1,196 |
| | | | | | |
| The notional amount of futures purchased as a percentage of Net Assets is 0.1% |
Legend
| (b) | Affiliated fund that is generally available only to investment companies and other accounts managed by Fidelity Investments. The rate quoted is the annualized seven-day yield of the fund at period end. A complete unaudited listing of the fund's holdings as of its most recent quarter end is available upon request. In addition, each Fidelity Central Fund's financial statements, which are not covered by the Fund's Report of Independent Registered Public Accounting Firm, are available on the SEC's website or upon request. |
Affiliated Central Funds
Fiscal year to date information regarding the Fund's investments in Fidelity Central Funds, including the ownership percentage, is presented below.
| Affiliate | Value, beginning of period ($) | Purchases ($) | Sales Proceeds ($) | Dividend Income ($) | Realized Gain (loss) ($) | Change in Unrealized appreciation (depreciation) ($) | Value, end of period ($) | % ownership, end of period |
| Fidelity Cash Central Fund 5.14% | - | 1,690,166 | 1,676,185 | 641 | - | - | 13,981 | 0.0% |
| Total | - | 1,690,166 | 1,676,185 | 641 | - | - | 13,981 | |
| | | | | | | | | |
Amounts in the dividend income column in the above table include any capital gain distributions from underlying funds, which are presented in the corresponding line item in the Statement of Operations, if applicable.
Amounts included in the purchases and sales proceeds columns may include in-kind transactions, if applicable.
Investment Valuation
The following is a summary of the inputs used, as of June 30, 2023, involving the Fund's assets and liabilities carried at fair value. The inputs or methodology used for valuing securities may not be an indication of the risk associated with investing in those securities. For more information on valuation inputs, and their aggregation into the levels used below, please refer to the Investment Valuation section in the accompanying Notes to Financial Statements.
| Valuation Inputs at Reporting Date: |
| Description | Total ($) | Level 1 ($) | Level 2 ($) | Level 3 ($) |
Investments in Securities: | | | | |
|
| Equities: | | | | |
Information Technology | 34,485,962 | 34,485,962 | - | - |
Real Estate | 2,425,696 | 2,425,696 | - | - |
|
| Money Market Funds | 13,981 | 13,981 | - | - |
| Total Investments in Securities: | 36,925,639 | 36,925,639 | - | - |
Derivative Instruments: | | | | |
|
| Assets | | | | |
Futures Contracts | 1,196 | 1,196 | - | - |
| Total Assets | 1,196 | 1,196 | - | - |
| Total Derivative Instruments: | 1,196 | 1,196 | - | - |
Value of Derivative Instruments
The following table is a summary of the Fund's value of derivative instruments by primary risk exposure as of June 30, 2023. For additional information on derivative instruments, please refer to the Derivative Instruments section in the accompanying Notes to Financial Statements.
Primary Risk Exposure / Derivative Type | Value |
| Asset ($) | Liability ($) |
| Equity Risk | | |
Futures Contracts (a) | 1,196 | 0 |
| Total Equity Risk | 1,196 | 0 |
| Total Value of Derivatives | 1,196 | 0 |
(a)Reflects gross cumulative appreciation (depreciation) on futures contracts as presented in the Schedule of Investments. In the Statement of Assets and Liabilities, the period end daily variation margin is included in receivable or payable for daily variation margin on futures contracts, and the net cumulative appreciation (depreciation) is included in Total accumulated earnings (loss).
Fidelity® Cloud Computing ETF
| Statement of Assets and Liabilities |
| | | | June 30, 2023 |
| | | | | |
| Assets | | | | |
| Investment in securities, at value - See accompanying schedule: | | | | |
Unaffiliated issuers (cost $37,125,287) | $ | 36,911,658 | | |
Fidelity Central Funds (cost $13,981) | | 13,981 | | |
| | | | | |
| | | | | |
| Total Investment in Securities (cost $37,139,268) | | | $ | 36,925,639 |
| Segregated cash with brokers for derivative instruments | | | | 1,680 |
| Cash | | | | 13,115 |
| Foreign currency held at value (cost $926) | | | | 926 |
| Dividends receivable | | | | 19,303 |
| Distributions receivable from Fidelity Central Funds | | | | 146 |
| Receivable for daily variation margin on futures contracts | | | | 474 |
| Other receivables | | | | 3,800 |
Total assets | | | | 36,965,083 |
| Liabilities | | | | |
| Payable for investments purchased | $ | 16,915 | | |
| Accrued management fee | | 10,620 | | |
| Total Liabilities | | | | 27,535 |
| Net Assets | | | $ | 36,937,548 |
| Net Assets consist of: | | | | |
| Paid in capital | | | $ | 41,983,301 |
| Total accumulated earnings (loss) | | | | (5,045,753) |
| Net Assets | | | $ | 36,937,548 |
Net Asset Value , offering price and redemption price per share ($36,937,548 ÷ 1,900,000 shares) | | | $ | 19.44 |
| Statement of Operations |
| | | | Year ended June 30, 2023 |
| Investment Income | | | | |
| Dividends | | | $ | 140,919 |
| Income from Fidelity Central Funds | | | | 641 |
| Total Income | | | | 141,560 |
| Expenses | | | | |
| Management fee | $ | 89,538 | | |
| Independent trustees' fees and expenses | | 107 | | |
| Total expenses before reductions | | 89,645 | | |
| Expense reductions | | (185) | | |
| Total expenses after reductions | | | | 89,460 |
| Net Investment income (loss) | | | | 52,100 |
| Realized and Unrealized Gain (Loss) | | | | |
| Net realized gain (loss) on: | | | | |
| Investment Securities: | | | | |
| Unaffiliated issuers | | (3,452,291) | | |
| Foreign currency transactions | | (7,489) | | |
| Futures contracts | | 6,228 | | |
| Total net realized gain (loss) | | | | (3,453,552) |
| Change in net unrealized appreciation (depreciation) on: | | | | |
| Investment Securities: | | | | |
| Unaffiliated issuers | | 8,600,221 | | |
| Assets and liabilities in foreign currencies | | 173 | | |
| Futures contracts | | 1,196 | | |
| Total change in net unrealized appreciation (depreciation) | | | | 8,601,590 |
| Net gain (loss) | | | | 5,148,038 |
| Net increase (decrease) in net assets resulting from operations | | | $ | 5,200,138 |
| Statement of Changes in Net Assets |
| |
| | Year ended June 30, 2023 | | For the period October 5, 2021 (commencement of operations) through June 30, 2022 |
| Increase (Decrease) in Net Assets | | | | |
| Operations | | | | |
| Net investment income (loss) | $ | 52,100 | $ | 55,996 |
| Net realized gain (loss) | | (3,453,552) | | (1,531,664) |
| Change in net unrealized appreciation (depreciation) | | 8,601,590 | | (8,813,883) |
| Net increase (decrease) in net assets resulting from operations | | 5,200,138 | | (10,289,551) |
| Distributions to shareholders | | (48,880) | | (57,350) |
| Distributions to shareholders from tax return of capital | | (14,820) | | - |
| | | | | |
| Total Distributions | | (63,700) | | (57,350) |
| Share transactions | | | | |
| Proceeds from sales of shares | | 13,508,181 | | 29,456,208 |
| Cost of shares redeemed | | - | | (816,378) |
| | | | | |
Net increase (decrease) in net assets resulting from share transactions | | 13,508,181 | | 28,639,830 |
| Total increase (decrease) in net assets | | 18,644,619 | | 18,292,929 |
| | | | | |
| Net Assets | | | | |
| Beginning of period | | 18,292,929 | | - |
| End of period | $ | 36,937,548 | $ | 18,292,929 |
| | | | | |
| Other Information | | | | |
| Shares | | | | |
| Sold | | 750,000 | | 1,200,000 |
| Redeemed | | - | | (50,000) |
| Net increase (decrease) | | 750,000 | | 1,150,000 |
| | | | | |
| Fidelity® Cloud Computing ETF |
| |
| Years ended June 30, | | 2023 | | 2022 A |
Selected Per-Share Data | | | | |
| Net asset value, beginning of period | $ | 15.91 | $ | 25.20 |
| Income from Investment Operations | | | | |
Net investment income (loss) B,C | | .04 | | .06 |
| Net realized and unrealized gain (loss) | | 3.53 | | (9.29) |
| Total from investment operations | | 3.57 | | (9.23) |
| Distributions from net investment income | | (.03) | | (.06) |
| Tax return of capital | | (.01) | | - |
| Total distributions | | (.04) | | (.06) |
| Net asset value, end of period | $ | 19.44 | $ | 15.91 |
Total Return D,E,F | | 22.51% | | (36.69)% |
Ratios to Average Net Assets C,G,H | | | | |
| Expenses before reductions | | .39% | | .39% I |
| Expenses net of fee waivers, if any | | .39% | | .39% I |
| Expenses net of all reductions | | .39% | | .39% I |
| Net investment income (loss) | | .23% | | .41% I |
| Supplemental Data | | | | |
| Net assets, end of period (000 omitted) | $ | 36,938 | $ | 18,293 |
Portfolio turnover rate J,K | | 38% | | 31% L |
A For the period October 5, 2021 (commencement of operations) through June 30, 2022.
B Calculated based on average shares outstanding during the period.
C Net investment income (loss) is affected by the timing of the declaration of dividends by any underlying mutual funds or exchange-traded funds (ETFs). Net investment income (loss) of any mutual funds or ETFs is not included in the Fund's net investment income (loss) ratio.
D Total returns for periods of less than one year are not annualized.
E Total returns would have been lower if certain expenses had not been reduced during the applicable periods shown.
F Based on net asset value.
G Fees and expenses of any underlying mutual funds or exchange-traded funds (ETFs) are not included in the Fund's expense ratio. The Fund indirectly bears its proportionate share of these expenses. For additional expense information related to investments in Fidelity Central Funds, please refer to the "Investments in Fidelity Central Funds" note found in the Notes to Financial Statements section of the most recent Annual or Semi-Annual report.
H Expense ratios reflect operating expenses of the class. Expenses before reductions do not reflect amounts reimbursed, waived, or reduced through arrangements with the investment adviser, brokerage services, or other offset arrangements, if applicable, and do not represent the amount paid by the class during periods when reimbursements, waivers or reductions occur.
I Annualized.
J Portfolio turnover rate excludes securities received or delivered in-kind.
K Amount does not include the portfolio activity of any underlying mutual funds or exchange-traded funds (ETFs).
L Amount not annualized.
NAV and closing market price average annual returns reflect the change in the value of an investment, assuming reinvestment of distributions from dividend income and capital gains (the profits earned upon the sale of securities that have grown in value, if any) at NAV and Market Price, respectively, and assumes a constant rate of performance each year. The hypothetical investment and the fund's returns do not reflect the deduction of taxes that a shareholder would pay on fund distributions or the redemption or selling of fund shares. How a fund did yesterday is no guarantee of how it will do tomorrow.
| Average Annual Total Returns |
| | | | |
Periods ended June 30, 2023 | Past 1 year | Life of Fund A |
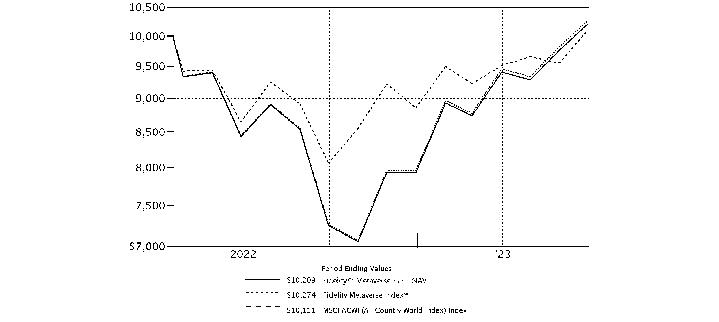
| Fidelity® Crypto Industry and Digital Payments ETF - NAV | 54.94% | -21.80% |
Fidelity® Crypto Industry and Digital Payments ETF - Market Price B | 56.21% | -15.03% |
| Fidelity Crypto Industry and Digital Payments Index℠ | 55.43% | -21.54% |
| MSCI ACWI (All Country World Index) Index | 16.97% | 0.92% |
A From April 19, 2022
B From April 21, 2022, date initially listed on The Nasdaq Stock Market exchange.
| $10,000 Over Life of Fund |
| |
Let's say hypothetically that $10,000 was invested in Fidelity® Crypto Industry and Digital Payments ETF - NAV, on April 19, 2022, when the fund started. The chart shows how the value of your investment would have changed, and also shows how the Fidelity Crypto Industry and Digital Payments Index℠ and MSCI ACWI (All Country World Index) Index performed over the same period. |
|
|
Fidelity® Crypto Industry and Digital Payments ETF
Market Recap:
U.S. equities gained 19.59% for the 12 months ending June 30, 2023, according to the S&P 500 ® index, as continued global economic expansion, falling commodity prices and a slowing in the pace of inflation provided a favorable backdrop for risk assets. U.S. large-cap stocks spearheaded the rally, which was driven by the shares of a narrow set of mega-cap companies in the information technology and communication services sectors, largely due to exuberance related to artificial intelligence. Aggressive policy tightening by the U.S. Federal Reserve continued amid consistent pressure on core inflation, a measure that excludes food and energy. Since March 2022, the Fed has hiked its benchmark interest rate 10 times, while also shrinking its massive asset portfolio. The latest bump came in early May, a third consecutive raise of a stepped down 25 basis points. In June, the Fed held interest rates steady and signaled it was prepared to raise rates next month if the economy and inflation don't cool more. The S&P 500® gained 6.61% for the month, raising hopes for a "soft landing" of the economy and bringing the index's year-to-date result to 16.89%. June saw the return of market breadth and lower dispersion. Smaller-cap stocks had a particularly strong month, achieving the best result for the category since January. For the full 12 months, value (+20%) topped growth (+18%). By sector, tech (+42%), consumer discretionary and industrials (+25% each) led, while real estate and utilities (-4% each) lagged.
Comments from the Geode Capital Management, LLC, passive equity index team:
For the fiscal year ending June 30, 2023, the exchange-traded fund's (ETF) net asset value returned 54.94% and its market price returned 56.21%, roughly in line with the 55.43% advance of the benchmark Fidelity Crypto Industry and Digital Payments Net Index. By region, the U.S. gained 59% and contributed most, followed by Canada (+82%). By sector, information technology advanced 123% and contributed most, driven by the software & services industry (+123%). Financials stocks also helped (+19%), benefiting from the financial services industry (+19%). Conversely, emerging markets returned -12% and was a notable detractor. From a sector standpoint, stocks in the consumer discretionary sector returned -57% and detracted. Turning to individual stocks, the biggest individual contributor was Marathon Digital Holdings (+156%), from the software & services industry. Also in software & services, Riot Platforms (+174%), Hut (+143%), and Applied Digital (+360%) helped. Coinbase Global, within the financial services category, gained about 51% and boosted the fund. Conversely, the biggest individual detractor was Bakkt Holdings (-41%), from the financial services segment. Also in financial services, Dlocal (-54%) and Marqeta (-40%) hurt. Bit Digital, within the software & services group, returned roughly -44% and hindered the fund. Another detractor was Mullen Automotive (-57%), a stock in the automobiles & components category.
The views expressed above reflect those of the portfolio manager(s) only through the end of the period as stated on the cover of this report and do not necessarily represent the views of Fidelity or any other person in the Fidelity organization, or Geode Capital Management, LLC, (the ETF's subadviser) or any other person in the Geode organization. Any such views are subject to change at any time based upon market or other conditions and Fidelity and Geode disclaim any responsibility to update such views. These views may not be relied on as investment advice and, because investment decisions for a Fidelity fund are based on numerous factors, may not be relied on as an indication of trading intent on behalf of any Fidelity fund.
Fidelity® Crypto Industry and Digital Payments ETF
Top Holdings (% of Fund's net assets) |
| |
| Coinbase Global, Inc. | 16.0 | |
| Marathon Digital Holdings, Inc. | 13.3 | |
| Riot Platforms, Inc. | 8.1 | |
| Hut 8 Mining Corp. | 5.8 | |
| Cleanspark, Inc. | 4.0 | |
| Applied Digital Corp. | 3.8 | |
| Bit Digital, Inc. | 3.5 | |
| HIVE Blockchain Technologies Ltd. | 3.1 | |
| Bitfarms Ltd. | 2.9 | |
| TeraWulf, Inc. | 2.5 | |
| | 63.0 | |
| |
| Market Sectors (% of Fund's net assets) |
| |
| Information Technology | 53.5 | |
| Financials | 46.5 | |
| |
Asset Allocation (% of Fund's net assets) |
|
|
Geographic Diversification (% of Fund's net assets) |
|
* Includes Short-Term investments and Net Other Assets (Liabilities). Percentages are adjusted for the effect of derivatives, if applicable. |
| |
Fidelity® Crypto Industry and Digital Payments ETF
Showing Percentage of Net Assets
| Common Stocks - 100.0% |
| | | Shares | Value ($) |
| FINANCIALS - 46.5% | | | |
| Capital Markets - 19.8% | | | |
| Bakkt Holdings, Inc. Class A (a) | | 521,342 | 641,251 |
| Coinbase Global, Inc. (a) | | 81,380 | 5,822,738 |
| Galaxy Digital Holdings Ltd. (a) | | 177,912 | 770,403 |
| | | | 7,234,392 |
| Consumer Finance - 0.9% | | | |
| Green Dot Corp. Class A (a) | | 17,558 | 329,037 |
| Financial Services - 25.8% | | | |
| Cielo SA | | 548,400 | 521,799 |
| Dlocal Ltd. (a) | | 41,828 | 510,511 |
| Edenred SA | | 8,126 | 543,808 |
| FleetCor Technologies, Inc. (a) | | 2,454 | 616,150 |
| Flywire Corp. (a) | | 16,675 | 517,592 |
| Global Payments, Inc. | | 5,660 | 557,623 |
| GMO Payment Gateway, Inc. | | 5,600 | 433,943 |
| Marqeta, Inc. Class A (a) | | 109,657 | 534,030 |
| MasterCard, Inc. Class A | | 1,508 | 593,096 |
| Network International Holdings PLC (a)(b) | | 89,887 | 438,370 |
| Nexi SpA (a)(b) | | 63,371 | 496,547 |
| Nuvei Corp. (a)(b) | | 12,709 | 375,678 |
| Payoneer Global, Inc. (a) | | 93,834 | 451,342 |
| Shift4 Payments, Inc. (a) | | 8,734 | 593,126 |
| StoneCo Ltd. Class A (a) | | 42,649 | 543,348 |
| Visa, Inc. Class A | | 2,470 | 586,576 |
| WEX, Inc. (a) | | 3,304 | 601,559 |
| Worldline SA (a)(b) | | 12,956 | 473,522 |
| | | | 9,388,620 |
TOTAL FINANCIALS | | | 16,952,049 |
| INFORMATION TECHNOLOGY - 53.5% | | | |
| IT Services - 1.7% | | | |
| Shopify, Inc. Class A (a) | | 9,651 | 623,455 |
| Software - 51.8% | | | |
| Applied Digital Corp. (a) | | 149,024 | 1,393,374 |
| Bit Digital, Inc. (a) | | 315,304 | 1,280,134 |
| Bitfarms Ltd. (a) | | 728,204 | 1,070,460 |
| Cipher Mining, Inc. (a) | | 301,587 | 862,539 |
| Cleanspark, Inc. (a) | | 337,880 | 1,449,505 |
| HIVE Blockchain Technologies Ltd. (a) | | 243,710 | 1,128,377 |
| Hut 8 Mining Corp. (a) | | 642,526 | 2,120,336 |
| Iris Energy Ltd. (a) | | 183,765 | 856,345 |
| Marathon Digital Holdings, Inc. (a) | | 349,393 | 4,842,587 |
| Riot Platforms, Inc. (a) | | 250,473 | 2,960,591 |
| TeraWulf, Inc. (a) | | 525,030 | 918,803 |
| | | | 18,883,051 |
TOTAL INFORMATION TECHNOLOGY | | | 19,506,506 |
| TOTAL COMMON STOCKS (Cost $27,558,125) | | | 36,458,555 |
| | | | |
| TOTAL INVESTMENT IN SECURITIES - 100.0% (Cost $27,558,125) | 36,458,555 |
NET OTHER ASSETS (LIABILITIES) - 0.0% | 3,226 |
| NET ASSETS - 100.0% | 36,461,781 |
| | |
Legend
| (b) | Security exempt from registration under Rule 144A of the Securities Act of 1933. These securities may be resold in transactions exempt from registration, normally to qualified institutional buyers. At the end of the period, the value of these securities amounted to $1,784,117 or 4.9% of net assets. |
Affiliated Central Funds
Fiscal year to date information regarding the Fund's investments in Fidelity Central Funds, including the ownership percentage, is presented below.
| Affiliate | Value, beginning of period ($) | Purchases ($) | Sales Proceeds ($) | Dividend Income ($) | Realized Gain (loss) ($) | Change in Unrealized appreciation (depreciation) ($) | Value, end of period ($) | % ownership, end of period |
| Fidelity Cash Central Fund 5.14% | - | 212,663 | 212,663 | 384 | - | - | - | 0.0% |
| Total | - | 212,663 | 212,663 | 384 | - | - | - | |
| | | | | | | | | |
Amounts in the dividend income column in the above table include any capital gain distributions from underlying funds, which are presented in the corresponding line item in the Statement of Operations, if applicable.
Amounts included in the purchases and sales proceeds columns may include in-kind transactions, if applicable.
Investment Valuation
The following is a summary of the inputs used, as of June 30, 2023, involving the Fund's assets and liabilities carried at fair value. The inputs or methodology used for valuing securities may not be an indication of the risk associated with investing in those securities. For more information on valuation inputs, and their aggregation into the levels used below, please refer to the Investment Valuation section in the accompanying Notes to Financial Statements.
| Valuation Inputs at Reporting Date: |
| Description | Total ($) | Level 1 ($) | Level 2 ($) | Level 3 ($) |
Investments in Securities: | | | | |
|
| Equities: | | | | |
Financials | 16,952,049 | 16,952,049 | - | - |
Information Technology | 19,506,506 | 19,506,506 | - | - |
| | | | | |
| Total Investments in Securities: | 36,458,555 | 36,458,555 | - | - |
Fidelity® Crypto Industry and Digital Payments ETF
| Statement of Assets and Liabilities |
| | | | June 30, 2023 |
| | | | | |
| Assets | | | | |
Investment in securities, at value - See accompanying schedule Unaffiliated issuers (cost $27,558,125): | | | $ | 36,458,555 |
| Cash | | | | 585,233 |
| Foreign currency held at value (cost $2,496) | | | | 2,483 |
| Distributions receivable from Fidelity Central Funds | | | | 67 |
Total assets | | | | 37,046,338 |
| Liabilities | | | | |
| Payable for investments purchased | $ | 573,951 | | |
| Accrued management fee | | 10,602 | | |
| Other payables and accrued expenses | | 4 | | |
| Total Liabilities | | | | 584,557 |
| Net Assets | | | $ | 36,461,781 |
| Net Assets consist of: | | | | |
| Paid in capital | | | $ | 31,924,647 |
| Total accumulated earnings (loss) | | | | 4,537,134 |
| Net Assets | | | $ | 36,461,781 |
Net Asset Value , offering price and redemption price per share ($36,461,781 ÷ 1,900,000 shares) | | | $ | 19.19 |
| Statement of Operations |
| | | | Year ended June 30, 2023 |
| Investment Income | | | | |
| Dividends | | | $ | 47,842 |
| Income from Fidelity Central Funds | | | | 384 |
| Income before foreign taxes withheld | | | $ | 48,226 |
| Less foreign taxes withheld | | | | (4,341) |
| Total Income | | | | 43,885 |
| Expenses | | | | |
| Management fee | $ | 87,834 | | |
| Independent trustees' fees and expenses | | 90 | | |
| Total expenses before reductions | | 87,924 | | |
| Expense reductions | | (495) | | |
| Total expenses after reductions | | | | 87,429 |
| Net Investment income (loss) | | | | (43,544) |
| Realized and Unrealized Gain (Loss) | | | | |
| Net realized gain (loss) on: | | | | |
| Investment Securities: | | | | |
| Redemptions in-kind | | (18,489) | | |
| Unaffiliated issuers | | (3,443,187) | | |
| Foreign currency transactions | | (258) | | |
| Futures contracts | | 5,863 | | |
| Total net realized gain (loss) | | | | (3,456,071) |
| Change in net unrealized appreciation (depreciation) on: | | | | |
| Investment Securities: | | | | |
| Unaffiliated issuers | | 13,810,348 | | |
| Assets and liabilities in foreign currencies | | 193 | | |
| Total change in net unrealized appreciation (depreciation) | | | | 13,810,541 |
| Net gain (loss) | | | | 10,354,470 |
| Net increase (decrease) in net assets resulting from operations | | | $ | 10,310,926 |
| Statement of Changes in Net Assets |
| |
| | Year ended June 30, 2023 | | For the period April 19, 2022 (commencement of operations) through June 30, 2022 |
| Increase (Decrease) in Net Assets | | | | |
| Operations | | | | |
| Net investment income (loss) | $ | (43,544) | $ | (5,137) |
| Net realized gain (loss) | | (3,456,071) | | (884,217) |
| Change in net unrealized appreciation (depreciation) | | 13,810,541 | | (4,910,077) |
| Net increase (decrease) in net assets resulting from operations | | 10,310,926 | | (5,799,431) |
| | | | | |
| Share transactions | | | | |
| Proceeds from sales of shares | | 14,414,125 | | 18,803,995 |
| Cost of shares redeemed | | (1,267,834) | | - |
| | | | | |
Net increase (decrease) in net assets resulting from share transactions | | 13,146,291 | | 18,803,995 |
| Total increase (decrease) in net assets | | 23,457,217 | | 13,004,564 |
| | | | | |
| Net Assets | | | | |
| Beginning of period | | 13,004,564 | | - |
| End of period | $ | 36,461,781 | $ | 13,004,564 |
| | | | | |
| Other Information | | | | |
| Shares | | | | |
| Sold | | 950,000 | | 1,050,000 |
| Redeemed | | (100,000) | | - |
| Net increase (decrease) | | 850,000 | | 1,050,000 |
| | | | | |
| Fidelity® Crypto Industry and Digital Payments ETF |
| |
| Years ended June 30, | | 2023 | | 2022 A |
Selected Per-Share Data | | | | |
| Net asset value, beginning of period | $ | 12.39 | $ | 25.76 |
| Income from Investment Operations | | | | |
Net investment income (loss) B,C | | (.03) | | (.01) |
| Net realized and unrealized gain (loss) | | 6.83 | | (13.36) |
| Total from investment operations | | 6.80 | | (13.37) |
| Net asset value, end of period | $ | 19.19 | $ | 12.39 |
Total Return D,E,F | | 54.94% | | (51.92)% |
Ratios to Average Net Assets C,G,H | | | | |
| Expenses before reductions | | .39% | | .39% I |
| Expenses net of fee waivers, if any | | .39% | | .39% I |
| Expenses net of all reductions | | .39% | | .39% I |
| Net investment income (loss) | | (.19)% | | (.29)% I |
| Supplemental Data | | | | |
| Net assets, end of period (000 omitted) | $ | 36,462 | $ | 13,005 |
Portfolio turnover rate J,K | | 55% | | 28% L |
A For the period April 19, 2022 (commencement of operations) through June 30, 2022.
B Calculated based on average shares outstanding during the period.
C Net investment income (loss) is affected by the timing of the declaration of dividends by any underlying mutual funds or exchange-traded funds (ETFs). Net investment income (loss) of any mutual funds or ETFs is not included in the Fund's net investment income (loss) ratio.
D Total returns for periods of less than one year are not annualized.
E Based on net asset value.
F Total returns would have been lower if certain expenses had not been reduced during the applicable periods shown.
G Fees and expenses of any underlying mutual funds or exchange-traded funds (ETFs) are not included in the Fund's expense ratio. The Fund indirectly bears its proportionate share of these expenses. For additional expense information related to investments in Fidelity Central Funds, please refer to the "Investments in Fidelity Central Funds" note found in the Notes to Financial Statements section of the most recent Annual or Semi-Annual report.
H Expense ratios reflect operating expenses of the class. Expenses before reductions do not reflect amounts reimbursed, waived, or reduced through arrangements with the investment adviser, brokerage services, or other offset arrangements, if applicable, and do not represent the amount paid by the class during periods when reimbursements, waivers or reductions occur.
I Annualized.
J Portfolio turnover rate excludes securities received or delivered in-kind.
K Amount does not include the portfolio activity of any underlying mutual funds or exchange-traded funds (ETFs).
L Amount not annualized.
NAV and closing market price average annual returns reflect the change in the value of an investment, assuming reinvestment of distributions from dividend income and capital gains (the profits earned upon the sale of securities that have grown in value, if any) at NAV and Market Price, respectively, and assumes a constant rate of performance each year. The hypothetical investment and the fund's returns do not reflect the deduction of taxes that a shareholder would pay on fund distributions or the redemption or selling of fund shares. How a fund did yesterday is no guarantee of how it will do tomorrow.
| Average Annual Total Returns |
| | | | |
Periods ended June 30, 2023 | Past 1 year | Life of Fund A |
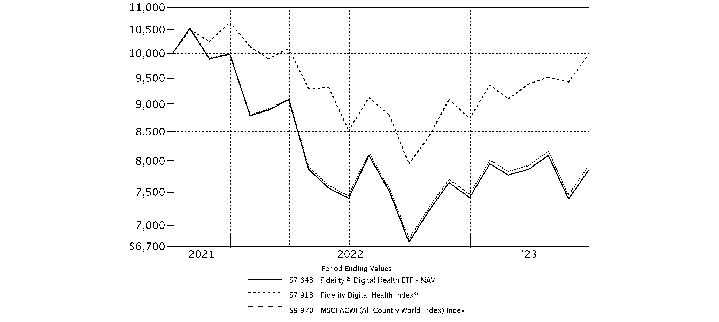
| Fidelity® Digital Health ETF - NAV | 5.98% | -13.07% |
Fidelity® Digital Health ETF - Market Price B | 6.39% | -13.61% |
| Fidelity Digital Health Index℠ | 6.34% | -12.63% |
| MSCI ACWI (All Country World Index) Index | 16.97% | -0.17% |
A From October 5, 2021
B From October 7, 2021, date initially listed on the CboeBZX Exchange, Inc.
| $10,000 Over Life of Fund |
| |
Let's say hypothetically that $10,000 was invested in Fidelity® Digital Health ETF - NAV, on October 5, 2021, when the fund started. The chart shows how the value of your investment would have changed, and also shows how the Fidelity Digital Health Index℠ and MSCI ACWI (All Country World Index) Index performed over the same period. |
|
|
Fidelity® Digital Health ETF
Market Recap:
U.S. equities gained 19.59% for the 12 months ending June 30, 2023, according to the S&P 500 ® index, as continued global economic expansion, falling commodity prices and a slowing in the pace of inflation provided a favorable backdrop for risk assets. U.S. large-cap stocks spearheaded the rally, which was driven by the shares of a narrow set of mega-cap companies in the information technology and communication services sectors, largely due to exuberance related to artificial intelligence. Aggressive policy tightening by the U.S. Federal Reserve continued amid consistent pressure on core inflation, a measure that excludes food and energy. Since March 2022, the Fed has hiked its benchmark interest rate 10 times, while also shrinking its massive asset portfolio. The latest bump came in early May, a third consecutive raise of a stepped down 25 basis points. In June, the Fed held interest rates steady and signaled it was prepared to raise rates next month if the economy and inflation don't cool more. The S&P 500® gained 6.61% for the month, raising hopes for a "soft landing" of the economy and bringing the index's year-to-date result to 16.89%. June saw the return of market breadth and lower dispersion. Smaller-cap stocks had a particularly strong month, achieving the best result for the category since January. For the full 12 months, value (+20%) topped growth (+18%). By sector, tech (+42%), consumer discretionary and industrials (+25% each) led, while real estate and utilities (-4% each) lagged.
Comments from the Geode Capital Management, LLC, passive equity index team:
For the fiscal year ending June 30, 2023, the exchange-traded fund's (ETF) net asset value returned 5.98%, and its market price returned 6.39%, roughly in line with the 6.34% advance of the benchmark Fidelity Digital Health Index NR. By region, the U.S. gained 5% and contributed most, followed by Europe ex U.K. (+18%). By sector, health care gained 7% and contributed most. Industrials stocks also helped (+42%), benefiting from the commercial & professional services industry (+42%). The information technology sector rose roughly 14%, boosted by the software & services industry (+37%). Conversely, emerging markets returned -16% and detracted most, followed by Japan (-10%). Turning to individual stocks, the biggest individual contributor was Intuitive Surgical (+71%), from the health care equipment & services industry. Also in health care equipment & services, Dexcom (+73%), Inspire Medical Systems (+78%), and Insulet (+32%) helped. Zealand Pharma, within the pharmaceuticals, biotechnology & life sciences group, gained 182% and boosted the fund. Conversely, the biggest individual detractor was Tandem Diabetes Care (-59%), from the health care equipment & services segment. Also in health care equipment & services, Multiplan (-80%), American Well (-51%), Nevro (-42%), and Definitive Healthcare (-52%) all hurt the fund.
The views expressed above reflect those of the portfolio manager(s) only through the end of the period as stated on the cover of this report and do not necessarily represent the views of Fidelity or any other person in the Fidelity organization, or Geode Capital Management, LLC, (the ETF's subadviser) or any other person in the Geode organization. Any such views are subject to change at any time based upon market or other conditions and Fidelity and Geode disclaim any responsibility to update such views. These views may not be relied on as investment advice and, because investment decisions for a Fidelity fund are based on numerous factors, may not be relied on as an indication of trading intent on behalf of any Fidelity fund.
Fidelity® Digital Health ETF
Top Holdings (% of Fund's net assets) |
| |
| Intuitive Surgical, Inc. | 4.8 | |
| DexCom, Inc. | 4.7 | |
| ResMed, Inc. | 4.3 | |
| Veeva Systems, Inc. Class A | 4.3 | |
| Insulet Corp. | 4.0 | |
| Sonova Holding AG | 3.5 | |
| Inspire Medical Systems, Inc. | 3.2 | |
| Fisher & Paykel Healthcare Corp. | 3.0 | |
| Cochlear Ltd. | 2.9 | |
| JD Health International, Inc. | 2.7 | |
| | 37.4 | |
| |
| Market Sectors (% of Fund's net assets) |
| |
| Health Care | 85.9 | |
| Consumer Staples | 7.7 | |
| Information Technology | 3.3 | |
| Industrials | 2.1 | |
| Consumer Discretionary | 1.0 | |
| |
Asset Allocation (% of Fund's net assets) |
|
|
Geographic Diversification (% of Fund's net assets) |
|
* Includes Short-Term investments and Net Other Assets (Liabilities). Percentages are adjusted for the effect of derivatives, if applicable. |
| |
Fidelity® Digital Health ETF
Showing Percentage of Net Assets
| Common Stocks - 100.0% |
| | | Shares | Value ($) |
| CONSUMER DISCRETIONARY - 1.0% | | | |
| Household Durables - 1.0% | | | |
| Vuzix Corp. (a) | | 18,992 | 96,859 |
| CONSUMER STAPLES - 7.7% | | | |
| Consumer Staples Distribution & Retail - 7.7% | | | |
| Alibaba Health Information Technology Ltd. (a) | | 322,000 | 193,530 |
| DocMorris AG (a) | | 3,205 | 139,786 |
| JD Health International, Inc. (a)(b) | | 42,200 | 266,288 |
| Redcare Pharmacy NV (a)(b) | | 1,552 | 160,586 |
| | | | 760,190 |
| HEALTH CARE - 85.9% | | | |
| Biotechnology - 1.6% | | | |
| Zealand Pharma A/S (a) | | 4,337 | 155,436 |
| Health Care Equipment & Supplies - 44.1% | | | |
| Axonics Modulation Technologies, Inc. (a) | | 3,836 | 193,603 |
| Butterfly Network, Inc. Class A (a) | | 41,314 | 95,022 |
| Cochlear Ltd. | | 1,902 | 290,018 |
| Demant A/S (a) | | 5,625 | 237,780 |
| DexCom, Inc. (a) | | 3,572 | 459,038 |
| Fisher & Paykel Healthcare Corp. | | 19,456 | 292,033 |
| Inspire Medical Systems, Inc. (a) | | 958 | 311,005 |
| Insulet Corp. (a) | | 1,374 | 396,179 |
| Integra LifeSciences Holdings Corp. (a) | | 5,149 | 211,778 |
| Intuitive Surgical, Inc. (a) | | 1,375 | 470,166 |
| iRhythm Technologies, Inc. (a) | | 1,898 | 197,999 |
| Nevro Corp. (a) | | 5,067 | 128,803 |
| ResMed, Inc. | | 1,954 | 426,949 |
| Senseonics Holdings, Inc. (a) | | 148,218 | 113,105 |
| Sonova Holding AG | | 1,284 | 341,864 |
| Tandem Diabetes Care, Inc. (a) | | 6,654 | 163,289 |
| | | | 4,328,631 |
| Health Care Providers & Services - 12.6% | | | |
| Apollo Medical Holdings, Inc. (a) | | 4,707 | 148,741 |
| Cigna Group | | 777 | 218,026 |
| Corvel Corp. (a) | | 872 | 168,732 |
| Hims & Hers Health, Inc. (a) | | 16,189 | 152,177 |
| Premier, Inc. | | 8,057 | 222,857 |
| R1 RCM, Inc. | | 11,206 | 206,751 |
| Well Health Technologies Corp. (a) | | 34,487 | 123,796 |
| | | | 1,241,080 |
| Health Care Technology - 27.6% | | | |
| American Well Corp. (a) | | 50,367 | 105,771 |
| CompuGroup Medical AG | | 2,960 | 145,580 |
| Computer Programs & Systems, Inc. (a) | | 4,027 | 99,427 |
| Definitive Healthcare Corp. (a) | | 9,887 | 108,757 |
| Doximity, Inc. (a) | | 6,917 | 235,316 |
| Evolent Health, Inc. (a) | | 6,555 | 198,617 |
| Health Catalyst, Inc. (a) | | 10,601 | 132,513 |
| HealthStream, Inc. | | 4,989 | 122,530 |
| JMDC, Inc. | | 3,600 | 142,072 |
| Nextgen Healthcare, Inc. (a) | | 8,472 | 137,416 |
| Phreesia, Inc. (a) | | 5,356 | 166,090 |
| Pro Medicus Ltd. | | 4,394 | 191,988 |
| Teladoc Health, Inc. (a) | | 9,252 | 234,261 |
| Veeva Systems, Inc. Class A (a) | | 2,149 | 424,922 |
| Veradigm, Inc. (a) | | 12,878 | 162,263 |
| Yidu Tech, Inc. (a)(b) | | 146,500 | 107,492 |
| | | | 2,715,015 |
TOTAL HEALTH CARE | | | 8,440,162 |
| INDUSTRIALS - 2.1% | | | |
| Professional Services - 2.1% | | | |
| Maximus, Inc. | | 2,406 | 203,331 |
| INFORMATION TECHNOLOGY - 3.3% | | | |
| IT Services - 2.1% | | | |
| Cognizant Technology Solutions Corp. Class A | | 3,167 | 206,742 |
| Software - 1.2% | | | |
| EngageSmart, Inc. (a) | | 6,137 | 117,155 |
TOTAL INFORMATION TECHNOLOGY | | | 323,897 |
| TOTAL COMMON STOCKS (Cost $11,264,664) | | | 9,824,439 |
| | | | |
| TOTAL INVESTMENT IN SECURITIES - 100.0% (Cost $11,264,664) | 9,824,439 |
NET OTHER ASSETS (LIABILITIES) - 0.0% | 3,713 |
| NET ASSETS - 100.0% | 9,828,152 |
| | |
Legend
| (b) | Security exempt from registration under Rule 144A of the Securities Act of 1933. These securities may be resold in transactions exempt from registration, normally to qualified institutional buyers. At the end of the period, the value of these securities amounted to $534,366 or 5.4% of net assets. |
Affiliated Central Funds
Fiscal year to date information regarding the Fund's investments in Fidelity Central Funds, including the ownership percentage, is presented below.
| Affiliate | Value, beginning of period ($) | Purchases ($) | Sales Proceeds ($) | Dividend Income ($) | Realized Gain (loss) ($) | Change in Unrealized appreciation (depreciation) ($) | Value, end of period ($) | % ownership, end of period |
| Fidelity Cash Central Fund 5.14% | - | 416,614 | 416,614 | 152 | - | - | - | 0.0% |
| Total | - | 416,614 | 416,614 | 152 | - | - | - | |
| | | | | | | | | |
Amounts in the dividend income column in the above table include any capital gain distributions from underlying funds, which are presented in the corresponding line item in the Statement of Operations, if applicable.
Amounts included in the purchases and sales proceeds columns may include in-kind transactions, if applicable.
Investment Valuation
The following is a summary of the inputs used, as of June 30, 2023, involving the Fund's assets and liabilities carried at fair value. The inputs or methodology used for valuing securities may not be an indication of the risk associated with investing in those securities. For more information on valuation inputs, and their aggregation into the levels used below, please refer to the Investment Valuation section in the accompanying Notes to Financial Statements.
| Valuation Inputs at Reporting Date: |
| Description | Total ($) | Level 1 ($) | Level 2 ($) | Level 3 ($) |
Investments in Securities: | | | | |
|
| Equities: | | | | |
Consumer Discretionary | 96,859 | 96,859 | - | - |
Consumer Staples | 760,190 | 760,190 | - | - |
Health Care | 8,440,162 | 8,440,162 | - | - |
Industrials | 203,331 | 203,331 | - | - |
Information Technology | 323,897 | 323,897 | - | - |
| | | | | |
| Total Investments in Securities: | 9,824,439 | 9,824,439 | - | - |
Fidelity® Digital Health ETF
| Statement of Assets and Liabilities |
| | | | June 30, 2023 |
| | | | | |
| Assets | | | | |
Investment in securities, at value - See accompanying schedule Unaffiliated issuers (cost $11,264,664): | | | $ | 9,824,439 |
| Cash | | | | 197 |
| Foreign currency held at value (cost $1,128) | | | | 1,126 |
| Dividends receivable | | | | 5,543 |
Total assets | | | | 9,831,305 |
| Liabilities | | | | |
| Accrued management fee | $ | 3,153 | | |
| Total Liabilities | | | | 3,153 |
| Net Assets | | | $ | 9,828,152 |
| Net Assets consist of: | | | | |
| Paid in capital | | | $ | 12,747,754 |
| Total accumulated earnings (loss) | | | | (2,919,602) |
| Net Assets | | | $ | 9,828,152 |
Net Asset Value , offering price and redemption price per share ($9,828,152 ÷ 500,000 shares) | | | $ | 19.66 |
| Statement of Operations |
| | | | Year ended June 30, 2023 |
| Investment Income | | | | |
| Dividends | | | $ | 34,523 |
| Special dividends | | | | 19,416 |
| Income from Fidelity Central Funds | | | | 152 |
| Total Income | | | | 54,091 |
| Expenses | | | | |
| Management fee | $ | 37,437 | | |
| Independent trustees' fees and expenses | | 49 | | |
| Total expenses before reductions | | 37,486 | | |
| Expense reductions | | (259) | | |
| Total expenses after reductions | | | | 37,227 |
| Net Investment income (loss) | | | | 16,864 |
| Realized and Unrealized Gain (Loss) | | | | |
| Net realized gain (loss) on: | | | | |
| Investment Securities: | | | | |
| Unaffiliated issuers | | (1,145,622) | | |
| Foreign currency transactions | | 9 | | |
| Total net realized gain (loss) | | | | (1,145,613) |
| Change in net unrealized appreciation (depreciation) on: | | | | |
| Investment Securities: | | | | |
| Unaffiliated issuers | | 1,683,678 | | |
| Assets and liabilities in foreign currencies | | 35 | | |
| Total change in net unrealized appreciation (depreciation) | | | | 1,683,713 |
| Net gain (loss) | | | | 538,100 |
| Net increase (decrease) in net assets resulting from operations | | | $ | 554,964 |
| Statement of Changes in Net Assets |
| |
| | Year ended June 30, 2023 | | For the period October 5, 2021 (commencement of operations) through June 30, 2022 |
| Increase (Decrease) in Net Assets | | | | |
| Operations | | | | |
| Net investment income (loss) | $ | 16,864 | $ | (3,322) |
| Net realized gain (loss) | | (1,145,613) | | (485,420) |
| Change in net unrealized appreciation (depreciation) | | 1,683,713 | | (3,123,941) |
| Net increase (decrease) in net assets resulting from operations | | 554,964 | | (3,612,683) |
| Distributions to shareholders | | (15,500) | | - |
| | | | | |
| Share transactions | | | | |
| Proceeds from sales of shares | | - | | 13,779,066 |
| Cost of shares redeemed | | - | | (877,695) |
| | | | | |
Net increase (decrease) in net assets resulting from share transactions | | - | | 12,901,371 |
| Total increase (decrease) in net assets | | 539,464 | | 9,288,688 |
| | | | | |
| Net Assets | | | | |
| Beginning of period | | 9,288,688 | | - |
| End of period | $ | 9,828,152 | $ | 9,288,688 |
| | | | | |
| Other Information | | | | |
| Shares | | | | |
| Sold | | - | | 550,000 |
| Redeemed | | - | | (50,000) |
| Net increase (decrease) | | - | | 500,000 |
| | | | | |
| Fidelity® Digital Health ETF |
| |
| Years ended June 30, | | 2023 | | 2022 A |
Selected Per-Share Data | | | | |
| Net asset value, beginning of period | $ | 18.58 | $ | 25.10 |
| Income from Investment Operations | | | | |
Net investment income (loss) B,C | | .03 D | | (.01) |
| Net realized and unrealized gain (loss) | | 1.08 | | (6.51) |
| Total from investment operations | | 1.11 | | (6.52) |
| Distributions from net investment income | | (.03) | | - |
| Total distributions | | (.03) | | - |
| Net asset value, end of period | $ | 19.66 | $ | 18.58 |
Total Return E,F,G | | 5.98% | | (25.99)% |
Ratios to Average Net Assets C,H,I | | | | |
| Expenses before reductions | | .39% | | .39% J |
| Expenses net of fee waivers, if any | | .39% | | .39% J |
| Expenses net of all reductions | | .39% | | .39% J |
| Net investment income (loss) | | .18% D | | (.05)% J |
| Supplemental Data | | | | |
| Net assets, end of period (000 omitted) | $ | 9,828 | $ | 9,289 |
Portfolio turnover rate K | | 36% | | 48% L,M |
A For the period October 5, 2021 (commencement of operations) through June 30, 2022.
B Calculated based on average shares outstanding during the period.
C Net investment income (loss) is affected by the timing of the declaration of dividends by any underlying mutual funds or exchange-traded funds (ETFs). Net investment income (loss) of any mutual funds or ETFs is not included in the Fund's net investment income (loss) ratio.
D Net investment income per share reflects one or more large, non-recurring dividend(s) which amounted to $.04 per share. Excluding such non-recurring dividend(s), the ratio of net investment income (loss) to average net assets would have been (.03)%.
E Total returns for periods of less than one year are not annualized.
F Total returns would have been lower if certain expenses had not been reduced during the applicable periods shown.
G Based on net asset value.
H Fees and expenses of any underlying mutual funds or exchange-traded funds (ETFs) are not included in the Fund's expense ratio. The Fund indirectly bears its proportionate share of these expenses. For additional expense information related to investments in Fidelity Central Funds, please refer to the "Investments in Fidelity Central Funds" note found in the Notes to Financial Statements section of the most recent Annual or Semi-Annual report.
I Expense ratios reflect operating expenses of the class. Expenses before reductions do not reflect amounts reimbursed, waived, or reduced through arrangements with the investment adviser, brokerage services, or other offset arrangements, if applicable, and do not represent the amount paid by the class during periods when reimbursements, waivers or reductions occur.
J Annualized.
K Amount does not include the portfolio activity of any underlying mutual funds or exchange-traded funds (ETFs).
L Portfolio turnover rate excludes securities received or delivered in-kind.
M Amount not annualized.
NAV and closing market price average annual returns reflect the change in the value of an investment, assuming reinvestment of distributions from dividend income and capital gains (the profits earned upon the sale of securities that have grown in value, if any) at NAV and Market Price, respectively, and assumes a constant rate of performance each year. The hypothetical investment and the fund's returns do not reflect the deduction of taxes that a shareholder would pay on fund distributions or the redemption or selling of fund shares. How a fund did yesterday is no guarantee of how it will do tomorrow.
| Average Annual Total Returns |
| | | | |
Periods ended June 30, 2023 | Past 1 year | Life of Fund A |
| Fidelity® Electric Vehicles and Future Transportation ETF - NAV | 7.36% | -14.59% |
Fidelity® Electric Vehicles and Future Transportation ETF - Market Price B | 7.30% | -15.33% |
| Fidelity Electric Vehicles and Future Transportation Index℠ | 7.89% | -13.67% |
| MSCI ACWI (All Country World Index) Index | 16.97% | -0.17% |
A From October 5, 2021
B From October 7, 2021, date initially listed on the CboeBZX Exchange, Inc.
| $10,000 Over Life of Fund |
| |
Let's say hypothetically that $10,000 was invested in Fidelity® Electric Vehicles and Future Transportation ETF - NAV, on October 5, 2021, when the fund started. The chart shows how the value of your investment would have changed, and also shows how the Fidelity Electric Vehicles and Future Transportation Index℠ and MSCI ACWI (All Country World Index) Index performed over the same period. |
|
|
Fidelity® Electric Vehicles and Future Transportation ETF
Market Recap:
U.S. equities gained 19.59% for the 12 months ending June 30, 2023, according to the S&P 500 ® index, as continued global economic expansion, falling commodity prices and a slowing in the pace of inflation provided a favorable backdrop for risk assets. U.S. large-cap stocks spearheaded the rally, which was driven by the shares of a narrow set of mega-cap companies in the information technology and communication services sectors, largely due to exuberance related to artificial intelligence. Aggressive policy tightening by the U.S. Federal Reserve continued amid consistent pressure on core inflation, a measure that excludes food and energy. Since March 2022, the Fed has hiked its benchmark interest rate 10 times, while also shrinking its massive asset portfolio. The latest bump came in early May, a third consecutive raise of a stepped down 25 basis points. In June, the Fed held interest rates steady and signaled it was prepared to raise rates next month if the economy and inflation don't cool more. The S&P 500® gained 6.61% for the month, raising hopes for a "soft landing" of the economy and bringing the index's year-to-date result to 16.89%. June saw the return of market breadth and lower dispersion. Smaller-cap stocks had a particularly strong month, achieving the best result for the category since January. For the full 12 months, value (+20%) topped growth (+18%). By sector, tech (+42%), consumer discretionary and industrials (+25% each) led, while real estate and utilities (-4% each) lagged.
Comments from the Geode Capital Management, LLC, passive equity index team:
For the fiscal year ending June 30, 2023, the exchange-traded fund's (ETF) net asset value returned 7.36% and its market price returned 7.30%, compared with the 7.89% advance of the benchmark Fidelity Electric Vehicles and Future Transportation Index NR. By region, the U.S. gained 9% and contributed most, followed by Europe ex U.K. (+34%). By sector, information technology advanced about 38% and contributed most, driven by the semiconductors & semiconductor equipment industry (+43%). Materials stocks also helped, gaining roughly 13%. In contrast, emerging markets returned -14% and detracted, followed by Canada (-43%). From a sector standpoint, stocks in the industrials sector returned about -20% and detracted most. This group was hampered by the capital goods (-16%) industry. Consumer discretionary (-8%) also hurt, hampered by the automobiles & components industry (-9%). Turning to individual stocks, the biggest individual contributor was Nvidia (+173%), from the semiconductors & semiconductor equipment category. In semiconductors & semiconductor equipment, On Semiconductor (+88%), Renesas Electronics (+107%), and Lattice Semiconductor (+93%) helped. Tesla, within the automobiles & components segment, gained about 16% and boosted the fund. In contrast, the biggest individual detractor was Nio (-55%), from the automobiles & components group. Also in automobiles & components, Xpeng (-60%) and Lucid (-60%) hurt. Wolfspeed, within the semiconductors & semiconductor equipment industry, returned -56% and hindered the fund. Another detractor was Ganfeng Lithium (-41%), a stock in the materials sector.
The views expressed above reflect those of the portfolio manager(s) only through the end of the period as stated on the cover of this report and do not necessarily represent the views of Fidelity or any other person in the Fidelity organization, or Geode Capital Management, LLC, (the ETF's subadviser) or any other person in the Geode organization. Any such views are subject to change at any time based upon market or other conditions and Fidelity and Geode disclaim any responsibility to update such views. These views may not be relied on as investment advice and, because investment decisions for a Fidelity fund are based on numerous factors, may not be relied on as an indication of trading intent on behalf of any Fidelity fund.
Fidelity® Electric Vehicles and Future Transportation ETF
Top Holdings (% of Fund's net assets) |
| |
| Tesla, Inc. | 5.2 | |
| NXP Semiconductors NV | 3.8 | |
| Infineon Technologies AG | 3.7 | |
| Aptiv PLC | 3.4 | |
| ON Semiconductor Corp. | 3.4 | |
| Albemarle Corp. | 3.4 | |
| STMicroelectronics NV (Italy) | 3.2 | |
| Li Auto, Inc. Class A | 3.2 | |
| Samsung SDI Co. Ltd. | 3.1 | |
| NIO, Inc. sponsored ADR | 2.9 | |
| | 35.3 | |
| |
| Market Sectors (% of Fund's net assets) |
| |
| Consumer Discretionary | 38.7 | |
| Information Technology | 32.9 | |
| Industrials | 17.0 | |
| Materials | 11.3 | |
| |
Asset Allocation (% of Fund's net assets) |
|
|
Geographic Diversification (% of Fund's net assets) |
|
* Includes Short-Term investments and Net Other Assets (Liabilities). Percentages are adjusted for the effect of derivatives, if applicable. |
| |
Fidelity® Electric Vehicles and Future Transportation ETF
Showing Percentage of Net Assets
| Common Stocks - 99.9% |
| | | Shares | Value ($) |
| CONSUMER DISCRETIONARY - 38.7% | | | |
| Automobile Components - 15.5% | | | |
| Aptiv PLC (a) | | 18,269 | 1,865,082 |
| Forvia (a) | | 41,097 | 967,130 |
| Gentex Corp. | | 39,503 | 1,155,858 |
| Lear Corp. | | 8,817 | 1,265,680 |
| Luminar Technologies, Inc. (a) | | 96,495 | 663,886 |
| Mobileye Global, Inc. | | 14,641 | 562,507 |
| Valeo SA | | 48,084 | 1,029,783 |
| Visteon Corp. (a) | | 6,556 | 941,507 |
| | | | 8,451,433 |
| Automobiles - 19.9% | | | |
| Li Auto, Inc. Class A (a) | | 101,200 | 1,749,815 |
| Lucid Group, Inc. Class A (a) | | 140,500 | 968,045 |
| NIO, Inc. sponsored ADR (a) | | 166,015 | 1,608,685 |
| Rivian Automotive, Inc. (a) | | 77,858 | 1,297,114 |
| Tesla, Inc. (a) | | 10,719 | 2,805,915 |
| XPeng, Inc. Class A (a) | | 237,500 | 1,515,326 |
| Yadea Group Holdings Ltd. (b) | | 380,000 | 864,099 |
| | | | 10,808,999 |
| Household Durables - 2.6% | | | |
| Garmin Ltd. | | 13,755 | 1,434,509 |
| Specialty Retail - 0.7% | | | |
| EVgo, Inc. Class A (a) | | 92,536 | 370,144 |
TOTAL CONSUMER DISCRETIONARY | | | 21,065,085 |
| INDUSTRIALS - 17.0% | | | |
| Electrical Equipment - 14.7% | | | |
| Ballard Power Systems, Inc. (a) | | 136,261 | 597,252 |
| Blink Charging Co. (a) | | 57,797 | 346,204 |
| Bloom Energy Corp. Class A (a) | | 55,272 | 903,697 |
| ChargePoint Holdings, Inc. Class A (a) | | 79,704 | 700,598 |
| Doosan Fuel Cell Co. Ltd. (a) | | 24,256 | 528,325 |
| FuelCell Energy, Inc. (a) | | 250,712 | 541,538 |
| LG Energy Solution (a) | | 3,406 | 1,429,452 |
| Mabuchi Motor Co. Ltd. | | 23,900 | 662,754 |
| Plug Power, Inc. (a) | | 110,308 | 1,146,100 |
| Sensata Technologies, Inc. PLC | | 25,202 | 1,133,838 |
| | | | 7,989,758 |
| Ground Transportation - 1.6% | | | |
| Lyft, Inc. (a) | | 87,615 | 840,228 |
| Machinery - 0.7% | | | |
| Blue Bird Corp. (a) | | 16,998 | 382,115 |
TOTAL INDUSTRIALS | | | 9,212,101 |
| INFORMATION TECHNOLOGY - 32.9% | | | |
| Electronic Equipment, Instruments & Components - 3.1% | | | |
| Samsung SDI Co. Ltd. | | 3,274 | 1,662,282 |
| Semiconductors & Semiconductor Equipment - 29.8% | | | |
| Allegro MicroSystems LLC (a) | | 17,781 | 802,634 |
| Ambarella, Inc. (a) | | 9,568 | 800,555 |
| Himax Technologies, Inc. sponsored ADR | | 69,409 | 468,511 |
| indie Semiconductor, Inc. (a) | | 47,153 | 443,238 |
| Infineon Technologies AG | | 49,431 | 2,037,716 |
| Lattice Semiconductor Corp. (a) | | 13,878 | 1,333,259 |
| Lx Semicon Co. Ltd. | | 5,754 | 496,949 |
| NVIDIA Corp. | | 2,431 | 1,028,362 |
| NXP Semiconductors NV | | 10,212 | 2,090,192 |
| ON Semiconductor Corp. (a) | | 19,591 | 1,852,917 |
| Renesas Electronics Corp. (a) | | 56,400 | 1,054,171 |
| SiTime Corp. (a) | | 5,892 | 695,079 |
| Skyworks Solutions, Inc. | | 12,405 | 1,373,109 |
| STMicroelectronics NV (Italy) | | 35,306 | 1,754,919 |
| | | | 16,231,611 |
TOTAL INFORMATION TECHNOLOGY | | | 17,893,893 |
| MATERIALS - 11.3% | | | |
| Chemicals - 9.2% | | | |
| Albemarle Corp. | | 8,248 | 1,840,046 |
| Ganfeng Lithium Group Co. Ltd. (H Shares) (b) | | 122,480 | 798,654 |
| Livent Corp. (a) | | 39,079 | 1,071,937 |
| SK IE Technology Co. Ltd. (a)(b) | | 10,271 | 754,550 |
| Tianqi Lithium Corp. (H Shares) | | 77,000 | 535,991 |
| | | | 5,001,178 |
| Metals & Mining - 2.1% | | | |
| Allkem Ltd. (a) | | 107,634 | 1,147,778 |
TOTAL MATERIALS | | | 6,148,956 |
| TOTAL COMMON STOCKS (Cost $58,461,337) | | | 54,320,035 |
| | | | |
| TOTAL INVESTMENT IN SECURITIES - 99.9% (Cost $58,461,337) | 54,320,035 |
NET OTHER ASSETS (LIABILITIES) - 0.1% | 75,349 |
| NET ASSETS - 100.0% | 54,395,384 |
| | |
Legend
| (b) | Security exempt from registration under Rule 144A of the Securities Act of 1933. These securities may be resold in transactions exempt from registration, normally to qualified institutional buyers. At the end of the period, the value of these securities amounted to $2,417,303 or 4.4% of net assets. |
Affiliated Central Funds
Fiscal year to date information regarding the Fund's investments in Fidelity Central Funds, including the ownership percentage, is presented below.
| Affiliate | Value, beginning of period ($) | Purchases ($) | Sales Proceeds ($) | Dividend Income ($) | Realized Gain (loss) ($) | Change in Unrealized appreciation (depreciation) ($) | Value, end of period ($) | % ownership, end of period |
| Fidelity Cash Central Fund 5.14% | - | 2,474,687 | 2,474,687 | 273 | - | - | - | 0.0% |
| Total | - | 2,474,687 | 2,474,687 | 273 | - | - | - | |
| | | | | | | | | |
Amounts in the dividend income column in the above table include any capital gain distributions from underlying funds, which are presented in the corresponding line item in the Statement of Operations, if applicable.
Amounts included in the purchases and sales proceeds columns may include in-kind transactions, if applicable.
Investment Valuation
The following is a summary of the inputs used, as of June 30, 2023, involving the Fund's assets and liabilities carried at fair value. The inputs or methodology used for valuing securities may not be an indication of the risk associated with investing in those securities. For more information on valuation inputs, and their aggregation into the levels used below, please refer to the Investment Valuation section in the accompanying Notes to Financial Statements.
| Valuation Inputs at Reporting Date: |
| Description | Total ($) | Level 1 ($) | Level 2 ($) | Level 3 ($) |
Investments in Securities: | | | | |
|
| Equities: | | | | |
Consumer Discretionary | 21,065,085 | 21,065,085 | - | - |
Industrials | 9,212,101 | 9,212,101 | - | - |
Information Technology | 17,893,893 | 17,893,893 | - | - |
Materials | 6,148,956 | 6,148,956 | - | - |
| | | | | |
| Total Investments in Securities: | 54,320,035 | 54,320,035 | - | - |
Fidelity® Electric Vehicles and Future Transportation ETF
| Statement of Assets and Liabilities |
| | | | June 30, 2023 |
| | | | | |
| Assets | | | | |
Investment in securities, at value - See accompanying schedule Unaffiliated issuers (cost $58,461,337): | | | $ | 54,320,035 |
| Cash | | | | 15,788 |
| Foreign currency held at value (cost $1,393) | | | | 1,394 |
| Dividends receivable | | | | 75,281 |
Total assets | | | | 54,412,498 |
| Liabilities | | | | |
| Accrued management fee | $ | 17,114 | | |
| Total Liabilities | | | | 17,114 |
| Net Assets | | | $ | 54,395,384 |
| Net Assets consist of: | | | | |
| Paid in capital | | | $ | 71,489,561 |
| Total accumulated earnings (loss) | | | | (17,094,177) |
| Net Assets | | | $ | 54,395,384 |
Net Asset Value , offering price and redemption price per share ($54,395,384 ÷ 2,850,000 shares) | | | $ | 19.09 |
| Statement of Operations |
| | | | Year ended June 30, 2023 |
| Investment Income | | | | |
| Dividends | | | $ | 315,221 |
| Income from Fidelity Central Funds | | | | 273 |
| Income before foreign taxes withheld | | | $ | 315,494 |
| Less foreign taxes withheld | | | | (18,776) |
| Total Income | | | | 296,718 |
| Expenses | | | | |
| Management fee | $ | 178,867 | | |
| Independent trustees' fees and expenses | | 221 | | |
| Total expenses before reductions | | 179,088 | | |
| Expense reductions | | (95) | | |
| Total expenses after reductions | | | | 178,993 |
| Net Investment income (loss) | | | | 117,725 |
| Realized and Unrealized Gain (Loss) | | | | |
| Net realized gain (loss) on: | | | | |
| Investment Securities: | | | | |
| Unaffiliated issuers | | (8,662,665) | | |
| Foreign currency transactions | | (15,215) | | |
| Total net realized gain (loss) | | | | (8,677,880) |
| Change in net unrealized appreciation (depreciation) on: | | | | |
| Investment Securities: | | | | |
| Unaffiliated issuers | | 12,015,537 | | |
| Assets and liabilities in foreign currencies | | 204 | | |
| Total change in net unrealized appreciation (depreciation) | | | | 12,015,741 |
| Net gain (loss) | | | | 3,337,861 |
| Net increase (decrease) in net assets resulting from operations | | | $ | 3,455,586 |
| Statement of Changes in Net Assets |
| |
| | Year ended June 30, 2023 | | For the period October 5, 2021 (commencement of operations) through June 30, 2022 |
| Increase (Decrease) in Net Assets | | | | |
| Operations | | | | |
| Net investment income (loss) | $ | 117,725 | $ | 67,784 |
| Net realized gain (loss) | | (8,677,880) | | (3,782,899) |
| Change in net unrealized appreciation (depreciation) | | 12,015,741 | | (16,156,923) |
| Net increase (decrease) in net assets resulting from operations | | 3,455,586 | | (19,872,038) |
| Distributions to shareholders | | (119,850) | | (64,350) |
| | | | | |
| Share transactions | | | | |
| Proceeds from sales of shares | | 12,741,845 | | 62,232,758 |
| Cost of shares redeemed | | - | | (3,978,567) |
| | | | | |
Net increase (decrease) in net assets resulting from share transactions | | 12,741,845 | | 58,254,191 |
| Total increase (decrease) in net assets | | 16,077,581 | | 38,317,803 |
| | | | | |
| Net Assets | | | | |
| Beginning of period | | 38,317,803 | | - |
| End of period | $ | 54,395,384 | $ | 38,317,803 |
| | | | | |
| Other Information | | | | |
| Shares | | | | |
| Sold | | 700,000 | | 2,300,000 |
| Redeemed | | - | | (150,000) |
| Net increase (decrease) | | 700,000 | | 2,150,000 |
| | | | | |
| Fidelity® Electric Vehicles and Future Transportation ETF |
| |
| Years ended June 30, | | 2023 | | 2022 A |
Selected Per-Share Data | | | | |
| Net asset value, beginning of period | $ | 17.82 | $ | 25.20 |
| Income from Investment Operations | | | | |
Net investment income (loss) B,C | | .05 | | .04 |
| Net realized and unrealized gain (loss) | | 1.27 | | (7.39) |
| Total from investment operations | | 1.32 | | (7.35) |
| Distributions from net investment income | | (.05) | | (.03) |
| Total distributions | | (.05) | | (.03) |
| Net asset value, end of period | $ | 19.09 | $ | 17.82 |
Total Return D,E,F | | 7.36% | | (29.15)% |
Ratios to Average Net Assets C,G,H | | | | |
| Expenses before reductions | | .39% | | .39% I |
| Expenses net of fee waivers, if any | | .39% | | .39% I |
| Expenses net of all reductions | | .39% | | .39% I |
| Net investment income (loss) | | .26% | | .25% I |
| Supplemental Data | | | | |
| Net assets, end of period (000 omitted) | $ | 54,395 | $ | 38,318 |
Portfolio turnover rate J,K | | 62% | | 31% L |
A For the period October 5, 2021 (commencement of operations) through June 30, 2022.
B Calculated based on average shares outstanding during the period.
C Net investment income (loss) is affected by the timing of the declaration of dividends by any underlying mutual funds or exchange-traded funds (ETFs). Net investment income (loss) of any mutual funds or ETFs is not included in the Fund's net investment income (loss) ratio.
D Total returns for periods of less than one year are not annualized.
E Total returns would have been lower if certain expenses had not been reduced during the applicable periods shown.
F Based on net asset value.
G Fees and expenses of any underlying mutual funds or exchange-traded funds (ETFs) are not included in the Fund's expense ratio. The Fund indirectly bears its proportionate share of these expenses. For additional expense information related to investments in Fidelity Central Funds, please refer to the "Investments in Fidelity Central Funds" note found in the Notes to Financial Statements section of the most recent Annual or Semi-Annual report.
H Expense ratios reflect operating expenses of the class. Expenses before reductions do not reflect amounts reimbursed, waived, or reduced through arrangements with the investment adviser, brokerage services, or other offset arrangements, if applicable, and do not represent the amount paid by the class during periods when reimbursements, waivers or reductions occur.
I Annualized.
J Portfolio turnover rate excludes securities received or delivered in-kind.
K Amount does not include the portfolio activity of any underlying mutual funds or exchange-traded funds (ETFs).
L Amount not annualized.
NAV and closing market price average annual returns reflect the change in the value of an investment, assuming reinvestment of distributions from dividend income and capital gains (the profits earned upon the sale of securities that have grown in value, if any) at NAV and Market Price, respectively, and assumes a constant rate of performance each year. The hypothetical investment and the fund's returns do not reflect the deduction of taxes that a shareholder would pay on fund distributions or the redemption or selling of fund shares. How a fund did yesterday is no guarantee of how it will do tomorrow.
| Average Annual Total Returns |
| | | | |
Periods ended June 30, 2023 | Past 1 year | Life of Fund A |
| Fidelity® Metaverse ETF - NAV | 21.06% | 1.75% |
Fidelity® Metaverse ETF - Market Price B | 21.49% | 6.14% |
| Fidelity Metaverse Index℠ | 21.68% | 2.28% |
| MSCI ACWI (All Country World Index) Index | 16.97% | 0.92% |
A From April 19, 2022
B From April 21, 2022, date initially listed on The Nasdaq Stock Market exchange.
| $10,000 Over Life of Fund |
| |
Let's say hypothetically that $10,000 was invested in Fidelity® Metaverse ETF - NAV, on April 19, 2022, when the fund started. The chart shows how the value of your investment would have changed, and also shows how the Fidelity Metaverse Index℠ and MSCI ACWI (All Country World Index) Index performed over the same period. |
|
|
Fidelity® Metaverse ETF
Market Recap:
U.S. equities gained 19.59% for the 12 months ending June 30, 2023, according to the S&P 500 ® index, as continued global economic expansion, falling commodity prices and a slowing in the pace of inflation provided a favorable backdrop for risk assets. U.S. large-cap stocks spearheaded the rally, which was driven by the shares of a narrow set of mega-cap companies in the information technology and communication services sectors, largely due to exuberance related to artificial intelligence. Aggressive policy tightening by the U.S. Federal Reserve continued amid consistent pressure on core inflation, a measure that excludes food and energy. Since March 2022, the Fed has hiked its benchmark interest rate 10 times, while also shrinking its massive asset portfolio. The latest bump came in early May, a third consecutive raise of a stepped down 25 basis points. In June, the Fed held interest rates steady and signaled it was prepared to raise rates next month if the economy and inflation don't cool more. The S&P 500® gained 6.61% for the month, raising hopes for a "soft landing" of the economy and bringing the index's year-to-date result to 16.89%. June saw the return of market breadth and lower dispersion. Smaller-cap stocks had a particularly strong month, achieving the best result for the category since January. For the full 12 months, value (+20%) topped growth (+18%). By sector, tech (+42%), consumer discretionary and industrials (+25% each) led, while real estate and utilities (-4% each) lagged.
Comments from the Geode Capital Management, LLC, passive equity index team:
For the fiscal year ending June 30, 2023, the exchange-traded fund's (ETF) net asset value returned 21.06% and its market price returned 21.49%, roughly in line with the 21.68% advance of the benchmark Fidelity Metaverse Net Index. By region, the U.S. gained 48% and contributed most, followed by Canada (+103%). By sector, information technology advanced 51% and contributed most. Communication services stocks also helped (+5%), benefiting from the media & entertainment industry (+5%). The industrials sector rose 103%, boosted by the capital goods industry (+103%). Real estate (+14%) also contributed, lifted by the equity real estate investment trusts industry (+14%). Conversely, emerging markets returned -11% and detracted, followed by Europe ex U.K., specifically Sweden, (-12%). From a sector standpoint, stocks in the consumer discretionary sector returned roughly -21% and detracted most. Also detracting overall were the fund's international holdings, in part due to a foreign exchange impact. Turning to individual stocks, the biggest individual contributor was Nvidia (+177%), from the semiconductors & semiconductor equipment industry. Meta Platforms, within the media & entertainment segment, advanced about 77% and lifted the fund. In technology hardware & equipment, Super Micro Computer (+541%) and Apple (+36%) helped. Another contributor was Adobe (+35%), a stock in the software & services group. Conversely, the biggest individual detractor was GDS Holdings (-68%), from the software & services category. In media & entertainment, Embracer (-67%), Naver (-25%), Bumble (-40%), and Ubisoft Entertainment (-35%) all hurt the fund.
The views expressed above reflect those of the portfolio manager(s) only through the end of the period as stated on the cover of this report and do not necessarily represent the views of Fidelity or any other person in the Fidelity organization, or Geode Capital Management, LLC, (the ETF's subadviser) or any other person in the Geode organization. Any such views are subject to change at any time based upon market or other conditions and Fidelity and Geode disclaim any responsibility to update such views. These views may not be relied on as investment advice and, because investment decisions for a Fidelity fund are based on numerous factors, may not be relied on as an indication of trading intent on behalf of any Fidelity fund.
Fidelity® Metaverse ETF
Top Holdings (% of Fund's net assets) |
| |
| Adobe, Inc. | 5.0 | |
| NVIDIA Corp. | 4.6 | |
| Meta Platforms, Inc. Class A | 4.6 | |
| Tencent Holdings Ltd. | 4.5 | |
| Samsung Electronics Co. Ltd. | 4.4 | |
| Alphabet, Inc. Class A | 4.2 | |
| Nintendo Co. Ltd. | 3.9 | |
| NetEase, Inc. | 3.6 | |
| Digital Realty Trust, Inc. | 3.4 | |
| Electronic Arts, Inc. | 3.3 | |
| | 41.5 | |
| |
| Market Sectors (% of Fund's net assets) |
| |
| Communication Services | 57.9 | |
| Information Technology | 36.9 | |
| Real Estate | 3.4 | |
| Consumer Discretionary | 1.4 | |
| |
Asset Allocation (% of Fund's net assets) |
|
Futures - 0.2% |
|
Geographic Diversification (% of Fund's net assets) |
|
* Includes Short-Term investments and Net Other Assets (Liabilities). Percentages are adjusted for the effect of derivatives, if applicable. |
| |
Fidelity® Metaverse ETF
Showing Percentage of Net Assets
| Common Stocks - 99.6% |
| | | Shares | Value ($) |
| COMMUNICATION SERVICES - 57.9% | | | |
| Entertainment - 38.3% | | | |
| Capcom Co. Ltd. | | 7,600 | 299,457 |
| China Ruyi Holdings Ltd. (a) | | 680,000 | 159,661 |
| CMGE Technology Group Ltd. (a) | | 442,000 | 98,704 |
| Com2uS Corp. | | 2,439 | 112,172 |
| Electronic Arts, Inc. | | 4,203 | 545,129 |
| Embracer Group AB (a) | | 85,438 | 213,253 |
| GungHo Online Entertainment, Inc. | | 8,500 | 166,136 |
| Kakao Games Corp. (a) | | 6,275 | 156,440 |
| Koei Tecmo Holdings Co. Ltd. | | 12,500 | 214,957 |
| Konami Group Corp. | | 5,400 | 280,994 |
| KRAFTON, Inc. (a) | | 2,002 | 295,974 |
| NCSOFT Corp. | | 1,075 | 240,675 |
| Neowiz (a) | | 3,456 | 103,078 |
| NetEase, Inc. | | 31,000 | 603,655 |
| Netmarble Corp. (a)(b) | | 4,093 | 152,519 |
| Nexon Co. Ltd. | | 16,900 | 321,198 |
| Nexon Games Co. Ltd. (a) | | 7,913 | 136,022 |
| Nintendo Co. Ltd. | | 14,400 | 651,778 |
| Roblox Corp. (a) | | 9,830 | 396,149 |
| Square Enix Holdings Co. Ltd. | | 5,800 | 268,381 |
| Take-Two Interactive Software, Inc. (a) | | 3,389 | 498,725 |
| Ubisoft Entertainment SA (a) | | 7,966 | 224,921 |
| WeMade Entertainment Co. Ltd. | | 4,118 | 122,041 |
| XD, Inc. (a) | | 53,800 | 135,245 |
| | | | 6,397,264 |
| Interactive Media & Services - 19.6% | | | |
| Alphabet, Inc. Class A (a) | | 5,871 | 702,759 |
| Bumble, Inc. (a) | | 11,870 | 199,179 |
| Meta Platforms, Inc. Class A (a) | | 2,665 | 764,802 |
| NAVER Corp. | | 3,075 | 426,600 |
| Snap, Inc. Class A (a) | | 34,980 | 414,163 |
| Tencent Holdings Ltd. | | 17,900 | 757,425 |
| | | | 3,264,928 |
TOTAL COMMUNICATION SERVICES | | | 9,662,192 |
| CONSUMER DISCRETIONARY - 1.4% | | | |
| Household Durables - 0.7% | | | |
| Vuzix Corp. (a) | | 22,578 | 115,148 |
| Leisure Products - 0.7% | | | |
| Golfzon Co. Ltd. | | 1,383 | 121,438 |
TOTAL CONSUMER DISCRETIONARY | | | 236,586 |
| INFORMATION TECHNOLOGY - 36.9% | | | |
| IT Services - 2.8% | | | |
| GDS Holdings Ltd. Class A (a) | | 142,300 | 194,295 |
| NEXTDC Ltd. (a) | | 32,787 | 274,554 |
| | | | 468,849 |
| Semiconductors & Semiconductor Equipment - 9.0% | | | |
| ams-OSRAM AG (a) | | 27,982 | 201,487 |
| Cirrus Logic, Inc. (a) | | 3,465 | 280,700 |
| NVIDIA Corp. | | 1,826 | 772,435 |
| Synaptics, Inc. (a) | | 2,966 | 253,237 |
| | | | 1,507,859 |
| Software - 18.3% | | | |
| Adobe, Inc. (a) | | 1,701 | 831,767 |
| Bentley Systems, Inc. Class B | | 7,208 | 390,890 |
| Dassault Systemes SA | | 11,773 | 521,801 |
| Matterport, Inc. (a) | | 49,401 | 155,613 |
| Nemetschek SE | | 3,422 | 256,261 |
| PTC, Inc. (a) | | 3,005 | 427,612 |
| Unity Software, Inc. (a) | | 10,771 | 467,677 |
| | | | 3,051,621 |
| Technology Hardware, Storage & Peripherals - 6.8% | | | |
| Samsung Electronics Co. Ltd. | | 13,541 | 741,973 |
| Super Micro Computer, Inc. (a) | | 1,595 | 397,554 |
| | | | 1,139,527 |
TOTAL INFORMATION TECHNOLOGY | | | 6,167,856 |
| REAL ESTATE - 3.4% | | | |
| Equity Real Estate Investment Trusts (REITs) - 3.4% | | | |
| Digital Realty Trust, Inc. | | 4,956 | 564,340 |
| TOTAL COMMON STOCKS (Cost $15,916,295) | | | 16,630,974 |
| | | | |
| Money Market Funds - 1.7% |
| | | Shares | Value ($) |
Fidelity Cash Central Fund 5.14% (c) (Cost $278,050) | | 277,994 | 278,050 |
| | | | |
| TOTAL INVESTMENT IN SECURITIES - 101.3% (Cost $16,194,345) | 16,909,024 |
NET OTHER ASSETS (LIABILITIES) - (1.3)% | (220,277) |
| NET ASSETS - 100.0% | 16,688,747 |
| | |
| Futures Contracts |
| | Number of contracts | Expiration Date | Notional Amount ($) | Value ($) | Unrealized Appreciation/ (Depreciation) ($) |
| Purchased | | | | | |
| | | | | | |
| Equity Index Contracts | | | | | |
| CME E-mini NASDAQ 100 Index Contracts (United States) | 1 | Sep 2023 | 30,674 | 1,311 | 1,311 |
| | | | | | |
| The notional amount of futures purchased as a percentage of Net Assets is 0.2% |
Legend
| (b) | Security exempt from registration under Rule 144A of the Securities Act of 1933. These securities may be resold in transactions exempt from registration, normally to qualified institutional buyers. At the end of the period, the value of these securities amounted to $152,519 or 0.9% of net assets. |
| (c) | Affiliated fund that is generally available only to investment companies and other accounts managed by Fidelity Investments. The rate quoted is the annualized seven-day yield of the fund at period end. A complete unaudited listing of the fund's holdings as of its most recent quarter end is available upon request. In addition, each Fidelity Central Fund's financial statements, which are not covered by the Fund's Report of Independent Registered Public Accounting Firm, are available on the SEC's website or upon request. |
Affiliated Central Funds
Fiscal year to date information regarding the Fund's investments in Fidelity Central Funds, including the ownership percentage, is presented below.
| Affiliate | Value, beginning of period ($) | Purchases ($) | Sales Proceeds ($) | Dividend Income ($) | Realized Gain (loss) ($) | Change in Unrealized appreciation (depreciation) ($) | Value, end of period ($) | % ownership, end of period |
| Fidelity Cash Central Fund 5.14% | - | 601,452 | 323,402 | 569 | - | - | 278,050 | 0.0% |
| Total | - | 601,452 | 323,402 | 569 | - | - | 278,050 | |
| | | | | | | | | |
Amounts in the dividend income column in the above table include any capital gain distributions from underlying funds, which are presented in the corresponding line item in the Statement of Operations, if applicable.
Amounts included in the purchases and sales proceeds columns may include in-kind transactions, if applicable.
Investment Valuation
The following is a summary of the inputs used, as of June 30, 2023, involving the Fund's assets and liabilities carried at fair value. The inputs or methodology used for valuing securities may not be an indication of the risk associated with investing in those securities. For more information on valuation inputs, and their aggregation into the levels used below, please refer to the Investment Valuation section in the accompanying Notes to Financial Statements.
| Valuation Inputs at Reporting Date: |
| Description | Total ($) | Level 1 ($) | Level 2 ($) | Level 3 ($) |
Investments in Securities: | | | | |
|
| Equities: | | | | |
Communication Services | 9,662,192 | 9,662,192 | - | - |
Consumer Discretionary | 236,586 | 236,586 | - | - |
Information Technology | 6,167,856 | 6,167,856 | - | - |
Real Estate | 564,340 | 564,340 | - | - |
|
| Money Market Funds | 278,050 | 278,050 | - | - |
| Total Investments in Securities: | 16,909,024 | 16,909,024 | - | - |
Derivative Instruments: | | | | |
|
| Assets | | | | |
Futures Contracts | 1,311 | 1,311 | - | - |
| Total Assets | 1,311 | 1,311 | - | - |
| Total Derivative Instruments: | 1,311 | 1,311 | - | - |
Value of Derivative Instruments
The following table is a summary of the Fund's value of derivative instruments by primary risk exposure as of June 30, 2023. For additional information on derivative instruments, please refer to the Derivative Instruments section in the accompanying Notes to Financial Statements.
Primary Risk Exposure / Derivative Type | Value |
| Asset ($) | Liability ($) |
| Equity Risk | | |
Futures Contracts (a) | 1,311 | 0 |
| Total Equity Risk | 1,311 | 0 |
| Total Value of Derivatives | 1,311 | 0 |
(a)Reflects gross cumulative appreciation (depreciation) on futures contracts as presented in the Schedule of Investments. In the Statement of Assets and Liabilities, the period end daily variation margin is included in receivable or payable for daily variation margin on futures contracts, and the net cumulative appreciation (depreciation) is included in Total accumulated earnings (loss).
Fidelity® Metaverse ETF
| Statement of Assets and Liabilities |
| | | | June 30, 2023 |
| | | | | |
| Assets | | | | |
| Investment in securities, at value - See accompanying schedule: | | | | |
Unaffiliated issuers (cost $15,916,295) | $ | 16,630,974 | | |
Fidelity Central Funds (cost $278,050) | | 278,050 | | |
| | | | | |
| | | | | |
| Total Investment in Securities (cost $16,194,345) | | | $ | 16,909,024 |
| Segregated cash with brokers for derivative instruments | | | | 1,680 |
| Cash | | | | 192 |
| Foreign currency held at value (cost $4,904) | | | | 4,918 |
| Dividends receivable | | | | 5,818 |
| Distributions receivable from Fidelity Central Funds | | | | 102 |
| Receivable for daily variation margin on futures contracts | | | | 474 |
Total assets | | | | 16,922,208 |
| Liabilities | | | | |
| Payable for investments purchased | $ | 228,390 | | |
| Accrued management fee | | 5,071 | | |
| Total Liabilities | | | | 233,461 |
| Net Assets | | | $ | 16,688,747 |
| Net Assets consist of: | | | | |
| Paid in capital | | | $ | 16,570,481 |
| Total accumulated earnings (loss) | | | | 118,266 |
| Net Assets | | | $ | 16,688,747 |
Net Asset Value , offering price and redemption price per share ($16,688,747 ÷ 650,000 shares) | | | $ | 25.67 |
| Statement of Operations |
| | | | Year ended June 30, 2023 |
| Investment Income | | | | |
| Dividends | | | $ | 86,936 |
| Non-Cash dividends | | | | 35,300 |
| Income from Fidelity Central Funds | | | | 569 |
| Income before foreign taxes withheld | | | $ | 122,805 |
| Less foreign taxes withheld | | | | (8,283) |
| Total Income | | | | 114,522 |
| Expenses | | | | |
| Management fee | $ | 50,615 | | |
| Independent trustees' fees and expenses | | 55 | | |
| Total expenses before reductions | | 50,670 | | |
| Expense reductions | | (282) | | |
| Total expenses after reductions | | | | 50,388 |
| Net Investment income (loss) | | | | 64,134 |
| Realized and Unrealized Gain (Loss) | | | | |
| Net realized gain (loss) on: | | | | |
| Investment Securities: | | | | |
| Unaffiliated issuers | | (414,949) | | |
| Redemptions in-kind | | 968,649 | | |
| Foreign currency transactions | | (4,020) | | |
| Futures contracts | | 8,410 | | |
| Total net realized gain (loss) | | | | 558,090 |
| Change in net unrealized appreciation (depreciation) on: | | | | |
| Investment Securities: | | | | |
| Unaffiliated issuers | | 2,002,047 | | |
| Assets and liabilities in foreign currencies | | 16 | | |
| Futures contracts | | 1,634 | | |
| Total change in net unrealized appreciation (depreciation) | | | | 2,003,697 |
| Net gain (loss) | | | | 2,561,787 |
| Net increase (decrease) in net assets resulting from operations | | | $ | 2,625,921 |
| Statement of Changes in Net Assets |
| |
| | Year ended June 30, 2023 | | For the period April 19, 2022 (commencement of operations) through June 30, 2022 |
| Increase (Decrease) in Net Assets | | | | |
| Operations | | | | |
| Net investment income (loss) | $ | 64,134 | $ | 214 |
| Net realized gain (loss) | | 558,090 | | (123,480) |
| Change in net unrealized appreciation (depreciation) | | 2,003,697 | | (1,287,738) |
| Net increase (decrease) in net assets resulting from operations | | 2,625,921 | | (1,411,004) |
| Distributions to shareholders | | (70,500) | | - |
| | | | | |
| Share transactions | | | | |
| Proceeds from sales of shares | | 6,111,398 | | 13,140,454 |
| Cost of shares redeemed | | (2,636,047) | | (1,071,475) |
| | | | | |
Net increase (decrease) in net assets resulting from share transactions | | 3,475,351 | | 12,068,979 |
| Total increase (decrease) in net assets | | 6,030,772 | | 10,657,975 |
| | | | | |
| Net Assets | | | | |
| Beginning of period | | 10,657,975 | | - |
| End of period | $ | 16,688,747 | $ | 10,657,975 |
| | | | | |
| Other Information | | | | |
| Shares | | | | |
| Sold | | 250,000 | | 550,000 |
| Redeemed | | (100,000) | | (50,000) |
| Net increase (decrease) | | 150,000 | | 500,000 |
| | | | | |
| Years ended June 30, | | 2023 | | 2022 A |
Selected Per-Share Data | | | | |
| Net asset value, beginning of period | $ | 21.32 | $ | 25.28 |
| Income from Investment Operations | | | | |
Net investment income (loss) B,C | | .11 D | | - E |
| Net realized and unrealized gain (loss) | | 4.36 | | (3.96) |
| Total from investment operations | | 4.47 | | (3.96) |
| Distributions from net investment income | | (.12) | | - |
| Total distributions | | (.12) | | - |
| Net asset value, end of period | $ | 25.67 | $ | 21.32 |
Total Return F,G,H | | 21.06% | | (15.67)% |
Ratios to Average Net Assets C,I,J | | | | |
| Expenses before reductions | | .39% | | .39% K |
| Expenses net of fee waivers, if any | | .39% | | .39% K |
| Expenses net of all reductions | | .39% | | .39% K |
| Net investment income (loss) | | .49% D | | .01% K |
| Supplemental Data | | | | |
| Net assets, end of period (000 omitted) | $ | 16,689 | $ | 10,658 |
Portfolio turnover rate L,M | | 47% | | 8% N |
A For the period April 19, 2022 (commencement of operations) through June 30, 2022.
B Calculated based on average shares outstanding during the period.
C Net investment income (loss) is affected by the timing of the declaration of dividends by any underlying mutual funds or exchange-traded funds (ETFs). Net investment income (loss) of any mutual funds or ETFs is not included in the Fund's net investment income (loss) ratio.
D Net investment income per share reflects one or more large, non-recurring dividend(s) which amounted to $.06 per share. Excluding such non-recurring dividend(s), the ratio of net investment income (loss) to average net assets would have been .22%.
E Amount represents less than $.005 per share.
F Total returns for periods of less than one year are not annualized.
G Total returns would have been lower if certain expenses had not been reduced during the applicable periods shown.
H Based on net asset value.
I Fees and expenses of any underlying mutual funds or exchange-traded funds (ETFs) are not included in the Fund's expense ratio. The Fund indirectly bears its proportionate share of these expenses. For additional expense information related to investments in Fidelity Central Funds, please refer to the "Investments in Fidelity Central Funds" note found in the Notes to Financial Statements section of the most recent Annual or Semi-Annual report.
J Expense ratios reflect operating expenses of the class. Expenses before reductions do not reflect amounts reimbursed, waived, or reduced through arrangements with the investment adviser, brokerage services, or other offset arrangements, if applicable, and do not represent the amount paid by the class during periods when reimbursements, waivers or reductions occur.
K Annualized.
L Portfolio turnover rate excludes securities received or delivered in-kind.
M Amount does not include the portfolio activity of any underlying mutual funds or exchange-traded funds (ETFs).
N Amount not annualized.
For the period ended June 30, 2023
1. Organization.
Fidelity Clean Energy ETF, Fidelity Cloud Computing ETF, Fidelity Crypto Industry and Digital Payments ETF, Fidelity Digital Health ETF, Fidelity Electric Vehicles and Future Transportation ETF and Fidelity Metaverse ETF (the Funds) are non-diversified exchange-traded funds of Fidelity Covington Trust (the Trust) and are authorized to issue an unlimited number of shares. The Trust is registered under the Investment Company Act of 1940, as amended (the 1940 Act), as an open-end management investment company organized as a Massachusetts business trust. Certain Funds' investments in emerging markets can be subject to social, economic, regulatory, and political uncertainties and can be extremely volatile.
For Fidelity Clean Energy ETF, clean energy companies are subject to various risks, including fluctuations in commodity prices and/or interest rates, obsolescence of existing technology, short product cycles, changes in governmental and environmental regulations and enforcement policies, changes in U.S. and foreign government policies, including tax incentives and government subsidies, reduced availability of clean energy sources or other commodities, and extreme weather or other natural disasters.
For Fidelity Cloud Computing ETF, cloud computing companies are subject to various risks, including those associated with limited operating history, product lines, markets, financial resources or personnel, changes in business cycles, intense competition, potentially rapid product obsolescence, disruptions in service, changes in regulation, and cybersecurity attacks and other types of theft.
For Fidelity Crypto Industry and Digital Payments ETF, cryptocurrency and blockchain companies are subject to various risks, including inability to develop digital asset applications or to capitalize on those applications, theft, loss, or destruction of cryptographic keys, the possibility that digital asset technologies may never be fully implemented, cybersecurity risk, conflicting intellectual property claims, and inconsistent and changing regulations. Digital payments processing companies are subject to various risks, including those associated with intense competition, changes in regulation, economic conditions, deterioration in credit markets, impairment of intellectual property rights, disruptions in service, and cybersecurity attacks and other types of theft.
For Fidelity Digital Health ETF, digital health companies are subject to various risks, including competition, potentially rapid product obsolescence, increasing regulatory scrutiny, changes in government regulatory requirements, regulatory approval for new drugs and medical products, changes in business cycles, vulnerability to cybersecurity breaches, and unexpected events such as pandemics.
For Fidelity Electric Vehicles and Future Transportation ETF, electric vehicles and future transportation companies are subject to various risks, including those associated with limited product lines, markets, financial resources or personnel, intense competition, production delays, changes in governmental regulation, and litigation based on product liability claims.
For Fidelity Metaverse ETF, metaverse companies are subject to various risks, including those associated with limited product lines, markets, financial resources or personnel, intense competition, potentially rapid product obsolescence, impairment of intellectual property rights, disruptions in service, cybersecurity attacks, and changes in regulation.
Although each Fund's underlying index uses a rules-based proprietary index methodology that seeks to identify such companies, there is no guarantee that this methodology will be successful.
2. Investments in Fidelity Central Funds.
Funds may invest in Fidelity Central Funds, which are open-end investment companies generally available only to other investment companies and accounts managed by the investment adviser and its affiliates. The Schedule of Investments lists any Fidelity Central Funds held as an investment as of period end, but does not include the underlying holdings of each Fidelity Central Fund. An investing fund indirectly bears its proportionate share of the expenses of the underlying Fidelity Central Funds.
Based on its investment objective, each Fidelity Central Fund may invest or participate in various investment vehicles or strategies that are similar to those of the investing fund. These strategies are consistent with the investment objectives of the investing fund and may involve certain economic risks which may cause a decline in value of each of the Fidelity Central Funds and thus a decline in the value of the investing fund.
| Fidelity Central Fund | Investment Manager | Investment Objective | Investment Practices | Expense Ratio A |
| Fidelity Money Market Central Funds | Fidelity Management & Research Company LLC (FMR) | Each fund seeks to obtain a high level of current income consistent with the preservation of capital and liquidity. | Short-term Investments | Less than .005% |
A Expenses expressed as a percentage of average net assets and are as of each underlying Central Fund's most recent annual or semi-annual shareholder report.
A complete unaudited list of holdings for each Fidelity Central Fund is available upon request or at the Securities and Exchange Commission website at www.sec.gov. In addition, the financial statements of the Fidelity Central Funds, which are not covered by the Report of Independent Registered Public Accounting Firm, are available on the Securities and Exchange Commission website or upon request.
3. Significant Accounting Policies.
Each Fund is an investment company and applies the accounting and reporting guidance of the Financial Accounting Standards Board (FASB) Accounting Standards Codification Topic 946 Financial Services - Investment Companies . The financial statements have been prepared in conformity with accounting principles generally accepted in the United States of America (GAAP), which require management to make certain estimates and assumptions at the date of the financial statements. Actual results could differ from those estimates. Subsequent events, if any, through the date that the financial statements were issued have been evaluated in the preparation of the financial statements. Each Fund's Schedule of Investments lists any underlying mutual funds or exchange-traded funds (ETFs) but does not include the underlying holdings of these funds. The following summarizes the significant accounting policies of each Fund:
Investment Valuation. Investments are valued as of 4:00 p.m. Eastern time on the last calendar day of the period. The Board of Trustees (the Board) has designated each Fund's investment adviser as the valuation designee responsible for the fair valuation function and performing fair value determinations as needed. The investment adviser has established a Fair Value Committee (the Committee) to carry out the day-to-day fair valuation responsibilities and has adopted policies and procedures to govern the fair valuation process and the activities of the Committee. In accordance with these fair valuation policies and procedures, which have been approved by the Board, each Fund attempts to obtain prices from one or more third party pricing services or brokers to value its investments. When current market prices, quotations or currency exchange rates are not readily available or reliable, investments will be fair valued in good faith by the Committee, in accordance with the policies and procedures. Factors used in determining fair value vary by investment type and may include market or investment specific events, transaction data, estimated cash flows, and market observations of comparable investments. The frequency that the fair valuation procedures are used cannot be predicted and they may be utilized to a significant extent. The Committee manages each Fund's fair valuation practices and maintains the fair valuation policies and procedures. Each Fund's investment adviser reports to the Board information regarding the fair valuation process and related material matters.
Each Fund categorizes the inputs to valuation techniques used to value its investments into a disclosure hierarchy consisting of three levels as shown below:
Level 1 - unadjusted quoted prices in active markets for identical investments
Level 2 - other significant observable inputs (including quoted prices for similar investments, interest rates, prepayment speeds, etc.)
Level 3 - unobservable inputs (including the Fund's own assumptions based on the best information available)
Valuation techniques used to value each Fund's investments by major category are as follows:
Equity securities, including restricted securities, for which market quotations are readily available, are valued at the last reported sale price or official closing price as reported by a third party pricing service on the primary market or exchange on which they are traded and are categorized as Level 1 in the hierarchy. In the event there were no sales during the day or closing prices are not available, securities are valued at the last quoted bid price or may be valued using the last available price and are generally categorized as Level 2 in the hierarchy. For foreign equity securities, when market or security specific events arise, comparisons to the valuation of American Depositary Receipts (ADRs), futures contracts, ETFs and certain indexes as well as quoted prices for similar securities may be used and would be categorized as Level 2 in the hierarchy. For equity securities, including restricted securities, where observable inputs are limited, assumptions about market activity and risk are used and these securities may be categorized as Level 3 in the hierarchy.
Futures contracts are valued at the settlement price established each day by the board of trade or exchange on which they are traded and are categorized as Level 1 in the hierarchy. Investments in open-end mutual funds, including the Fidelity Central Funds, are valued at their closing net asset value (NAV) each business day and are categorized as Level 1 in the hierarchy.
Changes in valuation techniques may result in transfers in or out of an assigned level within the disclosure hierarchy. The aggregate value of investments by input level as of June 30, 2023 is included at the end of each Fund's Schedule of Investments.
Foreign Currency. Certain Funds may use foreign currency contracts to facilitate transactions in foreign-denominated securities. Gains and losses from these transactions may arise from changes in the value of the foreign currency or if the counterparties do not perform under the contracts' terms.
Foreign-denominated assets, including investment securities, and liabilities are translated into U.S. dollars at the exchange rates at period end. Purchases and sales of investment securities, income and dividends received, and expenses denominated in foreign currencies are translated into U.S. dollars at the exchange rate in effect on the transaction date.
The effects of exchange rate fluctuations on investments are included with the net realized and unrealized gain (loss) on investment securities. Other foreign currency transactions resulting in realized and unrealized gain (loss) are disclosed separately.
Investment Transactions and Income. For financial reporting purposes, the Funds' investment holdings and NAV include trades executed through the end of the last business day of the period. The NAV per share for processing shareholder transactions is calculated as of the close of business (normally 4:00 p.m. Eastern time) of the Nasdaq Stock Market for Fidelity Crypto Industry and Digital Payments ETF and Fidelity Metaverse ETF, and of the Cboe BZX Exchange, Inc. (CboeBZX) for all other funds; and includes trades executed through the end of the prior business day. Gains and losses on securities sold are determined on the basis of identified cost. Commissions paid to certain brokers with whom the investment adviser, or its affiliates, places trades on behalf of a fund include an amount in addition to trade execution, which may be rebated back to a fund. Any such rebates are included in net realized gain (loss) on investments in the Statement of Operations. Dividend income is recorded on the ex-dividend date, except for certain dividends from foreign securities where the ex-dividend date may have passed, which are recorded as soon as the Funds are informed of the ex-dividend date. Non-cash dividends included in dividend income, if any, are recorded at the fair market value of the securities received. Income and capital gain distributions from Fidelity Central Funds, if any, are recorded on the ex-dividend date. Certain distributions received by the Funds represent a return of capital or capital gain. The Funds determine the components of these distributions subsequent to the ex-dividend date, based upon receipt of tax filings or other correspondence relating to the underlying investment. These distributions are recorded as a reduction of cost of investments and/or as a realized gain. Large, non-recurring dividends recognized by the Funds are presented separately on the Statement of Operations as "Special Dividends" and the impact of these dividends is presented in the Financial Highlights. Investment income is recorded net of foreign taxes withheld where recovery of such taxes is uncertain. Funds may file withholding tax reclaims in certain jurisdictions to recover a portion of amounts previously withheld. Any withholding tax reclaims income is included in the Statement of Operations in dividends or foreign taxes withheld. Any receivables for withholding tax reclaims are included in the Statement of Assets and Liabilities in dividends receivable.
Expenses. Expenses directly attributable to a fund are charged to that fund. Expenses attributable to more than one fund are allocated among the respective funds on the basis of relative net assets or other appropriate methods. Expenses included in the accompanying financial statements reflect the expenses of that fund and do not include any expenses associated with any underlying mutual funds or exchange-traded funds. Although not included in a fund's expenses, a fund indirectly bears its proportionate share of these expenses through the net asset value of each underlying mutual fund or exchange-traded fund. Expense estimates are accrued in the period to which they relate and adjustments are made when actual amounts are known.
Income Tax Information and Distributions to Shareholders. Each year, each Fund intends to qualify as a regulated investment company under Subchapter M of the Internal Revenue Code, including distributing substantially all of its taxable income and realized gains. As a result, no provision for U.S. Federal income taxes is required. As of June 30, 2023, each Fund did not have any unrecognized tax benefits in the financial statements; nor is each Fund aware of any tax positions for which it is reasonably possible that the total amounts of unrecognized tax benefits will significantly change in the next twelve months. Each Fund files a U.S. federal tax return, in addition to state and local tax returns as required. Each Fund's federal income tax returns are subject to examination by the Internal Revenue Service (IRS) for a period of three fiscal years after they are filed. State and local tax returns may be subject to examination for an additional fiscal year depending on the jurisdiction. Foreign taxes are provided for based on each Fund's understanding of the tax rules and rates that exist in the foreign markets in which it invests.
Distributions are declared and recorded on the ex-dividend date. Income and capital gain distributions are determined in accordance with income tax regulations, which may differ from GAAP.
Capital accounts within the financial statements are adjusted for permanent book-tax differences. These adjustments have no impact on net assets or the results of operations. Capital accounts are not adjusted for temporary book-tax differences which will reverse in a subsequent period.
Book-tax differences are primarily due to futures contracts, foreign currency transactions, passive foreign investment companies (PFIC), capital loss carryforwards, redemptions in- kind, tax return of capital distribution and losses deferred due to wash sales and excise tax regulations.
As of period end, the cost and unrealized appreciation (depreciation) in securities, and derivatives if applicable, for federal income tax purposes were as follows for each Fund:
| | Tax cost | Gross unrealized appreciation | Gross unrealized depreciation | Net unrealized appreciation (depreciation) |
| Fidelity Clean Energy ETF | $43,435,173 | $3,307,362 | $(8,307,451) | $(5,000,089) |
| Fidelity Cloud Computing ETF | 37,502,705 | 3,590,022 | (4,167,088) | (577,066) |
Fidelity Crypto Industry and Digital Payments ETF | 27,815,659 | 10,198,630 | (1,555,734) | 8,642,896 |
| Fidelity Digital Health ETF | 11,296,611 | 901,285 | (2,373,457) | (1,472,172) |
Fidelity Electric Vehicles and Future Transportation ETF | 58,626,550 | 7,189,130 | (11,495,645) | (4,306,515) |
| Fidelity Metaverse ETF | 16,327,224 | 1,978,112 | (1,396,312) | 581,800 |
The tax-based components of distributable earnings as of period end were as follows for each Fund:
| | Undistributed ordinary income | Capital loss carryforward | Net unrealized appreciation (depreciation) on securities and other investments |
| Fidelity Clean Energy ETF | $- | $ (2,737,402) | $ (4,995,816) |
| Fidelity Cloud Computing ETF | - | (4,465,903) | (574,369) |
Fidelity Crypto Industry and Digital Payments ETF | 132,239 | (4,237,988) | 8,642,883 |
| Fidelity Digital Health ETF | - | (1,447,697) | (1,471,905) |
Fidelity Electric Vehicles and Future Transportation ETF | - | (12,775,795) | (4,304,638) |
| Fidelity Metaverse ETF | 7,324 | (470,880) | 581,821 |
Capital loss carryforwards are only available to offset future capital gains of the Funds to the extent provided by regulations and may be limited. The capital loss carryforward information presented below, including any applicable limitation, is estimated as of fiscal period end and is subject to adjustment.
| | Short-term | Long-term | Total capital loss carryforward |
| Fidelity Clean Energy ETF | $(1,596,374) | $(1,141,028) | $(2,737,402) |
| Fidelity Cloud Computing ETF | (1,589,073) | (2,876,830) | (4,465,903) |
Fidelity Crypto Industry and Digital Payments ETF | (3,656,444) | (581,544) | (4,237,988) |
| Fidelity Digital Health ETF | (435,575) | (1,012,122) | (1,447,697) |
Fidelity Electric Vehicles and Future Transportation ETF | (8,644,807) | (4,130,988) | (12,775,795) |
| Fidelity Metaverse ETF | (430,373) | (40,507) | (470,880) |
Certain of the Funds intend to elect to defer to the next fiscal year ordinary losses recognized during the period January 1, 2023 to June 30, 2023. Loss deferrals are as follows:
| | Ordinary losses ($) |
| Fidelity Cloud Computing ETF | (5,481) |
| Fidelity Electric Vehicles and Future Transportation ETF | (13,743) |
The tax character of distributions paid was as follows:
| June 30, 2023 | | | |
| | Ordinary Income | Tax Return of Capital | Total |
| Fidelity Clean Energy ETF | $306,800 | $- | $306,800 |
| Fidelity Cloud Computing ETF | 48,880 | 14,820 | 63,700 |
Fidelity Crypto Industry and Digital Payments ETF | - | - | - |
| Fidelity Digital Health ETF | 15,500 | - | 15,500 |
Fidelity Electric Vehicles and Future Transportation ETF | 119,850 | - | 119,850 |
| Fidelity Metaverse ETF | 70,500 | - | 70,500 |
| June 30, 2022 | | |
| | Ordinary Income | Total |
| Fidelity Clean Energy ETF | $145,750 | $145,750 |
| Fidelity Cloud Computing ETF | 57,350 | 57,350 |
Fidelity Crypto Industry and Digital Payments ETF | - | - |
| Fidelity Digital Health ETF | - | - |
Fidelity Electric Vehicles and Future Transportation ETF | 64,350 | 64,350 |
| Fidelity Metaverse ETF | - | - |
Restricted Securities (including Private Placements). Funds may invest in securities that are subject to legal or contractual restrictions on resale. These securities generally may be resold in transactions exempt from registration or to the public if the securities are registered. Disposal of these securities may involve time-consuming negotiations and expense, and prompt sale at an acceptable price may be difficult. Information regarding restricted securities held at period end is included at the end of the Schedule of Investments, if applicable.
4. Derivative Instruments.
Risk Exposures and the Use of Derivative Instruments. Each Fund's investment objectives allow for various types of derivative instruments, including futures contracts. Derivatives are investments whose value is primarily derived from underlying assets, indices or reference rates and may be transacted on an exchange or over-the-counter (OTC). Derivatives may involve a future commitment to buy or sell a specified asset based on specified terms, to exchange future cash flows at periodic intervals based on a notional principal amount, or for one party to make one or more payments upon the occurrence of specified events in exchange for periodic payments from the other party.
Derivatives were used to increase returns and to manage exposure to certain risks as defined below. The success of any strategy involving derivatives depends on analysis of numerous economic factors, and if the strategies for investment do not work as intended, the objectives may not be achieved.
Derivatives were used to increase or decrease exposure to the following risk(s):
| | |
| Equity Risk | Equity risk relates to the fluctuations in the value of financial instruments as a result of changes in market prices (other than those arising from interest rate risk or foreign exchange risk), whether caused by factors specific to an individual investment, its issuer, or all factors affecting all instruments traded in a market or market segment. |
Funds are also exposed to additional risks from investing in derivatives, such as liquidity risk and counterparty credit risk. Liquidity risk is the risk that a fund will be unable to close out the derivative in the open market in a timely manner. Counterparty credit risk is the risk that the counterparty will not be able to fulfill its obligation to a fund. Counterparty credit risk related to exchange-traded contracts may be mitigated by the protection provided by the exchange on which they trade.
Investing in derivatives may involve greater risks than investing in the underlying assets directly and, to varying degrees, may involve risk of loss in excess of any initial investment and collateral received and amounts recognized in the Statement of Assets and Liabilities. In addition, there may be the risk that the change in value of the derivative contract does not correspond to the change in value of the underlying instrument.
Futures Contracts. A futures contract is an agreement between two parties to buy or sell a specified underlying instrument for a fixed price at a specified future date. Futures contracts were used to manage exposure to the stock market.
Upon entering into a futures contract, a fund is required to deposit either cash or securities (initial margin) with a clearing broker in an amount equal to a certain percentage of the face value of the contract. Futures contracts are marked-to-market daily and subsequent daily payments are made or received by a fund depending on the daily fluctuations in the value of the futures contracts and are recorded as unrealized appreciation or (depreciation). This receivable and/or payable, if any, is included in daily variation margin on futures contracts in the Statement of Assets and Liabilities. Realized gain or (loss) is recorded upon the expiration or closing of a futures contract. The net realized gain (loss) and change in net unrealized appreciation (depreciation) on futures contracts during the period is presented in the Statement of Operations.
Any open futures contracts at period end are presented in the Schedule of Investments under the caption "Futures Contracts". The notional amount at value reflects each contract's exposure to the underlying instrument or index at period end, and is representative of volume of activity during the period unless an average notional amount is presented. Any securities deposited to meet initial margin requirements are identified in the Schedule of Investments. Any cash deposited to meet initial margin requirements is presented as segregated cash with brokers for derivative instruments in the Statement of Assets and Liabilities.
5. Purchases and Sales of Investments.
Purchases and sales of securities, other than short-term securities and in-kind transactions, as applicable, are noted in the table below.
| | Purchases ($) | Sales ($) |
| Fidelity Clean Energy ETF | 16,878,361 | 13,858,742 |
| Fidelity Cloud Computing ETF | 10,186,048 | 8,423,487 |
| Fidelity Crypto Industry and Digital Payments ETF | 12,101,096 | 11,898,376 |
| Fidelity Digital Health ETF | 3,766,416 | 3,427,444 |
| Fidelity Electric Vehicles and Future Transportation ETF | 30,192,485 | 27,931,323 |
| Fidelity Metaverse ETF | 9,272,755 | 5,930,846 |
Securities received and delivered in-kind through subscriptions and redemptions are noted in the table below.
| | In-Kind Subscriptions ($) | In-Kind Redemptions ($) |
| Fidelity Clean Energy ETF | 11,699,401 | 2,000,822 |
| Fidelity Cloud Computing ETF | 13,318,107 | - |
| Fidelity Crypto Industry and Digital Payments ETF | 14,161,087 | 1,241,384 |
| Fidelity Electric Vehicles and Future Transportation ETF | 10,392,464 | - |
| Fidelity Metaverse ETF | 2,937,457 | 2,615,739 |
6. Fees and Other Transactions with Affiliates.
Management Fee. Fidelity Management & Research Company LLC (the investment adviser) provides the Funds with investment management related services for which the Funds pay a monthly management fee that is based on an annual rate of each Fund's average net assets as noted in the table below. Under the management contract, the investment adviser pays all other expenses, except the compensation of the independent Trustees and certain miscellaneous expenses such as proxy and shareholder meeting expenses.
| | Fee Rate |
| Fidelity Clean Energy ETF | .39% |
| Fidelity Cloud Computing ETF | .39% |
| Fidelity Crypto Industry and Digital Payments ETF | .39% |
| Fidelity Digital Health ETF | .39% |
Fidelity Electric Vehicles and Future Transportation ETF | .39% |
Fidelity Metaverse ETF | .39% |
Sub-Adviser. Geode Capital Management, LLC (Geode) serves as sub-adviser for the Funds. Geode provides discretionary investment advisory services to the Funds and is paid by the investment adviser for providing these services.
Interfund Trades. Funds may purchase from or sell securities to other Fidelity Funds under procedures adopted by the Board. The procedures have been designed to ensure these interfund trades are executed in accordance with Rule 17a-7 of the 1940 Act. Any interfund trades are included within the respective purchases and sales amounts shown in the Purchases and Sales of Investments note. During the period, there were no interfund trades.
Other. During the period, the investment adviser reimbursed the Fund for certain losses as follows:
| | Amount ($) |
| Fidelity Cloud Computing ETF | 6,267 |
7. Expense Reductions.
Through arrangements with each applicable Fund's custodian, credits realized as a result of certain uninvested cash balances were used to reduce each applicable Fund's expenses. All of the applicable expense reductions are noted in the table below.
| | Custodian credits |
| Fidelity Clean Energy ETF | $127 |
| Fidelity Cloud Computing ETF | 185 |
Fidelity Crypto Industry and Digital Payments ETF | 495 |
| Fidelity Digital Health ETF | 259 |
Fidelity Electric Vehicles and Future Transportation ETF | 95 |
| Fidelity Metaverse ETF | 282 |
8. Share Transactions.
Funds issue and redeem shares at NAV only with certain authorized participants in large increments known as Creation Units. Purchases of Creation Units are made by tendering a basket of designated securities to a fund and redemption proceeds are paid with a basket of securities from a fund's portfolio with a balancing cash component to equate the market value of the basket of securities delivered or redeemed to the NAV per Creation Unit on the transaction date. Cash may be substituted equivalent to the value of certain securities generally when they are not available in sufficient quantity for delivery. A fund's shares are available in smaller increments to investors in the secondary market at market prices and may be subject to commissions. Authorized participants pay a transaction fee to the shareholder servicing agent when purchasing and redeeming Creation Units of a fund. The transaction fee is used to offset the costs associated with the issuance and redemption of Creation Units.
To the extent the Funds permit the contribution of securities in exchange for the purchase of shares (contribution in-kind), shares may be issued in advance of receipt by the Funds of all or a portion of the applicable deposit securities. In these circumstances, the Authorized Participant provides collateral to the custodian, on behalf of the Funds, in an amount up to 115% of the daily mark-to-market value of the deposit securities not yet received.
9. Other.
A fund's organizational documents provide former and current trustees and officers with a limited indemnification against liabilities arising in connection with the performance of their duties to the fund. In the normal course of business, a fund may also enter into contracts that provide general indemnifications. A fund's maximum exposure under these arrangements is unknown as this would be dependent on future claims that may be made against a fund. The risk of material loss from such claims is considered remote.
10. Risk and Uncertainties.
Many factors affect a fund's performance. Developments that disrupt global economies and financial markets, such as pandemics, epidemics, outbreaks of infectious diseases, war, terrorism, and environmental disasters, may significantly affect a fund's investment performance. The effects of these developments to a fund will be impacted by the types of securities in which a fund invests, the financial condition, industry, economic sector, and geographic location of an issuer, and a fund's level of investment in the securities of that issuer. Significant concentrations in security types, issuers, industries, sectors, and geographic locations may magnify the factors that affect a fund's performance.
To the Board of Trustees of Fidelity Covington Trust and the Shareholders of Fidelity Clean Energy ETF, Fidelity Cloud Computing ETF, Fidelity Crypto Industry and Digital Payments ETF, Fidelity Digital Health ETF, Fidelity Electric Vehicles and Future Transportation ETF, and Fidelity Metaverse ETF:
Opinion on the Financial Statements and Financial Highlights
We have audited the accompanying statements of assets and liabilities of Fidelity Clean Energy ETF, Fidelity Cloud Computing ETF, Fidelity Crypto Industry and Digital Payments ETF, Fidelity Digital Health ETF, Fidelity Electric Vehicles and Future Transportation ETF, and Fidelity Metaverse ETF (the "Funds"), each a fund of Fidelity Covington Trust, including the schedules of investments, as of June 30, 2023, the related statements of operations for the year then ended, the statements of changes in net assets and financial highlights for the year then ended and for the period from October 5, 2021 (commencement of operations) through June 30, 2022, except for the statements of changes in net assets and financial highlights for Fidelity Crypto Industry and Digital Payments ETF and Fidelity Metaverse ETF, which are for the period from April 19, 2022 (commencement of operations) through June 30, 2022, and the related notes. In our opinion, the financial statements and financial highlights present fairly, in all material respects, the financial position of each of the Funds as of June 30, 2023, and the results of their operations for the year then ended and the changes in their net assets and the financial highlights for the year then ended and for the period from October 5, 2021(commencement of operations) through June 30, 2022 (or for the period mentioned above), in conformity with accounting principles generally accepted in the United States of America.
Basis for Opinion
These financial statements and financial highlights are the responsibility of the Funds' management. Our responsibility is to express an opinion on the Funds' financial statements and financial highlights based on our audits. We are a public accounting firm registered with the Public Company Accounting Oversight Board (United States) (PCAOB) and are required to be independent with respect to the Funds in accordance with the U.S. federal securities laws and the applicable rules and regulations of the Securities and Exchange Commission and the PCAOB.
We conducted our audits in accordance with the standards of the PCAOB. Those standards require that we plan and perform the audit to obtain reasonable assurance about whether the financial statements and financial highlights are free of material misstatement, whether due to error or fraud. The Funds are not required to have, nor were we engaged to perform, an audit of its internal control over financial reporting. As part of our audits we are required to obtain an understanding of internal control over financial reporting but not for the purpose of expressing an opinion on the effectiveness of the Funds' internal control over financial reporting. Accordingly, we express no such opinion.
Our audits included performing procedures to assess the risks of material misstatement of the financial statements and financial highlights, whether due to error or fraud, and performing procedures that respond to those risks. Such procedures included examining, on a test basis, evidence regarding the amounts and disclosures in the financial statements and financial highlights. Our audits also included evaluating the accounting principles used and significant estimates made by management, as well as evaluating the overall presentation of the financial statements and financial highlights. Our procedures included confirmation of securities owned as of June 30, 2023, by correspondence with the custodian and brokers; when replies were not received from brokers, we performed other auditing procedures. We believe that our audits provide a reasonable basis for our opinion.
/s/ Deloitte & Touche LLP
Boston, Massachusetts
August 15, 2023
We have served as the auditor of one or more of the Fidelity investment companies since 1999.
The Trustees, Members of the Advisory Board (if any), and officers of the trust and funds, as applicable, are listed below. The Board of Trustees governs each fund and is responsible for protecting the interests of shareholders. The Trustees are experienced executives who meet periodically throughout the year to oversee each fund's activities, review contractual arrangements with companies that provide services to each fund, oversee management of the risks associated with such activities and contractual arrangements, and review each fund's performance. Each of the Trustees oversees 321 funds.
The Trustees hold office without limit in time except that (a) any Trustee may resign; (b) any Trustee may be removed by written instrument, signed by at least two-thirds of the number of Trustees prior to such removal; (c) any Trustee who requests to be retired or who has become incapacitated by illness or injury may be retired by written instrument signed by a majority of the other Trustees; and (d) any Trustee may be removed at any special meeting of shareholders by a two-thirds vote of the outstanding voting securities of the trust. Each Trustee who is not an interested person (as defined in the 1940 Act) of the trust and the funds is referred to herein as an Independent Trustee. Each Independent Trustee shall retire not later than the last day of the calendar year in which his or her 75th birthday occurs. The Independent Trustees may waive this mandatory retirement age policy with respect to individual Trustees. Officers and Advisory Board Members hold office without limit in time, except that any officer or Advisory Board Member may resign or may be removed by a vote of a majority of the Trustees at any regular meeting or any special meeting of the Trustees. Except as indicated, each individual has held the office shown or other offices in the same company for the past five years.
The funds' Statement of Additional Information (SAI) includes more information about the Trustees. To request a free copy, call Fidelity at 1-800-FIDELITY.
Experience, Skills, Attributes, and Qualifications of the Trustees. The Governance and Nominating Committee has adopted a statement of policy that describes the experience, qualifications, attributes, and skills that are necessary and desirable for potential Independent Trustee candidates (Statement of Policy). The Board believes that each Trustee satisfied at the time he or she was initially elected or appointed a Trustee, and continues to satisfy, the standards contemplated by the Statement of Policy. The Governance and Nominating Committee also engages professional search firms to help identify potential Independent Trustee candidates who have the experience, qualifications, attributes, and skills consistent with the Statement of Policy. From time to time, additional criteria based on the composition and skills of the current Independent Trustees, as well as experience or skills that may be appropriate in light of future changes to board composition, business conditions, and regulatory or other developments, have also been considered by the professional search firms and the Governance and Nominating Committee. In addition, the Board takes into account the Trustees' commitment and participation in Board and committee meetings, as well as their leadership of standing and ad hoc committees throughout their tenure.
In determining that a particular Trustee was and continues to be qualified to serve as a Trustee, the Board has considered a variety of criteria, none of which, in isolation, was controlling. The Board believes that, collectively, the Trustees have balanced and diverse experience, qualifications, attributes, and skills, which allow the Board to operate effectively in governing each fund and protecting the interests of shareholders. Information about the specific experience, skills, attributes, and qualifications of each Trustee, which in each case led to the Board's conclusion that the Trustee should serve (or continue to serve) as a trustee of the funds, is provided below.
Board Structure and Oversight Function. Robert A. Lawrence is an interested person and currently serves as Chair. The Trustees have determined that an interested Chair is appropriate and benefits shareholders because an interested Chair has a personal and professional stake in the quality and continuity of services provided to the funds. Independent Trustees exercise their informed business judgment to appoint an individual of their choosing to serve as Chair, regardless of whether the Trustee happens to be independent or a member of management. The Independent Trustees have determined that they can act independently and effectively without having an Independent Trustee serve as Chair and that a key structural component for assuring that they are in a position to do so is for the Independent Trustees to constitute a substantial majority for the Board. The Independent Trustees also regularly meet in executive session. David M. Thomas serves as Lead Independent Trustee and as such (i) acts as a liaison between the Independent Trustees and management with respect to matters important to the Independent Trustees and (ii) with management prepares agendas for Board meetings.
Fidelity ® funds are overseen by different Boards of Trustees. The funds' Board oversees Fidelity's high income and certain equity funds, and other Boards oversee Fidelity's alternative investment, investment-grade bond, money market, asset allocation, and other equity funds. The asset allocation funds may invest in Fidelity ® funds overseen by the funds' Board. The use of separate Boards, each with its own committee structure, allows the Trustees of each group of Fidelity ® funds to focus on the unique issues of the funds they oversee, including common research, investment, and operational issues. On occasion, the separate Boards establish joint committees to address issues of overlapping consequences for the Fidelity ® funds overseen by each Board.
The Trustees operate using a system of committees to facilitate the timely and efficient consideration of all matters of importance to the Trustees, each fund, and fund shareholders and to facilitate compliance with legal and regulatory requirements and oversight of the funds' activities and associated risks. The Board, acting through its committees, has charged FMR and its affiliates with (i) identifying events or circumstances the occurrence of which could have demonstrably adverse effects on the funds' business and/or reputation; (ii) implementing processes and controls to lessen the possibility that such events or circumstances occur or to mitigate the effects of such events or circumstances if they do occur; and (iii) creating and maintaining a system designed to evaluate continuously business and market conditions in order to facilitate the identification and implementation processes described in (i) and (ii) above. Because the day-to-day operations and activities of the funds are carried out by or through FMR, its affiliates, and other service providers, the funds' exposure to risks is mitigated but not eliminated by the processes overseen by the Trustees. While each of the Board's committees has responsibility for overseeing different aspects of the funds' activities, oversight is exercised primarily through the Operations, Audit, and Compliance Committees. Appropriate personnel, including but not limited to the funds' Chief Compliance Officer (CCO), FMR's internal auditor, the independent accountants, the funds' Treasurer and portfolio management personnel, make periodic reports to the Board's committees, as appropriate, including an annual review of Fidelity's risk management program for the Fidelity ® funds. The responsibilities of each standing committee, including their oversight responsibilities, are described further under "Standing Committees of the Trustees."
Interested Trustees*:
Correspondence intended for a Trustee who is an interested person may be sent to Fidelity Investments, 245 Summer Street, Boston, Massachusetts 02210.
Name, Year of Birth; Principal Occupations and Other Relevant Experience+
Bettina Doulton (1964)
Year of Election or Appointment: 2020
Trustee
Ms. Doulton also serves as Trustee of other Fidelity ® funds. Prior to her retirement, Ms. Doulton served in a variety of positions at Fidelity Investments, including as a managing director of research (2006-2007), portfolio manager to certain Fidelity ® funds (1993-2005), equity analyst and portfolio assistant (1990-1993), and research assistant (1987-1990). Ms. Doulton currently owns and operates Phi Builders + Architects and Cellardoor Winery. Previously, Ms. Doulton served as a member of the Board of Brown Capital Management, LLC (2014-2018).
Robert A. Lawrence (1952)
Year of Election or Appointment: 2020
Trustee
Chair of the Board of Trustees
Mr. Lawrence also serves as Trustee of other funds. Previously, Mr. Lawrence served as a Trustee and Member of the Advisory Board of certain funds. Prior to his retirement in 2008, Mr. Lawrence served as Vice President of certain Fidelity ® funds (2006-2008), Senior Vice President, Head of High Income Division of Fidelity Management & Research Company (investment adviser firm, 2006-2008), and President of Fidelity Strategic Investments (investment adviser firm, 2002-2005).
* Determined to be an "Interested Trustee" by virtue of, among other things, his or her affiliation with the trust or various entities under common control with FMR.
+ The information includes the Trustee's principal occupation during the last five years and other information relating to the experience, attributes, and skills relevant to the Trustee's qualifications to serve as a Trustee, which led to the conclusion that the Trustee should serve as a Trustee for each fund.
Independent Trustees:
Correspondence intended for an Independent Trustee may be sent to Fidelity Investments, P.O. Box 55235, Boston, Massachusetts 02205-5235.
Name, Year of Birth; Principal Occupations and Other Relevant Experience+
Thomas P. Bostick (1956)
Year of Election or Appointment: 2021
Trustee
Lieutenant General Bostick also serves as Trustee of other Fidelity ® funds. Prior to his retirement, General Bostick (United States Army, Retired) held a variety of positions within the U.S. Army, including Commanding General and Chief of Engineers, U.S. Army Corps of Engineers (2012-2016) and Deputy Chief of Staff and Director of Human Resources, U.S. Army (2009-2012). General Bostick currently serves as a member of the Board and Finance and Governance & Sustainability Committees of CSX Corporation (transportation, 2020-present) and a member of the Board and Corporate Governance and Nominating Committee of Perma-Fix Environmental Services, Inc. (nuclear waste management, 2020-present). General Bostick serves as Chief Executive Officer of Bostick Global Strategies, LLC (consulting, 2016-present), as a member of the Board of HireVue, Inc. (video interview and assessment, 2020-present), as a member of the Board of Allonnia (biotechnology and engineering solutions, 2022-present) and on the Advisory Board of Solugen, Inc. (specialty bio-based chemicals manufacturer, 2022-present). Previously, General Bostick served as a Member of the Advisory Board of certain Fidelity ® funds (2021), President, Intrexon Bioengineering (2018-2020) and Chief Operating Officer (2017-2020) and Senior Vice President of the Environment Sector (2016-2017) of Intrexon Corporation (biopharmaceutical company).
Dennis J. Dirks (1948)
Year of Election or Appointment: 2018
Trustee
Mr. Dirks also serves as Trustee of other Fidelity ® funds. Prior to his retirement in May 2003, Mr. Dirks served as Chief Operating Officer and as a member of the Board of The Depository Trust & Clearing Corporation (financial markets infrastructure), President, Chief Operating Officer and a member of the Board of The Depository Trust Company (DTC), President and a member of the Board of the National Securities Clearing Corporation (NSCC), Chief Executive Officer and a member of the Board of the Government Securities Clearing Corporation and Chief Executive Officer and a member of the Board of the Mortgage-Backed Securities Clearing Corporation. Mr. Dirks currently serves as a member of the Finance Committee (2016-present) and Board (2017-present) and is Treasurer (2018-present) of the Asolo Repertory Theatre.
Donald F. Donahue (1950)
Year of Election or Appointment: 2018
Trustee
Mr. Donahue also serves as Trustee of other Fidelity ® funds. Mr. Donahue serves as President and Chief Executive Officer of Miranda Partners, LLC (risk consulting for the financial services industry, 2012-present). Previously, Mr. Donahue served as Chief Executive Officer (2006-2012), Chief Operating Officer (2003-2006) and Managing Director, Customer Marketing and Development (1999-2003) of The Depository Trust & Clearing Corporation (financial markets infrastructure). Mr. Donahue currently serves as a member (2007-present) and Co-Chairman (2016-present) of the Board of United Way of New York. Mr. Donahue previously served as a member of the Advisory Board of certain Fidelity ® funds (2015-2018) and as a member of the Board of The Leadership Academy (previously NYC Leadership Academy) (2012-2022).
Vicki L. Fuller (1957)
Year of Election or Appointment: 2020
Trustee
Ms. Fuller also serves as Trustee of other Fidelity ® funds. Previously, Ms. Fuller served as a member of the Advisory Board of certain Fidelity ® funds (2018-2020), Chief Investment Officer of the New York State Common Retirement Fund (2012-2018) and held a variety of positions at AllianceBernstein L.P. (global asset management, 1985-2012), including Managing Director (2006-2012) and Senior Vice President and Senior Portfolio Manager (2001-2006). Ms. Fuller currently serves as a member of the Board, Audit Committee and Nominating and Governance Committee of two Blackstone business development companies (2020-present), as a member of the Board of Treliant, LLC (consulting, 2019-present), as a member of the Board of Ariel Alternatives, LLC (private equity, 2022-present) and as a member of the Board and Chair of the Audit Committee of Gusto, Inc. (software, 2021-present). In addition, Ms. Fuller currently serves as a member of the Board of Roosevelt University (2019-present) and as a member of the Executive Board of New York University's Stern School of Business. Ms. Fuller previously served as a member of the Board, Audit Committee and Nominating and Governance Committee of The Williams Companies, Inc. (natural gas infrastructure, 2018-2021).
Patricia L. Kampling (1959)
Year of Election or Appointment: 2020
Trustee
Ms. Kampling also serves as Trustee of other Fidelity ® funds. Prior to her retirement, Ms. Kampling served as Chairman of the Board and Chief Executive Officer (2012-2019), President and Chief Operating Officer (2011-2012) and Executive Vice President and Chief Financial Officer (2010-2011) of Alliant Energy Corporation. Ms. Kampling currently serves as a member of the Board, Finance Committee and Governance, Compensation and Nominating Committee of Xcel Energy Inc. (utilities company, 2020-present) and as a member of the Board, Audit, Finance and Risk Committee and Safety, Environmental, Technology and Operations Committee and Chair of the Executive Development and Compensation Committee of American Water Works Company, Inc. (utilities company, 2019-present). In addition, Ms. Kampling currently serves as a member of the Board of the Nature Conservancy, Wisconsin Chapter (2019-present). Previously, Ms. Kampling served as a Member of the Advisory Board of certain Fidelity® funds (2020), a member of the Board, Compensation Committee and Executive Committee and Chair of the Audit Committee of Briggs & Stratton Corporation (manufacturing, 2011-2021), a member of the Board of Interstate Power and Light Company (2012-2019) and Wisconsin Power and Light Company (2012-2019) (each a subsidiary of Alliant Energy Corporation) and as a member of the Board and Workforce Development Committee of the Business Roundtable (2018-2019).
Thomas A. Kennedy (1955)
Year of Election or Appointment: 2021
Trustee
Mr. Kennedy also serves as Trustee of other Fidelity ® funds. Previously, Mr. Kennedy served as a Member of the Advisory Board of certain Fidelity ® funds (2020) and held a variety of positions at Raytheon Company (aerospace and defense, 1983-2020), including Chairman and Chief Executive Officer (2014-2020) and Executive Vice President and Chief Operating Officer (2013-2014). Mr. Kennedy served as Executive Chairman of the Board of Directors of Raytheon Technologies Corporation (aerospace and defense, 2020-2021). Mr. Kennedy serves as a Director of the Board of Directors of Textron Inc. (aerospace and defense, 2023-present).
Oscar Munoz (1959)
Year of Election or Appointment: 2021
Trustee
Mr. Munoz also serves as Trustee of other Fidelity ® funds. Prior to his retirement, Mr. Munoz served as Executive Chairman (2020-2021), Chief Executive Officer (2015-2020), President (2015-2016) and a member of the Board (2010-2021) of United Airlines Holdings, Inc. Mr. Munoz currently serves as a member of the Board of CBRE Group, Inc. (commercial real estate, 2020-present), a member of the Board of Univision Communications, Inc. (Hispanic media, 2020-present), a member of the Board of Archer Aviation Inc. (2021-present), a member of the Defense Business Board of the United States Department of Defense (2021-present) and a member of the Board of Salesforce.com, Inc. (cloud-based software, 2022-present). Previously, Mr. Munoz served as a Member of the Advisory Board of certain Fidelity ® funds (2021).
David M. Thomas (1949)
Year of Election or Appointment: 2018
Trustee
Lead Independent Trustee
Mr. Thomas also serves as Trustee of other Fidelity ® funds. Previously, Mr. Thomas served as Executive Chairman (2005-2006) and Chairman and Chief Executive Officer (2000-2005) of IMS Health, Inc. (pharmaceutical and healthcare information solutions). Mr. Thomas currently serves as a member of the Board of Fortune Brands Home and Security (home and security products, 2004-present) and as Director (2013-present) and Non-Executive Chairman of the Board (2022-present) of Interpublic Group of Companies, Inc. (marketing communication).
Susan Tomasky (1953)
Year of Election or Appointment: 2020
Trustee
Ms. Tomasky also serves as Trustee of other Fidelity ® funds. Prior to her retirement, Ms. Tomasky served in various executive officer positions at American Electric Power Company, Inc. (1998-2011), including most recently as President of AEP Transmission (2007-2011). Ms. Tomasky currently serves as a member of the Board and Sustainability Committee and as Chair of the Audit Committee of Marathon Petroleum Corporation (2018-present) and as a member of the Board, Executive Committee, Corporate Governance Committee and Organization and Compensation Committee and as Lead Director of the Board of Public Service Enterprise Group, Inc. (utilities company, 2012-present) and as a member of the Board of its subsidiary company, Public Service Electric and Gas Co. (2021-present). In addition, Ms. Tomasky currently serves as a member (2009-present) and President (2020-present) of the Board of the Royal Shakespeare Company - America (2009-present), as a member of the Board of the Columbus Association for the Performing Arts (2011-present) and as a member of the Board and Kenyon in the World Committee of Kenyon College (2016-present). Previously, Ms. Tomasky served as a Member of the Advisory Board of certain Fidelity ® funds (2020), as a member of the Board of the Columbus Regional Airport Authority (2007-2020), as a member of the Board (2011-2018) and Lead Independent Director (2015-2018) of Andeavor Corporation (previously Tesoro Corporation) (independent oil refiner and marketer) and as a member of the Board of Summit Midstream Partners LP (energy, 2012-2018).
Michael E. Wiley (1950)
Year of Election or Appointment: 2013
Trustee
Mr. Wiley also serves as Trustee of other Fidelity ® funds. Previously, Mr. Wiley served as a member of the Advisory Board of certain Fidelity ® funds (2018-2020), Chairman, President and CEO of Baker Hughes, Inc. (oilfield services, 2000-2004). Mr. Wiley also previously served as a member of the Board of Andeavor Corporation (independent oil refiner and marketer, 2005-2018), a member of the Board of Andeavor Logistics LP (natural resources logistics, 2015-2018) and a member of the Board of High Point Resources (exploration and production, 2005-2020).
+ The information includes the Trustee's principal occupation during the last five years and other information relating to the experience, attributes, and skills relevant to the Trustee's qualifications to serve as a Trustee, which led to the conclusion that the Trustee should serve as a Trustee for each fund.
Advisory Board Members and Officers:
Correspondence intended for a Member of the Advisory Board (if any) may be sent to Fidelity Investments, P.O. Box 55235, Boston, Massachusetts 02205-5235. Correspondence intended for an officer or Peter S. Lynch may be sent to Fidelity Investments, 245 Summer Street, Boston, Massachusetts 02210. Officers appear below in alphabetical order.
Name, Year of Birth; Principal Occupation
Peter S. Lynch (1944)
Year of Election or Appointment: 2018
Member of the Advisory Board
Mr. Lynch also serves as a Member of the Advisory Board of other Fidelity ® funds. Mr. Lynch is Vice Chairman and a Director of Fidelity Management & Research Company LLC (investment adviser firm). In addition, Mr. Lynch serves as a Trustee of Boston College and as the Chairman of the Inner-City Scholarship Fund. Previously, Mr. Lynch served as Vice Chairman and a Director of FMR Co., Inc. (investment adviser firm) and on the Special Olympics International Board of Directors (1997-2006).
Heather Bonner (1977)
Year of Election or Appointment: 2023
Assistant Treasurer
Ms. Bonner also serves as an officer of other funds. Ms. Bonner serves as Senior Vice President (2022-present), and is an employee of Fidelity Investments. Ms. Bonner serves as Assistant Treasurer of Fidelity CRET Trustee LLC (2022-present). Prior to joining Fidelity, Ms. Bonner served as Managing Director at AQR Capital Management (2013-2022) and was the Treasurer and Principal Financial Officer of the AQR Funds (2013-2022).
Craig S. Brown (1977)
Year of Election or Appointment: 2022
Deputy Treasurer
Mr. Brown also serves as an officer of other funds. Mr. Brown serves as Assistant Treasurer of FIMM, LLC (2021-present) and is an employee of Fidelity Investments (2013-present). Previously, Mr. Brown served as Assistant Treasurer of certain Fidelity ® funds (2019-2022).
John J. Burke III (1964)
Year of Election or Appointment: 2018
Chief Financial Officer
Mr. Burke also serves as Chief Financial Officer of other funds. Mr. Burke serves as Head of Investment Operations for Fidelity Fund and Investment Operations (2018-present) and is an employee of Fidelity Investments (1998-present). Previously Mr. Burke served as head of Asset Management Investment Operations (2012-2018).
Margaret Carey (1973)
Year of Election or Appointment: 2023
Secretary and Chief Legal Officer (CLO)
Ms. Carey also serves as an officer of other funds and as CLO of certain other Fidelity entities. She is a Senior Vice President and Deputy General Counsel of FMR LLC (diversified financial services company, 2019-present), and is an employee of Fidelity Investments.
William C. Coffey (1969)
Year of Election or Appointment: 2019
Assistant Secretary
Mr. Coffey also serves as Assistant Secretary of other funds. He is Senior Vice President and Deputy General Counsel of FMR LLC (diversified financial services company, 2010-present), and is an employee of Fidelity Investments. Previously, Mr. Coffey served as Secretary and CLO of certain funds (2018-2019); CLO, Secretary, and Senior Vice President of Fidelity Management & Research Company and FMR Co., Inc. (investment adviser firms, 2018-2019); Secretary of Fidelity SelectCo, LLC and Fidelity Investments Money Management, Inc. (investment adviser firms, 2018-2019); CLO of Fidelity Management & Research (Hong Kong) Limited, FMR Investment Management (UK) Limited, and Fidelity Management & Research (Japan) Limited (investment adviser firms, 2018-2019); and Assistant Secretary of certain funds (2009-2018).
Timothy M. Cohen (1969)
Year of Election or Appointment: 2018
Vice President
Mr. Cohen also serves as Vice President of other funds. Mr. Cohen serves as Co-Head of Equity (2018-present), a Director of Fidelity Management & Research (Japan) Limited (investment adviser firm, 2016-present), and is an employee of Fidelity Investments. Previously, Mr. Cohen served as Executive Vice President of Fidelity SelectCo, LLC (2019), Head of Global Equity Research (2016-2018), Chief Investment Officer - Equity and a Director of Fidelity Management & Research (U.K.) Inc. (investment adviser firm, 2013-2015) and as a Director of Fidelity Management & Research (Hong Kong) Limited (investment adviser firm, 2017).
Jonathan Davis (1968)
Year of Election or Appointment: 2013
Assistant Treasurer
Mr. Davis also serves as an officer of other funds. Mr. Davis serves as Vice President Assistant Treasurer and is an employee of Fidelity Investments. Mr. Davis serves as Assistant Treasurer of certain Fidelity entities.
Laura M. Del Prato (1964)
Year of Election or Appointment: 2018
Assistant Treasurer
Ms. Del Prato also serves as an officer of other funds. Ms. Del Prato serves as Assistant Treasurer of FIMM, LLC (2021-present) and is an employee of Fidelity Investments (2017-present). Previously, Ms. Del Prato served as President and Treasurer of The North Carolina Capital Management Trust: Cash Portfolio and Term Portfolio (2018-2020). Prior to joining Fidelity Investments, Ms. Del Prato served as a Managing Director and Treasurer of the JPMorgan Mutual Funds (2014-2017). Prior to JPMorgan, Ms. Del Prato served as a partner at Cohen Fund Audit Services (accounting firm, 2012-2013) and KPMG LLP (accounting firm, 2004-2012).
Colm A. Hogan (1973)
Year of Election or Appointment: 2020
Assistant Treasurer
Mr. Hogan also serves as an officer of other funds. Mr. Hogan serves as Assistant Treasurer of FIMM, LLC (2021-present) and FMR Capital, Inc. (2017-present) and is an employee of Fidelity Investments (2005-present). Previously, Mr. Hogan served as Deputy Treasurer of certain Fidelity ® funds (2016-2020) and Assistant Treasurer of certain Fidelity ® funds (2016-2018).
Pamela R. Holding (1964)
Year of Election or Appointment: 2018
Vice President
Ms. Holding also serves as Vice President of other funds. Ms. Holding serves as Co-Head of Equity (2018-present) and is an employee of Fidelity Investments (2013-present). Previously, Ms. Holding served as Executive Vice President of Fidelity SelectCo, LLC (2019) and as Chief Investment Officer of Fidelity Institutional Asset Management (2013-2018).
Chris Maher (1972)
Year of Election or Appointment: 2020
Deputy Treasurer
Mr. Maher also serves as an officer of other funds. Mr. Maher serves as Assistant Treasurer of FIMM, LLC (2021-present) and FMR Capital, Inc. (2017-present), and is an employee of Fidelity Investments (2008-present). Previously, Mr. Maher served as Assistant Treasurer of certain funds (2013-2020); Vice President of Asset Management Compliance (2013), Vice President of the Program Management Group of FMR (investment adviser firm, 2010-2013), and Vice President of Valuation Oversight (2008-2010).
Jason P. Pogorelec (1975)
Year of Election or Appointment: 2020
Chief Compliance Officer
Mr. Pogorelec also serves as Chief Compliance Officer of other funds. Mr. Pogorelec is a Senior Vice President of Asset Management Compliance for Fidelity Investments and is an employee of Fidelity Investments. Mr. Pogorelec serves as Compliance Officer of Fidelity Management & Research Company LLC (investment adviser firm, 2023-present). Previously, Mr. Pogorelec served as Vice President, Associate General Counsel for Fidelity Investments (2010-2020) and Assistant Secretary of certain Fidelity ® funds (2015-2020).
Brett Segaloff (1972)
Year of Election or Appointment: 2021
Anti-Money Laundering (AML) Officer
Mr. Segaloff also serves as an AML Officer of other funds and other related entities. He is Director, Anti-Money Laundering (2007-present) of FMR LLC (diversified financial services company) and is an employee of Fidelity Investments (1996-present).
Stacie M. Smith (1974)
Year of Election or Appointment: 2018
President and Treasurer
Ms. Smith also serves as an officer of other funds. Ms. Smith serves as Assistant Treasurer of FIMM, LLC (2021-present) and FMR Capital, Inc. (2017-present), is an employee of Fidelity Investments (2009-present), and has served in other fund officer roles. Prior to joining Fidelity Investments, Ms. Smith served as Senior Audit Manager of Ernst & Young LLP (accounting firm, 1996-2009). Previously, Ms. Smith served as Assistant Treasurer (2013-2019) and Deputy Treasurer (2013-2016) of certain Fidelity ® funds.
Jim Wegmann (1979)
Year of Election or Appointment: 2019
Assistant Treasurer
Mr. Wegmann also serves as an officer of other funds. Mr. Wegmann serves as Assistant Treasurer of FIMM, LLC (2021-present) and is an employee of Fidelity Investments (2011-present). Previously, Mr. Wegmann served as Assistant Treasurer of certain Fidelity ® funds (2019-2021).
As a shareholder, you incur two types of costs: (1) transaction costs, which may include sales charges (loads) on purchase payments or redemption proceeds, as applicable and (2) ongoing costs, which generally include management fees, distribution and/or service (12b-1) fees and other Fund expenses. This Example is intended to help you understand your ongoing costs (in dollars) of investing in a fund and to compare these costs with the ongoing costs of investing in other mutual funds.
| The Example is based on an investment of $1,000 invested at the beginning of the period and held for the entire period (January 1, 2023 to June 30, 2023). |
Actual Expenses
The first line of the accompanying table provides information about actual account values and actual expenses. You may use the information in this line, together with the amount you invested, to estimate the expenses that you paid over the period. Simply divide your account value by $1,000.00 (for example, an $8,600 account value divided by $1,000.00 = 8.6), then multiply the result by the number in the first line for a class/Fund under the heading entitled "Expenses Paid During Period" to estimate the expenses you paid on your account during this period. If any fund is a shareholder of any underlying mutual funds or exchange-traded funds (ETFs) (the Underlying Funds), such fund indirectly bears its proportional share of the expenses of the Underlying Funds in addition to the direct expenses incurred presented in the table. These fees and expenses are not included in the annualized expense ratio used to calculate the expense estimate in the table below.
Hypothetical Example for Comparison Purposes
The second line of the accompanying table provides information about hypothetical account values and hypothetical expenses based on the actual expense ratio and an assumed rate of return of 5% per year before expenses, which is not the actual return. The hypothetical account values and expenses may not be used to estimate the actual ending account balance or expenses you paid for the period. You may use this information to compare the ongoing costs of investing in the Fund and other funds. To do so, compare this 5% hypothetical example with the 5% hypothetical examples that appear in the shareholder reports of the other funds. If any fund is a shareholder of any Underlying Funds, such fund indirectly bears its proportional share of the expenses of the Underlying Funds in addition to the direct expenses as presented in the table. These fees and expenses are not included in the annualized expense ratio used to calculate the expense estimate in the table below.
Please note that the expenses shown in the table are meant to highlight your ongoing costs only and do not reflect any transaction costs. Therefore, the second line of the table is useful in comparing ongoing costs only, and will not help you determine the relative total costs of owning different funds. In addition, if these transactional costs were included, your costs would have been higher.
| | | | | Annualized Expense Ratio- A | | Beginning Account Value January 1, 2023 | | Ending Account Value June 30, 2023 | | Expenses Paid During Period- C January 1, 2023 to June 30, 2023 |
| | | | | | | | | | |
| Fidelity® Clean Energy ETF | | | | .39% | | | | | | |
| Actual | | | | | | $ 1,000 | | $ 964.00 | | $ 1.90 |
Hypothetical- B | | | | | | $ 1,000 | | $ 1,022.86 | | $ 1.96 |
| | | | | | | | | | |
| Fidelity® Cloud Computing ETF | | | | .39% | | | | | | |
| Actual | | | | | | $ 1,000 | | $ 1,313.20 | | $ 2.24 |
Hypothetical- B | | | | | | $ 1,000 | | $ 1,022.86 | | $ 1.96 |
| | | | | | | | | | |
| Fidelity® Crypto Industry and Digital Payments ETF | | | | .39% | | | | | | |
| Actual | | | | | | $ 1,000 | | $ 1,825.60 | | $ 2.73 |
Hypothetical- B | | | | | | $ 1,000 | | $ 1,022.86 | | $ 1.96 |
| | | | | | | | | | |
| Fidelity® Digital Health ETF | | | | .39% | | | | | | |
| Actual | | | | | | $ 1,000 | | $ 1,058.00 | | $ 1.99 |
Hypothetical- B | | | | | | $ 1,000 | | $ 1,022.86 | | $ 1.96 |
| | | | | | | | | | |
| Fidelity® Electric Vehicles and Future Transportation ETF | | | | .39% | | | | | | |
| Actual | | | | | | $ 1,000 | | $ 1,254.50 | | $ 2.18 |
Hypothetical- B | | | | | | $ 1,000 | | $ 1,022.86 | | $ 1.96 |
| | | | | | | | | | |
| Fidelity® Metaverse ETF | | | | .39% | | | | | | |
| Actual | | | | | | $ 1,000 | | $ 1,287.20 | | $ 2.21 |
Hypothetical- B | | | | | | $ 1,000 | | $ 1,022.86 | | $ 1.96 |
| |
A Annualized expense ratio reflects expenses net of applicable fee waivers.
B 5% return per year before expenses
C Expenses are equal to the annualized expense ratio, multiplied by the average account value over the period, multiplied by 181/ 365 (to reflect the one-half year period). The fees and expenses of any Underlying Funds are not included in each annualized expense ratio.
The dividend and capital gains distributions for the fund(s) are available on Fidelity.com or Institutional.Fidelity.com.
A percentage of the dividends distributed during the fiscal year for the following funds qualify for the dividends-received deduction for corporate shareholders:
| Fidelity® Clean Energy ETF | |
| September 2022 | 20% |
| December 2022 | 20% |
| March 2023 | 10% |
| June 2023 | 10% |
| Fidelity® Cloud Computing ETF | |
| September 2022 | 100% |
| December 2022 | 100% |
| March 2023 | 42% |
| June 2023 | 42% |
| Fidelity® Digital Health ETF | |
| September 2022 | - |
| December 2022 | 100% |
| March 2023 | - |
| June 2023 | 100% |
| Fidelity® Electric Vehicles and Future Transportation ETF | |
| September 2022 | 100% |
| December 2022 | 100% |
| March 2023 | - |
| June 2023 | 100% |
| Fidelity® Metaverse ETF | |
| September 2022 | 10% |
| December 2022 | 32% |
| March 2023 | 9% |
| June 2023 | 9% |
A percentage of the dividends distributed during the fiscal year for the following funds may be taken into account as a dividend for purposes of the maximum rate under section 1(h)(11) of the Internal Revenue Code.
| Fidelity® Clean Energy ETF | |
| September 2022 | 100% |
| December 2022 | 100% |
| March 2023 | 100% |
| June 2023 | 100% |
| Fidelity® Cloud Computing ETF | |
| September 2022 | 100% |
| December 2022 | 100% |
| March 2023 | 100% |
| June 2023 | 100% |
| Fidelity® Digital Health ETF | |
| September 2022 | - |
| December 2022 | 100% |
| March 2023 | - |
| June 2023 | 100% |
| Fidelity® Electric Vehicles and Future Transportation ETF | |
| September 2022 | 100% |
| December 2022 | 100% |
| March 2023 | - |
| June 2023 | 100% |
| Fidelity® Metaverse ETF | |
| September 2022 | 63.85% |
| December 2022 | 100% |
| March 2023 | 100% |
| June 2023 | 100% |
The amounts per share which represent income derived from sources within, and taxes paid to, foreign countries or possessions of the United States are as follows:
| | Pay Date | Income | Taxes |
| Fidelity® Clean Energy ETF | 09/21/22 | $0.0387 | $0.0067 |
| | 12/21/22 | $0.0157 | $0.0027 |
The funds will notify shareholders in January 2024 of amounts for use in preparing 2023 income tax returns.
Board Approval of Investment Advisory Contracts
Fidelity Clean Energy ETF
Fidelity Cloud Computing ETF
Fidelity Crypto Industry and Digital Payments ETF
Fidelity Digital Health ETF
Fidelity Electric Vehicles and Future Transportation ETF
Fidelity Metaverse ETF
At its May 2023 meeting, the Board of Trustees, including the Independent Trustees (together, the Board), voted to continue the management contract with Fidelity Management & Research Company LLC (FMR) and the sub-advisory agreement with Geode Capital Management, LLC for each fund (together, the Advisory Contracts), for two months from June 1, 2023 through July 31, 2023. The Board determined that it will consider the annual renewal of each fund's Advisory Contracts for a full one year period in July 2023, following its review of additional materials provided by FMR.
The Board considered that the approval of each fund's Advisory Contracts will not result in any changes in (i) the investment process or strategies employed in the management of each fund's assets; (ii) the fees and expenses paid by shareholders; (iii) the nature, extent or quality of services provided under each fund's Advisory Contracts; or (iv) the day-to-day management of each fund or the persons primarily responsible for such management. The Board also considered that since its last approval of each fund's Advisory Contracts, FMR had provided additional information on each fund in support of the annual contract renewal process, including competitive analyses on total expenses and management fees and in-depth reviews of fund performance and fund profitability information. The Board concluded that each fund's Advisory Contracts are fair and reasonable, and that each fund's Advisory Contracts should be renewed, without modification, through July 31, 2023, with the understanding that the Board will consider the annual renewal for a full one year period in July 2023.
In connection with its consideration of future renewals of each fund's Advisory Contracts, the Board will consider: (i) the nature, extent and quality of services provided to each fund, including shareholder and administrative services and investment performance; (ii) the competitiveness of the management fee and total expenses for each fund; (iii) the costs of the services and profitability, including the revenues earned and the expenses incurred in conducting the business of developing, marketing, distributing, managing, administering, and servicing each fund and its shareholders, to the extent applicable; and (iv) whether there have been economies of scale in respect of the Fidelity funds, whether the Fidelity funds (including the funds) have appropriately benefited from any such economies of scale, and whether there is the potential for realization of any further economies.
Based on its evaluation of all of the conclusions noted above, and after considering all factors it believed relevant, the Board ultimately concluded that each fund's management fee structure is fair and reasonable, and that the continuation of the funds' Advisory Contracts should be approved for two months from June 1, 2023 through July 31, 2023.
The Securities and Exchange Commission adopted Rule 22e-4 under the Investment Company Act of 1940 (the Liquidity Rule) to promote effective liquidity risk management throughout the open-end investment company industry, thereby reducing the risk that funds will be unable to meet their redemption obligations and mitigating dilution of the interests of fund shareholders.
The Funds have adopted and implemented a liquidity risk management program (the Program) reasonably designed to assess and manage each Fund's liquidity risk and to comply with the requirements of the Liquidity Rule. Each Fund's Board of Trustees (the Board) has designated each Fund's investment adviser as administrator of the Program. The Fidelity advisers have established a Liquidity Risk Management Committee (the LRM Committee) to manage the Program for each of the Fidelity Funds. The LRM Committee monitors the adequacy and effectiveness of implementation of the Program and on a periodic basis assesses each Fund's liquidity risk based on a variety of factors including (1) the Fund's investment strategy, (2) portfolio liquidity and cash flow projections during normal and reasonably foreseeable stressed conditions, (3) shareholder redemptions, (4) borrowings and other funding sources and (5) certain factor specific to ETFs including the effect of the Fund's prices and spreads, market participants, and basket compositions on the overall liquidity of the Fund's portfolio, as applicable.
In accordance with the Program, each of the Fund's portfolio investments is classified into one of four defined liquidity categories based on a determination of a reasonable expectation for how long it would take to convert the investment to cash (or sell or dispose of the investment) without significantly changing its market value.
- Highly liquid investments - cash or convertible to cash within three business days or less
- Moderately liquid investments - convertible to cash in three to seven calendar days
- Less liquid investments - can be sold or disposed of, but not settled, within seven calendar days
- Illiquid investments - cannot be sold or disposed of within seven calendar days
Liquidity classification determinations take into account a variety of factors including various market, trading and investment-specific considerations, as well as market depth, and generally utilize analysis from a third-party liquidity metrics service.
The Liquidity Rule places a 15% limit on a fund's illiquid investments and requires funds that do not primarily hold assets that are highly liquid investments to determine and maintain a minimum percentage of the fund's net assets to be invested in highly liquid investments (highly liquid investment minimum or HLIM). The Program includes provisions reasonably designed to comply with the 15% limit on illiquid investments and for determining, periodically reviewing and complying with the HLIM requirement as applicable.
At a recent meeting of the Fund's Board of Trustees, the LRM Committee provided a written report to the Board pertaining to the operation, adequacy, and effectiveness of the Program for the period December 1, 2021 through November 30, 2022. The report concluded that the Program is operating effectively and is reasonably designed to assess and manage the Fund's liquidity risk.
1.9903828.101
CEE-ANN-0823
Item 2.
Code of Ethics
As of the end of the period, June 30, 2023, Fidelity Covington Trust (the trust) has adopted a code of ethics, as defined in Item 2 of Form N-CSR, that applies to its President and Treasurer and its Chief Financial Officer. A copy of the code of ethics is filed as an exhibit to this Form N-CSR.
Item 3.
Audit Committee Financial Expert
The Board of Trustees of the trust has determined that Donald F. Donahue is an audit committee financial expert, as defined in Item 3 of Form N-CSR. Mr. Donahue is independent for purposes of Item 3 of Form N-CSR.
Item 4.
Principal Accountant Fees and Services
Fees and Services
The following table presents fees billed by Deloitte & Touche LLP, the member firms of Deloitte Touche Tohmatsu, and their respective affiliates (collectively, “Deloitte Entities”) in each of the last two fiscal years for services rendered to Fidelity Clean Energy ETF, Fidelity Cloud Computing ETF, Fidelity Crypto Industry and Digital Payments ETF, Fidelity Digital Health ETF, Fidelity Electric Vehicles and Future Transportation ETF, and Fidelity Metaverse ETF (the “Funds”):
Services Billed by Deloitte Entities
June 30, 2023 FeesA
| | | | |
| Audit Fees | Audit-Related Fees | Tax Fees | All Other Fees |
Fidelity Clean Energy ETF | $14,400 | $- | $4,000 | $300 |
Fidelity Cloud Computing ETF | $14,400 | $- | $4,000 | $300 |
Fidelity Crypto Industry and Digital Payments ETF | $14,600 | $- | $4,300 | $300 |
Fidelity Digital Health ETF | $14,400 | $- | $4,000 | $300 |
Fidelity Electric Vehicles and Future Transportation ETF | $14,400 | $- | $4,000 | $300 |
Fidelity Metaverse ETF | $14,600 | $- | $4,300 | $300 |
| | | | |
| Audit Fees | Audit-Related Fees | Tax Fees | All Other Fees |
Fidelity Clean Energy ETF | $11,100 | $- | $5,000 | $200 |
Fidelity Cloud Computing ETF | $11,100 | $- | $5,000 | $200 |
Fidelity Crypto Industry and Digital Payments ETF | $8,800 | $- | $3,700 | $- |
Fidelity Digital Health ETF | $11,100 | $- | $5,000 | $200 |
Fidelity Electric Vehicles and Future Transportation ETF | $11,100 | $- | $5,000 | $200 |
Fidelity Metaverse ETF | $8,800 | $- | $3,700 | $- |
A Amounts may reflect rounding.
B Fidelity Crypto Industry and Digital Payments ETF and Fidelity Metaverse ETF commenced operations on April 19, 2022.
The following table(s) present(s) fees billed by Deloitte Entities that were required to be approved by the Audit Committee for services that relate directly to the operations and financial reporting of the Fund(s) and that are rendered on behalf of Fidelity Management & Research Company LLC ("FMR") and entities controlling, controlled by, or under common control with FMR (not including any sub-adviser whose role is primarily portfolio management and is subcontracted with or overseen by another investment adviser) that provide ongoing services to the Fund(s) (“Fund Service Providers”):
Services Billed by Deloitte Entities
| | |
| June 30, 2023A | June 30, 2022A,B |
Audit-Related Fees | $- | $- |
Tax Fees | $- | $- |
All Other Fees | $- | $- |
A Amounts may reflect rounding.
B May include amounts billed prior to the Fidelity Crypto Industry and Digital Payments ETF and Fidelity Metaverse ETF’s commencement of operations.
“Audit-Related Fees” represent fees billed for assurance and related services that are reasonably related to the performance of the fund audit or the review of the fund's financial statements and that are not reported under Audit Fees.
“Tax Fees” represent fees billed for tax compliance, tax advice or tax planning that relate directly to the operations and financial reporting of the fund.
“All Other Fees” represent fees billed for services provided to the fund or Fund Service Provider, a significant portion of which are assurance related, that relate directly to the operations and financial reporting of the fund, excluding those services that are reported under Audit Fees, Audit-Related Fees or Tax Fees.
Assurance services must be performed by an independent public accountant.
* * *
The aggregate non-audit fees billed by Deloitte Entities for services rendered to the Fund(s), FMR (not including any sub-adviser whose role is primarily portfolio management and is subcontracted with or overseen by another investment adviser), and any Fund Service Provider for each of the last two fiscal years of the Fund(s) are as follows:
| | |
Billed By | June 30, 2023A | June 30, 2022A,B |
Deloitte Entities | $269,000 | $485,800 |
| | |
A Amounts may reflect rounding.
B May include amounts billed prior to the Fidelity Crypto Industry and Digital Payments ETF and Fidelity Metaverse ETF’s commencement of operations.
The trust's Audit Committee has considered non-audit services that were not pre-approved that were provided by Deloitte Entities to Fund Service Providers to be compatible with maintaining the independence of Deloitte Entities in its(their) audit of the Fund(s), taking into account representations from Deloitte Entities, in accordance with Public Company Accounting Oversight Board rules, regarding its independence from the Fund(s) and its(their) related entities and FMR’s review of the appropriateness and permissibility under applicable law of such non-audit services prior to their provision to the Fund(s) Service Providers.
Audit Committee Pre-Approval Policies and Procedures
The trust’s Audit Committee must pre-approve all audit and non-audit services provided by a fund’s independent registered public accounting firm relating to the operations or financial reporting of the fund. Prior to the commencement of any audit or non-audit services to a fund, the Audit Committee reviews the services to determine whether they are appropriate and permissible under applicable law.
The Audit Committee has adopted policies and procedures to, among other purposes, provide a framework for the Committee’s consideration of non-audit services by the audit firms that audit the Fidelity funds. The policies and procedures require that any non-audit service provided by a fund audit firm to a Fidelity fund and any non-audit service provided by a fund auditor to a Fund Service Provider that relates directly to the operations and financial reporting of a Fidelity fund (“Covered Service”) are subject to approval by the Audit Committee before such service is provided.
All Covered Services must be approved in advance of provision of the service either: (i) by formal resolution of the Audit Committee, or (ii) by oral or written approval of the service by the Chair of the Audit Committee (or if the Chair is unavailable, such other member of the Audit Committee as may be designated by the Chair to act in the Chair’s absence). The approval contemplated by (ii) above is permitted where the Treasurer determines that action on such an engagement is necessary before the next meeting of the Audit Committee.
Non-audit services provided by a fund audit firm to a Fund Service Provider that do not relate directly to the operations and financial reporting of a Fidelity fund are reported to the Audit Committee periodically.
Non-Audit Services Approved Pursuant to Rule 2-01(c)(7)(i)(C) and (ii) of Regulation S-X (“De Minimis Exception”)
There were no non-audit services approved or required to be approved by the Audit Committee pursuant to the De Minimis Exception during the Fund’s(s’) last two fiscal years relating to services provided to (i) the Fund(s) or (ii) any Fund Service Provider that relate directly to the operations and financial reporting of the Fund(s).
Item 5.
Audit Committee of Listed Registrants
The Audit Committee is a separately-designated standing audit committee in accordance with Section 3(a)(58)(A) of the Securities Exchange Act of 1934. As of June 30, 2023, the members of the Audit Committee were Donald F. Donahue, Thomas P. Bostick, Thomas Kennedy and Susan Tomasky.
Item 6.
Investments
(a)
Not applicable.
(b)
Not applicable.
Item 7.
Disclosure of Proxy Voting Policies and Procedures for Closed-End Management Investment Companies
Not applicable.
Item 8.
Portfolio Managers of Closed-End Management Investment Companies
Not applicable.
Item 9.
Purchase of Equity Securities by Closed-End Management Investment Company and Affiliated Purchasers
Not applicable.
Item 10.
Submission of Matters to a Vote of Security Holders
There were no material changes to the procedures by which shareholders may recommend nominees to the trust’s Board of Trustees.
Item 11.
Controls and Procedures
(a)(i) The President and Treasurer and the Chief Financial Officer have concluded that the trust’s disclosure controls and procedures (as defined in Rule 30a-3(c) under the Investment Company Act) provide reasonable assurances that material information relating to the trust is made known to them by the appropriate persons, based on their evaluation of these controls and procedures as of a date within 90 days of the filing date of this report.
(a)(ii) There was no change in the trust’s internal control over financial reporting (as defined in Rule 30a-3(d) under the Investment Company Act) that occurred during the period covered by this report that has materially affected, or is reasonably likely to materially affect, the trust’s internal control over financial reporting.
Item 12.
Disclosure of Securities Lending Activities for Closed-End Management
Investment Companies
Not applicable.
Item 13.
Exhibits
SIGNATURES
Pursuant to the requirements of the Securities Exchange Act of 1934 and the Investment Company Act of 1940, the registrant has duly caused this report to be signed on its behalf by the undersigned, thereunto duly authorized.
Fidelity Covington Trust
| |
By: | /s/Stacie M. Smith |
| Stacie M. Smith |
| President and Treasurer |
| |
Date: | August 22, 2023 |
Pursuant to the requirements of the Securities Exchange Act of 1934 and the Investment Company Act of 1940, this report has been signed below by the following persons on behalf of the registrant and in the capacities and on the dates indicated.
| |
By: | /s/Stacie M. Smith |
| Stacie M. Smith |
| President and Treasurer |
| |
Date: | August 22, 2023 |
By:
| |
| /s/John J. Burke III |
| John J. Burke III |
| Chief Financial Officer |
| |
Date: | August 22, 2023 |