UNITED STATES
SECURITIES AND EXCHANGE COMMISSION
Washington, D.C. 20549
FORM N-CSR
CERTIFIED SHAREHOLDER REPORT OF REGISTERED
MANAGEMENT INVESTMENT COMPANIES
Investment Company Act file number 811-07319
Fidelity Covington Trust
(Exact name of registrant as specified in charter)
245 Summer St., Boston, Massachusetts 02210
(Address of principal executive offices) (Zip code)
Margaret Carey, Secretary
245 Summer St.
Boston, Massachusetts 02210
(Name and address of agent for service)
Registrant's telephone number, including area code:
617-563-7000
| |
Date of fiscal year end: | July 31 |
|
|
Date of reporting period: | July 31, 2023 |
Item 1.
Reports to Stockholders
Fidelity® Dividend ETF for Rising Rates
Fidelity® High Dividend ETF
Fidelity® Low Volatility Factor ETF
Fidelity® Momentum Factor ETF
Fidelity® Quality Factor ETF
Fidelity® Small-Mid Multifactor ETF
Fidelity® Stocks for Inflation ETF
Fidelity® U.S. Multifactor ETF
Fidelity® Value Factor ETF
Annual Report
July 31, 2023
Contents
To view a fund's proxy voting guidelines and proxy voting record for the 12-month period ended June 30, visit http://www.fidelity.com/proxyvotingresults or visit the Securities and Exchange Commission's (SEC) web site at http://www.sec.gov.
You may also call 1-800-FIDELITY to request a free copy of the proxy voting guidelines.
The funds or securities referred to herein are not sponsored, endorsed, or promoted by Fidelity Product Services LLC (FPS), and FPS bears no liability with respect to any such funds or securities or any index on which such funds or securities are based. The prospectus contains a more detailed description of the relationship between FPS and any related funds.
Standard & Poor's, S&P and S&P 500 are registered service marks of The McGraw-Hill Companies, Inc. and have been licensed for use by Fidelity Distributors Corporation.
Other third-party marks appearing herein are the property of their respective owners.
All other marks appearing herein are registered or unregistered trademarks or service marks of FMR LLC or an affiliated company. © 2023 FMR LLC. All rights reserved.
This report and the financial statements contained herein are submitted for the general information of the shareholders of the Funds. This report is not authorized for distribution to prospective investors in the Funds unless preceded or accompanied by an effective prospectus.
A fund files its complete schedule of portfolio holdings with the SEC for the first and third quarters of each fiscal year on Form N-PORT. Forms N-PORT are available on the SEC's web site at http://www.sec.gov. A fund's Forms N-PORT may be reviewed and copied at the SEC's Public Reference Room in Washington, DC. Information regarding the operation of the SEC's Public Reference Room may be obtained by calling 1-800-SEC-0330.
For a complete list of a fund's portfolio holdings, view the most recent holdings listing, semiannual report, or annual report on Fidelity's web site at http://www.fidelity.com, http://www.institutional.fidelity.com, or http://www.401k.com, as applicable.
NOT FDIC INSURED •MAY LOSE VALUE •NO BANK GUARANTEE
Neither the Funds nor Fidelity Distributors Corporation is a bank.
NAV and closing market price average annual returns reflect the change in the value of an investment, assuming reinvestment of distributions from dividend income and capital gains (the profits earned upon the sale of securities that have grown in value, if any) at NAV and Market Price, respectively, and assumes a constant rate of performance each year. The hypothetical investment and the fund's returns do not reflect the deduction of taxes that a shareholder would pay on fund distributions or the redemption or selling of fund shares. How a fund did yesterday is no guarantee of how it will do tomorrow.
| Average Annual Total Returns |
| | | | |
Periods ended July 31, 2023 | Past 1 year | Past 5 years | Life of Fund |
Fidelity® Dividend ETF for Rising Rates - NAV A | 8.17% | 9.73% | 11.25% |
Fidelity® Dividend ETF for Rising Rates - Market Price B | 7.87% | 9.67% | 11.29% |
Fidelity Dividend Index for Rising Rates℠ A | 8.47% | 10.07% | 11.62% |
Russell 1000® Index A | 12.95% | 11.92% | 13.38% |
A From September 12, 2016
B From September 15, 2016, date initially listed on the NYSE ARCA exchange.
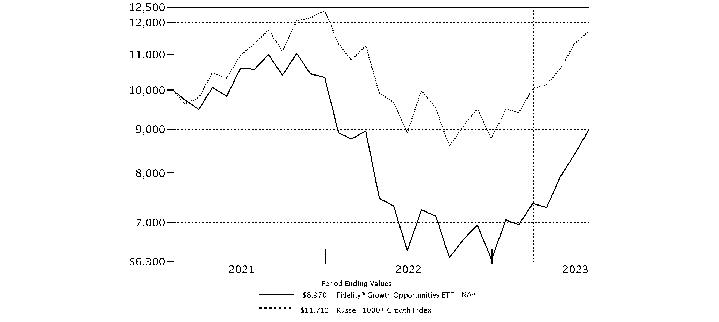
| $10,000 Over Life of Fund |
| |
Let's say hypothetically that $10,000 was invested in Fidelity® Dividend ETF for Rising Rates - NAV, on September 12, 2016, when the fund started. The chart shows how the value of your investment would have changed, and also shows how the Fidelity Dividend Index for Rising Rates℠ and Russell 1000® Index performed over the same period. |
|
|
Fidelity® Dividend ETF for Rising Rates
Market Recap:
U.S. equities gained 13.02% for the 12 months ending July 31, 2023, according to the S&P 500® index, as continued global economic expansion, falling commodity prices and a slowing in the pace of inflation provided a favorable backdrop for higher-risk assets. Large-cap stocks spearheaded the rally, which was driven by the shares of a narrow set of mega-cap companies in the information technology and communication services sectors, largely due to exuberance related to generative artificial intelligence. Aggressive monetary tightening by the U.S. Federal Reserve continued amid consistent pressure on core inflation, a measure that excludes food and energy. Since March 2022, the Fed has hiked its benchmark interest rate 11 times. The latest bump came in late July, a fourth consecutive raise of a stepped down 25 basis points. The S&P 500® gained 3.21% in July, as a "soft landing" of the U.S. economy became the consensus view amid better-than-expected earnings, slowing inflation and easing financial conditions, bringing the index's year-to-date gain to 20.65%. July saw a continuance of the recent shift to wider market breadth and lower dispersion. For the full 12 months, value (+17%) handily topped growth (+8%) within the index. By sector, tech (+28%), communication services (+21%) and industrials (+17%) led, whereas real estate (-10%) lagged most, due to high borrowing costs, low home inventory and a deteriorating commercial property market.
Comments from the Geode Capital Management, LLC, passive equity index team:
For the fiscal year ending July 31, 2023, the exchange-traded fund's (ETF) net asset value gained 8.17%, and its market priced returned 7.87% versus the 8.47% advance for the Fidelity Dividend Index for Rising Rates NR and the 12.95% return for the Russell 1000 Index. By sector, information technology gained 21% and contributed most. Financials stocks also helped (+8%). Consumer discretionary rose approximately 8%, boosted by the consumer discretionary distribution & retail industry (+22%). Conversely, communication services returned approximately -7% and detracted most. Real estate (-11%), hampered by the equity real estate investment trusts (REITS) industry (-11%), and utilities (-4%) also hurt.
Turning to individual stocks, the top contributor was Apple (+22%), from the technology hardware & equipment group. Microsoft (+21%), from the software & services industry, also boosted the fund. Another notable contributor was Broadcom (+74%), a stock in the semiconductors & semiconductor equipment industry. In contrast, the biggest individual detractor was Pfizer (-26%), from the pharmaceuticals, biotechnology & life sciences group. Another notable detractor was Lumen Technologies (-78%), a stock in the telecommunication services category, and Vf (-38%), a stock in the consumer durables & apparel category, also detracted.
The views expressed above reflect those of the portfolio manager(s) only through the end of the period as stated on the cover of this report and do not necessarily represent the views of Fidelity or any other person in the Fidelity organization, or Geode Capital Management, LLC, (the ETF's subadviser) or any other person in the Geode organization. Any such views are subject to change at any time based upon market or other conditions and Fidelity and Geode disclaim any responsibility to update such views. These views may not be relied on as investment advice and, because investment decisions for a Fidelity fund are based on numerous factors, may not be relied on as an indication of trading intent on behalf of any Fidelity fund.
Fidelity® Dividend ETF for Rising Rates
Top Holdings (% of Fund's net assets) |
| |
| Apple, Inc. | 8.7 | |
| Microsoft Corp. | 7.5 | |
| Broadcom, Inc. | 2.4 | |
| UnitedHealth Group, Inc. | 2.2 | |
| Johnson & Johnson | 2.1 | |
| Visa, Inc. Class A | 2.0 | |
| JPMorgan Chase & Co. | 2.0 | |
| Cisco Systems, Inc. | 1.6 | |
| Merck & Co., Inc. | 1.6 | |
| AbbVie, Inc. | 1.6 | |
| | 31.7 | |
| |
| Market Sectors (% of Fund's net assets) |
| |
| Information Technology | 27.9 | |
| Financials | 14.1 | |
| Health Care | 13.4 | |
| Consumer Discretionary | 9.4 | |
| Industrials | 8.8 | |
| Consumer Staples | 6.8 | |
| Communication Services | 6.2 | |
| Energy | 4.6 | |
| Materials | 2.8 | |
| Real Estate | 2.8 | |
| Utilities | 2.6 | |
| |
Asset Allocation (% of Fund's net assets) |
|
Futures - 0.5% |
|
Fidelity® Dividend ETF for Rising Rates
Showing Percentage of Net Assets
| Common Stocks - 99.4% |
| | | Shares | Value ($) |
| COMMUNICATION SERVICES - 6.2% | | | |
| Diversified Telecommunication Services - 1.2% | | | |
| AT&T, Inc. | | 199,741 | 2,900,239 |
| Verizon Communications, Inc. | | 107,100 | 3,649,968 |
| | | | 6,550,207 |
| Entertainment - 0.9% | | | |
| Electronic Arts, Inc. | | 21,370 | 2,913,800 |
| Warner Music Group Corp. Class A | | 56,635 | 1,786,834 |
| | | | 4,700,634 |
| Media - 4.1% | | | |
| Cable One, Inc. (a) | | 2,494 | 1,805,506 |
| Comcast Corp. Class A | | 109,533 | 4,957,464 |
| Fox Corp. Class A | | 64,827 | 2,168,463 |
| Interpublic Group of Companies, Inc. | | 58,463 | 2,001,188 |
| News Corp. Class A | | 102,815 | 2,037,793 |
| Nexstar Broadcasting Group, Inc. Class A | | 10,201 | 1,904,731 |
| Omnicom Group, Inc. | | 25,237 | 2,135,555 |
| Paramount Global Class B (a) | | 88,648 | 1,421,027 |
| TEGNA, Inc. | | 104,208 | 1,761,115 |
| The New York Times Co. Class A | | 58,346 | 2,378,183 |
| | | | 22,571,025 |
TOTAL COMMUNICATION SERVICES | | | 33,821,866 |
| CONSUMER DISCRETIONARY - 9.4% | | | |
| Automobiles - 0.8% | | | |
| Ford Motor Co. | | 332,630 | 4,394,042 |
| Broadline Retail - 0.6% | | | |
| Kohl's Corp. (a) | | 118,542 | 3,372,520 |
| Hotels, Restaurants & Leisure - 2.3% | | | |
| McDonald's Corp. | | 25,233 | 7,398,316 |
| Starbucks Corp. | | 52,317 | 5,313,838 |
| | | | 12,712,154 |
| Household Durables - 1.3% | | | |
| Newell Brands, Inc. | | 247,075 | 2,757,357 |
| Vistry Group PLC | | 408,886 | 4,153,506 |
| | | | 6,910,863 |
| Specialty Retail - 3.4% | | | |
| Best Buy Co., Inc. | | 46,342 | 3,848,703 |
| Lowe's Companies, Inc. | | 26,538 | 6,217,057 |
| The Home Depot, Inc. | | 25,832 | 8,623,755 |
| | | | 18,689,515 |
| Textiles, Apparel & Luxury Goods - 1.0% | | | |
| NIKE, Inc. Class B | | 48,226 | 5,323,668 |
TOTAL CONSUMER DISCRETIONARY | | | 51,402,762 |
| CONSUMER STAPLES - 6.8% | | | |
| Beverages - 2.4% | | | |
| PepsiCo, Inc. | | 36,550 | 6,851,663 |
| The Coca-Cola Co. | | 103,157 | 6,388,513 |
| | | | 13,240,176 |
| Consumer Staples Distribution & Retail - 0.7% | | | |
| Target Corp. | | 28,351 | 3,869,061 |
| Food Products - 0.5% | | | |
| Tyson Foods, Inc. Class A | | 49,829 | 2,776,472 |
| Household Products - 1.5% | | | |
| Procter & Gamble Co. | | 53,654 | 8,386,120 |
| Tobacco - 1.7% | | | |
| Altria Group, Inc. | | 88,257 | 4,008,633 |
| Philip Morris International, Inc. | | 50,207 | 5,006,642 |
| | | | 9,015,275 |
TOTAL CONSUMER STAPLES | | | 37,287,104 |
| ENERGY - 4.6% | | | |
| Oil, Gas & Consumable Fuels - 4.6% | | | |
| Chevron Corp. | | 33,159 | 5,426,802 |
| ConocoPhillips Co. | | 30,298 | 3,566,681 |
| Coterra Energy, Inc. | | 69,929 | 1,925,845 |
| Devon Energy Corp. | | 32,974 | 1,780,596 |
| EOG Resources, Inc. | | 19,806 | 2,624,889 |
| Exxon Mobil Corp. | | 69,893 | 7,495,325 |
| Pioneer Natural Resources Co. | | 9,918 | 2,238,195 |
| | | | 25,058,333 |
| FINANCIALS - 14.1% | | | |
| Banks - 8.2% | | | |
| Bank of America Corp. | | 208,781 | 6,680,992 |
| Citigroup, Inc. | | 104,601 | 4,985,284 |
| ING Groep NV (Certificaten Van Aandelen) | | 292,545 | 4,283,404 |
| Intesa Sanpaolo SpA | | 1,513,843 | 4,388,031 |
| JPMorgan Chase & Co. | | 69,701 | 11,009,970 |
| KBC Group NV | | 53,831 | 4,059,634 |
| Truist Financial Corp. | | 99,020 | 3,289,444 |
| Wells Fargo & Co. | | 138,649 | 6,400,038 |
| | | | 45,096,797 |
| Capital Markets - 1.0% | | | |
| Blackstone, Inc. | | 50,344 | 5,275,548 |
| Financial Services - 2.8% | | | |
| The Western Union Co. | | 384,942 | 4,688,594 |
| Visa, Inc. Class A | | 46,347 | 11,018,072 |
| | | | 15,706,666 |
| Insurance - 1.5% | | | |
| American Financial Group, Inc. | | 31,148 | 3,787,908 |
| Old Republic International Corp. | | 158,006 | 4,356,225 |
| | | | 8,144,133 |
| Mortgage Real Estate Investment Trusts - 0.6% | | | |
| Annaly Capital Management, Inc. | | 175,121 | 3,518,181 |
TOTAL FINANCIALS | | | 77,741,325 |
| HEALTH CARE - 13.4% | | | |
| Biotechnology - 2.9% | | | |
| AbbVie, Inc. | | 60,390 | 9,033,136 |
| Amgen, Inc. | | 28,517 | 6,677,256 |
| | | | 15,710,392 |
| Health Care Equipment & Supplies - 1.2% | | | |
| Medtronic PLC | | 77,881 | 6,834,837 |
| Health Care Providers & Services - 2.2% | | | |
| UnitedHealth Group, Inc. | | 23,960 | 12,132,625 |
| Pharmaceuticals - 7.1% | | | |
| Bristol-Myers Squibb Co. | | 100,987 | 6,280,382 |
| GSK PLC | | 297,078 | 5,292,431 |
| Johnson & Johnson | | 67,544 | 11,315,646 |
| Merck & Co., Inc. | | 85,362 | 9,103,857 |
| Pfizer, Inc. | | 195,002 | 7,031,772 |
| | | | 39,024,088 |
TOTAL HEALTH CARE | | | 73,701,942 |
| INDUSTRIALS - 8.8% | | | |
| Aerospace & Defense - 0.9% | | | |
| Raytheon Technologies Corp. | | 57,467 | 5,053,073 |
| Air Freight & Logistics - 1.0% | | | |
| United Parcel Service, Inc. Class B | | 28,919 | 5,411,612 |
| Ground Transportation - 1.1% | | | |
| Union Pacific Corp. | | 25,380 | 5,888,668 |
| Industrial Conglomerates - 2.3% | | | |
| 3M Co. | | 37,611 | 4,193,627 |
| Honeywell International, Inc. | | 26,664 | 5,176,282 |
| Jardine Matheson Holdings Ltd. | | 67,028 | 3,309,843 |
| | | | 12,679,752 |
| Machinery - 1.0% | | | |
| Caterpillar, Inc. | | 21,908 | 5,809,344 |
| Marine Transportation - 1.9% | | | |
| A.P. Moller - Maersk A/S Series B | | 1,525 | 3,143,946 |
| Mitsui OSK Lines Ltd. | | 142,100 | 3,675,517 |
| Nippon Yusen KK | | 146,700 | 3,560,118 |
| | | | 10,379,581 |
| Professional Services - 0.6% | | | |
| Randstad NV | | 54,317 | 3,190,790 |
TOTAL INDUSTRIALS | | | 48,412,820 |
| INFORMATION TECHNOLOGY - 27.9% | | | |
| Communications Equipment - 1.6% | | | |
| Cisco Systems, Inc. | | 167,417 | 8,712,381 |
| Electronic Equipment, Instruments & Components - 1.0% | | | |
| Corning, Inc. | | 161,126 | 5,468,616 |
| IT Services - 1.4% | | | |
| IBM Corp. | | 52,542 | 7,575,506 |
| Semiconductors & Semiconductor Equipment - 6.6% | | | |
| Broadcom, Inc. | | 14,606 | 13,125,682 |
| Intel Corp. | | 237,940 | 8,511,114 |
| Qualcomm, Inc. | | 55,688 | 7,360,283 |
| Texas Instruments, Inc. | | 42,099 | 7,577,820 |
| | | | 36,574,899 |
| Software - 7.5% | | | |
| Microsoft Corp. | | 123,383 | 41,446,817 |
| Technology Hardware, Storage & Peripherals - 9.8% | | | |
| Apple, Inc. | | 242,303 | 47,600,427 |
| HP, Inc. | | 189,741 | 6,229,197 |
| | | | 53,829,624 |
TOTAL INFORMATION TECHNOLOGY | | | 153,607,843 |
| MATERIALS - 2.8% | | | |
| Chemicals - 1.9% | | | |
| Air Products & Chemicals, Inc. | | 6,976 | 2,129,982 |
| Dow, Inc. | | 29,013 | 1,638,364 |
| Linde PLC | | 10,301 | 4,024,292 |
| LyondellBasell Industries NV Class A | | 15,519 | 1,534,208 |
| The Mosaic Co. | | 27,462 | 1,119,351 |
| | | | 10,446,197 |
| Containers & Packaging - 0.7% | | | |
| Amcor PLC | | 115,413 | 1,184,137 |
| International Paper Co. | | 32,780 | 1,182,047 |
| Packaging Corp. of America | | 9,256 | 1,419,408 |
| | | | 3,785,592 |
| Metals & Mining - 0.2% | | | |
| Newmont Corp. (a) | | 33,021 | 1,417,261 |
TOTAL MATERIALS | | | 15,649,050 |
| REAL ESTATE - 2.8% | | | |
| Equity Real Estate Investment Trusts (REITs) - 2.8% | | | |
| American Tower Corp. | | 11,137 | 2,119,482 |
| Crown Castle International Corp. | | 13,005 | 1,408,311 |
| Healthcare Trust of America, Inc. | | 54,111 | 1,056,788 |
| Medical Properties Trust, Inc. (a) | | 91,390 | 922,125 |
| Omega Healthcare Investors, Inc. | | 38,985 | 1,243,622 |
| Prologis (REIT), Inc. | | 20,696 | 2,581,826 |
| Public Storage | | 5,622 | 1,583,999 |
| Realty Income Corp. | | 24,453 | 1,490,899 |
| Simon Property Group, Inc. | | 12,647 | 1,575,816 |
| Weyerhaeuser Co. | | 40,180 | 1,368,531 |
| | | | 15,351,399 |
| UTILITIES - 2.6% | | | |
| Electric Utilities - 2.2% | | | |
| American Electric Power Co., Inc. | | 19,028 | 1,612,433 |
| Duke Energy Corp. | | 21,682 | 2,029,869 |
| Edison International | | 21,690 | 1,560,812 |
| NextEra Energy, Inc. | | 42,325 | 3,102,423 |
| NRG Energy, Inc. | | 35,486 | 1,348,113 |
| Southern Co. | | 31,460 | 2,275,816 |
| | | | 11,929,466 |
| Independent Power and Renewable Electricity Producers - 0.1% | | | |
| Clearway Energy, Inc. Class C | | 34,377 | 907,897 |
| Multi-Utilities - 0.3% | | | |
| Dominion Energy, Inc. | | 29,699 | 1,590,381 |
TOTAL UTILITIES | | | 14,427,744 |
| TOTAL COMMON STOCKS (Cost $502,490,537) | | | 546,462,188 |
| | | | |
| Money Market Funds - 1.5% |
| | | Shares | Value ($) |
| Fidelity Cash Central Fund 5.32% (b) | | 2,061,721 | 2,062,133 |
| Fidelity Securities Lending Cash Central Fund 5.32% (b)(c) | | 6,086,966 | 6,087,575 |
| TOTAL MONEY MARKET FUNDS (Cost $8,149,708) | | | 8,149,708 |
| | | | |
| TOTAL INVESTMENT IN SECURITIES - 100.9% (Cost $510,640,245) | 554,611,896 |
NET OTHER ASSETS (LIABILITIES) - (0.9)% | (5,076,195) |
| NET ASSETS - 100.0% | 549,535,701 |
| | |
| Futures Contracts |
| | Number of contracts | Expiration Date | Notional Amount ($) | Value ($) | Unrealized Appreciation/ (Depreciation) ($) |
| Purchased | | | | | |
| | | | | | |
| Equity Index Contracts | | | | | |
| CME E-mini S&P 500 Index Contracts (United States) | 12 | Sep 2023 | 2,768,700 | 153,385 | 153,385 |
| | | | | | |
| The notional amount of futures purchased as a percentage of Net Assets is 0.5% |
Legend
| (a) | Security or a portion of the security is on loan at period end. |
| (b) | Affiliated fund that is generally available only to investment companies and other accounts managed by Fidelity Investments. The rate quoted is the annualized seven-day yield of the fund at period end. A complete unaudited listing of the fund's holdings as of its most recent quarter end is available upon request. In addition, each Fidelity Central Fund's financial statements, which are not covered by the Fund's Report of Independent Registered Public Accounting Firm, are available on the SEC's website or upon request. |
| (c) | Investment made with cash collateral received from securities on loan. |
Affiliated Central Funds
Fiscal year to date information regarding the Fund's investments in Fidelity Central Funds, including the ownership percentage, is presented below.
| Affiliate | Value, beginning of period ($) | Purchases ($) | Sales Proceeds ($) | Dividend Income ($) | Realized Gain (loss) ($) | Change in Unrealized appreciation (depreciation) ($) | Value, end of period ($) | % ownership, end of period |
| Fidelity Cash Central Fund 5.32% | 1,664,238 | 37,620,438 | 37,222,543 | 49,256 | - | - | 2,062,133 | 0.0% |
| Fidelity Securities Lending Cash Central Fund 5.32% | 16,551,925 | 117,404,415 | 127,868,765 | 184,646 | - | - | 6,087,575 | 0.0% |
| Total | 18,216,163 | 155,024,853 | 165,091,308 | 233,902 | - | - | 8,149,708 | |
| | | | | | | | | |
Amounts in the dividend income column in the above table include any capital gain distributions from underlying funds, which are presented in the corresponding line item in the Statement of Operations, if applicable.
Amounts in the dividend income column for Fidelity Securities Lending Cash Central Fund represents the income earned on investing cash collateral, less rebates paid to borrowers and any lending agent fees associated with the loan, plus any premium payments received for lending certain types of securities.
Amounts included in the purchases and sales proceeds columns may include in-kind transactions, if applicable.
Investment Valuation
The following is a summary of the inputs used, as of July 31, 2023, involving the Fund's assets and liabilities carried at fair value. The inputs or methodology used for valuing securities may not be an indication of the risk associated with investing in those securities. For more information on valuation inputs, and their aggregation into the levels used below, please refer to the Investment Valuation section in the accompanying Notes to Financial Statements.
| Valuation Inputs at Reporting Date: |
| Description | Total ($) | Level 1 ($) | Level 2 ($) | Level 3 ($) |
Investments in Securities: | | | | |
|
| Equities: | | | | |
Communication Services | 33,821,866 | 33,821,866 | - | - |
Consumer Discretionary | 51,402,762 | 51,402,762 | - | - |
Consumer Staples | 37,287,104 | 37,287,104 | - | - |
Energy | 25,058,333 | 25,058,333 | - | - |
Financials | 77,741,325 | 77,741,325 | - | - |
Health Care | 73,701,942 | 73,701,942 | - | - |
Industrials | 48,412,820 | 48,412,820 | - | - |
Information Technology | 153,607,843 | 153,607,843 | - | - |
Materials | 15,649,050 | 15,649,050 | - | - |
Real Estate | 15,351,399 | 15,351,399 | - | - |
Utilities | 14,427,744 | 14,427,744 | - | - |
|
| Money Market Funds | 8,149,708 | 8,149,708 | - | - |
| Total Investments in Securities: | 554,611,896 | 554,611,896 | - | - |
Derivative Instruments: | | | | |
|
| Assets | | | | |
Futures Contracts | 153,385 | 153,385 | - | - |
| Total Assets | 153,385 | 153,385 | - | - |
| Total Derivative Instruments: | 153,385 | 153,385 | - | - |
Value of Derivative Instruments
The following table is a summary of the Fund's value of derivative instruments by primary risk exposure as of July 31, 2023. For additional information on derivative instruments, please refer to the Derivative Instruments section in the accompanying Notes to Financial Statements.
Primary Risk Exposure / Derivative Type | Value |
| Asset ($) | Liability ($) |
| Equity Risk | | |
Futures Contracts (a) | 153,385 | 0 |
| Total Equity Risk | 153,385 | 0 |
| Total Value of Derivatives | 153,385 | 0 |
(a)Reflects gross cumulative appreciation (depreciation) on futures contracts as presented in the Schedule of Investments. In the Statement of Assets and Liabilities, the period end daily variation margin is included in receivable or payable for daily variation margin on futures contracts, and the net cumulative appreciation (depreciation) is included in Total accumulated earnings (loss).
Fidelity® Dividend ETF for Rising Rates
| Statement of Assets and Liabilities |
| | | | July 31, 2023 |
| | | | | |
| Assets | | | | |
| Investment in securities, at value (including securities loaned of $5,983,178) - See accompanying schedule: | | | | |
Unaffiliated issuers (cost $502,490,537) | $ | 546,462,188 | | |
Fidelity Central Funds (cost $8,149,708) | | 8,149,708 | | |
| | | | | |
| | | | | |
| Total Investment in Securities (cost $510,640,245) | | | $ | 554,611,896 |
| Segregated cash with brokers for derivative instruments | | | | 134,400 |
| Foreign currency held at value (cost $182,326) | | | | 183,933 |
| Dividends receivable | | | | 811,244 |
| Distributions receivable from Fidelity Central Funds | | | | 7,729 |
| Receivable for daily variation margin on futures contracts | | | | 4,800 |
Total assets | | | | 555,754,002 |
| Liabilities | | | | |
| Accrued management fee | $ | 130,726 | | |
| Collateral on securities loaned | | 6,087,575 | | |
| Total Liabilities | | | | 6,218,301 |
| Net Assets | | | $ | 549,535,701 |
| Net Assets consist of: | | | | |
| Paid in capital | | | $ | 565,839,189 |
| Total accumulated earnings (loss) | | | | (16,303,488) |
| Net Assets | | | $ | 549,535,701 |
Net Asset Value, offering price and redemption price per share ($549,535,701 ÷ 12,750,000 shares) | | | $ | 43.10 |
| Statement of Operations |
| | | | Year ended July 31, 2023 |
| Investment Income | | | | |
| Dividends | | | $ | 18,446,725 |
| Income from Fidelity Central Funds (including $184,646 from security lending) | | | | 233,902 |
| Total Income | | | | 18,680,627 |
| Expenses | | | | |
| Management fee | $ | 1,625,282 | | |
| Independent trustees' fees and expenses | | 2,921 | | |
| Interest | | 1,254 | | |
| Total expenses before reductions | | 1,629,457 | | |
| Expense reductions | | (183) | | |
| Total expenses after reductions | | | | 1,629,274 |
| Net Investment income (loss) | | | | 17,051,353 |
| Realized and Unrealized Gain (Loss) | | | | |
| Net realized gain (loss) on: | | | | |
| Investment Securities: | | | | |
| Unaffiliated issuers | | (21,299,689) | | |
| Redemptions in-kind | | 41,388,416 | | |
| Foreign currency transactions | | (98,236) | | |
| Futures contracts | | (157,915) | | |
| Total net realized gain (loss) | | | | 19,832,576 |
| Change in net unrealized appreciation (depreciation) on: | | | | |
| Investment Securities: | | | | |
| Unaffiliated issuers | | 2,247,029 | | |
| Assets and liabilities in foreign currencies | | 57,752 | | |
| Futures contracts | | 77,600 | | |
| Total change in net unrealized appreciation (depreciation) | | | | 2,382,381 |
| Net gain (loss) | | | | 22,214,957 |
| Net increase (decrease) in net assets resulting from operations | | | $ | 39,266,310 |
| Statement of Changes in Net Assets |
| |
| | Year ended July 31, 2023 | | Year ended July 31, 2022 |
| Increase (Decrease) in Net Assets | | | | |
| Operations | | | | |
| Net investment income (loss) | $ | 17,051,353 | $ | 14,434,863 |
| Net realized gain (loss) | | 19,832,576 | | 16,773,810 |
| Change in net unrealized appreciation (depreciation) | | 2,382,381 | | (47,740,920) |
| Net increase (decrease) in net assets resulting from operations | | 39,266,310 | | (16,532,247) |
| Distributions to shareholders | | (16,860,450) | | (14,425,400) |
| | | | | |
| Share transactions | | | | |
| Proceeds from sales of shares | | 115,557,120 | | 291,688,328 |
| Cost of shares redeemed | | (200,570,072) | | (138,676,589) |
| | | | | |
Net increase (decrease) in net assets resulting from share transactions | | (85,012,952) | | 153,011,739 |
| Total increase (decrease) in net assets | | (62,607,092) | | 122,054,092 |
| | | | | |
| Net Assets | | | | |
| Beginning of period | | 612,142,793 | | 490,088,701 |
| End of period | $ | 549,535,701 | $ | 612,142,793 |
| | | | | |
| Other Information | | | | |
| Shares | | | | |
| Sold | | 2,750,000 | | 6,600,000 |
| Redeemed | | (4,900,000) | | (3,200,000) |
| Net increase (decrease) | | (2,150,000) | | 3,400,000 |
| | | | | |
| Fidelity® Dividend ETF for Rising Rates |
| |
| Years ended July 31, | | 2023 | | 2022 | | 2021 | | 2020 | | 2019 |
Selected Per-Share Data | | | | | | | | | | |
| Net asset value, beginning of period | $ | 41.08 | $ | 42.62 | $ | 31.72 | $ | 32.31 | $ | 31.54 |
| Income from Investment Operations | | | | | | | | | | |
Net investment income (loss) A,B | | 1.22 | | 1.08 | | .93 | | 1.01 | | 1.07 |
| Net realized and unrealized gain (loss) | | 2.02 | | (1.54) | | 10.85 | | (.56) | | .79 |
| Total from investment operations | | 3.24 | | (.46) | | 11.78 | | .45 | | 1.86 |
| Distributions from net investment income | | (1.22) | | (1.08) | | (.88) | | (1.04) | | (1.09) |
| Total distributions | | (1.22) | | (1.08) | | (.88) | | (1.04) | | (1.09) |
| Net asset value, end of period | $ | 43.10 | $ | 41.08 | $ | 42.62 | $ | 31.72 | $ | 32.31 |
Total Return C,D | | 8.17% | | (1.06)% | | 37.57% | | 1.86% | | 6.09% |
Ratios to Average Net Assets B,E,F | | | | | | | | | | |
| Expenses before reductions | | .29% | | .29% | | .29% | | .29% | | .29% |
| Expenses net of fee waivers, if any | | .29% | | .29% | | .29% | | .29% | | .29% |
| Expenses net of all reductions | | .29% | | .29% | | .29% | | .29% | | .29% |
| Net investment income (loss) | | 3.04% | | 2.54% | | 2.44% | | 3.15% | | 3.42% |
| Supplemental Data | | | | | | | | | | |
| Net assets, end of period (000 omitted) | $ | 549,536 | $ | 612,143 | $ | 490,089 | $ | 282,317 | $ | 360,229 |
Portfolio turnover rate G,H | | 29% | | 28% | | 32% | | 35% | | 35% |
ACalculated based on average shares outstanding during the period.
BNet investment income (loss) is affected by the timing of the declaration of dividends by any underlying mutual funds or exchange-traded funds (ETFs). Net investment income (loss) of any mutual funds or ETFs is not included in the Fund's net investment income (loss) ratio.
CBased on net asset value.
DTotal returns would have been lower if certain expenses had not been reduced during the applicable periods shown.
EFees and expenses of any underlying mutual funds or exchange-traded funds (ETFs) are not included in the Fund's expense ratio. The Fund indirectly bears its proportionate share of these expenses. For additional expense information related to investments in Fidelity Central Funds, please refer to the "Investments in Fidelity Central Funds" note found in the Notes to Financial Statements section of the most recent Annual or Semi-Annual report.
FExpense ratios reflect operating expenses of the class. Expenses before reductions do not reflect amounts reimbursed, waived, or reduced through arrangements with the investment adviser, brokerage services, or other offset arrangements, if applicable, and do not represent the amount paid by the class during periods when reimbursements, waivers or reductions occur.
GPortfolio turnover rate excludes securities received or delivered in-kind.
HAmount does not include the portfolio activity of any underlying mutual funds or exchange-traded funds (ETFs).
NAV and closing market price average annual returns reflect the change in the value of an investment, assuming reinvestment of distributions from dividend income and capital gains (the profits earned upon the sale of securities that have grown in value, if any) at NAV and Market Price, respectively, and assumes a constant rate of performance each year. The hypothetical investment and the fund's returns do not reflect the deduction of taxes that a shareholder would pay on fund distributions or the redemption or selling of fund shares. How a fund did yesterday is no guarantee of how it will do tomorrow.
| Average Annual Total Returns |
| | | | |
Periods ended July 31, 2023 | Past 1 year | Past 5 years | Life of Fund |
Fidelity® High Dividend ETF - NAV A | 12.22% | 10.66% | 11.49% |
Fidelity® High Dividend ETF - Market Price B | 12.09% | 10.62% | 11.60% |
Fidelity High Dividend Index℠ A | 12.55% | 10.98% | 11.83% |
Russell 1000® Index A | 12.95% | 11.92% | 13.38% |
A From September 12, 2016
B From September 15, 2016, date initially listed on the NYSE ARCA exchange.
| $10,000 Over Life of Fund |
| |
Let's say hypothetically that $10,000 was invested in Fidelity® High Dividend ETF - NAV, on September 12, 2016, when the fund started. The chart shows how the value of your investment would have changed, and also shows how the Fidelity High Dividend Index℠ and Russell 1000® Index performed over the same period. |
|
|
Fidelity® High Dividend ETF
Market Recap:
U.S. equities gained 13.02% for the 12 months ending July 31, 2023, according to the S&P 500® index, as continued global economic expansion, falling commodity prices and a slowing in the pace of inflation provided a favorable backdrop for higher-risk assets. Large-cap stocks spearheaded the rally, which was driven by the shares of a narrow set of mega-cap companies in the information technology and communication services sectors, largely due to exuberance related to generative artificial intelligence. Aggressive monetary tightening by the U.S. Federal Reserve continued amid consistent pressure on core inflation, a measure that excludes food and energy. Since March 2022, the Fed has hiked its benchmark interest rate 11 times. The latest bump came in late July, a fourth consecutive raise of a stepped down 25 basis points. The S&P 500® gained 3.21% in July, as a "soft landing" of the U.S. economy became the consensus view amid better-than-expected earnings, slowing inflation and easing financial conditions, bringing the index's year-to-date gain to 20.65%. July saw a continuance of the recent shift to wider market breadth and lower dispersion. For the full 12 months, value (+17%) handily topped growth (+8%) within the index. By sector, tech (+28%), communication services (+21%) and industrials (+17%) led, whereas real estate (-10%) lagged most, due to high borrowing costs, low home inventory and a deteriorating commercial property market.
Comments from Portfolio Manager Geode Capital Management, LLC, passive equity index team:
For the fiscal year ending July 31, 2023, the exchange-traded fund's (ETF) net asset value returned 12.22%, and its market price returned 12.09%, versus the 12.55% advance for the Fidelity High Dividend Index NR and the 12.95% return for the Russell 1000 Index. By sector, information technology gained 34% and contributed most. Financials stocks also helped (+13%). Energy rose 15%, materials gained about 12%, and industrials advanced 11%. Other Notable contributors included the consumer discretionary (+14%), consumer staples (+13%) and health care (+2%) sectors. Conversely, real estate returned -7% and detracted most. Utilities (-3%) and communication services (-6%) also hurt. Turning to individual stocks, the top contributor was Nvidia (+159%), from the semiconductors & semiconductor equipment industry. Also in semiconductors & semiconductor equipment, Broadcom (+74%) helped. Apple (+22%), from the technology hardware & equipment category, also boosted the fund. In contrast, the biggest individual detractor was Crown Castle (-37%), from the equity real estate investment trusts (REITS) industry. Also in equity real estate investment trusts (REITS), American Tower (-27%) and Medical Properties Trust (-35%) hurt. Pfizer (-26%), a stock in the pharmaceuticals, biotechnology & life sciences industry, also hindered the fund.
The views expressed above reflect those of the portfolio manager(s) only through the end of the period as stated on the cover of this report and do not necessarily represent the views of Fidelity or any other person in the Fidelity organization, or Geode Capital Management, LLC, (the ETF's subadviser) or any other person in the Geode organization. Any such views are subject to change at any time based upon market or other conditions and Fidelity and Geode disclaim any responsibility to update such views. These views may not be relied on as investment advice and, because investment decisions for a Fidelity fund are based on numerous factors, may not be relied on as an indication of trading intent on behalf of any Fidelity fund.
Fidelity® High Dividend ETF
Top Holdings (% of Fund's net assets) |
| |
| Apple, Inc. | 6.4 | |
| Microsoft Corp. | 5.6 | |
| NVIDIA Corp. | 3.6 | |
| JPMorgan Chase & Co. | 2.6 | |
| Procter & Gamble Co. | 2.5 | |
| Exxon Mobil Corp. | 2.2 | |
| PepsiCo, Inc. | 2.2 | |
| The Coca-Cola Co. | 2.0 | |
| Chevron Corp. | 1.9 | |
| Philip Morris International, Inc. | 1.7 | |
| | 30.7 | |
| |
| Market Sectors (% of Fund's net assets) |
| |
| Information Technology | 23.0 | |
| Financials | 19.1 | |
| Industrials | 14.5 | |
| Consumer Staples | 12.2 | |
| Energy | 11.0 | |
| Real Estate | 8.6 | |
| Health Care | 6.7 | |
| Consumer Discretionary | 3.6 | |
| Communication Services | 0.9 | |
| |
Asset Allocation (% of Fund's net assets) |
|
Futures - 0.4% |
|
Fidelity® High Dividend ETF
Showing Percentage of Net Assets
| Common Stocks - 99.6% |
| | | Shares | Value ($) |
| COMMUNICATION SERVICES - 0.9% | | | |
| Diversified Telecommunication Services - 0.2% | | | |
| AT&T, Inc. | | 92,780 | 1,347,166 |
| Verizon Communications, Inc. | | 49,690 | 1,693,435 |
| | | | 3,040,601 |
| Entertainment - 0.1% | | | |
| Electronic Arts, Inc. | | 9,905 | 1,350,547 |
| Warner Music Group Corp. Class A | | 26,289 | 829,418 |
| | | | 2,179,965 |
| Media - 0.6% | | | |
| Cable One, Inc. (a) | | 1,139 | 824,568 |
| Comcast Corp. Class A | | 50,417 | 2,281,873 |
| Fox Corp. Class A | | 30,048 | 1,005,106 |
| Interpublic Group of Companies, Inc. | | 27,140 | 929,002 |
| News Corp. Class A | | 47,771 | 946,821 |
| Nexstar Broadcasting Group, Inc. Class A | | 4,702 | 877,957 |
| Omnicom Group, Inc. | | 11,652 | 985,992 |
| Paramount Global Class B (a) | | 41,144 | 659,538 |
| TEGNA, Inc. | | 48,377 | 817,571 |
| The New York Times Co. Class A | | 27,075 | 1,103,577 |
| | | | 10,432,005 |
TOTAL COMMUNICATION SERVICES | | | 15,652,571 |
| CONSUMER DISCRETIONARY - 3.6% | | | |
| Automobiles - 0.3% | | | |
| Ford Motor Co. | | 403,460 | 5,329,707 |
| Broadline Retail - 0.3% | | | |
| Kohl's Corp. (a) | | 144,015 | 4,097,227 |
| Hotels, Restaurants & Leisure - 0.9% | | | |
| McDonald's Corp. | | 30,636 | 8,982,475 |
| Starbucks Corp. | | 63,539 | 6,453,656 |
| | | | 15,436,131 |
| Household Durables - 0.4% | | | |
| Newell Brands, Inc. | | 300,530 | 3,353,915 |
| Vistry Group PLC | | 386,894 | 3,930,109 |
| | | | 7,284,024 |
| Specialty Retail - 1.3% | | | |
| Best Buy Co., Inc. | | 56,199 | 4,667,327 |
| Lowe's Companies, Inc. | | 32,217 | 7,547,477 |
| The Home Depot, Inc. | | 31,358 | 10,468,555 |
| | | | 22,683,359 |
| Textiles, Apparel & Luxury Goods - 0.4% | | | |
| NIKE, Inc. Class B | | 58,481 | 6,455,718 |
TOTAL CONSUMER DISCRETIONARY | | | 61,286,166 |
| CONSUMER STAPLES - 12.2% | | | |
| Beverages - 4.2% | | | |
| PepsiCo, Inc. | | 196,737 | 36,880,318 |
| The Coca-Cola Co. | | 555,130 | 34,379,201 |
| | | | 71,259,519 |
| Consumer Staples Distribution & Retail - 0.3% | | | |
| Target Corp. | | 34,390 | 4,693,203 |
| Household Products - 2.5% | | | |
| Procter & Gamble Co. | | 265,949 | 41,567,829 |
| Tobacco - 5.2% | | | |
| Altria Group, Inc. | | 576,089 | 26,165,962 |
| British American Tobacco PLC (United Kingdom) | | 476,982 | 16,051,556 |
| Imperial Brands PLC | | 731,173 | 17,305,349 |
| Philip Morris International, Inc. | | 292,736 | 29,191,634 |
| | | | 88,714,501 |
TOTAL CONSUMER STAPLES | | | 206,235,052 |
| ENERGY - 11.0% | | | |
| Oil, Gas & Consumable Fuels - 11.0% | | | |
| Chevron Corp. | | 193,848 | 31,725,164 |
| ConocoPhillips Co. | | 232,461 | 27,365,309 |
| Coterra Energy, Inc. | | 841,308 | 23,169,622 |
| Devon Energy Corp. | | 355,552 | 19,199,808 |
| EOG Resources, Inc. | | 185,113 | 24,533,026 |
| Exxon Mobil Corp. | | 354,944 | 38,064,195 |
| Pioneer Natural Resources Co. | | 100,902 | 22,770,554 |
| | | | 186,827,678 |
| FINANCIALS - 19.1% | | | |
| Banks - 10.6% | | | |
| Bank of America Corp. | | 900,458 | 28,814,656 |
| Citigroup, Inc. | | 499,858 | 23,823,232 |
| ING Groep NV (Certificaten Van Aandelen) | | 1,220,779 | 17,874,480 |
| Intesa Sanpaolo SpA | | 6,317,624 | 18,312,290 |
| JPMorgan Chase & Co. | | 281,692 | 44,496,068 |
| KBC Group NV | | 224,621 | 16,939,662 |
| Wells Fargo & Co. | | 623,700 | 28,789,992 |
| | | | 179,050,380 |
| Capital Markets - 1.5% | | | |
| Blackstone, Inc. | | 247,795 | 25,966,438 |
| Financial Services - 2.0% | | | |
| The Western Union Co. | | 795,340 | 9,687,241 |
| Visa, Inc. Class A | | 101,225 | 24,064,219 |
| | | | 33,751,460 |
| Insurance - 2.5% | | | |
| American Financial Group, Inc. | | 164,705 | 20,029,775 |
| Old Republic International Corp. | | 837,889 | 23,100,600 |
| | | | 43,130,375 |
| Mortgage Real Estate Investment Trusts - 2.5% | | | |
| Annaly Capital Management, Inc. | | 923,945 | 18,562,055 |
| Rithm Capital Corp. | | 2,296,471 | 23,148,428 |
| | | | 41,710,483 |
TOTAL FINANCIALS | | | 323,609,136 |
| HEALTH CARE - 6.7% | | | |
| Biotechnology - 2.2% | | | |
| AbbVie, Inc. | | 102,631 | 15,351,545 |
| Amgen, Inc. | | 49,112 | 11,499,575 |
| Gilead Sciences, Inc. | | 140,766 | 10,717,923 |
| | | | 37,569,043 |
| Health Care Equipment & Supplies - 0.7% | | | |
| Medtronic PLC | | 134,404 | 11,795,295 |
| Pharmaceuticals - 3.8% | | | |
| Bristol-Myers Squibb Co. | | 173,430 | 10,785,612 |
| GSK PLC | | 407,536 | 7,260,236 |
| Johnson & Johnson | | 113,356 | 18,990,531 |
| Merck & Co., Inc. | | 144,982 | 15,462,330 |
| Pfizer, Inc. | | 331,553 | 11,955,801 |
| | | | 64,454,510 |
TOTAL HEALTH CARE | | | 113,818,848 |
| INDUSTRIALS - 14.5% | | | |
| Aerospace & Defense - 2.9% | | | |
| Lockheed Martin Corp. | | 54,897 | 24,504,374 |
| Raytheon Technologies Corp. | | 274,613 | 24,146,721 |
| | | | 48,651,095 |
| Air Freight & Logistics - 1.5% | | | |
| United Parcel Service, Inc. Class B | | 138,537 | 25,924,429 |
| Ground Transportation - 1.7% | | | |
| Union Pacific Corp. | | 122,488 | 28,419,666 |
| Industrial Conglomerates - 2.7% | | | |
| 3M Co. | | 194,472 | 21,683,628 |
| Honeywell International, Inc. | | 127,751 | 24,800,302 |
| | | | 46,483,930 |
| Machinery - 1.7% | | | |
| Caterpillar, Inc. | | 106,122 | 28,140,371 |
| Marine Transportation - 4.0% | | | |
| A.P. Moller - Maersk A/S Series B | | 6,739 | 13,893,149 |
| Kawasaki Kisen Kaisha Ltd. | | 738,100 | 22,244,821 |
| Mitsui OSK Lines Ltd. | | 627,700 | 16,235,906 |
| Nippon Yusen KK | | 647,000 | 15,701,408 |
| | | | 68,075,284 |
TOTAL INDUSTRIALS | | | 245,694,775 |
| INFORMATION TECHNOLOGY - 23.0% | | | |
| Communications Equipment - 1.1% | | | |
| Cisco Systems, Inc. | | 359,651 | 18,716,238 |
| IT Services - 0.9% | | | |
| IBM Corp. | | 111,496 | 16,075,493 |
| Semiconductors & Semiconductor Equipment - 8.2% | | | |
| Broadcom, Inc. | | 31,520 | 28,325,448 |
| Intel Corp. | | 505,194 | 18,070,789 |
| NVIDIA Corp. | | 131,314 | 61,361,719 |
| Qualcomm, Inc. | | 118,808 | 15,702,853 |
| Texas Instruments, Inc. | | 89,985 | 16,197,300 |
| | | | 139,658,109 |
| Software - 5.6% | | | |
| Microsoft Corp. | | 280,205 | 94,126,464 |
| Technology Hardware, Storage & Peripherals - 7.2% | | | |
| Apple, Inc. | | 551,400 | 108,322,529 |
| HP, Inc. | | 394,568 | 12,953,667 |
| | | | 121,276,196 |
TOTAL INFORMATION TECHNOLOGY | | | 389,852,500 |
| REAL ESTATE - 8.6% | | | |
| Equity Real Estate Investment Trusts (REITs) - 8.6% | | | |
| American Tower Corp. | | 82,109 | 15,626,164 |
| Crown Castle International Corp. | | 111,328 | 12,055,709 |
| Digital Realty Trust, Inc. | | 130,391 | 16,249,326 |
| Healthcare Trust of America, Inc. | | 661,882 | 12,926,555 |
| Medical Properties Trust, Inc. (a) | | 1,124,256 | 11,343,743 |
| Omega Healthcare Investors, Inc. | | 482,323 | 15,386,104 |
| Prologis (REIT), Inc. | | 144,705 | 18,051,949 |
| Public Storage | | 52,197 | 14,706,505 |
| Simon Property Group, Inc. | | 121,421 | 15,129,057 |
| Weyerhaeuser Co. | | 428,147 | 14,582,687 |
| | | | 146,057,799 |
| TOTAL COMMON STOCKS (Cost $1,559,841,105) | | | 1,689,034,525 |
| | | | |
| Money Market Funds - 1.0% |
| | | Shares | Value ($) |
| Fidelity Cash Central Fund 5.32% (b) | | 4,258,481 | 4,259,333 |
| Fidelity Securities Lending Cash Central Fund 5.32% (b)(c) | | 12,023,748 | 12,024,950 |
| TOTAL MONEY MARKET FUNDS (Cost $16,284,283) | | | 16,284,283 |
| | | | |
| TOTAL INVESTMENT IN SECURITIES - 100.6% (Cost $1,576,125,388) | 1,705,318,808 |
NET OTHER ASSETS (LIABILITIES) - (0.6)% | (9,551,560) |
| NET ASSETS - 100.0% | 1,695,767,248 |
| | |
| Futures Contracts |
| | Number of contracts | Expiration Date | Notional Amount ($) | Value ($) | Unrealized Appreciation/ (Depreciation) ($) |
| Purchased | | | | | |
| | | | | | |
| Equity Index Contracts | | | | | |
| CME E-mini S&P 500 Index Contracts (United States) | 27 | Sep 2023 | 6,229,575 | 274,053 | 274,053 |
| CME Micro E-mini S&P 500 Index Contracts (United States) | 20 | Sep 2023 | 461,450 | 753 | 753 |
| �� | | | | | |
| TOTAL FUTURES CONTRACTS | | | | | 274,806 |
| The notional amount of futures purchased as a percentage of Net Assets is 0.4% |
Legend
| (a) | Security or a portion of the security is on loan at period end. |
| (b) | Affiliated fund that is generally available only to investment companies and other accounts managed by Fidelity Investments. The rate quoted is the annualized seven-day yield of the fund at period end. A complete unaudited listing of the fund's holdings as of its most recent quarter end is available upon request. In addition, each Fidelity Central Fund's financial statements, which are not covered by the Fund's Report of Independent Registered Public Accounting Firm, are available on the SEC's website or upon request. |
| (c) | Investment made with cash collateral received from securities on loan. |
Affiliated Central Funds
Fiscal year to date information regarding the Fund's investments in Fidelity Central Funds, including the ownership percentage, is presented below.
| Affiliate | Value, beginning of period ($) | Purchases ($) | Sales Proceeds ($) | Dividend Income ($) | Realized Gain (loss) ($) | Change in Unrealized appreciation (depreciation) ($) | Value, end of period ($) | % ownership, end of period |
| Fidelity Cash Central Fund 5.32% | 2,743,400 | 111,350,344 | 109,834,411 | 80,442 | - | - | 4,259,333 | 0.0% |
| Fidelity Securities Lending Cash Central Fund 5.32% | 16,059,350 | 250,186,775 | 254,221,175 | 250,098 | - | - | 12,024,950 | 0.0% |
| Total | 18,802,750 | 361,537,119 | 364,055,586 | 330,540 | - | - | 16,284,283 | |
| | | | | | | | | |
Amounts in the dividend income column in the above table include any capital gain distributions from underlying funds, which are presented in the corresponding line item in the Statement of Operations, if applicable.
Amounts in the dividend income column for Fidelity Securities Lending Cash Central Fund represents the income earned on investing cash collateral, less rebates paid to borrowers and any lending agent fees associated with the loan, plus any premium payments received for lending certain types of securities.
Amounts included in the purchases and sales proceeds columns may include in-kind transactions, if applicable.
Investment Valuation
The following is a summary of the inputs used, as of July 31, 2023, involving the Fund's assets and liabilities carried at fair value. The inputs or methodology used for valuing securities may not be an indication of the risk associated with investing in those securities. For more information on valuation inputs, and their aggregation into the levels used below, please refer to the Investment Valuation section in the accompanying Notes to Financial Statements.
| Valuation Inputs at Reporting Date: |
| Description | Total ($) | Level 1 ($) | Level 2 ($) | Level 3 ($) |
Investments in Securities: | | | | |
|
| Equities: | | | | |
Communication Services | 15,652,571 | 15,652,571 | - | - |
Consumer Discretionary | 61,286,166 | 61,286,166 | - | - |
Consumer Staples | 206,235,052 | 206,235,052 | - | - |
Energy | 186,827,678 | 186,827,678 | - | - |
Financials | 323,609,136 | 323,609,136 | - | - |
Health Care | 113,818,848 | 113,818,848 | - | - |
Industrials | 245,694,775 | 245,694,775 | - | - |
Information Technology | 389,852,500 | 389,852,500 | - | - |
Real Estate | 146,057,799 | 146,057,799 | - | - |
|
| Money Market Funds | 16,284,283 | 16,284,283 | - | - |
| Total Investments in Securities: | 1,705,318,808 | 1,705,318,808 | - | - |
Derivative Instruments: | | | | |
|
| Assets | | | | |
Futures Contracts | 274,806 | 274,806 | - | - |
| Total Assets | 274,806 | 274,806 | - | - |
| Total Derivative Instruments: | 274,806 | 274,806 | - | - |
Value of Derivative Instruments
The following table is a summary of the Fund's value of derivative instruments by primary risk exposure as of July 31, 2023. For additional information on derivative instruments, please refer to the Derivative Instruments section in the accompanying Notes to Financial Statements.
Primary Risk Exposure / Derivative Type | Value |
| Asset ($) | Liability ($) |
| Equity Risk | | |
Futures Contracts (a) | 274,806 | 0 |
| Total Equity Risk | 274,806 | 0 |
| Total Value of Derivatives | 274,806 | 0 |
(a)Reflects gross cumulative appreciation (depreciation) on futures contracts as presented in the Schedule of Investments. In the Statement of Assets and Liabilities, the period end daily variation margin is included in receivable or payable for daily variation margin on futures contracts, and the net cumulative appreciation (depreciation) is included in Total accumulated earnings (loss).
Fidelity® High Dividend ETF
| Statement of Assets and Liabilities |
| | | | July 31, 2023 |
| | | | | |
| Assets | | | | |
| Investment in securities, at value (including securities loaned of $11,592,710) - See accompanying schedule: | | | | |
Unaffiliated issuers (cost $1,559,841,105) | $ | 1,689,034,525 | | |
Fidelity Central Funds (cost $16,284,283) | | 16,284,283 | | |
| | | | | |
| | | | | |
| Total Investment in Securities (cost $1,576,125,388) | | | $ | 1,705,318,808 |
| Segregated cash with brokers for derivative instruments | | | | 294,560 |
| Foreign currency held at value (cost $16,910) | | | | 17,024 |
| Receivable for fund shares sold | | | | 6,226,804 |
| Dividends receivable | | | | 2,475,289 |
| Distributions receivable from Fidelity Central Funds | | | | 11,588 |
| Receivable for daily variation margin on futures contracts | | | | 10,925 |
Total assets | | | | 1,714,354,998 |
| Liabilities | | | | |
| Payable for investments purchased | $ | 6,170,687 | | |
| Accrued management fee | | 392,108 | | |
| Other payables and accrued expenses | | 5 | | |
| Collateral on securities loaned | | 12,024,950 | | |
| Total Liabilities | | | | 18,587,750 |
| Net Assets | | | $ | 1,695,767,248 |
| Net Assets consist of: | | | | |
| Paid in capital | | | $ | 1,643,310,853 |
| Total accumulated earnings (loss) | | | | 52,456,395 |
| Net Assets | | | $ | 1,695,767,248 |
Net Asset Value, offering price and redemption price per share ($1,695,767,248 ÷ 40,850,000 shares) | | | $ | 41.51 |
| Statement of Operations |
| | | | Year ended July 31, 2023 |
| Investment Income | | | | |
| Dividends | | | $ | 54,352,353 |
| Income from Fidelity Central Funds (including $250,098 from security lending) | | | | 330,540 |
| Total Income | | | | 54,682,893 |
| Expenses | | | | |
| Management fee | $ | 4,015,094 | | |
| Independent trustees' fees and expenses | | 6,738 | | |
| Interest | | 6,792 | | |
| Total expenses before reductions | | 4,028,624 | | |
| Expense reductions | | (328) | | |
| Total expenses after reductions | | | | 4,028,296 |
| Net Investment income (loss) | | | | 50,654,597 |
| Realized and Unrealized Gain (Loss) | | | | |
| Net realized gain (loss) on: | | | | |
| Investment Securities: | | | | |
| Unaffiliated issuers | | (21,424,138) | | |
| Redemptions in-kind | | 64,640,243 | | |
| Foreign currency transactions | | (295,558) | | |
| Futures contracts | | 66,001 | | |
| Total net realized gain (loss) | | | | 42,986,548 |
| Change in net unrealized appreciation (depreciation) on: | | | | |
| Investment Securities: | | | | |
| Unaffiliated issuers | | 77,519,102 | | |
| Assets and liabilities in foreign currencies | | (22,089) | | |
| Futures contracts | | (37,105) | | |
| Total change in net unrealized appreciation (depreciation) | | | | 77,459,908 |
| Net gain (loss) | | | | 120,446,456 |
| Net increase (decrease) in net assets resulting from operations | | | $ | 171,101,053 |
| Statement of Changes in Net Assets |
| |
| | Year ended July 31, 2023 | | Year ended July 31, 2022 |
| Increase (Decrease) in Net Assets | | | | |
| Operations | | | | |
| Net investment income (loss) | $ | 50,654,597 | $ | 34,784,807 |
| Net realized gain (loss) | | 42,986,548 | | 95,057,679 |
| Change in net unrealized appreciation (depreciation) | | 77,459,908 | | (104,029,877) |
| Net increase (decrease) in net assets resulting from operations | | 171,101,053 | | 25,812,609 |
| Distributions to shareholders | | (52,210,250) | | (36,931,550) |
| | | | | |
| Share transactions | | | | |
| Proceeds from sales of shares | | 615,856,682 | | 758,176,457 |
| Cost of shares redeemed | | (317,034,432) | | (521,124,909) |
| | | | | |
Net increase (decrease) in net assets resulting from share transactions | | 298,822,250 | | 237,051,548 |
| Total increase (decrease) in net assets | | 417,713,053 | | 225,932,607 |
| | | | | |
| Net Assets | | | | |
| Beginning of period | | 1,278,054,195 | | 1,052,121,588 |
| End of period | $ | 1,695,767,248 | $ | 1,278,054,195 |
| | | | | |
| Other Information | | | | |
| Shares | | | | |
| Sold | | 15,700,000 | | 19,000,000 |
| Redeemed | | (8,100,000) | | (13,400,000) |
| Net increase (decrease) | | 7,600,000 | | 5,600,000 |
| | | | | |
| Fidelity® High Dividend ETF |
| |
| Years ended July 31, | | 2023 | | 2022 | | 2021 | | 2020 | | 2019 |
Selected Per-Share Data | | | | | | | | | | |
| Net asset value, beginning of period | $ | 38.44 | $ | 38.05 | $ | 27.56 | $ | 30.12 | $ | 30.15 |
| Income from Investment Operations | | | | | | | | | | |
Net investment income (loss) A,B | | 1.39 | | 1.21 | | 1.02 | | 1.10 | | 1.23 |
| Net realized and unrealized gain (loss) | | 3.11 | | .44 C | | 10.48 | | (2.52) | | (.03) |
| Total from investment operations | | 4.50 | | 1.65 | | 11.50 | | (1.42) | | 1.20 |
| Distributions from net investment income | | (1.43) | | (1.26) | | (1.01) | | (1.14) | | (1.23) |
| Total distributions | | (1.43) | | (1.26) | | (1.01) | | (1.14) | | (1.23) |
| Net asset value, end of period | $ | 41.51 | $ | 38.44 | $ | 38.05 | $ | 27.56 | $ | 30.12 |
Total Return D,E | | 12.22% | | 4.43% | | 42.42% | | (4.54)% | | 4.16% |
Ratios to Average Net Assets B,F,G | | | | | | | | | | |
| Expenses before reductions | | .29% | | .29% | | .29% | | .29% | | .29% |
| Expenses net of fee waivers, if any | | .29% | | .29% | | .29% | | .29% | | .29% |
| Expenses net of all reductions | | .29% | | .29% | | .29% | | .29% | | .29% |
| Net investment income (loss) | | 3.66% | | 3.11% | | 3.04% | | 3.85% | | 4.15% |
| Supplemental Data | | | | | | | | | | |
| Net assets, end of period (000 omitted) | $ | 1,695,767 | $ | 1,278,054 | $ | 1,052,122 | $ | 520,795 | $ | 362,952 |
Portfolio turnover rate H,I | | 52% | | 38% | | 32% | | 49% | | 50% |
ACalculated based on average shares outstanding during the period.
BNet investment income (loss) is affected by the timing of the declaration of dividends by any underlying mutual funds or exchange-traded funds (ETFs). Net investment income (loss) of any mutual funds or ETFs is not included in the Fund's net investment income (loss) ratio.
CThe amount shown for a share outstanding does not correspond with the aggregate net gain (loss) on investments for the period due to the timing of sales and repurchases of shares in relation to fluctuating market values of the investments of the Fund.
DBased on net asset value.
ETotal returns would have been lower if certain expenses had not been reduced during the applicable periods shown.
FFees and expenses of any underlying mutual funds or exchange-traded funds (ETFs) are not included in the Fund's expense ratio. The Fund indirectly bears its proportionate share of these expenses. For additional expense information related to investments in Fidelity Central Funds, please refer to the "Investments in Fidelity Central Funds" note found in the Notes to Financial Statements section of the most recent Annual or Semi-Annual report.
GExpense ratios reflect operating expenses of the class. Expenses before reductions do not reflect amounts reimbursed, waived, or reduced through arrangements with the investment adviser, brokerage services, or other offset arrangements, if applicable, and do not represent the amount paid by the class during periods when reimbursements, waivers or reductions occur.
HPortfolio turnover rate excludes securities received or delivered in-kind.
IAmount does not include the portfolio activity of any underlying mutual funds or exchange-traded funds (ETFs).
NAV and closing market price average annual returns reflect the change in the value of an investment, assuming reinvestment of distributions from dividend income and capital gains (the profits earned upon the sale of securities that have grown in value, if any) at NAV and Market Price, respectively, and assumes a constant rate of performance each year. The hypothetical investment and the fund's returns do not reflect the deduction of taxes that a shareholder would pay on fund distributions or the redemption or selling of fund shares. How a fund did yesterday is no guarantee of how it will do tomorrow.
| Average Annual Total Returns |
| | | | |
Periods ended July 31, 2023 | Past 1 year | Past 5 years | Life of Fund |
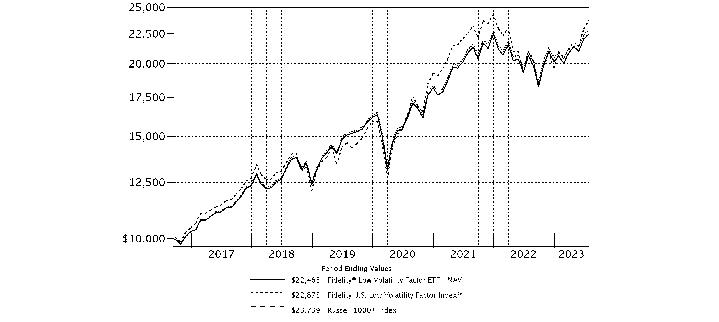
Fidelity® Low Volatility Factor ETF - NAV A | 8.96% | 11.22% | 12.47% |
Fidelity® Low Volatility Factor ETF - Market Price B | 9.11% | 11.21% | 12.63% |
Fidelity U.S. Low Volatility Factor Index℠ A | 9.27% | 11.47% | 12.77% |
Russell 1000® Index A | 12.95% | 11.92% | 13.38% |
A From September 12, 2016
B From September 15, 2016, date initially listed on the NYSE ARCA exchange.
| $10,000 Over Life of Fund |
| |
Let's say hypothetically that $10,000 was invested in Fidelity® Low Volatility Factor ETF - NAV, on September 12, 2016, when the fund started. The chart shows how the value of your investment would have changed, and also shows how the Fidelity U.S. Low Volatility Factor Index℠ and Russell 1000® Index performed over the same period. |
|
|
Fidelity® Low Volatility Factor ETF
Market Recap:
U.S. equities gained 13.02% for the 12 months ending July 31, 2023, according to the S&P 500® index, as continued global economic expansion, falling commodity prices and a slowing in the pace of inflation provided a favorable backdrop for higher-risk assets. Large-cap stocks spearheaded the rally, which was driven by the shares of a narrow set of mega-cap companies in the information technology and communication services sectors, largely due to exuberance related to generative artificial intelligence. Aggressive monetary tightening by the U.S. Federal Reserve continued amid consistent pressure on core inflation, a measure that excludes food and energy. Since March 2022, the Fed has hiked its benchmark interest rate 11 times. The latest bump came in late July, a fourth consecutive raise of a stepped down 25 basis points. The S&P 500® gained 3.21% in July, as a "soft landing" of the U.S. economy became the consensus view amid better-than-expected earnings, slowing inflation and easing financial conditions, bringing the index's year-to-date gain to 20.65%. July saw a continuance of the recent shift to wider market breadth and lower dispersion. For the full 12 months, value (+17%) handily topped growth (+8%) within the index. By sector, tech (+28%), communication services (+21%) and industrials (+17%) led, whereas real estate (-10%) lagged most, due to high borrowing costs, low home inventory and a deteriorating commercial property market.
Comments from Portfolio Manager Geode Capital Management, LLC, passive equity index team:
For the fiscal year ending July 31, 2023, the exchange-traded fund's (ETF) net asset value returned 8.96%, and its market price returned 9.11%, versus the 9.27% gain for the Fidelity U.S. Low Volatility Factor Index TR and the 12.95% return of the Russell 1000 Index. By sector, information technology gained roughly 16% and contributed most. Consumer discretionary stocks also helped (+25%), while industrials rose about 9%. In contrast, real estate returned about -13% and detracted most. This group was hampered by the equity real estate investment trusts (REITS) industry (-14%). Utilities (-9%) also hurt. Turning to individual stocks, the top contributor was Microsoft (+21%), from the software & services group. In technology hardware & equipment, Apple gained 15%, while Amazon.com, within the consumer discretionary distribution & retail category, gained 41% and lifted the fund. Conversely, the biggest individual detractor was Dollar General (-31%), from the consumer staples distribution & retail category. Other notable detractors were Verizon Communications (-21%), a stock in the telecommunication services group and Cable One (-44%), a stock in the media & entertainment category.
The views expressed above reflect those of the portfolio manager(s) only through the end of the period as stated on the cover of this report and do not necessarily represent the views of Fidelity or any other person in the Fidelity organization, or Geode Capital Management, LLC, (the ETF's subadviser) or any other person in the Geode organization. Any such views are subject to change at any time based upon market or other conditions and Fidelity and Geode disclaim any responsibility to update such views. These views may not be relied on as investment advice and, because investment decisions for a Fidelity fund are based on numerous factors, may not be relied on as an indication of trading intent on behalf of any Fidelity fund.
Fidelity® Low Volatility Factor ETF
Top Holdings (% of Fund's net assets) |
| |
| Apple, Inc. | 8.0 | |
| Microsoft Corp. | 6.9 | |
| Alphabet, Inc. Class A | 4.0 | |
| Amazon.com, Inc. | 3.4 | |
| UnitedHealth Group, Inc. | 1.7 | |
| Visa, Inc. Class A | 1.7 | |
| Eli Lilly & Co. | 1.7 | |
| Johnson & Johnson | 1.6 | |
| MasterCard, Inc. Class A | 1.6 | |
| Procter & Gamble Co. | 1.3 | |
| | 31.9 | |
| |
| Market Sectors (% of Fund's net assets) |
| |
| Information Technology | 21.1 | |
| Financials | 16.3 | |
| Health Care | 13.6 | |
| Industrials | 11.4 | |
| Consumer Discretionary | 10.3 | |
| Communication Services | 7.8 | |
| Consumer Staples | 6.3 | |
| Energy | 4.3 | |
| Real Estate | 3.2 | |
| Materials | 2.9 | |
| Utilities | 2.5 | |
| |
Asset Allocation (% of Fund's net assets) |
|
Futures - 0.2% |
|
Fidelity® Low Volatility Factor ETF
Showing Percentage of Net Assets
| Common Stocks - 99.7% |
| | | Shares | Value ($) |
| COMMUNICATION SERVICES - 7.8% | | | |
| Diversified Telecommunication Services - 1.2% | | | |
| AT&T, Inc. | | 191,386 | 2,778,925 |
| Verizon Communications, Inc. | | 102,616 | 3,497,153 |
| | | | 6,276,078 |
| Entertainment - 0.6% | | | |
| Activision Blizzard, Inc. | | 34,991 | 3,245,765 |
| Interactive Media & Services - 4.0% | | | |
| Alphabet, Inc. Class A (a) | | 167,757 | 22,264,709 |
| Media - 1.5% | | | |
| Comcast Corp. Class A | | 104,949 | 4,749,992 |
| Omnicom Group, Inc. | | 24,179 | 2,046,027 |
| TEGNA, Inc. | | 99,859 | 1,687,617 |
| | | | 8,483,636 |
| Wireless Telecommunication Services - 0.5% | | | |
| T-Mobile U.S., Inc. (a) | | 21,311 | 2,936,016 |
TOTAL COMMUNICATION SERVICES | | | 43,206,204 |
| CONSUMER DISCRETIONARY - 10.3% | | | |
| Broadline Retail - 3.4% | | | |
| Amazon.com, Inc. (a) | | 140,344 | 18,761,186 |
| Hotels, Restaurants & Leisure - 2.4% | | | |
| McDonald's Corp. | | 19,610 | 5,749,652 |
| Starbucks Corp. | | 39,125 | 3,973,926 |
| Yum! Brands, Inc. | | 24,126 | 3,321,426 |
| | | | 13,045,004 |
| Specialty Retail - 3.8% | | | |
| AutoZone, Inc. (a) | | 1,321 | 3,278,352 |
| O'Reilly Automotive, Inc. (a) | | 4,073 | 3,770,743 |
| The Home Depot, Inc. | | 21,214 | 7,082,082 |
| TJX Companies, Inc. | | 47,874 | 4,142,537 |
| Tractor Supply Co. | | 12,789 | 2,864,608 |
| | | | 21,138,322 |
| Textiles, Apparel & Luxury Goods - 0.7% | | | |
| NIKE, Inc. Class B | | 36,902 | 4,073,612 |
TOTAL CONSUMER DISCRETIONARY | | | 57,018,124 |
| CONSUMER STAPLES - 6.3% | | | |
| Beverages - 2.1% | | | |
| PepsiCo, Inc. | | 31,443 | 5,894,305 |
| The Coca-Cola Co. | | 88,757 | 5,496,721 |
| | | | 11,391,026 |
| Consumer Staples Distribution & Retail - 0.4% | | | |
| Dollar General Corp. | | 14,289 | 2,412,841 |
| Food Products - 1.4% | | | |
| General Mills, Inc. | | 37,518 | 2,804,095 |
| Hormel Foods Corp. | | 53,512 | 2,187,571 |
| The Hershey Co. | | 11,551 | 2,671,862 |
| | | | 7,663,528 |
| Household Products - 2.4% | | | |
| Colgate-Palmolive Co. | | 41,583 | 3,171,120 |
| Kimberly-Clark Corp. | | 21,762 | 2,809,474 |
| Procter & Gamble Co. | | 47,131 | 7,366,575 |
| | | | 13,347,169 |
TOTAL CONSUMER STAPLES | | | 34,814,564 |
| ENERGY - 4.3% | | | |
| Oil, Gas & Consumable Fuels - 4.3% | | | |
| Chevron Corp. | | 29,568 | 4,839,099 |
| ConocoPhillips Co. | | 25,686 | 3,023,756 |
| Coterra Energy, Inc. | | 51,977 | 1,431,447 |
| DT Midstream, Inc. | | 19,988 | 1,069,758 |
| EOG Resources, Inc. | | 15,994 | 2,119,685 |
| Exxon Mobil Corp. | | 63,617 | 6,822,287 |
| Kinder Morgan, Inc. | | 81,830 | 1,449,209 |
| Pioneer Natural Resources Co. | | 7,808 | 1,762,031 |
| The Williams Companies, Inc. | | 47,995 | 1,653,428 |
| | | | 24,170,700 |
| FINANCIALS - 16.3% | | | |
| Banks - 0.6% | | | |
| Commerce Bancshares, Inc. | | 58,889 | 3,131,717 |
| Capital Markets - 2.7% | | | |
| Cboe Global Markets, Inc. | | 33,340 | 4,656,931 |
| CME Group, Inc. | | 26,675 | 5,307,258 |
| Intercontinental Exchange, Inc. | | 42,997 | 4,936,056 |
| | | | 14,900,245 |
| Financial Services - 5.1% | | | |
| Fiserv, Inc. (a) | | 47,347 | 5,975,665 |
| Jack Henry & Associates, Inc. | | 23,939 | 4,011,458 |
| MasterCard, Inc. Class A | | 22,388 | 8,827,141 |
| Visa, Inc. Class A | | 39,848 | 9,473,065 |
| | | | 28,287,329 |
| Insurance - 7.9% | | | |
| Allstate Corp. | | 32,760 | 3,691,397 |
| Arthur J. Gallagher & Co. | | 22,606 | 4,855,769 |
| Assurant, Inc. | | 29,587 | 3,979,747 |
| Brown & Brown, Inc. | | 68,890 | 4,853,301 |
| Chubb Ltd. | | 23,840 | 4,873,134 |
| Erie Indemnity Co. Class A | | 16,156 | 3,585,986 |
| Marsh & McLennan Companies, Inc. | | 28,559 | 5,381,087 |
| Progressive Corp. | | 36,316 | 4,575,090 |
| The Travelers Companies, Inc. | | 24,326 | 4,198,911 |
| W.R. Berkley Corp. | | 60,650 | 3,741,499 |
| | | | 43,735,921 |
TOTAL FINANCIALS | | | 90,055,212 |
| HEALTH CARE - 13.6% | | | |
| Biotechnology - 3.0% | | | |
| AbbVie, Inc. | | 45,334 | 6,781,060 |
| Amgen, Inc. | | 19,962 | 4,674,102 |
| Vertex Pharmaceuticals, Inc. (a) | | 13,872 | 4,887,660 |
| | | | 16,342,822 |
| Health Care Equipment & Supplies - 1.7% | | | |
| Abbott Laboratories | | 51,390 | 5,721,249 |
| ResMed, Inc. | | 15,987 | 3,554,709 |
| | | | 9,275,958 |
| Health Care Providers & Services - 1.7% | | | |
| UnitedHealth Group, Inc. | | 19,098 | 9,670,654 |
| Life Sciences Tools & Services - 1.0% | | | |
| Thermo Fisher Scientific, Inc. | | 10,602 | 5,816,893 |
| Pharmaceuticals - 6.2% | | | |
| Bristol-Myers Squibb Co. | | 71,833 | 4,467,294 |
| Eli Lilly & Co. | | 20,042 | 9,110,091 |
| Johnson & Johnson | | 53,754 | 9,005,408 |
| Merck & Co., Inc. | | 64,253 | 6,852,582 |
| Zoetis, Inc. Class A | | 24,777 | 4,660,306 |
| | | | 34,095,681 |
TOTAL HEALTH CARE | | | 75,202,008 |
| INDUSTRIALS - 11.4% | | | |
| Aerospace & Defense - 2.2% | | | |
| General Dynamics Corp. | | 12,676 | 2,834,100 |
| L3Harris Technologies, Inc. | | 13,104 | 2,483,077 |
| Lockheed Martin Corp. | | 7,990 | 3,566,496 |
| Northrop Grumman Corp. | | 7,004 | 3,116,780 |
| | | | 12,000,453 |
| Commercial Services & Supplies - 1.1% | | | |
| Republic Services, Inc. | | 21,037 | 3,178,901 |
| Waste Management, Inc. | | 19,868 | 3,254,180 |
| | | | 6,433,081 |
| Ground Transportation - 0.8% | | | |
| Union Pacific Corp. | | 18,638 | 4,324,389 |
| Industrial Conglomerates - 1.2% | | | |
| 3M Co. | | 25,965 | 2,895,098 |
| Honeywell International, Inc. | | 19,704 | 3,825,138 |
| | | | 6,720,236 |
| Machinery - 1.7% | | | |
| Illinois Tool Works, Inc. | | 12,653 | 3,331,788 |
| Otis Worldwide Corp. | | 32,278 | 2,936,007 |
| PACCAR, Inc. | | 37,067 | 3,192,581 |
| | | | 9,460,376 |
| Professional Services - 4.4% | | | |
| Automatic Data Processing, Inc. | | 23,784 | 5,880,832 |
| Booz Allen Hamilton Holding Corp. Class A | | 25,267 | 3,059,328 |
| FTI Consulting, Inc. (a)(b) | | 14,399 | 2,522,129 |
| Maximus, Inc. | | 56,438 | 4,727,247 |
| Paychex, Inc. | | 38,997 | 4,892,954 |
| Verisk Analytics, Inc. | | 14,071 | 3,221,415 |
| | | | 24,303,905 |
TOTAL INDUSTRIALS | | | 63,242,440 |
| INFORMATION TECHNOLOGY - 21.1% | | | |
| Communications Equipment - 1.3% | | | |
| Cisco Systems, Inc. | | 139,211 | 7,244,540 |
| IT Services - 1.6% | | | |
| Akamai Technologies, Inc. (a) | | 48,005 | 4,536,473 |
| Amdocs Ltd. | | 46,087 | 4,315,587 |
| | | | 8,852,060 |
| Semiconductors & Semiconductor Equipment - 2.4% | | | |
| Intel Corp. | | 193,352 | 6,916,201 |
| Texas Instruments, Inc. | | 34,677 | 6,241,860 |
| | | | 13,158,061 |
| Software - 7.8% | | | |
| Microsoft Corp. | | 114,257 | 38,381,211 |
| Tyler Technologies, Inc. (a) | | 12,691 | 5,033,631 |
| | | | 43,414,842 |
| Technology Hardware, Storage & Peripherals - 8.0% | | | |
| Apple, Inc. | | 225,213 | 44,243,088 |
TOTAL INFORMATION TECHNOLOGY | | | 116,912,591 |
| MATERIALS - 2.9% | | | |
| Chemicals - 1.8% | | | |
| Air Products & Chemicals, Inc. | | 5,768 | 1,761,143 |
| Balchem Corp. | | 6,432 | 866,648 |
| Ecolab, Inc. | | 8,540 | 1,564,016 |
| FMC Corp. | | 8,184 | 787,546 |
| Linde PLC | | 9,054 | 3,537,126 |
| Sherwin-Williams Co. | | 6,535 | 1,806,928 |
| | | | 10,323,407 |
| Construction Materials - 0.5% | | | |
| Martin Marietta Materials, Inc. | | 3,087 | 1,378,222 |
| Vulcan Materials Co. | | 6,230 | 1,373,715 |
| | | | 2,751,937 |
| Containers & Packaging - 0.4% | | | |
| Aptargroup, Inc. | | 8,017 | 973,745 |
| Packaging Corp. of America | | 7,007 | 1,074,523 |
| | | | 2,048,268 |
| Metals & Mining - 0.2% | | | |
| Newmont Corp. | | 26,489 | 1,136,908 |
TOTAL MATERIALS | | | 16,260,520 |
| REAL ESTATE - 3.2% | | | |
| Equity Real Estate Investment Trusts (REITs) - 2.7% | | | |
| Agree Realty Corp. | | 13,208 | 855,614 |
| American Tower Corp. | | 10,102 | 1,922,512 |
| Crown Castle International Corp. | | 11,613 | 1,257,572 |
| CubeSmart | | 22,147 | 960,294 |
| Equinix, Inc. | | 2,416 | 1,956,767 |
| Equity Lifestyle Properties, Inc. | | 14,550 | 1,035,669 |
| Essex Property Trust, Inc. | | 4,651 | 1,132,751 |
| Extra Space Storage, Inc. | | 7,215 | 1,006,998 |
| Mid-America Apartment Communities, Inc. | | 6,690 | 1,001,225 |
| Public Storage | | 4,974 | 1,401,425 |
| Realty Income Corp. | | 21,534 | 1,312,928 |
| Sun Communities, Inc. | | 7,152 | 931,906 |
| | | | 14,775,661 |
| Real Estate Management & Development - 0.5% | | | |
| CoStar Group, Inc. (a) | | 33,435 | 2,807,537 |
TOTAL REAL ESTATE | | | 17,583,198 |
| UTILITIES - 2.5% | | | |
| Electric Utilities - 1.5% | | | |
| American Electric Power Co., Inc. | | 18,016 | 1,526,676 |
| Duke Energy Corp. | | 20,574 | 1,926,138 |
| Eversource Energy | | 17,332 | 1,253,624 |
| Southern Co. | | 29,849 | 2,159,277 |
| Xcel Energy, Inc. | | 22,492 | 1,410,923 |
| | | | 8,276,638 |
| Multi-Utilities - 1.0% | | | |
| Ameren Corp. | | 15,658 | 1,341,421 |
| CMS Energy Corp. | | 20,499 | 1,251,874 |
| Consolidated Edison, Inc. (b) | | 15,845 | 1,503,057 |
| WEC Energy Group, Inc. | | 15,352 | 1,379,531 |
| | | | 5,475,883 |
TOTAL UTILITIES | | | 13,752,521 |
| TOTAL COMMON STOCKS (Cost $503,837,258) | | | 552,218,082 |
| | | | |
| Money Market Funds - 0.8% |
| | | Shares | Value ($) |
| Fidelity Cash Central Fund 5.32% (c) | | 909,559 | 909,740 |
| Fidelity Securities Lending Cash Central Fund 5.32% (c)(d) | | 3,428,106 | 3,428,449 |
| TOTAL MONEY MARKET FUNDS (Cost $4,338,189) | | | 4,338,189 |
| | | | |
| TOTAL INVESTMENT IN SECURITIES - 100.5% (Cost $508,175,447) | 556,556,271 |
NET OTHER ASSETS (LIABILITIES) - (0.5)% | (2,951,538) |
| NET ASSETS - 100.0% | 553,604,733 |
| | |
| Futures Contracts |
| | Number of contracts | Expiration Date | Notional Amount ($) | Value ($) | Unrealized Appreciation/ (Depreciation) ($) |
| Purchased | | | | | |
| | | | | | |
| Equity Index Contracts | | | | | |
| CME Micro E-mini S&P 500 Index Contracts (United States) | 50 | Sep 2023 | 1,153,625 | 72,421 | 72,421 |
| | | | | | |
| The notional amount of futures purchased as a percentage of Net Assets is 0.2% |
Legend
| (b) | Security or a portion of the security is on loan at period end. |
| (c) | Affiliated fund that is generally available only to investment companies and other accounts managed by Fidelity Investments. The rate quoted is the annualized seven-day yield of the fund at period end. A complete unaudited listing of the fund's holdings as of its most recent quarter end is available upon request. In addition, each Fidelity Central Fund's financial statements, which are not covered by the Fund's Report of Independent Registered Public Accounting Firm, are available on the SEC's website or upon request. |
| (d) | Investment made with cash collateral received from securities on loan. |
Affiliated Central Funds
Fiscal year to date information regarding the Fund's investments in Fidelity Central Funds, including the ownership percentage, is presented below.
| Affiliate | Value, beginning of period ($) | Purchases ($) | Sales Proceeds ($) | Dividend Income ($) | Realized Gain (loss) ($) | Change in Unrealized appreciation (depreciation) ($) | Value, end of period ($) | % ownership, end of period |
| Fidelity Cash Central Fund 5.32% | 1,126,798 | 14,495,936 | 14,712,994 | 34,067 | - | - | 909,740 | 0.0% |
| Fidelity Securities Lending Cash Central Fund 5.32% | 1,748,660 | 29,274,831 | 27,595,042 | 8,042 | - | - | 3,428,449 | 0.0% |
| Total | 2,875,458 | 43,770,767 | 42,308,036 | 42,109 | - | - | 4,338,189 | |
| | | | | | | | | |
Amounts in the dividend income column in the above table include any capital gain distributions from underlying funds, which are presented in the corresponding line item in the Statement of Operations, if applicable.
Amounts in the dividend income column for Fidelity Securities Lending Cash Central Fund represents the income earned on investing cash collateral, less rebates paid to borrowers and any lending agent fees associated with the loan, plus any premium payments received for lending certain types of securities.
Amounts included in the purchases and sales proceeds columns may include in-kind transactions, if applicable.
Investment Valuation
The following is a summary of the inputs used, as of July 31, 2023, involving the Fund's assets and liabilities carried at fair value. The inputs or methodology used for valuing securities may not be an indication of the risk associated with investing in those securities. For more information on valuation inputs, and their aggregation into the levels used below, please refer to the Investment Valuation section in the accompanying Notes to Financial Statements.
| Valuation Inputs at Reporting Date: |
| Description | Total ($) | Level 1 ($) | Level 2 ($) | Level 3 ($) |
Investments in Securities: | | | | |
|
| Equities: | | | | |
Communication Services | 43,206,204 | 43,206,204 | - | - |
Consumer Discretionary | 57,018,124 | 57,018,124 | - | - |
Consumer Staples | 34,814,564 | 34,814,564 | - | - |
Energy | 24,170,700 | 24,170,700 | - | - |
Financials | 90,055,212 | 90,055,212 | - | - |
Health Care | 75,202,008 | 75,202,008 | - | - |
Industrials | 63,242,440 | 63,242,440 | - | - |
Information Technology | 116,912,591 | 116,912,591 | - | - |
Materials | 16,260,520 | 16,260,520 | - | - |
Real Estate | 17,583,198 | 17,583,198 | - | - |
Utilities | 13,752,521 | 13,752,521 | - | - |
|
| Money Market Funds | 4,338,189 | 4,338,189 | - | - |
| Total Investments in Securities: | 556,556,271 | 556,556,271 | - | - |
Derivative Instruments: | | | | |
|
| Assets | | | | |
Futures Contracts | 72,421 | 72,421 | - | - |
| Total Assets | 72,421 | 72,421 | - | - |
| Total Derivative Instruments: | 72,421 | 72,421 | - | - |
Value of Derivative Instruments
The following table is a summary of the Fund's value of derivative instruments by primary risk exposure as of July 31, 2023. For additional information on derivative instruments, please refer to the Derivative Instruments section in the accompanying Notes to Financial Statements.
Primary Risk Exposure / Derivative Type | Value |
| Asset ($) | Liability ($) |
| Equity Risk | | |
Futures Contracts (a) | 72,421 | 0 |
| Total Equity Risk | 72,421 | 0 |
| Total Value of Derivatives | 72,421 | 0 |
(a)Reflects gross cumulative appreciation (depreciation) on futures contracts as presented in the Schedule of Investments. In the Statement of Assets and Liabilities, the period end daily variation margin is included in receivable or payable for daily variation margin on futures contracts, and the net cumulative appreciation (depreciation) is included in Total accumulated earnings (loss).
Fidelity® Low Volatility Factor ETF
| Statement of Assets and Liabilities |
| | | | July 31, 2023 |
| | | | | |
| Assets | | | | |
| Investment in securities, at value (including securities loaned of $3,327,026) - See accompanying schedule: | | | | |
Unaffiliated issuers (cost $503,837,258) | $ | 552,218,082 | | |
Fidelity Central Funds (cost $4,338,189) | | 4,338,189 | | |
| | | | | |
| | | | | |
| Total Investment in Securities (cost $508,175,447) | | | $ | 556,556,271 |
| Segregated cash with brokers for derivative instruments | | | | 56,000 |
| Cash | | | | 45,224 |
| Dividends receivable | | | | 501,501 |
| Distributions receivable from Fidelity Central Funds | | | | 3,848 |
| Receivable for daily variation margin on futures contracts | | | | 2,000 |
Total assets | | | | 557,164,844 |
| Liabilities | | | | |
| Accrued management fee | $ | 131,686 | | |
| Collateral on securities loaned | | 3,428,425 | | |
| Total Liabilities | | | | 3,560,111 |
| Net Assets | | | $ | 553,604,733 |
| Net Assets consist of: | | | | |
| Paid in capital | | | $ | 545,183,306 |
| Total accumulated earnings (loss) | | | | 8,421,427 |
| Net Assets | | | $ | 553,604,733 |
Net Asset Value, offering price and redemption price per share ($553,604,733 ÷ 10,850,000 shares) | | | $ | 51.02 |
| Statement of Operations |
| | | | Year ended July 31, 2023 |
| Investment Income | | | | |
| Dividends | | | $ | 8,867,661 |
| Income from Fidelity Central Funds (including $8,042 from security lending) | | | | 42,109 |
| Total Income | | | | 8,909,770 |
| Expenses | | | | |
| Management fee | $ | 1,389,867 | | |
| Independent trustees' fees and expenses | | 2,393 | | |
| Total expenses before reductions | | 1,392,260 | | |
| Expense reductions | | (270) | | |
| Total expenses after reductions | | | | 1,391,990 |
| Net Investment income (loss) | | | | 7,517,780 |
| Realized and Unrealized Gain (Loss) | | | | |
| Net realized gain (loss) on: | | | | |
| Investment Securities: | | | | |
| Unaffiliated issuers | | (7,333,706) | | |
| Redemptions in-kind | | 8,225,322 | | |
| Futures contracts | | 145,567 | | |
| Total net realized gain (loss) | | | | 1,037,183 |
| Change in net unrealized appreciation (depreciation) on: | | | | |
| Investment Securities: | | | | |
| Unaffiliated issuers | | 36,488,563 | | |
| Futures contracts | | (42,574) | | |
| Total change in net unrealized appreciation (depreciation) | | | | 36,445,989 |
| Net gain (loss) | | | | 37,483,172 |
| Net increase (decrease) in net assets resulting from operations | | | $ | 45,000,952 |
| Statement of Changes in Net Assets |
| |
| | Year ended July 31, 2023 | | Year ended July 31, 2022 |
| Increase (Decrease) in Net Assets | | | | |
| Operations | | | | |
| Net investment income (loss) | $ | 7,517,780 | $ | 6,029,946 |
| Net realized gain (loss) | | 1,037,183 | | 57,400,773 |
| Change in net unrealized appreciation (depreciation) | | 36,445,989 | | (66,352,118) |
| Net increase (decrease) in net assets resulting from operations | | 45,000,952 | | (2,921,399) |
| Distributions to shareholders | | (7,460,700) | | (5,937,600) |
| | | | | |
| Share transactions | | | | |
| Proceeds from sales of shares | | 126,351,905 | | 286,611,056 |
| Cost of shares redeemed | | (55,150,184) | | (344,785,919) |
| | | | | |
Net increase (decrease) in net assets resulting from share transactions | | 71,201,721 | | (58,174,863) |
| Total increase (decrease) in net assets | | 108,741,973 | | (67,033,862) |
| | | | | |
| Net Assets | | | | |
| Beginning of period | | 444,862,760 | | 511,896,622 |
| End of period | $ | 553,604,733 | $ | 444,862,760 |
| | | | | |
| Other Information | | | | |
| Shares | | | | |
| Sold | | 2,700,000 | | 5,950,000 |
| Redeemed | | (1,200,000) | | (7,100,000) |
| Net increase (decrease) | | 1,500,000 | | (1,150,000) |
| | | | | |
| Fidelity® Low Volatility Factor ETF |
| |
| Years ended July 31, | | 2023 | | 2022 | | 2021 | | 2020 | | 2019 |
Selected Per-Share Data | | | | | | | | | | |
| Net asset value, beginning of period | $ | 47.58 | $ | 48.75 | $ | 38.33 | $ | 36.37 | $ | 32.40 |
| Income from Investment Operations | | | | | | | | | | |
Net investment income (loss) A,B | | .74 | | .62 | | .56 | | .62 | | .62 |
| Net realized and unrealized gain (loss) | | 3.44 | | (1.17) | | 10.43 | | 1.95 | | 3.92 |
| Total from investment operations | | 4.18 | | (.55) | | 10.99 | | 2.57 | | 4.54 |
| Distributions from net investment income | | (.74) | | (.62) | | (.57) | | (.61) | | (.57) |
| Total distributions | | (.74) | | (.62) | | (.57) | | (.61) | | (.57) |
| Net asset value, end of period | $ | 51.02 | $ | 47.58 | $ | 48.75 | $ | 38.33 | $ | 36.37 |
Total Return C,D | | 8.96% | | (1.12)% | | 28.90% | | 7.29% | | 14.20% |
Ratios to Average Net Assets B,E,F | | | | | | | | | | |
| Expenses before reductions | | .29% | | .29% | | .29% | | .29% | | .29% |
| Expenses net of fee waivers, if any | | .29% | | .29% | | .29% | | .29% | | .29% |
| Expenses net of all reductions | | .29% | | .29% | | .29% | | .29% | | .29% |
| Net investment income (loss) | | 1.57% | | 1.27% | | 1.31% | | 1.69% | | 1.83% |
| Supplemental Data | | | | | | | | | | |
| Net assets, end of period (000 omitted) | $ | 553,605 | $ | 444,863 | $ | 511,897 | $ | 350,708 | $ | 245,502 |
Portfolio turnover rate G,H | | 46% | | 28% | | 46% | | 31% | | 36% |
ACalculated based on average shares outstanding during the period.
BNet investment income (loss) is affected by the timing of the declaration of dividends by any underlying mutual funds or exchange-traded funds (ETFs). Net investment income (loss) of any mutual funds or ETFs is not included in the Fund's net investment income (loss) ratio.
CTotal returns would have been lower if certain expenses had not been reduced during the applicable periods shown.
DBased on net asset value.
EFees and expenses of any underlying mutual funds or exchange-traded funds (ETFs) are not included in the Fund's expense ratio. The Fund indirectly bears its proportionate share of these expenses. For additional expense information related to investments in Fidelity Central Funds, please refer to the "Investments in Fidelity Central Funds" note found in the Notes to Financial Statements section of the most recent Annual or Semi-Annual report.
FExpense ratios reflect operating expenses of the class. Expenses before reductions do not reflect amounts reimbursed, waived, or reduced through arrangements with the investment adviser, brokerage services, or other offset arrangements, if applicable, and do not represent the amount paid by the class during periods when reimbursements, waivers or reductions occur.
GAmount does not include the portfolio activity of any underlying mutual funds or exchange-traded funds (ETFs).
HPortfolio turnover rate excludes securities received or delivered in-kind.
NAV and closing market price average annual returns reflect the change in the value of an investment, assuming reinvestment of distributions from dividend income and capital gains (the profits earned upon the sale of securities that have grown in value, if any) at NAV and Market Price, respectively, and assumes a constant rate of performance each year. The hypothetical investment and the fund's returns do not reflect the deduction of taxes that a shareholder would pay on fund distributions or the redemption or selling of fund shares. How a fund did yesterday is no guarantee of how it will do tomorrow.
| Average Annual Total Returns |
| | | | |
Periods ended July 31, 2023 | Past 1 year | Past 5 years | Life of Fund |
Fidelity® Momentum Factor ETF - NAV A | 9.02% | 9.12% | 11.34% |
Fidelity® Momentum Factor ETF - Market Price B | 8.81% | 9.07% | 11.43% |
Fidelity U.S. Momentum Factor Index℠ A | 9.34% | 9.44% | 11.68% |
Russell 1000® Index A | 12.95% | 11.92% | 13.38% |
A From September 12, 2016
B From September 15, 2016, date initially listed on the NYSE ARCA exchange.
| $10,000 Over Life of Fund |
| |
Let's say hypothetically that $10,000 was invested in Fidelity® Momentum Factor ETF - NAV, on September 12, 2016, when the fund started. The chart shows how the value of your investment would have changed, and also shows how the Fidelity U.S. Momentum Factor Index℠ and Russell 1000® Index performed over the same period. |
|
|
Fidelity® Momentum Factor ETF
Market Recap:
U.S. equities gained 13.02% for the 12 months ending July 31, 2023, according to the S&P 500® index, as continued global economic expansion, falling commodity prices and a slowing in the pace of inflation provided a favorable backdrop for higher-risk assets. Large-cap stocks spearheaded the rally, which was driven by the shares of a narrow set of mega-cap companies in the information technology and communication services sectors, largely due to exuberance related to generative artificial intelligence. Aggressive monetary tightening by the U.S. Federal Reserve continued amid consistent pressure on core inflation, a measure that excludes food and energy. Since March 2022, the Fed has hiked its benchmark interest rate 11 times. The latest bump came in late July, a fourth consecutive raise of a stepped down 25 basis points. The S&P 500® gained 3.21% in July, as a "soft landing" of the U.S. economy became the consensus view amid better-than-expected earnings, slowing inflation and easing financial conditions, bringing the index's year-to-date gain to 20.65%. July saw a continuance of the recent shift to wider market breadth and lower dispersion. For the full 12 months, value (+17%) handily topped growth (+8%) within the index. By sector, tech (+28%), communication services (+21%) and industrials (+17%) led, whereas real estate (-10%) lagged most, due to high borrowing costs, low home inventory and a deteriorating commercial property market.
Comments from the Geode Capital Management, LLC, passive equity index team:
For the fiscal year ending July 31, 2023, the exchange-traded fund's (ETF) net asset value returned 9.02%, and its market price returned 8.81%, versus the 9.34% gain for the Fidelity U.S. Momentum Factor Index TR and the 12.95% for the Russell 1000 Index. By sector, information technology gained roughly 23% and contributed most. Financials stocks also helped, gaining 14%. The communication services sector rose about 17%. Conversely, consumer discretionary returned approximately -10% and detracted most. Health care (-2%) also hurt. Other detractors were the utilities (-8%) sector and the real estate (-3%) sector, especially the equity real estate investment trusts (REITS) industry (-4%). Turning to individual stocks, the biggest contributor was Apple (+22%), from the technology hardware & equipment industry. Also in technology hardware & equipment, Super Micro Computer (+113%) helped. Nvidia (+47%), from the semiconductors & semiconductor equipment category, also boosted the fund. In contrast, the biggest individual detractor was Amazon.com (-28%), from the consumer discretionary distribution & retail industry. Tesla, within the automobiles & components category, returned -30% and hurt the fund. Another notable detractor was Rogers (-62%), a stock in the technology hardware & equipment group.
The views expressed above reflect those of the portfolio manager(s) only through the end of the period as stated on the cover of this report and do not necessarily represent the views of Fidelity or any other person in the Fidelity organization, or Geode Capital Management, LLC, (the ETF's subadviser) or any other person in the Geode organization. Any such views are subject to change at any time based upon market or other conditions and Fidelity and Geode disclaim any responsibility to update such views. These views may not be relied on as investment advice and, because investment decisions for a Fidelity fund are based on numerous factors, may not be relied on as an indication of trading intent on behalf of any Fidelity fund.
Fidelity® Momentum Factor ETF
Top Holdings (% of Fund's net assets) |
| |
| Apple, Inc. | 7.7 | |
| Microsoft Corp. | 6.6 | |
| Alphabet, Inc. Class A | 3.9 | |
| NVIDIA Corp. | 3.7 | |
| Meta Platforms, Inc. Class A | 2.1 | |
| Berkshire Hathaway, Inc. Class B | 2.0 | |
| Eli Lilly & Co. | 1.8 | |
| Broadcom, Inc. | 1.8 | |
| JPMorgan Chase & Co. | 1.6 | |
| Super Micro Computer, Inc. | 1.4 | |
| | 32.6 | |
| |
| Market Sectors (% of Fund's net assets) |
| |
| Information Technology | 28.5 | |
| Financials | 12.7 | |
| Health Care | 11.9 | |
| Industrials | 9.6 | |
| Consumer Discretionary | 9.5 | |
| Communication Services | 8.7 | |
| Consumer Staples | 6.2 | |
| Energy | 4.5 | |
| Materials | 2.9 | |
| Real Estate | 2.7 | |
| Utilities | 2.6 | |
| |
Asset Allocation (% of Fund's net assets) |
|
Futures - 0.2% |
|
Fidelity® Momentum Factor ETF
Showing Percentage of Net Assets
| Common Stocks - 99.8% |
| | | Shares | Value ($) |
| COMMUNICATION SERVICES - 8.7% | | | |
| Diversified Telecommunication Services - 0.3% | | | |
| Iridium Communications, Inc. | | 7,859 | 412,990 |
| Entertainment - 1.6% | | | |
| Atlanta Braves Holdings, Inc. | | 231 | 9,406 |
| Liberty Media Corp. Liberty Formula One Series C (a) | | 7,995 | 580,437 |
| Netflix, Inc. (a) | | 3,110 | 1,365,197 |
| World Wrestling Entertainment, Inc. Class A (b) | | 4,670 | 490,350 |
| | | | 2,445,390 |
| Interactive Media & Services - 6.0% | | | |
| Alphabet, Inc. Class A (a) | | 45,373 | 6,021,905 |
| Meta Platforms, Inc. Class A (a) | | 10,170 | 3,240,162 |
| | | | 9,262,067 |
| Media - 0.8% | | | |
| Comcast Corp. Class A | | 27,198 | 1,230,981 |
TOTAL COMMUNICATION SERVICES | | | 13,351,428 |
| CONSUMER DISCRETIONARY - 9.5% | | | |
| Hotels, Restaurants & Leisure - 4.4% | | | |
| Booking Holdings, Inc. (a) | | 537 | 1,595,320 |
| Las Vegas Sands Corp. | | 17,904 | 1,070,838 |
| McDonald's Corp. | | 6,168 | 1,808,458 |
| Starbucks Corp. | | 14,041 | 1,426,144 |
| Wingstop, Inc. | | 5,074 | 855,375 |
| | | | 6,756,135 |
| Household Durables - 1.7% | | | |
| D.R. Horton, Inc. | | 10,753 | 1,365,846 |
| Lennar Corp. Class A | | 10,146 | 1,286,817 |
| | | | 2,652,663 |
| Specialty Retail - 2.6% | | | |
| AutoZone, Inc. (a) | | 456 | 1,131,664 |
| O'Reilly Automotive, Inc. (a) | | 1,332 | 1,233,152 |
| TJX Companies, Inc. | | 17,594 | 1,522,409 |
| | | | 3,887,225 |
| Textiles, Apparel & Luxury Goods - 0.8% | | | |
| Deckers Outdoor Corp. (a) | | 2,249 | 1,222,759 |
TOTAL CONSUMER DISCRETIONARY | | | 14,518,782 |
| CONSUMER STAPLES - 6.2% | | | |
| Beverages - 2.2% | | | |
| Monster Beverage Corp. | | 11,053 | 635,437 |
| PepsiCo, Inc. | | 7,505 | 1,406,887 |
| The Coca-Cola Co. | | 21,725 | 1,345,429 |
| | | | 3,387,753 |
| Consumer Staples Distribution & Retail - 0.9% | | | |
| Walmart, Inc. | | 8,302 | 1,327,158 |
| Food Products - 1.5% | | | |
| General Mills, Inc. | | 7,503 | 560,774 |
| Lamb Weston Holdings, Inc. | | 4,827 | 500,222 |
| Lancaster Colony Corp. | | 2,294 | 441,893 |
| Mondelez International, Inc. | | 11,168 | 827,884 |
| | | | 2,330,773 |
| Household Products - 1.2% | | | |
| Procter & Gamble Co. | | 11,695 | 1,827,929 |
| Personal Care Products - 0.4% | | | |
| elf Beauty, Inc. (a) | | 5,532 | 645,695 |
TOTAL CONSUMER STAPLES | | | 9,519,308 |
| ENERGY - 4.5% | | | |
| Energy Equipment & Services - 0.9% | | | |
| Schlumberger Ltd. | | 10,717 | 625,230 |
| TechnipFMC PLC | | 20,350 | 373,219 |
| Weatherford International PLC (a) | | 4,466 | 371,125 |
| | | | 1,369,574 |
| Oil, Gas & Consumable Fuels - 3.6% | | | |
| Chevron Corp. | | 8,095 | 1,324,828 |
| ConocoPhillips Co. | | 7,031 | 827,689 |
| Exxon Mobil Corp. | | 17,396 | 1,865,547 |
| Hess Corp. | | 2,917 | 442,596 |
| Marathon Petroleum Corp. | | 4,030 | 536,071 |
| Phillips 66 Co. | | 4,402 | 491,043 |
| | | | 5,487,774 |
TOTAL ENERGY | | | 6,857,348 |
| FINANCIALS - 12.7% | | | |
| Banks - 1.6% | | | |
| JPMorgan Chase & Co. | | 15,769 | 2,490,871 |
| Capital Markets - 2.8% | | | |
| Goldman Sachs Group, Inc. | | 3,346 | 1,190,741 |
| Interactive Brokers Group, Inc. | | 9,863 | 861,336 |
| Morgan Stanley | | 12,975 | 1,187,991 |
| MSCI, Inc. | | 1,760 | 964,621 |
| | | | 4,204,689 |
| Financial Services - 5.3% | | | |
| Berkshire Hathaway, Inc. Class B (a) | | 8,700 | 3,062,052 |
| Fiserv, Inc. (a) | | 8,072 | 1,018,767 |
| MasterCard, Inc. Class A | | 4,884 | 1,925,664 |
| Visa, Inc. Class A | | 8,940 | 2,125,306 |
| | | | 8,131,789 |
| Insurance - 3.0% | | | |
| Aon PLC | | 2,863 | 911,866 |
| Arch Capital Group Ltd. (a) | | 10,642 | 826,777 |
| Arthur J. Gallagher & Co. | | 3,988 | 856,622 |
| Marsh & McLennan Companies, Inc. | | 5,629 | 1,060,616 |
| Progressive Corp. | | 7,510 | 946,110 |
| | | | 4,601,991 |
TOTAL FINANCIALS | | | 19,429,340 |
| HEALTH CARE - 11.9% | | | |
| Biotechnology - 3.6% | | | |
| Biogen, Inc. (a) | | 4,663 | 1,259,896 |
| Gilead Sciences, Inc. | | 21,075 | 1,604,651 |
| Regeneron Pharmaceuticals, Inc. (a) | | 2,113 | 1,567,656 |
| Sarepta Therapeutics, Inc. (a) | | 10,285 | 1,114,791 |
| | | | 5,546,994 |
| Health Care Equipment & Supplies - 3.1% | | | |
| Boston Scientific Corp. (a) | | 30,206 | 1,566,181 |
| DexCom, Inc. (a) | | 12,458 | 1,551,768 |
| Stryker Corp. | | 5,789 | 1,640,660 |
| | | | 4,758,609 |
| Health Care Providers & Services - 2.0% | | | |
| Cardinal Health, Inc. | | 16,988 | 1,553,892 |
| HCA Holdings, Inc. | | 5,447 | 1,485,996 |
| | | | 3,039,888 |
| Pharmaceuticals - 3.2% | | | |
| Eli Lilly & Co. | | 5,909 | 2,685,936 |
| Merck & Co., Inc. | | 20,315 | 2,166,595 |
| | | | 4,852,531 |
TOTAL HEALTH CARE | | | 18,198,022 |
| INDUSTRIALS - 9.6% | | | |
| Aerospace & Defense - 2.5% | | | |
| Axon Enterprise, Inc. (a) | | 3,050 | 567,087 |
| Lockheed Martin Corp. | | 2,189 | 977,104 |
| Raytheon Technologies Corp. | | 11,756 | 1,033,705 |
| The Boeing Co. (a) | | 5,172 | 1,235,332 |
| | | | 3,813,228 |
| Building Products - 0.6% | | | |
| Trane Technologies PLC | | 4,327 | 862,977 |
| Commercial Services & Supplies - 1.0% | | | |
| Clean Harbors, Inc. (a) | | 4,682 | 778,429 |
| Copart, Inc. (a) | | 9,417 | 832,369 |
| | | | 1,610,798 |
| Construction & Engineering - 0.5% | | | |
| Quanta Services, Inc. | | 4,237 | 854,264 |
| Electrical Equipment - 1.3% | | | |
| Eaton Corp. PLC | | 5,100 | 1,047,132 |
| Rockwell Automation, Inc. | | 2,619 | 880,744 |
| | | | 1,927,876 |
| Industrial Conglomerates - 0.8% | | | |
| General Electric Co. | | 10,164 | 1,161,135 |
| Machinery - 2.4% | | | |
| Deere & Co. | | 2,632 | 1,130,707 |
| Illinois Tool Works, Inc. | | 3,718 | 979,024 |
| PACCAR, Inc. | | 10,556 | 909,188 |
| Toro Co. | | 6,331 | 643,546 |
| | | | 3,662,465 |
| Trading Companies & Distributors - 0.5% | | | |
| W.W. Grainger, Inc. | | 1,084 | 800,523 |
TOTAL INDUSTRIALS | | | 14,693,266 |
| INFORMATION TECHNOLOGY - 28.5% | | | |
| Communications Equipment - 1.5% | | | |
| Arista Networks, Inc. (a) | | 7,462 | 1,157,282 |
| Motorola Solutions, Inc. | | 3,667 | 1,051,072 |
| | | | 2,208,354 |
| Semiconductors & Semiconductor Equipment - 8.6% | | | |
| Analog Devices, Inc. | | 6,747 | 1,346,229 |
| Broadcom, Inc. | | 2,982 | 2,679,774 |
| First Solar, Inc. (a) | | 5,535 | 1,147,959 |
| Lattice Semiconductor Corp. (a) | | 11,387 | 1,035,534 |
| NVIDIA Corp. | | 12,209 | 5,705,144 |
| Rambus, Inc. (a) | | 19,386 | 1,213,757 |
| | | | 13,128,397 |
| Software - 9.3% | | | |
| Cadence Design Systems, Inc. (a) | | 5,331 | 1,247,507 |
| Fair Isaac Corp. (a) | | 1,297 | 1,086,847 |
| Microsoft Corp. | | 30,105 | 10,112,872 |
| Oracle Corp. | | 14,961 | 1,753,878 |
| | | | 14,201,104 |
| Technology Hardware, Storage & Peripherals - 9.1% | | | |
| Apple, Inc. | | 59,697 | 11,727,477 |
| Super Micro Computer, Inc. (a) | | 6,678 | 2,205,543 |
| | | | 13,933,020 |
TOTAL INFORMATION TECHNOLOGY | | | 43,470,875 |
| MATERIALS - 2.9% | | | |
| Chemicals - 1.6% | | | |
| Air Products & Chemicals, Inc. | | 1,476 | 450,667 |
| Corteva, Inc. | | 6,004 | 338,806 |
| DuPont de Nemours, Inc. | | 4,692 | 364,240 |
| Linde PLC | | 2,336 | 912,605 |
| PPG Industries, Inc. | | 2,286 | 328,955 |
| | | | 2,395,273 |
| Metals & Mining - 1.3% | | | |
| ATI, Inc. (a) | | 5,941 | 283,267 |
| Commercial Metals Co. | | 4,939 | 282,610 |
| Freeport-McMoRan, Inc. | | 10,712 | 478,291 |
| Nucor Corp. | | 2,307 | 397,012 |
| Reliance Steel & Aluminum Co. | | 1,021 | 299,010 |
| Steel Dynamics, Inc. | | 2,616 | 278,813 |
| | | | 2,019,003 |
TOTAL MATERIALS | | | 4,414,276 |
| REAL ESTATE - 2.7% | | | |
| Equity Real Estate Investment Trusts (REITs) - 2.5% | | | |
| American Tower Corp. | | 2,662 | 506,605 |
| Americold Realty Trust | | 7,379 | 239,227 |
| Equinix, Inc. | | 594 | 481,092 |
| Gaming & Leisure Properties | | 4,635 | 219,977 |
| Iron Mountain, Inc. | | 4,418 | 271,265 |
| Prologis (REIT), Inc. | | 4,868 | 607,283 |
| Public Storage | | 1,221 | 344,017 |
| Realty Income Corp. | | 5,307 | 323,568 |
| Simon Property Group, Inc. | | 2,926 | 364,580 |
| VICI Properties, Inc. | | 9,430 | 296,856 |
| WP Carey, Inc. | | 3,355 | 226,563 |
| | | | 3,881,033 |
| Real Estate Management & Development - 0.2% | | | |
| Zillow Group, Inc. Class C (a) | | 4,810 | 260,510 |
TOTAL REAL ESTATE | | | 4,141,543 |
| UTILITIES - 2.6% | | | |
| Electric Utilities - 1.3% | | | |
| Constellation Energy Corp. | | 5,057 | 488,759 |
| NextEra Energy, Inc. | | 11,280 | 826,824 |
| PG&E Corp. (a) | | 23,487 | 413,606 |
| PNM Resources, Inc. | | 6,660 | 298,501 |
| | | | 2,027,690 |
| Gas Utilities - 0.2% | | | |
| New Jersey Resources Corp. | | 6,288 | 281,074 |
| Independent Power and Renewable Electricity Producers - 0.2% | | | |
| The AES Corp. | | 15,942 | 344,825 |
| Multi-Utilities - 0.6% | | | |
| Consolidated Edison, Inc. (b) | | 4,377 | 415,202 |
| Sempra Energy | | 3,126 | 465,837 |
| | | | 881,039 |
| Water Utilities - 0.3% | | | |
| American Water Works Co., Inc. | | 2,758 | 406,612 |
TOTAL UTILITIES | | | 3,941,240 |
| TOTAL COMMON STOCKS (Cost $132,445,827) | | | 152,535,428 |
| | | | |
| Money Market Funds - 0.6% |
| | | Shares | Value ($) |
| Fidelity Cash Central Fund 5.32% (c) | | 267,644 | 267,697 |
| Fidelity Securities Lending Cash Central Fund 5.32% (c)(d) | | 632,637 | 632,700 |
| TOTAL MONEY MARKET FUNDS (Cost $900,397) | | | 900,397 |
| | | | |
| TOTAL INVESTMENT IN SECURITIES - 100.4% (Cost $133,346,224) | 153,435,825 |
NET OTHER ASSETS (LIABILITIES) - (0.4)% | (605,010) |
| NET ASSETS - 100.0% | 152,830,815 |
| | |
| Futures Contracts |
| | Number of contracts | Expiration Date | Notional Amount ($) | Value ($) | Unrealized Appreciation/ (Depreciation) ($) |
| Purchased | | | | | |
| | | | | | |
| Equity Index Contracts | | | | | |
| CME Micro E-mini S&P 500 Index Contracts (United States) | 12 | Sep 2023 | 276,870 | 14,984 | 14,984 |
| | | | | | |
| The notional amount of futures purchased as a percentage of Net Assets is 0.2% |
Legend
| (b) | Security or a portion of the security is on loan at period end. |
| (c) | Affiliated fund that is generally available only to investment companies and other accounts managed by Fidelity Investments. The rate quoted is the annualized seven-day yield of the fund at period end. A complete unaudited listing of the fund's holdings as of its most recent quarter end is available upon request. In addition, each Fidelity Central Fund's financial statements, which are not covered by the Fund's Report of Independent Registered Public Accounting Firm, are available on the SEC's website or upon request. |
| (d) | Investment made with cash collateral received from securities on loan. |
Affiliated Central Funds
Fiscal year to date information regarding the Fund's investments in Fidelity Central Funds, including the ownership percentage, is presented below.
| Affiliate | Value, beginning of period ($) | Purchases ($) | Sales Proceeds ($) | Dividend Income ($) | Realized Gain (loss) ($) | Change in Unrealized appreciation (depreciation) ($) | Value, end of period ($) | % ownership, end of period |
| Fidelity Cash Central Fund 5.32% | 180,280 | 5,140,550 | 5,053,133 | 10,750 | - | - | 267,697 | 0.0% |
| Fidelity Securities Lending Cash Central Fund 5.32% | 1,004,850 | 9,007,233 | 9,379,383 | 1,346 | - | - | 632,700 | 0.0% |
| Total | 1,185,130 | 14,147,783 | 14,432,516 | 12,096 | - | - | 900,397 | |
| | | | | | | | | |
Amounts in the dividend income column in the above table include any capital gain distributions from underlying funds, which are presented in the corresponding line item in the Statement of Operations, if applicable.
Amounts in the dividend income column for Fidelity Securities Lending Cash Central Fund represents the income earned on investing cash collateral, less rebates paid to borrowers and any lending agent fees associated with the loan, plus any premium payments received for lending certain types of securities.
Amounts included in the purchases and sales proceeds columns may include in-kind transactions, if applicable.
Investment Valuation
The following is a summary of the inputs used, as of July 31, 2023, involving the Fund's assets and liabilities carried at fair value. The inputs or methodology used for valuing securities may not be an indication of the risk associated with investing in those securities. For more information on valuation inputs, and their aggregation into the levels used below, please refer to the Investment Valuation section in the accompanying Notes to Financial Statements.
| Valuation Inputs at Reporting Date: |
| Description | Total ($) | Level 1 ($) | Level 2 ($) | Level 3 ($) |
Investments in Securities: | | | | |
|
| Equities: | | | | |
Communication Services | 13,351,428 | 13,351,428 | - | - |
Consumer Discretionary | 14,518,782 | 14,518,782 | - | - |
Consumer Staples | 9,519,308 | 9,519,308 | - | - |
Energy | 6,857,348 | 6,857,348 | - | - |
Financials | 19,429,340 | 19,429,340 | - | - |
Health Care | 18,198,022 | 18,198,022 | - | - |
Industrials | 14,693,266 | 14,693,266 | - | - |
Information Technology | 43,470,875 | 43,470,875 | - | - |
Materials | 4,414,276 | 4,414,276 | - | - |
Real Estate | 4,141,543 | 4,141,543 | - | - |
Utilities | 3,941,240 | 3,941,240 | - | - |
|
| Money Market Funds | 900,397 | 900,397 | - | - |
| Total Investments in Securities: | 153,435,825 | 153,435,825 | - | - |
Derivative Instruments: | | | | |
|
| Assets | | | | |
Futures Contracts | 14,984 | 14,984 | - | - |
| Total Assets | 14,984 | 14,984 | - | - |
| Total Derivative Instruments: | 14,984 | 14,984 | - | - |
Value of Derivative Instruments
The following table is a summary of the Fund's value of derivative instruments by primary risk exposure as of July 31, 2023. For additional information on derivative instruments, please refer to the Derivative Instruments section in the accompanying Notes to Financial Statements.
Primary Risk Exposure / Derivative Type | Value |
| Asset ($) | Liability ($) |
| Equity Risk | | |
Futures Contracts (a) | 14,984 | 0 |
| Total Equity Risk | 14,984 | 0 |
| Total Value of Derivatives | 14,984 | 0 |
(a)Reflects gross cumulative appreciation (depreciation) on futures contracts as presented in the Schedule of Investments. In the Statement of Assets and Liabilities, the period end daily variation margin is included in receivable or payable for daily variation margin on futures contracts, and the net cumulative appreciation (depreciation) is included in Total accumulated earnings (loss).
Fidelity® Momentum Factor ETF
| Statement of Assets and Liabilities |
| | | | July 31, 2023 |
| | | | | |
| Assets | | | | |
| Investment in securities, at value (including securities loaned of $613,776) - See accompanying schedule: | | | | |
Unaffiliated issuers (cost $132,445,827) | $ | 152,535,428 | | |
Fidelity Central Funds (cost $900,397) | | 900,397 | | |
| | | | | |
| | | | | |
| Total Investment in Securities (cost $133,346,224) | | | $ | 153,435,825 |
| Segregated cash with brokers for derivative instruments | | | | 13,440 |
| Dividends receivable | | | | 49,344 |
| Distributions receivable from Fidelity Central Funds | | | | 899 |
| Receivable for daily variation margin on futures contracts | | | | 480 |
Total assets | | | | 153,499,988 |
| Liabilities | | | | |
| Accrued management fee | $ | 36,473 | | |
| Collateral on securities loaned | | 632,700 | | |
| Total Liabilities | | | | 669,173 |
| Net Assets | | | $ | 152,830,815 |
| Net Assets consist of: | | | | |
| Paid in capital | | | $ | 165,302,152 |
| Total accumulated earnings (loss) | | | | (12,471,337) |
| Net Assets | | | $ | 152,830,815 |
Net Asset Value, offering price and redemption price per share ($152,830,815 ÷ 3,100,000 shares) | | | $ | 49.30 |
| Statement of Operations |
| | | | Year ended July 31, 2023 |
| Investment Income | | | | |
| Dividends | | | $ | 1,809,469 |
| Income from Fidelity Central Funds (including $1,346 from security lending) | | | | 12,096 |
| Total Income | | | | 1,821,565 |
| Expenses | | | | |
| Management fee | $ | 357,227 | | |
| Independent trustees' fees and expenses | | 606 | | |
| Total expenses before reductions | | 357,833 | | |
| Expense reductions | | (609) | | |
| Total expenses after reductions | | | | 357,224 |
| Net Investment income (loss) | | | | 1,464,341 |
| Realized and Unrealized Gain (Loss) | | | | |
| Net realized gain (loss) on: | | | | |
| Investment Securities: | | | | |
| Unaffiliated issuers | | (6,064,059) | | |
| Redemptions in-kind | | 3,256,474 | | |
| Futures contracts | | 14,499 | | |
| Total net realized gain (loss) | | | | (2,793,086) |
| Change in net unrealized appreciation (depreciation) on: | | | | |
| Investment Securities: | | | | |
| Unaffiliated issuers | | 13,282,846 | | |
| Futures contracts | | (2,634) | | |
| Total change in net unrealized appreciation (depreciation) | | | | 13,280,212 |
| Net gain (loss) | | | | 10,487,126 |
| Net increase (decrease) in net assets resulting from operations | | | $ | 11,951,467 |
| Statement of Changes in Net Assets |
| |
| | Year ended July 31, 2023 | | Year ended July 31, 2022 |
| Increase (Decrease) in Net Assets | | | | |
| Operations | | | | |
| Net investment income (loss) | $ | 1,464,341 | $ | 1,047,146 |
| Net realized gain (loss) | | (2,793,086) | | 9,388,516 |
| Change in net unrealized appreciation (depreciation) | | 13,280,212 | | (18,448,115) |
| Net increase (decrease) in net assets resulting from operations | | 11,951,467 | | (8,012,453) |
| Distributions to shareholders | | (1,506,200) | | (999,550) |
| | | | | |
| Share transactions | | | | |
| Proceeds from sales of shares | | 52,044,612 | | 86,253,555 |
| Cost of shares redeemed | | (26,407,433) | | (117,256,850) |
| | | | | |
Net increase (decrease) in net assets resulting from share transactions | | 25,637,179 | | (31,003,295) |
| Total increase (decrease) in net assets | | 36,082,446 | | (40,015,298) |
| | | | | |
| Net Assets | | | | |
| Beginning of period | | 116,748,369 | | 156,763,667 |
| End of period | $ | 152,830,815 | $ | 116,748,369 |
| | | | | |
| Other Information | | | | |
| Shares | | | | |
| Sold | | 1,150,000 | | 1,700,000 |
| Redeemed | | (600,000) | | (2,300,000) |
| Net increase (decrease) | | 550,000 | | (600,000) |
| | | | | |
| Fidelity® Momentum Factor ETF |
| |
| Years ended July 31, | | 2023 | | 2022 | | 2021 | | 2020 | | 2019 |
Selected Per-Share Data | | | | | | | | | | |
| Net asset value, beginning of period | $ | 45.78 | $ | 49.77 | $ | 39.26 | $ | 35.80 | $ | 33.58 |
| Income from Investment Operations | | | | | | | | | | |
Net investment income (loss) A,B | | .53 | | .43 | | .25 | | .42 | | .40 |
| Net realized and unrealized gain (loss) | | 3.53 | | (4.01) | | 10.54 | | 3.47 | | 2.22 |
| Total from investment operations | | 4.06 | | (3.58) | | 10.79 | | 3.89 | | 2.62 |
| Distributions from net investment income | | (.54) | | (.41) | | (.28) | | (.43) | | (.40) |
| Total distributions | | (.54) | | (.41) | | (.28) | | (.43) | | (.40) |
| Net asset value, end of period | $ | 49.30 | $ | 45.78 | $ | 49.77 | $ | 39.26 | $ | 35.80 |
Total Return C,D | | 9.02% | | (7.20)% | | 27.58% | | 11.06% | | 7.91% |
Ratios to Average Net Assets B,E,F | | | | | | | | | | |
| Expenses before reductions | | .29% | | .29% | | .29% | | .29% | | .29% |
| Expenses net of fee waivers, if any | | .29% | | .29% | | .29% | | .29% | | .29% |
| Expenses net of all reductions | | .29% | | .29% | | .29% | | .29% | | .29% |
| Net investment income (loss) | | 1.19% | | .88% | | .55% | | 1.18% | | 1.18% |
| Supplemental Data | | | | | | | | | | |
| Net assets, end of period (000 omitted) | $ | 152,831 | $ | 116,748 | $ | 156,764 | $ | 88,329 | $ | 121,736 |
Portfolio turnover rate G,H | | 137% | | 123% | | 128% | | 138% | | 133% |
ACalculated based on average shares outstanding during the period.
BNet investment income (loss) is affected by the timing of the declaration of dividends by any underlying mutual funds or exchange-traded funds (ETFs). Net investment income (loss) of any mutual funds or ETFs is not included in the Fund's net investment income (loss) ratio.
CBased on net asset value.
DTotal returns would have been lower if certain expenses had not been reduced during the applicable periods shown.
EFees and expenses of any underlying mutual funds or exchange-traded funds (ETFs) are not included in the Fund's expense ratio. The Fund indirectly bears its proportionate share of these expenses. For additional expense information related to investments in Fidelity Central Funds, please refer to the "Investments in Fidelity Central Funds" note found in the Notes to Financial Statements section of the most recent Annual or Semi-Annual report.
FExpense ratios reflect operating expenses of the class. Expenses before reductions do not reflect amounts reimbursed, waived, or reduced through arrangements with the investment adviser, brokerage services, or other offset arrangements, if applicable, and do not represent the amount paid by the class during periods when reimbursements, waivers or reductions occur.
GAmount does not include the portfolio activity of any underlying mutual funds or exchange-traded funds (ETFs).
HPortfolio turnover rate excludes securities received or delivered in-kind.
NAV and closing market price average annual returns reflect the change in the value of an investment, assuming reinvestment of distributions from dividend income and capital gains (the profits earned upon the sale of securities that have grown in value, if any) at NAV and Market Price, respectively, and assumes a constant rate of performance each year. The hypothetical investment and the fund's returns do not reflect the deduction of taxes that a shareholder would pay on fund distributions or the redemption or selling of fund shares. How a fund did yesterday is no guarantee of how it will do tomorrow.
| Average Annual Total Returns |
| | | | |
Periods ended July 31, 2023 | Past 1 year | Past 5 years | Life of Fund |
Fidelity® Quality Factor ETF - NAV A | 10.46% | 11.06% | 12.82% |
Fidelity® Quality Factor ETF - Market Price B | 10.22% | 11.03% | 12.86% |
Fidelity U.S. Quality Factor Index℠ A | 10.75% | 11.37% | 13.15% |
Russell 1000® Index A | 12.95% | 11.92% | 13.38% |
A From September 12, 2016
B From September 15, 2016, date initially listed on the NYSE ARCA exchange.
| $10,000 Over Life of Fund |
| |
Let's say hypothetically that $10,000 was invested in Fidelity® Quality Factor ETF - NAV, on September 12, 2016, when the fund started. The chart shows how the value of your investment would have changed, and also shows how the Fidelity U.S. Quality Factor Index℠ and Russell 1000® Index performed over the same period. |
|
|
Fidelity® Quality Factor ETF
Market Recap:
U.S. equities gained 13.02% for the 12 months ending July 31, 2023, according to the S&P 500® index, as continued global economic expansion, falling commodity prices and a slowing in the pace of inflation provided a favorable backdrop for higher-risk assets. Large-cap stocks spearheaded the rally, which was driven by the shares of a narrow set of mega-cap companies in the information technology and communication services sectors, largely due to exuberance related to generative artificial intelligence. Aggressive monetary tightening by the U.S. Federal Reserve continued amid consistent pressure on core inflation, a measure that excludes food and energy. Since March 2022, the Fed has hiked its benchmark interest rate 11 times. The latest bump came in late July, a fourth consecutive raise of a stepped down 25 basis points. The S&P 500® gained 3.21% in July, as a "soft landing" of the U.S. economy became the consensus view amid better-than-expected earnings, slowing inflation and easing financial conditions, bringing the index's year-to-date gain to 20.65%. July saw a continuance of the recent shift to wider market breadth and lower dispersion. For the full 12 months, value (+17%) handily topped growth (+8%) within the index. By sector, tech (+28%), communication services (+21%) and industrials (+17%) led, whereas real estate (-10%) lagged most, due to high borrowing costs, low home inventory and a deteriorating commercial property market.
Comments from the Geode Capital Management, LLC, passive equity index team:
For the fiscal year ending July 31, 2023, the exchange-traded fund's (ETF) net asset value returned 10.46%, and its market price returned 10.22%, versus the 10.75% advance for the Fidelity U.S. Quality Factor Index TR and 12.95% return for the Russell 1000 Index. By sector, information technology gained approximately 27% and contributed most. Industrials stocks also helped (+17%). Communication services rose about 19%, consumer discretionary gained 12%, and materials advanced approximately 22%. In contrast, health care returned roughly -8% and detracted most. Utilities (-9%) and real estate (-8%) also hurt. Turning to individual stocks, the top contributor was Apple (+22%), from the technology hardware & equipment category. Microsoft, within the software & services group, gained 21% and lifted the fund. In media & entertainment, Meta Platforms (+100%) and Alphabet (+14%) helped. Conversely, the biggest individual detractor was Pfizer (-26%), from the pharmaceuticals, biotechnology & life sciences group. Also in pharmaceuticals, biotechnology & life sciences, Moderna (-37%) and Royalty Pharma (-28%) hurt. Lastly, in banks, Signature Bank (-34%) and Western Alliance Bancorp (-30%) detracted.
The views expressed above reflect those of the portfolio manager(s) only through the end of the period as stated on the cover of this report and do not necessarily represent the views of Fidelity or any other person in the Fidelity organization, or Geode Capital Management, LLC, (the ETF's subadviser) or any other person in the Geode organization. Any such views are subject to change at any time based upon market or other conditions and Fidelity and Geode disclaim any responsibility to update such views. These views may not be relied on as investment advice and, because investment decisions for a Fidelity fund are based on numerous factors, may not be relied on as an indication of trading intent on behalf of any Fidelity fund.
Fidelity® Quality Factor ETF
Top Holdings (% of Fund's net assets) |
| |
| Apple, Inc. | 7.8 | |
| Microsoft Corp. | 6.7 | |
| Alphabet, Inc. Class A | 3.9 | |
| Tesla, Inc. | 2.5 | |
| Meta Platforms, Inc. Class A | 2.1 | |
| Broadcom, Inc. | 1.8 | |
| UnitedHealth Group, Inc. | 1.8 | |
| Johnson & Johnson | 1.7 | |
| Visa, Inc. Class A | 1.6 | |
| Adobe, Inc. | 1.5 | |
| | 31.4 | |
| |
| Market Sectors (% of Fund's net assets) |
| |
| Information Technology | 26.2 | |
| Financials | 13.7 | |
| Health Care | 12.2 | |
| Consumer Discretionary | 11.5 | |
| Industrials | 9.8 | |
| Communication Services | 8.6 | |
| Consumer Staples | 5.7 | |
| Energy | 4.3 | |
| Materials | 2.8 | |
| Real Estate | 2.5 | |
| Utilities | 2.5 | |
| |
Asset Allocation (% of Fund's net assets) |
|
Futures - 0.2% |
|
Fidelity® Quality Factor ETF
Showing Percentage of Net Assets
| Common Stocks - 99.8% |
| | | Shares | Value ($) |
| COMMUNICATION SERVICES - 8.6% | | | |
| Diversified Telecommunication Services - 1.2% | | | |
| AT&T, Inc. | | 95,753 | 1,390,334 |
| Liberty Global PLC Class A (a) | | 41,288 | 766,718 |
| Verizon Communications, Inc. | | 52,144 | 1,777,068 |
| | | | 3,934,120 |
| Entertainment - 0.4% | | | |
| Activision Blizzard, Inc. | | 16,253 | 1,507,628 |
| Interactive Media & Services - 6.0% | | | |
| Alphabet, Inc. Class A (a) | | 94,750 | 12,575,220 |
| Meta Platforms, Inc. Class A (a) | | 21,691 | 6,910,753 |
| | | | 19,485,973 |
| Media - 1.0% | | | |
| Comcast Corp. Class A | | 53,387 | 2,416,296 |
| Nexstar Broadcasting Group, Inc. Class A | | 4,196 | 783,477 |
| | | | 3,199,773 |
TOTAL COMMUNICATION SERVICES | | | 28,127,494 |
| CONSUMER DISCRETIONARY - 11.5% | | | |
| Automobiles - 2.5% | | | |
| Tesla, Inc. (a) | | 30,589 | 8,180,416 |
| Hotels, Restaurants & Leisure - 4.4% | | | |
| Airbnb, Inc. Class A (a) | | 18,869 | 2,871,673 |
| Booking Holdings, Inc. (a) | | 1,061 | 3,152,019 |
| Domino's Pizza, Inc. | | 5,469 | 2,169,771 |
| McDonald's Corp. | | 12,748 | 3,737,714 |
| Yum! Brands, Inc. | | 16,780 | 2,310,103 |
| | | | 14,241,280 |
| Specialty Retail - 3.8% | | | |
| AutoZone, Inc. (a) | | 912 | 2,263,329 |
| Lowe's Companies, Inc. | | 13,228 | 3,098,924 |
| O'Reilly Automotive, Inc. (a) | | 2,806 | 2,597,767 |
| The Home Depot, Inc. | | 13,385 | 4,468,448 |
| | | | 12,428,468 |
| Textiles, Apparel & Luxury Goods - 0.8% | | | |
| NIKE, Inc. Class B | | 24,202 | 2,671,659 |
TOTAL CONSUMER DISCRETIONARY | | | 37,521,823 |
| CONSUMER STAPLES - 5.7% | | | |
| Beverages - 1.5% | | | |
| Brown-Forman Corp. Class B (non-vtg.) | | 21,554 | 1,521,712 |
| The Coca-Cola Co. | | 52,255 | 3,236,152 |
| | | | 4,757,864 |
| Food Products - 0.5% | | | |
| The Hershey Co. | | 6,872 | 1,589,562 |
| Household Products - 2.4% | | | |
| Colgate-Palmolive Co. | | 24,684 | 1,882,402 |
| Kimberly-Clark Corp. | | 12,936 | 1,670,038 |
| Procter & Gamble Co. | | 27,686 | 4,327,322 |
| | | | 7,879,762 |
| Tobacco - 1.3% | | | |
| Altria Group, Inc. | | 42,449 | 1,928,034 |
| Philip Morris International, Inc. | | 24,926 | 2,485,621 |
| | | | 4,413,655 |
TOTAL CONSUMER STAPLES | | | 18,640,843 |
| ENERGY - 4.3% | | | |
| Oil, Gas & Consumable Fuels - 4.3% | | | |
| APA Corp. | | 17,522 | 709,466 |
| Chevron Corp. | | 17,455 | 2,856,685 |
| ConocoPhillips Co. | | 15,315 | 1,802,882 |
| Coterra Energy, Inc. | | 31,837 | 876,791 |
| EOG Resources, Inc. | | 9,626 | 1,275,734 |
| Exxon Mobil Corp. | | 37,407 | 4,011,527 |
| Marathon Oil Corp. | | 29,220 | 767,609 |
| Occidental Petroleum Corp. | | 15,793 | 997,012 |
| Texas Pacific Land Corp. | | 377 | 567,875 |
| | | | 13,865,581 |
| FINANCIALS - 13.7% | | | |
| Banks - 2.4% | | | |
| Comerica, Inc. | | 32,257 | 1,740,588 |
| East West Bancorp, Inc. | | 30,752 | 1,913,082 |
| Popular, Inc. | | 33,675 | 2,443,121 |
| Western Alliance Bancorp. | | 29,888 | 1,552,682 |
| | | | 7,649,473 |
| Capital Markets - 3.5% | | | |
| Ameriprise Financial, Inc. | | 7,549 | 2,630,449 |
| Blackstone, Inc. | | 28,796 | 3,017,533 |
| CME Group, Inc. | | 16,064 | 3,196,093 |
| MSCI, Inc. | | 4,732 | 2,593,515 |
| | | | 11,437,590 |
| Consumer Finance - 0.7% | | | |
| Discover Financial Services | | 21,944 | 2,316,189 |
| Financial Services - 3.9% | | | |
| Essent Group Ltd. | | 53,660 | 2,661,536 |
| MasterCard, Inc. Class A | | 12,252 | 4,830,719 |
| Visa, Inc. Class A | | 21,922 | 5,211,517 |
| | | | 12,703,772 |
| Insurance - 3.2% | | | |
| Aon PLC | | 8,836 | 2,814,266 |
| Kinsale Capital Group, Inc. | | 8,436 | 3,143,507 |
| Principal Financial Group, Inc. | | 26,954 | 2,152,816 |
| RLI Corp. | | 18,276 | 2,438,201 |
| | | | 10,548,790 |
TOTAL FINANCIALS | | | 44,655,814 |
| HEALTH CARE - 12.2% | | | |
| Biotechnology - 4.6% | | | |
| AbbVie, Inc. | | 28,599 | 4,277,838 |
| Amgen, Inc. | | 12,916 | 3,024,281 |
| Moderna, Inc. (a) | | 14,861 | 1,748,545 |
| Regeneron Pharmaceuticals, Inc. (a) | | 3,715 | 2,756,196 |
| Vertex Pharmaceuticals, Inc. (a) | | 9,128 | 3,216,160 |
| | | | 15,023,020 |
| Health Care Providers & Services - 1.8% | | | |
| UnitedHealth Group, Inc. | | 11,799 | 5,974,660 |
| Life Sciences Tools & Services - 1.2% | | | |
| Mettler-Toledo International, Inc. (a) | | 1,543 | 1,940,276 |
| Waters Corp. (a) | | 6,770 | 1,869,942 |
| | | | 3,810,218 |
| Pharmaceuticals - 4.6% | | | |
| Johnson & Johnson | | 33,227 | 5,566,519 |
| Merck & Co., Inc. | | 40,495 | 4,318,792 |
| Pfizer, Inc. | | 92,172 | 3,323,722 |
| Royalty Pharma PLC | | 58,724 | 1,842,759 |
| | | | 15,051,792 |
TOTAL HEALTH CARE | | | 39,859,690 |
| INDUSTRIALS - 9.8% | | | |
| Aerospace & Defense - 0.6% | | | |
| Lockheed Martin Corp. | | 4,617 | 2,060,890 |
| Air Freight & Logistics - 1.2% | | | |
| Expeditors International of Washington, Inc. | | 12,088 | 1,538,802 |
| United Parcel Service, Inc. Class B | | 12,362 | 2,313,301 |
| | | | 3,852,103 |
| Commercial Services & Supplies - 1.1% | | | |
| Cintas Corp. | | 3,567 | 1,790,777 |
| Copart, Inc. (a) | | 21,813 | 1,928,051 |
| | | | 3,718,828 |
| Electrical Equipment - 0.5% | | | |
| Atkore, Inc. (a) | | 9,470 | 1,502,605 |
| Ground Transportation - 2.8% | | | |
| CSX Corp. | | 55,743 | 1,857,357 |
| Landstar System, Inc. | | 7,311 | 1,488,446 |
| Norfolk Southern Corp. | | 6,847 | 1,599,391 |
| Old Dominion Freight Lines, Inc. | | 4,173 | 1,750,532 |
| Union Pacific Corp. | | 10,779 | 2,500,944 |
| | | | 9,196,670 |
| Industrial Conglomerates - 0.7% | | | |
| Honeywell International, Inc. | | 11,398 | 2,212,694 |
| Machinery - 0.6% | | | |
| Illinois Tool Works, Inc. | | 7,304 | 1,923,289 |
| Professional Services - 1.3% | | | |
| Paychex, Inc. | | 20,270 | 2,543,277 |
| Verisk Analytics, Inc. | | 8,107 | 1,856,017 |
| | | | 4,399,294 |
| Trading Companies & Distributors - 1.0% | | | |
| Fastenal Co. | | 27,756 | 1,626,779 |
| W.W. Grainger, Inc. | | 2,258 | 1,667,510 |
| | | | 3,294,289 |
TOTAL INDUSTRIALS | | | 32,160,662 |
| INFORMATION TECHNOLOGY - 26.2% | | | |
| Communications Equipment - 1.2% | | | |
| Cisco Systems, Inc. | | 75,095 | 3,907,944 |
| IT Services - 1.2% | | | |
| Accenture PLC Class A | | 12,144 | 3,841,754 |
| Semiconductors & Semiconductor Equipment - 6.0% | | | |
| Applied Materials, Inc. | | 23,891 | 3,621,637 |
| Broadcom, Inc. | | 6,657 | 5,982,313 |
| KLA Corp. | | 6,272 | 3,223,494 |
| Lam Research Corp. | | 5,016 | 3,603,946 |
| Texas Instruments, Inc. | | 18,599 | 3,347,820 |
| | | | 19,779,210 |
| Software - 10.0% | | | |
| Adobe, Inc. (a) | | 9,047 | 4,941,200 |
| Cadence Design Systems, Inc. (a) | | 13,453 | 3,148,137 |
| Fair Isaac Corp. (a) | | 3,301 | 2,766,139 |
| Microsoft Corp. | | 65,428 | 21,978,574 |
| | | | 32,834,050 |
| Technology Hardware, Storage & Peripherals - 7.8% | | | |
| Apple, Inc. | | 129,208 | 25,382,905 |
TOTAL INFORMATION TECHNOLOGY | | | 85,745,863 |
| MATERIALS - 2.8% | | | |
| Chemicals - 1.6% | | | |
| CF Industries Holdings, Inc. | | 7,559 | 620,443 |
| Dow, Inc. | | 14,009 | 791,088 |
| Linde PLC | | 5,352 | 2,090,866 |
| LyondellBasell Industries NV Class A | | 7,292 | 720,887 |
| Olin Corp. | | 9,142 | 527,311 |
| The Mosaic Co. | | 12,734 | 519,038 |
| | | | 5,269,633 |
| Construction Materials - 0.2% | | | |
| Eagle Materials, Inc. | | 3,691 | 680,510 |
| Metals & Mining - 1.0% | | | |
| Freeport-McMoRan, Inc. | | 22,765 | 1,016,457 |
| Nucor Corp. | | 4,885 | 840,660 |
| Reliance Steel & Aluminum Co. | | 2,643 | 774,029 |
| Steel Dynamics, Inc. | | 5,375 | 572,868 |
| | | | 3,204,014 |
TOTAL MATERIALS | | | 9,154,157 |
| REAL ESTATE - 2.5% | | | |
| Equity Real Estate Investment Trusts (REITs) - 2.5% | | | |
| Agree Realty Corp. | | 8,170 | 529,253 |
| Essex Property Trust, Inc. | | 2,862 | 697,040 |
| Extra Space Storage, Inc. | | 4,459 | 622,343 |
| Gaming & Leisure Properties | | 12,390 | 588,029 |
| NNN (REIT), Inc. | | 13,134 | 560,559 |
| Prologis (REIT), Inc. | | 11,257 | 1,404,311 |
| Public Storage | | 3,012 | 848,631 |
| Realty Income Corp. | | 13,065 | 796,573 |
| Simon Property Group, Inc. | | 6,760 | 842,296 |
| VICI Properties, Inc. | | 23,599 | 742,897 |
| WP Carey, Inc. | | 8,254 | 557,393 |
| | | | 8,189,325 |
| UTILITIES - 2.5% | | | |
| Electric Utilities - 1.6% | | | |
| FirstEnergy Corp. | | 20,692 | 815,058 |
| IDACORP, Inc. | | 6,589 | 677,481 |
| NextEra Energy, Inc. | | 24,243 | 1,777,012 |
| NRG Energy, Inc. | | 21,151 | 803,526 |
| Southern Co. | | 18,247 | 1,319,988 |
| | | | 5,393,065 |
| Gas Utilities - 0.4% | | | |
| National Fuel Gas Co. | | 12,386 | 657,820 |
| ONE Gas, Inc. (b) | | 8,495 | 672,209 |
| | | | 1,330,029 |
| Independent Power and Renewable Electricity Producers - 0.2% | | | |
| Clearway Energy, Inc. Class C | | 20,548 | 542,673 |
| Multi-Utilities - 0.3% | | | |
| WEC Energy Group, Inc. | | 9,568 | 859,780 |
TOTAL UTILITIES | | | 8,125,547 |
| TOTAL COMMON STOCKS (Cost $297,911,498) | | | 326,046,799 |
| | | | |
| Money Market Funds - 0.2% |
| | | Shares | Value ($) |
| Fidelity Cash Central Fund 5.32% (c) | | 508,726 | 508,828 |
| Fidelity Securities Lending Cash Central Fund 5.32% (c)(d) | | 161,984 | 162,000 |
| TOTAL MONEY MARKET FUNDS (Cost $670,828) | | | 670,828 |
| | | | |
| TOTAL INVESTMENT IN SECURITIES - 100.0% (Cost $298,582,326) | 326,717,627 |
NET OTHER ASSETS (LIABILITIES) - 0.0% | 124,912 |
| NET ASSETS - 100.0% | 326,842,539 |
| | |
| Futures Contracts |
| | Number of contracts | Expiration Date | Notional Amount ($) | Value ($) | Unrealized Appreciation/ (Depreciation) ($) |
| Purchased | | | | | |
| | | | | | |
| Equity Index Contracts | | | | | |
| CME Micro E-mini S&P 500 Index Contracts (United States) | 25 | Sep 2023 | 576,813 | 36,579 | 36,579 |
| | | | | | |
| The notional amount of futures purchased as a percentage of Net Assets is 0.2% |
Legend
| (b) | Security or a portion of the security is on loan at period end. |
| (c) | Affiliated fund that is generally available only to investment companies and other accounts managed by Fidelity Investments. The rate quoted is the annualized seven-day yield of the fund at period end. A complete unaudited listing of the fund's holdings as of its most recent quarter end is available upon request. In addition, each Fidelity Central Fund's financial statements, which are not covered by the Fund's Report of Independent Registered Public Accounting Firm, are available on the SEC's website or upon request. |
| (d) | Investment made with cash collateral received from securities on loan. |
Affiliated Central Funds
Fiscal year to date information regarding the Fund's investments in Fidelity Central Funds, including the ownership percentage, is presented below.
| Affiliate | Value, beginning of period ($) | Purchases ($) | Sales Proceeds ($) | Dividend Income ($) | Realized Gain (loss) ($) | Change in Unrealized appreciation (depreciation) ($) | Value, end of period ($) | % ownership, end of period |
| Fidelity Cash Central Fund 5.32% | 291,681 | 6,686,052 | 6,468,905 | 15,656 | - | - | 508,828 | 0.0% |
| Fidelity Securities Lending Cash Central Fund 5.32% | 3,524,275 | 24,641,385 | 28,003,660 | 37,353 | - | - | 162,000 | 0.0% |
| Total | 3,815,956 | 31,327,437 | 34,472,565 | 53,009 | - | - | 670,828 | |
| | | | | | | | | |
Amounts in the dividend income column in the above table include any capital gain distributions from underlying funds, which are presented in the corresponding line item in the Statement of Operations, if applicable.
Amounts in the dividend income column for Fidelity Securities Lending Cash Central Fund represents the income earned on investing cash collateral, less rebates paid to borrowers and any lending agent fees associated with the loan, plus any premium payments received for lending certain types of securities.
Amounts included in the purchases and sales proceeds columns may include in-kind transactions, if applicable.
Investment Valuation
The following is a summary of the inputs used, as of July 31, 2023, involving the Fund's assets and liabilities carried at fair value. The inputs or methodology used for valuing securities may not be an indication of the risk associated with investing in those securities. For more information on valuation inputs, and their aggregation into the levels used below, please refer to the Investment Valuation section in the accompanying Notes to Financial Statements.
| Valuation Inputs at Reporting Date: |
| Description | Total ($) | Level 1 ($) | Level 2 ($) | Level 3 ($) |
Investments in Securities: | | | | |
|
| Equities: | | | | |
Communication Services | 28,127,494 | 28,127,494 | - | - |
Consumer Discretionary | 37,521,823 | 37,521,823 | - | - |
Consumer Staples | 18,640,843 | 18,640,843 | - | - |
Energy | 13,865,581 | 13,865,581 | - | - |
Financials | 44,655,814 | 44,655,814 | - | - |
Health Care | 39,859,690 | 39,859,690 | - | - |
Industrials | 32,160,662 | 32,160,662 | - | - |
Information Technology | 85,745,863 | 85,745,863 | - | - |
Materials | 9,154,157 | 9,154,157 | - | - |
Real Estate | 8,189,325 | 8,189,325 | - | - |
Utilities | 8,125,547 | 8,125,547 | - | - |
|
| Money Market Funds | 670,828 | 670,828 | - | - |
| Total Investments in Securities: | 326,717,627 | 326,717,627 | - | - |
Derivative Instruments: | | | | |
|
| Assets | | | | |
Futures Contracts | 36,579 | 36,579 | - | - |
| Total Assets | 36,579 | 36,579 | - | - |
| Total Derivative Instruments: | 36,579 | 36,579 | - | - |
Value of Derivative Instruments
The following table is a summary of the Fund's value of derivative instruments by primary risk exposure as of July 31, 2023. For additional information on derivative instruments, please refer to the Derivative Instruments section in the accompanying Notes to Financial Statements.
Primary Risk Exposure / Derivative Type | Value |
| Asset ($) | Liability ($) |
| Equity Risk | | |
Futures Contracts (a) | 36,579 | 0 |
| Total Equity Risk | 36,579 | 0 |
| Total Value of Derivatives | 36,579 | 0 |
(a)Reflects gross cumulative appreciation (depreciation) on futures contracts as presented in the Schedule of Investments. In the Statement of Assets and Liabilities, the period end daily variation margin is included in receivable or payable for daily variation margin on futures contracts, and the net cumulative appreciation (depreciation) is included in Total accumulated earnings (loss).
Fidelity® Quality Factor ETF
| Statement of Assets and Liabilities |
| | | | July 31, 2023 |
| | | | | |
| Assets | | | | |
| Investment in securities, at value (including securities loaned of $158,260) - See accompanying schedule: | | | | |
Unaffiliated issuers (cost $297,911,498) | $ | 326,046,799 | | |
Fidelity Central Funds (cost $670,828) | | 670,828 | | |
| | | | | |
| | | | | |
| Total Investment in Securities (cost $298,582,326) | | | $ | 326,717,627 |
| Segregated cash with brokers for derivative instruments | | | | 28,000 |
| Cash | | | | 13,159 |
| Dividends receivable | | | | 319,968 |
| Distributions receivable from Fidelity Central Funds | | | | 2,020 |
| Receivable for daily variation margin on futures contracts | | | | 1,000 |
Total assets | | | | 327,081,774 |
| Liabilities | | | | |
| Accrued management fee | $ | 77,235 | | |
| Collateral on securities loaned | | 162,000 | | |
| Total Liabilities | | | | 239,235 |
| Net Assets | | | $ | 326,842,539 |
| Net Assets consist of: | | | | |
| Paid in capital | | | $ | 322,500,604 |
| Total accumulated earnings (loss) | | | | 4,341,935 |
| Net Assets | | | $ | 326,842,539 |
Net Asset Value, offering price and redemption price per share ($326,842,539 ÷ 6,250,000 shares) | | | $ | 52.29 |
| Statement of Operations |
| | | | Year ended July 31, 2023 |
| Investment Income | | | | |
| Dividends | | | $ | 4,931,626 |
| Income from Fidelity Central Funds (including $37,353 from security lending) | | | | 53,009 |
| Total Income | | | | 4,984,635 |
| Expenses | | | | |
| Management fee | $ | 787,289 | | |
| Independent trustees' fees and expenses | | 1,350 | | |
| Total expenses before reductions | | 788,639 | | |
| Expense reductions | | (294) | | |
| Total expenses after reductions | | | | 788,345 |
| Net Investment income (loss) | | | | 4,196,290 |
| Realized and Unrealized Gain (Loss) | | | | |
| Net realized gain (loss) on: | | | | |
| Investment Securities: | | | | |
| Unaffiliated issuers | | (5,689,837) | | |
| Redemptions in-kind | | 6,599,514 | | |
| Futures contracts | | 138,542 | | |
| Total net realized gain (loss) | | | | 1,048,219 |
| Change in net unrealized appreciation (depreciation) on: | | | | |
| Investment Securities: | | | | |
| Unaffiliated issuers | | 25,939,079 | | |
| Futures contracts | | 3,454 | | |
| Total change in net unrealized appreciation (depreciation) | | | | 25,942,533 |
| Net gain (loss) | | | | 26,990,752 |
| Net increase (decrease) in net assets resulting from operations | | | $ | 31,187,042 |
| Statement of Changes in Net Assets |
| |
| | Year ended July 31, 2023 | | Year ended July 31, 2022 |
| Increase (Decrease) in Net Assets | | | | |
| Operations | | | | |
| Net investment income (loss) | $ | 4,196,290 | $ | 3,315,679 |
| Net realized gain (loss) | | 1,048,219 | | 31,054,201 |
| Change in net unrealized appreciation (depreciation) | | 25,942,533 | | (49,818,448) |
| Net increase (decrease) in net assets resulting from operations | | 31,187,042 | | (15,448,568) |
| Distributions to shareholders | | (4,025,350) | | (3,437,350) |
| | | | | |
| Share transactions | | | | |
| Proceeds from sales of shares | | 68,034,031 | | 184,056,355 |
| Cost of shares redeemed | | (35,066,993) | | (144,177,423) |
| | | | | |
Net increase (decrease) in net assets resulting from share transactions | | 32,967,038 | | 39,878,932 |
| Total increase (decrease) in net assets | | 60,128,730 | | 20,993,014 |
| | | | | |
| Net Assets | | | | |
| Beginning of period | | 266,713,809 | | 245,720,795 |
| End of period | $ | 326,842,539 | $ | 266,713,809 |
| | | | | |
| Other Information | | | | |
| Shares | | | | |
| Sold | | 1,450,000 | | 3,600,000 |
| Redeemed | | (750,000) | | (2,850,000) |
| Net increase (decrease) | | 700,000 | | 750,000 |
| | | | | |
| Fidelity® Quality Factor ETF |
| |
| Years ended July 31, | | 2023 | | 2022 | | 2021 | | 2020 | | 2019 |
Selected Per-Share Data | | | | | | | | | | |
| Net asset value, beginning of period | $ | 48.06 | $ | 51.19 | $ | 38.19 | $ | 35.28 | $ | 33.47 |
| Income from Investment Operations | | | | | | | | | | |
Net investment income (loss) A,B | | .72 | | .67 | | .62 | | .62 | | .58 |
| Net realized and unrealized gain (loss) | | 4.20 | | (3.10) | | 13.00 | | 2.90 | | 1.77 |
| Total from investment operations | | 4.92 | | (2.43) | | 13.62 | | 3.52 | | 2.35 |
| Distributions from net investment income | | (.69) | | (.70) | | (.62) | | (.61) | | (.54) |
| Total distributions | | (.69) | | (.70) | | (.62) | | (.61) | | (.54) |
| Net asset value, end of period | $ | 52.29 | $ | 48.06 | $ | 51.19 | $ | 38.19 | $ | 35.28 |
Total Return C,D | | 10.46% | | (4.79)% | | 36.00% | | 10.26% | | 7.14% |
Ratios to Average Net Assets B,E,F | | | | | | | | | | |
| Expenses before reductions | | .29% | | .29% | | .29% | | .29% | | .29% |
| Expenses net of fee waivers, if any | | .29% | | .29% | | .29% | | .29% | | .29% |
| Expenses net of all reductions | | .29% | | .29% | | .29% | | .29% | | .29% |
| Net investment income (loss) | | 1.54% | | 1.33% | | 1.39% | | 1.74% | | 1.72% |
| Supplemental Data | | | | | | | | | | |
| Net assets, end of period (000 omitted) | $ | 326,843 | $ | 266,714 | $ | 245,721 | $ | 147,022 | $ | 162,282 |
Portfolio turnover rate G,H | | 43% | | 38% | | 35% | | 41% | | 29% |
ACalculated based on average shares outstanding during the period.
BNet investment income (loss) is affected by the timing of the declaration of dividends by any underlying mutual funds or exchange-traded funds (ETFs). Net investment income (loss) of any mutual funds or ETFs is not included in the Fund's net investment income (loss) ratio.
CBased on net asset value.
DTotal returns would have been lower if certain expenses had not been reduced during the applicable periods shown.
EFees and expenses of any underlying mutual funds or exchange-traded funds (ETFs) are not included in the Fund's expense ratio. The Fund indirectly bears its proportionate share of these expenses. For additional expense information related to investments in Fidelity Central Funds, please refer to the "Investments in Fidelity Central Funds" note found in the Notes to Financial Statements section of the most recent Annual or Semi-Annual report.
FExpense ratios reflect operating expenses of the class. Expenses before reductions do not reflect amounts reimbursed, waived, or reduced through arrangements with the investment adviser, brokerage services, or other offset arrangements, if applicable, and do not represent the amount paid by the class during periods when reimbursements, waivers or reductions occur.
GPortfolio turnover rate excludes securities received or delivered in-kind.
HAmount does not include the portfolio activity of any underlying mutual funds or exchange-traded funds (ETFs).
NAV and closing market price average annual returns reflect the change in the value of an investment, assuming reinvestment of distributions from dividend income and capital gains (the profits earned upon the sale of securities that have grown in value, if any) at NAV and Market Price, respectively, and assumes a constant rate of performance each year. The hypothetical investment and the fund's returns do not reflect the deduction of taxes that a shareholder would pay on fund distributions or the redemption or selling of fund shares. How a fund did yesterday is no guarantee of how it will do tomorrow.
| Average Annual Total Returns |
| | | | |
Periods ended July 31, 2023 | Past 1 year | Life of Fund |
Fidelity® Small-Mid Multifactor ETF - NAV A | 7.92% | 9.49% |
Fidelity® Small-Mid Multifactor ETF - Market Price B | 7.79% | 9.43% |
Fidelity Small-Mid Multifactor Index℠ A | 8.23% | 9.83% |
Dow Jones U.S. Completion Total Stock Market Index℠ A | 10.44% | 8.26% |
A From February 26, 2019
B From February 28, 2019, date initially listed on the NYSE ARCA exchange.
| $10,000 Over Life of Fund |
| |
Let's say hypothetically that $10,000 was invested in Fidelity® Small-Mid Multifactor ETF - NAV, on February 26, 2019, when the fund started. The chart shows how the value of your investment would have changed, and also shows how the Fidelity Small-Mid Multifactor Index℠ and Dow Jones U.S. Completion Total Stock Market Index℠ performed over the same period. |
|
|
Fidelity® Small-Mid Multifactor ETF
Market Recap:
U.S. equities gained 13.02% for the 12 months ending July 31, 2023, according to the S&P 500® index, as continued global economic expansion, falling commodity prices and a slowing in the pace of inflation provided a favorable backdrop for higher-risk assets. Large-cap stocks spearheaded the rally, which was driven by the shares of a narrow set of mega-cap companies in the information technology and communication services sectors, largely due to exuberance related to generative artificial intelligence. Aggressive monetary tightening by the U.S. Federal Reserve continued amid consistent pressure on core inflation, a measure that excludes food and energy. Since March 2022, the Fed has hiked its benchmark interest rate 11 times. The latest bump came in late July, a fourth consecutive raise of a stepped down 25 basis points. The S&P 500® gained 3.21% in July, as a "soft landing" of the U.S. economy became the consensus view amid better-than-expected earnings, slowing inflation and easing financial conditions, bringing the index's year-to-date gain to 20.65%. July saw a continuance of the recent shift to wider market breadth and lower dispersion. For the full 12 months, value (+17%) handily topped growth (+8%) within the index. By sector, tech (+28%), communication services (+21%) and industrials (+17%) led, whereas real estate (-10%) lagged most, due to high borrowing costs, low home inventory and a deteriorating commercial property market.
Comments from the Geode Capital Management, LLC, passive equity index team:
For the fiscal year ending July 31, 2023, the exchange-traded fund's net asset value gained 7.92%, versus 8.23% for the Fidelity Small-Mid Multifactor Index TR. The ETF's market price returned 7.79% the past 12 months, while the Dow Jones U.S. Completion Total Stock Market Index gained 10.44%. By sector, industrials gained 20% and contributed most. Information technology stocks also helped, gaining just under 20%. The consumer discretionary sector rose 14%; materials and energy each advanced about 16%; and the financials (+4%) and consumer staples (+10%) sectors also gained. In contrast, health care, a significant sector weighting, returned about -5% and detracted most from the fund's result. Real estate (-8%) also hurt. Other detractors included the communication services (-13%) and utilities (-7%) sectors. Turning to individual stocks, the top contributor was Super Micro Computer (+259%), from the technology hardware & equipment group. Also in technology hardware & equipment, Jabil (+88%) helped. First Citizens Bancshares (+109%), a stock in the banks group, contributed. Steel Dynamics (+62%), from the materials category, and Axcelis Technologies (+188%), from the semiconductors & semiconductor equipment group, also bolstered the fund's result. Conversely, the biggest individual detractor was Lumen Technologies (-83%), from the telecommunication services group. Advance Auto Parts (-63%), from the consumer discretionary distribution & retail category, and Novocure (-61%), from the health care equipment & services category, also hurt. Lastly, in pharmaceuticals, biotechnology & life sciences, Catalent (-32%) and Maravai LifeSciences (-57%) detracted.
The views expressed above reflect those of the portfolio manager(s) only through the end of the period as stated on the cover of this report and do not necessarily represent the views of Fidelity or any other person in the Fidelity organization, or Geode Capital Management, LLC, (the ETF's subadviser) or any other person in the Geode organization. Any such views are subject to change at any time based upon market or other conditions and Fidelity and Geode disclaim any responsibility to update such views. These views may not be relied on as investment advice and, because investment decisions for a Fidelity fund are based on numerous factors, may not be relied on as an indication of trading intent on behalf of any Fidelity fund.
Fidelity® Small-Mid Multifactor ETF
Top Holdings (% of Fund's net assets) |
| |
| Super Micro Computer, Inc. | 0.6 | |
| First Citizens Bancshares, Inc. | 0.5 | |
| EQT Corp. | 0.4 | |
| Jabil, Inc. | 0.4 | |
| Deckers Outdoor Corp. | 0.4 | |
| Dell Technologies, Inc. | 0.3 | |
| Owens Corning | 0.3 | |
| RPM International, Inc. | 0.3 | |
| Brown-Forman Corp. Class B (non-vtg.) | 0.3 | |
| Manhattan Associates, Inc. | 0.3 | |
| | 3.8 | |
| |
| Market Sectors (% of Fund's net assets) |
| |
| Industrials | 18.7 | |
| Financials | 15.2 | |
| Consumer Discretionary | 14.1 | |
| Information Technology | 13.8 | |
| Health Care | 12.5 | |
| Real Estate | 6.0 | |
| Materials | 5.0 | |
| Energy | 4.8 | |
| Consumer Staples | 3.8 | |
| Communication Services | 3.1 | |
| Utilities | 2.6 | |
| |
Asset Allocation (% of Fund's net assets) |
|
Futures - 0.3% |
|
Fidelity® Small-Mid Multifactor ETF
Showing Percentage of Net Assets
| Common Stocks - 99.6% |
| | | Shares | Value ($) |
| COMMUNICATION SERVICES - 3.1% | | | |
| Diversified Telecommunication Services - 0.7% | | | |
| Cogent Communications Group, Inc. | | 2,473 | 151,447 |
| Frontier Communications Parent, Inc. (a) | | 8,417 | 153,274 |
| Iridium Communications, Inc. | | 4,548 | 238,997 |
| Liberty Global PLC Class C (a) | | 14,005 | 276,739 |
| Lumen Technologies, Inc. | | 39,877 | 71,380 |
| | | | 891,837 |
| Entertainment - 0.5% | | | |
| Madison Square Garden Sports Corp. | | 992 | 211,048 |
| Sciplay Corp. (A Shares) (a) | | 7,090 | 138,964 |
| World Wrestling Entertainment, Inc. Class A | | 2,208 | 231,840 |
| | | | 581,852 |
| Interactive Media & Services - 0.6% | | | |
| Yelp, Inc. (a) | | 4,782 | 215,429 |
| Ziff Davis, Inc. (a) | | 2,192 | 158,964 |
| ZipRecruiter, Inc. (a) | | 6,212 | 115,046 |
| Zoominfo Technologies, Inc. (a) | | 9,518 | 243,375 |
| | | | 732,814 |
| Media - 1.3% | | | |
| Cable One, Inc. | | 232 | 167,954 |
| John Wiley & Sons, Inc. Class A | | 3,150 | 107,825 |
| News Corp. Class A | | 16,045 | 318,012 |
| Nexstar Broadcasting Group, Inc. Class A | | 1,333 | 248,898 |
| Scholastic Corp. | | 3,027 | 130,736 |
| Sirius XM Holdings, Inc. (b) | | 35,630 | 181,713 |
| TEGNA, Inc. | | 10,181 | 172,059 |
| The New York Times Co. Class A | | 6,549 | 266,937 |
| | | | 1,594,134 |
TOTAL COMMUNICATION SERVICES | | | 3,800,637 |
| CONSUMER DISCRETIONARY - 14.1% | | | |
| Automobile Components - 1.7% | | | |
| Autoliv, Inc. | | 2,959 | 298,652 |
| BorgWarner, Inc. | | 7,520 | 349,680 |
| Dorman Products, Inc. (a) | | 1,741 | 147,445 |
| Gentex Corp. | | 8,932 | 299,937 |
| Gentherm, Inc. (a) | | 2,271 | 135,738 |
| LCI Industries (b) | | 1,514 | 206,313 |
| Lear Corp. | | 2,088 | 323,139 |
| Phinia, Inc. | | 1,495 | 42,413 |
| Visteon Corp. (a) | | 1,330 | 204,940 |
| XPEL, Inc. (a) | | 1,885 | 153,119 |
| | | | 2,161,376 |
| Automobiles - 0.5% | | | |
| Harley-Davidson, Inc. | | 5,124 | 197,838 |
| Thor Industries, Inc. (b) | | 2,284 | 263,779 |
| Winnebago Industries, Inc. | | 2,340 | 160,992 |
| | | | 622,609 |
| Broadline Retail - 0.4% | | | |
| Dillard's, Inc. Class A (b) | | 353 | 121,093 |
| Macy's, Inc. | | 10,650 | 176,684 |
| Ollie's Bargain Outlet Holdings, Inc. (a) | | 3,232 | 235,548 |
| | | | 533,325 |
| Diversified Consumer Services - 1.5% | | | |
| ADT, Inc. | | 17,497 | 111,631 |
| Adtalem Global Education, Inc. (a) | | 3,943 | 170,495 |
| Chegg, Inc. (a) | | 8,162 | 82,681 |
| Frontdoor, Inc. (a) | | 5,811 | 202,920 |
| Graham Holdings Co. | | 255 | 149,621 |
| Grand Canyon Education, Inc. (a) | | 1,638 | 177,805 |
| H&R Block, Inc. | | 6,342 | 213,155 |
| Perdoceo Education Corp. | | 9,163 | 122,326 |
| Service Corp. International | | 4,940 | 329,251 |
| Strategic Education, Inc. | | 1,673 | 125,642 |
| Stride, Inc. (a) | | 3,575 | 136,601 |
| | | | 1,822,128 |
| Hotels, Restaurants & Leisure - 2.1% | | | |
| Bloomin' Brands, Inc. | | 6,525 | 175,327 |
| Bowlero Corp. Class A (a) | | 8,797 | 106,708 |
| Boyd Gaming Corp. | | 3,580 | 244,586 |
| Choice Hotels International, Inc. (b) | | 1,516 | 198,217 |
| Churchill Downs, Inc. | | 2,369 | 274,449 |
| Cracker Barrel Old Country Store, Inc. | | 1,467 | 136,724 |
| Monarch Casino & Resort, Inc. | | 1,777 | 123,182 |
| Planet Fitness, Inc. (a) | | 3,192 | 215,588 |
| RCI Hospitality Holdings, Inc. | | 1,419 | 98,975 |
| Texas Roadhouse, Inc. Class A | | 2,564 | 286,014 |
| Vail Resorts, Inc. | | 1,324 | 311,789 |
| Wendy's Co. | | 8,851 | 190,208 |
| Wingstop, Inc. | | 1,346 | 226,909 |
| | | | 2,588,676 |
| Household Durables - 2.6% | | | |
| Cavco Industries, Inc. (a) | | 590 | 174,434 |
| Ethan Allen Interiors, Inc. (b) | | 4,322 | 136,013 |
| KB Home | | 4,636 | 250,205 |
| La-Z-Boy, Inc. | | 4,771 | 149,666 |
| Leggett & Platt, Inc. | | 5,919 | 173,190 |
| M.D.C. Holdings, Inc. | | 4,024 | 206,351 |
| M/I Homes, Inc. (a) | | 2,400 | 240,000 |
| Meritage Homes Corp. | | 1,778 | 264,833 |
| Skyline Champion Corp. (a) | | 3,001 | 209,050 |
| Taylor Morrison Home Corp. (a) | | 5,442 | 263,502 |
| Tempur Sealy International, Inc. | | 6,326 | 282,329 |
| Toll Brothers, Inc. | | 4,170 | 334,976 |
| TopBuild Corp. (a) | | 1,243 | 340,495 |
| TRI Pointe Homes, Inc. (a) | | 7,151 | 227,974 |
| | | | 3,253,018 |
| Leisure Products - 1.0% | | | |
| Acushnet Holdings Corp. | | 3,009 | 179,427 |
| Brunswick Corp. | | 2,854 | 246,329 |
| JAKKS Pacific, Inc. (a) | | 5,485 | 114,307 |
| Malibu Boats, Inc. Class A (a) | | 2,197 | 131,710 |
| MasterCraft Boat Holdings, Inc. (a) | | 4,096 | 125,542 |
| Polaris, Inc. | | 2,158 | 293,143 |
| Sturm, Ruger & Co., Inc. | | 2,366 | 125,280 |
| | | | 1,215,738 |
| Specialty Retail - 2.9% | | | |
| Academy Sports & Outdoors, Inc. | | 3,587 | 214,467 |
| Advance Auto Parts, Inc. | | 2,053 | 152,723 |
| Arko Corp. | | 15,345 | 127,977 |
| Asbury Automotive Group, Inc. (a) | | 958 | 216,125 |
| AutoNation, Inc. (a) | | 1,579 | 254,187 |
| Dick's Sporting Goods, Inc. | | 2,069 | 291,729 |
| Five Below, Inc. (a) | | 1,789 | 372,720 |
| Foot Locker, Inc. (b) | | 4,199 | 112,827 |
| Group 1 Automotive, Inc. | | 811 | 209,668 |
| Haverty Furniture Companies, Inc. | | 3,431 | 122,144 |
| Hibbett, Inc. | | 1,913 | 88,763 |
| Monro, Inc. | | 2,801 | 102,657 |
| Murphy U.S.A., Inc. | | 894 | 274,485 |
| Penske Automotive Group, Inc. (b) | | 1,369 | 220,984 |
| The Buckle, Inc. | | 3,220 | 117,723 |
| Valvoline, Inc. | | 6,797 | 258,082 |
| Williams-Sonoma, Inc. (b) | | 2,262 | 313,604 |
| Winmark Corp. | | 466 | 169,372 |
| | | | 3,620,237 |
| Textiles, Apparel & Luxury Goods - 1.4% | | | |
| Capri Holdings Ltd. (a) | | 4,513 | 166,575 |
| Columbia Sportswear Co. | | 1,962 | 154,233 |
| Crocs, Inc. (a) | | 2,268 | 245,738 |
| Deckers Outdoor Corp. (a) | | 852 | 463,224 |
| Kontoor Brands, Inc. | | 3,382 | 143,262 |
| Skechers U.S.A., Inc. Class A (sub. vtg.) (a) | | 5,278 | 293,351 |
| Tapestry, Inc. | | 7,761 | 334,887 |
| | | | 1,801,270 |
TOTAL CONSUMER DISCRETIONARY | | | 17,618,377 |
| CONSUMER STAPLES - 3.8% | | | |
| Beverages - 0.6% | | | |
| Brown-Forman Corp. Class B (non-vtg.) | | 5,835 | 411,951 |
| MGP Ingredients, Inc. (b) | | 1,576 | 179,680 |
| National Beverage Corp. (a) | | 3,209 | 169,596 |
| | | | 761,227 |
| Consumer Staples Distribution & Retail - 1.1% | | | |
| Albertsons Companies, Inc. | | 9,177 | 199,416 |
| BJ's Wholesale Club Holdings, Inc. (a) | | 4,604 | 305,291 |
| Casey's General Stores, Inc. | | 1,359 | 343,365 |
| Ingles Markets, Inc. Class A | | 1,598 | 135,510 |
| Sprouts Farmers Market LLC (a) | | 6,035 | 236,874 |
| Weis Markets, Inc. (b) | | 1,747 | 115,896 |
| | | | 1,336,352 |
| Food Products - 1.3% | | | |
| Cal-Maine Foods, Inc. (b) | | 3,053 | 141,018 |
| Campbell Soup Co. | | 6,820 | 312,492 |
| Flowers Foods, Inc. | | 8,607 | 212,679 |
| Hostess Brands, Inc. Class A (a) | | 8,234 | 197,945 |
| Ingredion, Inc. | | 2,638 | 293,504 |
| John B. Sanfilippo & Son, Inc. | | 1,505 | 163,910 |
| Lancaster Colony Corp. | | 1,086 | 209,196 |
| Tootsie Roll Industries, Inc. | | 3,119 | 108,728 |
| | | | 1,639,472 |
| Household Products - 0.2% | | | |
| WD-40 Co. (b) | | 947 | 217,337 |
| Personal Care Products - 0.5% | | | |
| BellRing Brands, Inc. (a) | | 7,181 | 258,157 |
| elf Beauty, Inc. (a) | | 2,904 | 338,955 |
| | | | 597,112 |
| Tobacco - 0.1% | | | |
| Vector Group Ltd. | | 12,113 | 158,923 |
TOTAL CONSUMER STAPLES | | | 4,710,423 |
| ENERGY - 4.8% | | | |
| Energy Equipment & Services - 0.2% | | | |
| Helmerich & Payne, Inc. | | 4,881 | 218,522 |
| Oil, Gas & Consumable Fuels - 4.6% | | | |
| Arch Resources, Inc. | | 1,174 | 150,789 |
| Ardmore Shipping Corp. | | 8,924 | 125,650 |
| California Resources Corp. | | 4,478 | 238,901 |
| Chesapeake Energy Corp. | | 3,740 | 315,432 |
| Chord Energy Corp. | | 1,752 | 274,784 |
| Civitas Resources, Inc. (b) | | 3,009 | 225,254 |
| Comstock Resources, Inc. (b) | | 11,801 | 150,463 |
| CONSOL Energy, Inc. | | 2,746 | 204,632 |
| CVR Energy, Inc. | | 4,284 | 157,394 |
| Delek U.S. Holdings, Inc. | | 6,066 | 167,361 |
| DT Midstream, Inc. | | 4,270 | 228,530 |
| EQT Corp. | | 11,783 | 497,007 |
| Evolution Petroleum Corp. | | 20,070 | 187,454 |
| Gulfport Energy Corp. (a) | | 2,141 | 219,345 |
| HF Sinclair Corp. | | 5,133 | 267,378 |
| International Seaways, Inc. | | 3,951 | 169,458 |
| Magnolia Oil & Gas Corp. Class A | | 8,825 | 195,474 |
| Murphy Oil Corp. | | 6,065 | 262,433 |
| Par Pacific Holdings, Inc. (a) | | 5,685 | 178,964 |
| PBF Energy, Inc. Class A | | 5,457 | 258,880 |
| PDC Energy, Inc. | | 3,882 | 294,605 |
| Peabody Energy Corp. | | 6,710 | 150,572 |
| Southwestern Energy Co. (a) | | 46,377 | 300,523 |
| Talos Energy, Inc. (a) | | 7,704 | 123,264 |
| Teekay Tankers Ltd. | | 4,241 | 184,950 |
| Texas Pacific Land Corp. | | 196 | 295,235 |
| | | | 5,824,732 |
TOTAL ENERGY | | | 6,043,254 |
| FINANCIALS - 15.2% | | | |
| Banks - 6.6% | | | |
| 1st Source Corp. | | 2,844 | 133,384 |
| Amalgamated Financial Corp. | | 5,782 | 115,409 |
| Ameris Bancorp | | 3,904 | 170,410 |
| BancFirst Corp. | | 1,831 | 182,917 |
| Bank First National Corp. | | 1,666 | 147,208 |
| Banner Corp. | | 2,631 | 125,262 |
| Cambridge Bancorp | | 1,660 | 102,156 |
| Cathay General Bancorp | | 4,387 | 166,881 |
| City Holding Co. | | 1,585 | 156,772 |
| Columbia Banking Systems, Inc. | | 5,468 | 122,210 |
| Comerica, Inc. | | 4,542 | 245,086 |
| Commerce Bancshares, Inc. | | 4,356 | 231,652 |
| Community Trust Bancorp, Inc. | | 3,142 | 120,590 |
| CVB Financial Corp. | | 7,795 | 147,092 |
| Dime Community Bancshares, Inc. | | 4,689 | 105,034 |
| East West Bancorp, Inc. | | 4,661 | 289,961 |
| Enterprise Financial Services Corp. | | 3,091 | 126,731 |
| First Bancorp, Puerto Rico | | 12,686 | 188,387 |
| First Citizens Bancshares, Inc. | | 419 | 599,715 |
| First Financial Corp., Indiana | | 2,999 | 114,592 |
| First Merchants Corp. | | 4,162 | 133,683 |
| FNB Corp., Pennsylvania | | 16,391 | 209,641 |
| Fulton Financial Corp. | | 10,812 | 154,612 |
| Great Southern Bancorp, Inc. | | 2,306 | 127,591 |
| Hancock Whitney Corp. | | 4,178 | 183,874 |
| Hanmi Financial Corp. | | 5,767 | 109,573 |
| Heritage Financial Corp., Washington | | 4,960 | 93,050 |
| International Bancshares Corp. | | 3,767 | 186,994 |
| Midland States Bancorp, Inc. | | 5,308 | 124,366 |
| NBT Bancorp, Inc. | | 3,953 | 147,052 |
| OFG Bancorp | | 5,282 | 176,894 |
| Old Second Bancorp, Inc. | | 8,115 | 129,759 |
| Peapack-Gladstone Financial Corp. | | 3,645 | 106,543 |
| Popular, Inc. | | 3,348 | 242,897 |
| Preferred Bank, Los Angeles | | 1,989 | 131,433 |
| QCR Holdings, Inc. | | 2,666 | 136,579 |
| S&T Bancorp, Inc. | | 4,223 | 133,362 |
| Southstate Corp. | | 3,180 | 246,991 |
| Stock Yards Bancorp, Inc. | | 2,639 | 126,171 |
| Synovus Financial Corp. | | 6,032 | 204,485 |
| Trico Bancshares | | 3,124 | 116,775 |
| Trustco Bank Corp., New York | | 3,784 | 114,996 |
| UMB Financial Corp. | | 2,311 | 164,081 |
| United Bankshares, Inc., West Virginia | | 5,906 | 197,497 |
| Valley National Bancorp | | 19,104 | 196,007 |
| Webster Financial Corp. | | 6,087 | 288,037 |
| WesBanco, Inc. | | 4,556 | 127,614 |
| Westamerica Bancorp. | | 2,806 | 138,027 |
| Wintrust Financial Corp. | | 2,655 | 223,976 |
| | | | 8,264,009 |
| Capital Markets - 1.5% | | | |
| Evercore, Inc. Class A | | 1,721 | 232,438 |
| Federated Hermes, Inc. | | 4,934 | 166,917 |
| GCM Grosvenor, Inc. Class A | | 14,210 | 111,549 |
| Houlihan Lokey | | 2,340 | 233,649 |
| Interactive Brokers Group, Inc. | | 3,797 | 331,592 |
| Lazard Ltd. Class A | | 5,512 | 193,471 |
| PJT Partners, Inc. | | 2,095 | 166,154 |
| SEI Investments Co. | | 4,177 | 263,109 |
| StoneX Group, Inc. (a) | | 1,800 | 165,618 |
| | | | 1,864,497 |
| Consumer Finance - 0.4% | | | |
| Enova International, Inc. (a) | | 3,047 | 167,859 |
| FirstCash Holdings, Inc. | | 2,179 | 207,615 |
| Nelnet, Inc. Class A | | 1,686 | 166,374 |
| | | | 541,848 |
| Financial Services - 1.9% | | | |
| A-Mark Precious Metals, Inc. | | 3,577 | 145,906 |
| Cass Information Systems, Inc. | | 2,412 | 91,535 |
| Enact Holdings, Inc. | | 5,619 | 152,837 |
| Essent Group Ltd. | | 5,164 | 256,134 |
| Euronet Worldwide, Inc. (a) | | 1,953 | 171,610 |
| EVERTEC, Inc. | | 4,284 | 168,490 |
| International Money Express, Inc. (a) | | 5,319 | 128,879 |
| Jackson Financial, Inc. | | 3,955 | 130,594 |
| Merchants Bancorp | | 4,540 | 143,509 |
| MGIC Investment Corp. | | 15,205 | 254,532 |
| Radian Group, Inc. | | 8,857 | 238,519 |
| The Western Union Co. | | 16,023 | 195,160 |
| Voya Financial, Inc. | | 3,927 | 291,619 |
| | | | 2,369,324 |
| Insurance - 4.8% | | | |
| American Equity Investment Life Holding Co. | | 4,148 | 222,623 |
| American Financial Group, Inc. | | 2,456 | 298,674 |
| Amerisafe, Inc. | | 2,687 | 140,046 |
| Assurant, Inc. | | 2,091 | 281,260 |
| Axis Capital Holdings Ltd. | | 3,733 | 205,763 |
| Employers Holdings, Inc. | | 3,481 | 134,471 |
| Erie Indemnity Co. Class A | | 1,058 | 234,834 |
| Fidelity National Financial, Inc. | | 8,760 | 343,129 |
| Genworth Financial, Inc. Class A (a) | | 32,539 | 190,679 |
| Globe Life, Inc. | | 3,051 | 342,231 |
| Hanover Insurance Group, Inc. | | 1,678 | 190,419 |
| Kinsale Capital Group, Inc. | | 912 | 339,839 |
| Loews Corp. | | 6,400 | 400,960 |
| National Western Life Group, Inc. | | 511 | 215,473 |
| Old Republic International Corp. | | 10,894 | 300,348 |
| Primerica, Inc. | | 1,564 | 332,663 |
| Reinsurance Group of America, Inc. | | 2,317 | 325,191 |
| RenaissanceRe Holdings Ltd. | | 1,570 | 293,213 |
| RLI Corp. | | 1,840 | 245,474 |
| Safety Insurance Group, Inc. | | 1,748 | 125,856 |
| Selective Insurance Group, Inc. | | 2,628 | 271,183 |
| Unum Group | | 7,142 | 347,173 |
| White Mountains Insurance Group Ltd. | | 141 | 218,130 |
| | | | 5,999,632 |
TOTAL FINANCIALS | | | 19,039,310 |
| HEALTH CARE - 12.5% | | | |
| Biotechnology - 3.3% | | | |
| ADMA Biologics, Inc. (a) | | 35,193 | 146,051 |
| Akero Therapeutics, Inc. (a) | | 3,163 | 137,274 |
| Alkermes PLC (a) | | 7,901 | 231,341 |
| Amicus Therapeutics, Inc. (a) | | 14,279 | 194,480 |
| Ars Pharmaceuticals, Inc. (a) | | 17,543 | 128,941 |
| Catalyst Pharmaceutical Partners, Inc. (a) | | 9,596 | 132,713 |
| Chinook Therapeutics, Inc. (a) | | 5,659 | 221,720 |
| Cytokinetics, Inc. (a) | | 4,736 | 157,946 |
| Deciphera Pharmaceuticals, Inc. (a) | | 7,858 | 106,240 |
| Exelixis, Inc. (a) | | 13,791 | 271,821 |
| Halozyme Therapeutics, Inc. (a) | | 5,209 | 223,779 |
| Ionis Pharmaceuticals, Inc. (a) | | 6,003 | 248,704 |
| Ironwood Pharmaceuticals, Inc. Class A (a) | | 13,212 | 146,521 |
| Kiniksa Pharmaceuticals Ltd. (a) | | 8,974 | 169,070 |
| Neurocrine Biosciences, Inc. (a) | | 3,208 | 326,863 |
| Repligen Corp. (a) | | 1,745 | 299,372 |
| Sarepta Therapeutics, Inc. (a) | | 2,919 | 316,390 |
| Syndax Pharmaceuticals, Inc. (a) | | 5,545 | 118,219 |
| United Therapeutics Corp. (a) | | 1,459 | 354,128 |
| Vaxcyte, Inc. (a) | | 3,991 | 191,807 |
| Vir Biotechnology, Inc. (a) | | 5,596 | 78,792 |
| | | | 4,202,172 |
| Health Care Equipment & Supplies - 3.1% | | | |
| Atrion Corp. | | 199 | 111,561 |
| Axonics Modulation Technologies, Inc. (a) | | 2,997 | 180,929 |
| Embecta Corp. | | 5,378 | 114,767 |
| Globus Medical, Inc. (a) | | 3,204 | 193,105 |
| Haemonetics Corp. (a) | | 2,484 | 229,124 |
| Integer Holdings Corp. (a) | | 2,325 | 215,016 |
| Integra LifeSciences Holdings Corp. (a) | | 3,555 | 161,646 |
| Lantheus Holdings, Inc. (a) | | 3,469 | 300,034 |
| LeMaitre Vascular, Inc. | | 2,796 | 176,791 |
| Masimo Corp. (a) | | 1,742 | 213,047 |
| Merit Medical Systems, Inc. (a) | | 2,862 | 213,706 |
| Novocure Ltd. (a) | | 3,224 | 105,231 |
| PROCEPT BioRobotics Corp. (a) | | 3,711 | 127,807 |
| QuidelOrtho Corp. (a) | | 2,467 | 215,517 |
| Shockwave Medical, Inc. (a) | | 1,420 | 370,052 |
| Teleflex, Inc. | | 1,484 | 372,736 |
| TransMedics Group, Inc. (a) | | 2,445 | 227,825 |
| UFP Technologies, Inc. (a) | | 1,206 | 234,766 |
| Zynex, Inc. (a)(b) | | 8,754 | 85,439 |
| | | | 3,849,099 |
| Health Care Providers & Services - 3.4% | | | |
| Acadia Healthcare Co., Inc. (a) | | 3,444 | 272,179 |
| Addus HomeCare Corp. (a) | | 1,434 | 131,311 |
| Amedisys, Inc. (a) | | 1,944 | 176,593 |
| AMN Healthcare Services, Inc. (a) | | 2,109 | 225,979 |
| Chemed Corp. | | 556 | 289,726 |
| Corvel Corp. (a) | | 828 | 169,376 |
| Cross Country Healthcare, Inc. (a) | | 4,744 | 122,395 |
| DaVita HealthCare Partners, Inc. (a) | | 2,590 | 264,154 |
| DocGo, Inc. Class A (a) | | 13,573 | 113,877 |
| Encompass Health Corp. | | 4,128 | 272,572 |
| HealthEquity, Inc. (a) | | 3,863 | 262,452 |
| Henry Schein, Inc. (a) | | 4,315 | 339,979 |
| National Healthcare Corp. | | 2,198 | 129,726 |
| National Research Corp. Class A | | 2,881 | 123,624 |
| Option Care Health, Inc. (a) | | 7,448 | 251,593 |
| Premier, Inc. | | 6,123 | 169,913 |
| Select Medical Holdings Corp. | | 6,198 | 186,002 |
| The Ensign Group, Inc. | | 2,475 | 239,753 |
| U.S. Physical Therapy, Inc. | | 1,425 | 165,685 |
| Universal Health Services, Inc. Class B | | 2,199 | 305,573 |
| | | | 4,212,462 |
| Health Care Technology - 0.5% | | | |
| Computer Programs & Systems, Inc. (a) | | 4,339 | 113,769 |
| Doximity, Inc. (a)(b) | | 5,480 | 195,800 |
| HealthStream, Inc. | | 5,398 | 121,347 |
| Simulations Plus, Inc. (b) | | 3,148 | 156,770 |
| | | | 587,686 |
| Life Sciences Tools & Services - 0.5% | | | |
| Bruker Corp. | | 3,828 | 263,060 |
| Maravai LifeSciences Holdings, Inc. (a) | | 10,035 | 113,496 |
| Medpace Holdings, Inc. (a) | | 1,050 | 265,829 |
| | | | 642,385 |
| Pharmaceuticals - 1.7% | | | |
| Amphastar Pharmaceuticals, Inc. (a) | | 4,625 | 280,691 |
| Catalent, Inc. (a) | | 6,057 | 293,886 |
| Corcept Therapeutics, Inc. (a) | | 6,938 | 176,780 |
| Harmony Biosciences Holdings, Inc. (a) | | 3,085 | 109,116 |
| Innoviva, Inc. (a) | | 10,533 | 142,722 |
| Jazz Pharmaceuticals PLC (a) | | 2,146 | 279,881 |
| Organon & Co. | | 9,478 | 208,326 |
| Perrigo Co. PLC | | 6,156 | 225,556 |
| Prestige Brands Holdings, Inc. (a) | | 3,052 | 199,021 |
| Supernus Pharmaceuticals, Inc. (a) | | 4,005 | 122,913 |
| Ventyx Biosciences, Inc. (a) | | 3,362 | 124,562 |
| | | | 2,163,454 |
TOTAL HEALTH CARE | | | 15,657,258 |
| INDUSTRIALS - 18.7% | | | |
| Aerospace & Defense - 1.1% | | | |
| BWX Technologies, Inc. | | 3,698 | 255,162 |
| Curtiss-Wright Corp. | | 1,462 | 279,768 |
| Hexcel Corp. | | 3,299 | 233,173 |
| Huntington Ingalls Industries, Inc. | | 1,355 | 311,203 |
| Moog, Inc. Class A | | 1,731 | 182,517 |
| Parsons Corp. (a) | | 3,072 | 151,818 |
| | | | 1,413,641 |
| Air Freight & Logistics - 0.6% | | | |
| C.H. Robinson Worldwide, Inc. | | 3,584 | 359,045 |
| Forward Air Corp. | | 1,498 | 178,022 |
| Hub Group, Inc. Class A (a) | | 1,847 | 166,470 |
| | | | 703,537 |
| Building Products - 2.3% | | | |
| A.O. Smith Corp. | | 4,266 | 309,840 |
| AAON, Inc. | | 2,216 | 233,256 |
| Allegion PLC | | 2,786 | 325,572 |
| Apogee Enterprises, Inc. | | 2,652 | 131,354 |
| CSW Industrials, Inc. | | 1,044 | 188,494 |
| Griffon Corp. | | 3,512 | 146,521 |
| Lennox International, Inc. | | 1,082 | 397,570 |
| MasterBrand, Inc. | | 13,514 | 166,898 |
| Owens Corning | | 3,066 | 429,209 |
| Simpson Manufacturing Co. Ltd. | | 1,853 | 292,774 |
| UFP Industries, Inc. | | 2,404 | 247,035 |
| | | | 2,868,523 |
| Commercial Services & Supplies - 1.6% | | | |
| Brady Corp. Class A | | 2,905 | 149,840 |
| Casella Waste Systems, Inc. Class A (a) | | 2,398 | 193,495 |
| Clean Harbors, Inc. (a) | | 1,899 | 315,728 |
| CoreCivic, Inc. (a) | | 12,342 | 119,717 |
| Ennis, Inc. | | 5,416 | 116,661 |
| MSA Safety, Inc. | | 1,548 | 256,968 |
| Rollins, Inc. | | 7,964 | 325,170 |
| Tetra Tech, Inc. | | 1,825 | 308,808 |
| The GEO Group, Inc. (a) | | 11,502 | 85,920 |
| UniFirst Corp. | | 836 | 135,683 |
| | | | 2,007,990 |
| Construction & Engineering - 1.9% | | | |
| AECOM | | 4,264 | 370,968 |
| Arcosa, Inc. | | 2,784 | 214,869 |
| Comfort Systems U.S.A., Inc. | | 1,633 | 284,093 |
| EMCOR Group, Inc. | | 1,742 | 374,600 |
| MasTec, Inc. (a) | | 2,350 | 276,713 |
| MDU Resources Group, Inc. | | 7,772 | 171,917 |
| MYR Group, Inc. (a) | | 1,395 | 198,871 |
| Northwest Pipe Co. (a) | | 2,959 | 96,404 |
| Sterling Construction Co., Inc. (a) | | 3,520 | 211,165 |
| Valmont Industries, Inc. | | 792 | 209,682 |
| | | | 2,409,282 |
| Electrical Equipment - 1.1% | | | |
| Acuity Brands, Inc. | | 1,254 | 207,211 |
| Atkore, Inc. (a) | | 1,643 | 260,695 |
| Encore Wire Corp. | | 1,008 | 172,056 |
| nVent Electric PLC | | 6,305 | 333,408 |
| Regal Rexnord Corp. | | 2,119 | 330,945 |
| | | | 1,304,315 |
| Ground Transportation - 0.8% | | | |
| Knight-Swift Transportation Holdings, Inc. Class A | | 5,176 | 314,442 |
| Landstar System, Inc. | | 1,356 | 276,068 |
| Marten Transport Ltd. | | 5,798 | 131,383 |
| Universal Logistics Holdings, Inc. | | 2,889 | 89,819 |
| Werner Enterprises, Inc. | | 3,390 | 159,398 |
| | | | 971,110 |
| Machinery - 4.4% | | | |
| AGCO Corp. | | 2,150 | 286,165 |
| Alamo Group, Inc. | | 872 | 168,959 |
| Albany International Corp. Class A | | 1,598 | 153,855 |
| Allison Transmission Holdings, Inc. | | 4,305 | 252,660 |
| Crane Co. | | 1,923 | 180,166 |
| Crane Nxt Co. | | 1,932 | 114,278 |
| Donaldson Co., Inc. | | 4,324 | 271,677 |
| ESAB Corp. | | 2,811 | 193,116 |
| ESCO Technologies, Inc. | | 1,603 | 161,182 |
| Federal Signal Corp. | | 3,225 | 197,015 |
| Franklin Electric Co., Inc. | | 1,955 | 193,193 |
| Graco, Inc. | | 5,161 | 409,422 |
| Hillenbrand, Inc. | | 3,636 | 188,854 |
| ITT, Inc. | | 2,939 | 292,724 |
| Kadant, Inc. | | 738 | 164,463 |
| Lincoln Electric Holdings, Inc. | | 1,873 | 375,930 |
| Lindsay Corp. | | 911 | 120,735 |
| Mueller Industries, Inc. | | 2,727 | 221,051 |
| RBC Bearings, Inc. (a) | | 1,056 | 238,709 |
| SPX Technologies, Inc. (a) | | 2,332 | 197,311 |
| Standex International Corp. | | 1,119 | 166,250 |
| Terex Corp. | | 3,461 | 202,918 |
| Timken Co. | | 2,648 | 245,893 |
| Toro Co. | | 3,201 | 325,382 |
| Watts Water Technologies, Inc. Class A | | 1,206 | 224,955 |
| | | | 5,546,863 |
| Marine Transportation - 0.2% | | | |
| Matson, Inc. | | 2,285 | 213,556 |
| Professional Services - 3.4% | | | |
| Barrett Business Services, Inc. | | 1,208 | 109,602 |
| CACI International, Inc. Class A (a) | | 857 | 300,327 |
| CBIZ, Inc. (a) | | 3,244 | 171,575 |
| Concentrix Corp. | | 1,644 | 136,847 |
| CSG Systems International, Inc. | | 2,423 | 125,003 |
| ExlService Holdings, Inc. (a) | | 1,357 | 191,269 |
| Exponent, Inc. | | 2,100 | 188,118 |
| FTI Consulting, Inc. (a) | | 1,400 | 245,224 |
| Genpact Ltd. | | 5,993 | 216,287 |
| Huron Consulting Group, Inc. (a) | | 1,926 | 182,142 |
| ICF International, Inc. | | 1,356 | 159,452 |
| Insperity, Inc. | | 1,693 | 199,181 |
| KBR, Inc. | | 5,031 | 309,356 |
| Kforce, Inc. | | 2,215 | 140,520 |
| Korn Ferry | | 2,971 | 156,512 |
| Manpower, Inc. | | 2,251 | 177,559 |
| Maximus, Inc. | | 2,779 | 232,769 |
| NV5 Global, Inc. (a) | | 1,011 | 110,755 |
| Paylocity Holding Corp. (a) | | 1,387 | 314,641 |
| Resources Connection, Inc. | | 6,457 | 103,183 |
| Robert Half, Inc. | | 3,560 | 263,974 |
| Science Applications International Corp. | | 2,202 | 267,191 |
| | | | 4,301,487 |
| Trading Companies & Distributors - 1.3% | | | |
| Applied Industrial Technologies, Inc. | | 1,556 | 225,604 |
| Boise Cascade Co. | | 2,177 | 225,298 |
| McGrath RentCorp. | | 1,521 | 146,594 |
| MSC Industrial Direct Co., Inc. Class A | | 2,196 | 221,620 |
| Rush Enterprises, Inc. Class A | | 2,739 | 177,159 |
| Triton International Ltd. | | 2,716 | 228,986 |
| Watsco, Inc. (b) | | 1,059 | 400,503 |
| | | | 1,625,764 |
TOTAL INDUSTRIALS | | | 23,366,068 |
| INFORMATION TECHNOLOGY - 13.8% | | | |
| Communications Equipment - 1.1% | | | |
| Ciena Corp. (a) | | 5,372 | 226,698 |
| Clearfield, Inc. (a)(b) | | 1,796 | 83,945 |
| Digi International, Inc. (a) | | 3,757 | 157,531 |
| F5, Inc. (a) | | 2,009 | 317,904 |
| Harmonic, Inc. (a) | | 9,665 | 144,202 |
| Juniper Networks, Inc. | | 10,591 | 294,430 |
| NetScout Systems, Inc. (a) | | 4,846 | 135,446 |
| | | | 1,360,156 |
| Electronic Equipment, Instruments & Components - 4.4% | | | |
| Advanced Energy Industries, Inc. | | 1,912 | 239,344 |
| Arrow Electronics, Inc. (a) | | 2,176 | 310,167 |
| Avnet, Inc. | | 4,330 | 210,005 |
| Badger Meter, Inc. | | 1,561 | 257,003 |
| Bel Fuse, Inc. Class B (non-vtg.) | | 3,027 | 162,399 |
| Belden, Inc. | | 2,219 | 214,444 |
| Cognex Corp. | | 5,717 | 312,263 |
| CTS Corp. | | 3,020 | 134,783 |
| ePlus, Inc. (a) | | 2,626 | 147,975 |
| Fabrinet (a) | | 1,620 | 200,297 |
| Insight Enterprises, Inc. (a) | | 1,607 | 235,731 |
| IPG Photonics Corp. (a) | | 1,644 | 216,104 |
| Jabil, Inc. | | 4,297 | 475,549 |
| Littelfuse, Inc. | | 944 | 287,542 |
| Methode Electronics, Inc. Class A | | 2,969 | 99,877 |
| Napco Security Technologies, Inc. | | 4,177 | 156,554 |
| National Instruments Corp. | | 4,885 | 288,215 |
| Novanta, Inc. (a) | | 1,422 | 251,552 |
| OSI Systems, Inc. (a) | | 1,473 | 175,626 |
| PC Connection, Inc. | | 2,369 | 114,683 |
| Plexus Corp. (a) | | 1,694 | 166,842 |
| Sanmina Corp. (a) | | 2,970 | 182,536 |
| TD SYNNEX Corp. | | 1,962 | 193,669 |
| TTM Technologies, Inc. (a) | | 8,886 | 127,603 |
| Vishay Intertechnology, Inc. | | 7,315 | 205,917 |
| Vishay Precision Group, Inc. (a) | | 2,780 | 104,000 |
| | | | 5,470,680 |
| IT Services - 0.6% | | | |
| Amdocs Ltd. | | 3,833 | 358,922 |
| DXC Technology Co. (a) | | 8,727 | 241,302 |
| Hackett Group, Inc. | | 5,324 | 123,783 |
| | | | 724,007 |
| Semiconductors & Semiconductor Equipment - 2.6% | | | |
| Amkor Technology, Inc. | | 5,763 | 167,646 |
| Axcelis Technologies, Inc. (a) | | 1,635 | 327,785 |
| Cirrus Logic, Inc. (a) | | 2,358 | 190,526 |
| Diodes, Inc. (a) | | 2,139 | 202,114 |
| Kulicke & Soffa Industries, Inc. | | 3,139 | 187,963 |
| Lattice Semiconductor Corp. (a) | | 4,341 | 394,771 |
| NVE Corp. (b) | | 1,607 | 127,290 |
| Onto Innovation, Inc. (a) | | 2,336 | 290,412 |
| Photronics, Inc. (a) | | 6,985 | 184,753 |
| Power Integrations, Inc. | | 2,455 | 238,479 |
| Qorvo, Inc. (a) | | 3,250 | 357,565 |
| Rambus, Inc. (a) | | 4,813 | 301,342 |
| Universal Display Corp. | | 1,743 | 254,269 |
| | | | 3,224,915 |
| Software - 3.9% | | | |
| A10 Networks, Inc. | | 8,158 | 126,612 |
| ACI Worldwide, Inc. (a) | | 6,286 | 145,772 |
| Adeia, Inc. | | 12,178 | 146,380 |
| Agilysys, Inc. (a) | | 1,749 | 128,779 |
| Alarm.com Holdings, Inc. (a) | | 2,971 | 164,029 |
| Aspen Technology, Inc. (a) | | 1,169 | 208,667 |
| Bentley Systems, Inc. Class B | | 6,891 | 371,287 |
| Black Knight, Inc. (a) | | 5,196 | 365,383 |
| BlackLine, Inc. (a) | | 2,594 | 150,660 |
| Box, Inc. Class A (a) | | 6,268 | 195,875 |
| CommVault Systems, Inc. (a) | | 2,623 | 204,410 |
| Dolby Laboratories, Inc. Class A | | 2,671 | 236,677 |
| DoubleVerify Holdings, Inc. (a) | | 5,494 | 231,297 |
| Dropbox, Inc. Class A (a) | | 10,392 | 280,064 |
| Dynatrace, Inc. (a) | | 6,777 | 370,634 |
| Manhattan Associates, Inc. (a) | | 2,155 | 410,786 |
| Model N, Inc. (a) | | 3,450 | 114,954 |
| Progress Software Corp. | | 2,860 | 171,772 |
| Qualys, Inc. (a) | | 1,640 | 227,632 |
| SPS Commerce, Inc. (a) | | 1,553 | 280,146 |
| Teradata Corp. (a) | | 5,229 | 297,269 |
| | | | 4,829,085 |
| Technology Hardware, Storage & Peripherals - 1.2% | | | |
| Dell Technologies, Inc. | | 8,265 | 437,384 |
| Pure Storage, Inc. Class A (a) | | 9,773 | 361,503 |
| Super Micro Computer, Inc. (a) | | 2,340 | 772,821 |
| | | | 1,571,708 |
TOTAL INFORMATION TECHNOLOGY | | | 17,180,551 |
| MATERIALS - 5.0% | | | |
| Chemicals - 2.0% | | | |
| American Vanguard Corp. | | 5,258 | 94,959 |
| Balchem Corp. | | 1,464 | 197,259 |
| Chase Corp. | | 1,251 | 157,488 |
| Huntsman Corp. | | 7,176 | 213,630 |
| Ingevity Corp. (a) | | 2,001 | 128,104 |
| Innospec, Inc. | | 1,465 | 156,960 |
| NewMarket Corp. | | 439 | 198,296 |
| Olin Corp. | | 4,482 | 258,522 |
| RPM International, Inc. | | 3,994 | 412,620 |
| Sensient Technologies Corp. | | 2,271 | 145,435 |
| Stepan Co. | | 1,391 | 133,286 |
| The Chemours Co. LLC | | 6,277 | 232,123 |
| Westlake Corp. | | 1,607 | 220,963 |
| | | | 2,549,645 |
| Construction Materials - 0.3% | | | |
| Eagle Materials, Inc. | | 1,514 | 279,136 |
| Knife River Holding Co. | | 1,928 | 83,810 |
| | | | 362,946 |
| Containers & Packaging - 1.4% | | | |
| Aptargroup, Inc. | | 2,344 | 284,702 |
| Berry Global Group, Inc. | | 4,386 | 287,590 |
| Graphic Packaging Holding Co. | | 11,223 | 271,597 |
| Greif, Inc. Class A | | 2,155 | 159,405 |
| Myers Industries, Inc. | | 5,210 | 102,168 |
| Silgan Holdings, Inc. | | 3,768 | 165,227 |
| Sonoco Products Co. (b) | | 3,859 | 226,292 |
| WestRock Co. | | 8,582 | 285,695 |
| | | | 1,782,676 |
| Metals & Mining - 1.0% | | | |
| Alpha Metallurgical Resources | | 972 | 168,370 |
| Commercial Metals Co. | | 4,474 | 256,002 |
| Royal Gold, Inc. | | 2,276 | 273,439 |
| Ryerson Holding Corp. | | 3,121 | 132,611 |
| United States Steel Corp. (b) | | 8,798 | 224,349 |
| Warrior Metropolitan Coal, Inc. | | 3,906 | 172,841 |
| | | | 1,227,612 |
| Paper & Forest Products - 0.3% | | | |
| Louisiana-Pacific Corp. | | 3,047 | 231,968 |
| Sylvamo Corp. | | 2,926 | 143,579 |
| | | | 375,547 |
TOTAL MATERIALS | | | 6,298,426 |
| REAL ESTATE - 6.0% | | | |
| Equity Real Estate Investment Trusts (REITs) - 5.9% | | | |
| Agree Realty Corp. | | 3,202 | 207,426 |
| American Homes 4 Rent Class A | | 9,389 | 351,900 |
| Americold Realty Trust | | 8,822 | 286,009 |
| Apartment Income (REIT) Corp. | | 5,640 | 194,806 |
| Apartment Investment & Management Co. Class A | | 15,334 | 127,732 |
| Apple Hospitality (REIT), Inc. | | 9,888 | 153,264 |
| Brixmor Property Group, Inc. | | 10,518 | 239,179 |
| Broadstone Net Lease, Inc. | | 8,931 | 145,575 |
| CareTrust (REIT), Inc. | | 6,589 | 136,985 |
| City Office REIT, Inc. | | 10,102 | 55,258 |
| Corporate Office Properties Trust (SBI) | | 5,857 | 152,282 |
| Cousins Properties, Inc. | | 6,634 | 162,069 |
| CubeSmart | | 6,944 | 301,092 |
| EastGroup Properties, Inc. | | 1,496 | 265,061 |
| Equity Commonwealth | | 6,055 | 118,617 |
| Essential Properties Realty Trust, Inc. | | 6,808 | 167,136 |
| Federal Realty Investment Trust (SBI) | | 2,430 | 246,694 |
| First Industrial Realty Trust, Inc. | | 4,611 | 238,389 |
| Four Corners Property Trust, Inc. | | 5,068 | 133,288 |
| Getty Realty Corp. | | 3,537 | 114,316 |
| Kilroy Realty Corp. | | 4,521 | 161,400 |
| Lamar Advertising Co. Class A | | 2,761 | 272,511 |
| LTC Properties, Inc. | | 3,315 | 111,251 |
| LXP Industrial Trust (REIT) | | 13,996 | 140,940 |
| Medical Properties Trust, Inc. (b) | | 20,372 | 205,553 |
| National Health Investors, Inc. | | 2,524 | 138,593 |
| NexPoint Diversified Real Estate Trust | | 7,728 | 90,340 |
| NNN (REIT), Inc. | | 5,894 | 251,556 |
| Omega Healthcare Investors, Inc. | | 8,253 | 263,271 |
| Phillips Edison & Co., Inc. (b) | | 5,300 | 187,143 |
| Physicians Realty Trust | | 10,755 | 158,529 |
| Potlatch Corp. | | 3,651 | 195,803 |
| Regency Centers Corp. | | 4,775 | 312,906 |
| Rexford Industrial Realty, Inc. | | 5,450 | 300,241 |
| Sabra Health Care REIT, Inc. | | 11,839 | 153,789 |
| Spirit Realty Capital, Inc. | | 5,223 | 210,644 |
| Stag Industrial, Inc. | | 6,488 | 235,514 |
| Terreno Realty Corp. | | 2,890 | 171,493 |
| Universal Health Realty Income Trust (SBI) | | 1,896 | 90,496 |
| | | | 7,449,051 |
| Real Estate Management & Development - 0.1% | | | |
| The RMR Group, Inc. | | 3,289 | 77,555 |
TOTAL REAL ESTATE | | | 7,526,606 |
| UTILITIES - 2.6% | | | |
| Electric Utilities - 1.4% | | | |
| Allete, Inc. | | 2,898 | 166,432 |
| Hawaiian Electric Industries, Inc. | | 4,804 | 184,426 |
| IDACORP, Inc. | | 2,058 | 211,604 |
| NRG Energy, Inc. | | 8,055 | 306,009 |
| OGE Energy Corp. | | 7,013 | 253,520 |
| Otter Tail Corp. (b) | | 2,487 | 201,472 |
| Pinnacle West Capital Corp. | | 3,830 | 317,201 |
| PNM Resources, Inc. | | 4,010 | 179,728 |
| | | | 1,820,392 |
| Gas Utilities - 0.5% | | | |
| National Fuel Gas Co. | | 3,808 | 202,243 |
| New Jersey Resources Corp. | | 4,101 | 183,315 |
| ONE Gas, Inc. (b) | | 2,430 | 192,286 |
| | | | 577,844 |
| Independent Power and Renewable Electricity Producers - 0.2% | | | |
| Clearway Energy, Inc. Class C | | 5,552 | 146,628 |
| Ormat Technologies, Inc. (b) | | 2,184 | 177,559 |
| | | | 324,187 |
| Multi-Utilities - 0.4% | | | |
| Black Hills Corp. | | 2,845 | 171,639 |
| NorthWestern Energy Corp. | | 3,047 | 172,064 |
| Unitil Corp. | | 2,317 | 120,577 |
| | | | 464,280 |
| Water Utilities - 0.1% | | | |
| Artesian Resources Corp. Class A | | 1,879 | 85,607 |
TOTAL UTILITIES | | | 3,272,310 |
| TOTAL COMMON STOCKS (Cost $116,197,908) | | | 124,513,220 |
| | | | |
| Money Market Funds - 3.7% |
| | | Shares | Value ($) |
| Fidelity Cash Central Fund 5.32% (c) | | 217,373 | 217,417 |
| Fidelity Securities Lending Cash Central Fund 5.32% (c)(d) | | 4,431,607 | 4,432,050 |
| TOTAL MONEY MARKET FUNDS (Cost $4,649,467) | | | 4,649,467 |
| | | | |
| TOTAL INVESTMENT IN SECURITIES - 103.3% (Cost $120,847,375) | 129,162,687 |
NET OTHER ASSETS (LIABILITIES) - (3.3)% | (4,186,491) |
| NET ASSETS - 100.0% | 124,976,196 |
| | |
| Futures Contracts |
| | Number of contracts | Expiration Date | Notional Amount ($) | Value ($) | Unrealized Appreciation/ (Depreciation) ($) |
| Purchased | | | | | |
| | | | | | |
| Equity Index Contracts | | | | | |
| CME E-mini Russell 2000 Index Contracts (United States) | 4 | Sep 2023 | 402,720 | 12,952 | 12,952 |
| | | | | | |
| The notional amount of futures purchased as a percentage of Net Assets is 0.3% |
Legend
| (b) | Security or a portion of the security is on loan at period end. |
| (c) | Affiliated fund that is generally available only to investment companies and other accounts managed by Fidelity Investments. The rate quoted is the annualized seven-day yield of the fund at period end. A complete unaudited listing of the fund's holdings as of its most recent quarter end is available upon request. In addition, each Fidelity Central Fund's financial statements, which are not covered by the Fund's Report of Independent Registered Public Accounting Firm, are available on the SEC's website or upon request. |
| (d) | Investment made with cash collateral received from securities on loan. |
Affiliated Central Funds
Fiscal year to date information regarding the Fund's investments in Fidelity Central Funds, including the ownership percentage, is presented below.
| Affiliate | Value, beginning of period ($) | Purchases ($) | Sales Proceeds ($) | Dividend Income ($) | Realized Gain (loss) ($) | Change in Unrealized appreciation (depreciation) ($) | Value, end of period ($) | % ownership, end of period |
| Fidelity Cash Central Fund 5.32% | 79,549 | 4,084,812 | 3,946,944 | 4,938 | - | - | 217,417 | 0.0% |
| Fidelity Securities Lending Cash Central Fund 5.32% | 1,034,050 | 16,294,733 | 12,896,733 | 18,149 | - | - | 4,432,050 | 0.0% |
| Total | 1,113,599 | 20,379,545 | 16,843,677 | 23,087 | - | - | 4,649,467 | |
| | | | | | | | | |
Amounts in the dividend income column in the above table include any capital gain distributions from underlying funds, which are presented in the corresponding line item in the Statement of Operations, if applicable.
Amounts in the dividend income column for Fidelity Securities Lending Cash Central Fund represents the income earned on investing cash collateral, less rebates paid to borrowers and any lending agent fees associated with the loan, plus any premium payments received for lending certain types of securities.
Amounts included in the purchases and sales proceeds columns may include in-kind transactions, if applicable.
Investment Valuation
The following is a summary of the inputs used, as of July 31, 2023, involving the Fund's assets and liabilities carried at fair value. The inputs or methodology used for valuing securities may not be an indication of the risk associated with investing in those securities. For more information on valuation inputs, and their aggregation into the levels used below, please refer to the Investment Valuation section in the accompanying Notes to Financial Statements.
| Valuation Inputs at Reporting Date: |
| Description | Total ($) | Level 1 ($) | Level 2 ($) | Level 3 ($) |
Investments in Securities: | | | | |
|
| Equities: | | | | |
Communication Services | 3,800,637 | 3,800,637 | - | - |
Consumer Discretionary | 17,618,377 | 17,618,377 | - | - |
Consumer Staples | 4,710,423 | 4,710,423 | - | - |
Energy | 6,043,254 | 6,043,254 | - | - |
Financials | 19,039,310 | 19,039,310 | - | - |
Health Care | 15,657,258 | 15,657,258 | - | - |
Industrials | 23,366,068 | 23,366,068 | - | - |
Information Technology | 17,180,551 | 17,180,551 | - | - |
Materials | 6,298,426 | 6,298,426 | - | - |
Real Estate | 7,526,606 | 7,526,606 | - | - |
Utilities | 3,272,310 | 3,272,310 | - | - |
|
| Money Market Funds | 4,649,467 | 4,649,467 | - | - |
| Total Investments in Securities: | 129,162,687 | 129,162,687 | - | - |
Derivative Instruments: | | | | |
|
| Assets | | | | |
Futures Contracts | 12,952 | 12,952 | - | - |
| Total Assets | 12,952 | 12,952 | - | - |
| Total Derivative Instruments: | 12,952 | 12,952 | - | - |
Value of Derivative Instruments
The following table is a summary of the Fund's value of derivative instruments by primary risk exposure as of July 31, 2023. For additional information on derivative instruments, please refer to the Derivative Instruments section in the accompanying Notes to Financial Statements.
Primary Risk Exposure / Derivative Type | Value |
| Asset ($) | Liability ($) |
| Equity Risk | | |
Futures Contracts (a) | 12,952 | 0 |
| Total Equity Risk | 12,952 | 0 |
| Total Value of Derivatives | 12,952 | 0 |
(a)Reflects gross cumulative appreciation (depreciation) on futures contracts as presented in the Schedule of Investments. In the Statement of Assets and Liabilities, the period end daily variation margin is included in receivable or payable for daily variation margin on futures contracts, and the net cumulative appreciation (depreciation) is included in Total accumulated earnings (loss).
Fidelity® Small-Mid Multifactor ETF
| Statement of Assets and Liabilities |
| | | | July 31, 2023 |
| | | | | |
| Assets | | | | |
| Investment in securities, at value (including securities loaned of $4,357,805) - See accompanying schedule: | | | | |
Unaffiliated issuers (cost $116,197,908) | $ | 124,513,220 | | |
Fidelity Central Funds (cost $4,649,467) | | 4,649,467 | | |
| | | | | |
| | | | | |
| Total Investment in Securities (cost $120,847,375) | | | $ | 129,162,687 |
| Segregated cash with brokers for derivative instruments | | | | 12,400 |
| Foreign currency held at value (cost $1,224) | | | | 1,201 |
| Receivable for investments sold | | | | 203,986 |
| Dividends receivable | | | | 51,195 |
| Distributions receivable from Fidelity Central Funds | | | | 4,916 |
| Receivable for daily variation margin on futures contracts | | | | 2,256 |
| Other receivables | | | | 1,096 |
Total assets | | | | 129,439,737 |
| Liabilities | | | | |
| Payable to custodian bank | $ | 2,992 | | |
| Accrued management fee | | 28,499 | | |
| Collateral on securities loaned | | 4,432,050 | | |
| Total Liabilities | | | | 4,463,541 |
| Net Assets | | | $ | 124,976,196 |
| Net Assets consist of: | | | | |
| Paid in capital | | | $ | 125,109,278 |
| Total accumulated earnings (loss) | | | | (133,082) |
| Net Assets | | | $ | 124,976,196 |
Net Asset Value, offering price and redemption price per share ($124,976,196 ÷ 3,600,000 shares) | | | $ | 34.72 |
| Statement of Operations |
| | | | Year ended July 31, 2023 |
| Investment Income | | | | |
| Dividends | | | $ | 1,784,686 |
| Income from Fidelity Central Funds (including $18,149 from security lending) | | | | 23,087 |
| Total Income | | | | 1,807,773 |
| Expenses | | | | |
| Management fee | $ | 270,645 | | |
| Independent trustees' fees and expenses | | 441 | | |
| Total expenses before reductions | | 271,086 | | |
| Expense reductions | | (405) | | |
| Total expenses after reductions | | | | 270,681 |
| Net Investment income (loss) | | | | 1,537,092 |
| Realized and Unrealized Gain (Loss) | | | | |
| Net realized gain (loss) on: | | | | |
| Investment Securities: | | | | |
| Unaffiliated issuers | | (2,649,594) | | |
| Redemptions in-kind | | 95,289 | | |
| Foreign currency transactions | | (3,159) | | |
| Futures contracts | | (14,920) | | |
| Total net realized gain (loss) | | | | (2,572,384) |
| Change in net unrealized appreciation (depreciation) on: | | | | |
| Investment Securities: | | | | |
| Unaffiliated issuers | | 10,090,207 | | |
| Assets and liabilities in foreign currencies | | (25) | | |
| Futures contracts | | 4,090 | | |
| Total change in net unrealized appreciation (depreciation) | | | | 10,094,272 |
| Net gain (loss) | | | | 7,521,888 |
| Net increase (decrease) in net assets resulting from operations | | | $ | 9,058,980 |
| Statement of Changes in Net Assets |
| |
| | Year ended July 31, 2023 | | Year ended July 31, 2022 |
| Increase (Decrease) in Net Assets | | | | |
| Operations | | | | |
| Net investment income (loss) | $ | 1,537,092 | $ | 888,934 |
| Net realized gain (loss) | | (2,572,384) | | 5,306,202 |
| Change in net unrealized appreciation (depreciation) | | 10,094,272 | | (9,612,227) |
| Net increase (decrease) in net assets resulting from operations | | 9,058,980 | | (3,417,091) |
| Distributions to shareholders | | (1,518,700) | | (905,700) |
| | | | | |
| Share transactions | | | | |
| Proceeds from sales of shares | | 48,425,159 | | 67,940,474 |
| Cost of shares redeemed | | (2,938,248) | | (59,607,816) |
| | | | | |
Net increase (decrease) in net assets resulting from share transactions | | 45,486,911 | | 8,332,658 |
| Total increase (decrease) in net assets | | 53,027,191 | | 4,009,867 |
| | | | | |
| Net Assets | | | | |
| Beginning of period | | 71,949,005 | | 67,939,138 |
| End of period | $ | 124,976,196 | $ | 71,949,005 |
| | | | | |
| Other Information | | | | |
| Shares | | | | |
| Sold | | 1,500,000 | | 2,000,000 |
| Redeemed | | (100,000) | | (1,800,000) |
| Net increase (decrease) | | 1,400,000 | | 200,000 |
| | | | | |
| Fidelity® Small-Mid Multifactor ETF |
| |
| Years ended July 31, | | 2023 | | 2022 | | 2021 | | 2020 | | 2019 A |
Selected Per-Share Data | | | | | | | | | | |
| Net asset value, beginning of period | $ | 32.70 | $ | 33.97 | $ | 23.90 | $ | 25.50 | $ | 24.85 |
| Income from Investment Operations | | | | | | | | | | |
Net investment income (loss) B,C | | .53 | | .45 | | .38 | | .31 | | .18 |
| Net realized and unrealized gain (loss) | | 2.01 | | (1.26) | | 10.11 | | (1.58) | | .64 |
| Total from investment operations | | 2.54 | | (.81) | | 10.49 | | (1.27) | | .82 |
| Distributions from net investment income | | (.52) | | (.46) | | (.42) | | (.33) | | (.17) |
| Total distributions | | (.52) | | (.46) | | (.42) | | (.33) | | (.17) |
| Net asset value, end of period | $ | 34.72 | $ | 32.70 | $ | 33.97 | $ | 23.90 | $ | 25.50 |
Total Return D,E,F | | 7.92% | | (2.35)% | | 44.21% | | (4.90)% | | 3.35% |
Ratios to Average Net Assets C,G,H | | | | | | | | | | |
| Expenses before reductions | | .29% | | .29% | | .29% | | .29% | | .29% I |
| Expenses net of fee waivers, if any | | .29% | | .29% | | .29% | | .29% | | .29% I |
| Expenses net of all reductions | | .29% | | .29% | | .29% | | .29% | | .29% I |
| Net investment income (loss) | | 1.65% | | 1.35% | | 1.23% | | 1.32% | | 1.70% I |
| Supplemental Data | | | | | | | | | | |
| Net assets, end of period (000 omitted) | $ | 124,976 | $ | 71,949 | $ | 67,939 | $ | 19,117 | $ | 7,650 |
Portfolio turnover rate J,K | | 65% | | 60% | | 61% | | 52% | | 2% L |
AFor the period February 26, 2019 (commencement of operations) through July 31, 2019.
BCalculated based on average shares outstanding during the period.
CNet investment income (loss) is affected by the timing of the declaration of dividends by any underlying mutual funds or exchange-traded funds (ETFs). Net investment income (loss) of any mutual funds or ETFs is not included in the Fund's net investment income (loss) ratio.
DTotal returns for periods of less than one year are not annualized.
EBased on net asset value.
FTotal returns would have been lower if certain expenses had not been reduced during the applicable periods shown.
GFees and expenses of any underlying mutual funds or exchange-traded funds (ETFs) are not included in the Fund's expense ratio. The Fund indirectly bears its proportionate share of these expenses. For additional expense information related to investments in Fidelity Central Funds, please refer to the "Investments in Fidelity Central Funds" note found in the Notes to Financial Statements section of the most recent Annual or Semi-Annual report.
HExpense ratios reflect operating expenses of the class. Expenses before reductions do not reflect amounts reimbursed, waived, or reduced through arrangements with the investment adviser, brokerage services, or other offset arrangements, if applicable, and do not represent the amount paid by the class during periods when reimbursements, waivers or reductions occur.
IAnnualized.
JAmount does not include the portfolio activity of any underlying mutual funds or exchange-traded funds (ETFs).
KPortfolio turnover rate excludes securities received or delivered in-kind.
LAmount not annualized.
NAV and closing market price average annual returns reflect the change in the value of an investment, assuming reinvestment of distributions from dividend income and capital gains (the profits earned upon the sale of securities that have grown in value, if any) at NAV and Market Price, respectively, and assumes a constant rate of performance each year. The hypothetical investment and the fund's returns do not reflect the deduction of taxes that a shareholder would pay on fund distributions or the redemption or selling of fund shares. How a fund did yesterday is no guarantee of how it will do tomorrow.
| Average Annual Total Returns |
| | | | |
Periods ended July 31, 2023 | Past 1 year | Life of Fund |
Fidelity® Stocks for Inflation ETF - NAV A | 7.77% | 10.73% |
Fidelity® Stocks for Inflation ETF - Market Price B | 7.80% | 10.66% |
Fidelity Stocks for Inflation Factor Index℠ A | 8.09% | 11.10% |
Russell 1000® Index A | 12.95% | 12.92% |
A From November 5, 2019
B From November 7, 2019, date initially listed on the Cboe BZX Exchange, Inc.
| $10,000 Over Life of Fund |
| |
Let's say hypothetically that $10,000 was invested in Fidelity® Stocks for Inflation ETF - NAV, on November 5, 2019, when the fund started. The chart shows how the value of your investment would have changed, and also shows how the Fidelity Stocks for Inflation Factor Index℠ and Russell 1000® Index performed over the same period. |
|
|
Fidelity® Stocks for Inflation ETF
Market Recap:
U.S. equities gained 13.02% for the 12 months ending July 31, 2023, according to the S&P 500® index, as continued global economic expansion, falling commodity prices and a slowing in the pace of inflation provided a favorable backdrop for higher-risk assets. Large-cap stocks spearheaded the rally, which was driven by the shares of a narrow set of mega-cap companies in the information technology and communication services sectors, largely due to exuberance related to generative artificial intelligence. Aggressive monetary tightening by the U.S. Federal Reserve continued amid consistent pressure on core inflation, a measure that excludes food and energy. Since March 2022, the Fed has hiked its benchmark interest rate 11 times. The latest bump came in late July, a fourth consecutive raise of a stepped down 25 basis points. The S&P 500® gained 3.21% in July, as a "soft landing" of the U.S. economy became the consensus view amid better-than-expected earnings, slowing inflation and easing financial conditions, bringing the index's year-to-date gain to 20.65%. July saw a continuance of the recent shift to wider market breadth and lower dispersion. For the full 12 months, value (+17%) handily topped growth (+8%) within the index. By sector, tech (+28%), communication services (+21%) and industrials (+17%) led, whereas real estate (-10%) lagged most, due to high borrowing costs, low home inventory and a deteriorating commercial property market.
Comments from the Geode Capital Management, LLC, passive equity index team:
For the fiscal year ending July 31, 2023, the exchange-traded fund's net asset value gained 7.77%, versus 8.09% for the Fidelity Stocks for Inflation Factor Index. The ETF's market price returned 7.80% the past 12 months, while the Russell 1000 Index increased 12.95%. By sector, information technology gained roughly 19% and contributed most. Exposure to financials stocks also helped (+20%). Materials rose 16% and industrials advanced 17%, propelled by capital goods (+30%) firms. Consumer discretionary companies gained 13%. Other notable contributors included the health care (+2%), consumer staples (+2%) and energy (+0.4%) sectors. Conversely, utilities returned -13% and detracted most. Communication services (-10%) and real estate (0%) stocks also hurt. Turning to individual holdings, the top contributor was Apple (+22%), from the technology hardware & equipment group. Stakes in Steel Dynamics (+33%) and Nucor (+30%), within the materials category, also helped the fund's performance. Exposure to Microsoft (+21%), from the software & services industry, proved beneficial as well. Lastly, Eli Lilly (+42%), from the pharmaceuticals, biotechnology & life sciences category, further boosted the fund's return. In contrast, the biggest individual detractor was Lumen Technologies (-63%), from the telecommunication services industry. An allocation to Tyson Foods (-29%), within the food, beverage & tobacco category, also hurt. Among pharmaceuticals, biotechnology & life sciences firms, Pfizer (-25%) and Moderna (-27%) detracted as well. Lastly, National Fuel Gas (-24%), a stock in the utilities industry, also was detrimental to performance.
The views expressed above reflect those of the portfolio manager(s) only through the end of the period as stated on the cover of this report and do not necessarily represent the views of Fidelity or any other person in the Fidelity organization, or Geode Capital Management, LLC, (the ETF's subadviser) or any other person in the Geode organization. Any such views are subject to change at any time based upon market or other conditions and Fidelity and Geode disclaim any responsibility to update such views. These views may not be relied on as investment advice and, because investment decisions for a Fidelity fund are based on numerous factors, may not be relied on as an indication of trading intent on behalf of any Fidelity fund.
Fidelity® Stocks for Inflation ETF
Top Holdings (% of Fund's net assets) |
| |
| Apple, Inc. | 6.2 | |
| Microsoft Corp. | 5.3 | |
| Exxon Mobil Corp. | 2.5 | |
| Nucor Corp. | 2.5 | |
| CF Industries Holdings, Inc. | 2.4 | |
| Eli Lilly & Co. | 2.2 | |
| Steel Dynamics, Inc. | 2.2 | |
| ConocoPhillips Co. | 2.0 | |
| Philip Morris International, Inc. | 1.9 | |
| PBF Energy, Inc. Class A | 1.8 | |
| | 29.0 | |
| |
| Market Sectors (% of Fund's net assets) |
| |
| Information Technology | 20.7 | |
| Health Care | 18.1 | |
| Consumer Staples | 10.5 | |
| Financials | 9.5 | |
| Energy | 9.2 | |
| Materials | 7.1 | |
| Industrials | 5.8 | |
| Consumer Discretionary | 5.8 | |
| Real Estate | 4.9 | |
| Utilities | 4.4 | |
| Communication Services | 3.7 | |
| |
Asset Allocation (% of Fund's net assets) |
|
Futures - 0.2% |
|
Fidelity® Stocks for Inflation ETF
Showing Percentage of Net Assets
| Common Stocks - 99.7% |
| | | Shares | Value ($) |
| COMMUNICATION SERVICES - 3.7% | | | |
| Diversified Telecommunication Services - 1.0% | | | |
| AT&T, Inc. | | 16,454 | 238,912 |
| Iridium Communications, Inc. | | 25,231 | 1,325,889 |
| | | | 1,564,801 |
| Interactive Media & Services - 2.2% | | | |
| Alphabet, Inc. Class A (a) | | 14,980 | 1,988,146 |
| Meta Platforms, Inc. Class A (a) | | 3,534 | 1,125,932 |
| Ziff Davis, Inc. (a) | | 1,800 | 130,536 |
| | | | 3,244,614 |
| Media - 0.5% | | | |
| Comcast Corp. Class A | | 9,088 | 411,323 |
| Nexstar Broadcasting Group, Inc. Class A | | 810 | 151,243 |
| TEGNA, Inc. | | 8,200 | 138,580 |
| | | | 701,146 |
TOTAL COMMUNICATION SERVICES | | | 5,510,561 |
| CONSUMER DISCRETIONARY - 5.8% | | | |
| Broadline Retail - 0.3% | | | |
| Macy's, Inc. | | 26,664 | 442,356 |
| Diversified Consumer Services - 0.4% | | | |
| H&R Block, Inc. | | 16,633 | 559,035 |
| Hotels, Restaurants & Leisure - 1.3% | | | |
| McDonald's Corp. | | 3,865 | 1,133,218 |
| Yum! Brands, Inc. | | 5,541 | 762,829 |
| | | | 1,896,047 |
| Household Durables - 0.5% | | | |
| Taylor Morrison Home Corp. (a) | | 17,337 | 839,458 |
| Specialty Retail - 3.3% | | | |
| Academy Sports & Outdoors, Inc. | | 10,416 | 622,773 |
| AutoZone, Inc. (a) | | 299 | 742,034 |
| Murphy U.S.A., Inc. | | 2,491 | 764,812 |
| O'Reilly Automotive, Inc. (a) | | 918 | 849,875 |
| The Home Depot, Inc. | | 3,884 | 1,296,635 |
| Ulta Beauty, Inc. (a) | | 1,326 | 589,805 |
| | | | 4,865,934 |
TOTAL CONSUMER DISCRETIONARY | | | 8,602,830 |
| CONSUMER STAPLES - 10.5% | | | |
| Food Products - 3.4% | | | |
| Archer Daniels Midland Co. | | 30,312 | 2,575,308 |
| General Mills, Inc. | | 32,850 | 2,455,209 |
| | | | 5,030,517 |
| Household Products - 3.5% | | | |
| Colgate-Palmolive Co. | | 34,630 | 2,640,884 |
| Kimberly-Clark Corp. | | 19,127 | 2,469,296 |
| | | | 5,110,180 |
| Tobacco - 3.6% | | | |
| Altria Group, Inc. | | 56,074 | 2,546,881 |
| Philip Morris International, Inc. | | 28,100 | 2,802,132 |
| | | | 5,349,013 |
TOTAL CONSUMER STAPLES | | | 15,489,710 |
| ENERGY - 9.2% | | | |
| Oil, Gas & Consumable Fuels - 9.2% | | | |
| ConocoPhillips Co. | | 24,692 | 2,906,742 |
| Exxon Mobil Corp. | | 35,040 | 3,757,690 |
| Occidental Petroleum Corp. | | 38,628 | 2,438,586 |
| PBF Energy, Inc. Class A | | 56,716 | 2,690,607 |
| Texas Pacific Land Corp. | | 1,187 | 1,787,978 |
| | | | 13,581,603 |
| FINANCIALS - 9.5% | | | |
| Banks - 0.9% | | | |
| First Citizens Bancshares, Inc. | | 983 | 1,406,968 |
| Capital Markets - 0.7% | | | |
| Goldman Sachs Group, Inc. | | 2,728 | 970,813 |
| Consumer Finance - 1.0% | | | |
| Discover Financial Services | | 6,908 | 729,139 |
| Synchrony Financial | | 20,740 | 716,360 |
| | | | 1,445,499 |
| Financial Services - 3.7% | | | |
| Essent Group Ltd. | | 17,088 | 847,565 |
| Fiserv, Inc. (a) | | 5,697 | 719,018 |
| MasterCard, Inc. Class A | | 3,583 | 1,412,705 |
| MGIC Investment Corp. | | 52,954 | 886,450 |
| Visa, Inc. Class A | | 6,577 | 1,563,550 |
| | | | 5,429,288 |
| Insurance - 3.2% | | | |
| American International Group, Inc. | | 14,202 | 856,097 |
| Everest Re Group Ltd. | | 2,273 | 819,439 |
| MetLife, Inc. | | 12,092 | 761,433 |
| Principal Financial Group, Inc. | | 8,533 | 681,531 |
| RLI Corp. | | 5,819 | 776,313 |
| Unum Group | | 18,647 | 906,431 |
| | | | 4,801,244 |
TOTAL FINANCIALS | | | 14,053,812 |
| HEALTH CARE - 18.1% | | | |
| Biotechnology - 8.3% | | | |
| AbbVie, Inc. | | 16,347 | 2,445,184 |
| Amgen, Inc. | | 7,792 | 1,824,497 |
| Gilead Sciences, Inc. | | 22,289 | 1,697,084 |
| Moderna, Inc. (a) | | 9,392 | 1,105,063 |
| Regeneron Pharmaceuticals, Inc. (a) | | 2,311 | 1,714,554 |
| United Therapeutics Corp. (a) | | 5,742 | 1,393,698 |
| Vertex Pharmaceuticals, Inc. (a) | | 5,685 | 2,003,053 |
| | | | 12,183,133 |
| Health Care Providers & Services - 3.5% | | | |
| Cardinal Health, Inc. | | 19,905 | 1,820,710 |
| Humana, Inc. | | 3,412 | 1,558,704 |
| McKesson Corp. | | 4,460 | 1,794,704 |
| | | | 5,174,118 |
| Pharmaceuticals - 6.3% | | | |
| Bristol-Myers Squibb Co. | | 27,532 | 1,712,215 |
| Eli Lilly & Co. | | 7,213 | 3,278,669 |
| Merck & Co., Inc. | | 23,100 | 2,463,615 |
| Pfizer, Inc. | | 52,821 | 1,904,725 |
| | | | 9,359,224 |
TOTAL HEALTH CARE | | | 26,716,475 |
| INDUSTRIALS - 5.8% | | | |
| Aerospace & Defense - 1.0% | | | |
| Lockheed Martin Corp. | | 1,750 | 781,148 |
| Northrop Grumman Corp. | | 1,654 | 736,030 |
| | | | 1,517,178 |
| Building Products - 1.8% | | | |
| Builders FirstSource, Inc. (a) | | 7,637 | 1,103,012 |
| Owens Corning | | 6,209 | 869,198 |
| UFP Industries, Inc. | | 6,436 | 661,363 |
| | | | 2,633,573 |
| Electrical Equipment - 0.5% | | | |
| Atkore, Inc. (a) | | 4,481 | 711,000 |
| Machinery - 0.9% | | | |
| Mueller Industries, Inc. | | 9,003 | 729,783 |
| Snap-On, Inc. | | 2,506 | 682,735 |
| | | | 1,412,518 |
| Professional Services - 1.1% | | | |
| Automatic Data Processing, Inc. | | 3,020 | 746,725 |
| ExlService Holdings, Inc. (a) | | 2,483 | 349,979 |
| Paychex, Inc. | | 4,366 | 547,802 |
| | | | 1,644,506 |
| Trading Companies & Distributors - 0.5% | | | |
| Triton International Ltd. | | 8,675 | 731,389 |
TOTAL INDUSTRIALS | | | 8,650,164 |
| INFORMATION TECHNOLOGY - 20.7% | | | |
| Communications Equipment - 0.7% | | | |
| Cisco Systems, Inc. | | 20,371 | 1,060,107 |
| IT Services - 2.5% | | | |
| Accenture PLC Class A | | 3,247 | 1,027,188 |
| Amdocs Ltd. | | 4,748 | 444,603 |
| DXC Technology Co. (a) | | 14,652 | 405,128 |
| Gartner, Inc. (a) | | 1,416 | 500,683 |
| IBM Corp. | | 5,674 | 818,077 |
| VeriSign, Inc. (a) | | 2,127 | 448,691 |
| | | | 3,644,370 |
| Semiconductors & Semiconductor Equipment - 4.8% | | | |
| Analog Devices, Inc. | | 3,809 | 760,010 |
| Broadcom, Inc. | | 1,865 | 1,675,982 |
| Enphase Energy, Inc. (a) | | 2,216 | 336,455 |
| KLA Corp. | | 1,411 | 725,183 |
| Microchip Technology, Inc. | | 6,497 | 610,328 |
| ON Semiconductor Corp. (a) | | 6,303 | 679,148 |
| Qualcomm, Inc. | | 6,315 | 834,654 |
| Rambus, Inc. (a) | | 9,642 | 603,686 |
| Texas Instruments, Inc. | | 4,886 | 879,480 |
| | | | 7,104,926 |
| Software - 6.5% | | | |
| Cadence Design Systems, Inc. (a) | | 2,989 | 699,456 |
| Dropbox, Inc. Class A (a) | | 17,749 | 478,336 |
| Fair Isaac Corp. (a) | | 673 | 563,954 |
| Microsoft Corp. | | 23,322 | 7,834,326 |
| | | | 9,576,072 |
| Technology Hardware, Storage & Peripherals - 6.2% | | | |
| Apple, Inc. | | 46,392 | 9,113,708 |
TOTAL INFORMATION TECHNOLOGY | | | 30,499,183 |
| MATERIALS - 7.1% | | | |
| Chemicals - 2.4% | | | |
| CF Industries Holdings, Inc. | | 43,531 | 3,573,024 |
| Metals & Mining - 4.7% | | �� | |
| Nucor Corp. | | 21,537 | 3,706,302 |
| Steel Dynamics, Inc. | | 29,536 | 3,147,947 |
| | | | 6,854,249 |
TOTAL MATERIALS | | | 10,427,273 |
| REAL ESTATE - 4.9% | | | |
| Equity Real Estate Investment Trusts (REITs) - 4.9% | | | |
| Gaming & Leisure Properties | | 46,530 | 2,208,314 |
| Omega Healthcare Investors, Inc. | | 82,579 | 2,634,270 |
| VICI Properties, Inc. | | 74,430 | 2,343,056 |
| | | | 7,185,640 |
| UTILITIES - 4.4% | | | |
| Electric Utilities - 1.7% | | | |
| NRG Energy, Inc. | | 66,729 | 2,535,035 |
| Gas Utilities - 1.5% | | | |
| National Fuel Gas Co. | | 40,057 | 2,127,427 |
| Independent Power and Renewable Electricity Producers - 1.2% | | | |
| Clearway Energy, Inc. Class C | | 67,285 | 1,776,997 |
TOTAL UTILITIES | | | 6,439,459 |
| TOTAL COMMON STOCKS (Cost $141,771,314) | | | 147,156,710 |
| | | | |
| Money Market Funds - 0.1% |
| | | Shares | Value ($) |
Fidelity Cash Central Fund 5.32% (b) (Cost $107,212) | | 107,190 | 107,212 |
| | | | |
| TOTAL INVESTMENT IN SECURITIES - 99.8% (Cost $141,878,526) | 147,263,922 |
NET OTHER ASSETS (LIABILITIES) - 0.2% | 234,916 |
| NET ASSETS - 100.0% | 147,498,838 |
| | |
| Futures Contracts |
| | Number of contracts | Expiration Date | Notional Amount ($) | Value ($) | Unrealized Appreciation/ (Depreciation) ($) |
| Purchased | | | | | |
| | | | | | |
| Equity Index Contracts | | | | | |
| CME E-mini S&P 500 Index Contracts (United States) | 1 | Sep 2023 | 230,725 | 13,260 | 13,260 |
| | | | | | |
| The notional amount of futures purchased as a percentage of Net Assets is 0.2% |
Legend
| (b) | Affiliated fund that is generally available only to investment companies and other accounts managed by Fidelity Investments. The rate quoted is the annualized seven-day yield of the fund at period end. A complete unaudited listing of the fund's holdings as of its most recent quarter end is available upon request. In addition, each Fidelity Central Fund's financial statements, which are not covered by the Fund's Report of Independent Registered Public Accounting Firm, are available on the SEC's website or upon request. |
Affiliated Central Funds
Fiscal year to date information regarding the Fund's investments in Fidelity Central Funds, including the ownership percentage, is presented below.
| Affiliate | Value, beginning of period ($) | Purchases ($) | Sales Proceeds ($) | Dividend Income ($) | Realized Gain (loss) ($) | Change in Unrealized appreciation (depreciation) ($) | Value, end of period ($) | % ownership, end of period |
| Fidelity Cash Central Fund 5.32% | 111,694 | 6,933,617 | 6,938,099 | 4,447 | - | - | 107,212 | 0.0% |
| Total | 111,694 | 6,933,617 | 6,938,099 | 4,447 | - | - | 107,212 | |
| | | | | | | | | |
Amounts in the dividend income column in the above table include any capital gain distributions from underlying funds, which are presented in the corresponding line item in the Statement of Operations, if applicable.
Amounts included in the purchases and sales proceeds columns may include in-kind transactions, if applicable.
Investment Valuation
The following is a summary of the inputs used, as of July 31, 2023, involving the Fund's assets and liabilities carried at fair value. The inputs or methodology used for valuing securities may not be an indication of the risk associated with investing in those securities. For more information on valuation inputs, and their aggregation into the levels used below, please refer to the Investment Valuation section in the accompanying Notes to Financial Statements.
| Valuation Inputs at Reporting Date: |
| Description | Total ($) | Level 1 ($) | Level 2 ($) | Level 3 ($) |
Investments in Securities: | | | | |
|
| Equities: | | | | |
Communication Services | 5,510,561 | 5,510,561 | - | - |
Consumer Discretionary | 8,602,830 | 8,602,830 | - | - |
Consumer Staples | 15,489,710 | 15,489,710 | - | - |
Energy | 13,581,603 | 13,581,603 | - | - |
Financials | 14,053,812 | 14,053,812 | - | - |
Health Care | 26,716,475 | 26,716,475 | - | - |
Industrials | 8,650,164 | 8,650,164 | - | - |
Information Technology | 30,499,183 | 30,499,183 | - | - |
Materials | 10,427,273 | 10,427,273 | - | - |
Real Estate | 7,185,640 | 7,185,640 | - | - |
Utilities | 6,439,459 | 6,439,459 | - | - |
|
| Money Market Funds | 107,212 | 107,212 | - | - |
| Total Investments in Securities: | 147,263,922 | 147,263,922 | - | - |
Derivative Instruments: | | | | |
|
| Assets | | | | |
Futures Contracts | 13,260 | 13,260 | - | - |
| Total Assets | 13,260 | 13,260 | - | - |
| Total Derivative Instruments: | 13,260 | 13,260 | - | - |
Value of Derivative Instruments
The following table is a summary of the Fund's value of derivative instruments by primary risk exposure as of July 31, 2023. For additional information on derivative instruments, please refer to the Derivative Instruments section in the accompanying Notes to Financial Statements.
Primary Risk Exposure / Derivative Type | Value |
| Asset ($) | Liability ($) |
| Equity Risk | | |
Futures Contracts (a) | 13,260 | 0 |
| Total Equity Risk | 13,260 | 0 |
| Total Value of Derivatives | 13,260 | 0 |
(a)Reflects gross cumulative appreciation (depreciation) on futures contracts as presented in the Schedule of Investments. In the Statement of Assets and Liabilities, the period end daily variation margin is included in receivable or payable for daily variation margin on futures contracts, and the net cumulative appreciation (depreciation) is included in Total accumulated earnings (loss).
Fidelity® Stocks for Inflation ETF
| Statement of Assets and Liabilities |
| | | | July 31, 2023 |
| | | | | |
| Assets | | | | |
| Investment in securities, at value - See accompanying schedule: | | | | |
Unaffiliated issuers (cost $141,771,314) | $ | 147,156,710 | | |
Fidelity Central Funds (cost $107,212) | | 107,212 | | |
| | | | | |
| | | | | |
| Total Investment in Securities (cost $141,878,526) | | | $ | 147,263,922 |
| Segregated cash with brokers for derivative instruments | | | | 11,200 |
| Cash | | | | 42,543 |
| Receivable for investments sold | | | | 1,661,661 |
| Dividends receivable | | | | 232,558 |
| Distributions receivable from Fidelity Central Funds | | | | 377 |
| Receivable for daily variation margin on futures contracts | | | | 400 |
Total assets | | | | 149,212,661 |
| Liabilities | | | | |
| Payable for fund shares redeemed | $ | 1,676,123 | | |
| Accrued management fee | | 37,700 | | |
| Total Liabilities | | | | 1,713,823 |
| Net Assets | | | $ | 147,498,838 |
| Net Assets consist of: | | | | |
| Paid in capital | | | $ | 162,971,612 |
| Total accumulated earnings (loss) | | | | (15,472,774) |
| Net Assets | | | $ | 147,498,838 |
Net Asset Value, offering price and redemption price per share ($147,498,838 ÷ 4,400,000 shares) | | | $ | 33.52 |
| Statement of Operations |
| | | | Year ended July 31, 2023 |
| Investment Income | | | | |
| Dividends | | | $ | 4,658,104 |
| Income from Fidelity Central Funds | | | | 4,447 |
| Total Income | | | | 4,662,551 |
| Expenses | | | | |
| Management fee | $ | 602,121 | | |
| Independent trustees' fees and expenses | | 1,094 | | |
| Total expenses before reductions | | 603,215 | | |
| Expense reductions | | (328) | | |
| Total expenses after reductions | | | | 602,887 |
| Net Investment income (loss) | | | | 4,059,664 |
| Realized and Unrealized Gain (Loss) | | | | |
| Net realized gain (loss) on: | | | | |
| Investment Securities: | | | | |
| Unaffiliated issuers | | (14,017,400) | | |
| Redemptions in-kind | | 2,066,581 | | |
| Futures contracts | | 8,736 | | |
| Total net realized gain (loss) | | | | (11,942,083) |
| Change in net unrealized appreciation (depreciation) on: | | | | |
| Investment Securities: | | | | |
| Unaffiliated issuers | | 19,409,648 | | |
| Futures contracts | | 13,260 | | |
| Total change in net unrealized appreciation (depreciation) | | | | 19,422,908 |
| Net gain (loss) | | | | 7,480,825 |
| Net increase (decrease) in net assets resulting from operations | | | $ | 11,540,489 |
| Statement of Changes in Net Assets |
| |
| | Year ended July 31, 2023 | | Year ended July 31, 2022 |
| Increase (Decrease) in Net Assets | | | | |
| Operations | | | | |
| Net investment income (loss) | $ | 4,059,664 | $ | 2,664,450 |
| Net realized gain (loss) | | (11,942,083) | | 4,384,711 |
| Change in net unrealized appreciation (depreciation) | | 19,422,908 | | (16,922,706) |
| Net increase (decrease) in net assets resulting from operations | | 11,540,489 | | (9,873,545) |
| Distributions to shareholders | | (4,166,950) | | (2,544,600) |
| | | | | |
| Share transactions | | | | |
| Proceeds from sales of shares | | 7,889,065 | | 327,785,389 |
| Cost of shares redeemed | | (128,142,495) | | (101,071,269) |
| | | | | |
Net increase (decrease) in net assets resulting from share transactions | | (120,253,430) | | 226,714,120 |
| Total increase (decrease) in net assets | | (112,879,891) | | 214,295,975 |
| | | | | |
| Net Assets | | | | |
| Beginning of period | | 260,378,729 | | 46,082,754 |
| End of period | $ | 147,498,838 | $ | 260,378,729 |
| | | | | |
| Other Information | | | | |
| Shares | | | | |
| Sold | | 250,000 | | 9,900,000 |
| Redeemed | | (4,050,000) | | (3,200,000) |
| Net increase (decrease) | | (3,800,000) | | 6,700,000 |
| | | | | |
| Fidelity® Stocks for Inflation ETF |
| |
| Years ended July 31, | | 2023 | | 2022 | | 2021 | | 2020 A |
Selected Per-Share Data | | | | | | | | |
| Net asset value, beginning of period | $ | 31.75 | $ | 30.72 | $ | 24.07 | $ | 24.94 |
| Income from Investment Operations | | | | | | | | |
Net investment income (loss) B,C | | .61 | | .54 | | .39 | | .38 |
| Net realized and unrealized gain (loss) | | 1.80 | | 1.00 D | | 7.08 | | (.90) |
| Total from investment operations | | 2.41 | | 1.54 | | 7.47 | | (.52) |
| Distributions from net investment income | | (.64) | | (.51) | | (.82) | | (.35) |
| Total distributions | | (.64) | | (.51) | | (.82) | | (.35) |
| Net asset value, end of period | $ | 33.52 | $ | 31.75 | $ | 30.72 | $ | 24.07 |
Total Return E,F,G | | 7.77% | | 5.03% | | 31.78% | | (1.88)% |
Ratios to Average Net Assets C,H,I | | | | | | | | |
| Expenses before reductions | | .29% | | .29% | | .29% | | .29% J,K |
| Expenses net of fee waivers, if any | | .29% | | .29% | | .29% | | .29% J,K |
| Expenses net of all reductions | | .29% | | .29% | | .29% | | .29% J,K |
| Net investment income (loss) | | 1.95% | | 1.68% | | 1.34% | | 2.16% J,K |
| Supplemental Data | | | | | | | | |
| Net assets, end of period (000 omitted) | $ | 147,499 | $ | 260,379 | $ | 46,083 | $ | 3,610 |
Portfolio turnover rate L,M | | 105% | | 76% | | 52% | | 65% N |
AFor the period November 5, 2019 (commencement of operations) through July 31, 2020.
BCalculated based on average shares outstanding during the period.
CNet investment income (loss) is affected by the timing of the declaration of dividends by any underlying mutual funds or exchange-traded funds (ETFs). Net investment income (loss) of any mutual funds or ETFs is not included in the Fund's net investment income (loss) ratio.
DThe amount shown for a share outstanding does not correspond with the aggregate net gain (loss) on investments for the period due to the timing of sales and repurchases of shares in relation to fluctuating market values of the investments of the Fund.
ETotal returns for periods of less than one year are not annualized.
FBased on net asset value.
GTotal returns would have been lower if certain expenses had not been reduced during the applicable periods shown.
HFees and expenses of any underlying mutual funds or exchange-traded funds (ETFs) are not included in the Fund's expense ratio. The Fund indirectly bears its proportionate share of these expenses. For additional expense information related to investments in Fidelity Central Funds, please refer to the "Investments in Fidelity Central Funds" note found in the Notes to Financial Statements section of the most recent Annual or Semi-Annual report.
IExpense ratios reflect operating expenses of the class. Expenses before reductions do not reflect amounts reimbursed, waived, or reduced through arrangements with the investment adviser, brokerage services, or other offset arrangements, if applicable, and do not represent the amount paid by the class during periods when reimbursements, waivers or reductions occur.
JProxy expenses are not annualized.
KAnnualized.
LPortfolio turnover rate excludes securities received or delivered in-kind.
MAmount does not include the portfolio activity of any underlying mutual funds or exchange-traded funds (ETFs).
NAmount not annualized.
NAV and closing market price average annual returns reflect the change in the value of an investment, assuming reinvestment of distributions from dividend income and capital gains (the profits earned upon the sale of securities that have grown in value, if any) at NAV and Market Price, respectively, and assumes a constant rate of performance each year. The hypothetical investment and the fund's returns do not reflect the deduction of taxes that a shareholder would pay on fund distributions or the redemption or selling of fund shares. How a fund did yesterday is no guarantee of how it will do tomorrow.
| Average Annual Total Returns |
| | | | |
Periods ended July 31, 2023 | Past 1 year | Life of Fund |
Fidelity® U.S. Multifactor ETF - NAV A | 10.78% | 12.46% |
Fidelity® U.S. Multifactor ETF - Market Price B | 10.69% | 12.98% |
Fidelity U.S. Multifactor Index℠ A | 11.13% | 12.82% |
Russell 1000® Index A | 12.95% | 12.15% |
A From September 15, 2020
B From September 17, 2020, date initially listed on the NYSE ARCA exchange.
| $10,000 Over Life of Fund |
| |
Let's say hypothetically that $10,000 was invested in Fidelity® U.S. Multifactor ETF - NAV, on September 15, 2020, when the fund started. The chart shows how the value of your investment would have changed, and also shows how the Fidelity U.S. Multifactor Index℠ and Russell 1000® Index performed over the same period. |
|
|
Fidelity® U.S. Multifactor ETF
Market Recap:
U.S. equities gained 13.02% for the 12 months ending July 31, 2023, according to the S&P 500® index, as continued global economic expansion, falling commodity prices and a slowing in the pace of inflation provided a favorable backdrop for higher-risk assets. Large-cap stocks spearheaded the rally, which was driven by the shares of a narrow set of mega-cap companies in the information technology and communication services sectors, largely due to exuberance related to generative artificial intelligence. Aggressive monetary tightening by the U.S. Federal Reserve continued amid consistent pressure on core inflation, a measure that excludes food and energy. Since March 2022, the Fed has hiked its benchmark interest rate 11 times. The latest bump came in late July, a fourth consecutive raise of a stepped down 25 basis points. The S&P 500® gained 3.21% in July, as a "soft landing" of the U.S. economy became the consensus view amid better-than-expected earnings, slowing inflation and easing financial conditions, bringing the index's year-to-date gain to 20.65%. July saw a continuance of the recent shift to wider market breadth and lower dispersion. For the full 12 months, value (+17%) handily topped growth (+8%) within the index. By sector, tech (+28%), communication services (+21%) and industrials (+17%) led, whereas real estate (-10%) lagged most, due to high borrowing costs, low home inventory and a deteriorating commercial property market.
Comments from the Geode Capital Management, LLC, passive equity index team:
For the fiscal year ending July 31, 2023, the exchange-traded fund's net asset value gained 10.78%, versus 11.13% for the Fidelity U.S. Multifactor Index TR. The ETF's market price returned 10.69% the past 12 months, while the Russell 1000 Index gained 12.95%. By sector, information technology gained 20% and contributed most. Financials stocks also helped (+17%). Consumer discretionary rose 16%, industrials gained 11%, and communication services advanced 10%. Other contributors included the health care (+5%), energy (+9%), materials (+12%) and consumer staples (+4%) sectors. In contrast, real estate returned approximately -15% and detracted most. Utilities (-16%) also hurt. Turning to individual stocks, the top contributor was Apple (+22%), from the technology hardware & equipment industry. In software & services, Microsoft gained 21% and also helped. Broadcom, within the semiconductors & semiconductor equipment group, gained roughly 69% and further lifted the fund. Other notable contributors included Arch Capital (+65%), a stock in the insurance category, and Alphabet (+14%), from the media & entertainment industry. Conversely, the biggest individual detractor was Pfizer (-26%), from the pharmaceuticals, biotechnology & life sciences category. Another notable detractor was Dollar General (-25%), a stock in the consumer staples distribution & retail industry. In utilities, National Fuel Gas returned about -24%. W.P. Carey, within the equity real estate investment trusts (REITs) industry, returned roughly -19% and hurt the fund's result. Lastly, AT&T, within the telecommunication services industry, returned -23%.
The views expressed above reflect those of the portfolio manager(s) only through the end of the period as stated on the cover of this report and do not necessarily represent the views of Fidelity or any other person in the Fidelity organization, or Geode Capital Management, LLC, (the ETF's subadviser) or any other person in the Geode organization. Any such views are subject to change at any time based upon market or other conditions and Fidelity and Geode disclaim any responsibility to update such views. These views may not be relied on as investment advice and, because investment decisions for a Fidelity fund are based on numerous factors, may not be relied on as an indication of trading intent on behalf of any Fidelity fund.
Fidelity® U.S. Multifactor ETF
Top Holdings (% of Fund's net assets) |
| |
| Apple, Inc. | 7.5 | |
| Microsoft Corp. | 6.4 | |
| Alphabet, Inc. Class A | 4.1 | |
| Eli Lilly & Co. | 1.7 | |
| Johnson & Johnson | 1.6 | |
| Procter & Gamble Co. | 1.6 | |
| Exxon Mobil Corp. | 1.6 | |
| The Home Depot, Inc. | 1.6 | |
| Broadcom, Inc. | 1.4 | |
| McDonald's Corp. | 1.4 | |
| | 28.9 | |
| |
| Market Sectors (% of Fund's net assets) |
| |
| Information Technology | 24.2 | |
| Financials | 15.3 | |
| Health Care | 13.2 | |
| Industrials | 11.1 | |
| Consumer Discretionary | 9.8 | |
| Communication Services | 7.9 | |
| Consumer Staples | 6.4 | |
| Energy | 4.3 | |
| Materials | 2.7 | |
| Real Estate | 2.6 | |
| Utilities | 2.3 | |
| |
Asset Allocation (% of Fund's net assets) |
|
Futures - 0.1% |
|
Fidelity® U.S. Multifactor ETF
Showing Percentage of Net Assets
| Common Stocks - 99.8% |
| | | Shares | Value ($) |
| COMMUNICATION SERVICES - 7.9% | | | |
| Diversified Telecommunication Services - 0.5% | | | |
| AT&T, Inc. | | 13,298 | 193,087 |
| Entertainment - 0.7% | | | |
| Activision Blizzard, Inc. | | 2,534 | 235,054 |
| Interactive Media & Services - 4.5% | | | |
| Alphabet, Inc. Class A (a) | | 10,759 | 1,427,934 |
| Ziff Davis, Inc. (a) | | 1,649 | 119,585 |
| | | | 1,547,519 |
| Media - 2.2% | | | |
| Comcast Corp. Class A | | 7,223 | 326,913 |
| Fox Corp. Class A | | 4,649 | 155,509 |
| Nexstar Broadcasting Group, Inc. Class A | | 737 | 137,613 |
| TEGNA, Inc. | | 7,563 | 127,815 |
| | | | 747,850 |
TOTAL COMMUNICATION SERVICES | | | 2,723,510 |
| CONSUMER DISCRETIONARY - 9.8% | | | |
| Diversified Consumer Services - 1.4% | | | |
| H&R Block, Inc. | | 6,935 | 233,085 |
| Service Corp. International | | 3,756 | 250,337 |
| | | | 483,422 |
| Hotels, Restaurants & Leisure - 2.3% | | | |
| McDonald's Corp. | | 1,617 | 474,104 |
| Yum! Brands, Inc. | | 2,308 | 317,742 |
| | | | 791,846 |
| Household Durables - 1.0% | | | |
| Lennar Corp. Class A | | 2,682 | 340,158 |
| Specialty Retail - 5.1% | | | |
| Academy Sports & Outdoors, Inc. | | 4,342 | 259,608 |
| AutoZone, Inc. (a) | | 125 | 310,215 |
| Murphy U.S.A., Inc. | | 1,037 | 318,390 |
| O'Reilly Automotive, Inc. (a) | | 382 | 353,652 |
| The Home Depot, Inc. | | 1,630 | 544,159 |
| | | | 1,786,024 |
TOTAL CONSUMER DISCRETIONARY | | | 3,401,450 |
| CONSUMER STAPLES - 6.4% | | | |
| Consumer Staples Distribution & Retail - 0.7% | | | |
| Dollar General Corp. | | 1,336 | 225,597 |
| Food Products - 0.7% | | | |
| The Hershey Co. | | 1,091 | 252,359 |
| Household Products - 3.2% | | | |
| Colgate-Palmolive Co. | | 3,771 | 287,576 |
| Kimberly-Clark Corp. | | 2,024 | 261,298 |
| Procter & Gamble Co. | | 3,560 | 556,428 |
| | | | 1,105,302 |
| Tobacco - 1.8% | | | |
| Altria Group, Inc. | | 6,319 | 287,009 |
| Philip Morris International, Inc. | | 3,479 | 346,926 |
| | | | 633,935 |
TOTAL CONSUMER STAPLES | | | 2,217,193 |
| ENERGY - 4.3% | | | |
| Oil, Gas & Consumable Fuels - 4.3% | | | |
| ConocoPhillips Co. | | 2,733 | 321,729 |
| Coterra Energy, Inc. | | 8,316 | 229,023 |
| Exxon Mobil Corp. | | 5,114 | 548,425 |
| Texas Pacific Land Corp. | | 103 | 155,149 |
| Valero Energy Corp. | | 1,743 | 224,690 |
| | | | 1,479,016 |
| FINANCIALS - 15.3% | | | |
| Banks - 0.9% | | | |
| Popular, Inc. | | 4,277 | 310,296 |
| Financial Services - 5.6% | | | |
| Essent Group Ltd. | | 6,816 | 338,074 |
| Fiserv, Inc. (a) | | 1,615 | 203,829 |
| Jack Henry & Associates, Inc. | | 702 | 117,634 |
| MasterCard, Inc. Class A | | 1,015 | 400,194 |
| MGIC Investment Corp. | | 21,108 | 353,348 |
| The Western Union Co. | | 8,469 | 103,152 |
| Visa, Inc. Class A | | 1,863 | 442,891 |
| | | | 1,959,122 |
| Insurance - 8.8% | | | |
| AFLAC, Inc. | | 4,799 | 347,160 |
| Arch Capital Group Ltd. (a) | | 5,167 | 401,424 |
| Chubb Ltd. | | 1,762 | 360,170 |
| Everest Re Group Ltd. | | 906 | 326,622 |
| Progressive Corp. | | 2,694 | 339,390 |
| RLI Corp. | | 2,323 | 309,911 |
| The Travelers Companies, Inc. | | 1,835 | 316,739 |
| Unum Group | | 7,436 | 361,464 |
| W.R. Berkley Corp. | | 4,646 | 286,612 |
| | | | 3,049,492 |
TOTAL FINANCIALS | | | 5,318,910 |
| HEALTH CARE - 13.2% | | | |
| Biotechnology - 5.1% | | | |
| AbbVie, Inc. | | 2,859 | 427,649 |
| Amgen, Inc. | | 1,261 | 295,263 |
| Gilead Sciences, Inc. | | 3,521 | 268,089 |
| Regeneron Pharmaceuticals, Inc. (a) | | 358 | 265,604 |
| United Therapeutics Corp. (a) | | 817 | 198,302 |
| Vertex Pharmaceuticals, Inc. (a) | | 878 | 309,355 |
| | | | 1,764,262 |
| Health Care Providers & Services - 1.3% | | | |
| AMN Healthcare Services, Inc. (a) | | 2,009 | 215,264 |
| Molina Healthcare, Inc. (a) | | 712 | 216,797 |
| | | | 432,061 |
| Pharmaceuticals - 6.8% | | | |
| Bristol-Myers Squibb Co. | | 4,535 | 282,032 |
| Eli Lilly & Co. | | 1,264 | 574,551 |
| Johnson & Johnson | | 3,384 | 566,922 |
| Merck & Co., Inc. | | 4,053 | 432,252 |
| Pfizer, Inc. | | 9,206 | 331,968 |
| Royalty Pharma PLC | | 5,505 | 172,747 |
| | | | 2,360,472 |
TOTAL HEALTH CARE | | | 4,556,795 |
| INDUSTRIALS - 11.1% | | | |
| Aerospace & Defense - 2.2% | | | |
| Lockheed Martin Corp. | | 866 | 386,556 |
| Northrop Grumman Corp. | | 818 | 364,010 |
| | | | 750,566 |
| Air Freight & Logistics - 1.0% | | | |
| Expeditors International of Washington, Inc. | | 2,722 | 346,511 |
| Commercial Services & Supplies - 1.1% | | | |
| Waste Management, Inc. | | 2,357 | 386,053 |
| Electrical Equipment - 1.0% | | | |
| Atkore, Inc. (a) | | 2,216 | 351,613 |
| Machinery - 3.2% | | | |
| Allison Transmission Holdings, Inc. | | 6,800 | 399,092 |
| Mueller Industries, Inc. | | 4,451 | 360,798 |
| Snap-On, Inc. | | 1,237 | 337,008 |
| | | | 1,096,898 |
| Professional Services - 2.6% | | | |
| Automatic Data Processing, Inc. | | 855 | 211,407 |
| ExlService Holdings, Inc. (a) | | 703 | 99,088 |
| Genpact Ltd. | | 2,604 | 93,978 |
| Paychex, Inc. | | 1,237 | 155,206 |
| Science Applications International Corp. | | 2,994 | 363,292 |
| | | | 922,971 |
TOTAL INDUSTRIALS | | | 3,854,612 |
| INFORMATION TECHNOLOGY - 24.2% | | | |
| Communications Equipment - 0.9% | | | |
| Cisco Systems, Inc. | | 5,776 | 300,583 |
| IT Services - 2.6% | | | |
| Accenture PLC Class A | | 920 | 291,042 |
| Akamai Technologies, Inc. (a) | | 1,415 | 133,718 |
| Amdocs Ltd. | | 1,344 | 125,852 |
| IBM Corp. | | 1,607 | 231,697 |
| VeriSign, Inc. (a) | | 603 | 127,203 |
| | | | 909,512 |
| Semiconductors & Semiconductor Equipment - 3.3% | | | |
| Analog Devices, Inc. | | 1,080 | 215,492 |
| Broadcom, Inc. | | 528 | 474,487 |
| KLA Corp. | | 400 | 205,580 |
| Texas Instruments, Inc. | | 1,385 | 249,300 |
| | | | 1,144,859 |
| Software - 9.5% | | | |
| Adobe, Inc. (a) | | 684 | 373,580 |
| Cadence Design Systems, Inc. (a) | | 846 | 197,972 |
| Fair Isaac Corp. (a) | | 190 | 159,214 |
| Microsoft Corp. | | 6,612 | 2,221,103 |
| Qualys, Inc. (a) | | 976 | 135,469 |
| Synopsys, Inc. (a) | | 444 | 200,599 |
| | | | 3,287,937 |
| Technology Hardware, Storage & Peripherals - 7.9% | | | |
| Apple, Inc. | | 13,151 | 2,583,519 |
| HP, Inc. | | 4,542 | 149,114 |
| | | | 2,732,633 |
TOTAL INFORMATION TECHNOLOGY | | | 8,375,524 |
| MATERIALS - 2.7% | | | |
| Chemicals - 0.9% | | | |
| CF Industries Holdings, Inc. | | 3,686 | 302,547 |
| Metals & Mining - 0.9% | | | |
| Nucor Corp. | | 1,909 | 328,520 |
| Paper & Forest Products - 0.9% | | | |
| Louisiana-Pacific Corp. | | 4,214 | 320,812 |
TOTAL MATERIALS | | | 951,879 |
| REAL ESTATE - 2.6% | | | |
| Equity Real Estate Investment Trusts (REITs) - 2.6% | | | |
| Public Storage | | 1,157 | 325,985 |
| VICI Properties, Inc. | | 10,043 | 316,154 |
| WP Carey, Inc. | | 3,964 | 267,689 |
| | | | 909,828 |
| UTILITIES - 2.3% | | | |
| Gas Utilities - 0.8% | | | |
| National Fuel Gas Co. | | 5,073 | 269,427 |
| Independent Power and Renewable Electricity Producers - 0.6% | | | |
| Clearway Energy, Inc. Class C | | 8,510 | 224,749 |
| Multi-Utilities - 0.9% | | | |
| Consolidated Edison, Inc. | | 3,338 | 316,643 |
TOTAL UTILITIES | | | 810,819 |
| TOTAL COMMON STOCKS (Cost $31,653,505) | | | 34,599,536 |
| | | | |
| Money Market Funds - 0.1% |
| | | Shares | Value ($) |
Fidelity Cash Central Fund 5.32% (b) (Cost $18,721) | | 18,717 | 18,721 |
| | | | |
| TOTAL INVESTMENT IN SECURITIES - 99.9% (Cost $31,672,226) | 34,618,257 |
NET OTHER ASSETS (LIABILITIES) - 0.1% | 34,950 |
| NET ASSETS - 100.0% | 34,653,207 |
| | |
| Futures Contracts |
| | Number of contracts | Expiration Date | Notional Amount ($) | Value ($) | Unrealized Appreciation/ (Depreciation) ($) |
| Purchased | | | | | |
| | | | | | |
| Equity Index Contracts | | | | | |
| CME Micro E-mini S&P 500 Index Contracts (United States) | 2 | Sep 2023 | 46,145 | 2,260 | 2,260 |
| | | | | | |
| The notional amount of futures purchased as a percentage of Net Assets is 0.1% |
Legend
| (b) | Affiliated fund that is generally available only to investment companies and other accounts managed by Fidelity Investments. The rate quoted is the annualized seven-day yield of the fund at period end. A complete unaudited listing of the fund's holdings as of its most recent quarter end is available upon request. In addition, each Fidelity Central Fund's financial statements, which are not covered by the Fund's Report of Independent Registered Public Accounting Firm, are available on the SEC's website or upon request. |
Affiliated Central Funds
Fiscal year to date information regarding the Fund's investments in Fidelity Central Funds, including the ownership percentage, is presented below.
| Affiliate | Value, beginning of period ($) | Purchases ($) | Sales Proceeds ($) | Dividend Income ($) | Realized Gain (loss) ($) | Change in Unrealized appreciation (depreciation) ($) | Value, end of period ($) | % ownership, end of period |
| Fidelity Cash Central Fund 5.32% | - | 450,393 | 431,672 | 189 | - | - | 18,721 | 0.0% |
| Total | - | 450,393 | 431,672 | 189 | - | - | 18,721 | |
| | | | | | | | | |
Amounts in the dividend income column in the above table include any capital gain distributions from underlying funds, which are presented in the corresponding line item in the Statement of Operations, if applicable.
Amounts included in the purchases and sales proceeds columns may include in-kind transactions, if applicable.
Investment Valuation
The following is a summary of the inputs used, as of July 31, 2023, involving the Fund's assets and liabilities carried at fair value. The inputs or methodology used for valuing securities may not be an indication of the risk associated with investing in those securities. For more information on valuation inputs, and their aggregation into the levels used below, please refer to the Investment Valuation section in the accompanying Notes to Financial Statements.
| Valuation Inputs at Reporting Date: |
| Description | Total ($) | Level 1 ($) | Level 2 ($) | Level 3 ($) |
Investments in Securities: | | | | |
|
| Equities: | | | | |
Communication Services | 2,723,510 | 2,723,510 | - | - |
Consumer Discretionary | 3,401,450 | 3,401,450 | - | - |
Consumer Staples | 2,217,193 | 2,217,193 | - | - |
Energy | 1,479,016 | 1,479,016 | - | - |
Financials | 5,318,910 | 5,318,910 | - | - |
Health Care | 4,556,795 | 4,556,795 | - | - |
Industrials | 3,854,612 | 3,854,612 | - | - |
Information Technology | 8,375,524 | 8,375,524 | - | - |
Materials | 951,879 | 951,879 | - | - |
Real Estate | 909,828 | 909,828 | - | - |
Utilities | 810,819 | 810,819 | - | - |
|
| Money Market Funds | 18,721 | 18,721 | - | - |
| Total Investments in Securities: | 34,618,257 | 34,618,257 | - | - |
Derivative Instruments: | | | | |
|
| Assets | | | | |
Futures Contracts | 2,260 | 2,260 | - | - |
| Total Assets | 2,260 | 2,260 | - | - |
| Total Derivative Instruments: | 2,260 | 2,260 | - | - |
Value of Derivative Instruments
The following table is a summary of the Fund's value of derivative instruments by primary risk exposure as of July 31, 2023. For additional information on derivative instruments, please refer to the Derivative Instruments section in the accompanying Notes to Financial Statements.
Primary Risk Exposure / Derivative Type | Value |
| Asset ($) | Liability ($) |
| Equity Risk | | |
Futures Contracts (a) | 2,260 | 0 |
| Total Equity Risk | 2,260 | 0 |
| Total Value of Derivatives | 2,260 | 0 |
(a)Reflects gross cumulative appreciation (depreciation) on futures contracts as presented in the Schedule of Investments. In the Statement of Assets and Liabilities, the period end daily variation margin is included in receivable or payable for daily variation margin on futures contracts, and the net cumulative appreciation (depreciation) is included in Total accumulated earnings (loss).
Fidelity® U.S. Multifactor ETF
| Statement of Assets and Liabilities |
| | | | July 31, 2023 |
| | | | | |
| Assets | | | | |
| Investment in securities, at value - See accompanying schedule: | | | | |
Unaffiliated issuers (cost $31,653,505) | $ | 34,599,536 | | |
Fidelity Central Funds (cost $18,721) | | 18,721 | | |
| | | | | |
| | | | | |
| Total Investment in Securities (cost $31,672,226) | | | $ | 34,618,257 |
| Segregated cash with brokers for derivative instruments | | | | 2,240 |
| Cash | | | | 14,846 |
| Dividends receivable | | | | 25,700 |
| Distributions receivable from Fidelity Central Funds | | | | 82 |
| Receivable for daily variation margin on futures contracts | | | | 80 |
Total assets | | | | 34,661,205 |
| Liabilities | | | | |
| Accrued management fee | $ | 7,998 | | |
| Total Liabilities | | | | 7,998 |
| Net Assets | | | $ | 34,653,207 |
| Net Assets consist of: | | | | |
| Paid in capital | | | $ | 32,802,229 |
| Total accumulated earnings (loss) | | | | 1,850,978 |
| Net Assets | | | $ | 34,653,207 |
Net Asset Value, offering price and redemption price per share ($34,653,207 ÷ 1,300,000 shares) | | | $ | 26.66 |
| Statement of Operations |
| | | | Year ended July 31, 2023 |
| Investment Income | | | | |
| Dividends | | | $ | 442,256 |
| Income from Fidelity Central Funds | | | | 189 |
| Total Income | | | | 442,445 |
| Expenses | | | | |
| Management fee | $ | 66,133 | | |
| Independent trustees' fees and expenses | | 104 | | |
| Total expenses before reductions | | 66,237 | | |
| Expense reductions | | (172) | | |
| Total expenses after reductions | | | | 66,065 |
| Net Investment income (loss) | | | | 376,380 |
| Realized and Unrealized Gain (Loss) | | | | |
| Net realized gain (loss) on: | | | | |
| Investment Securities: | | | | |
| Unaffiliated issuers | | (702,633) | | |
| Redemptions in-kind | | 650,191 | | |
| Futures contracts | | 1,292 | | |
| Total net realized gain (loss) | | | | (51,150) |
| Change in net unrealized appreciation (depreciation) on: | | | | |
| Investment Securities: | | | | |
| Unaffiliated issuers | | 2,839,986 | | |
| Futures contracts | | 2,260 | | |
| Total change in net unrealized appreciation (depreciation) | | | | 2,842,246 |
| Net gain (loss) | | | | 2,791,096 |
| Net increase (decrease) in net assets resulting from operations | | | $ | 3,167,476 |
| Statement of Changes in Net Assets |
| |
| | Year ended July 31, 2023 | | Year ended July 31, 2022 |
| Increase (Decrease) in Net Assets | | | | |
| Operations | | | | |
| Net investment income (loss) | $ | 376,380 | $ | 236,930 |
| Net realized gain (loss) | | (51,150) | | 433,050 |
| Change in net unrealized appreciation (depreciation) | | 2,842,246 | | (1,195,944) |
| Net increase (decrease) in net assets resulting from operations | | 3,167,476 | | (525,964) |
| Distributions to shareholders | | (365,300) | | (235,000) |
| | | | | |
| Share transactions | | | | |
| Proceeds from sales of shares | | 20,841,939 | | 9,088,569 |
| Cost of shares redeemed | | (3,667,295) | | (5,142,624) |
| | | | | |
Net increase (decrease) in net assets resulting from share transactions | | 17,174,644 | | 3,945,945 |
| Total increase (decrease) in net assets | | 19,976,820 | | 3,184,981 |
| | | | | |
| Net Assets | | | | |
| Beginning of period | | 14,676,387 | | 11,491,406 |
| End of period | $ | 34,653,207 | $ | 14,676,387 |
| | | | | |
| Other Information | | | | |
| Shares | | | | |
| Sold | | 850,000 | | 350,000 |
| Redeemed | | (150,000) | | (200,000) |
| Net increase (decrease) | | 700,000 | | 150,000 |
| | | | | |
| Fidelity® U.S. Multifactor ETF |
| |
| Years ended July 31, | | 2023 | | 2022 | | 2021 A |
Selected Per-Share Data | | | | | | |
| Net asset value, beginning of period | $ | 24.46 | $ | 25.54 | $ | 20.09 |
| Income from Investment Operations | | | | | | |
Net investment income (loss) B,C | | .41 | | .41 | | .31 D |
| Net realized and unrealized gain (loss) | | 2.19 | | (1.09) | | 5.62 |
| Total from investment operations | | 2.60 | | (.68) | | 5.93 |
| Distributions from net investment income | | (.40) | | (.40) | | (.48) |
| Total distributions | | (.40) | | (.40) | | (.48) |
| Net asset value, end of period | $ | 26.66 | $ | 24.46 | $ | 25.54 |
Total Return E,F,G | | 10.78% | | (2.64)% | | 29.94% |
Ratios to Average Net Assets C,H,I | | | | | | |
| Expenses before reductions | | .29% | | .29% | | .29% J |
| Expenses net of fee waivers, if any | | .29% | | .29% | | .29% J |
| Expenses net of all reductions | | .29% | | .29% | | .29% J |
| Net investment income (loss) | | 1.66% | | 1.63% | | 1.56% D,J |
| Supplemental Data | | | | | | |
| Net assets, end of period (000 omitted) | $ | 34,653 | $ | 14,676 | $ | 11,491 |
Portfolio turnover rate K,L | | 45% | | 46% | | 30% M |
AFor the period September 15, 2020 (commencement of operations) through July 31, 2021.
BCalculated based on average shares outstanding during the period.
CNet investment income (loss) is affected by the timing of the declaration of dividends by any underlying mutual funds or exchange-traded funds (ETFs). Net investment income (loss) of any mutual funds or ETFs is not included in the Fund's net investment income (loss) ratio.
DNet investment income per share reflects one or more large, non-recurring dividend(s) which amounted to $.05 per share. Excluding such non-recurring dividend(s), the ratio of net investment income (loss) to average net assets would have been 1.33%.
EBased on net asset value.
FTotal returns for periods of less than one year are not annualized.
GTotal returns would have been lower if certain expenses had not been reduced during the applicable periods shown.
HFees and expenses of any underlying mutual funds or exchange-traded funds (ETFs) are not included in the Fund's expense ratio. The Fund indirectly bears its proportionate share of these expenses. For additional expense information related to investments in Fidelity Central Funds, please refer to the "Investments in Fidelity Central Funds" note found in the Notes to Financial Statements section of the most recent Annual or Semi-Annual report.
IExpense ratios reflect operating expenses of the class. Expenses before reductions do not reflect amounts reimbursed, waived, or reduced through arrangements with the investment adviser, brokerage services, or other offset arrangements, if applicable, and do not represent the amount paid by the class during periods when reimbursements, waivers or reductions occur.
JAnnualized.
KAmount does not include the portfolio activity of any underlying mutual funds or exchange-traded funds (ETFs).
LPortfolio turnover rate excludes securities received or delivered in-kind.
MAmount not annualized.
NAV and closing market price average annual returns reflect the change in the value of an investment, assuming reinvestment of distributions from dividend income and capital gains (the profits earned upon the sale of securities that have grown in value, if any) at NAV and Market Price, respectively, and assumes a constant rate of performance each year. The hypothetical investment and the fund's returns do not reflect the deduction of taxes that a shareholder would pay on fund distributions or the redemption or selling of fund shares. How a fund did yesterday is no guarantee of how it will do tomorrow.
| Average Annual Total Returns |
| | | | |
Periods ended July 31, 2023 | Past 1 year | Past 5 years | Life of Fund |
Fidelity® Value Factor ETF - NAV A | 12.33% | 10.54% | 12.67% |
Fidelity® Value Factor ETF - Market Price B | 12.37% | 10.51% | 12.75% |
Fidelity U.S. Value Factor Index℠ A | 12.64% | 10.85% | 13.00% |
Russell 1000® Index A | 12.95% | 11.92% | 13.38% |
A From September 12, 2016
B From September 15, 2016, date initially listed on the NYSE ARCA exchange.
| $10,000 Over Life of Fund |
| |
Let's say hypothetically that $10,000 was invested in Fidelity® Value Factor ETF - NAV, on September 12, 2016, when the fund started. The chart shows how the value of your investment would have changed, and also shows how the Fidelity U.S. Value Factor Index℠ and Russell 1000® Index performed over the same period. |
|
|
Fidelity® Value Factor ETF
Market Recap:
U.S. equities gained 13.02% for the 12 months ending July 31, 2023, according to the S&P 500® index, as continued global economic expansion, falling commodity prices and a slowing in the pace of inflation provided a favorable backdrop for higher-risk assets. Large-cap stocks spearheaded the rally, which was driven by the shares of a narrow set of mega-cap companies in the information technology and communication services sectors, largely due to exuberance related to generative artificial intelligence. Aggressive monetary tightening by the U.S. Federal Reserve continued amid consistent pressure on core inflation, a measure that excludes food and energy. Since March 2022, the Fed has hiked its benchmark interest rate 11 times. The latest bump came in late July, a fourth consecutive raise of a stepped down 25 basis points. The S&P 500® gained 3.21% in July, as a "soft landing" of the U.S. economy became the consensus view amid better-than-expected earnings, slowing inflation and easing financial conditions, bringing the index's year-to-date gain to 20.65%. July saw a continuance of the recent shift to wider market breadth and lower dispersion. For the full 12 months, value (+17%) handily topped growth (+8%) within the index. By sector, tech (+28%), communication services (+21%) and industrials (+17%) led, whereas real estate (-10%) lagged most, due to high borrowing costs, low home inventory and a deteriorating commercial property market.
Comments from the Geode Capital Management, LLC, passive equity index team:
For the fiscal year ending July 31, 2023, the exchange-traded fund's (ETF) net asset value returned 12.33%, and its market price returned 12.37%, versus the 12.64% advance for the Fidelity U.S. Value Factor Index TR and 12.95% return for the Russell 1000 Index. By sector, information technology gained about 15% and contributed most. Communication services stocks also helped (+27%), while industrials rose 23%, boosted by capital goods (+35%). In contrast, real estate returned about -7% and detracted most. This group was hampered by the equity real estate investment trusts (REITS) industry (-7%). Health care (0%) also hurt, hampered by the health care equipment & services industry (-6%). Turning to individual stocks, the top contributor was Apple (+22%), from the technology hardware & equipment category. Microsoft (+21%), from the software & services group, also boosted the fund. In media & entertainment, Meta Platforms (+100%) and Alphabet (+14%) helped. Conversely, the biggest individual detractor was Pfizer (-26%), from the pharmaceuticals, biotechnology & life sciences category. Also in pharmaceuticals, biotechnology & life sciences, Moderna (-28%) hurt. Intel (-21%), from the semiconductors & semiconductor equipment category, also hurt.
The views expressed above reflect those of the portfolio manager(s) only through the end of the period as stated on the cover of this report and do not necessarily represent the views of Fidelity or any other person in the Fidelity organization, or Geode Capital Management, LLC, (the ETF's subadviser) or any other person in the Geode organization. Any such views are subject to change at any time based upon market or other conditions and Fidelity and Geode disclaim any responsibility to update such views. These views may not be relied on as investment advice and, because investment decisions for a Fidelity fund are based on numerous factors, may not be relied on as an indication of trading intent on behalf of any Fidelity fund.
Fidelity® Value Factor ETF
Top Holdings (% of Fund's net assets) |
| |
| Apple, Inc. | 8.0 | |
| Microsoft Corp. | 6.9 | |
| Alphabet, Inc. Class A | 4.0 | |
| Amazon.com, Inc. | 3.4 | |
| Meta Platforms, Inc. Class A | 2.3 | |
| Berkshire Hathaway, Inc. Class B | 2.0 | |
| Broadcom, Inc. | 2.0 | |
| UnitedHealth Group, Inc. | 1.8 | |
| Visa, Inc. Class A | 1.7 | |
| Johnson & Johnson | 1.7 | |
| | 33.8 | |
| |
| Market Sectors (% of Fund's net assets) |
| |
| Information Technology | 25.6 | |
| Financials | 14.5 | |
| Health Care | 12.2 | |
| Consumer Discretionary | 11.1 | |
| Industrials | 9.3 | |
| Communication Services | 8.8 | |
| Consumer Staples | 5.8 | |
| Energy | 4.5 | |
| Real Estate | 2.7 | |
| Materials | 2.7 | |
| Utilities | 2.5 | |
| |
Asset Allocation (% of Fund's net assets) |
|
Futures - 0.3% |
|
Fidelity® Value Factor ETF
Showing Percentage of Net Assets
| Common Stocks - 99.7% |
| | | Shares | Value ($) |
| COMMUNICATION SERVICES - 8.8% | | | |
| Diversified Telecommunication Services - 0.4% | | | |
| Liberty Global PLC Class A (a) | | 91,894 | 1,706,472 |
| Interactive Media & Services - 6.3% | | | |
| Alphabet, Inc. Class A (a) | | 159,560 | 21,176,803 |
| Meta Platforms, Inc. Class A (a) | | 38,230 | 12,180,078 |
| | | | 33,356,881 |
| Media - 2.1% | | | |
| Comcast Corp. Class A | | 100,151 | 4,532,834 |
| Fox Corp. Class A | | 59,535 | 1,991,446 |
| Nexstar Broadcasting Group, Inc. Class A | | 9,368 | 1,749,193 |
| Paramount Global Class B (b) | | 81,421 | 1,305,179 |
| TEGNA, Inc. | | 95,759 | 1,618,327 |
| | | | 11,196,979 |
TOTAL COMMUNICATION SERVICES | | | 46,260,332 |
| CONSUMER DISCRETIONARY - 11.1% | | | |
| Automobiles - 1.3% | | | |
| Ford Motor Co. | | 249,342 | 3,293,808 |
| General Motors Co. | | 86,760 | 3,328,981 |
| | | | 6,622,789 |
| Broadline Retail - 3.8% | | | |
| Amazon.com, Inc. (a) | | 136,668 | 18,269,778 |
| Macy's, Inc. | | 120,611 | 2,000,936 |
| | | | 20,270,714 |
| Diversified Consumer Services - 0.5% | | | |
| H&R Block, Inc. (b) | | 75,141 | 2,525,489 |
| Hotels, Restaurants & Leisure - 2.0% | | | |
| Booking Holdings, Inc. (a) | | 1,647 | 4,892,908 |
| McDonald's Corp. | | 20,053 | 5,879,540 |
| | | | 10,772,448 |
| Household Durables - 2.2% | | | |
| Lennar Corp. Class A | | 29,815 | 3,781,436 |
| Taylor Morrison Home Corp. (a) | | 78,082 | 3,780,730 |
| Toll Brothers, Inc. | | 47,678 | 3,829,974 |
| | | | 11,392,140 |
| Specialty Retail - 1.3% | | | |
| The Home Depot, Inc. | | 21,259 | 7,097,105 |
TOTAL CONSUMER DISCRETIONARY | | | 58,680,685 |
| CONSUMER STAPLES - 5.8% | | | |
| Consumer Staples Distribution & Retail - 0.6% | | | |
| Kroger Co. | | 65,190 | 3,170,842 |
| Food Products - 1.7% | | | |
| Archer Daniels Midland Co. | | 38,042 | 3,232,048 |
| Bunge Ltd. | | 27,855 | 3,027,003 |
| Tyson Foods, Inc. Class A | | 43,002 | 2,396,071 |
| | | | 8,655,122 |
| Household Products - 2.0% | | | |
| Kimberly-Clark Corp. | | 23,929 | 3,089,234 |
| Procter & Gamble Co. | | 47,759 | 7,464,732 |
| | | | 10,553,966 |
| Tobacco - 1.5% | | | |
| Altria Group, Inc. | | 77,075 | 3,500,747 |
| Philip Morris International, Inc. | | 44,217 | 4,409,319 |
| | | | 7,910,066 |
TOTAL CONSUMER STAPLES | | | 30,289,996 |
| ENERGY - 4.5% | | | |
| Oil, Gas & Consumable Fuels - 4.5% | | | |
| Chevron Corp. | | 28,639 | 4,687,059 |
| ConocoPhillips Co. | | 25,231 | 2,970,193 |
| Coterra Energy, Inc. | | 53,116 | 1,462,815 |
| EQT Corp. | | 38,178 | 1,610,348 |
| Exxon Mobil Corp. | | 61,273 | 6,570,917 |
| Marathon Oil Corp. | | 48,782 | 1,281,503 |
| Marathon Petroleum Corp. | | 14,793 | 1,967,765 |
| PBF Energy, Inc. Class A (b) | | 28,186 | 1,337,144 |
| Valero Energy Corp. | | 12,870 | 1,659,072 |
| | | | 23,546,816 |
| FINANCIALS - 14.5% | | | |
| Banks - 4.2% | | | |
| Bank of America Corp. | | 158,332 | 5,066,624 |
| Citigroup, Inc. | | 73,266 | 3,491,858 |
| JPMorgan Chase & Co. | | 55,198 | 8,719,076 |
| Wells Fargo & Co. | | 101,946 | 4,705,827 |
| | | | 21,983,385 |
| Capital Markets - 0.7% | | | |
| Goldman Sachs Group, Inc. | | 11,165 | 3,973,289 |
| Consumer Finance - 2.0% | | | |
| Ally Financial, Inc. | | 76,397 | 2,333,164 |
| Capital One Financial Corp. | | 25,779 | 3,016,659 |
| Discover Financial Services | | 25,109 | 2,650,255 |
| Synchrony Financial | | 73,322 | 2,532,542 |
| | | | 10,532,620 |
| Financial Services - 6.4% | | | |
| Berkshire Hathaway, Inc. Class B (a) | | 30,797 | 10,839,312 |
| Essent Group Ltd. | | 59,067 | 2,929,723 |
| MGIC Investment Corp. | | 182,688 | 3,058,197 |
| PayPal Holdings, Inc. (a) | | 60,151 | 4,560,649 |
| The Western Union Co. | | 281,742 | 3,431,618 |
| Visa, Inc. Class A | | 37,874 | 9,003,786 |
| | | | 33,823,285 |
| Insurance - 1.2% | | | |
| American International Group, Inc. | | 52,644 | 3,173,380 |
| Unum Group | | 64,809 | 3,150,365 |
| | | | 6,323,745 |
TOTAL FINANCIALS | | | 76,636,324 |
| HEALTH CARE - 12.2% | | | |
| Biotechnology - 1.8% | | | |
| AbbVie, Inc. | | 45,644 | 6,827,430 |
| Moderna, Inc. (a) | | 23,414 | 2,754,891 |
| | | | 9,582,321 |
| Health Care Providers & Services - 4.9% | | | |
| Centene Corp. (a) | | 53,929 | 3,672,026 |
| CVS Health Corp. | | 55,910 | 4,175,918 |
| Elevance Health, Inc. | | 10,067 | 4,747,899 |
| Humana, Inc. | | 8,526 | 3,894,933 |
| UnitedHealth Group, Inc. | | 18,936 | 9,588,622 |
| | | | 26,079,398 |
| Pharmaceuticals - 5.5% | | | |
| Bristol-Myers Squibb Co. | | 73,368 | 4,562,756 |
| Johnson & Johnson | | 53,322 | 8,933,035 |
| Merck & Co., Inc. | | 64,649 | 6,894,816 |
| Pfizer, Inc. | | 147,049 | 5,302,587 |
| Viatris, Inc. | | 293,988 | 3,095,694 |
| | | | 28,788,888 |
TOTAL HEALTH CARE | | | 64,450,607 |
| INDUSTRIALS - 9.3% | | | |
| Aerospace & Defense - 0.7% | | | |
| Lockheed Martin Corp. | | 7,950 | 3,548,642 |
| Air Freight & Logistics - 0.7% | | | |
| United Parcel Service, Inc. Class B | | 21,166 | 3,960,794 |
| Building Products - 1.9% | | | |
| Builders FirstSource, Inc. (a) | | 29,120 | 4,205,802 |
| Owens Corning | | 23,486 | 3,287,805 |
| UFP Industries, Inc. | | 24,129 | 2,479,496 |
| | | | 9,973,103 |
| Electrical Equipment - 0.5% | | | |
| Atkore, Inc. (a) | | 16,802 | 2,665,973 |
| Industrial Conglomerates - 0.5% | | | |
| 3M Co. | | 26,032 | 2,902,568 |
| Machinery - 2.7% | | | |
| Caterpillar, Inc. | | 15,906 | 4,217,794 |
| Deere & Co. | | 9,093 | 3,906,353 |
| Mueller Industries, Inc. | | 33,576 | 2,721,671 |
| PACCAR, Inc. | | 37,422 | 3,223,157 |
| | | | 14,068,975 |
| Passenger Airlines - 0.5% | | | |
| United Airlines Holdings, Inc. (a) | | 48,023 | 2,608,129 |
| Professional Services - 0.8% | | | |
| Manpower, Inc. | | 25,888 | 2,042,045 |
| Robert Half, Inc. | | 27,260 | 2,021,329 |
| | | | 4,063,374 |
| Trading Companies & Distributors - 1.0% | | | |
| Triton International Ltd. | | 32,395 | 2,731,222 |
| United Rentals, Inc. | | 5,904 | 2,743,471 |
| | | | 5,474,693 |
TOTAL INDUSTRIALS | | | 49,266,251 |
| INFORMATION TECHNOLOGY - 25.6% | | | |
| Communications Equipment - 1.3% | | | |
| Cisco Systems, Inc. | | 132,346 | 6,887,286 |
| IT Services - 2.8% | | | |
| Accenture PLC Class A | | 21,458 | 6,788,238 |
| Cognizant Technology Solutions Corp. Class A | | 62,874 | 4,151,570 |
| DXC Technology Co. (a) | | 137,637 | 3,805,663 |
| | | | 14,745,471 |
| Semiconductors & Semiconductor Equipment - 4.9% | | | |
| Broadcom, Inc. | | 11,661 | 10,479,158 |
| Micron Technology, Inc. | | 76,755 | 5,479,539 |
| Qualcomm, Inc. | | 43,410 | 5,737,500 |
| Skyworks Solutions, Inc. | | 37,178 | 4,252,048 |
| | | | 25,948,245 |
| Software - 6.9% | | | |
| Microsoft Corp. | | 108,575 | 36,472,514 |
| Technology Hardware, Storage & Peripherals - 9.7% | | | |
| Apple, Inc. | | 214,011 | 42,042,456 |
| Hewlett Packard Enterprise Co. | | 259,118 | 4,503,471 |
| HP, Inc. | | 140,601 | 4,615,931 |
| | | | 51,161,858 |
TOTAL INFORMATION TECHNOLOGY | | | 135,215,374 |
| MATERIALS - 2.7% | | | |
| Chemicals - 1.6% | | | |
| CF Industries Holdings, Inc. | | 12,357 | 1,014,263 |
| Dow, Inc. | | 22,867 | 1,291,299 |
| Linde PLC | | 8,735 | 3,412,502 |
| LyondellBasell Industries NV Class A | | 11,919 | 1,178,312 |
| Olin Corp. | | 14,945 | 862,028 |
| The Mosaic Co. | | 20,822 | 848,705 |
| | | | 8,607,109 |
| Metals & Mining - 1.1% | | | |
| Cleveland-Cliffs, Inc. (a) | | 45,379 | 800,939 |
| Freeport-McMoRan, Inc. | | 37,184 | 1,660,266 |
| Nucor Corp. | | 7,980 | 1,373,278 |
| Steel Dynamics, Inc. | | 8,779 | 935,666 |
| United States Steel Corp. (b) | | 31,735 | 809,243 |
| | | | 5,579,392 |
TOTAL MATERIALS | | | 14,186,501 |
| REAL ESTATE - 2.7% | | | |
| Equity Real Estate Investment Trusts (REITs) - 2.3% | | | |
| Boston Properties, Inc. | | 14,454 | 963,070 |
| Host Hotels & Resorts, Inc. | | 60,596 | 1,114,966 |
| Kilroy Realty Corp. | | 24,680 | 881,076 |
| Medical Properties Trust, Inc. (b) | | 84,462 | 852,222 |
| Potlatch Corp. | | 20,937 | 1,122,851 |
| Prologis (REIT), Inc. | | 18,958 | 2,365,011 |
| Simon Property Group, Inc. | | 11,634 | 1,449,596 |
| VICI Properties, Inc. | | 40,817 | 1,284,919 |
| Vornado Realty Trust | | 39,724 | 892,996 |
| Weyerhaeuser Co. | | 37,030 | 1,261,242 |
| | | | 12,187,949 |
| Real Estate Management & Development - 0.4% | | | |
| CBRE Group, Inc. (a) | | 15,175 | 1,264,229 |
| Jones Lang LaSalle, Inc. (a) | | 5,958 | 992,305 |
| | | | 2,256,534 |
TOTAL REAL ESTATE | | | 14,444,483 |
| UTILITIES - 2.5% | | | |
| Electric Utilities - 1.5% | | | |
| American Electric Power Co., Inc. | | 18,614 | 1,577,350 |
| NRG Energy, Inc. | | 35,817 | 1,360,688 |
| PG&E Corp. (a) | | 93,829 | 1,652,329 |
| PPL Corp. | | 48,395 | 1,332,314 |
| Southern Co. | | 30,425 | 2,200,945 |
| | | | 8,123,626 |
| Gas Utilities - 0.2% | | | |
| National Fuel Gas Co. | | 20,997 | 1,115,151 |
| Independent Power and Renewable Electricity Producers - 0.2% | | | |
| Clearway Energy, Inc. Class C | | 34,859 | 920,626 |
| Multi-Utilities - 0.6% | | | |
| Consolidated Edison, Inc. | | 16,542 | 1,569,174 |
| Sempra Energy | | 11,083 | 1,651,589 |
| | | | 3,220,763 |
TOTAL UTILITIES | | | 13,380,166 |
| TOTAL COMMON STOCKS (Cost $493,386,419) | | | 526,357,535 |
| | | | |
| Money Market Funds - 1.0% |
| | | Shares | Value ($) |
| Fidelity Cash Central Fund 5.32% (c) | | 1,107,609 | 1,107,830 |
| Fidelity Securities Lending Cash Central Fund 5.32% (c)(d) | | 4,344,241 | 4,344,675 |
| TOTAL MONEY MARKET FUNDS (Cost $5,452,505) | | | 5,452,505 |
| | | | |
| TOTAL INVESTMENT IN SECURITIES - 100.7% (Cost $498,838,924) | 531,810,040 |
NET OTHER ASSETS (LIABILITIES) - (0.7)% | (3,949,718) |
| NET ASSETS - 100.0% | 527,860,322 |
| | |
| Futures Contracts |
| | Number of contracts | Expiration Date | Notional Amount ($) | Value ($) | Unrealized Appreciation/ (Depreciation) ($) |
| Purchased | | | | | |
| | | | | | |
| Equity Index Contracts | | | | | |
| CME Micro E-mini S&P 500 Index Contracts (United States) | 60 | Sep 2023 | 1,384,350 | 70,127 | 70,127 |
| | | | | | |
| The notional amount of futures purchased as a percentage of Net Assets is 0.3% |
Legend
| (b) | Security or a portion of the security is on loan at period end. |
| (c) | Affiliated fund that is generally available only to investment companies and other accounts managed by Fidelity Investments. The rate quoted is the annualized seven-day yield of the fund at period end. A complete unaudited listing of the fund's holdings as of its most recent quarter end is available upon request. In addition, each Fidelity Central Fund's financial statements, which are not covered by the Fund's Report of Independent Registered Public Accounting Firm, are available on the SEC's website or upon request. |
| (d) | Investment made with cash collateral received from securities on loan. |
Affiliated Central Funds
Fiscal year to date information regarding the Fund's investments in Fidelity Central Funds, including the ownership percentage, is presented below.
| Affiliate | Value, beginning of period ($) | Purchases ($) | Sales Proceeds ($) | Dividend Income ($) | Realized Gain (loss) ($) | Change in Unrealized appreciation (depreciation) ($) | Value, end of period ($) | % ownership, end of period |
| Fidelity Cash Central Fund 5.32% | 474,486 | 17,425,544 | 16,792,200 | 30,216 | - | - | 1,107,830 | 0.0% |
| Fidelity Securities Lending Cash Central Fund 5.32% | 834,375 | 53,345,301 | 49,835,001 | 9,446 | - | - | 4,344,675 | 0.0% |
| Total | 1,308,861 | 70,770,845 | 66,627,201 | 39,662 | - | - | 5,452,505 | |
| | | | | | | | | |
Amounts in the dividend income column in the above table include any capital gain distributions from underlying funds, which are presented in the corresponding line item in the Statement of Operations, if applicable.
Amounts in the dividend income column for Fidelity Securities Lending Cash Central Fund represents the income earned on investing cash collateral, less rebates paid to borrowers and any lending agent fees associated with the loan, plus any premium payments received for lending certain types of securities.
Amounts included in the purchases and sales proceeds columns may include in-kind transactions, if applicable.
Investment Valuation
The following is a summary of the inputs used, as of July 31, 2023, involving the Fund's assets and liabilities carried at fair value. The inputs or methodology used for valuing securities may not be an indication of the risk associated with investing in those securities. For more information on valuation inputs, and their aggregation into the levels used below, please refer to the Investment Valuation section in the accompanying Notes to Financial Statements.
| Valuation Inputs at Reporting Date: |
| Description | Total ($) | Level 1 ($) | Level 2 ($) | Level 3 ($) |
Investments in Securities: | | | | |
|
| Equities: | | | | |
Communication Services | 46,260,332 | 46,260,332 | - | - |
Consumer Discretionary | 58,680,685 | 58,680,685 | - | - |
Consumer Staples | 30,289,996 | 30,289,996 | - | - |
Energy | 23,546,816 | 23,546,816 | - | - |
Financials | 76,636,324 | 76,636,324 | - | - |
Health Care | 64,450,607 | 64,450,607 | - | - |
Industrials | 49,266,251 | 49,266,251 | - | - |
Information Technology | 135,215,374 | 135,215,374 | - | - |
Materials | 14,186,501 | 14,186,501 | - | - |
Real Estate | 14,444,483 | 14,444,483 | - | - |
Utilities | 13,380,166 | 13,380,166 | - | - |
|
| Money Market Funds | 5,452,505 | 5,452,505 | - | - |
| Total Investments in Securities: | 531,810,040 | 531,810,040 | - | - |
Derivative Instruments: | | | | |
|
| Assets | | | | |
Futures Contracts | 70,127 | 70,127 | - | - |
| Total Assets | 70,127 | 70,127 | - | - |
| Total Derivative Instruments: | 70,127 | 70,127 | - | - |
Value of Derivative Instruments
The following table is a summary of the Fund's value of derivative instruments by primary risk exposure as of July 31, 2023. For additional information on derivative instruments, please refer to the Derivative Instruments section in the accompanying Notes to Financial Statements.
Primary Risk Exposure / Derivative Type | Value |
| Asset ($) | Liability ($) |
| Equity Risk | | |
Futures Contracts (a) | 70,127 | 0 |
| Total Equity Risk | 70,127 | 0 |
| Total Value of Derivatives | 70,127 | 0 |
(a)Reflects gross cumulative appreciation (depreciation) on futures contracts as presented in the Schedule of Investments. In the Statement of Assets and Liabilities, the period end daily variation margin is included in receivable or payable for daily variation margin on futures contracts, and the net cumulative appreciation (depreciation) is included in Total accumulated earnings (loss).
Fidelity® Value Factor ETF
| Statement of Assets and Liabilities |
| | | | July 31, 2023 |
| | | | | |
| Assets | | | | |
| Investment in securities, at value (including securities loaned of $4,311,890) - See accompanying schedule: | | | | |
Unaffiliated issuers (cost $493,386,419) | $ | 526,357,535 | | |
Fidelity Central Funds (cost $5,452,505) | | 5,452,505 | | |
| | | | | |
| | | | | |
| Total Investment in Securities (cost $498,838,924) | | | $ | 531,810,040 |
| Segregated cash with brokers for derivative instruments | | | | 67,200 |
| Dividends receivable | | | | 440,344 |
| Distributions receivable from Fidelity Central Funds | | | | 4,474 |
| Receivable for daily variation margin on futures contracts | | | | 2,390 |
| Other receivables | | | | 4,295 |
Total assets | | | | 532,328,743 |
| Liabilities | | | | |
| Accrued management fee | $ | 123,746 | | |
| Collateral on securities loaned | | 4,344,675 | | |
| Total Liabilities | | | | 4,468,421 |
| Net Assets | | | $ | 527,860,322 |
| Net Assets consist of: | | | | |
| Paid in capital | | | $ | 540,357,082 |
| Total accumulated earnings (loss) | | | | (12,496,760) |
| Net Assets | | | $ | 527,860,322 |
Net Asset Value, offering price and redemption price per share ($527,860,322 ÷ 10,350,000 shares) | | | $ | 51.00 |
| Statement of Operations |
| | | | Year ended July 31, 2023 |
| Investment Income | | | | |
| Dividends | | | $ | 10,192,682 |
| Income from Fidelity Central Funds (including $9,446 from security lending) | | | | 39,662 |
| Total Income | | | | 10,232,344 |
| Expenses | | | | |
| Management fee | $ | 1,348,237 | | |
| Independent trustees' fees and expenses | | 2,392 | | |
| Total expenses before reductions | | 1,350,629 | | |
| Expense reductions | | (345) | | |
| Total expenses after reductions | | | | 1,350,284 |
| Net Investment income (loss) | | | | 8,882,060 |
| Realized and Unrealized Gain (Loss) | | | | |
| Net realized gain (loss) on: | | | | |
| Investment Securities: | | | | |
| Unaffiliated issuers | | (8,595,970) | | |
| Redemptions in-kind | | 15,085,153 | | |
| Futures contracts | | 56,793 | | |
| Total net realized gain (loss) | | | | 6,545,976 |
| Change in net unrealized appreciation (depreciation) on: | | | | |
| Investment Securities: | | | | |
| Unaffiliated issuers | | 38,183,141 | | |
| Futures contracts | | 11,052 | | |
| Total change in net unrealized appreciation (depreciation) | | | | 38,194,193 |
| Net gain (loss) | | | | 44,740,169 |
| Net increase (decrease) in net assets resulting from operations | | | $ | 53,622,229 |
| Statement of Changes in Net Assets |
| |
| | Year ended July 31, 2023 | | Year ended July 31, 2022 |
| Increase (Decrease) in Net Assets | | | | |
| Operations | | | | |
| Net investment income (loss) | $ | 8,882,060 | $ | 7,743,147 |
| Net realized gain (loss) | | 6,545,976 | | 55,705,980 |
| Change in net unrealized appreciation (depreciation) | | 38,194,193 | | (90,000,723) |
| Net increase (decrease) in net assets resulting from operations | | 53,622,229 | | (26,551,596) |
| Distributions to shareholders | | (8,641,250) | | (7,920,650) |
| | | | | |
| Share transactions | | | | |
| Proceeds from sales of shares | | 80,746,346 | | 409,246,223 |
| Cost of shares redeemed | | (97,539,980) | | (325,370,322) |
| | | | | |
Net increase (decrease) in net assets resulting from share transactions | | (16,793,634) | | 83,875,901 |
| Total increase (decrease) in net assets | | 28,187,345 | | 49,403,655 |
| | | | | |
| Net Assets | | | | |
| Beginning of period | | 499,672,977 | | 450,269,322 |
| End of period | $ | 527,860,322 | $ | 499,672,977 |
| | | | | |
| Other Information | | | | |
| Shares | | | | |
| Sold | | 1,750,000 | | 8,250,000 |
| Redeemed | | (2,200,000) | | (6,650,000) |
| Net increase (decrease) | | (450,000) | | 1,600,000 |
| | | | | |
| Fidelity® Value Factor ETF |
| |
| Years ended July 31, | | 2023 | | 2022 | | 2021 | | 2020 | | 2019 |
Selected Per-Share Data | | | | | | | | | | |
| Net asset value, beginning of period | $ | 46.27 | $ | 48.94 | $ | 34.85 | $ | 34.53 | $ | 33.90 |
| Income from Investment Operations | | | | | | | | | | |
Net investment income (loss) A,B | | .87 | | .79 | | .64 | | .73 | | .70 |
| Net realized and unrealized gain (loss) | | 4.70 | | (2.65) | | 14.07 | | .28 | | .59 |
| Total from investment operations | | 5.57 | | (1.86) | | 14.71 | | 1.01 | | 1.29 |
| Distributions from net investment income | | (.84) | | (.81) | | (.62) | | (.69) | | (.66) |
| Total distributions | | (.84) | | (.81) | | (.62) | | (.69) | | (.66) |
| Net asset value, end of period | $ | 51.00 | $ | 46.27 | $ | 48.94 | $ | 34.85 | $ | 34.53 |
Total Return C,D | | 12.33% | | (3.86)% | | 42.56% | | 3.12% | | 3.95% |
Ratios to Average Net Assets B,E,F | | | | | | | | | | |
| Expenses before reductions | | .29% | | .29% | | .29% | | .29% | | .29% |
| Expenses net of fee waivers, if any | | .29% | | .29% | | .29% | | .29% | | .29% |
| Expenses net of all reductions | | .29% | | .29% | | .29% | | .29% | | .29% |
| Net investment income (loss) | | 1.91% | | 1.61% | | 1.50% | | 2.13% | | 2.09% |
| Supplemental Data | | | | | | | | | | |
| Net assets, end of period (000 omitted) | $ | 527,860 | $ | 499,673 | $ | 450,269 | $ | 189,916 | $ | 136,403 |
Portfolio turnover rate G,H | | 43% | | 46% | | 42% | | 45% | | 31% |
ACalculated based on average shares outstanding during the period.
BNet investment income (loss) is affected by the timing of the declaration of dividends by any underlying mutual funds or exchange-traded funds (ETFs). Net investment income (loss) of any mutual funds or ETFs is not included in the Fund's net investment income (loss) ratio.
CTotal returns would have been lower if certain expenses had not been reduced during the applicable periods shown.
DBased on net asset value.
EFees and expenses of any underlying mutual funds or exchange-traded funds (ETFs) are not included in the Fund's expense ratio. The Fund indirectly bears its proportionate share of these expenses. For additional expense information related to investments in Fidelity Central Funds, please refer to the "Investments in Fidelity Central Funds" note found in the Notes to Financial Statements section of the most recent Annual or Semi-Annual report.
FExpense ratios reflect operating expenses of the class. Expenses before reductions do not reflect amounts reimbursed, waived, or reduced through arrangements with the investment adviser, brokerage services, or other offset arrangements, if applicable, and do not represent the amount paid by the class during periods when reimbursements, waivers or reductions occur.
GAmount does not include the portfolio activity of any underlying mutual funds or exchange-traded funds (ETFs).
HPortfolio turnover rate excludes securities received or delivered in-kind.
For the period ended July 31, 2023
1. Organization.
Fidelity Dividend ETF for Rising Rates, Fidelity High Dividend ETF, Fidelity Low Volatility Factor ETF, Fidelity Momentum Factor ETF, Fidelity Quality Factor ETF, Fidelity Small-Mid Multifactor ETF, Fidelity Stocks for Inflation ETF, Fidelity U.S. Multifactor ETF and Fidelity Value Factor ETF (the Funds) are exchange-traded funds of Fidelity Covington Trust (the Trust) and are authorized to issue an unlimited number of shares. The Trust is registered under the Investment Company Act of 1940, as amended (the 1940 Act), as an open-end management investment company organized as a Massachusetts business trust.
2. Investments in Fidelity Central Funds.
Funds may invest in Fidelity Central Funds, which are open-end investment companies generally available only to other investment companies and accounts managed by the investment adviser and its affiliates. The Schedule of Investments lists any Fidelity Central Funds held as an investment as of period end, but does not include the underlying holdings of each Fidelity Central Fund. An investing fund indirectly bears its proportionate share of the expenses of the underlying Fidelity Central Funds.
Based on its investment objective, each Fidelity Central Fund may invest or participate in various investment vehicles or strategies that are similar to those of the investing fund. These strategies are consistent with the investment objectives of the investing fund and may involve certain economic risks which may cause a decline in value of each of the Fidelity Central Funds and thus a decline in the value of the investing fund.
| Fidelity Central Fund | Investment Manager | Investment Objective | Investment Practices | Expense RatioA |
| Fidelity Money Market Central Funds | Fidelity Management & Research Company LLC (FMR) | Each fund seeks to obtain a high level of current income consistent with the preservation of capital and liquidity. | Short-term Investments | Less than .005% |
A Expenses expressed as a percentage of average net assets and are as of each underlying Central Fund's most recent annual or semi-annual shareholder report.
A complete unaudited list of holdings for each Fidelity Central Fund is available upon request or at the Securities and Exchange Commission website at www.sec.gov. In addition, the financial statements of the Fidelity Central Funds which contain the significant accounting policies (including investment valuation policies) of those funds, and are not covered by the Report of Independent Registered Public Accounting Firm, are available on the Securities and Exchange Commission website or upon request.
3. Significant Accounting Policies.
Each Fund is an investment company and applies the accounting and reporting guidance of the Financial Accounting Standards Board (FASB) Accounting Standards Codification Topic 946 Financial Services - Investment Companies. The financial statements have been prepared in conformity with accounting principles generally accepted in the United States of America (GAAP), which require management to make certain estimates and assumptions at the date of the financial statements. Actual results could differ from those estimates. Subsequent events, if any, through the date that the financial statements were issued have been evaluated in the preparation of the financial statements. Each Fund's Schedule of Investments lists any underlying mutual funds or exchange-traded funds (ETFs) but does not include the underlying holdings of these funds. The following summarizes the significant accounting policies of each Fund:
Investment Valuation. Investments are valued as of 4:00 p.m. Eastern time on the last calendar day of the period. The Board of Trustees (the Board) has designated each Fund's investment adviser as the valuation designee responsible for the fair valuation function and performing fair value determinations as needed. The investment adviser has established a Fair Value Committee (the Committee) to carry out the day-to-day fair valuation responsibilities and has adopted policies and procedures to govern the fair valuation process and the activities of the Committee. In accordance with these fair valuation policies and procedures, which have been approved by the Board, each Fund attempts to obtain prices from one or more third party pricing services or brokers to value its investments. When current market prices, quotations or currency exchange rates are not readily available or reliable, investments will be fair valued in good faith by the Committee, in accordance with the policies and procedures. Factors used in determining fair value vary by investment type and may include market or investment specific events, transaction data, estimated cash flows, and market observations of comparable investments. The frequency that the fair valuation procedures are used cannot be predicted and they may be utilized to a significant extent. The Committee manages each Fund's fair valuation practices and maintains the fair valuation policies and procedures. Each Fund's investment adviser reports to the Board information regarding the fair valuation process and related material matters.
Each Fund categorizes the inputs to valuation techniques used to value its investments into a disclosure hierarchy consisting of three levels as shown below:
Level 1 - unadjusted quoted prices in active markets for identical investments
Level 2 - other significant observable inputs (including quoted prices for similar investments, interest rates, prepayment speeds, etc.)
Level 3 - unobservable inputs (including the Fund's own assumptions based on the best information available)
Valuation techniques used to value each Fund's investments by major category are as follows:
Equity securities, including restricted securities, for which market quotations are readily available, are valued at the last reported sale price or official closing price as reported by a third party pricing service on the primary market or exchange on which they are traded and are categorized as Level 1 in the hierarchy. In the event there were no sales during the day or closing prices are not available, securities are valued at the last quoted bid price or may be valued using the last available price and are generally categorized as Level 2 in the hierarchy. For foreign equity securities, when market or security specific events arise, comparisons to the valuation of American Depositary Receipts (ADRs), futures contracts, ETFs and certain indexes as well as quoted prices for similar securities may be used and would be categorized as Level 2 in the hierarchy. For equity securities, including restricted securities, where observable inputs are limited, assumptions about market activity and risk are used and these securities may be categorized as Level 3 in the hierarchy.
Futures contracts are valued at the settlement price established each day by the board of trade or exchange on which they are traded and are categorized as Level 1 in the hierarchy. Investments in open-end mutual funds, including the Fidelity Central Funds, are valued at their closing net asset value (NAV) each business day and are categorized as Level 1 in the hierarchy.
Changes in valuation techniques may result in transfers in or out of an assigned level within the disclosure hierarchy. The aggregate value of investments by input level as of July 31, 2023 is included at the end of each Fund's Schedule of Investments.
Foreign Currency. Certain Funds may use foreign currency contracts to facilitate transactions in foreign-denominated securities. Gains and losses from these transactions may arise from changes in the value of the foreign currency or if the counterparties do not perform under the contracts' terms.
Foreign-denominated assets, including investment securities, and liabilities are translated into U.S. dollars at the exchange rates at period end. Purchases and sales of investment securities, income and dividends received, and expenses denominated in foreign currencies are translated into U.S. dollars at the exchange rate in effect on the transaction date.
The effects of exchange rate fluctuations on investments are included with the net realized and unrealized gain (loss) on investment securities. Other foreign currency transactions resulting in realized and unrealized gain (loss) are disclosed separately.
Investment Transactions and Income. For financial reporting purposes, the Funds' investment holdings and NAV include trades executed through the end of the last business day of the period. The NAV per share for processing shareholder transactions is calculated as of the close of business (normally 4:00 p.m. Eastern time) of the Cboe BZX Exchange, Inc. (CboeBZX) for Fidelity Stocks for Inflation ETF, and of the New York Stock Exchange, Archipelago Exchange (NYSE Arca) for all other funds and includes trades executed through the end of the prior business day. Gains and losses on securities sold are determined on the basis of identified cost and may include proceeds received from litigation. Commissions paid to certain brokers with whom the investment adviser, or its affiliates, places trades on behalf of a fund include an amount in addition to trade execution, which may be rebated back to a fund. Any such rebates are included in net realized gain (loss) on investments in the Statement of Operations. Dividend income is recorded on the ex-dividend date, except for certain dividends from foreign securities where the ex-dividend date may have passed, which are recorded as soon as the Funds are informed of the ex-dividend date. Non-cash dividends included in dividend income, if any, are recorded at the fair market value of the securities received. Income and capital gain distributions from Fidelity Central Funds, if any, are recorded on the ex-dividend date. Certain distributions received by the Funds represent a return of capital or capital gain. The Funds determine the components of these distributions subsequent to the ex-dividend date, based upon receipt of tax filings or other correspondence relating to the underlying investment. These distributions are recorded as a reduction of cost of investments and/or as a realized gain. Investment income is recorded net of foreign taxes withheld where recovery of such taxes is uncertain. Funds may file withholding tax reclaims in certain jurisdictions to recover a portion of amounts previously withheld. Any withholding tax reclaims income is included in the Statement of Operations in dividends. Any receivables for withholding tax reclaims are included in the Statement of Assets and Liabilities in dividends receivable.
Expenses. Expenses directly attributable to a fund are charged to that fund. Expenses attributable to more than one fund are allocated among the respective funds on the basis of relative net assets or other appropriate methods. Expenses included in the accompanying financial statements reflect the expenses of that fund and do not include any expenses associated with any underlying mutual funds or exchange-traded funds. Although not included in a fund's expenses, a fund indirectly bears its proportionate share of these expenses through the net asset value of each underlying mutual fund or exchange-traded fund. Expense estimates are accrued in the period to which they relate and adjustments are made when actual amounts are known.
Income Tax Information and Distributions to Shareholders. Each year, each Fund intends to qualify as a regulated investment company under Subchapter M of the Internal Revenue Code, including distributing substantially all of its taxable income and realized gains. As a result, no provision for U.S. Federal income taxes is required. As of July 31, 2023, each Fund did not have any unrecognized tax benefits in the financial statements; nor is each Fund aware of any tax positions for which it is reasonably possible that the total amounts of unrecognized tax benefits will significantly change in the next twelve months. Each Fund files a U.S. federal tax return, in addition to state and local tax returns as required. Each Fund's federal income tax returns are subject to examination by the Internal Revenue Service (IRS) for a period of three fiscal years after they are filed. State and local tax returns may be subject to examination for an additional fiscal year depending on the jurisdiction. Realized gain or loss resulting from in-kind redemptions is not taxable to the Fund and is not distributed to shareholders of the Fund. Foreign taxes are provided for based on each Fund's understanding of the tax rules and rates that exist in the foreign markets in which it invests.
Distributions are declared and recorded on the ex-dividend date. Income and capital gain distributions are determined in accordance with income tax regulations, which may differ from GAAP.
Capital accounts within the financial statements are adjusted for permanent book-tax differences. These adjustments have no impact on net assets or the results of operations. Capital accounts are not adjusted for temporary book-tax differences which will reverse in a subsequent period.
Book-tax differences are primarily due to futures transactions, redemptions in-kind, partnerships, passive foreign investment companies (PFIC), foreign currency transactions, capital loss carryforwards and losses deferred due to wash sales and excise tax regulations.
As of period end, the cost and unrealized appreciation (depreciation) in securities, and derivatives if applicable, for federal income tax purposes were as follows for each Fund:
| | Tax cost | Gross unrealized appreciation | Gross unrealized depreciation | Net unrealized appreciation (depreciation) |
| Fidelity Dividend ETF for Rising Rates | $511,622,296 | $83,253,954 | $(40,264,354) | $42,989,600 |
| Fidelity High Dividend ETF | 1,581,136,115 | 199,600,269 | (75,417,576) | 124,182,693 |
| Fidelity Low Volatility Factor ETF | 508,386,061 | 69,411,769 | (21,241,559) | 48,170,210 |
| Fidelity Momentum Factor ETF | 133,367,074 | 21,935,475 | (1,866,724) | 20,068,751 |
| Fidelity Quality Factor ETF | 298,797,321 | 41,107,199 | (13,186,893) | 27,920,306 |
| Fidelity Small-Mid Multifactor ETF | 120,972,842 | 15,179,121 | (6,989,276) | 8,189,845 |
| Fidelity Stocks for Inflation ETF | 141,922,428 | 13,209,662 | (7,868,168) | 5,341,494 |
| Fidelity U.S. Multifactor ETF | 31,689,760 | 3,850,175 | (921,678) | 2,928,497 |
| Fidelity Value Factor ETF | 499,298,970 | 62,204,784 | (29,693,714) | 32,511,070 |
The tax-based components of distributable earnings as of period end were as follows for each Fund:
| | Undistributed ordinary income | Capital loss carryforward | Net unrealized appreciation (depreciation) on securities and other investments |
| Fidelity Dividend ETF for Rising Rates | $413,605 | $ (59,736,344) | $43,019,251 |
| Fidelity High Dividend ETF | - | (71,499,125) | 124,201,629 |
| Fidelity Low Volatility Factor ETF | 211,898 | (39,960,681) | 48,170,210 |
| Fidelity Momentum Factor ETF | - | (32,540,088) | 20,068,751 |
| Fidelity Quality Factor ETF | 142,798 | (23,721,169) | 27,920,306 |
| Fidelity Small-Mid Multifactor ETF | - | (8,320,224) | 8,189,822 |
| Fidelity Stocks for Inflation ETF | - | (20,814,268) | 5,341,494 |
| Fidelity U.S. Multifactor ETF | 5,980 | (1,083,499) | 2,928,497 |
| Fidelity Value Factor ETF | 381,146 | (45,388,976) | 32,511,070 |
Capital loss carryforwards are only available to offset future capital gains of the Funds to the extent provided by regulations and may be limited. The capital loss carryforward information presented below, including any applicable limitation, is estimated as of fiscal period end and is subject to adjustment.
| | Short-term | Long-term | Total capital loss carryforward |
| Fidelity Dividend ETF for Rising Rates | $ (27,351,906) | $ (32,384,438) | $ (59,736,344) |
| Fidelity High Dividend ETF | (37,157,065) | (34,342,060) | (71,499,125) |
| Fidelity Low Volatility Factor ETF | (25,713,255) | (14,247,426) | (39,960,681) |
| Fidelity Momentum Factor ETF | (32,199,777) | (340,311) | (32,540,088) |
| Fidelity Quality Factor ETF | (17,277,163) | (6,444,006) | (23,721,169) |
| Fidelity Small-Mid Multifactor ETF | (6,770,927) | (1,549,297) | (8,320,224) |
| Fidelity Stocks for Inflation ETF | (17,304,578) | (3,509,690) | (20,814,268) |
| Fidelity U.S. Multifactor ETF | (688,778) | (394,721) | (1,083,499) |
| Fidelity Value Factor ETF | (28,724,493) | (16,664,483) | (45,388,976) |
Certain of the Funds intend to elect to defer to the next fiscal year ordinary losses recognized during the period January 1, 2023 to July 31, 2023. Loss deferrals were as follows:
| | Ordinary Losses |
| Fidelity High Dividend ETF | $(246,109) |
| Fidelity Small-Mid Multifactor ETF | (2,680) |
The tax character of distributions paid was as follows:
| July 31, 2023 | | |
| | Ordinary Income | Total |
| Fidelity Dividend ETF for Rising Rates | $16,860,450 | $16,860,450 |
| Fidelity High Dividend ETF | 52,210,250 | 52,210,250 |
| Fidelity Low Volatility Factor ETF | 7,460,700 | 7,460,700 |
| Fidelity Momentum Factor ETF | 1,506,200 | 1,506,200 |
| Fidelity Quality Factor ETF | 4,025,350 | 4,025,350 |
| Fidelity Small-Mid Multifactor ETF | 1,518,700 | 1,518,700 |
| Fidelity Stocks for Inflation ETF | 4,166,950 | 4,166,950 |
| Fidelity U.S. Multifactor ETF | 365,300 | 365,300 |
| Fidelity Value Factor ETF | 8,641,250 | 8,641,250 |
| July 31, 2022 | | |
| | Ordinary Income | Total |
| Fidelity Dividend ETF for Rising Rates | $14,425,400 | $14,425,400 |
| Fidelity High Dividend ETF | 36,931,550 | 36,931,550 |
| Fidelity Low Volatility Factor ETF | 5,937,600 | 5,937,600 |
| Fidelity Momentum Factor ETF | 999,550 | 999,550 |
| Fidelity Quality Factor ETF | 3,437,350 | 3,437,350 |
| Fidelity Small-Mid Multifactor ETF | 905,700 | 905,700 |
| Fidelity Stocks for Inflation ETF | 2,544,600 | 2,544,600 |
| Fidelity U.S. Multifactor ETF | 235,000 | 235,000 |
| Fidelity Value Factor ETF | 7,920,650 | 7,920,650 |
4. Derivative Instruments.
Risk Exposures and the Use of Derivative Instruments. Each Fund's investment objectives allow for various types of derivative instruments, including futures contracts. Derivatives are investments whose value is primarily derived from underlying assets, indices or reference rates and may be transacted on an exchange or over-the-counter (OTC). Derivatives may involve a future commitment to buy or sell a specified asset based on specified terms, to exchange future cash flows at periodic intervals based on a notional principal amount, or for one party to make one or more payments upon the occurrence of specified events in exchange for periodic payments from the other party.
Derivatives were used to increase returns and to manage exposure to certain risks as defined below. The success of any strategy involving derivatives depends on analysis of numerous economic factors, and if the strategies for investment do not work as intended, the objectives may not be achieved.
Derivatives were used to increase or decrease exposure to the following risk(s):
| Equity Risk | Equity risk relates to the fluctuations in the value of financial instruments as a result of changes in market prices (other than those arising from interest rate risk or foreign exchange risk), whether caused by factors specific to an individual investment, its issuer, or all factors affecting all instruments traded in a market or market segment. |
Funds are also exposed to additional risks from investing in derivatives, such as liquidity risk and counterparty credit risk. Liquidity risk is the risk that a fund will be unable to close out the derivative in the open market in a timely manner. Counterparty credit risk is the risk that the counterparty will not be able to fulfill its obligation to a fund. Counterparty credit risk related to exchange-traded contracts may be mitigated by the protection provided by the exchange on which they trade.
Investing in derivatives may involve greater risks than investing in the underlying assets directly and, to varying degrees, may involve risk of loss in excess of any initial investment and collateral received and amounts recognized in the Statement of Assets and Liabilities. In addition, there may be the risk that the change in value of the derivative contract does not correspond to the change in value of the underlying instrument.
Futures Contracts. A futures contract is an agreement between two parties to buy or sell a specified underlying instrument for a fixed price at a specified future date. Futures contracts were used to manage exposure to the stock market.
Upon entering into a futures contract, a fund is required to deposit either cash or securities (initial margin) with a clearing broker in an amount equal to a certain percentage of the face value of the contract. Futures contracts are marked-to-market daily and subsequent daily payments are made or received by a fund depending on the daily fluctuations in the value of the futures contracts and are recorded as unrealized appreciation or (depreciation). This receivable and/or payable, if any, is included in daily variation margin on futures contracts in the Statement of Assets and Liabilities. Realized gain or (loss) is recorded upon the expiration or closing of a futures contract. The net realized gain (loss) and change in net unrealized appreciation (depreciation) on futures contracts during the period is presented in the Statement of Operations.
Any open futures contracts at period end are presented in the Schedule of Investments under the caption "Futures Contracts". The notional amount at value reflects each contract's exposure to the underlying instrument or index at period end, and is representative of volume of activity during the period unless an average notional amount is presented. Any securities deposited to meet initial margin requirements are identified in the Schedule of Investments. Any cash deposited to meet initial margin requirements is presented as segregated cash with brokers for derivative instruments in the Statement of Assets and Liabilities.
5. Purchases and Sales of Investments.
Purchases and sales of securities, other than short-term securities and in-kind transactions, as applicable, are noted in the table below.
| | Purchases ($) | Sales ($) |
| Fidelity Dividend ETF for Rising Rates | 157,511,726 | 156,794,417 |
| Fidelity High Dividend ETF | 714,860,771 | 697,745,447 |
| Fidelity Low Volatility Factor ETF | 219,768,654 | 215,115,659 |
| Fidelity Momentum Factor ETF | 166,768,778 | 163,954,809 |
| Fidelity Quality Factor ETF | 117,016,021 | 116,592,522 |
| Fidelity Small-Mid Multifactor ETF | 60,617,478 | 58,257,340 |
| Fidelity Stocks for Inflation ETF | 216,692,483 | 217,621,838 |
| Fidelity U.S. Multifactor ETF | 9,841,972 | 9,638,776 |
| Fidelity Value Factor ETF | 196,017,174 | 196,331,203 |
Securities received and delivered in-kind through subscriptions and redemptions are noted in the table below.
| | In-Kind Subscriptions ($) | In-Kind Redemptions ($) |
| Fidelity Dividend ETF for Rising Rates | 111,394,937 | 198,524,166 |
| Fidelity High Dividend ETF | 594,423,423 | 313,396,955 |
| Fidelity Low Volatility Factor ETF | 125,436,747 | 54,746,046 |
| Fidelity Momentum Factor ETF | 51,577,311 | 26,175,464 |
| Fidelity Quality Factor ETF | 67,441,105 | 34,661,785 |
| Fidelity Small-Mid Multifactor ETF | 47,921,611 | 2,909,849 |
| Fidelity Stocks for Inflation ETF | 7,832,300 | 127,119,676 |
| Fidelity U.S. Multifactor ETF | 20,645,052 | 3,611,585 |
| Fidelity Value Factor ETF | 80,271,251 | 96,954,227 |
6. Fees and Other Transactions with Affiliates.
Management Fee. Fidelity Management & Research Company LLC (the investment adviser) provides the Funds with investment management related services for which the Funds pay a monthly management fee that is based on an annual rate of each Fund's average net assets as noted in the table below. Under the management contract, the investment adviser pays all other expenses, except the compensation of the independent Trustees and certain miscellaneous expenses such as proxy and shareholder meeting expenses. For each Fund, with the exception of Fidelity Small-Mid Multifactor ETF, Fidelity Stocks for Inflation ETF and Fidelity U.S. Multifactor ETF, the management fee paid to the investment adviser is reduced by an amount equal to the fees and expenses paid by each fund to the independent Trustees.
| | Fee Rate |
| Fidelity Dividend ETF for Rising Rates | .29% |
| Fidelity High Dividend ETF | .29% |
| Fidelity Low Volatility Factor ETF | .29% |
| Fidelity Momentum Factor ETF | .29% |
| Fidelity Quality Factor ETF | .29% |
| Fidelity Small-Mid Multifactor ETF | .29% |
| Fidelity Stocks for Inflation ETF | .29% |
| Fidelity U.S. Multifactor ETF | .29% |
| Fidelity Value Factor ETF | .29% |
Sub-Adviser. Geode Capital Management, LLC (Geode), serves as sub-adviser for the Fund. Geode provides discretionary investment advisory services to the Fund and is paid by the investment adviser for providing these services.
Interfund Lending Program. Pursuant to an Exemptive Order issued by the Securities and Exchange Commission (the SEC), each Fund, along with other registered investment companies having management contracts with Fidelity Management & Research Company LLC (FMR), or other affiliated entities of FMR, may participate in an interfund lending program. This program provides an alternative credit facility allowing each Fund to borrow from, or lend money to, other participating affiliated funds. At period end, there were no interfund loans outstanding. Activity in this program during the period for which loans were outstanding was as follows:
| | Borrower or Lender | Average Loan Balance | Weighted Average Interest Rate | Interest Expense |
| Fidelity Dividend ETF for Rising Rates | Borrower | $9,374,000 | 4.82% | $1,254 |
| Fidelity High Dividend ETF | Borrower | $50,779,000 | 4.82% | $6,792 |
Interfund Trades. Funds may purchase from or sell securities to other funds affiliated with each sub-adviser under procedures adopted by the Board. The procedures have been designed to ensure these interfund trades are executed in accordance with Rule 17a-7 of the 1940 Act. Any interfund trades are included within the respective purchases and sales amounts shown in the Purchases and Sales of Investments note. During the period, there were no interfund trades.
7. Security Lending.
Funds lend portfolio securities from time to time in order to earn additional income. Lending agents are used, including National Financial Services (NFS), an affiliate of the investment adviser. Pursuant to a securities lending agreement, NFS will receive a fee, which is capped at 9.9% of a fund's daily lending revenue, for its services as lending agent. A fund may lend securities to certain qualified borrowers, including NFS. On the settlement date of the loan, a fund receives collateral (in the form of U.S. Treasury obligations, letters of credit and/or cash) against the loaned securities and maintains collateral in an amount not less than 100% of the market value of the loaned securities during the period of the loan. The market value of the loaned securities is determined at the close of business of a fund and any additional required collateral is delivered to a fund on the next business day. A fund or borrower may terminate the loan at any time, and if the borrower defaults on its obligation to return the securities loaned because of insolvency or other reasons, a fund may apply collateral received from the borrower against the obligation. A fund may experience delays and costs in recovering the securities loaned. Any cash collateral received is invested in the Fidelity Securities Lending Cash Central Fund. Any loaned securities are identified as such in the Schedule of Investments, and the value of loaned securities and cash collateral at period end, as applicable, are presented in the Statement of Assets and Liabilities. Security lending income represents the income earned on investing cash collateral, less rebates paid to borrowers and any lending agent fees associated with the loan, plus any premium payments received for lending certain types of securities. Security lending income is presented in the Statement of Operations as a component of income from Fidelity Central Funds. Affiliated security lending activity, if any, was as follows:
| | Total Security Lending Fees Paid to NFS | Security Lending Income From Securities Loaned to NFS | Value of Securities Loaned to NFS at Period End |
| Fidelity Dividend ETF for Rising Rates | $19,765 | $- | $- |
| Fidelity High Dividend ETF | $26,955 | $2 | $- |
| Fidelity Low Volatility Factor ETF | $807 | $- | $- |
| Fidelity Momentum Factor ETF | $138 | $- | $- |
| Fidelity Quality Factor ETF | $3,977 | $- | $- |
| Fidelity Small-Mid Multifactor ETF | $1,918 | $31 | $- |
| Fidelity Value Factor ETF | $958 | $- | $- |
8. Expense Reductions.
Through arrangements with each applicable Fund's custodian, credits realized as a result of certain uninvested cash balances were used to reduce each applicable Fund's expenses. All of the applicable expense reductions are noted in the table below.
| | Custodian credits |
Fidelity Dividend ETF for Rising Rates | $183 |
| Fidelity High Dividend ETF | 328 |
| Fidelity Low Volatility Factor ETF | 270 |
| Fidelity Momentum Factor ETF | 609 |
| Fidelity Quality Factor ETF | 294 |
| Fidelity Small-Mid Multifactor ETF | 405 |
| Fidelity Stocks for Inflation ETF | 328 |
| Fidelity U.S. Multifactor ETF | 172 |
| Fidelity Value Factor ETF | 345 |
9. Share Transactions.
Funds issue and redeem shares at NAV only with certain authorized participants in large increments known as Creation Units. Purchases of Creation Units are made by tendering a basket of designated securities to a fund and redemption proceeds are paid with a basket of securities from a fund's portfolio with a balancing cash component to equate the market value of the basket of securities delivered or redeemed to the NAV per Creation Unit on the transaction date. Cash may be substituted equivalent to the value of certain securities generally when they are not available in sufficient quantity for delivery. A fund's shares are available in smaller increments to investors in the secondary market at market prices and may be subject to commissions. Authorized participants pay a transaction fee to the shareholder servicing agent when purchasing and redeeming Creation Units of a fund. The transaction fee is used to offset the costs associated with the issuance and redemption of Creation Units.
10. Other.
A fund's organizational documents provide former and current trustees and officers with a limited indemnification against liabilities arising in connection with the performance of their duties to the fund. In the normal course of business, a fund may also enter into contracts that provide general indemnifications. A fund's maximum exposure under these arrangements is unknown as this would be dependent on future claims that may be made against a fund. The risk of material loss from such claims is considered remote.
11. Risk and Uncertainties.
Many factors affect a fund's performance. Developments that disrupt global economies and financial markets, such as pandemics, epidemics, outbreaks of infectious diseases, war, terrorism, and environmental disasters, may significantly affect a fund's investment performance. The effects of these developments to a fund will be impacted by the types of securities in which a fund invests, the financial condition, industry, economic sector, and geographic location of an issuer, and a fund's level of investment in the securities of that issuer. Significant concentrations in security types, issuers, industries, sectors, and geographic locations may magnify the factors that affect a fund's performance.
To the Board of Trustees of Fidelity Covington Trust and Shareholders of Fidelity Dividend ETF for Rising Rates, Fidelity High Dividend ETF, Fidelity Low Volatility Factor ETF, Fidelity Momentum Factor ETF, Fidelity Quality Factor ETF, Fidelity Small-Mid Multifactor ETF, Fidelity U.S. Multifactor ETF, and Fidelity Value Factor ETF
Opinions on the Financial Statements
We have audited the accompanying statements of assets and liabilities, including the schedules of investments, of Fidelity Dividend ETF for Rising Rates, Fidelity High Dividend ETF, Fidelity Low Volatility Factor ETF, Fidelity Momentum Factor ETF, Fidelity Quality Factor ETF, Fidelity Small-Mid Multifactor ETF, Fidelity U.S. Multifactor ETF, and Fidelity Value Factor ETF (eight of the funds constituting Fidelity Covington Trust, hereafter collectively referred to as the "Funds") as of July 31, 2023, the related statements of operations for the year ended July 31, 2023, the statements of changes in net assets for each of the two years in the period ended July 31, 2023, including the related notes, and the financial highlights for each of the periods indicated therein (collectively referred to as the "financial statements"). In our opinion, the financial statements present fairly, in all material respects, the financial position of each of the Funds as of July 31, 2023, the results of each of their operations for the year then ended, the changes in each of their net assets for each of the two years in the period ended July 31, 2023 and each of the financial highlights for each of the periods indicated therein in conformity with accounting principles generally accepted in the United States of America.
Basis for Opinions
These financial statements are the responsibility of the Funds' management. Our responsibility is to express an opinion on the Funds' financial statements based on our audits. We are a public accounting firm registered with the Public Company Accounting Oversight Board (United States) (PCAOB) and are required to be independent with respect to the Funds in accordance with the U.S. federal securities laws and the applicable rules and regulations of the Securities and Exchange Commission and the PCAOB.
We conducted our audits of these financial statements in accordance with the standards of the PCAOB. Those standards require that we plan and perform the audit to obtain reasonable assurance about whether the financial statements are free of material misstatement, whether due to error or fraud.
Our audits included performing procedures to assess the risks of material misstatement of the financial statements, whether due to error or fraud, and performing procedures that respond to those risks. Such procedures included examining, on a test basis, evidence regarding the amounts and disclosures in the financial statements. Our audits also included evaluating the accounting principles used and significant estimates made by management, as well as evaluating the overall presentation of the financial statements. Our procedures included confirmation of securities owned as of July 31, 2023 by correspondence with the custodian and brokers; when replies were not received from brokers, we performed other auditing procedures. We believe that our audits provide a reasonable basis for our opinion.
/s/ PricewaterhouseCoopers LLP
Boston, Massachusetts
September 15, 2023
We have served as the auditor of one or more investment companies in the Fidelity group of funds since 1932.
To the Board of Trustees of Fidelity Covington Trust and Shareholders of Fidelity Stocks for Inflation ETF:
Opinion on the Financial Statements and Financial Highlights
We have audited the accompanying statement of assets and liabilities of Fidelity Stocks for Inflation ETF (the "Fund"), a fund of Fidelity Covington Trust, including the schedule of investments, as of July 31, 2023, the related statement of operations for the year then ended, the statement of changes in net assets for each of the two years in the period then ended, the financial highlights for each of the three years in the period then ended and for the period from November 5, 2019 (commencement of operations) through July 31, 2020, and the related notes. In our opinion, the financial statements and financial highlights present fairly, in all material respects, the financial position of the Fund as of July 31, 2023, and the results of its operations for the year then ended, the changes in its net assets for each of the two years in the period then ended, and the financial highlights for each of the three years in the period then ended and for the period from November 5, 2019 (commencement of operations) through July 31, 2020, in conformity with accounting principles generally accepted in the United States of America.
Basis for Opinion
These financial statements and financial highlights are the responsibility of the Fund's management. Our responsibility is to express an opinion on the Fund's financial statements and financial highlights based on our audits. We are a public accounting firm registered with the Public Company Accounting Oversight Board (United States) (PCAOB) and are required to be independent with respect to the Fund in accordance with the U.S. federal securities laws and the applicable rules and regulations of the Securities and Exchange Commission and the PCAOB.
We conducted our audits in accordance with the standards of the PCAOB. Those standards require that we plan and perform the audit to obtain reasonable assurance about whether the financial statements and financial highlights are free of material misstatement, whether due to error or fraud. The Fund is not required to have, nor were we engaged to perform, an audit of its internal control over financial reporting. As part of our audits we are required to obtain an understanding of internal control over financial reporting but not for the purpose of expressing an opinion on the effectiveness of the Fund's internal control over financial reporting. Accordingly, we express no such opinion.
Our audits included performing procedures to assess the risks of material misstatement of the financial statements and financial highlights, whether due to error or fraud, and performing procedures that respond to those risks. Such procedures included examining, on a test basis, evidence regarding the amounts and disclosures in the financial statements and financial highlights. Our audits also included evaluating the accounting principles used and significant estimates made by management, as well as evaluating the overall presentation of the financial statements and financial highlights. Our procedures included confirmation of securities owned as of July 31, 2023, by correspondence with the custodian and brokers; when replies were not received from brokers, we performed other auditing procedures. We believe that our audits provide a reasonable basis for our opinion.
/s/ Deloitte & Touche LLP
Boston, Massachusetts
September 15, 2023
We have served as the auditor of one or more of the Fidelity investment companies since 1999.
The Trustees, Members of the Advisory Board (if any), and officers of the trust and funds, as applicable, are listed below. The Board of Trustees governs each fund and is responsible for protecting the interests of shareholders. The Trustees are experienced executives who meet periodically throughout the year to oversee each fund's activities, review contractual arrangements with companies that provide services to each fund, oversee management of the risks associated with such activities and contractual arrangements, and review each fund's performance. Except for Vijay Advani, each of the Trustees oversees 321 funds. Mr. Advani oversees 215 funds.
The Trustees hold office without limit in time except that (a) any Trustee may resign; (b) any Trustee may be removed by written instrument, signed by at least two-thirds of the number of Trustees prior to such removal; (c) any Trustee who requests to be retired or who has become incapacitated by illness or injury may be retired by written instrument signed by a majority of the other Trustees; and (d) any Trustee may be removed at any special meeting of shareholders by a two-thirds vote of the outstanding voting securities of the trust. Each Trustee who is not an interested person (as defined in the 1940 Act) of the trust and the funds is referred to herein as an Independent Trustee. Each Independent Trustee shall retire not later than the last day of the calendar year in which his or her 75th birthday occurs. The Independent Trustees may waive this mandatory retirement age policy with respect to individual Trustees. Officers and Advisory Board Members hold office without limit in time, except that any officer or Advisory Board Member may resign or may be removed by a vote of a majority of the Trustees at any regular meeting or any special meeting of the Trustees. Except as indicated, each individual has held the office shown or other offices in the same company for the past five years.
The funds' Statement of Additional Information (SAI) includes more information about the Trustees. To request a free copy, call Fidelity at 1-800-FIDELITY.
Experience, Skills, Attributes, and Qualifications of the Trustees. The Governance and Nominating Committee has adopted a statement of policy that describes the experience, qualifications, attributes, and skills that are necessary and desirable for potential Independent Trustee candidates (Statement of Policy). The Board believes that each Trustee satisfied at the time he or she was initially elected or appointed a Trustee, and continues to satisfy, the standards contemplated by the Statement of Policy. The Governance and Nominating Committee also engages professional search firms to help identify potential Independent Trustee candidates who have the experience, qualifications, attributes, and skills consistent with the Statement of Policy. From time to time, additional criteria based on the composition and skills of the current Independent Trustees, as well as experience or skills that may be appropriate in light of future changes to board composition, business conditions, and regulatory or other developments, have also been considered by the professional search firms and the Governance and Nominating Committee. In addition, the Board takes into account the Trustees' commitment and participation in Board and committee meetings, as well as their leadership of standing and ad hoc committees throughout their tenure.
In determining that a particular Trustee was and continues to be qualified to serve as a Trustee, the Board has considered a variety of criteria, none of which, in isolation, was controlling. The Board believes that, collectively, the Trustees have balanced and diverse experience, qualifications, attributes, and skills, which allow the Board to operate effectively in governing each fund and protecting the interests of shareholders. Information about the specific experience, skills, attributes, and qualifications of each Trustee, which in each case led to the Board's conclusion that the Trustee should serve (or continue to serve) as a trustee of the funds, is provided below.
Board Structure and Oversight Function. Robert A. Lawrence is an interested person and currently serves as Chair. The Trustees have determined that an interested Chair is appropriate and benefits shareholders because an interested Chair has a personal and professional stake in the quality and continuity of services provided to the funds. Independent Trustees exercise their informed business judgment to appoint an individual of their choosing to serve as Chair, regardless of whether the Trustee happens to be independent or a member of management. The Independent Trustees have determined that they can act independently and effectively without having an Independent Trustee serve as Chair and that a key structural component for assuring that they are in a position to do so is for the Independent Trustees to constitute a substantial majority for the Board. The Independent Trustees also regularly meet in executive session. David M. Thomas serves as Lead Independent Trustee and as such (i) acts as a liaison between the Independent Trustees and management with respect to matters important to the Independent Trustees and (ii) with management prepares agendas for Board meetings.
Fidelity® funds are overseen by different Boards of Trustees. The funds' Board oversees Fidelity's high income and certain equity funds, and other Boards oversee Fidelity's alternative investment, investment-grade bond, money market, asset allocation, and other equity funds. The asset allocation funds may invest in Fidelity® funds overseen by the funds' Board. The use of separate Boards, each with its own committee structure, allows the Trustees of each group of Fidelity® funds to focus on the unique issues of the funds they oversee, including common research, investment, and operational issues. On occasion, the separate Boards establish joint committees to address issues of overlapping consequences for the Fidelity® funds overseen by each Board.
The Trustees operate using a system of committees to facilitate the timely and efficient consideration of all matters of importance to the Trustees, each fund, and fund shareholders and to facilitate compliance with legal and regulatory requirements and oversight of the funds' activities and associated risks. The Board, acting through its committees, has charged FMR and its affiliates with (i) identifying events or circumstances the occurrence of which could have demonstrably adverse effects on the funds' business and/or reputation; (ii) implementing processes and controls to lessen the possibility that such events or circumstances occur or to mitigate the effects of such events or circumstances if they do occur; and (iii) creating and maintaining a system designed to evaluate continuously business and market conditions in order to facilitate the identification and implementation processes described in (i) and (ii) above. Because the day-to-day operations and activities of the funds are carried out by or through FMR, its affiliates, and other service providers, the funds' exposure to risks is mitigated but not eliminated by the processes overseen by the Trustees. While each of the Board's committees has responsibility for overseeing different aspects of the funds' activities, oversight is exercised primarily through the Operations, Audit, and Compliance Committees. Appropriate personnel, including but not limited to the funds' Chief Compliance Officer (CCO), FMR's internal auditor, the independent accountants, the funds' Treasurer and portfolio management personnel, make periodic reports to the Board's committees, as appropriate, including an annual review of Fidelity's risk management program for the Fidelity® funds. The responsibilities of each standing committee, including their oversight responsibilities, are described further under "Standing Committees of the Trustees."
Interested Trustees*:
Correspondence intended for a Trustee who is an interested person may be sent to Fidelity Investments, 245 Summer Street, Boston, Massachusetts 02210.
Name, Year of Birth; Principal Occupations and Other Relevant Experience+
Bettina Doulton (1964)
Year of Election or Appointment: 2020
Trustee
Ms. Doulton also serves as Trustee of other Fidelity® funds. Prior to her retirement, Ms. Doulton served in a variety of positions at Fidelity Investments, including as a managing director of research (2006-2007), portfolio manager to certain Fidelity® funds (1993-2005), equity analyst and portfolio assistant (1990-1993), and research assistant (1987-1990). Ms. Doulton currently owns and operates Phi Builders + Architects and Cellardoor Winery. Previously, Ms. Doulton served as a member of the Board of Brown Capital Management, LLC (2014-2018).
Robert A. Lawrence (1952)
Year of Election or Appointment: 2020
Trustee
Chair of the Board of Trustees
Mr. Lawrence also serves as Trustee of other funds. Previously, Mr. Lawrence served as a Trustee and Member of the Advisory Board of certain funds. Prior to his retirement in 2008, Mr. Lawrence served as Vice President of certain Fidelity® funds (2006-2008), Senior Vice President, Head of High Income Division of Fidelity Management & Research Company (investment adviser firm, 2006-2008), and President of Fidelity Strategic Investments (investment adviser firm, 2002-2005).
* Determined to be an "Interested Trustee" by virtue of, among other things, his or her affiliation with the trust or various entities under common control with FMR.
+ The information includes the Trustee's principal occupation during the last five years and other information relating to the experience, attributes, and skills relevant to the Trustee's qualifications to serve as a Trustee, which led to the conclusion that the Trustee should serve as a Trustee for each fund.
Independent Trustees:
Correspondence intended for an Independent Trustee may be sent to Fidelity Investments, P.O. Box 55235, Boston, Massachusetts 02205-5235.
Name, Year of Birth; Principal Occupations and Other Relevant Experience+
Vijay C. Advani (1960)
Year of Election or Appointment: 2023
Trustee
Mr. Advani also serves as Trustee or Member of the Advisory Board of other funds. Previously, Mr. Advani served as Executive Chairman (2020-2022), Chief Executive Officer (2017-2020) and Chief Operating Officer (2016-2017) of Nuveen (global investment manager). He also served in various capacities at Franklin Resources (global investment manager), including Co-President (2015-2016), Executive Vice President, Global Advisory Services (2008-2015), Head of Global Retail Distribution (2005-2008), Executive Managing Director, International Retail Development (2002-2005), Managing Director, Product Developments, Sales & Marketing, Asia, Eastern Europe and Africa (2000-2002) and President, Templeton Asset Management India (1995-2000). Mr. Advani also served as Senior Investment Officer of International Finance Corporation (private equity and venture capital arm of The World Bank, 1984-1995). Mr. Advani is Chairman Emeritus of the U.S. India Business Council (2018-present), a Director of The Global Impact Investing Network (2019-present), a Director of LOK Capital (Mauritius) (2022-present), a member of the Advisory Council of LOK Capital (2022-present), a Senior Advisor of Neuberger Berman (2021-present), a Senior Advisor of Seviora Holdings Pte. Ltd (Temasek-Singapore) (2021-present), a Director of Seviora Capital (Singapore) (2021-present) and an Advisor of EQUIAM (2021-present). Mr. Advani formerly served as a member of the Board of BowX Acquisition Corp. (special purpose acquisition company, 2020-2021), a member of the Board of Intellecap (advisory arm of The Aavishkaar Group, 2018-2020), a member of the Board of Nuveen Investments, Inc. (2017-2020) and a member of the Board of Docusign (software, 2016-2019).
Thomas P. Bostick (1956)
Year of Election or Appointment: 2021
Trustee
Lieutenant General Bostick also serves as Trustee of other Fidelity® funds. Prior to his retirement, General Bostick (United States Army, Retired) held a variety of positions within the U.S. Army, including Commanding General and Chief of Engineers, U.S. Army Corps of Engineers (2012-2016) and Deputy Chief of Staff and Director of Human Resources, U.S. Army (2009-2012). General Bostick currently serves as a member of the Board and Finance and Governance & Sustainability Committees of CSX Corporation (transportation, 2020-present) and a member of the Board and Corporate Governance and Nominating Committee of Perma-Fix Environmental Services, Inc. (nuclear waste management, 2020-present). General Bostick serves as Chief Executive Officer of Bostick Global Strategies, LLC (consulting, 2016-present), as a member of the Board of HireVue, Inc. (video interview and assessment, 2020-present), as a member of the Board of Allonnia (biotechnology and engineering solutions, 2022-present) and on the Advisory Board of Solugen, Inc. (specialty bio-based chemicals manufacturer, 2022-present). Previously, General Bostick served as a Member of the Advisory Board of certain Fidelity® funds (2021), President, Intrexon Bioengineering (2018-2020) and Chief Operating Officer (2017-2020) and Senior Vice President of the Environment Sector (2016-2017) of Intrexon Corporation (biopharmaceutical company).
Dennis J. Dirks (1948)
Year of Election or Appointment: 2018
Trustee
Mr. Dirks also serves as Trustee of other Fidelity® funds. Prior to his retirement in May 2003, Mr. Dirks served as Chief Operating Officer and as a member of the Board of The Depository Trust & Clearing Corporation (financial markets infrastructure), President, Chief Operating Officer and a member of the Board of The Depository Trust Company (DTC), President and a member of the Board of the National Securities Clearing Corporation (NSCC), Chief Executive Officer and a member of the Board of the Government Securities Clearing Corporation and Chief Executive Officer and a member of the Board of the Mortgage-Backed Securities Clearing Corporation. Mr. Dirks currently serves as a member of the Finance Committee (2016-present) and Board (2017-present) and is Treasurer (2018-present) of the Asolo Repertory Theatre.
Donald F. Donahue (1950)
Year of Election or Appointment: 2018
Trustee
Mr. Donahue also serves as Trustee of other Fidelity® funds. Mr. Donahue serves as President and Chief Executive Officer of Miranda Partners, LLC (risk consulting for the financial services industry, 2012-present). Previously, Mr. Donahue served as Chief Executive Officer (2006-2012), Chief Operating Officer (2003-2006) and Managing Director, Customer Marketing and Development (1999-2003) of The Depository Trust & Clearing Corporation (financial markets infrastructure). Mr. Donahue currently serves as a member (2007-present) and Co-Chairman (2016-present) of the Board of United Way of New York. Mr. Donahue previously served as a member of the Advisory Board of certain Fidelity® funds (2015-2018) and as a member of the Board of The Leadership Academy (previously NYC Leadership Academy) (2012-2022).
Vicki L. Fuller (1957)
Year of Election or Appointment: 2020
Trustee
Ms. Fuller also serves as Trustee of other Fidelity® funds. Previously, Ms. Fuller served as a member of the Advisory Board of certain Fidelity® funds (2018-2020), Chief Investment Officer of the New York State Common Retirement Fund (2012-2018) and held a variety of positions at AllianceBernstein L.P. (global asset management, 1985-2012), including Managing Director (2006-2012) and Senior Vice President and Senior Portfolio Manager (2001-2006). Ms. Fuller currently serves as a member of the Board, Audit Committee and Nominating and Governance Committee of two Blackstone business development companies (2020-present), as a member of the Board of Treliant, LLC (consulting, 2019-present), as a member of the Board of Ariel Alternatives, LLC (private equity, 2022-present) and as a member of the Board and Chair of the Audit Committee of Gusto, Inc. (software, 2021-present). In addition, Ms. Fuller currently serves as a member of the Board of Roosevelt University (2019-present) and as a member of the Executive Board of New York University's Stern School of Business. Ms. Fuller previously served as a member of the Board, Audit Committee and Nominating and Governance Committee of The Williams Companies, Inc. (natural gas infrastructure, 2018-2021).
Patricia L. Kampling (1959)
Year of Election or Appointment: 2020
Trustee
Ms. Kampling also serves as Trustee of other Fidelity® funds. Prior to her retirement, Ms. Kampling served as Chairman of the Board and Chief Executive Officer (2012-2019), President and Chief Operating Officer (2011-2012) and Executive Vice President and Chief Financial Officer (2010-2011) of Alliant Energy Corporation. Ms. Kampling currently serves as a member of the Board, Finance Committee and Governance, Compensation and Nominating Committee of Xcel Energy Inc. (utilities company, 2020-present) and as a member of the Board, Audit, Finance and Risk Committee and Safety, Environmental, Technology and Operations Committee and Chair of the Executive Development and Compensation Committee of American Water Works Company, Inc. (utilities company, 2019-present). In addition, Ms. Kampling currently serves as a member of the Board of the Nature Conservancy, Wisconsin Chapter (2019-present). Previously, Ms. Kampling served as a Member of the Advisory Board of certain Fidelity® funds (2020), a member of the Board, Compensation Committee and Executive Committee and Chair of the Audit Committee of Briggs & Stratton Corporation (manufacturing, 2011-2021), a member of the Board of Interstate Power and Light Company (2012-2019) and Wisconsin Power and Light Company (2012-2019) (each a subsidiary of Alliant Energy Corporation) and as a member of the Board and Workforce Development Committee of the Business Roundtable (2018-2019).
Thomas A. Kennedy (1955)
Year of Election or Appointment: 2021
Trustee
Mr. Kennedy also serves as Trustee of other Fidelity® funds. Previously, Mr. Kennedy served as a Member of the Advisory Board of certain Fidelity® funds (2020) and held a variety of positions at Raytheon Company (aerospace and defense, 1983-2020), including Chairman and Chief Executive Officer (2014-2020) and Executive Vice President and Chief Operating Officer (2013-2014). Mr. Kennedy served as Executive Chairman of the Board of Directors of Raytheon Technologies Corporation (aerospace and defense, 2020-2021). Mr. Kennedy serves as a Director of the Board of Directors of Textron Inc. (aerospace and defense, 2023-present).
Oscar Munoz (1959)
Year of Election or Appointment: 2021
Trustee
Mr. Munoz also serves as Trustee of other Fidelity® funds. Prior to his retirement, Mr. Munoz served as Executive Chairman (2020-2021), Chief Executive Officer (2015-2020), President (2015-2016) and a member of the Board (2010-2021) of United Airlines Holdings, Inc. Mr. Munoz currently serves as a member of the Board of CBRE Group, Inc. (commercial real estate, 2020-present), a member of the Board of Univision Communications, Inc. (Hispanic media, 2020-present), a member of the Board of Archer Aviation Inc. (2021-present), a member of the Defense Business Board of the United States Department of Defense (2021-present) and a member of the Board of Salesforce.com, Inc. (cloud-based software, 2022-present). Previously, Mr. Munoz served as a Member of the Advisory Board of certain Fidelity® funds (2021).
David M. Thomas (1949)
Year of Election or Appointment: 2018
Trustee
Lead Independent Trustee
Mr. Thomas also serves as Trustee of other Fidelity® funds. Previously, Mr. Thomas served as Executive Chairman (2005-2006) and Chairman and Chief Executive Officer (2000-2005) of IMS Health, Inc. (pharmaceutical and healthcare information solutions). Mr. Thomas currently serves as a member of the Board of Fortune Brands Home and Security (home and security products, 2004-present) and as Director (2013-present) and Non-Executive Chairman of the Board (2022-present) of Interpublic Group of Companies, Inc. (marketing communication).
Susan Tomasky (1953)
Year of Election or Appointment: 2020
Trustee
Ms. Tomasky also serves as Trustee of other Fidelity® funds. Prior to her retirement, Ms. Tomasky served in various executive officer positions at American Electric Power Company, Inc. (1998-2011), including most recently as President of AEP Transmission (2007-2011). Ms. Tomasky currently serves as a member of the Board and Sustainability Committee and as Chair of the Audit Committee of Marathon Petroleum Corporation (2018-present) and as a member of the Board, Executive Committee, Corporate Governance Committee and Organization and Compensation Committee and as Lead Director of the Board of Public Service Enterprise Group, Inc. (utilities company, 2012-present) and as a member of the Board of its subsidiary company, Public Service Electric and Gas Co. (2021-present). In addition, Ms. Tomasky currently serves as a member (2009-present) and President (2020-present) of the Board of the Royal Shakespeare Company - America (2009-present), as a member of the Board of the Columbus Association for the Performing Arts (2011-present) and as a member of the Board and Kenyon in the World Committee of Kenyon College (2016-present). Previously, Ms. Tomasky served as a Member of the Advisory Board of certain Fidelity® funds (2020), as a member of the Board of the Columbus Regional Airport Authority (2007-2020), as a member of the Board (2011-2018) and Lead Independent Director (2015-2018) of Andeavor Corporation (previously Tesoro Corporation) (independent oil refiner and marketer) and as a member of the Board of Summit Midstream Partners LP (energy, 2012-2018).
Michael E. Wiley (1950)
Year of Election or Appointment: 2013
Trustee
Mr. Wiley also serves as Trustee of other Fidelity® funds. Previously, Mr. Wiley served as a member of the Advisory Board of certain Fidelity® funds (2018-2020), Chairman, President and CEO of Baker Hughes, Inc. (oilfield services, 2000-2004). Mr. Wiley also previously served as a member of the Board of Andeavor Corporation (independent oil refiner and marketer, 2005-2018), a member of the Board of Andeavor Logistics LP (natural resources logistics, 2015-2018) and a member of the Board of High Point Resources (exploration and production, 2005-2020).
+ The information includes the Trustee's principal occupation during the last five years and other information relating to the experience, attributes, and skills relevant to the Trustee's qualifications to serve as a Trustee, which led to the conclusion that the Trustee should serve as a Trustee for each fund.
Advisory Board Members and Officers:
Correspondence intended for a Member of the Advisory Board (if any) may be sent to Fidelity Investments, P.O. Box 55235, Boston, Massachusetts 02205-5235. Correspondence intended for an officer or Peter S. Lynch may be sent to Fidelity Investments, 245 Summer Street, Boston, Massachusetts 02210. Officers appear below in alphabetical order.
Name, Year of Birth; Principal Occupation
Peter S. Lynch (1944)
Year of Election or Appointment: 2018
Member of the Advisory Board
Mr. Lynch also serves as a Member of the Advisory Board of other Fidelity® funds. Mr. Lynch is Vice Chairman and a Director of Fidelity Management & Research Company LLC (investment adviser firm). In addition, Mr. Lynch serves as a Trustee of Boston College and as the Chairman of the Inner-City Scholarship Fund. Previously, Mr. Lynch served as Vice Chairman and a Director of FMR Co., Inc. (investment adviser firm) and on the Special Olympics International Board of Directors (1997-2006).
Karen B. Peetz (1955)
Year of Election or Appointment: 2023
Member of the Advisory Board
Ms. Peetz also serves as a Member of the Advisory Board of other funds. Previously, Ms. Peetz served as Chief Administration Officer (2020-2023) of Citigroup Inc. (a diversified financial service company). She also served in various capacities at Bank of New York Mellon Corporation, including President (2013-2016), Vice Chairman, Senior Executive Vice President and Chief Executive Officer of Financial Markets & Treasury Services (2010-2013), Senior Executive Vice President and Chief Executive Officer of Global Corporate Trust (2003-2008), Senior Vice President and Division Manager of Global Payments & Trade Services (2002-2003) and Senior Vice President and Division Manager of Domestic Corporate Trust (1998-2002). Ms. Peetz also served in various capacities at Chase Manhattan Corporation (1982-1998), including Senior Vice President and Manager of Corporate Trust International Business (1996-1998), Managing Director and Manager of Corporate Trust Services (1994-1996) and Managing Director and Group Manager of Financial Institution Sales (1990-1993). Ms. Peetz currently serves as Chair of Amherst Holdings Advisory Council (2018-present), Trustee of Johns Hopkins University (2016-present), Chair of the Carey Business School Advisory Council, Member of the Johns Hopkins Medicine Board and Finance Committee and Chair of the Lyme and Tick Related Disease Institute Advisory Council. Ms. Peetz previously served as a member of the Board of Guardian Life Insurance Company of America (2019-2023), a member of the Board of Trane Technologies (2018-2022), a member of the Board of Wells Fargo Corp. (2017-2019), a member of the Board of SunCoke Energy Inc. (2012-2016), a member of the Board of Private Export Funding Corporation (2010-2016) and as a Trustee of Penn State University (2010-2014) and the United Way of New York City (2008-2010).
Heather Bonner (1977)
Year of Election or Appointment: 2023
Assistant Treasurer
Ms. Bonner also serves as an officer of other funds. Ms. Bonner serves as Senior Vice President (2022-present), and is an employee of Fidelity Investments. Ms. Bonner serves as Assistant Treasurer of Fidelity CRET Trustee LLC (2022-present). Prior to joining Fidelity, Ms. Bonner served as Managing Director at AQR Capital Management (2013-2022) and was the Treasurer and Principal Financial Officer of the AQR Funds (2013-2022).
Craig S. Brown (1977)
Year of Election or Appointment: 2022
Deputy Treasurer
Mr. Brown also serves as an officer of other funds. Mr. Brown serves as Assistant Treasurer of FIMM, LLC (2021-present) and is an employee of Fidelity Investments (2013-present). Previously, Mr. Brown served as Assistant Treasurer of certain Fidelity® funds (2019-2022).
John J. Burke III (1964)
Year of Election or Appointment: 2018
Chief Financial Officer
Mr. Burke also serves as Chief Financial Officer of other funds. Mr. Burke serves as Head of Investment Operations for Fidelity Fund and Investment Operations (2018-present) and is an employee of Fidelity Investments (1998-present). Previously Mr. Burke served as head of Asset Management Investment Operations (2012-2018).
Margaret Carey (1973)
Year of Election or Appointment: 2023
Secretary and Chief Legal Officer (CLO)
Ms. Carey also serves as an officer of other funds and as CLO of certain other Fidelity entities. She is a Senior Vice President and Deputy General Counsel of FMR LLC (diversified financial services company, 2019-present), and is an employee of Fidelity Investments.
William C. Coffey (1969)
Year of Election or Appointment: 2019
Assistant Secretary
Mr. Coffey also serves as Assistant Secretary of other funds. He is Senior Vice President and Deputy General Counsel of FMR LLC (diversified financial services company, 2010-present), and is an employee of Fidelity Investments. Previously, Mr. Coffey served as Secretary and CLO of certain funds (2018-2019); CLO, Secretary, and Senior Vice President of Fidelity Management & Research Company and FMR Co., Inc. (investment adviser firms, 2018-2019); Secretary of Fidelity SelectCo, LLC and Fidelity Investments Money Management, Inc. (investment adviser firms, 2018-2019); CLO of Fidelity Management & Research (Hong Kong) Limited, FMR Investment Management (UK) Limited, and Fidelity Management & Research (Japan) Limited (investment adviser firms, 2018-2019); and Assistant Secretary of certain funds (2009-2018).
Timothy M. Cohen (1969)
Year of Election or Appointment: 2018
Vice President
Mr. Cohen also serves as Vice President of other funds. Mr. Cohen serves as Co-Head of Equity (2018-present), a Director of Fidelity Management & Research (Japan) Limited (investment adviser firm, 2016-present), and is an employee of Fidelity Investments. Previously, Mr. Cohen served as Executive Vice President of Fidelity SelectCo, LLC (2019), Head of Global Equity Research (2016-2018), Chief Investment Officer - Equity and a Director of Fidelity Management & Research (U.K.) Inc. (investment adviser firm, 2013-2015) and as a Director of Fidelity Management & Research (Hong Kong) Limited (investment adviser firm, 2017).
Jonathan Davis (1968)
Year of Election or Appointment: 2013
Assistant Treasurer
Mr. Davis also serves as an officer of other funds. Mr. Davis serves as Vice President Assistant Treasurer and is an employee of Fidelity Investments. Mr. Davis serves as Assistant Treasurer of certain Fidelity entities.
Laura M. Del Prato (1964)
Year of Election or Appointment: 2018
Assistant Treasurer
Ms. Del Prato also serves as an officer of other funds. Ms. Del Prato serves as Assistant Treasurer of FIMM, LLC (2021-present) and is an employee of Fidelity Investments (2017-present). Previously, Ms. Del Prato served as President and Treasurer of The North Carolina Capital Management Trust: Cash Portfolio and Term Portfolio (2018-2020). Prior to joining Fidelity Investments, Ms. Del Prato served as a Managing Director and Treasurer of the JPMorgan Mutual Funds (2014-2017). Prior to JPMorgan, Ms. Del Prato served as a partner at Cohen Fund Audit Services (accounting firm, 2012-2013) and KPMG LLP (accounting firm, 2004-2012).
Colm A. Hogan (1973)
Year of Election or Appointment: 2020
Assistant Treasurer
Mr. Hogan also serves as an officer of other funds. Mr. Hogan serves as Assistant Treasurer of FIMM, LLC (2021-present) and FMR Capital, Inc. (2017-present) and is an employee of Fidelity Investments (2005-present). Previously, Mr. Hogan served as Deputy Treasurer of certain Fidelity® funds (2016-2020) and Assistant Treasurer of certain Fidelity® funds (2016-2018).
Pamela R. Holding (1964)
Year of Election or Appointment: 2018
Vice President
Ms. Holding also serves as Vice President of other funds. Ms. Holding serves as Co-Head of Equity (2018-present) and is an employee of Fidelity Investments (2013-present). Previously, Ms. Holding served as Executive Vice President of Fidelity SelectCo, LLC (2019) and as Chief Investment Officer of Fidelity Institutional Asset Management (2013-2018).
Chris Maher (1972)
Year of Election or Appointment: 2020
Deputy Treasurer
Mr. Maher also serves as an officer of other funds. Mr. Maher serves as Assistant Treasurer of FIMM, LLC (2021-present) and FMR Capital, Inc. (2017-present), and is an employee of Fidelity Investments (2008-present). Previously, Mr. Maher served as Assistant Treasurer of certain funds (2013-2020); Vice President of Asset Management Compliance (2013), Vice President of the Program Management Group of FMR (investment adviser firm, 2010-2013), and Vice President of Valuation Oversight (2008-2010).
Jason P. Pogorelec (1975)
Year of Election or Appointment: 2020
Chief Compliance Officer
Mr. Pogorelec also serves as Chief Compliance Officer of other funds. Mr. Pogorelec is a Senior Vice President of Asset Management Compliance for Fidelity Investments and is an employee of Fidelity Investments. Mr. Pogorelec serves as Compliance Officer of Fidelity Management & Research Company LLC (investment adviser firm, 2023-present). Previously, Mr. Pogorelec served as Vice President, Associate General Counsel for Fidelity Investments (2010-2020) and Assistant Secretary of certain Fidelity® funds (2015-2020).
Brett Segaloff (1972)
Year of Election or Appointment: 2021
Anti-Money Laundering (AML) Officer
Mr. Segaloff also serves as an AML Officer of other funds and other related entities. He is Director, Anti-Money Laundering (2007-present) of FMR LLC (diversified financial services company) and is an employee of Fidelity Investments (1996-present).
Stacie M. Smith (1974)
Year of Election or Appointment: 2018
President and Treasurer
Ms. Smith also serves as an officer of other funds. Ms. Smith serves as Assistant Treasurer of FIMM, LLC (2021-present) and FMR Capital, Inc. (2017-present), is an employee of Fidelity Investments (2009-present), and has served in other fund officer roles. Prior to joining Fidelity Investments, Ms. Smith served as Senior Audit Manager of Ernst & Young LLP (accounting firm, 1996-2009). Previously, Ms. Smith served as Assistant Treasurer (2013-2019) and Deputy Treasurer (2013-2016) of certain Fidelity® funds.
Jim Wegmann (1979)
Year of Election or Appointment: 2019
Assistant Treasurer
Mr. Wegmann also serves as an officer of other funds. Mr. Wegmann serves as Assistant Treasurer of FIMM, LLC (2021-present) and is an employee of Fidelity Investments (2011-present). Previously, Mr. Wegmann served as Assistant Treasurer of certain Fidelity® funds (2019-2021).
As a shareholder, you incur two types of costs: (1) transaction costs, which may include sales charges (loads) on purchase payments or redemption proceeds, as applicable and (2) ongoing costs, which generally include management fees, distribution and/or service (12b-1) fees and other Fund expenses. This Example is intended to help you understand your ongoing costs (in dollars) of investing in a fund and to compare these costs with the ongoing costs of investing in other mutual funds.
| The Example is based on an investment of $1,000 invested at the beginning of the period and held for the entire period (February 1, 2023 to July 31, 2023). |
Actual Expenses
The first line of the accompanying table provides information about actual account values and actual expenses. You may use the information in this line, together with the amount you invested, to estimate the expenses that you paid over the period. Simply divide your account value by $1,000.00 (for example, an $8,600 account value divided by $1,000.00 = 8.6), then multiply the result by the number in the first line for a class/Fund under the heading entitled "Expenses Paid During Period" to estimate the expenses you paid on your account during this period. If any fund is a shareholder of any underlying mutual funds or exchange-traded funds (ETFs) (the Underlying Funds), such fund indirectly bears its proportional share of the expenses of the Underlying Funds in addition to the direct expenses incurred presented in the table. These fees and expenses are not included in the annualized expense ratio used to calculate the expense estimate in the table below.
Hypothetical Example for Comparison Purposes
The second line of the accompanying table provides information about hypothetical account values and hypothetical expenses based on the actual expense ratio and an assumed rate of return of 5% per year before expenses, which is not the actual return. The hypothetical account values and expenses may not be used to estimate the actual ending account balance or expenses you paid for the period. You may use this information to compare the ongoing costs of investing in the Fund and other funds. To do so, compare this 5% hypothetical example with the 5% hypothetical examples that appear in the shareholder reports of the other funds. If any fund is a shareholder of any Underlying Funds, such fund indirectly bears its proportional share of the expenses of the Underlying Funds in addition to the direct expenses as presented in the table. These fees and expenses are not included in the annualized expense ratio used to calculate the expense estimate in the table below.
Please note that the expenses shown in the table are meant to highlight your ongoing costs only and do not reflect any transaction costs. Therefore, the second line of the table is useful in comparing ongoing costs only, and will not help you determine the relative total costs of owning different funds. In addition, if these transactional costs were included, your costs would have been higher.
| | | | | Annualized Expense Ratio- A | | Beginning Account Value February 1, 2023 | | Ending Account Value July 31, 2023 | | Expenses Paid During Period- C February 1, 2023 to July 31, 2023 |
| | | | | | | | | | |
| Fidelity® Dividend ETF for Rising Rates | | | | .29% | | | | | | |
| Actual | | | | | | $ 1,000 | | $ 1,053.60 | | $ 1.48 |
Hypothetical-B | | | | | | $ 1,000 | | $ 1,023.36 | | $ 1.45 |
| | | | | | | | | | |
| Fidelity® High Dividend ETF | | | | .29% | | | | | | |
| Actual | | | | | | $ 1,000 | | $ 1,074.10 | | $ 1.49 |
Hypothetical-B | | | | | | $ 1,000 | | $ 1,023.36 | | $ 1.45 |
| | | | | | | | | | |
| Fidelity® Low Volatility Factor ETF | | | | .29% | | | | | | |
| Actual | | | | | | $ 1,000 | | $ 1,088.50 | | $ 1.50 |
Hypothetical-B | | | | | | $ 1,000 | | $ 1,023.36 | | $ 1.45 |
| | | | | | | | | | |
| Fidelity® Momentum Factor ETF | | | | .29% | | | | | | |
| Actual | | | | | | $ 1,000 | | $ 1,117.80 | | $ 1.52 |
Hypothetical-B | | | | | | $ 1,000 | | $ 1,023.36 | | $ 1.45 |
| | | | | | | | | | |
| Fidelity® Quality Factor ETF | | | | .29% | | | | | | |
| Actual | | | | | | $ 1,000 | | $ 1,119.20 | | $ 1.52 |
Hypothetical-B | | | | | | $ 1,000 | | $ 1,023.36 | | $ 1.45 |
| | | | | | | | | | |
| Fidelity® Small-Mid Multifactor ETF | | | | .29% | | | | | | |
| Actual | | | | | | $ 1,000 | | $ 1,038.70 | | $ 1.47 |
Hypothetical-B | | | | | | $ 1,000 | | $ 1,023.36 | | $ 1.45 |
| | | | | | | | | | |
| Fidelity® Stocks for Inflation ETF | | | | .29% | | | | | | |
| Actual | | | | | | $ 1,000 | | $ 1,055.30 | | $ 1.48 |
Hypothetical-B | | | | | | $ 1,000 | | $ 1,023.36 | | $ 1.45 |
| | | | | | | | | | |
| Fidelity® U.S. Multifactor ETF | | | | .29% | | | | | | |
| Actual | | | | | | $ 1,000 | | $ 1,084.00 | | $ 1.50 |
Hypothetical-B | | | | | | $ 1,000 | | $ 1,023.36 | | $ 1.45 |
| | | | | | | | | | |
| Fidelity® Value Factor ETF | | | | .29% | | | | | | |
| Actual | | | | | | $ 1,000 | | $ 1,102.00 | | $ 1.51 |
Hypothetical-B | | | | | | $ 1,000 | | $ 1,023.36 | | $ 1.45 |
| |
A Annualized expense ratio reflects expenses net of applicable fee waivers.
B 5% return per year before expenses
C Expenses are equal to the annualized expense ratio, multiplied by the average account value over the period, multiplied by 181/ 365 (to reflect the one-half year period). The fees and expenses of any Underlying Funds are not included in each annualized expense ratio.
The dividend and capital gains distributions for the fund(s) are available on Fidelity.com or Institutional.Fidelity.com.
A percentage of the dividends distributed during the fiscal year for the following funds qualify for the dividends-received deduction for corporate shareholders:
| Fidelity® Dividend ETF for Rising Rates | |
| September 2022 | 76% |
| December 2022 | 80% |
| March 2023 | 80% |
| June 2023 | 80% |
| Fidelity® High Dividend ETF | |
| September 2022 | 66% |
| December 2022 | 66% |
| March 2023 | 63% |
| June 2023 | 63% |
| Fidelity® Low Volatility Factor ETF | |
| September 2022 | 100% |
| December 2022 | 100% |
| March 2023 | 100% |
| June 2023 | 100% |
| Fidelity® Momentum Factor ETF | |
| September 2022 | 100% |
| December 2022 | 100% |
| March 2023 | 100% |
| June 2023 | 100% |
| Fidelity® Quality Factor ETF | |
| September 2022 | 99% |
| December 2022 | 99% |
| March 2023 | 100% |
| June 2023 | 100% |
| Fidelity® Small-Mid Multifactor ETF | |
| September 2022 | 85% |
| December 2022 | 85% |
| March 2023 | 87% |
| June 2023 | 87% |
| Fidelity® Stocks for Inflation ETF | |
| September 2022 | 89% |
| December 2022 | 100% |
| March 2023 | 99% |
| June 2023 | 99% |
| Fidelity® U.S. Multifactor ETF | |
| September 2022 | 99% |
| December 2022 | 99% |
| March 2023 | 100% |
| June 2023 | 100% |
| Fidelity® Value Factor ETF | |
| September 2022 | 100% |
| December 2022 | 100% |
| March 2023 | 100% |
| June 2023 | 100% |
A percentage of the dividends distributed during the fiscal year for the following funds may be taken into account as a dividend for purposes of the maximum rate under section 1(h)(11) of the Internal Revenue Code.
| Fidelity® Dividend ETF for Rising Rates | |
| September 2022 | 91.84% |
| December 2022 | 91.40% |
| March 2023 | 98.21% |
| June 2023 | 98.21% |
| Fidelity® High Dividend ETF | |
| September 2022 | 84.74% |
| December 2022 | 84.74% |
| March 2023 | 82.78% |
| June 2023 | 82.78% |
| Fidelity® Low Volatility Factor ETF | |
| September 2022 | 100% |
| December 2022 | 100% |
| March 2023 | 100% |
| June 2023 | 100% |
| Fidelity® Momentum Factor ETF | |
| September 2022 | 100% |
| December 2022 | 100% |
| March 2023 | 100% |
| June 2023 | 100% |
| Fidelity® Quality Factor ETF | |
| September 2022 | 100% |
| December 2022 | 100% |
| March 2023 | 100% |
| June 2023 | 100% |
| Fidelity® Small-Mid Multifactor ETF | |
| September 2022 | 87.75% |
| December 2022 | 87.75% |
| March 2023 | 92.30% |
| June 2023 | 92.30% |
| Fidelity® Stocks for Inflation ETF | |
| September 2022 | 100% |
| December 2022 | 100% |
| March 2023 | 100% |
| June 2023 | 100% |
| Fidelity® U.S. Multifactor ETF | |
| September 2022 | 100% |
| December 2022 | 100% |
| March 2023 | 100% |
| June 2023 | 100% |
| Fidelity® Value Factor ETF | |
| September 2022 | 100% |
| December 2022 | 100% |
| March 2023 | 100% |
| June 2023 | 100% |
A percentage of the dividends distributed during the fiscal year for the following funds qualify as a section 199A dividend:
| Fidelity® Dividend ETF for Rising Rates | |
| September 2022 | 5.98% |
| December 2022 | 6.30% |
| March 2023 | 1.79% |
| June 2023 | 1.79% |
| Fidelity® High Dividend ETF | |
| September 2022 | 15.26% |
| December 2022 | 15.26% |
| March 2023 | 14.17% |
| June 2023 | 14.17% |
| Fidelity® Small-Mid Multifactor ETF | |
| September 2022 | 12.25% |
| December 2022 | 12.25% |
| March 2023 | 7.70% |
| June 2023 | 7.70% |
The funds will notify shareholders in January 2024 of amounts for use in preparing 2023income tax returns.
Board Approval of Investment Advisory Contracts and Management Fees
Fidelity Dividend ETF for Rising Rates
Fidelity High Dividend ETF
Fidelity Low Volatility Factor ETF
Fidelity Momentum Factor ETF
Fidelity Quality Factor ETF
Fidelity Small-Mid Multifactor ETF
Fidelity Stocks for Inflation ETF
Fidelity U.S. Multifactor ETF
Fidelity Value Factor ETF
Each year, the Board of Trustees, including the Independent Trustees (together, the Board), considers the renewal of each fund's management contract with Fidelity Management & Research Company LLC (FMR) and the sub-advisory agreement (Sub-Advisory Agreement) for each fund with Geode Capital Management, LLC (Geode) (together, the Advisory Contracts). FMR and Geode are referred to herein as the Investment Advisers. The Board, assisted by the advice of fund counsel and Independent Trustees' counsel, requests and considers a broad range of information relevant to the renewal of the Advisory Contracts throughout the year.
The Board meets regularly and, at each of its meetings, covers an extensive agenda of topics and materials and considers factors that are relevant to its annual consideration of the renewal of each fund's Advisory Contracts, including the services and support provided to each fund and its shareholders. The Board, acting directly and through its Committees (each of which is composed of and chaired by Independent Trustees), requests and receives information concerning the annual consideration of the renewal of each fund's Advisory Contracts. The Board also meets as needed to review matters specifically related to the Board's annual consideration of the renewal of the Advisory Contracts. Members of the Board may also meet with trustees of other Fidelity funds through joint ad hoc committees to discuss certain matters relevant to all of the Fidelity funds.
Approval of Stub Period Continuation. At its May 2023 meeting, the Board of Trustees voted to continue each fund's management contract with FMR and the sub-advisory agreement with Geode, without modification, for two months from June 1, 2023 through July 31, 2023. The Board considered that the approval of each fund's Advisory Contracts will not result in any changes in (i) the investment process or strategies employed in the management of each fund's assets; (ii) the fees and expenses paid by shareholders; (iii) the nature, extent or quality of services provided under each fund's Advisory Contracts; or (iv) the day-to-day management of each fund or the persons primarily responsible for such management. The Board also considered that since its last approval of each fund's Advisory Contracts, FMR had provided additional information on each fund in support of the annual contract renewal process, including competitive analyses on total expenses and management fees and in-depth reviews of fund performance and fund profitability information. The Board concluded that each fund's Advisory Contracts are fair and reasonable, and that each fund's Advisory Contracts should be renewed, without modification, through July 31, 2023, with the understanding that the Board would consider the annual renewal for a full one year period in July 2023.
At its July 2023 meeting, the Board unanimously determined to renew each fund's Advisory Contracts. In reaching its determination, the Board considered all factors it believed relevant, including (i) the nature, extent, and quality of the services provided to each fund and its shareholders (including the investment performance of each fund); (ii) the competitiveness relative to peer funds of each fund's management fee and total expense ratio; (iii) the total costs of the services provided by and the profits realized by FMR and its affiliates (Fidelity) and Geode from their respective relationships with each fund; and (iv) the extent to which, if any, economies of scale exist and are realized as each fund grows, and whether any economies of scale are appropriately shared with fund shareholders. The Board also considered the broad range of investment choices available to shareholders from FMR's competitors and that each fund's shareholders have chosen to invest in the fund, which is part of the Fidelity family of funds. The Board's decision to renew the Advisory Contracts was not based on any single factor.
The Board reached a determination, with the assistance of fund counsel and Independent Trustees' counsel and through the exercise of its business judgment, that the renewal of the Advisory Contracts was in the best interests of each fund and its shareholders and that the compensation payable under the Advisory Contracts was fair and reasonable in light of all of the surrounding circumstances.
Nature, Extent, and Quality of Services Provided. The Board considered staffing as it relates to the funds, including the backgrounds and experience of investment personnel of the Investment Advisers, and also considered the Investment Advisers' implementation of the funds' investment program. The Independent Trustees also had discussions with senior management of Fidelity's investment operations and investment groups and with senior management of Geode. The Board considered the structure of the investment personnel compensation programs and whether the structures provide appropriate incentives to act in the best interests of each fund. Additionally, the Board considered the portfolio managers' investments, if any, in the funds that they manage.
The Trustees also discussed with representatives of Fidelity, at meetings throughout the year, Fidelity's role in, among other things, overseeing compliance with federal securities laws and other applicable requirements by Geode with respect to the funds and monitoring and overseeing the performance and investment capabilities of Geode. The Trustees considered that the Board had received from Fidelity periodic reports about its oversight and due diligence processes, as well as periodic reports regarding the performance of Geode.
The Board also considered the nature, extent and quality of services provided by Geode. The Trustees noted that under the Sub-Advisory Agreement, subject to oversight by Fidelity, Geode is responsible for, among other things, identifying investments and arranging for execution of portfolio transactions to implement each fund's investment strategy. In addition, the Trustees noted that Geode is responsible for providing such reporting as may be requested by Fidelity to fulfill its oversight responsibilities discussed above.
Resources Dedicated to Investment Management and Support Services. The Board and the Fund Oversight and Research Committees reviewed the general qualifications and capabilities of Fidelity's and Geode's investment staffs, including their size, education, experience, and resources, as well as Fidelity's and Geode's approach to recruiting, training, managing, and compensating investment personnel. The Board considered that Fidelity's and Geode's investment professionals have extensive resources, tools and capabilities so as to provide competitive investment results over time, and that those professionals also have access to sophisticated tools that permit them to assess portfolio construction and risk and performance attribution characteristics continuously. Additionally, in its deliberations, the Board considered Fidelity's and Geode's trading, risk management, compliance, and technology and operations capabilities and resources, which are integral parts of the investment management process.
Shareholder and Administrative Services. The Board considered (i) the nature, extent, quality, and cost of advisory and administrative services provided by the Investment Advisers and their affiliates under the Advisory Contracts and by FMR's affiliates under separate agreements covering pricing and bookkeeping and securities lending services for each fund; (ii) the nature and extent of Fidelity's supervision of third party service providers, principally State Street Bank and Trust Company, each fund's transfer agent and custodian; and (iii) the resources devoted by Fidelity to, and the record of compliance with, each fund's compliance policies and procedures. The Board also reviewed the allocation of fund brokerage, including allocations to brokers affiliated with the Investment Advisers. The Board also considered each fund's securities lending activities and any payments made to Fidelity relating to securities lending.
The Board noted that the growth of fund assets over time across the complex allows Fidelity to reinvest in the development of services designed to enhance the value and convenience of the Fidelity funds as investment vehicles. These services include 24-hour access to account information and market information over the Internet and through telephone representatives, investor education materials, and asset allocation tools. The Board also considered that it reviews customer service metrics such as telephone response times, continuity of services on the website and metrics addressing services at Fidelity Investor Centers.
Investment in a Large Fund Family. The Board considered the benefits to shareholders of investing in a fund that is part of a large family of funds offering a variety of investment disciplines and providing a large variety of fund investor services. The Board noted that Fidelity had taken, or had made recommendations that resulted in the Fidelity funds taking, a number of actions over the previous year that benefited particular funds and/or the Fidelity funds in general.
Investment Performance. The Board took into account discussions that occur with representatives of the Investment Advisers, and reports that it receives, at Board meetings throughout the year relating to fund investment performance. In this regard the Board noted that as part of regularly scheduled fund reviews and other reports to the Board on fund performance, the Board considered annualized return information for each fund for different time periods, measured against the securities market index the fund seeks to track. The Board also periodically considers each fund's tracking error versus its benchmark index. In its ongoing evaluation of fund investment performance, the Board gives particular attention to information indicating changes in performance of the funds over different time periods and discussed with the Investment Advisers the reasons for any overperformance or underperformance. The Board also considered information on each fund's bid-ask spread and premium/discount.
In addition to reviewing absolute and relative fund performance, the Independent Trustees periodically consider the appropriateness of fund performance metrics in evaluating the results achieved. In general, the Independent Trustees believe that an index fund's performance should be evaluated based on net performance (after fees and expenses) of the fund compared to a fund's benchmark index, over appropriate time periods taking into account relevant factors including the following: general market conditions; the characteristics of the fund's benchmark index; the extent to which statistical sampling is employed; any securities lending revenues; and fund cash flows and other factors.
Based on its review, the Board concluded that the nature, extent, and quality of services provided to each fund under the Advisory Contracts should continue to benefit the shareholders of each fund.
Competitiveness of Management Fee and Total Expense Ratio. The Board was provided with information regarding industry trends in management fees and expenses. In its review of each fund's management fee and total expense ratio, the Board considered each fund's all-inclusive fee rate and also considered other expenses, such as transfer agent fees, pricing and bookkeeping fees, and custodial, legal, and audit fees, paid by FMR under each fund's all-inclusive arrangement. The Board noted that Fidelity may agree to waive fees or reimburse expenses from time to time, and the extent to which, if any, it has done so for each fund.
Comparisons of Management Fees and Total Expense Ratios. Among other things, the Board reviewed data for selected groups of competitive funds and classes (referred to as "mapped groups") that were compiled by Fidelity based on combining similar investment objective categories (as classified by Lipper) that have comparable investment mandates. The data reviewed by the Board included (i) gross management fee comparisons (before taking into account expense reimbursements or caps) relative to the total universe of funds within the mapped group; (ii) gross management fee comparisons relative to a subset of non-Fidelity funds in the mapped group that are similar in size and management fee structure to each fund (referred to as the "asset size peer group"); (iii) total expense comparisons of each fund relative to funds and classes in the mapped group that have a similar load structure to the fund (referred to as the "similar load structure group"); and (iv) total expense comparisons of each fund relative to funds and classes in the similar load structure group that are similar in size and management fee structure to the fund (referred to as the "total expense asset size peer group"). The total expense asset size peer group comparison excludes performance adjustments and fund-paid 12b-1 fees to eliminate variability in fee structures.
For Fidelity Dividend ETF for Rising Rates, Fidelity High Dividend ETF and Fidelity Small-Mid Multifactor ETF, the information provided to the Board indicated that the fund's management fee rate ranked below the competitive median of the mapped group for the 12-month period ended September 30, 2022. For Fidelity Low Volatility Factor ETF, Fidelity Momentum Factor ETF, Fidelity Quality Factor ETF, Fidelity Stocks for Inflation ETF, Fidelity U.S. Multifactor ETF, and Fidelity Value Factor ETF, the information provided to the Board indicated that the fund's management fee rate ranked equal to the competitive median of the mapped group for the 12-month period ended September 30, 2022.
For Fidelity Dividend ETF for Rising Rates, Fidelity High Dividend ETF, Fidelity Momentum Factor ETF, Fidelity Small-Mid Multifactor ETF, Fidelity Stocks for Inflation ETF, and Fidelity U.S. Multifactor ETF, the fund's management fee rate ranked below the competitive median of the asset size peer group for the 12-month period ended September 30, 2022. For Fidelity Quality Factor ETF, the information provided to the Board indicated that the fund's management fee rate ranked equal to the competitive median of the asset size peer group for the 12-month period ended September 30, 2022. For Fidelity Low Volatility Factor ETF and Fidelity Value Factor ETF, the information provided to the Board indicated that the fund's management fee rate ranked above the competitive median of the asset size peer group for the 12-month period ended September 30, 2022.
For Fidelity Dividend ETF for Rising Rates, Fidelity High Dividend ETF, and Fidelity Small-Mid Multifactor ETF, the information provided to the Board indicated that the total expense ratio of the fund ranked below the competitive median of the similar load structure group for the 12-month period ended September 30, 2022. For Fidelity Low Volatility Factor ETF, Fidelity Momentum Factor ETF, Fidelity Quality Factor ETF, Fidelity Stocks for Inflation ETF, Fidelity U.S. Multifactor ETF and Fidelity Value Factor ETF, the information provided to the Board indicated that the total expense ratio of the fund ranked equal to the competitive median of the similar load structure group for the 12-month period ended September 30, 2022.
For Fidelity Dividend ETF for Rising Rates, Fidelity Momentum Factor ETF, Fidelity Quality Factor ETF, Fidelity Small-Mid Multifactor ETF, Fidelity Stocks for Inflation ETF, and Fidelity U.S. Multifactor ETF, the information provided to the Board indicated that the total expense ratio of the fund ranked below the competitive median of the total expense asset size peer group for the 12-month period ended September 30, 2022. For Fidelity High Dividend ETF, Fidelity Low Volatility Factor ETF, and Fidelity Value Factor ETF, the information provided to the Board indicated that the total expense ratio of the fund ranked above the competitive median of the total expense asset size peer group for the 12-month period ended September 30, 2022.
The Board considered that, when compared to a subset of the asset size peer group that FMR believes is most comparable, Fidelity High Dividend ETF would not be above the asset size peer group competitive median for 2022. For Fidelity Value Factor ETF, the Board considered that the fund's mapped group contains multiple quantitative ETFs, which have investment strategies that are generally less research intensive and rely more on advanced mathematical models than Fidelity Value Factor ETF. The Board also considered that when quantitative ETFs are excluded, Fidelity Value Factor ETF's total expense ratio ranked below the total expense asset size peer group median. For Fidelity Low Volatility Factor ETF, the Board considered that the fund's total expense ratio was 1 basis point above the total expense asset size peer group and that Fidelity believes the fees that the ETF is charged are reasonable for the overall value of the nature and quality of services shareholders receive.
Further, the Board considered that, effective November 1, 2023, the management fee rate for each fund will be reduced from 0.29% to 0.15%, and that after such reduction, each fund continues to be or will be, as applicable, below its competitive median.
Fees Charged to Other Clients. The Board also considered fee structures applicable to clients of Fidelity and Geode, such as other funds advised or subadvised by Fidelity or Geode, pension plan clients, and other institutional clients with similar mandates. The Board noted that a joint ad hoc committee created by it and the boards of other Fidelity funds periodically reviews and compares Fidelity's institutional investment advisory business with its business of providing services to the Fidelity funds and also noted the most recent findings of the committee. The Board noted that the committee's review included a consideration of the differences in services provided, fees charged, and costs incurred, as well as competition in the markets serving the different categories of clients.
Based on its review, the Board concluded that each fund's management fee is fair and reasonable in light of the services that the fund receives and the other factors considered. Further based on its review of total expense ratios and fees charged to other Fidelity clients, the Board concluded that each fund's total expense ratio was reasonable in light of the services that the fund and its shareholders receive and the other factors considered.
Costs of the Services and Profitability. The Board considered the revenues earned and the expenses incurred by Fidelity in conducting the business of developing, marketing, distributing, managing, administering and servicing each fund and servicing each fund's shareholders. The Board also considered the level of Fidelity's profits in respect of all the Fidelity funds.
On an annual basis, Fidelity presents to the Board information about the profitability of its relationships with each fund. Fidelity calculates profitability information for each fund, as well as aggregate profitability information for groups of Fidelity funds and all Fidelity funds, using a series of detailed revenue and cost allocation methodologies which originate with the books and records of Fidelity on which Fidelity's audited financial statements are based. The Audit Committee of the Board reviews any significant changes from the prior year's methodologies and the full Board approves such changes.
A public accounting firm has been engaged annually by the Board as part of the Board's assessment of Fidelity's profitability analysis. The engagement includes the review and assessment of the methodologies used by Fidelity in determining the revenues and expenses attributable to Fidelity's fund business, and completion of agreed-upon procedures in respect of the mathematical accuracy of certain fund profitability information and its conformity to established allocation methodologies. After considering the reports issued under the engagement and information provided by Fidelity, the Board concluded that while other allocation methods may also be reasonable, Fidelity's profitability methodologies are reasonable in all material respects.
The Board also reviewed Fidelity's and Geode's non-fund businesses and potential indirect benefits such businesses may have received as a result of their association with Fidelity's fund business (i.e., fall-out benefits) as well as cases where Fidelity's and Geode's affiliates may benefit from the funds' business. The Board considered areas where potential indirect benefits to the Fidelity funds from their relationships with Fidelity may exist. The Board's consideration of these matters was informed by the findings of a joint ad hoc committee created by it and the boards of other Fidelity funds to evaluate potential fall-out benefits.
The Board considered the costs of the services provided by and the profits realized by Fidelity in connection with the operation of each fund and was satisfied that the profitability was not excessive.
The Board also considered information regarding the profitability of Geode's relationship with each fund.
Economies of Scale. The Board considered whether there have been economies of scale in respect of the management of the Fidelity funds, whether the Fidelity funds (including each fund) have appropriately benefited from any such economies of scale, and whether there is potential for realization of any further economies of scale. The Board considered the extent to which each fund will benefit from economies of scale as assets grow through increased services to the fund, through waivers or reimbursements, or through fee or expense ratio reductions. The Board recognized that, due to each fund's current contractual arrangements, its expense ratio will not decline if the fund's operating costs decrease as assets grow, or rise as assets decrease. The Board also noted that a committee (the Economies of Scale Committee) created by it and the boards of other Fidelity funds periodically analyzes whether Fidelity attains economies of scale in respect of the management and servicing of the Fidelity funds, whether the Fidelity funds have appropriately benefited from such economies of scale, and whether there is potential for realization of any further economies of scale.
The Board concluded, taking into account the analysis of the Economies of Scale Committee, that economies of scale, if any, are being appropriately shared between fund shareholders and Fidelity.
Additional Information Requested by the Board. In order to develop fully the factual basis for consideration of the Fidelity funds' advisory contracts, the Board requested and received additional information on certain topics, including: (i) fund flow and performance trends, in particular the underperformance of certain funds and strategies, and Fidelity's long-term strategies for certain funds, including any consideration of fund liquidations or mergers; (ii) the operation of performance fees and competitor use of performance fees; (iii) Fidelity's pricing philosophy compared to competitors; (iv) fund profitability methodology and data; (v) evaluation of competitive fund data and peer group classifications and fee and expense comparisons; (vi) the management fee and expense structures for different funds and classes and information about the differences between various fee and expense structures; (vii) group fee breakpoints and related voluntary fee waivers; and (viii) information regarding other accounts managed by Fidelity and the funds' sub-advisory arrangements.
Conclusion. Based on its evaluation of all of the conclusions noted above, and after considering all factors it believed relevant, the Board, including the Independent Trustees, concluded that the advisory and sub-advisory fee arrangements are fair and reasonable in light of all of the surrounding circumstances and that each fund's Advisory Contracts should be renewed through July 31, 2024.
1.9881294.106
CPF-ANN-0923
Fidelity® Blue Chip Growth ETF
Fidelity® Blue Chip Value ETF
Fidelity® Growth Opportunities ETF
Fidelity® Magellan® ETF
Fidelity® New Millennium ETF
Fidelity® Real Estate Investment ETF
Fidelity® Small-Mid Cap Opportunities ETF
Fidelity® Sustainable U.S. Equity ETF
Fidelity® Women's Leadership ETF
Annual Report
July 31, 2023
Contents
To view a fund's proxy voting guidelines and proxy voting record for the 12-month period ended June 30, visit http://www.fidelity.com/proxyvotingresults or visit the Securities and Exchange Commission's (SEC) web site at http://www.sec.gov.
You may also call 1-800-FIDELITY to request a free copy of the proxy voting guidelines.
Standard & Poor's, S&P and S&P 500 are registered service marks of The McGraw-Hill Companies, Inc. and have been licensed for use by Fidelity Distributors Corporation.
Other third-party marks appearing herein are the property of their respective owners.
All other marks appearing herein are registered or unregistered trademarks or service marks of FMR LLC or an affiliated company. © 2023 FMR LLC. All rights reserved.
This report and the financial statements contained herein are submitted for the general information of the shareholders of the Funds. This report is not authorized for distribution to prospective investors in the Funds unless preceded or accompanied by an effective prospectus.
A fund files its complete schedule of portfolio holdings with the SEC for the first and third quarters of each fiscal year on Form N-PORT. Forms N-PORT are available on the SEC's web site at http://www.sec.gov. A fund's Forms N-PORT may be reviewed and copied at the SEC's Public Reference Room in Washington, DC. Information regarding the operation of the SEC's Public Reference Room may be obtained by calling 1-800-SEC-0330.
For a complete list of a fund's portfolio holdings, view the most recent holdings listing, semiannual report, or annual report on Fidelity's web site at http://www.fidelity.com, http://www.institutional.fidelity.com, or http://www.401k.com, as applicable.
NOT FDIC INSURED •MAY LOSE VALUE •NO BANK GUARANTEE
Neither the Funds nor Fidelity Distributors Corporation is a bank.
NAV and closing market price average annual returns reflect the change in the value of an investment, assuming reinvestment of distributions from dividend income and capital gains (the profits earned upon the sale of securities that have grown in value, if any) at NAV and Market Price, respectively, and assumes a constant rate of performance each year. The hypothetical investment and the fund's returns do not reflect the deduction of taxes that a shareholder would pay on fund distributions or the redemption or selling of fund shares. How a fund did yesterday is no guarantee of how it will do tomorrow.
| Average Annual Total Returns |
| | | | |
Periods ended July 31, 2023 | Past 1 year | Life of Fund |
Fidelity® Blue Chip Growth ETF - NAV A | 25.44% | 15.19% |
Fidelity® Blue Chip Growth ETF - Market Price B | 25.27% | 15.30% |
Russell 1000® Growth Index A | 17.31% | 15.30% |
A From June 2, 2020
B From June 4, 2020, date initially listed on the CboeBZX Exchange, Inc.
| $10,000 Over Life of Fund |
| |
Let's say hypothetically that $10,000 was invested in Fidelity® Blue Chip Growth ETF - NAV, on June 2, 2020, when the fund started. The chart shows how the value of your investment would have changed, and also shows how the Russell 1000® Growth Index performed over the same period. |
|
|
Fidelity® Blue Chip Growth ETF
Market Recap:
U.S. equities gained 13.02% for the 12 months ending July 31, 2023, according to the S&P 500® index, as continued global economic expansion, falling commodity prices and a slowing in the pace of inflation provided a favorable backdrop for higher-risk assets. Large-cap stocks spearheaded the rally, which was driven by the shares of a narrow set of mega-cap companies in the information technology and communication services sectors, largely due to exuberance related to generative artificial intelligence. Aggressive monetary tightening by the U.S. Federal Reserve continued amid consistent pressure on core inflation, a measure that excludes food and energy. Since March 2022, the Fed has hiked its benchmark interest rate 11 times. The latest bump came in late July, a fourth consecutive raise of a stepped down 25 basis points. The S&P 500® gained 3.21% in July, as a "soft landing" of the U.S. economy became the consensus view amid better-than-expected earnings, slowing inflation and easing financial conditions, bringing the index's year-to-date gain to 20.65%. July saw a continuance of the recent shift to wider market breadth and lower dispersion. For the full 12 months, value (+17%) handily topped growth (+8%) within the index. By sector, tech (+28%), communication services (+21%) and industrials (+17%) led, whereas real estate (-10%) lagged most, due to high borrowing costs, low home inventory and a deteriorating commercial property market.
Comments from Co-Managers Sonu Kalra and Michael Kim:
For the fiscal year ending July 31, 2023, the exchange-traded fund's net asset value gained 25.44%, versus 17.31% for the Russell 1000 Growth Index. The ETF's market price advanced 25.27% for the 12 months. Relative to the benchmark, security selection was the primary contributor, led by the information technology sector. Stock selection in communication services and industrials also boosted the fund's relative performance. The top individual relative contributor was an overweight in Nvidia (+158%). Nvidia was one of the fund's biggest holdings at period end. A second notable relative contributor was an overweight in Meta Platforms (+101%). Meta was also among our largest holdings; we increased our position during the 12 months. An overweight in Uber Technologies (+112%) - another of the fund's biggest holdings - also contributed. This period we increased our stake. In contrast, the primary detractor from performance versus the benchmark was an overweight in consumer discretionary. Stock picking in real estate also modestly hampered the fund's result, as did a small underweight in information technology. The fund's stake in Tesla returned roughly -10% and was the largest individual relative detractor. Tesla was one of our largest holdings. Not owning Broadcom, a benchmark component that gained 73%, was the second-largest relative detractor. An overweight in Amazon.com (0%), another of the fund's biggest holdings, also hurt. This period we increased our position in Amazon.com. Notable changes in positioning include decreased exposure to the energy sector and a higher allocation to communication services.
The views expressed above reflect those of the portfolio manager(s) only through the end of the period as stated on the cover of this report and do not necessarily represent the views of Fidelity or any other person in the Fidelity organization, or Geode Capital Management, LLC, (the ETF's subadviser) or any other person in the Geode organization. Any such views are subject to change at any time based upon market or other conditions and Fidelity and Geode disclaim any responsibility to update such views. These views may not be relied on as investment advice and, because investment decisions for a Fidelity fund are based on numerous factors, may not be relied on as an indication of trading intent on behalf of any Fidelity fund.
Fidelity® Blue Chip Growth ETF
Top Holdings (% of Fund's net assets) |
| |
| Apple, Inc. | 10.2 | |
| NVIDIA Corp. | 9.7 | |
| Microsoft Corp. | 9.2 | |
| Amazon.com, Inc. | 7.9 | |
| Alphabet, Inc. Class A | 6.1 | |
| Meta Platforms, Inc. Class A | 4.7 | |
| Marvell Technology, Inc. | 2.7 | |
| Uber Technologies, Inc. | 2.6 | |
| Tesla, Inc. | 2.3 | |
| Netflix, Inc. | 2.1 | |
| | 57.5 | |
| |
| Market Sectors (% of Fund's net assets) |
| |
| Information Technology | 40.8 | |
| Consumer Discretionary | 21.3 | |
| Communication Services | 14.8 | |
| Health Care | 8.7 | |
| Industrials | 4.5 | |
| Energy | 2.6 | |
| Consumer Staples | 2.5 | |
| Financials | 2.3 | |
| Materials | 0.7 | |
| Real Estate | 0.2 | |
| Utilities | 0.0 | |
| |
Asset Allocation (% of Fund's net assets) |
|
Futures - 0.4% |
|
Fidelity® Blue Chip Growth ETF
Showing Percentage of Net Assets
| Common Stocks - 98.4% |
| | | Shares | Value ($) |
| COMMUNICATION SERVICES - 14.8% | | | |
| Entertainment - 2.4% | | | |
| Bilibili, Inc. ADR (a) | | 420 | 8,009 |
| Netflix, Inc. (a) | | 37,235 | 16,345,048 |
| Sea Ltd. ADR (a) | | 33,357 | 2,218,908 |
| Take-Two Interactive Software, Inc. (a) | | 2,019 | 308,786 |
| | | | 18,880,751 |
| Interactive Media & Services - 12.3% | | | |
| Alphabet, Inc. Class A (a) | | 358,721 | 47,609,451 |
| Meta Platforms, Inc. Class A (a) | | 114,960 | 36,626,256 |
| Snap, Inc. Class A (a) | | 1,038,663 | 11,799,212 |
| | | | 96,034,919 |
| Wireless Telecommunication Services - 0.1% | | | |
| T-Mobile U.S., Inc. (a) | | 4,605 | 634,431 |
TOTAL COMMUNICATION SERVICES | | | 115,550,101 |
| CONSUMER DISCRETIONARY - 21.3% | | | |
| Automobile Components - 0.1% | | | |
| Aptiv PLC (a) | | 4,350 | 476,282 |
| Automobiles - 2.8% | | | |
| Rivian Automotive, Inc. (a) | | 124,957 | 3,453,811 |
| Tesla, Inc. (a) | | 67,881 | 18,153,416 |
| | | | 21,607,227 |
| Broadline Retail - 8.5% | | | |
| Alibaba Group Holding Ltd. sponsored ADR (a) | | 28,541 | 2,915,749 |
| Amazon.com, Inc. (a) | | 460,328 | 61,536,647 |
| MercadoLibre, Inc. (a) | | 313 | 387,510 |
| Ollie's Bargain Outlet Holdings, Inc. (a) | | 9,459 | 689,372 |
| PDD Holdings, Inc. ADR (a) | | 8,768 | 787,542 |
| | | | 66,316,820 |
| Diversified Consumer Services - 0.1% | | | |
| New Oriental Education & Technology Group, Inc. sponsored ADR (a) | | 10,644 | 597,448 |
| Hotels, Restaurants & Leisure - 3.2% | | | |
| Airbnb, Inc. Class A (a) | | 49,501 | 7,533,557 |
| Caesars Entertainment, Inc. (a) | | 64,732 | 3,820,483 |
| Chipotle Mexican Grill, Inc. (a) | | 383 | 751,553 |
| Draftkings Holdings, Inc. (a) | | 12,955 | 411,710 |
| Hilton Worldwide Holdings, Inc. | | 11,581 | 1,800,730 |
| Marriott International, Inc. Class A | | 20,053 | 4,046,896 |
| McDonald's Corp. | | 2,163 | 634,192 |
| Penn Entertainment, Inc. (a) | | 69,310 | 1,822,160 |
| Restaurant Brands International, Inc. | | 6,536 | 500,367 |
| Starbucks Corp. | | 17,443 | 1,771,686 |
| Sweetgreen, Inc. Class A (a) | | 71,307 | 1,074,596 |
| Trip.com Group Ltd. ADR (a) | | 13,758 | 564,628 |
| Yum China Holdings, Inc. | | 5,491 | 335,061 |
| Yum! Brands, Inc. | | 1,702 | 234,314 |
| | | | 25,301,933 |
| Leisure Products - 0.1% | | | |
| Peloton Interactive, Inc. Class A (a) | | 46,607 | 452,554 |
| Specialty Retail - 4.2% | | | |
| Abercrombie & Fitch Co. Class A (a) | | 16,123 | 638,632 |
| American Eagle Outfitters, Inc. | | 207,330 | 2,912,987 |
| Aritzia, Inc. (a) | | 14,982 | 285,063 |
| Bath & Body Works, Inc. | | 6,460 | 239,408 |
| Five Below, Inc. (a) | | 14,263 | 2,971,553 |
| Foot Locker, Inc. | | 27,757 | 745,831 |
| Lowe's Companies, Inc. | | 56,797 | 13,305,833 |
| RH (a) | | 13,167 | 5,111,034 |
| TJX Companies, Inc. | | 49,925 | 4,320,010 |
| Victoria's Secret & Co. (a) | | 10,177 | 208,527 |
| Warby Parker, Inc. (a) | | 98,779 | 1,475,758 |
| Wayfair LLC Class A (a) | | 7,079 | 551,242 |
| Williams-Sonoma, Inc. | | 3,069 | 425,486 |
| | | | 33,191,364 |
| Textiles, Apparel & Luxury Goods - 2.3% | | | |
| Capri Holdings Ltd. (a) | | 1,020 | 37,648 |
| Crocs, Inc. (a) | | 14,459 | 1,566,633 |
| Deckers Outdoor Corp. (a) | | 3,719 | 2,021,983 |
| lululemon athletica, Inc. (a) | | 13,457 | 5,093,878 |
| NIKE, Inc. Class B | | 68,893 | 7,605,098 |
| On Holding AG (a) | | 10,897 | 392,292 |
| PVH Corp. | | 6,917 | 620,040 |
| Ralph Lauren Corp. | | 2,478 | 325,436 |
| VF Corp. | | 26,871 | 532,315 |
| | | | 18,195,323 |
TOTAL CONSUMER DISCRETIONARY | | | 166,138,951 |
| CONSUMER STAPLES - 2.5% | | | |
| Beverages - 1.3% | | | |
| Boston Beer Co., Inc. Class A (a) | | 3,368 | 1,251,010 |
| Celsius Holdings, Inc. (a) | | 56,327 | 8,150,517 |
| Constellation Brands, Inc. Class A (sub. vtg.) | | 1,110 | 302,808 |
| PepsiCo, Inc. | | 3,584 | 671,857 |
| | | | 10,376,192 |
| Consumer Staples Distribution & Retail - 1.1% | | | |
| Dollar Tree, Inc. (a) | | 37,598 | 5,802,499 |
| Target Corp. | | 5,277 | 720,152 |
| Walmart, Inc. | | 11,552 | 1,846,703 |
| | | | 8,369,354 |
| Household Products - 0.1% | | | |
| Procter & Gamble Co. | | 3,877 | 605,975 |
| Personal Care Products - 0.0% | | | |
| Oddity Tech Ltd. | | 7,181 | 382,675 |
TOTAL CONSUMER STAPLES | | | 19,734,196 |
| ENERGY - 2.6% | | | |
| Oil, Gas & Consumable Fuels - 2.6% | | | |
| Antero Resources Corp. (a) | | 16,057 | 429,525 |
| Cenovus Energy, Inc. (Canada) | | 11,591 | 220,454 |
| Cheniere Energy, Inc. | | 3,491 | 565,053 |
| Denbury, Inc. (a) | | 11,783 | 1,035,844 |
| Diamondback Energy, Inc. | | 16,760 | 2,469,083 |
| EOG Resources, Inc. | | 25,402 | 3,366,527 |
| Exxon Mobil Corp. | | 20,144 | 2,160,243 |
| Hess Corp. | | 33,834 | 5,133,633 |
| Northern Oil & Gas, Inc. | | 6,131 | 241,377 |
| Occidental Petroleum Corp. | | 29,129 | 1,838,914 |
| Pioneer Natural Resources Co. | | 10,169 | 2,294,838 |
| | | | 19,755,491 |
| FINANCIALS - 2.3% | | | |
| Consumer Finance - 0.4% | | | |
| American Express Co. | | 19,848 | 3,351,930 |
| Financial Services - 1.9% | | | |
| Berkshire Hathaway, Inc. Class B (a) | | 965 | 339,641 |
| Block, Inc. Class A (a) | | 31,802 | 2,561,015 |
| MasterCard, Inc. Class A | | 23,909 | 9,426,841 |
| Visa, Inc. Class A | | 9,099 | 2,163,105 |
| | | | 14,490,602 |
TOTAL FINANCIALS | | | 17,842,532 |
| HEALTH CARE - 8.7% | | | |
| Biotechnology - 1.1% | | | |
| Alnylam Pharmaceuticals, Inc. (a) | | 11,032 | 2,155,653 |
| Argenx SE ADR (a) | | 1,678 | 846,517 |
| Ascendis Pharma A/S sponsored ADR (a) | | 1,785 | 160,918 |
| Exact Sciences Corp. (a) | | 3,214 | 313,494 |
| Generation Bio Co. (a) | | 939 | 4,770 |
| Karuna Therapeutics, Inc. (a) | | 2,106 | 420,716 |
| Moonlake Immunotherapeutics (a) | | 6,449 | 392,164 |
| Regeneron Pharmaceuticals, Inc. (a) | | 3,619 | 2,684,972 |
| Vertex Pharmaceuticals, Inc. (a) | | 4,842 | 1,706,030 |
| | | | 8,685,234 |
| Health Care Equipment & Supplies - 1.6% | | | |
| Axonics Modulation Technologies, Inc. (a) | | 9,799 | 591,566 |
| Boston Scientific Corp. (a) | | 35,952 | 1,864,111 |
| DexCom, Inc. (a) | | 39,697 | 4,944,658 |
| Insulet Corp. (a) | | 5,196 | 1,437,993 |
| Intuitive Surgical, Inc. (a) | | 856 | 277,686 |
| Shockwave Medical, Inc. (a) | | 6,647 | 1,732,208 |
| Stryker Corp. | | 5,493 | 1,556,771 |
| | | | 12,404,993 |
| Health Care Providers & Services - 2.4% | | | |
| agilon health, Inc. (a) | | 2,677 | 51,265 |
| Alignment Healthcare, Inc. (a) | | 7,815 | 48,531 |
| Guardant Health, Inc. (a) | | 37,565 | 1,465,786 |
| Humana, Inc. | | 5,012 | 2,289,632 |
| Surgery Partners, Inc. (a) | | 12,157 | 469,625 |
| UnitedHealth Group, Inc. | | 28,304 | 14,332,296 |
| | | | 18,657,135 |
| Health Care Technology - 0.0% | | | |
| Certara, Inc. (a) | | 4,447 | 86,583 |
| Life Sciences Tools & Services - 0.6% | | | |
| Danaher Corp. | | 9,444 | 2,408,787 |
| ICON PLC (a) | | 1,544 | 388,177 |
| Olink Holding AB ADR (a) | | 8,223 | 156,237 |
| Thermo Fisher Scientific, Inc. | | 3,169 | 1,738,704 |
| | | | 4,691,905 |
| Pharmaceuticals - 3.0% | | | |
| Eli Lilly & Co. | | 31,459 | 14,299,688 |
| Novo Nordisk A/S Series B sponsored ADR | | 20,833 | 3,356,196 |
| Zoetis, Inc. Class A | | 31,226 | 5,873,298 |
| | | | 23,529,182 |
TOTAL HEALTH CARE | | | 68,055,032 |
| INDUSTRIALS - 4.5% | | | |
| Aerospace & Defense - 0.7% | | | |
| Howmet Aerospace, Inc. | | 20,207 | 1,033,386 |
| L3Harris Technologies, Inc. | | 2,083 | 394,708 |
| Lockheed Martin Corp. | | 1,137 | 507,523 |
| Northrop Grumman Corp. | | 688 | 306,160 |
| The Boeing Co. (a) | | 12,959 | 3,095,257 |
| TransDigm Group, Inc. | | 387 | 348,192 |
| | | | 5,685,226 |
| Commercial Services & Supplies - 0.1% | | | |
| ACV Auctions, Inc. Class A (a) | | 31,788 | 555,972 |
| Electrical Equipment - 0.1% | | | |
| Eaton Corp. PLC | | 2,970 | 609,800 |
| Ground Transportation - 3.1% | | | |
| Avis Budget Group, Inc. (a) | | 3,548 | 781,589 |
| Bird Global, Inc. Class A (a) | | 5,840 | 14,483 |
| Hertz Global Holdings, Inc. (a) | | 26,074 | 439,347 |
| Lyft, Inc. (a) | | 221,003 | 2,808,948 |
| Uber Technologies, Inc. (a) | | 411,138 | 20,334,885 |
| | | | 24,379,252 |
| Passenger Airlines - 0.2% | | | |
| Delta Air Lines, Inc. | | 12,309 | 569,414 |
| United Airlines Holdings, Inc. (a) | | 20,711 | 1,124,814 |
| | | | 1,694,228 |
| Professional Services - 0.2% | | | |
| Paycom Software, Inc. | | 3,905 | 1,440,008 |
| Trading Companies & Distributors - 0.1% | | | |
| FTAI Aviation Ltd. | | 28,217 | 908,870 |
TOTAL INDUSTRIALS | | | 35,273,356 |
| INFORMATION TECHNOLOGY - 40.8% | | | |
| Communications Equipment - 0.1% | | | |
| Arista Networks, Inc. (a) | | 3,060 | 474,575 |
| IT Services - 0.5% | | | |
| MongoDB, Inc. Class A (a) | | 3,789 | 1,604,263 |
| Okta, Inc. (a) | | 22,770 | 1,750,102 |
| Shopify, Inc. Class A (a) | | 3,848 | 259,948 |
| Snowflake, Inc. (a) | | 3,860 | 685,961 |
| | | | 4,300,274 |
| Semiconductors & Semiconductor Equipment - 17.8% | | | |
| Advanced Micro Devices, Inc. (a) | | 42,732 | 4,888,541 |
| ASML Holding NV (depository receipt) | | 1,542 | 1,104,704 |
| Enphase Energy, Inc. (a) | | 2,982 | 452,757 |
| GlobalFoundries, Inc. (a) | | 84,899 | 5,407,217 |
| Impinj, Inc. (a) | | 3,085 | 205,523 |
| Marvell Technology, Inc. | | 323,958 | 21,099,385 |
| Monolithic Power Systems, Inc. | | 4,000 | 2,237,960 |
| NVIDIA Corp. | | 161,909 | 75,658,457 |
| NXP Semiconductors NV | | 60,099 | 13,400,875 |
| ON Semiconductor Corp. (a) | | 65,887 | 7,099,324 |
| Skyworks Solutions, Inc. | | 2,157 | 246,696 |
| SolarEdge Technologies, Inc. (a) | | 1,584 | 382,473 |
| Taiwan Semiconductor Manufacturing Co. Ltd. sponsored ADR | | 37,610 | 3,729,032 |
| Teradyne, Inc. | | 23,364 | 2,638,730 |
| | | | 138,551,674 |
| Software - 12.2% | | | |
| Adobe, Inc. (a) | | 1,930 | 1,054,108 |
| Bill Holdings, Inc. (a) | | 13,573 | 1,701,240 |
| Confluent, Inc. (a) | | 7,684 | 265,405 |
| Datadog, Inc. Class A (a) | | 9,329 | 1,088,881 |
| HubSpot, Inc. (a) | | 6,974 | 4,048,756 |
| Intuit, Inc. | | 5,310 | 2,717,127 |
| Microsoft Corp. | | 213,662 | 71,773,339 |
| Oracle Corp. | | 5,938 | 696,112 |
| Palantir Technologies, Inc. (a) | | 18,544 | 367,913 |
| Salesforce, Inc. (a) | | 33,181 | 7,466,057 |
| ServiceNow, Inc. (a) | | 2,838 | 1,654,554 |
| Splunk, Inc. (a) | | 8,959 | 970,528 |
| Workday, Inc. Class A (a) | | 1,379 | 327,002 |
| Zoom Video Communications, Inc. Class A (a) | | 14,573 | 1,068,930 |
| | | | 95,199,952 |
| Technology Hardware, Storage & Peripherals - 10.2% | | | |
| Apple, Inc. | | 406,356 | 79,828,633 |
TOTAL INFORMATION TECHNOLOGY | | | 318,355,108 |
| MATERIALS - 0.7% | | | |
| Chemicals - 0.0% | | | |
| Linde PLC | | 848 | 331,288 |
| Metals & Mining - 0.7% | | | |
| ATI, Inc. (a) | | 7,945 | 378,818 |
| Carpenter Technology Corp. | | 10,836 | 648,643 |
| Freeport-McMoRan, Inc. | | 91,390 | 4,080,564 |
| | | | 5,108,025 |
TOTAL MATERIALS | | | 5,439,313 |
| REAL ESTATE - 0.2% | | | |
| Equity Real Estate Investment Trusts (REITs) - 0.1% | | | |
| Equinix, Inc. | | 468 | 379,043 |
| Welltower, Inc. | | 6,211 | 510,234 |
| | | | 889,277 |
| Real Estate Management & Development - 0.1% | | | |
| Zillow Group, Inc. Class C (a) | | 12,158 | 658,477 |
TOTAL REAL ESTATE | | | 1,547,754 |
| UTILITIES - 0.0% | | | |
| Electric Utilities - 0.0% | | | |
| NextEra Energy, Inc. | | 3,169 | 232,287 |
| TOTAL COMMON STOCKS (Cost $628,565,003) | | | 767,924,121 |
| | | | |
| Money Market Funds - 0.9% |
| | | Shares | Value ($) |
State Street Institutional Treasury Plus Money Market Fund Trust Class 5.15% (b) (Cost $6,636,788) | | 6,636,788 | 6,636,788 |
| | | | |
| TOTAL INVESTMENT IN SECURITIES - 99.3% (Cost $635,201,791) | 774,560,909 |
NET OTHER ASSETS (LIABILITIES) - 0.7% | 5,822,177 |
| NET ASSETS - 100.0% | 780,383,086 |
| | |
| Futures Contracts |
| | Number of contracts | Expiration Date | Notional Amount ($) | Value ($) | Unrealized Appreciation/ (Depreciation) ($) |
| Purchased | | | | | |
| | | | | | |
| Equity Index Contracts | | | | | |
| CME E-mini NASDAQ 100 Index Contracts (United States) | 7 | Sep 2023 | 2,220,050 | (555) | (555) |
| CME E-mini S&P 500 Index Contracts (United States) | 5 | Sep 2023 | 1,153,625 | (137) | (137) |
| | | | | | |
| TOTAL FUTURES CONTRACTS | | | | | (692) |
| The notional amount of futures purchased as a percentage of Net Assets is 0.4% |
Legend
| (b) | The rate quoted is the annualized seven-day yield of the fund at period end. |
Investment Valuation
The following is a summary of the inputs used, as of July 31, 2023, involving the Fund's assets and liabilities carried at fair value. The inputs or methodology used for valuing securities may not be an indication of the risk associated with investing in those securities. For more information on valuation inputs, and their aggregation into the levels used below, please refer to the Investment Valuation section in the accompanying Notes to Financial Statements.
| Valuation Inputs at Reporting Date: |
| Description | Total ($) | Level 1 ($) | Level 2 ($) | Level 3 ($) |
Investments in Securities: | | | | |
|
| Equities: | | | | |
Communication Services | 115,550,101 | 115,550,101 | - | - |
Consumer Discretionary | 166,138,951 | 166,138,951 | - | - |
Consumer Staples | 19,734,196 | 19,734,196 | - | - |
Energy | 19,755,491 | 19,755,491 | - | - |
Financials | 17,842,532 | 17,842,532 | - | - |
Health Care | 68,055,032 | 68,055,032 | - | - |
Industrials | 35,273,356 | 35,273,356 | - | - |
Information Technology | 318,355,108 | 318,355,108 | - | - |
Materials | 5,439,313 | 5,439,313 | - | - |
Real Estate | 1,547,754 | 1,547,754 | - | - |
Utilities | 232,287 | 232,287 | - | - |
|
| Money Market Funds | 6,636,788 | 6,636,788 | - | - |
| Total Investments in Securities: | 774,560,909 | 774,560,909 | - | - |
Derivative Instruments: | | | | |
|
| Liabilities | | | | |
Futures Contracts | (692) | (692) | - | - |
| Total Liabilities | (692) | (692) | - | - |
| Total Derivative Instruments: | (692) | (692) | - | - |
Value of Derivative Instruments
The following table is a summary of the Fund's value of derivative instruments by primary risk exposure as of July 31, 2023. For additional information on derivative instruments, please refer to the Derivative Instruments section in the accompanying Notes to Financial Statements.
Primary Risk Exposure / Derivative Type | Value |
| Asset ($) | Liability ($) |
| Equity Risk | | |
Futures Contracts (a) | 0 | (692) |
| Total Equity Risk | 0 | (692) |
| Total Value of Derivatives | 0 | (692) |
(a)Reflects gross cumulative appreciation (depreciation) on futures contracts as presented in the Schedule of Investments. In the Statement of Assets and Liabilities, the period end daily variation margin is included in receivable or payable for daily variation margin on futures contracts, and the net cumulative appreciation (depreciation) is included in Total accumulated earnings (loss).
Fidelity® Blue Chip Growth ETF
| Statement of Assets and Liabilities |
| | | | July 31, 2023 |
| | | | | |
| Assets | | | | |
Investment in securities, at value - See accompanying schedule Unaffiliated issuers (cost $635,201,791): | | | $ | 774,560,909 |
| Segregated cash with brokers for derivative instruments | | | | 330,400 |
| Cash | | | | 7,347 |
| Foreign currency held at value (cost $163) | | | | 163 |
| Receivable for investments sold | | | | 2,295,447 |
| Receivable for fund shares sold | | | | 31,203,291 |
| Dividends receivable | | | | 115,283 |
| Receivable for daily variation margin on futures contracts | | | | 7,827 |
Total assets | | | | 808,520,667 |
| Liabilities | | | | |
| Payable for investments purchased | $ | 27,792,587 | | |
| Accrued management fee | | 344,907 | | |
| Other payables and accrued expenses | | 87 | | |
| Total Liabilities | | | | 28,137,581 |
| Net Assets | | | $ | 780,383,086 |
| Net Assets consist of: | | | | |
| Paid in capital | | | $ | 724,462,424 |
| Total accumulated earnings (loss) | | | | 55,920,662 |
| Net Assets | | | $ | 780,383,086 |
Net Asset Value, offering price and redemption price per share ($780,383,086 ÷ 24,950,000 shares) | | | $ | 31.28 |
| Statement of Operations |
| | | | Year ended July 31, 2023 |
| Investment Income | | | | |
| Dividends | | | $ | 2,732,916 |
| Expenses | | | | |
| Management fee | $ | 2,713,572 | | |
| Independent trustees' fees and expenses | | 2,152 | | |
| Total expenses before reductions | | 2,715,724 | | |
| Expense reductions | | (190) | | |
| Total expenses after reductions | | | | 2,715,534 |
| Net Investment income (loss) | | | | 17,382 |
| Realized and Unrealized Gain (Loss) | | | | |
| Net realized gain (loss) on: | | | | |
| Investment Securities: | | | | |
| Redemptions in-kind | | 5,140,160 | | |
| Unaffiliated issuers | | (30,865,470) | | |
| Foreign currency transactions | | (1,210) | | |
| Futures contracts | | (45,044) | | |
| Total net realized gain (loss) | | | | (25,771,564) |
| Change in net unrealized appreciation (depreciation) on: | | | | |
| Investment Securities: | | | | |
| Unaffiliated issuers | | 168,912,690 | | |
| Assets and liabilities in foreign currencies | | (717) | | |
| Futures contracts | | (692) | | |
| Total change in net unrealized appreciation (depreciation) | | | | 168,911,281 |
| Net gain (loss) | | | | 143,139,717 |
| Net increase (decrease) in net assets resulting from operations | | | $ | 143,157,099 |
| Statement of Changes in Net Assets |
| |
| | Year ended July 31, 2023 | | Year ended July 31, 2022 |
| Increase (Decrease) in Net Assets | | | | |
| Operations | | | | |
| Net investment income (loss) | $ | 17,382 | $ | (699,043) |
| Net realized gain (loss) | | (25,771,564) | | (25,007,726) |
| Change in net unrealized appreciation (depreciation) | | 168,911,281 | | (94,362,764) |
| Net increase (decrease) in net assets resulting from operations | | 143,157,099 | | (120,069,533) |
| | | | | |
| Share transactions | | | | |
| Proceeds from sales of shares | | 296,642,887 | | 209,141,668 |
| Cost of shares redeemed | | (22,813,838) | | (132,864,696) |
| | | | | |
Net increase (decrease) in net assets resulting from share transactions | | 273,829,049 | | 76,276,972 |
| Total increase (decrease) in net assets | | 416,986,148 | | (43,792,561) |
| | | | | |
| Net Assets | | | | |
| Beginning of period | | 363,396,938 | | 407,189,499 |
| End of period | $ | 780,383,086 | $ | 363,396,938 |
| | | | | |
| Other Information | | | | |
| Shares | | | | |
| Sold | | 11,300,000 | | 6,575,000 |
| Redeemed | | (925,000) | | (4,425,000) |
| Net increase (decrease) | | 10,375,000 | | 2,150,000 |
| | | | | |
| Fidelity® Blue Chip Growth ETF |
| |
| Years ended July 31, | | 2023 | | 2022 | | 2021 | | 2020 A |
Selected Per-Share Data | | | | | | | | |
| Net asset value, beginning of period | $ | 24.93 | $ | 32.77 | $ | 22.74 | $ | 20.00 |
| Income from Investment Operations | | | | | | | | |
Net investment income (loss) B,C | | - D | | (.05) | | (.08) | | (.01) |
| Net realized and unrealized gain (loss) | | 6.35 | | (7.79) | | 10.11 | | 2.75 |
| Total from investment operations | | 6.35 | | (7.84) | | 10.03 | | 2.74 |
| Distributions from net investment income | | - | | - | | - D | | - |
| Net asset value, end of period | $ | 31.28 | $ | 24.93 | $ | 32.77 | $ | 22.74 |
Total Return E,F,G | | 25.44% | | (23.92)% | | 44.14% | | 13.68% |
Ratios to Average Net Assets C,H,I | | | | | | | | |
| Expenses before reductions | | .59% | | .59% | | .59% | | .59% J |
| Expenses net of fee waivers, if any | | .59% | | .59% | | .59% | | .59% J |
| Expenses net of all reductions | | .59% | | .59% | | .59% | | .59% J |
| Net investment income (loss) | | -% K | | (.17)% | | (.27)% | | (.34)% J |
| Supplemental Data | | | | | | | | |
| Net assets, end of period (000 omitted) | $ | 780,383 | $ | 363,397 | $ | 407,189 | $ | 41,494 |
Portfolio turnover rate L,M | | 30% | | 57% | | 63% | | 11% N |
AFor the period June 2, 2020 (commencement of operations) through July 31, 2020.
BCalculated based on average shares outstanding during the period.
CNet investment income (loss) is affected by the timing of the declaration of dividends by any underlying mutual funds or exchange-traded funds (ETFs). Net investment income (loss) of any mutual funds or ETFs is not included in the Fund's net investment income (loss) ratio.
DAmount represents less than $.005 per share.
ETotal returns would have been lower if certain expenses had not been reduced during the applicable periods shown.
FBased on net asset value.
GTotal returns for periods of less than one year are not annualized.
HFees and expenses of any underlying mutual funds or exchange-traded funds (ETFs) are not included in the Fund's expense ratio. The Fund indirectly bears its proportionate share of these expenses.
IExpense ratios reflect operating expenses of the class. Expenses before reductions do not reflect amounts reimbursed, waived, or reduced through arrangements with the investment adviser, brokerage services, or other offset arrangements, if applicable, and do not represent the amount paid by the class during periods when reimbursements, waivers or reductions occur.
JAnnualized.
KAmount represents less than .005%.
LPortfolio turnover rate excludes securities received or delivered in-kind.
MAmount does not include the portfolio activity of any underlying mutual funds or exchange-traded funds (ETFs).
NAmount not annualized.
NAV and closing market price average annual returns reflect the change in the value of an investment, assuming reinvestment of distributions from dividend income and capital gains (the profits earned upon the sale of securities that have grown in value, if any) at NAV and Market Price, respectively, and assumes a constant rate of performance each year. The hypothetical investment and the fund's returns do not reflect the deduction of taxes that a shareholder would pay on fund distributions or the redemption or selling of fund shares. How a fund did yesterday is no guarantee of how it will do tomorrow.
| Average Annual Total Returns |
| | | | |
Periods ended July 31, 2023 | Past 1 year | Life of Fund |
Fidelity® Blue Chip Value ETF - NAV A | 5.35% | 14.70% |
Fidelity® Blue Chip Value ETF - Market Price B | 5.26% | 13.50% |
Russell 1000® Value Index A | 8.28% | 13.98% |
A From June 2, 2020
B From June 4, 2020, date initially listed on the CboeBZX Exchange, Inc.
| $10,000 Over Life of Fund |
| |
Let's say hypothetically that $10,000 was invested in Fidelity® Blue Chip Value ETF - NAV, on June 2, 2020, when the fund started. The chart shows how the value of your investment would have changed, and also shows how the Russell 1000® Value Index performed over the same period. |
|
|
Fidelity® Blue Chip Value ETF
Market Recap:
U.S. equities gained 13.02% for the 12 months ending July 31, 2023, according to the S&P 500® index, as continued global economic expansion, falling commodity prices and a slowing in the pace of inflation provided a favorable backdrop for higher-risk assets. Large-cap stocks spearheaded the rally, which was driven by the shares of a narrow set of mega-cap companies in the information technology and communication services sectors, largely due to exuberance related to generative artificial intelligence. Aggressive monetary tightening by the U.S. Federal Reserve continued amid consistent pressure on core inflation, a measure that excludes food and energy. Since March 2022, the Fed has hiked its benchmark interest rate 11 times. The latest bump came in late July, a fourth consecutive raise of a stepped down 25 basis points. The S&P 500® gained 3.21% in July, as a "soft landing" of the U.S. economy became the consensus view amid better-than-expected earnings, slowing inflation and easing financial conditions, bringing the index's year-to-date gain to 20.65%. July saw a continuance of the recent shift to wider market breadth and lower dispersion. For the full 12 months, value (+17%) handily topped growth (+8%) within the index. By sector, tech (+28%), communication services (+21%) and industrials (+17%) led, whereas real estate (-10%) lagged most, due to high borrowing costs, low home inventory and a deteriorating commercial property market.
Comments from Co-Managers Sean Gavin and Anastasia Zabolotnikova:
For the fiscal year ending July 31, 2023, the exchange-traded fund's net asset value gained 5.35%, versus 8.28% for the Russell 1000 Value Index. The primary detractor from performance versus the benchmark was an overweight in the utilities sector. Stock picks and an underweight in industrials and positioning in energy also proved to be problematic. Not owning Meta Platforms, a benchmark component that gained approximately 81%, was the biggest individual relative detractor. An outsized stake in Centene (-27%), one of our largest holdings, also hurt. Another notable relative detractor was a non-benchmark position in Dollar General (-31%). In contrast, the biggest contributor to performance versus the benchmark was security selection in utilities. An underweight in real estate was beneficial as well. Further contributing to the fund's relative result were investment choices and an overweight in financials. The top individual relative contributor was a larger-than-benchmark holding in PG&E (+62%). Not owning Pfizer, a benchmark component that returned about -26%, was a second notable relative contributor. An overweight in Constellation Energy (+48%) also helped. Notable changes in positioning include increased exposure to the energy sector and a lower allocation to communication services stocks.
The views expressed above reflect those of the portfolio manager(s) only through the end of the period as stated on the cover of this report and do not necessarily represent the views of Fidelity or any other person in the Fidelity organization, or Geode Capital Management, LLC, (the ETF's subadviser) or any other person in the Geode organization. Any such views are subject to change at any time based upon market or other conditions and Fidelity and Geode disclaim any responsibility to update such views. These views may not be relied on as investment advice and, because investment decisions for a Fidelity fund are based on numerous factors, may not be relied on as an indication of trading intent on behalf of any Fidelity fund.
Fidelity® Blue Chip Value ETF
Top Holdings (% of Fund's net assets) |
| |
| Berkshire Hathaway, Inc. Class B | 5.3 | |
| Exxon Mobil Corp. | 4.5 | |
| Comcast Corp. Class A | 3.6 | |
| JPMorgan Chase & Co. | 3.4 | |
| Cigna Group | 2.8 | |
| Bank of America Corp. | 2.5 | |
| Johnson & Johnson | 2.5 | |
| Centene Corp. | 2.4 | |
| Cisco Systems, Inc. | 2.4 | |
| Activision Blizzard, Inc. | 2.3 | |
| | 31.7 | |
| |
| Market Sectors (% of Fund's net assets) |
| |
| Financials | 24.6 | |
| Health Care | 20.0 | |
| Consumer Staples | 10.8 | |
| Utilities | 10.2 | |
| Energy | 8.6 | |
| Information Technology | 7.3 | |
| Industrials | 6.9 | |
| Communication Services | 5.9 | |
| Consumer Discretionary | 2.3 | |
| Materials | 1.7 | |
| Real Estate | 0.6 | |
| |
Asset Allocation (% of Fund's net assets) |
|
|
Fidelity® Blue Chip Value ETF
Showing Percentage of Net Assets
| Common Stocks - 98.9% |
| | | Shares | Value ($) |
| COMMUNICATION SERVICES - 5.9% | | | |
| Entertainment - 2.3% | | | |
| Activision Blizzard, Inc. | | 32,194 | 2,986,315 |
| Media - 3.6% | | | |
| Comcast Corp. Class A | | 101,905 | 4,612,220 |
TOTAL COMMUNICATION SERVICES | | | 7,598,535 |
| CONSUMER DISCRETIONARY - 2.3% | | | |
| Diversified Consumer Services - 1.3% | | | |
| H&R Block, Inc. | | 51,622 | 1,735,015 |
| Specialty Retail - 1.0% | | | |
| Ross Stores, Inc. | | 10,896 | 1,249,117 |
TOTAL CONSUMER DISCRETIONARY | | | 2,984,132 |
| CONSUMER STAPLES - 10.8% | | | |
| Beverages - 1.3% | | | |
| Coca-Cola European Partners PLC | | 16,104 | 1,020,833 |
| Keurig Dr. Pepper, Inc. | | 21,488 | 730,807 |
| | | | 1,751,640 |
| Consumer Staples Distribution & Retail - 2.3% | | | |
| BJ's Wholesale Club Holdings, Inc. (a) | | 6,473 | 429,225 |
| Dollar General Corp. | | 8,013 | 1,353,075 |
| U.S. Foods Holding Corp. (a) | | 28,562 | 1,220,454 |
| | | | 3,002,754 |
| Food Products - 3.0% | | | |
| Mondelez International, Inc. | | 39,356 | 2,917,460 |
| Tyson Foods, Inc. Class A | | 16,000 | 891,520 |
| | | | 3,808,980 |
| Household Products - 2.2% | | | |
| Procter & Gamble Co. | | 13,008 | 2,033,150 |
| The Clorox Co. | | 5,027 | 761,490 |
| | | | 2,794,640 |
| Personal Care Products - 2.0% | | | |
| Haleon PLC ADR | | 103,989 | 916,143 |
| Kenvue, Inc. | | 37,898 | 897,425 |
| Unilever PLC sponsored ADR | | 13,433 | 721,755 |
| | | | 2,535,323 |
TOTAL CONSUMER STAPLES | | | 13,893,337 |
| ENERGY - 8.6% | | | |
| Oil, Gas & Consumable Fuels - 8.6% | | | |
| Antero Resources Corp. (a) | | 18,659 | 499,128 |
| ConocoPhillips Co. | | 15,522 | 1,827,250 |
| Equinor ASA sponsored ADR | | 32,156 | 986,546 |
| Exxon Mobil Corp. | | 54,368 | 5,830,424 |
| Occidental Petroleum Corp. | | 16,075 | 1,014,815 |
| Ovintiv, Inc. | | 18,603 | 857,412 |
| | | | 11,015,575 |
| FINANCIALS - 24.6% | | | |
| Banks - 11.1% | | | |
| Bank of America Corp. | | 101,425 | 3,245,600 |
| Cullen/Frost Bankers, Inc. | | 2,582 | 280,354 |
| JPMorgan Chase & Co. | | 27,346 | 4,319,574 |
| M&T Bank Corp. | | 10,576 | 1,479,159 |
| PNC Financial Services Group, Inc. | | 10,180 | 1,393,540 |
| U.S. Bancorp | | 28,574 | 1,133,816 |
| Wells Fargo & Co. | | 52,759 | 2,435,355 |
| | | | 14,287,398 |
| Capital Markets - 3.2% | | | |
| Affiliated Managers Group, Inc. | | 5,833 | 808,687 |
| BlackRock, Inc. Class A | | 3,125 | 2,308,906 |
| Invesco Ltd. | | 11,048 | 185,606 |
| Northern Trust Corp. | | 9,289 | 744,235 |
| | | | 4,047,434 |
| Financial Services - 5.3% | | | |
| Berkshire Hathaway, Inc. Class B (a) | | 19,488 | 6,858,999 |
| Insurance - 5.0% | | | |
| Chubb Ltd. | | 9,373 | 1,915,935 |
| The Travelers Companies, Inc. | | 17,255 | 2,978,386 |
| Willis Towers Watson PLC | | 7,097 | 1,499,809 |
| | | | 6,394,130 |
TOTAL FINANCIALS | | | 31,587,961 |
| HEALTH CARE - 20.0% | | | |
| Health Care Providers & Services - 11.5% | | | |
| Centene Corp. (a) | | 44,973 | 3,062,212 |
| Cigna Group | | 12,454 | 3,675,175 |
| CVS Health Corp. | | 18,559 | 1,386,172 |
| Elevance Health, Inc. | | 4,282 | 2,019,520 |
| Humana, Inc. | | 3,860 | 1,763,364 |
| UnitedHealth Group, Inc. | | 5,733 | 2,903,019 |
| | | | 14,809,462 |
| Pharmaceuticals - 8.5% | | | |
| AstraZeneca PLC sponsored ADR | | 31,245 | 2,240,267 |
| Bristol-Myers Squibb Co. | | 47,569 | 2,958,316 |
| Johnson & Johnson | | 19,197 | 3,216,073 |
| Sanofi SA sponsored ADR | | 46,836 | 2,499,637 |
| | | | 10,914,293 |
TOTAL HEALTH CARE | | | 25,723,755 |
| INDUSTRIALS - 6.9% | | | |
| Aerospace & Defense - 3.4% | | | |
| L3Harris Technologies, Inc. | | 5,783 | 1,095,821 |
| Lockheed Martin Corp. | | 2,780 | 1,240,909 |
| Northrop Grumman Corp. | | 4,600 | 2,047,000 |
| | | | 4,383,730 |
| Electrical Equipment - 1.3% | | | |
| Eaton Corp. PLC | | 1,697 | 348,428 |
| Regal Rexnord Corp. | | 8,175 | 1,276,772 |
| | | | 1,625,200 |
| Machinery - 1.6% | | | |
| Deere & Co. | | 1,760 | 756,096 |
| Oshkosh Corp. | | 2,847 | 262,123 |
| Pentair PLC | | 14,420 | 1,002,190 |
| | | | 2,020,409 |
| Professional Services - 0.6% | | | |
| Maximus, Inc. | | 9,811 | 821,769 |
TOTAL INDUSTRIALS | | | 8,851,108 |
| INFORMATION TECHNOLOGY - 7.3% | | | |
| Communications Equipment - 2.4% | | | |
| Cisco Systems, Inc. | | 58,390 | 3,038,616 |
| Electronic Equipment, Instruments & Components - 0.2% | | | |
| TE Connectivity Ltd. | | 1,827 | 262,156 |
| IT Services - 2.2% | | | |
| Amdocs Ltd. | | 15,927 | 1,491,404 |
| Cognizant Technology Solutions Corp. Class A | | 20,694 | 1,366,425 |
| | | | 2,857,829 |
| Semiconductors & Semiconductor Equipment - 1.2% | | | |
| Broadcom, Inc. | | 356 | 319,919 |
| Micron Technology, Inc. | | 13,361 | 953,842 |
| NXP Semiconductors NV | | 1,286 | 286,752 |
| | | | 1,560,513 |
| Software - 1.3% | | | |
| Gen Digital, Inc. | | 48,466 | 942,664 |
| Open Text Corp. | | 16,262 | 698,453 |
| | | | 1,641,117 |
TOTAL INFORMATION TECHNOLOGY | | | 9,360,231 |
| MATERIALS - 1.7% | | | |
| Chemicals - 1.4% | | | |
| DuPont de Nemours, Inc. | | 24,018 | 1,864,517 |
| Metals & Mining - 0.3% | | | |
| Newmont Corp. | | 9,095 | 390,357 |
TOTAL MATERIALS | | | 2,254,874 |
| REAL ESTATE - 0.6% | | | |
| Real Estate Management & Development - 0.6% | | | |
| CBRE Group, Inc. (a) | | 9,176 | 764,453 |
| UTILITIES - 10.2% | | | |
| Electric Utilities - 7.7% | | | |
| Constellation Energy Corp. | | 16,127 | 1,558,675 |
| Edison International | | 19,669 | 1,415,381 |
| Evergy, Inc. | | 16,861 | 1,011,154 |
| NextEra Energy, Inc. | | 16,499 | 1,209,377 |
| PG&E Corp. (a) | | 143,359 | 2,524,552 |
| Portland General Electric Co. | | 12,978 | 618,661 |
| Southern Co. | | 21,771 | 1,574,914 |
| | | | 9,912,714 |
| Independent Power and Renewable Electricity Producers - 0.8% | | | |
| The AES Corp. | | 49,113 | 1,062,314 |
| Multi-Utilities - 1.7% | | | |
| Dominion Energy, Inc. | | 27,241 | 1,458,756 |
| National Grid PLC sponsored ADR | | 9,692 | 653,047 |
| | | | 2,111,803 |
TOTAL UTILITIES | | | 13,086,831 |
| TOTAL COMMON STOCKS (Cost $116,518,058) | | | 127,120,792 |
| | | | |
| Money Market Funds - 1.5% |
| | | Shares | Value ($) |
State Street Institutional Treasury Plus Money Market Fund Trust Class 5.15% (b) (Cost $1,861,792) | | 1,861,792 | 1,861,792 |
| | | | |
| TOTAL INVESTMENT IN SECURITIES - 100.4% (Cost $118,379,850) | 128,982,584 |
NET OTHER ASSETS (LIABILITIES) - (0.4)% | (484,477) |
| NET ASSETS - 100.0% | 128,498,107 |
| | |
Legend
| (b) | The rate quoted is the annualized seven-day yield of the fund at period end. |
Investment Valuation
The following is a summary of the inputs used, as of July 31, 2023, involving the Fund's assets and liabilities carried at fair value. The inputs or methodology used for valuing securities may not be an indication of the risk associated with investing in those securities. For more information on valuation inputs, and their aggregation into the levels used below, please refer to the Investment Valuation section in the accompanying Notes to Financial Statements.
| Valuation Inputs at Reporting Date: |
| Description | Total ($) | Level 1 ($) | Level 2 ($) | Level 3 ($) |
Investments in Securities: | | | | |
|
| Equities: | | | | |
Communication Services | 7,598,535 | 7,598,535 | - | - |
Consumer Discretionary | 2,984,132 | 2,984,132 | - | - |
Consumer Staples | 13,893,337 | 13,893,337 | - | - |
Energy | 11,015,575 | 11,015,575 | - | - |
Financials | 31,587,961 | 31,587,961 | - | - |
Health Care | 25,723,755 | 25,723,755 | - | - |
Industrials | 8,851,108 | 8,851,108 | - | - |
Information Technology | 9,360,231 | 9,360,231 | - | - |
Materials | 2,254,874 | 2,254,874 | - | - |
Real Estate | 764,453 | 764,453 | - | - |
Utilities | 13,086,831 | 13,086,831 | - | - |
|
| Money Market Funds | 1,861,792 | 1,861,792 | - | - |
| Total Investments in Securities: | 128,982,584 | 128,982,584 | - | - |
Fidelity® Blue Chip Value ETF
| Statement of Assets and Liabilities |
| | | | July 31, 2023 |
| | | | | |
| Assets | | | | |
Investment in securities, at value - See accompanying schedule Unaffiliated issuers (cost $118,379,850): | | | $ | 128,982,584 |
| Cash | | | | 409 |
| Receivable for investments sold | | | | 963,143 |
| Dividends receivable | | | | 112,030 |
Total assets | | | | 130,058,166 |
| Liabilities | | | | |
| Payable for investments purchased | $ | 1,497,676 | | |
| Accrued management fee | | 62,383 | | |
| Total Liabilities | | | | 1,560,059 |
| Net Assets | | | $ | 128,498,107 |
| Net Assets consist of: | | | | |
| Paid in capital | | | $ | 120,394,422 |
| Total accumulated earnings (loss) | | | | 8,103,685 |
| Net Assets | | | $ | 128,498,107 |
Net Asset Value, offering price and redemption price per share ($128,498,107 ÷ 4,450,000 shares) | | | $ | 28.88 |
| Statement of Operations |
| | | | Year ended July 31, 2023 |
| Investment Income | | | | |
| Dividends | | | $ | 2,699,887 |
| Expenses | | | | |
| Management fee | $ | 751,125 | | |
| Independent trustees' fees and expenses | | 632 | | |
| Total expenses before reductions | | 751,757 | | |
| Expense reductions | | (9) | | |
| Total expenses after reductions | | | | 751,748 |
| Net Investment income (loss) | | | | 1,948,139 |
| Realized and Unrealized Gain (Loss) | | | | |
| Net realized gain (loss) on: | | | | |
| Investment Securities: | | | | |
| Redemptions in-kind | | 3,457,839 | | |
| Unaffiliated issuers | | (1,110,565) | | |
| Foreign currency transactions | | 12 | | |
| Futures contracts | | (4,693) | | |
| Total net realized gain (loss) | | | | 2,342,593 |
| Change in net unrealized appreciation (depreciation) on investment securities | | | | 1,420,433 |
| Net gain (loss) | | | | 3,763,026 |
| Net increase (decrease) in net assets resulting from operations | | | $ | 5,711,165 |
| Statement of Changes in Net Assets |
| |
| | Year ended July 31, 2023 | | Year ended July 31, 2022 |
| Increase (Decrease) in Net Assets | | | | |
| Operations | | | | |
| Net investment income (loss) | $ | 1,948,139 | $ | 1,429,112 |
| Net realized gain (loss) | | 2,342,593 | | 1,521,586 |
| Change in net unrealized appreciation (depreciation) | | 1,420,433 | | (2,033,797) |
| Net increase (decrease) in net assets resulting from operations | | 5,711,165 | | 916,901 |
| Distributions to shareholders | | (2,839,975) | | (3,452,325) |
| | | | | |
| Share transactions | | | | |
| Proceeds from sales of shares | | 32,169,213 | | 25,101,299 |
| Cost of shares redeemed | | (20,717,724) | | (2,855,376) |
| | | | | |
Net increase (decrease) in net assets resulting from share transactions | | 11,451,489 | | 22,245,923 |
| Total increase (decrease) in net assets | | 14,322,679 | | 19,710,499 |
| | | | | |
| Net Assets | | | | |
| Beginning of period | | 114,175,428 | | 94,464,929 |
| End of period | $ | 128,498,107 | $ | 114,175,428 |
| | | | | |
| Other Information | | | | |
| Shares | | | | |
| Sold | | 1,125,000 | | 875,000 |
| Redeemed | | (750,000) | | (100,000) |
| Net increase (decrease) | | 375,000 | | 775,000 |
| | | | | |
| Fidelity® Blue Chip Value ETF |
| |
| Years ended July 31, | | 2023 | | 2022 | | 2021 | | 2020 A |
Selected Per-Share Data | | | | | | | | |
| Net asset value, beginning of period | $ | 28.02 | $ | 28.63 | $ | 20.23 | $ | 20.00 |
| Income from Investment Operations | | | | | | | | |
Net investment income (loss) B,C | | .43 | | .39 | | .32 | | .03 |
| Net realized and unrealized gain (loss) | | 1.04 | | (.03) | | 8.32 | | .21 |
| Total from investment operations | | 1.47 | | .36 | | 8.64 | | .24 |
| Distributions from net investment income | | (.42) | | (.39) | | (.24) | | (.01) |
| Distributions from net realized gain | | (.19) | | (.58) | | - | | - |
| Total distributions | | (.61) | | (.97) | | (.24) | | (.01) |
| Net asset value, end of period | $ | 28.88 | $ | 28.02 | $ | 28.63 | $ | 20.23 |
Total Return D,E,F | | 5.35% | | 1.27% | | 42.83% | | 1.23% |
Ratios to Average Net Assets C,G,H | | | | | | | | |
| Expenses before reductions | | .59% | | .59% | | .59% | | .59% I |
| Expenses net of fee waivers, if any | | .59% | | .59% | | .59% | | .59% I |
| Expenses net of all reductions | | .59% | | .59% | | .58% | | .59% I |
| Net investment income (loss) | | 1.53% | | 1.36% | | 1.22% | | 1.02% I |
| Supplemental Data | | | | | | | | |
| Net assets, end of period (000 omitted) | $ | 128,498 | $ | 114,175 | $ | 94,465 | $ | 8,093 |
Portfolio turnover rate J,K | | 35% | | 54% | | 97% | | 20% L |
AFor the period June 2, 2020 (commencement of operations) through July 31, 2020.
BCalculated based on average shares outstanding during the period.
CNet investment income (loss) is affected by the timing of the declaration of dividends by any underlying mutual funds or exchange-traded funds (ETFs). Net investment income (loss) of any mutual funds or ETFs is not included in the Fund's net investment income (loss) ratio.
DBased on net asset value.
ETotal returns would have been lower if certain expenses had not been reduced during the applicable periods shown.
FTotal returns for periods of less than one year are not annualized.
GFees and expenses of any underlying mutual funds or exchange-traded funds (ETFs) are not included in the Fund's expense ratio. The Fund indirectly bears its proportionate share of these expenses.
HExpense ratios reflect operating expenses of the class. Expenses before reductions do not reflect amounts reimbursed, waived, or reduced through arrangements with the investment adviser, brokerage services, or other offset arrangements, if applicable, and do not represent the amount paid by the class during periods when reimbursements, waivers or reductions occur.
IAnnualized.
JPortfolio turnover rate excludes securities received or delivered in-kind.
KAmount does not include the portfolio activity of any underlying mutual funds or exchange-traded funds (ETFs).
LAmount not annualized.
NAV and closing market price average annual returns reflect the change in the value of an investment, assuming reinvestment of distributions from dividend income and capital gains (the profits earned upon the sale of securities that have grown in value, if any) at NAV and Market Price, respectively, and assumes a constant rate of performance each year. The hypothetical investment and the fund's returns do not reflect the deduction of taxes that a shareholder would pay on fund distributions or the redemption or selling of fund shares. How a fund did yesterday is no guarantee of how it will do tomorrow.
| Average Annual Total Returns |
| | | | |
Periods ended July 31, 2023 | Past 1 year | Life of Fund |
Fidelity® Growth Opportunities ETF - NAV A | 23.80% | -4.27% |
Fidelity® Growth Opportunities ETF - Market Price B | 23.60% | -5.24% |
Russell 1000® Growth Index A | 17.31% | 6.55% |
A From February 2, 2021
B From February 4, 2021, date initially listed on the CboeBZX Exchange, Inc.
| $10,000 Over Life of Fund |
| |
Let's say hypothetically that $10,000 was invested in Fidelity® Growth Opportunities ETF - NAV, on February 2, 2021, when the fund started. The chart shows how the value of your investment would have changed, and also shows how the Russell 1000® Growth Index performed over the same period. |
|
|
Fidelity® Growth Opportunities ETF
Market Recap:
U.S. equities gained 13.02% for the 12 months ending July 31, 2023, according to the S&P 500® index, as continued global economic expansion, falling commodity prices and a slowing in the pace of inflation provided a favorable backdrop for higher-risk assets. Large-cap stocks spearheaded the rally, which was driven by the shares of a narrow set of mega-cap companies in the information technology and communication services sectors, largely due to exuberance related to generative artificial intelligence. Aggressive monetary tightening by the U.S. Federal Reserve continued amid consistent pressure on core inflation, a measure that excludes food and energy. Since March 2022, the Fed has hiked its benchmark interest rate 11 times. The latest bump came in late July, a fourth consecutive raise of a stepped down 25 basis points. The S&P 500® gained 3.21% in July, as a "soft landing" of the U.S. economy became the consensus view amid better-than-expected earnings, slowing inflation and easing financial conditions, bringing the index's year-to-date gain to 20.65%. July saw a continuance of the recent shift to wider market breadth and lower dispersion. For the full 12 months, value (+17%) handily topped growth (+8%) within the index. By sector, tech (+28%), communication services (+21%) and industrials (+17%) led, whereas real estate (-10%) lagged most, due to high borrowing costs, low home inventory and a deteriorating commercial property market.
Comments from Co-Managers Michael Kim and Kyle Weaver:
For the fiscal year ending July 31, 2023, the exchange-traded fund's net asset value gained 23.80%, versus 17.31% for the Russell 1000 Growth Index. The ETF's market price advanced 23.60% for the 12 months. The biggest contributor to performance versus the benchmark, by far, was stock selection in information technology. Security selection in industrials also boosted relative performance, as did a sizable underweight in consumer staples. The top individual relative contributor was an overweight in Nvidia (+161%), one of our biggest holdings. This period we increased our investment in Nvidia. The second-largest relative contributor was an overweight in Uber Technologies (+114%). Uber was one of the fund's largest holdings; this period we increased our position. An overweight in Meta Platforms (+103%) also helped. This past year we increased our stake, and Meta Platforms was among our biggest holdings at period end. In contrast, the primary detractor from performance versus the benchmark was stock selection in energy. Picks and an overweight in financials also hampered the fund's result. Further detracting from our result was security selection in consumer discretionary. The biggest individual relative detractor was our stake in Antero Resources (-32%). The second-largest relative detractor was our non-benchmark stake in T-Mobile (-4%), one of our largest holdings. This period we increased our investment. An overweight in EPAM Systems (-31%) also detracted. This period we increased our position in EPAM. Notable changes in positioning include significantly decreased exposure to the energy sector and a higher allocation to financials.
The views expressed above reflect those of the portfolio manager(s) only through the end of the period as stated on the cover of this report and do not necessarily represent the views of Fidelity or any other person in the Fidelity organization, or Geode Capital Management, LLC, (the ETF's subadviser) or any other person in the Geode organization. Any such views are subject to change at any time based upon market or other conditions and Fidelity and Geode disclaim any responsibility to update such views. These views may not be relied on as investment advice and, because investment decisions for a Fidelity fund are based on numerous factors, may not be relied on as an indication of trading intent on behalf of any Fidelity fund.
Fidelity® Growth Opportunities ETF
Top Holdings (% of Fund's net assets) |
| |
| Microsoft Corp. | 10.1 | |
| NVIDIA Corp. | 8.3 | |
| Amazon.com, Inc. | 4.8 | |
| Alphabet, Inc. Class C | 4.4 | |
| Meta Platforms, Inc. Class A | 3.5 | |
| T-Mobile U.S., Inc. | 3.4 | |
| Uber Technologies, Inc. | 3.1 | |
| Alphabet, Inc. Class A | 2.9 | |
| ON Semiconductor Corp. | 2.4 | |
| Roku, Inc. Class A | 2.3 | |
| | 45.2 | |
| |
| Market Sectors (% of Fund's net assets) |
| |
| Information Technology | 44.5 | |
| Communication Services | 19.6 | |
| Financials | 10.3 | |
| Health Care | 9.8 | |
| Consumer Discretionary | 7.3 | |
| Industrials | 4.3 | |
| Energy | 2.7 | |
| Utilities | 1.1 | |
| Consumer Staples | 0.3 | |
| |
Asset Allocation (% of Fund's net assets) |
|
|
Fidelity® Growth Opportunities ETF
Showing Percentage of Net Assets
| Common Stocks - 99.9% |
| | | Shares | Value ($) |
| COMMUNICATION SERVICES - 19.6% | | | |
| Entertainment - 3.9% | | | |
| Netflix, Inc. (a) | | 2,517 | 1,104,887 |
| Roku, Inc. Class A (a) | | 47,562 | 4,578,794 |
| Sea Ltd. ADR (a) | | 28,931 | 1,924,490 |
| | | | 7,608,171 |
| Interactive Media & Services - 11.6% | | | |
| Alphabet, Inc.: | | | |
| Class A (a) | | 42,176 | 5,597,599 |
| Class C (a) | | 65,021 | 8,654,945 |
| Meta Platforms, Inc. Class A (a) | | 21,233 | 6,764,834 |
| Snap, Inc. Class A (a) | | 53,249 | 604,909 |
| Zoominfo Technologies, Inc. (a) | | 42,289 | 1,081,330 |
| | | | 22,703,617 |
| Media - 0.7% | | | |
| Magnite, Inc. (a) | | 62,013 | 938,257 |
| TechTarget, Inc. (a) | | 10,538 | 342,274 |
| The Trade Desk, Inc. (a) | | 1,422 | 129,772 |
| | | | 1,410,303 |
| Wireless Telecommunication Services - 3.4% | | | |
| T-Mobile U.S., Inc. (a) | | 47,295 | 6,515,832 |
TOTAL COMMUNICATION SERVICES | | | 38,237,923 |
| CONSUMER DISCRETIONARY - 7.3% | | | |
| Automobile Components - 0.1% | | | |
| Aptiv PLC (a) | | 2,122 | 232,338 |
| Automobiles - 0.3% | | | |
| Rivian Automotive, Inc. (a) | | 13,253 | 366,313 |
| Tesla, Inc. (a) | | 438 | 117,134 |
| | | | 483,447 |
| Broadline Retail - 4.8% | | | |
| Amazon.com, Inc. (a) | | 69,761 | 9,325,650 |
| Household Durables - 0.0% | | | |
| Lennar Corp. Class A | | 307 | 38,937 |
| Leisure Products - 0.0% | | | |
| Peloton Interactive, Inc. Class A (a) | | 5,991 | 58,173 |
| Specialty Retail - 2.0% | | | |
| Carvana Co. Class A (a) | | 18,981 | 872,177 |
| Cazoo Group Ltd. Class A (a) | | 3,570 | 6,533 |
| Floor & Decor Holdings, Inc. Class A (a) | | 14,790 | 1,698,632 |
| Lowe's Companies, Inc. | | 4,066 | 952,542 |
| RH (a) | | 479 | 185,933 |
| Wayfair LLC Class A (a) | | 1,780 | 138,609 |
| | | | 3,854,426 |
| Textiles, Apparel & Luxury Goods - 0.1% | | | |
| lululemon athletica, Inc. (a) | | 612 | 231,660 |
TOTAL CONSUMER DISCRETIONARY | | | 14,224,631 |
| CONSUMER STAPLES - 0.3% | | | |
| Beverages - 0.1% | | | |
| Boston Beer Co., Inc. Class A (a) | | 673 | 249,979 |
| Consumer Staples Distribution & Retail - 0.2% | | | |
| BJ's Wholesale Club Holdings, Inc. (a) | | 4,840 | 320,940 |
| Food Products - 0.0% | | | |
| Local Bounti Corp. (a) | | 3,086 | 13,393 |
TOTAL CONSUMER STAPLES | | | 584,312 |
| ENERGY - 2.7% | | | |
| Oil, Gas & Consumable Fuels - 2.7% | | | |
| Antero Resources Corp. (a) | | 58,549 | 1,566,186 |
| Canadian Natural Resources Ltd. | | 9,053 | 550,533 |
| Exxon Mobil Corp. | | 896 | 96,087 |
| Hess Corp. | | 6,153 | 933,595 |
| Occidental Petroleum Corp. | | 484 | 30,555 |
| Ovintiv, Inc. | | 23,735 | 1,093,946 |
| Tourmaline Oil Corp. | | 20,566 | 1,065,848 |
| | | | 5,336,750 |
| FINANCIALS - 10.3% | | | |
| Capital Markets - 0.9% | | | |
| Coinbase Global, Inc. (a) | | 3,253 | 320,778 |
| LPL Financial | | 6,226 | 1,427,995 |
| | | | 1,748,773 |
| Financial Services - 9.4% | | | |
| Apollo Global Management, Inc. | | 2,697 | 220,372 |
| Block, Inc. Class A (a) | | 56,128 | 4,519,988 |
| Dlocal Ltd. (a) | | 62,078 | 941,723 |
| Fiserv, Inc. (a) | | 14,174 | 1,788,901 |
| Global Payments, Inc. | | 15,209 | 1,676,792 |
| Marqeta, Inc. Class A (a) | | 243,780 | 1,360,292 |
| MasterCard, Inc. Class A | | 3,622 | 1,428,082 |
| Nuvei Corp. (a)(b) | | 52,134 | 1,778,291 |
| Nuvei Corp. (Canada) (a)(b) | | 4,626 | 157,761 |
| Payoneer Global, Inc. (a) | | 9,705 | 51,631 |
| Repay Holdings Corp. (a) | | 75,794 | 632,880 |
| Shift4 Payments, Inc. (a) | | 10,395 | 717,151 |
| Visa, Inc. Class A | | 12,775 | 3,037,001 |
| | | | 18,310,865 |
TOTAL FINANCIALS | | | 20,059,638 |
| HEALTH CARE - 9.8% | | | |
| Biotechnology - 1.8% | | | |
| Alnylam Pharmaceuticals, Inc. (a) | | 1,465 | 286,261 |
| ALX Oncology Holdings, Inc. (a) | | 2,298 | 14,041 |
| Argenx SE ADR (a) | | 1,534 | 773,872 |
| Ascendis Pharma A/S sponsored ADR (a) | | 67 | 6,040 |
| Blueprint Medicines Corp. (a) | | 1,453 | 95,898 |
| Celldex Therapeutics, Inc. (a) | | 8,932 | 315,836 |
| Cytokinetics, Inc. (a) | | 11,478 | 382,791 |
| Icosavax, Inc. (a) | | 23,437 | 206,949 |
| Keros Therapeutics, Inc. (a) | | 3,661 | 153,323 |
| Morphic Holding, Inc. (a) | | 2,051 | 116,353 |
| Nuvalent, Inc. Class A (a) | | 3,518 | 175,372 |
| PTC Therapeutics, Inc. (a) | | 665 | 26,826 |
| Repligen Corp. (a) | | 750 | 128,670 |
| Vaxcyte, Inc. (a) | | 11,890 | 571,433 |
| Verve Therapeutics, Inc. (a) | | 3,101 | 63,539 |
| Zentalis Pharmaceuticals, Inc. (a) | | 7,407 | 197,841 |
| | | | 3,515,045 |
| Health Care Equipment & Supplies - 2.0% | | | |
| Boston Scientific Corp. (a) | | 33,200 | 1,721,420 |
| Insulet Corp. (a) | | 1,383 | 382,745 |
| Penumbra, Inc. (a) | | 2,423 | 735,041 |
| TransMedics Group, Inc. (a) | | 10,105 | 941,584 |
| | | | 3,780,790 |
| Health Care Providers & Services - 4.8% | | | |
| agilon health, Inc. (a) | | 57,727 | 1,105,472 |
| Alignment Healthcare, Inc. (a) | | 1,344 | 8,346 |
| Centene Corp. (a) | | 29,258 | 1,992,177 |
| Humana, Inc. | | 4,326 | 1,976,247 |
| P3 Health Partners, Inc. Class A (a) | | 20,863 | 46,316 |
| UnitedHealth Group, Inc. | | 8,403 | 4,255,027 |
| | | | 9,383,585 |
| Life Sciences Tools & Services - 0.8% | | | |
| 10X Genomics, Inc. (a) | | 1,896 | 119,410 |
| Danaher Corp. | | 3,060 | 780,484 |
| Thermo Fisher Scientific, Inc. | | 1,329 | 729,169 |
| | | | 1,629,063 |
| Pharmaceuticals - 0.4% | | | |
| Eli Lilly & Co. | | 1,835 | 834,099 |
TOTAL HEALTH CARE | | | 19,142,582 |
| INDUSTRIALS - 4.3% | | | |
| Aerospace & Defense - 0.5% | | | |
| The Boeing Co. (a) | | 4,062 | 970,209 |
| Commercial Services & Supplies - 0.3% | | | |
| ACV Auctions, Inc. Class A (a) | | 29,668 | 518,893 |
| Electrical Equipment - 0.1% | | | |
| Bloom Energy Corp. Class A (a) | | 6,964 | 124,377 |
| Nextracker, Inc. Class A | | 965 | 40,868 |
| | | | 165,245 |
| Ground Transportation - 3.4% | | | |
| Lyft, Inc. (a) | | 41,144 | 522,940 |
| Uber Technologies, Inc. (a) | | 121,638 | 6,016,215 |
| | | | 6,539,155 |
| Professional Services - 0.0% | | | |
| Paycom Software, Inc. | | 263 | 96,984 |
TOTAL INDUSTRIALS | | | 8,290,486 |
| INFORMATION TECHNOLOGY - 44.5% | | | |
| Communications Equipment - 0.2% | | | |
| Lumentum Holdings, Inc. (a) | | 8,276 | 433,331 |
| Electronic Equipment, Instruments & Components - 2.8% | | | |
| Coherent Corp. (a) | | 5,979 | 283,165 |
| Flex Ltd. (a) | | 139,117 | 3,806,241 |
| Jabil, Inc. | | 12,513 | 1,384,814 |
| | | | 5,474,220 |
| IT Services - 2.5% | | | |
| Cloudflare, Inc. (a) | | 1,897 | 130,457 |
| EPAM Systems, Inc. (a) | | 7,548 | 1,787,442 |
| Globant SA (a) | | 1,885 | 329,366 |
| MongoDB, Inc. Class A (a) | | 5,217 | 2,208,878 |
| Okta, Inc. (a) | | 1,325 | 101,840 |
| Shopify, Inc. Class A (a) | | 1,339 | 90,490 |
| Snowflake, Inc. (a) | | 504 | 89,566 |
| Twilio, Inc. Class A (a) | | 2,730 | 180,262 |
| | | | 4,918,301 |
| Semiconductors & Semiconductor Equipment - 18.2% | | | |
| Advanced Micro Devices, Inc. (a) | | 33,964 | 3,885,482 |
| Applied Materials, Inc. | | 8,233 | 1,248,040 |
| Enphase Energy, Inc. (a) | | 997 | 151,375 |
| GlobalFoundries, Inc. (a) | | 14,321 | 912,104 |
| Impinj, Inc. (a) | | 1,285 | 85,607 |
| Lam Research Corp. | | 1,042 | 748,667 |
| Lattice Semiconductor Corp. (a) | | 1,014 | 92,213 |
| Marvell Technology, Inc. | | 28,501 | 1,856,270 |
| Monolithic Power Systems, Inc. | | 140 | 78,329 |
| NVIDIA Corp. | | 34,844 | 16,282,253 |
| NXP Semiconductors NV | | 18,524 | 4,130,482 |
| ON Semiconductor Corp. (a) | | 42,597 | 4,589,827 |
| Taiwan Semiconductor Manufacturing Co. Ltd. sponsored ADR | | 13,555 | 1,343,978 |
| | | | 35,404,627 |
| Software - 18.5% | | | |
| Adobe, Inc. (a) | | 1,191 | 650,488 |
| Autodesk, Inc. (a) | | 432 | 91,580 |
| Bill Holdings, Inc. (a) | | 7,669 | 961,232 |
| Confluent, Inc. (a) | | 13,016 | 449,573 |
| Datadog, Inc. Class A (a) | | 9,977 | 1,164,515 |
| DoubleVerify Holdings, Inc. (a) | | 18,591 | 782,681 |
| Dynatrace, Inc. (a) | | 32,874 | 1,797,879 |
| Elastic NV (a) | | 12,840 | 853,218 |
| Five9, Inc. (a) | | 8,931 | 783,695 |
| HubSpot, Inc. (a) | | 1,961 | 1,138,459 |
| Intapp, Inc. (a) | | 17,870 | 733,742 |
| Intuit, Inc. | | 2,039 | 1,043,356 |
| Microsoft Corp. | | 58,799 | 19,751,759 |
| Oracle Corp. | | 14,212 | 1,666,073 |
| Palo Alto Networks, Inc. (a) | | 2,539 | 634,648 |
| Salesforce, Inc. (a) | | 6,386 | 1,436,914 |
| ServiceNow, Inc. (a) | | 3,197 | 1,863,851 |
| Workday, Inc. Class A (a) | | 969 | 229,779 |
| | | | 36,033,442 |
| Technology Hardware, Storage & Peripherals - 2.3% | | | |
| Apple, Inc. | | 21,817 | 4,285,950 |
| Pure Storage, Inc. Class A (a) | | 6,985 | 258,375 |
| | | | 4,544,325 |
TOTAL INFORMATION TECHNOLOGY | | | 86,808,246 |
| UTILITIES - 1.1% | | | |
| Electric Utilities - 1.1% | | | |
| Constellation Energy Corp. | | 5,533 | 534,764 |
| PG&E Corp. (a) | | 94,114 | 1,657,348 |
| | | | 2,192,112 |
| TOTAL COMMON STOCKS (Cost $152,870,581) | | | 194,876,680 |
| | | | |
| Money Market Funds - 0.1% |
| | | Shares | Value ($) |
State Street Institutional Treasury Plus Money Market Fund Trust Class 5.15% (c) (Cost $306,503) | | 306,503 | 306,503 |
| | | | |
| TOTAL INVESTMENT IN SECURITIES - 100.0% (Cost $153,177,084) | 195,183,183 |
NET OTHER ASSETS (LIABILITIES) - 0.0% | (84,100) |
| NET ASSETS - 100.0% | 195,099,083 |
| | |
Legend
| (b) | Security exempt from registration under Rule 144A of the Securities Act of 1933. These securities may be resold in transactions exempt from registration, normally to qualified institutional buyers. At the end of the period, the value of these securities amounted to $1,936,052 or 1.0% of net assets. |
| (c) | The rate quoted is the annualized seven-day yield of the fund at period end. |
Investment Valuation
The following is a summary of the inputs used, as of July 31, 2023, involving the Fund's assets and liabilities carried at fair value. The inputs or methodology used for valuing securities may not be an indication of the risk associated with investing in those securities. For more information on valuation inputs, and their aggregation into the levels used below, please refer to the Investment Valuation section in the accompanying Notes to Financial Statements.
| Valuation Inputs at Reporting Date: |
| Description | Total ($) | Level 1 ($) | Level 2 ($) | Level 3 ($) |
Investments in Securities: | | | | |
|
| Equities: | | | | |
Communication Services | 38,237,923 | 38,237,923 | - | - |
Consumer Discretionary | 14,224,631 | 14,224,631 | - | - |
Consumer Staples | 584,312 | 584,312 | - | - |
Energy | 5,336,750 | 5,336,750 | - | - |
Financials | 20,059,638 | 20,059,638 | - | - |
Health Care | 19,142,582 | 19,142,582 | - | - |
Industrials | 8,290,486 | 8,290,486 | - | - |
Information Technology | 86,808,246 | 86,808,246 | - | - |
Utilities | 2,192,112 | 2,192,112 | - | - |
|
| Money Market Funds | 306,503 | 306,503 | - | - |
| Total Investments in Securities: | 195,183,183 | 195,183,183 | - | - |
Fidelity® Growth Opportunities ETF
| Statement of Assets and Liabilities |
| | | | July 31, 2023 |
| | | | | |
| Assets | | | | |
Investment in securities, at value - See accompanying schedule Unaffiliated issuers (cost $153,177,084): | | | $ | 195,183,183 |
| Cash | | | | 280 |
| Dividends receivable | | | | 6,445 |
Total assets | | | | 195,189,908 |
| Liabilities | | | | |
| Accrued management fee | $ | 90,825 | | |
| Total Liabilities | | | | 90,825 |
| Net Assets | | | $ | 195,099,083 |
| Net Assets consist of: | | | | |
| Paid in capital | | | $ | 174,553,744 |
| Total accumulated earnings (loss) | | | | 20,545,339 |
| Net Assets | | | $ | 195,099,083 |
Net Asset Value, offering price and redemption price per share ($195,099,083 ÷ 10,875,000 shares) | | | $ | 17.94 |
| Statement of Operations |
| | | | Year ended July 31, 2023 |
| Investment Income | | | | |
| Dividends | | | $ | 593,747 |
| Income before foreign taxes withheld | | | $ | 593,747 |
| Less foreign taxes withheld | | | | (33,462) |
| Total Income | | | | 560,285 |
| Expenses | | | | |
| Management fee | $ | 636,426 | | |
| Independent trustees' fees and expenses | | 456 | | |
| Total expenses before reductions | | 636,882 | | |
| Expense reductions | | (70) | | |
| Total expenses after reductions | | | | 636,812 |
| Net Investment income (loss) | | | | (76,527) |
| Realized and Unrealized Gain (Loss) | | | | |
| Net realized gain (loss) on: | | | | |
| Investment Securities: | | | | |
| Redemptions in-kind | | 2,203,470 | | |
| Unaffiliated issuers | | (5,587,832) | | |
| Foreign currency transactions | | (23,276) | | |
| Futures contracts | | 38,610 | | |
| Total net realized gain (loss) | | | | (3,369,028) |
| Change in net unrealized appreciation (depreciation) on investment securities | | | | 44,562,111 |
| Net gain (loss) | | | | 41,193,083 |
| Net increase (decrease) in net assets resulting from operations | | | $ | 41,116,556 |
| Statement of Changes in Net Assets |
| |
| | Year ended July 31, 2023 | | Year ended July 31, 2022 |
| Increase (Decrease) in Net Assets | | | | |
| Operations | | | | |
| Net investment income (loss) | $ | (76,527) | $ | (96,288) |
| Net realized gain (loss) | | (3,369,028) | | (14,454,858) |
| Change in net unrealized appreciation (depreciation) | | 44,562,111 | | (5,201,464) |
| Net increase (decrease) in net assets resulting from operations | | 41,116,556 | | (19,752,610) |
| | | | | |
| Share transactions | | | | |
| Proceeds from sales of shares | | 118,430,789 | | 59,102,297 |
| Cost of shares redeemed | | (26,758,280) | | (16,719,011) |
| | | | | |
Net increase (decrease) in net assets resulting from share transactions | | 91,672,509 | | 42,383,286 |
| Total increase (decrease) in net assets | | 132,789,065 | | 22,630,676 |
| | | | | |
| Net Assets | | | | |
| Beginning of period | | 62,310,018 | | 39,679,342 |
| End of period | $ | 195,099,083 | $ | 62,310,018 |
| | | | | |
| Other Information | | | | |
| Shares | | | | |
| Sold | | 8,550,000 | | 3,500,000 |
| Redeemed | | (1,975,000) | | (1,075,000) |
| Net increase (decrease) | | 6,575,000 | | 2,425,000 |
| | | | | |
| Fidelity® Growth Opportunities ETF |
| |
| Years ended July 31, | | 2023 | | 2022 | | 2021 A |
Selected Per-Share Data | | | | | | |
| Net asset value, beginning of period | $ | 14.49 | $ | 21.16 | $ | 20.00 |
| Income from Investment Operations | | | | | | |
Net investment income (loss) B,C | | (.01) | | (.03) | | (.03) |
| Net realized and unrealized gain (loss) | | 3.46 | | (6.64) | | 1.19 |
| Total from investment operations | | 3.45 | | (6.67) | | 1.16 |
| Net asset value, end of period | $ | 17.94 | $ | 14.49 | $ | 21.16 |
Total Return D,E,F | | 23.80% | | (31.53)% | | 5.82% |
Ratios to Average Net Assets C,G,H | | | | | | |
| Expenses before reductions | | .59% | | .59% | | .59% I |
| Expenses net of fee waivers, if any | | .59% | | .59% | | .59% I |
| Expenses net of all reductions | | .59% | | .59% | | .59% I |
| Net investment income (loss) | | (.07)% | | (.19)% | | (.33)% I |
| Supplemental Data | | | | | | |
| Net assets, end of period (000 omitted) | $ | 195,099 | $ | 62,310 | $ | 39,679 |
Portfolio turnover rate J,K | | 78% | | 99% | | 49% L |
AFor the period February 2, 2021 (commencement of operations) through July 31, 2021.
BCalculated based on average shares outstanding during the period.
CNet investment income (loss) is affected by the timing of the declaration of dividends by any underlying mutual funds or exchange-traded funds (ETFs). Net investment income (loss) of any mutual funds or ETFs is not included in the Fund's net investment income (loss) ratio.
DTotal returns would have been lower if certain expenses had not been reduced during the applicable periods shown.
EBased on net asset value.
FTotal returns for periods of less than one year are not annualized.
GFees and expenses of any underlying mutual funds or exchange-traded funds (ETFs) are not included in the Fund's expense ratio. The Fund indirectly bears its proportionate share of these expenses.
HExpense ratios reflect operating expenses of the class. Expenses before reductions do not reflect amounts reimbursed, waived, or reduced through arrangements with the investment adviser, brokerage services, or other offset arrangements, if applicable, and do not represent the amount paid by the class during periods when reimbursements, waivers or reductions occur.
IAnnualized.
JPortfolio turnover rate excludes securities received or delivered in-kind.
KAmount does not include the portfolio activity of any underlying mutual funds or exchange-traded funds (ETFs).
LAmount not annualized.
NAV and closing market price average annual returns reflect the change in the value of an investment, assuming reinvestment of distributions from dividend income and capital gains (the profits earned upon the sale of securities that have grown in value, if any) at NAV and Market Price, respectively, and assumes a constant rate of performance each year. The hypothetical investment and the fund's returns do not reflect the deduction of taxes that a shareholder would pay on fund distributions or the redemption or selling of fund shares. How a fund did yesterday is no guarantee of how it will do tomorrow.
| Average Annual Total Returns |
| | | | |
Periods ended July 31, 2023 | Past 1 year | Life of Fund |
Fidelity® Magellan® ETF - NAV A | 7.21% | 4.74% |
Fidelity® Magellan® ETF - Market Price B | 6.85% | 4.31% |
S&P 500® Index A | 13.02% | 9.27% |
A From February 2, 2021
B From February 4, 2021, date initially listed on the CboeBZX Exchange, Inc.
| $10,000 Over Life of Fund |
| |
Let's say hypothetically that $10,000 was invested in Fidelity® Magellan® ETF - NAV, on February 2, 2021, when the fund started. The chart shows how the value of your investment would have changed, and also shows how the S&P 500® Index performed over the same period. |
|
|
Fidelity® Magellan® ETF
Market Recap:
U.S. equities gained 13.02% for the 12 months ending July 31, 2023, according to the S&P 500® index, as continued global economic expansion, falling commodity prices and a slowing in the pace of inflation provided a favorable backdrop for higher-risk assets. Large-cap stocks spearheaded the rally, which was driven by the shares of a narrow set of mega-cap companies in the information technology and communication services sectors, largely due to exuberance related to generative artificial intelligence. Aggressive monetary tightening by the U.S. Federal Reserve continued amid consistent pressure on core inflation, a measure that excludes food and energy. Since March 2022, the Fed has hiked its benchmark interest rate 11 times. The latest bump came in late July, a fourth consecutive raise of a stepped down 25 basis points. The S&P 500® gained 3.21% in July, as a "soft landing" of the U.S. economy became the consensus view amid better-than-expected earnings, slowing inflation and easing financial conditions, bringing the index's year-to-date gain to 20.65%. July saw a continuance of the recent shift to wider market breadth and lower dispersion. For the full 12 months, value (+17%) handily topped growth (+8%) within the index. By sector, tech (+28%), communication services (+21%) and industrials (+17%) led, whereas real estate (-10%) lagged most, due to high borrowing costs, low home inventory and a deteriorating commercial property market.
Comments from Co-Managers Tim Gannon and Sammy Simnegar:
For the fiscal year ending July 31, 2023, the exchange-traded fund's net asset value gained 7.21%, versus 13.02% for the S&P 500® index. The ETF's market price advanced 6.85% for the 12 months. Relative to the benchmark, security selection was the primary detractor, especially within the consumer discretionary and information technology sectors. An underweight and subpar picks among communication services stocks also hurt. The biggest individual relative detractor was an underweight in Apple (+22%), a position no longer held at period end. Untimely ownership of Amazon.com (-28%), a holding that was not held at period end, was problematic as well. An underweight in Alphabet (+14%), which was among the fund's largest holdings this period, also hurt. In contrast, the biggest contributor to performance versus the benchmark was an overweight in the semiconductors segment of the information technology sector. An underweight among consumer discretionary companies also boosted relative performance. The top individual relative contributor was an overweight in Nvidia (+156%), one of the portfolio's biggest holdings. Not owning Tesla, a benchmark component that returned -10%, added further value compared with the benchmark. Another notable relative contributor was our non-benchmark stake in Airbnb (+63%). This was a holding we established the past year. Notable changes in positioning include increased exposure to the industrials sector and a lower allocation to real estate stocks.
The views expressed above reflect those of the portfolio manager(s) only through the end of the period as stated on the cover of this report and do not necessarily represent the views of Fidelity or any other person in the Fidelity organization, or Geode Capital Management, LLC, (the ETF's subadviser) or any other person in the Geode organization. Any such views are subject to change at any time based upon market or other conditions and Fidelity and Geode disclaim any responsibility to update such views. These views may not be relied on as investment advice and, because investment decisions for a Fidelity fund are based on numerous factors, may not be relied on as an indication of trading intent on behalf of any Fidelity fund.
Fidelity® Magellan® ETF
Top Holdings (% of Fund's net assets) |
| |
| Microsoft Corp. | 8.3 | |
| NVIDIA Corp. | 4.7 | |
| UnitedHealth Group, Inc. | 3.0 | |
| Eli Lilly & Co. | 2.5 | |
| Visa, Inc. Class A | 2.4 | |
| MasterCard, Inc. Class A | 2.2 | |
| Costco Wholesale Corp. | 2.1 | |
| Linde PLC | 2.0 | |
| Broadcom, Inc. | 2.0 | |
| Thermo Fisher Scientific, Inc. | 2.0 | |
| | 31.2 | |
| |
| Market Sectors (% of Fund's net assets) |
| |
| Information Technology | 34.8 | |
| Industrials | 20.4 | |
| Health Care | 15.3 | |
| Financials | 14.2 | |
| Consumer Discretionary | 6.8 | |
| Materials | 4.4 | |
| Consumer Staples | 2.1 | |
| Communication Services | 2.0 | |
| |
Asset Allocation (% of Fund's net assets) |
|
|
Fidelity® Magellan® ETF
Showing Percentage of Net Assets
| Common Stocks - 100.0% |
| | | Shares | Value ($) |
| COMMUNICATION SERVICES - 2.0% | | | |
| Interactive Media & Services - 2.0% | | | |
| Meta Platforms, Inc. Class A (a) | | 3,132 | 997,855 |
| CONSUMER DISCRETIONARY - 6.8% | | | |
| Hotels, Restaurants & Leisure - 4.0% | | | |
| Airbnb, Inc. Class A (a) | | 4,699 | 715,141 |
| Hilton Worldwide Holdings, Inc. | | 4,271 | 664,098 |
| Yum! Brands, Inc. | | 4,566 | 628,601 |
| | | | 2,007,840 |
| Specialty Retail - 2.8% | | | |
| AutoZone, Inc. (a) | | 287 | 712,254 |
| O'Reilly Automotive, Inc. (a) | | 731 | 676,752 |
| | | | 1,389,006 |
TOTAL CONSUMER DISCRETIONARY | | | 3,396,846 |
| CONSUMER STAPLES - 2.1% | | | |
| Consumer Staples Distribution & Retail - 2.1% | | | |
| Costco Wholesale Corp. | | 1,929 | 1,081,532 |
| FINANCIALS - 14.2% | | | |
| Capital Markets - 4.6% | | | |
| Ares Management Corp. | | 5,123 | 508,304 |
| Moody's Corp. | | 2,452 | 864,943 |
| S&P Global, Inc. | | 2,337 | 921,970 |
| | | | 2,295,217 |
| Financial Services - 6.1% | | | |
| Fiserv, Inc. (a) | | 6,037 | 761,930 |
| MasterCard, Inc. Class A | | 2,803 | 1,105,167 |
| Visa, Inc. Class A | | 5,095 | 1,211,234 |
| | | | 3,078,331 |
| Insurance - 3.5% | | | |
| Arthur J. Gallagher & Co. | | 3,950 | 848,460 |
| Marsh & McLennan Companies, Inc. | | 4,883 | 920,055 |
| | | | 1,768,515 |
TOTAL FINANCIALS | | | 7,142,063 |
| HEALTH CARE - 15.3% | | | |
| Health Care Equipment & Supplies - 1.3% | | | |
| Boston Scientific Corp. (a) | | 12,962 | 672,080 |
| Health Care Providers & Services - 4.6% | | | |
| Humana, Inc. | | 1,785 | 815,442 |
| UnitedHealth Group, Inc. | | 2,941 | 1,489,234 |
| | | | 2,304,676 |
| Life Sciences Tools & Services - 5.1% | | | |
| Danaher Corp. | | 3,808 | 971,268 |
| Mettler-Toledo International, Inc. (a) | | 478 | 601,071 |
| Thermo Fisher Scientific, Inc. | | 1,833 | 1,005,694 |
| | | | 2,578,033 |
| Pharmaceuticals - 4.3% | | | |
| Eli Lilly & Co. | | 2,758 | 1,253,649 |
| Zoetis, Inc. Class A | | 4,732 | 890,042 |
| | | | 2,143,691 |
TOTAL HEALTH CARE | | | 7,698,480 |
| INDUSTRIALS - 20.4% | | | |
| Aerospace & Defense - 2.8% | | | |
| HEICO Corp. Class A | | 4,633 | 650,242 |
| TransDigm Group, Inc. | | 841 | 756,665 |
| | | | 1,406,907 |
| Commercial Services & Supplies - 4.0% | | | |
| Cintas Corp. | | 1,410 | 707,876 |
| Copart, Inc. (a) | | 7,699 | 680,515 |
| Waste Connections, Inc. (United States) | | 4,293 | 606,043 |
| | | | 1,994,434 |
| Construction & Engineering - 1.3% | | | |
| Quanta Services, Inc. | | 3,250 | 655,265 |
| Electrical Equipment - 4.0% | | | |
| AMETEK, Inc. | | 4,006 | 635,352 |
| Eaton Corp. PLC | | 3,828 | 785,965 |
| Rockwell Automation, Inc. | | 1,718 | 577,746 |
| | | | 1,999,063 |
| Machinery - 1.3% | | | |
| Ingersoll Rand, Inc. | | 9,851 | 642,975 |
| Professional Services - 5.6% | | | |
| Automatic Data Processing, Inc. | | 3,060 | 756,616 |
| Equifax, Inc. | | 870 | 177,550 |
| Paychex, Inc. | | 5,100 | 639,897 |
| TransUnion Holding Co., Inc. | | 6,473 | 515,833 |
| Verisk Analytics, Inc. | | 3,277 | 750,236 |
| | | | 2,840,132 |
| Trading Companies & Distributors - 1.4% | | | |
| United Rentals, Inc. | | 1,517 | 704,920 |
TOTAL INDUSTRIALS | | | 10,243,696 |
| INFORMATION TECHNOLOGY - 34.8% | | | |
| Communications Equipment - 1.2% | | | |
| Motorola Solutions, Inc. | | 2,124 | 608,802 |
| Electronic Equipment, Instruments & Components - 2.7% | | | |
| Amphenol Corp. Class A | | 7,944 | 701,535 |
| CDW Corp. | | 3,565 | 666,905 |
| | | | 1,368,440 |
| IT Services - 3.2% | | | |
| Accenture PLC Class A | | 2,964 | 937,661 |
| Gartner, Inc. (a) | | 1,886 | 666,871 |
| | | | 1,604,532 |
| Semiconductors & Semiconductor Equipment - 15.1% | | | |
| Analog Devices, Inc. | | 4,004 | 798,918 |
| Broadcom, Inc. | | 1,128 | 1,013,677 |
| First Solar, Inc. (a) | | 3,167 | 656,836 |
| KLA Corp. | | 1,735 | 891,703 |
| Lam Research Corp. | | 1,345 | 966,369 |
| NVIDIA Corp. | | 5,075 | 2,371,497 |
| ON Semiconductor Corp. (a) | | 8,371 | 901,975 |
| | | | 7,600,975 |
| Software - 12.6% | | | |
| Cadence Design Systems, Inc. (a) | | 3,295 | 771,063 |
| Fortinet, Inc. (a) | | 7,614 | 591,760 |
| Microsoft Corp. | | 12,323 | 4,139,539 |
| Synopsys, Inc. (a) | | 1,774 | 801,493 |
| | | | 6,303,855 |
TOTAL INFORMATION TECHNOLOGY | | | 17,486,604 |
| MATERIALS - 4.4% | | | |
| Chemicals - 3.2% | | | |
| Linde PLC | | 2,615 | 1,021,602 |
| Sherwin-Williams Co. | | 2,203 | 609,130 |
| | | | 1,630,732 |
| Construction Materials - 1.2% | | | |
| Vulcan Materials Co. | | 2,614 | 576,387 |
TOTAL MATERIALS | | | 2,207,119 |
| TOTAL COMMON STOCKS (Cost $41,363,844) | | | 50,254,195 |
| | | | |
| Money Market Funds - 1.1% |
| | | Shares | Value ($) |
State Street Institutional Treasury Plus Money Market Fund Trust Class 5.15% (b) (Cost $577,298) | | 577,298 | 577,298 |
| | | | |
| TOTAL INVESTMENT IN SECURITIES - 101.1% (Cost $41,941,142) | 50,831,493 |
NET OTHER ASSETS (LIABILITIES) - (1.1)% | (556,637) |
| NET ASSETS - 100.0% | 50,274,856 |
| | |
Legend
| (b) | The rate quoted is the annualized seven-day yield of the fund at period end. |
Investment Valuation
The following is a summary of the inputs used, as of July 31, 2023, involving the Fund's assets and liabilities carried at fair value. The inputs or methodology used for valuing securities may not be an indication of the risk associated with investing in those securities. For more information on valuation inputs, and their aggregation into the levels used below, please refer to the Investment Valuation section in the accompanying Notes to Financial Statements.
| Valuation Inputs at Reporting Date: |
| Description | Total ($) | Level 1 ($) | Level 2 ($) | Level 3 ($) |
Investments in Securities: | | | | |
|
| Equities: | | | | |
Communication Services | 997,855 | 997,855 | - | - |
Consumer Discretionary | 3,396,846 | 3,396,846 | - | - |
Consumer Staples | 1,081,532 | 1,081,532 | - | - |
Financials | 7,142,063 | 7,142,063 | - | - |
Health Care | 7,698,480 | 7,698,480 | - | - |
Industrials | 10,243,696 | 10,243,696 | - | - |
Information Technology | 17,486,604 | 17,486,604 | - | - |
Materials | 2,207,119 | 2,207,119 | - | - |
|
| Money Market Funds | 577,298 | 577,298 | - | - |
| Total Investments in Securities: | 50,831,493 | 50,831,493 | - | - |
Fidelity® Magellan® ETF
| Statement of Assets and Liabilities |
| | | | July 31, 2023 |
| | | | | |
| Assets | | | | |
Investment in securities, at value - See accompanying schedule Unaffiliated issuers (cost $41,941,142): | | | $ | 50,831,493 |
| Cash | | | | 55 |
| Receivable for investments sold | | | | 593,690 |
| Dividends receivable | | | | 10,046 |
| Other receivables | | | | 98 |
Total assets | | | | 51,435,382 |
| Liabilities | | | | |
| Payable for investments purchased | $ | 1,136,363 | | |
| Accrued management fee | | 24,163 | | |
| Total Liabilities | | | | 1,160,526 |
| Net Assets | | | $ | 50,274,856 |
| Net Assets consist of: | | | | |
| Paid in capital | | | $ | 50,017,710 |
| Total accumulated earnings (loss) | | | | 257,146 |
| Net Assets | | | $ | 50,274,856 |
Net Asset Value, offering price and redemption price per share ($50,274,856 ÷ 2,250,000 shares) | | | $ | 22.34 |
| Statement of Operations |
| | | | Year ended July 31, 2023 |
| Investment Income | | | | |
| Dividends | | | $ | 396,185 |
| Expenses | | | | |
| Management fee | $ | 261,422 | | |
| Independent trustees' fees and expenses | | 225 | | |
| Total expenses before reductions | | 261,647 | | |
| Expense reductions | | (37) | | |
| Total expenses after reductions | | | | 261,610 |
| Net Investment income (loss) | | | | 134,575 |
| Realized and Unrealized Gain (Loss) | | | | |
| Net realized gain (loss) on: | | | | |
| Investment Securities: | | | | |
| Redemptions in-kind | | 298,829 | | |
| Unaffiliated issuers | | (4,484,419) | | |
| Total net realized gain (loss) | | | | (4,185,590) |
| Change in net unrealized appreciation (depreciation) on investment securities | | | | 7,292,125 |
| Net gain (loss) | | | | 3,106,535 |
| Net increase (decrease) in net assets resulting from operations | | | $ | 3,241,110 |
| Statement of Changes in Net Assets |
| |
| | Year ended July 31, 2023 | | Year ended July 31, 2022 |
| Increase (Decrease) in Net Assets | | | | |
| Operations | | | | |
| Net investment income (loss) | $ | 134,575 | $ | 24,387 |
| Net realized gain (loss) | | (4,185,590) | | (3,743,475) |
| Change in net unrealized appreciation (depreciation) | | 7,292,125 | | (2,178,468) |
| Net increase (decrease) in net assets resulting from operations | | 3,241,110 | | (5,897,556) |
| Distributions to shareholders | | (144,575) | | (32,550) |
| | | | | |
| Share transactions | | | | |
| Proceeds from sales of shares | | 4,485,324 | | 19,270,749 |
| Cost of shares redeemed | | (3,834,411) | | (2,655,560) |
| | | | | |
Net increase (decrease) in net assets resulting from share transactions | | 650,913 | | 16,615,189 |
| Total increase (decrease) in net assets | | 3,747,448 | | 10,685,083 |
| | | | | |
| Net Assets | | | | |
| Beginning of period | | 46,527,408 | | 35,842,325 |
| End of period | $ | 50,274,856 | $ | 46,527,408 |
| | | | | |
| Other Information | | | | |
| Shares | | | | |
| Sold | | 225,000 | | 800,000 |
| Redeemed | | (200,000) | | (125,000) |
| Net increase (decrease) | | 25,000 | | 675,000 |
| | | | | |
| Years ended July 31, | | 2023 | | 2022 | | 2021 A |
Selected Per-Share Data | | | | | | |
| Net asset value, beginning of period | $ | 20.91 | $ | 23.12 | $ | 20.00 |
| Income from Investment Operations | | | | | | |
Net investment income (loss) B,C | | .06 | | .01 | | - D |
| Net realized and unrealized gain (loss) | | 1.44 | | (2.20) | | 3.13 |
| Total from investment operations | | 1.50 | | (2.19) | | 3.13 |
| Distributions from net investment income | | (.07) | | (.02) | | (.01) |
| Total distributions | | (.07) | | (.02) | | (.01) |
| Net asset value, end of period | $ | 22.34 | $ | 20.91 | $ | 23.12 |
Total Return E,F,G | | 7.21% | | (9.50)% | | 15.65% |
Ratios to Average Net Assets C,H,I | | | | | | |
| Expenses before reductions | | .59% | | .59% | | .59% J |
| Expenses net of fee waivers, if any | | .59% | | .59% | | .59% J |
| Expenses net of all reductions | | .59% | | .59% | | .59% J |
| Net investment income (loss) | | .30% | | .05% | | .01% J |
| Supplemental Data | | | | | | |
| Net assets, end of period (000 omitted) | $ | 50,275 | $ | 46,527 | $ | 35,842 |
Portfolio turnover rate K,L | | 89% | | 68% | | 41% M |
AFor the period February 2, 2021 (commencement of operations) through July 31, 2021.
BCalculated based on average shares outstanding during the period.
CNet investment income (loss) is affected by the timing of the declaration of dividends by any underlying mutual funds or exchange-traded funds (ETFs). Net investment income (loss) of any mutual funds or ETFs is not included in the Fund's net investment income (loss) ratio.
DAmount represents less than $.005 per share.
ETotal returns for periods of less than one year are not annualized.
FTotal returns would have been lower if certain expenses had not been reduced during the applicable periods shown.
GBased on net asset value.
HFees and expenses of any underlying mutual funds or exchange-traded funds (ETFs) are not included in the Fund's expense ratio. The Fund indirectly bears its proportionate share of these expenses.
IExpense ratios reflect operating expenses of the class. Expenses before reductions do not reflect amounts reimbursed, waived, or reduced through arrangements with the investment adviser, brokerage services, or other offset arrangements, if applicable, and do not represent the amount paid by the class during periods when reimbursements, waivers or reductions occur.
JAnnualized.
KPortfolio turnover rate excludes securities received or delivered in-kind.
LAmount does not include the portfolio activity of any underlying mutual funds or exchange-traded funds (ETFs).
MAmount not annualized.
NAV and closing market price average annual returns reflect the change in the value of an investment, assuming reinvestment of distributions from dividend income and capital gains (the profits earned upon the sale of securities that have grown in value, if any) at NAV and Market Price, respectively, and assumes a constant rate of performance each year. The hypothetical investment and the fund's returns do not reflect the deduction of taxes that a shareholder would pay on fund distributions or the redemption or selling of fund shares. How a fund did yesterday is no guarantee of how it will do tomorrow.
| Average Annual Total Returns |
| | | | |
Periods ended July 31, 2023 | Past 1 year | Life of Fund |
Fidelity® New Millennium ETF - NAV A | 21.36% | 20.69% |
Fidelity® New Millennium ETF - Market Price B | 21.21% | 19.59% |
S&P 500® Index A | 13.02% | 15.23% |
A From June 2, 2020
B From June 4, 2020, date initially listed on the CboeBZX Exchange, Inc.
| $10,000 Over Life of Fund |
| |
Let's say hypothetically that $10,000 was invested in Fidelity® New Millennium ETF - NAV, on June 2, 2020, when the fund started. The chart shows how the value of your investment would have changed, and also shows how the S&P 500® Index performed over the same period. |
|
|
Fidelity® New Millennium ETF
Market Recap:
U.S. equities gained 13.02% for the 12 months ending July 31, 2023, according to the S&P 500® index, as continued global economic expansion, falling commodity prices and a slowing in the pace of inflation provided a favorable backdrop for higher-risk assets. Large-cap stocks spearheaded the rally, which was driven by the shares of a narrow set of mega-cap companies in the information technology and communication services sectors, largely due to exuberance related to generative artificial intelligence. Aggressive monetary tightening by the U.S. Federal Reserve continued amid consistent pressure on core inflation, a measure that excludes food and energy. Since March 2022, the Fed has hiked its benchmark interest rate 11 times. The latest bump came in late July, a fourth consecutive raise of a stepped down 25 basis points. The S&P 500® gained 3.21% in July, as a "soft landing" of the U.S. economy became the consensus view amid better-than-expected earnings, slowing inflation and easing financial conditions, bringing the index's year-to-date gain to 20.65%. July saw a continuance of the recent shift to wider market breadth and lower dispersion. For the full 12 months, value (+17%) handily topped growth (+8%) within the index. By sector, tech (+28%), communication services (+21%) and industrials (+17%) led, whereas real estate (-10%) lagged most, due to high borrowing costs, low home inventory and a deteriorating commercial property market.
Comments from Co-Managers Andy Browder and Daniel Sherwood:
For the fiscal year ending July 31, 2023, the exchange-traded fund's net asset value gained 21.36%, versus 13.02% for the S&P 500® index. The ETF's market price advanced 21.21% for the 12 months. The biggest contributor to performance versus the benchmark was a sizable overweight in energy. Security selection among industrials stocks also boosted relative performance. Smaller-than-benchmark exposure to the information technology sector was another plus. The top individual relative contributor was an overweight in General Electric (+98%), which was among the fund's biggest holdings this period, though we decreased our position in the stock. Timely ownership of Amazon.com (+36%), one of the portfolio's largest holdings at period end and an investment we established the past year, also helped. An outsized stake in Hess (+39%), another of the fund's biggest holdings this period, proved beneficial as well, though we decreased exposure to the company. In contrast, the primary detractor from performance versus the benchmark was stock selection in energy. Also hurting the portfolio's result compared with the benchmark were picks among consumer staples and information technology firms. The largest individual relative detractor was an underweight in Nvidia (+157%), one of the biggest holdings in the fund at period end. This was an investment we established this period. Not owning Broadcom, a benchmark component that gained 73%, was the second-largest relative detractor. Undersized exposure to JPMorgan Chase (+41%) also proved detrimental. This was a position we established the past year. Notable changes in positioning include increased allocations to the information technology and communication services sectors.
The views expressed above reflect those of the portfolio manager(s) only through the end of the period as stated on the cover of this report and do not necessarily represent the views of Fidelity or any other person in the Fidelity organization, or Geode Capital Management, LLC, (the ETF's subadviser) or any other person in the Geode organization. Any such views are subject to change at any time based upon market or other conditions and Fidelity and Geode disclaim any responsibility to update such views. These views may not be relied on as investment advice and, because investment decisions for a Fidelity fund are based on numerous factors, may not be relied on as an indication of trading intent on behalf of any Fidelity fund.
Note to Shareholders: On October 20, 2022, Daniel Sherwood assumed co-management responsibilities for the fund. On December 31, 2022, Lead Manager John Roth retired from Fidelity after 24 years with the firm.
Fidelity® New Millennium ETF
Top Holdings (% of Fund's net assets) |
| |
| Microsoft Corp. | 7.1 | |
| Apple, Inc. | 6.1 | |
| Amazon.com, Inc. | 2.9 | |
| NVIDIA Corp. | 2.4 | |
| Meta Platforms, Inc. Class A | 2.3 | |
| Alphabet, Inc. Class A | 2.0 | |
| Eli Lilly & Co. | 1.9 | |
| Exxon Mobil Corp. | 1.8 | |
| Visa, Inc. Class A | 1.6 | |
| UnitedHealth Group, Inc. | 1.6 | |
| | 29.7 | |
| |
| Market Sectors (% of Fund's net assets) |
| |
| Information Technology | 29.2 | |
| Industrials | 14.3 | |
| Health Care | 11.7 | |
| Consumer Discretionary | 10.5 | |
| Financials | 9.7 | |
| Communication Services | 7.7 | |
| Energy | 5.2 | |
| Consumer Staples | 4.1 | |
| Materials | 3.9 | |
| Real Estate | 1.7 | |
| Utilities | 1.7 | |
| |
Asset Allocation (% of Fund's net assets) |
|
|
Fidelity® New Millennium ETF
Showing Percentage of Net Assets
| Common Stocks - 99.7% |
| | | Shares | Value ($) |
| COMMUNICATION SERVICES - 7.7% | | | |
| Entertainment - 2.1% | | | |
| Endeavor Group Holdings, Inc. (a) | | 21,832 | 515,235 |
| Netflix, Inc. (a) | | 2,677 | 1,175,123 |
| Spotify Technology SA (a) | | 2,729 | 407,740 |
| World Wrestling Entertainment, Inc. Class A | | 1,242 | 130,410 |
| | | | 2,228,508 |
| Interactive Media & Services - 4.3% | | | |
| Alphabet, Inc. Class A (a) | | 16,397 | 2,176,210 |
| Meta Platforms, Inc. Class A (a) | | 7,718 | 2,458,955 |
| | | | 4,635,165 |
| Media - 1.3% | | | |
| Comcast Corp. Class A | | 32,212 | 1,457,915 |
TOTAL COMMUNICATION SERVICES | | | 8,321,588 |
| CONSUMER DISCRETIONARY - 10.5% | | | |
| Automobile Components - 0.6% | | | |
| Aptiv PLC (a) | | 5,814 | 636,575 |
| Broadline Retail - 2.9% | | | |
| Amazon.com, Inc. (a) | | 23,870 | 3,190,942 |
| Hotels, Restaurants & Leisure - 2.5% | | | |
| Airbnb, Inc. Class A (a) | | 2,037 | 310,011 |
| Booking Holdings, Inc. (a) | | 205 | 609,014 |
| Chipotle Mexican Grill, Inc. (a) | | 208 | 408,154 |
| Churchill Downs, Inc. | | 4,067 | 471,162 |
| Hilton Worldwide Holdings, Inc. | | 3,474 | 540,172 |
| Yum! Brands, Inc. | | 2,315 | 318,706 |
| | | | 2,657,219 |
| Household Durables - 1.0% | | | |
| Lennar Corp. Class A | | 4,314 | 547,145 |
| NVR, Inc. (a) | | 82 | 517,128 |
| | | | 1,064,273 |
| Specialty Retail - 1.8% | | | |
| Dick's Sporting Goods, Inc. | | 2,343 | 330,363 |
| Floor & Decor Holdings, Inc. Class A (a) | | 3,005 | 345,124 |
| TJX Companies, Inc. | | 14,254 | 1,233,399 |
| | | | 1,908,886 |
| Textiles, Apparel & Luxury Goods - 1.7% | | | |
| NIKE, Inc. Class B | | 8,307 | 917,010 |
| Ralph Lauren Corp. | | 4,051 | 532,018 |
| Tapestry, Inc. | | 9,732 | 419,936 |
| | | | 1,868,964 |
TOTAL CONSUMER DISCRETIONARY | | | 11,326,859 |
| CONSUMER STAPLES - 4.1% | | | |
| Beverages - 2.4% | | | |
| Boston Beer Co., Inc. Class A (a) | | 1,179 | 437,928 |
| Constellation Brands, Inc. Class A (sub. vtg.) | | 1,062 | 289,714 |
| Diageo PLC sponsored ADR | | 1,590 | 279,745 |
| Keurig Dr. Pepper, Inc. | | 16,779 | 570,654 |
| The Coca-Cola Co. | | 15,815 | 979,423 |
| | | | 2,557,464 |
| Consumer Staples Distribution & Retail - 1.5% | | | |
| Alimentation Couche-Tard, Inc. Class A (multi-vtg.) | | 5,302 | 268,427 |
| BJ's Wholesale Club Holdings, Inc. (a) | | 10,012 | 663,896 |
| Performance Food Group Co. (a) | | 5,898 | 352,464 |
| Target Corp. | | 2,518 | 343,631 |
| | | | 1,628,418 |
| Personal Care Products - 0.2% | | | |
| Kenvue, Inc. | | 10,108 | 239,357 |
TOTAL CONSUMER STAPLES | | | 4,425,239 |
| ENERGY - 5.2% | | | |
| Energy Equipment & Services - 1.6% | | | |
| Baker Hughes Co. Class A | | 15,462 | 553,385 |
| Schlumberger Ltd. | | 14,173 | 826,853 |
| TechnipFMC PLC | | 19,022 | 348,863 |
| | | | 1,729,101 |
| Oil, Gas & Consumable Fuels - 3.6% | | | |
| Antero Resources Corp. (a) | | 4,131 | 110,504 |
| Canadian Natural Resources Ltd. | | 8,470 | 514,976 |
| Cheniere Energy, Inc. | | 3,520 | 569,747 |
| Exxon Mobil Corp. | | 18,047 | 1,935,360 |
| Hess Corp. | | 4,701 | 713,283 |
| | | | 3,843,870 |
TOTAL ENERGY | | | 5,572,971 |
| FINANCIALS - 9.7% | | | |
| Banks - 3.2% | | | |
| Bank of America Corp. | | 36,092 | 1,154,944 |
| JPMorgan Chase & Co. | | 5,649 | 892,316 |
| PNC Financial Services Group, Inc. | | 2,815 | 385,345 |
| Wells Fargo & Co. | | 23,028 | 1,062,972 |
| | | | 3,495,577 |
| Capital Markets - 0.7% | | | |
| Morgan Stanley | | 8,326 | 762,329 |
| Financial Services - 3.4% | | | |
| Block, Inc. Class A (a) | | 6,214 | 500,413 |
| Fiserv, Inc. (a) | | 8,545 | 1,078,464 |
| Shift4 Payments, Inc. (a) | | 4,711 | 325,012 |
| Visa, Inc. Class A | | 7,487 | 1,779,885 |
| | | | 3,683,774 |
| Insurance - 2.4% | | | |
| Arch Capital Group Ltd. (a) | | 4,585 | 356,209 |
| Chubb Ltd. | | 5,997 | 1,225,847 |
| First American Financial Corp. | | 4,270 | 270,633 |
| Marsh & McLennan Companies, Inc. | | 2,683 | 505,531 |
| RenaissanceRe Holdings Ltd. | | 1,156 | 215,895 |
| | | | 2,574,115 |
TOTAL FINANCIALS | | | 10,515,795 |
| HEALTH CARE - 11.7% | | | |
| Biotechnology - 1.1% | | | |
| Gilead Sciences, Inc. | | 4,793 | 364,939 |
| Legend Biotech Corp. ADR (a) | | 3,612 | 272,778 |
| Regeneron Pharmaceuticals, Inc. (a) | | 692 | 513,402 |
| | | | 1,151,119 |
| Health Care Equipment & Supplies - 2.5% | | | |
| Boston Scientific Corp. (a) | | 21,097 | 1,093,879 |
| GE Healthcare Holding LLC | | 4,053 | 316,134 |
| Hologic, Inc. (a) | | 4,870 | 386,775 |
| Masimo Corp. (a) | | 1,901 | 232,492 |
| Stryker Corp. | | 2,229 | 631,721 |
| | | | 2,661,001 |
| Health Care Providers & Services - 2.8% | | | |
| agilon health, Inc. (a) | | 13,308 | 254,848 |
| Centene Corp. (a) | | 5,293 | 360,400 |
| Cigna Group | | 1,984 | 585,478 |
| LifeStance Health Group, Inc. (a) | | 11,859 | 111,356 |
| UnitedHealth Group, Inc. | | 3,466 | 1,755,078 |
| | | | 3,067,160 |
| Life Sciences Tools & Services - 2.2% | | | |
| Danaher Corp. | | 3,111 | 793,492 |
| IQVIA Holdings, Inc. (a) | | 1,666 | 372,784 |
| Thermo Fisher Scientific, Inc. | | 1,715 | 940,952 |
| West Pharmaceutical Services, Inc. | | 832 | 306,209 |
| | | | 2,413,437 |
| Pharmaceuticals - 3.1% | | | |
| AstraZeneca PLC sponsored ADR | | 8,270 | 592,959 |
| Eli Lilly & Co. | | 4,562 | 2,073,657 |
| Merck & Co., Inc. | | 4,992 | 532,397 |
| Novo Nordisk A/S Series B sponsored ADR | | 976 | 157,234 |
| | | | 3,356,247 |
TOTAL HEALTH CARE | | | 12,648,964 |
| INDUSTRIALS - 14.3% | | | |
| Aerospace & Defense - 3.8% | | | |
| BWX Technologies, Inc. | | 7,173 | 494,937 |
| Howmet Aerospace, Inc. | | 16,579 | 847,850 |
| Lockheed Martin Corp. | | 1,961 | 875,332 |
| Northrop Grumman Corp. | | 1,507 | 670,615 |
| The Boeing Co. (a) | | 4,950 | 1,182,308 |
| | | | 4,071,042 |
| Building Products - 0.8% | | | |
| Builders FirstSource, Inc. (a) | | 3,230 | 466,509 |
| Fortune Brands Home & Security, Inc. | | 4,972 | 353,360 |
| | | | 819,869 |
| Construction & Engineering - 1.1% | | | |
| Quanta Services, Inc. | | 3,557 | 717,162 |
| Willscot Mobile Mini Holdings (a) | | 9,937 | 476,479 |
| | | | 1,193,641 |
| Electrical Equipment - 2.0% | | | |
| Eaton Corp. PLC | | 4,524 | 928,868 |
| Generac Holdings, Inc. (a) | | 3,960 | 608,652 |
| Regal Rexnord Corp. | | 4,155 | 648,928 |
| | | | 2,186,448 |
| Ground Transportation - 1.0% | | | |
| Uber Technologies, Inc. (a) | | 22,200 | 1,098,012 |
| Industrial Conglomerates - 1.0% | | | |
| General Electric Co. | | 8,983 | 1,026,218 |
| Machinery - 3.2% | | | |
| Caterpillar, Inc. | | 2,766 | 733,460 |
| Fortive Corp. | | 4,079 | 319,590 |
| Ingersoll Rand, Inc. | | 12,177 | 794,793 |
| ITT, Inc. | | 5,452 | 543,019 |
| Parker Hannifin Corp. | | 2,497 | 1,023,795 |
| | | | 3,414,657 |
| Professional Services - 1.1% | | | |
| FTI Consulting, Inc. (a) | | 2,805 | 491,324 |
| KBR, Inc. | | 8,991 | 552,857 |
| WNS Holdings Ltd. sponsored ADR (a) | | 2,797 | 193,301 |
| | | | 1,237,482 |
| Trading Companies & Distributors - 0.3% | | | |
| United Rentals, Inc. | | 730 | 339,216 |
TOTAL INDUSTRIALS | | | 15,386,585 |
| INFORMATION TECHNOLOGY - 29.2% | | | |
| Communications Equipment - 1.1% | | | |
| Cisco Systems, Inc. | | 22,221 | 1,156,381 |
| Electronic Equipment, Instruments & Components - 1.7% | | | |
| Flex Ltd. (a) | | 29,193 | 798,720 |
| Jabil, Inc. | | 6,429 | 711,497 |
| Keysight Technologies, Inc. (a) | | 2,226 | 358,564 |
| | | | 1,868,781 |
| IT Services - 0.9% | | | |
| MongoDB, Inc. Class A (a) | | 1,056 | 447,110 |
| Shopify, Inc. Class A (a) | | 8,305 | 561,252 |
| | | | 1,008,362 |
| Semiconductors & Semiconductor Equipment - 7.6% | | | |
| Advanced Micro Devices, Inc. (a) | | 11,036 | 1,262,518 |
| Analog Devices, Inc. | | 3,985 | 795,127 |
| Marvell Technology, Inc. | | 1,110 | 72,294 |
| NVIDIA Corp. | | 5,618 | 2,625,235 |
| NXP Semiconductors NV | | 4,677 | 1,042,877 |
| ON Semiconductor Corp. (a) | | 10,087 | 1,086,874 |
| Taiwan Semiconductor Manufacturing Co. Ltd. sponsored ADR | | 7,546 | 748,186 |
| Teradyne, Inc. | | 4,864 | 549,340 |
| | | | 8,182,451 |
| Software - 11.8% | | | |
| Adobe, Inc. (a) | | 2,286 | 1,248,545 |
| Dynatrace, Inc. (a) | | 9,987 | 546,189 |
| Intuit, Inc. | | 1,411 | 722,009 |
| Microsoft Corp. | | 22,918 | 7,698,616 |
| Oracle Corp. | | 8,838 | 1,036,079 |
| Salesforce, Inc. (a) | | 4,211 | 947,517 |
| Workday, Inc. Class A (a) | | 2,185 | 518,129 |
| | | | 12,717,084 |
| Technology Hardware, Storage & Peripherals - 6.1% | | | |
| Apple, Inc. | | 33,281 | 6,538,052 |
TOTAL INFORMATION TECHNOLOGY | | | 31,471,111 |
| MATERIALS - 3.9% | | | |
| Chemicals - 1.5% | | | |
| Celanese Corp. Class A | | 2,547 | 319,368 |
| Element Solutions, Inc. | | 19,119 | 400,734 |
| Linde PLC | | 2,218 | 866,506 |
| | | | 1,586,608 |
| Construction Materials - 0.3% | | | |
| Martin Marietta Materials, Inc. | | 877 | 391,545 |
| Containers & Packaging - 0.4% | | | |
| O-I Glass, Inc. (a) | | 19,209 | 441,039 |
| Metals & Mining - 1.7% | | | |
| Commercial Metals Co. | | 2,409 | 137,843 |
| Franco-Nevada Corp. | | 4,602 | 671,533 |
| Freeport-McMoRan, Inc. | | 22,547 | 1,006,724 |
| | | | 1,816,100 |
TOTAL MATERIALS | | | 4,235,292 |
| REAL ESTATE - 1.7% | | | |
| Equity Real Estate Investment Trusts (REITs) - 1.4% | | | |
| Essex Property Trust, Inc. | | 941 | 229,181 |
| Gaming & Leisure Properties | | 6,950 | 329,847 |
| Prologis (REIT), Inc. | | 5,835 | 727,916 |
| Spirit Realty Capital, Inc. | | 5,345 | 215,564 |
| | | | 1,502,508 |
| Real Estate Management & Development - 0.3% | | | |
| CBRE Group, Inc. (a) | | 4,358 | 363,065 |
TOTAL REAL ESTATE | | | 1,865,573 |
| UTILITIES - 1.7% | | | |
| Electric Utilities - 1.3% | | | |
| Constellation Energy Corp. | | 5,802 | 560,763 |
| Southern Co. | | 12,108 | 875,893 |
| | | | 1,436,656 |
| Independent Power and Renewable Electricity Producers - 0.4% | | | |
| Vistra Corp. | | 14,670 | 411,640 |
TOTAL UTILITIES | | | 1,848,296 |
| TOTAL COMMON STOCKS (Cost $87,851,092) | | | 107,618,273 |
| | | | |
| Money Market Funds - 1.2% |
| | | Shares | Value ($) |
State Street Institutional Treasury Plus Money Market Fund Trust Class 5.15% (b) (Cost $1,273,394) | | 1,273,394 | 1,273,394 |
| | | | |
| TOTAL INVESTMENT IN SECURITIES - 100.9% (Cost $89,124,486) | 108,891,667 |
NET OTHER ASSETS (LIABILITIES) - (0.9)% | (969,101) |
| NET ASSETS - 100.0% | 107,922,566 |
| | |
Legend
| (b) | The rate quoted is the annualized seven-day yield of the fund at period end. |
Investment Valuation
The following is a summary of the inputs used, as of July 31, 2023, involving the Fund's assets and liabilities carried at fair value. The inputs or methodology used for valuing securities may not be an indication of the risk associated with investing in those securities. For more information on valuation inputs, and their aggregation into the levels used below, please refer to the Investment Valuation section in the accompanying Notes to Financial Statements.
| Valuation Inputs at Reporting Date: |
| Description | Total ($) | Level 1 ($) | Level 2 ($) | Level 3 ($) |
Investments in Securities: | | | | |
|
| Equities: | | | | |
Communication Services | 8,321,588 | 8,321,588 | - | - |
Consumer Discretionary | 11,326,859 | 11,326,859 | - | - |
Consumer Staples | 4,425,239 | 4,425,239 | - | - |
Energy | 5,572,971 | 5,572,971 | - | - |
Financials | 10,515,795 | 10,515,795 | - | - |
Health Care | 12,648,964 | 12,648,964 | - | - |
Industrials | 15,386,585 | 15,386,585 | - | - |
Information Technology | 31,471,111 | 31,471,111 | - | - |
Materials | 4,235,292 | 4,235,292 | - | - |
Real Estate | 1,865,573 | 1,865,573 | - | - |
Utilities | 1,848,296 | 1,848,296 | - | - |
|
| Money Market Funds | 1,273,394 | 1,273,394 | - | - |
| Total Investments in Securities: | 108,891,667 | 108,891,667 | - | - |
Fidelity® New Millennium ETF
| Statement of Assets and Liabilities |
| | | | July 31, 2023 |
| | | | | |
| Assets | | | | |
Investment in securities, at value - See accompanying schedule Unaffiliated issuers (cost $89,124,486): | | | $ | 108,891,667 |
| Segregated cash with brokers for derivative instruments | | | | 33,600 |
| Cash | | | | 664 |
| Receivable for investments sold | | | | 5,441,664 |
| Receivable for fund shares sold | | | | 2,579,157 |
| Dividends receivable | | | | 20,755 |
| Receivable for daily variation margin on futures contracts | | | | 995 |
Total assets | | | | 116,968,502 |
| Liabilities | | | | |
| Payable for investments purchased | $ | 8,996,615 | | |
| Accrued management fee | | 49,321 | | |
| Total Liabilities | | | | 9,045,936 |
| Net Assets | | | $ | 107,922,566 |
| Net Assets consist of: | | | | |
| Paid in capital | | | $ | 91,907,582 |
| Total accumulated earnings (loss) | | | | 16,014,984 |
| Net Assets | | | $ | 107,922,566 |
Net Asset Value, offering price and redemption price per share ($107,922,566 ÷ 3,125,000 shares) | | | $ | 34.54 |
| Statement of Operations |
| | | | Year ended July 31, 2023 |
| Investment Income | | | | |
| Dividends | | | $ | 1,318,103 |
| Expenses | | | | |
| Management fee | $ | 492,076 | | |
| Independent trustees' fees and expenses | | 393 | | |
| Total expenses before reductions | | 492,469 | | |
| Expense reductions | | (126) | | |
| Total expenses after reductions | | | | 492,343 |
| Net Investment income (loss) | | | | 825,760 |
| Realized and Unrealized Gain (Loss) | | | | |
| Net realized gain (loss) on: | | | | |
| Investment Securities: | | | | |
| Redemptions in-kind | | 7,235,412 | | |
| Unaffiliated issuers | | (3,109,284) | | |
| Foreign currency transactions | | (10) | | |
| Futures contracts | | 203 | | |
| Total net realized gain (loss) | | | | 4,126,321 |
| Change in net unrealized appreciation (depreciation) on: | | | | |
| Investment Securities: | | | | |
| Unaffiliated issuers | | 13,991,436 | | |
| Assets and liabilities in foreign currencies | | 14 | | |
| Total change in net unrealized appreciation (depreciation) | | | | 13,991,450 |
| Net gain (loss) | | | | 18,117,771 |
| Net increase (decrease) in net assets resulting from operations | | | $ | 18,943,531 |
| Statement of Changes in Net Assets |
| |
| | Year ended July 31, 2023 | | Year ended July 31, 2022 |
| Increase (Decrease) in Net Assets | | | | |
| Operations | | | | |
| Net investment income (loss) | $ | 825,760 | $ | 816,005 |
| Net realized gain (loss) | | 4,126,321 | | 1,262,284 |
| Change in net unrealized appreciation (depreciation) | | 13,991,450 | | (1,701,394) |
| Net increase (decrease) in net assets resulting from operations | | 18,943,531 | | 376,895 |
| Distributions to shareholders | | (1,058,225) | | (1,100,175) |
| | | | | |
| Share transactions | | | | |
| Proceeds from sales of shares | | 63,669,740 | | 3,720,338 |
| Cost of shares redeemed | | (29,908,118) | | (7,128,248) |
| | | | | |
Net increase (decrease) in net assets resulting from share transactions | | 33,761,622 | | (3,407,910) |
| Total increase (decrease) in net assets | | 51,646,928 | | (4,131,190) |
| | | | | |
| Net Assets | | | | |
| Beginning of period | | 56,275,638 | | 60,406,828 |
| End of period | $ | 107,922,566 | $ | 56,275,638 |
| | | | | |
| Other Information | | | | |
| Shares | | | | |
| Sold | | 2,150,000 | | 125,000 |
| Redeemed | | (975,000) | | (250,000) |
| Net increase (decrease) | | 1,175,000 | | (125,000) |
| | | | | |
| Fidelity® New Millennium ETF |
| |
| Years ended July 31, | | 2023 | | 2022 | | 2021 | | 2020 A |
Selected Per-Share Data | | | | | | | | |
| Net asset value, beginning of period | $ | 28.86 | $ | 29.11 | $ | 20.37 | $ | 20.00 |
| Income from Investment Operations | | | | | | | | |
Net investment income (loss) B,C | | .30 | | .40 | | .36 | | .03 |
| Net realized and unrealized gain (loss) | | 5.78 | | (.12) | | 8.75 | | .36 |
| Total from investment operations | | 6.08 | | .28 | | 9.11 | | .39 |
| Distributions from net investment income | | (.33) | | (.53) | | (.37) | | (.02) |
| Distributions from net realized gain | | (.07) | | - | | - | | - |
| Total distributions | | (.40) | | (.53) | | (.37) | | (.02) |
| Net asset value, end of period | $ | 34.54 | $ | 28.86 | $ | 29.11 | $ | 20.37 |
Total Return D,E,F | | 21.36% | | 1.00% | | 45.03% | | 1.95% |
Ratios to Average Net Assets C,G,H | | | | | | | | |
| Expenses before reductions | | .59% | | .59% | | .59% | | .59% I |
| Expenses net of fee waivers, if any | | .59% | | .59% | | .59% | | .59% I |
| Expenses net of all reductions | | .59% | | .59% | | .58% | | .59% I |
| Net investment income (loss) | | .99% | | 1.36% | | 1.33% | | 1.00% I |
| Supplemental Data | | | | | | | | |
| Net assets, end of period (000 omitted) | $ | 107,923 | $ | 56,276 | $ | 60,407 | $ | 6,112 |
Portfolio turnover rate J,K | | 76% | | 36% | | 68% | | 10% L |
AFor the period June 2, 2020 (commencement of operations) through July 31, 2020.
BCalculated based on average shares outstanding during the period.
CNet investment income (loss) is affected by the timing of the declaration of dividends by any underlying mutual funds or exchange-traded funds (ETFs). Net investment income (loss) of any mutual funds or ETFs is not included in the Fund's net investment income (loss) ratio.
DTotal returns for periods of less than one year are not annualized.
ETotal returns would have been lower if certain expenses had not been reduced during the applicable periods shown.
FBased on net asset value.
GFees and expenses of any underlying mutual funds or exchange-traded funds (ETFs) are not included in the Fund's expense ratio. The Fund indirectly bears its proportionate share of these expenses.
HExpense ratios reflect operating expenses of the class. Expenses before reductions do not reflect amounts reimbursed, waived, or reduced through arrangements with the investment adviser, brokerage services, or other offset arrangements, if applicable, and do not represent the amount paid by the class during periods when reimbursements, waivers or reductions occur.
IAnnualized.
JPortfolio turnover rate excludes securities received or delivered in-kind.
KAmount does not include the portfolio activity of any underlying mutual funds or exchange-traded funds (ETFs).
LAmount not annualized.
NAV and closing market price average annual returns reflect the change in the value of an investment, assuming reinvestment of distributions from dividend income and capital gains (the profits earned upon the sale of securities that have grown in value, if any) at NAV and Market Price, respectively, and assumes a constant rate of performance each year. The hypothetical investment and the fund's returns do not reflect the deduction of taxes that a shareholder would pay on fund distributions or the redemption or selling of fund shares. How a fund did yesterday is no guarantee of how it will do tomorrow.
| Average Annual Total Returns |
| | | | |
Periods ended July 31, 2023 | Past 1 year | Life of Fund |
Fidelity® Real Estate Investment ETF - NAV A | -9.93% | 4.23% |
Fidelity® Real Estate Investment ETF - Market Price B | -10.11% | 4.16% |
MSCI US IMI Real Estate 25/50 Index A | -9.65% | 2.61% |
S&P 500® Index A | 13.02% | 9.27% |
A From February 2, 2021
B From February 4, 2021, date initially listed on the CboeBZX Exchange, Inc.
| $10,000 Over Life of Fund |
| |
Let's say hypothetically that $10,000 was invested in Fidelity® Real Estate Investment ETF - NAV, on February 2, 2021, when the fund started. The chart shows how the value of your investment would have changed, and also shows how the MSCI US IMI Real Estate 25/50 Index and S&P 500® Index performed over the same period. |
|
|
Fidelity® Real Estate Investment ETF
Market Recap:
U.S. equities gained 13.02% for the 12 months ending July 31, 2023, according to the S&P 500® index, as continued global economic expansion, falling commodity prices and a slowing in the pace of inflation provided a favorable backdrop for higher-risk assets. Large-cap stocks spearheaded the rally, which was driven by the shares of a narrow set of mega-cap companies in the information technology and communication services sectors, largely due to exuberance related to generative artificial intelligence. Aggressive monetary tightening by the U.S. Federal Reserve continued amid consistent pressure on core inflation, a measure that excludes food and energy. Since March 2022, the Fed has hiked its benchmark interest rate 11 times. The latest bump came in late July, a fourth consecutive raise of a stepped down 25 basis points. The S&P 500® gained 3.21% in July, as a "soft landing" of the U.S. economy became the consensus view amid better-than-expected earnings, slowing inflation and easing financial conditions, bringing the index's year-to-date gain to 20.65%. July saw a continuance of the recent shift to wider market breadth and lower dispersion. For the full 12 months, value (+17%) handily topped growth (+8%) within the index. By sector, tech (+28%), communication services (+21%) and industrials (+17%) led, whereas real estate (-10%) lagged most, due to high borrowing costs, low home inventory and a deteriorating commercial property market.
Comments from Co-Managers Steve Buller and Wan Hua Tan:
For the fiscal year ending July 31, 2023, the exchange-traded fund's net asset value returned -9.93%, versus -9.65% for the MSCI US IMI Real Estate 25/50 Index. The ETF's market price returned -10.11% the past 12 months, whereas the S&P 500® index gained 13.02%. The primary detractor from performance versus the sector index was an underweight in regional malls. Stock picks and an overweight among infrastructure REITs also hampered the fund's relative result. The biggest individual relative detractor was an overweight in Crown Castle (-37%), one of the fund's largest holdings. Outsized exposure to SBA Communications (-32%), another of our biggest positions, proved detrimental as well. Not owning Simon Property Group, an index component that gained about 22%, was an additional relative detractor of note. In contrast, the biggest contributor to performance versus the sector index was an underweight among office REITs. An overweight in data centers also boosted the fund's relative performance, as did security selection in the health care REIT industry. Not owning American Tower, an index component that returned about -28%, was the top individual relative contributor. An overweight stake in Equinix (+18%), one of the fund's largest holdings, helped as well. An outsized position in Iron Mountain (+33%) further contributed. Notable changes in positioning include a decreased allocation to the gaming industry and a higher exposure to shopping centers.
The views expressed above reflect those of the portfolio manager(s) only through the end of the period as stated on the cover of this report and do not necessarily represent the views of Fidelity or any other person in the Fidelity organization, or Geode Capital Management, LLC, (the ETF's subadviser) or any other person in the Geode organization. Any such views are subject to change at any time based upon market or other conditions and Fidelity and Geode disclaim any responsibility to update such views. These views may not be relied on as investment advice and, because investment decisions for a Fidelity fund are based on numerous factors, may not be relied on as an indication of trading intent on behalf of any Fidelity fund.
Fidelity® Real Estate Investment ETF
Top Holdings (% of Fund's net assets) |
| |
| Prologis (REIT), Inc. | 10.6 | |
| Crown Castle International Corp. | 8.1 | |
| Equinix, Inc. | 7.1 | |
| Ventas, Inc. | 5.0 | |
| Welltower, Inc. | 4.5 | |
| Digital Realty Trust, Inc. | 4.1 | |
| UDR, Inc. | 3.9 | |
| Mid-America Apartment Communities, Inc. | 3.6 | |
| SBA Communications Corp. Class A | 3.3 | |
| CBRE Group, Inc. | 3.3 | |
| | 53.5 | |
| |
| Top REIT Sectors (% of Fund's net assets) |
| |
| REITs - Diversified | 27.0 | |
| REITs - Apartments | 13.5 | |
| REITs - Warehouse/Industrial | 11.2 | |
| REITs - Health Care | 9.5 | |
| REITs - Shopping Centers | 8.0 | |
| |
Asset Allocation (% of Fund's net assets) |
|
|
Fidelity® Real Estate Investment ETF
Showing Percentage of Net Assets
| Common Stocks - 98.9% |
| | | Shares | Value ($) |
| Equity Real Estate Investment Trusts (REITs) - 93.2% | | | |
| REITs - Apartments - 13.5% | | | |
| American Homes 4 Rent Class A | | 8,037 | 301,227 |
| Equity Residential (SBI) | | 4,583 | 302,203 |
| Invitation Homes, Inc. | | 8,685 | 308,318 |
| Mid-America Apartment Communities, Inc. | | 3,670 | 549,252 |
| UDR, Inc. | | 14,228 | 581,641 |
| | | | 2,042,641 |
| REITs - Diversified - 27.0% | | | |
| Apartment Income (REIT) Corp. | | 6,246 | 215,737 |
| Crown Castle International Corp. | | 11,268 | 1,220,212 |
| Digital Realty Trust, Inc. | | 4,930 | 614,377 |
| Elme Communities (SBI) | | 1,935 | 31,444 |
| Equinix, Inc. | | 1,320 | 1,069,094 |
| Gaming & Leisure Properties | | 3,764 | 178,639 |
| Lamar Advertising Co. Class A | | 2,535 | 250,205 |
| SBA Communications Corp. Class A | | 2,281 | 499,425 |
| | | | 4,079,133 |
| REITs - Health Care - 9.5% | | | |
| Ventas, Inc. | | 15,550 | 754,486 |
| Welltower, Inc. | | 8,310 | 682,667 |
| | | | 1,437,153 |
| REITs - Hotels - 5.0% | | | |
| DiamondRock Hospitality Co. | | 21,839 | 185,632 |
| Host Hotels & Resorts, Inc. | | 17,750 | 326,600 |
| RLJ Lodging Trust | | 10,916 | 112,435 |
| Ryman Hospitality Properties, Inc. | | 1,460 | 139,123 |
| | | | 763,790 |
| REITs - Management/Investment - 5.3% | | | |
| NNN (REIT), Inc. | | 10,012 | 427,312 |
| Weyerhaeuser Co. | | 11,185 | 380,961 |
| | | | 808,273 |
| REITs - Manufactured Homes - 3.9% | | | |
| Equity Lifestyle Properties, Inc. | | 2,919 | 207,774 |
| Sun Communities, Inc. | | 2,952 | 384,646 |
| | | | 592,420 |
| REITs - Regional Malls - 0.4% | | | |
| Tanger Factory Outlet Centers, Inc. | | 2,435 | 57,003 |
| REITs - Shopping Centers - 8.0% | | | |
| Kimco Realty Corp. | | 18,540 | 375,620 |
| Phillips Edison & Co., Inc. | | 7,022 | 247,947 |
| Regency Centers Corp. | | 5,242 | 343,508 |
| SITE Centers Corp. | | 8,104 | 113,861 |
| Urban Edge Properties | | 8,040 | 136,760 |
| | | | 1,217,696 |
| REITs - Single Tenant - 2.7% | | | |
| Four Corners Property Trust, Inc. | | 3,961 | 104,174 |
| Spirit Realty Capital, Inc. | | 7,401 | 298,482 |
| | | | 402,656 |
| REITs - Storage - 6.7% | | | |
| CubeSmart | | 11,231 | 486,976 |
| Extra Space Storage, Inc. | | 1,542 | 215,217 |
| Iron Mountain, Inc. | | 5,099 | 313,079 |
| | | | 1,015,272 |
| REITs - Warehouse/Industrial - 11.2% | | | |
| Prologis (REIT), Inc. | | 12,794 | 1,596,051 |
| Terreno Realty Corp. | | 1,559 | 92,511 |
| | | | 1,688,562 |
TOTAL EQUITY REAL ESTATE INVESTMENT TRUSTS (REITS) | | | 14,104,599 |
| Real Estate Management & Development - 5.7% | | | |
| Real Estate Services - 5.7% | | | |
| CBRE Group, Inc. (a) | | 5,908 | 492,195 |
| CoStar Group, Inc. (a) | | 2,243 | 188,345 |
| Zillow Group, Inc. Class C (a) | | 3,418 | 185,119 |
| | | | 865,659 |
| TOTAL COMMON STOCKS (Cost $16,239,711) | | | 14,970,258 |
| | | | |
| Money Market Funds - 1.1% |
| | | Shares | Value ($) |
State Street Institutional Treasury Plus Money Market Fund Trust Class 5.15% (b) (Cost $167,489) | | 167,489 | 167,489 |
| | | | |
| TOTAL INVESTMENT IN SECURITIES - 100.0% (Cost $16,407,200) | 15,137,747 |
NET OTHER ASSETS (LIABILITIES) - 0.0% | (3,593) |
| NET ASSETS - 100.0% | 15,134,154 |
| | |
Legend
| (b) | The rate quoted is the annualized seven-day yield of the fund at period end. |
Investment Valuation
The following is a summary of the inputs used, as of July 31, 2023, involving the Fund's assets and liabilities carried at fair value. The inputs or methodology used for valuing securities may not be an indication of the risk associated with investing in those securities. For more information on valuation inputs, and their aggregation into the levels used below, please refer to the Investment Valuation section in the accompanying Notes to Financial Statements.
| Valuation Inputs at Reporting Date: |
| Description | Total ($) | Level 1 ($) | Level 2 ($) | Level 3 ($) |
Investments in Securities: | | | | |
|
| Common Stocks | 14,970,258 | 14,970,258 | - | - |
|
| Money Market Funds | 167,489 | 167,489 | - | - |
| Total Investments in Securities: | 15,137,747 | 15,137,747 | - | - |
Fidelity® Real Estate Investment ETF
| Statement of Assets and Liabilities |
| | | | July 31, 2023 |
| | | | | |
| Assets | | | | |
Investment in securities, at value - See accompanying schedule Unaffiliated issuers (cost $16,407,200): | | | $ | 15,137,747 |
| Receivable for investments sold | | | | 53,540 |
| Dividends receivable | | | | 6,906 |
| Other receivables | | | | 2,773 |
Total assets | | | | 15,200,966 |
| Liabilities | | | | |
| Payable for investments purchased | $ | 57,945 | | |
| Accrued management fee | | 7,480 | | |
| Other payables and accrued expenses | | 1,387 | | |
| Total Liabilities | | | | 66,812 |
| Net Assets | | | $ | 15,134,154 |
| Net Assets consist of: | | | | |
| Paid in capital | | | $ | 17,515,881 |
| Total accumulated earnings (loss) | | | | (2,381,727) |
| Net Assets | | | $ | 15,134,154 |
Net Asset Value, offering price and redemption price per share ($15,134,154 ÷ 725,000 shares) | | | $ | 20.87 |
| Statement of Operations |
| | | | Year ended July 31, 2023 |
| Investment Income | | | | |
| Dividends | | | $ | 505,167 |
| Expenses | | | | |
| Management fee | $ | 96,814 | | |
| Independent trustees' fees and expenses | | 89 | | |
| Total Expenses | | | | 96,903 |
| Net Investment income (loss) | | | | 408,264 |
| Realized and Unrealized Gain (Loss) | | | | |
| Net realized gain (loss) on: | | | | |
| Investment Securities: | | | | |
| Redemptions in-kind | | 192,538 | | |
| Unaffiliated issuers | | (970,377) | | |
| Total net realized gain (loss) | | | | (777,839) |
| Change in net unrealized appreciation (depreciation) on investment securities | | | | (1,729,975) |
| Net gain (loss) | | | | (2,507,814) |
| Net increase (decrease) in net assets resulting from operations | | | $ | (2,099,550) |
| Statement of Changes in Net Assets |
| |
| | Year ended July 31, 2023 | | Year ended July 31, 2022 |
| Increase (Decrease) in Net Assets | | | | |
| Operations | | | | |
| Net investment income (loss) | $ | 408,264 | $ | 322,595 |
| Net realized gain (loss) | | (777,839) | | 414,223 |
| Change in net unrealized appreciation (depreciation) | | (1,729,975) | | (1,439,266) |
| Net increase (decrease) in net assets resulting from operations | | (2,099,550) | | (702,448) |
| Distributions to shareholders | | (452,000) | | (456,700) |
| | | | | |
| Share transactions | | | | |
| Proceeds from sales of shares | | 1,073,585 | | 7,736,496 |
| Cost of shares redeemed | | (3,644,415) | | (3,056,221) |
| | | | | |
Net increase (decrease) in net assets resulting from share transactions | | (2,570,830) | | 4,680,275 |
| Total increase (decrease) in net assets | | (5,122,380) | | 3,521,127 |
| | | | | |
| Net Assets | | | | |
| Beginning of period | | 20,256,534 | | 16,735,407 |
| End of period | $ | 15,134,154 | $ | 20,256,534 |
| | | | | |
| Other Information | | | | |
| Shares | | | | |
| Sold | | 50,000 | | 300,000 |
| Redeemed | | (175,000) | | (125,000) |
| Net increase (decrease) | | (125,000) | | 175,000 |
| | | | | |
| Fidelity® Real Estate Investment ETF |
| |
| Years ended July 31, | | 2023 | | 2022 | | 2021 A |
Selected Per-Share Data | | | | | | |
| Net asset value, beginning of period | $ | 23.83 | $ | 24.79 | $ | 20.00 |
| Income from Investment Operations | | | | | | |
Net investment income (loss) B,C | | .52 | | .39 | | .21 |
| Net realized and unrealized gain (loss) | | (2.91) | | (.80) | | 4.79 |
| Total from investment operations | | (2.39) | | (.41) | | 5.00 |
| Distributions from net investment income | | (.57) | | (.55) | | (.21) |
| Total distributions | | (.57) | | (.55) | | (.21) |
| Net asset value, end of period | $ | 20.87 | $ | 23.83 | $ | 24.79 |
Total Return D,E,F | | (9.93)% | | (1.68)% | | 25.17% |
Ratios to Average Net Assets C,G,H | | | | | | |
| Expenses before reductions | | .59% | | .59% | | .59% I |
| Expenses net of fee waivers, if any | | .59% | | .59% | | .59% I |
| Expenses net of all reductions | | .59% | | .59% | | .58% I |
| Net investment income (loss) | | 2.49% | | 1.58% | | 1.80% I |
| Supplemental Data | | | | | | |
| Net assets, end of period (000 omitted) | $ | 15,134 | $ | 20,257 | $ | 16,735 |
Portfolio turnover rate J,K | | 33% | | 24% | | 23% L |
AFor the period February 2, 2021 (commencement of operations) through July 31, 2021.
BCalculated based on average shares outstanding during the period.
CNet investment income (loss) is affected by the timing of the declaration of dividends by any underlying mutual funds or exchange-traded funds (ETFs). Net investment income (loss) of any mutual funds or ETFs is not included in the Fund's net investment income (loss) ratio.
DBased on net asset value.
ETotal returns for periods of less than one year are not annualized.
FTotal returns would have been lower if certain expenses had not been reduced during the applicable periods shown.
GFees and expenses of any underlying mutual funds or exchange-traded funds (ETFs) are not included in the Fund's expense ratio. The Fund indirectly bears its proportionate share of these expenses.
HExpense ratios reflect operating expenses of the class. Expenses before reductions do not reflect amounts reimbursed, waived, or reduced through arrangements with the investment adviser, brokerage services, or other offset arrangements, if applicable, and do not represent the amount paid by the class during periods when reimbursements, waivers or reductions occur.
IAnnualized.
JPortfolio turnover rate excludes securities received or delivered in-kind.
KAmount does not include the portfolio activity of any underlying mutual funds or exchange-traded funds (ETFs).
LAmount not annualized.
NAV and closing market price average annual returns reflect the change in the value of an investment, assuming reinvestment of distributions from dividend income and capital gains (the profits earned upon the sale of securities that have grown in value, if any) at NAV and Market Price, respectively, and assumes a constant rate of performance each year. The hypothetical investment and the fund's returns do not reflect the deduction of taxes that a shareholder would pay on fund distributions or the redemption or selling of fund shares. How a fund did yesterday is no guarantee of how it will do tomorrow.
| Average Annual Total Returns |
| | | | |
Periods ended July 31, 2023 | Past 1 year | Life of Fund |
Fidelity® Small-Mid Cap Opportunities ETF - NAV A | 9.02% | 5.71% |
Fidelity® Small-Mid Cap Opportunities ETF - Market Price B | 8.91% | 4.75% |
Russell 2500™ Index A | 8.05% | 1.51% |
A From February 2, 2021
B From February 4, 2021, date initially listed on the CboeBZX Exchange, Inc.
| $10,000 Over Life of Fund |
| |
Let's say hypothetically that $10,000 was invested in Fidelity® Small-Mid Cap Opportunities ETF - NAV, on February 2, 2021, when the fund started. The chart shows how the value of your investment would have changed, and also shows how the Russell 2500™ Index performed over the same period. |
|
|
Fidelity® Small-Mid Cap Opportunities ETF
Market Recap:
U.S. equities gained 13.02% for the 12 months ending July 31, 2023, according to the S&P 500® index, as continued global economic expansion, falling commodity prices and a slowing in the pace of inflation provided a favorable backdrop for higher-risk assets. Large-cap stocks spearheaded the rally, which was driven by the shares of a narrow set of mega-cap companies in the information technology and communication services sectors, largely due to exuberance related to generative artificial intelligence. Aggressive monetary tightening by the U.S. Federal Reserve continued amid consistent pressure on core inflation, a measure that excludes food and energy. Since March 2022, the Fed has hiked its benchmark interest rate 11 times. The latest bump came in late July, a fourth consecutive raise of a stepped down 25 basis points. The S&P 500® gained 3.21% in July, as a "soft landing" of the U.S. economy became the consensus view amid better-than-expected earnings, slowing inflation and easing financial conditions, bringing the index's year-to-date gain to 20.65%. July saw a continuance of the recent shift to wider market breadth and lower dispersion. For the full 12 months, value (+17%) handily topped growth (+8%) within the index. By sector, tech (+28%), communication services (+21%) and industrials (+17%) led, whereas real estate (-10%) lagged most, due to high borrowing costs, low home inventory and a deteriorating commercial property market
Comments from Co-Portfolio Managers Tim Gannon and Michelle Hoerber:
For the fiscal year ending July 31, 2023, the exchange-traded fund's (ETF) net asset value returned 9.02% and its market price returned 8.91%, versus the 8.05% advance for the Russell 2500 Index. Relative to the benchmark, market selection was the primary contributor, especially an underweight in the real estate sector. The biggest contributor to performance versus the benchmark was security selection and an overweight in industrials. Stock picking in materials and energy also boosted the fund's relative performance. The top individual relative contributor was an overweight in Builders FirstSource (+111%), the fund's largest holding. The second-largest relative contributor was an overweight in Technipfmc (+127%), also among our biggest holdings. A non-benchmark stake in Arch Capital gained 75% and notably helped and also was among the largest holdings at period end. In contrast, the primary detractor from performance versus the benchmark was security selection in health care. Also hurting our result were stock selection in information technology and real estate. The largest individual relative detractor was our stake in Comerica (-48%), a stake we no longer held at period end. A second notable relative detractor was an overweight in Antero Resources (-33%). A stake in Cyxtera Technologies also returned -76% and notably hurt. Cyxtera Technologies was also not held at period end. Notable changes in positioning include increased exposure to the materials and information technology sectors.
The views expressed above reflect those of the portfolio manager(s) only through the end of the period as stated on the cover of this report and do not necessarily represent the views of Fidelity or any other person in the Fidelity organization, or Geode Capital Management, LLC, (the ETF's subadviser) or any other person in the Geode organization. Any such views are subject to change at any time based upon market or other conditions and Fidelity and Geode disclaim any responsibility to update such views. These views may not be relied on as investment advice and, because investment decisions for a Fidelity fund are based on numerous factors, may not be relied on as an indication of trading intent on behalf of any Fidelity fund.
Fidelity® Small-Mid Cap Opportunities ETF
Top Holdings (% of Fund's net assets) |
| |
| Builders FirstSource, Inc. | 2.0 | |
| TechnipFMC PLC | 1.7 | |
| TFI International, Inc. | 1.5 | |
| Tempur Sealy International, Inc. | 1.4 | |
| Hess Corp. | 1.4 | |
| AutoZone, Inc. | 1.3 | |
| Arch Capital Group Ltd. | 1.2 | |
| ON Semiconductor Corp. | 1.2 | |
| Amdocs Ltd. | 1.2 | |
| BJ's Wholesale Club Holdings, Inc. | 1.2 | |
| | 14.1 | |
| |
| Market Sectors (% of Fund's net assets) |
| |
| Industrials | 22.5 | |
| Financials | 15.8 | |
| Consumer Discretionary | 12.8 | |
| Information Technology | 12.6 | |
| Health Care | 10.7 | |
| Materials | 6.9 | |
| Energy | 6.3 | |
| Consumer Staples | 4.5 | |
| Real Estate | 3.9 | |
| Utilities | 1.6 | |
| Communication Services | 1.3 | |
| |
Asset Allocation (% of Fund's net assets) |
|
|
Fidelity® Small-Mid Cap Opportunities ETF
Showing Percentage of Net Assets
| Common Stocks - 98.9% |
| | | Shares | Value ($) |
| COMMUNICATION SERVICES - 1.3% | | | |
| Interactive Media & Services - 0.4% | | | |
| Ziff Davis, Inc. (a) | | 1,712 | 124,154 |
| Media - 0.9% | | | |
| Nexstar Broadcasting Group, Inc. Class A | | 1,700 | 317,424 |
TOTAL COMMUNICATION SERVICES | | | 441,578 |
| CONSUMER DISCRETIONARY - 12.8% | | | |
| Automobile Components - 0.6% | | | |
| Adient PLC (a) | | 2,852 | 121,381 |
| Patrick Industries, Inc. | | 818 | 70,798 |
| | | | 192,179 |
| Diversified Consumer Services - 0.6% | | | |
| Adtalem Global Education, Inc. (a) | | 1,699 | 73,465 |
| Duolingo, Inc. (a) | | 835 | 129,584 |
| | | | 203,049 |
| Hotels, Restaurants & Leisure - 2.8% | | | |
| Brinker International, Inc. (a) | | 3,255 | 127,856 |
| Churchill Downs, Inc. | | 2,713 | 314,301 |
| Light & Wonder, Inc. Class A (a) | | 2,169 | 152,481 |
| Red Rock Resorts, Inc. | | 2,110 | 102,335 |
| Wyndham Hotels & Resorts, Inc. | | 3,631 | 282,928 |
| | | | 979,901 |
| Household Durables - 2.9% | | | |
| Helen of Troy Ltd. (a) | | 1,007 | 142,289 |
| KB Home | | 3,087 | 166,605 |
| LGI Homes, Inc. (a) | | 1,580 | 219,225 |
| Tempur Sealy International, Inc. | | 11,157 | 497,937 |
| | | | 1,026,056 |
| Specialty Retail - 3.9% | | | |
| Academy Sports & Outdoors, Inc. | | 788 | 47,115 |
| AutoZone, Inc. (a) | | 187 | 464,082 |
| Dick's Sporting Goods, Inc. | | 2,040 | 287,640 |
| Murphy U.S.A., Inc. | | 852 | 261,590 |
| Upbound Group, Inc. | | 3,914 | 135,542 |
| Williams-Sonoma, Inc. | | 1,286 | 178,291 |
| | | | 1,374,260 |
| Textiles, Apparel & Luxury Goods - 2.0% | | | |
| Crocs, Inc. (a) | | 2,541 | 275,317 |
| Gildan Activewear, Inc. | | 3,290 | 102,319 |
| Tapestry, Inc. | | 7,887 | 340,324 |
| | | | 717,960 |
TOTAL CONSUMER DISCRETIONARY | | | 4,493,405 |
| CONSUMER STAPLES - 4.5% | | | |
| Consumer Staples Distribution & Retail - 3.2% | | | |
| BJ's Wholesale Club Holdings, Inc. (a) | | 6,111 | 405,220 |
| Performance Food Group Co. (a) | | 6,146 | 367,285 |
| U.S. Foods Holding Corp. (a) | | 7,872 | 336,371 |
| | | | 1,108,876 |
| Food Products - 1.3% | | | |
| Lamb Weston Holdings, Inc. | | 1,584 | 164,150 |
| Nomad Foods Ltd. (a) | | 13,962 | 248,244 |
| Seaboard Corp. | | 17 | 61,285 |
| | | | 473,679 |
TOTAL CONSUMER STAPLES | | | 1,582,555 |
| ENERGY - 6.3% | | | |
| Energy Equipment & Services - 1.7% | | | |
| TechnipFMC PLC | | 32,243 | 591,337 |
| Oil, Gas & Consumable Fuels - 4.6% | | | |
| Antero Resources Corp. (a) | | 10,095 | 270,041 |
| Cheniere Energy, Inc. | | 2,092 | 338,611 |
| Denbury, Inc. (a) | | 1,778 | 156,304 |
| Hess Corp. | | 3,183 | 482,957 |
| Marathon Oil Corp. | | 4,751 | 124,809 |
| Murphy Oil Corp. | | 5,077 | 219,682 |
| Sitio Royalties Corp. | | 1,261 | 34,476 |
| | | | 1,626,880 |
TOTAL ENERGY | | | 2,218,217 |
| FINANCIALS - 15.8% | | | |
| Banks - 6.3% | | | |
| BOK Financial Corp. | | 1,862 | 165,867 |
| Cadence Bank | | 7,915 | 198,271 |
| Eastern Bankshares, Inc. | | 12,875 | 181,795 |
| First Bancorp, Puerto Rico | | 10,487 | 155,732 |
| First Citizens Bancshares, Inc. | | 146 | 208,970 |
| First Hawaiian, Inc. | | 5,046 | 104,402 |
| First Interstate Bancsystem, Inc. | | 5,392 | 154,912 |
| Independent Bank Group, Inc. | | 2,625 | 117,784 |
| M&T Bank Corp. | | 699 | 97,762 |
| Pinnacle Financial Partners, Inc. | | 3,073 | 233,241 |
| Synovus Financial Corp. | | 6,528 | 221,299 |
| Trico Bancshares | | 817 | 30,539 |
| Webster Financial Corp. | | 3,417 | 161,692 |
| Wintrust Financial Corp. | | 1,990 | 167,876 |
| | | | 2,200,142 |
| Capital Markets - 1.5% | | | |
| LPL Financial | | 1,475 | 338,306 |
| Raymond James Financial, Inc. | | 1,736 | 191,082 |
| | | | 529,388 |
| Consumer Finance - 1.4% | | | |
| Discover Financial Services | | 2,625 | 277,069 |
| Encore Capital Group, Inc. (a) | | 1,240 | 66,340 |
| PROG Holdings, Inc. (a) | | 4,029 | 163,497 |
| | | | 506,906 |
| Financial Services - 0.4% | | | |
| Walker & Dunlop, Inc. | | 1,503 | 136,743 |
| Insurance - 6.2% | | | |
| American Financial Group, Inc. | | 1,515 | 184,239 |
| Arch Capital Group Ltd. (a) | | 5,354 | 415,952 |
| Assurant, Inc. | | 1,877 | 252,475 |
| Enstar Group Ltd. (a) | | 428 | 109,517 |
| First American Financial Corp. | | 6,362 | 403,224 |
| Old Republic International Corp. | | 11,205 | 308,922 |
| Primerica, Inc. | | 1,333 | 283,529 |
| Reinsurance Group of America, Inc. | | 1,505 | 211,227 |
| | | | 2,169,085 |
TOTAL FINANCIALS | | | 5,542,264 |
| HEALTH CARE - 10.7% | | | |
| Biotechnology - 1.6% | | | |
| Acelyrin, Inc. | | 701 | 17,413 |
| ALX Oncology Holdings, Inc. (a) | | 263 | 1,607 |
| Arcellx, Inc. (a) | | 719 | 24,626 |
| Arcutis Biotherapeutics, Inc. (a) | | 118 | 1,287 |
| Argenx SE ADR (a) | | 314 | 158,407 |
| Blueprint Medicines Corp. (a) | | 1,021 | 67,386 |
| Celldex Therapeutics, Inc. (a) | | 466 | 16,478 |
| Cytokinetics, Inc. (a) | | 905 | 30,182 |
| Day One Biopharmaceuticals, Inc. (a) | | 954 | 12,631 |
| Immunocore Holdings PLC ADR (a) | | 536 | 35,365 |
| Keros Therapeutics, Inc. (a) | | 176 | 7,371 |
| Nuvalent, Inc. Class A (a) | | 910 | 45,364 |
| Prelude Therapeutics, Inc. (a) | | 393 | 1,537 |
| PTC Therapeutics, Inc. (a) | | 756 | 30,497 |
| Vaxcyte, Inc. (a) | | 774 | 37,198 |
| Vericel Corp. (a) | | 528 | 18,966 |
| Verve Therapeutics, Inc. (a) | | 588 | 12,048 |
| Xenon Pharmaceuticals, Inc. (a) | | 824 | 30,422 |
| Zentalis Pharmaceuticals, Inc. (a) | | 771 | 20,593 |
| | | | 569,378 |
| Health Care Equipment & Supplies - 2.8% | | | |
| Envista Holdings Corp. (a) | | 6,871 | 236,431 |
| Haemonetics Corp. (a) | | 2,002 | 184,664 |
| Hologic, Inc. (a) | | 2,910 | 231,112 |
| ICU Medical, Inc. (a) | | 777 | 138,446 |
| TransMedics Group, Inc. (a) | | 2,152 | 200,523 |
| | | | 991,176 |
| Health Care Providers & Services - 3.5% | | | |
| Acadia Healthcare Co., Inc. (a) | | 3,390 | 267,912 |
| AdaptHealth Corp. (a) | | 7,558 | 103,847 |
| agilon health, Inc. (a) | | 5,345 | 102,357 |
| Molina Healthcare, Inc. (a) | | 1,243 | 378,481 |
| Owens & Minor, Inc. (a) | | 5,347 | 102,876 |
| Universal Health Services, Inc. Class B | | 2,034 | 282,645 |
| | | | 1,238,118 |
| Health Care Technology - 0.7% | | | |
| Evolent Health, Inc. (a) | | 3,399 | 103,296 |
| Phreesia, Inc. (a) | | 4,160 | 131,955 |
| | | | 235,251 |
| Life Sciences Tools & Services - 1.7% | | | |
| 10X Genomics, Inc. (a) | | 539 | 33,946 |
| Charles River Laboratories International, Inc. (a) | | 1,093 | 229,027 |
| ICON PLC (a) | | 142 | 35,700 |
| Medpace Holdings, Inc. (a) | | 695 | 175,953 |
| West Pharmaceutical Services, Inc. | | 311 | 114,460 |
| | | | 589,086 |
| Pharmaceuticals - 0.4% | | | |
| Arvinas Holding Co. LLC (a) | | 664 | 16,414 |
| Axsome Therapeutics, Inc. (a) | | 451 | 35,390 |
| Prestige Brands Holdings, Inc. (a) | | 368 | 23,997 |
| Ventyx Biosciences, Inc. (a) | | 561 | 20,785 |
| Verona Pharma PLC ADR (a) | | 1,517 | 33,511 |
| | | | 130,097 |
TOTAL HEALTH CARE | | | 3,753,106 |
| INDUSTRIALS - 22.5% | | | |
| Aerospace & Defense - 0.5% | | | |
| Curtiss-Wright Corp. | | 890 | 170,310 |
| Building Products - 2.5% | | | |
| Builders FirstSource, Inc. (a) | | 4,919 | 710,448 |
| Hayward Holdings, Inc. (a) | | 13,758 | 183,807 |
| | | | 894,255 |
| Commercial Services & Supplies - 0.4% | | | |
| The Brink's Co. | | 2,001 | 145,993 |
| Construction & Engineering - 2.7% | | | |
| AECOM | | 2,683 | 233,421 |
| EMCOR Group, Inc. | | 1,420 | 305,357 |
| Granite Construction, Inc. | | 5,007 | 204,937 |
| Willscot Mobile Mini Holdings (a) | | 3,965 | 190,122 |
| | | | 933,837 |
| Electrical Equipment - 3.8% | | | |
| Acuity Brands, Inc. | | 1,219 | 201,428 |
| AMETEK, Inc. | | 1,810 | 287,066 |
| Atkore, Inc. (a) | | 1,856 | 294,492 |
| Regal Rexnord Corp. | | 2,532 | 395,448 |
| Vertiv Holdings Co. | | 5,670 | 147,477 |
| | | | 1,325,911 |
| Ground Transportation - 2.2% | | | |
| TFI International, Inc. | | 4,187 | 537,401 |
| XPO, Inc. (a) | | 3,366 | 233,062 |
| | | | 770,463 |
| Machinery - 3.8% | | | |
| Allison Transmission Holdings, Inc. | | 3,329 | 195,379 |
| Crane Co. | | 2,695 | 252,495 |
| Crane Nxt Co. | | 2,695 | 159,409 |
| Federal Signal Corp. | | 2,707 | 165,371 |
| ITT, Inc. | | 3,302 | 328,879 |
| SPX Technologies, Inc. (a) | | 2,930 | 247,907 |
| | | | 1,349,440 |
| Professional Services - 5.2% | | | |
| ASGN, Inc. (a) | | 2,913 | 222,320 |
| CACI International, Inc. Class A (a) | | 888 | 311,191 |
| Concentrix Corp. | | 1,869 | 155,576 |
| ExlService Holdings, Inc. (a) | | 1,272 | 179,288 |
| Genpact Ltd. | | 5,652 | 203,981 |
| KBR, Inc. | | 5,211 | 320,424 |
| Kforce, Inc. | | 1,206 | 76,509 |
| Maximus, Inc. | | 1,959 | 164,086 |
| WNS Holdings Ltd. sponsored ADR (a) | | 2,554 | 176,507 |
| | | | 1,809,882 |
| Trading Companies & Distributors - 1.4% | | | |
| Applied Industrial Technologies, Inc. | | 988 | 143,250 |
| Beacon Roofing Supply, Inc. (a) | | 2,881 | 246,815 |
| Rush Enterprises, Inc. Class A | | 1,840 | 119,011 |
| | | | 509,076 |
TOTAL INDUSTRIALS | | | 7,909,167 |
| INFORMATION TECHNOLOGY - 12.6% | | | |
| Communications Equipment - 0.5% | | | |
| Lumentum Holdings, Inc. (a) | | 3,545 | 185,616 |
| Electronic Equipment, Instruments & Components - 4.7% | | | |
| Advanced Energy Industries, Inc. | | 2,585 | 323,590 |
| Coherent Corp. (a) | | 3,876 | 183,567 |
| Fabrinet (a) | | 2,144 | 265,084 |
| Flex Ltd. (a) | | 6,945 | 190,015 |
| Insight Enterprises, Inc. (a) | | 1,775 | 260,375 |
| TD SYNNEX Corp. | | 2,665 | 263,062 |
| Vontier Corp. | | 5,256 | 162,568 |
| | | | 1,648,261 |
| IT Services - 1.2% | | | |
| Amdocs Ltd. | | 4,377 | 409,862 |
| Semiconductors & Semiconductor Equipment - 3.1% | | | |
| Allegro MicroSystems LLC (a) | | 2,344 | 120,974 |
| Cirrus Logic, Inc. (a) | | 515 | 41,612 |
| Ichor Holdings Ltd. (a) | | 3,524 | 136,449 |
| Lattice Semiconductor Corp. (a) | | 2,483 | 225,804 |
| MACOM Technology Solutions Holdings, Inc. (a) | | 2,131 | 149,000 |
| ON Semiconductor Corp. (a) | | 3,808 | 410,312 |
| | | | 1,084,151 |
| Software - 2.1% | | | |
| Dynatrace, Inc. (a) | | 5,102 | 279,028 |
| Sprout Social, Inc. (a) | | 1,970 | 112,566 |
| Tenable Holdings, Inc. (a) | | 4,530 | 220,430 |
| Zoom Video Communications, Inc. Class A (a) | | 1,671 | 122,568 |
| | | | 734,592 |
| Technology Hardware, Storage & Peripherals - 1.0% | | | |
| Avid Technology, Inc. (a) | | 4,111 | 98,006 |
| Seagate Technology Holdings PLC | | 4,332 | 275,082 |
| | | | 373,088 |
TOTAL INFORMATION TECHNOLOGY | | | 4,435,570 |
| MATERIALS - 6.9% | | | |
| Chemicals - 2.7% | | | |
| Cabot Corp. | | 2,200 | 156,200 |
| Element Solutions, Inc. | | 8,375 | 175,540 |
| Olin Corp. | | 3,854 | 222,299 |
| The Chemours Co. LLC | | 9,644 | 356,635 |
| Tronox Holdings PLC | | 3,268 | 43,432 |
| | | | 954,106 |
| Construction Materials - 1.3% | | | |
| Eagle Materials, Inc. | | 1,606 | 296,098 |
| Summit Materials, Inc. | | 4,610 | 166,790 |
| | | | 462,888 |
| Containers & Packaging - 0.8% | | | |
| O-I Glass, Inc. (a) | | 11,803 | 270,997 |
| Metals & Mining - 1.6% | | | |
| Commercial Metals Co. | | 4,490 | 256,918 |
| Constellium NV (a) | | 5,325 | 101,654 |
| Steel Dynamics, Inc. | | 1,826 | 194,615 |
| | | | 553,187 |
| Paper & Forest Products - 0.5% | | | |
| Louisiana-Pacific Corp. | | 2,576 | 196,111 |
TOTAL MATERIALS | | | 2,437,289 |
| REAL ESTATE - 3.9% | | | |
| Equity Real Estate Investment Trusts (REITs) - 2.6% | | | |
| CubeSmart | | 9,229 | 400,169 |
| Douglas Emmett, Inc. | | 16,893 | 248,327 |
| Essential Properties Realty Trust, Inc. | | 6,746 | 165,614 |
| LXP Industrial Trust (REIT) | | 8,609 | 86,693 |
| | | | 900,803 |
| Real Estate Management & Development - 1.3% | | | |
| Cushman & Wakefield PLC (a) | | 15,204 | 149,455 |
| Jones Lang LaSalle, Inc. (a) | | 1,949 | 324,606 |
| | | | 474,061 |
TOTAL REAL ESTATE | | | 1,374,864 |
| UTILITIES - 1.6% | | | |
| Electric Utilities - 0.5% | | | |
| PG&E Corp. (a) | | 9,568 | 168,492 |
| Gas Utilities - 0.7% | | | |
| Brookfield Infrastructure Corp. A Shares | | 5,557 | 259,623 |
| Independent Power and Renewable Electricity Producers - 0.4% | | | |
| The AES Corp. | | 6,960 | 150,544 |
TOTAL UTILITIES | | | 578,659 |
| TOTAL COMMON STOCKS (Cost $29,866,160) | | | 34,766,674 |
| | | | |
| Money Market Funds - 1.2% |
| | | Shares | Value ($) |
State Street Institutional Treasury Plus Money Market Fund Trust Class 5.15% (b) (Cost $399,975) | | 399,975 | 399,975 |
| | | | |
| TOTAL INVESTMENT IN SECURITIES - 100.1% (Cost $30,266,135) | 35,166,649 |
NET OTHER ASSETS (LIABILITIES) - (0.1)% | (18,112) |
| NET ASSETS - 100.0% | 35,148,537 |
| | |
Legend
| (b) | The rate quoted is the annualized seven-day yield of the fund at period end. |
Investment Valuation
The following is a summary of the inputs used, as of July 31, 2023, involving the Fund's assets and liabilities carried at fair value. The inputs or methodology used for valuing securities may not be an indication of the risk associated with investing in those securities. For more information on valuation inputs, and their aggregation into the levels used below, please refer to the Investment Valuation section in the accompanying Notes to Financial Statements.
| Valuation Inputs at Reporting Date: |
| Description | Total ($) | Level 1 ($) | Level 2 ($) | Level 3 ($) |
Investments in Securities: | | | | |
|
| Equities: | | | | |
Communication Services | 441,578 | 441,578 | - | - |
Consumer Discretionary | 4,493,405 | 4,493,405 | - | - |
Consumer Staples | 1,582,555 | 1,582,555 | - | - |
Energy | 2,218,217 | 2,218,217 | - | - |
Financials | 5,542,264 | 5,542,264 | - | - |
Health Care | 3,753,106 | 3,753,106 | - | - |
Industrials | 7,909,167 | 7,909,167 | - | - |
Information Technology | 4,435,570 | 4,435,570 | - | - |
Materials | 2,437,289 | 2,437,289 | - | - |
Real Estate | 1,374,864 | 1,374,864 | - | - |
Utilities | 578,659 | 578,659 | - | - |
|
| Money Market Funds | 399,975 | 399,975 | - | - |
| Total Investments in Securities: | 35,166,649 | 35,166,649 | - | - |
Fidelity® Small-Mid Cap Opportunities ETF
| Statement of Assets and Liabilities |
| | | | July 31, 2023 |
| | | | | |
| Assets | | | | |
Investment in securities, at value - See accompanying schedule Unaffiliated issuers (cost $30,266,135): | | | $ | 35,166,649 |
| Dividends receivable | | | | 3,462 |
Total assets | | | | 35,170,111 |
| Liabilities | | | | |
| Payable for investments purchased | $ | 4,617 | | |
| Accrued management fee | | 16,957 | | |
| Total Liabilities | | | | 21,574 |
| Net Assets | | | $ | 35,148,537 |
| Net Assets consist of: | | | | |
| Paid in capital | | | $ | 34,516,899 |
| Total accumulated earnings (loss) | | | | 631,638 |
| Net Assets | | | $ | 35,148,537 |
Net Asset Value, offering price and redemption price per share ($35,148,537 ÷ 1,550,000 shares) | | | $ | 22.68 |
| Statement of Operations |
| | | | Year ended July 31, 2023 |
| Investment Income | | | | |
| Dividends | | | $ | 350,383 |
| Expenses | | | | |
| Management fee | $ | 176,672 | | |
| Independent trustees' fees and expenses | | 147 | | |
| Total expenses before reductions | | 176,819 | | |
| Expense reductions | | (10) | | |
| Total expenses after reductions | | | | 176,809 |
| Net Investment income (loss) | | | | 173,574 |
| Realized and Unrealized Gain (Loss) | | | | |
| Net realized gain (loss) on: | | | | |
| Investment Securities: | | | | |
| Redemptions in-kind | | 51,925 | | |
| Unaffiliated issuers | | (2,176,380) | | |
| Foreign currency transactions | | (5) | | |
| Futures contracts | | (1,685) | | |
| Total net realized gain (loss) | | | | (2,126,145) |
| Change in net unrealized appreciation (depreciation) on investment securities | | | | 4,570,740 |
| Net gain (loss) | | | | 2,444,595 |
| Net increase (decrease) in net assets resulting from operations | | | $ | 2,618,169 |
| Statement of Changes in Net Assets |
| |
| | Year ended July 31, 2023 | | Year ended July 31, 2022 |
| Increase (Decrease) in Net Assets | | | | |
| Operations | | | | |
| Net investment income (loss) | $ | 173,574 | $ | 127,019 |
| Net realized gain (loss) | | (2,126,145) | | (1,352,161) |
| Change in net unrealized appreciation (depreciation) | | 4,570,740 | | (1,276,518) |
| Net increase (decrease) in net assets resulting from operations | | 2,618,169 | | (2,501,660) |
| Distributions to shareholders | | (192,175) | | (131,575) |
| | | | | |
| Share transactions | | | | |
| Proceeds from sales of shares | | 5,939,963 | | 8,178,290 |
| Cost of shares redeemed | | (964,910) | | (2,355,247) |
| | | | | |
Net increase (decrease) in net assets resulting from share transactions | | 4,975,053 | | 5,823,043 |
| Total increase (decrease) in net assets | | 7,401,047 | | 3,189,808 |
| | | | | |
| Net Assets | | | | |
| Beginning of period | | 27,747,490 | | 24,557,682 |
| End of period | $ | 35,148,537 | $ | 27,747,490 |
| | | | | |
| Other Information | | | | |
| Shares | | | | |
| Sold | | 275,000 | | 350,000 |
| Redeemed | | (50,000) | | (100,000) |
| Net increase (decrease) | | 225,000 | | 250,000 |
| | | | | |
| Fidelity® Small-Mid Cap Opportunities ETF |
| |
| Years ended July 31, | | 2023 | | 2022 | | 2021 A |
Selected Per-Share Data | | | | | | |
| Net asset value, beginning of period | $ | 20.94 | $ | 22.84 | $ | 20.00 |
| Income from Investment Operations | | | | | | |
Net investment income (loss) B,C | | .12 | | .10 | | .03 |
| Net realized and unrealized gain (loss) | | 1.76 | | (1.89) | | 2.84 |
| Total from investment operations | | 1.88 | | (1.79) | | 2.87 |
| Distributions from net investment income | | (.14) | | (.11) | | (.03) |
| Total distributions | | (.14) | | (.11) | | (.03) |
| Net asset value, end of period | $ | 22.68 | $ | 20.94 | $ | 22.84 |
Total Return D,E,F | | 9.02% | | (7.88)% | | 14.36% |
Ratios to Average Net Assets C,G,H | | | | | | |
| Expenses before reductions | | .60% | | .62% | | .64% I |
| Expenses net of fee waivers, if any | | .60% | | .62% | | .64% I |
| Expenses net of all reductions | | .60% | | .62% | | .63% I |
| Net investment income (loss) | | .59% | | .45% | | .22% I |
| Supplemental Data | | | | | | |
| Net assets, end of period (000 omitted) | $ | 35,149 | $ | 27,747 | $ | 24,558 |
Portfolio turnover rate J,K | | 38% | | 42% | | 37% L |
AFor the period February 2, 2021 (commencement of operations) through July 31, 2021.
BCalculated based on average shares outstanding during the period.
CNet investment income (loss) is affected by the timing of the declaration of dividends by any underlying mutual funds or exchange-traded funds (ETFs). Net investment income (loss) of any mutual funds or ETFs is not included in the Fund's net investment income (loss) ratio.
DBased on net asset value.
ETotal returns would have been lower if certain expenses had not been reduced during the applicable periods shown.
FTotal returns for periods of less than one year are not annualized.
GFees and expenses of any underlying mutual funds or exchange-traded funds (ETFs) are not included in the Fund's expense ratio. The Fund indirectly bears its proportionate share of these expenses.
HExpense ratios reflect operating expenses of the class. Expenses before reductions do not reflect amounts reimbursed, waived, or reduced through arrangements with the investment adviser, brokerage services, or other offset arrangements, if applicable, and do not represent the amount paid by the class during periods when reimbursements, waivers or reductions occur.
IAnnualized.
JAmount does not include the portfolio activity of any underlying mutual funds or exchange-traded funds (ETFs).
KPortfolio turnover rate excludes securities received or delivered in-kind.
LAmount not annualized.
NAV and closing market price average annual returns reflect the change in the value of an investment, assuming reinvestment of distributions from dividend income and capital gains (the profits earned upon the sale of securities that have grown in value, if any) at NAV and Market Price, respectively, and assumes a constant rate of performance each year. The hypothetical investment and the fund's returns do not reflect the deduction of taxes that a shareholder would pay on fund distributions or the redemption or selling of fund shares. How a fund did yesterday is no guarantee of how it will do tomorrow.
| Average Annual Total Returns |
| | | | |
Periods ended July 31, 2023 | Past 1 year | Life of Fund |
Fidelity® Sustainable U.S. Equity ETF - NAV A | 14.25% | 4.80% |
Fidelity® Sustainable U.S. Equity ETF - Market Price B | 14.14% | 5.01% |
Russell 3000® Index A | 12.65% | 3.44% |
MSCI USA IMI ESG Leaders Index A | 13.04% | 4.51% |
A From June 15, 2021
B From June 17, 2021, date initially listed on the NYSE ARCA exchange.
| $10,000 Over Life of Fund |
| |
Let's say hypothetically that $10,000 was invested in Fidelity® Sustainability U.S. Equity ETF - NAV, on June 15, 2021, when the fund started. The chart shows how the value of your investment would have changed, and also shows how the Russell 3000® Index performed over the same period. |
|
|
Fidelity® Sustainable U.S. Equity ETF
Market Recap:
U.S. equities gained 13.02% for the 12 months ending July 31, 2023, according to the S&P 500® index, as continued global economic expansion, falling commodity prices and a slowing in the pace of inflation provided a favorable backdrop for higher-risk assets. Large-cap stocks spearheaded the rally, which was driven by the shares of a narrow set of mega-cap companies in the information technology and communication services sectors, largely due to exuberance related to generative artificial intelligence. Aggressive monetary tightening by the U.S. Federal Reserve continued amid consistent pressure on core inflation, a measure that excludes food and energy. Since March 2022, the Fed has hiked its benchmark interest rate 11 times. The latest bump came in late July, a fourth consecutive raise of a stepped down 25 basis points. The S&P 500® gained 3.21% in July, as a "soft landing" of the U.S. economy became the consensus view amid better-than-expected earnings, slowing inflation and easing financial conditions, bringing the index's year-to-date gain to 20.65%. July saw a continuance of the recent shift to wider market breadth and lower dispersion. For the full 12 months, value (+17%) handily topped growth (+8%) within the index. By sector, tech (+28%), communication services (+21%) and industrials (+17%) led, whereas real estate (-10%) lagged most, due to high borrowing costs, low home inventory and a deteriorating commercial property market.
Comments from Co-Portfolio Managers Nicole Connolly and Michael Robertson:
For the fiscal year ending July 31, 2023, the exchange-traded fund's (ETF) net asset value returned 14.25%, and its market price returned 14.14%, versus the 12.65% advance for the Russell 3000 Index, while the supplemental MSCI USA IMI ESG Leaders Index gained 13.04%. Relative to the supplemental benchmark, market selection was the primary contributor, led by an overweight in the information technology sector. Security selection in information technology also contributed. The biggest contributor to performance versus the benchmark was security selection in consumer discretionary. Stock picks and an overweight in information technology and stock selection and an underweight in energy also boosted the fund's relative performance. The top individual relative contributor was an overweight in Nvidia (+159%), which was among our biggest holdings. A second notable relative contributor was an overweight in Taylor Morrison Home (+69%). An overweight in Cheniere Energy (+12%) also helped. In contrast, the primary detractor from performance versus the benchmark was stock picking in industrials. Also hurting our result were stock picks in financials and materials. Not owning Meta Platforms, a benchmark component that gained about 100%, was the largest individual relative detractor. The second-largest relative detractor was an overweight in Danaher (-12%), one of the fund's largest holdings. Another notable relative detractor was our stake in Cable One (-47%), a stake we no longer held at period end. Notable changes in positioning include increased exposure to the information technology sector and a lower allocation to consumer staples.
Note to Shareholders: Application of FMR's environmental, social, and governance (ESG) ratings process and/or its sustainable investing exclusion criteria may affect the Fund's exposure to certain issuers, sectors, regions, and countries and may affect the Fund's performance.
The views expressed above reflect those of the portfolio manager(s) only through the end of the period as stated on the cover of this report and do not necessarily represent the views of Fidelity or any other person in the Fidelity organization, or Geode Capital Management, LLC, (the ETF's subadviser) or any other person in the Geode organization. Any such views are subject to change at any time based upon market or other conditions and Fidelity and Geode disclaim any responsibility to update such views. These views may not be relied on as investment advice and, because investment decisions for a Fidelity fund are based on numerous factors, may not be relied on as an indication of trading intent on behalf of any Fidelity fund.
Fidelity® Sustainable U.S. Equity ETF
Top Holdings (% of Fund's net assets) |
| |
| Microsoft Corp. | 7.9 | |
| NVIDIA Corp. | 4.0 | |
| Apple, Inc. | 3.1 | |
| Salesforce, Inc. | 2.8 | |
| Intuit, Inc. | 2.4 | |
| Cigna Group | 2.3 | |
| Alphabet, Inc. Class A | 2.2 | |
| Procter & Gamble Co. | 2.2 | |
| Danaher Corp. | 2.2 | |
| The Travelers Companies, Inc. | 2.2 | |
| | 31.3 | |
| |
| Market Sectors (% of Fund's net assets) |
| |
| Information Technology | 29.3 | |
| Health Care | 13.2 | |
| Financials | 12.1 | |
| Industrials | 10.4 | |
| Consumer Discretionary | 10.0 | |
| Communication Services | 6.2 | |
| Consumer Staples | 5.3 | |
| Materials | 4.5 | |
| Energy | 3.0 | |
| Real Estate | 2.1 | |
| Utilities | 1.8 | |
| |
Asset Allocation (% of Fund's net assets) |
|
|
Fidelity® Sustainable U.S. Equity ETF
Showing Percentage of Net Assets
| Common Stocks - 97.9% |
| | | Shares | Value ($) |
| COMMUNICATION SERVICES - 6.2% | | | |
| Entertainment - 1.8% | | | |
| Netflix, Inc. (a) | | 424 | 186,123 |
| Interactive Media & Services - 2.2% | | | |
| Alphabet, Inc. Class A (a) | | 1,734 | 230,136 |
| Media - 2.2% | | | |
| Comcast Corp. Class A | | 2,683 | 121,433 |
| Interpublic Group of Companies, Inc. | | 2,923 | 100,054 |
| | | | 221,487 |
TOTAL COMMUNICATION SERVICES | | | 637,746 |
| CONSUMER DISCRETIONARY - 10.0% | | | |
| Automobile Components - 0.8% | | | |
| Aptiv PLC (a) | | 784 | 85,840 |
| Automobiles - 1.2% | | | |
| General Motors Co. | | 2,132 | 81,805 |
| Tesla, Inc. (a) | | 173 | 46,265 |
| | | | 128,070 |
| Broadline Retail - 2.0% | | | |
| Amazon.com, Inc. (a) | | 1,520 | 203,194 |
| Diversified Consumer Services - 1.2% | | | |
| Adtalem Global Education, Inc. (a) | | 2,876 | 124,358 |
| Hotels, Restaurants & Leisure - 1.5% | | | |
| Marriott International, Inc. Class A | | 762 | 153,779 |
| Household Durables - 0.8% | | | |
| Taylor Morrison Home Corp. (a) | | 1,690 | 81,830 |
| Specialty Retail - 1.6% | | | |
| Lowe's Companies, Inc. | | 684 | 160,241 |
| Textiles, Apparel & Luxury Goods - 0.9% | | | |
| Tapestry, Inc. | | 2,203 | 95,059 |
TOTAL CONSUMER DISCRETIONARY | | | 1,032,371 |
| CONSUMER STAPLES - 5.3% | | | |
| Consumer Staples Distribution & Retail - 1.4% | | | |
| Albertsons Companies, Inc. | | 4,239 | 92,113 |
| Sprouts Farmers Market LLC (a) | | 1,337 | 52,477 |
| | | | 144,590 |
| Food Products - 1.1% | | | |
| Darling Ingredients, Inc. (a) | | 825 | 57,131 |
| Nomad Foods Ltd. (a) | | 2,889 | 51,366 |
| | | | 108,497 |
| Household Products - 2.2% | | | |
| Procter & Gamble Co. | | 1,468 | 229,448 |
| Personal Care Products - 0.6% | | | |
| Estee Lauder Companies, Inc. Class A | | 373 | 67,140 |
TOTAL CONSUMER STAPLES | | | 549,675 |
| ENERGY - 3.0% | | | |
| Energy Equipment & Services - 1.4% | | | |
| Baker Hughes Co. Class A | | 4,210 | 150,676 |
| Oil, Gas & Consumable Fuels - 1.6% | | | |
| Cheniere Energy, Inc. | | 581 | 94,041 |
| Occidental Petroleum Corp. | | 1,071 | 67,612 |
| | | | 161,653 |
TOTAL ENERGY | | | 312,329 |
| FINANCIALS - 12.1% | | | |
| Banks - 1.9% | | | |
| Bank of America Corp. | | 5,956 | 190,592 |
| Capital Markets - 5.3% | | | |
| BlackRock, Inc. Class A | | 162 | 119,694 |
| Moody's Corp. | | 413 | 145,686 |
| Northern Trust Corp. | | 1,722 | 137,967 |
| State Street Corp. | | 2,024 | 146,619 |
| | | | 549,966 |
| Consumer Finance - 1.5% | | | |
| American Express Co. | | 913 | 154,187 |
| Financial Services - 1.2% | | | |
| MasterCard, Inc. Class A | | 320 | 126,170 |
| Insurance - 2.2% | | | |
| The Travelers Companies, Inc. | | 1,315 | 226,982 |
TOTAL FINANCIALS | | | 1,247,897 |
| HEALTH CARE - 13.2% | | | |
| Biotechnology - 1.7% | | | |
| Moderna, Inc. (a) | | 329 | 38,710 |
| Vertex Pharmaceuticals, Inc. (a) | | 389 | 137,060 |
| | | | 175,770 |
| Health Care Providers & Services - 4.4% | | | |
| Centene Corp. (a) | | 1,629 | 110,919 |
| Cigna Group | | 788 | 232,539 |
| CVS Health Corp. | | 1,420 | 106,060 |
| | | | 449,518 |
| Life Sciences Tools & Services - 3.6% | | | |
| Danaher Corp. | | 894 | 228,024 |
| ICON PLC (a) | | 570 | 143,304 |
| | | | 371,328 |
| Pharmaceuticals - 3.5% | | | |
| Merck & Co., Inc. | | 2,000 | 213,300 |
| Zoetis, Inc. Class A | | 785 | 147,651 |
| | | | 360,951 |
TOTAL HEALTH CARE | | | 1,357,567 |
| INDUSTRIALS - 10.4% | | | |
| Air Freight & Logistics - 1.3% | | | |
| United Parcel Service, Inc. Class B | | 724 | 135,482 |
| Building Products - 1.2% | | | |
| Johnson Controls International PLC | | 1,739 | 120,947 |
| Electrical Equipment - 2.4% | | | |
| Acuity Brands, Inc. | | 605 | 99,970 |
| Generac Holdings, Inc. (a) | | 415 | 63,786 |
| Regal Rexnord Corp. | | 543 | 84,806 |
| | | | 248,562 |
| Machinery - 2.1% | | | |
| Deere & Co. | | 240 | 103,104 |
| Ingersoll Rand, Inc. | | 1,764 | 115,136 |
| | | | 218,240 |
| Professional Services - 3.4% | | | |
| KBR, Inc. | | 3,552 | 218,412 |
| Manpower, Inc. | | 1,006 | 79,353 |
| Verisk Analytics, Inc. | | 231 | 52,885 |
| | | | 350,650 |
TOTAL INDUSTRIALS | | | 1,073,881 |
| INFORMATION TECHNOLOGY - 29.3% | | | |
| Electronic Equipment, Instruments & Components - 0.7% | | | |
| Flex Ltd. (a) | | 2,591 | 70,890 |
| IT Services - 2.0% | | | |
| Accenture PLC Class A | | 655 | 207,209 |
| Semiconductors & Semiconductor Equipment - 8.8% | | | |
| Advanced Micro Devices, Inc. (a) | | 1,048 | 119,891 |
| NVIDIA Corp. | | 886 | 414,019 |
| NXP Semiconductors NV | | 643 | 143,376 |
| ON Semiconductor Corp. (a) | | 1,596 | 171,969 |
| SolarEdge Technologies, Inc. (a) | | 256 | 61,814 |
| | | | 911,069 |
| Software - 14.7% | | | |
| Adobe, Inc. (a) | | 309 | 168,767 |
| Intuit, Inc. | | 485 | 248,175 |
| Microsoft Corp. | | 2,417 | 811,919 |
| Salesforce, Inc. (a) | | 1,279 | 287,788 |
| | | | 1,516,649 |
| Technology Hardware, Storage & Peripherals - 3.1% | | | |
| Apple, Inc. | | 1,622 | 318,642 |
TOTAL INFORMATION TECHNOLOGY | | | 3,024,459 |
| MATERIALS - 4.5% | | | |
| Chemicals - 1.8% | | | |
| Linde PLC | | 478 | 186,740 |
| Containers & Packaging - 2.7% | | | |
| Avery Dennison Corp. | | 904 | 166,345 |
| Crown Holdings, Inc. | | 1,201 | 111,405 |
| | | | 277,750 |
TOTAL MATERIALS | | | 464,490 |
| REAL ESTATE - 2.1% | | | |
| Equity Real Estate Investment Trusts (REITs) - 2.1% | | | |
| Prologis (REIT), Inc. | | 1,728 | 215,568 |
| UTILITIES - 1.8% | | | |
| Electric Utilities - 1.1% | | | |
| NextEra Energy, Inc. | | 1,580 | 115,814 |
| Water Utilities - 0.7% | | | |
| American Water Works Co., Inc. | | 491 | 72,388 |
TOTAL UTILITIES | | | 188,202 |
| TOTAL COMMON STOCKS (Cost $8,907,367) | | | 10,104,185 |
| | | | |
| Money Market Funds - 1.8% |
| | | Shares | Value ($) |
State Street Institutional Treasury Plus Money Market Fund Trust Class 5.15% (b) (Cost $183,354) | | 183,354 | 183,354 |
| | | | |
| TOTAL INVESTMENT IN SECURITIES - 99.7% (Cost $9,090,721) | 10,287,539 |
NET OTHER ASSETS (LIABILITIES) - 0.3% | 29,031 |
| NET ASSETS - 100.0% | 10,316,570 |
| | |
Legend
| (b) | The rate quoted is the annualized seven-day yield of the fund at period end. |
Investment Valuation
The following is a summary of the inputs used, as of July 31, 2023, involving the Fund's assets and liabilities carried at fair value. The inputs or methodology used for valuing securities may not be an indication of the risk associated with investing in those securities. For more information on valuation inputs, and their aggregation into the levels used below, please refer to the Investment Valuation section in the accompanying Notes to Financial Statements.
| Valuation Inputs at Reporting Date: |
| Description | Total ($) | Level 1 ($) | Level 2 ($) | Level 3 ($) |
Investments in Securities: | | | | |
|
| Equities: | | | | |
Communication Services | 637,746 | 637,746 | - | - |
Consumer Discretionary | 1,032,371 | 1,032,371 | - | - |
Consumer Staples | 549,675 | 549,675 | - | - |
Energy | 312,329 | 312,329 | - | - |
Financials | 1,247,897 | 1,247,897 | - | - |
Health Care | 1,357,567 | 1,357,567 | - | - |
Industrials | 1,073,881 | 1,073,881 | - | - |
Information Technology | 3,024,459 | 3,024,459 | - | - |
Materials | 464,490 | 464,490 | - | - |
Real Estate | 215,568 | 215,568 | - | - |
Utilities | 188,202 | 188,202 | - | - |
|
| Money Market Funds | 183,354 | 183,354 | - | - |
| Total Investments in Securities: | 10,287,539 | 10,287,539 | - | - |
Fidelity® Sustainable U.S. Equity ETF
| Statement of Assets and Liabilities |
| | | | July 31, 2023 |
| | | | | |
| Assets | | | | |
Investment in securities, at value - See accompanying schedule Unaffiliated issuers (cost $9,090,721): | | | $ | 10,287,539 |
| Receivable for investments sold | | | | 28,472 |
| Dividends receivable | | | | 5,546 |
Total assets | | | | 10,321,557 |
| Liabilities | | | | |
| Accrued management fee | $ | 4,987 | | |
| Total Liabilities | | | | 4,987 |
| Net Assets | | | $ | 10,316,570 |
| Net Assets consist of: | | | | |
| Paid in capital | | | $ | 9,669,347 |
| Total accumulated earnings (loss) | | | | 647,223 |
| Net Assets | | | $ | 10,316,570 |
Net Asset Value, offering price and redemption price per share ($10,316,570 ÷ 475,000 shares) | | | $ | 21.72 |
| Statement of Operations |
| | | | Year ended July 31, 2023 |
| Investment Income | | | | |
| Dividends | | | $ | 108,815 |
| Special dividends | | | | 19,934 |
| Total Income | | | | 128,749 |
| Expenses | | | | |
| Management fee | $ | 46,132 | | |
| Independent trustees' fees and expenses | | 36 | | |
| Total Expenses | | | | 46,168 |
| Net Investment income (loss) | | | | 82,581 |
| Realized and Unrealized Gain (Loss) | | | | |
| Net realized gain (loss) on: | | | | |
| Investment Securities: | | | | |
| Unaffiliated issuers | | (274,000) | | |
| Total net realized gain (loss) | | | | (274,000) |
| Change in net unrealized appreciation (depreciation) on investment securities | | | | 1,506,035 |
| Net gain (loss) | | | | 1,232,035 |
| Net increase (decrease) in net assets resulting from operations | | | $ | 1,314,616 |
| Statement of Changes in Net Assets |
| |
| | Year ended July 31, 2023 | | Year ended July 31, 2022 |
| Increase (Decrease) in Net Assets | | | | |
| Operations | | | | |
| Net investment income (loss) | $ | 82,581 | $ | 29,286 |
| Net realized gain (loss) | | (274,000) | | (169,763) |
| Change in net unrealized appreciation (depreciation) | | 1,506,035 | | (408,202) |
| Net increase (decrease) in net assets resulting from operations | | 1,314,616 | | (548,679) |
| Distributions to shareholders | | (79,775) | | (36,950) |
| | | | | |
| Share transactions | | | | |
| Proceeds from sales of shares | | 3,318,417 | | 4,831,792 |
| Cost of shares redeemed | | - | | (1,603,015) |
| | | | | |
Net increase (decrease) in net assets resulting from share transactions | | 3,318,417 | | 3,228,777 |
| Total increase (decrease) in net assets | | 4,553,258 | | 2,643,148 |
| | | | | |
| Net Assets | | | | |
| Beginning of period | | 5,763,312 | | 3,120,164 |
| End of period | $ | 10,316,570 | $ | 5,763,312 |
| | | | | |
| Other Information | | | | |
| Shares | | | | |
| Sold | | 175,000 | | 225,000 |
| Redeemed | | - | | (75,000) |
| Net increase (decrease) | | 175,000 | | 150,000 |
| | | | | |
| Fidelity® Sustainability U.S. Equity ETF |
| |
| Years ended July 31, | | 2023 | | 2022 | | 2021 A |
Selected Per-Share Data | | | | | | |
| Net asset value, beginning of period | $ | 19.21 | $ | 20.80 | $ | 20.00 |
| Income from Investment Operations | | | | | | |
Net investment income (loss) B,C | | .20 D | | .11 | | - E |
| Net realized and unrealized gain (loss) | | 2.51 | | (1.57) | | .80 |
| Total from investment operations | | 2.71 | | (1.46) | | .80 |
| Distributions from net investment income | | (.20) | | (.13) | | - |
| Total distributions | | (.20) | | (.13) | | - |
| Net asset value, end of period | $ | 21.72 | $ | 19.21 | $ | 20.80 |
Total Return F,G | | 14.25% | | (7.01)% | | 3.99% |
Ratios to Average Net Assets C,H,I | | | | | | |
| Expenses before reductions | | .59% | | .59% | | .59% J |
| Expenses net of fee waivers, if any | | .59% | | .59% | | .59% J |
| Expenses net of all reductions | | .59% | | .59% | | .59% J |
| Net investment income (loss) | | 1.06% D | | .56% | | (.07)% J |
| Supplemental Data | | | | | | |
| Net assets, end of period (000 omitted) | $ | 10,317 | $ | 5,763 | $ | 3,120 |
Portfolio turnover rate K,L | | 45% | | 66% | | 23% M |
AFor the period June 15, 2021 (commencement of operations) through July 31, 2021.
BCalculated based on average shares outstanding during the period.
CNet investment income (loss) is affected by the timing of the declaration of dividends by any underlying mutual funds or exchange-traded funds (ETFs). Net investment income (loss) of any mutual funds or ETFs is not included in the Fund's net investment income (loss) ratio.
DNet investment income per share reflects one or more large, non-recurring dividend(s) which amounted to $.05 per share. Excluding such non-recurring dividend(s), the ratio of net investment income (loss) to average net assets would have been .80%.
EAmount represents less than $.005 per share.
FTotal returns for periods of less than one year are not annualized.
GBased on net asset value.
HFees and expenses of any underlying mutual funds or exchange-traded funds (ETFs) are not included in the Fund's expense ratio. The Fund indirectly bears its proportionate share of these expenses.
IExpense ratios reflect operating expenses of the class. Expenses before reductions do not reflect amounts reimbursed, waived, or reduced through arrangements with the investment adviser, brokerage services, or other offset arrangements, if applicable, and do not represent the amount paid by the class during periods when reimbursements, waivers or reductions occur.
JAnnualized.
KPortfolio turnover rate excludes securities received or delivered in-kind.
LAmount does not include the portfolio activity of any underlying mutual funds or exchange-traded funds (ETFs).
MAmount not annualized.
NAV and closing market price average annual returns reflect the change in the value of an investment, assuming reinvestment of distributions from dividend income and capital gains (the profits earned upon the sale of securities that have grown in value, if any) at NAV and Market Price, respectively, and assumes a constant rate of performance each year. The hypothetical investment and the fund's returns do not reflect the deduction of taxes that a shareholder would pay on fund distributions or the redemption or selling of fund shares. How a fund did yesterday is no guarantee of how it will do tomorrow.
| Average Annual Total Returns |
| | | | |
Periods ended July 31, 2023 | Past 1 year | Life of Fund |
Fidelity® Women's Leadership ETF - NAV A | 12.98% | -0.26% |
Fidelity® Women's Leadership ETF - Market Price B | 12.85% | -0.14% |
Russell 3000® Index A | 12.65% | 3.44% |
MSCI USA Women's Leadership Index A | 9.20% | -1.62% |
A From June 15, 2021
B From June 17, 2021, date initially listed on the NYSE ARCA exchange.
| $10,000 Over Life of Fund |
| |
Let's say hypothetically that $10,000 was invested in Fidelity® Women's Leadership ETF - NAV, on June 15, 2021, when the fund started. The chart shows how the value of your investment would have changed, and also shows how the Russell 3000® Index performed over the same period. |
|
|
Fidelity® Women's Leadership ETF
Market Recap:
U.S. equities gained 13.02% for the 12 months ending July 31, 2023, according to the S&P 500® index, as continued global economic expansion, falling commodity prices and a slowing in the pace of inflation provided a favorable backdrop for higher-risk assets. Large-cap stocks spearheaded the rally, which was driven by the shares of a narrow set of mega-cap companies in the information technology and communication services sectors, largely due to exuberance related to generative artificial intelligence. Aggressive monetary tightening by the U.S. Federal Reserve continued amid consistent pressure on core inflation, a measure that excludes food and energy. Since March 2022, the Fed has hiked its benchmark interest rate 11 times. The latest bump came in late July, a fourth consecutive raise of a stepped down 25 basis points. The S&P 500® gained 3.21% in July, as a "soft landing" of the U.S. economy became the consensus view amid better-than-expected earnings, slowing inflation and easing financial conditions, bringing the index's year-to-date gain to 20.65%. July saw a continuance of the recent shift to wider market breadth and lower dispersion. For the full 12 months, value (+17%) handily topped growth (+8%) within the index. By sector, tech (+28%), communication services (+21%) and industrials (+17%) led, whereas real estate (-10%) lagged most, due to high borrowing costs, low home inventory and a deteriorating commercial property market.
Comments from Co-Managers Nicole Connolly and Kenyon Hunt:
For the fiscal year ending July 31, 2023, the exchange-traded fund's (ETF) net asset value returned 12.98%, and its market price returned 12.85%, versus the 12.65% advance for the Russell 3000 Index and the 9.2% return for the MSCI USA Women's Leadership Index. Relative to the secondary benchmark, security selection was the primary contributor, led by the information technology sector. Stock picking in financials and materials also boosted the fund's relative performance. The top individual relative contributor was our non-benchmark stake in Nvidia (+156%), one of the fund's largest holdings at period end. A non-benchmark stake in Axcelis Technologies also gained 146% and was the second-largest relative contributor. This was a stake we established the past year. Another notable relative contributor was our non-benchmark stake in Federal Signal (+47%), a position we trimmed this period. All of these contributors were non-benchmark positions. In contrast, the primary detractor from performance versus the benchmark was stock selection in communication services. Stock picking in consumer discretionary also hampered the fund's result. Also detracting from our result was an overweight in financials. The fund's non-benchmark stake in Bumble returned roughly -53% and was the biggest individual relative detractor. A second notable relative detractor this period was avoiding Trade Desk, a benchmark component that gained 103%. Not owning Roku, a benchmark component that gained 47%, also detracted. Notable changes in positioning include higher allocations to the materials and information technology sectors.
Note to shareholders:
On January 31, 2023, Kenyon Hunt succeeded Michael Robertson as co-manager of the fund.
Application of FMR's environmental, social, and governance (ESG) ratings process and/or its sustainable investing exclusion criteria may affect the Fund's exposure to certain issuers, sectors, regions, and countries and may affect the Fund's performance.
The views expressed above reflect those of the portfolio manager(s) only through the end of the period as stated on the cover of this report and do not necessarily represent the views of Fidelity or any other person in the Fidelity organization, or Geode Capital Management, LLC, (the ETF's subadviser) or any other person in the Geode organization. Any such views are subject to change at any time based upon market or other conditions and Fidelity and Geode disclaim any responsibility to update such views. These views may not be relied on as investment advice and, because investment decisions for a Fidelity fund are based on numerous factors, may not be relied on as an indication of trading intent on behalf of any Fidelity fund.
Fidelity® Women's Leadership ETF
Top Holdings (% of Fund's net assets) |
| |
| Microsoft Corp. | 3.9 | |
| Apple, Inc. | 2.7 | |
| Accenture PLC Class A | 2.2 | |
| Amazon.com, Inc. | 2.1 | |
| NVIDIA Corp. | 2.1 | |
| Vertex Pharmaceuticals, Inc. | 1.9 | |
| Hologic, Inc. | 1.8 | |
| Salesforce, Inc. | 1.8 | |
| Adobe, Inc. | 1.7 | |
| MasterCard, Inc. Class A | 1.7 | |
| | 21.9 | |
| |
| Market Sectors (% of Fund's net assets) |
| |
| Information Technology | 25.6 | |
| Financials | 13.5 | |
| Health Care | 13.2 | |
| Industrials | 12.3 | |
| Consumer Discretionary | 11.5 | |
| Materials | 4.9 | |
| Communication Services | 4.7 | |
| Consumer Staples | 3.7 | |
| Energy | 3.3 | |
| Real Estate | 2.2 | |
| Utilities | 2.1 | |
| |
Asset Allocation (% of Fund's net assets) |
|
|
Fidelity® Women's Leadership ETF
Showing Percentage of Net Assets
| Common Stocks - 97.0% |
| | | Shares | Value ($) |
| COMMUNICATION SERVICES - 4.7% | | | |
| Entertainment - 2.1% | | | |
| Netflix, Inc. (a) | | 102 | 44,775 |
| The Walt Disney Co. (a) | | 294 | 26,134 |
| | | | 70,909 |
| Interactive Media & Services - 1.2% | | | |
| Alphabet, Inc. Class C (a) | | 170 | 22,629 |
| Bumble, Inc. (a) | | 1,036 | 19,187 |
| | | | 41,816 |
| Media - 1.4% | | | |
| Interpublic Group of Companies, Inc. | | 1,371 | 46,929 |
TOTAL COMMUNICATION SERVICES | | | 159,654 |
| CONSUMER DISCRETIONARY - 11.5% | | | |
| Automobiles - 0.7% | | | |
| General Motors Co. | | 644 | 24,710 |
| Broadline Retail - 3.3% | | | |
| Amazon.com, Inc. (a) | | 549 | 73,390 |
| Etsy, Inc. (a) | | 207 | 21,042 |
| Kohl's Corp. | | 657 | 18,692 |
| | | | 113,124 |
| Diversified Consumer Services - 1.3% | | | |
| Adtalem Global Education, Inc. (a) | | 658 | 28,452 |
| Bright Horizons Family Solutions, Inc. (a) | | 162 | 15,719 |
| | | | 44,171 |
| Hotels, Restaurants & Leisure - 1.7% | | | |
| Marriott International, Inc. Class A | | 186 | 37,537 |
| Vail Resorts, Inc. | | 86 | 20,252 |
| | | | 57,789 |
| Household Durables - 0.9% | | | |
| Taylor Morrison Home Corp. (a) | | 670 | 32,441 |
| Specialty Retail - 3.1% | | | |
| Aritzia, Inc. (a) | | 558 | 10,617 |
| Best Buy Co., Inc. | | 237 | 19,683 |
| Foot Locker, Inc. | | 296 | 7,954 |
| Lowe's Companies, Inc. | | 160 | 37,483 |
| Williams-Sonoma, Inc. | | 212 | 29,392 |
| | | | 105,129 |
| Textiles, Apparel & Luxury Goods - 0.5% | | | |
| Tapestry, Inc. | | 407 | 17,562 |
TOTAL CONSUMER DISCRETIONARY | | | 394,926 |
| CONSUMER STAPLES - 3.7% | | | |
| Consumer Staples Distribution & Retail - 0.5% | | | |
| Albertsons Companies, Inc. | | 793 | 17,232 |
| Food Products - 1.8% | | | |
| Bunge Ltd. | | 181 | 19,669 |
| The Hershey Co. | | 181 | 41,867 |
| | | | 61,536 |
| Household Products - 0.8% | | | |
| The Clorox Co. | | 164 | 24,843 |
| Personal Care Products - 0.6% | | | |
| Estee Lauder Companies, Inc. Class A | | 117 | 21,060 |
TOTAL CONSUMER STAPLES | | | 124,671 |
| ENERGY - 3.3% | | | |
| Energy Equipment & Services - 0.9% | | | |
| Baker Hughes Co. Class A | | 870 | 31,137 |
| Oil, Gas & Consumable Fuels - 2.4% | | | |
| Antero Resources Corp. (a) | | 782 | 20,919 |
| EQT Corp. | | 433 | 18,264 |
| Marathon Petroleum Corp. | | 145 | 19,288 |
| Occidental Petroleum Corp. | | 392 | 24,747 |
| | | | 83,218 |
TOTAL ENERGY | | | 114,355 |
| FINANCIALS - 13.5% | | | |
| Banks - 4.9% | | | |
| Bank of America Corp. | | 1,712 | 54,784 |
| Citigroup, Inc. | | 611 | 29,120 |
| First Horizon National Corp. | | 1,280 | 17,446 |
| Huntington Bancshares, Inc. | | 2,159 | 26,426 |
| JPMorgan Chase & Co. | | 253 | 39,964 |
| | | | 167,740 |
| Capital Markets - 1.9% | | | |
| Franklin Resources, Inc. | | 689 | 20,146 |
| NASDAQ, Inc. | | 930 | 46,956 |
| | | | 67,102 |
| Financial Services - 3.3% | | | |
| MasterCard, Inc. Class A | | 148 | 58,353 |
| WEX, Inc. (a) | | 288 | 54,533 |
| | | | 112,886 |
| Insurance - 3.4% | | | |
| Hartford Financial Services Group, Inc. | | 746 | 53,622 |
| Marsh & McLennan Companies, Inc. | | 147 | 27,698 |
| Progressive Corp. | | 272 | 34,267 |
| | | | 115,587 |
TOTAL FINANCIALS | | | 463,315 |
| HEALTH CARE - 13.2% | | | |
| Biotechnology - 3.6% | | | |
| Alnylam Pharmaceuticals, Inc. (a) | | 114 | 22,276 |
| Moderna, Inc. (a) | | 107 | 12,590 |
| Sage Therapeutics, Inc. (a) | | 286 | 9,918 |
| Vertex Pharmaceuticals, Inc. (a) | | 187 | 65,888 |
| Zai Lab Ltd. ADR (a) | | 392 | 11,784 |
| | | | 122,456 |
| Health Care Equipment & Supplies - 2.3% | | | |
| Hologic, Inc. (a) | | 800 | 63,536 |
| Insulet Corp. (a) | | 60 | 16,605 |
| | | | 80,141 |
| Health Care Providers & Services - 4.3% | | | |
| Centene Corp. (a) | | 556 | 37,858 |
| Cigna Group | | 155 | 45,741 |
| CVS Health Corp. | | 408 | 30,474 |
| Elevance Health, Inc. | | 71 | 33,486 |
| | | | 147,559 |
| Life Sciences Tools & Services - 0.8% | | | |
| ICON PLC (a) | | 110 | 27,655 |
| Pharmaceuticals - 2.2% | | | |
| Eli Lilly & Co. | | 53 | 24,091 |
| Zoetis, Inc. Class A | | 265 | 49,844 |
| | | | 73,935 |
TOTAL HEALTH CARE | | | 451,746 |
| INDUSTRIALS - 12.3% | | | |
| Air Freight & Logistics - 1.1% | | | |
| United Parcel Service, Inc. Class B | | 207 | 38,736 |
| Electrical Equipment - 4.3% | | | |
| AMETEK, Inc. | | 270 | 42,822 |
| Eaton Corp. PLC | | 146 | 29,977 |
| nVent Electric PLC | | 760 | 40,189 |
| Regal Rexnord Corp. | | 145 | 22,646 |
| Sunrun, Inc. (a) | | 590 | 11,198 |
| | | | 146,832 |
| Ground Transportation - 0.4% | | | |
| ArcBest Corp. | | 115 | 13,377 |
| Machinery - 3.3% | | | |
| Deere & Co. | | 82 | 35,227 |
| Federal Signal Corp. | | 427 | 26,085 |
| Hillenbrand, Inc. | | 339 | 17,608 |
| Otis Worldwide Corp. | | 365 | 33,200 |
| | | | 112,120 |
| Passenger Airlines - 0.2% | | | |
| JetBlue Airways Corp. (a) | | 1,099 | 8,539 |
| Professional Services - 3.0% | | | |
| Leidos Holdings, Inc. | | 343 | 32,081 |
| Manpower, Inc. | | 239 | 18,852 |
| Planet Labs PBC Class A (a) | | 2,311 | 8,597 |
| Science Applications International Corp. | | 357 | 43,318 |
| | | | 102,848 |
TOTAL INDUSTRIALS | | | 422,452 |
| INFORMATION TECHNOLOGY - 25.6% | | | |
| Communications Equipment - 0.9% | | | |
| Arista Networks, Inc. (a) | | 200 | 31,018 |
| Electronic Equipment, Instruments & Components - 2.2% | | | |
| CDW Corp. | | 193 | 36,105 |
| Flex Ltd. (a) | | 700 | 19,152 |
| Insight Enterprises, Inc. (a) | | 139 | 20,390 |
| | | | 75,647 |
| IT Services - 2.2% | | | |
| Accenture PLC Class A | | 237 | 74,975 |
| Semiconductors & Semiconductor Equipment - 6.5% | | | |
| Advanced Micro Devices, Inc. (a) | | 344 | 39,354 |
| Axcelis Technologies, Inc. (a) | | 186 | 37,289 |
| Marvell Technology, Inc. | | 483 | 31,458 |
| NVIDIA Corp. | | 154 | 71,963 |
| NXP Semiconductors NV | | 199 | 44,373 |
| | | | 224,437 |
| Software - 11.1% | | | |
| Adobe, Inc. (a) | | 109 | 59,533 |
| HubSpot, Inc. (a) | | 95 | 55,152 |
| Intuit, Inc. | | 108 | 55,264 |
| Microsoft Corp. | | 392 | 131,674 |
| Pagerduty, Inc. (a) | | 581 | 15,060 |
| Salesforce, Inc. (a) | | 280 | 63,003 |
| | | | 379,686 |
| Technology Hardware, Storage & Peripherals - 2.7% | | | |
| Apple, Inc. | | 474 | 93,117 |
TOTAL INFORMATION TECHNOLOGY | | | 878,880 |
| MATERIALS - 4.9% | | | |
| Chemicals - 2.3% | | | |
| Cabot Corp. | | 282 | 20,022 |
| Celanese Corp. Class A | | 168 | 21,066 |
| Eastman Chemical Co. | | 225 | 19,256 |
| The Chemours Co. LLC | | 524 | 19,378 |
| | | | 79,722 |
| Construction Materials - 0.7% | | | |
| Summit Materials, Inc. | | 632 | 22,866 |
| Metals & Mining - 1.9% | | | |
| Commercial Metals Co. | | 805 | 46,062 |
| Schnitzer Steel Industries, Inc. Class A | | 536 | 19,409 |
| | | | 65,471 |
TOTAL MATERIALS | | | 168,059 |
| REAL ESTATE - 2.2% | | | |
| Equity Real Estate Investment Trusts (REITs) - 2.2% | | | |
| Equity Lifestyle Properties, Inc. | | 574 | 40,857 |
| Ventas, Inc. | | 721 | 34,983 |
| | | | 75,840 |
| UTILITIES - 2.1% | | | |
| Electric Utilities - 0.9% | | | |
| NextEra Energy, Inc. | | 435 | 31,886 |
| Water Utilities - 1.2% | | | |
| American Water Works Co., Inc. | | 272 | 40,100 |
TOTAL UTILITIES | | | 71,986 |
| TOTAL COMMON STOCKS (Cost $2,984,024) | | | 3,325,884 |
| | | | |
| Money Market Funds - 3.4% |
| | | Shares | Value ($) |
State Street Institutional Treasury Plus Money Market Fund Trust Class 5.15% (b) (Cost $116,964) | | 116,964 | 116,964 |
| | | | |
| TOTAL INVESTMENT IN SECURITIES - 100.4% (Cost $3,100,988) | 3,442,848 |
NET OTHER ASSETS (LIABILITIES) - (0.4)% | (14,415) |
| NET ASSETS - 100.0% | 3,428,433 |
| | |
Legend
| (b) | The rate quoted is the annualized seven-day yield of the fund at period end. |
Investment Valuation
The following is a summary of the inputs used, as of July 31, 2023, involving the Fund's assets and liabilities carried at fair value. The inputs or methodology used for valuing securities may not be an indication of the risk associated with investing in those securities. For more information on valuation inputs, and their aggregation into the levels used below, please refer to the Investment Valuation section in the accompanying Notes to Financial Statements.
| Valuation Inputs at Reporting Date: |
| Description | Total ($) | Level 1 ($) | Level 2 ($) | Level 3 ($) |
Investments in Securities: | | | | |
|
| Equities: | | | | |
Communication Services | 159,654 | 159,654 | - | - |
Consumer Discretionary | 394,926 | 394,926 | - | - |
Consumer Staples | 124,671 | 124,671 | - | - |
Energy | 114,355 | 114,355 | - | - |
Financials | 463,315 | 463,315 | - | - |
Health Care | 451,746 | 451,746 | - | - |
Industrials | 422,452 | 422,452 | - | - |
Information Technology | 878,880 | 878,880 | - | - |
Materials | 168,059 | 168,059 | - | - |
Real Estate | 75,840 | 75,840 | - | - |
Utilities | 71,986 | 71,986 | - | - |
|
| Money Market Funds | 116,964 | 116,964 | - | - |
| Total Investments in Securities: | 3,442,848 | 3,442,848 | - | - |
Fidelity® Women's Leadership ETF
| Statement of Assets and Liabilities |
| | | | July 31, 2023 |
| | | | | |
| Assets | | | | |
Investment in securities, at value - See accompanying schedule Unaffiliated issuers (cost $3,100,988): | | | $ | 3,442,848 |
| Receivable for investments sold | | | | 33,299 |
| Dividends receivable | | | | 1,585 |
Total assets | | | | 3,477,732 |
| Liabilities | | | | |
| Payable for investments purchased | $ | 47,641 | | |
| Accrued management fee | | 1,658 | | |
| Total Liabilities | | | | 49,299 |
| Net Assets | | | $ | 3,428,433 |
| Net Assets consist of: | | | | |
| Paid in capital | | | $ | 3,547,462 |
| Total accumulated earnings (loss) | | | | (119,029) |
| Net Assets | | | $ | 3,428,433 |
Net Asset Value, offering price and redemption price per share ($3,428,433 ÷ 175,000 shares) | | | $ | 19.59 |
| Statement of Operations |
| | | | Year ended July 31, 2023 |
| Investment Income | | | | |
| Dividends | | | $ | 53,188 |
| Expenses | | | | |
| Management fee | $ | 20,979 | | |
| Independent trustees' fees and expenses | | 17 | | |
| Total Expenses | | | | 20,996 |
| Net Investment income (loss) | | | | 32,192 |
| Realized and Unrealized Gain (Loss) | | | | |
| Net realized gain (loss) on: | | | | |
| Investment Securities: | | | | |
| Redemptions in-kind | | 161,282 | | |
| Unaffiliated issuers | | (292,017) | | |
| Foreign currency transactions | | (8) | | |
| Total net realized gain (loss) | | | | (130,743) |
| Change in net unrealized appreciation (depreciation) on investment securities | | | | 583,271 |
| Net gain (loss) | | | | 452,528 |
| Net increase (decrease) in net assets resulting from operations | | | $ | 484,720 |
| Statement of Changes in Net Assets |
| |
| | Year ended July 31, 2023 | | Year ended July 31, 2022 |
| Increase (Decrease) in Net Assets | | | | |
| Operations | | | | |
| Net investment income (loss) | $ | 32,192 | $ | 14,603 |
| Net realized gain (loss) | | (130,743) | | (157,065) |
| Change in net unrealized appreciation (depreciation) | | 583,271 | | (292,520) |
| Net increase (decrease) in net assets resulting from operations | | 484,720 | | (434,982) |
| Distributions to shareholders | | (31,525) | | (13,700) |
| | | | | |
| Share transactions | | | | |
| Proceeds from sales of shares | | 2,547,748 | | 1,499,632 |
| Cost of shares redeemed | | (2,199,862) | | (474,202) |
| | | | | |
Net increase (decrease) in net assets resulting from share transactions | | 347,886 | | 1,025,430 |
| Total increase (decrease) in net assets | | 801,081 | | 576,748 |
| | | | | |
| Net Assets | | | | |
| Beginning of period | | 2,627,352 | | 2,050,604 |
| End of period | $ | 3,428,433 | $ | 2,627,352 |
| | | | | |
| Other Information | | | | |
| Shares | | | | |
| Sold | | 150,000 | | 75,000 |
| Redeemed | | (125,000) | | (25,000) |
| Net increase (decrease) | | 25,000 | | 50,000 |
| | | | | |
| Fidelity® Women's Leadership ETF |
| |
| Years ended July 31, | | 2023 | | 2022 | | 2021 A |
Selected Per-Share Data | | | | | | |
| Net asset value, beginning of period | $ | 17.52 | $ | 20.51 | $ | 20.00 |
| Income from Investment Operations | | | | | | |
Net investment income (loss) B,C | | .16 | | .11 | | - D |
| Net realized and unrealized gain (loss) | | 2.08 | | (3.01) | | .51 |
| Total from investment operations | | 2.24 | | (2.90) | | .51 |
| Distributions from net investment income | | (.17) | | (.09) | | - |
| Total distributions | | (.17) | | (.09) | | - |
| Net asset value, end of period | $ | 19.59 | $ | 17.52 | $ | 20.51 |
Total Return E,F | | 12.98% | | (14.14)% | | 2.53% |
Ratios to Average Net Assets C,G,H | | | | | | |
| Expenses before reductions | | .59% | | .59% | | .59% I |
| Expenses net of fee waivers, if any | | .59% | | .59% | | .59% I |
| Expenses net of all reductions | | .59% | | .59% | | .59% I |
| Net investment income (loss) | | .91% | | .56% | | .08% I |
| Supplemental Data | | | | | | |
| Net assets, end of period (000 omitted) | $ | 3,428 | $ | 2,627 | $ | 2,051 |
Portfolio turnover rate J,K | | 72% | | 64% | | 5% L |
AFor the period June 15, 2021 (commencement of operations) through July 31, 2021.
BCalculated based on average shares outstanding during the period.
CNet investment income (loss) is affected by the timing of the declaration of dividends by any underlying mutual funds or exchange-traded funds (ETFs). Net investment income (loss) of any mutual funds or ETFs is not included in the Fund's net investment income (loss) ratio.
DAmount represents less than $.005 per share.
ETotal returns for periods of less than one year are not annualized.
FBased on net asset value.
GFees and expenses of any underlying mutual funds or exchange-traded funds (ETFs) are not included in the Fund's expense ratio. The Fund indirectly bears its proportionate share of these expenses.
HExpense ratios reflect operating expenses of the class. Expenses before reductions do not reflect amounts reimbursed, waived, or reduced through arrangements with the investment adviser, brokerage services, or other offset arrangements, if applicable, and do not represent the amount paid by the class during periods when reimbursements, waivers or reductions occur.
IAnnualized.
JPortfolio turnover rate excludes securities received or delivered in-kind.
KAmount does not include the portfolio activity of any underlying mutual funds or exchange-traded funds (ETFs).
LAmount not annualized.
For the period ended July 31, 2023
1. Organization.
Fidelity Blue Chip Growth ETF, Fidelity Blue Chip Value ETF, Fidelity Growth Opportunities ETF, Fidelity Magellan ETF, Fidelity New Millennium ETF, Fidelity Real Estate Investment ETF, Fidelity Small-Mid Cap Opportunities ETF, Fidelity Sustainable U.S. Equity ETF and Fidelity Women's Leadership ETF (the Funds) are exchange-traded funds of Fidelity Covington Trust (the Trust) and are authorized to issue an unlimited number of shares. Each Fund, with the exception of Fidelity Blue Chip Value ETF and Fidelity New Millennium ETF, are non-diversified funds. The Trust is registered under the Investment Company Act of 1940, as amended (the 1940 Act), as an open-end management investment company organized as a Massachusetts business trust.
2. Significant Accounting Policies.
Each Fund is an investment company and applies the accounting and reporting guidance of the Financial Accounting Standards Board (FASB) Accounting Standards Codification Topic 946 Financial Services - Investment Companies. The financial statements have been prepared in conformity with accounting principles generally accepted in the United States of America (GAAP), which require management to make certain estimates and assumptions at the date of the financial statements. Actual results could differ from those estimates. Subsequent events, if any, through the date that the financial statements were issued have been evaluated in the preparation of the financial statements. Each Fund's Schedule of Investments lists any underlying mutual funds or exchange-traded funds (ETFs) but does not include the underlying holdings of these funds. The following summarizes the significant accounting policies of each Fund:
Investment Valuation. Investments are valued as of 4:00 p.m. Eastern time on the last calendar day of the period. The Board of Trustees (the Board) has designated each Fund's investment adviser as the valuation designee responsible for the fair valuation function and performing fair value determinations as needed. The investment adviser has established a Fair Value Committee (the Committee) to carry out the day-to-day fair valuation responsibilities and has adopted policies and procedures to govern the fair valuation process and the activities of the Committee. In accordance with these fair valuation policies and procedures, which have been approved by the Board, each Fund attempts to obtain prices from one or more third party pricing services or brokers to value its investments. When current market prices, quotations or currency exchange rates are not readily available or reliable, investments will be fair valued in good faith by the Committee, in accordance with the policies and procedures. Factors used in determining fair value vary by investment type and may include market or investment specific events, transaction data, estimated cash flows, and market observations of comparable investments. The frequency that the fair valuation procedures are used cannot be predicted and they may be utilized to a significant extent. The Committee manages each Fund's fair valuation practices and maintains the fair valuation policies and procedures. Each Fund's investment adviser reports to the Board information regarding the fair valuation process and related material matters.
Each Fund categorizes the inputs to valuation techniques used to value its investments into a disclosure hierarchy consisting of three levels as shown below:
Level 1 - unadjusted quoted prices in active markets for identical investments
Level 2 - other significant observable inputs (including quoted prices for similar investments, interest rates, prepayment speeds, etc.)
Level 3 - unobservable inputs (including the Fund's own assumptions based on the best information available)
Valuation techniques used to value each Fund's investments by major category are as follows:
Equity securities, including restricted securities, for which market quotations are readily available, are valued at the last reported sale price or official closing price as reported by a third party pricing service on the primary market or exchange on which they are traded and are categorized as Level 1 in the hierarchy. In the event there were no sales during the day or closing prices are not available, securities are valued at the last quoted bid price or may be valued using the last available price and are generally categorized as Level 2 in the hierarchy. For foreign equity securities, when market or security specific events arise, comparisons to the valuation of American Depositary Receipts (ADRs), futures contracts, ETFs and certain indexes as well as quoted prices for similar securities may be used and would be categorized as Level 2 in the hierarchy. For equity securities, including restricted securities, where observable inputs are limited, assumptions about market activity and risk are used and these securities may be categorized as Level 3 in the hierarchy.
Futures contracts are valued at the settlement price established each day by the board of trade or exchange on which they are traded and are categorized as Level 1 in the hierarchy. Investments in open-end mutual funds, are valued at their closing net asset value (NAV) each business day and are categorized as Level 1 in the hierarchy. If an unaffiliated open-end mutual fund's NAV is unavailable, shares of that fund may be valued by another method that the Board believes reflects fair value in accordance with the Board's fair value pricing policies and is categorized as Level 2 in the hierarchy.
Changes in valuation techniques may result in transfers in or out of an assigned level within the disclosure hierarchy. The aggregate value of investments by input level as of July 31, 2023 is included at the end of each Fund's Schedule of Investments.
Foreign Currency. Certain Funds may use foreign currency contracts to facilitate transactions in foreign-denominated securities. Gains and losses from these transactions may arise from changes in the value of the foreign currency or if the counterparties do not perform under the contracts' terms.
Foreign-denominated assets, including investment securities, and liabilities are translated into U.S. dollars at the exchange rates at period end. Purchases and sales of investment securities, income and dividends received, and expenses denominated in foreign currencies are translated into U.S. dollars at the exchange rate in effect on the transaction date.
The effects of exchange rate fluctuations on investments are included with the net realized and unrealized gain (loss) on investment securities. Other foreign currency transactions resulting in realized and unrealized gain (loss) are disclosed separately.
Investment Transactions and Income. For financial reporting purposes, the Funds' investment holdings and NAV include trades executed through the end of the last business day of the period. The NAV per share for processing shareholder transactions is calculated as of the close of business (normally 4:00 p.m. Eastern time) of the New York Stock Exchange, Archipelago Exchange (NYSE Arca) for Fidelity Sustainable U.S. Equity ETF and Fidelity Women's Leadership ETF, and of the Cboe BZX Exchange, Inc. (CboeBZX) for all other funds; and includes trades executed through the end of the prior business day. Gains and losses on securities sold are determined on the basis of identified cost and may include proceeds received from litigation. Commissions paid to certain brokers with whom the investment adviser, or its affiliates, places trades on behalf of a fund include an amount in addition to trade execution, which may be rebated back to a fund. Any such rebates are included in net realized gain (loss) on investments in the Statement of Operations. Dividend income is recorded on the ex-dividend date, except for certain dividends from foreign securities where the ex-dividend date may have passed, which are recorded as soon as the Funds are informed of the ex-dividend date. Non-cash dividends included in dividend income, if any, are recorded at the fair market value of the securities received. Certain distributions received by the Funds represent a return of capital or capital gain. The Funds determine the components of these distributions subsequent to the ex-dividend date, based upon receipt of tax filings or other correspondence relating to the underlying investment. These distributions are recorded as a reduction of cost of investments and/or as a realized gain. Large, non-recurring dividends recognized by the Funds are presented separately on the Statement of Operations as "Special Dividends" and the impact of these dividends is presented in the Financial Highlights. Investment income is recorded net of foreign taxes withheld where recovery of such taxes is uncertain. Funds may file withholding tax reclaims in certain jurisdictions to recover a portion of amounts previously withheld. Any withholding tax reclaims income is included in the Statement of Operations in dividends. Any receivables for withholding tax reclaims are included in the Statement of Assets and Liabilities in dividends receivable.
Expenses. Expenses directly attributable to a fund are charged to that fund. Expenses attributable to more than one fund are allocated among the respective funds on the basis of relative net assets or other appropriate methods. Expenses included in the accompanying financial statements reflect the expenses of that fund and do not include any expenses associated with any underlying mutual funds or exchange-traded funds. Although not included in a fund's expenses, a fund indirectly bears its proportionate share of these expenses through the net asset value of each underlying mutual fund or exchange-traded fund. Expense estimates are accrued in the period to which they relate and adjustments are made when actual amounts are known.
Income Tax Information and Distributions to Shareholders. Each year, each Fund intends to qualify as a regulated investment company under Subchapter M of the Internal Revenue Code, including distributing substantially all of its taxable income and realized gains. As a result, no provision for U.S. Federal income taxes is required. As of July 31, 2023, each Fund did not have any unrecognized tax benefits in the financial statements; nor is each Fund aware of any tax positions for which it is reasonably possible that the total amounts of unrecognized tax benefits will significantly change in the next twelve months. Each Fund files a U.S. federal tax return, in addition to state and local tax returns as required. Each Fund's federal income tax returns are subject to examination by the Internal Revenue Service (IRS) for a period of three fiscal years after they are filed. State and local tax returns may be subject to examination for an additional fiscal year depending on the jurisdiction. Realized gain or loss resulting from in-kind redemptions is not taxable to the Fund and is not distributed to shareholders of the Fund. Foreign taxes are provided for based on each Fund's understanding of the tax rules and rates that exist in the foreign markets in which it invests.
Distributions are declared and recorded on the ex-dividend date. Income and capital gain distributions are determined in accordance with income tax regulations, which may differ from GAAP.
Capital accounts within the financial statements are adjusted for permanent book-tax differences. These adjustments have no impact on net assets or the results of operations. Capital accounts are not adjusted for temporary book-tax differences which will reverse in a subsequent period.
Book-tax differences are primarily due to futures transactions, foreign currency transactions, passive foreign investment companies (PFIC), redemptions in kind, net operating losses, capital loss carryforwards and losses deferred due to wash sales and excise tax regulations.
As of period end, the cost and unrealized appreciation (depreciation) in securities, and derivatives if applicable, for federal income tax purposes were as follows for each Fund:
| | Tax cost | Gross unrealized appreciation | Gross unrealized depreciation | Net unrealized appreciation (depreciation) |
| Fidelity Blue Chip Growth ETF | $648,686,433 | $161,623,770 | $ (35,749,294) | $125,874,476 |
| Fidelity Blue Chip Value ETF | 118,943,682 | 15,347,591 | (5,308,689) | 10,038,902 |
| Fidelity Growth Opportunities ETF | 155,783,805 | 43,850,468 | (4,451,090) | 39,399,378 |
| Fidelity Magellan ETF | 42,055,838 | 9,079,661 | (304,006) | 8,775,655 |
| Fidelity New Millennium ETF | 89,317,459 | 20,260,414 | (686,206) | 19,574,208 |
| Fidelity Real Estate Investment ETF | 16,559,314 | 611,526 | (2,033,093) | (1,421,567) |
| Fidelity Small-Mid Cap Opportunities ETF | 30,347,867 | 6,482,889 | (1,664,107) | 4,818,782 |
| Fidelity Sustainable U.S. Equity ETF | 9,180,054 | 1,499,577 | (392,092) | 1,107,485 |
| Fidelity Women's Leadership ETF | 3,172,707 | 461,058 | (190,917) | 270,141 |
The tax-based components of distributable earnings as of period end were as follows for each Fund:
| | Undistributed ordinary income | Capital loss carryforward | Net unrealized appreciation (depreciation) on securities and other investments |
| Fidelity Blue Chip Growth ETF | $- | $ (69,953,822) | $125,874,484 |
| Fidelity Blue Chip Value ETF | 111,778 | (2,046,995) | 10,038,902 |
| Fidelity Growth Opportunities ETF | - | (18,717,238) | 39,399,378 |
| Fidelity Magellan ETF | - | (8,518,509) | 8,775,655 |
| Fidelity New Millennium ETF | - | (3,559,238) | 19,574,222 |
| Fidelity Real Estate Investment ETF | - | (960,160) | (1,421,567) |
Fidelity Small-Mid Cap Opportunities ETF | - | (4,187,144) | 4,818,782 |
| Fidelity Sustainable U.S. Equity ETF | 3,416 | (463,678) | 1,107,485 |
| Fidelity Women's Leadership ETF | 1,754 | (390,924) | 270,141 |
Capital loss carryforwards are only available to offset future capital gains of the Funds to the extent provided by regulations and may be limited. The capital loss carryforward information presented below, including any applicable limitation, is estimated as of fiscal period end and is subject to adjustment.
| | Short-term | Long-term | Total capital loss carryforward |
| Fidelity Blue Chip Growth ETF | $ (43,610,384) | $ (26,343,438) | $ (69,953,822) |
| Fidelity Blue Chip Value ETF | (1,191,788) | (855,207) | (2,046,995) |
| Fidelity Growth Opportunities ETF | (13,365,074) | (5,352,164) | (18,717,238) |
| Fidelity Magellan ETF | (6,595,196) | (1,923,313) | (8,518,509) |
| Fidelity New Millennium ETF | (1,383,007) | (2,176,231) | (3,559,238) |
| Fidelity Real Estate Investment ETF | (406,757) | (553,403) | (960,160) |
Fidelity Small-Mid Cap Opportunities ETF | (2,433,568) | (1,753,576) | (4,187,144) |
| Fidelity Sustainable U.S. Equity ETF | (174,560) | (289,118) | (463,678) |
| Fidelity Women's Leadership ETF | (149,043) | (241,881) | (390,924) |
Certain of the Funds intend to elect to defer to the next fiscal year ordinary losses recognized during the period January 1, 2023 to July 31, 2023. Loss deferrals were as follows:
| | Ordinary Losses |
| Fidelity Growth Opportunities ETF | $(136,801) |
The tax character of distributions paid was as follows:
| July 31, 2023 | | | |
| | Ordinary Income | Long-term Capital Gains | Total |
| Fidelity Blue Chip Growth ETF | $- | $- | $- |
| Fidelity Blue Chip Value ETF | 1,923,675 | 916,300 | 2,839,975 |
| Fidelity Growth Opportunities ETF | - | - | - |
| Fidelity Magellan ETF | 144,575 | - | 144,575 |
| Fidelity New Millennium ETF | 924,275 | 133,950 | 1,058,225 |
| Fidelity Real Estate Investment ETF | 452,000 | - | 452,000 |
Fidelity Small-Mid Cap Opportunities ETF | 192,175 | - | 192,175 |
| Fidelity Sustainable U.S. Equity ETF | 79,775 | - | 79,775 |
| Fidelity Women's Leadership ETF | 31,525 | - | 31,525 |
| July 31, 2022 | | | |
| | Ordinary Income | Long-term Capital Gains | Total |
| Fidelity Blue Chip Growth ETF | $- | $- | $- |
| Fidelity Blue Chip Value ETF | 3,109,325 | 343,000 | 3,452,325 |
| Fidelity Growth Opportunities ETF | - | - | - |
| Fidelity Magellan ETF | 32,550 | - | 32,550 |
| Fidelity New Millennium ETF | 1,100,175 | - | 1,100,175 |
| Fidelity Real Estate Investment ETF | 456,700 | - | 456,700 |
Fidelity Small-Mid Cap Opportunities ETF | 131,575 | - | 131,575 |
| Fidelity Sustainable U.S. Equity ETF | 36,950 | - | 36,950 |
| Fidelity Women's Leadership ETF | 13,700 | - | 13,700 |
Restricted Securities (including Private Placements). Funds may invest in securities that are subject to legal or contractual restrictions on resale. These securities generally may be resold in transactions exempt from registration or to the public if the securities are registered. Disposal of these securities may involve time-consuming negotiations and expense, and prompt sale at an acceptable price may be difficult. Information regarding restricted securities held at period end is included at the end of the Schedule of Investments, if applicable.
3. Derivative Instruments.
Risk Exposures and the Use of Derivative Instruments. Each Fund's investment objectives allow for various types of derivative instruments, including futures contracts. Derivatives are investments whose value is primarily derived from underlying assets, indices or reference rates and may be transacted on an exchange or over-the-counter (OTC). Derivatives may involve a future commitment to buy or sell a specified asset based on specified terms, to exchange future cash flows at periodic intervals based on a notional principal amount, or for one party to make one or more payments upon the occurrence of specified events in exchange for periodic payments from the other party.
Derivatives were used to increase returns and to manage exposure to certain risks as defined below. The success of any strategy involving derivatives depends on analysis of numerous economic factors, and if the strategies for investment do not work as intended, the objectives may not be achieved.
Derivatives were used to increase or decrease exposure to the following risk(s):
| | |
| Equity Risk | Equity risk relates to the fluctuations in the value of financial instruments as a result of changes in market prices (other than those arising from interest rate risk or foreign exchange risk), whether caused by factors specific to an individual investment, its issuer, or all factors affecting all instruments traded in a market or market segment. |
Funds are also exposed to additional risks from investing in derivatives, such as liquidity risk and counterparty credit risk. Liquidity risk is the risk that a fund will be unable to close out the derivative in the open market in a timely manner. Counterparty credit risk is the risk that the counterparty will not be able to fulfill its obligation to a fund. Counterparty credit risk related to exchange-traded contracts may be mitigated by the protection provided by the exchange on which they trade.
Investing in derivatives may involve greater risks than investing in the underlying assets directly and, to varying degrees, may involve risk of loss in excess of any initial investment and collateral received and amounts recognized in the Statement of Assets and Liabilities. In addition, there may be the risk that the change in value of the derivative contract does not correspond to the change in value of the underlying instrument.
Futures Contracts. A futures contract is an agreement between two parties to buy or sell a specified underlying instrument for a fixed price at a specified future date. Futures contracts were used to manage exposure to the stock market.
Upon entering into a futures contract, a fund is required to deposit either cash or securities (initial margin) with a clearing broker in an amount equal to a certain percentage of the face value of the contract. Futures contracts are marked-to-market daily and subsequent daily payments are made or received by a fund depending on the daily fluctuations in the value of the futures contracts and are recorded as unrealized appreciation or (depreciation). This receivable and/or payable, if any, is included in daily variation margin on futures contracts in the Statement of Assets and Liabilities. Realized gain or (loss) is recorded upon the expiration or closing of a futures contract. The net realized gain (loss) and change in net unrealized appreciation (depreciation) on futures contracts during the period is presented in the Statement of Operations.
Any open futures contracts at period end are presented in the Schedule of Investments under the caption "Futures Contracts". The notional amount at value reflects each contract's exposure to the underlying instrument or index at period end, and is representative of volume of activity during the period unless an average notional amount is presented. Any securities deposited to meet initial margin requirements are identified in the Schedule of Investments. Any cash deposited to meet initial margin requirements is presented as segregated cash with brokers for derivative instruments in the Statement of Assets and Liabilities.
4. Purchases and Sales of Investments.
Purchases and sales of securities, other than short-term securities and in-kind transactions, as applicable, are noted in the table below.
| | Purchases ($) | Sales ($) |
| Fidelity Blue Chip Growth ETF | 185,628,584 | 135,974,081 |
| Fidelity Blue Chip Value ETF | 45,027,096 | 42,244,756 |
| Fidelity Growth Opportunities ETF | 101,678,004 | 80,411,782 |
| Fidelity Magellan ETF | 39,729,235 | 39,103,582 |
| Fidelity New Millennium ETF | 93,552,325 | 60,300,126 |
| Fidelity Real Estate Investment ETF | 5,441,770 | 5,647,252 |
| Fidelity Small-Mid Cap Opportunities ETF | 12,614,333 | 10,908,700 |
| Fidelity Sustainable U.S. Equity ETF | 4,147,612 | 3,376,002 |
| Fidelity Women's Leadership ETF | 2,423,194 | 2,457,995 |
Securities received and delivered in-kind through subscriptions and redemptions are noted in the table below.
| | In-Kind Subscriptions ($) | In-Kind Redemptions ($) |
| Fidelity Blue Chip Growth ETF | 231,989,497 | 19,037,541 |
| Fidelity Blue Chip Value ETF | 26,801,209 | 17,534,098 |
| Fidelity Growth Opportunities ETF | 90,730,035 | 20,486,252 |
| Fidelity Magellan ETF | 3,897,711 | 3,260,112 |
| Fidelity New Millennium ETF | 29,718,317 | 27,410,936 |
| Fidelity Real Estate Investment ETF | 983,786 | 3,420,955 |
| Fidelity Small-Mid Cap Opportunities ETF | 3,819,844 | 644,488 |
| Fidelity Sustainable U.S. Equity ETF | 2,513,528 | - |
| Fidelity Women's Leadership ETF | 1,856,195 | 1,527,005 |
5. Fees and Other Transactions with Affiliates.
Management Fee. Fidelity Management & Research Company LLC (the investment adviser) provides the Funds with investment management related services for which the Funds pay a monthly management fee that is based on an annual rate of each Fund's average net assets as noted in the table below. Under the management contract, the investment adviser pays all other expenses, except the compensation of the independent Trustees and certain miscellaneous expenses such as proxy and shareholder meeting expenses.
| | Fee Rate |
| Fidelity Blue Chip Growth ETF | .59% |
| Fidelity Blue Chip Value ETF | .59% |
| Fidelity Growth Opportunities ETF | .59% |
| Fidelity Magellan ETF | .59% |
| Fidelity New Millennium ETF | .59% |
| Fidelity Real Estate Investment ETF | .59% |
| Fidelity Small-Mid Cap Opportunities ETF | .60% |
| Fidelity Sustainable U.S. Equity ETF | .59% |
| Fidelity Women's Leadership ETF | .59% |
Brokerage Commissions. A portion of portfolio transactions were placed with brokerage firms which are affiliates of the investment adviser. Brokerage commissions are included in net realized gain (loss) and change in net unrealized appreciation (depreciation) in the Statement of Operations. The commissions paid to these affiliated firms were as follows:
| | Amount |
| Fidelity Blue Chip Growth ETF | $2,739 |
| Fidelity Blue Chip Value ETF | 611 |
| Fidelity Growth Opportunities ETF | 1,487 |
| Fidelity Magellan ETF | 355 |
| Fidelity New Millennium ETF | 784 |
| Fidelity Real Estate Investment ETF | 121 |
| Fidelity Small-Mid Cap Opportunities ETF | 223 |
| Fidelity Sustainable U.S. Equity ETF | 48 |
| Fidelity Women's Leadership ETF | 34 |
Interfund Trades. Funds may purchase from or sell securities to other Fidelity Funds under procedures adopted by the Board. The procedures have been designed to ensure these interfund trades are executed in accordance with Rule 17a-7 of the 1940 Act. Any interfund trades are included within the respective purchases and sales amounts shown in the Purchases and Sales of Investments note. Interfund trades during the period are noted in the table below.
| | Purchases ($) | Sales ($) | Realized Gain (Loss) ($) |
| Fidelity Blue Chip Growth ETF | 9,752,524 | 2,320,020 | 4,019 |
| Fidelity Blue Chip Value ETF | 1,397,295 | 1,856,523 | 169,602 |
| Fidelity Growth Opportunities ETF | 3,579,035 | 1,440,972 | 108,356 |
| Fidelity Magellan ETF | 797,070 | 962,653 | (82,758) |
| Fidelity New Millennium ETF | 4,167,142 | 485,847 | (101,908) |
| Fidelity Real Estate Investment ETF | 43,668 | 8,061 | (433) |
| Fidelity Small-Mid Cap Opportunities ETF | 153,369 | 321,916 | (130,512) |
| Fidelity Sustainable U.S. Equity ETF | 152,888 | 148,046 | (9,582) |
| Fidelity Women's Leadership ETF | 37,478 | 17,786 | (3,325) |
6. Expense Reductions.
Through arrangements with each applicable Fund's custodian, credits realized as a result of certain uninvested cash balances were used to reduce each applicable Fund's expenses. All of the applicable expense reductions are noted in the table below.
| | Custodian credits |
| Fidelity Blue Chip Growth ETF | $190 |
| Fidelity Blue Chip Value ETF | 9 |
| Fidelity Growth Opportunities ETF | 70 |
| Fidelity Magellan ETF | 37 |
| Fidelity New Millennium ETF | 126 |
Fidelity Small-Mid Cap Opportunities ETF | 10 |
7. Share Transactions.
Funds issue and redeem shares at NAV only with certain authorized participants in large increments known as Creation Units. Purchases of Creation Units are made by tendering a basket of designated securities to a fund and redemption proceeds are paid with a basket of securities from a fund's portfolio with a balancing cash component to equate the market value of the basket of securities delivered or redeemed to the NAV per Creation Unit on the transaction date. Cash may be substituted equivalent to the value of certain securities generally when they are not available in sufficient quantity for delivery. A fund's shares are available in smaller increments to investors in the secondary market at market prices and may be subject to commissions. Authorized participants pay a transaction fee to the shareholder servicing agent when purchasing and redeeming Creation Units of a fund. The transaction fee is used to offset the costs associated with the issuance and redemption of Creation Units.
8. Other.
A fund's organizational documents provide former and current trustees and officers with a limited indemnification against liabilities arising in connection with the performance of their duties to the fund. In the normal course of business, a fund may also enter into contracts that provide general indemnifications. A fund's maximum exposure under these arrangements is unknown as this would be dependent on future claims that may be made against a fund. The risk of material loss from such claims is considered remote.
9. Risk and Uncertainties.
Many factors affect a fund's performance. Developments that disrupt global economies and financial markets, such as pandemics, epidemics, outbreaks of infectious diseases, war, terrorism, and environmental disasters, may significantly affect a fund's investment performance. The effects of these developments to a fund will be impacted by the types of securities in which a fund invests, the financial condition, industry, economic sector, and geographic location of an issuer, and a fund's level of investment in the securities of that issuer. Significant concentrations in security types, issuers, industries, sectors, and geographic locations may magnify the factors that affect a fund's performance.
To the Board of Trustees of Fidelity Covington Trust and Shareholders of Fidelity Blue Chip Growth ETF, Fidelity Blue Chip Value ETF and Fidelity New Millennium ETF
Opinions on the Financial Statements
We have audited the accompanying statements of assets and liabilities, including the schedules of investments, of Fidelity Blue Chip Growth ETF, Fidelity Blue Chip Value ETF and Fidelity New Millennium ETF (three of the funds constituting Fidelity Covington Trust, hereafter collectively referred to as the "Funds") as of July 31, 2023, the related statements of operations for the year ended July 31, 2023, the statements of changes in net assets for each of the two years in the period ended July 31, 2023, including the related notes, and the financial highlights for each of the three years in the period ended July 31, 2023, and for the period June 2, 2020 (commencement of operations) to July 31, 2020 (collectively referred to as the "financial statements"). In our opinion, the financial statements present fairly, in all material respects, the financial position of each of the Funds as of July 31, 2023, the results of each of their operations for the year then ended, the changes in each of their net assets for each of the two years in the period ended July 31, 2023 and the financial highlights for each of the three years in the period ended July 31, 2023 and for the period June 2, 2020 (commencement of operations) to July 31, 2020 in conformity with accounting principles generally accepted in the United States of America.
Basis for Opinions
These financial statements are the responsibility of the Funds' management. Our responsibility is to express an opinion on the Funds' financial statements based on our audits. We are a public accounting firm registered with the Public Company Accounting Oversight Board (United States) (PCAOB) and are required to be independent with respect to the Funds in accordance with the U.S. federal securities laws and the applicable rules and regulations of the Securities and Exchange Commission and the PCAOB.
We conducted our audits of these financial statements in accordance with the standards of the PCAOB. Those standards require that we plan and perform the audits to obtain reasonable assurance about whether the financial statements are free of material misstatement, whether due to error or fraud.
Our audits included performing procedures to assess the risks of material misstatement of the financial statements, whether due to error or fraud, and performing procedures that respond to those risks. Such procedures included examining, on a test basis, evidence regarding the amounts and disclosures in the financial statements. Our audits also included evaluating the accounting principles used and significant estimates made by management, as well as evaluating the overall presentation of the financial statements. Our procedures included confirmation of securities owned as of July 31, 2023 by correspondence with the custodian and brokers; when replies were not received from brokers, we performed other auditing procedures. We believe that our audits provide a reasonable basis for our opinions.
/s/ PricewaterhouseCoopers LLP
Boston, Massachusetts
September 18, 2023
We have served as the auditor of one or more investment companies in the Fidelity group of funds since 1932.
To the Board of Trustees of Fidelity Covington Trust and Shareholders of Fidelity Growth Opportunities ETF, Fidelity Magellan ETF, Fidelity Real Estate Investment ETF, Fidelity Small-Mid Cap Opportunities ETF, Fidelity Sustainability U.S. Equity ETF, and Fidelity Women's Leadership ETF:
Opinion on the Financial Statements and Financial Highlights
We have audited the accompanying statements of assets and liabilities of Fidelity Growth Opportunities ETF, Fidelity Magellan ETF, Fidelity Real Estate Investment ETF, Fidelity Small-Mid Cap Opportunities ETF, Fidelity Sustainability U.S. Equity ETF, and Fidelity Women's Leadership ETF (the "Funds"), each a fund of Fidelity Covington Trust, including the schedules of investments, as of July 31, 2023, the related statements of operations for the year then ended, the statements of changes in net assets for each of the two years in the period then ended, and the financial highlights for each of the two years in the period then ended and for the period from February 2, 2021 (commencement of operations) through July 31, 2021, except for the financial highlights for the Fidelity Sustainable U.S Equity ETF and Fidelity Women's Leadership ETF, which are for the two years in the period then ended and for the period from June 15, 2021 (commencement of operations) through July 31, 2021, and the related notes. In our opinion, the financial statements and financial highlights present fairly, in all material respects, the financial position of each of the Funds as of July 31, 2023, and the results of their operations for the year then ended, the changes in their net assets for each of the two years in the period then ended, and the financial highlights for each of the two years in the period then ended and for the period from February 2, 2021 (commencement of operations) through July 31, 2021 (or for the period mentioned above), in conformity with accounting principles generally accepted in the United States of America.
Basis for Opinion
These financial statements and financial highlights are the responsibility of the Funds' management. Our responsibility is to express an opinion on the Funds' financial statements and financial highlights based on our audits. We are a public accounting firm registered with the Public Company Accounting Oversight Board (United States) (PCAOB) and are required to be independent with respect to the Funds in accordance with the U.S. federal securities laws and the applicable rules and regulations of the Securities and Exchange Commission and the PCAOB.
We conducted our audits in accordance with the standards of the PCAOB. Those standards require that we plan and perform the audit to obtain reasonable assurance about whether the financial statements and financial highlights are free of material misstatement, whether due to error or fraud. The Funds are not required to have, nor were we engaged to perform, an audit of its internal control over financial reporting. As part of our audits we are required to obtain an understanding of internal control over financial reporting but not for the purpose of expressing an opinion on the effectiveness of the Funds' internal control over financial reporting. Accordingly, we express no such opinion.
Our audits included performing procedures to assess the risks of material misstatement of the financial statements and financial highlights, whether due to error or fraud, and performing procedures that respond to those risks. Such procedures included examining, on a test basis, evidence regarding the amounts and disclosures in the financial statements and financial highlights. Our audits also included evaluating the accounting principles used and significant estimates made by management, as well as evaluating the overall presentation of the financial statements and financial highlights. Our procedures included confirmation of securities owned as of July 31, 2023, by correspondence with the custodian and brokers; when replies were not received from brokers, we performed other auditing procedures. We believe that our audits provide a reasonable basis for our opinion.
/s/ Deloitte & Touche LLP
Boston, Massachusetts
September 18, 2023
We have served as the auditor of one or more of the Fidelity investment companies since 1999.
The Trustees, Members of the Advisory Board (if any), and officers of the trust and funds, as applicable, are listed below. The Board of Trustees governs each fund and is responsible for protecting the interests of shareholders. The Trustees are experienced executives who meet periodically throughout the year to oversee each fund's activities, review contractual arrangements with companies that provide services to each fund, oversee management of the risks associated with such activities and contractual arrangements, and review each fund's performance. Except for Vijay Advani, each of the Trustees oversees 321 funds. Mr. Advani oversees 215 funds.
The Trustees hold office without limit in time except that (a) any Trustee may resign; (b) any Trustee may be removed by written instrument, signed by at least two-thirds of the number of Trustees prior to such removal; (c) any Trustee who requests to be retired or who has become incapacitated by illness or injury may be retired by written instrument signed by a majority of the other Trustees; and (d) any Trustee may be removed at any special meeting of shareholders by a two-thirds vote of the outstanding voting securities of the trust. Each Trustee who is not an interested person (as defined in the 1940 Act) of the trust and the funds is referred to herein as an Independent Trustee. Each Independent Trustee shall retire not later than the last day of the calendar year in which his or her 75th birthday occurs. The Independent Trustees may waive this mandatory retirement age policy with respect to individual Trustees. Officers and Advisory Board Members hold office without limit in time, except that any officer or Advisory Board Member may resign or may be removed by a vote of a majority of the Trustees at any regular meeting or any special meeting of the Trustees. Except as indicated, each individual has held the office shown or other offices in the same company for the past five years.
The funds' Statement of Additional Information (SAI) includes more information about the Trustees. To request a free copy, call Fidelity at 1-800-FIDELITY.
Experience, Skills, Attributes, and Qualifications of the Trustees. The Governance and Nominating Committee has adopted a statement of policy that describes the experience, qualifications, attributes, and skills that are necessary and desirable for potential Independent Trustee candidates (Statement of Policy). The Board believes that each Trustee satisfied at the time he or she was initially elected or appointed a Trustee, and continues to satisfy, the standards contemplated by the Statement of Policy. The Governance and Nominating Committee also engages professional search firms to help identify potential Independent Trustee candidates who have the experience, qualifications, attributes, and skills consistent with the Statement of Policy. From time to time, additional criteria based on the composition and skills of the current Independent Trustees, as well as experience or skills that may be appropriate in light of future changes to board composition, business conditions, and regulatory or other developments, have also been considered by the professional search firms and the Governance and Nominating Committee. In addition, the Board takes into account the Trustees' commitment and participation in Board and committee meetings, as well as their leadership of standing and ad hoc committees throughout their tenure.
In determining that a particular Trustee was and continues to be qualified to serve as a Trustee, the Board has considered a variety of criteria, none of which, in isolation, was controlling. The Board believes that, collectively, the Trustees have balanced and diverse experience, qualifications, attributes, and skills, which allow the Board to operate effectively in governing each fund and protecting the interests of shareholders. Information about the specific experience, skills, attributes, and qualifications of each Trustee, which in each case led to the Board's conclusion that the Trustee should serve (or continue to serve) as a trustee of the funds, is provided below.
Board Structure and Oversight Function. Robert A. Lawrence is an interested person and currently serves as Chair. The Trustees have determined that an interested Chair is appropriate and benefits shareholders because an interested Chair has a personal and professional stake in the quality and continuity of services provided to the funds. Independent Trustees exercise their informed business judgment to appoint an individual of their choosing to serve as Chair, regardless of whether the Trustee happens to be independent or a member of management. The Independent Trustees have determined that they can act independently and effectively without having an Independent Trustee serve as Chair and that a key structural component for assuring that they are in a position to do so is for the Independent Trustees to constitute a substantial majority for the Board. The Independent Trustees also regularly meet in executive session. David M. Thomas serves as Lead Independent Trustee and as such (i) acts as a liaison between the Independent Trustees and management with respect to matters important to the Independent Trustees and (ii) with management prepares agendas for Board meetings.
Fidelity® funds are overseen by different Boards of Trustees. The funds' Board oversees Fidelity's high income and certain equity funds, and other Boards oversee Fidelity's alternative investment, investment-grade bond, money market, asset allocation, and other equity funds. The asset allocation funds may invest in Fidelity® funds overseen by the funds' Board. The use of separate Boards, each with its own committee structure, allows the Trustees of each group of Fidelity® funds to focus on the unique issues of the funds they oversee, including common research, investment, and operational issues. On occasion, the separate Boards establish joint committees to address issues of overlapping consequences for the Fidelity® funds overseen by each Board.
The Trustees operate using a system of committees to facilitate the timely and efficient consideration of all matters of importance to the Trustees, each fund, and fund shareholders and to facilitate compliance with legal and regulatory requirements and oversight of the funds' activities and associated risks. The Board, acting through its committees, has charged FMR and its affiliates with (i) identifying events or circumstances the occurrence of which could have demonstrably adverse effects on the funds' business and/or reputation; (ii) implementing processes and controls to lessen the possibility that such events or circumstances occur or to mitigate the effects of such events or circumstances if they do occur; and (iii) creating and maintaining a system designed to evaluate continuously business and market conditions in order to facilitate the identification and implementation processes described in (i) and (ii) above. Because the day-to-day operations and activities of the funds are carried out by or through FMR, its affiliates, and other service providers, the funds' exposure to risks is mitigated but not eliminated by the processes overseen by the Trustees. While each of the Board's committees has responsibility for overseeing different aspects of the funds' activities, oversight is exercised primarily through the Operations, Audit, and Compliance Committees. Appropriate personnel, including but not limited to the funds' Chief Compliance Officer (CCO), FMR's internal auditor, the independent accountants, the funds' Treasurer and portfolio management personnel, make periodic reports to the Board's committees, as appropriate, including an annual review of Fidelity's risk management program for the Fidelity® funds. The responsibilities of each standing committee, including their oversight responsibilities, are described further under "Standing Committees of the Trustees."
Interested Trustees*:
Correspondence intended for a Trustee who is an interested person may be sent to Fidelity Investments, 245 Summer Street, Boston, Massachusetts 02210.
Name, Year of Birth; Principal Occupations and Other Relevant Experience+
Bettina Doulton (1964)
Year of Election or Appointment: 2020
Trustee
Ms. Doulton also serves as Trustee of other Fidelity® funds. Prior to her retirement, Ms. Doulton served in a variety of positions at Fidelity Investments, including as a managing director of research (2006-2007), portfolio manager to certain Fidelity® funds (1993-2005), equity analyst and portfolio assistant (1990-1993), and research assistant (1987-1990). Ms. Doulton currently owns and operates Phi Builders + Architects and Cellardoor Winery. Previously, Ms. Doulton served as a member of the Board of Brown Capital Management, LLC (2014-2018).
Robert A. Lawrence (1952)
Year of Election or Appointment: 2020
Trustee
Chair of the Board of Trustees
Mr. Lawrence also serves as Trustee of other funds. Previously, Mr. Lawrence served as a Trustee and Member of the Advisory Board of certain funds. Prior to his retirement in 2008, Mr. Lawrence served as Vice President of certain Fidelity® funds (2006-2008), Senior Vice President, Head of High Income Division of Fidelity Management & Research Company (investment adviser firm, 2006-2008), and President of Fidelity Strategic Investments (investment adviser firm, 2002-2005).
* Determined to be an "Interested Trustee" by virtue of, among other things, his or her affiliation with the trust or various entities under common control with FMR.
+ The information includes the Trustee's principal occupation during the last five years and other information relating to the experience, attributes, and skills relevant to the Trustee's qualifications to serve as a Trustee, which led to the conclusion that the Trustee should serve as a Trustee for each fund.
Independent Trustees:
Correspondence intended for an Independent Trustee may be sent to Fidelity Investments, P.O. Box 55235, Boston, Massachusetts 02205-5235.
Name, Year of Birth; Principal Occupations and Other Relevant Experience+
Vijay C. Advani (1960)
Year of Election or Appointment: 2023
Trustee
Mr. Advani also serves as Trustee or Member of the Advisory Board of other funds. Previously, Mr. Advani served as Executive Chairman (2020-2022), Chief Executive Officer (2017-2020) and Chief Operating Officer (2016-2017) of Nuveen (global investment manager). He also served in various capacities at Franklin Resources (global investment manager), including Co-President (2015-2016), Executive Vice President, Global Advisory Services (2008-2015), Head of Global Retail Distribution (2005-2008), Executive Managing Director, International Retail Development (2002-2005), Managing Director, Product Developments, Sales & Marketing, Asia, Eastern Europe and Africa (2000-2002) and President, Templeton Asset Management India (1995-2000). Mr. Advani also served as Senior Investment Officer of International Finance Corporation (private equity and venture capital arm of The World Bank, 1984-1995). Mr. Advani is Chairman Emeritus of the U.S. India Business Council (2018-present), a Director of The Global Impact Investing Network (2019-present), a Director of LOK Capital (Mauritius) (2022-present), a member of the Advisory Council of LOK Capital (2022-present), a Senior Advisor of Neuberger Berman (2021-present), a Senior Advisor of Seviora Holdings Pte. Ltd (Temasek-Singapore) (2021-present), a Director of Seviora Capital (Singapore) (2021-present) and an Advisor of EQUIAM (2021-present). Mr. Advani formerly served as a member of the Board of BowX Acquisition Corp. (special purpose acquisition company, 2020-2021), a member of the Board of Intellecap (advisory arm of The Aavishkaar Group, 2018-2020), a member of the Board of Nuveen Investments, Inc. (2017-2020) and a member of the Board of Docusign (software, 2016-2019).
Thomas P. Bostick (1956)
Year of Election or Appointment: 2021
Trustee
Lieutenant General Bostick also serves as Trustee of other Fidelity® funds. Prior to his retirement, General Bostick (United States Army, Retired) held a variety of positions within the U.S. Army, including Commanding General and Chief of Engineers, U.S. Army Corps of Engineers (2012-2016) and Deputy Chief of Staff and Director of Human Resources, U.S. Army (2009-2012). General Bostick currently serves as a member of the Board and Finance and Governance & Sustainability Committees of CSX Corporation (transportation, 2020-present) and a member of the Board and Corporate Governance and Nominating Committee of Perma-Fix Environmental Services, Inc. (nuclear waste management, 2020-present). General Bostick serves as Chief Executive Officer of Bostick Global Strategies, LLC (consulting, 2016-present), as a member of the Board of HireVue, Inc. (video interview and assessment, 2020-present), as a member of the Board of Allonnia (biotechnology and engineering solutions, 2022-present) and on the Advisory Board of Solugen, Inc. (specialty bio-based chemicals manufacturer, 2022-present). Previously, General Bostick served as a Member of the Advisory Board of certain Fidelity® funds (2021), President, Intrexon Bioengineering (2018-2020) and Chief Operating Officer (2017-2020) and Senior Vice President of the Environment Sector (2016-2017) of Intrexon Corporation (biopharmaceutical company).
Dennis J. Dirks (1948)
Year of Election or Appointment: 2018
Trustee
Mr. Dirks also serves as Trustee of other Fidelity® funds. Prior to his retirement in May 2003, Mr. Dirks served as Chief Operating Officer and as a member of the Board of The Depository Trust & Clearing Corporation (financial markets infrastructure), President, Chief Operating Officer and a member of the Board of The Depository Trust Company (DTC), President and a member of the Board of the National Securities Clearing Corporation (NSCC), Chief Executive Officer and a member of the Board of the Government Securities Clearing Corporation and Chief Executive Officer and a member of the Board of the Mortgage-Backed Securities Clearing Corporation. Mr. Dirks currently serves as a member of the Finance Committee (2016-present) and Board (2017-present) and is Treasurer (2018-present) of the Asolo Repertory Theatre.
Donald F. Donahue (1950)
Year of Election or Appointment: 2018
Trustee
Mr. Donahue also serves as Trustee of other Fidelity® funds. Mr. Donahue serves as President and Chief Executive Officer of Miranda Partners, LLC (risk consulting for the financial services industry, 2012-present). Previously, Mr. Donahue served as Chief Executive Officer (2006-2012), Chief Operating Officer (2003-2006) and Managing Director, Customer Marketing and Development (1999-2003) of The Depository Trust & Clearing Corporation (financial markets infrastructure). Mr. Donahue currently serves as a member (2007-present) and Co-Chairman (2016-present) of the Board of United Way of New York. Mr. Donahue previously served as a member of the Advisory Board of certain Fidelity® funds (2015-2018) and as a member of the Board of The Leadership Academy (previously NYC Leadership Academy) (2012-2022).
Vicki L. Fuller (1957)
Year of Election or Appointment: 2020
Trustee
Ms. Fuller also serves as Trustee of other Fidelity® funds. Previously, Ms. Fuller served as a member of the Advisory Board of certain Fidelity® funds (2018-2020), Chief Investment Officer of the New York State Common Retirement Fund (2012-2018) and held a variety of positions at AllianceBernstein L.P. (global asset management, 1985-2012), including Managing Director (2006-2012) and Senior Vice President and Senior Portfolio Manager (2001-2006). Ms. Fuller currently serves as a member of the Board, Audit Committee and Nominating and Governance Committee of two Blackstone business development companies (2020-present), as a member of the Board of Treliant, LLC (consulting, 2019-present), as a member of the Board of Ariel Alternatives, LLC (private equity, 2022-present) and as a member of the Board and Chair of the Audit Committee of Gusto, Inc. (software, 2021-present). In addition, Ms. Fuller currently serves as a member of the Board of Roosevelt University (2019-present) and as a member of the Executive Board of New York University's Stern School of Business. Ms. Fuller previously served as a member of the Board, Audit Committee and Nominating and Governance Committee of The Williams Companies, Inc. (natural gas infrastructure, 2018-2021).
Patricia L. Kampling (1959)
Year of Election or Appointment: 2020
Trustee
Ms. Kampling also serves as Trustee of other Fidelity® funds. Prior to her retirement, Ms. Kampling served as Chairman of the Board and Chief Executive Officer (2012-2019), President and Chief Operating Officer (2011-2012) and Executive Vice President and Chief Financial Officer (2010-2011) of Alliant Energy Corporation. Ms. Kampling currently serves as a member of the Board, Finance Committee and Governance, Compensation and Nominating Committee of Xcel Energy Inc. (utilities company, 2020-present) and as a member of the Board, Audit, Finance and Risk Committee and Safety, Environmental, Technology and Operations Committee and Chair of the Executive Development and Compensation Committee of American Water Works Company, Inc. (utilities company, 2019-present). In addition, Ms. Kampling currently serves as a member of the Board of the Nature Conservancy, Wisconsin Chapter (2019-present). Previously, Ms. Kampling served as a Member of the Advisory Board of certain Fidelity® funds (2020), a member of the Board, Compensation Committee and Executive Committee and Chair of the Audit Committee of Briggs & Stratton Corporation (manufacturing, 2011-2021), a member of the Board of Interstate Power and Light Company (2012-2019) and Wisconsin Power and Light Company (2012-2019) (each a subsidiary of Alliant Energy Corporation) and as a member of the Board and Workforce Development Committee of the Business Roundtable (2018-2019).
Thomas A. Kennedy (1955)
Year of Election or Appointment: 2021
Trustee
Mr. Kennedy also serves as Trustee of other Fidelity® funds. Previously, Mr. Kennedy served as a Member of the Advisory Board of certain Fidelity® funds (2020) and held a variety of positions at Raytheon Company (aerospace and defense, 1983-2020), including Chairman and Chief Executive Officer (2014-2020) and Executive Vice President and Chief Operating Officer (2013-2014). Mr. Kennedy served as Executive Chairman of the Board of Directors of Raytheon Technologies Corporation (aerospace and defense, 2020-2021). Mr. Kennedy serves as a Director of the Board of Directors of Textron Inc. (aerospace and defense, 2023-present).
Oscar Munoz (1959)
Year of Election or Appointment: 2021
Trustee
Mr. Munoz also serves as Trustee of other Fidelity® funds. Prior to his retirement, Mr. Munoz served as Executive Chairman (2020-2021), Chief Executive Officer (2015-2020), President (2015-2016) and a member of the Board (2010-2021) of United Airlines Holdings, Inc. Mr. Munoz currently serves as a member of the Board of CBRE Group, Inc. (commercial real estate, 2020-present), a member of the Board of Univision Communications, Inc. (Hispanic media, 2020-present), a member of the Board of Archer Aviation Inc. (2021-present), a member of the Defense Business Board of the United States Department of Defense (2021-present) and a member of the Board of Salesforce.com, Inc. (cloud-based software, 2022-present). Previously, Mr. Munoz served as a Member of the Advisory Board of certain Fidelity® funds (2021).
David M. Thomas (1949)
Year of Election or Appointment: 2018
Trustee
Lead Independent Trustee
Mr. Thomas also serves as Trustee of other Fidelity® funds. Previously, Mr. Thomas served as Executive Chairman (2005-2006) and Chairman and Chief Executive Officer (2000-2005) of IMS Health, Inc. (pharmaceutical and healthcare information solutions). Mr. Thomas currently serves as a member of the Board of Fortune Brands Home and Security (home and security products, 2004-present) and as Director (2013-present) and Non-Executive Chairman of the Board (2022-present) of Interpublic Group of Companies, Inc. (marketing communication).
Susan Tomasky (1953)
Year of Election or Appointment: 2020
Trustee
Ms. Tomasky also serves as Trustee of other Fidelity® funds. Prior to her retirement, Ms. Tomasky served in various executive officer positions at American Electric Power Company, Inc. (1998-2011), including most recently as President of AEP Transmission (2007-2011). Ms. Tomasky currently serves as a member of the Board and Sustainability Committee and as Chair of the Audit Committee of Marathon Petroleum Corporation (2018-present) and as a member of the Board, Executive Committee, Corporate Governance Committee and Organization and Compensation Committee and as Lead Director of the Board of Public Service Enterprise Group, Inc. (utilities company, 2012-present) and as a member of the Board of its subsidiary company, Public Service Electric and Gas Co. (2021-present). In addition, Ms. Tomasky currently serves as a member (2009-present) and President (2020-present) of the Board of the Royal Shakespeare Company - America (2009-present), as a member of the Board of the Columbus Association for the Performing Arts (2011-present) and as a member of the Board and Kenyon in the World Committee of Kenyon College (2016-present). Previously, Ms. Tomasky served as a Member of the Advisory Board of certain Fidelity® funds (2020), as a member of the Board of the Columbus Regional Airport Authority (2007-2020), as a member of the Board (2011-2018) and Lead Independent Director (2015-2018) of Andeavor Corporation (previously Tesoro Corporation) (independent oil refiner and marketer) and as a member of the Board of Summit Midstream Partners LP (energy, 2012-2018).
Michael E. Wiley (1950)
Year of Election or Appointment: 2013
Trustee
Mr. Wiley also serves as Trustee of other Fidelity® funds. Previously, Mr. Wiley served as a member of the Advisory Board of certain Fidelity® funds (2018-2020), Chairman, President and CEO of Baker Hughes, Inc. (oilfield services, 2000-2004). Mr. Wiley also previously served as a member of the Board of Andeavor Corporation (independent oil refiner and marketer, 2005-2018), a member of the Board of Andeavor Logistics LP (natural resources logistics, 2015-2018) and a member of the Board of High Point Resources (exploration and production, 2005-2020).
+ The information includes the Trustee's principal occupation during the last five years and other information relating to the experience, attributes, and skills relevant to the Trustee's qualifications to serve as a Trustee, which led to the conclusion that the Trustee should serve as a Trustee for each fund.
Advisory Board Members and Officers:
Correspondence intended for a Member of the Advisory Board (if any) may be sent to Fidelity Investments, P.O. Box 55235, Boston, Massachusetts 02205-5235. Correspondence intended for an officer or Peter S. Lynch may be sent to Fidelity Investments, 245 Summer Street, Boston, Massachusetts 02210. Officers appear below in alphabetical order.
Name, Year of Birth; Principal Occupation
Peter S. Lynch (1944)
Year of Election or Appointment: 2018
Member of the Advisory Board
Mr. Lynch also serves as a Member of the Advisory Board of other Fidelity® funds. Mr. Lynch is Vice Chairman and a Director of Fidelity Management & Research Company LLC (investment adviser firm). In addition, Mr. Lynch serves as a Trustee of Boston College and as the Chairman of the Inner-City Scholarship Fund. Previously, Mr. Lynch served as Vice Chairman and a Director of FMR Co., Inc. (investment adviser firm) and on the Special Olympics International Board of Directors (1997-2006).
Karen B. Peetz (1955)
Year of Election or Appointment: 2023
Member of the Advisory Board
Ms. Peetz also serves as a Member of the Advisory Board of other funds. Previously, Ms. Peetz served as Chief Administration Officer (2020-2023) of Citigroup Inc. (a diversified financial service company). She also served in various capacities at Bank of New York Mellon Corporation, including President (2013-2016), Vice Chairman, Senior Executive Vice President and Chief Executive Officer of Financial Markets & Treasury Services (2010-2013), Senior Executive Vice President and Chief Executive Officer of Global Corporate Trust (2003-2008), Senior Vice President and Division Manager of Global Payments & Trade Services (2002-2003) and Senior Vice President and Division Manager of Domestic Corporate Trust (1998-2002). Ms. Peetz also served in various capacities at Chase Manhattan Corporation (1982-1998), including Senior Vice President and Manager of Corporate Trust International Business (1996-1998), Managing Director and Manager of Corporate Trust Services (1994-1996) and Managing Director and Group Manager of Financial Institution Sales (1990-1993). Ms. Peetz currently serves as Chair of Amherst Holdings Advisory Council (2018-present), Trustee of Johns Hopkins University (2016-present), Chair of the Carey Business School Advisory Council, Member of the Johns Hopkins Medicine Board and Finance Committee and Chair of the Lyme and Tick Related Disease Institute Advisory Council. Ms. Peetz previously served as a member of the Board of Guardian Life Insurance Company of America (2019-2023), a member of the Board of Trane Technologies (2018-2022), a member of the Board of Wells Fargo Corp. (2017-2019), a member of the Board of SunCoke Energy Inc. (2012-2016), a member of the Board of Private Export Funding Corporation (2010-2016) and as a Trustee of Penn State University (2010-2014) and the United Way of New York City (2008-2010).
Heather Bonner (1977)
Year of Election or Appointment: 2023
Assistant Treasurer
Ms. Bonner also serves as an officer of other funds. Ms. Bonner serves as Senior Vice President (2022-present), and is an employee of Fidelity Investments. Ms. Bonner serves as Assistant Treasurer of Fidelity CRET Trustee LLC (2022-present). Prior to joining Fidelity, Ms. Bonner served as Managing Director at AQR Capital Management (2013-2022) and was the Treasurer and Principal Financial Officer of the AQR Funds (2013-2022).
Craig S. Brown (1977)
Year of Election or Appointment: 2022
Deputy Treasurer
Mr. Brown also serves as an officer of other funds. Mr. Brown serves as Assistant Treasurer of FIMM, LLC (2021-present) and is an employee of Fidelity Investments (2013-present). Previously, Mr. Brown served as Assistant Treasurer of certain Fidelity® funds (2019-2022).
John J. Burke III (1964)
Year of Election or Appointment: 2018
Chief Financial Officer
Mr. Burke also serves as Chief Financial Officer of other funds. Mr. Burke serves as Head of Investment Operations for Fidelity Fund and Investment Operations (2018-present) and is an employee of Fidelity Investments (1998-present). Previously Mr. Burke served as head of Asset Management Investment Operations (2012-2018).
Margaret Carey (1973)
Year of Election or Appointment: 2023
Secretary and Chief Legal Officer (CLO)
Ms. Carey also serves as an officer of other funds and as CLO of certain other Fidelity entities. She is a Senior Vice President and Deputy General Counsel of FMR LLC (diversified financial services company, 2019-present), and is an employee of Fidelity Investments.
William C. Coffey (1969)
Year of Election or Appointment: 2019
Assistant Secretary
Mr. Coffey also serves as Assistant Secretary of other funds. He is Senior Vice President and Deputy General Counsel of FMR LLC (diversified financial services company, 2010-present), and is an employee of Fidelity Investments. Previously, Mr. Coffey served as Secretary and CLO of certain funds (2018-2019); CLO, Secretary, and Senior Vice President of Fidelity Management & Research Company and FMR Co., Inc. (investment adviser firms, 2018-2019); Secretary of Fidelity SelectCo, LLC and Fidelity Investments Money Management, Inc. (investment adviser firms, 2018-2019); CLO of Fidelity Management & Research (Hong Kong) Limited, FMR Investment Management (UK) Limited, and Fidelity Management & Research (Japan) Limited (investment adviser firms, 2018-2019); and Assistant Secretary of certain funds (2009-2018).
Timothy M. Cohen (1969)
Year of Election or Appointment: 2018
Vice President
Mr. Cohen also serves as Vice President of other funds. Mr. Cohen serves as Co-Head of Equity (2018-present), a Director of Fidelity Management & Research (Japan) Limited (investment adviser firm, 2016-present), and is an employee of Fidelity Investments. Previously, Mr. Cohen served as Executive Vice President of Fidelity SelectCo, LLC (2019), Head of Global Equity Research (2016-2018), Chief Investment Officer - Equity and a Director of Fidelity Management & Research (U.K.) Inc. (investment adviser firm, 2013-2015) and as a Director of Fidelity Management & Research (Hong Kong) Limited (investment adviser firm, 2017).
Jonathan Davis (1968)
Year of Election or Appointment: 2013
Assistant Treasurer
Mr. Davis also serves as an officer of other funds. Mr. Davis serves as Vice President Assistant Treasurer and is an employee of Fidelity Investments. Mr. Davis serves as Assistant Treasurer of certain Fidelity entities.
Laura M. Del Prato (1964)
Year of Election or Appointment: 2018
Assistant Treasurer
Ms. Del Prato also serves as an officer of other funds. Ms. Del Prato serves as Assistant Treasurer of FIMM, LLC (2021-present) and is an employee of Fidelity Investments (2017-present). Previously, Ms. Del Prato served as President and Treasurer of The North Carolina Capital Management Trust: Cash Portfolio and Term Portfolio (2018-2020). Prior to joining Fidelity Investments, Ms. Del Prato served as a Managing Director and Treasurer of the JPMorgan Mutual Funds (2014-2017). Prior to JPMorgan, Ms. Del Prato served as a partner at Cohen Fund Audit Services (accounting firm, 2012-2013) and KPMG LLP (accounting firm, 2004-2012).
Colm A. Hogan (1973)
Year of Election or Appointment: 2020
Assistant Treasurer
Mr. Hogan also serves as an officer of other funds. Mr. Hogan serves as Assistant Treasurer of FIMM, LLC (2021-present) and FMR Capital, Inc. (2017-present) and is an employee of Fidelity Investments (2005-present). Previously, Mr. Hogan served as Deputy Treasurer of certain Fidelity® funds (2016-2020) and Assistant Treasurer of certain Fidelity® funds (2016-2018).
Pamela R. Holding (1964)
Year of Election or Appointment: 2018
Vice President
Ms. Holding also serves as Vice President of other funds. Ms. Holding serves as Co-Head of Equity (2018-present) and is an employee of Fidelity Investments (2013-present). Previously, Ms. Holding served as Executive Vice President of Fidelity SelectCo, LLC (2019) and as Chief Investment Officer of Fidelity Institutional Asset Management (2013-2018).
Chris Maher (1972)
Year of Election or Appointment: 2020
Deputy Treasurer
Mr. Maher also serves as an officer of other funds. Mr. Maher serves as Assistant Treasurer of FIMM, LLC (2021-present) and FMR Capital, Inc. (2017-present), and is an employee of Fidelity Investments (2008-present). Previously, Mr. Maher served as Assistant Treasurer of certain funds (2013-2020); Vice President of Asset Management Compliance (2013), Vice President of the Program Management Group of FMR (investment adviser firm, 2010-2013), and Vice President of Valuation Oversight (2008-2010).
Jason P. Pogorelec (1975)
Year of Election or Appointment: 2020
Chief Compliance Officer
Mr. Pogorelec also serves as Chief Compliance Officer of other funds. Mr. Pogorelec is a Senior Vice President of Asset Management Compliance for Fidelity Investments and is an employee of Fidelity Investments. Mr. Pogorelec serves as Compliance Officer of Fidelity Management & Research Company LLC (investment adviser firm, 2023-present). Previously, Mr. Pogorelec served as Vice President, Associate General Counsel for Fidelity Investments (2010-2020) and Assistant Secretary of certain Fidelity® funds (2015-2020).
Brett Segaloff (1972)
Year of Election or Appointment: 2021
Anti-Money Laundering (AML) Officer
Mr. Segaloff also serves as an AML Officer of other funds and other related entities. He is Director, Anti-Money Laundering (2007-present) of FMR LLC (diversified financial services company) and is an employee of Fidelity Investments (1996-present).
Stacie M. Smith (1974)
Year of Election or Appointment: 2018
President and Treasurer
Ms. Smith also serves as an officer of other funds. Ms. Smith serves as Assistant Treasurer of FIMM, LLC (2021-present) and FMR Capital, Inc. (2017-present), is an employee of Fidelity Investments (2009-present), and has served in other fund officer roles. Prior to joining Fidelity Investments, Ms. Smith served as Senior Audit Manager of Ernst & Young LLP (accounting firm, 1996-2009). Previously, Ms. Smith served as Assistant Treasurer (2013-2019) and Deputy Treasurer (2013-2016) of certain Fidelity® funds.
Jim Wegmann (1979)
Year of Election or Appointment: 2019
Assistant Treasurer
Mr. Wegmann also serves as an officer of other funds. Mr. Wegmann serves as Assistant Treasurer of FIMM, LLC (2021-present) and is an employee of Fidelity Investments (2011-present). Previously, Mr. Wegmann served as Assistant Treasurer of certain Fidelity® funds (2019-2021).
As a shareholder, you incur two types of costs: (1) transaction costs, which may include sales charges (loads) on purchase payments or redemption proceeds, as applicable and (2) ongoing costs, which generally include management fees, distribution and/or service (12b-1) fees and other Fund expenses. This Example is intended to help you understand your ongoing costs (in dollars) of investing in a fund and to compare these costs with the ongoing costs of investing in other mutual funds.
| The Example is based on an investment of $1,000 invested at the beginning of the period and held for the entire period (February 1, 2023 to July 31, 2023). |
Actual Expenses
The first line of the accompanying table provides information about actual account values and actual expenses. You may use the information in this line, together with the amount you invested, to estimate the expenses that you paid over the period. Simply divide your account value by $1,000.00 (for example, an $8,600 account value divided by $1,000.00 = 8.6), then multiply the result by the number in the first line for a class/Fund under the heading entitled "Expenses Paid During Period" to estimate the expenses you paid on your account during this period. If any fund is a shareholder of any underlying mutual funds or exchange-traded funds (ETFs) (the Underlying Funds), such fund indirectly bears its proportional share of the expenses of the Underlying Funds in addition to the direct expenses incurred presented in the table. These fees and expenses are not included in the annualized expense ratio used to calculate the expense estimate in the table below.
Hypothetical Example for Comparison Purposes
The second line of the accompanying table provides information about hypothetical account values and hypothetical expenses based on the actual expense ratio and an assumed rate of return of 5% per year before expenses, which is not the actual return. The hypothetical account values and expenses may not be used to estimate the actual ending account balance or expenses you paid for the period. You may use this information to compare the ongoing costs of investing in the Fund and other funds. To do so, compare this 5% hypothetical example with the 5% hypothetical examples that appear in the shareholder reports of the other funds. If any fund is a shareholder of any Underlying Funds, such fund indirectly bears its proportional share of the expenses of the Underlying Funds in addition to the direct expenses as presented in the table. These fees and expenses are not included in the annualized expense ratio used to calculate the expense estimate in the table below.
Please note that the expenses shown in the table are meant to highlight your ongoing costs only and do not reflect any transaction costs. Therefore, the second line of the table is useful in comparing ongoing costs only, and will not help you determine the relative total costs of owning different funds. In addition, if these transactional costs were included, your costs would have been higher.
| | | | | Annualized Expense Ratio- A | | Beginning Account Value February 1, 2023 | | Ending Account Value July 31, 2023 | | Expenses Paid During Period- C February 1, 2023 to July 31, 2023 |
| | | | | | | | | | |
| Fidelity® Blue Chip Growth ETF | | | | .59% | | | | | | |
| Actual | | | | | | $ 1,000 | | $ 1,310.60 | | $ 3.38 |
Hypothetical-B | | | | | | $ 1,000 | | $ 1,021.87 | | $ 2.96 |
| | | | | | | | | | |
| Fidelity® Blue Chip Value ETF | | | | .59% | | | | | | |
| Actual | | | | | | $ 1,000 | | $ 1,007.80 | | $ 2.94 |
Hypothetical-B | | | | | | $ 1,000 | | $ 1,021.87 | | $ 2.96 |
| | | | | | | | | | |
| Fidelity® Growth Opportunities ETF | | | | .59% | | | | | | |
| Actual | | | | | | $ 1,000 | | $ 1,272.80 | | $ 3.32 |
Hypothetical-B | | | | | | $ 1,000 | | $ 1,021.87 | | $ 2.96 |
| | | | | | | | | | |
| Fidelity® Magellan® ETF | | | | .59% | | | | | | |
| Actual | | | | | | $ 1,000 | | $ 1,133.70 | | $ 3.12 |
Hypothetical-B | | | | | | $ 1,000 | | $ 1,021.87 | | $ 2.96 |
| | | | | | | | | | |
| Fidelity® New Millennium ETF | | | | .59% | | | | | | |
| Actual | | | | | | $ 1,000 | | $ 1,121.40 | | $ 3.10 |
Hypothetical-B | | | | | | $ 1,000 | | $ 1,021.87 | | $ 2.96 |
| | | | | | | | | | |
| Fidelity® Real Estate Investment ETF | | | | .59% | | | | | | |
| Actual | | | | | | $ 1,000 | | $ 950.50 | | $ 2.85 |
Hypothetical-B | | | | | | $ 1,000 | | $ 1,021.87 | | $ 2.96 |
| | | | | | | | | | |
| Fidelity® Small-Mid Cap Opportunities ETF | | | | .60% | | | | | | |
| Actual | | | | | | $ 1,000 | | $ 1,026.40 | | $ 3.01 |
Hypothetical-B | | | | | | $ 1,000 | | $ 1,021.82 | | $ 3.01 |
| | | | | | | | | | |
| Fidelity® Sustainable U.S. Equity ETF | | | | .59% | | | | | | |
| Actual | | | | | | $ 1,000 | | $ 1,110.50 | | $ 3.09 |
Hypothetical-B | | | | | | $ 1,000 | | $ 1,021.87 | | $ 2.96 |
| | | | | | | | | | |
| Fidelity® Women's Leadership ETF | | | | .59% | | | | | | |
| Actual | | | | | | $ 1,000 | | $ 1,077.90 | | $ 3.04 |
Hypothetical-B | | | | | | $ 1,000 | | $ 1,021.87 | | $ 2.96 |
| |
A Annualized expense ratio reflects expenses net of applicable fee waivers.
B 5% return per year before expenses
C Expenses are equal to the annualized expense ratio, multiplied by the average account value over the period, multiplied by 181/ 365 (to reflect the one-half year period). The fees and expenses of any Underlying Funds are not included in each annualized expense ratio.
The dividend and capital gains distributions for the fund(s) are available on Fidelity.com or Institutional.Fidelity.com.
A percentage of the dividends distributed during the fiscal year for the following funds qualify for the dividends-received deduction for corporate shareholders:
| Fidelity® Blue Chip Value ETF | |
September 2022 December 2022 March 2023 June 2023 | 100% 100% 100% 100% |
| Fidelity® Magellan ETF | |
September 2022 December 2022 March 2023 June 2023 | 100% 100% 100% 100% |
| Fidelity® New Millennium ETF | |
September 2022 December 2022 March 2023 June 2023 | 100% 100% 100% 100% |
| Fidelity® Small-Mid Cap Opportunities ETF | |
September 2022 December 2022 March 2023 June 2023 | 100% 100% 100% 100% |
| Fidelity® Sustainable U.S. Equity ETF | |
September 2022 December 2022 March 2023 June 2023 | 100% 100% 100% 100% |
| Fidelity® Women's Leadership ETF | |
September 2022 December 2022 March 2023 June 2023 | 100% 100% 100% 100% |
A percentage of the dividends distributed during the fiscal year for the following funds may be taken into account as a dividend for purposes of the maximum rate under section 1(h)(11) of the Internal Revenue Code.
| Fidelity® Blue Chip Value ETF | |
September 2022 December 2022 March 2023 June 2023 | 100% 100% 100% 100% |
| | |
Fidelity® Magellan ETF September 2022 December 2022 March 2023 June 2023 | 100% 100% 100% 100% |
| Fidelity® New Millennium ETF | |
September 2022 December 2022 March 2023 June 2023 | 100% 100% 100% 100% |
Fidelity® Small-Mid Cap Opportunities ETF | |
September 2022 December 2022 March 2023 June 2023 | 100% 100% 100% 100% |
| Fidelity® Sustainable U.S. Equity ETF | |
September 2022 December 2022 March 2023 June 2023 | 100% 100% 100% 100% |
| Fidelity® Women's Leadership ETF | |
September 2022 December 2022 March 2023 June 2023 | 100% 100% 100% 100% |
A percentage of the dividends distributed during the fiscal year for the following funds qualify as a section 199A dividend:
| Fidelity® Real Estate Investment ETF | |
September 2022 December 2022 March 2023 June 2023 | 100% 100% 82.04% 82.04% |
The funds hereby designate the percentages noted below of the short-term capital gain dividends distributed during the fiscal year as qualifying to be taxed as short-term capital gain dividends for nonresident alien shareholders:
| | December, 2022 |
| Fidelity® New Millennium ETF | 99.42% |
The funds will notify shareholders in January 2024 of amounts for use in preparing 2023 income tax returns.
Board Approval of Investment Advisory Contracts and Management Fees
Fidelity Blue Chip Growth ETF
Fidelity Blue Chip Value ETF
Fidelity Growth Opportunities ETF
Fidelity Magellan ETF
Fidelity New Millennium ETF
Fidelity Real Estate Investment ETF
Fidelity Small-Mid Cap Opportunities ETF
Fidelity Sustainable U.S. Equity ETF
Fidelity Women's Leadership ETF
Each year, the Board of Trustees, including the Independent Trustees (together, the Board), considers the renewal of each fund's management contract with Fidelity Management & Research Company LLC (FMR) and the sub-advisory agreements (together, the Advisory Contracts) for each fund. FMR and the sub-advisers are referred to herein as the Investment Advisers. The Board, assisted by the advice of fund counsel and Independent Trustees' counsel, requests and considers a broad range of information relevant to the renewal of the Advisory Contracts throughout the year.
The Board meets regularly and, at each of its meetings, covers an extensive agenda of topics and materials and considers factors that are relevant to its annual consideration of the renewal of each fund's Advisory Contracts, including the services and support provided to each fund and its shareholders. The Board, acting directly and through its Committees (each of which is composed of and chaired by Independent Trustees), requests and receives information concerning the annual consideration of the renewal of each fund's Advisory Contracts. The Board also meets as needed to review matters specifically related to the Board's annual consideration of the renewal of the Advisory Contracts. Members of the Board may also meet with trustees of other Fidelity funds through joint ad hoc committees to discuss certain matters relevant to all of the Fidelity funds.
Approval of Stub Period Continuation. At its May 2023 meeting, the Board of Trustees voted to continue each fund's management contract with FMR, and the sub-advisory agreements and sub-sub-advisory agreements, in each case, where applicable (together, the Advisory Contracts), without modification, for two months from June 1, 2023 through July 31, 2023. The Board considered that the approval of each fund's Advisory Contracts will not result in any changes in (i) the investment process or strategies employed in the management of each fund's assets; (ii) the fees and expenses paid by shareholders; (iii) the nature, extent or quality of services provided under each fund's Advisory Contracts; or (iv) the day-to-day management of each fund or the persons primarily responsible for such management. The Board also considered that since its last approval of each fund's Advisory Contracts, FMR had provided additional information on each fund in support of the annual contract renewal process, including competitive analyses on total expenses and management fees and in-depth reviews of fund performance and fund profitability information. The Board concluded that each fund's Advisory Contracts are fair and reasonable, and that each fund's Advisory Contracts should be renewed, without modification, through July 31, 2023, with the understanding that the Board would consider the annual renewal for a full one year period in July 2023.
At its July 2023 meeting, the Board unanimously determined to renew each fund's Advisory Contracts. In reaching its determination, the Board considered all factors it believed relevant, including (i) the nature, extent, and quality of the services provided to each fund and its shareholders (including the investment performance of each fund); (ii) the competitiveness relative to peer funds of each fund's management fee and total expense ratio; (iii) the total costs of the services provided by and the profits realized by FMR and its affiliates (Fidelity) from its relationships with each fund; and (iv) the extent to which, if any, economies of scale exist and are realized as each fund grows, and whether any economies of scale are appropriately shared with fund shareholders. The Board also considered the broad range of investment choices available to shareholders from FMR's competitors and that each fund's shareholders have chosen to invest in the fund, which is part of the Fidelity family of funds. The Board's decision to renew the Advisory Contracts was not based on any single factor.
The Board reached a determination, with the assistance of fund counsel and Independent Trustees' counsel and through the exercise of its business judgment, that the renewal of the Advisory Contracts was in the best interests of each fund and its shareholders and that the compensation payable under the Advisory Contracts was fair and reasonable in light of all of the surrounding circumstances.
Nature, Extent, and Quality of Services Provided. The Board considered staffing as it relates to the funds, including the backgrounds and experience of investment personnel of the Investment Advisers, and also considered the Investment Advisers' implementation of the funds' investment programs. The Independent Trustees also had discussions with senior management of Fidelity's investment operations and investment groups. The Board considered the structure of the investment personnel compensation program and whether this structure provides appropriate incentives to act in the best interests of each fund. Additionally, the Board considered the portfolio managers' investments, if any, in the funds that they manage.
Resources Dedicated to Investment Management and Support Services. The Board and the Fund Oversight and Research Committees reviewed the general qualifications and capabilities of Fidelity's investment staff, including its size, education, experience, and resources, as well as Fidelity's approach to recruiting, training, managing, and compensating investment personnel. The Board noted the resources devoted to Fidelity's global investment organization, and that Fidelity's analysts have extensive resources, tools, and capabilities that allow them to conduct sophisticated quantitative and fundamental analysis, as well as credit analysis of issuers, counterparties, and guarantors. Further, the Board considered that Fidelity's investment professionals have sufficient access to global information and data so as to provide competitive investment results over time, and that those professionals also have access to sophisticated tools that permit them to assess portfolio construction and risk and performance attribution characteristics continuously, as well as to transmit new information and research conclusions rapidly around the world. Additionally, in its deliberations, the Board considered Fidelity's trading, risk management, compliance, and technology and operations capabilities and resources, which are integral parts of the investment management process.
Shareholder and Administrative Services. The Board considered (i) the nature, extent, quality, and cost of advisory and administrative services provided by the Investment Advisers and their affiliates under the Advisory Contracts and under separate agreements covering pricing and bookkeeping and securities lending services for each fund; (ii) the nature and extent of Fidelity's supervision of third party service providers, principally State Street Bank and Trust Company, each fund's transfer agent and custodian; and (iii) the resources devoted by Fidelity to, and the record of compliance with, each fund's compliance policies and procedures. The Board also reviewed the allocation of fund brokerage, including allocations to brokers affiliated with the Investment Advisers, the use of brokerage commissions to pay fund expenses, and the use of "soft" commission dollars to pay for research services. The Board also considered each fund's securities lending activities and any payments made to Fidelity relating to securities lending.
The Board noted that the growth of fund assets over time across the complex allows Fidelity to reinvest in the development of services designed to enhance the value and convenience of the Fidelity funds as investment vehicles. These services include 24-hour access to account information and market information over the Internet and through telephone representatives, investor education materials, and asset allocation tools. The Board also considered that it reviews customer service metrics such as telephone response times, continuity of services on the website and metrics addressing services at Fidelity Investor Centers.
Investment in a Large Fund Family. The Board considered the benefits to shareholders of investing in a fund that is part of a large family of funds offering a variety of investment disciplines and providing a large variety of fund investor services. The Board noted that Fidelity had taken, or had made recommendations that resulted in the Fidelity funds taking, a number of actions over the previous year that benefited particular funds and/or the Fidelity funds in general.
Investment Performance. The Board took into account discussions that occur with representatives of the Investment Advisers, and reports that it receives, at Board meetings throughout the year, relating to fund investment performance. In this regard, the Board noted that as part of regularly scheduled fund reviews and other reports to the Board on fund performance, the Board considered annualized return information for the fund for different time periods, measured against an appropriate securities market index (benchmark index) and an appropriate peer group of funds with similar objectives (peer group), if applicable. The Board also considered information about performance attribution. In its ongoing evaluation of fund investment performance, the Board gives particular attention to information indicating changes in performance of the funds over different time periods and discussed with the Investment Advisers the reasons for any overperformance or underperformance. The Board also considered information on each fund's bid-ask spread and premium/discount.
In addition to reviewing absolute and relative fund performance, the Independent Trustees periodically consider the appropriateness of fund performance metrics in evaluating the results achieved. The Independent Trustees generally give greater weight to fund performance over longer time periods than over shorter time periods. Depending on the circumstances, the Independent Trustees may be satisfied with a fund's performance notwithstanding that it lags its benchmark index or peer group for certain periods.
Based on its review, the Board concluded that the nature, extent, and quality of services provided to each fund under the Advisory Contracts should continue to benefit the shareholders of each fund.
Competitiveness of Management Fee and Total Expense Ratio. The Board was provided with information regarding industry trends in management fees and expenses. In its review of each fund's management fee and total expense ratio, the Board considered each fund's all-inclusive fee rate and also considered other expenses, such as transfer agent fees, pricing and bookkeeping fees, and custodial, legal, and audit fees, paid by FMR under each fund's all-inclusive arrangement. The Board noted that Fidelity may agree to waive fees or reimburse expenses from time to time, and the extent to which, if any, it has done so for each fund.
Comparisons of Management Fees and Total Expense Ratios. Among other things, the Board reviewed data for selected groups of competitive funds and classes (referred to as "mapped groups") that were compiled by Fidelity based on combining similar investment objective categories (as classified by Lipper) that have comparable investment mandates. The data reviewed by the Board included (i) gross management fee comparisons (before taking into account expense reimbursements or caps) relative to the total universe of funds within the mapped group; (ii) gross management fee comparisons relative to a subset of non-Fidelity funds in the mapped group that are similar in size and management fee structure to each fund (referred to as the "asset size peer group"); (iii) total expense comparisons of each fund relative to funds and classes in the mapped group that have a similar load structure to the fund (referred to as the "similar load structure group"); and (iv) total expense comparisons of each fund relative to funds and classes in the similar load structure group that are similar in size and management fee structure to the fund (referred to as the "total expense asset size peer group"). The total expense asset size peer group comparison excludes performance adjustments and fund-paid 12b-1 fees to eliminate variability in fee structures.
The information provided to the Board indicated that each fund's management fee rate ranked equal to the competitive median of the mapped group for the 12-month period ended September 30, 2022 and equal to or below the competitive median of the asset size peer group for the 12-month period ended September 30, 2022.
The information provided to the Board indicated that the total expense ratio of each fund ranked equal to the competitive median of the similar load structure group for the 12-month period ended September 30, 2022. For each fund (except Fidelity Blue Chip Growth ETF and Fidelity Blue Chip Value ETF), the information provided to the Board indicated that the total expense ratio of the fund ranked below the competitive median of the total expense asset size peer group for the 12-month period ended September 30, 2022. For Fidelity Blue Chip Growth ETF and Fidelity Blue Chip Value ETF, the information provided to the Board indicated that the total expense ratio of the fund ranked above the competitive median of the total expense asset size peer group for the 12-month period ended September 30, 2022. The Board also noted that if funds in a fund complex with a unique at-cost service model were excluded from the total expense asset size peer group for Fidelity Blue Chip Value ETF, the total expense ratio for the fund was below the total expense asset size peer group for 2022.
Fees Charged to Other Fidelity Clients. The Board also considered Fidelity fee structures and other information with respect to clients of Fidelity, such as other funds advised or subadvised by Fidelity, pension plan clients, and other institutional clients with similar mandates. The Board noted that a joint ad hoc committee created by it and the boards of other Fidelity funds periodically reviews and compares Fidelity's institutional investment advisory business with its business of providing services to the Fidelity funds and also noted the most recent findings of the committee. The Board noted that the committee's review included a consideration of the differences in services provided, fees charged, and costs incurred, as well as competition in the markets serving the different categories of clients.
Based on its review, the Board concluded that each fund's management fee is fair and reasonable in light of the services that the fund receives and the other factors considered. Further, based on its review of total expense ratios and fees charged to other Fidelity clients, the Board concluded that each fund's total expense ratio was reasonable in light of the services that the fund and its shareholders receive and the other factors considered.
Costs of the Services and Profitability. The Board considered the revenues earned and the expenses incurred by Fidelity in conducting the business of developing, marketing, distributing, managing, administering, and servicing each fund and servicing each fund's shareholders. The Board also considered the level of Fidelity's profits in respect of all the Fidelity funds.
On an annual basis, Fidelity presents to the Board information about the profitability of its relationships with each fund. Fidelity calculates profitability information for each fund, as well as aggregate profitability information for groups of Fidelity funds and all Fidelity funds, using a series of detailed revenue and cost allocation methodologies which originate with the books and records of Fidelity on which Fidelity's audited financial statements are based. The Audit Committee of the Board reviews any significant changes from the prior year's methodologies and the full Board approves such changes.
A public accounting firm has been engaged annually by the Board as part of the Board's assessment of Fidelity's profitability analysis. The engagement includes the review and assessment of the methodologies used by Fidelity in determining the revenues and expenses attributable to Fidelity's fund business, and completion of agreed-upon procedures in respect of the mathematical accuracy of certain fund profitability information and its conformity to established allocation methodologies. After considering the reports issued under the engagement and information provided by Fidelity, the Board concluded that while other allocation methods may also be reasonable, Fidelity's profitability methodologies are reasonable in all material respects.
The Board also reviewed Fidelity's non-fund businesses and potential indirect benefits such businesses may have received as a result of their association with Fidelity's fund business (i.e., fall-out benefits) as well as cases where Fidelity's affiliates may benefit from the funds' business. The Board considered areas where potential indirect benefits to the Fidelity funds from their relationships with Fidelity may exist. The Board's consideration of these matters was informed by the findings of a joint ad hoc committee created by it and the boards of other Fidelity funds to evaluate potential fall-out benefits.
The Board considered the costs of the services provided by and the profits realized by Fidelity in connection with the operation of each fund and was satisfied that the profitability was not excessive.
Economies of Scale. The Board considered whether there have been economies of scale in respect of the management of the Fidelity funds, whether the Fidelity funds (including each fund) have appropriately benefited from any such economies of scale, and whether there is potential for realization of any further economies of scale. The Board considered the extent to which each fund will benefit from economies of scale as assets grow through increased services to the fund, through waivers or reimbursements, or through fee or expense ratio reductions. The Board recognized that, due to each fund's current contractual arrangements, its expense ratio will not decline if the fund's operating costs decrease as assets grow, or rise as assets decrease. The Board also noted that a committee (the Economies of Scale Committee) created by it and the boards of other Fidelity funds periodically analyzes whether Fidelity attains economies of scale in respect of the management and servicing of the Fidelity funds, whether the Fidelity funds have appropriately benefited from such economies of scale, and whether there is potential for realization of any further economies of scale.
The Board concluded, taking into account the analysis of the Economies of Scale Committee, that economies of scale, if any, are being appropriately shared between fund shareholders and Fidelity.
Additional Information Requested by the Board. In order to develop fully the factual basis for consideration of the Fidelity funds' advisory contracts, the Board requested and received additional information on certain topics, including: (i) fund flow and performance trends, in particular the underperformance of certain funds and strategies, and Fidelity's long-term strategies for certain funds, including any consideration of fund liquidations or mergers; (ii) the operation of performance fees and competitor use of performance fees; (iii) Fidelity's pricing philosophy compared to competitors; (iv) fund profitability methodology and data; (v) evaluation of competitive fund data and peer group classifications and fee and expense comparisons; (vi) the management fee and expense structures for different funds and classes and information about the differences between various fee and expense structures; (vii) group fee breakpoints and related voluntary fee waivers; and (viii) information regarding other accounts managed by Fidelity and the funds' sub-advisory arrangements.
Conclusion. Based on its evaluation of all of the conclusions noted above, and after considering all factors it believed relevant, the Board, including the Independent Trustees, concluded that the advisory and sub-advisory fee arrangements are fair and reasonable in light of all of the surrounding circumstances and that each fund's Advisory Contracts should be renewed through July 31, 2024.
1.9897894.103
GTF-ANN-0923
Item 2.
Code of Ethics
As of the end of the period, July 31, 2023, Fidelity Covington Trust (the trust) has adopted a code of ethics, as defined in Item 2 of Form N-CSR, that applies to its President and Treasurer and its Chief Financial Officer. A copy of the code of ethics is filed as an exhibit to this Form N-CSR.
Item 3.
Audit Committee Financial Expert
The Board of Trustees of the trust has determined that Donald F. Donahue is an audit committee financial expert, as defined in Item 3 of Form N-CSR. Mr. Donahue is independent for purposes of Item 3 of Form N-CSR.
Item 4.
Principal Accountant Fees and Services
Fees and Services
The following table presents fees billed by Deloitte & Touche LLP, the member firms of Deloitte Touche Tohmatsu, and their respective affiliates (collectively, “Deloitte Entities”) in each of the last two fiscal years for services rendered to Fidelity Growth Opportunities ETF, Fidelity Magellan ETF, Fidelity Real Estate Investment ETF, Fidelity Small-Mid Cap Opportunities ETF, Fidelity Stocks for Inflation ETF, Fidelity Sustainable U.S. Equity ETF, and Fidelity Women's Leadership ETF (the “Funds”):
Services Billed by Deloitte Entities
July 31, 2023 FeesA
| | | | |
| Audit Fees | Audit-Related Fees | Tax Fees | All Other Fees |
Fidelity Growth Opportunities ETF | $13,200 | $- | $3,200 | $300 |
Fidelity Magellan ETF | $13,200 | $- | $3,200 | $300 |
Fidelity Real Estate Investment ETF | $13,200 | $- | $3,200 | $300 |
Fidelity Small-Mid Cap Opportunities ETF | $13,200 | $- | $3,200 | $300 |
Fidelity Stocks for Inflation ETF | $14,000 | $- | $3,800 | $400 |
Fidelity Sustainable U.S. Equity ETF | $13,600 | $- | $3,700 | $300 |
Fidelity Women's Leadership ETF | $13,600 | $- | $3,700 | $300 |
| | | | |
| | | | |
| | | | |
| Audit Fees | Audit-Related Fees | Tax Fees | All Other Fees |
Fidelity Growth Opportunities ETF | $12,200 | $- | $4,000 | $300 |
Fidelity Magellan ETF | $12,200 | $- | $4,000 | $300 |
Fidelity Real Estate Investment ETF | $12,200 | $- | $4,000 | $300 |
Fidelity Small-Mid Cap Opportunities ETF | $12,200 | $- | $4,000 | $300 |
Fidelity Stocks for Inflation ETF | $12,900 | $- | $4,600 | $300 |
Fidelity Sustainable U.S. Equity ETF | $12,500 | $- | $4,500 | $400 |
Fidelity Women's Leadership ETF | $12,500 | $- | $4,500 | $400 |
| | | | |
| | | | |
A Amounts may reflect rounding.
The following table presents fees billed by PricewaterhouseCoopers LLP (“PwC”) in each of the last two fiscal years for services rendered to Fidelity Blue Chip Growth ETF, Fidelity Blue Chip Value ETF, Fidelity Dividend ETF for Rising Rates, Fidelity High Dividend ETF, Fidelity Low Volatility Factor ETF, Fidelity Momentum Factor ETF, Fidelity New Millennium ETF, Fidelity Quality Factor ETF, Fidelity Small-Mid Multifactor ETF, Fidelity U.S. Multifactor ETF, and Fidelity Value Factor ETF (the “Funds”):
Services Billed by PwC
July 31, 2023 FeesA
| | | | |
| Audit Fees | Audit-Related Fees | Tax Fees | All Other Fees |
Fidelity Blue Chip Growth ETF | $14,900 |
$- | $4,600 | $500 |
Fidelity Blue Chip Value ETF | $14,900 |
$- | $4,600 | $500 |
Fidelity Dividend ETF for Rising Rates | $11,900 |
$- | $4,600 | $400 |
Fidelity High Dividend ETF | $12,000 |
$- | $4,600 | $400 |
Fidelity Low Volatility Factor ETF | $11,700 |
$- | $4,400 | $400 |
Fidelity Momentum Factor ETF | $11,700 |
$- | $4,400 | $400 |
Fidelity New Millennium ETF | $14,900 |
$- | $4,600 | $500 |
Fidelity Quality Factor ETF | $11,700 |
$- | $4,400 | $400 |
Fidelity Small-Mid Multifactor ETF | $14,500 |
$- | $4,900 | $500 |
Fidelity U.S. Multifactor ETF | $14,900 | $- | $4,600 | $500 |
Fidelity Value Factor ETF | $11,700 | $- | $4,400 | $400 |
| | | | | |
| Audit Fees | Audit-Related Fees | Tax Fees | All Other Fees |
Fidelity Blue Chip Growth ETF | $14,400 |
$- | $4,600 | $500 |
Fidelity Blue Chip Value ETF | $14,400 |
$- | $4,600 | $500 |
Fidelity Dividend ETF for Rising Rates | $11,700 |
$- | $4,600 | $400 |
Fidelity High Dividend ETF | $11,700 |
$- | $4,600 | $400 |
Fidelity Low Volatility Factor ETF | $11,400 |
$- | $4,400 | $400 |
Fidelity Momentum Factor ETF | $11,400 |
$- | $4,400 | $400 |
Fidelity New Millennium ETF | $14,400 |
$- | $4,600 | $500 |
Fidelity Quality Factor ETF | $11,400 |
$- | $4,400 | $400 |
Fidelity Small-Mid Multifactor ETF | $14,200 |
$- | $4,900 | $500 |
Fidelity U.S. Multifactor ETF | $14,400 | $- | $4,600 | $500 |
Fidelity Value Factor ETF | $11,400 | $- | $4,400 | $400 |
A Amounts may reflect rounding.
The following table(s) present(s) fees billed by Deloitte Entities and PwC that were required to be approved by the Audit Committee for services that relate directly to the operations and financial reporting of the Fund(s) and that are rendered on behalf of Fidelity Management & Research Company LLC ("FMR") and entities controlling, controlled by, or under common control with FMR (not including any sub-adviser whose role is primarily portfolio management and is subcontracted with or overseen by another investment adviser) that provide ongoing services to the Fund(s) (“Fund Service Providers”):
Services Billed by Deloitte Entities
| | |
| July 31, 2023A | July 31, 2022A |
Audit-Related Fees | $- | $- |
Tax Fees | $- | $- |
All Other Fees | $- | $- |
A Amounts may reflect rounding.
Services Billed by PwC
| | |
| July 31, 2023A | July 31, 2022A |
Audit-Related Fees | $8,284,200 | $7,914,600 |
Tax Fees | $1,000 | $353,200 |
All Other Fees | $- | $- |
A Amounts may reflect rounding.
“Audit-Related Fees” represent fees billed for assurance and related services that are reasonably related to the performance of the fund audit or the review of the fund's financial statements and that are not reported under Audit Fees.
“Tax Fees” represent fees billed for tax compliance, tax advice or tax planning that relate directly to the operations and financial reporting of the fund.
“All Other Fees” represent fees billed for services provided to the fund or Fund Service Provider, a significant portion of which are assurance related, that relate directly to the operations and financial reporting of the fund, excluding those services that are reported under Audit Fees, Audit-Related Fees or Tax Fees.
Assurance services must be performed by an independent public accountant.
* * *
The aggregate non-audit fees billed by Deloitte Entities and PwC for services rendered to the Fund(s), FMR (not including any sub-adviser whose role is primarily portfolio management and is subcontracted with or overseen by another investment adviser), and any Fund Service Provider for each of the last two fiscal years of the Fund(s) are as follows:
| | |
Billed By | July 31, 2023A | July 31, 2022A |
Deloitte Entities | $268,800 | $489,500 |
PwC | $13,642,800 | $13,290,200 |
A Amounts may reflect rounding.
The trust's Audit Committee has considered non-audit services that were not pre-approved that were provided by Deloitte Entities and PwC to Fund Service Providers to be compatible with maintaining the independence of Deloitte Entities and PwC in its(their) audit of the Fund(s), taking into account representations from Deloitte Entities and PwC, in accordance with Public Company Accounting Oversight Board rules, regarding its independence from the Fund(s) and its(their) related entities and FMR’s review of the appropriateness and permissibility under applicable law of such non-audit services prior to their provision to the Fund(s) Service Providers.
Audit Committee Pre-Approval Policies and Procedures
The trust’s Audit Committee must pre-approve all audit and non-audit services provided by a fund’s independent registered public accounting firm relating to the operations or financial reporting of the fund. Prior to the commencement of any audit or non-audit services to a fund, the Audit Committee reviews the services to determine whether they are appropriate and permissible under applicable law.
The Audit Committee has adopted policies and procedures to, among other purposes, provide a framework for the Committee’s consideration of non-audit services by the audit firms that audit the Fidelity funds. The policies and procedures require that any non-audit service provided by a fund audit firm to a Fidelity fund and any non-audit service provided by a fund auditor to a Fund Service Provider that relates directly to the operations and financial reporting of a Fidelity fund (“Covered Service”) are subject to approval by the Audit Committee before such service is provided.
All Covered Services must be approved in advance of provision of the service either: (i) by formal resolution of the Audit Committee, or (ii) by oral or written approval of the service by the Chair of the Audit Committee (or if the Chair is unavailable, such other member of the Audit Committee as may be designated by the Chair to act in the Chair’s absence). The approval contemplated by (ii) above is permitted where the Treasurer determines that action on such an engagement is necessary before the next meeting of the Audit Committee.
Non-audit services provided by a fund audit firm to a Fund Service Provider that do not relate directly to the operations and financial reporting of a Fidelity fund are reported to the Audit Committee periodically.
Non-Audit Services Approved Pursuant to Rule 2-01(c)(7)(i)(C) and (ii) of Regulation S-X (“De Minimis Exception”)
There were no non-audit services approved or required to be approved by the Audit Committee pursuant to the De Minimis Exception during the Fund’s(s’) last two fiscal years relating to services provided to (i) the Fund(s) or (ii) any Fund Service Provider that relate directly to the operations and financial reporting of the Fund(s).
The Registrant has not retained, for the preparation of the audit report on the financial statements included in the Form N-CSR, a registered public accounting firm that has a branch or office that is located in a foreign jurisdiction and that the Public Company Accounting Oversight Board (the “PCAOB”) has determined that the PCAOB is unable to inspect or investigate completely because of a position taken by an authority in the foreign jurisdiction.
The Registrant is not a “foreign issuer,” as defined in 17 CFR 240.3b-4.
Item 5.
Audit Committee of Listed Registrants
The Audit Committee is a separately-designated standing audit committee in accordance with Section 3(a)(58)(A) of the Securities Exchange Act of 1934. As of July 31, 2023, the members of the Audit Committee were Donald Donahue, Thomas Bostick, Thomas Kennedy and Susan Tomasky.
Item 6.
Investments
(a)
Not applicable.
(b)
Not applicable.
Item 7.
Disclosure of Proxy Voting Policies and Procedures for Closed-End Management Investment Companies
Not applicable.
Item 8.
Portfolio Managers of Closed-End Management Investment Companies
Not applicable.
Item 9.
Purchase of Equity Securities by Closed-End Management Investment Company and Affiliated Purchasers
Not applicable.
Item 10.
Submission of Matters to a Vote of Security Holders
There were no material changes to the procedures by which shareholders may recommend nominees to the trust’s Board of Trustees.
Item 11.
Controls and Procedures
(a)(i) The President and Treasurer and the Chief Financial Officer have concluded that the trust’s disclosure controls and procedures (as defined in Rule 30a-3(c) under the Investment Company Act) provide reasonable assurances that material information relating to the trust is made known to them by the appropriate persons, based on their evaluation of these controls and procedures as of a date within 90 days of the filing date of this report.
(a)(ii) There was no change in the trust’s internal control over financial reporting (as defined in Rule 30a-3(d) under the Investment Company Act) that occurred during the period covered by this report that has materially affected, or is reasonably likely to materially affect, the trust’s internal control over financial reporting.
Item 12.
Disclosure of Securities Lending Activities for Closed-End Management
Investment Companies
Not applicable.
Item 13.
Exhibits
SIGNATURES
Pursuant to the requirements of the Securities Exchange Act of 1934 and the Investment Company Act of 1940, the registrant has duly caused this report to be signed on its behalf by the undersigned, thereunto duly authorized.
Fidelity Covington Trust
| |
By: | /s/Stacie M. Smith |
| Stacie M. Smith |
| President and Treasurer |
| |
Date: | September 21, 2023 |
Pursuant to the requirements of the Securities Exchange Act of 1934 and the Investment Company Act of 1940, this report has been signed below by the following persons on behalf of the registrant and in the capacities and on the dates indicated.
| |
By: | /s/Stacie M. Smith |
| Stacie M. Smith |
| President and Treasurer |
| |
Date: | September 21, 2023 |
| |
By: | /s/John J. Burke III |
| John J. Burke III |
| Chief Financial Officer |
| |
Date: | September 21, 2023 |