UNITED STATES
SECURITIES AND EXCHANGE COMMISSION
Washington, D.C. 20549
FORM N-CSR
CERTIFIED SHAREHOLDER REPORT OF REGISTERED
MANAGEMENT INVESTMENT COMPANIES
Investment Company Act file number 811-07319
Fidelity Covington Trust
(Exact name of registrant as specified in charter)
245 Summer St., Boston, MA 02210
(Address of principal executive offices) (Zip code)
Margaret Carey, Secretary
245 Summer St.
Boston, Massachusetts 02210
(Name and address of agent for service)
Registrant's telephone number, including area code:
617-563-7000
| |
Date of fiscal year end: | May 31 |
|
|
Date of reporting period: | November 30, 2023 |
Item 1.
Reports to Stockholders
Fidelity® Disruptive Automation ETF
Fidelity® Disruptive Communications ETF
Fidelity® Disruptive Finance ETF
Fidelity® Disruptive Medicine ETF
Fidelity® Disruptive Technology ETF
Semi-Annual Report
November 30, 2023
Contents
To view a fund's proxy voting guidelines and proxy voting record for the 12-month period ended June 30, visit http://www.fidelity.com/proxyvotingresults or visit the Securities and Exchange Commission's (SEC) web site at http://www.sec.gov.
You may also call 1-800-FIDELITY to request a free copy of the proxy voting guidelines.
Standard & Poor's, S&P and S&P 500 are registered service marks of The McGraw-Hill Companies, Inc. and have been licensed for use by Fidelity Distributors Corporation.
Other third-party marks appearing herein are the property of their respective owners.
All other marks appearing herein are registered or unregistered trademarks or service marks of FMR LLC or an affiliated company. © 2024 FMR LLC. All rights reserved.
This report and the financial statements contained herein are submitted for the general information of the shareholders of the Funds. This report is not authorized for distribution to prospective investors in the Funds unless preceded or accompanied by an effective prospectus.
A fund files its complete schedule of portfolio holdings with the SEC for the first and third quarters of each fiscal year on Form N-PORT. Forms N-PORT are available on the SEC's web site at http://www.sec.gov. A fund's Forms N-PORT may be reviewed and copied at the SEC's Public Reference Room in Washington, DC. Information regarding the operation of the SEC's Public Reference Room may be obtained by calling 1-800-SEC-0330.
For a complete list of a fund's portfolio holdings, view the most recent holdings listing, semiannual report, or annual report on Fidelity's web site at http://www.fidelity.com, http://www.institutional.fidelity.com, or http://www.401k.com, as applicable.
NOT FDIC INSURED •MAY LOSE VALUE •NO BANK GUARANTEE
Neither the Funds nor Fidelity Distributors Corporation is a bank.
Top Holdings (% of Fund's net assets) |
| |
| Taiwan Semiconductor Manufacturing Co. Ltd. | 5.8 | |
| Keyence Corp. | 5.5 | |
| NVIDIA Corp. | 5.4 | |
| PTC, Inc. | 5.3 | |
| FANUC Corp. | 5.0 | |
| SMC Corp. | 4.1 | |
| HIWIN Technologies Corp. | 3.9 | |
| Misumi Group, Inc. | 3.8 | |
| Teradyne, Inc. | 3.6 | |
| Leader Harmonious Drive Systems Co. Ltd. (A Shares) | 3.5 | |
| | 45.9 | |
| |
| Market Sectors (% of Fund's net assets) |
| |
| Industrials | 49.6 | |
| Information Technology | 42.8 | |
| Consumer Discretionary | 3.5 | |
| Health Care | 1.8 | |
| Communication Services | 1.6 | |
| |
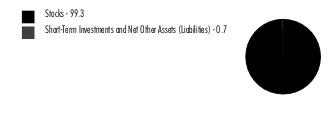
Asset Allocation (% of Fund's net assets) |
|
|
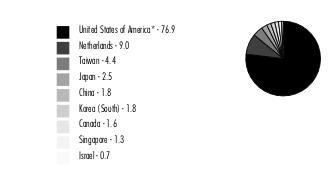
Geographic Diversification (% of Fund's net assets) |
|
* Includes Short-Term investments and Net Other Assets (Liabilities). Percentages are adjusted for the effect of derivatives, if applicable. |
| |
Fidelity® Disruptive Automation ETF
Showing Percentage of Net Assets
| Common Stocks - 99.3% |
| | | Shares | Value ($) |
| COMMUNICATION SERVICES - 1.6% | | | |
| Interactive Media & Services - 1.6% | | | |
| Alphabet, Inc. Class C (a) | | 12,388 | 1,659,001 |
| CONSUMER DISCRETIONARY - 3.5% | | | |
| Automobile Components - 1.4% | | | |
| Mobileye Global, Inc. (a)(b) | | 34,525 | 1,417,251 |
| Automobiles - 1.3% | | | |
| Tesla, Inc. (a) | | 5,424 | 1,302,194 |
| Broadline Retail - 0.8% | | | |
| Amazon.com, Inc. (a) | | 6,018 | 879,170 |
TOTAL CONSUMER DISCRETIONARY | | | 3,598,615 |
| HEALTH CARE - 1.8% | | | |
| Health Care Equipment & Supplies - 1.8% | | | |
| Intuitive Surgical, Inc. (a) | | 5,835 | 1,813,751 |
| INDUSTRIALS - 49.6% | | | |
| Electrical Equipment - 3.9% | | | |
| AMETEK, Inc. | | 8,685 | 1,348,173 |
| Rockwell Automation, Inc. | | 6,786 | 1,869,136 |
| Sensata Technologies, Inc. PLC | | 22,552 | 733,166 |
| | | | 3,950,475 |
| Industrial Conglomerates - 3.5% | | | |
| Honeywell International, Inc. | | 6,664 | 1,305,611 |
| Siemens AG | | 13,523 | 2,266,847 |
| | | | 3,572,458 |
| Machinery - 40.0% | | | |
| Airtac International Group | | 34,187 | 1,181,453 |
| ATS Corp. (a)(b) | | 47,255 | 1,859,972 |
| AutoStore Holdings Ltd. (a)(c) | | 596,075 | 988,597 |
| Daifuku Co. Ltd. | | 121,606 | 2,282,676 |
| Deere & Co. | | 5,050 | 1,840,271 |
| Dongguan Yiheda Automation Co. Ltd. | | 474,944 | 1,877,481 |
| Estun Automation Co. Ltd. (A Shares) | | 867,836 | 2,331,255 |
| FANUC Corp. | | 184,706 | 5,125,324 |
| HIWIN Technologies Corp. | | 548,012 | 3,988,430 |
| Kardex AG | | 6,564 | 1,570,353 |
| Leader Harmonious Drive Systems Co. Ltd. (A Shares) | | 162,381 | 3,632,966 |
| Misumi Group, Inc. | | 239,757 | 3,881,133 |
| Nabtesco Corp. | | 29,141 | 543,961 |
| Shenzhen Inovance Technology Co. Ltd. (A Shares) | | 238,293 | 2,204,200 |
| SMC Corp. | | 8,335 | 4,185,490 |
| Symbotic, Inc. (a)(b) | | 34,046 | 1,800,352 |
| THK Co. Ltd. | | 88,514 | 1,763,295 |
| | | | 41,057,209 |
| Professional Services - 2.2% | | | |
| Recruit Holdings Co. Ltd. | | 60,981 | 2,264,268 |
TOTAL INDUSTRIALS | | | 50,844,410 |
| INFORMATION TECHNOLOGY - 42.8% | | | |
| Electronic Equipment, Instruments & Components - 10.1% | | | |
| Keyence Corp. | | 13,172 | 5,628,263 |
| OPT Machine Vision Tech Co. Ltd. | | 127,256 | 2,025,753 |
| Renishaw PLC | | 39,900 | 1,579,658 |
| Teledyne Technologies, Inc. (a) | | 2,665 | 1,073,888 |
| | | | 10,307,562 |
| IT Services - 2.1% | | | |
| Accenture PLC Class A | | 6,587 | 2,194,393 |
| Semiconductors & Semiconductor Equipment - 14.8% | | | |
| NVIDIA Corp. | | 11,892 | 5,561,888 |
| Taiwan Semiconductor Manufacturing Co. Ltd. | | 323,363 | 5,942,807 |
| Teradyne, Inc. | | 40,263 | 3,713,456 |
| | | | 15,218,151 |
| Software - 15.8% | | | |
| Altair Engineering, Inc. Class A (a) | | 13,012 | 942,850 |
| ANSYS, Inc. (a) | | 3,201 | 939,045 |
| Autodesk, Inc. (a) | | 3,898 | 851,440 |
| Dassault Systemes SA | | 45,861 | 2,144,800 |
| Manhattan Associates, Inc. (a) | | 4,720 | 1,052,796 |
| Microsoft Corp. | | 3,064 | 1,160,980 |
| Nemetschek SE | | 10,214 | 889,880 |
| PTC, Inc. (a) | | 34,816 | 5,478,646 |
| Synopsys, Inc. (a) | | 4,257 | 2,312,530 |
| Unity Software, Inc. (a)(b) | | 15,600 | 460,356 |
| | | | 16,233,323 |
TOTAL INFORMATION TECHNOLOGY | | | 43,953,429 |
| TOTAL COMMON STOCKS (Cost $98,757,459) | | | 101,869,206 |
| | | | |
| Money Market Funds - 5.2% |
| | | Shares | Value ($) |
| Fidelity Cash Central Fund 5.40% (d) | | 544,816 | 544,925 |
| Fidelity Securities Lending Cash Central Fund 5.39% (d)(e) | | 4,840,041 | 4,840,525 |
| TOTAL MONEY MARKET FUNDS (Cost $5,385,450) | | | 5,385,450 |
| | | | |
| TOTAL INVESTMENT IN SECURITIES - 104.5% (Cost $104,142,909) | 107,254,656 |
NET OTHER ASSETS (LIABILITIES) - (4.5)% | (4,622,760) |
| NET ASSETS - 100.0% | 102,631,896 |
| | |
Legend
| (b) | Security or a portion of the security is on loan at period end. |
| (c) | Security exempt from registration under Rule 144A of the Securities Act of 1933. These securities may be resold in transactions exempt from registration, normally to qualified institutional buyers. At the end of the period, the value of these securities amounted to $988,597 or 1.0% of net assets. |
| (d) | Affiliated fund that is generally available only to investment companies and other accounts managed by Fidelity Investments. The rate quoted is the annualized seven-day yield of the fund at period end. A complete unaudited listing of the fund's holdings as of its most recent quarter end is available upon request. In addition, each Fidelity Central Fund's financial statements are available on the SEC's website or upon request. |
| (e) | Investment made with cash collateral received from securities on loan. |
Affiliated Central Funds
Fiscal year to date information regarding the Fund's investments in Fidelity Central Funds, including the ownership percentage, is presented below.
| Affiliate | Value, beginning of period ($) | Purchases ($) | Sales Proceeds ($) | Dividend Income ($) | Realized Gain (loss) ($) | Change in Unrealized appreciation (depreciation) ($) | Value, end of period ($) | % ownership, end of period |
| Fidelity Cash Central Fund 5.40% | 794,696 | 18,112,720 | 18,362,491 | 34,174 | - | - | 544,925 | 0.0% |
| Fidelity Securities Lending Cash Central Fund 5.39% | 2,079,750 | 28,075,568 | 25,314,793 | 62,582 | - | - | 4,840,525 | 0.0% |
| Total | 2,874,446 | 46,188,288 | 43,677,284 | 96,756 | - | - | 5,385,450 | |
| | | | | | | | | |
Amounts in the dividend income column in the above table include any capital gain distributions from underlying funds, which are presented in the corresponding line item in the Statement of Operations, if applicable.
Amounts in the dividend income column for Fidelity Securities Lending Cash Central Fund represents the income earned on investing cash collateral, less rebates paid to borrowers and any lending agent fees associated with the loan, plus any premium payments received for lending certain types of securities.
Amounts included in the purchases and sales proceeds columns may include in-kind transactions, if applicable.
Investment Valuation
The following is a summary of the inputs used, as of November 30, 2023, involving the Fund's assets and liabilities carried at fair value. The inputs or methodology used for valuing securities may not be an indication of the risk associated with investing in those securities. For more information on valuation inputs, and their aggregation into the levels used below, please refer to the Investment Valuation section in the accompanying Notes to Financial Statements.
| Valuation Inputs at Reporting Date: |
| Description | Total ($) | Level 1 ($) | Level 2 ($) | Level 3 ($) |
Investments in Securities: | | | | |
|
| Equities: | | | | |
Communication Services | 1,659,001 | 1,659,001 | - | - |
Consumer Discretionary | 3,598,615 | 3,598,615 | - | - |
Health Care | 1,813,751 | 1,813,751 | - | - |
Industrials | 50,844,410 | 50,844,410 | - | - |
Information Technology | 43,953,429 | 43,953,429 | - | - |
|
| Money Market Funds | 5,385,450 | 5,385,450 | - | - |
| Total Investments in Securities: | 107,254,656 | 107,254,656 | - | - |
Fidelity® Disruptive Automation ETF
| Statement of Assets and Liabilities |
| | | | November 30, 2023 (Unaudited) |
| | | | | |
| Assets | | | | |
| Investment in securities, at value (including securities loaned of $4,611,062) - See accompanying schedule: | | | | |
Unaffiliated issuers (cost $98,757,459) | $ | 101,869,206 | | |
Fidelity Central Funds (cost $5,385,450) | | 5,385,450 | | |
| | | | | |
| | | | | |
| Total Investment in Securities (cost $104,142,909) | | | $ | 107,254,656 |
| Dividends receivable | | | | 152,624 |
| Reclaims receivable | | | | 95,554 |
| Distributions receivable from Fidelity Central Funds | | | | 10,928 |
Total assets | | | | 107,513,762 |
| Liabilities | | | | |
| Accrued management fee | $ | 41,341 | | |
| Collateral on securities loaned | | 4,840,525 | | |
| Total Liabilities | | | | 4,881,866 |
| Net Assets | | | $ | 102,631,896 |
| Net Assets consist of: | | | | |
| Paid in capital | | | $ | 106,879,549 |
| Total accumulated earnings (loss) | | | | (4,247,653) |
| Net Assets | | | $ | 102,631,896 |
Net Asset Value, offering price and redemption price per share ($102,631,896 ÷ 4,305,492 shares) | | �� | $ | 23.84 |
| Statement of Operations |
| | | | Six months ended November 30, 2023 (Unaudited) |
| Investment Income | | | | |
| Dividends | | | $ | 393,263 |
| Interest | | | | 909 |
| Income from Fidelity Central Funds (including $62,582 from security lending) | | | | 96,756 |
| Total Income | | | | 490,928 |
| Expenses | | | | |
| Management fee | $ | 266,979 | | |
| Independent trustees' fees and expenses | | 287 | | |
| Interest | | 814 | | |
| Total expenses before reductions | | 268,080 | | |
| Expense reductions | | (102) | | |
| Total expenses after reductions | | | | 267,978 |
| Net Investment income (loss) | | | | 222,950 |
| Realized and Unrealized Gain (Loss) | | | | |
| Net realized gain (loss) on: | | | | |
| Investment Securities: | | | | |
| Unaffiliated issuers | | (1,751,265) | | |
| Redemptions in-kind | | 1,817,374 | | |
| Foreign currency transactions | | (1,748) | | |
| Total net realized gain (loss) | | | | 64,361 |
| Change in net unrealized appreciation (depreciation) on: | | | | |
| Investment Securities: | | | | |
| Unaffiliated issuers | | (5,086,134) | | |
| Assets and liabilities in foreign currencies | | 6,063 | | |
| Total change in net unrealized appreciation (depreciation) | | | | (5,080,071) |
| Net gain (loss) | | | | (5,015,710) |
| Net increase (decrease) in net assets resulting from operations | | | $ | (4,792,760) |
See Organization and Merger information note regarding reorganization from mutual fund to exchange traded fund.
| Statement of Changes in Net Assets |
| |
| | Six months ended November 30, 2023 (Unaudited) | | Year ended May 31, 2023 |
| Increase (Decrease) in Net Assets | | | | |
| Operations | | | | |
| Net investment income (loss) | $ | 222,950 | $ | 478,333 |
| Net realized gain (loss) | | 64,361 | | (4,420,381) |
| Change in net unrealized appreciation (depreciation) | | (5,080,071) | | 12,045,246 |
| Net increase (decrease) in net assets resulting from operations | | (4,792,760) | | 8,103,198 |
| Distributions to shareholders | | (397,501) | | (182,874) |
| | | | | |
| Share transactions - net increase (decrease) | | - | | (19,835,179) |
| Share transactions | | | | |
| Proceeds from sales of shares | | 6,340,894 | | - |
| Reinvestment of distributions | | 249,235 | | - |
| Cost of shares redeemed | | (10,493,526) | | - |
| | | | | |
Net increase (decrease) in net assets resulting from share transactions | | (3,903,397) | | (19,835,179) |
| Total increase (decrease) in net assets | | (9,093,658) | | (11,914,855) |
| | | | | |
| Net Assets | | | | |
| Beginning of period | | 111,725,554 | | 123,640,409 |
| End of period | $ | 102,631,896 | $ | 111,725,554 |
| | | | | |
| Other Information | | | | |
| Shares | | | | |
| Sold | | 323,637 | | 5,260,948 |
| Issued in reinvestment of distributions | | 9,878 | | 8,292 |
| Redeemed | | (534,365) | | (6,297,436) |
| Net increase (decrease) | | (200,850) | | (1,028,196) |
| | | | | |
See Organization and Merger information note regarding reorganization from mutual fund to exchange traded fund.
Share activity amounts in the Other Information section have been adjusted to reflect the impact of the change in capital structure associated with the merger. All financial information prior to the merger is that of the Predecessor Fund.
Financial Highlights
| Fidelity® Disruptive Automation ETF |
| |
| | Six months ended (Unaudited) November 30, 2023 A | | Years ended May 31, 2023 A | | 2022 A | | 2021 A | | 2020 A,B |
Selected Per-Share Data | | | | | | | | | | |
| Net asset value, beginning of period | $ | 24.80 | $ | 22.33 | $ | 27.34 | $ | 17.80 | $ | 14.96 |
| Income from Investment Operations | | | | | | | | | | |
Net investment income (loss) C,D | | .05 | | .05 | | (.09) | | .02 | | (.02) |
| Net realized and unrealized gain (loss) | | (.92) | | 2.42 | | (4.37) | | 9.60 | | 2.86 |
| Total from investment operations | | (.87) | | 2.47 | | (4.46) | | 9.62 | | 2.84 |
| Distributions from net investment income | | (.09) | | - | | - | | (.06) | | - |
| Distributions from net realized gain | | - | | - | | (.55) | | (.03) | | - |
| Total distributions | | (.09) | | - | | (.55) | | (.08) E | | - |
| Net asset value, end of period | $ | 23.84 | $ | 24.80 | $ | 22.33 | $ | 27.34 | $ | 17.80 |
Total Return F,G,H | | (3.52)% | | 11.05% | | (16.75)% | | 54.13% | | 19.00% |
Ratios to Average Net Assets D,I,J | | | | | | | | | | |
| Expenses before reductions | | .50% K | | .85% | | 1.00% | | 1.01% L | | 1.01% K,L |
| Expenses net of fee waivers, if any | | .50% K | | .85% | | 1.00% | | 1.01% L | | 1.01% K,L |
| Expenses net of all reductions | | .50% K | | .85% | | 1.00% | | 1.01% L | | 1.01% K,L |
| Net investment income (loss) | | .42% K | | .23% | | (.33)% | | .06% | | (.47)% K |
| Supplemental Data | | | | | | | | | | |
| Net assets, end of period (000 omitted) | $ | 102,632 | $ | 111,726 | $ | 36,333 | $ | 111,910 | $ | 5,308 |
Portfolio turnover rate M | | 38% K,N | | 26% | | 22% | | 14% | | 6% O |
AAs further described in Organization and Merger information notes, per share amounts have been adjusted to reflect the impact of the change in capital structure associated with the merger. All financial information prior to the merger is that of the Predecessor Fund.
BFor the period April 16, 2020 (commencement of operations) through May 31, 2020.
CCalculated based on average shares outstanding during the period.
DNet investment income (loss) is affected by the timing of the declaration of dividends by any underlying mutual funds or exchange-traded funds (ETFs). Net investment income (loss) of any mutual funds or ETFs is not included in the Fund's net investment income (loss) ratio.
ETotal distributions per share do not sum due to rounding.
FTotal returns for periods of less than one year are not annualized.
GTotal returns would have been lower if certain expenses had not been reduced during the applicable periods shown.
HBased on net asset value.
IFees and expenses of any underlying mutual funds or exchange-traded funds (ETFs) are not included in the Fund's expense ratio. The Fund indirectly bears its proportionate share of these expenses. For additional expense information related to investments in Fidelity Central Funds, please refer to the "Investments in Fidelity Central Funds" note found in the Notes to Financial Statements section of the most recent Annual or Semi-Annual report.
JExpense ratios reflect operating expenses of the class. Expenses before reductions do not reflect amounts reimbursed, waived, or reduced through arrangements with the investment adviser, brokerage services, or other offset arrangements, if applicable, and do not represent the amount paid by the class during periods when reimbursements, waivers or reductions occur.
KAnnualized.
LThe size and fluctuation of net assets and expense amounts may cause ratios to differ from contractual rates.
MAmount does not include the portfolio activity of any underlying mutual funds or exchange-traded funds (ETFs).
NPortfolio turnover rate excludes securities received or delivered in-kind.
OAmount not annualized.
Top Holdings (% of Fund's net assets) |
| |
| Snap, Inc. Class A | 6.2 | |
| Meta Platforms, Inc. Class A | 6.0 | |
| Netflix, Inc. | 5.9 | |
| American Tower Corp. | 5.3 | |
| Arista Networks, Inc. | 5.2 | |
| Liberty Broadband Corp. Class A | 5.2 | |
| Amazon.com, Inc. | 5.1 | |
| Alphabet, Inc. Class A | 5.1 | |
| NVIDIA Corp. | 4.8 | |
| PDD Holdings, Inc. ADR | 4.8 | |
| | 53.6 | |
| |
| Market Sectors (% of Fund's net assets) |
| |
| Communication Services | 48.4 | |
| Information Technology | 28.4 | |
| Consumer Discretionary | 11.5 | |
| Real Estate | 5.3 | |
| Industrials | 4.1 | |
| Energy | 2.1 | |
| |
Asset Allocation (% of Fund's net assets) |
|
|
Geographic Diversification (% of Fund's net assets) |
|
* Includes Short-Term investments and Net Other Assets (Liabilities). Percentages are adjusted for the effect of derivatives, if applicable. |
| |
Fidelity® Disruptive Communications ETF
Showing Percentage of Net Assets
| Common Stocks - 99.8% |
| | | Shares | Value ($) |
| COMMUNICATION SERVICES - 48.4% | | | |
| Diversified Telecommunication Services - 4.3% | | | |
| Cellnex Telecom SA (a) | | 35,610 | 1,358,202 |
| Liberty Latin America Ltd. Class C (b) | | 49,208 | 336,091 |
| | | | 1,694,293 |
| Entertainment - 9.7% | | | |
| Netflix, Inc. (b) | | 4,804 | 2,276,952 |
| Sea Ltd. ADR (b) | | 41,108 | 1,488,932 |
| | | | 3,765,884 |
| Interactive Media & Services - 25.0% | | | |
| Alphabet, Inc. Class A (b) | | 14,964 | 1,983,179 |
| Angi, Inc. (b) | | 171,855 | 386,674 |
| Bumble, Inc. (b) | | 21,372 | 296,216 |
| Match Group, Inc. (b) | | 23,958 | 775,760 |
| Meta Platforms, Inc. Class A (b) | | 7,197 | 2,354,499 |
| Pinterest, Inc. Class A (b) | | 25,263 | 860,710 |
| Snap, Inc. Class A (b) | | 175,691 | 2,429,807 |
| Tencent Holdings Ltd. | | 16,159 | 676,455 |
| | | | 9,763,300 |
| Media - 5.6% | | | |
| DISH Network Corp. Class A (b)(c) | | 45,026 | 164,795 |
| Liberty Broadband Corp. Class A (b) | | 24,241 | 2,010,549 |
| | | | 2,175,344 |
| Wireless Telecommunication Services - 3.8% | | | |
| T-Mobile U.S., Inc. | | 9,763 | 1,468,843 |
TOTAL COMMUNICATION SERVICES | | | 18,867,664 |
| CONSUMER DISCRETIONARY - 11.5% | | | |
| Broadline Retail - 11.5% | | | |
| Alibaba Group Holding Ltd. sponsored ADR (b) | | 8,054 | 603,084 |
| Amazon.com, Inc. (b) | | 13,716 | 2,003,770 |
| PDD Holdings, Inc. ADR (b) | | 12,632 | 1,862,462 |
| | | | 4,469,316 |
| ENERGY - 2.1% | | | |
| Oil, Gas & Consumable Fuels - 2.1% | | | |
| Reliance Industries Ltd. GDR (a) | | 14,117 | 808,904 |
| INDUSTRIALS - 4.1% | | | |
| Construction & Engineering - 0.9% | | | |
| Dycom Industries, Inc. (b) | | 3,574 | 371,231 |
| Ground Transportation - 3.2% | | | |
| Uber Technologies, Inc. (b) | | 21,920 | 1,235,850 |
TOTAL INDUSTRIALS | | | 1,607,081 |
| INFORMATION TECHNOLOGY - 28.4% | | | |
| Communications Equipment - 5.2% | | | |
| Arista Networks, Inc. (b) | | 9,186 | 2,018,256 |
| IT Services - 3.0% | | | |
| Cloudflare, Inc. (b) | | 5,626 | 434,046 |
| Twilio, Inc. Class A (b) | | 11,235 | 726,680 |
| | | | 1,160,726 |
| Semiconductors & Semiconductor Equipment - 12.2% | | | |
| Impinj, Inc. (b) | | 3,583 | 299,503 |
| NVIDIA Corp. | | 4,014 | 1,877,348 |
| NXP Semiconductors NV | | 2,731 | 557,342 |
| ON Semiconductor Corp. (b) | | 5,376 | 383,470 |
| Renesas Electronics Corp. (b) | | 33,749 | 592,645 |
| Taiwan Semiconductor Manufacturing Co. Ltd. sponsored ADR | | 10,764 | 1,047,445 |
| | | | 4,757,753 |
| Software - 8.0% | | | |
| Cadence Design Systems, Inc. (b) | | 3,915 | 1,069,852 |
| Microsoft Corp. | | 3,329 | 1,261,391 |
| RingCentral, Inc. (b) | | 9,146 | 260,295 |
| Synopsys, Inc. (b) | | 979 | 531,822 |
| | | | 3,123,360 |
TOTAL INFORMATION TECHNOLOGY | | | 11,060,095 |
| REAL ESTATE - 5.3% | | | |
| Equity Real Estate Investment Trusts (REITs) - 5.3% | | | |
| American Tower Corp. | | 10,016 | 2,091,140 |
| TOTAL COMMON STOCKS (Cost $35,337,120) | | | 38,904,200 |
| | | | |
| Money Market Funds - 0.7% |
| | | Shares | Value ($) |
| Fidelity Cash Central Fund 5.40% (d) | | 239,978 | 240,026 |
| Fidelity Securities Lending Cash Central Fund 5.39% (d)(e) | | 47,620 | 47,625 |
| TOTAL MONEY MARKET FUNDS (Cost $287,651) | | | 287,651 |
| | | | |
| TOTAL INVESTMENT IN SECURITIES - 100.5% (Cost $35,624,771) | 39,191,851 |
NET OTHER ASSETS (LIABILITIES) - (0.5)% | (205,405) |
| NET ASSETS - 100.0% | 38,986,446 |
| | |
Legend
| (a) | Security exempt from registration under Rule 144A of the Securities Act of 1933. These securities may be resold in transactions exempt from registration, normally to qualified institutional buyers. At the end of the period, the value of these securities amounted to $2,167,106 or 5.6% of net assets. |
| (c) | Security or a portion of the security is on loan at period end. |
| (d) | Affiliated fund that is generally available only to investment companies and other accounts managed by Fidelity Investments. The rate quoted is the annualized seven-day yield of the fund at period end. A complete unaudited listing of the fund's holdings as of its most recent quarter end is available upon request. In addition, each Fidelity Central Fund's financial statements are available on the SEC's website or upon request. |
| (e) | Investment made with cash collateral received from securities on loan. |
Affiliated Central Funds
Fiscal year to date information regarding the Fund's investments in Fidelity Central Funds, including the ownership percentage, is presented below.
| Affiliate | Value, beginning of period ($) | Purchases ($) | Sales Proceeds ($) | Dividend Income ($) | Realized Gain (loss) ($) | Change in Unrealized appreciation (depreciation) ($) | Value, end of period ($) | % ownership, end of period |
| Fidelity Cash Central Fund 5.40% | 149,758 | 1,943,974 | 1,853,706 | 5,647 | - | - | 240,026 | 0.0% |
| Fidelity Securities Lending Cash Central Fund 5.39% | - | 2,411,730 | 2,364,105 | 696 | - | - | 47,625 | 0.0% |
| Total | 149,758 | 4,355,704 | 4,217,811 | 6,343 | - | - | 287,651 | |
| | | | | | | | | |
Amounts in the dividend income column in the above table include any capital gain distributions from underlying funds, which are presented in the corresponding line item in the Statement of Operations, if applicable.
Amounts in the dividend income column for Fidelity Securities Lending Cash Central Fund represents the income earned on investing cash collateral, less rebates paid to borrowers and any lending agent fees associated with the loan, plus any premium payments received for lending certain types of securities.
Amounts included in the purchases and sales proceeds columns may include in-kind transactions, if applicable.
Investment Valuation
The following is a summary of the inputs used, as of November 30, 2023, involving the Fund's assets and liabilities carried at fair value. The inputs or methodology used for valuing securities may not be an indication of the risk associated with investing in those securities. For more information on valuation inputs, and their aggregation into the levels used below, please refer to the Investment Valuation section in the accompanying Notes to Financial Statements.
| Valuation Inputs at Reporting Date: |
| Description | Total ($) | Level 1 ($) | Level 2 ($) | Level 3 ($) |
Investments in Securities: | | | | |
|
| Equities: | | | | |
Communication Services | 18,867,664 | 18,867,664 | - | - |
Consumer Discretionary | 4,469,316 | 4,469,316 | - | - |
Energy | 808,904 | 808,904 | - | - |
Industrials | 1,607,081 | 1,607,081 | - | - |
Information Technology | 11,060,095 | 11,060,095 | - | - |
Real Estate | 2,091,140 | 2,091,140 | - | - |
|
| Money Market Funds | 287,651 | 287,651 | - | - |
| Total Investments in Securities: | 39,191,851 | 39,191,851 | - | - |
Fidelity® Disruptive Communications ETF
| Statement of Assets and Liabilities |
| | | | November 30, 2023 (Unaudited) |
| | | | | |
| Assets | | | | |
| Investment in securities, at value (including securities loaned of $46,482) - See accompanying schedule: | | | | |
Unaffiliated issuers (cost $35,337,120) | $ | 38,904,200 | | |
Fidelity Central Funds (cost $287,651) | | 287,651 | | |
| | | | | |
| | | | | |
| Total Investment in Securities (cost $35,624,771) | | | $ | 39,191,851 |
| Cash | | | | 1,604 |
| Foreign currency held at value (cost $109) | | | | 109 |
| Receivable for investments sold | | | | 96,204 |
| Dividends receivable | | | | 9,582 |
| Interest receivable | | | | 36 |
| Distributions receivable from Fidelity Central Funds | | | | 961 |
Total assets | | | | 39,300,347 |
| Liabilities | | | | |
| Payable for investments purchased | $ | 250,207 | | |
| Accrued management fee | | 16,069 | | |
| Collateral on securities loaned | | 47,625 | | |
| Total Liabilities | | | | 313,901 |
| Net Assets | | | $ | 38,986,446 |
| Net Assets consist of: | | | | |
| Paid in capital | | | $ | 44,258,795 |
| Total accumulated earnings (loss) | | | | (5,272,349) |
| Net Assets | | | $ | 38,986,446 |
Net Asset Value, offering price and redemption price per share ($38,986,446 ÷ 1,407,063 shares) | | | $ | 27.71 |
| Statement of Operations |
| | | | Six months ended November 30, 2023 (Unaudited) |
| Investment Income | | | | |
| Dividends | | | $ | 51,007 |
| Interest | | | | 147 |
| Income from Fidelity Central Funds (including $696 from security lending) | | | | 6,343 |
| Total Income | | | | 57,497 |
| Expenses | | | | |
| Management fee | $ | 96,845 | | |
| Independent trustees' fees and expenses | | 102 | | |
| Total expenses before reductions | | 96,947 | | |
| Expense reductions | | (110) | | |
| Total expenses after reductions | | | | 96,837 |
| Net Investment income (loss) | | | | (39,340) |
| Realized and Unrealized Gain (Loss) | | | | |
| Net realized gain (loss) on: | | | | |
| Investment Securities: | | | | |
| Unaffiliated issuers | | 826,831 | | |
| Redemptions in-kind | | 641,168 | | |
| Foreign currency transactions | | 594 | | |
| Total net realized gain (loss) | | | | 1,468,593 |
| Change in net unrealized appreciation (depreciation) on: | | | | |
| Investment Securities: | | | | |
| Unaffiliated issuers | | 3,405,713 | | |
| Assets and liabilities in foreign currencies | | (40) | | |
| Total change in net unrealized appreciation (depreciation) | | | | 3,405,673 |
| Net gain (loss) | | | | 4,874,266 |
| Net increase (decrease) in net assets resulting from operations | | | $ | 4,834,926 |
See Organization and Merger information note regarding reorganization from mutual fund to exchange traded fund.
| Statement of Changes in Net Assets |
| |
| | Six months ended November 30, 2023 (Unaudited) | | Year ended May 31, 2023 |
| Increase (Decrease) in Net Assets | | | | |
| Operations | | | | |
| Net investment income (loss) | $ | (39,340) | $ | (15,475) |
| Net realized gain (loss) | | 1,468,593 | | (5,754,830) |
| Change in net unrealized appreciation (depreciation) | | 3,405,673 | | 6,648,437 |
| Net increase (decrease) in net assets resulting from operations | | 4,834,926 | | 878,132 |
| | | | | |
| Share transactions - net increase (decrease) | | - | | (9,971,399) |
| Share transactions | | | | |
| Proceeds from sales of shares | | 1,993,878 | | - |
| Cost of shares redeemed | | (5,823,373) | | - |
| | | | | |
Net increase (decrease) in net assets resulting from share transactions | | (3,829,495) | | (9,971,399) |
| Total increase (decrease) in net assets | | 1,005,431 | | (9,093,267) |
| | | | | |
| Net Assets | | | | |
| Beginning of period | | 37,981,015 | | 47,074,282 |
| End of period | $ | 38,986,446 | $ | 37,981,015 |
| | | | | |
| Other Information | | | | |
| Shares | | | | |
| Sold | | 103,661 | | 1,803,846 |
| Redeemed | | (251,280) | | (2,265,568) |
| Net increase (decrease) | | (147,619) | | (461,722) |
| | | | | |
See Organization and Merger information note regarding reorganization from mutual fund to exchange traded fund.
Share activity amounts in the Other Information section have been adjusted to reflect the impact of the change in capital structure associated with the merger. All financial information prior to the merger is that of the Predecessor Fund.
Financial Highlights
| Fidelity® Disruptive Communications ETF |
| |
| | Six months ended (Unaudited) November 30, 2023 A | | Years ended May 31, 2023 A | | 2022 A | | 2021 A | | 2020 A,B |
Selected Per-Share Data | | | | | | | | | | |
| Net asset value, beginning of period | $ | 24.44 | $ | 23.29 | $ | 34.12 | $ | 23.21 | $ | 20.05 |
| Income from Investment Operations | | | | | | | | | | |
Net investment income (loss) C,D | | (.03) | | (.10) | | (.26) | | (.26) | | - E |
| Net realized and unrealized gain (loss) | | 3.30 | | 1.25 | | (8.93) | | 11.59 | | 3.16 |
| Total from investment operations | | 3.27 | | 1.15 | | (9.19) | | 11.33 | | 3.16 |
| Distributions from net investment income | | - | | - | | - | | - E | | - |
| Distributions from net realized gain | | - | | - | | (1.64) | | (.41) | | - |
| Total distributions | | - | | - | | (1.64) | | (.42) F | | - |
| Net asset value, end of period | $ | 27.71 | $ | 24.44 | $ | 23.29 | $ | 34.12 | $ | 23.21 |
Total Return G,H,I | | 13.39% | | 4.91% | | (28.39)% | | 48.96% | | 15.80% |
Ratios to Average Net Assets D,J,K | | | | | | | | | | |
| Expenses before reductions | | .50% L | | .79% | | .99% M | | 1.01% M | | 1.01% L,M |
| Expenses net of fee waivers, if any | | .50% L | | .79% | | .99% M | | 1.01% M | | 1.01% L,M |
| Expenses net of all reductions | | .50% L | | .79% | | .99% M | | 1.01% M | | 1.01% L,M |
| Net investment income (loss) | | (.20)% L | | (.44)% | | (.81)% | | (.83)% | | (.23)% L |
| Supplemental Data | | | | | | | | | | |
| Net assets, end of period (000 omitted) | $ | 38,986 | $ | 37,981 | $ | 7,746 | $ | 36,731 | $ | 2,880 |
Portfolio turnover rate N | | 17% L,O | | 31% | | 32% | | 39% | | -% P |
AAs further described in Organization and Merger information notes, per share amounts have been adjusted to reflect the impact of the change in capital structure associated with the merger. All financial information prior to the merger is that of the Predecessor Fund.
BFor the period April 16, 2020 (commencement of operations) through May 31, 2020.
CCalculated based on average shares outstanding during the period.
DNet investment income (loss) is affected by the timing of the declaration of dividends by any underlying mutual funds or exchange-traded funds (ETFs). Net investment income (loss) of any mutual funds or ETFs is not included in the Fund's net investment income (loss) ratio.
EAmount represents less than $.005 per share.
FTotal distributions per share do not sum due to rounding.
GTotal returns for periods of less than one year are not annualized.
HTotal returns would have been lower if certain expenses had not been reduced during the applicable periods shown.
IBased on net asset value.
JFees and expenses of any underlying mutual funds or exchange-traded funds (ETFs) are not included in the Fund's expense ratio. The Fund indirectly bears its proportionate share of these expenses. For additional expense information related to investments in Fidelity Central Funds, please refer to the "Investments in Fidelity Central Funds" note found in the Notes to Financial Statements section of the most recent Annual or Semi-Annual report.
KExpense ratios reflect operating expenses of the class. Expenses before reductions do not reflect amounts reimbursed, waived, or reduced through arrangements with the investment adviser, brokerage services, or other offset arrangements, if applicable, and do not represent the amount paid by the class during periods when reimbursements, waivers or reductions occur.
LAnnualized.
MThe size and fluctuation of net assets and expense amounts may cause ratios to differ from contractual rates.
NAmount does not include the portfolio activity of any underlying mutual funds or exchange-traded funds (ETFs).
OPortfolio turnover rate excludes securities received or delivered in-kind.
PAmount not annualized.
Top Holdings (% of Fund's net assets) |
| |
| Visa, Inc. Class A | 6.4 | |
| Adyen BV | 6.1 | |
| MasterCard, Inc. Class A | 5.8 | |
| BlackRock, Inc. Class A | 5.5 | |
| Dlocal Ltd. | 5.2 | |
| Equifax, Inc. | 5.1 | |
| Aon PLC | 4.7 | |
| Capital One Financial Corp. | 4.4 | |
| Intercontinental Exchange, Inc. | 4.0 | |
| FinecoBank SpA | 3.4 | |
| | 50.6 | |
| |
| Market Sectors (% of Fund's net assets) |
| |
| Financials | 89.2 | |
| Industrials | 6.4 | |
| Consumer Discretionary | 1.4 | |
| Information Technology | 1.4 | |
| Real Estate | 1.2 | |
| |
Asset Allocation (% of Fund's net assets) |
|
|
Geographic Diversification (% of Fund's net assets) |
|
* Includes Short-Term investments and Net Other Assets (Liabilities). Percentages are adjusted for the effect of derivatives, if applicable. |
| |
Fidelity® Disruptive Finance ETF
Showing Percentage of Net Assets
| Common Stocks - 99.6% |
| | | Shares | Value ($) |
| CONSUMER DISCRETIONARY - 1.4% | | | |
| Broadline Retail - 1.4% | | | |
| MercadoLibre, Inc. (a) | | 363 | 588,227 |
| FINANCIALS - 89.2% | | | |
| Banks - 10.4% | | | |
| DBS Group Holdings Ltd. | | 54,691 | 1,297,669 |
| DNB Bank ASA | | 62,473 | 1,189,995 |
| FinecoBank SpA | | 103,465 | 1,392,567 |
| Pathward Financial, Inc. | | 8,518 | 422,408 |
| SVB Financial Group (a) | | 3,427 | 69 |
| | | | 4,302,708 |
| Capital Markets - 20.5% | | | |
| BlackRock, Inc. Class A | | 3,060 | 2,298,764 |
| Cboe Global Markets, Inc. | | 4,976 | 906,577 |
| Coinbase Global, Inc. (a) | | 5,600 | 698,432 |
| Intercontinental Exchange, Inc. | | 14,738 | 1,677,774 |
| London Stock Exchange Group PLC | | 10,500 | 1,180,555 |
| MSCI, Inc. | | 1,036 | 539,601 |
| Tradeweb Markets, Inc. Class A | | 7,139 | 691,769 |
| Virtu Financial, Inc. Class A | | 29,962 | 538,717 |
| | | | 8,532,189 |
| Consumer Finance - 7.1% | | | |
| Ally Financial, Inc. | | 14,083 | 411,505 |
| Capital One Financial Corp. | | 16,419 | 1,833,346 |
| NerdWallet, Inc. (a) | | 61,676 | 724,693 |
| | | | 2,969,544 |
| Financial Services - 40.1% | | | |
| Adyen BV (a)(b) | | 2,184 | 2,546,071 |
| Apollo Global Management, Inc. | | 12,863 | 1,183,396 |
| AvidXchange Holdings, Inc. (a) | | 78,329 | 835,770 |
| Block, Inc. Class A (a) | | 9,857 | 625,230 |
| Dlocal Ltd. (a) | | 125,561 | 2,165,927 |
| Fiserv, Inc. (a) | | 5,200 | 679,172 |
| Flywire Corp. (a) | | 45,084 | 1,050,457 |
| MasterCard, Inc. Class A | | 5,808 | 2,403,525 |
| PennyMac Financial Services, Inc. | | 6,024 | 468,607 |
| Remitly Global, Inc. (a) | | 18,891 | 406,912 |
| Repay Holdings Corp. (a) | | 53,085 | 398,138 |
| Shift4 Payments, Inc. (a)(c) | | 5,354 | 352,400 |
| Visa, Inc. Class A | | 10,378 | 2,663,824 |
| Wise PLC (a) | | 93,544 | 922,083 |
| | | | 16,701,512 |
| Insurance - 11.1% | | | |
| Aon PLC | | 5,900 | 1,938,091 |
| Beazley PLC | | 66,013 | 446,692 |
| BRP Group, Inc. (a) | | 65,263 | 1,141,450 |
| Hiscox Ltd. | | 85,183 | 1,092,599 |
| | | | 4,618,832 |
TOTAL FINANCIALS | | | 37,124,785 |
| INDUSTRIALS - 6.4% | | | |
| Professional Services - 6.4% | | | |
| Equifax, Inc. | | 9,672 | 2,105,691 |
| Verisk Analytics, Inc. | | 2,310 | 557,703 |
| | | | 2,663,394 |
| INFORMATION TECHNOLOGY - 1.4% | | | |
| Software - 1.4% | | | |
| Bill Holdings, Inc. (a) | | 3,382 | 221,420 |
| MicroStrategy, Inc. Class A (a)(c) | | 700 | 348,810 |
| | | | 570,230 |
| REAL ESTATE - 1.2% | | | |
| Equity Real Estate Investment Trusts (REITs) - 1.2% | | | |
| American Homes 4 Rent Class A | | 14,440 | 523,739 |
| TOTAL COMMON STOCKS (Cost $39,158,821) | | | 41,470,375 |
| | | | |
| Money Market Funds - 1.4% |
| | | Shares | Value ($) |
| Fidelity Cash Central Fund 5.40% (d) | | 144,426 | 144,455 |
| Fidelity Securities Lending Cash Central Fund 5.39% (d)(e) | | 445,805 | 445,850 |
| TOTAL MONEY MARKET FUNDS (Cost $590,305) | | | 590,305 |
| | | | |
| TOTAL INVESTMENT IN SECURITIES - 101.0% (Cost $39,749,126) | 42,060,680 |
NET OTHER ASSETS (LIABILITIES) - (1.0)% | (434,996) |
| NET ASSETS - 100.0% | 41,625,684 |
| | |
Legend
| (b) | Security exempt from registration under Rule 144A of the Securities Act of 1933. These securities may be resold in transactions exempt from registration, normally to qualified institutional buyers. At the end of the period, the value of these securities amounted to $2,546,071 or 6.1% of net assets. |
| (c) | Security or a portion of the security is on loan at period end. |
| (d) | Affiliated fund that is generally available only to investment companies and other accounts managed by Fidelity Investments. The rate quoted is the annualized seven-day yield of the fund at period end. A complete unaudited listing of the fund's holdings as of its most recent quarter end is available upon request. In addition, each Fidelity Central Fund's financial statements are available on the SEC's website or upon request. |
| (e) | Investment made with cash collateral received from securities on loan. |
Affiliated Central Funds
Fiscal year to date information regarding the Fund's investments in Fidelity Central Funds, including the ownership percentage, is presented below.
| Affiliate | Value, beginning of period ($) | Purchases ($) | Sales Proceeds ($) | Dividend Income ($) | Realized Gain (loss) ($) | Change in Unrealized appreciation (depreciation) ($) | Value, end of period ($) | % ownership, end of period |
| Fidelity Cash Central Fund 5.40% | - | 4,637,471 | 4,493,016 | 11,580 | - | - | 144,455 | 0.0% |
| Fidelity Securities Lending Cash Central Fund 5.39% | 334,700 | 6,496,716 | 6,385,566 | 2,835 | - | - | 445,850 | 0.0% |
| Total | 334,700 | 11,134,187 | 10,878,582 | 14,415 | - | - | 590,305 | |
| | | | | | | | | |
Amounts in the dividend income column in the above table include any capital gain distributions from underlying funds, which are presented in the corresponding line item in the Statement of Operations, if applicable.
Amounts in the dividend income column for Fidelity Securities Lending Cash Central Fund represents the income earned on investing cash collateral, less rebates paid to borrowers and any lending agent fees associated with the loan, plus any premium payments received for lending certain types of securities.
Amounts included in the purchases and sales proceeds columns may include in-kind transactions, if applicable.
Investment Valuation
The following is a summary of the inputs used, as of November 30, 2023, involving the Fund's assets and liabilities carried at fair value. The inputs or methodology used for valuing securities may not be an indication of the risk associated with investing in those securities. For more information on valuation inputs, and their aggregation into the levels used below, please refer to the Investment Valuation section in the accompanying Notes to Financial Statements.
| Valuation Inputs at Reporting Date: |
| Description | Total ($) | Level 1 ($) | Level 2 ($) | Level 3 ($) |
Investments in Securities: | | | | |
|
| Equities: | | | | |
Consumer Discretionary | 588,227 | 588,227 | - | - |
Financials | 37,124,785 | 37,124,785 | - | - |
Industrials | 2,663,394 | 2,663,394 | - | - |
Information Technology | 570,230 | 570,230 | - | - |
Real Estate | 523,739 | 523,739 | - | - |
|
| Money Market Funds | 590,305 | 590,305 | - | - |
| Total Investments in Securities: | 42,060,680 | 42,060,680 | - | - |
Fidelity® Disruptive Finance ETF
| Statement of Assets and Liabilities |
| | | | November 30, 2023 (Unaudited) |
| | | | | |
| Assets | | | | |
| Investment in securities, at value (including securities loaned of $430,620) - See accompanying schedule: | | | | |
Unaffiliated issuers (cost $39,158,821) | $ | 41,470,375 | | |
Fidelity Central Funds (cost $590,305) | | 590,305 | | |
| | | | | |
| | | | | |
| Total Investment in Securities (cost $39,749,126) | | | $ | 42,060,680 |
| Cash | | | | 6,961 |
| Dividends receivable | | | | 19,738 |
| Distributions receivable from Fidelity Central Funds | | | | 718 |
Total assets | | | | 42,088,097 |
| Liabilities | | | | |
| Accrued management fee | $ | 16,563 | | |
| Collateral on securities loaned | | 445,850 | | |
| Total Liabilities | | | | 462,413 |
| Net Assets | | | $ | 41,625,684 |
| Net Assets consist of: | | | | |
| Paid in capital | | | $ | 44,054,535 |
| Total accumulated earnings (loss) | | | | (2,428,851) |
| Net Assets | | | $ | 41,625,684 |
Net Asset Value, offering price and redemption price per share ($41,625,684 ÷ 1,544,580 shares) | | | $ | 26.95 |
| Statement of Operations |
| | | | Six months ended November 30, 2023 (Unaudited) |
| Investment Income | | | | |
| Dividends | | | $ | 208,966 |
| Income from Fidelity Central Funds (including $2,835 from security lending) | | | | 14,415 |
| Total Income | | | | 223,381 |
| Expenses | | | | |
| Management fee | $ | 104,321 | | |
| Independent trustees' fees and expenses | | 112 | | |
| Total expenses before reductions | | 104,433 | | |
| Expense reductions | | (103) | | |
| Total expenses after reductions | | | | 104,330 |
| Net Investment income (loss) | | | | 119,051 |
| Realized and Unrealized Gain (Loss) | | | | |
| Net realized gain (loss) on: | | | | |
| Investment Securities: | | | | |
| Unaffiliated issuers | | 317,834 | | |
| Redemptions in-kind | | 1,835,433 | | |
| Foreign currency transactions | | 3,399 | | |
| Total net realized gain (loss) | | | | 2,156,666 |
| Change in net unrealized appreciation (depreciation) on: | | | | |
| Investment Securities: | | | | |
| Unaffiliated issuers | | 2,195,612 | | |
| Assets and liabilities in foreign currencies | | 317 | | |
| Total change in net unrealized appreciation (depreciation) | | | | 2,195,929 |
| Net gain (loss) | | | | 4,352,595 |
| Net increase (decrease) in net assets resulting from operations | | | $ | 4,471,646 |
See Organization and Merger information note regarding reorganization from mutual fund to exchange traded fund.
| Statement of Changes in Net Assets |
| |
| | Six months ended November 30, 2023 (Unaudited) | | Year ended May 31, 2023 |
| Increase (Decrease) in Net Assets | | | | |
| Operations | | | | |
| Net investment income (loss) | $ | 119,051 | $ | 429,106 |
| Net realized gain (loss) | | 2,156,666 | | (5,165,409) |
| Change in net unrealized appreciation (depreciation) | | 2,195,929 | | (2,264,698) |
| Net increase (decrease) in net assets resulting from operations | | 4,471,646 | | (7,001,001) |
| Distributions to shareholders | | (305,577) | | (3,640,977) |
| | | | | |
| Share transactions - net increase (decrease) | | - | | (13,799,786) |
| Share transactions | | | | |
| Proceeds from sales of shares | | 1,965,620 | | - |
| Reinvestment of distributions | | 224,111 | | - |
| Cost of shares redeemed | | (5,549,816) | | - |
| | | | | |
Net increase (decrease) in net assets resulting from share transactions | | (3,360,085) | | (13,799,786) |
| Total increase (decrease) in net assets | | 805,984 | | (24,441,764) |
| | | | | |
| Net Assets | | | | |
| Beginning of period | | 40,819,700 | | 65,261,464 |
| End of period | $ | 41,625,684 | $ | 40,819,700 |
| | | | | |
| Other Information | | | | |
| Shares | | | | |
| Sold | | 100,156 | | 2,055,446 |
| Issued in reinvestment of distributions | | 9,007 | | 136,875 |
| Redeemed | | (249,456) | | (2,748,212) |
| Net increase (decrease) | | (140,293) | | (555,891) |
| | | | | |
See Organization and Merger information note regarding reorganization from mutual fund to exchange traded fund.
Share activity amounts in the Other Information section have been adjusted to reflect the impact of the change in capital structure associated with the merger. All financial information prior to the merger is that of the Predecessor Fund.
Financial Highlights
| Fidelity® Disruptive Finance ETF |
| |
| | Six months ended (Unaudited) November 30, 2023 A | | Years ended May 31, 2023 A | | 2022 A | | 2021 A | | 2020 A,B |
Selected Per-Share Data | | | | | | | | | | |
| Net asset value, beginning of period | $ | 24.23 | $ | 29.04 | $ | 34.73 | $ | 22.63 | $ | 19.08 |
| Income from Investment Operations | | | | | | | | | | |
Net investment income (loss) C,D | | .07 | | .12 | | .04 | | .21 | | .06 |
| Net realized and unrealized gain (loss) | | 2.83 | | (3.38) | | (5.10) | | 12.24 | | 3.49 |
| Total from investment operations | | 2.90 | | (3.26) | | (5.06) | | 12.45 | | 3.55 |
| Distributions from net investment income | | (.18) | | - | | (.08) | | (.10) | | - |
| Distributions from net realized gain | | - | | (1.55) | | (.55) | | (.25) | | - |
| Total distributions | | (.18) | | (1.55) | | (.63) | | (.35) | | - |
| Net asset value, end of period | $ | 26.95 | $ | 24.23 | $ | 29.04 | $ | 34.73 | $ | 22.63 |
Total Return E,F,G | | 12.02% | | (11.46)% | | (14.88)% | | 55.31% | | 18.60% |
Ratios to Average Net Assets D,H,I | | | | | | | | | | |
| Expenses before reductions | | .50% J | | .86% | | 1.00% | | 1.01% K | | 1.01% J,K |
| Expenses net of fee waivers, if any | | .50% J | | .86% | | 1.00% | | 1.01% K | | 1.01% J,K |
| Expenses net of all reductions | | .50% J | | .86% | | 1.00% | | 1.01% K | | 1.01% J,K |
| Net investment income (loss) | | .57% J | | .48% | | .12% | | .72% | | 1.99% J |
| Supplemental Data | | | | | | | | | | |
| Net assets, end of period (000 omitted) | $ | 41,626 | $ | 40,820 | $ | 18,486 | $ | 48,219 | $ | 2,373 |
Portfolio turnover rate L | | 20% J,M | | 22% | | 43% | | 18% | | -% N |
AAs further described in Organization and Merger information notes, per share amounts have been adjusted to reflect the impact of the change in capital structure associated with the merger. All financial information prior to the merger is that of the Predecessor Fund.
BFor the period April 16, 2020 (commencement of operations) through May 31, 2020.
CCalculated based on average shares outstanding during the period.
DNet investment income (loss) is affected by the timing of the declaration of dividends by any underlying mutual funds or exchange-traded funds (ETFs). Net investment income (loss) of any mutual funds or ETFs is not included in the Fund's net investment income (loss) ratio.
EBased on net asset value.
FTotal returns for periods of less than one year are not annualized.
GTotal returns would have been lower if certain expenses had not been reduced during the applicable periods shown.
HFees and expenses of any underlying mutual funds or exchange-traded funds (ETFs) are not included in the Fund's expense ratio. The Fund indirectly bears its proportionate share of these expenses. For additional expense information related to investments in Fidelity Central Funds, please refer to the "Investments in Fidelity Central Funds" note found in the Notes to Financial Statements section of the most recent Annual or Semi-Annual report.
IExpense ratios reflect operating expenses of the class. Expenses before reductions do not reflect amounts reimbursed, waived, or reduced through arrangements with the investment adviser, brokerage services, or other offset arrangements, if applicable, and do not represent the amount paid by the class during periods when reimbursements, waivers or reductions occur.
JAnnualized.
KThe size and fluctuation of net assets and expense amounts may cause ratios to differ from contractual rates.
LAmount does not include the portfolio activity of any underlying mutual funds or exchange-traded funds (ETFs).
MPortfolio turnover rate excludes securities received or delivered in-kind.
NAmount not annualized.
Top Holdings (% of Fund's net assets) |
| |
| Boston Scientific Corp. | 5.5 | |
| UnitedHealth Group, Inc. | 5.2 | |
| Centene Corp. | 3.9 | |
| Danaher Corp. | 3.6 | |
| Vertex Pharmaceuticals, Inc. | 3.3 | |
| Penumbra, Inc. | 3.0 | |
| Bruker Corp. | 3.0 | |
| Argenx SE ADR | 3.0 | |
| Alnylam Pharmaceuticals, Inc. | 3.0 | |
| Royalty Pharma PLC | 3.0 | |
| | 36.5 | |
| |
| Market Sectors (% of Fund's net assets) |
| |
| Health Care | 98.4 | |
| |
Asset Allocation (% of Fund's net assets) |
|
|
Fidelity® Disruptive Medicine ETF
Showing Percentage of Net Assets
| Common Stocks - 98.4% |
| | | Shares | Value ($) |
| HEALTH CARE - 98.4% | | | |
| Biotechnology - 27.5% | | | |
| Alnylam Pharmaceuticals, Inc. (a) | | 8,061 | 1,356,263 |
| ALX Oncology Holdings, Inc. (a) | | 16,876 | 132,308 |
| Arcellx, Inc. (a) | | 9,164 | 481,385 |
| Argenx SE ADR (a) | | 3,016 | 1,359,040 |
| Arrowhead Pharmaceuticals, Inc. (a) | | 6,311 | 133,793 |
| Ascendis Pharma A/S sponsored ADR (a) | | 3,865 | 388,162 |
| Beam Therapeutics, Inc. (a)(b) | | 3,873 | 108,754 |
| Cytokinetics, Inc. (a) | | 15,335 | 513,416 |
| Exact Sciences Corp. (a) | | 9,330 | 597,120 |
| Icosavax, Inc. (a) | | 24,621 | 249,165 |
| Intellia Therapeutics, Inc. (a) | | 2,450 | 72,594 |
| Janux Therapeutics, Inc. (a) | | 14,042 | 122,587 |
| Keros Therapeutics, Inc. (a) | | 5,273 | 159,983 |
| Legend Biotech Corp. ADR (a) | | 11,059 | 672,608 |
| Moonlake Immunotherapeutics (a)(b) | | 3,889 | 170,766 |
| Natera, Inc. (a) | | 4,827 | 270,071 |
| Oxford BioMedica PLC (a) | | 105,735 | 222,653 |
| RayzeBio, Inc. | | 9,200 | 219,696 |
| Regeneron Pharmaceuticals, Inc. (a) | | 1,343 | 1,106,377 |
| Repligen Corp. (a)(b) | | 5,625 | 884,531 |
| Sarepta Therapeutics, Inc. (a) | | 5,031 | 408,920 |
| Tyra Biosciences, Inc. (a) | | 8,307 | 97,275 |
| Vaxcyte, Inc. (a) | | 8,985 | 465,153 |
| Vertex Pharmaceuticals, Inc. (a) | | 4,241 | 1,504,749 |
| Verve Therapeutics, Inc. (a)(b) | | 7,619 | 85,942 |
| Xenon Pharmaceuticals, Inc. (a) | | 6,169 | 225,662 |
| Zai Lab Ltd. ADR (a)(b) | | 18,315 | 499,816 |
| Zentalis Pharmaceuticals, Inc. (a) | | 7,282 | 81,923 |
| | | | 12,590,712 |
| Health Care Equipment & Supplies - 27.3% | | | |
| Align Technology, Inc. (a) | | 1,045 | 223,421 |
| Boston Scientific Corp. (a) | | 45,279 | 2,530,642 |
| DexCom, Inc. (a) | | 7,307 | 844,105 |
| Glaukos Corp. (a) | | 8,600 | 549,454 |
| ICU Medical, Inc. (a) | | 4,278 | 375,437 |
| Inspire Medical Systems, Inc. (a) | | 2,424 | 352,231 |
| Insulet Corp. (a) | | 6,434 | 1,216,605 |
| Intuitive Surgical, Inc. (a) | | 3,850 | 1,196,734 |
| iRhythm Technologies, Inc. (a) | | 4,403 | 375,488 |
| Masimo Corp. (a) | | 12,788 | 1,199,003 |
| Nevro Corp. (a) | | 11,624 | 201,328 |
| Penumbra, Inc. (a) | | 6,186 | 1,373,849 |
| ResMed, Inc. | | 4,344 | 685,179 |
| Stryker Corp. | | 3,887 | 1,151,835 |
| Tandem Diabetes Care, Inc. (a) | | 11,178 | 226,243 |
| | | | 12,501,554 |
| Health Care Providers & Services - 16.2% | | | |
| agilon health, Inc. (a) | | 49,094 | 521,378 |
| Centene Corp. (a) | | 24,261 | 1,787,550 |
| Guardant Health, Inc. (a) | | 12,326 | 310,245 |
| Humana, Inc. | | 2,276 | 1,103,541 |
| LifeStance Health Group, Inc. (a) | | 125,761 | 863,978 |
| Privia Health Group, Inc. (a) | | 21,746 | 449,272 |
| UnitedHealth Group, Inc. | | 4,288 | 2,371,135 |
| | | | 7,407,099 |
| Health Care Technology - 3.9% | | | |
| Doximity, Inc. (a) | | 8,273 | 192,347 |
| Evolent Health, Inc. (a) | | 15,428 | 428,898 |
| Phreesia, Inc. (a) | | 18,034 | 277,904 |
| Veeva Systems, Inc. Class A (a) | | 5,181 | 903,100 |
| | | | 1,802,249 |
| Life Sciences Tools & Services - 16.5% | | | |
| 10X Genomics, Inc. (a) | | 21,048 | 916,009 |
| Bio-Techne Corp. | | 12,588 | 791,785 |
| Bruker Corp. | | 21,063 | 1,370,991 |
| Danaher Corp. | | 7,509 | 1,676,835 |
| Lonza Group AG | | 613 | 236,884 |
| Sartorius Stedim Biotech | | 2,996 | 673,101 |
| Thermo Fisher Scientific, Inc. | | 1,907 | 945,414 |
| West Pharmaceutical Services, Inc. | | 2,720 | 954,067 |
| | | | 7,565,086 |
| Pharmaceuticals - 7.0% | | | |
| Edgewise Therapeutics, Inc. (a)(b) | | 23,957 | 145,659 |
| Eli Lilly & Co. | | 1,513 | 894,244 |
| Novo Nordisk A/S Series B sponsored ADR | | 4,100 | 417,544 |
| Royalty Pharma PLC | | 50,097 | 1,356,126 |
| Structure Therapeutics, Inc. ADR | | 6,800 | 378,692 |
| | | | 3,192,265 |
| TOTAL COMMON STOCKS (Cost $46,195,046) | | | 45,058,965 |
| | | | |
| Money Market Funds - 4.5% |
| | | Shares | Value ($) |
| Fidelity Cash Central Fund 5.40% (c) | | 723,065 | 723,210 |
| Fidelity Securities Lending Cash Central Fund 5.39% (c)(d) | | 1,331,692 | 1,331,825 |
| TOTAL MONEY MARKET FUNDS (Cost $2,055,035) | | | 2,055,035 |
| | | | |
| TOTAL INVESTMENT IN SECURITIES - 102.9% (Cost $48,250,081) | 47,114,000 |
NET OTHER ASSETS (LIABILITIES) - (2.9)% | (1,344,841) |
| NET ASSETS - 100.0% | 45,769,159 |
| | |
Legend
| (b) | Security or a portion of the security is on loan at period end. |
| (c) | Affiliated fund that is generally available only to investment companies and other accounts managed by Fidelity Investments. The rate quoted is the annualized seven-day yield of the fund at period end. A complete unaudited listing of the fund's holdings as of its most recent quarter end is available upon request. In addition, each Fidelity Central Fund's financial statements are available on the SEC's website or upon request. |
| (d) | Investment made with cash collateral received from securities on loan. |
Affiliated Central Funds
Fiscal year to date information regarding the Fund's investments in Fidelity Central Funds, including the ownership percentage, is presented below.
| Affiliate | Value, beginning of period ($) | Purchases ($) | Sales Proceeds ($) | Dividend Income ($) | Realized Gain (loss) ($) | Change in Unrealized appreciation (depreciation) ($) | Value, end of period ($) | % ownership, end of period |
| Fidelity Cash Central Fund 5.40% | - | 4,837,023 | 4,113,813 | 13,320 | - | - | 723,210 | 0.0% |
| Fidelity Securities Lending Cash Central Fund 5.39% | 461,500 | 8,702,827 | 7,832,502 | 1,602 | - | - | 1,331,825 | 0.0% |
| Total | 461,500 | 13,539,850 | 11,946,315 | 14,922 | - | - | 2,055,035 | |
| | | | | | | | | |
Amounts in the dividend income column in the above table include any capital gain distributions from underlying funds, which are presented in the corresponding line item in the Statement of Operations, if applicable.
Amounts in the dividend income column for Fidelity Securities Lending Cash Central Fund represents the income earned on investing cash collateral, less rebates paid to borrowers and any lending agent fees associated with the loan, plus any premium payments received for lending certain types of securities.
Amounts included in the purchases and sales proceeds columns may include in-kind transactions, if applicable.
Investment Valuation
The following is a summary of the inputs used, as of November 30, 2023, involving the Fund's assets and liabilities carried at fair value. The inputs or methodology used for valuing securities may not be an indication of the risk associated with investing in those securities. For more information on valuation inputs, and their aggregation into the levels used below, please refer to the Investment Valuation section in the accompanying Notes to Financial Statements.
| Valuation Inputs at Reporting Date: |
| Description | Total ($) | Level 1 ($) | Level 2 ($) | Level 3 ($) |
Investments in Securities: | | | | |
|
| Equities: | | | | |
Health Care | 45,058,965 | 45,058,965 | - | - |
|
| Money Market Funds | 2,055,035 | 2,055,035 | - | - |
| Total Investments in Securities: | 47,114,000 | 47,114,000 | - | - |
Fidelity® Disruptive Medicine ETF
| Statement of Assets and Liabilities |
| | | | November 30, 2023 (Unaudited) |
| | | | | |
| Assets | | | | |
| Investment in securities, at value (including securities loaned of $1,292,763) - See accompanying schedule: | | | | |
Unaffiliated issuers (cost $46,195,046) | $ | 45,058,965 | | |
Fidelity Central Funds (cost $2,055,035) | | 2,055,035 | | |
| | | | | |
| | | | | |
| Total Investment in Securities (cost $48,250,081) | | | $ | 47,114,000 |
| Dividends receivable | | | | 32,342 |
| Distributions receivable from Fidelity Central Funds | | | | 3,744 |
Total assets | | | | 47,150,086 |
| Liabilities | | | | |
| Payable for investments purchased | $ | 30,487 | | |
| Accrued management fee | | 18,613 | | |
| Other payables and accrued expenses | | 2 | | |
| Collateral on securities loaned | | 1,331,825 | | |
| Total Liabilities | | | | 1,380,927 |
| Net Assets | | | $ | 45,769,159 |
| Net Assets consist of: | | | | |
| Paid in capital | | | $ | 58,069,873 |
| Total accumulated earnings (loss) | | | | (12,300,714) |
| Net Assets | | | $ | 45,769,159 |
Net Asset Value, offering price and redemption price per share ($45,769,159 ÷ 2,123,806 shares) | | | $ | 21.55 |
| Statement of Operations |
| | | | Six months ended November 30, 2023 (Unaudited) |
| Investment Income | | | | |
| Dividends | | | $ | 63,296 |
| Income from Fidelity Central Funds (including $1,602 from security lending) | | | | 14,922 |
| Total Income | | | | 78,218 |
| Expenses | | | | |
| Management fee | $ | 108,709 | | |
| Independent trustees' fees and expenses | | 115 | | |
| Total expenses before reductions | | 108,824 | | |
| Expense reductions | | (133) | | |
| Total expenses after reductions | | | | 108,691 |
| Net Investment income (loss) | | | | (30,473) |
| Realized and Unrealized Gain (Loss) | | | | |
| Net realized gain (loss) on: | | | | |
| Investment Securities: | | | | |
| Unaffiliated issuers | | (1,703,599) | | |
| Redemptions in-kind | | 654,546 | | |
| Foreign currency transactions | | (7,829) | | |
| Total net realized gain (loss) | | | | (1,056,882) |
| Change in net unrealized appreciation (depreciation) on: | | | | |
| Investment Securities: | | | | |
| Unaffiliated issuers | | (4,192,730) | | |
| Assets and liabilities in foreign currencies | | 7,030 | | |
| Total change in net unrealized appreciation (depreciation) | | | | (4,185,700) |
| Net gain (loss) | | | | (5,242,582) |
| Net increase (decrease) in net assets resulting from operations | | | $ | (5,273,055) |
See Organization and Merger information note regarding reorganization from mutual fund to exchange traded fund.
| Statement of Changes in Net Assets |
| |
| | Six months ended November 30, 2023 (Unaudited) | | Year ended May 31, 2023 |
| Increase (Decrease) in Net Assets | | | | |
| Operations | | | | |
| Net investment income (loss) | $ | (30,473) | $ | (65,769) |
| Net realized gain (loss) | | (1,056,882) | | (6,730,978) |
| Change in net unrealized appreciation (depreciation) | | (4,185,700) | | 11,521,551 |
| Net increase (decrease) in net assets resulting from operations | | (5,273,055) | | 4,724,804 |
| | | | | |
| Share transactions - net increase (decrease) | | - | | (13,925,552) |
| Share transactions | | | | |
| Proceeds from sales of shares | | 10,797,368 | | - |
| Cost of shares redeemed | | (2,952,019) | | - |
| | | | | |
Net increase (decrease) in net assets resulting from share transactions | | 7,845,349 | | (13,925,552) |
| Total increase (decrease) in net assets | | 2,572,294 | | (9,200,748) |
| | | | | |
| Net Assets | | | | |
| Beginning of period | | 43,196,865 | | 52,397,613 |
| End of period | $ | 45,769,159 | $ | 43,196,865 |
| | | | | |
| Other Information | | | | |
| Shares | | | | |
| Sold | | 500,368 | | 2,183,358 |
| Redeemed | | (149,500) | | (2,768,145) |
| Net increase (decrease) | | 350,868 | | (584,787) |
| | | | | |
See Organization and Merger information note regarding reorganization from mutual fund to exchange traded fund.
Share activity amounts in the Other Information section have been adjusted to reflect the impact of the change in capital structure associated with the merger. All financial information prior to the merger is that of the Predecessor Fund.
Financial Highlights
| Fidelity® Disruptive Medicine ETF |
| |
| | Six months ended (Unaudited) November 30, 2023 A | | Years ended May 31, 2023 A | | 2022 A | | 2021 A | | 2020 A,B |
Selected Per-Share Data | | | | | | | | | | |
| Net asset value, beginning of period | $ | 24.36 | $ | 22.08 | $ | 28.82 | $ | 24.52 | $ | 22.17 |
| Income from Investment Operations | | | | | | | | | | |
Net investment income (loss) C,D | | (.02) | | (.11) | | (.20) | | (.16) | | (.02) |
| Net realized and unrealized gain (loss) | | (2.79) | | 2.39 | | (6.25) | | 4.66 | | 2.37 |
| Total from investment operations | | (2.81) | | 2.28 | | (6.45) | | 4.50 | | 2.35 |
| Distributions from net realized gain | | - | | - | | (.29) | | (.20) | | - |
| Total distributions | | - | | - | | (.29) | | (.20) | | - |
| Net asset value, end of period | $ | 21.55 | $ | 24.36 | $ | 22.08 | $ | 28.82 | $ | 24.52 |
Total Return E,F,G | | (11.53)% | | 10.34% | | (22.68)% | | 18.44% | | 10.60% |
Ratios to Average Net Assets D,H,I | | | | | | | | | | |
| Expenses before reductions | | .50% J | | .84% | | 1.00% | | 1.01% K | | 1.01% J,K |
| Expenses net of fee waivers, if any | | .50% J | | .84% | | 1.00% | | 1.01% K | | 1.01% J,K |
| Expenses net of all reductions | | .50% J | | .84% | | 1.00% | | 1.01% K | | 1.01% J,K |
| Net investment income (loss) | | (.14)% J | | (.51)% | | (.70)% | | (.58)% | | (.75)% J |
| Supplemental Data | | | | | | | | | | |
| Net assets, end of period (000 omitted) | $ | 45,769 | $ | 43,197 | $ | 11,027 | $ | 32,331 | $ | 5,666 |
Portfolio turnover rate L | | 10% J,M | | 39% | | 47% | | 44% | | -% N,O |
AAs further described in Organization and Merger information notes, per share amounts have been adjusted to reflect the impact of the change in capital structure associated with the merger. All financial information prior to the merger is that of the Predecessor Fund.
BFor the period April 16, 2020 (commencement of operations) through May 31, 2020.
CCalculated based on average shares outstanding during the period.
DNet investment income (loss) is affected by the timing of the declaration of dividends by any underlying mutual funds or exchange-traded funds (ETFs). Net investment income (loss) of any mutual funds or ETFs is not included in the Fund's net investment income (loss) ratio.
EBased on net asset value.
FTotal returns for periods of less than one year are not annualized.
GTotal returns would have been lower if certain expenses had not been reduced during the applicable periods shown.
HFees and expenses of any underlying mutual funds or exchange-traded funds (ETFs) are not included in the Fund's expense ratio. The Fund indirectly bears its proportionate share of these expenses. For additional expense information related to investments in Fidelity Central Funds, please refer to the "Investments in Fidelity Central Funds" note found in the Notes to Financial Statements section of the most recent Annual or Semi-Annual report.
IExpense ratios reflect operating expenses of the class. Expenses before reductions do not reflect amounts reimbursed, waived, or reduced through arrangements with the investment adviser, brokerage services, or other offset arrangements, if applicable, and do not represent the amount paid by the class during periods when reimbursements, waivers or reductions occur.
JAnnualized.
KThe size and fluctuation of net assets and expense amounts may cause ratios to differ from contractual rates.
LAmount does not include the portfolio activity of any underlying mutual funds or exchange-traded funds (ETFs).
MPortfolio turnover rate excludes securities received or delivered in-kind.
NAmount not annualized.
OAmount represents less than 1%.
Top Holdings (% of Fund's net assets) |
| |
| Adobe, Inc. | 5.7 | |
| Salesforce, Inc. | 5.5 | |
| NVIDIA Corp. | 5.4 | |
| Microsoft Corp. | 5.4 | |
| MongoDB, Inc. Class A | 4.7 | |
| Taiwan Semiconductor Manufacturing Co. Ltd. sponsored ADR | 4.4 | |
| Amazon.com, Inc. | 3.8 | |
| Marvell Technology, Inc. | 3.8 | |
| Alphabet, Inc. Class C | 3.8 | |
| ASML Holding NV (Netherlands) | 3.7 | |
| | 46.2 | |
| |
| Market Sectors (% of Fund's net assets) |
| |
| Information Technology | 70.2 | |
| Communication Services | 17.1 | |
| Consumer Discretionary | 7.6 | |
| Financials | 3.5 | |
| Industrials | 1.2 | |
| |
Asset Allocation (% of Fund's net assets) |
|
|
Geographic Diversification (% of Fund's net assets) |
|
* Includes Short-Term investments and Net Other Assets (Liabilities). Percentages are adjusted for the effect of derivatives, if applicable. |
| |
Fidelity® Disruptive Technology ETF
Showing Percentage of Net Assets
| Common Stocks - 99.6% |
| | | Shares | Value ($) |
| COMMUNICATION SERVICES - 17.1% | | | |
| Entertainment - 6.9% | | | |
| Netflix, Inc. (a) | | 7,762 | 3,678,955 |
| Sea Ltd. ADR (a) | | 37,333 | 1,352,201 |
| Spotify Technology SA (a) | | 5,516 | 1,021,067 |
| Universal Music Group NV | | 38,091 | 1,005,040 |
| | | | 7,057,263 |
| Interactive Media & Services - 9.3% | | | |
| Alphabet, Inc. Class C (a) | | 28,618 | 3,832,523 |
| Meta Platforms, Inc. Class A (a) | | 10,819 | 3,539,436 |
| Snap, Inc. Class A (a) | | 146,752 | 2,029,580 |
| | | | 9,401,539 |
| Wireless Telecommunication Services - 0.9% | | | |
| T-Mobile U.S., Inc. | | 6,262 | 942,118 |
TOTAL COMMUNICATION SERVICES | | | 17,400,920 |
| CONSUMER DISCRETIONARY - 7.6% | | | |
| Broadline Retail - 6.3% | | | |
| Amazon.com, Inc. (a) | | 26,433 | 3,861,597 |
| Global-e Online Ltd. (a)(b) | | 19,546 | 669,451 |
| PDD Holdings, Inc. ADR (a) | | 12,600 | 1,857,744 |
| | | | 6,388,792 |
| Hotels, Restaurants & Leisure - 0.7% | | | |
| Airbnb, Inc. Class A (a) | | 5,381 | 679,836 |
| Specialty Retail - 0.6% | | | |
| ZOZO, Inc. | | 30,364 | 640,007 |
TOTAL CONSUMER DISCRETIONARY | | | 7,708,635 |
| FINANCIALS - 3.5% | | | |
| Financial Services - 3.5% | | | |
| Adyen BV (a)(c) | | 2,130 | 2,483,119 |
| Block, Inc. Class A (a) | | 17,326 | 1,098,988 |
| | | | 3,582,107 |
| INDUSTRIALS - 1.2% | | | |
| Ground Transportation - 1.2% | | | |
| Uber Technologies, Inc. (a) | | 21,050 | 1,186,799 |
| INFORMATION TECHNOLOGY - 70.2% | | | |
| Electronic Equipment, Instruments & Components - 0.7% | | | |
| Samsung SDI Co. Ltd. | | 1,960 | 711,713 |
| IT Services - 9.0% | | | |
| Accenture PLC Class A | | 4,278 | 1,425,173 |
| MongoDB, Inc. Class A (a) | | 11,545 | 4,799,718 |
| Shopify, Inc. Class A (a) | | 22,028 | 1,604,079 |
| Snowflake, Inc. (a) | | 7,272 | 1,364,809 |
| | | | 9,193,779 |
| Semiconductors & Semiconductor Equipment - 23.0% | | | |
| Advantest Corp. | | 61,491 | 1,941,450 |
| ASML Holding NV (Netherlands) | | 5,536 | 3,754,158 |
| BE Semiconductor Industries NV | | 13,575 | 1,898,027 |
| Marvell Technology, Inc. | | 69,038 | 3,847,488 |
| Micron Technology, Inc. | | 16,600 | 1,263,592 |
| NVIDIA Corp. | | 11,873 | 5,553,002 |
| SolarEdge Technologies, Inc. (a) | | 8,877 | 704,656 |
| Taiwan Semiconductor Manufacturing Co. Ltd. sponsored ADR | | 45,576 | 4,435,001 |
| | | | 23,397,374 |
| Software - 35.0% | | | |
| Adobe, Inc. (a) | | 9,471 | 5,786,876 |
| Atlassian Corp. PLC (a) | | 6,933 | 1,323,856 |
| Confluent, Inc. (a) | | 56,358 | 1,195,917 |
| Crowdstrike Holdings, Inc. (a) | | 6,922 | 1,640,445 |
| Datadog, Inc. Class A (a) | | 16,763 | 1,954,063 |
| HashiCorp, Inc. (a) | | 45,634 | 977,480 |
| HubSpot, Inc. (a) | | 3,498 | 1,727,767 |
| Intuit, Inc. | | 4,190 | 2,394,417 |
| Microsoft Corp. | | 14,496 | 5,492,679 |
| Palo Alto Networks, Inc. (a) | | 8,024 | 2,367,802 |
| Salesforce, Inc. (a) | | 22,370 | 5,635,003 |
| Synopsys, Inc. (a) | | 4,700 | 2,553,181 |
| Workday, Inc. Class A (a) | | 9,376 | 2,538,271 |
| | | | 35,587,757 |
| Technology Hardware, Storage & Peripherals - 2.5% | | | |
| Apple, Inc. | | 7,672 | 1,457,296 |
| Samsung Electronics Co. Ltd. | | 20,450 | 1,145,332 |
| | | | 2,602,628 |
TOTAL INFORMATION TECHNOLOGY | | | 71,493,251 |
| TOTAL COMMON STOCKS (Cost $89,822,476) | | | 101,371,712 |
| | | | |
| Money Market Funds - 0.8% |
| | | Shares | Value ($) |
| Fidelity Cash Central Fund 5.40% (d) | | 393,819 | 393,898 |
| Fidelity Securities Lending Cash Central Fund 5.39% (d)(e) | | 399,484 | 399,524 |
| TOTAL MONEY MARKET FUNDS (Cost $793,422) | | | 793,422 |
| | | | |
| TOTAL INVESTMENT IN SECURITIES - 100.4% (Cost $90,615,898) | 102,165,134 |
NET OTHER ASSETS (LIABILITIES) - (0.4)% | (375,849) |
| NET ASSETS - 100.0% | 101,789,285 |
| | |
Legend
| (b) | Security or a portion of the security is on loan at period end. |
| (c) | Security exempt from registration under Rule 144A of the Securities Act of 1933. These securities may be resold in transactions exempt from registration, normally to qualified institutional buyers. At the end of the period, the value of these securities amounted to $2,483,119 or 2.4% of net assets. |
| (d) | Affiliated fund that is generally available only to investment companies and other accounts managed by Fidelity Investments. The rate quoted is the annualized seven-day yield of the fund at period end. A complete unaudited listing of the fund's holdings as of its most recent quarter end is available upon request. In addition, each Fidelity Central Fund's financial statements are available on the SEC's website or upon request. |
| (e) | Investment made with cash collateral received from securities on loan. |
Affiliated Central Funds
Fiscal year to date information regarding the Fund's investments in Fidelity Central Funds, including the ownership percentage, is presented below.
| Affiliate | Value, beginning of period ($) | Purchases ($) | Sales Proceeds ($) | Dividend Income ($) | Realized Gain (loss) ($) | Change in Unrealized appreciation (depreciation) ($) | Value, end of period ($) | % ownership, end of period |
| Fidelity Cash Central Fund 5.40% | 478,846 | 11,710,705 | 11,795,653 | 20,776 | - | - | 393,898 | 0.0% |
| Fidelity Securities Lending Cash Central Fund 5.39% | 3,121,750 | 7,343,557 | 10,065,783 | 1,150 | - | - | 399,524 | 0.0% |
| Total | 3,600,596 | 19,054,262 | 21,861,436 | 21,926 | - | - | 793,422 | |
| | | | | | | | | |
Amounts in the dividend income column in the above table include any capital gain distributions from underlying funds, which are presented in the corresponding line item in the Statement of Operations, if applicable.
Amounts in the dividend income column for Fidelity Securities Lending Cash Central Fund represents the income earned on investing cash collateral, less rebates paid to borrowers and any lending agent fees associated with the loan, plus any premium payments received for lending certain types of securities.
Amounts included in the purchases and sales proceeds columns may include in-kind transactions, if applicable.
Investment Valuation
The following is a summary of the inputs used, as of November 30, 2023, involving the Fund's assets and liabilities carried at fair value. The inputs or methodology used for valuing securities may not be an indication of the risk associated with investing in those securities. For more information on valuation inputs, and their aggregation into the levels used below, please refer to the Investment Valuation section in the accompanying Notes to Financial Statements.
| Valuation Inputs at Reporting Date: |
| Description | Total ($) | Level 1 ($) | Level 2 ($) | Level 3 ($) |
Investments in Securities: | | | | |
|
| Equities: | | | | |
Communication Services | 17,400,920 | 17,400,920 | - | - |
Consumer Discretionary | 7,708,635 | 7,708,635 | - | - |
Financials | 3,582,107 | 3,582,107 | - | - |
Industrials | 1,186,799 | 1,186,799 | - | - |
Information Technology | 71,493,251 | 71,493,251 | - | - |
|
| Money Market Funds | 793,422 | 793,422 | - | - |
| Total Investments in Securities: | 102,165,134 | 102,165,134 | - | - |
Fidelity® Disruptive Technology ETF
| Statement of Assets and Liabilities |
| | | | November 30, 2023 (Unaudited) |
| | | | | |
| Assets | | | | |
| Investment in securities, at value (including securities loaned of $388,190) - See accompanying schedule: | | | | |
Unaffiliated issuers (cost $89,822,476) | $ | 101,371,712 | | |
Fidelity Central Funds (cost $793,422) | | 793,422 | | |
| | | | | |
| | | | | |
| Total Investment in Securities (cost $90,615,898) | | | $ | 102,165,134 |
| Cash | | | | 27,937 |
| Dividends receivable | | | | 33,977 |
| Distributions receivable from Fidelity Central Funds | | | | 1,758 |
Total assets | | | | 102,228,806 |
| Liabilities | | | | |
| Accrued management fee | $ | 39,997 | | |
| Collateral on securities loaned | | 399,524 | | |
| Total Liabilities | | | | 439,521 |
| Net Assets | | | $ | 101,789,285 |
| Net Assets consist of: | | | | |
| Paid in capital | | | $ | 119,553,287 |
| Total accumulated earnings (loss) | | | | (17,764,002) |
| Net Assets | | | $ | 101,789,285 |
Net Asset Value, offering price and redemption price per share ($101,789,285 ÷ 3,788,469 shares) | | | $ | 26.87 |
| Statement of Operations |
| | | | Six months ended November 30, 2023 (Unaudited) |
| Investment Income | | | | |
| Dividends | | | $ | 131,959 |
| Interest | | | | 68 |
| Income from Fidelity Central Funds (including $1,150 from security lending) | | | | 21,926 |
| Total Income | | | | 153,953 |
| Expenses | | | | |
| Management fee | $ | 246,261 | | |
| Independent trustees' fees and expenses | | 259 | | |
| Total expenses before reductions | | 246,520 | | |
| Expense reductions | | (170) | | |
| Total expenses after reductions | | | | 246,350 |
| Net Investment income (loss) | | | | (92,397) |
| Realized and Unrealized Gain (Loss) | | | | |
| Net realized gain (loss) on: | | | | |
| Investment Securities: | | | | |
| Unaffiliated issuers | | (6,214,185) | | |
| Redemptions in-kind | | 1,393,703 | | |
| Foreign currency transactions | | 8,756 | | |
| Total net realized gain (loss) | | | | (4,811,726) |
| Change in net unrealized appreciation (depreciation) on: | | | | |
| Investment Securities: | | | | |
| Unaffiliated issuers | | 14,805,642 | | |
| Assets and liabilities in foreign currencies | | 5,608 | | |
| Total change in net unrealized appreciation (depreciation) | | | | 14,811,250 |
| Net gain (loss) | | | | 9,999,524 |
| Net increase (decrease) in net assets resulting from operations | | | $ | 9,907,127 |
See Organization and Merger information note regarding reorganization from mutual fund to exchange traded fund.
| Statement of Changes in Net Assets |
| |
| | Six months ended November 30, 2023 (Unaudited) | | Year ended May 31, 2023 |
| Increase (Decrease) in Net Assets | | | | |
| Operations | | | | |
| Net investment income (loss) | $ | (92,397) | $ | (164,342) |
| Net realized gain (loss) | | (4,811,726) | | (24,265,561) |
| Change in net unrealized appreciation (depreciation) | | 14,811,250 | | 33,937,798 |
| Net increase (decrease) in net assets resulting from operations | | 9,907,127 | | 9,507,895 |
| Distributions to shareholders | | - | | (1,210,975) |
| | | | | |
| Share transactions - net increase (decrease) | | - | | (12,866,094) |
| Share transactions | | | | |
| Proceeds from sales of shares | | 1,190,118 | | - |
| Cost of shares redeemed | | (10,852,977) | | - |
| | | | | |
Net increase (decrease) in net assets resulting from share transactions | | (9,662,859) | | (12,866,094) |
| Total increase (decrease) in net assets | | 244,268 | | (4,569,174) |
| | | | | |
| Net Assets | | | | |
| Beginning of period | | 101,545,017 | | 106,114,191 |
| End of period | $ | 101,789,285 | $ | 101,545,017 |
| | | | | |
| Other Information | | | | |
| Shares | | | | |
| Sold | | 48,177 | | 5,396,940 |
| Issued in reinvestment of distributions | | - | | 55,606 |
| Redeemed | | (434,792) | | (6,149,268) |
| Net increase (decrease) | | (386,615) | | (696,722) |
| | | | | |
See Organization and Merger information note regarding reorganization from mutual fund to exchange traded fund.
Share activity amounts in the Other Information section have been adjusted to reflect the impact of the change in capital structure associated with the merger. All financial information prior to the merger is that of the Predecessor Fund.
Financial Highlights
| Fidelity® Disruptive Technology ETF |
| |
| | Six months ended (Unaudited) November 30, 2023 A | | Years ended May 31, 2023 A | | 2022 A | | 2021 A | | 2020 A,B |
Selected Per-Share Data | | | | | | | | | | |
| Net asset value, beginning of period | $ | 24.32 | $ | 21.70 | $ | 33.25 | $ | 21.11 | $ | 18.37 |
| Income from Investment Operations | | | | | | | | | | |
Net investment income (loss) C,D | | (.02) | | (.09) | | (.26) | | (.24) | | (.02) |
| Net realized and unrealized gain (loss) | | 2.57 | | 2.97 | | (10.79) | | 12.51 | | 2.76 |
| Total from investment operations | | 2.55 | | 2.88 | | (11.05) | | 12.27 | | 2.74 |
| Distributions from net realized gain | | - | | (.26) | | (.50) E | | (.13) | | - |
| Total distributions | | - | | (.26) | | (.50) | | (.13) | | - |
| Net asset value, end of period | $ | 26.87 | $ | 24.32 | $ | 21.70 | $ | 33.25 | $ | 21.11 |
Total Return F,G,H | | 10.46% | | 13.45% | | (33.85)% | | 58.13% | | 14.90% |
Ratios to Average Net Assets D,I,J | | | | | | | | | | |
| Expenses before reductions | | .50% K | | .87% | | .99% | | 1.01% E | | 1.01% E,K |
| Expenses net of fee waivers, if any | | .50% K | | .87% | | .99% E | | 1.01% E | | 1.01% E,K |
| Expenses net of all reductions | | .50% K | | .87% | | .99% E | | 1.01% E | | 1.01% E,K |
| Net investment income (loss) | | (.19)% K | | (.42)% | | (.78)% | | (.77)% | | (.62)% K |
| Supplemental Data | | | | | | | | | | |
| Net assets, end of period (000 omitted) | $ | 101,789 | $ | 101,545 | $ | 34,802 | $ | 130,244 | $ | 6,198 |
Portfolio turnover rate L | | 19% K,M | | 28% | | 33% | | 29% | | -% N,O |
AAs further described in Organization and Merger information notes, per share amounts have been adjusted to reflect the impact of the change in capital structure associated with the merger. All financial information prior to the merger is that of the Predecessor Fund.
BFor the period April 16, 2020 (commencement of operations) through May 31, 2020.
CCalculated based on average shares outstanding during the period.
DNet investment income (loss) is affected by the timing of the declaration of dividends by any underlying mutual funds or exchange-traded funds (ETFs). Net investment income (loss) of any mutual funds or ETFs is not included in the Fund's net investment income (loss) ratio.
EThe size and fluctuation of net assets and expense amounts may cause ratios to differ from contractual rates.
FTotal returns for periods of less than one year are not annualized.
GTotal returns would have been lower if certain expenses had not been reduced during the applicable periods shown.
HBased on net asset value.
IFees and expenses of any underlying mutual funds or exchange-traded funds (ETFs) are not included in the Fund's expense ratio. The Fund indirectly bears its proportionate share of these expenses. For additional expense information related to investments in Fidelity Central Funds, please refer to the "Investments in Fidelity Central Funds" note found in the Notes to Financial Statements section of the most recent Annual or Semi-Annual report.
JExpense ratios reflect operating expenses of the class. Expenses before reductions do not reflect amounts reimbursed, waived, or reduced through arrangements with the investment adviser, brokerage services, or other offset arrangements, if applicable, and do not represent the amount paid by the class during periods when reimbursements, waivers or reductions occur.
KAnnualized.
LAmount does not include the portfolio activity of any underlying mutual funds or exchange-traded funds (ETFs).
MPortfolio turnover rate excludes securities received or delivered in-kind.
NAmount not annualized.
OAmount represents less than 1%.
For the period ended November 30, 2023
1. Organization.
Fidelity Disruptive Automation ETF, Fidelity Disruptive Communications ETF, Fidelity Disruptive Finance ETF, Fidelity Disruptive Medicine ETF and Fidelity Disruptive Technology ETF (the Funds) are non-diversified exchange-traded funds of Fidelity Covington Trust (the Trust) and are authorized to issue an unlimited number of shares. Each Fund, with the exception of Fidelity Disruptive Medicine ETF, are non-diversified funds. The Trust is registered under the Investment Company Act of 1940, as amended (the 1940 Act), as an open-end management investment company organized as a Massachusetts business trust. Investments in emerging markets, if applicable, can be subject to social, economic, regulatory, and political uncertainties and can be extremely volatile.
Effective June 9, 2023, each Fidelity Disruptive Fund (Predecessor Fund) reorganized into the newly created exchange traded fund (ETF) as noted in the table below. Each Predecessor Fund was the accounting survivor in the reorganization, and, as such, the financial statements and financial highlights of each Fund reflect the financial information of each Predecessor Fund through June 9, 2023 (see Merger Information note). During the prior fiscal year, Loyalty Class 1, Loyalty Class 2 and Class F shares were converted to Fidelity Disruptive Fund shares in each Predecessor Fund.
| Current ETFs | Former Mutual Funds (Predecessor Funds) |
| Fidelity Disruptive Automation ETF | Fidelity Disruptive Automation Fund |
| Fidelity Disruptive Communications ETF | Fidelity Disruptive Communications Fund |
| Fidelity Disruptive Finance ETF | Fidelity Disruptive Finance Fund |
| Fidelity Disruptive Medicine ETF | Fidelity Disruptive Medicine Fund |
| Fidelity Disruptive Technology ETF | Fidelity Disruptive Technology Fund |
2. Investments in Fidelity Central Funds.
Funds may invest in Fidelity Central Funds, which are open-end investment companies generally available only to other investment companies and accounts managed by the investment adviser and its affiliates. The Schedule of Investments lists any Fidelity Central Funds held as an investment as of period end, but does not include the underlying holdings of each Fidelity Central Fund. An investing fund indirectly bears its proportionate share of the expenses of the underlying Fidelity Central Funds.
Based on its investment objective, each Fidelity Central Fund may invest or participate in various investment vehicles or strategies that are similar to those of the investing fund. These strategies are consistent with the investment objectives of the investing fund and may involve certain economic risks which may cause a decline in value of each of the Fidelity Central Funds and thus a decline in the value of the investing fund.
| Fidelity Central Fund | Investment Manager | Investment Objective | Investment Practices | Expense RatioA |
| Fidelity Money Market Central Funds | Fidelity Management & Research Company LLC (FMR) | Each fund seeks to obtain a high level of current income consistent with the preservation of capital and liquidity. | Short-term Investments | Less than .005% |
A Expenses expressed as a percentage of average net assets and are as of each underlying Central Fund's most recent annual or semi-annual shareholder report.
A complete unaudited list of holdings for each Fidelity Central Fund is available upon request or at the Securities and Exchange Commission website at www.sec.gov. In addition, the financial statements of the Fidelity Central Funds, which are not covered by the Report of Independent Registered Public Accounting Firm, are available on the Securities and Exchange Commission website or upon request.
3. Significant Accounting Policies.
Each Fund is an investment company and applies the accounting and reporting guidance of the Financial Accounting Standards Board (FASB) Accounting Standards Codification Topic 946 Financial Services - Investment Companies. The financial statements have been prepared in conformity with accounting principles generally accepted in the United States of America (GAAP), which require management to make certain estimates and assumptions at the date of the financial statements. Actual results could differ from those estimates. Subsequent events, if any, through the date that the financial statements were issued have been evaluated in the preparation of the financial statements. Each Fund's Schedule of Investments lists any underlying mutual funds or exchange-traded funds (ETFs) but does not include the underlying holdings of these funds. The following summarizes the significant accounting policies of each Fund:
Investment Valuation. Investments are valued as of 4:00 p.m. Eastern time on the last calendar day of the period. The Board of Trustees (the Board) has designated each Fund's investment adviser as the valuation designee responsible for the fair valuation function and performing fair value determinations as needed. The investment adviser has established a Fair Value Committee (the Committee) to carry out the day-to-day fair valuation responsibilities and has adopted policies and procedures to govern the fair valuation process and the activities of the Committee. In accordance with these fair valuation policies and procedures, which have been approved by the Board, each Fund attempts to obtain prices from one or more third party pricing services or brokers to value its investments. When current market prices, quotations or currency exchange rates are not readily available or reliable, investments will be fair valued in good faith by the Committee, in accordance with the policies and procedures. Factors used in determining fair value vary by investment type and may include market or investment specific events, transaction data, estimated cash flows, and market observations of comparable investments. The frequency that the fair valuation procedures are used cannot be predicted and they may be utilized to a significant extent. The Committee manages each Fund's fair valuation practices and maintains the fair valuation policies and procedures. Each Fund's investment adviser reports to the Board information regarding the fair valuation process and related material matters.
Each Fund categorizes the inputs to valuation techniques used to value its investments into a disclosure hierarchy consisting of three levels as shown below:
Level 1 - unadjusted quoted prices in active markets for identical investments
Level 2 - other significant observable inputs (including quoted prices for similar investments, interest rates, prepayment speeds, etc.)
Level 3 - unobservable inputs (including the Fund's own assumptions based on the best information available)
Valuation techniques used to value each Fund's investments by major category are as follows:
Equity securities, including restricted securities, for which market quotations are readily available, are valued at the last reported sale price or official closing price as reported by a third party pricing service on the primary market or exchange on which they are traded and are categorized as Level 1 in the hierarchy. In the event there were no sales during the day or closing prices are not available, securities are valued at the last quoted bid price or may be valued using the last available price and are generally categorized as Level 2 in the hierarchy. For foreign equity securities, when market or security specific events arise, comparisons to the valuation of American Depositary Receipts (ADRs), futures contracts, ETFs and certain indexes as well as quoted prices for similar securities may be used and would be categorized as Level 2 in the hierarchy. For equity securities, including restricted securities, where observable inputs are limited, assumptions about market activity and risk are used and these securities may be categorized as Level 3 in the hierarchy.
Investments in open-end mutual funds, including the Fidelity Central Funds, are valued at their closing net asset value (NAV) each business day and are categorized as Level 1 in the hierarchy.
Foreign Currency. Certain Funds may use foreign currency contracts to facilitate transactions in foreign-denominated securities. Gains and losses from these transactions may arise from changes in the value of the foreign currency or if the counterparties do not perform under the contracts' terms.
Foreign-denominated assets, including investment securities, and liabilities are translated into U.S. dollars at the exchange rates at period end. Purchases and sales of investment securities, income and dividends received, and expenses denominated in foreign currencies are translated into U.S. dollars at the exchange rate in effect on the transaction date.
The effects of exchange rate fluctuations on investments are included with the net realized and unrealized gain (loss) on investment securities. Other foreign currency transactions resulting in realized and unrealized gain (loss) are disclosed separately.
Investment Transactions and Income. For financial reporting purposes, the Funds' investment holdings and NAV include trades executed through the end of the last business day of the period. The NAV per share for processing shareholder transactions is calculated as of the close of business (normally 4:00 p.m. Eastern time) of the Nasdaq Stock Market. Eastern time and includes trades executed through the end of the prior business day. Gains and losses on securities sold are determined on the basis of identified cost. Commissions paid to certain brokers with whom the investment adviser, or its affiliates, places trades on behalf of a fund include an amount in addition to trade execution, which may be rebated back to a fund. Any such rebates are included in net realized gain (loss) on investments in the Statement of Operations. Dividend income is recorded on the ex-dividend date, except for certain dividends from foreign securities where the ex-dividend date may have passed, which are recorded as soon as the Funds are informed of the ex-dividend date. Non-cash dividends included in dividend income, if any, are recorded at the fair market value of the securities received. Income and capital gain distributions from Fidelity Central Funds, if any, are recorded on the ex-dividend date. Certain distributions received by the Funds represent a return of capital or capital gain. The Funds determine the components of these distributions subsequent to the ex-dividend date, based upon receipt of tax filings or other correspondence relating to the underlying investment. These distributions are recorded as a reduction of cost of investments and/or as a realized gain. Interest income is accrued as earned and includes coupon interest and amortization of premium and accretion of discount on debt securities as applicable. Investment income is recorded net of foreign taxes withheld where recovery of such taxes is uncertain. Funds may file withholding tax reclaims in certain jurisdictions to recover a portion of amounts previously withheld. Any withholding tax reclaims income is included in the Statement of Operations in dividends. Any receivables for withholding tax reclaims are included in the Statement of Assets and Liabilities in dividends receivable or reclaims receivable, as applicable.
Expenses. Expenses directly attributable to a fund are charged to that fund. Expenses attributable to more than one fund are allocated among the respective funds on the basis of relative net assets or other appropriate methods. Expenses included in the accompanying financial statements reflect the expenses of that fund and do not include any expenses associated with any underlying mutual funds or exchange-traded funds. Although not included in a fund's expenses, a fund indirectly bears its proportionate share of these expenses through the net asset value of each underlying mutual fund or exchange-traded fund. Expense estimates are accrued in the period to which they relate and adjustments are made when actual amounts are known.
Income Tax Information and Distributions to Shareholders. Each year, each Fund intends to qualify as a regulated investment company under Subchapter M of the Internal Revenue Code, including distributing substantially all of its taxable income and realized gains. As a result, no provision for U.S. Federal income taxes is required. Each Fund files a U.S. federal tax return, in addition to state and local tax returns as required. Each Fund's federal income tax returns are subject to examination by the Internal Revenue Service (IRS) for a period of three fiscal years after they are filed. State and local tax returns may be subject to examination for an additional fiscal year depending on the jurisdiction. Foreign taxes are provided for based on each Fund's understanding of the tax rules and rates that exist in the foreign markets in which it invests.
Distributions are declared and recorded on the ex-dividend date. Income and capital gain distributions are determined in accordance with income tax regulations, which may differ from GAAP.
Capital accounts within the financial statements are adjusted for permanent book-tax differences. These adjustments have no impact on net assets or the results of operations. Capital accounts are not adjusted for temporary book-tax differences which will reverse in a subsequent period.
Book-tax differences are primarily due to foreign currency transactions, passive foreign investment companies (PFIC), net operating losses, capital loss carryforwards and losses deferred due to wash sales and excise tax regulations.
As of period end, the cost and unrealized appreciation (depreciation) in securities, and derivatives if applicable, for federal income tax purposes were as follows for each Fund:
| | Tax cost | Gross unrealized appreciation | Gross unrealized depreciation | Net unrealized appreciation (depreciation) |
| Fidelity Disruptive Automation ETF | $104,655,483 | $17,348,248 | $(14,749,075) | $2,599,173 |
Fidelity Disruptive Communications ETF | 36,873,006 | 10,987,284 | (8,668,439) | 2,318,845 |
| Fidelity Disruptive Finance ETF | 40,053,972 | 7,712,994 | (5,706,286) | 2,006,708 |
| Fidelity Disruptive Medicine ETF | 48,323,525 | 6,907,098 | (8,116,623) | (1,209,525) |
| Fidelity Disruptive Technology ETF | 92,111,225 | 25,321,900 | (15,267,991) | 10,053,909 |
Capital loss carryforwards are only available to offset future capital gains of the Funds to the extent provided by regulations and may be limited. The capital loss carryforward information presented below, including any applicable limitation, is estimated as of fiscal period end and is subject to adjustment.
| | Short-term | Long-term | Total capital loss carryforward |
| Fidelity Disruptive Automation Fund | $(2,580,613) | $(4,788,003) | $(7,368,616) |
Fidelity Disruptive Communications Fund | (4,856,673) | (4,392,633) | (9,249,306) |
| Fidelity Disruptive Finance Fund | (4,448,700) | (2,134,278) | (6,582,978) |
| Fidelity Disruptive Medicine Fund | (6,685,546) | (3,174,906) | (9,860,452) |
| Fidelity Disruptive Technology Fund | (3,935,299) | (18,903,217) | (22,838,516) |
Fidelity Disruptive Medicine Fund elected to defer to its next fiscal year $56,086 of ordinary losses recognized during the period January 1, 2023 to May 31, 2023.
Restricted Securities (including Private Placements). Funds may invest in securities that are subject to legal or contractual restrictions on resale. These securities generally may be resold in transactions exempt from registration or to the public if the securities are registered. Disposal of these securities may involve time-consuming negotiations and expense, and prompt sale at an acceptable price may be difficult. Information regarding restricted securities held at period end is included at the end of the Schedule of Investments, if applicable.
4. Purchases and Sales of Investments.
Purchases and sales of securities, other than short-term securities and in-kind transactions, as applicable, are noted in the table below.
| | Purchases ($) | Sales ($) |
| Fidelity Disruptive Automation ETF | 37,544,124 | 33,596,392 |
| Fidelity Disruptive Communications ETF | 6,843,293 | 5,445,911 |
| Fidelity Disruptive Finance ETF | 9,934,218 | 7,026,590 |
| Fidelity Disruptive Medicine ETF | 7,006,982 | 3,408,381 |
| Fidelity Disruptive Technology ETF | 15,500,992 | 15,267,380 |
Securities received and delivered in-kind through subscriptions and redemptions are noted in the table below.
| | In-Kind Subscriptions ($) | In-Kind Redemptions ($) |
| Fidelity Disruptive Automation ETF | 3,597,594 | 7,126,337 |
| Fidelity Disruptive Communications ETF | - | 3,895,711 |
| Fidelity Disruptive Finance ETF | - | 4,841,021 |
| Fidelity Disruptive Medicine ETF | 7,607,367 | 2,474,632 |
| Fidelity Disruptive Technology ETF | - | 4,587,682 |
Prior Fiscal Year Unaffiliated Redemptions In-Kind. Shares that were redeemed in-kind for investments, including accrued interest and cash, if any, are shown in the table below; along with realized gain or loss on investments delivered through in-kind redemptions. The amount of the in-kind redemptions is included in share transactions in the accompanying Statement of Changes in Net Assets. There was no gain or loss for federal income tax purposes.
| | Shares | Total net realized gain or loss ($) | Total Proceeds ($) |
| Fidelity Disruptive Automation Fund | 210,398 | 2,526,540 | 4,955,947 |
5. Fees and Other Transactions with Affiliates.
Management Fee. Fidelity Management & Research Company LLC (the investment adviser) provides the Funds with investment management related services for which the Funds pay a monthly management fee that is based on an annual rate of each Fund's average net assets as noted in the table below. Under the management contract, the investment adviser pays all expenses, except the compensation of the independent Trustees and certain miscellaneous expenses such as proxy and shareholder meeting expenses.
| | Fee Rate |
| Fidelity Disruptive Automation ETF | .50% |
| Fidelity Disruptive Communications ETF | .50% |
| Fidelity Disruptive Finance ETF | .50% |
| Fidelity Disruptive Medicine ETF | .50% |
| Fidelity Disruptive Technology ETF | .50% |
During the period June 1, 2023 through June 9, 2023, the Predecessor Funds paid a monthly all-inclusive management fee that was based on an annual rate of each Predecessor Fund's average net assets as noted in the table below. Under the management contract, the investment adviser paid all other expenses, except the compensation of the independent Trustees and certain miscellaneous expenses such as proxy and shareholder meeting expenses. Under a separate expense contract, the investment adviser paid all other operating expenses as necessary, except the compensation of the independent Trustees and certain miscellaneous expenses, such as proxy and shareholder meeting expenses, so that total expenses of the Predecessor Fund did not exceed an annual percentage of average net assets as noted in the table below.
| | Management Fee Annual % of Average Net Assets | Expense Contract Annual % of Average Net Assets |
| Fidelity Disruptive Automation Fund | 1.00% | .50% |
| Fidelity Disruptive Communications Fund | 1.00% | .50% |
| Fidelity Disruptive Finance Fund | 1.00% | .50% |
| Fidelity Disruptive Medicine Fund | 1.00% | .50% |
| Fidelity Disruptive Technology Fund | 1.00% | .50% |
Brokerage Commissions. A portion of portfolio transactions were placed with brokerage firms which are affiliates of the investment adviser. Brokerage commissions are included in net realized gain (loss) and change in net unrealized appreciation (depreciation) in the Statement of Operations. The commissions paid to these affiliated firms were as follows:
| | Amount |
| Fidelity Disruptive Automation ETF | $128 |
| Fidelity Disruptive Communications ETF | 71 |
| Fidelity Disruptive Finance ETF | 71 |
| Fidelity Disruptive Medicine ETF | 193 |
| Fidelity Disruptive Technology ETF | 81 |
Interfund Lending Program. Pursuant to an Exemptive Order issued by the Securities and Exchange Commission (the SEC), each Fund, along with other registered investment companies having management contracts with Fidelity Management & Research Company LLC (FMR), or other affiliated entities of FMR, may participate in an interfund lending program. This program provides an alternative credit facility allowing each Fund to borrow from, or lend money to, other participating affiliated funds. At period end, there were no interfund loans outstanding. Activity in this program during the period for which loans were outstanding was as follows:
| | Borrower or Lender | Average Loan Balance | Weighted Average Interest Rate | Interest Expense |
| Fidelity Disruptive Automation ETF | Borrower | $ 5,516,000 | 5.32% | $814 |
Interfund Trades. Funds may purchase from or sell securities to other Fidelity Funds under procedures adopted by the Board. The procedures have been designed to ensure these interfund trades are executed in accordance with Rule 17a-7 of the 1940 Act. Any interfund trades are included within the respective purchases and sales amounts shown in the Purchases and Sales of Investments note. Interfund trades during the period are noted in the table below.
| | Purchases ($) | Sales ($) | Realized Gain (Loss) ($) |
| Fidelity Disruptive Automation ETF | 1,038,847 | 1,075,914 | 253,185 |
| Fidelity Disruptive Communications ETF | 11,648 | 474,253 | 175,908 |
| Fidelity Disruptive Finance ETF | 1,955,770 | 1,402,362 | 812,533 |
| Fidelity Disruptive Medicine ETF | 283,263 | 35,656 | (15,544) |
| Fidelity Disruptive Technology ETF | 1,335,652 | 166,170 | (563,289) |
6. Committed Line of Credit.
During the period June 1, 2023 through June 9, 2023, the Predecessor Fund participated with other funds managed by the investment adviser or an affiliate in a $4.25 billion credit facility (the "line of credit") to be utilized for temporary or emergency purposes to fund shareholder redemptions or for other short-term liquidity purposes. The commitment fees on the pro-rata portion of the line of credit were borne by the investment adviser. During the period, there were no borrowings on this line of credit.
7. Security Lending.
Funds lend portfolio securities from time to time in order to earn additional income. Lending agents are used, including National Financial Services (NFS), an affiliate of the investment adviser. Pursuant to a securities lending agreement, NFS will receive a fee, which is capped at 9.9% of a fund's daily lending revenue, for its services as lending agent. A fund may lend securities to certain qualified borrowers, including NFS. On the settlement date of the loan, a fund receives collateral (in the form of U.S. Treasury obligations, letters of credit and/or cash) against the loaned securities and maintains collateral in an amount not less than 100% of the market value of the loaned securities during the period of the loan. The market value of the loaned securities is determined at the close of business of a fund and any additional required collateral is delivered to a fund on the next business day. A fund or borrower may terminate the loan at any time, and if the borrower defaults on its obligation to return the securities loaned because of insolvency or other reasons, a fund may apply collateral received from the borrower against the obligation. A fund may experience delays and costs in recovering the securities loaned. Any cash collateral received is invested in the Fidelity Securities Lending Cash Central Fund. Any loaned securities are identified as such in the Schedule of Investments, and the value of loaned securities and cash collateral at period end, as applicable, are presented in the Statement of Assets and Liabilities. Security lending income represents the income earned on investing cash collateral, less rebates paid to borrowers and any lending agent fees associated with the loan, plus any premium payments received for lending certain types of securities. Security lending income is presented in the Statement of Operations as a component of income from Fidelity Central Funds. Affiliated security lending activity, if any, was as follows:
| | Total Security Lending Fees Paid to NFS | Security Lending Income From Securities Loaned to NFS | Value of Securities Loaned to NFS at Period End |
| Fidelity Disruptive Automation ETF | $5,118 | $4,521 | $63,456 |
| Fidelity Disruptive Communications ETF | $26 | $- | $- |
| Fidelity Disruptive Finance ETF | $271 | $- | $- |
| Fidelity Disruptive Medicine ETF | $123 | $- | $- |
| Fidelity Disruptive Technology ETF | $80 | $- | $- |
8. Expense Reductions.
Through arrangements with each applicable Fund's custodian, credits realized as a result of certain uninvested cash balances were used to reduce each applicable Fund's expenses. All of the applicable expense reductions are noted in the table below.
| | Custodian credits |
| Fidelity Disruptive Automation ETF | $102 |
Fidelity Disruptive Communications ETF | 110 |
| Fidelity Disruptive Finance ETF | 103 |
| Fidelity Disruptive Medicine ETF | 133 |
| Fidelity Disruptive Technology ETF | 170 |
9. Distributions to Shareholders.
Prior fiscal year distributions to shareholder of each class were as follows:
| | Year ended May 31, 2023 |
| Fidelity Disruptive Automation Fund | |
| Distributions to shareholders | |
| Fidelity Disruptive Automation Fund | $- |
| Loyalty Class 1 | 70,285 |
| Loyalty Class 2 | 370 |
| Class F | 112,219 |
Total | $182,874 |
| Fidelity Disruptive Finance Fund | |
| Distributions to shareholders | |
| Fidelity Disruptive Finance Fund | $889,399 |
| Loyalty Class 1 | 1,176,792 |
| Loyalty Class 2 | 9,204 |
| Class F | 1,565,582 |
Total | $3,640,977 |
| Fidelity Disruptive Technology Fund | |
| Distributions to shareholders | |
| Fidelity Disruptive Technology Fund | $403,963 |
| Loyalty Class 1 | 534,280 |
| Loyalty Class 2 | 1,388 |
| Class F | 271,344 |
Total | $1,210,975 |
10. Share Transactions.
Funds issue and redeem shares at NAV only with certain authorized participants in large increments known as Creation Units. Purchases of Creation Units are made by tendering a basket of designated securities to a fund and redemption proceeds are paid with a basket of securities from a fund's portfolio with a balancing cash component to equate the market value of the basket of securities delivered or redeemed to the NAV per Creation Unit on the transaction date. Cash may be substituted equivalent to the value of certain securities generally when they are not available in sufficient quantity for delivery. A fund's shares are available in smaller increments to investors in the secondary market at market prices and may be subject to commissions. Authorized participants pay a transaction fee to the shareholder servicing agent when purchasing and redeeming Creation Units of a fund. The transaction fee is used to offset the costs associated with the issuance and redemption of Creation Units.
Prior fiscal year share transactions for each class of the Predecessor Fund were as follows and may contain in-kind transactions, automatic conversions between classes or exchanges between affiliated funds:
| | Shares | Dollars |
| | Year ended May 31, 2023 | Year ended May 31, 2023 |
| Fidelity Disruptive Automation Fund | | |
| Fidelity Disruptive Automation Fund | | |
| Shares sold | 4,549,471 | $106,491,639 |
| Reinvestment of distributions | - | - |
| Shares redeemed | (1,670,230) | (35,221,801) |
| Net increase (decrease) | 2,879,241 | $71,269,838 |
| Loyalty Class 1 | | |
| Shares sold | 687,455 | $14,592,727 |
| Reinvestment of distributions | 3,054 | 65,051 |
| Shares redeemed | (3,399,293) | (78,288,179) |
| Net increase (decrease) | (2,708,784) | $(63,630,401) |
| Loyalty Class 2 | | |
| Shares sold | 831 | $17,906 |
| Reinvestment of distributions | 17 | 370 |
| Shares redeemed | (7,730) | (180,614) |
| Net increase (decrease) | (6,882) | $(162,338) |
| Class F | | |
| Shares sold | 23,191 | $512,114 |
| Reinvestment of distributions | 5,221 | 112,219 |
| Shares redeemed | (1,220,183) | (27,936,611) |
| Net increase (decrease) | (1,191,771) | $(27,312,278) |
| Fidelity Disruptive Communications Fund | | |
| Fidelity Disruptive Communications Fund | | |
| Shares sold | 1,574,930 | $36,001,186 |
| Reinvestment of distributions | - | - |
| Shares redeemed | (352,668) | (7,507,221) |
| Net increase (decrease) | 1,222,262 | $28,493,965 |
| Loyalty Class 1 | | |
| Shares sold | 118,546 | $2,583,699 |
| Reinvestment of distributions | - | - |
| Shares redeemed | (741,539) | (16,870,638) |
| Net increase (decrease) | (622,993) | $(14,286,939) |
| Loyalty Class 2 | | |
| Shares sold | 234 | $5,415 |
| Reinvestment of distributions | - | - |
| Shares redeemed | (5,580) | (129,686) |
| Net increase (decrease) | (5,346) | $(124,271) |
| Class F | | |
| Shares sold | 110,136 | $2,260,556 |
| Reinvestment of distributions | - | - |
| Shares redeemed | (1,165,781) | (26,314,710) |
| Net increase (decrease) | (1,055,645) | $(24,054,154) |
| Fidelity Disruptive Finance Fund | | |
| Fidelity Disruptive Finance Fund | | |
| Shares sold | 1,667,868 | $41,586,096 |
| Reinvestment of distributions | 33,977 | 860,296 |
| Shares redeemed | (653,573) | (16,387,983) |
| Net increase (decrease) | 1,048,272 | $26,058,409 |
| Loyalty Class 1 | | |
| Shares sold | 262,880 | $6,806,499 |
| Reinvestment of distributions | 41,011 | 1,037,086 |
| Shares redeemed | (1,019,650) | (25,336,391) |
| Net increase (decrease) | (715,759) | $(17,492,806) |
| Loyalty Class 2 | | |
| Shares sold | 653 | $17,290 |
| Reinvestment of distributions | 362 | 9,204 |
| Shares redeemed | (6,443) | (160,502) |
| Net increase (decrease) | (5,428) | $(134,008) |
| Class F | | |
| Shares sold | 124,045 | $3,122,008 |
| Reinvestment of distributions | 61,525 | 1,565,581 |
| Shares redeemed | (1,068,546) | (26,918,970) |
| Net increase (decrease) | (882,976) | $(22,231,381) |
| Fidelity Disruptive Medicine Fund | | |
| Fidelity Disruptive Medicine Fund | | |
| Shares sold | 1,872,264 | $47,165,060 |
| Reinvestment of distributions | - | - |
| Shares redeemed | (598,763) | (13,951,368) |
| Net increase (decrease) | 1,273,501 | $33,213,692 |
| Loyalty Class 1 | | |
| Shares sold | 219,552 | $5,140,188 |
| Reinvestment of distributions | - | - |
| Shares redeemed | (976,902) | (24,624,657) |
| Net increase (decrease) | (757,350) | $(19,484,469) |
| Loyalty Class 2 | | |
| Shares sold | 69 | $1,704 |
| Reinvestment of distributions | - | - |
| Shares redeemed | (4,672) | (120,139) |
| Net increase (decrease) | (4,603) | $(118,435) |
| Class F | | |
| Shares sold | 91,473 | $2,265,715 |
| Reinvestment of distributions | - | - |
| Shares redeemed | (1,187,808) | (29,802,055) |
| Net increase (decrease) | (1,096,335) | $(27,536,340) |
| Fidelity Disruptive Technology Fund | | |
| Fidelity Disruptive Technology Fund | | |
| Shares sold | 4,693,753 | $100,997,985 |
| Reinvestment of distributions | 18,804 | 392,082 |
| Shares redeemed | (2,141,414) | (42,810,625) |
| Net increase (decrease) | 2,571,143 | $58,579,442 |
| Loyalty Class 1 | | |
| Shares sold | 577,993 | $11,797,211 |
| Reinvestment of distributions | 23,915 | 499,555 |
| Shares redeemed | (2,750,511) | (59,530,327) |
| Net increase (decrease) | (2,148,603) | $(47,233,561) |
| Loyalty Class 2 | | |
| Shares sold | 62 | $1,295 |
| Reinvestment of distributions | 66 | 1,388 |
| Shares redeemed | (5,683) | (125,896) |
| Net increase (decrease) | (5,555) | $(123,213) |
| Class F | | |
| Shares sold | 125,132 | $2,389,168 |
| Reinvestment of distributions | 12,821 | 271,344 |
| Shares redeemed | (1,251,660) | (26,749,274) |
| Net increase (decrease) | (1,113,707) | $(24,088,762) |
11. Other.
A fund's organizational documents provide former and current trustees and officers with a limited indemnification against liabilities arising in connection with the performance of their duties to the fund. In the normal course of business, a fund may also enter into contracts that provide general indemnifications. A fund's maximum exposure under these arrangements is unknown as this would be dependent on future claims that may be made against a fund. The risk of material loss from such claims is considered remote.
10. Merger Information.
On June 9, 2023 each Fund (Predecessor Fund) reorganized into a newly created exchange traded fund (ETF) pursuant to an Agreement and Plan of Reorganization (the Agreement) approved by its Board of Trustees. Per the Agreement, shareholders of each Predecessor Fund received ETF shares equal in value to the shares of the Predecessor Fund they owned on the day the reorganization was effective. Each Predecessor Fund was the accounting survivor after the reorganization. As such, performance and financial history prior to the reorganization is that of each Predecessor Fund. Historical share transactions and per share information for the Predecessor Fund was retroactively adjusted to reflect the change in capital structure due to the reorganization.
| Predecessor Funds | New ETFs |
| Fidelity Disruptive Automation Fund | Fidelity Disruptive Automation ETF |
| Fidelity Disruptive Communications Fund | Fidelity Disruptive Communications ETF |
| Fidelity Disruptive Finance Fund | Fidelity Disruptive Finance ETF |
| Fidelity Disruptive Medicine Fund | Fidelity Disruptive Medicine ETF |
| Fidelity Disruptive Technology Fund | Fidelity Disruptive Technology ETF |
For financial reporting purposes, the assets and liabilities of each Predecessor Fund and shares issued by each ETF were recorded at fair value; however, the cost basis of the investments received from each Predecessor Fund were carried forward and will be utilized for purposes of each ETF's ongoing reporting of realized and unrealized gains and losses to more closely align subsequent reporting of realized gains with amounts distributable to shareholders for tax purposes. The reorganization qualified as a tax-free reorganization for federal income tax purposes with no gain or loss recognized to each Predecessor Fund or their shareholders. Costs incurred in connection with the reorganization were paid by each Predecessor Fund.
| Predecessor Fund/Accounting Survivor | Investments ($) | Unrealized appreciation (depreciation) ($) | Net Assets ($) | Shares Exchanged | Shares Exchanged Ratio |
| | | | | | |
| Fidelity Disruptive Automation Fund | 111,001,230 | 9,648,810 | 111,488,793 | 4,459,561 | .6686440000 |
| Fidelity Disruptive Communications Fund | 38,182,670 | 416,225 | 38,176,192 | 1,527,044 | .4988520000 |
| Fidelity Disruptive Finance Fund | 41,565,870 | 1,661,222 | 41,616,228 | 1,664,653 | .5240880000 |
| Fidelity Disruptive Medicine Fund | 43,523,861 | 4,291,008 | 43,537,456 | 1,741,504 | .4511440000 |
| Fidelity Disruptive Technology Fund | 102,251,358 | 1,677,809 | 102,438,029 | 4,097,527 | .5443240000 |
| Legal Acquiring ETF | Net Assets ($) | Total net assets after the acquisition ($) |
| | | |
| Fidelity Disruptive Automation ETF | 25 | 111,488,818 |
| Fidelity Disruptive Communications ETF | 25 | 38,176,217 |
| Fidelity Disruptive Finance ETF | 25 | 41,616,253 |
| Fidelity Disruptive Medicine ETF | 25 | 43,537,481 |
| Fidelity Disruptive Technology ETF | 25 | 102,438,054 |
Pro forma results of operations of the combined entity for the entire period ended November 30, 2023, as though the acquisition had occurred as of the beginning of the year (rather than on the actual acquisition date), are as follows:
| ETF name | Net investment income (loss) | Total net realized gain (loss) | Total change in net unrealized appreciation (depreciation) | Net increase (decrease) in net assets resulting from operations |
| | | | | |
| Fidelity Disruptive Automation ETF | 223,453 | 64,361 | (5,080,071) | (4,792,257) |
| Fidelity Disruptive Communications ETF | (39,233) | 1,468,593 | 3,405,673 | 4,835,033 |
| Fidelity Disruptive Finance ETF | 119,138 | 2,156,666 | 2,195,929 | 4,471,733 |
| Fidelity Disruptive Medicine ETF | (30,380) | (1,056,882) | (4,185,700) | (5,272,962) |
| Fidelity Disruptive Technology ETF | (91,919) | (4,811,726) | 14,811,250 | 9,907,605 |
Because the combined investment portfolios have been managed as a single portfolio since the acquisition was completed, it is not practicable to separate the amounts of revenue and earnings of each Predecessor Fund that has been included in each ETF's Statement of Operations since June 9, 2023.
13. Risk and Uncertainties.
Many factors affect a fund's performance. Developments that disrupt global economies and financial markets, such as pandemics, epidemics, outbreaks of infectious diseases, war, terrorism, and environmental disasters, may significantly affect a fund's investment performance. The effects of these developments to a fund will be impacted by the types of securities in which a fund invests, the financial condition, industry, economic sector, and geographic location of an issuer, and a fund's level of investment in the securities of that issuer. Significant concentrations in security types, issuers, industries, sectors, and geographic locations may magnify the factors that affect a fund's performance.
As a shareholder, you incur two types of costs: (1) transaction costs, which may include sales charges (loads) on purchase payments or redemption proceeds, as applicable and (2) ongoing costs, which generally include management fees, distribution and/or service (12b-1) fees and other Fund expenses. This Example is intended to help you understand your ongoing costs (in dollars) of investing in a fund and to compare these costs with the ongoing costs of investing in other mutual funds.
| The Example is based on an investment of $1,000 invested at the beginning of the period and held for the entire period (June 1, 2023 to November 30, 2023). |
Actual Expenses
The first line of the accompanying table provides information about actual account values and actual expenses. You may use the information in this line, together with the amount you invested, to estimate the expenses that you paid over the period. Simply divide your account value by $1,000.00 (for example, an $8,600 account value divided by $1,000.00 = 8.6), then multiply the result by the number in the first line for a class/Fund under the heading entitled "Expenses Paid During Period" to estimate the expenses you paid on your account during this period. If any fund is a shareholder of any underlying mutual funds or exchange-traded funds (ETFs) (the Underlying Funds), such fund indirectly bears its proportional share of the expenses of the Underlying Funds in addition to the direct expenses incurred presented in the table. These fees and expenses are not included in the annualized expense ratio used to calculate the expense estimate in the table below.
Hypothetical Example for Comparison Purposes
The second line of the accompanying table provides information about hypothetical account values and hypothetical expenses based on the actual expense ratio and an assumed rate of return of 5% per year before expenses, which is not the actual return. The hypothetical account values and expenses may not be used to estimate the actual ending account balance or expenses you paid for the period. You may use this information to compare the ongoing costs of investing in the Fund and other funds. To do so, compare this 5% hypothetical example with the 5% hypothetical examples that appear in the shareholder reports of the other funds. If any fund is a shareholder of any Underlying Funds, such fund indirectly bears its proportional share of the expenses of the Underlying Funds in addition to the direct expenses as presented in the table. These fees and expenses are not included in the annualized expense ratio used to calculate the expense estimate in the table below.
Please note that the expenses shown in the table are meant to highlight your ongoing costs only and do not reflect any transaction costs. Therefore, the second line of the table is useful in comparing ongoing costs only, and will not help you determine the relative total costs of owning different funds. In addition, if these transactional costs were included, your costs would have been higher.
| | | | | Annualized Expense Ratio- A | | Beginning Account Value June 1, 2023 | | Ending Account Value November 30, 2023 | | Expenses Paid During Period- C June 1, 2023 to November 30, 2023 |
| | | | | | | | | | |
| Fidelity® Disruptive Automation ETF | | | | .50% | | | | | | |
| Actual | | | | | | $ 1,000 | | $ 964.80 | | $ 2.35 |
Hypothetical-B | | | | | | $ 1,000 | | $ 1,022.50 | | $ 2.53 |
| | | | | | | | | | |
| Fidelity® Disruptive Communications ETF | | | | .50% | | | | | | |
| Actual | | | | | | $ 1,000 | | $ 1,133.90 | | $ 2.55 |
Hypothetical-B | | | | | | $ 1,000 | | $ 1,022.50 | | $ 2.53 |
| | | | | | | | | | |
| Fidelity® Disruptive Finance ETF | | | | .50% | | | | | | |
| Actual | | | | | | $ 1,000 | | $ 1,120.20 | | $ 2.53 |
Hypothetical-B | | | | | | $ 1,000 | | $ 1,022.50 | | $ 2.53 |
| | | | | | | | | | |
| Fidelity® Disruptive Medicine ETF | | | | .50% | | | | | | |
| Actual | | | | | | $ 1,000 | | $ 884.70 | | $ 2.25 |
Hypothetical-B | | | | | | $ 1,000 | | $ 1,022.50 | | $ 2.53 |
| | | | | | | | | | |
| Fidelity® Disruptive Technology ETF | | | | .50% | | | | | | |
| Actual | | | | | | $ 1,000 | | $ 1,104.60 | | $ 2.52 |
Hypothetical-B | | | | | | $ 1,000 | | $ 1,022.50 | | $ 2.53 |
| |
A Annualized expense ratio reflects expenses net of applicable fee waivers.
B 5% return per year before expenses
C Expenses are equal to the annualized expense ratio, multiplied by the average account value over the period, multiplied by 183/ 366 (to reflect the one-half year period). The fees and expenses of any Underlying Funds are not included in each annualized expense ratio.
Board Approval of Investment Advisory Contracts and Management Fees
Fidelity® Disruptive Automation ETF
Fidelity® Disruptive Communications ETF
Fidelity® Disruptive Finance ETF
Fidelity® Disruptive Medicine ETF
Fidelity® Disruptive Technology ETF
At the November 2022 and January 2023 meetings, the Board of Trustees, including the Independent Trustees (together, the Board), voted to approve the management contract with Fidelity Management & Research Company LLC (FMR) and the sub-advisory agreements with affiliates of FMR (together, the Advisory Contracts) for each fund. FMR and the sub-advisers are collectively referred to herein as the Investment Advisers. The Board, assisted by the advice of fund counsel and Independent Trustees' counsel, considered a broad range of information.
Nature, Extent, and Quality of Services Provided. The Board considered Fidelity's staffing as it relates to the funds, including the backgrounds of investment personnel of Fidelity, and also considered the funds' investment objectives, strategies, and related investment philosophies. The Board considered the structure of the investment personnel compensation program and whether this structure provides appropriate incentives to act in the best interests of each fund.
Resources Dedicated to Investment Management and Support Services. The Board and the Fund Oversight and Research Committees reviewed the general qualifications and capabilities of Fidelity's investment staff, including its size, education, experience, and resources, as well as Fidelity's approach to recruiting, training, managing, and compensating investment personnel. The Board noted that Fidelity has continued to increase the resources devoted to non-U.S. offices, including expansion of Fidelity's global investment organization. The Board also noted that Fidelity's analysts have extensive resources, tools and capabilities that allow them to conduct sophisticated quantitative and fundamental analysis, as well as credit analysis of issuers, counterparties and guarantors. Further, the Board considered that Fidelity's investment professionals have sufficient access to global information and data so as to provide competitive investment results over time, and that those professionals also have access to sophisticated tools that permit them to assess portfolio construction and risk and performance attribution characteristics continuously, as well as to transmit new information and research conclusions rapidly around the world. Additionally, in its deliberations, the Board considered Fidelity's trading, risk management, compliance, and technology and operations capabilities and resources, which are integral parts of the investment management process. The Board also considered Fidelity's investments in business continuity planning, and its success in continuously providing services to the Fidelity funds notwithstanding the severe disruptions caused by the COVID-19 pandemic.
Shareholder and Administrative Services. The Board considered the nature, extent, quality, and cost of advisory, administrative, and shareholder services to be performed by the Investment Advisers and their affiliates under the Advisory Contracts and under separate agreements covering pricing and bookkeeping, and securities lending services for each fund. The Board also considered the nature and extent of the supervision of third party service providers, principally transfer agent, custodians, subcustodians, and pricing vendors.
The Board noted that the growth of fund assets over time across the complex allows Fidelity to reinvest in the development of services designed to enhance the value and convenience of the Fidelity funds as investment vehicles. These services include 24-hour access to account information and market information over the Internet and through telephone representatives, investor education materials and asset allocation tools, and the expanded availability of Fidelity Investor Centers.
Investment Performance. Each fund will commence operations by acquiring the assets of the relevant acquired fund, and each fund is to be the accounting survivor to the relevant acquired fund. Therefore, the Trustees were provided with performance information for the relevant acquired fund. The Board considered the Investment Advisers' strength in fundamental, research-driven security selection, which the Board is familiar with through its supervision of other Fidelity funds.
Based on its review, the Board concluded that the nature, extent, and quality of services to be provided to each fund under the Advisory Contracts should benefit the shareholders of each fund.
Competitiveness of Management Fee and Total Expense Ratio. In reviewing the Advisory Contracts, the Board considered each fund's all-inclusive fee rate. The Board also considered other expenses, such as transfer agent fees, pricing and bookkeeping fees, and custodial, legal, and audit fees, paid by FMR under the all-inclusive arrangement. The Board noted that each fund's proposed management fee rate is below the median fee rate of funds with similar Lipper investment objective categories and comparable investment mandates, regardless of whether their management fee structures are comparable. The Board also considered that the projected total expense ratio of each fund is below the median of those funds and classes used by the Board for management fee comparisons.
Based on its review, the Board concluded that each fund's management fee and projected total expense ratio were reasonable in light of the services that the fund and its shareholders will receive and the other factors considered.
Costs of the Services and Profitability. Each fund will commence operations by acquiring the assets of the relevant acquired fund, and each fund is to be the accounting survivor to the relevant acquired fund. The revenue, cost, or profitability data for the relevant acquired fund was available for the Board to review in respect of each fund.
Economies of Scale. The Board considered economies of scale based on the operating experience of the relevant acquired fund to permit assessment thereof. It noted that, notwithstanding the entrepreneurial risk associated with converting a mutual fund into an exchange-traded fund, the management fee for each fund was set at a level normally associated, by comparison with competitors, with very high fund net assets. The Board also considered Fidelity's assertion that the level of each fund's fee anticipated economies of scale at lower asset levels even before, if ever, economies of scale are achieved. The Board also noted that each fund and its shareholders would have access to the very considerable number and variety of services available through Fidelity and its affiliates.
Based on its evaluation of all of the conclusions noted above, and after considering all factors it believed relevant, the Board concluded that the advisory fee arrangements are fair and reasonable, and that each fund's Advisory Contracts should be approved.
1.9907222.100
DRA-SANN-0124
Fidelity® Disruptors ETF
Semi-Annual Report
November 30, 2023
Contents
To view a fund's proxy voting guidelines and proxy voting record for the 12-month period ended June 30, visit http://www.fidelity.com/proxyvotingresults or visit the Securities and Exchange Commission's (SEC) web site at http://www.sec.gov.
You may also call 1-800-FIDELITY to request a free copy of the proxy voting guidelines.
Standard & Poor's, S&P and S&P 500 are registered service marks of The McGraw-Hill Companies, Inc. and have been licensed for use by Fidelity Distributors Corporation.
Other third-party marks appearing herein are the property of their respective owners.
All other marks appearing herein are registered or unregistered trademarks or service marks of FMR LLC or an affiliated company. © 2024 FMR LLC. All rights reserved.
This report and the financial statements contained herein are submitted for the general information of the shareholders of the Fund. This report is not authorized for distribution to prospective investors in the Fund unless preceded or accompanied by an effective prospectus.
A fund files its complete schedule of portfolio holdings with the SEC for the first and third quarters of each fiscal year on Form N-PORT. Forms N-PORT are available on the SEC's web site at http://www.sec.gov. A fund's Forms N-PORT may be reviewed and copied at the SEC's Public Reference Room in Washington, DC. Information regarding the operation of the SEC's Public Reference Room may be obtained by calling 1-800-SEC-0330.
For a complete list of a fund's portfolio holdings, view the most recent holdings listing, semiannual report, or annual report on Fidelity's web site at http://www.fidelity.com, http://www.institutional.fidelity.com, or http://www.401k.com, as applicable.
NOT FDIC INSURED •MAY LOSE VALUE •NO BANK GUARANTEE
Neither the Fund nor Fidelity Distributors Corporation is a bank.
The information in the following tables is based on the direct Investments of the Fund.
Top Holdings (% of Fund's net assets) |
| |
| Fidelity Disruptive Communications ETF | 21.3 | |
| Fidelity Disruptive Technology ETF | 21.1 | |
| Fidelity Disruptive Finance ETF | 21.0 | |
| Fidelity Disruptive Automation ETF | 18.4 | |
| Fidelity Disruptive Medicine ETF | 18.1 | |
| Fidelity Cash Central Fund 5.40% | 0.3 | |
| | 100.2 | |
| |
Asset Allocation (% of Fund's net assets) |
|
Net Other Assets (Liabilities) - (0.2)% |
|
Showing Percentage of Net Assets
| Domestic Equity Funds - 99.9% |
| | | Shares | Value ($) |
| Fidelity Disruptive Automation ETF (a) | | 669,660 | 15,951,294 |
| Fidelity Disruptive Communications ETF (a)(b) | | 668,031 | 18,501,179 |
| Fidelity Disruptive Finance ETF (a) | | 676,449 | 18,230,305 |
| Fidelity Disruptive Medicine ETF (a)(b) | | 731,298 | 15,730,225 |
| Fidelity Disruptive Technology ETF (a)(b) | | 679,849 | 18,281,136 |
| TOTAL DOMESTIC EQUITY FUNDS (Cost $80,564,106) | | | 86,694,139 |
| | | | |
| Short-Term Funds - 0.3% |
| | | Shares | Value ($) |
Fidelity Cash Central Fund 5.40% (c) (Cost $231,420) | | 231,373 | 231,420 |
| | | | |
| TOTAL INVESTMENT IN SECURITIES - 100.2% (Cost $80,795,526) | 86,925,559 |
NET OTHER ASSETS (LIABILITIES) - (0.2)% | (139,894) |
| NET ASSETS - 100.0% | 86,785,665 |
| | |
Security Type Abbreviations
Legend
| (c) | Affiliated fund that is generally available only to investment companies and other accounts managed by Fidelity Investments. The rate quoted is the annualized seven-day yield of the fund at period end. A complete unaudited listing of the fund's holdings as of its most recent quarter end is available upon request. In addition, each Fidelity Central Fund's financial statements are available on the SEC's website or upon request. |
Affiliated Central Funds
Fiscal year to date information regarding the Fund's investments in Fidelity Central Funds, including the ownership percentage, is presented below.
| Affiliate | Value, beginning of period ($) | Purchases ($) | Sales Proceeds ($) | Dividend Income ($) | Realized Gain (loss) ($) | Change in Unrealized appreciation (depreciation) ($) | Value, end of period ($) | % ownership, end of period |
| Fidelity Cash Central Fund 5.40% | - | 2,296,732 | 2,065,312 | 8,412 | - | - | 231,420 | 0.0% |
| Total | - | 2,296,732 | 2,065,312 | 8,412 | - | - | 231,420 | |
| | | | | | | | | |
Amounts in the dividend income column in the above table include any capital gain distributions from underlying funds, which are presented in the corresponding line item in the Statement of Operations, if applicable.
Amounts included in the purchases and sales proceeds columns may include in-kind transactions, if applicable.
Affiliated Underlying Funds
Fiscal year to date information regarding the Fund's investments in affiliated Underlying Funds is presented below. Exchanges between classes of the same affiliated Underlying Funds may occur. If an Underlying Funds changes its name, the name presented below is the name in effect at period end.
| Affiliate | Value, beginning of period ($) | Purchases ($) | Sales Proceeds ($) | Dividend Income ($) | Realized Gain (loss) ($) | Change in Unrealized appreciation (depreciation) ($) | Value, end of period ($) |
| Fidelity Disruptive Automation ETF | 19,063,965 | 14,473,427 | 2,419,039 | 65,754 | 528,276 | (1,267,849) | 15,951,294 |
| Fidelity Disruptive Communications ETF | 19,096,640 | 20,044,285 | 3,019,959 | - | 17,692 | 2,271,051 | 18,501,179 |
| Fidelity Disruptive Finance ETF | 18,203,265 | 18,836,171 | 2,885,515 | 136,437 | 259,479 | 1,649,410 | 18,230,305 |
| Fidelity Disruptive Medicine ETF | 18,733,959 | 20,500,945 | 2,391,640 | - | (76,990) | (2,022,916) | 15,730,225 |
| Fidelity Disruptive Techology ETF | 20,318,052 | 18,511,060 | 4,099,187 | - | (155,133) | 2,007,747 | 18,281,136 |
| | 95,415,881 | 92,365,888 | 14,815,340 | 202,191 | 573,324 | 2,637,443 | 86,694,139 |
Amounts in the dividend income column in the above table include any capital gain distributions from underlying funds, which are presented in the corresponding line item in the Statement of Operations, if applicable.
Amounts included in the purchases and sales proceeds columns may include in-kind transactions, if applicable.
Investment Valuation
The following is a summary of the inputs used, as of November 30, 2023, involving the Fund's assets and liabilities carried at fair value. The inputs or methodology used for valuing securities may not be an indication of the risk associated with investing in those securities. For more information on valuation inputs, and their aggregation into the levels used below, please refer to the Investment Valuation section in the accompanying Notes to Financial Statements.
| Valuation Inputs at Reporting Date: |
| Description | Total ($) | Level 1 ($) | Level 2 ($) | Level 3 ($) |
Investments in Securities: | | | | |
|
| Domestic Equity Funds | 86,694,139 | 86,694,139 | - | - |
|
| Short-Term Funds | 231,420 | 231,420 | - | - |
| Total Investments in Securities: | 86,925,559 | 86,925,559 | - | - |
| Statement of Assets and Liabilities |
| | | | November 30, 2023 (Unaudited) |
| | | | | |
| Assets | | | | |
| Investment in securities, at value - See accompanying schedule: | | | | |
Fidelity Central Funds (cost $231,420) | $ | 231,420 | | |
Other affiliated issuers (cost $80,564,106) | | 86,694,139 | | |
| | | | | |
| | | | | |
| Total Investment in Securities (cost $80,795,526) | | | $ | 86,925,559 |
| Receivable for investments sold | | | | 758,617 |
| Distributions receivable from Fidelity Central Funds | | | | 1,025 |
Total assets | | | | 87,685,201 |
| Liabilities | | | | |
| Payable for investments purchased | $ | 899,536 | | |
| Total Liabilities | | | | 899,536 |
| Net Assets | | | $ | 86,785,665 |
| Net Assets consist of: | | | | |
| Paid in capital | | | $ | 94,998,406 |
| Total accumulated earnings (loss) | | | | (8,212,741) |
| Net Assets | | | $ | 86,785,665 |
Net Asset Value, offering price and redemption price per share ($86,785,665 ÷ 3,525,062 shares) | | | $ | 24.62 |
| Statement of Operations |
| | | | Six months ended November 30, 2023 (Unaudited) |
| Investment Income | | | | |
| Dividends: | | | | |
| Affiliated issuers | | | $ | 202,191 |
| Income from Fidelity Central Funds | | | | 8,412 |
| Total Income | | | | 210,603 |
| Expenses | | | | |
| Management fee | $ | 24,042 | | |
| Independent trustees' fees and expenses | | 245 | | |
| Total expenses before reductions | | 24,287 | | |
| Expense reductions | | (24,033) | | |
| Total expenses after reductions | | | | 254 |
| Net Investment income (loss) | | | | 210,349 |
| Realized and Unrealized Gain (Loss) | | | | |
| Net realized gain (loss) on: | | | | |
| Investment Securities: | | | | |
| Redemptions in-kind | | 1,332,620 | | |
| Affiliated issuers | | (759,296) | | |
| Total net realized gain (loss) | | | | 573,324 |
| Change in net unrealized appreciation (depreciation) on: | | | | |
| Investment Securities: | | | | |
| Affiliated issuers | | 2,637,443 | | |
| Total change in net unrealized appreciation (depreciation) | | | | 2,637,443 |
| Net gain (loss) | | | | 3,210,767 |
| Net increase (decrease) in net assets resulting from operations | | | $ | 3,421,116 |
See Organization and Merger information note regarding reorganization from mutual fund to exchange traded fund.
| Statement of Changes in Net Assets |
| |
| | Six months ended November 30, 2023 (Unaudited) | | Year ended May 31, 2023 |
| Increase (Decrease) in Net Assets | | | | |
| Operations | | | | |
| Net investment income (loss) | $ | 210,349 | $ | (438,548) |
| Net realized gain (loss) | | 573,324 | | (11,203,876) |
| Change in net unrealized appreciation (depreciation) | | 2,637,443 | | 14,746,550 |
| Net increase (decrease) in net assets resulting from operations | | 3,421,116 | | 3,104,126 |
| Distributions to shareholders | | (204,878) | | - |
| | | | | |
| Share transactions - net increase (decrease) | | - | | (33,405,540) |
| Share transactions | | | | |
| Proceeds from sales of shares | | 619,060 | | - |
| Cost of shares redeemed | | (12,458,404) | | - |
| | | | | |
Net increase (decrease) in net assets resulting from share transactions | | (11,839,344) | | (33,405,540) |
| Total increase (decrease) in net assets | | (8,623,106) | | (30,301,414) |
| | | | | |
| Net Assets | | | | |
| Beginning of period | | 95,408,771 | | 125,710,185 |
| End of period | $ | 86,785,665 | $ | 95,408,771 |
| | | | | |
| Other Information | | | | |
| Shares | | | | |
| Sold | | 25,397 | | 4,434,170 |
| Redeemed | | (527,857) | | (6,032,531) |
| Net increase (decrease) | | (502,460) | | (1,598,361) |
| | | | | |
See Organization and Merger information note regarding reorganization from mutual fund to exchange traded fund.
Share activity amounts in the Other Information section have been adjusted to reflect the impact of the change in capital structure associated with the merger. All financial information prior to the merger is that of the Predecessor Fund.
Financial Highlights
| | Six months ended (Unaudited) November 30, 2023 A | | Years ended May 31, 2023 A | | 2022 A | | 2021 A | | 2020 A,B |
Selected Per-Share Data | | | | | | | | | | |
| Net asset value, beginning of period | $ | 23.69 | $ | 22.31 | $ | 29.44 | $ | 20.17 | $ | 17.43 |
| Income from Investment Operations | | | | | | | | | | |
Net investment income (loss) C,D | | .06 | | (.10) | | (.21) | | (.21) | | (.02) |
| Net realized and unrealized gain (loss) | | .93 | | 1.48 | | (6.54) | | 9.67 | | 2.76 |
| Total from investment operations | | .99 | | 1.38 | | (6.75) | | 9.46 | | 2.74 |
| Distributions from net investment income | | (.06) | | - | | - | | - | | - |
| Distributions from net realized gain | | - | | - | | (.38) | | (.19) | | - |
| Total distributions | | (.06) | | - | | (.38) | | (.19) | | - |
| Net asset value, end of period | $ | 24.62 | $ | 23.69 | $ | 22.31 | $ | 29.44 | $ | 20.17 |
Total Return E,F,G | | 4.17% | | 6.17% | | (23.29)% | | 46.99% | | 15.70% |
Ratios to Average Net Assets D,H,I | | | | | | | | | | |
| Expenses before reductions | | .05% J | | .90% | | 1.00% | | 1.01% K | | 1.01% J,K |
| Expenses net of fee waivers, if any | | -% J,L | | .82% | | 1.00% | | 1.01% K | | 1.01% J,K |
| Expenses net of all reductions | | -% J,L | | .82% | | 1.00% | | 1.01% K | | 1.01% J,K |
| Net investment income (loss) | | .47% J | | (.50)% | | (.69)% | | (.77)% | | (1.01)% J |
| Supplemental Data | | | | | | | | | | |
| Net assets, end of period (000 omitted) | $ | 86,786 | $ | 95,409 | $ | 48,579 | $ | 141,385 | $ | 19,310 |
Portfolio turnover rate M | | 4% J,N | | 12% | | 22% | | 3% | | -% O |
AAs further described in Organization and Merger information notes, per share amounts have been adjusted to reflect the impact of the change in capital structure associated with the merger. All financial information prior to the merger is that of the Predecessor Fund.
BFor the period April 16, 2020 (commencement of operations) through May 31, 2020.
CCalculated based on average shares outstanding during the period.
DNet investment income (loss) is affected by the timing of the declaration of dividends by any underlying mutual funds or exchange-traded funds (ETFs). Net investment income (loss) of any mutual funds or ETFs is not included in the Fund's net investment income (loss) ratio.
ETotal returns for periods of less than one year are not annualized.
FTotal returns would have been lower if certain expenses had not been reduced during the applicable periods shown.
GBased on net asset value.
HExpense ratios reflect operating expenses of the class. Expenses before reductions do not reflect amounts reimbursed, waived, or reduced through arrangements with the investment adviser, brokerage services, or other offset arrangements, if applicable, and do not represent the amount paid by the class during periods when reimbursements, waivers or reductions occur.
IFees and expenses of any underlying mutual funds or exchange-traded funds (ETFs) are not included in the Fund's expense ratio. The Fund indirectly bears its proportionate share of these expenses. For additional expense information related to investments in Fidelity Central Funds, please refer to the "Investments in Fidelity Central Funds" note found in the Notes to Financial Statements section of the most recent Annual or Semi-Annual report.
JAnnualized.
KThe size and fluctuation of net assets and expense amounts may cause ratios to differ from contractual rates.
LAmount represents less than .005%.
MAmount does not include the portfolio activity of any underlying mutual funds or exchange-traded funds (ETFs).
NPortfolio turnover rate excludes securities received or delivered in-kind.
OAmount not annualized.
For the period ended November 30, 2023
1. Organization.
Fidelity Disruptors ETF (the Fund) is an exchange-traded fund of Fidelity Covington Trust (the Trust) and is authorized to issue an unlimited number of shares. The Trust is registered under the Investment Company Act of 1940, as amended (the 1940 Act), as an open-end management investment company organized as a Massachusetts business trust.
Effective June 16, 2023, Fidelity Disruptors Fund (Predecessor Fund) reorganized into the newly created Fidelity Disruptors ETF. The Predecessor Fund was the accounting survivor in the reorganization, and, as such, the financial statements and financial highlights of the Fund reflects the financial information of the Predecessor Fund through June 16, 2023 (see Merger Information note). During the prior fiscal year, Loyalty Class 1 and Loyalty Class 2 shares were converted to Fidelity Disruptors Fund shares in the Predecessor Fund.
2. Investments in Fidelity Central Funds.
Funds may invest in Fidelity Central Funds, which are open-end investment companies generally available only to other investment companies and accounts managed by the investment adviser and its affiliates. The Schedule of Investments lists any Fidelity Central Funds held as an investment as of period end, but does not include the underlying holdings of each Fidelity Central Fund. An investing fund indirectly bears its proportionate share of the expenses of the underlying Fidelity Central Funds.
Based on its investment objective, each Fidelity Central Fund may invest or participate in various investment vehicles or strategies that are similar to those of the investing fund. These strategies are consistent with the investment objectives of the investing fund and may involve certain economic risks which may cause a decline in value of each of the Fidelity Central Funds and thus a decline in the value of the investing fund.
| Fidelity Central Fund | Investment Manager | Investment Objective | Investment Practices | Expense RatioA |
| Fidelity Money Market Central Funds | Fidelity Management & Research Company LLC (FMR) | Each fund seeks to obtain a high level of current income consistent with the preservation of capital and liquidity. | Short-term Investments | Less than .005% |
A Expenses expressed as a percentage of average net assets and are as of each underlying Central Fund's most recent annual or semi-annual shareholder report.
A complete unaudited list of holdings for each Fidelity Central Fund is available upon request or at the Securities and Exchange Commission website at www.sec.gov. In addition, the financial statements of the Fidelity Central Funds, which are not covered by the Report of Independent Registered Public Accounting Firm, are available on the Securities and Exchange Commission website or upon request.
3. Significant Accounting Policies.
The Fund is an investment company and applies the accounting and reporting guidance of the Financial Accounting Standards Board (FASB) Accounting Standards Codification Topic 946 Financial Services - Investment Companies. The financial statements have been prepared in conformity with accounting principles generally accepted in the United States of America (GAAP), which require management to make certain estimates and assumptions at the date of the financial statements. Actual results could differ from those estimates. Subsequent events, if any, through the date that the financial statements were issued have been evaluated in the preparation of the financial statements. The Fund's Schedule of Investments lists any underlying mutual funds or exchange-traded funds (ETFs) but does not include the underlying holdings of these funds. The following summarizes the significant accounting policies of the Fund:
Investment Valuation. Investments are valued as of 4:00 p.m. Eastern time on the last calendar day of the period. The Board of Trustees (the Board) has designated the Fund's investment adviser as the valuation designee responsible for the fair valuation function and performing fair value determinations as needed. The investment adviser has established a Fair Value Committee (the Committee) to carry out the day-to-day fair valuation responsibilities and has adopted policies and procedures to govern the fair valuation process and the activities of the Committee. In accordance with these fair valuation policies and procedures, which have been approved by the Board, the Fund attempts to obtain prices from one or more third party pricing services or brokers to value its investments. When current market prices, quotations or currency exchange rates are not readily available or reliable, investments will be fair valued in good faith by the Committee, in accordance with the policies and procedures. Factors used in determining fair value vary by investment type and may include market or investment specific events, transaction data, estimated cash flows, and market observations of comparable investments. The frequency that the fair valuation procedures are used cannot be predicted and they may be utilized to a significant extent. The Committee manages the Fund's fair valuation practices and maintains the fair valuation policies and procedures. The Fund's investment adviser reports to the Board information regarding the fair valuation process and related material matters.
The Fund categorizes the inputs to valuation techniques used to value its investments into a disclosure hierarchy consisting of three levels as shown below:
Level 1 - unadjusted quoted prices in active markets for identical investments
Level 2 - other significant observable inputs (including quoted prices for similar investments, interest rates, prepayment speeds, etc.)
Level 3 - unobservable inputs (including the Fund's own assumptions based on the best information available)
Valuation techniques used to value the Fund's investments by major category are as follows:
Exchange-Traded Funds (ETFs) are valued at their last sale price or official closing price as reported by a third party pricing service on the primary market or exchange on which they are traded and are categorized as Level 1 in the hierarchy. In the event there were no sales during the day but the exchange reports a closing bid level, ETFs are valued at the closing bid and would be categorized as Level 1 in the hierarchy. In the event there was no closing bid, ETFs may be valued by another method that the Board believes reflects fair value in accordance with the Board's fair value pricing policies and may be categorized as Level 2 in the hierarchy.
Investments in open-end mutual funds, including the Fidelity Central Funds, are valued at their closing net asset value (NAV) each business day and are categorized as Level 1 in the hierarchy.
Changes in valuation techniques may result in transfers in or out of an assigned level within the disclosure hierarchy. The aggregate value of investments by input level as of November 30, 2023 is included at the end of the Fund's Schedule of Investments.
Investment Transactions and Income. For financial reporting purposes, the Fund's investment holdings and NAV include trades executed through the end of the last business day of the period. The NAV per share for processing shareholder transactions is calculated as of the close of business (normally 4:00 p.m. Eastern time) of the Nasdaq Stock Market and includes trades executed through the end of the prior business day. Gains and losses on securities sold are determined on the basis of identified cost. Income and capital gain distributions from any underlying mutual funds or exchange-traded funds (ETFs) are recorded on the ex-dividend date.
Expenses. Expenses directly attributable to a fund are charged to that fund. Expenses attributable to more than one fund are allocated among the respective funds on the basis of relative net assets or other appropriate methods. Expenses included in the accompanying financial statements reflect the expenses of that fund and do not include any expenses associated with any underlying mutual funds or exchange-traded funds. Although not included in a fund's expenses, a fund indirectly bears its proportionate share of these expenses through the net asset value of each underlying mutual fund or exchange-traded fund. Expense estimates are accrued in the period to which they relate and adjustments are made when actual amounts are known.
Income Tax Information and Distributions to Shareholders. Each year, the Fund intends to qualify as a regulated investment company under Subchapter M of the Internal Revenue Code, including distributing substantially all of its taxable income and realized gains. As a result, no provision for U.S. Federal income taxes is required. The Fund files a U.S. federal tax return, in addition to state and local tax returns as required. The Fund's federal income tax returns are subject to examination by the Internal Revenue Service (IRS) for a period of three fiscal years after they are filed. State and local tax returns may be subject to examination for an additional fiscal year depending on the jurisdiction.
Distributions are declared and recorded on the ex-dividend date. Income and capital gain distributions are determined in accordance with income tax regulations, which may differ from GAAP.
Capital accounts within the financial statements are adjusted for permanent book-tax differences. These adjustments have no impact on net assets or the results of operations. Capital accounts are not adjusted for temporary book-tax differences which will reverse in a subsequent period.
Book-tax differences are primarily due to net operating losses, capital loss carryforwards, losses deferred due to wash sales and excise tax regulations.
As of period end, the cost and unrealized appreciation (depreciation) in securities, and derivatives if applicable, for federal income tax purposes were as follows:
| Gross unrealized appreciation | $9,046,680 |
| Gross unrealized depreciation | (3,288,869) |
| Net unrealized appreciation (depreciation) | $5,757,811 |
| Tax cost | $81,167,748 |
Capital loss carryforwards are only available to offset future capital gains of the Fund to the extent provided by regulations and may be limited. The capital loss carryforward information presented below, including any applicable limitation, is estimated as of fiscal period end and is subject to adjustment.
Short-term | $(5,351,923) |
Long-term | (8,928,765) |
| Total capital loss carryforward | $(14,280,688) |
The Fund elected to defer to its next fiscal year $249,218 of ordinary losses recognized during the period January 1, 2023 to May 31, 2023.
4. Purchases and Sales of Investments.
Purchases and sales of securities, other than short-term securities and in-kind transactions, as applicable, are noted in the table below.
| | Purchases ($) | Sales ($) |
| Fidelity Disruptors ETF | 92,365,888 | 14,815,340 |
Securities received and delivered in-kind through subscriptions and redemptions are noted in the table below.
| | In-Kind Subscriptions ($) | In-Kind Redemptions ($) |
| Fidelity Disruptors ETF | - | 6,789,450 |
5. Fees and Other Transactions with Affiliates.
Management Fee. Fidelity Management & Research Company LLC (the investment adviser) provides the Fund with investment management related services. The Fund does not pay any fees for these services. Under the management contract, the investment adviser pays all expenses, except the compensation of the independent Trustees and certain miscellaneous expenses such as proxy and shareholders meeting expenses.
During the period June 1, 2023 through June 16, 2023, the Predecessor Fund paid a monthly all-inclusive management fee that was based on an annual rate of the Predecessor Fund's average net assets as noted in the table below. Under the management contract, the investment adviser paid all other expenses, except the compensation of the independent Trustees and certain miscellaneous expenses such as proxy and shareholder meeting expenses. Under a separate expense contract, the investment adviser paid all other operating expenses as necessary, except the compensation of the independent Trustees and certain miscellaneous expenses, such as proxy and shareholder meeting expenses, so that total expenses of the Predecessor Fund did not exceed an annual percentage of average net assets as noted in the table below.
| | Management Fee Annual % of Average Net Assets | Expense Contract Annual % of Average Net Assets |
| Fidelity Disruptors Fund | 1.00% | .50% |
Interfund Trades. Funds may purchase from or sell securities to other Fidelity Funds under procedures adopted by the Board. The procedures have been designed to ensure these interfund trades are executed in accordance with Rule 17a-7 of the 1940 Act. Any interfund trades are included within the respective purchases and sales amounts shown in the Purchases and Sales of Investments note. During the period, there were no interfund trades.
6. Committed Line of Credit.
During the period June 1, 2023 through June 16, 2023, the Predecessor Fund participated with other funds managed by the investment adviser or an affiliate in a $4.25 billion credit facility (the "line of credit") to be utilized for temporary or emergency purposes to fund shareholder redemptions or for other short-term liquidity purposes. The commitment fees on the pro-rata portion of the line of credit were borne by the investment adviser. During the period, there were no borrowings on this line of credit.
7. Expense Reductions.
During the period June 1, 2023 through June 16, 2023, the investment adviser voluntarily agreed to waive the Predecessor Fund's management fee as follows:
| | Management Fee Waiver Annual % of Average Net Assets | Management Fee Waiver |
| Fidelity Disruptors Fund | .50% | $24,025 |
Through arrangements with the Fund's custodian, credits realized as a result of certain uninvested cash balances were used to reduce the Fund's expenses by $8.
8. Share Transactions.
Funds issue and redeem shares at NAV only with certain authorized participants in large increments known as Creation Units. Purchases of Creation Units are made by tendering a basket of designated securities to a fund and redemption proceeds are paid with a basket of securities from a fund's portfolio with a balancing cash component to equate the market value of the basket of securities delivered or redeemed to the NAV per Creation Unit on the transaction date. Cash may be substituted equivalent to the value of certain securities generally when they are not available in sufficient quantity for delivery. A fund's shares are available in smaller increments to investors in the secondary market at market prices and may be subject to commissions. Authorized participants pay a transaction fee to the shareholder servicing agent when purchasing and redeeming Creation Units of a fund. The transaction fee is used to offset the costs associated with the issuance and redemption of Creation Units.
Prior fiscal year share transactions for each class of the Predecessor Fund were as follows and may contain in-kind transactions, automatic conversions between classes or exchanges between affiliated funds:
| | Shares | Dollars |
| | Year ended May 31, 2023 | Year ended May 31, 2023 |
| Fidelity Disruptors Fund | | |
| Fidelity Disruptors Fund | | |
| Shares sold | 3,703,937 | $84,461,331 |
| Reinvestment of distributions | - | - |
| Shares redeemed | (1,852,955) | (38,815,504) |
| Net increase (decrease) | 1,850,982 | $45,645,827 |
| Loyalty Class 1 | | |
| Shares sold | 730,233 | $15,839,358 |
| Reinvestment of distributions | - | - |
| Shares redeemed | (4,173,700) | (94,754,589) |
| Net increase (decrease) | (3,443,467) | $(78,915,231) |
| Loyalty Class 2 | | |
| Reinvestment of distributions | - | - |
| Shares redeemed | (5,876) | (136,136) |
| Net increase (decrease) | (5,876) | $(136,136) |
9. Other.
A fund's organizational documents provide former and current trustees and officers with a limited indemnification against liabilities arising in connection with the performance of their duties to the fund. In the normal course of business, a fund may also enter into contracts that provide general indemnifications. A fund's maximum exposure under these arrangements is unknown as this would be dependent on future claims that may be made against a fund. The risk of material loss from such claims is considered remote.
10. Merger Information.
On June 16, 2023 the Fidelity Disruptors Fund (Predecessor Fund) reorganized into a newly created Fidelity Disruptors ETF (ETF) pursuant to an Agreement and Plan of Reorganization (the Agreement) approved by its Board of Trustees. Per the Agreement, shareholders of the Predecessor Fund received ETF shares equal in value to the shares of the Predecessor Fund they owned on the day the reorganization was effective. The Predecessor Fund was the accounting survivor after the reorganization. As such, performance and financial history prior to the reorganization is that of the Predecessor Fund. Historical share transactions and per share information for the Predecessor Fund was retroactively adjusted to reflect the change in capital structure due to the reorganization.
For financial reporting purposes, the assets and liabilities of the Predecessor Fund and shares issued by the ETF were recorded at fair value; however, the cost basis of the investments received from the Predecessor Fund were carried forward and will be utilized for purposes of the ETF's ongoing reporting of realized and unrealized gains and losses to more closely align subsequent reporting of realized gains with amounts distributable to shareholders for tax purposes. The reorganization qualified as a tax-free reorganization for federal income tax purposes with no gain or loss recognized to the funds or their shareholders. Costs incurred in connection with the reorganization were paid by the Predecessor Fund.
| Predecessor Fund/Accounting Survivor | Investments ($) | Unrealized appreciation (depreciation) ($) | Net Assets ($) | Shares Exchanged | Shares Exchanged Ratio |
| | | | | | |
| Fidelity Disruptors Fund | 98,438,042 | 8,954,987 | 98,615,698 | 3,944,631 | .5736680000 |
| Legal Acquiring ETF | Net Assets ($) | Total net assets after the acquisition ($) |
| Fidelity Disruptors ETF | 25 | 98,615,723 |
Pro forma results of operations of the combined entity for the entire period ended November 30, 2023, as though the acquisition had occurred as of the beginning of the year (rather than on the actual acquisition date), are as follows:
| Net investment income (loss) | $210,276 |
| Total net realized gain (loss) | 573,324 |
| Total change in net unrealized appreciation (depreciation) | 2,637,443 |
| Net increase (decrease) in net assets resulting from operations | $3,421,043 |
Because the combined investment portfolios have been managed as a single portfolio since the acquisition was completed, it is not practicable to separate the amounts of revenue and earnings of the Predecessor Fund that has been included in the ETF's Statement of Operations since June 16, 2023.
11. Risk and Uncertainties.
Many factors affect a fund's performance. Developments that disrupt global economies and financial markets, such as pandemics, epidemics, outbreaks of infectious diseases, war, terrorism, and environmental disasters, may significantly affect a fund's investment performance. The effects of these developments to a fund will be impacted by the types of securities in which a fund invests, the financial condition, industry, economic sector, and geographic location of an issuer, and a fund's level of investment in the securities of that issuer. Significant concentrations in security types, issuers, industries, sectors, and geographic locations may magnify the factors that affect a fund's performance.
As a shareholder, you incur two types of costs: (1) transaction costs, which may include sales charges (loads) on purchase payments or redemption proceeds, as applicable and (2) ongoing costs, which generally include management fees, distribution and/or service (12b-1) fees and other Fund expenses. This Example is intended to help you understand your ongoing costs (in dollars) of investing in a fund and to compare these costs with the ongoing costs of investing in other mutual funds.
| The Example is based on an investment of $1,000 invested at the beginning of the period and held for the entire period (June 1, 2023 to November 30, 2023). |
Actual Expenses
The first line of the accompanying table provides information about actual account values and actual expenses. You may use the information in this line, together with the amount you invested, to estimate the expenses that you paid over the period. Simply divide your account value by $1,000.00 (for example, an $8,600 account value divided by $1,000.00 = 8.6), then multiply the result by the number in the first line for a class/Fund under the heading entitled "Expenses Paid During Period" to estimate the expenses you paid on your account during this period. If any fund is a shareholder of any underlying mutual funds or exchange-traded funds (ETFs) (the Underlying Funds), such fund indirectly bears its proportional share of the expenses of the Underlying Funds in addition to the direct expenses incurred presented in the table. These fees and expenses are not included in the annualized expense ratio used to calculate the expense estimate in the table below.
Hypothetical Example for Comparison Purposes
The second line of the accompanying table provides information about hypothetical account values and hypothetical expenses based on the actual expense ratio and an assumed rate of return of 5% per year before expenses, which is not the actual return. The hypothetical account values and expenses may not be used to estimate the actual ending account balance or expenses you paid for the period. You may use this information to compare the ongoing costs of investing in the Fund and other funds. To do so, compare this 5% hypothetical example with the 5% hypothetical examples that appear in the shareholder reports of the other funds. If any fund is a shareholder of any Underlying Funds, such fund indirectly bears its proportional share of the expenses of the Underlying Funds in addition to the direct expenses as presented in the table. These fees and expenses are not included in the annualized expense ratio used to calculate the expense estimate in the table below.
Please note that the expenses shown in the table are meant to highlight your ongoing costs only and do not reflect any transaction costs. Therefore, the second line of the table is useful in comparing ongoing costs only, and will not help you determine the relative total costs of owning different funds. In addition, if these transactional costs were included, your costs would have been higher.
| | | | | Annualized Expense Ratio- A | | Beginning Account Value June 1, 2023 | | Ending Account Value November 30, 2023 | | Expenses Paid During Period- C June 1, 2023 to November 30, 2023 |
| | | | | | | | | | |
| Fidelity® Disruptors ETF | | | | -%-D | | | | | | |
| Actual | | | | | | $ 1,000 | | $ 1,041.70 | | $-E |
Hypothetical-B | | | | | | $ 1,000 | | $ 1,025.00 | | $-E |
| |
A Annualized expense ratio reflects expenses net of applicable fee waivers.
B 5% return per year before expenses
C Expenses are equal to the annualized expense ratio, multiplied by the average account value over the period, multiplied by 183/ 366 (to reflect the one-half year period). The fees and expenses of any Underlying Funds are not included in each annualized expense ratio.
D Amount represents less than .005%.
E Amount represents less than $.005.
Board Approval of Investment Advisory Contracts and Management Fees
Fidelity® Disruptors ETF
At the November 2022 and January 2023 meetings, the Board of Trustees, including the Independent Trustees (together, the Board), voted to approve the management contract with Fidelity Management & Research Company LLC (FMR) and the sub-advisory agreements with affiliates of FMR (together, the Advisory Contracts) for the fund. FMR and the sub-advisers are collectively referred to herein as the Investment Advisers. The Board, assisted by the advice of fund counsel and Independent Trustees' counsel, considered a broad range of information.
Nature, Extent, and Quality of Services Provided. The Board considered Fidelity's staffing as it relates to the fund, including the backgrounds of investment personnel of Fidelity, and also considered the fund's investment objective, strategies, and related investment philosophy. The Board considered the structure of the investment personnel compensation program and whether this structure provides appropriate incentives to act in the best interests of the fund.
Resources Dedicated to Investment Management and Support Services. The Board and the Fund Oversight and Research Committees reviewed the general qualifications and capabilities of Fidelity's investment staff, including its size, education, experience, and resources, as well as Fidelity's approach to recruiting, training, managing, and compensating investment personnel. The Board noted that Fidelity has continued to increase the resources devoted to non-U.S. offices, including expansion of Fidelity's global investment organization. The Board also noted that Fidelity's analysts have extensive resources, tools and capabilities that allow them to conduct sophisticated quantitative and fundamental analysis, as well as credit analysis of issuers, counterparties and guarantors. Further, the Board considered that Fidelity's investment professionals have sufficient access to global information and data so as to provide competitive investment results over time, and that those professionals also have access to sophisticated tools that permit them to assess portfolio construction and risk and performance attribution characteristics continuously, as well as to transmit new information and research conclusions rapidly around the world. Additionally, in its deliberations, the Board considered Fidelity's trading, risk management, compliance, and technology and operations capabilities and resources, which are integral parts of the investment management process. The Board also considered Fidelity's investments in business continuity planning, and its success in continuously providing services to the Fidelity funds notwithstanding the severe disruptions caused by the COVID-19 pandemic.
Shareholder and Administrative Services. The Board considered the nature, extent, quality, and cost of advisory, administrative, and shareholder services to be performed by the Investment Advisers and their affiliates under the Advisory Contracts and under separate agreements covering pricing and bookkeeping, and securities lending services for the fund. The Board also considered the nature and extent of the supervision of third party service providers, principally transfer agent, custodians, subcustodians, and pricing vendors.
The Board noted that the growth of fund assets over time across the complex allows Fidelity to reinvest in the development of services designed to enhance the value and convenience of the Fidelity funds as investment vehicles. These services include 24-hour access to account information and market information over the Internet and through telephone representatives, investor education materials and asset allocation tools, and the expanded availability of Fidelity Investor Centers.
Investment Performance. The fund will commence operations by acquiring the assets of the relevant acquired fund, and the fund is to be the accounting survivor to the relevant acquired fund. Therefore, the Trustees were provided with performance information for the relevant acquired fund. The Board considered the Investment Advisers' strength in fundamental, research-driven security selection, which the Board is familiar with through its supervision of other Fidelity funds.
Based on its review, the Board concluded that the nature, extent, and quality of services to be provided to the fund under the Advisory Contracts should benefit the shareholders of the fund.
Competitiveness of Management Fee and Total Expense Ratio. In reviewing the Advisory Contracts, the Board considered the fund's all-inclusive fee rate. The Board also considered other expenses, such as transfer agent fees, pricing and bookkeeping fees, and custodial, legal, and audit fees, paid by FMR under the all-inclusive arrangement. The Board noted that the fund's proposed management fee rate is below the median fee rate of funds with similar Lipper investment objective categories and comparable investment mandates, regardless of whether their management fee structures are comparable. The Board also considered that the projected total expense ratio of the fund is below the median of those funds and classes used by the Board for management fee comparisons.
Based on its review, the Board concluded that the fund's management fee and projected total expense ratio were reasonable in light of the services that the fund and its shareholders will receive and the other factors considered.
Costs of the Services and Profitability. The fund will commence operations by acquiring the assets of the relevant acquired fund, and the fund is to be the accounting survivor to the relevant acquired fund. The revenue, cost, or profitability data for the relevant acquired fund was available for the Board to review in respect of the fund.
Economies of Scale. The Board considered economies of scale based on the operating experience of the relevant acquired fund to permit assessment thereof. It noted that, notwithstanding the entrepreneurial risk associated with converting a mutual fund into an exchange-traded fund, the management fee for the fund was set at a level normally associated, by comparison with competitors, with very high fund net assets. The Board also considered Fidelity's assertion that the level of the fund's fee anticipated economies of scale at lower asset levels even before, if ever, economies of scale are achieved. The Board also noted that the fund and its shareholders would have access to the very considerable number and variety of services available through Fidelity and its affiliates. The Board concluded that, because the fund will pay no management fee and FMR or an affiliate will bear all expenses of the fund, with limited exceptions, economies of scale cannot be realized by this fund.
Based on its evaluation of all of the conclusions noted above, and after considering all factors it believed relevant, the Board concluded that the advisory fee arrangements are fair and reasonable, and that the fund's Advisory Contracts should be approved.
1.9910204.100
DRE-SANN-0124
Item 2.
Code of Ethics
Not applicable.
Item 3.
Audit Committee Financial Expert
Not applicable.
Item 4.
Principal Accountant Fees and Services
Not applicable.
Item 5.
Audit Committee of Listed Registrants
Not applicable.
Item 6.
Investments
(a)
Not applicable.
(b)
Not applicable
Item 7.
Disclosure of Proxy Voting Policies and Procedures for Closed-End Management Investment Companies
Not applicable.
Item 8.
Portfolio Managers of Closed-End Management Investment Companies
Not applicable.
Item 9.
Purchase of Equity Securities by Closed-End Management Investment Company and Affiliated Purchasers
Not applicable.
Item 10.
Submission of Matters to a Vote of Security Holders
There were no material changes to the procedures by which shareholders may recommend nominees to the Fidelity Covington Trust’s Board of Trustees.
Item 11.
Controls and Procedures
(a)(i) The President and Treasurer and the Chief Financial Officer have concluded that the Fidelity Covington Trust’s (the “Trust”) disclosure controls and procedures (as defined in Rule 30a-3(c) under the Investment Company Act) provide reasonable
assurances that material information relating to the Trust is made known to them by the appropriate persons, based on their evaluation of these controls and procedures as of a date within 90 days of the filing date of this report.
(a)(ii) There was no change in the Trust’s internal control over financial reporting (as defined in Rule 30a-3(d) under the Investment Company Act) that occurred during the period covered by this report that has materially affected, or is reasonably likely to materially affect, the Trust’s internal control over financial reporting.
Item 12.
Disclosure of Securities Lending Activities for Closed-End Management
Investment Companies
Not applicable.
Item 18.
Recovery of Erroneously Awarded Compensation
(a) Not applicable.
(b) Not applicable.
Item 19.
Exhibits
SIGNATURES
Pursuant to the requirements of the Securities Exchange Act of 1934 and the Investment Company Act of 1940, the registrant has duly caused this report to be signed on its behalf by the undersigned, thereunto duly authorized.
Fidelity Covington Trust
| |
By: | /s/Stacie M. Smith |
| Stacie M. Smith |
| President and Treasurer |
|
|
Date: | January 22, 2024 |
Pursuant to the requirements of the Securities Exchange Act of 1934 and the Investment Company Act of 1940, this report has been signed below by the following persons on behalf of the registrant and in the capacities and on the dates indicated.
| |
By: | /s/Stacie M. Smith |
| Stacie M. Smith |
| President and Treasurer |
|
|
Date: | January 22, 2024 |
| |
By: | /s/John J. Burke III |
| John J. Burke III |
| Chief Financial Officer |
|
|
Date: | January 22, 2024 |