UNITED STATES
SECURITIES AND EXCHANGE COMMISSION
Washington, D.C. 20549
FORM N-CSR
CERTIFIED SHAREHOLDER REPORT OF REGISTERED
MANAGEMENT INVESTMENT COMPANIES
Investment Company Act file number 811-07319
Fidelity Covington Trust
(Exact name of registrant as specified in charter)
245 Summer St., Boston, MA 02210
(Address of principal executive offices) (Zip code)
Margaret Carey, Secretary
245 Summer St.
Boston, Massachusetts 02210
(Name and address of agent for service)
Registrant's telephone number, including area code:
617-563-7000
| |
Date of fiscal year end: | July 31 |
|
|
Date of reporting period: | January 31, 2024 |
Item 1.
Reports to Stockholders
Fidelity® Dividend ETF for Rising Rates
Fidelity® High Dividend ETF
Fidelity® Low Volatility Factor ETF
Fidelity® Momentum Factor ETF
Fidelity® Quality Factor ETF
Fidelity® Small-Mid Multifactor ETF
Fidelity® Stocks for Inflation ETF
Fidelity® U.S. Multifactor ETF
Fidelity® Value Factor ETF
Semi-Annual Report
January 31, 2024
Contents
To view a fund's proxy voting guidelines and proxy voting record for the 12-month period ended June 30, visit http://www.fidelity.com/proxyvotingresults or visit the Securities and Exchange Commission's (SEC) web site at http://www.sec.gov.
You may also call 1-800-FIDELITY to request a free copy of the proxy voting guidelines.
The funds or securities referred to herein are not sponsored, endorsed, or promoted by Fidelity Product Services LLC (FPS), and FPS bears no liability with respect to any such funds or securities or any index on which such funds or securities are based. The prospectus contains a more detailed description of the relationship between FPS and any related funds.
Standard & Poor's, S&P and S&P 500 are registered service marks of The McGraw-Hill Companies, Inc. and have been licensed for use by Fidelity Distributors Corporation.
Other third-party marks appearing herein are the property of their respective owners.
All other marks appearing herein are registered or unregistered trademarks or service marks of FMR LLC or an affiliated company. © 2024 FMR LLC. All rights reserved.
This report and the financial statements contained herein are submitted for the general information of the shareholders of the Funds. This report is not authorized for distribution to prospective investors in the Funds unless preceded or accompanied by an effective prospectus.
A fund files its complete schedule of portfolio holdings with the SEC for the first and third quarters of each fiscal year on Form N-PORT. Forms N-PORT are available on the SEC's web site at http://www.sec.gov. A fund's Forms N-PORT may be reviewed and copied at the SEC's Public Reference Room in Washington, DC. Information regarding the operation of the SEC's Public Reference Room may be obtained by calling 1-800-SEC-0330.
For a complete list of a fund's portfolio holdings, view the most recent holdings listing, semiannual report, or annual report on Fidelity's web site at http://www.fidelity.com, http://www.institutional.fidelity.com, or http://www.401k.com, as applicable.
NOT FDIC INSURED •MAY LOSE VALUE •NO BANK GUARANTEE
Neither the Funds nor Fidelity Distributors Corporation is a bank.
Top Holdings (% of Fund's net assets) |
| |
| Microsoft Corp. | 8.7 | |
| Apple, Inc. | 7.9 | |
| Broadcom, Inc. | 3.0 | |
| Visa, Inc. Class A | 2.2 | |
| UnitedHealth Group, Inc. | 2.2 | |
| JPMorgan Chase & Co. | 2.2 | |
| Merck & Co., Inc. | 1.8 | |
| Intel Corp. | 1.8 | |
| Johnson & Johnson | 1.8 | |
| AbbVie, Inc. | 1.7 | |
| | 33.3 | |
| |
| Market Sectors (% of Fund's net assets) |
| |
| Information Technology | 29.2 | |
| Financials | 14.8 | |
| Health Care | 13.2 | |
| Industrials | 8.9 | |
| Consumer Discretionary | 8.8 | |
| Consumer Staples | 6.4 | |
| Communication Services | 6.4 | |
| Energy | 4.1 | |
| Materials | 2.6 | |
| Real Estate | 2.6 | |
| Utilities | 2.4 | |
| |
Asset Allocation (% of Fund's net assets) |
|
Futures - 0.6% |
|
Fidelity® Dividend ETF for Rising Rates
Showing Percentage of Net Assets
| Common Stocks - 99.4% |
| | | Shares | Value ($) |
| COMMUNICATION SERVICES - 6.4% | | | |
| Diversified Telecommunication Services - 1.4% | | | |
| AT&T, Inc. | | 186,529 | 3,299,698 |
| Verizon Communications, Inc. | | 100,013 | 4,235,551 |
| | | | 7,535,249 |
| Entertainment - 0.9% | | | |
| Electronic Arts, Inc. | | 19,956 | 2,745,546 |
| Warner Music Group Corp. Class A | | 52,887 | 1,929,847 |
| | | | 4,675,393 |
| Media - 4.1% | | | |
| Cable One, Inc. (a) | | 2,328 | 1,277,909 |
| Comcast Corp. Class A | | 102,289 | 4,760,530 |
| Fox Corp. Class A | | 60,540 | 1,955,442 |
| Interpublic Group of Companies, Inc. | | 54,597 | 1,801,155 |
| News Corp. Class A | | 96,012 | 2,365,736 |
| Nexstar Media Group, Inc. Class A | | 9,523 | 1,692,332 |
| Omnicom Group, Inc. | | 23,563 | 2,129,624 |
| Paramount Global Class B | | 82,785 | 1,207,833 |
| TEGNA, Inc. | | 97,316 | 1,517,156 |
| The New York Times Co. Class A | | 54,487 | 2,645,889 |
| | | | 21,353,606 |
TOTAL COMMUNICATION SERVICES | | | 33,564,248 |
| CONSUMER DISCRETIONARY - 8.8% | | | |
| Automobiles - 0.7% | | | |
| Ford Motor Co. | | 310,627 | 3,640,548 |
| Broadline Retail - 0.5% | | | |
| Kohl's Corp. | | 110,699 | 2,851,606 |
| Hotels, Restaurants & Leisure - 2.2% | | | |
| McDonald's Corp. | | 23,564 | 6,897,654 |
| Starbucks Corp. | | 48,857 | 4,545,167 |
| | | | 11,442,821 |
| Household Durables - 1.3% | | | |
| Newell Brands, Inc. | | 230,732 | 1,919,690 |
| Vistry Group PLC | | 382,060 | 4,889,670 |
| | | | 6,809,360 |
| Specialty Retail - 3.2% | | | |
| Best Buy Co., Inc. | | 43,277 | 3,137,150 |
| Lowe's Companies, Inc. | | 24,779 | 5,273,962 |
| The Home Depot, Inc. | | 24,124 | 8,514,807 |
| | | | 16,925,919 |
| Textiles, Apparel & Luxury Goods - 0.9% | | | |
| NIKE, Inc. Class B | | 45,037 | 4,572,607 |
TOTAL CONSUMER DISCRETIONARY | | | 46,242,861 |
| CONSUMER STAPLES - 6.4% | | | |
| Beverages - 2.2% | | | |
| PepsiCo, Inc. | | 34,132 | 5,752,266 |
| The Coca-Cola Co. | | 96,335 | 5,730,969 |
| | | | 11,483,235 |
| Consumer Staples Distribution & Retail - 0.7% | | | |
| Target Corp. | | 26,476 | 3,682,282 |
| Food Products - 0.5% | | | |
| Tyson Foods, Inc. Class A | | 46,534 | 2,548,202 |
| Household Products - 1.5% | | | |
| Procter & Gamble Co. | | 50,105 | 7,873,500 |
| Personal Care Products - 0.1% | | | |
| Kenvue, Inc. | | 37,228 | 772,853 |
| Tobacco - 1.4% | | | |
| Altria Group, Inc. | | 82,417 | 3,306,570 |
| Philip Morris International, Inc. | | 46,886 | 4,259,593 |
| | | | 7,566,163 |
TOTAL CONSUMER STAPLES | | | 33,926,235 |
| ENERGY - 4.1% | | | |
| Oil, Gas & Consumable Fuels - 4.1% | | | |
| Chevron Corp. | | 30,963 | 4,564,875 |
| ConocoPhillips Co. | | 28,294 | 3,165,250 |
| Coterra Energy, Inc. | | 65,305 | 1,624,788 |
| Devon Energy Corp. | | 30,793 | 1,293,922 |
| EOG Resources, Inc. | | 18,496 | 2,104,660 |
| Exxon Mobil Corp. | | 65,268 | 6,710,203 |
| Pioneer Natural Resources Co. | | 9,261 | 2,128,456 |
| | | | 21,592,154 |
| FINANCIALS - 14.8% | | | |
| Banks - 8.5% | | | |
| Bank of America Corp. | | 194,970 | 6,630,930 |
| Citigroup, Inc. | | 97,680 | 5,486,686 |
| ING Groep NV (Certificaten Van Aandelen) | | 273,354 | 3,916,517 |
| Intesa Sanpaolo SpA | | 1,414,526 | 4,399,082 |
| JPMorgan Chase & Co. | | 65,092 | 11,349,441 |
| KBC Group NV | | 50,301 | 3,304,595 |
| Truist Financial Corp. | | 92,472 | 3,427,012 |
| Wells Fargo & Co. | | 129,476 | 6,497,106 |
| | | | 45,011,369 |
| Capital Markets - 1.1% | | | |
| Blackstone, Inc. | | 47,014 | 5,850,892 |
| Financial Services - 3.1% | | | |
| The Western Union Co. | | 359,479 | 4,518,651 |
| Visa, Inc. Class A | | 43,281 | 11,826,966 |
| | | | 16,345,617 |
| Insurance - 1.5% | | | |
| American Financial Group, Inc. | | 29,088 | 3,502,195 |
| Old Republic International Corp. | | 147,557 | 4,137,498 |
| | | | 7,639,693 |
| Mortgage Real Estate Investment Trusts - 0.6% | | | |
| Annaly Capital Management, Inc. | | 163,536 | 3,138,256 |
TOTAL FINANCIALS | | | 77,985,827 |
| HEALTH CARE - 13.2% | | | |
| Biotechnology - 3.3% | | | |
| AbbVie, Inc. | | 56,395 | 9,271,338 |
| Amgen, Inc. | | 26,630 | 8,368,744 |
| | | | 17,640,082 |
| Health Care Equipment & Supplies - 1.2% | | | |
| Medtronic PLC | | 72,730 | 6,366,784 |
| Health Care Providers & Services - 2.2% | | | |
| UnitedHealth Group, Inc. | | 22,374 | 11,449,671 |
| Pharmaceuticals - 6.5% | | | |
| Bristol-Myers Squibb Co. | | 94,306 | 4,608,734 |
| GSK PLC | | 277,586 | 5,542,753 |
| Johnson & Johnson | | 58,446 | 9,287,069 |
| Merck & Co., Inc. | | 79,716 | 9,628,098 |
| Pfizer, Inc. | | 182,102 | 4,931,322 |
| | | | 33,997,976 |
TOTAL HEALTH CARE | | | 69,454,513 |
| INDUSTRIALS - 8.9% | | | |
| Aerospace & Defense - 0.9% | | | |
| RTX Corp. | | 53,667 | 4,890,137 |
| Air Freight & Logistics - 0.7% | | | |
| United Parcel Service, Inc. Class B | | 27,006 | 3,832,151 |
| Ground Transportation - 1.1% | | | |
| Union Pacific Corp. | | 23,701 | 5,781,385 |
| Industrial Conglomerates - 2.1% | | | |
| 3M Co. | | 35,123 | 3,313,855 |
| Honeywell International, Inc. | | 24,900 | 5,036,274 |
| Jardine Matheson Holdings Ltd. | | 62,528 | 2,519,878 |
| | | | 10,870,007 |
| Machinery - 1.2% | | | |
| Caterpillar, Inc. | | 20,458 | 6,143,742 |
| Marine Transportation - 2.3% | | | |
| A.P. Moller - Maersk A/S Series B | | 1,424 | 2,640,765 |
| Mitsui OSK Lines Ltd. | | 132,700 | 4,820,503 |
| Nippon Yusen KK | | 137,000 | 4,778,013 |
| | | | 12,239,281 |
| Professional Services - 0.6% | | | |
| Randstad NV | | 50,751 | 2,908,568 |
TOTAL INDUSTRIALS | | | 46,665,271 |
| INFORMATION TECHNOLOGY - 29.2% | | | |
| Communications Equipment - 1.5% | | | |
| Cisco Systems, Inc. | | 156,346 | 7,845,442 |
| Electronic Equipment, Instruments & Components - 0.9% | | | |
| Corning, Inc. | | 150,467 | 4,888,673 |
| IT Services - 1.7% | | | |
| IBM Corp. | | 49,064 | 9,011,094 |
| Semiconductors & Semiconductor Equipment - 7.5% | | | |
| Broadcom, Inc. | | 13,640 | 16,095,200 |
| Intel Corp. | | 222,203 | 9,572,505 |
| Qualcomm, Inc. | | 52,005 | 7,723,263 |
| Texas Instruments, Inc. | | 39,316 | 6,295,278 |
| | | | 39,686,246 |
| Software - 8.7% | | | |
| Microsoft Corp. | | 115,219 | 45,808,767 |
| Technology Hardware, Storage & Peripherals - 8.9% | | | |
| Apple, Inc. | | 226,277 | 41,725,479 |
| HP, Inc. | | 177,191 | 5,087,154 |
| | | | 46,812,633 |
TOTAL INFORMATION TECHNOLOGY | | | 154,052,855 |
| MATERIALS - 2.6% | | | |
| Chemicals - 1.7% | | | |
| Air Products & Chemicals, Inc. | | 6,514 | 1,665,695 |
| Dow, Inc. | | 27,093 | 1,452,185 |
| Linde PLC | | 9,619 | 3,894,060 |
| LyondellBasell Industries NV Class A | | 14,491 | 1,363,893 |
| The Mosaic Co. | | 25,645 | 787,558 |
| | | | 9,163,391 |
| Containers & Packaging - 0.7% | | | |
| Amcor PLC | | 107,781 | 1,016,375 |
| International Paper Co. | | 30,612 | 1,096,828 |
| Packaging Corp. of America | | 8,643 | 1,433,701 |
| | | | 3,546,904 |
| Metals & Mining - 0.2% | | | |
| Newmont Corp. | | 30,836 | 1,064,150 |
TOTAL MATERIALS | | | 13,774,445 |
| REAL ESTATE - 2.6% | | | |
| Equity Real Estate Investment Trusts (REITs) - 2.6% | | | |
| American Tower Corp. | | 10,399 | 2,034,564 |
| Crown Castle, Inc. | | 12,139 | 1,314,047 |
| Healthcare Trust of America, Inc. | | 50,532 | 814,071 |
| Medical Properties Trust, Inc. (a) | | 85,346 | 264,573 |
| Omega Healthcare Investors, Inc. | | 36,406 | 1,055,774 |
| Prologis, Inc. | | 19,327 | 2,448,538 |
| Public Storage | | 5,250 | 1,486,748 |
| Realty Income Corp. | | 22,835 | 1,241,996 |
| Simon Property Group, Inc. | | 11,810 | 1,636,984 |
| Weyerhaeuser Co. | | 37,523 | 1,229,629 |
| | | | 13,526,924 |
| UTILITIES - 2.4% | | | |
| Electric Utilities - 2.1% | | | |
| American Electric Power Co., Inc. | | 17,769 | 1,388,470 |
| Duke Energy Corp. | | 20,244 | 1,939,983 |
| Edison International | | 20,256 | 1,366,875 |
| NextEra Energy, Inc. | | 39,521 | 2,317,116 |
| NRG Energy, Inc. | | 33,139 | 1,757,693 |
| Southern Co. | | 29,379 | 2,042,428 |
| | | | 10,812,565 |
| Independent Power and Renewable Electricity Producers - 0.1% | | | |
| Clearway Energy, Inc. Class C | | 32,103 | 778,177 |
| Multi-Utilities - 0.2% | | | |
| Dominion Energy, Inc. | | 27,734 | 1,267,998 |
TOTAL UTILITIES | | | 12,858,740 |
| TOTAL COMMON STOCKS (Cost $474,335,858) | | | 523,644,073 |
| | | | |
| Money Market Funds - 0.7% |
| | | Shares | Value ($) |
| Fidelity Cash Central Fund 5.39% (b) | | 2,214,833 | 2,215,276 |
| Fidelity Securities Lending Cash Central Fund 5.39% (b)(c) | | 1,125,837 | 1,125,950 |
| TOTAL MONEY MARKET FUNDS (Cost $3,341,226) | | | 3,341,226 |
| | | | |
| TOTAL INVESTMENT IN SECURITIES - 100.1% (Cost $477,677,084) | 526,985,299 |
NET OTHER ASSETS (LIABILITIES) - (0.1)% | (276,416) |
| NET ASSETS - 100.0% | 526,708,883 |
| | |
| Futures Contracts |
| | Number of contracts | Expiration Date | Notional Amount ($) | Value ($) | Unrealized Appreciation/ (Depreciation) ($) |
| Purchased | | | | | |
| | | | | | |
| Equity Index Contracts | | | | | |
| CME Micro E-mini S&P 500 Index Contracts (United States) | 12 | Mar 2024 | 2,922,300 | 94,933 | 94,933 |
| | | | | | |
| The notional amount of futures purchased as a percentage of Net Assets is 0.6% |
Legend
| (a) | Security or a portion of the security is on loan at period end. |
| (b) | Affiliated fund that is generally available only to investment companies and other accounts managed by Fidelity Investments. The rate quoted is the annualized seven-day yield of the fund at period end. A complete unaudited listing of the fund's holdings as of its most recent quarter end is available upon request. In addition, each Fidelity Central Fund's financial statements are available on the SEC's website or upon request. |
| (c) | Investment made with cash collateral received from securities on loan. |
Affiliated Central Funds
Fiscal year to date information regarding the Fund's investments in Fidelity Central Funds, including the ownership percentage, is presented below.
| Affiliate | Value, beginning of period ($) | Purchases ($) | Sales Proceeds ($) | Dividend Income ($) | Realized Gain (loss) ($) | Change in Unrealized appreciation (depreciation) ($) | Value, end of period ($) | % ownership, end of period |
| Fidelity Cash Central Fund 5.39% | 2,062,133 | 12,486,648 | 12,333,505 | 39,884 | - | - | 2,215,276 | 0.0% |
| Fidelity Securities Lending Cash Central Fund 5.39% | 6,087,575 | 30,410,662 | 35,372,287 | 9,499 | - | - | 1,125,950 | 0.0% |
| Total | 8,149,708 | 42,897,310 | 47,705,792 | 49,383 | - | - | 3,341,226 | |
| | | | | | | | | |
Amounts in the dividend income column in the above table include any capital gain distributions from underlying funds, which are presented in the corresponding line item in the Statement of Operations, if applicable.
Amounts in the dividend income column for Fidelity Securities Lending Cash Central Fund represents the income earned on investing cash collateral, less rebates paid to borrowers and any lending agent fees associated with the loan, plus any premium payments received for lending certain types of securities.
Amounts included in the purchases and sales proceeds columns may include in-kind transactions, if applicable.
Investment Valuation
The following is a summary of the inputs used, as of January 31, 2024, involving the Fund's assets and liabilities carried at fair value. The inputs or methodology used for valuing securities may not be an indication of the risk associated with investing in those securities. For more information on valuation inputs, and their aggregation into the levels used below, please refer to the Investment Valuation section in the accompanying Notes to Financial Statements.
| Valuation Inputs at Reporting Date: |
| Description | Total ($) | Level 1 ($) | Level 2 ($) | Level 3 ($) |
Investments in Securities: | | | | |
|
| Equities: | | | | |
Communication Services | 33,564,248 | 33,564,248 | - | - |
Consumer Discretionary | 46,242,861 | 46,242,861 | - | - |
Consumer Staples | 33,926,235 | 33,926,235 | - | - |
Energy | 21,592,154 | 21,592,154 | - | - |
Financials | 77,985,827 | 77,985,827 | - | - |
Health Care | 69,454,513 | 69,454,513 | - | - |
Industrials | 46,665,271 | 46,665,271 | - | - |
Information Technology | 154,052,855 | 154,052,855 | - | - |
Materials | 13,774,445 | 13,774,445 | - | - |
Real Estate | 13,526,924 | 13,526,924 | - | - |
Utilities | 12,858,740 | 12,858,740 | - | - |
|
| Money Market Funds | 3,341,226 | 3,341,226 | - | - |
| Total Investments in Securities: | 526,985,299 | 526,985,299 | - | - |
Derivative Instruments: Assets | | | | |
Futures Contracts | 94,933 | 94,933 | - | - |
| Total Assets | 94,933 | 94,933 | - | - |
| Total Derivative Instruments: | 94,933 | 94,933 | - | - |
Value of Derivative Instruments
The following table is a summary of the Fund's value of derivative instruments by primary risk exposure as of January 31, 2024. For additional information on derivative instruments, please refer to the Derivative Instruments section in the accompanying Notes to Financial Statements.
Primary Risk Exposure / Derivative Type | Value |
| Asset ($) | Liability ($) |
| Equity Risk | | |
Futures Contracts (a) | 94,933 | 0 |
| Total Equity Risk | 94,933 | 0 |
| Total Value of Derivatives | 94,933 | 0 |
(a)Reflects gross cumulative appreciation (depreciation) on futures contracts as presented in the Schedule of Investments. In the Statement of Assets and Liabilities, the period end daily variation margin is included in receivable or payable for daily variation margin on futures contracts, and the net cumulative appreciation (depreciation) is included in Total accumulated earnings (loss).
Fidelity® Dividend ETF for Rising Rates
| Statement of Assets and Liabilities |
| | | | January 31, 2024 (Unaudited) |
| | | | | |
| Assets | | | | |
| Investment in securities, at value (including securities loaned of $1,082,555) - See accompanying schedule: | | | | |
Unaffiliated issuers (cost $474,335,858) | $ | 523,644,073 | | |
Fidelity Central Funds (cost $3,341,226) | | 3,341,226 | | |
| | | | | |
| | | | | |
| Total Investment in Securities (cost $477,677,084) | | | $ | 526,985,299 |
| Segregated cash with brokers for derivative instruments | | | | 156,800 |
| Foreign currency held at value (cost $112,128) | | | | 111,996 |
| Dividends receivable | | | | 687,244 |
| Distributions receivable from Fidelity Central Funds | | | | 7,562 |
Total assets | | | | 527,948,901 |
| Liabilities | | | | |
| Accrued management fee | $ | 65,768 | | |
| Payable for daily variation margin on futures contracts | | 48,300 | | |
| Collateral on securities loaned | | 1,125,950 | | |
| Total Liabilities | | | | 1,240,018 |
| Net Assets | | | $ | 526,708,883 |
| Net Assets consist of: | | | | |
| Paid in capital | | | $ | 530,364,635 |
| Total accumulated earnings (loss) | | | | (3,655,752) |
| Net Assets | | | $ | 526,708,883 |
Net Asset Value, offering price and redemption price per share ($526,708,883 ÷ 11,900,000 shares) | | | $ | 44.26 |
| Statement of Operations |
| | | | Six months ended January 31, 2024 (Unaudited) |
| Investment Income | | | | |
| Dividends | | | $ | 7,475,100 |
| Income from Fidelity Central Funds (including $9,499 from security lending) | | | | 49,383 |
| Total Income | | | | 7,524,483 |
| Expenses | | | | |
| Management fee | $ | 564,837 | | |
| Independent trustees' fees and expenses | | 1,520 | | |
| Total expenses before reductions | | 566,357 | | |
| Expense reductions | | (89) | | |
| Total expenses after reductions | | | | 566,268 |
| Net Investment income (loss) | | | | 6,958,215 |
| Realized and Unrealized Gain (Loss) | | | | |
| Net realized gain (loss) on: | | | | |
| Investment Securities: | | | | |
| Unaffiliated issuers | | (389,147) | | |
| Redemptions in-kind | | 7,444,803 | | |
| Foreign currency transactions | | 2,323 | | |
| Futures contracts | | 163,073 | | |
| Total net realized gain (loss) | | | | 7,221,052 |
| Change in net unrealized appreciation (depreciation) on: | | | | |
| Investment Securities: | | | | |
| Unaffiliated issuers | | 5,336,564 | | |
| Assets and liabilities in foreign currencies | | (4,043) | | |
| Futures contracts | | (58,452) | | |
| Total change in net unrealized appreciation (depreciation) | | | | 5,274,069 |
| Net gain (loss) | | | | 12,495,121 |
| Net increase (decrease) in net assets resulting from operations | | | $ | 19,453,336 |
| Statement of Changes in Net Assets |
| |
| | Six months ended January 31, 2024 (Unaudited) | | Year ended July 31, 2023 |
| Increase (Decrease) in Net Assets | | | | |
| Operations | | | | |
| Net investment income (loss) | $ | 6,958,215 | $ | 17,051,353 |
| Net realized gain (loss) | | 7,221,052 | | 19,832,576 |
| Change in net unrealized appreciation (depreciation) | | 5,274,069 | | 2,382,381 |
| Net increase (decrease) in net assets resulting from operations | | 19,453,336 | | 39,266,310 |
| Distributions to shareholders | | (6,805,600) | | (16,860,450) |
| | | | | |
| Share transactions | | | | |
| Proceeds from sales of shares | | - | | 115,557,120 |
| Cost of shares redeemed | | (35,474,554) | | (200,570,072) |
| | | | | |
Net increase (decrease) in net assets resulting from share transactions | | (35,474,554) | | (85,012,952) |
| Total increase (decrease) in net assets | | (22,826,818) | | (62,607,092) |
| | | | | |
| Net Assets | | | | |
| Beginning of period | | 549,535,701 | | 612,142,793 |
| End of period | $ | 526,708,883 | $ | 549,535,701 |
| | | | | |
| Other Information | | | | |
| Shares | | | | |
| Sold | | - | | 2,750,000 |
| Redeemed | | (850,000) | | (4,900,000) |
| Net increase (decrease) | | (850,000) | | (2,150,000) |
| | | | | |
Financial Highlights
| Fidelity® Dividend ETF for Rising Rates |
| |
| | Six months ended (Unaudited) January 31, 2024 | | Years ended July 31, 2023 | | 2022 | | 2021 | | 2020 | | 2019 |
Selected Per-Share Data | | | | | | | | | | | | |
| Net asset value, beginning of period | $ | 43.10 | $ | 41.08 | $ | 42.62 | $ | 31.72 | $ | 32.31 | $ | 31.54 |
| Income from Investment Operations | | | | | | | | | | | | |
Net investment income (loss) A,B | | .56 | | 1.22 | | 1.08 | | .93 | | 1.01 | | 1.07 |
| Net realized and unrealized gain (loss) | | 1.15 | | 2.02 | | (1.54) | | 10.85 | | (.56) | | .79 |
| Total from investment operations | | 1.71 | | 3.24 | | (.46) | | 11.78 | | .45 | | 1.86 |
| Distributions from net investment income | | (.55) | | (1.22) | | (1.08) | | (.88) | | (1.04) | | (1.09) |
| Total distributions | | (.55) | | (1.22) | | (1.08) | | (.88) | | (1.04) | | (1.09) |
| Net asset value, end of period | $ | 44.26 | $ | 43.10 | $ | 41.08 | $ | 42.62 | $ | 31.72 | $ | 32.31 |
Total Return C,D,E | | 4.03% | | 8.17% | | (1.06)% | | 37.57% | | 1.86% | | 6.09% |
Ratios to Average Net Assets B,F,G | | | | | | | | | | | | |
| Expenses before reductions | | .22% H | | .29% | | .29% | | .29% | | .29% | | .29% |
| Expenses net of fee waivers, if any | | .22% H | | .29% | | .29% | | .29% | | .29% | | .29% |
| Expenses net of all reductions | | .22% H | | .29% | | .29% | | .29% | | .29% | | .29% |
| Net investment income (loss) | | 2.70% H | | 3.04% | | 2.54% | | 2.44% | | 3.15% | | 3.42% |
| Supplemental Data | | | | | | | | | | | | |
| Net assets, end of period (000 omitted) | $ | 526,709 | $ | 549,536 | $ | 612,143 | $ | 490,089 | $ | 282,317 | $ | 360,229 |
Portfolio turnover rate I,J | | 2% H | | 29% | | 28% | | 32% | | 35% | | 35% |
ACalculated based on average shares outstanding during the period.
BNet investment income (loss) is affected by the timing of the declaration of dividends by any underlying mutual funds or exchange-traded funds (ETFs). Net investment income (loss) of any mutual funds or ETFs is not included in the Fund's net investment income (loss) ratio.
CTotal returns for periods of less than one year are not annualized.
DTotal returns would have been lower if certain expenses had not been reduced during the applicable periods shown.
EBased on net asset value.
FFees and expenses of any underlying mutual funds or exchange-traded funds (ETFs) are not included in the Fund's expense ratio. The Fund indirectly bears its proportionate share of these expenses. For additional expense information related to investments in Fidelity Central Funds, please refer to the "Investments in Fidelity Central Funds" note found in the Notes to Financial Statements section of the most recent Annual or Semi-Annual report.
GExpense ratios reflect operating expenses of the class. Expenses before reductions do not reflect amounts reimbursed, waived, or reduced through arrangements with the investment adviser, brokerage services, or other offset arrangements, if applicable, and do not represent the amount paid by the class during periods when reimbursements, waivers or reductions occur.
HAnnualized.
IAmount does not include the portfolio activity of any underlying mutual funds or exchange-traded funds (ETFs).
JPortfolio turnover rate excludes securities received or delivered in-kind.
Top Holdings (% of Fund's net assets) |
| |
| Microsoft Corp. | 6.4 | |
| Apple, Inc. | 5.8 | |
| NVIDIA Corp. | 4.6 | |
| JPMorgan Chase & Co. | 2.8 | |
| Procter & Gamble Co. | 2.4 | |
| Broadcom, Inc. | 2.1 | |
| Exxon Mobil Corp. | 2.1 | |
| Kawasaki Kisen Kaisha Ltd. | 2.1 | |
| PepsiCo, Inc. | 1.9 | |
| The Coca-Cola Co. | 1.9 | |
| | 32.1 | |
| |
| Market Sectors (% of Fund's net assets) |
| |
| Information Technology | 24.9 | |
| Financials | 19.7 | |
| Industrials | 15.4 | |
| Consumer Staples | 11.2 | |
| Energy | 9.8 | |
| Real Estate | 7.9 | |
| Health Care | 6.6 | |
| Consumer Discretionary | 3.4 | |
| Communication Services | 0.9 | |
| |
Asset Allocation (% of Fund's net assets) |
|
Futures - 0.2% |
|
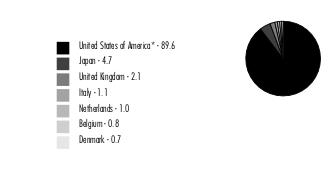
Geographic Diversification (% of Fund's net assets) |
|
* Includes Short-Term investments and Net Other Assets (Liabilities). Percentages are adjusted for the effect of derivatives, if applicable. |
| |
Fidelity® High Dividend ETF
Showing Percentage of Net Assets
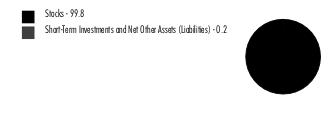
| Common Stocks - 99.8% |
| | | Shares | Value ($) |
| COMMUNICATION SERVICES - 0.9% | | | |
| Diversified Telecommunication Services - 0.2% | | | |
| AT&T, Inc. | | 114,644 | 2,028,052 |
| Verizon Communications, Inc. | | 61,961 | 2,624,048 |
| | | | 4,652,100 |
| Entertainment - 0.1% | | | |
| Electronic Arts, Inc. | | 12,264 | 1,687,281 |
| Warner Music Group Corp. Class A | | 32,465 | 1,184,648 |
| | | | 2,871,929 |
| Media - 0.6% | | | |
| Cable One, Inc. | | 1,444 | 792,655 |
| Comcast Corp. Class A | | 63,328 | 2,947,285 |
| Fox Corp. Class A | | 37,190 | 1,201,237 |
| Interpublic Group of Companies, Inc. | | 33,514 | 1,105,627 |
| News Corp. Class A | | 58,976 | 1,453,169 |
| Nexstar Media Group, Inc. Class A | | 5,815 | 1,033,384 |
| Omnicom Group, Inc. | | 14,475 | 1,308,251 |
| Paramount Global Class B | | 50,842 | 741,785 |
| TEGNA, Inc. | | 59,788 | 932,095 |
| The New York Times Co. Class A | | 33,449 | 1,624,283 |
| | | | 13,139,771 |
TOTAL COMMUNICATION SERVICES | | | 20,663,800 |
| CONSUMER DISCRETIONARY - 3.4% | | | |
| Automobiles - 0.3% | | | |
| Ford Motor Co. | | 503,241 | 5,897,985 |
| Broadline Retail - 0.2% | | | |
| Kohl's Corp. (a) | | 179,468 | 4,623,096 |
| Hotels, Restaurants & Leisure - 0.9% | | | |
| McDonald's Corp. | | 38,156 | 11,169,024 |
| Starbucks Corp. | | 79,070 | 7,355,882 |
| | | | 18,524,906 |
| Household Durables - 0.4% | | | |
| Newell Brands, Inc. | | 374,828 | 3,118,569 |
| Vistry Group PLC | | 481,710 | 6,165,008 |
| | | | 9,283,577 |
| Specialty Retail - 1.3% | | | |
| Best Buy Co., Inc. | | 70,102 | 5,081,694 |
| Lowe's Companies, Inc. | | 40,184 | 8,552,763 |
| The Home Depot, Inc. | | 39,064 | 13,788,029 |
| | | | 27,422,486 |
| Textiles, Apparel & Luxury Goods - 0.3% | | | |
| NIKE, Inc. Class B | | 72,888 | 7,400,319 |
TOTAL CONSUMER DISCRETIONARY | | | 73,152,369 |
| CONSUMER STAPLES - 11.2% | | | |
| Beverages - 3.8% | | | |
| PepsiCo, Inc. | | 245,184 | 41,320,860 |
| The Coca-Cola Co. | | 691,788 | 41,154,468 |
| | | | 82,475,328 |
| Consumer Staples Distribution & Retail - 0.3% | | | |
| Target Corp. | | 42,873 | 5,962,777 |
| Household Products - 2.4% | | | |
| Procter & Gamble Co. | | 331,447 | 52,083,582 |
| Personal Care Products - 0.1% | | | |
| Kenvue, Inc. | | 83,061 | 1,724,346 |
| Tobacco - 4.6% | | | |
| Altria Group, Inc. | | 718,150 | 28,812,178 |
| British American Tobacco PLC (United Kingdom) | | 594,214 | 17,695,472 |
| Imperial Brands PLC | | 910,246 | 22,006,515 |
| Philip Morris International, Inc. | | 364,930 | 33,153,891 |
| | | | 101,668,056 |
TOTAL CONSUMER STAPLES | | | 243,914,089 |
| ENERGY - 9.8% | | | |
| Oil, Gas & Consumable Fuels - 9.8% | | | |
| Chevron Corp. | | 241,613 | 35,621,005 |
| ConocoPhillips Co. | | 289,754 | 32,414,780 |
| Coterra Energy, Inc. | | 1,047,926 | 26,072,399 |
| Devon Energy Corp. | | 442,842 | 18,608,221 |
| EOG Resources, Inc. | | 230,564 | 26,235,878 |
| Exxon Mobil Corp. | | 442,289 | 45,471,732 |
| Pioneer Natural Resources Co. | | 125,770 | 28,905,719 |
| | | | 213,329,734 |
| FINANCIALS - 19.7% | | | |
| Banks - 10.9% | | | |
| Bank of America Corp. | | 1,121,979 | 38,158,506 |
| Citigroup, Inc. | | 622,984 | 34,993,011 |
| ING Groep NV (Certificaten Van Aandelen) | | 1,520,633 | 21,787,078 |
| Intesa Sanpaolo SpA | | 7,869,292 | 24,472,977 |
| JPMorgan Chase & Co. | | 351,002 | 61,200,709 |
| KBC Group NV | | 279,787 | 18,380,999 |
| Wells Fargo & Co. | | 777,269 | 39,003,358 |
| | | | 237,996,638 |
| Capital Markets - 1.8% | | | |
| Blackstone, Inc. | | 308,821 | 38,432,773 |
| Financial Services - 2.1% | | | |
| The Western Union Co. | | 991,667 | 12,465,254 |
| Visa, Inc. Class A | | 126,181 | 34,480,220 |
| | | | 46,945,474 |
| Insurance - 2.5% | | | |
| American Financial Group, Inc. | | 205,347 | 24,723,779 |
| Old Republic International Corp. | | 1,043,779 | 29,267,563 |
| | | | 53,991,342 |
| Mortgage Real Estate Investment Trusts - 2.4% | | | |
| Annaly Capital Management, Inc. | | 1,151,676 | 22,100,662 |
| Rithm Capital Corp. | | 2,861,706 | 30,620,254 |
| | | | 52,720,916 |
TOTAL FINANCIALS | | | 430,087,143 |
| HEALTH CARE - 6.6% | | | |
| Biotechnology - 2.5% | | | |
| AbbVie, Inc. | | 127,790 | 21,008,676 |
| Amgen, Inc. | | 61,232 | 19,242,768 |
| Gilead Sciences, Inc. | | 175,298 | 13,718,821 |
| | | | 53,970,265 |
| Health Care Equipment & Supplies - 0.7% | | | |
| Medtronic PLC | | 167,434 | 14,657,172 |
| Pharmaceuticals - 3.4% | | | |
| Bristol-Myers Squibb Co. | | 216,127 | 10,562,126 |
| GSK PLC | | 507,610 | 10,135,802 |
| Johnson & Johnson | | 130,837 | 20,789,999 |
| Merck & Co., Inc. | | 180,557 | 21,807,674 |
| Pfizer, Inc. | | 413,146 | 11,187,994 |
| | | | 74,483,595 |
TOTAL HEALTH CARE | | | 143,111,032 |
| INDUSTRIALS - 15.4% | | | |
| Aerospace & Defense - 2.8% | | | |
| Lockheed Martin Corp. | | 68,442 | 29,389,679 |
| RTX Corp. | | 342,338 | 31,193,839 |
| | | | 60,583,518 |
| Air Freight & Logistics - 1.1% | | | |
| United Parcel Service, Inc. Class B | | 172,723 | 24,509,394 |
| Ground Transportation - 1.7% | | | |
| Union Pacific Corp. | | 152,683 | 37,243,964 |
| Industrial Conglomerates - 2.6% | | | |
| 3M Co. | | 242,450 | 22,875,158 |
| Honeywell International, Inc. | | 159,252 | 32,210,310 |
| | | | 55,085,468 |
| Machinery - 1.8% | | | |
| Caterpillar, Inc. | | 132,229 | 39,709,691 |
| Marine Transportation - 5.4% | | | |
| A.P. Moller - Maersk A/S Series B | | 8,396 | 15,570,127 |
| Kawasaki Kisen Kaisha Ltd. (a) | | 919,400 | 45,292,283 |
| Mitsui OSK Lines Ltd. | | 782,600 | 28,428,979 |
| Nippon Yusen KK | | 806,800 | 28,137,961 |
| | | | 117,429,350 |
TOTAL INDUSTRIALS | | | 334,561,385 |
| INFORMATION TECHNOLOGY - 24.9% | | | |
| Communications Equipment - 1.0% | | | |
| Cisco Systems, Inc. | | 447,929 | 22,477,077 |
| IT Services - 1.2% | | | |
| IBM Corp. | | 139,027 | 25,533,699 |
| Semiconductors & Semiconductor Equipment - 9.8% | | | |
| Broadcom, Inc. | | 39,289 | 46,361,020 |
| Intel Corp. | | 629,760 | 27,130,061 |
| NVIDIA Corp. | | 163,644 | 100,685,244 |
| Qualcomm, Inc. | | 148,073 | 21,990,321 |
| Texas Instruments, Inc. | | 112,094 | 17,948,491 |
| | | | 214,115,137 |
| Software - 6.4% | | | |
| Microsoft Corp. | | 349,187 | 138,829,765 |
| Technology Hardware, Storage & Peripherals - 6.5% | | | |
| Apple, Inc. | | 687,096 | 126,700,502 |
| HP, Inc. | | 491,567 | 14,112,889 |
| | | | 140,813,391 |
TOTAL INFORMATION TECHNOLOGY | | | 541,769,069 |
| REAL ESTATE - 7.9% | | | |
| Equity Real Estate Investment Trusts (REITs) - 7.9% | | | |
| American Tower Corp. | | 102,396 | 20,033,777 |
| Crown Castle, Inc. | | 138,664 | 15,010,378 |
| Digital Realty Trust, Inc. | | 162,573 | 22,835,004 |
| Healthcare Trust of America, Inc. | | 824,524 | 13,283,082 |
| Medical Properties Trust, Inc. (a) | | 1,400,135 | 4,340,419 |
| Omega Healthcare Investors, Inc. | | 600,829 | 17,424,041 |
| Prologis, Inc. | | 180,302 | 22,842,460 |
| Public Storage | | 65,105 | 18,437,085 |
| Simon Property Group, Inc. | | 151,406 | 20,986,386 |
| Weyerhaeuser Co. | | 533,299 | 17,476,208 |
| | | | 172,668,840 |
| TOTAL COMMON STOCKS (Cost $1,966,969,761) | | | 2,173,257,461 |
| | | | |
| Money Market Funds - 2.3% |
| | | Shares | Value ($) |
| Fidelity Cash Central Fund 5.39% (b) | | 3,187,476 | 3,188,114 |
| Fidelity Securities Lending Cash Central Fund 5.39% (b)(c) | | 48,442,031 | 48,446,875 |
| TOTAL MONEY MARKET FUNDS (Cost $51,634,989) | | | 51,634,989 |
| | | | |
| TOTAL INVESTMENT IN SECURITIES - 102.1% (Cost $2,018,604,750) | 2,224,892,450 |
NET OTHER ASSETS (LIABILITIES) - (2.1)% | (46,716,869) |
| NET ASSETS - 100.0% | 2,178,175,581 |
| | |
| Futures Contracts |
| | Number of contracts | Expiration Date | Notional Amount ($) | Value ($) | Unrealized Appreciation/ (Depreciation) ($) |
| Purchased | | | | | |
| | | | | | |
| Equity Index Contracts | | | | | |
| CME Micro E-mini S&P 500 Index Contracts (United States) | 19 | Mar 2024 | 4,626,975 | 183,354 | 183,354 |
| | | | | | |
| The notional amount of futures purchased as a percentage of Net Assets is 0.2% |
Legend
| (a) | Security or a portion of the security is on loan at period end. |
| (b) | Affiliated fund that is generally available only to investment companies and other accounts managed by Fidelity Investments. The rate quoted is the annualized seven-day yield of the fund at period end. A complete unaudited listing of the fund's holdings as of its most recent quarter end is available upon request. In addition, each Fidelity Central Fund's financial statements are available on the SEC's website or upon request. |
| (c) | Investment made with cash collateral received from securities on loan. |
Affiliated Central Funds
Fiscal year to date information regarding the Fund's investments in Fidelity Central Funds, including the ownership percentage, is presented below.
| Affiliate | Value, beginning of period ($) | Purchases ($) | Sales Proceeds ($) | Dividend Income ($) | Realized Gain (loss) ($) | Change in Unrealized appreciation (depreciation) ($) | Value, end of period ($) | % ownership, end of period |
| Fidelity Cash Central Fund 5.39% | 4,259,333 | 58,612,685 | 59,683,904 | 70,840 | - | - | 3,188,114 | 0.0% |
| Fidelity Securities Lending Cash Central Fund 5.39% | 12,024,950 | 164,498,865 | 128,076,940 | 76,038 | - | - | 48,446,875 | 0.2% |
| Total | 16,284,283 | 223,111,550 | 187,760,844 | 146,878 | - | - | 51,634,989 | |
| | | | | | | | | |
Amounts in the dividend income column in the above table include any capital gain distributions from underlying funds, which are presented in the corresponding line item in the Statement of Operations, if applicable.
Amounts in the dividend income column for Fidelity Securities Lending Cash Central Fund represents the income earned on investing cash collateral, less rebates paid to borrowers and any lending agent fees associated with the loan, plus any premium payments received for lending certain types of securities.
Amounts included in the purchases and sales proceeds columns may include in-kind transactions, if applicable.
Investment Valuation
The following is a summary of the inputs used, as of January 31, 2024, involving the Fund's assets and liabilities carried at fair value. The inputs or methodology used for valuing securities may not be an indication of the risk associated with investing in those securities. For more information on valuation inputs, and their aggregation into the levels used below, please refer to the Investment Valuation section in the accompanying Notes to Financial Statements.
| Valuation Inputs at Reporting Date: |
| Description | Total ($) | Level 1 ($) | Level 2 ($) | Level 3 ($) |
Investments in Securities: | | | | |
|
| Equities: | | | | |
Communication Services | 20,663,800 | 20,663,800 | - | - |
Consumer Discretionary | 73,152,369 | 73,152,369 | - | - |
Consumer Staples | 243,914,089 | 243,914,089 | - | - |
Energy | 213,329,734 | 213,329,734 | - | - |
Financials | 430,087,143 | 430,087,143 | - | - |
Health Care | 143,111,032 | 143,111,032 | - | - |
Industrials | 334,561,385 | 334,561,385 | - | - |
Information Technology | 541,769,069 | 541,769,069 | - | - |
Real Estate | 172,668,840 | 172,668,840 | - | - |
|
| Money Market Funds | 51,634,989 | 51,634,989 | - | - |
| Total Investments in Securities: | 2,224,892,450 | 2,224,892,450 | - | - |
Derivative Instruments: Assets | | | | |
Futures Contracts | 183,354 | 183,354 | - | - |
| Total Assets | 183,354 | 183,354 | - | - |
| Total Derivative Instruments: | 183,354 | 183,354 | - | - |
Value of Derivative Instruments
The following table is a summary of the Fund's value of derivative instruments by primary risk exposure as of January 31, 2024. For additional information on derivative instruments, please refer to the Derivative Instruments section in the accompanying Notes to Financial Statements.
Primary Risk Exposure / Derivative Type | Value |
| Asset ($) | Liability ($) |
| Equity Risk | | |
Futures Contracts (a) | 183,354 | 0 |
| Total Equity Risk | 183,354 | 0 |
| Total Value of Derivatives | 183,354 | 0 |
(a)Reflects gross cumulative appreciation (depreciation) on futures contracts as presented in the Schedule of Investments. In the Statement of Assets and Liabilities, the period end daily variation margin is included in receivable or payable for daily variation margin on futures contracts, and the net cumulative appreciation (depreciation) is included in Total accumulated earnings (loss).
Fidelity® High Dividend ETF
| Statement of Assets and Liabilities |
| | | | January 31, 2024 (Unaudited) |
| | | | | |
| Assets | | | | |
| Investment in securities, at value (including securities loaned of $46,090,898) - See accompanying schedule: | | | | |
Unaffiliated issuers (cost $1,966,969,761) | $ | 2,173,257,461 | | |
Fidelity Central Funds (cost $51,634,989) | | 51,634,989 | | |
| | | | | |
| | | | | |
| Total Investment in Securities (cost $2,018,604,750) | | | $ | 2,224,892,450 |
| Segregated cash with brokers for derivative instruments | | | | 224,200 |
| Cash | | | | 354,324 |
| Foreign currency held at value (cost $19,628) | | | | 19,891 |
| Dividends receivable | | | | 2,413,343 |
| Distributions receivable from Fidelity Central Funds | | | | 14,899 |
Total assets | | | | 2,227,919,107 |
| Liabilities | | | | |
| Payable for investments purchased | $ | 955,980 | | |
| Accrued management fee | | 264,196 | | |
| Payable for daily variation margin on futures contracts | | 76,475 | | |
| Collateral on securities loaned | | 48,446,875 | | |
| Total Liabilities | | | | 49,743,526 |
| Net Assets | | | $ | 2,178,175,581 |
| Net Assets consist of: | | | | |
| Paid in capital | | | $ | 2,051,935,443 |
| Total accumulated earnings (loss) | | | | 126,240,138 |
| Net Assets | | | $ | 2,178,175,581 |
Net Asset Value, offering price and redemption price per share ($2,178,175,581 ÷ 50,900,000 shares) | | | $ | 42.79 |
| Statement of Operations |
| | | | Six months ended January 31, 2024 (Unaudited) |
| Investment Income | | | | |
| Dividends | | | $ | 30,881,371 |
| Income from Fidelity Central Funds (including $76,038 from security lending) | | | | 146,878 |
| Total Income | | | | 31,028,249 |
| Expenses | | | | |
| Management fee | $ | 1,962,297 | | |
| Independent trustees' fees and expenses | | 4,967 | | |
| Total expenses before reductions | | 1,967,264 | | |
| Expense reductions | | (22) | | |
| Total expenses after reductions | | | | 1,967,242 |
| Net Investment income (loss) | | | | 29,061,007 |
| Realized and Unrealized Gain (Loss) | | | | |
| Net realized gain (loss) on: | | | | |
| Investment Securities: | | | | |
| Unaffiliated issuers | | (1,281,789) | | |
| Redemptions in-kind | | 2,021,652 | | |
| Foreign currency transactions | | 7,073 | | |
| Futures contracts | | 217,287 | | |
| Total net realized gain (loss) | | | | 964,223 |
| Change in net unrealized appreciation (depreciation) on: | | | | |
| Investment Securities: | | | | |
| Unaffiliated issuers | | 77,094,280 | | |
| Assets and liabilities in foreign currencies | | 385 | | |
| Futures contracts | | (91,452) | | |
| Total change in net unrealized appreciation (depreciation) | | | | 77,003,213 |
| Net gain (loss) | | | | 77,967,436 |
| Net increase (decrease) in net assets resulting from operations | | | $ | 107,028,443 |
| Statement of Changes in Net Assets |
| |
| | Six months ended January 31, 2024 (Unaudited) | | Year ended July 31, 2023 |
| Increase (Decrease) in Net Assets | | | | |
| Operations | | | | |
| Net investment income (loss) | $ | 29,061,007 | $ | 50,654,597 |
| Net realized gain (loss) | | 964,223 | | 42,986,548 |
| Change in net unrealized appreciation (depreciation) | | 77,003,213 | | 77,459,908 |
| Net increase (decrease) in net assets resulting from operations | | 107,028,443 | | 171,101,053 |
| Distributions to shareholders | | (33,244,700) | | (52,210,250) |
| | | | | |
| Share transactions | | | | |
| Proceeds from sales of shares | | 414,930,090 | | 615,856,682 |
| Cost of shares redeemed | | (6,305,500) | | (317,034,432) |
| | | | | |
Net increase (decrease) in net assets resulting from share transactions | | 408,624,590 | | 298,822,250 |
| Total increase (decrease) in net assets | | 482,408,333 | | 417,713,053 |
| | | | | |
| Net Assets | | | | |
| Beginning of period | | 1,695,767,248 | | 1,278,054,195 |
| End of period | $ | 2,178,175,581 | $ | 1,695,767,248 |
| | | | | |
| Other Information | | | | |
| Shares | | | | |
| Sold | | 10,200,000 | | 15,700,000 |
| Redeemed | | (150,000) | | (8,100,000) |
| Net increase (decrease) | | 10,050,000 | | 7,600,000 |
| | | | | |
Financial Highlights
| Fidelity® High Dividend ETF |
| |
| | Six months ended (Unaudited) January 31, 2024 | | Years ended July 31, 2023 | | 2022 | | 2021 | | 2020 | | 2019 |
Selected Per-Share Data | | | | | | | | | | | | |
| Net asset value, beginning of period | $ | 41.51 | $ | 38.44 | $ | 38.05 | $ | 27.56 | $ | 30.12 | $ | 30.15 |
| Income from Investment Operations | | | | | | | | | | | | |
Net investment income (loss) A,B | | .64 | | 1.39 | | 1.21 | | 1.02 | | 1.10 | | 1.23 |
| Net realized and unrealized gain (loss) | | 1.37 | | 3.11 | | .44 | | 10.48 | | (2.52) | | (.03) |
| Total from investment operations | | 2.01 | | 4.50 | | 1.65 | | 11.50 | | (1.42) | | 1.20 |
| Distributions from net investment income | | (.73) | | (1.43) | | (1.26) | | (1.01) | | (1.14) | | (1.23) |
| Total distributions | | (.73) | | (1.43) | | (1.26) | | (1.01) | | (1.14) | | (1.23) |
| Net asset value, end of period | $ | 42.79 | $ | 41.51 | $ | 38.44 | $ | 38.05 | $ | 27.56 | $ | 30.12 |
Total Return C,D,E | | 4.93% | | 12.22% | | 4.43% | | 42.42% | | (4.54)% | | 4.16% |
Ratios to Average Net Assets B,F,G | | | | | | | | | | | | |
| Expenses before reductions | | .22% H | | .29% | | .29% | | .29% | | .29% | | .29% |
| Expenses net of fee waivers, if any | | .22% H | | .29% | | .29% | | .29% | | .29% | | .29% |
| Expenses net of all reductions | | .22% H | | .29% | | .29% | | .29% | | .29% | | .29% |
| Net investment income (loss) | | 3.18% H | | 3.66% | | 3.11% | | 3.04% | | 3.85% | | 4.15% |
| Supplemental Data | | | | | | | | | | | | |
| Net assets, end of period (000 omitted) | $ | 2,178,176 | $ | 1,695,767 | $ | 1,278,054 | $ | 1,052,122 | $ | 520,795 | $ | 362,952 |
Portfolio turnover rate I,J | | 4% H | | 52% | | 38% | | 32% | | 49% | | 50% |
ACalculated based on average shares outstanding during the period.
BNet investment income (loss) is affected by the timing of the declaration of dividends by any underlying mutual funds or exchange-traded funds (ETFs). Net investment income (loss) of any mutual funds or ETFs is not included in the Fund's net investment income (loss) ratio.
CTotal returns for periods of less than one year are not annualized.
DTotal returns would have been lower if certain expenses had not been reduced during the applicable periods shown.
EBased on net asset value.
FFees and expenses of any underlying mutual funds or exchange-traded funds (ETFs) are not included in the Fund's expense ratio. The Fund indirectly bears its proportionate share of these expenses. For additional expense information related to investments in Fidelity Central Funds, please refer to the "Investments in Fidelity Central Funds" note found in the Notes to Financial Statements section of the most recent Annual or Semi-Annual report.
GExpense ratios reflect operating expenses of the class. Expenses before reductions do not reflect amounts reimbursed, waived, or reduced through arrangements with the investment adviser, brokerage services, or other offset arrangements, if applicable, and do not represent the amount paid by the class during periods when reimbursements, waivers or reductions occur.
HAnnualized.
IAmount does not include the portfolio activity of any underlying mutual funds or exchange-traded funds (ETFs).
JPortfolio turnover rate excludes securities received or delivered in-kind.
Top Holdings (% of Fund's net assets) |
| |
| Microsoft Corp. | 7.7 | |
| Apple, Inc. | 7.0 | |
| Alphabet, Inc. Class A | 4.0 | |
| Eli Lilly & Co. | 2.0 | |
| JPMorgan Chase & Co. | 1.8 | |
| UnitedHealth Group, Inc. | 1.7 | |
| Visa, Inc. Class A | 1.7 | |
| The Home Depot, Inc. | 1.5 | |
| MasterCard, Inc. Class A | 1.5 | |
| Accenture PLC Class A | 1.5 | |
| | 30.4 | |
| |
| Market Sectors (% of Fund's net assets) |
| |
| Information Technology | 26.9 | |
| Financials | 14.4 | |
| Health Care | 13.4 | |
| Consumer Discretionary | 10.4 | |
| Industrials | 9.6 | |
| Communication Services | 8.0 | |
| Consumer Staples | 5.7 | |
| Energy | 4.0 | |
| Real Estate | 2.6 | |
| Materials | 2.6 | |
| Utilities | 2.2 | |
| |
Asset Allocation (% of Fund's net assets) |
|
Futures - 0.2% |
|
Fidelity® Low Volatility Factor ETF
Showing Percentage of Net Assets
| Common Stocks - 99.8% |
| | | Shares | Value ($) |
| COMMUNICATION SERVICES - 8.0% | | | |
| Diversified Telecommunication Services - 1.8% | | | |
| AT&T, Inc. | | 500,991 | 8,862,531 |
| Verizon Communications, Inc. | | 240,730 | 10,194,916 |
| | | | 19,057,447 |
| Interactive Media & Services - 4.0% | | | |
| Alphabet, Inc. Class A (a) | | 296,679 | 41,564,728 |
| Media - 1.4% | | | |
| Comcast Corp. Class A | | 201,613 | 9,383,069 |
| Omnicom Group, Inc. | | 61,924 | 5,596,691 |
| | | | 14,979,760 |
| Wireless Telecommunication Services - 0.8% | | | |
| T-Mobile U.S., Inc. | | 48,181 | 7,768,223 |
TOTAL COMMUNICATION SERVICES | | | 83,370,158 |
| CONSUMER DISCRETIONARY - 10.4% | | | |
| Hotels, Restaurants & Leisure - 2.8% | | | |
| McDonald's Corp. | | 41,215 | 12,064,455 |
| Starbucks Corp. | | 95,290 | 8,864,829 |
| Yum! Brands, Inc. | | 58,163 | 7,531,527 |
| | | | 28,460,811 |
| Household Durables - 0.8% | | | |
| Garmin Ltd. | | 69,348 | 8,286,393 |
| Specialty Retail - 5.9% | | | |
| AutoZone, Inc. (a) | | 3,269 | 9,029,403 |
| Lowe's Companies, Inc. | | 44,852 | 9,546,300 |
| O'Reilly Automotive, Inc. (a) | | 8,947 | 9,153,228 |
| The Home Depot, Inc. | | 45,006 | 15,885,318 |
| TJX Companies, Inc. | | 108,312 | 10,279,892 |
| Tractor Supply Co. (b) | | 33,365 | 7,493,779 |
| | | | 61,387,920 |
| Textiles, Apparel & Luxury Goods - 0.9% | | | |
| NIKE, Inc. Class B | | 93,332 | 9,475,998 |
TOTAL CONSUMER DISCRETIONARY | | | 107,611,122 |
| CONSUMER STAPLES - 5.7% | | | |
| Beverages - 1.6% | | | |
| PepsiCo, Inc. | | 48,597 | 8,190,052 |
| The Coca-Cola Co. | | 140,755 | 8,373,515 |
| | | | 16,563,567 |
| Consumer Staples Distribution & Retail - 1.1% | | | |
| Dollar General Corp. | | 23,109 | 3,052,006 |
| Walmart, Inc. | | 52,015 | 8,595,479 |
| | | | 11,647,485 |
| Food Products - 0.9% | | | |
| General Mills, Inc. | | 54,511 | 3,538,309 |
| Hormel Foods Corp. | | 81,089 | 2,462,673 |
| The Hershey Co. | | 16,584 | 3,209,667 |
| | | | 9,210,649 |
| Household Products - 2.0% | | | |
| Colgate-Palmolive Co. | | 59,128 | 4,978,578 |
| Kimberly-Clark Corp. | | 31,514 | 3,812,249 |
| Procter & Gamble Co. | | 74,758 | 11,747,472 |
| | | | 20,538,299 |
| Personal Care Products - 0.1% | | | |
| Kenvue, Inc. | | 56,863 | 1,180,476 |
TOTAL CONSUMER STAPLES | | | 59,140,476 |
| ENERGY - 4.0% | | | |
| Oil, Gas & Consumable Fuels - 4.0% | | | |
| Cheniere Energy, Inc. | | 16,781 | 2,751,916 |
| Chesapeake Energy Corp. (b) | | 24,234 | 1,868,684 |
| Chevron Corp. | | 52,400 | 7,725,332 |
| ConocoPhillips Co. | | 44,323 | 4,958,414 |
| Coterra Energy, Inc. | | 83,583 | 2,079,545 |
| DT Midstream, Inc. | | 37,220 | 1,998,342 |
| Exxon Mobil Corp. | | 112,062 | 11,521,094 |
| Kinder Morgan, Inc. | | 150,715 | 2,550,098 |
| Pioneer Natural Resources Co. | | 13,443 | 3,089,605 |
| The Williams Companies, Inc. | | 81,554 | 2,826,662 |
| | | | 41,369,692 |
| FINANCIALS - 14.4% | | | |
| Banks - 1.8% | | | |
| JPMorgan Chase & Co. | | 107,254 | 18,700,807 |
| Capital Markets - 1.5% | | | |
| Cboe Global Markets, Inc. | | 45,512 | 8,367,381 |
| CME Group, Inc. | | 38,164 | 7,855,678 |
| | | | 16,223,059 |
| Financial Services - 3.8% | | | |
| Jack Henry & Associates, Inc. | | 36,920 | 6,122,444 |
| MasterCard, Inc. Class A | | 35,007 | 15,726,195 |
| Visa, Inc. Class A | | 63,276 | 17,290,800 |
| | | | 39,139,439 |
| Insurance - 7.3% | | | |
| Arthur J. Gallagher & Co. | | 32,146 | 7,463,015 |
| Assurant, Inc. | | 43,766 | 7,350,500 |
| Brown & Brown, Inc. | | 90,837 | 7,045,318 |
| Chubb Ltd. | | 39,442 | 9,663,290 |
| Erie Indemnity Co. Class A | | 23,133 | 8,000,085 |
| Marsh & McLennan Companies, Inc. | | 43,184 | 8,370,787 |
| Progressive Corp. | | 60,538 | 10,790,899 |
| The Travelers Companies, Inc. | | 41,001 | 8,665,971 |
| W.R. Berkley Corp. | | 101,375 | 8,300,585 |
| | | | 75,650,450 |
TOTAL FINANCIALS | | | 149,713,755 |
| HEALTH CARE - 13.4% | | | |
| Biotechnology - 3.4% | | | |
| AbbVie, Inc. | | 81,843 | 13,454,989 |
| Amgen, Inc. | | 38,645 | 12,144,578 |
| Regeneron Pharmaceuticals, Inc. (a) | | 10,362 | 9,769,086 |
| | | | 35,368,653 |
| Health Care Equipment & Supplies - 2.6% | | | |
| Abbott Laboratories | | 96,878 | 10,961,746 |
| Becton, Dickinson & Co. | | 29,079 | 6,944,356 |
| Medtronic PLC | | 102,538 | 8,976,177 |
| | | | 26,882,279 |
| Health Care Providers & Services - 1.7% | | | |
| UnitedHealth Group, Inc. | | 33,814 | 17,303,976 |
| Life Sciences Tools & Services - 1.0% | | | |
| Thermo Fisher Scientific, Inc. | | 20,045 | 10,803,854 |
| Pharmaceuticals - 4.7% | | | |
| Eli Lilly & Co. | | 31,932 | 20,615,619 |
| Johnson & Johnson | | 89,290 | 14,188,181 |
| Merck & Co., Inc. | | 116,583 | 14,080,895 |
| | | | 48,884,695 |
TOTAL HEALTH CARE | | | 139,243,457 |
| INDUSTRIALS - 9.6% | | | |
| Aerospace & Defense - 2.5% | | | |
| General Dynamics Corp. | | 25,829 | 6,844,427 |
| L3Harris Technologies, Inc. | | 29,499 | 6,148,182 |
| Lockheed Martin Corp. | | 15,664 | 6,726,278 |
| Northrop Grumman Corp. | | 13,872 | 6,197,455 |
| | | | 25,916,342 |
| Commercial Services & Supplies - 1.2% | | | |
| Republic Services, Inc. | | 35,920 | 6,146,630 |
| Waste Management, Inc. | | 37,509 | 6,962,796 |
| | | | 13,109,426 |
| Ground Transportation - 0.8% | | | |
| Union Pacific Corp. | | 34,503 | 8,416,317 |
| Industrial Conglomerates - 0.8% | | | |
| Honeywell International, Inc. | | 39,988 | 8,087,973 |
| Machinery - 1.5% | | | |
| Graco, Inc. | | 63,068 | 5,379,700 |
| Otis Worldwide Corp. | | 61,444 | 5,434,107 |
| Toro Co. | | 48,161 | 4,453,929 |
| | | | 15,267,736 |
| Professional Services - 2.8% | | | |
| Automatic Data Processing, Inc. | | 28,419 | 6,984,822 |
| Booz Allen Hamilton Holding Corp. Class A (b) | | 40,348 | 5,679,788 |
| FTI Consulting, Inc. (a) | | 26,161 | 5,012,709 |
| Paychex, Inc. | | 44,719 | 5,443,644 |
| Verisk Analytics, Inc. | | 23,525 | 5,681,993 |
| | | | 28,802,956 |
TOTAL INDUSTRIALS | | | 99,600,750 |
| INFORMATION TECHNOLOGY - 26.9% | | | |
| Communications Equipment - 2.3% | | | |
| Cisco Systems, Inc. | | 255,794 | 12,835,743 |
| Motorola Solutions, Inc. | | 33,397 | 10,670,342 |
| | | | 23,506,085 |
| IT Services - 5.7% | | | |
| Accenture PLC Class A | | 41,585 | 15,131,950 |
| Akamai Technologies, Inc. (a) | | 94,959 | 11,701,798 |
| Amdocs Ltd. | | 98,135 | 8,997,017 |
| IBM Corp. | | 80,033 | 14,698,861 |
| VeriSign, Inc. (a) | | 42,853 | 8,522,605 |
| | | | 59,052,231 |
| Semiconductors & Semiconductor Equipment - 1.1% | | | |
| Texas Instruments, Inc. | | 70,667 | 11,315,200 |
| Software - 10.8% | | | |
| Microsoft Corp. | | 200,790 | 79,830,077 |
| Oracle Corp. | | 110,181 | 12,307,218 |
| Roper Technologies, Inc. | | 19,763 | 10,612,731 |
| Tyler Technologies, Inc. (a) | | 23,133 | 9,779,476 |
| | | | 112,529,502 |
| Technology Hardware, Storage & Peripherals - 7.0% | | | |
| Apple, Inc. | | 392,013 | 72,287,197 |
TOTAL INFORMATION TECHNOLOGY | | | 278,690,215 |
| MATERIALS - 2.6% | | | |
| Chemicals - 1.9% | | | |
| Air Products & Chemicals, Inc. | | 10,043 | 2,568,096 |
| Balchem Corp. | | 10,809 | 1,514,989 |
| Ecolab, Inc. | | 13,249 | 2,626,217 |
| FMC Corp. | | 17,733 | 996,595 |
| Linde PLC | | 15,039 | 6,088,238 |
| PPG Industries, Inc. | | 15,136 | 2,134,781 |
| Sherwin-Williams Co. | | 10,443 | 3,178,640 |
| | | | 19,107,556 |
| Construction Materials - 0.4% | | | |
| Martin Marietta Materials, Inc. | | 4,441 | 2,257,893 |
| Vulcan Materials Co. | | 9,096 | 2,055,787 |
| | | | 4,313,680 |
| Containers & Packaging - 0.3% | | | |
| Aptargroup, Inc. | | 12,729 | 1,653,243 |
| Packaging Corp. of America | | 10,785 | 1,789,016 |
| | | | 3,442,259 |
TOTAL MATERIALS | | | 26,863,495 |
| REAL ESTATE - 2.6% | | | |
| Equity Real Estate Investment Trusts (REITs) - 2.6% | | | |
| Agree Realty Corp. (b) | | 22,555 | 1,344,504 |
| American Homes 4 Rent Class A | | 43,154 | 1,512,548 |
| American Tower Corp. | | 18,040 | 3,529,526 |
| Crown Castle, Inc. | | 22,743 | 2,461,930 |
| CubeSmart | | 35,818 | 1,548,054 |
| Equinix, Inc. | | 3,932 | 3,262,656 |
| Equity Lifestyle Properties, Inc. | | 22,760 | 1,540,624 |
| Extra Space Storage, Inc. | | 14,384 | 2,077,625 |
| Mid-America Apartment Communities, Inc. | | 11,757 | 1,485,850 |
| Prologis, Inc. | | 32,340 | 4,097,155 |
| Public Storage | | 8,308 | 2,352,743 |
| Realty Income Corp. | | 38,120 | 2,073,347 |
| | | | 27,286,562 |
| UTILITIES - 2.2% | | | |
| Electric Utilities - 1.3% | | | |
| American Electric Power Co., Inc. | | 34,864 | 2,724,273 |
| Duke Energy Corp. | | 38,769 | 3,715,233 |
| NextEra Energy, Inc. | | 74,191 | 4,349,818 |
| Xcel Energy, Inc. | | 43,372 | 2,596,682 |
| | | | 13,386,006 |
| Multi-Utilities - 0.9% | | | |
| Ameren Corp. | | 28,683 | 1,995,476 |
| CMS Energy Corp. | | 38,852 | 2,220,780 |
| Consolidated Edison, Inc. | | 28,831 | 2,620,738 |
| WEC Energy Group, Inc. | | 28,552 | 2,305,860 |
| | | | 9,142,854 |
TOTAL UTILITIES | | | 22,528,860 |
| TOTAL COMMON STOCKS (Cost $971,631,353) | | | 1,035,418,542 |
| | | | |
| Money Market Funds - 0.7% |
| | | Shares | Value ($) |
| Fidelity Cash Central Fund 5.39% (c) | | 1,439,350 | 1,439,638 |
| Fidelity Securities Lending Cash Central Fund 5.39% (c)(d) | | 5,828,966 | 5,829,549 |
| TOTAL MONEY MARKET FUNDS (Cost $7,269,187) | | | 7,269,187 |
| | | | |
| TOTAL INVESTMENT IN SECURITIES - 100.5% (Cost $978,900,540) | 1,042,687,729 |
NET OTHER ASSETS (LIABILITIES) - (0.5)% | (4,839,365) |
| NET ASSETS - 100.0% | 1,037,848,364 |
| | |
| Futures Contracts |
| | Number of contracts | Expiration Date | Notional Amount ($) | Value ($) | Unrealized Appreciation/ (Depreciation) ($) |
| Purchased | | | | | |
| | | | | | |
| Equity Index Contracts | | | | | |
| CME E-mini S&P 500 Index Contracts (United States) | 93 | Mar 2024 | 2,264,783 | 67,584 | 67,584 |
| | | | | | |
| The notional amount of futures purchased as a percentage of Net Assets is 0.2% |
Legend
| (b) | Security or a portion of the security is on loan at period end. |
| (c) | Affiliated fund that is generally available only to investment companies and other accounts managed by Fidelity Investments. The rate quoted is the annualized seven-day yield of the fund at period end. A complete unaudited listing of the fund's holdings as of its most recent quarter end is available upon request. In addition, each Fidelity Central Fund's financial statements are available on the SEC's website or upon request. |
| (d) | Investment made with cash collateral received from securities on loan. |
Affiliated Central Funds
Fiscal year to date information regarding the Fund's investments in Fidelity Central Funds, including the ownership percentage, is presented below.
| Affiliate | Value, beginning of period ($) | Purchases ($) | Sales Proceeds ($) | Dividend Income ($) | Realized Gain (loss) ($) | Change in Unrealized appreciation (depreciation) ($) | Value, end of period ($) | % ownership, end of period |
| Fidelity Cash Central Fund 5.39% | 909,740 | 28,186,305 | 27,656,407 | 32,187 | - | - | 1,439,638 | 0.0% |
| Fidelity Securities Lending Cash Central Fund 5.39% | 3,428,449 | 31,895,900 | 29,494,800 | 7,879 | - | - | 5,829,549 | 0.0% |
| Total | 4,338,189 | 60,082,205 | 57,151,207 | 40,066 | - | - | 7,269,187 | |
| | | | | | | | | |
Amounts in the dividend income column in the above table include any capital gain distributions from underlying funds, which are presented in the corresponding line item in the Statement of Operations, if applicable.
Amounts in the dividend income column for Fidelity Securities Lending Cash Central Fund represents the income earned on investing cash collateral, less rebates paid to borrowers and any lending agent fees associated with the loan, plus any premium payments received for lending certain types of securities.
Amounts included in the purchases and sales proceeds columns may include in-kind transactions, if applicable.
Investment Valuation
The following is a summary of the inputs used, as of January 31, 2024, involving the Fund's assets and liabilities carried at fair value. The inputs or methodology used for valuing securities may not be an indication of the risk associated with investing in those securities. For more information on valuation inputs, and their aggregation into the levels used below, please refer to the Investment Valuation section in the accompanying Notes to Financial Statements.
| Valuation Inputs at Reporting Date: |
| Description | Total ($) | Level 1 ($) | Level 2 ($) | Level 3 ($) |
Investments in Securities: | | | | |
|
| Equities: | | | | |
Communication Services | 83,370,158 | 83,370,158 | - | - |
Consumer Discretionary | 107,611,122 | 107,611,122 | - | - |
Consumer Staples | 59,140,476 | 59,140,476 | - | - |
Energy | 41,369,692 | 41,369,692 | - | - |
Financials | 149,713,755 | 149,713,755 | - | - |
Health Care | 139,243,457 | 139,243,457 | - | - |
Industrials | 99,600,750 | 99,600,750 | - | - |
Information Technology | 278,690,215 | 278,690,215 | - | - |
Materials | 26,863,495 | 26,863,495 | - | - |
Real Estate | 27,286,562 | 27,286,562 | - | - |
Utilities | 22,528,860 | 22,528,860 | - | - |
|
| Money Market Funds | 7,269,187 | 7,269,187 | - | - |
| Total Investments in Securities: | 1,042,687,729 | 1,042,687,729 | - | - |
Derivative Instruments: Assets | | | | |
Futures Contracts | 67,584 | 67,584 | - | - |
| Total Assets | 67,584 | 67,584 | - | - |
| Total Derivative Instruments: | 67,584 | 67,584 | - | - |
Value of Derivative Instruments
The following table is a summary of the Fund's value of derivative instruments by primary risk exposure as of January 31, 2024. For additional information on derivative instruments, please refer to the Derivative Instruments section in the accompanying Notes to Financial Statements.
Primary Risk Exposure / Derivative Type | Value |
| Asset ($) | Liability ($) |
| Equity Risk | | |
Futures Contracts (a) | 67,584 | 0 |
| Total Equity Risk | 67,584 | 0 |
| Total Value of Derivatives | 67,584 | 0 |
(a)Reflects gross cumulative appreciation (depreciation) on futures contracts as presented in the Schedule of Investments. In the Statement of Assets and Liabilities, the period end daily variation margin is included in receivable or payable for daily variation margin on futures contracts, and the net cumulative appreciation (depreciation) is included in Total accumulated earnings (loss).
Fidelity® Low Volatility Factor ETF
| Statement of Assets and Liabilities |
| | | | January 31, 2024 (Unaudited) |
| | | | | |
| Assets | | | | |
| Investment in securities, at value (including securities loaned of $5,620,507) - See accompanying schedule: | | | | |
Unaffiliated issuers (cost $971,631,353) | $ | 1,035,418,542 | | |
Fidelity Central Funds (cost $7,269,187) | | 7,269,187 | | |
| | | | | |
| | | | | |
| Total Investment in Securities (cost $978,900,540) | | | $ | 1,042,687,729 |
| Segregated cash with brokers for derivative instruments | | | | 109,740 |
| Receivable for fund shares sold | | | | 2,735,621 |
| Dividends receivable | | | | 1,025,041 |
| Distributions receivable from Fidelity Central Funds | | | | 4,778 |
Total assets | | | | 1,046,562,909 |
| Liabilities | | | | |
| Payable for investments purchased | $ | 2,717,073 | | |
| Accrued management fee | | 130,504 | | |
| Payable for daily variation margin on futures contracts | | 37,433 | | |
| Other payables and accrued expenses | | 10 | | |
| Collateral on securities loaned | | 5,829,525 | | |
| Total Liabilities | | | | 8,714,545 |
| Net Assets | | | $ | 1,037,848,364 |
| Net Assets consist of: | | | | |
| Paid in capital | | | $ | 974,894,904 |
| Total accumulated earnings (loss) | | | | 62,953,460 |
| Net Assets | | | $ | 1,037,848,364 |
Net Asset Value, offering price and redemption price per share ($1,037,848,364 ÷ 19,250,000 shares) | | | $ | 53.91 |
| Statement of Operations |
| | | | Six months ended January 31, 2024 (Unaudited) |
| Investment Income | | | | |
| Dividends | | | $ | 6,935,989 |
| Income from Fidelity Central Funds (including $7,879 from security lending) | | | | 40,066 |
| Total Income | | | | 6,976,055 |
| Expenses | | | | |
| Management fee | $ | 760,705 | | |
| Independent trustees' fees and expenses | | 1,821 | | |
| Total expenses before reductions | | 762,526 | | |
| Expense reductions | | (218) | | |
| Total expenses after reductions | | | | 762,308 |
| Net Investment income (loss) | | | | 6,213,747 |
| Realized and Unrealized Gain (Loss) | | | | |
| Net realized gain (loss) on: | | | | |
| Investment Securities: | | | | |
| Unaffiliated issuers | | (13,472,043) | | |
| Redemptions in-kind | | 51,597,529 | | |
| Futures contracts | | 83,822 | | |
| Total net realized gain (loss) | | | | 38,209,308 |
| Change in net unrealized appreciation (depreciation) on: | | | | |
| Investment Securities: | | | | |
| Unaffiliated issuers | | 15,406,365 | | |
| Futures contracts | | (4,837) | | |
| Total change in net unrealized appreciation (depreciation) | | | | 15,401,528 |
| Net gain (loss) | | | | 53,610,836 |
| Net increase (decrease) in net assets resulting from operations | | | $ | 59,824,583 |
| Statement of Changes in Net Assets |
| |
| | Six months ended January 31, 2024 (Unaudited) | | Year ended July 31, 2023 |
| Increase (Decrease) in Net Assets | | | | |
| Operations | | | | |
| Net investment income (loss) | $ | 6,213,747 | $ | 7,517,780 |
| Net realized gain (loss) | | 38,209,308 | | 1,037,183 |
| Change in net unrealized appreciation (depreciation) | | 15,401,528 | | 36,445,989 |
| Net increase (decrease) in net assets resulting from operations | | 59,824,583 | | 45,000,952 |
| Distributions to shareholders | | (5,292,550) | | (7,460,700) |
| | | | | |
| Share transactions | | | | |
| Proceeds from sales of shares | | 678,737,692 | | 126,351,905 |
| Cost of shares redeemed | | (249,026,094) | | (55,150,184) |
| | | | | |
Net increase (decrease) in net assets resulting from share transactions | | 429,711,598 | | 71,201,721 |
| Total increase (decrease) in net assets | | 484,243,631 | | 108,741,973 |
| | | | | |
| Net Assets | | | | |
| Beginning of period | | 553,604,733 | | 444,862,760 |
| End of period | $ | 1,037,848,364 | $ | 553,604,733 |
| | | | | |
| Other Information | | | | |
| Shares | | | | |
| Sold | | 13,200,000 | | 2,700,000 |
| Redeemed | | (4,800,000) | | (1,200,000) |
| Net increase (decrease) | | 8,400,000 | | 1,500,000 |
| | | | | |
Financial Highlights
| Fidelity® Low Volatility Factor ETF |
| |
| | Six months ended (Unaudited) January 31, 2024 | | Years ended July 31, 2023 | | 2022 | | 2021 | | 2020 | | 2019 |
Selected Per-Share Data | | | | | | | | | | | | |
| Net asset value, beginning of period | $ | 51.02 | $ | 47.58 | $ | 48.75 | $ | 38.33 | $ | 36.37 | $ | 32.40 |
| Income from Investment Operations | | | | | | | | | | | | |
Net investment income (loss) A,B | | .43 | | .74 | | .62 | | .56 | | .62 | | .62 |
| Net realized and unrealized gain (loss) | | 2.80 | | 3.44 | | (1.17) | | 10.43 | | 1.95 | | 3.92 |
| Total from investment operations | | 3.23 | | 4.18 | | (.55) | | 10.99 | | 2.57 | | 4.54 |
| Distributions from net investment income | | (.34) | | (.74) | | (.62) | | (.57) | | (.61) | | (.57) |
| Total distributions | | (.34) | | (.74) | | (.62) | | (.57) | | (.61) | | (.57) |
| Net asset value, end of period | $ | 53.91 | $ | 51.02 | $ | 47.58 | $ | 48.75 | $ | 38.33 | $ | 36.37 |
Total Return C,D,E | | 6.36% | | 8.96% | | (1.12)% | | 28.90% | | 7.29% | | 14.20% |
Ratios to Average Net Assets B,F,G | | | | | | | | | | | | |
| Expenses before reductions | | .21% H | | .29% | | .29% | | .29% | | .29% | | .29% |
| Expenses net of fee waivers, if any | | .21% H | | .29% | | .29% | | .29% | | .29% | | .29% |
| Expenses net of all reductions | | .20% H | | .29% | | .29% | | .29% | | .29% | | .29% |
| Net investment income (loss) | | 1.67% H | | 1.57% | | 1.27% | | 1.31% | | 1.69% | | 1.83% |
| Supplemental Data | | | | | | | | | | | | |
| Net assets, end of period (000 omitted) | $ | 1,037,848 | $ | 553,605 | $ | 444,863 | $ | 511,897 | $ | 350,708 | $ | 245,502 |
Portfolio turnover rate I,J | | 34% H | | 46% | | 28% | | 46% | | 31% | | 36% |
ACalculated based on average shares outstanding during the period.
BNet investment income (loss) is affected by the timing of the declaration of dividends by any underlying mutual funds or exchange-traded funds (ETFs). Net investment income (loss) of any mutual funds or ETFs is not included in the Fund's net investment income (loss) ratio.
CTotal returns for periods of less than one year are not annualized.
DTotal returns would have been lower if certain expenses had not been reduced during the applicable periods shown.
EBased on net asset value.
FFees and expenses of any underlying mutual funds or exchange-traded funds (ETFs) are not included in the Fund's expense ratio. The Fund indirectly bears its proportionate share of these expenses. For additional expense information related to investments in Fidelity Central Funds, please refer to the "Investments in Fidelity Central Funds" note found in the Notes to Financial Statements section of the most recent Annual or Semi-Annual report.
GExpense ratios reflect operating expenses of the class. Expenses before reductions do not reflect amounts reimbursed, waived, or reduced through arrangements with the investment adviser, brokerage services, or other offset arrangements, if applicable, and do not represent the amount paid by the class during periods when reimbursements, waivers or reductions occur.
HAnnualized.
IPortfolio turnover rate excludes securities received or delivered in-kind.
JAmount does not include the portfolio activity of any underlying mutual funds or exchange-traded funds (ETFs).
Top Holdings (% of Fund's net assets) |
| |
| Microsoft Corp. | 6.9 | |
| Apple, Inc. | 6.4 | |
| NVIDIA Corp. | 4.0 | |
| Alphabet, Inc. Class A | 3.6 | |
| Amazon.com, Inc. | 3.5 | |
| Meta Platforms, Inc. Class A | 2.1 | |
| Eli Lilly & Co. | 2.0 | |
| Berkshire Hathaway, Inc. Class B | 2.0 | |
| Broadcom, Inc. | 1.8 | |
| JPMorgan Chase & Co. | 1.6 | |
| | 33.9 | |
| |
| Market Sectors (% of Fund's net assets) |
| |
| Information Technology | 28.5 | |
| Health Care | 13.4 | |
| Financials | 12.7 | |
| Consumer Discretionary | 10.5 | |
| Industrials | 9.7 | |
| Communication Services | 8.2 | |
| Consumer Staples | 5.8 | |
| Energy | 3.8 | |
| Real Estate | 2.6 | |
| Materials | 2.5 | |
| Utilities | 2.1 | |
| |
Asset Allocation (% of Fund's net assets) |
|
Futures - 0.2% |
|
Fidelity® Momentum Factor ETF
Showing Percentage of Net Assets
| Common Stocks - 99.8% |
| | | Shares | Value ($) |
| COMMUNICATION SERVICES - 8.2% | | | |
| Entertainment - 1.5% | | | |
| Liberty Media Corp. Liberty Formula One Class C | | 8,344 | 561,134 |
| Netflix, Inc. (a) | | 2,885 | 1,627,457 |
| Take-Two Interactive Software, Inc. (a) | | 3,944 | 650,484 |
| | | | 2,839,075 |
| Interactive Media & Services - 5.7% | | | |
| Alphabet, Inc. Class A (a) | | 48,793 | 6,835,899 |
| Meta Platforms, Inc. Class A | | 10,579 | 4,127,291 |
| | | | 10,963,190 |
| Media - 1.0% | | | |
| Comcast Corp. Class A | | 27,558 | 1,282,549 |
| The Trade Desk, Inc. (a) | | 7,819 | 535,054 |
| | | | 1,817,603 |
TOTAL COMMUNICATION SERVICES | | | 15,619,868 |
| CONSUMER DISCRETIONARY - 10.5% | | | |
| Automobiles - 1.5% | | | |
| Tesla, Inc. (a) | | 14,899 | 2,790,434 |
| Broadline Retail - 3.5% | | | |
| Amazon.com, Inc. (a) | | 42,918 | 6,660,874 |
| Diversified Consumer Services - 0.5% | | | |
| Duolingo, Inc. (a) | | 5,347 | 956,525 |
| Hotels, Restaurants & Leisure - 3.2% | | | |
| Airbnb, Inc. Class A (a) | | 8,509 | 1,226,487 |
| Booking Holdings, Inc. (a) | | 421 | 1,476,645 |
| Doordash, Inc. (a) | | 10,125 | 1,055,025 |
| Draftkings Holdings, Inc. (a) | | 28,863 | 1,127,100 |
| Royal Caribbean Cruises Ltd. (a) | | 9,812 | 1,251,030 |
| | | | 6,136,287 |
| Household Durables - 1.8% | | | |
| D.R. Horton, Inc. | | 8,095 | 1,156,856 |
| PulteGroup, Inc. | | 10,646 | 1,113,146 |
| TopBuild Corp. (a) | | 3,191 | 1,177,894 |
| | | | 3,447,896 |
TOTAL CONSUMER DISCRETIONARY | | | 19,992,016 |
| CONSUMER STAPLES - 5.8% | | | |
| Beverages - 1.0% | | | |
| Celsius Holdings, Inc. (a) | | 11,253 | 561,525 |
| Constellation Brands, Inc. Class A (sub. vtg.) | | 3,080 | 754,846 |
| Molson Coors Beverage Co. Class B | | 10,711 | 661,833 |
| | | | 1,978,204 |
| Consumer Staples Distribution & Retail - 1.8% | | | |
| Costco Wholesale Corp. | | 2,847 | 1,978,323 |
| Walmart, Inc. | | 9,330 | 1,541,783 |
| | | | 3,520,106 |
| Food Products - 0.6% | | | |
| Mondelez International, Inc. | | 14,042 | 1,056,941 |
| Household Products - 1.5% | | | |
| Church & Dwight Co., Inc. | | 7,259 | 724,811 |
| Procter & Gamble Co. | | 13,469 | 2,116,519 |
| | | | 2,841,330 |
| Personal Care Products - 0.9% | | | |
| BellRing Brands, Inc. (a) | | 13,515 | 746,974 |
| elf Beauty, Inc. (a) | | 6,094 | 972,176 |
| | | | 1,719,150 |
TOTAL CONSUMER STAPLES | | | 11,115,731 |
| ENERGY - 3.8% | | | |
| Energy Equipment & Services - 1.4% | | | |
| Baker Hughes Co. Class A | | 15,941 | 454,319 |
| Schlumberger Ltd. | | 13,134 | 639,626 |
| TechnipFMC PLC | | 20,474 | 395,967 |
| Tidewater, Inc. (a) | | 6,107 | 410,329 |
| Transocean Ltd. (United States) (a)(b) | | 63,606 | 347,289 |
| Weatherford International PLC (a) | | 4,520 | 404,766 |
| | | | 2,652,296 |
| Oil, Gas & Consumable Fuels - 2.4% | | | |
| Cheniere Energy, Inc. | | 3,348 | 549,039 |
| Exxon Mobil Corp. | | 20,265 | 2,083,445 |
| Marathon Petroleum Corp. | | 4,324 | 716,054 |
| Phillips 66 Co. | | 5,369 | 774,800 |
| Targa Resources Corp. | | 5,559 | 472,293 |
| | | | 4,595,631 |
TOTAL ENERGY | | | 7,247,927 |
| FINANCIALS - 12.7% | | | |
| Banks - 2.1% | | | |
| First Citizens Bancshares, Inc. | | 615 | 928,650 |
| JPMorgan Chase & Co. | | 17,574 | 3,064,203 |
| | | | 3,992,853 |
| Capital Markets - 2.5% | | | |
| CME Group, Inc. | | 5,227 | 1,075,926 |
| Moody's Corp. | | 3,090 | 1,211,404 |
| S&P Global, Inc. | | 3,457 | 1,549,946 |
| Tradeweb Markets, Inc. Class A | | 9,195 | 877,111 |
| | | | 4,714,387 |
| Financial Services - 6.5% | | | |
| Apollo Global Management, Inc. | | 11,285 | 1,133,014 |
| Berkshire Hathaway, Inc. Class B (a) | | 9,767 | 3,747,989 |
| Fiserv, Inc. (a) | | 9,277 | 1,316,128 |
| FleetCor Technologies, Inc. (a) | | 3,674 | 1,065,203 |
| MasterCard, Inc. Class A | | 5,496 | 2,468,968 |
| Visa, Inc. Class A | | 9,877 | 2,698,989 |
| | | | 12,430,291 |
| Insurance - 1.6% | | | |
| Arch Capital Group Ltd. (a) | | 10,820 | 891,893 |
| Kinsale Capital Group, Inc. | | 2,406 | 956,553 |
| Marsh & McLennan Companies, Inc. | | 6,148 | 1,191,728 |
| | | | 3,040,174 |
TOTAL FINANCIALS | | | 24,177,705 |
| HEALTH CARE - 13.4% | | | |
| Biotechnology - 3.5% | | | |
| Exact Sciences Corp. (a) | | 25,085 | 1,640,559 |
| ImmunoGen, Inc. (a) | | 99,034 | 2,903,677 |
| Vertex Pharmaceuticals, Inc. (a) | | 5,090 | 2,205,904 |
| | | | 6,750,140 |
| Health Care Equipment & Supplies - 5.8% | | | |
| Align Technology, Inc. (a) | | 8,198 | 2,191,489 |
| Boston Scientific Corp. (a) | | 34,960 | 2,211,570 |
| Intuitive Surgical, Inc. (a) | | 6,907 | 2,612,366 |
| STERIS PLC | | 7,542 | 1,651,321 |
| Stryker Corp. | | 6,845 | 2,296,361 |
| | | | 10,963,107 |
| Life Sciences Tools & Services - 1.0% | | | |
| West Pharmaceutical Services, Inc. | | 4,937 | 1,841,649 |
| Pharmaceuticals - 3.1% | | | |
| Eli Lilly & Co. | | 5,891 | 3,803,289 |
| Zoetis, Inc. Class A | | 11,340 | 2,129,765 |
| | | | 5,933,054 |
TOTAL HEALTH CARE | | | 25,487,950 |
| INDUSTRIALS - 9.7% | | | |
| Aerospace & Defense - 0.6% | | | |
| TransDigm Group, Inc. | | 1,071 | 1,170,260 |
| Air Freight & Logistics - 0.5% | | | |
| FedEx Corp. | | 3,931 | 948,511 |
| Building Products - 1.1% | | | |
| Builders FirstSource, Inc. (a) | | 6,594 | 1,145,576 |
| Owens Corning | | 6,590 | 998,583 |
| | | | 2,144,159 |
| Commercial Services & Supplies - 0.5% | | | |
| Copart, Inc. | | 19,859 | 954,026 |
| Electrical Equipment - 1.2% | | | |
| Eaton Corp. PLC | | 5,048 | 1,242,212 |
| Vertiv Holdings Co. | | 19,885 | 1,120,122 |
| | | | 2,362,334 |
| Ground Transportation - 1.8% | | | |
| Old Dominion Freight Lines, Inc. | | 2,261 | 884,096 |
| Saia, Inc. (a) | | 2,058 | 927,294 |
| Uber Technologies, Inc. (a) | | 24,250 | 1,582,798 |
| | | | 3,394,188 |
| Industrial Conglomerates - 0.8% | | | |
| General Electric Co. | | 11,305 | 1,497,008 |
| Machinery - 2.1% | | | |
| ESAB Corp. | | 10,431 | 896,962 |
| PACCAR, Inc. | | 10,881 | 1,092,344 |
| Parker Hannifin Corp. | | 2,344 | 1,088,788 |
| Pentair PLC | | 12,916 | 945,064 |
| | | | 4,023,158 |
| Professional Services - 0.5% | | | |
| Verisk Analytics, Inc. | | 3,801 | 918,056 |
| Trading Companies & Distributors - 0.6% | | | |
| Ferguson PLC | | 5,562 | 1,044,877 |
TOTAL INDUSTRIALS | | | 18,456,577 |
| INFORMATION TECHNOLOGY - 28.5% | | | |
| IT Services - 0.7% | | | |
| MongoDB, Inc. Class A (a) | | 3,345 | 1,339,739 |
| Semiconductors & Semiconductor Equipment - 7.2% | | | |
| Advanced Micro Devices, Inc. (a) | | 15,974 | 2,678,680 |
| Broadcom, Inc. | | 2,844 | 3,355,920 |
| NVIDIA Corp. | | 12,444 | 7,656,420 |
| | | | 13,691,020 |
| Software - 14.2% | | | |
| Adobe, Inc. (a) | | 3,670 | 2,267,253 |
| Cadence Design Systems, Inc. (a) | | 5,230 | 1,508,646 |
| Fair Isaac Corp. (a) | | 1,217 | 1,458,976 |
| HubSpot, Inc. (a) | | 2,594 | 1,584,934 |
| Microsoft Corp. | | 33,374 | 13,268,830 |
| Salesforce, Inc. (a) | | 8,837 | 2,483,992 |
| ServiceNow, Inc. (a) | | 2,509 | 1,920,389 |
| Splunk, Inc. (a) | | 7,490 | 1,148,741 |
| Synopsys, Inc. (a) | | 2,730 | 1,456,046 |
| | | | 27,097,807 |
| Technology Hardware, Storage & Peripherals - 6.4% | | | |
| Apple, Inc. | | 65,978 | 12,166,343 |
TOTAL INFORMATION TECHNOLOGY | | | 54,294,909 |
| MATERIALS - 2.5% | | | |
| Chemicals - 1.5% | | | |
| Air Products & Chemicals, Inc. | | 1,615 | 412,972 |
| Ecolab, Inc. | | 2,225 | 441,040 |
| Linde PLC | | 2,525 | 1,022,196 |
| PPG Industries, Inc. | | 2,598 | 366,422 |
| Sherwin-Williams Co. | | 1,796 | 546,666 |
| | | | 2,789,296 |
| Construction Materials - 0.3% | | | |
| Eagle Materials, Inc. | | 1,408 | 318,602 |
| Martin Marietta Materials, Inc. | | 714 | 363,012 |
| | | | 681,614 |
| Metals & Mining - 0.7% | | | |
| ATI, Inc. (a) | | 5,543 | 226,542 |
| Nucor Corp. | | 2,362 | 441,529 |
| Reliance Steel & Aluminum Co. | | 1,006 | 287,133 |
| United States Steel Corp. | | 6,870 | 323,027 |
| | | | 1,278,231 |
TOTAL MATERIALS | | | 4,749,141 |
| REAL ESTATE - 2.6% | | | |
| Equity Real Estate Investment Trusts (REITs) - 2.4% | | | |
| American Homes 4 Rent Class A | | 8,310 | 291,266 |
| AvalonBay Communities, Inc. | | 1,979 | 354,261 |
| Digital Realty Trust, Inc. | | 3,041 | 427,139 |
| EastGroup Properties, Inc. | | 1,572 | 278,920 |
| Equinix, Inc. | | 684 | 567,563 |
| Invitation Homes, Inc. | | 9,984 | 328,773 |
| Iron Mountain, Inc. | | 5,149 | 347,660 |
| Prologis, Inc. | | 6,032 | 764,194 |
| Simon Property Group, Inc. | | 3,369 | 466,977 |
| Stag Industrial, Inc. (b) | | 7,403 | 273,467 |
| Welltower, Inc. | | 4,798 | 415,075 |
| | | | 4,515,295 |
| Real Estate Management & Development - 0.2% | | | |
| Zillow Group, Inc. Class C (a) | | 7,469 | 424,538 |
TOTAL REAL ESTATE | | | 4,939,833 |
| UTILITIES - 2.1% | | | |
| Electric Utilities - 1.6% | | | |
| Constellation Energy Corp. | | 4,456 | 543,632 |
| Edison International | | 7,360 | 496,653 |
| Exelon Corp. | | 13,129 | 457,020 |
| PG&E Corp. | | 30,555 | 515,463 |
| Pinnacle West Capital Corp. | | 5,359 | 369,235 |
| Southern Co. | | 9,720 | 675,734 |
| | | | 3,057,737 |
| Gas Utilities - 0.2% | | | |
| Atmos Energy Corp. | | 3,908 | 445,278 |
| Independent Power and Renewable Electricity Producers - 0.3% | | | |
| Vistra Corp. | | 12,045 | 494,206 |
TOTAL UTILITIES | | | 3,997,221 |
| TOTAL COMMON STOCKS (Cost $158,251,288) | | | 190,078,878 |
| | | | |
| Money Market Funds - 0.5% |
| | | Shares | Value ($) |
| Fidelity Cash Central Fund 5.39% (c) | | 383,901 | 383,978 |
| Fidelity Securities Lending Cash Central Fund 5.39% (c)(d) | | 564,993 | 565,050 |
| TOTAL MONEY MARKET FUNDS (Cost $949,028) | | | 949,028 |
| | | | |
| TOTAL INVESTMENT IN SECURITIES - 100.3% (Cost $159,200,316) | 191,027,906 |
NET OTHER ASSETS (LIABILITIES) - (0.3)% | (481,629) |
| NET ASSETS - 100.0% | 190,546,277 |
| | |
| Futures Contracts |
| | Number of contracts | Expiration Date | Notional Amount ($) | Value ($) | Unrealized Appreciation/ (Depreciation) ($) |
| Purchased | | | | | |
| | | | | | |
| Equity Index Contracts | | | | | |
| CME E-mini S&P 500 Index Contracts (United States) | 18 | Mar 2024 | 438,345 | 8,777 | 8,777 |
| | | | | | |
| The notional amount of futures purchased as a percentage of Net Assets is 0.2% |
Legend
| (b) | Security or a portion of the security is on loan at period end. |
| (c) | Affiliated fund that is generally available only to investment companies and other accounts managed by Fidelity Investments. The rate quoted is the annualized seven-day yield of the fund at period end. A complete unaudited listing of the fund's holdings as of its most recent quarter end is available upon request. In addition, each Fidelity Central Fund's financial statements are available on the SEC's website or upon request. |
| (d) | Investment made with cash collateral received from securities on loan. |
Affiliated Central Funds
Fiscal year to date information regarding the Fund's investments in Fidelity Central Funds, including the ownership percentage, is presented below.
| Affiliate | Value, beginning of period ($) | Purchases ($) | Sales Proceeds ($) | Dividend Income ($) | Realized Gain (loss) ($) | Change in Unrealized appreciation (depreciation) ($) | Value, end of period ($) | % ownership, end of period |
| Fidelity Cash Central Fund 5.39% | 267,697 | 1,362,100 | 1,245,819 | 5,811 | - | - | 383,978 | 0.0% |
| Fidelity Securities Lending Cash Central Fund 5.39% | 632,700 | 3,440,017 | 3,507,667 | 164 | - | - | 565,050 | 0.0% |
| Total | 900,397 | 4,802,117 | 4,753,486 | 5,975 | - | - | 949,028 | |
| | | | | | | | | |
Amounts in the dividend income column in the above table include any capital gain distributions from underlying funds, which are presented in the corresponding line item in the Statement of Operations, if applicable.
Amounts in the dividend income column for Fidelity Securities Lending Cash Central Fund represents the income earned on investing cash collateral, less rebates paid to borrowers and any lending agent fees associated with the loan, plus any premium payments received for lending certain types of securities.
Amounts included in the purchases and sales proceeds columns may include in-kind transactions, if applicable.
Investment Valuation
The following is a summary of the inputs used, as of January 31, 2024, involving the Fund's assets and liabilities carried at fair value. The inputs or methodology used for valuing securities may not be an indication of the risk associated with investing in those securities. For more information on valuation inputs, and their aggregation into the levels used below, please refer to the Investment Valuation section in the accompanying Notes to Financial Statements.
| Valuation Inputs at Reporting Date: |
| Description | Total ($) | Level 1 ($) | Level 2 ($) | Level 3 ($) |
Investments in Securities: | | | | |
|
| Equities: | | | | |
Communication Services | 15,619,868 | 15,619,868 | - | - |
Consumer Discretionary | 19,992,016 | 19,992,016 | - | - |
Consumer Staples | 11,115,731 | 11,115,731 | - | - |
Energy | 7,247,927 | 7,247,927 | - | - |
Financials | 24,177,705 | 24,177,705 | - | - |
Health Care | 25,487,950 | 25,487,950 | - | - |
Industrials | 18,456,577 | 18,456,577 | - | - |
Information Technology | 54,294,909 | 54,294,909 | - | - |
Materials | 4,749,141 | 4,749,141 | - | - |
Real Estate | 4,939,833 | 4,939,833 | - | - |
Utilities | 3,997,221 | 3,997,221 | - | - |
|
| Money Market Funds | 949,028 | 949,028 | - | - |
| Total Investments in Securities: | 191,027,906 | 191,027,906 | - | - |
Derivative Instruments: Assets | | | | |
Futures Contracts | 8,777 | 8,777 | - | - |
| Total Assets | 8,777 | 8,777 | - | - |
| Total Derivative Instruments: | 8,777 | 8,777 | - | - |
Value of Derivative Instruments
The following table is a summary of the Fund's value of derivative instruments by primary risk exposure as of January 31, 2024. For additional information on derivative instruments, please refer to the Derivative Instruments section in the accompanying Notes to Financial Statements.
Primary Risk Exposure / Derivative Type | Value |
| Asset ($) | Liability ($) |
| Equity Risk | | |
Futures Contracts (a) | 8,777 | 0 |
| Total Equity Risk | 8,777 | 0 |
| Total Value of Derivatives | 8,777 | 0 |
(a)Reflects gross cumulative appreciation (depreciation) on futures contracts as presented in the Schedule of Investments. In the Statement of Assets and Liabilities, the period end daily variation margin is included in receivable or payable for daily variation margin on futures contracts, and the net cumulative appreciation (depreciation) is included in Total accumulated earnings (loss).
Fidelity® Momentum Factor ETF
| Statement of Assets and Liabilities |
| | | | January 31, 2024 (Unaudited) |
| | | | | |
| Assets | | | | |
| Investment in securities, at value (including securities loaned of $524,858) - See accompanying schedule: | | | | |
Unaffiliated issuers (cost $158,251,288) | $ | 190,078,878 | | |
Fidelity Central Funds (cost $949,028) | | 949,028 | | |
| | | | | |
| | | | | |
| Total Investment in Securities (cost $159,200,316) | | | $ | 191,027,906 |
| Segregated cash with brokers for derivative instruments | | | | 28,000 |
| Cash | | | | 40,952 |
| Dividends receivable | | | | 42,243 |
| Distributions receivable from Fidelity Central Funds | | | | 983 |
Total assets | | | | 191,140,084 |
| Liabilities | | | | |
| Accrued management fee | $ | 21,512 | | |
| Payable for daily variation margin on futures contracts | | 7,245 | | |
| Collateral on securities loaned | | 565,050 | | |
| Total Liabilities | | | | 593,807 |
| Net Assets | | | $ | 190,546,277 |
| Net Assets consist of: | | | | |
| Paid in capital | | | $ | 187,118,831 |
| Total accumulated earnings (loss) | | | | 3,427,446 |
| Net Assets | | | $ | 190,546,277 |
Net Asset Value, offering price and redemption price per share ($190,546,277 ÷ 3,500,000 shares) | | | $ | 54.44 |
| Statement of Operations |
| | | | Six months ended January 31, 2024 (Unaudited) |
| Investment Income | | | | |
| Dividends | | | $ | 785,860 |
| Income from Fidelity Central Funds (including $164 from security lending) | | | | 5,975 |
| Total Income | | | | 791,835 |
| Expenses | | | | |
| Management fee | $ | 164,258 | | |
| Independent trustees' fees and expenses | | 427 | | |
| Total expenses before reductions | | 164,685 | | |
| Expense reductions | | (432) | | |
| Total expenses after reductions | | | | 164,253 |
| Net Investment income (loss) | | | | 627,582 |
| Realized and Unrealized Gain (Loss) | | | | |
| Net realized gain (loss) on: | | | | |
| Investment Securities: | | | | |
| Unaffiliated issuers | | (317,996) | | |
| Redemptions in-kind | | 4,436,533 | | |
| Futures contracts | | 20,332 | | |
| Total net realized gain (loss) | | | | 4,138,869 |
| Change in net unrealized appreciation (depreciation) on: | | | | |
| Investment Securities: | | | | |
| Unaffiliated issuers | | 11,737,989 | | |
| Futures contracts | | (6,207) | | |
| Total change in net unrealized appreciation (depreciation) | | | | 11,731,782 |
| Net gain (loss) | | | | 15,870,651 |
| Net increase (decrease) in net assets resulting from operations | | | $ | 16,498,233 |
| Statement of Changes in Net Assets |
| |
| | Six months ended January 31, 2024 (Unaudited) | | Year ended July 31, 2023 |
| Increase (Decrease) in Net Assets | | | | |
| Operations | | | | |
| Net investment income (loss) | $ | 627,582 | $ | 1,464,341 |
| Net realized gain (loss) | | 4,138,869 | | (2,793,086) |
| Change in net unrealized appreciation (depreciation) | | 11,731,782 | | 13,280,212 |
| Net increase (decrease) in net assets resulting from operations | | 16,498,233 | | 11,951,467 |
| Distributions to shareholders | | (599,450) | | (1,506,200) |
| | | | | |
| Share transactions | | | | |
| Proceeds from sales of shares | | 39,171,002 | | 52,044,612 |
| Cost of shares redeemed | | (17,354,323) | | (26,407,433) |
| | | | | |
Net increase (decrease) in net assets resulting from share transactions | | 21,816,679 | | 25,637,179 |
| Total increase (decrease) in net assets | | 37,715,462 | | 36,082,446 |
| | | | | |
| Net Assets | | | | |
| Beginning of period | | 152,830,815 | | 116,748,369 |
| End of period | $ | 190,546,277 | $ | 152,830,815 |
| | | | | |
| Other Information | | | | |
| Shares | | | | |
| Sold | | 750,000 | | 1,150,000 |
| Redeemed | | (350,000) | | (600,000) |
| Net increase (decrease) | | 400,000 | | 550,000 |
| | | | | |
Financial Highlights
| Fidelity® Momentum Factor ETF |
| |
| | Six months ended (Unaudited) January 31, 2024 | | Years ended July 31, 2023 | | 2022 | | 2021 | | 2020 | | 2019 |
Selected Per-Share Data | | | | | | | | | | | | |
| Net asset value, beginning of period | $ | 49.30 | $ | 45.78 | $ | 49.77 | $ | 39.26 | $ | 35.80 | $ | 33.58 |
| Income from Investment Operations | | | | | | | | | | | | |
Net investment income (loss) A,B | | .20 | | .53 | | .43 | | .25 | | .42 | | .40 |
| Net realized and unrealized gain (loss) | | 5.14 | | 3.53 | | (4.01) | | 10.54 | | 3.47 | | 2.22 |
| Total from investment operations | | 5.34 | | 4.06 | | (3.58) | | 10.79 | | 3.89 | | 2.62 |
| Distributions from net investment income | | (.20) | | (.54) | | (.41) | | (.28) | | (.43) | | (.40) |
| Total distributions | | (.20) | | (.54) | | (.41) | | (.28) | | (.43) | | (.40) |
| Net asset value, end of period | $ | 54.44 | $ | 49.30 | $ | 45.78 | $ | 49.77 | $ | 39.26 | $ | 35.80 |
Total Return C,D,E | | 10.86% | | 9.02% | | (7.20)% | | 27.58% | | 11.06% | | 7.91% |
Ratios to Average Net Assets B,F,G | | | | | | | | | | | | |
| Expenses before reductions | | .22% H | | .29% | | .29% | | .29% | | .29% | | .29% |
| Expenses net of fee waivers, if any | | .22% H | | .29% | | .29% | | .29% | | .29% | | .29% |
| Expenses net of all reductions | | .22% H | | .29% | | .29% | | .29% | | .29% | | .29% |
| Net investment income (loss) | | .82% H | | 1.19% | | .88% | | .55% | | 1.18% | | 1.18% |
| Supplemental Data | | | | | | | | | | | | |
| Net assets, end of period (000 omitted) | $ | 190,546 | $ | 152,831 | $ | 116,748 | $ | 156,764 | $ | 88,329 | $ | 121,736 |
Portfolio turnover rate I,J | | 112% H | | 137% | | 123% | | 128% | | 138% | | 133% |
ACalculated based on average shares outstanding during the period.
BNet investment income (loss) is affected by the timing of the declaration of dividends by any underlying mutual funds or exchange-traded funds (ETFs). Net investment income (loss) of any mutual funds or ETFs is not included in the Fund's net investment income (loss) ratio.
CTotal returns for periods of less than one year are not annualized.
DTotal returns would have been lower if certain expenses had not been reduced during the applicable periods shown.
EBased on net asset value.
FFees and expenses of any underlying mutual funds or exchange-traded funds (ETFs) are not included in the Fund's expense ratio. The Fund indirectly bears its proportionate share of these expenses. For additional expense information related to investments in Fidelity Central Funds, please refer to the "Investments in Fidelity Central Funds" note found in the Notes to Financial Statements section of the most recent Annual or Semi-Annual report.
GExpense ratios reflect operating expenses of the class. Expenses before reductions do not reflect amounts reimbursed, waived, or reduced through arrangements with the investment adviser, brokerage services, or other offset arrangements, if applicable, and do not represent the amount paid by the class during periods when reimbursements, waivers or reductions occur.
HAnnualized.
IPortfolio turnover rate excludes securities received or delivered in-kind.
JAmount does not include the portfolio activity of any underlying mutual funds or exchange-traded funds (ETFs).
Top Holdings (% of Fund's net assets) |
| |
| Microsoft Corp. | 7.5 | |
| Apple, Inc. | 6.8 | |
| Alphabet, Inc. Class A | 3.8 | |
| Meta Platforms, Inc. Class A | 2.2 | |
| Eli Lilly & Co. | 2.1 | |
| Broadcom, Inc. | 2.1 | |
| UnitedHealth Group, Inc. | 1.8 | |
| Visa, Inc. Class A | 1.7 | |
| MasterCard, Inc. Class A | 1.6 | |
| Tesla, Inc. | 1.5 | |
| | 31.1 | |
| |
| Market Sectors (% of Fund's net assets) |
| |
| Information Technology | 28.4 | |
| Health Care | 13.6 | |
| Financials | 13.5 | |
| Consumer Discretionary | 9.8 | |
| Industrials | 9.3 | |
| Communication Services | 8.2 | |
| Consumer Staples | 5.8 | |
| Energy | 3.9 | |
| Materials | 2.7 | |
| Real Estate | 2.6 | |
| Utilities | 2.0 | |
| |
Asset Allocation (% of Fund's net assets) |
|
Futures - 0.2% |
|
Fidelity® Quality Factor ETF
Showing Percentage of Net Assets
| Common Stocks - 99.8% |
| | | Shares | Value ($) |
| COMMUNICATION SERVICES - 8.2% | | | |
| Diversified Telecommunication Services - 1.3% | | | |
| AT&T, Inc. | | 202,624 | 3,584,419 |
| Verizon Communications, Inc. | | 102,140 | 4,325,629 |
| | | | 7,910,048 |
| Interactive Media & Services - 6.0% | | | |
| Alphabet, Inc. Class A (a) | | 162,434 | 22,757,003 |
| Meta Platforms, Inc. Class A | | 34,901 | 13,616,276 |
| | | | 36,373,279 |
| Media - 0.9% | | | |
| Comcast Corp. Class A | | 89,520 | 4,166,261 |
| The Trade Desk, Inc. (a) | | 23,529 | 1,610,089 |
| | | | 5,776,350 |
TOTAL COMMUNICATION SERVICES | | | 50,059,677 |
| CONSUMER DISCRETIONARY - 9.8% | | | |
| Automobiles - 1.5% | | | |
| Tesla, Inc. (a) | | 49,435 | 9,258,681 |
| Hotels, Restaurants & Leisure - 3.9% | | | |
| Airbnb, Inc. Class A (a) | | 28,986 | 4,178,042 |
| Booking Holdings, Inc. (a) | | 1,662 | 5,829,415 |
| Domino's Pizza, Inc. | | 8,682 | 3,700,442 |
| McDonald's Corp. | | 21,266 | 6,224,984 |
| Yum! Brands, Inc. | | 28,088 | 3,637,115 |
| | | | 23,569,998 |
| Specialty Retail - 3.6% | | | |
| AutoZone, Inc. (a) | | 1,579 | 4,361,403 |
| Lowe's Companies, Inc. | | 22,651 | 4,821,039 |
| O'Reilly Automotive, Inc. (a) | | 4,365 | 4,465,613 |
| The Home Depot, Inc. | | 23,790 | 8,396,918 |
| | | | 22,044,973 |
| Textiles, Apparel & Luxury Goods - 0.8% | | | |
| NIKE, Inc. Class B | | 47,100 | 4,782,063 |
TOTAL CONSUMER DISCRETIONARY | | | 59,655,715 |
| CONSUMER STAPLES - 5.8% | | | |
| Beverages - 1.3% | | | |
| Monster Beverage Corp. | | 46,785 | 2,574,111 |
| The Coca-Cola Co. | | 87,290 | 5,192,882 |
| | | | 7,766,993 |
| Food Products - 0.4% | | | |
| The Hershey Co. | | 11,135 | 2,155,068 |
| Household Products - 2.9% | | | |
| Church & Dwight Co., Inc. | | 25,498 | 2,545,975 |
| Colgate-Palmolive Co. | | 38,845 | 3,270,749 |
| Kimberly-Clark Corp. | | 20,988 | 2,538,918 |
| Procter & Gamble Co. | | 45,576 | 7,161,813 |
| The Clorox Co. | | 14,376 | 2,088,114 |
| | | | 17,605,569 |
| Personal Care Products - 0.1% | | | |
| Kenvue, Inc. | | 35,600 | 739,056 |
| Tobacco - 1.1% | | | |
| Altria Group, Inc. | | 71,940 | 2,886,233 |
| Philip Morris International, Inc. | | 42,812 | 3,889,470 |
| | | | 6,775,703 |
TOTAL CONSUMER STAPLES | | | 35,042,389 |
| ENERGY - 3.9% | | | |
| Oil, Gas & Consumable Fuels - 3.9% | | | |
| Antero Midstream GP LP | | 98,028 | 1,199,863 |
| Cheniere Energy, Inc. | | 10,009 | 1,641,376 |
| Chevron Corp. | | 30,680 | 4,523,152 |
| ConocoPhillips Co. | | 26,100 | 2,919,807 |
| Coterra Energy, Inc. | | 50,179 | 1,248,454 |
| EOG Resources, Inc. | | 16,356 | 1,861,149 |
| Exxon Mobil Corp. | | 65,444 | 6,728,298 |
| Magnolia Oil & Gas Corp. Class A (b) | | 50,176 | 1,034,629 |
| Marathon Oil Corp. | | 51,232 | 1,170,651 |
| Texas Pacific Land Corp. | | 768 | 1,122,301 |
| | | | 23,449,680 |
| FINANCIALS - 13.5% | | | |
| Banks - 3.0% | | | |
| Cullen/Frost Bankers, Inc. | | 37,611 | 3,991,279 |
| East West Bancorp, Inc. | | 67,365 | 4,904,846 |
| First Citizens Bancshares, Inc. | | 2,824 | 4,264,240 |
| Popular, Inc. | | 55,377 | 4,731,965 |
| | | | 17,892,330 |
| Capital Markets - 4.4% | | | |
| Ameriprise Financial, Inc. | | 12,698 | 4,911,967 |
| Blackstone, Inc. | | 48,370 | 6,019,647 |
| CME Group, Inc. | | 24,504 | 5,043,903 |
| Moody's Corp. | | 13,911 | 5,453,668 |
| MSCI, Inc. | | 8,401 | 5,029,007 |
| | | | 26,458,192 |
| Financial Services - 3.3% | | | |
| MasterCard, Inc. Class A | | 21,526 | 9,670,125 |
| Visa, Inc. Class A | | 38,720 | 10,580,627 |
| | | | 20,250,752 |
| Insurance - 2.8% | | | |
| Aon PLC | | 15,311 | 4,569,262 |
| Kinsale Capital Group, Inc. | | 10,846 | 4,312,044 |
| Principal Financial Group, Inc. | | 53,170 | 4,205,747 |
| RLI Corp. | | 29,719 | 4,052,780 |
| | | | 17,139,833 |
TOTAL FINANCIALS | | | 81,741,107 |
| HEALTH CARE - 13.6% | | | |
| Biotechnology - 5.0% | | | |
| AbbVie, Inc. | | 52,538 | 8,637,247 |
| Amgen, Inc. | | 25,684 | 8,071,454 |
| Regeneron Pharmaceuticals, Inc. (a) | | 6,972 | 6,573,062 |
| Vertex Pharmaceuticals, Inc. (a) | | 15,717 | 6,811,433 |
| | | | 30,093,196 |
| Health Care Equipment & Supplies - 0.8% | | | |
| IDEXX Laboratories, Inc. (a) | | 9,489 | 4,887,594 |
| Health Care Providers & Services - 1.8% | | | |
| UnitedHealth Group, Inc. | | 21,105 | 10,800,273 |
| Life Sciences Tools & Services - 1.5% | | | |
| Medpace Holdings, Inc. (a) | | 16,784 | 4,893,879 |
| Mettler-Toledo International, Inc. (a) | | 3,644 | 4,362,560 |
| | | | 9,256,439 |
| Pharmaceuticals - 4.5% | | | |
| Eli Lilly & Co. | | 20,194 | 13,037,448 |
| Johnson & Johnson | | 55,889 | 8,880,762 |
| Zoetis, Inc. Class A | | 29,767 | 5,590,540 |
| | | | 27,508,750 |
TOTAL HEALTH CARE | | | 82,546,252 |
| INDUSTRIALS - 9.3% | | | |
| Aerospace & Defense - 0.6% | | | |
| Lockheed Martin Corp. | | 8,354 | 3,587,291 |
| Air Freight & Logistics - 1.0% | | | |
| Expeditors International of Washington, Inc. | | 21,095 | 2,664,931 |
| United Parcel Service, Inc. Class B | | 22,918 | 3,252,064 |
| | | | 5,916,995 |
| Commercial Services & Supplies - 1.1% | | | |
| Cintas Corp. | | 5,938 | 3,589,937 |
| Copart, Inc. | | 64,673 | 3,106,891 |
| | | | 6,696,828 |
| Electrical Equipment - 0.4% | | | |
| Atkore, Inc. | | 15,849 | 2,417,448 |
| Ground Transportation - 1.8% | | | |
| CSX Corp. | | 99,606 | 3,555,934 |
| Old Dominion Freight Lines, Inc. | | 6,953 | 2,718,762 |
| Union Pacific Corp. | | 18,604 | 4,538,074 |
| | | | 10,812,770 |
| Machinery - 1.8% | | | |
| Caterpillar, Inc. | | 15,433 | 4,634,684 |
| Illinois Tool Works, Inc. | | 13,224 | 3,450,142 |
| Otis Worldwide Corp. | | 32,031 | 2,832,822 |
| | | | 10,917,648 |
| Professional Services - 1.5% | | | |
| Automatic Data Processing, Inc. | | 15,172 | 3,728,974 |
| Paychex, Inc. | | 23,350 | 2,842,396 |
| Verisk Analytics, Inc. | | 12,241 | 2,956,569 |
| | | | 9,527,939 |
| Trading Companies & Distributors - 1.1% | | | |
| Fastenal Co. | | 49,353 | 3,367,355 |
| W.W. Grainger, Inc. | | 3,880 | 3,475,083 |
| | | | 6,842,438 |
TOTAL INDUSTRIALS | | | 56,719,357 |
| INFORMATION TECHNOLOGY - 28.4% | | | |
| Communications Equipment - 1.2% | | | |
| Cisco Systems, Inc. | | 139,467 | 6,998,454 |
| IT Services - 2.1% | | | |
| Accenture PLC Class A | | 22,624 | 8,232,421 |
| VeriSign, Inc. (a) | | 22,584 | 4,491,506 |
| | | | 12,723,927 |
| Semiconductors & Semiconductor Equipment - 6.1% | | | |
| Applied Materials, Inc. | | 41,589 | 6,833,073 |
| Broadcom, Inc. | | 10,707 | 12,634,260 |
| Lam Research Corp. | | 8,241 | 6,800,226 |
| Microchip Technology, Inc. | | 57,109 | 4,864,545 |
| Texas Instruments, Inc. | | 38,244 | 6,123,629 |
| | | | 37,255,733 |
| Software - 12.2% | | | |
| Adobe, Inc. (a) | | 14,739 | 9,105,459 |
| Autodesk, Inc. (a) | | 24,850 | 6,307,179 |
| Fair Isaac Corp. (a) | | 5,535 | 6,635,524 |
| Microsoft Corp. | | 115,016 | 45,728,066 |
| Qualys, Inc. (a) | | 32,648 | 6,176,022 |
| | | | 73,952,250 |
| Technology Hardware, Storage & Peripherals - 6.8% | | | |
| Apple, Inc. | | 224,896 | 41,470,822 |
TOTAL INFORMATION TECHNOLOGY | | | 172,401,186 |
| MATERIALS - 2.7% | | | |
| Chemicals - 1.7% | | | |
| CF Industries Holdings, Inc. | | 12,985 | 980,497 |
| Ecolab, Inc. | | 8,001 | 1,585,958 |
| Linde PLC | | 8,881 | 3,595,295 |
| LyondellBasell Industries NV Class A | | 12,159 | 1,144,405 |
| Olin Corp. | | 15,887 | 827,236 |
| Sherwin-Williams Co. | | 6,271 | 1,908,767 |
| | | | 10,042,158 |
| Construction Materials - 0.2% | | | |
| Eagle Materials, Inc. | | 4,976 | 1,125,969 |
| Containers & Packaging - 0.2% | | | |
| Packaging Corp. of America | | 6,630 | 1,099,784 |
| Metals & Mining - 0.6% | | | |
| Nucor Corp. | | 8,309 | 1,553,201 |
| Reliance Steel & Aluminum Co. | | 3,712 | 1,059,479 |
| Steel Dynamics, Inc. | | 10,145 | 1,224,400 |
| | | | 3,837,080 |
TOTAL MATERIALS | | | 16,104,991 |
| REAL ESTATE - 2.6% | | | |
| Equity Real Estate Investment Trusts (REITs) - 2.6% | | | |
| Alexandria Real Estate Equities, Inc. | | 9,254 | 1,118,809 |
| AvalonBay Communities, Inc. | | 6,653 | 1,190,954 |
| Equity Residential (SBI) | | 17,943 | 1,079,989 |
| Essex Property Trust, Inc. | | 4,436 | 1,034,786 |
| Extra Space Storage, Inc. | | 9,119 | 1,317,148 |
| Gaming & Leisure Properties | | 21,831 | 996,585 |
| Net Lease Office Properties | | 1,061 | 26,292 |
| Prologis, Inc. | | 19,621 | 2,485,784 |
| Public Storage | | 5,189 | 1,469,473 |
| SBA Communications Corp. Class A | | 5,386 | 1,205,710 |
| Simon Property Group, Inc. | | 11,809 | 1,636,845 |
| VICI Properties, Inc. | | 41,685 | 1,255,552 |
| WP Carey, Inc. | | 15,933 | 987,209 |
| | | | 15,805,136 |
| UTILITIES - 2.0% | | | |
| Electric Utilities - 0.8% | | | |
| FirstEnergy Corp. | | 43,064 | 1,579,588 |
| Hawaiian Electric Industries, Inc. | | 36,616 | 474,910 |
| NextEra Energy, Inc. | | 46,496 | 2,726,060 |
| | | | 4,780,558 |
| Gas Utilities - 0.4% | | | |
| National Fuel Gas Co. | | 26,057 | 1,228,848 |
| ONE Gas, Inc. (b) | | 17,730 | 1,088,090 |
| | | | 2,316,938 |
| Independent Power and Renewable Electricity Producers - 0.3% | | | |
| Vistra Corp. | | 52,200 | 2,141,766 |
| Multi-Utilities - 0.5% | | | |
| Public Service Enterprise Group, Inc. | | 28,457 | 1,650,221 |
| WEC Energy Group, Inc. | | 19,311 | 1,559,556 |
| | | | 3,209,777 |
TOTAL UTILITIES | | | 12,449,039 |
| TOTAL COMMON STOCKS (Cost $556,846,460) | | | 605,974,529 |
| | | | |
| Money Market Funds - 0.5% |
| | | Shares | Value ($) |
| Fidelity Cash Central Fund 5.39% (c) | | 2,250,317 | 2,250,767 |
| Fidelity Securities Lending Cash Central Fund 5.39% (c)(d) | | 992,926 | 993,025 |
| TOTAL MONEY MARKET FUNDS (Cost $3,243,792) | | | 3,243,792 |
| | | | |
| TOTAL INVESTMENT IN SECURITIES - 100.3% (Cost $560,090,252) | 609,218,321 |
NET OTHER ASSETS (LIABILITIES) - (0.3)% | (1,757,900) |
| NET ASSETS - 100.0% | 607,460,421 |
| | |
| Futures Contracts |
| | Number of contracts | Expiration Date | Notional Amount ($) | Value ($) | Unrealized Appreciation/ (Depreciation) ($) |
| Purchased | | | | | |
| | | | | | |
| Equity Index Contracts | | | | | |
| CME E-mini S&P 500 Index Contracts (United States) | 56 | Mar 2024 | 1,363,740 | 30,912 | 30,912 |
| | | | | | |
| The notional amount of futures purchased as a percentage of Net Assets is 0.2% |
Legend
| (b) | Security or a portion of the security is on loan at period end. |
| (c) | Affiliated fund that is generally available only to investment companies and other accounts managed by Fidelity Investments. The rate quoted is the annualized seven-day yield of the fund at period end. A complete unaudited listing of the fund's holdings as of its most recent quarter end is available upon request. In addition, each Fidelity Central Fund's financial statements are available on the SEC's website or upon request. |
| (d) | Investment made with cash collateral received from securities on loan. |
Affiliated Central Funds
Fiscal year to date information regarding the Fund's investments in Fidelity Central Funds, including the ownership percentage, is presented below.
| Affiliate | Value, beginning of period ($) | Purchases ($) | Sales Proceeds ($) | Dividend Income ($) | Realized Gain (loss) ($) | Change in Unrealized appreciation (depreciation) ($) | Value, end of period ($) | % ownership, end of period |
| Fidelity Cash Central Fund 5.39% | 508,828 | 9,835,454 | 8,093,515 | 16,067 | - | - | 2,250,767 | 0.0% |
| Fidelity Securities Lending Cash Central Fund 5.39% | 162,000 | 13,753,395 | 12,922,370 | 4,511 | - | - | 993,025 | 0.0% |
| Total | 670,828 | 23,588,849 | 21,015,885 | 20,578 | - | - | 3,243,792 | |
| | | | | | | | | |
Amounts in the dividend income column in the above table include any capital gain distributions from underlying funds, which are presented in the corresponding line item in the Statement of Operations, if applicable.
Amounts in the dividend income column for Fidelity Securities Lending Cash Central Fund represents the income earned on investing cash collateral, less rebates paid to borrowers and any lending agent fees associated with the loan, plus any premium payments received for lending certain types of securities.
Amounts included in the purchases and sales proceeds columns may include in-kind transactions, if applicable.
Investment Valuation
The following is a summary of the inputs used, as of January 31, 2024, involving the Fund's assets and liabilities carried at fair value. The inputs or methodology used for valuing securities may not be an indication of the risk associated with investing in those securities. For more information on valuation inputs, and their aggregation into the levels used below, please refer to the Investment Valuation section in the accompanying Notes to Financial Statements.
| Valuation Inputs at Reporting Date: |
| Description | Total ($) | Level 1 ($) | Level 2 ($) | Level 3 ($) |
Investments in Securities: | | | | |
|
| Equities: | | | | |
Communication Services | 50,059,677 | 50,059,677 | - | - |
Consumer Discretionary | 59,655,715 | 59,655,715 | - | - |
Consumer Staples | 35,042,389 | 35,042,389 | - | - |
Energy | 23,449,680 | 23,449,680 | - | - |
Financials | 81,741,107 | 81,741,107 | - | - |
Health Care | 82,546,252 | 82,546,252 | - | - |
Industrials | 56,719,357 | 56,719,357 | - | - |
Information Technology | 172,401,186 | 172,401,186 | - | - |
Materials | 16,104,991 | 16,104,991 | - | - |
Real Estate | 15,805,136 | 15,805,136 | - | - |
Utilities | 12,449,039 | 12,449,039 | - | - |
|
| Money Market Funds | 3,243,792 | 3,243,792 | - | - |
| Total Investments in Securities: | 609,218,321 | 609,218,321 | - | - |
Derivative Instruments: Assets | | | | |
Futures Contracts | 30,912 | 30,912 | - | - |
| Total Assets | 30,912 | 30,912 | - | - |
| Total Derivative Instruments: | 30,912 | 30,912 | - | - |
Value of Derivative Instruments
The following table is a summary of the Fund's value of derivative instruments by primary risk exposure as of January 31, 2024. For additional information on derivative instruments, please refer to the Derivative Instruments section in the accompanying Notes to Financial Statements.
Primary Risk Exposure / Derivative Type | Value |
| Asset ($) | Liability ($) |
| Equity Risk | | |
Futures Contracts (a) | 30,912 | 0 |
| Total Equity Risk | 30,912 | 0 |
| Total Value of Derivatives | 30,912 | 0 |
(a)Reflects gross cumulative appreciation (depreciation) on futures contracts as presented in the Schedule of Investments. In the Statement of Assets and Liabilities, the period end daily variation margin is included in receivable or payable for daily variation margin on futures contracts, and the net cumulative appreciation (depreciation) is included in Total accumulated earnings (loss).
Fidelity® Quality Factor ETF
| Statement of Assets and Liabilities |
| | | | January 31, 2024 (Unaudited) |
| | | | | |
| Assets | | | | |
| Investment in securities, at value (including securities loaned of $956,041) - See accompanying schedule: | | | | |
Unaffiliated issuers (cost $556,846,460) | $ | 605,974,529 | | |
Fidelity Central Funds (cost $3,243,792) | | 3,243,792 | | |
| | | | | |
| | | | | |
| Total Investment in Securities (cost $560,090,252) | | | $ | 609,218,321 |
| Segregated cash with brokers for derivative instruments | | | | 83,780 |
| Cash | | | | 1,499,707 |
| Receivable for fund shares sold | | | | 5,564,864 |
| Dividends receivable | | | | 372,921 |
| Distributions receivable from Fidelity Central Funds | | | | 4,597 |
| Other receivables | | | | 20 |
Total assets | | | | 616,744,210 |
| Liabilities | | | | |
| Payable for investments purchased | $ | 8,212,791 | | |
| Accrued management fee | | 55,433 | | |
| Payable for daily variation margin on futures contracts | | 22,540 | | |
| Collateral on securities loaned | | 993,025 | | |
| Total Liabilities | | | | 9,283,789 |
| Net Assets | | | $ | 607,460,421 |
| Net Assets consist of: | | | | |
| Paid in capital | | | $ | 587,231,619 |
| Total accumulated earnings (loss) | | | | 20,228,802 |
| Net Assets | | | $ | 607,460,421 |
Net Asset Value, offering price and redemption price per share ($607,460,421 ÷ 11,100,000 shares) | | | $ | 54.73 |
| Statement of Operations |
| | | | Six months ended January 31, 2024 (Unaudited) |
| Investment Income | | | | |
| Dividends | | | $ | 2,868,127 |
| Income from Fidelity Central Funds (including $4,511 from security lending) | | | | 20,578 |
| Total Income | | | | 2,888,705 |
| Expenses | | | | |
| Management fee | $ | 374,129 | | |
| Independent trustees' fees and expenses | | 944 | | |
| Total expenses before reductions | | 375,073 | | |
| Expense reductions | | (239) | | |
| Total expenses after reductions | | | | 374,834 |
| Net Investment income (loss) | | | | 2,513,871 |
| Realized and Unrealized Gain (Loss) | | | | |
| Net realized gain (loss) on: | | | | |
| Investment Securities: | | | | |
| Unaffiliated issuers | | (6,332,596) | | |
| Redemptions in-kind | | 1,026,844 | | |
| Futures contracts | | 56,097 | | |
| Total net realized gain (loss) | | | | (5,249,655) |
| Change in net unrealized appreciation (depreciation) on: | | | | |
| Investment Securities: | | | | |
| Unaffiliated issuers | | 20,992,768 | | |
| Futures contracts | | (5,667) | | |
| Total change in net unrealized appreciation (depreciation) | | | | 20,987,101 |
| Net gain (loss) | | | | 15,737,446 |
| Net increase (decrease) in net assets resulting from operations | | | $ | 18,251,317 |
| Statement of Changes in Net Assets |
| |
| | Six months ended January 31, 2024 (Unaudited) | | Year ended July 31, 2023 |
| Increase (Decrease) in Net Assets | | | | |
| Operations | | | | |
| Net investment income (loss) | $ | 2,513,871 | $ | 4,196,290 |
| Net realized gain (loss) | | (5,249,655) | | 1,048,219 |
| Change in net unrealized appreciation (depreciation) | | 20,987,101 | | 25,942,533 |
| Net increase (decrease) in net assets resulting from operations | | 18,251,317 | | 31,187,042 |
| Distributions to shareholders | | (2,364,450) | | (4,025,350) |
| | | | | |
| Share transactions | | | | |
| Proceeds from sales of shares | | 269,658,325 | | 68,034,031 |
| Cost of shares redeemed | | (4,927,310) | | (35,066,993) |
| | | | | |
Net increase (decrease) in net assets resulting from share transactions | | 264,731,015 | | 32,967,038 |
| Total increase (decrease) in net assets | | 280,617,882 | | 60,128,730 |
| | | | | |
| Net Assets | | | | |
| Beginning of period | | 326,842,539 | | 266,713,809 |
| End of period | $ | 607,460,421 | $ | 326,842,539 |
| | | | | |
| Other Information | | | | |
| Shares | | | | |
| Sold | | 4,950,000 | | 1,450,000 |
| Redeemed | | (100,000) | | (750,000) |
| Net increase (decrease) | | 4,850,000 | | 700,000 |
| | | | | |
Financial Highlights
| Fidelity® Quality Factor ETF |
| |
| | Six months ended (Unaudited) January 31, 2024 | | Years ended July 31, 2023 | | 2022 | | 2021 | | 2020 | | 2019 |
Selected Per-Share Data | | | | | | | | | | | | |
| Net asset value, beginning of period | $ | 52.29 | $ | 48.06 | $ | 51.19 | $ | 38.19 | $ | 35.28 | $ | 33.47 |
| Income from Investment Operations | | | | | | | | | | | | |
Net investment income (loss) A,B | | .37 | | .72 | | .67 | | .62 | | .62 | | .58 |
| Net realized and unrealized gain (loss) | | 2.43 | | 4.20 | | (3.10) | | 13.00 | | 2.90 | | 1.77 |
| Total from investment operations | | 2.80 | | 4.92 | | (2.43) | | 13.62 | | 3.52 | | 2.35 |
| Distributions from net investment income | | (.36) | | (.69) | | (.70) | | (.62) | | (.61) | | (.54) |
| Total distributions | | (.36) | | (.69) | | (.70) | | (.62) | | (.61) | | (.54) |
| Net asset value, end of period | $ | 54.73 | $ | 52.29 | $ | 48.06 | $ | 51.19 | $ | 38.19 | $ | 35.28 |
Total Return C,D,E | | 5.36% | | 10.46% | | (4.79)% | | 36.00% | | 10.26% | | 7.14% |
Ratios to Average Net Assets B,F,G | | | | | | | | | | | | |
| Expenses before reductions | | .21% H | | .29% | | .29% | | .29% | | .29% | | .29% |
| Expenses net of fee waivers, if any | | .21% H | | .29% | | .29% | | .29% | | .29% | | .29% |
| Expenses net of all reductions | | .21% H | | .29% | | .29% | | .29% | | .29% | | .29% |
| Net investment income (loss) | | 1.43% H | | 1.54% | | 1.33% | | 1.39% | | 1.74% | | 1.72% |
| Supplemental Data | | | | | | | | | | | | |
| Net assets, end of period (000 omitted) | $ | 607,460 | $ | 326,843 | $ | 266,714 | $ | 245,721 | $ | 147,022 | $ | 162,282 |
Portfolio turnover rate I,J | | 35% H | | 43% | | 38% | | 35% | | 41% | | 29% |
ACalculated based on average shares outstanding during the period.
BNet investment income (loss) is affected by the timing of the declaration of dividends by any underlying mutual funds or exchange-traded funds (ETFs). Net investment income (loss) of any mutual funds or ETFs is not included in the Fund's net investment income (loss) ratio.
CTotal returns for periods of less than one year are not annualized.
DTotal returns would have been lower if certain expenses had not been reduced during the applicable periods shown.
EBased on net asset value.
FFees and expenses of any underlying mutual funds or exchange-traded funds (ETFs) are not included in the Fund's expense ratio. The Fund indirectly bears its proportionate share of these expenses. For additional expense information related to investments in Fidelity Central Funds, please refer to the "Investments in Fidelity Central Funds" note found in the Notes to Financial Statements section of the most recent Annual or Semi-Annual report.
GExpense ratios reflect operating expenses of the class. Expenses before reductions do not reflect amounts reimbursed, waived, or reduced through arrangements with the investment adviser, brokerage services, or other offset arrangements, if applicable, and do not represent the amount paid by the class during periods when reimbursements, waivers or reductions occur.
HAnnualized.
IPortfolio turnover rate excludes securities received or delivered in-kind.
JAmount does not include the portfolio activity of any underlying mutual funds or exchange-traded funds (ETFs).
Top Holdings (% of Fund's net assets) |
| |
| Super Micro Computer, Inc. | 0.6 | |
| Builders FirstSource, Inc. | 0.5 | |
| Deckers Outdoor Corp. | 0.5 | |
| First Citizens Bancshares, Inc. | 0.4 | |
| Booz Allen Hamilton Holding Corp. Class A | 0.4 | |
| Hubbell, Inc. Class B | 0.4 | |
| Jabil, Inc. | 0.4 | |
| Neurocrine Biosciences, Inc. | 0.4 | |
| Manhattan Associates, Inc. | 0.4 | |
| Carlisle Companies, Inc. | 0.4 | |
| | 4.4 | |
| |
| Market Sectors (% of Fund's net assets) |
| |
| Industrials | 20.6 | |
| Financials | 16.8 | |
| Consumer Discretionary | 14.5 | |
| Information Technology | 12.0 | |
| Health Care | 10.8 | |
| Real Estate | 6.3 | |
| Materials | 5.1 | |
| Energy | 5.0 | |
| Consumer Staples | 3.6 | |
| Communication Services | 2.7 | |
| Utilities | 2.4 | |
| |
Asset Allocation (% of Fund's net assets) |
|
Futures - 0.1% |
|
Fidelity® Small-Mid Multifactor ETF
Showing Percentage of Net Assets
| Common Stocks - 99.8% |
| | | Shares | Value ($) |
| COMMUNICATION SERVICES - 2.7% | | | |
| Diversified Telecommunication Services - 0.4% | | | |
| Cogent Communications Group, Inc. | | 3,960 | 305,712 |
| EchoStar Holding Corp. Class A (a)(b) | | 9,520 | 127,473 |
| GCI Liberty, Inc. Class A (Escrow) (c) | | 869 | 0 |
| Iridium Communications, Inc. | | 6,711 | 243,341 |
| | | | 676,526 |
| Entertainment - 0.4% | | | |
| Madison Square Garden Sports Corp. (a) | | 1,251 | 231,560 |
| Playtika Holding Corp. (a) | | 16,861 | 121,736 |
| TKO Group Holdings, Inc. | | 2,725 | 228,055 |
| | | | 581,351 |
| Interactive Media & Services - 0.5% | | | |
| Shutterstock, Inc. (b) | | 4,417 | 207,466 |
| Yelp, Inc. (a) | | 5,779 | 252,716 |
| Ziff Davis, Inc. (a) | | 3,541 | 238,663 |
| | | | 698,845 |
| Media - 1.3% | | | |
| Integral Ad Science Holding Corp. (a) | | 9,860 | 143,463 |
| News Corp. Class A | | 22,001 | 542,105 |
| Nexstar Media Group, Inc. Class A | | 1,908 | 339,071 |
| Scholastic Corp. | | 4,517 | 173,633 |
| TEGNA, Inc. | | 15,662 | 244,171 |
| The New York Times Co. Class A | | 8,522 | 413,828 |
| Thryv Holdings, Inc. (a) | | 7,536 | 154,036 |
| | | | 2,010,307 |
| Wireless Telecommunication Services - 0.1% | | | |
| Spok Holdings, Inc. | | 12,732 | 210,842 |
TOTAL COMMUNICATION SERVICES | | | 4,177,871 |
| CONSUMER DISCRETIONARY - 14.5% | | | |
| Automobile Components - 1.2% | | | |
| Autoliv, Inc. | | 3,429 | 367,314 |
| BorgWarner, Inc. | | 9,654 | 327,271 |
| Dorman Products, Inc. (a) | | 2,261 | 184,068 |
| Gentex Corp. | | 10,367 | 343,459 |
| Lear Corp. | | 2,478 | 329,326 |
| Patrick Industries, Inc. | | 2,156 | 216,441 |
| Standard Motor Products, Inc. | | 4,116 | 166,081 |
| | | | 1,933,960 |
| Automobiles - 0.5% | | | |
| Harley-Davidson, Inc. | | 7,172 | 232,731 |
| Thor Industries, Inc. | | 2,637 | 298,034 |
| Winnebago Industries, Inc. | | 2,810 | 184,673 |
| | | | 715,438 |
| Broadline Retail - 0.1% | | | |
| Dillard's, Inc. Class A | | 485 | 187,826 |
| Diversified Consumer Services - 1.8% | | | |
| Adtalem Global Education, Inc. (a) | | 4,193 | 211,663 |
| Duolingo, Inc. (a) | | 1,723 | 308,227 |
| Frontdoor, Inc. (a) | | 5,827 | 190,893 |
| Graham Holdings Co. | | 328 | 236,291 |
| Grand Canyon Education, Inc. (a) | | 2,075 | 270,974 |
| H&R Block, Inc. | | 8,070 | 377,999 |
| Perdoceo Education Corp. | | 11,389 | 206,141 |
| Service Corp. International | | 6,229 | 418,090 |
| Strategic Education, Inc. | | 2,371 | 223,016 |
| Stride, Inc. (a) | | 4,518 | 270,854 |
| | | | 2,714,148 |
| Hotels, Restaurants & Leisure - 2.4% | | | |
| Bloomin' Brands, Inc. | | 7,671 | 204,202 |
| Boyd Gaming Corp. | | 4,079 | 258,976 |
| Choice Hotels International, Inc. (b) | | 1,775 | 214,988 |
| Churchill Downs, Inc. | | 2,928 | 354,200 |
| Chuy's Holdings, Inc. (a) | | 3,870 | 130,845 |
| Hyatt Hotels Corp. Class A | | 2,487 | 319,256 |
| Jack in the Box, Inc. | | 1,969 | 153,523 |
| Monarch Casino & Resort, Inc. | | 2,361 | 162,744 |
| Texas Roadhouse, Inc. Class A | | 3,067 | 385,583 |
| Travel+Leisure Co. | | 5,488 | 221,825 |
| Vail Resorts, Inc. | | 1,688 | 374,736 |
| Wendy's Co. | | 10,769 | 205,473 |
| Wingstop, Inc. | | 1,629 | 457,928 |
| Wyndham Hotels & Resorts, Inc. | | 4,123 | 321,305 |
| | | | 3,765,584 |
| Household Durables - 3.3% | | | |
| Beazer Homes U.S.A., Inc. (a) | | 4,842 | 153,734 |
| Cavco Industries, Inc. (a) | | 702 | 233,008 |
| Century Communities, Inc. | | 2,566 | 222,472 |
| Ethan Allen Interiors, Inc. (b) | | 4,358 | 126,949 |
| Green Brick Partners, Inc. (a) | | 3,323 | 173,361 |
| Installed Building Products, Inc. (b) | | 1,526 | 297,341 |
| KB Home | | 4,699 | 280,013 |
| La-Z-Boy, Inc. | | 5,145 | 179,097 |
| M.D.C. Holdings, Inc. | | 4,309 | 269,657 |
| M/I Homes, Inc. (a) | | 2,169 | 276,374 |
| Meritage Homes Corp. | | 1,928 | 319,296 |
| Mohawk Industries, Inc. (a) | | 2,726 | 284,186 |
| Skyline Champion Corp. (a) | | 3,493 | 239,201 |
| Taylor Morrison Home Corp. (a) | | 5,816 | 303,246 |
| Tempur Sealy International, Inc. | | 7,629 | 380,611 |
| Toll Brothers, Inc. | | 4,541 | 451,148 |
| TopBuild Corp. (a) | | 1,341 | 495,003 |
| TRI Pointe Homes, Inc. (a) | | 7,112 | 245,577 |
| Worthington Enterprises, Inc. | | 2,644 | 150,814 |
| | | | 5,081,088 |
| Leisure Products - 0.7% | | | |
| Brunswick Corp. | | 3,528 | 284,639 |
| Malibu Boats, Inc. Class A (a) | | 2,961 | 123,622 |
| MasterCraft Boat Holdings, Inc. (a) | | 5,196 | 100,647 |
| Polaris, Inc. | | 2,474 | 222,561 |
| Sturm, Ruger & Co., Inc. | | 2,896 | 126,439 |
| Vista Outdoor, Inc. (a) | | 6,020 | 168,981 |
| | | | 1,026,889 |
| Specialty Retail - 3.0% | | | |
| Abercrombie & Fitch Co. Class A (a) | | 4,806 | 489,731 |
| Academy Sports & Outdoors, Inc. | | 4,400 | 276,012 |
| Asbury Automotive Group, Inc. (a) | | 1,185 | 247,736 |
| AutoNation, Inc. (a) | | 1,698 | 237,143 |
| Dick's Sporting Goods, Inc. | | 2,606 | 388,476 |
| Five Below, Inc. (a) | | 2,201 | 394,991 |
| Group 1 Automotive, Inc. | | 884 | 229,893 |
| Haverty Furniture Companies, Inc. | | 4,292 | 145,499 |
| Murphy U.S.A., Inc. | | 999 | 352,167 |
| Penske Automotive Group, Inc. | | 1,430 | 212,169 |
| The Aaron's Co., Inc. | | 11,032 | 113,519 |
| The Buckle, Inc. | | 4,533 | 168,582 |
| Upbound Group, Inc. | | 5,493 | 182,368 |
| Urban Outfitters, Inc. (a) | | 5,238 | 199,044 |
| Valvoline, Inc. (a) | | 7,461 | 272,252 |
| Williams-Sonoma, Inc. | | 2,754 | 532,596 |
| Winmark Corp. | | 448 | 161,580 |
| | | | 4,603,758 |
| Textiles, Apparel & Luxury Goods - 1.5% | | | |
| Crocs, Inc. (a) | | 2,997 | 304,136 |
| Deckers Outdoor Corp. (a) | | 970 | 731,118 |
| Kontoor Brands, Inc. | | 4,158 | 243,742 |
| Ralph Lauren Corp. | | 2,135 | 306,735 |
| Skechers U.S.A., Inc. Class A (sub. vtg.) (a) | | 6,177 | 385,692 |
| Tapestry, Inc. | | 9,483 | 367,846 |
| | | | 2,339,269 |
TOTAL CONSUMER DISCRETIONARY | | | 22,367,960 |
| CONSUMER STAPLES - 3.6% | | | |
| Beverages - 0.6% | | | |
| Coca-Cola Bottling Co. Consolidated | | 330 | 284,259 |
| Molson Coors Beverage Co. Class B | | 7,347 | 453,971 |
| The Vita Coco Co., Inc. (a) | | 6,553 | 129,029 |
| | | | 867,259 |
| Consumer Staples Distribution & Retail - 0.6% | | | |
| Casey's General Stores, Inc. | | 1,613 | 437,704 |
| Ingles Markets, Inc. Class A | | 2,112 | 177,936 |
| Sprouts Farmers Market LLC (a) | | 6,579 | 331,384 |
| | | | 947,024 |
| Food Products - 1.4% | | | |
| Cal-Maine Foods, Inc. (b) | | 4,141 | 229,494 |
| Campbell Soup Co. | | 8,699 | 388,236 |
| Flowers Foods, Inc. | | 11,054 | 252,031 |
| Ingredion, Inc. | | 3,114 | 334,973 |
| John B. Sanfilippo & Son, Inc. | | 1,577 | 168,944 |
| Lancaster Colony Corp. | | 1,290 | 237,076 |
| Seaboard Corp. | | 45 | 162,135 |
| Sovos Brands, Inc. (a) | | 9,312 | 205,330 |
| Tootsie Roll Industries, Inc. | | 4,687 | 152,749 |
| | | | 2,130,968 |
| Household Products - 0.2% | | | |
| WD-40 Co. (b) | | 1,004 | 260,016 |
| Personal Care Products - 0.7% | | | |
| BellRing Brands, Inc. (a) | | 7,742 | 427,900 |
| elf Beauty, Inc. (a) | | 2,503 | 399,304 |
| Inter Parfums, Inc. | | 1,485 | 206,638 |
| USANA Health Sciences, Inc. (a) | | 2,495 | 116,816 |
| | | | 1,150,658 |
| Tobacco - 0.1% | | | |
| Vector Group Ltd. | | 14,538 | 152,213 |
TOTAL CONSUMER STAPLES | | | 5,508,138 |
| ENERGY - 5.0% | | | |
| Energy Equipment & Services - 0.9% | | | |
| Cactus, Inc. | | 4,620 | 196,073 |
| Championx Corp. | | 9,583 | 262,670 |
| TechnipFMC PLC | | 20,214 | 390,939 |
| Tidewater, Inc. (a) | | 3,635 | 244,236 |
| Weatherford International PLC (a) | | 3,568 | 319,514 |
| | | | 1,413,432 |
| Oil, Gas & Consumable Fuels - 4.1% | | | |
| Ardmore Shipping Corp. | | 11,408 | 189,031 |
| California Resources Corp. | | 4,795 | 228,626 |
| Chesapeake Energy Corp. (b) | | 4,651 | 358,639 |
| Chord Energy Corp. | | 2,115 | 325,202 |
| Civitas Resources, Inc. | | 3,359 | 217,697 |
| CNX Resources Corp. (a) | | 11,380 | 229,876 |
| CONSOL Energy, Inc. | | 2,941 | 278,219 |
| Crescent Energy, Inc. Class A (b) | | 13,326 | 147,252 |
| CVR Energy, Inc. (b) | | 4,746 | 160,083 |
| Dorian LPG Ltd. (b) | | 6,090 | 228,010 |
| DT Midstream, Inc. | | 5,402 | 290,033 |
| Evolution Petroleum Corp. (b) | | 15,558 | 87,280 |
| Gulfport Energy Corp. (a) | | 1,731 | 219,664 |
| HF Sinclair Corp. | | 6,274 | 354,418 |
| International Seaways, Inc. | | 4,451 | 238,752 |
| Magnolia Oil & Gas Corp. Class A | | 11,107 | 229,026 |
| Par Pacific Holdings, Inc. (a) | | 6,068 | 222,028 |
| PBF Energy, Inc. Class A | | 6,204 | 313,364 |
| Peabody Energy Corp. | | 9,938 | 265,345 |
| Rex American Resources Corp. (a) | | 4,344 | 179,798 |
| Scorpio Tankers, Inc. | | 4,417 | 312,282 |
| Southwestern Energy Co. (a) | | 52,490 | 338,561 |
| Teekay Corp. (a) | | 23,869 | 214,582 |
| Teekay Tankers Ltd. | | 3,948 | 246,947 |
| Texas Pacific Land Corp. | | 259 | 378,484 |
| | | | 6,253,199 |
TOTAL ENERGY | | | 7,666,631 |
| FINANCIALS - 16.8% | | | |
| Banks - 5.0% | | | |
| Amalgamated Financial Corp. | | 7,840 | 208,230 |
| Associated Banc-Corp. | | 11,939 | 250,838 |
| Axos Financial, Inc. (a) | | 4,619 | 256,031 |
| Bancorp, Inc., Delaware (a) | | 5,131 | 223,917 |
| Bank OZK | | 6,331 | 285,591 |
| Cathay General Bancorp | | 5,765 | 237,345 |
| City Holding Co. | | 1,881 | 192,257 |
| East West Bancorp, Inc. | | 6,287 | 457,756 |
| Enterprise Financial Services Corp. | | 4,521 | 188,209 |
| Esquire Financial Holdings, Inc. (b) | | 3,022 | 150,677 |
| First Citizens Bancshares, Inc. | | 424 | 640,240 |
| First Commonwealth Financial Corp. | | 12,878 | 180,421 |
| First Financial Corp., Indiana | | 4,021 | 158,508 |
| FNB Corp., Pennsylvania | | 21,097 | 278,058 |
| Fulton Financial Corp. | | 14,465 | 225,509 |
| Hanmi Financial Corp. | | 8,465 | 141,789 |
| HomeTrust Bancshares, Inc. | | 6,286 | 170,665 |
| Independent Bank Corp. | | 7,516 | 191,207 |
| International Bancshares Corp. | | 4,364 | 230,681 |
| Midland States Bancorp, Inc. | | 6,657 | 174,813 |
| New York Community Bancorp, Inc. | | 30,284 | 195,937 |
| OFG Bancorp | | 5,639 | 207,346 |
| Old Second Bancorp, Inc. | | 9,775 | 133,136 |
| Pathward Financial, Inc. | | 3,506 | 181,541 |
| Popular, Inc. | | 3,952 | 337,698 |
| Preferred Bank, Los Angeles | | 2,504 | 179,887 |
| S&T Bancorp, Inc. (b) | | 5,566 | 185,570 |
| Synovus Financial Corp. | | 8,375 | 315,403 |
| Trustco Bank Corp., New York | | 5,204 | 150,396 |
| Univest Corp. of Pennsylvania | | 8,129 | 172,660 |
| Webster Financial Corp. | | 8,001 | 395,889 |
| WesBanco, Inc. | | 6,914 | 202,857 |
| Westamerica Bancorp. | | 3,645 | 173,939 |
| | | | 7,675,001 |
| Capital Markets - 3.1% | | | |
| Affiliated Managers Group, Inc. | | 2,044 | 304,229 |
| Artisan Partners Asset Management, Inc. | | 5,645 | 236,526 |
| Assetmark Financial Holdings, Inc. (a) | | 5,533 | 169,697 |
| BrightSphere Investment Group, Inc. | | 8,012 | 177,225 |
| Evercore, Inc. Class A | | 2,017 | 346,379 |
| Federated Hermes, Inc. | | 6,631 | 231,820 |
| Franklin Resources, Inc. | | 12,926 | 344,219 |
| GCM Grosvenor, Inc. Class A | | 19,015 | 165,240 |
| Hamilton Lane, Inc. Class A | | 2,577 | 298,777 |
| Houlihan Lokey | | 2,824 | 338,259 |
| Interactive Brokers Group, Inc. | | 4,415 | 391,831 |
| Janus Henderson Group PLC | | 9,061 | 260,594 |
| Oppenheimer Holdings, Inc. Class A (non-vtg.) | | 3,897 | 145,670 |
| SEI Investments Co. | | 5,105 | 322,840 |
| Stifel Financial Corp. | | 5,212 | 380,215 |
| Tradeweb Markets, Inc. Class A | | 4,900 | 467,411 |
| Victory Capital Holdings, Inc. | | 5,127 | 172,934 |
| | | | 4,753,866 |
| Consumer Finance - 1.5% | | | |
| Ally Financial, Inc. | | 13,342 | 489,385 |
| Bread Financial Holdings, Inc. (b) | | 5,019 | 182,039 |
| Credit Acceptance Corp. (a)(b) | | 456 | 246,728 |
| Enova International, Inc. (a) | | 3,519 | 191,539 |
| FirstCash Holdings, Inc. | | 2,456 | 281,875 |
| Green Dot Corp. Class A (a) | | 8,797 | 79,261 |
| Navient Corp. | | 10,555 | 181,757 |
| Nelnet, Inc. Class A | | 1,915 | 166,854 |
| OneMain Holdings, Inc. | | 6,477 | 308,305 |
| PROG Holdings, Inc. (a) | | 4,992 | 152,955 |
| | | | 2,280,698 |
| Financial Services - 2.1% | | | |
| A-Mark Precious Metals, Inc. (b) | | 4,206 | 113,436 |
| Cass Information Systems, Inc. | | 4,160 | 179,546 |
| Enact Holdings, Inc. | | 5,826 | 165,983 |
| Essent Group Ltd. | | 5,762 | 317,832 |
| Euronet Worldwide, Inc. (a) | | 2,959 | 294,864 |
| EVERTEC, Inc. | | 5,355 | 215,057 |
| Federal Agricultural Mortgage Corp. Class C (non-vtg.) | | 1,119 | 208,459 |
| Jackson Financial, Inc. | | 6,057 | 303,274 |
| MGIC Investment Corp. | | 15,987 | 317,182 |
| NMI Holdings, Inc. (a) | | 7,207 | 230,047 |
| Radian Group, Inc. | | 9,518 | 275,832 |
| The Western Union Co. | | 22,344 | 280,864 |
| Voya Financial, Inc. | | 4,633 | 335,290 |
| | | | 3,237,666 |
| Insurance - 5.1% | | | |
| American Equity Investment Life Holding Co. (a) | | 4,454 | 245,905 |
| American Financial Group, Inc. | | 3,186 | 383,594 |
| Amerisafe, Inc. | | 3,190 | 158,990 |
| Assurant, Inc. | | 2,488 | 417,860 |
| Axis Capital Holdings Ltd. | | 4,652 | 276,887 |
| CNO Financial Group, Inc. | | 8,887 | 241,549 |
| Employers Holdings, Inc. | | 4,363 | 182,024 |
| Erie Indemnity Co. Class A | | 1,224 | 423,296 |
| First American Financial Corp. | | 5,179 | 312,553 |
| Genworth Financial, Inc. Class A (a) | | 37,190 | 229,462 |
| Globe Life, Inc. | | 3,700 | 454,434 |
| Hanover Insurance Group, Inc. | | 2,262 | 298,607 |
| Kinsale Capital Group, Inc. | | 979 | 389,221 |
| Loews Corp. | | 7,441 | 542,151 |
| National Western Life Group, Inc. | | 399 | 193,116 |
| Old Republic International Corp. | | 12,623 | 353,949 |
| Primerica, Inc. | | 1,664 | 389,642 |
| Reinsurance Group of America, Inc. | | 2,847 | 495,065 |
| RenaissanceRe Holdings Ltd. | | 2,118 | 484,662 |
| RLI Corp. | | 2,160 | 294,559 |
| Selective Insurance Group, Inc. | | 3,064 | 321,291 |
| Siriuspoint Ltd. (a) | | 16,585 | 195,703 |
| Unum Group | | 7,965 | 385,028 |
| White Mountains Insurance Group Ltd. | | 160 | 252,155 |
| | | | 7,921,703 |
TOTAL FINANCIALS | | | 25,868,934 |
| HEALTH CARE - 10.8% | | | |
| Biotechnology - 3.0% | | | |
| ACADIA Pharmaceuticals, Inc. (a) | | 8,797 | 227,930 |
| ADMA Biologics, Inc. (a) | | 41,891 | 217,414 |
| Akero Therapeutics, Inc. (a) | | 4,437 | 95,884 |
| Alkermes PLC (a) | | 9,989 | 270,202 |
| Arcellx, Inc. (a) | | 5,208 | 322,063 |
| Catalyst Pharmaceutical Partners, Inc. (a) | | 13,737 | 197,813 |
| Exelixis, Inc. (a) | | 16,105 | 350,445 |
| Ironwood Pharmaceuticals, Inc. Class A (a) | | 17,288 | 245,317 |
| Kiniksa Pharmaceuticals Ltd. (a) | | 8,703 | 153,434 |
| Krystal Biotech, Inc. (a) | | 1,793 | 199,471 |
| Morphic Holding, Inc. (a) | | 3,601 | 114,116 |
| Mural Oncology PLC | | 980 | 4,302 |
| Neurocrine Biosciences, Inc. (a) | | 4,137 | 578,228 |
| Prothena Corp. PLC (a) | | 3,381 | 95,987 |
| Repligen Corp. (a) | | 2,312 | 437,893 |
| United Therapeutics Corp. (a) | | 1,923 | 413,022 |
| Vaxcyte, Inc. (a) | | 5,173 | 369,456 |
| Viking Therapeutics, Inc. (a) | | 13,557 | 327,266 |
| | | | 4,620,243 |
| Health Care Equipment & Supplies - 2.9% | | | |
| Atrion Corp. | | 316 | 107,440 |
| CONMED Corp. | | 2,154 | 205,922 |
| Dentsply Sirona, Inc. | | 9,640 | 334,990 |
| Embecta Corp. | | 8,610 | 147,575 |
| Envista Holdings Corp. (a) | | 8,893 | 208,986 |
| Globus Medical, Inc. (a) | | 4,797 | 253,234 |
| Haemonetics Corp. (a) | | 3,002 | 229,533 |
| ICU Medical, Inc. (a) | | 1,440 | 131,803 |
| Inspire Medical Systems, Inc. (a) | | 1,329 | 280,246 |
| Integer Holdings Corp. (a) | | 2,574 | 260,798 |
| Integra LifeSciences Holdings Corp. (a) | | 5,279 | 211,952 |
| Lantheus Holdings, Inc. (a) | | 3,929 | 204,033 |
| LeMaitre Vascular, Inc. | | 3,129 | 181,607 |
| Masimo Corp. (a) | | 2,598 | 334,986 |
| Merit Medical Systems, Inc. (a) | | 3,656 | 286,265 |
| Neogen Corp. (a) | | 12,614 | 195,517 |
| Penumbra, Inc. (a) | | 1,640 | 413,592 |
| QuidelOrtho Corp. (a) | | 3,290 | 225,398 |
| Tactile Systems Technology, Inc. (a) | | 7,331 | 111,211 |
| UFP Technologies, Inc. (a) | | 997 | 168,004 |
| | | | 4,493,092 |
| Health Care Providers & Services - 2.8% | | | |
| Addus HomeCare Corp. (a) | | 2,032 | 175,971 |
| Amedisys, Inc. (a) | | 2,503 | 235,958 |
| AMN Healthcare Services, Inc. (a) | | 2,558 | 189,318 |
| Chemed Corp. | | 706 | 418,510 |
| Corvel Corp. (a) | | 961 | 226,162 |
| Cross Country Healthcare, Inc. (a) | | 7,745 | 164,581 |
| DaVita, Inc. (a) | | 2,999 | 324,372 |
| Encompass Health Corp. | | 4,851 | 344,615 |
| Henry Schein, Inc. (a) | | 5,519 | 413,042 |
| National Healthcare Corp. (b) | | 2,871 | 267,118 |
| National Research Corp. Class A | | 3,884 | 153,030 |
| Premier, Inc. | | 8,643 | 186,862 |
| Select Medical Holdings Corp. | | 7,729 | 200,877 |
| The Ensign Group, Inc. | | 3,056 | 346,000 |
| U.S. Physical Therapy, Inc. | | 1,669 | 153,982 |
| Universal Health Services, Inc. Class B | | 2,835 | 450,226 |
| | | | 4,250,624 |
| Health Care Technology - 0.4% | | | |
| Computer Programs & Systems, Inc. (a) | | 6,079 | 61,580 |
| Doximity, Inc. (a) | | 7,784 | 209,779 |
| HealthStream, Inc. | | 7,132 | 189,854 |
| Simulations Plus, Inc. (b) | | 3,492 | 132,347 |
| | | | 593,560 |
| Life Sciences Tools & Services - 0.7% | | | |
| Bio-Rad Laboratories, Inc. Class A (a) | | 957 | 307,092 |
| Bruker Corp. | | 4,974 | 355,691 |
| Maravai LifeSciences Holdings, Inc. (a) | | 15,399 | 89,314 |
| Medpace Holdings, Inc. (a) | | 1,259 | 367,099 |
| | | | 1,119,196 |
| Pharmaceuticals - 1.0% | | | |
| Amphastar Pharmaceuticals, Inc. (a) | | 3,407 | 181,798 |
| ANI Pharmaceuticals, Inc. (a) | | 3,232 | 180,410 |
| Assertio Holdings, Inc. (a) | | 29,643 | 26,163 |
| Corcept Therapeutics, Inc. (a) | | 7,245 | 152,870 |
| Innoviva, Inc. (a) | | 12,993 | 210,487 |
| Organon & Co. | | 13,969 | 232,584 |
| Phibro Animal Health Corp. Class A | | 10,633 | 114,943 |
| Prestige Brands Holdings, Inc. (a) | | 3,596 | 221,298 |
| Supernus Pharmaceuticals, Inc. (a) | | 6,180 | 171,062 |
| | | | 1,491,615 |
TOTAL HEALTH CARE | | | 16,568,330 |
| INDUSTRIALS - 20.6% | | | |
| Aerospace & Defense - 1.4% | | | |
| AAR Corp. (a) | | 2,567 | 156,125 |
| BWX Technologies, Inc. | | 3,908 | 318,424 |
| Curtiss-Wright Corp. | | 1,540 | 342,758 |
| Hexcel Corp. | | 3,749 | 248,896 |
| Huntington Ingalls Industries, Inc. | | 1,531 | 396,407 |
| Moog, Inc. Class A | | 1,680 | 234,864 |
| National Presto Industries, Inc. | | 1,362 | 107,830 |
| Woodward, Inc. | | 2,425 | 334,092 |
| | | | 2,139,396 |
| Air Freight & Logistics - 0.2% | | | |
| Forward Air Corp. | | 1,591 | 70,529 |
| Hub Group, Inc. Class A (a) | | 4,014 | 181,754 |
| | | | 252,283 |
| Building Products - 3.3% | | | |
| A.O. Smith Corp. | | 4,749 | 368,570 |
| AAON, Inc. | | 3,183 | 223,319 |
| Allegion PLC | | 3,292 | 407,846 |
| Builders FirstSource, Inc. (a) | | 4,221 | 733,314 |
| Carlisle Companies, Inc. | | 1,754 | 551,212 |
| CSW Industrials, Inc. | | 952 | 201,415 |
| Fortune Brands Innovations, Inc. | | 4,904 | 380,501 |
| Gibraltar Industries, Inc. (a) | | 2,197 | 177,781 |
| Lennox International, Inc. | | 1,150 | 492,384 |
| Masonite International Corp. (a) | | 1,579 | 145,347 |
| Owens Corning | | 3,183 | 482,320 |
| PGT Innovations, Inc. (a) | | 5,332 | 219,785 |
| Simpson Manufacturing Co. Ltd. | | 1,823 | 329,945 |
| Tecnoglass, Inc. | | 2,677 | 123,169 |
| UFP Industries, Inc. | | 2,671 | 303,025 |
| | | | 5,139,933 |
| Commercial Services & Supplies - 1.4% | | | |
| Brady Corp. Class A | | 3,168 | 190,809 |
| Clean Harbors, Inc. (a) | | 1,967 | 330,377 |
| CoreCivic, Inc. (a) | | 13,336 | 189,638 |
| Ennis, Inc. | | 5,212 | 106,168 |
| MSA Safety, Inc. | | 1,560 | 257,447 |
| Rollins, Inc. | | 8,781 | 380,305 |
| Tetra Tech, Inc. | | 2,038 | 322,371 |
| The Brink's Co. | | 2,619 | 211,720 |
| The GEO Group, Inc. (a) | | 16,928 | 188,239 |
| | | | 2,177,074 |
| Construction & Engineering - 1.7% | | | |
| AECOM | | 4,953 | 436,805 |
| API Group Corp. (a) | | 8,989 | 283,333 |
| Arcosa, Inc. | | 2,607 | 204,076 |
| Comfort Systems U.S.A., Inc. | | 1,538 | 334,469 |
| EMCOR Group, Inc. | | 1,760 | 401,474 |
| MasTec, Inc. (a) | | 2,451 | 160,957 |
| MDU Resources Group, Inc. | | 10,055 | 196,173 |
| MYR Group, Inc. (a) | | 1,140 | 163,989 |
| Sterling Construction Co., Inc. (a) | | 2,437 | 183,019 |
| Valmont Industries, Inc. | | 963 | 217,359 |
| | | | 2,581,654 |
| Electrical Equipment - 1.9% | | | |
| Acuity Brands, Inc. | | 1,462 | 348,190 |
| Atkore, Inc. | | 1,709 | 260,674 |
| Encore Wire Corp. | | 1,086 | 244,893 |
| EnerSys | | 2,046 | 195,536 |
| Hubbell, Inc. Class B | | 1,791 | 601,006 |
| nVent Electric PLC | | 6,323 | 379,633 |
| Powell Industries, Inc. | | 1,443 | 171,039 |
| Regal Rexnord Corp. | | 2,431 | 324,441 |
| Sensata Technologies, Inc. PLC | | 6,538 | 236,479 |
| Thermon Group Holdings, Inc. (a) | | 4,630 | 151,771 |
| | | | 2,913,662 |
| Ground Transportation - 0.8% | | | |
| Knight-Swift Transportation Holdings, Inc. Class A | | 6,005 | 344,567 |
| Landstar System, Inc. | | 1,484 | 284,512 |
| Saia, Inc. (a) | | 962 | 433,458 |
| Schneider National, Inc. Class B | | 4,074 | 99,894 |
| Werner Enterprises, Inc. | | 3,659 | 144,713 |
| | | | 1,307,144 |
| Machinery - 5.2% | | | |
| AGCO Corp. | | 2,473 | 302,522 |
| Alamo Group, Inc. | | 817 | 173,433 |
| Albany International Corp. Class A | | 1,867 | 165,995 |
| Allison Transmission Holdings, Inc. | | 4,168 | 252,331 |
| Barnes Group, Inc. | | 3,916 | 129,659 |
| Donaldson Co., Inc. | | 4,895 | 316,168 |
| ESAB Corp. | | 2,776 | 238,708 |
| ESCO Technologies, Inc. | | 1,694 | 172,568 |
| Federal Signal Corp. | | 3,313 | 255,035 |
| Flowserve Corp. | | 6,091 | 243,214 |
| Franklin Electric Co., Inc. | | 2,082 | 196,249 |
| Graco, Inc. | | 5,908 | 503,952 |
| ITT, Inc. | | 3,236 | 390,844 |
| Kadant, Inc. | | 789 | 225,654 |
| Lincoln Electric Holdings, Inc. | | 2,080 | 462,218 |
| Middleby Corp. (a) | | 2,167 | 305,699 |
| Mueller Industries, Inc. | | 5,697 | 273,456 |
| Mueller Water Products, Inc. Class A | | 10,369 | 142,159 |
| Nordson Corp. | | 1,867 | 469,961 |
| Pentair PLC | | 5,937 | 434,410 |
| Snap-On, Inc. | | 1,817 | 526,803 |
| SPX Technologies, Inc. (a) | | 2,357 | 237,208 |
| Standex International Corp. | | 990 | 146,183 |
| Tennant Co. | | 1,699 | 160,589 |
| Terex Corp. | | 3,409 | 209,415 |
| Timken Co. | | 2,981 | 244,174 |
| Toro Co. | | 3,835 | 354,661 |
| Wabash National Corp. | | 5,369 | 135,836 |
| Watts Water Technologies, Inc. Class A | | 1,283 | 254,047 |
| | | | 7,923,151 |
| Marine Transportation - 0.1% | | | |
| Matson, Inc. | | 2,031 | 227,533 |
| Professional Services - 2.8% | | | |
| Booz Allen Hamilton Holding Corp. Class A | | 4,428 | 623,330 |
| CACI International, Inc. Class A (a) | | 898 | 308,670 |
| CBIZ, Inc. (a) | | 3,157 | 200,975 |
| Concentrix Corp. | | 2,391 | 212,488 |
| Exponent, Inc. | | 2,503 | 220,740 |
| FTI Consulting, Inc. (a) | | 1,470 | 281,667 |
| Heidrick & Struggles International, Inc. | | 4,019 | 120,449 |
| Huron Consulting Group, Inc. (a) | | 1,479 | 153,121 |
| ICF International, Inc. | | 1,268 | 176,303 |
| Insperity, Inc. | | 2,010 | 230,527 |
| KBR, Inc. | | 5,323 | 277,382 |
| Kforce, Inc. | | 2,148 | 146,816 |
| Manpower, Inc. | | 2,614 | 193,802 |
| Maximus, Inc. | | 2,898 | 235,086 |
| Resources Connection, Inc. (b) | | 7,023 | 94,530 |
| Robert Half, Inc. | | 4,260 | 338,840 |
| Science Applications International Corp. | | 2,279 | 290,937 |
| TriNet Group, Inc. (a) | | 1,923 | 218,645 |
| | | | 4,324,308 |
| Trading Companies & Distributors - 1.8% | | | |
| Applied Industrial Technologies, Inc. | | 1,754 | 309,511 |
| BlueLinx Corp. (a) | | 1,381 | 159,285 |
| Boise Cascade Co. | | 1,997 | 270,514 |
| Core & Main, Inc. (a) | | 5,560 | 229,684 |
| GMS, Inc. (a) | | 2,443 | 205,603 |
| McGrath RentCorp. | | 1,701 | 213,731 |
| MSC Industrial Direct Co., Inc. Class A | | 2,300 | 226,964 |
| Rush Enterprises, Inc. Class A | | 3,988 | 179,101 |
| SiteOne Landscape Supply, Inc. (a) | | 1,838 | 284,063 |
| Textainer Group Holdings Ltd. | | 3,374 | 167,519 |
| Watsco, Inc. | | 1,199 | 468,785 |
| | | | 2,714,760 |
TOTAL INDUSTRIALS | | | 31,700,898 |
| INFORMATION TECHNOLOGY - 12.0% | | | |
| Communications Equipment - 0.8% | | | |
| Ciena Corp. (a) | | 7,039 | 373,067 |
| Harmonic, Inc. (a) | | 14,273 | 166,994 |
| Juniper Networks, Inc. | | 13,151 | 486,061 |
| NetScout Systems, Inc. (a) | | 6,154 | 132,373 |
| | | | 1,158,495 |
| Electronic Equipment, Instruments & Components - 3.5% | | | |
| Advanced Energy Industries, Inc. | | 2,028 | 211,277 |
| Arrow Electronics, Inc. (a) | | 2,501 | 277,986 |
| Avnet, Inc. | | 5,138 | 232,751 |
| Badger Meter, Inc. | | 1,541 | 221,889 |
| Bel Fuse, Inc. Class B (non-vtg.) | | 2,716 | 181,592 |
| Belden, Inc. | | 2,544 | 188,714 |
| Cognex Corp. | | 7,135 | 257,859 |
| CTS Corp. | | 3,544 | 145,517 |
| ePlus, Inc. (a) | | 2,819 | 212,947 |
| Fabrinet (a) | | 1,997 | 426,379 |
| Insight Enterprises, Inc. (a) | | 1,667 | 307,962 |
| IPG Photonics Corp. (a) | | 1,958 | 191,669 |
| Jabil, Inc. | | 4,784 | 599,387 |
| Littelfuse, Inc. | | 1,154 | 279,153 |
| Methode Electronics, Inc. Class A | | 4,631 | 96,140 |
| Novanta, Inc. (a) | | 1,679 | 259,489 |
| OSI Systems, Inc. (a) | | 1,448 | 185,387 |
| PC Connection, Inc. | | 2,644 | 170,564 |
| Plexus Corp. (a) | | 2,001 | 189,535 |
| Sanmina Corp. (a) | | 3,797 | 227,137 |
| Vishay Intertechnology, Inc. | | 7,873 | 171,080 |
| Vishay Precision Group, Inc. (a) | | 3,545 | 113,015 |
| Vontier Corp. | | 8,305 | 287,270 |
| | | | 5,434,699 |
| IT Services - 0.5% | | | |
| Amdocs Ltd. | | 4,682 | 429,246 |
| DXC Technology Co. (a) | | 12,585 | 274,353 |
| Hackett Group, Inc. | | 5,817 | 134,489 |
| | | | 838,088 |
| Semiconductors & Semiconductor Equipment - 2.1% | | | |
| Allegro MicroSystems LLC (a) | | 4,608 | 119,532 |
| Amkor Technology, Inc. | | 7,059 | 223,488 |
| Axcelis Technologies, Inc. (a) | | 1,550 | 201,578 |
| Cirrus Logic, Inc. (a) | | 3,064 | 236,541 |
| Diodes, Inc. (a) | | 2,628 | 176,917 |
| Kulicke & Soffa Industries, Inc. | | 3,744 | 188,398 |
| Lattice Semiconductor Corp. (a) | | 5,144 | 313,064 |
| NVE Corp. | | 1,653 | 132,223 |
| Onto Innovation, Inc. (a) | | 2,378 | 384,047 |
| PDF Solutions, Inc. (a) | | 3,623 | 113,038 |
| Photronics, Inc. (a) | | 6,419 | 187,563 |
| Power Integrations, Inc. | | 2,933 | 219,858 |
| Rambus, Inc. (a) | | 5,289 | 362,455 |
| Universal Display Corp. | | 2,088 | 354,480 |
| | | | 3,213,182 |
| Software - 4.2% | | | |
| ACI Worldwide, Inc. (a) | | 8,080 | 242,966 |
| Adeia, Inc. | | 13,040 | 158,306 |
| Agilysys, Inc. (a) | | 2,209 | 184,915 |
| Altair Engineering, Inc. Class A (a) | | 3,186 | 270,874 |
| AppFolio, Inc. (a) | | 1,226 | 268,813 |
| Aspen Technology, Inc. (a) | | 1,425 | 273,586 |
| Bentley Systems, Inc. Class B | | 7,881 | 397,202 |
| Blackbaud, Inc. (a) | | 2,899 | 234,587 |
| BlackLine, Inc. (a) | | 3,768 | 221,106 |
| Box, Inc. Class A (a) | | 7,965 | 206,931 |
| CommVault Systems, Inc. (a) | | 2,908 | 266,605 |
| Dolby Laboratories, Inc. Class A | | 3,029 | 251,952 |
| DoubleVerify Holdings, Inc. (a) | | 6,001 | 240,100 |
| Dropbox, Inc. Class A (a) | | 12,136 | 384,468 |
| Dynatrace, Inc. (a) | | 8,564 | 488,148 |
| Intapp, Inc. (a) | | 3,853 | 165,987 |
| InterDigital, Inc. (b) | | 2,123 | 223,021 |
| Manhattan Associates, Inc. (a) | | 2,380 | 577,293 |
| Progress Software Corp. | | 3,163 | 179,690 |
| Qualys, Inc. (a) | | 1,822 | 344,668 |
| SPS Commerce, Inc. (a) | | 1,742 | 320,180 |
| Teradata Corp. (a) | | 4,951 | 228,637 |
| Workiva, Inc. (a) | | 2,454 | 228,075 |
| Yext, Inc. (a) | | 15,711 | 93,166 |
| | | | 6,451,276 |
| Technology Hardware, Storage & Peripherals - 0.9% | | | |
| Pure Storage, Inc. Class A (a) | | 11,198 | 447,808 |
| Super Micro Computer, Inc. (a) | | 1,642 | 869,609 |
| | | | 1,317,417 |
TOTAL INFORMATION TECHNOLOGY | | | 18,413,157 |
| MATERIALS - 5.1% | | | |
| Chemicals - 1.9% | | | |
| Axalta Coating Systems Ltd. (a) | | 10,635 | 344,787 |
| Balchem Corp. | | 1,879 | 263,361 |
| Hawkins, Inc. | | 3,204 | 213,290 |
| Innospec, Inc. | | 1,916 | 222,467 |
| Minerals Technologies, Inc. | | 3,101 | 202,650 |
| NewMarket Corp. | | 471 | 262,729 |
| Olin Corp. | | 5,551 | 289,041 |
| Orion SA | | 7,724 | 173,018 |
| RPM International, Inc. | | 4,825 | 514,635 |
| Sensient Technologies Corp. | | 3,275 | 203,148 |
| Westlake Corp. | | 1,942 | 268,676 |
| | | | 2,957,802 |
| Construction Materials - 0.2% | | | |
| Eagle Materials, Inc. | | 1,698 | 384,223 |
| Containers & Packaging - 1.2% | | | |
| Aptargroup, Inc. | | 2,873 | 373,145 |
| Berry Global Group, Inc. | | 5,399 | 353,419 |
| Graphic Packaging Holding Co. | | 14,237 | 363,186 |
| Greif, Inc. Class A | | 2,623 | 164,226 |
| Silgan Holdings, Inc. | | 5,317 | 244,263 |
| Sonoco Products Co. | | 4,978 | 283,248 |
| | | | 1,781,487 |
| Metals & Mining - 1.5% | | | |
| Alpha Metallurgical Resources | | 1,158 | 462,320 |
| Arch Resources, Inc. | | 1,531 | 270,926 |
| ATI, Inc. (a) | | 6,519 | 266,432 |
| Commercial Metals Co. | | 5,536 | 289,090 |
| Materion Corp. | | 1,836 | 214,757 |
| Royal Gold, Inc. | | 2,979 | 340,768 |
| Warrior Metropolitan Coal, Inc. | | 4,884 | 313,406 |
| Worthington Steel, Inc. | | 2,644 | 79,188 |
| | | | 2,236,887 |
| Paper & Forest Products - 0.3% | | | |
| Louisiana-Pacific Corp. | | 3,989 | 265,468 |
| Sylvamo Corp. | | 3,661 | 169,980 |
| | | | 435,448 |
TOTAL MATERIALS | | | 7,795,847 |
| REAL ESTATE - 6.3% | | | |
| Equity Real Estate Investment Trusts (REITs) - 5.9% | | | |
| Agree Realty Corp. | | 4,300 | 256,323 |
| American Homes 4 Rent Class A | | 11,729 | 411,101 |
| Apartment Income (REIT) Corp. | | 7,427 | 242,789 |
| Apartment Investment & Management Co. Class A (a) | | 17,229 | 128,011 |
| Armada Hoffler Properties, Inc. | | 11,117 | 132,959 |
| Brixmor Property Group, Inc. | | 13,244 | 297,195 |
| Broadstone Net Lease, Inc. | | 11,889 | 191,056 |
| Camden Property Trust (SBI) | | 3,980 | 373,483 |
| COPT Defense Properties (SBI) | | 7,370 | 173,637 |
| Cousins Properties, Inc. | | 9,092 | 208,298 |
| CubeSmart | | 8,765 | 378,823 |
| EastGroup Properties, Inc. | | 1,862 | 330,375 |
| EPR Properties | | 4,619 | 204,483 |
| Equity Commonwealth | | 8,634 | 164,996 |
| Equity Lifestyle Properties, Inc. | | 6,344 | 429,425 |
| Essential Properties Realty Trust, Inc. | | 8,838 | 220,155 |
| Federal Realty Investment Trust (SBI) | | 3,108 | 316,177 |
| First Industrial Realty Trust, Inc. | | 5,832 | 300,465 |
| Four Corners Property Trust, Inc. | | 6,768 | 158,439 |
| Getty Realty Corp. | | 4,715 | 130,417 |
| Highwoods Properties, Inc. (SBI) | | 7,537 | 173,125 |
| Independence Realty Trust, Inc. | | 12,923 | 189,839 |
| Kimco Realty Corp. | | 22,560 | 455,712 |
| Lamar Advertising Co. Class A | | 3,590 | 375,801 |
| LXP Industrial Trust (REIT) | | 19,366 | 176,037 |
| Medical Properties Trust, Inc. (b) | | 27,577 | 85,489 |
| National Health Investors, Inc. | | 3,148 | 167,411 |
| NNN (REIT), Inc. | | 7,743 | 312,353 |
| Omega Healthcare Investors, Inc. | | 9,865 | 286,085 |
| Physicians Realty Trust | | 14,224 | 174,102 |
| Piedmont Office Realty Trust, Inc. Class A | | 18,707 | 127,208 |
| Potlatch Corp. | | 4,344 | 194,307 |
| Regency Centers Corp. | | 5,956 | 373,263 |
| Rexford Industrial Realty, Inc. | | 7,620 | 400,736 |
| Stag Industrial, Inc. | | 8,124 | 300,101 |
| Terreno Realty Corp. | | 3,910 | 233,544 |
| | | | 9,073,720 |
| Real Estate Management & Development - 0.4% | | | |
| Forestar Group, Inc. (a) | | 3,981 | 124,446 |
| The RMR Group, Inc. | | 5,032 | 131,285 |
| Zillow Group, Inc. Class C (a) | | 7,896 | 448,809 |
| | | | 704,540 |
TOTAL REAL ESTATE | | | 9,778,260 |
| UTILITIES - 2.4% | | | |
| Electric Utilities - 1.1% | | | |
| Allete, Inc. | | 3,818 | 225,682 |
| Hawaiian Electric Industries, Inc. | | 6,378 | 82,723 |
| IDACORP, Inc. | | 2,647 | 245,059 |
| OGE Energy Corp. | | 9,059 | 301,121 |
| Otter Tail Corp. | | 2,553 | 230,842 |
| Pinnacle West Capital Corp. | | 4,696 | 323,554 |
| Portland General Electric Co. | | 5,372 | 219,876 |
| | | | 1,628,857 |
| Gas Utilities - 0.5% | | | |
| Chesapeake Utilities Corp. | | 1,587 | 160,731 |
| National Fuel Gas Co. | | 4,850 | 228,726 |
| New Jersey Resources Corp. | | 5,501 | 224,606 |
| ONE Gas, Inc. (b) | | 3,142 | 192,825 |
| | | | 806,888 |
| Independent Power and Renewable Electricity Producers - 0.1% | | | |
| Clearway Energy, Inc. Class C | | 8,282 | 200,756 |
| Multi-Utilities - 0.5% | | | |
| Avista Corp. | | 5,422 | 184,402 |
| NiSource, Inc. | | 16,159 | 419,649 |
| NorthWestern Energy Corp. | | 3,942 | 189,689 |
| | | | 793,740 |
| Water Utilities - 0.2% | | | |
| Consolidated Water Co., Inc. (b) | | 6,949 | 221,882 |
TOTAL UTILITIES | | | 3,652,123 |
| TOTAL COMMON STOCKS (Cost $138,722,936) | | | 153,498,149 |
| | | | |
| Money Market Funds - 2.4% |
| | | Shares | Value ($) |
| Fidelity Cash Central Fund 5.39% (d) | | 177,388 | 177,423 |
| Fidelity Securities Lending Cash Central Fund 5.39% (d)(e) | | 3,436,004 | 3,436,347 |
| TOTAL MONEY MARKET FUNDS (Cost $3,613,770) | | | 3,613,770 |
| | | | |
| TOTAL INVESTMENT IN SECURITIES - 102.2% (Cost $142,336,706) | 157,111,919 |
NET OTHER ASSETS (LIABILITIES) - (2.2)% | (3,326,824) |
| NET ASSETS - 100.0% | 153,785,095 |
| | |
| Futures Contracts |
| | Number of contracts | Expiration Date | Notional Amount ($) | Value ($) | Unrealized Appreciation/ (Depreciation) ($) |
| Purchased | | | | | |
| | | | | | |
| Equity Index Contracts | | | | | |
| CME E-mini Russell 2000 Index Contracts (United States) | 2 | Mar 2024 | 195,590 | 2,001 | 2,001 |
| | | | | | |
| The notional amount of futures purchased as a percentage of Net Assets is 0.1% |
Legend
| (b) | Security or a portion of the security is on loan at period end. |
| (d) | Affiliated fund that is generally available only to investment companies and other accounts managed by Fidelity Investments. The rate quoted is the annualized seven-day yield of the fund at period end. A complete unaudited listing of the fund's holdings as of its most recent quarter end is available upon request. In addition, each Fidelity Central Fund's financial statements are available on the SEC's website or upon request. |
| (e) | Investment made with cash collateral received from securities on loan. |
Affiliated Central Funds
Fiscal year to date information regarding the Fund's investments in Fidelity Central Funds, including the ownership percentage, is presented below.
| Affiliate | Value, beginning of period ($) | Purchases ($) | Sales Proceeds ($) | Dividend Income ($) | Realized Gain (loss) ($) | Change in Unrealized appreciation (depreciation) ($) | Value, end of period ($) | % ownership, end of period |
| Fidelity Cash Central Fund 5.39% | 217,417 | 2,490,504 | 2,530,498 | 4,079 | - | - | 177,423 | 0.0% |
| Fidelity Securities Lending Cash Central Fund 5.39% | 4,432,050 | 11,315,198 | 12,310,901 | 2,964 | - | - | 3,436,347 | 0.0% |
| Total | 4,649,467 | 13,805,702 | 14,841,399 | 7,043 | - | - | 3,613,770 | |
| | | | | | | | | |
Amounts in the dividend income column in the above table include any capital gain distributions from underlying funds, which are presented in the corresponding line item in the Statement of Operations, if applicable.
Amounts in the dividend income column for Fidelity Securities Lending Cash Central Fund represents the income earned on investing cash collateral, less rebates paid to borrowers and any lending agent fees associated with the loan, plus any premium payments received for lending certain types of securities.
Amounts included in the purchases and sales proceeds columns may include in-kind transactions, if applicable.
Investment Valuation
The following is a summary of the inputs used, as of January 31, 2024, involving the Fund's assets and liabilities carried at fair value. The inputs or methodology used for valuing securities may not be an indication of the risk associated with investing in those securities. For more information on valuation inputs, and their aggregation into the levels used below, please refer to the Investment Valuation section in the accompanying Notes to Financial Statements.
| Valuation Inputs at Reporting Date: |
| Description | Total ($) | Level 1 ($) | Level 2 ($) | Level 3 ($) |
Investments in Securities: | | | | |
|
| Equities: | | | | |
Communication Services | 4,177,871 | 4,177,871 | - | - |
Consumer Discretionary | 22,367,960 | 22,367,960 | - | - |
Consumer Staples | 5,508,138 | 5,508,138 | - | - |
Energy | 7,666,631 | 7,666,631 | - | - |
Financials | 25,868,934 | 25,868,934 | - | - |
Health Care | 16,568,330 | 16,568,330 | - | - |
Industrials | 31,700,898 | 31,700,898 | - | - |
Information Technology | 18,413,157 | 18,413,157 | - | - |
Materials | 7,795,847 | 7,795,847 | - | - |
Real Estate | 9,778,260 | 9,778,260 | - | - |
Utilities | 3,652,123 | 3,652,123 | - | - |
|
| Money Market Funds | 3,613,770 | 3,613,770 | - | - |
| Total Investments in Securities: | 157,111,919 | 157,111,919 | - | - |
Derivative Instruments: Assets | | | | |
Futures Contracts | 2,001 | 2,001 | - | - |
| Total Assets | 2,001 | 2,001 | - | - |
| Total Derivative Instruments: | 2,001 | 2,001 | - | - |
Value of Derivative Instruments
The following table is a summary of the Fund's value of derivative instruments by primary risk exposure as of January 31, 2024. For additional information on derivative instruments, please refer to the Derivative Instruments section in the accompanying Notes to Financial Statements.
Primary Risk Exposure / Derivative Type | Value |
| Asset ($) | Liability ($) |
| Equity Risk | | |
Futures Contracts (a) | 2,001 | 0 |
| Total Equity Risk | 2,001 | 0 |
| Total Value of Derivatives | 2,001 | 0 |
(a)Reflects gross cumulative appreciation (depreciation) on futures contracts as presented in the Schedule of Investments. In the Statement of Assets and Liabilities, the period end daily variation margin is included in receivable or payable for daily variation margin on futures contracts, and the net cumulative appreciation (depreciation) is included in Total accumulated earnings (loss).
Fidelity® Small-Mid Multifactor ETF
| Statement of Assets and Liabilities |
| | | | January 31, 2024 (Unaudited) |
| | | | | |
| Assets | | | | |
| Investment in securities, at value (including securities loaned of $3,272,517) - See accompanying schedule: | | | | |
Unaffiliated issuers (cost $138,722,936) | $ | 153,498,149 | | |
Fidelity Central Funds (cost $3,613,770) | | 3,613,770 | | |
| | | | | |
| | | | | |
| Total Investment in Securities (cost $142,336,706) | | | $ | 157,111,919 |
| Segregated cash with brokers for derivative instruments | | | | 37,200 |
| Cash | | | | 44,185 |
| Foreign currency held at value (cost $1,224) | | | | 1,174 |
| Dividends receivable | | | | 45,891 |
| Distributions receivable from Fidelity Central Funds | | | | 976 |
| Other receivables | | | | 1,096 |
Total assets | | | | 157,242,441 |
| Liabilities | | | | |
| Accrued management fee | $ | 18,748 | | |
| Payable for daily variation margin on futures contracts | | 2,250 | | |
| Collateral on securities loaned | | 3,436,348 | | |
| Total Liabilities | | | | 3,457,346 |
| Net Assets | | | $ | 153,785,095 |
| Net Assets consist of: | | | | |
| Paid in capital | | | $ | 149,182,767 |
| Total accumulated earnings (loss) | | | | 4,602,328 |
| Net Assets | | | $ | 153,785,095 |
Net Asset Value, offering price and redemption price per share ($153,785,095 ÷ 4,300,000 shares) | | | $ | 35.76 |
| Statement of Operations |
| | | | Six months ended January 31, 2024 (Unaudited) |
| Investment Income | | | | |
| Dividends | | | $ | 1,028,601 |
| Income from Fidelity Central Funds (including $2,964 from security lending) | | | | 7,043 |
| Total Income | | | | 1,035,644 |
| Expenses | | | | |
| Management fee | $ | 138,029 | | |
| Independent trustees' fees and expenses | | 349 | | |
| Total expenses before reductions | | 138,378 | | |
| Expense reductions | | (777) | | |
| Total expenses after reductions | | | | 137,601 |
| Net Investment income (loss) | | | | 898,043 |
| Realized and Unrealized Gain (Loss) | | | | |
| Net realized gain (loss) on: | | | | |
| Investment Securities: | | | | |
| Unaffiliated issuers | | (4,560,514) | | |
| Redemptions in-kind | | 2,867,410 | | |
| Futures contracts | | (11,252) | | |
| Total net realized gain (loss) | | | | (1,704,356) |
| Change in net unrealized appreciation (depreciation) on: | | | | |
| Investment Securities: | | | | |
| Unaffiliated issuers | | 6,459,901 | | |
| Assets and liabilities in foreign currencies | | (27) | | |
| Futures contracts | | (10,951) | | |
| Total change in net unrealized appreciation (depreciation) | | | | 6,448,923 |
| Net gain (loss) | | | | 4,744,567 |
| Net increase (decrease) in net assets resulting from operations | | | $ | 5,642,610 |
| Statement of Changes in Net Assets |
| |
| | Six months ended January 31, 2024 (Unaudited) | | Year ended July 31, 2023 |
| Increase (Decrease) in Net Assets | | | | |
| Operations | | | | |
| Net investment income (loss) | $ | 898,043 | $ | 1,537,092 |
| Net realized gain (loss) | | (1,704,356) | | (2,572,384) |
| Change in net unrealized appreciation (depreciation) | | 6,448,923 | | 10,094,272 |
| Net increase (decrease) in net assets resulting from operations | | 5,642,610 | | 9,058,980 |
| Distributions to shareholders | | (907,200) | | (1,518,700) |
| | | | | |
| Share transactions | | | | |
| Proceeds from sales of shares | | 37,349,645 | | 48,425,159 |
| Cost of shares redeemed | | (13,276,156) | | (2,938,248) |
| | | | | |
Net increase (decrease) in net assets resulting from share transactions | | 24,073,489 | | 45,486,911 |
| Total increase (decrease) in net assets | | 28,808,899 | | 53,027,191 |
| | | | | |
| Net Assets | | | | |
| Beginning of period | | 124,976,196 | | 71,949,005 |
| End of period | $ | 153,785,095 | $ | 124,976,196 |
| | | | | |
| Other Information | | | | |
| Shares | | | | |
| Sold | | 1,100,000 | | 1,500,000 |
| Redeemed | | (400,000) | | (100,000) |
| Net increase (decrease) | | 700,000 | | 1,400,000 |
| | | | | |
Financial Highlights
| Fidelity® Small-Mid Multifactor ETF |
| |
| | Six months ended (Unaudited) January 31, 2024 | | Years ended July 31, 2023 | | 2022 | | 2021 | | 2020 | | 2019 A |
Selected Per-Share Data | | | | | | | | | | | | |
| Net asset value, beginning of period | $ | 34.72 | $ | 32.70 | $ | 33.97 | $ | 23.90 | $ | 25.50 | $ | 24.85 |
| Income from Investment Operations | | | | | | | | | | | | |
Net investment income (loss) B,C | | .24 | | .53 | | .45 | | .38 | | .31 | | .18 |
| Net realized and unrealized gain (loss) | | 1.04 | | 2.01 | | (1.26) | | 10.11 | | (1.58) | | .64 |
| Total from investment operations | | 1.28 | | 2.54 | | (.81) | | 10.49 | | (1.27) | | .82 |
| Distributions from net investment income | | (.24) | | (.52) | | (.46) | | (.42) | | (.33) | | (.17) |
| Total distributions | | (.24) | | (.52) | | (.46) | | (.42) | | (.33) | | (.17) |
| Net asset value, end of period | $ | 35.76 | $ | 34.72 | $ | 32.70 | $ | 33.97 | $ | 23.90 | $ | 25.50 |
Total Return D,E,F | | 3.74% | | 7.92% | | (2.35)% | | 44.21% | | (4.90)% | | 3.35% |
Ratios to Average Net Assets C,G,H | | | | | | | | | | | | |
| Expenses before reductions | | .22% I | | .29% | | .29% | | .29% | | .29% | | .29% I |
| Expenses net of fee waivers, if any | | .22% I | | .29% | | .29% | | .29% | | .29% | | .29% I |
| Expenses net of all reductions | | .21% I | | .29% | | .29% | | .29% | | .29% | | .29% I |
| Net investment income (loss) | | 1.40% I | | 1.65% | | 1.35% | | 1.23% | | 1.32% | | 1.70% I |
| Supplemental Data | | | | | | | | | | | | |
| Net assets, end of period (000 omitted) | $ | 153,785 | $ | 124,976 | $ | 71,949 | $ | 67,939 | $ | 19,117 | $ | 7,650 |
Portfolio turnover rate J,K | | 54% I | | 65% | | 60% | | 61% | | 52% | | 2% L |
AFor the period February 26, 2019 (commencement of operations) through July 31, 2019.
BCalculated based on average shares outstanding during the period.
CNet investment income (loss) is affected by the timing of the declaration of dividends by any underlying mutual funds or exchange-traded funds (ETFs). Net investment income (loss) of any mutual funds or ETFs is not included in the Fund's net investment income (loss) ratio.
DTotal returns for periods of less than one year are not annualized.
ETotal returns would have been lower if certain expenses had not been reduced during the applicable periods shown.
FBased on net asset value.
GFees and expenses of any underlying mutual funds or exchange-traded funds (ETFs) are not included in the Fund's expense ratio. The Fund indirectly bears its proportionate share of these expenses. For additional expense information related to investments in Fidelity Central Funds, please refer to the "Investments in Fidelity Central Funds" note found in the Notes to Financial Statements section of the most recent Annual or Semi-Annual report.
HExpense ratios reflect operating expenses of the class. Expenses before reductions do not reflect amounts reimbursed, waived, or reduced through arrangements with the investment adviser, brokerage services, or other offset arrangements, if applicable, and do not represent the amount paid by the class during periods when reimbursements, waivers or reductions occur.
IAnnualized.
JAmount does not include the portfolio activity of any underlying mutual funds or exchange-traded funds (ETFs).
KPortfolio turnover rate excludes securities received or delivered in-kind.
LAmount not annualized.
Top Holdings (% of Fund's net assets) |
| |
| Microsoft Corp. | 5.8 | |
| Apple, Inc. | 5.3 | |
| NVIDIA Corp. | 3.1 | |
| Marathon Petroleum Corp. | 2.8 | |
| Steel Dynamics, Inc. | 2.7 | |
| Nucor Corp. | 2.7 | |
| Eli Lilly & Co. | 2.6 | |
| PBF Energy, Inc. Class A | 2.4 | |
| Reliance Steel & Aluminum Co. | 2.4 | |
| Procter & Gamble Co. | 2.3 | |
| | 32.1 | |
| |
| Market Sectors (% of Fund's net assets) |
| |
| Information Technology | 23.2 | |
| Health Care | 18.9 | |
| Consumer Staples | 10.4 | |
| Financials | 8.4 | |
| Materials | 7.8 | |
| Energy | 7.4 | |
| Consumer Discretionary | 6.1 | |
| Real Estate | 5.7 | |
| Industrials | 4.6 | |
| Utilities | 4.0 | |
| Communication Services | 3.3 | |
| |
Asset Allocation (% of Fund's net assets) |
|
Futures - 0.2% |
|
Fidelity® Stocks for Inflation ETF
Showing Percentage of Net Assets
| Common Stocks - 99.8% |
| | | Shares | Value ($) |
| COMMUNICATION SERVICES - 3.3% | | | |
| Diversified Telecommunication Services - 0.2% | | | |
| AT&T, Inc. | | 15,851 | 280,404 |
| Entertainment - 0.3% | | | |
| Netflix, Inc. (a) | | 764 | 430,980 |
| Interactive Media & Services - 2.3% | | | |
| Alphabet, Inc. Class A (a) | | 13,718 | 1,921,892 |
| Meta Platforms, Inc. Class A | | 2,916 | 1,137,648 |
| | | | 3,059,540 |
| Media - 0.5% | | | |
| Comcast Corp. Class A | | 7,195 | 334,855 |
| Fox Corp. Class A | | 3,667 | 118,444 |
| Nexstar Media Group, Inc. Class A | | 644 | 114,445 |
| | | | 567,744 |
TOTAL COMMUNICATION SERVICES | | | 4,338,668 |
| CONSUMER DISCRETIONARY - 6.1% | | | |
| Hotels, Restaurants & Leisure - 1.8% | | | |
| Booking Holdings, Inc. (a) | | 266 | 932,987 |
| Boyd Gaming Corp. | | 8,842 | 561,379 |
| McDonald's Corp. | | 3,188 | 933,191 |
| | | | 2,427,557 |
| Household Durables - 3.7% | | | |
| D.R. Horton, Inc. | | 5,247 | 749,849 |
| KB Home | | 11,109 | 661,985 |
| Lennar Corp. Class A | | 5,200 | 779,220 |
| Meritage Homes Corp. | | 4,103 | 679,498 |
| NVR, Inc. (a) | | 99 | 700,454 |
| PulteGroup, Inc. | | 7,536 | 787,964 |
| Taylor Morrison Home Corp. (a) | | 12,473 | 650,342 |
| | | | 5,009,312 |
| Specialty Retail - 0.6% | | | |
| O'Reilly Automotive, Inc. (a) | | 727 | 743,757 |
TOTAL CONSUMER DISCRETIONARY | | | 8,180,626 |
| CONSUMER STAPLES - 10.4% | | | |
| Beverages - 1.9% | | | |
| The Coca-Cola Co. | | 42,660 | 2,537,843 |
| Household Products - 5.4% | | | |
| Colgate-Palmolive Co. | | 27,354 | 2,303,207 |
| Kimberly-Clark Corp. | | 15,808 | 1,912,294 |
| Procter & Gamble Co. | | 19,262 | 3,026,831 |
| | | | 7,242,332 |
| Tobacco - 3.1% | | | |
| Altria Group, Inc. | | 48,354 | 1,939,962 |
| Philip Morris International, Inc. | | 24,232 | 2,201,477 |
| | | | 4,141,439 |
TOTAL CONSUMER STAPLES | | | 13,921,614 |
| ENERGY - 7.4% | | | |
| Oil, Gas & Consumable Fuels - 7.4% | | | |
| Chord Energy Corp. | | 18,816 | 2,893,148 |
| Marathon Petroleum Corp. | | 22,722 | 3,762,763 |
| PBF Energy, Inc. Class A | | 64,607 | 3,263,300 |
| | | | 9,919,211 |
| FINANCIALS - 8.4% | | | |
| Banks - 0.5% | | | |
| First Citizens Bancshares, Inc. | | 467 | 705,170 |
| Consumer Finance - 1.8% | | | |
| Capital One Financial Corp. | | 6,596 | 892,571 |
| Discover Financial Services | | 6,952 | 733,575 |
| Synchrony Financial | | 20,155 | 783,425 |
| | | | 2,409,571 |
| Financial Services - 3.9% | | | |
| Essent Group Ltd. | | 13,191 | 727,616 |
| MasterCard, Inc. Class A | | 3,259 | 1,464,041 |
| MGIC Investment Corp. | | 38,142 | 756,737 |
| Radian Group, Inc. | | 24,437 | 708,184 |
| Visa, Inc. Class A | | 5,816 | 1,589,280 |
| | | | 5,245,858 |
| Insurance - 2.2% | | | |
| Arch Capital Group Ltd. (a) | | 9,280 | 764,950 |
| Everest Re Group Ltd. | | 1,913 | 736,448 |
| Principal Financial Group, Inc. | | 8,794 | 695,605 |
| Unum Group | | 13,511 | 653,122 |
| | | | 2,850,125 |
TOTAL FINANCIALS | | | 11,210,724 |
| HEALTH CARE - 18.9% | | | |
| Biotechnology - 7.0% | | | |
| AbbVie, Inc. | | 14,401 | 2,367,524 |
| Gilead Sciences, Inc. | | 21,646 | 1,694,016 |
| Regeneron Pharmaceuticals, Inc. (a) | | 2,076 | 1,957,211 |
| United Therapeutics Corp. (a) | | 5,964 | 1,280,948 |
| Vertex Pharmaceuticals, Inc. (a) | | 4,661 | 2,019,984 |
| | | | 9,319,683 |
| Health Care Equipment & Supplies - 1.5% | | | |
| Stryker Corp. | | 5,920 | 1,986,042 |
| Health Care Providers & Services - 3.8% | | | |
| Cardinal Health, Inc. | | 15,160 | 1,655,320 |
| HCA Holdings, Inc. | | 5,609 | 1,710,184 |
| McKesson Corp. | | 3,512 | 1,755,614 |
| | | | 5,121,118 |
| Pharmaceuticals - 6.6% | | | |
| Bristol-Myers Squibb Co. | | 28,407 | 1,388,250 |
| Eli Lilly & Co. | | 5,393 | 3,481,775 |
| Merck & Co., Inc. | | 20,454 | 2,470,434 |
| Pfizer, Inc. | | 55,670 | 1,507,544 |
| | | | 8,848,003 |
TOTAL HEALTH CARE | | | 25,274,846 |
| INDUSTRIALS - 4.6% | | | |
| Building Products - 1.0% | | | |
| Builders FirstSource, Inc. (a) | | 3,967 | 689,187 |
| Owens Corning | | 4,034 | 611,272 |
| | | | 1,300,459 |
| Electrical Equipment - 0.4% | | | |
| Atkore, Inc. | | 3,599 | 548,955 |
| Industrial Conglomerates - 0.6% | | | |
| General Electric Co. | | 6,454 | 854,639 |
| Machinery - 1.5% | | | |
| Allison Transmission Holdings, Inc. | | 9,434 | 571,134 |
| Mueller Industries, Inc. | | 14,109 | 677,232 |
| PACCAR, Inc. | | 7,211 | 723,912 |
| | | | 1,972,278 |
| Trading Companies & Distributors - 1.1% | | | |
| Boise Cascade Co. | | 5,032 | 681,635 |
| W.W. Grainger, Inc. | | 822 | 736,216 |
| | | | 1,417,851 |
TOTAL INDUSTRIALS | | | 6,094,182 |
| INFORMATION TECHNOLOGY - 23.2% | | | |
| Communications Equipment - 0.6% | | | |
| Cisco Systems, Inc. | | 15,746 | 790,134 |
| Electronic Equipment, Instruments & Components - 0.5% | | | |
| Arrow Electronics, Inc. (a) | | 2,480 | 275,652 |
| Jabil, Inc. | | 3,071 | 384,766 |
| | | | 660,418 |
| IT Services - 0.8% | | | |
| Amdocs Ltd. | | 3,657 | 335,274 |
| Cognizant Technology Solutions Corp. Class A | | 5,490 | 423,389 |
| VeriSign, Inc. (a) | | 1,655 | 329,146 |
| | | | 1,087,809 |
| Semiconductors & Semiconductor Equipment - 7.3% | | | |
| Analog Devices, Inc. | | 2,808 | 540,147 |
| Applied Materials, Inc. | | 4,106 | 674,616 |
| Axcelis Technologies, Inc. (a) | | 1,676 | 217,964 |
| Broadcom, Inc. | | 1,371 | 1,617,780 |
| Diodes, Inc. (a) | | 3,442 | 231,715 |
| KLA Corp. | | 932 | 553,645 |
| Lam Research Corp. | | 762 | 628,780 |
| Microchip Technology, Inc. | | 4,689 | 399,409 |
| NVIDIA Corp. | | 6,785 | 4,174,607 |
| Rambus, Inc. (a) | | 5,837 | 400,010 |
| Skyworks Solutions, Inc. | | 3,123 | 326,229 |
| | | | 9,764,902 |
| Software - 8.7% | | | |
| Adobe, Inc. (a) | | 1,703 | 1,052,079 |
| Cadence Design Systems, Inc. (a) | | 1,980 | 571,151 |
| Dolby Laboratories, Inc. Class A | | 3,550 | 295,289 |
| Fair Isaac Corp. (a) | | 411 | 492,719 |
| Fortinet, Inc. (a) | | 5,553 | 358,113 |
| Manhattan Associates, Inc. (a) | | 1,744 | 423,025 |
| Microsoft Corp. | | 19,297 | 7,672,102 |
| Oracle Corp. | | 6,406 | 715,550 |
| | | | 11,580,028 |
| Technology Hardware, Storage & Peripherals - 5.3% | | | |
| Apple, Inc. | | 38,116 | 7,028,590 |
TOTAL INFORMATION TECHNOLOGY | | | 30,911,881 |
| MATERIALS - 7.8% | | | |
| Metals & Mining - 7.8% | | | |
| Nucor Corp. | | 19,216 | 3,592,047 |
| Reliance Steel & Aluminum Co. | | 11,180 | 3,190,996 |
| Steel Dynamics, Inc. | | 30,552 | 3,687,321 |
| | | | 10,470,364 |
| REAL ESTATE - 5.7% | | | |
| Equity Real Estate Investment Trusts (REITs) - 5.7% | | | |
| Public Storage | | 8,585 | 2,431,186 |
| Simon Property Group, Inc. | | 20,642 | 2,861,188 |
| VICI Properties, Inc. | | 77,885 | 2,345,896 |
| | | | 7,638,270 |
| UTILITIES - 4.0% | | | |
| Gas Utilities - 1.8% | | | |
| National Fuel Gas Co. | | 52,028 | 2,453,640 |
| Multi-Utilities - 2.2% | | | |
| Consolidated Edison, Inc. | | 31,647 | 2,876,712 |
TOTAL UTILITIES | | | 5,330,352 |
| TOTAL COMMON STOCKS (Cost $117,162,779) | | | 133,290,738 |
| | | | |
| Money Market Funds - 0.1% |
| | | Shares | Value ($) |
Fidelity Cash Central Fund 5.39% (b) (Cost $138,928) | | 138,900 | 138,928 |
| | | | |
| TOTAL INVESTMENT IN SECURITIES - 99.9% (Cost $117,301,707) | 133,429,666 |
NET OTHER ASSETS (LIABILITIES) - 0.1% | 157,391 |
| NET ASSETS - 100.0% | 133,587,057 |
| | |
| Futures Contracts |
| | Number of contracts | Expiration Date | Notional Amount ($) | Value ($) | Unrealized Appreciation/ (Depreciation) ($) |
| Purchased | | | | | |
| | | | | | |
| Equity Index Contracts | | | | | |
| CME Micro E-mini S&P 500 Index Contracts (United States) | 1 | Mar 2024 | 243,525 | 9,646 | 9,646 |
| | | | | | |
| The notional amount of futures purchased as a percentage of Net Assets is 0.2% |
Legend
| (b) | Affiliated fund that is generally available only to investment companies and other accounts managed by Fidelity Investments. The rate quoted is the annualized seven-day yield of the fund at period end. A complete unaudited listing of the fund's holdings as of its most recent quarter end is available upon request. In addition, each Fidelity Central Fund's financial statements are available on the SEC's website or upon request. |
Affiliated Central Funds
Fiscal year to date information regarding the Fund's investments in Fidelity Central Funds, including the ownership percentage, is presented below.
| Affiliate | Value, beginning of period ($) | Purchases ($) | Sales Proceeds ($) | Dividend Income ($) | Realized Gain (loss) ($) | Change in Unrealized appreciation (depreciation) ($) | Value, end of period ($) | % ownership, end of period |
| Fidelity Cash Central Fund 5.39% | 107,212 | 13,240,085 | 13,208,369 | 5,027 | - | - | 138,928 | 0.0% |
| Total | 107,212 | 13,240,085 | 13,208,369 | 5,027 | - | - | 138,928 | |
| | | | | | | | | |
Amounts in the dividend income column in the above table include any capital gain distributions from underlying funds, which are presented in the corresponding line item in the Statement of Operations, if applicable.
Amounts included in the purchases and sales proceeds columns may include in-kind transactions, if applicable.
Investment Valuation
The following is a summary of the inputs used, as of January 31, 2024, involving the Fund's assets and liabilities carried at fair value. The inputs or methodology used for valuing securities may not be an indication of the risk associated with investing in those securities. For more information on valuation inputs, and their aggregation into the levels used below, please refer to the Investment Valuation section in the accompanying Notes to Financial Statements.
| Valuation Inputs at Reporting Date: |
| Description | Total ($) | Level 1 ($) | Level 2 ($) | Level 3 ($) |
Investments in Securities: | | | | |
|
| Equities: | | | | |
Communication Services | 4,338,668 | 4,338,668 | - | - |
Consumer Discretionary | 8,180,626 | 8,180,626 | - | - |
Consumer Staples | 13,921,614 | 13,921,614 | - | - |
Energy | 9,919,211 | 9,919,211 | - | - |
Financials | 11,210,724 | 11,210,724 | - | - |
Health Care | 25,274,846 | 25,274,846 | - | - |
Industrials | 6,094,182 | 6,094,182 | - | - |
Information Technology | 30,911,881 | 30,911,881 | - | - |
Materials | 10,470,364 | 10,470,364 | - | - |
Real Estate | 7,638,270 | 7,638,270 | - | - |
Utilities | 5,330,352 | 5,330,352 | - | - |
|
| Money Market Funds | 138,928 | 138,928 | - | - |
| Total Investments in Securities: | 133,429,666 | 133,429,666 | - | - |
Derivative Instruments: Assets | | | | |
Futures Contracts | 9,646 | 9,646 | - | - |
| Total Assets | 9,646 | 9,646 | - | - |
| Total Derivative Instruments: | 9,646 | 9,646 | - | - |
Value of Derivative Instruments
The following table is a summary of the Fund's value of derivative instruments by primary risk exposure as of January 31, 2024. For additional information on derivative instruments, please refer to the Derivative Instruments section in the accompanying Notes to Financial Statements.
Primary Risk Exposure / Derivative Type | Value |
| Asset ($) | Liability ($) |
| Equity Risk | | |
Futures Contracts (a) | 9,646 | 0 |
| Total Equity Risk | 9,646 | 0 |
| Total Value of Derivatives | 9,646 | 0 |
(a)Reflects gross cumulative appreciation (depreciation) on futures contracts as presented in the Schedule of Investments. In the Statement of Assets and Liabilities, the period end daily variation margin is included in receivable or payable for daily variation margin on futures contracts, and the net cumulative appreciation (depreciation) is included in Total accumulated earnings (loss).
Fidelity® Stocks for Inflation ETF
| Statement of Assets and Liabilities |
| | | | January 31, 2024 (Unaudited) |
| | | | | |
| Assets | | | | |
| Investment in securities, at value - See accompanying schedule: | | | | |
Unaffiliated issuers (cost $117,162,779) | $ | 133,290,738 | | |
Fidelity Central Funds (cost $138,928) | | 138,928 | | |
| | | | | |
| | | | | |
| Total Investment in Securities (cost $117,301,707) | | | $ | 133,429,666 |
| Segregated cash with brokers for derivative instruments | | | | 33,600 |
| Cash | | | | 25,178 |
| Dividends receivable | | | | 118,408 |
| Distributions receivable from Fidelity Central Funds | | | | 639 |
Total assets | | | | 133,607,491 |
| Liabilities | | | | |
| Accrued management fee | $ | 16,409 | | |
| Payable for daily variation margin on futures contracts | | 4,025 | | |
| Total Liabilities | | | | 20,434 |
| Net Assets | | | $ | 133,587,057 |
| Net Assets consist of: | | | | |
| Paid in capital | | | $ | 139,736,919 |
| Total accumulated earnings (loss) | | | | (6,149,862) |
| Net Assets | | | $ | 133,587,057 |
Net Asset Value, offering price and redemption price per share ($133,587,057 ÷ 3,700,000 shares) | | | $ | 36.10 |
| Statement of Operations |
| | | | Six months ended January 31, 2024 (Unaudited) |
| Investment Income | | | | |
| Dividends | | | $ | 1,404,265 |
| Income from Fidelity Central Funds | | | | 5,027 |
| Total Income | | | | 1,409,292 |
| Expenses | | | | |
| Management fee | $ | 147,129 | | |
| Independent trustees' fees and expenses | | 419 | | |
| Total expenses before reductions | | 147,548 | | |
| Expense reductions | | (160) | | |
| Total expenses after reductions | | | | 147,388 |
| Net Investment income (loss) | | | | 1,261,904 |
| Realized and Unrealized Gain (Loss) | | | | |
| Net realized gain (loss) on: | | | | |
| Investment Securities: | | | | |
| Unaffiliated issuers | | (3,068,785) | | |
| Redemptions in-kind | | 1,587,317 | | |
| Futures contracts | | 11,677 | | |
| Total net realized gain (loss) | | | | (1,469,791) |
| Change in net unrealized appreciation (depreciation) on: | | | | |
| Investment Securities: | | | | |
| Unaffiliated issuers | | 10,742,563 | | |
| Futures contracts | | (3,614) | | |
| Total change in net unrealized appreciation (depreciation) | | | | 10,738,949 |
| Net gain (loss) | | | | 9,269,158 |
| Net increase (decrease) in net assets resulting from operations | | | $ | 10,531,062 |
| Statement of Changes in Net Assets |
| |
| | Six months ended January 31, 2024 (Unaudited) | | Year ended July 31, 2023 |
| Increase (Decrease) in Net Assets | | | | |
| Operations | | | | |
| Net investment income (loss) | $ | 1,261,904 | $ | 4,059,664 |
| Net realized gain (loss) | | (1,469,791) | | (11,942,083) |
| Change in net unrealized appreciation (depreciation) | | 10,738,949 | | 19,422,908 |
| Net increase (decrease) in net assets resulting from operations | | 10,531,062 | | 11,540,489 |
| Distributions to shareholders | | (1,208,150) | | (4,166,950) |
| | | | | |
| Share transactions | | | | |
| Proceeds from sales of shares | | - | | 7,889,065 |
| Cost of shares redeemed | | (23,234,693) | | (128,142,495) |
| | | | | |
Net increase (decrease) in net assets resulting from share transactions | | (23,234,693) | | (120,253,430) |
| Total increase (decrease) in net assets | | (13,911,781) | | (112,879,891) |
| | | | | |
| Net Assets | | | | |
| Beginning of period | | 147,498,838 | | 260,378,729 |
| End of period | $ | 133,587,057 | $ | 147,498,838 |
| | | | | |
| Other Information | | | | |
| Shares | | | | |
| Sold | | - | | 250,000 |
| Redeemed | | (700,000) | | (4,050,000) |
| Net increase (decrease) | | (700,000) | | (3,800,000) |
| | | | | |
Financial Highlights
| Fidelity® Stocks for Inflation ETF |
| |
| | Six months ended (Unaudited) January 31, 2024 | | Years ended July 31, 2023 | | 2022 | | 2021 | | 2020 A |
Selected Per-Share Data | | | | | | | | | | |
| Net asset value, beginning of period | $ | 33.52 | $ | 31.75 | $ | 30.72 | $ | 24.07 | $ | 24.94 |
| Income from Investment Operations | | | | | | | | | | |
Net investment income (loss) B,C | | .32 | | .61 | | .54 | | .39 | | .38 |
| Net realized and unrealized gain (loss) | | 2.57 | | 1.80 | | 1.00 | | 7.08 | | (.90) |
| Total from investment operations | | 2.89 | | 2.41 | | 1.54 | | 7.47 | | (.52) |
| Distributions from net investment income | | (.31) | | (.64) | | (.51) | | (.82) | | (.35) |
| Total distributions | | (.31) | | (.64) | | (.51) | | (.82) | | (.35) |
| Net asset value, end of period | $ | 36.10 | $ | 33.52 | $ | 31.75 | $ | 30.72 | $ | 24.07 |
Total Return D,E,F | | 8.68% | | 7.77% | | 5.03% | | 31.78% | | (1.88)% |
Ratios to Average Net Assets C,G,H | | | | | | | | | | |
| Expenses before reductions | | .22% I | | .29% | | .29% | | .29% | | .29% I,J |
| Expenses net of fee waivers, if any | | .22% I | | .29% | | .29% | | .29% | | .29% I,J |
| Expenses net of all reductions | | .22% I | | .29% | | .29% | | .29% | | .29% I,J |
| Net investment income (loss) | | 1.90% I | | 1.95% | | 1.68% | | 1.34% | | 2.16% I,J |
| Supplemental Data | | | | | | | | | | |
| Net assets, end of period (000 omitted) | $ | 133,587 | $ | 147,499 | $ | 260,379 | $ | 46,083 | $ | 3,610 |
Portfolio turnover rate K,L | | 88% I | | 105% | | 76% | | 52% | | 65% M |
AFor the period November 5, 2019 (commencement of operations) through July 31, 2020.
BCalculated based on average shares outstanding during the period.
CNet investment income (loss) is affected by the timing of the declaration of dividends by any underlying mutual funds or exchange-traded funds (ETFs). Net investment income (loss) of any mutual funds or ETFs is not included in the Fund's net investment income (loss) ratio.
DTotal returns for periods of less than one year are not annualized.
ETotal returns would have been lower if certain expenses had not been reduced during the applicable periods shown.
FBased on net asset value.
GFees and expenses of any underlying mutual funds or exchange-traded funds (ETFs) are not included in the Fund's expense ratio. The Fund indirectly bears its proportionate share of these expenses. For additional expense information related to investments in Fidelity Central Funds, please refer to the "Investments in Fidelity Central Funds" note found in the Notes to Financial Statements section of the most recent Annual or Semi-Annual report.
HExpense ratios reflect operating expenses of the class. Expenses before reductions do not reflect amounts reimbursed, waived, or reduced through arrangements with the investment adviser, brokerage services, or other offset arrangements, if applicable, and do not represent the amount paid by the class during periods when reimbursements, waivers or reductions occur.
IAnnualized.
JProxy expenses are not annualized.
KAmount does not include the portfolio activity of any underlying mutual funds or exchange-traded funds (ETFs).
LPortfolio turnover rate excludes securities received or delivered in-kind.
MAmount not annualized.
Top Holdings (% of Fund's net assets) |
| |
| Microsoft Corp. | 7.1 | |
| Apple, Inc. | 6.5 | |
| Alphabet, Inc. Class A | 3.8 | |
| Meta Platforms, Inc. Class A | 2.3 | |
| Eli Lilly & Co. | 2.0 | |
| Visa, Inc. Class A | 1.9 | |
| MasterCard, Inc. Class A | 1.8 | |
| The Home Depot, Inc. | 1.6 | |
| Exxon Mobil Corp. | 1.6 | |
| Broadcom, Inc. | 1.6 | |
| | 30.2 | |
| |
| Market Sectors (% of Fund's net assets) |
| |
| Information Technology | 27.4 | |
| Financials | 13.8 | |
| Health Care | 13.1 | |
| Consumer Discretionary | 11.3 | |
| Industrials | 8.6 | |
| Communication Services | 8.2 | |
| Consumer Staples | 5.8 | |
| Energy | 4.1 | |
| Materials | 2.7 | |
| Real Estate | 2.5 | |
| Utilities | 2.2 | |
| |
Asset Allocation (% of Fund's net assets) |
|
Futures - 0.2% |
|
Fidelity® U.S. Multifactor ETF
Showing Percentage of Net Assets
| Common Stocks - 99.7% |
| | | Shares | Value ($) |
| COMMUNICATION SERVICES - 8.2% | | | |
| Diversified Telecommunication Services - 0.6% | | | |
| AT&T, Inc. | | 27,618 | 488,562 |
| Interactive Media & Services - 6.1% | | | |
| Alphabet, Inc. Class A (a) | | 21,519 | 3,014,812 |
| Meta Platforms, Inc. Class A | | 4,640 | 1,810,250 |
| | | | 4,825,062 |
| Media - 1.5% | | | |
| Comcast Corp. Class A | | 12,078 | 562,110 |
| Fox Corp. Class A | | 7,015 | 226,585 |
| Omnicom Group, Inc. | | 2,896 | 261,740 |
| TEGNA, Inc. | | 12,733 | 198,507 |
| | | | 1,248,942 |
TOTAL COMMUNICATION SERVICES | | | 6,562,566 |
| CONSUMER DISCRETIONARY - 11.3% | | | |
| Hotels, Restaurants & Leisure - 3.2% | | | |
| Booking Holdings, Inc. (a) | | 272 | 954,032 |
| McDonald's Corp. | | 3,341 | 977,978 |
| Yum! Brands, Inc. | | 4,860 | 629,321 |
| | | | 2,561,331 |
| Household Durables - 4.6% | | | |
| Lennar Corp. Class A | | 5,296 | 793,606 |
| Meritage Homes Corp. | | 4,153 | 687,778 |
| NVR, Inc. (a) | | 98 | 693,378 |
| PulteGroup, Inc. | | 7,653 | 800,198 |
| Taylor Morrison Home Corp. (a) | | 12,615 | 657,746 |
| | | | 3,632,706 |
| Specialty Retail - 3.5% | | | |
| AutoZone, Inc. (a) | | 269 | 743,013 |
| O'Reilly Automotive, Inc. (a) | | 744 | 761,149 |
| The Home Depot, Inc. | | 3,612 | 1,274,892 |
| | | | 2,779,054 |
TOTAL CONSUMER DISCRETIONARY | | | 8,973,091 |
| CONSUMER STAPLES - 5.8% | | | |
| Food Products - 0.7% | | | |
| The Hershey Co. | | 2,698 | 522,171 |
| Household Products - 3.2% | | | |
| Colgate-Palmolive Co. | | 8,829 | 743,402 |
| Kimberly-Clark Corp. | | 4,969 | 601,100 |
| Procter & Gamble Co. | | 7,817 | 1,228,363 |
| | | | 2,572,865 |
| Personal Care Products - 0.1% | | | |
| Kenvue, Inc. | | 4,336 | 90,015 |
| Tobacco - 1.8% | | | |
| Altria Group, Inc. | | 15,887 | 637,386 |
| Philip Morris International, Inc. | | 8,553 | 777,040 |
| | | | 1,414,426 |
TOTAL CONSUMER STAPLES | | | 4,599,477 |
| ENERGY - 4.1% | | | |
| Oil, Gas & Consumable Fuels - 4.1% | | | |
| ConocoPhillips Co. | | 6,840 | 765,191 |
| Coterra Energy, Inc. | | 20,727 | 515,688 |
| Exxon Mobil Corp. | | 12,281 | 1,262,610 |
| Valero Energy Corp. | | 4,918 | 683,110 |
| | | | 3,226,599 |
| FINANCIALS - 13.8% | | | |
| Banks - 0.8% | | | |
| First Citizens Bancshares, Inc. | | 441 | 665,910 |
| Financial Services - 6.3% | | | |
| Essent Group Ltd. | | 12,537 | 691,541 |
| MasterCard, Inc. Class A | | 3,110 | 1,397,105 |
| MGIC Investment Corp. | | 36,278 | 719,756 |
| Radian Group, Inc. | | 23,251 | 673,814 |
| Visa, Inc. Class A | | 5,554 | 1,517,686 |
| | | | 4,999,902 |
| Insurance - 6.7% | | | |
| Arch Capital Group Ltd. (a) | | 8,819 | 726,950 |
| Chubb Ltd. | | 3,852 | 943,740 |
| Everest Re Group Ltd. | | 1,818 | 699,875 |
| Reinsurance Group of America, Inc. | | 4,555 | 792,069 |
| RLI Corp. | | 4,705 | 641,621 |
| The Travelers Companies, Inc. | | 4,137 | 874,396 |
| Unum Group | | 12,858 | 621,556 |
| | | | 5,300,207 |
TOTAL FINANCIALS | | | 10,966,019 |
| HEALTH CARE - 13.1% | | | |
| Biotechnology - 6.4% | | | |
| AbbVie, Inc. | | 6,241 | 1,026,020 |
| Amgen, Inc. | | 2,941 | 924,239 |
| Biogen, Inc. (a) | | 1,968 | 485,427 |
| Gilead Sciences, Inc. | | 8,293 | 649,010 |
| Regeneron Pharmaceuticals, Inc. (a) | | 786 | 741,025 |
| United Therapeutics Corp. (a) | | 2,052 | 440,729 |
| Vertex Pharmaceuticals, Inc. (a) | | 1,775 | 769,250 |
| | | | 5,035,700 |
| Pharmaceuticals - 6.7% | | | |
| Bristol-Myers Squibb Co. | | 11,234 | 549,006 |
| Eli Lilly & Co. | | 2,433 | 1,570,769 |
| Johnson & Johnson | | 6,810 | 1,082,109 |
| Merck & Co., Inc. | | 8,887 | 1,073,372 |
| Pfizer, Inc. | | 23,219 | 628,771 |
| Royalty Pharma PLC | | 15,616 | 443,338 |
| | | | 5,347,365 |
TOTAL HEALTH CARE | | | 10,383,065 |
| INDUSTRIALS - 8.6% | | | |
| Aerospace & Defense - 1.0% | | | |
| Lockheed Martin Corp. | | 1,895 | 813,732 |
| Air Freight & Logistics - 0.9% | | | |
| Expeditors International of Washington, Inc. | | 5,644 | 713,007 |
| Building Products - 1.1% | | | |
| Builders FirstSource, Inc. (a) | | 4,852 | 842,938 |
| Electrical Equipment - 0.8% | | | |
| Atkore, Inc. | | 4,398 | 670,827 |
| Machinery - 2.8% | | | |
| Allison Transmission Holdings, Inc. | | 11,528 | 697,905 |
| Mueller Industries, Inc. | | 17,221 | 826,608 |
| Snap-On, Inc. | | 2,538 | 735,842 |
| | | | 2,260,355 |
| Professional Services - 2.0% | | | |
| Automatic Data Processing, Inc. | | 3,439 | 845,237 |
| Paychex, Inc. | | 5,938 | 722,833 |
| | | | 1,568,070 |
TOTAL INDUSTRIALS | | | 6,868,929 |
| INFORMATION TECHNOLOGY - 27.4% | | | |
| Communications Equipment - 0.8% | | | |
| Cisco Systems, Inc. | | 12,657 | 635,128 |
| Electronic Equipment, Instruments & Components - 1.1% | | | |
| Arrow Electronics, Inc. (a) | | 2,303 | 255,978 |
| Badger Meter, Inc. | | 1,770 | 254,862 |
| Jabil, Inc. | | 2,821 | 353,443 |
| | | | 864,283 |
| IT Services - 2.7% | | | |
| Accenture PLC Class A | | 2,023 | 736,129 |
| Akamai Technologies, Inc. (a) | | 3,309 | 407,768 |
| Amdocs Ltd. | | 3,383 | 310,153 |
| Cognizant Technology Solutions Corp. Class A | | 4,904 | 378,196 |
| VeriSign, Inc. (a) | | 1,515 | 301,303 |
| | | | 2,133,549 |
| Semiconductors & Semiconductor Equipment - 4.5% | | | |
| Analog Devices, Inc. | | 2,377 | 457,240 |
| Applied Materials, Inc. | | 3,424 | 562,563 |
| Broadcom, Inc. | | 1,068 | 1,260,240 |
| Cirrus Logic, Inc. (a) | | 3,626 | 279,927 |
| Diodes, Inc. (a) | | 3,225 | 217,107 |
| KLA Corp. | | 806 | 478,796 |
| Skyworks Solutions, Inc. | | 2,864 | 299,173 |
| | | | 3,555,046 |
| Software - 11.8% | | | |
| Adobe, Inc. (a) | | 1,361 | 840,799 |
| Cadence Design Systems, Inc. (a) | | 1,720 | 496,151 |
| Dolby Laboratories, Inc. Class A | | 3,310 | 275,326 |
| Fair Isaac Corp. (a) | | 372 | 445,965 |
| Fortinet, Inc. (a) | | 4,884 | 314,969 |
| Microsoft Corp. | | 14,236 | 5,659,951 |
| Oracle Corp. | | 5,223 | 583,409 |
| SPS Commerce, Inc. (a) | | 1,738 | 319,444 |
| Synopsys, Inc. (a) | | 912 | 486,415 |
| | | | 9,422,429 |
| Technology Hardware, Storage & Peripherals - 6.5% | | | |
| Apple, Inc. | | 28,067 | 5,175,555 |
TOTAL INFORMATION TECHNOLOGY | | | 21,785,990 |
| MATERIALS - 2.7% | | | |
| Chemicals - 0.8% | | | |
| CF Industries Holdings, Inc. | | 8,033 | 606,572 |
| Metals & Mining - 1.9% | | | |
| Nucor Corp. | | 4,082 | 763,048 |
| Steel Dynamics, Inc. | | 6,209 | 749,364 |
| | | | 1,512,412 |
TOTAL MATERIALS | | | 2,118,984 |
| REAL ESTATE - 2.5% | | | |
| Equity Real Estate Investment Trusts (REITs) - 2.5% | | | |
| Net Lease Office Properties | | 683 | 16,925 |
| Public Storage | | 2,514 | 711,940 |
| VICI Properties, Inc. | | 22,408 | 674,929 |
| WP Carey, Inc. | | 9,968 | 617,617 |
| | | | 2,021,411 |
| UTILITIES - 2.2% | | | |
| Gas Utilities - 1.0% | | | |
| National Fuel Gas Co. | | 16,741 | 789,506 |
| Multi-Utilities - 1.2% | | | |
| Consolidated Edison, Inc. | | 10,424 | 947,542 |
TOTAL UTILITIES | | | 1,737,048 |
| TOTAL COMMON STOCKS (Cost $72,922,711) | | | 79,243,179 |
| | | | |
| Money Market Funds - 0.2% |
| | | Shares | Value ($) |
Fidelity Cash Central Fund 5.39% (b) (Cost $116,991) | | 116,968 | 116,991 |
| | | | |
| TOTAL INVESTMENT IN SECURITIES - 99.9% (Cost $73,039,702) | 79,360,170 |
NET OTHER ASSETS (LIABILITIES) - 0.1% | 86,955 |
| NET ASSETS - 100.0% | 79,447,125 |
| | |
| Futures Contracts |
| | Number of contracts | Expiration Date | Notional Amount ($) | Value ($) | Unrealized Appreciation/ (Depreciation) ($) |
| Purchased | | | | | |
| | | | | | |
| Equity Index Contracts | | | | | |
| CME E-mini S&P 500 Index Contracts (United States) | 5 | Mar 2024 | 121,763 | 2,808 | 2,808 |
| | | | | | |
| The notional amount of futures purchased as a percentage of Net Assets is 0.2% |
Legend
| (b) | Affiliated fund that is generally available only to investment companies and other accounts managed by Fidelity Investments. The rate quoted is the annualized seven-day yield of the fund at period end. A complete unaudited listing of the fund's holdings as of its most recent quarter end is available upon request. In addition, each Fidelity Central Fund's financial statements are available on the SEC's website or upon request. |
Affiliated Central Funds
Fiscal year to date information regarding the Fund's investments in Fidelity Central Funds, including the ownership percentage, is presented below.
| Affiliate | Value, beginning of period ($) | Purchases ($) | Sales Proceeds ($) | Dividend Income ($) | Realized Gain (loss) ($) | Change in Unrealized appreciation (depreciation) ($) | Value, end of period ($) | % ownership, end of period |
| Fidelity Cash Central Fund 5.39% | 18,721 | 1,197,623 | 1,099,353 | 1,265 | - | - | 116,991 | 0.0% |
| Total | 18,721 | 1,197,623 | 1,099,353 | 1,265 | - | - | 116,991 | |
| | | | | | | | | |
Amounts in the dividend income column in the above table include any capital gain distributions from underlying funds, which are presented in the corresponding line item in the Statement of Operations, if applicable.
Amounts included in the purchases and sales proceeds columns may include in-kind transactions, if applicable.
Investment Valuation
The following is a summary of the inputs used, as of January 31, 2024, involving the Fund's assets and liabilities carried at fair value. The inputs or methodology used for valuing securities may not be an indication of the risk associated with investing in those securities. For more information on valuation inputs, and their aggregation into the levels used below, please refer to the Investment Valuation section in the accompanying Notes to Financial Statements.
| Valuation Inputs at Reporting Date: |
| Description | Total ($) | Level 1 ($) | Level 2 ($) | Level 3 ($) |
Investments in Securities: | | | | |
|
| Equities: | | | | |
Communication Services | 6,562,566 | 6,562,566 | - | - |
Consumer Discretionary | 8,973,091 | 8,973,091 | - | - |
Consumer Staples | 4,599,477 | 4,599,477 | - | - |
Energy | 3,226,599 | 3,226,599 | - | - |
Financials | 10,966,019 | 10,966,019 | - | - |
Health Care | 10,383,065 | 10,383,065 | - | - |
Industrials | 6,868,929 | 6,868,929 | - | - |
Information Technology | 21,785,990 | 21,785,990 | - | - |
Materials | 2,118,984 | 2,118,984 | - | - |
Real Estate | 2,021,411 | 2,021,411 | - | - |
Utilities | 1,737,048 | 1,737,048 | - | - |
|
| Money Market Funds | 116,991 | 116,991 | - | - |
| Total Investments in Securities: | 79,360,170 | 79,360,170 | - | - |
Derivative Instruments: Assets | | | | |
Futures Contracts | 2,808 | 2,808 | - | - |
| Total Assets | 2,808 | 2,808 | - | - |
| Total Derivative Instruments: | 2,808 | 2,808 | - | - |
Value of Derivative Instruments
The following table is a summary of the Fund's value of derivative instruments by primary risk exposure as of January 31, 2024. For additional information on derivative instruments, please refer to the Derivative Instruments section in the accompanying Notes to Financial Statements.
Primary Risk Exposure / Derivative Type | Value |
| Asset ($) | Liability ($) |
| Equity Risk | | |
Futures Contracts (a) | 2,808 | 0 |
| Total Equity Risk | 2,808 | 0 |
| Total Value of Derivatives | 2,808 | 0 |
(a)Reflects gross cumulative appreciation (depreciation) on futures contracts as presented in the Schedule of Investments. In the Statement of Assets and Liabilities, the period end daily variation margin is included in receivable or payable for daily variation margin on futures contracts, and the net cumulative appreciation (depreciation) is included in Total accumulated earnings (loss).
Fidelity® U.S. Multifactor ETF
| Statement of Assets and Liabilities |
| | | | January 31, 2024 (Unaudited) |
| | | | | |
| Assets | | | | |
| Investment in securities, at value - See accompanying schedule: | | | | |
Unaffiliated issuers (cost $72,922,711) | $ | 79,243,179 | | |
Fidelity Central Funds (cost $116,991) | | 116,991 | | |
| | | | | |
| | | | | |
| Total Investment in Securities (cost $73,039,702) | | | $ | 79,360,170 |
| Segregated cash with brokers for derivative instruments | | | | 8,960 |
| Cash | | | | 913 |
| Receivable for fund shares sold | | | | 4,256,095 |
| Dividends receivable | | | | 54,932 |
| Distributions receivable from Fidelity Central Funds | | | | 424 |
Total assets | | | | 83,681,494 |
| Liabilities | | | | |
| Payable for investments purchased | $ | 4,224,138 | | |
| Accrued management fee | | 8,218 | | |
| Payable for daily variation margin on futures contracts | | 2,013 | | |
| Total Liabilities | | | | 4,234,369 |
| Net Assets | | | $ | 79,447,125 |
| Net Assets consist of: | | | | |
| Paid in capital | | | $ | 74,021,131 |
| Total accumulated earnings (loss) | | | | 5,425,994 |
| Net Assets | | | $ | 79,447,125 |
Net Asset Value, offering price and redemption price per share ($79,447,125 ÷ 2,800,000 shares) | | | $ | 28.37 |
| Statement of Operations |
| | | | Six months ended January 31, 2024 (Unaudited) |
| Investment Income | | | | |
| Dividends | | | $ | 381,299 |
| Income from Fidelity Central Funds | | | | 1,265 |
| Total Income | | | | 382,564 |
| Expenses | | | | |
| Management fee | $ | 45,339 | | |
| Independent trustees' fees and expenses | | 106 | | |
| Total expenses before reductions | | 45,445 | | |
| Expense reductions | | (249) | | |
| Total expenses after reductions | | | | 45,196 |
| Net Investment income (loss) | | | | 337,368 |
| Realized and Unrealized Gain (Loss) | | | | |
| Net realized gain (loss) on: | | | | |
| Investment Securities: | | | | |
| Unaffiliated issuers | | (510,939) | | |
| Redemptions in-kind | | 660,597 | | |
| Futures contracts | | 8,205 | | |
| Total net realized gain (loss) | | | | 157,863 |
| Change in net unrealized appreciation (depreciation) on: | | | | |
| Investment Securities: | | | | |
| Unaffiliated issuers | | 3,374,437 | | |
| Futures contracts | | 548 | | |
| Total change in net unrealized appreciation (depreciation) | | | | 3,374,985 |
| Net gain (loss) | | | | 3,532,848 |
| Net increase (decrease) in net assets resulting from operations | | | $ | 3,870,216 |
| Statement of Changes in Net Assets |
| |
| | Six months ended January 31, 2024 (Unaudited) | | Year ended July 31, 2023 |
| Increase (Decrease) in Net Assets | | | | |
| Operations | | | | |
| Net investment income (loss) | $ | 337,368 | $ | 376,380 |
| Net realized gain (loss) | | 157,863 | | (51,150) |
| Change in net unrealized appreciation (depreciation) | | 3,374,985 | | 2,842,246 |
| Net increase (decrease) in net assets resulting from operations | | 3,870,216 | | 3,167,476 |
| Distributions to shareholders | | (295,200) | | (365,300) |
| | | | | |
| Share transactions | | | | |
| Proceeds from sales of shares | | 45,113,274 | | 20,841,939 |
| Cost of shares redeemed | | (3,894,372) | | (3,667,295) |
| | | | | |
Net increase (decrease) in net assets resulting from share transactions | | 41,218,902 | | 17,174,644 |
| Total increase (decrease) in net assets | | 44,793,918 | | 19,976,820 |
| | | | | |
| Net Assets | | | | |
| Beginning of period | | 34,653,207 | | 14,676,387 |
| End of period | $ | 79,447,125 | $ | 34,653,207 |
| | | | | |
| Other Information | | | | |
| Shares | | | | |
| Sold | | 1,650,000 | | 850,000 |
| Redeemed | | (150,000) | | (150,000) |
| Net increase (decrease) | | 1,500,000 | | 700,000 |
| | | | | |
Financial Highlights
| Fidelity® U.S. Multifactor ETF |
| |
| | Six months ended (Unaudited) January 31, 2024 | | Years ended July 31, 2023 | | 2022 | | 2021 A |
Selected Per-Share Data | | | | | | | | |
| Net asset value, beginning of period | $ | 26.66 | $ | 24.46 | $ | 25.54 | $ | 20.09 |
| Income from Investment Operations | | | | | | | | |
Net investment income (loss) B,C | | .20 | | .41 | | .41 | | .31 D |
| Net realized and unrealized gain (loss) | | 1.69 | | 2.19 | | (1.09) | | 5.62 |
| Total from investment operations | | 1.89 | | 2.60 | | (.68) | | 5.93 |
| Distributions from net investment income | | (.18) | | (.40) | | (.40) | | (.48) |
| Total distributions | | (.18) | | (.40) | | (.40) | | (.48) |
| Net asset value, end of period | $ | 28.37 | $ | 26.66 | $ | 24.46 | $ | 25.54 |
Total Return E,F,G | | 7.17% | | 10.78% | | (2.64)% | | 29.94% |
Ratios to Average Net Assets C,H,I | | | | | | | | |
| Expenses before reductions | | .21% J | | .29% | | .29% | | .29% J |
| Expenses net of fee waivers, if any | | .21% J | | .29% | | .29% | | .29% J |
| Expenses net of all reductions | | .21% J | | .29% | | .29% | | .29% J |
| Net investment income (loss) | | 1.54% J | | 1.66% | | 1.63% | | 1.56% D,J |
| Supplemental Data | | | | | | | | |
| Net assets, end of period (000 omitted) | $ | 79,447 | $ | 34,653 | $ | 14,676 | $ | 11,491 |
Portfolio turnover rate K,L | | 38% J | | 45% | | 46% | | 30% M |
AFor the period September 15, 2020 (commencement of operations) through July 31, 2021.
BCalculated based on average shares outstanding during the period.
CNet investment income (loss) is affected by the timing of the declaration of dividends by any underlying mutual funds or exchange-traded funds (ETFs). Net investment income (loss) of any mutual funds or ETFs is not included in the Fund's net investment income (loss) ratio.
DNet investment income per share reflects one or more large, non-recurring dividend(s) which amounted to $.05 per share. Excluding such non-recurring dividend(s), the ratio of net investment income (loss) to average net assets would have been 1.33%.
ETotal returns for periods of less than one year are not annualized.
FTotal returns would have been lower if certain expenses had not been reduced during the applicable periods shown.
GBased on net asset value.
HFees and expenses of any underlying mutual funds or exchange-traded funds (ETFs) are not included in the Fund's expense ratio. The Fund indirectly bears its proportionate share of these expenses. For additional expense information related to investments in Fidelity Central Funds, please refer to the "Investments in Fidelity Central Funds" note found in the Notes to Financial Statements section of the most recent Annual or Semi-Annual report.
IExpense ratios reflect operating expenses of the class. Expenses before reductions do not reflect amounts reimbursed, waived, or reduced through arrangements with the investment adviser, brokerage services, or other offset arrangements, if applicable, and do not represent the amount paid by the class during periods when reimbursements, waivers or reductions occur.
JAnnualized.
KAmount does not include the portfolio activity of any underlying mutual funds or exchange-traded funds (ETFs).
LPortfolio turnover rate excludes securities received or delivered in-kind.
MAmount not annualized.
Top Holdings (% of Fund's net assets) |
| |
| Microsoft Corp. | 7.6 | |
| Apple, Inc. | 6.9 | |
| Alphabet, Inc. Class A | 3.8 | |
| Amazon.com, Inc. | 3.6 | |
| Meta Platforms, Inc. Class A | 2.3 | |
| Broadcom, Inc. | 2.1 | |
| Berkshire Hathaway, Inc. Class B | 2.1 | |
| UnitedHealth Group, Inc. | 1.8 | |
| JPMorgan Chase & Co. | 1.8 | |
| Salesforce, Inc. | 1.6 | |
| | 33.6 | |
| |
| Market Sectors (% of Fund's net assets) |
| |
| Information Technology | 28.3 | |
| Financials | 13.9 | |
| Health Care | 11.8 | |
| Consumer Discretionary | 10.9 | |
| Industrials | 8.9 | |
| Communication Services | 8.8 | |
| Consumer Staples | 5.7 | |
| Energy | 4.0 | |
| Materials | 2.6 | |
| Real Estate | 2.6 | |
| Utilities | 2.2 | |
| |
Asset Allocation (% of Fund's net assets) |
|
Futures - 0.3% |
|
Fidelity® Value Factor ETF
Showing Percentage of Net Assets
| Common Stocks - 99.7% |
| | | Shares | Value ($) |
| COMMUNICATION SERVICES - 8.8% | | | |
| Diversified Telecommunication Services - 1.4% | | | |
| AT&T, Inc. | | 248,698 | 4,399,468 |
| Verizon Communications, Inc. | | 124,280 | 5,263,258 |
| | | | 9,662,726 |
| Interactive Media & Services - 6.1% | | | |
| Alphabet, Inc. Class A (a) | | 189,790 | 26,589,579 |
| Meta Platforms, Inc. Class A | | 41,074 | 16,024,610 |
| | | | 42,614,189 |
| Media - 1.3% | | | |
| Comcast Corp. Class A | | 108,062 | 5,029,205 |
| Fox Corp. Class A | | 64,279 | 2,076,212 |
| TEGNA, Inc. | | 116,998 | 1,823,999 |
| | | | 8,929,416 |
TOTAL COMMUNICATION SERVICES | | | 61,206,331 |
| CONSUMER DISCRETIONARY - 10.9% | | | |
| Automobiles - 2.4% | | | |
| Ford Motor Co. | | 265,495 | 3,111,601 |
| General Motors Co. | | 94,117 | 3,651,740 |
| Tesla, Inc. (a) | | 52,867 | 9,901,460 |
| | | | 16,664,801 |
| Broadline Retail - 4.1% | | | |
| Amazon.com, Inc. (a) | | 161,791 | 25,109,963 |
| Macy's, Inc. | | 170,714 | 3,122,359 |
| | | | 28,232,322 |
| Diversified Consumer Services - 0.5% | | | |
| H&R Block, Inc. | | 80,111 | 3,752,399 |
| Hotels, Restaurants & Leisure - 2.3% | | | |
| Booking Holdings, Inc. (a) | | 1,502 | 5,268,220 |
| Expedia, Inc. (a) | | 29,250 | 4,338,653 |
| McDonald's Corp. | | 20,680 | 6,053,450 |
| | | | 15,660,323 |
| Household Durables - 0.4% | | | |
| Taylor Morrison Home Corp. (a) | | 57,708 | 3,008,895 |
| Specialty Retail - 1.2% | | | |
| The Home Depot, Inc. | | 24,073 | 8,496,806 |
TOTAL CONSUMER DISCRETIONARY | | | 75,815,546 |
| CONSUMER STAPLES - 5.7% | | | |
| Beverages - 0.8% | | | |
| The Coca-Cola Co. | | 96,118 | 5,718,060 |
| Consumer Staples Distribution & Retail - 1.2% | | | |
| Kroger Co. | | 53,483 | 2,467,706 |
| Walmart, Inc. | | 35,560 | 5,876,290 |
| | | | 8,343,996 |
| Food Products - 0.5% | | | |
| Archer Daniels Midland Co. | | 33,704 | 1,873,268 |
| Bunge Global SA | | 21,000 | 1,849,890 |
| | | | 3,723,158 |
| Household Products - 2.0% | | | |
| Colgate-Palmolive Co. | | 40,943 | 3,447,401 |
| Kimberly-Clark Corp. | | 21,901 | 2,649,364 |
| Procter & Gamble Co. | | 50,838 | 7,988,683 |
| | | | 14,085,448 |
| Personal Care Products - 0.1% | | | |
| Kenvue, Inc. | | 40,773 | 846,447 |
| Tobacco - 1.1% | | | |
| Altria Group, Inc. | | 76,351 | 3,063,202 |
| Philip Morris International, Inc. | | 46,416 | 4,216,894 |
| | | | 7,280,096 |
TOTAL CONSUMER STAPLES | | | 39,997,205 |
| ENERGY - 4.0% | | | |
| Oil, Gas & Consumable Fuels - 4.0% | | | |
| Chevron Corp. | | 35,390 | 5,217,548 |
| Chord Energy Corp. | | 8,683 | 1,335,098 |
| ConocoPhillips Co. | | 30,032 | 3,359,680 |
| Exxon Mobil Corp. | | 75,613 | 7,773,773 |
| Marathon Oil Corp. | | 58,407 | 1,334,600 |
| Marathon Petroleum Corp. | | 15,901 | 2,633,206 |
| PBF Energy, Inc. Class A | | 29,325 | 1,481,206 |
| Phillips 66 Co. | | 18,594 | 2,683,300 |
| Valero Energy Corp. | | 15,683 | 2,178,369 |
| | | | 27,996,780 |
| FINANCIALS - 13.9% | | | |
| Banks - 5.5% | | | |
| Bank of America Corp. | | 229,560 | 7,807,336 |
| Citigroup, Inc. | | 112,322 | 6,309,127 |
| JPMorgan Chase & Co. | | 70,295 | 12,256,636 |
| Wells Fargo & Co. | | 142,761 | 7,163,747 |
| Western Alliance Bancorp. | | 74,019 | 4,734,255 |
| | | | 38,271,101 |
| Capital Markets - 1.5% | | | |
| Goldman Sachs Group, Inc. | | 15,912 | 6,110,367 |
| State Street Corp. | | 56,896 | 4,202,908 |
| | | | 10,313,275 |
| Consumer Finance - 2.7% | | | |
| Ally Financial, Inc. | | 136,362 | 5,001,758 |
| Capital One Financial Corp. | | 39,386 | 5,329,714 |
| Discover Financial Services | | 40,723 | 4,297,091 |
| Synchrony Financial | | 116,625 | 4,533,214 |
| | | | 19,161,777 |
| Financial Services - 2.1% | | | |
| Berkshire Hathaway, Inc. Class B (a) | | 38,827 | 14,899,473 |
| Insurance - 2.1% | | | |
| American International Group, Inc. | | 73,055 | 5,078,053 |
| MetLife, Inc. | | 68,664 | 4,759,788 |
| Prudential Financial, Inc. | | 44,679 | 4,688,167 |
| | | | 14,526,008 |
TOTAL FINANCIALS | | | 97,171,634 |
| HEALTH CARE - 11.8% | | | |
| Biotechnology - 1.4% | | | |
| AbbVie, Inc. | | 59,921 | 9,851,012 |
| Health Care Providers & Services - 5.2% | | | |
| Centene Corp. (a) | | 80,966 | 6,097,549 |
| CVS Health Corp. | | 84,534 | 6,286,794 |
| Elevance Health, Inc. | | 13,954 | 6,885,462 |
| Humana, Inc. | | 11,762 | 4,446,742 |
| UnitedHealth Group, Inc. | | 24,158 | 12,362,615 |
| | | | 36,079,162 |
| Pharmaceuticals - 5.2% | | | |
| Bristol-Myers Squibb Co. | | 111,209 | 5,434,784 |
| Johnson & Johnson | | 64,001 | 10,169,759 |
| Merck & Co., Inc. | | 85,291 | 10,301,447 |
| Pfizer, Inc. | | 225,731 | 6,112,795 |
| Royalty Pharma PLC | | 162,107 | 4,602,218 |
| | | | 36,621,003 |
TOTAL HEALTH CARE | | | 82,551,177 |
| INDUSTRIALS - 8.9% | | | |
| Aerospace & Defense - 0.6% | | | |
| Lockheed Martin Corp. | | 10,220 | 4,388,570 |
| Air Freight & Logistics - 1.1% | | | |
| FedEx Corp. | | 15,009 | 3,621,522 |
| United Parcel Service, Inc. Class B | | 27,939 | 3,964,544 |
| | | | 7,586,066 |
| Building Products - 1.6% | | | |
| Builders FirstSource, Inc. (a) | | 22,704 | 3,944,366 |
| Owens Corning | | 22,748 | 3,447,004 |
| UFP Industries, Inc. | | 30,424 | 3,451,603 |
| | | | 10,842,973 |
| Electrical Equipment - 0.4% | | | |
| Atkore, Inc. | | 19,993 | 3,049,532 |
| Industrial Conglomerates - 0.8% | | | |
| General Electric Co. | | 43,830 | 5,803,969 |
| Machinery - 2.6% | | | |
| Caterpillar, Inc. | | 18,770 | 5,636,819 |
| Deere & Co. | | 11,320 | 4,455,326 |
| Mueller Industries, Inc. | | 77,969 | 3,742,512 |
| PACCAR, Inc. | | 43,501 | 4,367,065 |
| | | | 18,201,722 |
| Passenger Airlines - 0.4% | | | |
| United Airlines Holdings, Inc. (a) | | 62,533 | 2,587,616 |
| Professional Services - 0.9% | | | |
| Manpower, Inc. | | 38,783 | 2,875,372 |
| Robert Half, Inc. | | 41,204 | 3,277,366 |
| | | | 6,152,738 |
| Trading Companies & Distributors - 0.5% | | | |
| Boise Cascade Co. | | 27,818 | 3,768,226 |
TOTAL INDUSTRIALS | | | 62,381,412 |
| INFORMATION TECHNOLOGY - 28.3% | | | |
| Communications Equipment - 1.2% | | | |
| Cisco Systems, Inc. | | 165,355 | 8,297,514 |
| Electronic Equipment, Instruments & Components - 0.7% | | | |
| Arrow Electronics, Inc. (a) | | 42,751 | 4,751,774 |
| IT Services - 4.6% | | | |
| Accenture PLC Class A | | 26,846 | 9,768,722 |
| Cognizant Technology Solutions Corp. Class A | | 83,912 | 6,471,293 |
| DXC Technology Co. (a) | | 283,590 | 6,182,262 |
| IBM Corp. | | 51,370 | 9,434,614 |
| | | | 31,856,891 |
| Semiconductors & Semiconductor Equipment - 4.2% | | | |
| Broadcom, Inc. | | 12,634 | 14,908,120 |
| Qualcomm, Inc. | | 62,660 | 9,305,637 |
| Skyworks Solutions, Inc. | | 51,520 | 5,381,779 |
| | | | 29,595,536 |
| Software - 10.0% | | | |
| Microsoft Corp. | | 133,921 | 53,244,305 |
| Salesforce, Inc. (a) | | 40,284 | 11,323,430 |
| Zoom Video Communications, Inc. Class A (a) | | 80,003 | 5,168,994 |
| | | | 69,736,729 |
| Technology Hardware, Storage & Peripherals - 7.6% | | | |
| Apple, Inc. | | 261,722 | 48,261,537 |
| Hewlett Packard Enterprise Co. | | 329,238 | 5,034,049 |
| | | | 53,295,586 |
TOTAL INFORMATION TECHNOLOGY | | | 197,534,030 |
| MATERIALS - 2.6% | | | |
| Chemicals - 1.5% | | | |
| Albemarle Corp. (b) | | 7,142 | 819,473 |
| CF Industries Holdings, Inc. | | 16,064 | 1,212,993 |
| Dow, Inc. | | 30,381 | 1,628,422 |
| Linde PLC | | 10,487 | 4,245,452 |
| LyondellBasell Industries NV Class A | | 14,928 | 1,405,023 |
| The Mosaic Co. | | 31,096 | 954,958 |
| | | | 10,266,321 |
| Metals & Mining - 1.1% | | | |
| Cleveland-Cliffs, Inc. (a) | | 71,437 | 1,432,312 |
| Commercial Metals Co. | | 20,317 | 1,060,954 |
| Nucor Corp. | | 10,101 | 1,888,180 |
| Steel Dynamics, Inc. | | 12,525 | 1,511,642 |
| United States Steel Corp. (b) | | 47,034 | 2,211,539 |
| | | | 8,104,627 |
TOTAL MATERIALS | | | 18,370,948 |
| REAL ESTATE - 2.6% | | | |
| Equity Real Estate Investment Trusts (REITs) - 2.6% | | | |
| Alexandria Real Estate Equities, Inc. | | 11,217 | 1,356,135 |
| Boston Properties, Inc. | | 18,201 | 1,210,367 |
| Host Hotels & Resorts, Inc. | | 74,908 | 1,439,732 |
| Kilroy Realty Corp. | | 31,220 | 1,116,427 |
| Kimco Realty Corp. | | 63,077 | 1,274,155 |
| Medical Properties Trust, Inc. (b) | | 117,887 | 365,450 |
| Net Lease Office Properties | | 1,279 | 31,694 |
| Prologis, Inc. | | 23,235 | 2,943,642 |
| Public Storage | | 6,214 | 1,759,743 |
| Realty Income Corp. | | 28,817 | 1,567,357 |
| Simon Property Group, Inc. | | 14,210 | 1,969,648 |
| VICI Properties, Inc. | | 50,305 | 1,515,187 |
| WP Carey, Inc. | | 19,377 | 1,200,599 |
| | | | 17,750,136 |
| UTILITIES - 2.2% | | | |
| Electric Utilities - 1.2% | | | |
| American Electric Power Co., Inc. | | 24,462 | 1,911,461 |
| NextEra Energy, Inc. | | 51,076 | 2,994,586 |
| PG&E Corp. | | 102,869 | 1,735,400 |
| PPL Corp. | | 61,899 | 1,621,754 |
| | | | 8,263,201 |
| Gas Utilities - 0.2% | | | |
| National Fuel Gas Co. | | 26,489 | 1,249,221 |
| Multi-Utilities - 0.8% | | | |
| Consolidated Edison, Inc. | | 20,291 | 1,844,452 |
| Public Service Enterprise Group, Inc. | | 29,756 | 1,725,550 |
| Sempra | | 28,605 | 2,046,974 |
| | | | 5,616,976 |
TOTAL UTILITIES | | | 15,129,398 |
| TOTAL COMMON STOCKS (Cost $628,528,794) | | | 695,904,597 |
| | | | |
| Money Market Funds - 0.6% |
| | | Shares | Value ($) |
| Fidelity Cash Central Fund 5.39% (c) | | 1,708,524 | 1,708,866 |
| Fidelity Securities Lending Cash Central Fund 5.39% (c)(d) | | 2,566,218 | 2,566,475 |
| TOTAL MONEY MARKET FUNDS (Cost $4,275,341) | | | 4,275,341 |
| | | | |
| TOTAL INVESTMENT IN SECURITIES - 100.3% (Cost $632,804,135) | 700,179,938 |
NET OTHER ASSETS (LIABILITIES) - (0.3)% | (1,889,850) |
| NET ASSETS - 100.0% | 698,290,088 |
| | |
| Futures Contracts |
| | Number of contracts | Expiration Date | Notional Amount ($) | Value ($) | Unrealized Appreciation/ (Depreciation) ($) |
| Purchased | | | | | |
| | | | | | |
| Equity Index Contracts | | | | | |
| CME E-mini S&P 500 Index Contracts (United States) | 91 | Mar 2024 | 2,216,078 | 52,826 | 52,826 |
| | | | | | |
| The notional amount of futures purchased as a percentage of Net Assets is 0.3% |
Legend
| (b) | Security or a portion of the security is on loan at period end. |
| (c) | Affiliated fund that is generally available only to investment companies and other accounts managed by Fidelity Investments. The rate quoted is the annualized seven-day yield of the fund at period end. A complete unaudited listing of the fund's holdings as of its most recent quarter end is available upon request. In addition, each Fidelity Central Fund's financial statements are available on the SEC's website or upon request. |
| (d) | Investment made with cash collateral received from securities on loan. |
Affiliated Central Funds
Fiscal year to date information regarding the Fund's investments in Fidelity Central Funds, including the ownership percentage, is presented below.
| Affiliate | Value, beginning of period ($) | Purchases ($) | Sales Proceeds ($) | Dividend Income ($) | Realized Gain (loss) ($) | Change in Unrealized appreciation (depreciation) ($) | Value, end of period ($) | % ownership, end of period |
| Fidelity Cash Central Fund 5.39% | 1,107,830 | 12,677,239 | 12,076,203 | 27,789 | - | - | 1,708,866 | 0.0% |
| Fidelity Securities Lending Cash Central Fund 5.39% | 4,344,675 | 25,680,031 | 27,458,231 | 8,273 | - | - | 2,566,475 | 0.0% |
| Total | 5,452,505 | 38,357,270 | 39,534,434 | 36,062 | - | - | 4,275,341 | |
| | | | | | | | | |
Amounts in the dividend income column in the above table include any capital gain distributions from underlying funds, which are presented in the corresponding line item in the Statement of Operations, if applicable.
Amounts in the dividend income column for Fidelity Securities Lending Cash Central Fund represents the income earned on investing cash collateral, less rebates paid to borrowers and any lending agent fees associated with the loan, plus any premium payments received for lending certain types of securities.
Amounts included in the purchases and sales proceeds columns may include in-kind transactions, if applicable.
Investment Valuation
The following is a summary of the inputs used, as of January 31, 2024, involving the Fund's assets and liabilities carried at fair value. The inputs or methodology used for valuing securities may not be an indication of the risk associated with investing in those securities. For more information on valuation inputs, and their aggregation into the levels used below, please refer to the Investment Valuation section in the accompanying Notes to Financial Statements.
| Valuation Inputs at Reporting Date: |
| Description | Total ($) | Level 1 ($) | Level 2 ($) | Level 3 ($) |
Investments in Securities: | | | | |
|
| Equities: | | | | |
Communication Services | 61,206,331 | 61,206,331 | - | - |
Consumer Discretionary | 75,815,546 | 75,815,546 | - | - |
Consumer Staples | 39,997,205 | 39,997,205 | - | - |
Energy | 27,996,780 | 27,996,780 | - | - |
Financials | 97,171,634 | 97,171,634 | - | - |
Health Care | 82,551,177 | 82,551,177 | - | - |
Industrials | 62,381,412 | 62,381,412 | - | - |
Information Technology | 197,534,030 | 197,534,030 | - | - |
Materials | 18,370,948 | 18,370,948 | - | - |
Real Estate | 17,750,136 | 17,750,136 | - | - |
Utilities | 15,129,398 | 15,129,398 | - | - |
|
| Money Market Funds | 4,275,341 | 4,275,341 | - | - |
| Total Investments in Securities: | 700,179,938 | 700,179,938 | - | - |
Derivative Instruments: Assets | | | | |
Futures Contracts | 52,826 | 52,826 | - | - |
| Total Assets | 52,826 | 52,826 | - | - |
| Total Derivative Instruments: | 52,826 | 52,826 | - | - |
Value of Derivative Instruments
The following table is a summary of the Fund's value of derivative instruments by primary risk exposure as of January 31, 2024. For additional information on derivative instruments, please refer to the Derivative Instruments section in the accompanying Notes to Financial Statements.
Primary Risk Exposure / Derivative Type | Value |
| Asset ($) | Liability ($) |
| Equity Risk | | |
Futures Contracts (a) | 52,826 | 0 |
| Total Equity Risk | 52,826 | 0 |
| Total Value of Derivatives | 52,826 | 0 |
(a)Reflects gross cumulative appreciation (depreciation) on futures contracts as presented in the Schedule of Investments. In the Statement of Assets and Liabilities, the period end daily variation margin is included in receivable or payable for daily variation margin on futures contracts, and the net cumulative appreciation (depreciation) is included in Total accumulated earnings (loss).
Fidelity® Value Factor ETF
| Statement of Assets and Liabilities |
| | | | January 31, 2024 (Unaudited) |
| | | | | |
| Assets | | | | |
| Investment in securities, at value (including securities loaned of $2,444,058) - See accompanying schedule: | | | | |
Unaffiliated issuers (cost $628,528,794) | $ | 695,904,597 | | |
Fidelity Central Funds (cost $4,275,341) | | 4,275,341 | | |
| | | | | |
| | | | | |
| Total Investment in Securities (cost $632,804,135) | | | $ | 700,179,938 |
| Segregated cash with brokers for derivative instruments | | | | 129,920 |
| Cash | | | | 282 |
| Dividends receivable | | | | 657,287 |
| Distributions receivable from Fidelity Central Funds | | | | 5,690 |
| Other receivables | | | | 4,293 |
Total assets | | | | 700,977,410 |
| Liabilities | | | | |
| Accrued management fee | $ | 84,219 | | |
| Payable for daily variation margin on futures contracts | | 36,628 | | |
| Collateral on securities loaned | | 2,566,475 | | |
| Total Liabilities | | | | 2,687,322 |
| Net Assets | | | $ | 698,290,088 |
| Net Assets consist of: | | | | |
| Paid in capital | | | $ | 680,337,704 |
| Total accumulated earnings (loss) | | | | 17,952,384 |
| Net Assets | | | $ | 698,290,088 |
Net Asset Value, offering price and redemption price per share ($698,290,088 ÷ 13,150,000 shares) | | | $ | 53.10 |
| Statement of Operations |
| | | | Six months ended January 31, 2024 (Unaudited) |
| Investment Income | | | | |
| Dividends | | | $ | 5,916,386 |
| Income from Fidelity Central Funds (including $8,273 from security lending) | | | | 36,062 |
| Total Income | | | | 5,952,448 |
| Expenses | | | | |
| Management fee | $ | 612,636 | | |
| Independent trustees' fees and expenses | | 1,559 | | |
| Total expenses before reductions | | 614,195 | | |
| Expense reductions | | (158) | | |
| Total expenses after reductions | | | | 614,037 |
| Net Investment income (loss) | | | | 5,338,411 |
| Realized and Unrealized Gain (Loss) | | | | |
| Net realized gain (loss) on: | | | | |
| Investment Securities: | | | | |
| Unaffiliated issuers | | (7,190,245) | | |
| Redemptions in-kind | | 2,847,601 | | |
| Futures contracts | | 135,291 | | |
| Total net realized gain (loss) | | | | (4,207,353) |
| Change in net unrealized appreciation (depreciation) on: | | | | |
| Investment Securities: | | | | |
| Unaffiliated issuers | | 34,404,687 | | |
| Futures contracts | | (17,301) | | |
| Total change in net unrealized appreciation (depreciation) | | | | 34,387,386 |
| Net gain (loss) | | | | 30,180,033 |
| Net increase (decrease) in net assets resulting from operations | | | $ | 35,518,444 |
| Statement of Changes in Net Assets |
| |
| | Six months ended January 31, 2024 (Unaudited) | | Year ended July 31, 2023 |
| Increase (Decrease) in Net Assets | | | | |
| Operations | | | | |
| Net investment income (loss) | $ | 5,338,411 | $ | 8,882,060 |
| Net realized gain (loss) | | (4,207,353) | | 6,545,976 |
| Change in net unrealized appreciation (depreciation) | | 34,387,386 | | 38,194,193 |
| Net increase (decrease) in net assets resulting from operations | | 35,518,444 | | 53,622,229 |
| Distributions to shareholders | | (5,069,300) | | (8,641,250) |
| | | | | |
| Share transactions | | | | |
| Proceeds from sales of shares | | 154,539,576 | | 80,746,346 |
| Cost of shares redeemed | | (14,558,954) | | (97,539,980) |
| | | | | |
Net increase (decrease) in net assets resulting from share transactions | | 139,980,622 | | (16,793,634) |
| Total increase (decrease) in net assets | | 170,429,766 | | 28,187,345 |
| | | | | |
| Net Assets | | | | |
| Beginning of period | | 527,860,322 | | 499,672,977 |
| End of period | $ | 698,290,088 | $ | 527,860,322 |
| | | | | |
| Other Information | | | | |
| Shares | | | | |
| Sold | | 3,100,000 | | 1,750,000 |
| Redeemed | | (300,000) | | (2,200,000) |
| Net increase (decrease) | | 2,800,000 | | (450,000) |
| | | | | |
Financial Highlights
| Fidelity® Value Factor ETF |
| |
| | Six months ended (Unaudited) January 31, 2024 | | Years ended July 31, 2023 | | 2022 | | 2021 | | 2020 | | 2019 |
Selected Per-Share Data | | | | | | | | | | | | |
| Net asset value, beginning of period | $ | 51.00 | $ | 46.27 | $ | 48.94 | $ | 34.85 | $ | 34.53 | $ | 33.90 |
| Income from Investment Operations | | | | | | | | | | | | |
Net investment income (loss) A,B | | .47 | | .87 | | .79 | | .64 | | .73 | | .70 |
| Net realized and unrealized gain (loss) | | 2.08 | | 4.70 | | (2.65) | | 14.07 | | .28 | | .59 |
| Total from investment operations | | 2.55 | | 5.57 | | (1.86) | | 14.71 | | 1.01 | | 1.29 |
| Distributions from net investment income | | (.45) | | (.84) | | (.81) | | (.62) | | (.69) | | (.66) |
| Total distributions | | (.45) | | (.84) | | (.81) | | (.62) | | (.69) | | (.66) |
| Net asset value, end of period | $ | 53.10 | $ | 51.00 | $ | 46.27 | $ | 48.94 | $ | 34.85 | $ | 34.53 |
Total Return C,D,E | | 5.03% | | 12.33% | | (3.86)% | | 42.56% | | 3.12% | | 3.95% |
Ratios to Average Net Assets B,F,G | | | | | | | | | | | | |
| Expenses before reductions | | .21% H | | .29% | | .29% | | .29% | | .29% | | .29% |
| Expenses net of fee waivers, if any | | .21% H | | .29% | | .29% | | .29% | | .29% | | .29% |
| Expenses net of all reductions | | .21% H | | .29% | | .29% | | .29% | | .29% | | .29% |
| Net investment income (loss) | | 1.86% H | | 1.91% | | 1.61% | | 1.50% | | 2.13% | | 2.09% |
| Supplemental Data | | | | | | | | | | | | |
| Net assets, end of period (000 omitted) | $ | 698,290 | $ | 527,860 | $ | 499,673 | $ | 450,269 | $ | 189,916 | $ | 136,403 |
Portfolio turnover rate I,J | | 39% H | | 43% | | 46% | | 42% | | 45% | | 31% |
ACalculated based on average shares outstanding during the period.
BNet investment income (loss) is affected by the timing of the declaration of dividends by any underlying mutual funds or exchange-traded funds (ETFs). Net investment income (loss) of any mutual funds or ETFs is not included in the Fund's net investment income (loss) ratio.
CTotal returns for periods of less than one year are not annualized.
DTotal returns would have been lower if certain expenses had not been reduced during the applicable periods shown.
EBased on net asset value.
FFees and expenses of any underlying mutual funds or exchange-traded funds (ETFs) are not included in the Fund's expense ratio. The Fund indirectly bears its proportionate share of these expenses. For additional expense information related to investments in Fidelity Central Funds, please refer to the "Investments in Fidelity Central Funds" note found in the Notes to Financial Statements section of the most recent Annual or Semi-Annual report.
GExpense ratios reflect operating expenses of the class. Expenses before reductions do not reflect amounts reimbursed, waived, or reduced through arrangements with the investment adviser, brokerage services, or other offset arrangements, if applicable, and do not represent the amount paid by the class during periods when reimbursements, waivers or reductions occur.
HAnnualized.
IAmount does not include the portfolio activity of any underlying mutual funds or exchange-traded funds (ETFs).
JPortfolio turnover rate excludes securities received or delivered in-kind.
For the period ended January 31, 2024
1. Organization.
Fidelity Dividend ETF for Rising Rates, Fidelity High Dividend ETF, Fidelity Low Volatility Factor ETF, Fidelity Momentum Factor ETF, Fidelity Quality Factor ETF, Fidelity Small-Mid Multifactor ETF, Fidelity Stocks for Inflation ETF, Fidelity U.S. Multifactor ETF and Fidelity Value Factor ETF (the Funds) are exchange-traded funds of Fidelity Covington Trust (the Trust) and are authorized to issue an unlimited number of shares. The Trust is registered under the Investment Company Act of 1940, as amended (the 1940 Act), as an open-end management investment company organized as a Massachusetts business trust.
2. Investments in Fidelity Central Funds.
Funds may invest in Fidelity Central Funds, which are open-end investment companies generally available only to other investment companies and accounts managed by the investment adviser and its affiliates. The Schedule of Investments lists any Fidelity Central Funds held as an investment as of period end, but does not include the underlying holdings of each Fidelity Central Fund. An investing fund indirectly bears its proportionate share of the expenses of the underlying Fidelity Central Funds.
Based on its investment objective, each Fidelity Central Fund may invest or participate in various investment vehicles or strategies that are similar to those of the investing fund. These strategies are consistent with the investment objectives of the investing fund and may involve certain economic risks which may cause a decline in value of each of the Fidelity Central Funds and thus a decline in the value of the investing fund.
| Fidelity Central Fund | Investment Manager | Investment Objective | Investment Practices | Expense RatioA |
| Fidelity Money Market Central Funds | Fidelity Management & Research Company LLC (FMR) | Each fund seeks to obtain a high level of current income consistent with the preservation of capital and liquidity. | Short-term Investments | Less than .005% |
A Expenses expressed as a percentage of average net assets and are as of each underlying Central Fund's most recent annual or semi-annual shareholder report.
A complete unaudited list of holdings for each Fidelity Central Fund is available upon request or at the Securities and Exchange Commission website at www.sec.gov. In addition, the financial statements of the Fidelity Central Funds, which are not covered by the Report of Independent Registered Public Accounting Firm, are available on the Securities and Exchange Commission website or upon request.
3. Significant Accounting Policies.
Each Fund is an investment company and applies the accounting and reporting guidance of the Financial Accounting Standards Board (FASB) Accounting Standards Codification Topic 946 Financial Services - Investment Companies. The financial statements have been prepared in conformity with accounting principles generally accepted in the United States of America (GAAP), which require management to make certain estimates and assumptions at the date of the financial statements. Actual results could differ from those estimates. Subsequent events, if any, through the date that the financial statements were issued have been evaluated in the preparation of the financial statements. Each Fund's Schedule of Investments lists any underlying mutual funds or exchange-traded funds (ETFs) but does not include the underlying holdings of these funds. The following summarizes the significant accounting policies of each Fund:
Investment Valuation. Investments are valued as of 4:00 p.m. Eastern time on the last calendar day of the period. The Board of Trustees (the Board) has designated each Fund's investment adviser as the valuation designee responsible for the fair valuation function and performing fair value determinations as needed. The investment adviser has established a Fair Value Committee (the Committee) to carry out the day-to-day fair valuation responsibilities and has adopted policies and procedures to govern the fair valuation process and the activities of the Committee. In accordance with these fair valuation policies and procedures, which have been approved by the Board, each Fund attempts to obtain prices from one or more third party pricing services or brokers to value its investments. When current market prices, quotations or currency exchange rates are not readily available or reliable, investments will be fair valued in good faith by the Committee, in accordance with the policies and procedures. Factors used in determining fair value vary by investment type and may include market or investment specific events, transaction data, estimated cash flows, and market observations of comparable investments. The frequency that the fair valuation procedures are used cannot be predicted and they may be utilized to a significant extent. The Committee manages each Fund's fair valuation practices and maintains the fair valuation policies and procedures. Each Fund's investment adviser reports to the Board information regarding the fair valuation process and related material matters.
Each Fund categorizes the inputs to valuation techniques used to value its investments into a disclosure hierarchy consisting of three levels as shown below:
Level 1 - unadjusted quoted prices in active markets for identical investments
Level 2 - other significant observable inputs (including quoted prices for similar investments, interest rates, prepayment speeds, etc.)
Level 3 - unobservable inputs (including the Fund's own assumptions based on the best information available)
Valuation techniques used to value each Fund's investments by major category are as follows:
Equity securities, including restricted securities, for which market quotations are readily available, are valued at the last reported sale price or official closing price as reported by a third party pricing service on the primary market or exchange on which they are traded and are categorized as Level 1 in the hierarchy. In the event there were no sales during the day or closing prices are not available, securities are valued at the last quoted bid price or may be valued using the last available price and are generally categorized as Level 2 in the hierarchy. For foreign equity securities, when market or security specific events arise, comparisons to the valuation of American Depositary Receipts (ADRs), futures contracts, ETFs and certain indexes as well as quoted prices for similar securities may be used and would be categorized as Level 2 in the hierarchy. For equity securities, including restricted securities, where observable inputs are limited, assumptions about market activity and risk are used and these securities may be categorized as Level 3 in the hierarchy.
Futures contracts are valued at the settlement price established each day by the board of trade or exchange on which they are traded and are categorized as Level 1 in the hierarchy. Investments in open-end mutual funds, including the Fidelity Central Funds, are valued at their closing net asset value (NAV) each business day and are categorized as Level 1 in the hierarchy.
Changes in valuation techniques may result in transfers in or out of an assigned level within the disclosure hierarchy. The aggregate value of investments by input level as of January 31, 2024 is included at the end of each Fund's Schedule of Investments.
Foreign Currency. Certain Funds may use foreign currency contracts to facilitate transactions in foreign-denominated securities. Gains and losses from these transactions may arise from changes in the value of the foreign currency or if the counterparties do not perform under the contracts' terms.
Foreign-denominated assets, including investment securities, and liabilities are translated into U.S. dollars at the exchange rates at period end. Purchases and sales of investment securities, income and dividends received, and expenses denominated in foreign currencies are translated into U.S. dollars at the exchange rate in effect on the transaction date.
The effects of exchange rate fluctuations on investments are included with the net realized and unrealized gain (loss) on investment securities. Other foreign currency transactions resulting in realized and unrealized gain (loss) are disclosed separately.
Investment Transactions and Income. For financial reporting purposes, the Funds' investment holdings and NAV include trades executed through the end of the last business day of the period. The NAV per share for processing shareholder transactions is calculated as of the close of business (normally 4:00 p.m. Eastern time) of the Cboe BZX Exchange, Inc. (CboeBZX) for Fidelity Stocks for Inflation ETF, and of the New York Stock Exchange, Archipelago Exchange (NYSE Arca) for all other funds and includes trades executed through the end of the prior business day. Gains and losses on securities sold are determined on the basis of identified cost and may include proceeds received from litigation. Commissions paid to certain brokers with whom the investment adviser, or its affiliates, places trades on behalf of a fund include an amount in addition to trade execution, which may be rebated back to a fund. Any such rebates are included in net realized gain (loss) on investments in the Statement of Operations. Dividend income is recorded on the ex-dividend date, except for certain dividends from foreign securities where the ex-dividend date may have passed, which are recorded as soon as the Funds are informed of the ex-dividend date. Non-cash dividends included in dividend income, if any, are recorded at the fair market value of the securities received. Income and capital gain distributions from Fidelity Central Funds, if any, are recorded on the ex-dividend date. Certain distributions received by the Funds represent a return of capital or capital gain. The Funds determine the components of these distributions subsequent to the ex-dividend date, based upon receipt of tax filings or other correspondence relating to the underlying investment. These distributions are recorded as a reduction of cost of investments and/or as a realized gain. Investment income is recorded net of foreign taxes withheld where recovery of such taxes is uncertain. Funds may file withholding tax reclaims in certain jurisdictions to recover a portion of amounts previously withheld. Any withholding tax reclaims income is included in the Statement of Operations in dividends. Any receivables for withholding tax reclaims are included in the Statement of Assets and Liabilities in dividends receivable.
Expenses. Expenses directly attributable to a fund are charged to that fund. Expenses attributable to more than one fund are allocated among the respective funds on the basis of relative net assets or other appropriate methods. Expenses included in the accompanying financial statements reflect the expenses of that fund and do not include any expenses associated with any underlying mutual funds or exchange-traded funds. Although not included in a fund's expenses, a fund indirectly bears its proportionate share of these expenses through the net asset value of each underlying mutual fund or exchange-traded fund. Expense estimates are accrued in the period to which they relate and adjustments are made when actual amounts are known.
Income Tax Information and Distributions to Shareholders. Each year, each Fund intends to qualify as a regulated investment company under Subchapter M of the Internal Revenue Code, including distributing substantially all of its taxable income and realized gains. As a result, no provision for U.S. Federal income taxes is required. Each Fund files a U.S. federal tax return, in addition to state and local tax returns as required. Each Fund's federal income tax returns are subject to examination by the Internal Revenue Service (IRS) for a period of three fiscal years after they are filed. State and local tax returns may be subject to examination for an additional fiscal year depending on the jurisdiction. Realized gain or loss resulting from in-kind redemptions is not taxable to the Fund and is not distributed to shareholders of the Fund. Foreign taxes are provided for based on each Fund's understanding of the tax rules and rates that exist in the foreign markets in which it invests.
Distributions are declared and recorded on the ex-dividend date. Income and capital gain distributions are determined in accordance with income tax regulations, which may differ from GAAP.
Capital accounts within the financial statements are adjusted for permanent book-tax differences. These adjustments have no impact on net assets or the results of operations. Capital accounts are not adjusted for temporary book-tax differences which will reverse in a subsequent period.
Book-tax differences are primarily due to futures transactions, redemptions in kind, passive foreign investment companies (PFIC), foreign currency transactions, capital loss carryforwards and losses deferred due to wash sales and excise tax regulations.
As of period end, the cost and unrealized appreciation (depreciation) in securities, and derivatives if applicable, for federal income tax purposes were as follows for each Fund:
| | Tax cost | Gross unrealized appreciation | Gross unrealized depreciation | Net unrealized appreciation (depreciation) |
| Fidelity Dividend ETF for Rising Rates | $478,717,853 | $94,918,026 | $(46,555,647) | $48,362,379 |
| Fidelity High Dividend ETF | 2,023,198,566 | 319,586,059 | (117,708,821) | 201,877,238 |
| Fidelity Low Volatility Factor ETF | 979,532,398 | 84,032,004 | (20,809,089) | 63,222,915 |
| Fidelity Momentum Factor ETF | 159,209,696 | 33,754,375 | (1,927,388) | 31,826,987 |
| Fidelity Quality Factor ETF | 560,253,026 | 63,478,256 | (14,482,049) | 48,996,207 |
| Fidelity Small-Mid Multifactor ETF | 142,511,544 | 21,785,048 | (7,182,672) | 14,602,376 |
| Fidelity Stocks for Inflation ETF | 117,347,603 | 20,876,278 | (4,784,569) | 16,091,709 |
| Fidelity U.S. Multifactor ETF | 73,066,353 | 7,700,393 | (1,403,768) | 6,296,625 |
| Fidelity Value Factor ETF | 633,116,943 | 95,384,438 | (28,268,617) | 67,115,821 |
Capital loss carryforwards are only available to offset future capital gains of the Funds to the extent provided by regulations and may be limited. The capital loss carryforward information presented below, including any applicable limitation, is estimated as of prior fiscal period end and is subject to adjustment.
| | Short-term | Long-term | Total capital loss carryforward |
| Fidelity Dividend ETF for Rising Rates | $(27,351,906) | $(32,384,438) | $(59,736,344) |
| Fidelity High Dividend ETF | (37,157,065) | (34,342,060) | (71,499,125) |
| Fidelity Low Volatility Factor ETF | (25,713,255) | (14,247,426) | (39,960,681) |
| Fidelity Momentum Factor ETF | (32,199,777) | (340,311) | (32,540,088) |
| Fidelity Quality Factor ETF | (17,277,163) | (6,444,006) | (23,721,169) |
| Fidelity Small-Mid Multifactor ETF | (6,770,927) | (1,549,297) | (8,320,224) |
| Fidelity Stocks for Inflation ETF | (17,304,578) | (3,509,690) | (20,814,268) |
| Fidelity U.S. Multifactor ETF | (688,778) | (394,721) | (1,083,499) |
| Fidelity Value Factor ETF | (28,724,493) | (16,664,483) | (45,388,976) |
Certain of the Funds elected to defer to the next fiscal year ordinary losses recognized during the period January 1, 2023 to July 31, 2023. Loss deferrals were as follows:
| | Ordinary Losses |
| Fidelity High Dividend ETF | $(246,109) |
| Fidelity Small-Mid Multifactor ETF | (2,680) |
4. Derivative Instruments.
Risk Exposures and the Use of Derivative Instruments. Each Fund's investment objectives allow for various types of derivative instruments, including futures contracts. Derivatives are investments whose value is primarily derived from underlying assets, indices or reference rates and may be transacted on an exchange or over-the-counter (OTC). Derivatives may involve a future commitment to buy or sell a specified asset based on specified terms, to exchange future cash flows at periodic intervals based on a notional principal amount, or for one party to make one or more payments upon the occurrence of specified events in exchange for periodic payments from the other party.
Derivatives were used to increase returns and to manage exposure to certain risks as defined below. The success of any strategy involving derivatives depends on analysis of numerous economic factors, and if the strategies for investment do not work as intended, the objectives may not be achieved.
Derivatives were used to increase or decrease exposure to the following risk(s):
| | |
| Equity Risk | Equity risk relates to the fluctuations in the value of financial instruments as a result of changes in market prices (other than those arising from interest rate risk or foreign exchange risk), whether caused by factors specific to an individual investment, its issuer, or all factors affecting all instruments traded in a market or market segment. |
Funds are also exposed to additional risks from investing in derivatives, such as liquidity risk and counterparty credit risk. Liquidity risk is the risk that a fund will be unable to close out the derivative in the open market in a timely manner. Counterparty credit risk is the risk that the counterparty will not be able to fulfill its obligation to a fund. Counterparty credit risk related to exchange-traded contracts may be mitigated by the protection provided by the exchange on which they trade.
Investing in derivatives may involve greater risks than investing in the underlying assets directly and, to varying degrees, may involve risk of loss in excess of any initial investment and collateral received and amounts recognized in the Statement of Assets and Liabilities. In addition, there may be the risk that the change in value of the derivative contract does not correspond to the change in value of the underlying instrument.
Futures Contracts. A futures contract is an agreement between two parties to buy or sell a specified underlying instrument for a fixed price at a specified future date. Futures contracts were used to manage exposure to the stock market.
Upon entering into a futures contract, a fund is required to deposit either cash or securities (initial margin) with a clearing broker in an amount equal to a certain percentage of the face value of the contract. Futures contracts are marked-to-market daily and subsequent daily payments are made or received by a fund depending on the daily fluctuations in the value of the futures contracts and are recorded as unrealized appreciation or (depreciation). This receivable and/or payable, if any, is included in daily variation margin on futures contracts in the Statement of Assets and Liabilities. Realized gain or (loss) is recorded upon the expiration or closing of a futures contract. The net realized gain (loss) and change in net unrealized appreciation (depreciation) on futures contracts during the period is presented in the Statement of Operations.
Any open futures contracts at period end are presented in the Schedule of Investments under the caption "Futures Contracts". The notional amount at value reflects each contract's exposure to the underlying instrument or index at period end, and is representative of volume of activity during the period unless an average notional amount is presented. Any securities deposited to meet initial margin requirements are identified in the Schedule of Investments. Any cash deposited to meet initial margin requirements is presented as segregated cash with brokers for derivative instruments in the Statement of Assets and Liabilities.
5. Purchases and Sales of Investments.
Purchases and sales of securities, other than short-term securities and in-kind transactions, as applicable, are noted in the table below.
| | Purchases ($) | Sales ($) |
| Fidelity Dividend ETF for Rising Rates | 5,860,055 | 6,561,050 |
| Fidelity High Dividend ETF | 42,260,627 | 31,476,872 |
| Fidelity Low Volatility Factor ETF | 119,709,830 | 110,368,927 |
| Fidelity Momentum Factor ETF | 85,461,439 | 84,003,328 |
| Fidelity Quality Factor ETF | 61,702,346 | 58,254,135 |
| Fidelity Small-Mid Multifactor ETF | 34,468,656 | 33,122,882 |
| Fidelity Stocks for Inflation ETF | 59,316,716 | 59,115,224 |
| Fidelity U.S. Multifactor ETF | 8,734,864 | 7,654,645 |
| Fidelity Value Factor ETF | 109,040,359 | 108,343,774 |
Securities received and delivered in-kind through subscriptions and redemptions are noted in the table below.
| | In-Kind Subscriptions ($) | In-Kind Redemptions ($) |
| Fidelity Dividend ETF for Rising Rates | - | 34,411,836 |
| Fidelity High Dividend ETF | 401,899,816 | 6,240,084 |
| Fidelity Low Volatility Factor ETF | 671,993,831 | 247,437,549 |
| Fidelity Momentum Factor ETF | 38,863,923 | 17,212,682 |
| Fidelity Quality Factor ETF | 267,181,171 | 4,889,213 |
| Fidelity Small-Mid Multifactor ETF | 36,959,736 | 13,172,487 |
| Fidelity Stocks for Inflation ETF | - | 22,915,728 |
| Fidelity U.S. Multifactor ETF | 44,161,675 | 3,871,082 |
| Fidelity Value Factor ETF | 153,315,522 | 14,442,842 |
6. Fees and Other Transactions with Affiliates.
Management Fee. Fidelity Management & Research Company LLC (the investment adviser) provides the Funds with investment management related services for which the Funds pay a monthly management fee that, effective November 1, 2023, is based on an annual rate of each Fund's average net assets as noted in the table below. Prior to November 1, 2023, each Fund paid a monthly management fee that was based on an annual rate of .29% of each Fund's average net assets. Under the management contract, the investment adviser pays all other expenses, except the compensation of the independent Trustees and certain miscellaneous expenses such as proxy and shareholder meeting expenses. For each Fund, with the exception of Fidelity Small-Mid Multifactor ETF, Fidelity Stocks for Inflation ETF and Fidelity U.S. Multifactor ETF, the management fee paid to the investment adviser is reduced by an amount equal to the fees and expenses paid by each fund to the independent Trustees.
| | Fee Rate |
| Fidelity Dividend ETF for Rising Rates | .15% |
| Fidelity High Dividend ETF | .15% |
| Fidelity Low Volatility Factor ETF | .15% |
| Fidelity Momentum Factor ETF | .15% |
| Fidelity Quality Factor ETF | .15% |
| Fidelity Small-Mid Multifactor ETF | .15% |
| Fidelity Stocks for Inflation ETF | .15% |
| Fidelity U.S. Multifactor ETF | .15% |
| Fidelity Value Factor ETF | .15% |
Sub-Adviser. Geode Capital Management, LLC (Geode), serves as sub-adviser for the Funds. Geode provides discretionary investment advisory services to the Funds and is paid by the investment adviser for providing these services.
Interfund Trades. Funds may purchase from or sell securities to other funds affiliated with each sub-adviser under procedures adopted by the Board. The procedures have been designed to ensure these interfund trades are executed in accordance with Rule 17a-7 of the 1940 Act. Any interfund trades are included within the respective purchases and sales amounts shown in the Purchases and Sales of Investments note. During the period, there were no interfund trades.
7. Security Lending.
Funds lend portfolio securities from time to time in order to earn additional income. Lending agents are used, including National Financial Services (NFS), an affiliate of the investment adviser. Pursuant to a securities lending agreement, NFS will receive a fee, which is capped at 9.9% of a fund's daily lending revenue, for its services as lending agent. A fund may lend securities to certain qualified borrowers, including NFS. On the settlement date of the loan, a fund receives collateral (in the form of U.S. Treasury obligations, letters of credit and/or cash) against the loaned securities and maintains collateral in an amount not less than 100% of the market value of the loaned securities during the period of the loan. The market value of the loaned securities is determined at the close of business of a fund and any additional required collateral is delivered to a fund on the next business day. A fund or borrower may terminate the loan at any time, and if the borrower defaults on its obligation to return the securities loaned because of insolvency or other reasons, a fund may apply collateral received from the borrower against the obligation. A fund may experience delays and costs in recovering the securities loaned. Any cash collateral received is invested in the Fidelity Securities Lending Cash Central Fund. Any loaned securities are identified as such in the Schedule of Investments, and the value of loaned securities and cash collateral at period end, as applicable, are presented in the Statement of Assets and Liabilities. Security lending income represents the income earned on investing cash collateral, less rebates paid to borrowers and any lending agent fees associated with the loan, plus any premium payments received for lending certain types of securities. Security lending income is presented in the Statement of Operations as a component of income from Fidelity Central Funds. Affiliated security lending activity, if any, was as follows:
| | Total Security Lending Fees Paid to NFS | Security Lending Income From Securities Loaned to NFS | Value of Securities Loaned to NFS at Period End |
| Fidelity Dividend ETF for Rising Rates | $835 | $- | $- |
| Fidelity High Dividend ETF | $7,997 | $- | $- |
| Fidelity Low Volatility Factor ETF | $707 | $- | $- |
| Fidelity Momentum Factor ETF | $14 | $- | $- |
| Fidelity Quality Factor ETF | $395 | $- | $- |
| Fidelity Small-Mid Multifactor ETF | $244 | $39 | $- |
| Fidelity Value Factor ETF | $727 | $12 | $16,430 |
8. Expense Reductions.
Through arrangements with each applicable Fund's custodian, credits realized as a result of certain uninvested cash balances were used to reduce each applicable Fund's expenses. All of the applicable expense reductions are noted in the table below.
| | Custodian credits |
Fidelity Dividend ETF for Rising Rates | $89 |
| Fidelity High Dividend ETF | 22 |
| Fidelity Low Volatility Factor ETF | 218 |
| Fidelity Momentum Factor ETF | 432 |
| Fidelity Quality Factor ETF | 239 |
| Fidelity Small-Mid Multifactor ETF | 777 |
| Fidelity Stocks for Inflation ETF | 160 |
| Fidelity U.S. Multifactor ETF | 249 |
| Fidelity Value Factor ETF | 158 |
9. Share Transactions.
Funds issue and redeem shares at NAV only with certain authorized participants in large increments known as Creation Units. Purchases of Creation Units are made by tendering a basket of designated securities to a fund and redemption proceeds are paid with a basket of securities from a fund's portfolio with a balancing cash component to equate the market value of the basket of securities delivered or redeemed to the NAV per Creation Unit on the transaction date. Cash may be substituted equivalent to the value of certain securities generally when they are not available in sufficient quantity for delivery. A fund's shares are available in smaller increments to investors in the secondary market at market prices and may be subject to commissions. Authorized participants pay a transaction fee to the shareholder servicing agent when purchasing and redeeming Creation Units of a fund. The transaction fee is used to offset the costs associated with the issuance and redemption of Creation Units.
To the extent the Funds permit the contribution of securities in exchange for the purchase of shares (contribution in-kind), shares may be issued in advance of receipt by the Funds of all or a portion of the applicable deposit securities. In these circumstances, the Authorized Participant provides collateral to the custodian, on behalf of the Funds, in an amount up to 115% of the daily mark-to-market value of the deposit securities not yet received.
10. Other.
A fund's organizational documents provide former and current trustees and officers with a limited indemnification against liabilities arising in connection with the performance of their duties to the fund. In the normal course of business, a fund may also enter into contracts that provide general indemnifications. A fund's maximum exposure under these arrangements is unknown as this would be dependent on future claims that may be made against a fund. The risk of material loss from such claims is considered remote.
11. Risk and Uncertainties.
Many factors affect a fund's performance. Developments that disrupt global economies and financial markets, such as pandemics, epidemics, outbreaks of infectious diseases, war, terrorism, and environmental disasters, may significantly affect a fund's investment performance. The effects of these developments to a fund will be impacted by the types of securities in which a fund invests, the financial condition, industry, economic sector, and geographic location of an issuer, and a fund's level of investment in the securities of that issuer. Significant concentrations in security types, issuers, industries, sectors, and geographic locations may magnify the factors that affect a fund's performance.
As a shareholder, you incur two types of costs: (1) transaction costs, which may include sales charges (loads) on purchase payments or redemption proceeds, as applicable and (2) ongoing costs, which generally include management fees, distribution and/or service (12b-1) fees and other Fund expenses. This Example is intended to help you understand your ongoing costs (in dollars) of investing in a fund and to compare these costs with the ongoing costs of investing in other mutual funds.
| The Example is based on an investment of $1,000 invested at the beginning of the period and held for the entire period (August 1, 2023 to January 31, 2024). |
Actual Expenses
The first line of the accompanying table provides information about actual account values and actual expenses. You may use the information in this line, together with the amount you invested, to estimate the expenses that you paid over the period. Simply divide your account value by $1,000.00 (for example, an $8,600 account value divided by $1,000.00 = 8.6), then multiply the result by the number in the first line for a class/Fund under the heading entitled "Expenses Paid During Period" to estimate the expenses you paid on your account during this period. If any fund is a shareholder of any underlying mutual funds or exchange-traded funds (ETFs) (the Underlying Funds), such fund indirectly bears its proportional share of the expenses of the Underlying Funds in addition to the direct expenses incurred presented in the table. These fees and expenses are not included in the annualized expense ratio used to calculate the expense estimate in the table below.
Hypothetical Example for Comparison Purposes
The second line of the accompanying table provides information about hypothetical account values and hypothetical expenses based on the actual expense ratio and an assumed rate of return of 5% per year before expenses, which is not the actual return. The hypothetical account values and expenses may not be used to estimate the actual ending account balance or expenses you paid for the period. You may use this information to compare the ongoing costs of investing in the Fund and other funds. To do so, compare this 5% hypothetical example with the 5% hypothetical examples that appear in the shareholder reports of the other funds. If any fund is a shareholder of any Underlying Funds, such fund indirectly bears its proportional share of the expenses of the Underlying Funds in addition to the direct expenses as presented in the table. These fees and expenses are not included in the annualized expense ratio used to calculate the expense estimate in the table below.
Please note that the expenses shown in the table are meant to highlight your ongoing costs only and do not reflect any transaction costs. Therefore, the second line of the table is useful in comparing ongoing costs only, and will not help you determine the relative total costs of owning different funds. In addition, if these transactional costs were included, your costs would have been higher.
| | | | | Annualized Expense Ratio- A | | Beginning Account Value August 1, 2023 | | Ending Account Value January 31, 2024 | | Expenses Paid During Period- C August 1, 2023 to January 31, 2024 |
| | | | | | | | | | |
Fidelity® Dividend ETF for Rising Rates ** | | | | .22% | | | | | | |
| Actual | | | | | | $ 1,000 | | $ 1,040.30 | | $ 1.13 |
Hypothetical-B | | | | | | $ 1,000 | | $ 1,024.03 | | $ 1.12 |
| | | | | | | | | | |
Fidelity® High Dividend ETF ** | | | | .22% | | | | | | |
| Actual | | | | | | $ 1,000 | | $ 1,049.30 | | $ 1.13 |
Hypothetical-B | | | | | | $ 1,000 | | $ 1,024.03 | | $ 1.12 |
| | | | | | | | | | |
Fidelity® Low Volatility Factor ETF ** | | | | .21% | | | | | | |
| Actual | | | | | | $ 1,000 | | $ 1,063.60 | | $ 1.09 |
Hypothetical-B | | | | | | $ 1,000 | | $ 1,024.08 | | $ 1.07 |
| | | | | | | | | | |
Fidelity® Momentum Factor ETF ** | | | | .22% | | | | | | |
| Actual | | | | | | $ 1,000 | | $ 1,108.60 | | $ 1.17 |
Hypothetical-B | | | | | | $ 1,000 | | $ 1,024.03 | | $ 1.12 |
| | | | | | | | | | |
Fidelity® Quality Factor ETF ** | | | | .21% | | | | | | |
| Actual | | | | | | $ 1,000 | | $ 1,053.60 | | $ 1.08 |
Hypothetical-B | | | | | | $ 1,000 | | $ 1,024.08 | | $ 1.07 |
| | | | | | | | | | |
Fidelity® Small-Mid Multifactor ETF ** | | | | .22% | | | | | | |
| Actual | | | | | | $ 1,000 | | $ 1,037.40 | | $ 1.13 |
Hypothetical-B | | | | | | $ 1,000 | | $ 1,024.03 | | $ 1.12 |
| | | | | | | | | | |
Fidelity® Stocks for Inflation ETF ** | | | | .22% | | | | | | |
| Actual | | | | | | $ 1,000 | | $ 1,086.80 | | $ 1.15 |
Hypothetical-B | | | | | | $ 1,000 | | $ 1,024.03 | | $ 1.12 |
| | | | | | | | | | |
Fidelity® U.S. Multifactor ETF ** | | | | .21% | | | | | | |
| Actual | | | | | | $ 1,000 | | $ 1,071.70 | | $ 1.09 |
Hypothetical-B | | | | | | $ 1,000 | | $ 1,024.08 | | $ 1.07 |
| | | | | | | | | | |
Fidelity® Value Factor ETF ** | | | | .21% | | | | | | |
| Actual | | | | | | $ 1,000 | | $ 1,050.30 | | $ 1.08 |
Hypothetical-B | | | | | | $ 1,000 | | $ 1,024.08 | | $ 1.07 |
| |
A Annualized expense ratio reflects expenses net of applicable fee waivers.
B 5% return per year before expenses
C Expenses are equal to the annualized expense ratio, multiplied by the average account value over the period, multiplied by 184/ 366 (to reflect the one-half year period). The fees and expenses of any Underlying Funds are not included in each annualized expense ratio.
** If fees and changes to the expense contract and/or expense cap, effective November 1, 2023, had been in effect during the entire current period, the restated annualized expense ratio and the expenses paid in the actual and hypothetical examples above would have been as shown in table below:
| | | | | Annualized Expense Ratio- A | | Expenses Paid |
| | | | | | |
| Fidelity® Dividend ETF for Rising Rates | | | | .15% | | |
| Actual | | | | | | $ 0.77 |
Hypothetical- B | | | | | | $ 0.76 |
| | | | | | |
| Fidelity® High Dividend ETF | | | | .15% | | |
| Actual | | | | | | $ 0.77 |
Hypothetical- B | | | | | | $ 0.76 |
| | | | | | |
| Fidelity® Low Volatility Factor ETF | | | | .15% | | |
| Actual | | | | | | $ 0.78 |
Hypothetical- B | | | | | | $ 0.76 |
| | | | | | |
| Fidelity® Momentum Factor ETF | | | | .15% | | |
| Actual | | | | | | $ 0.80 |
Hypothetical- B | | | | | | $ 0.76 |
| | | | | | |
| Fidelity® Quality Factor ETF | | | | .15% | | |
| Actual | | | | | | $ 0.77 |
Hypothetical- B | | | | | | $ 0.76 |
| | | | | | |
| Fidelity® Small-Mid Multifactor ETF | | | | .15% | | |
| Actual | | | | | | $ 0.77 |
Hypothetical- B | | | | | | $ 0.76 |
| | | | | | |
| Fidelity® Stocks for Inflation ETF | | | | .15% | | |
| Actual | | | | | | $ 0.79 |
Hypothetical- B | | | | | | $ 0.76 |
| | | | | | |
| Fidelity® U.S. Multifactor ETF | | | | .15% | | |
| Actual | | | | | | $ 0.78 |
Hypothetical- B | | | | | | $ 0.76 |
| | | | | | |
| Fidelity® Value Factor ETF | | | | .15% | | |
| Actual | | | | | | $ 0.77 |
Hypothetical- B | | | | | | $ 0.76 |
| | | | | | | |
| A Annualized expense ratio reflects expenses net of applicable fee waivers. | | | | | | |
| B 5% return per year before expenses | | | | | | |
The Securities and Exchange Commission adopted Rule 22e-4 under the Investment Company Act of 1940 (the Liquidity Rule) to promote effective liquidity risk management throughout the open-end investment company industry, thereby reducing the risk that funds will be unable to meet their redemption obligations and mitigating dilution of the interests of fund shareholders.
The Funds have adopted and implemented a liquidity risk management program (the Program) reasonably designed to assess and manage each Fund's liquidity risk and to comply with the requirements of the Liquidity Rule. Each Fund's Board of Trustees (the Board) has designated each Fund's investment adviser as administrator of the Program. The Fidelity advisers have established a Liquidity Risk Management Committee (the LRM Committee) to manage the Program for each of the Fidelity Funds. The LRM Committee monitors the adequacy and effectiveness of implementation of the Program and on a periodic basis assesses each Fund's liquidity risk based on a variety of factors including (1) the Fund's investment strategy, (2) portfolio liquidity and cash flow projections during normal and reasonably foreseeable stressed conditions, (3) shareholder redemptions, (4) borrowings and other funding sources and (5) certain factor specific to ETFs including the effect of the Fund's prices and spreads, market participants, and basket compositions on the overall liquidity of the Fund's portfolio, as applicable.
In accordance with the Program, each of the Fund's portfolio investments is classified into one of four defined liquidity categories based on a determination of a reasonable expectation for how long it would take to convert the investment to cash (or sell or dispose of the investment) without significantly changing its market value.
- Highly liquid investments - cash or convertible to cash within three business days or less
- Moderately liquid investments - convertible to cash in three to seven calendar days
- Less liquid investments - can be sold or disposed of, but not settled, within seven calendar days
- Illiquid investments - cannot be sold or disposed of within seven calendar days
Liquidity classification determinations take into account a variety of factors including various market, trading and investment-specific considerations, as well as market depth, and generally utilize analysis from a third-party liquidity metrics service.
The Liquidity Rule places a 15% limit on a fund's illiquid investments and requires funds that do not primarily hold assets that are highly liquid investments to determine and maintain a minimum percentage of the fund's net assets to be invested in highly liquid investments (highly liquid investment minimum or HLIM). The Program includes provisions reasonably designed to comply with the 15% limit on illiquid investments and for determining, periodically reviewing and complying with the HLIM requirement as applicable.
At a recent meeting of the Fund's Board of Trustees, the LRM Committee provided a written report to the Board pertaining to the operation, adequacy, and effectiveness of the Program for the period December 1, 2022 through November 30, 2023. The report concluded that the Program is operating effectively and is reasonably designed to assess and manage the Fund's liquidity risk.
1.9881295.107
CPF-SANN-0324
Fidelity® Blue Chip Growth ETF
Fidelity® Blue Chip Value ETF
Fidelity® Fundamental Large Cap Core ETF
Fidelity® Fundamental Large Cap Growth ETF
Fidelity® Fundamental Small-Mid Cap ETF
Fidelity® Magellan℠ ETF
Fidelity® Real Estate Investment ETF
Fidelity® Sustainable U.S. Equity ETF
Fidelity® Women's Leadership ETF
(Fidelity Fundamental Large Cap Core ETF formerly named Fidelity New Millennium ETF, Fidelity Fundamental Large Cap Growth ETF formerly named Fidelity Growth Opportunities ETF, and Fidelity Fundamental Small-Mid Cap ETF formerly named Fidelity Small-Mid Cap Opportunities ETF)
Semi-Annual Report
January 31, 2024
Contents
To view a fund's proxy voting guidelines and proxy voting record for the 12-month period ended June 30, visit http://www.fidelity.com/proxyvotingresults or visit the Securities and Exchange Commission's (SEC) web site at http://www.sec.gov.
You may also call 1-800-FIDELITY to request a free copy of the proxy voting guidelines.
Standard & Poor's, S&P and S&P 500 are registered service marks of The McGraw-Hill Companies, Inc. and have been licensed for use by Fidelity Distributors Corporation.
Other third-party marks appearing herein are the property of their respective owners.
All other marks appearing herein are registered or unregistered trademarks or service marks of FMR LLC or an affiliated company. © 2024 FMR LLC. All rights reserved.
This report and the financial statements contained herein are submitted for the general information of the shareholders of the Funds. This report is not authorized for distribution to prospective investors in the Funds unless preceded or accompanied by an effective prospectus.
A fund files its complete schedule of portfolio holdings with the SEC for the first and third quarters of each fiscal year on Form N-PORT. Forms N-PORT are available on the SEC's web site at http://www.sec.gov. A fund's Forms N-PORT may be reviewed and copied at the SEC's Public Reference Room in Washington, DC. Information regarding the operation of the SEC's Public Reference Room may be obtained by calling 1-800-SEC-0330.
For a complete list of a fund's portfolio holdings, view the most recent holdings listing, semiannual report, or annual report on Fidelity's web site at http://www.fidelity.com, http://www.institutional.fidelity.com, or http://www.401k.com, as applicable.
NOT FDIC INSURED •MAY LOSE VALUE •NO BANK GUARANTEE
Neither the Funds nor Fidelity Distributors Corporation is a bank.
Top Holdings (% of Fund's net assets) |
| |
| NVIDIA Corp. | 11.2 | |
| Microsoft Corp. | 10.5 | |
| Amazon.com, Inc. | 9.1 | |
| Apple, Inc. | 9.0 | |
| Alphabet, Inc. Class A | 6.5 | |
| Meta Platforms, Inc. Class A | 4.8 | |
| Eli Lilly & Co. | 2.7 | |
| Netflix, Inc. | 2.5 | |
| Uber Technologies, Inc. | 2.5 | |
| Marvell Technology, Inc. | 2.0 | |
| | 60.8 | |
| |
| Market Sectors (% of Fund's net assets) |
| |
| Information Technology | 41.2 | |
| Consumer Discretionary | 20.6 | |
| Communication Services | 16.3 | |
| Health Care | 9.7 | |
| Industrials | 4.3 | |
| Financials | 2.7 | |
| Consumer Staples | 2.2 | |
| Energy | 1.6 | |
| Materials | 0.4 | |
| Real Estate | 0.3 | |
| |
Asset Allocation (% of Fund's net assets) |
|
|
Fidelity® Blue Chip Growth ETF
Showing Percentage of Net Assets
| Common Stocks - 99.3% |
| | | Shares | Value ($) |
| COMMUNICATION SERVICES - 16.3% | | | |
| Entertainment - 3.0% | | | |
| Netflix, Inc. (a) | | 50,736 | 28,620,685 |
| Roblox Corp. (a) | | 23,903 | 927,675 |
| Roku, Inc. Class A (a) | | 10,703 | 942,506 |
| Sea Ltd. ADR (a) | | 58,731 | 2,240,000 |
| Sphere Entertainment Co. (a) | | 12,284 | 434,608 |
| Take-Two Interactive Software, Inc. (a) | | 2,753 | 454,052 |
| The Walt Disney Co. | | 7,757 | 745,060 |
| | | | 34,364,586 |
| Interactive Media & Services - 13.2% | | | |
| Alphabet, Inc. Class A (a) | | 521,965 | 73,127,297 |
| Meta Platforms, Inc. Class A | | 137,242 | 53,543,594 |
| Pinterest, Inc. Class A (a) | | 8,682 | 325,315 |
| Snap, Inc. Class A (a) | | 1,333,113 | 21,183,166 |
| | | | 148,179,372 |
| Wireless Telecommunication Services - 0.1% | | | |
| T-Mobile U.S., Inc. | | 6,035 | 973,023 |
TOTAL COMMUNICATION SERVICES | | | 183,516,981 |
| CONSUMER DISCRETIONARY - 20.6% | | | |
| Automobiles - 1.5% | | | |
| Rivian Automotive, Inc. (a) | | 163,163 | 2,498,026 |
| Tesla, Inc. (a) | | 77,681 | 14,548,874 |
| | | | 17,046,900 |
| Broadline Retail - 9.8% | | | |
| Alibaba Group Holding Ltd. sponsored ADR | | 29,006 | 2,093,363 |
| Amazon.com, Inc. (a) | | 657,947 | 102,113,374 |
| Dollarama, Inc. | | 6,100 | 447,683 |
| Kohl's Corp. | | 31,835 | 820,070 |
| Ollie's Bargain Outlet Holdings, Inc. (a) | | 9,599 | 690,456 |
| PDD Holdings, Inc. ADR (a) | | 32,830 | 4,165,142 |
| | | | 110,330,088 |
| Diversified Consumer Services - 0.1% | | | |
| New Oriental Education & Technology Group, Inc. sponsored ADR (a) | | 18,613 | 1,426,873 |
| Hotels, Restaurants & Leisure - 2.7% | | | |
| Airbnb, Inc. Class A (a) | | 57,620 | 8,305,347 |
| Caesars Entertainment, Inc. (a) | | 53,984 | 2,368,278 |
| Chipotle Mexican Grill, Inc. (a) | | 1,754 | 4,224,983 |
| Draftkings Holdings, Inc. (a) | | 44,961 | 1,755,727 |
| Las Vegas Sands Corp. | | 6,534 | 319,643 |
| Light & Wonder, Inc. Class A (a) | | 5,614 | 451,253 |
| Marriott International, Inc. Class A | | 10,399 | 2,492,952 |
| McDonald's Corp. | | 5,293 | 1,549,367 |
| Penn Entertainment, Inc. (a) | | 91,247 | 2,057,620 |
| Planet Fitness, Inc. (a) | | 4,473 | 303,090 |
| Restaurant Brands International, Inc. | | 8,632 | 673,828 |
| Starbucks Corp. | | 39,874 | 3,709,478 |
| Sweetgreen, Inc. Class A (a) | | 164,380 | 1,755,578 |
| Yum! Brands, Inc. | | 2,211 | 286,302 |
| | | | 30,253,446 |
| Household Durables - 0.1% | | | |
| SharkNinja Hong Kong Co. Ltd. | | 20,746 | 969,253 |
| Specialty Retail - 3.9% | | | |
| Abercrombie & Fitch Co. Class A (a) | | 59,296 | 6,042,262 |
| American Eagle Outfitters, Inc. | | 262,803 | 5,208,755 |
| Aritzia, Inc. (a) | | 42,936 | 1,044,618 |
| Dick's Sporting Goods, Inc. | | 200 | 29,814 |
| Five Below, Inc. (a) | | 18,081 | 3,244,816 |
| Foot Locker, Inc. | | 10,386 | 292,470 |
| Gap, Inc. | | 28,646 | 535,394 |
| Lowe's Companies, Inc. | | 56,912 | 12,113,150 |
| RH (a) | | 19,678 | 4,987,979 |
| TJX Companies, Inc. | | 70,539 | 6,694,856 |
| Victoria's Secret & Co. (a) | | 15,575 | 405,729 |
| Warby Parker, Inc. (a) | | 128,725 | 1,641,244 |
| Wayfair LLC Class A (a) | | 7,730 | 388,433 |
| Williams-Sonoma, Inc. | | 2,225 | 430,293 |
| | | | 43,059,813 |
| Textiles, Apparel & Luxury Goods - 2.5% | | | |
| Crocs, Inc. (a) | | 25,811 | 2,619,300 |
| Deckers Outdoor Corp. (a) | | 7,643 | 5,760,758 |
| lululemon athletica, Inc. (a) | | 14,457 | 6,560,876 |
| NIKE, Inc. Class B | | 80,569 | 8,180,171 |
| On Holding AG (a) | | 13,340 | 354,310 |
| PVH Corp. | | 33,783 | 4,062,744 |
| Ralph Lauren Corp. | | 3,079 | 442,360 |
| | | | 27,980,519 |
TOTAL CONSUMER DISCRETIONARY | | | 231,066,892 |
| CONSUMER STAPLES - 2.2% | | | |
| Beverages - 0.6% | | | |
| Celsius Holdings, Inc. (a) | | 112,541 | 5,615,796 |
| Constellation Brands, Inc. Class A (sub. vtg.) | | 1,319 | 323,261 |
| PepsiCo, Inc. | | 6,721 | 1,132,690 |
| | | | 7,071,747 |
| Consumer Staples Distribution & Retail - 0.9% | | | |
| BJ's Wholesale Club Holdings, Inc. (a) | | 30 | 1,930 |
| Costco Wholesale Corp. | | 727 | 505,178 |
| Dollar Tree, Inc. (a) | | 18,630 | 2,433,451 |
| Maplebear, Inc. (NASDAQ) | | 12,685 | 310,402 |
| Target Corp. | | 17,075 | 2,374,791 |
| Walmart, Inc. | | 23,758 | 3,926,010 |
| | | | 9,551,762 |
| Food Products - 0.2% | | | |
| Lamb Weston Holdings, Inc. | | 10,635 | 1,089,449 |
| The Hershey Co. | | 2,026 | 392,112 |
| Tyson Foods, Inc. Class A | | 5,920 | 324,179 |
| | | | 1,805,740 |
| Household Products - 0.2% | | | |
| Procter & Gamble Co. | | 15,594 | 2,450,441 |
| Personal Care Products - 0.3% | | | |
| Estee Lauder Companies, Inc. Class A | | 9,276 | 1,224,339 |
| Kenvue, Inc. | | 64,916 | 1,347,656 |
| Oddity Tech Ltd. | | 16,813 | 694,377 |
| | | | 3,266,372 |
| Tobacco - 0.0% | | | |
| Philip Morris International, Inc. | | 4,698 | 426,813 |
TOTAL CONSUMER STAPLES | | | 24,572,875 |
| ENERGY - 1.6% | | | |
| Energy Equipment & Services - 0.0% | | | |
| Secure Energy Services, Inc. | | 47,335 | 362,991 |
| Oil, Gas & Consumable Fuels - 1.6% | | | |
| Cameco Corp. | | 14,469 | 690,814 |
| Cheniere Energy, Inc. | | 4,730 | 775,673 |
| Diamondback Energy, Inc. | | 22,006 | 3,383,202 |
| EOG Resources, Inc. | | 34,068 | 3,876,598 |
| Exxon Mobil Corp. | | 26,998 | 2,775,664 |
| Hess Corp. | | 23,493 | 3,301,471 |
| Northern Oil & Gas, Inc. | | 8,086 | 270,881 |
| Occidental Petroleum Corp. | | 39,204 | 2,256,974 |
| | | | 17,331,277 |
TOTAL ENERGY | | | 17,694,268 |
| FINANCIALS - 2.7% | | | |
| Banks - 0.1% | | | |
| Citigroup, Inc. | | 12,679 | 712,179 |
| HDFC Bank Ltd. sponsored ADR | | 8,684 | 481,875 |
| | | | 1,194,054 |
| Capital Markets - 0.2% | | | |
| Coinbase Global, Inc. (a) | | 3,554 | 455,623 |
| Goldman Sachs Group, Inc. | | 1,702 | 653,585 |
| Morgan Stanley | | 7,528 | 656,743 |
| | | | 1,765,951 |
| Consumer Finance - 0.4% | | | |
| American Express Co. | | 20,300 | 4,075,022 |
| SoFi Technologies, Inc. (a) | | 100 | 783 |
| | | | 4,075,805 |
| Financial Services - 1.9% | | | |
| Berkshire Hathaway, Inc. Class B (a) | | 1,272 | 488,117 |
| Block, Inc. Class A (a) | | 48,816 | 3,173,528 |
| MasterCard, Inc. Class A | | 32,711 | 14,694,763 |
| Visa, Inc. Class A | | 11,922 | 3,257,806 |
| | | | 21,614,214 |
| Insurance - 0.1% | | | |
| Progressive Corp. | | 7,686 | 1,370,030 |
TOTAL FINANCIALS | | | 30,020,054 |
| HEALTH CARE - 9.7% | | | |
| Biotechnology - 1.5% | | | |
| Alnylam Pharmaceuticals, Inc. (a) | | 14,490 | 2,505,466 |
| Amgen, Inc. | | 3,304 | 1,038,315 |
| Argenx SE ADR (a) | | 15 | 5,708 |
| Ascendis Pharma A/S sponsored ADR (a) | | 1,781 | 231,405 |
| Gilead Sciences, Inc. | | 4,963 | 388,404 |
| Karuna Therapeutics, Inc. (a) | | 15 | 4,701 |
| Moderna, Inc. (a) | | 2,849 | 287,891 |
| Moonlake Immunotherapeutics (a) | | 8,474 | 473,527 |
| Regeneron Pharmaceuticals, Inc. (a) | | 8,846 | 8,339,832 |
| Vertex Pharmaceuticals, Inc. (a) | | 7,617 | 3,301,055 |
| | | | 16,576,304 |
| Health Care Equipment & Supplies - 1.5% | | | |
| Axonics, Inc. (a) | | 55 | 3,733 |
| Boston Scientific Corp. (a) | | 76,717 | 4,853,117 |
| DexCom, Inc. (a) | | 50,599 | 6,140,189 |
| Glaukos Corp. (a) | | 3,831 | 341,074 |
| Inspire Medical Systems, Inc. (a) | | 4,849 | 1,022,509 |
| Insulet Corp. (a) | | 6,753 | 1,288,945 |
| Intuitive Surgical, Inc. (a) | | 829 | 313,544 |
| Shockwave Medical, Inc. (a) | | 2,642 | 597,753 |
| Stryker Corp. | | 7,381 | 2,476,178 |
| | | | 17,037,042 |
| Health Care Providers & Services - 2.3% | | | |
| Alignment Healthcare, Inc. (a) | | 8,727 | 58,471 |
| Cigna Group | | 5 | 1,505 |
| Guardant Health, Inc. (a) | | 50,085 | 1,098,364 |
| Humana, Inc. | | 6,189 | 2,339,813 |
| McKesson Corp. | | 701 | 350,423 |
| Surgery Partners, Inc. (a) | | 15,800 | 484,902 |
| UnitedHealth Group, Inc. | | 42,806 | 21,905,542 |
| | | | 26,239,020 |
| Life Sciences Tools & Services - 0.4% | | | |
| Danaher Corp. | | 15,458 | 3,708,529 |
| Thermo Fisher Scientific, Inc. | | 2,606 | 1,404,582 |
| | | | 5,113,111 |
| Pharmaceuticals - 4.0% | | | |
| Eli Lilly & Co. | | 46,294 | 29,887,869 |
| Novo Nordisk A/S Series B sponsored ADR | | 57,921 | 6,645,856 |
| Zoetis, Inc. Class A | | 41,877 | 7,864,919 |
| | | | 44,398,644 |
TOTAL HEALTH CARE | | | 109,364,121 |
| INDUSTRIALS - 4.3% | | | |
| Aerospace & Defense - 0.7% | | | |
| Howmet Aerospace, Inc. | | 26,281 | 1,478,569 |
| L3Harris Technologies, Inc. | | 2,825 | 588,787 |
| Northrop Grumman Corp. | | 936 | 418,167 |
| Spirit AeroSystems Holdings, Inc. Class A (a) | | 13,127 | 360,467 |
| The Boeing Co. (a) | | 22,787 | 4,808,968 |
| TransDigm Group, Inc. | | 525 | 573,657 |
| | | | 8,228,615 |
| Air Freight & Logistics - 0.1% | | | |
| FedEx Corp. | | 4,080 | 984,463 |
| Commercial Services & Supplies - 0.1% | | | |
| ACV Auctions, Inc. Class A (a) | | 42,315 | 548,826 |
| Electrical Equipment - 0.1% | | | |
| Eaton Corp. PLC | | 5,827 | 1,433,908 |
| Generac Holdings, Inc. (a) | | 1,016 | 115,489 |
| | | | 1,549,397 |
| Ground Transportation - 2.8% | | | |
| Canadian Pacific Kansas City Ltd. | | 4,071 | 327,593 |
| Lyft, Inc. (a) | | 258,075 | 3,223,357 |
| Uber Technologies, Inc. (a) | | 424,996 | 27,739,489 |
| | | | 31,290,439 |
| Industrial Conglomerates - 0.1% | | | |
| General Electric Co. | | 12,031 | 1,593,145 |
| Passenger Airlines - 0.1% | | | |
| Alaska Air Group, Inc. (a) | | 8,604 | 308,281 |
| Southwest Airlines Co. | | 13,441 | 401,751 |
| | | | 710,032 |
| Trading Companies & Distributors - 0.3% | | | |
| Ferguson PLC | | 1,668 | 313,350 |
| FTAI Aviation Ltd. | | 47,553 | 2,565,484 |
| Xometry, Inc. (a) | | 9,010 | 289,942 |
| | | | 3,168,776 |
TOTAL INDUSTRIALS | | | 48,073,693 |
| INFORMATION TECHNOLOGY - 41.2% | | | |
| Communications Equipment - 0.1% | | | |
| Arista Networks, Inc. (a) | | 2,764 | 714,992 |
| IT Services - 0.6% | | | |
| MongoDB, Inc. Class A (a) | | 5,383 | 2,155,999 |
| Okta, Inc. (a) | | 40,598 | 3,355,425 |
| Shopify, Inc. Class A (a) | | 7,674 | 614,342 |
| Snowflake, Inc. (a) | | 5,121 | 1,001,872 |
| | | | 7,127,638 |
| Semiconductors & Semiconductor Equipment - 17.8% | | | |
| Advanced Micro Devices, Inc. (a) | | 29,626 | 4,967,984 |
| ASML Holding NV (depository receipt) | | 2,051 | 1,784,001 |
| Broadcom, Inc. | | 546 | 644,280 |
| GlobalFoundries, Inc. (a) | | 129,204 | 7,103,636 |
| Impinj, Inc. (a) | | 3,252 | 315,379 |
| Marvell Technology, Inc. | | 336,658 | 22,791,747 |
| Micron Technology, Inc. | | 7,800 | 668,850 |
| Monolithic Power Systems, Inc. | | 5,222 | 3,147,404 |
| NVIDIA Corp. | | 204,076 | 125,561,845 |
| NXP Semiconductors NV | | 80,907 | 17,036,587 |
| ON Semiconductor Corp. (a) | | 105,422 | 7,498,667 |
| Taiwan Semiconductor Manufacturing Co. Ltd. sponsored ADR | | 53,772 | 6,074,085 |
| Teradyne, Inc. | | 26,173 | 2,528,050 |
| | | | 200,122,515 |
| Software - 13.5% | | | |
| Adobe, Inc. (a) | | 3,093 | 1,910,794 |
| Bill Holdings, Inc. (a) | | 18,618 | 1,453,135 |
| Datadog, Inc. Class A (a) | | 14,774 | 1,838,477 |
| HubSpot, Inc. (a) | | 7,758 | 4,740,138 |
| Intuit, Inc. | | 7,026 | 4,435,725 |
| Microsoft Corp. | | 296,592 | 117,919,047 |
| Oracle Corp. | | 7,773 | 868,244 |
| Salesforce, Inc. (a) | | 47,094 | 13,237,652 |
| ServiceNow, Inc. (a) | | 4,134 | 3,164,164 |
| Zoom Video Communications, Inc. Class A (a) | | 24,937 | 1,611,180 |
| | | | 151,178,556 |
| Technology Hardware, Storage & Peripherals - 9.2% | | | |
| Apple, Inc. | | 549,705 | 101,365,602 |
| Dell Technologies, Inc. | | 20,137 | 1,668,955 |
| | | | 103,034,557 |
TOTAL INFORMATION TECHNOLOGY | | | 462,178,258 |
| MATERIALS - 0.4% | | | |
| Chemicals - 0.0% | | | |
| Linde PLC | | 1,321 | 534,780 |
| Metals & Mining - 0.4% | | | |
| ATI, Inc. (a) | | 18,231 | 745,101 |
| Carpenter Technology Corp. | | 14,458 | 890,468 |
| Freeport-McMoRan, Inc. | | 64,382 | 2,555,322 |
| | | | 4,190,891 |
TOTAL MATERIALS | | | 4,725,671 |
| REAL ESTATE - 0.3% | | | |
| Equity Real Estate Investment Trusts (REITs) - 0.2% | | | |
| Digital Realty Trust, Inc. | | 2,153 | 302,410 |
| Welltower, Inc. | | 17,855 | 1,544,636 |
| | | | 1,847,046 |
| Real Estate Management & Development - 0.1% | | | |
| Zillow Group, Inc. Class C (a) | | 18,930 | 1,075,981 |
TOTAL REAL ESTATE | | | 2,923,027 |
| TOTAL COMMON STOCKS (Cost $882,800,251) | | | 1,114,135,840 |
| | | | |
| Money Market Funds - 1.6% |
| | | Shares | Value ($) |
State Street Institutional Treasury Plus Money Market Fund Trust Class 5.23% (b) (Cost $18,044,267) | | 18,044,267 | 18,044,267 |
| | | | |
| TOTAL INVESTMENT IN SECURITIES - 100.9% (Cost $900,844,518) | 1,132,180,107 |
NET OTHER ASSETS (LIABILITIES) - (0.9)% | (10,136,364) |
| NET ASSETS - 100.0% | 1,122,043,743 |
| | |
Legend
| (b) | The rate quoted is the annualized seven-day yield of the fund at period end. |
Investment Valuation
The following is a summary of the inputs used, as of January 31, 2024, involving the Fund's assets and liabilities carried at fair value. The inputs or methodology used for valuing securities may not be an indication of the risk associated with investing in those securities. For more information on valuation inputs, and their aggregation into the levels used below, please refer to the Investment Valuation section in the accompanying Notes to Financial Statements.
| Valuation Inputs at Reporting Date: |
| Description | Total ($) | Level 1 ($) | Level 2 ($) | Level 3 ($) |
Investments in Securities: | | | | |
|
| Equities: | | | | |
Communication Services | 183,516,981 | 183,516,981 | - | - |
Consumer Discretionary | 231,066,892 | 231,066,892 | - | - |
Consumer Staples | 24,572,875 | 24,572,875 | - | - |
Energy | 17,694,268 | 17,694,268 | - | - |
Financials | 30,020,054 | 30,020,054 | - | - |
Health Care | 109,364,121 | 109,364,121 | - | - |
Industrials | 48,073,693 | 48,073,693 | - | - |
Information Technology | 462,178,258 | 462,178,258 | - | - |
Materials | 4,725,671 | 4,725,671 | - | - |
Real Estate | 2,923,027 | 2,923,027 | - | - |
|
| Money Market Funds | 18,044,267 | 18,044,267 | - | - |
| Total Investments in Securities: | 1,132,180,107 | 1,132,180,107 | - | - |
Fidelity® Blue Chip Growth ETF
| Statement of Assets and Liabilities |
| | | | January 31, 2024 (Unaudited) |
| | | | | |
| Assets | | | | |
Investment in securities, at value - See accompanying schedule Unaffiliated issuers (cost $900,844,518): | | | $ | 1,132,180,107 |
| Cash | | | | 108 |
| Foreign currency held at value (cost $161) | | | | 161 |
| Receivable for investments sold | | | | 2,831,243 |
| Receivable for fund shares sold | | | | 4,276,186 |
| Dividends receivable | | | | 153,386 |
Total assets | | | | 1,139,441,191 |
| Liabilities | | | | |
| Payable for investments purchased | $ | 16,872,103 | | |
| Accrued management fee | | 525,345 | | |
| Total Liabilities | | | | 17,397,448 |
| Net Assets | | | $ | 1,122,043,743 |
| Net Assets consist of: | | | | |
| Paid in capital | | | $ | 975,219,147 |
| Total accumulated earnings (loss) | | | | 146,824,596 |
| Net Assets | | | $ | 1,122,043,743 |
Net Asset Value, offering price and redemption price per share ($1,122,043,743 ÷ 32,800,000 shares) | | | $ | 34.21 |
| Statement of Operations |
| | | | Six months ended January 31, 2024 (Unaudited) |
| Investment Income | | | | |
| Dividends | | | $ | 2,282,877 |
| Expenses | | | | |
| Management fee | $ | 2,569,969 | | |
| Independent trustees' fees and expenses | | 2,242 | | |
| Total expenses before reductions | | 2,572,211 | | |
| Expense reductions | | (203) | | |
| Total expenses after reductions | | | | 2,572,008 |
| Net Investment income (loss) | | | | (289,131) |
| Realized and Unrealized Gain (Loss) | | | | |
| Net realized gain (loss) on: | | | | |
| Investment Securities: | | | | |
| Redemptions in-kind | | 4,541,174 | | |
| Unaffiliated issuers | | (5,079,037) | | |
| Foreign currency transactions | | (155) | | |
| Futures contracts | | (9,198) | | |
| Total net realized gain (loss) | | | | (547,216) |
| Change in net unrealized appreciation (depreciation) on: | | | | |
| Investment Securities: | | | | |
| Unaffiliated issuers | | 91,976,471 | | |
| Assets and liabilities in foreign currencies | | (82) | | |
| Futures contracts | | 692 | | |
| Total change in net unrealized appreciation (depreciation) | | | | 91,977,081 |
| Net gain (loss) | | | | 91,429,865 |
| Net increase (decrease) in net assets resulting from operations | | | $ | 91,140,734 |
| Statement of Changes in Net Assets |
| |
| | Six months ended January 31, 2024 (Unaudited) | | Year ended July 31, 2023 |
| Increase (Decrease) in Net Assets | | | | |
| Operations | | | | |
| Net investment income (loss) | $ | (289,131) | $ | 17,382 |
| Net realized gain (loss) | | (547,216) | | (25,771,564) |
| Change in net unrealized appreciation (depreciation) | | 91,977,081 | | 168,911,281 |
| Net increase (decrease) in net assets resulting from operations | | 91,140,734 | | 143,157,099 |
| Distributions to shareholders | | (236,800) | | - |
| | | | | |
| Share transactions | | | | |
| Proceeds from sales of shares | | 270,883,796 | | 296,642,887 |
| Cost of shares redeemed | | (20,127,073) | | (22,813,838) |
| | | | | |
Net increase (decrease) in net assets resulting from share transactions | | 250,756,723 | | 273,829,049 |
| Total increase (decrease) in net assets | | 341,660,657 | | 416,986,148 |
| | | | | |
| Net Assets | | | | |
| Beginning of period | | 780,383,086 | | 363,396,938 |
| End of period | $ | 1,122,043,743 | $ | 780,383,086 |
| | | | | |
| Other Information | | | | |
| Shares | | | | |
| Sold | | 8,525,000 | | 11,300,000 |
| Redeemed | | (675,000) | | (925,000) |
| Net increase (decrease) | | 7,850,000 | | 10,375,000 |
| | | | | |
Financial Highlights
| Fidelity® Blue Chip Growth ETF |
| |
| | Six months ended (Unaudited) January 31, 2024 | | Years ended July 31, 2023 | | 2022 | | 2021 | | 2020 A |
Selected Per-Share Data | | | | | | | | | | |
| Net asset value, beginning of period | $ | 31.28 | $ | 24.93 | $ | 32.77 | $ | 22.74 | $ | 20.00 |
| Income from Investment Operations | | | | | | | | | | |
Net investment income (loss) B,C | | (.01) | | - D | | (.05) | | (.08) | | (.01) |
| Net realized and unrealized gain (loss) | | 2.95 | | 6.35 | | (7.79) | | 10.11 | | 2.75 |
| Total from investment operations | | 2.94 | | 6.35 | | (7.84) | | 10.03 | | 2.74 |
| Distributions from net investment income | | (.01) | | - | | - | | - D | | - |
| Total distributions | | (.01) | | - | | - | | - D | | - |
| Net asset value, end of period | $ | 34.21 | $ | 31.28 | $ | 24.93 | $ | 32.77 | $ | 22.74 |
Total Return E,F,G | | 9.40% | | 25.44% | | (23.92)% | | 44.14% | | 13.68% |
Ratios to Average Net Assets C,H,I | | | | | | | | | | |
| Expenses before reductions | | .59% J | | .59% | | .59% | | .59% | | .59% J |
| Expenses net of fee waivers, if any | | .59% J | | .59% | | .59% | | .59% | | .59% J |
| Expenses net of all reductions | | .59% J | | .59% | | .59% | | .59% | | .59% J |
| Net investment income (loss) | | (.07)% J | | -% K | | (.17)% | | (.27)% | | (.34)% J |
| Supplemental Data | | | | | | | | | | |
| Net assets, end of period (000 omitted) | $ | 1,122,044 | $ | 780,383 | $ | 363,397 | $ | 407,189 | $ | 41,494 |
Portfolio turnover rate L,M | | 32% J | | 30% | | 57% | | 63% | | 11% N |
AFor the period June 2, 2020 (commencement of operations) through July 31, 2020.
BCalculated based on average shares outstanding during the period.
CNet investment income (loss) is affected by the timing of the declaration of dividends by any underlying mutual funds or exchange-traded funds (ETFs). Net investment income (loss) of any mutual funds or ETFs is not included in the Fund's net investment income (loss) ratio.
DAmount represents less than $.005 per share.
ETotal returns for periods of less than one year are not annualized.
FTotal returns would have been lower if certain expenses had not been reduced during the applicable periods shown.
GBased on net asset value.
HFees and expenses of any underlying mutual funds or exchange-traded funds (ETFs) are not included in the Fund's expense ratio. The Fund indirectly bears its proportionate share of these expenses.
IExpense ratios reflect operating expenses of the class. Expenses before reductions do not reflect amounts reimbursed, waived, or reduced through arrangements with the investment adviser, brokerage services, or other offset arrangements, if applicable, and do not represent the amount paid by the class during periods when reimbursements, waivers or reductions occur.
JAnnualized.
KAmount represents less than .005%.
LPortfolio turnover rate excludes securities received or delivered in-kind.
MAmount does not include the portfolio activity of any underlying mutual funds or exchange-traded funds (ETFs).
NAmount not annualized.
Top Holdings (% of Fund's net assets) |
| |
| Exxon Mobil Corp. | 4.4 | |
| Berkshire Hathaway, Inc. Class B | 4.3 | |
| Comcast Corp. Class A | 3.7 | |
| JPMorgan Chase & Co. | 3.7 | |
| Cigna Group | 2.9 | |
| The Travelers Companies, Inc. | 2.8 | |
| Centene Corp. | 2.6 | |
| Bank of America Corp. | 2.6 | |
| PG&E Corp. | 2.4 | |
| Cisco Systems, Inc. | 2.3 | |
| | 31.7 | |
| |
| Market Sectors (% of Fund's net assets) |
| |
| Financials | 23.9 | |
| Health Care | 17.1 | |
| Consumer Staples | 13.4 | |
| Utilities | 9.6 | |
| Energy | 7.7 | |
| Information Technology | 7.5 | |
| Industrials | 7.0 | |
| Communication Services | 5.7 | |
| Consumer Discretionary | 2.8 | |
| Materials | 2.2 | |
| Real Estate | 1.0 | |
| |
Asset Allocation (% of Fund's net assets) |
|
|
Fidelity® Blue Chip Value ETF
Showing Percentage of Net Assets
| Common Stocks - 97.9% |
| | | Shares | Value ($) |
| COMMUNICATION SERVICES - 5.7% | | | |
| Entertainment - 2.0% | | | |
| The Walt Disney Co. | | 24,881 | 2,389,820 |
| Media - 3.7% | | | |
| Comcast Corp. Class A | | 95,196 | 4,430,422 |
TOTAL COMMUNICATION SERVICES | | | 6,820,242 |
| CONSUMER DISCRETIONARY - 2.8% | | | |
| Diversified Consumer Services - 1.8% | | | |
| H&R Block, Inc. | | 46,636 | 2,184,430 |
| Specialty Retail - 1.0% | | | |
| Ross Stores, Inc. | | 8,649 | 1,213,282 |
TOTAL CONSUMER DISCRETIONARY | | | 3,397,712 |
| CONSUMER STAPLES - 13.4% | | | |
| Beverages - 3.1% | | | |
| Coca-Cola European Partners PLC | | 14,648 | 1,009,247 |
| Diageo PLC sponsored ADR | | 2,156 | 311,175 |
| Keurig Dr. Pepper, Inc. | | 29,233 | 919,086 |
| The Coca-Cola Co. | | 25,515 | 1,517,887 |
| | | | 3,757,395 |
| Consumer Staples Distribution & Retail - 1.6% | | | |
| BJ's Wholesale Club Holdings, Inc. (a) | | 10,362 | 666,691 |
| U.S. Foods Holding Corp. (a) | | 26,268 | 1,208,591 |
| | | | 1,875,282 |
| Food Products - 3.4% | | | |
| Lamb Weston Holdings, Inc. | | 5,758 | 589,850 |
| Mondelez International, Inc. | | 35,158 | 2,646,343 |
| Tyson Foods, Inc. Class A | | 15,792 | 864,770 |
| | | | 4,100,963 |
| Household Products - 2.2% | | | |
| Procter & Gamble Co. | | 12,008 | 1,886,937 |
| The Clorox Co. | | 5,168 | 750,652 |
| | | | 2,637,589 |
| Personal Care Products - 3.1% | | | |
| Haleon PLC ADR | | 103,967 | 852,529 |
| Kenvue, Inc. | | 108,135 | 2,244,883 |
| Unilever PLC sponsored ADR | | 14,211 | 691,934 |
| | | | 3,789,346 |
TOTAL CONSUMER STAPLES | | | 16,160,575 |
| ENERGY - 7.7% | | | |
| Oil, Gas & Consumable Fuels - 7.7% | | | |
| Antero Resources Corp. (a) | | 16,858 | 376,608 |
| ConocoPhillips Co. | | 1,682 | 188,165 |
| Equinor ASA sponsored ADR | | 27,781 | 796,481 |
| Exxon Mobil Corp. | | 51,452 | 5,289,780 |
| Occidental Petroleum Corp. | | 14,827 | 853,590 |
| Ovintiv, Inc. | | 16,967 | 719,740 |
| Shell PLC ADR | | 16,150 | 1,015,997 |
| | | | 9,240,361 |
| FINANCIALS - 23.9% | | | |
| Banks - 10.8% | | | |
| Bank of America Corp. | | 92,545 | 3,147,455 |
| Cullen/Frost Bankers, Inc. | | 2,405 | 255,219 |
| JPMorgan Chase & Co. | | 25,346 | 4,419,329 |
| M&T Bank Corp. | | 5,583 | 771,012 |
| PNC Financial Services Group, Inc. | | 8,111 | 1,226,464 |
| U.S. Bancorp | | 16,659 | 692,015 |
| Wells Fargo & Co. | | 49,547 | 2,486,268 |
| | | | 12,997,762 |
| Capital Markets - 3.1% | | | |
| Affiliated Managers Group, Inc. | | 5,270 | 784,387 |
| BlackRock, Inc. Class A | | 2,930 | 2,268,728 |
| Northern Trust Corp. | | 8,472 | 674,710 |
| | | | 3,727,825 |
| Financial Services - 4.3% | | | |
| Berkshire Hathaway, Inc. Class B (a) | | 13,586 | 5,213,492 |
| Insurance - 5.7% | | | |
| Chubb Ltd. | | 8,466 | 2,074,170 |
| The Travelers Companies, Inc. | | 16,070 | 3,396,555 |
| Willis Towers Watson PLC | | 5,564 | 1,370,413 |
| | | | 6,841,138 |
TOTAL FINANCIALS | | | 28,780,217 |
| HEALTH CARE - 17.1% | | | |
| Health Care Providers & Services - 10.3% | | | |
| Centene Corp. (a) | | 41,956 | 3,159,706 |
| Cigna Group | | 11,526 | 3,468,750 |
| CVS Health Corp. | | 24,102 | 1,792,466 |
| Elevance Health, Inc. | | 3,510 | 1,731,974 |
| UnitedHealth Group, Inc. | | 4,282 | 2,191,271 |
| | | | 12,344,167 |
| Pharmaceuticals - 6.8% | | | |
| AstraZeneca PLC sponsored ADR | | 28,571 | 1,903,971 |
| Bristol-Myers Squibb Co. | | 45,014 | 2,199,834 |
| Johnson & Johnson | | 13,700 | 2,176,930 |
| Sanofi SA sponsored ADR | | 38,546 | 1,923,445 |
| | | | 8,204,180 |
TOTAL HEALTH CARE | | | 20,548,347 |
| INDUSTRIALS - 7.0% | | | |
| Aerospace & Defense - 3.4% | | | |
| L3Harris Technologies, Inc. | | 5,228 | 1,089,620 |
| Lockheed Martin Corp. | | 2,655 | 1,140,084 |
| Northrop Grumman Corp. | | 4,184 | 1,869,244 |
| | | | 4,098,948 |
| Electrical Equipment - 0.5% | | | |
| Eaton Corp. PLC | | 1,879 | 462,384 |
| Regal Rexnord Corp. | | 1,567 | 209,132 |
| | | | 671,516 |
| Machinery - 2.5% | | | |
| Deere & Co. | | 4,640 | 1,826,211 |
| Oshkosh Corp. | | 1,607 | 176,931 |
| Pentair PLC | | 13,150 | 962,186 |
| | | | 2,965,328 |
| Professional Services - 0.6% | | | |
| Maximus, Inc. | | 8,865 | 719,129 |
TOTAL INDUSTRIALS | | | 8,454,921 |
| INFORMATION TECHNOLOGY - 7.5% | | | |
| Communications Equipment - 2.3% | | | |
| Cisco Systems, Inc. | | 55,003 | 2,760,051 |
| Electronic Equipment, Instruments & Components - 0.2% | | | |
| TE Connectivity Ltd. | | 1,699 | 241,581 |
| IT Services - 2.5% | | | |
| Amdocs Ltd. | | 16,366 | 1,500,435 |
| Cognizant Technology Solutions Corp. Class A | | 19,599 | 1,511,475 |
| | | | 3,011,910 |
| Semiconductors & Semiconductor Equipment - 1.1% | | | |
| Broadcom, Inc. | | 194 | 228,920 |
| Micron Technology, Inc. | | 9,873 | 846,610 |
| NXP Semiconductors NV | | 1,164 | 245,103 |
| | | | 1,320,633 |
| Software - 1.4% | | | |
| Gen Digital, Inc. | | 44,332 | 1,040,915 |
| Open Text Corp. | | 14,811 | 645,908 |
| | | | 1,686,823 |
TOTAL INFORMATION TECHNOLOGY | | | 9,020,998 |
| MATERIALS - 2.2% | | | |
| Chemicals - 1.3% | | | |
| CF Industries Holdings, Inc. | | 11,832 | 893,434 |
| Nutrien Ltd. | | 14,451 | 720,671 |
| | | | 1,614,105 |
| Containers & Packaging - 0.6% | | | |
| Crown Holdings, Inc. | | 8,547 | 756,410 |
| Metals & Mining - 0.3% | | | |
| Newmont Corp. | | 8,528 | 294,301 |
TOTAL MATERIALS | | | 2,664,816 |
| REAL ESTATE - 1.0% | | | |
| Equity Real Estate Investment Trusts (REITs) - 0.7% | | | |
| Crown Castle, Inc. | | 7,515 | 813,499 |
| Real Estate Management & Development - 0.3% | | | |
| CBRE Group, Inc. (a) | | 4,618 | 398,580 |
TOTAL REAL ESTATE | | | 1,212,079 |
| UTILITIES - 9.6% | | | |
| Electric Utilities - 6.3% | | | |
| Constellation Energy Corp. | | 12,008 | 1,464,976 |
| Edison International | | 22,309 | 1,505,411 |
| NextEra Energy, Inc. | | 10,193 | 597,616 |
| PG&E Corp. | | 167,421 | 2,824,392 |
| Southern Co. | | 15,956 | 1,109,261 |
| | | | 7,501,656 |
| Independent Power and Renewable Electricity Producers - 0.5% | | | |
| The AES Corp. | | 35,853 | 598,028 |
| Multi-Utilities - 2.8% | | | |
| Dominion Energy, Inc. | | 25,075 | 1,146,429 |
| National Grid PLC sponsored ADR | | 9,738 | 657,607 |
| Sempra | | 21,858 | 1,564,158 |
| | | | 3,368,194 |
TOTAL UTILITIES | | | 11,467,878 |
| TOTAL COMMON STOCKS (Cost $106,581,589) | | | 117,768,146 |
| | | | |
| Money Market Funds - 0.6% |
| | | Shares | Value ($) |
State Street Institutional Treasury Plus Money Market Fund Trust Class 5.23% (b) (Cost $786,636) | | 786,636 | 786,636 |
| | | | |
| TOTAL INVESTMENT IN SECURITIES - 98.5% (Cost $107,368,225) | 118,554,782 |
NET OTHER ASSETS (LIABILITIES) - 1.5% | 1,794,543 |
| NET ASSETS - 100.0% | 120,349,325 |
| | |
Legend
| (b) | The rate quoted is the annualized seven-day yield of the fund at period end. |
Investment Valuation
The following is a summary of the inputs used, as of January 31, 2024, involving the Fund's assets and liabilities carried at fair value. The inputs or methodology used for valuing securities may not be an indication of the risk associated with investing in those securities. For more information on valuation inputs, and their aggregation into the levels used below, please refer to the Investment Valuation section in the accompanying Notes to Financial Statements.
| Valuation Inputs at Reporting Date: |
| Description | Total ($) | Level 1 ($) | Level 2 ($) | Level 3 ($) |
Investments in Securities: | | | | |
|
| Equities: | | | | |
Communication Services | 6,820,242 | 6,820,242 | - | - |
Consumer Discretionary | 3,397,712 | 3,397,712 | - | - |
Consumer Staples | 16,160,575 | 16,160,575 | - | - |
Energy | 9,240,361 | 9,240,361 | - | - |
Financials | 28,780,217 | 28,780,217 | - | - |
Health Care | 20,548,347 | 20,548,347 | - | - |
Industrials | 8,454,921 | 8,454,921 | - | - |
Information Technology | 9,020,998 | 9,020,998 | - | - |
Materials | 2,664,816 | 2,664,816 | - | - |
Real Estate | 1,212,079 | 1,212,079 | - | - |
Utilities | 11,467,878 | 11,467,878 | - | - |
|
| Money Market Funds | 786,636 | 786,636 | - | - |
| Total Investments in Securities: | 118,554,782 | 118,554,782 | - | - |
Fidelity® Blue Chip Value ETF
| Statement of Assets and Liabilities |
| | | | January 31, 2024 (Unaudited) |
| | | | | |
| Assets | | | | |
Investment in securities, at value - See accompanying schedule Unaffiliated issuers (cost $107,368,225): | | | $ | 118,554,782 |
| Receivable for investments sold | | | | 2,831,718 |
| Dividends receivable | | | | 88,194 |
Total assets | | | | 121,474,694 |
| Liabilities | | | | |
| Payable for investments purchased | $ | 1,066,523 | | |
| Accrued management fee | | 58,846 | | |
| Total Liabilities | | | | 1,125,369 |
| Net Assets | | | $ | 120,349,325 |
| Net Assets consist of: | | | | |
| Paid in capital | | | $ | 111,500,133 |
| Total accumulated earnings (loss) | | | | 8,849,192 |
| Net Assets | | | $ | 120,349,325 |
Net Asset Value, offering price and redemption price per share ($120,349,325 ÷ 4,125,000 shares) | | | $ | 29.18 |
| Statement of Operations |
| | | | Six months ended January 31, 2024 (Unaudited) |
| Investment Income | | | | |
| Dividends | | | $ | 1,428,333 |
| Expenses | | | | |
| Management fee | $ | 350,741 | | |
| Independent trustees' fees and expenses | | 354 | | |
| Total Expenses | | | | 351,095 |
| Net Investment income (loss) | | | | 1,077,238 |
| Realized and Unrealized Gain (Loss) | | | | |
| Net realized gain (loss) on: | | | | |
| Investment Securities: | | | | |
| Redemptions in-kind | | 1,543,091 | | |
| Unaffiliated issuers | | (1,371,820) | | |
| Total net realized gain (loss) | | | | 171,271 |
| Change in net unrealized appreciation (depreciation) on investment securities | | | | 583,823 |
| Net gain (loss) | | | | 755,094 |
| Net increase (decrease) in net assets resulting from operations | | | $ | 1,832,332 |
| Statement of Changes in Net Assets |
| |
| | Six months ended January 31, 2024 (Unaudited) | | Year ended July 31, 2023 |
| Increase (Decrease) in Net Assets | | | | |
| Operations | | | | |
| Net investment income (loss) | $ | 1,077,238 | $ | 1,948,139 |
| Net realized gain (loss) | | 171,271 | | 2,342,593 |
| Change in net unrealized appreciation (depreciation) | | 583,823 | | 1,420,433 |
| Net increase (decrease) in net assets resulting from operations | | 1,832,332 | | 5,711,165 |
| Distributions to shareholders | | (1,086,825) | | (2,839,975) |
| | | | | |
| Share transactions | | | | |
| Proceeds from sales of shares | | 2,846,287 | | 32,169,213 |
| Cost of shares redeemed | | (11,740,576) | | (20,717,724) |
| | | | | |
Net increase (decrease) in net assets resulting from share transactions | | (8,894,289) | | 11,451,489 |
| Total increase (decrease) in net assets | | (8,148,782) | | 14,322,679 |
| | | | | |
| Net Assets | | | | |
| Beginning of period | | 128,498,107 | | 114,175,428 |
| End of period | $ | 120,349,325 | $ | 128,498,107 |
| | | | | |
| Other Information | | | | |
| Shares | | | | |
| Sold | | 100,000 | | 1,125,000 |
| Redeemed | | (425,000) | | (750,000) |
| Net increase (decrease) | | (325,000) | | 375,000 |
| | | | | |
Financial Highlights
| Fidelity® Blue Chip Value ETF |
| |
| | Six months ended (Unaudited) January 31, 2024 | | Years ended July 31, 2023 | | 2022 | | 2021 | | 2020 A |
Selected Per-Share Data | | | | | | | | | | |
| Net asset value, beginning of period | $ | 28.88 | $ | 28.02 | $ | 28.63 | $ | 20.23 | $ | 20.00 |
| Income from Investment Operations | | | | | | | | | | |
Net investment income (loss) B,C | | .26 | | .43 | | .39 | | .32 | | .03 |
| Net realized and unrealized gain (loss) | | .30 | | 1.04 | | (.03) | | 8.32 | | .21 |
| Total from investment operations | | .56 | | 1.47 | | .36 | | 8.64 | | .24 |
| Distributions from net investment income | | (.26) | | (.42) | | (.39) | | (.24) | | (.01) |
| Distributions from net realized gain | | - | | (.19) | | (.58) | | - | | - |
| Total distributions | | (.26) | | (.61) | | (.97) | | (.24) | | (.01) |
| Net asset value, end of period | $ | 29.18 | $ | 28.88 | $ | 28.02 | $ | 28.63 | $ | 20.23 |
Total Return D,E,F | | 1.95% | | 5.35% | | 1.27% | | 42.83% | | 1.23% |
Ratios to Average Net Assets C,G,H | | | | | | | | | | |
| Expenses before reductions | | .59% I | | .59% | | .59% | | .59% | | .59% I |
| Expenses net of fee waivers, if any | | .59% I | | .59% | | .59% | | .59% | | .59% I |
| Expenses net of all reductions | | .59% I | | .59% | | .59% | | .58% | | .59% I |
| Net investment income (loss) | | 1.81% I | | 1.53% | | 1.36% | | 1.22% | | 1.02% I |
| Supplemental Data | | | | | | | | | | |
| Net assets, end of period (000 omitted) | $ | 120,349 | $ | 128,498 | $ | 114,175 | $ | 94,465 | $ | 8,093 |
Portfolio turnover rate J,K | | 32% I | | 35% | | 54% | | 97% | | 20% L |
AFor the period June 2, 2020 (commencement of operations) through July 31, 2020.
BCalculated based on average shares outstanding during the period.
CNet investment income (loss) is affected by the timing of the declaration of dividends by any underlying mutual funds or exchange-traded funds (ETFs). Net investment income (loss) of any mutual funds or ETFs is not included in the Fund's net investment income (loss) ratio.
DTotal returns for periods of less than one year are not annualized.
ETotal returns would have been lower if certain expenses had not been reduced during the applicable periods shown.
FBased on net asset value.
GFees and expenses of any underlying mutual funds or exchange-traded funds (ETFs) are not included in the Fund's expense ratio. The Fund indirectly bears its proportionate share of these expenses.
HExpense ratios reflect operating expenses of the class. Expenses before reductions do not reflect amounts reimbursed, waived, or reduced through arrangements with the investment adviser, brokerage services, or other offset arrangements, if applicable, and do not represent the amount paid by the class during periods when reimbursements, waivers or reductions occur.
IAnnualized.
JPortfolio turnover rate excludes securities received or delivered in-kind.
KAmount does not include the portfolio activity of any underlying mutual funds or exchange-traded funds (ETFs).
LAmount not annualized.
Top Holdings (% of Fund's net assets) |
| |
| Microsoft Corp. | 7.7 | |
| Apple, Inc. | 4.4 | |
| NVIDIA Corp. | 4.0 | |
| Amazon.com, Inc. | 3.4 | |
| Meta Platforms, Inc. Class A | 2.7 | |
| Alphabet, Inc. Class A | 2.0 | |
| Eli Lilly & Co. | 1.9 | |
| Visa, Inc. Class A | 1.8 | |
| UnitedHealth Group, Inc. | 1.5 | |
| Exxon Mobil Corp. | 1.4 | |
| | 30.8 | |
| |
| Market Sectors (% of Fund's net assets) |
| |
| Information Technology | 28.5 | |
| Industrials | 14.4 | |
| Health Care | 11.5 | |
| Financials | 10.3 | |
| Consumer Discretionary | 10.0 | |
| Communication Services | 9.0 | |
| Energy | 4.4 | |
| Consumer Staples | 4.2 | |
| Materials | 3.3 | |
| Utilities | 2.1 | |
| Real Estate | 1.0 | |
| |
Asset Allocation (% of Fund's net assets) |
|
|
Fidelity® Fundamental Large Cap Core ETF
Showing Percentage of Net Assets
| Common Stocks - 98.7% |
| | | Shares | Value ($) |
| COMMUNICATION SERVICES - 9.0% | | | |
| Entertainment - 3.2% | | | |
| Endeavor Group Holdings, Inc. | | 19,565 | 484,234 |
| Netflix, Inc. (a) | | 3,509 | 1,979,462 |
| Spotify Technology SA (a) | | 3,891 | 837,927 |
| The Walt Disney Co. | | 21,304 | 2,046,249 |
| TKO Group Holdings, Inc. | | 8,625 | 721,826 |
| | | | 6,069,698 |
| Interactive Media & Services - 4.7% | | | |
| Alphabet, Inc. Class A (a) | | 27,362 | 3,833,416 |
| Meta Platforms, Inc. Class A | | 13,168 | 5,137,364 |
| | | | 8,970,780 |
| Media - 1.1% | | | |
| Comcast Corp. Class A | | 46,376 | 2,158,339 |
TOTAL COMMUNICATION SERVICES | | | 17,198,817 |
| CONSUMER DISCRETIONARY - 10.0% | | | |
| Automobile Components - 0.4% | | | |
| Aptiv PLC (a) | | 9,867 | 802,483 |
| Broadline Retail - 3.4% | | | |
| Amazon.com, Inc. (a) | | 41,447 | 6,432,574 |
| Hotels, Restaurants & Leisure - 2.5% | | | |
| Airbnb, Inc. Class A (a) | | 8,425 | 1,214,380 |
| Booking Holdings, Inc. (a) | | 315 | 1,104,853 |
| Chipotle Mexican Grill, Inc. (a) | | 344 | 828,617 |
| Churchill Downs, Inc. | | 3,550 | 429,444 |
| Domino's Pizza, Inc. | | 624 | 265,961 |
| Hilton Worldwide Holdings, Inc. | | 5,142 | 981,916 |
| | | | 4,825,171 |
| Household Durables - 0.8% | | | |
| Lennar Corp. Class A | | 4,800 | 719,280 |
| NVR, Inc. (a) | | 112 | 792,432 |
| | | | 1,511,712 |
| Specialty Retail - 1.7% | | | |
| Dick's Sporting Goods, Inc. | | 2,606 | 388,476 |
| Floor & Decor Holdings, Inc. Class A (a) | | 4,496 | 452,118 |
| TJX Companies, Inc. | | 24,218 | 2,298,530 |
| | | | 3,139,124 |
| Textiles, Apparel & Luxury Goods - 1.2% | | | |
| NIKE, Inc. Class B | | 12,984 | 1,318,266 |
| Ralph Lauren Corp. | | 7,276 | 1,045,343 |
| | | | 2,363,609 |
TOTAL CONSUMER DISCRETIONARY | | | 19,074,673 |
| CONSUMER STAPLES - 4.2% | | | |
| Beverages - 0.9% | | | |
| Boston Beer Co., Inc. Class A (a) | | 1,113 | 388,738 |
| Constellation Brands, Inc. Class A (sub. vtg.) | | 1,662 | 407,323 |
| Keurig Dr. Pepper, Inc. | | 32,836 | 1,032,364 |
| | | | 1,828,425 |
| Consumer Staples Distribution & Retail - 2.1% | | | |
| Alimentation Couche-Tard, Inc. Class A (multi-vtg.) | | 10,687 | 626,220 |
| BJ's Wholesale Club Holdings, Inc. (a) | | 10,070 | 647,904 |
| Maplebear, Inc. (NASDAQ) | | 7,449 | 182,277 |
| Performance Food Group Co. (a) | | 18,340 | 1,332,951 |
| Walmart, Inc. | | 7,345 | 1,213,761 |
| | | | 4,003,113 |
| Household Products - 0.4% | | | |
| The Clorox Co. | | 5,117 | 743,244 |
| Personal Care Products - 0.8% | | | |
| Kenvue, Inc. | | 69,992 | 1,453,034 |
TOTAL CONSUMER STAPLES | | | 8,027,816 |
| ENERGY - 4.4% | | | |
| Energy Equipment & Services - 1.4% | | | |
| Baker Hughes Co. Class A | | 39,109 | 1,114,607 |
| Schlumberger Ltd. | | 23,154 | 1,127,600 |
| TechnipFMC PLC | | 25,014 | 483,771 |
| | | | 2,725,978 |
| Oil, Gas & Consumable Fuels - 3.0% | | | |
| Antero Resources Corp. (a) | | 18,417 | 411,436 |
| Canadian Natural Resources Ltd. | | 12,179 | 779,334 |
| Cenovus Energy, Inc. (Canada) | | 36,253 | 587,296 |
| Cheniere Energy, Inc. | | 5,569 | 913,260 |
| Exxon Mobil Corp. | | 26,314 | 2,705,342 |
| New Fortress Energy, Inc. | | 7,525 | 250,056 |
| | | | 5,646,724 |
TOTAL ENERGY | | | 8,372,702 |
| FINANCIALS - 10.3% | | | |
| Banks - 3.3% | | | |
| Bank of America Corp. | | 49,176 | 1,672,476 |
| JPMorgan Chase & Co. | | 11,162 | 1,946,206 |
| KeyCorp | | 37,607 | 546,430 |
| Wells Fargo & Co. | | 41,464 | 2,080,664 |
| | | | 6,245,776 |
| Capital Markets - 2.2% | | | |
| Ares Management Corp. | | 6,316 | 767,268 |
| Blue Owl Capital, Inc. Class A | | 50,967 | 792,027 |
| Goldman Sachs Group, Inc. | | 2,433 | 934,296 |
| Houlihan Lokey | | 4,701 | 563,086 |
| Morgan Stanley | | 13,048 | 1,138,308 |
| | | | 4,194,985 |
| Financial Services - 3.3% | | | |
| Fiserv, Inc. (a) | | 14,438 | 2,048,319 |
| Shift4 Payments, Inc. (a) | | 10,977 | 788,258 |
| Visa, Inc. Class A | | 12,965 | 3,542,816 |
| | | | 6,379,393 |
| Insurance - 1.5% | | | |
| Chubb Ltd. | | 7,626 | 1,868,370 |
| Marsh & McLennan Companies, Inc. | | 5,522 | 1,070,384 |
| | | | 2,938,754 |
TOTAL FINANCIALS | | | 19,758,908 |
| HEALTH CARE - 11.5% | | | |
| Biotechnology - 1.6% | | | |
| Gilead Sciences, Inc. | | 10,687 | 836,365 |
| Legend Biotech Corp. ADR (a) | | 4,053 | 223,158 |
| Regeneron Pharmaceuticals, Inc. (a) | | 2,138 | 2,015,664 |
| | | | 3,075,187 |
| Health Care Equipment & Supplies - 2.3% | | | |
| Boston Scientific Corp. (a) | | 38,110 | 2,410,839 |
| Glaukos Corp. (a) | | 2,730 | 243,052 |
| Masimo Corp. (a) | | 1,897 | 244,599 |
| Stryker Corp. | | 4,474 | 1,500,938 |
| | | | 4,399,428 |
| Health Care Providers & Services - 2.6% | | | |
| Centene Corp. (a) | | 14,668 | 1,104,647 |
| Cigna Group | | 3,113 | 936,857 |
| LifeStance Health Group, Inc. (a) | | 17,783 | 106,342 |
| UnitedHealth Group, Inc. | | 5,474 | 2,801,265 |
| | | | 4,949,111 |
| Life Sciences Tools & Services - 2.1% | | | |
| Danaher Corp. | | 8,764 | 2,102,571 |
| Thermo Fisher Scientific, Inc. | | 3,632 | 1,957,575 |
| | | | 4,060,146 |
| Pharmaceuticals - 2.9% | | | |
| AstraZeneca PLC sponsored ADR | | 9,964 | 664,001 |
| Eli Lilly & Co. | | 5,770 | 3,725,170 |
| Merck & Co., Inc. | | 6,251 | 754,996 |
| Novo Nordisk A/S Series B sponsored ADR | | 4,404 | 505,315 |
| | | | 5,649,482 |
TOTAL HEALTH CARE | | | 22,133,354 |
| INDUSTRIALS - 14.4% | | | |
| Aerospace & Defense - 3.3% | | | |
| BWX Technologies, Inc. | | 11,286 | 919,583 |
| General Dynamics Corp. | | 2,914 | 772,181 |
| Howmet Aerospace, Inc. | | 22,829 | 1,284,360 |
| Northrop Grumman Corp. | | 2,541 | 1,135,217 |
| The Boeing Co. (a) | | 10,390 | 2,192,706 |
| | | | 6,304,047 |
| Building Products - 1.4% | | | |
| Builders FirstSource, Inc. (a) | | 4,964 | 862,396 |
| Fortune Brands Innovations, Inc. | | 8,721 | 676,662 |
| Trane Technologies PLC | | 4,587 | 1,156,153 |
| | | | 2,695,211 |
| Construction & Engineering - 1.0% | | | |
| Quanta Services, Inc. | | 8,252 | 1,601,301 |
| Willscot Mobile Mini Holdings (a) | | 6,369 | 301,254 |
| | | | 1,902,555 |
| Electrical Equipment - 2.4% | | | |
| Eaton Corp. PLC | | 8,025 | 1,974,792 |
| Generac Holdings, Inc. (a) | | 8,192 | 931,185 |
| Nextracker, Inc. Class A | | 16,171 | 732,061 |
| Vertiv Holdings Co. | | 17,325 | 975,917 |
| | | | 4,613,955 |
| Ground Transportation - 1.5% | | | |
| Saia, Inc. (a) | | 1,678 | 756,073 |
| Uber Technologies, Inc. (a) | | 32,437 | 2,117,163 |
| | | | 2,873,236 |
| Industrial Conglomerates - 0.9% | | | |
| General Electric Co. | | 13,838 | 1,832,428 |
| Machinery - 2.8% | | | |
| Caterpillar, Inc. | | 4,634 | 1,391,637 |
| Ingersoll Rand, Inc. | | 17,352 | 1,385,731 |
| ITT, Inc. | | 5,895 | 711,998 |
| Parker Hannifin Corp. | | 4,058 | 1,884,941 |
| | | | 5,374,307 |
| Professional Services - 0.7% | | | |
| FTI Consulting, Inc. (a) | | 3,047 | 583,836 |
| KBR, Inc. | | 13,166 | 686,080 |
| | | | 1,269,916 |
| Trading Companies & Distributors - 0.4% | | | |
| United Rentals, Inc. | | 1,305 | 816,147 |
TOTAL INDUSTRIALS | | | 27,681,802 |
| INFORMATION TECHNOLOGY - 28.5% | | | |
| Communications Equipment - 0.4% | | | |
| Cisco Systems, Inc. | | 15,003 | 752,851 |
| Electronic Equipment, Instruments & Components - 1.0% | | | |
| Flex Ltd. (a) | | 29,377 | 697,410 |
| Jabil, Inc. | | 9,493 | 1,189,378 |
| | | | 1,886,788 |
| IT Services - 0.9% | | | |
| MongoDB, Inc. Class A (a) | | 1,179 | 472,213 |
| Shopify, Inc. Class A (a) | | 15,252 | 1,221,228 |
| | | | 1,693,441 |
| Semiconductors & Semiconductor Equipment - 9.0% | | | |
| Advanced Micro Devices, Inc. (a) | | 15,452 | 2,591,146 |
| Analog Devices, Inc. | | 5,106 | 982,190 |
| ASML Holding NV (depository receipt) | | 1,201 | 1,044,654 |
| First Solar, Inc. (a) | | 3,374 | 493,616 |
| Marvell Technology, Inc. | | 1,139 | 77,110 |
| Micron Technology, Inc. | | 11,661 | 999,931 |
| NVIDIA Corp. | | 12,583 | 7,741,942 |
| NXP Semiconductors NV | | 5,563 | 1,171,401 |
| ON Semiconductor Corp. (a) | | 12,402 | 882,154 |
| Taiwan Semiconductor Manufacturing Co. Ltd. sponsored ADR | | 11,057 | 1,248,999 |
| | | | 17,233,143 |
| Software - 12.8% | | | |
| Adobe, Inc. (a) | | 4,300 | 2,656,454 |
| Dynatrace, Inc. (a) | | 16,482 | 939,474 |
| Intuit, Inc. | | 2,669 | 1,685,020 |
| Microsoft Corp. | | 37,394 | 14,867,105 |
| Oracle Corp. | | 10,191 | 1,138,335 |
| Salesforce, Inc. (a) | | 8,680 | 2,439,861 |
| Workday, Inc. Class A (a) | | 2,746 | 799,278 |
| | | | 24,525,527 |
| Technology Hardware, Storage & Peripherals - 4.4% | | | |
| Apple, Inc. | | 46,241 | 8,526,840 |
TOTAL INFORMATION TECHNOLOGY | | | 54,618,590 |
| MATERIALS - 3.3% | | | |
| Chemicals - 1.6% | | | |
| Celanese Corp. Class A | | 5,648 | 826,246 |
| Element Solutions, Inc. | | 33,109 | 736,013 |
| Linde PLC | | 3,563 | 1,442,409 |
| | | | 3,004,668 |
| Construction Materials - 0.4% | | | |
| Martin Marietta Materials, Inc. | | 1,696 | 862,280 |
| Containers & Packaging - 0.3% | | | |
| Avery Dennison Corp. | | 3,331 | 664,368 |
| Metals & Mining - 1.0% | | | |
| Franco-Nevada Corp. | | 4,893 | 529,388 |
| Freeport-McMoRan, Inc. | | 33,899 | 1,345,451 |
| | | | 1,874,839 |
TOTAL MATERIALS | | | 6,406,155 |
| REAL ESTATE - 1.0% | | | |
| Equity Real Estate Investment Trusts (REITs) - 0.6% | | | |
| Kimco Realty Corp. | | 24,320 | 491,264 |
| Terreno Realty Corp. | | 11,855 | 708,099 |
| | | | 1,199,363 |
| Real Estate Management & Development - 0.4% | | | |
| CBRE Group, Inc. (a) | | 7,599 | 655,870 |
TOTAL REAL ESTATE | | | 1,855,233 |
| UTILITIES - 2.1% | | | |
| Electric Utilities - 1.4% | | | |
| Constellation Energy Corp. | | 10,073 | 1,228,906 |
| Southern Co. | | 19,387 | 1,347,784 |
| | | | 2,576,690 |
| Independent Power and Renewable Electricity Producers - 0.7% | | | |
| Vistra Corp. | | 33,870 | 1,389,686 |
TOTAL UTILITIES | | | 3,966,376 |
| TOTAL COMMON STOCKS (Cost $154,850,947) | | | 189,094,426 |
| | | | |
| Money Market Funds - 0.6% |
| | | Shares | Value ($) |
State Street Institutional Treasury Plus Money Market Fund Trust Class 5.23% (b) (Cost $1,169,617) | | 1,169,617 | 1,169,617 |
| | | | |
| TOTAL INVESTMENT IN SECURITIES - 99.3% (Cost $156,020,564) | 190,264,043 |
NET OTHER ASSETS (LIABILITIES) - 0.7% | 1,264,992 |
| NET ASSETS - 100.0% | 191,529,035 |
| | |
Legend
| (b) | The rate quoted is the annualized seven-day yield of the fund at period end. |
Investment Valuation
The following is a summary of the inputs used, as of January 31, 2024, involving the Fund's assets and liabilities carried at fair value. The inputs or methodology used for valuing securities may not be an indication of the risk associated with investing in those securities. For more information on valuation inputs, and their aggregation into the levels used below, please refer to the Investment Valuation section in the accompanying Notes to Financial Statements.
| Valuation Inputs at Reporting Date: |
| Description | Total ($) | Level 1 ($) | Level 2 ($) | Level 3 ($) |
Investments in Securities: | | | | |
|
| Equities: | | | | |
Communication Services | 17,198,817 | 17,198,817 | - | - |
Consumer Discretionary | 19,074,673 | 19,074,673 | - | - |
Consumer Staples | 8,027,816 | 8,027,816 | - | - |
Energy | 8,372,702 | 8,372,702 | - | - |
Financials | 19,758,908 | 19,758,908 | - | - |
Health Care | 22,133,354 | 22,133,354 | - | - |
Industrials | 27,681,802 | 27,681,802 | - | - |
Information Technology | 54,618,590 | 54,618,590 | - | - |
Materials | 6,406,155 | 6,406,155 | - | - |
Real Estate | 1,855,233 | 1,855,233 | - | - |
Utilities | 3,966,376 | 3,966,376 | - | - |
|
| Money Market Funds | 1,169,617 | 1,169,617 | - | - |
| Total Investments in Securities: | 190,264,043 | 190,264,043 | - | - |
Fidelity® Fundamental Large Cap Core ETF
| Statement of Assets and Liabilities |
| | | | January 31, 2024 (Unaudited) |
| | | | | |
| Assets | | | | |
Investment in securities, at value - See accompanying schedule Unaffiliated issuers (cost $156,020,564): | | | $ | 190,264,043 |
| Receivable for investments sold | | | | 14,286,871 |
| Dividends receivable | | | | 34,412 |
Total assets | | | | 204,585,326 |
| Liabilities | | | | |
| Payable for investments purchased | $ | 12,966,873 | | |
| Accrued management fee | | 89,418 | | |
| Total Liabilities | | | | 13,056,291 |
| Net Assets | | | $ | 191,529,035 |
| Net Assets consist of: | | | | |
| Paid in capital | | | $ | 161,654,339 |
| Total accumulated earnings (loss) | | | | 29,874,696 |
| Net Assets | | | $ | 191,529,035 |
Net Asset Value, offering price and redemption price per share ($191,529,035 ÷ 5,175,000 shares) | | | $ | 37.01 |
| Statement of Operations |
| | | | Six months ended January 31, 2024 (Unaudited) |
| Investment Income | | | | |
| Dividends | | | $ | 692,933 |
| Expenses | | | | |
| Management fee | $ | 404,270 | | |
| Independent trustees' fees and expenses | | 342 | | |
| Total expenses before reductions | | 404,612 | | |
| Expense reductions | | (5) | | |
| Total expenses after reductions | | | | 404,607 |
| Net Investment income (loss) | | | | 288,326 |
| Realized and Unrealized Gain (Loss) | | | | |
| Net realized gain (loss) on: | | | | |
| Investment Securities: | | | | |
| Redemptions in-kind | | 265,915 | | |
| Unaffiliated issuers | | (848,388) | | |
| Foreign currency transactions | | 323 | | |
| Futures contracts | | (332) | | |
| Total net realized gain (loss) | | | | (582,482) |
| Change in net unrealized appreciation (depreciation) on: | | | | |
| Investment Securities: | | | | |
| Unaffiliated issuers | | 14,476,298 | | |
| Assets and liabilities in foreign currencies | | (155) | | |
| Total change in net unrealized appreciation (depreciation) | | | | 14,476,143 |
| Net gain (loss) | | | | 13,893,661 |
| Net increase (decrease) in net assets resulting from operations | | | $ | 14,181,987 |
| Statement of Changes in Net Assets |
| |
| | Six months ended January 31, 2024 (Unaudited) | | Year ended July 31, 2023 |
| Increase (Decrease) in Net Assets | | | | |
| Operations | | | | |
| Net investment income (loss) | $ | 288,326 | $ | 825,760 |
| Net realized gain (loss) | | (582,482) | | 4,126,321 |
| Change in net unrealized appreciation (depreciation) | | 14,476,143 | | 13,991,450 |
| Net increase (decrease) in net assets resulting from operations | | 14,181,987 | | 18,943,531 |
| Distributions to shareholders | | (322,275) | | (1,058,225) |
| | | | | |
| Share transactions | | | | |
| Proceeds from sales of shares | | 70,671,291 | | 63,669,740 |
| Cost of shares redeemed | | (924,534) | | (29,908,118) |
| | | | | |
Net increase (decrease) in net assets resulting from share transactions | | 69,746,757 | | 33,761,622 |
| Total increase (decrease) in net assets | | 83,606,469 | | 51,646,928 |
| | | | | |
| Net Assets | | | | |
| Beginning of period | | 107,922,566 | | 56,275,638 |
| End of period | $ | 191,529,035 | $ | 107,922,566 |
| | | | | |
| Other Information | | | | |
| Shares | | | | |
| Sold | | 2,075,000 | | 2,150,000 |
| Redeemed | | (25,000) | | (975,000) |
| Net increase (decrease) | | 2,050,000 | | 1,175,000 |
| | | | | |
Financial Highlights
| Fidelity® Fundamental Large Cap Core ETF |
| |
| | Six months ended (Unaudited) January 31, 2024 | | Years ended July 31, 2023 | | 2022 | | 2021 | | 2020 A |
Selected Per-Share Data | | | | | | | | | | |
| Net asset value, beginning of period | $ | 34.54 | $ | 28.86 | $ | 29.11 | $ | 20.37 | $ | 20.00 |
| Income from Investment Operations | | | | | | | | | | |
Net investment income (loss) B,C | | .07 | | .30 | | .40 | | .36 | | .03 |
| Net realized and unrealized gain (loss) | | 2.48 | | 5.78 | | (.12) | | 8.75 | | .36 |
| Total from investment operations | | 2.55 | | 6.08 | | .28 | | 9.11 | | .39 |
| Distributions from net investment income | | (.08) | | (.33) | | (.53) | | (.37) | | (.02) |
| Distributions from net realized gain | | - | | (.07) | | - | | - | | - |
| Total distributions | | (.08) | | (.40) | | (.53) | | (.37) | | (.02) |
| Net asset value, end of period | $ | 37.01 | $ | 34.54 | $ | 28.86 | $ | 29.11 | $ | 20.37 |
Total Return D,E,F | | 7.40% | | 21.36% | | 1.00% | | 45.03% | | 1.95% |
Ratios to Average Net Assets C,G,H | | | | | | | | | | |
| Expenses before reductions | | .59% I | | .59% | | .59% | | .59% | | .59% I |
| Expenses net of fee waivers, if any | | .59% I | | .59% | | .59% | | .59% | | .59% I |
| Expenses net of all reductions | | .59% I | | .59% | | .59% | | .58% | | .59% I |
| Net investment income (loss) | | .42% I | | .99% | | 1.36% | | 1.33% | | 1.00% I |
| Supplemental Data | | | | | | | | | | |
| Net assets, end of period (000 omitted) | $ | 191,529 | $ | 107,923 | $ | 56,276 | $ | 60,407 | $ | 6,112 |
Portfolio turnover rate J,K | | 72% I | | 76% | | 36% | | 68% | | 10% L |
AFor the period June 2, 2020 (commencement of operations) through July 31, 2020.
BCalculated based on average shares outstanding during the period.
CNet investment income (loss) is affected by the timing of the declaration of dividends by any underlying mutual funds or exchange-traded funds (ETFs). Net investment income (loss) of any mutual funds or ETFs is not included in the Fund's net investment income (loss) ratio.
DTotal returns for periods of less than one year are not annualized.
ETotal returns would have been lower if certain expenses had not been reduced during the applicable periods shown.
FBased on net asset value.
GFees and expenses of any underlying mutual funds or exchange-traded funds (ETFs) are not included in the Fund's expense ratio. The Fund indirectly bears its proportionate share of these expenses.
HExpense ratios reflect operating expenses of the class. Expenses before reductions do not reflect amounts reimbursed, waived, or reduced through arrangements with the investment adviser, brokerage services, or other offset arrangements, if applicable, and do not represent the amount paid by the class during periods when reimbursements, waivers or reductions occur.
IAnnualized.
JAmount does not include the portfolio activity of any underlying mutual funds or exchange-traded funds (ETFs).
KPortfolio turnover rate excludes securities received or delivered in-kind.
LAmount not annualized.
Top Holdings (% of Fund's net assets) |
| |
| Microsoft Corp. | 10.9 | |
| NVIDIA Corp. | 9.2 | |
| Meta Platforms, Inc. Class A | 5.8 | |
| Amazon.com, Inc. | 5.2 | |
| Alphabet, Inc. Class C | 4.5 | |
| Uber Technologies, Inc. | 3.6 | |
| Alphabet, Inc. Class A | 2.7 | |
| Roku, Inc. Class A | 2.6 | |
| T-Mobile U.S., Inc. | 2.5 | |
| Apple, Inc. | 2.1 | |
| | 49.1 | |
| |
| Market Sectors (% of Fund's net assets) |
| |
| Information Technology | 40.4 | |
| Communication Services | 22.3 | |
| Health Care | 11.0 | |
| Consumer Discretionary | 9.0 | |
| Financials | 7.2 | |
| Industrials | 7.0 | |
| Utilities | 1.0 | |
| Energy | 0.9 | |
| Consumer Staples | 0.7 | |
| Real Estate | 0.3 | |
| |
Asset Allocation (% of Fund's net assets) |
|
|
Fidelity® Fundamental Large Cap Growth ETF
Showing Percentage of Net Assets
| Common Stocks - 99.8% |
| | | Shares | Value ($) |
| COMMUNICATION SERVICES - 22.3% | | | |
| Entertainment - 5.1% | | | |
| Netflix, Inc. (a) | | 2,347 | 1,323,966 |
| Roku, Inc. Class A (a) | | 70,732 | 6,228,660 |
| Sea Ltd. ADR (a) | | 126,409 | 4,821,239 |
| | | | 12,373,865 |
| Interactive Media & Services - 14.4% | | | |
| Alphabet, Inc.: | | | |
| Class A (a) | | 47,270 | 6,622,527 |
| Class C (a) | | 76,505 | 10,848,409 |
| Meta Platforms, Inc. Class A | | 35,829 | 13,978,326 |
| Snap, Inc. Class A (a) | | 119,759 | 1,902,971 |
| Zoominfo Technologies, Inc. (a) | | 91,410 | 1,466,216 |
| | | | 34,818,449 |
| Media - 0.3% | | | |
| Charter Communications, Inc. Class A (a) | | 15 | 5,561 |
| Magnite, Inc. (a) | | 73,160 | 647,466 |
| | | | 653,027 |
| Wireless Telecommunication Services - 2.5% | | | |
| T-Mobile U.S., Inc. | | 37,306 | 6,014,846 |
TOTAL COMMUNICATION SERVICES | | | 53,860,187 |
| CONSUMER DISCRETIONARY - 9.0% | | | |
| Automobiles - 0.0% | | | |
| Tesla, Inc. (a) | | 56 | 10,488 |
| Broadline Retail - 5.2% | | | |
| Amazon.com, Inc. (a) | | 81,313 | 12,619,778 |
| Hotels, Restaurants & Leisure - 1.1% | | | |
| Domino's Pizza, Inc. | | 1,544 | 658,084 |
| Doordash, Inc. (a) | | 657 | 68,459 |
| Hilton Worldwide Holdings, Inc. | | 5,959 | 1,137,931 |
| Planet Fitness, Inc. (a) | | 12,686 | 859,603 |
| | | | 2,724,077 |
| Household Durables - 0.0% | | | |
| Lennar Corp. Class A | | 357 | 53,496 |
| Specialty Retail - 2.5% | | | |
| Carvana Co. Class A (a) | | 28,386 | 1,222,301 |
| Floor & Decor Holdings, Inc. Class A (a) | | 21,064 | 2,118,196 |
| Lowe's Companies, Inc. | | 12,472 | 2,654,540 |
| Wayfair LLC Class A (a) | | 1,821 | 91,505 |
| | | | 6,086,542 |
| Textiles, Apparel & Luxury Goods - 0.2% | | | |
| lululemon athletica, Inc. (a) | | 755 | 342,634 |
TOTAL CONSUMER DISCRETIONARY | | | 21,837,015 |
| CONSUMER STAPLES - 0.7% | | | |
| Beverages - 0.2% | | | |
| The Coca-Cola Co. | | 5,699 | 339,034 |
| Consumer Staples Distribution & Retail - 0.5% | | | |
| BJ's Wholesale Club Holdings, Inc. (a) | | 16,959 | 1,091,142 |
| Maplebear, Inc. (NASDAQ) | | 7,586 | 185,629 |
| | | | 1,276,771 |
| Food Products - 0.0% | | | |
| Local Bounti Corp. (a) | | 3,136 | 6,586 |
TOTAL CONSUMER STAPLES | | | 1,622,391 |
| ENERGY - 0.9% | | | |
| Oil, Gas & Consumable Fuels - 0.9% | | | |
| Antero Resources Corp. (a) | | 35,827 | 800,375 |
| Canadian Natural Resources Ltd. | | 6,463 | 413,609 |
| Ovintiv, Inc. | | 13,582 | 576,148 |
| Tourmaline Oil Corp. | | 11,928 | 515,731 |
| | | | 2,305,863 |
| FINANCIALS - 7.2% | | | |
| Capital Markets - 1.1% | | | |
| LPL Financial | | 11,388 | 2,723,896 |
| Financial Services - 6.1% | | | |
| Apollo Global Management, Inc. | | 3,072 | 308,429 |
| Block, Inc. Class A (a) | | 27,770 | 1,805,328 |
| Dlocal Ltd. (a) | | 68,119 | 1,097,397 |
| Fiserv, Inc. (a) | | 18,105 | 2,568,556 |
| Global Payments, Inc. | | 24,392 | 3,249,746 |
| Marqeta, Inc. Class A (a) | | 292,687 | 1,759,049 |
| Visa, Inc. Class A | | 14,492 | 3,960,084 |
| | | | 14,748,589 |
TOTAL FINANCIALS | | | 17,472,485 |
| HEALTH CARE - 11.0% | | | |
| Biotechnology - 2.0% | | | |
| Alnylam Pharmaceuticals, Inc. (a) | | 1,280 | 221,325 |
| ALX Oncology Holdings, Inc. (a) | | 9,098 | 131,102 |
| Argenx SE ADR (a) | | 1,347 | 512,547 |
| Ascendis Pharma A/S sponsored ADR (a) | | 67 | 8,705 |
| Celldex Therapeutics, Inc. (a) | | 13,213 | 465,362 |
| Cytokinetics, Inc. (a) | | 12,013 | 938,576 |
| Icosavax, Inc. (a) | | 20,074 | 307,333 |
| Keros Therapeutics, Inc. (a) | | 4,097 | 226,810 |
| Moderna, Inc. (a) | | 2,283 | 230,697 |
| Nuvalent, Inc. Class A (a) | | 3,783 | 284,368 |
| Regeneron Pharmaceuticals, Inc. (a) | | 278 | 262,093 |
| Vaxcyte, Inc. (a) | | 14,716 | 1,051,017 |
| Zentalis Pharmaceuticals, Inc. (a) | | 11,694 | 138,574 |
| | | | 4,778,509 |
| Health Care Equipment & Supplies - 3.1% | | | |
| Boston Scientific Corp. (a) | | 78,172 | 4,945,161 |
| Penumbra, Inc. (a) | | 4,974 | 1,254,393 |
| TransMedics Group, Inc. (a) | | 15,074 | 1,292,897 |
| | | | 7,492,451 |
| Health Care Providers & Services - 3.5% | | | |
| agilon health, Inc. (a) | | 193,664 | 1,140,681 |
| Alignment Healthcare, Inc. (a) | | 1,344 | 9,005 |
| Centene Corp. (a) | | 15,722 | 1,184,024 |
| Humana, Inc. | | 3,837 | 1,450,616 |
| UnitedHealth Group, Inc. | | 9,346 | 4,782,722 |
| | | | 8,567,048 |
| Life Sciences Tools & Services - 0.8% | | | |
| Danaher Corp. | | 3,885 | 932,050 |
| Thermo Fisher Scientific, Inc. | | 1,866 | 1,005,737 |
| | | | 1,937,787 |
| Pharmaceuticals - 1.6% | | | |
| Eli Lilly & Co. | | 5,424 | 3,501,789 |
| Novo Nordisk A/S Series B sponsored ADR | | 2,288 | 262,525 |
| Structure Therapeutics, Inc. ADR | | 3,450 | 150,489 |
| | | | 3,914,803 |
TOTAL HEALTH CARE | | | 26,690,598 |
| INDUSTRIALS - 7.0% | | | |
| Aerospace & Defense - 0.5% | | | |
| The Boeing Co. (a) | | 5,999 | 1,266,029 |
| Building Products - 0.4% | | | |
| Builders FirstSource, Inc. (a) | | 6,126 | 1,064,270 |
| Commercial Services & Supplies - 0.3% | | | |
| ACV Auctions, Inc. Class A (a) | | 39,486 | 512,133 |
| Veralto Corp. | | 1,144 | 87,733 |
| | | | 599,866 |
| Electrical Equipment - 2.0% | | | |
| Bloom Energy Corp. Class A (a) | | 605 | 6,849 |
| Eaton Corp. PLC | | 1,696 | 417,352 |
| Nextracker, Inc. Class A | | 28,531 | 1,291,598 |
| Vertiv Holdings Co. | | 54,323 | 3,060,015 |
| | | | 4,775,814 |
| Ground Transportation - 3.8% | | | |
| Lyft, Inc. (a) | | 44,368 | 554,156 |
| Uber Technologies, Inc. (a) | | 131,291 | 8,569,364 |
| | | | 9,123,520 |
TOTAL INDUSTRIALS | | | 16,829,499 |
| INFORMATION TECHNOLOGY - 40.4% | | | |
| Communications Equipment - 0.4% | | | |
| Arista Networks, Inc. (a) | | 1,237 | 319,987 |
| Lumentum Holdings, Inc. (a) | | 11,577 | 636,040 |
| | | | 956,027 |
| Electronic Equipment, Instruments & Components - 1.8% | | | |
| Flex Ltd. (a) | | 140,393 | 3,332,930 |
| Jabil, Inc. | | 8,770 | 1,098,793 |
| | | | 4,431,723 |
| IT Services - 1.8% | | | |
| Accenture PLC Class A | | 671 | 244,163 |
| EPAM Systems, Inc. (a) | | 6,791 | 1,888,645 |
| MongoDB, Inc. Class A (a) | | 5,290 | 2,118,751 |
| Snowflake, Inc. (a) | | 692 | 135,383 |
| | | | 4,386,942 |
| Semiconductors & Semiconductor Equipment - 16.4% | | | |
| Advanced Micro Devices, Inc. (a) | | 24,678 | 4,138,254 |
| Applied Materials, Inc. | | 3,739 | 614,318 |
| Arm Holdings Ltd. ADR | | 814 | 57,525 |
| Broadcom, Inc. | | 74 | 87,320 |
| First Solar, Inc. (a) | | 1,586 | 232,032 |
| GlobalFoundries, Inc. (a) | | 11,960 | 657,561 |
| Marvell Technology, Inc. | | 31,058 | 2,102,627 |
| NVIDIA Corp. | | 36,041 | 22,174,946 |
| NXP Semiconductors NV | | 18,635 | 3,923,972 |
| ON Semiconductor Corp. (a) | | 54,835 | 3,900,414 |
| Taiwan Semiconductor Manufacturing Co. Ltd. sponsored ADR | | 15,171 | 1,713,716 |
| | | | 39,602,685 |
| Software - 17.8% | | | |
| Adobe, Inc. (a) | | 4,004 | 2,473,591 |
| Datadog, Inc. Class A (a) | | 11,254 | 1,400,448 |
| DoubleVerify Holdings, Inc. (a) | | 16,682 | 667,447 |
| Dynatrace, Inc. (a) | | 14,228 | 810,996 |
| HubSpot, Inc. (a) | | 2,108 | 1,287,988 |
| Intapp, Inc. (a) | | 30,788 | 1,326,347 |
| Intuit, Inc. | | 2,280 | 1,439,432 |
| Klaviyo, Inc. Class A | | 411 | 10,624 |
| Microsoft Corp. | | 66,371 | 26,387,783 |
| Oracle Corp. | | 26,732 | 2,985,964 |
| Salesforce, Inc. (a) | | 6,879 | 1,933,618 |
| Samsara, Inc. (a) | | 3,568 | 112,035 |
| ServiceNow, Inc. (a) | | 2,631 | 2,013,767 |
| Synopsys, Inc. (a) | | 179 | 95,470 |
| | | | 42,945,510 |
| Technology Hardware, Storage & Peripherals - 2.2% | | | |
| Apple, Inc. | | 27,214 | 5,018,262 |
| Pure Storage, Inc. Class A (a) | | 10,124 | 404,859 |
| | | | 5,423,121 |
TOTAL INFORMATION TECHNOLOGY | | | 97,746,008 |
| REAL ESTATE - 0.3% | | | |
| Equity Real Estate Investment Trusts (REITs) - 0.3% | | | |
| American Tower Corp. | | 4,171 | 816,056 |
| UTILITIES - 1.0% | | | |
| Electric Utilities - 1.0% | | | |
| Constellation Energy Corp. | | 9,952 | 1,214,144 |
| PG&E Corp. | | 68,946 | 1,163,119 |
| | | | 2,377,263 |
| TOTAL COMMON STOCKS (Cost $181,099,525) | | | 241,557,365 |
| | | | |
| Money Market Funds - 0.2% |
| | | Shares | Value ($) |
State Street Institutional Treasury Plus Money Market Fund Trust Class 5.23% (b) (Cost $504,303) | | 504,303 | 504,303 |
| | | | |
| TOTAL INVESTMENT IN SECURITIES - 100.0% (Cost $181,603,828) | 242,061,668 |
NET OTHER ASSETS (LIABILITIES) - 0.0% | (105,236) |
| NET ASSETS - 100.0% | 241,956,432 |
| | |
Legend
| (b) | The rate quoted is the annualized seven-day yield of the fund at period end. |
Investment Valuation
The following is a summary of the inputs used, as of January 31, 2024, involving the Fund's assets and liabilities carried at fair value. The inputs or methodology used for valuing securities may not be an indication of the risk associated with investing in those securities. For more information on valuation inputs, and their aggregation into the levels used below, please refer to the Investment Valuation section in the accompanying Notes to Financial Statements.
| Valuation Inputs at Reporting Date: |
| Description | Total ($) | Level 1 ($) | Level 2 ($) | Level 3 ($) |
Investments in Securities: | | | | |
|
| Equities: | | | | |
Communication Services | 53,860,187 | 53,860,187 | - | - |
Consumer Discretionary | 21,837,015 | 21,837,015 | - | - |
Consumer Staples | 1,622,391 | 1,622,391 | - | - |
Energy | 2,305,863 | 2,305,863 | - | - |
Financials | 17,472,485 | 17,472,485 | - | - |
Health Care | 26,690,598 | 26,690,598 | - | - |
Industrials | 16,829,499 | 16,829,499 | - | - |
Information Technology | 97,746,008 | 97,746,008 | - | - |
Real Estate | 816,056 | 816,056 | - | - |
Utilities | 2,377,263 | 2,377,263 | - | - |
|
| Money Market Funds | 504,303 | 504,303 | - | - |
| Total Investments in Securities: | 242,061,668 | 242,061,668 | - | - |
Fidelity® Fundamental Large Cap Growth ETF
| Statement of Assets and Liabilities |
| | | | January 31, 2024 (Unaudited) |
| | | | | |
| Assets | | | | |
Investment in securities, at value - See accompanying schedule Unaffiliated issuers (cost $181,603,828): | | | $ | 242,061,668 |
| Cash | | | | 5,247 |
| Receivable for investments sold | | | | 2,439,330 |
| Dividends receivable | | | | 21,064 |
Total assets | | | | 244,527,309 |
| Liabilities | | | | |
| Payable for investments purchased | $ | 2,455,142 | | |
| Accrued management fee | | 115,735 | | |
| Total Liabilities | | | | 2,570,877 |
| Net Assets | | | $ | 241,956,432 |
| Net Assets consist of: | | | | |
| Paid in capital | | | $ | 202,590,567 |
| Total accumulated earnings (loss) | | | | 39,365,865 |
| Net Assets | | | $ | 241,956,432 |
Net Asset Value, offering price and redemption price per share ($241,956,432 ÷ 12,425,000 shares) | | | $ | 19.47 |
| Statement of Operations |
| | | | Six months ended January 31, 2024 (Unaudited) |
| Investment Income | | | | |
| Dividends | | | $ | 370,374 |
| Expenses | | | | |
| Management fee | $ | 593,164 | | |
| Independent trustees' fees and expenses | | 542 | | |
| Total expenses before reductions | | 593,706 | | |
| Expense reductions | | (59) | | |
| Total expenses after reductions | | | | 593,647 |
| Net Investment income (loss) | | | | (223,273) |
| Realized and Unrealized Gain (Loss) | | | | |
| Net realized gain (loss) on: | | | | |
| Investment Securities: | | | | |
| Redemptions in-kind | | 213,380 | | |
| Unaffiliated issuers | | 358,757 | | |
| Foreign currency transactions | | (185) | | |
| Futures contracts | | 20,106 | | |
| Total net realized gain (loss) | | | | 592,058 |
| Change in net unrealized appreciation (depreciation) on investment securities | | | | 18,451,741 |
| Net gain (loss) | | | | 19,043,799 |
| Net increase (decrease) in net assets resulting from operations | | | $ | 18,820,526 |
| Statement of Changes in Net Assets |
| |
| | Six months ended January 31, 2024 (Unaudited) | | Year ended July 31, 2023 |
| Increase (Decrease) in Net Assets | | | | |
| Operations | | | | |
| Net investment income (loss) | $ | (223,273) | $ | (76,527) |
| Net realized gain (loss) | | 592,058 | | (3,369,028) |
| Change in net unrealized appreciation (depreciation) | | 18,451,741 | | 44,562,111 |
| Net increase (decrease) in net assets resulting from operations | | 18,820,526 | | 41,116,556 |
| | | | | |
| Share transactions | | | | |
| Proceeds from sales of shares | | 28,914,403 | | 118,430,789 |
| Cost of shares redeemed | | (877,580) | | (26,758,280) |
| | | | | |
Net increase (decrease) in net assets resulting from share transactions | | 28,036,823 | | 91,672,509 |
| Total increase (decrease) in net assets | | 46,857,349 | | 132,789,065 |
| | | | | |
| Net Assets | | | | |
| Beginning of period | | 195,099,083 | | 62,310,018 |
| End of period | $ | 241,956,432 | $ | 195,099,083 |
| | | | | |
| Other Information | | | | |
| Shares | | | | |
| Sold | | 1,600,000 | | 8,550,000 |
| Redeemed | | (50,000) | | (1,975,000) |
| Net increase (decrease) | | 1,550,000 | | 6,575,000 |
| | | | | |
Financial Highlights
| Fidelity® Fundamental Large Cap Growth ETF |
| |
| | Six months ended (Unaudited) January 31, 2024 | | Years ended July 31, 2023 | | 2022 | | 2021 A |
Selected Per-Share Data | | | | | | | | |
| Net asset value, beginning of period | $ | 17.94 | $ | 14.49 | $ | 21.16 | $ | 20.00 |
| Income from Investment Operations | | | | | | | | |
Net investment income (loss) B,C | | (.02) | | (.01) | | (.03) | | (.03) |
| Net realized and unrealized gain (loss) | | 1.55 | | 3.46 | | (6.64) | | 1.19 |
| Total from investment operations | | 1.53 | | 3.45 | | (6.67) | | 1.16 |
| Net asset value, end of period | $ | 19.47 | $ | 17.94 | $ | 14.49 | $ | 21.16 |
Total Return D,E,F | | 8.55% | | 23.80% | | (31.53)% | | 5.82% |
Ratios to Average Net Assets B,G,H | | | | | | | | |
| Expenses before reductions | | .59% I | | .59% | | .59% | | .59% I |
| Expenses net of fee waivers, if any | | .59% I | | .59% | | .59% | | .59% I |
| Expenses net of all reductions | | .59% I | | .59% | | .59% | | .59% I |
| Net investment income (loss) | | (.22)% I | | (.07)% | | (.19)% | | (.33)% I |
| Supplemental Data | | | | | | | | |
| Net assets, end of period (000 omitted) | $ | 241,956 | $ | 195,099 | $ | 62,310 | $ | 39,679 |
Portfolio turnover rate J,K | | 47% I | | 78% | | 99% | | 49% L |
AFor the period February 2, 2021 (commencement of operations) through July 31, 2021.
BNet investment income (loss) is affected by the timing of the declaration of dividends by any underlying mutual funds or exchange-traded funds (ETFs). Net investment income (loss) of any mutual funds or ETFs is not included in the Fund's net investment income (loss) ratio.
CCalculated based on average shares outstanding during the period.
DBased on net asset value.
ETotal returns for periods of less than one year are not annualized.
FTotal returns would have been lower if certain expenses had not been reduced during the applicable periods shown.
GFees and expenses of any underlying mutual funds or exchange-traded funds (ETFs) are not included in the Fund's expense ratio. The Fund indirectly bears its proportionate share of these expenses.
HExpense ratios reflect operating expenses of the class. Expenses before reductions do not reflect amounts reimbursed, waived, or reduced through arrangements with the investment adviser, brokerage services, or other offset arrangements, if applicable, and do not represent the amount paid by the class during periods when reimbursements, waivers or reductions occur.
IAnnualized.
JAmount does not include the portfolio activity of any underlying mutual funds or exchange-traded funds (ETFs).
KPortfolio turnover rate excludes securities received or delivered in-kind.
LAmount not annualized.
Top Holdings (% of Fund's net assets) |
| |
| Tempur Sealy International, Inc. | 1.5 | |
| TFI International, Inc. | 1.5 | |
| AutoZone, Inc. | 1.4 | |
| TechnipFMC PLC | 1.4 | |
| Molina Healthcare, Inc. | 1.3 | |
| Fabrinet | 1.3 | |
| Performance Food Group Co. | 1.2 | |
| Arch Capital Group Ltd. | 1.2 | |
| Universal Health Services, Inc. Class B | 1.2 | |
| ITT, Inc. | 1.1 | |
| | 13.1 | |
| |
| Market Sectors (% of Fund's net assets) |
| |
| Industrials | 23.2 | |
| Financials | 16.8 | |
| Consumer Discretionary | 12.8 | |
| Information Technology | 12.7 | |
| Health Care | 10.3 | |
| Materials | 7.0 | |
| Energy | 5.9 | |
| Consumer Staples | 3.9 | |
| Real Estate | 3.6 | |
| Utilities | 1.9 | |
| Communication Services | 0.9 | |
| |
Asset Allocation (% of Fund's net assets) |
|
|
Fidelity® Fundamental Small-Mid Cap ETF
Showing Percentage of Net Assets
| Common Stocks - 99.0% |
| | | Shares | Value ($) |
| COMMUNICATION SERVICES - 0.9% | | | |
| Media - 0.9% | | | |
| Nexstar Media Group, Inc. Class A | | 2,347 | 417,085 |
| CONSUMER DISCRETIONARY - 12.8% | | | |
| Automobile Components - 0.9% | | | |
| Adient PLC (a) | | 3,043 | 105,623 |
| Lear Corp. | | 1,474 | 195,895 |
| Patrick Industries, Inc. | | 882 | 88,544 |
| | | | 390,062 |
| Hotels, Restaurants & Leisure - 1.5% | | | |
| Brinker International, Inc. (a) | | 3,295 | 140,993 |
| Churchill Downs, Inc. | | 3,348 | 405,008 |
| Red Rock Resorts, Inc. | | 2,423 | 132,490 |
| | | | 678,491 |
| Household Durables - 3.4% | | | |
| Helen of Troy Ltd. (a) | | 1,237 | 141,637 |
| KB Home | | 3,813 | 227,217 |
| LGI Homes, Inc. (a) | | 1,955 | 230,710 |
| SharkNinja Hong Kong Co. Ltd. | | 5,206 | 243,224 |
| Tempur Sealy International, Inc. | | 13,752 | 686,083 |
| | | | 1,528,871 |
| Leisure Products - 1.1% | | | |
| BRP, Inc. | | 2,335 | 147,339 |
| Brunswick Corp. | | 4,093 | 330,223 |
| | | | 477,562 |
| Specialty Retail - 3.9% | | | |
| Academy Sports & Outdoors, Inc. | | 3,291 | 206,444 |
| AutoZone, Inc. (a) | | 230 | 635,290 |
| Dick's Sporting Goods, Inc. | | 2,280 | 339,880 |
| Murphy U.S.A., Inc. | | 1,184 | 417,384 |
| Upbound Group, Inc. | | 4,844 | 160,821 |
| | | | 1,759,819 |
| Textiles, Apparel & Luxury Goods - 2.0% | | | |
| Crocs, Inc. (a) | | 3,138 | 318,444 |
| Gildan Activewear, Inc. | | 4,042 | 133,426 |
| PVH Corp. | | 3,515 | 422,714 |
| | | | 874,584 |
TOTAL CONSUMER DISCRETIONARY | | | 5,709,389 |
| CONSUMER STAPLES - 3.9% | | | |
| Consumer Staples Distribution & Retail - 3.3% | | | |
| BJ's Wholesale Club Holdings, Inc. (a) | | 7,530 | 484,480 |
| Performance Food Group Co. (a) | | 7,568 | 550,042 |
| U.S. Foods Holding Corp. (a) | | 9,720 | 447,217 |
| | | | 1,481,739 |
| Food Products - 0.6% | | | |
| Nomad Foods Ltd. | | 13,762 | 247,578 |
TOTAL CONSUMER STAPLES | | | 1,729,317 |
| ENERGY - 5.9% | | | |
| Energy Equipment & Services - 2.9% | | | |
| Cactus, Inc. | | 3,897 | 165,389 |
| Championx Corp. | | 5,902 | 161,774 |
| Expro Group Holdings NV (a) | | 5,161 | 90,834 |
| Liberty Oilfield Services, Inc. Class A | | 11,387 | 236,736 |
| TechnipFMC PLC | | 32,211 | 622,961 |
| | | | 1,277,694 |
| Oil, Gas & Consumable Fuels - 3.0% | | | |
| Antero Resources Corp. (a) | | 14,075 | 314,436 |
| Cheniere Energy, Inc. | | 2,575 | 422,274 |
| Hess Corp. | | 3,130 | 439,859 |
| Northern Oil & Gas, Inc. | | 4,298 | 143,983 |
| Sitio Royalties Corp. | | 1,490 | 31,782 |
| | | | 1,352,334 |
TOTAL ENERGY | | | 2,630,028 |
| FINANCIALS - 16.8% | | | |
| Banks - 6.1% | | | |
| BOK Financial Corp. | | 2,301 | 192,916 |
| Cadence Bank | | 9,741 | 259,305 |
| Eastern Bankshares, Inc. | | 15,922 | 222,271 |
| First Bancorp, Puerto Rico | | 12,828 | 213,971 |
| First Citizens Bancshares, Inc. | | 180 | 271,800 |
| First Interstate Bancsystem, Inc. | | 6,605 | 181,770 |
| Independent Bank Group, Inc. | | 2,715 | 131,270 |
| M&T Bank Corp. | | 864 | 119,318 |
| Pinnacle Financial Partners, Inc. | | 3,796 | 335,490 |
| Synovus Financial Corp. | | 8,026 | 302,259 |
| Trico Bancshares | | 907 | 32,969 |
| Webster Financial Corp. | | 4,235 | 209,548 |
| Wintrust Financial Corp. | | 2,455 | 238,086 |
| | | | 2,710,973 |
| Capital Markets - 2.1% | | | |
| Houlihan Lokey | | 2,287 | 273,937 |
| LPL Financial | | 1,820 | 435,326 |
| Raymond James Financial, Inc. | | 2,145 | 236,336 |
| | | | 945,599 |
| Consumer Finance - 1.8% | | | |
| Discover Financial Services | | 3,239 | 341,779 |
| Encore Capital Group, Inc. (a) | | 1,543 | 77,273 |
| FirstCash Holdings, Inc. | | 3,089 | 354,525 |
| | | | 773,577 |
| Financial Services - 0.4% | | | |
| Walker & Dunlop, Inc. | | 1,856 | 179,271 |
| Insurance - 6.4% | | | |
| American Financial Group, Inc. | | 1,874 | 225,630 |
| Arch Capital Group Ltd. (a) | | 6,592 | 543,379 |
| Assurant, Inc. | | 2,319 | 389,476 |
| Enstar Group Ltd. (a) | | 538 | 143,587 |
| First American Financial Corp. | | 7,340 | 442,969 |
| Old Republic International Corp. | | 13,857 | 388,550 |
| Primerica, Inc. | | 1,624 | 380,276 |
| Reinsurance Group of America, Inc. | | 1,860 | 323,435 |
| | | | 2,837,302 |
TOTAL FINANCIALS | | | 7,446,722 |
| HEALTH CARE - 10.3% | | | |
| Biotechnology - 2.2% | | | |
| Acelyrin, Inc. | | 792 | 6,035 |
| ALX Oncology Holdings, Inc. (a) | | 263 | 3,790 |
| Arcellx, Inc. (a) | | 881 | 54,481 |
| Argenx SE ADR (a) | | 388 | 147,638 |
| Cargo Therapeutics, Inc. | | 2,526 | 55,597 |
| Celldex Therapeutics, Inc. (a) | | 532 | 18,737 |
| Cogent Biosciences, Inc. (a) | | 3,946 | 17,481 |
| Crinetics Pharmaceuticals, Inc. (a) | | 1,832 | 66,831 |
| Cytokinetics, Inc. (a) | | 1,103 | 86,177 |
| Keros Therapeutics, Inc. (a) | | 183 | 10,131 |
| Madrigal Pharmaceuticals, Inc. (a) | | 374 | 81,050 |
| Moonlake Immunotherapeutics (a) | | 719 | 40,178 |
| Morphic Holding, Inc. (a) | | 967 | 30,644 |
| Nuvalent, Inc. Class A (a) | | 966 | 72,614 |
| Repligen Corp. (a) | | 674 | 127,656 |
| Vaxcyte, Inc. (a) | | 877 | 62,635 |
| Vericel Corp. (a) | | 627 | 26,948 |
| Xenon Pharmaceuticals, Inc. (a) | | 1,021 | 46,170 |
| Zentalis Pharmaceuticals, Inc. (a) | | 921 | 10,914 |
| | | | 965,707 |
| Health Care Equipment & Supplies - 1.6% | | | |
| Haemonetics Corp. (a) | | 3,458 | 264,399 |
| Hologic, Inc. (a) | | 3,600 | 267,984 |
| TransMedics Group, Inc. (a) | | 2,334 | 200,187 |
| | | | 732,570 |
| Health Care Providers & Services - 4.2% | | | |
| Acadia Healthcare Co., Inc. (a) | | 4,191 | 344,249 |
| Cardinal Health, Inc. | | 2,595 | 283,348 |
| Molina Healthcare, Inc. (a) | | 1,638 | 583,849 |
| Owens & Minor, Inc. (a) | | 6,525 | 128,608 |
| Universal Health Services, Inc. Class B | | 3,340 | 530,425 |
| | | | 1,870,479 |
| Life Sciences Tools & Services - 1.7% | | | |
| 10X Genomics, Inc. (a) | | 635 | 26,460 |
| Charles River Laboratories International, Inc. (a) | | 1,344 | 290,680 |
| ICON PLC (a) | | 177 | 46,174 |
| Medpace Holdings, Inc. (a) | | 859 | 250,467 |
| West Pharmaceutical Services, Inc. | | 386 | 143,990 |
| | | | 757,771 |
| Pharmaceuticals - 0.6% | | | |
| Arvinas Holding Co. LLC (a) | | 829 | 34,404 |
| Axsome Therapeutics, Inc. (a) | | 553 | 49,787 |
| CymaBay Therapeutics, Inc. (a) | | 3,803 | 89,409 |
| Prestige Brands Holdings, Inc. (a) | | 449 | 27,631 |
| Structure Therapeutics, Inc. ADR | | 590 | 25,736 |
| Verona Pharma PLC ADR (a) | | 1,882 | 34,535 |
| | | | 261,502 |
TOTAL HEALTH CARE | | | 4,588,029 |
| INDUSTRIALS - 23.2% | | | |
| Building Products - 1.1% | | | |
| Hayward Holdings, Inc. (a) | | 16,995 | 212,777 |
| Tecnoglass, Inc. | | 6,123 | 281,719 |
| | | | 494,496 |
| Commercial Services & Supplies - 0.5% | | | |
| The Brink's Co. | | 2,470 | 199,675 |
| Construction & Engineering - 2.9% | | | |
| AECOM | | 3,302 | 291,203 |
| EMCOR Group, Inc. | | 2,141 | 488,384 |
| Granite Construction, Inc. | | 6,182 | 278,870 |
| Willscot Mobile Mini Holdings (a) | | 4,899 | 231,723 |
| | | | 1,290,180 |
| Electrical Equipment - 4.4% | | | |
| Acuity Brands, Inc. | | 1,508 | 359,145 |
| AMETEK, Inc. | | 2,230 | 361,372 |
| Atkore, Inc. | | 2,290 | 349,294 |
| Regal Rexnord Corp. | | 3,129 | 417,596 |
| Vertiv Holdings Co. | | 8,479 | 477,622 |
| | | | 1,965,029 |
| Ground Transportation - 2.5% | | | |
| TFI International, Inc. | | 5,163 | 678,780 |
| XPO, Inc. (a) | | 4,912 | 419,681 |
| | | | 1,098,461 |
| Machinery - 4.0% | | | |
| Allison Transmission Holdings, Inc. | | 4,100 | 248,214 |
| Crane Co. | | 3,330 | 413,286 |
| Federal Signal Corp. | | 3,345 | 257,498 |
| ITT, Inc. | | 4,076 | 492,299 |
| SPX Technologies, Inc. (a) | | 3,621 | 364,417 |
| | | | 1,775,714 |
| Professional Services - 5.5% | | | |
| ASGN, Inc. (a) | | 3,592 | 333,409 |
| CACI International, Inc. Class A (a) | | 1,098 | 377,416 |
| Concentrix Corp. | | 2,878 | 255,768 |
| ExlService Holdings, Inc. (a) | | 7,846 | 245,423 |
| Genpact Ltd. | | 9,475 | 340,153 |
| KBR, Inc. | | 5,811 | 302,811 |
| Kforce, Inc. | | 1,505 | 102,867 |
| Maximus, Inc. | | 3,416 | 277,106 |
| WNS Holdings Ltd. sponsored ADR (a) | | 3,150 | 218,453 |
| | | | 2,453,406 |
| Trading Companies & Distributors - 2.3% | | | |
| Applied Industrial Technologies, Inc. | | 1,992 | 351,508 |
| Beacon Roofing Supply, Inc. (a) | | 3,546 | 293,928 |
| Core & Main, Inc. (a) | | 5,548 | 229,188 |
| Rush Enterprises, Inc. Class A | | 3,384 | 151,975 |
| | | | 1,026,599 |
TOTAL INDUSTRIALS | | | 10,303,560 |
| INFORMATION TECHNOLOGY - 12.7% | | | |
| Communications Equipment - 0.9% | | | |
| Ciena Corp. (a) | | 3,031 | 160,643 |
| Lumentum Holdings, Inc. (a) | | 4,077 | 223,990 |
| | | | 384,633 |
| Electronic Equipment, Instruments & Components - 5.2% | | | |
| Advanced Energy Industries, Inc. | | 3,189 | 332,230 |
| Crane Nxt Co. | | 3,308 | 192,790 |
| Fabrinet (a) | | 2,635 | 562,599 |
| Flex Ltd. (a) | | 7,217 | 171,332 |
| Insight Enterprises, Inc. (a) | | 2,229 | 411,785 |
| TD SYNNEX Corp. | | 3,285 | 328,434 |
| Vontier Corp. | | 9,017 | 311,898 |
| | | | 2,311,068 |
| IT Services - 1.1% | | | |
| Amdocs Ltd. | | 5,334 | 489,021 |
| Semiconductors & Semiconductor Equipment - 2.5% | | | |
| Cirrus Logic, Inc. (a) | | 652 | 50,334 |
| Diodes, Inc. (a) | | 2,154 | 145,007 |
| Ichor Holdings Ltd. (a) | | 4,370 | 158,194 |
| Lattice Semiconductor Corp. (a) | | 3,067 | 186,658 |
| MACOM Technology Solutions Holdings, Inc. (a) | | 2,616 | 225,578 |
| ON Semiconductor Corp. (a) | | 4,691 | 333,671 |
| | | | 1,099,442 |
| Software - 2.3% | | | |
| Dynatrace, Inc. (a) | | 6,280 | 357,960 |
| Intapp, Inc. (a) | | 2,897 | 124,803 |
| JFrog Ltd. (a) | | 4,299 | 139,846 |
| PROS Holdings, Inc. (a) | | 3,959 | 136,269 |
| Tenable Holdings, Inc. (a) | | 5,564 | 262,064 |
| | | | 1,020,942 |
| Technology Hardware, Storage & Peripherals - 0.7% | | | |
| Seagate Technology Holdings PLC | | 3,880 | 332,438 |
TOTAL INFORMATION TECHNOLOGY | | | 5,637,544 |
| MATERIALS - 7.0% | | | |
| Chemicals - 2.3% | | | |
| Cabot Corp. | | 2,719 | 196,040 |
| Element Solutions, Inc. | | 10,268 | 228,258 |
| Olin Corp. | | 4,764 | 248,061 |
| The Chemours Co. LLC | | 11,932 | 359,988 |
| | | | 1,032,347 |
| Construction Materials - 1.5% | | | |
| Eagle Materials, Inc. | | 1,984 | 448,940 |
| Summit Materials, Inc. (a) | | 5,695 | 206,045 |
| | | | 654,985 |
| Containers & Packaging - 1.2% | | | |
| Graphic Packaging Holding Co. | | 12,160 | 310,202 |
| O-I Glass, Inc. (a) | | 14,468 | 210,654 |
| | | | 520,856 |
| Metals & Mining - 1.5% | | | |
| Commercial Metals Co. | | 5,548 | 289,717 |
| Constellium NV (a) | | 6,042 | 113,288 |
| Steel Dynamics, Inc. | | 2,256 | 272,277 |
| | | | 675,282 |
| Paper & Forest Products - 0.5% | | | |
| Louisiana-Pacific Corp. | | 3,182 | 211,762 |
TOTAL MATERIALS | | | 3,095,232 |
| REAL ESTATE - 3.6% | | | |
| Equity Real Estate Investment Trusts (REITs) - 1.3% | | | |
| Essential Properties Realty Trust, Inc. | | 8,334 | 207,600 |
| LXP Industrial Trust (REIT) | | 10,740 | 97,627 |
| Ventas, Inc. | | 6,186 | 286,969 |
| | | | 592,196 |
| Real Estate Management & Development - 2.3% | | | |
| Colliers International Group, Inc. | | 3,800 | 446,272 |
| Cushman & Wakefield PLC (a) | | 18,761 | 197,366 |
| Jones Lang LaSalle, Inc. (a) | | 2,063 | 365,275 |
| | | | 1,008,913 |
TOTAL REAL ESTATE | | | 1,601,109 |
| UTILITIES - 1.9% | | | |
| Electric Utilities - 0.7% | | | |
| PG&E Corp. | | 18,977 | 320,142 |
| Gas Utilities - 0.6% | | | |
| Brookfield Infrastructure Corp. A Shares | | 6,837 | 239,363 |
| Independent Power and Renewable Electricity Producers - 0.6% | | | |
| The AES Corp. | | 16,624 | 277,288 |
TOTAL UTILITIES | | | 836,793 |
| TOTAL COMMON STOCKS (Cost $37,599,481) | | | 43,994,808 |
| | | | |
| Money Market Funds - 1.0% |
| | | Shares | Value ($) |
State Street Institutional Treasury Plus Money Market Fund Trust Class 5.23% (b) (Cost $473,130) | | 473,130 | 473,130 |
| | | | |
| TOTAL INVESTMENT IN SECURITIES - 100.0% (Cost $38,072,611) | 44,467,938 |
NET OTHER ASSETS (LIABILITIES) - 0.0% | (17,061) |
| NET ASSETS - 100.0% | 44,450,877 |
| | |
Legend
| (b) | The rate quoted is the annualized seven-day yield of the fund at period end. |
Investment Valuation
The following is a summary of the inputs used, as of January 31, 2024, involving the Fund's assets and liabilities carried at fair value. The inputs or methodology used for valuing securities may not be an indication of the risk associated with investing in those securities. For more information on valuation inputs, and their aggregation into the levels used below, please refer to the Investment Valuation section in the accompanying Notes to Financial Statements.
| Valuation Inputs at Reporting Date: |
| Description | Total ($) | Level 1 ($) | Level 2 ($) | Level 3 ($) |
Investments in Securities: | | | | |
|
| Equities: | | | | |
Communication Services | 417,085 | 417,085 | - | - |
Consumer Discretionary | 5,709,389 | 5,709,389 | - | - |
Consumer Staples | 1,729,317 | 1,729,317 | - | - |
Energy | 2,630,028 | 2,630,028 | - | - |
Financials | 7,446,722 | 7,446,722 | - | - |
Health Care | 4,588,029 | 4,588,029 | - | - |
Industrials | 10,303,560 | 10,303,560 | - | - |
Information Technology | 5,637,544 | 5,637,544 | - | - |
Materials | 3,095,232 | 3,095,232 | - | - |
Real Estate | 1,601,109 | 1,601,109 | - | - |
Utilities | 836,793 | 836,793 | - | - |
|
| Money Market Funds | 473,130 | 473,130 | - | - |
| Total Investments in Securities: | 44,467,938 | 44,467,938 | - | - |
Fidelity® Fundamental Small-Mid Cap ETF
| Statement of Assets and Liabilities |
| | | | January 31, 2024 (Unaudited) |
| | | | | |
| Assets | | | | |
Investment in securities, at value - See accompanying schedule Unaffiliated issuers (cost $38,072,611): | | | $ | 44,467,938 |
| Dividends receivable | | | | 4,861 |
Total assets | | | | 44,472,799 |
| Liabilities | | | | |
| Accrued management fee | $ | 21,922 | | |
| Total Liabilities | | | | 21,922 |
| Net Assets | | | $ | 44,450,877 |
| Net Assets consist of: | | | | |
| Paid in capital | | | $ | 42,232,901 |
| Total accumulated earnings (loss) | | | | 2,217,976 |
| Net Assets | | | $ | 44,450,877 |
Net Asset Value, offering price and redemption price per share ($44,450,877 ÷ 1,900,000 shares) | | | $ | 23.40 |
| Statement of Operations |
| | | | Six months ended January 31, 2024 (Unaudited) |
| Investment Income | | | | |
| Dividends | | | $ | 210,204 |
| Expenses | | | | |
| Management fee | $ | 112,501 | | |
| Independent trustees' fees and expenses | | 102 | | |
| Total expenses before reductions | | 112,603 | | |
| Expense reductions | | (3) | | |
| Total expenses after reductions | | | | 112,600 |
| Net Investment income (loss) | | | | 97,604 |
| Realized and Unrealized Gain (Loss) | | | | |
| Net realized gain (loss) on: | | | | |
| Investment Securities: | | | | |
| Redemptions in-kind | | 218,926 | | |
| Unaffiliated issuers | | (97,932) | | |
| Foreign currency transactions | | (2) | | |
| Futures contracts | | (8,071) | | |
| Total net realized gain (loss) | | | | 112,921 |
| Change in net unrealized appreciation (depreciation) on investment securities | | | | 1,494,813 |
| Net gain (loss) | | | | 1,607,734 |
| Net increase (decrease) in net assets resulting from operations | | | $ | 1,705,338 |
| Statement of Changes in Net Assets |
| |
| | Six months ended January 31, 2024 (Unaudited) | | Year ended July 31, 2023 |
| Increase (Decrease) in Net Assets | | | | |
| Operations | | | | |
| Net investment income (loss) | $ | 97,604 | $ | 173,574 |
| Net realized gain (loss) | | 112,921 | | (2,126,145) |
| Change in net unrealized appreciation (depreciation) | | 1,494,813 | | 4,570,740 |
| Net increase (decrease) in net assets resulting from operations | | 1,705,338 | | 2,618,169 |
| Distributions to shareholders | | (119,000) | | (192,175) |
| | | | | |
| Share transactions | | | | |
| Proceeds from sales of shares | | 8,218,191 | | 5,939,963 |
| Cost of shares redeemed | | (502,189) | | (964,910) |
| | | | | |
Net increase (decrease) in net assets resulting from share transactions | | 7,716,002 | | 4,975,053 |
| Total increase (decrease) in net assets | | 9,302,340 | | 7,401,047 |
| | | | | |
| Net Assets | | | | |
| Beginning of period | | 35,148,537 | | 27,747,490 |
| End of period | $ | 44,450,877 | $ | 35,148,537 |
| | | | | |
| Other Information | | | | |
| Shares | | | | |
| Sold | | 375,000 | | 275,000 |
| Redeemed | | (25,000) | | (50,000) |
| Net increase (decrease) | | 350,000 | | 225,000 |
| | | | | |
Financial Highlights
| Fidelity® Fundamental Small-Mid Cap ETF |
| |
| | Six months ended (Unaudited) January 31, 2024 | | Years ended July 31, 2023 | | 2022 | | 2021 A |
Selected Per-Share Data | | | | | | | | |
| Net asset value, beginning of period | $ | 22.68 | $ | 20.94 | $ | 22.84 | $ | 20.00 |
| Income from Investment Operations | | | | | | | | |
Net investment income (loss) B,C | | .06 | | .12 | | .10 | | .03 |
| Net realized and unrealized gain (loss) | | .73 | | 1.76 | | (1.89) | | 2.84 |
| Total from investment operations | | .79 | | 1.88 | | (1.79) | | 2.87 |
| Distributions from net investment income | | (.07) | | (.14) | | (.11) | | (.03) |
| Total distributions | | (.07) | | (.14) | | (.11) | | (.03) |
| Net asset value, end of period | $ | 23.40 | $ | 22.68 | $ | 20.94 | $ | 22.84 |
Total Return D,E,F | | 3.49% | | 9.02% | | (7.88)% | | 14.36% |
Ratios to Average Net Assets C,G,H | | | | | | | | |
| Expenses before reductions | | .60% I | | .60% | | .62% | | .64% I |
| Expenses net of fee waivers, if any | | .60% I | | .60% | | .62% | | .64% I |
| Expenses net of all reductions | | .60% I | | .60% | | .62% | | .63% I |
| Net investment income (loss) | | .52% I | | .59% | | .45% | | .22% I |
| Supplemental Data | | | | | | | | |
| Net assets, end of period (000 omitted) | $ | 44,451 | $ | 35,149 | $ | 27,747 | $ | 24,558 |
Portfolio turnover rate J,K | | 35% I | | 38% | | 42% | | 37% L |
AFor the period February 2, 2021 (commencement of operations) through July 31, 2021.
BCalculated based on average shares outstanding during the period.
CNet investment income (loss) is affected by the timing of the declaration of dividends by any underlying mutual funds or exchange-traded funds (ETFs). Net investment income (loss) of any mutual funds or ETFs is not included in the Fund's net investment income (loss) ratio.
DTotal returns for periods of less than one year are not annualized.
ETotal returns would have been lower if certain expenses had not been reduced during the applicable periods shown.
FBased on net asset value.
GFees and expenses of any underlying mutual funds or exchange-traded funds (ETFs) are not included in the Fund's expense ratio. The Fund indirectly bears its proportionate share of these expenses.
HExpense ratios reflect operating expenses of the class. Expenses before reductions do not reflect amounts reimbursed, waived, or reduced through arrangements with the investment adviser, brokerage services, or other offset arrangements, if applicable, and do not represent the amount paid by the class during periods when reimbursements, waivers or reductions occur.
IAnnualized.
JAmount does not include the portfolio activity of any underlying mutual funds or exchange-traded funds (ETFs).
KPortfolio turnover rate excludes securities received or delivered in-kind.
LAmount not annualized.
Top Holdings (% of Fund's net assets) |
| |
| Microsoft Corp. | 8.4 | |
| NVIDIA Corp. | 4.9 | |
| Amazon.com, Inc. | 4.5 | |
| Meta Platforms, Inc. Class A | 3.5 | |
| Alphabet, Inc. Class A | 3.3 | |
| Broadcom, Inc. | 2.5 | |
| UnitedHealth Group, Inc. | 2.3 | |
| Visa, Inc. Class A | 2.3 | |
| Eli Lilly & Co. | 2.3 | |
| MasterCard, Inc. Class A | 2.1 | |
| | 36.1 | |
| |
| Market Sectors (% of Fund's net assets) |
| |
| Information Technology | 32.8 | |
| Industrials | 14.7 | |
| Health Care | 12.6 | |
| Consumer Discretionary | 12.0 | |
| Financials | 11.3 | |
| Communication Services | 8.4 | |
| Materials | 5.2 | |
| Consumer Staples | 1.9 | |
| |
Asset Allocation (% of Fund's net assets) |
|
|
Fidelity® Magellan℠ ETF
Showing Percentage of Net Assets
| Common Stocks - 98.9% |
| | | Shares | Value ($) |
| COMMUNICATION SERVICES - 8.4% | | | |
| Interactive Media & Services - 8.4% | | | |
| Alphabet, Inc.: | | | |
| Class A (a) | | 15,213 | 2,131,341 |
| Class C (a) | | 7,478 | 1,060,380 |
| Meta Platforms, Inc. Class A | | 5,684 | 2,217,556 |
| | | | 5,409,277 |
| CONSUMER DISCRETIONARY - 12.0% | | | |
| Broadline Retail - 4.5% | | | |
| Amazon.com, Inc. (a) | | 18,652 | 2,894,790 |
| Hotels, Restaurants & Leisure - 3.8% | | | |
| Airbnb, Inc. Class A (a) | | 5,278 | 760,771 |
| Hilton Worldwide Holdings, Inc. | | 4,545 | 867,913 |
| Marriott International, Inc. Class A | | 3,229 | 774,088 |
| | | | 2,402,772 |
| Specialty Retail - 3.7% | | | |
| AutoZone, Inc. (a) | | 280 | 773,396 |
| O'Reilly Automotive, Inc. (a) | | 754 | 771,380 |
| TJX Companies, Inc. | | 8,524 | 809,013 |
| | | | 2,353,789 |
TOTAL CONSUMER DISCRETIONARY | | | 7,651,351 |
| CONSUMER STAPLES - 1.9% | | | |
| Beverages - 0.0% | | | |
| Monster Beverage Corp. | | 96 | 5,282 |
| Consumer Staples Distribution & Retail - 1.9% | | | |
| Costco Wholesale Corp. | | 1,737 | 1,207,007 |
TOTAL CONSUMER STAPLES | | | 1,212,289 |
| FINANCIALS - 11.3% | | | |
| Capital Markets - 4.1% | | | |
| Ares Management Corp. | | 5,783 | 702,519 |
| Moody's Corp. | | 2,329 | 913,061 |
| S&P Global, Inc. | | 2,237 | 1,002,959 |
| | | | 2,618,539 |
| Financial Services - 4.5% | | | |
| MasterCard, Inc. Class A | | 3,009 | 1,351,733 |
| Visa, Inc. Class A | | 5,469 | 1,494,459 |
| | | | 2,846,192 |
| Insurance - 2.7% | | | |
| Arthur J. Gallagher & Co. | | 3,691 | 856,903 |
| Marsh & McLennan Companies, Inc. | | 4,625 | 896,510 |
| | | | 1,753,413 |
TOTAL FINANCIALS | | | 7,218,144 |
| HEALTH CARE - 12.6% | | | |
| Health Care Equipment & Supplies - 1.3% | | | |
| Boston Scientific Corp. (a) | | 13,368 | 845,660 |
| Health Care Providers & Services - 3.5% | | | |
| Cencora, Inc. | | 3,243 | 754,581 |
| Humana, Inc. | | 16 | 6,049 |
| UnitedHealth Group, Inc. | | 2,934 | 1,501,445 |
| | | | 2,262,075 |
| Life Sciences Tools & Services - 3.1% | | | |
| Danaher Corp. | | 3,823 | 917,176 |
| Thermo Fisher Scientific, Inc. | | 1,951 | 1,051,550 |
| | | | 1,968,726 |
| Pharmaceuticals - 4.7% | | | |
| Eli Lilly & Co. | | 2,266 | 1,462,952 |
| Novo Nordisk A/S Series B sponsored ADR | | 6,010 | 689,587 |
| Zoetis, Inc. Class A | | 4,496 | 844,394 |
| | | | 2,996,933 |
TOTAL HEALTH CARE | | | 8,073,394 |
| INDUSTRIALS - 14.7% | | | |
| Aerospace & Defense - 2.6% | | | |
| HEICO Corp. Class A | | 5,352 | 757,147 |
| TransDigm Group, Inc. | | 816 | 891,627 |
| | | | 1,648,774 |
| Commercial Services & Supplies - 3.5% | | | |
| Cintas Corp. | | 1,424 | 860,908 |
| Copart, Inc. | | 15,611 | 749,952 |
| Waste Connections, Inc. (United States) | | 4,127 | 640,758 |
| | | | 2,251,618 |
| Construction & Engineering - 1.1% | | | |
| Quanta Services, Inc. | | 3,546 | 688,101 |
| Electrical Equipment - 2.5% | | | |
| AMETEK, Inc. | | 4,199 | 680,448 |
| Eaton Corp. PLC | | 3,714 | 913,941 |
| | | | 1,594,389 |
| Industrial Conglomerates - 1.4% | | | |
| General Electric Co. | | 6,752 | 894,100 |
| Professional Services - 2.4% | | | |
| Automatic Data Processing, Inc. | | 3,281 | 806,404 |
| Paychex, Inc. | | 132 | 16,068 |
| Verisk Analytics, Inc. | | 2,886 | 697,056 |
| | | | 1,519,528 |
| Trading Companies & Distributors - 1.2% | | | |
| United Rentals, Inc. | | 1,259 | 787,379 |
TOTAL INDUSTRIALS | | | 9,383,889 |
| INFORMATION TECHNOLOGY - 32.8% | | | |
| Communications Equipment - 1.2% | | | |
| Motorola Solutions, Inc. | | 2,517 | 804,182 |
| Electronic Equipment, Instruments & Components - 2.6% | | | |
| Amphenol Corp. Class A | | 8,453 | 854,598 |
| CDW Corp. | | 3,659 | 829,568 |
| | | | 1,684,166 |
| IT Services - 3.2% | | | |
| Accenture PLC Class A | | 3,238 | 1,178,243 |
| Gartner, Inc. (a) | | 1,890 | 864,562 |
| | | | 2,042,805 |
| Semiconductors & Semiconductor Equipment - 11.7% | | | |
| ASML Holding NV (depository receipt) | | 850 | 739,347 |
| Broadcom, Inc. | | 1,323 | 1,561,140 |
| KLA Corp. | | 1,635 | 971,255 |
| Lam Research Corp. | | 1,263 | 1,042,190 |
| NVIDIA Corp. | | 5,108 | 3,142,799 |
| ON Semiconductor Corp. (a) | | 174 | 12,377 |
| | | | 7,469,108 |
| Software - 14.1% | | | |
| Adobe, Inc. (a) | | 1,767 | 1,091,617 |
| Cadence Design Systems, Inc. (a) | | 2,819 | 813,169 |
| Intuit, Inc. | | 1,518 | 958,359 |
| Microsoft Corp. | | 13,497 | 5,366,137 |
| Synopsys, Inc. (a) | | 1,486 | 792,558 |
| | | | 9,021,840 |
TOTAL INFORMATION TECHNOLOGY | | | 21,022,101 |
| MATERIALS - 5.2% | | | |
| Chemicals - 2.8% | | | |
| Linde PLC | | 2,561 | 1,036,770 |
| Sherwin-Williams Co. | | 2,610 | 794,432 |
| | | | 1,831,202 |
| Construction Materials - 2.4% | | | |
| Martin Marietta Materials, Inc. | | 1,618 | 822,624 |
| Vulcan Materials Co. | | 3,064 | 692,495 |
| | | | 1,515,119 |
TOTAL MATERIALS | | | 3,346,321 |
| TOTAL COMMON STOCKS (Cost $49,518,758) | | | 63,316,766 |
| | | | |
| Money Market Funds - 1.0% |
| | | Shares | Value ($) |
State Street Institutional Treasury Plus Money Market Fund Trust Class 5.23% (b) (Cost $660,620) | | 660,620 | 660,620 |
| | | | |
| TOTAL INVESTMENT IN SECURITIES - 99.9% (Cost $50,179,378) | 63,977,386 |
NET OTHER ASSETS (LIABILITIES) - 0.1% | 73,446 |
| NET ASSETS - 100.0% | 64,050,832 |
| | |
Legend
| (b) | The rate quoted is the annualized seven-day yield of the fund at period end. |
Investment Valuation
The following is a summary of the inputs used, as of January 31, 2024, involving the Fund's assets and liabilities carried at fair value. The inputs or methodology used for valuing securities may not be an indication of the risk associated with investing in those securities. For more information on valuation inputs, and their aggregation into the levels used below, please refer to the Investment Valuation section in the accompanying Notes to Financial Statements.
| Valuation Inputs at Reporting Date: |
| Description | Total ($) | Level 1 ($) | Level 2 ($) | Level 3 ($) |
Investments in Securities: | | | | |
|
| Equities: | | | | |
Communication Services | 5,409,277 | 5,409,277 | - | - |
Consumer Discretionary | 7,651,351 | 7,651,351 | - | - |
Consumer Staples | 1,212,289 | 1,212,289 | - | - |
Financials | 7,218,144 | 7,218,144 | - | - |
Health Care | 8,073,394 | 8,073,394 | - | - |
Industrials | 9,383,889 | 9,383,889 | - | - |
Information Technology | 21,022,101 | 21,022,101 | - | - |
Materials | 3,346,321 | 3,346,321 | - | - |
|
| Money Market Funds | 660,620 | 660,620 | - | - |
| Total Investments in Securities: | 63,977,386 | 63,977,386 | - | - |
Fidelity® Magellan℠ ETF
| Statement of Assets and Liabilities |
| | | | January 31, 2024 (Unaudited) |
| | | | | |
| Assets | | | | |
Investment in securities, at value - See accompanying schedule Unaffiliated issuers (cost $50,179,378): | | | $ | 63,977,386 |
| Cash | | | | 5 |
| Receivable for investments sold | | | | 320,601 |
| Receivable for fund shares sold | | | | 1,255,913 |
| Dividends receivable | | | | 10,412 |
Total assets | | | | 65,564,317 |
| Liabilities | | | | |
| Payable for investments purchased | $ | 1,485,435 | | |
| Accrued management fee | | 28,050 | | |
| Total Liabilities | | | | 1,513,485 |
| Net Assets | | | $ | 64,050,832 |
| Net Assets consist of: | | | | |
| Paid in capital | | | $ | 57,546,472 |
| Total accumulated earnings (loss) | | | | 6,504,360 |
| Net Assets | | | $ | 64,050,832 |
Net Asset Value, offering price and redemption price per share ($64,050,832 ÷ 2,550,000 shares) | | | $ | 25.12 |
| Statement of Operations |
| | | | Six months ended January 31, 2024 (Unaudited) |
| Investment Income | | | | |
| Dividends | | | $ | 233,967 |
| Expenses | | | | |
| Management fee | $ | 149,443 | | |
| Independent trustees' fees and expenses | | 142 | | |
| Total expenses before reductions | | 149,585 | | |
| Expense reductions | | (13) | | |
| Total expenses after reductions | | | | 149,572 |
| Net Investment income (loss) | | | | 84,395 |
| Realized and Unrealized Gain (Loss) | | | | |
| Net realized gain (loss) on: | | | | |
| Investment Securities: | | | | |
| Redemptions in-kind | | 948,872 | | |
| Unaffiliated issuers | | 414,040 | | |
| Total net realized gain (loss) | | | | 1,362,912 |
| Change in net unrealized appreciation (depreciation) on investment securities | | | | 4,907,657 |
| Net gain (loss) | | | | 6,270,569 |
| Net increase (decrease) in net assets resulting from operations | | | $ | 6,354,964 |
| Statement of Changes in Net Assets |
| |
| | Six months ended January 31, 2024 (Unaudited) | | Year ended July 31, 2023 |
| Increase (Decrease) in Net Assets | | | | |
| Operations | | | | |
| Net investment income (loss) | $ | 84,395 | $ | 134,575 |
| Net realized gain (loss) | | 1,362,912 | | (4,185,590) |
| Change in net unrealized appreciation (depreciation) | | 4,907,657 | | 7,292,125 |
| Net increase (decrease) in net assets resulting from operations | | 6,354,964 | | 3,241,110 |
| Distributions to shareholders | | (107,750) | | (144,575) |
| | | | | |
| Share transactions | | | | |
| Proceeds from sales of shares | | 12,078,177 | | 4,485,324 |
| Cost of shares redeemed | | (4,549,415) | | (3,834,411) |
| | | | | |
Net increase (decrease) in net assets resulting from share transactions | | 7,528,762 | | 650,913 |
| Total increase (decrease) in net assets | | 13,775,976 | | 3,747,448 |
| | | | | |
| Net Assets | | | | |
| Beginning of period | | 50,274,856 | | 46,527,408 |
| End of period | $ | 64,050,832 | $ | 50,274,856 |
| | | | | |
| Other Information | | | | |
| Shares | | | | |
| Sold | | 500,000 | | 225,000 |
| Redeemed | | (200,000) | | (200,000) |
| Net increase (decrease) | | 300,000 | | 25,000 |
| | | | | |
Financial Highlights
| | Six months ended (Unaudited) January 31, 2024 | | Years ended July 31, 2023 | | 2022 | | 2021 A |
Selected Per-Share Data | | | | | | | | |
| Net asset value, beginning of period | $ | 22.34 | $ | 20.91 | $ | 23.12 | $ | 20.00 |
| Income from Investment Operations | | | | | | | | |
Net investment income (loss) B,C | | .04 | | .06 | | .01 | | - D |
| Net realized and unrealized gain (loss) | | 2.79 | | 1.44 | | (2.20) | | 3.13 |
| Total from investment operations | | 2.83 | | 1.50 | | (2.19) | | 3.13 |
| Distributions from net investment income | | (.05) | | (.07) | | (.02) | | (.01) |
| Total distributions | | (.05) | | (.07) | | (.02) | | (.01) |
| Net asset value, end of period | $ | 25.12 | $ | 22.34 | $ | 20.91 | $ | 23.12 |
Total Return E,F,G | | 12.65% | | 7.21% | | (9.50)% | | 15.65% |
Ratios to Average Net Assets C,H,I | | | | | | | | |
| Expenses before reductions | | .59% J | | .59% | | .59% | | .59% J |
| Expenses net of fee waivers, if any | | .59% J | | .59% | | .59% | | .59% J |
| Expenses net of all reductions | | .59% J | | .59% | | .59% | | .59% J |
| Net investment income (loss) | | .33% J | | .30% | | .05% | | .01% J |
| Supplemental Data | | | | | | | | |
| Net assets, end of period (000 omitted) | $ | 64,051 | $ | 50,275 | $ | 46,527 | $ | 35,842 |
Portfolio turnover rate K,L | | 77% J | | 89% | | 68% | | 41% M |
AFor the period February 2, 2021 (commencement of operations) through July 31, 2021.
BCalculated based on average shares outstanding during the period.
CNet investment income (loss) is affected by the timing of the declaration of dividends by any underlying mutual funds or exchange-traded funds (ETFs). Net investment income (loss) of any mutual funds or ETFs is not included in the Fund's net investment income (loss) ratio.
DAmount represents less than $.005 per share.
ETotal returns for periods of less than one year are not annualized.
FTotal returns would have been lower if certain expenses had not been reduced during the applicable periods shown.
GBased on net asset value.
HFees and expenses of any underlying mutual funds or exchange-traded funds (ETFs) are not included in the Fund's expense ratio. The Fund indirectly bears its proportionate share of these expenses.
IExpense ratios reflect operating expenses of the class. Expenses before reductions do not reflect amounts reimbursed, waived, or reduced through arrangements with the investment adviser, brokerage services, or other offset arrangements, if applicable, and do not represent the amount paid by the class during periods when reimbursements, waivers or reductions occur.
JAnnualized.
KPortfolio turnover rate excludes securities received or delivered in-kind.
LAmount does not include the portfolio activity of any underlying mutual funds or exchange-traded funds (ETFs).
MAmount not annualized.
Top Holdings (% of Fund's net assets) |
| |
| Prologis, Inc. | 11.4 | |
| Equinix, Inc. | 7.5 | |
| Crown Castle, Inc. | 6.4 | |
| Ventas, Inc. | 5.9 | |
| SBA Communications Corp. Class A | 5.8 | |
| Public Storage | 4.2 | |
| Digital Realty Trust, Inc. | 3.6 | |
| Kimco Realty Corp. | 3.4 | |
| CubeSmart | 3.2 | |
| CBRE Group, Inc. | 3.1 | |
| | 54.5 | |
| |
| Top REIT Sectors (% of Fund's net assets) |
| |
| REITs - Diversified | 26.9 | |
| REITs - Warehouse/Industrial | 13.4 | |
| REITs - Shopping Centers | 11.6 | |
| REITs - Apartments | 11.0 | |
| REITs - Storage | 10.8 | |
| |
Asset Allocation (% of Fund's net assets) |
|
|
Fidelity® Real Estate Investment ETF
Showing Percentage of Net Assets
| Common Stocks - 98.9% |
| | | Shares | Value ($) |
| Equity Real Estate Investment Trusts (REITs) - 94.0% | | | |
| REITs - Apartments - 11.0% | | | |
| American Homes 4 Rent Class A | | 7,153 | 250,713 |
| Equity Residential (SBI) | | 5,039 | 303,297 |
| Invitation Homes, Inc. | | 5,285 | 174,035 |
| Mid-America Apartment Communities, Inc. | | 2,946 | 372,315 |
| UDR, Inc. | | 10,398 | 374,536 |
| | | | 1,474,896 |
| REITs - Diversified - 26.9% | | | |
| Apartment Income (REIT) Corp. | | 6,528 | 213,400 |
| Crown Castle, Inc. | | 7,948 | 860,371 |
| Digital Realty Trust, Inc. | | 3,475 | 488,099 |
| Elme Communities (SBI) | | 1,912 | 27,686 |
| Equinix, Inc. | | 1,213 | 1,006,511 |
| Gaming & Leisure Properties | | 1,628 | 74,318 |
| Lamar Advertising Co. Class A | | 1,584 | 165,813 |
| SBA Communications Corp. Class A | | 3,469 | 776,570 |
| | | | 3,612,768 |
| REITs - Health Care - 8.6% | | | |
| Ventas, Inc. | | 17,111 | 793,779 |
| Welltower, Inc. | | 4,066 | 351,750 |
| | | | 1,145,529 |
| REITs - Hotels - 2.5% | | | |
| DiamondRock Hospitality Co. | | 20,548 | 187,809 |
| Ryman Hospitality Properties, Inc. | | 1,338 | 147,046 |
| | | | 334,855 |
| REITs - Management/Investment - 4.5% | | | |
| NNN (REIT), Inc. | | 10,400 | 419,536 |
| Weyerhaeuser Co. | | 5,704 | 186,920 |
| | | | 606,456 |
| REITs - Manufactured Homes - 3.6% | | | |
| Equity Lifestyle Properties, Inc. | | 1,097 | 74,256 |
| Sun Communities, Inc. | | 3,240 | 406,134 |
| | | | 480,390 |
| REITs - Regional Malls - 0.4% | | | |
| Tanger, Inc. | | 1,996 | 53,692 |
| REITs - Shopping Centers - 11.6% | | | |
| Kimco Realty Corp. | | 22,838 | 461,328 |
| Phillips Edison & Co., Inc. | | 5,790 | 200,971 |
| Realty Income Corp. | | 4,898 | 266,402 |
| Regency Centers Corp. | | 5,516 | 345,688 |
| SITE Centers Corp. | | 9,419 | 125,461 |
| Urban Edge Properties | | 9,100 | 157,157 |
| | | | 1,557,007 |
| REITs - Single Tenant - 0.7% | | | |
| Four Corners Property Trust, Inc. | | 4,014 | 93,968 |
| REITs - Storage - 10.8% | | | |
| CubeSmart | | 9,951 | 430,082 |
| Extra Space Storage, Inc. | | 1,049 | 151,518 |
| Iron Mountain, Inc. | | 4,526 | 305,596 |
| Public Storage | | 1,983 | 561,566 |
| | | | 1,448,762 |
| REITs - Warehouse/Industrial - 13.4% | | | |
| Americold Realty Trust | | 6,126 | 168,465 |
| Prologis, Inc. | | 12,077 | 1,530,035 |
| Terreno Realty Corp. | | 1,607 | 95,986 |
| | | | 1,794,486 |
TOTAL EQUITY REAL ESTATE INVESTMENT TRUSTS (REITS) | | | 12,602,809 |
| Real Estate Management & Development - 4.9% | | | |
| Real Estate Services - 4.9% | | | |
| CBRE Group, Inc. (a) | | 4,875 | 420,761 |
| CoStar Group, Inc. (a) | | 2,826 | 235,914 |
| | | | 656,675 |
| TOTAL COMMON STOCKS (Cost $14,310,956) | | | 13,259,484 |
| | | | |
| Money Market Funds - 1.1% |
| | | Shares | Value ($) |
State Street Institutional Treasury Plus Money Market Fund Trust Class 5.23% (b) (Cost $147,035) | | 147,035 | 147,035 |
| | | | |
| TOTAL INVESTMENT IN SECURITIES - 100.0% (Cost $14,457,991) | 13,406,519 |
NET OTHER ASSETS (LIABILITIES) - 0.0% | 2,858 |
| NET ASSETS - 100.0% | 13,409,377 |
| | |
Legend
| (b) | The rate quoted is the annualized seven-day yield of the fund at period end. |
Investment Valuation
The following is a summary of the inputs used, as of January 31, 2024, involving the Fund's assets and liabilities carried at fair value. The inputs or methodology used for valuing securities may not be an indication of the risk associated with investing in those securities. For more information on valuation inputs, and their aggregation into the levels used below, please refer to the Investment Valuation section in the accompanying Notes to Financial Statements.
| Valuation Inputs at Reporting Date: |
| Description | Total ($) | Level 1 ($) | Level 2 ($) | Level 3 ($) |
Investments in Securities: | | | | |
|
| Common Stocks | 13,259,484 | 13,259,484 | - | - |
|
| Money Market Funds | 147,035 | 147,035 | - | - |
| Total Investments in Securities: | 13,406,519 | 13,406,519 | - | - |
Fidelity® Real Estate Investment ETF
| Statement of Assets and Liabilities |
| | | | January 31, 2024 (Unaudited) |
| | | | | |
| Assets | | | | |
Investment in securities, at value - See accompanying schedule Unaffiliated issuers (cost $14,457,991): | | | $ | 13,406,519 |
| Dividends receivable | | | | 8,223 |
| Other receivables | | | | 1,386 |
Total assets | | | | 13,416,128 |
| Liabilities | | | | |
| Accrued management fee | $ | 6,751 | | |
| Total Liabilities | | | | 6,751 |
| Net Assets | | | $ | 13,409,377 |
| Net Assets consist of: | | | | |
| Paid in capital | | | $ | 15,981,201 |
| Total accumulated earnings (loss) | | | | (2,571,824) |
| Net Assets | | | $ | 13,409,377 |
Net Asset Value, offering price and redemption price per share ($13,409,377 ÷ 650,000 shares) | | | $ | 20.63 |
| Statement of Operations |
| | | | Six months ended January 31, 2024 (Unaudited) |
| Investment Income | | | | |
| Dividends | | | $ | 196,086 |
| Expenses | | | | |
| Management fee | $ | 40,228 | | |
| Independent trustees' fees and expenses | | 41 | | |
| Total expenses before reductions | | 40,269 | | |
| Expense reductions | | (1) | | |
| Total expenses after reductions | | | | 40,268 |
| Net Investment income (loss) | | | | 155,818 |
| Realized and Unrealized Gain (Loss) | | | | |
| Net realized gain (loss) on: | | | | |
| Investment Securities: | | | | |
| Redemptions in-kind | | 117,867 | | |
| Unaffiliated issuers | | (488,663) | | |
| Total net realized gain (loss) | | | | (370,796) |
| Change in net unrealized appreciation (depreciation) on investment securities | | | | 217,981 |
| Net gain (loss) | | | | (152,815) |
| Net increase (decrease) in net assets resulting from operations | | | $ | 3,003 |
| Statement of Changes in Net Assets |
| |
| | Six months ended January 31, 2024 (Unaudited) | | Year ended July 31, 2023 |
| Increase (Decrease) in Net Assets | | | | |
| Operations | | | | |
| Net investment income (loss) | $ | 155,818 | $ | 408,264 |
| Net realized gain (loss) | | (370,796) | | (777,839) |
| Change in net unrealized appreciation (depreciation) | | 217,981 | | (1,729,975) |
| Net increase (decrease) in net assets resulting from operations | | 3,003 | | (2,099,550) |
| Distributions to shareholders | | (193,100) | | (452,000) |
| | | | | |
| Share transactions | | | | |
| Proceeds from sales of shares | | - | | 1,073,585 |
| Cost of shares redeemed | | (1,534,680) | | (3,644,415) |
| | | | | |
Net increase (decrease) in net assets resulting from share transactions | | (1,534,680) | | (2,570,830) |
| Total increase (decrease) in net assets | | (1,724,777) | | (5,122,380) |
| | | | | |
| Net Assets | | | | |
| Beginning of period | | 15,134,154 | | 20,256,534 |
| End of period | $ | 13,409,377 | $ | 15,134,154 |
| | | | | |
| Other Information | | | | |
| Shares | | | | |
| Sold | | - | | 50,000 |
| Redeemed | | (75,000) | | (175,000) |
| Net increase (decrease) | | (75,000) | | (125,000) |
| | | | | |
Financial Highlights
| Fidelity® Real Estate Investment ETF |
| |
| | Six months ended (Unaudited) January 31, 2024 | | Years ended July 31, 2023 | | 2022 | | 2021 A |
Selected Per-Share Data | | | | | | | | |
| Net asset value, beginning of period | $ | 20.87 | $ | 23.83 | $ | 24.79 | $ | 20.00 |
| Income from Investment Operations | | | | | | | | |
Net investment income (loss) B,C | | .23 | | .52 | | .39 | | .21 |
| Net realized and unrealized gain (loss) | | (.18) | | (2.91) | | (.80) | | 4.79 |
| Total from investment operations | | .05 | | (2.39) | | (.41) | | 5.00 |
| Distributions from net investment income | | (.29) | | (.57) | | (.55) | | (.21) |
| Total distributions | | (.29) | | (.57) | | (.55) | | (.21) |
| Net asset value, end of period | $ | 20.63 | $ | 20.87 | $ | 23.83 | $ | 24.79 |
Total Return D,E,F | | .20% | | (9.93)% | | (1.68)% | | 25.17% |
Ratios to Average Net Assets C,G,H | | | | | | | | |
| Expenses before reductions | | .59% I | | .59% | | .59% | | .59% I |
| Expenses net of fee waivers, if any | | .59% I | | .59% | | .59% | | .59% I |
| Expenses net of all reductions | | .59% I | | .59% | | .59% | | .58% I |
| Net investment income (loss) | | 2.29% I | | 2.49% | | 1.58% | | 1.80% I |
| Supplemental Data | | | | | | | | |
| Net assets, end of period (000 omitted) | $ | 13,409 | $ | 15,134 | $ | 20,257 | $ | 16,735 |
Portfolio turnover rate J,K | | 39% I | | 33% | | 24% | | 23% L |
AFor the period February 2, 2021 (commencement of operations) through July 31, 2021.
BCalculated based on average shares outstanding during the period.
CNet investment income (loss) is affected by the timing of the declaration of dividends by any underlying mutual funds or exchange-traded funds (ETFs). Net investment income (loss) of any mutual funds or ETFs is not included in the Fund's net investment income (loss) ratio.
DTotal returns for periods of less than one year are not annualized.
ETotal returns would have been lower if certain expenses had not been reduced during the applicable periods shown.
FBased on net asset value.
GFees and expenses of any underlying mutual funds or exchange-traded funds (ETFs) are not included in the Fund's expense ratio. The Fund indirectly bears its proportionate share of these expenses.
HExpense ratios reflect operating expenses of the class. Expenses before reductions do not reflect amounts reimbursed, waived, or reduced through arrangements with the investment adviser, brokerage services, or other offset arrangements, if applicable, and do not represent the amount paid by the class during periods when reimbursements, waivers or reductions occur.
IAnnualized.
JPortfolio turnover rate excludes securities received or delivered in-kind.
KAmount does not include the portfolio activity of any underlying mutual funds or exchange-traded funds (ETFs).
LAmount not annualized.
Top Holdings (% of Fund's net assets) |
| |
| Microsoft Corp. | 7.9 | |
| NVIDIA Corp. | 5.1 | |
| Amazon.com, Inc. | 3.7 | |
| Alphabet, Inc. Class A | 3.3 | |
| Apple, Inc. | 2.8 | |
| The Travelers Companies, Inc. | 2.7 | |
| Salesforce, Inc. | 2.3 | |
| Merck & Co., Inc. | 2.3 | |
| Cigna Group | 2.3 | |
| Procter & Gamble Co. | 2.2 | |
| | 34.6 | |
| |
| Market Sectors (% of Fund's net assets) |
| |
| Information Technology | 26.7 | |
| Financials | 12.7 | |
| Health Care | 11.2 | |
| Consumer Discretionary | 10.8 | |
| Industrials | 9.9 | |
| Communication Services | 8.3 | |
| Consumer Staples | 5.1 | |
| Materials | 4.6 | |
| Energy | 2.7 | |
| Utilities | 2.2 | |
| Real Estate | 2.1 | |
| |
Asset Allocation (% of Fund's net assets) |
|
|
Fidelity® Sustainable U.S. Equity ETF
Showing Percentage of Net Assets
| Common Stocks - 96.3% |
| | | Shares | Value ($) |
| COMMUNICATION SERVICES - 8.3% | | | |
| Entertainment - 2.9% | | | |
| Netflix, Inc. (a) | | 163 | 91,950 |
| The Walt Disney Co. | | 2,460 | 236,283 |
| | | | 328,233 |
| Interactive Media & Services - 3.3% | | | |
| Alphabet, Inc. Class A (a) | | 2,672 | 374,347 |
| Media - 2.1% | | | |
| Comcast Corp. Class A | | 2,950 | 137,293 |
| Interpublic Group of Companies, Inc. | | 3,216 | 106,096 |
| | | | 243,389 |
TOTAL COMMUNICATION SERVICES | | | 945,969 |
| CONSUMER DISCRETIONARY - 10.8% | | | |
| Automobile Components - 0.6% | | | |
| Aptiv PLC (a) | | 867 | 70,513 |
| Automobiles - 1.1% | | | |
| General Motors Co. | | 2,353 | 91,296 |
| Tesla, Inc. (a) | | 189 | 35,398 |
| | | | 126,694 |
| Broadline Retail - 3.7% | | | |
| Amazon.com, Inc. (a) | | 2,709 | 420,437 |
| Diversified Consumer Services - 0.5% | | | |
| Adtalem Global Education, Inc. (a) | | 1,236 | 62,393 |
| Hotels, Restaurants & Leisure - 1.8% | | | |
| Marriott International, Inc. Class A | | 839 | 201,133 |
| Household Durables - 0.9% | | | |
| Taylor Morrison Home Corp. (a) | | 1,862 | 97,085 |
| Specialty Retail - 1.4% | | | |
| Lowe's Companies, Inc. | | 752 | 160,056 |
| Textiles, Apparel & Luxury Goods - 0.8% | | | |
| Tapestry, Inc. | | 2,429 | 94,221 |
TOTAL CONSUMER DISCRETIONARY | | | 1,232,532 |
| CONSUMER STAPLES - 5.1% | | | |
| Consumer Staples Distribution & Retail - 1.5% | | | |
| Albertsons Companies, Inc. | | 4,665 | 98,991 |
| Sprouts Farmers Market LLC (a) | | 1,479 | 74,497 |
| | | | 173,488 |
| Food Products - 0.9% | | | |
| Darling Ingredients, Inc. (a) | | 1,116 | 48,323 |
| Nomad Foods Ltd. | | 2,789 | 50,174 |
| | | | 98,497 |
| Household Products - 2.2% | | | |
| Procter & Gamble Co. | | 1,615 | 253,781 |
| Personal Care Products - 0.5% | | | |
| Estee Lauder Companies, Inc. Class A | | 414 | 54,644 |
TOTAL CONSUMER STAPLES | | | 580,410 |
| ENERGY - 2.7% | | | |
| Energy Equipment & Services - 1.2% | | | |
| Baker Hughes Co. Class A | | 4,630 | 131,955 |
| Oil, Gas & Consumable Fuels - 1.5% | | | |
| Cheniere Energy, Inc. | | 640 | 104,954 |
| Occidental Petroleum Corp. | | 1,186 | 68,278 |
| | | | 173,232 |
TOTAL ENERGY | | | 305,187 |
| FINANCIALS - 12.7% | | | |
| Banks - 1.2% | | | |
| Bank of America Corp. | | 4,022 | 136,788 |
| Capital Markets - 4.9% | | | |
| BlackRock, Inc. Class A | | 239 | 185,060 |
| Moody's Corp. | | 581 | 227,775 |
| Northern Trust Corp. | | 1,894 | 150,838 |
| | | | 563,673 |
| Consumer Finance - 2.5% | | | |
| American Express Co. | | 1,005 | 201,744 |
| Discover Financial Services | | 811 | 85,577 |
| | | | 287,321 |
| Financial Services - 1.4% | | | |
| MasterCard, Inc. Class A | | 351 | 157,680 |
| Insurance - 2.7% | | | |
| The Travelers Companies, Inc. | | 1,447 | 305,838 |
TOTAL FINANCIALS | | | 1,451,300 |
| HEALTH CARE - 11.2% | | | |
| Biotechnology - 0.3% | | | |
| Moderna, Inc. (a) | | 359 | 36,277 |
| Health Care Providers & Services - 3.7% | | | |
| Centene Corp. (a) | | 1,792 | 134,956 |
| Cigna Group | | 866 | 260,623 |
| CVS Health Corp. | | 309 | 22,980 |
| | | | 418,559 |
| Life Sciences Tools & Services - 3.5% | | | |
| Danaher Corp. | | 983 | 235,832 |
| ICON PLC (a) | | 627 | 163,565 |
| | | | 399,397 |
| Pharmaceuticals - 3.7% | | | |
| Merck & Co., Inc. | | 2,200 | 265,716 |
| Zoetis, Inc. Class A | | 863 | 162,080 |
| | | | 427,796 |
TOTAL HEALTH CARE | | | 1,282,029 |
| INDUSTRIALS - 9.9% | | | |
| Air Freight & Logistics - 1.0% | | | |
| United Parcel Service, Inc. Class B | | 797 | 113,094 |
| Building Products - 0.9% | | | |
| Johnson Controls International PLC | | 1,915 | 100,901 |
| Commercial Services & Supplies - 0.2% | | | |
| Veralto Corp. | | 330 | 25,308 |
| Electrical Equipment - 2.5% | | | |
| Acuity Brands, Inc. | | 665 | 158,376 |
| Generac Holdings, Inc. (a) | | 452 | 51,379 |
| Regal Rexnord Corp. | | 600 | 80,076 |
| | | | 289,831 |
| Machinery - 3.0% | | | |
| Deere & Co. | | 264 | 103,905 |
| Energy Recovery, Inc. (a) | | 1,571 | 24,366 |
| Ingersoll Rand, Inc. | | 1,940 | 154,928 |
| Timken Co. | | 726 | 59,467 |
| | | | 342,666 |
| Professional Services - 2.3% | | | |
| KBR, Inc. | | 3,552 | 185,095 |
| Manpower, Inc. | | 1,110 | 82,295 |
| | | | 267,390 |
TOTAL INDUSTRIALS | | | 1,139,190 |
| INFORMATION TECHNOLOGY - 26.7% | | | |
| IT Services - 2.8% | | | |
| Accenture PLC Class A | | 697 | 253,624 |
| Okta, Inc. (a) | | 827 | 68,352 |
| | | | 321,976 |
| Semiconductors & Semiconductor Equipment - 7.7% | | | |
| Advanced Micro Devices, Inc. (a) | | 791 | 132,643 |
| First Solar, Inc. (a) | | 355 | 51,937 |
| NVIDIA Corp. | | 943 | 580,200 |
| ON Semiconductor Corp. (a) | | 1,700 | 120,921 |
| | | | 885,701 |
| Software - 13.4% | | | |
| Autodesk, Inc. (a) | | 568 | 144,164 |
| Intuit, Inc. | | 336 | 212,127 |
| Microsoft Corp. | | 2,288 | 909,661 |
| Salesforce, Inc. (a) | | 950 | 267,036 |
| | | | 1,532,988 |
| Technology Hardware, Storage & Peripherals - 2.8% | | | |
| Apple, Inc. | | 1,727 | 318,459 |
TOTAL INFORMATION TECHNOLOGY | | | 3,059,124 |
| MATERIALS - 4.6% | | | |
| Chemicals - 1.9% | | | |
| Linde PLC | | 526 | 212,941 |
| Containers & Packaging - 2.7% | | | |
| Avery Dennison Corp. | | 994 | 198,253 |
| Crown Holdings, Inc. | | 1,322 | 116,997 |
| | | | 315,250 |
TOTAL MATERIALS | | | 528,191 |
| REAL ESTATE - 2.1% | | | |
| Equity Real Estate Investment Trusts (REITs) - 2.1% | | | |
| Prologis, Inc. | | 1,900 | 240,711 |
| UTILITIES - 2.2% | | | |
| Electric Utilities - 1.1% | | | |
| NextEra Energy, Inc. | | 2,224 | 130,393 |
| Independent Power and Renewable Electricity Producers - 0.5% | | | |
| Clearway Energy, Inc. Class C | | 2,437 | 59,073 |
| Water Utilities - 0.6% | | | |
| American Water Works Co., Inc. | | 543 | 67,343 |
TOTAL UTILITIES | | | 256,809 |
| TOTAL COMMON STOCKS (Cost $9,509,468) | | | 11,021,452 |
| | | | |
| Money Market Funds - 2.5% |
| | | Shares | Value ($) |
State Street Institutional Treasury Plus Money Market Fund Trust Class 5.23% (b) (Cost $290,572) | | 290,572 | 290,572 |
| | | | |
| TOTAL INVESTMENT IN SECURITIES - 98.8% (Cost $9,800,040) | 11,312,024 |
NET OTHER ASSETS (LIABILITIES) - 1.2% | 135,140 |
| NET ASSETS - 100.0% | 11,447,164 |
| | |
Legend
| (b) | The rate quoted is the annualized seven-day yield of the fund at period end. |
Investment Valuation
The following is a summary of the inputs used, as of January 31, 2024, involving the Fund's assets and liabilities carried at fair value. The inputs or methodology used for valuing securities may not be an indication of the risk associated with investing in those securities. For more information on valuation inputs, and their aggregation into the levels used below, please refer to the Investment Valuation section in the accompanying Notes to Financial Statements.
| Valuation Inputs at Reporting Date: |
| Description | Total ($) | Level 1 ($) | Level 2 ($) | Level 3 ($) |
Investments in Securities: | | | | |
|
| Equities: | | | | |
Communication Services | 945,969 | 945,969 | - | - |
Consumer Discretionary | 1,232,532 | 1,232,532 | - | - |
Consumer Staples | 580,410 | 580,410 | - | - |
Energy | 305,187 | 305,187 | - | - |
Financials | 1,451,300 | 1,451,300 | - | - |
Health Care | 1,282,029 | 1,282,029 | - | - |
Industrials | 1,139,190 | 1,139,190 | - | - |
Information Technology | 3,059,124 | 3,059,124 | - | - |
Materials | 528,191 | 528,191 | - | - |
Real Estate | 240,711 | 240,711 | - | - |
Utilities | 256,809 | 256,809 | - | - |
|
| Money Market Funds | 290,572 | 290,572 | - | - |
| Total Investments in Securities: | 11,312,024 | 11,312,024 | - | - |
Fidelity® Sustainable U.S. Equity ETF
| Statement of Assets and Liabilities |
| | | | January 31, 2024 (Unaudited) |
| | | | | |
| Assets | | | | |
Investment in securities, at value - See accompanying schedule Unaffiliated issuers (cost $9,800,040): | | | $ | 11,312,024 |
| Receivable for investments sold | | | | 291,118 |
| Dividends receivable | | | | 6,264 |
Total assets | | | | 11,609,406 |
| Liabilities | | | | |
| Payable for investments purchased | $ | 156,669 | | |
| Accrued management fee | | 5,573 | | |
| Total Liabilities | | | | 162,242 |
| Net Assets | | | $ | 11,447,164 |
| Net Assets consist of: | | | | |
| Paid in capital | | | $ | 10,188,154 |
| Total accumulated earnings (loss) | | | | 1,259,010 |
| Net Assets | | | $ | 11,447,164 |
Net Asset Value, offering price and redemption price per share ($11,447,164 ÷ 500,000 shares) | | | $ | 22.89 |
| Statement of Operations |
| | | | Six months ended January 31, 2024 (Unaudited) |
| Investment Income | | | | |
| Dividends | | | $ | 66,588 |
| Expenses | | | | |
| Management fee | $ | 30,538 | | |
| Independent trustees' fees and expenses | | 29 | | |
| Total Expenses | | | | 30,567 |
| Net Investment income (loss) | | | | 36,021 |
| Realized and Unrealized Gain (Loss) | | | | |
| Net realized gain (loss) on: | | | | |
| Investment Securities: | | | | |
| Redemptions in-kind | | 100,431 | | |
| Unaffiliated issuers | | 199,244 | | |
| Total net realized gain (loss) | | | | 299,675 |
| Change in net unrealized appreciation (depreciation) on investment securities | | | | 315,166 |
| Net gain (loss) | | | | 614,841 |
| Net increase (decrease) in net assets resulting from operations | | | $ | 650,862 |
| Statement of Changes in Net Assets |
| |
| | Six months ended January 31, 2024 (Unaudited) | | Year ended July 31, 2023 |
| Increase (Decrease) in Net Assets | | | | |
| Operations | | | | |
| Net investment income (loss) | $ | 36,021 | $ | 82,581 |
| Net realized gain (loss) | | 299,675 | | (274,000) |
| Change in net unrealized appreciation (depreciation) | | 315,166 | | 1,506,035 |
| Net increase (decrease) in net assets resulting from operations | | 650,862 | | 1,314,616 |
| Distributions to shareholders | | (39,075) | | (79,775) |
| | | | | |
| Share transactions | | | | |
| Proceeds from sales of shares | | 1,048,136 | | 3,318,417 |
| Cost of shares redeemed | | (529,329) | | - |
| | | | | |
Net increase (decrease) in net assets resulting from share transactions | | 518,807 | | 3,318,417 |
| Total increase (decrease) in net assets | | 1,130,594 | | 4,553,258 |
| | | | | |
| Net Assets | | | | |
| Beginning of period | | 10,316,570 | | 5,763,312 |
| End of period | $ | 11,447,164 | $ | 10,316,570 |
| | | | | |
| Other Information | | | | |
| Shares | | | | |
| Sold | | 50,000 | | 175,000 |
| Redeemed | | (25,000) | | - |
| Net increase (decrease) | | 25,000 | | 175,000 |
| | | | | |
Financial Highlights
| Fidelity® Sustainable U.S. Equity ETF |
| |
| | Six months ended (Unaudited) January 31, 2024 | | Years ended July 31, 2023 | | 2022 | | 2021 A |
Selected Per-Share Data | | | | | | | | |
| Net asset value, beginning of period | $ | 21.72 | $ | 19.21 | $ | 20.80 | $ | 20.00 |
| Income from Investment Operations | | | | | | | | |
Net investment income (loss) B,C | | .07 | | .20 D | | .11 | | - E |
| Net realized and unrealized gain (loss) | | 1.18 | | 2.51 | | (1.57) | | .80 |
| Total from investment operations | | 1.25 | | 2.71 | | (1.46) | | .80 |
| Distributions from net investment income | | (.08) | | (.20) | | (.13) | | - |
| Total distributions | | (.08) | | (.20) | | (.13) | | - |
| Net asset value, end of period | $ | 22.89 | $ | 21.72 | $ | 19.21 | $ | 20.80 |
Total Return F,G | | 5.80% | | 14.25% | | (7.01)% | | 3.99% |
Ratios to Average Net Assets C,H,I | | | | | | | | |
| Expenses before reductions | | .59% J | | .59% | | .59% | | .59% J |
| Expenses net of fee waivers, if any | | .59% J | | .59% | | .59% | | .59% J |
| Expenses net of all reductions | | .59% J | | .59% | | .59% | | .59% J |
| Net investment income (loss) | | .70% J | | 1.06% D | | .56% | | (.07)% J |
| Supplemental Data | | | | | | | | |
| Net assets, end of period (000 omitted) | $ | 11,447 | $ | 10,317 | $ | 5,763 | $ | 3,120 |
Portfolio turnover rate K,L | | 36% J | | 45% | | 66% | | 23% M |
AFor the period June 15, 2021 (commencement of operations) through July 31, 2021.
BCalculated based on average shares outstanding during the period.
CNet investment income (loss) is affected by the timing of the declaration of dividends by any underlying mutual funds or exchange-traded funds (ETFs). Net investment income (loss) of any mutual funds or ETFs is not included in the Fund's net investment income (loss) ratio.
DNet investment income per share reflects one or more large, non-recurring dividend(s) which amounted to $.05 per share. Excluding such non-recurring dividend(s), the ratio of net investment income (loss) to average net assets would have been .80%.
EAmount represents less than $.005 per share.
FTotal returns for periods of less than one year are not annualized.
GBased on net asset value.
HFees and expenses of any underlying mutual funds or exchange-traded funds (ETFs) are not included in the Fund's expense ratio. The Fund indirectly bears its proportionate share of these expenses.
IExpense ratios reflect operating expenses of the class. Expenses before reductions do not reflect amounts reimbursed, waived, or reduced through arrangements with the investment adviser, brokerage services, or other offset arrangements, if applicable, and do not represent the amount paid by the class during periods when reimbursements, waivers or reductions occur.
JAnnualized.
KAmount does not include the portfolio activity of any underlying mutual funds or exchange-traded funds (ETFs).
LPortfolio turnover rate excludes securities received or delivered in-kind.
MAmount not annualized.
Top Holdings (% of Fund's net assets) |
| |
| Microsoft Corp. | 4.2 | |
| Amazon.com, Inc. | 3.1 | |
| Accenture PLC Class A | 2.9 | |
| The Walt Disney Co. | 2.2 | |
| Salesforce, Inc. | 2.2 | |
| Intuit, Inc. | 2.2 | |
| Adobe, Inc. | 2.1 | |
| Apple, Inc. | 1.9 | |
| WEX, Inc. | 1.9 | |
| Hologic, Inc. | 1.8 | |
| | 24.5 | |
| |
| Market Sectors (% of Fund's net assets) |
| |
| Information Technology | 29.4 | |
| Financials | 13.7 | |
| Industrials | 12.5 | |
| Consumer Discretionary | 12.0 | |
| Health Care | 11.3 | |
| Communication Services | 6.3 | |
| Materials | 3.9 | |
| Energy | 2.8 | |
| Utilities | 2.8 | |
| Consumer Staples | 2.6 | |
| Real Estate | 1.0 | |
| |
Asset Allocation (% of Fund's net assets) |
|
|
Fidelity® Women's Leadership ETF
Showing Percentage of Net Assets
| Common Stocks - 98.3% |
| | | Shares | Value ($) |
| COMMUNICATION SERVICES - 6.3% | | | |
| Entertainment - 3.5% | | | |
| Netflix, Inc. (a) | | 38 | 21,436 |
| Roku, Inc. Class A (a) | | 292 | 25,714 |
| The Walt Disney Co. | | 823 | 79,049 |
| | | | 126,199 |
| Interactive Media & Services - 1.4% | | | |
| Alphabet, Inc. Class C (a) | | 349 | 49,488 |
| Media - 1.4% | | | |
| Interpublic Group of Companies, Inc. | | 1,507 | 49,716 |
TOTAL COMMUNICATION SERVICES | | | 225,403 |
| CONSUMER DISCRETIONARY - 12.0% | | | |
| Automobiles - 0.8% | | | |
| General Motors Co. | | 723 | 28,052 |
| Broadline Retail - 4.5% | | | |
| Amazon.com, Inc. (a) | | 717 | 111,278 |
| Etsy, Inc. (a) | | 467 | 31,084 |
| Kohl's Corp. | | 684 | 17,620 |
| | | | 159,982 |
| Diversified Consumer Services - 1.1% | | | |
| Adtalem Global Education, Inc. (a) | | 423 | 21,353 |
| Bright Horizons Family Solutions, Inc. (a) | | 178 | 17,489 |
| | | | 38,842 |
| Hotels, Restaurants & Leisure - 1.5% | | | |
| Marriott International, Inc. Class A | | 136 | 32,603 |
| Vail Resorts, Inc. | | 102 | 22,644 |
| | | | 55,247 |
| Household Durables - 1.0% | | | |
| Taylor Morrison Home Corp. (a) | | 695 | 36,237 |
| Specialty Retail - 2.6% | | | |
| Aritzia, Inc. (a) | | 833 | 20,267 |
| Best Buy Co., Inc. | | 260 | 18,847 |
| Foot Locker, Inc. | | 465 | 13,094 |
| Williams-Sonoma, Inc. | | 223 | 43,126 |
| | | | 95,334 |
| Textiles, Apparel & Luxury Goods - 0.5% | | | |
| Tapestry, Inc. | | 447 | 17,339 |
TOTAL CONSUMER DISCRETIONARY | | | 431,033 |
| CONSUMER STAPLES - 2.6% | | | |
| Consumer Staples Distribution & Retail - 0.3% | | | |
| Maplebear, Inc. (NASDAQ) | | 429 | 10,498 |
| Food Products - 0.5% | | | |
| Bunge Global SA | | 199 | 17,530 |
| Household Products - 0.9% | | | |
| The Clorox Co. | | 232 | 33,698 |
| Personal Care Products - 0.9% | | | |
| Estee Lauder Companies, Inc. Class A | | 243 | 32,074 |
TOTAL CONSUMER STAPLES | | | 93,800 |
| ENERGY - 2.8% | | | |
| Energy Equipment & Services - 0.9% | | | |
| Baker Hughes Co. Class A | | 1,168 | 33,288 |
| Oil, Gas & Consumable Fuels - 1.9% | | | |
| Antero Resources Corp. (a) | | 940 | 21,000 |
| EQT Corp. | | 527 | 18,656 |
| Occidental Petroleum Corp. | | 462 | 26,597 |
| | | | 66,253 |
TOTAL ENERGY | | | 99,541 |
| FINANCIALS - 13.7% | | | |
| Banks - 5.7% | | | |
| Bank of America Corp. | | 1,882 | 64,007 |
| Citigroup, Inc. | | 672 | 37,746 |
| Huntington Bancshares, Inc. | | 2,507 | 31,914 |
| JPMorgan Chase & Co. | | 278 | 48,472 |
| U.S. Bancorp | | 502 | 20,853 |
| | | | 202,992 |
| Capital Markets - 1.6% | | | |
| NASDAQ, Inc. | | 1,022 | 59,041 |
| Financial Services - 3.0% | | | |
| MasterCard, Inc. Class A | | 90 | 40,431 |
| WEX, Inc. (a) | | 325 | 66,427 |
| | | | 106,858 |
| Insurance - 3.4% | | | |
| Hartford Financial Services Group, Inc. | | 482 | 41,915 |
| Marsh & McLennan Companies, Inc. | | 162 | 31,402 |
| Progressive Corp. | | 268 | 47,771 |
| | | | 121,088 |
TOTAL FINANCIALS | | | 489,979 |
| HEALTH CARE - 11.3% | | | |
| Biotechnology - 1.6% | | | |
| Alnylam Pharmaceuticals, Inc. (a) | | 125 | 21,614 |
| Moderna, Inc. (a) | | 173 | 17,482 |
| Sage Therapeutics, Inc. (a) | | 404 | 10,359 |
| Zai Lab Ltd. ADR (a) | | 431 | 9,297 |
| | | | 58,752 |
| Health Care Equipment & Supplies - 2.7% | | | |
| Hologic, Inc. (a) | | 879 | 65,433 |
| Insulet Corp. (a) | | 163 | 31,112 |
| | | | 96,545 |
| Health Care Providers & Services - 4.5% | | | |
| Centene Corp. (a) | | 611 | 46,014 |
| Cigna Group | | 199 | 59,889 |
| Elevance Health, Inc. | | 72 | 35,528 |
| Humana, Inc. | | 57 | 21,549 |
| | | | 162,980 |
| Life Sciences Tools & Services - 1.0% | | | |
| ICON PLC (a) | | 135 | 35,217 |
| Pharmaceuticals - 1.5% | | | |
| Zoetis, Inc. Class A | | 281 | 52,775 |
TOTAL HEALTH CARE | | | 406,269 |
| INDUSTRIALS - 12.5% | | | |
| Air Freight & Logistics - 1.7% | | | |
| FedEx Corp. | | 115 | 27,748 |
| United Parcel Service, Inc. Class B | | 228 | 32,353 |
| | | | 60,101 |
| Commercial Services & Supplies - 0.3% | | | |
| Veralto Corp. | | 155 | 11,887 |
| Electrical Equipment - 4.2% | | | |
| AMETEK, Inc. | | 297 | 48,129 |
| Eaton Corp. PLC | | 129 | 31,744 |
| nVent Electric PLC | | 513 | 30,801 |
| Regal Rexnord Corp. | | 172 | 22,955 |
| Sunrun, Inc. (a) | | 1,184 | 17,144 |
| | | | 150,773 |
| Ground Transportation - 0.4% | | | |
| ArcBest Corp. | | 126 | 15,010 |
| Machinery - 3.9% | | | |
| Deere & Co. | | 90 | 35,422 |
| Federal Signal Corp. | | 469 | 36,104 |
| Hillenbrand, Inc. | | 410 | 19,094 |
| Otis Worldwide Corp. | | 278 | 24,586 |
| Parker Hannifin Corp. | | 52 | 24,154 |
| | | | 139,360 |
| Professional Services - 2.0% | | | |
| Leidos Holdings, Inc. | | 236 | 26,071 |
| Manpower, Inc. | | 262 | 19,425 |
| Science Applications International Corp. | | 208 | 26,553 |
| | | | 72,049 |
TOTAL INDUSTRIALS | | | 449,180 |
| INFORMATION TECHNOLOGY - 29.4% | | | |
| Communications Equipment - 0.9% | | | |
| Arista Networks, Inc. (a) | | 126 | 32,594 |
| Electronic Equipment, Instruments & Components - 2.1% | | | |
| CDW Corp. | | 204 | 46,251 |
| Insight Enterprises, Inc. (a) | | 160 | 29,558 |
| | | | 75,809 |
| IT Services - 2.9% | | | |
| Accenture PLC Class A | | 286 | 104,070 |
| Semiconductors & Semiconductor Equipment - 7.6% | | | |
| Advanced Micro Devices, Inc. (a) | | 236 | 39,575 |
| Axcelis Technologies, Inc. (a) | | 101 | 13,135 |
| First Solar, Inc. (a) | | 106 | 15,508 |
| Marvell Technology, Inc. | | 513 | 34,730 |
| Micron Technology, Inc. | | 359 | 30,784 |
| NVIDIA Corp. | | 106 | 65,219 |
| NXP Semiconductors NV | | 183 | 38,534 |
| SolarEdge Technologies, Inc. (a) | | 217 | 14,431 |
| Universal Display Corp. | | 111 | 18,844 |
| | | | 270,760 |
| Software - 14.0% | | | |
| Adobe, Inc. (a) | | 120 | 74,134 |
| Autodesk, Inc. (a) | | 150 | 38,072 |
| HubSpot, Inc. (a) | | 105 | 64,155 |
| Intuit, Inc. | | 123 | 77,654 |
| Microsoft Corp. | | 383 | 152,270 |
| Pagerduty, Inc. (a) | | 639 | 15,132 |
| Salesforce, Inc. (a) | | 279 | 78,424 |
| | | | 499,841 |
| Technology Hardware, Storage & Peripherals - 1.9% | | | |
| Apple, Inc. | | 372 | 68,597 |
TOTAL INFORMATION TECHNOLOGY | | | 1,051,671 |
| MATERIALS - 3.9% | | | |
| Chemicals - 2.3% | | | |
| Cabot Corp. | | 284 | 20,476 |
| Celanese Corp. Class A | | 170 | 24,869 |
| Eastman Chemical Co. | | 226 | 18,882 |
| The Chemours Co. LLC | | 576 | 17,378 |
| | | | 81,605 |
| Construction Materials - 0.6% | | | |
| Summit Materials, Inc. (a) | | 596 | 21,563 |
| Containers & Packaging - 0.6% | | | |
| Ball Corp. | | 413 | 22,901 |
| Metals & Mining - 0.4% | | | |
| Schnitzer Steel Industries, Inc. Class A | | 534 | 14,060 |
TOTAL MATERIALS | | | 140,129 |
| REAL ESTATE - 1.0% | | | |
| Equity Real Estate Investment Trusts (REITs) - 1.0% | | | |
| Ventas, Inc. | | 735 | 34,097 |
| UTILITIES - 2.8% | | | |
| Electric Utilities - 1.0% | | | |
| NextEra Energy, Inc. | | 597 | 35,002 |
| Independent Power and Renewable Electricity Producers - 0.7% | | | |
| Clearway Energy, Inc. Class C | | 1,032 | 25,016 |
| Water Utilities - 1.1% | | | |
| American Water Works Co., Inc. | | 312 | 38,694 |
TOTAL UTILITIES | | | 98,712 |
| TOTAL COMMON STOCKS (Cost $3,085,443) | | | 3,519,814 |
| | | | |
| Money Market Funds - 1.9% |
| | | Shares | Value ($) |
State Street Institutional Treasury Plus Money Market Fund Trust Class 5.23% (b) (Cost $66,900) | | 66,900 | 66,900 |
| | | | |
| TOTAL INVESTMENT IN SECURITIES - 100.2% (Cost $3,152,343) | 3,586,714 |
NET OTHER ASSETS (LIABILITIES) - (0.2)% | (7,680) |
| NET ASSETS - 100.0% | 3,579,034 |
| | |
Legend
| (b) | The rate quoted is the annualized seven-day yield of the fund at period end. |
Investment Valuation
The following is a summary of the inputs used, as of January 31, 2024, involving the Fund's assets and liabilities carried at fair value. The inputs or methodology used for valuing securities may not be an indication of the risk associated with investing in those securities. For more information on valuation inputs, and their aggregation into the levels used below, please refer to the Investment Valuation section in the accompanying Notes to Financial Statements.
| Valuation Inputs at Reporting Date: |
| Description | Total ($) | Level 1 ($) | Level 2 ($) | Level 3 ($) |
Investments in Securities: | | | | |
|
| Equities: | | | | |
Communication Services | 225,403 | 225,403 | - | - |
Consumer Discretionary | 431,033 | 431,033 | - | - |
Consumer Staples | 93,800 | 93,800 | - | - |
Energy | 99,541 | 99,541 | - | - |
Financials | 489,979 | 489,979 | - | - |
Health Care | 406,269 | 406,269 | - | - |
Industrials | 449,180 | 449,180 | - | - |
Information Technology | 1,051,671 | 1,051,671 | - | - |
Materials | 140,129 | 140,129 | - | - |
Real Estate | 34,097 | 34,097 | - | - |
Utilities | 98,712 | 98,712 | - | - |
|
| Money Market Funds | 66,900 | 66,900 | - | - |
| Total Investments in Securities: | 3,586,714 | 3,586,714 | - | - |
Fidelity® Women's Leadership ETF
| Statement of Assets and Liabilities |
| | | | January 31, 2024 (Unaudited) |
| | | | | |
| Assets | | | | |
Investment in securities, at value - See accompanying schedule Unaffiliated issuers (cost $3,152,343): | | | $ | 3,586,714 |
| Receivable for investments sold | | | | 8,996 |
| Dividends receivable | | | | 1,451 |
Total assets | | | | 3,597,161 |
| Liabilities | | | | |
| Payable for investments purchased | $ | 16,373 | | |
| Accrued management fee | | 1,754 | | |
| Total Liabilities | | | | 18,127 |
| Net Assets | | | $ | 3,579,034 |
| Net Assets consist of: | | | | |
| Paid in capital | | | $ | 3,547,462 |
| Total accumulated earnings (loss) | | | | 31,572 |
| Net Assets | | | $ | 3,579,034 |
Net Asset Value, offering price and redemption price per share ($3,579,034 ÷ 175,000 shares) | | | $ | 20.45 |
| Statement of Operations |
| | | | Six months ended January 31, 2024 (Unaudited) |
| Investment Income | | | | |
| Dividends | | | $ | 23,082 |
| Expenses | | | | |
| Management fee | $ | 9,849 | | |
| Independent trustees' fees and expenses | | 10 | | |
| Total expenses before reductions | | 9,859 | | |
| Expense reductions | | (2) | | |
| Total expenses after reductions | | | | 9,857 |
| Net Investment income (loss) | | | | 13,225 |
| Realized and Unrealized Gain (Loss) | | | | |
| Net realized gain (loss) on: | | | | |
| Investment Securities: | | | | |
| Unaffiliated issuers | | 59,916 | | |
| Foreign currency transactions | | (1) | | |
| Total net realized gain (loss) | | | | 59,915 |
| Change in net unrealized appreciation (depreciation) on investment securities | | | | 92,511 |
| Net gain (loss) | | | | 152,426 |
| Net increase (decrease) in net assets resulting from operations | | | $ | 165,651 |
| Statement of Changes in Net Assets |
| |
| | Six months ended January 31, 2024 (Unaudited) | | Year ended July 31, 2023 |
| Increase (Decrease) in Net Assets | | | | |
| Operations | | | | |
| Net investment income (loss) | $ | 13,225 | $ | 32,192 |
| Net realized gain (loss) | | 59,915 | | (130,743) |
| Change in net unrealized appreciation (depreciation) | | 92,511 | | 583,271 |
| Net increase (decrease) in net assets resulting from operations | | 165,651 | | 484,720 |
| Distributions to shareholders | | (15,050) | | (31,525) |
| | | | | |
| Share transactions | | | | |
| Proceeds from sales of shares | | - | | 2,547,748 |
| Cost of shares redeemed | | - | | (2,199,862) |
| | | | | |
Net increase (decrease) in net assets resulting from share transactions | | - | | 347,886 |
| Total increase (decrease) in net assets | | 150,601 | | 801,081 |
| | | | | |
| Net Assets | | | | |
| Beginning of period | | 3,428,433 | | 2,627,352 |
| End of period | $ | 3,579,034 | $ | 3,428,433 |
| | | | | |
| Other Information | | | | |
| Shares | | | | |
| Sold | | - | | 150,000 |
| Redeemed | | - | | (125,000) |
| Net increase (decrease) | | - | | 25,000 |
| | | | | |
Financial Highlights
| Fidelity® Women's Leadership ETF |
| |
| | Six months ended (Unaudited) January 31, 2024 | | Years ended July 31, 2023 | | 2022 | | 2021 A |
Selected Per-Share Data | | | | | | | | |
| Net asset value, beginning of period | $ | 19.59 | $ | 17.52 | $ | 20.51 | $ | 20.00 |
| Income from Investment Operations | | | | | | | | |
Net investment income (loss) B,C | | .08 | | .16 | | .11 | | - D |
| Net realized and unrealized gain (loss) | | .87 | | 2.08 | | (3.01) | | .51 |
| Total from investment operations | | .95 | | 2.24 | | (2.90) | | .51 |
| Distributions from net investment income | | (.09) | | (.17) | | (.09) | | - |
| Total distributions | | (.09) | | (.17) | | (.09) | | - |
| Net asset value, end of period | $ | 20.45 | $ | 19.59 | $ | 17.52 | $ | 20.51 |
Total Return E,F,G | | 4.85% | | 12.98% | | (14.14)% | | 2.53% |
Ratios to Average Net Assets C,H,I | | | | | | | | |
| Expenses before reductions | | .59% J | | .59% | | .59% | | .59% J |
| Expenses net of fee waivers, if any | | .59% J | | .59% | | .59% | | .59% J |
| Expenses net of all reductions | | .59% J | | .59% | | .59% | | .59% J |
| Net investment income (loss) | | .79% J | | .91% | | .56% | | .08% J |
| Supplemental Data | | | | | | | | |
| Net assets, end of period (000 omitted) | $ | 3,579 | $ | 3,428 | $ | 2,627 | $ | 2,051 |
Portfolio turnover rate K | | 55% J | | 72% L | | 64% L | | 5% L,M |
AFor the period June 15, 2021 (commencement of operations) through July 31, 2021.
BCalculated based on average shares outstanding during the period.
CNet investment income (loss) is affected by the timing of the declaration of dividends by any underlying mutual funds or exchange-traded funds (ETFs). Net investment income (loss) of any mutual funds or ETFs is not included in the Fund's net investment income (loss) ratio.
DAmount represents less than $.005 per share.
ETotal returns for periods of less than one year are not annualized.
FTotal returns would have been lower if certain expenses had not been reduced during the applicable periods shown.
GBased on net asset value.
HFees and expenses of any underlying mutual funds or exchange-traded funds (ETFs) are not included in the Fund's expense ratio. The Fund indirectly bears its proportionate share of these expenses.
IExpense ratios reflect operating expenses of the class. Expenses before reductions do not reflect amounts reimbursed, waived, or reduced through arrangements with the investment adviser, brokerage services, or other offset arrangements, if applicable, and do not represent the amount paid by the class during periods when reimbursements, waivers or reductions occur.
JAnnualized.
KAmount does not include the portfolio activity of any underlying mutual funds or exchange-traded funds (ETFs).
LPortfolio turnover rate excludes securities received or delivered in-kind.
MAmount not annualized.
For the period ended January 31, 2024
1. Organization.
Fidelity Blue Chip Growth ETF, Fidelity Blue Chip Value ETF, Fidelity Fundamental Large Cap Core ETF (formerly Fidelity New Millennium ETF), Fidelity Fundamental Large Cap Growth ETF (formerly Fidelity Growth Opportunities ETF), Fidelity Fundamental Small-Mid Cap ETF (formerly Fidelity Small-Mid Cap Opportunities ETF), Fidelity Magellan ETF, Fidelity Real Estate Investment ETF, Fidelity Sustainable U.S. Equity ETF and Fidelity Women's Leadership ETF (the Funds) are exchange-traded funds of Fidelity Covington Trust (the Trust) and are authorized to issue an unlimited number of shares. Each Fund, with the exception of Fidelity Blue Chip Value ETF and Fidelity Fundamental Large Cap Core ETF, are non-diversified funds. The Trust is registered under the Investment Company Act of 1940, as amended (the 1940 Act), as an open-end management investment company organized as a Massachusetts business trust.
In November 2023, the Board of Trustees approved the three ETF name changes outlined above effective February 26, 2024. Effective February 2, 2024, Fidelity Fundamental Small-Mid Cap ETF changed its classification from a non-diversified to a diversified fund.
2. Significant Accounting Policies.
Each Fund is an investment company and applies the accounting and reporting guidance of the Financial Accounting Standards Board (FASB) Accounting Standards Codification Topic 946 Financial Services - Investment Companies. The financial statements have been prepared in conformity with accounting principles generally accepted in the United States of America (GAAP), which require management to make certain estimates and assumptions at the date of the financial statements. Actual results could differ from those estimates. Subsequent events, if any, through the date that the financial statements were issued have been evaluated in the preparation of the financial statements. Each Fund's Schedule of Investments lists any underlying mutual funds or exchange-traded funds (ETFs) but does not include the underlying holdings of these funds. The following summarizes the significant accounting policies of each Fund:
Investment Valuation. Investments are valued as of 4:00 p.m. Eastern time on the last calendar day of the period. The Board of Trustees (the Board) has designated each Fund's investment adviser as the valuation designee responsible for the fair valuation function and performing fair value determinations as needed. The investment adviser has established a Fair Value Committee (the Committee) to carry out the day-to-day fair valuation responsibilities and has adopted policies and procedures to govern the fair valuation process and the activities of the Committee. In accordance with these fair valuation policies and procedures, which have been approved by the Board, each Fund attempts to obtain prices from one or more third party pricing services or brokers to value its investments. When current market prices, quotations or currency exchange rates are not readily available or reliable, investments will be fair valued in good faith by the Committee, in accordance with the policies and procedures. Factors used in determining fair value vary by investment type and may include market or investment specific events, transaction data, estimated cash flows, and market observations of comparable investments. The frequency that the fair valuation procedures are used cannot be predicted and they may be utilized to a significant extent. The Committee manages each Fund's fair valuation practices and maintains the fair valuation policies and procedures. Each Fund's investment adviser reports to the Board information regarding the fair valuation process and related material matters.
Each Fund categorizes the inputs to valuation techniques used to value its investments into a disclosure hierarchy consisting of three levels as shown below:
Level 1 - unadjusted quoted prices in active markets for identical investments
Level 2 - other significant observable inputs (including quoted prices for similar investments, interest rates, prepayment speeds, etc.)
Level 3 - unobservable inputs (including the Fund's own assumptions based on the best information available)
Valuation techniques used to value each Fund's investments by major category are as follows:
Equity securities, including restricted securities, for which market quotations are readily available, are valued at the last reported sale price or official closing price as reported by a third party pricing service on the primary market or exchange on which they are traded and are categorized as Level 1 in the hierarchy. In the event there were no sales during the day or closing prices are not available, securities are valued at the last quoted bid price or may be valued using the last available price and are generally categorized as Level 2 in the hierarchy. For foreign equity securities, when market or security specific events arise, comparisons to the valuation of American Depositary Receipts (ADRs), futures contracts, ETFs and certain indexes as well as quoted prices for similar securities may be used and would be categorized as Level 2 in the hierarchy. For equity securities, including restricted securities, where observable inputs are limited, assumptions about market activity and risk are used and these securities may be categorized as Level 3 in the hierarchy.
Changes in valuation techniques may result in transfers in or out of an assigned level within the disclosure hierarchy. The aggregate value of investments by input level as of January 31, 2024 is included at the end of each Fund's Schedule of Investments.
Foreign Currency. Certain Funds may use foreign currency contracts to facilitate transactions in foreign-denominated securities. Gains and losses from these transactions may arise from changes in the value of the foreign currency or if the counterparties do not perform under the contracts' terms.
Foreign-denominated assets, including investment securities, and liabilities are translated into U.S. dollars at the exchange rates at period end. Purchases and sales of investment securities, income and dividends received, and expenses denominated in foreign currencies are translated into U.S. dollars at the exchange rate in effect on the transaction date.
The effects of exchange rate fluctuations on investments are included with the net realized and unrealized gain (loss) on investment securities. Other foreign currency transactions resulting in realized and unrealized gain (loss) are disclosed separately.
Investment Transactions and Income. For financial reporting purposes, the Funds' investment holdings and NAV include trades executed through the end of the last business day of the period. The NAV per share for processing shareholder transactions is calculated as of the close of business (normally 4:00 p.m. Eastern time) of the New York Stock Exchange, Archipelago Exchange (NYSE Arca) for Fidelity Sustainable U.S. Equity ETF and Fidelity Women's Leadership ETF, and of the Cboe BZX Exchange, Inc. (CboeBZX) for all other funds; and includes trades executed through the end of the prior business day. Gains and losses on securities sold are determined on the basis of identified cost and may include proceeds received from litigation. Commissions paid to certain brokers with whom the investment adviser, or its affiliates, places trades on behalf of a fund include an amount in addition to trade execution, which may be rebated back to a fund. Any such rebates are included in net realized gain (loss) on investments in the Statement of Operations. Dividend income is recorded on the ex-dividend date, except for certain dividends from foreign securities where the ex-dividend date may have passed, which are recorded as soon as the Funds are informed of the ex-dividend date. Non-cash dividends included in dividend income, if any, are recorded at the fair market value of the securities received. Certain distributions received by the Funds represent a return of capital or capital gain. The Funds determine the components of these distributions subsequent to the ex-dividend date, based upon receipt of tax filings or other correspondence relating to the underlying investment. These distributions are recorded as a reduction of cost of investments and/or as a realized gain. Investment income is recorded net of foreign taxes withheld where recovery of such taxes is uncertain. Funds may file withholding tax reclaims in certain jurisdictions to recover a portion of amounts previously withheld. Any withholding tax reclaims income is included in the Statement of Operations in dividends. Any receivables for withholding tax reclaims are included in the Statement of Assets and Liabilities in dividends receivable.
Expenses. Expenses directly attributable to a fund are charged to that fund. Expenses attributable to more than one fund are allocated among the respective funds on the basis of relative net assets or other appropriate methods. Expenses included in the accompanying financial statements reflect the expenses of that fund and do not include any expenses associated with any underlying mutual funds or exchange-traded funds. Although not included in a fund's expenses, a fund indirectly bears its proportionate share of these expenses through the net asset value of each underlying mutual fund or exchange-traded fund. Expense estimates are accrued in the period to which they relate and adjustments are made when actual amounts are known.
Income Tax Information and Distributions to Shareholders. Each year, each Fund intends to qualify as a regulated investment company under Subchapter M of the Internal Revenue Code, including distributing substantially all of its taxable income and realized gains. As a result, no provision for U.S. Federal income taxes is required. Each Fund files a U.S. federal tax return, in addition to state and local tax returns as required. Each Fund's federal income tax returns are subject to examination by the Internal Revenue Service (IRS) for a period of three fiscal years after they are filed. State and local tax returns may be subject to examination for an additional fiscal year depending on the jurisdiction. Realized gain or loss resulting from in-kind redemptions is not taxable to the Fund and is not distributed to shareholders of the Fund. Foreign taxes are provided for based on each Fund's understanding of the tax rules and rates that exist in the foreign markets in which it invests.
Distributions are declared and recorded on the ex-dividend date. Income and capital gain distributions are determined in accordance with income tax regulations, which may differ from GAAP.
Capital accounts within the financial statements are adjusted for permanent book-tax differences. These adjustments have no impact on net assets or the results of operations. Capital accounts are not adjusted for temporary book-tax differences which will reverse in a subsequent period.
Book-tax differences are primarily due to futures transactions, foreign currency transactions, passive foreign investment companies (PFIC), redemptions in-kind, net operating losses, capital loss carryforwards and losses deferred due to wash sales and excise tax regulations.
As of period end, the cost and unrealized appreciation (depreciation) in securities, and derivatives if applicable, for federal income tax purposes were as follows for each Fund:
| | Tax cost | Gross unrealized appreciation | Gross unrealized depreciation | Net unrealized appreciation (depreciation) |
| | | | | |
| Fidelity Blue Chip Growth ETF | $910,880,052 | $256,870,497 | $(35,570,442) | $221,300,055 |
| Fidelity Blue Chip Value ETF | 107,855,294 | 15,847,670 | (5,148,182) | 10,699,488 |
Fidelity Fundamental Large Cap Core ETF | 156,368,573 | 35,303,920 | (1,408,450) | 33,895,470 |
Fidelity Fundamental Large Cap Growth ETF | 183,316,991 | 64,353,845 | (5,609,168) | 58,744,677 |
Fidelity Fundamental Small-Mid Cap ETF | 38,148,183 | 7,858,155 | (1,538,400) | 6,319,755 |
| Fidelity Magellan ETF | 50,248,970 | 13,800,741 | (72,325) | 13,728,416 |
| Fidelity Real Estate Investment ETF | 14,578,593 | 599,097 | (1,771,171) | (1,172,074) |
| Fidelity Sustainable U.S. Equity ETF | 9,870,391 | 1,895,337 | (453,704) | 1,441,633 |
| Fidelity Women's Leadership ETF | 3,207,745 | 589,363 | (210,394) | 378,969 |
Capital loss carryforwards are only available to offset future capital gains of the Funds to the extent provided by regulations and may be limited. The capital loss carryforward information presented below, including any applicable limitation, is estimated as of prior fiscal period end and is subject to adjustment.
| | Short-term | Long-term | Total capital loss carryforward |
| Fidelity Blue Chip Growth ETF | $(43,610,384) | $(26,343,438) | $(69,953,822) |
| Fidelity Blue Chip Value ETF | (1,191,788) | (855,207) | (2,046,995) |
Fidelity Fundamental Large Cap Core ETF | (1,383,007) | (2,176,231) | (3,559,238) |
Fidelity Fundamental Large Cap Growth ETF | (13,365,074) | (5,352,164) | (18,717,238) |
Fidelity Fundamental Small-Mid Cap ETF | (2,433,568) | (1,753,576) | (4,187,144) |
| Fidelity Magellan ETF | (6,595,196) | (1,923,313) | (8,518,509) |
| Fidelity Real Estate Investment ETF | (406,757) | (553,403) | (960,160) |
| Fidelity Sustainable U.S. Equity ETF | (174,560) | (289,118) | (463,678) |
| Fidelity Women's Leadership ETF | (149,043) | (241,881) | (390,924) |
| | | | |
Certain of the Funds elected to defer to the next fiscal year ordinary losses recognized during the period January 1, 2023 to July 31, 2023. Loss deferrals were as follows:
| | Ordinary losses |
Fidelity Fundamental Large Cap Core ETF | $(136,801) |
3. Derivative Instruments.
Risk Exposures and the Use of Derivative Instruments. Each Fund's investment objectives allow for various types of derivative instruments, including futures contracts. Derivatives are investments whose value is primarily derived from underlying assets, indices or reference rates and may be transacted on an exchange or over-the-counter (OTC). Derivatives may involve a future commitment to buy or sell a specified asset based on specified terms, to exchange future cash flows at periodic intervals based on a notional principal amount, or for one party to make one or more payments upon the occurrence of specified events in exchange for periodic payments from the other party.
Derivatives were used to increase returns and to manage exposure to certain risks as defined below. The success of any strategy involving derivatives depends on analysis of numerous economic factors, and if the strategies for investment do not work as intended, the objectives may not be achieved.
Derivatives were used to increase or decrease exposure to the following risk(s):
| | |
| Equity Risk | Equity risk relates to the fluctuations in the value of financial instruments as a result of changes in market prices (other than those arising from interest rate risk or foreign exchange risk), whether caused by factors specific to an individual investment, its issuer, or all factors affecting all instruments traded in a market or market segment. |
Funds are also exposed to additional risks from investing in derivatives, such as liquidity risk and counterparty credit risk. Liquidity risk is the risk that a fund will be unable to close out the derivative in the open market in a timely manner. Counterparty credit risk is the risk that the counterparty will not be able to fulfill its obligation to a fund. Counterparty credit risk related to exchange-traded contracts may be mitigated by the protection provided by the exchange on which they trade.
Investing in derivatives may involve greater risks than investing in the underlying assets directly and, to varying degrees, may involve risk of loss in excess of any initial investment and collateral received and amounts recognized in the Statement of Assets and Liabilities. In addition, there may be the risk that the change in value of the derivative contract does not correspond to the change in value of the underlying instrument.
Futures Contracts. A futures contract is an agreement between two parties to buy or sell a specified underlying instrument for a fixed price at a specified future date. Futures contracts were used to manage exposure to the stock market.
Upon entering into a futures contract, a fund is required to deposit either cash or securities (initial margin) with a clearing broker in an amount equal to a certain percentage of the face value of the contract. Futures contracts are marked-to-market daily and subsequent daily payments are made or received by a fund depending on the daily fluctuations in the value of the futures contracts and are recorded as unrealized appreciation or (depreciation). This receivable and/or payable, if any, is included in daily variation margin on futures contracts in the Statement of Assets and Liabilities. Realized gain or (loss) is recorded upon the expiration or closing of a futures contract. The net realized gain (loss) and change in net unrealized appreciation (depreciation) on futures contracts during the period is presented in the Statement of Operations.
Any open futures contracts at period end are presented in the Schedule of Investments under the caption "Futures Contracts". The notional amount at value reflects each contract's exposure to the underlying instrument or index at period end, and is representative of volume of activity during the period unless an average notional amount is presented. Any securities deposited to meet initial margin requirements are identified in the Schedule of Investments. Any cash deposited to meet initial margin requirements is presented as segregated cash with brokers for derivative instruments in the Statement of Assets and Liabilities.
4. Purchases and Sales of Investments.
Purchases and sales of securities, other than short-term securities and in-kind transactions, as applicable, are noted in the table below.
| | Purchases ($) | Sales ($) | | | | |
| Fidelity Blue Chip Growth ETF | 237,543,065 | 133,755,712 | | | | |
| Fidelity Blue Chip Value ETF | 19,336,005 | 18,540,971 | | | | |
| Fidelity Fundamental Large Cap Core ETF | 54,537,995 | 46,147,123 | | | | |
| Fidelity Fundamental Large Cap Growth ETF | 54,783,301 | 47,461,469 | | | | |
| Fidelity Fundamental Small-Mid Cap ETF | 9,693,803 | 6,489,494 | | | | |
| Fidelity Magellan ETF | 19,226,224 | 19,514,541 | | | | |
| Fidelity Real Estate Investment ETF | 2,622,430 | 2,639,659 | | | | |
| Fidelity Sustainable U.S. Equity ETF | 1,794,406 | 1,892,931 | | | | |
| Fidelity Women's Leadership ETF | 952,627 | 910,587 | | | | |
Securities received and delivered in-kind through subscriptions and redemptions are noted in the table below.
| | In-Kind Subscriptions ($) | In-Kind Redemptions ($) |
| Fidelity Blue Chip Growth ETF | 163,977,087 | 12,984,288 |
| Fidelity Blue Chip Value ETF | 2,537,415 | 10,501,166 |
| Fidelity Fundamental Large Cap Core ETF | 59,983,482 | 782,705 |
| Fidelity Fundamental Large Cap Growth ETF | 20,981,643 | 645,027 |
| Fidelity Fundamental Small-Mid Cap ETF | 4,900,963 | 482,646 |
| Fidelity Magellan ETF | 10,927,551 | 3,839,156 |
| Fidelity Real Estate Investment ETF | - | 1,486,077 |
| Fidelity Sustainable U.S. Equity ETF | 800,439 | 398,411 |
5. Fees and Other Transactions with Affiliates.
Management Fee. Fidelity Management & Research Company LLC (the investment adviser) provides the Funds with investment management related services for which the Funds pay a monthly management fee that is based on an annual rate of each Fund's average net assets as noted in the table below, except for Fidelity Fundamental Small-Mid Cap ETF. Under the management contract, the investment adviser pays all other expenses, except the compensation of the independent Trustees and certain miscellaneous expenses such as proxy and shareholder meeting expenses.
| | Fee Rate |
| Fidelity Blue Chip Growth ETF | .59% |
| Fidelity Blue Chip Value ETF | .59% |
| Fidelity Fundamental Large Cap Core ETF | .59% |
| Fidelity Fundamental Large Cap Growth ETF | .59% |
| Fidelity Fundamental Small-Mid Cap ETF | .60% |
| Fidelity Magellan ETF | .59% |
| Fidelity Real Estate Investment ETF | .59% |
| Fidelity Sustainable U.S. Equity ETF | .59% |
| Fidelity Women's Leadership ETF | .59% |
| | |
During November 2023, the Board approved changes to certain Funds' management fee effective February 26, 2024. Each Fund will pay a monthly management fee as presented in the table below. Under the management contract, the investment adviser will pay all other expenses, except the compensation of the independent Trustees and certain miscellaneous expenses such as proxy and shareholder meeting expenses.
| | Fee Rate |
| Fidelity Fundamental Large Cap Core ETF | .38% |
| Fidelity Fundamental Large Cap Growth ETF | .38% |
| Fidelity Fundamental Small-Mid Cap ETF | .43% |
| | |
Brokerage Commissions. A portion of portfolio transactions were placed with brokerage firms which are affiliates of the investment adviser. Brokerage commissions are included in net realized gain (loss) and change in net unrealized appreciation (depreciation) in the Statement of Operations. The commissions paid to these affiliated firms were as follows:
| | Amount |
| Fidelity Blue Chip Growth ETF | $1,656 |
| Fidelity Blue Chip Value ETF | 183 |
| Fidelity Fundamental Large Cap Core ETF | 446 |
| Fidelity Fundamental Large Cap Growth ETF | 581 |
| Fidelity Fundamental Small-Mid Cap ETF | 147 |
| Fidelity Magellan ETF | 116 |
| Fidelity Real Estate Investment ETF | 59 |
| Fidelity Sustainable U.S. Equity ETF | 19 |
| Fidelity Women's Leadership ETF | 15 |
Interfund Trades. Funds may purchase from or sell securities to other Fidelity Funds under procedures adopted by the Board. The procedures have been designed to ensure these interfund trades are executed in accordance with Rule 17a-7 of the 1940 Act. Any interfund trades are included within the respective purchases and sales amounts shown in the Purchases and Sales of Investments note. Interfund trades during the period are noted in the table below.
| | Purchases ($) | Sales ($) | Realized Gain (Loss) ($) |
| Fidelity Blue Chip Growth ETF | 4,639,452 | 2,142,813 | 80,904 |
| Fidelity Blue Chip Value ETF | 1,207,109 | 255,054 | (826) |
| Fidelity Fundamental Large Cap Core ETF | 2,315,200 | 1,126,908 | (82,799) |
| Fidelity Fundamental Large Cap Growth ETF | 2,523,349 | 1,238,854 | (204,506) |
| Fidelity Fundamental Small-Mid Cap ETF | 125,361 | 1,313,548 | 242,421 |
| Fidelity Magellan ETF | 533,842 | 1,015,642 | 8,058 |
| Fidelity Real Estate Investment ETF | 29,584 | 11,457 | (4,614) |
| Fidelity Sustainable U.S. Equity ETF | 83,861 | 197,934 | 38,591 |
| Fidelity Women's Leadership ETF | 3,643 | 17,789 | 1,119 |
| | | | |
Subsequent Event - Sub-Advisory Arrangements. Effective March 1, 2024, each Fund's sub-advisory agreements with FMR Investment Management (UK) Limited, Fidelity Management & Research (Hong Kong) Limited, and Fidelity Management & Research (Japan) Limited will be amended to provide that the investment adviser will pay each sub-adviser monthly fees equal to 110% of the sub-adviser's costs for providing sub-advisory services.
6. Expense Reductions.
Through arrangements with each applicable Fund's custodian, credits realized as a result of certain uninvested cash balances were used to reduce each applicable Fund's expenses. All of the applicable expense reductions are noted in the table below.
| | Custodian credits |
| Fidelity Blue Chip Growth ETF | $203 |
Fidelity Fundamental Large Cap Core ETF | 5 |
Fidelity Fundamental Large Cap Growth ETF | 59 |
Fidelity Fundamental Small-Mid Cap ETF | 3 |
| Fidelity Magellan ETF | 13 |
| Fidelity Real Estate Investment ETF | 1 |
| Fidelity Women's Leadership ETF | 2 |
7. Share Transactions.
Funds issue and redeem shares at NAV only with certain authorized participants in large increments known as Creation Units. Purchases of Creation Units are made by tendering a basket of designated securities to a fund and redemption proceeds are paid with a basket of securities from a fund's portfolio with a balancing cash component to equate the market value of the basket of securities delivered or redeemed to the NAV per Creation Unit on the transaction date. Cash may be substituted equivalent to the value of certain securities generally when they are not available in sufficient quantity for delivery. A fund's shares are available in smaller increments to investors in the secondary market at market prices and may be subject to commissions. Authorized participants pay a transaction fee to the shareholder servicing agent when purchasing and redeeming Creation Units of a fund. The transaction fee is used to offset the costs associated with the issuance and redemption of Creation Units.
8. Other.
A fund's organizational documents provide former and current trustees and officers with a limited indemnification against liabilities arising in connection with the performance of their duties to the fund. In the normal course of business, a fund may also enter into contracts that provide general indemnifications. A fund's maximum exposure under these arrangements is unknown as this would be dependent on future claims that may be made against a fund. The risk of material loss from such claims is considered remote.
9. Risk and Uncertainties.
Many factors affect a fund's performance. Developments that disrupt global economies and financial markets, such as pandemics, epidemics, outbreaks of infectious diseases, war, terrorism, and environmental disasters, may significantly affect a fund's investment performance. The effects of these developments to a fund will be impacted by the types of securities in which a fund invests, the financial condition, industry, economic sector, and geographic location of an issuer, and a fund's level of investment in the securities of that issuer. Significant concentrations in security types, issuers, industries, sectors, and geographic locations may magnify the factors that affect a fund's performance.
As a shareholder, you incur two types of costs: (1) transaction costs, which may include sales charges (loads) on purchase payments or redemption proceeds, as applicable and (2) ongoing costs, which generally include management fees, distribution and/or service (12b-1) fees and other Fund expenses. This Example is intended to help you understand your ongoing costs (in dollars) of investing in a fund and to compare these costs with the ongoing costs of investing in other mutual funds.
| The Example is based on an investment of $1,000 invested at the beginning of the period and held for the entire period (August 1, 2023 to January 31, 2024). |
Actual Expenses
The first line of the accompanying table provides information about actual account values and actual expenses. You may use the information in this line, together with the amount you invested, to estimate the expenses that you paid over the period. Simply divide your account value by $1,000.00 (for example, an $8,600 account value divided by $1,000.00 = 8.6), then multiply the result by the number in the first line for a class/Fund under the heading entitled "Expenses Paid During Period" to estimate the expenses you paid on your account during this period. If any fund is a shareholder of any underlying mutual funds or exchange-traded funds (ETFs) (the Underlying Funds), such fund indirectly bears its proportional share of the expenses of the Underlying Funds in addition to the direct expenses incurred presented in the table. These fees and expenses are not included in the annualized expense ratio used to calculate the expense estimate in the table below.
Hypothetical Example for Comparison Purposes
The second line of the accompanying table provides information about hypothetical account values and hypothetical expenses based on the actual expense ratio and an assumed rate of return of 5% per year before expenses, which is not the actual return. The hypothetical account values and expenses may not be used to estimate the actual ending account balance or expenses you paid for the period. You may use this information to compare the ongoing costs of investing in the Fund and other funds. To do so, compare this 5% hypothetical example with the 5% hypothetical examples that appear in the shareholder reports of the other funds. If any fund is a shareholder of any Underlying Funds, such fund indirectly bears its proportional share of the expenses of the Underlying Funds in addition to the direct expenses as presented in the table. These fees and expenses are not included in the annualized expense ratio used to calculate the expense estimate in the table below.
Please note that the expenses shown in the table are meant to highlight your ongoing costs only and do not reflect any transaction costs. Therefore, the second line of the table is useful in comparing ongoing costs only, and will not help you determine the relative total costs of owning different funds. In addition, if these transactional costs were included, your costs would have been higher.
| | | | | Annualized Expense Ratio- A | | Beginning Account Value August 1, 2023 | | Ending Account Value January 31, 2024 | | Expenses Paid During Period- C August 1, 2023 to January 31, 2024 |
| | | | | | | | | | |
| Fidelity® Blue Chip Growth ETF | | | | .59% | | | | | | |
| Actual | | | | | | $ 1,000 | | $ 1,094.00 | | $ 3.11 |
Hypothetical-B | | | | | | $ 1,000 | | $ 1,022.17 | | $ 3.00 |
| | | | | | | | | | |
| Fidelity® Blue Chip Value ETF | | | | .59% | | | | | | |
| Actual | | | | | | $ 1,000 | | $ 1,019.50 | | $ 3.00 |
Hypothetical-B | | | | | | $ 1,000 | | $ 1,022.17 | | $ 3.00 |
| | | | | | | | | | |
Fidelity® Fundamental Large Cap Core ETF ** | | | | .59% | | | | | | |
| Actual | | | | | | $ 1,000 | | $ 1,074.00 | | $ 3.08 |
Hypothetical-B | | | | | | $ 1,000 | | $ 1,022.17 | | $ 3.00 |
| | | | | | | | | | |
Fidelity® Fundamental Large Cap Growth ETF ** | | | | .59% | | | | | | |
| Actual | | | | | | $ 1,000 | | $ 1,085.50 | | $ 3.09 |
Hypothetical-B | | | | | | $ 1,000 | | $ 1,022.17 | | $ 3.00 |
| | | | | | | | | | |
Fidelity® Fundamental Small-Mid Cap ETF ** | | | | .60% | | | | | | |
| Actual | | | | | | $ 1,000 | | $ 1,034.90 | | $ 3.07 |
Hypothetical-B | | | | | | $ 1,000 | | $ 1,022.12 | | $ 3.05 |
| | | | | | | | | | |
| Fidelity® Magellan℠ ETF | | | | .59% | | | | | | |
| Actual | | | | | | $ 1,000 | | $ 1,126.50 | | $ 3.15 |
Hypothetical-B | | | | | | $ 1,000 | | $ 1,022.17 | | $ 3.00 |
| | | | | | | | | | |
| Fidelity® Real Estate Investment ETF | | | | .59% | | | | | | |
| Actual | | | | | | $ 1,000 | | $ 1,002.00 | | $ 2.97 |
Hypothetical-B | | | | | | $ 1,000 | | $ 1,022.17 | | $ 3.00 |
| | | | | | | | | | |
| Fidelity® Sustainable U.S. Equity ETF | | | | .59% | | | | | | |
| Actual | | | | | | $ 1,000 | | $ 1,058.00 | | $ 3.05 |
Hypothetical-B | | | | | | $ 1,000 | | $ 1,022.17 | | $ 3.00 |
| | | | | | | | | | |
| Fidelity® Women's Leadership ETF | | | | .59% | | | | | | |
| Actual | | | | | | $ 1,000 | | $ 1,048.50 | | $ 3.04 |
Hypothetical-B | | | | | | $ 1,000 | | $ 1,022.17 | | $ 3.00 |
| |
A Annualized expense ratio reflects expenses net of applicable fee waivers.
B 5% return per year before expenses
C Expenses are equal to the annualized expense ratio, multiplied by the average account value over the period, multiplied by 184/ 366 (to reflect the one-half year period). The fees and expenses of any Underlying Funds are not included in each annualized expense ratio.
** If fees and changes to the expense contract and/or expense cap, effective February 26, 2024, had been in effect during the current period, the restated annualized expense ratio and the expenses paid in the actual and hypothetical examples above would have been as shown in table below:
| | | | | Annualized Expense Ratio- A | | Expenses Paid |
| | | | | | |
| | | | | | |
| | | | | | |
| Fidelity® Fundamental Large Cap Core ETF | | | | .38% | | |
| Actual | | | | | | $ 1.98 |
Hypothetical- B | | | | | | $ 1.93 |
| | | | | | |
| Fidelity® Fundamental Large Cap Growth ETF | | | | .38% | | |
| Actual | | | | | | $ 1.99 |
Hypothetical- B | | | | | | $ 1.93 |
| | | | | | |
| Fidelity® Fundamental Small-Mid Cap ETF | | | | .43% | | |
| Actual | | | | | | $ 2.20 |
Hypothetical- B | | | | | | $ 2.19 |
| | | | | | |
| | | | | | |
| | | | | | |
| | | | | | |
| | | | | | | |
| A Annualized expense ratio reflects expenses net of applicable fee waivers. | | | | | | |
| B 5% return per year before expenses | | | | | | |
Board Approval of Investment Advisory Contracts and Management Fees
Fidelity Growth Opportunities ETF
Fidelity New Millennium ETF
Fidelity Small-Mid Cap Opportunities ETF
At its November 2023 meeting, the Board of Trustees, including the Independent Trustees (together, the Board), voted to approve an amended and restated management contract with Fidelity Management & Research Company LLC (FMR) for each fund (the Amended Contracts) to decrease the management fee paid for each fund, effective February 26, 2024. The Board, assisted by the advice of fund counsel and Independent Trustees' counsel, considered a broad range of information.
Nature, Extent, and Quality of Services Provided. The Board previously received and considered materials relating to the nature, extent and quality of services provided by FMR to each fund, including the resources dedicated to investment management and support services, shareholder and administrative services, the benefits to shareholders of investment in a large fund family and the investment performance of each fund in connection with the annual renewal of each fund's current management contract (Current Management Contracts). At its July 2023 meeting, the Board concluded that the nature, extent and quality of the services provided to each fund under the Current Management Contracts should benefit each fund's shareholders. In connection with its approval of the Amended Contracts at its November 2023 meeting, the Board noted that although certain changes would be made to the investment process for Fidelity Growth Opportunities ETF and Fidelity New Millennium ETF, the nature, extent, and quality of services provided to the funds would not be diminished. The Board concluded that the nature, extent, and quality of services to be provided to each fund under the Amended Contract will continue to benefit each fund's shareholders.
Competitiveness of Management Fee and Total Expense Ratio. The Board considered that it received and reviewed information regarding each fund's management fee rate and total expense ratio compared to "mapped groups" of competitive funds at the current management fee and expense levels in connection with the annual renewal of the Current Management Contracts. Based on its review, the Board concluded at its July 2023 meeting that each fund's current management fee and total expense ratio are fair and reasonable in light of the services that each fund and its shareholders receive, and the other factors considered.
In its review of the proposed management fee rate under the Amended Contracts, the Board considered that the proposed fee rate is lower than the current management fee rate by 21 basis points for Fidelity Growth Opportunities ETF and Fidelity New Millennium ETF and 17 basis points for Fidelity Small-Mid Cap Opportunities ETF. The Board also considered that each fund's proposed management fee rate and total net expense ratio would rank below the median of its competitor funds based on the competitive mapped group data provided to the Board in connection with the annual renewal of the Current Management Contracts.
Based on its review, the Board concluded that the management fee and the projected total expense ratio of each fund continue to be fair and reasonable in light of the services that the fund receives and the other factors considered.
Costs of the Services and Profitability. The Board considered that it previously reviewed information regarding the revenues earned, the expenses incurred by Fidelity in providing services to each fund and the level of Fidelity's profitability. At its July 2023 meeting, the Board concluded that it was satisfied that the profitability of Fidelity in connection with the operation of each fund was not excessive. Because the Board was approving an arrangement under which the management fees were being reduced, the Board did not consider Fidelity's costs of services, revenues, or profitability to be significant factors in its decision to approve the Amended Contracts.
Economies of Scale. The Board considered that it previously received and reviewed information regarding whether there have been economies of scale in respect of the management of the Fidelity funds, whether the Fidelity funds (including each fund) have appropriately benefited from any such economies of scale, and whether there is potential for realization of any further economies of scale and that it concluded, at its July 2023 meeting, that economies of scale, if any, are being appropriately shared between fund shareholders and Fidelity. In connection with the approval of each fund's Amended Contract, the Board did not consider economies of scale because the proposed fee arrangement lowers each fund's management fee. The Board will continue to review economies of scale in connection with its consideration of future renewals of the Amended Contracts.
Based on its evaluation of all of the conclusions noted above, and after considering all factors it believed relevant, the Board ultimately concluded that the advisory fee structures are fair and reasonable, and that each fund's Amended Contract should be approved.
Board Approval of Investment Advisory Contracts
At its January 2024 meeting, the Board of Trustees, including the Independent Trustees (together, the Board), approved amended and restated sub-advisory agreements (the Sub-Advisory Contracts) for each fund, including each fund's sub-advisory agreements with FMR Investment Management (UK) Limited (FMR UK), Fidelity Management & Research (Hong Kong) Limited (FMR H.K.), and Fidelity Management & Research (Japan) Limited (FMR Japan). The Sub-Advisory Contracts will be effective March 1, 2024. The Board will consider the annual renewal of the funds' Sub-Advisory Contracts in May 2024, following its review of additional materials provided by FMR.
The Board considered the Sub-Advisory Contracts, which simplified the calculation of the fees paid by FMR to the sub-advisers under the agreements. The Board noted that the agreements with FMR UK, FMR H.K., and FMR Japan were amended to provide that FMR will compensate each sub-adviser at a fee rate equal to 110% of the sub-adviser's costs incurred in providing services under the agreement. The Board considered that, under the Sub-Advisory Contracts, FMR, and not each fund, will continue to pay the sub-advisory fees to each applicable sub-adviser, and that the management fee paid by the funds under the management contracts with FMR will remain unchanged.
The Board further considered that the approval of each fund's Sub-Advisory Contracts will not result in any changes in the investment process or strategies employed in the management of each fund's assets or the day-to-day management of each fund or the persons primarily responsible for such management. Further, the Board considered that the Sub-Advisory Contracts would not change the obligations and services of FMR and its affiliates on behalf of each fund, and, in particular, there would be no change in the nature and level of services provided to each fund by FMR and its affiliates.
In connection with its consideration of future renewals of each fund's advisory contracts, the Board will consider: (i) the nature, extent and quality of services provided to the funds, including shareholder and administrative services and investment performance; (ii) the competitiveness of the management fee and total expenses for each fund; (iii) the costs of the services and profitability, including the revenues earned and the expenses incurred in conducting the business of developing, marketing, distributing, managing, administering, and servicing each fund and its shareholders, to the extent applicable; and (iv) whether there have been economies of scale in respect of the Fidelity funds, whether the Fidelity funds (including the funds) have appropriately benefited from any such economies of scale, and whether there is the potential for realization of any further economies.
Based on its evaluation of all of the conclusions noted above, and after considering all factors it believed relevant, the Board concluded that each fund's management fee structure is fair and reasonable, and that the funds' Sub-Advisory Contracts should be approved.
The Securities and Exchange Commission adopted Rule 22e-4 under the Investment Company Act of 1940 (the Liquidity Rule) to promote effective liquidity risk management throughout the open-end investment company industry, thereby reducing the risk that funds will be unable to meet their redemption obligations and mitigating dilution of the interests of fund shareholders.
The Funds have adopted and implemented a liquidity risk management program (the Program) reasonably designed to assess and manage each Fund's liquidity risk and to comply with the requirements of the Liquidity Rule. Each Fund's Board of Trustees (the Board) has designated each Fund's investment adviser as administrator of the Program. The Fidelity advisers have established a Liquidity Risk Management Committee (the LRM Committee) to manage the Program for each of the Fidelity Funds. The LRM Committee monitors the adequacy and effectiveness of implementation of the Program and on a periodic basis assesses each Fund's liquidity risk based on a variety of factors including (1) the Fund's investment strategy, (2) portfolio liquidity and cash flow projections during normal and reasonably foreseeable stressed conditions, (3) shareholder redemptions, (4) borrowings and other funding sources and (5) certain factor specific to ETFs including the effect of the Fund's prices and spreads, market participants, and basket compositions on the overall liquidity of the Fund's portfolio, as applicable.
In accordance with the Program, each of the Fund's portfolio investments is classified into one of four defined liquidity categories based on a determination of a reasonable expectation for how long it would take to convert the investment to cash (or sell or dispose of the investment) without significantly changing its market value.
- Highly liquid investments - cash or convertible to cash within three business days or less
- Moderately liquid investments - convertible to cash in three to seven calendar days
- Less liquid investments - can be sold or disposed of, but not settled, within seven calendar days
- Illiquid investments - cannot be sold or disposed of within seven calendar days
Liquidity classification determinations take into account a variety of factors including various market, trading and investment-specific considerations, as well as market depth, and generally utilize analysis from a third-party liquidity metrics service.
The Liquidity Rule places a 15% limit on a fund's illiquid investments and requires funds that do not primarily hold assets that are highly liquid investments to determine and maintain a minimum percentage of the fund's net assets to be invested in highly liquid investments (highly liquid investment minimum or HLIM). The Program includes provisions reasonably designed to comply with the 15% limit on illiquid investments and for determining, periodically reviewing and complying with the HLIM requirement as applicable.
At a recent meeting of the Fund's Board of Trustees, the LRM Committee provided a written report to the Board pertaining to the operation, adequacy, and effectiveness of the Program for the period December 1, 2022 through November 30, 2023. The report concluded that the Program is operating effectively and is reasonably designed to assess and manage the Fund's liquidity risk.
1.9897895.103
GTF-SANN-0324
Item 2.
Code of Ethics
Not applicable.
Item 3.
Audit Committee Financial Expert
Not applicable.
Item 4.
Principal Accountant Fees and Services
Not applicable.
Item 5.
Audit Committee of Listed Registrants
Not applicable.
Item 6.
Investments
(a)
Not applicable.
(b)
Not applicable
Item 7.
Disclosure of Proxy Voting Policies and Procedures for Closed-End Management Investment Companies
Not applicable.
Item 8.
Portfolio Managers of Closed-End Management Investment Companies
Not applicable.
Item 9.
Purchase of Equity Securities by Closed-End Management Investment Company and Affiliated Purchasers
Not applicable.
Item 10.
Submission of Matters to a Vote of Security Holders
There were no material changes to the procedures by which shareholders may recommend nominees to the Fidelity Covington Trust’s Board of Trustees.
Item 11.
Controls and Procedures
(a)(i) The President and Treasurer and the Chief Financial Officer have concluded that the Fidelity Covington Trust’s (the “Trust”) disclosure controls and procedures (as defined in Rule 30a-3(c) under the Investment Company Act) provide reasonable
assurances that material information relating to the Trust is made known to them by the appropriate persons, based on their evaluation of these controls and procedures as of a date within 90 days of the filing date of this report.
(a)(ii) There was no change in the Trust’s internal control over financial reporting (as defined in Rule 30a-3(d) under the Investment Company Act) that occurred during the period covered by this report that has materially affected, or is reasonably likely to materially affect, the Trust’s internal control over financial reporting.
Item 12.
Disclosure of Securities Lending Activities for Closed-End Management
Investment Companies
Not applicable.
Item 18.
Recovery of Erroneously Awarded Compensation
(a)
Not applicable.
(b)
Not applicable.
Item 19.
Exhibits
SIGNATURES
Pursuant to the requirements of the Securities Exchange Act of 1934 and the Investment Company Act of 1940, the registrant has duly caused this report to be signed on its behalf by the undersigned, thereunto duly authorized.
Fidelity Covington Trust
| |
By: | /s/Stacie M. Smith |
| Stacie M. Smith |
| President and Treasurer |
|
|
Date: | March 21, 2024 |
Pursuant to the requirements of the Securities Exchange Act of 1934 and the Investment Company Act of 1940, this report has been signed below by the following persons on behalf of the registrant and in the capacities and on the dates indicated.
| |
By: | /s/Stacie M. Smith |
| Stacie M. Smith |
| President and Treasurer |
|
|
Date: | March 21, 2024 |
| |
By: | /s/John J. Burke III |
| John J. Burke III |
| Chief Financial Officer |
|
|
Date: | March 21, 2024 |