UNITED STATES
SECURITIES AND EXCHANGE COMMISSION
Washington, D.C. 20549
FORM N-CSR
CERTIFIED SHAREHOLDER REPORT OF REGISTERED
MANAGEMENT INVESTMENT COMPANIES
Investment Company Act file number 811-07319
Fidelity Covington Trust
(Exact name of registrant as specified in charter)
245 Summer St., Boston, MA 02210
(Address of principal executive offices) (Zip code)
Margaret Carey, Secretary
245 Summer St.
Boston, Massachusetts 02210
(Name and address of agent for service)
Registrant's telephone number, including area code:
617-563-7000
Date of fiscal year end: | August 31 |
Date of reporting period: | February 29, 2024 |
Item 1.
Reports to Stockholders


Contents
| Top Bond Issuers (% of Fund's net assets) | ||
(with maturities greater than one year) | ||
| Mineral Resources Ltd. | 2.6 | |
| FMG Resources Pty Ltd. | 2.1 | |
| TransDigm, Inc. | 1.9 | |
| Northern Oil & Gas, Inc. | 1.8 | |
| CCO Holdings LLC/CCO Holdings Capital Corp. | 1.7 | |
| CVR Energy, Inc. | 1.6 | |
| New Fortress Energy, Inc. | 1.5 | |
| OneMain Finance Corp. | 1.5 | |
| Performance Food Group, Inc. | 1.4 | |
| Royal Caribbean Cruises Ltd. | 1.3 | |
| 17.4 | ||
| Market Sectors (% of Fund's net assets) | ||
| Energy | 18.2 | |
| Diversified Financial Services | 7.9 | |
| Metals/Mining | 5.3 | |
| Services | 4.9 | |
| Telecommunications | 4.7 | |
Quality Diversification (% of Fund's net assets) |
 |
| We have used ratings from Moody's Investors Service, Inc. Where Moody's® ratings are not available, we have used S&P® ratings. All ratings are as of the date indicated and do not reflect subsequent changes. |
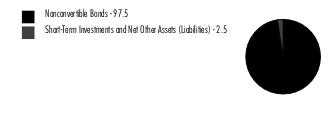
Asset Allocation (% of Fund's net assets) |
 |
Geographic Diversification (% of Fund's net assets) |
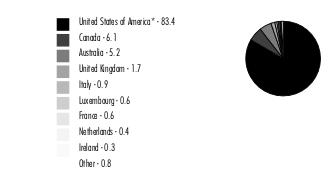 |
* Includes Short-Term investments and Net Other Assets (Liabilities). Percentages are adjusted for the effect of derivatives, if applicable. |
| Nonconvertible Bonds - 97.5% | |||
Principal Amount (a) | Value ($) | ||
| Aerospace - 3.8% | |||
| Bombardier, Inc.: | |||
| 7.5% 2/1/29 (b) | 1,697,000 | 1,721,258 | |
| 7.875% 4/15/27 (b) | 218,000 | 218,278 | |
| 8.75% 11/15/30 (b) | 450,000 | 471,380 | |
| Hexcel Corp. 4.95% 8/15/25 | 269,000 | 264,746 | |
| Spirit Aerosystems, Inc.: | |||
| 4.6% 6/15/28 | 550,000 | 482,801 | |
| 9.75% 11/15/30 (b) | 1,797,000 | 1,925,229 | |
| TransDigm, Inc.: | |||
| 4.875% 5/1/29 | 3,525,000 | 3,237,821 | |
| 6.375% 3/1/29 (b) | 1,000,000 | 1,004,520 | |
| 6.875% 12/15/30 (b) | 1,329,000 | 1,344,828 | |
| VistaJet Malta Finance PLC / XO Management Holding, Inc. 9.5% 6/1/28 (b) | 500,000 | 421,250 | |
TOTAL AEROSPACE | 11,092,111 | ||
| Air Transportation - 1.5% | |||
| Air Canada 3.875% 8/15/26 (b) | 600,000 | 568,233 | |
| Allegiant Travel Co. 7.25% 8/15/27 (b) | 1,030,000 | 1,002,708 | |
| American Airlines, Inc. 7.25% 2/15/28 (b) | 265,000 | 267,206 | |
| American Airlines, Inc. / AAdvantage Loyalty IP Ltd. 5.5% 4/20/26 (b) | 484,226 | 479,787 | |
| Bristow Group, Inc. 6.875% 3/1/28 (b) | 166,000 | 162,514 | |
| Rand Parent LLC 8.5% 2/15/30 (b) | 300,000 | 291,350 | |
| Spirit Loyalty Cayman Ltd. / Spirit IP Cayman Ltd. 8% 9/20/25 (b) | 584,000 | 422,384 | |
| United Airlines Holdings, Inc. 4.875% 1/15/25 | 369,000 | 365,310 | |
| United Airlines, Inc. 4.375% 4/15/26 (b) | 874,900 | 842,060 | |
TOTAL AIR TRANSPORTATION | 4,401,552 | ||
| Automotive & Auto Parts - 2.1% | |||
| Allison Transmission, Inc. 3.75% 1/30/31 (b) | 2,845,000 | 2,458,323 | |
| Champions Financing, Inc. 8.75% 2/15/29 (b) | 300,000 | 306,441 | |
| EquipmentShare.Com, Inc. 9% 5/15/28 (b) | 300,000 | 307,417 | |
| Ford Motor Credit Co. LLC 6.95% 3/6/26 | 900,000 | 916,204 | |
| Gates Global LLC/Gates Global Co. 6.25% 1/15/26 (b) | 175,000 | 174,404 | |
| Jaguar Land Rover Automotive PLC 7.75% 10/15/25 (b) | 175,000 | 176,518 | |
| LCM Investments Holdings 8.25% 8/1/31 (b) | 365,000 | 372,517 | |
| Macquarie AirFinance Holdings 8.125% 3/30/29 (b) | 460,000 | 478,285 | |
| Tenneco, Inc. 8% 11/17/28 (b) | 550,000 | 501,188 | |
| Thor Industries, Inc. 4% 10/15/29 (b) | 643,000 | 569,055 | |
TOTAL AUTOMOTIVE & AUTO PARTS | 6,260,352 | ||
| Banks & Thrifts - 1.6% | |||
| AG TTMT Escrow Issuer LLC 8.625% 9/30/27 (b) | 500,000 | 514,669 | |
| Freedom Mortgage Hold 9.25% 2/1/29 (b) | 930,000 | 944,136 | |
| PennyMac Financial Services, Inc.: | |||
| 5.75% 9/15/31 (b) | 900,000 | 827,552 | |
| 7.875% 12/15/29 (b) | 1,100,000 | 1,125,970 | |
| UniCredit SpA: | |||
| 5.459% 6/30/35 (b)(c) | 1,150,000 | 1,062,623 | |
| 7.296% 4/2/34 (b)(c) | 149,693 | 152,774 | |
TOTAL BANKS & THRIFTS | 4,627,724 | ||
| Broadcasting - 4.5% | |||
| Clear Channel Outdoor Holdings, Inc. 9% 9/15/28 (b) | 500,000 | 521,500 | |
| DISH Network Corp. 11.75% 11/15/27 (b) | 2,700,000 | 2,814,961 | |
| Gray Television, Inc.: | |||
| 5.375% 11/15/31 (b) | 600,000 | 393,000 | |
| 7% 5/15/27 (b) | 30,000 | 27,111 | |
| iHeartCommunications, Inc. 4.75% 1/15/28 (b) | 500,000 | 360,000 | |
| Nexstar Media, Inc. 4.75% 11/1/28 (b) | 3,102,000 | 2,754,423 | |
| Sinclair Television Group, Inc. 4.125% 12/1/30 (b) | 958,000 | 700,059 | |
| Sirius XM Radio, Inc. 3.125% 9/1/26 (b) | 729,000 | 679,741 | |
| TEGNA, Inc.: | |||
| 4.625% 3/15/28 | 1,339,000 | 1,202,154 | |
| 5% 9/15/29 | 1,460,000 | 1,284,800 | |
| Univision Communications, Inc.: | |||
| 7.375% 6/30/30 (b) | 1,576,000 | 1,522,212 | |
| 8% 8/15/28 (b) | 920,000 | 924,913 | |
TOTAL BROADCASTING | 13,184,874 | ||
| Building Materials - 2.1% | |||
| AmeriTex Holdco Intermediate LLC 10.25% 10/15/28 (b) | 300,000 | 314,250 | |
| Beacon Roofing Supply, Inc. 6.5% 8/1/30 (b) | 290,000 | 291,570 | |
| Builders FirstSource, Inc. 6.375% 3/1/34 (b) | 1,000,000 | 997,667 | |
| Eco Material Technologies, Inc. 7.875% 1/31/27 (b) | 165,000 | 164,631 | |
| Emrld Borrower LP / Emerald Co. 6.625% 12/15/30 (b) | 1,000,000 | 1,003,500 | |
| Griffon Corp. 5.75% 3/1/28 | 1,220,000 | 1,180,350 | |
| Jeld-Wen, Inc. 4.625% 12/15/25 (b) | 235,000 | 229,098 | |
| Smyrna Ready Mix LLC 8.875% 11/15/31 (b) | 600,000 | 635,870 | |
| Standard Industries, Inc./New Jersey 4.375% 7/15/30 (b) | 479,000 | 427,069 | |
| Wesco Distribution, Inc. 6.375% 3/15/29 (b) | 1,000,000 | 1,000,092 | |
TOTAL BUILDING MATERIALS | 6,244,097 | ||
| Cable/Satellite TV - 3.3% | |||
| CCO Holdings LLC/CCO Holdings Capital Corp.: | |||
| 4.25% 1/15/34 (b) | 861,000 | 643,733 | |
| 4.5% 5/1/32 | 1,669,000 | 1,318,518 | |
| 6.375% 9/1/29 (b) | 1,168,000 | 1,097,356 | |
| 7.375% 3/1/31 (b) | 2,000,000 | 1,937,500 | |
| CSC Holdings LLC: | |||
| 4.5% 11/15/31 (b) | 1,350,000 | 1,002,375 | |
| 11.25% 5/15/28 (b) | 850,000 | 877,005 | |
| DIRECTV Financing LLC 8.875% 2/1/30 (b) | 450,000 | 452,999 | |
| DIRECTV Financing LLC / DIRECTV Financing Co-Obligor, Inc. 5.875% 8/15/27 (b) | 1,083,000 | 1,022,211 | |
| Dolya Holdco 18 DAC 5% 7/15/28 (b) | 450,000 | 415,200 | |
| Ziggo BV 4.875% 1/15/30 (b) | 1,200,000 | 1,068,974 | |
TOTAL CABLE/SATELLITE TV | 9,835,871 | ||
| Capital Goods - 0.9% | |||
| ATS Corp. 4.125% 12/15/28 (b) | 440,000 | 401,566 | |
| EnerSys 4.375% 12/15/27 (b) | 1,238,000 | 1,165,268 | |
| Husky Injection / Titan 9% 2/15/29 (b) | 400,000 | 408,735 | |
| Patrick Industries, Inc. 4.75% 5/1/29 (b) | 886,000 | 810,814 | |
TOTAL CAPITAL GOODS | 2,786,383 | ||
| Chemicals - 2.5% | |||
| Avient Corp. 5.75% 5/15/25 (b) | 105,000 | 104,386 | |
| CVR Partners LP/CVR Nitrogen Finance Corp. 6.125% 6/15/28 (b) | 380,000 | 359,320 | |
| INEOS Finance PLC 7.5% 4/15/29 (b) | 500,000 | 497,750 | |
| INEOS Quattro Finance 2 PLC: | |||
| 3.375% 1/15/26 (b) | 480,000 | 453,124 | |
| 9.625% 3/15/29 (b) | 500,000 | 525,877 | |
| NOVA Chemicals Corp.: | |||
| 8.5% 11/15/28 (b) | 380,000 | 401,225 | |
| 9% 2/15/30 (b) | 500,000 | 501,599 | |
| Nufarm Australia Ltd. 5% 1/27/30 (b) | 605,000 | 554,827 | |
| Olin Corp. 5% 2/1/30 | 1,861,300 | 1,739,625 | |
| Olympus Water U.S. Holding Corp. 9.75% 11/15/28 (b) | 900,000 | 956,292 | |
| The Chemours Co. LLC: | |||
| 4.625% 11/15/29 (b) | 1,500,000 | 1,233,416 | |
| 5.75% 11/15/28 (b) | 70,000 | 61,393 | |
TOTAL CHEMICALS | 7,388,834 | ||
| Consumer Products - 2.3% | |||
| BlueLinx Corp. 6% 11/15/29 (b) | 225,000 | 214,706 | |
| Energizer Holdings, Inc. 4.75% 6/15/28 (b) | 500,000 | 457,174 | |
| Ferrellgas LP/Ferrellgas Finance Corp. 5.375% 4/1/26 (b) | 556,000 | 550,457 | |
| Grubhub Holdings, Inc. 5.5% 7/1/27 (b) | 101,000 | 88,051 | |
| Newell Brands, Inc. 6.375% 9/15/27 | 300,000 | 290,612 | |
| Rakuten Group, Inc. 11.25% 2/15/27 (b) | 600,000 | 635,357 | |
| Tempur Sealy International, Inc. 3.875% 10/15/31 (b) | 3,003,000 | 2,497,736 | |
| TripAdvisor, Inc. 7% 7/15/25 (b) | 1,224,000 | 1,225,457 | |
| Verde Purchaser LLC 10.5% 11/30/30 (b) | 700,000 | 731,500 | |
TOTAL CONSUMER PRODUCTS | 6,691,050 | ||
| Containers - 0.5% | |||
| Ardagh Packaging Finance PLC/Ardagh MP Holdings U.S.A., Inc. 5.25% 4/30/25 (b) | 361,000 | 356,987 | |
| BWAY Holding Co. 7.875% 8/15/26 (b) | 730,000 | 739,721 | |
| LABL, Inc. 9.5% 11/1/28 (b) | 300,000 | 300,072 | |
TOTAL CONTAINERS | 1,396,780 | ||
| Diversified Financial Services - 7.9% | |||
| BrightSphere Investment Group, Inc. 4.8% 7/27/26 | 1,696,000 | 1,613,557 | |
| Castlelake Aviation Finance 5% 4/15/27 (b) | 414,000 | 392,770 | |
| Credit Acceptance Corp. 6.625% 3/15/26 | 1,351,000 | 1,346,070 | |
| Enova International, Inc. 8.5% 9/15/25 (b) | 325,000 | 321,891 | |
| First Cash Financial Services, Inc. 5.625% 1/1/30 (b) | 2,702,000 | 2,559,569 | |
| Fortress Transportation & Infrastructure Investors LLC 7.875% 12/1/30 (b) | 850,000 | 891,227 | |
| Freedom Mortgage Corp.: | |||
| 12% 10/1/28 (b) | 300,000 | 325,004 | |
| 12.25% 10/1/30 (b) | 300,000 | 330,069 | |
| GGAM Finance Ltd. 8% 2/15/27 (b) | 775,000 | 794,353 | |
| Gn Bondco LLC 9.5% 10/15/31 (b) | 230,000 | 227,700 | |
| goeasy Ltd. 9.25% 12/1/28 (b) | 1,275,000 | 1,352,871 | |
| Howden UK Refinance PLC / Howden UK Refinance 2 PLC / Howden U.S. Finance LLC 7.25% 2/15/31 (b) | 500,000 | 500,625 | |
| Icahn Enterprises LP/Icahn Enterprises Finance Corp. 4.375% 2/1/29 | 1,418,000 | 1,196,423 | |
| Jefferson Capital Holding 9.5% 2/15/29 (b) | 500,000 | 505,019 | |
| Ladder Capital Finance Holdings LLLP/Ladder Capital Finance Corp. 4.75% 6/15/29 (b) | 713,000 | 639,877 | |
| MidCap Financial Issuer Trust 5.625% 1/15/30 (b) | 840,000 | 710,480 | |
| Nationstar Mortgage Holdings, Inc.: | |||
| 5.125% 12/15/30 (b) | 500,000 | 446,303 | |
| 5.5% 8/15/28 (b) | 933,000 | 880,788 | |
| 5.75% 11/15/31 (b) | 700,000 | 641,346 | |
| 6% 1/15/27 (b) | 550,000 | 540,744 | |
| Navient Corp. 9.375% 7/25/30 | 758,000 | 792,146 | |
| OneMain Finance Corp.: | |||
| 3.875% 9/15/28 | 1,857,000 | 1,622,449 | |
| 6.625% 1/15/28 | 731,000 | 726,849 | |
| 7.875% 3/15/30 | 450,000 | 457,665 | |
| 9% 1/15/29 | 1,592,000 | 1,671,982 | |
| PRA Group, Inc. 8.375% 2/1/28 (b) | 537,000 | 524,918 | |
| StoneX Group, Inc. 8.625% 6/15/25 (b) | 1,231,000 | 1,238,644 | |
TOTAL DIVERSIFIED FINANCIAL SERVICES | 23,251,339 | ||
| Diversified Media - 0.0% | |||
| Outfront Media Capital LLC / Corp. 4.25% 1/15/29 (b) | 65,000 | 58,380 | |
| Energy - 18.2% | |||
| Aethon United BR LP / Aethon United Finance Corp. 8.25% 2/15/26 (b) | 185,000 | 185,766 | |
| AmeriGas Partners LP/AmeriGas Finance Corp. 9.375% 6/1/28 (b) | 625,000 | 634,375 | |
| Antero Midstream Partners LP/Antero Midstream Finance Corp. 5.375% 6/15/29 (b) | 633,000 | 602,051 | |
| Antero Resources Corp. 8.375% 7/15/26 (b) | 275,000 | 285,078 | |
| Baytex Energy Corp.: | |||
| 8.5% 4/30/30 (b) | 3,238,000 | 3,366,902 | |
| 8.75% 4/1/27 (b) | 195,000 | 202,283 | |
| Buckeye Partners LP 4.5% 3/1/28 (b) | 1,370,000 | 1,273,700 | |
| California Resources Corp. 7.125% 2/1/26 (b) | 140,000 | 140,738 | |
| Chord Energy Corp. 6.375% 6/1/26 (b) | 508,000 | 508,635 | |
| Citgo Petroleum Corp.: | |||
| 6.375% 6/15/26 (b) | 715,000 | 719,457 | |
| 7% 6/15/25 (b) | 124,000 | 123,708 | |
| 8.375% 1/15/29 (b) | 650,000 | 682,610 | |
| Civitas Resources, Inc.: | |||
| 5% 10/15/26 (b) | 1,131,000 | 1,095,877 | |
| 8.375% 7/1/28 (b) | 450,000 | 470,891 | |
| 8.625% 11/1/30 (b) | 860,000 | 920,270 | |
| 8.75% 7/1/31 (b) | 710,000 | 755,064 | |
| CNX Midstream Partners LP 4.75% 4/15/30 (b) | 553,000 | 483,794 | |
| CNX Resources Corp. 7.25% 3/1/32 (b) | 400,000 | 398,610 | |
| Comstock Resources, Inc. 6.75% 3/1/29 (b) | 300,000 | 276,732 | |
| Coronado Finance Pty Ltd. 10.75% 5/15/26 (b) | 160,000 | 165,729 | |
| CQP Holdco LP / BIP-V Chinook Holdco LLC 7.5% 12/15/33 (b) | 365,000 | 372,141 | |
| CVR Energy, Inc.: | |||
| 5.75% 2/15/28 (b) | 2,910,000 | 2,701,091 | |
| 8.5% 1/15/29 (b) | 2,000,000 | 2,012,500 | |
| Delek Logistics Partners LP/Delek Logistics Finance Corp.: | |||
| 7.125% 6/1/28 (b) | 1,975,000 | 1,891,063 | |
| 8.625% 3/15/29 (b)(d) | 500,000 | 500,532 | |
| Energy Ventures GoM LLC / EnVen Finance Corp. 11.75% 4/15/26 (b) | 150,000 | 155,325 | |
| EQM Midstream Partners LP: | |||
| 6.375% 4/1/29 (b) | 1,000,000 | 1,002,871 | |
| 7.5% 6/1/27 (b) | 728,000 | 744,818 | |
| Genesis Energy LP/Genesis Energy Finance Corp. 8.875% 4/15/30 | 600,000 | 622,079 | |
| Global Partners LP/GLP Finance Corp. 8.25% 1/15/32 (b) | 170,000 | 174,369 | |
| Harvest Midstream I LP 7.5% 9/1/28 (b) | 50,000 | 50,404 | |
| Howard Midstream Energy Partners LLC 8.875% 7/15/28 (b) | 500,000 | 526,875 | |
| Independence Energy Finance LLC 7.25% 5/1/26 (b) | 402,000 | 400,533 | |
| Kodiak Gas Services LLC 7.25% 2/15/29 (b) | 500,000 | 509,038 | |
| Matador Resources Co. 5.875% 9/15/26 | 165,300 | 163,686 | |
| Moss Creek Resources Holdings, Inc. 7.5% 1/15/26 (b) | 362,000 | 359,899 | |
| Nabors Industries, Inc.: | |||
| 7.375% 5/15/27 (b) | 200,000 | 199,264 | |
| 9.125% 1/31/30 (b) | 230,000 | 235,750 | |
| New Fortress Energy, Inc. 6.5% 9/30/26 (b) | 4,675,000 | 4,513,891 | |
| NGL Energy Operating LLC/NGL Energy Finance Corp. 8.125% 2/15/29 (b) | 600,000 | 605,656 | |
| Northern Oil & Gas, Inc.: | |||
| 8.125% 3/1/28 (b) | 866,000 | 876,938 | |
| 8.75% 6/15/31 (b) | 4,107,000 | 4,291,815 | |
| NuStar Logistics LP 5.625% 4/28/27 | 160,000 | 158,354 | |
| PBF Holding Co. LLC/PBF Finance Corp.: | |||
| 6% 2/15/28 | 465,000 | 452,213 | |
| 7.875% 9/15/30 (b) | 450,000 | 461,106 | |
| Perenti Finance Pty Ltd. 6.5% 10/7/25 (b) | 555,000 | 547,369 | |
| Prairie Acquiror LP 9% 8/1/29 (b)(d) | 500,000 | 503,805 | |
| Rockies Express Pipeline LLC 4.8% 5/15/30 (b) | 504,000 | 466,830 | |
| Seadrill Finance Ltd. 8.375% 8/1/30 (b) | 120,000 | 123,320 | |
| Sitio Royalties OP / Sitio Finance Corp. 7.875% 11/1/28 (b) | 500,000 | 511,050 | |
| SM Energy Co. 6.75% 9/15/26 | 450,000 | 447,486 | |
| Summit Midstream Holdings LLC 9% 10/15/26 (b) | 300,000 | 296,797 | |
| Sunnova Energy Corp. 11.75% 10/1/28 (b) | 200,000 | 168,270 | |
| Sunoco LP/Sunoco Finance Corp. 7% 9/15/28 (b) | 879,000 | 900,264 | |
| Tallgrass Energy Partners LP / Tallgrass Energy Finance Corp. 6% 9/1/31 (b) | 500,000 | 458,017 | |
| Talos Production, Inc. 9% 2/1/29 (b) | 555,000 | 567,245 | |
| Transocean Aquila Ltd. 8% 9/30/28 (b) | 560,000 | 570,500 | |
| Transocean Titan Finance Ltd. 8.375% 2/1/28 (b) | 222,000 | 227,828 | |
| Transocean, Inc. 8.75% 2/15/30 (b) | 405,000 | 415,863 | |
| U.S.A. Compression Partners LP/U.S.A. Compression Finance Corp.: | |||
| 6.875% 4/1/26 | 1,870,000 | 1,867,454 | |
| 6.875% 9/1/27 | 400,000 | 397,945 | |
| Valaris Ltd. 8.375% 4/30/30 (b) | 300,000 | 307,616 | |
| Venture Global Calcasieu Pass LLC 6.25% 1/15/30 (b) | 820,000 | 818,702 | |
| Venture Global LNG, Inc.: | |||
| 8.125% 6/1/28 (b) | 924,000 | 938,698 | |
| 9.5% 2/1/29 (b) | 650,000 | 693,039 | |
| 9.875% 2/1/32 (b) | 972,000 | 1,023,400 | |
| Vital Energy, Inc.: | |||
| 7.75% 7/31/29 (b) | 214,000 | 212,857 | |
| 9.75% 10/15/30 | 1,060,000 | 1,135,386 | |
| 10.125% 1/15/28 | 676,000 | 707,519 | |
| Weatherford International Ltd. 8.625% 4/30/30 (b) | 1,922,000 | 1,992,703 | |
TOTAL ENERGY | 53,574,444 | ||
| Entertainment/Film - 0.6% | |||
| Live Nation Entertainment, Inc. 4.875% 11/1/24 (b) | 1,195,000 | 1,185,082 | |
| Resorts World Las Vegas LLC / RWLV Capital, Inc. 8.45% 7/27/30 (b) | 515,000 | 548,434 | |
TOTAL ENTERTAINMENT/FILM | 1,733,516 | ||
| Environmental - 1.2% | |||
| GFL Environmental, Inc. 4% 8/1/28 (b) | 3,730,000 | 3,419,933 | |
| Food & Drug Retail - 1.3% | |||
| Albertsons Companies LLC/Safeway, Inc./New Albertson's, Inc./Albertson's LLC 6.5% 2/15/28 (b) | 878,000 | 883,452 | |
| Murphy Oil U.S.A., Inc. 4.75% 9/15/29 | 2,526,000 | 2,355,205 | |
| Parkland Corp. 5.875% 7/15/27 (b) | 614,000 | 602,569 | |
TOTAL FOOD & DRUG RETAIL | 3,841,226 | ||
| Food/Beverage/Tobacco - 3.3% | |||
| HLF Financing SARL LLC / Herbalife International, Inc. 4.875% 6/1/29 (b) | 500,000 | 357,630 | |
| KeHE Distributor / Nextwave 9% 2/15/29 (b) | 200,000 | 200,587 | |
| Lamb Weston Holdings, Inc. 4.125% 1/31/30 (b) | 883,000 | 800,063 | |
| Performance Food Group, Inc. 4.25% 8/1/29 (b) | 4,521,000 | 4,103,051 | |
| Post Holdings, Inc.: | |||
| 4.5% 9/15/31 (b) | 383,000 | 340,985 | |
| 6.25% 2/15/32 (b) | 800,000 | 804,136 | |
| Turning Point Brands, Inc. 5.625% 2/15/26 (b) | 1,421,000 | 1,392,807 | |
| Vector Group Ltd. 5.75% 2/1/29 (b) | 2,012,000 | 1,843,238 | |
TOTAL FOOD/BEVERAGE/TOBACCO | 9,842,497 | ||
| Gaming - 1.6% | |||
| Caesars Entertainment, Inc.: | |||
| 6.25% 7/1/25 (b) | 300 | 300 | |
| 6.5% 2/15/32 (b) | 500,000 | 503,741 | |
| 8.125% 7/1/27 (b) | 250,000 | 256,697 | |
| Carnival Corp. 10.5% 6/1/30 (b) | 340,000 | 370,951 | |
| Churchill Downs, Inc.: | |||
| 5.5% 4/1/27 (b) | 246,000 | 241,602 | |
| 5.75% 4/1/30 (b) | 1,066,000 | 1,024,272 | |
| International Game Technology PLC 4.125% 4/15/26 (b) | 205,000 | 197,855 | |
| Las Vegas Sands Corp. 3.9% 8/8/29 | 250,000 | 226,100 | |
| Light & Wonder International, Inc. 7.5% 9/1/31 (b) | 210,000 | 218,787 | |
| MGM Resorts International 6.75% 5/1/25 | 151,000 | 151,210 | |
| Ontario Gaming GTA LP 8% 8/1/30 (b) | 145,000 | 147,887 | |
| Premier Entertainment Sub LLC 5.625% 9/1/29 (b) | 400,000 | 288,056 | |
| Raptor Acquisition Corp. / Raptor Co-Issuer LLC 4.875% 11/1/26 (b) | 677,000 | 651,625 | |
| Wynn Resorts Finance LLC / Wynn Resorts Capital Corp. 7.125% 2/15/31 (b) | 377,000 | 389,322 | |
TOTAL GAMING | 4,668,405 | ||
| Healthcare - 4.2% | |||
| AMN Healthcare 4% 4/15/29 (b) | 866,000 | 759,915 | |
| Bausch + Lomb Corp. 8.375% 10/1/28 (b) | 400,000 | 418,000 | |
| Bausch Health Companies, Inc. 4.875% 6/1/28 (b) | 2,495,000 | 1,421,474 | |
| Community Health Systems, Inc.: | |||
| 4.75% 2/15/31 (b) | 1,751,000 | 1,332,441 | |
| 10.875% 1/15/32 (b) | 250,000 | 254,575 | |
| CTR Partnership LP/CareTrust Capital Corp. 3.875% 6/30/28 (b) | 545,000 | 492,892 | |
| DaVita, Inc. 4.625% 6/1/30 (b) | 2,867,000 | 2,521,948 | |
| Medline Borrower LP: | |||
| 3.875% 4/1/29 (b) | 456,000 | 408,865 | |
| 5.25% 10/1/29 (b) | 345,000 | 319,120 | |
| ModivCare Escrow Issuer, Inc. 5% 10/1/29 (b) | 65,000 | 47,938 | |
| Organon & Co. / Organon Foreign Debt Co-Issuer BV 5.125% 4/30/31 (b) | 260,000 | 222,851 | |
| Owens & Minor, Inc. 6.625% 4/1/30 (b) | 195,000 | 188,426 | |
| RegionalCare Hospital Partners Holdings, Inc.: | |||
| 9.875% 8/15/30 (b) | 300,000 | 311,246 | |
| 11% 10/15/30 (b) | 800,000 | 846,242 | |
| Star Parent, Inc. 9% 10/1/30 (b) | 400,000 | 422,148 | |
| Tenet Healthcare Corp. 4.375% 1/15/30 | 2,625,000 | 2,404,222 | |
TOTAL HEALTHCARE | 12,372,303 | ||
| Homebuilders/Real Estate - 3.9% | |||
| Anywhere Real Estate Group LLC 7% 4/15/30 (b) | 304,000 | 275,485 | |
| Arcosa, Inc. 4.375% 4/15/29 (b) | 230,000 | 212,289 | |
| Ardonagh Finco Ltd. 7.75% 2/15/31 (b) | 300,000 | 297,390 | |
| Brookfield Property REIT, Inc./BPR Nimbus LLC/BPR Cumulus LLC/GGSI Sellco LLC: | |||
| 4.5% 4/1/27 (b) | 500,000 | 439,548 | |
| 5.75% 5/15/26 (b) | 950,000 | 916,265 | |
| Cushman & Wakefield U.S. Borrower LLC 8.875% 9/1/31 (b) | 535,000 | 557,069 | |
| Greystar Real Estate Partners 7.75% 9/1/30 (b) | 130,000 | 134,868 | |
| HAT Holdings I LLC/HAT Holdings II LLC 6% 4/15/25 (b) | 790,000 | 781,972 | |
| Howard Hughes Corp. 4.125% 2/1/29 (b) | 800,000 | 710,152 | |
| Kennedy-Wilson, Inc. 4.75% 2/1/30 | 1,306,000 | 1,033,373 | |
| LGI Homes, Inc.: | |||
| 4% 7/15/29 (b) | 860,000 | 737,474 | |
| 8.75% 12/15/28 (b) | 525,000 | 550,266 | |
| MPT Operating Partnership LP/MPT Finance Corp. 3.5% 3/15/31 | 1,000,000 | 669,698 | |
| RHP Hotel Properties LP/RHP Finance Corp. 7.25% 7/15/28 (b) | 400,000 | 409,671 | |
| Service Properties Trust: | |||
| 4.75% 10/1/26 | 889,000 | 825,306 | |
| 5.25% 2/15/26 | 181,000 | 175,784 | |
| 7.5% 9/15/25 | 408,300 | 413,656 | |
| 8.625% 11/15/31 (b) | 500,000 | 528,056 | |
| Starwood Property Trust, Inc. 4.375% 1/15/27 (b) | 502,000 | 470,625 | |
| Uniti Group LP/Uniti Group Finance, Inc./CSL Capital LLC 10.5% 2/15/28 (b) | 1,173,000 | 1,214,170 | |
TOTAL HOMEBUILDERS/REAL ESTATE | 11,353,117 | ||
| Hotels - 1.3% | |||
| Carnival Holdings (Bermuda) Ltd. 10.375% 5/1/28 (b) | 75,000 | 81,822 | |
| Hilton Grand Vacations Borrower Escrow LLC: | |||
| 5% 6/1/29 (b) | 500,000 | 463,245 | |
| 6.625% 1/15/32 (b) | 2,000,000 | 1,999,994 | |
| Travel+Leisure Co.: | |||
| 4.5% 12/1/29 (b) | 80,000 | 73,266 | |
| 6.625% 7/31/26 (b) | 370,000 | 373,922 | |
| Wyndham Hotels & Resorts, Inc. 4.375% 8/15/28 (b) | 805,000 | 748,451 | |
TOTAL HOTELS | 3,740,700 | ||
| Insurance - 0.8% | |||
| Alliant Holdings Intermediate LLC/Alliant Holdings Co.-Issuer 7% 1/15/31 (b) | 725,000 | 722,165 | |
| AmWINS Group, Inc. 6.375% 2/15/29 (b) | 500,000 | 500,326 | |
| National Financial Partners Corp. 8.5% 10/1/31 (b) | 250,000 | 275,956 | |
| NMI Holdings, Inc. 7.375% 6/1/25 (b) | 725,000 | 730,873 | |
TOTAL INSURANCE | 2,229,320 | ||
| Leisure - 2.7% | |||
| Carnival Corp.: | |||
| 4% 8/1/28 (b) | 1,408,000 | 1,298,682 | |
| 6% 5/1/29 (b) | 422,000 | 411,706 | |
| 7.625% 3/1/26 (b) | 102,000 | 103,327 | |
| NCL Corp. Ltd. 8.125% 1/15/29 (b) | 1,775,000 | 1,867,446 | |
| Royal Caribbean Cruises Ltd.: | |||
| 5.5% 8/31/26 (b) | 1,202,000 | 1,188,247 | |
| 6.25% 3/15/32 (b)(d) | 375,000 | 376,073 | |
| 8.25% 1/15/29 (b) | 250,000 | 265,170 | |
| 11.625% 8/15/27 (b) | 1,879,000 | 2,032,418 | |
| Viking Cruises Ltd. 9.125% 7/15/31 (b) | 300,000 | 324,774 | |
TOTAL LEISURE | 7,867,843 | ||
| Metals/Mining - 5.3% | |||
| Arsenal AIC Parent LLC 8% 10/1/30 (b) | 170,000 | 178,075 | |
| Cleveland-Cliffs, Inc. 5.875% 6/1/27 | 596,000 | 589,674 | |
| Eldorado Gold Corp. 6.25% 9/1/29 (b) | 325,000 | 304,521 | |
| First Quantum Minerals Ltd. 9.375% 3/1/29 (b) | 330,000 | 341,983 | |
| FMG Resources Pty Ltd.: | |||
| 4.375% 4/1/31 (b) | 353,000 | 316,341 | |
| 5.875% 4/15/30 (b) | 5,903,000 | 5,777,406 | |
| HudBay Minerals, Inc. 4.5% 4/1/26 (b) | 282,000 | 271,747 | |
| Mineral Resources Ltd.: | |||
| 8% 11/1/27 (b) | 650,000 | 662,032 | |
| 8.125% 5/1/27 (b) | 909,000 | 917,072 | |
| 8.5% 5/1/30 (b) | 2,706,000 | 2,779,102 | |
| 9.25% 10/1/28 (b) | 3,343,000 | 3,505,971 | |
TOTAL METALS/MINING | 15,643,924 | ||
| Paper - 0.3% | |||
| Ardagh Metal Packaging Finance U.S.A. LLC/Ardagh Metal Packaging Finance PLC 6% 6/15/27 (b) | 360,000 | 353,484 | |
| Louisiana-Pacific Corp. 3.625% 3/15/29 (b) | 483,000 | 433,306 | |
| Mercer International, Inc. 12.875% 10/1/28 (b) | 200,000 | 214,479 | |
TOTAL PAPER | 1,001,269 | ||
| Restaurants - 0.7% | |||
| 1011778 BC Unlimited Liability Co./New Red Finance, Inc. 4% 10/15/30 (b) | 2,201,000 | 1,933,367 | |
| Services - 4.9% | |||
| Allied Universal Holdco LLC 7.875% 2/15/31 (b) | 300,000 | 297,924 | |
| Allied Universal Holdco LLC / Allied Universal Finance Corp. 6.625% 7/15/26 (b) | 335,000 | 333,985 | |
| Aramark Services, Inc. 5% 4/1/25 (b) | 150,000 | 149,043 | |
| Artera Services LLC 8.5% 2/15/31 (b) | 300,000 | 306,466 | |
| Avis Budget Car Rental LLC/Avis Budget Finance, Inc. 5.75% 7/15/27 (b) | 918,000 | 872,085 | |
| Brand Industrial Services, Inc. 10.375% 8/1/30 (b) | 400,000 | 425,371 | |
| Bread Financial Holdings, Inc. 9.75% 3/15/29 (b) | 700,000 | 715,925 | |
| CoreCivic, Inc. 8.25% 4/15/26 | 429,000 | 438,404 | |
| Iron Mountain, Inc.: | |||
| 5% 7/15/28 (b) | 2,389,000 | 2,261,756 | |
| 5.25% 7/15/30 (b) | 1,054,000 | 986,312 | |
| Neptune BidCo U.S., Inc. 9.29% 4/15/29 (b) | 700,000 | 656,250 | |
| Ritchie Bros. Holdings, Inc. 7.75% 3/15/31 (b) | 1,792,000 | 1,883,840 | |
| Sabre GLBL, Inc. 8.625% 6/1/27 (b) | 406,000 | 357,347 | |
| TriNet Group, Inc. 3.5% 3/1/29 (b) | 2,322,000 | 2,055,992 | |
| WASH Multifamily Acquisition, Inc. 5.75% 4/15/26 (b) | 601,000 | 582,970 | |
| Williams Scotsman, Inc. 4.625% 8/15/28 (b) | 2,392,000 | 2,246,136 | |
TOTAL SERVICES | 14,569,806 | ||
| Steel - 0.5% | |||
| ATI, Inc. 7.25% 8/15/30 | 883,000 | 907,609 | |
| Carpenter Technology Corp. 7.625% 3/15/30 | 500,000 | 516,395 | |
TOTAL STEEL | 1,424,004 | ||
| Super Retail - 2.4% | |||
| Asbury Automotive Group, Inc. 4.75% 3/1/30 | 1,362,000 | 1,239,461 | |
| Bath & Body Works, Inc.: | |||
| 6.75% 7/1/36 | 597,000 | 586,740 | |
| 6.875% 11/1/35 | 187,000 | 187,094 | |
| 9.375% 7/1/25 (b) | 858,000 | 894,155 | |
| EG Global Finance PLC 12% 11/30/28 (b) | 300,000 | 316,725 | |
| Gap, Inc. 3.625% 10/1/29 (b) | 500,000 | 422,342 | |
| Group 1 Automotive, Inc. 4% 8/15/28 (b) | 2,289,000 | 2,089,405 | |
| QVC, Inc. 4.375% 9/1/28 | 500,000 | 410,116 | |
| Sally Holdings LLC: | |||
| 5.625% 12/1/25 | 105,000 | 104,932 | |
| 6.75% 3/1/32 | 300,000 | 299,138 | |
| Sonic Automotive, Inc. 4.625% 11/15/29 (b) | 65,000 | 57,359 | |
| Staples, Inc. 7.5% 4/15/26 (b) | 500,000 | 480,707 | |
TOTAL SUPER RETAIL | 7,088,174 | ||
| Technology - 3.2% | |||
| Alteryx, Inc. 8.75% 3/15/28 (b) | 585,000 | 593,267 | |
| Atkore, Inc. 4.25% 6/1/31 (b) | 1,017,000 | 893,394 | |
| Clarivate Science Holdings Corp. 4.875% 7/1/29 (b) | 250,000 | 226,728 | |
| Cloud Software Group, Inc. 6.5% 3/31/29 (b) | 1,009,000 | 939,639 | |
| CNT PRNT/CDK GLO II/FIN 8% 6/15/29 (b) | 300,000 | 307,482 | |
| CommScope, Inc. 4.75% 9/1/29 (b) | 500,000 | 342,500 | |
| Consensus Cloud Solutions, Inc. 6.5% 10/15/28 (b) | 1,141,000 | 1,015,056 | |
| Gen Digital, Inc. 5% 4/15/25 (b) | 193,000 | 191,070 | |
| Iron Mountain Information Management Services, Inc. 5% 7/15/32 (b) | 3,282,000 | 2,934,224 | |
| MicroStrategy, Inc. 6.125% 6/15/28 (b) | 195,000 | 188,019 | |
| NCR Atleos Corp. 9.5% 4/1/29 (b) | 730,000 | 772,190 | |
| PTC, Inc. 3.625% 2/15/25 (b) | 440,000 | 429,480 | |
| Seagate HDD Cayman 3.125% 7/15/29 | 203 | 168 | |
| UKG, Inc. 6.875% 2/1/31 (b) | 355,000 | 358,692 | |
| Xerox Corp. 4.8% 3/1/35 | 250,000 | 189,664 | |
| Xerox Holdings Corp. 5% 8/15/25 (b) | 105,000 | 103,269 | |
TOTAL TECHNOLOGY | 9,484,842 | ||
| Telecommunications - 4.7% | |||
| Altice Financing SA 5.75% 8/15/29 (b) | 800,000 | 689,016 | |
| Altice France SA: | |||
| 5.5% 10/15/29 (b) | 1,860,000 | 1,408,335 | |
| 8.125% 2/1/27 (b) | 199,000 | 182,895 | |
| C&W Senior Financing Designated Activity Co. 6.875% 9/15/27 (b) | 165,000 | 155,513 | |
| Cogent Communications Group, Inc. 7% 6/15/27 (b) | 2,356,000 | 2,352,749 | |
| Consolidated Communications, Inc. 5% 10/1/28 (b) | 450,000 | 371,705 | |
| Dycom Industries, Inc. 4.5% 4/15/29 (b) | 975,000 | 897,226 | |
| Frontier Communications Holdings LLC: | |||
| 5% 5/1/28 (b) | 1,216,000 | 1,125,352 | |
| 6% 1/15/30 (b) | 555,000 | 474,522 | |
| 8.75% 5/15/30 (b) | 483,000 | 492,646 | |
| Intelsat Jackson Holdings SA 6.5% 3/15/30 (b) | 700,000 | 651,268 | |
| Level 3 Financing, Inc. 10.5% 5/15/30 (b) | 415,000 | 425,375 | |
| Sabre GLBL, Inc. 9.25% 4/15/25 (b) | 900 | 842 | |
| Telecom Italia Capital SA 7.2% 7/18/36 | 1,541,000 | 1,531,684 | |
| ViaSat, Inc.: | |||
| 5.625% 4/15/27 (b) | 700,000 | 657,125 | |
| 7.5% 5/30/31 (b) | 200,000 | 140,500 | |
| Virgin Media Finance PLC 5% 7/15/30 (b) | 700,000 | 604,261 | |
| Virgin Media Secured Finance PLC 5.5% 5/15/29 (b) | 800,000 | 749,593 | |
| Windstream Escrow LLC 7.75% 8/15/28 (b) | 500,000 | 466,812 | |
| Zayo Group Holdings, Inc. 4% 3/1/27 (b) | 400,000 | 333,000 | |
TOTAL TELECOMMUNICATIONS | 13,710,419 | ||
| Textiles/Apparel - 0.0% | |||
| Foot Locker, Inc. 4% 10/1/29 (b) | 127,000 | 107,472 | |
| Kontoor Brands, Inc. 4.125% 11/15/29 (b) | 50,000 | 44,714 | |
TOTAL TEXTILES/APPAREL | 152,186 | ||
| Transportation Ex Air/Rail - 0.9% | |||
| RXO, Inc. 7.5% 11/15/27 (b) | 1,702,000 | 1,757,314 | |
| Stena International SA 7.625% 2/15/31 (b) | 500,000 | 502,103 | |
| XPO, Inc. 7.125% 2/1/32 (b) | 500,000 | 508,327 | |
TOTAL TRANSPORTATION EX AIR/RAIL | 2,767,744 | ||
| Utilities - 2.5% | |||
| Calpine Corp. 5.25% 6/1/26 (b) | 105,000 | 103,445 | |
| NextEra Energy Partners LP 7.25% 1/15/29 (b) | 564,000 | 573,301 | |
| NRG Energy, Inc. 3.375% 2/15/29 (b) | 1,065,000 | 929,567 | |
| PG&E Corp. 5.25% 7/1/30 | 2,199,000 | 2,067,188 | |
| Talen Energy Supply LLC 8.625% 6/1/30 (b) | 450,000 | 474,769 | |
| Vistra Operations Co. LLC: | |||
| 5.625% 2/15/27 (b) | 757,000 | 737,658 | |
| 7.75% 10/15/31 (b) | 2,523,000 | 2,609,784 | |
TOTAL UTILITIES | 7,495,712 | ||
| TOTAL NONCONVERTIBLE BONDS (Cost $288,701,824) | 287,134,098 | ||
| Money Market Funds - 2.4% | |||
| Shares | Value ($) | ||
Fidelity Cash Central Fund 5.39% (e) (Cost $7,078,419) | 7,077,003 | 7,078,419 | |
| TOTAL INVESTMENT IN SECURITIES - 99.9% (Cost $295,780,243) | 294,212,517 |
NET OTHER ASSETS (LIABILITIES) - 0.1% | 409,196 |
| NET ASSETS - 100.0% | 294,621,713 |
| (a) | Amount is stated in United States dollars unless otherwise noted. |
| (b) | Security exempt from registration under Rule 144A of the Securities Act of 1933. These securities may be resold in transactions exempt from registration, normally to qualified institutional buyers. At the end of the period, the value of these securities amounted to $242,149,073 or 82.2% of net assets. |
| (c) | Coupon rates for floating and adjustable rate securities reflect the rates in effect at period end. |
| (d) | Security or a portion of the security purchased on a delayed delivery or when-issued basis. |
| (e) | Affiliated fund that is generally available only to investment companies and other accounts managed by Fidelity Investments. The rate quoted is the annualized seven-day yield of the fund at period end. A complete unaudited listing of the fund's holdings as of its most recent quarter end is available upon request. In addition, each Fidelity Central Fund's financial statements are available on the SEC's website or upon request. |
| Affiliate | Value, beginning of period ($) | Purchases ($) | Sales Proceeds ($) | Dividend Income ($) | Realized Gain (loss) ($) | Change in Unrealized appreciation (depreciation) ($) | Value, end of period ($) | % ownership, end of period |
| Fidelity Cash Central Fund 5.39% | 6,320,516 | 61,388,418 | 60,630,515 | 81,121 | - | - | 7,078,419 | 0.0% |
| Total | 6,320,516 | 61,388,418 | 60,630,515 | 81,121 | - | - | 7,078,419 | |
| Valuation Inputs at Reporting Date: | ||||
| Description | Total ($) | Level 1 ($) | Level 2 ($) | Level 3 ($) |
Investments in Securities: | ||||
| Corporate Bonds | 287,134,098 | - | 287,134,098 | - |
| Money Market Funds | 7,078,419 | 7,078,419 | - | - |
| Total Investments in Securities: | 294,212,517 | 7,078,419 | 287,134,098 | - |
| Statement of Assets and Liabilities | ||||
February 29, 2024 (Unaudited) | ||||
| Assets | ||||
| Investment in securities, at value - See accompanying schedule: | ||||
Unaffiliated issuers (cost $288,701,824) | $ | 287,134,098 | ||
Fidelity Central Funds (cost $7,078,419) | 7,078,419 | |||
| Total Investment in Securities (cost $295,780,243) | $ | 294,212,517 | ||
| Cash | 265,225 | |||
| Receivable for investments sold | 1,678,515 | |||
| Receivable for fund shares sold | 2,375,942 | |||
| Interest receivable | 4,837,890 | |||
| Distributions receivable from Fidelity Central Funds | 21,756 | |||
Total assets | 303,391,845 | |||
| Liabilities | ||||
| Payable for investments purchased | ||||
Regular delivery | $ | 5,655,961 | ||
Delayed delivery | 1,375,000 | |||
| Distributions payable | 1,629,750 | |||
| Accrued management fee | 109,421 | |||
| Total Liabilities | 8,770,132 | |||
| Commitments and contingent liabilities (see Commitments note) | ||||
| Net Assets | $ | 294,621,713 | ||
| Net Assets consist of: | ||||
| Paid in capital | $ | 328,145,998 | ||
| Total accumulated earnings (loss) | (33,524,285) | |||
| Net Assets | $ | 294,621,713 | ||
Net Asset Value, offering price and redemption price per share ($294,621,713 ÷ 6,200,000 shares) | $ | 47.52 | ||
| Statement of Operations | ||||
Six months ended February 29, 2024 (Unaudited) | ||||
| Investment Income | ||||
| Interest | $ | 10,010,571 | ||
| Income from Fidelity Central Funds | 81,121 | |||
| Total Income | 10,091,692 | |||
| Expenses | ||||
| Management fee | $ | 624,393 | ||
| Independent trustees' fees and expenses | 714 | |||
| Total expenses before reductions | 625,107 | |||
| Expense reductions | (377) | |||
| Total expenses after reductions | 624,730 | |||
| Net Investment income (loss) | 9,466,962 | |||
| Realized and Unrealized Gain (Loss) | ||||
| Net realized gain (loss) on: | ||||
| Investment Securities: | ||||
| Unaffiliated issuers | (1,771,429) | |||
| Redemptions in-kind | (671,179) | |||
| Total net realized gain (loss) | (2,442,608) | |||
| Change in net unrealized appreciation (depreciation) on investment securities | 7,275,684 | |||
| Net gain (loss) | 4,833,076 | |||
| Net increase (decrease) in net assets resulting from operations | $ | 14,300,038 | ||
| Statement of Changes in Net Assets | ||||
Six months ended February 29, 2024 (Unaudited) | Year ended August 31, 2023 | |||
| Increase (Decrease) in Net Assets | ||||
| Operations | ||||
| Net investment income (loss) | $ | 9,466,962 | $ | 16,330,455 |
| Net realized gain (loss) | (2,442,608) | (17,127,374) | ||
| Change in net unrealized appreciation (depreciation) | 7,275,684 | 18,328,525 | ||
| Net increase (decrease) in net assets resulting from operations | 14,300,038 | 17,531,606 | ||
| Distributions to shareholders | (9,396,950) | (16,489,950) | ||
| Share transactions | ||||
| Proceeds from sales of shares | 49,807,245 | 46,271,158 | ||
| Cost of shares redeemed | (48,338,542) | (34,058,789) | ||
Net increase (decrease) in net assets resulting from share transactions | 1,468,703 | 12,212,369 | ||
| Total increase (decrease) in net assets | 6,371,791 | 13,254,025 | ||
| Net Assets | ||||
| Beginning of period | 288,249,922 | 274,995,897 | ||
| End of period | $ | 294,621,713 | $ | 288,249,922 |
| Other Information | ||||
| Shares | ||||
| Sold | 1,050,000 | 1,000,000 | ||
| Redeemed | (1,050,000) | (750,000) | ||
| Net increase (decrease) | - | 250,000 | ||
| Fidelity® High Yield Factor ETF |
Six months ended (Unaudited) February 29, 2024 | Years ended August 31, 2023 | 2022 | 2021 | 2020 | 2019 | |||||||
Selected Per-Share Data | ||||||||||||
| Net asset value, beginning of period | $ | 46.49 | $ | 46.22 | $ | 56.07 | $ | 54.49 | $ | 52.32 | $ | 50.21 |
| Income from Investment Operations | ||||||||||||
Net investment income (loss) A,B | 1.594 | 2.781 | 2.383 | 2.250 | 2.518 | 2.589 | ||||||
| Net realized and unrealized gain (loss) | 1.028 | .297 | (8.748) | 2.335 | 2.323 | 2.006 | ||||||
| Total from investment operations | 2.622 | 3.078 | (6.365) | 4.585 | 4.841 | 4.595 | ||||||
| Distributions from net investment income | (1.592) | (2.808) | (2.355) | (2.195) | (2.429) | (2.485) | ||||||
| Distributions from net realized gain | - | - | (1.128) | (.808) | (.242) | - | ||||||
| Total distributions | (1.592) | (2.808) | (3.483) | (3.003) | (2.671) | (2.485) | ||||||
| Net asset value, end of period | $ | 47.52 | $ | 46.49 | $ | 46.22 | $ | 56.07 | $ | 54.49 | $ | 52.32 |
Total Return C,D,E | 5.75% | 6.90% | (11.85)% | 8.66% | 9.61% | 9.48% | ||||||
Ratios to Average Net Assets B,F,G | ||||||||||||
| Expenses before reductions | .45% H | .45% | .45% | .45% | .45% | .44% I | ||||||
| Expenses net of fee waivers, if any | .45% H | .45% | .45% | .45% | .45% | .44% I | ||||||
| Expenses net of all reductions | .45% H | .45% | .45% | .45% | .45% | .44% I | ||||||
| Net investment income (loss) | 6.87% H | 6.02% | 4.64% | 4.07% | 4.84% | 5.03% | ||||||
| Supplemental Data | ||||||||||||
| Net assets, end of period (000 omitted) | $ | 294,622 | $ | 288,250 | $ | 274,996 | $ | 277,532 | $ | 114,421 | $ | 68,016 |
Portfolio turnover rate J | 47% H,K | 84% K | 72% K | 177% K | 179% K | 76% |
Top Holdings (% of Fund's net assets) | ||
| U.S. Treasury Bonds 3.875% 2/15/43 | 4.2 | |
| Bank of America Corp. 5.875% | 2.8 | |
| Charles Schwab Corp. 4% | 2.0 | |
| PNC Financial Services Group, Inc. 5% | 1.5 | |
| Citigroup, Inc. 6.3% | 1.5 | |
| BP Capital Markets PLC 4.875% | 1.5 | |
| Energy Transfer LP 7.125% | 1.4 | |
| JPMorgan Chase & Co. 4.55% | 1.4 | |
| Goldman Sachs Group, Inc. 4.4% | 1.4 | |
| Wells Fargo & Co. 5.9% | 1.4 | |
| 19.1 | ||
| Market Sectors (% of Fund's net assets) | ||
| Financials | 60.5 | |
| Utilities | 12.6 | |
| Energy | 10.0 | |
| Communication Services | 4.4 | |
| Industrials | 3.6 | |
| Real Estate | 2.3 | |
| Consumer Discretionary | 0.7 | |
Quality Diversification (% of Fund's net assets) |
 |
| We have used ratings from Moody's Investors Service, Inc. Where Moody's® ratings are not available, we have used S&P® ratings. All ratings are as of the date indicated and do not reflect subsequent changes. |
Asset Allocation (% of Fund's net assets) |
 |
Geographic Diversification (% of Fund's net assets) |
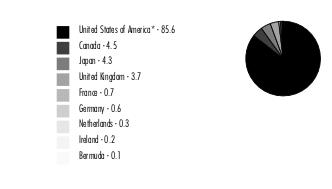 |
* Includes Short-Term investments and Net Other Assets (Liabilities). Percentages are adjusted for the effect of derivatives, if applicable. |
| Nonconvertible Bonds - 19.4% | |||
Principal Amount (a) | Value ($) | ||
| COMMUNICATION SERVICES - 1.7% | |||
| Media - 0.5% | |||
| Paramount Global: | |||
| 6.25% 2/28/57 (b) | 80,000 | 65,910 | |
| 6.375% 3/30/62 (b) | 125,000 | 108,438 | |
| 174,348 | |||
| Wireless Telecommunication Services - 1.2% | |||
| Vodafone Group PLC 7% 4/4/79 (b) | 400,000 | 409,890 | |
TOTAL COMMUNICATION SERVICES | 584,238 | ||
| ENERGY - 3.1% | |||
| Oil, Gas & Consumable Fuels - 3.1% | |||
| Enbridge, Inc. 8.5% 1/15/84 (b) | 250,000 | 266,580 | |
| Energy Transfer LP 8% 5/15/54 (b) | 35,000 | 36,365 | |
| Enterprise Products Operating LP: | |||
| CME Term SOFR 3 Month Index + 2.980% 8.5733% 8/16/77 (b)(c) | 33,000 | 33,123 | |
| 5.25% 8/16/77 (b) | 126,000 | 119,528 | |
| 5.375% 2/15/78 (b) | 67,000 | 61,936 | |
| Transcanada Trust: | |||
| 5.3% 3/15/77 (b) | 161,000 | 148,042 | |
| 5.5% 9/15/79 (b) | 128,000 | 114,455 | |
| 5.6% 3/7/82 (b) | 200,000 | 175,004 | |
| 5.875% 8/15/76 (b) | 129,000 | 123,719 | |
| 1,078,752 | |||
| FINANCIALS - 10.6% | |||
| Capital Markets - 0.2% | |||
| Ares Finance Co. III LLC 4.125% 6/30/51 (b)(d) | 75,000 | 67,755 | |
| Financial Services - 0.9% | |||
| Apollo Management Holdings LP 4.95% 1/14/50 (b)(d) | 324,000 | 300,666 | |
| Insurance - 9.5% | |||
| American International Group, Inc. 5.75% 4/1/48 (b) | 129,000 | 126,730 | |
| Assurant, Inc. 7% 3/27/48 (b) | 61,000 | 61,785 | |
| Liberty Mutual Group, Inc.: | |||
| 4.125% 12/15/51 (b)(d) | 150,000 | 131,686 | |
| 4.3% 2/1/61 (d) | 125,000 | 79,521 | |
| Meiji Yasuda Life Insurance Co.: | |||
| 5.1% 4/26/48 (b)(d) | 200,000 | 195,233 | |
| 5.2% 10/20/45 (b)(d) | 200,000 | 196,577 | |
| MetLife, Inc.: | |||
| 6.4% 12/15/66 (b) | 319,000 | 323,817 | |
| 10.75% 8/1/69 (b) | 128,000 | 172,012 | |
| Muenchener Rueckversicherungs-Gesellschaft AG in Muenchen 5.875% 5/23/42 (b)(d) | 200,000 | 201,600 | |
| Nippon Life Insurance Co.: | |||
| 2.75% 1/21/51 (b)(d) | 200,000 | 165,058 | |
| 3.4% 1/23/50 (b)(d) | 100,000 | 87,799 | |
| 4.7% 1/20/46 (b)(d) | 200,000 | 194,938 | |
| 6.25% 9/13/53 (b)(d) | 200,000 | 207,246 | |
| PartnerRe Finance B LLC 4.5% 10/1/50 (b) | 67,000 | 59,735 | |
| Prudential Financial, Inc.: | |||
| 3.7% 10/1/50 (b) | 200,000 | 174,691 | |
| 5.125% 3/1/52 (b) | 150,000 | 140,226 | |
| 6% 9/1/52 (b) | 200,000 | 199,459 | |
| 6.75% 3/1/53 (b) | 250,000 | 259,895 | |
| Sumitomo Life Insurance Co. 4% 9/14/77 (b)(d) | 270,000 | 253,398 | |
| 3,231,406 | |||
TOTAL FINANCIALS | 3,599,827 | ||
| UTILITIES - 4.0% | |||
| Electric Utilities - 2.2% | |||
| Edison International 7.875% 6/15/54 (b) | 15,000 | 15,292 | |
| Emera, Inc. 6.75% 6/15/76 (b) | 125,000 | 122,486 | |
| NextEra Energy Capital Holdings, Inc. 5.65% 5/1/79 (b) | 104,000 | 99,757 | |
| Southern Co.: | |||
| 3.75% 9/15/51 (b) | 125,000 | 117,232 | |
| 4% 1/15/51 (b) | 400,000 | 384,124 | |
| 738,891 | |||
| Multi-Utilities - 1.8% | |||
| CMS Energy Corp.: | |||
| 3.75% 12/1/50 (b) | 409,000 | 327,132 | |
| 4.75% 6/1/50 (b) | 300,000 | 274,893 | |
| Sempra 4.125% 4/1/52 (b) | 25,000 | 22,937 | |
| 624,962 | |||
TOTAL UTILITIES | 1,363,853 | ||
| TOTAL NONCONVERTIBLE BONDS (Cost $6,723,083) | 6,626,670 | ||
| U.S. Treasury Obligations - 5.6% | |||
Principal Amount (a) | Value ($) | ||
| U.S. Treasury Bonds: | |||
| 3.875% 2/15/43 | 1,575,000 | 1,441,921 | |
| 3.875% 5/15/43 | 500,000 | 456,953 | |
| TOTAL U.S. TREASURY OBLIGATIONS (Cost $1,820,953) | 1,898,874 | ||
| Preferred Stocks - 25.1% | |||
| Shares | Value ($) | ||
| Convertible Preferred Stocks - 1.2% | |||
| FINANCIALS - 1.2% | |||
| Banks - 1.2% | |||
| Wells Fargo & Co. 7.50% | 350 | 413,246 | |
| Nonconvertible Preferred Stocks - 23.9% | |||
| COMMUNICATION SERVICES - 2.7% | |||
| Diversified Telecommunication Services - 1.5% | |||
| AT&T, Inc.: | |||
| 4.75% | 21,000 | 435,960 | |
| 5.35% | 3,500 | 84,595 | |
| 520,555 | |||
| Wireless Telecommunication Services - 1.2% | |||
| Telephone & Data Systems, Inc.: | |||
| 6.00% | 3,500 | 56,350 | |
| 6.625% | 1,500 | 27,870 | |
| U.S. Cellular Corp. | 3,500 | 66,395 | |
| U.S. Cellular Corp.: | |||
| 5.50% | 3,500 | 67,025 | |
| 6.25% | 8,500 | 177,225 | |
| 394,865 | |||
TOTAL COMMUNICATION SERVICES | 915,420 | ||
| ENERGY - 0.6% | |||
| Oil, Gas & Consumable Fuels - 0.6% | |||
| Energy Transfer LP 7.60% (b) | 8,000 | 201,360 | |
| FINANCIALS - 14.7% | |||
| Banks - 4.2% | |||
| Bank of America Corp.: | |||
| 4.25% | 5,500 | 108,845 | |
| 4.375% | 19,000 | 386,460 | |
| Cadence Bank 5.50% | 2,000 | 41,820 | |
| Citizens Financial Group, Inc. Series E, 5.00% | 2,000 | 42,580 | |
| Fifth Third Bancorp Series K 4.95% | 800 | 19,032 | |
| JPMorgan Chase & Co.: | |||
| 4.55% | 22,900 | 491,892 | |
| Series MM, 4.20% | 1,700 | 33,796 | |
| KeyCorp: | |||
| 6.125%(b) | 3,000 | 70,530 | |
| 6.20%(b) | 2,000 | 45,600 | |
| Regions Financial Corp.: | |||
| 4.45% | 500 | 9,100 | |
| 5.75%(b) | 3,000 | 69,810 | |
| U.S. Bancorp Series M, 4.00% | 2,000 | 37,620 | |
| Webster Financial Corp. Series F, 5.25% | 750 | 14,719 | |
| Western Alliance Bancorp. (b) | 1,500 | 26,370 | |
| Wintrust Financial Corp. 6.50% (b) | 2,000 | 46,880 | |
| 1,445,054 | |||
| Capital Markets - 3.8% | |||
| Affiliated Managers Group, Inc. 4.75% | 3,000 | 59,040 | |
| Charles Schwab Corp. 4.45% | 4,500 | 95,220 | |
| Morgan Stanley: | |||
| Series K, 5.85%(b) | 16,000 | 403,520 | |
| Series O, 4.50% | 4,300 | 84,581 | |
| Northern Trust Corp. Series E, 4.70% | 1,500 | 34,860 | |
| Oaktree Capital Group LLC: | |||
| 6.55% | 7,000 | 157,430 | |
| Series A, 6.625% | 7,000 | 156,800 | |
| SCE Trust III 5.75% (b) | 1,550 | 39,246 | |
| State Street Corp. Series G, 5.35% (b) | 1,000 | 23,960 | |
| Stifel Financial Corp. Series D, 4.50% | 13,000 | 235,300 | |
| 1,289,957 | |||
| Consumer Finance - 0.1% | |||
| Navient Corp. 6.00% | 1,500 | 31,800 | |
| Financial Services - 1.1% | |||
| Carlyle Finance LLC 4.625% | 2,500 | 49,300 | |
| Equitable Holdings, Inc.: | |||
| 4.30% | 1,000 | 18,540 | |
| Series A 5.25% | 3,000 | 68,370 | |
| KKR Group Finance Co. IX LLC 4.625% | 5,000 | 101,500 | |
| Voya Financial, Inc. Series B, 5.35% (b) | 5,000 | 124,650 | |
| 362,360 | |||
| Insurance - 5.5% | |||
| Aegon Funding Co. LLC 5.10% | 3,950 | 87,967 | |
| Allstate Corp.: | |||
| 5.10% | 10,000 | 234,300 | |
| Series I, 4.75% | 2,000 | 47,720 | |
| American Financial Group, Inc. 4.50% | 6,000 | 119,880 | |
| Arch Capital Group Ltd.: | |||
| 5.45% | 2,000 | 48,240 | |
| Series G, 4.55% | 2,250 | 47,273 | |
| Assurant, Inc. 5.25% | 2,500 | 53,425 | |
| Athene Holding Ltd.: | |||
| 7.25%(b) | 8,800 | 220,000 | |
| Series A, 6.35%(b) | 2,500 | 61,375 | |
| Series C, 6.375%(b) | 9,000 | 225,450 | |
| Series D, 4.875% | 4,000 | 74,480 | |
| Brighthouse Financial, Inc. | 4,000 | 77,120 | |
| Brighthouse Financial, Inc.: | |||
| Series A, 6.60% | 2,000 | 48,780 | |
| Series B, 6.75% | 2,000 | 50,080 | |
| Series D, 0.00% | 4,000 | 65,200 | |
| Globe Life, Inc. Series D, 4.25% | 2,500 | 51,375 | |
| Prudential Financial, Inc. 5.625% | 1,500 | 37,470 | |
| Reinsurance Group of America, Inc. 7.125% (b) | 4,000 | 104,560 | |
| RenaissanceRe Holdings Ltd. Series G, 4.20% | 1,550 | 28,830 | |
| Unum Group 6.25% | 3,500 | 86,424 | |
| W.R. Berkley Corp. 4.25% | 5,000 | 109,400 | |
| 1,879,349 | |||
TOTAL FINANCIALS | 5,008,520 | ||
| INDUSTRIALS - 1.6% | |||
| Trading Companies & Distributors - 1.6% | |||
| FTAI Aviation Ltd.: | |||
| 8.00%(b) | 2,000 | 51,340 | |
| 8.25%(b) | 2,000 | 51,000 | |
| 8.25%(b) | 8,000 | 208,240 | |
| WESCO International, Inc. (b) | 9,000 | 243,900 | |
| 554,480 | |||
| REAL ESTATE - 2.3% | |||
| Equity Real Estate Investment Trusts (REITs) - 2.3% | |||
| American Homes 4 Rent 6.25% | 1,000 | 24,940 | |
| Digital Realty Trust, Inc.: | |||
| 5.25% | 1,750 | 39,323 | |
| Series L, 5.20% | 10,000 | 222,900 | |
| Public Storage: | |||
| 4.00% | 20,000 | 386,200 | |
| Series H, 5.60% | 1,500 | 37,740 | |
| Series I, 4.875% | 1,500 | 35,610 | |
| SITE Centers Corp. 6.375% | 1,000 | 23,380 | |
| Summit Hotel Properties, Inc. Series F, 5.875% | 775 | 15,748 | |
| 785,841 | |||
| UTILITIES - 2.0% | |||
| Electric Utilities - 1.2% | |||
| Entergy Louisiana LLC 4.875% | 1,000 | 22,910 | |
| SCE Trust V 5.45% (b) | 1,550 | 38,177 | |
| SCE Trust VII 7.75% | 5,000 | 134,100 | |
| Southern Co.: | |||
| 4.20% | 3,500 | 71,925 | |
| Series A, 4.95% | 5,000 | 116,950 | |
| 384,062 | |||
| Independent Power and Renewable Electricity Producers - 0.1% | |||
| Brookfield Renewable Partners LP 5.25% | 2,395 | 43,062 | |
| Multi-Utilities - 0.7% | |||
| Algonquin Power & Utilities Corp. Series A, 6.20% (b) | 3,000 | 75,720 | |
| Brookfield Infrastructure Partners LP: | |||
| 5.125% | 825 | 15,263 | |
| Class A 5.00% | 825 | 14,545 | |
| DTE Energy Co.: | |||
| 4.375% | 1,000 | 21,400 | |
| 4.375% | 2,825 | 59,254 | |
| SCE Trust VI | 2,375 | 48,925 | |
| 235,107 | |||
TOTAL UTILITIES | 662,231 | ||
| TOTAL NONCONVERTIBLE PREFERRED STOCKS | 8,127,852 | ||
| TOTAL PREFERRED STOCKS (Cost $8,458,696) | 8,541,098 | ||
| Preferred Securities - 49.6% | |||
Principal Amount (a) | Value ($) | ||
| CONSUMER DISCRETIONARY - 0.7% | |||
| Automobiles - 0.7% | |||
| General Motors Financial Co., Inc. 5.7% 12/31/99 (b)(e) | 252,000 | 241,918 | |
| ENERGY - 6.3% | |||
| Oil, Gas & Consumable Fuels - 6.3% | |||
| BP Capital Markets PLC: | |||
| 4.375% (b)(e) | 125,000 | 125,590 | |
| 4.875% (b)(e) | 525,000 | 500,363 | |
| 6.45% (b)(e) | 215,000 | 215,482 | |
| Enbridge, Inc.: | |||
| 5.5% 7/15/77 (b) | 126,000 | 118,008 | |
| 5.75% 7/15/80 (b) | 126,000 | 118,416 | |
| 6% 1/15/77 (b) | 68,000 | 66,577 | |
| 6.25% 3/1/78 (b) | 123,000 | 121,239 | |
| Energy Transfer LP: | |||
| 3 month U.S. LIBOR + 4.020% 9.5966% (b)(c)(e) | 240,000 | 238,059 | |
| 6.625% (b)(e) | 50,000 | 46,457 | |
| 7.125% (b)(e) | 500,000 | 492,407 | |
| Plains All American Pipeline LP CME Term SOFR 3 Month Index + 4.110% 9.6786% (b)(c)(e) | 100,000 | 99,851 | |
| 2,142,449 | |||
| FINANCIALS - 34.0% | |||
| Banks - 19.3% | |||
| Bank of America Corp.: | |||
| 5.875% (b)(e) | 943,000 | 939,295 | |
| 6.1% (b)(e) | 200,000 | 205,428 | |
| 6.125% (b)(e) | 100,000 | 100,454 | |
| Citigroup, Inc.: | |||
| 3.875% (b)(e) | 400,000 | 376,182 | |
| 4.15% (b)(e) | 89,000 | 80,363 | |
| 5.95% (b)(e) | 393,000 | 396,515 | |
| 6.3% (b)(e) | 495,000 | 501,698 | |
| Fifth Third Bancorp 4.5% (b)(e) | 50,000 | 47,888 | |
| Huntington Bancshares, Inc. 5.625% (b)(e) | 226,000 | 206,101 | |
| JPMorgan Chase & Co.: | |||
| 4.6% (b)(e) | 300,000 | 293,147 | |
| 5% (b)(e) | 401,000 | 400,334 | |
| 6.1% (b)(e) | 321,000 | 328,721 | |
| 6.125% (b)(e) | 150,000 | 152,874 | |
| KeyCorp 5% (b)(e) | 100,000 | 86,260 | |
| M&T Bank Corp. 5.125% (b)(e) | 50,000 | 44,539 | |
| PNC Financial Services Group, Inc. 5% (b)(e) | 542,000 | 523,016 | |
| Regions Financial Corp. 5.75% 12/31/99 (b) | 75,000 | 73,836 | |
| Truist Financial Corp.: | |||
| 4.95% (b)(e) | 135,000 | 132,938 | |
| 5.1% (b)(e) | 403,000 | 377,792 | |
| 5.125% 12/31/99 (b)(e) | 60,000 | 52,755 | |
| U.S. Bancorp: | |||
| 3.7% (b)(e) | 400,000 | 343,164 | |
| 5.3% (b)(e) | 115,000 | 108,037 | |
| Wells Fargo & Co.: | |||
| 3.9% (b)(e) | 266,000 | 252,485 | |
| 5.9% (b)(e) | 471,000 | 474,626 | |
| 7.625% (b)(e) | 75,000 | 80,569 | |
| 6,579,017 | |||
| Capital Markets - 8.9% | |||
| Bank of New York Mellon Corp.: | |||
| 3.7% (b)(e) | 425,000 | 402,000 | |
| 3.75% (b)(e) | 96,000 | 86,664 | |
| 4.625% (b)(e) | 200,000 | 193,537 | |
| 4.7% (b)(e) | 65,000 | 65,008 | |
| Charles Schwab Corp.: | |||
| 4% (b)(e) | 831,000 | 692,704 | |
| 4% (b)(e) | 200,000 | 186,213 | |
| 5% (b)(e) | 100,000 | 93,502 | |
| Goldman Sachs Group, Inc.: | |||
| 4.125% (b)(e) | 29,000 | 26,853 | |
| 4.4% (b)(e) | 500,000 | 480,497 | |
| 5.3% (b)(e) | 79,000 | 79,369 | |
| Morgan Stanley 5.875% (b)(e) | 400,000 | 403,235 | |
| Northern Trust Corp. 4.6% (b)(e) | 60,000 | 58,954 | |
| State Street Corp. CME Term SOFR 3 Month Index + 2.800% 8.1852% (b)(c)(e) | 248,000 | 252,449 | |
| 3,020,985 | |||
| Consumer Finance - 3.6% | |||
| Ally Financial, Inc.: | |||
| 4.7% (b)(e) | 470,000 | 403,968 | |
| 4.7% (b)(e) | 220,000 | 173,131 | |
| American Express Co. 3.55% (b)(e) | 217,000 | 197,430 | |
| Capital One Financial Corp. 3.95% (b)(e) | 400,000 | 355,906 | |
| Discover Financial Services 5.5% 12/31/99 (b)(e) | 100,000 | 85,931 | |
| 1,216,366 | |||
| Financial Services - 0.2% | |||
| Equitable Holdings, Inc. 4.95% (b)(e) | 75,000 | 73,500 | |
| Insurance - 2.0% | |||
| Dai-Ichi Life Insurance Co. Ltd. 4% 12/31/99 (b)(d) | 200,000 | 191,781 | |
| Markel Group, Inc. 6% (b)(e) | 200,000 | 201,629 | |
| MetLife, Inc. 3.85% (b)(e) | 275,000 | 268,199 | |
| SBL Holdings, Inc. 6.5% 12/31/99 (b)(d)(e) | 34,000 | 24,565 | |
| 686,174 | |||
TOTAL FINANCIALS | 11,576,042 | ||
| INDUSTRIALS - 2.0% | |||
| Trading Companies & Distributors - 2.0% | |||
| AerCap Holdings NV 5.875% 10/10/79 (b) | 50,000 | 50,629 | |
| Air Lease Corp.: | |||
| 4.125% (b)(e) | 56,000 | 48,402 | |
| 4.65% (b)(e) | 300,000 | 284,084 | |
| Aircastle Ltd. 5.25% (b)(d)(e) | 326,000 | 310,045 | |
| 693,160 | |||
| UTILITIES - 6.6% | |||
| Electric Utilities - 3.6% | |||
| Duke Energy Corp. 4.875% (b)(e) | 325,000 | 329,029 | |
| Edison International: | |||
| 5% (b)(e) | 324,000 | 315,121 | |
| 5.375% (b)(e) | 366,000 | 361,850 | |
| Electricite de France SA 9.125% (b)(d)(e) | 200,000 | 225,751 | |
| 1,231,751 | |||
| Independent Power and Renewable Electricity Producers - 1.2% | |||
| Vistra Corp.: | |||
| 7% (b)(d)(e) | 295,000 | 289,758 | |
| 8% (b)(d)(e) | 100,000 | 102,994 | |
| 392,752 | |||
| Multi-Utilities - 1.8% | |||
| Dominion Energy, Inc.: | |||
| 4.35% (b)(e) | 225,000 | 213,586 | |
| 4.65% (b)(e) | 80,000 | 78,662 | |
| Sempra 4.875% (b)(e) | 325,000 | 324,090 | |
| 616,338 | |||
TOTAL UTILITIES | 2,240,841 | ||
| TOTAL PREFERRED SECURITIES (Cost $17,082,480) | 16,894,410 | ||
| Money Market Funds - 1.5% | |||
| Shares | Value ($) | ||
Fidelity Cash Central Fund 5.39% (f) (Cost $520,619) | 520,515 | 520,619 | |
| TOTAL INVESTMENT IN SECURITIES - 101.2% (Cost $34,605,831) | 34,481,671 |
NET OTHER ASSETS (LIABILITIES) - (1.2)% | (422,088) |
| NET ASSETS - 100.0% | 34,059,583 |
| (a) | Amount is stated in United States dollars unless otherwise noted. |
| (b) | Coupon rates for floating and adjustable rate securities reflect the rates in effect at period end. |
| (c) | Coupon is indexed to a floating interest rate which may be multiplied by a specified factor and/or subject to caps or floors. |
| (d) | Security exempt from registration under Rule 144A of the Securities Act of 1933. These securities may be resold in transactions exempt from registration, normally to qualified institutional buyers. At the end of the period, the value of these securities amounted to $3,226,371 or 9.5% of net assets. |
| (e) | Security is perpetual in nature with no stated maturity date. |
| (f) | Affiliated fund that is generally available only to investment companies and other accounts managed by Fidelity Investments. The rate quoted is the annualized seven-day yield of the fund at period end. A complete unaudited listing of the fund's holdings as of its most recent quarter end is available upon request. In addition, each Fidelity Central Fund's financial statements are available on the SEC's website or upon request. |
| Affiliate | Value, beginning of period ($) | Purchases ($) | Sales Proceeds ($) | Dividend Income ($) | Realized Gain (loss) ($) | Change in Unrealized appreciation (depreciation) ($) | Value, end of period ($) | % ownership, end of period |
| Fidelity Cash Central Fund 5.39% | 325,515 | 4,089,339 | 3,894,235 | 13,340 | - | - | 520,619 | 0.0% |
| Total | 325,515 | 4,089,339 | 3,894,235 | 13,340 | - | - | 520,619 | |
| Valuation Inputs at Reporting Date: | ||||
| Description | Total ($) | Level 1 ($) | Level 2 ($) | Level 3 ($) |
Investments in Securities: | ||||
| Equities: | ||||
Communication Services | 915,420 | 915,420 | - | - |
Energy | 201,360 | 201,360 | - | - |
Financials | 5,421,766 | 4,788,520 | 633,246 | - |
Industrials | 554,480 | 554,480 | - | - |
Real Estate | 785,841 | 785,841 | - | - |
Utilities | 662,231 | 662,231 | - | - |
| Corporate Bonds | 6,626,670 | - | 6,626,670 | - |
| U.S. Government and Government Agency Obligations | 1,898,874 | - | 1,898,874 | - |
| Preferred Securities | 16,894,410 | - | 16,894,410 | - |
| Money Market Funds | 520,619 | 520,619 | - | - |
| Total Investments in Securities: | 34,481,671 | 8,428,471 | 26,053,200 | - |
| Statement of Assets and Liabilities | ||||
February 29, 2024 (Unaudited) | ||||
| Assets | ||||
| Investment in securities, at value - See accompanying schedule: | ||||
Unaffiliated issuers (cost $34,085,212) | $ | 33,961,052 | ||
Fidelity Central Funds (cost $520,619) | 520,619 | |||
| Total Investment in Securities (cost $34,605,831) | $ | 34,481,671 | ||
| Cash | 17,616 | |||
| Dividends receivable | 40,720 | |||
| Interest receivable | 113,192 | |||
| Distributions receivable from Fidelity Central Funds | 2,020 | |||
| Other receivables | 50 | |||
Total assets | 34,655,269 | |||
| Liabilities | ||||
| Payable for investments purchased | $ | 435,000 | ||
| Distributions payable | 144,000 | |||
| Accrued management fee | 16,686 | |||
| Total Liabilities | 595,686 | |||
| Net Assets | $ | 34,059,583 | ||
| Net Assets consist of: | ||||
| Paid in capital | $ | 39,147,209 | ||
| Total accumulated earnings (loss) | (5,087,626) | |||
| Net Assets | $ | 34,059,583 | ||
Net Asset Value, offering price and redemption price per share ($34,059,583 ÷ 1,600,000 shares) | $ | 21.29 | ||
| Statement of Operations | ||||
Six months ended February 29, 2024 (Unaudited) | ||||
| Investment Income | ||||
| Dividends | $ | 773,253 | ||
| Interest | 185,933 | |||
| Income from Fidelity Central Funds | 13,340 | |||
| Total Income | 972,526 | |||
| Expenses | ||||
| Management fee | $ | 96,037 | ||
| Independent trustees' fees and expenses | 83 | |||
| Total expenses before reductions | 96,120 | |||
| Expense reductions | (163) | |||
| Total expenses after reductions | 95,957 | |||
| Net Investment income (loss) | 876,569 | |||
| Realized and Unrealized Gain (Loss) | ||||
| Net realized gain (loss) on: | ||||
| Investment Securities: | ||||
| Unaffiliated issuers | (308,449) | |||
| Total net realized gain (loss) | (308,449) | |||
| Change in net unrealized appreciation (depreciation) on investment securities | 2,247,425 | |||
| Net gain (loss) | 1,938,976 | |||
| Net increase (decrease) in net assets resulting from operations | $ | 2,815,545 | ||
| Statement of Changes in Net Assets | ||||
Six months ended February 29, 2024 (Unaudited) | Year ended August 31, 2023 | |||
| Increase (Decrease) in Net Assets | ||||
| Operations | ||||
| Net investment income (loss) | $ | 876,569 | $ | 1,456,762 |
| Net realized gain (loss) | (308,449) | (3,256,717) | ||
| Change in net unrealized appreciation (depreciation) | 2,247,425 | 2,451,438 | ||
| Net increase (decrease) in net assets resulting from operations | 2,815,545 | 651,483 | ||
| Distributions to shareholders | (851,200) | (1,416,301) | ||
| Distributions to shareholders from tax return of capital | - | (195,299) | ||
| Total Distributions | (851,200) | (1,611,600) | ||
| Share transactions | ||||
| Proceeds from sales of shares | - | 1,002,305 | ||
| Cost of shares redeemed | - | (1,015,599) | ||
Net increase (decrease) in net assets resulting from share transactions | - | (13,294) | ||
| Total increase (decrease) in net assets | 1,964,345 | (973,411) | ||
| Net Assets | ||||
| Beginning of period | 32,095,238 | 33,068,649 | ||
| End of period | $ | 34,059,583 | $ | 32,095,238 |
| Other Information | ||||
| Shares | ||||
| Sold | - | 50,000 | ||
| Redeemed | - | (50,000) | ||
| Fidelity® Preferred Securities & Income ETF |
Six months ended (Unaudited) February 29, 2024 | Years ended August 31, 2023 | 2022 | 2021 A | |||||
Selected Per-Share Data | ||||||||
| Net asset value, beginning of period | $ | 20.06 | $ | 20.67 | $ | 25.20 | $ | 25.00 |
| Income from Investment Operations | ||||||||
Net investment income (loss) B,C | .548 | .937 | .886 | .170 | ||||
| Net realized and unrealized gain (loss) | 1.214 | (.510) | (4.485) | .187 | ||||
| Total from investment operations | 1.762 | .427 | (3.599) | .357 | ||||
| Distributions from net investment income | (.532) | (.856) | (.931) | (.157) | ||||
| Distributions from tax return of capital | - | (.181) | - | - | ||||
| Total distributions | (.532) | (1.037) | (.931) | (.157) | ||||
| Net asset value, end of period | $ | 21.29 | $ | 20.06 | $ | 20.67 | $ | 25.20 |
Total Return D,E,F | 8.92% | 2.19% | (14.50)% | 1.44% | ||||
Ratios to Average Net Assets C,G,H | ||||||||
| Expenses before reductions | .59% I | .59% | .59% | .59% I | ||||
| Expenses net of fee waivers, if any | .59% I | .59% | .59% | .59% I | ||||
| Expenses net of all reductions | .59% I | .59% | .59% | .59% I | ||||
| Net investment income (loss) | 5.42% I | 4.65% | 3.98% | 3.16% I | ||||
| Supplemental Data | ||||||||
| Net assets, end of period (000 omitted) | $ | 34,060 | $ | 32,095 | $ | 33,069 | $ | 6,300 |
Portfolio turnover rate J | 38% I | 50% | 21% | -% |
| Fidelity Central Fund | Investment Manager | Investment Objective | Investment Practices | Expense RatioA |
| Fidelity Money Market Central Funds | Fidelity Management & Research Company LLC (FMR) | Each fund seeks to obtain a high level of current income consistent with the preservation of capital and liquidity. | Short-term Investments | Less than .005% |
| Tax cost | Gross unrealized appreciation | Gross unrealized depreciation | Net unrealized appreciation (depreciation) | |
| Fidelity High Yield Factor ETF | $295,785,897 | $4,911,652 | $(6,485,032) | $(1,573,380) |
Fidelity Preferred Securities & Income ETF | 34,632,804 | 1,408,797 | (1,559,930) | (151,133) |
| Short-term | Long-term | Total capital loss carryforward | |
| Fidelity High Yield Factor ETF | $(12,626,744) | $(16,940,925) | $(29,567,669) |
Fidelity Preferred Securities & Income ETF | (2,091,775) | (2,456,559) | (4,548,334) |
| Investment to be Acquired | Commitment Amount | Unrealized Appreciation (Depreciation) | |
| Fidelity High Yield Factor ETF | Level 3 Financing, Inc. 1LN note 11% 11/15/29 | $93,597 | $ - |
| Purchases ($) | Sales ($) | |
| Fidelity High Yield Factor ETF | 62,002,525 | 63,791,660 |
| Fidelity Preferred Securities & Income ETF | 4,376,145 | 5,953,632 |
| In-Kind Subscriptions ($) | In-Kind Redemptions ($) | |
| Fidelity High Yield Factor ETF | 48,817,039 | 46,685,806 |
| Fee Rate | |
| Fidelity High Yield Factor ETF | .45% |
| Fidelity Preferred Securities & Income ETF | .59% |
| Amount | |
Fidelity Preferred Securities & Income ETF | $73 |
| Custodian credits | |
| Fidelity High Yield Factor ETF | $377 |
Fidelity Preferred Securities & Income ETF | 163 |
| The Example is based on an investment of $1,000 invested at the beginning of the period and held for the entire period (September 1, 2023 to February 29, 2024). |
Annualized Expense Ratio- A | Beginning Account Value September 1, 2023 | Ending Account Value February 29, 2024 | Expenses Paid During Period- C September 1, 2023 to February 29, 2024 | |||||||
| Fidelity® High Yield Factor ETF | .45% | |||||||||
| Actual | $ 1,000 | $ 1,057.50 | $ 2.30 | |||||||
Hypothetical-B | $ 1,000 | $ 1,022.63 | $ 2.26 | |||||||
| Fidelity® Preferred Securities & Income ETF | .59% | |||||||||
| Actual | $ 1,000 | $ 1,089.20 | $ 3.06 | |||||||
Hypothetical-B | $ 1,000 | $ 1,021.93 | $ 2.97 | |||||||
- Highly liquid investments - cash or convertible to cash within three business days or less
- Moderately liquid investments - convertible to cash in three to seven calendar days
- Less liquid investments - can be sold or disposed of, but not settled, within seven calendar days
- Illiquid investments - cannot be sold or disposed of within seven calendar days
 |


Contents
Top Holdings (% of Fund's net assets) | ||
| Novo Nordisk A/S Series B (Denmark, Pharmaceuticals) | 2.8 | |
| Novartis AG (Switzerland, Pharmaceuticals) | 1.7 | |
| SAP SE (Germany, Software) | 1.7 | |
| ASML Holding NV (Netherlands) (Netherlands, Semiconductors & Semiconductor Equipment) | 1.7 | |
| Shell PLC (London) (Netherlands, Oil, Gas & Consumable Fuels) | 1.6 | |
| Siemens AG (Germany, Industrial Conglomerates) | 1.4 | |
| Toyota Motor Corp. (Japan, Automobiles) | 1.4 | |
| TotalEnergies SE (France, Oil, Gas & Consumable Fuels) | 1.3 | |
| Tokyo Electron Ltd. (Japan, Semiconductors & Semiconductor Equipment) | 1.3 | |
| Nestle SA (Reg. S) (United States of America, Food Products) | 1.2 | |
| 16.1 | ||
| Market Sectors (% of Fund's net assets) | ||
| Financials | 17.8 | |
| Industrials | 16.8 | |
| Consumer Discretionary | 13.3 | |
| Health Care | 12.4 | |
| Information Technology | 11.3 | |
| Materials | 9.0 | |
| Consumer Staples | 6.6 | |
| Communication Services | 4.5 | |
| Energy | 3.0 | |
| Utilities | 2.9 | |
| Real Estate | 1.5 | |
Asset Allocation (% of Fund's net assets) |
 |
Futures - 0.6% |
Geographic Diversification (% of Fund's net assets) |
 |
* Includes Short-Term investments and Net Other Assets (Liabilities). Percentages are adjusted for the effect of derivatives, if applicable. |
| Common Stocks - 98.4% | |||
| Shares | Value ($) | ||
| Australia - 5.7% | |||
| ANZ Group Holdings Ltd. | 357,817 | 6,616,931 | |
| Aristocrat Leisure Ltd. | 213,963 | 6,485,112 | |
| BHP Group Ltd. | 314,726 | 8,986,844 | |
| Brambles Ltd. | 537,129 | 5,261,447 | |
| Cochlear Ltd. | 5,053 | 1,150,116 | |
| Commonwealth Bank of Australia | 45,058 | 3,409,381 | |
| Fortescue Ltd. | 545,836 | 9,199,793 | |
| Glencore PLC | 551,906 | 2,613,561 | |
| Goodman Group unit | 548,865 | 10,667,191 | |
| Macquarie Group Ltd. | 62,568 | 7,922,767 | |
| Medibank Private Ltd. | 1,535,097 | 3,582,149 | |
| Northern Star Resources Ltd. | 42,530 | 356,614 | |
| Origin Energy Ltd. | 291,819 | 1,705,244 | |
| Rio Tinto Ltd. (a) | 34,785 | 2,798,697 | |
| Suncorp Group Ltd. | 100,448 | 998,955 | |
| Telstra Group Ltd. | 2,282,377 | 5,667,142 | |
| Transurban Group unit | 75,559 | 664,995 | |
| Wesfarmers Ltd. | 52,157 | 2,259,233 | |
TOTAL AUSTRALIA | 80,346,172 | ||
| Belgium - 0.8% | |||
| Ageas | 178,910 | 7,579,944 | |
| D'ieteren Group | 223 | 42,901 | |
| UCB SA | 31,808 | 3,661,266 | |
TOTAL BELGIUM | 11,284,111 | ||
| China - 1.3% | |||
| BOC Hong Kong (Holdings) Ltd. | 3,011,000 | 7,941,395 | |
| Prosus NV | 248,037 | 7,235,436 | |
| Wilmar International Ltd. | 1,025,600 | 2,530,558 | |
TOTAL CHINA | 17,707,389 | ||
| Denmark - 3.3% | |||
| Genmab A/S (b) | 24,119 | 6,749,753 | |
| Genmab A/S ADR (b) | 53,186 | 1,476,975 | |
| Novo Nordisk A/S: | |||
| Series B | 300,924 | 35,767,040 | |
| Series B sponsored ADR | 28,177 | 3,374,759 | |
TOTAL DENMARK | 47,368,527 | ||
| Finland - 2.0% | |||
| Fortum Corp. | 143,516 | 1,791,545 | |
| Kesko Oyj | 205,531 | 3,924,066 | |
| Kone OYJ (B Shares) | 152,658 | 7,460,973 | |
| Nordea Bank Abp | 712,191 | 8,652,313 | |
| UPM-Kymmene Corp. | 113,219 | 3,784,814 | |
| Wartsila Corp. | 179,851 | 2,778,704 | |
TOTAL FINLAND | 28,392,415 | ||
| France - 10.3% | |||
| Air Liquide SA | 79,665 | 16,178,553 | |
| Airbus Group NV | 4,138 | 684,001 | |
| AXA SA | 31,635 | 1,124,204 | |
| BNP Paribas SA | 52,437 | 3,138,601 | |
| Carrefour SA | 5,301 | 88,976 | |
| Compagnie de St.-Gobain | 135,452 | 10,423,432 | |
| Danone SA | 30,212 | 1,927,188 | |
| Edenred SA | 39,106 | 1,935,349 | |
| Eiffage SA | 45,257 | 4,923,171 | |
| EssilorLuxottica SA | 998 | 211,586 | |
| Eurazeo SA | 7,303 | 616,450 | |
| Gecina SA | 7,119 | 687,093 | |
| Hermes International SCA | 5,866 | 14,664,357 | |
| L'Oreal SA | 35,150 | 16,780,236 | |
| La Francaise des Jeux SAEM (c) | 78,163 | 3,271,010 | |
| Legrand SA | 83,739 | 8,462,228 | |
| LVMH Moet Hennessy Louis Vuitton SE | 14,306 | 13,031,310 | |
| LVMH Moet Hennessy Louis Vuitton SE ADR | 2,075 | 379,684 | |
| Orange SA | 150,379 | 1,723,789 | |
| Orange SA ADR | 54,513 | 626,900 | |
| Publicis Groupe SA | 87,292 | 9,225,073 | |
| Safran SA | 39,010 | 8,166,781 | |
| Teleperformance | 5,298 | 655,922 | |
| Thales SA | 21,274 | 3,151,182 | |
| TotalEnergies SE | 294,405 | 18,770,201 | |
| Ubisoft Entertainment SA (b) | 92,640 | 2,122,657 | |
| VINCI SA | 25,359 | 3,245,108 | |
| Wendel SA | 10 | 978 | |
TOTAL FRANCE | 146,216,020 | ||
| Germany - 8.0% | |||
| Allianz SE | 11,498 | 3,154,604 | |
| Bayerische Motoren Werke AG (BMW) | 27,035 | 3,191,346 | |
| Beiersdorf AG | 8,596 | 1,231,463 | |
| Deutsche Bank AG | 711,392 | 9,504,802 | |
| Deutsche Borse AG | 33,778 | 7,067,806 | |
| DHL Group | 564 | 26,157 | |
| E.ON SE | 136,343 | 1,740,316 | |
| Fresenius Medical Care AG & Co. KGaA | 6,958 | 266,065 | |
| Fresenius SE & Co. KGaA | 221,585 | 6,197,977 | |
| GEA Group AG | 46,124 | 1,857,940 | |
| Hannover Reuck SE | 3,705 | 950,236 | |
| HeidelbergCement AG | 86,248 | 8,361,550 | |
| Knorr-Bremse AG | 29,016 | 2,028,397 | |
| Mercedes-Benz Group AG: | |||
| ADR | 49,787 | 990,761 | |
| (Germany) | 368 | 29,289 | |
| Muenchener Rueckversicherungs-Gesellschaft AG in Muenchen | 27,138 | 12,623,955 | |
| Rational AG | 1,019 | 837,015 | |
| RWE AG | 136,802 | 4,583,524 | |
| SAP SE | 121,185 | 22,643,260 | |
| SAP SE sponsored ADR | 9,010 | 1,692,709 | |
| Scout24 AG (c) | 41,147 | 2,988,497 | |
| Siemens AG | 88,571 | 17,512,396 | |
| Siemens AG sponsored ADR | 25,652 | 2,535,957 | |
| Talanx AG | 17,713 | 1,263,518 | |
TOTAL GERMANY | 113,279,540 | ||
| Hong Kong - 2.3% | |||
| AIA Group Ltd. | 1,725,632 | 14,017,523 | |
| AIA Group Ltd. ADR | 18,465 | 595,681 | |
| Hang Seng Bank Ltd. | 273,100 | 3,118,352 | |
| Hongkong Land Holdings Ltd. | 81,400 | 275,132 | |
| Jardine Matheson Holdings Ltd. | 118,900 | 4,983,099 | |
| Prudential PLC ADR | 23,574 | 474,073 | |
| Sun Hung Kai Properties Ltd. | 562,000 | 5,667,016 | |
| Swire Pacific Ltd. (A Shares) | 30,500 | 252,819 | |
| WH Group Ltd. (c) | 4,837,455 | 2,916,251 | |
TOTAL HONG KONG | 32,299,946 | ||
| Ireland - 0.6% | |||
| AerCap Holdings NV (b) | 105,102 | 8,111,772 | |
| Israel - 0.6% | |||
| Bank Hapoalim BM (Reg.) | 37,292 | 356,747 | |
| Wix.com Ltd. (b) | 62,760 | 8,797,697 | |
TOTAL ISRAEL | 9,154,444 | ||
| Italy - 2.4% | |||
| Assicurazioni Generali SpA | 110,735 | 2,623,438 | |
| Coca-Cola HBC AG | 247,076 | 7,687,941 | |
| Ferrari NV (Italy) | 2,448 | 1,031,597 | |
| Intesa Sanpaolo SpA | 3,529,347 | 11,207,055 | |
| UniCredit SpA | 339,797 | 11,351,778 | |
| UniCredit SpA ADR | 21,049 | 351,097 | |
TOTAL ITALY | 34,252,906 | ||
| Japan - 23.4% | |||
| Ajinomoto Co., Inc. | 25,100 | 921,327 | |
| Asahi Group Holdings | 75,800 | 2,595,260 | |
| Central Japan Railway Co. | 185,500 | 4,663,484 | |
| Chubu Electric Power Co., Inc. | 508,800 | 6,334,546 | |
| Daiwa Securities Group, Inc. | 1,097,948 | 8,070,562 | |
| DENSO Corp. | 584,800 | 10,742,657 | |
| Disco Corp. | 32,550 | 10,478,008 | |
| Fast Retailing Co. Ltd. | 41,242 | 11,900,540 | |
| Fujitsu Ltd. | 38,300 | 5,974,156 | |
| Hitachi Ltd. | 171,900 | 14,521,835 | |
| Honda Motor Co. Ltd. | 958,206 | 11,389,562 | |
| Hoya Corp. | 85,984 | 11,175,282 | |
| Itochu Corp. | 40,050 | 1,740,700 | |
| Japan Exchange Group, Inc. | 78,000 | 2,036,366 | |
| JFE Holdings, Inc. | 401,600 | 6,576,361 | |
| Kansai Electric Power Co., Inc. | 541,800 | 6,940,548 | |
| Keyence Corp. | 6,300 | 2,943,250 | |
| Kintetsu Group Holdings Co. Ltd. | 32,700 | 1,004,644 | |
| Koito Manufacturing Co. Ltd. | 41,500 | 524,425 | |
| Komatsu Ltd. | 71,000 | 2,058,204 | |
| LY Corp. | 2,392,922 | 6,590,432 | |
| Makita Corp. | 36,200 | 943,392 | |
| Marubeni Corp. | 340,600 | 5,616,083 | |
| Mazda Motor Corp. | 397,000 | 4,655,323 | |
| Mitsubishi Chemical Holdings Corp. | 789,100 | 4,518,692 | |
| Mitsubishi Corp. | 648,118 | 13,855,511 | |
| Mitsubishi UFJ Financial Group, Inc. | 460,600 | 4,737,495 | |
| Mitsui & Co. Ltd. (a) | 268,500 | 11,736,129 | |
| Murata Manufacturing Co. Ltd. | 244,400 | 4,928,103 | |
| Nexon Co. Ltd. | 194,800 | 3,152,247 | |
| Nidec Corp. | 111,300 | 4,217,551 | |
| Nintendo Co. Ltd. | 51,308 | 2,874,781 | |
| Nippon Paint Holdings Co. Ltd. | 745,400 | 5,521,389 | |
| Nippon Sanso Holdings Corp. | 42,400 | 1,226,862 | |
| Nippon Steel & Sumitomo Metal Corp. | 145,700 | 3,610,429 | |
| Nippon Telegraph & Telephone Corp. | 37,600 | 45,721 | |
| Nissan Motor Co. Ltd. | 88,300 | 346,792 | |
| Nissan Motor Co. Ltd. sponsored ADR (a) | 86,801 | 681,388 | |
| Nitto Denko Corp. | 79,800 | 7,318,903 | |
| Nomura Research Institute Ltd. | 10,300 | 288,829 | |
| Ono Pharmaceutical Co. Ltd. | 155,500 | 2,580,603 | |
| Oracle Corp. Japan | 5,400 | 413,140 | |
| ORIX Corp. | 146,700 | 3,069,623 | |
| Otsuka Holdings Co. Ltd. | 13,500 | 547,672 | |
| Pan Pacific International Holdings Ltd. | 33,800 | 794,724 | |
| Panasonic Holdings Corp. | 917,100 | 8,689,571 | |
| Rakuten Group, Inc. | 1,488,400 | 8,140,929 | |
| Renesas Electronics Corp. | 106,800 | 1,748,537 | |
| Shin-Etsu Chemical Co. Ltd. | 320,300 | 13,645,652 | |
| Shin-Etsu Chemical Co. Ltd. ADR (a) | 15,800 | 335,750 | |
| Shiseido Co. Ltd. | 27,098 | 731,494 | |
| SoftBank Corp. | 798,564 | 10,506,720 | |
| Sompo Holdings, Inc. | 84,900 | 4,973,264 | |
| Sony Group Corp. | 34,436 | 2,973,413 | |
| Subaru Corp. | 272,858 | 6,195,362 | |
| Tokyo Electron Ltd. | 72,500 | 17,830,009 | |
| Tokyo Gas Co. Ltd. | 38,800 | 848,621 | |
| Toyota Motor Corp. | 705,561 | 17,041,331 | |
| Toyota Motor Corp. sponsored ADR (a) | 12,417 | 2,986,909 | |
| Toyota Tsusho Corp. | 129,100 | 8,330,532 | |
| Trend Micro, Inc. | 42,900 | 2,124,969 | |
| USS Co. Ltd. | 36,700 | 637,819 | |
| Yokogawa Electric Corp. | 311,800 | 6,580,411 | |
TOTAL JAPAN | 331,184,824 | ||
| Luxembourg - 0.2% | |||
| ArcelorMittal SA (Netherlands) | 96,760 | 2,522,426 | |
| Eurofins Scientific SA | 11,553 | 689,753 | |
TOTAL LUXEMBOURG | 3,212,179 | ||
| Netherlands - 6.4% | |||
| Akzo Nobel NV | 13,711 | 997,901 | |
| ASML Holding NV: | |||
| (depository receipt) | 16,772 | 15,961,577 | |
| (Netherlands) | 25,428 | 23,923,588 | |
| BE Semiconductor Industries NV | 14,664 | 2,649,135 | |
| Koninklijke Ahold Delhaize NV | 161,068 | 4,790,745 | |
| Koninklijke Philips Electronics NV | 414,252 | 8,283,781 | |
| NN Group NV | 209,366 | 9,336,427 | |
| Shell PLC: | |||
| (London) | 726,302 | 22,526,047 | |
| rights (b)(d) | 720,638 | 247,899 | |
| Wolters Kluwer NV | 12,299 | 1,938,749 | |
TOTAL NETHERLANDS | 90,655,849 | ||
| New Zealand - 0.2% | |||
| Meridian Energy Ltd. | 580,283 | 2,112,766 | |
| Norway - 0.6% | |||
| DNB Bank ASA | 268,453 | 5,365,875 | |
| Gjensidige Forsikring ASA | 161,501 | 2,548,423 | |
| Salmar ASA | 13,229 | 838,731 | |
TOTAL NORWAY | 8,753,029 | ||
| Singapore - 2.0% | |||
| CapitaLand Ascendas REIT | 540,500 | 1,100,643 | |
| Genting Singapore Ltd. | 2,453,200 | 1,659,107 | |
| Oversea-Chinese Banking Corp. Ltd. | 907,700 | 8,756,231 | |
| Sembcorp Industries Ltd. | 82,800 | 313,834 | |
| Singapore Technologies Engineering Ltd. | 180,500 | 533,901 | |
| Singapore Telecommunications Ltd. | 457,600 | 799,197 | |
| STMicroelectronics NV: | |||
| (depository receipt) | 12,310 | 561,582 | |
| (France) | 114,403 | 5,159,161 | |
| United Overseas Bank Ltd. | 438,755 | 9,113,896 | |
TOTAL SINGAPORE | 27,997,552 | ||
| Spain - 3.1% | |||
| ACS Actividades de Construccion y Servicios SA | 23,953 | 982,206 | |
| Aena SME SA (c) | 39,421 | 7,462,479 | |
| Banco Santander SA (Spain) | 848,891 | 3,528,175 | |
| CaixaBank SA | 954,112 | 4,300,122 | |
| Iberdrola SA | 1,075,358 | 12,343,062 | |
| Industria de Diseno Textil SA | 262,069 | 11,615,844 | |
| Redeia Corp. SA | 4,754 | 75,530 | |
| Telefonica SA | 982,528 | 4,027,848 | |
TOTAL SPAIN | 44,335,266 | ||
| Sweden - 2.5% | |||
| Essity AB (B Shares) | 65,828 | 1,534,827 | |
| Evolution AB (c) | 28,784 | 3,724,616 | |
| Industrivarden AB (A Shares) | 67,047 | 2,285,046 | |
| Svenska Handelsbanken AB (A Shares) (a) | 763,569 | 9,118,869 | |
| Swedish Orphan Biovitrum AB (b) | 224,325 | 5,509,448 | |
| Volvo AB (B Shares) | 427,486 | 11,756,855 | |
| Volvo Car AB (b) | 459,101 | 1,672,293 | |
TOTAL SWEDEN | 35,601,954 | ||
| Switzerland - 5.2% | |||
| ABB Ltd.: | |||
| (Reg.) | 224,801 | 10,350,989 | |
| sponsored ADR | 75,889 | 3,493,930 | |
| Alcon, Inc. (Switzerland) | 61,436 | 5,222,772 | |
| Barry Callebaut AG | 504 | 707,828 | |
| BKW AG | 4,959 | 695,331 | |
| Clariant AG (Reg.) | 27,812 | 344,053 | |
| Compagnie Financiere Richemont SA (a) | 7,377 | 1,179,820 | |
| Compagnie Financiere Richemont SA Series A | 23,354 | 3,712,978 | |
| Givaudan SA | 2,586 | 10,839,941 | |
| Lindt & Spruengli AG (participation certificate) | 155 | 1,896,421 | |
| Logitech International SA (Reg.) | 94,228 | 8,308,814 | |
| Novartis AG | 233,595 | 23,638,171 | |
| Novartis AG sponsored ADR | 7,582 | 765,555 | |
| Temenos AG | 15,392 | 1,153,943 | |
| UBS Group AG | 28,902 | 823,904 | |
TOTAL SWITZERLAND | 73,134,450 | ||
| United Kingdom - 10.3% | |||
| 3i Group PLC | 109,730 | 3,418,481 | |
| AstraZeneca PLC (United Kingdom) | 77,848 | 9,810,048 | |
| Aviva PLC | 594,449 | 3,348,915 | |
| BAE Systems PLC | 745,514 | 11,687,994 | |
| Barclays PLC sponsored ADR (a) | 52,597 | 447,075 | |
| BP PLC | 263,652 | 1,533,246 | |
| British American Tobacco PLC: | |||
| (United Kingdom) | 79,611 | 2,356,560 | |
| sponsored ADR (a) | 172,332 | 5,151,003 | |
| BT Group PLC | 2,154,876 | 2,841,144 | |
| Bunzl PLC | 78,827 | 3,137,340 | |
| Centrica PLC | 524,426 | 833,106 | |
| Coca-Cola European Partners PLC | 38,879 | 2,668,266 | |
| Diageo PLC sponsored ADR | 2,246 | 338,697 | |
| Halma PLC | 42,364 | 1,231,019 | |
| Hargreaves Lansdown PLC | 217,138 | 1,996,496 | |
| HSBC Holdings PLC: | |||
| (United Kingdom) | 1,754,047 | 13,605,850 | |
| sponsored ADR (a) | 139,406 | 5,461,927 | |
| Imperial Brands PLC | 86,099 | 1,852,498 | |
| InterContinental Hotel Group PLC | 39,627 | 4,191,773 | |
| InterContinental Hotel Group PLC ADR | 40,683 | 4,359,590 | |
| J Sainsbury PLC | 248,253 | 782,171 | |
| Land Securities Group PLC | 226,645 | 1,772,638 | |
| Lloyds Banking Group PLC | 6,403,388 | 3,764,252 | |
| Lloyds Banking Group PLC sponsored ADR | 173,637 | 406,311 | |
| London Stock Exchange Group PLC | 18,313 | 2,051,821 | |
| National Grid PLC sponsored ADR (a) | 16,187 | 1,079,025 | |
| NatWest Group PLC | 400,094 | 1,207,547 | |
| NatWest Group PLC sponsored ADR (a) | 75,627 | 468,887 | |
| Next PLC | 76 | 7,976 | |
| Pearson PLC | 451,745 | 5,477,703 | |
| Rolls-Royce Holdings PLC (b) | 2,517,741 | 11,730,531 | |
| Sage Group PLC | 461,300 | 7,246,711 | |
| Schroders PLC | 731,328 | 3,630,770 | |
| Smith & Nephew PLC sponsored ADR (a) | 29,473 | 781,329 | |
| Tesco PLC | 2,461,382 | 8,662,323 | |
| Tesco PLC Sponsored ADR | 30,306 | 328,214 | |
| Unilever PLC | 92,057 | 4,493,010 | |
| Vodafone Group PLC | 6,442,718 | 5,621,283 | |
| Vodafone Group PLC sponsored ADR (a) | 351,797 | 3,145,065 | |
| Whitbread PLC | 26,829 | 1,118,602 | |
| Wise PLC (b) | 156,162 | 1,809,198 | |
TOTAL UNITED KINGDOM | 145,856,395 | ||
| United States of America - 7.2% | |||
| CRH PLC | 43,445 | 3,605,223 | |
| CSL Ltd. | 2,047 | 380,857 | |
| GSK PLC | 341,842 | 7,182,868 | |
| GSK PLC sponsored ADR | 175,716 | 7,362,500 | |
| Holcim AG | 139,992 | 11,413,381 | |
| James Hardie Industries PLC CDI (b) | 36,154 | 1,427,631 | |
| Monday.com Ltd. (b) | 30,543 | 6,811,394 | |
| Nestle SA (Reg. S) | 163,583 | 16,973,343 | |
| QIAGEN NV (Germany) | 124,785 | 5,345,478 | |
| Roche Holding AG: | |||
| (Bearer) | 3,144 | 872,435 | |
| (participation certificate) | 39,416 | 10,338,148 | |
| Sanofi SA | 136,685 | 12,983,915 | |
| Sanofi SA sponsored ADR | 53,375 | 2,553,994 | |
| Schneider Electric SA | 61,186 | 13,874,038 | |
| Schneider Electric SA ADR (a) | 7,117 | 323,539 | |
TOTAL UNITED STATES OF AMERICA | 101,448,744 | ||
| TOTAL COMMON STOCKS (Cost $1,106,705,908) | 1,392,706,250 | ||
| Nonconvertible Preferred Stocks - 0.7% | |||
| Shares | Value ($) | ||
| Germany - 0.7% | |||
| Dr. Ing. h.c. F. Porsche AG Series F (c) | 55,457 | 5,175,041 | |
| Volkswagen AG | 37,077 | 5,022,727 | |
| TOTAL NONCONVERTIBLE PREFERRED STOCKS (Cost $11,744,506) | 10,197,768 | ||
| Government Obligations - 0.0% | |||
Principal Amount (e) | Value ($) | ||
| United States of America - 0.0% | |||
U.S. Treasury Bills, yield at date of purchase 5.31% 5/30/24 (f) (Cost $246,727) | 250,000 | 246,730 | |
| Money Market Funds - 3.2% | |||
| Shares | Value ($) | ||
| Fidelity Cash Central Fund 5.39% (g) | 7,406,478 | 7,407,960 | |
| Fidelity Securities Lending Cash Central Fund 5.39% (g)(h) | 38,152,155 | 38,155,971 | |
| TOTAL MONEY MARKET FUNDS (Cost $45,563,931) | 45,563,931 | ||
| TOTAL INVESTMENT IN SECURITIES - 102.3% (Cost $1,164,261,072) | 1,448,714,679 |
NET OTHER ASSETS (LIABILITIES) - (2.3)% | (32,916,798) |
| NET ASSETS - 100.0% | 1,415,797,881 |
| Futures Contracts | |||||
Number of contracts | Expiration Date | Notional Amount ($) | Value ($) | Unrealized Appreciation/ (Depreciation) ($) | |
| Purchased | |||||
| Equity Index Contracts | |||||
| ICE MSCI EAFE Index Contracts (United States) | 69 | Mar 2024 | 7,893,255 | 228,363 | 228,363 |
| The notional amount of futures purchased as a percentage of Net Assets is 0.6% | |||||
| (a) | Security or a portion of the security is on loan at period end. |
| (b) | Non-income producing |
| (c) | Security exempt from registration under Rule 144A of the Securities Act of 1933. These securities may be resold in transactions exempt from registration, normally to qualified institutional buyers. At the end of the period, the value of these securities amounted to $25,537,894 or 1.8% of net assets. |
| (d) | Security or a portion of the security purchased on a delayed delivery or when-issued basis. |
| (e) | Amount is stated in United States dollars unless otherwise noted. |
| (f) | Security or a portion of the security was pledged to cover margin requirements for futures contracts. At period end, the value of securities pledged amounted to $246,730. |
| (g) | Affiliated fund that is generally available only to investment companies and other accounts managed by Fidelity Investments. The rate quoted is the annualized seven-day yield of the fund at period end. A complete unaudited listing of the fund's holdings as of its most recent quarter end is available upon request. In addition, each Fidelity Central Fund's financial statements are available on the SEC's website or upon request. |
| (h) | Investment made with cash collateral received from securities on loan. |
| Affiliate | Value, beginning of period ($) | Purchases ($) | Sales Proceeds ($) | Dividend Income ($) | Realized Gain (loss) ($) | Change in Unrealized appreciation (depreciation) ($) | Value, end of period ($) | % ownership, end of period |
| Fidelity Cash Central Fund 5.39% | 19,925,982 | 249,386,745 | 261,904,767 | 260,099 | - | - | 7,407,960 | 0.0% |
| Fidelity Securities Lending Cash Central Fund 5.39% | 10,181,938 | 133,266,580 | 105,292,547 | 68,307 | - | - | 38,155,971 | 0.1% |
| Total | 30,107,920 | 382,653,325 | 367,197,314 | 328,406 | - | - | 45,563,931 | |
| Valuation Inputs at Reporting Date: | ||||
| Description | Total ($) | Level 1 ($) | Level 2 ($) | Level 3 ($) |
Investments in Securities: | ||||
| Equities: | ||||
Communication Services | 61,958,496 | 37,640,804 | 24,317,692 | - |
Consumer Discretionary | 189,230,851 | 87,119,232 | 102,111,619 | - |
Consumer Staples | 94,709,397 | 36,053,024 | 58,656,373 | - |
Energy | 43,077,393 | 247,899 | 42,829,494 | - |
Financials | 251,861,890 | 137,469,584 | 114,392,306 | - |
Health Care | 174,880,146 | 57,279,754 | 117,600,392 | - |
Industrials | 239,731,293 | 140,563,148 | 99,168,145 | - |
Information Technology | 159,450,002 | 77,243,188 | 82,206,814 | - |
Materials | 126,185,020 | 83,762,509 | 42,422,511 | - |
Real Estate | 20,422,532 | 14,755,516 | 5,667,016 | - |
Utilities | 41,396,998 | 24,470,412 | 16,926,586 | - |
| Government Obligations | 246,730 | - | 246,730 | - |
| Money Market Funds | 45,563,931 | 45,563,931 | - | - |
| Total Investments in Securities: | 1,448,714,679 | 742,169,001 | 706,545,678 | - |
Derivative Instruments: Assets | ||||
Futures Contracts | 228,363 | 228,363 | - | - |
| Total Assets | 228,363 | 228,363 | - | - |
| Total Derivative Instruments: | 228,363 | 228,363 | - | - |
Primary Risk Exposure / Derivative Type | Value | |
| Asset ($) | Liability ($) | |
| Equity Risk | ||
Futures Contracts (a) | 228,363 | 0 |
| Total Equity Risk | 228,363 | 0 |
| Total Value of Derivatives | 228,363 | 0 |
| Statement of Assets and Liabilities | ||||
February 29, 2024 (Unaudited) | ||||
| Assets | ||||
| Investment in securities, at value (including securities loaned of $36,814,657) - See accompanying schedule: | ||||
Unaffiliated issuers (cost $1,118,697,141) | $ | 1,403,150,748 | ||
Fidelity Central Funds (cost $45,563,931) | 45,563,931 | |||
| Total Investment in Securities (cost $1,164,261,072) | $ | 1,448,714,679 | ||
| Cash | 914 | |||
| Foreign currency held at value (cost $112,565) | 112,164 | |||
| Receivable for investments sold | 25,825,043 | |||
| Receivable for fund shares sold | 11,044,426 | |||
| Dividends receivable | 1,599,325 | |||
| Reclaims receivable | 3,293,943 | |||
| Interest receivable | 55 | |||
| Distributions receivable from Fidelity Central Funds | 36,123 | |||
| Receivable for daily variation margin on futures contracts | 16,123 | |||
| Other receivables | 10,612 | |||
Total assets | 1,490,653,407 | |||
| Liabilities | ||||
| Payable for investments purchased | ||||
Regular delivery | $ | 36,096,219 | ||
Delayed delivery | 249,329 | |||
| Accrued management fee | 320,600 | |||
| Other payables and accrued expenses | 33,320 | |||
| Collateral on securities loaned | 38,156,058 | |||
| Total Liabilities | 74,855,526 | |||
| Net Assets | $ | 1,415,797,881 | ||
| Net Assets consist of: | ||||
| Paid in capital | $ | 1,278,697,275 | ||
| Total accumulated earnings (loss) | 137,100,606 | |||
| Net Assets | $ | 1,415,797,881 | ||
Net Asset Value, offering price and redemption price per share ($1,415,797,881 ÷ 51,279,106 shares) | $ | 27.61 | ||
| Statement of Operations | ||||
Six months ended February 29, 2024 (Unaudited) | ||||
| Investment Income | ||||
| Dividends | $ | 13,409,637 | ||
| Interest | 38,028 | |||
| Income from Fidelity Central Funds (including $68,307 from security lending) | 328,406 | |||
| Income before foreign taxes withheld | $ | 13,776,071 | ||
| Less foreign taxes withheld | (796,304) | |||
| Total Income | 12,979,767 | |||
| Expenses | ||||
| Management fee | $ | 2,762,898 | ||
| Independent trustees' fees and expenses | 3,688 | |||
| Interest | 19,359 | |||
| Miscellaneous | 55,907 | |||
| Total expenses before reductions | 2,841,852 | |||
| Expense reductions | (107) | |||
| Total expenses after reductions | 2,841,745 | |||
| Net Investment income (loss) | 10,138,022 | |||
| Realized and Unrealized Gain (Loss) | ||||
| Net realized gain (loss) on: | ||||
| Investment Securities: | ||||
| Unaffiliated issuers | 29,613,301 | |||
| Redemptions in-kind | 19,376,262 | |||
| Foreign currency transactions | 221,358 | |||
| Futures contracts | 2,658,851 | |||
| Total net realized gain (loss) | 51,869,772 | |||
| Change in net unrealized appreciation (depreciation) on: | ||||
| Investment Securities: | ||||
| Unaffiliated issuers | 69,873,385 | |||
| Assets and liabilities in foreign currencies | 133,850 | |||
| Futures contracts | 241,593 | |||
| Total change in net unrealized appreciation (depreciation) | 70,248,828 | |||
| Net gain (loss) | 122,118,600 | |||
| Net increase (decrease) in net assets resulting from operations | $ | 132,256,622 | ||
See Organization and Merger information note regarding reorganization from mutual fund to exchange traded fund.
| Statement of Changes in Net Assets | ||||
Six months ended February 29, 2024 (Unaudited) | Year ended August 31, 2023 | |||
| Increase (Decrease) in Net Assets | ||||
| Operations | ||||
| Net investment income (loss) | $ | 10,138,022 | $ | 40,722,351 |
| Net realized gain (loss) | 51,869,772 | (32,079,780) | ||
| Change in net unrealized appreciation (depreciation) | 70,248,828 | 261,209,693 | ||
| Net increase (decrease) in net assets resulting from operations | 132,256,622 | 269,852,264 | ||
| Distributions to shareholders | (43,955,486) | (33,763,256) | ||
| Share transactions | ||||
| Proceeds from sales of shares | 96,087,384 | 600,539,896 | ||
| Reinvestment of distributions | 30,814,353 | 24,033,209 | ||
| Cost of shares redeemed | (364,517,536) | (600,353,896) | ||
Net increase (decrease) in net assets resulting from share transactions | (237,615,799) | 24,219,209 | ||
| Total increase (decrease) in net assets | (149,314,663) | 260,308,217 | ||
| Net Assets | ||||
| Beginning of period | 1,565,112,544 | 1,304,804,327 | ||
| End of period | $ | 1,415,797,881 | $ | 1,565,112,544 |
| Other Information | ||||
| Shares | ||||
| Sold | 3,775,592 | 26,342,964 | ||
| Issued in reinvestment of distributions | 1,276,109 | 1,026,385 | ||
| Redeemed | (14,596,865) | (25,639,395) | ||
| Net increase (decrease) | (9,545,164) | 1,729,954 | ||
| Fidelity® Enhanced International ETF |
Six months ended (Unaudited) February 29, 2024 A | Years ended August 31, 2023 A | 2022 A | 2021 A | 2020 A | 2019 A | |||||||
Selected Per-Share Data | ||||||||||||
| Net asset value, beginning of period | $ | 25.73 | $ | 22.08 | $ | 28.49 | $ | 22.68 | $ | 22.13 | $ | 24.23 |
| Income from Investment Operations | ||||||||||||
Net investment income (loss) B,C | .19 | .64 | .76 | .62 | .47 | .74 | ||||||
| Net realized and unrealized gain (loss) | 2.47 | 3.58 | (6.43) | 5.61 | .79 | (2.35) | ||||||
| Total from investment operations | 2.66 | 4.22 | (5.67) | 6.23 | 1.26 | (1.61) | ||||||
| Distributions from net investment income | (.78) | (.57) | (.74) | (.42) | (.71) | (.49) | ||||||
| Total distributions | (.78) | (.57) | (.74) | (.42) | (.71) | (.49) | ||||||
| Net asset value, end of period | $ | 27.61 | $ | 25.73 | $ | 22.08 | $ | 28.49 | $ | 22.68 | $ | 22.13 |
Total Return D,E,F | 10.77% | 19.29% | (20.35)% | 27.77% | 5.55% | (6.51)% | ||||||
Ratios to Average Net Assets C,G,H | ||||||||||||
| Expenses before reductions | .41% I | .55% | .57% | .59% | .59% | .59% | ||||||
| Expenses net of fee waivers, if any | .41% I | .55% | .57% | .59% | .59% | .59% | ||||||
| Expenses net of all reductions | .41% I | .55% | .57% | .59% | .59% | .59% | ||||||
| Net investment income (loss) | 1.47% I | 2.69% | 2.99% | 2.32% | 2.13% | 3.27% | ||||||
| Supplemental Data | ||||||||||||
| Net assets, end of period (000 omitted) | $ | 1,415,798 | $ | 1,565,113 | $ | 1,304,804 | $ | 1,679,091 | $ | 1,182,923 | $ | 1,505,889 |
Portfolio turnover rate J | 115% I,K | 105% | 114% | 82% | 75% | 103% |
Top Holdings (% of Fund's net assets) | ||
| Microsoft Corp. | 7.3 | |
| Apple, Inc. | 5.8 | |
| NVIDIA Corp. | 5.1 | |
| Amazon.com, Inc. | 4.2 | |
| Meta Platforms, Inc. Class A | 3.0 | |
| Alphabet, Inc. Class C | 2.1 | |
| Alphabet, Inc. Class A | 1.9 | |
| Berkshire Hathaway, Inc. Class B | 1.9 | |
| Broadcom, Inc. | 1.8 | |
| JPMorgan Chase & Co. | 1.8 | |
| 34.9 | ||
| Market Sectors (% of Fund's net assets) | ||
| Information Technology | 28.9 | |
| Financials | 13.5 | |
| Health Care | 13.1 | |
| Consumer Discretionary | 10.7 | |
| Communication Services | 10.6 | |
| Industrials | 10.4 | |
| Consumer Staples | 4.5 | |
| Energy | 2.6 | |
| Materials | 2.3 | |
| Real Estate | 1.6 | |
| Utilities | 0.5 | |
Asset Allocation (% of Fund's net assets) |
 |
Futures - 1.1% |
| Common Stocks - 98.7% | |||
| Shares | Value ($) | ||
| COMMUNICATION SERVICES - 10.6% | |||
| Diversified Telecommunication Services - 1.2% | |||
| AT&T, Inc. | 458,063 | 7,755,007 | |
| Verizon Communications, Inc. | 491,068 | 19,652,541 | |
| 27,407,548 | |||
| Entertainment - 1.9% | |||
| Electronic Arts, Inc. | 94,146 | 13,131,484 | |
| Netflix, Inc. (a) | 22,032 | 13,283,533 | |
| Spotify Technology SA (a) | 42,646 | 10,934,861 | |
| The Walt Disney Co. | 67,876 | 7,573,604 | |
| 44,923,482 | |||
| Interactive Media & Services - 7.0% | |||
| Alphabet, Inc.: | |||
| Class A (a) | 317,873 | 44,012,696 | |
| Class C (a) | 345,635 | 48,312,860 | |
| Meta Platforms, Inc. Class A | 145,066 | 71,101,199 | |
| 163,426,755 | |||
| Media - 0.5% | |||
| Comcast Corp. Class A | 252,825 | 10,833,551 | |
TOTAL COMMUNICATION SERVICES | 246,591,336 | ||
| CONSUMER DISCRETIONARY - 10.7% | |||
| Automobiles - 1.4% | |||
| Ford Motor Co. | 1,198,714 | 14,912,002 | |
| Tesla, Inc. (a) | 87,758 | 17,716,585 | |
| 32,628,587 | |||
| Broadline Retail - 4.2% | |||
| Amazon.com, Inc. (a) | 553,060 | 97,758,886 | |
| Diversified Consumer Services - 0.4% | |||
| Duolingo, Inc. (a) | 36,246 | 8,662,794 | |
| Hotels, Restaurants & Leisure - 1.8% | |||
| Airbnb, Inc. Class A (a) | 72 | 11,338 | |
| Booking Holdings, Inc. | 493 | 1,710,133 | |
| Chipotle Mexican Grill, Inc. (a) | 6,027 | 16,205,217 | |
| International Game Technology PLC | 224,804 | 6,107,925 | |
| McDonald's Corp. | 50,821 | 14,853,962 | |
| Starbucks Corp. | 37,594 | 3,567,671 | |
| 42,456,246 | |||
| Household Durables - 0.6% | |||
| D.R. Horton, Inc. | 6,420 | 959,405 | |
| Lennar Corp. Class A | 3,922 | 621,676 | |
| NVR, Inc. (a) | 728 | 5,551,415 | |
| Toll Brothers, Inc. | 24,881 | 2,852,358 | |
| TopBuild Corp. (a) | 1,113 | 447,849 | |
| TRI Pointe Homes, Inc. (a) | 91,245 | 3,228,248 | |
| 13,660,951 | |||
| Specialty Retail - 1.9% | |||
| The Home Depot, Inc. | 86,111 | 32,774,708 | |
| TJX Companies, Inc. | 60,443 | 5,992,319 | |
| Ulta Beauty, Inc. (a) | 11,483 | 6,299,114 | |
| 45,066,141 | |||
| Textiles, Apparel & Luxury Goods - 0.4% | |||
| Crocs, Inc. (a) | 4,477 | 547,313 | |
| NIKE, Inc. Class B | 14 | 1,455 | |
| Tapestry, Inc. | 188,670 | 8,967,485 | |
| 9,516,253 | |||
TOTAL CONSUMER DISCRETIONARY | 249,749,858 | ||
| CONSUMER STAPLES - 4.5% | |||
| Beverages - 1.1% | |||
| Molson Coors Beverage Co. Class B | 88,718 | 5,537,778 | |
| PepsiCo, Inc. | 7,504 | 1,240,711 | |
| The Coca-Cola Co. | 327,956 | 19,683,919 | |
| 26,462,408 | |||
| Consumer Staples Distribution & Retail - 1.9% | |||
| Costco Wholesale Corp. | 27,235 | 20,259,844 | |
| Sysco Corp. | 68,429 | 5,540,696 | |
| Walmart, Inc. | 309,129 | 18,118,051 | |
| 43,918,591 | |||
| Food Products - 0.3% | |||
| Seaboard Corp. | 808 | 2,656,373 | |
| The Kraft Heinz Co. | 132,398 | 4,671,001 | |
| 7,327,374 | |||
| Household Products - 1.2% | |||
| Colgate-Palmolive Co. | 36,746 | 3,179,264 | |
| Kimberly-Clark Corp. | 78 | 9,451 | |
| Procter & Gamble Co. | 155,932 | 24,783,832 | |
| 27,972,547 | |||
TOTAL CONSUMER STAPLES | 105,680,920 | ||
| ENERGY - 2.6% | |||
| Energy Equipment & Services - 0.1% | |||
| Baker Hughes Co. Class A | 94,424 | 2,794,006 | |
| Oil, Gas & Consumable Fuels - 2.5% | |||
| Chevron Corp. | 18,397 | 2,796,528 | |
| ConocoPhillips Co. | 96,074 | 10,812,168 | |
| Coterra Energy, Inc. | 86,053 | 2,218,446 | |
| Devon Energy Corp. | 295,852 | 13,035,239 | |
| EOG Resources, Inc. | 132,545 | 15,171,101 | |
| Exxon Mobil Corp. | 103,090 | 10,774,967 | |
| Marathon Petroleum Corp. | 8,573 | 1,450,809 | |
| Occidental Petroleum Corp. warrants 8/3/27 (a) | 4,716 | 182,038 | |
| Pioneer Natural Resources Co. | 2,915 | 685,579 | |
| 57,126,875 | |||
TOTAL ENERGY | 59,920,881 | ||
| FINANCIALS - 13.5% | |||
| Banks - 2.8% | |||
| Bank of America Corp. | 706,792 | 24,398,460 | |
| JPMorgan Chase & Co. | 220,853 | 41,091,909 | |
| 65,490,369 | |||
| Capital Markets - 1.9% | |||
| Ameriprise Financial, Inc. | 15,994 | 6,515,316 | |
| CME Group, Inc. | 69,241 | 15,257,254 | |
| Goldman Sachs Group, Inc. | 46,278 | 18,004,456 | |
| LPL Financial | 10,322 | 2,765,161 | |
| NASDAQ, Inc. | 333 | 18,715 | |
| S&P Global, Inc. | 3 | 1,285 | |
| Tradeweb Markets, Inc. Class A | 15,649 | 1,655,977 | |
| 44,218,164 | |||
| Consumer Finance - 1.1% | |||
| American Express Co. | 88,449 | 19,407,480 | |
| Capital One Financial Corp. | 36,472 | 5,018,912 | |
| 24,426,392 | |||
| Financial Services - 5.7% | |||
| Berkshire Hathaway, Inc. Class B (a) | 107,296 | 43,926,982 | |
| Block, Inc. Class A (a) | 160,125 | 12,725,134 | |
| FleetCor Technologies, Inc. (a) | 13,169 | 3,677,707 | |
| MasterCard, Inc. Class A | 70,384 | 33,415,508 | |
| MGIC Investment Corp. | 40,102 | 797,629 | |
| PayPal Holdings, Inc. (a) | 252,402 | 15,229,937 | |
| Visa, Inc. Class A | 77,961 | 22,034,897 | |
| 131,807,794 | |||
| Insurance - 2.0% | |||
| Brown & Brown, Inc. | 6,160 | 518,734 | |
| Hartford Financial Services Group, Inc. | 2 | 192 | |
| Marsh & McLennan Companies, Inc. | 41,351 | 8,364,067 | |
| MetLife, Inc. | 61,501 | 4,289,080 | |
| Progressive Corp. | 92,177 | 17,473,072 | |
| Selective Insurance Group, Inc. | 22,188 | 2,318,202 | |
| The Travelers Companies, Inc. | 63,210 | 13,966,882 | |
| 46,930,229 | |||
TOTAL FINANCIALS | 312,872,948 | ||
| HEALTH CARE - 13.1% | |||
| Biotechnology - 2.8% | |||
| AbbVie, Inc. | 99,349 | 17,490,391 | |
| Alkermes PLC (a) | 125 | 3,711 | |
| Amgen, Inc. | 16,532 | 4,526,958 | |
| Exelixis, Inc. (a) | 455,215 | 9,969,209 | |
| Gilead Sciences, Inc. | 223,774 | 16,134,105 | |
| Incyte Corp. (a) | 204,231 | 11,918,921 | |
| United Therapeutics Corp. (a) | 25,883 | 5,840,240 | |
| 65,883,535 | |||
| Health Care Equipment & Supplies - 1.9% | |||
| Becton, Dickinson & Co. | 10,076 | 2,373,402 | |
| Edwards Lifesciences Corp. (a) | 10,990 | 932,721 | |
| GE Healthcare Holding LLC | 36,405 | 3,323,048 | |
| Hologic, Inc. (a) | 161,811 | 11,941,652 | |
| IDEXX Laboratories, Inc. (a) | 22,816 | 13,124,448 | |
| Lantheus Holdings, Inc. (a) | 98,622 | 6,447,906 | |
| Zimmer Biomet Holdings, Inc. | 37,717 | 4,690,486 | |
| 42,833,663 | |||
| Health Care Providers & Services - 3.9% | |||
| Centene Corp. (a) | 177,218 | 13,899,208 | |
| Cigna Group | 27,358 | 9,196,118 | |
| CVS Health Corp. | 178,307 | 13,260,692 | |
| Elevance Health, Inc. | 35,526 | 17,807,408 | |
| Humana, Inc. | 5,072 | 1,776,823 | |
| McKesson Corp. | 358 | 186,665 | |
| UnitedHealth Group, Inc. | 68,435 | 33,779,516 | |
| 89,906,430 | |||
| Life Sciences Tools & Services - 0.2% | |||
| Agilent Technologies, Inc. | 39,562 | 5,434,236 | |
| Thermo Fisher Scientific, Inc. | 305 | 173,905 | |
| 5,608,141 | |||
| Pharmaceuticals - 4.3% | |||
| Bristol-Myers Squibb Co. | 339,073 | 17,207,955 | |
| Eli Lilly & Co. | 26,378 | 19,880,571 | |
| Jazz Pharmaceuticals PLC (a) | 34,953 | 4,155,912 | |
| Johnson & Johnson | 62,850 | 10,142,733 | |
| Merck & Co., Inc. | 231,781 | 29,470,954 | |
| Pfizer, Inc. | 717,450 | 19,055,472 | |
| 99,913,597 | |||
TOTAL HEALTH CARE | 304,145,366 | ||
| INDUSTRIALS - 10.4% | |||
| Aerospace & Defense - 1.8% | |||
| Lockheed Martin Corp. | 37,989 | 16,268,409 | |
| Northrop Grumman Corp. | 13,948 | 6,430,307 | |
| Textron, Inc. | 147,104 | 13,102,553 | |
| The Boeing Co. (a) | 34,810 | 7,091,493 | |
| 42,892,762 | |||
| Commercial Services & Supplies - 1.3% | |||
| Cintas Corp. | 24,446 | 15,367,000 | |
| Republic Services, Inc. | 78,867 | 14,479,981 | |
| 29,846,981 | |||
| Construction & Engineering - 0.2% | |||
| AECOM | 43,767 | 3,887,823 | |
| Valmont Industries, Inc. | 2,681 | 568,184 | |
| 4,456,007 | |||
| Electrical Equipment - 1.1% | |||
| AMETEK, Inc. | 78,521 | 14,147,914 | |
| Eaton Corp. PLC | 6,766 | 1,955,374 | |
| Emerson Electric Co. | 82,567 | 8,822,284 | |
| EnerSys | 6,352 | 583,622 | |
| 25,509,194 | |||
| Ground Transportation - 2.8% | |||
| CSX Corp. | 435,911 | 16,538,463 | |
| Norfolk Southern Corp. | 11 | 2,787 | |
| Old Dominion Freight Lines, Inc. | 17,018 | 7,530,125 | |
| Uber Technologies, Inc. (a) | 256,537 | 20,394,692 | |
| Union Pacific Corp. | 80,139 | 20,330,463 | |
| 64,796,530 | |||
| Industrial Conglomerates - 0.6% | |||
| 3M Co. | 154,380 | 14,221,486 | |
| Machinery - 1.9% | |||
| AGCO Corp. | 22,010 | 2,414,497 | |
| Allison Transmission Holdings, Inc. | 15,101 | 1,137,558 | |
| Caterpillar, Inc. | 65,140 | 21,754,154 | |
| Deere & Co. | 13,703 | 5,002,280 | |
| Donaldson Co., Inc. | 397 | 28,433 | |
| PACCAR, Inc. | 136,027 | 15,084,034 | |
| 45,420,956 | |||
| Passenger Airlines - 0.1% | |||
| American Airlines Group, Inc. (a) | 109,048 | 1,709,873 | |
| United Airlines Holdings, Inc. (a) | 49 | 2,229 | |
| 1,712,102 | |||
| Professional Services - 0.6% | |||
| CACI International, Inc. Class A (a) | 6,110 | 2,290,334 | |
| SS&C Technologies Holdings, Inc. | 176,130 | 11,230,049 | |
| 13,520,383 | |||
| Trading Companies & Distributors - 0.0% | |||
| W.W. Grainger, Inc. | 2 | 1,947 | |
TOTAL INDUSTRIALS | 242,378,348 | ||
| INFORMATION TECHNOLOGY - 28.9% | |||
| Communications Equipment - 0.3% | |||
| Cisco Systems, Inc. | 132,728 | 6,420,053 | |
| Electronic Equipment, Instruments & Components - 0.3% | |||
| Amphenol Corp. Class A | 74,525 | 8,141,111 | |
| IT Services - 0.6% | |||
| Accenture PLC Class A | 957 | 358,664 | |
| Squarespace, Inc. Class A (a) | 70,913 | 2,359,985 | |
| Twilio, Inc. Class A (a) | 73,339 | 4,370,271 | |
| Wix.com Ltd. (a) | 44,917 | 6,296,465 | |
| 13,385,385 | |||
| Semiconductors & Semiconductor Equipment - 10.8% | |||
| Advanced Micro Devices, Inc. (a) | 18,884 | 3,635,737 | |
| Applied Materials, Inc. | 108,406 | 21,856,818 | |
| Broadcom, Inc. | 32,967 | 42,873,254 | |
| Cirrus Logic, Inc. (a) | 63,760 | 5,854,443 | |
| Intel Corp. | 485,373 | 20,895,308 | |
| KLA Corp. | 8,650 | 5,901,895 | |
| Lam Research Corp. | 2,938 | 2,756,579 | |
| NVIDIA Corp. | 148,610 | 117,568,343 | |
| Qorvo, Inc. (a) | 66,778 | 7,649,420 | |
| Qualcomm, Inc. | 137,133 | 21,638,216 | |
| 250,630,013 | |||
| Software - 11.0% | |||
| Adobe, Inc. (a) | 45,143 | 25,292,720 | |
| AppLovin Corp. (a) | 1,639 | 97,881 | |
| Cadence Design Systems, Inc. (a) | 13,808 | 4,202,879 | |
| DocuSign, Inc. (a) | 118,250 | 6,299,178 | |
| Microsoft Corp. | 412,010 | 170,423,810 | |
| Palo Alto Networks, Inc. (a) | 12 | 3,727 | |
| Pegasystems, Inc. | 34,225 | 2,225,994 | |
| RingCentral, Inc. (a) | 44,629 | 1,491,501 | |
| Salesforce, Inc. | 94,046 | 29,043,286 | |
| Teradata Corp. (a) | 309,279 | 11,635,076 | |
| Zoom Video Communications, Inc. Class A (a) | 72,313 | 5,114,698 | |
| 255,830,750 | |||
| Technology Hardware, Storage & Peripherals - 5.9% | |||
| Apple, Inc. | 744,543 | 134,576,147 | |
| NetApp, Inc. | 45,987 | 4,098,361 | |
| 138,674,508 | |||
TOTAL INFORMATION TECHNOLOGY | 673,081,820 | ||
| MATERIALS - 2.3% | |||
| Chemicals - 1.5% | |||
| Eastman Chemical Co. | 82,100 | 7,203,454 | |
| Ecolab, Inc. | 65,422 | 14,709,482 | |
| Linde PLC | 13,270 | 5,955,841 | |
| Sherwin-Williams Co. | 23,791 | 7,899,326 | |
| 35,768,103 | |||
| Containers & Packaging - 0.1% | |||
| Sealed Air Corp. | 53,957 | 1,881,481 | |
| Metals & Mining - 0.7% | |||
| Nucor Corp. | 77,303 | 14,865,367 | |
TOTAL MATERIALS | 52,514,951 | ||
| REAL ESTATE - 1.6% | |||
| Equity Real Estate Investment Trusts (REITs) - 1.6% | |||
| Crown Castle, Inc. | 129,550 | 14,242,727 | |
| Federal Realty Investment Trust (SBI) | 7,756 | 782,193 | |
| Invitation Homes, Inc. | 28,557 | 972,937 | |
| Public Storage | 48,305 | 13,712,340 | |
| Ryman Hospitality Properties, Inc. | 58,462 | 6,926,578 | |
| 36,636,775 | |||
| UTILITIES - 0.5% | |||
| Electric Utilities - 0.5% | |||
| Allete, Inc. | 5,329 | 301,835 | |
| NextEra Energy, Inc. | 191,573 | 10,572,914 | |
| 10,874,749 | |||
| Gas Utilities - 0.0% | |||
| UGI Corp. | 12 | 294 | |
| Multi-Utilities - 0.0% | |||
| Black Hills Corp. | 32 | 1,665 | |
| CenterPoint Energy, Inc. | 44,604 | 1,226,610 | |
| 1,228,275 | |||
TOTAL UTILITIES | 12,103,318 | ||
| TOTAL COMMON STOCKS (Cost $1,616,328,918) | 2,295,676,521 | ||
| U.S. Treasury Obligations - 0.2% | |||
Principal Amount (b) | Value ($) | ||
U.S. Treasury Bills, yield at date of purchase 5.25% to 5.31% 3/7/24 to 5/30/24 (c) (Cost $3,345,080) | 3,350,000 | 3,345,056 | |
| Money Market Funds - 3.0% | |||
| Shares | Value ($) | ||
Fidelity Cash Central Fund 5.39% (d) (Cost $70,480,986) | 70,466,893 | 70,480,986 | |
| TOTAL INVESTMENT IN SECURITIES - 101.9% (Cost $1,690,154,984) | 2,369,502,563 |
NET OTHER ASSETS (LIABILITIES) - (1.9)% | (43,717,265) |
| NET ASSETS - 100.0% | 2,325,785,298 |
| Futures Contracts | |||||
Number of contracts | Expiration Date | Notional Amount ($) | Value ($) | Unrealized Appreciation/ (Depreciation) ($) | |
| Purchased | |||||
| Equity Index Contracts | |||||
| CME Micro E-mini S&P 500 Index Contracts (United States) | 97 | Mar 2024 | 24,753,188 | 1,710,824 | 1,710,824 |
| The notional amount of futures purchased as a percentage of Net Assets is 1.1% | |||||
| (a) | Non-income producing |
| (b) | Amount is stated in United States dollars unless otherwise noted. |
| (c) | Security or a portion of the security was pledged to cover margin requirements for futures contracts. At period end, the value of securities pledged amounted to $3,335,187. |
| (d) | Affiliated fund that is generally available only to investment companies and other accounts managed by Fidelity Investments. The rate quoted is the annualized seven-day yield of the fund at period end. A complete unaudited listing of the fund's holdings as of its most recent quarter end is available upon request. In addition, each Fidelity Central Fund's financial statements are available on the SEC's website or upon request. |
| Affiliate | Value, beginning of period ($) | Purchases ($) | Sales Proceeds ($) | Dividend Income ($) | Realized Gain (loss) ($) | Change in Unrealized appreciation (depreciation) ($) | Value, end of period ($) | % ownership, end of period |
| Fidelity Cash Central Fund 5.39% | 70,527,060 | 449,453,361 | 449,499,435 | 597,175 | - | - | 70,480,986 | 0.1% |
| Fidelity Securities Lending Cash Central Fund 5.39% | 1,387,050 | 23,328,864 | 24,715,914 | 790 | - | - | - | 0.0% |
| Total | 71,914,110 | 472,782,225 | 474,215,349 | 597,965 | - | - | 70,480,986 | |
| Valuation Inputs at Reporting Date: | ||||
| Description | Total ($) | Level 1 ($) | Level 2 ($) | Level 3 ($) |
Investments in Securities: | ||||
| Equities: | ||||
Communication Services | 246,591,336 | 246,591,336 | - | - |
Consumer Discretionary | 249,749,858 | 249,749,858 | - | - |
Consumer Staples | 105,680,920 | 105,680,920 | - | - |
Energy | 59,920,881 | 59,920,881 | - | - |
Financials | 312,872,948 | 312,872,948 | - | - |
Health Care | 304,145,366 | 304,145,366 | - | - |
Industrials | 242,378,348 | 242,378,348 | - | - |
Information Technology | 673,081,820 | 673,081,820 | - | - |
Materials | 52,514,951 | 52,514,951 | - | - |
Real Estate | 36,636,775 | 36,636,775 | - | - |
Utilities | 12,103,318 | 12,103,318 | - | - |
| U.S. Government and Government Agency Obligations | 3,345,056 | - | 3,345,056 | - |
| Money Market Funds | 70,480,986 | 70,480,986 | - | - |
| Total Investments in Securities: | 2,369,502,563 | 2,366,157,507 | 3,345,056 | - |
Derivative Instruments: Assets | ||||
Futures Contracts | 1,710,824 | 1,710,824 | - | - |
| Total Assets | 1,710,824 | 1,710,824 | - | - |
| Total Derivative Instruments: | 1,710,824 | 1,710,824 | - | - |
Primary Risk Exposure / Derivative Type | Value | |
| Asset ($) | Liability ($) | |
| Equity Risk | ||
Futures Contracts (a) | 1,710,824 | 0 |
| Total Equity Risk | 1,710,824 | 0 |
| Total Value of Derivatives | 1,710,824 | 0 |
| Statement of Assets and Liabilities | ||||
February 29, 2024 (Unaudited) | ||||
| Assets | ||||
| Investment in securities, at value - See accompanying schedule: | ||||
Unaffiliated issuers (cost $1,619,673,998) | $ | 2,299,021,577 | ||
Fidelity Central Funds (cost $70,480,986) | 70,480,986 | |||
| Total Investment in Securities (cost $1,690,154,984) | $ | 2,369,502,563 | ||
| Receivable for investments sold | 44,886,776 | |||
| Receivable for fund shares sold | 8,599,568 | |||
| Dividends receivable | 2,962,534 | |||
| Distributions receivable from Fidelity Central Funds | 166,760 | |||
| Receivable for daily variation margin on futures contracts | 272,221 | |||
| Other receivables | 4,342 | |||
Total assets | 2,426,394,764 | |||
| Liabilities | ||||
| Payable to custodian bank | $ | 50,398 | ||
| Payable for investments purchased | 54,353,008 | |||
| Payable for fund shares redeemed | 45,864,362 | |||
| Accrued management fee | 329,049 | |||
| Other payables and accrued expenses | 12,653 | |||
| Total Liabilities | 100,609,470 | |||
| Net Assets | $ | 2,325,785,294 | ||
| Net Assets consist of: | ||||
| Paid in capital | $ | 1,567,500,659 | ||
| Total accumulated earnings (loss) | 758,284,635 | |||
| Net Assets | $ | 2,325,785,294 | ||
Net Asset Value, offering price and redemption price per share ($2,325,785,294 ÷ 81,135,453 shares) | $ | 28.67 | ||
| Statement of Operations | ||||
Six months ended February 29, 2024 (Unaudited) | ||||
| Investment Income | ||||
| Dividends | $ | 14,684,321 | ||
| Interest | 56,221 | |||
| Income from Fidelity Central Funds (including $790 from security lending) | 597,965 | |||
| Total Income | 15,338,507 | |||
| Expenses | ||||
| Management fee | $ | 2,672,849 | ||
| Independent trustees' fees and expenses | 5,013 | |||
| Interest | 3,088 | |||
| Miscellaneous | 35,800 | |||
| Total expenses before reductions | 2,716,750 | |||
| Expense reductions | (101) | |||
| Total expenses after reductions | 2,716,649 | |||
| Net Investment income (loss) | 12,621,858 | |||
| Realized and Unrealized Gain (Loss) | ||||
| Net realized gain (loss) on: | ||||
| Investment Securities: | ||||
| Unaffiliated issuers | (8,549,204) | |||
| Redemptions in-kind | 128,420,649 | |||
| Futures contracts | 1,233,547 | |||
| Total net realized gain (loss) | 121,104,992 | |||
| Change in net unrealized appreciation (depreciation) on: | ||||
| Investment Securities: | ||||
| Unaffiliated issuers | 157,245,284 | |||
| Futures contracts | 1,200,375 | |||
| Total change in net unrealized appreciation (depreciation) | 158,445,659 | |||
| Net gain (loss) | 279,550,651 | |||
| Net increase (decrease) in net assets resulting from operations | $ | 292,172,509 | ||
See Organization and Merger information note regarding reorganization from mutual fund to exchange traded fund.
| Statement of Changes in Net Assets | ||||
Six months ended February 29, 2024 (Unaudited) | Year ended August 31, 2023 | |||
| Increase (Decrease) in Net Assets | ||||
| Operations | ||||
| Net investment income (loss) | $ | 12,621,858 | $ | 24,807,007 |
| Net realized gain (loss) | 121,104,992 | (3,624,422) | ||
| Change in net unrealized appreciation (depreciation) | 158,445,659 | 223,258,386 | ||
| Net increase (decrease) in net assets resulting from operations | 292,172,509 | 244,440,971 | ||
| Distributions to shareholders | (20,844,331) | (22,292,999) | ||
| Share transactions | ||||
| Proceeds from sales of shares | 660,717,939 | 629,039,473 | ||
| Reinvestment of distributions | 16,466,045 | 18,530,259 | ||
| Cost of shares redeemed | (671,041,736) | (1,283,514,169) | ||
Net increase (decrease) in net assets resulting from share transactions | 6,142,248 | (635,944,437) | ||
| Total increase (decrease) in net assets | 277,470,426 | (413,796,465) | ||
| Net Assets | ||||
| Beginning of period | 2,048,314,868 | 2,462,111,333 | ||
| End of period | $ | 2,325,785,294 | $ | 2,048,314,868 |
| Other Information | ||||
| Shares | ||||
| Sold | 24,366,892 | 27,859,340 | ||
| Issued in reinvestment of distributions | 676,837 | 875,246 | ||
| Redeemed | (25,773,623) | (58,631,055) | ||
| Net increase (decrease) | (729,894) | (29,896,469) | ||
| Fidelity® Enhanced Large Cap Core ETF |
Six months ended (Unaudited) February 29, 2024 A | Years ended August 31, 2023 A | 2022 A | 2021 A | 2020 A | 2019 A | |||||||
Selected Per-Share Data | ||||||||||||
| Net asset value, beginning of period | $ | 25.02 | $ | 22.03 | $ | 27.89 | $ | 21.60 | $ | 18.13 | $ | 19.34 |
| Income from Investment Operations | ||||||||||||
Net investment income (loss) B,C | .16 | .29 | .29 | .26 | .29 | .32 | ||||||
| Net realized and unrealized gain (loss) | 3.76 | 2.96 | (2.48) | 6.55 | 3.64 | (.32) | ||||||
| Total from investment operations | 3.92 | 3.25 | (2.19) | 6.81 | 3.93 | - | ||||||
| Distributions from net investment income | (.27) | (.18) | (.43) | (.26) | (.31) | (.29) | ||||||
| Distributions from net realized gain | - | (.10) | (3.24) | (.26) | (.15) | (.93) | ||||||
| Total distributions | (.27) | (.26) D | (3.67) | (.52) | (.46) | (1.21) D | ||||||
| Net asset value, end of period | $ | 28.67 | $ | 25.02 | $ | 22.03 | $ | 27.89 | $ | 21.60 | $ | 18.13 |
Total Return E,F,G | 15.80% | 15.01% | (9.41)% | 32.14% | 21.97% | .65% | ||||||
Ratios to Average Net Assets C,H,I | ||||||||||||
| Expenses before reductions | .27% J | .39% | .39% | .39% | .39% | .39% | ||||||
| Expenses net of fee waivers, if any | .27% J | .39% | .39% | .39% | .39% | .39% | ||||||
| Expenses net of all reductions | .27% J | .39% | .39% | .39% | .39% | .39% | ||||||
| Net investment income (loss) | 1.27% J | 1.26% | 1.18% | 1.09% | 1.49% | 1.81% | ||||||
| Supplemental Data | ||||||||||||
| Net assets, end of period (000 omitted) | $ | 2,325,785 | $ | 2,048,315 | $ | 2,462,111 | $ | 1,508,781 | $ | 1,087,245 | $ | 834,635 |
Portfolio turnover rate K | 76% J,L | 105% | 104% | 83% | 63% | 77% |
Top Holdings (% of Fund's net assets) | ||
| Microsoft Corp. | 11.4 | |
| Apple, Inc. | 10.6 | |
| NVIDIA Corp. | 7.7 | |
| Amazon.com, Inc. | 5.5 | |
| Meta Platforms, Inc. Class A | 4.7 | |
| Alphabet, Inc. Class C | 3.1 | |
| Alphabet, Inc. Class A | 3.1 | |
| Broadcom, Inc. | 2.7 | |
| MasterCard, Inc. Class A | 2.0 | |
| The Home Depot, Inc. | 1.9 | |
| 52.7 | ||
| Market Sectors (% of Fund's net assets) | ||
| Information Technology | 42.1 | |
| Communication Services | 13.4 | |
| Consumer Discretionary | 13.2 | |
| Health Care | 10.7 | |
| Financials | 7.4 | |
| Industrials | 6.3 | |
| Consumer Staples | 2.3 | |
| Energy | 1.5 | |
| Materials | 1.3 | |
| Real Estate | 0.6 | |
Asset Allocation (% of Fund's net assets) |
 |
Futures - 1% |
| Common Stocks - 98.8% | |||
| Shares | Value ($) | ||
| COMMUNICATION SERVICES - 13.4% | |||
| Entertainment - 2.5% | |||
| Electronic Arts, Inc. | 79,981 | 11,155,750 | |
| Netflix, Inc. (a) | 49,972 | 30,129,118 | |
| Spotify Technology SA (a) | 62,792 | 16,100,497 | |
| 57,385,365 | |||
| Interactive Media & Services - 10.9% | |||
| Alphabet, Inc.: | |||
| Class A (a) | 529,533 | 73,319,139 | |
| Class C (a) | 525,690 | 73,480,948 | |
| Meta Platforms, Inc. Class A | 223,448 | 109,518,568 | |
| 256,318,655 | |||
TOTAL COMMUNICATION SERVICES | 313,704,020 | ||
| CONSUMER DISCRETIONARY - 13.2% | |||
| Automobiles - 1.6% | |||
| Tesla, Inc. (a) | 185,042 | 37,356,279 | |
| Broadline Retail - 5.8% | |||
| Amazon.com, Inc. (a) | 730,588 | 129,138,735 | |
| Dillard's, Inc. Class A | 2 | 829 | |
| eBay, Inc. | 152,139 | 7,193,132 | |
| 136,332,696 | |||
| Distributors - 0.0% | |||
| Genuine Parts Co. | 12 | 1,791 | |
| Diversified Consumer Services - 0.7% | |||
| Duolingo, Inc. (a) | 64,305 | 15,368,895 | |
| Hotels, Restaurants & Leisure - 1.8% | |||
| Booking Holdings, Inc. | 6,450 | 22,373,954 | |
| Chipotle Mexican Grill, Inc. (a) | 7,174 | 19,289,236 | |
| Draftkings Holdings, Inc. (a) | 16 | 693 | |
| 41,663,883 | |||
| Household Durables - 0.7% | |||
| NVR, Inc. (a) | 1,342 | 10,233,515 | |
| TopBuild Corp. (a) | 17,010 | 6,844,484 | |
| 17,077,999 | |||
| Specialty Retail - 2.6% | |||
| The Home Depot, Inc. | 120,309 | 45,790,808 | |
| TJX Companies, Inc. | 165,628 | 16,420,360 | |
| 62,211,168 | |||
TOTAL CONSUMER DISCRETIONARY | 310,012,711 | ||
| CONSUMER STAPLES - 2.3% | |||
| Beverages - 0.5% | |||
| PepsiCo, Inc. | 16,822 | 2,781,349 | |
| The Coca-Cola Co. | 129,213 | 7,755,364 | |
| 10,536,713 | |||
| Consumer Staples Distribution & Retail - 1.8% | |||
| Costco Wholesale Corp. | 55,021 | 40,929,572 | |
| Sysco Corp. | 17,344 | 1,404,344 | |
| 42,333,916 | |||
TOTAL CONSUMER STAPLES | 52,870,629 | ||
| ENERGY - 1.5% | |||
| Oil, Gas & Consumable Fuels - 1.5% | |||
| Cheniere Energy, Inc. | 85,449 | 13,261,685 | |
| Devon Energy Corp. | 256,631 | 11,307,162 | |
| EOG Resources, Inc. | 102,803 | 11,766,831 | |
| Hess Corp. | 3 | 437 | |
| 36,336,115 | |||
| FINANCIALS - 7.4% | |||
| Capital Markets - 1.1% | |||
| MSCI, Inc. | 23,347 | 13,096,967 | |
| Tradeweb Markets, Inc. Class A (b) | 113,228 | 11,981,787 | |
| 25,078,754 | |||
| Consumer Finance - 0.7% | |||
| American Express Co. | 75,424 | 16,549,534 | |
| Financial Services - 4.6% | |||
| Block, Inc. Class A (a) | 187,282 | 14,883,301 | |
| MasterCard, Inc. Class A | 98,842 | 46,926,228 | |
| PayPal Holdings, Inc. (a) | 282,621 | 17,053,351 | |
| Visa, Inc. Class A | 101,233 | 28,612,495 | |
| 107,475,375 | |||
| Insurance - 1.0% | |||
| Brown & Brown, Inc. | 64,684 | 5,447,040 | |
| Progressive Corp. | 100,927 | 19,131,722 | |
| 24,578,762 | |||
TOTAL FINANCIALS | 173,682,425 | ||
| HEALTH CARE - 10.7% | |||
| Biotechnology - 2.9% | |||
| AbbVie, Inc. | 160,733 | 28,297,045 | |
| Exelixis, Inc. (a) | 582,371 | 12,753,925 | |
| Gilead Sciences, Inc. | 156,243 | 11,265,120 | |
| Incyte Corp. (a) | 154,361 | 9,008,508 | |
| Sarepta Therapeutics, Inc. (a) | 53,611 | 6,856,847 | |
| 68,181,445 | |||
| Health Care Equipment & Supplies - 1.2% | |||
| IDEXX Laboratories, Inc. (a) | 28,231 | 16,239,318 | |
| Intuitive Surgical, Inc. (a) | 1,269 | 489,326 | |
| Lantheus Holdings, Inc. (a) | 190,790 | 12,473,850 | |
| 29,202,494 | |||
| Health Care Providers & Services - 2.2% | |||
| Elevance Health, Inc. | 24,871 | 12,466,589 | |
| UnitedHealth Group, Inc. | 78,622 | 38,807,819 | |
| 51,274,408 | |||
| Health Care Technology - 0.5% | |||
| Veeva Systems, Inc. Class A (a) | 56,504 | 12,742,217 | |
| Life Sciences Tools & Services - 0.6% | |||
| Medpace Holdings, Inc. (a) | 33,980 | 13,507,730 | |
| Thermo Fisher Scientific, Inc. | 547 | 311,888 | |
| 13,819,618 | |||
| Pharmaceuticals - 3.3% | |||
| Bristol-Myers Squibb Co. | 233,056 | 11,827,592 | |
| Eli Lilly & Co. | 58,943 | 44,424,160 | |
| Jazz Pharmaceuticals PLC (a) | 23,750 | 2,823,875 | |
| Merck & Co., Inc. | 138,435 | 17,602,010 | |
| 76,677,637 | |||
TOTAL HEALTH CARE | 251,897,819 | ||
| INDUSTRIALS - 6.3% | |||
| Aerospace & Defense - 1.5% | |||
| Axon Enterprise, Inc. (a) | 44,824 | 13,777,553 | |
| Lockheed Martin Corp. | 47,055 | 20,150,833 | |
| 33,928,386 | |||
| Commercial Services & Supplies - 0.3% | |||
| Cintas Corp. | 8,864 | 5,571,999 | |
| MSA Safety, Inc. | 6,566 | 1,209,129 | |
| 6,781,128 | |||
| Construction & Engineering - 0.0% | |||
| AECOM | 7,543 | 670,045 | |
| Ground Transportation - 2.4% | |||
| CSX Corp. | 321,581 | 12,200,783 | |
| Uber Technologies, Inc. (a) | 334,214 | 26,570,013 | |
| Union Pacific Corp. | 69,866 | 17,724,306 | |
| 56,495,102 | |||
| Industrial Conglomerates - 0.5% | |||
| 3M Co. | 123,478 | 11,374,793 | |
| Machinery - 1.6% | |||
| Allison Transmission Holdings, Inc. | 28,894 | 2,176,585 | |
| Caterpillar, Inc. | 69,470 | 23,200,201 | |
| PACCAR, Inc. | 107,406 | 11,910,251 | |
| 37,287,037 | |||
| Professional Services - 0.0% | |||
| Verisk Analytics, Inc. | 7 | 1,693 | |
TOTAL INDUSTRIALS | 146,538,184 | ||
| INFORMATION TECHNOLOGY - 42.1% | |||
| Electronic Equipment, Instruments & Components - 0.4% | |||
| Amphenol Corp. Class A | 81,035 | 8,852,263 | |
| IT Services - 0.6% | |||
| Accenture PLC Class A | 24,325 | 9,116,524 | |
| Squarespace, Inc. Class A (a) | 123,820 | 4,120,730 | |
| 13,237,254 | |||
| Semiconductors & Semiconductor Equipment - 14.2% | |||
| Advanced Micro Devices, Inc. (a) | 13,155 | 2,532,732 | |
| Applied Materials, Inc. | 127,750 | 25,756,955 | |
| Broadcom, Inc. | 48,083 | 62,531,461 | |
| KLA Corp. | 30,960 | 21,124,008 | |
| Monolithic Power Systems, Inc. | 20,943 | 15,079,798 | |
| NVIDIA Corp. | 229,032 | 181,191,796 | |
| Qualcomm, Inc. | 164,415 | 25,943,043 | |
| 334,159,793 | |||
| Software - 16.3% | |||
| Adobe, Inc. (a) | 61,682 | 34,559,191 | |
| AppLovin Corp. (a) | 57,218 | 3,417,059 | |
| Cadence Design Systems, Inc. (a) | 64,177 | 19,534,195 | |
| HubSpot, Inc. (a) | 9,971 | 6,170,155 | |
| Intuit, Inc. | 5,497 | 3,643,906 | |
| Manhattan Associates, Inc. (a) | 49,704 | 12,591,514 | |
| Microsoft Corp. | 645,825 | 267,139,053 | |
| Pegasystems, Inc. | 5,028 | 327,021 | |
| Qualys, Inc. (a) | 2,721 | 467,631 | |
| Salesforce, Inc. | 44,965 | 13,886,091 | |
| ServiceNow, Inc. (a) | 2,655 | 2,047,908 | |
| Splunk, Inc. (a) | 1 | 156 | |
| Teradata Corp. (a) | 302,825 | 11,392,277 | |
| Zoom Video Communications, Inc. Class A (a) | 95,126 | 6,728,262 | |
| 381,904,419 | |||
| Technology Hardware, Storage & Peripherals - 10.6% | |||
| Apple, Inc. | 1,377,966 | 249,067,355 | |
TOTAL INFORMATION TECHNOLOGY | 987,221,084 | ||
| MATERIALS - 1.3% | |||
| Chemicals - 0.8% | |||
| CF Industries Holdings, Inc. | 37,434 | 3,021,672 | |
| Ecolab, Inc. | 69,353 | 15,593,329 | |
| 18,615,001 | |||
| Metals & Mining - 0.5% | |||
| Nucor Corp. | 64,571 | 12,417,003 | |
TOTAL MATERIALS | 31,032,004 | ||
| REAL ESTATE - 0.6% | |||
| Equity Real Estate Investment Trusts (REITs) - 0.6% | |||
| Public Storage | 46,715 | 13,260,987 | |
| TOTAL COMMON STOCKS (Cost $1,216,551,307) | 2,316,555,978 | ||
| U.S. Treasury Obligations - 0.1% | |||
Principal Amount (c) | Value ($) | ||
U.S. Treasury Bills, yield at date of purchase 5.31% to 5.31% 3/14/24 to 5/30/24 (d) (Cost $1,216,024) | 1,230,000 | 1,216,034 | |
| Money Market Funds - 0.1% | |||
| Shares | Value ($) | ||
| Fidelity Cash Central Fund 5.39% (e) | 1,494,983 | 1,495,282 | |
| Fidelity Securities Lending Cash Central Fund 5.39% (e)(f) | 248,950 | 248,975 | |
| TOTAL MONEY MARKET FUNDS (Cost $1,744,257) | 1,744,257 | ||
| TOTAL INVESTMENT IN SECURITIES - 99.0% (Cost $1,219,511,588) | 2,319,516,269 |
NET OTHER ASSETS (LIABILITIES) - 1.0% | 24,070,157 |
| NET ASSETS - 100.0% | 2,343,586,426 |
| Futures Contracts | |||||
Number of contracts | Expiration Date | Notional Amount ($) | Value ($) | Unrealized Appreciation/ (Depreciation) ($) | |
| Purchased | |||||
| Equity Index Contracts | |||||
| CME Micro E-mini S&P 500 Index Contracts (United States) | 95 | Mar 2024 | 24,242,813 | 100,207 | 100,207 |
| The notional amount of futures purchased as a percentage of Net Assets is 1.0% | |||||
| (a) | Non-income producing |
| (b) | Security or a portion of the security is on loan at period end. |
| (c) | Amount is stated in United States dollars unless otherwise noted. |
| (d) | Security or a portion of the security was pledged to cover margin requirements for futures contracts. At period end, the value of securities pledged amounted to $1,216,034. |
| (e) | Affiliated fund that is generally available only to investment companies and other accounts managed by Fidelity Investments. The rate quoted is the annualized seven-day yield of the fund at period end. A complete unaudited listing of the fund's holdings as of its most recent quarter end is available upon request. In addition, each Fidelity Central Fund's financial statements are available on the SEC's website or upon request. |
| (f) | Investment made with cash collateral received from securities on loan. |
| Affiliate | Value, beginning of period ($) | Purchases ($) | Sales Proceeds ($) | Dividend Income ($) | Realized Gain (loss) ($) | Change in Unrealized appreciation (depreciation) ($) | Value, end of period ($) | % ownership, end of period |
| Fidelity Cash Central Fund 5.39% | 80,138 | 384,035,650 | 382,620,506 | 223,960 | - | - | 1,495,282 | 0.0% |
| Fidelity Securities Lending Cash Central Fund 5.39% | 6,142,650 | 25,027,788 | 30,921,463 | 730 | - | - | 248,975 | 0.0% |
| Total | 6,222,788 | 409,063,438 | 413,541,969 | 224,690 | - | - | 1,744,257 | |
| Valuation Inputs at Reporting Date: | ||||
| Description | Total ($) | Level 1 ($) | Level 2 ($) | Level 3 ($) |
Investments in Securities: | ||||
| Equities: | ||||
Communication Services | 313,704,020 | 313,704,020 | - | - |
Consumer Discretionary | 310,012,711 | 310,012,711 | - | - |
Consumer Staples | 52,870,629 | 52,870,629 | - | - |
Energy | 36,336,115 | 36,336,115 | - | - |
Financials | 173,682,425 | 173,682,425 | - | - |
Health Care | 251,897,819 | 251,897,819 | - | - |
Industrials | 146,538,184 | 146,538,184 | - | - |
Information Technology | 987,221,084 | 987,221,084 | - | - |
Materials | 31,032,004 | 31,032,004 | - | - |
Real Estate | 13,260,987 | 13,260,987 | - | - |
| U.S. Government and Government Agency Obligations | 1,216,034 | - | 1,216,034 | - |
| Money Market Funds | 1,744,257 | 1,744,257 | - | - |
| Total Investments in Securities: | 2,319,516,269 | 2,318,300,235 | 1,216,034 | - |
Derivative Instruments: Assets | ||||
Futures Contracts | 100,207 | 100,207 | - | - |
| Total Assets | 100,207 | 100,207 | - | - |
| Total Derivative Instruments: | 100,207 | 100,207 | - | - |
Primary Risk Exposure / Derivative Type | Value | |
| Asset ($) | Liability ($) | |
| Equity Risk | ||
Futures Contracts (a) | 100,207 | 0 |
| Total Equity Risk | 100,207 | 0 |
| Total Value of Derivatives | 100,207 | 0 |
| Statement of Assets and Liabilities | ||||
February 29, 2024 (Unaudited) | ||||
| Assets | ||||
| Investment in securities, at value (including securities loaned of $243,386) - See accompanying schedule: | ||||
Unaffiliated issuers (cost $1,217,767,331) | $ | 2,317,772,012 | ||
Fidelity Central Funds (cost $1,744,257) | 1,744,257 | |||
| Total Investment in Securities (cost $1,219,511,588) | $ | 2,319,516,269 | ||
| Receivable for fund shares sold | 22,967,083 | |||
| Dividends receivable | 1,557,670 | |||
| Distributions receivable from Fidelity Central Funds | 31,802 | |||
| Receivable for daily variation margin on futures contracts | 111,755 | |||
| Other receivables | 4,422 | |||
Total assets | 2,344,189,001 | |||
| Liabilities | ||||
| Accrued management fee | $ | 341,048 | ||
| Other payables and accrued expenses | 12,553 | |||
| Collateral on securities loaned | 248,975 | |||
| Total Liabilities | 602,576 | |||
| Net Assets | $ | 2,343,586,425 | ||
| Net Assets consist of: | ||||
| Paid in capital | $ | 1,100,654,203 | ||
| Total accumulated earnings (loss) | 1,242,932,222 | |||
| Net Assets | $ | 2,343,586,425 | ||
Net Asset Value, offering price and redemption price per share ($2,343,586,425 ÷ 81,018,998 shares) | $ | 28.93 | ||
| Statement of Operations | ||||
Six months ended February 29, 2024 (Unaudited) | ||||
| Investment Income | ||||
| Dividends | $ | 9,247,256 | ||
| Interest | 51,727 | |||
| Income from Fidelity Central Funds (including $730 from security lending) | 224,690 | |||
| Total Income | 9,523,673 | |||
| Expenses | ||||
| Management fee | $ | 2,929,614 | ||
| Independent trustees' fees and expenses | 5,723 | |||
| Interest | 19,184 | |||
| Miscellaneous | 44,897 | |||
| Total expenses before reductions | 2,999,418 | |||
| Expense reductions | (255) | |||
| Total expenses after reductions | 2,999,163 | |||
| Net Investment income (loss) | 6,524,510 | |||
| Realized and Unrealized Gain (Loss) | ||||
| Net realized gain (loss) on: | ||||
| Investment Securities: | ||||
| Unaffiliated issuers | 14,010,580 | |||
| Redemptions in-kind | 134,153,813 | |||
| Foreign currency transactions | (628) | |||
| Futures contracts | 3,349,731 | |||
| Total net realized gain (loss) | 151,513,496 | |||
| Change in net unrealized appreciation (depreciation) on: | ||||
| Investment Securities: | ||||
| Unaffiliated issuers | 201,893,531 | |||
| Futures contracts | 99,997 | |||
| Total change in net unrealized appreciation (depreciation) | 201,993,528 | |||
| Net gain (loss) | 353,507,024 | |||
| Net increase (decrease) in net assets resulting from operations | $ | 360,031,534 | ||
See Organization and Merger information note regarding reorganization from mutual fund to exchange traded fund.
| Statement of Changes in Net Assets | ||||
Six months ended February 29, 2024 (Unaudited) | Year ended August 31, 2023 | |||
| Increase (Decrease) in Net Assets | ||||
| Operations | ||||
| Net investment income (loss) | $ | 6,524,510 | $ | 14,345,783 |
| Net realized gain (loss) | 151,513,496 | 46,418,406 | ||
| Change in net unrealized appreciation (depreciation) | 201,993,528 | 358,739,553 | ||
| Net increase (decrease) in net assets resulting from operations | 360,031,534 | 419,503,742 | ||
| Distributions to shareholders | (15,162,806) | (10,050,462) | ||
| Share transactions | ||||
| Proceeds from sales of shares | 535,992,640 | 1,206,466,982 | ||
| Reinvestment of distributions | 11,773,276 | 8,894,596 | ||
| Cost of shares redeemed | (917,492,770) | (882,002,420) | ||
Net increase (decrease) in net assets resulting from share transactions | (369,726,854) | 333,359,158 | ||
| Total increase (decrease) in net assets | (24,858,126) | 742,812,438 | ||
| Net Assets | ||||
| Beginning of period | 2,368,444,551 | 1,625,632,113 | ||
| End of period | $ | 2,343,586,425 | $ | 2,368,444,551 |
| Other Information | ||||
| Shares | ||||
| Sold | 20,374,709 | 56,403,387 | ||
| Issued in reinvestment of distributions | 488,957 | 467,755 | ||
| Redeemed | (36,200,883) | (39,305,302) | ||
| Net increase (decrease) | (15,337,217) | 17,565,840 | ||
| Fidelity® Enhanced Large Cap Growth ETF |
Six months ended (Unaudited) February 29, 2024 A | Years ended August 31, 2023 A | 2022 A | 2021 A | 2020 A | 2019 A | |||||||
Selected Per-Share Data | ||||||||||||
| Net asset value, beginning of period | $ | 24.58 | $ | 20.64 | $ | 28.47 | $ | 23.10 | $ | 16.82 | $ | 17.94 |
| Income from Investment Operations | ||||||||||||
Net investment income (loss) B,C | .08 | .15 | .12 | .12 | .13 | .17 | ||||||
| Net realized and unrealized gain (loss) | 4.44 | 3.91 | (4.19) | 6.34 | 6.72 | (.13) | ||||||
| Total from investment operations | 4.52 | 4.06 | (4.07) | 6.46 | 6.85 | .04 | ||||||
| Distributions from net investment income | (.17) | (.12) | (.12) | (.13) | (.15) | (.20) | ||||||
| Distributions from net realized gain | (.01) | - | (3.64) | (.96) | (.42) | (.96) | ||||||
| Total distributions | (.17) D | (.12) | (3.76) | (1.09) | (.57) | (1.16) | ||||||
| Net asset value, end of period | $ | 28.93 | $ | 24.58 | $ | 20.64 | $ | 28.47 | $ | 23.10 | $ | 16.82 |
Total Return E,F,G | 18.53% | 19.85% | (16.70)% | 29.08% | 41.73% | 1.28% | ||||||
Ratios to Average Net Assets C,H,I | ||||||||||||
| Expenses before reductions | .28% J | .39% | .39% | .39% | .39% | .39% | ||||||
| Expenses net of fee waivers, if any | .28% J | .39% | .39% | .39% | .39% | .39% | ||||||
| Expenses net of all reductions | .28% J | .39% | .39% | .39% | .39% | .39% | ||||||
| Net investment income (loss) | .61% J | .71% | .52% | .47% | .74% | 1.07% | ||||||
| Supplemental Data | ||||||||||||
| Net assets, end of period (000 omitted) | $ | 2,343,586 | $ | 2,368,445 | $ | 1,625,632 | $ | 1,784,746 | $ | 1,417,537 | $ | 1,106,497 |
Portfolio turnover rate K | 82% J,L | 108% | 101% | 84% | 69% | 85% |
Top Holdings (% of Fund's net assets) | ||
| Berkshire Hathaway, Inc. Class B | 3.5 | |
| JPMorgan Chase & Co. | 3.1 | |
| Procter & Gamble Co. | 1.7 | |
| Bank of America Corp. | 1.7 | |
| Exxon Mobil Corp. | 1.5 | |
| Walmart, Inc. | 1.5 | |
| Johnson & Johnson | 1.4 | |
| Intel Corp. | 1.4 | |
| The Walt Disney Co. | 1.2 | |
| Merck & Co., Inc. | 1.2 | |
| 18.2 | ||
| Market Sectors (% of Fund's net assets) | ||
| Financials | 22.5 | |
| Industrials | 15.9 | |
| Health Care | 14.2 | |
| Information Technology | 9.3 | |
| Consumer Staples | 7.5 | |
| Energy | 6.5 | |
| Consumer Discretionary | 6.4 | |
| Communication Services | 5.2 | |
| Materials | 4.3 | |
| Real Estate | 4.1 | |
| Utilities | 3.1 | |
Asset Allocation (% of Fund's net assets) |
 |
Futures - 0.6% |
| Common Stocks - 99.0% | |||
| Shares | Value ($) | ||
| COMMUNICATION SERVICES - 5.2% | |||
| Diversified Telecommunication Services - 1.6% | |||
| AT&T, Inc. | 890,953 | 15,083,834 | |
| Verizon Communications, Inc. | 402,404 | 16,104,208 | |
| 31,188,042 | |||
| Entertainment - 1.8% | |||
| Electronic Arts, Inc. | 46,807 | 6,528,640 | |
| Spotify Technology SA (a) | 18,342 | 4,703,072 | |
| The Walt Disney Co. | 206,766 | 23,070,950 | |
| 34,302,662 | |||
| Interactive Media & Services - 0.7% | |||
| Alphabet, Inc.: | |||
| Class A (a) | 810 | 112,153 | |
| Class C (a) | 40,000 | 5,591,200 | |
| Meta Platforms, Inc. Class A | 14,922 | 7,313,720 | |
| 13,017,073 | |||
| Media - 1.0% | |||
| Comcast Corp. Class A | 419,930 | 17,994,001 | |
| Liberty Media Corp. Liberty SiriusXM | 9,085 | 263,283 | |
| Liberty Media Corp. Liberty SiriusXM Class A | 1,993 | 58,076 | |
| 18,315,360 | |||
| Wireless Telecommunication Services - 0.1% | |||
| T-Mobile U.S., Inc. | 9,703 | 1,584,500 | |
TOTAL COMMUNICATION SERVICES | 98,407,637 | ||
| CONSUMER DISCRETIONARY - 6.4% | |||
| Automobiles - 0.7% | |||
| Ford Motor Co. | 1,107,002 | 13,771,105 | |
| Broadline Retail - 0.7% | |||
| Amazon.com, Inc. (a) | 43,701 | 7,724,589 | |
| eBay, Inc. | 130,495 | 6,169,804 | |
| 13,894,393 | |||
| Distributors - 0.1% | |||
| Genuine Parts Co. | 13,638 | 2,035,608 | |
| Diversified Consumer Services - 0.2% | |||
| H&R Block, Inc. | 8,299 | 406,236 | |
| Service Corp. International | 36,296 | 2,656,504 | |
| 3,062,740 | |||
| Hotels, Restaurants & Leisure - 1.9% | |||
| Airbnb, Inc. Class A (a) | 8,839 | 1,391,877 | |
| Chipotle Mexican Grill, Inc. (a) | 1,696 | 4,560,154 | |
| International Game Technology PLC (b) | 255,041 | 6,929,464 | |
| Light & Wonder, Inc. Class A (a) | 25,694 | 2,582,504 | |
| McDonald's Corp. | 51,376 | 15,016,177 | |
| MGM Resorts International (a) | 80,716 | 3,493,388 | |
| Wendy's Co. (b) | 117,782 | 2,133,032 | |
| 36,106,596 | |||
| Household Durables - 2.5% | |||
| D.R. Horton, Inc. | 54,612 | 8,161,217 | |
| Lennar Corp. Class A | 43,033 | 6,821,161 | |
| Mohawk Industries, Inc. (a) | 6,800 | 806,616 | |
| NVR, Inc. (a) | 748 | 5,703,926 | |
| Taylor Morrison Home Corp. (a) | 32,234 | 1,824,767 | |
| Toll Brothers, Inc. | 76,619 | 8,783,602 | |
| TopBuild Corp. (a) | 25,178 | 10,131,124 | |
| TRI Pointe Homes, Inc. (a) | 95,217 | 3,368,777 | |
| Whirlpool Corp. | 9,416 | 1,011,184 | |
| 46,612,374 | |||
| Leisure Products - 0.0% | |||
| Peloton Interactive, Inc. Class A (a) | 45,670 | 206,428 | |
| Specialty Retail - 0.2% | |||
| Murphy U.S.A., Inc. | 1,795 | 748,533 | |
| The Home Depot, Inc. | 796 | 302,966 | |
| TJX Companies, Inc. | 24,241 | 2,403,253 | |
| Ulta Beauty, Inc. (a) | 1,362 | 747,139 | |
| 4,201,891 | |||
| Textiles, Apparel & Luxury Goods - 0.1% | |||
| Tapestry, Inc. | 29,504 | 1,402,325 | |
| Under Armour, Inc.: | |||
| Class A (sub. vtg.) (a) | 81,799 | 732,919 | |
| Class C (non-vtg.) (a) | 61,739 | 527,251 | |
| 2,662,495 | |||
TOTAL CONSUMER DISCRETIONARY | 122,553,630 | ||
| CONSUMER STAPLES - 7.5% | |||
| Beverages - 1.3% | |||
| Constellation Brands, Inc. Class A (sub. vtg.) | 8,063 | 2,003,817 | |
| Keurig Dr. Pepper, Inc. | 127,666 | 3,818,490 | |
| Molson Coors Beverage Co. Class B (b) | 99,363 | 6,202,238 | |
| The Coca-Cola Co. | 199,378 | 11,966,668 | |
| 23,991,213 | |||
| Consumer Staples Distribution & Retail - 1.9% | |||
| Casey's General Stores, Inc. | 638 | 194,265 | |
| Costco Wholesale Corp. | 7,544 | 5,611,906 | |
| Kroger Co. | 2,625 | 130,226 | |
| Sysco Corp. | 22,542 | 1,825,226 | |
| Walmart, Inc. | 474,739 | 27,824,453 | |
| 35,586,076 | |||
| Food Products - 1.1% | |||
| Archer Daniels Midland Co. | 92,593 | 4,917,614 | |
| Mondelez International, Inc. | 15,027 | 1,098,023 | |
| Post Holdings, Inc. (a) | 20,531 | 2,138,509 | |
| Seaboard Corp. | 229 | 752,858 | |
| The J.M. Smucker Co. | 10,606 | 1,274,523 | |
| The Kraft Heinz Co. | 321,607 | 11,346,295 | |
| 21,527,822 | |||
| Household Products - 2.6% | |||
| Colgate-Palmolive Co. | 133,710 | 11,568,589 | |
| Kimberly-Clark Corp. | 20,088 | 2,434,063 | |
| Procter & Gamble Co. | 208,925 | 33,206,540 | |
| Spectrum Brands Holdings, Inc. (b) | 19,675 | 1,582,264 | |
| The Clorox Co. | 9,096 | 1,394,508 | |
| 50,185,964 | |||
| Tobacco - 0.6% | |||
| Altria Group, Inc. | 16,484 | 674,360 | |
| Philip Morris International, Inc. | 115,492 | 10,389,660 | |
| 11,064,020 | |||
TOTAL CONSUMER STAPLES | 142,355,095 | ||
| ENERGY - 6.5% | |||
| Energy Equipment & Services - 0.5% | |||
| Baker Hughes Co. Class A | 316,028 | 9,351,269 | |
| Schlumberger Ltd. | 4,099 | 198,105 | |
| 9,549,374 | |||
| Oil, Gas & Consumable Fuels - 6.0% | |||
| Chevron Corp. | 91,662 | 13,933,541 | |
| ConocoPhillips Co. | 119,964 | 13,500,749 | |
| Coterra Energy, Inc. | 120,407 | 3,104,092 | |
| Devon Energy Corp. | 149,627 | 6,592,566 | |
| Diamondback Energy, Inc. | 24,948 | 4,553,509 | |
| EOG Resources, Inc. | 134,634 | 15,410,208 | |
| Exxon Mobil Corp. | 274,849 | 28,727,217 | |
| Kinder Morgan, Inc. | 464,414 | 8,076,159 | |
| Marathon Oil Corp. | 119,847 | 2,906,290 | |
| Marathon Petroleum Corp. | 23,464 | 3,970,813 | |
| Murphy Oil Corp. | 73,916 | 2,932,248 | |
| ONEOK, Inc. | 42,835 | 3,217,765 | |
| Phillips 66 Co. | 10,676 | 1,521,437 | |
| Pioneer Natural Resources Co. | 13,028 | 3,064,055 | |
| Valero Energy Corp. | 11,562 | 1,635,561 | |
| 113,146,210 | |||
TOTAL ENERGY | 122,695,584 | ||
| FINANCIALS - 22.5% | |||
| Banks - 6.2% | |||
| Bank of America Corp. | 914,498 | 31,568,471 | |
| Bank OZK (b) | 42,377 | 1,856,113 | |
| Citigroup, Inc. | 33,721 | 1,871,178 | |
| Columbia Banking Systems, Inc. | 152,394 | 2,758,331 | |
| Fifth Third Bancorp | 60,398 | 2,074,067 | |
| First Horizon National Corp. | 43,003 | 606,342 | |
| Hancock Whitney Corp. | 6,289 | 274,200 | |
| JPMorgan Chase & Co. | 316,883 | 58,959,251 | |
| KeyCorp | 198,423 | 2,831,496 | |
| PNC Financial Services Group, Inc. | 4,462 | 656,806 | |
| Regions Financial Corp. | 8,374 | 156,008 | |
| UMB Financial Corp. | 9,918 | 809,408 | |
| United Bankshares, Inc., West Virginia | 21,749 | 754,473 | |
| Wells Fargo & Co. | 215,230 | 11,964,636 | |
| Wintrust Financial Corp. | 6,761 | 651,422 | |
| Zions Bancorporation NA | 8,362 | 329,714 | |
| 118,121,916 | |||
| Capital Markets - 4.5% | |||
| Affiliated Managers Group, Inc. | 9,254 | 1,446,493 | |
| Bank of New York Mellon Corp. | 232,655 | 13,049,619 | |
| BlackRock, Inc. Class A | 953 | 773,207 | |
| Charles Schwab Corp. | 17,353 | 1,158,833 | |
| CME Group, Inc. | 69,456 | 15,304,630 | |
| Coinbase Global, Inc. (a) | 4,329 | 881,211 | |
| Federated Hermes, Inc. | 101,711 | 3,583,279 | |
| Goldman Sachs Group, Inc. | 33,992 | 13,224,588 | |
| Intercontinental Exchange, Inc. | 9,219 | 1,276,094 | |
| Jefferies Financial Group, Inc. | 45,987 | 1,923,176 | |
| Morgan Stanley | 68,704 | 5,911,292 | |
| NASDAQ, Inc. | 47,578 | 2,673,884 | |
| Northern Trust Corp. | 54,285 | 4,458,427 | |
| Robinhood Markets, Inc. (a) | 202,632 | 3,304,928 | |
| S&P Global, Inc. | 18,441 | 7,899,756 | |
| State Street Corp. | 68,663 | 5,062,523 | |
| Stifel Financial Corp. | 25,075 | 1,902,190 | |
| Tradeweb Markets, Inc. Class A | 15,023 | 1,589,734 | |
| 85,423,864 | |||
| Consumer Finance - 1.7% | |||
| American Express Co. | 79,992 | 17,551,845 | |
| Capital One Financial Corp. | 55,521 | 7,640,245 | |
| Discover Financial Services | 7,594 | 916,596 | |
| Synchrony Financial | 148,461 | 6,131,439 | |
| 32,240,125 | |||
| Financial Services - 5.9% | |||
| Berkshire Hathaway, Inc. Class B (a) | 164,624 | 67,397,060 | |
| Block, Inc. Class A (a) | 150,262 | 11,941,321 | |
| Euronet Worldwide, Inc. (a) | 10,370 | 1,134,893 | |
| Fidelity National Information Services, Inc. | 106,863 | 7,393,851 | |
| MasterCard, Inc. Class A | 20,994 | 9,967,111 | |
| MGIC Investment Corp. (b) | 269,377 | 5,357,909 | |
| PayPal Holdings, Inc. (a) | 147,620 | 8,907,391 | |
| 112,099,536 | |||
| Insurance - 4.2% | |||
| Allstate Corp. | 36,728 | 5,858,851 | |
| American International Group, Inc. | 36,185 | 2,637,525 | |
| Aon PLC | 13,625 | 4,305,364 | |
| Assurant, Inc. | 15,108 | 2,741,347 | |
| Brown & Brown, Inc. | 1,309 | 110,231 | |
| Chubb Ltd. | 32,007 | 8,055,202 | |
| Cincinnati Financial Corp. | 39,698 | 4,525,572 | |
| Globe Life, Inc. | 39,073 | 4,959,536 | |
| Hartford Financial Services Group, Inc. | 83,530 | 8,005,515 | |
| Loews Corp. | 88,858 | 6,675,902 | |
| MetLife, Inc. | 118,559 | 8,268,305 | |
| Progressive Corp. | 3,877 | 734,924 | |
| Reinsurance Group of America, Inc. | 18,725 | 3,311,516 | |
| Selective Insurance Group, Inc. | 9,239 | 965,291 | |
| The Travelers Companies, Inc. | 58,744 | 12,980,074 | |
| Unum Group | 104,279 | 5,156,597 | |
| Willis Towers Watson PLC | 6,663 | 1,816,400 | |
| 81,108,152 | |||
TOTAL FINANCIALS | 428,993,593 | ||
| HEALTH CARE - 14.2% | |||
| Biotechnology - 2.2% | |||
| Alkermes PLC (a) | 6,098 | 181,050 | |
| Biogen, Inc. (a) | 41,723 | 9,053,474 | |
| Exelixis, Inc. (a) | 91,267 | 1,998,747 | |
| Gilead Sciences, Inc. | 242,275 | 17,468,028 | |
| Incyte Corp. (a) | 99,246 | 5,791,997 | |
| Sarepta Therapeutics, Inc. (a) | 34,505 | 4,413,190 | |
| United Therapeutics Corp. (a) | 17,445 | 3,936,290 | |
| 42,842,776 | |||
| Health Care Equipment & Supplies - 3.2% | |||
| Abbott Laboratories | 60,342 | 7,158,975 | |
| Becton, Dickinson & Co. | 36,237 | 8,535,625 | |
| Boston Scientific Corp. (a) | 57,710 | 3,820,979 | |
| Edwards Lifesciences Corp. (a) | 20,184 | 1,713,016 | |
| GE Healthcare Holding LLC | 40,899 | 3,733,261 | |
| Hologic, Inc. (a) | 78,339 | 5,781,418 | |
| IDEXX Laboratories, Inc. (a) | 11,486 | 6,607,092 | |
| Insulet Corp. (a) | 2,754 | 451,656 | |
| Integra LifeSciences Holdings Corp. (a) | 39,676 | 1,464,441 | |
| Lantheus Holdings, Inc. (a) | 17,514 | 1,145,065 | |
| Medtronic PLC | 98,073 | 8,175,365 | |
| Zimmer Biomet Holdings, Inc. | 98,254 | 12,218,867 | |
| 60,805,760 | |||
| Health Care Providers & Services - 3.2% | |||
| Cardinal Health, Inc. | 2,250 | 251,955 | |
| Centene Corp. (a) | 165,834 | 13,006,361 | |
| Cigna Group | 30,924 | 10,394,793 | |
| CVS Health Corp. | 158,532 | 11,790,025 | |
| Elevance Health, Inc. | 29,587 | 14,830,484 | |
| Guardant Health, Inc. (a) | 3,921 | 74,499 | |
| Humana, Inc. | 9,140 | 3,201,925 | |
| McKesson Corp. | 10,316 | 5,378,866 | |
| UnitedHealth Group, Inc. | 5,877 | 2,900,887 | |
| 61,829,795 | |||
| Health Care Technology - 0.2% | |||
| Teladoc Health, Inc. (a)(b) | 193,141 | 2,912,566 | |
| Life Sciences Tools & Services - 0.6% | |||
| Agilent Technologies, Inc. | 14,014 | 1,924,963 | |
| Bio-Rad Laboratories, Inc. Class A (a) | 14,098 | 4,594,256 | |
| Danaher Corp. | 18,994 | 4,808,141 | |
| 11,327,360 | |||
| Pharmaceuticals - 4.8% | |||
| Bristol-Myers Squibb Co. | 366,448 | 18,597,236 | |
| Johnson & Johnson | 161,918 | 26,130,327 | |
| Merck & Co., Inc. | 180,779 | 22,986,050 | |
| Organon & Co. | 147,453 | 2,567,157 | |
| Pfizer, Inc. | 782,066 | 20,771,673 | |
| Viatris, Inc. | 1,325 | 16,390 | |
| 91,068,833 | |||
TOTAL HEALTH CARE | 270,787,090 | ||
| INDUSTRIALS - 15.9% | |||
| Aerospace & Defense - 2.7% | |||
| General Dynamics Corp. | 19,497 | 5,327,555 | |
| L3Harris Technologies, Inc. | 21,271 | 4,502,220 | |
| Lockheed Martin Corp. | 12,035 | 5,153,868 | |
| Moog, Inc. Class A | 4,304 | 645,385 | |
| Northrop Grumman Corp. | 11,825 | 5,451,562 | |
| RTX Corp. | 81,353 | 7,294,924 | |
| Textron, Inc. | 131,480 | 11,710,924 | |
| The Boeing Co. (a) | 32,463 | 6,613,362 | |
| Woodward, Inc. | 32,634 | 4,617,385 | |
| 51,317,185 | |||
| Air Freight & Logistics - 0.4% | |||
| FedEx Corp. | 30,038 | 7,478,561 | |
| Building Products - 0.7% | |||
| A.O. Smith Corp. | 2,933 | 243,146 | |
| Builders FirstSource, Inc. (a) | 5,807 | 1,133,410 | |
| Johnson Controls International PLC | 114,804 | 6,804,433 | |
| Owens Corning | 3,476 | 520,635 | |
| Trane Technologies PLC | 16,792 | 4,734,840 | |
| 13,436,464 | |||
| Commercial Services & Supplies - 1.5% | |||
| Cintas Corp. | 17,212 | 10,819,635 | |
| MSA Safety, Inc. | 13,013 | 2,396,344 | |
| Republic Services, Inc. | 74,286 | 13,638,910 | |
| Tetra Tech, Inc. | 5,611 | 994,943 | |
| Veralto Corp. | 9,137 | 789,620 | |
| 28,639,452 | |||
| Construction & Engineering - 0.6% | |||
| AECOM | 100,609 | 8,937,097 | |
| EMCOR Group, Inc. | 6,957 | 2,181,159 | |
| Valmont Industries, Inc. | 2,722 | 576,873 | |
| 11,695,129 | |||
| Electrical Equipment - 2.2% | |||
| Acuity Brands, Inc. | 3,852 | 967,776 | |
| AMETEK, Inc. | 46,135 | 8,312,604 | |
| Eaton Corp. PLC | 50,593 | 14,621,377 | |
| Emerson Electric Co. | 147,826 | 15,795,208 | |
| EnerSys | 17,826 | 1,637,853 | |
| 41,334,818 | |||
| Ground Transportation - 1.7% | |||
| CSX Corp. | 221,229 | 8,393,428 | |
| Norfolk Southern Corp. | 26,491 | 6,712,290 | |
| Union Pacific Corp. | 71,876 | 18,234,222 | |
| 33,339,940 | |||
| Industrial Conglomerates - 1.4% | |||
| 3M Co. | 141,578 | 13,042,165 | |
| General Electric Co. | 75,005 | 11,767,534 | |
| Honeywell International, Inc. | 7,374 | 1,465,435 | |
| 26,275,134 | |||
| Machinery - 3.1% | |||
| AGCO Corp. | 63,503 | 6,966,279 | |
| Allison Transmission Holdings, Inc. | 44,977 | 3,388,117 | |
| Caterpillar, Inc. | 24,889 | 8,311,930 | |
| CNH Industrial NV | 564,641 | 6,747,460 | |
| Deere & Co. | 6,927 | 2,528,701 | |
| Donaldson Co., Inc. | 20,935 | 1,499,365 | |
| Flowserve Corp. | 34,612 | 1,464,780 | |
| Fortive Corp. | 20,496 | 1,744,824 | |
| Gates Industrial Corp. PLC (a) | 46,066 | 678,092 | |
| Oshkosh Corp. | 51,762 | 5,738,335 | |
| PACCAR, Inc. | 75,756 | 8,400,583 | |
| Parker Hannifin Corp. | 2,740 | 1,467,133 | |
| Westinghouse Air Brake Tech Co. | 75,826 | 10,713,456 | |
| 59,649,055 | |||
| Passenger Airlines - 0.1% | |||
| American Airlines Group, Inc. (a) | 52,444 | 822,322 | |
| United Airlines Holdings, Inc. (a) | 24,320 | 1,106,317 | |
| 1,928,639 | |||
| Professional Services - 1.2% | |||
| Automatic Data Processing, Inc. | 9,550 | 2,398,292 | |
| CACI International, Inc. Class A (a) | 18,661 | 6,995,076 | |
| Leidos Holdings, Inc. | 47,705 | 6,099,561 | |
| SS&C Technologies Holdings, Inc. | 108,265 | 6,902,976 | |
| 22,395,905 | |||
| Trading Companies & Distributors - 0.3% | |||
| Beacon Roofing Supply, Inc. (a) | 34,896 | 2,997,217 | |
| Boise Cascade Co. | 7,795 | 1,059,418 | |
| Core & Main, Inc. (a) | 30,228 | 1,442,782 | |
| 5,499,417 | |||
TOTAL INDUSTRIALS | 302,989,699 | ||
| INFORMATION TECHNOLOGY - 9.3% | |||
| Communications Equipment - 0.5% | |||
| Cisco Systems, Inc. | 196,404 | 9,500,061 | |
| Extreme Networks, Inc. (a) | 12,877 | 162,765 | |
| 9,662,826 | |||
| Electronic Equipment, Instruments & Components - 0.3% | |||
| Amphenol Corp. Class A | 32,948 | 3,599,240 | |
| Avnet, Inc. | 21,977 | 1,023,908 | |
| Belden, Inc. | 15,652 | 1,333,237 | |
| Trimble, Inc. (a) | 11,410 | 698,178 | |
| 6,654,563 | |||
| IT Services - 0.9% | |||
| IBM Corp. | 47,705 | 8,826,856 | |
| Kyndryl Holdings, Inc. (a) | 69,354 | 1,523,707 | |
| Twilio, Inc. Class A (a) | 100,359 | 5,980,393 | |
| 16,330,956 | |||
| Semiconductors & Semiconductor Equipment - 4.9% | |||
| Advanced Micro Devices, Inc. (a) | 31,656 | 6,094,730 | |
| Applied Materials, Inc. | 5,799 | 1,169,194 | |
| Broadcom, Inc. | 7,804 | 10,149,024 | |
| Cirrus Logic, Inc. (a) | 39,619 | 3,637,817 | |
| Intel Corp. | 605,174 | 26,052,741 | |
| Micron Technology, Inc. | 132,556 | 12,010,899 | |
| NVIDIA Corp. | 13,191 | 10,435,664 | |
| Qorvo, Inc. (a) | 97,188 | 11,132,885 | |
| Qualcomm, Inc. | 78,077 | 12,319,770 | |
| 93,002,724 | |||
| Software - 2.2% | |||
| Adobe, Inc. (a) | 9,914 | 5,554,616 | |
| Aurora Innovation, Inc. (a) | 283,424 | 719,897 | |
| DocuSign, Inc. (a) | 106,684 | 5,683,057 | |
| NCR Voyix Corp. (a) | 4,767 | 69,646 | |
| Oracle Corp. | 349 | 38,976 | |
| Salesforce, Inc. | 49,384 | 15,250,767 | |
| SolarWinds, Inc. (a) | 8,266 | 98,696 | |
| Teradata Corp. (a) | 192,164 | 7,229,210 | |
| Workday, Inc. Class A (a) | 4,990 | 1,470,353 | |
| Zoom Video Communications, Inc. Class A (a) | 84,359 | 5,966,712 | |
| 42,081,930 | |||
| Technology Hardware, Storage & Peripherals - 0.5% | |||
| Hewlett Packard Enterprise Co. | 328,416 | 5,001,776 | |
| NetApp, Inc. | 49,288 | 4,392,547 | |
| 9,394,323 | |||
TOTAL INFORMATION TECHNOLOGY | 177,127,322 | ||
| MATERIALS - 4.3% | |||
| Chemicals - 2.7% | |||
| Air Products & Chemicals, Inc. | 21,363 | 4,999,797 | |
| Corteva, Inc. | 118,926 | 6,364,920 | |
| DuPont de Nemours, Inc. | 163,186 | 11,290,839 | |
| Eastman Chemical Co. | 78,213 | 6,862,409 | |
| Ecolab, Inc. | 32,524 | 7,312,696 | |
| Linde PLC | 22,281 | 10,000,158 | |
| PPG Industries, Inc. | 19,164 | 2,713,622 | |
| Sherwin-Williams Co. | 6,850 | 2,274,406 | |
| 51,818,847 | |||
| Construction Materials - 0.6% | |||
| Vulcan Materials Co. | 40,711 | 10,823,019 | |
| Containers & Packaging - 0.2% | |||
| Sealed Air Corp. | 96,769 | 3,374,335 | |
| Metals & Mining - 0.8% | |||
| Nucor Corp. | 76,713 | 14,751,910 | |
| Steel Dynamics, Inc. | 10,811 | 1,446,728 | |
| Worthington Steel, Inc. | 7,869 | 249,133 | |
| 16,447,771 | |||
TOTAL MATERIALS | 82,463,972 | ||
| REAL ESTATE - 4.1% | |||
| Equity Real Estate Investment Trusts (REITs) - 3.8% | |||
| Agree Realty Corp. | 23,745 | 1,304,788 | |
| American Homes 4 Rent Class A | 157,971 | 5,846,507 | |
| Cousins Properties, Inc. | 33,445 | 762,880 | |
| Crown Castle, Inc. | 120,905 | 13,292,296 | |
| CubeSmart | 28,345 | 1,236,125 | |
| EastGroup Properties, Inc. | 4,646 | 816,256 | |
| Equinix, Inc. | 799 | 710,167 | |
| Federal Realty Investment Trust (SBI) | 94,737 | 9,554,226 | |
| First Industrial Realty Trust, Inc. | 53,661 | 2,844,033 | |
| Gaming & Leisure Properties | 21,893 | 995,694 | |
| Invitation Homes, Inc. | 313,398 | 10,677,470 | |
| Mid-America Apartment Communities, Inc. | 25,214 | 3,168,896 | |
| Park Hotels & Resorts, Inc. | 129,924 | 2,156,738 | |
| Prologis, Inc. | 7,836 | 1,044,304 | |
| Public Storage | 22,554 | 6,402,404 | |
| Ryman Hospitality Properties, Inc. | 12,380 | 1,466,782 | |
| SBA Communications Corp. Class A | 9,985 | 2,089,162 | |
| Terreno Realty Corp. | 50,284 | 3,233,261 | |
| VICI Properties, Inc. | 147,609 | 4,417,937 | |
| 72,019,926 | |||
| Real Estate Management & Development - 0.3% | |||
| Zillow Group, Inc.: | |||
| Class A (a)(b) | 37,052 | 2,003,031 | |
| Class C (a) | 69,380 | 3,895,687 | |
| 5,898,718 | |||
TOTAL REAL ESTATE | 77,918,644 | ||
| UTILITIES - 3.1% | |||
| Electric Utilities - 2.0% | |||
| Allete, Inc. (b) | 650 | 36,816 | |
| Constellation Energy Corp. | 26,213 | 4,415,580 | |
| Duke Energy Corp. | 15,842 | 1,454,771 | |
| Entergy Corp. | 10,584 | 1,075,017 | |
| Evergy, Inc. | 48,875 | 2,421,268 | |
| Exelon Corp. | 261,622 | 9,376,532 | |
| Hawaiian Electric Industries, Inc. (b) | 14,571 | 177,475 | |
| NextEra Energy, Inc. | 198,692 | 10,965,811 | |
| OGE Energy Corp. (b) | 30,083 | 990,032 | |
| Otter Tail Corp. (b) | 6,910 | 625,079 | |
| PG&E Corp. | 144,683 | 2,414,759 | |
| Southern Co. | 7,324 | 492,539 | |
| Xcel Energy, Inc. | 55,429 | 2,920,554 | |
| 37,366,233 | |||
| Gas Utilities - 0.0% | |||
| New Jersey Resources Corp. | 11,885 | 494,535 | |
| UGI Corp. | 18,806 | 460,371 | |
| 954,906 | |||
| Independent Power and Renewable Electricity Producers - 0.3% | |||
| Brookfield Renewable Corp. | 27,033 | 641,223 | |
| Clearway Energy, Inc.: | |||
| Class A | 15,698 | 318,041 | |
| Class C | 105,843 | 2,307,377 | |
| The AES Corp. | 44,134 | 670,837 | |
| Vistra Corp. | 38,929 | 2,123,188 | |
| 6,060,666 | |||
| Multi-Utilities - 0.8% | |||
| Black Hills Corp. | 49,730 | 2,587,452 | |
| CenterPoint Energy, Inc. | 77,926 | 2,142,965 | |
| DTE Energy Co. | 15,910 | 1,723,849 | |
| NiSource, Inc. | 200,833 | 5,233,708 | |
| Public Service Enterprise Group, Inc. | 50,213 | 3,133,291 | |
| 14,821,265 | |||
TOTAL UTILITIES | 59,203,070 | ||
| TOTAL COMMON STOCKS (Cost $1,707,099,725) | 1,885,495,336 | ||
| U.S. Treasury Obligations - 0.1% | |||
Principal Amount (c) | Value ($) | ||
U.S. Treasury Bills, yield at date of purchase 5.31% to 5.31% 3/7/24 to 5/30/24 (d) (Cost $1,635,634) | 1,640,000 | 1,635,632 | |
| Money Market Funds - 2.5% | |||
| Shares | Value ($) | ||
| Fidelity Cash Central Fund 5.39% (e) | 35,407,135 | 35,414,216 | |
| Fidelity Securities Lending Cash Central Fund 5.39% (e)(f) | 12,680,133 | 12,681,401 | |
| TOTAL MONEY MARKET FUNDS (Cost $48,095,617) | 48,095,617 | ||
| TOTAL INVESTMENT IN SECURITIES - 101.6% (Cost $1,756,830,976) | 1,935,226,585 |
NET OTHER ASSETS (LIABILITIES) - (1.6)% | (31,273,976) |
| NET ASSETS - 100.0% | 1,903,952,609 |
| Futures Contracts | |||||
Number of contracts | Expiration Date | Notional Amount ($) | Value ($) | Unrealized Appreciation/ (Depreciation) ($) | |
| Purchased | |||||
| Equity Index Contracts | |||||
| CME Micro E-mini S&P 500 Index Contracts (United States) | 45 | Mar 2024 | 11,483,438 | 591,952 | 591,952 |
| The notional amount of futures purchased as a percentage of Net Assets is 0.6% | |||||
| (a) | Non-income producing |
| (b) | Security or a portion of the security is on loan at period end. |
| (c) | Amount is stated in United States dollars unless otherwise noted. |
| (d) | Security or a portion of the security was pledged to cover margin requirements for futures contracts. At period end, the value of securities pledged amounted to $1,635,632. |
| (e) | Affiliated fund that is generally available only to investment companies and other accounts managed by Fidelity Investments. The rate quoted is the annualized seven-day yield of the fund at period end. A complete unaudited listing of the fund's holdings as of its most recent quarter end is available upon request. In addition, each Fidelity Central Fund's financial statements are available on the SEC's website or upon request. |
| (f) | Investment made with cash collateral received from securities on loan. |
| Affiliate | Value, beginning of period ($) | Purchases ($) | Sales Proceeds ($) | Dividend Income ($) | Realized Gain (loss) ($) | Change in Unrealized appreciation (depreciation) ($) | Value, end of period ($) | % ownership, end of period |
| Fidelity Cash Central Fund 5.39% | 155,216,114 | 737,013,394 | 856,815,292 | 1,050,318 | - | - | 35,414,216 | 0.1% |
| Fidelity Securities Lending Cash Central Fund 5.39% | 13,096,389 | 119,402,642 | 119,817,630 | 8,450 | - | - | 12,681,401 | 0.0% |
| Total | 168,312,503 | 856,416,036 | 976,632,922 | 1,058,768 | - | - | 48,095,617 | |
| Valuation Inputs at Reporting Date: | ||||
| Description | Total ($) | Level 1 ($) | Level 2 ($) | Level 3 ($) |
Investments in Securities: | ||||
| Equities: | ||||
Communication Services | 98,407,637 | 98,407,637 | - | - |
Consumer Discretionary | 122,553,630 | 122,553,630 | - | - |
Consumer Staples | 142,355,095 | 142,355,095 | - | - |
Energy | 122,695,584 | 122,695,584 | - | - |
Financials | 428,993,593 | 428,993,593 | - | - |
Health Care | 270,787,090 | 270,787,090 | - | - |
Industrials | 302,989,699 | 302,989,699 | - | - |
Information Technology | 177,127,322 | 177,127,322 | - | - |
Materials | 82,463,972 | 82,463,972 | - | - |
Real Estate | 77,918,644 | 77,918,644 | - | - |
Utilities | 59,203,070 | 59,203,070 | - | - |
| U.S. Government and Government Agency Obligations | 1,635,632 | - | 1,635,632 | - |
| Money Market Funds | 48,095,617 | 48,095,617 | - | - |
| Total Investments in Securities: | 1,935,226,585 | 1,933,590,953 | 1,635,632 | - |
Derivative Instruments: Assets | ||||
Futures Contracts | 591,952 | 591,952 | - | - |
| Total Assets | 591,952 | 591,952 | - | - |
| Total Derivative Instruments: | 591,952 | 591,952 | - | - |
Primary Risk Exposure / Derivative Type | Value | |
| Asset ($) | Liability ($) | |
| Equity Risk | ||
Futures Contracts (a) | 591,952 | 0 |
| Total Equity Risk | 591,952 | 0 |
| Total Value of Derivatives | 591,952 | 0 |
| Statement of Assets and Liabilities | ||||
February 29, 2024 (Unaudited) | ||||
| Assets | ||||
| Investment in securities, at value (including securities loaned of $12,352,392) - See accompanying schedule: | ||||
Unaffiliated issuers (cost $1,708,735,358) | $ | 1,887,130,967 | ||
Fidelity Central Funds (cost $48,095,618) | 48,095,618 | |||
| Total Investment in Securities (cost $1,756,830,976) | $ | 1,935,226,585 | ||
| Receivable for investments sold | 39,403,429 | |||
| Dividends receivable | 3,678,467 | |||
| Distributions receivable from Fidelity Central Funds | 57,882 | |||
| Receivable for daily variation margin on futures contracts | 133,614 | |||
| Other receivables | 5,783 | |||
Total assets | 1,978,505,760 | |||
| Liabilities | ||||
| Payable for investments purchased | $ | 36,373,772 | ||
| Payable for fund shares redeemed | 25,197,823 | |||
| Accrued management fee | 281,509 | |||
| Other payables and accrued expenses | 21,647 | |||
| Collateral on securities loaned | 12,678,400 | |||
| Total Liabilities | 74,553,151 | |||
| Net Assets | $ | 1,903,952,609 | ||
| Net Assets consist of: | ||||
| Paid in capital | $ | 1,285,733,604 | ||
| Total accumulated earnings (loss) | 618,219,005 | |||
| Net Assets | $ | 1,903,952,609 | ||
Net Asset Value, offering price and redemption price per share ($1,903,952,609 ÷ 67,978,976 shares) | $ | 28.01 | ||
| Statement of Operations | ||||
Six months ended February 29, 2024 (Unaudited) | ||||
| Investment Income | ||||
| Dividends | $ | 31,528,977 | ||
| Interest | 75,602 | |||
| Income from Fidelity Central Funds (including $8,450 from security lending) | 1,058,768 | |||
| Total Income | 32,663,347 | |||
| Expenses | ||||
| Management fee | $ | 4,802,566 | ||
| Independent trustees' fees and expenses | 10,429 | |||
| Interest | 4,057 | |||
| Miscellaneous | 48,955 | |||
| Total expenses before reductions | 4,866,007 | |||
| Expense reductions | (6,129) | |||
| Total expenses after reductions | 4,859,878 | |||
| Net Investment income (loss) | 27,803,469 | |||
| Realized and Unrealized Gain (Loss) | ||||
| Net realized gain (loss) on: | ||||
| Investment Securities: | ||||
| Unaffiliated issuers | (60,665,642) | |||
| Redemptions in-kind | 439,246,047 | |||
| Futures contracts | (4,305,095) | |||
| Total net realized gain (loss) | 374,275,310 | |||
| Change in net unrealized appreciation (depreciation) on: | ||||
| Investment Securities: | ||||
| Unaffiliated issuers | (544,942,015) | |||
| Futures contracts | 51,251 | |||
| Total change in net unrealized appreciation (depreciation) | (544,890,764) | |||
| Net gain (loss) | (170,615,454) | |||
| Net increase (decrease) in net assets resulting from operations | $ | (142,811,985) | ||
See Organization and Merger information note regarding reorganization from mutual fund to exchange traded fund.
| Statement of Changes in Net Assets | ||||
Six months ended February 29, 2024 (Unaudited) | Year ended August 31, 2023 | |||
| Increase (Decrease) in Net Assets | ||||
| Operations | ||||
| Net investment income (loss) | $ | 27,803,469 | $ | 104,218,377 |
| Net realized gain (loss) | 374,275,310 | 209,018,224 | ||
| Change in net unrealized appreciation (depreciation) | (544,890,764) | 130,413,938 | ||
| Net increase (decrease) in net assets resulting from operations | (142,811,985) | 443,650,539 | ||
| Distributions to shareholders | (80,073,002) | (257,200,574) | ||
| Share transactions | ||||
| Proceeds from sales of shares | 749,294,989 | 817,757,697 | ||
| Reinvestment of distributions | 143,727,046 | 243,302,994 | ||
| Cost of shares redeemed | (4,297,948,767) | (1,407,138,550) | ||
Net increase (decrease) in net assets resulting from share transactions | (3,404,926,732) | (346,077,859) | ||
| Total increase (decrease) in net assets | (3,627,811,719) | (159,627,894) | ||
| Net Assets | ||||
| Beginning of period | 5,531,764,328 | 5,691,392,222 | ||
| End of period | $ | 1,903,952,609 | $ | 5,531,764,328 |
| Other Information | ||||
| Shares | ||||
| Sold | 32,459,161 | 32,117,183 | ||
| Issued in reinvestment of distributions | 5,858,095 | 9,686,875 | ||
| Redeemed | (180,777,486) | (55,489,324) | ||
| Net increase (decrease) | (142,460,230) | (13,685,266) | ||
| Fidelity® Enhanced Large Cap Value ETF |
Six months ended (Unaudited) February 29, 2024 A | Years ended August 31, 2023 A | 2022 A | 2021 A | 2020 A | 2019 A | |||||||
Selected Per-Share Data | ||||||||||||
| Net asset value, beginning of period | $ | 26.29 | $ | 25.40 | $ | 30.16 | $ | 22.04 | $ | 22.36 | $ | 24.10 |
| Income from Investment Operations | ||||||||||||
Net investment income (loss) B,C | .24 | .47 | .49 | .44 | .49 | .52 | ||||||
| Net realized and unrealized gain (loss) | 2.29 D | 1.59 | (1.81) | 8.08 | - | (.80) | ||||||
| Total from investment operations | 2.53 | 2.06 | (1.32) | 8.52 | .49 | (.28) | ||||||
| Distributions from net investment income | (.48) | (.38) | (.58) | (.40) | (.51) | (.54) | ||||||
| Distributions from net realized gain | (.33) | (.79) | (2.86) | - | (.30) | (.94) | ||||||
| Total distributions | (.81) | (1.17) | (3.44) | (.40) | (.81) | (1.46) E | ||||||
| Net asset value, end of period | $ | 28.01 | $ | 26.29 | $ | 25.40 | $ | 30.16 | $ | 22.04 | $ | 22.36 |
Total Return F,G,H | 10.04% | 8.30% | (5.18)% | 39.12% | 1.95% | (.77)% | ||||||
Ratios to Average Net Assets C,I,J | ||||||||||||
| Expenses before reductions | .32% K | .39% | .39% | .39% | .39% | .39% | ||||||
| Expenses net of fee waivers, if any | .32% K | .39% | .39% | .39% | .39% | .39% | ||||||
| Expenses net of all reductions | .32% K | .39% | .39% | .39% | .39% | .39% | ||||||
| Net investment income (loss) | 1.83% K | 1.88% | 1.76% | 1.65% | 2.21% | 2.37% | ||||||
| Supplemental Data | ||||||||||||
| Net assets, end of period (000 omitted) | $ | 1,903,953 | $ | 5,531,764 | $ | 5,691,392 | $ | 6,187,508 | $ | 3,887,139 | $ | 3,757,353 |
Portfolio turnover rate L | 103% K,M | 88% | 112% | 75% | 81% | 94% |
Top Holdings (% of Fund's net assets) | ||
| Trane Technologies PLC | 1.1 | |
| Amphenol Corp. Class A | 1.1 | |
| PACCAR, Inc. | 1.0 | |
| Cintas Corp. | 1.0 | |
| Block, Inc. Class A | 0.9 | |
| Nucor Corp. | 0.9 | |
| IDEXX Laboratories, Inc. | 0.9 | |
| Simon Property Group, Inc. | 0.9 | |
| Old Dominion Freight Lines, Inc. | 0.9 | |
| D.R. Horton, Inc. | 0.9 | |
| 9.6 | ||
| Market Sectors (% of Fund's net assets) | ||
| Industrials | 21.5 | |
| Financials | 14.3 | |
| Information Technology | 14.2 | |
| Consumer Discretionary | 11.8 | |
| Health Care | 9.8 | |
| Materials | 6.8 | |
| Real Estate | 5.9 | |
| Energy | 4.2 | |
| Utilities | 3.6 | |
| Communication Services | 2.9 | |
| Consumer Staples | 2.5 | |
Asset Allocation (% of Fund's net assets) |
 |
Futures - 2.3% |
| Common Stocks - 97.5% | |||
| Shares | Value ($) | ||
| COMMUNICATION SERVICES - 2.9% | |||
| Entertainment - 2.4% | |||
| Electronic Arts, Inc. | 85,042 | 11,861,658 | |
| Playtika Holding Corp. | 556,556 | 4,124,080 | |
| Roku, Inc. Class A (a) | 124,589 | 7,871,533 | |
| Spotify Technology SA (a) | 51,623 | 13,236,653 | |
| 37,093,924 | |||
| Interactive Media & Services - 0.1% | |||
| Vimeo, Inc. (a) | 276,991 | 1,326,787 | |
| Media - 0.4% | |||
| Liberty Media Corp. Liberty SiriusXM | 47,570 | 1,378,579 | |
| Liberty Media Corp. Liberty SiriusXM Class A | 63,406 | 1,847,651 | |
| News Corp. Class B | 48,840 | 1,367,032 | |
| The New York Times Co. Class A | 26,511 | 1,173,907 | |
| 5,767,169 | |||
TOTAL COMMUNICATION SERVICES | 44,187,880 | ||
| CONSUMER DISCRETIONARY - 11.8% | |||
| Automobiles - 0.5% | |||
| Ford Motor Co. | 619,174 | 7,702,525 | |
| Broadline Retail - 0.7% | |||
| eBay, Inc. | 151,067 | 7,142,448 | |
| Etsy, Inc. (a) | 58,414 | 4,187,700 | |
| 11,330,148 | |||
| Distributors - 0.6% | |||
| Genuine Parts Co. | 60,623 | 9,048,589 | |
| Diversified Consumer Services - 0.7% | |||
| ADT, Inc. (b) | 65,470 | 475,312 | |
| Duolingo, Inc. (a) | 15,106 | 3,610,334 | |
| H&R Block, Inc. | 141,800 | 6,941,110 | |
| 11,026,756 | |||
| Hotels, Restaurants & Leisure - 1.5% | |||
| Airbnb, Inc. Class A (a) | 12,694 | 1,998,924 | |
| Booking Holdings, Inc. | 2,069 | 7,177,009 | |
| Chipotle Mexican Grill, Inc. (a) | 3,032 | 8,152,351 | |
| Draftkings Holdings, Inc. (a) | 76,666 | 3,321,171 | |
| Expedia, Inc. (a) | 5,235 | 716,253 | |
| International Game Technology PLC | 26,344 | 715,766 | |
| Wendy's Co. | 83,873 | 1,518,940 | |
| 23,600,414 | |||
| Household Durables - 3.4% | |||
| D.R. Horton, Inc. | 91,381 | 13,655,977 | |
| Lennar Corp. Class A | 30,551 | 4,842,639 | |
| NVR, Inc. (a) | 1,458 | 11,118,081 | |
| PulteGroup, Inc. | 2,268 | 245,806 | |
| Toll Brothers, Inc. | 89,771 | 10,291,347 | |
| TopBuild Corp. (a) | 24,442 | 9,834,972 | |
| Whirlpool Corp. | 11,692 | 1,255,604 | |
| 51,244,426 | |||
| Specialty Retail - 3.1% | |||
| AutoNation, Inc. (a) | 35,167 | 5,268,017 | |
| GameStop Corp. Class A (a)(b) | 23,460 | 334,774 | |
| Gap, Inc. | 319,844 | 6,057,845 | |
| Murphy U.S.A., Inc. | 16,881 | 7,039,546 | |
| Ross Stores, Inc. | 88,998 | 13,257,142 | |
| Ulta Beauty, Inc. (a) | 20,903 | 11,466,550 | |
| Williams-Sonoma, Inc. | 19,720 | 4,644,652 | |
| 48,068,526 | |||
| Textiles, Apparel & Luxury Goods - 1.3% | |||
| Crocs, Inc. (a) | 77,300 | 9,449,925 | |
| Tapestry, Inc. | 201,740 | 9,588,702 | |
| 19,038,627 | |||
TOTAL CONSUMER DISCRETIONARY | 181,060,011 | ||
| CONSUMER STAPLES - 2.5% | |||
| Beverages - 0.3% | |||
| Molson Coors Beverage Co. Class B | 67,570 | 4,217,719 | |
| Consumer Staples Distribution & Retail - 1.0% | |||
| Casey's General Stores, Inc. | 27,438 | 8,354,597 | |
| Grocery Outlet Holding Corp. (a) | 58,326 | 1,504,228 | |
| Maplebear, Inc. (NASDAQ) | 170,550 | 5,549,697 | |
| 15,408,522 | |||
| Food Products - 0.3% | |||
| Ingredion, Inc. | 23,549 | 2,770,069 | |
| Seaboard Corp. | 608 | 1,998,855 | |
| The J.M. Smucker Co. | 3,475 | 417,591 | |
| 5,186,515 | |||
| Household Products - 0.8% | |||
| Kimberly-Clark Corp. | 35,640 | 4,318,499 | |
| Spectrum Brands Holdings, Inc. | 17,400 | 1,399,308 | |
| The Clorox Co. | 37,885 | 5,808,149 | |
| 11,525,956 | |||
| Personal Care Products - 0.1% | |||
| Coty, Inc. Class A (a) | 183,408 | 2,303,604 | |
TOTAL CONSUMER STAPLES | 38,642,316 | ||
| ENERGY - 4.2% | |||
| Energy Equipment & Services - 0.7% | |||
| Baker Hughes Co. Class A | 59,069 | 1,747,852 | |
| Halliburton Co. | 229,195 | 8,037,869 | |
| 9,785,721 | |||
| Oil, Gas & Consumable Fuels - 3.5% | |||
| Cheniere Energy, Inc. | 65,447 | 10,157,374 | |
| Coterra Energy, Inc. | 100,032 | 2,578,825 | |
| Devon Energy Corp. | 83,564 | 3,681,830 | |
| Diamondback Energy, Inc. | 25,197 | 4,598,956 | |
| Hess Corp. | 27,116 | 3,952,157 | |
| Marathon Oil Corp. | 252,210 | 6,116,093 | |
| Murphy Oil Corp. | 45,657 | 1,811,213 | |
| ONEOK, Inc. | 95,034 | 7,138,954 | |
| Phillips 66 Co. | 5,957 | 848,932 | |
| Targa Resources Corp. | 63,762 | 6,263,979 | |
| The Williams Companies, Inc. | 193,925 | 6,969,665 | |
| 54,117,978 | |||
TOTAL ENERGY | 63,903,699 | ||
| FINANCIALS - 14.3% | |||
| Banks - 0.5% | |||
| Columbia Banking Systems, Inc. | 81,822 | 1,480,978 | |
| KeyCorp | 422,635 | 6,031,001 | |
| 7,511,979 | |||
| Capital Markets - 6.7% | |||
| Ameriprise Financial, Inc. | 12,476 | 5,082,223 | |
| Bank of New York Mellon Corp. | 240,447 | 13,486,672 | |
| Cboe Global Markets, Inc. | 32,441 | 6,228,672 | |
| Janus Henderson Group PLC | 26,852 | 836,708 | |
| Jefferies Financial Group, Inc. | 3,320 | 138,842 | |
| KKR & Co. LP | 7,226 | 710,027 | |
| LPL Financial | 23,509 | 6,297,826 | |
| MSCI, Inc. | 2,446 | 1,372,133 | |
| NASDAQ, Inc. | 173,217 | 9,734,795 | |
| Northern Trust Corp. | 97,861 | 8,037,324 | |
| Raymond James Financial, Inc. | 72,117 | 8,677,117 | |
| Robinhood Markets, Inc. (a) | 657,521 | 10,724,168 | |
| State Street Corp. | 134,964 | 9,950,896 | |
| Stifel Financial Corp. | 66,266 | 5,026,939 | |
| Tradeweb Markets, Inc. Class A | 89,923 | 9,515,652 | |
| XP, Inc. Class A | 323,069 | 7,637,351 | |
| 103,457,345 | |||
| Consumer Finance - 1.0% | |||
| Capital One Financial Corp. | 15,104 | 2,078,461 | |
| Discover Financial Services | 22,018 | 2,657,573 | |
| Synchrony Financial | 249,595 | 10,308,274 | |
| 15,044,308 | |||
| Financial Services - 3.4% | |||
| Affirm Holdings, Inc. (a)(b) | 155,775 | 5,844,678 | |
| Apollo Global Management, Inc. | 3,132 | 350,158 | |
| Block, Inc. Class A (a) | 183,669 | 14,596,175 | |
| Euronet Worldwide, Inc. (a) | 24,410 | 2,671,430 | |
| FleetCor Technologies, Inc. (a) | 15,127 | 4,224,517 | |
| MGIC Investment Corp. | 40,920 | 813,899 | |
| PayPal Holdings, Inc. (a) | 98,045 | 5,916,035 | |
| The Western Union Co. | 546,650 | 7,330,577 | |
| Toast, Inc. (a)(b) | 404,729 | 9,308,767 | |
| WEX, Inc. (a) | 6,411 | 1,408,689 | |
| 52,464,925 | |||
| Insurance - 2.7% | |||
| Allstate Corp. | 13,233 | 2,110,928 | |
| Arch Capital Group Ltd. (a) | 36,700 | 3,214,553 | |
| Assurant, Inc. | 31,304 | 5,680,111 | |
| Brown & Brown, Inc. | 123,408 | 10,392,188 | |
| Reinsurance Group of America, Inc. | 38,709 | 6,845,687 | |
| Unum Group | 161,828 | 8,002,395 | |
| Willis Towers Watson PLC | 18,068 | 4,925,517 | |
| 41,171,379 | |||
| Mortgage Real Estate Investment Trusts - 0.0% | |||
| Rithm Capital Corp. | 25,003 | 271,033 | |
TOTAL FINANCIALS | 219,920,969 | ||
| HEALTH CARE - 9.8% | |||
| Biotechnology - 2.3% | |||
| Biogen, Inc. (a) | 3,863 | 838,232 | |
| Exelixis, Inc. (a) | 366,739 | 8,031,584 | |
| Gilead Sciences, Inc. | 60,080 | 4,331,768 | |
| Incyte Corp. (a) | 150,776 | 8,799,287 | |
| Karuna Therapeutics, Inc. (a) | 226 | 70,957 | |
| Sarepta Therapeutics, Inc. (a) | 70,733 | 9,046,751 | |
| United Therapeutics Corp. (a) | 21,577 | 4,868,634 | |
| 35,987,213 | |||
| Health Care Equipment & Supplies - 2.1% | |||
| Abiomed, Inc. (a)(c) | 3,289 | 9,143 | |
| DexCom, Inc. (a) | 38,933 | 4,480,020 | |
| Hologic, Inc. (a) | 23,396 | 1,726,625 | |
| IDEXX Laboratories, Inc. (a) | 24,659 | 14,184,597 | |
| Insulet Corp. (a) | 22,687 | 3,720,668 | |
| Zimmer Biomet Holdings, Inc. | 63,571 | 7,905,690 | |
| Zimvie, Inc. (a) | 17,036 | 288,760 | |
| 32,315,503 | |||
| Health Care Providers & Services - 2.5% | |||
| Cardinal Health, Inc. | 103,646 | 11,606,279 | |
| Cencora, Inc. | 44,200 | 10,413,520 | |
| Centene Corp. (a) | 62,822 | 4,927,129 | |
| Cigna Group | 5,674 | 1,907,258 | |
| Elevance Health, Inc. | 7,380 | 3,699,225 | |
| Humana, Inc. | 263 | 92,134 | |
| Molina Healthcare, Inc. (a) | 13,425 | 5,288,242 | |
| 37,933,787 | |||
| Health Care Technology - 0.3% | |||
| Teladoc Health, Inc. (a)(b) | 172,029 | 2,594,197 | |
| Veeva Systems, Inc. Class A (a) | 12,077 | 2,723,484 | |
| 5,317,681 | |||
| Life Sciences Tools & Services - 1.6% | |||
| 10X Genomics, Inc. (a) | 138,696 | 6,468,781 | |
| Agilent Technologies, Inc. | 29,696 | 4,079,043 | |
| Bruker Corp. | 93,952 | 8,130,606 | |
| Mettler-Toledo International, Inc. (a) | 4,182 | 5,215,874 | |
| 23,894,304 | |||
| Pharmaceuticals - 1.0% | |||
| Jazz Pharmaceuticals PLC (a) | 66,886 | 7,952,745 | |
| Organon & Co. | 43,965 | 765,431 | |
| Perrigo Co. PLC | 66,497 | 1,746,211 | |
| Viatris, Inc. | 392,330 | 4,853,122 | |
| 15,317,509 | |||
TOTAL HEALTH CARE | 150,765,997 | ||
| INDUSTRIALS - 21.5% | |||
| Aerospace & Defense - 2.8% | |||
| Axon Enterprise, Inc. (a) | 39,025 | 11,995,114 | |
| Curtiss-Wright Corp. | 10,509 | 2,482,961 | |
| Howmet Aerospace, Inc. | 132,664 | 8,828,789 | |
| Textron, Inc. | 115,060 | 10,248,394 | |
| TransDigm Group, Inc. | 265 | 312,101 | |
| Woodward, Inc. | 60,522 | 8,563,258 | |
| 42,430,617 | |||
| Building Products - 2.4% | |||
| Builders FirstSource, Inc. (a) | 51,186 | 9,990,483 | |
| Carlisle Companies, Inc. | 1,877 | 656,950 | |
| Carrier Global Corp. | 81,933 | 4,553,836 | |
| Lennox International, Inc. | 550 | 259,166 | |
| Owens Corning | 30,177 | 4,519,911 | |
| Trane Technologies PLC | 59,670 | 16,825,149 | |
| 36,805,495 | |||
| Commercial Services & Supplies - 2.0% | |||
| Cintas Corp. | 24,194 | 15,208,590 | |
| MSA Safety, Inc. | 5,327 | 980,967 | |
| Republic Services, Inc. | 70,552 | 12,953,347 | |
| Tetra Tech, Inc. | 10,667 | 1,891,472 | |
| 31,034,376 | |||
| Construction & Engineering - 0.4% | |||
| AECOM | 33,289 | 2,957,062 | |
| EMCOR Group, Inc. | 3,936 | 1,234,015 | |
| Valmont Industries, Inc. | 6,306 | 1,336,431 | |
| 5,527,508 | |||
| Electrical Equipment - 3.3% | |||
| Acuity Brands, Inc. | 6,294 | 1,581,305 | |
| AMETEK, Inc. | 74,085 | 13,348,635 | |
| Hubbell, Inc. Class B | 27,786 | 10,577,297 | |
| nVent Electric PLC | 134,998 | 9,088,065 | |
| Rockwell Automation, Inc. | 36,466 | 10,395,727 | |
| Vertiv Holdings Co. | 77,887 | 5,266,719 | |
| 50,257,748 | |||
| Ground Transportation - 1.3% | |||
| Old Dominion Freight Lines, Inc. | 30,865 | 13,657,145 | |
| XPO, Inc. (a) | 47,865 | 5,759,117 | |
| 19,416,262 | |||
| Machinery - 6.0% | |||
| AGCO Corp. | 64,413 | 7,066,106 | |
| Allison Transmission Holdings, Inc. | 124,574 | 9,384,159 | |
| CNH Industrial NV | 73,585 | 879,341 | |
| Cummins, Inc. | 35,341 | 9,492,946 | |
| Donaldson Co., Inc. | 106,848 | 7,652,454 | |
| Flowserve Corp. | 18,554 | 785,205 | |
| Fortive Corp. | 127,884 | 10,886,765 | |
| Gates Industrial Corp. PLC (a) | 26,842 | 395,114 | |
| Graco, Inc. | 47,516 | 4,336,310 | |
| ITT, Inc. | 6,746 | 850,940 | |
| Oshkosh Corp. | 19,035 | 2,110,220 | |
| PACCAR, Inc. | 143,592 | 15,922,917 | |
| Parker Hannifin Corp. | 19,990 | 10,703,646 | |
| Westinghouse Air Brake Tech Co. | 80,505 | 11,374,551 | |
| 91,840,674 | |||
| Passenger Airlines - 0.6% | |||
| American Airlines Group, Inc. (a) | 179,306 | 2,811,518 | |
| United Airlines Holdings, Inc. (a) | 158,343 | 7,203,023 | |
| 10,014,541 | |||
| Professional Services - 1.6% | |||
| CACI International, Inc. Class A (a) | 23,301 | 8,734,380 | |
| KBR, Inc. | 85,609 | 5,139,108 | |
| Leidos Holdings, Inc. | 12,605 | 1,611,675 | |
| SS&C Technologies Holdings, Inc. | 148,823 | 9,488,954 | |
| 24,974,117 | |||
| Trading Companies & Distributors - 1.1% | |||
| Core & Main, Inc. (a) | 130,029 | 6,206,284 | |
| W.W. Grainger, Inc. | 10,954 | 10,663,281 | |
| 16,869,565 | |||
TOTAL INDUSTRIALS | 329,170,903 | ||
| INFORMATION TECHNOLOGY - 14.2% | |||
| Communications Equipment - 0.0% | |||
| Juniper Networks, Inc. | 3,823 | 141,566 | |
| Electronic Equipment, Instruments & Components - 1.8% | |||
| Amphenol Corp. Class A | 148,461 | 16,217,880 | |
| Keysight Technologies, Inc. (a) | 71,679 | 11,060,070 | |
| 27,277,950 | |||
| IT Services - 2.6% | |||
| Gartner, Inc. (a) | 26,682 | 12,422,072 | |
| GoDaddy, Inc. (a) | 57,843 | 6,602,778 | |
| Kyndryl Holdings, Inc. (a) | 43,872 | 963,868 | |
| MongoDB, Inc. Class A (a) | 7,431 | 3,325,967 | |
| Twilio, Inc. Class A (a) | 122,721 | 7,312,944 | |
| Wix.com Ltd. (a) | 60,138 | 8,430,145 | |
| 39,057,774 | |||
| Semiconductors & Semiconductor Equipment - 2.3% | |||
| Cirrus Logic, Inc. (a) | 88,135 | 8,092,556 | |
| KLA Corp. | 5,262 | 3,590,263 | |
| Lattice Semiconductor Corp. (a) | 22,792 | 1,746,095 | |
| Monolithic Power Systems, Inc. | 16,918 | 12,181,637 | |
| Qorvo, Inc. (a) | 83,984 | 9,620,367 | |
| 35,230,918 | |||
| Software - 7.1% | |||
| ANSYS, Inc. (a) | 7,379 | 2,465,840 | |
| AppLovin Corp. (a) | 167,651 | 10,012,118 | |
| Cadence Design Systems, Inc. (a) | 25,846 | 7,867,005 | |
| Crowdstrike Holdings, Inc. (a) | 4,975 | 1,612,646 | |
| DocuSign, Inc. (a) | 157,142 | 8,370,954 | |
| Dropbox, Inc. Class A (a) | 231,871 | 5,553,310 | |
| HubSpot, Inc. (a) | 18,639 | 11,534,000 | |
| Manhattan Associates, Inc. (a) | 8,542 | 2,163,945 | |
| Nutanix, Inc. Class A (a) | 108,285 | 6,839,281 | |
| Palo Alto Networks, Inc. (a) | 21,644 | 6,721,544 | |
| Pegasystems, Inc. | 94,320 | 6,134,573 | |
| RingCentral, Inc. (a) | 208,139 | 6,956,005 | |
| Splunk, Inc. (a) | 11,556 | 1,805,278 | |
| Synopsys, Inc. (a) | 4,539 | 2,604,160 | |
| Teradata Corp. (a) | 203,798 | 7,666,881 | |
| Workday, Inc. Class A (a) | 26,291 | 7,746,906 | |
| Zoom Video Communications, Inc. Class A (a) | 89,377 | 6,321,635 | |
| Zscaler, Inc. (a) | 28,823 | 6,974,301 | |
| 109,350,382 | |||
| Technology Hardware, Storage & Peripherals - 0.4% | |||
| Hewlett Packard Enterprise Co. | 252,877 | 3,851,317 | |
| NetApp, Inc. | 23,106 | 2,059,207 | |
| 5,910,524 | |||
TOTAL INFORMATION TECHNOLOGY | 216,969,114 | ||
| MATERIALS - 6.8% | |||
| Chemicals - 2.6% | |||
| Axalta Coating Systems Ltd. (a) | 70,563 | 2,309,527 | |
| CF Industries Holdings, Inc. | 15,696 | 1,266,981 | |
| DuPont de Nemours, Inc. | 126,672 | 8,764,436 | |
| Eastman Chemical Co. | 104,367 | 9,157,161 | |
| Ecolab, Inc. | 17,459 | 3,925,482 | |
| Element Solutions, Inc. | 53,266 | 1,251,751 | |
| Ginkgo Bioworks Holdings, Inc. Class A (a)(b) | 998,849 | 1,518,250 | |
| PPG Industries, Inc. | 65,811 | 9,318,838 | |
| The Chemours Co. LLC | 119,778 | 2,356,033 | |
| 39,868,459 | |||
| Construction Materials - 1.8% | |||
| Eagle Materials, Inc. | 3,419 | 866,887 | |
| Martin Marietta Materials, Inc. | 22,875 | 13,215,116 | |
| Vulcan Materials Co. | 49,308 | 13,108,532 | |
| 27,190,535 | |||
| Containers & Packaging - 0.6% | |||
| Berry Global Group, Inc. | 121,761 | 7,087,708 | |
| Sealed Air Corp. | 52,960 | 1,846,715 | |
| 8,934,423 | |||
| Metals & Mining - 1.8% | |||
| Nucor Corp. | 74,639 | 14,353,080 | |
| Reliance, Inc. | 9,271 | 2,978,031 | |
| Steel Dynamics, Inc. | 79,663 | 10,660,503 | |
| 27,991,614 | |||
TOTAL MATERIALS | 103,985,031 | ||
| REAL ESTATE - 5.9% | |||
| Equity Real Estate Investment Trusts (REITs) - 5.1% | |||
| Agree Realty Corp. | 127,249 | 6,992,333 | |
| American Homes 4 Rent Class A | 233,634 | 8,646,794 | |
| Crown Castle, Inc. | 32,137 | 3,533,142 | |
| EastGroup Properties, Inc. | 5,156 | 905,858 | |
| EPR Properties | 32,944 | 1,353,340 | |
| Federal Realty Investment Trust (SBI) | 81,668 | 8,236,218 | |
| First Industrial Realty Trust, Inc. | 17,810 | 943,930 | |
| Invitation Homes, Inc. | 303,588 | 10,343,243 | |
| Park Hotels & Resorts, Inc. | 313,042 | 5,196,497 | |
| Public Storage | 14,358 | 4,075,805 | |
| Regency Centers Corp. | 32,361 | 2,004,764 | |
| Ryman Hospitality Properties, Inc. | 16,850 | 1,996,388 | |
| SBA Communications Corp. Class A | 20,420 | 4,272,477 | |
| Simon Property Group, Inc. | 95,714 | 14,179,072 | |
| VICI Properties, Inc. | 198,889 | 5,952,748 | |
| 78,632,609 | |||
| Real Estate Management & Development - 0.8% | |||
| CoStar Group, Inc. (a) | 28,162 | 2,450,939 | |
| Zillow Group, Inc.: | |||
| Class A (a) | 74,016 | 4,001,305 | |
| Class C (a) | 85,098 | 4,778,253 | |
| 11,230,497 | |||
TOTAL REAL ESTATE | 89,863,106 | ||
| UTILITIES - 3.6% | |||
| Electric Utilities - 0.1% | |||
| Entergy Corp. | 9,427 | 957,500 | |
| Hawaiian Electric Industries, Inc. (b) | 32,355 | 394,084 | |
| 1,351,584 | |||
| Gas Utilities - 0.4% | |||
| National Fuel Gas Co. | 128,626 | 6,269,231 | |
| UGI Corp. | 26,372 | 645,587 | |
| 6,914,818 | |||
| Independent Power and Renewable Electricity Producers - 1.3% | |||
| Brookfield Renewable Corp. | 59,058 | 1,400,856 | |
| Clearway Energy, Inc.: | |||
| Class A | 27,576 | 558,690 | |
| Class C | 44,044 | 960,159 | |
| The AES Corp. | 330,929 | 5,030,121 | |
| Vistra Corp. | 222,084 | 12,112,461 | |
| 20,062,287 | |||
| Multi-Utilities - 1.8% | |||
| CenterPoint Energy, Inc. | 295,210 | 8,118,275 | |
| Consolidated Edison, Inc. | 41,360 | 3,607,006 | |
| NiSource, Inc. | 339,730 | 8,853,364 | |
| WEC Energy Group, Inc. | 81,940 | 6,431,471 | |
| 27,010,116 | |||
TOTAL UTILITIES | 55,338,805 | ||
| TOTAL COMMON STOCKS (Cost $1,203,655,807) | 1,493,807,831 | ||
| U.S. Treasury Obligations - 0.1% | |||
Principal Amount (d) | Value ($) | ||
U.S. Treasury Bills, yield at date of purchase 5.26% to 5.31% 3/21/24 to 5/30/24 (e) (Cost $1,903,511) | 1,920,000 | 1,903,322 | |
| Money Market Funds - 1.4% | |||
| Shares | Value ($) | ||
| Fidelity Cash Central Fund 5.39% (f) | 9,364,741 | 9,366,614 | |
| Fidelity Securities Lending Cash Central Fund 5.39% (f)(g) | 11,881,840 | 11,883,029 | |
| TOTAL MONEY MARKET FUNDS (Cost $21,249,642) | 21,249,643 | ||
| TOTAL INVESTMENT IN SECURITIES - 99.0% (Cost $1,226,808,960) | 1,516,960,796 |
NET OTHER ASSETS (LIABILITIES) - 1.0% | 15,702,937 |
| NET ASSETS - 100.0% | 1,532,663,733 |
| Futures Contracts | |||||
Number of contracts | Expiration Date | Notional Amount ($) | Value ($) | Unrealized Appreciation/ (Depreciation) ($) | |
| Purchased | |||||
| Equity Index Contracts | |||||
| CME E-mini S&P MidCap 400 Index Contracts (United States) | 124 | Mar 2024 | 35,868,240 | 696,032 | 696,032 |
| The notional amount of futures purchased as a percentage of Net Assets is 2.3% | |||||
| (a) | Non-income producing |
| (b) | Security or a portion of the security is on loan at period end. |
| (c) | Level 3 security |
| (d) | Amount is stated in United States dollars unless otherwise noted. |
| (e) | Security or a portion of the security was pledged to cover margin requirements for futures contracts. At period end, the value of securities pledged amounted to $1,903,322. |
| (f) | Affiliated fund that is generally available only to investment companies and other accounts managed by Fidelity Investments. The rate quoted is the annualized seven-day yield of the fund at period end. A complete unaudited listing of the fund's holdings as of its most recent quarter end is available upon request. In addition, each Fidelity Central Fund's financial statements are available on the SEC's website or upon request. |
| (g) | Investment made with cash collateral received from securities on loan. |
| Affiliate | Value, beginning of period ($) | Purchases ($) | Sales Proceeds ($) | Dividend Income ($) | Realized Gain (loss) ($) | Change in Unrealized appreciation (depreciation) ($) | Value, end of period ($) | % ownership, end of period |
| Fidelity Cash Central Fund 5.39% | 49,721,554 | 239,303,438 | 279,658,378 | 250,150 | - | - | 9,366,614 | 0.0% |
| Fidelity Securities Lending Cash Central Fund 5.39% | 13,170,745 | 82,806,559 | 84,094,276 | 14,705 | - | 1 | 11,883,029 | 0.0% |
| Total | 62,892,299 | 322,109,997 | 363,752,654 | 264,855 | - | 1 | 21,249,643 | |
| Valuation Inputs at Reporting Date: | ||||
| Description | Total ($) | Level 1 ($) | Level 2 ($) | Level 3 ($) |
Investments in Securities: | ||||
| Equities: | ||||
Communication Services | 44,187,880 | 44,187,880 | - | - |
Consumer Discretionary | 181,060,011 | 181,060,011 | - | - |
Consumer Staples | 38,642,316 | 38,642,316 | - | - |
Energy | 63,903,699 | 63,903,699 | - | - |
Financials | 219,920,969 | 219,920,969 | - | - |
Health Care | 150,765,997 | 150,756,854 | - | 9,143 |
Industrials | 329,170,903 | 329,170,903 | - | - |
Information Technology | 216,969,114 | 216,969,114 | - | - |
Materials | 103,985,031 | 103,985,031 | - | - |
Real Estate | 89,863,106 | 89,863,106 | - | - |
Utilities | 55,338,805 | 55,338,805 | - | - |
| U.S. Government and Government Agency Obligations | 1,903,322 | - | 1,903,322 | - |
| Money Market Funds | 21,249,643 | 21,249,643 | - | - |
| Total Investments in Securities: | 1,516,960,796 | 1,515,048,331 | 1,903,322 | 9,143 |
Derivative Instruments: Assets | ||||
Futures Contracts | 696,032 | 696,032 | - | - |
| Total Assets | 696,032 | 696,032 | - | - |
| Total Derivative Instruments: | 696,032 | 696,032 | - | - |
Primary Risk Exposure / Derivative Type | Value | |
| Asset ($) | Liability ($) | |
| Equity Risk | ||
Futures Contracts (a) | 696,032 | 0 |
| Total Equity Risk | 696,032 | 0 |
| Total Value of Derivatives | 696,032 | 0 |
| Statement of Assets and Liabilities | ||||
February 29, 2024 (Unaudited) | ||||
| Assets | ||||
| Investment in securities, at value (including securities loaned of $11,491,801) - See accompanying schedule: | ||||
Unaffiliated issuers (cost $1,205,559,318) | $ | 1,495,711,153 | ||
Fidelity Central Funds (cost $21,249,642) | 21,249,643 | |||
| Total Investment in Securities (cost $1,226,808,960) | $ | 1,516,960,796 | ||
| Cash | 24,139 | |||
| Receivable for investments sold | 2,776,359 | |||
| Receivable for fund shares sold | 26,148,668 | |||
| Dividends receivable | 1,490,987 | |||
| Distributions receivable from Fidelity Central Funds | 74,548 | |||
| Receivable for daily variation margin on futures contracts | 272,800 | |||
| Other receivables | 4,525 | |||
Total assets | 1,547,752,822 | |||
| Liabilities | ||||
| Payable for fund shares redeemed | $ | 2,905,408 | ||
| Accrued management fee | 281,784 | |||
| Other payables and accrued expenses | 17,781 | |||
| Collateral on securities loaned | 11,884,116 | |||
| Total Liabilities | 15,089,089 | |||
| Net Assets | $ | 1,532,663,733 | ||
| Net Assets consist of: | ||||
| Paid in capital | $ | 1,248,239,230 | ||
| Total accumulated earnings (loss) | 284,424,503 | |||
| Net Assets | $ | 1,532,663,733 | ||
Net Asset Value, offering price and redemption price per share ($1,532,663,733 ÷ 52,516,761 shares) | $ | 29.18 | ||
| Statement of Operations | ||||
Six months ended February 29, 2024 (Unaudited) | ||||
| Investment Income | ||||
| Dividends | $ | 11,106,883 | ||
| Interest | 26,411 | |||
| Income from Fidelity Central Funds (including $14,705 from security lending) | 264,855 | |||
| Total Income | 11,398,149 | |||
| Expenses | ||||
| Management fee | $ | 2,400,710 | ||
| Independent trustees' fees and expenses | 3,922 | |||
| Interest | 12,560 | |||
| Miscellaneous | 37,496 | |||
| Total expenses before reductions | 2,454,688 | |||
| Expense reductions | (4,214) | |||
| Total expenses after reductions | 2,450,474 | |||
| Net Investment income (loss) | 8,947,675 | |||
| Realized and Unrealized Gain (Loss) | ||||
| Net realized gain (loss) on: | ||||
| Investment Securities: | ||||
| Unaffiliated issuers | 3,949,732 | |||
| Redemptions in-kind | 56,484,201 | |||
| Futures contracts | 1,447,823 | |||
| Total net realized gain (loss) | 61,881,756 | |||
| Change in net unrealized appreciation (depreciation) on: | ||||
| Investment Securities: | ||||
| Unaffiliated issuers | 114,921,711 | |||
| Fidelity Central Funds | 1 | |||
| Futures contracts | 344,239 | |||
| Total change in net unrealized appreciation (depreciation) | 115,265,951 | |||
| Net gain (loss) | 177,147,707 | |||
| Net increase (decrease) in net assets resulting from operations | $ | 186,095,382 | ||
See Organization and Merger information note regarding reorganization from mutual fund to exchange traded fund.
| Statement of Changes in Net Assets | ||||
Six months ended February 29, 2024 (Unaudited) | Year ended August 31, 2023 | |||
| Increase (Decrease) in Net Assets | ||||
| Operations | ||||
| Net investment income (loss) | $ | 8,947,675 | $ | 19,450,767 |
| Net realized gain (loss) | 61,881,756 | 8,724,420 | ||
| Change in net unrealized appreciation (depreciation) | 115,265,951 | 111,463,962 | ||
| Net increase (decrease) in net assets resulting from operations | 186,095,382 | 139,639,149 | ||
| Distributions to shareholders | (16,844,266) | (57,460,804) | ||
| Share transactions | ||||
| Proceeds from sales of shares | 194,331,547 | 531,911,323 | ||
| Reinvestment of distributions | 14,294,274 | 54,197,269 | ||
| Cost of shares redeemed | (481,728,880) | (686,633,472) | ||
Net increase (decrease) in net assets resulting from share transactions | (273,103,059) | (100,524,880) | ||
| Total increase (decrease) in net assets | (103,851,943) | (18,346,535) | ||
| Net Assets | ||||
| Beginning of period | 1,636,515,676 | 1,654,862,211 | ||
| End of period | $ | 1,532,663,733 | $ | 1,636,515,676 |
| Other Information | ||||
| Shares | ||||
| Sold | 7,293,531 | 21,113,682 | ||
| Issued in reinvestment of distributions | 584,792 | 2,258,425 | ||
| Redeemed | (18,819,866) | (27,059,804) | ||
| Net increase (decrease) | (10,941,543) | (3,687,697) | ||
| Fidelity® Enhanced Mid Cap ETF |
Six months ended (Unaudited) February 29, 2024 A | Years ended August 31, 2023 A | 2022 A | 2021 A | 2020 A | 2019 A | |||||||
Selected Per-Share Data | ||||||||||||
| Net asset value, beginning of period | $ | 25.79 | $ | 24.65 | $ | 32.17 | $ | 23.47 | $ | 22.59 | $ | 25.42 |
| Income from Investment Operations | ||||||||||||
Net investment income (loss) B,C | .16 | .28 | .28 | .22 | .29 | .33 | ||||||
| Net realized and unrealized gain (loss) | 3.53 | 1.69 | (3.81) | 9.40 | 1.50 | (1.10) | ||||||
| Total from investment operations | 3.69 | 1.97 | (3.53) | 9.62 | 1.79 | (.77) | ||||||
| Distributions from net investment income | (.30) | (.23) | (.23) | (.25) | (.34) | (.39) | ||||||
| Distributions from net realized gain | - | (.57) | (3.76) | (.67) | (.59) | (1.69) | ||||||
| Total distributions | (.30) | (.83) D | (3.99) | (.92) | (.91) D | (2.06) D | ||||||
| Net asset value, end of period | $ | 29.18 | $ | 25.79 | $ | 24.65 | $ | 32.17 | $ | 23.47 | $ | 22.59 |
Total Return E,F,G | 14.44% | 8.19% | (12.36)% | 41.82% | 7.91% | (2.19)% | ||||||
Ratios to Average Net Assets C,H,I | ||||||||||||
| Expenses before reductions | .34% J | .45% | .51% | .59% | .59% | .59% | ||||||
| Expenses net of fee waivers, if any | .34% J | .45% | .51% | .59% | .59% | .59% | ||||||
| Expenses net of all reductions | .34% J | .45% | .51% | .59% | .59% | .59% | ||||||
| Net investment income (loss) | 1.22% J | 1.12% | 1.00% | .77% | 1.33% | 1.46% | ||||||
| Supplemental Data | ||||||||||||
| Net assets, end of period (000 omitted) | $ | 1,532,664 | $ | 1,636,516 | $ | 1,654,862 | $ | 2,042,347 | $ | 1,182,253 | $ | 1,263,319 |
Portfolio turnover rate K | 88% J,L | 104% | 116% | 70% | 73% | 90% |
| Current ETFs | Former Mutual Funds (Predecessor Funds) |
| Fidelity Enhanced International ETF | Fidelity International Enhanced Index Fund |
| Fidelity Enhanced Large Cap Core ETF | Fidelity Large Cap Core Enhanced Index Fund |
| Fidelity Enhanced Large Cap Growth ETF | Fidelity Large Cap Growth Enhanced Index Fund |
| Fidelity Enhanced Large Cap Value ETF | Fidelity Large Cap Value Enhanced Index Fund |
| Fidelity Enhanced Mid Cap ETF | Fidelity Mid Cap Enhanced Index Fund |
| Fidelity Central Fund | Investment Manager | Investment Objective | Investment Practices | Expense RatioA |
| Fidelity Money Market Central Funds | Fidelity Management & Research Company LLC (FMR) | Each fund seeks to obtain a high level of current income consistent with the preservation of capital and liquidity. | Short-term Investments | Less than .005% |
| Tax cost | Gross unrealized appreciation | Gross unrealized depreciation | Net unrealized appreciation (depreciation) | |
| Fidelity Enhanced International ETF | $1,167,281,372 | $309,791,815 | $(28,130,145) | $281,661,670 |
| Fidelity Enhanced Large Cap Core ETF | 1,695,849,107 | 703,138,889 | (27,774,609) | 675,364,280 |
| Fidelity Enhanced Large Cap Growth ETF | 1,221,743,257 | 1,107,196,002 | (9,322,783) | 1,097,873,219 |
| Fidelity Enhanced Large Cap Value ETF | 1,768,710,573 | 238,626,654 | (71,518,690) | 167,107,964 |
| Fidelity Enhanced Mid Cap ETF | 1,230,189,209 | 326,476,068 | (39,008,449) | 287,467,619 |
| Short-term | Long-term | Total capital loss carryforward | |
Fidelity Large Cap Core Enhanced Index Fund | $(38,240,595) | $- | $(38,240,595) |
| Fidelity Mid Cap Enhanced Index Fund | (58,232,433) | (4,681,120) | (62,913,553) |
Fidelity International Enhanced Index Fund | (174,393,866) | (17,784,456) | (192,178,322) |
| Equity Risk | Equity risk relates to the fluctuations in the value of financial instruments as a result of changes in market prices (other than those arising from interest rate risk or foreign exchange risk), whether caused by factors specific to an individual investment, its issuer, or all factors affecting all instruments traded in a market or market segment. |
| Purchases ($) | Sales ($) | |
| Fidelity Enhanced International ETF | 703,614,037 | 875,012,936 |
| Fidelity Enhanced Large Cap Core ETF | 854,651,819 | 664,615,727 |
| Fidelity Enhanced Large Cap Growth ETF | 812,066,675 | 825,210,513 |
| Fidelity Enhanced Large Cap Value ETF | 1,704,703,577 | 1,345,472,366 |
| Fidelity Enhanced Mid Cap ETF | 561,657,051 | 637,372,869 |
| In-Kind Subscriptions ($) | In-Kind Redemptions ($) | |
| Fidelity Enhanced International ETF | 9,848,909 | 93,099,370 |
| Fidelity Enhanced Large Cap Core ETF | 230,631,699 | 414,137,115 |
| Fidelity Enhanced Large Cap Growth ETF | 89,035,610 | 407,363,959 |
| Fidelity Enhanced Large Cap Value ETF | 29,598,917 | 194,472,421 |
| Fidelity Enhanced Mid Cap ETF | 2,708,887 | 173,914,632 |
| Shares | Total net realized gain or loss ($) | Total Proceeds ($) | |
| Fidelity Large Cap Growth Enhanced Index Fund | 2,858,909 | 30,168,211 | 67,930,785 |
| Fidelity Large Cap Value Enhanced Index Fund | 154,627,201 | 408,600,213 | 3,633,326,017 |
| Fidelity Mid Cap Enhanced Index Fund | 1,624,636 | 10,553,430 | 40,748,466 |
| Shares | Total net realized gain or loss ($) | Total Proceeds ($) | |
| Fidelity Large Cap Core Enhanced Index Fund | 1,643,260 | 23,998,066 | 41,117,535 |
| Fidelity Large Cap Growth Enhanced Index Fund | 3,558,843 | 14,287,867 | 83,970,422 |
| Fidelity Large Cap Value Enhanced Index Fund | 14,611,088 | 117,706,408 | 375,867,257 |
| Fidelity Mid Cap Enhanced Index Fund | 7,819,926 | 69,766,859 | 200,533,885 |
| Fee Rate | |
| Fidelity Enhanced International ETF | .28% |
| Fidelity Enhanced Large Cap Core ETF | .18% |
| Fidelity Enhanced Large Cap Growth ETF | .18% |
| Fidelity Enhanced Large Cap Value ETF | .18% |
| Fidelity Enhanced Mid Cap ETF | .23% |
| Fee Rate | |
| Fidelity International Enhanced Index Fund | .55% |
| Fidelity Large Cap Core Enhanced Index Fund | .39% |
| Fidelity Large Cap Growth Enhanced Index Fund | .39% |
| Fidelity Large Cap Value Enhanced Index Fund | .39% |
| Fidelity Mid Cap Enhanced Index Fund | .45% |
| Amount | |
| Fidelity Enhanced International ETF | $1,231 |
| Fidelity Enhanced Large Cap Core ETF | 572 |
| Fidelity Enhanced Large Cap Growth ETF | 851 |
| Fidelity Enhanced Large Cap Value ETF | 2,906 |
| Fidelity Enhanced Mid Cap ETF | 961 |
| Borrower or Lender | Average Loan Balance | Weighted Average Interest Rate | Interest Expense | |
| Fidelity Enhanced International ETF | Borrower | $ 9,632,077 | 5.57% | $19,359 |
| Fidelity Enhanced Large Cap Core ETF | Borrower | $ 4,991,000 | 5.57% | $3,088 |
| Fidelity Enhanced Large Cap Growth ETF | Borrower | $12,409,800 | 5.57% | $19,184 |
| Fidelity Enhanced Large Cap Value ETF | Borrower | $ 13,109,000 | 5.57% | $4,057 |
| Fidelity Enhanced Mid Cap ETF | Borrower | $9,026,889 | 5.57% | $12,560 |
| Purchases ($) | Sales ($) | Realized Gain (Loss) ($) | |
| Fidelity Enhanced International ETF | 1,434,524 | 16,111,438 | 1,570,096 |
| Fidelity Enhanced Large Cap Core ETF | 12,255,596 | 19,293,493 | (1,661,964) |
| Fidelity Enhanced Large Cap Growth ETF | 25,713,939 | 13,476,461 | (1,254,718) |
| Fidelity Enhanced Large Cap Value ETF | 37,843,508 | 14,284,152 | (3,597,725) |
| Fidelity Enhanced Mid Cap ETF | 10,359,569 | 5,553,072 | 456,016 |
| Amount ($) | |
| Fidelity Enhanced International ETF | 6,846 |
| Total Security Lending Fees Paid to NFS | Security Lending Income From Securities Loaned to NFS | Value of Securities Loaned to NFS at Period End | |
| Fidelity Enhanced International ETF | $6,976 | $- | $- |
| Fidelity Enhanced Large Cap Core ETF | $81 | $- | $- |
| Fidelity Enhanced Large Cap Growth ETF | $63 | $- | $- |
| Fidelity Enhanced Large Cap Value ETF | $784 | $28 | $- |
| Fidelity Enhanced Mid Cap ETF | $1,473 | $15 | $- |
| Custodian credits | |
| Fidelity Enhanced International ETF | $107 |
Fidelity Enhanced Large Cap Core ETF | 101 |
Fidelity Enhanced Large Cap Growth ETF | 255 |
Fidelity Enhanced Large Cap Value ETF | 6,129 |
| Fidelity Enhanced Mid Cap ETF | 4,214 |
| Predecessor Funds | New ETFs |
| Fidelity International Enhanced Index Fund | Fidelity Enhanced International ETF |
| Fidelity Large Cap Core Enhanced Index Fund | Fidelity Enhanced Large Cap Core ETF |
| Fidelity Large Cap Growth Enhanced Index Fund | Fidelity Enhanced Large Cap Growth ETF |
| Fidelity Large Cap Value Enhanced Index Fund | Fidelity Enhanced Large Cap Value ETF |
| Fidelity Mid Cap Enhanced Index Fund | Fidelity Enhanced Mid Cap ETF |
| Predecessor Fund/Accounting Survivor | Investments ($) | Unrealized appreciation (depreciation) ($) | Net Assets ($) | Shares Exchanged | Shares Exchanged Ratio |
| Fidelity International Enhanced Index Fund | 1,368,602,643 | 195,092,188 | 1,368,248,892 | 54,730,068 | .4057160000 |
| Fidelity Large Cap Core Enhanced Index Fund | 1,840,988,775 | 537,069,093 | 1,948,361,461 | 77,934,309 | .8388640000 |
| Fidelity Large Cap Growth Enhanced Index Fund | 2,012,959,825 | 875,152,421 | 2,145,716,375 | 85,828,689 | 1.2032280000 |
| Fidelity Large Cap Value Enhanced Index Fund | 1,827,644,613 | 392,942 | 2,004,099,301 | 80,163,716 | .5729240000 |
| Fidelity Mid Cap Enhanced Index Fund | 1,369,301,709 | 129,571,229 | 1,460,889,645 | 58,435,751 | .6458920000 |
| Legal Acquiring ETF | Net Assets ($) | Total net assets after the acquisition ($) |
| Fidelity Enhanced International ETF | 25 | 1,368,248,917 |
| Fidelity Enhanced Large Cap Core ETF | 25 | 1,948,361,486 |
| Fidelity Enhanced Large Cap Growth ETF | 25 | 2,145,716,400 |
| Fidelity Enhanced Large Cap Value ETF | 25 | 2,004,099,326 |
| Fidelity Enhanced Mid Cap ETF | 25 | 1,460,889,670 |
| ETF name | Net investment income (loss) | Total net realized gain (loss) | Total change in net unrealized appreciation (depreciation) | Net increase (decrease) in net assets resulting from operations |
| Fidelity Enhanced International ETF | $10,973,923 | 51,869,772 | 70,248,828 | $133,092,523 |
| Fidelity Enhanced Large Cap Core ETF | $13,515,281 | 121,104,992 | 158,445,659 | $293,065,932 |
| Fidelity Enhanced Large Cap Growth ETF | $7,517,620 | 151,513,496 | 201,993,528 | $361,024,644 |
| Fidelity Enhanced Large Cap Value ETF | $29,875,874 | 374,275,310 | (544,890,764) | $(140,739,580) |
| Fidelity Enhanced Mid Cap ETF | $9,669,175 | 61,881,756 | 115,265,951 | $186,816,882 |
| The Example is based on an investment of $1,000 invested at the beginning of the period and held for the entire period (September 1, 2023 to February 29, 2024). |
Annualized Expense Ratio- A | Beginning Account Value September 1, 2023 | Ending Account Value February 29, 2024 | Expenses Paid During Period- C September 1, 2023 to February 29, 2024 | |||||||
| Fidelity® Enhanced International ETF | .41% | |||||||||
| Actual | $ 1,000 | $ 1,107.70 | $ 2.15 | |||||||
Hypothetical-B | $ 1,000 | $ 1,022.82 | $ 2.06 | |||||||
| Fidelity® Enhanced Large Cap Core ETF | .27% | |||||||||
| Actual | $ 1,000 | $ 1,158.00 | $ 1.45 | |||||||
Hypothetical-B | $ 1,000 | $ 1,023.52 | $ 1.36 | |||||||
| Fidelity® Enhanced Large Cap Growth ETF | .28% | |||||||||
| Actual | $ 1,000 | $ 1,185.30 | $ 1.52 | |||||||
Hypothetical-B | $ 1,000 | $ 1,023.47 | $ 1.41 | |||||||
| Fidelity® Enhanced Large Cap Value ETF | .32% | |||||||||
| Actual | $ 1,000 | $ 1,100.40 | $ 1.67 | |||||||
Hypothetical-B | $ 1,000 | $ 1,023.27 | $ 1.61 | |||||||
| Fidelity® Enhanced Mid Cap ETF | .34% | |||||||||
| Actual | $ 1,000 | $ 1,144.40 | $ 1.81 | |||||||
Hypothetical-B | $ 1,000 | $ 1,023.17 | $ 1.71 | |||||||
- Highly liquid investments - cash or convertible to cash within three business days or less
- Moderately liquid investments - convertible to cash in three to seven calendar days
- Less liquid investments - can be sold or disposed of, but not settled, within seven calendar days
- Illiquid investments - cannot be sold or disposed of within seven calendar days
 |


Contents
| Top Bond Issuers (% of Fund's net assets) | ||
(with maturities greater than one year) | ||
| Hilton Domestic Operating Company, Inc. | 2.6 | |
| Block, Inc. | 2.2 | |
| NOVA Chemicals Corp | 2.0 | |
| Clear Channel Outdoor Holdings, Inc. | 1.8 | |
| FMG Resources Pty Ltd. | 1.8 | |
| Royal Caribbean Cruises Ltd. | 1.8 | |
| Stericycle, Inc. | 1.8 | |
| Uber Technologies, Inc. | 1.7 | |
| Tenet Healthcare Corp. | 1.6 | |
| MPT Operating Partnership LP/MPT Finance Corp. | 1.5 | |
| 18.8 | ||
| Market Sectors (% of Fund's net assets) | ||
| Technology | 12.1 | |
| Energy | 11.2 | |
| Services | 8.7 | |
| Healthcare | 6.9 | |
| Homebuilders/Real Estate | 6.4 | |
Quality Diversification (% of Fund's net assets) |
 |
| We have used ratings from Moody's Investors Service, Inc. Where Moody's® ratings are not available, we have used S&P® ratings. All ratings are as of the date indicated and do not reflect subsequent changes. |
Asset Allocation (% of Fund's net assets) |
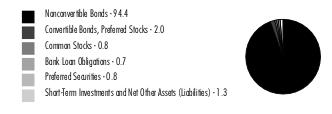 |
Geographic Diversification (% of Fund's net assets) |
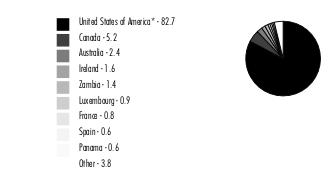 |
* Includes Short-Term investments and Net Other Assets (Liabilities). Percentages are adjusted for the effect of derivatives, if applicable. |
| Corporate Bonds - 96.4% | |||
Principal Amount (a) | Value ($) | ||
| Convertible Bonds - 2.0% | |||
| Broadcasting - 0.9% | |||
| DISH Network Corp.: | |||
| 0% 12/15/25 | 14,000 | 10,143 | |
| 2.375% 3/15/24 | 68,000 | 66,898 | |
| 3.375% 8/15/26 | 106,000 | 62,673 | |
| 139,714 | |||
| Energy - 0.3% | |||
| NextEra Energy Partners LP 2.5% 6/15/26 (b) | 46,000 | 41,400 | |
| Sunnova Energy International, Inc. 0.25% 12/1/26 | 10,000 | 5,002 | |
| 46,402 | |||
| Homebuilders/Real Estate - 0.2% | |||
| Redfin Corp. 0.5% 4/1/27 | 61,000 | 34,829 | |
| Super Retail - 0.1% | |||
| Wayfair LLC 0.625% 10/1/25 | 12,000 | 11,070 | |
| Technology - 0.5% | |||
| MicroStrategy, Inc. 0% 2/15/27 | 18,000 | 18,605 | |
| Seagate HDD Cayman 3.5% 6/1/28 (b) | 9,000 | 11,276 | |
| Western Digital Corp. 3% 11/15/28 (b) | 10,000 | 13,200 | |
| Wolfspeed, Inc. 1.875% 12/1/29 | 63,000 | 32,823 | |
| 75,904 | |||
| Utilities - 0.0% | |||
| PG&E Corp. 4.25% 12/1/27 (b) | 9,000 | 8,991 | |
TOTAL CONVERTIBLE BONDS | 316,910 | ||
| Nonconvertible Bonds - 94.4% | |||
| Aerospace - 1.4% | |||
| ATI, Inc. 4.875% 10/1/29 | 50,000 | 45,911 | |
| Bombardier, Inc. 6% 2/15/28 (b) | 120,000 | 116,493 | |
| Spirit Aerosystems, Inc. 9.75% 11/15/30 (b) | 15,000 | 16,070 | |
| TransDigm, Inc.: | |||
| 4.875% 5/1/29 | 25,000 | 22,963 | |
| 6.375% 3/1/29 (b) | 10,000 | 10,045 | |
| 6.625% 3/1/32 (b) | 10,000 | 10,062 | |
| 221,544 | |||
| Air Transportation - 0.9% | |||
| Hawaiian Brand Intellectual Property Ltd. / HawaiianMiles Loyalty Ltd. 5.75% 1/20/26 (b) | 15,000 | 14,156 | |
| Rand Parent LLC 8.5% 2/15/30 (b) | 121,000 | 117,511 | |
| Spirit Loyalty Cayman Ltd. / Spirit IP Cayman Ltd. 8% 9/20/25 (b) | 10,000 | 7,233 | |
| 138,900 | |||
| Automotive & Auto Parts - 1.2% | |||
| Champions Financing, Inc. 8.75% 2/15/29 (b) | 41,000 | 41,880 | |
| Ford Motor Credit Co. LLC 4.687% 6/9/25 | 25,000 | 24,647 | |
| Macquarie AirFinance Holdings: | |||
| 8.125% 3/30/29 (b) | 12,000 | 12,477 | |
| 8.375% 5/1/28 (b) | 10,000 | 10,475 | |
| McLaren Finance PLC 7.5% 8/1/26 (b) | 5,000 | 4,350 | |
| PECF USS Intermediate Holding III Corp. 8% 11/15/29 (b) | 44,000 | 19,203 | |
| Rivian Holdco & Rivian LLC & Rivian Automotive LLC 6 month U.S. LIBOR + 5.620% 11.4932% 10/15/26 (b)(c)(d) | 80,000 | 76,127 | |
| 189,159 | |||
| Banks & Thrifts - 0.5% | |||
| Ally Financial, Inc. 5.75% 11/20/25 | 39,000 | 38,806 | |
| UniCredit SpA: | |||
| 5.459% 6/30/35 (b)(c) | 3,000 | 2,772 | |
| 5.861% 6/19/32 (b)(c) | 10,000 | 9,692 | |
| Western Alliance Bancorp. 3% 6/15/31 (c) | 41,000 | 35,957 | |
| 87,227 | |||
| Broadcasting - 2.4% | |||
| Clear Channel Outdoor Holdings, Inc.: | |||
| 5.125% 8/15/27 (b) | 153,000 | 143,061 | |
| 7.5% 6/1/29 (b) | 6,000 | 4,965 | |
| 9% 9/15/28 (b) | 140,000 | 146,020 | |
| DISH Network Corp. 11.75% 11/15/27 (b) | 20,000 | 20,852 | |
| Univision Communications, Inc.: | |||
| 7.375% 6/30/30 (b) | 61,000 | 58,918 | |
| 8% 8/15/28 (b) | 15,000 | 15,080 | |
| 388,896 | |||
| Building Materials - 0.9% | |||
| Advanced Drain Systems, Inc. 6.375% 6/15/30 (b) | 25,000 | 24,999 | |
| Beacon Roofing Supply, Inc. 6.5% 8/1/30 (b) | 24,000 | 24,130 | |
| Builders FirstSource, Inc. 6.375% 3/1/34 (b) | 10,000 | 9,977 | |
| Cornerstone Building Brands, Inc. 6.125% 1/15/29 (b) | 60,000 | 54,075 | |
| Eco Material Technologies, Inc. 7.875% 1/31/27 (b) | 25,000 | 24,944 | |
| Oscar Acquisition Co. LLC / Oscar Finance, Inc. 9.5% 4/15/30 (b) | 5,000 | 4,863 | |
| 142,988 | |||
| Cable/Satellite TV - 2.7% | |||
| CCO Holdings LLC/CCO Holdings Capital Corp.: | |||
| 4.25% 1/15/34 (b) | 75,000 | 56,074 | |
| 4.75% 3/1/30 (b) | 25,000 | 21,267 | |
| 4.75% 2/1/32 (b) | 145,000 | 116,982 | |
| 5.5% 5/1/26 (b) | 40,000 | 39,301 | |
| CSC Holdings LLC: | |||
| 3.375% 2/15/31 (b) | 125,000 | 88,241 | |
| 4.625% 12/1/30 (b) | 110,000 | 61,175 | |
| DIRECTV Financing LLC / DIRECTV Financing Co-Obligor, Inc. 5.875% 8/15/27 (b) | 50,000 | 47,193 | |
| DISH DBS Corp. 5.75% 12/1/28 (b) | 8,000 | 5,540 | |
| Ziggo Bond Co. BV 6% 1/15/27 (b) | 5,000 | 4,888 | |
| 440,661 | |||
| Capital Goods - 0.8% | |||
| Chart Industries, Inc. 9.5% 1/1/31 (b) | 112,000 | 120,329 | |
| Vertical Holdco GmbH 7.625% 7/15/28 (b) | 14,000 | 13,698 | |
| 134,027 | |||
| Chemicals - 5.7% | |||
| Axalta Coating Systems LLC 3.375% 2/15/29 (b) | 20,000 | 17,774 | |
| Consolidated Energy Finance SA 12% 2/15/31 (b) | 20,000 | 20,442 | |
| Kobe U.S. Midco 2, Inc. 9.25% 11/1/26 pay-in-kind (b)(c) | 15,750 | 13,220 | |
| Methanex Corp. 5.65% 12/1/44 | 132,000 | 111,875 | |
| NOVA Chemicals Corp.: | |||
| 4.25% 5/15/29 (b) | 101,000 | 83,541 | |
| 5.25% 6/1/27 (b) | 120,000 | 111,146 | |
| 8.5% 11/15/28 (b) | 104,000 | 109,809 | |
| 9% 2/15/30 (b) | 10,000 | 10,032 | |
| Olympus Water U.S. Holding Corp.: | |||
| 6.25% 10/1/29 (b) | 135,000 | 119,746 | |
| 9.75% 11/15/28 (b) | 35,000 | 37,189 | |
| SCIH Salt Holdings, Inc. 6.625% 5/1/29 (b) | 15,000 | 13,639 | |
| The Chemours Co. LLC 4.625% 11/15/29 (b) | 248,000 | 203,925 | |
| Tronox, Inc. 4.625% 3/15/29 (b) | 73,000 | 64,615 | |
| 916,953 | |||
| Consumer Products - 0.5% | |||
| Kohl's Corp. 4.25% 7/17/25 | 40,000 | 38,865 | |
| Macy's Retail Holdings LLC 5.875% 4/1/29 (b) | 50,000 | 48,154 | |
| 87,019 | |||
| Containers - 1.2% | |||
| Ardagh Packaging Finance PLC/Ardagh MP Holdings U.S.A., Inc.: | |||
| 5.25% 4/30/25 (b) | 20,000 | 19,778 | |
| 5.25% 8/15/27 (b) | 11,000 | 7,976 | |
| Ball Corp. 6% 6/15/29 | 8,000 | 8,039 | |
| Crown Americas LLC/Crown Americas Capital Corp. IV 4.75% 2/1/26 | 75,000 | 73,376 | |
| Graphic Packaging International, Inc. 4.75% 7/15/27 (b) | 38,000 | 36,755 | |
| LABL, Inc.: | |||
| 6.75% 7/15/26 (b) | 25,000 | 24,246 | |
| 10.5% 7/15/27 (b) | 8,000 | 7,767 | |
| OI European Group BV 4.75% 2/15/30 (b) | 20,000 | 18,412 | |
| 196,349 | |||
| Diversified Financial Services - 3.9% | |||
| Aercap Global Aviation Trust 6.5% 6/15/45 (b)(c) | 50,000 | 49,585 | |
| Coinbase Global, Inc. 3.625% 10/1/31 (b) | 28,000 | 21,922 | |
| FLY Leasing Ltd. 7% 10/15/24 (b) | 3,000 | 2,940 | |
| GGAM Finance Ltd.: | |||
| 7.75% 5/15/26 (b) | 15,000 | 15,244 | |
| 8% 2/15/27 (b) | 89,000 | 91,222 | |
| 8% 6/15/28 (b) | 60,000 | 62,075 | |
| Gn Bondco LLC 9.5% 10/15/31 (b) | 6,000 | 5,940 | |
| Hightower Holding LLC 6.75% 4/15/29 (b) | 25,000 | 23,462 | |
| HTA Group Ltd. 7% 12/18/25 (b) | 41,000 | 40,626 | |
| OneMain Finance Corp.: | |||
| 3.5% 1/15/27 | 50,000 | 46,024 | |
| 3.875% 9/15/28 | 155,000 | 135,423 | |
| 9% 1/15/29 | 45,000 | 47,261 | |
| SLM Corp. 4.2% 10/29/25 | 36,000 | 34,909 | |
| StoneX Group, Inc. 7.875% 3/1/31 (b)(e) | 50,000 | 50,638 | |
| 627,271 | |||
| Diversified Media - 0.1% | |||
| Outfront Media Capital LLC / Corp. 7.375% 2/15/31 (b) | 15,000 | 15,655 | |
| Energy - 10.3% | |||
| Archrock Partners LP / Archrock Partners Finance Corp. 6.25% 4/1/28 (b) | 93,000 | 90,681 | |
| Atlantica Sustainable Infrastructure PLC 4.125% 6/15/28 (b) | 105,000 | 95,949 | |
| California Resources Corp. 7.125% 2/1/26 (b) | 162,000 | 162,854 | |
| CGG SA 8.75% 4/1/27 (b) | 67,000 | 59,763 | |
| CNX Midstream Partners LP 4.75% 4/15/30 (b) | 60,000 | 52,491 | |
| CNX Resources Corp.: | |||
| 6% 1/15/29 (b) | 50,000 | 48,057 | |
| 7.25% 3/1/32 (b) | 20,000 | 19,931 | |
| 7.375% 1/15/31 (b) | 5,000 | 5,041 | |
| CVR Energy, Inc. 5.75% 2/15/28 (b) | 20,000 | 18,564 | |
| Delek Logistics Partners LP/Delek Logistics Finance Corp. 8.625% 3/15/29 (b)(e) | 15,000 | 15,016 | |
| Energean PLC 6.5% 4/30/27 (b) | 40,000 | 36,488 | |
| Global Partners LP/GLP Finance Corp. 6.875% 1/15/29 | 77,000 | 75,892 | |
| Harbour Energy PLC 5.5% 10/15/26 (b) | 10,000 | 9,747 | |
| MEG Energy Corp. 5.875% 2/1/29 (b) | 110,000 | 107,246 | |
| Murphy Oil Corp. 6.375% 7/15/28 | 44,000 | 44,057 | |
| New Fortress Energy, Inc. 6.5% 9/30/26 (b) | 158,000 | 152,555 | |
| NGL Energy Operating LLC/NGL Energy Finance Corp. 8.375% 2/15/32 (b) | 5,000 | 5,079 | |
| Northern Oil & Gas, Inc. 8.125% 3/1/28 (b) | 48,000 | 48,606 | |
| Oceaneering International, Inc. 6% 2/1/28 | 90,000 | 88,500 | |
| Permian Resources Operating LLC 5.875% 7/1/29 (b) | 73,000 | 71,175 | |
| Prairie Acquiror LP 9% 8/1/29 (b)(e) | 10,000 | 10,076 | |
| Southwestern Energy Co. 5.375% 3/15/30 | 20,000 | 19,116 | |
| Sunnova Energy Corp. 5.875% 9/1/26 (b) | 155,000 | 125,992 | |
| Sunoco LP/Sunoco Finance Corp. 4.5% 5/15/29 | 233,000 | 215,233 | |
| Tallgrass Energy Partners LP / Tallgrass Energy Finance Corp. 6% 3/1/27 (b) | 57,000 | 56,259 | |
| Talos Production, Inc.: | |||
| 9% 2/1/29 (b) | 15,000 | 15,331 | |
| 9.375% 2/1/31 (b) | 15,000 | 15,494 | |
| 1,665,193 | |||
| Environmental - 3.2% | |||
| Covanta Holding Corp. 4.875% 12/1/29 (b) | 256,000 | 223,717 | |
| Darling Ingredients, Inc. 6% 6/15/30 (b) | 5,000 | 4,927 | |
| Stericycle, Inc.: | |||
| 3.875% 1/15/29 (b) | 235,000 | 211,481 | |
| 5.375% 7/15/24 (b) | 70,000 | 69,965 | |
| 510,090 | |||
| Food & Drug Retail - 1.4% | |||
| Albertsons Companies LLC/Safeway, Inc./New Albertson's, Inc./Albertson's LLC: | |||
| 3.25% 3/15/26 (b) | 142,000 | 134,928 | |
| 4.875% 2/15/30 (b) | 65,000 | 61,016 | |
| Emergent BioSolutions, Inc. 3.875% 8/15/28 (b) | 43,000 | 17,415 | |
| Murphy Oil U.S.A., Inc. 3.75% 2/15/31 (b) | 25,000 | 21,332 | |
| 234,691 | |||
| Food/Beverage/Tobacco - 1.7% | |||
| C&S Group Enterprises LLC 5% 12/15/28 (b) | 14,000 | 11,091 | |
| KeHE Distributor / Nextwave 9% 2/15/29 (b) | 30,000 | 30,088 | |
| Performance Food Group, Inc. 4.25% 8/1/29 (b) | 20,000 | 18,151 | |
| Post Holdings, Inc.: | |||
| 4.5% 9/15/31 (b) | 49,000 | 43,625 | |
| 4.625% 4/15/30 (b) | 20,000 | 18,198 | |
| 6.25% 2/15/32 (b) | 30,000 | 30,155 | |
| Triton Water Holdings, Inc. 6.25% 4/1/29 (b) | 68,000 | 59,363 | |
| U.S. Foods, Inc. 4.625% 6/1/30 (b) | 79,000 | 72,389 | |
| 283,060 | |||
| Healthcare - 6.7% | |||
| AdaptHealth LLC 5.125% 3/1/30 (b) | 106,000 | 88,643 | |
| Akumin, Inc. 8% 8/1/28 (b) | 30,000 | 24,750 | |
| Cano Health, Inc. 6.25% (b)(f) | 29,000 | 290 | |
| Charles River Laboratories International, Inc. 3.75% 3/15/29 (b) | 10,000 | 9,021 | |
| Community Health Systems, Inc.: | |||
| 4.75% 2/15/31 (b) | 104,000 | 79,140 | |
| 5.25% 5/15/30 (b) | 130,000 | 103,718 | |
| 6.875% 4/15/29 (b) | 33,000 | 21,057 | |
| 8% 3/15/26 (b) | 17,000 | 16,831 | |
| 10.875% 1/15/32 (b) | 8,000 | 8,146 | |
| DaVita, Inc. 3.75% 2/15/31 (b) | 67,000 | 54,979 | |
| Encompass Health Corp. 4.625% 4/1/31 | 49,000 | 44,353 | |
| IQVIA, Inc.: | |||
| 5% 10/15/26 (b) | 10,000 | 9,774 | |
| 5% 5/15/27 (b) | 30,000 | 29,206 | |
| Jazz Securities DAC 4.375% 1/15/29 (b) | 20,000 | 18,426 | |
| Modivcare, Inc. 5.875% 11/15/25 (b) | 55,000 | 53,702 | |
| Omega Healthcare Investors, Inc. 3.25% 4/15/33 | 17,000 | 13,532 | |
| Organon & Co. / Organon Foreign Debt Co-Issuer BV 5.125% 4/30/31 (b) | 93,000 | 79,712 | |
| Owens & Minor, Inc. 6.625% 4/1/30 (b) | 20,000 | 19,326 | |
| Pediatrix Medical Group, Inc. 5.375% 2/15/30 (b) | 82,000 | 73,700 | |
| Radiology Partners, Inc. 8.5% 1/31/29 pay-in-kind (b)(c) | 16,000 | 15,380 | |
| RegionalCare Hospital Partners Holdings, Inc.: | |||
| 5.375% 1/15/29 (b) | 62,000 | 49,431 | |
| 9.875% 8/15/30 (b) | 10,000 | 10,375 | |
| Tenet Healthcare Corp. 6.125% 10/1/28 | 260,000 | 257,075 | |
| 1,080,567 | |||
| Homebuilders/Real Estate - 6.2% | |||
| Anywhere Real Estate Group LLC 7% 4/15/30 (b) | 29,000 | 26,280 | |
| ATP Tower Holdings LLC/Andean Tower Partners 4.05% 4/27/26 (b) | 16,000 | 14,840 | |
| HAT Holdings I LLC/HAT Holdings II LLC: | |||
| 3.375% 6/15/26 (b) | 113,000 | 105,664 | |
| 6% 4/15/25 (b) | 39,000 | 38,604 | |
| 8% 6/15/27 (b) | 5,000 | 5,192 | |
| Howard Hughes Corp. 4.375% 2/1/31 (b) | 217,000 | 184,861 | |
| MPT Operating Partnership LP/MPT Finance Corp.: | |||
| 4.625% 8/1/29 | 40,000 | 29,795 | |
| 5% 10/15/27 | 255,000 | 208,606 | |
| Railworks Holdings LP 8.25% 11/15/28 (b) | 30,000 | 29,798 | |
| Realogy Group LLC/Realogy Co.-Issuer Corp. 5.25% 4/15/30 (b) | 1,000 | 700 | |
| Rithm Capital Corp. 6.25% 10/15/25 (b) | 50,000 | 49,354 | |
| Starwood Property Trust, Inc. 3.75% 12/31/24 (b) | 70,000 | 68,599 | |
| Taylor Morrison Communities, Inc./Monarch Communities, Inc. 5.125% 8/1/30 (b) | 156,000 | 147,241 | |
| TRI Pointe Homes, Inc. 5.25% 6/1/27 | 40,000 | 39,000 | |
| Uniti Group LP/Uniti Group Finance, Inc./CSL Capital LLC 10.5% 2/15/28 (b) | 45,000 | 46,579 | |
| 995,113 | |||
| Hotels - 2.6% | |||
| Hilton Domestic Operating Co., Inc. 3.625% 2/15/32 (b) | 492,000 | 420,286 | |
| Insurance - 0.1% | |||
| AssuredPartners, Inc. 7.5% 2/15/32 (b) | 15,000 | 14,741 | |
| Leisure - 2.2% | |||
| Amer Sports Co. 6.75% 2/16/31 (b) | 15,000 | 14,928 | |
| ClubCorp Holdings, Inc. 8.5% 9/15/25 (b) | 30,000 | 27,000 | |
| MajorDrive Holdings IV LLC 6.375% 6/1/29 (b) | 35,000 | 30,188 | |
| Royal Caribbean Cruises Ltd.: | |||
| 5.375% 7/15/27 (b) | 99,000 | 97,099 | |
| 5.5% 4/1/28 (b) | 155,000 | 152,166 | |
| 6.25% 3/15/32 (b)(e) | 35,000 | 35,100 | |
| 356,481 | |||
| Metals/Mining - 5.1% | |||
| Eldorado Gold Corp. 6.25% 9/1/29 (b) | 35,000 | 32,795 | |
| ERO Copper Corp. 6.5% 2/15/30 (b) | 75,000 | 70,350 | |
| First Quantum Minerals Ltd.: | |||
| 6.875% 10/15/27 (b) | 15,000 | 14,290 | |
| 7.5% 4/1/25 (b) | 2,000 | 1,979 | |
| 9.375% 3/1/29 (b) | 200,000 | 207,263 | |
| FMG Resources Pty Ltd. 6.125% 4/15/32 (b) | 290,000 | 286,566 | |
| HudBay Minerals, Inc. 6.125% 4/1/29 (b) | 29,000 | 28,456 | |
| IAMGOLD Corp. 5.75% 10/15/28 (b) | 96,000 | 85,387 | |
| Mineral Resources Ltd. 8.5% 5/1/30 (b) | 95,000 | 97,566 | |
| 824,652 | |||
| Paper - 2.0% | |||
| Berry Global, Inc. 5.625% 7/15/27 (b) | 190,000 | 187,322 | |
| Clydesdale Acquisition Holdings, Inc. 6.625% 4/15/29 (b) | 81,000 | 80,532 | |
| Domtar Corp. 6.75% 10/1/28 (b) | 30,000 | 27,714 | |
| Mercer International, Inc. 5.125% 2/1/29 | 40,000 | 34,461 | |
| 330,029 | |||
| Publishing/Printing - 0.2% | |||
| Mcgraw-Hill Education, Inc. 8% 8/1/29 (b) | 29,000 | 26,463 | |
| Restaurants - 1.0% | |||
| Yum! Brands, Inc. 4.625% 1/31/32 | 185,000 | 169,832 | |
| Services - 8.5% | |||
| AECOM 5.125% 3/15/27 | 190,000 | 186,116 | |
| APX Group, Inc. 5.75% 7/15/29 (b) | 40,000 | 38,037 | |
| Aramark Services, Inc. 5% 2/1/28 (b) | 40,000 | 38,333 | |
| Artera Services LLC 8.5% 2/15/31 (b) | 90,000 | 91,940 | |
| Avis Budget Car Rental LLC/Avis Budget Finance, Inc.: | |||
| 5.375% 3/1/29 (b) | 37,000 | 33,686 | |
| 5.75% 7/15/27 (b) | 86,000 | 81,945 | |
| Brand Industrial Services, Inc. 10.375% 8/1/30 (b) | 107,000 | 113,787 | |
| GEMS MENASA Cayman Ltd./GEMS Education Delaware LLC 7.125% 7/31/26 (b) | 50,000 | 49,542 | |
| Hertz Corp. 4.625% 12/1/26 (b) | 106,000 | 93,832 | |
| Legends Hospitality Holding Co. LLC/Legends Hospitality Co-Issuer, Inc. 5% 2/1/26 (b) | 19,000 | 18,887 | |
| Life Time, Inc.: | |||
| 5.75% 1/15/26 (b) | 26,000 | 25,782 | |
| 8% 4/15/26 (b) | 100,000 | 100,915 | |
| Neptune BidCo U.S., Inc. 9.29% 4/15/29 (b) | 55,000 | 51,563 | |
| Sotheby's 7.375% 10/15/27 (b) | 30,000 | 28,816 | |
| Staples, Inc. 10.75% 4/15/27 (b) | 20,000 | 18,050 | |
| StoneMor, Inc. 8.5% 5/15/29 (b) | 73,000 | 52,980 | |
| Uber Technologies, Inc.: | |||
| 4.5% 8/15/29 (b) | 268,000 | 250,936 | |
| 8% 11/1/26 (b) | 20,000 | 20,352 | |
| WASH Multifamily Acquisition, Inc. 5.75% 4/15/26 (b) | 80,000 | 77,600 | |
| 1,373,099 | |||
| Steel - 0.1% | |||
| ATI, Inc. 7.25% 8/15/30 | 16,000 | 16,446 | |
| Super Retail - 2.5% | |||
| At Home Group, Inc. 4.875% 7/15/28 (b) | 30,000 | 12,600 | |
| Bath & Body Works, Inc. 6.75% 7/1/36 | 72,000 | 70,763 | |
| Carvana Co.: | |||
| 4.875% 9/1/29 (b) | 25,000 | 16,750 | |
| 12% 12/1/28 pay-in-kind (b)(c) | 9,492 | 9,123 | |
| 13% 6/1/30 pay-in-kind (b)(c) | 19,829 | 18,538 | |
| 14% 6/1/31 pay-in-kind (b)(c) | 25,530 | 24,840 | |
| EG Global Finance PLC 12% 11/30/28 (b) | 35,000 | 36,951 | |
| Hanesbrands, Inc. 4.875% 5/15/26 (b) | 16,000 | 15,440 | |
| LBM Acquisition LLC 6.25% 1/15/29 (b) | 50,000 | 45,044 | |
| Michaels Companies, Inc. 5.25% 5/1/28 (b) | 70,000 | 54,348 | |
| Nordstrom, Inc. 4.375% 4/1/30 | 30,000 | 26,505 | |
| Sally Holdings LLC 6.75% 3/1/32 | 15,000 | 14,957 | |
| Staples, Inc. 7.5% 4/15/26 (b) | 16,000 | 15,383 | |
| Upbound Group, Inc. 6.375% 2/15/29 (b) | 50,000 | 47,856 | |
| 409,098 | |||
| Technology - 11.3% | |||
| Atkore, Inc. 4.25% 6/1/31 (b) | 45,000 | 39,531 | |
| Block, Inc. 3.5% 6/1/31 | 412,000 | 351,466 | |
| Cloud Software Group, Inc. 9% 9/30/29 (b) | 35,000 | 32,666 | |
| Elastic NV 4.125% 7/15/29 (b) | 90,000 | 80,841 | |
| Entegris, Inc.: | |||
| 3.625% 5/1/29 (b) | 60,000 | 53,100 | |
| 5.95% 6/15/30 (b) | 174,000 | 170,616 | |
| Gen Digital, Inc.: | |||
| 5% 4/15/25 (b) | 90,000 | 89,100 | |
| 7.125% 9/30/30 (b) | 48,000 | 49,038 | |
| Go Daddy Operating Co. LLC / GD Finance Co., Inc. 3.5% 3/1/29 (b) | 235,000 | 209,239 | |
| GrafTech Global Enterprises, Inc. 9.875% 12/15/28 (b) | 5,000 | 3,970 | |
| MicroStrategy, Inc. 6.125% 6/15/28 (b) | 10,000 | 9,642 | |
| NCR Voyix Corp. 5.125% 4/15/29 (b) | 45,000 | 41,723 | |
| ON Semiconductor Corp. 3.875% 9/1/28 (b) | 24,000 | 21,949 | |
| Open Text Corp.: | |||
| 3.875% 2/15/28 (b) | 30,000 | 27,566 | |
| 3.875% 12/1/29 (b) | 89,000 | 78,664 | |
| Open Text Holdings, Inc.: | |||
| 4.125% 2/15/30 (b) | 10,000 | 8,829 | |
| 4.125% 12/1/31 (b) | 18,000 | 15,407 | |
| Rackspace Hosting, Inc. 3.5% 2/15/28 (b) | 15,000 | 6,039 | |
| Seagate HDD Cayman: | |||
| 4.125% 1/15/31 | 30,000 | 26,351 | |
| 4.75% 1/1/25 | 102,000 | 100,548 | |
| 5.75% 12/1/34 | 15,000 | 14,418 | |
| 8.25% 12/15/29 (b) | 33,000 | 35,360 | |
| Sensata Technologies BV: | |||
| 4% 4/15/29 (b) | 30,000 | 27,208 | |
| 5% 10/1/25 (b) | 211,000 | 209,032 | |
| TTM Technologies, Inc. 4% 3/1/29 (b) | 30,000 | 26,703 | |
| UKG, Inc. 6.875% 2/1/31 (b) | 15,000 | 15,156 | |
| Veritas U.S., Inc./Veritas Bermuda Ltd. 7.5% 9/1/25 (b) | 10,000 | 9,169 | |
| Virtusa Corp. 7.125% 12/15/28 (b) | 40,000 | 35,475 | |
| VM Consolidated, Inc. 5.5% 4/15/29 (b) | 20,000 | 18,849 | |
| Western Digital Corp.: | |||
| 2.85% 2/1/29 | 10,000 | 8,422 | |
| 3.1% 2/1/32 | 10,000 | 7,827 | |
| 1,823,904 | |||
| Telecommunications - 4.1% | |||
| Altice Financing SA 5.75% 8/15/29 (b) | 135,000 | 116,272 | |
| Altice France Holding SA 6% 2/15/28 (b) | 75,000 | 37,856 | |
| Altice France SA 5.125% 7/15/29 (b) | 93,000 | 70,228 | |
| C&W Senior Financing Designated Activity Co. 6.875% 9/15/27 (b) | 100,000 | 94,250 | |
| Frontier Communications Holdings LLC 8.75% 5/15/30 (b) | 40,000 | 40,799 | |
| IHS Netherlands Holdco BV 8% 9/18/27 (b) | 10,000 | 8,967 | |
| Level 3 Financing, Inc. 3.75% 7/15/29 (b) | 80,000 | 46,800 | |
| Millicom International Cellular SA 4.5% 4/27/31 (b) | 40,000 | 34,548 | |
| SBA Communications Corp. 3.125% 2/1/29 | 76,000 | 67,260 | |
| Uniti Group LP/Uniti Fiber Holdings, Inc./CSL Capital LLC 6% 1/15/30 (b) | 140,000 | 102,207 | |
| Zayo Group Holdings, Inc. 4% 3/1/27 (b) | 62,000 | 51,615 | |
| 670,802 | |||
| Textiles/Apparel - 0.2% | |||
| Crocs, Inc. 4.125% 8/15/31 (b) | 15,000 | 12,762 | |
| Victoria's Secret & Co. 4.625% 7/15/29 (b) | 15,000 | 12,653 | |
| 25,415 | |||
| Transportation Ex Air/Rail - 0.4% | |||
| Golar LNG Ltd. 7% 10/20/25 (b) | 17,000 | 16,795 | |
| Seaspan Corp. 5.5% 8/1/29 (b) | 30,000 | 25,576 | |
| XPO, Inc. 7.125% 2/1/32 (b) | 20,000 | 20,333 | |
| 62,704 | |||
| Utilities - 2.4% | |||
| DPL, Inc. 4.35% 4/15/29 | 140,000 | 126,861 | |
| NextEra Energy Partners LP 4.5% 9/15/27 (b) | 21,000 | 19,592 | |
| PG&E Corp.: | |||
| 5% 7/1/28 | 50,000 | 47,689 | |
| 5.25% 7/1/30 | 107,000 | 100,586 | |
| Pike Corp. 8.625% 1/31/31 (b) | 22,000 | 23,233 | |
| TerraForm Power Operating LLC 4.75% 1/15/30 (b) | 73,000 | 65,999 | |
| 383,960 | |||
TOTAL NONCONVERTIBLE BONDS | 15,263,275 | ||
| TOTAL CORPORATE BONDS (Cost $15,836,048) | 15,580,185 | ||
| Common Stocks - 0.8% | |||
| Shares | Value ($) | ||
| Automotive & Auto Parts - 0.0% | |||
| Aptiv PLC (g) | 100 | 7,949 | |
| Capital Goods - 0.1% | |||
| Regal Rexnord Corp. | 80 | 13,719 | |
| Energy - 0.2% | |||
| New Fortress Energy, Inc. | 700 | 24,605 | |
| Healthcare - 0.1% | |||
| Centene Corp. (g) | 205 | 16,078 | |
| Technology - 0.3% | |||
| Coherent Corp. (g) | 380 | 22,602 | |
| MKS Instruments, Inc. | 60 | 7,366 | |
| ON Semiconductor Corp. (g) | 190 | 14,995 | |
TOTAL TECHNOLOGY | 44,963 | ||
| Telecommunications - 0.1% | |||
| Helios Towers PLC (g) | 20,800 | 19,810 | |
| TOTAL COMMON STOCKS (Cost $111,647) | 127,124 | ||
| Bank Loan Obligations - 0.7% | |||
Principal Amount (a) | Value ($) | ||
| Automotive & Auto Parts - 0.0% | |||
| PECF USS Intermediate Holding III Corp. Tranche B 1LN, term loan CME Term SOFR 1 Month Index + 4.250% 9.8239% 12/17/28 (c)(d)(h) | 7,964 | 6,157 | |
| Chemicals - 0.1% | |||
| Hexion Holdings Corp. 1LN, term loan CME Term SOFR 3 Month Index + 4.500% 9.9757% 3/15/29 (c)(d)(h) | 15,000 | 14,386 | |
| Healthcare - 0.1% | |||
| Cano Health, Inc.: | |||
| Tranche B 1LN, term loan CME Term SOFR 1 Month Index + 4.000% 9.4626% (c)(d)(f)(h) | 21,888 | 6,430 | |
| Tranche DD, term loan CME Term SOFR 1 Month Index + 11.000% 16.3225% 10/2/24 (c)(h) | 2,271 | 2,259 | |
TOTAL HEALTHCARE | 8,689 | ||
| Leisure - 0.3% | |||
| ClubCorp Holdings, Inc. Tranche B 1LN, term loan CME Term SOFR 1 Month Index + 5.000% 10.6098% 9/18/26 (c)(d)(h) | 24,471 | 24,364 | |
| United PF Holdings LLC 1LN, term loan CME Term SOFR 1 Month Index + 4.000% 9.5743% 12/30/26 (c)(d)(h) | 25,956 | 23,211 | |
TOTAL LEISURE | 47,575 | ||
| Services - 0.2% | |||
| AI Aqua Merger Sub, Inc. Tranche B 1LN, term loan CME Term SOFR 1 Month Index + 4.250% 8.5934% 7/31/28 (c)(d)(h)(i) | 5,000 | 5,003 | |
| Artera Services LLC Tranche B 1LN, term loan CME Term SOFR 1 Month Index + 4.500% 2/7/31 (d)(h)(j) | 5,000 | 5,013 | |
| Ascend Learning LLC 2LN, term loan CME Term SOFR 1 Month Index + 5.750% 11.1763% 12/10/29 (c)(d)(h) | 5,000 | 4,800 | |
| Brand Industrial Services, Inc. Tranche B 1LN, term loan CME Term SOFR 1 Month Index + 5.500% 10.8064% 8/1/30 (c)(d)(h) | 9,975 | 9,991 | |
| Galaxy U.S. Opco, Inc. 1LN, term loan CME Term SOFR 1 Month Index + 4.750% 10.0627% 4/29/29 (c)(d)(h) | 5,000 | 4,375 | |
TOTAL SERVICES | 29,182 | ||
| Technology - 0.0% | |||
| McAfee Corp. Tranche B 1LN, term loan CME Term SOFR 1 Month Index + 3.750% 9.1783% 3/1/29 (c)(d)(h) | 1,995 | 1,982 | |
| UKG, Inc. 2LN, term loan CME Term SOFR 3 Month Index + 5.250% 10.6802% 5/3/27 (c)(d)(h) | 3,276 | 3,305 | |
TOTAL TECHNOLOGY | 5,287 | ||
| TOTAL BANK LOAN OBLIGATIONS (Cost $118,153) | 111,276 | ||
| Preferred Securities - 0.8% | |||
Principal Amount (a) | Value ($) | ||
| Air Transportation - 0.2% | |||
| AerCap Holdings NV 5.875% 10/10/79 (c) | 30,000 | 30,377 | |
| Banks & Thrifts - 0.2% | |||
| Ally Financial, Inc. 4.7% (c)(k) | 50,000 | 42,975 | |
| Energy - 0.4% | |||
| Energy Transfer LP 3 month U.S. LIBOR + 4.020% 9.5966% (c)(d)(k) | 67,000 | 66,458 | |
| TOTAL PREFERRED SECURITIES (Cost $141,115) | 139,810 | ||
| Money Market Funds - 1.0% | |||
| Shares | Value ($) | ||
Fidelity Cash Central Fund 5.39% (l) (Cost $162,726) | 162,693 | 162,726 | |
| TOTAL INVESTMENT IN SECURITIES - 99.7% (Cost $16,369,689) | 16,121,121 |
NET OTHER ASSETS (LIABILITIES) - 0.3% | 42,153 |
| NET ASSETS - 100.0% | 16,163,274 |
| (a) | Amount is stated in United States dollars unless otherwise noted. |
| (b) | Security exempt from registration under Rule 144A of the Securities Act of 1933. These securities may be resold in transactions exempt from registration, normally to qualified institutional buyers. At the end of the period, the value of these securities amounted to $12,268,419 or 75.9% of net assets. |
| (c) | Coupon rates for floating and adjustable rate securities reflect the rates in effect at period end. |
| (d) | Coupon is indexed to a floating interest rate which may be multiplied by a specified factor and/or subject to caps or floors. |
| (e) | Security or a portion of the security purchased on a delayed delivery or when-issued basis. |
| (f) | Non-income producing - Security is in default. |
| (g) | Non-income producing |
| (h) | Remaining maturities of bank loan obligations may be less than the stated maturities shown as a result of contractual or optional prepayments by the borrower. Such prepayments cannot be predicted with certainty. |
| (i) | Position or a portion of the position represents an unfunded loan commitment. At period end, the total principal amount and market value of unfunded commitments totaled $513 and $513, respectively. |
| (j) | The coupon rate will be determined upon settlement of the loan after period end. |
| (k) | Security is perpetual in nature with no stated maturity date. |
| (l) | Affiliated fund that is generally available only to investment companies and other accounts managed by Fidelity Investments. The rate quoted is the annualized seven-day yield of the fund at period end. A complete unaudited listing of the fund's holdings as of its most recent quarter end is available upon request. In addition, each Fidelity Central Fund's financial statements are available on the SEC's website or upon request. |
| Affiliate | Value, beginning of period ($) | Purchases ($) | Sales Proceeds ($) | Dividend Income ($) | Realized Gain (loss) ($) | Change in Unrealized appreciation (depreciation) ($) | Value, end of period ($) | % ownership, end of period |
| Fidelity Cash Central Fund 5.39% | 76,427 | 1,145,730 | 1,059,431 | 1,698 | - | - | 162,726 | 0.0% |
| Total | 76,427 | 1,145,730 | 1,059,431 | 1,698 | - | - | 162,726 | |
| Valuation Inputs at Reporting Date: | ||||
| Description | Total ($) | Level 1 ($) | Level 2 ($) | Level 3 ($) |
Investments in Securities: | ||||
| Equities: | ||||
Communication Services | 19,810 | 19,810 | - | - |
Consumer Discretionary | 7,949 | 7,949 | - | - |
Energy | 24,605 | 24,605 | - | - |
Health Care | 16,078 | 16,078 | - | - |
Industrials | 13,719 | 13,719 | - | - |
Information Technology | 44,963 | 44,963 | - | - |
| Corporate Bonds | 15,580,185 | - | 15,580,185 | - |
| Bank Loan Obligations | 111,276 | - | 111,276 | - |
| Preferred Securities | 139,810 | - | 139,810 | - |
| Money Market Funds | 162,726 | 162,726 | - | - |
| Total Investments in Securities: | 16,121,121 | 289,850 | 15,831,271 | - |
| Statement of Assets and Liabilities | ||||
February 29, 2024 (Unaudited) | ||||
| Assets | ||||
| Investment in securities, at value - See accompanying schedule: | ||||
Unaffiliated issuers (cost $16,206,963) | $ | 15,958,395 | ||
Fidelity Central Funds (cost $162,726) | 162,726 | |||
| Total Investment in Securities (cost $16,369,689) | $ | 16,121,121 | ||
| Receivable for investments sold | 59,593 | |||
| Dividends receivable | 13 | |||
| Interest receivable | 231,634 | |||
| Distributions receivable from Fidelity Central Funds | 536 | |||
| Other receivables | 13 | |||
Total assets | 16,412,910 | |||
| Liabilities | ||||
| Payable for investments purchased | ||||
Regular delivery | $ | 49,227 | ||
Delayed delivery | 110,075 | |||
| Distributions payable | 83,300 | |||
| Accrued management fee | 7,034 | |||
| Total Liabilities | 249,636 | |||
| Commitments and contingent liabilities (see Commitments note) | ||||
| Net Assets | $ | 16,163,274 | ||
| Net Assets consist of: | ||||
| Paid in capital | $ | 16,981,518 | ||
| Total accumulated earnings (loss) | (818,244) | |||
| Net Assets | $ | 16,163,274 | ||
Net Asset Value, offering price and redemption price per share ($16,163,274 ÷ 350,000 shares) | $ | 46.18 | ||
| Statement of Operations | ||||
Six months ended February 29, 2024 (Unaudited) | ||||
| Investment Income | ||||
| Dividends | $ | 4,650 | ||
| Interest | 390,002 | |||
| Income from Fidelity Central Funds | 1,698 | |||
| Total Income | 396,350 | |||
| Expenses | ||||
| Management fee | $ | 28,939 | ||
| Independent trustees' fees and expenses | 24 | |||
| Total expenses before reductions | 28,963 | |||
| Expense reductions | (158) | |||
| Total expenses after reductions | 28,805 | |||
| Net Investment income (loss) | 367,545 | |||
| Realized and Unrealized Gain (Loss) | ||||
| Net realized gain (loss) on: | ||||
| Investment Securities: | ||||
| Unaffiliated issuers | (47,811) | |||
| Foreign currency transactions | 14 | |||
| Total net realized gain (loss) | (47,797) | |||
| Change in net unrealized appreciation (depreciation) on investment securities | 222,041 | |||
| Net gain (loss) | 174,244 | |||
| Net increase (decrease) in net assets resulting from operations | $ | 541,789 | ||
| Statement of Changes in Net Assets | ||||
Six months ended February 29, 2024 (Unaudited) | Year ended August 31, 2023 | |||
| Increase (Decrease) in Net Assets | ||||
| Operations | ||||
| Net investment income (loss) | $ | 367,545 | $ | 609,041 |
| Net realized gain (loss) | (47,797) | (359,381) | ||
| Change in net unrealized appreciation (depreciation) | 222,041 | 341,668 | ||
| Net increase (decrease) in net assets resulting from operations | 541,789 | 591,328 | ||
| Distributions to shareholders | (376,925) | (596,600) | ||
| Share transactions | ||||
| Proceeds from sales of shares | 6,952,177 | - | ||
Net increase (decrease) in net assets resulting from share transactions | 6,952,177 | - | ||
| Total increase (decrease) in net assets | 7,117,041 | (5,272) | ||
| Net Assets | ||||
| Beginning of period | 9,046,233 | 9,051,505 | ||
| End of period | $ | 16,163,274 | $ | 9,046,233 |
| Other Information | ||||
| Shares | ||||
| Sold | 150,000 | - | ||
| Net increase (decrease) | 150,000 | - | ||
| Fidelity® Sustainable High Yield ETF |
Six months ended (Unaudited) February 29, 2024 | Years ended August 31, 2023 | 2022 A | ||||
Selected Per-Share Data | ||||||
| Net asset value, beginning of period | $ | 45.23 | $ | 45.26 | $ | 50.00 |
| Income from Investment Operations | ||||||
Net investment income (loss) B,C | 1.578 | 3.045 | 1.404 | |||
| Net realized and unrealized gain (loss) | .928 | (.092) | (4.758) | |||
| Total from investment operations | 2.506 | 2.953 | (3.354) | |||
| Distributions from net investment income | (1.556) | (2.983) | (1.386) | |||
| Total distributions | (1.556) | (2.983) | (1.386) | |||
| Net asset value, end of period | $ | 46.18 | $ | 45.23 | $ | 45.26 |
Total Return D,E | 5.68% | 6.83% | (6.78)% | |||
Ratios to Average Net Assets C,F,G | ||||||
| Expenses before reductions | .55% H | .55% | .55% | |||
| Expenses net of fee waivers, if any | .55% H | .55% | .55% | |||
| Expenses net of all reductions | .55% H | .55% | .55% | |||
| Net investment income (loss) | 7.04% H | 6.78% | 5.49% | |||
| Supplemental Data | ||||||
| Net assets, end of period (000 omitted) | $ | 16,163 | $ | 9,046 | $ | 9,052 |
Portfolio turnover rate I | 52% H,J | 48% | 24% K |
| Fidelity Central Fund | Investment Manager | Investment Objective | Investment Practices | Expense RatioA |
| Fidelity Money Market Central Funds | Fidelity Management & Research Company LLC (FMR) | Each fund seeks to obtain a high level of current income consistent with the preservation of capital and liquidity. | Short-term Investments | Less than .005% |
| Gross unrealized appreciation | $250,454 |
| Gross unrealized depreciation | (478,360) |
| Net unrealized appreciation (depreciation) | $(227,906) |
| Tax cost | $16,349,027 |
Short-term | $(352,215) |
Long-term | (174,666) |
| Total capital loss carryforward | $(526,881) |
| Investment to be Acquired | Commitment Amount | Unrealized Appreciation (Depreciation) | |
| Fidelity Sustainable High Yield ETF | LEVEL 3 Financing, Inc 1LN note 11% 11/15/29 | $8,728 | $- |
| Purchases ($) | Sales ($) | |
| Fidelity Sustainable High Yield ETF | 2,508,593 | 2,563,710 |
| In-Kind Subscriptions ($) | In-Kind Redemptions ($) | |
| Fidelity Sustainable High Yield ETF | 6,813,713 | - |
| The Example is based on an investment of $1,000 invested at the beginning of the period and held for the entire period (September 1, 2023 to February 29, 2024). |
Annualized Expense Ratio- A | Beginning Account Value September 1, 2023 | Ending Account Value February 29, 2024 | Expenses Paid During Period- C September 1, 2023 to February 29, 2024 | |||||||
| Fidelity® Sustainable High Yield ETF | .55% | |||||||||
| Actual | $ 1,000 | $ 1,056.80 | $ 2.81 | |||||||
Hypothetical-B | $ 1,000 | $ 1,022.13 | $ 2.77 | |||||||
- Highly liquid investments - cash or convertible to cash within three business days or less
- Moderately liquid investments - convertible to cash in three to seven calendar days
- Less liquid investments - can be sold or disposed of, but not settled, within seven calendar days
- Illiquid investments - cannot be sold or disposed of within seven calendar days
 |
Item 2.
Code of Ethics
Not applicable.
Item 3.
Audit Committee Financial Expert
Not applicable.
Item 4.
Principal Accountant Fees and Services
Not applicable.
Item 5.
Audit Committee of Listed Registrants
Not applicable.
Item 6.
Investments
(a)
Not applicable.
(b)
Not applicable
Item 7.
Disclosure of Proxy Voting Policies and Procedures for Closed-End Management Investment Companies
Not applicable.
Item 8.
Portfolio Managers of Closed-End Management Investment Companies
Not applicable.
Item 9.
Purchase of Equity Securities by Closed-End Management Investment Company and Affiliated Purchasers
Not applicable.
Item 10.
Submission of Matters to a Vote of Security Holders
There were no material changes to the procedures by which shareholders may recommend nominees to the Fidelity Covington Trust’s Board of Trustees.
Item 11.
Controls and Procedures
(a)(i) The President and Treasurer and the Chief Financial Officer have concluded that the Fidelity Covington Trust’s (the “Trust”) disclosure controls and procedures (as defined in Rule 30a-3(c) under the Investment Company Act) provide reasonable
assurances that material information relating to the Trust is made known to them by the appropriate persons, based on their evaluation of these controls and procedures as of a date within 90 days of the filing date of this report.
(a)(ii) There was no change in the Trust’s internal control over financial reporting (as defined in Rule 30a-3(d) under the Investment Company Act) that occurred during the period covered by this report that has materially affected, or is reasonably likely to materially affect, the Trust’s internal control over financial reporting.
Item 12.
Disclosure of Securities Lending Activities for Closed-End Management
Investment Companies
Not applicable.
Item 18.
Recovery of Erroneously Awarded Compensation
(a)
Not applicable.
(b)
Not applicable.
Item 19.
Exhibits
(a) | (1) | Not applicable. |
(a) | (2) | |
(a) | (3) | Not applicable. |
(b) |
SIGNATURES
Pursuant to the requirements of the Securities Exchange Act of 1934 and the Investment Company Act of 1940, the registrant has duly caused this report to be signed on its behalf by the undersigned, thereunto duly authorized.
Fidelity Covington Trust
By: | /s/Stacie M. Smith |
Stacie M. Smith | |
President and Treasurer (Principal Executive Officer) | |
Date: | April 22, 2024 |
Pursuant to the requirements of the Securities Exchange Act of 1934 and the Investment Company Act of 1940, this report has been signed below by the following persons on behalf of the registrant and in the capacities and on the dates indicated.
By: | /s/Stacie M. Smith |
Stacie M. Smith | |
President and Treasurer (Principal Executive Officer) | |
Date: | April 22, 2024 |
By: | /s/John J. Burke III |
John J. Burke III | |
Chief Financial Officer (Principal Financial Officer) | |
Date: | April 22, 2024 |