UNITED STATES
SECURITIES AND EXCHANGE COMMISSION
Washington, D.C. 20549
FORM N-CSR
CERTIFIED SHAREHOLDER REPORT OF REGISTERED
MANAGEMENT INVESTMENT COMPANIES
Investment Company Act file number 811-07319
Fidelity Covington Trust
(Exact name of registrant as specified in charter)
245 Summer St., Boston, MA 02210
(Address of principal executive offices) (Zip code)
Margaret Carey, Secretary
245 Summer St.
Boston, Massachusetts 02210
(Name and address of agent for service)
Registrant's telephone number, including area code:
617-563-7000
Date of fiscal year end: | October 31 |
Date of reporting period: | April 30, 2024 |
Item 1.
Reports to Stockholders


Contents
Top Holdings (% of Fund's net assets) | ||
| Tencent Holdings Ltd. (China, Interactive Media & Services) | 4.2 | |
| Samsung Electronics Co. Ltd. (Korea (South), Technology Hardware, Storage & Peripherals) | 3.6 | |
| Longfor Properties Co. Ltd. (China, Real Estate Management & Development) | 2.1 | |
| Emaar Properties PJSC (United Arab Emirates, Real Estate Management & Development) | 1.7 | |
| Yuhan Corp. (Korea (South), Pharmaceuticals) | 1.7 | |
| Terrafina (Mexico, Equity Real Estate Investment Trusts (REITs)) | 1.7 | |
| Dr. Reddy's Laboratories Ltd. (India, Pharmaceuticals) | 1.4 | |
| Alibaba Group Holding Ltd. (China, Broadline Retail) | 1.4 | |
| Aurobindo Pharma Ltd. (India, Pharmaceuticals) | 1.4 | |
| PetroChina Co. Ltd. (H Shares) (China, Oil, Gas & Consumable Fuels) | 1.3 | |
| 20.5 | ||
| Market Sectors (% of Fund's net assets) | ||
| Financials | 20.1 | |
| Information Technology | 18.0 | |
| Communication Services | 12.8 | |
| Energy | 11.0 | |
| Consumer Staples | 8.7 | |
| Consumer Discretionary | 8.4 | |
| Health Care | 8.0 | |
| Real Estate | 6.7 | |
| Industrials | 2.9 | |
| Materials | 2.8 | |
| Utilities | 0.1 | |
Asset Allocation (% of Fund's net assets) |
 |
Futures - 0.4% |
Geographic Diversification (% of Fund's net assets) |
 |
* Includes Short-Term investments and Net Other Assets (Liabilities). Percentages are adjusted for the effect of derivatives, if applicable. |
| Common Stocks - 98.9% | |||
| Shares | Value ($) | ||
| Brazil - 2.0% | |||
| Banco do Brasil SA | 51,600 | 272,978 | |
| BB Seguridade Participacoes SA | 31,900 | 198,179 | |
| Caixa Seguridade Participacoes | 69,400 | 209,682 | |
| TIM SA | 92,400 | 313,936 | |
| Vale SA | 16,300 | 199,037 | |
TOTAL BRAZIL | 1,193,812 | ||
| Chile - 0.4% | |||
| Banco de Chile | 1,959,723 | 218,294 | |
| China - 26.5% | |||
| Agricultural Bank of China Ltd. (H Shares) | 549,000 | 246,380 | |
| Alibaba Group Holding Ltd. | 85,800 | 815,633 | |
| Anta Sports Products Ltd. | 14,600 | 167,445 | |
| Autohome, Inc. ADR Class A | 12,879 | 330,990 | |
| Baidu, Inc. Class A (a) | 36,500 | 488,614 | |
| Bank of China Ltd. (H Shares) | 855,000 | 385,893 | |
| Bank of Communications Co. Ltd. (H Shares) | 318,000 | 230,128 | |
| Bosideng International Holdings Ltd. | 170,000 | 98,463 | |
| Brilliance China Automotive Holdings Ltd. | 140,000 | 117,066 | |
| China CITIC Bank Corp. Ltd. (H Shares) | 243,000 | 142,919 | |
| China Construction Bank Corp. (H Shares) | 810,000 | 528,180 | |
| China Railway Group Ltd. (H Shares) | 175,000 | 86,815 | |
| China Resources Pharmaceutical Group Ltd. (b) | 1,080,000 | 701,478 | |
| China Shenhua Energy Co. Ltd. (H Shares) | 152,000 | 635,504 | |
| China Tower Corp. Ltd. (H Shares) (b) | 2,568,000 | 302,071 | |
| China Vanke Co. Ltd. (H Shares) | 1,165,500 | 689,954 | |
| CITIC Pacific Ltd. | 93,000 | 88,824 | |
| Fuyao Glass Industries Group Co. Ltd. (H Shares) (b) | 19,200 | 115,501 | |
| Haier Smart Home Co. Ltd. | 39,600 | 148,097 | |
| Hengan International Group Co. Ltd. | 142,500 | 481,000 | |
| Industrial & Commercial Bank of China Ltd. (H Shares) | 733,000 | 396,434 | |
| Inner Mongolia Yitai Coal Co. Ltd. (B Shares) | 240,237 | 467,982 | |
| JD.com, Inc. Class A | 19,150 | 281,085 | |
| Jiangxi Copper Co. Ltd. (H Shares) | 76,000 | 156,447 | |
| Kingboard Chemical Holdings Ltd. | 83,500 | 184,483 | |
| Lenovo Group Ltd. | 182,000 | 207,802 | |
| Longfor Properties Co. Ltd. (b) | 826,000 | 1,246,203 | |
| MINISO Group Holding Ltd. ADR | 3,642 | 81,836 | |
| NetEase, Inc. | 26,000 | 499,642 | |
| PDD Holdings, Inc. ADR (a) | 4,036 | 505,226 | |
| People's Insurance Co. of China Group Ltd. (H Shares) | 340,000 | 112,157 | |
| PetroChina Co. Ltd. (H Shares) | 828,000 | 781,292 | |
| PICC Property & Casualty Co. Ltd. (H Shares) | 116,000 | 144,904 | |
| Pop Mart International Group Ltd. (b) | 33,600 | 145,635 | |
| Sinopharm Group Co. Ltd. (H Shares) | 260,400 | 660,555 | |
| Tencent Holdings Ltd. | 56,400 | 2,503,726 | |
| Topsports International Holdings Ltd. (b) | 118,000 | 82,376 | |
| Trip.com Group Ltd. (a) | 4,800 | 236,526 | |
| Vipshop Holdings Ltd. ADR | 4,579 | 68,868 | |
| Yangzijiang Shipbuilding Holdings Ltd. | 54,200 | 69,948 | |
| Yum China Holdings, Inc. | 3,613 | 131,911 | |
TOTAL CHINA | 15,765,993 | ||
| Egypt - 0.2% | |||
| Commercial International Bank SAE | 97,875 | 147,068 | |
| Greece - 0.6% | |||
| Jumbo SA | 6,150 | 191,884 | |
| OPAP SA | 10,069 | 168,062 | |
TOTAL GREECE | 359,946 | ||
| Hong Kong - 1.0% | |||
| WH Group Ltd. (b) | 795,500 | 581,785 | |
| Hungary - 2.1% | |||
| MOL Hungarian Oil and Gas PLC Series A (For. Reg.) | 68,617 | 564,988 | |
| Richter Gedeon PLC | 27,351 | 698,814 | |
TOTAL HUNGARY | 1,263,802 | ||
| India - 16.8% | |||
| Angel One Ltd. | 5,378 | 179,614 | |
| Asian Paints Ltd. | 4,036 | 139,114 | |
| Aurobindo Pharma Ltd. | 58,087 | 803,048 | |
| Bajaj Auto Ltd. | 2,240 | 239,035 | |
| Bank of Baroda | 73,419 | 247,703 | |
| Bharat Electronics Ltd. | 58,562 | 164,064 | |
| Canara Bank Ltd. | 36,388 | 271,243 | |
| Coal India Ltd. | 108,377 | 590,099 | |
| Dr. Reddy's Laboratories Ltd. | 10,971 | 815,801 | |
| Eicher Motors Ltd. | 4,409 | 242,939 | |
| Federal Bank Ltd. | 128,106 | 249,652 | |
| HCL Technologies Ltd. | 9,386 | 153,733 | |
| HDFC Asset Management Co. Ltd. (b) | 5,436 | 253,742 | |
| HDFC Standard Life Insurance Co. Ltd. (b) | 36,160 | 252,945 | |
| Hero Motocorp Ltd. | 3,834 | 208,759 | |
| Hindustan Aeronautics Ltd. | 3,475 | 164,068 | |
| Hindustan Unilever Ltd. | 21,809 | 583,007 | |
| Infosys Ltd. | 25,745 | 438,323 | |
| ITC Ltd. | 105,855 | 552,706 | |
| L&T Finance Ltd. | 104,627 | 208,975 | |
| Motherson Sumi Wiring India Ltd. | 214,928 | 177,870 | |
| NMDC Ltd. | 37,164 | 113,314 | |
| Oil & Natural Gas Corp. Ltd. | 179,225 | 607,575 | |
| Oil India Ltd. | 86,872 | 645,687 | |
| Oracle Financial Services Soft | 758 | 69,032 | |
| Pidilite Industries Ltd. | 3,497 | 127,790 | |
| Polycab India Ltd. | 2,154 | 146,288 | |
| Power Finance Corp. Ltd. | 47,935 | 253,675 | |
| REC Ltd. | 42,747 | 259,829 | |
| State Bank of India | 38,272 | 378,999 | |
| Tata Consultancy Services Ltd. | 7,704 | 352,776 | |
| Wipro Ltd. | 17,465 | 96,790 | |
TOTAL INDIA | 9,988,195 | ||
| Indonesia - 4.1% | |||
| PT Adaro Energy Indonesia Tbk | 2,995,600 | 499,267 | |
| PT Astra International Tbk | 242,600 | 76,838 | |
| PT Bank Central Asia Tbk | 601,900 | 362,769 | |
| PT Bank Mandiri (Persero) Tbk | 643,400 | 273,030 | |
| PT Indah Kiat Pulp & Paper Tbk | 54,400 | 31,365 | |
| PT Indofood Sukses Makmur Tbk | 1,119,600 | 430,351 | |
| PT Telkom Indonesia Persero Tbk | 1,322,800 | 257,889 | |
| PT United Tractors Tbk | 318,000 | 485,507 | |
TOTAL INDONESIA | 2,417,016 | ||
| Korea (South) - 11.5% | |||
| Cosmo AM&T Co. Ltd. (a) | 151 | 16,585 | |
| DB HiTek Co. Ltd. | 246 | 7,369 | |
| Db Insurance Co. Ltd. | 2,957 | 208,173 | |
| Doosan Bobcat, Inc. | 2,461 | 92,949 | |
| GS Holdings Corp. | 2,408 | 78,228 | |
| Hankook Tire Co. Ltd. | 3,124 | 133,585 | |
| Hanmi Semiconductor Co. Ltd. | 350 | 34,187 | |
| Hanwha Corp. | 3,950 | 78,165 | |
| Hyundai Marine & Fire Insurance Co. Ltd. | 7,224 | 163,600 | |
| Hyundai Mobis | 978 | 161,691 | |
| Hyundai Steel Co. | 1,534 | 35,905 | |
| Kia Corp. | 2,670 | 227,957 | |
| KT&G Corp. | 7,085 | 458,287 | |
| Kumho Petro Chemical Co. Ltd. | 397 | 39,697 | |
| Leeno Industrial, Inc. | 63 | 11,441 | |
| LG Corp. | 1,648 | 94,676 | |
| LG Display Co. Ltd. (a) | 1,970 | 15,023 | |
| LG Innotek Co. Ltd. | 89 | 14,296 | |
| LG Uplus Corp. | 32,523 | 231,786 | |
| NCSOFT Corp. | 1,735 | 221,065 | |
| Orion Corp./Republic of Korea | 6,550 | 440,268 | |
| POSCO | 340 | 99,631 | |
| POSCO ICT Co. Ltd. | 338 | 9,966 | |
| Samsung Electro-Mechanics Co. Ltd. | 372 | 41,961 | |
| Samsung Electronics Co. Ltd. | 37,958 | 2,128,460 | |
| Samsung SDI Co. Ltd. | 347 | 108,963 | |
| Samsung SDS Co. Ltd. | 257 | 29,770 | |
| SK Hynix, Inc. | 3,523 | 444,039 | |
| Woori Financial Group, Inc. | 21,264 | 218,933 | |
| Yuhan Corp. | 19,130 | 1,002,107 | |
TOTAL KOREA (SOUTH) | 6,848,763 | ||
| Malaysia - 0.9% | |||
| Malayan Banking Bhd | 121,900 | 248,525 | |
| Petronas Chemicals Group Bhd | 24,700 | 35,090 | |
| TIME dotCom Bhd | 216,200 | 233,754 | |
TOTAL MALAYSIA | 517,369 | ||
| Mexico - 4.4% | |||
| Arca Continental S.A.B. de CV | 49,300 | 483,553 | |
| El Puerto de Liverpool S.A.B. Dcv Series C | 7,900 | 63,372 | |
| Grupo Aeroportuario del Sureste S.A.B. de CV Series B | 3,300 | 113,970 | |
| Grupo Aeroportuario Norte S.A.B. de CV | 9,500 | 105,747 | |
| Kimberly-Clark de Mexico SA de CV Series A | 245,200 | 513,181 | |
| Promotora y Operadora de Infraestructura S.A.B. de CV | 8,655 | 87,416 | |
| Qualitas Controladora S.A.B. de CV | 18,500 | 243,236 | |
| Terrafina | 403,800 | 998,213 | |
TOTAL MEXICO | 2,608,688 | ||
| Qatar - 0.2% | |||
| Mesaieed Petrochemical Holding Co. | 172,854 | 91,103 | |
| Russia - 0.1% | |||
| Gazprom OAO (a)(c) | 14,450 | 1,505 | |
| Inter Rao Ues JSC (a)(c) | 7,348,600 | 40,330 | |
| MMC Norilsk Nickel PJSC (a)(c) | 18,800 | 1,245 | |
| Sberbank of Russia (a)(c) | 38,410 | 235 | |
| Surgutneftegas OJSC (a)(c) | 56,600 | 689 | |
| VTB Bank OJSC (a)(c) | 91,900,000 | 3,495 | |
TOTAL RUSSIA | 47,499 | ||
| Saudi Arabia - 2.7% | |||
| Al Rajhi Bank | 16,189 | 344,878 | |
| Bupa Arabia for Cooperative Insurance Co. | 1,525 | 98,072 | |
| Elm Co. | 715 | 174,356 | |
| Luberef | 2,020 | 81,649 | |
| Sabic Agriculture-Nutrients Co. | 2,904 | 89,661 | |
| Saudi Telecom Co. | 47,511 | 476,934 | |
| The Co. for Cooperative Insurance | 2,713 | 107,779 | |
| The Saudi National Bank | 26,095 | 261,604 | |
TOTAL SAUDI ARABIA | 1,634,933 | ||
| South Africa - 1.8% | |||
| Exxaro Resources Ltd. | 55,407 | 532,460 | |
| Kumba Iron Ore Ltd. | 2,572 | 63,293 | |
| Momentum Metropolitan Holdings | 192,636 | 210,783 | |
| Standard Bank Group Ltd. | 28,377 | 266,796 | |
TOTAL SOUTH AFRICA | 1,073,332 | ||
| Taiwan - 14.9% | |||
| Accton Technology Corp. | 14,000 | 198,421 | |
| ASE Technology Holding Co. Ltd. | 67,000 | 304,527 | |
| ASPEED Tech, Inc. | 2,000 | 189,485 | |
| Catcher Technology Co. Ltd. | 35,000 | 234,322 | |
| Chicony Electronics Co. Ltd. | 41,000 | 254,975 | |
| Chipbond Technology Corp. | 88,000 | 205,663 | |
| Chunghwa Telecom Co. Ltd. | 93,000 | 354,155 | |
| Compal Electronics, Inc. | 192,000 | 211,093 | |
| Elan Microelectronics Corp. | 42,000 | 212,180 | |
| Far Eastern International Bank | 485,000 | 228,633 | |
| Far Eastern New Century Corp. | 154,000 | 153,707 | |
| Far EasTone Telecommunications Co. Ltd. | 106,000 | 263,031 | |
| Formosa Plastics Corp. | 46,000 | 96,769 | |
| Foxconn Technology Co. Ltd. | 125,000 | 236,472 | |
| Getac Holdings Corp. | 60,000 | 193,477 | |
| Gold Circuit Electronics Ltd. | 28,000 | 169,400 | |
| International Games Systems Co. Ltd. | 10,000 | 307,106 | |
| Jentech Precision Industrial Co. Ltd. | 9,000 | 270,039 | |
| King Slide Works Co. Ltd. | 6,000 | 226,645 | |
| King Yuan Electronics Co. Ltd. | 80,000 | 235,366 | |
| Largan Precision Co. Ltd. | 3,000 | 201,308 | |
| Lite-On Technology Corp. | 69,000 | 211,903 | |
| MediaTek, Inc. | 17,000 | 517,904 | |
| Micro-Star International Co. Ltd. | 37,000 | 181,239 | |
| MiTAC Holdings Corp. | 140,000 | 195,197 | |
| Novatek Microelectronics Corp. | 15,000 | 284,688 | |
| Pegatron Corp. | 85,000 | 255,037 | |
| Pou Chen Corp. | 178,000 | 197,614 | |
| Radiant Opto-Electronics Corp. | 47,000 | 287,237 | |
| Realtek Semiconductor Corp. | 16,000 | 254,530 | |
| Simplo Technology Co. Ltd. | 17,000 | 228,671 | |
| Sinopac Financial Holdings Co. | 374,000 | 252,113 | |
| Taichung Commercial Bank Co. Ltd. | 391,305 | 212,705 | |
| Taiwan Cooperative Financial Holding Co. Ltd. | 288,550 | 232,173 | |
| Taiwan Fertilizer Co. Ltd. | 36,000 | 72,305 | |
| Tripod Technology Corp. | 34,000 | 206,222 | |
| Wiwynn Corp. | 3,000 | 217,431 | |
| Yuanta Financial Holding Co. Ltd. | 292,000 | 274,854 | |
TOTAL TAIWAN | 8,828,597 | ||
| Thailand - 1.1% | |||
| Advanced Information Service PCL NVDR | 47,300 | 252,071 | |
| Intouch Holdings PCL NVDR | 123,900 | 223,996 | |
| Krung Thai Bank PCL NVDR | 343,200 | 155,579 | |
TOTAL THAILAND | 631,646 | ||
| Turkey - 5.3% | |||
| Akbank TAS | 191,117 | 350,931 | |
| Bim Birlesik Magazalar A/S JSC | 54,099 | 646,652 | |
| Haci Omer Sabanci Holding A/S | 101,767 | 290,121 | |
| Koc Holding A/S | 19,681 | 137,441 | |
| Turkcell Iletisim Hizmet A/S | 169,918 | 424,054 | |
| Turkiye Is Bankasi A/S Series C | 718,134 | 304,098 | |
| Turkiye Petrol Rafinerileri A/S | 112,471 | 680,179 | |
| Yapi ve Kredi Bankasi A/S | 323,249 | 322,286 | |
TOTAL TURKEY | 3,155,762 | ||
| United Arab Emirates - 2.3% | |||
| Abu Dhabi Islamic Bank | 83,568 | 253,919 | |
| Emaar Properties PJSC | 459,308 | 1,026,687 | |
| Salik Co. PJSC | 96,906 | 91,289 | |
TOTAL UNITED ARAB EMIRATES | 1,371,895 | ||
| TOTAL COMMON STOCKS (Cost $55,189,570) | 58,745,498 | ||
| Nonconvertible Preferred Stocks - 0.6% | |||
| Shares | Value ($) | ||
| Brazil - 0.6% | |||
| Bradespar SA (PN) | 14,700 | 56,524 | |
| Itausa-Investimentos Itau SA (PN) | 131,029 | 241,677 | |
| Metalurgica Gerdau SA (PN) | 33,700 | 68,790 | |
TOTAL BRAZIL | 366,991 | ||
| Russia - 0.0% | |||
| AK Transneft OAO (a)(c) | 1,200 | 3,466 | |
| TOTAL NONCONVERTIBLE PREFERRED STOCKS (Cost $403,978) | 370,457 | ||
| Money Market Funds - 0.3% | |||
| Shares | Value ($) | ||
Fidelity Cash Central Fund 5.39% (d) (Cost $151,076) | 151,045 | 151,076 | |
| TOTAL INVESTMENT IN SECURITIES - 99.8% (Cost $55,744,624) | 59,267,031 |
NET OTHER ASSETS (LIABILITIES) - 0.2% | 122,119 |
| NET ASSETS - 100.0% | 59,389,150 |
| Futures Contracts | |||||
Number of contracts | Expiration Date | Notional Amount ($) | Value ($) | Unrealized Appreciation/ (Depreciation) ($) | |
| Purchased | |||||
| Equity Index Contracts | |||||
| ICE MSCI Emerging Markets Index Contracts (United States) | 5 | Jun 2024 | 260,500 | 1,216 | 1,216 |
| The notional amount of futures purchased as a percentage of Net Assets is 0.4% | |||||
| (a) | Non-income producing |
| (b) | Security exempt from registration under Rule 144A of the Securities Act of 1933. These securities may be resold in transactions exempt from registration, normally to qualified institutional buyers. At the end of the period, the value of these securities amounted to $3,681,736 or 6.2% of net assets. |
| (c) | Level 3 security |
| (d) | Affiliated fund that is generally available only to investment companies and other accounts managed by Fidelity Investments. The rate quoted is the annualized seven-day yield of the fund at period end. A complete unaudited listing of the fund's holdings as of its most recent quarter end is available upon request. In addition, each Fidelity Central Fund's financial statements are available on the SEC's website or upon request. |
| Affiliate | Value, beginning of period ($) | Purchases ($) | Sales Proceeds ($) | Dividend Income ($) | Realized Gain (loss) ($) | Change in Unrealized appreciation (depreciation) ($) | Value, end of period ($) | % ownership, end of period |
| Fidelity Cash Central Fund 5.39% | - | 6,540,074 | 6,389,051 | 4,832 | 53 | - | 151,076 | 0.0% |
| Total | - | 6,540,074 | 6,389,051 | 4,832 | 53 | - | 151,076 | |
| Valuation Inputs at Reporting Date: | ||||
| Description | Total ($) | Level 1 ($) | Level 2 ($) | Level 3 ($) |
Investments in Securities: | ||||
| Equities: | ||||
Communication Services | 7,684,820 | 7,684,820 | - | - |
Consumer Discretionary | 5,008,436 | 5,008,436 | - | - |
Consumer Staples | 5,170,790 | 5,170,790 | - | - |
Energy | 6,496,200 | 6,490,540 | - | 5,660 |
Financials | 11,920,570 | 11,916,840 | - | 3,730 |
Health Care | 4,681,803 | 4,681,803 | - | - |
Industrials | 1,830,433 | 1,830,433 | - | - |
Information Technology | 10,722,787 | 10,722,787 | - | - |
Materials | 1,598,729 | 1,597,484 | - | 1,245 |
Real Estate | 3,961,057 | 3,961,057 | - | - |
Utilities | 40,330 | - | - | 40,330 |
| Money Market Funds | 151,076 | 151,076 | - | - |
| Total Investments in Securities: | 59,267,031 | 59,216,066 | - | 50,965 |
Derivative Instruments: Assets | ||||
Futures Contracts | 1,216 | 1,216 | - | - |
| Total Assets | 1,216 | 1,216 | - | - |
| Total Derivative Instruments: | 1,216 | 1,216 | - | - |
Primary Risk Exposure / Derivative Type | Value | |
| Asset ($) | Liability ($) | |
| Equity Risk | ||
Futures Contracts (a) | 1,216 | 0 |
| Total Equity Risk | 1,216 | 0 |
| Total Value of Derivatives | 1,216 | 0 |
| Statement of Assets and Liabilities | ||||
April 30, 2024 (Unaudited) | ||||
| Assets | ||||
| Investment in securities, at value - See accompanying schedule: | ||||
Unaffiliated issuers (cost $55,593,548) | $ | 59,115,955 | ||
Fidelity Central Funds (cost $151,076) | 151,076 | |||
| Total Investment in Securities (cost $55,744,624) | $ | 59,267,031 | ||
| Segregated cash with brokers for derivative instruments | 22,513 | |||
| Foreign currency held at value (cost $196,744) | 184,052 | |||
| Dividends receivable | 113,556 | |||
| Distributions receivable from Fidelity Central Funds | 1,912 | |||
Total assets | 59,589,064 | |||
| Liabilities | ||||
| Accrued management fee | $ | 11,972 | ||
| Payable for daily variation margin on futures contracts | 3,152 | |||
| Deferred taxes | 184,755 | |||
| Other payables and accrued expenses | 35 | |||
| Total liabilities | 199,914 | |||
| Net Assets | $ | 59,389,150 | ||
| Net Assets consist of: | ||||
| Paid in capital | $ | 59,227,603 | ||
| Total accumulated earnings (loss) | 161,547 | |||
| Net Assets | $ | 59,389,150 | ||
Net Asset Value, offering price and redemption price per share ($59,389,150 ÷ 2,400,000 shares) | $ | 24.75 | ||
| Statement of Operations | ||||
Six months ended April 30, 2024 (Unaudited) | ||||
| Investment Income | ||||
| Dividends | $ | 732,360 | ||
| Income from Fidelity Central Funds | 4,832 | |||
| Income before foreign taxes withheld | $ | 737,192 | ||
| Less foreign taxes withheld | (94,858) | |||
| Total income | 642,334 | |||
| Expenses | ||||
| Management fee | $ | 48,446 | ||
| Independent trustees' fees and expenses | 80 | |||
| Total expenses before reductions | 48,526 | |||
| Expense reductions | (277) | |||
| Total expenses after reductions | 48,249 | |||
| Net Investment income (loss) | 594,085 | |||
| Realized and Unrealized Gain (Loss) | ||||
| Net realized gain (loss) on: | ||||
| Investment Securities: | ||||
| Unaffiliated issuers (net of foreign taxes of $174,472) | 314,307 | |||
| Fidelity Central Funds | 53 | |||
| Foreign currency transactions | (50,244) | |||
| Futures contracts | 16,025 | |||
| Total net realized gain (loss) | 280,141 | |||
| Change in net unrealized appreciation (depreciation) on: | ||||
| Investment Securities: | ||||
| Unaffiliated issuers (net of increase in deferred foreign taxes of $93,164) | 4,109,624 | |||
| Assets and liabilities in foreign currencies | (2,422) | |||
| Futures contracts | 1,978 | |||
| Total change in net unrealized appreciation (depreciation) | 4,109,180 | |||
| Net gain (loss) | 4,389,321 | |||
| Net increase (decrease) in net assets resulting from operations | $ | 4,983,406 | ||
| Statement of Changes in Net Assets | ||||
Six months ended April 30, 2024 (Unaudited) | Year ended October 31, 2023 | |||
| Increase (Decrease) in Net Assets | ||||
| Operations | ||||
| Net investment income (loss) | $ | 594,085 | $ | 1,033,942 |
| Net realized gain (loss) | 280,141 | (1,236,537) | ||
| Change in net unrealized appreciation (depreciation) | 4,109,180 | 3,102,891 | ||
| Net increase (decrease) in net assets resulting from operations | 4,983,406 | 2,900,296 | ||
| Distributions to shareholders | (379,400) | (1,198,769) | ||
| Distributions to shareholders from tax return of capital | - | (11,231) | ||
| Total Distributions | (379,400) | (1,210,000) | ||
| Share transactions | ||||
| Proceeds from sales of shares | 29,142,414 | 4,445,155 | ||
Net increase (decrease) in net assets resulting from share transactions | 29,142,414 | 4,445,155 | ||
| Total increase (decrease) in net assets | 33,746,420 | 6,135,451 | ||
| Net Assets | ||||
| Beginning of period | 25,642,730 | 19,507,279 | ||
| End of period | $ | 59,389,150 | $ | 25,642,730 |
| Other Information | ||||
| Shares | ||||
| Sold | 1,200,000 | 200,000 | ||
| Net increase (decrease) | 1,200,000 | 200,000 | ||
Fidelity® Emerging Markets Multifactor ETF |
Six months ended (Unaudited) April 30, 2024 | Years ended October 31, 2023 | 2022 | 2021 | 2020 | 2019 A | |||||||
Selected Per-Share Data | ||||||||||||
| Net asset value, beginning of period | $ | 21.37 | $ | 19.51 | $ | 25.88 | $ | 23.12 | $ | 24.68 | $ | 25.00 |
| Income from Investment Operations | ||||||||||||
Net investment income (loss) B,C | .36 | .95 | .89 | .72 | .55 | .50 | ||||||
| Net realized and unrealized gain (loss) | 3.27 | 1.96 | (6.37) | 2.67 | (1.57) | (.34) | ||||||
| Total from investment operations | 3.63 | 2.91 | (5.48) | 3.39 | (1.02) | .16 | ||||||
| Distributions from net investment income | (.25) | (1.04) | (.86) | (.63) | (.54) | (.48) | ||||||
| Distributions from tax return of capital | - | (.01) | (.03) | - | - | - | ||||||
| Total distributions | (.25) | (1.05) | (.89) | (.63) | (.54) | (.48) | ||||||
| Net asset value, end of period | $ | 24.75 | $ | 21.37 | $ | 19.51 | $ | 25.88 | $ | 23.12 | $ | 24.68 |
Total Return D,E,F | 17.04 % | 14.76% | (21.56)% | 14.55% | (4.03)% | .66% | ||||||
Ratios to Average Net Assets C,G,H | ||||||||||||
| Expenses before reductions | .25% I | .45% | .45% | .45% | .45% | .45% I | ||||||
| Expenses net of fee waivers, if any | .25 % I | .45% | .45% | .45% | .45% | .45% I | ||||||
| Expenses net of all reductions | .25% I | .45% | .45% | .45% | .45% | .45% I | ||||||
| Net investment income (loss) | 3.05% I | 4.29% | 3.84% | 2.64% | 2.39% | 3.05% I | ||||||
| Supplemental Data | ||||||||||||
| Net assets, end of period (000 omitted) | $ | 59,389 | $ | 25,643 | $ | 19,507 | $ | 20,703 | $ | 9,249 | $ | 9,872 |
Portfolio turnover rate J | 57 % I,K | 82% K | 91% K | 65% K | 66% | 34% K,L |
Top Holdings (% of Fund's net assets) | ||
| Engie SA (France, Multi-Utilities) | 3.0 | |
| Telefonica SA (Spain, Diversified Telecommunication Services) | 3.0 | |
| TotalEnergies SE (France, Oil, Gas & Consumable Fuels) | 3.0 | |
| SoftBank Corp. (Japan, Wireless Telecommunication Services) | 2.9 | |
| Enel SpA (Italy, Electric Utilities) | 2.8 | |
| Vodafone Group PLC (United Kingdom, Wireless Telecommunication Services) | 2.6 | |
| Hong Kong & China Gas Co. Ltd. (Hong Kong, Gas Utilities) | 2.5 | |
| Glencore PLC (Australia, Metals & Mining) | 2.4 | |
| Enbridge, Inc. (Canada, Oil, Gas & Consumable Fuels) | 2.2 | |
| Tourmaline Oil Corp. (Canada, Oil, Gas & Consumable Fuels) | 2.2 | |
| 26.6 | ||
| Market Sectors (% of Fund's net assets) | ||
| Financials | 28.0 | |
| Materials | 14.4 | |
| Energy | 12.8 | |
| Utilities | 10.3 | |
| Communication Services | 10.3 | |
| Industrials | 10.3 | |
| Consumer Discretionary | 4.7 | |
| Health Care | 4.2 | |
| Information Technology | 2.3 | |
| Consumer Staples | 1.7 | |
Asset Allocation (% of Fund's net assets) |
 |
Futures - 0.9% |
Geographic Diversification (% of Fund's net assets) |
 |
* Includes Short-Term investments and Net Other Assets (Liabilities). Percentages are adjusted for the effect of derivatives, if applicable. |
| Common Stocks - 99.1% | |||
| Shares | Value ($) | ||
| Australia - 10.7% | |||
| ANZ Group Holdings Ltd. | 76,572 | 1,400,172 | |
| BHP Group Ltd. | 63,601 | 1,777,109 | |
| Brambles Ltd. | 16,640 | 157,972 | |
| Glencore PLC | 395,160 | 2,314,178 | |
| IGO Ltd. | 251,988 | 1,294,301 | |
| Sonic Healthcare Ltd. | 13,390 | 232,760 | |
| Wesfarmers Ltd. | 5,600 | 242,872 | |
| Westpac Banking Corp. | 87,239 | 1,470,599 | |
| Woodside Energy Group Ltd. | 77,177 | 1,414,743 | |
TOTAL AUSTRALIA | 10,304,706 | ||
| Austria - 2.0% | |||
| OMV AG | 41,076 | 1,962,369 | |
| Brazil - 1.4% | |||
| Yara International ASA | 47,161 | 1,352,123 | |
| Canada - 16.0% | |||
| Bank of Nova Scotia | 21,818 | 1,003,039 | |
| BCE, Inc. | 52,172 | 1,717,611 | |
| Canadian Imperial Bank of Commerce | 21,314 | 996,934 | |
| Canadian National Railway Co. | 4,355 | 529,663 | |
| Canadian Tire Ltd. Class A (non-vtg.) | 1,358 | 131,456 | |
| Emera, Inc. | 55,611 | 1,879,404 | |
| Enbridge, Inc. | 60,390 | 2,151,684 | |
| Nutrien Ltd. | 34,897 | 1,843,850 | |
| Royal Bank of Canada | 14,627 | 1,418,037 | |
| The Toronto-Dominion Bank | 21,499 | 1,278,031 | |
| Thomson Reuters Corp. | 2,601 | 393,657 | |
| Tourmaline Oil Corp. | 42,829 | 2,097,416 | |
TOTAL CANADA | 15,440,782 | ||
| China - 0.2% | |||
| Wilmar International Ltd. | 65,200 | 154,424 | |
| Denmark - 1.3% | |||
| A.P. Moller - Maersk A/S Series B | 240 | 350,606 | |
| Novo Nordisk A/S Series B | 7,167 | 927,399 | |
| Svitzer A/S | 480 | 16,161 | |
TOTAL DENMARK | 1,294,166 | ||
| Finland - 3.3% | |||
| Kesko Oyj | 6,104 | 104,623 | |
| Kone OYJ (B Shares) | 9,121 | 446,670 | |
| Nokia Corp. | 36,080 | 131,611 | |
| Nordea Bank Abp | 110,588 | 1,295,713 | |
| Sampo Oyj (A Shares) | 29,361 | 1,190,470 | |
TOTAL FINLAND | 3,169,087 | ||
| France - 10.4% | |||
| BNP Paribas SA | 21,138 | 1,528,108 | |
| Bouygues SA | 11,929 | 441,453 | |
| Capgemini SA | 673 | 142,410 | |
| Compagnie Generale des Etablissements Michelin SCA Series B | 7,873 | 304,571 | |
| Engie SA | 167,860 | 2,920,209 | |
| EssilorLuxottica SA | 969 | 208,050 | |
| LVMH Moet Hennessy Louis Vuitton SE | 786 | 650,829 | |
| Rexel SA | 16,245 | 424,348 | |
| TotalEnergies SE | 38,931 | 2,855,194 | |
| VINCI SA | 4,864 | 573,392 | |
TOTAL FRANCE | 10,048,564 | ||
| Germany - 3.9% | |||
| BASF AG | 37,090 | 1,949,413 | |
| Bayer AG | 4,505 | 131,744 | |
| Bayerische Motoren Werke AG (BMW) | 2,716 | 297,523 | |
| DHL Group | 17,376 | 729,423 | |
| Fresenius SE & Co. KGaA | 3,598 | 107,605 | |
| Infineon Technologies AG | 4,609 | 161,250 | |
| Mercedes-Benz Group AG (Germany) | 4,762 | 361,210 | |
TOTAL GERMANY | 3,738,168 | ||
| Hong Kong - 2.9% | |||
| ASMPT Ltd. | 29,500 | 371,145 | |
| Hong Kong & China Gas Co. Ltd. | 3,175,000 | 2,423,509 | |
TOTAL HONG KONG | 2,794,654 | ||
| Italy - 4.2% | |||
| Enel SpA | 415,423 | 2,745,545 | |
| Mediobanca SpA | 90,978 | 1,298,664 | |
TOTAL ITALY | 4,044,209 | ||
| Japan - 15.8% | |||
| Astellas Pharma, Inc. | 26,700 | 256,879 | |
| Canon, Inc. | 8,900 | 242,061 | |
| Isuzu Motors Ltd. | 21,200 | 269,370 | |
| Japan Tobacco, Inc. | 10,700 | 288,638 | |
| Kawasaki Kisen Kaisha Ltd. | 34,200 | 480,515 | |
| Mitsubishi Corp. | 42,600 | 979,964 | |
| Mitsui & Co. Ltd. | 17,100 | 830,089 | |
| Mitsui OSK Lines Ltd. | 15,300 | 485,159 | |
| Mizuho Financial Group, Inc. | 67,500 | 1,309,122 | |
| Nippon Steel & Sumitomo Metal Corp. | 82,000 | 1,845,150 | |
| Nippon Yusen KK | 16,300 | 462,592 | |
| Niterra Co. Ltd. | 10,600 | 348,382 | |
| Sekisui House Ltd. | 13,700 | 315,675 | |
| SoftBank Corp. | 227,700 | 2,765,130 | |
| Sumco Corp. | 14,100 | 213,608 | |
| Sumitomo Mitsui Financial Group, Inc. | 25,800 | 1,472,271 | |
| Sumitomo Mitsui Trust Holdings, Inc. | 53,200 | 1,121,708 | |
| Takeda Pharmaceutical Co. Ltd. | 12,200 | 321,969 | |
| Tokyo Electron Ltd. | 1,700 | 379,398 | |
| Toyota Motor Corp. | 39,135 | 904,732 | |
TOTAL JAPAN | 15,292,412 | ||
| Netherlands - 2.2% | |||
| ABN AMRO Bank NV: | |||
| GDR (Bearer) (a) | 81,583 | 1,316,340 | |
| rights (b)(c) | 81,583 | 77,637 | |
| ASML Holding NV (Netherlands) | 647 | 576,066 | |
| Koninklijke Ahold Delhaize NV | 5,098 | 155,027 | |
TOTAL NETHERLANDS | 2,125,070 | ||
| Norway - 3.7% | |||
| Equinor ASA | 67,310 | 1,817,054 | |
| Mowi ASA | 6,771 | 119,809 | |
| Norsk Hydro ASA | 269,989 | 1,679,790 | |
TOTAL NORWAY | 3,616,653 | ||
| Singapore - 1.8% | |||
| Oversea-Chinese Banking Corp. Ltd. | 171,200 | 1,788,891 | |
| Spain - 4.7% | |||
| Banco Bilbao Vizcaya Argentaria SA | 150,303 | 1,635,239 | |
| Telefonica SA | 638,481 | 2,871,419 | |
TOTAL SPAIN | 4,506,658 | ||
| Sweden - 2.0% | |||
| Svenska Handelsbanken AB (A Shares) | 113,996 | 998,928 | |
| Telefonaktiebolaget LM Ericsson (B Shares) | 23,263 | 119,156 | |
| Volvo AB (B Shares) | 31,855 | 822,503 | |
TOTAL SWEDEN | 1,940,587 | ||
| Switzerland - 2.4% | |||
| Kuehne & Nagel International AG | 1,591 | 422,752 | |
| Novartis AG | 4,911 | 476,830 | |
| Zurich Insurance Group Ltd. | 2,987 | 1,446,683 | |
TOTAL SWITZERLAND | 2,346,265 | ||
| United Kingdom - 8.5% | |||
| AstraZeneca PLC (United Kingdom) | 3,706 | 559,733 | |
| BAE Systems PLC | 39,124 | 653,025 | |
| British American Tobacco PLC (United Kingdom) | 8,732 | 257,053 | |
| CK Hutchison Holdings Ltd. | 47,000 | 229,856 | |
| DCC PLC (United Kingdom) | 6,342 | 435,571 | |
| HSBC Holdings PLC (United Kingdom) | 235,650 | 2,052,501 | |
| Imperial Brands PLC | 8,842 | 202,443 | |
| Schroders PLC | 214,889 | 949,290 | |
| Taylor Wimpey PLC | 226,360 | 373,853 | |
| Vodafone Group PLC | 2,999,881 | 2,541,513 | |
TOTAL UNITED KINGDOM | 8,254,838 | ||
| United States of America - 1.7% | |||
| GSK PLC | 12,084 | 253,141 | |
| Nestle SA (Reg. S) | 3,907 | 392,766 | |
| Roche Holding AG (participation certificate) | 1,758 | 422,848 | |
| Sanofi SA | 3,032 | 301,762 | |
| Stellantis NV (Italy) | 13,981 | 312,139 | |
TOTAL UNITED STATES OF AMERICA | 1,682,656 | ||
| TOTAL COMMON STOCKS (Cost $96,127,467) | 95,857,282 | ||
| Money Market Funds - 0.1% | |||
| Shares | Value ($) | ||
Fidelity Cash Central Fund 5.39% (d) (Cost $83,612) | 83,595 | 83,612 | |
| TOTAL INVESTMENT IN SECURITIES - 99.2% (Cost $96,211,079) | 95,940,894 |
NET OTHER ASSETS (LIABILITIES) - 0.8% | 801,244 |
| NET ASSETS - 100.0% | 96,742,138 |
| Futures Contracts | |||||
Number of contracts | Expiration Date | Notional Amount ($) | Value ($) | Unrealized Appreciation/ (Depreciation) ($) | |
| Purchased | |||||
| Equity Index Contracts | |||||
| ICE E-mini MSCI EAFE Index Contracts (United States) | 8 | Jun 2024 | 907,000 | (27,440) | (27,440) |
| The notional amount of futures purchased as a percentage of Net Assets is 0.9% | |||||
| (a) | Security exempt from registration under Rule 144A of the Securities Act of 1933. These securities may be resold in transactions exempt from registration, normally to qualified institutional buyers. At the end of the period, the value of these securities amounted to $1,316,340 or 1.4% of net assets. |
| (b) | Non-income producing |
| (c) | Security or a portion of the security purchased on a delayed delivery or when-issued basis. |
| (d) | Affiliated fund that is generally available only to investment companies and other accounts managed by Fidelity Investments. The rate quoted is the annualized seven-day yield of the fund at period end. A complete unaudited listing of the fund's holdings as of its most recent quarter end is available upon request. In addition, each Fidelity Central Fund's financial statements are available on the SEC's website or upon request. |
| Affiliate | Value, beginning of period ($) | Purchases ($) | Sales Proceeds ($) | Dividend Income ($) | Realized Gain (loss) ($) | Change in Unrealized appreciation (depreciation) ($) | Value, end of period ($) | % ownership, end of period |
| Fidelity Cash Central Fund 5.39% | 30,635 | 6,799,196 | 6,746,219 | 3,049 | - | - | 83,612 | 0.0% |
| Fidelity Securities Lending Cash Central Fund 5.39% | 2,024,860 | 3,411,268 | 5,436,128 | 6,433 | - | - | - | 0.0% |
| Total | 2,055,495 | 10,210,464 | 12,182,347 | 9,482 | - | - | 83,612 | |
| Valuation Inputs at Reporting Date: | ||||
| Description | Total ($) | Level 1 ($) | Level 2 ($) | Level 3 ($) |
Investments in Securities: | ||||
| Equities: | ||||
Communication Services | 9,895,673 | 9,895,673 | - | - |
Consumer Discretionary | 4,512,612 | 4,512,612 | - | - |
Consumer Staples | 1,674,783 | 1,674,783 | - | - |
Energy | 12,298,460 | 12,298,460 | - | - |
Financials | 27,048,377 | 27,048,377 | - | - |
Health Care | 4,200,720 | 4,200,720 | - | - |
Industrials | 9,865,371 | 9,865,371 | - | - |
Information Technology | 2,336,705 | 2,336,705 | - | - |
Materials | 14,055,914 | 14,055,914 | - | - |
Utilities | 9,968,667 | 9,968,667 | - | - |
| Money Market Funds | 83,612 | 83,612 | - | - |
| Total Investments in Securities: | 95,940,894 | 95,940,894 | - | - |
Derivative Instruments: Liabilities | ||||
Futures Contracts | (27,440) | (27,440) | - | - |
| Total Liabilities | (27,440) | (27,440) | - | - |
| Total Derivative Instruments: | (27,440) | (27,440) | - | - |
Primary Risk Exposure / Derivative Type | Value | |
| Asset ($) | Liability ($) | |
| Equity Risk | ||
Futures Contracts (a) | 0 | (27,440) |
| Total Equity Risk | 0 | (27,440) |
| Total Value of Derivatives | 0 | (27,440) |
| Statement of Assets and Liabilities | ||||
April 30, 2024 (Unaudited) | ||||
| Assets | ||||
| Investment in securities, at value - See accompanying schedule: | ||||
Unaffiliated issuers (cost $96,127,467) | $ | 95,857,282 | ||
Fidelity Central Funds (cost $83,612) | 83,612 | |||
| Total Investment in Securities (cost $96,211,079) | $ | 95,940,894 | ||
| Segregated cash with brokers for derivative instruments | 36,868 | |||
| Foreign currency held at value (cost $169,876) | 169,803 | |||
| Receivable for investments sold | 235 | |||
| Dividends receivable | 498,449 | |||
| Reclaims receivable | 199,925 | |||
| Distributions receivable from Fidelity Central Funds | 252 | |||
| Other receivables | 363 | |||
Total assets | 96,846,789 | |||
| Liabilities | ||||
| Payable for investments purchased on a delayed delivery basis | $ | 77,637 | ||
| Accrued management fee | 14,534 | |||
| Payable for daily variation margin on futures contracts | 12,480 | |||
| Total liabilities | 104,651 | |||
| Net Assets | $ | 96,742,138 | ||
| Net Assets consist of: | ||||
| Paid in capital | $ | 106,606,027 | ||
| Total accumulated earnings (loss) | (9,863,889) | |||
| Net Assets | $ | 96,742,138 | ||
Net Asset Value, offering price and redemption price per share ($96,742,138 ÷ 4,700,000 shares) | $ | 20.58 | ||
| Statement of Operations | ||||
Six months ended April 30, 2024 (Unaudited) | ||||
| Investment Income | ||||
| Dividends | $ | 2,641,515 | ||
| Income from Fidelity Central Funds (including $6,433 from security lending) | 9,482 | |||
| Income before foreign taxes withheld | $ | 2,650,997 | ||
| Less foreign taxes withheld | (281,752) | |||
| Total income | 2,369,245 | |||
| Expenses | ||||
| Management fee | $ | 84,082 | ||
| Independent trustees' fees and expenses | 228 | |||
| Total expenses before reductions | 84,310 | |||
| Expense reductions | (166) | |||
| Total expenses after reductions | 84,144 | |||
| Net Investment income (loss) | 2,285,101 | |||
| Realized and Unrealized Gain (Loss) | ||||
| Net realized gain (loss) on: | ||||
| Investment Securities: | ||||
| Unaffiliated issuers | (2,708,096) | |||
| Redemptions in-kind | 2,092,472 | |||
| Foreign currency transactions | 21,623 | |||
| Futures contracts | 60,673 | |||
| Total net realized gain (loss) | (533,328) | |||
| Change in net unrealized appreciation (depreciation) on: | ||||
| Investment Securities: | ||||
| Unaffiliated issuers | 12,654,985 | |||
| Assets and liabilities in foreign currencies | (24,881) | |||
| Futures contracts | 4,260 | |||
| Total change in net unrealized appreciation (depreciation) | 12,634,364 | |||
| Net gain (loss) | 12,101,036 | |||
| Net increase (decrease) in net assets resulting from operations | $ | 14,386,137 | ||
| Statement of Changes in Net Assets | ||||
Six months ended April 30, 2024 (Unaudited) | Year ended October 31, 2023 | |||
| Increase (Decrease) in Net Assets | ||||
| Operations | ||||
| Net investment income (loss) | $ | 2,285,101 | $ | 4,080,155 |
| Net realized gain (loss) | (533,328) | (1,882,311) | ||
| Change in net unrealized appreciation (depreciation) | 12,634,364 | 7,259,993 | ||
| Net increase (decrease) in net assets resulting from operations | 14,386,137 | 9,457,837 | ||
| Distributions to shareholders | (1,992,100) | (4,144,700) | ||
| Share transactions | ||||
| Proceeds from sales of shares | 9,892,925 | - | ||
| Cost of shares redeemed | (6,057,904) | (5,529,770) | ||
Net increase (decrease) in net assets resulting from share transactions | 3,835,021 | (5,529,770) | ||
| Total increase (decrease) in net assets | 16,229,058 | (216,633) | ||
| Net Assets | ||||
| Beginning of period | 80,513,080 | 80,729,713 | ||
| End of period | $ | 96,742,138 | $ | 80,513,080 |
| Other Information | ||||
| Shares | ||||
| Sold | 500,000 | - | ||
| Redeemed | (300,000) | (300,000) | ||
| Net increase (decrease) | 200,000 | (300,000) | ||
Fidelity® International High Dividend ETF |
Six months ended (Unaudited) April 30, 2024 | Years ended October 31, 2023 | 2022 | 2021 | 2020 | 2019 | |||||||
Selected Per-Share Data | ||||||||||||
| Net asset value, beginning of period | $ | 17.89 | $ | 16.82 | $ | 21.08 | $ | 15.10 | $ | 20.96 | $ | 20.56 |
| Income from Investment Operations | ||||||||||||
Net investment income (loss) A,B | .49 | .89 | .97 | .77 | .60 | 1.04 | ||||||
| Net realized and unrealized gain (loss) | 2.63 | 1.08 | (4.22) | 5.95 | (5.81) | .31 | ||||||
| Total from investment operations | 3.12 | 1.97 | (3.25) | 6.72 | (5.21) | 1.35 | ||||||
| Distributions from net investment income | (.43) | (.90) | (1.01) | (.74) | (.65) | (.95) | ||||||
| Total distributions | (.43) | (.90) | (1.01) | (.74) | (.65) | (.95) | ||||||
| Net asset value, end of period | $ | 20.58 | $ | 17.89 | $ | 16.82 | $ | 21.08 | $ | 15.10 | $ | 20.96 |
Total Return C,D,E | 17.48 % | 11.57% | (15.83)% | 44.78% | (24.98)% | 6.84% | ||||||
Ratios to Average Net Assets B,F,G | ||||||||||||
| Expenses before reductions | .18% H | .39% | .39% | .39% | .39% | .39% | ||||||
| Expenses net of fee waivers, if any | .18 % H | .39% | .39% | .39% | .39% | .39% | ||||||
| Expenses net of all reductions | .18% H | .39% | .39% | .39% | .39% | .39% | ||||||
| Net investment income (loss) | 4.89% H | 4.68% | 4.96% | 3.82% | 3.38% | 5.07% | ||||||
| Supplemental Data | ||||||||||||
| Net assets, end of period (000 omitted) | $ | 96,742 | $ | 80,513 | $ | 80,730 | $ | 82,197 | $ | 45,290 | $ | 44,022 |
Portfolio turnover rate I,J | 123 % H | 67% | 71% | 67% | 82% | 47% |
Top Holdings (% of Fund's net assets) | ||
| Novo Nordisk A/S Series B (Denmark, Pharmaceuticals) | 2.6 | |
| AstraZeneca PLC (United Kingdom) (United Kingdom, Pharmaceuticals) | 1.6 | |
| Redeia Corp. SA (Spain, Electric Utilities) | 1.4 | |
| Tokyo Gas Co. Ltd. (Japan, Gas Utilities) | 1.4 | |
| Novartis AG (Switzerland, Pharmaceuticals) | 1.4 | |
| PSP Swiss Property AG (Switzerland, Real Estate Management & Development) | 1.3 | |
| Snam SpA (Italy, Gas Utilities) | 1.3 | |
| Endesa SA (Spain, Electric Utilities) | 1.3 | |
| Publicis Groupe SA (France, Media) | 1.3 | |
| BKW AG (Switzerland, Electric Utilities) | 1.3 | |
| 14.9 | ||
| Market Sectors (% of Fund's net assets) | ||
| Financials | 16.9 | |
| Health Care | 16.0 | |
| Consumer Staples | 13.4 | |
| Industrials | 13.4 | |
| Communication Services | 8.3 | |
| Utilities | 7.7 | |
| Consumer Discretionary | 7.2 | |
| Real Estate | 6.5 | |
| Information Technology | 4.7 | |
| Materials | 3.4 | |
| Energy | 1.7 | |
Asset Allocation (% of Fund's net assets) |
 |
Futures - 0.7% |
Geographic Diversification (% of Fund's net assets) |
 |
* Includes Short-Term investments and Net Other Assets (Liabilities). Percentages are adjusted for the effect of derivatives, if applicable. |
| Common Stocks - 99.3% | |||
| Shares | Value ($) | ||
| Australia - 5.1% | |||
| BHP Group Ltd. | 9,588 | 267,903 | |
| Brambles Ltd. | 14,517 | 137,817 | |
| Fortescue Ltd. | 4,877 | 82,497 | |
| Insurance Australia Group Ltd. | 72,629 | 303,721 | |
| JB Hi-Fi Ltd. | 1,968 | 78,017 | |
| Medibank Private Ltd. | 112,424 | 259,889 | |
| Rio Tinto Ltd. | 1,079 | 91,428 | |
| Rio Tinto PLC | 2,757 | 188,903 | |
| Sonic Healthcare Ltd. | 30,807 | 535,521 | |
| Suncorp Group Ltd. | 31,681 | 341,908 | |
| Telstra Group Ltd. | 279,328 | 665,671 | |
| Washington H. Soul Pattinson & Co. Ltd. | 12,603 | 267,363 | |
| Wesfarmers Ltd. | 4,182 | 181,374 | |
TOTAL AUSTRALIA | 3,402,012 | ||
| Austria - 0.1% | |||
| Mondi PLC | 4,418 | 84,031 | |
| Brazil - 0.2% | |||
| Yara International ASA | 4,472 | 128,214 | |
| Canada - 8.9% | |||
| ARC Resources Ltd. | 4,429 | 80,369 | |
| B2Gold Corp. | 56,371 | 142,789 | |
| Boyd Group Services, Inc. | 934 | 175,012 | |
| Canadian Apartment Properties (REIT) unit | 17,124 | 534,093 | |
| Canadian National Railway Co. | 3,090 | 375,811 | |
| Canadian Natural Resources Ltd. | 1,935 | 146,930 | |
| CGI, Inc. Class A (sub. vtg.) (a) | 1,648 | 167,325 | |
| Constellation Software, Inc. | 89 | 229,604 | |
| Constellation Software, Inc. warrants 3/31/40 (a)(b) | 40 | 0 | |
| Dollarama, Inc. | 2,141 | 178,966 | |
| Fairfax Financial Holdings Ltd. (sub. vtg.) | 272 | 296,324 | |
| Great-West Lifeco, Inc. | 7,311 | 216,640 | |
| iA Financial Corp., Inc. | 3,517 | 213,654 | |
| Imperial Oil Ltd. | 1,196 | 82,397 | |
| Intact Financial Corp. | 1,881 | 309,796 | |
| Loblaw Companies Ltd. | 4,440 | 487,872 | |
| Manulife Financial Corp. | 15,034 | 351,379 | |
| Metro, Inc. | 8,300 | 425,437 | |
| Northland Power, Inc. | 41,785 | 639,009 | |
| Parkland Corp. | 1,880 | 58,035 | |
| Power Corp. of Canada (sub. vtg.) | 9,022 | 240,876 | |
| Stantec, Inc. | 2,671 | 213,101 | |
| Stella-Jones, Inc. | 2,690 | 156,601 | |
| TMX Group Ltd. | 9,496 | 251,941 | |
TOTAL CANADA | 5,973,961 | ||
| China - 0.4% | |||
| BOC Hong Kong (Holdings) Ltd. | 92,000 | 284,074 | |
| Denmark - 4.2% | |||
| A.P. Moller - Maersk A/S Series B | 127 | 185,529 | |
| Carlsberg A/S Series B | 3,705 | 500,986 | |
| Demant A/S (a) | 5,301 | 255,651 | |
| Novo Nordisk A/S Series B | 13,344 | 1,726,696 | |
| Pandora A/S | 1,088 | 166,818 | |
| Svitzer A/S | 254 | 8,552 | |
TOTAL DENMARK | 2,844,232 | ||
| Finland - 0.7% | |||
| Kone OYJ (B Shares) | 4,958 | 242,801 | |
| Orion Oyj (B Shares) | 5,359 | 205,081 | |
TOTAL FINLAND | 447,882 | ||
| France - 7.6% | |||
| bioMerieux SA | 2,248 | 240,367 | |
| Compagnie de St.-Gobain | 4,041 | 322,594 | |
| Dassault Aviation SA | 1,056 | 227,181 | |
| Dassault Systemes SA | 3,160 | 125,118 | |
| Edenred SA | 4,817 | 228,995 | |
| Eiffage SA | 2,027 | 217,387 | |
| Gaztransport et Technigaz SA | 198 | 27,734 | |
| Hermes International SCA | 136 | 327,336 | |
| Ipsen SA | 2,139 | 260,961 | |
| L'Oreal SA | 1,702 | 800,103 | |
| La Francaise des Jeux SAEM (c) | 3,431 | 130,088 | |
| Publicis Groupe SA | 7,652 | 849,690 | |
| SCOR SE | 8,447 | 276,739 | |
| Sodexo SA | 1,811 | 158,302 | |
| Sopra Steria Group | 411 | 90,529 | |
| Thales SA | 1,548 | 261,439 | |
| TotalEnergies SE | 2,427 | 177,996 | |
| VINCI SA | 2,866 | 337,858 | |
TOTAL FRANCE | 5,060,417 | ||
| Germany - 4.9% | |||
| Allianz SE | 1,865 | 531,641 | |
| Bayerische Motoren Werke AG (BMW) | 2,012 | 220,404 | |
| Beiersdorf AG | 3,289 | 494,281 | |
| Deutsche Borse AG | 1,504 | 291,317 | |
| DHL Group | 4,104 | 172,281 | |
| Fresenius Medical Care AG & Co. KGaA | 6,624 | 280,475 | |
| Fresenius SE & Co. KGaA | 9,612 | 287,465 | |
| Hannover Reuck SE | 989 | 245,760 | |
| Knorr-Bremse AG | 1,395 | 103,741 | |
| Siemens AG | 2,429 | 456,849 | |
| Talanx AG | 2,916 | 220,438 | |
TOTAL GERMANY | 3,304,652 | ||
| Hong Kong - 1.2% | |||
| Jardine Matheson Holdings Ltd. | 2,377 | 91,205 | |
| Sino Land Ltd. | 667,295 | 717,531 | |
TOTAL HONG KONG | 808,736 | ||
| Ireland - 0.7% | |||
| Glanbia PLC | 24,702 | 471,201 | |
| Israel - 2.0% | |||
| Bank Hapoalim BM (Reg.) | 26,972 | 244,684 | |
| Bank Leumi le-Israel BM | 30,389 | 238,556 | |
| Icl Group Ltd. | 32,090 | 151,489 | |
| Israel Discount Bank Ltd. (Class A) | 44,449 | 229,602 | |
| Mizrahi Tefahot Bank Ltd. | 5,827 | 213,412 | |
| NICE Ltd. (a) | 549 | 123,172 | |
| Nova Ltd. (a) | 667 | 115,674 | |
TOTAL ISRAEL | 1,316,589 | ||
| Italy - 3.3% | |||
| Assicurazioni Generali SpA | 12,096 | 296,181 | |
| BPER Banca | 58,363 | 305,221 | |
| Buzzi SpA | 4,339 | 157,093 | |
| Eni SpA | 3,764 | 60,917 | |
| Ferrari NV (Italy) | 621 | 257,102 | |
| Recordati SpA | 4,509 | 241,303 | |
| Snam SpA | 191,701 | 881,808 | |
TOTAL ITALY | 2,199,625 | ||
| Japan - 23.3% | |||
| Advance Residence Investment Corp. | 371 | 805,112 | |
| Dai Nippon Printing Co. Ltd. | 6,900 | 201,960 | |
| Daito Trust Construction Co. Ltd. | 7,100 | 763,172 | |
| Daiwa Securities Group, Inc. | 32,600 | 240,722 | |
| Honda Motor Co. Ltd. | 26,500 | 305,138 | |
| INPEX Corp. | 6,700 | 101,864 | |
| Itochu Corp. | 7,700 | 349,170 | |
| Japan Exchange Group, Inc. | 10,200 | 240,278 | |
| Japan Tobacco, Inc. | 20,600 | 555,695 | |
| Kajima Corp. | 11,000 | 212,010 | |
| KDDI Corp. | 24,100 | 673,847 | |
| Kyushu Financial Group, Inc. | 31,300 | 210,636 | |
| McDonald's Holdings Co. (Japan) Ltd. | 4,100 | 180,815 | |
| Medipal Holdings Corp. | 25,600 | 401,817 | |
| Mitsubishi Corp. | 21,500 | 494,583 | |
| Mitsubishi UFJ Lease & Finance Co. Ltd. | 30,400 | 197,721 | |
| Mitsui & Co. Ltd. | 8,300 | 402,909 | |
| NEC Corp. | 3,200 | 233,851 | |
| Nexon Co. Ltd. | 41,600 | 653,350 | |
| Nippon Telegraph & Telephone Corp. | 598,200 | 649,271 | |
| NOF Corp. | 8,300 | 111,975 | |
| Obayashi Corp. | 20,800 | 232,896 | |
| OBIC Co. Ltd. | 1,200 | 155,257 | |
| Ono Pharmaceutical Co. Ltd. | 25,000 | 361,580 | |
| Otsuka Corp. | 8,600 | 172,038 | |
| Otsuka Holdings Co. Ltd. | 12,200 | 522,685 | |
| Sanwa Holdings Corp. | 12,100 | 199,187 | |
| SCSK Corp. | 9,600 | 175,419 | |
| Secom Co. Ltd. | 2,900 | 202,345 | |
| Sekisui Chemical Co. Ltd. | 13,000 | 190,128 | |
| Sekisui House Ltd. | 9,100 | 209,682 | |
| SHIMANO, Inc. | 1,400 | 229,664 | |
| Shin-Etsu Chemical Co. Ltd. | 6,300 | 248,013 | |
| Shionogi & Co. Ltd. | 9,200 | 431,105 | |
| Sojitz Corp. | 8,000 | 206,348 | |
| Sompo Holdings, Inc. | 14,300 | 283,519 | |
| Subaru Corp. | 10,000 | 224,446 | |
| Sumitomo Corp. | 10,900 | 287,799 | |
| Sumitomo Forestry Co. Ltd. | 6,300 | 195,568 | |
| Suntory Beverage & Food Ltd. | 13,900 | 452,778 | |
| TIS, Inc. | 8,100 | 173,772 | |
| Tokio Marine Holdings, Inc. | 13,100 | 415,481 | |
| Tokyo Gas Co. Ltd. | 41,100 | 924,303 | |
| Toppan Holdings, Inc. | 7,300 | 173,866 | |
| Toyo Suisan Kaisha Ltd. | 8,400 | 525,304 | |
| Trend Micro, Inc. | 3,300 | 163,778 | |
| USS Co. Ltd. | 19,200 | 147,143 | |
| Zensho Holdings Co. Ltd. | 3,700 | 144,247 | |
TOTAL JAPAN | 15,634,247 | ||
| Jordan - 0.4% | |||
| Hikma Pharmaceuticals PLC | 10,061 | 242,383 | |
| Netherlands - 3.9% | |||
| ASML Holding NV (Netherlands) | 863 | 768,385 | |
| EXOR NV | 2,251 | 247,187 | |
| Koninklijke Ahold Delhaize NV | 18,951 | 576,290 | |
| Koninklijke KPN NV | 206,873 | 753,846 | |
| Wolters Kluwer NV | 1,968 | 296,178 | |
TOTAL NETHERLANDS | 2,641,886 | ||
| Norway - 0.7% | |||
| Equinor ASA | 1,780 | 48,052 | |
| Orkla ASA | 57,936 | 396,559 | |
TOTAL NORWAY | 444,611 | ||
| Portugal - 0.7% | |||
| Galp Energia SGPS SA Class B | 2,018 | 43,586 | |
| Jeronimo Martins SGPS SA | 19,715 | 407,903 | |
TOTAL PORTUGAL | 451,489 | ||
| Singapore - 1.8% | |||
| CapitaLand Integrated Commercial Trust | 474,000 | 681,239 | |
| Oversea-Chinese Banking Corp. Ltd. | 31,181 | 325,814 | |
| Singapore Exchange Ltd. | 30,100 | 206,589 | |
TOTAL SINGAPORE | 1,213,642 | ||
| Spain - 3.1% | |||
| Endesa SA | 47,154 | 862,172 | |
| Industria de Diseno Textil SA | 5,544 | 254,011 | |
| Redeia Corp. SA | 55,912 | 935,618 | |
TOTAL SPAIN | 2,051,801 | ||
| Sweden - 3.1% | |||
| Atlas Copco AB (A Shares) | 19,606 | 349,128 | |
| Epiroc AB (A Shares) | 10,796 | 203,410 | |
| Essity AB (B Shares) | 20,803 | 520,459 | |
| Evolution AB (c) | 1,481 | 166,236 | |
| H&M Hennes & Mauritz AB (B Shares) | 10,884 | 175,270 | |
| Holmen AB (B Shares) | 3,802 | 149,504 | |
| Securitas AB (B Shares) | 16,633 | 168,893 | |
| Swedish Orphan Biovitrum AB (a) | 9,419 | 244,917 | |
| Telefonaktiebolaget LM Ericsson (B Shares) | 22,067 | 113,030 | |
TOTAL SWEDEN | 2,090,847 | ||
| Switzerland - 6.3% | |||
| Banque Cantonale Vaudoise | 1,617 | 169,607 | |
| BKW AG | 5,675 | 843,376 | |
| Galenica AG (c) | 2,789 | 213,626 | |
| Geberit AG (Reg.) | 402 | 216,352 | |
| Kuehne & Nagel International AG | 687 | 182,546 | |
| Logitech International SA (Reg.) | 1,359 | 106,776 | |
| Novartis AG | 9,459 | 918,415 | |
| Partners Group Holding AG | 205 | 265,875 | |
| PSP Swiss Property AG | 7,329 | 910,182 | |
| UBS Group AG | 15,233 | 403,102 | |
TOTAL SWITZERLAND | 4,229,857 | ||
| United Kingdom - 12.1% | |||
| 3i Group PLC | 10,010 | 360,478 | |
| Admiral Group PLC | 7,595 | 259,530 | |
| AstraZeneca PLC (United Kingdom) | 7,176 | 1,083,822 | |
| Auto Trader Group PLC (c) | 77,247 | 675,526 | |
| BAE Systems PLC | 14,542 | 242,723 | |
| British American Tobacco PLC (United Kingdom) | 19,044 | 560,618 | |
| CK Hutchison Holdings Ltd. | 22,000 | 107,592 | |
| Compass Group PLC | 9,692 | 270,872 | |
| Computacenter PLC | 2,554 | 82,572 | |
| IG Group Holdings PLC | 25,500 | 238,835 | |
| Imperial Brands PLC | 17,101 | 391,537 | |
| InterContinental Hotel Group PLC | 2,029 | 199,489 | |
| J Sainsbury PLC | 104,207 | 343,692 | |
| Man Group PLC | 76,281 | 246,047 | |
| Marks & Spencer Group PLC | 115,283 | 369,251 | |
| RELX PLC (London Stock Exchange) | 7,445 | 307,914 | |
| Rightmove PLC | 98,168 | 633,043 | |
| Rolls-Royce Holdings PLC (a) | 47,550 | 245,959 | |
| Sage Group PLC | 7,890 | 115,195 | |
| Smith & Nephew PLC | 19,567 | 239,863 | |
| Standard Chartered PLC (United Kingdom) | 34,879 | 301,261 | |
| Unilever PLC | 15,629 | 810,192 | |
TOTAL UNITED KINGDOM | 8,086,011 | ||
| United States of America - 4.6% | |||
| CRH PLC | 2,131 | 166,397 | |
| Experian PLC | 4,716 | 191,563 | |
| GSK PLC | 25,784 | 540,135 | |
| Holcim AG | 2,739 | 230,492 | |
| Roche Holding AG (participation certificate) | 3,412 | 820,681 | |
| Sanofi SA | 6,274 | 624,425 | |
| Shell PLC (London) | 6,791 | 243,451 | |
| Stellantis NV (Italy) | 10,727 | 239,490 | |
TOTAL UNITED STATES OF AMERICA | 3,056,634 | ||
| TOTAL COMMON STOCKS (Cost $63,877,378) | 66,469,034 | ||
| Money Market Funds - 0.3% | |||
| Shares | Value ($) | ||
Fidelity Cash Central Fund 5.39% (d) (Cost $208,323) | 208,282 | 208,323 | |
| TOTAL INVESTMENT IN SECURITIES - 99.6% (Cost $64,085,701) | 66,677,357 |
NET OTHER ASSETS (LIABILITIES) - 0.4% | 274,611 |
| NET ASSETS - 100.0% | 66,951,968 |
| Futures Contracts | |||||
Number of contracts | Expiration Date | Notional Amount ($) | Value ($) | Unrealized Appreciation/ (Depreciation) ($) | |
| Purchased | |||||
| Equity Index Contracts | |||||
| ICE E-mini MSCI EAFE Index Contracts (United States) | 4 | Jun 2024 | 453,500 | (13,181) | (13,181) |
| The notional amount of futures purchased as a percentage of Net Assets is 0.7% | |||||
| (a) | Non-income producing |
| (b) | Level 3 security |
| (c) | Security exempt from registration under Rule 144A of the Securities Act of 1933. These securities may be resold in transactions exempt from registration, normally to qualified institutional buyers. At the end of the period, the value of these securities amounted to $1,185,476 or 1.8% of net assets. |
| (d) | Affiliated fund that is generally available only to investment companies and other accounts managed by Fidelity Investments. The rate quoted is the annualized seven-day yield of the fund at period end. A complete unaudited listing of the fund's holdings as of its most recent quarter end is available upon request. In addition, each Fidelity Central Fund's financial statements are available on the SEC's website or upon request. |
| Affiliate | Value, beginning of period ($) | Purchases ($) | Sales Proceeds ($) | Dividend Income ($) | Realized Gain (loss) ($) | Change in Unrealized appreciation (depreciation) ($) | Value, end of period ($) | % ownership, end of period |
| Fidelity Cash Central Fund 5.39% | 208,816 | 2,735,026 | 2,735,519 | 3,580 | - | - | 208,323 | 0.0% |
| Total | 208,816 | 2,735,026 | 2,735,519 | 3,580 | - | - | 208,323 | |
| Valuation Inputs at Reporting Date: | ||||
| Description | Total ($) | Level 1 ($) | Level 2 ($) | Level 3 ($) |
Investments in Securities: | ||||
| Equities: | ||||
Communication Services | 5,554,244 | 5,554,244 | - | - |
Consumer Discretionary | 4,830,606 | 4,830,606 | - | - |
Consumer Staples | 9,090,158 | 9,090,158 | - | - |
Energy | 1,071,331 | 1,071,331 | - | - |
Financials | 11,272,793 | 11,272,793 | - | - |
Health Care | 10,678,974 | 10,678,974 | - | - |
Industrials | 9,004,489 | 9,004,489 | - | - |
Information Technology | 3,111,495 | 3,111,495 | - | - |
Materials | 2,357,329 | 2,357,329 | - | - |
Real Estate | 4,411,329 | 4,411,329 | - | - |
Utilities | 5,086,286 | 5,086,286 | - | - |
| Money Market Funds | 208,323 | 208,323 | - | - |
| Total Investments in Securities: | 66,677,357 | 66,677,357 | - | - |
Derivative Instruments: Liabilities | ||||
Futures Contracts | (13,181) | (13,181) | - | - |
| Total Liabilities | (13,181) | (13,181) | - | - |
| Total Derivative Instruments: | (13,181) | (13,181) | - | - |
Primary Risk Exposure / Derivative Type | Value | |
| Asset ($) | Liability ($) | |
| Equity Risk | ||
Futures Contracts (a) | 0 | (13,181) |
| Total Equity Risk | 0 | (13,181) |
| Total Value of Derivatives | 0 | (13,181) |
| Statement of Assets and Liabilities | ||||
April 30, 2024 (Unaudited) | ||||
| Assets | ||||
| Investment in securities, at value - See accompanying schedule: | ||||
Unaffiliated issuers (cost $63,877,378) | $ | 66,469,034 | ||
Fidelity Central Funds (cost $208,323) | 208,323 | |||
| Total Investment in Securities (cost $64,085,701) | $ | 66,677,357 | ||
| Segregated cash with brokers for derivative instruments | 18,941 | |||
| Foreign currency held at value (cost $112,080) | 111,422 | |||
| Dividends receivable | 255,207 | |||
| Reclaims receivable | 78,234 | |||
| Distributions receivable from Fidelity Central Funds | 448 | |||
| Other receivables | 227 | |||
Total assets | 67,141,836 | |||
| Liabilities | ||||
| Payable for investments purchased | $ | 173,980 | ||
| Accrued management fee | 9,648 | |||
| Payable for daily variation margin on futures contracts | 6,240 | |||
| Total liabilities | 189,868 | |||
| Net Assets | $ | 66,951,968 | ||
| Net Assets consist of: | ||||
| Paid in capital | $ | 65,850,977 | ||
| Total accumulated earnings (loss) | 1,100,991 | |||
| Net Assets | $ | 66,951,968 | ||
Net Asset Value, offering price and redemption price per share ($66,951,968 ÷ 2,500,000 shares) | $ | 26.78 | ||
| Statement of Operations | ||||
Six months ended April 30, 2024 (Unaudited) | ||||
| Investment Income | ||||
| Dividends | $ | 868,685 | ||
| Income from Fidelity Central Funds | 3,580 | |||
| Income before foreign taxes withheld | $ | 872,265 | ||
| Less foreign taxes withheld | (91,242) | |||
| Total income | 781,023 | |||
| Expenses | ||||
| Management fee | $ | 44,119 | ||
| Independent trustees' fees and expenses | 101 | |||
| Total expenses before reductions | 44,220 | |||
| Expense reductions | (131) | |||
| Total expenses after reductions | 44,089 | |||
| Net Investment income (loss) | 736,934 | |||
| Realized and Unrealized Gain (Loss) | ||||
| Net realized gain (loss) on: | ||||
| Investment Securities: | ||||
| Unaffiliated issuers | (340,317) | |||
| Redemptions in-kind | 940,371 | |||
| Foreign currency transactions | (7,501) | |||
| Futures contracts | 35,167 | |||
| Total net realized gain (loss) | 627,720 | |||
| Change in net unrealized appreciation (depreciation) on: | ||||
| Investment Securities: | ||||
| Unaffiliated issuers | 3,616,114 | |||
| Assets and liabilities in foreign currencies | (4,286) | |||
| Futures contracts | (8,683) | |||
| Total change in net unrealized appreciation (depreciation) | 3,603,145 | |||
| Net gain (loss) | 4,230,865 | |||
| Net increase (decrease) in net assets resulting from operations | $ | 4,967,799 | ||
| Statement of Changes in Net Assets | ||||
Six months ended April 30, 2024 (Unaudited) | Year ended October 31, 2023 | |||
| Increase (Decrease) in Net Assets | ||||
| Operations | ||||
| Net investment income (loss) | $ | 736,934 | $ | 628,622 |
| Net realized gain (loss) | 627,720 | (549,531) | ||
| Change in net unrealized appreciation (depreciation) | 3,603,145 | 560,479 | ||
| Net increase (decrease) in net assets resulting from operations | 4,967,799 | 639,570 | ||
| Distributions to shareholders | (648,300) | (626,600) | ||
| Share transactions | ||||
| Proceeds from sales of shares | 37,075,518 | 17,630,620 | ||
| Cost of shares redeemed | (5,329,251) | - | ||
Net increase (decrease) in net assets resulting from share transactions | 31,746,267 | 17,630,620 | ||
| Total increase (decrease) in net assets | 36,065,766 | 17,643,590 | ||
| Net Assets | ||||
| Beginning of period | 30,886,202 | 13,242,612 | ||
| End of period | $ | 66,951,968 | $ | 30,886,202 |
| Other Information | ||||
| Shares | ||||
| Sold | 1,400,000 | 700,000 | ||
| Redeemed | (200,000) | - | ||
| Net increase (decrease) | 1,200,000 | 700,000 | ||
Fidelity® International Multifactor ETF |
Six months ended (Unaudited) April 30, 2024 | Years ended October 31, 2023 | 2022 | 2021 | 2020 | 2019 A | |||||||
Selected Per-Share Data | ||||||||||||
| Net asset value, beginning of period | $ | 23.76 | $ | 22.07 | $ | 29.41 | $ | 24.01 | $ | 26.18 | $ | 25.05 |
| Income from Investment Operations | ||||||||||||
Net investment income (loss) B,C | .40 | .70 | .65 | .65 | .57 | .55 | ||||||
| Net realized and unrealized gain (loss) | 2.96 | 1.67 | (7.12) | 5.34 | (2.07) | 1.12 | ||||||
| Total from investment operations | 3.36 | 2.37 | (6.47) | 5.99 | (1.50) | 1.67 | ||||||
| Distributions from net investment income | (.34) | (.68) | (.87) | (.59) | (.67) | (.54) | ||||||
| Total distributions | (.34) | (.68) | (.87) | (.59) | (.67) | (.54) | ||||||
| Net asset value, end of period | $ | 26.78 | $ | 23.76 | $ | 22.07 | $ | 29.41 | $ | 24.01 | $ | 26.18 |
Total Return D,E,F | 14.15 % | 10.58% | (22.36)% | 25.08% | (5.73)% | 6.72% | ||||||
Ratios to Average Net Assets C,G,H | ||||||||||||
| Expenses before reductions | .18% I | .39% | .39% | .39% | .39% | .39% I | ||||||
| Expenses net of fee waivers, if any | .18 % I | .39% | .39% | .39% | .39% | .39% I | ||||||
| Expenses net of all reductions | .18% I | .39% | .39% | .39% | .39% | .39% I | ||||||
| Net investment income (loss) | 3.00% I | 2.78% | 2.51% | 2.28% | 2.29% | 3.18% I | ||||||
| Supplemental Data | ||||||||||||
| Net assets, end of period (000 omitted) | $ | 66,952 | $ | 30,886 | $ | 13,243 | $ | 17,648 | $ | 7,202 | $ | 10,473 |
Portfolio turnover rate J,K | 37 % I | 60% | 61% | 74% | 69% | 35% L |
Top Holdings (% of Fund's net assets) | ||
| ASML Holding NV (Netherlands) (Netherlands, Semiconductors & Semiconductor Equipment) | 2.2 | |
| Nestle SA (Reg. S) (United States of America, Food Products) | 1.8 | |
| BOC Hong Kong (Holdings) Ltd. (China, Banks) | 1.7 | |
| AstraZeneca PLC (United Kingdom) (United Kingdom, Pharmaceuticals) | 1.7 | |
| HSBC Holdings PLC (United Kingdom) (United Kingdom, Banks) | 1.6 | |
| Shell PLC (London) (United States of America, Oil, Gas & Consumable Fuels) | 1.6 | |
| Mitsubishi Corp. (Japan, Trading Companies & Distributors) | 1.5 | |
| Siemens AG (Germany, Industrial Conglomerates) | 1.4 | |
| Glencore PLC (Australia, Metals & Mining) | 1.4 | |
| Novartis AG (Switzerland, Pharmaceuticals) | 1.4 | |
| 16.3 | ||
| Market Sectors (% of Fund's net assets) | ||
| Financials | 21.8 | |
| Industrials | 17.4 | |
| Consumer Discretionary | 10.9 | |
| Health Care | 10.5 | |
| Information Technology | 8.6 | |
| Consumer Staples | 8.0 | |
| Materials | 7.2 | |
| Energy | 6.2 | |
| Communication Services | 3.6 | |
| Utilities | 3.1 | |
| Real Estate | 1.8 | |
Asset Allocation (% of Fund's net assets) |
|
Futures - 0.9% |
Geographic Diversification (% of Fund's net assets) |
 |
* Includes Short-Term investments and Net Other Assets (Liabilities). Percentages are adjusted for the effect of derivatives, if applicable. |
| Common Stocks - 99.1% | |||
| Shares | Value ($) | ||
| Australia - 6.3% | |||
| Aristocrat Leisure Ltd. | 21,404 | 554,836 | |
| BHP Group Ltd. | 39,995 | 1,117,522 | |
| Brambles Ltd. | 32,001 | 303,801 | |
| Glencore PLC | 281,910 | 1,650,951 | |
| Macquarie Group Ltd. | 10,386 | 1,264,326 | |
| QBE Insurance Group Ltd. | 105,991 | 1,220,272 | |
| Rio Tinto Ltd. | 5,834 | 494,336 | |
| Sonic Healthcare Ltd. | 39,279 | 682,791 | |
TOTAL AUSTRALIA | 7,288,835 | ||
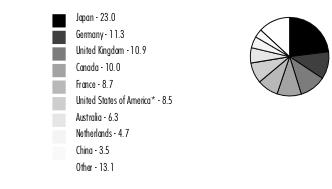
| Canada - 10.0% | |||
| Air Canada (a) | 51,188 | 757,099 | |
| Canadian Apartment Properties (REIT) unit | 2,842 | 88,641 | |
| Canadian National Railway Co. | 8,707 | 1,058,960 | |
| Canadian Natural Resources Ltd. | 17,763 | 1,348,791 | |
| Canadian Tire Ltd. Class A (non-vtg.) | 3,951 | 382,461 | |
| CGI, Inc. Class A (sub. vtg.) (a) | 11,832 | 1,201,329 | |
| Fairfax Financial Holdings Ltd. (sub. vtg.) | 645 | 702,681 | |
| Fortis, Inc. | 9,477 | 372,913 | |
| Manulife Financial Corp. | 35,134 | 821,162 | |
| Nutrien Ltd. | 22,013 | 1,163,099 | |
| Royal Bank of Canada | 13,685 | 1,326,713 | |
| Suncor Energy, Inc. | 29,553 | 1,129,977 | |
| The Toronto-Dominion Bank | 19,576 | 1,163,717 | |
TOTAL CANADA | 11,517,543 | ||
| China - 3.5% | |||
| BOC Hong Kong (Holdings) Ltd. | 644,500 | 1,990,062 | |
| Prosus NV | 36,747 | 1,238,082 | |
| Wilmar International Ltd. | 354,200 | 838,912 | |
TOTAL CHINA | 4,067,056 | ||
| Denmark - 0.6% | |||
| A.P. Moller - Maersk A/S Series B | 481 | 702,673 | |
| Svitzer A/S | 962 | 32,389 | |
TOTAL DENMARK | 735,062 | ||
| Finland - 0.5% | |||
| Nokia Corp. | 162,685 | 593,434 | |
| France - 8.7% | |||
| BNP Paribas SA | 18,391 | 1,329,522 | |
| Capgemini SA | 3,032 | 641,585 | |
| Carrefour SA | 38,418 | 648,629 | |
| Compagnie de St.-Gobain | 14,985 | 1,196,256 | |
| Dassault Aviation SA | 4,582 | 985,740 | |
| Engie SA | 73,629 | 1,280,901 | |
| Klepierre SA | 27,809 | 751,100 | |
| Publicis Groupe SA | 10,593 | 1,176,264 | |
| Teleperformance | 5,963 | 545,015 | |
| TotalEnergies SE | 19,959 | 1,463,790 | |
TOTAL FRANCE | 10,018,802 | ||
| Germany - 11.3% | |||
| Allianz SE | 5,389 | 1,536,199 | |
| BASF AG | 22,721 | 1,194,193 | |
| Bayer AG | 21,714 | 635,004 | |
| Bayerische Motoren Werke AG (BMW) | 10,025 | 1,098,185 | |
| Commerzbank AG | 76,302 | 1,138,939 | |
| Deutsche Bank AG | 71,819 | 1,152,655 | |
| Fresenius Medical Care AG & Co. KGaA | 13,783 | 583,604 | |
| Fresenius SE & Co. KGaA | 19,806 | 592,337 | |
| Infineon Technologies AG | 20,767 | 726,551 | |
| Mercedes-Benz Group AG (Germany) | 17,011 | 1,290,328 | |
| Merck KGaA | 3,770 | 600,428 | |
| Siemens AG | 8,831 | 1,660,944 | |
| TUI AG (a) | 128,453 | 911,444 | |
TOTAL GERMANY | 13,120,811 | ||
| Hong Kong - 0.4% | |||
| CK Asset Holdings Ltd. | 107,500 | 462,509 | |
| Italy - 2.2% | |||
| Enel SpA | 195,304 | 1,290,771 | |
| UniCredit SpA | 35,003 | 1,294,224 | |
TOTAL ITALY | 2,584,995 | ||
| Japan - 23.0% | |||
| Daiwa House Industry Co. Ltd. | 28,700 | 809,761 | |
| Fujitsu Ltd. | 82,300 | 1,273,737 | |
| Honda Motor Co. Ltd. | 109,500 | 1,260,852 | |
| INPEX Corp. | 43,300 | 658,312 | |
| Itochu Corp. | 27,700 | 1,256,107 | |
| Japan Tobacco, Inc. | 57,800 | 1,559,184 | |
| KDDI Corp. | 49,100 | 1,372,859 | |
| Marubeni Corp. | 61,000 | 1,094,678 | |
| Medipal Holdings Corp. | 59,600 | 935,481 | |
| Mitsubishi Corp. | 75,800 | 1,743,691 | |
| Mitsubishi UFJ Financial Group, Inc. | 139,500 | 1,400,186 | |
| Mitsui & Co. Ltd. | 30,300 | 1,470,859 | |
| NEC Corp. | 17,500 | 1,278,874 | |
| Nippon Steel & Sumitomo Metal Corp. | 55,700 | 1,253,352 | |
| Ono Pharmaceutical Co. Ltd. | 57,400 | 830,187 | |
| ORIX Corp. | 39,000 | 803,222 | |
| Panasonic Holdings Corp. | 109,800 | 964,278 | |
| Renesas Electronics Corp. | 71,600 | 1,195,950 | |
| Sony Group Corp. | 16,600 | 1,380,301 | |
| Subaru Corp. | 48,500 | 1,088,565 | |
| Sumitomo Corp. | 45,300 | 1,196,082 | |
| Sumitomo Mitsui Financial Group, Inc. | 19,700 | 1,124,176 | |
| Tokyo Gas Co. Ltd. | 29,300 | 658,931 | |
TOTAL JAPAN | 26,609,625 | ||
| Luxembourg - 0.7% | |||
| ArcelorMittal SA (Netherlands) | 32,894 | 829,705 | |
| Netherlands - 4.7% | |||
| ASML Holding NV (Netherlands) | 2,903 | 2,584,727 | |
| ING Groep NV (Certificaten Van Aandelen) | 81,326 | 1,292,367 | |
| Koninklijke Ahold Delhaize NV | 27,195 | 826,986 | |
| Randstad NV | 14,706 | 742,191 | |
TOTAL NETHERLANDS | 5,446,271 | ||
| Singapore - 0.5% | |||
| Singapore Telecommunications Ltd. | 298,800 | 521,462 | |
| Spain - 1.7% | |||
| Banco Santander SA (Spain) | 293,214 | 1,433,723 | |
| Repsol SA | 37,205 | 585,782 | |
TOTAL SPAIN | 2,019,505 | ||
| Sweden - 3.0% | |||
| Essity AB (B Shares) | 29,388 | 735,242 | |
| SSAB AB (B Shares) (b) | 114,282 | 648,673 | |
| Telefonaktiebolaget LM Ericsson (B Shares) | 104,884 | 537,230 | |
| Volvo AB (B Shares) | 60,873 | 1,571,753 | |
TOTAL SWEDEN | 3,492,898 | ||
| Switzerland - 3.5% | |||
| ABB Ltd. (Reg.) | 23,626 | 1,156,377 | |
| Novartis AG | 16,804 | 1,631,572 | |
| UBS Group AG | 45,412 | 1,201,711 | |
TOTAL SWITZERLAND | 3,989,660 | ||
| United Kingdom - 10.9% | |||
| Ashtead Group PLC | 14,305 | 1,046,419 | |
| AstraZeneca PLC (United Kingdom) | 12,783 | 1,930,672 | |
| BAE Systems PLC | 70,192 | 1,171,586 | |
| Barclays PLC | 516,300 | 1,310,425 | |
| British American Tobacco PLC (United Kingdom) | 47,272 | 1,391,595 | |
| CK Hutchison Holdings Ltd. | 89,500 | 437,705 | |
| Compass Group PLC | 44,569 | 1,245,614 | |
| HSBC Holdings PLC (United Kingdom) | 217,289 | 1,892,578 | |
| Imperial Brands PLC | 47,810 | 1,094,637 | |
| Vodafone Group PLC | 1,219,717 | 1,033,350 | |
TOTAL UNITED KINGDOM | 12,554,581 | ||
| United States of America - 7.6% | |||
| GSK PLC | 48,305 | 1,011,916 | |
| Nestle SA (Reg. S) | 20,923 | 2,103,364 | |
| Roche Holding AG (participation certificate) | 6,089 | 1,464,573 | |
| Sanofi SA | 11,566 | 1,151,115 | |
| Shell PLC (London) | 52,699 | 1,889,209 | |
| Stellantis NV (Italy) | 50,348 | 1,124,066 | |
TOTAL UNITED STATES OF AMERICA | 8,744,243 | ||
| TOTAL COMMON STOCKS (Cost $106,618,624) | 114,596,997 | ||
| Money Market Funds - 0.7% | |||
| Shares | Value ($) | ||
| Fidelity Cash Central Fund 5.39% (c) | 151,929 | 151,960 | |
| Fidelity Securities Lending Cash Central Fund 5.39% (c)(d) | 677,032 | 677,100 | |
| TOTAL MONEY MARKET FUNDS (Cost $829,060) | 829,060 | ||
| TOTAL INVESTMENT IN SECURITIES - 99.8% (Cost $107,447,684) | 115,426,057 |
NET OTHER ASSETS (LIABILITIES) - 0.2% | 244,814 |
| NET ASSETS - 100.0% | 115,670,871 |
| Futures Contracts | |||||
Number of contracts | Expiration Date | Notional Amount ($) | Value ($) | Unrealized Appreciation/ (Depreciation) ($) | |
| Purchased | |||||
| Equity Index Contracts | |||||
| ICE E-mini MSCI EAFE Index Contracts (United States) | 9 | Jun 2024 | 1,020,375 | (32,465) | (32,465) |
| The notional amount of futures purchased as a percentage of Net Assets is 0.9% | |||||
| (a) | Non-income producing |
| (b) | Security or a portion of the security is on loan at period end. |
| (c) | Affiliated fund that is generally available only to investment companies and other accounts managed by Fidelity Investments. The rate quoted is the annualized seven-day yield of the fund at period end. A complete unaudited listing of the fund's holdings as of its most recent quarter end is available upon request. In addition, each Fidelity Central Fund's financial statements are available on the SEC's website or upon request. |
| (d) | Investment made with cash collateral received from securities on loan. |
| Affiliate | Value, beginning of period ($) | Purchases ($) | Sales Proceeds ($) | Dividend Income ($) | Realized Gain (loss) ($) | Change in Unrealized appreciation (depreciation) ($) | Value, end of period ($) | % ownership, end of period |
| Fidelity Cash Central Fund 5.39% | 74,181 | 11,089,029 | 11,011,250 | 6,974 | - | - | 151,960 | 0.0% |
| Fidelity Securities Lending Cash Central Fund 5.39% | - | 715,950 | 38,850 | 1,279 | - | - | 677,100 | 0.0% |
| Total | 74,181 | 11,804,979 | 11,050,100 | 8,253 | - | - | 829,060 | |
| Valuation Inputs at Reporting Date: | ||||
| Description | Total ($) | Level 1 ($) | Level 2 ($) | Level 3 ($) |
Investments in Securities: | ||||
| Equities: | ||||
Communication Services | 4,103,935 | 4,103,935 | - | - |
Consumer Discretionary | 12,539,012 | 12,539,012 | - | - |
Consumer Staples | 9,198,549 | 9,198,549 | - | - |
Energy | 7,075,861 | 7,075,861 | - | - |
Financials | 25,398,860 | 25,398,860 | - | - |
Health Care | 12,049,680 | 12,049,680 | - | - |
Industrials | 20,130,325 | 20,130,325 | - | - |
Information Technology | 10,033,417 | 10,033,417 | - | - |
Materials | 8,351,831 | 8,351,831 | - | - |
Real Estate | 2,112,011 | 2,112,011 | - | - |
Utilities | 3,603,516 | 3,603,516 | - | - |
| Money Market Funds | 829,060 | 829,060 | - | - |
| Total Investments in Securities: | 115,426,057 | 115,426,057 | - | - |
Derivative Instruments: Liabilities | ||||
Futures Contracts | (32,465) | (32,465) | - | - |
| Total Liabilities | (32,465) | (32,465) | - | - |
| Total Derivative Instruments: | (32,465) | (32,465) | - | - |
Primary Risk Exposure / Derivative Type | Value | |
| Asset ($) | Liability ($) | |
| Equity Risk | ||
Futures Contracts (a) | 0 | (32,465) |
| Total Equity Risk | 0 | (32,465) |
| Total Value of Derivatives | 0 | (32,465) |
| Statement of Assets and Liabilities | ||||
April 30, 2024 (Unaudited) | ||||
| Assets | ||||
| Investment in securities, at value (including securities loaned of $630,044) - See accompanying schedule: | ||||
Unaffiliated issuers (cost $106,618,624) | $ | 114,596,997 | ||
Fidelity Central Funds (cost $829,060) | 829,060 | |||
| Total Investment in Securities (cost $107,447,684) | $ | 115,426,057 | ||
| Segregated cash with brokers for derivative instruments | 38,784 | |||
| Cash | 13,014 | |||
| Foreign currency held at value (cost $153,422) | 153,741 | |||
| Dividends receivable | 600,781 | |||
| Reclaims receivable | 145,113 | |||
| Distributions receivable from Fidelity Central Funds | 1,847 | |||
Total assets | 116,379,337 | |||
| Liabilities | ||||
| Accrued management fee | $ | 17,326 | ||
| Payable for daily variation margin on futures contracts | 14,040 | |||
| Collateral on securities loaned | 677,100 | |||
| Total liabilities | 708,466 | |||
| Net Assets | $ | 115,670,871 | ||
| Net Assets consist of: | ||||
| Paid in capital | $ | 111,629,623 | ||
| Total accumulated earnings (loss) | 4,041,248 | |||
| Net Assets | $ | 115,670,871 | ||
Net Asset Value, offering price and redemption price per share ($115,670,871 ÷ 4,600,000 shares) | $ | 25.15 | ||
| Statement of Operations | ||||
Six months ended April 30, 2024 (Unaudited) | ||||
| Investment Income | ||||
| Dividends | $ | 2,122,719 | ||
| Income from Fidelity Central Funds (including $1,279 from security lending) | 8,253 | |||
| Income before foreign taxes withheld | $ | 2,130,972 | ||
| Less foreign taxes withheld | (214,219) | |||
| Total income | 1,916,753 | |||
| Expenses | ||||
| Management fee | $ | 92,131 | ||
| Independent trustees' fees and expenses | 223 | |||
| Total expenses before reductions | 92,354 | |||
| Expense reductions | (84) | |||
| Total expenses after reductions | 92,270 | |||
| Net Investment income (loss) | 1,824,483 | |||
| Realized and Unrealized Gain (Loss) | ||||
| Net realized gain (loss) on: | ||||
| Investment Securities: | ||||
| Unaffiliated issuers | (1,181,260) | |||
| Redemptions in-kind | 3,731,085 | |||
| Foreign currency transactions | (3,667) | |||
| Futures contracts | 66,123 | |||
| Total net realized gain (loss) | 2,612,281 | |||
| Change in net unrealized appreciation (depreciation) on: | ||||
| Investment Securities: | ||||
| Unaffiliated issuers | 11,052,295 | |||
| Assets and liabilities in foreign currencies | (10,074) | |||
| Futures contracts | (21,326) | |||
| Total change in net unrealized appreciation (depreciation) | 11,020,895 | |||
| Net gain (loss) | 13,633,176 | |||
| Net increase (decrease) in net assets resulting from operations | $ | 15,457,659 | ||
| Statement of Changes in Net Assets | ||||
Six months ended April 30, 2024 (Unaudited) | Year ended October 31, 2023 | |||
| Increase (Decrease) in Net Assets | ||||
| Operations | ||||
| Net investment income (loss) | $ | 1,824,483 | $ | 1,738,220 |
| Net realized gain (loss) | 2,612,281 | 502,232 | ||
| Change in net unrealized appreciation (depreciation) | 11,020,895 | 2,970,322 | ||
| Net increase (decrease) in net assets resulting from operations | 15,457,659 | 5,210,774 | ||
| Distributions to shareholders | (1,697,900) | (1,727,100) | ||
| Share transactions | ||||
| Proceeds from sales of shares | 47,624,203 | 41,390,748 | ||
| Cost of shares redeemed | (19,480,689) | (8,989,408) | ||
Net increase (decrease) in net assets resulting from share transactions | 28,143,514 | 32,401,340 | ||
| Total increase (decrease) in net assets | 41,903,273 | 35,885,014 | ||
| Net Assets | ||||
| Beginning of period | 73,767,598 | 37,882,584 | ||
| End of period | $ | 115,670,871 | $ | 73,767,598 |
| Other Information | ||||
| Shares | ||||
| Sold | 2,000,000 | 1,800,000 | ||
| Redeemed | (800,000) | (400,000) | ||
| Net increase (decrease) | 1,200,000 | 1,400,000 | ||
Fidelity® International Value Factor ETF |
Six months ended (Unaudited) April 30, 2024 | Years ended October 31, 2023 | 2022 | 2021 | 2020 | 2019 | |||||||
Selected Per-Share Data | ||||||||||||
| Net asset value, beginning of period | $ | 21.70 | $ | 18.94 | $ | 24.38 | $ | 17.82 | $ | 21.89 | $ | 20.89 |
| Income from Investment Operations | ||||||||||||
Net investment income (loss) A,B | .43 | .79 | .83 | .79 | .51 | .80 | ||||||
| Net realized and unrealized gain (loss) | 3.41 | 2.78 | (5.32) | 6.54 | (4.09) | 1.05 | ||||||
| Total from investment operations | 3.84 | 3.57 | (4.49) | 7.33 | (3.58) | 1.85 | ||||||
| Distributions from net investment income | (.39) | (.81) | (.95) | (.77) | (.49) | (.85) | ||||||
| Total distributions | (.39) | (.81) | (.95) | (.77) | (.49) | (.85) | ||||||
| Net asset value, end of period | $ | 25.15 | $ | 21.70 | $ | 18.94 | $ | 24.38 | $ | 17.82 | $ | 21.89 |
Total Return C,D,E | 17.77 % | 18.72% | (18.82)% | 41.36% | (16.32)% | 9.04% | ||||||
Ratios to Average Net Assets B,F,G | ||||||||||||
| Expenses before reductions | .18% H | .39% | .39% | .39% | .39% | .39% | ||||||
| Expenses net of fee waivers, if any | .18 % H | .39% | .39% | .39% | .39% | .39% | ||||||
| Expenses net of all reductions | .18% H | .39% | .39% | .39% | .39% | .39% | ||||||
| Net investment income (loss) | 3.56% H | 3.52% | 3.79% | 3.32% | 2.60% | 3.74% | ||||||
| Supplemental Data | ||||||||||||
| Net assets, end of period (000 omitted) | $ | 115,671 | $ | 73,768 | $ | 37,883 | $ | 41,449 | $ | 14,254 | $ | 13,135 |
Portfolio turnover rate I | 57 % H,J | 81% J | 69% J | 101% J | 76% J | 56% |
| Fidelity Central Fund | Investment Manager | Investment Objective | Investment Practices | Expense RatioA |
| Fidelity Money Market Central Funds | Fidelity Management & Research Company LLC (FMR) | Each fund seeks to obtain a high level of current income consistent with the preservation of capital and liquidity. | Short-term Investments | Less than .005% |
| Tax cost ($) | Gross unrealized appreciation ($) | Gross unrealized depreciation ($) | Net unrealized appreciation (depreciation)($) | |
Fidelity Emerging Markets Multifactor ETF | 56,014,045 | 6,504,045 | (3,249,843) | 3,254,202 |
Fidelity International High Dividend ETF | 96,342,143 | 5,957,086 | (6,385,775) | (428,689) |
Fidelity International Multifactor ETF | 64,160,878 | 5,154,925 | (2,651,627) | 2,503,298 |
| Fidelity International Value Factor ETF | 107,607,558 | 11,830,853 | (4,044,819) | 7,786,034 |
| Short-term ($) | Long-term ($) | Total capital loss carryforward ($) | |
Fidelity Emerging Markets Multifactor ETF | (1,719,663) | (1,721,069) | (3,440,732) |
Fidelity International High Dividend ETF | (4,953,437) | (4,182,330) | (9,135,767) |
Fidelity International Multifactor ETF | (1,527,752) | (657,571) | (2,185,323) |
| Fidelity International Value Factor ETF | (2,954,147) | (3,800,525) | (6,754,672) |
| Equity Risk | Equity risk relates to the fluctuations in the value of financial instruments as a result of changes in market prices (other than those arising from interest rate risk or foreign exchange risk), whether caused by factors specific to an individual investment, its issuer, or all factors affecting all instruments traded in a market or market segment. |
| Purchases ($) | Sales ($) | |
| Fidelity Emerging Markets Multifactor ETF | 33,314,030 | 10,774,502 |
| Fidelity International High Dividend ETF | 56,928,508 | 55,594,514 |
| Fidelity International Multifactor ETF | 11,031,566 | 8,335,395 |
| Fidelity International Value Factor ETF | 30,566,707 | 26,832,703 |
| In-Kind Subscriptions ($) | In-Kind Redemptions ($) | |
| Fidelity Emerging Markets Multifactor ETF | 6,300,675 | - |
| Fidelity International High Dividend ETF | 8,601,348 | 6,092,784 |
| Fidelity International Multifactor ETF | 34,218,878 | 5,345,252 |
| Fidelity International Value Factor ETF | 43,284,734 | 19,407,109 |
| Fee Rate | |
| Fidelity Emerging Markets Multifactor ETF | .25% |
| Fidelity International High Dividend ETF | .18% |
| Fidelity International Multifactor ETF | .18% |
| Fidelity International Value Factor ETF | .18% |
| Total Security Lending Fees Paid to NFS ($) | Security Lending Income From Securities Loaned to NFS ($) | Value of Securities Loaned to NFS at Period End ($) | |
| Fidelity International High Dividend ETF | 697 | - | - |
| Fidelity International Value Factor ETF | 175 | - | - |
| Custodian credits ($) | |
Fidelity Emerging Markets Multifactor ETF | 277 |
Fidelity International High Dividend ETF | 166 |
Fidelity International Multifactor ETF | 131 |
Fidelity International Value Factor ETF | 84 |
| The Example is based on an investment of $1,000 invested at the beginning of the period and held for the entire period (November 1, 2023 to April 30, 2024). |
Annualized Expense Ratio- A | Beginning Account Value November 1, 2023 | Ending Account Value April 30, 2024 | Expenses Paid During Period- C November 1, 2023 to April 30, 2024 | |||||||
| Fidelity® Emerging Markets Multifactor ETF | .25% | |||||||||
| Actual | $ 1,000 | $ 1,170.40 | $ 1.35 | |||||||
Hypothetical-B | $ 1,000 | $ 1,023.62 | $ 1.26 | |||||||
| Fidelity® International High Dividend ETF | .18% | |||||||||
| Actual | $ 1,000 | $ 1,174.80 | $ .97 | |||||||
Hypothetical-B | $ 1,000 | $ 1,023.97 | $ .91 | |||||||
| Fidelity® International Multifactor ETF | .18% | |||||||||
| Actual | $ 1,000 | $ 1,141.50 | $ .96 | |||||||
Hypothetical-B | $ 1,000 | $ 1,023.97 | $ .91 | |||||||
| Fidelity® International Value Factor ETF | .18% | |||||||||
| Actual | $ 1,000 | $ 1,177.70 | $ .97 | |||||||
Hypothetical-B | $ 1,000 | $ 1,023.97 | $ .91 | |||||||
- Highly liquid investments - cash or convertible to cash within three business days or less
- Moderately liquid investments - convertible to cash in three to seven calendar days
- Less liquid investments - can be sold or disposed of, but not settled, within seven calendar days
- Illiquid investments - cannot be sold or disposed of within seven calendar days
 |
Item 2.
Code of Ethics
Not applicable.
Item 3.
Audit Committee Financial Expert
Not applicable.
Item 4.
Principal Accountant Fees and Services
Not applicable.
Item 5.
Audit Committee of Listed Registrants
Not applicable.
Item 6.
Investments
(a)
Not applicable.
(b)
Not applicable
Item 7.
Disclosure of Proxy Voting Policies and Procedures for Closed-End Management Investment Companies
Not applicable.
Item 8.
Portfolio Managers of Closed-End Management Investment Companies
Not applicable.
Item 9.
Purchase of Equity Securities by Closed-End Management Investment Company and Affiliated Purchasers
Not applicable.
Item 10.
Submission of Matters to a Vote of Security Holders
There were no material changes to the procedures by which shareholders may recommend nominees to the Fidelity Covington Trust’s Board of Trustees.
Item 11.
Controls and Procedures
(a)(i) The President and Treasurer and the Chief Financial Officer have concluded that the Fidelity Covington Trust’s (the “Trust”) disclosure controls and procedures (as defined in Rule 30a-3(c) under the Investment Company Act) provide reasonable
assurances that material information relating to the Trust is made known to them by the appropriate persons, based on their evaluation of these controls and procedures as of a date within 90 days of the filing date of this report.
(a)(ii) There was no change in the Trust’s internal control over financial reporting (as defined in Rule 30a-3(d) under the Investment Company Act) that occurred during the period covered by this report that has materially affected, or is reasonably likely to materially affect, the Trust’s internal control over financial reporting.
Item 12.
Disclosure of Securities Lending Activities for Closed-End Management
Investment Companies
Not applicable.
Item 18.
Recovery of Erroneously Awarded Compensation
(a)
Not applicable.
(b)
Not applicable.
Item 19.
Exhibits
(a) | (1) | Not applicable. |
(a) | (2) | |
(a) | (3) | Not applicable. |
(b) |
SIGNATURES
Pursuant to the requirements of the Securities Exchange Act of 1934 and the Investment Company Act of 1940, the registrant has duly caused this report to be signed on its behalf by the undersigned, thereunto duly authorized.
Fidelity Covington Trust
By: | /s/Stacie M. Smith |
Stacie M. Smith | |
President and Treasurer (Principal Executive Officer) | |
Date: | June 21, 2024 |
Pursuant to the requirements of the Securities Exchange Act of 1934 and the Investment Company Act of 1940, this report has been signed below by the following persons on behalf of the registrant and in the capacities and on the dates indicated.
By: | /s/Stacie M. Smith |
Stacie M. Smith | |
President and Treasurer (Principal Executive Officer) | |
Date: | June 21, 2024 |
By: | /s/John J. Burke III |
John J. Burke III | |
Chief Financial Officer (Principal Financial Officer) | |
Date: | June 21, 2024 |