UNITED STATES
SECURITIES AND EXCHANGE COMMISSION
Washington, D.C. 20549
FORM N-CSR
CERTIFIED SHAREHOLDER REPORT OF REGISTERED
MANAGEMENT INVESTMENT COMPANIES
Investment Company Act file number 811-07319
Fidelity Covington Trust
(Exact name of registrant as specified in charter)
245 Summer St., Boston, Massachusetts 02210
(Address of principal executive offices) (Zip code)
Margaret Carey, Secretary
245 Summer St.
Boston, Massachusetts 02210
(Name and address of agent for service)
Registrant's telephone number, including area code:
617-563-7000
| |
Date of fiscal year end: | June 30 |
|
|
Date of reporting period: | June 30, 2024 |
Item 1.
Reports to Stockholders
| |
| | ANNUAL SHAREHOLDER REPORT | AS OF JUNE 30, 2024 | This report describes changes to the Fund that occurred during the reporting period. |
| | Fidelity® Enhanced Large Cap Value ETF Fidelity® Enhanced Large Cap Value ETF : FELV Principal U.S. Listing Exchange :NYSEArca NYSE Arca, Inc. |
| | | |
This annual shareholder report contains information about Fidelity® Enhanced Large Cap Value ETF for the period September 1, 2023 to June 30, 2024. You can find additional information about the Fund at fundresearch.fidelity.com/
prospectus/sec. You can also request this information by contacting us at 1-800-FIDELITY or by sending an e-mail to fidfunddocuments@fidelity.com.
What were your Fund costs for the last year?(based on hypothetical $10,000 investment)
FUND COST (PREVIOUS YEAR)
| | Costs of a $10,000 investment | Costs paid as a percentage of a $10,000 investment | |
| Fidelity® Enhanced Large Cap Value ETF | $ 25 | 0.28% | |
What affected the Fund's performance this period?
- •U.S. equities gained considerably for the 12 months ending June 30, 2024, driven by resilient corporate profits, a frenzy over generative artificial intelligence and the Federal Reserve's likely pivot to cutting interest rates later this year. Amid this favorable backdrop for higher-risk assets, stocks continued their late-2023 momentum, powered by signs of continued U.S. economic strength.
- •Against this backdrop, security selection was the primary contributor to the fund's performance versus the benchmark, especially within information technology, where our stock picking in semiconductors & semiconductor equipment helped most. Picks in communication services, consumer staples and consumer discretionary also helped.
- •The top individual relative contributor was our non-benchmark stake in Nvidia (+194%). Other notable relative contributors included an overweight in Qualcomm (+70%) and a non-benchmark stake in Broadcom (+87%). This period we decreased our positions in Qualcomm and Broadcom.
- •In contrast, the largest detractor from performance versus the benchmark was stock picking in health care. Security selection in real estate, primarily within the equity real estate investment trusts (REITs) industry, also hampered the fund's result.
- •The biggest individual relative detractor was our non-benchmark stake in Teradata (-36%). The second-largest detractor was an overweight in Zimmer Biomet (-25%). This period we decreased our positions in Teradata and Zimmer Biomet. A stake in Hawaiian Electric Industries returned -66% and also notably hurt. Hawaiian Electric was not held at period end.
- •Notable changes in positioning include decreased exposure to consumer discretionary and health care.
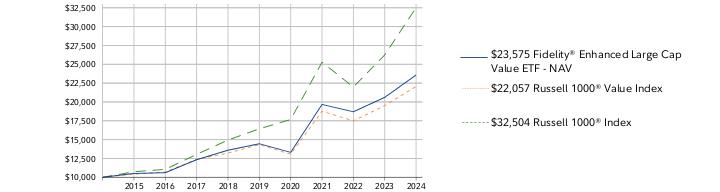
How did the Fund perform over the past 10 years?
CUMULATIVE PERFORMANCE
June 30, 2014 through June 30, 2024.
Initial investment of $10,000.
Fidelity® Enhanced Large Cap Value ETF | $10,000 | $10,508 | $10,610 | $12,338 | $13,594 | $14,453 | $13,310 | $19,669 | $18,695 | $20,608 | $23,575 |
Russell 1000® Value Index | $10,000 | $10,413 | $10,711 | $12,375 | $13,212 | $14,331 | $13,064 | $18,771 | $17,491 | $19,509 | $22,057 |
Russell 1000® Index | $10,000 | $10,737 | $11,052 | $13,044 | $14,941 | $16,438 | $17,667 | $25,277 | $21,982 | $26,239 | $32,504 |
| | 2014 | 2015 | 2016 | 2017 | 2018 | 2019 | 2020 | 2021 | 2022 | 2023 | 2024 |
AVERAGE ANNUAL TOTAL RETURNS: | | 1 Year | 5 Year | 10 Year |
Fidelity® Enhanced Large Cap Value ETF - NAV | 14.40% | 10.28% | 8.95% |
Fidelity® Enhanced Large Cap Value ETF - Market Price A | 14.60% | 10.32% | 8.97% |
| Russell 1000® Value Index | 13.06% | 9.01% | 8.23% |
| Russell 1000® Index | 23.88% | 14.61% | 12.51% |
A From November 20, 2023, date initially listed on the NYSE Arca, Inc. exchange
Visit www.fidelity.com for more recent performance information. |
The Fund's past performance is not a good predictor of the Fund's future performance. The graph and table do not reflect the deduction of taxes that a shareholder would pay on fund distributions or redemption of fund shares. |
Key Fund Statistics (as of June 30, 2024)
KEY FACTS | | |
| Fund Size | $1,792,516,935 | |
| Number of Holdings | 333 | |
| Total Advisory Fee | $5,908,652 | |
| Portfolio Turnover | 90% | |
What did the Fund invest in?
(as of June 30, 2024)
MARKET SECTORS (% of Fund's net assets) | | |
| Financials | 22.4 | |
| Industrials | 16.3 | |
| Health Care | 14.3 | |
| Information Technology | 10.8 | |
| Consumer Staples | 7.3 | |
| Energy | 6.7 | |
| Consumer Discretionary | 5.6 | |
| Communication Services | 4.5 | |
| Materials | 4.4 | |
| Utilities | 4.0 | |
| Real Estate | 3.0 | |
| |
| Common Stocks | 99.3 |
| Short-Term Investments and Net Other Assets (Liabilities) | 0.7 |
ASSET ALLOCATION (% of Fund's net assets) |
|
|
GEOGRAPHIC DIVERSIFICATION (% of Fund's net assets) |
|
| |
|
TOP HOLDINGS (% of Fund's net assets) | | |
| Berkshire Hathaway Inc Class B | 3.7 | |
| JPMorgan Chase & Co | 3.1 | |
| Exxon Mobil Corp | 2.8 | |
| Bank of America Corp | 1.7 | |
| Walmart Inc | 1.7 | |
| Procter & Gamble Co/The | 1.4 | |
| Unitedhealth Group Inc | 1.4 | |
| Johnson & Johnson | 1.3 | |
| Intel Corp | 1.2 | |
| Pfizer Inc | 1.1 | |
| | 19.4 | |
| |
How has the Fund changed?
This is a summary of certain changes to the Fund since September 1, 2023. For more complete information, you may review the Fund's next prospectus, which we expect to be available by October 30, 2024 at fundresearch.fidelity.com/prospectus/sec or upon request at 1-800-FIDELITY or by sending an e-mail to fidfunddocuments@fidelity.com.
The fees associated with this class changed during the reporting year. The variations in class fees are primarily the result of the following changes: - •Management fee
- •Operating expenses
| Fidelity Enhanced Large Cap Value ETF converted from Fidelity Enhanced Large Cap Value Index Fund on November 17, 2023. This move, approved by the Board of Trustees in June 2023, was deemed in the best interest of shareholders. The new ETF and its former corresponding fund have identical investment objectives and fundamental investment policies and have substantially similar investment strategies. Returns prior to the conversion are those of the former corresponding fund. Fidelity believes that the conversion will provide multiple benefits for investors of the fund, including lower net expenses, additional trading flexibility, increased portfolio holdings transparency and the potential for enhanced tax efficiency. Effective March 1, 2024, the fund's fiscal year end changed from August 31 to June 30. |
| Fidelity, the Fidelity Investments Logo and all other Fidelity trademarks or service marks used herein are trademarks or service marks of FMR LLC. Any third-party marks that are used herein are trademarks or service marks of their respective owners. © 2024 FMR LLC. All rights reserved. |
| | For additional information about the Fund; including its prospectus, financial information, holdings and proxy information, scan the QR code or visit fundresearch.fidelity.com/prospectus/sec 1.9913704.100 7542-TSRA-0824 |
| |
| | ANNUAL SHAREHOLDER REPORT | AS OF JUNE 30, 2024 | This report describes changes to the Fund that occurred during the reporting period. |
| | Fidelity® Enhanced Small Cap ETF Fidelity® Enhanced Small Cap ETF : FESM Principal U.S. Listing Exchange :NYSEArca NYSE Arca, Inc. |
| | | |
This annual shareholder report contains information about Fidelity® Enhanced Small Cap ETF for the period March 1, 2024 to June 30, 2024. You can find additional information about the Fund at fundresearch.fidelity.com/
prospectus/sec. You can also request this information by contacting us at 1-800-FIDELITY or by sending an e-mail to fidfunddocuments@fidelity.com.
What were your Fund costs for the last year?(based on hypothetical $10,000 investment)
FUND COST (PREVIOUS YEAR)
| | Costs of a $10,000 investment | Costs paid as a percentage of a $10,000 investment | |
| Fidelity® Enhanced Small Cap ETF | $ 10 | 0.28% | |
What affected the Fund's performance this period?
- •U.S. equities gained considerably for the 12 months ending June 30, 2024, driven by resilient corporate profits, a frenzy over generative artificial intelligence and the Federal Reserve's likely pivot to cutting interest rates later this year. Amid this favorable backdrop for higher-risk assets, stocks continued their late-2023 momentum, powered by signs of continued U.S. economic strength.
- •Against this backdrop, security selection was the primary contributor to the fund's performance versus the benchmark, led by industrials. Stock selection in consumer discretionary, consumer staples and materials also boosted the fund's relative performance.
- •The top individual relative contributor was an overweight in Super Micro Computer (+240%), which was our top stock holding. Overweight holdings in Abercrombie & Fitch (+376%) and Carvana (+160%) also notably helped. Abercrombie & Fitch and Carvana were among the fund's largest holdings at period end. The stake in Carvana was established this period.
- •In contrast, the biggest detractor from performance versus the benchmark was stock picking in real estate, primarily within the equity real estate investment trusts (REITs) industry. Security selection in health care also hampered the fund's result, as did an overweight in communication services.
- •The biggest individual relative detractor was an underweight in MicroStrategy (+302%), which ended the 12-month period as a top-10 fund holding. This was an investment we established this period. A second notable relative detractor was an overweight in CommScope (-78%). A stake in Omnicell returned -60% and also notably hurt. Omnicell was not held at period end.
- •Notable changes in positioning include decreased exposure to real estate and consumer discretionary.
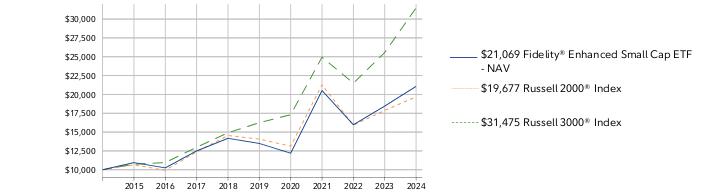
How did the Fund perform over the past 10 years?
CUMULATIVE PERFORMANCE
June 30, 2014 through June 30, 2024.
Initial investment of $10,000.
Fidelity® Enhanced Small Cap ETF | $10,000 | $10,945 | $10,250 | $12,504 | $14,173 | $13,493 | $12,195 | $20,519 | $15,971 | $18,451 | $21,069 |
Russell 2000® Index | $10,000 | $10,649 | $9,932 | $12,375 | $14,549 | $14,067 | $13,135 | $21,283 | $15,920 | $17,879 | $19,677 |
Russell 3000® Index | $10,000 | $10,729 | $10,959 | $12,987 | $14,907 | $16,246 | $17,306 | $24,950 | $21,490 | $25,563 | $31,475 |
| | 2014 | 2015 | 2016 | 2017 | 2018 | 2019 | 2020 | 2021 | 2022 | 2023 | 2024 |
AVERAGE ANNUAL TOTAL RETURNS: | | 1 Year | 5 Year | 10 Year |
Fidelity® Enhanced Small Cap ETF - NAV | 14.19% | 9.32% | 7.74% |
Fidelity® Enhanced Small Cap ETF - Market Price A | 14.29% | 9.34% | 7.75% |
| Russell 2000® Index | 10.06% | 6.94% | 7.00% |
| Russell 3000® Index | 23.13% | 14.14% | 12.15% |
A From November 20, 2023, date initially listed on the NYSE Arca, Inc. exchange
Visit www.fidelity.com for more recent performance information. |
The Fund's past performance is not a good predictor of the Fund's future performance. The graph and table do not reflect the deduction of taxes that a shareholder would pay on fund distributions or redemption of fund shares. |
Key Fund Statistics (as of June 30, 2024)
KEY FACTS | | |
| Fund Size | $574,172,456 | |
| Number of Holdings | 568 | |
| Total Advisory Fee | $514,102 | |
| Portfolio Turnover | 71% | |
What did the Fund invest in?
(as of June 30, 2024)
MARKET SECTORS (% of Fund's net assets) | | |
| Industrials | 19.0 | |
| Financials | 15.1 | |
| Health Care | 14.9 | |
| Information Technology | 14.9 | |
| Consumer Discretionary | 10.3 | |
| Energy | 5.7 | |
| Materials | 5.3 | |
| Real Estate | 4.1 | |
| Consumer Staples | 3.5 | |
| Communication Services | 3.0 | |
| Utilities | 2.2 | |
| |
| Common Stocks | 98.0 |
| Short-Term Investments and Net Other Assets (Liabilities) | 2.0 |
ASSET ALLOCATION (% of Fund's net assets) |
|
|
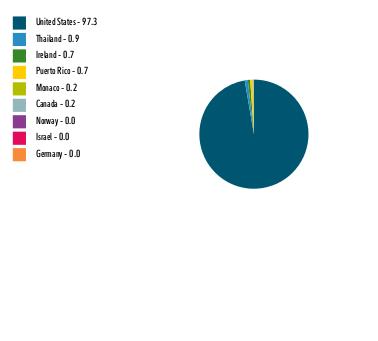
| United States | 97.3 |
| Thailand | 0.9 |
| Ireland | 0.7 |
| Puerto Rico | 0.7 |
| Monaco | 0.2 |
| Canada | 0.2 |
| Norway | 0.0 |
| Israel | 0.0 |
| Germany | 0.0 |
GEOGRAPHIC DIVERSIFICATION (% of Fund's net assets) |
|
| |
|
TOP HOLDINGS (% of Fund's net assets) | | |
| Abercrombie & Fitch Co Class A | 1.0 | |
| Fabrinet | 0.9 | |
| SPS Commerce Inc | 0.9 | |
| Applied Industrial Technologies Inc | 0.8 | |
| Taylor Morrison Home Corp | 0.8 | |
| Carpenter Technology Corp | 0.7 | |
| Installed Building Products Inc | 0.7 | |
| Murphy Oil Corp | 0.7 | |
| CommVault Systems Inc | 0.7 | |
| SkyWest Inc | 0.7 | |
| | 7.9 | |
| |
How has the Fund changed?
This is a summary of certain changes to the Fund since March 1, 2024. For more complete information, you may review the Fund's next prospectus, which we expect to be available by October 30, 2024 at fundresearch.fidelity.com/prospectus/sec or upon request at 1-800-FIDELITY or by sending an e-mail to fidfunddocuments@fidelity.com.
The fees associated with this class changed during the reporting year. The variations in class fees are primarily the result of the following changes: - •Management fee
- •Operating expenses
- •Expense reductions
| Fidelity Enhanced Small Cap ETF converted from Fidelity Enhanced Small Cap Index Fund on November 17, 2023. This move, approved by the Board of Trustees in June 2023, was deemed in the best interest of shareholders. The new ETF and its former corresponding fund have identical investment objectives and fundamental investment policies and have substantially similar investment strategies. Returns prior to the conversion are those of the former corresponding fund. Fidelity believes that the conversion will provide multiple benefits for investors of the fund, including lower net expenses, additional trading flexibility, increased portfolio holdings transparency and the potential for enhanced tax efficiency. Effective March 1, 2024, the fund's fiscal year end changed from February 28 to June 30. |
| Fidelity, the Fidelity Investments Logo and all other Fidelity trademarks or service marks used herein are trademarks or service marks of FMR LLC. Any third-party marks that are used herein are trademarks or service marks of their respective owners. © 2024 FMR LLC. All rights reserved. |
| | For additional information about the Fund; including its prospectus, financial information, holdings and proxy information, scan the QR code or visit fundresearch.fidelity.com/prospectus/sec 1.9912775.100 7545-TSRA-0824 |
| |
| | ANNUAL SHAREHOLDER REPORT | AS OF JUNE 30, 2024 | This report describes changes to the Fund that occurred during the reporting period. |
| | Fidelity® Enhanced Mid Cap ETF Fidelity® Enhanced Mid Cap ETF : FMDE Principal U.S. Listing Exchange :NYSEArca NYSE Arca, Inc. |
| | | |
This annual shareholder report contains information about Fidelity® Enhanced Mid Cap ETF for the period September 1, 2023 to June 30, 2024. You can find additional information about the Fund at fundresearch.fidelity.com/
prospectus/sec. You can also request this information by contacting us at 1-800-FIDELITY or by sending an e-mail to fidfunddocuments@fidelity.com.
What were your Fund costs for the last year?(based on hypothetical $10,000 investment)
FUND COST (PREVIOUS YEAR)
| | Costs of a $10,000 investment | Costs paid as a percentage of a $10,000 investment | |
| Fidelity® Enhanced Mid Cap ETF | $ 26 | 0.29% | |
What affected the Fund's performance this period?
- •U.S. equities gained considerably for the 12 months ending June 30, 2024, driven by resilient corporate profits, a frenzy over generative artificial intelligence and the Federal Reserve's likely pivot to cutting interest rates later this year. Amid this favorable backdrop for higher-risk assets, stocks continued their late-2023 momentum, powered by signs of continued U.S. economic strength.
- •Against this backdrop, security selection was the primary contributor to the fund's performance versus the benchmark, led by industrials. Stock picking in information technology and consumer discretionary, and positioning in consumer staples and communication services, also boosted relative performance.
- •The top individual relative contributor was an overweight in Vistra (+233%). Overweight holdings in AppLovin (+217%) and Robinhood Markets (+126%) also helped.
- •In contrast, the biggest detractors from performance versus the benchmark were stock selection and an overweight in health care. An underweight in energy also hampered the fund's result, as did stock picking and an underweight in financials.
- •The largest individual relative detractor was an underweight in CrowdStrike Holdings (+161%). We established a position in the stock during the period. Other notable relative detractors included an overweight in 10x Genomics (-66%) and an underweight in Constellation Energy (+121%). The latter was an investment we established this period.
- •Notable changes in positioning include lower allocations to health care and real estate.
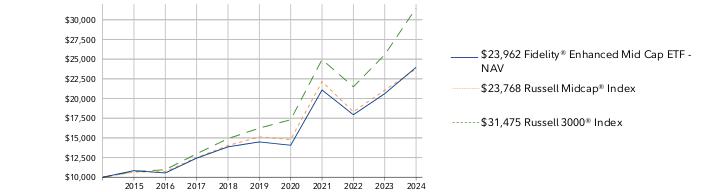
How did the Fund perform over the past 10 years?
CUMULATIVE PERFORMANCE
June 30, 2014 through June 30, 2024.
Initial investment of $10,000.
Fidelity® Enhanced Mid Cap ETF | $10,000 | $10,845 | $10,548 | $12,433 | $13,862 | $14,491 | $14,067 | $21,084 | $17,942 | $20,616 | $23,962 |
Russell Midcap® Index | $10,000 | $10,663 | $10,723 | $12,490 | $14,030 | $15,128 | $14,789 | $22,154 | $18,322 | $21,057 | $23,768 |
Russell 3000® Index | $10,000 | $10,729 | $10,959 | $12,987 | $14,907 | $16,246 | $17,306 | $24,950 | $21,490 | $25,563 | $31,475 |
| | 2014 | 2015 | 2016 | 2017 | 2018 | 2019 | 2020 | 2021 | 2022 | 2023 | 2024 |
AVERAGE ANNUAL TOTAL RETURNS: | | 1 Year | 5 Year | 10 Year |
Fidelity® Enhanced Mid Cap ETF - NAV | 16.23% | 10.58% | 9.13% |
Fidelity® Enhanced Mid Cap ETF - Market Price A | 16.35% | 10.61% | 9.14% |
| Russell Midcap® Index | 12.88% | 9.46% | 9.04% |
| Russell 3000® Index | 23.13% | 14.14% | 12.15% |
A From November 20, 2023, date initially listed on the NYSE Arca, Inc. exchange
Visit www.fidelity.com for more recent performance information. |
The Fund's past performance is not a good predictor of the Fund's future performance. The graph and table do not reflect the deduction of taxes that a shareholder would pay on fund distributions or redemption of fund shares. |
Key Fund Statistics (as of June 30, 2024)
KEY FACTS | | |
| Fund Size | $1,653,576,076 | |
| Number of Holdings | 278 | |
| Total Advisory Fee | $3,648,331 | |
| Portfolio Turnover | 73% | |
What did the Fund invest in?
(as of June 30, 2024)
MARKET SECTORS (% of Fund's net assets) | | |
| Industrials | 18.9 | |
| Financials | 16.4 | |
| Information Technology | 14.8 | |
| Consumer Discretionary | 12.1 | |
| Health Care | 9.9 | |
| Materials | 6.3 | |
| Real Estate | 5.6 | |
| Energy | 4.9 | |
| Utilities | 4.0 | |
| Consumer Staples | 3.9 | |
| Communication Services | 2.4 | |
| |
| Common Stocks | 99.2 |
| Short-Term Investments and Net Other Assets (Liabilities) | 0.8 |
ASSET ALLOCATION (% of Fund's net assets) |
|
|
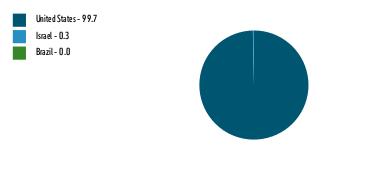
| United States | 99.7 |
| Israel | 0.3 |
| Brazil | 0.0 |
GEOGRAPHIC DIVERSIFICATION (% of Fund's net assets) |
|
| |
|
TOP HOLDINGS (% of Fund's net assets) | | |
| Simon Property Group Inc | 1.0 | |
| Bank of New York Mellon Corp/The | 1.0 | |
| Ross Stores Inc | 1.0 | |
| Monolithic Power Systems Inc | 0.9 | |
| Nucor Corp | 0.9 | |
| DR Horton Inc | 0.9 | |
| Cummins Inc | 0.9 | |
| Cencora Inc | 0.9 | |
| AMETEK Inc | 0.8 | |
| Block Inc Class A | 0.8 | |
| | 9.1 | |
| |
How has the Fund changed?
This is a summary of certain changes to the Fund since September 1, 2023. For more complete information, you may review the Fund's next prospectus, which we expect to be available by October 30, 2024 at fundresearch.fidelity.com/prospectus/sec or upon request at 1-800-FIDELITY or by sending an e-mail to fidfunddocuments@fidelity.com.
The fees associated with this class changed during the reporting year. The variations in class fees are primarily the result of the following changes: - •Management fee
- •Operating expenses
| Fidelity Enhanced Mid Cap ETF converted from Fidelity Enhanced Mid Cap Index Fund on November 17, 2023. This move, approved by the Board of Trustees in June 2023, was deemed in the best interest of shareholders. The new ETF and its former corresponding fund have identical investment objectives and fundamental investment policies and have substantially similar investment strategies. Returns prior to the conversion are those of the former corresponding fund. Fidelity believes that the conversion will provide multiple benefits for investors of the fund, including lower net expenses, additional trading flexibility, increased portfolio holdings transparency and the potential for enhanced tax efficiency. Effective March 1, 2024, the fund's fiscal year end changed from August 31 to June 30. |
| Fidelity, the Fidelity Investments Logo and all other Fidelity trademarks or service marks used herein are trademarks or service marks of FMR LLC. Any third-party marks that are used herein are trademarks or service marks of their respective owners. © 2024 FMR LLC. All rights reserved. |
| | For additional information about the Fund; including its prospectus, financial information, holdings and proxy information, scan the QR code or visit fundresearch.fidelity.com/prospectus/sec 1.9913707.100 7546-TSRA-0824 |
| |
| | ANNUAL SHAREHOLDER REPORT | AS OF JUNE 30, 2024 | This report describes changes to the Fund that occurred during the reporting period. |
| | Fidelity® Enhanced International ETF Fidelity® Enhanced International ETF : FENI Principal U.S. Listing Exchange :NYSEArca NYSE Arca, Inc. |
| | | |
This annual shareholder report contains information about Fidelity® Enhanced International ETF for the period September 1, 2023 to June 30, 2024. You can find additional information about the Fund at fundresearch.fidelity.com/
prospectus/sec. You can also request this information by contacting us at 1-800-FIDELITY or by sending an e-mail to fidfunddocuments@fidelity.com.
What were your Fund costs for the last year?(based on hypothetical $10,000 investment)
FUND COST (PREVIOUS YEAR)
| | Costs of a $10,000 investment | Costs paid as a percentage of a $10,000 investment | |
| Fidelity® Enhanced International ETF | $ 32 | 0.36% | |
What affected the Fund's performance this period?
- •International equities gained for the 12 months ending June 30, 2024, as global economic expansion amid improved financial conditions, fairly low volatility and firmer manufacturing activity provided a favorable backdrop for risk assets. Performance was largely driven by a narrow set of technology-focused firms riding high-growth megatrends, fanned by enthusiasm for artificial intelligence.
- •Against this backdrop, stock picks in the U.K. and stock picking and an underweight in Europe ex the U.K. contributed to the fund's performance versus the benchmark. By sector, security selection was the primary contributor, especially within industrials, where our picks in capital goods helped most. Stock selection in information technology, and picks and an underweight in consumer staples, also boosted relative performance, as did stock selection in health care, primarily within the pharmaceuticals, biotechnology & life sciences industry.
- •The top individual relative contributor was an overweight in Rolls-Royce Holdings (+193%). This period we decreased our position. Other notable relative contributors included overweight holdings in Disco (+141%) and Wix.com (+98%). We decreased our investment in Wix.com during the period.
- •In contrast, from a regional standpoint, an overweight in Asia Pacific ex Japan, primarily in Hong Kong, and security selection in emerging markets detracted from the fund's relative result. By sector, the biggest detractor from performance versus the benchmark was stock selection in communication services. Also hurting our result were stock picks and an underweight in financials, primarily within the banks industry, and selection and an overweight in consumer discretionary, primarily within the automobiles & components industry.
- •The largest individual relative detractor was an overweight in Genmab (-34%). Overweight stakes in Panasonic Holdings (-33%) and RWE (-23%) also hurt. RWE was not held at period end.
- •Notable changes in positioning include increased exposure to the Netherlands and a lower allocation to Sweden. By sector, meaningful changes in positioning include decreased exposure to consumer discretionary and a higher allocation to information technology.
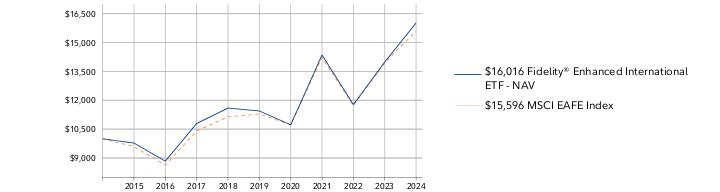
How did the Fund perform over the past 10 years?
CUMULATIVE PERFORMANCE
June 30, 2014 through June 30, 2024.
Initial investment of $10,000.
Fidelity® Enhanced International ETF | $10,000 | $9,777 | $8,838 | $10,792 | $11,596 | $11,445 | $10,724 | $14,351 | $11,777 | $13,983 | $16,016 |
MSCI EAFE Index | $10,000 | $9,591 | $8,633 | $10,403 | $11,139 | $11,285 | $10,726 | $14,222 | $11,721 | $13,952 | $15,596 |
| | 2014 | 2015 | 2016 | 2017 | 2018 | 2019 | 2020 | 2021 | 2022 | 2023 | 2024 |
AVERAGE ANNUAL TOTAL RETURNS: | | 1 Year | 5 Year | 10 Year |
Fidelity® Enhanced International ETF - NAV | 14.54% | 6.95% | 4.82% |
Fidelity® Enhanced International ETF - Market Price A | 14.45% | 6.94% | 4.81% |
| MSCI EAFE Index | 11.79% | 6.69% | 4.54% |
A From November 20, 2023, date initially listed on the NYSE Arca, Inc. exchange
Visit www.fidelity.com for more recent performance information. |
The Fund's past performance is not a good predictor of the Fund's future performance. The graph and table do not reflect the deduction of taxes that a shareholder would pay on fund distributions or redemption of fund shares. |
Key Fund Statistics (as of June 30, 2024)
KEY FACTS | | |
| Fund Size | $1,557,851,321 | |
| Number of Holdings | 285 | |
| Total Advisory Fee | $4,154,555 | |
| Portfolio Turnover | 109% | |
What did the Fund invest in?
(as of June 30, 2024)
MARKET SECTORS (% of Fund's net assets) | | |
| Financials | 19.1 | |
| Industrials | 18.7 | |
| Health Care | 13.8 | |
| Information Technology | 11.2 | |
| Consumer Discretionary | 9.3 | |
| Materials | 8.2 | |
| Consumer Staples | 6.5 | |
| Energy | 3.4 | |
| Utilities | 3.3 | |
| Communication Services | 3.3 | |
| Real Estate | 1.6 | |
| |
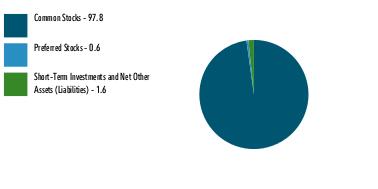
| Common Stocks | 97.8 |
| Preferred Stocks | 0.6 |
| Short-Term Investments and Net Other Assets (Liabilities) | 1.6 |
ASSET ALLOCATION (% of Fund's net assets) |
|
|
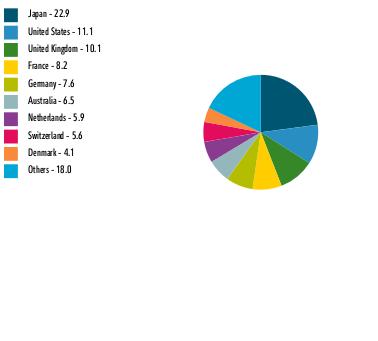
| Japan | 22.9 |
| United States | 11.1 |
| United Kingdom | 10.1 |
| France | 8.2 |
| Germany | 7.6 |
| Australia | 6.5 |
| Netherlands | 5.9 |
| Switzerland | 5.6 |
| Denmark | 4.1 |
| Others | 18.0 |
GEOGRAPHIC DIVERSIFICATION (% of Fund's net assets) |
|
| |
|
TOP HOLDINGS (% of Fund's net assets) | | |
| Novo Nordisk A/S Series B | 3.0 | |
| ASML Holding NV | 1.9 | |
| Shell PLC | 1.7 | |
| Novartis AG | 1.7 | |
| Roche Holding AG | 1.5 | |
| TotalEnergies SE | 1.4 | |
| Schneider Electric SE | 1.2 | |
| Hitachi Ltd | 1.2 | |
| ASML Holding NV depository receipt | 1.1 | |
| Nestle SA | 1.1 | |
| | 15.8 | |
| |
How has the Fund changed?
This is a summary of certain changes to the Fund since September 1, 2023. For more complete information, you may review the Fund's next prospectus, which we expect to be available by October 30, 2024 at fundresearch.fidelity.com/prospectus/sec or upon request at 1-800-FIDELITY or by sending an e-mail to fidfunddocuments@fidelity.com.
The fees associated with this class changed during the reporting year. The variations in class fees are primarily the result of the following changes: - •Management fee
- •Operating expenses
| Fidelity Enhanced International ETF converted from Fidelity Enhanced International Index Fund on November 17, 2023. This move, approved by the Board of Trustees in June 2023, was deemed in the best interest of shareholders. The new ETF and its former corresponding fund have identical investment objectives and fundamental investment policies and have substantially similar investment strategies. Returns prior to the conversion are those of the former corresponding fund. Fidelity believes that the conversion will provide multiple benefits for investors of the fund, including lower net expenses, additional trading flexibility, increased portfolio holdings transparency and the potential for enhanced tax efficiency. Effective March 1, 2024, the fund's fiscal year end changed from August 31 to June 30. |
| Fidelity, the Fidelity Investments Logo and all other Fidelity trademarks or service marks used herein are trademarks or service marks of FMR LLC. Any third-party marks that are used herein are trademarks or service marks of their respective owners. © 2024 FMR LLC. All rights reserved. |
| | For additional information about the Fund; including its prospectus, financial information, holdings and proxy information, scan the QR code or visit fundresearch.fidelity.com/prospectus/sec 1.9913706.100 7544-TSRA-0824 |
| |
| | ANNUAL SHAREHOLDER REPORT | AS OF JUNE 30, 2024 | This report describes changes to the Fund that occurred during the reporting period. |
| | Fidelity® Enhanced Large Cap Growth ETF Fidelity® Enhanced Large Cap Growth ETF : FELG Principal U.S. Listing Exchange :NYSEArca NYSE Arca, Inc. |
| | | |
This annual shareholder report contains information about Fidelity® Enhanced Large Cap Growth ETF for the period September 1, 2023 to June 30, 2024. You can find additional information about the Fund at fundresearch.fidelity.com/
prospectus/sec. You can also request this information by contacting us at 1-800-FIDELITY or by sending an e-mail to fidfunddocuments@fidelity.com.
What were your Fund costs for the last year?(based on hypothetical $10,000 investment)
FUND COST (PREVIOUS YEAR)
| | Costs of a $10,000 investment | Costs paid as a percentage of a $10,000 investment | |
| Fidelity® Enhanced Large Cap Growth ETF | $ 23 | 0.24% | |
What affected the Fund's performance this period?
- •U.S. equities gained considerably for the 12 months ending June 30, 2024, driven by resilient corporate profits, a frenzy over generative artificial intelligence and the Federal Reserve's likely pivot to cutting interest rates later this year. Amid this favorable backdrop for higher-risk assets, stocks continued their late-2023 momentum, powered by signs of continued U.S. economic strength.
- •Against this backdrop, security selection was the primary contributor to the fund's performance versus the benchmark, especially within industrials. Stock picks and an underweight in consumer discretionary, and picks in information technology, also boosted relative performance, as did an underweight in consumer staples, primarily within the food, beverage & tobacco industry.
- •The top individual relative contributor was an overweight in Nvidia (+190%), which was one of our biggest holdings. Other notable relative contributors included a non-benchmark stake in Abercrombie & Fitch (+120%), an investment we established this period, and an underweight in Starbucks (-19%). Starbucks was not held at period end.
- •In contrast, the biggest detractor from performance versus the benchmark was security selection in health care, primarily within the health care equipment & services industry. Stock picking and an overweight in energy also hampered the fund's result.
- •The largest individual relative detractor was an overweight in Teradata (-33%). This period we increased our stake in the stock. The second-largest relative detractor was our non-benchmark stake in Bristol-Myers Squibb (-23%). An overweight in Lattice Semiconductor (-40%) also hurt. Lattice Semiconductor was not held at period end.
- •Notable changes in positioning include higher allocations to communication services and financials.
How did the Fund perform over the past 10 years?
CUMULATIVE PERFORMANCE
June 30, 2014 through June 30, 2024.
Initial investment of $10,000.
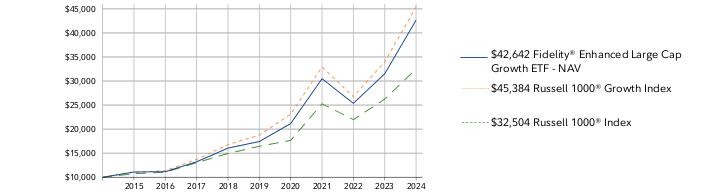
Fidelity® Enhanced Large Cap Growth ETF | $10,000 | $11,094 | $11,159 | $13,221 | $16,059 | $17,436 | $21,164 | $30,479 | $25,359 | $31,510 | $42,642 |
Russell 1000® Growth Index | $10,000 | $11,056 | $11,390 | $13,716 | $16,804 | $18,746 | $23,110 | $32,932 | $26,749 | $34,000 | $45,384 |
Russell 1000® Index | $10,000 | $10,737 | $11,052 | $13,044 | $14,941 | $16,438 | $17,667 | $25,277 | $21,982 | $26,239 | $32,504 |
| | 2014 | 2015 | 2016 | 2017 | 2018 | 2019 | 2020 | 2021 | 2022 | 2023 | 2024 |
AVERAGE ANNUAL TOTAL RETURNS: | | 1 Year | 5 Year | 10 Year |
Fidelity® Enhanced Large Cap Growth ETF - NAV | 35.33% | 19.59% | 15.61% |
Fidelity® Enhanced Large Cap Growth ETF - Market Price A | 35.76% | 19.66% | 15.64% |
| Russell 1000® Growth Index | 33.48% | 19.34% | 16.33% |
| Russell 1000® Index | 23.88% | 14.61% | 12.51% |
A From November 20, 2023, date initially listed on the NYSE Arca, Inc. exchange
Visit www.fidelity.com for more recent performance information. |
The Fund's past performance is not a good predictor of the Fund's future performance. The graph and table do not reflect the deduction of taxes that a shareholder would pay on fund distributions or redemption of fund shares. |
Key Fund Statistics (as of June 30, 2024)
KEY FACTS | | |
| Fund Size | $2,686,905,203 | |
| Number of Holdings | 112 | |
| Total Advisory Fee | $4,395,441 | |
| Portfolio Turnover | 58% | |
What did the Fund invest in?
(as of June 30, 2024)
MARKET SECTORS (% of Fund's net assets) | | |
| Information Technology | 49.1 | |
| Communication Services | 13.4 | |
| Consumer Discretionary | 13.3 | |
| Health Care | 7.9 | |
| Financials | 5.9 | |
| Industrials | 5.4 | |
| Consumer Staples | 1.6 | |
| Materials | 1.2 | |
| Energy | 1.1 | |
| Utilities | 0.5 | |
| |
| Common Stocks | 99.4 |
| Short-Term Investments and Net Other Assets (Liabilities) | 0.6 |
ASSET ALLOCATION (% of Fund's net assets) |
|
|
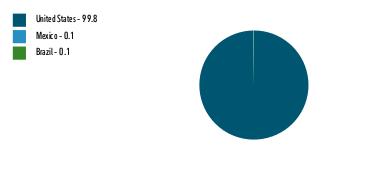
| United States | 99.8 |
| Mexico | 0.1 |
| Brazil | 0.1 |
GEOGRAPHIC DIVERSIFICATION (% of Fund's net assets) |
|
| |
|
TOP HOLDINGS (% of Fund's net assets) | | |
| Microsoft Corp | 11.7 | |
| NVIDIA Corp | 11.3 | |
| Apple Inc | 11.2 | |
| Amazon.com Inc | 6.1 | |
| Meta Platforms Inc Class A | 4.4 | |
| Alphabet Inc Class A | 3.8 | |
| Alphabet Inc Class C | 3.7 | |
| Broadcom Inc | 2.9 | |
| Eli Lilly & Co | 2.3 | |
| Mastercard Inc Class A | 1.8 | |
| | 59.2 | |
| |
How has the Fund changed?
This is a summary of certain changes to the Fund since September 1, 2023. For more complete information, you may review the Fund's next prospectus, which we expect to be available by October 30, 2024 at fundresearch.fidelity.com/prospectus/sec or upon request at 1-800-FIDELITY or by sending an e-mail to fidfunddocuments@fidelity.com.
The fees associated with this class changed during the reporting year. The variations in class fees are primarily the result of the following changes: - •Management fee
- •Operating expenses
| Fidelity Enhanced Large Cap Growth ETF converted from Fidelity Enhanced Large Cap Growth Index Fund on November 17, 2023. This move, approved by the Board of Trustees in June 2023, was deemed in the best interest of shareholders. The new ETF and its former corresponding fund have identical investment objectives and fundamental investment policies and have substantially similar investment strategies. Returns prior to the conversion are those of the former corresponding fund. Fidelity believes that the conversion will provide multiple benefits for investors of the fund, including lower net expenses, additional trading flexibility, increased portfolio holdings transparency and the potential for enhanced tax efficiency. Effective March 1, 2024, the fund's fiscal year end changed from August 31 to June 30. |
| Fidelity, the Fidelity Investments Logo and all other Fidelity trademarks or service marks used herein are trademarks or service marks of FMR LLC. Any third-party marks that are used herein are trademarks or service marks of their respective owners. © 2024 FMR LLC. All rights reserved. |
| | For additional information about the Fund; including its prospectus, financial information, holdings and proxy information, scan the QR code or visit fundresearch.fidelity.com/prospectus/sec 1.9913705.100 7543-TSRA-0824 |
| |
| | ANNUAL SHAREHOLDER REPORT | AS OF JUNE 30, 2024 | |
| | Fidelity® Cloud Computing ETF Fidelity® Cloud Computing ETF : FCLD Principal U.S. Listing Exchange :CboeBZX Cboe BZX Exchange, Inc. |
| | | |
This annual shareholder report contains information about Fidelity® Cloud Computing ETF for the period July 1, 2023 to June 30, 2024. You can find additional information about the Fund at fundresearch.fidelity.com/
prospectus/sec. You can also request this information by contacting us at 1-800-FIDELITY or by sending an e-mail to fidfunddocuments@fidelity.com.
What were your Fund costs for the last year?(based on hypothetical $10,000 investment)
FUND COST (PREVIOUS YEAR)
| | Costs of a $10,000 investment | Costs paid as a percentage of a $10,000 investment | |
| Fidelity® Cloud Computing ETF | $ 45 | 0.40% | |
What affected the Fund's performance this period?
•U.S. equities gained considerably for the 12 months ending June 30, 2024, driven by resilient corporate profits, a frenzy over generative artificial intelligence and the Federal Reserve's likely pivot to cutting interest rates later this year. Amid this favorable backdrop for higher-risk assets, stocks continued their late-2023 momentum, powered by signs of continued U.S. economic strength.
•Against this backdrop, the United States gained 27% and contributed most from a security selection standpoint, followed by the U.K. (+8%). By sector, picks among information technology (+26%) stocks helped most. Exposure to the real estate (+16%) category proved advantageous as well.
•Conversely, emerging markets returned -44% and detracted most, followed by Canada (-6%). As it relates to sectors, industrials generated an approximately -28% result and hurt most.
•Turning to individual stocks, the biggest contributor was technology hardware & equipment company Super Micro Computer (+243%). A stake in Western Digital (+100%) - another technology hardware & equipment stock - was a plus as well. MicroStrategy (+340%), Microsoft (+36%) and ServiceNow (+40%), within the software & services industry, further lifted the fund's performance.
•Conversely, the biggest individual detractor was software & services firm MongoDB (-39%). Other software & services holdings, including Five9 (-46%), Snowflake (-23%), Fastly (-53%) and Teradata (-35%), proved detrimental as well.
How did the Fund perform over the life of Fund?
CUMULATIVE PERFORMANCE
October 5, 2021 through June 30, 2024.
Initial investment of $10,000.
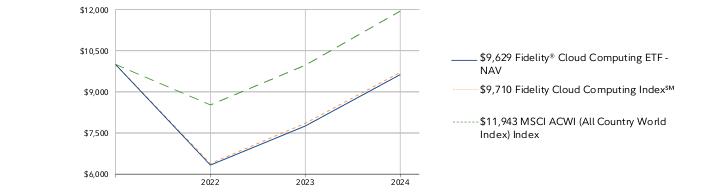
Fidelity® Cloud Computing ETF | $10,000 | $6,331 | $7,755 | $9,629 |
Fidelity Cloud Computing Index℠ | $10,000 | $6,385 | $7,854 | $9,710 |
MSCI ACWI (All Country World Index) Index | $10,000 | $8,524 | $9,970 | $11,943 |
| | 2021 | 2022 | 2023 | 2024 |
AVERAGE ANNUAL TOTAL RETURNS: | | 1 Year | Life of Fund |
Fidelity® Cloud Computing ETF - NAV A | 24.16% | -1.37% |
Fidelity® Cloud Computing ETF - Market Price B | 24.03% | -1.89% |
Fidelity Cloud Computing Index℠ A | 23.63% | -1.07% |
MSCI ACWI (All Country World Index) Index A | 19.79% | 6.70% |
A From October 5, 2021
B From October 7, 2021, date initially listed on the Cboe BZX Exchange, Inc. exchange
Visit www.fidelity.com for more recent performance information. |
The Fund's past performance is not a good predictor of the Fund's future performance. The graph and table do not reflect the deduction of taxes that a shareholder would pay on fund distributions or redemption of fund shares. |
Key Fund Statistics (as of June 30, 2024)
KEY FACTS | | |
| Fund Size | $77,121,561 | |
| Number of Holdings | 51 | |
| Total Advisory Fee | $225,751 | |
| Portfolio Turnover | 33% | |
What did the Fund invest in?
(as of June 30, 2024)
MARKET SECTORS (% of Fund's net assets) | | |
| Information Technology | 92.3 | |
| Real Estate | 6.2 | |
| Industrials | 1.5 | |
| |
| Common Stocks | 100.0 |
| Short-Term Investments and Net Other Assets (Liabilities) | 0.0 |
ASSET ALLOCATION (% of Fund's net assets) |
|
|
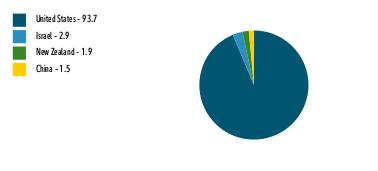
| United States | 93.7 |
| Israel | 2.9 |
| New Zealand | 1.9 |
| China | 1.5 |
GEOGRAPHIC DIVERSIFICATION (% of Fund's net assets) |
|
| |
|
TOP HOLDINGS (% of Fund's net assets) | | |
| Oracle Corp | 5.2 | |
| Intuit Inc | 4.8 | |
| Salesforce Inc | 4.7 | |
| Servicenow Inc | 4.6 | |
| Microsoft Corp | 4.5 | |
| Equinix Inc | 3.3 | |
| Datadog Inc Class A | 2.9 | |
| Digital Realty Trust Inc | 2.9 | |
| Workday Inc Class A | 2.9 | |
| Snowflake Inc Class A | 2.8 | |
| | 38.6 | |
| |
| Fidelity, the Fidelity Investments Logo and all other Fidelity trademarks or service marks used herein are trademarks or service marks of FMR LLC. Any third-party marks that are used herein are trademarks or service marks of their respective owners. © 2024 FMR LLC. All rights reserved. |
| | For additional information about the Fund; including its prospectus, financial information, holdings and proxy information, scan the QR code or visit fundresearch.fidelity.com/prospectus/sec 1.9913373.100 6443-TSRA-0824 |
| |
| | ANNUAL SHAREHOLDER REPORT | AS OF JUNE 30, 2024 | |
| | Fidelity® Electric Vehicles and Future Transportation ETF Fidelity® Electric Vehicles and Future Transportation ETF : FDRV Principal U.S. Listing Exchange :CBOE Cboe BZX Exchange, Inc. |
| | | |
This annual shareholder report contains information about Fidelity® Electric Vehicles and Future Transportation ETF for the period July 1, 2023 to June 30, 2024. You can find additional information about the Fund at fundresearch.fidelity.com/
prospectus/sec. You can also request this information by contacting us at 1-800-FIDELITY or by sending an e-mail to fidfunddocuments@fidelity.com.
What were your Fund costs for the last year?(based on hypothetical $10,000 investment)
FUND COST (PREVIOUS YEAR)
| | Costs of a $10,000 investment | Costs paid as a percentage of a $10,000 investment | |
| Fidelity® Electric Vehicles and Future Transportation ETF | $ 34 | 0.40% | |
What affected the Fund's performance this period?
•U.S. equities gained considerably for the 12 months ending June 30, 2024, driven by resilient corporate profits, a frenzy over generative artificial intelligence and the Federal Reserve's likely pivot to cutting interest rates later this year. Amid this favorable backdrop for higher-risk assets, stocks continued their late-2023 momentum, powered by signs of continued U.S. economic strength.
•Against this backdrop, the United States returned -24% and detracted most from a security selection standpoint, followed by emerging markets (-41%). By sector, consumer discretionary stocks generated a -31% result and hurt most. Specifically, this group was hampered by the automobiles & components industry (-34%). Elsewhere, industrials (-37%) firms also were challenged, particularly the capital goods industry (-46%). Other notable detractors were the materials (-63%) and information technology (-14%) sectors.
•Turning to individual stocks, the biggest detractor was materials stock Albemarle (-57%). In capital goods, stakes in Plug Power (-78%) and ChargePoint Holdings (-83%) hurt as well. Samsung SDI (-49%), a technology hardware & equipment company, further detracted. Lastly, NIO (-57%), within the automobiles & components group, also proved detrimental to performance.
•Conversely, the top individual contributor was semiconductors & semiconductor equipment stock Analog Devices (+31%). Elsewhere in the industry, NXP Semiconductors (+34%) was another plus. In the consumer durables & apparel category, Garmin advanced roughly 37% and aided performance. Capital goods company Blue Bird rose 139% and helped as well. Lastly, Lyft (+46%), from the transportation category, was another plus.
How did the Fund perform over the life of Fund?
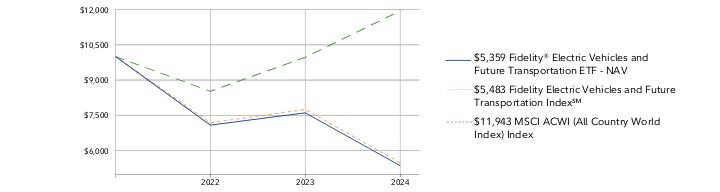
CUMULATIVE PERFORMANCE
October 5, 2021 through June 30, 2024.
Initial investment of $10,000.
Fidelity® Electric Vehicles and Future Transportation ETF | $10,000 | $7,085 | $7,607 | $5,359 |
Fidelity Electric Vehicles and Future Transportation Index℠ | $10,000 | $7,184 | $7,751 | $5,483 |
MSCI ACWI (All Country World Index) Index | $10,000 | $8,524 | $9,970 | $11,943 |
| | 2021 | 2022 | 2023 | 2024 |
AVERAGE ANNUAL TOTAL RETURNS: | | 1 Year | Life of Fund |
Fidelity® Electric Vehicles and Future Transportation ETF - NAV A | -29.55% | -20.38% |
Fidelity® Electric Vehicles and Future Transportation ETF - Market Price B | -30.25% | -21.12% |
Fidelity Electric Vehicles and Future Transportation Index℠ A | -29.25% | -19.71% |
MSCI ACWI (All Country World Index) Index A | 19.79% | 6.70% |
A From October 5, 2021
B From October 7, 2021, date initially listed on the Cboe BZX Exchange, Inc. exchange
Visit www.fidelity.com for more recent performance information. |
The Fund's past performance is not a good predictor of the Fund's future performance. The graph and table do not reflect the deduction of taxes that a shareholder would pay on fund distributions or redemption of fund shares. |
Key Fund Statistics (as of June 30, 2024)
KEY FACTS | | |
| Fund Size | $32,787,168 | |
| Number of Holdings | 51 | |
| Total Advisory Fee | $169,524 | |
| Portfolio Turnover | 54% | |
What did the Fund invest in?
(as of June 30, 2024)
MARKET SECTORS (% of Fund's net assets) | | |
| Consumer Discretionary | 39.7 | |
| Information Technology | 33.5 | |
| Industrials | 18.6 | |
| Materials | 8.0 | |
| |
| Common Stocks | 99.8 |
| Short-Term Investments and Net Other Assets (Liabilities) | 0.2 |
ASSET ALLOCATION (% of Fund's net assets) |
|
|
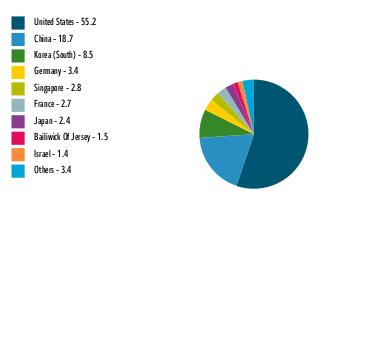
| United States | 55.2 |
| China | 18.7 |
| Korea (South) | 8.5 |
| Germany | 3.4 |
| Singapore | 2.8 |
| France | 2.7 |
| Japan | 2.4 |
| Bailiwick Of Jersey | 1.5 |
| Israel | 1.4 |
| Others | 3.4 |
GEOGRAPHIC DIVERSIFICATION (% of Fund's net assets) |
|
| |
|
TOP HOLDINGS (% of Fund's net assets) | | |
| Tesla Inc | 5.5 | |
| Uber Technologies Inc | 5.3 | |
| Analog Devices Inc | 4.8 | |
| NXP Semiconductors NV | 4.0 | |
| BYD Co Ltd H Shares | 3.7 | |
| Garmin Ltd | 3.4 | |
| Infineon Technologies AG | 3.4 | |
| ON Semiconductor Corp | 2.9 | |
| Aptiv PLC | 2.9 | |
| Skyworks Solutions Inc | 2.8 | |
| | 38.7 | |
| |
| Fidelity, the Fidelity Investments Logo and all other Fidelity trademarks or service marks used herein are trademarks or service marks of FMR LLC. Any third-party marks that are used herein are trademarks or service marks of their respective owners. © 2024 FMR LLC. All rights reserved. |
| | For additional information about the Fund; including its prospectus, financial information, holdings and proxy information, scan the QR code or visit fundresearch.fidelity.com/prospectus/sec 1.9913375.100 6445-TSRA-0824 |
| |
| | ANNUAL SHAREHOLDER REPORT | AS OF JUNE 30, 2024 | |
| | Fidelity® Clean Energy ETF Fidelity® Clean Energy ETF : FRNW Principal U.S. Listing Exchange :CBOE Cboe BZX Exchange, Inc. |
| | | |
This annual shareholder report contains information about Fidelity® Clean Energy ETF for the period July 1, 2023 to June 30, 2024. You can find additional information about the Fund at fundresearch.fidelity.com/
prospectus/sec. You can also request this information by contacting us at 1-800-FIDELITY or by sending an e-mail to fidfunddocuments@fidelity.com.
What were your Fund costs for the last year?(based on hypothetical $10,000 investment)
FUND COST (PREVIOUS YEAR)
| | Costs of a $10,000 investment | Costs paid as a percentage of a $10,000 investment | |
| Fidelity® Clean Energy ETF | $ 34 | 0.40% | |
What affected the Fund's performance this period?
•U.S. equities gained considerably for the 12 months ending June 30, 2024, driven by resilient corporate profits, a frenzy over generative artificial intelligence and the Federal Reserve's likely pivot to cutting interest rates later this year. Amid this favorable backdrop for higher-risk assets, stocks continued their late-2023 momentum, powered by signs of continued U.S. economic strength.
•Against this backdrop, the United States returned -43% and was the foremost detractor this period from a security selection standpoint, followed by emerging markets (-30%). By sector, information technology generated a roughly -49% result and hurt performance most. This group was hampered by the semiconductors & semiconductor equipment industry (-53%) in particular. Industrials (-35%) stocks also were challenged, hindered by the capital goods industry (-36%). Other notable detractors were the utilities (-13%) and the energy (-88%) sectors.
•Turning to individual stocks, the biggest detractor was SolarEdge Technologies (-82%), within the semiconductors & semiconductor equipment category. Enphase Energy (-41%) - another semiconductors & semiconductor equipment firm - also proved detrimental in terms of the portfolio's result. Plug Power (-77%) and Shoals Technologies (-76%), within the capital goods industry, hindered the fund's return as well. Additionally, utilities stock Ørsted (-44%) further pressured performance.
•In contrast, the biggest individual contributor was First Solar (+18%), within the semiconductors & semiconductor equipment industry. Among utilities holdings, Neoen (+29%) and Meridian Energy (+15%) aided performance. Cadeler (+42%), a stock in the capital goods group, was another plus. Lastly, in technology hardware & equipment, Itron gained 14% and lifted the fund as well.
How did the Fund perform over the life of Fund?
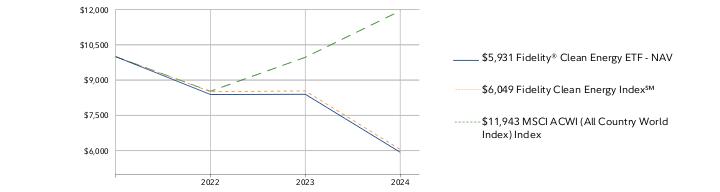
CUMULATIVE PERFORMANCE
October 5, 2021 through June 30, 2024.
Initial investment of $10,000.
Fidelity® Clean Energy ETF | $10,000 | $8,388 | $8,397 | $5,931 |
Fidelity Clean Energy Index℠ | $10,000 | $8,508 | $8,539 | $6,049 |
MSCI ACWI (All Country World Index) Index | $10,000 | $8,524 | $9,970 | $11,943 |
| | 2021 | 2022 | 2023 | 2024 |
AVERAGE ANNUAL TOTAL RETURNS: | | 1 Year | Life of Fund |
Fidelity® Clean Energy ETF - NAV A | -29.37% | -17.38% |
Fidelity® Clean Energy ETF - Market Price B | -29.77% | -17.94% |
Fidelity Clean Energy Index℠ A | -29.16% | -16.78% |
MSCI ACWI (All Country World Index) Index A | 19.79% | 6.70% |
A From October 5, 2021
B From October 7, 2021, date initially listed on the Cboe BZX Exchange, Inc. exchange
Visit www.fidelity.com for more recent performance information. |
The Fund's past performance is not a good predictor of the Fund's future performance. The graph and table do not reflect the deduction of taxes that a shareholder would pay on fund distributions or redemption of fund shares. |
Key Fund Statistics (as of June 30, 2024)
KEY FACTS | | |
| Fund Size | $25,386,822 | |
| Number of Holdings | 52 | |
| Total Advisory Fee | $112,407 | |
| Portfolio Turnover | 45% | |
What did the Fund invest in?
(as of June 30, 2024)
MARKET SECTORS (% of Fund's net assets) | | |
| Utilities | 50.6 | |
| Industrials | 32.3 | |
| Information Technology | 16.7 | |
| |
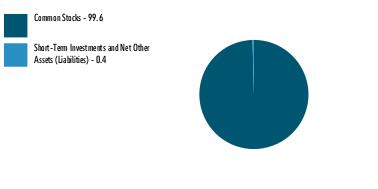
| Common Stocks | 99.6 |
| Short-Term Investments and Net Other Assets (Liabilities) | 0.4 |
ASSET ALLOCATION (% of Fund's net assets) |
|
|
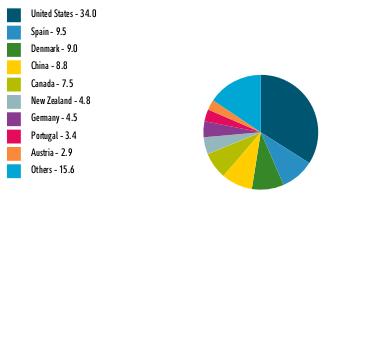
| United States | 34.0 |
| Spain | 9.5 |
| Denmark | 9.0 |
| China | 8.8 |
| Canada | 7.5 |
| New Zealand | 4.8 |
| Germany | 4.5 |
| Portugal | 3.4 |
| Austria | 2.9 |
| Others | 15.6 |
GEOGRAPHIC DIVERSIFICATION (% of Fund's net assets) |
|
| |
|
TOP HOLDINGS (% of Fund's net assets) | | |
| GE Vernova Inc | 5.4 | |
| First Solar Inc | 4.2 | |
| Vestas Wind Systems A/S | 4.1 | |
| Energias DE Portugal SA | 3.4 | |
| Orsted AS | 3.2 | |
| Enphase Energy Inc | 3.2 | |
| Verbund AG Class A | 2.9 | |
| Meridian Energy Ltd | 2.7 | |
| Northland Power Inc | 2.6 | |
| NEXTracker Inc Class A | 2.6 | |
| | 34.3 | |
| |
| Fidelity, the Fidelity Investments Logo and all other Fidelity trademarks or service marks used herein are trademarks or service marks of FMR LLC. Any third-party marks that are used herein are trademarks or service marks of their respective owners. © 2024 FMR LLC. All rights reserved. |
| | For additional information about the Fund; including its prospectus, financial information, holdings and proxy information, scan the QR code or visit fundresearch.fidelity.com/prospectus/sec 1.9913372.100 6442-TSRA-0824 |
| |
| | ANNUAL SHAREHOLDER REPORT | AS OF JUNE 30, 2024 | |
| | Fidelity® Digital Health ETF Fidelity® Digital Health ETF : FDHT Principal U.S. Listing Exchange :CBOE Cboe BZX Exchange, Inc. |
| | | |
This annual shareholder report contains information about Fidelity® Digital Health ETF for the period July 1, 2023 to June 30, 2024. You can find additional information about the Fund at fundresearch.fidelity.com/
prospectus/sec. You can also request this information by contacting us at 1-800-FIDELITY or by sending an e-mail to fidfunddocuments@fidelity.com.
What were your Fund costs for the last year?(based on hypothetical $10,000 investment)
FUND COST (PREVIOUS YEAR)
| | Costs of a $10,000 investment | Costs paid as a percentage of a $10,000 investment | |
| Fidelity® Digital Health ETF | $ 39 | 0.40% | |
What affected the Fund's performance this period?
•U.S. equities gained considerably for the 12 months ending June 30, 2024, driven by resilient corporate profits, a frenzy over generative artificial intelligence and the Federal Reserve's likely pivot to cutting interest rates later this year. Amid this favorable backdrop for higher-risk assets, stocks continued their late-2023 momentum, powered by signs of continued U.S. economic strength.
•Against this backdrop, the United States returned -13% and detracted most from a security selection standpoint, followed by emerging markets (-43%). By sector, health care stocks produced a -6% result and were most detrimental to performance. Specifically, this group was hampered by the health care equipment & services industry (-6%). Elsewhere, exposure to consumer staples (-18%) and communication services (0%) companies further detracted.
•In contrast, Asia Pacific ex Japan gained 56% and contributed most, followed by Europe ex the U.K. (+24%), especially Sweden (+13%). In terms of sectors, information technology returned -1% and contributed most, driven by the software & services industry (+7%). Stakes in industrials stocks also helped (+3%).
•On an individual basis, the biggest detractor was health care equipment & services firm Inspire Medical Systems (-59%). Teladoc Health (-61%), Nevro (-67%) and Accolade (-71%) - all health care equipment & services holdings as well - further challenged performance. Among consumer staples distribution & retail stocks, JD Health International returned about -53% and further weighed on performance.
•In contrast, the top individual contributor was health care equipment & services company Pro Medicus (+122%). Elsewhere in the health care equipment & services industry, stakes in Hims & Hers Health (+107%), Cochlear (+48%), Intuitive Surgical (+30%) and Tandem Diabetes Care (+66%) also helped.
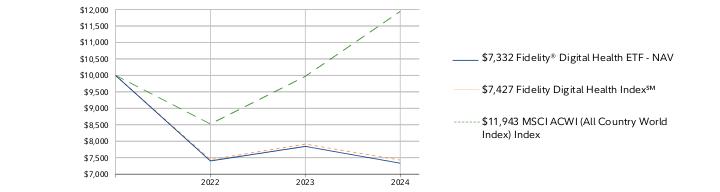
How did the Fund perform over the life of Fund?
CUMULATIVE PERFORMANCE
October 5, 2021 through June 30, 2024.
Initial investment of $10,000.
Fidelity® Digital Health ETF | $10,000 | $7,401 | $7,843 | $7,332 |
Fidelity Digital Health Index℠ | $10,000 | $7,441 | $7,913 | $7,427 |
MSCI ACWI (All Country World Index) Index | $10,000 | $8,524 | $9,970 | $11,943 |
| | 2021 | 2022 | 2023 | 2024 |
AVERAGE ANNUAL TOTAL RETURNS: | | 1 Year | Life of Fund |
Fidelity® Digital Health ETF - NAV A | -6.52% | -10.72% |
Fidelity® Digital Health ETF - Market Price B | -7.03% | -11.24% |
Fidelity Digital Health Index℠ A | -6.14% | -10.30% |
MSCI ACWI (All Country World Index) Index A | 19.79% | 6.70% |
A From October 5, 2021
B From October 7, 2021, date initially listed on the Cboe BZX Exchange, Inc. exchange
Visit www.fidelity.com for more recent performance information. |
The Fund's past performance is not a good predictor of the Fund's future performance. The graph and table do not reflect the deduction of taxes that a shareholder would pay on fund distributions or redemption of fund shares. |
Key Fund Statistics (as of June 30, 2024)
KEY FACTS | | |
| Fund Size | $8,264,028 | |
| Number of Holdings | 45 | |
| Total Advisory Fee | $35,407 | |
| Portfolio Turnover | 42% | |
What did the Fund invest in?
(as of June 30, 2024)
MARKET SECTORS (% of Fund's net assets) | | |
| Health Care | 87.4 | |
| Consumer Staples | 6.2 | |
| Industrials | 2.6 | |
| Information Technology | 2.2 | |
| Communication Services | 1.5 | |
| |
| Common Stocks | 99.9 |
| Short-Term Investments and Net Other Assets (Liabilities) | 0.1 |
ASSET ALLOCATION (% of Fund's net assets) |
|
|
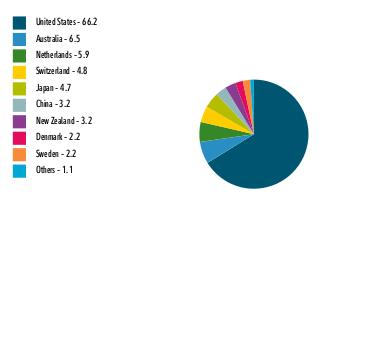
| United States | 66.2 |
| Australia | 6.5 |
| Netherlands | 5.9 |
| Switzerland | 4.8 |
| Japan | 4.7 |
| China | 3.2 |
| New Zealand | 3.2 |
| Denmark | 2.2 |
| Sweden | 2.2 |
| Others | 1.1 |
GEOGRAPHIC DIVERSIFICATION (% of Fund's net assets) |
|
| |
|
TOP HOLDINGS (% of Fund's net assets) | | |
| Intuitive Surgical Inc | 4.9 | |
| Veeva Systems Inc Class A | 4.5 | |
| Dexcom Inc | 4.4 | |
| ResMed Inc | 4.2 | |
| Koninklijke Philips NV | 4.1 | |
| Insulet Corp | 3.8 | |
| Cochlear Ltd | 3.7 | |
| Sonova Holding AG | 3.6 | |
| Fisher & Paykel Healthcare Corp Ltd | 3.2 | |
| Pro Medicus Ltd | 2.8 | |
| | 39.2 | |
| |
| Fidelity, the Fidelity Investments Logo and all other Fidelity trademarks or service marks used herein are trademarks or service marks of FMR LLC. Any third-party marks that are used herein are trademarks or service marks of their respective owners. © 2024 FMR LLC. All rights reserved. |
| | For additional information about the Fund; including its prospectus, financial information, holdings and proxy information, scan the QR code or visit fundresearch.fidelity.com/prospectus/sec 1.9913374.100 6444-TSRA-0824 |
| |
| | ANNUAL SHAREHOLDER REPORT | AS OF JUNE 30, 2024 | This report describes changes to the Fund that occurred during the reporting period. |
| | Fidelity® Enhanced Large Cap Core ETF Fidelity® Enhanced Large Cap Core ETF : FELC Principal U.S. Listing Exchange :NYSEArca NYSE Arca, Inc. |
| | | |
This annual shareholder report contains information about Fidelity® Enhanced Large Cap Core ETF for the period September 1, 2023 to June 30, 2024. You can find additional information about the Fund at fundresearch.fidelity.com/
prospectus/sec. You can also request this information by contacting us at 1-800-FIDELITY or by sending an e-mail to fidfunddocuments@fidelity.com.
What were your Fund costs for the last year?(based on hypothetical $10,000 investment)
FUND COST (PREVIOUS YEAR)
| | Costs of a $10,000 investment | Costs paid as a percentage of a $10,000 investment | |
| Fidelity® Enhanced Large Cap Core ETF | $ 22 | 0.23% | |
What affected the Fund's performance this period?
- • U.S. equities gained considerably for the 12 months ending June 30, 2024, driven by resilient corporate profits, a frenzy over generative artificial intelligence and the Federal Reserve's likely pivot to cutting interest rates later this year. Amid this favorable backdrop for higher-risk assets, stocks continued their late-2023 momentum, powered by signs of continued U.S. economic strength.
- •Against this backdrop, security selection was the primary contributor to the fund's performance versus the benchmark, especially within information technology. Stock selection in consumer discretionary, stock picks and an underweight in consumer staples, and picks and an overweight in communication services also boosted the fund's relative performance.
- •The top individual relative contributor was an overweight in Nvidia (+190%), which was the fund's largest holding at period end. An underweight in Tesla (-24%) and an overweight in Broadcom (+87%) also contributed. Broadcom was among the fund's biggest holdings.
- •In contrast, the biggest detractor from performance versus the benchmark was stock picking in health care, primarily within the pharmaceuticals, biotechnology & life sciences industry. Also hurting our result were security selection and an overweight in industrials, primarily within the capital goods industry, and stock picks and an underweight in energy.
- •The biggest individual relative detractor was our non-benchmark stake in Teradata (-36%). This period we increased our investment in the stock. Other notable relative detractors included an underweight in Eli Lilly (+94%) and a non-benchmark stake in Hawaiian Electric Industries (-54%). Hawaiian Electric was not held at period end.
- •Notable changes in positioning include increased exposure to communication services and a lower allocation to consumer discretionary.
How did the Fund perform over the past 10 years?
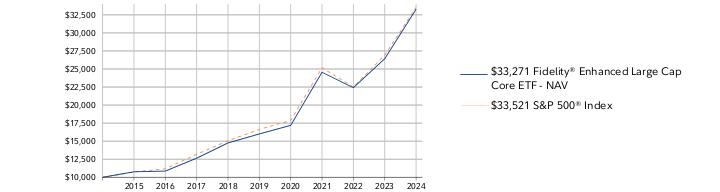
CUMULATIVE PERFORMANCE
June 30, 2014 through June 30, 2024.
Initial investment of $10,000.
Fidelity® Enhanced Large Cap Core ETF | $10,000 | $10,760 | $10,860 | $12,647 | $14,756 | $16,007 | $17,193 | $24,547 | $22,411 | $26,419 | $33,271 |
S&P 500® Index | $10,000 | $10,742 | $11,171 | $13,170 | $15,064 | $16,633 | $17,881 | $25,175 | $22,503 | $26,912 | $33,521 |
| | 2014 | 2015 | 2016 | 2017 | 2018 | 2019 | 2020 | 2021 | 2022 | 2023 | 2024 |
AVERAGE ANNUAL TOTAL RETURNS: | | 1 Year | 5 Year | 10 Year |
Fidelity® Enhanced Large Cap Core ETF - NAV | 25.94% | 15.76% | 12.77% |
Fidelity® Enhanced Large Cap Core ETF - Market Price A | 26.28% | 15.82% | 12.80% |
| S&P 500® Index | 24.56% | 15.05% | 12.86% |
A From November 20, 2023, date initially listed on the NYSE Arca, Inc. exchange
Visit www.fidelity.com for more recent performance information. |
The Fund's past performance is not a good predictor of the Fund's future performance. The graph and table do not reflect the deduction of taxes that a shareholder would pay on fund distributions or redemption of fund shares. |
Key Fund Statistics (as of June 30, 2024)
KEY FACTS | | |
| Fund Size | $2,911,234,375 | |
| Number of Holdings | 201 | |
| Total Advisory Fee | $4,204,212 | |
| Portfolio Turnover | 58% | |
What did the Fund invest in?
(as of June 30, 2024)
MARKET SECTORS (% of Fund's net assets) | | |
| Information Technology | 31.7 | |
| Health Care | 12.5 | |
| Financials | 12.2 | |
| Communication Services | 11.3 | |
| Industrials | 9.9 | |
| Consumer Discretionary | 9.7 | |
| Consumer Staples | 4.3 | |
| Energy | 3.0 | |
| Materials | 2.4 | |
| Utilities | 1.2 | |
| Real Estate | 0.9 | |
| |
| Common Stocks | 99.1 |
| Short-Term Investments and Net Other Assets (Liabilities) | 0.9 |
ASSET ALLOCATION (% of Fund's net assets) |
|
|
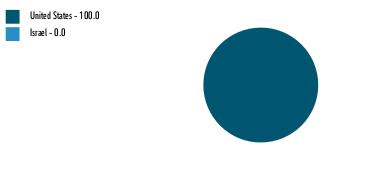
| United States | 100.0 |
| Israel | 0.0 |
GEOGRAPHIC DIVERSIFICATION (% of Fund's net assets) |
|
| |
|
TOP HOLDINGS (% of Fund's net assets) | | |
| NVIDIA Corp | 7.1 | |
| Apple Inc | 7.1 | |
| Microsoft Corp | 6.7 | |
| Amazon.com Inc | 3.9 | |
| Meta Platforms Inc Class A | 2.9 | |
| Alphabet Inc Class C | 2.5 | |
| Alphabet Inc Class A | 2.3 | |
| Berkshire Hathaway Inc Class B | 2.1 | |
| Broadcom Inc | 2.0 | |
| JPMorgan Chase & Co | 1.8 | |
| | 38.4 | |
| |
How has the Fund changed?
This is a summary of certain changes to the Fund since September 1, 2023. For more complete information, you may review the Fund's next prospectus, which we expect to be available by October 30, 2024 at fundresearch.fidelity.com/prospectus/sec or upon request at 1-800-FIDELITY or by sending an e-mail to fidfunddocuments@fidelity.com.
The fees associated with this class changed during the reporting year. The variations in class fees are primarily the result of the following changes: - •Management fee
- •Operating expenses
| Fidelity Enhanced Large Cap Core ETF converted from Fidelity Enhanced Large Cap Core Index Fund on November 17, 2023. This move, approved by the Board of Trustees in June 2023, was deemed in the best interest of shareholders. The new ETF and its former corresponding fund have identical investment objectives and fundamental investment policies and have substantially similar investment strategies. Returns prior to the conversion are those of the former corresponding fund. Fidelity believes that the conversion will provide multiple benefits for investors of the fund, including lower net expenses, additional trading flexibility, increased portfolio holdings transparency and the potential for enhanced tax efficiency. Effective March 1, 2024, the fund's fiscal year end changed from August 31 to June 30. |
| Fidelity, the Fidelity Investments Logo and all other Fidelity trademarks or service marks used herein are trademarks or service marks of FMR LLC. Any third-party marks that are used herein are trademarks or service marks of their respective owners. © 2024 FMR LLC. All rights reserved. |
| | For additional information about the Fund; including its prospectus, financial information, holdings and proxy information, scan the QR code or visit fundresearch.fidelity.com/prospectus/sec 1.9913703.100 7541-TSRA-0824 |
| |
| | ANNUAL SHAREHOLDER REPORT | AS OF JUNE 30, 2024 | |
| | Fidelity® Crypto Industry and Digital Payments ETF Fidelity® Crypto Industry and Digital Payments ETF : FDIG Principal U.S. Listing Exchange :NASDAQ NASDAQ/NMS Global Market |
| | | |
This annual shareholder report contains information about Fidelity® Crypto Industry and Digital Payments ETF for the period July 1, 2023 to June 30, 2024. You can find additional information about the Fund at fundresearch.fidelity.com/
prospectus/sec. You can also request this information by contacting us at 1-800-FIDELITY or by sending an e-mail to fidfunddocuments@fidelity.com.
What were your Fund costs for the last year?(based on hypothetical $10,000 investment)
FUND COST (PREVIOUS YEAR)
| | Costs of a $10,000 investment | Costs paid as a percentage of a $10,000 investment | |
| Fidelity® Crypto Industry and Digital Payments ETF | $ 51 | 0.40% | |
What affected the Fund's performance this period?
•U.S. equities gained considerably for the 12 months ending June 30, 2024, driven by resilient corporate profits, a frenzy over generative artificial intelligence and the Federal Reserve's likely pivot to cutting interest rates later this year. Amid this favorable backdrop for higher-risk assets, stocks continued their late-2023 momentum, powered by signs of continued U.S. economic strength.
•Against this backdrop, the United States gained roughly 78% and contributed most from a security selection standpoint, followed by Asia Pacific ex Japan (+91%), especially Singapore (+29%). By sector, information technology stocks rose about 52% and helped most, driven by the software & services industry (+60%). Exposure to financials stocks (+52%) proved advantageous as well.
•Conversely, Europe ex the U.K. returned -43% and detracted most, followed by emerging markets (-22%), especially Brazil (+6%). As it relates to sectors, communication services firms returned about -27% and were the biggest challenge.
•In terms of individual holdings, the biggest contributor was financial services stock Coinbase Global (+208%). Elsewhere, CleanSpark (+265%), TeraWulf (+154%), Core Scientific (+171%) and Iris Energy (+145%), within the software & services industry, also stood out to the upside.
•In contrast, the biggest individual detractor was Riot Platforms (-23%), a software & services company. Exposure to another software & services stock, Hive Digital Technologies (-33%), hurt as well. Among technology hardware & equipment firms, Canaan returned approximately -47% and further detracted, as did financial services positions Worldline (-71%) and Flywire (-47%).
How did the Fund perform over the life of Fund?
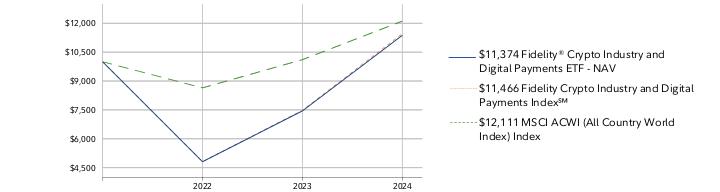
CUMULATIVE PERFORMANCE
April 19, 2022 through June 30, 2024.
Initial investment of $10,000.
Fidelity® Crypto Industry and Digital Payments ETF | $10,000 | $4,808 | $7,450 |
Fidelity Crypto Industry and Digital Payments Index℠ | $10,000 | $4,812 | $7,479 |
MSCI ACWI (All Country World Index) Index | $10,000 | $8,644 | $10,111 |
| | 2022 | 2023 | 2024 |
AVERAGE ANNUAL TOTAL RETURNS: | | 1 Year | Life of Fund |
Fidelity® Crypto Industry and Digital Payments ETF - NAV A | 52.67% | 6.02% |
Fidelity® Crypto Industry and Digital Payments ETF - Market Price B | 52.59% | 10.97% |
Fidelity Crypto Industry and Digital Payments Index℠ A | 53.31% | 6.42% |
MSCI ACWI (All Country World Index) Index A | 19.79% | 9.10% |
A From April 19, 2022
B From April 21, 2022, date initially listed on the NASDAQ/NMS Global Market exchange
Visit www.fidelity.com for more recent performance information. |
The Fund's past performance is not a good predictor of the Fund's future performance. The graph and table do not reflect the deduction of taxes that a shareholder would pay on fund distributions or redemption of fund shares. |
Key Fund Statistics (as of June 30, 2024)
KEY FACTS | | |
| Fund Size | $103,792,520 | |
| Number of Holdings | 39 | |
| Total Advisory Fee | $267,622 | |
| Portfolio Turnover | 53% | |
What did the Fund invest in?
(as of June 30, 2024)
MARKET SECTORS (% of Fund's net assets) | | |
| Information Technology | 58.6 | |
| Financials | 41.3 | |
| |
| Common Stocks | 99.9 |
| Short-Term Investments and Net Other Assets (Liabilities) | 0.1 |
ASSET ALLOCATION (% of Fund's net assets) |
|
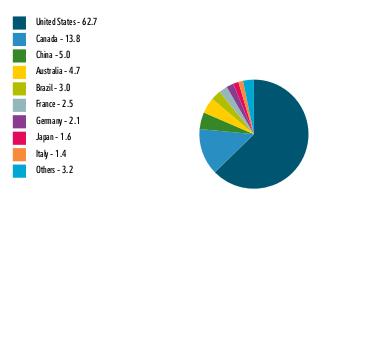
|
| United States | 62.7 |
| Canada | 13.8 |
| China | 5.0 |
| Australia | 4.7 |
| Brazil | 3.0 |
| France | 2.5 |
| Germany | 2.1 |
| Japan | 1.6 |
| Italy | 1.4 |
| Others | 3.2 |
GEOGRAPHIC DIVERSIFICATION (% of Fund's net assets) |
|
| |
|
TOP HOLDINGS (% of Fund's net assets) | | |
| Coinbase Global Inc Class A | 11.2 | |
| Marathon Digital Holdings Inc | 9.3 | |
| Cleanspark Inc | 6.8 | |
| Terawulf Inc | 5.2 | |
| Riot Platforms Inc | 5.2 | |
| Hut 8 Corp (United States) | 4.8 | |
| Iris Energy Ltd | 4.7 | |
| Bitfarms Ltd/Canada (United States) | 3.6 | |
| Core Scientific Inc | 3.5 | |
| Cipher Mining Inc | 2.9 | |
| | 57.2 | |
| |
| Fidelity, the Fidelity Investments Logo and all other Fidelity trademarks or service marks used herein are trademarks or service marks of FMR LLC. Any third-party marks that are used herein are trademarks or service marks of their respective owners. © 2024 FMR LLC. All rights reserved. |
| | For additional information about the Fund; including its prospectus, financial information, holdings and proxy information, scan the QR code or visit fundresearch.fidelity.com/prospectus/sec 1.9913376.100 6565-TSRA-0824 |
| |
| | ANNUAL SHAREHOLDER REPORT | AS OF JUNE 30, 2024 | |
| | Fidelity® Metaverse ETF Fidelity® Metaverse ETF : FMET Principal U.S. Listing Exchange :NASDAQ NASDAQ/NMS Global Market |
| | | |
This annual shareholder report contains information about Fidelity® Metaverse ETF for the period July 1, 2023 to June 30, 2024. You can find additional information about the Fund at fundresearch.fidelity.com/
prospectus/sec. You can also request this information by contacting us at 1-800-FIDELITY or by sending an e-mail to fidfunddocuments@fidelity.com.
What were your Fund costs for the last year?(based on hypothetical $10,000 investment)
FUND COST (PREVIOUS YEAR)
| | Costs of a $10,000 investment | Costs paid as a percentage of a $10,000 investment | |
| Fidelity® Metaverse ETF | $ 44 | 0.40% | |
What affected the Fund's performance this period?
•U.S. equities gained considerably for the 12 months ending June 30, 2024, driven by resilient corporate profits, a frenzy over generative artificial intelligence and the Federal Reserve's likely pivot to cutting interest rates later this year. Amid this favorable backdrop for higher-risk assets, stocks continued their late-2023 momentum, powered by signs of continued U.S. economic strength.
•Against this backdrop, the United States gained approximately 34% and was a notable contributor in terms of security selection. By sector, information technology stocks rose about 22% and added the most value. Exposure to communication services (+18%) firms also helped. Elsewhere, the real estate sector was up about 17%, boosted by real estate investment trusts (+24%) in particular.
•Conversely, equity markets in Europe ex the U.K., especially Switzerland (-68%), returned -27% and detracted most, followed by the U.K. (-44%). From a sector standpoint, consumer discretionary firms returned -20% and were the biggest performance challenge.
•Turning to individual stocks, the top contributor was semiconductors & semiconductor equipment company Nvidia (+199%). A stake in Qualcomm (+81%), another position within the semiconductors & semiconductor equipment industry, helped as well. Among technology hardware & equipment firms, Super Micro Computer gained roughly 244% and further boosted the fund's performance. Stakes in Meta Platforms (+74%) and Alphabet (+52%), within the media & entertainment category, proved advantageous as well.
•In contrast, the biggest individual detractor was semiconductors & semiconductor equipment stock Intel (-32%). ams ORSAM (-68%) and Advanced Micro Devices (-15%), also in the semiconductors & semiconductor equipment industry, further pressured the portfolio's return. Exposure to software & services company Unity Software (-61%) hurt as well. Lastly, another notable detractor was NCSoft (-41%), a media & entertainment holding.
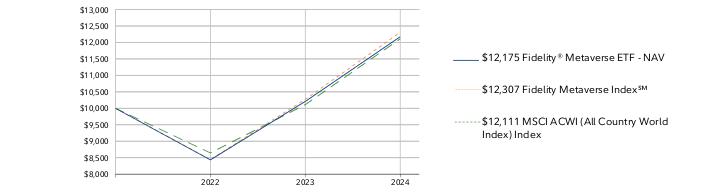
How did the Fund perform over the life of Fund?
CUMULATIVE PERFORMANCE
April 19, 2022 through June 30, 2024.
Initial investment of $10,000.
Fidelity® Metaverse ETF | $10,000 | $8,433 | $10,209 |
Fidelity Metaverse Index℠ | $10,000 | $8,444 | $10,274 |
MSCI ACWI (All Country World Index) Index | $10,000 | $8,644 | $10,111 |
| | 2022 | 2023 | 2024 |
AVERAGE ANNUAL TOTAL RETURNS: | | 1 Year | Life of Fund |
Fidelity® Metaverse ETF - NAV A | 19.25% | 9.36% |
Fidelity® Metaverse ETF - Market Price B | 18.53% | 11.61% |
Fidelity Metaverse Index℠ A | 19.79% | 9.89% |
MSCI ACWI (All Country World Index) Index A | 19.79% | 9.10% |
A From April 19, 2022
B From April 21, 2022, date initially listed on the NASDAQ/NMS Global Market exchange
Visit www.fidelity.com for more recent performance information. |
The Fund's past performance is not a good predictor of the Fund's future performance. The graph and table do not reflect the deduction of taxes that a shareholder would pay on fund distributions or redemption of fund shares. |
Key Fund Statistics (as of June 30, 2024)
KEY FACTS | | |
| Fund Size | $33,559,600 | |
| Number of Holdings | 51 | |
| Total Advisory Fee | $93,953 | |
| Portfolio Turnover | 52% | |
What did the Fund invest in?
(as of June 30, 2024)
MARKET SECTORS (% of Fund's net assets) | | |
| Information Technology | 56.8 | |
| Communication Services | 36.9 | |
| Real Estate | 6.1 | |
| |
| Common Stocks | 99.8 |
| Short-Term Investments and Net Other Assets (Liabilities) | 0.2 |
ASSET ALLOCATION (% of Fund's net assets) |
|
|
| United States | 73.1 |
| China | 10.5 |
| Korea (South) | 9.9 |
| France | 2.7 |
| Japan | 1.4 |
| Sweden | 0.8 |
| United Kingdom | 0.8 |
| Taiwan | 0.8 |
GEOGRAPHIC DIVERSIFICATION (% of Fund's net assets) |
|
| |
|
TOP HOLDINGS (% of Fund's net assets) | | |
| Adobe Inc | 5.0 | |
| Samsung Electronics Co Ltd | 4.8 | |
| Apple Inc | 4.7 | |
| Microsoft Corp | 4.6 | |
| Alphabet Inc Class A | 4.6 | |
| Tencent Holdings Ltd | 4.5 | |
| Meta Platforms Inc Class A | 4.5 | |
| NVIDIA Corp | 4.4 | |
| Advanced Micro Devices Inc | 4.3 | |
| QUALCOMM Inc | 4.0 | |
| | 45.4 | |
| |
| Fidelity, the Fidelity Investments Logo and all other Fidelity trademarks or service marks used herein are trademarks or service marks of FMR LLC. Any third-party marks that are used herein are trademarks or service marks of their respective owners. © 2024 FMR LLC. All rights reserved. |
| | For additional information about the Fund; including its prospectus, financial information, holdings and proxy information, scan the QR code or visit fundresearch.fidelity.com/prospectus/sec 1.9913377.100 6566-TSRA-0824 |
Item 2.
Code of Ethics
As of the end of the period, June 30, 2024, Fidelity Covington Trust (the trust) has adopted a code of ethics, as defined in Item 2 of Form N-CSR, that applies to its President and Treasurer and its Chief Financial Officer. A copy of the code of ethics is filed as an exhibit to this Form N-CSR.
Item 3.
Audit Committee Financial Expert
The Board of Trustees of the trust has determined that Donald F. Donahue is an audit committee financial expert, as defined in Item 3 of Form N-CSR. Mr. Donahue is independent for purposes of Item 3 of Form N-CSR.
Item 4.
Principal Accountant Fees and Services
Fees and Services
The following table presents fees billed by Deloitte & Touche LLP, the member firms of Deloitte Touche Tohmatsu, and their respective affiliates (collectively, “Deloitte Entities”) in each of the last two fiscal years for services rendered to Fidelity Clean Energy ETF, Fidelity Cloud Computing ETF, Fidelity Crypto Industry and Digital Payments ETF, Fidelity Digital Health ETF, Fidelity Electric Vehicles and Future Transportation ETF, and Fidelity Metaverse ETF (the “Funds”):
Services Billed by Deloitte Entities
June 30, 2024 FeesA
| | | | |
| Audit Fees | Audit-Related Fees | Tax Fees | All Other Fees |
Fidelity Clean Energy ETF | $15,600 | $- | $4,000 | $400 |
Fidelity Cloud Computing ETF | $15,600 | $- | $4,000 | $400 |
Fidelity Crypto Industry and Digital Payments ETF | $15,700 | $- | $4,300 | $400 |
Fidelity Digital Health ETF | $15,600 | $- | $4,000 | $400 |
Fidelity Electric Vehicles and Future Transportation ETF | $15,600 | $- | $4,000 | $400 |
Fidelity Metaverse ETF | $15,800 | $- | $4,300 | $400 |
| | | | |
| Audit Fees | Audit-Related Fees | Tax Fees | All Other Fees |
Fidelity Clean Energy ETF | $14,400 | $- | $4,000 | $300 |
Fidelity Cloud Computing ETF | $14,400 | $- | $4,000 | $300 |
Fidelity Crypto Industry and Digital Payments ETF | $14,600 | $- | $4,300 | $300 |
Fidelity Digital Health ETF | $14,400 | $- | $4,000 | $300 |
Fidelity Electric Vehicles and Future Transportation ETF | $14,400 | $- | $4,000 | $300 |
Fidelity Metaverse ETF | $14,600 | $- | $4,300 | $300 |
A Amounts may reflect rounding.
The following table presents fees billed by PricewaterhouseCoopers LLP (“PwC”) in each of the last two fiscal years for services rendered to Fidelity Enhanced International ETF, Fidelity Enhanced Large Cap Core ETF, Fidelity Enhanced Large Cap Growth ETF, Fidelity Enhanced Large Cap Value ETF, Fidelity Enhanced Mid Cap ETF, and
Fidelity Enhanced Small Cap ETF (the “Funds”):
Services Billed by PwC
June 30, 2024 FeesA,B
| | | | |
| Audit Fees | Audit-Related Fees | Tax Fees | All Other Fees |
Fidelity Enhanced International ETF | $39,700 | $- | $9,800 | $700 |
Fidelity Enhanced Large Cap Core ETF | $39,200 | $- | $9,800 | $700 |
Fidelity Enhanced Large Cap Growth ETF | $39,200 | $- | $9,800 | $700 |
Fidelity Enhanced Large Cap Value ETF | $39,200 | $- | $9,800 | $700 |
Fidelity Enhanced Mid Cap ETF | $39,200 | $- | $9,800 | $700 |
Fidelity Enhanced Small Cap ETF | $- | $- | $- | $1,000 |
| | | | |
| Audit Fees | Audit-Related Fees | Tax Fees | All Other Fees |
Fidelity Enhanced International ETF | $- | $- | $- | $- |
Fidelity Enhanced Large Cap Core ETF | $- | $- | $- | $- |
Fidelity Enhanced Large Cap Growth ETF | $- | $- | $- | $- |
Fidelity Enhanced Large Cap Value ETF | $- | $- | $- | $- |
Fidelity Enhanced Mid Cap ETF | $- | $- | $- | $- |
Fidelity Enhanced Small Cap ETF | $- | $- | $- | $- |
A Amounts may reflect rounding.
B Fidelity Enhanced International ETF, Fidelity Enhanced Large Cap Core ETF, Fidelity Enhanced Large Cap Growth ETF, Fidelity Enhanced Large Cap Value ETF, Fidelity Enhanced Mid Cap ETF, and Fidelity Enhanced Small Cap ETF commenced operations on November 17, 2023.
The following table(s) present(s) fees billed by Deloitte Entities and PwC that were required to be approved by the Audit Committee for services that relate directly to the operations and financial reporting of the Fund(s) and that are rendered on behalf of Fidelity Management & Research Company LLC ("FMR") and entities controlling, controlled by, or under common control with FMR (not including any sub-adviser whose role is primarily portfolio management and is subcontracted with or overseen by another investment adviser) that provide ongoing services to the Fund(s) (“Fund Service Providers”):
Services Billed by Deloitte Entities
| | |
| June 30, 2024A | June 30, 2023A |
Audit-Related Fees | $200,000 | $80,000 |
Tax Fees | $- | $- |
All Other Fees | $1,929,500 | $- |
A Amounts may reflect rounding.
Services Billed by PwC
| | |
| June 30, 2024A,B | June 30, 2023A,B |
Audit-Related Fees | $9,437,800 | $8,699,200 |
Tax Fees | $61,000 | $1,000 |
All Other Fees | $35,000 | $- |
A Amounts may reflect rounding.
B May include amounts billed prior to the Fidelity Enhanced International ETF, Fidelity Enhanced Large Cap Core ETF, Fidelity Enhanced Large Cap Growth ETF, Fidelity Enhanced Large Cap Value ETF, Fidelity Enhanced Mid Cap ETF, and Fidelity Enhanced Small Cap ETF’s commencement of operations.
“Audit-Related Fees” represent fees billed for assurance and related services that are reasonably related to the performance of the fund audit or the review of the fund's financial statements and that are not reported under Audit Fees.
“Tax Fees” represent fees billed for tax compliance, tax advice or tax planning that relate directly to the operations and financial reporting of the fund.
“All Other Fees” represent fees billed for services provided to the fund or Fund Service Provider, a significant portion of which are assurance related, that relate directly to the operations and financial reporting of the fund, excluding those services that are reported under Audit Fees, Audit-Related Fees or Tax Fees.
Assurance services must be performed by an independent public accountant.
* * *
The aggregate non-audit fees billed by Deloitte Entities and PwC for services rendered to the Fund(s), FMR (not including any sub-adviser whose role is primarily portfolio management and is subcontracted with or overseen by another investment adviser), and any Fund Service Provider for each of the last two fiscal years of the Fund(s) are as follows:
| | |
Billed By | June 30, 2024A,B | June 30, 2023A,B |
Deloitte Entities | $6,225,500 | $2,074,400 |
PwC | $15,061,900 | $14,153,000 |
|
|
|
A Amounts may reflect rounding.
B May include amounts billed prior to the Fidelity Enhanced International ETF, Fidelity Enhanced Large Cap Core ETF, Fidelity Enhanced Large Cap Growth ETF, Fidelity Enhanced Large Cap Value ETF, Fidelity Enhanced Mid Cap ETF, and Fidelity Enhanced Small Cap ETF’s commencement of operations.
The trust's Audit Committee has considered non-audit services that were not pre-approved that were provided by Deloitte Entities and PwC to Fund Service Providers to be compatible with maintaining the independence of Deloitte Entities and PwC in its(their) audit of the Fund(s), taking into account representations from Deloitte Entities and PwC, in accordance with Public Company Accounting Oversight Board rules, regarding its independence from the Fund(s) and its(their) related entities and FMR’s review of the appropriateness and permissibility under applicable law of such non-audit services prior to their provision to the Fund(s) Service Providers.
Audit Committee Pre-Approval Policies and Procedures
The trust’s Audit Committee must pre-approve all audit and non-audit services provided by a fund’s independent registered public accounting firm relating to the operations or financial reporting of the fund. Prior to the commencement of any audit or non-audit services to a fund, the Audit Committee reviews the services to determine whether they are appropriate and permissible under applicable law.
The Audit Committee has adopted policies and procedures to, among other purposes, provide a framework for the Committee’s consideration of non-audit services by the audit firms that audit the Fidelity funds. The policies and procedures require that any non-audit service provided by a fund audit firm to a Fidelity fund and any non-audit service provided by a fund auditor to a Fund Service Provider that relates directly to the operations and financial reporting of a Fidelity fund (“Covered Service”) are subject to approval by the Audit Committee before such service is provided.
All Covered Services must be approved in advance of provision of the service either: (i) by formal resolution of the Audit Committee, or (ii) by oral or written approval of the service by the Chair of the Audit Committee (or if the Chair is unavailable, such other member of the Audit Committee as may be designated by the Chair to act in the Chair’s absence). The approval contemplated by (ii) above is permitted where the Treasurer determines that action on such an engagement is necessary before the next meeting of the Audit Committee.
Non-audit services provided by a fund audit firm to a Fund Service Provider that do not relate directly to the operations and financial reporting of a Fidelity fund are reported to the Audit Committee periodically.
Non-Audit Services Approved Pursuant to Rule 2-01(c)(7)(i)(C) and (ii) of Regulation S-X (“De Minimis Exception”)
There were no non-audit services approved or required to be approved by the Audit Committee pursuant to the De Minimis Exception during the Fund’s(s’) last two fiscal years relating to services provided to (i) the Fund(s) or (ii) any Fund Service Provider that relate directly to the operations and financial reporting of the Fund(s).
The Registrant has not retained, for the preparation of the audit report on the financial statements included in the Form N-CSR, a registered public accounting firm that has a branch or office that is located in a foreign jurisdiction and that the Public Company Accounting Oversight Board (the “PCAOB”) has determined that the PCAOB is unable to inspect or investigate completely because of a position taken by an authority in the foreign jurisdiction.
The Registrant is not a “foreign issuer,” as defined in 17 CFR 240.3b-4.
Item 5.
Audit Committee of Listed Registrants
The Audit Committee is a separately-designated standing audit committee in accordance with Section 3(a)(58)(A) of the Securities Exchange Act of 1934. As of June 30, 2024, the members of the Audit Committee were Donald F. Donahue, Thomas P. Bostick, Thomas Kennedy and Susan Tomasky.
Item 6.
Investments
(a)
Not applicable.
(b)
Not applicable.
Item 7.
Financial Statements and Financial Highlights for Open-End Management Investment Companies
Fidelity® Clean Energy ETF
Fidelity® Cloud Computing ETF
Fidelity® Crypto Industry and Digital Payments ETF
Fidelity® Digital Health ETF
Fidelity® Electric Vehicles and Future Transportation ETF
Fidelity® Metaverse ETF
Annual Report
June 30, 2024
Contents
To view a fund's proxy voting guidelines and proxy voting record for the 12-month period ended June 30, visit http://www.fidelity.com/proxyvotingresults or visit the Securities and Exchange Commission's (SEC) web site at http://www.sec.gov.
You may also call 1-800-FIDELITY to request a free copy of the proxy voting guidelines.
The funds or securities referred to herein are not sponsored, endorsed, or promoted by Fidelity Product Services LLC (FPS), and FPS bears no liability with respect to any such funds or securities or any index on which such funds or securities are based. The prospectus contains a more detailed description of the relationship between FPS and any related funds.
Standard & Poor's, S&P and S&P 500 are registered service marks of The McGraw-Hill Companies, Inc. and have been licensed for use by Fidelity Distributors Corporation.
Other third-party marks appearing herein are the property of their respective owners.
All other marks appearing herein are registered or unregistered trademarks or service marks of FMR LLC or an affiliated company. © 2024 FMR LLC. All rights reserved.
This report and the financial statements contained herein are submitted for the general information of the shareholders of the Funds. This report is not authorized for distribution to prospective investors in the Funds unless preceded or accompanied by an effective prospectus.
A fund files its complete schedule of portfolio holdings with the SEC for the first and third quarters of each fiscal year on Form N-PORT. Forms N-PORT are available on the SEC's web site at http://www.sec.gov. A fund's Forms N-PORT may be reviewed and copied at the SEC's Public Reference Room in Washington, DC. Information regarding the operation of the SEC's Public Reference Room may be obtained by calling 1-800-SEC-0330.
For a complete list of a fund's portfolio holdings, view the most recent holdings listing, semiannual report, or annual report on Fidelity's web site at http://www.fidelity.com, http://www.institutional.fidelity.com, or http://www.401k.com, as applicable.
NOT FDIC INSURED •MAY LOSE VALUE •NO BANK GUARANTEE
Neither the Funds nor Fidelity Distributors Corporation is a bank.
Item 7: Financial Statements and Financial Highlights for Open-End Management Investment Companies (Annual Report)
Fidelity® Clean Energy ETF
Schedule of Investments June 30, 2024
Showing Percentage of Net Assets
| Common Stocks - 99.6% |
| | | Shares | Value ($) |
| INDUSTRIALS - 32.2% | | | |
| Construction & Engineering - 5.6% | | | |
| Ameresco, Inc. Class A (a) | | 12,000 | 345,720 |
| Cadeler A/S (a) | | 66,787 | 422,770 |
| OX2 AB (a) | | 68,146 | 382,550 |
| West Holdings Corp. | | 16,700 | 270,547 |
| | | | 1,421,587 |
| Electrical Equipment - 26.6% | | | |
| Array Technologies, Inc. (a) | | 37,212 | 381,795 |
| Bloom Energy Corp. Class A (a) | | 39,145 | 479,135 |
| CS Wind Corp. | | 11,293 | 406,105 |
| Doosan Fuel Cell Co. Ltd. (a) | | 21,702 | 333,452 |
| GE Vernova LLC | | 7,948 | 1,363,160 |
| Goldwind Science & Technology Co. Ltd. (H Shares) | | 623,200 | 253,833 |
| Nextracker, Inc. Class A (a) | | 13,942 | 653,601 |
| Nordex SE (a) | | 32,879 | 403,124 |
| Plug Power, Inc. (a) | | 161,528 | 376,360 |
| Shoals Technologies Group, Inc. (a) | | 61,145 | 381,545 |
| Sunrun, Inc. (a) | | 40,967 | 485,869 |
| TPI Composites, Inc. (a) | | 46,412 | 185,184 |
| Vestas Wind Systems A/S (a) | | 44,877 | 1,039,984 |
| | | | 6,743,147 |
TOTAL INDUSTRIALS | | | 8,164,734 |
| INFORMATION TECHNOLOGY - 16.7% | | | |
| Electronic Equipment, Instruments & Components - 1.9% | | | |
| Landis+Gyr Group AG | | 5,900 | 476,675 |
| Semiconductors & Semiconductor Equipment - 14.8% | | | |
| Canadian Solar, Inc. (a) | | 21,515 | 317,346 |
| Enphase Energy, Inc. (a) | | 8,120 | 809,645 |
| First Solar, Inc. (a) | | 4,645 | 1,047,262 |
| Flat Glass Group Co. Ltd. | | 188,000 | 276,917 |
| JinkoSolar Holdings Co. Ltd. ADR | | 15,663 | 324,537 |
| SMA Solar Technology AG | | 7,612 | 215,049 |
| SolarEdge Technologies, Inc. (a) | | 11,854 | 299,432 |
| Xinyi Solar Holdings Ltd. | | 922,000 | 464,106 |
| | | | 3,754,294 |
TOTAL INFORMATION TECHNOLOGY | | | 4,230,969 |
| UTILITIES - 50.7% | | | |
| Electric Utilities - 13.9% | | | |
| Acciona SA | | 4,653 | 550,050 |
| Energias de Portugal SA | | 230,611 | 864,804 |
| Mercury Nz Ltd. | | 138,507 | 554,081 |
| ORSTED A/S (a)(b) | | 15,346 | 817,342 |
| Verbund AG | | 9,432 | 744,509 |
| | | | 3,530,786 |
| Independent Power and Renewable Electricity Producers - 36.8% | | | |
| Atlantica Sustainable Infrastructure PLC | | 21,311 | 467,776 |
| Boralex, Inc. Class A | | 20,783 | 508,962 |
| Brookfield Renewable Corp. | | 20,917 | 592,497 |
| China Datang Corp. Renewable Power Co. Ltd. | | 1,375,000 | 355,752 |
| China Longyuan Power Grid Corp. Ltd. (H Shares) | | 634,000 | 570,059 |
| Clearway Energy, Inc. Class C | | 19,124 | 472,172 |
| Corp. ACCIONA Energias Renovables SA | | 18,931 | 390,163 |
| EDP Renovaveis SA | | 42,622 | 596,126 |
| Encavis AG | | 28,920 | 530,015 |
| Enlight Renewable Energy Ltd. (a) | | 30,263 | 480,792 |
| ERG SpA | | 16,887 | 424,232 |
| Innergex Renewable Energy, Inc. | | 56,513 | 422,500 |
| Meridian Energy Ltd. | | 175,567 | 672,915 |
| Neoen SA (b) | | 14,736 | 594,776 |
| Northland Power, Inc. | | 38,315 | 658,581 |
| Ormat Technologies, Inc. | | 8,688 | 622,930 |
| ReNew Energy Global PLC (a) | | 53,239 | 332,211 |
| RENOVA, Inc. (a) | | 41,200 | 254,587 |
| Solaria Energia y Medio Ambiente SA (a) | | 31,932 | 395,962 |
| | | | 9,343,008 |
TOTAL UTILITIES | | | 12,873,794 |
| TOTAL COMMON STOCKS (Cost $35,344,672) | | | 25,269,497 |
| | | | |
| Money Market Funds - 0.1% |
| | | Shares | Value ($) |
Fidelity Cash Central Fund 5.38% (c) (Cost $32,219) | | 32,213 | 32,219 |
| | | | |
| TOTAL INVESTMENT IN SECURITIES - 99.7% (Cost $35,376,891) | 25,301,716 |
NET OTHER ASSETS (LIABILITIES) - 0.3% | 85,106 |
| NET ASSETS - 100.0% | 25,386,822 |
| | |
| Futures Contracts |
| | Number of contracts | Expiration Date | Notional Amount ($) | Value ($) | Unrealized Appreciation/ (Depreciation) ($) |
| Purchased | | | | | |
| | | | | | |
| Equity Index Contracts | | | | | |
| CME E-mini S&P 500 Index Contracts (United States) | 3 | Sep 2024 | 82,823 | 268 | 268 |
| | | | | | |
| The notional amount of futures purchased as a percentage of Net Assets is 0.3% |
Legend
| (b) | Security exempt from registration under Rule 144A of the Securities Act of 1933. These securities may be resold in transactions exempt from registration, normally to qualified institutional buyers. At the end of the period, the value of these securities amounted to $1,412,118 or 5.6% of net assets. |
| (c) | Affiliated fund that is generally available only to investment companies and other accounts managed by Fidelity Investments. The rate quoted is the annualized seven-day yield of the fund at period end. A complete unaudited listing of the fund's holdings as of its most recent quarter end is available upon request. In addition, each Fidelity Central Fund's financial statements, which are not covered by the Fund's Report of Independent Registered Public Accounting Firm, are available on the SEC's website or upon request. |
Affiliated Central Funds
Fiscal year to date information regarding the Fund's investments in Fidelity Central Funds, including the ownership percentage, is presented below.
| Affiliate | Value, beginning of period ($) | Purchases ($) | Sales Proceeds ($) | Dividend Income ($) | Realized Gain (loss) ($) | Change in Unrealized appreciation (depreciation) ($) | Value, end of period ($) | % ownership, end of period |
| Fidelity Cash Central Fund 5.38% | - | 986,135 | 953,916 | 235 | - | - | 32,219 | 0.0% |
| Total | - | 986,135 | 953,916 | 235 | - | - | 32,219 | |
| | | | | | | | | |
Amounts in the dividend income column in the above table include any capital gain distributions from underlying funds, which are presented in the corresponding line item in the Statement of Operations, if applicable.
Amounts included in the purchases and sales proceeds columns may include in-kind transactions, if applicable.
Investment Valuation
The following is a summary of the inputs used, as of June 30, 2024, involving the Fund's assets and liabilities carried at fair value. The inputs or methodology used for valuing securities may not be an indication of the risk associated with investing in those securities. For more information on valuation inputs, and their aggregation into the levels used below, please refer to the Investment Valuation section in the accompanying Notes to Financial Statements.
| Valuation Inputs at Reporting Date: |
| Description | Total ($) | Level 1 ($) | Level 2 ($) | Level 3 ($) |
Investments in Securities: | | | | |
|
| Equities: | | | | |
Industrials | 8,164,734 | 8,164,734 | - | - |
Information Technology | 4,230,969 | 4,230,969 | - | - |
Utilities | 12,873,794 | 12,873,794 | - | - |
|
| Money Market Funds | 32,219 | 32,219 | - | - |
| Total Investments in Securities: | 25,301,716 | 25,301,716 | - | - |
Derivative Instruments: Assets | | | | |
Futures Contracts | 268 | 268 | - | - |
| Total Assets | 268 | 268 | - | - |
| Total Derivative Instruments: | 268 | 268 | - | - |
Value of Derivative Instruments
The following table is a summary of the Fund's value of derivative instruments by primary risk exposure as of June 30, 2024. For additional information on derivative instruments, please refer to the Derivative Instruments section in the accompanying Notes to Financial Statements.
Primary Risk Exposure / Derivative Type | Value |
| Asset ($) | Liability ($) |
| Equity Risk | | |
Futures Contracts (a) | 268 | 0 |
| Total Equity Risk | 268 | 0 |
| Total Value of Derivatives | 268 | 0 |
(a)Reflects gross cumulative appreciation (depreciation) on futures contracts as presented in the Schedule of Investments. In the Statement of Assets and Liabilities, the period end daily variation margin is included in receivable or payable for daily variation margin on futures contracts, and the net cumulative appreciation (depreciation) is included in Total accumulated earnings (loss).
Fidelity® Clean Energy ETF
Financial Statements
| Statement of Assets and Liabilities |
| | | | June 30, 2024 |
| | | | | |
| Assets | | | | |
| Investment in securities, at value - See accompanying schedule: | | | | |
Unaffiliated issuers (cost $35,344,672) | $ | 25,269,497 | | |
Fidelity Central Funds (cost $32,219) | | 32,219 | | |
| | | | | |
| | | | | |
| Total Investment in Securities (cost $35,376,891) | | | $ | 25,301,716 |
| Segregated cash with brokers for derivative instruments | | | | 5,900 |
| Foreign currency held at value (cost $10,183) | | | | 10,177 |
| Dividends receivable | | | | 86,613 |
| Reclaims receivable | | | | 20,181 |
| Distributions receivable from Fidelity Central Funds | | | | 54 |
| Receivable from investment adviser for expense reductions | | | | 5,060 |
Total assets | | | | 25,429,701 |
| Liabilities | | | | |
| Payable to custodian bank | $ | 303 | | |
| Payable for investments purchased | | 25,314 | | |
| Accrued management fee | | 8,991 | | |
| Payable for daily variation margin on futures contracts | | 368 | | |
| Proxy fee payable | | 7,903 | | |
| Total liabilities | | | | 42,879 |
| Net Assets | | | $ | 25,386,822 |
| Net Assets consist of: | | | | |
| Paid in capital | | | $ | 44,613,519 |
| Total accumulated earnings (loss) | | | | (19,226,697) |
| Net Assets | | | $ | 25,386,822 |
Net Asset Value, offering price and redemption price per share ($25,386,822 ÷ 1,750,000 shares) | | | $ | 14.51 |
| Statement of Operations |
| | | | Year ended June 30, 2024 |
| Investment Income | | | | |
| Dividends | | | $ | 484,689 |
| Income from Fidelity Central Funds | | | | 235 |
| Income before foreign taxes withheld | | | $ | 484,924 |
| Less foreign taxes withheld | | | | (44,236) |
| Total income | | | | 440,688 |
| Expenses | | | | |
| Management fee | $ | 112,407 | | |
| Independent trustees' fees and expenses | | 155 | | |
| Proxy | | 7,903 | | |
| Total expenses before reductions | | 120,465 | | |
| Expense reductions | | (5,266) | | |
| Total expenses after reductions | | | | 115,199 |
| Net Investment income (loss) | | | | 325,489 |
| Realized and Unrealized Gain (Loss) | | | | |
| Net realized gain (loss) on: | | | | |
| Investment Securities: | | | | |
| Unaffiliated issuers | | (6,083,315) | | |
| Redemptions in-kind | | 123,957 | | |
| Foreign currency transactions | | (928) | | |
| Futures contracts | | 1,319 | | |
| Total net realized gain (loss) | | | | (5,958,967) |
| Change in net unrealized appreciation (depreciation) on: | | | | |
| Investment Securities: | | | | |
| Unaffiliated issuers | | (5,409,835) | | |
| Assets and liabilities in foreign currencies | | (449) | | |
| Futures contracts | | 268 | | |
| Total change in net unrealized appreciation (depreciation) | | | | (5,410,016) |
| Net gain (loss) | | | | (11,368,983) |
| Net increase (decrease) in net assets resulting from operations | | | $ | (11,043,494) |
| Statement of Changes in Net Assets |
| |
| | Year ended June 30, 2024 | | Year ended June 30, 2023 |
| Increase (Decrease) in Net Assets | | | | |
| Operations | | | | |
| Net investment income (loss) | $ | 325,489 | $ | 267,416 |
| Net realized gain (loss) | | (5,958,967) | | (1,728,914) |
| Change in net unrealized appreciation (depreciation) | | (5,410,016) | | (190,092) |
| Net increase (decrease) in net assets resulting from operations | | (11,043,494) | | (1,651,590) |
| Distributions to shareholders | | (378,500) | | (306,800) |
| | | | | |
| Share transactions | | | | |
| Proceeds from sales of shares | | - | | 14,295,218 |
| Cost of shares redeemed | | (1,695,052) | | (2,120,671) |
| | | | | |
Net increase (decrease) in net assets resulting from share transactions | | (1,695,052) | | 12,174,547 |
| Total increase (decrease) in net assets | | (13,117,046) | | 10,216,157 |
| | | | | |
| Net Assets | | | | |
| Beginning of period | | 38,503,868 | | 28,287,711 |
| End of period | $ | 25,386,822 | $ | 38,503,868 |
| | | | | |
| Other Information | | | | |
| Shares | | | | |
| Sold | | - | | 600,000 |
| Redeemed | | (100,000) | | (100,000) |
| Net increase (decrease) | | (100,000) | | 500,000 |
| | | | | |
Financial Highlights
Fidelity® Clean Energy ETF |
| |
| Years ended June 30, | | 2024 | | 2023 | | 2022 A |
Selected Per-Share Data | | | | | | |
| Net asset value, beginning of period | $ | 20.81 | $ | 20.95 | $ | 25.12 |
| Income from Investment Operations | | | | | | |
Net investment income (loss) B,C | | .18 | | .15 | | .15 |
| Net realized and unrealized gain (loss) | | (6.27) | | (.12) | | (4.20) |
| Total from investment operations | | (6.09) | | .03 | | (4.05) |
| Distributions from net investment income | | (.21) | | (.17) | | (.12) |
| Total distributions | | (.21) | | (.17) | | (.12) |
| Net asset value, end of period | $ | 14.51 | $ | 20.81 | $ | 20.95 |
Total Return D,E,F | | | | .10% | | (16.12)% |
Ratios to Average Net Assets C,G,H | | | | | | |
| Expenses before reductions | | .42% | | .39% | | .39% I |
| Expenses net of fee waivers, if any | | | | .39% | | .39% I |
| Expenses net of all reductions | | .40% | | .39% | | .39% I |
| Net investment income (loss) | | 1.13% | | .69% | | .90% I |
| Supplemental Data | | | | | | |
| Net assets, end of period (000 omitted) | $ | 25,387 | $ | 38,504 | $ | 28,288 |
Portfolio turnover rate J,K | | | | 37% | | 30% L |
AFor the period October 5, 2021 (commencement of operations) through June 30, 2022.
BCalculated based on average shares outstanding during the period.
CNet investment income (loss) is affected by the timing of the declaration of dividends by any underlying mutual funds or exchange-traded funds (ETFs). Net investment income (loss) of any mutual funds or ETFs is not included in the Fund's net investment income (loss) ratio.
DTotal returns for periods of less than one year are not annualized.
ETotal returns would have been lower if certain expenses had not been reduced during the applicable periods shown.
FBased on net asset value.
GFees and expenses of any underlying mutual funds or exchange-traded funds (ETFs) are not included in the Fund's expense ratio. The Fund indirectly bears its proportionate share of these expenses. For additional expense information related to investments in Fidelity Central Funds, please refer to the "Investments in Fidelity Central Funds" note found in the Notes to Financial Statements section of the most recent Annual or Semi-Annual report.
HExpense ratios reflect operating expenses of the class. Expenses before reductions do not reflect amounts reimbursed, waived, or reduced through arrangements with the investment adviser, brokerage services, or other offset arrangements, if applicable, and do not represent the amount paid by the class during periods when reimbursements, waivers or reductions occur.
IAnnualized.
JPortfolio turnover rate excludes securities received or delivered in-kind.
KAmount does not include the portfolio activity of any underlying mutual funds or exchange-traded funds (ETFs).
LAmount not annualized.
Fidelity® Cloud Computing ETF
Schedule of Investments June 30, 2024
Showing Percentage of Net Assets
| Common Stocks - 100.0% |
| | | Shares | Value ($) |
| INDUSTRIALS - 1.6% | | | |
| Professional Services - 1.6% | | | |
| Dayforce, Inc. (a) | | 23,918 | 1,186,333 |
| INFORMATION TECHNOLOGY - 92.3% | | | |
| Communications Equipment - 1.7% | | | |
| F5, Inc. (a) | | 7,694 | 1,325,138 |
| IT Services - 8.7% | | | |
| Digitalocean Holdings, Inc. (a) | | 19,813 | 688,502 |
| Fastly, Inc. Class A (a) | | 75,341 | 555,263 |
| Kingsoft Cloud Holdings Ltd. (a) | | 2,158,000 | 378,674 |
| MongoDB, Inc. Class A (a) | | 6,583 | 1,645,487 |
| Snowflake, Inc. (a) | | 15,775 | 2,131,045 |
| Twilio, Inc. Class A (a) | | 22,871 | 1,299,302 |
| | | | 6,698,273 |
| Software - 67.8% | | | |
| Atlassian Corp. PLC Class A, (a) | | 11,072 | 1,958,415 |
| Box, Inc. Class A (a) | | 34,749 | 918,764 |
| C3.ai, Inc. (a) | | 28,005 | 811,025 |
| CommVault Systems, Inc. (a) | | 9,022 | 1,096,805 |
| Confluent, Inc. (a) | | 40,789 | 1,204,499 |
| Datadog, Inc. Class A (a) | | 17,459 | 2,264,258 |
| Dropbox, Inc. Class A (a) | | 48,572 | 1,091,413 |
| Dynatrace, Inc. (a) | | 28,704 | 1,284,217 |
| Elastic NV (a) | | 11,518 | 1,312,015 |
| Five9, Inc. (a) | | 20,644 | 910,400 |
| GitLab, Inc. (a) | | 21,218 | 1,054,959 |
| HubSpot, Inc. (a) | | 3,090 | 1,822,451 |
| Informatica, Inc. (a) | | 21,687 | 669,695 |
| Intuit, Inc. | | 5,672 | 3,727,695 |
| JFrog Ltd. (a) | | 25,435 | 955,084 |
| Kingdee International Software Group Co. Ltd. (a) | | 831,500 | 779,591 |
| Microsoft Corp. | | 7,831 | 3,500,065 |
| MicroStrategy, Inc. Class A (a) | | 1,037 | 1,428,447 |
| NICE Ltd. (a) | | 7,948 | 1,299,841 |
| Nutanix, Inc. Class A (a) | | 26,374 | 1,499,362 |
| Oracle Corp. | | 28,354 | 4,003,584 |
| Pagerduty, Inc. (a) | | 37,413 | 857,880 |
| Pegasystems, Inc. | | 13,915 | 842,275 |
| RingCentral, Inc. (a) | | 24,570 | 692,874 |
| Salesforce, Inc. | | 14,039 | 3,609,427 |
| ServiceNow, Inc. (a) | | 4,463 | 3,510,908 |
| SolarWinds, Inc. | | 43,584 | 525,187 |
| Teradata Corp. (a) | | 27,302 | 943,557 |
| UiPath, Inc. Class A (a) | | 85,259 | 1,081,084 |
| Verint Systems, Inc. (a) | | 22,398 | 721,216 |
| Vertex, Inc. Class A (a) | | 20,006 | 721,216 |
| Workday, Inc. Class A (a) | | 9,984 | 2,232,023 |
| Xero Ltd. (a) | | 16,320 | 1,486,666 |
| Zoom Video Communications, Inc. Class A (a) | | 24,313 | 1,439,086 |
| | | | 52,255,984 |
| Technology Hardware, Storage & Peripherals - 14.1% | | | |
| Hewlett Packard Enterprise Co. | | 90,308 | 1,911,820 |
| NetApp, Inc. | | 14,363 | 1,849,954 |
| Pure Storage, Inc. Class A (a) | | 25,117 | 1,612,763 |
| Seagate Technology Holdings PLC | | 16,496 | 1,703,542 |
| Super Micro Computer, Inc. (a) | | 2,562 | 2,099,175 |
| Western Digital Corp. (a) | | 22,758 | 1,724,374 |
| | | | 10,901,628 |
TOTAL INFORMATION TECHNOLOGY | | | 71,181,023 |
| REAL ESTATE - 6.1% | | | |
| Equity Real Estate Investment Trusts (REITs) - 6.1% | | | |
| Digital Realty Trust, Inc. | | 14,730 | 2,239,697 |
| Equinix, Inc. | | 3,273 | 2,476,352 |
| | | | 4,716,049 |
| TOTAL COMMON STOCKS (Cost $72,730,273) | | | 77,083,405 |
| | | | |
| TOTAL INVESTMENT IN SECURITIES - 100.0% (Cost $72,730,273) | 77,083,405 |
NET OTHER ASSETS (LIABILITIES) - 0.0% | 38,156 |
| NET ASSETS - 100.0% | 77,121,561 |
| | |
| Futures Contracts |
| | Number of contracts | Expiration Date | Notional Amount ($) | Value ($) | Unrealized Appreciation/ (Depreciation) ($) |
| Purchased | | | | | |
| | | | | | |
| Equity Index Contracts | | | | | |
| CME Micro E-mini NASDAQ 100 Index Contracts (United States) | 1 | Sep 2024 | 39,855 | (30) | (30) |
| | | | | | |
| The notional amount of futures purchased as a percentage of Net Assets is 0.1% |
Legend
Affiliated Central Funds
Fiscal year to date information regarding the Fund's investments in Fidelity Central Funds, including the ownership percentage, is presented below.
| Affiliate | Value, beginning of period ($) | Purchases ($) | Sales Proceeds ($) | Dividend Income ($) | Realized Gain (loss) ($) | Change in Unrealized appreciation (depreciation) ($) | Value, end of period ($) | % ownership, end of period |
| Fidelity Cash Central Fund 5.38% | 13,981 | 3,749,763 | 3,763,745 | 4,235 | 1 | - | - | 0.0% |
| Total | 13,981 | 3,749,763 | 3,763,745 | 4,235 | 1 | - | - | |
| | | | | | | | | |
Amounts in the dividend income column in the above table include any capital gain distributions from underlying funds, which are presented in the corresponding line item in the Statement of Operations, if applicable.
Amounts included in the purchases and sales proceeds columns may include in-kind transactions, if applicable.
Investment Valuation
The following is a summary of the inputs used, as of June 30, 2024, involving the Fund's assets and liabilities carried at fair value. The inputs or methodology used for valuing securities may not be an indication of the risk associated with investing in those securities. For more information on valuation inputs, and their aggregation into the levels used below, please refer to the Investment Valuation section in the accompanying Notes to Financial Statements.
| Valuation Inputs at Reporting Date: |
| Description | Total ($) | Level 1 ($) | Level 2 ($) | Level 3 ($) |
Investments in Securities: | | | | |
|
| Equities: | | | | |
Industrials | 1,186,333 | 1,186,333 | - | - |
Information Technology | 71,181,023 | 71,181,023 | - | - |
Real Estate | 4,716,049 | 4,716,049 | - | - |
| | | | | |
| Total Investments in Securities: | 77,083,405 | 77,083,405 | - | - |
Derivative Instruments: Liabilities | | | | |
Futures Contracts | (30) | (30) | - | - |
| Total Liabilities | (30) | (30) | - | - |
| Total Derivative Instruments: | (30) | (30) | - | - |
Value of Derivative Instruments
The following table is a summary of the Fund's value of derivative instruments by primary risk exposure as of June 30, 2024. For additional information on derivative instruments, please refer to the Derivative Instruments section in the accompanying Notes to Financial Statements.
Primary Risk Exposure / Derivative Type | Value |
| Asset ($) | Liability ($) |
| Equity Risk | | |
Futures Contracts (a) | 0 | (30) |
| Total Equity Risk | 0 | (30) |
| Total Value of Derivatives | 0 | (30) |
(a)Reflects gross cumulative appreciation (depreciation) on futures contracts as presented in the Schedule of Investments. In the Statement of Assets and Liabilities, the period end daily variation margin is included in receivable or payable for daily variation margin on futures contracts, and the net cumulative appreciation (depreciation) is included in Total accumulated earnings (loss).
Fidelity® Cloud Computing ETF
Financial Statements
| Statement of Assets and Liabilities |
| | | | June 30, 2024 |
| | | | | |
| Assets | | | | |
Investment in securities, at value - See accompanying schedule Unaffiliated issuers (cost $72,730,273): | | | $ | 77,083,405 |
| Segregated cash with brokers for derivative instruments | | | | 1,770 |
| Cash | | | | 18,934 |
| Foreign currency held at value (cost $15,431) | | | | 15,398 |
| Dividends receivable | | | | 33,573 |
| Distributions receivable from Fidelity Central Funds | | | | 113 |
| Receivable from investment adviser for expense reductions | | | | 4,036 |
Total assets | | | | 77,157,229 |
| Liabilities | | | | |
| Accrued management fee | $ | 24,667 | | |
| Payable for daily variation margin on futures contracts | | 225 | | |
| Proxy fee payable | | 10,477 | | |
| Other payables and accrued expenses | | 299 | | |
| Total liabilities | | | | 35,668 |
| Net Assets | | | $ | 77,121,561 |
| Net Assets consist of: | | | | |
| Paid in capital | | | $ | 79,235,665 |
| Total accumulated earnings (loss) | | | | (2,114,104) |
| Net Assets | | | $ | 77,121,561 |
Net Asset Value, offering price and redemption price per share ($77,121,561 ÷ 3,200,000 shares) | | | $ | 24.10 |
| Statement of Operations |
| | | | Year ended June 30, 2024 |
| Investment Income | | | | |
| Dividends | | | $ | 287,754 |
| Special dividends | | | | 45,544 |
| Interest | | | | 340 |
| Income from Fidelity Central Funds | | | | 4,235 |
| Total income | | | | 337,873 |
| Expenses | | | | |
| Management fee | $ | 225,751 | | |
| Independent trustees' fees and expenses | | 252 | | |
| Miscellaneous | | 10,477 | | |
| Total expenses before reductions | | 236,480 | | |
| Expense reductions | | (4,563) | | |
| Total expenses after reductions | | | | 231,917 |
| Net Investment income (loss) | | | | 105,956 |
| Realized and Unrealized Gain (Loss) | | | | |
| Net realized gain (loss) on: | | | | |
| Investment Securities: | | | | |
| Unaffiliated issuers | | (1,680,596) | | |
| Redemptions in-kind | | 7,002,313 | | |
| Fidelity Central Funds | | 1 | | |
| Foreign currency transactions | | (3,590) | | |
| Futures contracts | | 24,982 | | |
| Total net realized gain (loss) | | | | 5,343,110 |
| Change in net unrealized appreciation (depreciation) on: | | | | |
| Investment Securities: | | | | |
| Unaffiliated issuers | | 4,566,761 | | |
| Assets and liabilities in foreign currencies | | (126) | | |
| Futures contracts | | (1,226) | | |
| Total change in net unrealized appreciation (depreciation) | | | | 4,565,409 |
| Net gain (loss) | | | | 9,908,519 |
| Net increase (decrease) in net assets resulting from operations | | | $ | 10,014,475 |
| Statement of Changes in Net Assets |
| |
| | Year ended June 30, 2024 | | Year ended June 30, 2023 |
| Increase (Decrease) in Net Assets | | | | |
| Operations | | | | |
| Net investment income (loss) | $ | 105,956 | $ | 52,100 |
| Net realized gain (loss) | | 5,343,110 | | (3,453,552) |
| Change in net unrealized appreciation (depreciation) | | 4,565,409 | | 8,601,590 |
| Net increase (decrease) in net assets resulting from operations | | 10,014,475 | | 5,200,138 |
| Distributions to shareholders | | (106,250) | | (48,880) |
| Distributions to shareholders from tax return of capital | | - | | (14,820) |
| | | | | |
| Total Distributions | | (106,250) | | (63,700) |
| Share transactions | | | | |
| Proceeds from sales of shares | | 44,981,125 | | 13,508,181 |
| Cost of shares redeemed | | (14,705,337) | | - |
| | | | | |
Net increase (decrease) in net assets resulting from share transactions | | 30,275,788 | | 13,508,181 |
| Total increase (decrease) in net assets | | 40,184,013 | | 18,644,619 |
| | | | | |
| Net Assets | | | | |
| Beginning of period | | 36,937,548 | | 18,292,929 |
| End of period | $ | 77,121,561 | $ | 36,937,548 |
| | | | | |
| Other Information | | | | |
| Shares | | | | |
| Sold | | 1,950,000 | | 750,000 |
| Redeemed | | (650,000) | | - |
| Net increase (decrease) | | 1,300,000 | | 750,000 |
| | | | | |
Financial Highlights
Fidelity® Cloud Computing ETF |
| |
| Years ended June 30, | | 2024 | | 2023 | | 2022 A |
Selected Per-Share Data | | | | | | |
| Net asset value, beginning of period | $ | 19.44 | $ | 15.91 | $ | 25.20 |
| Income from Investment Operations | | | | | | |
Net investment income (loss) B,C | | .04 D | | .04 | | .06 |
| Net realized and unrealized gain (loss) | | 4.66 | | 3.53 | | (9.29) |
| Total from investment operations | | 4.70 | | 3.57 | | (9.23) |
| Distributions from net investment income | | (.04) | | (.03) | | (.06) |
| Distributions from tax return of capital | | - | | (.01) | | - |
| Total distributions | | (.04) | | (.04) | | (.06) |
| Net asset value, end of period | $ | 24.10 | $ | 19.44 | $ | 15.91 |
Total Return E,F,G | | | | 22.51% | | (36.69)% |
Ratios to Average Net Assets C,H,I | | | | | | |
| Expenses before reductions | | .41% | | .39% | | .39% J |
| Expenses net of fee waivers, if any | | | | .39% | | .39% J |
| Expenses net of all reductions | | .40% | | .39% | | .39% J |
| Net investment income (loss) | | .18% D | | .23% | | .41% J |
| Supplemental Data | | | | | | |
| Net assets, end of period (000 omitted) | $ | 77,122 | $ | 36,938 | $ | 18,293 |
Portfolio turnover rate K,L | | | | 38% | | 31% M |
AFor the period October 5, 2021 (commencement of operations) through June 30, 2022.
BCalculated based on average shares outstanding during the period.
CNet investment income (loss) is affected by the timing of the declaration of dividends by any underlying mutual funds or exchange-traded funds (ETFs). Net investment income (loss) of any mutual funds or ETFs is not included in the Fund's net investment income (loss) ratio.
DNet investment income per share reflects one or more large, non-recurring dividend(s) which amounted to $.02 per share. Excluding such non-recurring dividend(s), the ratio of net investment income (loss) to average net assets would have been .10%.
ETotal returns for periods of less than one year are not annualized.
FTotal returns would have been lower if certain expenses had not been reduced during the applicable periods shown.
GBased on net asset value.
HFees and expenses of any underlying mutual funds or exchange-traded funds (ETFs) are not included in the Fund's expense ratio. The Fund indirectly bears its proportionate share of these expenses. For additional expense information related to investments in Fidelity Central Funds, please refer to the "Investments in Fidelity Central Funds" note found in the Notes to Financial Statements section of the most recent Annual or Semi-Annual report.
IExpense ratios reflect operating expenses of the class. Expenses before reductions do not reflect amounts reimbursed, waived, or reduced through arrangements with the investment adviser, brokerage services, or other offset arrangements, if applicable, and do not represent the amount paid by the class during periods when reimbursements, waivers or reductions occur.
JAnnualized.
KPortfolio turnover rate excludes securities received or delivered in-kind.
LAmount does not include the portfolio activity of any underlying mutual funds or exchange-traded funds (ETFs).
MAmount not annualized.
Fidelity® Crypto Industry and Digital Payments ETF
Schedule of Investments June 30, 2024
Showing Percentage of Net Assets
| Common Stocks - 99.9% |
| | | Shares | Value ($) |
| FINANCIALS - 41.3% | | | |
| Capital Markets - 13.8% | | | |
| Bakkt Holdings, Inc. Class A (a) | | 82,719 | 1,565,043 |
| Bitcoin Group SE | | 19,842 | 1,103,688 |
| Coinbase Global, Inc. (a) | | 52,291 | 11,620,632 |
| | | | 14,289,363 |
| Financial Services - 27.5% | | | |
| Cielo SA | | 1,475,000 | 1,495,063 |
| Corpay, Inc. (a) | | 6,688 | 1,781,750 |
| Dlocal Ltd. (a) | | 143,876 | 1,163,957 |
| Edenred SA | | 33,872 | 1,430,674 |
| Flywire Corp. (a) | | 92,727 | 1,519,796 |
| Galaxia Moneytree Co. Ltd. | | 224,024 | 953,709 |
| Global Payments, Inc. | | 17,548 | 1,696,892 |
| GMO Payment Gateway, Inc. | | 30,200 | 1,662,070 |
| Marqeta, Inc. Class A (a) | | 298,324 | 1,634,816 |
| MasterCard, Inc. Class A | | 3,877 | 1,710,377 |
| Network International Holdings PLC (a)(b) | | 248,219 | 1,226,855 |
| Nexi SpA (a)(b) | | 238,920 | 1,458,020 |
| Nuvei Corp. (b) | | 53,135 | 1,720,511 |
| Payoneer Global, Inc. (a) | | 222,278 | 1,231,420 |
| Shift4 Payments, Inc. (a) | | 24,402 | 1,789,887 |
| StoneCo Ltd. Class A (a) | | 130,681 | 1,566,865 |
| Visa, Inc. Class A | | 6,273 | 1,646,474 |
| WEX, Inc. (a) | | 9,489 | 1,680,881 |
| Worldline SA (a)(b) | | 109,034 | 1,182,595 |
| | | | 28,552,612 |
TOTAL FINANCIALS | | | 42,841,975 |
| INFORMATION TECHNOLOGY - 58.6% | | | |
| IT Services - 5.3% | | | |
| Core Scientific, Inc. | | 395,628 | 3,679,340 |
| Shopify, Inc. Class A (a) | | 28,208 | 1,863,138 |
| | | | 5,542,478 |
| Software - 51.1% | | | |
| Bit Digital, Inc. (a) | | 905,812 | 2,880,482 |
| Bitdeer Technologies Group Class A, (a) | | 282,088 | 2,894,223 |
| Bitfarms Ltd. (a) | | 1,439,197 | 3,698,736 |
| Cipher Mining, Inc. (a) | | 726,816 | 3,016,286 |
| Cleanspark, Inc. (a) | | 444,438 | 7,088,786 |
| HIVE Digital Technologies Ltd. (a) | | 663,005 | 2,042,055 |
| Hut 8 Mining Corp. (a) | | 333,471 | 4,998,730 |
| Iris Energy Ltd. (a) | | 431,308 | 4,869,467 |
| Marathon Digital Holdings, Inc. (a) | | 480,425 | 9,536,436 |
| Northern Data AG (a) | | 44,033 | 1,123,178 |
| Riot Platforms, Inc. (a) | | 591,879 | 5,409,774 |
| TeraWulf, Inc. (a) | | 1,221,942 | 5,437,642 |
| | | | 52,995,795 |
| Technology Hardware, Storage & Peripherals - 2.2% | | | |
| Canaan, Inc. ADR (a) | | 2,319,863 | 2,319,399 |
TOTAL INFORMATION TECHNOLOGY | | | 60,857,672 |
| TOTAL COMMON STOCKS (Cost $77,329,199) | | | 103,699,647 |
| | | | |
| Money Market Funds - 0.0% |
| | | Shares | Value ($) |
Fidelity Cash Central Fund 5.38% (c) (Cost $40,485) | | 40,477 | 40,485 |
| | | | |
| TOTAL INVESTMENT IN SECURITIES - 99.9% (Cost $77,369,684) | 103,740,132 |
NET OTHER ASSETS (LIABILITIES) - 0.1% | 52,388 |
| NET ASSETS - 100.0% | 103,792,520 |
| | |
| Futures Contracts |
| | Number of contracts | Expiration Date | Notional Amount ($) | Value ($) | Unrealized Appreciation/ (Depreciation) ($) |
| Purchased | | | | | |
| | | | | | |
| Equity Index Contracts | | | | | |
| CME Micro E-mini NASDAQ 100 Index Contracts (United States) | 2 | Sep 2024 | 79,709 | 80 | 80 |
| | | | | | |
| The notional amount of futures purchased as a percentage of Net Assets is 0.1% |
Legend
| (b) | Security exempt from registration under Rule 144A of the Securities Act of 1933. These securities may be resold in transactions exempt from registration, normally to qualified institutional buyers. At the end of the period, the value of these securities amounted to $5,587,981 or 5.4% of net assets. |
| (c) | Affiliated fund that is generally available only to investment companies and other accounts managed by Fidelity Investments. The rate quoted is the annualized seven-day yield of the fund at period end. A complete unaudited listing of the fund's holdings as of its most recent quarter end is available upon request. In addition, each Fidelity Central Fund's financial statements, which are not covered by the Fund's Report of Independent Registered Public Accounting Firm, are available on the SEC's website or upon request. |
Affiliated Central Funds
Fiscal year to date information regarding the Fund's investments in Fidelity Central Funds, including the ownership percentage, is presented below.
| Affiliate | Value, beginning of period ($) | Purchases ($) | Sales Proceeds ($) | Dividend Income ($) | Realized Gain (loss) ($) | Change in Unrealized appreciation (depreciation) ($) | Value, end of period ($) | % ownership, end of period |
| Fidelity Cash Central Fund 5.38% | - | 1,149,419 | 1,108,937 | 2,320 | 3 | - | 40,485 | 0.0% |
| Total | - | 1,149,419 | 1,108,937 | 2,320 | 3 | - | 40,485 | |
| | | | | | | | | |
Amounts in the dividend income column in the above table include any capital gain distributions from underlying funds, which are presented in the corresponding line item in the Statement of Operations, if applicable.
Amounts included in the purchases and sales proceeds columns may include in-kind transactions, if applicable.
Investment Valuation
The following is a summary of the inputs used, as of June 30, 2024, involving the Fund's assets and liabilities carried at fair value. The inputs or methodology used for valuing securities may not be an indication of the risk associated with investing in those securities. For more information on valuation inputs, and their aggregation into the levels used below, please refer to the Investment Valuation section in the accompanying Notes to Financial Statements.
| Valuation Inputs at Reporting Date: |
| Description | Total ($) | Level 1 ($) | Level 2 ($) | Level 3 ($) |
Investments in Securities: | | | | |
|
| Equities: | | | | |
Financials | 42,841,975 | 42,841,975 | - | - |
Information Technology | 60,857,672 | 60,857,672 | - | - |
|
| Money Market Funds | 40,485 | 40,485 | - | - |
| Total Investments in Securities: | 103,740,132 | 103,740,132 | - | - |
Derivative Instruments: Assets | | | | |
Futures Contracts | 80 | 80 | - | - |
| Total Assets | 80 | 80 | - | - |
| Total Derivative Instruments: | 80 | 80 | - | - |
Value of Derivative Instruments
The following table is a summary of the Fund's value of derivative instruments by primary risk exposure as of June 30, 2024. For additional information on derivative instruments, please refer to the Derivative Instruments section in the accompanying Notes to Financial Statements.
Primary Risk Exposure / Derivative Type | Value |
| Asset ($) | Liability ($) |
| Equity Risk | | |
Futures Contracts (a) | 80 | 0 |
| Total Equity Risk | 80 | 0 |
| Total Value of Derivatives | 80 | 0 |
(a)Reflects gross cumulative appreciation (depreciation) on futures contracts as presented in the Schedule of Investments. In the Statement of Assets and Liabilities, the period end daily variation margin is included in receivable or payable for daily variation margin on futures contracts, and the net cumulative appreciation (depreciation) is included in Total accumulated earnings (loss).
Fidelity® Crypto Industry and Digital Payments ETF
Financial Statements
| Statement of Assets and Liabilities |
| | | | June 30, 2024 |
| | | | | |
| Assets | | | | |
| Investment in securities, at value - See accompanying schedule: | | | | |
Unaffiliated issuers (cost $77,329,199) | $ | 103,699,647 | | |
Fidelity Central Funds (cost $40,485) | | 40,485 | | |
| | | | | |
| | | | | |
| Total Investment in Securities (cost $77,369,684) | | | $ | 103,740,132 |
| Segregated cash with brokers for derivative instruments | | | | 21,240 |
| Cash | | | | 5,743 |
| Foreign currency held at value (cost $104,116) | | | | 104,175 |
| Receivable for investments sold | | | | 74 |
| Dividends receivable | | | | 5,375 |
| Distributions receivable from Fidelity Central Funds | | | | 169 |
| Receivable from investment adviser for expense reductions | | | | 10,264 |
Total assets | | | | 103,887,172 |
| Liabilities | | | | |
| Payable for investments purchased | $ | 42,207 | | |
| Accrued management fee | | 33,586 | | |
| Payable for daily variation margin on futures contracts | | 449 | | |
| Proxy fee payable | | 17,910 | | |
| Other payables and accrued expenses | | 500 | | |
| Total liabilities | | | | 94,652 |
| Net Assets | | | $ | 103,792,520 |
| Net Assets consist of: | | | | |
| Paid in capital | | | $ | 80,863,218 |
| Total accumulated earnings (loss) | | | | 22,929,302 |
| Net Assets | | | $ | 103,792,520 |
Net Asset Value, offering price and redemption price per share ($103,792,520 ÷ 3,550,000 shares) | | | $ | 29.24 |
| Statement of Operations |
| | | | Year ended June 30, 2024 |
| Investment Income | | | | |
| Dividends | | | $ | 157,088 |
| Interest | | | | 375 |
| Income from Fidelity Central Funds | | | | 2,320 |
| Income before foreign taxes withheld | | | $ | 159,783 |
| Less foreign taxes withheld | | | | (14,258) |
| Total income | | | | 145,525 |
| Expenses | | | | |
| Management fee | $ | 267,622 | | |
| Independent trustees' fees and expenses | | 290 | | |
| Proxy | | 17,910 | | |
| Total expenses before reductions | | 285,822 | | |
| Expense reductions | | (12,404) | | |
| Total expenses after reductions | | | | 273,418 |
| Net Investment income (loss) | | | | (127,893) |
| Realized and Unrealized Gain (Loss) | | | | |
| Net realized gain (loss) on: | | | | |
| Investment Securities: | | | | |
| Unaffiliated issuers | | 1,172,182 | | |
| Redemptions in-kind | | 7,827,094 | | |
| Fidelity Central Funds | | 3 | | |
| Foreign currency transactions | | (6,056) | | |
| Futures contracts | | 6,298 | | |
| Total net realized gain (loss) | | | | 8,999,521 |
| Change in net unrealized appreciation (depreciation) on: | | | | |
| Investment Securities: | | | | |
| Unaffiliated issuers | | 17,470,018 | | |
| Assets and liabilities in foreign currencies | | 18 | | |
| Futures contracts | | 80 | | |
| Total change in net unrealized appreciation (depreciation) | | | | 17,470,116 |
| Net gain (loss) | | | | 26,469,637 |
| Net increase (decrease) in net assets resulting from operations | | | $ | 26,341,744 |
| Statement of Changes in Net Assets |
| |
| | Year ended June 30, 2024 | | Year ended June 30, 2023 |
| Increase (Decrease) in Net Assets | | | | |
| Operations | | | | |
| Net investment income (loss) | $ | (127,893) | $ | (43,544) |
| Net realized gain (loss) | | 8,999,521 | | (3,456,071) |
| Change in net unrealized appreciation (depreciation) | | 17,470,116 | | 13,810,541 |
| Net increase (decrease) in net assets resulting from operations | | 26,341,744 | | 10,310,926 |
| Distributions to shareholders | | (135,150) | | - |
| | | | | |
| Share transactions | | | | |
| Proceeds from sales of shares | | 51,747,447 | | 14,414,125 |
| Cost of shares redeemed | | (10,623,302) | | (1,267,834) |
| | | | | |
Net increase (decrease) in net assets resulting from share transactions | | 41,124,145 | | 13,146,291 |
| Total increase (decrease) in net assets | | 67,330,739 | | 23,457,217 |
| | | | | |
| Net Assets | | | | |
| Beginning of period | | 36,461,781 | | 13,004,564 |
| End of period | $ | 103,792,520 | $ | 36,461,781 |
| | | | | |
| Other Information | | | | |
| Shares | | | | |
| Sold | | 2,050,000 | | 950,000 |
| Redeemed | | (400,000) | | (100,000) |
| Net increase (decrease) | | 1,650,000 | | 850,000 |
| | | | | |
Financial Highlights
Fidelity® Crypto Industry and Digital Payments ETF |
| |
| Years ended June 30, | | 2024 | | 2023 | | 2022 A |
Selected Per-Share Data | | | | | | |
| Net asset value, beginning of period | $ | 19.19 | $ | 12.39 | $ | 25.76 |
| Income from Investment Operations | | | | | | |
Net investment income (loss) B,C | | (.04) | | (.03) | | (.01) |
| Net realized and unrealized gain (loss) | | 10.14 | | 6.83 | | (13.36) |
| Total from investment operations | | 10.10 | | 6.80 | | (13.37) |
| Distributions from net investment income | | (.05) | | - | | - |
| Total distributions | | (.05) | | - | | - |
| Net asset value, end of period | $ | 29.24 | $ | 19.19 | $ | 12.39 |
Total Return D,E,F | | | | 54.94% | | (51.92)% |
Ratios to Average Net Assets C,G,H | | | | | | |
| Expenses before reductions | | .42% | | .39% | | .39% I |
| Expenses net of fee waivers, if any | | | | .39% | | .39% I |
| Expenses net of all reductions | | .40% | | .39% | | .39% |
| Net investment income (loss) | | (.19)% | | (.19)% | | (.29)% I |
| Supplemental Data | | | | | | |
| Net assets, end of period (000 omitted) | $ | 103,793 | $ | 36,462 | $ | 13,005 |
Portfolio turnover rate J,K | | | | 55% | | 28% L |
AFor the period April 19, 2022 (commencement of operations) through June 30, 2022.
BCalculated based on average shares outstanding during the period.
CNet investment income (loss) is affected by the timing of the declaration of dividends by any underlying mutual funds or exchange-traded funds (ETFs). Net investment income (loss) of any mutual funds or ETFs is not included in the Fund's net investment income (loss) ratio.
DTotal returns for periods of less than one year are not annualized.
ETotal returns would have been lower if certain expenses had not been reduced during the applicable periods shown.
FBased on net asset value.
GFees and expenses of any underlying mutual funds or exchange-traded funds (ETFs) are not included in the Fund's expense ratio. The Fund indirectly bears its proportionate share of these expenses. For additional expense information related to investments in Fidelity Central Funds, please refer to the "Investments in Fidelity Central Funds" note found in the Notes to Financial Statements section of the most recent Annual or Semi-Annual report.
HExpense ratios reflect operating expenses of the class. Expenses before reductions do not reflect amounts reimbursed, waived, or reduced through arrangements with the investment adviser, brokerage services, or other offset arrangements, if applicable, and do not represent the amount paid by the class during periods when reimbursements, waivers or reductions occur.
IAnnualized.
JPortfolio turnover rate excludes securities received or delivered in-kind.
KAmount does not include the portfolio activity of any underlying mutual funds or exchange-traded funds (ETFs).
LAmount not annualized.
Fidelity® Digital Health ETF
Schedule of Investments June 30, 2024
Showing Percentage of Net Assets
| Common Stocks - 99.9% |
| | | Shares | Value ($) |
| COMMUNICATION SERVICES - 1.5% | | | |
| Interactive Media & Services - 1.5% | | | |
| Infocom Corp. | | 3,300 | 124,319 |
| CONSUMER STAPLES - 6.3% | | | |
| Consumer Staples Distribution & Retail - 6.3% | | | |
| Alibaba Health Information Technology Ltd. (a) | | 376,000 | 150,739 |
| DocMorris AG (a) | | 1,724 | 102,642 |
| Ping An Healthcare and Technology Co. Ltd. (a)(b) | | 78,400 | 114,878 |
| Redcare Pharmacy NV (a)(b) | | 1,243 | 151,869 |
| | | | 520,128 |
| HEALTH CARE - 87.4% | | | |
| Health Care Equipment & Supplies - 49.6% | | | |
| Axonics, Inc. (a) | | 2,751 | 184,950 |
| Cochlear Ltd. | | 1,369 | 303,680 |
| Demant A/S (a) | | 4,261 | 184,569 |
| DexCom, Inc. (a) | | 3,241 | 367,465 |
| Fisher & Paykel Healthcare Corp. | | 14,279 | 261,723 |
| Inspire Medical Systems, Inc. (a) | | 1,337 | 178,931 |
| Insulet Corp. (a) | | 1,541 | 310,974 |
| Intuitive Surgical, Inc. (a) | | 916 | 407,480 |
| iRhythm Technologies, Inc. (a) | | 1,908 | 205,377 |
| Koninklijke Philips Electronics NV | | 13,429 | 339,520 |
| Masimo Corp. (a) | | 1,744 | 219,639 |
| Nevro Corp. (a) | | 9,216 | 77,599 |
| Nihon Kohden Corp. | | 11,000 | 158,921 |
| Omnicell, Inc. (a) | | 4,490 | 121,544 |
| ResMed, Inc. | | 1,814 | 347,236 |
| Sonova Holding AG | | 944 | 291,625 |
| Tandem Diabetes Care, Inc. (a) | | 3,548 | 142,949 |
| | | | 4,104,182 |
| Health Care Providers & Services - 13.4% | | | |
| Accolade, Inc. (a) | | 14,125 | 50,568 |
| Astrana Health, Inc. (a) | | 3,552 | 144,069 |
| Cigna Group | | 529 | 174,872 |
| Corvel Corp. (a) | | 664 | 168,835 |
| Hims & Hers Health, Inc. (a) | | 8,316 | 167,900 |
| Premier, Inc. Class A | | 8,487 | 158,452 |
| R1 RCM, Inc. (a) | | 13,103 | 164,574 |
| Talkspace, Inc. Class A (a) | | 32,863 | 75,585 |
| | | | 1,104,855 |
| Health Care Technology - 22.3% | | | |
| CompuGroup Medical AG | | 3,803 | 97,006 |
| Definitive Healthcare Corp. (a) | | 14,647 | 79,973 |
| Doximity, Inc. (a) | | 6,517 | 182,280 |
| Evolent Health, Inc. Class A (a) | | 7,387 | 141,239 |
| GoodRx Holdings, Inc. (a) | | 12,684 | 98,935 |
| Health Catalyst, Inc. (a) | | 13,347 | 85,287 |
| JMDC, Inc. | | 4,900 | 101,162 |
| Phreesia, Inc. (a) | | 6,334 | 134,281 |
| Pro Medicus Ltd. | | 2,444 | 233,833 |
| Sectra AB (B Shares) | | 8,059 | 184,311 |
| Teladoc Health, Inc. (a) | | 13,656 | 133,556 |
| Veeva Systems, Inc. Class A (a) | | 2,013 | 368,399 |
| | | | 1,840,262 |
| Life Sciences Tools & Services - 2.1% | | | |
| IQVIA Holdings, Inc. (a) | | 808 | 170,844 |
TOTAL HEALTH CARE | | | 7,220,143 |
| INDUSTRIALS - 2.5% | | | |
| Professional Services - 2.5% | | | |
| Maximus, Inc. | | 2,467 | 211,422 |
| INFORMATION TECHNOLOGY - 2.2% | | | |
| IT Services - 2.2% | | | |
| Cognizant Technology Solutions Corp. Class A | | 2,698 | 183,464 |
| TOTAL COMMON STOCKS (Cost $9,359,943) | | | 8,259,476 |
| | | | |
| TOTAL INVESTMENT IN SECURITIES - 99.9% (Cost $9,359,943) | 8,259,476 |
NET OTHER ASSETS (LIABILITIES) - 0.1% | 4,552 |
| NET ASSETS - 100.0% | 8,264,028 |
| | |
Legend
| (b) | Security exempt from registration under Rule 144A of the Securities Act of 1933. These securities may be resold in transactions exempt from registration, normally to qualified institutional buyers. At the end of the period, the value of these securities amounted to $266,747 or 3.2% of net assets. |
Affiliated Central Funds
Fiscal year to date information regarding the Fund's investments in Fidelity Central Funds, including the ownership percentage, is presented below.
| Affiliate | Value, beginning of period ($) | Purchases ($) | Sales Proceeds ($) | Dividend Income ($) | Realized Gain (loss) ($) | Change in Unrealized appreciation (depreciation) ($) | Value, end of period ($) | % ownership, end of period |
| Fidelity Cash Central Fund 5.38% | - | 171,342 | 171,342 | 26 | - | - | - | 0.0% |
| Total | - | 171,342 | 171,342 | 26 | - | - | - | |
| | | | | | | | | |
Amounts in the dividend income column in the above table include any capital gain distributions from underlying funds, which are presented in the corresponding line item in the Statement of Operations, if applicable.
Amounts included in the purchases and sales proceeds columns may include in-kind transactions, if applicable.
Investment Valuation
The following is a summary of the inputs used, as of June 30, 2024, involving the Fund's assets and liabilities carried at fair value. The inputs or methodology used for valuing securities may not be an indication of the risk associated with investing in those securities. For more information on valuation inputs, and their aggregation into the levels used below, please refer to the Investment Valuation section in the accompanying Notes to Financial Statements.
| Valuation Inputs at Reporting Date: |
| Description | Total ($) | Level 1 ($) | Level 2 ($) | Level 3 ($) |
Investments in Securities: | | | | |
|
| Equities: | | | | |
Communication Services | 124,319 | 124,319 | - | - |
Consumer Staples | 520,128 | 520,128 | - | - |
Health Care | 7,220,143 | 7,220,143 | - | - |
Industrials | 211,422 | 211,422 | - | - |
Information Technology | 183,464 | 183,464 | - | - |
| | | | | |
| Total Investments in Securities: | 8,259,476 | 8,259,476 | - | - |
Fidelity® Digital Health ETF
Financial Statements
| Statement of Assets and Liabilities |
| | | | June 30, 2024 |
| | | | | |
| Assets | | | | |
Investment in securities, at value - See accompanying schedule Unaffiliated issuers (cost $9,359,943): | | | $ | 8,259,476 |
| Cash | | | | 748 |
| Foreign currency held at value (cost $1,664) | | | | 1,662 |
| Dividends receivable | | | | 5,837 |
| Receivable from investment adviser for expense reductions | | | | 1,761 |
Total assets | | | | 8,269,484 |
| Liabilities | | | | |
| Accrued management fee | $ | 2,759 | | |
| Proxy fee payable | | 2,697 | | |
| Total liabilities | | | | 5,456 |
| Net Assets | | | $ | 8,264,028 |
| Net Assets consist of: | | | | |
| Paid in capital | | | $ | 12,010,760 |
| Total accumulated earnings (loss) | | | | (3,746,732) |
| Net Assets | | | $ | 8,264,028 |
Net Asset Value, offering price and redemption price per share ($8,264,028 ÷ 450,000 shares) | | | $ | 18.36 |
| Statement of Operations |
| | | | Year ended June 30, 2024 |
| Investment Income | | | | |
| Dividends | | | $ | 41,365 |
| Income from Fidelity Central Funds | | | | 26 |
| Income before foreign taxes withheld | | | $ | 41,391 |
| Less foreign taxes withheld | | | | (2,251) |
| Total income | | | | 39,140 |
| Expenses | | | | |
| Management fee | $ | 35,407 | | |
| Independent trustees' fees and expenses | | 46 | | |
| Proxy | | 2,697 | | |
| Total expenses before reductions | | 38,150 | | |
| Expense reductions | | (1,861) | | |
| Total expenses after reductions | | | | 36,289 |
| Net Investment income (loss) | | | | 2,851 |
| Realized and Unrealized Gain (Loss) | | | | |
| Net realized gain (loss) on: | | | | |
| Investment Securities: | | | | |
| Redemptions in-kind | | 228,371 | | |
| Unaffiliated issuers | | (1,166,967) | | |
| Foreign currency transactions | | (159) | | |
| Total net realized gain (loss) | | | | (938,755) |
| Change in net unrealized appreciation (depreciation) on: | | | | |
| Investment Securities: | | | | |
| Unaffiliated issuers | | 339,758 | | |
| Assets and liabilities in foreign currencies | | (7) | | |
| Total change in net unrealized appreciation (depreciation) | | | | 339,751 |
| Net gain (loss) | | | | (599,004) |
| Net increase (decrease) in net assets resulting from operations | | | $ | (596,153) |
| Statement of Changes in Net Assets |
| |
| | Year ended June 30, 2024 | | Year ended June 30, 2023 |
| Increase (Decrease) in Net Assets | | | | |
| Operations | | | | |
| Net investment income (loss) | $ | 2,851 | $ | 16,864 |
| Net realized gain (loss) | | (938,755) | | (1,145,613) |
| Change in net unrealized appreciation (depreciation) | | 339,751 | | 1,683,713 |
| Net increase (decrease) in net assets resulting from operations | | (596,153) | | 554,964 |
| Distributions to shareholders | | (4,950) | | (15,500) |
| | | | | |
| Share transactions | | | | |
| Cost of shares redeemed | | (963,021) | | - |
| | | | | |
Net increase (decrease) in net assets resulting from share transactions | | (963,021) | | - |
| Total increase (decrease) in net assets | | (1,564,124) | | 539,464 |
| | | | | |
| Net Assets | | | | |
| Beginning of period | | 9,828,152 | | 9,288,688 |
| End of period | $ | 8,264,028 | $ | 9,828,152 |
| | | | | |
| Other Information | | | | |
| Shares | | | | |
| Redeemed | | (50,000) | | - |
| Net increase (decrease) | | (50,000) | | - |
| | | | | |
Financial Highlights
Fidelity® Digital Health ETF |
| |
| Years ended June 30, | | 2024 | | 2023 | | 2022 A |
Selected Per-Share Data | | | | | | |
| Net asset value, beginning of period | $ | 19.66 | $ | 18.58 | $ | 25.10 |
| Income from Investment Operations | | | | | | |
Net investment income (loss) B,C | | .01 | | .03 D | | (.01) |
| Net realized and unrealized gain (loss) | | (1.30) | | 1.08 | | (6.51) |
| Total from investment operations | | (1.29) | | 1.11 | | (6.52) |
| Distributions from net investment income | | (.01) | | (.03) | | - |
| Total distributions | | (.01) | | (.03) | | - |
| Net asset value, end of period | $ | 18.36 | $ | 19.66 | $ | 18.58 |
Total Return E,F,G | | | | 5.98% | | (25.99)% |
Ratios to Average Net Assets C,H,I | | | | | | |
| Expenses before reductions | | .42% | | .39% | | .39% J |
| Expenses net of fee waivers, if any | | | | .39% | | .39% J |
| Expenses net of all reductions | | .40% | | .39% | | .39% J |
| Net investment income (loss) | | .03% | | .18% D | | (.05)% J |
| Supplemental Data | | | | | | |
| Net assets, end of period (000 omitted) | $ | 8,264 | $ | 9,828 | $ | 9,289 |
Portfolio turnover rate K | | | | 36% | | 48% L,M |
AFor the period October 5, 2021 (commencement of operations) through June 30, 2022.
BCalculated based on average shares outstanding during the period.
CNet investment income (loss) is affected by the timing of the declaration of dividends by any underlying mutual funds or exchange-traded funds (ETFs). Net investment income (loss) of any mutual funds or ETFs is not included in the Fund's net investment income (loss) ratio.
DNet investment income per share reflects one or more large, non-recurring dividend(s) which amounted to $.04 per share. Excluding such non-recurring dividend(s), the ratio of net investment income (loss) to average net assets would have been (.03)%.
ETotal returns would have been lower if certain expenses had not been reduced during the applicable periods shown.
FBased on net asset value.
GTotal returns for periods of less than one year are not annualized.
HFees and expenses of any underlying mutual funds or exchange-traded funds (ETFs) are not included in the Fund's expense ratio. The Fund indirectly bears its proportionate share of these expenses. For additional expense information related to investments in Fidelity Central Funds, please refer to the "Investments in Fidelity Central Funds" note found in the Notes to Financial Statements section of the most recent Annual or Semi-Annual report.
IExpense ratios reflect operating expenses of the class. Expenses before reductions do not reflect amounts reimbursed, waived, or reduced through arrangements with the investment adviser, brokerage services, or other offset arrangements, if applicable, and do not represent the amount paid by the class during periods when reimbursements, waivers or reductions occur.
JAnnualized.
KAmount does not include the portfolio activity of any underlying mutual funds or exchange-traded funds (ETFs).
LPortfolio turnover rate excludes securities received or delivered in-kind.
MAmount not annualized.
Fidelity® Electric Vehicles and Future Transportation ETF
Schedule of Investments June 30, 2024
Showing Percentage of Net Assets
| Common Stocks - 99.8% |
| | | Shares | Value ($) |
| CONSUMER DISCRETIONARY - 39.6% | | | |
| Automobile Components - 13.0% | | | |
| Adient PLC (a) | | 18,938 | 467,958 |
| Aptiv PLC (a) | | 13,503 | 950,881 |
| Forvia SE | | 35,003 | 414,722 |
| Lear Corp. | | 6,030 | 688,686 |
| Luminar Technologies, Inc. Class A (a) | | 188,847 | 281,382 |
| Mobileye Global, Inc. Class A (a) | | 15,854 | 445,260 |
| Valeo SA | | 43,813 | 466,655 |
| Visteon Corp. (a) | | 5,188 | 553,560 |
| | | | 4,269,104 |
| Automobiles - 22.0% | | | |
| BYD Co. Ltd. (H Shares) | | 39,500 | 1,173,758 |
| Li Auto, Inc. Class A (a) | | 87,300 | 786,073 |
| Lucid Group, Inc. Class A (a) | | 188,674 | 492,439 |
| NIO, Inc. sponsored ADR (a) | | 143,365 | 596,398 |
| Rivian Automotive, Inc. (a) | | 67,104 | 900,536 |
| Tesla, Inc. (a) | | 8,996 | 1,780,130 |
| XPeng, Inc. Class A (a) | | 160,100 | 605,958 |
| Yadea Group Holdings Ltd. (b) | | 296,000 | 374,199 |
| Zhejiang Leapmotor Technology Co. Ltd. (H Shares) (a)(b) | | 144,500 | 496,017 |
| | | | 7,205,508 |
| Household Durables - 4.6% | | | |
| Garmin Ltd. | | 6,934 | 1,129,687 |
| JVCKENWOOD Holdings, Inc. | | 67,000 | 388,188 |
| | | | 1,517,875 |
TOTAL CONSUMER DISCRETIONARY | | | 12,992,487 |
| INDUSTRIALS - 18.7% | | | |
| Electrical Equipment - 8.7% | | | |
| Bloom Energy Corp. Class A (a) | | 36,879 | 451,399 |
| ChargePoint Holdings, Inc. Class A (a) | | 190,298 | 287,350 |
| Doosan Fuel Cell Co. Ltd. (a) | | 20,452 | 314,246 |
| LG Energy Solution (a) | | 3,287 | 779,663 |
| Plug Power, Inc. (a) | | 152,155 | 354,521 |
| Sensata Technologies PLC | | 17,687 | 661,317 |
| | | | 2,848,496 |
| Ground Transportation - 7.2% | | | |
| Lyft, Inc. (a) | | 43,794 | 617,495 |
| Uber Technologies, Inc. (a) | | 23,921 | 1,738,578 |
| | | | 2,356,073 |
| Machinery - 2.8% | | | |
| Blue Bird Corp. (a) | | 6,724 | 362,087 |
| NFI Group, Inc. (a) | | 32,873 | 380,537 |
| Nikola Corp. (a) | | 20,022 | 163,980 |
| | | | 906,604 |
TOTAL INDUSTRIALS | | | 6,111,173 |
| INFORMATION TECHNOLOGY - 33.5% | | | |
| Electronic Equipment, Instruments & Components - 2.6% | | | |
| Samsung SDI Co. Ltd. | | 3,351 | 861,790 |
| Semiconductors & Semiconductor Equipment - 30.9% | | | |
| Allegro MicroSystems LLC (a) | | 14,206 | 401,177 |
| ams-OSRAM AG (a) | | 237,041 | 328,286 |
| Analog Devices, Inc. | | 6,789 | 1,549,657 |
| Diodes, Inc. (a) | | 6,600 | 474,738 |
| indie Semiconductor, Inc. (a) | | 42,808 | 264,125 |
| Infineon Technologies AG | | 30,337 | 1,115,382 |
| Lattice Semiconductor Corp. (a) | | 10,574 | 613,186 |
| Melexis NV | | 4,432 | 381,900 |
| NXP Semiconductors NV | | 4,917 | 1,323,116 |
| ON Semiconductor Corp. (a) | | 13,921 | 954,285 |
| SiTime Corp. (a) | | 3,415 | 424,758 |
| Skyworks Solutions, Inc. | | 8,707 | 927,992 |
| STMicroelectronics NV (Italy) | | 22,925 | 906,014 |
| Synaptics, Inc. (a) | | 5,322 | 469,400 |
| | | | 10,134,016 |
TOTAL INFORMATION TECHNOLOGY | | | 10,995,806 |
| MATERIALS - 8.0% | | | |
| Chemicals - 8.0% | | | |
| Albemarle Corp. | | 7,883 | 752,984 |
| Arcadium Lithium PLC | | 148,113 | 497,660 |
| Ganfeng Lithium Group Co. Ltd. (H Shares) (b) | | 147,280 | 287,112 |
| LG Chemical Ltd. | | 3,338 | 837,834 |
| Tianqi Lithium Corp. (H Shares) | | 81,400 | 233,543 |
| | | | 2,609,133 |
| TOTAL COMMON STOCKS (Cost $44,918,091) | | | 32,708,599 |
| | | | |
| Money Market Funds - 0.0% |
| | | Shares | Value ($) |
Fidelity Cash Central Fund 5.38% (c) (Cost $8,184) | | 8,182 | 8,184 |
| | | | |
| TOTAL INVESTMENT IN SECURITIES - 99.8% (Cost $44,926,275) | 32,716,783 |
NET OTHER ASSETS (LIABILITIES) - 0.2% | 70,385 |
| NET ASSETS - 100.0% | 32,787,168 |
| | |
Legend
| (b) | Security exempt from registration under Rule 144A of the Securities Act of 1933. These securities may be resold in transactions exempt from registration, normally to qualified institutional buyers. At the end of the period, the value of these securities amounted to $1,157,328 or 3.5% of net assets. |
| (c) | Affiliated fund that is generally available only to investment companies and other accounts managed by Fidelity Investments. The rate quoted is the annualized seven-day yield of the fund at period end. A complete unaudited listing of the fund's holdings as of its most recent quarter end is available upon request. In addition, each Fidelity Central Fund's financial statements, which are not covered by the Fund's Report of Independent Registered Public Accounting Firm, are available on the SEC's website or upon request. |
Affiliated Central Funds
Fiscal year to date information regarding the Fund's investments in Fidelity Central Funds, including the ownership percentage, is presented below.
| Affiliate | Value, beginning of period ($) | Purchases ($) | Sales Proceeds ($) | Dividend Income ($) | Realized Gain (loss) ($) | Change in Unrealized appreciation (depreciation) ($) | Value, end of period ($) | % ownership, end of period |
| Fidelity Cash Central Fund 5.38% | - | 1,066,824 | 1,058,640 | 174 | - | - | 8,184 | 0.0% |
| Total | - | 1,066,824 | 1,058,640 | 174 | - | - | 8,184 | |
| | | | | | | | | |
Amounts in the dividend income column in the above table include any capital gain distributions from underlying funds, which are presented in the corresponding line item in the Statement of Operations, if applicable.
Amounts included in the purchases and sales proceeds columns may include in-kind transactions, if applicable.
Investment Valuation
The following is a summary of the inputs used, as of June 30, 2024, involving the Fund's assets and liabilities carried at fair value. The inputs or methodology used for valuing securities may not be an indication of the risk associated with investing in those securities. For more information on valuation inputs, and their aggregation into the levels used below, please refer to the Investment Valuation section in the accompanying Notes to Financial Statements.
| Valuation Inputs at Reporting Date: |
| Description | Total ($) | Level 1 ($) | Level 2 ($) | Level 3 ($) |
Investments in Securities: | | | | |
|
| Equities: | | | | |
Consumer Discretionary | 12,992,487 | 12,992,487 | - | - |
Industrials | 6,111,173 | 6,111,173 | - | - |
Information Technology | 10,995,806 | 10,995,806 | - | - |
Materials | 2,609,133 | 2,609,133 | - | - |
|
| Money Market Funds | 8,184 | 8,184 | - | - |
| Total Investments in Securities: | 32,716,783 | 32,716,783 | - | - |
Fidelity® Electric Vehicles and Future Transportation ETF
Financial Statements
| Statement of Assets and Liabilities |
| | | | June 30, 2024 |
| | | | | |
| Assets | | | | |
| Investment in securities, at value - See accompanying schedule: | | | | |
Unaffiliated issuers (cost $44,918,091) | $ | 32,708,599 | | |
Fidelity Central Funds (cost $8,184) | | 8,184 | | |
| | | | | |
| | | | | |
| Total Investment in Securities (cost $44,926,275) | | | $ | 32,716,783 |
| Cash | | | | 11,450 |
| Foreign currency held at value (cost $4,051) | | | | 4,050 |
| Dividends receivable | | | | 85,244 |
| Distributions receivable from Fidelity Central Funds | | | | 102 |
| Receivable from investment adviser for expense reductions | | | | 6,803 |
Total assets | | | | 32,824,432 |
| Liabilities | | | | |
| Payable for investments purchased | $ | 15,223 | | |
| Accrued management fee | | 10,998 | | |
| Proxy fee payable | | 11,043 | | |
| Total liabilities | | | | 37,264 |
| Net Assets | | | $ | 32,787,168 |
| Net Assets consist of: | | | | |
| Paid in capital | | | $ | 66,044,260 |
| Total accumulated earnings (loss) | | | | (33,257,092) |
| Net Assets | | | $ | 32,787,168 |
Net Asset Value, offering price and redemption price per share ($32,787,168 ÷ 2,450,000 shares) | | | $ | 13.38 |
| Statement of Operations |
| | | | Year ended June 30, 2024 |
| Investment Income | | | | |
| Dividends | | | $ | 385,465 |
| Income from Fidelity Central Funds | | | | 174 |
| Income before foreign taxes withheld | | | $ | 385,639 |
| Less foreign taxes withheld | | | | (21,261) |
| Total income | | | | 364,378 |
| Expenses | | | | |
| Management fee | $ | 169,524 | | |
| Independent trustees' fees and expenses | | 233 | | |
| Proxy | | 11,043 | | |
| Total expenses before reductions | | 180,800 | | |
| Expense reductions | | (7,132) | | |
| Total expenses after reductions | | | | 173,668 |
| Net Investment income (loss) | | | | 190,710 |
| Realized and Unrealized Gain (Loss) | | | | |
| Net realized gain (loss) on: | | | | |
| Investment Securities: | | | | |
| Unaffiliated issuers | | (8,104,859) | | |
| Redemptions in-kind | | 465,380 | | |
| Foreign currency transactions | | (5,974) | | |
| Total net realized gain (loss) | | | | (7,645,453) |
| Change in net unrealized appreciation (depreciation) on: | | | | |
| Investment Securities: | | | | |
| Unaffiliated issuers | | (8,068,190) | | |
| Assets and liabilities in foreign currencies | | (177) | | |
| Total change in net unrealized appreciation (depreciation) | | | | (8,068,367) |
| Net gain (loss) | | | | (15,713,820) |
| Net increase (decrease) in net assets resulting from operations | | | $ | (15,523,110) |
| Statement of Changes in Net Assets |
| |
| | Year ended June 30, 2024 | | Year ended June 30, 2023 |
| Increase (Decrease) in Net Assets | | | | |
| Operations | | | | |
| Net investment income (loss) | $ | 190,710 | $ | 117,725 |
| Net realized gain (loss) | | (7,645,453) | | (8,677,880) |
| Change in net unrealized appreciation (depreciation) | | (8,068,367) | | 12,015,741 |
| Net increase (decrease) in net assets resulting from operations | | (15,523,110) | | 3,455,586 |
| Distributions to shareholders | | (178,200) | | (119,850) |
| | | | | |
| Share transactions | | | | |
| Proceeds from sales of shares | | 1,007,818 | | 12,741,845 |
| Cost of shares redeemed | | (6,914,724) | | - |
| | | | | |
Net increase (decrease) in net assets resulting from share transactions | | (5,906,906) | | 12,741,845 |
| Total increase (decrease) in net assets | | (21,608,216) | | 16,077,581 |
| | | | | |
| Net Assets | | | | |
| Beginning of period | | 54,395,384 | | 38,317,803 |
| End of period | $ | 32,787,168 | $ | 54,395,384 |
| | | | | |
| Other Information | | | | |
| Shares | | | | |
| Sold | | 50,000 | | 700,000 |
| Redeemed | | (450,000) | | - |
| Net increase (decrease) | | (400,000) | | 700,000 |
| | | | | |
Financial Highlights
Fidelity® Electric Vehicles and Future Transportation ETF |
| |
| Years ended June 30, | | 2024 | | 2023 | | 2022 A |
Selected Per-Share Data | | | | | | |
| Net asset value, beginning of period | $ | 19.09 | $ | 17.82 | $ | 25.20 |
| Income from Investment Operations | | | | | | |
Net investment income (loss) B,C | | .07 | | .05 | | .04 |
| Net realized and unrealized gain (loss) | | (5.71) | | 1.27 | | (7.39) |
| Total from investment operations | | (5.64) | | 1.32 | | (7.35) |
| Distributions from net investment income | | (.07) | | (.05) | | (.03) |
| Total distributions | | (.07) | | (.05) | | (.03) |
| Net asset value, end of period | $ | 13.38 | $ | 19.09 | $ | 17.82 |
Total Return D,E,F | | | | 7.36% | | (29.15)% |
Ratios to Average Net Assets C,G,H | | | | | | |
| Expenses before reductions | | .42% | | .39% | | .39% I |
| Expenses net of fee waivers, if any | | | | .39% | | .39% I |
| Expenses net of all reductions | | .40% | | .39% | | .39% I |
| Net investment income (loss) | | .44% | | .26% | | .25% I |
| Supplemental Data | | | | | | |
| Net assets, end of period (000 omitted) | $ | 32,787 | $ | 54,395 | $ | 38,318 |
Portfolio turnover rate J,K | | | | 62% | | 31% L |
AFor the period October 5, 2021 (commencement of operations) through June 30, 2022.
BCalculated based on average shares outstanding during the period.
CNet investment income (loss) is affected by the timing of the declaration of dividends by any underlying mutual funds or exchange-traded funds (ETFs). Net investment income (loss) of any mutual funds or ETFs is not included in the Fund's net investment income (loss) ratio.
DTotal returns for periods of less than one year are not annualized.
ETotal returns would have been lower if certain expenses had not been reduced during the applicable periods shown.
FBased on net asset value.
GFees and expenses of any underlying mutual funds or exchange-traded funds (ETFs) are not included in the Fund's expense ratio. The Fund indirectly bears its proportionate share of these expenses. For additional expense information related to investments in Fidelity Central Funds, please refer to the "Investments in Fidelity Central Funds" note found in the Notes to Financial Statements section of the most recent Annual or Semi-Annual report.
HExpense ratios reflect operating expenses of the class. Expenses before reductions do not reflect amounts reimbursed, waived, or reduced through arrangements with the investment adviser, brokerage services, or other offset arrangements, if applicable, and do not represent the amount paid by the class during periods when reimbursements, waivers or reductions occur.
IAnnualized.
JAmount does not include the portfolio activity of any underlying mutual funds or exchange-traded funds (ETFs).
KPortfolio turnover rate excludes securities received or delivered in-kind.
LAmount not annualized.
Schedule of Investments June 30, 2024
Showing Percentage of Net Assets
| Common Stocks - 99.8% |
| | | Shares | Value ($) |
| COMMUNICATION SERVICES - 37.0% | | | |
| Entertainment - 15.2% | | | |
| Electronic Arts, Inc. | | 5,375 | 748,899 |
| Embracer Group AB (a) | | 125,074 | 275,063 |
| Kakao Games Corp. (a) | | 12,888 | 191,939 |
| KRAFTON, Inc. (a) | | 2,318 | 474,041 |
| NCSOFT Corp. | | 2,120 | 277,071 |
| NetEase, Inc. | | 39,900 | 761,981 |
| Nexon Co. Ltd. | | 26,200 | 484,552 |
| Playtika Holding Corp. | | 21,939 | 172,660 |
| Roblox Corp. (a) | | 16,793 | 624,868 |
| Take-Two Interactive Software, Inc. (a) | | 4,096 | 636,887 |
| Ubisoft Entertainment SA (a) | | 12,441 | 272,540 |
| WeMade Entertainment Co. Ltd. (a) | | 6,074 | 188,199 |
| | | | 5,108,700 |
| Interactive Media & Services - 21.8% | | | |
| Alphabet, Inc. Class A | | 8,390 | 1,528,239 |
| Bumble, Inc. (a) | | 20,705 | 217,610 |
| Hello Group, Inc. ADR | | 37,607 | 230,155 |
| Meitu, Inc. (b) | | 619,500 | 209,478 |
| Meta Platforms, Inc. Class A | | 2,973 | 1,499,046 |
| NAVER Corp. | | 4,778 | 579,330 |
| Pinterest, Inc. Class A (a) | | 16,209 | 714,331 |
| Snap, Inc. Class A (a) | | 37,878 | 629,154 |
| Tencent Holdings Ltd. | | 31,500 | 1,502,498 |
| Weibo Corp. sponsored ADR | | 24,044 | 184,658 |
| | | | 7,294,499 |
TOTAL COMMUNICATION SERVICES | | | 12,403,199 |
| INFORMATION TECHNOLOGY - 56.8% | | | |
| Electronic Equipment, Instruments & Components - 1.1% | | | |
| Sunny Optical Technology Group Co. Ltd. | | 62,200 | 384,398 |
| IT Services - 3.7% | | | |
| Endava PLC ADR (a) | | 8,959 | 261,961 |
| Fastly, Inc. Class A (a) | | 28,882 | 212,860 |
| GDS Holdings Ltd. Class A (a) | | 219,300 | 262,068 |
| Globant SA (a) | | 2,792 | 497,702 |
| | | | 1,234,591 |
| Semiconductors & Semiconductor Equipment - 20.2% | | | |
| Advanced Micro Devices, Inc. (a) | | 8,925 | 1,447,724 |
| Ambarella, Inc. (a) | | 5,084 | 274,282 |
| Cirrus Logic, Inc. (a) | | 3,631 | 463,533 |
| Himax Technologies, Inc. sponsored ADR | | 32,552 | 258,463 |
| Intel Corp. | | 37,849 | 1,172,184 |
| NVIDIA Corp. | | 12,019 | 1,484,827 |
| Qualcomm, Inc. | | 6,709 | 1,336,299 |
| Synaptics, Inc. (a) | | 3,742 | 330,044 |
| | | | 6,767,356 |
| Software - 19.5% | | | |
| Adobe, Inc. (a) | | 2,979 | 1,654,950 |
| Autodesk, Inc. (a) | | 3,816 | 944,269 |
| Bentley Systems, Inc. Class B | | 10,291 | 507,964 |
| Dassault Systemes SA | | 16,968 | 641,947 |
| Matterport, Inc. Class A (a) | | 53,909 | 240,973 |
| Microsoft Corp. | | 3,471 | 1,551,363 |
| PTC, Inc. (a) | | 3,659 | 664,731 |
| Unity Software, Inc. (a) | | 21,074 | 342,663 |
| | | | 6,548,860 |
| Technology Hardware, Storage & Peripherals - 12.3% | | | |
| Apple, Inc. | | 7,513 | 1,582,388 |
| Samsung Electronics Co. Ltd. | | 26,975 | 1,597,139 |
| Super Micro Computer, Inc. (a) | | 983 | 805,421 |
| Turtle Beach Corp. (a) | | 9,621 | 137,965 |
| | | | 4,122,913 |
TOTAL INFORMATION TECHNOLOGY | | | 19,058,118 |
| REAL ESTATE - 6.0% | | | |
| Equity Real Estate Investment Trusts (REITs) - 5.4% | | | |
| Digital Realty Trust, Inc. | | 5,653 | 859,539 |
| Equinix, Inc. | | 1,256 | 950,290 |
| | | | 1,809,829 |
| Real Estate Management & Development - 0.6% | | | |
| eXp World Holdings, Inc. | | 19,753 | 222,913 |
TOTAL REAL ESTATE | | | 2,032,742 |
| TOTAL COMMON STOCKS (Cost $30,729,422) | | | 33,494,059 |
| | | | |
| TOTAL INVESTMENT IN SECURITIES - 99.8% (Cost $30,729,422) | 33,494,059 |
NET OTHER ASSETS (LIABILITIES) - 0.2% | 65,541 |
| NET ASSETS - 100.0% | 33,559,600 |
| | |
| Futures Contracts |
| | Number of contracts | Expiration Date | Notional Amount ($) | Value ($) | Unrealized Appreciation/ (Depreciation) ($) |
| Purchased | | | | | |
| | | | | | |
| Equity Index Contracts | | | | | |
| CME Micro E-mini NASDAQ 100 Index Contracts (United States) | 1 | Sep 2024 | 39,855 | 338 | 338 |
| | | | | | |
| The notional amount of futures purchased as a percentage of Net Assets is 0.1% |
Legend
| (b) | Security exempt from registration under Rule 144A of the Securities Act of 1933. These securities may be resold in transactions exempt from registration, normally to qualified institutional buyers. At the end of the period, the value of these securities amounted to $209,478 or 0.6% of net assets. |
Affiliated Central Funds
Fiscal year to date information regarding the Fund's investments in Fidelity Central Funds, including the ownership percentage, is presented below.
| Affiliate | Value, beginning of period ($) | Purchases ($) | Sales Proceeds ($) | Dividend Income ($) | Realized Gain (loss) ($) | Change in Unrealized appreciation (depreciation) ($) | Value, end of period ($) | % ownership, end of period |
| Fidelity Cash Central Fund 5.38% | 278,050 | 1,696,145 | 1,974,196 | 3,196 | 1 | - | - | 0.0% |
| Total | 278,050 | 1,696,145 | 1,974,196 | 3,196 | 1 | - | - | |
| | | | | | | | | |
Amounts in the dividend income column in the above table include any capital gain distributions from underlying funds, which are presented in the corresponding line item in the Statement of Operations, if applicable.
Amounts included in the purchases and sales proceeds columns may include in-kind transactions, if applicable.
Investment Valuation
The following is a summary of the inputs used, as of June 30, 2024, involving the Fund's assets and liabilities carried at fair value. The inputs or methodology used for valuing securities may not be an indication of the risk associated with investing in those securities. For more information on valuation inputs, and their aggregation into the levels used below, please refer to the Investment Valuation section in the accompanying Notes to Financial Statements.
| Valuation Inputs at Reporting Date: |
| Description | Total ($) | Level 1 ($) | Level 2 ($) | Level 3 ($) |
Investments in Securities: | | | | |
|
| Equities: | | | | |
Communication Services | 12,403,199 | 12,403,199 | - | - |
Information Technology | 19,058,118 | 19,058,118 | - | - |
Real Estate | 2,032,742 | 2,032,742 | - | - |
| | | | | |
| Total Investments in Securities: | 33,494,059 | 33,494,059 | - | - |
Derivative Instruments: Assets | | | | |
Futures Contracts | 338 | 338 | - | - |
| Total Assets | 338 | 338 | - | - |
| Total Derivative Instruments: | 338 | 338 | - | - |
Value of Derivative Instruments
The following table is a summary of the Fund's value of derivative instruments by primary risk exposure as of June 30, 2024. For additional information on derivative instruments, please refer to the Derivative Instruments section in the accompanying Notes to Financial Statements.
Primary Risk Exposure / Derivative Type | Value |
| Asset ($) | Liability ($) |
| Equity Risk | | |
Futures Contracts (a) | 338 | 0 |
| Total Equity Risk | 338 | 0 |
| Total Value of Derivatives | 338 | 0 |
(a)Reflects gross cumulative appreciation (depreciation) on futures contracts as presented in the Schedule of Investments. In the Statement of Assets and Liabilities, the period end daily variation margin is included in receivable or payable for daily variation margin on futures contracts, and the net cumulative appreciation (depreciation) is included in Total accumulated earnings (loss).
Fidelity® Metaverse ETF
Financial Statements
| Statement of Assets and Liabilities |
| | | | June 30, 2024 |
| | | | | |
| Assets | | | | |
Investment in securities, at value - See accompanying schedule Unaffiliated issuers (cost $30,729,422): | | | $ | 33,494,059 |
| Segregated cash with brokers for derivative instruments | | | | 7,080 |
| Cash | | | | 39,077 |
| Foreign currency held at value (cost $12,869) | | | | 12,918 |
| Dividends receivable | | | | 20,098 |
| Distributions receivable from Fidelity Central Funds | | | | 339 |
| Receivable from investment adviser for expense reductions | | | | 4,418 |
Total assets | | | | 33,577,989 |
| Liabilities | | | | |
| Accrued management fee | $ | 10,807 | | |
| Payable for daily variation margin on futures contracts | | 225 | | |
| Proxy fee payable | | 7,079 | | |
| Other payables and accrued expenses | | 278 | | |
| Total liabilities | | | | 18,389 |
| Net Assets | | | $ | 33,559,600 |
| Net Assets consist of: | | | | |
| Paid in capital | | | $ | 32,637,544 |
| Total accumulated earnings (loss) | | | | 922,056 |
| Net Assets | | | $ | 33,559,600 |
Net Asset Value, offering price and redemption price per share ($33,559,600 ÷ 1,100,000 shares) | | | $ | 30.51 |
| Statement of Operations |
| | | | Year ended June 30, 2024 |
| Investment Income | | | | |
| Dividends | | | $ | 176,486 |
| Interest | | | | 225 |
| Income from Fidelity Central Funds | | | | 3,196 |
| Total income | | | | 179,907 |
| Expenses | | | | |
| Management fee | $ | 93,953 | | |
| Independent trustees' fees and expenses | | 107 | | |
| Proxy | | 7,079 | | |
| Total expenses before reductions | | 101,139 | | |
| Expense reductions | | (5,114) | | |
| Total expenses after reductions | | | | 96,025 |
| Net Investment income (loss) | | | | 83,882 |
| Realized and Unrealized Gain (Loss) | | | | |
| Net realized gain (loss) on: | | | | |
| Investment Securities: | | | | |
| Unaffiliated issuers | | (1,267,761) | | |
| Redemptions in-kind | | 3,556,311 | | |
| Fidelity Central Funds | | 1 | | |
| Foreign currency transactions | | (5,088) | | |
| Futures contracts | | 25,165 | | |
| Total net realized gain (loss) | | | | 2,308,628 |
| Change in net unrealized appreciation (depreciation) on: | | | | |
| Investment Securities: | | | | |
| Unaffiliated issuers | | 2,049,958 | | |
| Assets and liabilities in foreign currencies | | 116 | | |
| Futures contracts | | (973) | | |
| Total change in net unrealized appreciation (depreciation) | | | | 2,049,101 |
| Net gain (loss) | | | | 4,357,729 |
| Net increase (decrease) in net assets resulting from operations | | | $ | 4,441,611 |
| Statement of Changes in Net Assets |
| |
| | Year ended June 30, 2024 | | Year ended June 30, 2023 |
| Increase (Decrease) in Net Assets | | | | |
| Operations | | | | |
| Net investment income (loss) | $ | 83,882 | $ | 64,134 |
| Net realized gain (loss) | | 2,308,628 | | 558,090 |
| Change in net unrealized appreciation (depreciation) | | 2,049,101 | | 2,003,697 |
| Net increase (decrease) in net assets resulting from operations | | 4,441,611 | | 2,625,921 |
| Distributions to shareholders | | (100,500) | | (70,500) |
| | | | | |
| Share transactions | | | | |
| Proceeds from sales of shares | | 20,617,140 | | 6,111,398 |
| Cost of shares redeemed | | (8,087,398) | | (2,636,047) |
| | | | | |
Net increase (decrease) in net assets resulting from share transactions | | 12,529,742 | | 3,475,351 |
| Total increase (decrease) in net assets | | 16,870,853 | | 6,030,772 |
| | | | | |
| Net Assets | | | | |
| Beginning of period | | 16,688,747 | | 10,657,975 |
| End of period | $ | 33,559,600 | $ | 16,688,747 |
| | | | | |
| Other Information | | | | |
| Shares | | | | |
| Sold | | 750,000 | | 250,000 |
| Redeemed | | (300,000) | | (100,000) |
| Net increase (decrease) | | 450,000 | | 150,000 |
| | | | | |
Financial Highlights
| Years ended June 30, | | 2024 | | 2023 | | 2022 A |
Selected Per-Share Data | | | | | | |
| Net asset value, beginning of period | $ | 25.67 | $ | 21.32 | $ | 25.28 |
| Income from Investment Operations | | | | | | |
Net investment income (loss) B,C | | .10 | | .11 D | | - E |
| Net realized and unrealized gain (loss) | | 4.84 | | 4.36 | | (3.96) |
| Total from investment operations | | 4.94 | | 4.47 | | (3.96) |
| Distributions from net investment income | | (.10) | | (.12) | | - |
| Total distributions | | (.10) | | (.12) | | - |
| Net asset value, end of period | $ | 30.51 | $ | 25.67 | $ | 21.32 |
Total Return F,G,H | | | | 21.06% | | (15.67)% |
Ratios to Average Net Assets C,I,J | | | | | | |
| Expenses before reductions | | .42% | | .39% | | .39% K |
| Expenses net of fee waivers, if any | | | | .39% | | .39% K |
| Expenses net of all reductions | | .40% | | .39% | | .39% K |
| Net investment income (loss) | | .35% | | .49% D | | .01% K |
| Supplemental Data | | | | | | |
| Net assets, end of period (000 omitted) | $ | 33,560 | $ | 16,689 | $ | 10,658 |
Portfolio turnover rate L,M | | | | 47% | | 8% N |
AFor the period April 19, 2022 (commencement of operations) through June 30, 2022.
BCalculated based on average shares outstanding during the period.
CNet investment income (loss) is affected by the timing of the declaration of dividends by any underlying mutual funds or exchange-traded funds (ETFs). Net investment income (loss) of any mutual funds or ETFs is not included in the Fund's net investment income (loss) ratio.
DNet investment income per share reflects one or more large, non-recurring dividend(s) which amounted to $.06 per share. Excluding such non-recurring dividend(s), the ratio of net investment income (loss) to average net assets would have been .22%.
EAmount represents less than $.005 per share.
FTotal returns for periods of less than one year are not annualized.
GTotal returns would have been lower if certain expenses had not been reduced during the applicable periods shown.
HBased on net asset value.
IFees and expenses of any underlying mutual funds or exchange-traded funds (ETFs) are not included in the Fund's expense ratio. The Fund indirectly bears its proportionate share of these expenses. For additional expense information related to investments in Fidelity Central Funds, please refer to the "Investments in Fidelity Central Funds" note found in the Notes to Financial Statements section of the most recent Annual or Semi-Annual report.
JExpense ratios reflect operating expenses of the class. Expenses before reductions do not reflect amounts reimbursed, waived, or reduced through arrangements with the investment adviser, brokerage services, or other offset arrangements, if applicable, and do not represent the amount paid by the class during periods when reimbursements, waivers or reductions occur.
KAnnualized.
LPortfolio turnover rate excludes securities received or delivered in-kind.
MAmount does not include the portfolio activity of any underlying mutual funds or exchange-traded funds (ETFs).
NAmount not annualized.
Notes to Financial Statements
For the period ended June 30, 2024
1. Organization.
Fidelity Clean Energy ETF, Fidelity Cloud Computing ETF, Fidelity Crypto Industry and Digital Payments ETF, Fidelity Digital Health ETF, Fidelity Electric Vehicles and Future Transportation ETF and Fidelity Metaverse ETF (the Funds) are non-diversified exchange-traded funds of Fidelity Covington Trust (the Trust) and are authorized to issue an unlimited number of shares. The Trust is registered under the Investment Company Act of 1940, as amended (the 1940 Act), as an open-end management investment company organized as a Massachusetts business trust. Certain Funds' investments in emerging markets can be subject to social, economic, regulatory, and political uncertainties and can be extremely volatile.
For Fidelity Clean Energy ETF, clean energy companies are subject to various risks, including fluctuations in commodity prices and/or interest rates, obsolescence of existing technology, short product cycles, changes in governmental and environmental regulations and enforcement policies, changes in U.S. and foreign government policies, including tax incentives and government subsidies, reduced availability of clean energy sources or other commodities, and extreme weather or other natural disasters.
For Fidelity Cloud Computing ETF, cloud computing companies are subject to various risks, including those associated with limited operating history, product lines, markets, financial resources or personnel, changes in business cycles, intense competition, potentially rapid product obsolescence, disruptions in service, changes in regulation, and cybersecurity attacks and other types of theft.
For Fidelity Crypto Industry and Digital Payments ETF, cryptocurrency and blockchain companies are subject to various risks, including inability to develop digital asset applications or to capitalize on those applications, theft, loss, or destruction of cryptographic keys, the possibility that digital asset technologies may never be fully implemented, cybersecurity risk, conflicting intellectual property claims, and inconsistent and changing regulations. Digital payments processing companies are subject to various risks, including those associated with intense competition, changes in regulation, economic conditions, deterioration in credit markets, impairment of intellectual property rights, disruptions in service, and cybersecurity attacks and other types of theft.
For Fidelity Digital Health ETF, digital health companies are subject to various risks, including competition, potentially rapid product obsolescence, increasing regulatory scrutiny, changes in government regulatory requirements, regulatory approval for new drugs and medical products, changes in business cycles, vulnerability to cybersecurity breaches, and unexpected events such as pandemics.
For Fidelity Electric Vehicles and Future Transportation ETF, electric vehicles and future transportation companies are subject to various risks, including those associated with limited product lines, markets, financial resources or personnel, intense competition, production delays, changes in governmental regulation, and litigation based on product liability claims.
For Fidelity Metaverse ETF, metaverse companies are subject to various risks, including those associated with limited product lines, markets, financial resources or personnel, intense competition, potentially rapid product obsolescence, impairment of intellectual property rights, disruptions in service, cybersecurity attacks, and changes in regulation.
Although each Fund's underlying index uses a rules-based proprietary index methodology that seeks to identify such companies, there is no guarantee that this methodology will be successful.
2. Investments in Fidelity Central Funds.
Funds may invest in Fidelity Central Funds, which are open-end investment companies generally available only to other investment companies and accounts managed by the investment adviser and its affiliates. The Schedule of Investments lists any Fidelity Central Funds held as an investment as of period end, but does not include the underlying holdings of each Fidelity Central Fund. An investing fund indirectly bears its proportionate share of the expenses of the underlying Fidelity Central Funds.
Based on its investment objective, each Fidelity Central Fund may invest or participate in various investment vehicles or strategies that are similar to those of the investing fund. These strategies are consistent with the investment objectives of the investing fund and may involve certain economic risks which may cause a decline in value of each of the Fidelity Central Funds and thus a decline in the value of the investing fund.
| Fidelity Central Fund | Investment Manager | Investment Objective | Investment Practices | Expense RatioA |
| Fidelity Money Market Central Funds | Fidelity Management & Research Company LLC (FMR) | Each fund seeks to obtain a high level of current income consistent with the preservation of capital and liquidity. | Short-term Investments | Less than .005% |
A Expenses expressed as a percentage of average net assets and are as of each underlying Central Fund's most recent annual or semi-annual shareholder report.
A complete unaudited list of holdings for each Fidelity Central Fund is available upon request or at the Securities and Exchange Commission website at www.sec.gov. In addition, the financial statements of the Fidelity Central Funds which contain the significant accounting policies (including investment valuation policies) of those funds and are not covered by the Report of Independent Registered Public Accounting Firm, are available on the Securities and Exchange Commission website or upon request.
3. Significant Accounting Policies.
Each Fund is an investment company and applies the accounting and reporting guidance of the Financial Accounting Standards Board (FASB) Accounting Standards Codification Topic 946 Financial Services - Investment Companies. The financial statements have been prepared in conformity with accounting principles generally accepted in the United States of America (GAAP), which require management to make certain estimates and assumptions at the date of the financial statements. Actual results could differ from those estimates. Subsequent events, if any, through the date that the financial statements were issued have been evaluated in the preparation of the financial statements. Each Fund's Schedule of Investments lists any underlying mutual funds or exchange-traded funds (ETFs) but does not include the underlying holdings of these funds. The following summarizes the significant accounting policies of each Fund:
Investment Valuation. Investments are valued as of 4:00 p.m. Eastern time on the last calendar day of the period. The Board of Trustees (the Board) has designated each Fund's investment adviser as the valuation designee responsible for the fair valuation function and performing fair value determinations as needed. The investment adviser has established a Fair Value Committee (the Committee) to carry out the day-to-day fair valuation responsibilities and has adopted policies and procedures to govern the fair valuation process and the activities of the Committee. In accordance with these fair valuation policies and procedures, which have been approved by the Board, each Fund attempts to obtain prices from one or more third party pricing services or brokers to value its investments. When current market prices, quotations or currency exchange rates are not readily available or reliable, investments will be fair valued in good faith by the Committee, in accordance with the policies and procedures. Factors used in determining fair value vary by investment type and may include market or investment specific events, transaction data, estimated cash flows, and market observations of comparable investments. The frequency that the fair valuation procedures are used cannot be predicted and they may be utilized to a significant extent. The Committee manages each Fund's fair valuation practices and maintains the fair valuation policies and procedures. Each Fund's investment adviser reports to the Board information regarding the fair valuation process and related material matters.
Each Fund categorizes the inputs to valuation techniques used to value its investments into a disclosure hierarchy consisting of three levels as shown below:
Level 1 - unadjusted quoted prices in active markets for identical investments
Level 2 - other significant observable inputs (including quoted prices for similar investments, interest rates, prepayment speeds, etc.)
Level 3 - unobservable inputs (including the Fund's own assumptions based on the best information available)
Valuation techniques used to value each Fund's investments by major category are as follows:
Equity securities, including restricted securities, for which market quotations are readily available, are valued at the last reported sale price or official closing price as reported by a third party pricing service on the primary market or exchange on which they are traded and are categorized as Level 1 in the hierarchy. In the event there were no sales during the day or closing prices are not available, securities are valued at the last quoted bid price or may be valued using the last available price and are generally categorized as Level 2 in the hierarchy. For foreign equity securities, when market or security specific events arise, comparisons to the valuation of American Depositary Receipts (ADRs), futures contracts, Exchange-Traded Funds (ETFs) and certain indexes as well as quoted prices for similar securities may be used and would be categorized as Level 2 in the hierarchy. For equity securities, including restricted securities, where observable inputs are limited, assumptions about market activity and risk are used and these securities may be categorized as Level 3 in the hierarchy.
Futures contracts are valued at the settlement price established each day by the board of trade or exchange on which they are traded and are categorized as Level 1 in the hierarchy. Investments in open-end mutual funds, including the Fidelity Central Funds, are valued at their closing net asset value (NAV) each business day and are categorized as Level 1 in the hierarchy.
Changes in valuation techniques may result in transfers in or out of an assigned level within the disclosure hierarchy. The aggregate value of investments by input level as of June 30, 2024 is included at the end of each Fund's Schedule of Investments.
Foreign Currency. Certain Funds may use foreign currency contracts to facilitate transactions in foreign-denominated securities. Gains and losses from these transactions may arise from changes in the value of the foreign currency or if the counterparties do not perform under the contracts' terms.
Foreign-denominated assets, including investment securities, and liabilities are translated into U.S. dollars at the exchange rates at period end. Purchases and sales of investment securities, income and dividends received, and expenses denominated in foreign currencies are translated into U.S. dollars at the exchange rate in effect on the transaction date.
The effects of exchange rate fluctuations on investments are included with the net realized and unrealized gain (loss) on investment securities. Other foreign currency transactions resulting in realized and unrealized gain (loss) are disclosed separately.
Investment Transactions and Income. For financial reporting purposes, the Funds' investment holdings and NAV include trades executed through the end of the last business day of the period. The NAV per share for processing shareholder transactions is calculated as of the close of business (normally 4:00 p.m. Eastern time) of the Nasdaq Stock Market for Fidelity Crypto Industry and Digital Payments ETF and Fidelity Metaverse ETF, and of the Cboe BZX Exchange, Inc. (CboeBZX) for all other funds; and includes trades executed through the end of the prior business day. Gains and losses on securities sold are determined on the basis of identified cost. Commissions paid to certain brokers with whom the investment adviser, or its affiliates, places trades on behalf of a fund include an amount in addition to trade execution, which may be rebated back to a fund. Any such rebates are included in net realized gain (loss) on investments in the Statement of Operations. Dividend income is recorded on the ex-dividend date, except for certain dividends from foreign securities where the ex-dividend date may have passed, which are recorded as soon as the Funds are informed of the ex-dividend date. Non-cash dividends included in dividend income, if any, are recorded at the fair market value of the securities received. Income and capital gain distributions from Fidelity Central Funds, if any, are recorded on the ex-dividend date. Certain distributions received by the Funds represent a return of capital or capital gain. The Funds determine the components of these distributions subsequent to the ex-dividend date, based upon receipt of tax filings or other correspondence relating to the underlying investment. These distributions are recorded as a reduction of cost of investments and/or as a realized gain. Large, non-recurring dividends recognized by the Funds are presented separately on the Statement of Operations as "Special Dividends" and the impact of these dividends is presented in the Financial Highlights. Interest income is accrued as earned and includes coupon interest and amortization of premium and accretion of discount on debt securities as applicable. Investment income is recorded net of foreign taxes withheld where recovery of such taxes is uncertain. Funds may file withholding tax reclaims in certain jurisdictions to recover a portion of amounts previously withheld. Any withholding tax reclaims income is included in the Statement of Operations in dividends or foreign taxes withheld. Any receivables for withholding tax reclaims are included in the Statement of Assets and Liabilities in dividends receivable or reclaims receivable, as applicable.
Expenses. Expenses directly attributable to a fund are charged to that fund. Expenses attributable to more than one fund are allocated among the respective funds on the basis of relative net assets or other appropriate methods. Expenses included in the accompanying financial statements reflect the expenses of that fund and do not include any expenses associated with any underlying mutual funds or exchange-traded funds. Although not included in a fund's expenses, a fund indirectly bears its proportionate share of these expenses through the net asset value of each underlying mutual fund or exchange-traded fund. Expense estimates are accrued in the period to which they relate and adjustments are made when actual amounts are known.
Income Tax Information and Distributions to Shareholders. Each year, each Fund intends to qualify as a regulated investment company under Subchapter M of the Internal Revenue Code, including distributing substantially all of its taxable income and realized gains. As a result, no provision for U.S. Federal income taxes is required. As of June 30, 2024, each Fund did not have any unrecognized tax benefits in the financial statements; nor is each Fund aware of any tax positions for which it is reasonably possible that the total amounts of unrecognized tax benefits will significantly change in the next twelve months. Each Fund files a U.S. federal tax return, in addition to state and local tax returns as required. Each Fund's federal income tax returns are subject to examination by the Internal Revenue Service (IRS) for a period of three fiscal years after they are filed. State and local tax returns may be subject to examination for an additional fiscal year depending on the jurisdiction. Realized gain or loss resulting from in-kind redemptions is not taxable to the Funds and is not distributed to shareholders of the Funds. Foreign taxes are provided for based on each Fund's understanding of the tax rules and rates that exist in the foreign markets in which it invests.
Distributions are declared and recorded on the ex-dividend date. Income and capital gain distributions are determined in accordance with income tax regulations, which may differ from GAAP.
Capital accounts within the financial statements are adjusted for permanent book-tax differences. These adjustments have no impact on net assets or the results of operations. Capital accounts are not adjusted for temporary book-tax differences which will reverse in a subsequent period.
Book-tax differences are primarily due to futures contracts, foreign currency transactions, passive foreign investment companies (PFIC), redemptions in-kind, capital loss carryforwards and losses deferred due to wash sales and excise tax regulations.
As of period end, the cost and unrealized appreciation (depreciation) in securities, and derivatives if applicable, for federal income tax purposes were as follows for each Fund:
| | Tax cost ($) | Gross unrealized appreciation ($) | Gross unrealized depreciation ($) | Net unrealized appreciation (depreciation)($) |
| Fidelity Clean Energy ETF | 35,551,992 | 1,452,123 | (11,702,399) | (10,250,276) |
| Fidelity Cloud Computing ETF | 73,599,354 | 10,514,566 | (7,030,515) | 3,484,051 |
Fidelity Crypto Industry and Digital Payments ETF | 77,789,930 | 33,673,398 | (7,723,196) | 25,950,202 |
| Fidelity Digital Health ETF | 9,399,152 | 1,196,181 | (2,335,857) | (1,139,676) |
Fidelity Electric Vehicles and Future Transportation ETF | 45,069,558 | 2,047,674 | (14,400,449) | (12,352,775) |
| Fidelity Metaverse ETF | 30,934,468 | 5,269,149 | (2,709,558) | 2,559,591 |
The tax-based components of distributable earnings as of period end were as follows for each Fund:
| | Undistributed ordinary income ($) | Capital loss carryforward ($) | Net unrealized appreciation (depreciation) on securities and other investments ($) |
| Fidelity Clean Energy ETF | - | (8,979,616) | (10,246,496) |
| Fidelity Cloud Computing ETF | - | (5,600,648) | 3,486,622 |
Fidelity Crypto Industry and Digital Payments ETF | 1,430,284 | (4,451,188) | 25,950,207 |
| Fidelity Digital Health ETF | - | (2,607,316) | (1,139,416) |
Fidelity Electric Vehicles and Future Transportation ETF | - | (20,900,598) | (12,351,074) |
| Fidelity Metaverse ETF | - | (1,634,643) | 2,559,728 |
Capital loss carryforwards are only available to offset future capital gains of the Funds to the extent provided by regulations and may be limited. The capital loss carryforward information presented below, including any applicable limitation, is estimated as of fiscal period end and is subject to adjustment.
| | Short-term ($) | Long-term ($) | Total capital loss carryforward ($) |
| Fidelity Clean Energy ETF | (2,939,218) | (6,040,398) | (8,979,616) |
| Fidelity Cloud Computing ETF | (1,564,044) | (4,036,604) | (5,600,648) |
Fidelity Crypto Industry and Digital Payments ETF | (3,574,238) | (876,950) | (4,451,188) |
| Fidelity Digital Health ETF | (613,214) | (1,994,102) | (2,607,316) |
Fidelity Electric Vehicles and Future Transportation ETF | (9,148,744) | (11,751,854) | (20,900,598) |
| Fidelity Metaverse ETF | (815,493) | (819,150) | (1,634,643) |
Certain of the Funds intend to elect to defer to the next fiscal year ordinary losses recognized during the period January 1, 2024 to June 30, 2024. Loss deferrals are as follows:
| | |
| | Ordinary losses ($) |
| Fidelity Clean Energy ETF | (585) |
| Fidelity Cloud Computing ETF | (78) |
| Fidelity Electric Vehicles and Future Transportation ETF | (5,419) |
| Fidelity Metaverse ETF | (3,029) |
The tax character of distributions paid was as follows:
| June 30, 2024 | |
| | Ordinary Income ($) |
| Fidelity Clean Energy ETF | 378,500 |
| Fidelity Cloud Computing ETF | 106,250 |
Fidelity Crypto Industry and Digital Payments ETF | 135,150 |
| Fidelity Digital Health ETF | 4,950 |
Fidelity Electric Vehicles and Future Transportation ETF | 178,200 |
| Fidelity Metaverse ETF | 100,500 |
| June 30, 2023 | | | |
| | Ordinary Income ($) | Tax Return of Capital ($) | Total ($) |
| Fidelity Clean Energy ETF | 306,800 | - | 306,800 |
| Fidelity Cloud Computing ETF | 48,880 | 14,820 | 63,700 |
Fidelity Crypto Industry and Digital Payments ETF | - | - | - |
| Fidelity Digital Health ETF | 15,500 | - | 15,500 |
Fidelity Electric Vehicles and Future Transportation ETF | 119,850 | - | 119,850 |
| Fidelity Metaverse ETF | 70,500 | - | 70,500 |
Restricted Securities (including Private Placements). Funds may invest in securities that are subject to legal or contractual restrictions on resale. These securities generally may be resold in transactions exempt from registration or to the public if the securities are registered. Disposal of these securities may involve time-consuming negotiations and expense, and prompt sale at an acceptable price may be difficult. Information regarding restricted securities held at period end is included at the end of the Schedule of Investments, if applicable.
4. Derivative Instruments.
Risk Exposures and the Use of Derivative Instruments. Each Fund's investment objectives allow for various types of derivative instruments, including futures contracts. Derivatives are investments whose value is primarily derived from underlying assets, indices or reference rates and may be transacted on an exchange or over-the-counter (OTC). Derivatives may involve a future commitment to buy or sell a specified asset based on specified terms, to exchange future cash flows at periodic intervals based on a notional principal amount, or for one party to make one or more payments upon the occurrence of specified events in exchange for periodic payments from the other party.
Derivatives were used to increase returns and to manage exposure to certain risks as defined below. The success of any strategy involving derivatives depends on analysis of numerous economic factors, and if the strategies for investment do not work as intended, the objectives may not be achieved.
Derivatives were used to increase or decrease exposure to the following risk(s):
| | |
| Equity Risk | Equity risk relates to the fluctuations in the value of financial instruments as a result of changes in market prices (other than those arising from interest rate risk or foreign exchange risk), whether caused by factors specific to an individual investment, its issuer, or all factors affecting all instruments traded in a market or market segment. |
Funds are also exposed to additional risks from investing in derivatives, such as liquidity risk and counterparty credit risk. Liquidity risk is the risk that a fund will be unable to close out the derivative in the open market in a timely manner. Counterparty credit risk is the risk that the counterparty will not be able to fulfill its obligation to a fund. Counterparty credit risk related to exchange-traded contracts may be mitigated by the protection provided by the exchange on which they trade.
Investing in derivatives may involve greater risks than investing in the underlying assets directly and, to varying degrees, may involve risk of loss in excess of any initial investment and collateral received and amounts recognized in the Statement of Assets and Liabilities. In addition, there may be the risk that the change in value of the derivative contract does not correspond to the change in value of the underlying instrument.
Futures Contracts. A futures contract is an agreement between two parties to buy or sell a specified underlying instrument for a fixed price at a specified future date. Futures contracts were used to manage exposure to the stock market.
Upon entering into a futures contract, a fund is required to deposit either cash or securities (initial margin) with a clearing broker in an amount equal to a certain percentage of the face value of the contract. Futures contracts are marked-to-market daily and subsequent daily payments are made or received by a fund depending on the daily fluctuations in the value of the futures contracts and are recorded as unrealized appreciation or (depreciation). This receivable and/or payable, if any, is included in daily variation margin on futures contracts in the Statement of Assets and Liabilities. Realized gain or (loss) is recorded upon the expiration or closing of a futures contract. The net realized gain (loss) and change in net unrealized appreciation (depreciation) on futures contracts during the period is presented in the Statement of Operations.
Any open futures contracts at period end are presented in the Schedule of Investments under the caption "Futures Contracts". The notional amount at value reflects each contract's exposure to the underlying instrument or index at period end, and is representative of volume of activity during the period unless an average notional amount is presented. Any securities deposited to meet initial margin requirements are identified in the Schedule of Investments. Any cash deposited to meet initial margin requirements is presented as segregated cash with brokers for derivative instruments in the Statement of Assets and Liabilities.
5. Purchases and Sales of Investments.
Purchases and sales of securities, other than short-term securities and in-kind transactions, as applicable, are noted in the table below.
| | Purchases ($) | Sales ($) |
| Fidelity Clean Energy ETF | 13,226,873 | 13,409,584 |
| Fidelity Cloud Computing ETF | 25,178,537 | 17,854,650 |
| Fidelity Crypto Industry and Digital Payments ETF | 39,208,552 | 34,174,208 |
| Fidelity Digital Health ETF | 3,963,284 | 3,810,845 |
| Fidelity Electric Vehicles and Future Transportation ETF | 23,680,379 | 24,204,489 |
| Fidelity Metaverse ETF | 16,909,820 | 11,787,673 |
| | | |
Securities received and delivered in-kind through subscriptions and redemptions are noted in the table below.
| | In-Kind Subscriptions ($) | In-Kind Redemptions ($) |
| Fidelity Clean Energy ETF | - | 1,555,875 |
| Fidelity Cloud Computing ETF | 40,637,218 | 14,460,978 |
| Fidelity Crypto Industry and Digital Payments ETF | 46,285,474 | 10,548,059 |
| Fidelity Digital Health ETF | - | 947,279 |
| Fidelity Electric Vehicles and Future Transportation ETF | 804,432 | 6,183,964 |
| Fidelity Metaverse ETF | 15,335,797 | 7,910,141 |
6. Fees and Other Transactions with Affiliates.
Management Fee. Fidelity Management & Research Company LLC (the investment adviser) provides the Funds with investment management related services for which the Funds pay a monthly management fee that is based on an annual rate of each Fund's average net assets as noted in the table below. Under the management contract, the investment adviser pays all other expenses, except the compensation of the independent Trustees and certain miscellaneous expenses such as proxy and shareholder meeting expenses.
| | Fee Rate |
| Fidelity Clean Energy ETF | .39% |
| Fidelity Cloud Computing ETF | .39% |
| Fidelity Crypto Industry and Digital Payments ETF | .39% |
| Fidelity Digital Health ETF | .39% |
| Fidelity Electric Vehicles and Future Transportation ETF | .39% |
| Fidelity Metaverse ETF | .39% |
Sub-Adviser. Geode Capital Management, LLC (Geode) serves as sub-adviser for the Funds. Geode provides discretionary investment advisory services to the Funds and is paid by the investment adviser for providing these services.
Interfund Trades. Funds may purchase from or sell securities to other Fidelity Funds under procedures adopted by the Board. The procedures have been designed to ensure these interfund trades are executed in accordance with Rule 17a-7 of the 1940 Act. Any interfund trades are included within the respective purchases and sales amounts shown in the Purchases and Sales of Investments note. During the period, there were no interfund trades.
7. Expense Reductions.
The investment adviser contractually agreed to reimburse the Funds to the extent proxy and shareholder meeting expenses exceeded .013% of average net assets. This reimbursement will remain in place through October 31, 2025. During the period this reimbursement reduced the Funds' expenses as follows:
| | Reimbursement ($) |
| Fidelity Clean Energy ETF | 5,060 |
| Fidelity Cloud Computing ETF | 4,036 |
| Fidelity Crypto Industry and Digital Payments ETF | 10,264 |
| Fidelity Digital Health ETF | 1,761 |
| Fidelity Electric Vehicles and Future Transportation ETF | 6,803 |
| Fidelity Metaverse ETF | 4,418 |
Through arrangements with each applicable Fund's custodian, credits realized as a result of certain uninvested cash balances were used to reduce each applicable Fund's expenses. All of the applicable expense reductions are noted in the table below.
| | Custodian credits ($) |
| Fidelity Clean Energy ETF | 206 |
| Fidelity Cloud Computing ETF | 527 |
Fidelity Crypto Industry and Digital Payments ETF | 2,140 |
| Fidelity Digital Health ETF | 100 |
Fidelity Electric Vehicles and Future Transportation ETF | 329 |
| Fidelity Metaverse ETF | 696 |
8. Share Transactions.
Funds issue and redeem shares at NAV only with certain authorized participants in large increments known as Creation Units. Purchases of Creation Units are made by tendering a basket of designated securities to a fund and redemption proceeds are paid with a basket of securities from a fund's portfolio with a balancing cash component to equate the market value of the basket of securities delivered or redeemed to the NAV per Creation Unit on the transaction date. Cash may be substituted equivalent to the value of certain securities generally when they are not available in sufficient quantity for delivery. A fund's shares are available in smaller increments to investors in the secondary market at market prices and may be subject to commissions. Authorized participants pay a transaction fee to the shareholder servicing agent when purchasing and redeeming Creation Units of a fund. The transaction fee is used to offset the costs associated with the issuance and redemption of Creation Units.
9. Other.
A fund's organizational documents provide former and current trustees and officers with a limited indemnification against liabilities arising in connection with the performance of their duties to the fund. In the normal course of business, a fund may also enter into contracts that provide general indemnifications. A fund's maximum exposure under these arrangements is unknown as this would be dependent on future claims that may be made against a fund. The risk of material loss from such claims is considered remote.
10. Risk and Uncertainties.
Many factors affect a fund's performance. Developments that disrupt global economies and financial markets, such as pandemics, epidemics, outbreaks of infectious diseases, war, terrorism, and environmental disasters, may significantly affect a fund's investment performance. The effects of these developments to a fund will be impacted by the types of securities in which a fund invests, the financial condition, industry, economic sector, and geographic location of an issuer, and a fund's level of investment in the securities of that issuer. Significant concentrations in security types, issuers, industries, sectors, and geographic locations may magnify the factors that affect a fund's performance.
Report of Independent Registered Public Accounting Firm
To the Board of Trustees of Fidelity Covington Trust and the Shareholders of Fidelity Clean Energy ETF, Fidelity Cloud Computing ETF, Fidelity Crypto Industry and Digital Payments ETF, Fidelity Digital Health ETF, Fidelity Electric Vehicles and Future Transportation ETF and Fidelity Metaverse ETF:
Opinion on the Financial Statements and Financial Highlights
We have audited the accompanying statements of assets and liabilities of Fidelity Clean Energy ETF, Fidelity Cloud Computing ETF, Fidelity Crypto Industry and Digital Payments ETF, Fidelity Digital Health ETF, Fidelity Electric Vehicles and Future Transportation ETF and Fidelity Metaverse ETF (the "Funds"), each a fund of Fidelity Covington Trust, including the schedules of investments, as of June 30, 2024, the related statements of operations for the year then ended, the statements of changes in net assets for each of the two years in the period then ended, the financial highlights for each of the two years in the period then ended and for the period from October 5, 2021 (commencement of operations) through June 30, 2022, except for the financial highlights for the Fidelity Crypto Industry and Digital Payments ETF and Fidelity Metaverse ETF, which are for the two years in the period then ended and for the period from April 19, 2022 (commencement of operations) to June 30, 2022, and the related notes. In our opinion, the financial statements and financial highlights present fairly, in all material respects, the financial position of each of the Funds as of June 30, 2024, and the results of their operations for the year then ended, the changes in their net assets for each of the two years in the period then ended, and the financial highlights for each of the two years in the period then ended and for the period from October 5, 2021 (commencement of operations) through June 30, 2022 (or for the period mentioned above), in conformity with accounting principles generally accepted in the United States of America.
Basis for Opinion
These financial statements and financial highlights are the responsibility of the Funds' management. Our responsibility is to express an opinion on the Funds' financial statements and financial highlights based on our audits. We are a public accounting firm registered with the Public Company Accounting Oversight Board (United States) (PCAOB) and are required to be independent with respect to the Funds in accordance with the U.S. federal securities laws and the applicable rules and regulations of the Securities and Exchange Commission and the PCAOB.
We conducted our audits in accordance with the standards of the PCAOB. Those standards require that we plan and perform the audit to obtain reasonable assurance about whether the financial statements and financial highlights are free of material misstatement, whether due to error or fraud. The Funds are not required to have, nor were we engaged to perform, an audit of their internal control over financial reporting. As part of our audits, we are required to obtain an understanding of internal control over financial reporting but not for the purpose of expressing an opinion on the effectiveness of the Funds' internal control over financial reporting. Accordingly, we express no such opinion.
Our audits included performing procedures to assess the risks of material misstatement of the financial statements and financial highlights, whether due to error or fraud, and performing procedures that respond to those risks. Such procedures included examining, on a test basis, evidence regarding the amounts and disclosures in the financial statements and financial highlights. Our audits also included evaluating the accounting principles used and significant estimates made by management, as well as evaluating the overall presentation of the financial statements and financial highlights. Our procedures included confirmation of securities owned as of June 30, 2024, by correspondence with the custodian and brokers; when replies were not received from brokers, we performed other auditing procedures. We believe that our audits provide a reasonable basis for our opinion.
/s/ Deloitte & Touche LLP
Boston, Massachusetts
August 14, 2024
We have served as the auditor of one or more of the Fidelity investment companies since 1999.
Distributions
(Unaudited)The dividend and capital gains distributions for the fund(s) are available on Fidelity.com or Institutional.Fidelity.com.
A percentage of the dividends distributed during the fiscal year for the following funds qualify for the dividends-received deduction for corporate shareholders:
| Fidelity Clean Energy ETF | | | |
September 2023 December 2023 March 2024 June 2024 | | | 1% 1% 10% 10% |
| Fidelity Cloud Computing ETF | | | |
September 2023 December 2023 March 2024 June 2024 | | | 100% 100% 100% 100% |
| Fidelity Crypto Industry and Digital Payments ETF | | | |
September 2023 December 2023 March 2024 June 2024 | | | - 15% - - |
| Fidelity Digital Health ETF | | | |
September 2023 December 2023 March 2024 June 2024 | | | - - - 100% |
| Fidelity Electric Vehicles and Future Transportation ETF | | | |
September 2023 December 2023 March 2024 June 2024 | | | 100% 100% - 56% |
| Fidelity Metaverse ETF | | | |
September 2023 December 2023 March 2024 June 2024 | | | 11% 50% 57% 57% |
A percentage of the dividends distributed during the fiscal year for the following funds may be taken into account as a dividend for purposes of the maximum rate under section 1(h)(11) of the Internal Revenue Code.
| Fidelity Clean Energy ETF | | | |
September 2023 December 2023 March 2024 June 2024 | | | 100% 100% 100% 100% |
| Fidelity Cloud Computing ETF | | | |
September 2023 December 2023 March 2024 June 2024 | | | 100% 100% 100% 100% |
| Fidelity Crypto Industry and Digital Payments ETF | | | |
September 2023 December 2023 March 2024 June 2024 | | | - 23.34% - - |
| Fidelity Digital Health ETF | | | |
September 2023 December 2023 March 2024 June 2024 | | | - - - 100% |
| Fidelity Electric Vehicles and Future Transportation ETF | | | |
September 2023 December 2023 March 2024 June 2024 | | | 100% 100% - 100% |
| Fidelity Metaverse ETF | | | |
September 2023 December 2023 March 2024 June 2024 | | | 100% 100% 100% 100% |
The funds hereby designate the amounts noted below as distributions paid during the fiscal year ended 2024 as qualifying to be taxed as section 163(j) interest dividends:
| Fidelity Crypto Industry and Digital Payments ETF | $1,269 |
The amounts per share which represent income derived from sources within, and taxes paid to, foreign countries or possessions of the United States are as follows:
| | Pay Date | Income | Taxes |
| Fidelity Clean Energy ETF | 03/22/23 | $0.0283 | $0.0043 |
| | 06/22/23 | $0.1077 | $0.0164 |
| | 09/20/23 | $0.0688 | $0.0060 |
| | 12/20/23 | $0.0295 | $0.0026 |
Fidelity Electric Vehicles and Future Transportation ETF | 06/22/23 | $0.0133 | $0.0066 |
The funds will notify shareholders in January 2025 of amounts for use in preparing 2024 income tax returns.
Item 8: Changes in and Disagreements with Accountants for Open-End Management Investment Companies
Note: This is not applicable for any fund included in this document.
Item 9: Proxy Disclosures for Open-End Management Investment Companies
Note: This is not applicable for any fund included in this document.
Item 10: Remuneration Paid to Directors, Officers, and others of Open-End Management Investment Companies
Note: This information is disclosed as part of the financial statements for each Fund as part of Item 7: Financial Statements and Financial Highlights for Open-End Management Investment companies.
Item 11: Statement Regarding Basis for Approval of Investment Advisory Contract
Board Approval of Investment Advisory Contracts and Management Fees
Fidelity Clean Energy ETF
Fidelity Cloud Computing ETF
Fidelity Crypto Industry and Digital Payments ETF
Fidelity Digital Health ETF
Fidelity Electric Vehicles and Future Transportation ETF
Fidelity Metaverse ETF
Each year, the Board of Trustees, including the Independent Trustees (together, the Board), considers the renewal of each fund's management contract with Fidelity Management & Research Company LLC (FMR) and the sub-advisory agreement (Sub-Advisory Agreement) for each fund with Geode Capital Management, LLC (Geode) (together, the Advisory Contracts). FMR and Geode are referred to herein as the Investment Advisers. The Board, assisted by the advice of fund counsel and Independent Trustees' counsel, requests and considers a broad range of information relevant to the renewal of the Advisory Contracts throughout the year.
The Board meets regularly and, at each of its meetings, covers an extensive agenda of topics and materials and considers factors that are relevant to its annual consideration of the renewal of each fund's Advisory Contracts, including the services and support provided to each fund and its shareholders. The Board, acting directly and through its Committees (each of which is composed of and chaired by Independent Trustees), requests and receives information concerning the annual consideration of the renewal of each fund's Advisory Contracts. The Board also meets as needed to review matters specifically related to the Board's annual consideration of the renewal of the Advisory Contracts. Members of the Board may also meet with trustees of other Fidelity funds through joint ad hoc committees to discuss certain matters relevant to all of the Fidelity funds.
At its May 2024 meeting, the Board unanimously determined to renew each fund's Advisory Contracts. In reaching its determination, the Board considered all factors it believed relevant, including (i) the nature, extent, and quality of the services provided to each fund and its shareholders (including the investment performance of each fund); (ii) the competitiveness relative to peer funds of each fund's management fee and total expense ratio; (iii) the total costs of the services provided by and the profits realized by FMR and its affiliates (Fidelity) and Geode from their respective relationships with each fund; and (iv) the extent to which, if any, economies of scale exist and are realized as each fund grows, and whether any economies of scale are appropriately shared with fund shareholders. The Board also considered the broad range of investment choices available to shareholders from FMR's competitors and that each fund's shareholders have chosen to invest in the fund, which is part of the Fidelity family of funds. The Board's decision to renew the Advisory Contracts was not based on any single factor.
The Board reached a determination, with the assistance of fund counsel and Independent Trustees' counsel and through the exercise of its business judgment, that the renewal of the Advisory Contracts was in the best interests of each fund and its shareholders and that the compensation payable under the Advisory Contracts was fair and reasonable in light of all of the surrounding circumstances.
Nature, Extent, and Quality of Services Provided. The Board considered staffing as it relates to the funds, including the backgrounds and experience of investment personnel of the Investment Advisers, and also considered the Investment Advisers' implementation of the funds' investment program. The Independent Trustees also had discussions with senior management of Fidelity's investment operations and investment groups and with senior management of Geode. The Board considered the structure of the investment personnel compensation programs and whether the structures provide appropriate incentives to act in the best interests of each fund. Additionally, the Board considered the portfolio managers' investments, if any, in the funds that they manage.
The Trustees also discussed with representatives of Fidelity, at meetings throughout the year, Fidelity's role in, among other things, overseeing compliance with federal securities laws and other applicable requirements by Geode with respect to the funds and monitoring and overseeing the performance and investment capabilities of Geode. The Trustees considered that the Board had received from Fidelity periodic reports about its oversight and due diligence processes, as well as periodic reports regarding the performance of Geode.
The Board also considered the nature, extent and quality of services provided by Geode. The Trustees noted that under the Sub-Advisory Agreement, subject to oversight by Fidelity, Geode is responsible for, among other things, identifying investments and arranging for execution of portfolio transactions to implement each fund's investment strategy. In addition, the Trustees noted that Geode is responsible for providing such reporting as may be requested by Fidelity to fulfill its oversight responsibilities discussed above.
Resources Dedicated to Investment Management and Support Services. The Board and the Fund Oversight and Research Committees reviewed the general qualifications and capabilities of Fidelity's and Geode's investment staffs, including their size, education, experience, and resources, as well as Fidelity's and Geode's approach to recruiting, training, managing, and compensating investment personnel. The Board considered that Fidelity's and Geode's investment professionals have extensive resources, tools and capabilities so as to provide competitive investment results over time, and that those professionals also have access to sophisticated tools that permit them to assess portfolio construction and risk and performance attribution characteristics continuously. Additionally, in its deliberations, the Board considered Fidelity's and Geode's trading, risk management, compliance, and technology and operations capabilities and resources, which are integral parts of the investment management process.
Shareholder and Administrative Services. The Board considered (i) the nature, extent, quality, and cost of advisory and administrative services provided by the Investment Advisers and their affiliates under the Advisory Contracts and by FMR's affiliates under a separate agreement covering pricing and bookkeeping services for each fund; (ii) the nature and extent of Fidelity's supervision of third party service providers, principally State Street Bank and Trust Company, each fund's transfer agent and custodian; and (iii) the resources devoted by Fidelity to, and the record of compliance with, each fund's compliance policies and procedures. The Board also reviewed the allocation of fund brokerage, including allocations to brokers affiliated with the Investment Advisers. The Board also considered each fund's securities lending activities and any payments made to Fidelity relating to securities lending, under a separate agreement.
The Board noted that the growth of fund assets over time across the complex allows Fidelity to reinvest in the development of services designed to enhance the value and convenience of the Fidelity funds as investment vehicles. These services include 24-hour access to account information and market information over the Internet and through telephone representatives, investor education materials, and asset allocation tools. The Board also considered that it reviews customer service metrics such as telephone response times, continuity of services on the website and metrics addressing services at Fidelity Investor Centers.
Investment in a Large Fund Family. The Board considered the benefits to shareholders of investing in a fund that is part of a large family of funds offering a variety of investment disciplines and providing a large variety of fund investor services. The Board noted that Fidelity had taken, or had made recommendations that resulted in the Fidelity funds taking, a number of actions over the previous year that benefited particular funds and/or the Fidelity funds in general.
Investment Performance. The Board took into account discussions that occur with representatives of the Investment Advisers, and reports that it receives, at Board meetings throughout the year relating to fund investment performance. In this regard the Board noted that as part of regularly scheduled fund reviews and other reports to the Board on fund performance, the Board considered annualized return information for each fund for different time periods, measured against the securities market index the fund seeks to track. The Board also periodically considers each fund's tracking error versus its benchmark index. In its ongoing evaluation of fund investment performance, the Board gives particular attention to information indicating changes in performance of the funds over different time periods and discussed with the Investment Advisers the reasons for any overperformance or underperformance. The Board also considered information on each fund's bid-ask spread and premium/discount.
In addition to reviewing absolute and relative fund performance, the Independent Trustees periodically consider the appropriateness of fund performance metrics in evaluating the results achieved. In general, the Independent Trustees believe that an index fund's performance should be evaluated based on net performance (after fees and expenses) of the fund compared to a fund's benchmark index, over appropriate time periods taking into account relevant factors including the following: general market conditions; the characteristics of the fund's benchmark index; the extent to which statistical sampling is employed; any securities lending revenues; and fund cash flows and other factors.
Based on its review, the Board concluded that the nature, extent, and quality of services provided to each fund under the Advisory Contracts should continue to benefit the shareholders of each fund.
Competitiveness of Management Fee and Total Expense Ratio. The Board was provided with information regarding industry trends in management fees and expenses. In its review of each fund's management fee and total expense ratio, the Board considered each fund's all-inclusive fee rate and also considered other expenses, such as transfer agent fees, pricing and bookkeeping fees, and custodial, legal, and audit fees, paid by FMR under each fund's all-inclusive arrangement. The Board noted that Fidelity may agree to waive fees or reimburse expenses from time to time, and the extent to which, if any, it has done so for each fund.
Comparisons of Management Fees and Total Expense Ratios. Among other things, the Board reviewed data for selected groups of competitive funds and classes (referred to as "mapped groups") that were compiled by Fidelity based on combining similar investment objective categories (as classified by Morningstar) that have comparable investment mandates. The data reviewed by the Board included (i) gross management fee comparisons (before taking into account expense reimbursements or caps) relative to the total universe of funds within the mapped group; (ii) gross management fee comparisons relative to a subset of non-Fidelity funds in the mapped group that are similar in size and management fee structure to each fund (referred to as the "asset size peer group"); (iii) total expense comparisons of each fund relative to funds and classes in the mapped group that have a similar load structure to the fund (referred to as the "similar load structure group"); and (iv) total expense comparisons of each fund relative to funds and classes in the similar load structure group that are similar in size and management fee structure to the fund (referred to as the "total expense asset size peer group"). The total expense asset size peer group comparison excludes performance adjustments and fund-paid 12b-1 fees to eliminate variability in fee structures.
The information provided to the Board indicated that each fund's management fee rate ranked below the competitive median of the mapped group for the 12-month period ended September 30, 2023 and below the competitive median of the asset size peer group for the 12-month period ended September 30, 2023. Further, the information provided to the Board indicated that the total expense ratio of each fund ranked below the competitive median of the similar sales load structure group for the 12-month period ended September 30, 2023 and below the competitive median of the total expense asset size peer group for the 12-month period ended September 30, 2023.
Fees Charged to Other Clients. The Board also considered fee structures applicable to clients of Fidelity and Geode, such as other funds advised or subadvised by Fidelity or Geode, pension plan clients, and other institutional clients with similar mandates. The Board noted that a joint ad hoc committee created by it and the boards of other Fidelity funds periodically reviews and compares Fidelity's institutional investment advisory business with its business of providing services to the Fidelity funds and also noted the most recent findings of the committee. The Board noted that the committee's review included a consideration of the differences in services provided, fees charged, and costs incurred, as well as competition in the markets serving the different categories of clients.
Based on its review, the Board concluded that each fund's management fee is fair and reasonable in light of the services that the fund receives and the other factors considered. Further based on its review of total expense ratios and fees charged to other Fidelity clients, the Board concluded that each fund's total expense ratio was reasonable in light of the services that the fund and its shareholders receive and the other factors considered.
Costs of the Services and Profitability. The Board considered the revenues earned and the expenses incurred by Fidelity in conducting the business of developing, marketing, distributing, managing, administering and servicing each fund and servicing each fund's shareholders. The Board also considered the level of Fidelity's profits in respect of all the Fidelity funds.
On an annual basis, Fidelity presents to the Board information about the profitability of its relationships with each fund. Fidelity calculates profitability information for each fund, as well as aggregate profitability information for groups of Fidelity funds and all Fidelity funds, using a series of detailed revenue and cost allocation methodologies which originate with the books and records of Fidelity on which Fidelity's audited financial statements are based. The Audit Committee of the Board reviews any significant changes from the prior year's methodologies and the full Board approves such changes.
A public accounting firm has been engaged annually by the Board as part of the Board's assessment of Fidelity's profitability analysis. The engagement includes the review and assessment of the methodologies used by Fidelity in determining the revenues and expenses attributable to Fidelity's fund business, and completion of agreed-upon procedures in respect of the mathematical accuracy of certain fund profitability information and its conformity to established allocation methodologies. After considering the reports issued under the engagement and information provided by Fidelity, the Board concluded that while other allocation methods may also be reasonable, Fidelity's profitability methodologies are reasonable in all material respects.
The Board also reviewed Fidelity's and Geode's non-fund businesses and potential indirect benefits such businesses may have received as a result of their association with Fidelity's fund business (i.e., fall-out benefits) as well as cases where Fidelity's and Geode's affiliates may benefit from the funds' business. The Board considered areas where potential indirect benefits to the Fidelity funds from their relationships with Fidelity may exist. The Board's consideration of these matters was informed by the findings of a joint ad hoc committee created by it and the boards of other Fidelity funds to evaluate potential fall-out benefits.
The Board considered the costs of the services provided by and the profits realized by Fidelity in connection with the operation of each fund and was satisfied that the profitability was not excessive.
The Board also considered information regarding the profitability of Geode's relationship with each fund.
Economies of Scale. The Board considered whether there have been economies of scale in respect of the management of the Fidelity funds, whether the Fidelity funds (including each fund) have appropriately benefited from any such economies of scale, and whether there is potential for realization of any further economies of scale. The Board considered the extent to which each fund will benefit from economies of scale as assets grow through increased services to the fund, through waivers or reimbursements, or through fee or expense ratio reductions. The Board recognized that, due to each fund's current contractual arrangements, its expense ratio will not decline if the fund's operating costs decrease as assets grow, or rise as assets decrease. The Board also noted that a committee created by it and the boards of other Fidelity funds periodically analyzes whether Fidelity attains economies of scale in respect of the management and servicing of the Fidelity funds, whether the Fidelity funds have appropriately benefited from such economies of scale, and whether there is potential for realization of any further economies of scale.
The Board concluded, taking into account the analysis of the committee, that economies of scale, if any, are being appropriately shared between fund shareholders and Fidelity.
Additional Information Requested by the Board. In order to develop fully the factual basis for consideration of the Fidelity funds' advisory contracts, the Board requested and received additional information on certain topics, including, but not limited to: (i) fund flow and performance trends, in particular the underperformance of certain funds and strategies, and Fidelity's long-term strategies for certain funds; (ii) the operation of performance fees and the rationale for implementing performance fees on certain categories of funds but not others; (iii) Fidelity's pricing philosophy compared to competitors; (iv) fund profitability methodology and data; (v) evaluation of competitive fund data and peer group classifications and fee and expense comparisons; (vi) the management fee and expense structures for different funds and classes and information about the differences between various fee and expense structures; (vii) the variable management fee implemented for certain funds effective March 1, 2024; and (viii) information regarding other accounts managed by Fidelity and the funds' sub-advisory arrangements.
Conclusion. Based on its evaluation of all of the conclusions noted above, and after considering all factors it believed relevant, the Board, including the Independent Trustees, concluded that the advisory and sub-advisory fee arrangements are fair and reasonable in light of all of the surrounding circumstances and that each fund's Advisory Contracts should be renewed through May 31, 2025.
1.9903828.102
CEE-ANN-0824
Fidelity® Enhanced International ETF
Fidelity® Enhanced Large Cap Core ETF
Fidelity® Enhanced Large Cap Growth ETF
Fidelity® Enhanced Large Cap Value ETF
Fidelity® Enhanced Mid Cap ETF
Annual Report
June 30, 2024
Contents
To view a fund's proxy voting guidelines and proxy voting record for the 12-month period ended June 30, visit http://www.fidelity.com/proxyvotingresults or visit the Securities and Exchange Commission's (SEC) web site at http://www.sec.gov.
You may also call 1-800-FIDELITY to request a free copy of the proxy voting guidelines.
Standard & Poor's, S&P and S&P 500 are registered service marks of The McGraw-Hill Companies, Inc. and have been licensed for use by Fidelity Distributors Corporation.
Other third-party marks appearing herein are the property of their respective owners.
All other marks appearing herein are registered or unregistered trademarks or service marks of FMR LLC or an affiliated company. © 2024 FMR LLC. All rights reserved.
This report and the financial statements contained herein are submitted for the general information of the shareholders of the Funds. This report is not authorized for distribution to prospective investors in the Funds unless preceded or accompanied by an effective prospectus.
A fund files its complete schedule of portfolio holdings with the SEC for the first and third quarters of each fiscal year on Form N-PORT. Forms N-PORT are available on the SEC's web site at http://www.sec.gov. A fund's Forms N-PORT may be reviewed and copied at the SEC's Public Reference Room in Washington, DC. Information regarding the operation of the SEC's Public Reference Room may be obtained by calling 1-800-SEC-0330.
For a complete list of a fund's portfolio holdings, view the most recent holdings listing, semiannual report, or annual report on Fidelity's web site at http://www.fidelity.com, http://www.institutional.fidelity.com, or http://www.401k.com, as applicable.
NOT FDIC INSURED •MAY LOSE VALUE •NO BANK GUARANTEE
Neither the Funds nor Fidelity Distributors Corporation is a bank.
Item 7: Financial Statements and Financial Highlights for Open-End Management Investment Companies (Annual Report)
Fidelity® Enhanced International ETF
Schedule of Investments June 30, 2024
Showing Percentage of Net Assets
| Common Stocks - 97.8% |
| | | Shares | Value ($) |
| Australia - 6.5% | | | |
| ANZ Group Holdings Ltd. | | 372,453 | 7,016,606 |
| Aristocrat Leisure Ltd. | | 222,719 | 7,393,134 |
| BHP Group Ltd. | | 541,305 | 15,411,943 |
| Brambles Ltd. | | 213,905 | 2,073,373 |
| Commonwealth Bank of Australia | | 54,048 | 4,592,740 |
| Fortescue Ltd. | | 691,944 | 9,882,767 |
| Glencore PLC | | 574,500 | 3,276,003 |
| Goodman Group unit | | 397,976 | 9,225,770 |
| Macquarie Group Ltd. | | 65,129 | 8,893,280 |
| Medibank Private Ltd. | | 382,300 | 951,271 |
| National Australia Bank Ltd. | | 83,586 | 2,020,193 |
| Northern Star Resources Ltd. | | 337,899 | 2,930,362 |
| Origin Energy Ltd. | | 18,135 | 131,383 |
| QBE Insurance Group Ltd. | | 71,953 | 834,717 |
| Reece Ltd. | | 79,693 | 1,338,118 |
| Rio Tinto Ltd. | | 62,212 | 4,938,693 |
| Rio Tinto PLC sponsored ADR | | 108,918 | 7,180,964 |
| Telstra Group Ltd. | | 1,046,434 | 2,527,036 |
| The GPT Group | | 678,446 | 1,810,365 |
| Wesfarmers Ltd. | | 209,080 | 9,091,128 |
TOTAL AUSTRALIA | | | 101,519,846 |
| Austria - 0.1% | | | |
| Mondi PLC | | 55,426 | 1,063,922 |
| Belgium - 0.6% | | | |
| Ageas | | 157,466 | 7,197,479 |
| Groupe Bruxelles Lambert SA | | 4,909 | 350,399 |
| Warehouses de Pauw | | 54,120 | 1,466,383 |
TOTAL BELGIUM | | | 9,014,261 |
| China - 1.5% | | | |
| BOC Hong Kong (Holdings) Ltd. | | 2,838,000 | 8,740,359 |
| Prosus NV | | 333,320 | 11,872,791 |
| Wilmar International Ltd. | | 1,067,500 | 2,440,450 |
TOTAL CHINA | | | 23,053,600 |
| Denmark - 4.1% | | | |
| A.P. Moller - Maersk A/S: | | | |
| Series A | | 1,050 | 1,782,191 |
| Series B | | 1,188 | 2,065,041 |
| Genmab A/S (a) | | 25,105 | 6,290,760 |
| Genmab A/S ADR (a)(b) | | 109,586 | 2,753,896 |
| Novo Nordisk A/S: | | | |
| Series B | | 317,005 | 45,776,113 |
| Series B sponsored ADR | | 24,954 | 3,561,934 |
| Pandora A/S | | 7,470 | 1,127,381 |
| Vestas Wind Systems A/S (a) | | 46,538 | 1,077,593 |
TOTAL DENMARK | | | 64,434,909 |
| Finland - 2.4% | | | |
| Fortum Corp. | | 66,017 | 965,067 |
| Kesko Oyj | | 160,532 | 2,817,797 |
| Kone OYJ (B Shares) | | 183,683 | 9,066,609 |
| Nokia Corp. | | 1,709,458 | 6,514,703 |
| Nokia Corp. sponsored ADR | | 881,040 | 3,330,331 |
| Nordea Bank Abp | | 607,927 | 7,232,720 |
| UPM-Kymmene Corp. | | 73,475 | 2,566,804 |
| Wartsila Corp. | | 249,749 | 4,814,436 |
TOTAL FINLAND | | | 37,308,467 |
| France - 8.2% | | | |
| Air Liquide SA | | 91,211 | 15,754,221 |
| Airbus Group NV | | 1,535 | 210,848 |
| Arkema SA | | 29,272 | 2,543,959 |
| bioMerieux SA | | 5,635 | 535,589 |
| BNP Paribas SA | | 54,579 | 3,479,611 |
| Capgemini SA | | 11,467 | 2,280,504 |
| Carrefour SA | | 117,006 | 1,654,060 |
| Compagnie de St.-Gobain | | 45,777 | 3,560,187 |
| Covivio | | 31,285 | 1,486,937 |
| Danone SA | | 31,430 | 1,921,310 |
| Eiffage SA | | 82,465 | 7,573,971 |
| Gecina SA | | 15,721 | 1,447,089 |
| Hermes International SCA | | 830 | 1,902,221 |
| L'Oreal SA | | 37,883 | 16,636,056 |
| La Francaise des Jeux SAEM (c) | | 73,167 | 2,491,791 |
| Legrand SA | | 99,661 | 9,887,648 |
| LVMH Moet Hennessy Louis Vuitton SE | | 15,356 | 11,735,515 |
| Publicis Groupe SA | | 6,169 | 656,573 |
| Safran SA | | 63,300 | 13,381,970 |
| TotalEnergies SE | | 307,056 | 20,496,698 |
| Ubisoft Entertainment SA (a) | | 50,533 | 1,106,178 |
| Veolia Environnement SA | | 225,259 | 6,735,452 |
TOTAL FRANCE | | | 127,478,388 |
| Germany - 7.0% | | | |
| Allianz SE | | 18,320 | 5,091,339 |
| BASF AG | | 19,503 | 943,767 |
| Bayer AG | | 159,902 | 4,517,497 |
| Deutsche Bank AG | | 659,104 | 10,523,072 |
| Deutsche Borse AG | | 27,669 | 5,662,697 |
| Deutsche Telekom AG | | 384,462 | 9,667,645 |
| Evonik Industries AG | | 87,872 | 1,792,729 |
| Fresenius SE & Co. KGaA (a) | | 277,161 | 8,275,497 |
| GEA Group AG | | 24,996 | 1,041,332 |
| Hannover Reuck SE | | 3 | 760 |
| HeidelbergCement AG | | 74,982 | 7,774,837 |
| Infineon Technologies AG | | 190,941 | 7,014,970 |
| Knorr-Bremse AG | | 24,206 | 1,848,340 |
| Mercedes-Benz Group AG: | | | |
| ADR | | 51,823 | 893,947 |
| (Germany) | | 368 | 25,448 |
| Muenchener Rueckversicherungs-Gesellschaft AG in Muenchen | | 27,426 | 13,716,665 |
| Rational AG | | 1,117 | 930,085 |
| SAP SE | | 53,956 | 10,951,257 |
| Scout24 AG (c) | | 14,317 | 1,091,695 |
| Siemens AG | | 63,978 | 11,902,815 |
| Siemens AG sponsored ADR | | 21,587 | 2,012,988 |
| Talanx AG | | 34,463 | 2,751,503 |
| Volkswagen AG | | 2,744 | 329,427 |
TOTAL GERMANY | | | 108,760,312 |
| Hong Kong - 2.6% | | | |
| AIA Group Ltd. | | 1,725,632 | 11,711,859 |
| AIA Group Ltd. ADR | | 75,816 | 2,049,306 |
| CLP Holdings Ltd. | | 913,000 | 7,377,376 |
| HKT Trust/HKT Ltd. unit | | 258,000 | 289,418 |
| Hong Kong Exchanges and Clearing Ltd. | | 55,000 | 1,762,186 |
| Jardine Matheson Holdings Ltd. | | 110,700 | 3,916,566 |
| Prudential PLC | | 206,385 | 1,874,243 |
| Sun Hung Kai Properties Ltd. | | 831,500 | 7,192,658 |
| Swire Pacific Ltd. (A Shares) | | 90,000 | 795,231 |
| WH Group Ltd. (c) | | 4,172,455 | 2,746,354 |
TOTAL HONG KONG | | | 39,715,197 |
| Israel - 0.6% | | | |
| Bank Hapoalim BM (Reg.) | | 38,804 | 342,201 |
| Wix.com Ltd. (a) | | 54,661 | 8,694,925 |
TOTAL ISRAEL | | | 9,037,126 |
| Italy - 1.9% | | | |
| Assicurazioni Generali SpA | | 115,250 | 2,874,615 |
| Coca-Cola HBC AG | | 257,176 | 8,771,095 |
| Eni SpA | | 48,294 | 742,395 |
| Intesa Sanpaolo SpA | | 3,449,235 | 12,821,729 |
| UniCredit SpA | | 118,055 | 4,375,145 |
| UniCredit SpA ADR | | 21,909 | 408,822 |
TOTAL ITALY | | | 29,993,801 |
| Japan - 22.8% | | | |
| Central Japan Railway Co. | | 191,800 | 4,140,229 |
| Chubu Electric Power Co., Inc. | | 557,800 | 6,590,700 |
| Daiichi Sankyo Kabushiki Kaisha | | 18,900 | 648,913 |
| Daiwa Securities Group, Inc. | | 1,116,448 | 8,514,399 |
| DENSO Corp. | | 6,400 | 99,367 |
| Disco Corp. | | 28,250 | 10,717,757 |
| Fast Retailing Co. Ltd. | | 36,742 | 9,262,574 |
| Fujitsu Ltd. | | 201,100 | 3,146,054 |
| Hitachi Ltd. | | 804,000 | 17,994,928 |
| Honda Motor Co. Ltd. | | 1,112,306 | 11,891,145 |
| Hoya Corp. | | 88,084 | 10,240,607 |
| JFE Holdings, Inc. | | 499,900 | 7,194,471 |
| Kansai Electric Power Co., Inc. | | 522,500 | 8,774,908 |
| Kawasaki Kisen Kaisha Ltd. | | 63,000 | 916,278 |
| KDDI Corp. | | 336,700 | 8,902,491 |
| Keyence Corp. | | 800 | 350,799 |
| Komatsu Ltd. | | 73,100 | 2,122,258 |
| Kyocera Corp. | | 117,800 | 1,355,626 |
| LY Corp. | | 3,038,122 | 7,343,686 |
| Makita Corp. | | 158,400 | 4,304,337 |
| Marubeni Corp. | | 353,200 | 6,532,082 |
| Mazda Motor Corp. | | 411,700 | 3,981,635 |
| Mitsubishi Chemical Group Corp. | | 591,800 | 3,285,080 |
| Mitsubishi Corp. | | 629,918 | 12,325,078 |
| Mitsubishi Electric Corp. | | 459,100 | 7,326,367 |
| Mitsubishi UFJ Financial Group, Inc. | | 1,316,500 | 14,147,731 |
| Mitsubishi UFJ Financial Group, Inc. sponsored ADR | | 95,809 | 1,034,737 |
| Mitsui & Co. Ltd. | | 406,200 | 9,217,703 |
| MS&AD Insurance Group Holdings, Inc. | | 497,700 | 11,058,969 |
| Murata Manufacturing Co. Ltd. | | 252,800 | 5,219,725 |
| Nidec Corp. | | 52,700 | 2,353,468 |
| Nippon Paint Holdings Co. Ltd. | | 767,500 | 4,999,316 |
| Nippon Steel Corp. | | 121,600 | 2,570,462 |
| Nippon Telegraph & Telephone Corp. | | 1,320,400 | 1,245,800 |
| Nippon Yusen KK (b) | | 201,700 | 5,869,597 |
| Nissan Motor Co. Ltd. sponsored ADR (b) | | 90,349 | 613,470 |
| Nitto Denko Corp. | | 81,900 | 6,469,942 |
| Nomura Holdings, Inc. | | 312,900 | 1,793,112 |
| Nomura Research Institute Ltd. | | 10,300 | 289,429 |
| ORIX Corp. | | 85,800 | 1,894,223 |
| Osaka Gas Co. Ltd. | | 215,700 | 4,749,985 |
| Pan Pacific International Holdings Ltd. | | 33,800 | 790,746 |
| Panasonic Holdings Corp. | | 1,000,500 | 8,189,810 |
| Rakuten Group, Inc. (a) | | 470,300 | 2,425,893 |
| Recruit Holdings Co. Ltd. | | 79,900 | 4,274,345 |
| Renesas Electronics Corp. | | 549,000 | 10,267,518 |
| Screen Holdings Co. Ltd. | | 10,000 | 901,237 |
| SCSK Corp. | | 48,300 | 964,559 |
| Shin-Etsu Chemical Co. Ltd. ADR (b) | | 16,430 | 319,399 |
| Shionogi & Co. Ltd. | | 34,400 | 1,342,090 |
| SoftBank Corp. | | 830,064 | 10,135,252 |
| Sompo Holdings, Inc. | | 439,700 | 9,387,591 |
| Sony Group Corp. | | 104,836 | 8,887,830 |
| Subaru Corp. | | 283,358 | 6,005,661 |
| Sumitomo Corp. | | 39,900 | 996,198 |
| Terumo Corp. | | 193,100 | 3,184,128 |
| Tokio Marine Holdings, Inc. | | 236,400 | 8,823,308 |
| Tokyo Electron Ltd. | | 72,900 | 15,813,351 |
| Tokyo Electron Ltd. ADR | | 14,481 | 1,585,670 |
| Toppan Holdings, Inc. | | 29,400 | 810,058 |
| Toyota Motor Corp. | | 594,361 | 12,153,942 |
| Toyota Tsusho Corp. | | 417,000 | 8,117,621 |
| Yokogawa Electric Corp. | | 344,100 | 8,319,653 |
TOTAL JAPAN | | | 355,185,298 |
| Luxembourg - 0.1% | | | |
| Eurofins Scientific SA | | 39,607 | 1,974,517 |
| Netherlands - 5.9% | | | |
| Akzo Nobel NV | | 14,257 | 866,947 |
| ASM International NV (Netherlands) | | 8,445 | 6,437,642 |
| ASML Holding NV: | | | |
| (depository receipt) | | 17,444 | 17,840,502 |
| (Netherlands) | | 27,834 | 28,741,666 |
| BE Semiconductor Industries NV | | 14,664 | 2,452,244 |
| EXOR NV | | 7,169 | 750,105 |
| Koninklijke Ahold Delhaize NV | | 167,661 | 4,953,965 |
| Koninklijke Philips Electronics NV | | 376,581 | 9,513,833 |
| NN Group NV | | 190,847 | 8,880,641 |
| Wolters Kluwer NV | | 69,493 | 11,520,762 |
TOTAL NETHERLANDS | | | 91,958,307 |
| New Zealand - 0.1% | | | |
| Meridian Energy Ltd. | | 604,032 | 2,314,191 |
| Norway - 0.3% | | | |
| DNB Bank ASA | | 45,515 | 893,930 |
| Gjensidige Forsikring ASA | | 168,095 | 3,003,889 |
TOTAL NORWAY | | | 3,897,819 |
| Singapore - 1.9% | | | |
| CapitaLand Ascendas REIT | | 1,482,600 | 2,799,009 |
| Oversea-Chinese Banking Corp. Ltd. | | 1,002,800 | 10,671,389 |
| Singapore Technologies Engineering Ltd. | | 1,940,700 | 6,197,073 |
| STMicroelectronics NV (France) | | 42 | 1,658 |
| United Overseas Bank Ltd. | | 455,555 | 10,525,471 |
TOTAL SINGAPORE | | | 30,194,600 |
| South Africa - 0.0% | | | |
| Anglo American PLC (United Kingdom) | | 20,640 | 652,797 |
| Spain - 3.8% | | | |
| ACS Actividades de Construccion y Servicios SA | | 34,151 | 1,473,201 |
| Aena SME SA (c) | | 41,159 | 8,286,895 |
| Banco Bilbao Vizcaya Argentaria SA | | 1,107,708 | 11,094,276 |
| Banco Bilbao Vizcaya Argentaria SA sponsored ADR | | 221,521 | 2,221,856 |
| Banco Santander SA (Spain) | | 881,991 | 4,090,453 |
| CaixaBank SA | | 797,190 | 4,220,089 |
| Iberdrola SA | | 1,119,391 | 14,523,605 |
| Industria de Diseno Textil SA | | 253,656 | 12,593,828 |
TOTAL SPAIN | | | 58,504,203 |
| Sweden - 2.2% | | | |
| ASSA ABLOY AB (B Shares) | | 26,249 | 741,976 |
| Essity AB (B Shares) | | 58,113 | 1,488,052 |
| Evolution AB (c) | | 30,897 | 3,218,255 |
| H&M Hennes & Mauritz AB (B Shares) | | 223,661 | 3,537,765 |
| Industrivarden AB (A Shares) | | 69,777 | 2,373,959 |
| Saab AB (B Shares) | | 91,281 | 2,196,118 |
| SKF AB (B Shares) | | 86,627 | 1,739,242 |
| Swedish Orphan Biovitrum AB (a) | | 144,003 | 3,853,123 |
| Volvo AB (B Shares) | | 451,094 | 11,538,030 |
| Volvo Car AB (a)(b) | | 1,403,482 | 4,341,273 |
TOTAL SWEDEN | | | 35,027,793 |
| Switzerland - 5.6% | | | |
| ABB Ltd.: | | | |
| (Reg.) | | 219,022 | 12,169,379 |
| sponsored ADR | | 78,976 | 4,399,753 |
| Alcon, Inc. (Switzerland) | | 96,888 | 8,650,849 |
| BKW AG | | 4,769 | 760,641 |
| Compagnie Financiere Richemont SA | | 2,830 | 443,299 |
| Givaudan SA | | 2,593 | 12,294,708 |
| Kuehne & Nagel International AG | | 8,164 | 2,348,019 |
| Logitech International SA (Reg.) | | 33,262 | 3,217,912 |
| Novartis AG | | 247,228 | 26,463,261 |
| Novartis AG sponsored ADR | | 15,755 | 1,677,277 |
| SGS SA (Reg.) | | 65,042 | 5,791,485 |
| UBS Group AG | | 29,729 | 875,210 |
| Zurich Insurance Group Ltd. | | 16,109 | 8,590,152 |
TOTAL SWITZERLAND | | | 87,681,945 |
| United Kingdom - 10.1% | | | |
| 3i Group PLC | | 31,022 | 1,202,329 |
| AstraZeneca PLC: | | | |
| (United Kingdom) | | 83,405 | 13,027,210 |
| sponsored ADR | | 14,814 | 1,155,344 |
| Aviva PLC | | 217,261 | 1,308,932 |
| BAE Systems PLC | | 752,969 | 12,564,131 |
| Barclays PLC sponsored ADR | | 179,643 | 1,923,977 |
| British American Tobacco PLC: | | | |
| (United Kingdom) | | 82,865 | 2,545,416 |
| sponsored ADR (b) | | 338,962 | 10,484,095 |
| Bunzl PLC | | 120,325 | 4,578,295 |
| Centrica PLC | | 952,061 | 1,623,522 |
| CK Hutchison Holdings Ltd. | | 560,500 | 2,684,411 |
| Coca-Cola Europacific Partners PLC | | 40,454 | 2,947,883 |
| Halma PLC | | 35,781 | 1,223,944 |
| Hargreaves Lansdown PLC | | 108,605 | 1,554,095 |
| HSBC Holdings PLC: | | | |
| (United Kingdom) | | 1,825,861 | 15,784,897 |
| sponsored ADR (b) | | 145,097 | 6,311,720 |
| Land Securities Group PLC | | 142,504 | 1,115,963 |
| Lloyds Banking Group PLC | | 2,578,404 | 1,784,174 |
| London Stock Exchange Group PLC | | 19,048 | 2,263,386 |
| M&G PLC | | 861,900 | 2,222,637 |
| NatWest Group PLC | | 6,528 | 25,730 |
| NatWest Group PLC sponsored ADR (b) | | 78,714 | 632,073 |
| Reckitt Benckiser Group PLC | | 13,015 | 704,486 |
| RELX PLC sponsored ADR | | 73,154 | 3,356,306 |
| Rolls-Royce Holdings PLC (a) | | 2,138,416 | 12,348,088 |
| Sage Group PLC | | 661,520 | 9,102,336 |
| Schroders PLC | | 397,809 | 1,829,442 |
| Smith & Nephew PLC sponsored ADR (b) | | 30,670 | 760,003 |
| SSE PLC | | 23,115 | 522,886 |
| Standard Chartered PLC (United Kingdom) | | 426,799 | 3,862,939 |
| Tesco PLC | | 2,562,152 | 9,910,778 |
| Tesco PLC Sponsored ADR (b) | | 31,544 | 371,588 |
| Unilever PLC | | 95,816 | 5,262,708 |
| Unilever PLC sponsored ADR | | 165,019 | 9,074,395 |
| Vodafone Group PLC | | 6,706,538 | 5,914,068 |
| Vodafone Group PLC sponsored ADR | | 406,778 | 3,608,121 |
| Wise PLC (a) | | 162,545 | 1,400,299 |
TOTAL UNITED KINGDOM | | | 156,992,607 |
| United States of America - 9.5% | | | |
| BP PLC | | 335,633 | 2,016,149 |
| BP PLC sponsored ADR | | 11 | 397 |
| CRH PLC | | 45,209 | 3,369,487 |
| CSL Ltd. | | 2,110 | 415,532 |
| GSK PLC | | 355,827 | 6,879,705 |
| GSK PLC sponsored ADR | | 205,834 | 7,924,609 |
| Holcim AG | | 86,288 | 7,646,781 |
| Monday.com Ltd. (a) | | 27,418 | 6,601,158 |
| Nestle SA (Reg. S) | | 169,457 | 17,299,344 |
| QIAGEN NV (Germany) | | 203,034 | 8,382,284 |
| Roche Holding AG: | | | |
| (Bearer) | | 3,334 | 1,016,027 |
| (participation certificate) | | 83,037 | 23,059,415 |
| sponsored ADR | | 69,899 | 2,423,398 |
| Sanofi SA | | 110,864 | 10,678,558 |
| Sanofi SA sponsored ADR | | 22,588 | 1,095,970 |
| Schneider Electric SA | | 78,685 | 18,901,245 |
| Schneider Electric SA ADR | | 16,786 | 808,078 |
| Shell PLC: | | | |
| ADR | | 32,660 | 2,357,399 |
| (London) | | 756,035 | 27,084,647 |
TOTAL UNITED STATES OF AMERICA | | | 147,960,183 |
| TOTAL COMMON STOCKS (Cost $1,248,973,324) | | | 1,523,724,089 |
| | | | |
| Nonconvertible Preferred Stocks - 0.6% |
| | | Shares | Value ($) |
| Germany - 0.6% | | | |
Volkswagen AG (Cost $11,022,711) | | 84,797 | 9,571,727 |
| | | | |
| Government Obligations - 0.1% |
| | | Principal Amount (d) | Value ($) |
| United States of America - 0.1% | | | |
U.S. Treasury Bills, yield at date of purchase 5.3% to 5.32% 8/29/24 to 9/19/24 (e) (Cost $1,058,952) | | 1,070,000 | 1,058,969 |
| | | | |
| Money Market Funds - 1.7% |
| | | Shares | Value ($) |
| Fidelity Cash Central Fund 5.38% (f) | | 15,815,510 | 15,818,673 |
| Fidelity Securities Lending Cash Central Fund 5.38% (f)(g) | | 10,014,522 | 10,015,523 |
| TOTAL MONEY MARKET FUNDS (Cost $25,834,196) | | | 25,834,196 |
| | | | |
| TOTAL INVESTMENT IN SECURITIES - 100.2% (Cost $1,286,889,183) | 1,560,188,981 |
NET OTHER ASSETS (LIABILITIES) - (0.2)% | (2,337,660) |
| NET ASSETS - 100.0% | 1,557,851,321 |
| | |
| Futures Contracts |
| | Number of contracts | Expiration Date | Notional Amount ($) | Value ($) | Unrealized Appreciation/ (Depreciation) ($) |
| Purchased | | | | | |
| | | | | | |
| Equity Index Contracts | | | | | |
| ICE MSCI EAFE Index Contracts (United States) | 145 | Sep 2024 | 16,988,200 | 77,419 | 77,419 |
| | | | | | |
| The notional amount of futures purchased as a percentage of Net Assets is 1.1% |
Legend
| (b) | Security or a portion of the security is on loan at period end. |
| (c) | Security exempt from registration under Rule 144A of the Securities Act of 1933. These securities may be resold in transactions exempt from registration, normally to qualified institutional buyers. At the end of the period, the value of these securities amounted to $17,834,990 or 1.1% of net assets. |
| (d) | Amount is stated in United States dollars unless otherwise noted. |
| (e) | Security or a portion of the security was pledged to cover margin requirements for futures contracts. At period end, the value of securities pledged amounted to $548,960. |
| (f) | Affiliated fund that is generally available only to investment companies and other accounts managed by Fidelity Investments. The rate quoted is the annualized seven-day yield of the fund at period end. A complete unaudited listing of the fund's holdings as of its most recent quarter end is available upon request. In addition, each Fidelity Central Fund's financial statements, which are not covered by the Fund's Report of Independent Registered Public Accounting Firm, are available on the SEC's website or upon request. |
| (g) | Investment made with cash collateral received from securities on loan. |
Affiliated Central Funds
Fiscal year to date information regarding the Fund's investments in Fidelity Central Funds, including the ownership percentage, is presented below.
| Affiliate | Value, beginning of period ($) | Purchases ($) | Sales Proceeds ($) | Dividend Income ($) | Realized Gain (loss) ($) | Change in Unrealized appreciation (depreciation) ($) | Value, end of period ($) | % ownership, end of period |
| Fidelity Cash Central Fund 5.38% | 19,925,982 | 355,358,755 | 359,466,128 | 632,835 | 64 | - | 15,818,673 | 0.0% |
| Fidelity Securities Lending Cash Central Fund 5.38% | 10,181,938 | 230,180,221 | 230,346,636 | 250,150 | - | - | 10,015,523 | 0.0% |
| Total | 30,107,920 | 585,538,976 | 589,812,764 | 882,985 | 64 | - | 25,834,196 | |
| | | | | | | | | |
Amounts in the dividend income column in the above table include any capital gain distributions from underlying funds, which are presented in the corresponding line item in the Statement of Operations, if applicable.
Amounts in the dividend income column for Fidelity Securities Lending Cash Central Fund represents the income earned on investing cash collateral, less rebates paid to borrowers and any lending agent fees associated with the loan, plus any premium payments received for lending certain types of securities.
Amounts included in the purchases and sales proceeds columns may include in-kind transactions, if applicable.
Investment Valuation
The following is a summary of the inputs used, as of June 30, 2024, involving the Fund's assets and liabilities carried at fair value. The inputs or methodology used for valuing securities may not be an indication of the risk associated with investing in those securities. For more information on valuation inputs, and their aggregation into the levels used below, please refer to the Investment Valuation section in the accompanying Notes to Financial Statements.
| Valuation Inputs at Reporting Date: |
| Description | Total ($) | Level 1 ($) | Level 2 ($) | Level 3 ($) |
Investments in Securities: | | | | |
|
| Equities: | | | | |
Communication Services | 52,487,963 | 52,487,963 | - | - |
Consumer Discretionary | 144,871,003 | 144,871,003 | - | - |
Consumer Staples | 102,029,832 | 102,029,832 | - | - |
Energy | 52,697,685 | 52,697,685 | - | - |
Financials | 294,227,637 | 294,227,637 | - | - |
Health Care | 216,077,939 | 216,077,939 | - | - |
Industrials | 289,427,145 | 289,427,145 | - | - |
Information Technology | 173,337,130 | 173,337,130 | - | - |
Materials | 125,730,361 | 125,730,361 | - | - |
Real Estate | 27,339,405 | 27,339,405 | - | - |
Utilities | 55,069,716 | 55,069,716 | - | - |
|
| Government Obligations | 1,058,969 | - | 1,058,969 | - |
|
| Money Market Funds | 25,834,196 | 25,834,196 | - | - |
| Total Investments in Securities: | 1,560,188,981 | 1,559,130,012 | 1,058,969 | - |
Derivative Instruments: Assets | | | | |
Futures Contracts | 77,419 | 77,419 | - | - |
| Total Assets | 77,419 | 77,419 | - | - |
| Total Derivative Instruments: | 77,419 | 77,419 | - | - |
Value of Derivative Instruments
The following table is a summary of the Fund's value of derivative instruments by primary risk exposure as of June 30, 2024. For additional information on derivative instruments, please refer to the Derivative Instruments section in the accompanying Notes to Financial Statements.
Primary Risk Exposure / Derivative Type | Value |
| Asset ($) | Liability ($) |
| Equity Risk | | |
Futures Contracts (a) | 77,419 | 0 |
| Total Equity Risk | 77,419 | 0 |
| Total Value of Derivatives | 77,419 | 0 |
(a)Reflects gross cumulative appreciation (depreciation) on futures contracts as presented in the Schedule of Investments. In the Statement of Assets and Liabilities, the period end daily variation margin is included in receivable or payable for daily variation margin on futures contracts, and the net cumulative appreciation (depreciation) is included in Total accumulated earnings (loss).
Fidelity® Enhanced International ETF
Financial Statements
| Statement of Assets and Liabilities |
| | | | June 30, 2024 |
| | | | | |
| Assets | | | | |
| Investment in securities, at value (including securities loaned of $9,681,309) - See accompanying schedule: | | | | |
Unaffiliated issuers (cost $1,261,054,987) | $ | 1,534,354,785 | | |
Fidelity Central Funds (cost $25,834,196) | | 25,834,196 | | |
| | | | | |
| | | | | |
| Total Investment in Securities (cost $1,286,889,183) | | | $ | 1,560,188,981 |
| Cash | | | | 493,456 |
| Foreign currency held at value (cost $1,264,442) | | | | 1,264,850 |
| Receivable for investments sold | | | | 40,945,439 |
| Dividends receivable | | | | 1,950,776 |
| Reclaims receivable | | | | 4,485,026 |
| Interest receivable | | | | 304 |
| Distributions receivable from Fidelity Central Funds | | | | 189,849 |
| Receivable for daily variation margin on futures contracts | | | | 23,200 |
| Receivable from investment adviser for expense reductions | | | | 34,752 |
| Other receivables | | | | 9,146 |
Total assets | | | | 1,609,585,779 |
| Liabilities | | | | |
| Payable for investments purchased | $ | 41,264,596 | | |
| Accrued management fee | | 360,090 | | |
| Other payables and accrued expenses | | 94,162 | | |
| Collateral on securities loaned | | 10,015,610 | | |
| Total liabilities | | | | 51,734,458 |
| Net Assets | | | $ | 1,557,851,321 |
| Net Assets consist of: | | | | |
| Paid in capital | | | $ | 1,412,926,033 |
| Total accumulated earnings (loss) | | | | 144,925,288 |
| Net Assets | | | $ | 1,557,851,321 |
Net Asset Value, offering price and redemption price per share ($1,557,851,321 ÷ 55,079,106 shares) | | | $ | 28.28 |
| Statement of Operations |
| | | | Ten months ended June 30, 2024 | | Year ended August 31, 2023 |
| Investment Income | | | | | | |
| Dividends | | | $ | 41,545,874 | | 52,511,526 |
| Interest | | | | 58,810 | | 45,321 |
| Income from Fidelity Central Funds (including $250,150 and $307,137 from security lending) | | | | 882,985 | | 1,171,963 |
| Income before foreign taxes withheld | | | $ | 42,487,669 | | 53,728,810 |
| Less foreign taxes withheld | | | | (3,292,750) | | (4,648,683) |
| Total income | | | | 39,194,919 | | 49,080,127 |
| Expenses | | | | | | |
| Management fee | | | $ | 4,154,555 | | 8,333,434 |
| Independent trustees' fees and expenses | | | | 5,791 | | 8,052 |
| Interest | | | | 19,359 | | 16,731 |
| Miscellaneous | | | | 116,659 | | - |
| Total expenses before reductions | | | | 4,296,364 | | 8,358,217 |
| Expense reductions | | | | (34,901) | | (441) |
| Total expenses after reductions | | | | 4,261,463 | | 8,357,776 |
| Net Investment income (loss) | | | | 34,933,456 | | 40,722,351 |
| Realized and Unrealized Gain (Loss) | | | | | | |
| Net realized gain (loss) on: | | | | | | |
| Investment Securities: | | | | | | |
| Unaffiliated issuers | | | | 70,605,208 | | (34,624,969) |
| Redemptions in-kind | | | | 25,930,557 | | - |
| Fidelity Central Funds | | | | 64 | | - |
| Foreign currency transactions | | | | 93,905 | | (599,124) |
| Futures contracts | | | | 2,637,988 | | 3,144,313 |
| Total net realized gain (loss) | | | | 99,267,722 | | (32,079,780) |
| Change in net unrealized appreciation (depreciation) on: | | | | | | |
| Investment Securities: | | | | | | |
| Unaffiliated issuers | | | | 58,719,576 | | 261,104,444 |
| Assets and liabilities in foreign currencies | | | | 7,628 | | 281,786 |
| Futures contracts | | | | 90,649 | | (176,537) |
| Total change in net unrealized appreciation (depreciation) | | | | 58,817,853 | | 261,209,693 |
| Net gain (loss) | | | | 158,085,575 | | 229,129,913 |
| Net increase (decrease) in net assets resulting from operations | | | $ | 193,019,031 | | 269,852,264 |
See Organization and Merger information note regarding reorganization from mutual fund to exchange traded fund.
| Statement of Changes in Net Assets |
| | | |
| | Ten months ended June 30, 2024 | | Year ended August 31, 2023 | | Year ended August 31, 2022 |
| Increase (Decrease) in Net Assets | | | | | | |
| Operations | | | | | | |
| Net investment income (loss) | $ | 34,933,456 | $ | 40,722,351 | $ | 44,150,052 |
| Net realized gain (loss) | | 99,267,722 | | (32,079,780) | | (40,880,584) |
| Change in net unrealized appreciation (depreciation) | | 58,817,853 | | 261,209,693 | | (317,751,294) |
| Net increase (decrease) in net assets resulting from operations | | 193,019,031 | | 269,852,264 | | (314,481,826) |
| Distributions to shareholders | | (71,077,009) | | (33,763,256) | | (40,640,601) |
| | | | | | | |
| Share transactions | | | | | | |
| Proceeds from sales of shares | | 229,678,767 | | 600,539,896 | | 742,204,628 |
| Reinvestment of distributions | | 30,814,353 | | 24,033,209 | | 33,150,295 |
| Cost of shares redeemed | | (389,696,365) | | (600,353,896) | | (794,518,975) |
| | | | | | | |
Net increase (decrease) in net assets resulting from share transactions | | (129,203,245) | | 24,219,209 | | (19,164,052) |
| Total increase (decrease) in net assets | | (7,261,223) | | 260,308,217 | | (374,286,479) |
| | | | | | | |
| Net Assets | | | | | | |
| Beginning of period | | 1,565,112,544 | | 1,304,804,327 | | 1,679,090,806 |
| End of period | $ | 1,557,851,321 | $ | 1,565,112,544 | $ | 1,304,804,327 |
| | | | | | | |
| Other Information | | | | | | |
| Shares | | | | | | |
| Sold | | 8,475,592 | | 26,342,964 | | 29,583,912 |
| Issued in reinvestment of distributions | | 1,276,109 | | 1,026,385 | | 1,227,154 |
| Redeemed | | (15,496,865) | | (25,639,395) | | (30,636,231) |
| Net increase (decrease) | | (5,745,164) | | 1,729,954 | | 174,835 |
| | | | | | | |
See Organization and Merger information note regarding reorganization from mutual fund to exchange traded fund.
Share activity is further described in Organization and Merger information notes, amounts have been adjusted to reflect the impact of the change in capital structure associated with the merger. All financial information prior to the merger is that of the Predecessor Fund.
Financial Highlights
Fidelity® Enhanced International ETF |
| |
| Years ended June 30, | | 2024 A,B | | 2023 A,C | | 2022 A,C | | 2021 A,C | | 2020 A,C | | 2019 A,C |
Selected Per-Share Data | | | | | | | | | | | | |
| Net asset value, beginning of period | $ | 25.73 | $ | 22.08 | $ | 28.49 | $ | 22.68 | $ | 22.13 | $ | 24.23 |
| Income from Investment Operations | | | | | | | | | | | | |
Net investment income (loss) D,E | | .65 | | .64 | | .76 | | .62 | | .47 | | .74 |
| Net realized and unrealized gain (loss) | | 3.19 | | 3.58 | | (6.43) | | 5.61 | | .79 | | (2.35) |
| Total from investment operations | | 3.84 | | 4.22 | | (5.67) | | 6.23 | | 1.26 | | (1.61) |
| Distributions from net investment income | | (1.29) | | (.57) | | (.74) | | (.42) | | (.71) | | (.49) |
| Total distributions | | (1.29) | | (.57) | | (.74) | | (.42) | | (.71) | | (.49) |
| Net asset value, end of period | $ | 28.28 | $ | 25.73 | $ | 22.08 | $ | 28.49 | $ | 22.68 | $ | 22.13 |
Total Return F,G,H | | | | 19.29% | | (20.35)% | | 27.77% | | 5.55% | | (6.51)% |
Ratios to Average Net Assets E,I,J | | | | | | | | | | | | |
| Expenses before reductions | | .36% K,L | | .55% | | .57% | | .59% | | .59% | | .59% |
| Expenses net of fee waivers, if any | | | | .55% | | .57% | | .59% | | .59% | | .59% |
| Expenses net of all reductions | | .36% K,L | | .55% | | .57% | | .59% | | .59% | | .59% |
| Net investment income (loss) | | 2.95% K,L | | 2.69% | | 2.99% | | 2.32% | | 2.13% | | 3.27% |
| Supplemental Data | | | | | | | | | | | | |
| Net assets, end of period (000 omitted) | $ | 1,557,851 | $ | 1,565,113 | $ | 1,304,804 | $ | 1,679,091 | $ | 1,182,923 | $ | 1,505,889 |
Portfolio turnover rate M | | | | 105% | | 114% | | 82% | | 75% | | 103% |
AAs further described in Organization and Merger information notes, per share amounts have been adjusted to reflect the impact of the change in capital structure associated with the merger. All financial information prior to the merger is that of the Predecessor Fund.
BFor the ten month period ended June 30. The Fund changed its fiscal year end from August 31 to June 30, effective March 1, 2024.
CFor the year ended August 31.
DCalculated based on average shares outstanding during the period.
ENet investment income (loss) is affected by the timing of the declaration of dividends by any underlying mutual funds or exchange-traded funds (ETFs). Net investment income (loss) of any mutual funds or ETFs is not included in the Fund's net investment income (loss) ratio.
FTotal returns for periods of less than one year are not annualized.
GTotal returns would have been lower if certain expenses had not been reduced during the applicable periods shown.
HBased on net asset value.
IFees and expenses of any underlying mutual funds or exchange-traded funds (ETFs) are not included in the Fund's expense ratio. The Fund indirectly bears its proportionate share of these expenses. For additional expense information related to investments in Fidelity Central Funds, please refer to the "Investments in Fidelity Central Funds" note found in the Notes to Financial Statements section of the most recent Annual or Semi-Annual report.
JExpense ratios reflect operating expenses of the class. Expenses before reductions do not reflect amounts reimbursed, waived, or reduced through arrangements with the investment adviser, brokerage services, or other offset arrangements, if applicable, and do not represent the amount paid by the class during periods when reimbursements, waivers or reductions occur.
KProxy expenses are not annualized.
LAnnualized.
MAmount does not include the portfolio activity of any underlying mutual funds or exchange-traded funds (ETFs).
NPortfolio turnover rate excludes securities received or delivered in-kind.
Fidelity® Enhanced Large Cap Core ETF
Schedule of Investments June 30, 2024
Showing Percentage of Net Assets
| Common Stocks - 99.1% |
| | | Shares | Value ($) |
| COMMUNICATION SERVICES - 11.3% | | | |
| Diversified Telecommunication Services - 0.9% | | | |
| AT&T, Inc. | | 815,773 | 15,589,422 |
| Verizon Communications, Inc. | | 276,635 | 11,408,427 |
| | | | 26,997,849 |
| Entertainment - 1.9% | | | |
| Electronic Arts, Inc. | | 30,915 | 4,307,387 |
| Netflix, Inc. (a) | | 39,462 | 26,632,115 |
| Playtika Holding Corp. | | 181,585 | 1,429,074 |
| Spotify Technology SA (a) | | 27,880 | 8,748,465 |
| The Walt Disney Co. | | 134,593 | 13,363,739 |
| | | | 54,480,780 |
| Interactive Media & Services - 7.7% | | | |
| Alphabet, Inc.: | | | |
| Class A | | 369,980 | 67,391,857 |
| Class C | | 392,379 | 71,970,156 |
| Meta Platforms, Inc. Class A | | 167,870 | 84,643,411 |
| | | | 224,005,424 |
| Media - 0.8% | | | |
| Comcast Corp. Class A | | 614,180 | 24,051,289 |
TOTAL COMMUNICATION SERVICES | | | 329,535,342 |
| CONSUMER DISCRETIONARY - 9.7% | | | |
| Automobiles - 1.1% | | | |
| Ford Motor Co. | | 1,186,492 | 14,878,610 |
| Tesla, Inc. (a) | | 93,280 | 18,458,246 |
| | | | 33,336,856 |
| Broadline Retail - 3.9% | | | |
| Amazon.com, Inc. (a) | | 584,786 | 113,009,895 |
| Hotels, Restaurants & Leisure - 1.5% | | | |
| Chipotle Mexican Grill, Inc. (a) | | 167,757 | 10,509,976 |
| International Game Technology PLC | | 540,912 | 11,067,060 |
| McDonald's Corp. | | 59,527 | 15,169,861 |
| MGM Resorts International (a) | | 162,049 | 7,201,458 |
| | | | 43,948,355 |
| Household Durables - 0.2% | | | |
| Lennar Corp. Class A | | 4,486 | 672,317 |
| Taylor Morrison Home Corp. (a) | | 32,133 | 1,781,454 |
| Toll Brothers, Inc. | | 29,111 | 3,353,005 |
| | | | 5,806,776 |
| Specialty Retail - 3.0% | | | |
| Abercrombie & Fitch Co. Class A (a) | | 39,181 | 6,967,949 |
| Burlington Stores, Inc. (a) | | 25,457 | 6,109,680 |
| Carvana Co. Class A (a) | | 125,426 | 16,144,835 |
| Gap, Inc. | | 366,032 | 8,744,504 |
| Ross Stores, Inc. | | 70,549 | 10,252,181 |
| The Home Depot, Inc. | | 101,769 | 35,032,961 |
| TJX Companies, Inc. | | 25,593 | 2,817,789 |
| | | | 86,069,899 |
| Textiles, Apparel & Luxury Goods - 0.0% | | | |
| Crocs, Inc. (a) | | 10 | 1,459 |
| NIKE, Inc. Class B | | 14 | 1,055 |
| Tapestry, Inc. | | 19 | 813 |
| | | | 3,327 |
TOTAL CONSUMER DISCRETIONARY | | | 282,175,108 |
| CONSUMER STAPLES - 4.3% | | | |
| Beverages - 0.8% | | | |
| Boston Beer Co., Inc. Class A (a) | | 16,091 | 4,908,560 |
| PepsiCo, Inc. | | 17,559 | 2,896,006 |
| The Coca-Cola Co. | | 228,591 | 14,549,817 |
| | | | 22,354,383 |
| Consumer Staples Distribution & Retail - 2.1% | | | |
| Costco Wholesale Corp. | | 31,879 | 27,096,831 |
| Kroger Co. | | 15,356 | 766,725 |
| Maplebear, Inc. (NASDAQ) | | 16 | 514 |
| Walmart, Inc. | | 477,882 | 32,357,390 |
| | | | 60,221,460 |
| Food Products - 0.0% | | | |
| Archer Daniels Midland Co. | | 10,060 | 608,127 |
| The Kraft Heinz Co. | | 756 | 24,358 |
| | | | 632,485 |
| Household Products - 1.4% | | | |
| Colgate-Palmolive Co. | | 129,816 | 12,597,345 |
| Kimberly-Clark Corp. | | 78 | 10,780 |
| Procter & Gamble Co. | | 177,163 | 29,217,722 |
| | | | 41,825,847 |
| Tobacco - 0.0% | | | |
| Philip Morris International, Inc. | | 7,420 | 751,869 |
TOTAL CONSUMER STAPLES | | | 125,786,044 |
| ENERGY - 3.1% | | | |
| Energy Equipment & Services - 0.0% | | | |
| Baker Hughes Co. Class A | | 540 | 18,992 |
| Oil, Gas & Consumable Fuels - 3.1% | | | |
| California Resources Corp. | | 198 | 10,538 |
| Chevron Corp. | | 17,812 | 2,786,153 |
| ConocoPhillips Co. | | 136,359 | 15,596,742 |
| Devon Energy Corp. | | 87,024 | 4,124,938 |
| EOG Resources, Inc. | | 145,841 | 18,357,007 |
| Exxon Mobil Corp. | | 411,520 | 47,374,182 |
| Occidental Petroleum Corp. warrants 8/3/27 (a) | | 4,716 | 194,111 |
| | | | 88,443,671 |
TOTAL ENERGY | | | 88,462,663 |
| FINANCIALS - 12.2% | | | |
| Banks - 2.9% | | | |
| Bank of America Corp. | | 820,931 | 32,648,426 |
| JPMorgan Chase & Co. | | 256,981 | 51,976,977 |
| Wells Fargo & Co. | | 4,153 | 246,647 |
| | | | 84,872,050 |
| Capital Markets - 2.2% | | | |
| Ameriprise Financial, Inc. | | 7,780 | 3,323,538 |
| Bank of New York Mellon Corp. | | 128,670 | 7,706,046 |
| BlackRock, Inc. | | 9,165 | 7,215,788 |
| Charles Schwab Corp. | | 125,522 | 9,249,716 |
| CME Group, Inc. | | 85,141 | 16,738,721 |
| Goldman Sachs Group, Inc. | | 7,889 | 3,568,352 |
| LPL Financial | | 17,244 | 4,816,249 |
| Morgan Stanley | | 46,978 | 4,565,792 |
| S&P Global, Inc. | | 3 | 1,338 |
| T. Rowe Price Group, Inc. | | 44,540 | 5,135,907 |
| Tradeweb Markets, Inc. Class A | | 18,295 | 1,939,270 |
| | | | 64,260,717 |
| Consumer Finance - 0.8% | | | |
| American Express Co. | | 97,863 | 22,660,178 |
| Financial Services - 4.3% | | | |
| Berkshire Hathaway, Inc. Class B (a) | | 149,135 | 60,668,118 |
| Block, Inc. Class A (a) | | 43,978 | 2,836,141 |
| Enact Holdings, Inc. | | 16,780 | 514,475 |
| Jackson Financial, Inc. | | 25,246 | 1,874,768 |
| MasterCard, Inc. Class A | | 80,247 | 35,401,767 |
| PayPal Holdings, Inc. (a) | | 218,459 | 12,677,176 |
| Visa, Inc. Class A | | 47,644 | 12,505,121 |
| | | | 126,477,566 |
| Insurance - 2.0% | | | |
| Aon PLC | | 36,692 | 10,772,037 |
| Brown & Brown, Inc. | | 7,147 | 639,013 |
| Globe Life, Inc. | | 55,340 | 4,553,375 |
| Hartford Financial Services Group, Inc. | | 2 | 201 |
| Marsh & McLennan Companies, Inc. | | 13,662 | 2,878,857 |
| Progressive Corp. | | 106,718 | 22,166,396 |
| Selective Insurance Group, Inc. | | 8 | 751 |
| The Travelers Companies, Inc. | | 35,635 | 7,246,021 |
| Unum Group | | 90,994 | 4,650,703 |
| Willis Towers Watson PLC | | 17,933 | 4,700,957 |
| | | | 57,608,311 |
TOTAL FINANCIALS | | | 355,878,822 |
| HEALTH CARE - 12.5% | | | |
| Biotechnology - 3.5% | | | |
| AbbVie, Inc. | | 163,694 | 28,076,795 |
| Alkermes PLC (a)(b) | | 173,295 | 4,176,410 |
| Amgen, Inc. | | 36,655 | 11,452,855 |
| Biogen, Inc. (a) | | 25,087 | 5,815,668 |
| Exelixis, Inc. (a) | | 553,462 | 12,436,291 |
| Gilead Sciences, Inc. | | 296,575 | 20,348,011 |
| Halozyme Therapeutics, Inc. (a) | | 78,559 | 4,113,349 |
| Incyte Corp. (a) | | 226,518 | 13,731,521 |
| Neurocrine Biosciences, Inc. (a) | | 12,879 | 1,773,052 |
| | | | 101,923,952 |
| Health Care Equipment & Supplies - 1.3% | | | |
| Becton, Dickinson & Co. | | 53,646 | 12,537,607 |
| Edwards Lifesciences Corp. (a) | | 54,559 | 5,039,615 |
| GE Healthcare Technologies, Inc. | | 12,826 | 999,402 |
| Hologic, Inc. (a) | | 189,759 | 14,089,606 |
| IDEXX Laboratories, Inc. (a) | | 4 | 1,949 |
| Lantheus Holdings, Inc. (a) | | 44,268 | 3,554,278 |
| Solventum Corp. | | 44,294 | 2,342,267 |
| | | | 38,564,724 |
| Health Care Providers & Services - 3.1% | | | |
| Cencora, Inc. | | 7,689 | 1,732,332 |
| Centene Corp. (a) | | 156,456 | 10,373,033 |
| Cigna Group | | 60,899 | 20,131,382 |
| Elevance Health, Inc. | | 42,083 | 22,803,094 |
| UnitedHealth Group, Inc. | | 65,627 | 33,421,206 |
| | | | 88,461,047 |
| Life Sciences Tools & Services - 0.4% | | | |
| Medpace Holdings, Inc. (a) | | 7,432 | 3,060,869 |
| Thermo Fisher Scientific, Inc. | | 16,378 | 9,057,034 |
| | | | 12,117,903 |
| Pharmaceuticals - 4.2% | | | |
| Bristol-Myers Squibb Co. | | 472,194 | 19,610,217 |
| Eli Lilly & Co. | | 32,483 | 29,409,459 |
| Jazz Pharmaceuticals PLC (a) | | 5,346 | 570,579 |
| Johnson & Johnson | | 94,830 | 13,860,353 |
| Merck & Co., Inc. | | 271,813 | 33,650,449 |
| Pfizer, Inc. | | 875,884 | 24,507,234 |
| | | | 121,608,291 |
TOTAL HEALTH CARE | | | 362,675,917 |
| INDUSTRIALS - 9.9% | | | |
| Aerospace & Defense - 1.8% | | | |
| Howmet Aerospace, Inc. | | 81,844 | 6,353,550 |
| Lockheed Martin Corp. | | 45,131 | 21,080,690 |
| Northrop Grumman Corp. | | 24,594 | 10,721,754 |
| Textron, Inc. | | 169,592 | 14,561,169 |
| | | | 52,717,163 |
| Building Products - 0.4% | | | |
| Owens Corning | | 68,576 | 11,913,023 |
| Commercial Services & Supplies - 1.7% | | | |
| Cintas Corp. | | 27,426 | 19,205,331 |
| Republic Services, Inc. | | 56,545 | 10,988,955 |
| Waste Management, Inc. | | 91,938 | 19,614,053 |
| | | | 49,808,339 |
| Construction & Engineering - 0.0% | | | |
| EMCOR Group, Inc. | | 1,847 | 674,303 |
| Electrical Equipment - 1.2% | | | |
| AMETEK, Inc. | | 38,667 | 6,446,176 |
| Eaton Corp. PLC | | 29,087 | 9,120,229 |
| Emerson Electric Co. | | 167,244 | 18,423,599 |
| EnerSys | | 7,339 | 759,733 |
| | | | 34,749,737 |
| Ground Transportation - 2.5% | | | |
| CSX Corp. | | 523,309 | 17,504,686 |
| Norfolk Southern Corp. | | 22,519 | 4,834,604 |
| Old Dominion Freight Lines, Inc. | | 26,953 | 4,759,900 |
| Uber Technologies, Inc. (a) | | 312,936 | 22,744,188 |
| Union Pacific Corp. | | 102,824 | 23,264,958 |
| | | | 73,108,336 |
| Industrial Conglomerates - 0.0% | | | |
| 3M Co. | | 118 | 12,058 |
| Machinery - 1.3% | | | |
| Caterpillar, Inc. | | 72,534 | 24,161,075 |
| Deere & Co. | | 5 | 1,868 |
| PACCAR, Inc. | | 144,761 | 14,901,697 |
| | | | 39,064,640 |
| Passenger Airlines - 0.1% | | | |
| SkyWest, Inc. (a) | | 18,029 | 1,479,640 |
| United Airlines Holdings, Inc. (a) | | 49 | 2,384 |
| | | | 1,482,024 |
| Professional Services - 0.9% | | | |
| CACI International, Inc. (a) | | 14,057 | 6,046,337 |
| Leidos Holdings, Inc. | | 35,360 | 5,158,317 |
| SS&C Technologies Holdings, Inc. | | 218,940 | 13,720,970 |
| | | | 24,925,624 |
| Trading Companies & Distributors - 0.0% | | | |
| W.W. Grainger, Inc. | | 2 | 1,804 |
TOTAL INDUSTRIALS | | | 288,457,051 |
| INFORMATION TECHNOLOGY - 31.6% | | | |
| Communications Equipment - 0.2% | | | |
| Arista Networks, Inc. (a) | | 17,306 | 6,065,407 |
| Cisco Systems, Inc. | | 28,802 | 1,368,383 |
| | | | 7,433,790 |
| Electronic Equipment, Instruments & Components - 0.2% | | | |
| Trimble, Inc. (a) | | 111,052 | 6,210,028 |
| IT Services - 0.2% | | | |
| Squarespace, Inc. Class A (a) | | 20 | 873 |
| Twilio, Inc. Class A (a) | | 98,575 | 5,600,046 |
| Wix.com Ltd. (a) | | 492 | 78,262 |
| | | | 5,679,181 |
| Semiconductors & Semiconductor Equipment - 12.4% | | | |
| Advanced Micro Devices, Inc. (a) | | 9,845 | 1,596,957 |
| Applied Materials, Inc. | | 118,075 | 27,864,519 |
| Broadcom, Inc. | | 36,691 | 58,908,501 |
| Cirrus Logic, Inc. (a) | | 54,956 | 7,015,683 |
| Intel Corp. | | 628,007 | 19,449,377 |
| KLA Corp. | | 10,831 | 8,930,268 |
| Lam Research Corp. | | 111 | 118,198 |
| Micron Technology, Inc. | | 17,752 | 2,334,921 |
| NVIDIA Corp. | | 1,668,399 | 206,114,010 |
| Qualcomm, Inc. | | 143,267 | 28,535,921 |
| | | | 360,868,355 |
| Software - 11.4% | | | |
| Adobe, Inc. (a) | | 56,548 | 31,414,676 |
| Alarm.com Holdings, Inc. (a) | | 29,793 | 1,893,047 |
| Cadence Design Systems, Inc. (a) | | 8 | 2,462 |
| DocuSign, Inc. (a) | | 138,619 | 7,416,117 |
| Dropbox, Inc. Class A (a) | | 686,426 | 15,423,992 |
| Gen Digital, Inc. | | 85,041 | 2,124,324 |
| GitLab, Inc. (a) | | 133,568 | 6,641,001 |
| Manhattan Associates, Inc. (a) | | 9,851 | 2,430,045 |
| Microsoft Corp. | | 434,729 | 194,302,127 |
| Pegasystems, Inc. | | 99,894 | 6,046,584 |
| RingCentral, Inc. (a) | | 52,261 | 1,473,760 |
| Salesforce, Inc. | | 120,302 | 30,929,644 |
| Smartsheet, Inc. (a) | | 69,988 | 3,085,071 |
| Teradata Corp. (a) | | 412,883 | 14,269,236 |
| Zoom Video Communications, Inc. Class A (a) | | 250,798 | 14,844,734 |
| | | | 332,296,820 |
| Technology Hardware, Storage & Peripherals - 7.2% | | | |
| Apple, Inc. | | 977,850 | 205,954,767 |
| NetApp, Inc. | | 19,623 | 2,527,442 |
| | | | 208,482,209 |
TOTAL INFORMATION TECHNOLOGY | | | 920,970,383 |
| MATERIALS - 2.4% | | | |
| Chemicals - 1.0% | | | |
| Eastman Chemical Co. | | 162 | 15,871 |
| Ecolab, Inc. | | 76,666 | 18,246,508 |
| Linde PLC | | 32 | 14,042 |
| Olin Corp. | | 48,089 | 2,267,396 |
| Sherwin-Williams Co. | | 27,844 | 8,309,485 |
| | | | 28,853,302 |
| Construction Materials - 0.5% | | | |
| Vulcan Materials Co. | | 56,419 | 14,030,277 |
| Metals & Mining - 0.9% | | | |
| Nucor Corp. | | 90,629 | 14,326,632 |
| Steel Dynamics, Inc. | | 91,960 | 11,908,820 |
| | | | 26,235,452 |
| Paper & Forest Products - 0.0% | | | |
| Louisiana-Pacific Corp. | | 2,130 | 175,363 |
TOTAL MATERIALS | | | 69,294,394 |
| REAL ESTATE - 0.9% | | | |
| Equity Real Estate Investment Trusts (REITs) - 0.9% | | | |
| Crown Castle, Inc. | | 151,892 | 14,839,848 |
| Federal Realty Investment Trust (SBI) | | 18 | 1,817 |
| Invitation Homes, Inc. | | 219,561 | 7,880,044 |
| Public Storage Operating Co. | | 8,194 | 2,357,004 |
| | | | 25,078,713 |
| UTILITIES - 1.2% | | | |
| Electric Utilities - 1.0% | | | |
| Evergy, Inc. | | 32,655 | 1,729,735 |
| NextEra Energy, Inc. | | 289,521 | 20,500,982 |
| Otter Tail Corp. | | 15,584 | 1,365,003 |
| Xcel Energy, Inc. | | 86,129 | 4,600,150 |
| | | | 28,195,870 |
| Gas Utilities - 0.0% | | | |
| UGI Corp. | | 12 | 275 |
| Independent Power and Renewable Electricity Producers - 0.2% | | | |
| The AES Corp. | | 228,208 | 4,009,615 |
| Vistra Corp. | | 36,454 | 3,134,315 |
| | | | 7,143,930 |
| Multi-Utilities - 0.0% | | | |
| Black Hills Corp. | | 32 | 1,740 |
TOTAL UTILITIES | | | 35,341,815 |
| TOTAL COMMON STOCKS (Cost $2,114,284,029) | | | 2,883,656,252 |
| | | | |
| U.S. Treasury Obligations - 0.1% |
| | | Principal Amount (c) | Value ($) |
U.S. Treasury Bills, yield at date of purchase 5.3% to 5.32% 9/5/24 to 9/19/24 (d) (Cost $3,165,631) | | 3,200,000 | 3,165,752 |
| | | | |
| Money Market Funds - 0.8% |
| | | Shares | Value ($) |
| Fidelity Cash Central Fund 5.38% (e) | | 23,486,799 | 23,491,496 |
| Fidelity Securities Lending Cash Central Fund 5.38% (e)(f) | | 562,444 | 562,500 |
| TOTAL MONEY MARKET FUNDS (Cost $24,053,996) | | | 24,053,996 |
| | | | |
| TOTAL INVESTMENT IN SECURITIES - 100.0% (Cost $2,141,503,656) | 2,910,876,000 |
NET OTHER ASSETS (LIABILITIES) - 0.0% | 358,375 |
| NET ASSETS - 100.0% | 2,911,234,375 |
| | |
| Futures Contracts |
| | Number of contracts | Expiration Date | Notional Amount ($) | Value ($) | Unrealized Appreciation/ (Depreciation) ($) |
| Purchased | | | | | |
| | | | | | |
| Equity Index Contracts | | | | | |
| CME E-mini S&P 500 Index Contracts (United States) | 85 | Sep 2024 | 23,466,375 | 74,839 | 74,839 |
| | | | | | |
| The notional amount of futures purchased as a percentage of Net Assets is 0.8% |
Legend
| (b) | Security or a portion of the security is on loan at period end. |
| (c) | Amount is stated in United States dollars unless otherwise noted. |
| (d) | Security or a portion of the security was pledged to cover margin requirements for futures contracts. At period end, the value of securities pledged amounted to $1,062,545. |
| (e) | Affiliated fund that is generally available only to investment companies and other accounts managed by Fidelity Investments. The rate quoted is the annualized seven-day yield of the fund at period end. A complete unaudited listing of the fund's holdings as of its most recent quarter end is available upon request. In addition, each Fidelity Central Fund's financial statements, which are not covered by the Fund's Report of Independent Registered Public Accounting Firm, are available on the SEC's website or upon request. |
| (f) | Investment made with cash collateral received from securities on loan. |
Affiliated Central Funds
Fiscal year to date information regarding the Fund's investments in Fidelity Central Funds, including the ownership percentage, is presented below.
| Affiliate | Value, beginning of period ($) | Purchases ($) | Sales Proceeds ($) | Dividend Income ($) | Realized Gain (loss) ($) | Change in Unrealized appreciation (depreciation) ($) | Value, end of period ($) | % ownership, end of period |
| Fidelity Cash Central Fund 5.38% | 70,527,060 | 760,032,872 | 807,068,414 | 1,189,983 | (22) | - | 23,491,496 | 0.0% |
| Fidelity Securities Lending Cash Central Fund 5.38% | 1,387,050 | 26,365,179 | 27,189,729 | 818 | - | - | 562,500 | 0.0% |
| Total | 71,914,110 | 786,398,051 | 834,258,143 | 1,190,801 | (22) | - | 24,053,996 | |
| | | | | | | | | |
Amounts in the dividend income column in the above table include any capital gain distributions from underlying funds, which are presented in the corresponding line item in the Statement of Operations, if applicable.
Amounts in the dividend income column for Fidelity Securities Lending Cash Central Fund represents the income earned on investing cash collateral, less rebates paid to borrowers and any lending agent fees associated with the loan, plus any premium payments received for lending certain types of securities.
Amounts included in the purchases and sales proceeds columns may include in-kind transactions, if applicable.
Investment Valuation
The following is a summary of the inputs used, as of June 30, 2024, involving the Fund's assets and liabilities carried at fair value. The inputs or methodology used for valuing securities may not be an indication of the risk associated with investing in those securities. For more information on valuation inputs, and their aggregation into the levels used below, please refer to the Investment Valuation section in the accompanying Notes to Financial Statements.
| Valuation Inputs at Reporting Date: |
| Description | Total ($) | Level 1 ($) | Level 2 ($) | Level 3 ($) |
Investments in Securities: | | | | |
|
| Equities: | | | | |
Communication Services | 329,535,342 | 329,535,342 | - | - |
Consumer Discretionary | 282,175,108 | 282,175,108 | - | - |
Consumer Staples | 125,786,044 | 125,786,044 | - | - |
Energy | 88,462,663 | 88,462,663 | - | - |
Financials | 355,878,822 | 355,878,822 | - | - |
Health Care | 362,675,917 | 362,675,917 | - | - |
Industrials | 288,457,051 | 288,457,051 | - | - |
Information Technology | 920,970,383 | 920,970,383 | - | - |
Materials | 69,294,394 | 69,294,394 | - | - |
Real Estate | 25,078,713 | 25,078,713 | - | - |
Utilities | 35,341,815 | 35,341,815 | - | - |
|
| U.S. Government and Government Agency Obligations | 3,165,752 | - | 3,165,752 | - |
|
| Money Market Funds | 24,053,996 | 24,053,996 | - | - |
| Total Investments in Securities: | 2,910,876,000 | 2,907,710,248 | 3,165,752 | - |
Derivative Instruments: Assets | | | | |
Futures Contracts | 74,839 | 74,839 | - | - |
| Total Assets | 74,839 | 74,839 | - | - |
| Total Derivative Instruments: | 74,839 | 74,839 | - | - |
Value of Derivative Instruments
The following table is a summary of the Fund's value of derivative instruments by primary risk exposure as of June 30, 2024. For additional information on derivative instruments, please refer to the Derivative Instruments section in the accompanying Notes to Financial Statements.
Primary Risk Exposure / Derivative Type | Value |
| Asset ($) | Liability ($) |
| Equity Risk | | |
Futures Contracts (a) | 74,839 | 0 |
| Total Equity Risk | 74,839 | 0 |
| Total Value of Derivatives | 74,839 | 0 |
(a)Reflects gross cumulative appreciation (depreciation) on futures contracts as presented in the Schedule of Investments. In the Statement of Assets and Liabilities, the period end daily variation margin is included in receivable or payable for daily variation margin on futures contracts, and the net cumulative appreciation (depreciation) is included in Total accumulated earnings (loss).
Fidelity® Enhanced Large Cap Core ETF
Financial Statements
| Statement of Assets and Liabilities |
| | | | June 30, 2024 |
| | | | | |
| Assets | | | | |
| Investment in securities, at value (including securities loaned of $542,250) - See accompanying schedule: | | | | |
Unaffiliated issuers (cost $2,117,449,660) | $ | 2,886,822,004 | | |
Fidelity Central Funds (cost $24,053,996) | | 24,053,996 | | |
| | | | | |
| | | | | |
| Total Investment in Securities (cost $2,141,503,656) | | | $ | 2,910,876,000 |
| Cash | | | | 1,022,818 |
| Receivable for fund shares sold | | | | 24,454,961 |
| Dividends receivable | | | | 761,166 |
| Distributions receivable from Fidelity Central Funds | | | | 136,277 |
| Receivable from investment adviser for expense reductions | | | | 63,754 |
| Other receivables | | | | 11,194 |
Total assets | | | | 2,937,326,170 |
| Liabilities | | | | |
| Payable for investments purchased | $ | 24,884,729 | | |
| Accrued management fee | | 418,037 | | |
| Payable for daily variation margin on futures contracts | | 107,865 | | |
| Other payables and accrued expenses | | 118,664 | | |
| Collateral on securities loaned | | 562,500 | | |
| Total liabilities | | | | 26,091,795 |
| Net Assets | | | $ | 2,911,234,375 |
| Net Assets consist of: | | | | |
| Paid in capital | | | $ | 2,206,109,165 |
| Total accumulated earnings (loss) | | | | 705,125,210 |
| Net Assets | | | $ | 2,911,234,375 |
Net Asset Value, offering price and redemption price per share ($2,911,234,375 ÷ 95,235,453 shares) | | | $ | 30.57 |
| Statement of Operations |
| | | | Ten months ended June 30, 2024 | | Year ended August 31, 2023 |
| Investment Income | | | | | | |
| Dividends | | | $ | 25,072,989 | | 31,203,225 |
| Interest | | | | 113,042 | | 62,568 |
| Income from Fidelity Central Funds (including $818 and $43,997 from security lending) | | | | 1,190,801 | | 1,229,150 |
| Total income | | | | 26,376,832 | | 32,494,943 |
| Expenses | | | | | | |
| Management fee | | | $ | 4,204,212 | | 7,651,709 |
| Independent trustees' fees and expenses | | | | 8,431 | | 10,392 |
| Interest | | | | 3,088 | | 27,922 |
| Miscellaneous | | | | 141,577 | | - |
| Total expenses before reductions | | | | 4,357,308 | | 7,690,023 |
| Expense reductions | | | | (63,917) | | (2,087) |
| Total expenses after reductions | | | | 4,293,391 | | 7,687,936 |
| Net Investment income (loss) | | | | 22,083,441 | | 24,807,007 |
| Realized and Unrealized Gain (Loss) | | | | | | |
| Net realized gain (loss) on: | | | | | | |
| Investment Securities: | | | | | | |
| Unaffiliated issuers | | | | (20,970,330) | | (34,334,099) |
| Redemptions in-kind | | | | 224,859,103 | | 23,998,066 |
| Fidelity Central Funds | | | | (22) | | 35 |
| Futures contracts | | | | 5,141,713 | | 6,711,576 |
| Total net realized gain (loss) | | | | 209,030,464 | | (3,624,422) |
| Change in net unrealized appreciation (depreciation) on: | | | | | | |
| Investment Securities: | | | | | | |
| Unaffiliated issuers | | | | 247,270,049 | | 223,701,589 |
| Fidelity Central Funds | | | | - | | (35) |
| Futures contracts | | | | (435,610) | | (443,168) |
| Total change in net unrealized appreciation (depreciation) | | | | 246,834,439 | | 223,258,386 |
| Net gain (loss) | | | | 455,864,903 | | 219,633,964 |
| Net increase (decrease) in net assets resulting from operations | | | $ | 477,948,344 | | 244,440,971 |
See Organization and Merger information note regarding reorganization from mutual fund to exchange traded fund.
| Statement of Changes in Net Assets |
| | | |
| | Ten months ended June 30, 2024 | | Year ended August 31, 2023 | | Year ended August 31, 2022 |
| Increase (Decrease) in Net Assets | | | | | | |
| Operations | | | | | | |
| Net investment income (loss) | $ | 22,083,441 | $ | 24,807,007 | $ | 19,467,302 |
| Net realized gain (loss) | | 209,030,464 | | (3,624,422) | | 12,825,524 |
| Change in net unrealized appreciation (depreciation) | | 246,834,439 | | 223,258,386 | | (204,549,067) |
| Net increase (decrease) in net assets resulting from operations | | 477,948,344 | | 244,440,971 | | (172,256,241) |
| Distributions to shareholders | | (35,565,387) | | (22,292,999) | | (204,215,644) |
| | | | | | | |
| Share transactions | | | | | | |
| Proceeds from sales of shares | | 1,442,966,046 | | 629,039,473 | | 1,542,789,506 |
| Reinvestment of distributions | | 16,466,045 | | 18,530,259 | | 176,281,500 |
| Cost of shares redeemed | | (1,038,895,541) | | (1,283,514,169) | | (389,268,600) |
| | | | | | | |
Net increase (decrease) in net assets resulting from share transactions | | 420,536,550 | | (635,944,437) | | 1,329,802,406 |
| Total increase (decrease) in net assets | | 862,919,507 | | (413,796,465) | | 953,330,521 |
| | | | | | | |
| Net Assets | | | | | | |
| Beginning of period | | 2,048,314,868 | | 2,462,111,333 | | 1,508,780,812 |
| End of period | $ | 2,911,234,375 | $ | 2,048,314,868 | $ | 2,462,111,333 |
| | | | | | | |
| Other Information | | | | | | |
| Shares | | | | | | |
| Sold | | 50,966,892 | | 27,859,340 | | 66,890,566 |
| Issued in reinvestment of distributions | | 676,837 | | 875,246 | | 7,072,033 |
| Redeemed | | (38,273,623) | | (58,631,055) | | (16,300,102) |
| Net increase (decrease) | | 13,370,106 | | (29,896,469) | | 57,662,497 |
| | | | | | | |
See Organization and Merger information note regarding reorganization from mutual fund to exchange traded fund.
Share activity is further described in Organization and Merger information notes, amounts have been adjusted to reflect the impact of the change in capital structure associated with the merger. All financial information prior to the merger is that of the Predecessor Fund.
Financial Highlights
Fidelity® Enhanced Large Cap Core ETF |
| |
| Years ended June 30, | | 2024 A,B | | 2023 B,C | | 2022 B,C | | 2021 B,C | | 2020 B,C | | 2019 B,C |
Selected Per-Share Data | | | | | | | | | | | | |
| Net asset value, beginning of period | $ | 25.02 | $ | 22.03 | $ | 27.89 | $ | 21.60 | $ | 18.13 | $ | 19.34 |
| Income from Investment Operations | | | | | | | | | | | | |
Net investment income (loss) D,E | | .27 | | .29 | | .29 | | .26 | | .29 | | .32 |
| Net realized and unrealized gain (loss) | | 5.71 | | 2.96 | | (2.48) | | 6.55 | | 3.64 | | (.32) |
| Total from investment operations | | 5.98 | | 3.25 | | (2.19) | | 6.81 | | 3.93 | | - |
| Distributions from net investment income | | (.43) | | (.18) | | (.43) | | (.26) | | (.31) | | (.29) |
| Distributions from net realized gain | | - | | (.10) | | (3.24) | | (.26) | | (.15) | | (.93) |
| Total distributions | | (.43) | | (.26) F | | (3.67) | | (.52) | | (.46) | | (1.21) F |
| Net asset value, end of period | $ | 30.57 | $ | 25.02 | $ | 22.03 | $ | 27.89 | $ | 21.60 | $ | 18.13 |
Total Return G,H,I | | | | 15.01% | | (9.41)% | | 32.14% | | 21.97% | | .65% |
Ratios to Average Net Assets E,J,K | | | | | | | | | | | | |
| Expenses before reductions | | .24% L,M | | .39% | | .39% | | .39% | | .39% | | .39% |
| Expenses net of fee waivers, if any | | | | .39% | | .39% | | .39% | | .39% | | .39% |
| Expenses net of all reductions | | .23% L,M | | .39% | | .39% | | .39% | | .39% | | .39% |
| Net investment income (loss) | | 1.20% L,M | | 1.26% | | 1.18% | | 1.09% | | 1.49% | | 1.81% |
| Supplemental Data | | | | | | | | | | | | |
| Net assets, end of period (000 omitted) | $ | 2,911,234 | $ | 2,048,315 | $ | 2,462,111 | $ | 1,508,781 | $ | 1,087,245 | $ | 834,635 |
Portfolio turnover rate N | | | | 105% | | 104% | | 83% | | 63% | | 77% |
AFor the ten month period ended June 30. The Fund changed its fiscal year end from August 31 to June 30, effective March 1, 2024.
BAs further described in Organization and Merger information notes, per share amounts have been adjusted to reflect the impact of the change in capital structure associated with the merger. All financial information prior to the merger is that of the Predecessor Fund.
CFor the year ended August 31.
DCalculated based on average shares outstanding during the period.
ENet investment income (loss) is affected by the timing of the declaration of dividends by any underlying mutual funds or exchange-traded funds (ETFs). Net investment income (loss) of any mutual funds or ETFs is not included in the Fund's net investment income (loss) ratio.
FTotal distributions per share do not sum due to rounding.
GTotal returns for periods of less than one year are not annualized.
HTotal returns would have been lower if certain expenses had not been reduced during the applicable periods shown.
IBased on net asset value.
JFees and expenses of any underlying mutual funds or exchange-traded funds (ETFs) are not included in the Fund's expense ratio. The Fund indirectly bears its proportionate share of these expenses. For additional expense information related to investments in Fidelity Central Funds, please refer to the "Investments in Fidelity Central Funds" note found in the Notes to Financial Statements section of the most recent Annual or Semi-Annual report.
KExpense ratios reflect operating expenses of the class. Expenses before reductions do not reflect amounts reimbursed, waived, or reduced through arrangements with the investment adviser, brokerage services, or other offset arrangements, if applicable, and do not represent the amount paid by the class during periods when reimbursements, waivers or reductions occur.
LAnnualized.
MProxy expenses are not annualized.
NAmount does not include the portfolio activity of any underlying mutual funds or exchange-traded funds (ETFs).
OPortfolio turnover rate excludes securities received or delivered in-kind.
Fidelity® Enhanced Large Cap Growth ETF
Schedule of Investments June 30, 2024
Showing Percentage of Net Assets
| Common Stocks - 99.4% |
| | | Shares | Value ($) |
| COMMUNICATION SERVICES - 13.4% | | | |
| Entertainment - 1.5% | | | |
| Netflix, Inc. (a) | | 59,693 | 40,285,612 |
| Interactive Media & Services - 11.9% | | | |
| Alphabet, Inc.: | | | |
| Class A | | 558,114 | 101,660,465 |
| Class C | | 543,657 | 99,717,567 |
| Meta Platforms, Inc. Class A | | 233,052 | 117,509,479 |
| | | | 318,887,511 |
TOTAL COMMUNICATION SERVICES | | | 359,173,123 |
| CONSUMER DISCRETIONARY - 13.3% | | | |
| Automobiles - 1.4% | | | |
| Tesla, Inc. (a) | | 182,707 | 36,154,061 |
| Broadline Retail - 6.0% | | | |
| Amazon.com, Inc. (a) | | 839,337 | 162,201,875 |
| Dillard's, Inc. Class A | | 2 | 881 |
| eBay, Inc. | | 30 | 1,612 |
| | | | 162,204,368 |
| Distributors - 0.0% | | | |
| Genuine Parts Co. | | 12 | 1,660 |
| Hotels, Restaurants & Leisure - 2.3% | | | |
| Airbnb, Inc. Class A (a) | | 62,169 | 9,426,685 |
| Booking Holdings, Inc. | | 6,692 | 26,510,358 |
| Chipotle Mexican Grill, Inc. (a) | | 328,716 | 20,594,057 |
| Draftkings Holdings, Inc. (a) | | 101,882 | 3,888,836 |
| | | | 60,419,936 |
| Household Durables - 0.0% | | | |
| TopBuild Corp. (a) | | 1,705 | 656,885 |
| Specialty Retail - 3.6% | | | |
| Abercrombie & Fitch Co. Class A (a) | | 76,874 | 13,671,272 |
| Carvana Co. Class A (a) | | 102,902 | 13,245,545 |
| Ross Stores, Inc. | | 113,382 | 16,476,672 |
| The Home Depot, Inc. | | 125,218 | 43,105,044 |
| Ulta Beauty, Inc. (a) | | 27,434 | 10,585,958 |
| | | | 97,084,491 |
TOTAL CONSUMER DISCRETIONARY | | | 356,521,401 |
| CONSUMER STAPLES - 1.6% | | | |
| Beverages - 0.2% | | | |
| Boston Beer Co., Inc. Class A (a) | | 9,466 | 2,887,603 |
| Celsius Holdings, Inc. (a) | | 9,491 | 541,841 |
| PepsiCo, Inc. | | 13,413 | 2,212,206 |
| The Coca-Cola Co. | | 12 | 764 |
| | | | 5,642,414 |
| Consumer Staples Distribution & Retail - 1.4% | | | |
| Costco Wholesale Corp. | | 29,279 | 24,886,857 |
| Kroger Co. | | 233,470 | 11,657,157 |
| Maplebear, Inc. (NASDAQ) | | 45,929 | 1,476,158 |
| Sysco Corp. | | 21 | 1,499 |
| | | | 38,021,671 |
TOTAL CONSUMER STAPLES | | | 43,664,085 |
| ENERGY - 1.1% | | | |
| Oil, Gas & Consumable Fuels - 1.1% | | | |
| Cheniere Energy, Inc. | | 101,510 | 17,746,993 |
| EOG Resources, Inc. | | 90,103 | 11,341,265 |
| Hess Corp. | | 3 | 443 |
| | | | 29,088,701 |
| FINANCIALS - 5.9% | | | |
| Banks - 0.1% | | | |
| Nu Holdings Ltd. Class A (a) | | 227,003 | 2,926,069 |
| Capital Markets - 0.6% | | | |
| MSCI, Inc. | | 31,214 | 15,037,345 |
| Tradeweb Markets, Inc. Class A | | 9,167 | 971,702 |
| | | | 16,009,047 |
| Consumer Finance - 0.6% | | | |
| American Express Co. | | 71,671 | 16,595,420 |
| Financial Services - 3.3% | | | |
| MasterCard, Inc. Class A | | 107,382 | 47,372,643 |
| PayPal Holdings, Inc. (a) | | 174,771 | 10,141,961 |
| Toast, Inc. (a)(b) | | 151,386 | 3,901,217 |
| Visa, Inc. Class A | | 101,538 | 26,650,679 |
| | | | 88,066,500 |
| Insurance - 1.3% | | | |
| Aon PLC | | 44,952 | 13,197,008 |
| Brown & Brown, Inc. | | 17,505 | 1,565,122 |
| Progressive Corp. | | 104,311 | 21,666,438 |
| | | | 36,428,568 |
TOTAL FINANCIALS | | | 160,025,604 |
| HEALTH CARE - 7.9% | | | |
| Biotechnology - 2.5% | | | |
| AbbVie, Inc. | | 170,698 | 29,278,121 |
| Exelixis, Inc. (a) | | 630,901 | 14,176,345 |
| Gilead Sciences, Inc. | | 179,207 | 12,295,392 |
| Incyte Corp. (a) | | 88,553 | 5,368,083 |
| Neurocrine Biosciences, Inc. (a) | | 32,810 | 4,516,953 |
| | | | 65,634,894 |
| Health Care Equipment & Supplies - 0.3% | | | |
| DexCom, Inc. (a) | | 62,426 | 7,077,860 |
| Intuitive Surgical, Inc. (a) | | 921 | 409,707 |
| | | | 7,487,567 |
| Health Care Providers & Services - 0.8% | | | |
| Cigna Group | | 21,739 | 7,186,261 |
| Elevance Health, Inc. | | 26,842 | 14,544,606 |
| UnitedHealth Group, Inc. | | 352 | 179,260 |
| | | | 21,910,127 |
| Health Care Technology - 0.4% | | | |
| Veeva Systems, Inc. Class A (a) | | 58,213 | 10,653,561 |
| Life Sciences Tools & Services - 0.5% | | | |
| Medpace Holdings, Inc. (a) | | 34,873 | 14,362,445 |
| Pharmaceuticals - 3.4% | | | |
| Bristol-Myers Squibb Co. | | 313,286 | 13,010,768 |
| Eli Lilly & Co. | | 66,762 | 60,444,980 |
| Jazz Pharmaceuticals PLC (a) | | 1,462 | 156,039 |
| Merck & Co., Inc. | | 142,094 | 17,591,237 |
| | | | 91,203,024 |
TOTAL HEALTH CARE | | | 211,251,618 |
| INDUSTRIALS - 5.4% | | | |
| Aerospace & Defense - 1.1% | | | |
| Howmet Aerospace, Inc. | | 167,679 | 13,016,921 |
| Lockheed Martin Corp. | | 38,409 | 17,940,844 |
| | | | 30,957,765 |
| Commercial Services & Supplies - 0.8% | | | |
| Cintas Corp. | | 2,670 | 1,869,694 |
| MSA Safety, Inc. | | 6,410 | 1,203,093 |
| Waste Management, Inc. | | 82,729 | 17,649,405 |
| | | | 20,722,192 |
| Construction & Engineering - 0.0% | | | |
| AECOM | | 9 | 793 |
| Ground Transportation - 1.9% | | | |
| CSX Corp. | | 117,449 | 3,928,669 |
| Uber Technologies, Inc. (a) | | 378,916 | 27,539,615 |
| Union Pacific Corp. | | 83,691 | 18,935,926 |
| | | | 50,404,210 |
| Machinery - 0.7% | | | |
| Caterpillar, Inc. | | 56,209 | 18,723,218 |
| Illinois Tool Works, Inc. | | 2,057 | 487,427 |
| | | | 19,210,645 |
| Professional Services - 0.9% | | | |
| Leidos Holdings, Inc. | | 50,078 | 7,305,379 |
| Verisk Analytics, Inc. | | 63,206 | 17,037,177 |
| | | | 24,342,556 |
TOTAL INDUSTRIALS | | | 145,638,161 |
| INFORMATION TECHNOLOGY - 49.0% | | | |
| Electronic Equipment, Instruments & Components - 0.1% | | | |
| Trimble, Inc. (a) | | 34,510 | 1,929,799 |
| IT Services - 0.2% | | | |
| Accenture PLC Class A | | 15,230 | 4,620,934 |
| Semiconductors & Semiconductor Equipment - 18.4% | | | |
| Advanced Micro Devices, Inc. (a) | | 3,855 | 625,320 |
| Applied Materials, Inc. | | 126,122 | 29,763,531 |
| Broadcom, Inc. | | 48,914 | 78,532,894 |
| KLA Corp. | | 30,365 | 25,036,246 |
| Lam Research Corp. | | 14,070 | 14,982,440 |
| Monolithic Power Systems, Inc. | | 14,626 | 12,017,892 |
| NVIDIA Corp. | | 2,445,470 | 302,113,364 |
| Qualcomm, Inc. | | 158,433 | 31,556,685 |
| | | | 494,628,372 |
| Software - 18.5% | | | |
| Adobe, Inc. (a) | | 70,409 | 39,115,016 |
| AppLovin Corp. Class A, (a) | | 150,931 | 12,560,478 |
| Atlassian Corp. PLC Class A, (a) | | 8,542 | 1,510,909 |
| Crowdstrike Holdings, Inc. (a) | | 39,090 | 14,978,897 |
| DocuSign, Inc. (a) | | 268,319 | 14,355,067 |
| Dropbox, Inc. Class A (a) | | 657,356 | 14,770,789 |
| Intuit, Inc. | | 3,192 | 2,097,814 |
| Manhattan Associates, Inc. (a) | | 62,980 | 15,535,906 |
| Microsoft Corp. | | 701,827 | 313,681,579 |
| Oracle Corp. | | 40,711 | 5,748,393 |
| Pegasystems, Inc. | | 38,748 | 2,345,416 |
| Qualys, Inc. (a) | | 3 | 428 |
| Salesforce, Inc. | | 120,061 | 30,867,683 |
| SentinelOne, Inc. (a) | | 231,542 | 4,873,959 |
| ServiceNow, Inc. (a) | | 2,079 | 1,635,487 |
| Teradata Corp. (a) | | 359,418 | 12,421,486 |
| Zoom Video Communications, Inc. Class A (a) | | 210,663 | 12,469,143 |
| | | | 498,968,450 |
| Technology Hardware, Storage & Peripherals - 11.8% | | | |
| Apple, Inc. | | 1,432,310 | 301,673,132 |
| Super Micro Computer, Inc. (a) | | 19,540 | 16,010,099 |
| | | | 317,683,231 |
TOTAL INFORMATION TECHNOLOGY | | | 1,317,830,786 |
| MATERIALS - 1.3% | | | |
| Chemicals - 0.6% | | | |
| Ecolab, Inc. | | 71,182 | 16,941,316 |
| Metals & Mining - 0.7% | | | |
| Nucor Corp. | | 83,537 | 13,205,529 |
| Southern Copper Corp. (b) | | 37,120 | 3,999,309 |
| | | | 17,204,838 |
TOTAL MATERIALS | | | 34,146,154 |
| UTILITIES - 0.5% | | | |
| Independent Power and Renewable Electricity Producers - 0.5% | | | |
| Vistra Corp. | | 158,081 | 13,591,804 |
| TOTAL COMMON STOCKS (Cost $1,404,262,735) | | | 2,670,931,437 |
| | | | |
| U.S. Treasury Obligations - 0.1% |
| | | Principal Amount (c) | Value ($) |
U.S. Treasury Bills, yield at date of purchase 5.3% to 5.33% 7/18/24 to 9/12/24 (d) (Cost $3,085,644) | | 3,100,000 | 3,085,688 |
| | | | |
| Money Market Funds - 1.9% |
| | | Shares | Value ($) |
| Fidelity Cash Central Fund 5.38% (e) | | 45,126,288 | 45,135,313 |
| Fidelity Securities Lending Cash Central Fund 5.38% (e)(f) | | 5,210,854 | 5,211,375 |
| TOTAL MONEY MARKET FUNDS (Cost $50,346,688) | | | 50,346,688 |
| | | | |
| TOTAL INVESTMENT IN SECURITIES - 101.4% (Cost $1,457,695,067) | 2,724,363,813 |
NET OTHER ASSETS (LIABILITIES) - (1.4)% | (37,458,610) |
| NET ASSETS - 100.0% | 2,686,905,203 |
| | |
| Futures Contracts |
| | Number of contracts | Expiration Date | Notional Amount ($) | Value ($) | Unrealized Appreciation/ (Depreciation) ($) |
| Purchased | | | | | |
| | | | | | |
| Equity Index Contracts | | | | | |
| CME E-mini S&P 500 Index Contracts (United States) | 40 | Sep 2024 | 11,043,000 | 35,219 | 35,219 |
| | | | | | |
| The notional amount of futures purchased as a percentage of Net Assets is 0.4% |
Legend
| (b) | Security or a portion of the security is on loan at period end. |
| (c) | Amount is stated in United States dollars unless otherwise noted. |
| (d) | Security or a portion of the security was pledged to cover margin requirements for futures contracts. At period end, the value of securities pledged amounted to $1,914,739. |
| (e) | Affiliated fund that is generally available only to investment companies and other accounts managed by Fidelity Investments. The rate quoted is the annualized seven-day yield of the fund at period end. A complete unaudited listing of the fund's holdings as of its most recent quarter end is available upon request. In addition, each Fidelity Central Fund's financial statements, which are not covered by the Fund's Report of Independent Registered Public Accounting Firm, are available on the SEC's website or upon request. |
| (f) | Investment made with cash collateral received from securities on loan. |
Affiliated Central Funds
Fiscal year to date information regarding the Fund's investments in Fidelity Central Funds, including the ownership percentage, is presented below.
| Affiliate | Value, beginning of period ($) | Purchases ($) | Sales Proceeds ($) | Dividend Income ($) | Realized Gain (loss) ($) | Change in Unrealized appreciation (depreciation) ($) | Value, end of period ($) | % ownership, end of period |
| Fidelity Cash Central Fund 5.38% | 80,138 | 777,807,931 | 732,752,792 | 619,486 | 36 | - | 45,135,313 | 0.1% |
| Fidelity Securities Lending Cash Central Fund 5.38% | 6,142,650 | 35,032,030 | 35,963,305 | 1,078 | - | - | 5,211,375 | 0.0% |
| Total | 6,222,788 | 812,839,961 | 768,716,097 | 620,564 | 36 | - | 50,346,688 | |
| | | | | | | | | |
Amounts in the dividend income column in the above table include any capital gain distributions from underlying funds, which are presented in the corresponding line item in the Statement of Operations, if applicable.
Amounts in the dividend income column for Fidelity Securities Lending Cash Central Fund represents the income earned on investing cash collateral, less rebates paid to borrowers and any lending agent fees associated with the loan, plus any premium payments received for lending certain types of securities.
Amounts included in the purchases and sales proceeds columns may include in-kind transactions, if applicable.
Investment Valuation
The following is a summary of the inputs used, as of June 30, 2024, involving the Fund's assets and liabilities carried at fair value. The inputs or methodology used for valuing securities may not be an indication of the risk associated with investing in those securities. For more information on valuation inputs, and their aggregation into the levels used below, please refer to the Investment Valuation section in the accompanying Notes to Financial Statements.
| Valuation Inputs at Reporting Date: |
| Description | Total ($) | Level 1 ($) | Level 2 ($) | Level 3 ($) |
Investments in Securities: | | | | |
|
| Equities: | | | | |
Communication Services | 359,173,123 | 359,173,123 | - | - |
Consumer Discretionary | 356,521,401 | 356,521,401 | - | - |
Consumer Staples | 43,664,085 | 43,664,085 | - | - |
Energy | 29,088,701 | 29,088,701 | - | - |
Financials | 160,025,604 | 160,025,604 | - | - |
Health Care | 211,251,618 | 211,251,618 | - | - |
Industrials | 145,638,161 | 145,638,161 | - | - |
Information Technology | 1,317,830,786 | 1,317,830,786 | - | - |
Materials | 34,146,154 | 34,146,154 | - | - |
Utilities | 13,591,804 | 13,591,804 | - | - |
|
| U.S. Government and Government Agency Obligations | 3,085,688 | - | 3,085,688 | - |
|
| Money Market Funds | 50,346,688 | 50,346,688 | - | - |
| Total Investments in Securities: | 2,724,363,813 | 2,721,278,125 | 3,085,688 | - |
Derivative Instruments: Assets | | | | |
Futures Contracts | 35,219 | 35,219 | - | - |
| Total Assets | 35,219 | 35,219 | - | - |
| Total Derivative Instruments: | 35,219 | 35,219 | - | - |
Value of Derivative Instruments
The following table is a summary of the Fund's value of derivative instruments by primary risk exposure as of June 30, 2024. For additional information on derivative instruments, please refer to the Derivative Instruments section in the accompanying Notes to Financial Statements.
Primary Risk Exposure / Derivative Type | Value |
| Asset ($) | Liability ($) |
| Equity Risk | | |
Futures Contracts (a) | 35,219 | 0 |
| Total Equity Risk | 35,219 | 0 |
| Total Value of Derivatives | 35,219 | 0 |
(a)Reflects gross cumulative appreciation (depreciation) on futures contracts as presented in the Schedule of Investments. In the Statement of Assets and Liabilities, the period end daily variation margin is included in receivable or payable for daily variation margin on futures contracts, and the net cumulative appreciation (depreciation) is included in Total accumulated earnings (loss).
Fidelity® Enhanced Large Cap Growth ETF
Financial Statements
| Statement of Assets and Liabilities |
| | | | June 30, 2024 |
| | | | | |
| Assets | | | | |
| Investment in securities, at value (including securities loaned of $5,108,793) - See accompanying schedule: | | | | |
Unaffiliated issuers (cost $1,407,348,379) | $ | 2,674,017,125 | | |
Fidelity Central Funds (cost $50,346,688) | | 50,346,688 | | |
| | | | | |
| | | | | |
| Total Investment in Securities (cost $1,457,695,067) | | | $ | 2,724,363,813 |
| Receivable for investments sold | | | | 73,713,224 |
| Receivable for fund shares sold | | | | 12,907,347 |
| Dividends receivable | | | | 290,167 |
| Distributions receivable from Fidelity Central Funds | | | | 123,239 |
| Receivable from investment adviser for expense reductions | | | | 26,209 |
Total assets | | | | 2,811,423,999 |
| Liabilities | | | | |
| Payable for investments purchased | $ | 92,933,843 | | |
| Payable for fund shares redeemed | | 25,814,694 | | |
| Accrued management fee | | 394,853 | | |
| Payable for daily variation margin on futures contracts | | 83,216 | | |
| Other payables and accrued expenses | | 80,815 | | |
| Collateral on securities loaned | | 5,211,375 | | |
| Total liabilities | | | | 124,518,796 |
| Net Assets | | | $ | 2,686,905,203 |
| Net Assets consist of: | | | | |
| Paid in capital | | | $ | 1,422,414,082 |
| Total accumulated earnings (loss) | | | | 1,264,491,121 |
| Net Assets | | | $ | 2,686,905,203 |
Net Asset Value, offering price and redemption price per share ($2,686,905,203 ÷ 83,318,998 shares) | | | $ | 32.25 |
| Statement of Operations |
| | | | Ten months ended June 30, 2024 | | Year ended August 31, 2023 |
| Investment Income | | | | | | |
| Dividends | | | $ | 15,140,478 | | 20,177,977 |
| Interest | | | | 93,808 | | 93,311 |
| Income from Fidelity Central Funds (including $1,078 and $2,853 from security lending) | | | | 620,564 | | 2,054,934 |
| Total income | | | | 15,854,850 | | 22,326,222 |
| Expenses | | | | | | |
| Management fee | | | $ | 4,395,441 | | 7,896,319 |
| Independent trustees' fees and expenses | | | | 9,124 | | 10,270 |
| Interest | | | | 19,184 | | 41,394 |
| Miscellaneous | | | | 113,164 | | 35,374 |
| Total expenses before reductions | | | | 4,536,913 | | 7,983,357 |
| Expense reductions | | | | (26,573) | | (2,918) |
| Total expenses after reductions | | | | 4,510,340 | | 7,980,439 |
| Net Investment income (loss) | | | | 11,344,510 | | 14,345,783 |
| Realized and Unrealized Gain (Loss) | | | | | | |
| Net realized gain (loss) on: | | | | | | |
| Investment Securities: | | | | | | |
| Unaffiliated issuers | | | | 1,295,100 | | 29,491,248 |
| Redemptions in-kind | | | | 253,118,501 | | 14,287,867 |
| Fidelity Central Funds | | | | 36 | | - |
| Foreign currency transactions | | | | (628) | | - |
| Futures contracts | | | | 6,155,143 | | 2,639,291 |
| Total net realized gain (loss) | | | | 260,568,152 | | 46,418,406 |
| Change in net unrealized appreciation (depreciation) on: | | | | | | |
| Investment Securities: | | | | | | |
| Unaffiliated issuers | | | | 368,557,596 | | 358,359,152 |
| Futures contracts | | | | 35,009 | | 380,401 |
| Total change in net unrealized appreciation (depreciation) | | | | 368,592,605 | | 358,739,553 |
| Net gain (loss) | | | | 629,160,757 | | 405,157,959 |
| Net increase (decrease) in net assets resulting from operations | | | $ | 640,505,267 | | 419,503,742 |
See Organization and Merger information note regarding reorganization from mutual fund to exchange traded fund.
| Statement of Changes in Net Assets |
| | | |
| | Ten months ended June 30, 2024 | | Year ended August 31, 2023 | | Year ended August 31, 2022 |
| Increase (Decrease) in Net Assets | | | | | | |
| Operations | | | | | | |
| Net investment income (loss) | $ | 11,344,510 | $ | 14,345,783 | $ | 8,691,799 |
| Net realized gain (loss) | | 260,568,152 | | 46,418,406 | | (8,165,601) |
| Change in net unrealized appreciation (depreciation) | | 368,592,605 | | 358,739,553 | | (299,422,252) |
| Net increase (decrease) in net assets resulting from operations | | 640,505,267 | | 419,503,742 | | (298,896,054) |
| Distributions to shareholders | | (21,679,293) | | (10,050,462) | | (234,756,175) |
| | | | | | | |
| Share transactions | | | | | | |
| Proceeds from sales of shares | | 1,183,970,024 | | 1,206,466,982 | | 431,325,162 |
| Reinvestment of distributions | | 11,773,276 | | 8,894,596 | | 220,826,073 |
| Cost of shares redeemed | | (1,496,108,622) | | (882,002,420) | | (277,612,906) |
| | | | | | | |
Net increase (decrease) in net assets resulting from share transactions | | (300,365,322) | | 333,359,158 | | 374,538,329 |
| Total increase (decrease) in net assets | | 318,460,652 | | 742,812,438 | | (159,113,900) |
| | | | | | | |
| Net Assets | | | | | | |
| Beginning of period | | 2,368,444,551 | | 1,625,632,113 | | 1,784,746,013 |
| End of period | $ | 2,686,905,203 | $ | 2,368,444,551 | $ | 1,625,632,113 |
| | | | | | | |
| Other Information | | | | | | |
| Shares | | | | | | |
| Sold | | 41,974,709 | | 56,403,387 | | 19,038,860 |
| Issued in reinvestment of distributions | | 488,957 | | 467,755 | | 8,757,552 |
| Redeemed | | (55,500,883) | | (39,305,302) | | (11,711,412) |
| Net increase (decrease) | | (13,037,217) | | 17,565,840 | | 16,085,000 |
| | | | | | | |
See Organization and Merger information note regarding reorganization from mutual fund to exchange traded fund.
Share activity is further described in Organization and Merger information notes, amounts have been adjusted to reflect the impact of the change in capital structure associated with the merger. All financial information prior to the merger is that of the Predecessor Fund.
Financial Highlights
Fidelity® Enhanced Large Cap Growth ETF |
| |
| Years ended June 30, | | 2024 A,B | | 2023 B,C | | 2022 B,C | | 2021 B,C | | 2020 B,C | | 2019 B,C |
Selected Per-Share Data | | | | | | | | | | | | |
| Net asset value, beginning of period | $ | 24.58 | $ | 20.64 | $ | 28.47 | $ | 23.10 | $ | 16.82 | $ | 17.94 |
| Income from Investment Operations | | | | | | | | | | | | |
Net investment income (loss) D,E | | .14 | | .15 | | .12 | | .12 | | .13 | | .17 |
| Net realized and unrealized gain (loss) | | 7.78 | | 3.91 | | (4.19) | | 6.34 | | 6.72 | | (.13) |
| Total from investment operations | | 7.92 | | 4.06 | | (4.07) | | 6.46 | | 6.85 | | .04 |
| Distributions from net investment income | | (.24) | | (.12) | | (.12) | | (.13) | | (.15) | | (.20) |
| Distributions from net realized gain | | (.01) | | - | | (3.64) | | (.96) | | (.42) | | (.96) |
| Total distributions | | (.25) | | (.12) | | (3.76) | | (1.09) | | (.57) | | (1.16) |
| Net asset value, end of period | $ | 32.25 | $ | 24.58 | $ | 20.64 | $ | 28.47 | $ | 23.10 | $ | 16.82 |
Total Return F,G,H | | | | 19.85% | | (16.70)% | | 29.08% | | 41.73% | | 1.28% |
Ratios to Average Net Assets E,I,J | | | | | | | | | | | | |
| Expenses before reductions | | .24% K,L | | .39% | | .39% | | .39% | | .39% | | .39% |
| Expenses net of fee waivers, if any | | | | .39% | | .39% | | .39% | | .39% | | .39% |
| Expenses net of all reductions | | .24% K,L | | .39% | | .39% | | .39% | | .39% | | .39% |
| Net investment income (loss) | | .60% K,L | | .71% | | .52% | | .47% | | .74% | | 1.07% |
| Supplemental Data | | | | | | | | | | | | |
| Net assets, end of period (000 omitted) | $ | 2,686,905 | $ | 2,368,445 | $ | 1,625,632 | $ | 1,784,746 | $ | 1,417,537 | $ | 1,106,497 |
Portfolio turnover rate M | | | | 108% | | 101% | | 84% | | 69% | | 85% |
AFor the ten month period ended June 30. The Fund changed its fiscal year end from August 31 to June 30, effective March 1, 2024.
BAs further described in Organization and Merger information notes, per share amounts have been adjusted to reflect the impact of the change in capital structure associated with the merger. All financial information prior to the merger is that of the Predecessor Fund.
CFor the year ended August 31.
DCalculated based on average shares outstanding during the period.
ENet investment income (loss) is affected by the timing of the declaration of dividends by any underlying mutual funds or exchange-traded funds (ETFs). Net investment income (loss) of any mutual funds or ETFs is not included in the Fund's net investment income (loss) ratio.
FBased on net asset value.
GTotal returns for periods of less than one year are not annualized.
HTotal returns would have been lower if certain expenses had not been reduced during the applicable periods shown.
IFees and expenses of any underlying mutual funds or exchange-traded funds (ETFs) are not included in the Fund's expense ratio. The Fund indirectly bears its proportionate share of these expenses. For additional expense information related to investments in Fidelity Central Funds, please refer to the "Investments in Fidelity Central Funds" note found in the Notes to Financial Statements section of the most recent Annual or Semi-Annual report.
JExpense ratios reflect operating expenses of the class. Expenses before reductions do not reflect amounts reimbursed, waived, or reduced through arrangements with the investment adviser, brokerage services, or other offset arrangements, if applicable, and do not represent the amount paid by the class during periods when reimbursements, waivers or reductions occur.
KAnnualized.
LProxy expenses are not annualized.
MAmount does not include the portfolio activity of any underlying mutual funds or exchange-traded funds (ETFs).
NPortfolio turnover rate excludes securities received or delivered in-kind.
Fidelity® Enhanced Large Cap Value ETF
Schedule of Investments June 30, 2024
Showing Percentage of Net Assets
| Common Stocks - 99.3% |
| | | Shares | Value ($) |
| COMMUNICATION SERVICES - 4.5% | | | |
| Diversified Telecommunication Services - 1.8% | | | |
| AT&T, Inc. | | 922,537 | 17,629,682 |
| Verizon Communications, Inc. | | 371,660 | 15,327,258 |
| | | | 32,956,940 |
| Entertainment - 1.5% | | | |
| Electronic Arts, Inc. | | 38,869 | 5,415,618 |
| Netflix, Inc. (a) | | 4,446 | 3,000,516 |
| Playtika Holding Corp. | | 126,786 | 997,806 |
| Spotify Technology SA (a) | | 11,227 | 3,522,920 |
| The Walt Disney Co. | | 140,405 | 13,940,812 |
| | | | 26,877,672 |
| Interactive Media & Services - 0.3% | | | |
| Alphabet, Inc.: | | | |
| Class A | | 758 | 138,070 |
| Class C | | 2,685 | 492,483 |
| Meta Platforms, Inc. Class A | | 7,477 | 3,770,053 |
| | | | 4,400,606 |
| Media - 0.9% | | | |
| Comcast Corp. Class A | | 399,899 | 15,660,045 |
TOTAL COMMUNICATION SERVICES | | | 79,895,263 |
| CONSUMER DISCRETIONARY - 5.6% | | | |
| Automobile Components - 0.0% | | | |
| BorgWarner, Inc. | | 12,278 | 395,843 |
| Automobiles - 0.6% | | | |
| Ford Motor Co. | | 852,873 | 10,695,027 |
| Broadline Retail - 0.2% | | | |
| eBay, Inc. | | 51,425 | 2,762,551 |
| Distributors - 0.1% | | | |
| Genuine Parts Co. | | 19,172 | 2,651,871 |
| Diversified Consumer Services - 0.2% | | | |
| ADT, Inc. (b) | | 577,961 | 4,392,504 |
| Hotels, Restaurants & Leisure - 2.0% | | | |
| Airbnb, Inc. Class A (a) | | 8,163 | 1,237,756 |
| Chipotle Mexican Grill, Inc. (a) | | 143,450 | 8,987,143 |
| International Game Technology PLC | | 423,461 | 8,664,012 |
| Light & Wonder, Inc. Class A (a) | | 36,376 | 3,815,115 |
| McDonald's Corp. | | 31,943 | 8,140,354 |
| MGM Resorts International (a) | | 74,580 | 3,314,335 |
| Norwegian Cruise Line Holdings Ltd. (a) | | 50,153 | 942,375 |
| Wendy's Co. | | 1,951 | 33,089 |
| | | | 35,134,179 |
| Household Durables - 1.8% | | | |
| KB Home | | 28,175 | 1,977,322 |
| Lennar Corp.: | | | |
| Class A | | 44,577 | 6,680,755 |
| Class B | | 1,241 | 173,033 |
| Taylor Morrison Home Corp. (a) | | 70,722 | 3,920,828 |
| Toll Brothers, Inc. (b) | | 70,795 | 8,154,168 |
| TopBuild Corp. (a) | | 11,848 | 4,564,679 |
| TRI Pointe Homes, Inc. (a) | | 128,006 | 4,768,224 |
| Whirlpool Corp. | | 21,265 | 2,173,283 |
| | | | 32,412,292 |
| Leisure Products - 0.0% | | | |
| Peloton Interactive, Inc. Class A (a)(b) | | 227,129 | 767,696 |
| Specialty Retail - 0.6% | | | |
| Carvana Co. Class A (a) | | 33,393 | 4,298,347 |
| Gap, Inc. | | 123,551 | 2,951,633 |
| Lowe's Companies, Inc. | | 3,544 | 781,310 |
| Petco Health & Wellness Co., Inc. Class A (a)(b) | | 122,636 | 463,564 |
| Ross Stores, Inc. | | 10,622 | 1,543,589 |
| The Home Depot, Inc. | | 744 | 256,115 |
| Ulta Beauty, Inc. (a) | | 141 | 54,408 |
| | | | 10,348,966 |
| Textiles, Apparel & Luxury Goods - 0.1% | | | |
| Tapestry, Inc. | | 34,062 | 1,457,513 |
TOTAL CONSUMER DISCRETIONARY | | | 101,018,442 |
| CONSUMER STAPLES - 7.4% | | | |
| Beverages - 1.2% | | | |
| Boston Beer Co., Inc. Class A (a) | | 12,933 | 3,945,212 |
| Keurig Dr. Pepper, Inc. | | 124,970 | 4,173,998 |
| Molson Coors Beverage Co. Class B | | 48,040 | 2,441,873 |
| The Coca-Cola Co. | | 167,146 | 10,638,843 |
| | | | 21,199,926 |
| Consumer Staples Distribution & Retail - 2.0% | | | |
| Costco Wholesale Corp. | | 1,118 | 950,289 |
| Kroger Co. | | 105,289 | 5,257,080 |
| Walmart, Inc. | | 438,443 | 29,686,976 |
| | | | 35,894,345 |
| Food Products - 0.9% | | | |
| Archer Daniels Midland Co. | | 67,982 | 4,109,512 |
| General Mills, Inc. | | 38,104 | 2,410,459 |
| Kellanova | | 33,042 | 1,905,863 |
| Post Holdings, Inc. (a) | | 380 | 39,581 |
| Seaboard Corp. | | 109 | 344,521 |
| The Kraft Heinz Co. | | 210,790 | 6,791,654 |
| | | | 15,601,590 |
| Household Products - 2.0% | | | |
| Colgate-Palmolive Co. | | 77,106 | 7,482,366 |
| Kimberly-Clark Corp. | | 18,580 | 2,567,756 |
| Procter & Gamble Co. | | 148,777 | 24,536,303 |
| Spectrum Brands Holdings, Inc. | | 9,516 | 817,710 |
| The Clorox Co. | | 8,420 | 1,149,077 |
| | | | 36,553,212 |
| Tobacco - 1.3% | | | |
| Altria Group, Inc. | | 141,982 | 6,467,280 |
| Philip Morris International, Inc. | | 157,949 | 16,004,972 |
| | | | 22,472,252 |
TOTAL CONSUMER STAPLES | | | 131,721,325 |
| ENERGY - 6.7% | | | |
| Energy Equipment & Services - 0.6% | | | |
| Baker Hughes Co. Class A | | 291,900 | 10,266,123 |
| Oil, Gas & Consumable Fuels - 6.1% | | | |
| California Resources Corp. (b) | | 19,448 | 1,035,023 |
| Chevron Corp. | | 84,694 | 13,247,835 |
| ConocoPhillips Co. | | 167,341 | 19,140,464 |
| Coterra Energy, Inc. | | 36,875 | 983,456 |
| Devon Energy Corp. | | 40,412 | 1,915,529 |
| Diamondback Energy, Inc. | | 16,338 | 3,270,704 |
| EOG Resources, Inc. | | 87,313 | 10,990,087 |
| Exxon Mobil Corp. | | 429,006 | 49,387,171 |
| Kinder Morgan, Inc. | | 396,632 | 7,881,078 |
| Marathon Petroleum Corp. | | 6,744 | 1,169,949 |
| Murphy Oil Corp. | | 4,747 | 195,766 |
| Valero Energy Corp. | | 2,835 | 444,415 |
| | | | 109,661,477 |
TOTAL ENERGY | | | 119,927,600 |
| FINANCIALS - 22.3% | | | |
| Banks - 7.0% | | | |
| Bank of America Corp. | | 768,923 | 30,580,068 |
| Citigroup, Inc. | | 31,173 | 1,978,239 |
| Citizens Financial Group, Inc. | | 153,892 | 5,544,729 |
| Columbia Banking Systems, Inc. | | 140,746 | 2,799,438 |
| Commerce Bancshares, Inc. | | 31,994 | 1,784,625 |
| First Horizon National Corp. | | 39,727 | 626,495 |
| Hancock Whitney Corp. | | 31,708 | 1,516,594 |
| JPMorgan Chase & Co. | | 268,732 | 54,353,734 |
| KeyCorp | | 183,291 | 2,604,565 |
| PNC Financial Services Group, Inc. | | 30,935 | 4,809,774 |
| TFS Financial Corp. | | 15 | 189 |
| Truist Financial Corp. | | 102,308 | 3,974,666 |
| United Bankshares, Inc., West Virginia | | 2 | 65 |
| Wells Fargo & Co. | | 241,242 | 14,327,362 |
| Wintrust Financial Corp. | | 6,281 | 619,055 |
| | | | 125,519,598 |
| Capital Markets - 5.3% | | | |
| Bank of New York Mellon Corp. | | 222,625 | 13,333,011 |
| BlackRock, Inc. | | 3,699 | 2,912,297 |
| Charles Schwab Corp. | | 63,407 | 4,672,462 |
| CME Group, Inc. | | 51,150 | 10,056,090 |
| Coinbase Global, Inc. (a) | | 13,660 | 3,035,662 |
| Goldman Sachs Group, Inc. | | 39,552 | 17,890,161 |
| Intercontinental Exchange, Inc. | | 23,358 | 3,197,477 |
| Morgan Stanley | | 133,578 | 12,982,446 |
| NASDAQ, Inc. | | 43,978 | 2,650,114 |
| Northern Trust Corp. | | 5,463 | 458,783 |
| Raymond James Financial, Inc. | | 28,281 | 3,495,814 |
| Robinhood Markets, Inc. (a) | | 187,136 | 4,249,859 |
| S&P Global, Inc. | | 17,037 | 7,598,502 |
| State Street Corp. | | 13,840 | 1,024,160 |
| Stifel Financial Corp. | | 68,494 | 5,763,770 |
| Tradeweb Markets, Inc. Class A | | 16,533 | 1,752,498 |
| Virtu Financial, Inc. Class A | | 37,705 | 846,477 |
| | | | 95,919,583 |
| Consumer Finance - 1.4% | | | |
| American Express Co. | | 61,802 | 14,310,253 |
| Capital One Financial Corp. | | 51,309 | 7,103,731 |
| Discover Financial Services | | 6,079 | 795,194 |
| Synchrony Financial | | 65,201 | 3,076,835 |
| | | | 25,286,013 |
| Financial Services - 4.6% | | | |
| Berkshire Hathaway, Inc. Class B (a) | | 164,255 | 66,818,923 |
| Block, Inc. Class A (a) | | 64,518 | 4,160,766 |
| Enact Holdings, Inc. | | 8,261 | 253,282 |
| Euronet Worldwide, Inc. (a) | | 9,590 | 992,565 |
| MasterCard, Inc. Class A | | 18,684 | 8,242,633 |
| PayPal Holdings, Inc. (a) | | 32,893 | 1,908,781 |
| | | | 82,376,950 |
| Insurance - 4.0% | | | |
| Allstate Corp. | | 33,920 | 5,415,667 |
| American Financial Group, Inc. | | 2 | 246 |
| Aon PLC | | 8,768 | 2,574,109 |
| Assurant, Inc. | | 7,995 | 1,329,169 |
| Assured Guaranty Ltd. | | 6,180 | 476,787 |
| Axis Capital Holdings Ltd. | | 35,996 | 2,543,117 |
| Brown & Brown, Inc. | | 1,256 | 112,299 |
| Chubb Ltd. | | 32,007 | 8,164,346 |
| Cincinnati Financial Corp. | | 36,682 | 4,332,144 |
| Globe Life, Inc. | | 46,919 | 3,860,495 |
| Hartford Financial Services Group, Inc. | | 11,648 | 1,171,090 |
| Loews Corp. | | 82,098 | 6,136,005 |
| Marsh & McLennan Companies, Inc. | | 18,787 | 3,958,797 |
| MetLife, Inc. | | 85,243 | 5,983,206 |
| Progressive Corp. | | 34,544 | 7,175,134 |
| Reinsurance Group of America, Inc. | | 2,577 | 528,981 |
| The Travelers Companies, Inc. | | 41,189 | 8,375,371 |
| Unum Group | | 104,279 | 5,329,700 |
| Willis Towers Watson PLC | | 14,313 | 3,752,010 |
| | | | 71,218,673 |
TOTAL FINANCIALS | | | 400,320,817 |
| HEALTH CARE - 14.3% | | | |
| Biotechnology - 2.5% | | | |
| AbbVie, Inc. | | 34,967 | 5,997,540 |
| Alkermes PLC (a)(b) | | 98,669 | 2,377,923 |
| Amgen, Inc. | | 5,698 | 1,780,340 |
| Biogen, Inc. (a) | | 38,551 | 8,936,893 |
| BioMarin Pharmaceutical, Inc. (a) | | 34,244 | 2,819,309 |
| Gilead Sciences, Inc. | | 240,193 | 16,479,642 |
| Grail, Inc. | | 1,184 | 18,198 |
| Incyte Corp. (a) | | 116,054 | 7,035,193 |
| | | | 45,445,038 |
| Health Care Equipment & Supplies - 3.1% | | | |
| Abbott Laboratories | | 54,560 | 5,669,330 |
| Baxter International, Inc. | | 66,246 | 2,215,929 |
| Becton, Dickinson & Co. | | 36,453 | 8,519,431 |
| Boston Scientific Corp. (a) | | 53,342 | 4,107,867 |
| Edwards Lifesciences Corp. (a) | | 45,696 | 4,220,940 |
| GE Healthcare Technologies, Inc. | | 37,779 | 2,943,740 |
| Hologic, Inc. (a) | | 72,359 | 5,372,656 |
| Insulet Corp. (a) | | 4 | 807 |
| Integra LifeSciences Holdings Corp. (a) | | 56,510 | 1,646,701 |
| Medtronic PLC | | 90,585 | 7,129,945 |
| Solventum Corp. | | 34,498 | 1,824,254 |
| Stryker Corp. | | 13,236 | 4,503,549 |
| Zimmer Biomet Holdings, Inc. | | 65,956 | 7,158,205 |
| | | | 55,313,354 |
| Health Care Providers & Services - 4.0% | | | |
| Cencora, Inc. | | 2,937 | 661,706 |
| Centene Corp. (a) | | 102,227 | 6,777,650 |
| Cigna Group | | 37,357 | 12,349,103 |
| CVS Health Corp. | | 68,928 | 4,070,888 |
| Elevance Health, Inc. | | 31,726 | 17,191,050 |
| Guardant Health, Inc. (a) | | 20,455 | 590,740 |
| Humana, Inc. | | 1,970 | 736,091 |
| McKesson Corp. | | 9,536 | 5,569,405 |
| UnitedHealth Group, Inc. | | 45,658 | 23,251,793 |
| | | | 71,198,426 |
| Health Care Technology - 0.1% | | | |
| Teladoc Health, Inc. (a)(b) | | 144,212 | 1,410,393 |
| Life Sciences Tools & Services - 0.8% | | | |
| Bio-Rad Laboratories, Inc. Class A (a) | | 8,640 | 2,359,670 |
| Danaher Corp. | | 18,203 | 4,548,020 |
| Illumina, Inc. (a) | | 7,104 | 741,516 |
| Thermo Fisher Scientific, Inc. | | 13,174 | 7,285,222 |
| | | | 14,934,428 |
| Pharmaceuticals - 3.8% | | | |
| Bristol-Myers Squibb Co. | | 385,664 | 16,016,626 |
| Elanco Animal Health, Inc. (a) | | 51,802 | 747,503 |
| Johnson & Johnson | | 149,542 | 21,857,059 |
| Merck & Co., Inc. | | 75,156 | 9,304,313 |
| Organon & Co. | | 31,260 | 647,082 |
| Pfizer, Inc. | | 722,266 | 20,209,003 |
| | | | 68,781,586 |
TOTAL HEALTH CARE | | | 257,083,225 |
| INDUSTRIALS - 16.3% | | | |
| Aerospace & Defense - 3.4% | | | |
| Curtiss-Wright Corp. | | 1,014 | 274,774 |
| General Dynamics Corp. | | 16,151 | 4,686,051 |
| General Electric Co. | | 82,087 | 13,049,370 |
| Hexcel Corp. | | 9,583 | 598,458 |
| L3Harris Technologies, Inc. | | 33,419 | 7,505,239 |
| Lockheed Martin Corp. | | 14,909 | 6,963,994 |
| Northrop Grumman Corp. | | 20,003 | 8,720,308 |
| RTX Corp. | | 75,165 | 7,545,814 |
| Textron, Inc. | | 76,629 | 6,579,366 |
| Woodward, Inc. | | 24,842 | 4,331,948 |
| | | | 60,255,322 |
| Building Products - 0.8% | | | |
| A.O. Smith Corp. | | 2,725 | 222,851 |
| Builders FirstSource, Inc. (a) | | 5,391 | 746,168 |
| Owens Corning | | 44,185 | 7,675,818 |
| Trane Technologies PLC | | 15,544 | 5,112,888 |
| | | | 13,757,725 |
| Commercial Services & Supplies - 2.0% | | | |
| Cintas Corp. | | 14,048 | 9,837,252 |
| MSA Safety, Inc. | | 12,025 | 2,256,972 |
| Republic Services, Inc. | | 64,286 | 12,493,341 |
| Tetra Tech, Inc. (b) | | 16,617 | 3,397,844 |
| Veralto Corp. | | 8,461 | 807,772 |
| Vestis Corp. | | 179,459 | 2,194,784 |
| Waste Management, Inc. | | 22,684 | 4,839,405 |
| | | | 35,827,370 |
| Construction & Engineering - 0.1% | | | |
| Valmont Industries, Inc. | | 10,036 | 2,754,380 |
| Electrical Equipment - 2.1% | | | |
| AMETEK, Inc. | | 30,354 | 5,060,315 |
| Eaton Corp. PLC | | 45,810 | 14,363,726 |
| Emerson Electric Co. | | 133,623 | 14,719,910 |
| EnerSys | | 10,500 | 1,086,960 |
| GE Vernova LLC | | 17,349 | 2,975,527 |
| | | | 38,206,438 |
| Ground Transportation - 1.8% | | | |
| CSX Corp. | | 204,329 | 6,834,805 |
| Norfolk Southern Corp. | | 43,613 | 9,363,275 |
| Union Pacific Corp. | | 68,227 | 15,437,041 |
| | | | 31,635,121 |
| Industrial Conglomerates - 0.8% | | | |
| 3M Co. | | 92,221 | 9,424,064 |
| Honeywell International, Inc. | | 25,924 | 5,535,811 |
| | | | 14,959,875 |
| Machinery - 2.9% | | | |
| AGCO Corp. | | 20,163 | 1,973,554 |
| Caterpillar, Inc. | | 5,078 | 1,691,482 |
| CNH Industrial NV | | 144,523 | 1,464,018 |
| Cummins, Inc. | | 37,574 | 10,405,368 |
| Donaldson Co., Inc. | | 19,375 | 1,386,475 |
| Flowserve Corp. | | 74,582 | 3,587,394 |
| Fortive Corp. | | 18,936 | 1,403,158 |
| Gates Industrial Corp. PLC (a) | | 37,600 | 594,456 |
| Illinois Tool Works, Inc. | | 11,717 | 2,776,460 |
| ITT, Inc. | | 23,776 | 3,071,384 |
| Oshkosh Corp. | | 47,810 | 5,173,042 |
| PACCAR, Inc. | | 69,984 | 7,204,153 |
| Westinghouse Air Brake Tech Co. | | 70,054 | 11,072,035 |
| | | | 51,802,979 |
| Marine Transportation - 0.1% | | | |
| Kirby Corp. (a) | | 1,620 | 193,963 |
| Matson, Inc. | | 8,842 | 1,158,037 |
| | | | 1,352,000 |
| Passenger Airlines - 0.1% | | | |
| SkyWest, Inc. (a) | | 16,037 | 1,316,157 |
| United Airlines Holdings, Inc. (a) | | 27,341 | 1,330,413 |
| | | | 2,646,570 |
| Professional Services - 2.1% | | | |
| Automatic Data Processing, Inc. | | 7,013 | 1,673,933 |
| Booz Allen Hamilton Holding Corp. Class A | | 14,200 | 2,185,380 |
| CACI International, Inc. (a) | | 24,084 | 10,359,251 |
| Leidos Holdings, Inc. | | 62,506 | 9,118,375 |
| SS&C Technologies Holdings, Inc. | | 158,304 | 9,920,912 |
| Verisk Analytics, Inc. | | 14,218 | 3,832,462 |
| | | | 37,090,313 |
| Trading Companies & Distributors - 0.1% | | | |
| Applied Industrial Technologies, Inc. | | 1,199 | 232,606 |
| Boise Cascade Co. (b) | | 7,223 | 861,126 |
| | | | 1,093,732 |
TOTAL INDUSTRIALS | | | 291,381,825 |
| INFORMATION TECHNOLOGY - 10.8% | | | |
| Communications Equipment - 0.5% | | | |
| Cisco Systems, Inc. | | 179,323 | 8,519,636 |
| Extreme Networks, Inc. (a) | | 82,024 | 1,103,223 |
| | | | 9,622,859 |
| Electronic Equipment, Instruments & Components - 0.8% | | | |
| Avnet, Inc. | | 20,313 | 1,045,916 |
| Belden, Inc. | | 12,348 | 1,158,242 |
| Itron, Inc. (a)(b) | | 13,021 | 1,288,558 |
| TD SYNNEX Corp. | | 24,684 | 2,848,534 |
| Trimble, Inc. (a) | | 124,763 | 6,976,747 |
| | | | 13,317,997 |
| IT Services - 1.1% | | | |
| Accenture PLC Class A | | 18,852 | 5,719,885 |
| IBM Corp. | | 28,075 | 4,855,571 |
| Kyndryl Holdings, Inc. (a) | | 64,050 | 1,685,156 |
| Okta, Inc. (a) | | 6,321 | 591,709 |
| Twilio, Inc. Class A (a) | | 129,476 | 7,355,532 |
| | | | 20,207,853 |
| Semiconductors & Semiconductor Equipment - 4.7% | | | |
| Advanced Micro Devices, Inc. (a) | | 22,577 | 3,662,215 |
| Analog Devices, Inc. | | 3,430 | 782,932 |
| Applied Materials, Inc. | | 43,165 | 10,186,508 |
| Broadcom, Inc. | | 1,555 | 2,496,599 |
| Cirrus Logic, Inc. (a) | | 36,603 | 4,672,739 |
| Intel Corp. | | 640,929 | 19,849,571 |
| Micron Technology, Inc. | | 122,456 | 16,106,638 |
| NVIDIA Corp. | | 64,354 | 7,950,293 |
| Qorvo, Inc. (a) | | 40,404 | 4,688,480 |
| Qualcomm, Inc. | | 54,799 | 10,914,865 |
| Texas Instruments, Inc. | | 15,485 | 3,012,297 |
| | | | 84,323,137 |
| Software - 2.9% | | | |
| Adobe, Inc. (a) | | 16,971 | 9,428,069 |
| ANSYS, Inc. (a) | | 1,173 | 377,120 |
| DocuSign, Inc. (a) | | 77,877 | 4,166,420 |
| Dropbox, Inc. Class A (a) | | 428,899 | 9,637,361 |
| MicroStrategy, Inc. Class A (a) | | 543 | 747,972 |
| NCR Voyix Corp. (a) | | 18,277 | 225,721 |
| Oracle Corp. | | 48,197 | 6,805,416 |
| Pegasystems, Inc. | | 20,020 | 1,211,811 |
| Salesforce, Inc. | | 18,371 | 4,723,184 |
| SolarWinds, Inc. | | 27,372 | 329,833 |
| Teradata Corp. (a) | | 205,937 | 7,117,183 |
| Workday, Inc. Class A (a) | | 4,626 | 1,034,189 |
| Zoom Video Communications, Inc. Class A (a) | | 99,445 | 5,886,150 |
| | | | 51,690,429 |
| Technology Hardware, Storage & Peripherals - 0.8% | | | |
| Hewlett Packard Enterprise Co. | | 303,300 | 6,420,861 |
| NetApp, Inc. | | 19,802 | 2,550,498 |
| Western Digital Corp. (a) | | 73,526 | 5,571,065 |
| | | | 14,542,424 |
TOTAL INFORMATION TECHNOLOGY | | | 193,704,699 |
| MATERIALS - 4.4% | | | |
| Chemicals - 2.1% | | | |
| Corteva, Inc. | | 102,897 | 5,550,264 |
| DuPont de Nemours, Inc. | | 116,555 | 9,381,512 |
| Eastman Chemical Co. | | 28,110 | 2,753,937 |
| Ecolab, Inc. | | 43,297 | 10,304,686 |
| Linde PLC | | 20,617 | 9,046,946 |
| | | | 37,037,345 |
| Construction Materials - 0.6% | | | |
| Vulcan Materials Co. | | 41,295 | 10,269,241 |
| Containers & Packaging - 0.4% | | | |
| Ardagh Metal Packaging SA (b) | | 98,967 | 336,488 |
| Crown Holdings, Inc. | | 23,639 | 1,758,505 |
| Sealed Air Corp. | | 142,668 | 4,963,420 |
| | | | 7,058,413 |
| Metals & Mining - 1.0% | | | |
| Hecla Mining Co. | | 26,413 | 128,103 |
| Newmont Corp. | | 63,914 | 2,676,079 |
| Nucor Corp. | | 59,950 | 9,476,896 |
| Steel Dynamics, Inc. | | 46,534 | 6,026,153 |
| Worthington Steel, Inc. | | 13,910 | 464,038 |
| | | | 18,771,269 |
| Paper & Forest Products - 0.3% | | | |
| Louisiana-Pacific Corp. | | 63,494 | 5,227,461 |
TOTAL MATERIALS | | | 78,363,729 |
| REAL ESTATE - 3.0% | | | |
| Equity Real Estate Investment Trusts (REITs) - 2.8% | | | |
| American Homes 4 Rent Class A | | 60,363 | 2,243,089 |
| Brixmor Property Group, Inc. | | 21,856 | 504,655 |
| Cousins Properties, Inc. | | 49 | 1,134 |
| Crown Castle, Inc. | | 121,829 | 11,902,693 |
| EPR Properties | | 8,078 | 339,114 |
| First Industrial Realty Trust, Inc. | | 46,319 | 2,200,616 |
| Gaming & Leisure Properties | | 20,229 | 914,553 |
| Healthpeak Properties, Inc. | | 132,695 | 2,600,822 |
| Invitation Homes, Inc. | | 310,756 | 11,153,033 |
| Park Hotels & Resorts, Inc. | | 39,015 | 584,445 |
| Public Storage Operating Co. | | 37,381 | 10,752,645 |
| STAG Industrial, Inc. | | 14,745 | 531,705 |
| UDR, Inc. | | 54,934 | 2,260,534 |
| VICI Properties, Inc. | | 154,041 | 4,411,734 |
| | | | 50,400,772 |
| Real Estate Management & Development - 0.2% | | | |
| Zillow Group, Inc.: | | | |
| Class A (a) | | 36,261 | 1,633,195 |
| Class C (a) | | 52,929 | 2,455,376 |
| | | | 4,088,571 |
TOTAL REAL ESTATE | | | 54,489,343 |
| UTILITIES - 4.0% | | | |
| Electric Utilities - 2.6% | | | |
| Constellation Energy Corp. | | 24,237 | 4,853,944 |
| Duke Energy Corp. | | 5,553 | 556,577 |
| Edison International | | 35,002 | 2,513,494 |
| Entergy Corp. | | 8,110 | 867,770 |
| Evergy, Inc. | | 85,880 | 4,549,064 |
| Eversource Energy | | 42,633 | 2,417,717 |
| Exelon Corp. | | 241,654 | 8,363,645 |
| NextEra Energy, Inc. | | 183,508 | 12,994,201 |
| Otter Tail Corp. (b) | | 6,390 | 559,700 |
| PG&E Corp. | | 213,173 | 3,722,001 |
| Southern Co. | | 10,089 | 782,604 |
| Xcel Energy, Inc. | | 72,899 | 3,893,536 |
| | | | 46,074,253 |
| Gas Utilities - 0.3% | | | |
| New Jersey Resources Corp. | | 31,855 | 1,361,483 |
| UGI Corp. | | 154,452 | 3,536,951 |
| | | | 4,898,434 |
| Independent Power and Renewable Electricity Producers - 0.5% | | | |
| Brookfield Renewable Corp. | | 8,197 | 232,631 |
| Clearway Energy, Inc.: | | | |
| Class A | | 14,502 | 328,615 |
| Class C | | 55,126 | 1,361,061 |
| The AES Corp. | | 336,528 | 5,912,797 |
| Vistra Corp. | | 21,566 | 1,854,245 |
| | | | 9,689,349 |
| Multi-Utilities - 0.6% | | | |
| Black Hills Corp. | | 31,493 | 1,712,589 |
| CenterPoint Energy, Inc. | | 167,029 | 5,174,558 |
| DTE Energy Co. | | 14,714 | 1,633,401 |
| Public Service Enterprise Group, Inc. | | 33,112 | 2,440,354 |
| | | | 10,960,902 |
TOTAL UTILITIES | | | 71,622,938 |
| TOTAL COMMON STOCKS (Cost $1,630,328,700) | | | 1,779,529,206 |
| | | | |
| U.S. Treasury Obligations - 0.1% |
| | | Principal Amount (c) | Value ($) |
U.S. Treasury Bills, yield at date of purchase 5.3% to 5.33% 7/18/24 to 9/26/24 (d) (Cost $1,810,891) | | 1,820,000 | 1,810,891 |
| | | | |
| Money Market Funds - 2.9% |
| | | Shares | Value ($) |
| Fidelity Cash Central Fund 5.38% (e) | | 43,109,975 | 43,118,597 |
| Fidelity Securities Lending Cash Central Fund 5.38% (e)(f) | | 9,989,303 | 9,990,301 |
| TOTAL MONEY MARKET FUNDS (Cost $53,108,898) | | | 53,108,898 |
| | | | |
| TOTAL INVESTMENT IN SECURITIES - 102.3% (Cost $1,685,248,489) | 1,834,448,995 |
NET OTHER ASSETS (LIABILITIES) - (2.3)% | (41,932,060) |
| NET ASSETS - 100.0% | 1,792,516,935 |
| | |
| Futures Contracts |
| | Number of contracts | Expiration Date | Notional Amount ($) | Value ($) | Unrealized Appreciation/ (Depreciation) ($) |
| Purchased | | | | | |
| | | | | | |
| Equity Index Contracts | | | | | |
| CME E-mini S&P 500 Index Contracts (United States) | 30 | Sep 2024 | 8,282,250 | 26,414 | 26,414 |
| | | | | | |
| The notional amount of futures purchased as a percentage of Net Assets is 0.5% |
Legend
| (b) | Security or a portion of the security is on loan at period end. |
| (c) | Amount is stated in United States dollars unless otherwise noted. |
| (d) | Security or a portion of the security was pledged to cover margin requirements for futures contracts. At period end, the value of securities pledged amounted to $1,810,891. |
| (e) | Affiliated fund that is generally available only to investment companies and other accounts managed by Fidelity Investments. The rate quoted is the annualized seven-day yield of the fund at period end. A complete unaudited listing of the fund's holdings as of its most recent quarter end is available upon request. In addition, each Fidelity Central Fund's financial statements, which are not covered by the Fund's Report of Independent Registered Public Accounting Firm, are available on the SEC's website or upon request. |
| (f) | Investment made with cash collateral received from securities on loan. |
Affiliated Central Funds
Fiscal year to date information regarding the Fund's investments in Fidelity Central Funds, including the ownership percentage, is presented below.
| Affiliate | Value, beginning of period ($) | Purchases ($) | Sales Proceeds ($) | Dividend Income ($) | Realized Gain (loss) ($) | Change in Unrealized appreciation (depreciation) ($) | Value, end of period ($) | % ownership, end of period |
| Fidelity Cash Central Fund 5.38% | 155,216,114 | 892,164,357 | 1,004,261,860 | 1,267,323 | (14) | - | 43,118,597 | 0.1% |
| Fidelity Securities Lending Cash Central Fund 5.38% | 13,096,389 | 168,382,274 | 171,488,362 | 10,325 | - | - | 9,990,301 | 0.0% |
| Total | 168,312,503 | 1,060,546,631 | 1,175,750,222 | 1,277,648 | (14) | - | 53,108,898 | |
| | | | | | | | | |
Amounts in the dividend income column in the above table include any capital gain distributions from underlying funds, which are presented in the corresponding line item in the Statement of Operations, if applicable.
Amounts in the dividend income column for Fidelity Securities Lending Cash Central Fund represents the income earned on investing cash collateral, less rebates paid to borrowers and any lending agent fees associated with the loan, plus any premium payments received for lending certain types of securities.
Amounts included in the purchases and sales proceeds columns may include in-kind transactions, if applicable.
Investment Valuation
The following is a summary of the inputs used, as of June 30, 2024, involving the Fund's assets and liabilities carried at fair value. The inputs or methodology used for valuing securities may not be an indication of the risk associated with investing in those securities. For more information on valuation inputs, and their aggregation into the levels used below, please refer to the Investment Valuation section in the accompanying Notes to Financial Statements.
| Valuation Inputs at Reporting Date: |
| Description | Total ($) | Level 1 ($) | Level 2 ($) | Level 3 ($) |
Investments in Securities: | | | | |
|
| Equities: | | | | |
Communication Services | 79,895,263 | 79,895,263 | - | - |
Consumer Discretionary | 101,018,442 | 101,018,442 | - | - |
Consumer Staples | 131,721,325 | 131,721,325 | - | - |
Energy | 119,927,600 | 119,927,600 | - | - |
Financials | 400,320,817 | 400,320,817 | - | - |
Health Care | 257,083,225 | 257,083,225 | - | - |
Industrials | 291,381,825 | 291,381,825 | - | - |
Information Technology | 193,704,699 | 193,704,699 | - | - |
Materials | 78,363,729 | 78,363,729 | - | - |
Real Estate | 54,489,343 | 54,489,343 | - | - |
Utilities | 71,622,938 | 71,622,938 | - | - |
|
| U.S. Government and Government Agency Obligations | 1,810,891 | - | 1,810,891 | - |
|
| Money Market Funds | 53,108,898 | 53,108,898 | - | - |
| Total Investments in Securities: | 1,834,448,995 | 1,832,638,104 | 1,810,891 | - |
Derivative Instruments: Assets | | | | |
Futures Contracts | 26,414 | 26,414 | - | - |
| Total Assets | 26,414 | 26,414 | - | - |
| Total Derivative Instruments: | 26,414 | 26,414 | - | - |
Value of Derivative Instruments
The following table is a summary of the Fund's value of derivative instruments by primary risk exposure as of June 30, 2024. For additional information on derivative instruments, please refer to the Derivative Instruments section in the accompanying Notes to Financial Statements.
Primary Risk Exposure / Derivative Type | Value |
| Asset ($) | Liability ($) |
| Equity Risk | | |
Futures Contracts (a) | 26,414 | 0 |
| Total Equity Risk | 26,414 | 0 |
| Total Value of Derivatives | 26,414 | 0 |
(a)Reflects gross cumulative appreciation (depreciation) on futures contracts as presented in the Schedule of Investments. In the Statement of Assets and Liabilities, the period end daily variation margin is included in receivable or payable for daily variation margin on futures contracts, and the net cumulative appreciation (depreciation) is included in Total accumulated earnings (loss).
Fidelity® Enhanced Large Cap Value ETF
Financial Statements
| Statement of Assets and Liabilities |
| | | | June 30, 2024 |
| | | | | |
| Assets | | | | |
| Investment in securities, at value (including securities loaned of $9,518,253) - See accompanying schedule: | | | | |
Unaffiliated issuers (cost $1,632,139,591) | $ | 1,781,340,097 | | |
Fidelity Central Funds (cost $53,108,898) | | 53,108,898 | | |
| | | | | |
| | | | | |
| Total Investment in Securities (cost $1,685,248,489) | | | $ | 1,834,448,995 |
| Cash | | | | 33,398 |
| Receivable for investments sold | | | | 34,914,040 |
| Dividends receivable | | | | 1,495,678 |
| Distributions receivable from Fidelity Central Funds | | | | 68,603 |
| Receivable from investment adviser for expense reductions | | | | 25,566 |
| Other receivables | | | | 225,715 |
Total assets | | | | 1,871,211,995 |
| Liabilities | | | | |
| Payable for investments purchased | $ | 36,880,466 | | |
| Payable for fund shares redeemed | | 31,401,465 | | |
| Accrued management fee | | 269,530 | | |
| Payable for daily variation margin on futures contracts | | 75,380 | | |
| Other payables and accrued expenses | | 80,919 | | |
| Collateral on securities loaned | | 9,987,300 | | |
| Total liabilities | | | | 78,695,060 |
| Net Assets | | | $ | 1,792,516,935 |
| Net Assets consist of: | | | | |
| Paid in capital | | | $ | 1,709,855,020 |
| Total accumulated earnings (loss) | | | | 82,661,915 |
| Net Assets | | | $ | 1,792,516,935 |
Net Asset Value, offering price and redemption price per share ($1,792,516,935 ÷ 62,778,976 shares) | | | $ | 28.55 |
| Statement of Operations |
| | | | Ten months ended June 30, 2024 | | Year ended August 31, 2023 |
| Investment Income | | | | | | |
| Dividends | | | $ | 43,442,662 | | 123,931,441 |
| Interest | | | | 100,421 | | 78,834 |
| Income from Fidelity Central Funds (including $10,325 and $193,813 from security lending) | | | | 1,277,648 | | 1,871,666 |
| Total income | | | | 44,820,731 | | 125,881,941 |
| Expenses | | | | | | |
| Management fee | | | $ | 5,908,652 | | 21,604,951 |
| Independent trustees' fees and expenses | | | | 13,181 | | 30,662 |
| Interest | | | | 4,057 | | 29,724 |
| Miscellaneous | | | | 108,229 | | - |
| Total expenses before reductions | | | | 6,034,119 | | 21,665,337 |
| Expense reductions | | | | (40,328) | | (1,773) |
| Total expenses after reductions | | | | 5,993,791 | | 21,663,564 |
| Net Investment income (loss) | | | | 38,826,940 | | 104,218,377 |
| Realized and Unrealized Gain (Loss) | | | | | | |
| Net realized gain (loss) on: | | | | | | |
| Investment Securities: | | | | | | |
| Unaffiliated issuers | | | | (43,602,963) | | 87,781,805 |
| Redemptions in-kind | | | | 499,548,049 | | 117,706,408 |
| Fidelity Central Funds | | | | (14) | | - |
| Foreign currency transactions | | | | 2,399 | | - |
| Futures contracts | | | | (2,545,317) | | 3,530,011 |
| Total net realized gain (loss) | | | | 453,402,154 | | 209,018,224 |
| Change in net unrealized appreciation (depreciation) on: | | | | | | |
| Investment Securities: | | | | | | |
| Unaffiliated issuers | | | | (574,137,118) | | 129,900,340 |
| Assets and liabilities in foreign currencies | | | | 908 | | - |
| Futures contracts | | | | (514,287) | | 513,598 |
| Total change in net unrealized appreciation (depreciation) | | | | (574,650,497) | | 130,413,938 |
| Net gain (loss) | | | | (121,248,343) | | 339,432,162 |
| Net increase (decrease) in net assets resulting from operations | | | $ | (82,421,403) | | 443,650,539 |
See Organization and Merger information note regarding reorganization from mutual fund to exchange traded fund.
| Statement of Changes in Net Assets |
| | | |
| | Ten months ended June 30, 2024 | | Year ended August 31, 2023 | | Year ended August 31, 2022 |
| Increase (Decrease) in Net Assets | | | | | | |
| Operations | | | | | | |
| Net investment income (loss) | $ | 38,826,940 | $ | 104,218,377 | $ | 109,310,484 |
| Net realized gain (loss) | | 453,402,154 | | 209,018,224 | | 269,166,406 |
| Change in net unrealized appreciation (depreciation) | | (574,650,497) | | 130,413,938 | | (702,930,899) |
| Net increase (decrease) in net assets resulting from operations | | (82,421,403) | | 443,650,539 | | (324,454,009) |
| Distributions to shareholders | | (175,458,721) | | (257,200,574) | | (697,082,541) |
| | | | | | | |
| Share transactions | | | | | | |
| Proceeds from sales of shares | | 996,838,223 | | 817,757,697 | | 1,055,115,905 |
| Reinvestment of distributions | | 143,727,046 | | 243,302,994 | | 669,849,842 |
| Cost of shares redeemed | | (4,621,932,538) | | (1,407,138,550) | | (1,199,545,360) |
| | | | | | | |
Net increase (decrease) in net assets resulting from share transactions | | (3,481,367,269) | | (346,077,859) | | 525,420,387 |
| Total increase (decrease) in net assets | | (3,739,247,393) | | (159,627,894) | | (496,116,163) |
| | | | | | | |
| Net Assets | | | | | | |
| Beginning of period | | 5,531,764,328 | | 5,691,392,222 | | 6,187,508,385 |
| End of period | $ | 1,792,516,935 | $ | 5,531,764,328 | $ | 5,691,392,222 |
| | | | | | | |
| Other Information | | | | | | |
| Shares | | | | | | |
| Sold | | 38,559,161 | | 32,117,183 | | 38,780,477 |
| Issued in reinvestment of distributions | | 5,858,095 | | 9,686,875 | | 24,600,837 |
| Redeemed | | (192,077,486) | | (55,489,324) | | (44,365,352) |
| Net increase (decrease) | | (147,660,230) | | (13,685,266) | | 19,015,962 |
| | | | | | | |
See Organization and Merger information note regarding reorganization from mutual fund to exchange traded fund.
Share activity is further described in Organization and Merger information notes, amounts have been adjusted to reflect the impact of the change in capital structure associated with the merger. All financial information prior to the merger is that of the Predecessor Fund.
Financial Highlights
Fidelity® Enhanced Large Cap Value ETF |
| |
| Years ended June 30, | | 2024 A,B | | 2023 A,C | | 2022 A,C | | 2021 A,C | | 2020 A,C | | 2019 A,C |
Selected Per-Share Data | | | | | | | | | | | | |
| Net asset value, beginning of period | $ | 26.29 | $ | 25.40 | $ | 30.16 | $ | 22.04 | $ | 22.36 | $ | 24.10 |
| Income from Investment Operations | | | | | | | | | | | | |
Net investment income (loss) D,E | | .40 | | .47 | | .49 | | .44 | | .49 | | .52 |
| Net realized and unrealized gain (loss) | | 2.99 F | | 1.59 | | (1.81) | | 8.08 | | - | | (.80) |
| Total from investment operations | | 3.39 | | 2.06 | | (1.32) | | 8.52 | | .49 | | (.28) |
| Distributions from net investment income | | (.80) | | (.38) | | (.58) | | (.40) | | (.51) | | (.54) |
| Distributions from net realized gain | | (.33) | | (.79) | | (2.86) | | - | | (.30) | | (.94) |
| Total distributions | | (1.13) | | (1.17) | | (3.44) | | (.40) | | (.81) | | (1.46) G |
| Net asset value, end of period | $ | 28.55 | $ | 26.29 | $ | 25.40 | $ | 30.16 | $ | 22.04 | $ | 22.36 |
Total Return H,I,J | | | | 8.30% | | (5.18)% | | 39.12% | | 1.95% | | (.77)% |
Ratios to Average Net Assets E,K,L | | | | | | | | | | | | |
| Expenses before reductions | | .28% M,N | | .39% | | .39% | | .39% | | .39% | | .39% |
| Expenses net of fee waivers, if any | | | | .39% | | .39% | | .39% | | .39% | | .39% |
| Expenses net of all reductions | | .28% M,N | | .39% | | .39% | | .39% | | .39% | | .39% |
| Net investment income (loss) | | 1.82% M,N | | 1.88% | | 1.76% | | 1.65% | | 2.21% | | 2.37% |
| Supplemental Data | | | | | | | | | | | | |
| Net assets, end of period (000 omitted) | $ | 1,792,517 | $ | 5,531,764 | $ | 5,691,392 | $ | 6,187,508 | $ | 3,887,139 | $ | 3,757,353 |
Portfolio turnover rate O | | | | 88% | | 112% | | 75% | | 81% | | 94% |
AAs further described in Organization and Merger information notes, per share amounts have been adjusted to reflect the impact of the change in capital structure associated with the merger. All financial information prior to the merger is that of the Predecessor Fund.
BFor the ten month period ended June 30. The Fund changed its fiscal year end from August 31 to June 30, effective March 1, 2024.
CFor the year ended August 31.
DCalculated based on average shares outstanding during the period.
ENet investment income (loss) is affected by the timing of the declaration of dividends by any underlying mutual funds or exchange-traded funds (ETFs). Net investment income (loss) of any mutual funds or ETFs is not included in the Fund's net investment income (loss) ratio.
FThe amount shown for a share outstanding does not correspond with the aggregate net gain (loss) on investments for the period due to the timing of sales and repurchases of shares in relation to fluctuating market values of the investments of the Fund.
GTotal distributions per share do not sum due to rounding.
HBased on net asset value.
ITotal returns for periods of less than one year are not annualized.
JTotal returns would have been lower if certain expenses had not been reduced during the applicable periods shown.
KFees and expenses of any underlying mutual funds or exchange-traded funds (ETFs) are not included in the Fund's expense ratio. The Fund indirectly bears its proportionate share of these expenses. For additional expense information related to investments in Fidelity Central Funds, please refer to the "Investments in Fidelity Central Funds" note found in the Notes to Financial Statements section of the most recent Annual or Semi-Annual report.
LExpense ratios reflect operating expenses of the class. Expenses before reductions do not reflect amounts reimbursed, waived, or reduced through arrangements with the investment adviser, brokerage services, or other offset arrangements, if applicable, and do not represent the amount paid by the class during periods when reimbursements, waivers or reductions occur.
MAnnualized.
NProxy expenses are not annualized.
OAmount does not include the portfolio activity of any underlying mutual funds or exchange-traded funds (ETFs).
PPortfolio turnover rate excludes securities received or delivered in-kind.
Fidelity® Enhanced Mid Cap ETF
Schedule of Investments June 30, 2024
Showing Percentage of Net Assets
| Common Stocks - 99.2% |
| | | Shares | Value ($) |
| COMMUNICATION SERVICES - 2.4% | | | |
| Entertainment - 2.2% | | | |
| Electronic Arts, Inc. | | 92,415 | 12,876,182 |
| Playtika Holding Corp. | | 666,450 | 5,244,962 |
| Roku, Inc. Class A (a) | | 157,491 | 9,438,436 |
| Spotify Technology SA (a) | | 28,573 | 8,965,922 |
| | | | 36,525,502 |
| Media - 0.2% | | | |
| The New York Times Co. Class A | | 66,127 | 3,386,364 |
TOTAL COMMUNICATION SERVICES | | | 39,911,866 |
| CONSUMER DISCRETIONARY - 12.1% | | | |
| Automobiles - 0.5% | | | |
| Ford Motor Co. | | 673,078 | 8,440,398 |
| Broadline Retail - 0.6% | | | |
| eBay, Inc. | | 182,112 | 9,783,057 |
| Distributors - 0.1% | | | |
| Genuine Parts Co. | | 18,179 | 2,514,519 |
| Diversified Consumer Services - 0.4% | | | |
| ADT, Inc. | | 498,888 | 3,791,549 |
| H&R Block, Inc. | | 50,373 | 2,731,728 |
| | | | 6,523,277 |
| Hotels, Restaurants & Leisure - 3.1% | | | |
| Airbnb, Inc. Class A (a) | | 13,773 | 2,088,400 |
| Chipotle Mexican Grill, Inc. (a) | | 139,889 | 8,764,046 |
| Domino's Pizza, Inc. | | 4,380 | 2,261,525 |
| Doordash, Inc. (a) | | 81,440 | 8,859,043 |
| Draftkings Holdings, Inc. (a) | | 255,188 | 9,740,526 |
| Expedia Group, Inc. (a) | | 14,028 | 1,767,388 |
| International Game Technology PLC | | 259,404 | 5,307,406 |
| Light & Wonder, Inc. Class A (a) | | 29,637 | 3,108,329 |
| Royal Caribbean Cruises Ltd. (a) | | 28,806 | 4,592,541 |
| Texas Roadhouse, Inc. | | 6,224 | 1,068,723 |
| Travel+Leisure Co. | | 21,939 | 986,816 |
| Wendy's Co. (b) | | 134,207 | 2,276,151 |
| | | | 50,820,894 |
| Household Durables - 3.1% | | | |
| D.R. Horton, Inc. | | 99,338 | 13,999,704 |
| Lennar Corp. Class A | | 33,203 | 4,976,134 |
| NVR, Inc. (a) | | 1,548 | 11,747,091 |
| Toll Brothers, Inc. | | 84,306 | 9,710,365 |
| TopBuild Corp. (a) | | 26,273 | 10,122,199 |
| | | | 50,555,493 |
| Specialty Retail - 3.7% | | | |
| Abercrombie & Fitch Co. Class A (a) | | 28,985 | 5,154,692 |
| Burlington Stores, Inc. (a) | | 43,894 | 10,534,560 |
| Carvana Co. Class A (a) | | 12,434 | 1,600,504 |
| GameStop Corp. Class A (a)(b) | | 25,483 | 629,175 |
| Gap, Inc. | | 370,949 | 8,861,972 |
| Ross Stores, Inc. | | 107,922 | 15,683,225 |
| Ulta Beauty, Inc. (a) | | 22,701 | 8,759,635 |
| Williams-Sonoma, Inc. | | 38,116 | 10,762,815 |
| | | | 61,986,578 |
| Textiles, Apparel & Luxury Goods - 0.6% | | | |
| Crocs, Inc. (a) | | 4,952 | 722,695 |
| Tapestry, Inc. | | 219,274 | 9,382,734 |
| | | | 10,105,429 |
TOTAL CONSUMER DISCRETIONARY | | | 200,729,645 |
| CONSUMER STAPLES - 4.0% | | | |
| Beverages - 0.5% | | | |
| Boston Beer Co., Inc. Class A (a) | | 22,926 | 6,993,576 |
| Celsius Holdings, Inc. (a) | | 26,492 | 1,512,428 |
| | | | 8,506,004 |
| Consumer Staples Distribution & Retail - 2.0% | | | |
| Casey's General Stores, Inc. | | 29,131 | 11,115,224 |
| Kroger Co. | | 244,123 | 12,189,061 |
| Maplebear, Inc. (NASDAQ) | | 283,912 | 9,124,932 |
| | | | 32,429,217 |
| Food Products - 0.3% | | | |
| Ingredion, Inc. | | 25,572 | 2,933,108 |
| Seaboard Corp. | | 555 | 1,754,211 |
| | | | 4,687,319 |
| Household Products - 1.2% | | | |
| Colgate-Palmolive Co. | | 90,625 | 8,794,250 |
| Kimberly-Clark Corp. | | 37,382 | 5,166,192 |
| The Clorox Co. | | 41,166 | 5,617,924 |
| | | | 19,578,366 |
TOTAL CONSUMER STAPLES | | | 65,200,906 |
| ENERGY - 5.0% | | | |
| Energy Equipment & Services - 0.8% | | | |
| Baker Hughes Co. Class A | | 133,888 | 4,708,841 |
| Halliburton Co. | | 249,155 | 8,416,456 |
| | | | 13,125,297 |
| Oil, Gas & Consumable Fuels - 4.2% | | | |
| Cheniere Energy, Inc. | | 69,641 | 12,175,336 |
| Coterra Energy, Inc. | | 176,851 | 4,716,616 |
| Devon Energy Corp. | | 142,191 | 6,739,853 |
| Diamondback Energy, Inc. | | 27,355 | 5,476,197 |
| Hess Corp. | | 29,454 | 4,345,054 |
| Marathon Oil Corp. | | 27,963 | 801,699 |
| Matador Resources Co. | | 68,114 | 4,059,594 |
| Murphy Oil Corp. | | 49,613 | 2,046,040 |
| ONEOK, Inc. | | 23,157 | 1,888,453 |
| Ovintiv, Inc. | | 9,404 | 440,765 |
| Phillips 66 Co. | | 8 | 1,129 |
| Targa Resources Corp. | | 103,394 | 13,315,079 |
| The Williams Companies, Inc. | | 296,187 | 12,587,948 |
| | | | 68,593,763 |
TOTAL ENERGY | | | 81,719,060 |
| FINANCIALS - 16.3% | | | |
| Banks - 1.8% | | | |
| Citizens Financial Group, Inc. | | 305,102 | 10,992,825 |
| Columbia Banking Systems, Inc. | | 123,841 | 2,463,197 |
| Commerce Bancshares, Inc. | | 17,638 | 983,848 |
| First Citizens Bancshares, Inc. | | 1,213 | 2,042,219 |
| KeyCorp | | 657,960 | 9,349,612 |
| Zions Bancorporation NA | | 110,076 | 4,773,996 |
| | | | 30,605,697 |
| Capital Markets - 6.6% | | | |
| Ameriprise Financial, Inc. | | 20,116 | 8,593,354 |
| Bank of New York Mellon Corp. | | 263,487 | 15,780,236 |
| Cboe Global Markets, Inc. | | 17 | 2,891 |
| Coinbase Global, Inc. (a) | | 1,838 | 408,459 |
| Interactive Brokers Group, Inc. | | 24,306 | 2,979,916 |
| Janus Henderson Group PLC | | 29,189 | 983,961 |
| Jefferies Financial Group, Inc. | | 4,605 | 229,145 |
| KKR & Co. LP | | 29 | 3,052 |
| LPL Financial | | 27,015 | 7,545,290 |
| Morningstar, Inc. | | 5,792 | 1,713,563 |
| MSCI, Inc. | | 2,626 | 1,265,076 |
| NASDAQ, Inc. | | 177,407 | 10,690,546 |
| Northern Trust Corp. | | 127,065 | 10,670,919 |
| Raymond James Financial, Inc. | | 91,869 | 11,355,927 |
| Robinhood Markets, Inc. (a) | | 476,433 | 10,819,793 |
| State Street Corp. | | 91,052 | 6,737,848 |
| Stifel Financial Corp. | | 72,020 | 6,060,483 |
| Tradeweb Markets, Inc. Class A | | 98,850 | 10,478,100 |
| Virtu Financial, Inc. Class A | | 79,281 | 1,779,858 |
| XP, Inc. Class A | | 16,702 | 293,788 |
| | | | 108,392,205 |
| Consumer Finance - 0.7% | | | |
| Discover Financial Services | | 23,254 | 3,041,856 |
| Synchrony Financial | | 166,419 | 7,853,313 |
| | | | 10,895,169 |
| Financial Services - 3.1% | | | |
| Affirm Holdings, Inc. Class A, (a)(b) | | 169,307 | 5,114,764 |
| Apollo Global Management, Inc. | | 5 | 590 |
| Block, Inc. Class A (a) | | 214,556 | 13,836,716 |
| Corpay, Inc. (a) | | 16,431 | 4,377,383 |
| Euronet Worldwide, Inc. (a) | | 26,523 | 2,745,131 |
| PayPal Holdings, Inc. (a) | | 138,764 | 8,052,475 |
| The Western Union Co. | | 594,259 | 7,261,845 |
| Toast, Inc. (a)(b) | | 393,533 | 10,141,345 |
| WEX, Inc. (a) | | 7 | 1,240 |
| | | | 51,531,489 |
| Insurance - 4.1% | | | |
| Allstate Corp. | | 37,048 | 5,915,084 |
| Arch Capital Group Ltd. (a) | | 39,892 | 4,024,704 |
| Arthur J. Gallagher & Co. | | 547 | 141,843 |
| Assurant, Inc. | | 56,815 | 9,445,494 |
| Axis Capital Holdings Ltd. | | 19,237 | 1,359,094 |
| Brown & Brown, Inc. | | 132,905 | 11,883,036 |
| Everest Re Group Ltd. | | 10,987 | 4,186,267 |
| Globe Life, Inc. | | 113,506 | 9,339,274 |
| Reinsurance Group of America, Inc. | | 38,640 | 7,931,633 |
| Unum Group | | 161,828 | 8,271,029 |
| Willis Towers Watson PLC | | 19,641 | 5,148,692 |
| | | | 67,646,150 |
TOTAL FINANCIALS | | | 269,070,710 |
| HEALTH CARE - 9.9% | | | |
| Biotechnology - 2.7% | | | |
| Biogen, Inc. (a) | | 3,391 | 786,102 |
| BioMarin Pharmaceutical, Inc. (a) | | 3,171 | 261,068 |
| Exelixis, Inc. (a) | | 426,152 | 9,575,635 |
| Gilead Sciences, Inc. | | 128,777 | 8,835,390 |
| Incyte Corp. (a) | | 174,281 | 10,564,914 |
| Neurocrine Biosciences, Inc. (a) | | 76,072 | 10,472,832 |
| Sarepta Therapeutics, Inc. (a) | | 7,699 | 1,216,442 |
| United Therapeutics Corp. (a) | | 10,028 | 3,194,419 |
| | | | 44,906,802 |
| Health Care Equipment & Supplies - 2.2% | | | |
| Abiomed, Inc. (a)(c) | | 3,289 | 6,446 |
| DexCom, Inc. (a) | | 75,137 | 8,519,033 |
| Hologic, Inc. (a) | | 25,419 | 1,887,361 |
| IDEXX Laboratories, Inc. (a) | | 26,772 | 13,043,318 |
| Novocure Ltd. (a) | | 31,640 | 541,993 |
| Solventum Corp. | | 94,371 | 4,990,338 |
| Zimmer Biomet Holdings, Inc. | | 69,101 | 7,499,532 |
| | | | 36,488,021 |
| Health Care Providers & Services - 2.0% | | | |
| Cardinal Health, Inc. | | 102,034 | 10,031,983 |
| Cencora, Inc. | | 60,788 | 13,695,536 |
| Centene Corp. (a) | | 33,359 | 2,211,702 |
| Cigna Group | | 6,124 | 2,024,411 |
| Elevance Health, Inc. | | 8,008 | 4,339,215 |
| | | | 32,302,847 |
| Health Care Technology - 0.6% | | | |
| Teladoc Health, Inc. (a) | | 4,828 | 47,218 |
| Veeva Systems, Inc. Class A (a) | | 57,622 | 10,545,402 |
| | | | 10,592,620 |
| Life Sciences Tools & Services - 1.2% | | | |
| 10X Genomics, Inc. (a) | | 138,696 | 2,697,637 |
| Agilent Technologies, Inc. | | 3,521 | 456,427 |
| Bruker Corp. | | 102,134 | 6,517,171 |
| Medpace Holdings, Inc. (a) | | 24,200 | 9,966,770 |
| | | | 19,638,005 |
| Pharmaceuticals - 1.2% | | | |
| Bristol-Myers Squibb Co. | | 81,079 | 3,367,211 |
| Elanco Animal Health, Inc. (a) | | 535,380 | 7,725,533 |
| Jazz Pharmaceuticals PLC (a) | | 85,604 | 9,136,515 |
| | | | 20,229,259 |
TOTAL HEALTH CARE | | | 164,157,554 |
| INDUSTRIALS - 18.8% | | | |
| Aerospace & Defense - 2.7% | | | |
| Axon Enterprise, Inc. (a) | | 8,214 | 2,416,887 |
| Curtiss-Wright Corp. | | 21,246 | 5,757,241 |
| Hexcel Corp. | | 47,432 | 2,962,128 |
| Howmet Aerospace, Inc. | | 164,357 | 12,759,034 |
| Textron, Inc. | | 122,938 | 10,555,457 |
| TransDigm Group, Inc. | | 2 | 2,555 |
| Woodward, Inc. | | 57,702 | 10,062,075 |
| | | | 44,515,377 |
| Building Products - 1.8% | | | |
| Allegion PLC | | 55,716 | 6,582,845 |
| Builders FirstSource, Inc. (a) | | 21,433 | 2,966,542 |
| Carlisle Companies, Inc. | | 2,012 | 815,283 |
| Carrier Global Corp. | | 152 | 9,588 |
| Lennox International, Inc. | | 595 | 318,313 |
| Owens Corning | | 61,487 | 10,681,522 |
| Trane Technologies PLC | | 27,031 | 8,891,307 |
| | | | 30,265,400 |
| Commercial Services & Supplies - 1.2% | | | |
| Cintas Corp. | | 12,669 | 8,871,594 |
| MSA Safety, Inc. | | 8,226 | 1,543,938 |
| Republic Services, Inc. | | 43,961 | 8,543,381 |
| Vestis Corp. | | 107,524 | 1,315,019 |
| | | | 20,273,932 |
| Construction & Engineering - 0.3% | | | |
| EMCOR Group, Inc. | | 8,219 | 3,000,593 |
| Valmont Industries, Inc. | | 6,845 | 1,878,610 |
| | | | 4,879,203 |
| Electrical Equipment - 3.5% | | | |
| Acuity Brands, Inc. | | 18,733 | 4,522,896 |
| AMETEK, Inc. | | 84,025 | 14,007,808 |
| Emerson Electric Co. | | 93 | 10,245 |
| Hubbell, Inc. | | 25,577 | 9,347,882 |
| nVent Electric PLC | | 132,689 | 10,165,304 |
| Rockwell Automation, Inc. | | 39,613 | 10,904,667 |
| Vertiv Holdings Co. | | 96,242 | 8,331,670 |
| | | | 57,290,472 |
| Ground Transportation - 0.9% | | | |
| Old Dominion Freight Lines, Inc. | | 55,780 | 9,850,748 |
| XPO, Inc. (a) | | 52,000 | 5,519,800 |
| | | | 15,370,548 |
| Machinery - 4.7% | | | |
| Allison Transmission Holdings, Inc. | | 99,792 | 7,574,213 |
| Cummins, Inc. | | 50,513 | 13,988,565 |
| Donaldson Co., Inc. | | 132,980 | 9,516,049 |
| Flowserve Corp. | | 67,516 | 3,247,520 |
| Fortive Corp. | | 138,988 | 10,299,011 |
| Gates Industrial Corp. PLC (a) | | 353,925 | 5,595,554 |
| ITT, Inc. | | 15,107 | 1,951,522 |
| Oshkosh Corp. | | 20,654 | 2,234,763 |
| PACCAR, Inc. | | 86,678 | 8,922,633 |
| Parker Hannifin Corp. | | 34 | 17,198 |
| Westinghouse Air Brake Tech Co. | | 80,170 | 12,670,869 |
| Xylem, Inc. | | 13,359 | 1,811,881 |
| | | | 77,829,778 |
| Marine Transportation - 0.5% | | | |
| Kirby Corp. (a) | | 67,892 | 8,128,709 |
| Professional Services - 2.6% | | | |
| Booz Allen Hamilton Holding Corp. Class A | | 36,992 | 5,693,069 |
| CACI International, Inc. (a) | | 24,065 | 10,351,078 |
| Leidos Holdings, Inc. | | 77,316 | 11,278,858 |
| SS&C Technologies Holdings, Inc. | | 167,595 | 10,503,179 |
| Verisk Analytics, Inc. | | 18,440 | 4,970,502 |
| | | | 42,796,686 |
| Trading Companies & Distributors - 0.6% | | | |
| Core & Main, Inc. (a) | | 42,658 | 2,087,683 |
| W.W. Grainger, Inc. | | 8,895 | 8,025,425 |
| | | | 10,113,108 |
TOTAL INDUSTRIALS | | | 311,463,213 |
| INFORMATION TECHNOLOGY - 14.8% | | | |
| Communications Equipment - 0.1% | | | |
| Arista Networks, Inc. (a) | | 5,337 | 1,870,512 |
| Juniper Networks, Inc. | | 1,147 | 41,820 |
| | | | 1,912,332 |
| Electronic Equipment, Instruments & Components - 1.5% | | | |
| Amphenol Corp. Class A | | 95 | 6,400 |
| Keysight Technologies, Inc. (a) | | 42,223 | 5,773,995 |
| TD SYNNEX Corp. | | 78,206 | 9,024,972 |
| Trimble, Inc. (a) | | 184,639 | 10,325,013 |
| | | | 25,130,380 |
| IT Services - 1.4% | | | |
| Gartner, Inc. (a) | | 15,607 | 7,008,479 |
| Kyndryl Holdings, Inc. (a) | | 105,986 | 2,788,492 |
| Twilio, Inc. Class A (a) | | 133,376 | 7,577,091 |
| Wix.com Ltd. (a) | | 36,601 | 5,822,121 |
| | | | 23,196,183 |
| Semiconductors & Semiconductor Equipment - 2.9% | | | |
| Cirrus Logic, Inc. (a) | | 78,973 | 10,081,693 |
| Enphase Energy, Inc. (a) | | 35,596 | 3,549,277 |
| KLA Corp. | | 10,452 | 8,617,779 |
| Monolithic Power Systems, Inc. | | 17,417 | 14,311,201 |
| Qorvo, Inc. (a) | | 90,141 | 10,459,962 |
| | | | 47,019,912 |
| Software - 7.4% | | | |
| ANSYS, Inc. (a) | | 7,763 | 2,495,805 |
| AppLovin Corp. Class A, (a) | | 138,281 | 11,507,745 |
| Crowdstrike Holdings, Inc. (a) | | 41 | 15,711 |
| DocuSign, Inc. (a) | | 191,023 | 10,219,731 |
| Dropbox, Inc. Class A (a) | | 433,103 | 9,731,824 |
| HubSpot, Inc. (a) | | 20,257 | 11,947,376 |
| Manhattan Associates, Inc. (a) | | 43,721 | 10,785,096 |
| MicroStrategy, Inc. Class A (a) | | 1,840 | 2,534,563 |
| Nutanix, Inc. Class A (a) | | 126,323 | 7,181,463 |
| Pegasystems, Inc. | | 150,587 | 9,115,031 |
| RingCentral, Inc. (a) | | 289,583 | 8,166,241 |
| Smartsheet, Inc. (a) | | 154,392 | 6,805,599 |
| Teradata Corp. (a) | | 263,570 | 9,108,979 |
| Workday, Inc. Class A (a) | | 28,539 | 6,380,179 |
| Zoom Video Communications, Inc. Class A (a) | | 184,284 | 10,907,770 |
| Zscaler, Inc. (a) | | 31,296 | 6,014,778 |
| | | | 122,917,891 |
| Technology Hardware, Storage & Peripherals - 1.5% | | | |
| Hewlett Packard Enterprise Co. | | 606,138 | 12,831,941 |
| NetApp, Inc. | | 94,720 | 12,199,936 |
| | | | 25,031,877 |
TOTAL INFORMATION TECHNOLOGY | | | 245,208,575 |
| MATERIALS - 6.3% | | | |
| Chemicals - 2.3% | | | |
| Axalta Coating Systems Ltd. (a) | | 85,594 | 2,924,747 |
| DuPont de Nemours, Inc. | | 137,686 | 11,082,346 |
| Eastman Chemical Co. | | 51,005 | 4,996,960 |
| Ecolab, Inc. | | 31,808 | 7,570,304 |
| Element Solutions, Inc. | | 128,971 | 3,497,694 |
| International Flavors & Fragrances, Inc. | | 5,502 | 523,845 |
| PPG Industries, Inc. | | 59,740 | 7,520,669 |
| | | | 38,116,565 |
| Construction Materials - 0.8% | | | |
| Vulcan Materials Co. | | 52,944 | 13,166,114 |
| Containers & Packaging - 0.6% | | | |
| Ardagh Metal Packaging SA | | 59,262 | 201,491 |
| Berry Global Group, Inc. | | 132,327 | 7,787,444 |
| International Paper Co. | | 8,922 | 384,984 |
| Sealed Air Corp. | | 57,546 | 2,002,025 |
| WestRock Co. | | 894 | 44,932 |
| | | | 10,420,876 |
| Metals & Mining - 2.1% | | | |
| Nucor Corp. | | 89,248 | 14,108,324 |
| Reliance, Inc. | | 33,525 | 9,574,740 |
| Steel Dynamics, Inc. | | 85,005 | 11,008,148 |
| | | | 34,691,212 |
| Paper & Forest Products - 0.5% | | | |
| Louisiana-Pacific Corp. | | 87,371 | 7,193,254 |
TOTAL MATERIALS | | | 103,588,021 |
| REAL ESTATE - 5.6% | | | |
| Equity Real Estate Investment Trusts (REITs) - 5.1% | | | |
| Agree Realty Corp. | | 109,857 | 6,804,543 |
| American Homes 4 Rent Class A | | 253,954 | 9,436,931 |
| Crown Castle, Inc. | | 66,231 | 6,470,769 |
| EastGroup Properties, Inc. | | 5,561 | 945,926 |
| EPR Properties | | 139,738 | 5,866,201 |
| First Industrial Realty Trust, Inc. | | 25,633 | 1,217,824 |
| Gaming & Leisure Properties | | 29,812 | 1,347,801 |
| Invitation Homes, Inc. | | 332,604 | 11,937,158 |
| Park Hotels & Resorts, Inc. | | 308,651 | 4,623,592 |
| Public Storage Operating Co. | | 23,336 | 6,712,600 |
| Regency Centers Corp. | | 35,149 | 2,186,268 |
| SBA Communications Corp. Class A | | 22,173 | 4,352,560 |
| Simon Property Group, Inc. | | 104,097 | 15,801,919 |
| UDR, Inc. | | 6,206 | 255,377 |
| VICI Properties, Inc. | | 252,116 | 7,220,602 |
| Welltower, Inc. | | 2 | 209 |
| | | | 85,180,280 |
| Real Estate Management & Development - 0.5% | | | |
| CoStar Group, Inc. (a) | | 31,152 | 2,309,609 |
| Zillow Group, Inc.: | | | |
| Class A (a) | | 54,895 | 2,472,471 |
| Class C (a) | | 63,780 | 2,958,754 |
| | | | 7,740,834 |
TOTAL REAL ESTATE | | | 92,921,114 |
| UTILITIES - 4.0% | | | |
| Electric Utilities - 1.3% | | | |
| Constellation Energy Corp. | | 12 | 2,403 |
| Edison International | | 15,821 | 1,136,106 |
| Evergy, Inc. | | 46,829 | 2,480,532 |
| Hawaiian Electric Industries, Inc. (b) | | 35,143 | 316,990 |
| NRG Energy, Inc. | | 136,484 | 10,626,644 |
| PG&E Corp. | | 231,878 | 4,048,590 |
| Xcel Energy, Inc. | | 64,395 | 3,439,337 |
| | | | 22,050,602 |
| Gas Utilities - 0.3% | | | |
| National Fuel Gas Co. | | 92,146 | 4,993,392 |
| Independent Power and Renewable Electricity Producers - 1.4% | | | |
| Clearway Energy, Inc.: | | | |
| Class A | | 29,959 | 678,871 |
| Class C | | 47,865 | 1,181,787 |
| The AES Corp. | | 525,687 | 9,236,321 |
| Vistra Corp. | | 146,154 | 12,566,321 |
| | | | 23,663,300 |
| Multi-Utilities - 1.0% | | | |
| CenterPoint Energy, Inc. | | 320,881 | 9,940,893 |
| WEC Energy Group, Inc. | | 77,281 | 6,063,467 |
| | | | 16,004,360 |
TOTAL UTILITIES | | | 66,711,654 |
| TOTAL COMMON STOCKS (Cost $1,451,304,338) | | | 1,640,682,318 |
| | | | |
| U.S. Treasury Obligations - 0.3% |
| | | Principal Amount (d) | Value ($) |
U.S. Treasury Bills, yield at date of purchase 5.28% to 5.32% 7/5/24 to 9/26/24 (e) (Cost $4,283,503) | | 4,320,000 | 4,283,540 |
| | | | |
| Money Market Funds - 5.4% |
| | | Shares | Value ($) |
| Fidelity Cash Central Fund 5.38% (f) | | 79,612,733 | 79,628,655 |
| Fidelity Securities Lending Cash Central Fund 5.38% (f)(g) | | 10,079,334 | 10,080,342 |
| TOTAL MONEY MARKET FUNDS (Cost $89,708,996) | | | 89,708,997 |
| | | | |
| TOTAL INVESTMENT IN SECURITIES - 104.9% (Cost $1,545,296,837) | 1,734,674,855 |
NET OTHER ASSETS (LIABILITIES) - (4.9)% | (81,098,779) |
| NET ASSETS - 100.0% | 1,653,576,076 |
| | |
| Futures Contracts |
| | Number of contracts | Expiration Date | Notional Amount ($) | Value ($) | Unrealized Appreciation/ (Depreciation) ($) |
| Purchased | | | | | |
| | | | | | |
| Equity Index Contracts | | | | | |
| CME E-mini S&P MidCap 400 Index Contracts (United States) | 17 | Sep 2024 | 5,028,770 | 48,099 | 48,099 |
| | | | | | |
| The notional amount of futures purchased as a percentage of Net Assets is 0.3% |
Legend
| (b) | Security or a portion of the security is on loan at period end. |
| (d) | Amount is stated in United States dollars unless otherwise noted. |
| (e) | Security or a portion of the security was pledged to cover margin requirements for futures contracts. At period end, the value of securities pledged amounted to $4,113,640. |
| (f) | Affiliated fund that is generally available only to investment companies and other accounts managed by Fidelity Investments. The rate quoted is the annualized seven-day yield of the fund at period end. A complete unaudited listing of the fund's holdings as of its most recent quarter end is available upon request. In addition, each Fidelity Central Fund's financial statements, which are not covered by the Fund's Report of Independent Registered Public Accounting Firm, are available on the SEC's website or upon request. |
| (g) | Investment made with cash collateral received from securities on loan. |
Affiliated Central Funds
Fiscal year to date information regarding the Fund's investments in Fidelity Central Funds, including the ownership percentage, is presented below.
| Affiliate | Value, beginning of period ($) | Purchases ($) | Sales Proceeds ($) | Dividend Income ($) | Realized Gain (loss) ($) | Change in Unrealized appreciation (depreciation) ($) | Value, end of period ($) | % ownership, end of period |
| Fidelity Cash Central Fund 5.38% | 49,721,554 | 506,053,519 | 476,149,819 | 567,172 | 3,401 | - | 79,628,655 | 0.2% |
| Fidelity Securities Lending Cash Central Fund 5.38% | 13,170,745 | 142,307,195 | 145,397,599 | 20,112 | - | 1 | 10,080,342 | 0.0% |
| Total | 62,892,299 | 648,360,714 | 621,547,418 | 587,284 | 3,401 | 1 | 89,708,997 | |
| | | | | | | | | |
Amounts in the dividend income column in the above table include any capital gain distributions from underlying funds, which are presented in the corresponding line item in the Statement of Operations, if applicable.
Amounts in the dividend income column for Fidelity Securities Lending Cash Central Fund represents the income earned on investing cash collateral, less rebates paid to borrowers and any lending agent fees associated with the loan, plus any premium payments received for lending certain types of securities.
Amounts included in the purchases and sales proceeds columns may include in-kind transactions, if applicable.
Investment Valuation
The following is a summary of the inputs used, as of June 30, 2024, involving the Fund's assets and liabilities carried at fair value. The inputs or methodology used for valuing securities may not be an indication of the risk associated with investing in those securities. For more information on valuation inputs, and their aggregation into the levels used below, please refer to the Investment Valuation section in the accompanying Notes to Financial Statements.
| Valuation Inputs at Reporting Date: |
| Description | Total ($) | Level 1 ($) | Level 2 ($) | Level 3 ($) |
Investments in Securities: | | | | |
|
| Equities: | | | | |
Communication Services | 39,911,866 | 39,911,866 | - | - |
Consumer Discretionary | 200,729,645 | 200,729,645 | - | - |
Consumer Staples | 65,200,906 | 65,200,906 | - | - |
Energy | 81,719,060 | 81,719,060 | - | - |
Financials | 269,070,710 | 269,070,710 | - | - |
Health Care | 164,157,554 | 164,151,108 | - | 6,446 |
Industrials | 311,463,213 | 311,463,213 | - | - |
Information Technology | 245,208,575 | 245,208,575 | - | - |
Materials | 103,588,021 | 103,588,021 | - | - |
Real Estate | 92,921,114 | 92,921,114 | - | - |
Utilities | 66,711,654 | 66,711,654 | - | - |
|
| U.S. Government and Government Agency Obligations | 4,283,540 | - | 4,283,540 | - |
|
| Money Market Funds | 89,708,997 | 89,708,997 | - | - |
| Total Investments in Securities: | 1,734,674,855 | 1,730,384,869 | 4,283,540 | 6,446 |
Derivative Instruments: Assets | | | | |
Futures Contracts | 48,099 | 48,099 | - | - |
| Total Assets | 48,099 | 48,099 | - | - |
| Total Derivative Instruments: | 48,099 | 48,099 | - | - |
Value of Derivative Instruments
The following table is a summary of the Fund's value of derivative instruments by primary risk exposure as of June 30, 2024. For additional information on derivative instruments, please refer to the Derivative Instruments section in the accompanying Notes to Financial Statements.
Primary Risk Exposure / Derivative Type | Value |
| Asset ($) | Liability ($) |
| Equity Risk | | |
Futures Contracts (a) | 48,099 | 0 |
| Total Equity Risk | 48,099 | 0 |
| Total Value of Derivatives | 48,099 | 0 |
(a)Reflects gross cumulative appreciation (depreciation) on futures contracts as presented in the Schedule of Investments. In the Statement of Assets and Liabilities, the period end daily variation margin is included in receivable or payable for daily variation margin on futures contracts, and the net cumulative appreciation (depreciation) is included in Total accumulated earnings (loss).
Fidelity® Enhanced Mid Cap ETF
Financial Statements
| Statement of Assets and Liabilities |
| | | | June 30, 2024 |
| | | | | |
| Assets | | | | |
| Investment in securities, at value (including securities loaned of $9,827,924) - See accompanying schedule: | | | | |
Unaffiliated issuers (cost $1,455,587,841) | $ | 1,644,965,858 | | |
Fidelity Central Funds (cost $89,708,996) | | 89,708,997 | | |
| | | | | |
| | | | | |
| Total Investment in Securities (cost $1,545,296,837) | | | $ | 1,734,674,855 |
| Receivable for investments sold | | | | 83,620,752 |
| Receivable for fund shares sold | | | | 2,946,807 |
| Dividends receivable | | | | 1,200,715 |
| Distributions receivable from Fidelity Central Funds | | | | 95,719 |
| Receivable for daily variation margin on futures contracts | | | | 109,753 |
| Receivable from investment adviser for expense reductions | | | | 30,062 |
| Other receivables | | | | 3,442 |
Total assets | | | | 1,822,682,105 |
| Liabilities | | | | |
| Payable to custodian bank | $ | 49,314 | | |
| Payable for investments purchased | | 87,847,472 | | |
| Payable for fund shares redeemed | | 70,723,378 | | |
| Accrued management fee | | 316,698 | | |
| Other payables and accrued expenses | | 87,738 | | |
| Collateral on securities loaned | | 10,081,429 | | |
| Total liabilities | | | | 169,106,029 |
| Net Assets | | | $ | 1,653,576,076 |
| Net Assets consist of: | | | | |
| Paid in capital | | | $ | 1,524,835,092 |
| Total accumulated earnings (loss) | | | | 128,740,984 |
| Net Assets | | | $ | 1,653,576,076 |
Net Asset Value, offering price and redemption price per share ($1,653,576,076 ÷ 56,116,761 shares) | | | $ | 29.47 |
| Statement of Operations |
| | | | Ten months ended June 30, 2024 | | Year ended August 31, 2023 |
| Investment Income | | | | | | |
| Dividends | | | $ | 18,243,821 | | 26,198,952 |
| Interest | | | | 64,890 | | 43,267 |
| Income from Fidelity Central Funds (including $20,112 and $126,747 from security lending) | | | | 587,284 | | 1,013,463 |
| Total income | | | | 18,895,995 | | 27,255,682 |
| Expenses | | | | | | |
| Management fee | | | $ | 3,648,331 | | 7,794,857 |
| Independent trustees' fees and expenses | | | | 6,197 | | 9,500 |
| Interest | | | | 12,560 | | 2,322 |
| Miscellaneous | | | | 95,644 | | - |
| Total expenses before reductions | | | | 3,762,732 | | 7,806,679 |
| Expense reductions | | | | (36,231) | | (1,764) |
| Total expenses after reductions | | | | 3,726,501 | | 7,804,915 |
| Net Investment income (loss) | | | | 15,169,494 | | 19,450,767 |
| Realized and Unrealized Gain (Loss) | | | | | | |
| Net realized gain (loss) on: | | | | | | |
| Investment Securities: | | | | | | |
| Unaffiliated issuers | | | | 6,384,996 | | (62,536,880) |
| Redemptions in-kind | | | | 169,834,541 | | 69,766,859 |
| Fidelity Central Funds | | | | 3,401 | | - |
| Foreign currency transactions | | | | 504 | | - |
| Futures contracts | | | | 2,242,957 | | 1,494,441 |
| Total net realized gain (loss) | | | | 178,466,399 | | 8,724,420 |
| Change in net unrealized appreciation (depreciation) on: | | | | | | |
| Investment Securities: | | | | | | |
| Unaffiliated issuers | | | | 14,147,893 | | 112,237,090 |
| Fidelity Central Funds | | | | 1 | | - |
| Futures contracts | | | | (303,694) | | (773,128) |
| Total change in net unrealized appreciation (depreciation) | | | | 13,844,200 | | 111,463,962 |
| Net gain (loss) | | | | 192,310,599 | | 120,188,382 |
| Net increase (decrease) in net assets resulting from operations | | | $ | 207,480,093 | | 139,639,149 |
See Organization and Merger information note regarding reorganization from mutual fund to exchange traded fund.
| Statement of Changes in Net Assets |
| | | |
| | Ten months ended June 30, 2024 | | Year ended August 31, 2023 | | Year ended August 31, 2022 |
| Increase (Decrease) in Net Assets | | | | | | |
| Operations | | | | | | |
| Net investment income (loss) | $ | 15,169,494 | $ | 19,450,767 | $ | 19,011,742 |
| Net realized gain (loss) | | 178,466,399 | | 8,724,420 | | 101,845,182 |
| Change in net unrealized appreciation (depreciation) | | 13,844,200 | | 111,463,962 | | (369,508,755) |
| Net increase (decrease) in net assets resulting from operations | | 207,480,093 | | 139,639,149 | | (248,651,831) |
| Distributions to shareholders | | (25,950,215) | | (57,460,804) | | (258,245,278) |
| | | | | | | |
| Share transactions | | | | | | |
| Proceeds from sales of shares | | 655,066,382 | | 531,911,323 | | 330,859,667 |
| Reinvestment of distributions | | 14,294,274 | | 54,197,269 | | 243,001,334 |
| Cost of shares redeemed | | (833,830,134) | | (686,633,472) | | (454,449,105) |
| | | | | | | |
Net increase (decrease) in net assets resulting from share transactions | | (164,469,478) | | (100,524,880) | | 119,411,896 |
| Total increase (decrease) in net assets | | 17,060,400 | | (18,346,535) | | (387,485,213) |
| | | | | | | |
| Net Assets | | | | | | |
| Beginning of period | | 1,636,515,676 | | 1,654,862,211 | | 2,042,347,424 |
| End of period | $ | 1,653,576,076 | $ | 1,636,515,676 | $ | 1,654,862,211 |
| | | | | | | |
| Other Information | | | | | | |
| Shares | | | | | | |
| Sold | | 22,793,530 | | 21,113,682 | | 11,511,431 |
| Issued in reinvestment of distributions | | 584,792 | | 2,258,425 | | 8,758,517 |
| Redeemed | | (30,719,865) | | (27,059,804) | | (16,614,762) |
| Net increase (decrease) | | (7,341,543) | | (3,687,697) | | 3,655,186 |
| | | | | | | |
See Organization and Merger information note regarding reorganization from mutual fund to exchange traded fund.
Share activity is further described in Organization and Merger information notes, amounts have been adjusted to reflect the impact of the change in capital structure associated with the merger. All financial information prior to the merger is that of the Predecessor Fund.
Financial Highlights
Fidelity® Enhanced Mid Cap ETF |
| |
| Years ended June 30, | | 2024 A,B | | 2023 B,C | | 2022 B,C | | 2021 B,C | | 2020 B,C | | 2019 B,C |
Selected Per-Share Data | | | | | | | | | | | | |
| Net asset value, beginning of period | $ | 25.79 | $ | 24.65 | $ | 32.17 | $ | 23.47 | $ | 22.59 | $ | 25.42 |
| Income from Investment Operations | | | | | | | | | | | | |
Net investment income (loss) D,E | | .27 | | .28 | | .28 | | .22 | | .29 | | .33 |
| Net realized and unrealized gain (loss) | | 3.86 | | 1.69 | | (3.81) | | 9.40 | | 1.50 | | (1.10) |
| Total from investment operations | | 4.13 | | 1.97 | | (3.53) | | 9.62 | | 1.79 | | (.77) |
| Distributions from net investment income | | (.45) | | (.23) | | (.23) | | (.25) | | (.34) | | (.39) |
| Distributions from net realized gain | | - | | (.57) | | (3.76) | | (.67) | | (.59) | | (1.69) |
| Total distributions | | (.45) | | (.83) F | | (3.99) | | (.92) | | (.91) F | | (2.06) F |
| Net asset value, end of period | $ | 29.47 | $ | 25.79 | $ | 24.65 | $ | 32.17 | $ | 23.47 | $ | 22.59 |
Total Return G,H,I | | | | 8.19% | | (12.36)% | | 41.82% | | 7.91% | | (2.19)% |
Ratios to Average Net Assets E,J,K | | | | | | | | | | | | |
| Expenses before reductions | | .29% L,M | | .45% | | .51% | | .59% | | .59% | | .59% |
| Expenses net of fee waivers, if any | | | | .45% | | .51% | | .59% | | .59% | | .59% |
| Expenses net of all reductions | | .29% L,M | | .45% | | .51% | | .59% | | .59% | | .59% |
| Net investment income (loss) | | 1.19% L,M | | 1.12% | | 1.00% | | .77% | | 1.33% | | 1.46% |
| Supplemental Data | | | | | | | | | | | | |
| Net assets, end of period (000 omitted) | $ | 1,653,576 | $ | 1,636,516 | $ | 1,654,862 | $ | 2,042,347 | $ | 1,182,253 | $ | 1,263,319 |
Portfolio turnover rate N | | | | 104% | | 116% | | 70% | | 73% | | 90% |
AFor the ten month period ended June 30. The Fund changed its fiscal year end from August 31 to June 30, effective March 1, 2024.
BAs further described in Organization and Merger information notes, per share amounts have been adjusted to reflect the impact of the change in capital structure associated with the merger. All financial information prior to the merger is that of the Predecessor Fund.
CFor the year ended August 31.
DCalculated based on average shares outstanding during the period.
ENet investment income (loss) is affected by the timing of the declaration of dividends by any underlying mutual funds or exchange-traded funds (ETFs). Net investment income (loss) of any mutual funds or ETFs is not included in the Fund's net investment income (loss) ratio.
FTotal distributions per share do not sum due to rounding.
GTotal returns for periods of less than one year are not annualized.
HTotal returns would have been lower if certain expenses had not been reduced during the applicable periods shown.
IBased on net asset value.
JFees and expenses of any underlying mutual funds or exchange-traded funds (ETFs) are not included in the Fund's expense ratio. The Fund indirectly bears its proportionate share of these expenses. For additional expense information related to investments in Fidelity Central Funds, please refer to the "Investments in Fidelity Central Funds" note found in the Notes to Financial Statements section of the most recent Annual or Semi-Annual report.
KExpense ratios reflect operating expenses of the class. Expenses before reductions do not reflect amounts reimbursed, waived, or reduced through arrangements with the investment adviser, brokerage services, or other offset arrangements, if applicable, and do not represent the amount paid by the class during periods when reimbursements, waivers or reductions occur.
LAnnualized.
MProxy expenses are not annualized.
NAmount does not include the portfolio activity of any underlying mutual funds or exchange-traded funds (ETFs).
OPortfolio turnover rate excludes securities received or delivered in-kind.
Notes to Financial Statements
For the period ended June 30, 2024
1. Organization.
Fidelity Enhanced International ETF, Fidelity Enhanced Large Cap Core ETF, Fidelity Enhanced Large Cap Growth ETF, Fidelity Enhanced Large Cap Value ETF and Fidelity Enhanced Mid Cap ETF (the Funds) are exchange-traded funds of Fidelity Covington Trust (the Trust) and are authorized to issue an unlimited number of shares. Fidelity Enhanced Large Cap Growth ETF is a non-diversified fund. The Trust is registered under the Investment Company Act of 1940, as amended (the 1940 Act), as an open-end management investment company organized as a Massachusetts business trust.
Effective November 17, 2023, each Fidelity Enhanced Index Fund (Predecessor Fund) reorganized into the newly created exchange traded fund (ETF) as noted in the table below. Each Predecessor Fund was the accounting survivor in the reorganization, and, as such, the financial statements and financial highlights of each Fund reflect the financial information of each Predecessor Fund through November 17, 2023 (see Merger Information note).
| Current ETFs | Former Mutual Funds (Predecessor Funds) |
| Fidelity Enhanced International ETF | Fidelity International Enhanced Index Fund |
| Fidelity Enhanced Large Cap Core ETF | Fidelity Large Cap Core Enhanced Index Fund |
| Fidelity Enhanced Large Cap Growth ETF | Fidelity Large Cap Growth Enhanced Index Fund |
| Fidelity Enhanced Large Cap Value ETF | Fidelity Large Cap Value Enhanced Index Fund |
| Fidelity Enhanced Mid Cap ETF | Fidelity Mid Cap Enhanced Index Fund |
Effective March 1, 2024 each Fund's fiscal year-end changed from August 31 to June 30. Accordingly, the Fund's financial statements and related notes include information as of the ten month period ended June 30, 2024 and the one year periods ended August 31, 2023 and August 31, 2022, as applicable.
2. Investments in Fidelity Central Funds.
Funds may invest in Fidelity Central Funds, which are open-end investment companies generally available only to other investment companies and accounts managed by the investment adviser and its affiliates. The Schedule of Investments lists any Fidelity Central Funds held as an investment as of period end, but does not include the underlying holdings of each Fidelity Central Fund. An investing fund indirectly bears its proportionate share of the expenses of the underlying Fidelity Central Funds.
Based on its investment objective, each Fidelity Central Fund may invest or participate in various investment vehicles or strategies that are similar to those of the investing fund. These strategies are consistent with the investment objectives of the investing fund and may involve certain economic risks which may cause a decline in value of each of the Fidelity Central Funds and thus a decline in the value of the investing fund.
| Fidelity Central Fund | Investment Manager | Investment Objective | Investment Practices | Expense RatioA |
| Fidelity Money Market Central Funds | Fidelity Management & Research Company LLC (FMR) | Each fund seeks to obtain a high level of current income consistent with the preservation of capital and liquidity. | Short-term Investments | .005% |
A Expenses expressed as a percentage of average net assets and are as of each underlying Central Fund's most recent annual or semi-annual shareholder report.
A complete unaudited list of holdings for each Fidelity Central Fund is available upon request or at the Securities and Exchange Commission website at www.sec.gov. In addition, the financial statements of the Fidelity Central Funds, which are not covered by the Report of Independent Registered Public Accounting Firm, are available on the Securities and Exchange Commission website or upon request.
3. Significant Accounting Policies.
Each Fund is an investment company and applies the accounting and reporting guidance of the Financial Accounting Standards Board (FASB) Accounting Standards Codification Topic 946 Financial Services - Investment Companies. The financial statements have been prepared in conformity with accounting principles generally accepted in the United States of America (GAAP), which require management to make certain estimates and assumptions at the date of the financial statements. Actual results could differ from those estimates. Subsequent events, if any, through the date that the financial statements were issued have been evaluated in the preparation of the financial statements. Each Fund's Schedule of Investments lists any underlying mutual funds or exchange-traded funds (ETFs) but does not include the underlying holdings of these funds. The following summarizes the significant accounting policies of each Fund:
Investment Valuation. Investments are valued as of 4:00 p.m. Eastern time on the last calendar day of the period. The Board of Trustees (the Board) has designated each Fund's investment adviser as the valuation designee responsible for the fair valuation function and performing fair value determinations as needed. The investment adviser has established a Fair Value Committee (the Committee) to carry out the day-to-day fair valuation responsibilities and has adopted policies and procedures to govern the fair valuation process and the activities of the Committee. In accordance with these fair valuation policies and procedures, which have been approved by the Board, each Fund attempts to obtain prices from one or more third party pricing services or brokers to value its investments. When current market prices, quotations or currency exchange rates are not readily available or reliable, investments will be fair valued in good faith by the Committee, in accordance with the policies and procedures. Factors used in determining fair value vary by investment type and may include market or investment specific events, transaction data, estimated cash flows, and market observations of comparable investments. The frequency that the fair valuation procedures are used cannot be predicted and they may be utilized to a significant extent. The Committee manages each Fund's fair valuation practices and maintains the fair valuation policies and procedures. Each Fund's investment adviser reports to the Board information regarding the fair valuation process and related material matters.
Each Fund categorizes the inputs to valuation techniques used to value its investments into a disclosure hierarchy consisting of three levels as shown below:
Level 1 - unadjusted quoted prices in active markets for identical investments
Level 2 - other significant observable inputs (including quoted prices for similar investments, interest rates, prepayment speeds, etc.)
Level 3 - unobservable inputs (including the Fund's own assumptions based on the best information available)
Valuation techniques used to value each Fund's investments by major category are as follows:
Equity securities, including restricted securities, for which market quotations are readily available, are valued at the last reported sale price or official closing price as reported by a third party pricing service on the primary market or exchange on which they are traded and are categorized as Level 1 in the hierarchy. In the event there were no sales during the day or closing prices are not available, securities are valued at the last quoted bid price or may be valued using the last available price and are generally categorized as Level 2 in the hierarchy. For foreign equity securities, when market or security specific events arise, comparisons to the valuation of American Depositary Receipts (ADRs), futures contracts, ETFs and certain indexes as well as quoted prices for similar securities may be used and would be categorized as Level 2 in the hierarchy. For equity securities, including restricted securities, where observable inputs are limited, assumptions about market activity and risk are used and these securities may be categorized as Level 3 in the hierarchy.
Debt securities, including restricted securities, are valued based on evaluated prices received from third party pricing services or from brokers who make markets in such securities. U.S. government and government agency obligations are valued by pricing services who utilize matrix pricing which considers yield or price of bonds of comparable quality, coupon, maturity and type or by broker-supplied prices. When independent prices are unavailable or unreliable, debt securities may be valued utilizing pricing methodologies which consider similar factors that would be used by third party pricing services. Debt securities are generally categorized as Level 2 in the hierarchy but may be Level 3 depending on the circumstances.
Futures contracts are valued at the settlement price established each day by the board of trade or exchange on which they are traded and are categorized as Level 1 in the hierarchy. Investments in open-end mutual funds, including the Fidelity Central Funds, are valued at their closing net asset value (NAV) each business day and are categorized as Level 1 in the hierarchy.
Changes in valuation techniques may result in transfers in or out of an assigned level within the disclosure hierarchy. The aggregate value of investments by input level as of June 30, 2024 is included at the end of the Fund's Schedule of Investments.
Foreign Currency. Certain Funds may use foreign currency contracts to facilitate transactions in foreign-denominated securities. Gains and losses from these transactions may arise from changes in the value of the foreign currency or if the counterparties do not perform under the contracts' terms.
Foreign-denominated assets, including investment securities, and liabilities are translated into U.S. dollars at the exchange rates at period end. Purchases and sales of investment securities, income and dividends received, and expenses denominated in foreign currencies are translated into U.S. dollars at the exchange rate in effect on the transaction date.
The effects of exchange rate fluctuations on investments are included with the net realized and unrealized gain (loss) on investment securities. Other foreign currency transactions resulting in realized and unrealized gain (loss) are disclosed separately.
Investment Transactions and Income. For financial reporting purposes, the Funds' investment holdings and NAV include trades executed through the end of the last business day of the period. The NAV per share for processing shareholder transactions is calculated as of the close of business (normally 4:00 p.m. Eastern time) of the New York Stock Exchange, Archipelago Exchange (NYSE Arca) and includes trades executed through the end of the prior business day. Gains and losses on securities sold are determined on the basis of identified cost and for certain Funds include proceeds received from litigation. Commissions paid to certain brokers with whom the investment adviser, or its affiliates, places trades on behalf of a fund include an amount in addition to trade execution, which may be rebated back to a fund. Any such rebates are included in net realized gain (loss) on investments in the Statement of Operations. Dividend income is recorded on the ex-dividend date, except for certain dividends from foreign securities where the ex-dividend date may have passed, which are recorded as soon as the Funds are informed of the ex-dividend date. Non-cash dividends included in dividend income, if any, are recorded at the fair market value of the securities received. Income and capital gain distributions from Fidelity Central Funds, if any, are recorded on the ex-dividend date. Certain distributions received by the Funds represent a return of capital or capital gain. The Funds determine the components of these distributions subsequent to the ex-dividend date, based upon receipt of tax filings or other correspondence relating to the underlying investment. These distributions are recorded as a reduction of cost of investments and/or as a realized gain. Interest income is accrued as earned and includes coupon interest and amortization of premium and accretion of discount on debt securities as applicable. Investment income is recorded net of foreign taxes withheld where recovery of such taxes is uncertain. Funds may file withholding tax reclaims in certain jurisdictions to recover a portion of amounts previously withheld. Any withholding tax reclaims income is included in the Statement of Operations in dividends or foreign taxes withheld, as applicable. Any receivables for withholding tax reclaims are included in the Statement of Assets and Liabilities in dividends receivable or reclaims receivable, as applicable.
Expenses. Expenses directly attributable to a fund are charged to that fund. Expenses attributable to more than one fund are allocated among the respective funds on the basis of relative net assets or other appropriate methods. Expenses included in the accompanying financial statements reflect the expenses of that fund and do not include any expenses associated with any underlying mutual funds or exchange-traded funds. Although not included in a fund's expenses, a fund indirectly bears its proportionate share of these expenses through the net asset value of each underlying mutual fund or exchange-traded fund. Expense estimates are accrued in the period to which they relate and adjustments are made when actual amounts are known.
Income Tax Information and Distributions to Shareholders. Each year, each Fund intends to qualify as a regulated investment company under Subchapter M of the Internal Revenue Code, including distributing substantially all of its taxable income and realized gains. As a result, no provision for U.S. Federal income taxes is required. As of June 30, 2024, each Fund did not have any unrecognized tax benefits in the financial statements; nor is each Fund aware of any tax positions for which it is reasonably possible that the total amounts of unrecognized tax benefits will significantly change in the next twelve months. Each Fund files a U.S. federal tax return, in addition to state and local tax returns as required. Each Fund's federal income tax returns are subject to examination by the Internal Revenue Service (IRS) for a period of three fiscal years after they are filed. State and local tax returns may be subject to examination for an additional fiscal year depending on the jurisdiction. Realized gain or loss resulting from in-kind redemptions is not taxable to the Funds and is not distributed to shareholders of the Funds. Foreign taxes are provided for based on each Fund's understanding of the tax rules and rates that exist in the foreign markets in which it invests.
Distributions are declared and recorded on the ex-dividend date. Income and capital gain distributions are determined in accordance with income tax regulations, which may differ from GAAP. In addition, certain Funds claimed a portion of the payment made to redeeming shareholders as a distribution for income tax purposes.
Capital accounts within the financial statements are adjusted for permanent book-tax differences. These adjustments have no impact on net assets or the results of operations. Capital accounts are not adjusted for temporary book-tax differences which will reverse in a subsequent period.
Book-tax differences are primarily due to futures contracts, foreign currency transactions, passive foreign investment companies (PFIC), redemptions in-kind, capital loss carryforwards and losses deferred due to wash sales.
As of period end, the cost and unrealized appreciation (depreciation) in securities, and derivatives if applicable, for federal income tax purposes were as follows for each Fund:
| | Tax cost ($) | Gross unrealized appreciation ($) | Gross unrealized depreciation ($) | Net unrealized appreciation (depreciation)($) |
| Fidelity Enhanced International ETF | 1,295,415,423 | 297,487,526 | (32,713,968) | 264,773,558 |
| Fidelity Enhanced Large Cap Core ETF | 2,145,089,914 | 811,903,767 | (46,117,681) | 765,786,086 |
Fidelity Enhanced Large Cap Growth ETF | 1,459,926,138 | 1,289,465,331 | (25,027,656) | 1,264,437,675 |
| Fidelity Enhanced Large Cap Value ETF | 1,697,132,318 | 209,765,075 | (72,448,398) | 137,316,677 |
| Fidelity Enhanced Mid Cap ETF | 1,547,950,194 | 245,175,059 | (58,450,398) | 186,724,661 |
The tax-based components of distributable earnings as of period end were as follows for each Fund:
| | Undistributed ordinary income ($) | Capital loss carryforward ($) | Net unrealized appreciation (depreciation) on securities and other investments ($) |
| Fidelity Enhanced International ETF | 5,151,360 | (124,949,980) | 264,723,907 |
| Fidelity Enhanced Large Cap Core ETF | - | (60,660,874) | 765,786,086 |
Fidelity Enhanced Large Cap Growth ETF | 308,054 | (254,608) | 1,264,437,675 |
| Fidelity Enhanced Large Cap Value ETF | - | (54,655,669) | 137,317,585 |
| Fidelity Enhanced Mid Cap ETF | - | (57,983,678) | 186,724,661 |
Capital loss carryforwards are only available to offset future capital gains of the Funds to the extent provided by regulations and may be limited. The capital loss carryforward information presented below, including any applicable limitation, is estimated as of fiscal period end and is subject to adjustment.
| | Short-term ($) | Long-term ($) | Total capital loss carryforward ($) |
| Fidelity Enhanced International ETF | (124,949,980) | (-) | (124,949,980) |
| Fidelity Enhanced Large Cap Core ETF | (60,660,874) | (-) | (60,660,874) |
Fidelity Enhanced Large Cap Growth ETF | (254,608) | (-) | (254,608) |
| Fidelity Enhanced Large Cap Value ETF | (31,743,490) | (22,912,179) | (54,655,669) |
| Fidelity Enhanced Mid Cap ETF | (57,983,678) | (-) | (57,983,678) |
| | | | |
The tax character of distributions paid was as follows:
| June 30, 2024 | | | |
| | Ordinary Income ($) | Long-term Capital Gains ($) | Total ($) |
| Fidelity Enhanced International ETF | 71,077,009 | - | 71,077,009 |
| Fidelity Enhanced Large Cap Core ETF | 35,565,387 | - | 35,565,387 |
Fidelity Enhanced Large Cap Growth ETF | 21,077,755 | 601,538 | 21,679,293 |
| Fidelity Enhanced Large Cap Value ETF | 102,487,259 | 72,971,462 | 175,458,721 |
| Fidelity Enhanced Mid Cap ETF | 25,950,215 | - | 25,950,215 |
| August 31, 2023 | | | |
| | Ordinary Income ($) | Long-term Capital Gains ($) | Total ($) |
Fidelity International Enhanced Index Fund | 33,763,256 | - | 33,763,256 |
Fidelity Large Cap Core Enhanced Index Fund | 14,695,385 | 7,597,614 | 22,292,999 |
Fidelity Large Cap Growth Enhanced Index Fund | 10,050,462 | - | 10,050,462 |
Fidelity Large Cap Value Enhanced Index Fund | 84,574,965 | 172,625,609 | 257,200,574 |
| Fidelity Mid Cap Enhanced Index Fund | 16,855,170 | 40,605,634 | 57,460,804 |
| August 31, 2022 | | | |
| | Ordinary Income ($) | Long-term Capital Gains ($) | Total ($) |
Fidelity International Enhanced Index Fund | 40,640,601 | - | 40,640,601 |
Fidelity Large Cap Core Enhanced Index Fund | 93,609,903 | 110,605,741 | 204,215,644 |
Fidelity Large Cap Growth Enhanced Index Fund | 84,709,586 | 150,046,589 | 234,756,175 |
Fidelity Large Cap Value Enhanced Index Fund | 298,040,890 | 399,041,651 | 697,082,541 |
| Fidelity Mid Cap Enhanced Index Fund | 40,554,225 | 217,691,053 | 258,245,278 |
Restricted Securities (including Private Placements). Funds may invest in securities that are subject to legal or contractual restrictions on resale. These securities generally may be resold in transactions exempt from registration or to the public if the securities are registered. Disposal of these securities may involve time-consuming negotiations and expense, and prompt sale at an acceptable price may be difficult. Information regarding restricted securities held at period end is included at the end of the Schedule of Investments, if applicable.
4. Derivative Instruments.
Risk Exposures and the Use of Derivative Instruments. Each Fund's investment objectives allow for various types of derivative instruments, including futures contracts. Derivatives are investments whose value is primarily derived from underlying assets, indices or reference rates and may be transacted on an exchange or over-the-counter (OTC). Derivatives may involve a future commitment to buy or sell a specified asset based on specified terms, to exchange future cash flows at periodic intervals based on a notional principal amount, or for one party to make one or more payments upon the occurrence of specified events in exchange for periodic payments from the other party.
Derivatives were used to increase returns and to manage exposure to certain risks as defined below. The success of any strategy involving derivatives depends on analysis of numerous economic factors, and if the strategies for investment do not work as intended, the objectives may not be achieved.
Derivatives were used to increase or decrease exposure to the following risk(s):
| | |
| Equity Risk | Equity risk relates to the fluctuations in the value of financial instruments as a result of changes in market prices (other than those arising from interest rate risk or foreign exchange risk), whether caused by factors specific to an individual investment, its issuer, or all factors affecting all instruments traded in a market or market segment. |
Funds are also exposed to additional risks from investing in derivatives, such as liquidity risk and counterparty credit risk. Liquidity risk is the risk that a fund will be unable to close out the derivative in the open market in a timely manner. Counterparty credit risk is the risk that the counterparty will not be able to fulfill its obligation to a fund. Counterparty credit risk related to exchange-traded contracts may be mitigated by the protection provided by the exchange on which they trade.
Investing in derivatives may involve greater risks than investing in the underlying assets directly and, to varying degrees, may involve risk of loss in excess of any initial investment and collateral received and amounts recognized in the Statement of Assets and Liabilities. In addition, there may be the risk that the change in value of the derivative contract does not correspond to the change in value of the underlying instrument.
Futures Contracts. A futures contract is an agreement between two parties to buy or sell a specified underlying instrument for a fixed price at a specified future date. Futures contracts were used to manage exposure to the stock market.
Upon entering into a futures contract, a fund is required to deposit either cash or securities (initial margin) with a clearing broker in an amount equal to a certain percentage of the face value of the contract. Futures contracts are marked-to-market daily and subsequent daily payments are made or received by a fund depending on the daily fluctuations in the value of the futures contracts and are recorded as unrealized appreciation or (depreciation). This receivable and/or payable, if any, is included in daily variation margin on futures contracts in the Statement of Assets and Liabilities. Realized gain or (loss) is recorded upon the expiration or closing of a futures contract. The net realized gain (loss) and change in net unrealized appreciation (depreciation) on futures contracts during the period is presented in the Statement of Operations.
Any open futures contracts at period end are presented in the Schedule of Investments under the caption "Futures Contracts". The notional amount at value reflects each contract's exposure to the underlying instrument or index at period end, and is representative of volume of activity during the period unless an average notional amount is presented. Any securities deposited to meet initial margin requirements are identified in the Schedule of Investments. Any cash deposited to meet initial margin requirements is presented as segregated cash with brokers for derivative instruments in the Statement of Assets and Liabilities.
5. Purchases and Sales of Investments.
Purchases and sales of securities, other than short-term securities, U.S. government securities and in-kind transactions, as applicable, are noted in the table below.
| | Purchases ($) | Sales ($) |
| Fidelity Enhanced International ETF | 1,186,864,415 | 1,291,747,707 |
| Fidelity Enhanced Large Cap Core ETF | 1,518,276,833 | 983,060,135 |
| Fidelity Enhanced Large Cap Growth ETF | 1,570,226,140 | 1,037,863,293 |
| Fidelity Enhanced Large Cap Value ETF | 2,266,867,914 | 1,760,524,035 |
| Fidelity Enhanced Mid Cap ETF | 1,115,577,326 | 851,638,788 |
Securities received and delivered in-kind through subscriptions and redemptions are noted in the table below. The net realized gain or (loss) on investments delivered through in-kind redemptions is included in the "Net realized gain (loss) on: Redemptions in-kind" line in the accompanying Statement of Operations.
| | In-Kind Subscriptions ($) | In-Kind Redemptions ($) | Total net realized gain or (loss) ($) |
| Fidelity Enhanced International ETF | 62,960,600 | 118,251,946 | 25,930,557 |
| Fidelity Enhanced Large Cap Core ETF | 639,079,257 | 773,633,770 | 224,859,103 |
| Fidelity Enhanced Large Cap Growth ETF | 190,819,337 | 973,172,501 | 222,950,290 |
| Fidelity Enhanced Large Cap Value ETF | 46,401,388 | 511,959,464 | 90,947,836 |
| Fidelity Enhanced Mid Cap ETF | 140,444,287 | 517,264,468 | 159,281,111 |
Unaffiliated Redemptions In-Kind. Shares that were redeemed in-kind for investments, including accrued interest and cash, if any, are shown in the table below. The net realized gain or loss on investments delivered through in-kind redemptions is included in the "Net realized gain (loss) on: Redemptions in-kind" line in the accompanying Statement of Operations. The amount of the in-kind redemptions is included in share transactions in the accompanying Statement of Changes in Net Assets. There was no gain or loss for federal income tax purposes.
| | Shares | Total net realized gain or loss ($) | Total Proceeds ($) |
| Fidelity Enhanced Large Cap Growth ETF | 2,376,033 | 30,168,211 | 67,930,785 |
| Fidelity Enhanced Large Cap Value ETF | 269,891,296 | 408,600,213 | 3,633,326,017 |
| Fidelity Enhanced Mid Cap ETF | 2,515,337 | 10,553,430 | 40,748,466 |
Prior Fiscal Year Unaffiliated Redemptions In-Kind. Shares that were redeemed in-kind for investments, including accrued interest and cash, if any, are shown in the table below; along with realized gain or loss on investments delivered through in-kind redemptions. The amount of the in-kind redemptions is included in share transactions in the accompanying Statement of Changes in Net Assets. There was no gain or loss for federal income tax purposes.
| | Shares | Total net realized gain or loss ($) | Total Proceeds ($) |
| Fidelity Large Cap Core Enhanced Index Fund | 1,643,260 | 23,998,066 | 41,117,535 |
| Fidelity Large Cap Growth Enhanced Index Fund | 3,558,843 | 14,287,867 | 83,970,422 |
| Fidelity Large Cap Value Enhanced Index Fund | 14,611,088 | 117,706,408 | 375,867,257 |
| Fidelity Mid Cap Enhanced Index Fund | 7,819,926 | 69,766,859 | 200,533,885 |
6. Fees and Other Transactions with Affiliates.
Management Fee. Fidelity Management & Research Company LLC (the investment adviser) provides the Funds with investment management related services for which the Funds pay a monthly management fee that is based on an annual rate of each Fund's average net assets as noted in the table below. Under the management contract, the investment adviser pays all other expenses, except the compensation of the independent Trustees and certain miscellaneous expenses such as proxy and shareholder meeting expenses. The management fees are reduced by an amount equal to the fees and expenses paid by the Funds to the independent Trustees.
| | Fee Rate |
| Fidelity Enhanced International ETF | .28% |
| Fidelity Enhanced Large Cap Core ETF | .18% |
| Fidelity Enhanced Large Cap Growth ETF | .18% |
| Fidelity Enhanced Large Cap Value ETF | .18% |
| Fidelity Enhanced Mid Cap ETF | .23% |
During the period September 1, 2023 through November 17, 2023 and the period ended August 31, 2023, each Predecessor Fund paid an all-inclusive management fee based on the annual rates noted in the following table; and the investment adviser paid all ordinary operating expenses of each Fund, except fees and expenses of the independent Trustees and certain miscellaneous expenses such as proxy and shareholder meeting expenses. The management fees were reduced by an amount equal to the fees and expenses paid by the Funds to the independent Trustees.
| | Fee Rate |
| Fidelity International Enhanced Index Fund | .55% |
| Fidelity Large Cap Core Enhanced Index Fund | .39% |
| Fidelity Large Cap Growth Enhanced Index Fund | .39% |
| Fidelity Large Cap Value Enhanced Index Fund | .39% |
| Fidelity Mid Cap Enhanced Index Fund | .45% |
Brokerage Commissions. A portion of portfolio transactions were placed with brokerage firms which are affiliates of the investment adviser. Brokerage commissions are included in net realized gain (loss) and change in net unrealized appreciation (depreciation) in the Statement of Operations. The commissions paid to these affiliated firms were as follows:
| June 30, 2024 | Amount ($) |
| Fidelity Enhanced International ETF | 2,583 |
| Fidelity Enhanced Large Cap Core ETF | 2,742 |
| Fidelity Enhanced Large Cap Growth ETF | 2,264 |
| Fidelity Enhanced Large Cap Value ETF | 6,571 |
| Fidelity Enhanced Mid Cap ETF | 3,624 |
| | |
| August 31, 2023 | Amount ($) |
| Fidelity International Enhanced Index Fund | 579 |
| Fidelity Large Cap Core Enhanced Index Fund | 1,974 |
| Fidelity Large Cap Growth Enhanced Index Fund | 4,259 |
| Fidelity Large Cap Value Enhanced Index Fund | 3,848 |
| Fidelity Mid Cap Enhanced Index Fund | 1,614 |
Interfund Lending Program. Pursuant to an Exemptive Order issued by the Securities and Exchange Commission (the SEC), each Fund, along with other registered investment companies having management contracts with Fidelity Management & Research Company LLC (FMR), or other affiliated entities of FMR, may participate in an interfund lending program. This program provides an alternative credit facility allowing each Fund to borrow from, or lend money to, other participating affiliated funds.
June 30, 2024
At period end, there were no interfund loans outstanding. Activity in the program during the period ended June 30, 2024 for which loans were outstanding was as follows:
| | Borrower or Lender | Average Loan Balance ($) | Weighted Average Interest Rate | Interest Expense ($) |
| Fidelity Enhanced International ETF | Borrower | 9,632,077 | 5.57% | 19,359 |
| Fidelity Enhanced Large Cap Core ETF | Borrower | 4,991,000 | 5.57% | 3,088 |
Fidelity Enhanced Large Cap Growth ETF | Borrower | 12,409,800 | 5.57% | 19,184 |
| Fidelity Enhanced Large Cap Value ETF | Borrower | 13,109,000 | 5.57% | 4,057 |
Fidelity Enhanced Mid Cap ETF | Borrower | 9,026,889 | 5.57% | 12,560 |
August 31, 2023
At period end, there were no interfund loans outstanding. Activity in the program during the period ended August 31, 2023 for which loans were outstanding was as follows:
| | Borrower or Lender | Average Loan Balance ($) | Weighted Average Interest Rate | Interest Expense ($) |
Fidelity International Enhanced Index Fund | Borrower | 12,807,600 | 4.70% | 16,731 |
Fidelity Large Cap Core Enhanced Index Fund | Borrower | 22,101,250 | 3.68% | 27,112 |
Fidelity Large Cap Growth Enhanced Index Fund | Borrower | 54,770,800 | 5.44% | 41,394 |
Fidelity Large Cap Value Enhanced Index Fund | Borrower | 61,479,000 | 4.35% | 29,724 |
| Fidelity Mid Cap Enhanced Index Fund | Borrower | 4,314,500 | 4.84% | 2,322 |
Interfund Trades. Funds may purchase from or sell securities to other Fidelity Funds under procedures adopted by the Board. The procedures have been designed to ensure these interfund trades are executed in accordance with Rule 17a-7 of the 1940 Act. Any interfund trades are included within the respective purchases and sales amounts shown in the Purchases and Sales of Investments note. Interfund trades during the period are noted in the table below.
| | Purchases ($) | Sales ($) | Realized Gain (Loss) ($) |
| Fidelity Enhanced International ETF | 1,434,524 | 23,607,800 | 3,650,536 |
| Fidelity Enhanced Large Cap Core ETF | 17,099,874 | 29,165,147 | (2,360,477) |
| Fidelity Enhanced Large Cap Growth ETF | 50,050,683 | 46,431,231 | (1,595,145) |
| Fidelity Enhanced Large Cap Value ETF | 54,149,399 | 27,378,273 | (4,087,871) |
| Fidelity Enhanced Mid Cap ETF | 28,107,684 | 12,405,491 | 708,527 |
Other. During the period, the investment adviser reimbursed the Funds for certain losses as follows:
June 30, 2024 | Amount ($) |
| Fidelity Enhanced International ETF | 6,846 |
August 31, 2023 | Amount ($) |
| Fidelity Large Cap Value Enhanced Index Fund | 3,045 |
7. Committed Line of Credit.
During the period September 1, 2023 through November 17, 2023 and for the period August 31, 2023, each Predecessor Fund participated with other funds managed by the investment adviser or an affiliate in a $4.25 billion credit facility (the "line of credit") to be utilized for temporary or emergency purposes to fund shareholder redemptions or for other short-term liquidity purposes. The commitment fees on the pro-rata portion of the line of credit were borne by the investment adviser. During the respective periods, there were no borrowings on this line of credit.
8. Security Lending.
Funds lend portfolio securities from time to time in order to earn additional income. Lending agents are used, including National Financial Services (NFS), an affiliate of the investment adviser. Pursuant to a securities lending agreement, NFS will receive a fee, which is capped at 9.9% of a fund's daily lending revenue, for its services as lending agent. A fund may lend securities to certain qualified borrowers, including NFS. On the settlement date of the loan, a fund receives collateral (in the form of U.S. Treasury obligations, letters of credit and/or cash) against the loaned securities and maintains collateral in an amount not less than 100% of the market value of the loaned securities during the period of the loan. The market value of the loaned securities is determined at the close of business of a fund and any additional required collateral is delivered to a fund on the next business day. A fund or borrower may terminate the loan at any time, and if the borrower defaults on its obligation to return the securities loaned because of insolvency or other reasons, a fund may apply collateral received from the borrower against the obligation. A fund may experience delays and costs in recovering the securities loaned. Any cash collateral received is invested in the Fidelity Securities Lending Cash Central Fund. Any loaned securities are identified as such in the Schedule of Investments, and the value of loaned securities and cash collateral at period end, as applicable, are presented in the Statement of Assets and Liabilities. Security lending income represents the income earned on investing cash collateral, less rebates paid to borrowers and any lending agent fees associated with the loan, plus any premium payments received for lending certain types of securities. Security lending income is presented in the Statement of Operations as a component of income from Fidelity Central Funds. Affiliated security lending activity, if any, was as follows:
| June 30, 2024 | Total Security Lending Fees Paid to NFS ($) | Security Lending Income From Securities Loaned to NFS ($) | Value of Securities Loaned to NFS at Period End ($) |
| Fidelity Enhanced International ETF | 26,690 | - | - |
| Fidelity Enhanced Large Cap Core ETF | 85 | - | - |
| Fidelity Enhanced Large Cap Growth ETF | 102 | - | - |
| Fidelity Enhanced Large Cap Value ETF | 972 | 28 | - |
| Fidelity Enhanced Mid Cap ETF | 2,051 | 15 | - |
| | | | |
| August 31, 2023 | Total Security Lending Fees Paid to NFS ($) | Security Lending Income From Securities Loaned to NFS ($) | Value of Securities Loaned to NFS at Period End ($) |
| Fidelity International Enhanced Index Fund | 33,238 | 9 | - |
| Fidelity Large Cap Core Enhanced Index Fund | 3,721 | - | - |
| Fidelity Large Cap Growth Enhanced Index Fund | 310 | - | - |
| Fidelity Large Cap Value Enhanced Index Fund | 17,561 | 374 | - |
| Fidelity Mid Cap Enhanced Index Fund | 13,555 | 3,917 | - |
9. Bank Borrowings.
Each Fund is permitted to have bank borrowings for temporary or emergency purposes to fund shareholder redemptions or for other short-term liquidity requirements. Each fund has established borrowing arrangements with certain banks. The interest rate on the borrowings is the bank's base rate, as revised from time to time. Activity in this program during the period ended August 31, 2023 for which loans were outstanding was as follows:
| | Average Loan Balance | Weighted Average Interest Rate | Interest Expense |
| Fidelity Large Cap Core Enhanced Index | $8,149,000 | 3.58% | $810 |
10. Expense Reductions.
The investment adviser contractually agreed to reimburse the Funds to the extent proxy and shareholder meeting expenses exceeded .003% of average net assets. This reimbursement will remain in place through October 31, 2025. During the period this reimbursement reduced the Funds' expenses as follows:
| | Reimbursement ($) |
| Fidelity Enhanced International ETF | 34,752 |
| Fidelity Enhanced Large Cap Core ETF | 63,754 |
| Fidelity Enhanced Large Cap Growth ETF | 26,209 |
| Fidelity Enhanced Large Cap Value ETF | 25,566 |
| Fidelity Enhanced Mid Cap ETF | 30,062 |
Through arrangements with each applicable Fund's custodian, credits realized as a result of certain uninvested cash balances were used to reduce each applicable Fund's expenses. All of the applicable expense reductions are noted in the table below.
| June 30, 2024 | Custodian credits ($) |
| Fidelity Enhanced International ETF | 149 |
Fidelity Enhanced Large Cap Core ETF | 163 |
Fidelity Enhanced Large Cap Growth ETF | 364 |
Fidelity Enhanced Large Cap Value ETF | 14,762 |
| Fidelity Enhanced Mid Cap ETF | 6,169 |
| | |
| August 31, 2023 | Custodian credits ($) |
Fidelity International Enhanced Index Fund | 441 |
Fidelity Large Cap Core Enhanced Index Fund | 2,087 |
Fidelity Large Cap Growth Enhanced Index Fund | 2,918 |
Fidelity Large Cap Value Enhanced Index Fund | 1,773 |
Fidelity Mid Cap Enhanced Index Fund | 1,764 |
11. Share Transactions.
Funds issue and redeem shares at NAV only with certain authorized participants in large increments known as Creation Units. Purchases of Creation Units are made by tendering a basket of designated securities and/or cash to a fund and redemption proceeds are paid with a basket of securities from a fund's portfolio with a balancing cash component to equate the market value of the basket of securities delivered or redeemed to the NAV per Creation Unit on the transaction date. Cash may be substituted equivalent to the value of certain securities generally when they are not available in sufficient quantity for delivery. A fund's shares are available in smaller increments to investors in the secondary market at market prices and may be subject to commissions. Authorized participants pay a transaction fee to the shareholder servicing agent when purchasing and redeeming Creation Units of a fund. The transaction fee is used to offset the costs associated with the issuance and redemption of Creation Units.
12. Other.
A fund's organizational documents provide former and current trustees and officers with a limited indemnification against liabilities arising in connection with the performance of their duties to the fund. In the normal course of business, a fund may also enter into contracts that provide general indemnifications. A fund's maximum exposure under these arrangements is unknown as this would be dependent on future claims that may be made against a fund. The risk of material loss from such claims is considered remote.
13. Merger Information.
On November 17, 2023 each Fund (Predecessor Fund) reorganized into a newly created exchange traded fund (ETF) pursuant an Agreement and Plan of Reorganization (the Agreement) approved by its Board of Trustees. Per the Agreement, shareholders of each Predecessor Fund received ETF shares equal in value to the shares of the Predecessor Fund they owned on the day the reorganization was effective. Each Predecessor Fund was the accounting survivor after the reorganization. As such, performance and financial history prior to the reorganization is that of each Predecessor Fund. Historical share transactions and per share information for the Predecessor Fund was retroactively adjusted to reflect the change in capital structure due to the reorganization.
| Predecessor Funds | New ETFs |
| Fidelity International Enhanced Index Fund | Fidelity Enhanced International ETF |
| Fidelity Large Cap Core Enhanced Index Fund | Fidelity Enhanced Large Cap Core ETF |
| Fidelity Large Cap Growth Enhanced Index Fund | Fidelity Enhanced Large Cap Growth ETF |
| Fidelity Large Cap Value Enhanced Index Fund | Fidelity Enhanced Large Cap Value ETF |
| Fidelity Mid Cap Enhanced Index Fund | Fidelity Enhanced Mid Cap ETF |
For financial reporting purposes, the assets and liabilities of each Predecessor Fund and shares issued by each ETF were recorded at fair value; however, the cost basis of the investments received from each Predecessor Fund were carried forward and will be utilized for purposes of each ETF's ongoing reporting of realized and unrealized gains and losses to more closely align subsequent reporting of realized gains with amounts distributable to shareholders for tax purposes. The reorganization qualified as a tax-free reorganization for federal income tax purposes with no gain or loss recognized to each Predecessor Fund or their shareholders. Costs incurred in connection with the reorganization were paid by each Predecessor Fund.
| Predecessor Fund/Accounting Survivor | Investments $ | Unrealized appreciation (depreciation) $ | Net Assets $ | Shares Exchanged | Shares Exchanged Ratio |
| Fidelity International Enhanced Index Fund | 1,368,602,643 | 195,092,188 | 1,368,248,892 | 54,730,068 | .4057160000 |
| Fidelity Large Cap Core Enhanced Index Fund | 1,840,988,775 | 537,069,093 | 1,948,361,461 | 77,934,309 | .8388640000 |
| Fidelity Large Cap Growth Enhanced Index Fund | 2,012,959,825 | 875,152,421 | 2,145,716,375 | 85,828,689 | 1.2032280000 |
| Fidelity Large Cap Value Enhanced Index Fund | 1,827,644,613 | 392,942 | 2,004,099,301 | 80,163,716 | .5729240000 |
| Fidelity Mid Cap Enhanced Index Fund | 1,369,301,709 | 129,571,229 | 1,460,889,645 | 58,435,751 | .6458920000 |
| Acquiring ETF | Net Assets $ | Total net assets after the acquisition $ |
| Fidelity Enhanced International ETF | 25 | 1,368,248,917 |
| Fidelity Enhanced Large Cap Core ETF | 25 | 1,948,361,486 |
| Fidelity Enhanced Large Cap Growth ETF | 25 | 2,145,716,400 |
| Fidelity Enhanced Large Cap Value ETF | 25 | 2,004,099,326 |
| Fidelity Enhanced Mid Cap ETF | 25 | 1,460,889,670 |
Pro forma results of operations of the combined entity for the entire period ended June 30, 2024, as though the acquisition had occurred as of the beginning of the year (rather than on the actual acquisition date), are as follows:
| ETF name | Net investment income (loss) | Total net realized gain (loss) | Total change in net unrealized appreciation (depreciation) | Net increase (decrease) in net assets resulting from operations |
| Fidelity Enhanced International ETF | $35,812,169 | $99,267,722 | $58,817,853 | $193,897,744 |
| Fidelity Enhanced Large Cap Core ETF | 22,993,277 | 209,030,464 | 246,834,439 | 478,858,180 |
| Fidelity Enhanced Large Cap Growth ETF | 12,362,182 | 260,568,152 | 368,592,605 | 641,522,939 |
| Fidelity Enhanced Large Cap Value ETF | 40,907,004 | 453,402,154 | (574,650,497) | (80,341,339) |
| Fidelity Enhanced Mid Cap ETF | 15,874,097 | 178,466,399 | 13,844,200 | 208,184,696 |
Because the combined investment portfolios have been managed as a single portfolio since the acquisition was completed, it is not practicable to separate the amounts of revenue and earnings of each Predecessor Fund that has been included in each ETF's Statement of Operations since November 17, 2023.
14. Risk and Uncertainties.
Many factors affect a fund's performance. Developments that disrupt global economies and financial markets, such as pandemics, epidemics, outbreaks of infectious diseases, war, terrorism, and environmental disasters, may significantly affect a fund's investment performance. The effects of these developments to a fund will be impacted by the types of securities in which a fund invests, the financial condition, industry, economic sector, and geographic location of an issuer, and a fund's level of investment in the securities of that issuer. Significant concentrations in security types, issuers, industries, sectors, and geographic locations may magnify the factors that affect a fund's performance.
Report of Independent Registered Public Accounting Firm
To the Board of Trustees of Fidelity Covington Trust and Shareholders of Fidelity Enhanced International ETF, Fidelity Enhanced Large Cap Core ETF, Fidelity Enhanced Large Cap Growth ETF, Fidelity Enhanced Large Cap Value ETF, and Fidelity Enhanced Mid Cap ETF
Opinions on the Financial Statements
We have audited the accompanying statement of assets and liabilities, including the schedules of investments, of Fidelity Enhanced International ETF, Fidelity Enhanced Large Cap Core ETF, Fidelity Enhanced Large Cap Growth ETF, Fidelity Enhanced Large Cap Value ETF, and Fidelity Enhanced Mid Cap ETF (five of the funds constituting Fidelity Covington Trust, referred to hereafter as the "Funds") as of June 30, 2024, the related statements of operations for the period September 1, 2023 through June 30, 2024 and the year ended August 31, 2023, the statements of changes in net assets for the period September 1, 2023 through June 30, 2024 and for each of the two years in the period ended August 31, 2023, including the related notes, and the financial highlights for each of the periods indicated therein (collectively referred to as the "financial statements"). In our opinion, the financial statements present fairly, in all material respects, the financial position of each of the Funds as of June 30, 2024, the results of each of their operations for the period September 1, 2023 through June 30, 2024 and for the year ended August 31, 2023, the changes in each of their net assets for the period September 1, 2023 through June 30, 2024 and for each of the two years in the period ended August 31, 2023, and the financial highlights for each of the periods indicated therein in conformity with accounting principles generally accepted in the United States of America.
Basis for Opinions
These financial statements are the responsibility of the Funds' management. Our responsibility is to express an opinion on the Funds' financial statements based on our audits. We are a public accounting firm registered with the Public Company Accounting Oversight Board (United States) (PCAOB) and are required to be independent with respect to the Fund in accordance with the U.S. federal securities laws and the applicable rules and regulations of the Securities and Exchange Commission and the PCAOB.
We conducted our audits of these financial statements in accordance with the standards of the PCAOB. Those standards require that we plan and perform the audit to obtain reasonable assurance about whether the financial statements are free of material misstatement, whether due to error or fraud.
Our audits included performing procedures to assess the risks of material misstatement of the financial statements, whether due to error or fraud, and performing procedures that respond to those risks. Such procedures included examining, on a test basis, evidence regarding the amounts and disclosures in the financial statements. Our audits also included evaluating the accounting principles used and significant estimates made by management, as well as evaluating the overall presentation of the financial statements. Our procedures included confirmation of securities owned as of June 30, 2024 by correspondence with the custodian and brokers; when replies were not received from brokers, we performed other auditing procedures. We believe that our audits provide a reasonable basis for our opinion.
/s/ PricewaterhouseCoopers LLP
Boston, Massachusetts
August 19, 2024
We have served as the auditor of one or more investment companies in the Fidelity group of funds since 1932.
Distributions
(Unaudited)The dividend and capital gains distributions for the fund(s) are available on Fidelity.com or Institutional.Fidelity.com.
A percentage of the dividends distributed during the fiscal year for the following funds qualify for the dividends-received deduction for corporate shareholders:
| Fidelity Enhanced Large Cap Core ETF | |
| December 2023 | 100% |
| March 2024 | 100% |
| June 2024 | 100% |
| Fidelity Enhanced Large Cap Growth ETF | |
| December 2023 | 100% |
| March 2024 | 100% |
| June 2024 | 100% |
| Fidelity Enhanced Large Cap Value ETF | |
| December 2023 | 100% |
| March 2024 | 100% |
| June 2024 | 100% |
| Fidelity Enhanced Mid Cap ETF | |
| December 2023 | 100% |
| March 2024 | 86% |
| June 2024 | 86% |
A percentage of the dividends distributed during the fiscal year for the following funds may be taken into account as a dividend for purposes of the maximum rate under section 1(h)(11) of the Internal Revenue Code.
| Fidelity Enhanced International ETF | |
| December 2023 | - |
| March 2024 | 100% |
| June 2024 | 100% |
| Fidelity Enhanced Large Cap Core ETF | |
| December 2023 | 100% |
| March 2024 | 100% |
| June 2024 | 100% |
| Fidelity Enhanced Large Cap Growth ETF | |
| December 2023 | 100% |
| March 2024 | 100% |
| June 2024 | 100% |
| Fidelity Enhanced Large Cap Value ETF | |
| December 2023 | 100% |
| March 2024 | 100% |
| June 2024 | 100% |
| Fidelity Enhanced Mid Cap ETF | |
| December 2023 | 100% |
| March 2024 | 94.74% |
| June 2024 | 94.74% |
| | |
| | |
| | |
| | |
A percentage of the dividends distributed during the fiscal year for the following funds qualify as a section 199A dividend:
| Fidelity Enhanced Mid Cap ETF | |
| March 2024 | 5.27% |
| June 2024 | 5.27% |
The funds hereby designate the amounts noted below as distributions paid during the fiscal year ended 2024 as qualifying to be taxed as section 163(j) interest dividends:
| Fidelity Enhanced International ETF | $456,938 |
| Fidelity Enhanced Mid Cap ETF | $462,145 |
A percentage of the dividends distributed during the fiscal year for the following funds qualify for the dividends-received deduction for corporate shareholders:
| Fidelity Large Cap Core Enhanced Index Fund | |
| October 2023 | 100% |
| November 2023 | 100% |
| Fidelity Large Cap Growth Enhanced Index Fund | |
| October 2023 | 100% |
| November 2023 | 100% |
| Fidelity Large Cap Value Enhanced Index Fund | |
| October 2023 | 100% |
| November 2023 | 100% |
| Fidelity Mid Cap Enhanced Index Fund | |
| October 2023 | 100% |
| November 2023 | 76% |
A percentage of the dividends distributed during the fiscal year for the following funds may be taken into account as a dividend for purposes of the maximum rate under section 1(h)(11) of the Internal Revenue Code.
| Fidelity International Enhanced Index Fund | |
| October 2023 | 89.31% |
| November 2023 | 86.60% |
| Fidelity Large Cap Core Enhanced Index Fund | |
| October 2023 | 100% |
| November 2023 | 100% |
| Fidelity Large Cap Growth Enhanced Index Fund | |
| October 2023 | 100% |
| November 2023 | 100% |
| Fidelity Large Cap Value Enhanced Index Fund | |
| October 2023 | 100% |
| November 2023 | 100% |
| Fidelity Mid Cap Enhanced Index Fund | |
| October 2023 | 99.86% |
| November 2023 | 92.24% |
A percentage of the dividends distributed during the fiscal year for the following funds qualify as a section 199A dividend:
| Fidelity Mid Cap Enhanced Index Fund | |
| October 2023 | 0.15% |
| November 2023 | 7.77% |
The amounts per share which represent income derived from sources within, and taxes paid to, foreign countries or possessions of the United States are as follows:
| | Pay Date | Income | Taxes |
Fidelity International Enhanced Index Fund | | | |
| | 10/16/2023 | $0.2736 | $0.0214 |
| | 11/15/2023 | $0.0561 | $0.0023 |
The funds will notify shareholders in January 2025 of amounts for use in preparing 2024 income tax returns.
Item 8: Changes in and Disagreements with Accountants for Open-End Management Investment Companies
Note: This is not applicable for any fund included in this document.
Item 9: Proxy Disclosures for Open-End Management Investment Companies
Note: This is not applicable for any fund included in this document.
Item 10: Remuneration Paid to Directors, Officers, and others of Open-End Management Investment Companies
Note: This information is disclosed as part of the financial statements for each Fund as part of Item 7: Financial Statements and Financial Highlights for Open-End Management Investment companies.
Item 11: Statement Regarding Basis for Approval of Investment Advisory Contract
Note: This is not applicable for any fund included in this document.
1.9910053.100
EIE-ANN-0824
Fidelity® Enhanced Small Cap ETF
Annual Report
June 30, 2024
Contents
To view a fund's proxy voting guidelines and proxy voting record for the 12-month period ended June 30, visit http://www.fidelity.com/proxyvotingresults or visit the Securities and Exchange Commission's (SEC) web site at http://www.sec.gov.
You may also call 1-800-FIDELITY to request a free copy of the proxy voting guidelines.
Standard & Poor's, S&P and S&P 500 are registered service marks of The McGraw-Hill Companies, Inc. and have been licensed for use by Fidelity Distributors Corporation.
Other third-party marks appearing herein are the property of their respective owners.
All other marks appearing herein are registered or unregistered trademarks or service marks of FMR LLC or an affiliated company. © 2024 FMR LLC. All rights reserved.
This report and the financial statements contained herein are submitted for the general information of the shareholders of the Fund. This report is not authorized for distribution to prospective investors in the Fund unless preceded or accompanied by an effective prospectus.
A fund files its complete schedule of portfolio holdings with the SEC for the first and third quarters of each fiscal year on Form N-PORT. Forms N-PORT are available on the SEC's web site at http://www.sec.gov. A fund's Forms N-PORT may be reviewed and copied at the SEC's Public Reference Room in Washington, DC. Information regarding the operation of the SEC's Public Reference Room may be obtained by calling 1-800-SEC-0330.
For a complete list of a fund's portfolio holdings, view the most recent holdings listing, semiannual report, or annual report on Fidelity's web site at http://www.fidelity.com, http://www.institutional.fidelity.com, or http://www.401k.com, as applicable.
NOT FDIC INSURED •MAY LOSE VALUE •NO BANK GUARANTEE
Neither the Fund nor Fidelity Distributors Corporation is a bank.
Item 7: Financial Statements and Financial Highlights for Open-End Management Investment Companies (Annual Report)
Fidelity® Enhanced Small Cap ETF
Schedule of Investments June 30, 2024
Showing Percentage of Net Assets
| Common Stocks - 98.0% |
| | | Shares | Value ($) |
| COMMUNICATION SERVICES - 3.0% | | | |
| Diversified Telecommunication Services - 0.9% | | | |
| ATN International, Inc. | | 24,296 | 553,949 |
| Bandwidth, Inc. Class A, (a) | | 108,491 | 1,831,328 |
| Lumen Technologies, Inc. (a)(b) | | 2,128,500 | 2,341,350 |
| Shenandoah Telecommunications Co. | | 14,690 | 239,888 |
| | | | 4,966,515 |
| Entertainment - 0.6% | | | |
| Eventbrite, Inc. (a) | | 29,678 | 143,642 |
| Lions Gate Entertainment Corp.: | | | |
| Class A (a)(b) | | 99,607 | 938,298 |
| Class B (a) | | 111,568 | 956,138 |
| Madison Square Garden Entertainment Corp. Class A (a) | | 36,561 | 1,251,483 |
| | | | 3,289,561 |
| Interactive Media & Services - 0.9% | | | |
| Shutterstock, Inc. (b) | | 7,192 | 278,330 |
| TrueCar, Inc. (a) | | 159,299 | 498,606 |
| Vimeo, Inc. (a) | | 297,321 | 1,109,007 |
| Yelp, Inc. (a) | | 91,809 | 3,392,343 |
| Zedge, Inc. (a) | | 22,926 | 69,924 |
| ZipRecruiter, Inc. (a) | | 16,857 | 153,230 |
| | | | 5,501,440 |
| Media - 0.2% | | | |
| John Wiley & Sons, Inc. Class A | | 36,808 | 1,498,086 |
| Wireless Telecommunication Services - 0.4% | | | |
| Spok Holdings, Inc. | | 8,728 | 129,262 |
| Telephone & Data Systems, Inc. | | 96,482 | 2,000,072 |
| | | | 2,129,334 |
TOTAL COMMUNICATION SERVICES | | | 17,384,936 |
| CONSUMER DISCRETIONARY - 10.3% | | | |
| Automobile Components - 0.8% | | | |
| American Axle & Manufacturing Holdings, Inc. (a) | | 228,912 | 1,600,095 |
| Cooper-Standard Holding, Inc. (a)(b) | | 64,049 | 796,770 |
| The Goodyear Tire & Rubber Co. (a) | | 181,098 | 2,055,462 |
| | | | 4,452,327 |
| Diversified Consumer Services - 0.9% | | | |
| 2U, Inc. (a)(b) | | 19,211 | 98,552 |
| Chegg, Inc. (a)(b) | | 173,005 | 546,696 |
| Duolingo, Inc. (a) | | 14,312 | 2,986,485 |
| Frontdoor, Inc. (a) | | 49,243 | 1,663,921 |
| | | | 5,295,654 |
| Hotels, Restaurants & Leisure - 2.0% | | | |
| Dine Brands Global, Inc. | | 3,320 | 120,184 |
| Everi Holdings, Inc. (a) | | 78,214 | 656,998 |
| International Game Technology PLC | | 163,664 | 3,348,565 |
| Light & Wonder, Inc. Class A (a) | | 22,115 | 2,319,421 |
| PlayAGS, Inc. (a) | | 56,623 | 651,165 |
| Shake Shack, Inc. Class A (a) | | 12,110 | 1,089,900 |
| Sweetgreen, Inc. Class A (a) | | 12,858 | 387,540 |
| Texas Roadhouse, Inc. | | 1,602 | 275,079 |
| Wingstop, Inc. | | 5,965 | 2,521,167 |
| | | | 11,370,019 |
| Household Durables - 3.4% | | | |
| Flexsteel Industries, Inc. | | 17,102 | 531,188 |
| Installed Building Products, Inc. (b) | | 19,391 | 3,988,341 |
| KB Home | | 7,366 | 516,946 |
| M/I Homes, Inc. (a) | | 29,663 | 3,623,039 |
| Meritage Homes Corp. | | 19,022 | 3,078,711 |
| Taylor Morrison Home Corp. (a) | | 74,674 | 4,139,927 |
| TRI Pointe Homes, Inc. (a) | | 100,185 | 3,731,891 |
| | | | 19,610,043 |
| Specialty Retail - 3.2% | | | |
| Abercrombie & Fitch Co. Class A (a) | | 27,459 | 4,883,309 |
| American Eagle Outfitters, Inc. | | 55,577 | 1,109,317 |
| CarParts.com, Inc. (a) | | 198,007 | 198,007 |
| Carvana Co. Class A (a)(b) | | 23,218 | 2,988,621 |
| Murphy U.S.A., Inc. | | 1,411 | 662,408 |
| Petco Health & Wellness Co., Inc. Class A (a) | | 43,300 | 163,674 |
| Sally Beauty Holdings, Inc. (a) | | 89,718 | 962,674 |
| Sonic Automotive, Inc. Class A (sub. vtg.) | | 25,671 | 1,398,299 |
| The Container Store Group, Inc. (a) | | 81,939 | 44,247 |
| The ODP Corp. (a) | | 52,760 | 2,071,885 |
| Upbound Group, Inc. | | 80,086 | 2,458,640 |
| Urban Outfitters, Inc. (a) | | 31,973 | 1,312,492 |
| | | | 18,253,573 |
| Textiles, Apparel & Luxury Goods - 0.0% | | | |
| Rocky Brands, Inc. | | 7,381 | 272,802 |
TOTAL CONSUMER DISCRETIONARY | | | 59,254,418 |
| CONSUMER STAPLES - 3.5% | | | |
| Beverages - 1.2% | | | |
| Coca-Cola Consolidated, Inc. | | 2,881 | 3,125,885 |
| Primo Water Corp. | | 169,758 | 3,710,910 |
| | | | 6,836,795 |
| Consumer Staples Distribution & Retail - 0.7% | | | |
| Ingles Markets, Inc. Class A | | 8,948 | 613,922 |
| Natural Grocers by Vitamin Cottage, Inc. | | 20,376 | 431,971 |
| PriceSmart, Inc. | | 2,405 | 195,286 |
| Sprouts Farmers Market LLC (a) | | 24,761 | 2,071,505 |
| Weis Markets, Inc. | | 10,239 | 642,702 |
| | | | 3,955,386 |
| Food Products - 0.8% | | | |
| B&G Foods, Inc. (b) | | 43,463 | 351,181 |
| Fresh Del Monte Produce, Inc. | | 89,406 | 1,953,521 |
| John B. Sanfilippo & Son, Inc. | | 8,876 | 862,481 |
| Vital Farms, Inc. (a) | | 27,653 | 1,293,331 |
| | | | 4,460,514 |
| Household Products - 0.3% | | | |
| WD-40 Co. | | 7,247 | 1,591,731 |
| Personal Care Products - 0.5% | | | |
| elf Beauty, Inc. (a) | | 14,153 | 2,982,320 |
| Tobacco - 0.0% | | | |
| Turning Point Brands, Inc. | | 8,242 | 264,486 |
TOTAL CONSUMER STAPLES | | | 20,091,232 |
| ENERGY - 5.9% | | | |
| Energy Equipment & Services - 1.7% | | | |
| Archrock, Inc. | | 4,313 | 87,209 |
| Bristow Group, Inc. (a) | | 19,272 | 646,190 |
| Championx Corp. | | 28,221 | 937,219 |
| Helix Energy Solutions Group, Inc. (a) | | 108,060 | 1,290,236 |
| Kodiak Gas Services, Inc. | | 40,142 | 1,094,271 |
| Nabors Industries Ltd. (a)(b) | | 26,304 | 1,871,793 |
| Nabors Industries Ltd. warrants 6/11/26 (a) | | 10,764 | 71,042 |
| Oceaneering International, Inc. (a) | | 3,820 | 90,381 |
| Oil States International, Inc. (a) | | 42,348 | 188,025 |
| Tidewater, Inc. (a) | | 10,611 | 1,010,273 |
| Transocean Ltd. (United States) (a) | | 104,848 | 560,937 |
| Weatherford International PLC (a) | | 14,569 | 1,783,974 |
| | | | 9,631,550 |
| Oil, Gas & Consumable Fuels - 4.2% | | | |
| Ardmore Shipping Corp. | | 37,805 | 851,747 |
| California Resources Corp. | | 40,262 | 2,142,744 |
| Civitas Resources, Inc. | | 34,184 | 2,358,696 |
| CONSOL Energy, Inc. (a) | | 3,802 | 387,918 |
| Crescent Energy, Inc. Class A | | 135,443 | 1,605,000 |
| Delek U.S. Holdings, Inc. | | 61,807 | 1,530,341 |
| DHT Holdings, Inc. | | 2,532 | 29,295 |
| Equitrans Midstream Corp. | | 44,934 | 583,243 |
| Excelerate Energy, Inc. | | 5,556 | 102,453 |
| Green Plains, Inc. (a)(b) | | 116,041 | 1,840,410 |
| Kinetik Holdings, Inc. | | 4,586 | 190,044 |
| Matador Resources Co. | | 51,740 | 3,083,704 |
| Murphy Oil Corp. | | 95,615 | 3,943,163 |
| Overseas Shipholding Group, Inc. Class A | | 45,371 | 384,746 |
| PBF Energy, Inc. Class A | | 7,415 | 341,238 |
| Riley Exploration Permian, Inc. (b) | | 25,328 | 717,036 |
| Scorpio Tankers, Inc. | | 17,072 | 1,387,783 |
| SFL Corp. Ltd. | | 16,891 | 234,447 |
| Teekay Tankers Ltd. | | 18,106 | 1,245,874 |
| Uranium Energy Corp. (a)(b) | | 40,168 | 241,410 |
| World Kinect Corp. | | 34,819 | 898,330 |
| | | | 24,099,622 |
TOTAL ENERGY | | | 33,731,172 |
| FINANCIALS - 15.0% | | | |
| Banks - 6.6% | | | |
| 1st Source Corp. | | 13,970 | 749,071 |
| Amalgamated Financial Corp. | | 5,327 | 145,960 |
| Ameris Bancorp | | 41,150 | 2,071,903 |
| Atlantic Union Bankshares Corp. (b) | | 35,156 | 1,154,875 |
| Axos Financial, Inc. (a) | | 24,024 | 1,372,972 |
| BancFirst Corp. | | 34,023 | 2,983,817 |
| Bancorp, Inc., Delaware (a) | | 42,277 | 1,596,380 |
| Banner Corp. | | 21,942 | 1,089,201 |
| Byline Bancorp, Inc. | | 11,106 | 263,656 |
| Cadence Bank | | 48,427 | 1,369,516 |
| Capital City Bank Group, Inc. | | 2,715 | 77,215 |
| Central Pacific Financial Corp. | | 33,899 | 718,659 |
| Community Bank System, Inc. | | 23,393 | 1,104,384 |
| Community Trust Bancorp, Inc. | | 8,194 | 357,750 |
| CVB Financial Corp. (b) | | 50,350 | 868,034 |
| Financial Institutions, Inc. | | 17,255 | 333,367 |
| First Bancorp, Puerto Rico | | 139,452 | 2,550,577 |
| First Busey Corp. | | 34,254 | 829,289 |
| First Commonwealth Financial Corp. | | 8,212 | 113,408 |
| First Financial Bankshares, Inc. | | 21,202 | 626,095 |
| Great Southern Bancorp, Inc. (b) | | 26,378 | 1,466,881 |
| Hancock Whitney Corp. | | 19,442 | 929,911 |
| Hope Bancorp, Inc. | | 15,036 | 161,487 |
| Lakeland Financial Corp. (b) | | 36,450 | 2,242,404 |
| Mercantile Bank Corp. | | 3,872 | 157,087 |
| Midland States Bancorp, Inc. | | 10,124 | 229,309 |
| NBT Bancorp, Inc. | | 5,048 | 194,853 |
| Northfield Bancorp, Inc. | | 37,545 | 355,927 |
| Northwest Bancshares, Inc. | | 138,276 | 1,597,088 |
| OFG Bancorp | | 31,713 | 1,187,652 |
| Peapack-Gladstone Financial Corp. | | 12,984 | 294,088 |
| Provident Financial Services, Inc. | | 169,558 | 2,433,157 |
| Renasant Corp. | | 56,272 | 1,718,547 |
| Sierra Bancorp | | 16,592 | 371,329 |
| Stellar Bancorp, Inc. (b) | | 5,502 | 126,326 |
| UMB Financial Corp. | | 29,211 | 2,436,782 |
| Univest Corp. of Pennsylvania | | 10,072 | 229,944 |
| Westamerica Bancorp. | | 24,902 | 1,208,494 |
| | | | 37,717,395 |
| Capital Markets - 3.4% | | | |
| Assetmark Financial Holdings, Inc. (a) | | 80,407 | 2,778,062 |
| BGC Group, Inc. Class A | | 432,926 | 3,593,286 |
| Federated Hermes, Inc. | | 78,107 | 2,568,158 |
| Oppenheimer Holdings, Inc. Class A (non-vtg.) | | 5,632 | 269,829 |
| Piper Sandler Cos. | | 3,594 | 827,231 |
| Stifel Financial Corp. | | 26,736 | 2,249,834 |
| StoneX Group, Inc. (a) | | 26,192 | 1,972,520 |
| Virtus Investment Partners, Inc. | | 9,745 | 2,200,908 |
| WisdomTree Investments, Inc. (b) | | 339,721 | 3,366,635 |
| | | | 19,826,463 |
| Consumer Finance - 0.8% | | | |
| EZCORP, Inc. (non-vtg.) Class A (a)(b) | | 96,356 | 1,008,847 |
| PROG Holdings, Inc. | | 86,331 | 2,993,959 |
| Regional Management Corp. | | 13,844 | 397,877 |
| | | | 4,400,683 |
| Financial Services - 1.8% | | | |
| AvidXchange Holdings, Inc. (a) | | 169,946 | 2,049,549 |
| Compass Diversified Holdings | | 68,975 | 1,509,863 |
| Enact Holdings, Inc. | | 44,810 | 1,373,875 |
| Flywire Corp. (a) | | 22,903 | 375,380 |
| Jackson Financial, Inc. | | 18,379 | 1,364,825 |
| Payoneer Global, Inc. (a) | | 566,424 | 3,137,989 |
| Waterstone Financial, Inc. | | 32,952 | 421,456 |
| | | | 10,232,937 |
| Insurance - 1.7% | | | |
| Amerisafe, Inc. | | 20,061 | 880,477 |
| CNO Financial Group, Inc. | | 14,958 | 414,636 |
| Genworth Financial, Inc. Class A (a) | | 218,149 | 1,317,620 |
| HCI Group, Inc. (b) | | 14,777 | 1,361,996 |
| Horace Mann Educators Corp. (b) | | 4,368 | 142,484 |
| Lemonade, Inc. (a)(b) | | 87,245 | 1,439,543 |
| Oscar Health, Inc. Class A (a) | | 50,777 | 803,292 |
| Palomar Holdings, Inc. (a) | | 300 | 24,345 |
| Selective Insurance Group, Inc. | | 40,000 | 3,753,200 |
| | | | 10,137,593 |
| Mortgage Real Estate Investment Trusts - 0.7% | | | |
| Apollo Commercial Real Estate Finance, Inc. | | 49,233 | 481,991 |
| BrightSpire Capital, Inc. | | 87,594 | 499,286 |
| KKR Real Estate Finance Trust, Inc. (b) | | 127,874 | 1,157,260 |
| Ladder Capital Corp. Class A | | 58,866 | 664,597 |
| TPG RE Finance Trust, Inc. | | 118,881 | 1,027,132 |
| | | | 3,830,266 |
TOTAL FINANCIALS | | | 86,145,337 |
| HEALTH CARE - 14.9% | | | |
| Biotechnology - 7.7% | | | |
| 2seventy bio, Inc. (a)(b) | | 58,072 | 223,577 |
| ACADIA Pharmaceuticals, Inc. (a) | | 41,488 | 674,180 |
| Acelyrin, Inc. (a) | | 34,650 | 152,807 |
| Adaptimmune Therapeutics PLC sponsored ADR (a)(b) | | 111,698 | 108,894 |
| Adicet Bio, Inc. (a)(b) | | 153,842 | 186,149 |
| ADMA Biologics, Inc. (a) | | 26,227 | 293,218 |
| Adverum Biotechnologies, Inc. (a) | | 13,361 | 91,656 |
| Affimed NV (a)(b) | | 9,142 | 49,824 |
| Agenus, Inc. (a)(b) | | 35,183 | 589,315 |
| Agios Pharmaceuticals, Inc. (a) | | 6,360 | 274,243 |
| Akebia Therapeutics, Inc. (a) | | 293,477 | 299,347 |
| Alector, Inc. (a) | | 44,330 | 201,258 |
| Alkermes PLC (a) | | 45,699 | 1,101,346 |
| Allakos, Inc. (a) | | 233,829 | 233,829 |
| Allovir, Inc. (a)(b) | | 83,484 | 60,384 |
| ALX Oncology Holdings, Inc. (a) | | 18,232 | 109,939 |
| Amicus Therapeutics, Inc. (a) | | 95,846 | 950,792 |
| Anika Therapeutics, Inc. (a) | | 10,801 | 273,589 |
| Annexon, Inc. (a) | | 58,386 | 286,091 |
| Apogee Therapeutics, Inc. | | 1,800 | 70,830 |
| Arbutus Biopharma Corp. (a)(b) | | 38,294 | 118,328 |
| Arcturus Therapeutics Holdings, Inc. (a) | | 20,392 | 496,545 |
| Arcutis Biotherapeutics, Inc. (a)(b) | | 64,366 | 598,604 |
| Ardelyx, Inc. (a) | | 20,284 | 150,304 |
| Arrowhead Pharmaceuticals, Inc. (a) | | 12,570 | 326,694 |
| Assembly Biosciences, Inc. (a) | | 8,206 | 112,586 |
| Atara Biotherapeutics, Inc. (a) | | 6,352 | 53,992 |
| Atreca, Inc. (a)(c) | | 1,061 | 95 |
| Avidity Biosciences, Inc. (a) | | 4,938 | 201,717 |
| Beam Therapeutics, Inc. (a) | | 7,045 | 165,064 |
| BioCryst Pharmaceuticals, Inc. (a) | | 93,470 | 577,645 |
| Biohaven Ltd. (a) | | 23,571 | 818,149 |
| bluebird bio, Inc. (a) | | 27,396 | 26,963 |
| Blueprint Medicines Corp. (a) | | 11,889 | 1,281,396 |
| Bolt Biotherapeutics, Inc. (a)(b) | | 56,717 | 42,538 |
| BridgeBio Pharma, Inc. (a) | | 21,228 | 537,705 |
| CareDx, Inc. (a) | | 39,483 | 613,171 |
| Carisma Therapeutics, Inc. (a)(b) | | 17,028 | 25,883 |
| Carisma Therapeutics, Inc. rights (a)(c) | | 304,482 | 3 |
| Cartesian Therapeutics, Inc. rights (a)(c) | | 85,524 | 11,973 |
| Catalyst Pharmaceutical Partners, Inc. (a) | | 41,479 | 642,510 |
| Celldex Therapeutics, Inc. (a) | | 16,103 | 595,972 |
| Cogent Biosciences, Inc. (a) | | 20,047 | 168,996 |
| Coherus BioSciences, Inc. (a)(b) | | 101,824 | 176,156 |
| Corbus Pharmaceuticals Holdings, Inc. (a) | | 5,405 | 244,576 |
| Crinetics Pharmaceuticals, Inc. (a) | | 11,460 | 513,293 |
| Cytokinetics, Inc. (a) | | 20,499 | 1,110,636 |
| CytomX Therapeutics, Inc. (a) | | 119,373 | 145,635 |
| Denali Therapeutics, Inc. (a) | | 11,664 | 270,838 |
| Design Therapeutics, Inc. (a)(b) | | 47,305 | 158,472 |
| Disc Medicine, Inc. (a) | | 5,131 | 231,254 |
| Dynavax Technologies Corp. (a) | | 9,881 | 110,964 |
| Dyne Therapeutics, Inc. (a) | | 17,355 | 612,458 |
| Eagle Pharmaceuticals, Inc. (a)(b) | | 13,232 | 74,099 |
| Editas Medicine, Inc. (a)(b) | | 46,898 | 219,014 |
| Emergent BioSolutions, Inc. (a)(b) | | 56,790 | 387,308 |
| Enanta Pharmaceuticals, Inc. (a) | | 17,765 | 230,412 |
| Erasca, Inc. (a) | | 129,651 | 305,976 |
| Fate Therapeutics, Inc. (a) | | 99,316 | 325,756 |
| FibroGen, Inc. (a) | | 189,644 | 169,219 |
| Fortress Biotech, Inc. (a)(b) | | 4,032 | 6,895 |
| G1 Therapeutics, Inc. (a) | | 51,389 | 117,167 |
| Geron Corp. (a) | | 69,386 | 294,197 |
| Gritstone Bio, Inc. (a)(b) | | 224,374 | 138,641 |
| Halozyme Therapeutics, Inc. (a) | | 34,149 | 1,788,042 |
| Heron Therapeutics, Inc. (a)(b) | | 196,713 | 688,496 |
| Humacyte, Inc. Class A (a)(b) | | 43,619 | 209,371 |
| Ideaya Biosciences, Inc. (a) | | 6,592 | 231,445 |
| Immunovant, Inc. (a) | | 7,406 | 195,518 |
| Inhibrx Biosciences, Inc. (b) | | 15,936 | 225,813 |
| Insmed, Inc. (a) | | 41,844 | 2,803,548 |
| Intellia Therapeutics, Inc. (a) | | 7,782 | 174,161 |
| Iovance Biotherapeutics, Inc. (a) | | 17,683 | 141,818 |
| Ironwood Pharmaceuticals, Inc. Class A (a) | | 78,328 | 510,699 |
| Jounce Therapeutics, Inc. rights (a)(c) | | 118,367 | 1 |
| Kalvista Pharmaceuticals, Inc. (a)(b) | | 27,119 | 319,462 |
| Karyopharm Therapeutics, Inc. (a) | | 189,548 | 164,452 |
| Kodiak Sciences, Inc. (a) | | 91,420 | 214,837 |
| Krystal Biotech, Inc. (a) | | 2,953 | 542,289 |
| Kura Oncology, Inc. (a) | | 39,447 | 812,214 |
| Madrigal Pharmaceuticals, Inc. (a)(b) | | 3,056 | 856,169 |
| Mersana Therapeutics, Inc. (a)(b) | | 67,383 | 135,440 |
| MiMedx Group, Inc. (a) | | 22,505 | 155,960 |
| Mustang Bio, Inc. (a)(b) | | 5,203 | 2,461 |
| Myriad Genetics, Inc. (a) | | 30,405 | 743,706 |
| Nkarta, Inc. (a) | | 33,564 | 198,363 |
| Novavax, Inc. (a) | | 10,570 | 133,816 |
| Nurix Therapeutics, Inc. (a)(b) | | 35,746 | 746,019 |
| Nuvalent, Inc. Class A (a) | | 1,727 | 131,010 |
| Oncternal Therapeutics, Inc. rights (a)(c) | | 1,148 | 0 |
| Organogenesis Holdings, Inc. Class A (a) | | 95,945 | 268,646 |
| ORIC Pharmaceuticals, Inc. (a) | | 45,084 | 318,744 |
| Precigen, Inc. (a)(b) | | 157,096 | 248,212 |
| Protagonist Therapeutics, Inc. (a) | | 4,159 | 144,109 |
| PTC Therapeutics, Inc. (a) | | 23,365 | 714,502 |
| Puma Biotechnology, Inc. (a)(b) | | 53,472 | 174,319 |
| Q32 Bio, Inc. (a) | | 2,531 | 45,431 |
| Q32 Bio, Inc. rights (a)(c) | | 40,603 | 0 |
| RAPT Therapeutics, Inc. (a) | | 8,720 | 26,596 |
| Recursion Pharmaceuticals, Inc. Class A (a)(b) | | 24,699 | 185,243 |
| Relay Therapeutics, Inc. (a)(b) | | 34,569 | 225,390 |
| Revolution Medicines, Inc. (a) | | 27,797 | 1,078,802 |
| Rhythm Pharmaceuticals, Inc. (a)(b) | | 3,841 | 157,711 |
| Rigel Pharmaceuticals, Inc. (a) | | 13,826 | 113,650 |
| Rocket Pharmaceuticals, Inc. (a) | | 26,050 | 560,857 |
| Sage Therapeutics, Inc. (a) | | 23,732 | 257,730 |
| Sana Biotechnology, Inc. (a)(b) | | 45,675 | 249,386 |
| Sangamo Therapeutics, Inc. (a)(b) | | 198,275 | 71,042 |
| Scholar Rock Holding Corp. (a) | | 7,904 | 65,840 |
| SpringWorks Therapeutics, Inc. (a) | | 7,122 | 268,286 |
| Summit Therapeutics, Inc. (a)(b) | | 15,886 | 123,911 |
| Surface Oncology, Inc. rights (a)(c) | | 60,289 | 1 |
| Sutro Biopharma, Inc. (a) | | 86,806 | 254,342 |
| Syndax Pharmaceuticals, Inc. (a) | | 24,584 | 504,710 |
| Taysha Gene Therapies, Inc. (a) | | 166,373 | 372,676 |
| Tenaya Therapeutics, Inc. (a) | | 54,264 | 168,218 |
| TG Therapeutics, Inc. (a) | | 15,132 | 269,198 |
| Travere Therapeutics, Inc. (a) | | 66,491 | 546,556 |
| Twist Bioscience Corp. (a) | | 22,040 | 1,086,131 |
| Vanda Pharmaceuticals, Inc. (a)(b) | | 65,874 | 372,188 |
| Vaxcyte, Inc. (a) | | 21,572 | 1,628,902 |
| Vera Therapeutics, Inc. (a) | | 20,278 | 733,658 |
| Veracyte, Inc. (a)(b) | | 26,746 | 579,586 |
| Vericel Corp. (a) | | 3,571 | 163,837 |
| Voyager Therapeutics, Inc. (a)(b) | | 41,743 | 330,187 |
| Xbiotech, Inc. (a) | | 14,492 | 74,489 |
| Y-mAbs Therapeutics, Inc. (a) | | 14,661 | 177,105 |
| Zentalis Pharmaceuticals, Inc. (a) | | 12,499 | 51,121 |
| | | | 44,377,489 |
| Health Care Equipment & Supplies - 3.5% | | | |
| Accuray, Inc. (a) | | 275,189 | 500,844 |
| Alphatec Holdings, Inc. (a) | | 12,477 | 130,385 |
| Angiodynamics, Inc. (a) | | 14,911 | 90,212 |
| Artivion, Inc. (a) | | 56,405 | 1,446,788 |
| Atricure, Inc. (a) | | 43,194 | 983,527 |
| Avanos Medical, Inc. (a) | | 64,663 | 1,288,087 |
| AxoGen, Inc. (a) | | 13,943 | 100,947 |
| Axonics, Inc. (a) | | 2,975 | 200,009 |
| Cerus Corp. (a)(b) | | 231,868 | 408,088 |
| CONMED Corp. | | 48,652 | 3,372,557 |
| Haemonetics Corp. (a) | | 10,577 | 875,035 |
| Inari Medical, Inc. (a) | | 22,147 | 1,066,378 |
| Integra LifeSciences Holdings Corp. (a) | | 30,086 | 876,706 |
| IRadimed Corp. | | 9 | 395 |
| Lantheus Holdings, Inc. (a) | | 16,120 | 1,294,275 |
| LivaNova PLC (a) | | 8,725 | 478,305 |
| Merit Medical Systems, Inc. (a) | | 29,044 | 2,496,332 |
| RxSight, Inc. (a) | | 55,289 | 3,326,739 |
| Tactile Systems Technology, Inc. (a) | | 36,209 | 432,335 |
| Treace Medical Concepts, Inc. (a) | | 19,485 | 129,575 |
| Zimvie, Inc. (a) | | 18,249 | 333,044 |
| | | | 19,830,563 |
| Health Care Providers & Services - 1.7% | | | |
| 23andMe Holding Co. Class A (a)(b) | | 468,196 | 183,158 |
| Addus HomeCare Corp. (a) | | 7,722 | 896,601 |
| AMN Healthcare Services, Inc. (a) | | 17,333 | 887,970 |
| BrightSpring Health Services, Inc. | | 165,248 | 1,877,217 |
| Brookdale Senior Living, Inc. (a) | | 78,689 | 537,446 |
| Guardant Health, Inc. (a) | | 81,684 | 2,359,034 |
| HealthEquity, Inc. (a) | | 7,830 | 674,946 |
| Hims & Hers Health, Inc. (a) | | 9,160 | 184,940 |
| Option Care Health, Inc. (a) | | 61,613 | 1,706,680 |
| Patterson Companies, Inc. | | 17,044 | 411,101 |
| Talkspace, Inc. Class A (a) | | 52,842 | 121,537 |
| | | | 9,840,630 |
| Health Care Technology - 0.5% | | | |
| Health Catalyst, Inc. (a) | | 93,560 | 597,848 |
| HealthStream, Inc. | | 43,303 | 1,208,154 |
| Phreesia, Inc. (a) | | 39,291 | 832,969 |
| Veradigm, Inc. (a)(b) | | 42,522 | 403,959 |
| | | | 3,042,930 |
| Life Sciences Tools & Services - 0.3% | | | |
| Adaptive Biotechnologies Corp. (a)(b) | | 63,760 | 230,811 |
| Codexis, Inc. (a)(b) | | 100,489 | 311,516 |
| Cytek Biosciences, Inc. (a) | | 65,404 | 364,954 |
| Medpace Holdings, Inc. (a) | | 1,418 | 584,003 |
| Nanostring Technologies, Inc. (a)(b)(c) | | 84,939 | 6,099 |
| OmniAb, Inc. (a)(b) | | 72,199 | 270,746 |
| Pacific Biosciences of California, Inc. (a)(b) | | 26,060 | 35,702 |
| | | | 1,803,831 |
| Pharmaceuticals - 1.2% | | | |
| Amneal Intermediate, Inc. Class A, (a) | | 93,405 | 593,122 |
| Amphastar Pharmaceuticals, Inc. (a) | | 14,469 | 578,760 |
| Amylyx Pharmaceuticals, Inc. (a) | | 12,268 | 23,309 |
| ANI Pharmaceuticals, Inc. (a) | | 8,702 | 554,143 |
| Arvinas Holding Co. LLC (a) | | 16,463 | 438,245 |
| Atea Pharmaceuticals, Inc. (a) | | 43,885 | 145,259 |
| Axsome Therapeutics, Inc. (a) | | 4,780 | 384,790 |
| Cara Therapeutics, Inc. (a) | | 107,219 | 27,663 |
| Corcept Therapeutics, Inc. (a) | | 9,800 | 318,402 |
| Edgewise Therapeutics, Inc. (a) | | 13,732 | 247,313 |
| Evolus, Inc. (a) | | 27,585 | 299,297 |
| Harmony Biosciences Holdings, Inc. (a) | | 13,554 | 408,924 |
| Pacira Biosciences, Inc. (a) | | 3,621 | 103,597 |
| Phibro Animal Health Corp. Class A | | 13,119 | 220,006 |
| Prestige Consumer Healthcare, Inc. (a) | | 17,845 | 1,228,628 |
| Relmada Therapeutics, Inc. (a) | | 58,393 | 175,179 |
| Revance Therapeutics, Inc. (a)(b) | | 96,408 | 247,769 |
| SIGA Technologies, Inc. | | 19,003 | 144,233 |
| Supernus Pharmaceuticals, Inc. (a) | | 2,822 | 75,489 |
| Terns Pharmaceuticals, Inc. (a) | | 37,916 | 258,208 |
| Ventyx Biosciences, Inc. (a) | | 7,077 | 16,348 |
| WAVE Life Sciences (a) | | 36,059 | 179,934 |
| | | | 6,668,618 |
TOTAL HEALTH CARE | | | 85,564,061 |
| INDUSTRIALS - 18.9% | | | |
| Aerospace & Defense - 0.9% | | | |
| AAR Corp. (a) | | 50,499 | 3,671,277 |
| Astronics Corp. (a) | | 19,520 | 390,986 |
| Ducommun, Inc. (a) | | 15,209 | 883,035 |
| Park Aerospace Corp. | | 11,796 | 161,369 |
| Virgin Galactic Holdings, Inc. (a)(b) | | 12,963 | 109,278 |
| | | | 5,215,945 |
| Building Products - 1.3% | | | |
| American Woodmark Corp. (a) | | 7,033 | 552,794 |
| Apogee Enterprises, Inc. | | 30,983 | 1,946,817 |
| Gibraltar Industries, Inc. (a) | | 21,714 | 1,488,495 |
| Griffon Corp. | | 26,482 | 1,691,141 |
| Janus International Group, Inc. (a) | | 49,087 | 619,969 |
| Resideo Technologies, Inc. (a) | | 68,368 | 1,337,278 |
| | | | 7,636,494 |
| Commercial Services & Supplies - 3.1% | | | |
| ABM Industries, Inc. | | 39,329 | 1,988,868 |
| Brady Corp. Class A | | 42,993 | 2,838,398 |
| CECO Environmental Corp. (a) | | 97,170 | 2,803,355 |
| Cimpress PLC (a)(b) | | 36,210 | 3,172,358 |
| HNI Corp. | | 24,394 | 1,098,218 |
| Interface, Inc. (b) | | 24,368 | 357,722 |
| OpenLane, Inc. (a) | | 189,496 | 3,143,739 |
| The Brink's Co. | | 17,740 | 1,816,576 |
| The GEO Group, Inc. (a) | | 40,671 | 584,036 |
| | | | 17,803,270 |
| Construction & Engineering - 1.9% | | | |
| Arcosa, Inc. | | 5,594 | 466,596 |
| Comfort Systems U.S.A., Inc. | | 6,930 | 2,107,552 |
| Dycom Industries, Inc. (a) | | 5,480 | 924,805 |
| EMCOR Group, Inc. | | 7,886 | 2,879,021 |
| Fluor Corp. (a) | | 72,801 | 3,170,484 |
| IES Holdings, Inc. (a) | | 1,133 | 157,861 |
| Limbach Holdings, Inc. (a)(b) | | 19,270 | 1,097,041 |
| | | | 10,803,360 |
| Electrical Equipment - 1.9% | | | |
| Array Technologies, Inc. (a) | | 63,598 | 652,515 |
| Atkore, Inc. | | 7,570 | 1,021,420 |
| EnerSys | | 36,610 | 3,789,867 |
| Enovix Corp. (a) | | 16,338 | 252,585 |
| Fluence Energy, Inc. (a) | | 24,190 | 419,455 |
| LSI Industries, Inc. | | 37,674 | 545,143 |
| Powell Industries, Inc. (b) | | 2,487 | 356,636 |
| Preformed Line Products Co. (b) | | 12,242 | 1,524,619 |
| Thermon Group Holdings, Inc. (a) | | 16,774 | 515,968 |
| Vicor Corp. (a) | | 46,033 | 1,526,454 |
| | | | 10,604,662 |
| Ground Transportation - 0.3% | | | |
| Marten Transport Ltd. | | 100,278 | 1,850,129 |
| Machinery - 3.7% | | | |
| Albany International Corp. Class A | | 7,230 | 610,574 |
| Blue Bird Corp. (a) | | 6,557 | 353,094 |
| Chart Industries, Inc. (a) | | 10,066 | 1,452,926 |
| Enerpac Tool Group Corp. Class A | | 42,606 | 1,626,697 |
| Federal Signal Corp. | | 8,275 | 692,369 |
| Gorman-Rupp Co. | | 5,665 | 207,962 |
| Hurco Companies, Inc. | | 19,036 | 290,489 |
| Hyster-Yale Materials Handling, Inc. Class A | | 24,289 | 1,693,672 |
| L.B. Foster Co. Class A (a) | | 7,447 | 160,259 |
| Mueller Water Products, Inc. | | 195,499 | 3,503,342 |
| Proto Labs, Inc. (a) | | 13,475 | 416,243 |
| Tennant Co. | | 20,752 | 2,042,827 |
| Terex Corp. | | 62,951 | 3,452,233 |
| Trinity Industries, Inc. | | 48,369 | 1,447,200 |
| Watts Water Technologies, Inc. Class A | | 17,435 | 3,197,056 |
| | | | 21,146,943 |
| Marine Transportation - 0.6% | | | |
| Matson, Inc. | | 28,216 | 3,695,450 |
| Passenger Airlines - 0.7% | | | |
| Joby Aviation, Inc. (a) | | 37,520 | 191,352 |
| SkyWest, Inc. (a) | | 46,527 | 3,818,471 |
| | | | 4,009,823 |
| Professional Services - 2.2% | | | |
| Barrett Business Services, Inc. | | 48,632 | 1,593,671 |
| CRA International, Inc. | | 4,548 | 783,257 |
| CSG Systems International, Inc. | | 73,892 | 3,042,134 |
| ExlService Holdings, Inc. (a) | | 80,101 | 2,511,967 |
| Huron Consulting Group, Inc. (a) | | 11,580 | 1,140,630 |
| Parsons Corp. (a) | | 22,940 | 1,876,721 |
| Planet Labs PBC Class A (a)(b) | | 185,871 | 345,720 |
| TriNet Group, Inc. | | 1,474 | 147,400 |
| Ttec Holdings, Inc. | | 61 | 359 |
| Upwork, Inc. (a) | | 90,534 | 973,241 |
| | | | 12,415,100 |
| Trading Companies & Distributors - 2.3% | | | |
| Applied Industrial Technologies, Inc. | | 22,692 | 4,402,248 |
| Beacon Roofing Supply, Inc. (a) | | 1,945 | 176,023 |
| Boise Cascade Co. | | 1,777 | 211,854 |
| DXP Enterprises, Inc. (a) | | 10,501 | 481,366 |
| FTAI Aviation Ltd. | | 31,347 | 3,235,951 |
| GATX Corp. (b) | | 5,979 | 791,380 |
| Global Industrial Co. | | 14,859 | 465,978 |
| H&E Equipment Services, Inc. | | 36,145 | 1,596,525 |
| McGrath RentCorp. | | 1,112 | 118,484 |
| MRC Global, Inc. (a) | | 42,955 | 554,549 |
| Rush Enterprises, Inc. Class A | | 28,711 | 1,202,130 |
| | | | 13,236,488 |
TOTAL INDUSTRIALS | | | 108,417,664 |
| INFORMATION TECHNOLOGY - 14.9% | | | |
| Communications Equipment - 0.3% | | | |
| CommScope Holding Co., Inc. (a) | | 522,714 | 642,938 |
| Extreme Networks, Inc. (a) | | 78,492 | 1,055,717 |
| | | | 1,698,655 |
| Electronic Equipment, Instruments & Components - 4.0% | | | |
| Arlo Technologies, Inc. (a) | | 101,122 | 1,318,631 |
| Badger Meter, Inc. | | 12,543 | 2,337,388 |
| Belden, Inc. | | 36,964 | 3,467,223 |
| Benchmark Electronics, Inc. | | 57,520 | 2,269,739 |
| Fabrinet (a) | | 20,144 | 4,931,034 |
| Itron, Inc. (a) | | 33,057 | 3,271,321 |
| Kimball Electronics, Inc. (a) | | 23,042 | 506,463 |
| OSI Systems, Inc. (a) | | 1,705 | 234,472 |
| Ouster, Inc. Class A (a) | | 38,241 | 375,909 |
| PC Connection, Inc. | | 17,829 | 1,144,622 |
| Sanmina Corp. (a) | | 49,170 | 3,257,513 |
| | | | 23,114,315 |
| Semiconductors & Semiconductor Equipment - 3.5% | | | |
| Ambarella, Inc. (a) | | 4,197 | 226,428 |
| Axcelis Technologies, Inc. (a) | | 6,170 | 877,312 |
| Credo Technology Group Holding Ltd. (a) | | 78,818 | 2,517,447 |
| Diodes, Inc. (a) | | 2,863 | 205,936 |
| Lattice Semiconductor Corp. (a) | | 29,475 | 1,709,255 |
| MaxLinear, Inc. Class A (a) | | 104,903 | 2,112,746 |
| Onto Innovation, Inc. (a) | | 2,155 | 473,152 |
| PDF Solutions, Inc. (a) | | 67,801 | 2,466,600 |
| Photronics, Inc. (a) | | 49,959 | 1,232,489 |
| Rambus, Inc. (a) | | 24,578 | 1,444,203 |
| Semtech Corp. (a) | | 112,677 | 3,366,789 |
| SMART Global Holdings, Inc. (a) | | 140,999 | 3,224,647 |
| | | | 19,857,004 |
| Software - 6.5% | | | |
| 8x8, Inc. (a)(b) | | 698,446 | 1,550,550 |
| AppFolio, Inc. Class A, (a)(b) | | 2,411 | 589,658 |
| Aurora Innovation, Inc. Class A, (a)(b) | | 80,177 | 222,090 |
| BlackLine, Inc. (a) | | 49,577 | 2,402,006 |
| Clear Secure, Inc. (b) | | 73,750 | 1,379,863 |
| CommVault Systems, Inc. (a) | | 31,686 | 3,852,067 |
| Domo, Inc. Class B (a)(b) | | 114,022 | 880,250 |
| E2open Parent Holdings, Inc. (a) | | 69,713 | 313,011 |
| Everbridge, Inc. (a) | | 6,660 | 233,033 |
| Intapp, Inc. (a) | | 20,688 | 758,629 |
| Jamf Holding Corp. (a) | | 30,260 | 499,290 |
| LivePerson, Inc. (a)(b) | | 297,541 | 172,723 |
| Liveramp Holdings, Inc. (a) | | 88,050 | 2,724,267 |
| MeridianLink, Inc. (a) | | 13,632 | 291,180 |
| N-able, Inc. (a) | | 41,197 | 627,430 |
| ON24, Inc. | | 17,677 | 106,239 |
| Pagerduty, Inc. (a)(b) | | 62,112 | 1,424,228 |
| Progress Software Corp. | | 13,742 | 745,641 |
| PROS Holdings, Inc. (a) | | 26,858 | 769,482 |
| Q2 Holdings, Inc. (a) | | 62,347 | 3,761,395 |
| Qualys, Inc. (a) | | 25,174 | 3,589,812 |
| Sapiens International Corp. NV | | 4,500 | 152,685 |
| SecureWorks Corp. (a) | | 8,890 | 62,230 |
| Sprinklr, Inc. (a)(b) | | 33,885 | 325,974 |
| Sprout Social, Inc. (a)(b) | | 20,463 | 730,120 |
| SPS Commerce, Inc. (a) | | 22,888 | 4,306,606 |
| Tenable Holdings, Inc. (a) | | 31,261 | 1,362,354 |
| Upland Software, Inc. (a) | | 40,385 | 100,559 |
| Weave Communications, Inc. (a) | | 20,924 | 188,734 |
| Workiva, Inc. (a) | | 5,610 | 409,474 |
| Xperi, Inc. (a) | | 69,334 | 569,232 |
| Yext, Inc. (a) | | 246,584 | 1,319,224 |
| Zuora, Inc. (a) | | 118,643 | 1,178,125 |
| | | | 37,598,161 |
| Technology Hardware, Storage & Peripherals - 0.6% | | | |
| Super Micro Computer, Inc. (a) | | 3,465 | 2,839,048 |
| Xerox Holdings Corp. | | 30,115 | 349,936 |
| | | | 3,188,984 |
TOTAL INFORMATION TECHNOLOGY | | | 85,457,119 |
| MATERIALS - 5.3% | | | |
| Chemicals - 2.3% | | | |
| American Vanguard Corp. | | 73,624 | 633,166 |
| Balchem Corp. | | 3,717 | 572,232 |
| H.B. Fuller Co. | | 48,173 | 3,707,394 |
| Hawkins, Inc. | | 13,996 | 1,273,636 |
| Innospec, Inc. | | 18,452 | 2,280,483 |
| Minerals Technologies, Inc. | | 43,922 | 3,652,554 |
| Sensient Technologies Corp. | | 15,801 | 1,172,276 |
| Trinseo PLC | | 43,852 | 101,298 |
| | | | 13,393,039 |
| Containers & Packaging - 0.3% | | | |
| Myers Industries, Inc. | | 39,899 | 533,849 |
| Pactiv Evergreen, Inc. | | 33,000 | 373,560 |
| TriMas Corp. | | 27,367 | 699,501 |
| | | | 1,606,910 |
| Metals & Mining - 2.3% | | | |
| ATI, Inc. (a) | | 40,139 | 2,225,708 |
| Carpenter Technology Corp. | | 38,621 | 4,232,089 |
| Constellium NV (a) | | 70,220 | 1,323,647 |
| Hecla Mining Co. | | 112,727 | 546,726 |
| Materion Corp. | | 4,684 | 506,481 |
| Olympic Steel, Inc. | | 5,824 | 261,090 |
| SunCoke Energy, Inc. | | 155,523 | 1,524,125 |
| Warrior Metropolitan Coal, Inc. | | 23,430 | 1,470,701 |
| Worthington Steel, Inc. | | 24,169 | 806,278 |
| | | | 12,896,845 |
| Paper & Forest Products - 0.4% | | | |
| Clearwater Paper Corp. (a) | | 20,919 | 1,013,944 |
| Sylvamo Corp. | | 19,721 | 1,352,861 |
| | | | 2,366,805 |
TOTAL MATERIALS | | | 30,263,599 |
| REAL ESTATE - 4.1% | | | |
| Equity Real Estate Investment Trusts (REITs) - 3.5% | | | |
| Alexanders, Inc. | | 1,319 | 296,590 |
| American Assets Trust, Inc. | | 90,583 | 2,027,248 |
| Ashford Hospitality Trust, Inc. (a)(b) | | 88,598 | 86,073 |
| CareTrust (REIT), Inc. | | 44,625 | 1,120,088 |
| Community Healthcare Trust, Inc. | | 11,873 | 277,709 |
| EastGroup Properties, Inc. | | 14,101 | 2,398,580 |
| Empire State Realty Trust, Inc. | | 226,599 | 2,125,499 |
| Equity Commonwealth (a) | | 67,792 | 1,315,165 |
| Global Medical REIT, Inc. | | 80,921 | 734,763 |
| National Health Investors, Inc. | | 21,853 | 1,480,104 |
| NexPoint Residential Trust, Inc. | | 5,985 | 236,467 |
| Outfront Media, Inc. | | 57,327 | 819,776 |
| Phillips Edison & Co., Inc. | | 61,475 | 2,010,847 |
| Retail Opportunity Investments Corp. | | 45,243 | 562,370 |
| Ryman Hospitality Properties, Inc. | | 16,319 | 1,629,615 |
| SITE Centers Corp. | | 48,717 | 706,397 |
| Tanger, Inc. | | 20,949 | 567,927 |
| Terreno Realty Corp. | | 7,998 | 473,322 |
| The Macerich Co. | | 14,099 | 217,689 |
| Uniti Group, Inc. | | 133,386 | 389,487 |
| Universal Health Realty Income Trust (SBI) | | 7,997 | 313,003 |
| Urban Edge Properties | | 2,007 | 37,069 |
| Whitestone REIT | | 40,794 | 542,968 |
| | | | 20,368,756 |
| Real Estate Management & Development - 0.6% | | | |
| Anywhere Real Estate, Inc. (a) | | 243,962 | 807,514 |
| Compass, Inc. (a) | | 522,356 | 1,880,482 |
| Opendoor Technologies, Inc. Class A (a)(b) | | 275,345 | 506,635 |
| RE/MAX Holdings, Inc. Class A | | 16,240 | 131,544 |
| | | | 3,326,175 |
TOTAL REAL ESTATE | | | 23,694,931 |
| UTILITIES - 2.2% | | | |
| Electric Utilities - 0.7% | | | |
| Allete, Inc. | | 16,464 | 1,026,530 |
| Otter Tail Corp. | | 30,845 | 2,701,714 |
| | | | 3,728,244 |
| Gas Utilities - 0.6% | | | |
| New Jersey Resources Corp. | | 76,671 | 3,276,919 |
| Independent Power and Renewable Electricity Producers - 0.0% | | | |
| Altus Power, Inc. Class A (a)(b) | | 38,693 | 151,677 |
| Water Utilities - 0.9% | | | |
| American States Water Co. | | 28,929 | 2,099,378 |
| California Water Service Group | | 18,727 | 908,072 |
| Consolidated Water Co., Inc. (b) | | 7,627 | 202,421 |
| SJW Group | | 38,902 | 2,109,266 |
| | | | 5,319,137 |
TOTAL UTILITIES | | | 12,475,977 |
| TOTAL COMMON STOCKS (Cost $509,769,192) | | | 562,480,446 |
| | | | |
| U.S. Treasury Obligations - 0.4% |
| | | Principal Amount (d) | Value ($) |
U.S. Treasury Bills, yield at date of purchase 5.28% to 5.32% 7/5/24 to 9/26/24 (e) (Cost $2,100,578) | | 2,120,000 | 2,100,613 |
| | | | |
| Money Market Funds - 10.6% |
| | | Shares | Value ($) |
| Fidelity Cash Central Fund 5.38% (f) | | 31,385,324 | 31,391,601 |
| Fidelity Securities Lending Cash Central Fund 5.38% (f)(g) | | 29,675,042 | 29,678,010 |
| TOTAL MONEY MARKET FUNDS (Cost $61,069,610) | | | 61,069,611 |
| | | | |
| TOTAL INVESTMENT IN SECURITIES - 109.0% (Cost $572,939,380) | 625,650,670 |
NET OTHER ASSETS (LIABILITIES) - (9.0)% | (51,478,214) |
| NET ASSETS - 100.0% | 574,172,456 |
| | |
| Futures Contracts |
| | Number of contracts | Expiration Date | Notional Amount ($) | Value ($) | Unrealized Appreciation/ (Depreciation) ($) |
| Purchased | | | | | |
| | | | | | |
| Equity Index Contracts | | | | | |
| CME E-mini Russell 2000 Index Contracts (United States) | 98 | Sep 2024 | 10,118,500 | 160,719 | 160,719 |
| | | | | | |
| The notional amount of futures purchased as a percentage of Net Assets is 1.8% |
For the period, the average monthly notional amount at value for futures contracts in the aggregate was $11,803,840.
Legend
| (b) | Security or a portion of the security is on loan at period end. |
| (d) | Amount is stated in United States dollars unless otherwise noted. |
| (e) | Security or a portion of the security was pledged to cover margin requirements for futures contracts. At period end, the value of securities pledged amounted to $2,005,668. |
| (f) | Affiliated fund that is generally available only to investment companies and other accounts managed by Fidelity Investments. The rate quoted is the annualized seven-day yield of the fund at period end. A complete unaudited listing of the fund's holdings as of its most recent quarter end is available upon request. In addition, each Fidelity Central Fund's financial statements, which are not covered by the Fund's Report of Independent Registered Public Accounting Firm, are available on the SEC's website or upon request. |
| (g) | Investment made with cash collateral received from securities on loan. |
Affiliated Central Funds
Fiscal year to date information regarding the Fund's investments in Fidelity Central Funds, including the ownership percentage, is presented below.
| Affiliate | Value, beginning of period ($) | Purchases ($) | Sales Proceeds ($) | Dividend Income ($) | Realized Gain (loss) ($) | Change in Unrealized appreciation (depreciation) ($) | Value, end of period ($) | % ownership, end of period |
| Fidelity Cash Central Fund 5.38% | 8,990,995 | 57,678,758 | 35,278,124 | 210,997 | (28) | - | 31,391,601 | 0.1% |
| Fidelity Securities Lending Cash Central Fund 5.38% | 21,311,490 | 68,242,224 | 59,875,704 | 15,256 | - | - | 29,678,010 | 0.1% |
| Total | 30,302,485 | 125,920,982 | 95,153,828 | 226,253 | (28) | - | 61,069,611 | |
| | | | | | | | | |
Amounts in the dividend income column in the above table include any capital gain distributions from underlying funds, which are presented in the corresponding line item in the Statement of Operations, if applicable.
Amounts in the dividend income column for Fidelity Securities Lending Cash Central Fund represents the income earned on investing cash collateral, less rebates paid to borrowers and any lending agent fees associated with the loan, plus any premium payments received for lending certain types of securities.
Amounts included in the purchases and sales proceeds columns may include in-kind transactions, if applicable.
Investment Valuation
The following is a summary of the inputs used, as of June 30, 2024, involving the Fund's assets and liabilities carried at fair value. The inputs or methodology used for valuing securities may not be an indication of the risk associated with investing in those securities. For more information on valuation inputs, and their aggregation into the levels used below, please refer to the Investment Valuation section in the accompanying Notes to Financial Statements.
| Valuation Inputs at Reporting Date: |
| Description | Total ($) | Level 1 ($) | Level 2 ($) | Level 3 ($) |
Investments in Securities: | | | | |
|
| Equities: | | | | |
Communication Services | 17,384,936 | 17,384,936 | - | - |
Consumer Discretionary | 59,254,418 | 59,254,418 | - | - |
Consumer Staples | 20,091,232 | 20,091,232 | - | - |
Energy | 33,731,172 | 33,731,172 | - | - |
Financials | 86,145,337 | 86,145,337 | - | - |
Health Care | 85,564,061 | 85,545,889 | - | 18,172 |
Industrials | 108,417,664 | 108,417,664 | - | - |
Information Technology | 85,457,119 | 85,457,119 | - | - |
Materials | 30,263,599 | 30,263,599 | - | - |
Real Estate | 23,694,931 | 23,694,931 | - | - |
Utilities | 12,475,977 | 12,475,977 | - | - |
|
| U.S. Government and Government Agency Obligations | 2,100,613 | - | 2,100,613 | - |
|
| Money Market Funds | 61,069,611 | 61,069,611 | - | - |
| Total Investments in Securities: | 625,650,670 | 623,531,885 | 2,100,613 | 18,172 |
Derivative Instruments: Assets | | | | |
Futures Contracts | 160,719 | 160,719 | - | - |
| Total Assets | 160,719 | 160,719 | - | - |
| Total Derivative Instruments: | 160,719 | 160,719 | - | - |
Value of Derivative Instruments
The following table is a summary of the Fund's value of derivative instruments by primary risk exposure as of June 30, 2024. For additional information on derivative instruments, please refer to the Derivative Instruments section in the accompanying Notes to Financial Statements.
Primary Risk Exposure / Derivative Type | Value |
| Asset ($) | Liability ($) |
| Equity Risk | | |
Futures Contracts (a) | 160,719 | 0 |
| Total Equity Risk | 160,719 | 0 |
| Total Value of Derivatives | 160,719 | 0 |
(a)Reflects gross cumulative appreciation (depreciation) on futures contracts as presented in the Schedule of Investments. In the Statement of Assets and Liabilities, the period end daily variation margin is included in receivable or payable for daily variation margin on futures contracts, and the net cumulative appreciation (depreciation) is included in Total accumulated earnings (loss).
Fidelity® Enhanced Small Cap ETF
Financial Statements
| Statement of Assets and Liabilities |
| | | | June 30, 2024 |
| | | | | |
| Assets | | | | |
| Investment in securities, at value (including securities loaned of $28,375,344) - See accompanying schedule: | | | | |
Unaffiliated issuers (cost $511,869,770) | $ | 564,581,059 | | |
Fidelity Central Funds (cost $61,069,610) | | 61,069,611 | | |
| | | | | |
| | | | | |
| Total Investment in Securities (cost $572,939,380) | | | $ | 625,650,670 |
| Cash | | | | 2,768 |
| Receivable for investments sold | | | | 22,851,124 |
| Dividends receivable | | | | 416,442 |
| Distributions receivable from Fidelity Central Funds | | | | 61,267 |
| Receivable for daily variation margin on futures contracts | | | | 58,306 |
| Receivable from investment adviser for expense reductions | | | | 16,210 |
| Other receivables | | | | 22 |
Total assets | | | | 649,056,809 |
| Liabilities | | | | |
| Payable for investments purchased | $ | 21,760,437 | | |
| Payable for fund shares redeemed | | 23,289,390 | | |
| Accrued management fee | | 133,084 | | |
| Other payables and accrued expenses | | 29,577 | | |
| Collateral on securities loaned | | 29,671,865 | | |
| Total liabilities | | | | 74,884,353 |
| Net Assets | | | $ | 574,172,456 |
| Net Assets consist of: | | | | |
| Paid in capital | | | $ | 547,279,769 |
| Total accumulated earnings (loss) | | | | 26,892,687 |
| Net Assets | | | $ | 574,172,456 |
Net Asset Value, offering price and redemption price per share ($574,172,456 ÷ 19,721,356 shares) | | | $ | 29.11 |
| Statement of Operations |
| | | | Four months ended June 30, 2024 | | Year ended February 29, 2024 |
| Investment Income | | | | | | |
| Dividends | | | $ | 2,461,415 | | 6,718,777 |
| Interest | | | | 19,082 | | 26,617 |
| Income from Fidelity Central Funds (including $15,256 and $88,263 from security lending) | | | | 226,253 | | 467,252 |
| Total income | | | | 2,706,750 | | 7,212,646 |
| Expenses | | | | | | |
| Management fee | | | $ | 514,102 | | 2,551,454 |
| Independent trustees' fees and expenses | | | | 765 | | 3,413 |
| Miscellaneous | | | | 25,690 | | 11,754 |
| Total expenses before reductions | | | | 540,557 | | 2,566,621 |
| Expense reductions | | | | (16,301) | | (3,509) |
| Total expenses after reductions | | | | 524,256 | | 2,563,112 |
| Net Investment income (loss) | | | | 2,182,494 | | 4,649,534 |
| Realized and Unrealized Gain (Loss) | | | | | | |
| Net realized gain (loss) on: | | | | | | |
| Investment Securities: | | | | | | |
| Unaffiliated issuers | | | | 4,089,824 | | 3,174,058 |
| Redemptions in-kind | | | | 23,751,146 | | 29,724,397 |
| Fidelity Central Funds | | | | (28) | | 2,245 |
| Futures contracts | | | | 233,575 | | (106,111) |
| Total net realized gain (loss) | | | | 28,074,517 | | 32,794,589 |
| Change in net unrealized appreciation (depreciation) on: | | | | | | |
| Investment Securities: | | | | | | |
| Unaffiliated issuers | | | | (29,628,072) | | 27,423,408 |
| Fidelity Central Funds | | | | - | | (2,244) |
| Futures contracts | | | | (339,928) | | 283,082 |
| Total change in net unrealized appreciation (depreciation) | | | | (29,968,000) | | 27,704,246 |
| Net gain (loss) | | | | (1,893,483) | | 60,498,835 |
| Net increase (decrease) in net assets resulting from operations | | | $ | 289,011 | | 65,148,369 |
See Organization and Merger information note regarding reorganization from mutual fund to exchange traded fund during the prior fiscal year.
| Statement of Changes in Net Assets |
| | | |
| | Four months ended June 30, 2024 | | Year ended February 29, 2024 | | Year ended February 28, 2023 |
| Increase (Decrease) in Net Assets | | | | | | |
| Operations | | | | | | |
| Net investment income (loss) | $ | 2,182,494 | $ | 4,649,534 | $ | 5,449,677 |
| Net realized gain (loss) | | 28,074,517 | | 32,794,589 | | (26,454,327) |
| Change in net unrealized appreciation (depreciation) | | (29,968,000) | | 27,704,246 | | 865,031 |
| Net increase (decrease) in net assets resulting from operations | | 289,011 | | 65,148,369 | | (20,139,619) |
| Distributions to shareholders | | (2,247,305) | | (4,715,442) | | (28,460,527) |
| | | | | | | |
| Share transactions | | | | | | |
| Proceeds from sales of shares | | 113,489,919 | | 117,577,525 | | 54,476,948 |
| Reinvestment of distributions | | - | | 4,092,903 | | 26,941,979 |
| Cost of shares redeemed | | (43,439,075) | | (261,496,096) | | (102,513,711) |
| | | | | | | |
Net increase (decrease) in net assets resulting from share transactions | | 70,050,844 | | (139,825,668) | | (21,094,784) |
| Total increase (decrease) in net assets | | 68,092,550 | | (79,392,741) | | (69,694,930) |
| | | | | | | |
| Net Assets | | | | | | |
| Beginning of period | | 506,079,906 | | 585,472,647 | | 655,167,577 |
| End of period | $ | 574,172,456 | $ | 506,079,906 | $ | 585,472,647 |
| | | | | | | |
| Other Information | | | | | | |
| Shares | | | | | | |
| Sold | | 3,900,000 | | 4,564,341 | | 2,217,524 |
| Issued in reinvestment of distributions | | - | | 163,135 | | 1,060,903 |
| Redeemed | | (1,500,000) | | (10,287,720) | | (4,201,984) |
| Net increase (decrease) | | 2,400,000 | | (5,560,244) | | (923,557) |
| | | | | | | |
See Organization and Merger information note regarding reorganization from mutual fund to exchange traded fund during the prior fiscal year.
Share activity is further described in Organization and Merger information notes, and amounts for the prior fiscal years have been adjusted to reflect the impact of the change in capital structure associated with the merger. All financial information prior to the merger is that of the Predecessor Fund.
Financial Highlights
Fidelity® Enhanced Small Cap ETF |
| |
| Years ended June 30, | | 2024 A | | 2024 B,C | | 2023 B,D | | 2022 B,D | | 2021 B,D | | 2020 B,C |
Selected Per-Share Data | | | | | | | | | | | | |
| Net asset value, beginning of period | $ | 29.22 | $ | 25.58 | $ | 27.53 | $ | 34.05 | $ | 22.27 | $ | 24.75 |
| Income from Investment Operations | | | | | | | | | | | | |
Net investment income (loss) E,F | | .11 | | .22 | | .24 | | .14 | | .16 | | .24 |
| Net realized and unrealized gain (loss) | | (.10) | | 3.65 | | (.99) | | (.40) | | 11.80 | | (2.48) |
| Total from investment operations | | .01 | | 3.87 | | (.75) | | (.26) | | 11.96 | | (2.24) |
| Distributions from net investment income | | (.12) | | (.23) | | (.22) | | (.14) | | (.18) | | (.24) |
| Distributions from net realized gain | | - | | - | | (1.00) | | (6.12) | | - | | - |
| Total distributions | | (.12) | | (.23) | | (1.20) G | | (6.26) | | (.18) | | (.24) |
| Net asset value, end of period | $ | 29.11 | $ | 29.22 | $ | 25.58 | $ | 27.53 | $ | 34.05 | $ | 22.27 |
Total Return H,I,J | | | | 15.26% | | (2.62)% | | (1.64)% | | 53.78% | | (9.18)% |
Ratios to Average Net Assets F,K,L | | | | | | | | | | | | |
| Expenses before reductions | | .28% M,N | | .48% | | .55% | | .63% | | .64% | | .64% |
| Expenses net of fee waivers, if any | | | | .48% | | .55% | | .63% | | .64% | | .64% |
| Expenses net of all reductions | | .28% M,N | | .48% | | .55% | | .63% | | .64% | | .64% |
| Net investment income (loss) | | 1.20% M,N | | .87% | | .94% | | .41% | | .62% | | .94% |
| Supplemental Data | | | | | | | | | | | | |
| Net assets, end of period (000 omitted) | $ | 574,172 | $ | 506,080 | $ | 585,473 | $ | 655,168 | $ | 689,131 | $ | 515,960 |
Portfolio turnover rate O | | | | 97% P | | 98% | | 96% | | 44% | | 79% |
AFor the four month period ended June 30. The Fund changed its fiscal year end from February 29 to June 30, effective March 1, 2024.
BAs further described in Organization and Merger information notes, per share amounts have been adjusted to reflect the impact of the change in capital structure associated with the merger. All financial information prior to the merger is that of the Predecessor Fund.
CFor the year ended February 29.
DFor the year ended February 28.
ECalculated based on average shares outstanding during the period.
FNet investment income (loss) is affected by the timing of the declaration of dividends by any underlying mutual funds or exchange-traded funds (ETFs). Net investment income (loss) of any mutual funds or ETFs is not included in the Fund's net investment income (loss) ratio.
GTotal distributions per share do not sum due to rounding.
HTotal returns for periods of less than one year are not annualized.
ITotal returns would have been lower if certain expenses had not been reduced during the applicable periods shown.
JBased on net asset value.
KFees and expenses of any underlying mutual funds or exchange-traded funds (ETFs) are not included in the Fund's expense ratio. The Fund indirectly bears its proportionate share of these expenses. For additional expense information related to investments in Fidelity Central Funds, please refer to the "Investments in Fidelity Central Funds" note found in the Notes to Financial Statements section of the most recent Annual or Semi-Annual report.
LExpense ratios reflect operating expenses of the class. Expenses before reductions do not reflect amounts reimbursed, waived, or reduced through arrangements with the investment adviser, brokerage services, or other offset arrangements, if applicable, and do not represent the amount paid by the class during periods when reimbursements, waivers or reductions occur.
MAnnualized.
NProxy expenses are not annualized.
OAmount does not include the portfolio activity of any underlying mutual funds or exchange-traded funds (ETFs).
PPortfolio turnover rate excludes securities received or delivered in-kind.
Notes to Financial Statements
For the period ended June 30, 2024
1. Organization.
Fidelity Enhanced Small Cap ETF (the Fund) is an exchange-traded fund of Fidelity Covington Trust (the Trust) and is authorized to issue an unlimited number of shares. The Trust is registered under the Investment Company Act of 1940, as amended (the 1940 Act), as an open-end management investment company organized as a Massachusetts business trust.
Effective November 17, 2023, Fidelity Small Cap Enhanced Index Fund (Predecessor Fund) reorganized into the newly created Fidelity Enhanced Small Cap ETF. The Predecessor Fund was the accounting survivor in the reorganization, and, as such, the financial statements and financial highlights for the fiscal year ended February 29, 2024 and prior reflect the financial information of the Predecessor Fund through November 17, 2023 (see Prior Fiscal Year Merger Information note).
Effective March 1, 2024 the Fund's fiscal year-end changed from February 28 to June 30. Accordingly, the Fund's financial statements and related notes include information as of the four month period ended June 30, 2024 and the one year periods ended February 29, 2024 and February 28, 2023, as applicable.
2. Investments in Fidelity Central Funds.
Funds may invest in Fidelity Central Funds, which are open-end investment companies generally available only to other investment companies and accounts managed by the investment adviser and its affiliates. The Schedule of Investments lists any Fidelity Central Funds held as an investment as of period end, but does not include the underlying holdings of each Fidelity Central Fund. An investing fund indirectly bears its proportionate share of the expenses of the underlying Fidelity Central Funds.
Based on its investment objective, each Fidelity Central Fund may invest or participate in various investment vehicles or strategies that are similar to those of the investing fund. These strategies are consistent with the investment objectives of the investing fund and may involve certain economic risks which may cause a decline in value of each of the Fidelity Central Funds and thus a decline in the value of the investing fund.
| Fidelity Central Fund | Investment Manager | Investment Objective | Investment Practices | Expense RatioA |
| Fidelity Money Market Central Funds | Fidelity Management & Research Company LLC (FMR) | Each fund seeks to obtain a high level of current income consistent with the preservation of capital and liquidity. | Short-term Investments | Less than .005% |
A Expenses expressed as a percentage of average net assets and are as of each underlying Central Fund's most recent annual or semi-annual shareholder report.
A complete unaudited list of holdings for each Fidelity Central Fund is available upon request or at the Securities and Exchange Commission website at www.sec.gov. In addition, the financial statements of the Fidelity Central Funds, which are not covered by the Report of Independent Registered Public Accounting Firm, are available on the Securities and Exchange Commission website or upon request.
3. Significant Accounting Policies.
The Fund is an investment company and applies the accounting and reporting guidance of the Financial Accounting Standards Board (FASB) Accounting Standards Codification Topic 946 Financial Services - Investment Companies. The financial statements have been prepared in conformity with accounting principles generally accepted in the United States of America (GAAP), which require management to make certain estimates and assumptions at the date of the financial statements. Actual results could differ from those estimates. Subsequent events, if any, through the date that the financial statements were issued have been evaluated in the preparation of the financial statements. The Fund's Schedule of Investments lists any underlying mutual funds or exchange-traded funds (ETFs) but does not include the underlying holdings of these funds. The following summarizes the significant accounting policies of the Fund:
Investment Valuation. Investments are valued as of 4:00 p.m. Eastern time on the last calendar day of the period. The Board of Trustees (the Board) has designated the Fund's investment adviser as the valuation designee responsible for the fair valuation function and performing fair value determinations as needed. The investment adviser has established a Fair Value Committee (the Committee) to carry out the day-to-day fair valuation responsibilities and has adopted policies and procedures to govern the fair valuation process and the activities of the Committee. In accordance with these fair valuation policies and procedures, which have been approved by the Board, the Fund attempts to obtain prices from one or more third party pricing services or brokers to value its investments. When current market prices, quotations or currency exchange rates are not readily available or reliable, investments will be fair valued in good faith by the Committee, in accordance with the policies and procedures. Factors used in determining fair value vary by investment type and may include market or investment specific events, transaction data, estimated cash flows, and market observations of comparable investments. The frequency that the fair valuation procedures are used cannot be predicted and they may be utilized to a significant extent. The Committee manages the Fund's fair valuation practices and maintains the fair valuation policies and procedures. The Fund's investment adviser reports to the Board information regarding the fair valuation process and related material matters.
The Fund categorizes the inputs to valuation techniques used to value its investments into a disclosure hierarchy consisting of three levels as shown below:
Level 1 - unadjusted quoted prices in active markets for identical investments
Level 2 - other significant observable inputs (including quoted prices for similar investments, interest rates, prepayment speeds, etc.)
Level 3 - unobservable inputs (including the Fund's own assumptions based on the best information available)
Valuation techniques used to value the Fund's investments by major category are as follows:
Equity securities, including restricted securities, for which market quotations are readily available, are valued at the last reported sale price or official closing price as reported by a third party pricing service on the primary market or exchange on which they are traded and are categorized as Level 1 in the hierarchy. In the event there were no sales during the day or closing prices are not available, securities are valued at the last quoted bid price or may be valued using the last available price and are generally categorized as Level 2 in the hierarchy. For foreign equity securities, when market or security specific events arise, comparisons to the valuation of American Depositary Receipts (ADRs), futures contracts, Exchange-Traded Funds (ETFs) and certain indexes as well as quoted prices for similar securities may be used and would be categorized as Level 2 in the hierarchy. For equity securities, including restricted securities, where observable inputs are limited, assumptions about market activity and risk are used and these securities may be categorized as Level 3 in the hierarchy.
Debt securities, including restricted securities, are valued based on evaluated prices received from third party pricing services or from brokers who make markets in such securities. U.S. government and government agency obligations are valued by pricing services who utilize matrix pricing which considers yield or price of bonds of comparable quality, coupon, maturity and type or by broker-supplied prices. When independent prices are unavailable or unreliable, debt securities may be valued utilizing pricing methodologies which consider similar factors that would be used by third party pricing services. Debt securities are generally categorized as Level 2 in the hierarchy but may be Level 3 depending on the circumstances.
Futures contracts are valued at the settlement price established each day by the board of trade or exchange on which they are traded and are categorized as Level 1 in the hierarchy. Investments in open-end mutual funds, including the Fidelity Central Funds, are valued at their closing net asset value (NAV) each business day and are categorized as Level 1 in the hierarchy.
Changes in valuation techniques may result in transfers in or out of an assigned level within the disclosure hierarchy. The aggregate value of investments by input level as of June 30, 2024 is included at the end of the Fund's Schedule of Investments.
Investment Transactions and Income. For financial reporting purposes, the Fund's investment holdings and NAV include trades executed through the end of the last business day of the period. The NAV per share for processing shareholder transactions is calculated as of the close of business of the New York Stock Exchange (NYSE)business (normally 4:00 p.m. Eastern time) of the New York Stock Exchange, Archipelago Exchange (NYSE Arca), normally 4:00 p.m. Eastern time and includes trades executed through the end of the prior business day. Gains and losses on securities sold are determined on the basis of identified cost and include proceeds received from litigation. Commissions paid to certain brokers with whom the investment adviser, or its affiliates, places trades on behalf of a fund include an amount in addition to trade execution, which may be rebated back to a fund. Any such rebates are included in net realized gain (loss) on investments in the Statement of Operations. Dividend income is recorded on the ex-dividend date, except for certain dividends from foreign securities where the ex-dividend date may have passed, which are recorded as soon as the Fund is informed of the ex-dividend date. Non-cash dividends included in dividend income, if any, are recorded at the fair market value of the securities received. Income and capital gain distributions from Fidelity Central Funds, if any, are recorded on the ex-dividend date. Certain distributions received by the Fund represent a return of capital or capital gain. The Fund determines the components of these distributions subsequent to the ex-dividend date, based upon receipt of tax filings or other correspondence relating to the underlying investment. These distributions are recorded as a reduction of cost of investments and/or as a realized gain. Interest income is accrued as earned and includes coupon interest and amortization of premium and accretion of discount on debt securities as applicable.
Expenses. Expenses directly attributable to a fund are charged to that fund. Expenses attributable to more than one fund are allocated among the respective funds on the basis of relative net assets or other appropriate methods. Expenses included in the accompanying financial statements reflect the expenses of that fund and do not include any expenses associated with any underlying mutual funds or exchange-traded funds. Although not included in a fund's expenses, a fund indirectly bears its proportionate share of these expenses through the net asset value of each underlying mutual fund or exchange-traded fund. Expense estimates are accrued in the period to which they relate and adjustments are made when actual amounts are known.
Income Tax Information and Distributions to Shareholders. Each year, the Fund intends to qualify as a regulated investment company under Subchapter M of the Internal Revenue Code, including distributing substantially all of its taxable income and realized gains. As a result, no provision for U.S. Federal income taxes is required. As of June 30, 2024, the Fund did not have any unrecognized tax benefits in the financial statements; nor is the Fund aware of any tax positions for which it is reasonably possible that the total amounts of unrecognized tax benefits will significantly change in the next twelve months. The Fund files a U.S. federal tax return, in addition to state and local tax returns as required. The Fund's federal income tax returns are subject to examination by the Internal Revenue Service (IRS) for a period of three fiscal years after they are filed. State and local tax returns may be subject to examination for an additional fiscal year depending on the jurisdiction. Realized gain or loss resulting from in-kind redemptions is not taxable to the Fund and is not distributed to shareholders of the Fund.
Distributions are declared and recorded on the ex-dividend date. Income and capital gain distributions are determined in accordance with income tax regulations, which may differ from GAAP.
Capital accounts within the financial statements are adjusted for permanent book-tax differences. These adjustments have no impact on net assets or the results of operations. Capital accounts are not adjusted for temporary book-tax differences which will reverse in a subsequent period.
Book-tax differences are primarily due to futures contracts, passive foreign investment companies (PFIC), redemptions in-kind, capital loss carryforwards and losses deferred due to wash sales.
As of period end, the cost and unrealized appreciation (depreciation) in securities, and derivatives if applicable, for federal income tax purposes were as follows:
| Gross unrealized appreciation | $101,254,015 |
| Gross unrealized depreciation | (51,636,053) |
| Net unrealized appreciation (depreciation) | $49,617,962 |
| Tax Cost | $576,032,708 |
The tax-based components of distributable earnings as of period end were as follows:
| Undistributed ordinary income | $458,582 |
| Capital loss carryforward | $(23,183,857) |
| Net unrealized appreciation (depreciation) on securities and other investments | $49,617,962 |
Capital loss carryforwards are only available to offset future capital gains of the Fund to the extent provided by regulations and may be limited. The capital loss carryforward information presented below, including any applicable limitation, is estimated as of fiscal period end and is subject to adjustment.
Short-term | $(23,183,857) |
| Total capital loss carryforward | $(23,183,857) |
The tax character of distributions paid was as follows:
| | June 30, 2024 | February 29, 2024 | February 28, 2023 |
| Ordinary Income | $2,247,305 | $ 4,715,442 | $ 4,900,302 |
| Long-term Capital Gains | - | - | 23,560,225 |
| Total | $2,247,305 | $ 4,715,442 | $ 28,460,527 |
4. Derivative Instruments.
Risk Exposures and the Use of Derivative Instruments. The Fund's investment objectives allow for various types of derivative instruments, including futures contracts. Derivatives are investments whose value is primarily derived from underlying assets, indices or reference rates and may be transacted on an exchange or over-the-counter (OTC). Derivatives may involve a future commitment to buy or sell a specified asset based on specified terms, to exchange future cash flows at periodic intervals based on a notional principal amount, or for one party to make one or more payments upon the occurrence of specified events in exchange for periodic payments from the other party.
Derivatives were used to increase returns and to manage exposure to certain risks as defined below. The success of any strategy involving derivatives depends on analysis of numerous economic factors, and if the strategies for investment do not work as intended, the objectives may not be achieved.
Derivatives were used to increase or decrease exposure to the following risk(s):
| | |
| Equity Risk | Equity risk relates to the fluctuations in the value of financial instruments as a result of changes in market prices (other than those arising from interest rate risk or foreign exchange risk), whether caused by factors specific to an individual investment, its issuer, or all factors affecting all instruments traded in a market or market segment. |
Funds are also exposed to additional risks from investing in derivatives, such as liquidity risk and counterparty credit risk. Liquidity risk is the risk that a fund will be unable to close out the derivative in the open market in a timely manner. Counterparty credit risk is the risk that the counterparty will not be able to fulfill its obligation to a fund. Counterparty credit risk related to exchange-traded contracts may be mitigated by the protection provided by the exchange on which they trade.
Investing in derivatives may involve greater risks than investing in the underlying assets directly and, to varying degrees, may involve risk of loss in excess of any initial investment and collateral received and amounts recognized in the Statement of Assets and Liabilities. In addition, there may be the risk that the change in value of the derivative contract does not correspond to the change in value of the underlying instrument.
Futures Contracts. A futures contract is an agreement between two parties to buy or sell a specified underlying instrument for a fixed price at a specified future date. Futures contracts were used to manage exposure to the stock market.
Upon entering into a futures contract, a fund is required to deposit either cash or securities (initial margin) with a clearing broker in an amount equal to a certain percentage of the face value of the contract. Futures contracts are marked-to-market daily and subsequent daily payments are made or received by a fund depending on the daily fluctuations in the value of the futures contracts and are recorded as unrealized appreciation or (depreciation). This receivable and/or payable, if any, is included in daily variation margin on futures contracts in the Statement of Assets and Liabilities. Realized gain or (loss) is recorded upon the expiration or closing of a futures contract. The net realized gain (loss) and change in net unrealized appreciation (depreciation) on futures contracts during the period is presented in the Statement of Operations.
Any open futures contracts at period end are presented in the Schedule of Investments under the caption "Futures Contracts". The notional amount at value reflects each contract's exposure to the underlying instrument or index at period end, and is representative of volume of activity during the period unless an average notional amount is presented. Any securities deposited to meet initial margin requirements are identified in the Schedule of Investments. Any cash deposited to meet initial margin requirements is presented as segregated cash with brokers for derivative instruments in the Statement of Assets and Liabilities.
5. Purchases and Sales of Investments.
Purchases and sales of securities, other than short-term securities, U.S. government securities and in-kind transactions, as applicable, are noted in the table below.
| | Purchases ($) | Sales ($) |
| Fidelity Enhanced Small Cap ETF | 166,037,952 | 122,930,939 |
Securities received and delivered in-kind through subscriptions and redemptions are noted in the table below.
| | In-Kind Subscriptions ($) | In-Kind Redemptions ($) |
| Fidelity Enhanced Small Cap ETF | 66,555,131 | 40,758,295 |
6. Fees and Other Transactions with Affiliates.
Management Fee. Fidelity Management & Research Company LLC (the investment adviser) provides the Fund with investment management related services for which the Funds pay a monthly management fee that is based on an annual rate of .28% of average net assets. Under the management contract, the investment adviser pays all other expenses, except the compensation of the independent Trustees and certain miscellaneous expenses such as proxy and shareholders meeting expenses. The management fee is reduced by an amount equal to the fees and expenses paid by the Fund to the independent Trustees.
During the period March 1, 2023 through November 17, 2023, the Predecessor Fund paid an all-inclusive management fee based on annual rate of .55% of the Fund's average net assets; and the investment adviser paid all ordinary operating expenses of the Fund, except fees and expenses of the independent Trustees and certain miscellaneous expenses such as proxy and shareholder meeting expenses. The management fee was reduced by an amount equal to the fees and expenses paid by the Fund to the independent Trustees.
Brokerage Commissions. A portion of portfolio transactions were placed with brokerage firms which are affiliates of the investment adviser. Brokerage commissions are included in net realized gain (loss) and change in net unrealized appreciation (depreciation) in the Statement of Operations. The commissions paid to these affiliated firms were as follows:
| June 30, 2024 | Amount ($) |
| Fidelity Enhanced Small Cap ETF | 4,530 |
| |
| February 29, 2024 | Amount ($) |
| Fidelity Enhanced Small Cap ETF | 1,756 |
Interfund Trades. Funds may purchase from or sell securities to other Fidelity Funds under procedures adopted by the Board. The procedures have been designed to ensure these interfund trades are executed in accordance with Rule 17a-7 of the 1940 Act. Any interfund trades are included within the respective purchases and sales amounts shown in the Purchases and Sales of Investments note. Interfund trades during the period are noted in the table below.
| | Purchases ($) | Sales ($) | Realized Gain (Loss)($) |
| Fidelity Enhanced Small Cap ETF | 6,655,391 | 4,273,376 | 847,342 |
7. Committed Line of Credit.
During the period September 1, 2023 through November 17, 2023, the Predecessor Fund participated with other funds managed by the investment adviser or an affiliate in a $4.25 billion credit facility (the "line of credit") to be utilized for temporary or emergency purposes to fund shareholder redemptions or for other short-term liquidity purposes. The commitment fees on the pro-rata portion of the line of credit were borne by the investment adviser. During the period, there were no borrowings on this line of credit.
8. Security Lending.
Funds lend portfolio securities from time to time in order to earn additional income. Lending agents are used, including National Financial Services (NFS), an affiliate of the investment adviser. Pursuant to a securities lending agreement, NFS will receive a fee, which is capped at 9.9% of a fund's daily lending revenue, for its services as lending agent. A fund may lend securities to certain qualified borrowers, including NFS. On the settlement date of the loan, a fund receives collateral (in the form of U.S. Treasury obligations, letters of credit and/or cash) against the loaned securities and maintains collateral in an amount not less than 100% of the market value of the loaned securities during the period of the loan. The market value of the loaned securities is determined at the close of business of a fund and any additional required collateral is delivered to a fund on the next business day. A fund or borrower may terminate the loan at any time, and if the borrower defaults on its obligation to return the securities loaned because of insolvency or other reasons, a fund may apply collateral received from the borrower against the obligation. A fund may experience delays and costs in recovering the securities loaned. Any cash collateral received is invested in the Fidelity Securities Lending Cash Central Fund. Any loaned securities are identified as such in the Schedule of Investments, and the value of loaned securities and cash collateral at period end, as applicable, are presented in the Statement of Assets and Liabilities. Security lending income represents the income earned on investing cash collateral, less rebates paid to borrowers and any lending agent fees associated with the loan, plus any premium payments received for lending certain types of securities. Security lending income is presented in the Statement of Operations as a component of income from Fidelity Central Funds. Affiliated security lending activity, if any, was as follows:
| June 30, 2024 | Total Security Lending Fees Paid to NFS ($) | Security Lending Income From Securities Loaned to NFS ($) | Value of Securities Loaned to NFS at Period End ($) |
| Fidelity Enhanced Small Cap ETF | 1,545 | 366 | 141,265 |
| | | |
| February 29, 2024 | Total Security Lending Fees Paid to NFS ($) | Security Lending Income From Securities Loaned to NFS ($) | Value of Securities Loaned to NFS at Period End ($) |
| Fidelity Enhanced Small Cap ETF | 8,684 | 2,414 | 57,346 |
9. Expense Reductions.
The investment adviser contractually agreed to reimburse the Fund to the extent proxy and shareholder meeting expenses exceeded .003% of average net assets. This reimbursement will remain in place through October 31, 2025. During the period this reimbursement reduced the Fund's expenses as follows:
| | Reimbursement ($) |
| Fidelity Enhanced Small Cap ETF | 16,210 |
June 30, 2024
Through arrangements with the Fund's custodian, credits realized as a result of certain uninvested cash balances were used to reduce the Fund's expenses by $91.
February 29, 2024
Through arrangements with the Fund's custodian, credits realized as a result of certain uninvested cash balances were used to reduce the Fund's expenses by $3,509.
10. Share Transactions.
Funds issue and redeem shares at NAV only with certain authorized participants in large increments known as Creation Units. Purchases of Creation Units are made by tendering a basket of designated securities to a fund and redemption proceeds are paid with a basket of securities from a fund's portfolio with a balancing cash component to equate the market value of the basket of securities delivered or redeemed to the NAV per Creation Unit on the transaction date. Cash may be substituted equivalent to the value of certain securities generally when they are not available in sufficient quantity for delivery. A fund's shares are available in smaller increments to investors in the secondary market at market prices and may be subject to commissions. Authorized participants pay a transaction fee to the shareholder servicing agent when purchasing and redeeming Creation Units of a fund. The transaction fee is used to offset the costs associated with the issuance and redemption of Creation Units.
11. Other.
A fund's organizational documents provide former and current trustees and officers with a limited indemnification against liabilities arising in connection with the performance of their duties to the fund. In the normal course of business, a fund may also enter into contracts that provide general indemnifications. A fund's maximum exposure under these arrangements is unknown as this would be dependent on future claims that may be made against a fund. The risk of material loss from such claims is considered remote.
12. Prior Fiscal Year Merger Information.
On November 17, 2023, Fidelity Small Cap Enhanced Index Fund (Predecessor Fund) reorganized into a newly created Fidelity Enhanced Small Cap ETF (ETF) pursuant an Agreement and Plan of Reorganization (the Agreement) approved by its Board of Trustees. Per the Agreement, shareholders of the Predecessor Fund received ETF shares equal in value to the shares of the Predecessor Fund they owned on the day the reorganization was effective. The Predecessor Fund was the accounting survivor after the reorganization. As such, performance and financial history prior to the reorganization is that of the Predecessor Fund. Historical share transactions and per share information for the Predecessor Fund was retroactively adjusted to reflect the change in capital structure due to the reorganization.
For financial reporting purposes, the assets and liabilities of the Predecessor Fund and shares issued by the ETF were recorded at fair value; however, the cost basis of the investments received from the Predecessor Fund were carried forward and will be utilized for purposes of the ETF's ongoing reporting of realized and unrealized gains and losses to more closely align subsequent reporting of realized gains with amounts distributable to shareholders for tax purposes. The reorganization qualified as a tax-free reorganization for federal income tax purposes with no gain or loss recognized to the funds or their shareholders. Costs incurred in connection with the reorganization were paid by the Predecessor Fund.
| Predecessor Fund/Accounting Survivor | Investments $ | Unrealized appreciation (depreciation) $ | Net Assets $ | Shares Exchanged | Shares Exchanged Ratio |
| Fidelity Small Cap Enhanced Index Fund | 510,635,061 | 30,515,551 | 511,993,789 | 20,479,785 | .5077880000 |
| Acquiring ETF | Net Assets $ | Total net assets after the acquisition $ |
| Fidelity Enhanced Small Cap ETF | 25 | 511,993,814 |
Pro forma results of operations of the combined entity for the entire period ended February 29, 2024, as though the acquisition had occurred as of the beginning of the year (rather than on the actual acquisition date), are as follows:
| Net investment income (loss) | $5,714,131 |
| Total net realized gain (loss) | 32,794,589 |
| Total change in net unrealized appreciation (depreciation) | 27,704,246 |
| Net increase (decrease) in net assets resulting from operations | $66,212,966 |
Because the combined investment portfolios have been managed as a single portfolio since the acquisition was completed, it is not practicable to separate the amounts of revenue and earnings of the Predecessor Fund that has been included in the ETF's Statement of Operations since November 17, 2023.
13. Risk and Uncertainties.
Many factors affect a fund's performance. Developments that disrupt global economies and financial markets, such as pandemics, epidemics, outbreaks of infectious diseases, war, terrorism, and environmental disasters, may significantly affect a fund's investment performance. The effects of these developments to a fund will be impacted by the types of securities in which a fund invests, the financial condition, industry, economic sector, and geographic location of an issuer, and a fund's level of investment in the securities of that issuer. Significant concentrations in security types, issuers, industries, sectors, and geographic locations may magnify the factors that affect a fund's performance.
Report of Independent Registered Public Accounting Firm
To the Board of Trustees of Fidelity Covington Trust and Shareholders of Fidelity Enhanced Small Cap ETF
Opinion on the Financial Statements
We have audited the accompanying statement of assets and liabilities, including the schedule of investments, of Fidelity Enhanced Small Cap ETF (one of the funds constituting Fidelity Covington Trust, referred to hereafter as the "Fund") as of June 30, 2024, the related statement of operations for the period March 1, 2024 through June 30, 2024 and the year ended February 29, 2024, the statement of changes in net assets for the period March 1, 2024 through June 30, 2024 and for each of the two years in the period ended February 29, 2024, including the related notes, and the financial highlights for each of the periods indicated therein (collectively referred to as the "financial statements"). In our opinion, the financial statements present fairly, in all material respects, the financial position of the Fund as of June 30, 2024, the results of its operations for the period March 1, 2024 through June 30, 2024 and for the year ended February 29, 2024, the changes in its net assets for the period March 1, 2024 through June 30, 2024 and for each of the two years in the period ended February 29, 2024, and the financial highlights for each of the periods indicated therein in conformity with accounting principles generally accepted in the United States of America.
Basis for Opinion
These financial statements are the responsibility of the Fund's management. Our responsibility is to express an opinion on the Fund's financial statements based on our audit. We are a public accounting firm registered with the Public Company Accounting Oversight Board (United States) (PCAOB) and are required to be independent with respect to the Fund in accordance with the U.S. federal securities laws and the applicable rules and regulations of the Securities and Exchange Commission and the PCAOB.
We conducted our audit of these financial statements in accordance with the standards of the PCAOB. Those standards require that we plan and perform the audit to obtain reasonable assurance about whether the financial statements are free of material misstatement, whether due to error or fraud.
Our audit included performing procedures to assess the risks of material misstatement of the financial statements, whether due to error or fraud, and performing procedures that respond to those risks. Such procedures included examining, on a test basis, evidence regarding the amounts and disclosures in the financial statements. Our audit also included evaluating the accounting principles used and significant estimates made by management, as well as evaluating the overall presentation of the financial statements. Our procedures included confirmation of securities owned as of June 30, 2024 by correspondence with the custodian and brokers; when replies were not received from brokers, we performed other auditing procedures. We believe that our audit provides a reasonable basis for our opinion.
/s/ PricewaterhouseCoopers LLP
Boston, Massachusetts
August 19, 2024
We have served as the auditor of one or more investment companies in the Fidelity group of funds since 1932.
Distributions
(Unaudited)
The dividend and capital gains distributions for the fund(s) are available on Fidelity.com or Institutional.Fidelity.com.
The fund designates $255,612 of distributions paid during the fiscal year ended 2024 as qualifying to be taxed as section 163(j) interest dividends.
The fund designates 85% of the dividends distributed during the fiscal year as qualifying for the dividends-received deduction for corporate shareholders.
The fund designates 99.55% of the dividends distributed during the fiscal year as amounts which may be taken into account as a dividend for the purposes of the maximum rate under section 1(h)(11) of the Internal Revenue Code.
The fund designates 0.45% of the dividends distributed during the fiscal year as a section 199A dividend.
The fund will notify shareholders in January 2025 of amounts for use in preparing 2024 income tax returns.
Item 8: Changes in and Disagreements with Accountants for Open-End Management Investment Companies
Note: This is not applicable for any fund included in this document.
Item 9: Proxy Disclosures for Open-End Management Investment Companies
Note: This is not applicable for any fund included in this document.
Item 10: Remuneration Paid to Directors, Officers, and others of Open-End Management Investment Companies
Note: This information is disclosed as part of the financial statements for each Fund as part of Item 7: Financial Statements and Financial Highlights for Open-End Management Investment companies.
Item 11: Statement Regarding Basis for Approval of Investment Advisory Contract
Note: This is not applicable for any fund included in this document.
1.9910154.101
CPE-ANN-0824
Item 8.
Changes in and Disagreements with Accountants for Open-End Management Investment Companies
See Item 7.
Item 9.
Proxy Disclosures for Open-End Management Investment Companies
See Item 7.
Item 10.
Remuneration Paid to Directors, Officers, and Others of Open-End Management Investment Companies
See Item 7.
Item 11.
Statement Regarding Basis for Approval of Investment Advisory Contract
See Item 7.
Item 12.
Disclosure of Proxy Voting Policies and Procedures for Closed-End Management Investment Companies
Not applicable.
Item 13.
Portfolio Managers of Closed-End Management Investment Companies
Not applicable.
Item 14.
Purchase of Equity Securities by Closed-End Management Investment Company and Affiliated Purchasers
Not applicable.
Item 15.
Submission of Matters to a Vote of Security Holders
There were no material changes to the procedures by which shareholders may recommend nominees to the trust’s Board of Trustees.
Item 16.
Controls and Procedures
(a)(i) The President and Treasurer and the Chief Financial Officer have concluded that the trust’s disclosure controls and procedures (as defined in Rule 30a-3(c) under the Investment Company Act) provide reasonable assurances that material information relating to the trust is made known to them by the appropriate persons, based on their evaluation of these controls and procedures as of a date within 90 days of the filing date of this report.
(a)(ii) There was no change in the trust’s internal control over financial reporting (as defined in Rule 30a-3(d) under the Investment Company Act) that occurred during the period covered by this report that has materially affected, or is reasonably likely to materially affect, the trust’s internal control over financial reporting.
Item 17.
Disclosure of Securities Lending Activities for Closed-End Management Investment Companies
Not applicable.
Item 18.
Recovery of Erroneously Awarded Compensation
(a)
Not applicable.
(b)
Not applicable.
Item 19.
Exhibits
SIGNATURES
Pursuant to the requirements of the Securities Exchange Act of 1934 and the Investment Company Act of 1940, the registrant has duly caused this report to be signed on its behalf by the undersigned, thereunto duly authorized.
Fidelity Covington Trust
|
By: | /s/Stacie M. Smith |
| Stacie M. Smith |
| President and Treasurer (Principal Executive Officer) |
|
|
Date: | August 22, 2024 |
Pursuant to the requirements of the Securities Exchange Act of 1934 and the Investment Company Act of 1940, this report has been signed below by the following persons on behalf of the registrant and in the capacities and on the dates indicated.
|
By: | /s/Stacie M. Smith |
| Stacie M. Smith |
| President and Treasurer (Principal Executive Officer) |
|
|
Date: | August 22, 2024 |
|
By: | /s/John J. Burke III |
| John J. Burke III |
| Chief Financial Officer (Principal Financial Officer) |
|
|
Date: | August 22, 2024 |