UNITED STATES
SECURITIES AND EXCHANGE COMMISSION
Washington, D.C. 20549
FORM N-CSR
CERTIFIED SHAREHOLDER REPORT OF REGISTERED
MANAGEMENT INVESTMENT COMPANIES
Investment Company Act file number 811-07319
Fidelity Covington Trust
(Exact name of registrant as specified in charter)
245 Summer St., Boston, Massachusetts 02210
(Address of principal executive offices) (Zip code)
Margaret Carey, Secretary
245 Summer St.
Boston, Massachusetts 02210
(Name and address of agent for service)
Registrant's telephone number, including area code:
617-563-7000
| |
Date of fiscal year end: | July 31 |
|
|
Date of reporting period: | July 31, 2024 |
Item 1.
Reports to Stockholders
| |
| | ANNUAL SHAREHOLDER REPORT | AS OF JULY 31, 2024 | This report describes changes to the Fund that occurred during the reporting period. |
| | Fidelity® Women's Leadership ETF Fidelity® Women's Leadership ETF : FDWM Principal U.S. Listing Exchange :NYSEArca NYSE Arca, Inc. |
| | | |
This annual shareholder report contains information about Fidelity® Women's Leadership ETF for the period August 1, 2023 to July 31, 2024. You can find additional information about the Fund at fundresearch.fidelity.com/prospectus/sec. You can also request this information by contacting us at 1-800-FIDELITY or by sending an e-mail to fidfunddocuments@fidelity.com.
What were your Fund costs for the last year?(based on hypothetical $10,000 investment)
FUND COST (PREVIOUS YEAR)
| | Costs of a $10,000 investment | Costs paid as a percentage of a $10,000 investment | |
| Fidelity® Women's Leadership ETF | $ 64 | 0.59% | |
What affected the Fund's performance this period?
•U.S. equities gained for the 12 months ending July 31, 2024, driven by resilient corporate profits, a frenzy over generative artificial intelligence and the Federal Reserve's likely pivot to cutting interest rates later this year.
•Against this backdrop, security selection was the primary contributor to the fund's performance versus the benchmark for the fiscal year, led by picks in the consumer discretionary sector. Stock selection in information technology, primarily within the semiconductors & semiconductor equipment industry, also boosted the fund's relative performance.
•The fund's non-benchmark stake in Nvidia gained approximately 150% and was the top individual relative contributor. The stock was among our largest holdings. An overweight in Williams-Sonoma (+128%) also contributed, as did avoiding Unity Software, a benchmark component that returned about -64%.
•In contrast, the biggest detractor from performance versus the benchmark was stock picking in communication services, utilities and materials.
•Not owning Godaddy, a benchmark component that gained roughly 89%, was the biggest individual relative detractor. Not owning Fair Isaac, a benchmark component that gained 91%, was the second-largest relative detractor. Another notable relative detractor was an overweight in Estee Lauder (-43%).
•Notable changes in positioning include higher allocations to the consumer discretionary and communication services sectors.
•Application of FMR's environmental, social, and governance (ESG) ratings process and/or its sustainable investing exclusion criteria may affect the Fund's exposure to certain issuers, sectors, regions, and countries and may affect the Fund's performance.
How did the Fund perform over the life of Fund?
CUMULATIVE PERFORMANCE
June 15, 2021 through July 31, 2024.
Initial investment of $10,000.
Fidelity® Women's Leadership ETF | $10,000 | $10,253 | $8,803 | $9,945 |
MSCI USA Women's Leadership Index | $10,000 | $10,293 | $8,844 | $9,658 |
Russell 3000® Index | $10,000 | $10,297 | $9,540 | $10,746 |
| | 2021 | 2022 | 2023 | 2024 |
AVERAGE ANNUAL TOTAL RETURNS: | | 1 Year | Life of Fund |
Fidelity® Women's Leadership ETF - NAV A | 15.82% | 4.62% |
Fidelity® Women's Leadership ETF - Market Price B | 16.09% | 4.79% |
MSCI USA Women's Leadership Index A | 11.28% | 2.33% |
Russell 3000® Index A | 21.07% | 8.78% |
A From June 15, 2021
B From June 17, 2021, date initially listed on the NYSE Arca, Inc. exchange
Visit www.fidelity.com for more recent performance information. |
The Fund's past performance is not a good predictor of the Fund's future performance. The graph and table do not reflect the deduction of taxes that a shareholder would pay on fund distributions or redemption of fund shares. |
Key Fund Statistics (as of July 31, 2024)
KEY FACTS | | |
| Fund Size | $3,942,372 | |
| Number of Holdings | 106 | |
| Total Advisory Fee | $21,836 | |
| Portfolio Turnover | 59% | |
What did the Fund invest in?
(as of July 31, 2024)
MARKET SECTORS (% of Fund's net assets) | | |
| Information Technology | 29.1 | |
| Health Care | 13.9 | |
| Consumer Discretionary | 13.2 | |
| Financials | 12.5 | |
| Industrials | 11.5 | |
| Communication Services | 5.8 | |
| Materials | 4.0 | |
| Consumer Staples | 3.3 | |
| Energy | 3.0 | |
| Utilities | 2.0 | |
| Real Estate | 1.0 | |
| |
| Common Stocks | 99.3 |
| Short-Term Investments and Net Other Assets (Liabilities) | 0.7 |
ASSET ALLOCATION (% of Fund's net assets) |
|
|
| United States | 95.9 |
| Ireland | 2.0 |
| China | 1.5 |
| Canada | 0.6 |
GEOGRAPHIC DIVERSIFICATION (% of Fund's net assets) |
|
| |
|
TOP HOLDINGS (% of Fund's net assets) | | |
| Amazon.com Inc | 4.4 | |
| Apple Inc | 4.2 | |
| Microsoft Corp | 3.8 | |
| NVIDIA Corp | 3.2 | |
| Alphabet Inc Class C | 2.8 | |
| Accenture PLC Class A | 2.0 | |
| Walt Disney Co/The | 2.0 | |
| Hologic Inc | 1.9 | |
| Cigna Group/The | 1.8 | |
| Salesforce Inc | 1.6 | |
| | 27.7 | |
| |
How has the Fund changed?
This is a summary of certain changes to the Fund since August 1, 2023. For more complete information, you may review the Fund's next prospectus, which we expect to be available by November 29, 2024 at fundresearch.fidelity.com/prospectus/sec or upon request at 1-800-FIDELITY or by sending an e-mail to fidfunddocuments@fidelity.com.
The fund changed its classification form non-diversified to diversified and modified its principal investment strategies and risks to reflect the change during the reporting period. | |
| Fidelity, the Fidelity Investments Logo and all other Fidelity trademarks or service marks used herein are trademarks or service marks of FMR LLC. Any third-party marks that are used herein are trademarks or service marks of their respective owners. © 2024 FMR LLC. All rights reserved. |
| | For additional information about the Fund; including its prospectus, financial information, holdings and proxy information, scan the QR code or visit fundresearch.fidelity.com/prospectus/sec 1.9913572.100 6416-TSRA-0924 |
| |
| | ANNUAL SHAREHOLDER REPORT | AS OF JULY 31, 2024 | This report describes changes to the Fund that occurred during the reporting period. |
| | Fidelity® Blue Chip Value ETF Fidelity® Blue Chip Value ETF : FBCV Principal U.S. Listing Exchange :CboeBZX Cboe BZX Exchange, Inc. |
| | | |
This annual shareholder report contains information about Fidelity® Blue Chip Value ETF for the period August 1, 2023 to July 31, 2024. You can find additional information about the Fund at fundresearch.fidelity.com/prospectus/sec. You can also request this information by contacting us at 1-800-FIDELITY or by sending an e-mail to fidfunddocuments@fidelity.com.
What were your Fund costs for the last year?(based on hypothetical $10,000 investment)
FUND COST (PREVIOUS YEAR)
| | Costs of a $10,000 investment | Costs paid as a percentage of a $10,000 investment | |
| Fidelity® Blue Chip Value ETF | $ 63 | 0.59% | |
What affected the Fund's performance this period?
•U.S. equities gained for the 12 months ending July 31, 2024, driven by resilient corporate profits, a frenzy over generative artificial intelligence and the Federal Reserve's likely pivot to cutting interest rates later this year.
•Against this backdrop, both security selection and sector positioning detracted from the fund's performance versus the Russell 1000 Value Index for the fiscal year, especially in consumer staples. Subpar stock picks in communication services also hampered the fund's result. Investment choices and an underweight in industrials, primarily within the capital goods industry, hurt as well.
•The largest individual relative detractor was an outsized stake in Lamb Weston Holdings (-36%). An overweight in Kenvue (-9%), where we increased our position this period, also was detrimental to performance. Larger-than-benchmark exposure to Comcast (-6%), one of our biggest holdings, was another challenge.
•In contrast, the biggest contributors to performance versus the benchmark were stock picks and an underweight among consumer discretionary firms. Investment choices and outsized exposure to financials - banks in particular - also boosted the fund's relative performance. Comparatively light exposure to the real estate sector, especially the equity real estate investment trusts industry, proved advantageous as well.
•The top individual relative contributor was an overweight in H&R Block (+77%). An outsized stake in Constellation Energy (+90%) was another plus, though the stock was not held at period end. An underweight in ConocoPhillips (-3%) helped as well. The stock was not held at period end.
•Notable changes in positioning include higher allocations to the consumer discretionary and industrials sectors.
How did the Fund perform over the life of Fund?
CUMULATIVE PERFORMANCE
June 2, 2020 through July 31, 2024.
Initial investment of $10,000.
Fidelity® Blue Chip Value ETF | $10,000 | $10,123 | $14,459 | $14,642 | $15,426 |
Russell 1000® Value Index | $10,000 | $10,170 | $14,169 | $13,967 | $15,124 |
Russell 1000® Index | $10,000 | $10,678 | $14,731 | $13,719 | $15,496 |
| | 2020 | 2021 | 2022 | 2023 | 2024 |
AVERAGE ANNUAL TOTAL RETURNS: | | 1 Year | Life of Fund |
Fidelity® Blue Chip Value ETF - NAV A | 11.22% | 13.84% |
Fidelity® Blue Chip Value ETF - Market Price B | 11.33% | 12.97% |
Russell 1000® Value Index A | 14.80% | 14.17% |
Russell 1000® Index A | 21.50% | 16.41% |
A From June 2, 2020
B From June 4, 2020, date initially listed on the Cboe BZX Exchange, Inc. exchange
Visit www.fidelity.com for more recent performance information. |
The Fund's past performance is not a good predictor of the Fund's future performance. The graph and table do not reflect the deduction of taxes that a shareholder would pay on fund distributions or redemption of fund shares. |
Key Fund Statistics (as of July 31, 2024)
KEY FACTS | | |
| Fund Size | $125,357,284 | |
| Number of Holdings | 84 | |
| Total Advisory Fee | $712,115 | |
| Portfolio Turnover | 33% | |
What did the Fund invest in?
(as of July 31, 2024)
MARKET SECTORS (% of Fund's net assets) | | |
| Financials | 24.8 | |
| Health Care | 17.0 | |
| Industrials | 10.7 | |
| Consumer Staples | 10.4 | |
| Energy | 8.4 | |
| Information Technology | 7.3 | |
| Utilities | 6.7 | |
| Communication Services | 5.1 | |
| Consumer Discretionary | 4.4 | |
| Materials | 2.4 | |
| Real Estate | 1.2 | |
| |
| Common Stocks | 98.4 |
| Short-Term Investments and Net Other Assets (Liabilities) | 1.6 |
ASSET ALLOCATION (% of Fund's net assets) |
|
|
| United States | 94.0 |
| United Kingdom | 4.0 |
| Canada | 1.1 |
| Norway | 0.7 |
| China | 0.2 |
GEOGRAPHIC DIVERSIFICATION (% of Fund's net assets) |
|
| |
|
TOP HOLDINGS (% of Fund's net assets) | | |
| Exxon Mobil Corp | 4.6 | |
| JPMorgan Chase & Co | 4.1 | |
| Bank of America Corp | 2.9 | |
| Cigna Group/The | 2.9 | |
| UnitedHealth Group Inc | 2.9 | |
| Comcast Corp Class A | 2.9 | |
| Travelers Cos Inc/The | 2.8 | |
| Berkshire Hathaway Inc Class B | 2.7 | |
| PG&E Corp | 2.3 | |
| Walt Disney Co/The | 2.2 | |
| | 30.3 | |
| |
How has the Fund changed?
This is a summary of certain changes to the Fund since August 1, 2023. For more complete information, you may review the Fund's next prospectus, which we expect to be available by November 29, 2024 at fundresearch.fidelity.com/prospectus/sec or upon request at 1-800-FIDELITY or by sending an e-mail to fidfunddocuments@fidelity.com.
The fund changed its classification from non-diversified to diversified and modified its principal investment strategies and risks to reflect the change during the reporting period. | |
| Fidelity, the Fidelity Investments Logo and all other Fidelity trademarks or service marks used herein are trademarks or service marks of FMR LLC. Any third-party marks that are used herein are trademarks or service marks of their respective owners. © 2024 FMR LLC. All rights reserved. |
| | For additional information about the Fund; including its prospectus, financial information, holdings and proxy information, scan the QR code or visit fundresearch.fidelity.com/prospectus/sec 1.9913566.100 6190-TSRA-0924 |
| |
| | ANNUAL SHAREHOLDER REPORT | AS OF JULY 31, 2024 | This report describes changes to the Fund that occurred during the reporting period. |
| | Fidelity® Quality Factor ETF Fidelity® Quality Factor ETF : FQAL Principal U.S. Listing Exchange :NYSEArca NYSE Arca, Inc. |
| | | |
This annual shareholder report contains information about Fidelity® Quality Factor ETF for the period August 1, 2023 to July 31, 2024. You can find additional information about the Fund at fundresearch.fidelity.com/prospectus/sec. You can also request this information by contacting us at 1-800-FIDELITY or by sending an e-mail to fidfunddocuments@fidelity.com.
What were your Fund costs for the last year?(based on hypothetical $10,000 investment)
FUND COST (PREVIOUS YEAR)
| | Costs of a $10,000 investment | Costs paid as a percentage of a $10,000 investment | |
| Fidelity® Quality Factor ETF | $ 20 | 0.18% | |
What affected the Fund's performance this period?
•U.S. equities gained for the 12 months ending July 31, 2024, driven by resilient corporate profits, a frenzy over generative artificial intelligence and the Federal Reserve's likely pivot to cutting interest rates later this year.
•Against this backdrop, information technology gained 31% and contributed most to the fund's performance for the fiscal year. Health care, which gained 25%, also helped, benefiting from the pharmaceuticals, biotechnology & life sciences industry (+29%), as did financials, which advanced about 23%. The communication services sector rose 29%, boosted by the media & entertainment industry (+28%), while industrials gained about 11% and utilities advanced about 25%. Other contributors included the energy (+12%), consumer staples (+7%), consumer discretionary (+4%), materials (+13%) and real estate (+9%) sectors.
•Turning to individual stocks, the top contributor was Nvidia (+61%), from the semiconductors & semiconductor equipment category. From the same group, Broadcom gained 81% and helped. Microsoft, within the software & services group, gained approximately 25% and contributed. Alphabet, within the media & entertainment industry, gained about 29%. Lastly, Apple (+14%), from the technology hardware & equipment industry, also helped.
•In contrast, the biggest detractor was Tesla (-26%), from the automobiles & components group. Starbucks, within the consumer services category, returned about -16% and hurt the fund. Another notable detractor was United Parcel Service (-18%), a stock in the transportation industry. In software & services, Palo Alto Networks (-11%) hurt the fund. Lastly, ZoomInfo Technologies (-35%), a stock in the media & entertainment industry, hindered the fund.
How did the Fund perform over the life of Fund?
CUMULATIVE PERFORMANCE
September 12, 2016 through July 31, 2024.
Initial investment of $10,000.
Fidelity® Quality Factor ETF | $10,000 | $11,613 | $13,581 | $14,551 | $16,044 | $21,820 | $20,776 | $22,948 | $27,615 |
Fidelity U.S. Quality Factor Index℠ | $10,000 | $11,648 | $13,664 | $14,681 | $16,233 | $22,144 | $21,143 | $23,416 | $28,228 |
Russell 1000® Index | $10,000 | $11,635 | $13,519 | $14,600 | $16,357 | $22,568 | $21,017 | $23,739 | $28,843 |
| | 2016 | 2017 | 2018 | 2019 | 2020 | 2021 | 2022 | 2023 | 2024 |
AVERAGE ANNUAL TOTAL RETURNS: | | 1 Year | 5 Year | Life of Fund |
Fidelity® Quality Factor ETF - NAV A | 20.34% | 13.67% | 13.74% |
Fidelity® Quality Factor ETF - Market Price B | 20.47% | 13.67% | 13.79% |
Fidelity U.S. Quality Factor Index℠ A | 20.55% | 13.97% | 14.06% |
Russell 1000® Index A | 21.50% | 14.59% | 14.37% |
A From September 12, 2016
B From September 15, 2016, date initially listed on the NYSE Arca, Inc. exchange
Visit www.fidelity.com for more recent performance information. |
The Fund's past performance is not a good predictor of the Fund's future performance. The graph and table do not reflect the deduction of taxes that a shareholder would pay on fund distributions or redemption of fund shares. |
Key Fund Statistics (as of July 31, 2024)
KEY FACTS | | |
| Fund Size | $1,028,550,951 | |
| Number of Holdings | 128 | |
| Total Advisory Fee | $1,048,929 | |
| Portfolio Turnover | 34% | |
What did the Fund invest in?
(as of July 31, 2024)
MARKET SECTORS (% of Fund's net assets) | | |
| Information Technology | 31.1 | |
| Financials | 13.1 | |
| Health Care | 12.0 | |
| Consumer Discretionary | 9.7 | |
| Industrials | 9.1 | |
| Communication Services | 8.5 | |
| Consumer Staples | 5.5 | |
| Energy | 3.9 | |
| Utilities | 2.4 | |
| Real Estate | 2.3 | |
| Materials | 2.3 | |
| |
| Common Stocks | 99.9 |
| Short-Term Investments and Net Other Assets (Liabilities) | 0.1 |
ASSET ALLOCATION (% of Fund's net assets) |
|
|
GEOGRAPHIC DIVERSIFICATION (% of Fund's net assets) |
|
| |
|
TOP HOLDINGS (% of Fund's net assets) | | |
| Apple Inc | 7.0 | |
| NVIDIA Corp | 6.8 | |
| Microsoft Corp | 6.7 | |
| Alphabet Inc Class A | 4.0 | |
| Meta Platforms Inc Class A | 2.3 | |
| Broadcom Inc | 2.2 | |
| Berkshire Hathaway Inc Class B | 2.2 | |
| Eli Lilly & Co | 2.1 | |
| Abbvie Inc | 1.5 | |
| Johnson & Johnson | 1.4 | |
| | 36.2 | |
| |
How has the Fund changed?
This is a summary of certain changes to the Fund since August 1, 2023. For more complete information, you may review the Fund's next prospectus, which we expect to be available by November 29, 2024 at fundresearch.fidelity.com/prospectus/sec or upon request at 1-800-FIDELITY or by sending an e-mail to fidfunddocuments@fidelity.com.
The fees associated with this class changed during the reporting year. The variations in class fees are primarily the result of the following changes: - •Management fee
- •Operating expenses
The fund's contractual management fee was reduced during the reporting period. |
| Fidelity, the Fidelity Investments Logo and all other Fidelity trademarks or service marks used herein are trademarks or service marks of FMR LLC. Any third-party marks that are used herein are trademarks or service marks of their respective owners. © 2024 FMR LLC. All rights reserved. |
| | For additional information about the Fund; including its prospectus, financial information, holdings and proxy information, scan the QR code or visit fundresearch.fidelity.com/prospectus/sec 1.9913543.100 2857-TSRA-0924 |
| |
| | ANNUAL SHAREHOLDER REPORT | AS OF JULY 31, 2024 | |
| | Fidelity® Real Estate Investment ETF Fidelity® Real Estate Investment ETF : FPRO Principal U.S. Listing Exchange :CboeBZX Cboe BZX Exchange, Inc. |
| | | |
This annual shareholder report contains information about Fidelity® Real Estate Investment ETF for the period August 1, 2023 to July 31, 2024. You can find additional information about the Fund at fundresearch.fidelity.com/prospectus/sec. You can also request this information by contacting us at 1-800-FIDELITY or by sending an e-mail to fidfunddocuments@fidelity.com.
What were your Fund costs for the last year?(based on hypothetical $10,000 investment)
FUND COST (PREVIOUS YEAR)
| | Costs of a $10,000 investment | Costs paid as a percentage of a $10,000 investment | |
| Fidelity® Real Estate Investment ETF | $ 62 | 0.59% | |
What affected the Fund's performance this period?
•U.S. equities gained for the 12 months ending July 31, 2024, driven by resilient corporate profits, a frenzy over generative artificial intelligence and the Federal Reserve's likely pivot to cutting interest rates later this year.
•Against this backdrop, industry positioning was the primary detractor from the fund's performance versus the MSCI US IMI Real Estate 25/50 Index for the fiscal year, especially a lack of exposure to regional malls. Stock picks in the infrastructure category also hampered the fund's result, as did investment choices and an overweight in apartments.
•The largest individual relative detractor was an outsized stake in SBA Communications (+2%). This period we decreased our position in the stock, making it one of the fund's largest holdings this period. Avoiding Simon Property Group, an index component that gained roughly 30%, proved detrimental to performance as well. A larger-than-index position in Mid-America Apartment Communities (-3%) also hurt.
•In contrast, the primary contributor to performance versus the real estate index was security selection in health care. Stock picking and an underweight in the diversified segment of the market also boosted the fund's relative performance. Favorable investment choices among freestanding real estate stocks helped as well.
•The top individual relative contributor was our timely positioning in Costar (-7%), followed by an overweight stake in Ventas (+17%). The latter was one of the fund's biggest holdings. Comparatively light exposure to Realty Income (-1%) was another plus.
•Notable changes in positioning include increased exposure to the self storage industry and a lower allocation to lodging resorts.
How did the Fund perform over the life of Fund?
CUMULATIVE PERFORMANCE
February 2, 2021 through July 31, 2024.
Initial investment of $10,000.
Fidelity® Real Estate Investment ETF | $10,000 | $12,517 | $12,307 | $11,086 |
MSCI US IMI Real Estate 25/50 Index | $10,000 | $12,325 | $11,803 | $10,663 |
S&P 500® Index | $10,000 | $11,570 | $11,033 | $12,469 |
| | 2021 | 2022 | 2023 | 2024 |
AVERAGE ANNUAL TOTAL RETURNS: | | 1 Year | Life of Fund |
Fidelity® Real Estate Investment ETF - NAV A | 10.20% | 5.90% |
Fidelity® Real Estate Investment ETF - Market Price B | 10.47% | 5.93% |
MSCI US IMI Real Estate 25/50 Index A | 10.73% | 4.87% |
S&P 500® Index A | 22.15% | 12.80% |
A From February 2, 2021
B From February 4, 2021, date initially listed on the Cboe BZX Exchange, Inc. exchange
Visit www.fidelity.com for more recent performance information. |
The Fund's past performance is not a good predictor of the Fund's future performance. The graph and table do not reflect the deduction of taxes that a shareholder would pay on fund distributions or redemption of fund shares. |
Key Fund Statistics (as of July 31, 2024)
KEY FACTS | | |
| Fund Size | $12,851,950 | |
| Number of Holdings | 41 | |
| Total Advisory Fee | $76,515 | |
| Portfolio Turnover | 45% | |
What did the Fund invest in?
(as of July 31, 2024)
TOP INDUSTRIES (% of Fund's net assets) |
| Specialized REITs | 38.4 | |
| Residential REITs | 17.1 | |
| Industrial REITs | 15.0 | |
| Retail REITs | 12.7 | |
| Health Care REITs | 8.2 | |
| Real Estate Management & Development | 6.1 | |
| Hotel & Resort REITs | 1.4 | |
| |
| Common Stocks | 98.9 |
| Short-Term Investments and Net Other Assets (Liabilities) | 1.1 |
ASSET ALLOCATION (% of Fund's net assets) |
|
|
GEOGRAPHIC DIVERSIFICATION (% of Fund's net assets) |
|
| |
|
TOP HOLDINGS (% of Fund's net assets) | | |
| Prologis Inc | 11.0 | |
| American Tower Corp | 9.1 | |
| Equinix Inc | 6.7 | |
| Ventas Inc | 5.6 | |
| Public Storage Operating Co | 5.4 | |
| CBRE Group Inc Class A | 4.0 | |
| Kimco Realty Corp | 4.0 | |
| NNN REIT Inc | 3.6 | |
| Digital Realty Trust Inc | 3.5 | |
| CubeSmart | 3.4 | |
| | 56.3 | |
| |
| Fidelity, the Fidelity Investments Logo and all other Fidelity trademarks or service marks used herein are trademarks or service marks of FMR LLC. Any third-party marks that are used herein are trademarks or service marks of their respective owners. © 2024 FMR LLC. All rights reserved. |
| | For additional information about the Fund; including its prospectus, financial information, holdings and proxy information, scan the QR code or visit fundresearch.fidelity.com/prospectus/sec 1.9913569.100 6341-TSRA-0924 |
| |
| | ANNUAL SHAREHOLDER REPORT | AS OF JULY 31, 2024 | This report describes changes to the Fund that occurred during the reporting period. |
| | Fidelity® Fundamental Large Cap Core ETF Fidelity® Fundamental Large Cap Core ETF : FFLC Principal U.S. Listing Exchange :CboeBZX Cboe BZX Exchange, Inc. |
| | | |
This annual shareholder report contains information about Fidelity® Fundamental Large Cap Core ETF for the period August 1, 2023 to July 31, 2024. You can find additional information about the Fund at fundresearch.fidelity.com/prospectus/sec. You can also request this information by contacting us at 1-800-FIDELITY or by sending an e-mail to fidfunddocuments@fidelity.com.
What were your Fund costs for the last year?(based on hypothetical $10,000 investment)
FUND COST (PREVIOUS YEAR)
| | Costs of a $10,000 investment | Costs paid as a percentage of a $10,000 investment | |
| Fidelity® Fundamental Large Cap Core ETF | $ 53 | 0.47% | |
What affected the Fund's performance this period?
- •U.S. equities gained for the 12 months ending July 31, 2024, driven by resilient corporate profits, a frenzy over generative artificial intelligence and the Federal Reserve's likely pivot to cutting interest rates later this year.
- •Against this backdrop, security selection was the primary contributor to the fund's performance versus the S&P 500® index for the fiscal year, especially within industrials. Stock selection and an underweight in consumer discretionary and picks and an overweight in utilities also boosted the fund's relative performance.
- •Not owning Tesla, a benchmark component that returned -13%, was the top individual relative contributor. The second-largest relative contributor was an overweight in Constellation Energy (+97%). This period we increased our position in the stock. Another notable relative contributor was an overweight in Eli Lilly (+78%), which was one of the fund's biggest holdings this period.
- •In contrast, stock picking and an underweight in financials notably detracted from the fund's performance versus the benchmark. An overweight in materials also hampered the fund's result, as did our stock picks in consumer staples, primarily within the household & personal products industry.
- •The biggest individual relative detractor was an overweight in Boeing (-20%). This period we increased our stake. The second-largest relative detractor was our stake in ON Semiconductor (-29%), a stock that was not held at period end. Another notable relative detractor was our holding in Broadcom (+24%). This was an investment we established this period. The company was one of our biggest holdings at period end.
- •Notable changes in positioning include decreased exposure to the materials sector and a higher allocation to financials.
How did the Fund perform over the life of Fund?
CUMULATIVE PERFORMANCE
June 2, 2020 through July 31, 2024.
Initial investment of $10,000.
Fidelity® Fundamental Large Cap Core ETF | $10,000 | $10,195 | $14,786 | $14,933 | $18,122 |
S&P 500® Index | $10,000 | $10,645 | $14,525 | $13,851 | $15,654 |
| | 2020 | 2021 | 2022 | 2023 | 2024 |
AVERAGE ANNUAL TOTAL RETURNS: | | 1 Year | Life of Fund |
Fidelity® Fundamental Large Cap Core ETF - NAV A | 27.19% | 22.20% |
Fidelity® Fundamental Large Cap Core ETF - Market Price B | 27.46% | 21.42% |
S&P 500® Index A | 22.15% | 16.84% |
A From June 2, 2020
B From June 4, 2020, date initially listed on the Cboe BZX Exchange, Inc. exchange
Visit www.fidelity.com for more recent performance information. |
The Fund's past performance is not a good predictor of the Fund's future performance. The graph and table do not reflect the deduction of taxes that a shareholder would pay on fund distributions or redemption of fund shares. |
Key Fund Statistics (as of July 31, 2024)
KEY FACTS | | |
| Fund Size | $386,344,630 | |
| Number of Holdings | 103 | |
| Total Advisory Fee | $982,378 | |
| Portfolio Turnover | 63% | |
What did the Fund invest in?
(as of July 31, 2024)
MARKET SECTORS (% of Fund's net assets) | | |
| Information Technology | 29.3 | |
| Health Care | 12.6 | |
| Financials | 12.5 | |
| Industrials | 11.7 | |
| Communication Services | 9.9 | |
| Consumer Discretionary | 7.3 | |
| Energy | 5.5 | |
| Consumer Staples | 4.4 | |
| Utilities | 3.9 | |
| Materials | 1.2 | |
| Real Estate | 1.1 | |
| |
| Common Stocks | 99.4 |
| Short-Term Investments and Net Other Assets (Liabilities) | 0.6 |
ASSET ALLOCATION (% of Fund's net assets) |
|
|
| United States | 94.7 |
| Netherlands | 1.2 |
| Germany | 1.1 |
| Taiwan | 1.0 |
| United Kingdom | 0.4 |
| Canada | 0.4 |
| Denmark | 0.3 |
| Zambia | 0.3 |
| China | 0.3 |
| Others | 0.3 |
GEOGRAPHIC DIVERSIFICATION (% of Fund's net assets) |
|
| |
|
TOP HOLDINGS (% of Fund's net assets) | | |
| Microsoft Corp | 7.6 | |
| NVIDIA Corp | 6.2 | |
| Meta Platforms Inc Class A | 4.3 | |
| Apple Inc | 4.0 | |
| Alphabet Inc Class A | 3.6 | |
| Exxon Mobil Corp | 3.2 | |
| Amazon.com Inc | 3.0 | |
| Bank of America Corp | 2.5 | |
| Wells Fargo & Co | 2.0 | |
| Broadcom Inc | 2.0 | |
| | 38.4 | |
| |
How has the Fund changed?
This is a summary of certain changes to the Fund since August 1, 2023. For more complete information, you may review the Fund's next prospectus, which we expect to be available by November 29, 2024 at fundresearch.fidelity.com/prospectus/sec or upon request at 1-800-FIDELITY or by sending an e-mail to fidfunddocuments@fidelity.com.
The fees associated with this class changed during the reporting year. The variations in class fees are primarily the result of the following changes: - •Management fee
- •Operating expenses
The fund's contractual management fee was reduced during the reporting period. | Effective February 26, 2024, the fund has operated in reliance on Rule 6c-11 rather than pursuant to an exemptive order from the Securities and Exchange Commission. The fund changed its classification from non-diversified to diversified and modified its principal investment strategies and risks to reflect the change during the reporting period. |
The fund's name changed from Fidelity New Millennium ETF to Fidelity Fundamental Large Cap Core ETF during the reporting period. | The fund modified its principal investment strategies to include adopting a policy of investing at least 80% of assets in equity securities of companies with large market capitalizations. |
The fund modified its investment process and principal investment risks pursuant to the change in its principal investment strategies. | |
| Fidelity, the Fidelity Investments Logo and all other Fidelity trademarks or service marks used herein are trademarks or service marks of FMR LLC. Any third-party marks that are used herein are trademarks or service marks of their respective owners. © 2024 FMR LLC. All rights reserved. |
| | For additional information about the Fund; including its prospectus, financial information, holdings and proxy information, scan the QR code or visit fundresearch.fidelity.com/prospectus/sec 1.9913564.100 6079-TSRA-0924 |
| |
| | ANNUAL SHAREHOLDER REPORT | AS OF JULY 31, 2024 | This report describes changes to the Fund that occurred during the reporting period. |
| | Fidelity® Sustainable U.S. Equity ETF Fidelity® Sustainable U.S. Equity ETF : FSST Principal U.S. Listing Exchange :NYSEArca NYSE Arca, Inc. |
| | | |
This annual shareholder report contains information about Fidelity® Sustainable U.S. Equity ETF for the period August 1, 2023 to July 31, 2024. You can find additional information about the Fund at fundresearch.fidelity.com/prospectus/sec. You can also request this information by contacting us at 1-800-FIDELITY or by sending an e-mail to fidfunddocuments@fidelity.com.
What were your Fund costs for the last year?(based on hypothetical $10,000 investment)
FUND COST (PREVIOUS YEAR)
| | Costs of a $10,000 investment | Costs paid as a percentage of a $10,000 investment | |
| Fidelity® Sustainable U.S. Equity ETF | $ 66 | 0.59% | |
What affected the Fund's performance this period?
•U.S. equities gained for the 12 months ending July 31, 2024, driven by resilient corporate profits, a frenzy over generative artificial intelligence and the Federal Reserve's likely pivot to cutting interest rates later this year.
•Against this backdrop, security selection was the primary contributor to the fund's performance versus the benchmark for the fiscal year, led by information technology. Security selection in consumer discretionary and health care also boosted the fund's relative performance.
•The top individual relative contributor was our stake in Nvidia (+153%). The stock was one of our biggest holdings. The second-largest relative contributor was an overweight in Sprouts Farmers Market (+145%). An underweight in Tesla (-13%) also helped.
•In contrast, security selection in communication services, primarily within the media & entertainment industry, detracted.
•The biggest individual relative detractor was an overweight in ON Semiconductor (-27%). This period we increased our position in ON Semiconductor. The second-largest relative detractor this period was avoiding Broadcom, a benchmark component that gained 82%.
•Notable changes in positioning include decreased exposure to the consumer staples sector and a higher allocation to communication services.
•Application of FMR's environmental, social, and governance (ESG) ratings process and/or its sustainable investing exclusion criteria may affect the Fund's exposure to certain issuers, sectors, regions, and countries and may affect the Fund's performance.
How did the Fund perform over the life of Fund?
CUMULATIVE PERFORMANCE
June 15, 2021 through July 31, 2024.
Initial investment of $10,000.
Fidelity® Sustainable U.S. Equity ETF | $10,000 | $10,399 | $9,670 | $11,048 |
MSCI USA IMI ESG Leaders Index | $10,000 | $10,375 | $9,716 | $10,983 |
Russell 3000® Index | $10,000 | $10,297 | $9,540 | $10,746 |
| | 2021 | 2022 | 2023 | 2024 |
AVERAGE ANNUAL TOTAL RETURNS: | | 1 Year | Life of Fund |
Fidelity® Sustainable U.S. Equity ETF - NAV A | 21.14% | 9.76% |
Fidelity® Sustainable U.S. Equity ETF - Market Price B | 21.39% | 9.99% |
MSCI USA IMI ESG Leaders Index A | 22.55% | 9.96% |
Russell 3000® Index A | 21.07% | 8.78% |
A From June 15, 2021
B From June 17, 2021, date initially listed on the NYSE Arca, Inc. exchange
Visit www.fidelity.com for more recent performance information. |
The Fund's past performance is not a good predictor of the Fund's future performance. The graph and table do not reflect the deduction of taxes that a shareholder would pay on fund distributions or redemption of fund shares. |
Key Fund Statistics (as of July 31, 2024)
KEY FACTS | | |
| Fund Size | $14,374,224 | |
| Number of Holdings | 69 | |
| Total Advisory Fee | $69,263 | |
| Portfolio Turnover | 52% | |
What did the Fund invest in?
(as of July 31, 2024)
MARKET SECTORS (% of Fund's net assets) | | |
| Information Technology | 27.5 | |
| Health Care | 12.7 | |
| Financials | 11.3 | |
| Industrials | 10.6 | |
| Consumer Discretionary | 10.3 | |
| Communication Services | 8.2 | |
| Materials | 4.3 | |
| Consumer Staples | 3.2 | |
| Energy | 2.8 | |
| Utilities | 1.9 | |
| Real Estate | 1.5 | |
| |
| Common Stocks | 94.3 |
| Short-Term Investments and Net Other Assets (Liabilities) | 5.7 |
ASSET ALLOCATION (% of Fund's net assets) |
|
|
| United States | 97.6 |
| Ireland | 1.9 |
| China | 0.5 |
GEOGRAPHIC DIVERSIFICATION (% of Fund's net assets) |
|
| |
|
TOP HOLDINGS (% of Fund's net assets) | | |
| Apple Inc | 6.9 | |
| Microsoft Corp | 6.0 | |
| NVIDIA Corp | 5.1 | |
| Amazon.com Inc | 4.2 | |
| Alphabet Inc Class A | 3.5 | |
| Procter & Gamble Co/The | 2.7 | |
| Cigna Group/The | 2.6 | |
| Moody's Corp | 2.5 | |
| Merck & Co Inc | 2.5 | |
| Walt Disney Co/The | 2.2 | |
| | 38.2 | |
| |
How has the Fund changed?
This is a summary of certain changes to the Fund since August 1, 2023. For more complete information, you may review the Fund's next prospectus, which we expect to be available by November 29, 2024 at fundresearch.fidelity.com/prospectus/sec or upon request at 1-800-FIDELITY or by sending an e-mail to fidfunddocuments@fidelity.com.
The fund changed its classification form non-diversified to diversified and modified its principal investment strategies and risks to reflect the change during the reporting period. | |
| Fidelity, the Fidelity Investments Logo and all other Fidelity trademarks or service marks used herein are trademarks or service marks of FMR LLC. Any third-party marks that are used herein are trademarks or service marks of their respective owners. © 2024 FMR LLC. All rights reserved. |
| | For additional information about the Fund; including its prospectus, financial information, holdings and proxy information, scan the QR code or visit fundresearch.fidelity.com/prospectus/sec 1.9913571.100 6415-TSRA-0924 |
| |
| | ANNUAL SHAREHOLDER REPORT | AS OF JULY 31, 2024 | This report describes changes to the Fund that occurred during the reporting period. |
| | Fidelity® Stocks for Inflation ETF Fidelity® Stocks for Inflation ETF : FCPI Principal U.S. Listing Exchange :CboeBZX Cboe BZX Exchange, Inc. |
| | | |
This annual shareholder report contains information about Fidelity® Stocks for Inflation ETF for the period August 1, 2023 to July 31, 2024. You can find additional information about the Fund at fundresearch.fidelity.com/prospectus/sec. You can also request this information by contacting us at 1-800-FIDELITY or by sending an e-mail to fidfunddocuments@fidelity.com.
What were your Fund costs for the last year?(based on hypothetical $10,000 investment)
FUND COST (PREVIOUS YEAR)
| | Costs of a $10,000 investment | Costs paid as a percentage of a $10,000 investment | |
| Fidelity® Stocks for Inflation ETF | $ 22 | 0.19% | |
What affected the Fund's performance this period?
- •U.S. equities gained for the 12 months ending July 31, 2024, driven by resilient corporate profits, a frenzy over generative artificial intelligence and the Federal Reserve's likely pivot to cutting interest rates later this year.
- •Against this backdrop, information technology - the ETF's largest sector weighting - gained 31% and contributed most to the fund's performance for the fiscal year. Health care, which gained 27%, also helped, benefiting from the pharmaceuticals, biotechnology & life sciences industry (+29%), as did consumer discretionary, which advanced 45%. The financials sector rose approximately 27%, while utilities gained about 38% and energy advanced 21%. Other contributors included the consumer staples (+12%), industrials (+35%), real estate (+20%), communication services (+30%) and materials (+1%) sectors.
- •Turning to individual stocks, the top contributor was Nvidia (+171%), from the semiconductors & semiconductor equipment group. From the same category, Broadcom gained roughly 97%. Vistra (+75%), from the utilities sector, also contributed. In pharmaceuticals, biotechnology & life sciences, Eli Lilly (+79%) helped, as did Microsoft (+26%), from the software & services industry.
- •Conversely, the biggest detractor was Alpha Metallurgical Resources (-21%), from the materials sector. Pfizer (-21%) and Bristol-Myers Squibb (-18%), within the pharmaceuticals, biotechnology & life sciences category, also hindered the fund. Molina Healthcare (-15%), from the health care equipment & services industry, further hurt the fund, as did BellRing Brands, in household & personal products.
How did the Fund perform over the life of Fund?
CUMULATIVE PERFORMANCE
November 5, 2019 through July 31, 2024.
Initial investment of $10,000.
Fidelity® Stocks for Inflation ETF | $10,000 | $9,812 | $12,930 | $13,580 | $14,635 | $18,380 |
Fidelity Stocks for Inflation Factor Index℠ | $10,000 | $9,844 | $13,016 | $13,712 | $14,821 | $18,629 |
Russell 1000® Index | $10,000 | $10,850 | $14,969 | $13,941 | $15,746 | $19,132 |
| | 2019 | 2020 | 2021 | 2022 | 2023 | 2024 |
AVERAGE ANNUAL TOTAL RETURNS: | | 1 Year | Life of Fund |
Fidelity® Stocks for Inflation ETF - NAV A | 25.59% | 13.70% |
Fidelity® Stocks for Inflation ETF - Market Price B | 25.56% | 13.64% |
Fidelity Stocks for Inflation Factor Index℠ A | 25.69% | 14.03% |
Russell 1000® Index A | 21.50% | 14.67% |
A From November 5, 2019
B From November 7, 2019, date initially listed on the Cboe BZX Exchange, Inc. exchange
Visit www.fidelity.com for more recent performance information. |
The Fund's past performance is not a good predictor of the Fund's future performance. The graph and table do not reflect the deduction of taxes that a shareholder would pay on fund distributions or redemption of fund shares. |
Key Fund Statistics (as of July 31, 2024)
KEY FACTS | | |
| Fund Size | $180,247,155 | |
| Number of Holdings | 102 | |
| Total Advisory Fee | $263,531 | |
| Portfolio Turnover | 76% | |
What did the Fund invest in?
(as of July 31, 2024)
MARKET SECTORS (% of Fund's net assets) | | |
| Information Technology | 25.0 | |
| Health Care | 17.2 | |
| Consumer Staples | 10.4 | |
| Financials | 8.4 | |
| Energy | 8.3 | |
| Consumer Discretionary | 5.9 | |
| Materials | 5.7 | |
| Utilities | 5.6 | |
| Real Estate | 5.5 | |
| Industrials | 4.4 | |
| Communication Services | 3.4 | |
| |
| Common Stocks | 99.8 |
| Short-Term Investments and Net Other Assets (Liabilities) | 0.2 |
ASSET ALLOCATION (% of Fund's net assets) |
|
|
| United States | 99.6 |
| Ireland | 0.4 |
GEOGRAPHIC DIVERSIFICATION (% of Fund's net assets) |
|
| |
|
TOP HOLDINGS (% of Fund's net assets) | | |
| Apple Inc | 5.4 | |
| Microsoft Corp | 5.2 | |
| NVIDIA Corp | 5.0 | |
| Vistra Corp | 3.4 | |
| Eli Lilly & Co | 2.5 | |
| National Fuel Gas Co | 2.2 | |
| Cheniere Energy Inc | 2.2 | |
| CF Industries Holdings Inc | 2.2 | |
| Procter & Gamble Co/The | 2.1 | |
| Chord Energy Corp | 2.1 | |
| | 32.3 | |
| |
How has the Fund changed?
This is a summary of certain changes to the Fund since August 1, 2023. For more complete information, you may review the Fund's next prospectus, which we expect to be available by November 29, 2024 at fundresearch.fidelity.com/prospectus/sec or upon request at 1-800-FIDELITY or by sending an e-mail to fidfunddocuments@fidelity.com.
The fees associated with this class changed during the reporting year. The variations in class fees are primarily the result of the following changes: - •Management fee
- •Operating expenses
The fund's contractual management fee was reduced during the reporting period. |
| Fidelity, the Fidelity Investments Logo and all other Fidelity trademarks or service marks used herein are trademarks or service marks of FMR LLC. Any third-party marks that are used herein are trademarks or service marks of their respective owners. © 2024 FMR LLC. All rights reserved. |
| | For additional information about the Fund; including its prospectus, financial information, holdings and proxy information, scan the QR code or visit fundresearch.fidelity.com/prospectus/sec 1.9913562.100 5027-TSRA-0924 |
| |
| | ANNUAL SHAREHOLDER REPORT | AS OF JULY 31, 2024 | |
| | Fidelity® Magellan℠ ETF Fidelity® Magellan℠ ETF : FMAG Principal U.S. Listing Exchange :CboeBZX Cboe BZX Exchange, Inc. |
| | | |
This annual shareholder report contains information about Fidelity® Magellan℠ ETF for the period August 1, 2023 to July 31, 2024. You can find additional information about the Fund at fundresearch.fidelity.com/prospectus/sec. You can also request this information by contacting us at 1-800-FIDELITY or by sending an e-mail to fidfunddocuments@fidelity.com.
What were your Fund costs for the last year?(based on hypothetical $10,000 investment)
FUND COST (PREVIOUS YEAR)
| | Costs of a $10,000 investment | Costs paid as a percentage of a $10,000 investment | |
| Fidelity® Magellan℠ ETF | $ 69 | 0.59% | |
What affected the Fund's performance this period?
•U.S. equities gained for the 12 months ending July 31, 2024, driven by resilient corporate profits, a frenzy over generative artificial intelligence and the Federal Reserve's likely pivot to cutting interest rates later this year.
•Against this backdrop, security selection was the primary contributor to the fund's performance versus the S&P 500® index for the fiscal year, led by the information technology sector. Picks among industrials stocks, primarily within the capital goods industry, also helped. Investment choices in health care further boosted the fund's relative performance.
•The top individual relative contributor was an overweight in Nvidia (+151%). The company was one of our largest holdings. Not owning Tesla, a benchmark component that returned -13%, was another plus. Outsized exposure to Eli Lilly (+79%) also helped. The stock was one of the fund's biggest holdings.
•In contrast, the biggest detractor from performance versus the benchmark was a sizable overweight in industrials. Larger-than-benchmark exposure to materials and consumer discretionary also hurt, especially within the consumer services industry.
•The largest individual relative detractor was an overweight in ON Semiconductor (-28%), though the stock was not held at period end. Untimely positioning in Zoetis (-17%) and Uber Technologies (-20%) also proved detrimental to performance.
•Notable changes in positioning include increased exposure to the communication services and consumer discretionary sectors.
How did the Fund perform over the life of Fund?
CUMULATIVE PERFORMANCE
February 2, 2021 through July 31, 2024.
Initial investment of $10,000.
Fidelity® Magellan℠ ETF | $10,000 | $11,565 | $10,466 | $11,221 |
S&P 500® Index | $10,000 | $11,570 | $11,033 | $12,469 |
| | 2021 | 2022 | 2023 | 2024 |
AVERAGE ANNUAL TOTAL RETURNS: | | 1 Year | Life of Fund |
Fidelity® Magellan℠ ETF - NAV A | 32.40% | 12.00% |
Fidelity® Magellan℠ ETF - Market Price B | 32.45% | 11.70% |
S&P 500® Index A | 22.15% | 12.80% |
A From February 2, 2021
B From February 4, 2021, date initially listed on the Cboe BZX Exchange, Inc. exchange
Visit www.fidelity.com for more recent performance information. |
The Fund's past performance is not a good predictor of the Fund's future performance. The graph and table do not reflect the deduction of taxes that a shareholder would pay on fund distributions or redemption of fund shares. |
Key Fund Statistics (as of July 31, 2024)
KEY FACTS | | |
| Fund Size | $115,822,790 | |
| Number of Holdings | 57 | |
| Total Advisory Fee | $426,548 | |
| Portfolio Turnover | 62% | |
What did the Fund invest in?
(as of July 31, 2024)
MARKET SECTORS (% of Fund's net assets) | | |
| Information Technology | 35.8 | |
| Industrials | 15.9 | |
| Financials | 10.9 | |
| Health Care | 9.9 | |
| Consumer Discretionary | 9.6 | |
| Communication Services | 8.4 | |
| Materials | 5.3 | |
| Consumer Staples | 1.8 | |
| Utilities | 1.2 | |
| |
| Common Stocks | 98.8 |
| Short-Term Investments and Net Other Assets (Liabilities) | 1.2 |
ASSET ALLOCATION (% of Fund's net assets) |
|
|
| United States | 96.8 |
| Canada | 1.2 |
| Netherlands | 1.0 |
| Denmark | 1.0 |
GEOGRAPHIC DIVERSIFICATION (% of Fund's net assets) |
|
| |
|
TOP HOLDINGS (% of Fund's net assets) | | |
| Microsoft Corp | 7.9 | |
| NVIDIA Corp | 7.3 | |
| Amazon.com Inc | 4.8 | |
| Meta Platforms Inc Class A | 3.4 | |
| Alphabet Inc Class A | 3.4 | |
| Broadcom Inc | 2.8 | |
| Eli Lilly & Co | 2.4 | |
| UnitedHealth Group Inc | 2.4 | |
| Visa Inc Class A | 2.1 | |
| Mastercard Inc Class A | 2.0 | |
| | 38.5 | |
| |
| Fidelity, the Fidelity Investments Logo and all other Fidelity trademarks or service marks used herein are trademarks or service marks of FMR LLC. Any third-party marks that are used herein are trademarks or service marks of their respective owners. © 2024 FMR LLC. All rights reserved. |
| | For additional information about the Fund; including its prospectus, financial information, holdings and proxy information, scan the QR code or visit fundresearch.fidelity.com/prospectus/sec 1.9913568.100 6340-TSRA-0924 |
| |
| | ANNUAL SHAREHOLDER REPORT | AS OF JULY 31, 2024 | This report describes changes to the Fund that occurred during the reporting period. |
| | Fidelity® Fundamental Small-Mid Cap ETF Fidelity® Fundamental Small-Mid Cap ETF : FFSM Principal U.S. Listing Exchange :CboeBZX Cboe BZX Exchange, Inc. |
| | | |
This annual shareholder report contains information about Fidelity® Fundamental Small-Mid Cap ETF for the period August 1, 2023 to July 31, 2024. You can find additional information about the Fund at fundresearch.fidelity.com/prospectus/sec. You can also request this information by contacting us at 1-800-FIDELITY or by sending an e-mail to fidfunddocuments@fidelity.com.
What were your Fund costs for the last year?(based on hypothetical $10,000 investment)
FUND COST (PREVIOUS YEAR)
| | Costs of a $10,000 investment | Costs paid as a percentage of a $10,000 investment | |
| Fidelity® Fundamental Small-Mid Cap ETF | $ 56 | 0.51% | |
What affected the Fund's performance this period?
•U.S. equities gained for the 12 months ending July 31, 2024, driven by resilient corporate profits, a frenzy over generative artificial intelligence and the Federal Reserve's likely pivot to cutting interest rates later this year.
•Against this backdrop, security selection was the primary contributor to the fund's performance versus the Russell 2500 Index for the fiscal year, especially within the industrials sector, capital goods firms in particular. Stock picking in consumer discretionary and energy also boosted the fund's relative performance.
•The top individual relative contributor was an overweight in TechnipFMC (+63%), the fund's largest position. Outsized exposure to Vertiv Holdings (+205%) and EMCOR Groups (+75%) helped as well. This period we increased our stake in the latter, making it one of the portfolio's biggest holdings.
•In contrast, the biggest detractors from performance versus the benchmark were subpar picks and an underweight in utilities. Investment choices in materials and information technology, primarily within the software & services industry, also hurt.
•On a stock-specific basis, a non-benchmark stake in ON Semiconductor (-27%) was the biggest relative detractor. An overweight in O-I Glass (-48%), where we decreased our position this period, also was detrimental to performance. A comparatively large holding in Chemours (-32%) was another negative.
•Notable changes in positioning include a lower allocation to information technology stocks.
How did the Fund perform over the life of Fund?
CUMULATIVE PERFORMANCE
February 2, 2021 through July 31, 2024.
Initial investment of $10,000.
Fidelity® Fundamental Small-Mid Cap ETF | $10,000 | $11,436 | $10,534 | $11,484 |
Russell 2500™ Index | $10,000 | $10,827 | $9,607 | $10,380 |
Russell 3000® Index | $10,000 | $11,395 | $10,557 | $11,893 |
| | 2021 | 2022 | 2023 | 2024 |
AVERAGE ANNUAL TOTAL RETURNS: | | 1 Year | Life of Fund |
Fidelity® Fundamental Small-Mid Cap ETF - NAV A | 19.70% | 9.54% |
Fidelity® Fundamental Small-Mid Cap ETF - Market Price B | 20.03% | 8.92% |
Russell 2500™ Index A | 13.06% | 4.69% |
Russell 3000® Index A | 21.07% | 11.00% |
A From February 2, 2021
B From February 4, 2021, date initially listed on the Cboe BZX Exchange, Inc. exchange
Visit www.fidelity.com for more recent performance information. |
The Fund's past performance is not a good predictor of the Fund's future performance. The graph and table do not reflect the deduction of taxes that a shareholder would pay on fund distributions or redemption of fund shares. |
Key Fund Statistics (as of July 31, 2024)
KEY FACTS | | |
| Fund Size | $75,562,094 | |
| Number of Holdings | 177 | |
| Total Advisory Fee | $248,027 | |
| Portfolio Turnover | 38% | |
What did the Fund invest in?
(as of July 31, 2024)
MARKET SECTORS (% of Fund's net assets) | | |
| Industrials | 22.5 | |
| Financials | 16.3 | |
| Consumer Discretionary | 13.7 | |
| Information Technology | 11.4 | |
| Health Care | 10.6 | |
| Energy | 6.8 | |
| Materials | 6.7 | |
| Consumer Staples | 4.3 | |
| Real Estate | 4.0 | |
| Utilities | 1.8 | |
| Communication Services | 0.9 | |
| |
| Common Stocks | 99.0 |
| Short-Term Investments and Net Other Assets (Liabilities) | 1.0 |
ASSET ALLOCATION (% of Fund's net assets) |
|
|
| United States | 91.8 |
| Canada | 3.1 |
| United Kingdom | 2.3 |
| Thailand | 1.1 |
| Israel | 0.6 |
| Netherlands | 0.5 |
| Puerto Rico | 0.4 |
| Japan | 0.2 |
GEOGRAPHIC DIVERSIFICATION (% of Fund's net assets) |
|
| |
|
TOP HOLDINGS (% of Fund's net assets) | | |
| TechnipFMC PLC | 1.7 | |
| EMCOR Group Inc | 1.6 | |
| Tempur Sealy International Inc | 1.5 | |
| AutoZone Inc | 1.4 | |
| Murphy USA Inc | 1.4 | |
| Universal Health Services Inc Class B | 1.4 | |
| BJ's Wholesale Club Holdings Inc | 1.4 | |
| Antero Resources Corp | 1.3 | |
| Arch Capital Group Ltd | 1.2 | |
| TFI International Inc (United States) | 1.2 | |
| | 14.1 | |
| |
How has the Fund changed?
This is a summary of certain changes to the Fund since August 1, 2023. For more complete information, you may review the Fund's next prospectus, which we expect to be available by November 29, 2024 at fundresearch.fidelity.com/prospectus/sec or upon request at 1-800-FIDELITY or by sending an e-mail to fidfunddocuments@fidelity.com.
The fund changed its classification form non-diversified to diversified and modified its principal investment strategies and risks to reflect the change during the reporting period. | The fund changed its name from Fidelity Small-Mid Cap Opportunities ETF to Fidelity Fundamental Small-Mid Cap ETF. |
The fees associated with this class changed during the reporting year. The variations in class fees are primarily the result of the following changes: - •Management fee
- •Operating expenses
- •Expense reductions
The fund's contractual management fee was reduced during the reporting period. |
| Fidelity, the Fidelity Investments Logo and all other Fidelity trademarks or service marks used herein are trademarks or service marks of FMR LLC. Any third-party marks that are used herein are trademarks or service marks of their respective owners. © 2024 FMR LLC. All rights reserved. |
| | For additional information about the Fund; including its prospectus, financial information, holdings and proxy information, scan the QR code or visit fundresearch.fidelity.com/prospectus/sec 1.9913570.100 6342-TSRA-0924 |
| |
| | ANNUAL SHAREHOLDER REPORT | AS OF JULY 31, 2024 | |
| | Fidelity® Blue Chip Growth ETF Fidelity® Blue Chip Growth ETF : FBCG Principal U.S. Listing Exchange :CboeBZX Cboe BZX Exchange, Inc. |
| | | |
This annual shareholder report contains information about Fidelity® Blue Chip Growth ETF for the period August 1, 2023 to July 31, 2024. You can find additional information about the Fund at fundresearch.fidelity.com/prospectus/sec. You can also request this information by contacting us at 1-800-FIDELITY or by sending an e-mail to fidfunddocuments@fidelity.com.
What were your Fund costs for the last year?(based on hypothetical $10,000 investment)
FUND COST (PREVIOUS YEAR)
| | Costs of a $10,000 investment | Costs paid as a percentage of a $10,000 investment | |
| Fidelity® Blue Chip Growth ETF | $ 69 | 0.59% | |
What affected the Fund's performance this period?
•U.S. equities gained for the 12 months ending July 31, 2024, driven by resilient corporate profits, a frenzy over generative artificial intelligence and the Federal Reserve's likely pivot to cutting interest rates later this year.
•Against this backdrop, security selection was the primary contributor to the fund's performance versus the benchmark for the fiscal year, led by information technology. Security selection and an underweight in industrials and picks and an overweight in communication services, primarily within the media & entertainment industry, also boosted the fund's relative performance.
•The top individual relative contributor by far was an overweight in Nvidia (+151%), the fund's biggest holding. A non-benchmark stake in Abercrombie & Fitch (+268%) and an overweight in Amazon.com (+40%), two positions we increased this period, also helped. Amazon.com was among the fund's biggest holdings.
•In contrast, the biggest detractor from relative performance was an overweight in consumer discretionary, primarily within the consumer durables & apparel industry. Security selection in consumer staples, especially within the consumer staples distribution & retail industry, also hampered the fund's result, as did an underweight in information technology. The fund's position in cash also weighed on relative performance.
•The biggest individual relative detractor was an underweight in Broadcom (+82%), a position we established this period. A non-benchmark stake in ON Semiconductor (-28%) and an overweight in Marvell Technology (+3%) also detracted. This period we increased our investment in ON Semiconductor and Marvell was one of our biggest holdings.
How did the Fund perform over the life of Fund?
CUMULATIVE PERFORMANCE
June 2, 2020 through July 31, 2024.
Initial investment of $10,000.
Fidelity® Blue Chip Growth ETF | $10,000 | $11,368 | $16,387 | $12,467 | $15,639 |
Russell 1000® Growth Index | $10,000 | $11,108 | $15,182 | $13,371 | $15,685 |
Russell 1000® Index | $10,000 | $10,678 | $14,731 | $13,719 | $15,496 |
| | 2020 | 2021 | 2022 | 2023 | 2024 |
AVERAGE ANNUAL TOTAL RETURNS: | | 1 Year | Life of Fund |
Fidelity® Blue Chip Growth ETF - NAV A | 31.18% | 18.83% |
Fidelity® Blue Chip Growth ETF - Market Price B | 31.23% | 18.93% |
Russell 1000® Growth Index A | 26.94% | 17.98% |
Russell 1000® Index A | 21.50% | 16.41% |
A From June 2, 2020
B From June 4, 2020, date initially listed on the Cboe BZX Exchange, Inc. exchange
Visit www.fidelity.com for more recent performance information. |
The Fund's past performance is not a good predictor of the Fund's future performance. The graph and table do not reflect the deduction of taxes that a shareholder would pay on fund distributions or redemption of fund shares. |
Key Fund Statistics (as of July 31, 2024)
KEY FACTS | | |
| Fund Size | $1,975,020,161 | |
| Number of Holdings | 225 | |
| Total Advisory Fee | $7,203,240 | |
| Portfolio Turnover | 42% | |
What did the Fund invest in?
(as of July 31, 2024)
MARKET SECTORS (% of Fund's net assets) | | |
| Information Technology | 44.3 | |
| Consumer Discretionary | 19.9 | |
| Communication Services | 16.0 | |
| Health Care | 8.6 | |
| Industrials | 3.9 | |
| Financials | 3.9 | |
| Consumer Staples | 1.3 | |
| Energy | 1.1 | |
| Materials | 0.7 | |
| Real Estate | 0.2 | |
| |
| Common Stocks | 99.9 |
| Short-Term Investments and Net Other Assets (Liabilities) | 0.1 |
ASSET ALLOCATION (% of Fund's net assets) |
|
|
| United States | 95.6 |
| China | 1.6 |
| Taiwan | 0.8 |
| Denmark | 0.6 |
| Canada | 0.5 |
| Netherlands | 0.3 |
| Singapore | 0.1 |
| Israel | 0.1 |
| United Kingdom | 0.1 |
| Others | 0.3 |
GEOGRAPHIC DIVERSIFICATION (% of Fund's net assets) |
|
| |
|
TOP HOLDINGS (% of Fund's net assets) | | |
| NVIDIA Corp | 13.7 | |
| Apple Inc | 10.9 | |
| Microsoft Corp | 9.1 | |
| Amazon.com Inc | 9.0 | |
| Alphabet Inc Class A | 6.8 | |
| Meta Platforms Inc Class A | 4.9 | |
| Eli Lilly & Co | 3.0 | |
| Netflix Inc | 2.4 | |
| Snap Inc Class A | 1.4 | |
| NXP Semiconductors NV | 1.3 | |
| | 62.5 | |
| |
| Fidelity, the Fidelity Investments Logo and all other Fidelity trademarks or service marks used herein are trademarks or service marks of FMR LLC. Any third-party marks that are used herein are trademarks or service marks of their respective owners. © 2024 FMR LLC. All rights reserved. |
| | For additional information about the Fund; including its prospectus, financial information, holdings and proxy information, scan the QR code or visit fundresearch.fidelity.com/prospectus/sec 1.9913565.100 6157-TSRA-0924 |
| |
| | ANNUAL SHAREHOLDER REPORT | AS OF JULY 31, 2024 | This report describes changes to the Fund that occurred during the reporting period. |
| | Fidelity® U.S. Multifactor ETF Fidelity® U.S. Multifactor ETF : FLRG Principal U.S. Listing Exchange :NYSEArca NYSE Arca, Inc. |
| | | |
This annual shareholder report contains information about Fidelity® U.S. Multifactor ETF for the period August 1, 2023 to July 31, 2024. You can find additional information about the Fund at fundresearch.fidelity.com/prospectus/sec. You can also request this information by contacting us at 1-800-FIDELITY or by sending an e-mail to fidfunddocuments@fidelity.com.
What were your Fund costs for the last year?(based on hypothetical $10,000 investment)
FUND COST (PREVIOUS YEAR)
| | Costs of a $10,000 investment | Costs paid as a percentage of a $10,000 investment | |
| Fidelity® U.S. Multifactor ETF | $ 20 | 0.18% | |
What affected the Fund's performance this period?
- •U.S. equities gained for the 12 months ending July 31, 2024, driven by resilient corporate profits, a frenzy over generative artificial intelligence and the Federal Reserve's likely pivot to cutting interest rates later this year.
- •Against this backdrop, information technology - the ETF's largest sector weighting - gained 27% and contributed most to the fund's performance for the fiscal year. Financials, which gained 30%, also helped, as did consumer discretionary, which advanced about 27%. The health care sector rose approximately 20%, boosted by the pharmaceuticals, biotechnology & life sciences industry (+24%), while communication services gained 31% and industrials advanced 19%. Other contributors included the utilities (+38%), consumer staples (+11%), energy (+14%) and real estate (+8%) sectors.
- •In contrast, materials returned about -2% and detracted.
- •Turning to individual stocks, the top contributor was Nvidia (+61%), from the semiconductors & semiconductor equipment group. From the same category, Broadcom gained 97%. Microsoft (+25%), from the software & services industry, also boosted the fund. In media & entertainment, Meta Platforms gained 68%. Lastly, in pharmaceuticals, biotechnology & life sciences, Eli Lilly (+79%) also helped.
- •Conversely, the biggest detractor was Pfizer (-21%), from the pharmaceuticals, biotechnology & life sciences industry. From the same category, Bristol-Myers Squibb returned -18%, and Louisiana Pacific (-22%), from the materials sector, also detracted. Hershey, within the food, beverage & tobacco group, returned -16%. Lastly, Molina Healthcare (-12%), from the health care equipment & services industry, also hindered the fund.
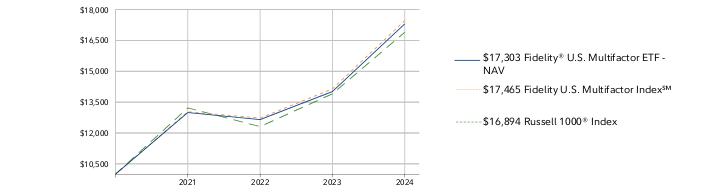
How did the Fund perform over the life of Fund?
CUMULATIVE PERFORMANCE
September 15, 2020 through July 31, 2024.
Initial investment of $10,000.
Fidelity® U.S. Multifactor ETF | $10,000 | $12,994 | $12,651 | $14,015 | $17,303 |
Fidelity U.S. Multifactor Index℠ | $10,000 | $13,032 | $12,726 | $14,143 | $17,465 |
Russell 1000® Index | $10,000 | $13,219 | $12,310 | $13,904 | $16,894 |
| | 2020 | 2021 | 2022 | 2023 | 2024 |
AVERAGE ANNUAL TOTAL RETURNS: | | 1 Year | Life of Fund |
Fidelity® U.S. Multifactor ETF - NAV A | 23.46% | 15.19% |
Fidelity® U.S. Multifactor ETF - Market Price B | 23.66% | 15.64% |
Fidelity U.S. Multifactor Index℠ A | 23.49% | 15.47% |
Russell 1000® Index A | 21.50% | 14.48% |
A From September 15, 2020
B From September 17, 2020, date initially listed on the NYSE Arca, Inc. exchange
Visit www.fidelity.com for more recent performance information. |
The Fund's past performance is not a good predictor of the Fund's future performance. The graph and table do not reflect the deduction of taxes that a shareholder would pay on fund distributions or redemption of fund shares. |
Key Fund Statistics (as of July 31, 2024)
KEY FACTS | | |
| Fund Size | $121,738,768 | |
| Number of Holdings | 102 | |
| Total Advisory Fee | $123,002 | |
| Portfolio Turnover | 42% | |
What did the Fund invest in?
(as of July 31, 2024)
MARKET SECTORS (% of Fund's net assets) | | |
| Information Technology | 29.9 | |
| Financials | 13.2 | |
| Health Care | 12.0 | |
| Consumer Discretionary | 10.1 | |
| Industrials | 9.4 | |
| Communication Services | 8.4 | |
| Consumer Staples | 5.6 | |
| Energy | 3.7 | |
| Utilities | 2.9 | |
| Real Estate | 2.5 | |
| Materials | 2.1 | |
| |
| Common Stocks | 99.8 |
| Short-Term Investments and Net Other Assets (Liabilities) | 0.2 |
ASSET ALLOCATION (% of Fund's net assets) |
|
|
| United States | 99.4 |
| Ireland | 0.6 |
GEOGRAPHIC DIVERSIFICATION (% of Fund's net assets) |
|
| |
|
TOP HOLDINGS (% of Fund's net assets) | | |
| Apple Inc | 6.5 | |
| Microsoft Corp | 6.2 | |
| NVIDIA Corp | 6.0 | |
| Alphabet Inc Class A | 3.8 | |
| Meta Platforms Inc Class A | 2.3 | |
| Eli Lilly & Co | 2.0 | |
| Vistra Corp | 1.8 | |
| Broadcom Inc | 1.6 | |
| Visa Inc Class A | 1.5 | |
| Mastercard Inc Class A | 1.5 | |
| | 33.2 | |
| |
How has the Fund changed?
This is a summary of certain changes to the Fund since August 1, 2023. For more complete information, you may review the Fund's next prospectus, which we expect to be available by November 29, 2024 at fundresearch.fidelity.com/prospectus/sec or upon request at 1-800-FIDELITY or by sending an e-mail to fidfunddocuments@fidelity.com.
The fees associated with this class changed during the reporting year. The variations in class fees are primarily the result of the following changes: - •Management fee
- •Operating expenses
The fund's contractual management fee was reduced during the reporting period. |
| Fidelity, the Fidelity Investments Logo and all other Fidelity trademarks or service marks used herein are trademarks or service marks of FMR LLC. Any third-party marks that are used herein are trademarks or service marks of their respective owners. © 2024 FMR LLC. All rights reserved. |
| | For additional information about the Fund; including its prospectus, financial information, holdings and proxy information, scan the QR code or visit fundresearch.fidelity.com/prospectus/sec 1.9913563.100 6044-TSRA-0924 |
| |
| | ANNUAL SHAREHOLDER REPORT | AS OF JULY 31, 2024 | This report describes changes to the Fund that occurred during the reporting period. |
| | Fidelity® Fundamental Large Cap Growth ETF Fidelity® Fundamental Large Cap Growth ETF : FFLG Principal U.S. Listing Exchange :CboeBZX Cboe BZX Exchange, Inc. |
| | | |
This annual shareholder report contains information about Fidelity® Fundamental Large Cap Growth ETF for the period August 1, 2023 to July 31, 2024. You can find additional information about the Fund at fundresearch.fidelity.com/prospectus/sec. You can also request this information by contacting us at 1-800-FIDELITY or by sending an e-mail to fidfunddocuments@fidelity.com.
What were your Fund costs for the last year?(based on hypothetical $10,000 investment)
FUND COST (PREVIOUS YEAR)
| | Costs of a $10,000 investment | Costs paid as a percentage of a $10,000 investment | |
| Fidelity® Fundamental Large Cap Growth ETF | $ 55 | 0.48% | |
What affected the Fund's performance this period?
- •U.S. equities gained for the 12 months ending July 31, 2024, driven by resilient corporate profits, a frenzy over generative artificial intelligence and the Federal Reserve's likely pivot to cutting interest rates later this year.
- •Against this backdrop, market selection was the primary contributor to the fund's performance versus the Russell 1000 Growth Index for the fiscal year, helped by an underweight in consumer discretionary, where an underweight in automobiles & components helped most. Stock selection in industrials and information technology also boosted the fund's relative performance.
- •The top individual relative contributor was a sizable underweight in Apple (+14%). This period we increased our stake in Apple, and the stock was among the fund's biggest holdings at period end. The second-largest relative contributor was an overweight in Nvidia (+151%), which was the fund's largest holding as of July 31. Another notable relative contributor was an underweight in Tesla (-13%). The stock was not held at the end of the period.
- •In contrast, the biggest detractor from performance versus the benchmark was stock picking in communication services, primarily within the media & entertainment industry. Stock picks in financials also hampered the fund's result.
- •The largest individual relative detractor was an overweight in Roku (-38%). This period we decreased our position. A non-benchmark stake in ON Semiconductor returned -28%. An underweight in Broadcom (+82%) also hurt. This was an investment we established this period.
- •Notable changes in positioning include increased exposure to the consumer discretionary and industrials sectors.
How did the Fund perform over the life of Fund?
CUMULATIVE PERFORMANCE
February 2, 2021 through July 31, 2024.
Initial investment of $10,000.
Fidelity® Fundamental Large Cap Growth ETF | $10,000 | $10,582 | $7,245 | $8,970 |
Russell 1000® Growth Index | $10,000 | $11,336 | $9,984 | $11,712 |
Russell 1000® Index | $10,000 | $11,471 | $10,683 | $12,066 |
| | 2021 | 2022 | 2023 | 2024 |
AVERAGE ANNUAL TOTAL RETURNS: | | 1 Year | Life of Fund |
Fidelity® Fundamental Large Cap Growth ETF - NAV A | 28.10% | 4.06% |
Fidelity® Fundamental Large Cap Growth ETF - Market Price B | 28.29% | 3.36% |
Russell 1000® Growth Index A | 26.94% | 12.02% |
Russell 1000® Index A | 21.50% | 11.57% |
A From February 2, 2021
B From February 4, 2021, date initially listed on the Cboe BZX Exchange, Inc. exchange
Visit www.fidelity.com for more recent performance information. |
The Fund's past performance is not a good predictor of the Fund's future performance. The graph and table do not reflect the deduction of taxes that a shareholder would pay on fund distributions or redemption of fund shares. |
Key Fund Statistics (as of July 31, 2024)
KEY FACTS | | |
| Fund Size | $317,130,502 | |
| Number of Holdings | 93 | |
| Total Advisory Fee | $1,192,982 | |
| Portfolio Turnover | 52% | |
What did the Fund invest in?
(as of July 31, 2024)
MARKET SECTORS (% of Fund's net assets) | | |
| Information Technology | 46.1 | |
| Communication Services | 15.5 | |
| Consumer Discretionary | 14.1 | |
| Health Care | 9.6 | |
| Industrials | 7.2 | |
| Financials | 3.4 | |
| Consumer Staples | 2.0 | |
| Energy | 1.1 | |
| Real Estate | 0.4 | |
| Utilities | 0.3 | |
| Materials | 0.1 | |
| |
| Common Stocks | 99.8 |
| Short-Term Investments and Net Other Assets (Liabilities) | 0.2 |
ASSET ALLOCATION (% of Fund's net assets) |
|
|
| United States | 92.4 |
| Taiwan | 2.0 |
| Netherlands | 1.8 |
| China | 1.8 |
| France | 0.6 |
| Denmark | 0.4 |
| Canada | 0.3 |
| India | 0.3 |
| Singapore | 0.2 |
| Others | 0.2 |
GEOGRAPHIC DIVERSIFICATION (% of Fund's net assets) |
|
| |
|
TOP HOLDINGS (% of Fund's net assets) | | |
| NVIDIA Corp | 13.0 | |
| Microsoft Corp | 10.5 | |
| Apple Inc | 9.7 | |
| Amazon.com Inc | 7.5 | |
| Meta Platforms Inc Class A | 4.6 | |
| Alphabet Inc Class C | 4.4 | |
| Alphabet Inc Class A | 2.7 | |
| Uber Technologies Inc | 2.0 | |
| Taiwan Semiconductor Manufacturing Co Ltd ADR | 2.0 | |
| Mastercard Inc Class A | 1.9 | |
| | 58.3 | |
| |
How has the Fund changed?
This is a summary of certain changes to the Fund since August 1, 2023. For more complete information, you may review the Fund's next prospectus, which we expect to be available by November 29, 2024 at fundresearch.fidelity.com/prospectus/sec or upon request at 1-800-FIDELITY or by sending an e-mail to fidfunddocuments@fidelity.com.
The fees associated with this class changed during the reporting year. The variations in class fees are primarily the result of the following changes: The fund's contractual management fee was reduced during the reporting period. | Effective February 26, 2024, the fund has operated in reliance on Rule 6c-11 rather than pursuant to an exemptive order from the Securities and Exchange Commission. |
The fund's name changed from Fidelity Growth Opportunities ETF to Fidelity Fundamental Large Cap Growth ETF during the reporting period. | The fund modified its principal investment strategies to include adopting a policy of investing at least 80% of assets in equity securities of companies with large market capitalizations. |
The fund modified its investment process and principal investment risks pursuant to the change in its principal investment strategies. | |
| Fidelity, the Fidelity Investments Logo and all other Fidelity trademarks or service marks used herein are trademarks or service marks of FMR LLC. Any third-party marks that are used herein are trademarks or service marks of their respective owners. © 2024 FMR LLC. All rights reserved. |
| | For additional information about the Fund; including its prospectus, financial information, holdings and proxy information, scan the QR code or visit fundresearch.fidelity.com/prospectus/sec 1.9913567.100 6339-TSRA-0924 |
| |
| | ANNUAL SHAREHOLDER REPORT | AS OF JULY 31, 2024 | This report describes changes to the Fund that occurred during the reporting period. |
| | Fidelity® Momentum Factor ETF Fidelity® Momentum Factor ETF : FDMO Principal U.S. Listing Exchange :NYSEArca NYSE Arca, Inc. |
| | | |
This annual shareholder report contains information about Fidelity® Momentum Factor ETF for the period August 1, 2023 to July 31, 2024. You can find additional information about the Fund at fundresearch.fidelity.com/prospectus/sec. You can also request this information by contacting us at 1-800-FIDELITY or by sending an e-mail to fidfunddocuments@fidelity.com.
What were your Fund costs for the last year?(based on hypothetical $10,000 investment)
FUND COST (PREVIOUS YEAR)
| | Costs of a $10,000 investment | Costs paid as a percentage of a $10,000 investment | |
| Fidelity® Momentum Factor ETF | $ 21 | 0.18% | |
What affected the Fund's performance this period?
•U.S. equities gained for the 12 months ending July 31, 2024, driven by resilient corporate profits, a frenzy over generative artificial intelligence and the Federal Reserve's likely pivot to cutting interest rates later this year.
•Against this backdrop, information technology gained about 29% and contributed most to the fund's performance for the fiscal year. Exposure to health care stocks, which rose about 39%, also helped, as did industrials (+40%), propelled by the capital goods (+48%) industry in particular. The financials sector was up 26%, while consumer discretionary increased 31% and communication services advanced approximately 27%, all bolstering performance. The portfolio's stakes in consumer staples (+25%), utilities (+31%), energy (+14%), real estate (+14%) and materials (+8%) companies were advantageous as well.
•Turning to individual stocks, the top contributor was Nvidia (+148%), within the semiconductors & semiconductor equipment industry. Also in that category, a position in Broadcom gained 81%, providing an added lift. Exposure to software & services firm Microsoft (+25%) was another plus, along with consumer discretionary distribution & retail giant Amazon.com (+41%). In the pharmaceuticals, biotechnology & life sciences industry, a holding in Eli Lilly (+79%) further aided performance.
•In contrast, the biggest detractor was Tesla (-24%), within the automobiles & components industry. A stake in technology hardware & equipment company Super Micro Computer (-26%) also hurt the fund's performance. Among software & services stocks, exposure to CrowdStrike Holdings (-30%) and Nutanix (-28%) proved detrimental. Lastly, semiconductors & semiconductor equipment stock Intel (-27%) pressured the fund's return as well.
How did the Fund perform over the life of Fund?
CUMULATIVE PERFORMANCE
September 12, 2016 through July 31, 2024.
Initial investment of $10,000.
Fidelity® Momentum Factor ETF | $10,000 | $11,408 | $13,543 | $14,614 | $16,231 | $20,708 | $19,217 | $20,950 | $27,012 |
Fidelity U.S. Momentum Factor Index℠ | $10,000 | $11,443 | $13,633 | $14,749 | $16,427 | $21,025 | $19,571 | $21,399 | $27,651 |
Russell 1000® Index | $10,000 | $11,635 | $13,519 | $14,600 | $16,357 | $22,568 | $21,017 | $23,739 | $28,843 |
| | 2016 | 2017 | 2018 | 2019 | 2020 | 2021 | 2022 | 2023 | 2024 |
AVERAGE ANNUAL TOTAL RETURNS: | | 1 Year | 5 Year | Life of Fund |
Fidelity® Momentum Factor ETF - NAV A | 28.94% | 13.07% | 13.43% |
Fidelity® Momentum Factor ETF - Market Price B | 29.08% | 13.02% | 13.53% |
Fidelity U.S. Momentum Factor Index℠ A | 29.22% | 13.39% | 13.76% |
Russell 1000® Index A | 21.50% | 14.59% | 14.37% |
A From September 12, 2016
B From September 15, 2016, date initially listed on the NYSE Arca, Inc. exchange
Visit www.fidelity.com for more recent performance information. |
The Fund's past performance is not a good predictor of the Fund's future performance. The graph and table do not reflect the deduction of taxes that a shareholder would pay on fund distributions or redemption of fund shares. |
Key Fund Statistics (as of July 31, 2024)
KEY FACTS | | |
| Fund Size | $220,921,232 | |
| Number of Holdings | 126 | |
| Total Advisory Fee | $316,309 | |
| Portfolio Turnover | 119% | |
What did the Fund invest in?
(as of July 31, 2024)
MARKET SECTORS (% of Fund's net assets) | | |
| Information Technology | 29.7 | |
| Financials | 13.4 | |
| Health Care | 12.2 | |
| Consumer Discretionary | 10.2 | |
| Industrials | 9.4 | |
| Communication Services | 8.4 | |
| Consumer Staples | 5.7 | |
| Energy | 3.5 | |
| Real Estate | 2.6 | |
| Materials | 2.5 | |
| Utilities | 2.2 | |
| |
| Common Stocks | 99.8 |
| Short-Term Investments and Net Other Assets (Liabilities) | 0.2 |
ASSET ALLOCATION (% of Fund's net assets) |
|
|
| United States | 99.6 |
| United Kingdom | 0.4 |
GEOGRAPHIC DIVERSIFICATION (% of Fund's net assets) |
|
| |
|
TOP HOLDINGS (% of Fund's net assets) | | |
| Microsoft Corp | 7.2 | |
| NVIDIA Corp | 7.0 | |
| Alphabet Inc Class A | 3.9 | |
| Amazon.com Inc | 3.8 | |
| Broadcom Inc | 2.6 | |
| Meta Platforms Inc Class A | 2.3 | |
| Berkshire Hathaway Inc Class B | 2.1 | |
| Eli Lilly & Co | 2.0 | |
| JPMorgan Chase & Co | 1.7 | |
| Abbvie Inc | 1.5 | |
| | 34.1 | |
| |
How has the Fund changed?
This is a summary of certain changes to the Fund since August 1, 2023. For more complete information, you may review the Fund's next prospectus, which we expect to be available by November 29, 2024 at fundresearch.fidelity.com/prospectus/sec or upon request at 1-800-FIDELITY or by sending an e-mail to fidfunddocuments@fidelity.com.
The fees associated with this class changed during the reporting year. The variations in class fees are primarily the result of the following changes: - •Management fee
- •Operating expenses
The fund's contractual management fee was reduced during the reporting period. |
| Fidelity, the Fidelity Investments Logo and all other Fidelity trademarks or service marks used herein are trademarks or service marks of FMR LLC. Any third-party marks that are used herein are trademarks or service marks of their respective owners. © 2024 FMR LLC. All rights reserved. |
| | For additional information about the Fund; including its prospectus, financial information, holdings and proxy information, scan the QR code or visit fundresearch.fidelity.com/prospectus/sec 1.9913542.100 2856-TSRA-0924 |
| |
| | ANNUAL SHAREHOLDER REPORT | AS OF JULY 31, 2024 | This report describes changes to the Fund that occurred during the reporting period. |
| | Fidelity® High Dividend ETF Fidelity® High Dividend ETF : FDVV Principal U.S. Listing Exchange :NYSEArca NYSE Arca, Inc. |
| | | |
This annual shareholder report contains information about Fidelity® High Dividend ETF for the period August 1, 2023 to July 31, 2024. You can find additional information about the Fund at fundresearch.fidelity.com/prospectus/sec. You can also request this information by contacting us at 1-800-FIDELITY or by sending an e-mail to fidfunddocuments@fidelity.com.
What were your Fund costs for the last year?(based on hypothetical $10,000 investment)
FUND COST (PREVIOUS YEAR)
| | Costs of a $10,000 investment | Costs paid as a percentage of a $10,000 investment | |
| Fidelity® High Dividend ETF | $ 21 | 0.19% | |
What affected the Fund's performance this period?
•U.S. equities gained for the 12 months ending July 31, 2024, driven by resilient corporate profits, a frenzy over generative artificial intelligence and the Federal Reserve's likely pivot to cutting interest rates later this year.
•Against this backdrop, the information technology sector gained 45% and contributed most to the fund's performance for the fiscal year. Exposure to industrials stocks also helped (+20%). Stakes among financials (+27%), utilities (+23%) and energy (+10%) companies were advantageous as well. Holdings in the consumer staples (+4%), health care (+9%), real estate (+4%) and communication services (+12%) sectors further aided the portfolio's result. The fund's international holdings contributed overall, despite a broadly stronger U.S. dollar.
•Turning to individual holdings, the biggest contributor was Nvidia (+155%), a company in the semiconductors & semiconductor equipment industry. In the same industry, a position in Broadcom (+83%) was another plus. Software & services firm Microsoft rose approximately 26% and boosted the fund as well. Apple, within the technology hardware & equipment group, was up 14% and provided an added performance lift. Also helping was transportation company Kawasaki Kisen Kaisha (+59%).
•In contrast, consumer discretionary stocks were effectively flat (0%), detracting the most from performance. This group was notably pressured by the consumer durables & apparel (-30%) industry.
•On a stock-specific basis, the biggest detractor was Walgreens Boots Alliance (-45%), a consumer staples distribution & retail firm. Exposure to United Parcel Service, within the transportation industry, returned about -27% and hurt as well. Stakes in equity real estate investment trusts Medical Properties Trust (-63%) and Healthcare Realty Trust (-27%) also were detrimental to performance. Lastly, 3M (-14%), within the capital goods industry, was another negative.
How did the Fund perform over the life of Fund?
CUMULATIVE PERFORMANCE
September 12, 2016 through July 31, 2024.
Initial investment of $10,000.
Fidelity® High Dividend ETF | $10,000 | $10,961 | $12,739 | $13,269 | $12,667 | $18,040 | $18,839 | $21,140 | $25,581 |
Fidelity High Dividend Index℠ | $10,000 | $10,996 | $12,826 | $13,410 | $12,818 | $18,315 | $19,188 | $21,596 | $26,186 |
Russell 1000® Index | $10,000 | $11,635 | $13,519 | $14,600 | $16,357 | $22,568 | $21,017 | $23,739 | $28,843 |
| | 2016 | 2017 | 2018 | 2019 | 2020 | 2021 | 2022 | 2023 | 2024 |
AVERAGE ANNUAL TOTAL RETURNS: | | 1 Year | 5 Year | Life of Fund |
Fidelity® High Dividend ETF - NAV A | 21.01% | 14.03% | 12.65% |
Fidelity® High Dividend ETF - Market Price B | 21.32% | 14.01% | 12.78% |
Fidelity High Dividend Index℠ A | 21.25% | 14.32% | 12.98% |
Russell 1000® Index A | 21.50% | 14.59% | 14.37% |
A From September 12, 2016
B From September 15, 2016, date initially listed on the NYSE Arca, Inc. exchange
Visit www.fidelity.com for more recent performance information. |
The Fund's past performance is not a good predictor of the Fund's future performance. The graph and table do not reflect the deduction of taxes that a shareholder would pay on fund distributions or redemption of fund shares. |
Key Fund Statistics (as of July 31, 2024)
KEY FACTS | | |
| Fund Size | $3,166,847,867 | |
| Number of Holdings | 107 | |
| Total Advisory Fee | $3,934,584 | |
| Portfolio Turnover | 14% | |
What did the Fund invest in?
(as of July 31, 2024)
MARKET SECTORS (% of Fund's net assets) | | |
| Information Technology | 25.2 | |
| Industrials | 16.2 | |
| Consumer Staples | 12.1 | |
| Energy | 10.3 | |
| Utilities | 9.9 | |
| Real Estate | 9.1 | |
| Financials | 6.9 | |
| Health Care | 5.3 | |
| Consumer Discretionary | 3.2 | |
| Communication Services | 1.6 | |
| |
| Common Stocks | 99.8 |
| Short-Term Investments and Net Other Assets (Liabilities) | 0.2 |
ASSET ALLOCATION (% of Fund's net assets) |
|
|
| United States | 91.4 |
| United Kingdom | 4.3 |
| Japan | 2.8 |
| Denmark | 1.0 |
| Germany | 0.5 |
GEOGRAPHIC DIVERSIFICATION (% of Fund's net assets) |
|
| |
|
TOP HOLDINGS (% of Fund's net assets) | | |
| Apple Inc | 5.8 | |
| NVIDIA Corp | 5.7 | |
| Microsoft Corp | 5.4 | |
| Exxon Mobil Corp | 2.1 | |
| Broadcom Inc | 2.0 | |
| Procter & Gamble Co/The | 2.0 | |
| Philip Morris International Inc | 2.0 | |
| PepsiCo Inc | 1.7 | |
| NextEra Energy Inc | 1.7 | |
| Altria Group Inc | 1.6 | |
| | 30.0 | |
| |
How has the Fund changed?
This is a summary of certain changes to the Fund since August 1, 2023. For more complete information, you may review the Fund's next prospectus, which we expect to be available by November 29, 2024 at fundresearch.fidelity.com/prospectus/sec or upon request at 1-800-FIDELITY or by sending an e-mail to fidfunddocuments@fidelity.com.
The fees associated with this class changed during the reporting year. The variations in class fees are primarily the result of the following changes: - •Management fee
- •Operating expenses
The fund's contractual management fee was reduced during the reporting period. |
| Fidelity, the Fidelity Investments Logo and all other Fidelity trademarks or service marks used herein are trademarks or service marks of FMR LLC. Any third-party marks that are used herein are trademarks or service marks of their respective owners. © 2024 FMR LLC. All rights reserved. |
| | For additional information about the Fund; including its prospectus, financial information, holdings and proxy information, scan the QR code or visit fundresearch.fidelity.com/prospectus/sec 1.9913539.100 2853-TSRA-0924 |
| |
| | ANNUAL SHAREHOLDER REPORT | AS OF JULY 31, 2024 | This report describes changes to the Fund that occurred during the reporting period. |
| | Fidelity® Value Factor ETF Fidelity® Value Factor ETF : FVAL Principal U.S. Listing Exchange :NYSEArca NYSE Arca, Inc. |
| | | |
This annual shareholder report contains information about Fidelity® Value Factor ETF for the period August 1, 2023 to July 31, 2024. You can find additional information about the Fund at fundresearch.fidelity.com/prospectus/sec. You can also request this information by contacting us at 1-800-FIDELITY or by sending an e-mail to fidfunddocuments@fidelity.com.
What were your Fund costs for the last year?(based on hypothetical $10,000 investment)
FUND COST (PREVIOUS YEAR)
| | Costs of a $10,000 investment | Costs paid as a percentage of a $10,000 investment | |
| Fidelity® Value Factor ETF | $ 20 | 0.18% | |
What affected the Fund's performance this period?
- •U.S. equities gained for the 12 months ending July 31, 2024, driven by resilient corporate profits, a frenzy over generative artificial intelligence and the Federal Reserve's likely pivot to cutting interest rates later this year.
- •Against this backdrop, information technology gained roughly 17% and contributed most to the fund's performance for the fiscal year. Financials, which gained about 33%, also helped, as did communication services, which advanced 28%, lifted by the media & entertainment industry (+27%). The consumer discretionary sector rose 21%, boosted by the consumer discretionary distribution & retail industry (+33%), while industrials gained about 19% and consumer staples advanced approximately 10%. Other contributors included the energy (+14%), utilities (+22%), health care (+3%), materials (+8%) and real estate (+6%) sectors.
- •Turning to individual stocks, the top contributor was Microsoft (+26%), from the software & services group. Amazon.com (+40%), from the consumer discretionary distribution & retail group, also helped. In media & entertainment, Alphabet (+29%) and Meta Platforms (+49%) further contributed.
- •Conversely, the biggest detractor was United Parcel Service (-27%), from the transportation industry. Other notable detractors included Bristol-Myers Squibb (-20%), a stock in the pharmaceuticals, biotechnology & life sciences category, and DXC Technology (-26%), a stock in the software & services industry. Financial firm PayPal Holdings (-22%) also hurt, as did Humana (-20%), in health care equipment & services.
How did the Fund perform over the life of Fund?
CUMULATIVE PERFORMANCE
September 12, 2016 through July 31, 2024.
Initial investment of $10,000.
Fidelity® Value Factor ETF | $10,000 | $11,866 | $13,777 | $14,322 | $14,769 | $21,055 | $20,241 | $22,736 | $26,698 |
Fidelity U.S. Value Factor Index℠ | $10,000 | $11,901 | $13,865 | $14,454 | $14,942 | $21,371 | $20,600 | $23,204 | $27,287 |
Russell 1000® Index | $10,000 | $11,635 | $13,519 | $14,600 | $16,357 | $22,568 | $21,017 | $23,739 | $28,843 |
| | 2016 | 2017 | 2018 | 2019 | 2020 | 2021 | 2022 | 2023 | 2024 |
AVERAGE ANNUAL TOTAL RETURNS: | | 1 Year | 5 Year | Life of Fund |
Fidelity® Value Factor ETF - NAV A | 17.43% | 13.27% | 13.26% |
Fidelity® Value Factor ETF - Market Price B | 17.56% | 13.24% | 13.35% |
Fidelity U.S. Value Factor Index℠ A | 17.60% | 13.55% | 13.57% |
Russell 1000® Index A | 21.50% | 14.59% | 14.37% |
A From September 12, 2016
B From September 15, 2016, date initially listed on the NYSE Arca, Inc. exchange
Visit www.fidelity.com for more recent performance information. |
The Fund's past performance is not a good predictor of the Fund's future performance. The graph and table do not reflect the deduction of taxes that a shareholder would pay on fund distributions or redemption of fund shares. |
Key Fund Statistics (as of July 31, 2024)
KEY FACTS | | |
| Fund Size | $809,153,121 | |
| Number of Holdings | 129 | |
| Total Advisory Fee | $1,192,232 | |
| Portfolio Turnover | 31% | |
What did the Fund invest in?
(as of July 31, 2024)
MARKET SECTORS (% of Fund's net assets) | | |
| Information Technology | 28.4 | |
| Financials | 14.2 | |
| Health Care | 11.6 | |
| Consumer Discretionary | 10.2 | |
| Industrials | 9.7 | |
| Communication Services | 8.6 | |
| Consumer Staples | 5.9 | |
| Energy | 3.8 | |
| Utilities | 2.5 | |
| Real Estate | 2.5 | |
| Materials | 2.4 | |
| |
| Common Stocks | 99.8 |
| Short-Term Investments and Net Other Assets (Liabilities) | 0.2 |
ASSET ALLOCATION (% of Fund's net assets) |
|
|
| United States | 98.8 |
| Ireland | 1.2 |
GEOGRAPHIC DIVERSIFICATION (% of Fund's net assets) |
|
| |
|
TOP HOLDINGS (% of Fund's net assets) | | |
| Apple Inc | 7.5 | |
| Microsoft Corp | 7.2 | |
| Alphabet Inc Class A | 4.0 | |
| Amazon.com Inc | 3.9 | |
| Meta Platforms Inc Class A | 2.4 | |
| Berkshire Hathaway Inc Class B | 2.1 | |
| UnitedHealth Group Inc | 1.9 | |
| JPMorgan Chase & Co | 1.8 | |
| QUALCOMM Inc | 1.5 | |
| Applied Materials Inc | 1.5 | |
| | 33.8 | |
| |
How has the Fund changed?
This is a summary of certain changes to the Fund since August 1, 2023. For more complete information, you may review the Fund's next prospectus, which we expect to be available by November 29, 2024 at fundresearch.fidelity.com/prospectus/sec or upon request at 1-800-FIDELITY or by sending an e-mail to fidfunddocuments@fidelity.com.
The fees associated with this class changed during the reporting year. The variations in class fees are primarily the result of the following changes: - •Management fee
- •Operating expenses
The fund's contractual management fee was reduced during the reporting period. |
| Fidelity, the Fidelity Investments Logo and all other Fidelity trademarks or service marks used herein are trademarks or service marks of FMR LLC. Any third-party marks that are used herein are trademarks or service marks of their respective owners. © 2024 FMR LLC. All rights reserved. |
| | For additional information about the Fund; including its prospectus, financial information, holdings and proxy information, scan the QR code or visit fundresearch.fidelity.com/prospectus/sec 1.9913544.100 2858-TSRA-0924 |
| |
| | ANNUAL SHAREHOLDER REPORT | AS OF JULY 31, 2024 | This report describes changes to the Fund that occurred during the reporting period. |
| | Fidelity® Low Volatility Factor ETF Fidelity® Low Volatility Factor ETF : FDLO Principal U.S. Listing Exchange :NYSEArca NYSE Arca, Inc. |
| | | |
This annual shareholder report contains information about Fidelity® Low Volatility Factor ETF for the period August 1, 2023 to July 31, 2024. You can find additional information about the Fund at fundresearch.fidelity.com/prospectus/sec. You can also request this information by contacting us at 1-800-FIDELITY or by sending an e-mail to fidfunddocuments@fidelity.com.
What were your Fund costs for the last year?(based on hypothetical $10,000 investment)
FUND COST (PREVIOUS YEAR)
| | Costs of a $10,000 investment | Costs paid as a percentage of a $10,000 investment | |
| Fidelity® Low Volatility Factor ETF | $ 20 | 0.18% | |
What affected the Fund's performance this period?
•U.S. equities gained for the 12 months ending July 31, 2024, driven by resilient corporate profits, a frenzy over generative artificial intelligence and the Federal Reserve's likely pivot to cutting interest rates later this year.
•Against this backdrop, the information technology sector gained 15% and contributed most to the fund's performance for the fiscal year. Positions in financials stocks, which gained 25%, also helped, as did exposure to health care (+17%) companies, especially in the pharmaceuticals, biotechnology & life sciences (+28%) industry. Other bright spots in the portfolio included the communication services (+26%), industrials (+14%) and consumer discretionary (+12%) sectors. Stakes among energy (+12%), consumer staples (+7%), materials (+14%), real estate (+7%) and utilities (+6%) firms proved advantageous as well.
•Turning to individual stocks, the biggest contributor was software & services company Microsoft (+25%). Shares of Eli Lilly (+79%), within the pharmaceuticals, biotechnology & life sciences industry, helped as well. Media & entertainment stock Alphabet (+29%), along with Apple (+14%), in the technology hardware & equipment industry, provided an added lift. A position in insurance provider Progressive (+ 71%) also bolstered performance.
•In contrast, the biggest detractor was consumer durables & apparel company Nike (-31%). Exposure to Globe Life (-26%), an insurance stock, proved detrimental as well. Stakes in CVS Health (-20%), along with health care equipment & services firm ResMed (-25%), further weighed on performance. Lastly, in consumer services, a position in Starbucks (-21%) was another negative.
How did the Fund perform over the life of Fund?
CUMULATIVE PERFORMANCE
September 12, 2016 through July 31, 2024.
Initial investment of $10,000.
Fidelity® Low Volatility Factor ETF | $10,000 | $11,295 | $13,203 | $15,077 | $16,176 | $20,851 | $20,618 | $22,465 | $26,124 |
Fidelity U.S. Low Volatility Factor Index℠ | $10,000 | $11,330 | $13,289 | $15,181 | $16,329 | $21,107 | $20,933 | $22,873 | $26,642 |
Russell 1000® Index | $10,000 | $11,635 | $13,519 | $14,600 | $16,357 | $22,568 | $21,017 | $23,739 | $28,843 |
| | 2016 | 2017 | 2018 | 2019 | 2020 | 2021 | 2022 | 2023 | 2024 |
AVERAGE ANNUAL TOTAL RETURNS: | | 1 Year | 5 Year | Life of Fund |
Fidelity® Low Volatility Factor ETF - NAV A | 16.29% | 11.62% | 12.95% |
Fidelity® Low Volatility Factor ETF - Market Price B | 16.31% | 11.62% | 13.09% |
Fidelity U.S. Low Volatility Factor Index℠ A | 16.48% | 11.91% | 13.23% |
Russell 1000® Index A | 21.50% | 14.59% | 14.37% |
A From September 12, 2016
B From September 15, 2016, date initially listed on the NYSE Arca, Inc. exchange
Visit www.fidelity.com for more recent performance information. |
The Fund's past performance is not a good predictor of the Fund's future performance. The graph and table do not reflect the deduction of taxes that a shareholder would pay on fund distributions or redemption of fund shares. |
Key Fund Statistics (as of July 31, 2024)
KEY FACTS | | |
| Fund Size | $1,143,576,609 | |
| Number of Holdings | 127 | |
| Total Advisory Fee | $1,550,627 | |
| Portfolio Turnover | 32% | |
What did the Fund invest in?
(as of July 31, 2024)
MARKET SECTORS (% of Fund's net assets) | | |
| Information Technology | 29.0 | |
| Financials | 12.9 | |
| Health Care | 12.2 | |
| Consumer Discretionary | 10.4 | |
| Industrials | 9.6 | |
| Communication Services | 8.7 | |
| Consumer Staples | 6.0 | |
| Energy | 3.7 | |
| Materials | 2.6 | |
| Real Estate | 2.5 | |
| Utilities | 2.2 | |
| |
| Common Stocks | 99.8 |
| Short-Term Investments and Net Other Assets (Liabilities) | 0.2 |
ASSET ALLOCATION (% of Fund's net assets) |
|
|
| United States | 98.7 |
| Ireland | 1.3 |
GEOGRAPHIC DIVERSIFICATION (% of Fund's net assets) |
|
| |
|
TOP HOLDINGS (% of Fund's net assets) | | |
| Apple Inc | 7.8 | |
| Microsoft Corp | 7.4 | |
| Alphabet Inc Class A | 4.4 | |
| Amazon.com Inc | 3.9 | |
| Eli Lilly & Co | 2.0 | |
| UnitedHealth Group Inc | 1.7 | |
| Oracle Corp | 1.6 | |
| Texas Instruments Inc | 1.5 | |
| Visa Inc Class A | 1.5 | |
| Mastercard Inc Class A | 1.4 | |
| | 33.2 | |
| |
How has the Fund changed?
This is a summary of certain changes to the Fund since August 1, 2023. For more complete information, you may review the Fund's next prospectus, which we expect to be available by November 29, 2024 at fundresearch.fidelity.com/prospectus/sec or upon request at 1-800-FIDELITY or by sending an e-mail to fidfunddocuments@fidelity.com.
The fees associated with this class changed during the reporting year. The variations in class fees are primarily the result of the following changes: - •Management fee
- •Operating expenses
The fund's contractual management fee was reduced during the reporting period. |
| Fidelity, the Fidelity Investments Logo and all other Fidelity trademarks or service marks used herein are trademarks or service marks of FMR LLC. Any third-party marks that are used herein are trademarks or service marks of their respective owners. © 2024 FMR LLC. All rights reserved. |
| | For additional information about the Fund; including its prospectus, financial information, holdings and proxy information, scan the QR code or visit fundresearch.fidelity.com/prospectus/sec 1.9913541.100 2855-TSRA-0924 |
| |
| | ANNUAL SHAREHOLDER REPORT | AS OF JULY 31, 2024 | This report describes changes to the Fund that occurred during the reporting period. |
| | Fidelity® Small-Mid Multifactor ETF Fidelity® Small-Mid Multifactor ETF : FSMD Principal U.S. Listing Exchange :NYSEArca NYSE Arca, Inc. |
| | | |
This annual shareholder report contains information about Fidelity® Small-Mid Multifactor ETF for the period August 1, 2023 to July 31, 2024. You can find additional information about the Fund at fundresearch.fidelity.com/prospectus/sec. You can also request this information by contacting us at 1-800-FIDELITY or by sending an e-mail to fidfunddocuments@fidelity.com.
What were your Fund costs for the last year?(based on hypothetical $10,000 investment)
FUND COST (PREVIOUS YEAR)
| | Costs of a $10,000 investment | Costs paid as a percentage of a $10,000 investment | |
| Fidelity® Small-Mid Multifactor ETF | $ 20 | 0.18% | |
What affected the Fund's performance this period?
- •U.S. equities gained for the 12 months ending July 31, 2024, driven by resilient corporate profits, a frenzy over generative artificial intelligence and the Federal Reserve's likely pivot to cutting interest rates later this year.
- •Against this backdrop, industrials - the ETF's largest sector weighting - gained 26% and contributed most to the fund's performance for the fiscal year, driven by the capital goods industry (+30%). Financials, which gained approximately 29%, also helped, as did consumer discretionary, which advanced roughly 27%. The information technology sector rose about 13%, boosted by the technology hardware & equipment industry (+36%), while materials gained approximately 25% and energy advanced about 23%. All other sectors - including real estate (+12%), consumer staples (+20%), health care (+4%), utilities (+8%) and communication services (+1%) - also had positive results.
- •Turning to individual stocks, the biggest contributor was Super Micro Computer (+139%), from the technology hardware & equipment category. Viking Therapeutics (+307%), a stock in the pharmaceuticals, biotechnology & life sciences category, also helped. Abercrombie & Fitch, within the consumer discretionary distribution & retail industry, gained 248%. In consumer staples distribution & retail, Sprouts Farmers Market (+154%) contributed. Lastly, in consumer services, Wingstop (+121%) also boosted the fund.
- •In contrast, the biggest detractor was New York Community Bancorp (-69%), from the banks category. UiPath (-51%) and DoubleVerify Holdings (-50%), from the software & services industry, also hindered the fund. Another notable detractor was QuidelOrtho (-55%), a stock in the health care equipment & services group. Lastly, in telecommunication services, Iridium Communications returned roughly -42%.
How did the Fund perform over the life of Fund?
CUMULATIVE PERFORMANCE
February 26, 2019 through July 31, 2024.
Initial investment of $10,000.
Fidelity® Small-Mid Multifactor ETF | $10,000 | $10,335 | $9,829 | $14,174 | $13,841 | $14,937 |
Fidelity Small-Mid Multifactor Index℠ | $10,000 | $10,350 | $9,866 | $14,281 | $13,993 | $15,144 |
Dow Jones U.S. Completion Total Stock Market Index℠ | $10,000 | $10,374 | $10,905 | $16,466 | $12,868 | $14,212 |
Dow Jones U.S. Total Stock Market Index℠ | $10,000 | $10,689 | $11,843 | $16,453 | $15,173 | $17,088 |
| | 2019 | 2020 | 2021 | 2022 | 2023 | 2024 |
AVERAGE ANNUAL TOTAL RETURNS: | | 1 Year | 5 Year | Life of Fund |
Fidelity® Small-Mid Multifactor ETF - NAV A | 19.10% | 11.47% | 11.19% |
Fidelity® Small-Mid Multifactor ETF - Market Price B | 19.39% | 11.49% | 11.20% |
Fidelity Small-Mid Multifactor Index℠ A | 19.37% | 11.80% | 11.52% |
Dow Jones U.S. Completion Total Stock Market Index℠ A | 14.96% | 9.51% | 9.46% |
Dow Jones U.S. Total Stock Market Index℠ A | 21.10% | 14.13% | 14.33% |
A From February 26, 2019
B From February 28, 2019, date initially listed on the NYSE Arca, Inc. exchange
Visit www.fidelity.com for more recent performance information. |
The Fund's past performance is not a good predictor of the Fund's future performance. The graph and table do not reflect the deduction of taxes that a shareholder would pay on fund distributions or redemption of fund shares. |
Key Fund Statistics (as of July 31, 2024)
KEY FACTS | | |
| Fund Size | $428,135,489 | |
| Number of Holdings | 589 | |
| Total Advisory Fee | $339,784 | |
| Portfolio Turnover | 50% | |
What did the Fund invest in?
(as of July 31, 2024)
MARKET SECTORS (% of Fund's net assets) | | |
| Industrials | 17.9 | |
| Financials | 16.9 | |
| Consumer Discretionary | 13.9 | |
| Health Care | 13.0 | |
| Information Technology | 11.6 | |
| Real Estate | 6.7 | |
| Materials | 5.7 | |
| Energy | 4.5 | |
| Consumer Staples | 3.9 | |
| Communication Services | 2.9 | |
| Utilities | 2.8 | |
| |
| Common Stocks | 99.8 |
| Short-Term Investments and Net Other Assets (Liabilities) | 0.2 |
ASSET ALLOCATION (% of Fund's net assets) |
|
|
| United States | 97.3 |
| Puerto Rico | 0.6 |
| Canada | 0.5 |
| Bermuda | 0.4 |
| United Kingdom | 0.4 |
| Thailand | 0.2 |
| Sweden | 0.2 |
| Monaco | 0.2 |
| Ireland | 0.1 |
| Others | 0.1 |
GEOGRAPHIC DIVERSIFICATION (% of Fund's net assets) |
|
| |
|
TOP HOLDINGS (% of Fund's net assets) | | |
| Texas Pacific Land Corp | 0.5 | |
| EMCOR Group Inc | 0.5 | |
| Pure Storage Inc Class A | 0.4 | |
| Toll Brothers Inc | 0.4 | |
| United Therapeutics Corp | 0.4 | |
| Reinsurance Group of America Inc | 0.4 | |
| TechnipFMC PLC | 0.4 | |
| TopBuild Corp | 0.4 | |
| International Paper Co | 0.4 | |
| Casey's General Stores Inc | 0.4 | |
| | 4.2 | |
| |
How has the Fund changed?
This is a summary of certain changes to the Fund since August 1, 2023. For more complete information, you may review the Fund's next prospectus, which we expect to be available by November 29, 2024 at fundresearch.fidelity.com/prospectus/sec or upon request at 1-800-FIDELITY or by sending an e-mail to fidfunddocuments@fidelity.com.
The fees associated with this class changed during the reporting year. The variations in class fees are primarily the result of the following changes: - •Management fee
- •Operating expenses
The fund's contractual management fee was reduced during the reporting period. |
| Fidelity, the Fidelity Investments Logo and all other Fidelity trademarks or service marks used herein are trademarks or service marks of FMR LLC. Any third-party marks that are used herein are trademarks or service marks of their respective owners. © 2024 FMR LLC. All rights reserved. |
| | For additional information about the Fund; including its prospectus, financial information, holdings and proxy information, scan the QR code or visit fundresearch.fidelity.com/prospectus/sec 1.9913553.100 3356-TSRA-0924 |
| |
| | ANNUAL SHAREHOLDER REPORT | AS OF JULY 31, 2024 | This report describes changes to the Fund that occurred during the reporting period. |
| | Fidelity® Dividend ETF for Rising Rates Fidelity® Dividend ETF for Rising Rates : FDRR Principal U.S. Listing Exchange :NYSEArca NYSE Arca, Inc. |
| | | |
This annual shareholder report contains information about Fidelity® Dividend ETF for Rising Rates for the period August 1, 2023 to July 31, 2024. You can find additional information about the Fund at fundresearch.fidelity.com/prospectus/sec. You can also request this information by contacting us at 1-800-FIDELITY or by sending an e-mail to fidfunddocuments@fidelity.com.
What were your Fund costs for the last year?(based on hypothetical $10,000 investment)
FUND COST (PREVIOUS YEAR)
| | Costs of a $10,000 investment | Costs paid as a percentage of a $10,000 investment | |
| Fidelity® Dividend ETF for Rising Rates | $ 21 | 0.19% | |
What affected the Fund's performance this period?
•U.S. equities gained for the 12 months ending July 31, 2024, driven by resilient corporate profits, a frenzy over generative artificial intelligence and the Federal Reserve's likely pivot to cutting interest rates later this year.
•Against this backdrop, the information technology sector gained 36% and contributed most to the fund's performance for the fiscal year. Exposure to financials stocks, which rose 27%, also helped, as did industrials (+14%), propelled by the capital goods (+19%) industry in particular. The communication services sector increased roughly 12%, while health care was up about 6% and consumer staples advanced 7%, all bolstering performance. The portfolio's stakes in utilities (+19%), energy (+8%), materials (+11%) and real estate (+3%) companies were advantageous as well.
•Turning to individual holdings, the top contributor was Nvidia (+61%), within the semiconductors & semiconductor equipment industry. Also in that category, a position in Broadcom (+83%) provided an added lift. Exposure to software & services firm Microsoft (+25%) was another plus, along with technology hardware & equipment giant Apple (+14%). Among banks, JPMorgan Chase (+38%) further aided performance.
•Conversely, the fund's positions in the consumer discretionary sector returned -2% and hurt most, notably pressured by the consumer services industry (-12%). The portfolio's international holdings detracted overall, hampered in part by broadly stronger U.S. dollar.
•On a stock-specific basis, the biggest detractor was consumer durables & apparel company Nike (-31%). In transportation, a stake in United Parcel Service (-27%) was another challenge for the fund. Pharmaceuticals, biotechnology & life sciences firm Bristol-Myers Squibb returned approximately -20% and hurt as well. Exposure to CVS Health (-20%), a stock in the health care equipment & services group, also proved detrimental. Lastly, in terms of consumer staples distribution & retail holdings, Walgreens Boots Alliance (-45%) further pressured the fund's return.
How did the Fund perform over the life of Fund?
CUMULATIVE PERFORMANCE
September 12, 2016 through July 31, 2024.
Initial investment of $10,000.
Fidelity® Dividend ETF for Rising Rates | $10,000 | $11,485 | $13,098 | $13,896 | $14,154 | $19,471 | $19,264 | $20,838 | $24,558 |
Fidelity Dividend Index for Rising Rates℠ | $10,000 | $11,526 | $13,195 | $14,045 | $14,341 | $19,793 | $19,650 | $21,314 | $25,156 |
Russell 1000® Index | $10,000 | $11,635 | $13,519 | $14,600 | $16,357 | $22,568 | $21,017 | $23,739 | $28,843 |
| | 2016 | 2017 | 2018 | 2019 | 2020 | 2021 | 2022 | 2023 | 2024 |
AVERAGE ANNUAL TOTAL RETURNS: | | 1 Year | 5 Year | Life of Fund |
Fidelity® Dividend ETF for Rising Rates - NAV A | 17.85% | 12.06% | 12.06% |
Fidelity® Dividend ETF for Rising Rates - Market Price B | 17.95% | 12.03% | 12.11% |
Fidelity Dividend Index for Rising Rates℠ A | 18.03% | 12.36% | 12.41% |
Russell 1000® Index A | 21.50% | 14.59% | 14.37% |
A From September 12, 2016
B From September 15, 2016, date initially listed on the NYSE Arca, Inc. exchange
Visit www.fidelity.com for more recent performance information. |
The Fund's past performance is not a good predictor of the Fund's future performance. The graph and table do not reflect the deduction of taxes that a shareholder would pay on fund distributions or redemption of fund shares. |
Key Fund Statistics (as of July 31, 2024)
KEY FACTS | | |
| Fund Size | $544,623,603 | |
| Number of Holdings | 116 | |
| Total Advisory Fee | $961,817 | |
| Portfolio Turnover | 32% | |
What did the Fund invest in?
(as of July 31, 2024)
MARKET SECTORS (% of Fund's net assets) | | |
| Information Technology | 32.5 | |
| Financials | 13.6 | |
| Health Care | 11.6 | |
| Industrials | 9.2 | |
| Consumer Discretionary | 9.0 | |
| Communication Services | 7.6 | |
| Consumer Staples | 5.5 | |
| Energy | 3.5 | |
| Materials | 2.5 | |
| Real Estate | 2.4 | |
| Utilities | 2.3 | |
| |
| Common Stocks | 99.7 |
| Short-Term Investments and Net Other Assets (Liabilities) | 0.3 |
ASSET ALLOCATION (% of Fund's net assets) |
|
|
| United States | 93.7 |
| United Kingdom | 2.0 |
| Germany | 1.8 |
| Sweden | 1.2 |
| Japan | 0.9 |
| Denmark | 0.4 |
GEOGRAPHIC DIVERSIFICATION (% of Fund's net assets) |
|
| |
|
TOP HOLDINGS (% of Fund's net assets) | | |
| Apple Inc | 7.5 | |
| NVIDIA Corp | 7.4 | |
| Microsoft Corp | 7.1 | |
| Broadcom Inc | 2.6 | |
| Eli Lilly & Co | 2.2 | |
| JPMorgan Chase & Co | 1.9 | |
| UnitedHealth Group Inc | 1.9 | |
| Texas Instruments Inc | 1.6 | |
| Johnson & Johnson | 1.5 | |
| Abbvie Inc | 1.4 | |
| | 35.1 | |
| |
How has the Fund changed?
This is a summary of certain changes to the Fund since August 1, 2023. For more complete information, you may review the Fund's next prospectus, which we expect to be available by November 29, 2024 at fundresearch.fidelity.com/prospectus/sec or upon request at 1-800-FIDELITY or by sending an e-mail to fidfunddocuments@fidelity.com.
The fees associated with this class changed during the reporting year. The variations in class fees are primarily the result of the following changes: The fund's contractual management fee was reduced during the reporting period. |
| Fidelity, the Fidelity Investments Logo and all other Fidelity trademarks or service marks used herein are trademarks or service marks of FMR LLC. Any third-party marks that are used herein are trademarks or service marks of their respective owners. © 2024 FMR LLC. All rights reserved. |
| | For additional information about the Fund; including its prospectus, financial information, holdings and proxy information, scan the QR code or visit fundresearch.fidelity.com/prospectus/sec 1.9913540.100 2854-TSRA-0924 |
| |
| | ANNUAL SHAREHOLDER REPORT | AS OF JULY 31, 2024 | |
| | Fidelity® Fundamental Large Cap Value ETF Fidelity® Fundamental Large Cap Value ETF : FFLV Principal U.S. Listing Exchange :CboeBZX Cboe BZX Exchange, Inc. |
| | | |
This annual shareholder report contains information about Fidelity® Fundamental Large Cap Value ETF for the period February 22, 2024 to July 31, 2024. You can find additional information about the Fund at fundresearch.fidelity.com/prospectus/sec. You can also request this information by contacting us at 1-800-FIDELITY or by sending an e-mail to fidfunddocuments@fidelity.com.
What were your Fund costs for the last year?(based on hypothetical $10,000 investment)
FUND COST (PREVIOUS YEAR)
| | Costs of a $10,000 investment | Costs paid as a percentage of a $10,000 investment | |
Fidelity® Fundamental Large Cap Value ETF A | $ 17 | 0.38% | |
A Expenses for the full reporting period would be higher.
Key Fund Statistics (as of July 31, 2024)
KEY FACTS | | |
| Fund Size | $1,601,511 | |
| Number of Holdings | 114 | |
| Total Advisory Fee | $2,281 | |
Portfolio TurnoverA | 29% | |
A Amount not annualized
What did the Fund invest in?
(as of July 31, 2024)
MARKET SECTORS (% of Fund's net assets) | | |
| Financials | 23.7 | |
| Industrials | 14.2 | |
| Health Care | 13.4 | |
| Energy | 10.1 | |
| Information Technology | 9.3 | |
| Consumer Staples | 7.5 | |
| Utilities | 5.5 | |
| Consumer Discretionary | 4.5 | |
| Real Estate | 4.3 | |
| Communication Services | 3.7 | |
| Materials | 3.3 | |
| |
| Common Stocks | 99.5 |
| Short-Term Investments and Net Other Assets (Liabilities) | 0.5 |
ASSET ALLOCATION (% of Fund's net assets) |
|
|
| United States | 94.8 |
| Canada | 2.4 |
| United Kingdom | 1.1 |
| Taiwan | 0.9 |
| Spain | 0.8 |
GEOGRAPHIC DIVERSIFICATION (% of Fund's net assets) |
|
| |
|
TOP HOLDINGS (% of Fund's net assets) | | |
| Exxon Mobil Corp | 4.6 | |
| JPMorgan Chase & Co | 4.5 | |
| Cisco Systems Inc | 3.6 | |
| Wells Fargo & Co | 3.1 | |
| Hartford Financial Services Group Inc/The | 2.6 | |
| Bank of America Corp | 2.3 | |
| Comcast Corp Class A | 2.3 | |
| UnitedHealth Group Inc | 2.2 | |
| Travelers Cos Inc/The | 2.2 | |
| Shell PLC ADR | 2.1 | |
| | 29.5 | |
| |
| Fidelity, the Fidelity Investments Logo and all other Fidelity trademarks or service marks used herein are trademarks or service marks of FMR LLC. Any third-party marks that are used herein are trademarks or service marks of their respective owners. © 2024 FMR LLC. All rights reserved. |
| | For additional information about the Fund; including its prospectus, financial information, holdings and proxy information, scan the QR code or visit fundresearch.fidelity.com/prospectus/sec 1.9916936.100 7573-TSRA-0924 |
Item 2.
Code of Ethics
As of the end of the period, July 31, 2024, Fidelity Covington Trust (the trust) has adopted a code of ethics, as defined in Item 2 of Form N-CSR, that applies to its President and Treasurer and its Chief Financial Officer. A copy of the code of ethics is filed as an exhibit to this Form N-CSR.
Item 3.
Audit Committee Financial Expert
The Board of Trustees of the trust has determined that Donald F. Donahue is an audit committee financial expert, as defined in Item 3 of Form N-CSR. Mr. Donahue is independent for purposes of Item 3 of Form N-CSR.
Item 4.
Principal Accountant Fees and Services
Fees and Services
The following table presents fees billed by Deloitte & Touche LLP, the member firms of Deloitte Touche Tohmatsu, and their respective affiliates (collectively, “Deloitte Entities”) in each of the last two fiscal years for services rendered to Fidelity Fundamental Large Cap Growth ETF, Fidelity Fundamental Small-Mid Cap ETF,
Fidelity Magellan ETF, Fidelity Real Estate Investment ETF, Fidelity Stocks for Inflation ETF, Fidelity Sustainable U.S. Equity ETF, and Fidelity Women's Leadership ETF (the “Funds”):
Services Billed by Deloitte Entities
July 31, 2024 FeesA
| | | | |
| Audit Fees | Audit-Related Fees | Tax Fees | All Other Fees |
Fidelity Fundamental Large Cap Growth ETF | $16,700 | $- | $3,200 | $300 |
Fidelity Fundamental Small-Mid Cap ETF | $14,800 |
| $3,200 | $300 |
Fidelity Magellan ETF | $14,800 | $- | $3,200 | $300 |
Fidelity Real Estate Investment ETF | $14,800 | $- | $3,200 | $300 |
Fidelity Stocks for Inflation ETF | $15,400 | $- | $4,100 | $400 |
Fidelity Sustainable U.S. Equity ETF | $15,100 | $- | $3,700 | $400 |
Fidelity Women's Leadership ETF | $15,100 | $- | $3,700 | $400 |
|
|
|
|
|
|
|
|
|
|
| | | | |
| Audit Fees | Audit-Related Fees | Tax Fees | All Other Fees |
Fidelity Fundamental Large Cap Growth ETF | $13,200 | $- | $3,200 | $300 |
Fidelity Fundamental Small-Mid Cap ETF | $13,200 | $- | $3,200 | $300 |
Fidelity Magellan ETF | $13,200 | $- | $3,200 | $300 |
Fidelity Real Estate Investment ETF | $13,200 | $- | $3,200 | $300 |
Fidelity Stocks for Inflation ETF | $14,000 | $- | $3,800 | $400 |
Fidelity Sustainable U.S. Equity ETF | $13,600 | $- | $3,700 | $300 |
Fidelity Women's Leadership ETF | $13,600 | $- | $3,700 | $300 |
|
|
|
|
|
|
|
|
|
|
A Amounts may reflect rounding.
The following table presents fees billed by PricewaterhouseCoopers LLP (“PwC”) in each of the last two fiscal years for services rendered to Fidelity Blue Chip Growth ETF, Fidelity Blue Chip Value ETF, Fidelity Dividend ETF for Rising Rates, Fidelity Fundamental Large Cap Core ETF, Fidelity Fundamental Large Cap Value ETF, Fidelity High Dividend ETF, Fidelity Low Volatility Factor ETF, Fidelity Momentum Factor ETF, Fidelity Quality Factor ETF, Fidelity Small-Mid Multifactor ETF, Fidelity U.S. Multifactor ETF, and Fidelity Value Factor ETF (the “Funds”):
Services Billed by PwC
July 31, 2024 FeesA,B
| | | | |
| Audit Fees | Audit-Related Fees | Tax Fees | All Other Fees |
Fidelity Blue Chip Growth ETF | $15,000 |
$- | $4,600 | $500 |
Fidelity Blue Chip Value ETF | $14,900 |
$- | $4,600 | $500 |
Fidelity Dividend ETF for Rising Rates | $11,900 |
$- | $4,600 | $400 |
Fidelity Fundamental Large Cap Core ETF | $14,900 | $- | $4,600 | $500 |
Fidelity Fundamental Large Cap Value ETF | $15,300 | $- | $4,700 | $100 |
Fidelity High Dividend ETF | $12,000 |
$- | $4,600 | $400 |
Fidelity Low Volatility Factor ETF | $11,600 |
$- | $4,400 | $400 |
Fidelity Momentum Factor ETF | $11,600 |
$- | $4,400 | $400 |
Fidelity Quality Factor ETF | $11,600 |
$- | $4,400 | $400 |
Fidelity Small-Mid Multifactor ETF | $14,500 |
$- | $4,900 | $500 |
Fidelity U.S. Multifactor ETF | $14,900 | $- | $4,600 | $500 |
Fidelity Value Factor ETF | $11,600 | $- | $4,400 | $400 |
| | | | | |
| Audit Fees | Audit-Related Fees | Tax Fees | All Other Fees |
Fidelity Blue Chip Growth ETF | $14,900 |
$- | $4,600 | $500 |
Fidelity Blue Chip Value ETF | $14,900 |
$- | $4,600 | $500 |
Fidelity Dividend ETF for Rising Rates | $11,900 |
$- | $4,600 | $400 |
Fidelity Fundamental Large Cap Core ETF | $14,900 |
$- | $4,600 | $500 |
Fidelity Fundamental Large Cap Value ETF | $- | $- | $- | $- |
Fidelity High Dividend ETF | $12,000 |
$- | $4,600 | $400 |
Fidelity Low Volatility Factor ETF | $11,700 |
$- | $4,400 | $400 |
Fidelity Momentum Factor ETF | $11,700 |
$- | $4,400 | $400 |
Fidelity Quality Factor ETF | $11,700 |
$- | $4,400 | $400 |
Fidelity Small-Mid Multifactor ETF | $14,500 | $- | $4,900 | $500 |
Fidelity U.S. Multifactor ETF | $14,900 | $- | $4,600 | $500 |
Fidelity Value Factor ETF | $11,700 | $- | $4,400 | $400 |
A Amounts may reflect rounding.
B Fidelity Fundamental Large Cap Value ETF commenced operations on February 22, 2024.
The following table(s) present(s) fees billed by Deloitte Entities and PwC that were required to be approved by the Audit Committee for services that relate directly to the operations and financial reporting of the Fund(s) and that are rendered on behalf of Fidelity Management & Research Company LLC ("FMR") and entities controlling, controlled by, or under common control with FMR (not including any sub-adviser whose role is primarily portfolio management and is subcontracted with or overseen by another investment adviser) that provide ongoing services to the Fund(s) (“Fund Service Providers”):
Services Billed by Deloitte Entities
| | |
| July 31, 2024A | July 31, 2023A |
Audit-Related Fees | $200,000 | $80,000 |
Tax Fees | $- | $- |
All Other Fees | $1,929,500
| $- |
|
|
|
A Amounts may reflect rounding.
Services Billed by PwC
| | |
| July 31, 2024A,B | July 31, 2023A,B |
Audit-Related Fees | $9,437,800 | $8,699,200 |
Tax Fees | $61,000 | $1,000 |
All Other Fees | $35,000 | $- |
A Amounts may reflect rounding.
B May include amounts billed prior to the Fidelity Fundamental Large Cap Value ETF’s commencement of operations.
“Audit-Related Fees” represent fees billed for assurance and related services that are reasonably related to the performance of the fund audit or the review of the fund's financial statements and that are not reported under Audit Fees.
“Tax Fees” represent fees billed for tax compliance, tax advice or tax planning that relate directly to the operations and financial reporting of the fund.
“All Other Fees” represent fees billed for services provided to the fund or Fund Service Provider, a significant portion of which are assurance related, that relate directly to the operations and financial reporting of the fund, excluding those services that are reported under Audit Fees, Audit-Related Fees or Tax Fees.
Assurance services must be performed by an independent public accountant.
* * *
The aggregate non-audit fees billed by Deloitte Entities and PwC for services rendered to the Fund(s), FMR (not including any sub-adviser whose role is primarily portfolio management and is subcontracted with or overseen by another investment adviser), and any Fund Service Provider for each of the last two fiscal years of the Fund(s) are as follows:
| | |
Billed By | July 31, 2024A,B | July 31, 2023A,B |
Deloitte Entities | $5,035,700 | $3,370,400 |
PwC | $15,068,200 | $14,208,000 |
A Amounts may reflect rounding.
B May include amounts billed prior to the Fidelity Fundamental Large Cap Value ETF’s commencement of operations.
The trust's Audit Committee has considered non-audit services that were not pre-approved that were provided by Deloitte Entities and PwC to Fund Service Providers to be compatible with maintaining the independence of Deloitte Entities and PwC in its(their) audit of the Fund(s), taking into account representations from Deloitte Entities and PwC, in accordance with Public Company Accounting Oversight Board rules, regarding its independence from the Fund(s) and its(their) related entities and FMR’s review of the appropriateness and permissibility under applicable law of such non-audit services prior to their provision to the Fund(s) Service Providers.
Audit Committee Pre-Approval Policies and Procedures
The trust’s Audit Committee must pre-approve all audit and non-audit services provided by a fund’s independent registered public accounting firm relating to the operations or financial reporting of the fund. Prior to the commencement of any audit or non-audit services to a fund, the Audit Committee reviews the services to determine whether they are appropriate and permissible under applicable law.
The Audit Committee has adopted policies and procedures to, among other purposes, provide a framework for the Committee’s consideration of non-audit services by the audit firms that audit the Fidelity funds. The policies and procedures require that any non-audit service provided by a fund audit firm to a Fidelity fund and any non-audit service provided by a fund auditor to a Fund Service Provider that relates directly to the operations and financial reporting of a Fidelity fund (“Covered Service”) are subject to approval by the Audit Committee before such service is provided.
All Covered Services must be approved in advance of provision of the service either: (i) by formal resolution of the Audit Committee, or (ii) by oral or written approval of the service by the Chair of the Audit Committee (or if the Chair is unavailable, such other member of the Audit Committee as may be designated by the Chair to act in the Chair’s absence). The approval contemplated by (ii) above is permitted where the Treasurer determines that action on such an engagement is necessary before the next meeting of the Audit Committee.
Non-audit services provided by a fund audit firm to a Fund Service Provider that do not relate directly to the operations and financial reporting of a Fidelity fund are reported to the Audit Committee periodically.
Non-Audit Services Approved Pursuant to Rule 2-01(c)(7)(i)(C) and (ii) of Regulation S-X (“De Minimis Exception”)
There were no non-audit services approved or required to be approved by the Audit Committee pursuant to the De Minimis Exception during the Fund’s(s’) last two fiscal years relating to services provided to (i) the Fund(s) or (ii) any Fund Service Provider that relate directly to the operations and financial reporting of the Fund(s).
The Registrant has not retained, for the preparation of the audit report on the financial statements included in the Form N-CSR, a registered public accounting firm that has a branch or office that is located in a foreign jurisdiction and that the Public Company Accounting Oversight Board (the “PCAOB”) has determined that the PCAOB is unable to inspect or investigate completely because of a position taken by an authority in the foreign jurisdiction.
The Registrant is not a “foreign issuer,” as defined in 17 CFR 240.3b-4.
Item 5.
Audit Committee of Listed Registrants
The Audit Committee is a separately-designated standing audit committee in accordance with Section 3(a)(58)(A) of the Securities Exchange Act of 1934. As of July 31, 2024, the members of the Audit Committee were Donald Donahue, Thomas Bostick, Thomas Kennedy and Susan Tomasky.
Item 6.
Investments
(a)
Not applicable.
(b)
Not applicable.
Item 7.
Financial Statements and Financial Highlights for Open-End Management Investment Companies
Fidelity® Dividend ETF for Rising Rates
Fidelity® High Dividend ETF
Fidelity® Low Volatility Factor ETF
Fidelity® Momentum Factor ETF
Fidelity® Quality Factor ETF
Fidelity® Small-Mid Multifactor ETF
Fidelity® Stocks for Inflation ETF
Fidelity® U.S. Multifactor ETF
Fidelity® Value Factor ETF
Annual Report
July 31, 2024
Contents
To view a fund's proxy voting guidelines and proxy voting record for the 12-month period ended June 30, visit http://www.fidelity.com/proxyvotingresults or visit the Securities and Exchange Commission's (SEC) web site at http://www.sec.gov.
You may also call 1-800-FIDELITY to request a free copy of the proxy voting guidelines.
The funds or securities referred to herein are not sponsored, endorsed, or promoted by Fidelity Product Services LLC (FPS), and FPS bears no liability with respect to any such funds or securities or any index on which such funds or securities are based. The prospectus contains a more detailed description of the relationship between FPS and any related funds.
Standard & Poor's, S&P and S&P 500 are registered service marks of The McGraw-Hill Companies, Inc. and have been licensed for use by Fidelity Distributors Corporation.
Other third-party marks appearing herein are the property of their respective owners.
All other marks appearing herein are registered or unregistered trademarks or service marks of FMR LLC or an affiliated company. © 2024 FMR LLC. All rights reserved.
This report and the financial statements contained herein are submitted for the general information of the shareholders of the Funds. This report is not authorized for distribution to prospective investors in the Funds unless preceded or accompanied by an effective prospectus.
A fund files its complete schedule of portfolio holdings with the SEC for the first and third quarters of each fiscal year on Form N-PORT. Forms N-PORT are available on the SEC's web site at http://www.sec.gov. A fund's Forms N-PORT may be reviewed and copied at the SEC's Public Reference Room in Washington, DC. Information regarding the operation of the SEC's Public Reference Room may be obtained by calling 1-800-SEC-0330.
For a complete list of a fund's portfolio holdings, view the most recent holdings listing, semiannual report, or annual report on Fidelity's web site at http://www.fidelity.com, http://www.institutional.fidelity.com, or http://www.401k.com, as applicable.
NOT FDIC INSURED •MAY LOSE VALUE •NO BANK GUARANTEE
Neither the Funds nor Fidelity Distributors Corporation is a bank.
Item 7: Financial Statements and Financial Highlights for Open-End Management Investment Companies (Annual Report)
Fidelity® Dividend ETF for Rising Rates
Schedule of Investments July 31, 2024
Showing Percentage of Net Assets
| Common Stocks - 99.7% |
| | | Shares | Value ($) |
| COMMUNICATION SERVICES - 7.6% | | | |
| Diversified Telecommunication Services - 1.6% | | | |
| AT&T, Inc. | | 221,436 | 4,262,643 |
| Verizon Communications, Inc. | | 106,450 | 4,313,354 |
| | | | 8,575,997 |
| Entertainment - 1.6% | | | |
| Electronic Arts, Inc. | | 21,617 | 3,262,870 |
| TKO Group Holdings, Inc. | | 31,285 | 3,421,015 |
| Warner Music Group Corp. Class A (a) | | 72,091 | 2,163,451 |
| | | | 8,847,336 |
| Media - 4.4% | | | |
| Comcast Corp. Class A | | 98,844 | 4,079,292 |
| Fox Corp. Class A | | 84,839 | 3,227,276 |
| Interpublic Group of Companies, Inc. | | 83,054 | 2,671,847 |
| News Corp. Class A | | 111,174 | 3,066,179 |
| Nexstar Media Group, Inc. | | 15,033 | 2,777,948 |
| Omnicom Group, Inc. | | 31,302 | 3,068,848 |
| Paramount Global Class B (a) | | 183,907 | 2,100,218 |
| The New York Times Co. Class A | | 55,242 | 2,960,419 |
| | | | 23,952,027 |
TOTAL COMMUNICATION SERVICES | | | 41,375,360 |
| CONSUMER DISCRETIONARY - 9.0% | | | |
| Automobiles - 2.4% | | | |
| Bayerische Motoren Werke AG (BMW) | | 29,449 | 2,734,806 |
| Ford Motor Co. | | 297,560 | 3,219,599 |
| General Motors Co. | | 94,176 | 4,173,880 |
| Mercedes-Benz Group AG (Germany) | | 45,298 | 2,997,878 |
| | | | 13,126,163 |
| Hotels, Restaurants & Leisure - 2.2% | | | |
| Marriott International, Inc. Class A | | 15,325 | 3,483,373 |
| McDonald's Corp. | | 18,100 | 4,803,740 |
| Starbucks Corp. | | 45,299 | 3,531,057 |
| | | | 11,818,170 |
| Specialty Retail - 3.8% | | | |
| Best Buy Co., Inc. | | 43,186 | 3,736,453 |
| Lowe's Companies, Inc. | | 20,193 | 4,957,583 |
| The Home Depot, Inc. | | 19,236 | 7,081,926 |
| TJX Companies, Inc. | | 44,054 | 4,978,983 |
| | | | 20,754,945 |
| Textiles, Apparel & Luxury Goods - 0.6% | | | |
| NIKE, Inc. Class B | | 43,433 | 3,251,394 |
TOTAL CONSUMER DISCRETIONARY | | | 48,950,672 |
| CONSUMER STAPLES - 5.5% | | | |
| Beverages - 1.8% | | | |
| PepsiCo, Inc. | | 26,898 | 4,644,478 |
| The Coca-Cola Co. | | 75,947 | 5,068,703 |
| | | | 9,713,181 |
| Consumer Staples Distribution & Retail - 0.2% | | | |
| Walgreens Boots Alliance, Inc. | | 98,221 | 1,165,883 |
| Household Products - 1.1% | | | |
| Procter & Gamble Co. | | 38,312 | 6,159,037 |
| Tobacco - 2.4% | | | |
| Altria Group, Inc. | | 69,305 | 3,396,638 |
| British American Tobacco PLC (United Kingdom) | | 70,979 | 2,502,588 |
| Imperial Brands PLC | | 88,329 | 2,432,458 |
| Philip Morris International, Inc. | | 39,098 | 4,502,526 |
| | | | 12,834,210 |
TOTAL CONSUMER STAPLES | | | 29,872,311 |
| ENERGY - 3.5% | | | |
| Oil, Gas & Consumable Fuels - 3.5% | | | |
| Chevron Corp. | | 25,524 | 4,095,836 |
| Civitas Resources, Inc. | | 16,881 | 1,177,619 |
| ConocoPhillips Co. | | 21,721 | 2,415,375 |
| Devon Energy Corp. | | 31,023 | 1,459,012 |
| EOG Resources, Inc. | | 15,191 | 1,926,219 |
| Exxon Mobil Corp. | | 52,510 | 6,227,161 |
| Targa Resources Corp. | | 14,133 | 1,911,912 |
| | | | 19,213,134 |
| FINANCIALS - 13.6% | | | |
| Banks - 7.9% | | | |
| Bank of America Corp. | | 172,215 | 6,941,987 |
| Citigroup, Inc. | | 79,585 | 5,163,475 |
| JPMorgan Chase & Co. | | 49,875 | 10,613,400 |
| PNC Financial Services Group, Inc. | | 27,064 | 4,901,290 |
| Truist Financial Corp. | | 105,144 | 4,698,885 |
| U.S. Bancorp | | 97,755 | 4,387,244 |
| Wells Fargo & Co. | | 106,771 | 6,335,791 |
| | | | 43,042,072 |
| Capital Markets - 4.3% | | | |
| Blackstone, Inc. | | 34,270 | 4,871,481 |
| CME Group, Inc. | | 19,964 | 3,867,226 |
| Goldman Sachs Group, Inc. | | 12,119 | 6,168,935 |
| Morgan Stanley | | 51,687 | 5,334,615 |
| Schroders PLC | | 650,094 | 3,279,932 |
| | | | 23,522,189 |
| Financial Services - 1.4% | | | |
| Visa, Inc. Class A | | 28,946 | 7,690,084 |
TOTAL FINANCIALS | | | 74,254,345 |
| HEALTH CARE - 11.6% | | | |
| Biotechnology - 1.4% | | | |
| AbbVie, Inc. | | 42,235 | 7,826,990 |
| Health Care Providers & Services - 2.6% | | | |
| CVS Health Corp. | | 66,824 | 4,031,492 |
| UnitedHealth Group, Inc. | | 17,592 | 10,135,807 |
| | | | 14,167,299 |
| Pharmaceuticals - 7.6% | | | |
| Bayer AG | | 128,322 | 3,817,880 |
| Bristol-Myers Squibb Co. | | 102,383 | 4,869,335 |
| Eli Lilly & Co. | | 14,436 | 11,610,442 |
| Johnson & Johnson | | 50,429 | 7,960,218 |
| Merck & Co., Inc. | | 58,058 | 6,568,102 |
| Pfizer, Inc. | | 204,065 | 6,232,145 |
| | | | 41,058,122 |
TOTAL HEALTH CARE | | | 63,052,411 |
| INDUSTRIALS - 9.3% | | | |
| Aerospace & Defense - 2.8% | | | |
| General Electric Co. | | 31,386 | 5,341,897 |
| Lockheed Martin Corp. | | 8,589 | 4,654,551 |
| RTX Corp. | | 44,395 | 5,215,969 |
| | | | 15,212,417 |
| Air Freight & Logistics - 0.6% | | | |
| United Parcel Service, Inc. Class B | | 26,526 | 3,458,195 |
| Electrical Equipment - 0.3% | | | |
| GE Vernova LLC | | 7,847 | 1,398,649 |
| Ground Transportation - 0.8% | | | |
| Union Pacific Corp. | | 17,245 | 4,254,859 |
| Industrial Conglomerates - 1.3% | | | |
| CK Hutchison Holdings Ltd. | | 519,200 | 2,724,936 |
| Honeywell International, Inc. | | 20,606 | 4,219,079 |
| | | | 6,944,015 |
| Machinery - 2.1% | | | |
| Caterpillar, Inc. | | 14,144 | 4,896,653 |
| Deere & Co. | | 9,663 | 3,594,443 |
| PACCAR, Inc. | | 31,851 | 3,142,420 |
| | | | 11,633,516 |
| Marine Transportation - 1.4% | | | |
| A.P. Moller - Maersk A/S Series B | | 1,483 | 2,458,082 |
| Mitsui OSK Lines Ltd. | | 73,800 | 2,360,266 |
| Nippon Yusen KK (a) | | 77,000 | 2,507,131 |
| | | | 7,325,479 |
| Transportation Infrastructure - 0.0% | | | |
| Svitzer A/S | | 2,962 | 113,503 |
TOTAL INDUSTRIALS | | | 50,340,633 |
| INFORMATION TECHNOLOGY - 32.4% | | | |
| Communications Equipment - 2.5% | | | |
| Cisco Systems, Inc. | | 145,278 | 7,038,719 |
| Telefonaktiebolaget LM Ericsson (B Shares) | | 939,223 | 6,420,045 |
| | | | 13,458,764 |
| IT Services - 1.3% | | | |
| IBM Corp. | | 37,151 | 7,138,193 |
| Semiconductors & Semiconductor Equipment - 11.6% | | | |
| Broadcom, Inc. | | 89,437 | 14,370,737 |
| NVIDIA Corp. | | 344,197 | 40,277,933 |
| Texas Instruments, Inc. | | 41,773 | 8,513,755 |
| | | | 63,162,425 |
| Software - 7.0% | | | |
| Microsoft Corp. | | 91,790 | 38,400,347 |
| Technology Hardware, Storage & Peripherals - 10.0% | | | |
| Apple, Inc. | | 183,016 | 40,644,193 |
| Dell Technologies, Inc. | | 62,478 | 7,102,499 |
| HP, Inc. | | 186,416 | 6,727,753 |
| | | | 54,474,445 |
TOTAL INFORMATION TECHNOLOGY | | | 176,634,174 |
| MATERIALS - 2.5% | | | |
| Chemicals - 1.6% | | | |
| Air Products & Chemicals, Inc. | | 5,122 | 1,351,440 |
| Dow, Inc. | | 20,834 | 1,134,828 |
| International Flavors & Fragrances, Inc. | | 11,428 | 1,136,857 |
| Linde PLC | | 6,912 | 3,134,592 |
| LyondellBasell Industries NV Class A | | 10,294 | 1,023,841 |
| The Mosaic Co. | | 26,665 | 793,817 |
| | | | 8,575,375 |
| Containers & Packaging - 0.4% | | | |
| Amcor PLC | | 91,038 | 958,630 |
| International Paper Co. | | 24,515 | 1,139,457 |
| | | | 2,098,087 |
| Metals & Mining - 0.5% | | | |
| Freeport-McMoRan, Inc. | | 33,074 | 1,501,890 |
| Newmont Corp. | | 32,364 | 1,588,101 |
| | | | 3,089,991 |
TOTAL MATERIALS | | | 13,763,453 |
| REAL ESTATE - 2.4% | | | |
| Equity Real Estate Investment Trusts (REITs) - 2.4% | | | |
| Crown Castle, Inc. | | 13,717 | 1,509,967 |
| Gaming & Leisure Properties | | 24,599 | 1,234,870 |
| Omega Healthcare Investors, Inc. | | 36,834 | 1,340,758 |
| Prologis, Inc. | | 17,580 | 2,215,959 |
| Public Storage Operating Co. | | 5,213 | 1,542,631 |
| Simon Property Group, Inc. | | 10,721 | 1,645,030 |
| VICI Properties, Inc. | | 43,550 | 1,361,373 |
| Weyerhaeuser Co. | | 37,975 | 1,206,086 |
| WP Carey, Inc. | | 18,440 | 1,066,016 |
| | | | 13,122,690 |
| UTILITIES - 2.3% | | | |
| Electric Utilities - 2.0% | | | |
| American Electric Power Co., Inc. | | 16,385 | 1,607,696 |
| Duke Energy Corp. | | 16,993 | 1,856,825 |
| Edison International | | 16,669 | 1,333,687 |
| Exelon Corp. | | 35,142 | 1,307,282 |
| NextEra Energy, Inc. | | 36,223 | 2,767,075 |
| Southern Co. | | 23,800 | 1,987,776 |
| | | | 10,860,341 |
| Multi-Utilities - 0.3% | | | |
| Dominion Energy, Inc. | | 27,321 | 1,460,581 |
TOTAL UTILITIES | | | 12,320,922 |
| TOTAL COMMON STOCKS (Cost $440,039,047) | | | 542,900,105 |
| | | | |
| Money Market Funds - 1.0% |
| | | Shares | Value ($) |
| Fidelity Cash Central Fund 5.39% (b) | | 520,190 | 520,294 |
| Fidelity Securities Lending Cash Central Fund 5.39% (b)(c) | | 5,046,076 | 5,046,580 |
| TOTAL MONEY MARKET FUNDS (Cost $5,566,874) | | | 5,566,874 |
| | | | |
| TOTAL INVESTMENT IN SECURITIES - 100.7% (Cost $445,605,921) | 548,466,979 |
NET OTHER ASSETS (LIABILITIES) - (0.7)% | (3,843,376) |
| NET ASSETS - 100.0% | 544,623,603 |
| | |
| Futures Contracts |
| | Number of contracts | Expiration Date | Notional Amount ($) | Value ($) | Unrealized Appreciation/ (Depreciation) ($) |
| Purchased | | | | | |
| | | | | | |
| Equity Index Contracts | | | | | |
| CME E-mini S&P 500 Index Contracts (United States) | 5 | Sep 2024 | 1,389,500 | 15,322 | 15,322 |
| | | | | | |
| The notional amount of futures purchased as a percentage of Net Assets is 0.3% |
Legend
| (a) | Security or a portion of the security is on loan at period end. |
| (b) | Affiliated fund that is generally available only to investment companies and other accounts managed by Fidelity Investments. The rate quoted is the annualized seven-day yield of the fund at period end. A complete unaudited listing of the fund's holdings as of its most recent quarter end is available upon request. In addition, each Fidelity Central Fund's financial statements, which are not covered by the Fund's Report of Independent Registered Public Accounting Firm, are available on the SEC's website or upon request. |
| (c) | Investment made with cash collateral received from securities on loan. |
Affiliated Central Funds
Fiscal year to date information regarding the Fund's investments in Fidelity Central Funds, including the ownership percentage, is presented below.
| Affiliate | Value, beginning of period ($) | Purchases ($) | Sales Proceeds ($) | Dividend Income ($) | Realized Gain (loss) ($) | Change in Unrealized appreciation (depreciation) ($) | Value, end of period ($) | % ownership, end of period |
| Fidelity Cash Central Fund 5.39% | 2,062,133 | 29,196,469 | 30,738,298 | 72,411 | (10) | - | 520,294 | 0.0% |
| Fidelity Securities Lending Cash Central Fund 5.39% | 6,087,575 | 57,338,080 | 58,379,075 | 18,298 | - | - | 5,046,580 | 0.0% |
| Total | 8,149,708 | 86,534,549 | 89,117,373 | 90,709 | (10) | - | 5,566,874 | |
| | | | | | | | | |
Amounts in the dividend income column in the above table include any capital gain distributions from underlying funds, which are presented in the corresponding line item in the Statement of Operations, if applicable.
Amounts in the dividend income column for Fidelity Securities Lending Cash Central Fund represents the income earned on investing cash collateral, less rebates paid to borrowers and any lending agent fees associated with the loan, plus any premium payments received for lending certain types of securities.
Amounts included in the purchases and sales proceeds columns may include in-kind transactions, if applicable.
Investment Valuation
The following is a summary of the inputs used, as of July 31, 2024, involving the Fund's assets and liabilities carried at fair value. The inputs or methodology used for valuing securities may not be an indication of the risk associated with investing in those securities. For more information on valuation inputs, and their aggregation into the levels used below, please refer to the Investment Valuation section in the accompanying Notes to Financial Statements.
| Valuation Inputs at Reporting Date: |
| Description | Total ($) | Level 1 ($) | Level 2 ($) | Level 3 ($) |
Investments in Securities: | | | | |
|
| Equities: | | | | |
Communication Services | 41,375,360 | 41,375,360 | - | - |
Consumer Discretionary | 48,950,672 | 48,950,672 | - | - |
Consumer Staples | 29,872,311 | 29,872,311 | - | - |
Energy | 19,213,134 | 19,213,134 | - | - |
Financials | 74,254,345 | 74,254,345 | - | - |
Health Care | 63,052,411 | 63,052,411 | - | - |
Industrials | 50,340,633 | 50,340,633 | - | - |
Information Technology | 176,634,174 | 176,634,174 | - | - |
Materials | 13,763,453 | 13,763,453 | - | - |
Real Estate | 13,122,690 | 13,122,690 | - | - |
Utilities | 12,320,922 | 12,320,922 | - | - |
|
| Money Market Funds | 5,566,874 | 5,566,874 | - | - |
| Total Investments in Securities: | 548,466,979 | 548,466,979 | - | - |
Derivative Instruments: Assets | | | | |
Futures Contracts | 15,322 | 15,322 | - | - |
| Total Assets | 15,322 | 15,322 | - | - |
| Total Derivative Instruments: | 15,322 | 15,322 | - | - |
Value of Derivative Instruments
The following table is a summary of the Fund's value of derivative instruments by primary risk exposure as of July 31, 2024. For additional information on derivative instruments, please refer to the Derivative Instruments section in the accompanying Notes to Financial Statements.
Primary Risk Exposure / Derivative Type | Value |
| Asset ($) | Liability ($) |
| Equity Risk | | |
Futures Contracts (a) | 15,322 | 0 |
| Total Equity Risk | 15,322 | 0 |
| Total Value of Derivatives | 15,322 | 0 |
(a)Reflects gross cumulative appreciation (depreciation) on futures contracts as presented in the Schedule of Investments. In the Statement of Assets and Liabilities, the period end daily variation margin is included in receivable or payable for daily variation margin on futures contracts, and the net cumulative appreciation (depreciation) is included in Total accumulated earnings (loss).
Fidelity® Dividend ETF for Rising Rates
Financial Statements
| Statement of Assets and Liabilities |
As of July 31, 2024 |
| Assets | | | | |
| Investment in securities, at value (including securities loaned of $4,782,008) - See accompanying schedule: | | | | |
Unaffiliated issuers (cost $440,039,047) | $ | 542,900,105 | | |
Fidelity Central Funds (cost $5,566,874) | | 5,566,874 | | |
| | | | | |
| | | | | |
| Total Investment in Securities (cost $445,605,921) | | | $ | 548,466,979 |
| Segregated cash with brokers for derivative instruments | | | | 141,600 |
| Foreign currency held at value (cost $197,049) | | | | 198,736 |
| Dividends receivable | | | | 931,110 |
| Distributions receivable from Fidelity Central Funds | | | | 3,880 |
| Receivable for daily variation margin on futures contracts | | | | 21,375 |
| Other receivables | | | | 77 |
Total assets | | | | 549,763,757 |
| Liabilities | | | | |
| Accrued management fee | $ | 68,568 | | |
| Other payables and accrued expenses | | 25,006 | | |
| Collateral on securities loaned | | 5,046,580 | | |
| Total liabilities | | | | 5,140,154 |
| Net Assets | | | $ | 544,623,603 |
| Net Assets consist of: | | | | |
| Paid in capital | | | $ | 506,681,077 |
| Total accumulated earnings (loss) | | | | 37,942,526 |
| Net Assets | | | $ | 544,623,603 |
Net Asset Value, offering price and redemption price per share ($544,623,603 ÷ 11,000,000 shares) | | | $ | 49.51 |
| Statement of Operations |
| Year ended July 31, 2024 |
| Investment Income | | | | |
| Dividends | | | $ | 14,674,700 |
| Income from Fidelity Central Funds (including $18,298 from security lending) | | | | 90,709 |
| Total income | | | | 14,765,409 |
| Expenses | | | | |
| Management fee | $ | 961,817 | | |
| Independent trustees' fees and expenses | | 2,568 | | |
| Miscellaneous | | 25,009 | | |
| Total expenses before reductions | | 989,394 | | |
| Expense reductions | | (255) | | |
| Total expenses after reductions | | | | 989,139 |
| Net Investment income (loss) | | | | 13,776,270 |
| Realized and Unrealized Gain (Loss) | | | | |
| Net realized gain (loss) on: | | | | |
| Investment Securities: | | | | |
| Unaffiliated issuers | | (5,276,856) | | |
| Redemptions in-kind | | 17,921,004 | | |
| Fidelity Central Funds | | (10) | | |
| Foreign currency transactions | | 1,733 | | |
| Futures contracts | | 508,622 | | |
| Total net realized gain (loss) | | | | 13,154,493 |
| Change in net unrealized appreciation (depreciation) on: | | | | |
| Investment Securities: | | | | |
| Unaffiliated issuers | | 58,889,407 | | |
| Assets and liabilities in foreign currencies | | (2,301) | | |
| Futures contracts | | (138,063) | | |
| Total change in net unrealized appreciation (depreciation) | | | | 58,749,043 |
| Net gain (loss) | | | | 71,903,536 |
| Net increase (decrease) in net assets resulting from operations | | | $ | 85,679,806 |
| Statement of Changes in Net Assets |
| |
| | Year ended July 31, 2024 | | Year ended July 31, 2023 |
| Increase (Decrease) in Net Assets | | | | |
| Operations | | | | |
| Net investment income (loss) | $ | 13,776,270 | $ | 17,051,353 |
| Net realized gain (loss) | | 13,154,493 | | 19,832,576 |
| Change in net unrealized appreciation (depreciation) | | 58,749,043 | | 2,382,381 |
| Net increase (decrease) in net assets resulting from operations | | 85,679,806 | | 39,266,310 |
| Distributions to shareholders | | (13,531,400) | | (16,860,450) |
| | | | | |
| Share transactions | | | | |
| Proceeds from sales of shares | | - | | 115,557,120 |
| Cost of shares redeemed | | (77,060,504) | | (200,570,072) |
| | | | | |
Net increase (decrease) in net assets resulting from share transactions | | (77,060,504) | | (85,012,952) |
| Total increase (decrease) in net assets | | (4,912,098) | | (62,607,092) |
| | | | | |
| Net Assets | | | | |
| Beginning of period | | 549,535,701 | | 612,142,793 |
| End of period | $ | 544,623,603 | $ | 549,535,701 |
| | | | | |
| Other Information | | | | |
| Shares | | | | |
| Sold | | - | | 2,750,000 |
| Redeemed | | (1,750,000) | | (4,900,000) |
| Net increase (decrease) | | (1,750,000) | | (2,150,000) |
| | | | | |
Financial Highlights
Fidelity® Dividend ETF for Rising Rates |
| |
| Years ended July 31, | | 2024 | | 2023 | | 2022 | | 2021 | | 2020 |
Selected Per-Share Data | | | | | | | | | | |
| Net asset value, beginning of period | $ | 43.10 | $ | 41.08 | $ | 42.62 | $ | 31.72 | $ | 32.31 |
| Income from Investment Operations | | | | | | | | | | |
Net investment income (loss) A,B | | 1.16 | | 1.22 | | 1.08 | | .93 | | 1.01 |
| Net realized and unrealized gain (loss) | | 6.40 | | 2.02 | | (1.54) | | 10.85 | | (.56) |
| Total from investment operations | | 7.56 | | 3.24 | | (.46) | | 11.78 | | .45 |
| Distributions from net investment income | | (1.15) | | (1.22) | | (1.08) | | (.88) | | (1.04) |
| Total distributions | | (1.15) | | (1.22) | | (1.08) | | (.88) | | (1.04) |
| Net asset value, end of period | $ | 49.51 | $ | 43.10 | $ | 41.08 | $ | 42.62 | $ | 31.72 |
Total Return C,D | | | | 8.17% | | (1.06)% | | 37.57% | | 1.86% |
Ratios to Average Net Assets B,E,F | | | | | | | | | | |
| Expenses before reductions | | .19% | | .29% | | .29% | | .29% | | .29% |
| Expenses net of fee waivers, if any | | | | .29% | | .29% | | .29% | | .29% |
| Expenses net of all reductions | | .19% | | .29% | | .29% | | .29% | | .29% |
| Net investment income (loss) | | 2.63% | | 3.04% | | 2.54% | | 2.44% | | 3.15% |
| Supplemental Data | | | | | | | | | | |
| Net assets, end of period (000 omitted) | $ | 544,624 | $ | 549,536 | $ | 612,143 | $ | 490,089 | $ | 282,317 |
Portfolio turnover rate G,H | | | | 29% | | 28% | | 32% | | 35% |
ACalculated based on average shares outstanding during the period.
BNet investment income (loss) is affected by the timing of the declaration of dividends by any underlying mutual funds or exchange-traded funds (ETFs). Net investment income (loss) of any mutual funds or ETFs is not included in the Fund's net investment income (loss) ratio.
CTotal returns would have been lower if certain expenses had not been reduced during the applicable periods shown.
DBased on net asset value.
EFees and expenses of any underlying mutual funds or exchange-traded funds (ETFs) are not included in the Fund's expense ratio. The Fund indirectly bears its proportionate share of these expenses. For additional expense information related to investments in Fidelity Central Funds, please refer to the "Investments in Fidelity Central Funds" note found in the Notes to Financial Statements section of the most recent Annual or Semi-Annual report.
FExpense ratios reflect operating expenses of the class. Expenses before reductions do not reflect amounts reimbursed, waived, or reduced through arrangements with the investment adviser, brokerage services, or other offset arrangements, if applicable, and do not represent the amount paid by the class during periods when reimbursements, waivers or reductions occur.
GAmount does not include the portfolio activity of any underlying mutual funds or exchange-traded funds (ETFs).
HPortfolio turnover rate excludes securities received or delivered in-kind.
Fidelity® High Dividend ETF
Schedule of Investments July 31, 2024
Showing Percentage of Net Assets
| Common Stocks - 99.8% |
| | | Shares | Value ($) |
| COMMUNICATION SERVICES - 1.6% | | | |
| Diversified Telecommunication Services - 0.3% | | | |
| AT&T, Inc. | | 266,196 | 5,124,273 |
| Verizon Communications, Inc. | | 127,908 | 5,182,832 |
| | | | 10,307,105 |
| Entertainment - 0.4% | | | |
| Electronic Arts, Inc. | | 25,975 | 3,920,667 |
| TKO Group Holdings, Inc. | | 37,586 | 4,110,029 |
| Warner Music Group Corp. Class A (a) | | 86,131 | 2,584,791 |
| | | | 10,615,487 |
| Media - 0.9% | | | |
| Comcast Corp. Class A | | 118,828 | 4,904,032 |
| Fox Corp. Class A | | 101,313 | 3,853,947 |
| Interpublic Group of Companies, Inc. | | 99,205 | 3,191,425 |
| News Corp. Class A | | 132,792 | 3,662,403 |
| Nexstar Media Group, Inc. | | 17,938 | 3,314,763 |
| Omnicom Group, Inc. | | 37,669 | 3,693,069 |
| Paramount Global Class B (a) | | 219,696 | 2,508,928 |
| The New York Times Co. Class A | | 65,962 | 3,534,904 |
| | | | 28,663,471 |
TOTAL COMMUNICATION SERVICES | | | 49,586,063 |
| CONSUMER DISCRETIONARY - 3.3% | | | |
| Automobiles - 0.7% | | | |
| Bayerische Motoren Werke AG (BMW) | | 61,179 | 5,681,438 |
| Ford Motor Co. | | 618,264 | 6,689,616 |
| General Motors Co. | | 195,579 | 8,668,061 |
| | | | 21,039,115 |
| Hotels, Restaurants & Leisure - 0.8% | | | |
| Marriott International, Inc. Class A | | 31,813 | 7,231,095 |
| McDonald's Corp. | | 37,661 | 9,995,229 |
| Starbucks Corp. | | 94,148 | 7,338,837 |
| | | | 24,565,161 |
| Specialty Retail - 1.6% | | | |
| Best Buy Co., Inc. | | 89,688 | 7,759,806 |
| Dick's Sporting Goods, Inc. | | 43,442 | 9,398,677 |
| Lowe's Companies, Inc. | | 41,941 | 10,296,935 |
| The Home Depot, Inc. | | 39,995 | 14,724,559 |
| TJX Companies, Inc. | | 91,489 | 10,340,087 |
| | | | 52,520,064 |
| Textiles, Apparel & Luxury Goods - 0.2% | | | |
| NIKE, Inc. Class B | | 90,319 | 6,761,280 |
TOTAL CONSUMER DISCRETIONARY | | | 104,885,620 |
| CONSUMER STAPLES - 12.0% | | | |
| Beverages - 1.7% | | | |
| PepsiCo, Inc. | | 316,299 | 54,615,348 |
| Consumer Staples Distribution & Retail - 1.8% | | | |
| Albertsons Companies, Inc. | | 1,873,863 | 37,158,703 |
| Walgreens Boots Alliance, Inc. | | 1,747,774 | 20,746,077 |
| | | | 57,904,780 |
| Household Products - 2.0% | | | |
| Procter & Gamble Co. | | 395,690 | 63,611,124 |
| Tobacco - 6.5% | | | |
| Altria Group, Inc. | | 1,059,198 | 51,911,294 |
| British American Tobacco PLC (United Kingdom) | | 1,334,275 | 47,044,071 |
| Imperial Brands PLC | | 1,660,380 | 45,724,554 |
| Philip Morris International, Inc. | | 521,170 | 60,017,937 |
| | | | 204,697,856 |
TOTAL CONSUMER STAPLES | | | 380,829,108 |
| ENERGY - 10.3% | | | |
| Oil, Gas & Consumable Fuels - 10.3% | | | |
| Chevron Corp. | | 320,289 | 51,396,776 |
| ConocoPhillips Co. | | 354,105 | 39,376,476 |
| Devon Energy Corp. | | 785,711 | 36,951,988 |
| EOG Resources, Inc. | | 313,383 | 39,736,964 |
| Exxon Mobil Corp. | | 554,302 | 65,734,674 |
| Kinder Morgan, Inc. | | 1,951,611 | 41,237,540 |
| Targa Resources Corp. | | 376,268 | 50,901,535 |
| | | | 325,335,953 |
| FINANCIALS - 6.9% | | | |
| Banks - 4.0% | | | |
| Bank of America Corp. | | 505,217 | 20,365,297 |
| Citigroup, Inc. | | 233,618 | 15,157,136 |
| JPMorgan Chase & Co. | | 146,390 | 31,151,792 |
| PNC Financial Services Group, Inc. | | 79,452 | 14,388,757 |
| Truist Financial Corp. | | 308,198 | 13,773,369 |
| U.S. Bancorp | | 286,579 | 12,861,666 |
| Wells Fargo & Co. | | 313,290 | 18,590,629 |
| | | | 126,288,646 |
| Capital Markets - 2.2% | | | |
| Blackstone, Inc. | | 100,646 | 14,306,829 |
| CME Group, Inc. | | 58,620 | 11,355,280 |
| Goldman Sachs Group, Inc. | | 35,551 | 18,096,526 |
| Morgan Stanley | | 151,708 | 15,657,783 |
| Schroders PLC | | 1,907,326 | 9,623,069 |
| | | | 69,039,487 |
| Financial Services - 0.7% | | | |
| Visa, Inc. Class A | | 84,911 | 22,558,305 |
TOTAL FINANCIALS | | | 217,886,438 |
| HEALTH CARE - 5.3% | | | |
| Biotechnology - 1.8% | | | |
| AbbVie, Inc. | | 125,803 | 23,313,812 |
| Amgen, Inc. | | 54,080 | 17,979,978 |
| Gilead Sciences, Inc. | | 196,532 | 14,948,224 |
| | | | 56,242,014 |
| Health Care Providers & Services - 1.3% | | | |
| CVS Health Corp. | | 206,476 | 12,456,697 |
| UnitedHealth Group, Inc. | | 51,479 | 29,660,141 |
| | | | 42,116,838 |
| Pharmaceuticals - 2.2% | | | |
| Bayer AG | | 408,892 | 12,165,494 |
| Bristol-Myers Squibb Co. | | 315,948 | 15,026,487 |
| Johnson & Johnson | | 148,743 | 23,479,083 |
| Pfizer, Inc. | | 622,595 | 19,014,051 |
| | | | 69,685,115 |
TOTAL HEALTH CARE | | | 168,043,967 |
| INDUSTRIALS - 16.2% | | | |
| Aerospace & Defense - 4.8% | | | |
| General Electric Co. | | 303,387 | 51,636,467 |
| Lockheed Martin Corp. | | 87,960 | 47,667,283 |
| RTX Corp. | | 435,659 | 51,185,576 |
| | | | 150,489,326 |
| Air Freight & Logistics - 1.1% | | | |
| United Parcel Service, Inc. Class B | | 269,087 | 35,080,872 |
| Electrical Equipment - 0.4% | | | |
| GE Vernova LLC | | 75,767 | 13,504,710 |
| Ground Transportation - 1.3% | | | |
| Union Pacific Corp. | | 165,962 | 40,947,804 |
| Industrial Conglomerates - 2.3% | | | |
| CK Hutchison Holdings Ltd. | | 6,161,500 | 32,337,622 |
| Honeywell International, Inc. | | 202,758 | 41,514,701 |
| | | | 73,852,323 |
| Machinery - 2.6% | | | |
| Caterpillar, Inc. | | 135,454 | 46,894,175 |
| PACCAR, Inc. | | 345,252 | 34,062,562 |
| | | | 80,956,737 |
| Marine Transportation - 3.7% | | | |
| A.P. Moller - Maersk A/S Series B | | 17,617 | 29,200,294 |
| Kawasaki Kisen Kaisha Ltd. | | 1,979,200 | 30,781,125 |
| Mitsui OSK Lines Ltd. | | 876,300 | 28,025,758 |
| Nippon Yusen KK | | 914,300 | 29,769,744 |
| | | | 117,776,921 |
| Transportation Infrastructure - 0.0% | | | |
| Svitzer A/S | | 35,063 | 1,343,610 |
TOTAL INDUSTRIALS | | | 513,952,303 |
| INFORMATION TECHNOLOGY - 25.2% | | | |
| Communications Equipment - 1.0% | | | |
| Cisco Systems, Inc. | | 640,256 | 31,020,403 |
| IT Services - 1.0% | | | |
| IBM Corp. | | 163,516 | 31,417,964 |
| Semiconductors & Semiconductor Equipment - 10.1% | | | |
| Broadcom, Inc. | | 397,269 | 63,833,183 |
| NVIDIA Corp. | | 1,541,149 | 180,345,256 |
| Qualcomm, Inc. | | 212,052 | 38,370,809 |
| Texas Instruments, Inc. | | 183,776 | 37,455,387 |
| | | | 320,004,635 |
| Software - 5.4% | | | |
| Microsoft Corp. | | 412,299 | 172,485,287 |
| Technology Hardware, Storage & Peripherals - 7.7% | | | |
| Apple, Inc. | | 821,782 | 182,501,346 |
| Dell Technologies, Inc. | | 273,153 | 31,052,033 |
| HP, Inc. | | 814,793 | 29,405,879 |
| | | | 242,959,258 |
TOTAL INFORMATION TECHNOLOGY | | | 797,887,547 |
| REAL ESTATE - 9.1% | | | |
| Equity Real Estate Investment Trusts (REITs) - 9.1% | | | |
| Crown Castle, Inc. | | 284,086 | 31,272,187 |
| Gaming & Leisure Properties | | 631,323 | 31,692,415 |
| Omega Healthcare Investors, Inc. | | 982,959 | 35,779,708 |
| Prologis, Inc. | | 276,645 | 34,871,102 |
| Public Storage Operating Co. | | 109,596 | 32,431,648 |
| Simon Property Group, Inc. | | 225,235 | 34,560,058 |
| VICI Properties, Inc. | | 983,906 | 30,756,902 |
| Weyerhaeuser Co. | | 899,025 | 28,553,034 |
| WP Carey, Inc. | | 468,859 | 27,104,739 |
| | | | 287,021,793 |
| UTILITIES - 9.9% | | | |
| Electric Utilities - 8.6% | | | |
| American Electric Power Co., Inc. | | 462,931 | 45,422,790 |
| Duke Energy Corp. | | 398,568 | 43,551,525 |
| Edison International | | 525,903 | 42,077,499 |
| Eversource Energy | | 634,408 | 41,179,423 |
| NextEra Energy, Inc. | | 701,622 | 53,596,905 |
| Southern Co. | | 554,177 | 46,284,863 |
| | | | 272,113,005 |
| Multi-Utilities - 1.3% | | | |
| Dominion Energy, Inc. | | 786,570 | 42,050,032 |
TOTAL UTILITIES | | | 314,163,037 |
| TOTAL COMMON STOCKS (Cost $2,697,037,354) | | | 3,159,591,829 |
| | | | |
| Money Market Funds - 0.2% |
| | | Shares | Value ($) |
| Fidelity Cash Central Fund 5.39% (b) | | 1,677,995 | 1,678,331 |
| Fidelity Securities Lending Cash Central Fund 5.39% (b)(c) | | 4,973,778 | 4,974,275 |
| TOTAL MONEY MARKET FUNDS (Cost $6,652,606) | | | 6,652,606 |
| | | | |
| TOTAL INVESTMENT IN SECURITIES - 100.0% (Cost $2,703,689,960) | 3,166,244,435 |
NET OTHER ASSETS (LIABILITIES) - 0.0% | 603,432 |
| NET ASSETS - 100.0% | 3,166,847,867 |
| | |
| Futures Contracts |
| | Number of contracts | Expiration Date | Notional Amount ($) | Value ($) | Unrealized Appreciation/ (Depreciation) ($) |
| Purchased | | | | | |
| | | | | | |
| Equity Index Contracts | | | | | |
| CME E-mini S&P 500 Index Contracts (United States) | 21 | Sep 2024 | 5,835,900 | 59,540 | 59,540 |
| CME Micro E-mini S&P 500 Index Contracts (United States) | 4 | Sep 2024 | 111,160 | 730 | 730 |
| | | | | | |
| TOTAL FUTURES CONTRACTS | | | | | 60,270 |
| The notional amount of futures purchased as a percentage of Net Assets is 0.2% |
Legend
| (a) | Security or a portion of the security is on loan at period end. |
| (b) | Affiliated fund that is generally available only to investment companies and other accounts managed by Fidelity Investments. The rate quoted is the annualized seven-day yield of the fund at period end. A complete unaudited listing of the fund's holdings as of its most recent quarter end is available upon request. In addition, each Fidelity Central Fund's financial statements, which are not covered by the Fund's Report of Independent Registered Public Accounting Firm, are available on the SEC's website or upon request. |
| (c) | Investment made with cash collateral received from securities on loan. |
Affiliated Central Funds
Fiscal year to date information regarding the Fund's investments in Fidelity Central Funds, including the ownership percentage, is presented below.
| Affiliate | Value, beginning of period ($) | Purchases ($) | Sales Proceeds ($) | Dividend Income ($) | Realized Gain (loss) ($) | Change in Unrealized appreciation (depreciation) ($) | Value, end of period ($) | % ownership, end of period |
| Fidelity Cash Central Fund 5.39% | 4,259,333 | 224,812,689 | 227,393,617 | 152,438 | (74) | - | 1,678,331 | 0.0% |
| Fidelity Securities Lending Cash Central Fund 5.39% | 12,024,950 | 205,240,954 | 212,291,629 | 130,682 | - | - | 4,974,275 | 0.0% |
| Total | 16,284,283 | 430,053,643 | 439,685,246 | 283,120 | (74) | - | 6,652,606 | |
| | | | | | | | | |
Amounts in the dividend income column in the above table include any capital gain distributions from underlying funds, which are presented in the corresponding line item in the Statement of Operations, if applicable.
Amounts in the dividend income column for Fidelity Securities Lending Cash Central Fund represents the income earned on investing cash collateral, less rebates paid to borrowers and any lending agent fees associated with the loan, plus any premium payments received for lending certain types of securities.
Amounts included in the purchases and sales proceeds columns may include in-kind transactions, if applicable.
Investment Valuation
The following is a summary of the inputs used, as of July 31, 2024, involving the Fund's assets and liabilities carried at fair value. The inputs or methodology used for valuing securities may not be an indication of the risk associated with investing in those securities. For more information on valuation inputs, and their aggregation into the levels used below, please refer to the Investment Valuation section in the accompanying Notes to Financial Statements.
| Valuation Inputs at Reporting Date: |
| Description | Total ($) | Level 1 ($) | Level 2 ($) | Level 3 ($) |
Investments in Securities: | | | | |
|
| Equities: | | | | |
Communication Services | 49,586,063 | 49,586,063 | - | - |
Consumer Discretionary | 104,885,620 | 104,885,620 | - | - |
Consumer Staples | 380,829,108 | 380,829,108 | - | - |
Energy | 325,335,953 | 325,335,953 | - | - |
Financials | 217,886,438 | 217,886,438 | - | - |
Health Care | 168,043,967 | 168,043,967 | - | - |
Industrials | 513,952,303 | 513,952,303 | - | - |
Information Technology | 797,887,547 | 797,887,547 | - | - |
Real Estate | 287,021,793 | 287,021,793 | - | - |
Utilities | 314,163,037 | 314,163,037 | - | - |
|
| Money Market Funds | 6,652,606 | 6,652,606 | - | - |
| Total Investments in Securities: | 3,166,244,435 | 3,166,244,435 | - | - |
Derivative Instruments: Assets | | | | |
Futures Contracts | 60,270 | 60,270 | - | - |
| Total Assets | 60,270 | 60,270 | - | - |
| Total Derivative Instruments: | 60,270 | 60,270 | - | - |
Value of Derivative Instruments
The following table is a summary of the Fund's value of derivative instruments by primary risk exposure as of July 31, 2024. For additional information on derivative instruments, please refer to the Derivative Instruments section in the accompanying Notes to Financial Statements.
Primary Risk Exposure / Derivative Type | Value |
| Asset ($) | Liability ($) |
| Equity Risk | | |
Futures Contracts (a) | 60,270 | 0 |
| Total Equity Risk | 60,270 | 0 |
| Total Value of Derivatives | 60,270 | 0 |
(a)Reflects gross cumulative appreciation (depreciation) on futures contracts as presented in the Schedule of Investments. In the Statement of Assets and Liabilities, the period end daily variation margin is included in receivable or payable for daily variation margin on futures contracts, and the net cumulative appreciation (depreciation) is included in Total accumulated earnings (loss).
Fidelity® High Dividend ETF
Financial Statements
| Statement of Assets and Liabilities |
As of July 31, 2024 |
| Assets | | | | |
| Investment in securities, at value (including securities loaned of $4,897,637) - See accompanying schedule: | | | | |
Unaffiliated issuers (cost $2,697,037,354) | $ | 3,159,591,829 | | |
Fidelity Central Funds (cost $6,652,606) | | 6,652,606 | | |
| | | | | |
| | | | | |
| Total Investment in Securities (cost $2,703,689,960) | | | $ | 3,166,244,435 |
| Segregated cash with brokers for derivative instruments | | | | 314,400 |
| Foreign currency held at value (cost $15,345) | | | | 15,589 |
| Receivable for fund shares sold | | | | 9,721,712 |
| Dividends receivable | | | | 5,577,923 |
| Distributions receivable from Fidelity Central Funds | | | | 10,127 |
| Receivable for daily variation margin on futures contracts | | | | 91,485 |
| Other receivables | | | | 1,148 |
Total assets | | | | 3,181,976,819 |
| Liabilities | | | | |
| Payable for investments purchased | $ | 9,653,404 | | |
| Accrued management fee | | 382,176 | | |
| Other payables and accrued expenses | | 119,097 | | |
| Collateral on securities loaned | | 4,974,275 | | |
| Total liabilities | | | | 15,128,952 |
| Net Assets | | | $ | 3,166,847,867 |
| Net Assets consist of: | | | | |
| Paid in capital | | | $ | 2,842,779,055 |
| Total accumulated earnings (loss) | | | | 324,068,812 |
| Net Assets | | | $ | 3,166,847,867 |
Net Asset Value, offering price and redemption price per share ($3,166,847,867 ÷ 65,150,000 shares) | | | $ | 48.61 |
| Statement of Operations |
| Year ended July 31, 2024 |
| Investment Income | | | | |
| Dividends | | | $ | 73,310,172 |
| Income from Fidelity Central Funds (including $130,682 from security lending) | | | | 283,120 |
| Total income | | | | 73,593,292 |
| Expenses | | | | |
| Management fee | $ | 3,934,584 | | |
| Independent trustees' fees and expenses | | 9,781 | | |
| Interest | | 77,480 | | |
| Miscellaneous | | 119,080 | | |
| Total expenses before reductions | | 4,140,925 | | |
| Expense reductions | | (3,845) | | |
| Total expenses after reductions | | | | 4,137,080 |
| Net Investment income (loss) | | | | 69,456,212 |
| Realized and Unrealized Gain (Loss) | | | | |
| Net realized gain (loss) on: | | | | |
| Investment Securities: | | | | |
| Unaffiliated issuers | | (58,619,679) | | |
| Redemptions in-kind | | 141,723,617 | | |
| Fidelity Central Funds | | (74) | | |
| Foreign currency transactions | | (104,610) | | |
| Futures contracts | | 1,191,593 | | |
| Total net realized gain (loss) | | | | 84,190,847 |
| Change in net unrealized appreciation (depreciation) on: | | | | |
| Investment Securities: | | | | |
| Unaffiliated issuers | | 333,361,055 | | |
| Assets and liabilities in foreign currencies | | 23,163 | | |
| Futures contracts | | (214,536) | | |
| Total change in net unrealized appreciation (depreciation) | | | | 333,169,682 |
| Net gain (loss) | | | | 417,360,529 |
| Net increase (decrease) in net assets resulting from operations | | | $ | 486,816,741 |
| Statement of Changes in Net Assets |
| |
| | Year ended July 31, 2024 | | Year ended July 31, 2023 |
| Increase (Decrease) in Net Assets | | | | |
| Operations | | | | |
| Net investment income (loss) | $ | 69,456,212 | $ | 50,654,597 |
| Net realized gain (loss) | | 84,190,847 | | 42,986,548 |
| Change in net unrealized appreciation (depreciation) | | 333,169,682 | | 77,459,908 |
| Net increase (decrease) in net assets resulting from operations | | 486,816,741 | | 171,101,053 |
| Distributions to shareholders | | (72,844,900) | | (52,210,250) |
| | | | | |
| Share transactions | | | | |
| Proceeds from sales of shares | | 1,551,037,321 | | 615,856,682 |
| Cost of shares redeemed | | (493,928,543) | | (317,034,432) |
| | | | | |
Net increase (decrease) in net assets resulting from share transactions | | 1,057,108,778 | | 298,822,250 |
| Total increase (decrease) in net assets | | 1,471,080,619 | | 417,713,053 |
| | | | | |
| Net Assets | | | | |
| Beginning of period | | 1,695,767,248 | | 1,278,054,195 |
| End of period | $ | 3,166,847,867 | $ | 1,695,767,248 |
| | | | | |
| Other Information | | | | |
| Shares | | | | |
| Sold | | 35,700,000 | | 15,700,000 |
| Redeemed | | (11,400,000) | | (8,100,000) |
| Net increase (decrease) | | 24,300,000 | | 7,600,000 |
| | | | | |
Financial Highlights
Fidelity® High Dividend ETF |
| |
| Years ended July 31, | | 2024 | | 2023 | | 2022 | | 2021 | | 2020 |
Selected Per-Share Data | | | | | | | | | | |
| Net asset value, beginning of period | $ | 41.51 | $ | 38.44 | $ | 38.05 | $ | 27.56 | $ | 30.12 |
| Income from Investment Operations | | | | | | | | | | |
Net investment income (loss) A,B | | 1.35 | | 1.39 | | 1.21 | | 1.02 | | 1.10 |
| Net realized and unrealized gain (loss) | | 7.17 | | 3.11 | | .44 C | | 10.48 | | (2.52) |
| Total from investment operations | | 8.52 | | 4.50 | | 1.65 | | 11.50 | | (1.42) |
| Distributions from net investment income | | (1.42) | | (1.43) | | (1.26) | | (1.01) | | (1.14) |
| Total distributions | | (1.42) | | (1.43) | | (1.26) | | (1.01) | | (1.14) |
| Net asset value, end of period | $ | 48.61 | $ | 41.51 | $ | 38.44 | $ | 38.05 | $ | 27.56 |
Total Return D,E | | | | 12.22% | | 4.43% | | 42.42% | | (4.54)% |
Ratios to Average Net Assets B,F,G | | | | | | | | | | |
| Expenses before reductions | | .19% | | .29% | | .29% | | .29% | | .29% |
| Expenses net of fee waivers, if any | | | | .29% | | .29% | | .29% | | .29% |
| Expenses net of all reductions | | .19% | | .29% | | .29% | | .29% | | .29% |
| Net investment income (loss) | | 3.11% | | 3.66% | | 3.11% | | 3.04% | | 3.85% |
| Supplemental Data | | | | | | | | | | |
| Net assets, end of period (000 omitted) | $ | 3,166,848 | $ | 1,695,767 | $ | 1,278,054 | $ | 1,052,122 | $ | 520,795 |
Portfolio turnover rate H,I | | | | 52% | | 38% | | 32% | | 49% |
ACalculated based on average shares outstanding during the period.
BNet investment income (loss) is affected by the timing of the declaration of dividends by any underlying mutual funds or exchange-traded funds (ETFs). Net investment income (loss) of any mutual funds or ETFs is not included in the Fund's net investment income (loss) ratio.
CThe amount shown for a share outstanding does not correspond with the aggregate net gain (loss) on investments for the period due to the timing of sales and repurchases of shares in relation to fluctuating market values of the investments of the Fund.
DTotal returns would have been lower if certain expenses had not been reduced during the applicable periods shown.
EBased on net asset value.
FFees and expenses of any underlying mutual funds or exchange-traded funds (ETFs) are not included in the Fund's expense ratio. The Fund indirectly bears its proportionate share of these expenses. For additional expense information related to investments in Fidelity Central Funds, please refer to the "Investments in Fidelity Central Funds" note found in the Notes to Financial Statements section of the most recent Annual or Semi-Annual report.
GExpense ratios reflect operating expenses of the class. Expenses before reductions do not reflect amounts reimbursed, waived, or reduced through arrangements with the investment adviser, brokerage services, or other offset arrangements, if applicable, and do not represent the amount paid by the class during periods when reimbursements, waivers or reductions occur.
HPortfolio turnover rate excludes securities received or delivered in-kind.
IAmount does not include the portfolio activity of any underlying mutual funds or exchange-traded funds (ETFs).
Fidelity® Low Volatility Factor ETF
Schedule of Investments July 31, 2024
Showing Percentage of Net Assets
| Common Stocks - 99.8% |
| | | Shares | Value ($) |
| COMMUNICATION SERVICES - 8.7% | | | |
| Diversified Telecommunication Services - 1.6% | | | |
| AT&T, Inc. | | 473,341 | 9,111,814 |
| Verizon Communications, Inc. | | 228,344 | 9,252,499 |
| | | | 18,364,313 |
| Entertainment - 0.6% | | | |
| Electronic Arts, Inc. | | 45,729 | 6,902,335 |
| Interactive Media & Services - 4.4% | | | |
| Alphabet, Inc. Class A | | 295,704 | 50,725,064 |
| Media - 1.4% | | | |
| Comcast Corp. Class A | | 212,141 | 8,755,059 |
| Fox Corp. Class A | | 178,892 | 6,805,052 |
| | | | 15,560,111 |
| Wireless Telecommunication Services - 0.7% | | | |
| T-Mobile U.S., Inc. | | 45,871 | 8,361,366 |
TOTAL COMMUNICATION SERVICES | | | 99,913,189 |
| CONSUMER DISCRETIONARY - 10.4% | | | |
| Broadline Retail - 3.9% | | | |
| Amazon.com, Inc. (a) | | 240,615 | 44,990,193 |
| Hotels, Restaurants & Leisure - 1.2% | | | |
| McDonald's Corp. | | 31,720 | 8,418,488 |
| Starbucks Corp. | | 73,781 | 5,751,229 |
| | | | 14,169,717 |
| Household Durables - 0.6% | | | |
| Garmin Ltd. | | 39,856 | 6,825,340 |
| Specialty Retail - 4.2% | | | |
| AutoZone, Inc. (a) | | 1,981 | 6,207,840 |
| Lowe's Companies, Inc. | | 33,451 | 8,212,555 |
| O'Reilly Automotive, Inc. (a) | | 5,598 | 6,305,251 |
| The Home Depot, Inc. | | 35,621 | 13,114,227 |
| TJX Companies, Inc. | | 72,033 | 8,141,170 |
| Tractor Supply Co. | | 21,220 | 5,587,650 |
| | | | 47,568,693 |
| Textiles, Apparel & Luxury Goods - 0.5% | | | |
| NIKE, Inc. Class B | | 71,813 | 5,375,921 |
TOTAL CONSUMER DISCRETIONARY | | | 118,929,864 |
| CONSUMER STAPLES - 6.0% | | | |
| Beverages - 1.4% | | | |
| PepsiCo, Inc. | | 42,593 | 7,354,533 |
| The Coca-Cola Co. | | 120,410 | 8,036,163 |
| | | | 15,390,696 |
| Consumer Staples Distribution & Retail - 1.7% | | | |
| Costco Wholesale Corp. | | 12,905 | 10,607,910 |
| Walmart, Inc. | | 132,057 | 9,064,392 |
| | | | 19,672,302 |
| Food Products - 0.8% | | | |
| General Mills, Inc. | | 41,136 | 2,761,871 |
| Mondelez International, Inc. | | 55,180 | 3,771,553 |
| The Hershey Co. | | 12,494 | 2,467,315 |
| | | | 9,000,739 |
| Household Products - 1.5% | | | |
| Colgate-Palmolive Co. | | 40,004 | 3,967,997 |
| Kimberly-Clark Corp. | | 22,370 | 3,021,069 |
| Procter & Gamble Co. | | 66,418 | 10,677,358 |
| | | | 17,666,424 |
| Tobacco - 0.6% | | | |
| Philip Morris International, Inc. | | 55,486 | 6,389,768 |
TOTAL CONSUMER STAPLES | | | 68,119,929 |
| ENERGY - 3.7% | | | |
| Oil, Gas & Consumable Fuels - 3.7% | | | |
| Chesapeake Energy Corp. (b) | | 28,662 | 2,187,770 |
| Chevron Corp. | | 54,676 | 8,773,858 |
| ConocoPhillips Co. | | 45,813 | 5,094,406 |
| Coterra Energy, Inc. | | 99,033 | 2,555,051 |
| DT Midstream, Inc. | | 39,396 | 2,968,883 |
| Exxon Mobil Corp. | | 113,422 | 13,450,715 |
| Kinder Morgan, Inc. | | 162,995 | 3,444,084 |
| The Williams Companies, Inc. | | 85,974 | 3,691,724 |
| | | | 42,166,491 |
| FINANCIALS - 12.9% | | | |
| Capital Markets - 2.0% | | | |
| Cboe Global Markets, Inc. | | 42,056 | 7,717,697 |
| CME Group, Inc. | | 43,967 | 8,516,848 |
| FactSet Research Systems, Inc. | | 15,975 | 6,599,113 |
| | | | 22,833,658 |
| Financial Services - 3.6% | | | |
| Jack Henry & Associates, Inc. | | 45,579 | 7,815,887 |
| MasterCard, Inc. Class A | | 35,265 | 16,352,733 |
| Visa, Inc. Class A | | 63,741 | 16,934,071 |
| | | | 41,102,691 |
| Insurance - 7.3% | | | |
| Arthur J. Gallagher & Co. | | 36,559 | 10,364,111 |
| Assurant, Inc. | | 44,423 | 7,768,250 |
| Brown & Brown, Inc. | | 99,539 | 9,897,163 |
| Chubb Ltd. | | 39,407 | 10,862,934 |
| Globe Life, Inc. | | 62,915 | 5,834,737 |
| Marsh & McLennan Companies, Inc. | | 49,298 | 10,972,256 |
| Progressive Corp. | | 54,622 | 11,695,663 |
| The Travelers Companies, Inc. | | 39,835 | 8,621,887 |
| W.R. Berkley Corp. | | 143,794 | 7,927,363 |
| | | | 83,944,364 |
TOTAL FINANCIALS | | | 147,880,713 |
| HEALTH CARE - 12.2% | | | |
| Biotechnology - 3.9% | | | |
| AbbVie, Inc. | | 78,455 | 14,539,281 |
| Amgen, Inc. | | 31,693 | 10,536,972 |
| Regeneron Pharmaceuticals, Inc. (a) | | 9,001 | 9,713,789 |
| Vertex Pharmaceuticals, Inc. (a) | | 20,366 | 10,095,834 |
| | | | 44,885,876 |
| Health Care Equipment & Supplies - 1.6% | | | |
| Abbott Laboratories | | 94,951 | 10,059,109 |
| Becton, Dickinson & Co. | | 32,441 | 7,820,227 |
| | | | 17,879,336 |
| Health Care Providers & Services - 2.3% | | | |
| CVS Health Corp. | | 114,196 | 6,889,445 |
| UnitedHealth Group, Inc. | | 33,922 | 19,544,500 |
| | | | 26,433,945 |
| Pharmaceuticals - 4.4% | | | |
| Eli Lilly & Co. | | 28,089 | 22,591,140 |
| Johnson & Johnson | | 95,651 | 15,098,510 |
| Merck & Co., Inc. | | 108,555 | 12,280,827 |
| | | | 49,970,477 |
TOTAL HEALTH CARE | | | 139,169,634 |
| INDUSTRIALS - 9.6% | | | |
| Aerospace & Defense - 2.7% | | | |
| General Dynamics Corp. | | 21,318 | 6,367,900 |
| Huntington Ingalls Industries, Inc. | | 16,888 | 4,728,302 |
| L3Harris Technologies, Inc. | | 24,839 | 5,635,721 |
| Lockheed Martin Corp. | | 15,113 | 8,190,037 |
| Northrop Grumman Corp. | | 12,890 | 6,242,885 |
| | | | 31,164,845 |
| Commercial Services & Supplies - 1.1% | | | |
| Republic Services, Inc. | | 29,378 | 5,708,733 |
| Waste Management, Inc. | | 31,262 | 6,335,557 |
| | | | 12,044,290 |
| Electrical Equipment - 0.7% | | | |
| Eaton Corp. PLC | | 25,507 | 7,774,279 |
| Ground Transportation - 0.7% | | | |
| Union Pacific Corp. | | 31,425 | 7,753,490 |
| Industrial Conglomerates - 0.7% | | | |
| Honeywell International, Inc. | | 37,098 | 7,595,816 |
| Machinery - 1.3% | | | |
| Graco, Inc. | | 53,294 | 4,532,655 |
| Otis Worldwide Corp. | | 57,295 | 5,414,378 |
| PACCAR, Inc. | | 54,145 | 5,341,946 |
| | | | 15,288,979 |
| Professional Services - 2.4% | | | |
| Automatic Data Processing, Inc. | | 26,927 | 7,071,569 |
| Booz Allen Hamilton Holding Corp. Class A | | 33,112 | 4,745,281 |
| FTI Consulting, Inc. (a) | | 23,157 | 5,047,531 |
| Paychex, Inc. | | 42,821 | 5,481,944 |
| Verisk Analytics, Inc. | | 20,728 | 5,425,554 |
| | | | 27,771,879 |
TOTAL INDUSTRIALS | | | 109,393,578 |
| INFORMATION TECHNOLOGY - 29.0% | | | |
| Communications Equipment - 2.6% | | | |
| Cisco Systems, Inc. | | 306,568 | 14,853,220 |
| Motorola Solutions, Inc. | | 36,552 | 14,581,324 |
| | | | 29,434,544 |
| IT Services - 5.1% | | | |
| Accenture PLC Class A | | 43,333 | 14,326,756 |
| Akamai Technologies, Inc. (a) | | 89,164 | 8,763,038 |
| Amdocs Ltd. | | 117,381 | 10,267,316 |
| IBM Corp. | | 78,223 | 15,029,767 |
| VeriSign, Inc. (a) | | 55,114 | 10,306,869 |
| | | | 58,693,746 |
| Semiconductors & Semiconductor Equipment - 1.6% | | | |
| Texas Instruments, Inc. | | 87,788 | 17,892,072 |
| Software - 12.0% | | | |
| Microsoft Corp. | | 200,426 | 83,848,217 |
| Oracle Corp. | | 129,160 | 18,011,362 |
| Qualys, Inc. (a) | | 56,643 | 8,447,737 |
| Roper Technologies, Inc. | | 21,962 | 11,963,800 |
| Tyler Technologies, Inc. (a) | | 25,700 | 14,600,427 |
| | | | 136,871,543 |
| Technology Hardware, Storage & Peripherals - 7.7% | | | |
| Apple, Inc. | | 399,353 | 88,688,309 |
TOTAL INFORMATION TECHNOLOGY | | | 331,580,214 |
| MATERIALS - 2.6% | | | |
| Chemicals - 1.9% | | | |
| Air Products & Chemicals, Inc. | | 10,399 | 2,743,776 |
| Balchem Corp. | | 10,199 | 1,809,915 |
| Corteva, Inc. | | 41,476 | 2,326,804 |
| Ecolab, Inc. | | 12,689 | 2,927,225 |
| Linde PLC | | 14,659 | 6,647,857 |
| NewMarket Corp. | | 2,433 | 1,364,597 |
| Sherwin-Williams Co. | | 9,882 | 3,466,606 |
| | | | 21,286,780 |
| Construction Materials - 0.4% | | | |
| Martin Marietta Materials, Inc. | | 4,063 | 2,410,781 |
| Vulcan Materials Co. | | 8,964 | 2,460,708 |
| | | | 4,871,489 |
| Containers & Packaging - 0.3% | | | |
| Aptargroup, Inc. | | 11,880 | 1,746,122 |
| Packaging Corp. of America | | 10,368 | 2,072,252 |
| | | | 3,818,374 |
TOTAL MATERIALS | | | 29,976,643 |
| REAL ESTATE - 2.5% | | | |
| Equity Real Estate Investment Trusts (REITs) - 2.5% | | | |
| Agree Realty Corp. | | 25,765 | 1,777,012 |
| American Homes 4 Rent Class A | | 47,565 | 1,716,621 |
| American Tower Corp. | | 18,144 | 3,998,938 |
| Crown Castle, Inc. | | 23,075 | 2,540,096 |
| Digital Realty Trust, Inc. | | 17,055 | 2,549,552 |
| Equinix, Inc. | | 3,886 | 3,070,873 |
| Equity Lifestyle Properties, Inc. | | 25,025 | 1,718,717 |
| Prologis, Inc. | | 32,633 | 4,113,390 |
| Public Storage Operating Co. | | 8,709 | 2,577,167 |
| Realty Income Corp. | | 45,427 | 2,608,873 |
| SBA Communications Corp. Class A | | 8,732 | 1,917,023 |
| | | | 28,588,262 |
| UTILITIES - 2.2% | | | |
| Electric Utilities - 1.4% | | | |
| American Electric Power Co., Inc. | | 40,852 | 4,008,398 |
| Duke Energy Corp. | | 41,305 | 4,513,397 |
| Southern Co. | | 57,799 | 4,827,372 |
| Xcel Energy, Inc. | | 50,120 | 2,920,994 |
| | | | 16,270,161 |
| Multi-Utilities - 0.8% | | | |
| CMS Energy Corp. | | 45,480 | 2,947,104 |
| Consolidated Edison, Inc. | | 32,595 | 3,178,664 |
| WEC Energy Group, Inc. | | 35,196 | 3,028,968 |
| | | | 9,154,736 |
TOTAL UTILITIES | | | 25,424,897 |
| TOTAL COMMON STOCKS (Cost $1,035,187,818) | | | 1,141,143,414 |
| | | | |
| Money Market Funds - 0.1% |
| | | Shares | Value ($) |
| Fidelity Cash Central Fund 5.39% (c) | | 1,477,146 | 1,477,441 |
| Fidelity Securities Lending Cash Central Fund 5.39% (c)(d) | | 241,799 | 241,824 |
| TOTAL MONEY MARKET FUNDS (Cost $1,719,265) | | | 1,719,265 |
| | | | |
| TOTAL INVESTMENT IN SECURITIES - 99.9% (Cost $1,036,907,083) | 1,142,862,679 |
NET OTHER ASSETS (LIABILITIES) - 0.1% | 713,930 |
| NET ASSETS - 100.0% | 1,143,576,609 |
| | |
| Futures Contracts |
| | Number of contracts | Expiration Date | Notional Amount ($) | Value ($) | Unrealized Appreciation/ (Depreciation) ($) |
| Purchased | | | | | |
| | | | | | |
| Equity Index Contracts | | | | | |
| CME Micro E-mini S&P 500 Index Contracts (United States) | 70 | Sep 2024 | 1,945,300 | (17,028) | (17,028) |
| | | | | | |
| The notional amount of futures purchased as a percentage of Net Assets is 0.2% |
Legend
| (b) | Security or a portion of the security is on loan at period end. |
| (c) | Affiliated fund that is generally available only to investment companies and other accounts managed by Fidelity Investments. The rate quoted is the annualized seven-day yield of the fund at period end. A complete unaudited listing of the fund's holdings as of its most recent quarter end is available upon request. In addition, each Fidelity Central Fund's financial statements, which are not covered by the Fund's Report of Independent Registered Public Accounting Firm, are available on the SEC's website or upon request. |
| (d) | Investment made with cash collateral received from securities on loan. |
Affiliated Central Funds
Fiscal year to date information regarding the Fund's investments in Fidelity Central Funds, including the ownership percentage, is presented below.
| Affiliate | Value, beginning of period ($) | Purchases ($) | Sales Proceeds ($) | Dividend Income ($) | Realized Gain (loss) ($) | Change in Unrealized appreciation (depreciation) ($) | Value, end of period ($) | % ownership, end of period |
| Fidelity Cash Central Fund 5.39% | 909,740 | 51,013,194 | 50,445,485 | 80,067 | (8) | - | 1,477,441 | 0.0% |
| Fidelity Securities Lending Cash Central Fund 5.39% | 3,428,449 | 52,599,426 | 55,786,051 | 9,943 | - | - | 241,824 | 0.0% |
| Total | 4,338,189 | 103,612,620 | 106,231,536 | 90,010 | (8) | - | 1,719,265 | |
| | | | | | | | | |
Amounts in the dividend income column in the above table include any capital gain distributions from underlying funds, which are presented in the corresponding line item in the Statement of Operations, if applicable.
Amounts in the dividend income column for Fidelity Securities Lending Cash Central Fund represents the income earned on investing cash collateral, less rebates paid to borrowers and any lending agent fees associated with the loan, plus any premium payments received for lending certain types of securities.
Amounts included in the purchases and sales proceeds columns may include in-kind transactions, if applicable.
Investment Valuation
The following is a summary of the inputs used, as of July 31, 2024, involving the Fund's assets and liabilities carried at fair value. The inputs or methodology used for valuing securities may not be an indication of the risk associated with investing in those securities. For more information on valuation inputs, and their aggregation into the levels used below, please refer to the Investment Valuation section in the accompanying Notes to Financial Statements.
| Valuation Inputs at Reporting Date: |
| Description | Total ($) | Level 1 ($) | Level 2 ($) | Level 3 ($) |
Investments in Securities: | | | | |
|
| Equities: | | | | |
Communication Services | 99,913,189 | 99,913,189 | - | - |
Consumer Discretionary | 118,929,864 | 118,929,864 | - | - |
Consumer Staples | 68,119,929 | 68,119,929 | - | - |
Energy | 42,166,491 | 42,166,491 | - | - |
Financials | 147,880,713 | 147,880,713 | - | - |
Health Care | 139,169,634 | 139,169,634 | - | - |
Industrials | 109,393,578 | 109,393,578 | - | - |
Information Technology | 331,580,214 | 331,580,214 | - | - |
Materials | 29,976,643 | 29,976,643 | - | - |
Real Estate | 28,588,262 | 28,588,262 | - | - |
Utilities | 25,424,897 | 25,424,897 | - | - |
|
| Money Market Funds | 1,719,265 | 1,719,265 | - | - |
| Total Investments in Securities: | 1,142,862,679 | 1,142,862,679 | - | - |
Derivative Instruments: Liabilities | | | | |
Futures Contracts | (17,028) | (17,028) | - | - |
| Total Liabilities | (17,028) | (17,028) | - | - |
| Total Derivative Instruments: | (17,028) | (17,028) | - | - |
Value of Derivative Instruments
The following table is a summary of the Fund's value of derivative instruments by primary risk exposure as of July 31, 2024. For additional information on derivative instruments, please refer to the Derivative Instruments section in the accompanying Notes to Financial Statements.
Primary Risk Exposure / Derivative Type | Value |
| Asset ($) | Liability ($) |
| Equity Risk | | |
Futures Contracts (a) | 0 | (17,028) |
| Total Equity Risk | 0 | (17,028) |
| Total Value of Derivatives | 0 | (17,028) |
(a)Reflects gross cumulative appreciation (depreciation) on futures contracts as presented in the Schedule of Investments. In the Statement of Assets and Liabilities, the period end daily variation margin is included in receivable or payable for daily variation margin on futures contracts, and the net cumulative appreciation (depreciation) is included in Total accumulated earnings (loss).
Fidelity® Low Volatility Factor ETF
Financial Statements
| Statement of Assets and Liabilities |
As of July 31, 2024 |
| Assets | | | | |
| Investment in securities, at value (including securities loaned of $236,623) - See accompanying schedule: | | | | |
Unaffiliated issuers (cost $1,035,187,818) | $ | 1,141,143,414 | | |
Fidelity Central Funds (cost $1,719,265) | | 1,719,265 | | |
| | | | | |
| | | | | |
| Total Investment in Securities (cost $1,036,907,083) | | | $ | 1,142,862,679 |
| Segregated cash with brokers for derivative instruments | | | | 91,700 |
| Dividends receivable | | | | 1,056,603 |
| Distributions receivable from Fidelity Central Funds | | | | 5,242 |
| Receivable for daily variation margin on futures contracts | | | | 29,925 |
Total assets | | | | 1,144,046,149 |
| Liabilities | | | | |
| Accrued management fee | $ | 140,302 | | |
| Proxy fee payable | | 87,438 | | |
| Collateral on securities loaned | | 241,800 | | |
| Total liabilities | | | | 469,540 |
| Net Assets | | | $ | 1,143,576,609 |
| Net Assets consist of: | | | | |
| Paid in capital | | | $ | 1,098,583,802 |
| Total accumulated earnings (loss) | | | | 44,992,807 |
| Net Assets | | | $ | 1,143,576,609 |
Net Asset Value, offering price and redemption price per share ($1,143,576,609 ÷ 19,550,000 shares) | | | $ | 58.49 |
| Statement of Operations |
| Year ended July 31, 2024 |
| Investment Income | | | | |
| Dividends | | | $ | 15,579,724 |
| Income from Fidelity Central Funds (including $9,943 from security lending) | | | | 90,010 |
| Total income | | | | 15,669,734 |
| Expenses | | | | |
| Management fee | $ | 1,550,627 | | |
| Independent trustees' fees and expenses | | 3,891 | | |
| Proxy fee | | 87,438 | | |
| Total expenses before reductions | | 1,641,956 | | |
| Expense reductions | | (445) | | |
| Total expenses after reductions | | | | 1,641,511 |
| Net Investment income (loss) | | | | 14,028,223 |
| Realized and Unrealized Gain (Loss) | | | | |
| Net realized gain (loss) on: | | | | |
| Investment Securities: | | | | |
| Unaffiliated issuers | | (22,173,252) | | |
| Redemptions in-kind | | 106,133,327 | | |
| Fidelity Central Funds | | (8) | | |
| Futures contracts | | 467,247 | | |
| Total net realized gain (loss) | | | | 84,427,314 |
| Change in net unrealized appreciation (depreciation) on: | | | | |
| Investment Securities: | | | | |
| Unaffiliated issuers | | 57,574,772 | | |
| Futures contracts | | (89,449) | | |
| Total change in net unrealized appreciation (depreciation) | | | | 57,485,323 |
| Net gain (loss) | | | | 141,912,637 |
| Net increase (decrease) in net assets resulting from operations | | | $ | 155,940,860 |
| Statement of Changes in Net Assets |
| |
| | Year ended July 31, 2024 | | Year ended July 31, 2023 |
| Increase (Decrease) in Net Assets | | | | |
| Operations | | | | |
| Net investment income (loss) | $ | 14,028,223 | $ | 7,517,780 |
| Net realized gain (loss) | | 84,427,314 | | 1,037,183 |
| Change in net unrealized appreciation (depreciation) | | 57,485,323 | | 36,445,989 |
| Net increase (decrease) in net assets resulting from operations | | 155,940,860 | | 45,000,952 |
| Distributions to shareholders | | (13,235,700) | | (7,460,700) |
| | | | | |
| Share transactions | | | | |
| Proceeds from sales of shares | | 1,031,797,552 | | 126,351,905 |
| Cost of shares redeemed | | (584,530,836) | | (55,150,184) |
| | | | | |
Net increase (decrease) in net assets resulting from share transactions | | 447,266,716 | | 71,201,721 |
| Total increase (decrease) in net assets | | 589,971,876 | | 108,741,973 |
| | | | | |
| Net Assets | | | | |
| Beginning of period | | 553,604,733 | | 444,862,760 |
| End of period | $ | 1,143,576,609 | $ | 553,604,733 |
| | | | | |
| Other Information | | | | |
| Shares | | | | |
| Sold | | 19,600,000 | | 2,700,000 |
| Redeemed | | (10,900,000) | | (1,200,000) |
| Net increase (decrease) | | 8,700,000 | | 1,500,000 |
| | | | | |
Financial Highlights
Fidelity® Low Volatility Factor ETF |
| |
| Years ended July 31, | | 2024 | | 2023 | | 2022 | | 2021 | | 2020 |
Selected Per-Share Data | | | | | | | | | | |
| Net asset value, beginning of period | $ | 51.02 | $ | 47.58 | $ | 48.75 | $ | 38.33 | $ | 36.37 |
| Income from Investment Operations | | | | | | | | | | |
Net investment income (loss) A,B | | .84 | | .74 | | .62 | | .56 | | .62 |
| Net realized and unrealized gain (loss) | | 7.40 | | 3.44 | | (1.17) | | 10.43 | | 1.95 |
| Total from investment operations | | 8.24 | | 4.18 | | (.55) | | 10.99 | | 2.57 |
| Distributions from net investment income | | (.77) | | (.74) | | (.62) | | (.57) | | (.61) |
| Total distributions | | (.77) | | (.74) | | (.62) | | (.57) | | (.61) |
| Net asset value, end of period | $ | 58.49 | $ | 51.02 | $ | 47.58 | $ | 48.75 | $ | 38.33 |
Total Return C,D | | | | 8.96% | | (1.12)% | | 28.90% | | 7.29% |
Ratios to Average Net Assets B,E,F | | | | | | | | | | |
| Expenses before reductions | | .18% | | .29% | | .29% | | .29% | | .29% |
| Expenses net of fee waivers, if any | | | | .29% | | .29% | | .29% | | .29% |
| Expenses net of all reductions | | .18% | | .29% | | .29% | | .29% | | .29% |
| Net investment income (loss) | | 1.56% | | 1.57% | | 1.27% | | 1.31% | | 1.69% |
| Supplemental Data | | | | | | | | | | |
| Net assets, end of period (000 omitted) | $ | 1,143,577 | $ | 553,605 | $ | 444,863 | $ | 511,897 | $ | 350,708 |
Portfolio turnover rate G,H | | | | 46% | | 28% | | 46% | | 31% |
ACalculated based on average shares outstanding during the period.
BNet investment income (loss) is affected by the timing of the declaration of dividends by any underlying mutual funds or exchange-traded funds (ETFs). Net investment income (loss) of any mutual funds or ETFs is not included in the Fund's net investment income (loss) ratio.
CTotal returns would have been lower if certain expenses had not been reduced during the applicable periods shown.
DBased on net asset value.
EFees and expenses of any underlying mutual funds or exchange-traded funds (ETFs) are not included in the Fund's expense ratio. The Fund indirectly bears its proportionate share of these expenses. For additional expense information related to investments in Fidelity Central Funds, please refer to the "Investments in Fidelity Central Funds" note found in the Notes to Financial Statements section of the most recent Annual or Semi-Annual report.
FExpense ratios reflect operating expenses of the class. Expenses before reductions do not reflect amounts reimbursed, waived, or reduced through arrangements with the investment adviser, brokerage services, or other offset arrangements, if applicable, and do not represent the amount paid by the class during periods when reimbursements, waivers or reductions occur.
GAmount does not include the portfolio activity of any underlying mutual funds or exchange-traded funds (ETFs).
HPortfolio turnover rate excludes securities received or delivered in-kind.
Fidelity® Momentum Factor ETF
Schedule of Investments July 31, 2024
Showing Percentage of Net Assets
| Common Stocks - 99.8% |
| | | Shares | Value ($) |
| COMMUNICATION SERVICES - 8.4% | | | |
| Diversified Telecommunication Services - 0.5% | | | |
| Verizon Communications, Inc. | | 28,175 | 1,141,651 |
| Entertainment - 1.2% | | | |
| Netflix, Inc. (a) | | 2,566 | 1,612,346 |
| The Walt Disney Co. | | 11,403 | 1,068,347 |
| | | | 2,680,693 |
| Interactive Media & Services - 6.3% | | | |
| Alphabet, Inc. Class A | | 49,816 | 8,545,437 |
| Meta Platforms, Inc. Class A | | 10,474 | 4,973,369 |
| Pinterest, Inc. Class A (a) | | 12,032 | 384,422 |
| | | | 13,903,228 |
| Wireless Telecommunication Services - 0.4% | | | |
| T-Mobile U.S., Inc. | | 4,597 | 837,941 |
TOTAL COMMUNICATION SERVICES | | | 18,563,513 |
| CONSUMER DISCRETIONARY - 10.2% | | | |
| Broadline Retail - 3.8% | | | |
| Amazon.com, Inc. (a) | | 45,118 | 8,436,164 |
| Hotels, Restaurants & Leisure - 2.9% | | | |
| Airbnb, Inc. Class A (a) | | 7,963 | 1,111,316 |
| Booking Holdings, Inc. | | 429 | 1,593,739 |
| Doordash, Inc. (a) | | 9,723 | 1,076,531 |
| Hilton Worldwide Holdings, Inc. | | 5,959 | 1,279,219 |
| Royal Caribbean Cruises Ltd. | | 8,015 | 1,256,111 |
| | | | 6,316,916 |
| Specialty Retail - 3.5% | | | |
| Abercrombie & Fitch Co. Class A (a) | | 7,903 | 1,165,534 |
| Carvana Co. Class A (a) | | 8,685 | 1,157,103 |
| The Home Depot, Inc. | | 7,207 | 2,653,329 |
| TJX Companies, Inc. | | 15,088 | 1,705,246 |
| Williams-Sonoma, Inc. | | 7,128 | 1,102,559 |
| | | | 7,783,771 |
TOTAL CONSUMER DISCRETIONARY | | | 22,536,851 |
| CONSUMER STAPLES - 5.7% | | | |
| Beverages - 0.9% | | | |
| Celsius Holdings, Inc. (a) | | 7,758 | 363,307 |
| The Coca-Cola Co. | | 25,526 | 1,703,605 |
| | | | 2,066,912 |
| Consumer Staples Distribution & Retail - 2.9% | | | |
| Casey's General Stores, Inc. | | 1,833 | 710,911 |
| Costco Wholesale Corp. | | 2,660 | 2,186,520 |
| Sprouts Farmers Market LLC (a) | | 7,789 | 778,043 |
| Target Corp. | | 5,361 | 806,348 |
| Walmart, Inc. | | 27,554 | 1,891,307 |
| | | | 6,373,129 |
| Household Products - 1.4% | | | |
| Colgate-Palmolive Co. | | 9,289 | 921,376 |
| Procter & Gamble Co. | | 13,505 | 2,171,064 |
| | | | 3,092,440 |
| Personal Care Products - 0.5% | | | |
| BellRing Brands, Inc. (a) | | 9,822 | 503,672 |
| elf Beauty, Inc. (a) | | 3,537 | 610,415 |
| | | | 1,114,087 |
TOTAL CONSUMER STAPLES | | | 12,646,568 |
| ENERGY - 3.5% | | | |
| Energy Equipment & Services - 0.7% | | | |
| TechnipFMC PLC | | 29,881 | 881,490 |
| Weatherford International PLC | | 6,249 | 736,507 |
| | | | 1,617,997 |
| Oil, Gas & Consumable Fuels - 2.8% | | | |
| ConocoPhillips Co. | | 11,080 | 1,232,096 |
| Diamondback Energy, Inc. | | 4,453 | 900,886 |
| Marathon Petroleum Corp. | | 5,573 | 986,532 |
| ONEOK, Inc. | | 11,972 | 997,627 |
| Phillips 66 Co. | | 6,921 | 1,006,867 |
| Valero Energy Corp. | | 6,098 | 986,169 |
| | | | 6,110,177 |
TOTAL ENERGY | | | 7,728,174 |
| FINANCIALS - 13.4% | | | |
| Banks - 2.6% | | | |
| JPMorgan Chase & Co. | | 17,929 | 3,815,291 |
| Wells Fargo & Co. | | 32,705 | 1,940,715 |
| | | | 5,756,006 |
| Capital Markets - 2.6% | | | |
| Ares Management Corp. Class A, | | 8,286 | 1,269,415 |
| Blackstone, Inc. | | 11,683 | 1,660,738 |
| Coinbase Global, Inc. (a) | | 5,187 | 1,163,755 |
| KKR & Co., Inc. | | 13,363 | 1,649,662 |
| | | | 5,743,570 |
| Financial Services - 5.6% | | | |
| Affirm Holdings, Inc. Class A, (a) | | 30,542 | 864,033 |
| Apollo Global Management, Inc. | | 10,977 | 1,375,528 |
| Berkshire Hathaway, Inc. Class B (a) | | 10,483 | 4,596,796 |
| MasterCard, Inc. Class A | | 5,907 | 2,739,135 |
| Visa, Inc. Class A | | 10,705 | 2,843,997 |
| | | | 12,419,489 |
| Insurance - 2.6% | | | |
| Allstate Corp. | | 7,154 | 1,224,192 |
| American International Group, Inc. | | 16,079 | 1,273,939 |
| Chubb Ltd. | | 5,831 | 1,607,373 |
| Progressive Corp. | | 7,418 | 1,588,342 |
| | | | 5,693,846 |
TOTAL FINANCIALS | | | 29,612,911 |
| HEALTH CARE - 12.2% | | | |
| Biotechnology - 4.8% | | | |
| AbbVie, Inc. | | 17,363 | 3,217,711 |
| Amgen, Inc. | | 7,912 | 2,630,503 |
| Regeneron Pharmaceuticals, Inc. (a) | | 2,117 | 2,284,645 |
| Vertex Pharmaceuticals, Inc. (a) | | 5,004 | 2,480,583 |
| | | | 10,613,442 |
| Health Care Equipment & Supplies - 2.1% | | | |
| Boston Scientific Corp. (a) | | 27,946 | 2,064,650 |
| Intuitive Surgical, Inc. (a) | | 5,649 | 2,511,602 |
| | | | 4,576,252 |
| Health Care Providers & Services - 2.6% | | | |
| Cigna Group | | 5,783 | 2,016,359 |
| McKesson Corp. | | 3,501 | 2,160,187 |
| Molina Healthcare, Inc. (a) | | 4,824 | 1,646,286 |
| | | | 5,822,832 |
| Life Sciences Tools & Services - 0.7% | | | |
| Medpace Holdings, Inc. (a) | | 4,071 | 1,557,239 |
| Pharmaceuticals - 2.0% | | | |
| Eli Lilly & Co. | | 5,536 | 4,452,439 |
TOTAL HEALTH CARE | | | 27,022,204 |
| INDUSTRIALS - 9.4% | | | |
| Aerospace & Defense - 1.8% | | | |
| General Dynamics Corp. | | 3,736 | 1,115,981 |
| General Electric Co. | | 9,603 | 1,634,431 |
| TransDigm Group, Inc. | | 863 | 1,116,912 |
| | | | 3,867,324 |
| Building Products - 0.9% | | | |
| Builders FirstSource, Inc. (a) | | 4,718 | 789,652 |
| Trane Technologies PLC | | 3,483 | 1,164,297 |
| | | | 1,953,949 |
| Commercial Services & Supplies - 0.5% | | | |
| Cintas Corp. | | 1,567 | 1,197,094 |
| Construction & Engineering - 0.4% | | | |
| EMCOR Group, Inc. | | 2,419 | 908,189 |
| Electrical Equipment - 0.9% | | | |
| Eaton Corp. PLC | | 4,246 | 1,294,138 |
| Vertiv Holdings Co. | | 10,090 | 794,083 |
| | | | 2,088,221 |
| Ground Transportation - 1.7% | | | |
| Uber Technologies, Inc. (a) | | 20,490 | 1,320,990 |
| Union Pacific Corp. | | 5,981 | 1,475,692 |
| XPO, Inc. (a) | | 7,748 | 890,168 |
| | | | 3,686,850 |
| Machinery - 1.7% | | | |
| Caterpillar, Inc. | | 4,575 | 1,583,865 |
| PACCAR, Inc. | | 9,693 | 956,311 |
| Parker Hannifin Corp. | | 2,047 | 1,148,695 |
| | | | 3,688,871 |
| Trading Companies & Distributors - 1.5% | | | |
| Ferguson PLC | | 4,589 | 1,021,741 |
| FTAI Aviation Ltd. | | 10,883 | 1,212,910 |
| United Rentals, Inc. | | 1,480 | 1,120,508 |
| | | | 3,355,159 |
TOTAL INDUSTRIALS | | | 20,745,657 |
| INFORMATION TECHNOLOGY - 29.6% | | | |
| Communications Equipment - 1.4% | | | |
| Arista Networks, Inc. (a) | | 8,934 | 3,096,078 |
| IT Services - 1.4% | | | |
| IBM Corp. | | 16,451 | 3,160,895 |
| Semiconductors & Semiconductor Equipment - 12.3% | | | |
| Advanced Micro Devices, Inc. (a) | | 21,091 | 3,047,228 |
| Applied Materials, Inc. | | 13,998 | 2,970,376 |
| Broadcom, Inc. | | 35,780 | 5,749,130 |
| NVIDIA Corp. | | 131,778 | 15,420,662 |
| | | | 27,187,396 |
| Software - 12.7% | | | |
| Crowdstrike Holdings, Inc. (a) | | 7,752 | 1,798,154 |
| Intuit, Inc. | | 4,563 | 2,953,858 |
| Microsoft Corp. | | 37,608 | 15,733,304 |
| Nutanix, Inc. Class A (a) | | 34,042 | 1,719,461 |
| Palantir Technologies, Inc. Class A (a) | | 99,367 | 2,671,979 |
| ServiceNow, Inc. (a) | | 3,844 | 3,130,515 |
| | | | 28,007,271 |
| Technology Hardware, Storage & Peripherals - 1.8% | | | |
| Dell Technologies, Inc. | | 17,789 | 2,022,254 |
| Super Micro Computer, Inc. (a) | | 2,910 | 2,041,802 |
| | | | 4,064,056 |
TOTAL INFORMATION TECHNOLOGY | | | 65,515,696 |
| MATERIALS - 2.5% | | | |
| Chemicals - 1.4% | | | |
| Celanese Corp. | | 2,177 | 307,284 |
| Ecolab, Inc. | | 2,308 | 532,433 |
| Linde PLC | | 2,766 | 1,254,381 |
| RPM International, Inc. | | 3,074 | 373,368 |
| Sherwin-Williams Co. | | 1,922 | 674,238 |
| | | | 3,141,704 |
| Construction Materials - 0.4% | | | |
| Martin Marietta Materials, Inc. | | 731 | 433,739 |
| Vulcan Materials Co. | | 1,609 | 441,687 |
| | | | 875,426 |
| Containers & Packaging - 0.3% | | | |
| Packaging Corp. of America | | 1,940 | 387,748 |
| Smurfit Westrock PLC | | 6,445 | 288,994 |
| | | | 676,742 |
| Metals & Mining - 0.4% | | | |
| Nucor Corp. | | 2,669 | 434,887 |
| Steel Dynamics, Inc. | | 2,744 | 365,556 |
| | | | 800,443 |
TOTAL MATERIALS | | | 5,494,315 |
| REAL ESTATE - 2.6% | | | |
| Equity Real Estate Investment Trusts (REITs) - 2.2% | | | |
| American Tower Corp. | | 3,442 | 758,617 |
| Digital Realty Trust, Inc. | | 3,126 | 467,306 |
| Equinix, Inc. | | 772 | 610,065 |
| Iron Mountain, Inc. | | 4,557 | 467,366 |
| Prologis, Inc. | | 6,453 | 813,401 |
| Simon Property Group, Inc. | | 3,211 | 492,696 |
| Vornado Realty Trust | | 10,350 | 310,397 |
| Welltower, Inc. | | 5,047 | 561,479 |
| Weyerhaeuser Co. | | 11,336 | 360,031 |
| | | | 4,841,358 |
| Real Estate Management & Development - 0.4% | | | |
| CBRE Group, Inc. (a) | | 4,210 | 474,509 |
| CoStar Group, Inc. (a) | | 4,599 | 358,814 |
| | | | 833,323 |
TOTAL REAL ESTATE | | | 5,674,681 |
| UTILITIES - 2.3% | | | |
| Electric Utilities - 2.0% | | | |
| Constellation Energy Corp. | | 3,518 | 667,716 |
| Duke Energy Corp. | | 7,348 | 802,916 |
| NextEra Energy, Inc. | | 14,703 | 1,123,162 |
| NRG Energy, Inc. | | 6,248 | 469,662 |
| PG&E Corp. | | 31,871 | 581,646 |
| Southern Co. | | 10,012 | 836,202 |
| | | | 4,481,304 |
| Independent Power and Renewable Electricity Producers - 0.3% | | | |
| Vistra Corp. | | 6,418 | 508,434 |
TOTAL UTILITIES | | | 4,989,738 |
| TOTAL COMMON STOCKS (Cost $180,068,634) | | | 220,530,308 |
| | | | |
| Money Market Funds - 0.1% |
| | | Shares | Value ($) |
Fidelity Cash Central Fund 5.39% (b) (Cost $244,389) | | 244,340 | 244,389 |
| | | | |
| TOTAL INVESTMENT IN SECURITIES - 99.9% (Cost $180,313,023) | 220,774,697 |
NET OTHER ASSETS (LIABILITIES) - 0.1% | 146,535 |
| NET ASSETS - 100.0% | 220,921,232 |
| | |
| Futures Contracts |
| | Number of contracts | Expiration Date | Notional Amount ($) | Value ($) | Unrealized Appreciation/ (Depreciation) ($) |
| Purchased | | | | | |
| | | | | | |
| Equity Index Contracts | | | | | |
| CME Micro E-mini S&P 500 Index Contracts (United States) | 14 | Sep 2024 | 389,060 | 4,666 | 4,666 |
| | | | | | |
| The notional amount of futures purchased as a percentage of Net Assets is 0.2% |
Legend
| (b) | Affiliated fund that is generally available only to investment companies and other accounts managed by Fidelity Investments. The rate quoted is the annualized seven-day yield of the fund at period end. A complete unaudited listing of the fund's holdings as of its most recent quarter end is available upon request. In addition, each Fidelity Central Fund's financial statements, which are not covered by the Fund's Report of Independent Registered Public Accounting Firm, are available on the SEC's website or upon request. |
Affiliated Central Funds
Fiscal year to date information regarding the Fund's investments in Fidelity Central Funds, including the ownership percentage, is presented below.
| Affiliate | Value, beginning of period ($) | Purchases ($) | Sales Proceeds ($) | Dividend Income ($) | Realized Gain (loss) ($) | Change in Unrealized appreciation (depreciation) ($) | Value, end of period ($) | % ownership, end of period |
| Fidelity Cash Central Fund 5.39% | 267,697 | 6,093,154 | 6,116,491 | 19,282 | 29 | - | 244,389 | 0.0% |
| Fidelity Securities Lending Cash Central Fund 5.39% | 632,700 | 21,886,201 | 22,518,901 | 716 | - | - | - | 0.0% |
| Total | 900,397 | 27,979,355 | 28,635,392 | 19,998 | 29 | - | 244,389 | |
| | | | | | | | | |
Amounts in the dividend income column in the above table include any capital gain distributions from underlying funds, which are presented in the corresponding line item in the Statement of Operations, if applicable.
Amounts in the dividend income column for Fidelity Securities Lending Cash Central Fund represents the income earned on investing cash collateral, less rebates paid to borrowers and any lending agent fees associated with the loan, plus any premium payments received for lending certain types of securities.
Amounts included in the purchases and sales proceeds columns may include in-kind transactions, if applicable.
Investment Valuation
The following is a summary of the inputs used, as of July 31, 2024, involving the Fund's assets and liabilities carried at fair value. The inputs or methodology used for valuing securities may not be an indication of the risk associated with investing in those securities. For more information on valuation inputs, and their aggregation into the levels used below, please refer to the Investment Valuation section in the accompanying Notes to Financial Statements.
| Valuation Inputs at Reporting Date: |
| Description | Total ($) | Level 1 ($) | Level 2 ($) | Level 3 ($) |
Investments in Securities: | | | | |
|
| Equities: | | | | |
Communication Services | 18,563,513 | 18,563,513 | - | - |
Consumer Discretionary | 22,536,851 | 22,536,851 | - | - |
Consumer Staples | 12,646,568 | 12,646,568 | - | - |
Energy | 7,728,174 | 7,728,174 | - | - |
Financials | 29,612,911 | 29,612,911 | - | - |
Health Care | 27,022,204 | 27,022,204 | - | - |
Industrials | 20,745,657 | 20,745,657 | - | - |
Information Technology | 65,515,696 | 65,515,696 | - | - |
Materials | 5,494,315 | 5,494,315 | - | - |
Real Estate | 5,674,681 | 5,674,681 | - | - |
Utilities | 4,989,738 | 4,989,738 | - | - |
|
| Money Market Funds | 244,389 | 244,389 | - | - |
| Total Investments in Securities: | 220,774,697 | 220,774,697 | - | - |
Derivative Instruments: Assets | | | | |
Futures Contracts | 4,666 | 4,666 | - | - |
| Total Assets | 4,666 | 4,666 | - | - |
| Total Derivative Instruments: | 4,666 | 4,666 | - | - |
Value of Derivative Instruments
The following table is a summary of the Fund's value of derivative instruments by primary risk exposure as of July 31, 2024. For additional information on derivative instruments, please refer to the Derivative Instruments section in the accompanying Notes to Financial Statements.
Primary Risk Exposure / Derivative Type | Value |
| Asset ($) | Liability ($) |
| Equity Risk | | |
Futures Contracts (a) | 4,666 | 0 |
| Total Equity Risk | 4,666 | 0 |
| Total Value of Derivatives | 4,666 | 0 |
(a)Reflects gross cumulative appreciation (depreciation) on futures contracts as presented in the Schedule of Investments. In the Statement of Assets and Liabilities, the period end daily variation margin is included in receivable or payable for daily variation margin on futures contracts, and the net cumulative appreciation (depreciation) is included in Total accumulated earnings (loss).
Fidelity® Momentum Factor ETF
Financial Statements
| Statement of Assets and Liabilities |
As of July 31, 2024 |
| Assets | | | | |
| Investment in securities, at value - See accompanying schedule: | | | | |
Unaffiliated issuers (cost $180,068,634) | $ | 220,530,308 | | |
Fidelity Central Funds (cost $244,389) | | 244,389 | | |
| | | | | |
| | | | | |
| Total Investment in Securities (cost $180,313,023) | | | $ | 220,774,697 |
| Segregated cash with brokers for derivative instruments | | | | 42,480 |
| Cash | | | | 28,317 |
| Dividends receivable | | | | 106,848 |
| Distributions receivable from Fidelity Central Funds | | | | 1,959 |
| Receivable for daily variation margin on futures contracts | | | | 5,985 |
Total assets | | | | 220,960,286 |
| Liabilities | | | | |
| Accrued management fee | $ | 27,959 | | |
| Proxy fee payable | | 11,095 | | |
| Total liabilities | | | | 39,054 |
| Net Assets | | | $ | 220,921,232 |
| Net Assets consist of: | | | | |
| Paid in capital | | | $ | 215,576,533 |
| Total accumulated earnings (loss) | | | | 5,344,699 |
| Net Assets | | | $ | 220,921,232 |
Net Asset Value, offering price and redemption price per share ($220,921,232 ÷ 3,500,000 shares) | | | $ | 63.12 |
| Statement of Operations |
| Year ended July 31, 2024 |
| Investment Income | | | | |
| Dividends | | | $ | 1,636,619 |
| Income from Fidelity Central Funds (including $716 from security lending) | | | | 19,998 |
| Total income | | | | 1,656,617 |
| Expenses | | | | |
| Management fee | $ | 316,309 | | |
| Independent trustees' fees and expenses | | 806 | | |
| Miscellaneous | | 11,095 | | |
| Total expenses before reductions | | 328,210 | | |
| Expense reductions | | (1,067) | | |
| Total expenses after reductions | | | | 327,143 |
| Net Investment income (loss) | | | | 1,329,474 |
| Realized and Unrealized Gain (Loss) | | | | |
| Net realized gain (loss) on: | | | | |
| Investment Securities: | | | | |
| Unaffiliated issuers | | (2,742,068) | | |
| Redemptions in-kind | | 26,472,032 | | |
| Fidelity Central Funds | | 29 | | |
| Futures contracts | | 104,262 | | |
| Total net realized gain (loss) | | | | 23,834,255 |
| Change in net unrealized appreciation (depreciation) on: | | | | |
| Investment Securities: | | | | |
| Unaffiliated issuers | | 20,372,073 | | |
| Futures contracts | | (10,318) | | |
| Total change in net unrealized appreciation (depreciation) | | | | 20,361,755 |
| Net gain (loss) | | | | 44,196,010 |
| Net increase (decrease) in net assets resulting from operations | | | $ | 45,525,484 |
| Statement of Changes in Net Assets |
| |
| | Year ended July 31, 2024 | | Year ended July 31, 2023 |
| Increase (Decrease) in Net Assets | | | | |
| Operations | | | | |
| Net investment income (loss) | $ | 1,329,474 | $ | 1,464,341 |
| Net realized gain (loss) | | 23,834,255 | | (2,793,086) |
| Change in net unrealized appreciation (depreciation) | | 20,361,755 | | 13,280,212 |
| Net increase (decrease) in net assets resulting from operations | | 45,525,484 | | 11,951,467 |
| Distributions to shareholders | | (1,236,100) | | (1,506,200) |
| | | | | |
| Share transactions | | | | |
| Proceeds from sales of shares | | 146,020,437 | | 52,044,612 |
| Cost of shares redeemed | | (122,219,404) | | (26,407,433) |
| | | | | |
Net increase (decrease) in net assets resulting from share transactions | | 23,801,033 | | 25,637,179 |
| Total increase (decrease) in net assets | | 68,090,417 | | 36,082,446 |
| | | | | |
| Net Assets | | | | |
| Beginning of period | | 152,830,815 | | 116,748,369 |
| End of period | $ | 220,921,232 | $ | 152,830,815 |
| | | | | |
| Other Information | | | | |
| Shares | | | | |
| Sold | | 2,550,000 | | 1,150,000 |
| Redeemed | | (2,150,000) | | (600,000) |
| Net increase (decrease) | | 400,000 | | 550,000 |
| | | | | |
Financial Highlights
Fidelity® Momentum Factor ETF |
| |
| Years ended July 31, | | 2024 | | 2023 | | 2022 | | 2021 | | 2020 |
Selected Per-Share Data | | | | | | | | | | |
| Net asset value, beginning of period | $ | 49.30 | $ | 45.78 | $ | 49.77 | $ | 39.26 | $ | 35.80 |
| Income from Investment Operations | | | | | | | | | | |
Net investment income (loss) A,B | | .41 | | .53 | | .43 | | .25 | | .42 |
| Net realized and unrealized gain (loss) | | 13.80 | | 3.53 | | (4.01) | | 10.54 | | 3.47 |
| Total from investment operations | | 14.21 | | 4.06 | | (3.58) | | 10.79 | | 3.89 |
| Distributions from net investment income | | (.39) | | (.54) | | (.41) | | (.28) | | (.43) |
| Total distributions | | (.39) | | (.54) | | (.41) | | (.28) | | (.43) |
| Net asset value, end of period | $ | 63.12 | $ | 49.30 | $ | 45.78 | $ | 49.77 | $ | 39.26 |
Total Return C,D | | | | 9.02% | | (7.20)% | | 27.58% | | 11.06% |
Ratios to Average Net Assets A,E,F | | | | | | | | | | |
| Expenses before reductions | | .18% | | .29% | | .29% | | .29% | | .29% |
| Expenses net of fee waivers, if any | | | | .29% | | .29% | | .29% | | .29% |
| Expenses net of all reductions | | .18% | | .29% | | .29% | | .29% | | .29% |
| Net investment income (loss) | | .75% | | 1.19% | | .88% | | .55% | | 1.18% |
| Supplemental Data | | | | | | | | | | |
| Net assets, end of period (000 omitted) | $ | 220,921 | $ | 152,831 | $ | 116,748 | $ | 156,764 | $ | 88,329 |
Portfolio turnover rate G,H | | | | 137% | | 123% | | 128% | | 138% |
ANet investment income (loss) is affected by the timing of the declaration of dividends by any underlying mutual funds or exchange-traded funds (ETFs). Net investment income (loss) of any mutual funds or ETFs is not included in the Fund's net investment income (loss) ratio.
BCalculated based on average shares outstanding during the period.
CBased on net asset value.
DTotal returns would have been lower if certain expenses had not been reduced during the applicable periods shown.
EFees and expenses of any underlying mutual funds or exchange-traded funds (ETFs) are not included in the Fund's expense ratio. The Fund indirectly bears its proportionate share of these expenses. For additional expense information related to investments in Fidelity Central Funds, please refer to the "Investments in Fidelity Central Funds" note found in the Notes to Financial Statements section of the most recent Annual or Semi-Annual report.
FExpense ratios reflect operating expenses of the class. Expenses before reductions do not reflect amounts reimbursed, waived, or reduced through arrangements with the investment adviser, brokerage services, or other offset arrangements, if applicable, and do not represent the amount paid by the class during periods when reimbursements, waivers or reductions occur.
GAmount does not include the portfolio activity of any underlying mutual funds or exchange-traded funds (ETFs).
HPortfolio turnover rate excludes securities received or delivered in-kind.
Fidelity® Quality Factor ETF
Schedule of Investments July 31, 2024
Showing Percentage of Net Assets
| Common Stocks - 99.9% |
| | | Shares | Value ($) |
| COMMUNICATION SERVICES - 8.5% | | | |
| Diversified Telecommunication Services - 1.1% | | | |
| AT&T, Inc. | | 279,608 | 5,382,454 |
| Verizon Communications, Inc. | | 142,031 | 5,755,096 |
| | | | 11,137,550 |
| Interactive Media & Services - 6.5% | | | |
| Alphabet, Inc. Class A | | 236,144 | 40,508,142 |
| Meta Platforms, Inc. Class A | | 50,575 | 24,014,527 |
| Zoominfo Technologies, Inc. (a) | | 161,716 | 1,837,094 |
| | | | 66,359,763 |
| Media - 0.9% | | | |
| Comcast Corp. Class A | | 133,017 | 5,489,612 |
| The Trade Desk, Inc. Class A (a) | | 45,666 | 4,104,460 |
| | | | 9,594,072 |
TOTAL COMMUNICATION SERVICES | | | 87,091,385 |
| CONSUMER DISCRETIONARY - 9.7% | | | |
| Broadline Retail - 0.9% | | | |
| eBay, Inc. | | 168,875 | 9,391,139 |
| Hotels, Restaurants & Leisure - 4.7% | | | |
| Airbnb, Inc. Class A (a) | | 53,814 | 7,510,282 |
| Booking Holdings, Inc. | | 2,564 | 9,525,286 |
| Domino's Pizza, Inc. | | 15,947 | 6,836,479 |
| McDonald's Corp. | | 36,671 | 9,732,483 |
| Starbucks Corp. | | 93,623 | 7,297,913 |
| Yum! Brands, Inc. | | 56,275 | 7,475,008 |
| | | | 48,377,451 |
| Specialty Retail - 4.1% | | | |
| AutoZone, Inc. (a) | | 2,718 | 8,517,369 |
| O'Reilly Automotive, Inc. (a) | | 7,539 | 8,491,477 |
| The Home Depot, Inc. | | 38,334 | 14,113,045 |
| Williams-Sonoma, Inc. | | 69,684 | 10,778,721 |
| | | | 41,900,612 |
TOTAL CONSUMER DISCRETIONARY | | | 99,669,202 |
| CONSUMER STAPLES - 5.4% | | | |
| Beverages - 1.1% | | | |
| Monster Beverage Corp. (a) | | 66,142 | 3,403,006 |
| The Coca-Cola Co. | | 124,804 | 8,329,419 |
| | | | 11,732,425 |
| Food Products - 0.3% | | | |
| The Hershey Co. | | 17,491 | 3,454,123 |
| Household Products - 2.2% | | | |
| Church & Dwight Co., Inc. | | 33,161 | 3,250,110 |
| Colgate-Palmolive Co. | | 49,821 | 4,941,745 |
| Kimberly-Clark Corp. | | 30,044 | 4,057,442 |
| Procter & Gamble Co. | | 65,114 | 10,467,727 |
| | | | 22,717,024 |
| Personal Care Products - 0.6% | | | |
| BellRing Brands, Inc. (a) | | 53,596 | 2,748,403 |
| Kenvue, Inc. | | 171,992 | 3,180,132 |
| | | | 5,928,535 |
| Tobacco - 1.2% | | | |
| Altria Group, Inc. | | 104,218 | 5,107,724 |
| Philip Morris International, Inc. | | 61,811 | 7,118,155 |
| | | | 12,225,879 |
TOTAL CONSUMER STAPLES | | | 56,057,986 |
| ENERGY - 3.9% | | | |
| Oil, Gas & Consumable Fuels - 3.9% | | | |
| Antero Midstream GP LP | | 144,652 | 2,077,203 |
| Cheniere Energy, Inc. | | 15,135 | 2,764,256 |
| Chevron Corp. | | 46,476 | 7,458,004 |
| ConocoPhillips Co. | | 38,882 | 4,323,678 |
| Coterra Energy, Inc. | | 83,669 | 2,158,660 |
| EOG Resources, Inc. | | 26,657 | 3,380,108 |
| Exxon Mobil Corp. | | 96,468 | 11,440,140 |
| Kinder Morgan, Inc. | | 137,829 | 2,912,327 |
| Texas Pacific Land Corp. (b) | | 3,880 | 3,278,212 |
| | | | 39,792,588 |
| FINANCIALS - 13.0% | | | |
| Banks - 0.8% | | | |
| First Citizens Bancshares, Inc. | | 3,911 | 8,164,956 |
| Capital Markets - 3.4% | | | |
| Ameriprise Financial, Inc. | | 16,126 | 6,935,309 |
| Blackstone, Inc. | | 57,952 | 8,237,877 |
| CME Group, Inc. | | 33,631 | 6,514,661 |
| Moody's Corp. | | 16,662 | 7,605,870 |
| MSCI, Inc. | | 10,599 | 5,731,515 |
| | | | 35,025,232 |
| Consumer Finance - 0.8% | | | |
| Discover Financial Services | | 56,050 | 8,070,640 |
| Financial Services - 6.0% | | | |
| Berkshire Hathaway, Inc. Class B (a) | | 50,400 | 22,100,400 |
| Essent Group Ltd. | | 100,823 | 6,335,717 |
| MasterCard, Inc. Class A | | 28,343 | 13,142,933 |
| MGIC Investment Corp. | | 277,969 | 6,904,750 |
| Visa, Inc. Class A | | 51,462 | 13,671,910 |
| | | | 62,155,710 |
| Insurance - 2.0% | | | |
| Aon PLC | | 22,145 | 7,274,854 |
| Arch Capital Group Ltd. (a) | | 73,734 | 7,062,243 |
| Kinsale Capital Group, Inc. | | 14,237 | 6,507,306 |
| | | | 20,844,403 |
TOTAL FINANCIALS | | | 134,260,941 |
| HEALTH CARE - 12.0% | | | |
| Biotechnology - 5.2% | | | |
| AbbVie, Inc. | | 76,507 | 14,178,277 |
| Amgen, Inc. | | 32,001 | 10,639,372 |
| Gilead Sciences, Inc. | | 113,353 | 8,621,629 |
| Regeneron Pharmaceuticals, Inc. (a) | | 9,363 | 10,104,456 |
| Vertex Pharmaceuticals, Inc. (a) | | 21,095 | 10,457,213 |
| | | | 54,000,947 |
| Health Care Equipment & Supplies - 0.7% | | | |
| IDEXX Laboratories, Inc. (a) | | 14,785 | 7,039,434 |
| Life Sciences Tools & Services - 1.8% | | | |
| Medpace Holdings, Inc. (a) | | 23,898 | 9,141,463 |
| Mettler-Toledo International, Inc. (a) | | 6,089 | 9,261,552 |
| | | | 18,403,015 |
| Pharmaceuticals - 4.3% | | | |
| Eli Lilly & Co. | | 26,401 | 21,233,532 |
| Johnson & Johnson | | 91,720 | 14,478,002 |
| Zoetis, Inc. Class A | | 45,728 | 8,232,869 |
| | | | 43,944,403 |
TOTAL HEALTH CARE | | | 123,387,799 |
| INDUSTRIALS - 9.1% | | | |
| Aerospace & Defense - 1.2% | | | |
| Lockheed Martin Corp. | | 12,814 | 6,944,163 |
| TransDigm Group, Inc. | | 4,346 | 5,624,680 |
| | | | 12,568,843 |
| Air Freight & Logistics - 0.4% | | | |
| Expeditors International of Washington, Inc. | | 32,083 | 4,004,600 |
| Building Products - 0.4% | | | |
| A.O. Smith Corp. | | 47,798 | 4,064,742 |
| Commercial Services & Supplies - 1.0% | | | |
| Cintas Corp. | | 7,585 | 5,794,485 |
| Copart, Inc. | | 90,772 | 4,750,099 |
| | | | 10,544,584 |
| Electrical Equipment - 0.4% | | | |
| AMETEK, Inc. | | 26,365 | 4,573,800 |
| Ground Transportation - 1.6% | | | |
| CSX Corp. | | 138,887 | 4,874,934 |
| Old Dominion Freight Lines, Inc. | | 21,975 | 4,618,706 |
| Union Pacific Corp. | | 26,649 | 6,575,108 |
| | | | 16,068,748 |
| Machinery - 1.7% | | | |
| Caterpillar, Inc. | | 21,911 | 7,585,588 |
| Illinois Tool Works, Inc. | | 19,585 | 4,842,979 |
| Otis Worldwide Corp. | | 48,448 | 4,578,336 |
| | | | 17,006,903 |
| Professional Services - 1.5% | | | |
| Automatic Data Processing, Inc. | | 22,827 | 5,994,827 |
| Paychex, Inc. | | 36,213 | 4,635,988 |
| Verisk Analytics, Inc. | | 17,539 | 4,590,833 |
| | | | 15,221,648 |
| Trading Companies & Distributors - 0.9% | | | |
| Fastenal Co. | | 63,070 | 4,462,203 |
| W.W. Grainger, Inc. | | 4,800 | 4,688,688 |
| | | | 9,150,891 |
TOTAL INDUSTRIALS | | | 93,204,759 |
| INFORMATION TECHNOLOGY - 31.1% | | | |
| Communications Equipment - 1.0% | | | |
| Cisco Systems, Inc. | | 204,633 | 9,914,469 |
| IT Services - 0.6% | | | |
| VeriSign, Inc. (a) | | 32,792 | 6,132,432 |
| Semiconductors & Semiconductor Equipment - 12.7% | | | |
| Applied Materials, Inc. | | 53,914 | 11,440,551 |
| Broadcom, Inc. | | 139,383 | 22,396,060 |
| KLA Corp. | | 13,091 | 10,774,809 |
| Lam Research Corp. | | 10,103 | 9,307,288 |
| Microchip Technology, Inc. | | 83,331 | 7,398,126 |
| NVIDIA Corp. | | 591,593 | 69,228,213 |
| | | | 130,545,047 |
| Software - 9.8% | | | |
| Adobe, Inc. (a) | | 18,986 | 10,473,627 |
| Fair Isaac Corp. (a) | | 5,500 | 8,800,000 |
| Microsoft Corp. | | 163,752 | 68,505,649 |
| Palo Alto Networks, Inc. (a) | | 24,492 | 7,953,287 |
| Qualys, Inc. (a) | | 33,373 | 4,977,249 |
| | | | 100,709,812 |
| Technology Hardware, Storage & Peripherals - 7.0% | | | |
| Apple, Inc. | | 325,064 | 72,190,210 |
TOTAL INFORMATION TECHNOLOGY | | | 319,491,970 |
| MATERIALS - 2.4% | | | |
| Chemicals - 1.4% | | | |
| CF Industries Holdings, Inc. | | 20,451 | 1,562,252 |
| Ecolab, Inc. | | 11,465 | 2,644,861 |
| Linde PLC | | 12,818 | 5,812,963 |
| NewMarket Corp. | | 2,302 | 1,291,123 |
| Sherwin-Williams Co. | | 8,846 | 3,103,177 |
| | | | 14,414,376 |
| Construction Materials - 0.2% | | | |
| Eagle Materials, Inc. | | 6,169 | 1,679,819 |
| Metals & Mining - 0.8% | | | |
| Alpha Metallurgical Resources (b) | | 3,378 | 997,895 |
| Nucor Corp. | | 11,800 | 1,922,692 |
| Reliance, Inc. | | 5,569 | 1,696,095 |
| Royal Gold, Inc. | | 12,247 | 1,691,556 |
| Steel Dynamics, Inc. | | 13,709 | 1,826,313 |
| | | | 8,134,551 |
TOTAL MATERIALS | | | 24,228,746 |
| REAL ESTATE - 2.4% | | | |
| Equity Real Estate Investment Trusts (REITs) - 2.4% | | | |
| AvalonBay Communities, Inc. | | 10,859 | 2,225,226 |
| Equity Residential (SBI) | | 30,312 | 2,110,625 |
| Extra Space Storage, Inc. | | 13,990 | 2,233,084 |
| Gaming & Leisure Properties | | 36,067 | 1,810,563 |
| Prologis, Inc. | | 29,395 | 3,705,240 |
| Public Storage Operating Co. | | 8,151 | 2,412,044 |
| Realty Income Corp. | | 42,424 | 2,436,410 |
| SBA Communications Corp. Class A | | 8,335 | 1,829,866 |
| Simon Property Group, Inc. | | 16,759 | 2,571,501 |
| VICI Properties, Inc. | | 66,605 | 2,082,072 |
| WP Carey, Inc. | | 27,132 | 1,568,501 |
| | | | 24,985,132 |
| UTILITIES - 2.4% | | | |
| Electric Utilities - 1.2% | | | |
| NextEra Energy, Inc. | | 74,596 | 5,698,388 |
| Otter Tail Corp. (b) | | 22,233 | 2,154,822 |
| Southern Co. | | 50,287 | 4,199,970 |
| | | | 12,053,180 |
| Gas Utilities - 0.2% | | | |
| National Fuel Gas Co. | | 44,155 | 2,587,041 |
| Independent Power and Renewable Electricity Producers - 0.4% | | | |
| Vistra Corp. | | 53,182 | 4,213,078 |
| Multi-Utilities - 0.6% | | | |
| Public Service Enterprise Group, Inc. | | 44,013 | 3,510,917 |
| WEC Energy Group, Inc. | | 30,872 | 2,656,844 |
| | | | 6,167,761 |
TOTAL UTILITIES | | | 25,021,060 |
| TOTAL COMMON STOCKS (Cost $888,520,747) | | | 1,027,191,568 |
| | | | |
| Money Market Funds - 0.4% |
| | | Shares | Value ($) |
| Fidelity Cash Central Fund 5.39% (c) | | 777,950 | 778,106 |
| Fidelity Securities Lending Cash Central Fund 5.39% (c)(d) | | 3,950,730 | 3,951,125 |
| TOTAL MONEY MARKET FUNDS (Cost $4,729,231) | | | 4,729,231 |
| | | | |
| TOTAL INVESTMENT IN SECURITIES - 100.3% (Cost $893,249,978) | 1,031,920,799 |
NET OTHER ASSETS (LIABILITIES) - (0.3)% | (3,369,848) |
| NET ASSETS - 100.0% | 1,028,550,951 |
| | |
| Futures Contracts |
| | Number of contracts | Expiration Date | Notional Amount ($) | Value ($) | Unrealized Appreciation/ (Depreciation) ($) |
| Purchased | | | | | |
| | | | | | |
| Equity Index Contracts | | | | | |
| CME Micro E-mini S&P 500 Index Contracts (United States) | 38 | Sep 2024 | 1,056,020 | 6,743 | 6,743 |
| | | | | | |
| The notional amount of futures purchased as a percentage of Net Assets is 0.1% |
Legend
| (b) | Security or a portion of the security is on loan at period end. |
| (c) | Affiliated fund that is generally available only to investment companies and other accounts managed by Fidelity Investments. The rate quoted is the annualized seven-day yield of the fund at period end. A complete unaudited listing of the fund's holdings as of its most recent quarter end is available upon request. In addition, each Fidelity Central Fund's financial statements, which are not covered by the Fund's Report of Independent Registered Public Accounting Firm, are available on the SEC's website or upon request. |
| (d) | Investment made with cash collateral received from securities on loan. |
Affiliated Central Funds
Fiscal year to date information regarding the Fund's investments in Fidelity Central Funds, including the ownership percentage, is presented below.
| Affiliate | Value, beginning of period ($) | Purchases ($) | Sales Proceeds ($) | Dividend Income ($) | Realized Gain (loss) ($) | Change in Unrealized appreciation (depreciation) ($) | Value, end of period ($) | % ownership, end of period |
| Fidelity Cash Central Fund 5.39% | 508,828 | 26,588,661 | 26,319,351 | 62,235 | (32) | - | 778,106 | 0.0% |
| Fidelity Securities Lending Cash Central Fund 5.39% | 162,000 | 55,951,210 | 52,162,085 | 6,574 | - | - | 3,951,125 | 0.0% |
| Total | 670,828 | 82,539,871 | 78,481,436 | 68,809 | (32) | - | 4,729,231 | |
| | | | | | | | | |
Amounts in the dividend income column in the above table include any capital gain distributions from underlying funds, which are presented in the corresponding line item in the Statement of Operations, if applicable.
Amounts in the dividend income column for Fidelity Securities Lending Cash Central Fund represents the income earned on investing cash collateral, less rebates paid to borrowers and any lending agent fees associated with the loan, plus any premium payments received for lending certain types of securities.
Amounts included in the purchases and sales proceeds columns may include in-kind transactions, if applicable.
Investment Valuation
The following is a summary of the inputs used, as of July 31, 2024, involving the Fund's assets and liabilities carried at fair value. The inputs or methodology used for valuing securities may not be an indication of the risk associated with investing in those securities. For more information on valuation inputs, and their aggregation into the levels used below, please refer to the Investment Valuation section in the accompanying Notes to Financial Statements.
| Valuation Inputs at Reporting Date: |
| Description | Total ($) | Level 1 ($) | Level 2 ($) | Level 3 ($) |
Investments in Securities: | | | | |
|
| Equities: | | | | |
Communication Services | 87,091,385 | 87,091,385 | - | - |
Consumer Discretionary | 99,669,202 | 99,669,202 | - | - |
Consumer Staples | 56,057,986 | 56,057,986 | - | - |
Energy | 39,792,588 | 39,792,588 | - | - |
Financials | 134,260,941 | 134,260,941 | - | - |
Health Care | 123,387,799 | 123,387,799 | - | - |
Industrials | 93,204,759 | 93,204,759 | - | - |
Information Technology | 319,491,970 | 319,491,970 | - | - |
Materials | 24,228,746 | 24,228,746 | - | - |
Real Estate | 24,985,132 | 24,985,132 | - | - |
Utilities | 25,021,060 | 25,021,060 | - | - |
|
| Money Market Funds | 4,729,231 | 4,729,231 | - | - |
| Total Investments in Securities: | 1,031,920,799 | 1,031,920,799 | - | - |
Derivative Instruments: Assets | | | | |
Futures Contracts | 6,743 | 6,743 | - | - |
| Total Assets | 6,743 | 6,743 | - | - |
| Total Derivative Instruments: | 6,743 | 6,743 | - | - |
Value of Derivative Instruments
The following table is a summary of the Fund's value of derivative instruments by primary risk exposure as of July 31, 2024. For additional information on derivative instruments, please refer to the Derivative Instruments section in the accompanying Notes to Financial Statements.
Primary Risk Exposure / Derivative Type | Value |
| Asset ($) | Liability ($) |
| Equity Risk | | |
Futures Contracts (a) | 6,743 | 0 |
| Total Equity Risk | 6,743 | 0 |
| Total Value of Derivatives | 6,743 | 0 |
(a)Reflects gross cumulative appreciation (depreciation) on futures contracts as presented in the Schedule of Investments. In the Statement of Assets and Liabilities, the period end daily variation margin is included in receivable or payable for daily variation margin on futures contracts, and the net cumulative appreciation (depreciation) is included in Total accumulated earnings (loss).
Fidelity® Quality Factor ETF
Financial Statements
| Statement of Assets and Liabilities |
As of July 31, 2024 |
| Assets | | | | |
| Investment in securities, at value (including securities loaned of $3,947,563) - See accompanying schedule: | | | | |
Unaffiliated issuers (cost $888,520,747) | $ | 1,027,191,568 | | |
Fidelity Central Funds (cost $4,729,231) | | 4,729,231 | | |
| | | | | |
| | | | | |
| Total Investment in Securities (cost $893,249,978) | | | $ | 1,031,920,799 |
| Segregated cash with brokers for derivative instruments | | | | 66,960 |
| Cash | | | | 31,433 |
| Dividends receivable | | | | 672,321 |
| Distributions receivable from Fidelity Central Funds | | | | 4,251 |
| Receivable for daily variation margin on futures contracts | | | | 16,245 |
| Other receivables | | | | 3,074 |
Total assets | | | | 1,032,715,083 |
| Liabilities | | | | |
| Accrued management fee | $ | 138,871 | | |
| Other payables and accrued expenses | | 74,136 | | |
| Collateral on securities loaned | | 3,951,125 | | |
| Total liabilities | | | | 4,164,132 |
| Net Assets | | | $ | 1,028,550,951 |
| Net Assets consist of: | | | | |
| Paid in capital | | | $ | 920,241,855 |
| Total accumulated earnings (loss) | | | | 108,309,096 |
| Net Assets | | | $ | 1,028,550,951 |
Net Asset Value, offering price and redemption price per share ($1,028,550,951 ÷ 16,550,000 shares) | | | $ | 62.15 |
| Statement of Operations |
| Year ended July 31, 2024 |
| Investment Income | | | | |
| Dividends | | | $ | 9,158,150 |
| Income from Fidelity Central Funds (including $6,574 from security lending) | | | | 68,809 |
| Total income | | | | 9,226,959 |
| Expenses | | | | |
| Management fee | $ | 1,048,929 | | |
| Independent trustees' fees and expenses | | 2,438 | | |
| Proxy fee | | 71,103 | | |
| Total expenses before reductions | | 1,122,470 | | |
| Expense reductions | | (885) | | |
| Total expenses after reductions | | | | 1,121,585 |
| Net Investment income (loss) | | | | 8,105,374 |
| Realized and Unrealized Gain (Loss) | | | | |
| Net realized gain (loss) on: | | | | |
| Investment Securities: | | | | |
| Unaffiliated issuers | | (7,243,632) | | |
| Redemptions in-kind | | 23,453,273 | | |
| Fidelity Central Funds | | (32) | | |
| Futures contracts | | 308,803 | | |
| Total net realized gain (loss) | | | | 16,518,412 |
| Change in net unrealized appreciation (depreciation) on: | | | | |
| Investment Securities: | | | | |
| Unaffiliated issuers | | 110,535,520 | | |
| Futures contracts | | (29,836) | | |
| Total change in net unrealized appreciation (depreciation) | | | | 110,505,684 |
| Net gain (loss) | | | | 127,024,096 |
| Net increase (decrease) in net assets resulting from operations | | | $ | 135,129,470 |
| Statement of Changes in Net Assets |
| |
| | Year ended July 31, 2024 | | Year ended July 31, 2023 |
| Increase (Decrease) in Net Assets | | | | |
| Operations | | | | |
| Net investment income (loss) | $ | 8,105,374 | $ | 4,196,290 |
| Net realized gain (loss) | | 16,518,412 | | 1,048,219 |
| Change in net unrealized appreciation (depreciation) | | 110,505,684 | | 25,942,533 |
| Net increase (decrease) in net assets resulting from operations | | 135,129,470 | | 31,187,042 |
| Distributions to shareholders | | (7,699,650) | | (4,025,350) |
| | | | | |
| Share transactions | | | | |
| Proceeds from sales of shares | | 650,190,885 | | 68,034,031 |
| Cost of shares redeemed | | (75,912,293) | | (35,066,993) |
| | | | | |
Net increase (decrease) in net assets resulting from share transactions | | 574,278,592 | | 32,967,038 |
| Total increase (decrease) in net assets | | 701,708,412 | | 60,128,730 |
| | | | | |
| Net Assets | | | | |
| Beginning of period | | 326,842,539 | | 266,713,809 |
| End of period | $ | 1,028,550,951 | $ | 326,842,539 |
| | | | | |
| Other Information | | | | |
| Shares | | | | |
| Sold | | 11,550,000 | | 1,450,000 |
| Redeemed | | (1,250,000) | | (750,000) |
| Net increase (decrease) | | 10,300,000 | | 700,000 |
| | | | | |
Financial Highlights
Fidelity® Quality Factor ETF |
| |
| Years ended July 31, | | 2024 | | 2023 | | 2022 | | 2021 | | 2020 |
Selected Per-Share Data | | | | | | | | | | |
| Net asset value, beginning of period | $ | 52.29 | $ | 48.06 | $ | 51.19 | $ | 38.19 | $ | 35.28 |
| Income from Investment Operations | | | | | | | | | | |
Net investment income (loss) A,B | | .73 | | .72 | | .67 | | .62 | | .62 |
| Net realized and unrealized gain (loss) | | 9.83 | | 4.20 | | (3.10) | | 13.00 | | 2.90 |
| Total from investment operations | | 10.56 | | 4.92 | | (2.43) | | 13.62 | | 3.52 |
| Distributions from net investment income | | (.70) | | (.69) | | (.70) | | (.62) | | (.61) |
| Total distributions | | (.70) | | (.69) | | (.70) | | (.62) | | (.61) |
| Net asset value, end of period | $ | 62.15 | $ | 52.29 | $ | 48.06 | $ | 51.19 | $ | 38.19 |
Total Return C,D | | | | 10.46% | | (4.79)% | | 36.00% | | 10.26% |
Ratios to Average Net Assets B,E,F | | | | | | | | | | |
| Expenses before reductions | | .18% | | .29% | | .29% | | .29% | | .29% |
| Expenses net of fee waivers, if any | | | | .29% | | .29% | | .29% | | .29% |
| Expenses net of all reductions | | .18% | | .29% | | .29% | | .29% | | .29% |
| Net investment income (loss) | | 1.30% | | 1.54% | | 1.33% | | 1.39% | | 1.74% |
| Supplemental Data | | | | | | | | | | |
| Net assets, end of period (000 omitted) | $ | 1,028,551 | $ | 326,843 | $ | 266,714 | $ | 245,721 | $ | 147,022 |
Portfolio turnover rate G,H | | | | 43% | | 38% | | 35% | | 41% |
ACalculated based on average shares outstanding during the period.
BNet investment income (loss) is affected by the timing of the declaration of dividends by any underlying mutual funds or exchange-traded funds (ETFs). Net investment income (loss) of any mutual funds or ETFs is not included in the Fund's net investment income (loss) ratio.
CTotal returns would have been lower if certain expenses had not been reduced during the applicable periods shown.
DBased on net asset value.
EFees and expenses of any underlying mutual funds or exchange-traded funds (ETFs) are not included in the Fund's expense ratio. The Fund indirectly bears its proportionate share of these expenses. For additional expense information related to investments in Fidelity Central Funds, please refer to the "Investments in Fidelity Central Funds" note found in the Notes to Financial Statements section of the most recent Annual or Semi-Annual report.
FExpense ratios reflect operating expenses of the class. Expenses before reductions do not reflect amounts reimbursed, waived, or reduced through arrangements with the investment adviser, brokerage services, or other offset arrangements, if applicable, and do not represent the amount paid by the class during periods when reimbursements, waivers or reductions occur.
GPortfolio turnover rate excludes securities received or delivered in-kind.
HAmount does not include the portfolio activity of any underlying mutual funds or exchange-traded funds (ETFs).
Fidelity® Small-Mid Multifactor ETF
Schedule of Investments July 31, 2024
Showing Percentage of Net Assets
| Common Stocks - 99.8% |
| | | Shares | Value ($) |
| COMMUNICATION SERVICES - 2.9% | | | |
| Diversified Telecommunication Services - 0.1% | | | |
| Cogent Communications Group, Inc. | | 7,878 | 556,108 |
| GCI Liberty, Inc. Class A (Escrow) (a)(f) | | 869 | 0 |
| | | | 556,108 |
| Entertainment - 0.5% | | | |
| Playtika Holding Corp. | | 54,567 | 416,346 |
| TKO Group Holdings, Inc. | | 8,482 | 927,507 |
| Warner Music Group Corp. Class A | | 19,591 | 587,926 |
| | | | 1,931,779 |
| Interactive Media & Services - 0.6% | | | |
| CarGurus, Inc. Class A (b) | | 21,394 | 530,999 |
| Match Group, Inc. (b) | | 28,626 | 1,091,796 |
| Yelp, Inc. (b) | | 13,034 | 474,829 |
| Ziff Davis, Inc. (b) | | 8,542 | 408,991 |
| | | | 2,506,615 |
| Media - 1.5% | | | |
| AMC Networks, Inc. Class A (b)(c) | | 21,784 | 242,456 |
| EchoStar Corp. Class A (b) | | 35,331 | 709,446 |
| Fox Corp. Class A | | 37,320 | 1,419,653 |
| Liberty Broadband Corp. Class C (b) | | 13,733 | 925,467 |
| Nexstar Media Group, Inc. | | 4,306 | 795,706 |
| Scholastic Corp. | | 11,404 | 357,287 |
| Sirius XM Holdings, Inc. (c) | | 114,614 | 395,418 |
| TEGNA, Inc. | | 36,859 | 587,164 |
| The New York Times Co. Class A | | 19,073 | 1,022,122 |
| | | | 6,454,719 |
| Wireless Telecommunication Services - 0.2% | | | |
| Spok Holdings, Inc. | | 22,997 | 352,544 |
| U.S. Cellular Corp. (b) | | 9,179 | 493,371 |
| | | | 845,915 |
TOTAL COMMUNICATION SERVICES | | | 12,295,136 |
| CONSUMER DISCRETIONARY - 13.9% | | | |
| Automobile Components - 1.5% | | | |
| Autoliv, Inc. | | 8,362 | 845,733 |
| BorgWarner, Inc. | | 26,434 | 933,385 |
| Dorman Products, Inc. (b) | | 6,118 | 620,182 |
| Gentex Corp. | | 26,586 | 825,761 |
| LCI Industries | | 4,796 | 559,645 |
| Lear Corp. | | 6,585 | 803,633 |
| Mobileye Global, Inc. Class A (b)(c) | | 18,699 | 392,679 |
| Patrick Industries, Inc. | | 4,839 | 619,682 |
| Phinia, Inc. | | 14,407 | 643,993 |
| | | | 6,244,693 |
| Automobiles - 0.4% | | | |
| Harley-Davidson, Inc. | | 19,159 | 718,463 |
| Thor Industries, Inc. | | 6,700 | 711,138 |
| Winnebago Industries, Inc. (c) | | 7,154 | 447,268 |
| | | | 1,876,869 |
| Broadline Retail - 0.3% | | | |
| Dillard's, Inc. Class A (c) | | 1,114 | 444,029 |
| Ollie's Bargain Outlet Holdings, Inc. (b) | | 8,982 | 877,002 |
| | | | 1,321,031 |
| Diversified Consumer Services - 2.1% | | | |
| Adtalem Global Education, Inc. (b) | | 10,163 | 796,881 |
| Bright Horizons Family Solutions, Inc. (b) | | 7,494 | 901,154 |
| Duolingo, Inc. (b) | | 4,422 | 760,319 |
| Frontdoor, Inc. (b) | | 15,986 | 630,808 |
| Graham Holdings Co. | | 717 | 555,567 |
| Grand Canyon Education, Inc. (b) | | 4,691 | 731,561 |
| H&R Block, Inc. | | 17,600 | 1,019,744 |
| Laureate Education, Inc. | | 35,977 | 557,644 |
| Perdoceo Education Corp. | | 23,284 | 577,210 |
| Service Corp. International | | 15,491 | 1,237,886 |
| Strategic Education, Inc. | | 5,112 | 538,805 |
| Stride, Inc. (b) | | 8,469 | 643,475 |
| | | | 8,951,054 |
| Hotels, Restaurants & Leisure - 1.7% | | | |
| Boyd Gaming Corp. | | 10,216 | 621,848 |
| Choice Hotels International, Inc. (c) | | 4,562 | 581,427 |
| Light & Wonder, Inc. Class A (b) | | 10,585 | 1,134,712 |
| Texas Roadhouse, Inc. | | 7,411 | 1,294,035 |
| Travel+Leisure Co. | | 13,388 | 617,053 |
| Vail Resorts, Inc. | | 4,222 | 768,446 |
| Wendy's Co. | | 29,342 | 496,760 |
| Wingstop, Inc. | | 3,281 | 1,226,700 |
| Wyndham Hotels & Resorts, Inc. | | 10,124 | 766,589 |
| | | | 7,507,570 |
| Household Durables - 3.7% | | | |
| Beazer Homes U.S.A., Inc. (b) | | 12,614 | 424,713 |
| Cavco Industries, Inc. (b) | | 1,580 | 655,100 |
| Century Communities, Inc. | | 5,699 | 596,742 |
| Dream Finders Homes, Inc. (b)(c) | | 11,716 | 369,640 |
| Ethan Allen Interiors, Inc. | | 13,101 | 404,428 |
| Green Brick Partners, Inc. (b) | | 8,243 | 602,975 |
| Helen of Troy Ltd. (b) | | 4,621 | 273,147 |
| Installed Building Products, Inc. | | 3,384 | 914,864 |
| KB Home | | 11,085 | 954,197 |
| La-Z-Boy, Inc. | | 12,739 | 562,299 |
| Landsea Homes Corp. Class A (b) | | 27,765 | 338,178 |
| M/I Homes, Inc. (b) | | 4,650 | 775,760 |
| Meritage Homes Corp. | | 4,850 | 983,920 |
| Mohawk Industries, Inc. (b) | | 6,849 | 1,103,168 |
| Skyline Champion Corp. (b) | | 8,659 | 705,795 |
| Taylor Morrison Home Corp. (b) | | 14,145 | 948,847 |
| Tempur Sealy International, Inc. | | 18,978 | 993,498 |
| Toll Brothers, Inc. | | 11,027 | 1,573,663 |
| TopBuild Corp. (b) | | 3,162 | 1,513,143 |
| TRI Pointe Homes, Inc. (b) | | 16,733 | 757,168 |
| Worthington Enterprises, Inc. | | 8,023 | 400,428 |
| | | | 15,851,673 |
| Leisure Products - 0.7% | | | |
| Acushnet Holdings Corp. (c) | | 7,462 | 541,592 |
| Brunswick Corp. | | 8,932 | 727,511 |
| Hasbro, Inc. | | 16,069 | 1,035,808 |
| Vista Outdoor, Inc. (b) | | 15,380 | 624,889 |
| | | | 2,929,800 |
| Specialty Retail - 2.6% | | | |
| Abercrombie & Fitch Co. Class A (b) | | 6,797 | 1,002,422 |
| Academy Sports & Outdoors, Inc. | | 10,613 | 573,845 |
| American Eagle Outfitters, Inc. | | 30,010 | 661,721 |
| Asbury Automotive Group, Inc. (b)(c) | | 3,062 | 824,352 |
| AutoNation, Inc. (b) | | 4,180 | 797,210 |
| Dick's Sporting Goods, Inc. | | 6,604 | 1,428,775 |
| Group 1 Automotive, Inc. | | 2,255 | 824,699 |
| Haverty Furniture Companies, Inc. | | 10,867 | 318,077 |
| Lithia Motors, Inc. Class A (sub. vtg.) | | 3,074 | 849,438 |
| Murphy U.S.A., Inc. | | 2,343 | 1,183,028 |
| Penske Automotive Group, Inc. | | 3,593 | 625,577 |
| The Buckle, Inc. | | 11,135 | 480,921 |
| Upbound Group, Inc. | | 13,382 | 504,903 |
| Urban Outfitters, Inc. (b) | | 12,709 | 585,249 |
| Winmark Corp. | | 1,114 | 440,743 |
| | | | 11,100,960 |
| Textiles, Apparel & Luxury Goods - 0.9% | | | |
| Carter's, Inc. (c) | | 6,936 | 419,975 |
| G-III Apparel Group Ltd. (b) | | 13,948 | 384,546 |
| Kontoor Brands, Inc. | | 9,275 | 650,641 |
| Ralph Lauren Corp. Class A | | 5,149 | 904,113 |
| Skechers U.S.A., Inc. Class A (sub. vtg.) (b) | | 14,846 | 966,920 |
| Steven Madden Ltd. | | 13,002 | 589,511 |
| | | | 3,915,706 |
TOTAL CONSUMER DISCRETIONARY | | | 59,699,356 |
| CONSUMER STAPLES - 3.9% | | | |
| Beverages - 0.8% | | | |
| Brown-Forman Corp. Class B (non-vtg.) | | 18,438 | 832,660 |
| Coca-Cola Consolidated, Inc. | | 681 | 780,351 |
| Molson Coors Beverage Co. Class B | | 18,066 | 954,788 |
| National Beverage Corp. | | 8,311 | 405,494 |
| The Vita Coco Co., Inc. (b) | | 17,916 | 462,949 |
| | | | 3,436,242 |
| Consumer Staples Distribution & Retail - 1.1% | | | |
| Albertsons Companies, Inc. | | 43,346 | 859,551 |
| Andersons, Inc. | | 8,208 | 447,582 |
| Casey's General Stores, Inc. | | 3,799 | 1,473,404 |
| Ingles Markets, Inc. Class A | | 4,833 | 391,715 |
| Sprouts Farmers Market LLC (b) | | 13,343 | 1,332,832 |
| | | | 4,505,084 |
| Food Products - 1.0% | | | |
| Cal-Maine Foods, Inc. | | 8,567 | 613,140 |
| Campbell Soup Co. | | 20,896 | 979,187 |
| Hormel Foods Corp. | | 30,727 | 986,644 |
| Ingredion, Inc. | | 7,493 | 931,904 |
| J&J Snack Foods Corp. | | 3,070 | 517,909 |
| John B. Sanfilippo & Son, Inc. | | 3,683 | 386,236 |
| | | | 4,415,020 |
| Household Products - 0.3% | | | |
| Central Garden & Pet Co. Class A (non-vtg.) | | 14,108 | 484,751 |
| Oil-Dri Corp. of America | | 5,183 | 337,413 |
| WD-40 Co. | | 2,164 | 566,124 |
| | | | 1,388,288 |
| Personal Care Products - 0.5% | | | |
| BellRing Brands, Inc. (b) | | 14,934 | 765,816 |
| elf Beauty, Inc. (b) | | 5,865 | 1,012,182 |
| MediFast, Inc. (c) | | 6,407 | 140,506 |
| | | | 1,918,504 |
| Tobacco - 0.2% | | | |
| Universal Corp. | | 7,079 | 378,160 |
| Vector Group Ltd. | | 39,033 | 498,842 |
| | | | 877,002 |
TOTAL CONSUMER STAPLES | | | 16,540,140 |
| ENERGY - 4.5% | | | |
| Energy Equipment & Services - 0.4% | | | |
| TechnipFMC PLC | | 51,332 | 1,514,294 |
| Oil, Gas & Consumable Fuels - 4.1% | | | |
| Ardmore Shipping Corp. | | 27,278 | 591,387 |
| California Resources Corp. | | 12,851 | 661,055 |
| Chesapeake Energy Corp. | | 13,002 | 992,443 |
| Chord Energy Corp. | | 5,499 | 943,958 |
| CNX Resources Corp. (b) | | 30,854 | 816,705 |
| CONSOL Energy, Inc. (b) | | 6,114 | 610,238 |
| CVR Energy, Inc. | | 13,722 | 392,449 |
| Dorian LPG Ltd. | | 12,819 | 523,784 |
| DT Midstream, Inc. | | 14,244 | 1,073,428 |
| Gulfport Energy Corp. (b) | | 3,865 | 568,967 |
| Hallador Energy Co. (b) | | 46,683 | 371,597 |
| HF Sinclair Corp. | | 17,962 | 924,504 |
| International Seaways, Inc. | | 10,224 | 572,544 |
| Magnolia Oil & Gas Corp. Class A | | 32,503 | 885,382 |
| Murphy Oil Corp. | | 20,595 | 852,221 |
| Par Pacific Holdings, Inc. (b) | | 14,564 | 386,674 |
| PBF Energy, Inc. Class A | | 15,575 | 634,681 |
| Peabody Energy Corp. | | 22,391 | 497,304 |
| Rex American Resources Corp. (b) | | 10,508 | 533,911 |
| Scorpio Tankers, Inc. | | 9,139 | 700,779 |
| Southwestern Energy Co. (b) | | 139,335 | 898,711 |
| Teekay Corp. (b) | | 48,697 | 422,203 |
| Teekay Tankers Ltd. | | 8,227 | 538,375 |
| Texas Pacific Land Corp. (c) | | 2,138 | 1,806,398 |
| Vitesse Energy, Inc. (c) | | 20,700 | 537,372 |
| | | | 17,737,070 |
TOTAL ENERGY | | | 19,251,364 |
| FINANCIALS - 16.9% | | | |
| Banks - 5.5% | | | |
| 1st Source Corp. | | 8,204 | 521,364 |
| Amalgamated Financial Corp. | | 15,283 | 486,152 |
| Axos Financial, Inc. (b) | | 10,320 | 753,463 |
| Bancorp, Inc., Delaware (b) | | 12,315 | 638,410 |
| Bank OZK | | 15,967 | 748,693 |
| Business First Bancshares, Inc. | | 17,881 | 454,535 |
| Cathay General Bancorp | | 14,191 | 628,945 |
| City Holding Co. | | 4,627 | 564,031 |
| Columbia Banking Systems, Inc. | | 33,566 | 878,087 |
| Community Trust Bancorp, Inc. | | 9,915 | 502,889 |
| Customers Bancorp, Inc. (b) | | 8,888 | 573,098 |
| East West Bancorp, Inc. | | 15,247 | 1,340,059 |
| First Bancorp, Puerto Rico | | 34,346 | 736,722 |
| First Commonwealth Financial Corp. | | 33,935 | 613,545 |
| First Financial Corp., Indiana | | 10,082 | 453,287 |
| FNB Corp., Pennsylvania | | 53,172 | 815,658 |
| Fulton Financial Corp. | | 34,942 | 676,827 |
| Hanmi Financial Corp. | | 24,101 | 491,660 |
| Independent Bank Corp. | | 16,024 | 555,873 |
| International Bancshares Corp. | | 10,666 | 719,315 |
| Metropolitan Bank Holding Corp. (b) | | 8,795 | 463,760 |
| Midland States Bancorp, Inc. | | 15,623 | 370,890 |
| New York Community Bancorp, Inc. | | 38,120 | 401,022 |
| OFG Bancorp | | 13,240 | 601,361 |
| Old Second Bancorp, Inc. | | 29,665 | 501,932 |
| Pathward Financial, Inc. | | 9,030 | 609,886 |
| Peoples Bancorp, Inc. | | 14,933 | 496,821 |
| Popular, Inc. | | 9,360 | 960,617 |
| Preferred Bank, Los Angeles | | 6,116 | 526,343 |
| QCR Holdings, Inc. | | 7,508 | 573,912 |
| UMB Financial Corp. | | 7,423 | 757,294 |
| Valley National Bancorp | | 70,516 | 592,334 |
| Webster Financial Corp. | | 19,858 | 985,354 |
| Westamerica Bancorp. | | 9,640 | 520,174 |
| Wintrust Financial Corp. | | 8,213 | 888,647 |
| Zions Bancorporation NA | | 19,719 | 1,018,881 |
| | | | 23,421,841 |
| Capital Markets - 3.0% | | | |
| Affiliated Managers Group, Inc. | | 4,775 | 886,336 |
| Artisan Partners Asset Management, Inc. Class A, | | 13,056 | 576,553 |
| Evercore, Inc. Class A | | 4,533 | 1,135,018 |
| GQG Partners, Inc. CDI | | 325,951 | 633,072 |
| Hamilton Lane, Inc. Class A | | 5,651 | 815,835 |
| Houlihan Lokey | | 6,649 | 999,012 |
| Interactive Brokers Group, Inc. | | 11,588 | 1,382,101 |
| Morningstar, Inc. | | 3,137 | 996,468 |
| SEI Investments Co. | | 12,567 | 852,545 |
| Stifel Financial Corp. | | 12,248 | 1,086,030 |
| StoneX Group, Inc. (b) | | 7,361 | 613,466 |
| Tradeweb Markets, Inc. Class A | | 11,945 | 1,334,018 |
| Victory Capital Holdings, Inc. | | 13,198 | 691,443 |
| Virtu Financial, Inc. Class A | | 28,016 | 765,397 |
| | | | 12,767,294 |
| Consumer Finance - 1.3% | | | |
| Ally Financial, Inc. | | 29,103 | 1,309,926 |
| Bread Financial Holdings, Inc. | | 13,448 | 733,992 |
| Credit Acceptance Corp. (b) | | 1,066 | 612,843 |
| Enova International, Inc. (b) | | 8,729 | 754,797 |
| FirstCash Holdings, Inc. | | 5,674 | 633,218 |
| Navient Corp. | | 27,833 | 456,740 |
| OneMain Holdings, Inc. | | 16,033 | 837,885 |
| World Acceptance Corp. (b)(c) | | 2,903 | 354,514 |
| | | | 5,693,915 |
| Financial Services - 2.6% | | | |
| Cass Information Systems, Inc. (c) | | 9,358 | 401,833 |
| Corebridge Financial, Inc. | | 32,516 | 960,848 |
| Enact Holdings, Inc. | | 14,966 | 509,293 |
| Essent Group Ltd. | | 14,145 | 888,872 |
| EVERTEC, Inc. | | 13,533 | 466,483 |
| Federal Agricultural Mortgage Corp. Class C (non-vtg.) | | 2,578 | 531,635 |
| Jack Henry & Associates, Inc. | | 7,337 | 1,258,149 |
| Jackson Financial, Inc. | | 12,355 | 1,087,981 |
| MGIC Investment Corp. | | 37,838 | 939,896 |
| Mr. Cooper Group, Inc. (b) | | 10,087 | 906,620 |
| NMI Holdings, Inc. Class A (b) | | 17,193 | 676,545 |
| Radian Group, Inc. | | 23,179 | 859,941 |
| The Western Union Co. | | 54,326 | 645,936 |
| Voya Financial, Inc. | | 12,474 | 907,234 |
| | | | 11,041,266 |
| Insurance - 4.3% | | | |
| American Financial Group, Inc. | | 7,666 | 1,003,939 |
| Assurant, Inc. | | 5,856 | 1,024,039 |
| Axis Capital Holdings Ltd. | | 11,819 | 895,289 |
| CNO Financial Group, Inc. | | 21,393 | 745,760 |
| Enstar Group Ltd. (b) | | 2,281 | 739,956 |
| Erie Indemnity Co. Class A | | 2,813 | 1,240,955 |
| Genworth Financial, Inc. Class A (b) | | 90,351 | 611,676 |
| Globe Life, Inc. | | 9,076 | 841,708 |
| Goosehead Insurance (b)(c) | | 6,350 | 573,342 |
| Kinsale Capital Group, Inc. | | 2,478 | 1,132,619 |
| Old Republic International Corp. | | 31,447 | 1,088,695 |
| Palomar Holdings, Inc. (b) | | 7,891 | 726,051 |
| Primerica, Inc. | | 4,057 | 1,021,431 |
| Reinsurance Group of America, Inc. | | 6,784 | 1,529,317 |
| RenaissanceRe Holdings Ltd. | | 5,344 | 1,239,327 |
| RLI Corp. | | 5,499 | 828,094 |
| Ryan Specialty Group Holdings, Inc. | | 15,646 | 963,637 |
| Selective Insurance Group, Inc. | | 8,016 | 724,005 |
| Skyward Specialty Insurance Group, Inc. (b) | | 14,388 | 569,333 |
| Unum Group | | 20,592 | 1,184,658 |
| | | | 18,683,831 |
| Mortgage Real Estate Investment Trusts - 0.2% | | | |
| Blackstone Mortgage Trust, Inc. (c) | | 31,192 | 556,777 |
| KKR Real Estate Finance Trust, Inc. | | 34,243 | 393,110 |
| | | | 949,887 |
TOTAL FINANCIALS | | | 72,558,034 |
| HEALTH CARE - 13.0% | | | |
| Biotechnology - 3.8% | | | |
| ACADIA Pharmaceuticals, Inc. (b) | | 22,268 | 423,537 |
| ADMA Biologics, Inc. (b) | | 82,865 | 1,017,582 |
| Alkermes PLC (b) | | 25,232 | 689,338 |
| Arcellx, Inc. (b) | | 7,880 | 487,063 |
| Ardelyx, Inc. (b) | | 54,960 | 305,028 |
| Blueprint Medicines Corp. (b) | | 8,825 | 955,748 |
| Catalyst Pharmaceutical Partners, Inc. (b) | | 32,849 | 566,317 |
| Disc Medicine, Inc. (b) | | 6,171 | 266,340 |
| Exact Sciences Corp. (b) | | 18,438 | 842,248 |
| Exelixis, Inc. (b) | | 38,641 | 906,131 |
| Halozyme Therapeutics, Inc. (b) | | 19,860 | 1,097,464 |
| Ideaya Biosciences, Inc. (b) | | 12,693 | 546,434 |
| Incyte Corp. (b) | | 19,250 | 1,252,598 |
| Ionis Pharmaceuticals, Inc. (b) | | 17,176 | 849,525 |
| Ironwood Pharmaceuticals, Inc. Class A (b) | | 33,959 | 231,940 |
| Kiniksa Pharmaceuticals Intern (b)(c) | | 22,063 | 586,876 |
| Repligen Corp. (b) | | 5,532 | 925,780 |
| United Therapeutics Corp. (b) | | 4,996 | 1,565,197 |
| Vaxcyte, Inc. (b) | | 10,905 | 860,295 |
| Vericel Corp. (b) | | 11,640 | 588,053 |
| Viking Therapeutics, Inc. (b) | | 22,065 | 1,257,705 |
| | | | 16,221,199 |
| Health Care Equipment & Supplies - 2.7% | | | |
| Axonics, Inc. (b) | | 9,210 | 630,701 |
| Dentsply Sirona, Inc. | | 25,160 | 682,842 |
| Globus Medical, Inc. (b) | | 15,019 | 1,080,767 |
| Haemonetics Corp. (b) | | 8,193 | 737,780 |
| Integer Holdings Corp. (b) | | 5,837 | 693,202 |
| Integra LifeSciences Holdings Corp. (b) | | 13,620 | 337,912 |
| IRadimed Corp. | | 8,943 | 417,728 |
| Lantheus Holdings, Inc. (b) | | 11,636 | 1,219,802 |
| LeMaitre Vascular, Inc. | | 7,546 | 655,672 |
| LivaNova PLC (b) | | 11,071 | 546,907 |
| Merit Medical Systems, Inc. (b) | | 8,612 | 734,517 |
| Neogen Corp. (b)(c) | | 37,385 | 636,667 |
| Omnicell, Inc. (b) | | 14,266 | 416,710 |
| OraSure Technologies, Inc. (b) | | 53,250 | 238,560 |
| QuidelOrtho Corp. (b) | | 8,623 | 338,798 |
| Semler Scientific, Inc. (b)(c) | | 8,334 | 276,272 |
| Teleflex, Inc. | | 4,763 | 1,052,242 |
| UFP Technologies, Inc. (b) | | 2,524 | 811,693 |
| | | | 11,508,772 |
| Health Care Providers & Services - 3.3% | | | |
| Addus HomeCare Corp. (b) | | 5,224 | 633,985 |
| Amedisys, Inc. (b) | | 6,128 | 600,850 |
| AMN Healthcare Services, Inc. (b) | | 7,385 | 499,374 |
| Astrana Health, Inc. (b)(c) | | 13,001 | 682,032 |
| Chemed Corp. | | 1,665 | 949,316 |
| Corvel Corp. (b) | | 2,118 | 649,802 |
| Cross Country Healthcare, Inc. (b) | | 18,802 | 342,948 |
| DaVita, Inc. (b) | | 7,017 | 958,663 |
| Encompass Health Corp. | | 12,030 | 1,118,068 |
| HealthEquity, Inc. (b) | | 10,850 | 851,508 |
| Henry Schein, Inc. (b) | | 13,984 | 1,006,009 |
| National Healthcare Corp. | | 4,870 | 663,099 |
| National Research Corp. Class A | | 10,232 | 260,814 |
| Option Care Health, Inc. (b) | | 23,924 | 710,304 |
| PetIQ, Inc. Class A (b) | | 21,555 | 471,623 |
| Premier, Inc. Class A | | 24,905 | 522,507 |
| Progyny, Inc. (b) | | 15,190 | 428,358 |
| The Ensign Group, Inc. | | 7,145 | 1,005,659 |
| U.S. Physical Therapy, Inc. | | 4,867 | 474,533 |
| Universal Health Services, Inc. Class B | | 6,537 | 1,397,349 |
| | | | 14,226,801 |
| Health Care Technology - 0.3% | | | |
| Doximity, Inc. (b) | | 21,399 | 599,172 |
| HealthStream, Inc. | | 15,292 | 454,325 |
| Simulations Plus, Inc. | | 10,618 | 433,639 |
| | | | 1,487,136 |
| Life Sciences Tools & Services - 1.2% | | | |
| Bio-Techne Corp. | | 16,495 | 1,345,827 |
| Bruker Corp. | | 11,562 | 792,113 |
| Charles River Laboratories International, Inc. (b) | | 5,274 | 1,287,383 |
| Medpace Holdings, Inc. (b) | | 2,879 | 1,101,275 |
| OmniAb, Inc. (b) | | 67,605 | 323,828 |
| Quanterix Corp. (b) | | 17,919 | 264,484 |
| | | | 5,114,910 |
| Pharmaceuticals - 1.7% | | | |
| Amneal Intermediate, Inc. Class A, (b) | | 72,849 | 533,983 |
| Amphastar Pharmaceuticals, Inc. (b) | | 9,318 | 405,519 |
| ANI Pharmaceuticals, Inc. (b) | | 7,463 | 490,468 |
| Collegium Pharmaceutical, Inc. (b) | | 13,148 | 507,118 |
| Corcept Therapeutics, Inc. (b) | | 23,039 | 890,918 |
| Elanco Animal Health, Inc. (b) | | 59,129 | 771,042 |
| Innoviva, Inc. (b)(c) | | 26,198 | 493,570 |
| Jazz Pharmaceuticals PLC (b) | | 7,364 | 811,881 |
| Prestige Consumer Healthcare, Inc. (b) | | 9,261 | 655,771 |
| Royalty Pharma PLC | | 39,561 | 1,114,433 |
| Supernus Pharmaceuticals, Inc. (b) | | 16,800 | 500,976 |
| | | | 7,175,679 |
TOTAL HEALTH CARE | | | 55,734,497 |
| INDUSTRIALS - 17.9% | | | |
| Aerospace & Defense - 1.2% | | | |
| BWX Technologies, Inc. | | 10,105 | 1,005,346 |
| Curtiss-Wright Corp. | | 4,079 | 1,202,081 |
| Huntington Ingalls Industries, Inc. | | 3,936 | 1,102,001 |
| Moog, Inc. Class A | | 4,188 | 821,267 |
| Woodward, Inc. | | 6,482 | 1,011,127 |
| | | | 5,141,822 |
| Air Freight & Logistics - 0.4% | | | |
| C.H. Robinson Worldwide, Inc. | | 12,391 | 1,103,419 |
| Hub Group, Inc. Class A | | 11,137 | 520,877 |
| | | | 1,624,296 |
| Building Products - 2.9% | | | |
| A.O. Smith Corp. | | 12,519 | 1,064,616 |
| AAON, Inc. | | 8,938 | 791,281 |
| Advanced Drain Systems, Inc. | | 7,140 | 1,264,066 |
| Allegion PLC | | 8,569 | 1,172,325 |
| American Woodmark Corp. (b) | | 4,347 | 444,046 |
| Armstrong World Industries, Inc. | | 6,123 | 804,562 |
| AZZ, Inc. | | 6,455 | 516,142 |
| CSW Industrials, Inc. | | 2,485 | 806,184 |
| Fortune Brands Innovations, Inc. | | 12,720 | 1,027,903 |
| Gibraltar Industries, Inc. (b) | | 5,726 | 425,270 |
| Janus International Group, Inc. (b) | | 27,370 | 394,675 |
| MasterBrand, Inc. (b) | | 30,157 | 544,334 |
| Simpson Manufacturing Co. Ltd. | | 4,660 | 895,139 |
| Trex Co., Inc. (b) | | 11,192 | 935,987 |
| UFP Industries, Inc. | | 6,975 | 920,212 |
| Zurn Elkay Water Solutions Cor | | 19,884 | 645,435 |
| | | | 12,652,177 |
| Commercial Services & Supplies - 2.0% | | | |
| Brady Corp. Class A | | 8,194 | 586,772 |
| Clean Harbors, Inc. (b) | | 5,340 | 1,274,818 |
| CoreCivic, Inc. (b) | | 28,680 | 399,799 |
| Ennis, Inc. | | 16,830 | 401,227 |
| HNI Corp. | | 10,714 | 588,734 |
| MSA Safety, Inc. | | 4,426 | 834,965 |
| RB Global, Inc. | | 17,603 | 1,401,727 |
| Steelcase, Inc. Class A | | 30,147 | 436,830 |
| Tetra Tech, Inc. | | 5,621 | 1,198,622 |
| The Brink's Co. | | 6,900 | 758,931 |
| The GEO Group, Inc. (b) | | 35,094 | 508,863 |
| | | | 8,391,288 |
| Construction & Engineering - 1.6% | | | |
| Arcosa, Inc. | | 7,191 | 668,116 |
| Argan, Inc. | | 7,473 | 589,844 |
| Comfort Systems U.S.A., Inc. | | 3,872 | 1,287,130 |
| Construction Partners, Inc. Class A (b) | | 9,540 | 616,761 |
| EMCOR Group, Inc. | | 4,638 | 1,741,291 |
| IES Holdings, Inc. (b) | | 4,109 | 632,663 |
| MYR Group, Inc. (b) | | 3,205 | 450,238 |
| Sterling Construction Co., Inc. (b) | | 6,047 | 703,629 |
| | | | 6,689,672 |
| Electrical Equipment - 1.0% | | | |
| Acuity Brands, Inc. | | 3,444 | 865,649 |
| Atkore, Inc. | | 4,700 | 634,500 |
| EnerSys | | 5,956 | 654,743 |
| nVent Electric PLC | | 16,629 | 1,207,764 |
| Powell Industries, Inc. | | 3,233 | 593,676 |
| Preformed Line Products Co. | | 2,550 | 351,569 |
| | | | 4,307,901 |
| Ground Transportation - 0.8% | | | |
| ArcBest Corp. | | 4,166 | 525,124 |
| Knight-Swift Transportation Holdings, Inc. | | 16,574 | 902,123 |
| Landstar System, Inc. | | 4,119 | 783,640 |
| XPO, Inc. (b) | | 11,667 | 1,340,422 |
| | | | 3,551,309 |
| Machinery - 4.1% | | | |
| AGCO Corp. | | 6,807 | 642,717 |
| Alamo Group, Inc. | | 2,120 | 408,566 |
| Allison Transmission Holdings, Inc. | | 11,249 | 996,549 |
| Crane Co. | | 5,865 | 940,863 |
| Donaldson Co., Inc. | | 13,084 | 978,945 |
| ESAB Corp. | | 7,472 | 759,155 |
| ESCO Technologies, Inc. | | 4,746 | 583,568 |
| Federal Signal Corp. | | 8,159 | 815,655 |
| Flowserve Corp. | | 16,643 | 841,304 |
| Franklin Electric Co., Inc. | | 5,937 | 633,003 |
| Gorman-Rupp Co. | | 10,694 | 441,769 |
| ITT, Inc. | | 8,267 | 1,169,450 |
| Kadant, Inc. (c) | | 1,864 | 655,177 |
| Miller Industries, Inc. | | 8,248 | 560,369 |
| Mueller Industries, Inc. | | 14,199 | 1,007,277 |
| Oshkosh Corp. | | 7,281 | 791,081 |
| RBC Bearings, Inc. (b)(c) | | 3,163 | 919,927 |
| SPX Technologies, Inc. (b) | | 6,142 | 906,191 |
| Standex International Corp. | | 2,841 | 530,699 |
| Tennant Co. | | 4,444 | 478,574 |
| Terex Corp. | | 9,527 | 602,678 |
| Toro Co. | | 10,554 | 1,010,334 |
| Watts Water Technologies, Inc. Class A | | 3,416 | 708,888 |
| | | | 17,382,739 |
| Marine Transportation - 0.2% | | | |
| Matson, Inc. | | 5,219 | 692,613 |
| Passenger Airlines - 0.1% | | | |
| SkyWest, Inc. (b) | | 8,443 | 674,933 |
| Professional Services - 2.4% | | | |
| CACI International, Inc. (b) | | 2,455 | 1,132,933 |
| CBIZ, Inc. (b) | | 8,232 | 571,301 |
| FTI Consulting, Inc. (b) | | 4,099 | 893,459 |
| Huron Consulting Group, Inc. (b) | | 4,218 | 464,022 |
| ICF International, Inc. | | 3,348 | 492,491 |
| Insperity, Inc. | | 5,159 | 529,932 |
| KBR, Inc. | | 15,167 | 1,009,971 |
| Kelly Services, Inc. Class A (non-vtg.) | | 16,808 | 395,492 |
| Kforce, Inc. | | 5,748 | 399,314 |
| Maximus, Inc. | | 8,003 | 743,399 |
| Parsons Corp. (b) | | 7,544 | 689,295 |
| RCM Technologies, Inc. (b)(c) | | 11,238 | 218,916 |
| Robert Half, Inc. | | 11,268 | 723,293 |
| Science Applications International Corp. | | 6,075 | 755,730 |
| TriNet Group, Inc. | | 4,843 | 504,883 |
| Verra Mobility Corp. (b) | | 24,231 | 730,080 |
| | | | 10,254,511 |
| Trading Companies & Distributors - 1.2% | | | |
| Applied Industrial Technologies, Inc. | | 4,422 | 964,836 |
| Boise Cascade Co. | | 4,985 | 708,319 |
| Core & Main, Inc. (b) | | 19,093 | 1,020,903 |
| Global Industrial Co. | | 7,789 | 271,680 |
| GMS, Inc. (b) | | 6,396 | 615,487 |
| McGrath RentCorp. | | 4,106 | 450,962 |
| MSC Industrial Direct Co., Inc. Class A | | 6,250 | 555,938 |
| Rush Enterprises, Inc. Class A | | 10,855 | 553,714 |
| | | | 5,141,839 |
TOTAL INDUSTRIALS | | | 76,505,100 |
| INFORMATION TECHNOLOGY - 11.5% | | | |
| Communications Equipment - 0.5% | | | |
| F5, Inc. (b) | | 5,788 | 1,178,668 |
| Juniper Networks, Inc. | | 30,591 | 1,152,975 |
| | | | 2,331,643 |
| Electronic Equipment, Instruments & Components - 2.6% | | | |
| Arrow Electronics, Inc. (b) | | 6,421 | 794,213 |
| Avnet, Inc. | | 12,851 | 690,870 |
| Badger Meter, Inc. | | 4,068 | 838,659 |
| Bel Fuse, Inc. Class B (non-vtg.) | | 4,892 | 363,329 |
| Belden, Inc. | | 6,792 | 629,550 |
| Daktronics, Inc. (b) | | 39,759 | 595,590 |
| ePlus, Inc. (b) | | 5,676 | 521,738 |
| Fabrinet (b) | | 3,885 | 856,876 |
| Insight Enterprises, Inc. (b) | | 3,501 | 785,975 |
| Littelfuse, Inc. | | 2,944 | 786,372 |
| OSI Systems, Inc. (b) | | 3,333 | 493,217 |
| PC Connection, Inc. | | 5,200 | 372,164 |
| Plexus Corp. (b) | | 4,917 | 630,212 |
| Sanmina Corp. (b) | | 8,843 | 666,143 |
| TD SYNNEX Corp. | | 6,941 | 827,159 |
| Vishay Intertechnology, Inc. | | 22,063 | 536,352 |
| Vontier Corp. | | 19,057 | 747,606 |
| | | | 11,136,025 |
| IT Services - 0.8% | | | |
| Amdocs Ltd. | | 11,519 | 1,007,567 |
| ASGN, Inc. (b) | | 6,549 | 619,994 |
| DXC Technology Co. (b) | | 26,919 | 547,532 |
| Hackett Group, Inc. | | 14,349 | 391,441 |
| Kyndryl Holdings, Inc. (b) | | 30,125 | 809,459 |
| | | | 3,375,993 |
| Semiconductors & Semiconductor Equipment - 1.8% | | | |
| Amkor Technology, Inc. | | 16,303 | 532,456 |
| Axcelis Technologies, Inc. (b) | | 4,532 | 572,618 |
| Cirrus Logic, Inc. (b) | | 7,566 | 987,212 |
| Diodes, Inc. (b) | | 7,490 | 585,718 |
| FormFactor, Inc. (b) | | 12,847 | 688,085 |
| Onto Innovation, Inc. (b) | | 5,259 | 1,006,047 |
| Photronics, Inc. (b) | | 13,924 | 353,809 |
| Qorvo, Inc. (b) | | 9,625 | 1,153,075 |
| Rambus, Inc. (b) | | 11,834 | 608,741 |
| Universal Display Corp. | | 4,778 | 1,063,678 |
| | | | 7,551,439 |
| Software - 5.4% | | | |
| ACI Worldwide, Inc. (b) | | 17,442 | 754,018 |
| Alarm.com Holdings, Inc. (b) | | 8,219 | 579,850 |
| Altair Engineering, Inc. Class A (b) | | 7,231 | 638,931 |
| AppFolio, Inc. Class A, (b) | | 2,700 | 597,996 |
| AppLovin Corp. Class A, (b) | | 16,240 | 1,252,104 |
| Aspen Technology, Inc. (b) | | 3,446 | 647,676 |
| Bentley Systems, Inc. Class B | | 21,983 | 1,071,451 |
| Blackbaud, Inc. (b) | | 6,526 | 518,034 |
| BlackLine, Inc. (b) | | 8,384 | 398,408 |
| Box, Inc. Class A (b) | | 21,192 | 595,919 |
| CCC Intelligent Solutions Holdings, Inc. Class A (b) | | 43,523 | 446,546 |
| Clearwater Analytics Holdings, Inc. (b) | | 24,065 | 470,471 |
| CommVault Systems, Inc. (b) | | 6,197 | 947,211 |
| DocuSign, Inc. (b) | | 19,345 | 1,073,261 |
| Dolby Laboratories, Inc. Class A | | 7,607 | 599,127 |
| DoubleVerify Holdings, Inc. (b) | | 16,931 | 357,583 |
| Dropbox, Inc. Class A (b) | | 27,063 | 647,347 |
| Elastic NV (b) | | 8,151 | 893,920 |
| Five9, Inc. (b) | | 8,931 | 397,876 |
| Freshworks, Inc. (b) | | 24,580 | 307,250 |
| Guidewire Software, Inc. (b) | | 8,353 | 1,253,535 |
| Informatica, Inc. (b) | | 12,112 | 289,961 |
| InterDigital, Inc. (c) | | 4,596 | 564,205 |
| Liveramp Holdings, Inc. (b) | | 11,814 | 357,728 |
| Mitek Systems, Inc. (b)(c) | | 25,332 | 337,169 |
| nCino, Inc. (b) | | 13,614 | 445,995 |
| Procore Technologies, Inc. (b) | | 10,256 | 728,484 |
| Progress Software Corp. | | 8,052 | 470,237 |
| Qualys, Inc. (b) | | 4,129 | 615,799 |
| Samsara, Inc. (b) | | 20,619 | 789,295 |
| Smartsheet, Inc. (b) | | 16,004 | 767,552 |
| SolarWinds, Inc. | | 27,132 | 323,685 |
| SPS Commerce, Inc. (b) | | 4,176 | 899,594 |
| Tenable Holdings, Inc. (b) | | 14,290 | 656,197 |
| Teradata Corp. (b) | | 12,942 | 419,580 |
| UiPath, Inc. Class A (b) | | 41,312 | 502,767 |
| Varonis Systems, Inc. (b) | | 14,042 | 774,135 |
| | | | 23,390,897 |
| Technology Hardware, Storage & Peripherals - 0.4% | | | |
| Pure Storage, Inc. Class A (b) | | 27,920 | 1,673,246 |
TOTAL INFORMATION TECHNOLOGY | | | 49,459,243 |
| MATERIALS - 5.7% | | | |
| Chemicals - 1.9% | | | |
| Axalta Coating Systems Ltd. (b) | | 23,640 | 842,766 |
| Balchem Corp. | | 4,179 | 741,605 |
| Eastman Chemical Co. | | 11,531 | 1,191,498 |
| Element Solutions, Inc. | | 27,732 | 747,377 |
| H.B. Fuller Co. | | 7,303 | 629,519 |
| Hawkins, Inc. | | 5,751 | 597,529 |
| Innospec, Inc. | | 4,075 | 534,396 |
| Minerals Technologies, Inc. | | 6,408 | 502,259 |
| NewMarket Corp. | | 946 | 530,583 |
| Orion SA | | 16,092 | 396,185 |
| The Mosaic Co. | | 31,829 | 947,549 |
| Westlake Corp. | | 4,168 | 616,280 |
| | | | 8,277,546 |
| Construction Materials - 0.5% | | | |
| Eagle Materials, Inc. | | 3,624 | 986,815 |
| Summit Materials, Inc. (b) | | 15,663 | 654,400 |
| United States Lime & Minerals, Inc. | | 6,129 | 521,271 |
| | | | 2,162,486 |
| Containers & Packaging - 1.7% | | | |
| Aptargroup, Inc. | | 6,748 | 991,821 |
| Berry Global Group, Inc. | | 12,447 | 818,017 |
| Crown Holdings, Inc. | | 11,559 | 1,025,283 |
| Graphic Packaging Holding Co. | | 32,150 | 967,715 |
| Greif, Inc. Class A | | 6,075 | 405,081 |
| International Paper Co. | | 32,430 | 1,507,346 |
| Smurfit Westrock PLC | | 24,974 | 1,119,834 |
| Sonoco Products Co. | | 11,582 | 624,501 |
| | | | 7,459,598 |
| Metals & Mining - 1.3% | | | |
| Alpha Metallurgical Resources | | 1,503 | 444,001 |
| Arch Resources, Inc. Class A, | | 2,838 | 415,909 |
| Commercial Metals Co. | | 13,502 | 811,470 |
| Materion Corp. | | 3,710 | 446,795 |
| Royal Gold, Inc. | | 6,957 | 960,901 |
| SunCoke Energy, Inc. | | 31,478 | 368,293 |
| United States Steel Corp. | | 21,633 | 888,900 |
| Warrior Metropolitan Coal, Inc. | | 7,895 | 545,623 |
| Worthington Steel, Inc. | | 10,977 | 437,653 |
| | | | 5,319,545 |
| Paper & Forest Products - 0.3% | | | |
| Clearwater Paper Corp. (b) | | 9,391 | 520,919 |
| Sylvamo Corp. | | 8,313 | 612,751 |
| | | | 1,133,670 |
TOTAL MATERIALS | | | 24,352,845 |
| REAL ESTATE - 6.7% | | | |
| Equity Real Estate Investment Trusts (REITs) - 6.2% | | | |
| American Homes 4 Rent Class A | | 32,293 | 1,165,454 |
| Brandywine Realty Trust (SBI) | | 85,691 | 431,883 |
| Brixmor Property Group, Inc. | | 36,466 | 928,789 |
| Broadstone Net Lease, Inc. | | 34,043 | 592,689 |
| BXP, Inc. | | 15,231 | 1,086,123 |
| CareTrust (REIT), Inc. | | 24,206 | 652,594 |
| COPT Defense Properties (SBI) | | 22,273 | 645,249 |
| Cousins Properties, Inc. | | 25,540 | 702,605 |
| CubeSmart | | 23,607 | 1,123,221 |
| Douglas Emmett, Inc. | | 36,459 | 586,625 |
| Easterly Government Properties, Inc. | | 34,390 | 479,053 |
| EastGroup Properties, Inc. | | 5,154 | 963,746 |
| EPR Properties | | 13,398 | 602,910 |
| Equity Commonwealth (b) | | 25,871 | 526,992 |
| Essential Properties Realty Trust, Inc. | | 24,616 | 728,387 |
| Federal Realty Investment Trust (SBI) | | 8,536 | 953,044 |
| First Industrial Realty Trust, Inc. | | 15,680 | 858,010 |
| Highwoods Properties, Inc. (SBI) | | 21,883 | 677,717 |
| Kilroy Realty Corp. | | 16,834 | 622,353 |
| Kite Realty Group Trust | | 31,261 | 770,896 |
| Lamar Advertising Co. Class A | | 9,369 | 1,122,968 |
| LTC Properties, Inc. | | 14,116 | 504,082 |
| Medical Properties Trust, Inc. (c) | | 139,608 | 671,514 |
| National Health Investors, Inc. | | 9,270 | 693,952 |
| Net Lease Office Properties | | 13,976 | 412,432 |
| NNN (REIT), Inc. | | 21,549 | 967,335 |
| Omega Healthcare Investors, Inc. | | 28,524 | 1,038,274 |
| Orion Office (REIT), Inc. | | 66,478 | 269,236 |
| Piedmont Office Realty Trust, Inc. Class A | | 56,050 | 484,833 |
| Regency Centers Corp. | | 17,068 | 1,149,359 |
| STAG Industrial, Inc. | | 21,989 | 897,371 |
| Tanger, Inc. | | 19,693 | 569,128 |
| Terreno Realty Corp. | | 11,381 | 778,574 |
| UDR, Inc. | | 30,670 | 1,228,947 |
| Vornado Realty Trust | | 23,350 | 700,267 |
| | | | 26,586,612 |
| Real Estate Management & Development - 0.5% | | | |
| Forestar Group, Inc. (b) | | 11,239 | 355,490 |
| Jones Lang LaSalle, Inc. (b) | | 5,133 | 1,287,870 |
| The RMR Group, Inc. Class A | | 13,303 | 345,080 |
| | | | 1,988,440 |
TOTAL REAL ESTATE | | | 28,575,052 |
| UTILITIES - 2.9% | | | |
| Electric Utilities - 1.7% | | | |
| Allete, Inc. | | 9,459 | 610,106 |
| Evergy, Inc. | | 22,416 | 1,300,128 |
| Genie Energy Ltd. Class B | | 18,347 | 311,165 |
| Hawaiian Electric Industries, Inc. (c) | | 31,631 | 523,809 |
| IDACORP, Inc. | | 6,986 | 682,882 |
| MGE Energy, Inc. (c) | | 7,428 | 652,476 |
| OGE Energy Corp. | | 23,651 | 916,949 |
| Otter Tail Corp. | | 6,348 | 615,248 |
| Pinnacle West Capital Corp. | | 12,550 | 1,074,155 |
| Portland General Electric Co. | | 14,818 | 702,077 |
| | | | 7,388,995 |
| Gas Utilities - 0.3% | | | |
| National Fuel Gas Co. | | 13,309 | 779,774 |
| ONE Gas, Inc. | | 9,086 | 632,658 |
| | | | 1,412,432 |
| Independent Power and Renewable Electricity Producers - 0.2% | | | |
| Clearway Energy, Inc. Class C | | 21,010 | 560,547 |
| Multi-Utilities - 0.6% | | | |
| Avista Corp. | | 14,848 | 581,745 |
| Black Hills Corp. | | 10,885 | 642,759 |
| NiSource, Inc. | | 41,511 | 1,297,219 |
| | | | 2,521,723 |
| Water Utilities - 0.1% | | | |
| Consolidated Water Co., Inc. | | 11,286 | 327,971 |
TOTAL UTILITIES | | | 12,211,668 |
| TOTAL COMMON STOCKS (Cost $389,250,655) | | | 427,182,435 |
| | | | |
| Money Market Funds - 2.7% |
| | | Shares | Value ($) |
| Fidelity Cash Central Fund 5.39% (d) | | 654,672 | 654,803 |
| Fidelity Securities Lending Cash Central Fund 5.39% (d)(e) | | 11,018,606 | 11,019,708 |
| TOTAL MONEY MARKET FUNDS (Cost $11,674,511) | | | 11,674,511 |
| | | | |
| TOTAL INVESTMENT IN SECURITIES - 102.5% (Cost $400,925,166) | 438,856,946 |
NET OTHER ASSETS (LIABILITIES) - (2.5)% | (10,721,457) |
| NET ASSETS - 100.0% | 428,135,489 |
| | |
| Futures Contracts |
| | Number of contracts | Expiration Date | Notional Amount ($) | Value ($) | Unrealized Appreciation/ (Depreciation) ($) |
| Purchased | | | | | |
| | | | | | |
| Equity Index Contracts | | | | | |
| CME E-mini Russell 2000 Index Contracts (United States) | 6 | Sep 2024 | 681,900 | 39,988 | 39,988 |
| | | | | | |
| The notional amount of futures purchased as a percentage of Net Assets is 0.2% |
Legend
| (c) | Security or a portion of the security is on loan at period end. |
| (d) | Affiliated fund that is generally available only to investment companies and other accounts managed by Fidelity Investments. The rate quoted is the annualized seven-day yield of the fund at period end. A complete unaudited listing of the fund's holdings as of its most recent quarter end is available upon request. In addition, each Fidelity Central Fund's financial statements, which are not covered by the Fund's Report of Independent Registered Public Accounting Firm, are available on the SEC's website or upon request. |
| (e) | Investment made with cash collateral received from securities on loan. |
| (f) | Restricted securities (including private placements) - Investment in securities not registered under the Securities Act of 1933 (excluding 144A issues). At the end of the period, the value of restricted securities (excluding 144A issues) amounted to $0 or 0.0% of net assets. |
| Additional information on each restricted holding is as follows: |
| Security | Acquisition Date | Acquisition Cost ($) |
| GCI Liberty, Inc. Class A (Escrow) | 5/23/23 | 0 |
| | | |
Affiliated Central Funds
Fiscal year to date information regarding the Fund's investments in Fidelity Central Funds, including the ownership percentage, is presented below.
| Affiliate | Value, beginning of period ($) | Purchases ($) | Sales Proceeds ($) | Dividend Income ($) | Realized Gain (loss) ($) | Change in Unrealized appreciation (depreciation) ($) | Value, end of period ($) | % ownership, end of period |
| Fidelity Cash Central Fund 5.39% | 217,417 | 10,147,423 | 9,710,031 | 11,182 | (6) | - | 654,803 | 0.0% |
| Fidelity Securities Lending Cash Central Fund 5.39% | 4,432,050 | 37,634,171 | 31,046,513 | 55,277 | - | - | 11,019,708 | 0.1% |
| Total | 4,649,467 | 47,781,594 | 40,756,544 | 66,459 | (6) | - | 11,674,511 | |
| | | | | | | | | |
Amounts in the dividend income column in the above table include any capital gain distributions from underlying funds, which are presented in the corresponding line item in the Statement of Operations, if applicable.
Amounts in the dividend income column for Fidelity Securities Lending Cash Central Fund represents the income earned on investing cash collateral, less rebates paid to borrowers and any lending agent fees associated with the loan, plus any premium payments received for lending certain types of securities.
Amounts included in the purchases and sales proceeds columns may include in-kind transactions, if applicable.
Investment Valuation
The following is a summary of the inputs used, as of July 31, 2024, involving the Fund's assets and liabilities carried at fair value. The inputs or methodology used for valuing securities may not be an indication of the risk associated with investing in those securities. For more information on valuation inputs, and their aggregation into the levels used below, please refer to the Investment Valuation section in the accompanying Notes to Financial Statements.
| Valuation Inputs at Reporting Date: |
| Description | Total ($) | Level 1 ($) | Level 2 ($) | Level 3 ($) |
Investments in Securities: | | | | |
|
| Equities: | | | | |
Communication Services | 12,295,136 | 12,295,136 | - | - |
Consumer Discretionary | 59,699,356 | 59,699,356 | - | - |
Consumer Staples | 16,540,140 | 16,540,140 | - | - |
Energy | 19,251,364 | 19,251,364 | - | - |
Financials | 72,558,034 | 72,558,034 | - | - |
Health Care | 55,734,497 | 55,734,497 | - | - |
Industrials | 76,505,100 | 76,505,100 | - | - |
Information Technology | 49,459,243 | 49,459,243 | - | - |
Materials | 24,352,845 | 24,352,845 | - | - |
Real Estate | 28,575,052 | 28,575,052 | - | - |
Utilities | 12,211,668 | 12,211,668 | - | - |
|
| Money Market Funds | 11,674,511 | 11,674,511 | - | - |
| Total Investments in Securities: | 438,856,946 | 438,856,946 | - | - |
Derivative Instruments: Assets | | | | |
Futures Contracts | 39,988 | 39,988 | - | - |
| Total Assets | 39,988 | 39,988 | - | - |
| Total Derivative Instruments: | 39,988 | 39,988 | - | - |
Value of Derivative Instruments
The following table is a summary of the Fund's value of derivative instruments by primary risk exposure as of July 31, 2024. For additional information on derivative instruments, please refer to the Derivative Instruments section in the accompanying Notes to Financial Statements.
Primary Risk Exposure / Derivative Type | Value |
| Asset ($) | Liability ($) |
| Equity Risk | | |
Futures Contracts (a) | 39,988 | 0 |
| Total Equity Risk | 39,988 | 0 |
| Total Value of Derivatives | 39,988 | 0 |
(a)Reflects gross cumulative appreciation (depreciation) on futures contracts as presented in the Schedule of Investments. In the Statement of Assets and Liabilities, the period end daily variation margin is included in receivable or payable for daily variation margin on futures contracts, and the net cumulative appreciation (depreciation) is included in Total accumulated earnings (loss).
Fidelity® Small-Mid Multifactor ETF
Financial Statements
| Statement of Assets and Liabilities |
As of July 31, 2024 |
| Assets | | | | |
| Investment in securities, at value (including securities loaned of $10,754,177) - See accompanying schedule: | | | | |
Unaffiliated issuers (cost $389,250,655) | $ | 427,182,435 | | |
Fidelity Central Funds (cost $11,674,511) | | 11,674,511 | | |
| | | | | |
| | | | | |
| Total Investment in Securities (cost $400,925,166) | | | $ | 438,856,946 |
| Segregated cash with brokers for derivative instruments | | | | 65,000 |
| Cash | | | | 15 |
| Foreign currency held at value (cost $924) | | | | 918 |
| Receivable for fund shares sold | | | | 16,309,920 |
| Dividends receivable | | | | 106,844 |
| Distributions receivable from Fidelity Central Funds | | | | 32,297 |
| Receivable for daily variation margin on futures contracts | | | | 6,006 |
| Other receivables | | | | 2,901 |
Total assets | | | | 455,380,847 |
| Liabilities | | | | |
| Payable for investments purchased | $ | 16,151,585 | | |
| Accrued management fee | | 50,004 | | |
| Other payables and accrued expenses | | 24,061 | | |
| Collateral on securities loaned | | 11,019,708 | | |
| Total liabilities | | | | 27,245,358 |
| Net Assets | | | $ | 428,135,489 |
| Net Assets consist of: | | | | |
| Paid in capital | | | $ | 406,165,538 |
| Total accumulated earnings (loss) | | | | 21,969,951 |
| Net Assets | | | $ | 428,135,489 |
Net Asset Value, offering price and redemption price per share ($428,135,489 ÷ 10,500,000 shares) | | | $ | 40.77 |
| Statement of Operations |
| Year ended July 31, 2024 |
| Investment Income | | | | |
| Dividends | | | $ | 3,108,173 |
| Income from Fidelity Central Funds (including $55,277 from security lending) | | | | 66,459 |
| Total income | | | | 3,174,632 |
| Expenses | | | | |
| Management fee | $ | 339,784 | | |
| Independent trustees' fees and expenses | | 781 | | |
| Proxy fee | | 24,059 | | |
| Total expenses before reductions | | 364,624 | | |
| Expense reductions | | (1,351) | | |
| Total expenses after reductions | | | | 363,273 |
| Net Investment income (loss) | | | | 2,811,359 |
| Realized and Unrealized Gain (Loss) | | | | |
| Net realized gain (loss) on: | | | | |
| Investment Securities: | | | | |
| Unaffiliated issuers | | (7,594,404) | | |
| Redemptions in-kind | | 22,038,945 | | |
| Fidelity Central Funds | | (6) | | |
| Foreign currency transactions | | (173) | | |
| Futures contracts | | (32,969) | | |
| Total net realized gain (loss) | | | | 14,411,393 |
| Change in net unrealized appreciation (depreciation) on: | | | | |
| Investment Securities: | | | | |
| Unaffiliated issuers | | 29,616,468 | | |
| Assets and liabilities in foreign currencies | | 17 | | |
| Futures contracts | | 27,036 | | |
| Total change in net unrealized appreciation (depreciation) | | | | 29,643,521 |
| Net gain (loss) | | | | 44,054,914 |
| Net increase (decrease) in net assets resulting from operations | | | $ | 46,866,273 |
| Statement of Changes in Net Assets |
| |
| | Year ended July 31, 2024 | | Year ended July 31, 2023 |
| Increase (Decrease) in Net Assets | | | | |
| Operations | | | | |
| Net investment income (loss) | $ | 2,811,359 | $ | 1,537,092 |
| Net realized gain (loss) | | 14,411,393 | | (2,572,384) |
| Change in net unrealized appreciation (depreciation) | | 29,643,521 | | 10,094,272 |
| Net increase (decrease) in net assets resulting from operations | | 46,866,273 | | 9,058,980 |
| Distributions to shareholders | | (2,726,100) | | (1,518,700) |
| | | | | |
| Share transactions | | | | |
| Proceeds from sales of shares | | 361,178,492 | | 48,425,159 |
| Cost of shares redeemed | | (102,159,372) | | (2,938,248) |
| | | | | |
Net increase (decrease) in net assets resulting from share transactions | | 259,019,120 | | 45,486,911 |
| Total increase (decrease) in net assets | | 303,159,293 | | 53,027,191 |
| | | | | |
| Net Assets | | | | |
| Beginning of period | | 124,976,196 | | 71,949,005 |
| End of period | $ | 428,135,489 | $ | 124,976,196 |
| | | | | |
| Other Information | | | | |
| Shares | | | | |
| Sold | | 9,700,000 | | 1,500,000 |
| Redeemed | | (2,800,000) | | (100,000) |
| Net increase (decrease) | | 6,900,000 | | 1,400,000 |
| | | | | |
Financial Highlights
Fidelity® Small-Mid Multifactor ETF |
| |
| Years ended July 31, | | 2024 | | 2023 | | 2022 | | 2021 | | 2020 |
Selected Per-Share Data | | | | | | | | | | |
| Net asset value, beginning of period | $ | 34.72 | $ | 32.70 | $ | 33.97 | $ | 23.90 | $ | 25.50 |
| Income from Investment Operations | | | | | | | | | | |
Net investment income (loss) A,B | | .51 | | .53 | | .45 | | .38 | | .31 |
| Net realized and unrealized gain (loss) | | 6.04 | | 2.01 | | (1.26) | | 10.11 | | (1.58) |
| Total from investment operations | | 6.55 | | 2.54 | | (.81) | | 10.49 | | (1.27) |
| Distributions from net investment income | | (.50) | | (.52) | | (.46) | | (.42) | | (.33) |
| Total distributions | | (.50) | | (.52) | | (.46) | | (.42) | | (.33) |
| Net asset value, end of period | $ | 40.77 | $ | 34.72 | $ | 32.70 | $ | 33.97 | $ | 23.90 |
Total Return C,D | | | | 7.92% | | (2.35)% | | 44.21% | | (4.90)% |
Ratios to Average Net Assets B,E,F | | | | | | | | | | |
| Expenses before reductions | | .18% | | .29% | | .29% | | .29% | | .29% |
| Expenses net of fee waivers, if any | | | | .29% | | .29% | | .29% | | .29% |
| Expenses net of all reductions | | .18% | | .29% | | .29% | | .29% | | .29% |
| Net investment income (loss) | | 1.41% | | 1.65% | | 1.35% | | 1.23% | | 1.32% |
| Supplemental Data | | | | | | | | | | |
| Net assets, end of period (000 omitted) | $ | 428,135 | $ | 124,976 | $ | 71,949 | $ | 67,939 | $ | 19,117 |
Portfolio turnover rate G,H | | | | 65% | | 60% | | 61% | | 52% |
ACalculated based on average shares outstanding during the period.
BNet investment income (loss) is affected by the timing of the declaration of dividends by any underlying mutual funds or exchange-traded funds (ETFs). Net investment income (loss) of any mutual funds or ETFs is not included in the Fund's net investment income (loss) ratio.
CTotal returns would have been lower if certain expenses had not been reduced during the applicable periods shown.
DBased on net asset value.
EFees and expenses of any underlying mutual funds or exchange-traded funds (ETFs) are not included in the Fund's expense ratio. The Fund indirectly bears its proportionate share of these expenses. For additional expense information related to investments in Fidelity Central Funds, please refer to the "Investments in Fidelity Central Funds" note found in the Notes to Financial Statements section of the most recent Annual or Semi-Annual report.
FExpense ratios reflect operating expenses of the class. Expenses before reductions do not reflect amounts reimbursed, waived, or reduced through arrangements with the investment adviser, brokerage services, or other offset arrangements, if applicable, and do not represent the amount paid by the class during periods when reimbursements, waivers or reductions occur.
GPortfolio turnover rate excludes securities received or delivered in-kind.
HAmount does not include the portfolio activity of any underlying mutual funds or exchange-traded funds (ETFs).
Fidelity® Stocks for Inflation ETF
Schedule of Investments July 31, 2024
Showing Percentage of Net Assets
| Common Stocks - 99.8% |
| | | Shares | Value ($) |
| COMMUNICATION SERVICES - 3.4% | | | |
| Diversified Telecommunication Services - 0.4% | | | |
| AT&T, Inc. | | 15,859 | 305,286 |
| Verizon Communications, Inc. | | 8,383 | 339,679 |
| | | | 644,965 |
| Entertainment - 0.4% | | | |
| Electronic Arts, Inc. | | 1,116 | 168,449 |
| Netflix, Inc. (a) | | 799 | 502,052 |
| | | | 670,501 |
| Interactive Media & Services - 2.4% | | | |
| Alphabet, Inc. Class A | | 16,032 | 2,750,129 |
| Meta Platforms, Inc. Class A | | 3,366 | 1,598,278 |
| | | | 4,348,407 |
| Media - 0.2% | | | |
| Comcast Corp. Class A | | 7,887 | 325,496 |
| The New York Times Co. Class A | | 2,393 | 128,241 |
| | | | 453,737 |
TOTAL COMMUNICATION SERVICES | | | 6,117,610 |
| CONSUMER DISCRETIONARY - 5.9% | | | |
| Diversified Consumer Services - 0.6% | | | |
| H&R Block, Inc. | | 17,285 | 1,001,493 |
| Hotels, Restaurants & Leisure - 1.6% | | | |
| Airbnb, Inc. Class A (a) | | 6,165 | 860,387 |
| Booking Holdings, Inc. | | 284 | 1,055,063 |
| Royal Caribbean Cruises Ltd. | | 6,640 | 1,040,621 |
| | | | 2,956,071 |
| Household Durables - 3.0% | | | |
| KB Home | | 13,122 | 1,129,542 |
| Meritage Homes Corp. | | 5,211 | 1,057,156 |
| PulteGroup, Inc. | | 7,783 | 1,027,356 |
| Taylor Morrison Home Corp. (a) | | 15,131 | 1,014,987 |
| Toll Brothers, Inc. | | 8,009 | 1,142,964 |
| | | | 5,372,005 |
| Specialty Retail - 0.7% | | | |
| Williams-Sonoma, Inc. | | 8,248 | 1,275,801 |
TOTAL CONSUMER DISCRETIONARY | | | 10,605,370 |
| CONSUMER STAPLES - 10.4% | | | |
| Beverages - 1.8% | | | |
| Coca-Cola Consolidated, Inc. | | 2,819 | 3,230,264 |
| Household Products - 5.5% | | | |
| Colgate-Palmolive Co. | | 32,102 | 3,184,197 |
| Kimberly-Clark Corp. | | 21,579 | 2,914,244 |
| Procter & Gamble Co. | | 23,976 | 3,854,382 |
| | | | 9,952,823 |
| Personal Care Products - 1.3% | | | |
| BellRing Brands, Inc. (a) | | 45,116 | 2,313,548 |
| Tobacco - 1.8% | | | |
| Altria Group, Inc. | | 66,498 | 3,259,067 |
TOTAL CONSUMER STAPLES | | | 18,755,702 |
| ENERGY - 8.3% | | | |
| Oil, Gas & Consumable Fuels - 8.3% | | | |
| Cheniere Energy, Inc. | | 21,479 | 3,922,925 |
| Chord Energy Corp. | | 22,087 | 3,791,454 |
| Marathon Petroleum Corp. | | 21,409 | 3,789,821 |
| Southwestern Energy Co. (a) | | 526,589 | 3,396,499 |
| | | | 14,900,699 |
| FINANCIALS - 8.4% | | | |
| Banks - 0.6% | | | |
| First Citizens Bancshares, Inc. | | 516 | 1,077,248 |
| Consumer Finance - 1.7% | | | |
| Capital One Financial Corp. | | 6,232 | 943,525 |
| Discover Financial Services | | 7,371 | 1,061,350 |
| Synchrony Financial | | 19,753 | 1,003,255 |
| | | | 3,008,130 |
| Financial Services - 5.2% | | | |
| Berkshire Hathaway, Inc. Class B (a) | | 5,819 | 2,551,632 |
| Essent Group Ltd. | | 13,439 | 844,507 |
| MasterCard, Inc. Class A | | 3,370 | 1,562,703 |
| MGIC Investment Corp. | | 37,060 | 920,570 |
| Mr. Cooper Group, Inc. (a) | | 11,020 | 990,478 |
| Radian Group, Inc. | | 25,146 | 932,917 |
| Visa, Inc. Class A | | 6,075 | 1,613,945 |
| | | | 9,416,752 |
| Insurance - 0.9% | | | |
| Arch Capital Group Ltd. (a) | | 9,676 | 926,767 |
| Everest Re Group Ltd. | | 2,018 | 792,812 |
| | | | 1,719,579 |
TOTAL FINANCIALS | | | 15,221,709 |
| HEALTH CARE - 17.2% | | | |
| Biotechnology - 7.6% | | | |
| AbbVie, Inc. | | 17,304 | 3,206,777 |
| Amgen, Inc. | | 7,634 | 2,538,076 |
| Regeneron Pharmaceuticals, Inc. (a) | | 2,330 | 2,514,513 |
| United Therapeutics Corp. (a) | | 8,853 | 2,773,556 |
| Vertex Pharmaceuticals, Inc. (a) | | 5,217 | 2,586,171 |
| | | | 13,619,093 |
| Health Care Providers & Services - 5.7% | | | |
| Cardinal Health, Inc. | | 18,711 | 1,886,630 |
| Centene Corp. (a) | | 26,774 | 2,059,456 |
| Humana, Inc. | | 5,420 | 1,959,926 |
| McKesson Corp. | | 4,200 | 2,591,484 |
| Molina Healthcare, Inc. (a) | | 5,486 | 1,872,207 |
| | | | 10,369,703 |
| Life Sciences Tools & Services - 1.4% | | | |
| Medpace Holdings, Inc. (a) | | 6,440 | 2,463,429 |
| Pharmaceuticals - 2.5% | | | |
| Eli Lilly & Co. | | 5,599 | 4,503,108 |
TOTAL HEALTH CARE | | | 30,955,333 |
| INDUSTRIALS - 4.4% | | | |
| Building Products - 1.3% | | | |
| Builders FirstSource, Inc. (a) | | 3,969 | 664,292 |
| Owens Corning | | 4,476 | 834,237 |
| UFP Industries, Inc. | | 5,899 | 778,255 |
| | | | 2,276,784 |
| Electrical Equipment - 0.3% | | | |
| Atkore, Inc. | | 4,623 | 624,105 |
| Machinery - 1.5% | | | |
| Allison Transmission Holdings, Inc. | | 11,118 | 984,944 |
| Mueller Industries, Inc. | | 13,811 | 979,752 |
| PACCAR, Inc. | | 7,469 | 736,892 |
| | | | 2,701,588 |
| Professional Services - 0.9% | | | |
| Automatic Data Processing, Inc. | | 3,406 | 894,484 |
| Paychex, Inc. | | 6,098 | 780,666 |
| | | | 1,675,150 |
| Trading Companies & Distributors - 0.4% | | | |
| Boise Cascade Co. | | 4,918 | 698,799 |
TOTAL INDUSTRIALS | | | 7,976,426 |
| INFORMATION TECHNOLOGY - 25.0% | | | |
| Communications Equipment - 0.8% | | | |
| Arista Networks, Inc. (a) | | 1,860 | 644,583 |
| Cisco Systems, Inc. | | 17,566 | 851,073 |
| | | | 1,495,656 |
| IT Services - 1.3% | | | |
| Accenture PLC Class A | | 2,604 | 860,934 |
| Akamai Technologies, Inc. (a) | | 2,845 | 279,607 |
| Cognizant Technology Solutions Corp. Class A | | 5,289 | 400,272 |
| IBM Corp. | | 4,216 | 810,062 |
| | | | 2,350,875 |
| Semiconductors & Semiconductor Equipment - 8.3% | | | |
| Applied Materials, Inc. | | 4,189 | 888,906 |
| Broadcom, Inc. | | 15,057 | 2,419,359 |
| KLA Corp. | | 889 | 731,709 |
| Lam Research Corp. | | 737 | 678,954 |
| NVIDIA Corp. | | 75,421 | 8,825,765 |
| Qualcomm, Inc. | | 5,308 | 960,483 |
| Skyworks Solutions, Inc. | | 3,370 | 382,899 |
| | | | 14,888,075 |
| Software - 9.0% | | | |
| Adobe, Inc. (a) | | 1,780 | 981,937 |
| AppLovin Corp. Class A, (a) | | 7,696 | 593,362 |
| Cadence Design Systems, Inc. (a) | | 1,812 | 485,000 |
| Crowdstrike Holdings, Inc. (a) | | 1,649 | 382,502 |
| Dropbox, Inc. Class A (a) | | 10,012 | 239,487 |
| Fair Isaac Corp. (a) | | 312 | 499,200 |
| Manhattan Associates, Inc. (a) | | 1,382 | 352,935 |
| Microsoft Corp. | | 22,005 | 9,205,792 |
| Palantir Technologies, Inc. Class A (a) | | 23,884 | 642,241 |
| Palo Alto Networks, Inc. (a) | | 1,771 | 575,097 |
| Qualys, Inc. (a) | | 1,680 | 250,555 |
| Salesforce, Inc. | | 3,840 | 993,792 |
| ServiceNow, Inc. (a) | | 975 | 794,030 |
| Zoom Video Communications, Inc. Class A (a) | | 5,356 | 323,502 |
| | | | 16,319,432 |
| Technology Hardware, Storage & Peripherals - 5.6% | | | |
| Apple, Inc. | | 43,429 | 9,644,709 |
| Dell Technologies, Inc. | | 4,226 | 480,412 |
| | | | 10,125,121 |
TOTAL INFORMATION TECHNOLOGY | | | 45,179,159 |
| MATERIALS - 5.7% | | | |
| Chemicals - 2.2% | | | |
| CF Industries Holdings, Inc. | | 51,030 | 3,898,182 |
| Metals & Mining - 3.5% | | | |
| Alpha Metallurgical Resources | | 9,550 | 2,821,166 |
| Nucor Corp. | | 21,701 | 3,535,961 |
| | | | 6,357,127 |
TOTAL MATERIALS | | | 10,255,309 |
| REAL ESTATE - 5.5% | | | |
| Equity Real Estate Investment Trusts (REITs) - 5.5% | | | |
| Omega Healthcare Investors, Inc. | | 97,380 | 3,544,632 |
| Public Storage Operating Co. | | 10,495 | 3,105,680 |
| Simon Property Group, Inc. | | 21,570 | 3,309,701 |
| | | | 9,960,013 |
| UTILITIES - 5.6% | | | |
| Gas Utilities - 2.2% | | | |
| National Fuel Gas Co. | | 68,542 | 4,015,876 |
| Independent Power and Renewable Electricity Producers - 3.4% | | | |
| Vistra Corp. | | 76,073 | 6,026,503 |
TOTAL UTILITIES | | | 10,042,379 |
| TOTAL COMMON STOCKS (Cost $146,051,639) | | | 179,969,709 |
| | | | |
| Money Market Funds - 0.2% |
| | | Shares | Value ($) |
Fidelity Cash Central Fund 5.39% (b) (Cost $286,511) | | 286,454 | 286,511 |
| | | | |
| TOTAL INVESTMENT IN SECURITIES - 100.0% (Cost $146,338,150) | 180,256,220 |
NET OTHER ASSETS (LIABILITIES) - 0.0% | (9,065) |
| NET ASSETS - 100.0% | 180,247,155 |
| | |
| Futures Contracts |
| | Number of contracts | Expiration Date | Notional Amount ($) | Value ($) | Unrealized Appreciation/ (Depreciation) ($) |
| Purchased | | | | | |
| | | | | | |
| Equity Index Contracts | | | | | |
| CME E-mini S&P 500 Index Contracts (United States) | 1 | Sep 2024 | 277,900 | 2,720 | 2,720 |
| | | | | | |
| The notional amount of futures purchased as a percentage of Net Assets is 0.2% |
Legend
| (b) | Affiliated fund that is generally available only to investment companies and other accounts managed by Fidelity Investments. The rate quoted is the annualized seven-day yield of the fund at period end. A complete unaudited listing of the fund's holdings as of its most recent quarter end is available upon request. In addition, each Fidelity Central Fund's financial statements, which are not covered by the Fund's Report of Independent Registered Public Accounting Firm, are available on the SEC's website or upon request. |
Affiliated Central Funds
Fiscal year to date information regarding the Fund's investments in Fidelity Central Funds, including the ownership percentage, is presented below.
| Affiliate | Value, beginning of period ($) | Purchases ($) | Sales Proceeds ($) | Dividend Income ($) | Realized Gain (loss) ($) | Change in Unrealized appreciation (depreciation) ($) | Value, end of period ($) | % ownership, end of period |
| Fidelity Cash Central Fund 5.39% | 107,212 | 15,255,833 | 15,076,535 | 9,947 | 1 | - | 286,511 | 0.0% |
| Total | 107,212 | 15,255,833 | 15,076,535 | 9,947 | 1 | - | 286,511 | |
| | | | | | | | | |
Amounts in the dividend income column in the above table include any capital gain distributions from underlying funds, which are presented in the corresponding line item in the Statement of Operations, if applicable.
Amounts included in the purchases and sales proceeds columns may include in-kind transactions, if applicable.
Investment Valuation
The following is a summary of the inputs used, as of July 31, 2024, involving the Fund's assets and liabilities carried at fair value. The inputs or methodology used for valuing securities may not be an indication of the risk associated with investing in those securities. For more information on valuation inputs, and their aggregation into the levels used below, please refer to the Investment Valuation section in the accompanying Notes to Financial Statements.
| Valuation Inputs at Reporting Date: |
| Description | Total ($) | Level 1 ($) | Level 2 ($) | Level 3 ($) |
Investments in Securities: | | | | |
|
| Equities: | | | | |
Communication Services | 6,117,610 | 6,117,610 | - | - |
Consumer Discretionary | 10,605,370 | 10,605,370 | - | - |
Consumer Staples | 18,755,702 | 18,755,702 | - | - |
Energy | 14,900,699 | 14,900,699 | - | - |
Financials | 15,221,709 | 15,221,709 | - | - |
Health Care | 30,955,333 | 30,955,333 | - | - |
Industrials | 7,976,426 | 7,976,426 | - | - |
Information Technology | 45,179,159 | 45,179,159 | - | - |
Materials | 10,255,309 | 10,255,309 | - | - |
Real Estate | 9,960,013 | 9,960,013 | - | - |
Utilities | 10,042,379 | 10,042,379 | - | - |
|
| Money Market Funds | 286,511 | 286,511 | - | - |
| Total Investments in Securities: | 180,256,220 | 180,256,220 | - | - |
Derivative Instruments: Assets | | | | |
Futures Contracts | 2,720 | 2,720 | - | - |
| Total Assets | 2,720 | 2,720 | - | - |
| Total Derivative Instruments: | 2,720 | 2,720 | - | - |
Value of Derivative Instruments
The following table is a summary of the Fund's value of derivative instruments by primary risk exposure as of July 31, 2024. For additional information on derivative instruments, please refer to the Derivative Instruments section in the accompanying Notes to Financial Statements.
Primary Risk Exposure / Derivative Type | Value |
| Asset ($) | Liability ($) |
| Equity Risk | | |
Futures Contracts (a) | 2,720 | 0 |
| Total Equity Risk | 2,720 | 0 |
| Total Value of Derivatives | 2,720 | 0 |
(a)Reflects gross cumulative appreciation (depreciation) on futures contracts as presented in the Schedule of Investments. In the Statement of Assets and Liabilities, the period end daily variation margin is included in receivable or payable for daily variation margin on futures contracts, and the net cumulative appreciation (depreciation) is included in Total accumulated earnings (loss).
Fidelity® Stocks for Inflation ETF
Financial Statements
| Statement of Assets and Liabilities |
As of July 31, 2024 |
| Assets | | | | |
| Investment in securities, at value - See accompanying schedule: | | | | |
Unaffiliated issuers (cost $146,051,639) | $ | 179,969,709 | | |
Fidelity Central Funds (cost $286,511) | | 286,511 | | |
| | | | | |
| | | | | |
| Total Investment in Securities (cost $146,338,150) | | | $ | 180,256,220 |
| Segregated cash with brokers for derivative instruments | | | | 33,600 |
| Cash | | | | 4,553 |
| Dividends receivable | | | | 101,764 |
| Distributions receivable from Fidelity Central Funds | | | | 1,022 |
| Receivable for daily variation margin on futures contracts | | | | 4,275 |
Total assets | | | | 180,401,434 |
| Liabilities | | | | |
| Payable for investments purchased | $ | 120,946 | | |
| Accrued management fee | | 21,935 | | |
| Proxy fee payable | | 11,398 | | |
| Total liabilities | | | | 154,279 |
| Net Assets | | | $ | 180,247,155 |
| Net Assets consist of: | | | | |
| Paid in capital | | | $ | 167,210,071 |
| Total accumulated earnings (loss) | | | | 13,037,084 |
| Net Assets | | | $ | 180,247,155 |
Net Asset Value, offering price and redemption price per share ($180,247,155 ÷ 4,350,000 shares) | | | $ | 41.44 |
| Statement of Operations |
| Year ended July 31, 2024 |
| Investment Income | | | | |
| Dividends | | | $ | 2,572,108 |
| Income from Fidelity Central Funds | | | | 9,947 |
| Total income | | | | 2,582,055 |
| Expenses | | | | |
| Management fee | $ | 263,531 | | |
| Independent trustees' fees and expenses | | 708 | | |
| Miscellaneous | | 11,398 | | |
| Total expenses before reductions | | 275,637 | | |
| Expense reductions | | (401) | | |
| Total expenses after reductions | | | | 275,236 |
| Net Investment income (loss) | | | | 2,306,819 |
| Realized and Unrealized Gain (Loss) | | | | |
| Net realized gain (loss) on: | | | | |
| Investment Securities: | | | | |
| Unaffiliated issuers | | (138,355) | | |
| Redemptions in-kind | | 1,587,317 | | |
| Fidelity Central Funds | | 1 | | |
| Futures contracts | | 46,270 | | |
| Total net realized gain (loss) | | | | 1,495,233 |
| Change in net unrealized appreciation (depreciation) on: | | | | |
| Investment Securities: | | | | |
| Unaffiliated issuers | | 28,532,674 | | |
| Futures contracts | | (10,540) | | |
| Total change in net unrealized appreciation (depreciation) | | | | 28,522,134 |
| Net gain (loss) | | | | 30,017,367 |
| Net increase (decrease) in net assets resulting from operations | | | $ | 32,324,186 |
| Statement of Changes in Net Assets |
| |
| | Year ended July 31, 2024 | | Year ended July 31, 2023 |
| Increase (Decrease) in Net Assets | | | | |
| Operations | | | | |
| Net investment income (loss) | $ | 2,306,819 | $ | 4,059,664 |
| Net realized gain (loss) | | 1,495,233 | | (11,942,083) |
| Change in net unrealized appreciation (depreciation) | | 28,522,134 | | 19,422,908 |
| Net increase (decrease) in net assets resulting from operations | | 32,324,186 | | 11,540,489 |
| Distributions to shareholders | | (2,269,650) | | (4,166,950) |
| | | | | |
| Share transactions | | | | |
| Proceeds from sales of shares | | 25,928,474 | | 7,889,065 |
| Cost of shares redeemed | | (23,234,693) | | (128,142,495) |
| | | | | |
Net increase (decrease) in net assets resulting from share transactions | | 2,693,781 | | (120,253,430) |
| Total increase (decrease) in net assets | | 32,748,317 | | (112,879,891) |
| | | | | |
| Net Assets | | | | |
| Beginning of period | | 147,498,838 | | 260,378,729 |
| End of period | $ | 180,247,155 | $ | 147,498,838 |
| | | | | |
| Other Information | | | | |
| Shares | | | | |
| Sold | | 650,000 | | 250,000 |
| Redeemed | | (700,000) | | (4,050,000) |
| Net increase (decrease) | | (50,000) | | (3,800,000) |
| | | | | |
Financial Highlights
Fidelity® Stocks for Inflation ETF |
| |
| Years ended July 31, | | 2024 | | 2023 | | 2022 | | 2021 | | 2020 A |
Selected Per-Share Data | | | | | | | | | | |
| Net asset value, beginning of period | $ | 33.52 | $ | 31.75 | $ | 30.72 | $ | 24.07 | $ | 24.94 |
| Income from Investment Operations | | | | | | | | | | |
Net investment income (loss) B,C | | .58 | | .61 | | .54 | | .39 | | .38 |
| Net realized and unrealized gain (loss) | | 7.92 | | 1.80 | | 1.00 | | 7.08 | | (.90) |
| Total from investment operations | | 8.50 | | 2.41 | | 1.54 | | 7.47 | | (.52) |
| Distributions from net investment income | | (.58) | | (.64) | | (.51) | | (.82) | | (.35) |
| Total distributions | | (.58) | | (.64) | | (.51) | | (.82) | | (.35) |
| Net asset value, end of period | $ | 41.44 | $ | 33.52 | $ | 31.75 | $ | 30.72 | $ | 24.07 |
Total Return D,E,F | | | | 7.77% | | 5.03% | | 31.78% | | (1.88)% |
Ratios to Average Net Assets C,G,H | | | | | | | | | | |
| Expenses before reductions | | .19% | | .29% | | .29% | | .29% | | .29% I,J |
| Expenses net of fee waivers, if any | | | | .29% | | .29% | | .29% | | .29% I,J |
| Expenses net of all reductions | | .19% | | .29% | | .29% | | .29% | | .29% I,J |
| Net investment income (loss) | | 1.60% | | 1.95% | | 1.68% | | 1.34% | | 2.16% I,J |
| Supplemental Data | | | | | | | | | | |
| Net assets, end of period (000 omitted) | $ | 180,247 | $ | 147,499 | $ | 260,379 | $ | 46,083 | $ | 3,610 |
Portfolio turnover rate K,L | | | | 105% | | 76% | | 52% | | 65% M |
AFor the period November 5, 2019 (commencement of operations) through July 31, 2020.
BCalculated based on average shares outstanding during the period.
CNet investment income (loss) is affected by the timing of the declaration of dividends by any underlying mutual funds or exchange-traded funds (ETFs). Net investment income (loss) of any mutual funds or ETFs is not included in the Fund's net investment income (loss) ratio.
DTotal returns for periods of less than one year are not annualized.
ETotal returns would have been lower if certain expenses had not been reduced during the applicable periods shown.
FBased on net asset value.
GFees and expenses of any underlying mutual funds or exchange-traded funds (ETFs) are not included in the Fund's expense ratio. The Fund indirectly bears its proportionate share of these expenses. For additional expense information related to investments in Fidelity Central Funds, please refer to the "Investments in Fidelity Central Funds" note found in the Notes to Financial Statements section of the most recent Annual or Semi-Annual report.
HExpense ratios reflect operating expenses of the class. Expenses before reductions do not reflect amounts reimbursed, waived, or reduced through arrangements with the investment adviser, brokerage services, or other offset arrangements, if applicable, and do not represent the amount paid by the class during periods when reimbursements, waivers or reductions occur.
IAnnualized.
JProxy expenses are not annualized.
KPortfolio turnover rate excludes securities received or delivered in-kind.
LAmount does not include the portfolio activity of any underlying mutual funds or exchange-traded funds (ETFs).
MAmount not annualized.
Fidelity® U.S. Multifactor ETF
Schedule of Investments July 31, 2024
Showing Percentage of Net Assets
| Common Stocks - 99.8% |
| | | Shares | Value ($) |
| COMMUNICATION SERVICES - 8.4% | | | |
| Diversified Telecommunication Services - 1.0% | | | |
| AT&T, Inc. | | 30,387 | 584,950 |
| Verizon Communications, Inc. | | 15,627 | 633,206 |
| | | | 1,218,156 |
| Entertainment - 0.3% | | | |
| Electronic Arts, Inc. | | 2,360 | 356,218 |
| Interactive Media & Services - 6.1% | | | |
| Alphabet, Inc. Class A | | 27,317 | 4,685,958 |
| Meta Platforms, Inc. Class A | | 5,807 | 2,757,338 |
| | | | 7,443,296 |
| Media - 1.0% | | | |
| Comcast Corp. Class A | | 14,657 | 604,894 |
| Fox Corp. Class A | | 8,485 | 322,769 |
| The New York Times Co. Class A | | 5,420 | 290,458 |
| | | | 1,218,121 |
TOTAL COMMUNICATION SERVICES | | | 10,235,791 |
| CONSUMER DISCRETIONARY - 10.0% | | | |
| Hotels, Restaurants & Leisure - 2.0% | | | |
| Booking Holdings, Inc. | | 331 | 1,229,668 |
| McDonald's Corp. | | 4,682 | 1,242,603 |
| | | | 2,472,271 |
| Household Durables - 4.7% | | | |
| Lennar Corp. Class A | | 6,401 | 1,132,529 |
| Meritage Homes Corp. | | 5,888 | 1,194,499 |
| NVR, Inc. (a) | | 129 | 1,110,365 |
| PulteGroup, Inc. | | 8,855 | 1,168,860 |
| Taylor Morrison Home Corp. (a) | | 17,113 | 1,147,940 |
| | | | 5,754,193 |
| Specialty Retail - 3.3% | | | |
| AutoZone, Inc. (a) | | 358 | 1,121,861 |
| O'Reilly Automotive, Inc. (a) | | 993 | 1,118,456 |
| The Home Depot, Inc. | | 4,810 | 1,770,850 |
| | | | 4,011,167 |
TOTAL CONSUMER DISCRETIONARY | | | 12,237,631 |
| CONSUMER STAPLES - 5.6% | | | |
| Household Products - 3.0% | | | |
| Colgate-Palmolive Co. | | 10,745 | 1,065,797 |
| Kimberly-Clark Corp. | | 6,943 | 937,652 |
| Procter & Gamble Co. | | 10,272 | 1,651,327 |
| | | | 3,654,776 |
| Personal Care Products - 0.6% | | | |
| BellRing Brands, Inc. (a) | | 13,778 | 706,536 |
| Tobacco - 2.0% | | | |
| Altria Group, Inc. | | 22,341 | 1,094,932 |
| Philip Morris International, Inc. | | 11,767 | 1,355,088 |
| | | | 2,450,020 |
TOTAL CONSUMER STAPLES | | | 6,811,332 |
| ENERGY - 3.7% | | | |
| Oil, Gas & Consumable Fuels - 3.7% | | | |
| Cheniere Energy, Inc. | | 6,352 | 1,160,129 |
| Chord Energy Corp. | | 6,250 | 1,072,875 |
| Coterra Energy, Inc. | | 40,110 | 1,034,838 |
| Valero Energy Corp. | | 7,620 | 1,232,306 |
| | | | 4,500,148 |
| FINANCIALS - 13.2% | | | |
| Banks - 1.1% | | | |
| First Citizens Bancshares, Inc. | | 633 | 1,321,508 |
| Capital Markets - 1.6% | | | |
| Cboe Global Markets, Inc. | | 5,121 | 939,755 |
| CME Group, Inc. | | 5,215 | 1,010,198 |
| | | | 1,949,953 |
| Consumer Finance - 1.0% | | | |
| Synchrony Financial | | 24,294 | 1,233,892 |
| Financial Services - 5.7% | | | |
| Essent Group Ltd. | | 16,588 | 1,042,390 |
| MasterCard, Inc. Class A | | 3,886 | 1,801,977 |
| MGIC Investment Corp. | | 45,755 | 1,136,554 |
| Radian Group, Inc. | | 31,058 | 1,152,252 |
| Visa, Inc. Class A | | 6,970 | 1,851,720 |
| | | | 6,984,893 |
| Insurance - 3.8% | | | |
| AFLAC, Inc. | | 13,061 | 1,245,758 |
| Arch Capital Group Ltd. (a) | | 11,842 | 1,134,227 |
| Everest Re Group Ltd. | | 2,481 | 974,710 |
| Reinsurance Group of America, Inc. | | 5,393 | 1,215,744 |
| | | | 4,570,439 |
TOTAL FINANCIALS | | | 16,060,685 |
| HEALTH CARE - 12.0% | | | |
| Biotechnology - 5.8% | | | |
| AbbVie, Inc. | | 8,561 | 1,586,525 |
| Amgen, Inc. | | 3,541 | 1,177,276 |
| Gilead Sciences, Inc. | | 12,429 | 945,350 |
| Regeneron Pharmaceuticals, Inc. (a) | | 1,026 | 1,107,249 |
| United Therapeutics Corp. (a) | | 3,554 | 1,113,433 |
| Vertex Pharmaceuticals, Inc. (a) | | 2,315 | 1,147,592 |
| | | | 7,077,425 |
| Health Care Providers & Services - 2.3% | | | |
| Centene Corp. (a) | | 11,129 | 856,043 |
| McKesson Corp. | | 1,792 | 1,105,700 |
| Molina Healthcare, Inc. (a) | | 2,232 | 761,715 |
| | | | 2,723,458 |
| Pharmaceuticals - 3.9% | | | |
| Eli Lilly & Co. | | 2,986 | 2,401,550 |
| Johnson & Johnson | | 10,316 | 1,628,381 |
| Royalty Pharma PLC | | 26,840 | 756,083 |
| | | | 4,786,014 |
TOTAL HEALTH CARE | | | 14,586,897 |
| INDUSTRIALS - 9.4% | | | |
| Aerospace & Defense - 1.2% | | | |
| Lockheed Martin Corp. | | 2,679 | 1,451,804 |
| Building Products - 0.8% | | | |
| Builders FirstSource, Inc. (a) | | 5,484 | 917,857 |
| Machinery - 3.8% | | | |
| Allison Transmission Holdings, Inc. | | 15,347 | 1,359,591 |
| Mueller Industries, Inc. | | 19,062 | 1,352,258 |
| PACCAR, Inc. | | 10,338 | 1,019,947 |
| Snap-On, Inc. | | 3,329 | 955,523 |
| | | | 4,687,319 |
| Professional Services - 2.8% | | | |
| Automatic Data Processing, Inc. | | 4,725 | 1,240,880 |
| Paychex, Inc. | | 8,431 | 1,079,337 |
| Verisk Analytics, Inc. | | 4,108 | 1,075,269 |
| | | | 3,395,486 |
| Trading Companies & Distributors - 0.8% | | | |
| Boise Cascade Co. | | 6,787 | 964,365 |
TOTAL INDUSTRIALS | | | 11,416,831 |
| INFORMATION TECHNOLOGY - 29.9% | | | |
| Communications Equipment - 1.1% | | | |
| Arista Networks, Inc. (a) | | 1,612 | 558,639 |
| Cisco Systems, Inc. | | 14,820 | 718,029 |
| | | | 1,276,668 |
| IT Services - 2.1% | | | |
| Accenture PLC Class A | | 2,190 | 724,058 |
| Akamai Technologies, Inc. (a) | | 2,517 | 247,371 |
| Amdocs Ltd. | | 3,178 | 277,980 |
| Cognizant Technology Solutions Corp. Class A | | 4,621 | 349,717 |
| IBM Corp. | | 3,570 | 685,940 |
| VeriSign, Inc. (a) | | 1,553 | 290,427 |
| | | | 2,575,493 |
| Semiconductors & Semiconductor Equipment - 9.5% | | | |
| Applied Materials, Inc. | | 3,563 | 756,069 |
| Broadcom, Inc. | | 12,492 | 2,007,215 |
| KLA Corp. | | 766 | 630,472 |
| Lam Research Corp. | | 630 | 580,381 |
| NVIDIA Corp. | | 61,922 | 7,246,112 |
| Skyworks Solutions, Inc. | | 2,983 | 338,928 |
| | | | 11,559,177 |
| Software - 10.4% | | | |
| Adobe, Inc. (a) | | 1,490 | 821,959 |
| Cadence Design Systems, Inc. (a) | | 1,560 | 417,550 |
| Dolby Laboratories, Inc. Class A | | 3,309 | 260,617 |
| Dropbox, Inc. Class A (a) | | 8,933 | 213,677 |
| Fair Isaac Corp. (a) | | 273 | 436,800 |
| Fortinet, Inc. (a) | | 5,535 | 321,251 |
| Intuit, Inc. | | 1,079 | 698,491 |
| Manhattan Associates, Inc. (a) | | 1,223 | 312,330 |
| Microsoft Corp. | | 18,014 | 7,536,157 |
| Qualys, Inc. (a) | | 1,495 | 222,964 |
| ServiceNow, Inc. (a) | | 828 | 674,315 |
| Synopsys, Inc. (a) | | 853 | 476,247 |
| Zoom Video Communications, Inc. Class A (a) | | 4,738 | 286,175 |
| | | | 12,678,533 |
| Technology Hardware, Storage & Peripherals - 6.8% | | | |
| Apple, Inc. | | 35,564 | 7,898,046 |
| Dell Technologies, Inc. | | 3,728 | 423,799 |
| | | | 8,321,845 |
TOTAL INFORMATION TECHNOLOGY | | | 36,411,716 |
| MATERIALS - 2.2% | | | |
| Chemicals - 0.7% | | | |
| CF Industries Holdings, Inc. | | 11,296 | 862,901 |
| Metals & Mining - 1.5% | | | |
| Nucor Corp. | | 5,064 | 825,128 |
| Steel Dynamics, Inc. | | 7,314 | 974,371 |
| | | | 1,799,499 |
TOTAL MATERIALS | | | 2,662,400 |
| REAL ESTATE - 2.5% | | | |
| Equity Real Estate Investment Trusts (REITs) - 2.5% | | | |
| Omega Healthcare Investors, Inc. | | 30,068 | 1,094,475 |
| Public Storage Operating Co. | | 3,411 | 1,009,383 |
| VICI Properties, Inc. | | 30,460 | 952,180 |
| | | | 3,056,038 |
| UTILITIES - 2.9% | | | |
| Gas Utilities - 1.2% | | | |
| National Fuel Gas Co. | | 23,884 | 1,399,364 |
| Independent Power and Renewable Electricity Producers - 1.7% | | | |
| Vistra Corp. | | 26,775 | 2,121,116 |
TOTAL UTILITIES | | | 3,520,480 |
| TOTAL COMMON STOCKS (Cost $103,047,850) | | | 121,499,949 |
| | | | |
| Money Market Funds - 0.2% |
| | | Shares | Value ($) |
Fidelity Cash Central Fund 5.39% (b) (Cost $186,494) | | 186,456 | 186,494 |
| | | | |
| TOTAL INVESTMENT IN SECURITIES - 100.0% (Cost $103,234,344) | 121,686,443 |
NET OTHER ASSETS (LIABILITIES) - 0.0% | 52,325 |
| NET ASSETS - 100.0% | 121,738,768 |
| | |
| Futures Contracts |
| | Number of contracts | Expiration Date | Notional Amount ($) | Value ($) | Unrealized Appreciation/ (Depreciation) ($) |
| Purchased | | | | | |
| | | | | | |
| Equity Index Contracts | | | | | |
| CME Micro E-mini S&P 500 Index Contracts (United States) | 7 | Sep 2024 | 194,530 | 718 | 718 |
| | | | | | |
| The notional amount of futures purchased as a percentage of Net Assets is 0.2% |
Legend
| (b) | Affiliated fund that is generally available only to investment companies and other accounts managed by Fidelity Investments. The rate quoted is the annualized seven-day yield of the fund at period end. A complete unaudited listing of the fund's holdings as of its most recent quarter end is available upon request. In addition, each Fidelity Central Fund's financial statements, which are not covered by the Fund's Report of Independent Registered Public Accounting Firm, are available on the SEC's website or upon request. |
Affiliated Central Funds
Fiscal year to date information regarding the Fund's investments in Fidelity Central Funds, including the ownership percentage, is presented below.
| Affiliate | Value, beginning of period ($) | Purchases ($) | Sales Proceeds ($) | Dividend Income ($) | Realized Gain (loss) ($) | Change in Unrealized appreciation (depreciation) ($) | Value, end of period ($) | % ownership, end of period |
| Fidelity Cash Central Fund 5.39% | 18,721 | 2,857,836 | 2,690,058 | 3,803 | (5) | - | 186,494 | 0.0% |
| Total | 18,721 | 2,857,836 | 2,690,058 | 3,803 | (5) | - | 186,494 | |
| | | | | | | | | |
Amounts in the dividend income column in the above table include any capital gain distributions from underlying funds, which are presented in the corresponding line item in the Statement of Operations, if applicable.
Amounts included in the purchases and sales proceeds columns may include in-kind transactions, if applicable.
Investment Valuation
The following is a summary of the inputs used, as of July 31, 2024, involving the Fund's assets and liabilities carried at fair value. The inputs or methodology used for valuing securities may not be an indication of the risk associated with investing in those securities. For more information on valuation inputs, and their aggregation into the levels used below, please refer to the Investment Valuation section in the accompanying Notes to Financial Statements.
| Valuation Inputs at Reporting Date: |
| Description | Total ($) | Level 1 ($) | Level 2 ($) | Level 3 ($) |
Investments in Securities: | | | | |
|
| Equities: | | | | |
Communication Services | 10,235,791 | 10,235,791 | - | - |
Consumer Discretionary | 12,237,631 | 12,237,631 | - | - |
Consumer Staples | 6,811,332 | 6,811,332 | - | - |
Energy | 4,500,148 | 4,500,148 | - | - |
Financials | 16,060,685 | 16,060,685 | - | - |
Health Care | 14,586,897 | 14,586,897 | - | - |
Industrials | 11,416,831 | 11,416,831 | - | - |
Information Technology | 36,411,716 | 36,411,716 | - | - |
Materials | 2,662,400 | 2,662,400 | - | - |
Real Estate | 3,056,038 | 3,056,038 | - | - |
Utilities | 3,520,480 | 3,520,480 | - | - |
|
| Money Market Funds | 186,494 | 186,494 | - | - |
| Total Investments in Securities: | 121,686,443 | 121,686,443 | - | - |
Derivative Instruments: Assets | | | | |
Futures Contracts | 718 | 718 | - | - |
| Total Assets | 718 | 718 | - | - |
| Total Derivative Instruments: | 718 | 718 | - | - |
Value of Derivative Instruments
The following table is a summary of the Fund's value of derivative instruments by primary risk exposure as of July 31, 2024. For additional information on derivative instruments, please refer to the Derivative Instruments section in the accompanying Notes to Financial Statements.
Primary Risk Exposure / Derivative Type | Value |
| Asset ($) | Liability ($) |
| Equity Risk | | |
Futures Contracts (a) | 718 | 0 |
| Total Equity Risk | 718 | 0 |
| Total Value of Derivatives | 718 | 0 |
(a)Reflects gross cumulative appreciation (depreciation) on futures contracts as presented in the Schedule of Investments. In the Statement of Assets and Liabilities, the period end daily variation margin is included in receivable or payable for daily variation margin on futures contracts, and the net cumulative appreciation (depreciation) is included in Total accumulated earnings (loss).
Fidelity® U.S. Multifactor ETF
Financial Statements
| Statement of Assets and Liabilities |
As of July 31, 2024 |
| Assets | | | | |
| Investment in securities, at value - See accompanying schedule: | | | | |
Unaffiliated issuers (cost $103,047,850) | $ | 121,499,949 | | |
Fidelity Central Funds (cost $186,494) | | 186,494 | | |
| | | | | |
| | | | | |
| Total Investment in Securities (cost $103,234,344) | | | $ | 121,686,443 |
| Segregated cash with brokers for derivative instruments | | | | 10,620 |
| Cash | | | | 7,493 |
| Dividends receivable | | | | 56,310 |
| Distributions receivable from Fidelity Central Funds | | | | 618 |
| Receivable for daily variation margin on futures contracts | | | | 2,993 |
Total assets | | | | 121,764,477 |
| Liabilities | | | | |
| Accrued management fee | $ | 16,085 | | |
| Proxy fee payable | | 9,624 | | |
| Total liabilities | | | | 25,709 |
| Net Assets | | | $ | 121,738,768 |
| Net Assets consist of: | | | | |
| Paid in capital | | | $ | 105,823,269 |
| Total accumulated earnings (loss) | | | | 15,915,499 |
| Net Assets | | | $ | 121,738,768 |
Net Asset Value, offering price and redemption price per share ($121,738,768 ÷ 3,750,000 shares) | | | $ | 32.46 |
| Statement of Operations |
| Year ended July 31, 2024 |
| Investment Income | | | | |
| Dividends | | | $ | 1,173,534 |
| Income from Fidelity Central Funds | | | | 3,803 |
| Total income | | | | 1,177,337 |
| Expenses | | | | |
| Management fee | $ | 123,002 | | |
| Independent trustees' fees and expenses | | 287 | | |
| Proxy fee | | 9,624 | | |
| Total expenses before reductions | | 132,913 | | |
| Expense reductions | | (1,139) | | |
| Total expenses after reductions | | | | 131,774 |
| Net Investment income (loss) | | | | 1,045,563 |
| Realized and Unrealized Gain (Loss) | | | | |
| Net realized gain (loss) on: | | | | |
| Investment Securities: | | | | |
| Unaffiliated issuers | | (1,497,686) | | |
| Redemptions in-kind | | 3,123,728 | | |
| Fidelity Central Funds | | (5) | | |
| Futures contracts | | 23,614 | | |
| Total net realized gain (loss) | | | | 1,649,651 |
| Change in net unrealized appreciation (depreciation) on: | | | | |
| Investment Securities: | | | | |
| Unaffiliated issuers | | 15,506,068 | | |
| Futures contracts | | (1,542) | | |
| Total change in net unrealized appreciation (depreciation) | | | | 15,504,526 |
| Net gain (loss) | | | | 17,154,177 |
| Net increase (decrease) in net assets resulting from operations | | | $ | 18,199,740 |
| Statement of Changes in Net Assets |
| |
| | Year ended July 31, 2024 | | Year ended July 31, 2023 |
| Increase (Decrease) in Net Assets | | | | |
| Operations | | | | |
| Net investment income (loss) | $ | 1,045,563 | $ | 376,380 |
| Net realized gain (loss) | | 1,649,651 | | (51,150) |
| Change in net unrealized appreciation (depreciation) | | 15,504,526 | | 2,842,246 |
| Net increase (decrease) in net assets resulting from operations | | 18,199,740 | | 3,167,476 |
| Distributions to shareholders | | (1,013,200) | | (365,300) |
| | | | | |
| Share transactions | | | | |
| Proceeds from sales of shares | | 85,305,789 | | 20,841,939 |
| Cost of shares redeemed | | (15,406,768) | | (3,667,295) |
| | | | | |
Net increase (decrease) in net assets resulting from share transactions | | 69,899,021 | | 17,174,644 |
| Total increase (decrease) in net assets | | 87,085,561 | | 19,976,820 |
| | | | | |
| Net Assets | | | | |
| Beginning of period | | 34,653,207 | | 14,676,387 |
| End of period | $ | 121,738,768 | $ | 34,653,207 |
| | | | | |
| Other Information | | | | |
| Shares | | | | |
| Sold | | 3,000,000 | | 850,000 |
| Redeemed | | (550,000) | | (150,000) |
| Net increase (decrease) | | 2,450,000 | | 700,000 |
| | | | | |
Financial Highlights
Fidelity® U.S. Multifactor ETF |
| |
| Years ended July 31, | | 2024 | | 2023 | | 2022 | | 2021 A |
Selected Per-Share Data | | | | | | | | |
| Net asset value, beginning of period | $ | 26.66 | $ | 24.46 | $ | 25.54 | $ | 20.09 |
| Income from Investment Operations | | | | | | | | |
Net investment income (loss) B,C | | .41 | | .41 | | .41 | | .31 D |
| Net realized and unrealized gain (loss) | | 5.78 | | 2.19 | | (1.09) | | 5.62 |
| Total from investment operations | | 6.19 | | 2.60 | | (.68) | | 5.93 |
| Distributions from net investment income | | (.39) | | (.40) | | (.40) | | (.48) |
| Total distributions | | (.39) | | (.40) | | (.40) | | (.48) |
| Net asset value, end of period | $ | 32.46 | $ | 26.66 | $ | 24.46 | $ | 25.54 |
Total Return E,F,G | | | | 10.78% | | (2.64)% | | 29.94% |
Ratios to Average Net Assets C,H,I | | | | | | | | |
| Expenses before reductions | | .18% | | .29% | | .29% | | .29% J |
| Expenses net of fee waivers, if any | | | | .29% | | .29% | | .29% J |
| Expenses net of all reductions | | .18% | | .29% | | .29% | | .29% J |
| Net investment income (loss) | | 1.42% | | 1.66% | | 1.63% | | 1.56% D,J |
| Supplemental Data | | | | | | | | |
| Net assets, end of period (000 omitted) | $ | 121,739 | $ | 34,653 | $ | 14,676 | $ | 11,491 |
Portfolio turnover rate K,L | | | | 45% | | 46% | | 30% M |
AFor the period September 15, 2020 (commencement of operations) through July 31, 2021.
BCalculated based on average shares outstanding during the period.
CNet investment income (loss) is affected by the timing of the declaration of dividends by any underlying mutual funds or exchange-traded funds (ETFs). Net investment income (loss) of any mutual funds or ETFs is not included in the Fund's net investment income (loss) ratio.
DNet investment income per share reflects one or more large, non-recurring dividend(s) which amounted to $.05 per share. Excluding such non-recurring dividend(s), the ratio of net investment income (loss) to average net assets would have been 1.33%.
ETotal returns for periods of less than one year are not annualized.
FTotal returns would have been lower if certain expenses had not been reduced during the applicable periods shown.
GBased on net asset value.
HFees and expenses of any underlying mutual funds or exchange-traded funds (ETFs) are not included in the Fund's expense ratio. The Fund indirectly bears its proportionate share of these expenses. For additional expense information related to investments in Fidelity Central Funds, please refer to the "Investments in Fidelity Central Funds" note found in the Notes to Financial Statements section of the most recent Annual or Semi-Annual report.
IExpense ratios reflect operating expenses of the class. Expenses before reductions do not reflect amounts reimbursed, waived, or reduced through arrangements with the investment adviser, brokerage services, or other offset arrangements, if applicable, and do not represent the amount paid by the class during periods when reimbursements, waivers or reductions occur.
JAnnualized.
KPortfolio turnover rate excludes securities received or delivered in-kind.
LAmount does not include the portfolio activity of any underlying mutual funds or exchange-traded funds (ETFs).
MAmount not annualized.
Fidelity® Value Factor ETF
Schedule of Investments July 31, 2024
Showing Percentage of Net Assets
| Common Stocks - 99.8% |
| | | Shares | Value ($) |
| COMMUNICATION SERVICES - 8.6% | | | |
| Diversified Telecommunication Services - 1.1% | | | |
| AT&T, Inc. | | 225,427 | 4,339,470 |
| Verizon Communications, Inc. | | 114,519 | 4,640,310 |
| | | | 8,979,780 |
| Entertainment - 0.2% | | | |
| Warner Bros Discovery, Inc. (a) | | 226,000 | 1,954,900 |
| Interactive Media & Services - 6.4% | | | |
| Alphabet, Inc. Class A | | 190,431 | 32,666,534 |
| Meta Platforms, Inc. Class A | | 40,774 | 19,360,718 |
| | | | 52,027,252 |
| Media - 0.9% | | | |
| Comcast Corp. Class A | | 107,239 | 4,425,754 |
| Fox Corp. Class A | | 67,366 | 2,562,603 |
| | | | 6,988,357 |
TOTAL COMMUNICATION SERVICES | | | 69,950,289 |
| CONSUMER DISCRETIONARY - 10.2% | | | |
| Automobiles - 1.1% | | | |
| Ford Motor Co. | | 350,797 | 3,795,624 |
| General Motors Co. | | 111,544 | 4,943,630 |
| | | | 8,739,254 |
| Broadline Retail - 4.9% | | | |
| Amazon.com, Inc. (a) | | 168,239 | 31,457,328 |
| eBay, Inc. | | 91,780 | 5,103,886 |
| Macy's, Inc. (b) | | 193,055 | 3,335,990 |
| | | | 39,897,204 |
| Diversified Consumer Services - 0.5% | | | |
| H&R Block, Inc. | | 77,323 | 4,480,095 |
| Hotels, Restaurants & Leisure - 2.5% | | | |
| Booking Holdings, Inc. | | 1,541 | 5,724,830 |
| Expedia Group, Inc. (a) | | 25,107 | 3,205,411 |
| McDonald's Corp. | | 23,351 | 6,197,355 |
| Royal Caribbean Cruises Ltd. | | 31,198 | 4,889,351 |
| | | | 20,016,947 |
| Specialty Retail - 1.2% | | | |
| The Home Depot, Inc. | | 25,763 | 9,484,906 |
TOTAL CONSUMER DISCRETIONARY | | | 82,618,406 |
| CONSUMER STAPLES - 5.9% | | | |
| Beverages - 0.8% | | | |
| The Coca-Cola Co. | | 95,697 | 6,386,818 |
| Consumer Staples Distribution & Retail - 1.6% | | | |
| Kroger Co. | | 53,807 | 2,932,482 |
| Target Corp. | | 21,391 | 3,217,420 |
| Walmart, Inc. | | 104,822 | 7,194,982 |
| | | | 13,344,884 |
| Food Products - 0.7% | | | |
| Archer Daniels Midland Co. | | 44,099 | 2,734,579 |
| Bunge Global SA | | 24,638 | 2,592,657 |
| | | | 5,327,236 |
| Household Products - 1.4% | | | |
| Kimberly-Clark Corp. | | 21,771 | 2,940,174 |
| Procter & Gamble Co. | | 50,605 | 8,135,260 |
| | | | 11,075,434 |
| Personal Care Products - 0.3% | | | |
| Kenvue, Inc. | | 124,234 | 2,297,087 |
| Tobacco - 1.1% | | | |
| Altria Group, Inc. | | 76,786 | 3,763,282 |
| Philip Morris International, Inc. | | 46,599 | 5,366,341 |
| | | | 9,129,623 |
TOTAL CONSUMER STAPLES | | | 47,561,082 |
| ENERGY - 3.8% | | | |
| Oil, Gas & Consumable Fuels - 3.8% | | | |
| Chevron Corp. | | 36,798 | 5,904,975 |
| ConocoPhillips Co. | | 30,449 | 3,385,929 |
| Devon Energy Corp. | | 40,507 | 1,905,044 |
| EOG Resources, Inc. | | 20,598 | 2,611,826 |
| Exxon Mobil Corp. | | 76,811 | 9,109,016 |
| HF Sinclair Corp. | | 24,448 | 1,258,339 |
| Marathon Oil Corp. | | 65,118 | 1,826,560 |
| Marathon Petroleum Corp. | | 13,648 | 2,415,969 |
| Valero Energy Corp. | | 14,607 | 2,362,244 |
| | | | 30,779,902 |
| FINANCIALS - 14.2% | | | |
| Banks - 4.7% | | | |
| Bank of America Corp. | | 221,783 | 8,940,073 |
| Citigroup, Inc. | | 97,208 | 6,306,855 |
| JPMorgan Chase & Co. | | 67,966 | 14,463,165 |
| Wells Fargo & Co. | | 134,848 | 8,001,880 |
| | | | 37,711,973 |
| Capital Markets - 0.9% | | | |
| Goldman Sachs Group, Inc. | | 14,949 | 7,609,489 |
| Consumer Finance - 3.4% | | | |
| Ally Financial, Inc. | | 104,730 | 4,713,897 |
| American Express Co. | | 27,586 | 6,980,361 |
| Capital One Financial Corp. | | 33,796 | 5,116,714 |
| Discover Financial Services | | 38,959 | 5,609,706 |
| Synchrony Financial | | 103,070 | 5,234,925 |
| | | | 27,655,603 |
| Financial Services - 3.4% | | | |
| Berkshire Hathaway, Inc. Class B (a) | | 38,924 | 17,068,174 |
| Visa, Inc. Class A | | 39,097 | 10,386,900 |
| | | | 27,455,074 |
| Insurance - 1.8% | | | |
| American International Group, Inc. | | 65,391 | 5,180,929 |
| Everest Re Group Ltd. | | 10,536 | 4,139,278 |
| MetLife, Inc. | | 66,970 | 5,146,645 |
| | | | 14,466,852 |
TOTAL FINANCIALS | | | 114,898,991 |
| HEALTH CARE - 11.6% | | | |
| Biotechnology - 1.4% | | | |
| AbbVie, Inc. | | 59,482 | 11,023,204 |
| Health Care Providers & Services - 5.8% | | | |
| Centene Corp. (a) | | 77,728 | 5,978,838 |
| Cigna Group | | 21,651 | 7,549,054 |
| CVS Health Corp. | | 91,094 | 5,495,701 |
| Elevance Health, Inc. | | 14,292 | 7,603,773 |
| Humana, Inc. | | 15,834 | 5,725,733 |
| UnitedHealth Group, Inc. | | 25,155 | 14,493,305 |
| | | | 46,846,404 |
| Pharmaceuticals - 4.4% | | | |
| Bristol-Myers Squibb Co. | | 139,705 | 6,644,370 |
| Johnson & Johnson | | 71,624 | 11,305,848 |
| Merck & Co., Inc. | | 81,981 | 9,274,511 |
| Pfizer, Inc. | | 281,632 | 8,601,041 |
| | | | 35,825,770 |
TOTAL HEALTH CARE | | | 93,695,378 |
| INDUSTRIALS - 9.7% | | | |
| Aerospace & Defense - 2.3% | | | |
| General Electric Co. | | 39,315 | 6,691,413 |
| Lockheed Martin Corp. | | 10,424 | 5,648,974 |
| RTX Corp. | | 55,163 | 6,481,101 |
| | | | 18,821,488 |
| Air Freight & Logistics - 1.1% | | | |
| FedEx Corp. | | 15,923 | 4,812,727 |
| United Parcel Service, Inc. Class B | | 32,365 | 4,219,425 |
| | | | 9,032,152 |
| Building Products - 0.5% | | | |
| Owens Corning | | 20,385 | 3,799,356 |
| Electrical Equipment - 0.6% | | | |
| Atkore, Inc. | | 20,564 | 2,776,140 |
| GE Vernova LLC | | 9,831 | 1,752,277 |
| | | | 4,528,417 |
| Machinery - 3.1% | | | |
| AGCO Corp. | | 24,940 | 2,354,835 |
| Caterpillar, Inc. | | 17,805 | 6,164,091 |
| Cummins, Inc. | | 14,428 | 4,210,090 |
| Deere & Co. | | 11,810 | 4,393,084 |
| Mueller Industries, Inc. | | 61,451 | 4,359,334 |
| PACCAR, Inc. | | 37,345 | 3,684,458 |
| | | | 25,165,892 |
| Passenger Airlines - 0.4% | | | |
| United Airlines Holdings, Inc. (a) | | 76,384 | 3,469,361 |
| Professional Services - 1.3% | | | |
| Automatic Data Processing, Inc. | | 18,565 | 4,875,540 |
| Genpact Ltd. | | 83,750 | 2,903,613 |
| Robert Half, Inc. | | 38,603 | 2,477,927 |
| | | | 10,257,080 |
| Trading Companies & Distributors - 0.4% | | | |
| Boise Cascade Co. | | 21,881 | 3,109,071 |
TOTAL INDUSTRIALS | | | 78,182,817 |
| INFORMATION TECHNOLOGY - 28.4% | | | |
| Communications Equipment - 1.2% | | | |
| Cisco Systems, Inc. | | 206,955 | 10,026,970 |
| Electronic Equipment, Instruments & Components - 1.0% | | | |
| Arrow Electronics, Inc. (a) | | 64,689 | 8,001,382 |
| IT Services - 4.2% | | | |
| Accenture PLC Class A | | 29,282 | 9,681,215 |
| Cognizant Technology Solutions Corp. Class A | | 99,405 | 7,522,970 |
| DXC Technology Co. (a)(b) | | 331,657 | 6,745,903 |
| IBM Corp. | | 52,759 | 10,137,114 |
| | | | 34,087,202 |
| Semiconductors & Semiconductor Equipment - 4.0% | | | |
| Applied Materials, Inc. | | 56,070 | 11,898,054 |
| Qualcomm, Inc. | | 68,326 | 12,363,590 |
| Skyworks Solutions, Inc. | | 71,652 | 8,141,100 |
| | | | 32,402,744 |
| Software - 9.3% | | | |
| Microsoft Corp. | | 137,261 | 57,423,139 |
| Salesforce, Inc. | | 40,727 | 10,540,148 |
| Zoom Video Communications, Inc. Class A (a) | | 113,778 | 6,872,191 |
| | | | 74,835,478 |
| Technology Hardware, Storage & Peripherals - 8.7% | | | |
| Apple, Inc. | | 273,413 | 60,719,560 |
| Hewlett Packard Enterprise Co. | | 483,730 | 9,631,064 |
| | | | 70,350,624 |
TOTAL INFORMATION TECHNOLOGY | | | 229,704,400 |
| MATERIALS - 2.4% | | | |
| Chemicals - 1.4% | | | |
| Albemarle Corp. (b) | | 10,988 | 1,029,246 |
| CF Industries Holdings, Inc. | | 16,902 | 1,291,144 |
| Dow, Inc. | | 31,133 | 1,695,815 |
| Linde PLC | | 10,409 | 4,720,482 |
| LyondellBasell Industries NV Class A | | 15,356 | 1,527,308 |
| The Mosaic Co. | | 39,673 | 1,181,065 |
| | | | 11,445,060 |
| Metals & Mining - 1.0% | | | |
| Cleveland-Cliffs, Inc. (a) | | 60,303 | 925,651 |
| Commercial Metals Co. | | 22,362 | 1,343,956 |
| Newmont Corp. | | 48,386 | 2,374,301 |
| Nucor Corp. | | 9,681 | 1,577,422 |
| Steel Dynamics, Inc. | | 11,317 | 1,507,651 |
| | | | 7,728,981 |
TOTAL MATERIALS | | | 19,174,041 |
| REAL ESTATE - 2.5% | | | |
| Equity Real Estate Investment Trusts (REITs) - 2.3% | | | |
| Alexandria Real Estate Equities, Inc. | | 12,529 | 1,469,526 |
| BXP, Inc. | | 21,102 | 1,504,784 |
| Gaming & Leisure Properties | | 30,695 | 1,540,889 |
| Host Hotels & Resorts, Inc. | | 74,479 | 1,304,127 |
| Kimco Realty Corp. | | 70,441 | 1,530,683 |
| Prologis, Inc. | | 24,273 | 3,059,612 |
| Public Storage Operating Co. | | 6,830 | 2,021,134 |
| Realty Income Corp. | | 35,575 | 2,043,072 |
| Simon Property Group, Inc. | | 14,046 | 2,155,218 |
| VICI Properties, Inc. | | 56,132 | 1,754,686 |
| | | | 18,383,731 |
| Real Estate Management & Development - 0.2% | | | |
| Jones Lang LaSalle, Inc. (a) | | 7,566 | 1,898,309 |
TOTAL REAL ESTATE | | | 20,282,040 |
| UTILITIES - 2.5% | | | |
| Electric Utilities - 1.2% | | | |
| American Electric Power Co., Inc. | | 28,737 | 2,819,674 |
| Entergy Corp. | | 19,245 | 2,231,843 |
| NextEra Energy, Inc. | | 60,065 | 4,588,365 |
| | | | 9,639,882 |
| Gas Utilities - 0.2% | | | |
| National Fuel Gas Co. | | 35,486 | 2,079,125 |
| Independent Power and Renewable Electricity Producers - 0.4% | | | |
| Vistra Corp. | | 42,753 | 3,386,893 |
| Multi-Utilities - 0.7% | | | |
| Public Service Enterprise Group, Inc. | | 35,390 | 2,823,060 |
| Sempra | | 32,458 | 2,598,587 |
| | | | 5,421,647 |
TOTAL UTILITIES | | | 20,527,547 |
| TOTAL COMMON STOCKS (Cost $688,678,782) | | | 807,374,893 |
| | | | |
| Money Market Funds - 0.4% |
| | | Shares | Value ($) |
| Fidelity Cash Central Fund 5.39% (c) | | 1,114,170 | 1,114,392 |
| Fidelity Securities Lending Cash Central Fund 5.39% (c)(d) | | 1,894,861 | 1,895,050 |
| TOTAL MONEY MARKET FUNDS (Cost $3,009,442) | | | 3,009,442 |
| | | | |
| TOTAL INVESTMENT IN SECURITIES - 100.2% (Cost $691,688,224) | 810,384,335 |
NET OTHER ASSETS (LIABILITIES) - (0.2)% | (1,231,214) |
| NET ASSETS - 100.0% | 809,153,121 |
| | |
| Futures Contracts |
| | Number of contracts | Expiration Date | Notional Amount ($) | Value ($) | Unrealized Appreciation/ (Depreciation) ($) |
| Purchased | | | | | |
| | | | | | |
| Equity Index Contracts | | | | | |
| CME Micro E-mini S&P 500 Index Contracts (United States) | 53 | Sep 2024 | 1,472,870 | (4,251) | (4,251) |
| | | | | | |
| The notional amount of futures purchased as a percentage of Net Assets is 0.2% |
Legend
| (b) | Security or a portion of the security is on loan at period end. |
| (c) | Affiliated fund that is generally available only to investment companies and other accounts managed by Fidelity Investments. The rate quoted is the annualized seven-day yield of the fund at period end. A complete unaudited listing of the fund's holdings as of its most recent quarter end is available upon request. In addition, each Fidelity Central Fund's financial statements, which are not covered by the Fund's Report of Independent Registered Public Accounting Firm, are available on the SEC's website or upon request. |
| (d) | Investment made with cash collateral received from securities on loan. |
Affiliated Central Funds
Fiscal year to date information regarding the Fund's investments in Fidelity Central Funds, including the ownership percentage, is presented below.
| Affiliate | Value, beginning of period ($) | Purchases ($) | Sales Proceeds ($) | Dividend Income ($) | Realized Gain (loss) ($) | Change in Unrealized appreciation (depreciation) ($) | Value, end of period ($) | % ownership, end of period |
| Fidelity Cash Central Fund 5.39% | 1,107,830 | 26,260,007 | 26,253,438 | 78,439 | (7) | - | 1,114,392 | 0.0% |
| Fidelity Securities Lending Cash Central Fund 5.39% | 4,344,675 | 57,755,288 | 60,204,913 | 19,300 | - | - | 1,895,050 | 0.0% |
| Total | 5,452,505 | 84,015,295 | 86,458,351 | 97,739 | (7) | - | 3,009,442 | |
| | | | | | | | | |
Amounts in the dividend income column in the above table include any capital gain distributions from underlying funds, which are presented in the corresponding line item in the Statement of Operations, if applicable.
Amounts in the dividend income column for Fidelity Securities Lending Cash Central Fund represents the income earned on investing cash collateral, less rebates paid to borrowers and any lending agent fees associated with the loan, plus any premium payments received for lending certain types of securities.
Amounts included in the purchases and sales proceeds columns may include in-kind transactions, if applicable.
Investment Valuation
The following is a summary of the inputs used, as of July 31, 2024, involving the Fund's assets and liabilities carried at fair value. The inputs or methodology used for valuing securities may not be an indication of the risk associated with investing in those securities. For more information on valuation inputs, and their aggregation into the levels used below, please refer to the Investment Valuation section in the accompanying Notes to Financial Statements.
| Valuation Inputs at Reporting Date: |
| Description | Total ($) | Level 1 ($) | Level 2 ($) | Level 3 ($) |
Investments in Securities: | | | | |
|
| Equities: | | | | |
Communication Services | 69,950,289 | 69,950,289 | - | - |
Consumer Discretionary | 82,618,406 | 82,618,406 | - | - |
Consumer Staples | 47,561,082 | 47,561,082 | - | - |
Energy | 30,779,902 | 30,779,902 | - | - |
Financials | 114,898,991 | 114,898,991 | - | - |
Health Care | 93,695,378 | 93,695,378 | - | - |
Industrials | 78,182,817 | 78,182,817 | - | - |
Information Technology | 229,704,400 | 229,704,400 | - | - |
Materials | 19,174,041 | 19,174,041 | - | - |
Real Estate | 20,282,040 | 20,282,040 | - | - |
Utilities | 20,527,547 | 20,527,547 | - | - |
|
| Money Market Funds | 3,009,442 | 3,009,442 | - | - |
| Total Investments in Securities: | 810,384,335 | 810,384,335 | - | - |
Derivative Instruments: Liabilities | | | | |
Futures Contracts | (4,251) | (4,251) | - | - |
| Total Liabilities | (4,251) | (4,251) | - | - |
| Total Derivative Instruments: | (4,251) | (4,251) | - | - |
Value of Derivative Instruments
The following table is a summary of the Fund's value of derivative instruments by primary risk exposure as of July 31, 2024. For additional information on derivative instruments, please refer to the Derivative Instruments section in the accompanying Notes to Financial Statements.
Primary Risk Exposure / Derivative Type | Value |
| Asset ($) | Liability ($) |
| Equity Risk | | |
Futures Contracts (a) | 0 | (4,251) |
| Total Equity Risk | 0 | (4,251) |
| Total Value of Derivatives | 0 | (4,251) |
(a)Reflects gross cumulative appreciation (depreciation) on futures contracts as presented in the Schedule of Investments. In the Statement of Assets and Liabilities, the period end daily variation margin is included in receivable or payable for daily variation margin on futures contracts, and the net cumulative appreciation (depreciation) is included in Total accumulated earnings (loss).
Fidelity® Value Factor ETF
Financial Statements
| Statement of Assets and Liabilities |
As of July 31, 2024 |
| Assets | | | | |
| Investment in securities, at value (including securities loaned of $1,855,798) - See accompanying schedule: | | | | |
Unaffiliated issuers (cost $688,678,782) | $ | 807,374,893 | | |
Fidelity Central Funds (cost $3,009,442) | | 3,009,442 | | |
| | | | | |
| | | | | |
| Total Investment in Securities (cost $691,688,224) | | | $ | 810,384,335 |
| Segregated cash with brokers for derivative instruments | | | | 102,660 |
| Dividends receivable | | | | 670,214 |
| Distributions receivable from Fidelity Central Funds | | | | 3,958 |
| Receivable for daily variation margin on futures contracts | | | | 22,658 |
| Other receivables | | | | 9,143 |
Total assets | | | | 811,192,968 |
| Liabilities | | | | |
| Accrued management fee | $ | 101,866 | | |
| Other payables and accrued expenses | | 42,931 | | |
| Collateral on securities loaned | | 1,895,050 | | |
| Total liabilities | | | | 2,039,847 |
| Net Assets | | | $ | 809,153,121 |
| Net Assets consist of: | | | | |
| Paid in capital | | | $ | 748,984,573 |
| Total accumulated earnings (loss) | | | | 60,168,548 |
| Net Assets | | | $ | 809,153,121 |
Net Asset Value, offering price and redemption price per share ($809,153,121 ÷ 13,750,000 shares) | | | $ | 58.85 |
| Statement of Operations |
| Year ended July 31, 2024 |
| Investment Income | | | | |
| Dividends | | | $ | 13,334,413 |
| Income from Fidelity Central Funds (including $19,300 from security lending) | | | | 97,739 |
| Total income | | | | 13,432,152 |
| Expenses | | | | |
| Management fee | $ | 1,192,232 | | |
| Independent trustees' fees and expenses | | 3,031 | | |
| Miscellaneous | | 42,930 | | |
| Total expenses before reductions | | 1,238,193 | | |
| Expense reductions | | (330) | | |
| Total expenses after reductions | | | | 1,237,863 |
| Net Investment income (loss) | | | | 12,194,289 |
| Realized and Unrealized Gain (Loss) | | | | |
| Net realized gain (loss) on: | | | | |
| Investment Securities: | | | | |
| Unaffiliated issuers | | (13,757,020) | | |
| Redemptions in-kind | | 36,133,154 | | |
| Fidelity Central Funds | | (7) | | |
| Futures contracts | | 462,151 | | |
| Total net realized gain (loss) | | | | 22,838,278 |
| Change in net unrealized appreciation (depreciation) on: | | | | |
| Investment Securities: | | | | |
| Unaffiliated issuers | | 85,724,995 | | |
| Futures contracts | | (74,378) | | |
| Total change in net unrealized appreciation (depreciation) | | | | 85,650,617 |
| Net gain (loss) | | | | 108,488,895 |
| Net increase (decrease) in net assets resulting from operations | | | $ | 120,683,184 |
| Statement of Changes in Net Assets |
| |
| | Year ended July 31, 2024 | | Year ended July 31, 2023 |
| Increase (Decrease) in Net Assets | | | | |
| Operations | | | | |
| Net investment income (loss) | $ | 12,194,289 | $ | 8,882,060 |
| Net realized gain (loss) | | 22,838,278 | | 6,545,976 |
| Change in net unrealized appreciation (depreciation) | | 85,650,617 | | 38,194,193 |
| Net increase (decrease) in net assets resulting from operations | | 120,683,184 | | 53,622,229 |
| Distributions to shareholders | | (11,890,450) | | (8,641,250) |
| | | | | |
| Share transactions | | | | |
| Proceeds from sales of shares | | 302,891,483 | | 80,746,346 |
| Cost of shares redeemed | | (130,391,418) | | (97,539,980) |
| | | | | |
Net increase (decrease) in net assets resulting from share transactions | | 172,500,065 | | (16,793,634) |
| Total increase (decrease) in net assets | | 281,292,799 | | 28,187,345 |
| | | | | |
| Net Assets | | | | |
| Beginning of period | | 527,860,322 | | 499,672,977 |
| End of period | $ | 809,153,121 | $ | 527,860,322 |
| | | | | |
| Other Information | | | | |
| Shares | | | | |
| Sold | | 5,800,000 | | 1,750,000 |
| Redeemed | | (2,400,000) | | (2,200,000) |
| Net increase (decrease) | | 3,400,000 | | (450,000) |
| | | | | |
Financial Highlights
Fidelity® Value Factor ETF |
| |
| Years ended July 31, | | 2024 | | 2023 | | 2022 | | 2021 | | 2020 |
Selected Per-Share Data | | | | | | | | | | |
| Net asset value, beginning of period | $ | 51.00 | $ | 46.27 | $ | 48.94 | $ | 34.85 | $ | 34.53 |
| Income from Investment Operations | | | | | | | | | | |
Net investment income (loss) A,B | | .97 | | .87 | | .79 | | .64 | | .73 |
| Net realized and unrealized gain (loss) | | 7.82 | | 4.70 | | (2.65) | | 14.07 | | .28 |
| Total from investment operations | | 8.79 | | 5.57 | | (1.86) | | 14.71 | | 1.01 |
| Distributions from net investment income | | (.94) | | (.84) | | (.81) | | (.62) | | (.69) |
| Total distributions | | (.94) | | (.84) | | (.81) | | (.62) | | (.69) |
| Net asset value, end of period | $ | 58.85 | $ | 51.00 | $ | 46.27 | $ | 48.94 | $ | 34.85 |
Total Return C,D | | | | 12.33% | | (3.86)% | | 42.56% | | 3.12% |
Ratios to Average Net Assets B,E,F | | | | | | | | | | |
| Expenses before reductions | | .18% | | .29% | | .29% | | .29% | | .29% |
| Expenses net of fee waivers, if any | | | | .29% | | .29% | | .29% | | .29% |
| Expenses net of all reductions | | .18% | | .29% | | .29% | | .29% | | .29% |
| Net investment income (loss) | | 1.81% | | 1.91% | | 1.61% | | 1.50% | | 2.13% |
| Supplemental Data | | | | | | | | | | |
| Net assets, end of period (000 omitted) | $ | 809,153 | $ | 527,860 | $ | 499,673 | $ | 450,269 | $ | 189,916 |
Portfolio turnover rate G,H | | | | 43% | | 46% | | 42% | | 45% |
ACalculated based on average shares outstanding during the period.
BNet investment income (loss) is affected by the timing of the declaration of dividends by any underlying mutual funds or exchange-traded funds (ETFs). Net investment income (loss) of any mutual funds or ETFs is not included in the Fund's net investment income (loss) ratio.
CTotal returns would have been lower if certain expenses had not been reduced during the applicable periods shown.
DBased on net asset value.
EFees and expenses of any underlying mutual funds or exchange-traded funds (ETFs) are not included in the Fund's expense ratio. The Fund indirectly bears its proportionate share of these expenses. For additional expense information related to investments in Fidelity Central Funds, please refer to the "Investments in Fidelity Central Funds" note found in the Notes to Financial Statements section of the most recent Annual or Semi-Annual report.
FExpense ratios reflect operating expenses of the class. Expenses before reductions do not reflect amounts reimbursed, waived, or reduced through arrangements with the investment adviser, brokerage services, or other offset arrangements, if applicable, and do not represent the amount paid by the class during periods when reimbursements, waivers or reductions occur.
GPortfolio turnover rate excludes securities received or delivered in-kind.
HAmount does not include the portfolio activity of any underlying mutual funds or exchange-traded funds (ETFs).
Notes to Financial Statements
For the period ended July 31, 2024
1. Organization.
Fidelity Dividend ETF for Rising Rates, Fidelity High Dividend ETF, Fidelity Low Volatility Factor ETF, Fidelity Momentum Factor ETF, Fidelity Quality Factor ETF, Fidelity Small-Mid Multifactor ETF, Fidelity Stocks for Inflation ETF, Fidelity U.S. Multifactor ETF and Fidelity Value Factor ETF (the Funds) are exchange-traded funds of Fidelity Covington Trust (the Trust) and are authorized to issue an unlimited number of shares. The Trust is registered under the Investment Company Act of 1940, as amended (the 1940 Act), as an open-end management investment company organized as a Massachusetts business trust.
2. Investments in Fidelity Central Funds.
Funds may invest in Fidelity Central Funds, which are open-end investment companies generally available only to other investment companies and accounts managed by the investment adviser and its affiliates. The Schedule of Investments lists any Fidelity Central Funds held as an investment as of period end, but does not include the underlying holdings of each Fidelity Central Fund. An investing fund indirectly bears its proportionate share of the expenses of the underlying Fidelity Central Funds.
Based on its investment objective, each Fidelity Central Fund may invest or participate in various investment vehicles or strategies that are similar to those of the investing fund. These strategies are consistent with the investment objectives of the investing fund and may involve certain economic risks which may cause a decline in value of each of the Fidelity Central Funds and thus a decline in the value of the investing fund.
| Fidelity Central Fund | Investment Manager | Investment Objective | Investment Practices | Expense RatioA |
| Fidelity Money Market Central Funds | Fidelity Management & Research Company LLC (FMR) | Each fund seeks to obtain a high level of current income consistent with the preservation of capital and liquidity. | Short-term Investments | Less than .005% |
A Expenses expressed as a percentage of average net assets and are as of each underlying Central Fund's most recent annual or semi-annual shareholder report.
A complete unaudited list of holdings for each Fidelity Central Fund is available upon request or at the Securities and Exchange Commission website at www.sec.gov. In addition, the financial statements of the Fidelity Central Funds which contain the significant accounting policies (including investment valuation policies) of those funds, and are not covered by the Report of Independent Registered Public Accounting Firm, are available on the Securities and Exchange Commission website or upon request.
3. Significant Accounting Policies.
Each Fund is an investment company and applies the accounting and reporting guidance of the Financial Accounting Standards Board (FASB) Accounting Standards Codification Topic 946 Financial Services - Investment Companies. The financial statements have been prepared in conformity with accounting principles generally accepted in the United States of America (GAAP), which require management to make certain estimates and assumptions at the date of the financial statements. Actual results could differ from those estimates. Subsequent events, if any, through the date that the financial statements were issued have been evaluated in the preparation of the financial statements. Each Fund's Schedule of Investments lists any underlying mutual funds or exchange-traded funds (ETFs) but does not include the underlying holdings of these funds. The following summarizes the significant accounting policies of each Fund:
Investment Valuation. Investments are valued as of 4:00 p.m. Eastern time on the last calendar day of the period. The Board of Trustees (the Board) has designated each Fund's investment adviser as the valuation designee responsible for the fair valuation function and performing fair value determinations as needed. The investment adviser has established a Fair Value Committee (the Committee) to carry out the day-to-day fair valuation responsibilities and has adopted policies and procedures to govern the fair valuation process and the activities of the Committee. In accordance with these fair valuation policies and procedures, which have been approved by the Board, each Fund attempts to obtain prices from one or more third party pricing services or brokers to value its investments. When current market prices, quotations or currency exchange rates are not readily available or reliable, investments will be fair valued in good faith by the Committee, in accordance with the policies and procedures. Factors used in determining fair value vary by investment type and may include market or investment specific events, transaction data, estimated cash flows, and market observations of comparable investments. The frequency that the fair valuation procedures are used cannot be predicted and they may be utilized to a significant extent. The Committee manages each Fund's fair valuation practices and maintains the fair valuation policies and procedures. Each Fund's investment adviser reports to the Board information regarding the fair valuation process and related material matters.
Each Fund categorizes the inputs to valuation techniques used to value its investments into a disclosure hierarchy consisting of three levels as shown below:
Level 1 - unadjusted quoted prices in active markets for identical investments
Level 2 - other significant observable inputs (including quoted prices for similar investments, interest rates, prepayment speeds, etc.)
Level 3 - unobservable inputs (including the Fund's own assumptions based on the best information available)
Valuation techniques used to value each Fund's investments by major category are as follows:
Equity securities, including restricted securities, for which market quotations are readily available, are valued at the last reported sale price or official closing price as reported by a third party pricing service on the primary market or exchange on which they are traded and are categorized as Level 1 in the hierarchy. In the event there were no sales during the day or closing prices are not available, securities are valued at the last quoted bid price or may be valued using the last available price and are generally categorized as Level 2 in the hierarchy. For foreign equity securities, when market or security specific events arise, comparisons to the valuation of American Depositary Receipts (ADRs), futures contracts, Exchange-Traded Funds (ETFs) and certain indexes as well as quoted prices for similar securities may be used and would be categorized as Level 2 in the hierarchy. For equity securities, including restricted securities, where observable inputs are limited, assumptions about market activity and risk are used and these securities may be categorized as Level 3 in the hierarchy.
Futures contracts are valued at the settlement price established each day by the board of trade or exchange on which they are traded and are categorized as Level 1 in the hierarchy. Investments in open-end mutual funds, including the Fidelity Central Funds, are valued at their closing net asset value (NAV) each business day and are categorized as Level 1 in the hierarchy.
Changes in valuation techniques may result in transfers in or out of an assigned level within the disclosure hierarchy. The aggregate value of investments by input level as of July 31, 2024 is included at the end of each Fund's Schedule of Investments.
Foreign Currency. Certain Funds may use foreign currency contracts to facilitate transactions in foreign-denominated securities. Gains and losses from these transactions may arise from changes in the value of the foreign currency or if the counterparties do not perform under the contracts' terms.
Foreign-denominated assets, including investment securities, and liabilities are translated into U.S. dollars at the exchange rates at period end. Purchases and sales of investment securities, income and dividends received, and expenses denominated in foreign currencies are translated into U.S. dollars at the exchange rate in effect on the transaction date.
The effects of exchange rate fluctuations on investments are included with the net realized and unrealized gain (loss) on investment securities. Other foreign currency transactions resulting in realized and unrealized gain (loss) are disclosed separately.
Investment Transactions and Income. For financial reporting purposes, the Funds' investment holdings and NAV include trades executed through the end of the last business day of the period. The NAV per share for processing shareholder transactions is calculated as of the close of business (normally 4:00 p.m. Eastern time) of the Cboe BZX Exchange, Inc. (CboeBZX) for Fidelity Stocks for Inflation ETF, and of the New York Stock Exchange, Archipelago Exchange (NYSE Arca) for all other funds and includes trades executed through the end of the prior business day. Gains and losses on securities sold are determined on the basis of identified cost and may include proceeds received from litigation. Commissions paid to certain brokers with whom the investment adviser, or its affiliates, places trades on behalf of a fund include an amount in addition to trade execution, which may be rebated back to a fund. Any such rebates are included in net realized gain (loss) on investments in the Statement of Operations. Dividend income is recorded on the ex-dividend date, except for certain dividends from foreign securities where the ex-dividend date may have passed, which are recorded as soon as the Funds are informed of the ex-dividend date. Non-cash dividends included in dividend income, if any, are recorded at the fair market value of the securities received. Income and capital gain distributions from Fidelity Central Funds, if any, are recorded on the ex-dividend date. Certain distributions received by the Funds represent a return of capital or capital gain. The Funds determine the components of these distributions subsequent to the ex-dividend date, based upon receipt of tax filings or other correspondence relating to the underlying investment. These distributions are recorded as a reduction of cost of investments and/or as a realized gain. Investment income is recorded net of foreign taxes withheld where recovery of such taxes is uncertain. Funds may file withholding tax reclaims in certain jurisdictions to recover a portion of amounts previously withheld. Any withholding tax reclaims income is included in the Statement of Operations in dividends. Any receivables for withholding tax reclaims are included in the Statement of Assets and Liabilities in dividends receivable.
Expenses. Expenses directly attributable to a fund are charged to that fund. Expenses attributable to more than one fund are allocated among the respective funds on the basis of relative net assets or other appropriate methods. Expenses included in the accompanying financial statements reflect the expenses of that fund and do not include any expenses associated with any underlying mutual funds or exchange-traded funds. Although not included in a fund's expenses, a fund indirectly bears its proportionate share of these expenses through the net asset value of each underlying mutual fund or exchange-traded fund. Expense estimates are accrued in the period to which they relate and adjustments are made when actual amounts are known.
Income Tax Information and Distributions to Shareholders. Each year, each Fund intends to qualify as a regulated investment company under Subchapter M of the Internal Revenue Code, including distributing substantially all of its taxable income and realized gains. As a result, no provision for U.S. Federal income taxes is required. As of July 31, 2024, each Fund did not have any unrecognized tax benefits in the financial statements; nor is each Fund aware of any tax positions for which it is reasonably possible that the total amounts of unrecognized tax benefits will significantly change in the next twelve months. Each Fund files a U.S. federal tax return, in addition to state and local tax returns as required. Each Fund's federal income tax returns are subject to examination by the Internal Revenue Service (IRS) for a period of three fiscal years after they are filed. State and local tax returns may be subject to examination for an additional fiscal year depending on the jurisdiction. Realized gain or loss resulting from in-kind redemptions is not taxable to the Funds and is not distributed to shareholders of the Funds. Foreign taxes are provided for based on each Fund's understanding of the tax rules and rates that exist in the foreign markets in which it invests.
Distributions are declared and recorded on the ex-dividend date. Income and capital gain distributions are determined in accordance with income tax regulations, which may differ from GAAP.
Capital accounts within the financial statements are adjusted for permanent book-tax differences. These adjustments have no impact on net assets or the results of operations. Capital accounts are not adjusted for temporary book-tax differences which will reverse in a subsequent period.
Book-tax differences are primarily due to future transactions, foreign currency transactions, passive foreign investment companies (PFIC), partnerships, redemptions in-kind, capital loss carryforwards and losses deferred due to wash sales and excise tax regulations.
As of period end, the cost and unrealized appreciation (depreciation) in securities, and derivatives if applicable, for federal income tax purposes were as follows for each Fund:
| | Tax cost ($) | Gross unrealized appreciation ($) | Gross unrealized depreciation ($) | Net unrealized appreciation (depreciation)($) |
| Fidelity Dividend ETF for Rising Rates | 447,365,756 | 124,658,769 | (23,557,546) | 101,101,223 |
| Fidelity High Dividend ETF | 2,722,663,276 | 519,793,117 | (76,211,958) | 443,581,159 |
| Fidelity Low Volatility Factor ETF | 1,037,326,010 | 127,453,460 | (21,916,791) | 105,536,669 |
| Fidelity Momentum Factor ETF | 180,900,052 | 43,674,925 | (3,800,280) | 39,874,645 |
| Fidelity Quality Factor ETF | 893,416,274 | 152,101,265 | (13,596,740) | 138,504,525 |
| Fidelity Small-Mid Multifactor ETF | 401,220,810 | 49,096,029 | (11,459,893) | 37,636,136 |
| Fidelity Stocks for Inflation ETF | 146,399,626 | 36,873,233 | (3,016,639) | 33,856,594 |
| Fidelity U.S. Multifactor ETF | 103,289,063 | 19,734,981 | (1,337,601) | 18,397,380 |
| Fidelity Value Factor ETF | 692,040,794 | 139,299,671 | (20,956,130) | 118,343,541 |
The tax-based components of distributable earnings as of period end were as follows for each Fund:
| | Undistributed ordinary income ($) | Capital loss carryforward ($) | Net unrealized appreciation (depreciation) on securities and other investments ($) |
| Fidelity Dividend ETF for Rising Rates | 2,557,557 | (65,743,604) | 101,128,573 |
| Fidelity High Dividend ETF | 12,177,648 | (131,732,094) | 443,623,258 |
| Fidelity Low Volatility Factor ETF | 992,733 | (61,536,595) | 105,536,669 |
| Fidelity Momentum Factor ETF | 669,213 | (35,199,159) | 39,874,645 |
| Fidelity Quality Factor ETF | 538,717 | (30,734,146) | 138,504,525 |
| Fidelity Small-Mid Multifactor ETF | 78,121 | (15,744,300) | 37,636,130 |
| Fidelity Stocks for Inflation ETF | - | (20,819,510) | 33,856,594 |
| Fidelity U.S. Multifactor ETF | 41,956 | (2,523,837) | 18,397,380 |
| Fidelity Value Factor ETF | 681,672 | (58,856,665) | 118,343,541 |
Capital loss carryforwards are only available to offset future capital gains of the Funds to the extent provided by regulations and may be limited. The capital loss carryforward information presented below, including any applicable limitation, is estimated as of fiscal period end and is subject to adjustment.
| | Short-term ($) | Long-term ($) | Total capital loss carryforward ($) |
| Fidelity Dividend ETF for Rising Rates | (29,260,424) | (36,483,180) | (65,743,604) |
| Fidelity High Dividend ETF | (58,024,097) | (73,707,997) | (131,732,094) |
| Fidelity Low Volatility Factor ETF | (36,337,795) | (25,198,800) | (61,536,595) |
| Fidelity Momentum Factor ETF | (35,199,159) | - | (35,199,159) |
| Fidelity Quality Factor ETF | (19,577,414) | (11,156,732) | (30,734,146) |
| Fidelity Small-Mid Multifactor ETF | (12,045,924) | (3,698,376) | (15,744,300) |
| Fidelity Stocks for Inflation ETF | (16,289,453) | (4,530,057) | (20,819,510) |
| Fidelity U.S. Multifactor ETF | (1,623,011) | (900,826) | (2,523,837) |
| Fidelity Value Factor ETF | (29,454,153) | (29,402,512) | (58,856,665) |
| | | | |
The tax character of distributions paid was as follows:
| July 31, 2024 | | |
| | Ordinary Income ($) | Total ($) |
| Fidelity Dividend ETF for Rising Rates | 13,531,400 | 13,531,400 |
| Fidelity High Dividend ETF | 72,844,900 | 72,844,900 |
| Fidelity Low Volatility Factor ETF | 13,235,700 | 13,235,700 |
| Fidelity Momentum Factor ETF | 1,236,100 | 1,236,100 |
| Fidelity Quality Factor ETF | 7,699,650 | 7,699,650 |
| Fidelity Small-Mid Multifactor ETF | 2,726,100 | 2,726,100 |
| Fidelity Stocks for Inflation ETF | 2,269,650 | 2,269,650 |
| Fidelity U.S. Multifactor ETF | 1,013,200 | 1,013,200 |
| Fidelity Value Factor ETF | 11,890,450 | 11,890,450 |
| July 31, 2023 | | |
| | Ordinary Income ($) | Total ($) |
| Fidelity Dividend ETF for Rising Rates | 16,860,450 | 16,860,450 |
| Fidelity High Dividend ETF | 52,210,250 | 52,210,250 |
| Fidelity Low Volatility Factor ETF | 7,460,700 | 7,460,700 |
| Fidelity Momentum Factor ETF | 1,506,200 | 1,506,200 |
| Fidelity Quality Factor ETF | 4,025,350 | 4,025,350 |
| Fidelity Small-Mid Multifactor ETF | 1,518,700 | 1,518,700 |
| Fidelity Stocks for Inflation ETF | 4,166,950 | 4,166,950 |
| Fidelity U.S. Multifactor ETF | 365,300 | 365,300 |
| Fidelity Value Factor ETF | 8,641,250 | 8,641,250 |
4. Derivative Instruments.
Risk Exposures and the Use of Derivative Instruments. Each Fund's investment objectives allow for various types of derivative instruments, including futures contracts. Derivatives are investments whose value is primarily derived from underlying assets, indices or reference rates and may be transacted on an exchange or over-the-counter (OTC). Derivatives may involve a future commitment to buy or sell a specified asset based on specified terms, to exchange future cash flows at periodic intervals based on a notional principal amount, or for one party to make one or more payments upon the occurrence of specified events in exchange for periodic payments from the other party.
Derivatives were used to increase returns and to manage exposure to certain risks as defined below. The success of any strategy involving derivatives depends on analysis of numerous economic factors, and if the strategies for investment do not work as intended, the objectives may not be achieved.
Derivatives were used to increase or decrease exposure to the following risk(s):
| | |
| Equity Risk | Equity risk relates to the fluctuations in the value of financial instruments as a result of changes in market prices (other than those arising from interest rate risk or foreign exchange risk), whether caused by factors specific to an individual investment, its issuer, or all factors affecting all instruments traded in a market or market segment. |
Funds are also exposed to additional risks from investing in derivatives, such as liquidity risk and counterparty credit risk. Liquidity risk is the risk that a fund will be unable to close out the derivative in the open market in a timely manner. Counterparty credit risk is the risk that the counterparty will not be able to fulfill its obligation to a fund. Counterparty credit risk related to exchange-traded contracts may be mitigated by the protection provided by the exchange on which they trade.
Investing in derivatives may involve greater risks than investing in the underlying assets directly and, to varying degrees, may involve risk of loss in excess of any initial investment and collateral received and amounts recognized in the Statement of Assets and Liabilities. In addition, there may be the risk that the change in value of the derivative contract does not correspond to the change in value of the underlying instrument.
Futures Contracts. A futures contract is an agreement between two parties to buy or sell a specified underlying instrument for a fixed price at a specified future date. Futures contracts were used to manage exposure to the stock market.
Upon entering into a futures contract, a fund is required to deposit either cash or securities (initial margin) with a clearing broker in an amount equal to a certain percentage of the face value of the contract. Futures contracts are marked-to-market daily and subsequent daily payments are made or received by a fund depending on the daily fluctuations in the value of the futures contracts and are recorded as unrealized appreciation or (depreciation). This receivable and/or payable, if any, is included in daily variation margin on futures contracts in the Statement of Assets and Liabilities. Realized gain or (loss) is recorded upon the expiration or closing of a futures contract. The net realized gain (loss) and change in net unrealized appreciation (depreciation) on futures contracts during the period is presented in the Statement of Operations.
Any open futures contracts at period end are presented in the Schedule of Investments under the caption "Futures Contracts". The notional amount at value reflects each contract's exposure to the underlying instrument or index at period end, and is representative of volume of activity during the period unless an average notional amount is presented. Any securities deposited to meet initial margin requirements are identified in the Schedule of Investments. Any cash deposited to meet initial margin requirements is presented as segregated cash with brokers for derivative instruments in the Statement of Assets and Liabilities.
5. Purchases and Sales of Investments.
Purchases and sales of securities, other than short-term securities and in-kind transactions, as applicable, are noted in the table below.
| | Purchases ($) | Sales ($) |
| Fidelity Dividend ETF for Rising Rates | 168,891,640 | 169,072,041 |
| Fidelity High Dividend ETF | 853,469,333 | 292,317,265 |
| Fidelity Low Volatility Factor ETF | 266,403,684 | 255,013,694 |
| Fidelity Momentum Factor ETF | 202,184,858 | 196,754,084 |
| Fidelity Quality Factor ETF | 202,306,384 | 194,809,738 |
| Fidelity Small-Mid Multifactor ETF | 96,217,857 | 88,916,747 |
| Fidelity Stocks for Inflation ETF | 109,917,716 | 109,432,359 |
| Fidelity U.S. Multifactor ETF | 29,710,059 | 28,125,748 |
| Fidelity Value Factor ETF | 205,229,717 | 203,164,444 |
Securities received and delivered in-kind through subscriptions and redemptions are noted in the table below.
| | In-Kind Subscriptions ($) | In-Kind Redemptions ($) |
| Fidelity Dividend ETF for Rising Rates | - | 74,760,999 |
| Fidelity High Dividend ETF | 1,431,343,149 | 493,703,730 |
| Fidelity Low Volatility Factor ETF | 1,022,211,385 | 581,950,087 |
| Fidelity Momentum Factor ETF | 144,781,149 | 121,796,919 |
| Fidelity Quality Factor ETF | 643,714,539 | 75,253,099 |
| Fidelity Small-Mid Multifactor ETF | 357,618,551 | 101,167,095 |
| Fidelity Stocks for Inflation ETF | 25,685,810 | 22,915,728 |
| Fidelity U.S. Multifactor ETF | 83,799,166 | 15,361,944 |
| Fidelity Value Factor ETF | 300,546,957 | 129,600,034 |
6. Fees and Other Transactions with Affiliates.
Management Fee. Fidelity Management & Research Company LLC (the investment adviser) provides the Funds with investment management related services for which the Funds pay a monthly management fee that, effective November 1, 2023, is based on an annual rate of each Fund's average net assets as noted in the table below. Prior to November 1, 2023, each Fund paid a monthly management fee that was based on an annual rate of .29% of each Fund's average net assets. Under the management contract, the investment adviser pays all other expenses, except the compensation of the independent Trustees and certain miscellaneous expenses such as proxy and shareholder meeting expenses. For each Fund, with the exception of Fidelity Small-Mid Multifactor ETF, Fidelity Stocks for Inflation ETF and Fidelity U.S. Multifactor ETF, the management fee paid to the investment adviser is reduced by an amount equal to the fees and expenses paid by each fund to the independent Trustees.
| | Fee Rate |
| Fidelity Dividend ETF for Rising Rates | .15% |
| Fidelity High Dividend ETF | .15% |
| Fidelity Low Volatility Factor ETF | .15% |
| Fidelity Momentum Factor ETF | .15% |
| Fidelity Quality Factor ETF | .15% |
| Fidelity Small-Mid Multifactor ETF | .15% |
| Fidelity Stocks for Inflation ETF | .15% |
| Fidelity U.S. Multifactor ETF | .15% |
| Fidelity Value Factor ETF | .15% |
Sub-Adviser. Geode Capital Management, LLC (Geode), serves as sub-adviser for the Funds. Geode provides discretionary investment advisory services to the Funds and is paid by the investment adviser for providing these services.
Interfund Lending Program. Pursuant to an Exemptive Order issued by the Securities and Exchange Commission (the SEC), each Fund, along with other registered investment companies having management contracts with Fidelity Management & Research Company LLC (FMR), or other affiliated entities of FMR, may participate in an interfund lending program. This program provides an alternative credit facility allowing each Fund to borrow from, or lend money to, other participating affiliated funds. At period end, there were no interfund loans outstanding. Activity in this program during the period for which loans were outstanding was as follows:
| | Borrower or Lender | Average Loan Balance ($) | Weighted Average Interest Rate | Interest Expense ($) |
| Fidelity High Dividend ETF | Borrower | 41,768,167 | 5.57% | 77,480 |
Interfund Trades. Funds may purchase from or sell securities to other funds affiliated with each sub-adviser under procedures adopted by the Board. The procedures have been designed to ensure these interfund trades are executed in accordance with Rule 17a-7 of the 1940 Act. Any interfund trades are included within the respective purchases and sales amounts shown in the Purchases and Sales of Investments note. During the period, there were no interfund trades.
7. Security Lending.
Funds lend portfolio securities from time to time in order to earn additional income. Lending agents are used, including National Financial Services (NFS), an affiliate of the investment adviser. Pursuant to a securities lending agreement, NFS will receive a fee, which is capped at 9.9% of a fund's daily lending revenue, for its services as lending agent. A fund may lend securities to certain qualified borrowers, including NFS. On the settlement date of the loan, a fund receives collateral (in the form of U.S. Treasury obligations, letters of credit and/or cash) against the loaned securities and maintains collateral in an amount not less than 100% of the market value of the loaned securities during the period of the loan. The market value of the loaned securities is determined at the close of business of a fund and any additional required collateral is delivered to a fund on the next business day. A fund or borrower may terminate the loan at any time, and if the borrower defaults on its obligation to return the securities loaned because of insolvency or other reasons, a fund may apply collateral received from the borrower against the obligation. A fund may experience delays and costs in recovering the securities loaned. Any cash collateral received is invested in the Fidelity Securities Lending Cash Central Fund. Any loaned securities are identified as such in the Schedule of Investments, and the value of loaned securities and cash collateral at period end, as applicable, are presented in the Statement of Assets and Liabilities. Security lending income represents the income earned on investing cash collateral, less rebates paid to borrowers and any lending agent fees associated with the loan, plus any premium payments received for lending certain types of securities. Security lending income is presented in the Statement of Operations as a component of income from Fidelity Central Funds. Affiliated security lending activity, if any, was as follows:
| | Total Security Lending Fees Paid to NFS ($) | Security Lending Income From Securities Loaned to NFS ($) | Value of Securities Loaned to NFS at Period End ($) |
| Fidelity Dividend ETF for Rising Rates | 1,794 | - | - |
| Fidelity High Dividend ETF | 13,837 | - | - |
| Fidelity Low Volatility Factor ETF | 920 | - | - |
| Fidelity Momentum Factor ETF | 70 | - | - |
| Fidelity Quality Factor ETF | 611 | - | - |
| Fidelity Small-Mid Multifactor ETF | 6,075 | 100 | 35,620 |
| Fidelity Value Factor ETF | 1,912 | 25 | - |
8. Expense Reductions.
The investment adviser contractually agreed to reimburse certain Funds to the extent proxy and shareholder meeting expenses exceeded .013% of average net assets. This reimbursement will remain in place through November 30, 2025. During the period this reimbursement reduced each applicable Fund's expenses as follows:
| | Reimbursement ($) |
| Fidelity Small-Mid Multifactor ETF | 158 |
| Fidelity U.S. Multifactor ETF | 606 |
Through arrangements with each applicable Fund's custodian, credits realized as a result of certain uninvested cash balances were used to reduce each applicable Fund's expenses. All of the applicable expense reductions are noted in the table below.
| | Custodian credits ($) |
Fidelity Dividend ETF for Rising Rates | 255 |
| Fidelity High Dividend ETF | 3,845 |
| Fidelity Low Volatility Factor ETF | 445 |
| Fidelity Momentum Factor ETF | 1,067 |
| Fidelity Quality Factor ETF | 885 |
| Fidelity Small-Mid Multifactor ETF | 1,193 |
| Fidelity Stocks for Inflation ETF | 401 |
| Fidelity U.S. Multifactor ETF | 533 |
| Fidelity Value Factor ETF | 330 |
9. Share Transactions.
Funds issue and redeem shares at NAV only with certain authorized participants in large increments known as Creation Units. Purchases of Creation Units are made by tendering a basket of designated securities to a fund and redemption proceeds are paid with a basket of securities from a fund's portfolio with a balancing cash component to equate the market value of the basket of securities delivered or redeemed to the NAV per Creation Unit on the transaction date. Cash may be substituted equivalent to the value of certain securities generally when they are not available in sufficient quantity for delivery. A fund's shares are available in smaller increments to investors in the secondary market at market prices and may be subject to commissions. Authorized participants pay a transaction fee to the shareholder servicing agent when purchasing and redeeming Creation Units of a fund. The transaction fee is used to offset the costs associated with the issuance and redemption of Creation Units.
10. Other.
A fund's organizational documents provide former and current trustees and officers with a limited indemnification against liabilities arising in connection with the performance of their duties to the fund. In the normal course of business, a fund may also enter into contracts that provide general indemnifications. A fund's maximum exposure under these arrangements is unknown as this would be dependent on future claims that may be made against a fund. The risk of material loss from such claims is considered remote.
11. Risk and Uncertainties.
Many factors affect a fund's performance. Developments that disrupt global economies and financial markets, such as pandemics, epidemics, outbreaks of infectious diseases, war, terrorism, and environmental disasters, may significantly affect a fund's investment performance. The effects of these developments to a fund will be impacted by the types of securities in which a fund invests, the financial condition, industry, economic sector, and geographic location of an issuer, and a fund's level of investment in the securities of that issuer. Significant concentrations in security types, issuers, industries, sectors, and geographic locations may magnify the factors that affect a fund's performance.
Report of Independent Registered Public Accounting Firm
Report of Independent Registered Public Accounting Firm
To the Board of Trustees of Fidelity Covington Trust and Shareholders of Fidelity Dividend ETF for Rising Rates, Fidelity High Dividend ETF, Fidelity Low Volatility Factor ETF, Fidelity Momentum Factor ETF, Fidelity Quality Factor ETF, Fidelity Small-Mid Multifactor ETF, Fidelity U.S. Multifactor ETF, and Fidelity Value Factor ETF
Opinions on the Financial Statements
We have audited the accompanying statements of assets and liabilities, including the schedules of investments, of Fidelity Dividend ETF for Rising Rates, Fidelity High Dividend ETF, Fidelity Low Volatility Factor ETF, Fidelity Momentum Factor ETF, Fidelity Quality Factor ETF, Fidelity Small-Mid Multifactor ETF, Fidelity U.S. Multifactor ETF, and Fidelity Value Factor ETF (eight of the funds constituting Fidelity Covington Trust, hereafter collectively referred to as the "Funds") as of July 31, 2024, the related statements of operations for the year ended July 31, 2024, the statements of changes in net assets for each of the two years in the period ended July 31, 2024, including the related notes, and the financial highlights for each of the periods indicated therein (collectively referred to as the "financial statements"). In our opinion, the financial statements present fairly, in all material respects, the financial position of each of the Funds as of July 31, 2024, the results of each of their operations for the year then ended, the changes in each of their net assets for each of the two years in the period ended July 31, 2024 and each of the financial highlights for each of the periods indicated therein in conformity with accounting principles generally accepted in the United States of America.
Basis for Opinions
These financial statements are the responsibility of the Funds' management. Our responsibility is to express an opinion on the Funds' financial statements based on our audits. We are a public accounting firm registered with the Public Company Accounting Oversight Board (United States) (PCAOB) and are required to be independent with respect to the Funds in accordance with the U.S. federal securities laws and the applicable rules and regulations of the Securities and Exchange Commission and the PCAOB.
We conducted our audits of these financial statements in accordance with the standards of the PCAOB. Those standards require that we plan and perform the audit to obtain reasonable assurance about whether the financial statements are free of material misstatement, whether due to error or fraud.
Our audits included performing procedures to assess the risks of material misstatement of the financial statements, whether due to error or fraud, and performing procedures that respond to those risks. Such procedures included examining, on a test basis, evidence regarding the amounts and disclosures in the financial statements. Our audits also included evaluating the accounting principles used and significant estimates made by management, as well as evaluating the overall presentation of the financial statements. Our procedures included confirmation of securities owned as of July 31, 2024 by correspondence with the custodian and brokers; when replies were not received from brokers, we performed other auditing procedures. We believe that our audits provide a reasonable basis for our opinions.
/s/ PricewaterhouseCoopers LLP
Boston, Massachusetts
September 17, 2024
We have served as the auditor of one or more investment companies in the Fidelity group of funds since 1932.
Report of Independent Registered Public Accounting Firm
To the Board of Trustees of Fidelity Covington Trust and the Shareholders of Fidelity Stocks for Inflation ETF:
Opinion on the Financial Statements and Financial Highlights
We have audited the accompanying statement of assets and liabilities of Fidelity Stocks for Inflation ETF (the "Fund"), a fund of Fidelity Covington Trust, including the schedule of investments, as of July 31, 2024, the related statement of operations for the year then ended, the statement of changes in net assets for each of the two years in the period then ended, the financial highlights for each of the four years in the period then ended and for the period from November 5, 2019 (commencement of operations) through July 31, 2020, and the related notes. In our opinion, the financial statements and financial highlights present fairly, in all material respects, the financial position of the Fund as of July 31, 2024, and the results of its operations for the year then ended, the changes in its net assets for each of the two years in the period then ended, and the financial highlights for each of the four years in the period then ended and for the period from November 5, 2019 (commencement of operations) through July 31, 2020, in conformity with accounting principles generally accepted in the United States of America.
Basis for Opinion
These financial statements and financial highlights are the responsibility of the Fund's management. Our responsibility is to express an opinion on the Fund's financial statements and financial highlights based on our audits. We are a public accounting firm registered with the Public Company Accounting Oversight Board (United States) (PCAOB) and are required to be independent with respect to the Fund in accordance with the U.S. federal securities laws and the applicable rules and regulations of the Securities and Exchange Commission and the PCAOB.
We conducted our audits in accordance with the standards of the PCAOB. Those standards require that we plan and perform the audit to obtain reasonable assurance about whether the financial statements and financial highlights are free of material misstatement, whether due to error or fraud. The Fund is not required to have, nor were we engaged to perform, an audit of its internal control over financial reporting. As part of our audits, we are required to obtain an understanding of internal control over financial reporting but not for the purpose of expressing an opinion on the effectiveness of the Fund's internal control over financial reporting. Accordingly, we express no such opinion.
Our audits included performing procedures to assess the risks of material misstatement of the financial statements and financial highlights, whether due to error or fraud, and performing procedures that respond to those risks. Such procedures included examining, on a test basis, evidence regarding the amounts and disclosures in the financial statements and financial highlights. Our audits also included evaluating the accounting principles used and significant estimates made by management, as well as evaluating the overall presentation of the financial statements and financial highlights. Our procedures included confirmation of securities owned as of July 31, 2024, by correspondence with the custodian and brokers; when replies were not received from brokers, we performed other auditing procedures. We believe that our audits provide a reasonable basis for our opinion.
/s/ Deloitte & Touche LLP
Boston, Massachusetts
September 17, 2024
We have served as the auditor of one or more of the Fidelity investment companies since 1999.
Distributions
(Unaudited)The dividend and capital gains distributions for the fund(s) are available on Fidelity.com or Institutional.Fidelity.com.
A percentage of the dividends distributed during the fiscal year for the following funds qualify for the dividends-received deduction for corporate shareholders:
| Fidelity Dividend ETF for Rising Rates | |
| September 2023 | 75% |
| December 2023 | 85% |
| March 2024 | 96% |
| June 2024 | 96% |
| Fidelity High Dividend ETF | |
| September 2023 | 54% |
| December 2023 | 54% |
| March 2024 | 79% |
| June 2024 | 79% |
| Fidelity Low Volatility Factor ETF | |
| September 2023 | 96% |
| December 2023 | 96% |
| March 2024 | 100% |
| June 2024 | 100% |
| Fidelity Momentum Factor ETF | |
| September 2023 | 100% |
| December 2023 | 100% |
| March 2024 | 100% |
| June 2024 | 100% |
| Fidelity Quality Factor ETF | |
| September 2023 | 98% |
| December 2023 | 98% |
| March 2024 | 100% |
| June 2024 | 100% |
| Fidelity Small-Mid Multifactor ETF | |
| September 2023 | 75% |
| December 2023 | 75% |
| March 2024 | 85% |
| June 2024 | 85% |
| Fidelity Stocks for Inflation ETF | |
| September 2023 | 90% |
| December 2023 | 90% |
| March 2024 | 100% |
| June 2024 | 100% |
| Fidelity U.S. Multifactor ETF | |
| September 2023 | 95% |
| December 2023 | 94% |
| March 2024 | 100% |
| June 2024 | 100% |
| Fidelity Value Factor ETF | |
| September 2023 | 97% |
| December 2023 | 96% |
| March 2024 | 100% |
| June 2024 | 100% |
A percentage of the dividends distributed during the fiscal year for the following funds may be taken into account as a dividend for purposes of the maximum rate under section 1(h)(11) of the Internal Revenue Code.
Fidelity Dividend ETF for Rising Rates | |
| September 2023 | 84.50% |
| December 2023 | 95.86% |
| March 2024 | 100% |
| June 2024 | 100% |
| Fidelity High Dividend ETF | |
| September 2023 | 64.41% |
| December 2023 | 64.41% |
| March 2024 | 90.25% |
| June 2024 | 90.25% |
| Fidelity Low Volatility Factor ETF | |
| September 2023 | 100% |
| December 2023 | 100% |
| March 2024 | 100% |
| June 2024 | 100% |
| Fidelity Momentum Factor ETF | |
| September 2023 | 100% |
| December 2023 | 100% |
| March 2024 | 100% |
| June 2024 | 100% |
| Fidelity Quality Factor ETF | |
| September 2023 | 100% |
| December 2023 | 100% |
| March 2024 | 100% |
| June 2024 | 100% |
| Fidelity Small-Mid Multifactor ETF | |
| September 2023 | 85.07% |
| December 2023 | 85.07% |
| March 2024 | 89.17% |
| June 2024 | 89.17% |
| Fidelity Stocks for Inflation ETF | |
| September 2023 | 92.35% |
| December 2023 | 92.35% |
| March 2024 | 100% |
| June 2024 | 100% |
| Fidelity U.S. Multifactor ETF | |
| September 2023 | 97.18% |
| December 2023 | 97.04% |
| March 2024 | 100% |
| June 2024 | 100% |
| Fidelity Value Factor ETF | |
| September 2023 | 99.25% |
| December 2023 | 99.09% |
| March 2024 | 100% |
| June 2024 | 100% |
A percentage of the dividends distributed during the fiscal year for the following funds qualify as a section 199A dividend:
Fidelity Dividend ETF for Rising Rates | |
| September 2023 | 15.51% |
| December 2023 | 4.15% |
| Fidelity High Dividend ETF | |
| September 2023 | 17.17% |
| December 2023 | 17.17% |
| March 2024 | 9.76% |
| June 2024 | 9.76% |
| Fidelity Small-Mid Multifactor ETF | |
| September 2023 | 14.94% |
| December 2023 | 14.94% |
| March 2024 | 10.83% |
| June 2024 | 10.83% |
| Fidelity Stocks for Inflation ETF | |
| September 2023 | 7.66% |
| December 2023 | 7.66% |
| Fidelity U.S. Multifactor ETF | |
| September 2023 | 2.83% |
| December 2023 | 2.97% |
| Fidelity Value Factor ETF | |
| September 2023 | 0.76% |
| December 2023 | 0.92% |
The funds hereby designate the amounts noted below as distributions paid during the fiscal year ended 2024 as qualifying to be taxed as section 163(j) interest dividends:
| Fidelity Dividend ETF for Rising Rates | $80,448 |
| Fidelity Small-Mid Multifactor ETF | $9,192 |
| Fidelity Value Factor ETF | $24,514 |
The funds will notify shareholders in January 2025 of amounts for use in preparing 2024 income tax returns.
Item 8: Changes in and Disagreements with Accountants for Open-End Management Investment Companies
Note: This is not applicable for any fund included in this document.
Item 9: Proxy Disclosures for Open-End Management Investment Companies
| A special meeting of shareholders was held on July 16, 2024. The results of votes taken among shareholders on the proposal before them are reported below. Each vote reported represents one dollar of net asset value held on the record date for the meeting. |
| Proposal 1 |
| To elect a Board of Trustees. |
| | # of Votes | % of Votes |
| Bettina Doulton |
| Affirmative | 38,080,283,823.03 | 97.17 |
| Withheld | 1,109,333,237.47 | 2.83 |
| TOTAL | 39,189,617,060.50 | 100.00 |
| Robert A. Lawrence |
| Affirmative | 37,781,807,251.33 | 96.41 |
| Withheld | 1,407,809,809.17 | 3.59 |
| TOTAL | 39,189,617,060.50 | 100.00 |
| Vijay C. Advani |
| Affirmative | 37,869,526,083.09 | 96.63 |
| Withheld | 1,320,090,977.41 | 3.37 |
| TOTAL | 39,189,617,060.50 | 100.00 |
| Thomas P. Bostick |
| Affirmative | 38,025,875,898.31 | 97.03 |
| Withheld | 1,163,741,162.19 | 2.97 |
| TOTAL | 39,189,617,060.50 | 100.00 |
| Donald F. Donahue |
| Affirmative | 37,825,198,238.79 | 96.52 |
| Withheld | 1,364,418,821.71 | 3.48 |
| TOTAL | 39,189,617,060.50 | 100.00 |
| Vicki L. Fuller |
| Affirmative | 38,031,768,119.99 | 97.05 |
| Withheld | 1,157,848,940.51 | 2.95 |
| TOTAL | 39,189,617,060.50 | 100.00 |
| Patricia L. Kampling |
| Affirmative | 38,062,391,881.90 | 97.12 |
| Withheld | 1,127,225,178.60 | 2.88 |
| TOTAL | 39,189,617,060.50 | 100.00 |
| Thomas A. Kennedy |
| Affirmative | 37,891,434,776.27 | 96.69 |
| Withheld | 1,298,182,284.23 | 3.31 |
| TOTAL | 39,189,617,060.50 | 100.00 |
| Oscar Munoz |
| Affirmative | 37,976,932,673.73 | 96.91 |
| Withheld | 1,212,684,386.77 | 3.09 |
| TOTAL | 39,189,617,060.50 | 100.00 |
| Karen B. Peetz |
| Affirmative | 38,011,822,212.28 | 96.99 |
| Withheld | 1,177,794,848.22 | 3.01 |
| TOTAL | 39,189,617,060.50 | 100.00 |
| David M. Thomas |
| Affirmative | 37,976,058,118.16 | 96.90 |
| Withheld | 1,213,558,942.34 | 3.10 |
| TOTAL | 39,189,617,060.50 | 100.00 |
| Susan Tomasky |
| Affirmative | 37,845,471,684.67 | 96.57 |
| Withheld | 1,344,145,375.83 | 3.43 |
| TOTAL | 39,189,617,060.50 | 100.00 |
| Michael E. Wiley |
| Affirmative | 37,736,569,620.69 | 96.29 |
| Withheld | 1,453,047,439.81 | 3.71 |
| TOTAL | 39,189,617,060.50 | 100.00 |
| | | |
| Proposal 1 reflects trust-wide proposal and voting results. |
Item 10: Remuneration Paid to Directors, Officers, and others of Open-End Management Investment Companies
Note: This information is disclosed as part of the financial statements for each Fund as part of Item 7: Financial Statements and Financial Highlights for Open-End Management Investment companies.
Item 11: Statement Regarding Basis for Approval of Investment Advisory Contract
Board Approval of Investment Advisory Contracts and Management Fees
Fidelity Dividend ETF for Rising Rates
Fidelity High Dividend ETF
Fidelity Low Volatility Factor ETF
Fidelity Momentum Factor ETF
Fidelity Quality Factor ETF
Fidelity Small-Mid Multifactor ETF
Fidelity Stocks for Inflation ETF
Fidelity U.S. Multifactor ETF
Fidelity Value Factor ETF
Each year, the Board of Trustees, including the Independent Trustees (together, the Board), considers the renewal of each fund's management contract with Fidelity Management & Research Company LLC (FMR) and the sub-advisory agreement (Sub-Advisory Agreement) for each fund with Geode Capital Management, LLC (Geode) (together, the Advisory Contracts). FMR and Geode are referred to herein as the Investment Advisers. The Board, assisted by the advice of fund counsel and Independent Trustees' counsel, requests and considers a broad range of information relevant to the renewal of the Advisory Contracts throughout the year.
The Board meets regularly and, at each of its meetings, covers an extensive agenda of topics and materials and considers factors that are relevant to its annual consideration of the renewal of each fund's Advisory Contracts, including the services and support provided to each fund and its shareholders. The Board, acting directly and through its Committees (each of which is composed of and chaired by Independent Trustees), requests and receives information concerning the annual consideration of the renewal of each fund's Advisory Contracts. The Board also meets as needed to review matters specifically related to the Board's annual consideration of the renewal of the Advisory Contracts. Members of the Board may also meet with trustees of other Fidelity funds through joint ad hoc committees to discuss certain matters relevant to all of the Fidelity funds.
At its May 2024 meeting, the Board unanimously determined to renew each fund's Advisory Contracts. In reaching its determination, the Board considered all factors it believed relevant, including (i) the nature, extent, and quality of the services provided to each fund and its shareholders (including the investment performance of each fund); (ii) the competitiveness relative to peer funds of each fund's management fee and total expense ratio; (iii) the total costs of the services provided by and the profits realized by FMR and its affiliates (Fidelity) and Geode from their respective relationships with each fund; and (iv) the extent to which, if any, economies of scale exist and are realized as each fund grows, and whether any economies of scale are appropriately shared with fund shareholders. The Board also considered the broad range of investment choices available to shareholders from FMR's competitors and that each fund's shareholders have chosen to invest in the fund, which is part of the Fidelity family of funds. The Board's decision to renew the Advisory Contracts was not based on any single factor.
The Board reached a determination, with the assistance of fund counsel and Independent Trustees' counsel and through the exercise of its business judgment, that the renewal of the Advisory Contracts was in the best interests of each fund and its shareholders and that the compensation payable under the Advisory Contracts was fair and reasonable in light of all of the surrounding circumstances.
Nature, Extent, and Quality of Services Provided. The Board considered staffing as it relates to the funds, including the backgrounds and experience of investment personnel of the Investment Advisers, and also considered the Investment Advisers' implementation of the funds' investment program. The Independent Trustees also had discussions with senior management of Fidelity's investment operations and investment groups and with senior management of Geode. The Board considered the structure of the investment personnel compensation programs and whether the structures provide appropriate incentives to act in the best interests of each fund. Additionally, the Board considered the portfolio managers' investments, if any, in the funds that they manage.
The Trustees also discussed with representatives of Fidelity, at meetings throughout the year, Fidelity's role in, among other things, overseeing compliance with federal securities laws and other applicable requirements by Geode with respect to the funds and monitoring and overseeing the performance and investment capabilities of Geode. The Trustees considered that the Board had received from Fidelity periodic reports about its oversight and due diligence processes, as well as periodic reports regarding the performance of Geode.
The Board also considered the nature, extent and quality of services provided by Geode. The Trustees noted that under the Sub-Advisory Agreement, subject to oversight by Fidelity, Geode is responsible for, among other things, identifying investments and arranging for execution of portfolio transactions to implement each fund's investment strategy. In addition, the Trustees noted that Geode is responsible for providing such reporting as may be requested by Fidelity to fulfill its oversight responsibilities discussed above.
Resources Dedicated to Investment Management and Support Services. The Board and the Fund Oversight and Research Committees reviewed the general qualifications and capabilities of Fidelity's and Geode's investment staffs, including their size, education, experience, and resources, as well as Fidelity's and Geode's approach to recruiting, training, managing, and compensating investment personnel. The Board considered that Fidelity's and Geode's investment professionals have extensive resources, tools and capabilities so as to provide competitive investment results over time, and that those professionals also have access to sophisticated tools that permit them to assess portfolio construction and risk and performance attribution characteristics continuously. Additionally, in its deliberations, the Board considered Fidelity's and Geode's trading, risk management, compliance, and technology and operations capabilities and resources, which are integral parts of the investment management process.
Shareholder and Administrative Services. The Board considered (i) the nature, extent, quality, and cost of advisory and administrative services provided by the Investment Advisers and their affiliates under the Advisory Contracts and by FMR's affiliates under a separate agreement covering pricing and bookkeeping services for each fund; (ii) the nature and extent of Fidelity's supervision of third party service providers, principally State Street Bank and Trust Company, each fund's transfer agent and custodian; and (iii) the resources devoted by Fidelity to, and the record of compliance with, each fund's compliance policies and procedures. The Board also reviewed the allocation of fund brokerage, including allocations to brokers affiliated with the Investment Advisers. The Board also considered each fund's securities lending activities and any payments made to Fidelity relating to securities lending, under a separate agreement.
The Board noted that the growth of fund assets over time across the complex allows Fidelity to reinvest in the development of services designed to enhance the value and convenience of the Fidelity funds as investment vehicles. These services include 24-hour access to account information and market information over the Internet and through telephone representatives, investor education materials, and asset allocation tools. The Board also considered that it reviews customer service metrics such as telephone response times, continuity of services on the website and metrics addressing services at Fidelity Investor Centers.
Investment in a Large Fund Family. The Board considered the benefits to shareholders of investing in a fund that is part of a large family of funds offering a variety of investment disciplines and providing a large variety of fund investor services. The Board noted that Fidelity had taken, or had made recommendations that resulted in the Fidelity funds taking, a number of actions over the previous year that benefited particular funds and/or the Fidelity funds in general.
Investment Performance. The Board took into account discussions that occur with representatives of the Investment Advisers, and reports that it receives, at Board meetings throughout the year relating to fund investment performance. In this regard the Board noted that as part of regularly scheduled fund reviews and other reports to the Board on fund performance, the Board considered annualized return information for each fund for different time periods, measured against the securities market index the fund seeks to track. The Board also periodically considers each fund's tracking error versus its benchmark index. In its ongoing evaluation of fund investment performance, the Board gives particular attention to information indicating changes in performance of the funds over different time periods and discussed with the Investment Advisers the reasons for any overperformance or underperformance. The Board also considered information on each fund's bid-ask spread and premium/discount.
In addition to reviewing absolute and relative fund performance, the Independent Trustees periodically consider the appropriateness of fund performance metrics in evaluating the results achieved. In general, the Independent Trustees believe that an index fund's performance should be evaluated based on net performance (after fees and expenses) of the fund compared to a fund's benchmark index, over appropriate time periods taking into account relevant factors including the following: general market conditions; the characteristics of the fund's benchmark index; the extent to which statistical sampling is employed; any securities lending revenues; and fund cash flows and other factors.
Based on its review, the Board concluded that the nature, extent, and quality of services provided to each fund under the Advisory Contracts should continue to benefit the shareholders of each fund.
Competitiveness of Management Fee and Total Expense Ratio. The Board was provided with information regarding industry trends in management fees and expenses. In its review of each fund's management fee and total expense ratio, the Board considered each fund's all-inclusive fee rate and also considered other expenses, such as transfer agent fees, pricing and bookkeeping fees, and custodial, legal, and audit fees, paid by FMR under each fund's all-inclusive arrangement. The Board noted that Fidelity may agree to waive fees or reimburse expenses from time to time, and the extent to which, if any, it has done so for each fund.
Comparisons of Management Fees and Total Expense Ratios. Among other things, the Board reviewed data for selected groups of competitive funds and classes (referred to as "mapped groups") that were compiled by Fidelity based on combining similar investment objective categories (as classified by Morningstar) that have comparable investment mandates. The data reviewed by the Board included (i) gross management fee comparisons (before taking into account expense reimbursements or caps) relative to the total universe of funds within the mapped group; (ii) gross management fee comparisons relative to a subset of non-Fidelity funds in the mapped group that are similar in size and management fee structure to each fund (referred to as the "asset size peer group"); (iii) total expense comparisons of each fund relative to funds and classes in the mapped group that have a similar load structure to the fund (referred to as the "similar load structure group"); and (iv) total expense comparisons of each fund relative to funds and classes in the similar load structure group that are similar in size and management fee structure to the fund (referred to as the "total expense asset size peer group"). The total expense asset size peer group comparison excludes performance adjustments and fund-paid 12b-1 fees to eliminate variability in fee structures.
The information provided to the Board indicated that each fund's management fee rate ranked below the competitive median of the mapped group for the 12-month period ended September 30, 2023 and below the competitive median of the asset size peer group for the 12-month period ended September 30, 2023. Further, the information provided to the Board indicated that the total expense ratio of each fund ranked below the competitive median of the similar sales load structure group for the 12-month period ended September 30, 2023 and below the competitive median of the total expense asset size peer group for the 12-month period ended September 30, 2023.
Fees Charged to Other Clients. The Board also considered fee structures applicable to clients of Fidelity and Geode, such as other funds advised or subadvised by Fidelity or Geode, pension plan clients, and other institutional clients with similar mandates. The Board noted that a joint ad hoc committee created by it and the boards of other Fidelity funds periodically reviews and compares Fidelity's institutional investment advisory business with its business of providing services to the Fidelity funds and also noted the most recent findings of the committee. The Board noted that the committee's review included a consideration of the differences in services provided, fees charged, and costs incurred, as well as competition in the markets serving the different categories of clients.
Based on its review, the Board concluded that each fund's management fee is fair and reasonable in light of the services that the fund receives and the other factors considered. Further based on its review of total expense ratios and fees charged to other Fidelity clients, the Board concluded that each fund's total expense ratio was reasonable in light of the services that the fund and its shareholders receive and the other factors considered.
Costs of the Services and Profitability. The Board considered the revenues earned and the expenses incurred by Fidelity in conducting the business of developing, marketing, distributing, managing, administering and servicing each fund and servicing each fund's shareholders. The Board also considered the level of Fidelity's profits in respect of all the Fidelity funds.
On an annual basis, Fidelity presents to the Board information about the profitability of its relationships with each fund. Fidelity calculates profitability information for each fund, as well as aggregate profitability information for groups of Fidelity funds and all Fidelity funds, using a series of detailed revenue and cost allocation methodologies which originate with the books and records of Fidelity on which Fidelity's audited financial statements are based. The Audit Committee of the Board reviews any significant changes from the prior year's methodologies and the full Board approves such changes.
A public accounting firm has been engaged annually by the Board as part of the Board's assessment of Fidelity's profitability analysis. The engagement includes the review and assessment of the methodologies used by Fidelity in determining the revenues and expenses attributable to Fidelity's fund business, and completion of agreed-upon procedures in respect of the mathematical accuracy of certain fund profitability information and its conformity to established allocation methodologies. After considering the reports issued under the engagement and information provided by Fidelity, the Board concluded that while other allocation methods may also be reasonable, Fidelity's profitability methodologies are reasonable in all material respects.
The Board also reviewed Fidelity's and Geode's non-fund businesses and potential indirect benefits such businesses may have received as a result of their association with Fidelity's fund business (i.e., fall-out benefits) as well as cases where Fidelity's and Geode's affiliates may benefit from the funds' business. The Board considered areas where potential indirect benefits to the Fidelity funds from their relationships with Fidelity may exist. The Board's consideration of these matters was informed by the findings of a joint ad hoc committee created by it and the boards of other Fidelity funds to evaluate potential fall-out benefits.
The Board considered the costs of the services provided by and the profits realized by Fidelity in connection with the operation of each fund and was satisfied that the profitability was not excessive.
The Board also considered information regarding the profitability of Geode's relationship with each fund.
Economies of Scale. The Board considered whether there have been economies of scale in respect of the management of the Fidelity funds, whether the Fidelity funds (including each fund) have appropriately benefited from any such economies of scale, and whether there is potential for realization of any further economies of scale. The Board considered the extent to which each fund will benefit from economies of scale as assets grow through increased services to the fund, through waivers or reimbursements, or through fee or expense ratio reductions. The Board recognized that, due to each fund's current contractual arrangements, its expense ratio will not decline if the fund's operating costs decrease as assets grow, or rise as assets decrease. The Board also noted that a committee created by it and the boards of other Fidelity funds periodically analyzes whether Fidelity attains economies of scale in respect of the management and servicing of the Fidelity funds, whether the Fidelity funds have appropriately benefited from such economies of scale, and whether there is potential for realization of any further economies of scale.
The Board concluded, taking into account the analysis of the committee, that economies of scale, if any, are being appropriately shared between fund shareholders and Fidelity.
Additional Information Requested by the Board. In order to develop fully the factual basis for consideration of the Fidelity funds' advisory contracts, the Board requested and received additional information on certain topics, including, but not limited to: (i) fund flow and performance trends, in particular the underperformance of certain funds and strategies, and Fidelity's long-term strategies for certain funds; (ii) the operation of performance fees and the rationale for implementing performance fees on certain categories of funds but not others; (iii) Fidelity's pricing philosophy compared to competitors; (iv) fund profitability methodology and data; (v) evaluation of competitive fund data and peer group classifications and fee and expense comparisons; (vi) the management fee and expense structures for different funds and classes and information about the differences between various fee and expense structures; (vii) the variable management fee implemented for certain funds effective March 1, 2024; and (viii) information regarding other accounts managed by Fidelity and the funds' sub-advisory arrangements.
Conclusion. Based on its evaluation of all of the conclusions noted above, and after considering all factors it believed relevant, the Board, including the Independent Trustees, concluded that the advisory and sub-advisory fee arrangements are fair and reasonable in light of all of the surrounding circumstances and that each fund's Advisory Contracts should be renewed through May 31, 2025.
1.9881294.107
CPF-ANN-0924
Fidelity® Blue Chip Growth ETF
Fidelity® Blue Chip Value ETF
Fidelity® Fundamental Large Cap Core ETF
Fidelity® Fundamental Large Cap Growth ETF
Fidelity® Fundamental Large Cap Value ETF
Fidelity® Fundamental Small-Mid Cap ETF
Fidelity® Magellan℠ ETF
Fidelity® Real Estate Investment ETF
Fidelity® Sustainable U.S. Equity ETF
Fidelity® Women's Leadership ETF
(Fidelity Fundamental Large Cap Core ETF formerly named Fidelity New Millennium ETF, Fidelity Fundamental Large Cap Growth ETF formerly named Fidelity Growth Opportunities ETF, and Fidelity Fundamental Small-Mid Cap ETF formerly named Fidelity Small-Mid Cap Opportunities ETF)
Annual Report
July 31, 2024
Contents
To view a fund's proxy voting guidelines and proxy voting record for the 12-month period ended June 30, visit http://www.fidelity.com/proxyvotingresults or visit the Securities and Exchange Commission's (SEC) web site at http://www.sec.gov.
You may also call 1-800-FIDELITY to request a free copy of the proxy voting guidelines.
Standard & Poor's, S&P and S&P 500 are registered service marks of The McGraw-Hill Companies, Inc. and have been licensed for use by Fidelity Distributors Corporation.
Other third-party marks appearing herein are the property of their respective owners.
All other marks appearing herein are registered or unregistered trademarks or service marks of FMR LLC or an affiliated company. © 2024 FMR LLC. All rights reserved.
This report and the financial statements contained herein are submitted for the general information of the shareholders of the Funds. This report is not authorized for distribution to prospective investors in the Funds unless preceded or accompanied by an effective prospectus.
A fund files its complete schedule of portfolio holdings with the SEC for the first and third quarters of each fiscal year on Form N-PORT. Forms N-PORT are available on the SEC's web site at http://www.sec.gov. A fund's Forms N-PORT may be reviewed and copied at the SEC's Public Reference Room in Washington, DC. Information regarding the operation of the SEC's Public Reference Room may be obtained by calling 1-800-SEC-0330.
For a complete list of a fund's portfolio holdings, view the most recent holdings listing, semiannual report, or annual report on Fidelity's web site at http://www.fidelity.com, http://www.institutional.fidelity.com, or http://www.401k.com, as applicable.
NOT FDIC INSURED •MAY LOSE VALUE •NO BANK GUARANTEE
Neither the Funds nor Fidelity Distributors Corporation is a bank.
Item 7: Financial Statements and Financial Highlights for Open-End Management Investment Companies (Annual Report)
Fidelity® Blue Chip Growth ETF
Schedule of Investments July 31, 2024
Showing Percentage of Net Assets
| Common Stocks - 99.9% |
| | | Shares | Value ($) |
| COMMUNICATION SERVICES - 16.0% | | | |
| Entertainment - 2.6% | | | |
| Netflix, Inc. (a) | | 71,919 | 45,190,304 |
| Roblox Corp. (a) | | 48 | 1,993 |
| Sea Ltd. ADR Class A (a) | | 41,188 | 2,706,052 |
| Sphere Entertainment Co. (a) | | 4,077 | 181,345 |
| Spotify Technology SA (a) | | 4,678 | 1,608,951 |
| Take-Two Interactive Software, Inc. (a) | | 4,203 | 632,678 |
| The Walt Disney Co. | | 10 | 937 |
| TKO Group Holdings, Inc. | | 7,467 | 816,516 |
| | | | 51,138,776 |
| Interactive Media & Services - 13.3% | | | |
| Alphabet, Inc. Class A | | 782,969 | 134,310,502 |
| Meta Platforms, Inc. Class A | | 205,703 | 97,673,955 |
| Pinterest, Inc. Class A (a) | | 45,534 | 1,454,811 |
| Reddit, Inc. Class A | | 37,730 | 2,295,871 |
| Snap, Inc. Class A (a) | | 2,057,188 | 27,401,744 |
| | | | 263,136,883 |
| Media - 0.0% | | | |
| The Trade Desk, Inc. Class A (a) | | 6,010 | 540,179 |
| Wireless Telecommunication Services - 0.1% | | | |
| T-Mobile U.S., Inc. | | 9,096 | 1,658,019 |
TOTAL COMMUNICATION SERVICES | | | 316,473,857 |
| CONSUMER DISCRETIONARY - 19.9% | | | |
| Automobiles - 1.3% | | | |
| General Motors Co. | | 21,296 | 943,839 |
| Rivian Automotive, Inc. (a) | | 326,531 | 5,358,374 |
| Tesla, Inc. (a) | | 83,487 | 19,374,828 |
| | | | 25,677,041 |
| Broadline Retail - 9.4% | | | |
| Amazon.com, Inc. (a) | | 946,498 | 176,976,196 |
| Dollarama, Inc. | | 8,939 | 837,993 |
| Ollie's Bargain Outlet Holdings, Inc. (a) | | 24,801 | 2,421,570 |
| PDD Holdings, Inc. ADR (a) | | 49,881 | 6,429,162 |
| | | | 186,664,921 |
| Diversified Consumer Services - 0.1% | | | |
| Duolingo, Inc. (a) | | 5,271 | 906,296 |
| New Oriental Education & Technology Group, Inc. sponsored ADR (a) | | 1,851 | 116,280 |
| | | | 1,022,576 |
| Hotels, Restaurants & Leisure - 2.6% | | | |
| Airbnb, Inc. Class A (a) | | 76,786 | 10,716,254 |
| Caesars Entertainment, Inc. (a) | | 53,582 | 2,140,601 |
| Carnival Corp. (a) | | 39,397 | 656,354 |
| Cava Group, Inc. (a) | | 7,174 | 604,194 |
| Chipotle Mexican Grill, Inc. (a) | | 169,558 | 9,210,391 |
| Draftkings Holdings, Inc. (a) | | 105,455 | 3,896,562 |
| Flutter Entertainment PLC (a) | | 11,276 | 2,225,882 |
| Hilton Worldwide Holdings, Inc. | | 2,873 | 616,747 |
| MakeMyTrip Ltd. (a) | | 6,098 | 570,712 |
| Marriott International, Inc. Class A | | 11,283 | 2,564,626 |
| McDonald's Corp. | | 10,231 | 2,715,307 |
| Misa Investments Ltd. | | 19,869 | 709,323 |
| Penn Entertainment, Inc. (a) | | 131,230 | 2,620,663 |
| Restaurant Brands International, Inc. | | 12,850 | 899,728 |
| Royal Caribbean Cruises Ltd. | | 3,533 | 553,692 |
| Starbucks Corp. | | 88,693 | 6,913,619 |
| Sweetgreen, Inc. Class A (a) | | 153,200 | 4,209,936 |
| | | | 51,824,591 |
| Household Durables - 0.4% | | | |
| D.R. Horton, Inc. | | 11,257 | 2,025,472 |
| Garmin Ltd. | | 4,072 | 697,330 |
| PulteGroup, Inc. | | 9,642 | 1,272,744 |
| SharkNinja, Inc. | | 31,105 | 2,390,419 |
| TopBuild Corp. (a) | | 2,656 | 1,271,002 |
| | | | 7,656,967 |
| Specialty Retail - 4.1% | | | |
| Abercrombie & Fitch Co. Class A (a) | | 62,321 | 9,191,101 |
| American Eagle Outfitters, Inc. | | 304,109 | 6,705,603 |
| Aritzia, Inc. (a) | | 64,217 | 2,107,931 |
| Beyond, Inc. (a) | | 23 | 260 |
| Carvana Co. Class A (a) | | 70,787 | 9,430,952 |
| Dick's Sporting Goods, Inc. | | 27,887 | 6,033,352 |
| Five Below, Inc. (a) | | 25,915 | 1,885,057 |
| Foot Locker, Inc. | | 15,641 | 454,527 |
| Gap, Inc. | | 47,819 | 1,122,790 |
| Lowe's Companies, Inc. | | 81,306 | 19,961,436 |
| RH (a) | | 22,244 | 6,452,540 |
| The Home Depot, Inc. | | 3,221 | 1,185,843 |
| TJX Companies, Inc. | | 100,345 | 11,340,992 |
| Warby Parker, Inc. (a) | | 193,814 | 3,192,117 |
| Wayfair LLC Class A (a) | | 8,511 | 463,254 |
| Williams-Sonoma, Inc. | | 6,926 | 1,071,314 |
| | | | 80,599,069 |
| Textiles, Apparel & Luxury Goods - 2.0% | | | |
| Amer Sports, Inc. | | 80,785 | 937,914 |
| Crocs, Inc. (a) | | 40,650 | 5,462,141 |
| Deckers Outdoor Corp. (a) | | 12,229 | 11,282,842 |
| lululemon athletica, Inc. (a) | | 38,122 | 9,860,637 |
| NIKE, Inc. Class B | | 101,711 | 7,614,085 |
| On Holding AG (a) | | 13,340 | 552,543 |
| PVH Corp. | | 34,997 | 3,569,344 |
| Ralph Lauren Corp. Class A | | 3,681 | 646,347 |
| Tapestry, Inc. | | 13,099 | 525,139 |
| | | | 40,450,992 |
TOTAL CONSUMER DISCRETIONARY | | | 393,896,157 |
| CONSUMER STAPLES - 1.3% | | | |
| Beverages - 0.1% | | | |
| Celsius Holdings, Inc. (a) | | 40,383 | 1,891,136 |
| Consumer Staples Distribution & Retail - 0.6% | | | |
| Costco Wholesale Corp. | | 1,063 | 873,786 |
| Maplebear, Inc. (NASDAQ) | | 19,372 | 668,140 |
| Target Corp. | | 14,886 | 2,239,003 |
| Walmart, Inc. | | 105,118 | 7,215,300 |
| | | | 10,996,229 |
| Food Products - 0.0% | | | |
| Lamb Weston Holdings, Inc. | | 1,452 | 87,149 |
| The Hershey Co. | | 3,031 | 598,562 |
| | | | 685,711 |
| Household Products - 0.3% | | | |
| Procter & Gamble Co. | | 35,352 | 5,683,188 |
| Personal Care Products - 0.2% | | | |
| elf Beauty, Inc. (a) | | 6,236 | 1,076,209 |
| Estee Lauder Companies, Inc. Class A | | 14,418 | 1,436,177 |
| Kenvue, Inc. | | 51,522 | 952,642 |
| Oddity Tech Ltd. | | 20,277 | 820,103 |
| | | | 4,285,131 |
| Tobacco - 0.1% | | | |
| Philip Morris International, Inc. | | 17,986 | 2,071,268 |
TOTAL CONSUMER STAPLES | | | 25,612,663 |
| ENERGY - 1.2% | | | |
| Energy Equipment & Services - 0.0% | | | |
| Secure Energy Services, Inc. | | 71,836 | 634,253 |
| Oil, Gas & Consumable Fuels - 1.2% | | | |
| Cameco Corp. | | 46,436 | 2,113,525 |
| Cheniere Energy, Inc. | | 2,950 | 538,788 |
| Diamondback Energy, Inc. | | 32,995 | 6,675,218 |
| EOG Resources, Inc. | | 38,116 | 4,833,109 |
| Exxon Mobil Corp. | | 35,078 | 4,159,900 |
| Marathon Petroleum Corp. | | 2 | 354 |
| Occidental Petroleum Corp. | | 58,534 | 3,560,038 |
| Shell PLC ADR | | 7,830 | 573,313 |
| Valero Energy Corp. | | 1 | 162 |
| | | | 22,454,407 |
TOTAL ENERGY | | | 23,088,660 |
| FINANCIALS - 3.9% | | | |
| Banks - 0.3% | | | |
| Citigroup, Inc. | | 57,494 | 3,730,211 |
| HDFC Bank Ltd. sponsored ADR | | 13,620 | 817,336 |
| KeyCorp | | 46,271 | 746,351 |
| U.S. Bancorp | | 12,399 | 556,467 |
| | | | 5,850,365 |
| Capital Markets - 1.2% | | | |
| Blue Owl Capital, Inc. Class A | | 132,437 | 2,525,574 |
| Coinbase Global, Inc. (a) | | 35,911 | 8,056,992 |
| Goldman Sachs Group, Inc. | | 9,079 | 4,621,483 |
| Jefferies Financial Group, Inc. | | 21,281 | 1,244,300 |
| KKR & Co., Inc. | | 16,847 | 2,079,762 |
| Moody's Corp. | | 3,194 | 1,457,997 |
| Morgan Stanley | | 24,115 | 2,488,909 |
| | | | 22,475,017 |
| Consumer Finance - 0.4% | | | |
| American Express Co. | | 30,113 | 7,619,794 |
| Financial Services - 1.8% | | | |
| Apollo Global Management, Inc. | | 15,111 | 1,893,559 |
| Berkshire Hathaway, Inc. Class B (a) | | 1,960 | 859,460 |
| Block, Inc. Class A (a) | | 88,442 | 5,472,791 |
| MasterCard, Inc. Class A | | 47,002 | 21,795,297 |
| Toast, Inc. (a) | | 45,245 | 1,183,609 |
| Visa, Inc. Class A | | 17,650 | 4,689,076 |
| | | | 35,893,792 |
| Insurance - 0.2% | | | |
| Progressive Corp. | | 20,597 | 4,410,230 |
TOTAL FINANCIALS | | | 76,249,198 |
| HEALTH CARE - 8.5% | | | |
| Biotechnology - 1.2% | | | |
| Alnylam Pharmaceuticals, Inc. (a) | | 6,804 | 1,615,678 |
| Apogee Therapeutics, Inc. | | 6,900 | 336,030 |
| Ascendis Pharma A/S sponsored ADR (a) | | 1,781 | 237,764 |
| Legend Biotech Corp. ADR (a) | | 19,766 | 1,114,605 |
| Moderna, Inc. (a) | | 13,832 | 1,649,051 |
| Moonlake Immunotherapeutics Class A (a) | | 13,001 | 541,492 |
| Natera, Inc. (a) | | 5,421 | 555,056 |
| Regeneron Pharmaceuticals, Inc. (a) | | 15,406 | 16,626,001 |
| | | | 22,675,677 |
| Health Care Equipment & Supplies - 1.3% | | | |
| Boston Scientific Corp. (a) | | 203,436 | 15,029,852 |
| DexCom, Inc. (a) | | 2,500 | 169,550 |
| Glaukos Corp. (a) | | 5,807 | 680,406 |
| Intuitive Surgical, Inc. (a) | | 12,076 | 5,369,110 |
| Masimo Corp. (a) | | 3,818 | 408,450 |
| Stryker Corp. | | 11,126 | 3,643,209 |
| TransMedics Group, Inc. (a) | | 4,263 | 606,454 |
| | | | 25,907,031 |
| Health Care Providers & Services - 1.4% | | | |
| Hims & Hers Health, Inc. (a) | | 25,911 | 550,350 |
| McKesson Corp. | | 1,069 | 659,594 |
| Tenet Healthcare Corp. (a) | | 16,705 | 2,500,739 |
| UnitedHealth Group, Inc. | | 43,032 | 24,793,317 |
| | | | 28,504,000 |
| Life Sciences Tools & Services - 0.4% | | | |
| Danaher Corp. | | 23,327 | 6,463,445 |
| Thermo Fisher Scientific, Inc. | | 2,397 | 1,470,176 |
| | | | 7,933,621 |
| Pharmaceuticals - 4.2% | | | |
| Eli Lilly & Co. | | 70,215 | 56,471,818 |
| Merck & Co., Inc. | | 38,225 | 4,324,394 |
| Novo Nordisk A/S Series B sponsored ADR | | 82,170 | 10,898,207 |
| Teva Pharmaceutical Industries Ltd. sponsored ADR (a) | | 106,737 | 1,860,426 |
| Zoetis, Inc. Class A | | 52,605 | 9,471,004 |
| | | | 83,025,849 |
TOTAL HEALTH CARE | | | 168,046,178 |
| INDUSTRIALS - 3.9% | | | |
| Aerospace & Defense - 1.1% | | | |
| General Electric Co. | | 28,125 | 4,786,875 |
| Howmet Aerospace, Inc. | | 40,515 | 3,877,286 |
| L3Harris Technologies, Inc. | | 149 | 33,807 |
| Loar Holdings, Inc. | | 1,937 | 121,063 |
| Spirit AeroSystems Holdings, Inc. Class A (a) | | 34,625 | 1,255,156 |
| The Boeing Co. (a) | | 55,843 | 10,643,676 |
| TransDigm Group, Inc. | | 761 | 984,901 |
| | | | 21,702,764 |
| Air Freight & Logistics - 0.2% | | | |
| C.H. Robinson Worldwide, Inc. | | 10,505 | 935,470 |
| FedEx Corp. | | 7,686 | 2,323,094 |
| | | | 3,258,564 |
| Building Products - 0.1% | | | |
| Builders FirstSource, Inc. (a) | | 6,887 | 1,152,677 |
| The AZEK Co., Inc. Class A, (a) | | 14,931 | 670,253 |
| Trane Technologies PLC | | 1,731 | 578,639 |
| | | | 2,401,569 |
| Commercial Services & Supplies - 0.0% | | | |
| ACV Auctions, Inc. Class A (a) | | 62,846 | 1,073,410 |
| Construction & Engineering - 0.1% | | | |
| Comfort Systems U.S.A., Inc. | | 2 | 665 |
| EMCOR Group, Inc. | | 2,571 | 965,256 |
| Fluor Corp. (a) | | 12,977 | 624,194 |
| | | | 1,590,115 |
| Electrical Equipment - 0.3% | | | |
| Acuity Brands, Inc. | | 4,273 | 1,074,019 |
| Eaton Corp. PLC | | 7,438 | 2,267,028 |
| GE Vernova LLC | | 9,586 | 1,708,609 |
| nVent Electric PLC | | 254 | 18,448 |
| | | | 5,068,104 |
| Ground Transportation - 1.6% | | | |
| Lyft, Inc. (a) | | 734,615 | 8,852,111 |
| Uber Technologies, Inc. (a) | | 369,327 | 23,810,512 |
| | | | 32,662,623 |
| Passenger Airlines - 0.0% | | | |
| Delta Air Lines, Inc. | | 18 | 774 |
| Trading Companies & Distributors - 0.5% | | | |
| Ferguson PLC | | 7,730 | 1,721,085 |
| FTAI Aviation Ltd. | | 63,325 | 7,057,571 |
| Watsco, Inc. | | 1,132 | 554,103 |
| | | | 9,332,759 |
TOTAL INDUSTRIALS | | | 77,090,682 |
| INFORMATION TECHNOLOGY - 44.2% | | | |
| Communications Equipment - 0.1% | | | |
| Arista Networks, Inc. (a) | | 5,866 | 2,032,862 |
| Ciena Corp. (a) | | 19,965 | 1,052,954 |
| | | | 3,085,816 |
| Electronic Equipment, Instruments & Components - 0.1% | | | |
| Celestica, Inc. (a) | | 11,251 | 590,002 |
| Corning, Inc. | | 62,138 | 2,486,141 |
| | | | 3,076,143 |
| IT Services - 0.7% | | | |
| MongoDB, Inc. Class A (a) | | 8,017 | 2,023,170 |
| Okta, Inc. (a) | | 81,850 | 7,688,989 |
| Shopify, Inc. Class A (a) | | 34,327 | 2,102,409 |
| Snowflake, Inc. (a) | | 19,681 | 2,566,009 |
| | | | 14,380,577 |
| Semiconductors & Semiconductor Equipment - 21.2% | | | |
| Advanced Micro Devices, Inc. (a) | | 48,345 | 6,984,886 |
| Allegro MicroSystems LLC (a) | | 43,684 | 1,050,163 |
| Applied Materials, Inc. | | 5,374 | 1,140,363 |
| ASML Holding NV (depository receipt) | | 5,306 | 4,970,130 |
| Astera Labs, Inc. | | 96,953 | 4,250,420 |
| Broadcom, Inc. | | 68,484 | 11,004,009 |
| Enphase Energy, Inc. (a) | | 10,269 | 1,182,065 |
| First Solar, Inc. (a) | | 3,577 | 772,596 |
| GlobalFoundries, Inc. (a) | | 201,643 | 10,285,809 |
| Impinj, Inc. (a) | | 3,775 | 601,320 |
| Lam Research Corp. | | 2,773 | 2,554,599 |
| Marvell Technology, Inc. | | 345,358 | 23,132,079 |
| Micron Technology, Inc. | | 54,127 | 5,944,227 |
| Monolithic Power Systems, Inc. | | 10,873 | 9,384,378 |
| NVIDIA Corp. | | 2,303,986 | 269,612,434 |
| NXP Semiconductors NV | | 97,128 | 25,560,204 |
| ON Semiconductor Corp. (a) | | 155,793 | 12,190,802 |
| Qorvo, Inc. (a) | | 10,735 | 1,286,053 |
| Qualcomm, Inc. | | 22,050 | 3,989,948 |
| Taiwan Semiconductor Manufacturing Co. Ltd. sponsored ADR | | 95,435 | 15,823,123 |
| Teradyne, Inc. | | 46,728 | 6,128,844 |
| | | | 417,848,452 |
| Software - 10.8% | | | |
| Adobe, Inc. (a) | | 4,737 | 2,613,166 |
| AppLovin Corp. Class A, (a) | | 15,905 | 1,226,276 |
| Bill Holdings, Inc. (a) | | 10 | 500 |
| Datadog, Inc. Class A (a) | | 22,277 | 2,593,934 |
| HubSpot, Inc. (a) | | 10,700 | 5,318,221 |
| Intuit, Inc. | | 8,697 | 5,630,003 |
| Life360, Inc. | | 20,341 | 682,441 |
| Microsoft Corp. | | 427,782 | 178,962,600 |
| Onestream, Inc. | | 2,699 | 75,167 |
| Oracle Corp. | | 25,043 | 3,492,246 |
| Palantir Technologies, Inc. Class A (a) | | 32,553 | 875,350 |
| Salesforce, Inc. | | 19 | 4,917 |
| SAP SE sponsored ADR | | 5,378 | 1,137,985 |
| ServiceNow, Inc. (a) | | 7,650 | 6,230,084 |
| Synopsys, Inc. (a) | | 2,636 | 1,471,732 |
| Zoom Video Communications, Inc. Class A (a) | | 36,922 | 2,230,089 |
| | | | 212,544,711 |
| Technology Hardware, Storage & Peripherals - 11.3% | | | |
| Apple, Inc. | | 965,902 | 214,507,516 |
| Dell Technologies, Inc. | | 35,743 | 4,063,264 |
| Western Digital Corp. (a) | | 59,529 | 3,991,419 |
| | | | 222,562,199 |
TOTAL INFORMATION TECHNOLOGY | | | 873,497,898 |
| MATERIALS - 0.7% | | | |
| Chemicals - 0.1% | | | |
| Linde PLC | | 2,042 | 926,047 |
| Sherwin-Williams Co. | | 3,440 | 1,206,752 |
| | | | 2,132,799 |
| Construction Materials - 0.2% | | | |
| CRH PLC | | 6,496 | 556,707 |
| Eagle Materials, Inc. | | 4,960 | 1,350,608 |
| Martin Marietta Materials, Inc. | | 2,106 | 1,249,595 |
| Vulcan Materials Co. | | 4,605 | 1,264,119 |
| | | | 4,421,029 |
| Containers & Packaging - 0.1% | | | |
| International Paper Co. | | 12,061 | 560,595 |
| Metals & Mining - 0.3% | | | |
| ATI, Inc. (a) | | 25,115 | 1,700,537 |
| Carpenter Technology Corp. | | 21,789 | 3,178,361 |
| Freeport-McMoRan, Inc. | | 21,014 | 954,246 |
| | | | 5,833,144 |
TOTAL MATERIALS | | | 12,947,567 |
| REAL ESTATE - 0.3% | | | |
| Equity Real Estate Investment Trusts (REITs) - 0.2% | | | |
| Welltower, Inc. | | 39,079 | 4,347,539 |
| Real Estate Management & Development - 0.1% | | | |
| Zillow Group, Inc. Class C (a) | | 28,682 | 1,396,813 |
TOTAL REAL ESTATE | | | 5,744,352 |
| TOTAL COMMON STOCKS (Cost $1,503,467,418) | | | 1,972,647,212 |
| | | | |
| Money Market Funds - 0.1% |
| | | Shares | Value ($) |
State Street Institutional Treasury Plus Money Market Fund Trust Class 5.23% (b) (Cost $2,974,402) | | 2,974,402 | 2,974,402 |
| | | | |
| TOTAL INVESTMENT IN SECURITIES - 100.0% (Cost $1,506,441,820) | 1,975,621,614 |
NET OTHER ASSETS (LIABILITIES) - 0.0% | (601,453) |
| NET ASSETS - 100.0% | 1,975,020,161 |
| | |
Legend
| (b) | The rate quoted is the annualized seven-day yield of the fund at period end. |
Investment Valuation
The following is a summary of the inputs used, as of July 31, 2024, involving the Fund's assets and liabilities carried at fair value. The inputs or methodology used for valuing securities may not be an indication of the risk associated with investing in those securities. For more information on valuation inputs, and their aggregation into the levels used below, please refer to the Investment Valuation section in the accompanying Notes to Financial Statements.
| Valuation Inputs at Reporting Date: |
| Description | Total ($) | Level 1 ($) | Level 2 ($) | Level 3 ($) |
Investments in Securities: | | | | |
|
| Equities: | | | | |
Communication Services | 316,473,857 | 316,473,857 | - | - |
Consumer Discretionary | 393,896,157 | 393,896,157 | - | - |
Consumer Staples | 25,612,663 | 25,612,663 | - | - |
Energy | 23,088,660 | 23,088,660 | - | - |
Financials | 76,249,198 | 76,249,198 | - | - |
Health Care | 168,046,178 | 168,046,178 | - | - |
Industrials | 77,090,682 | 77,090,682 | - | - |
Information Technology | 873,497,898 | 873,497,898 | - | - |
Materials | 12,947,567 | 12,947,567 | - | - |
Real Estate | 5,744,352 | 5,744,352 | - | - |
|
| Money Market Funds | 2,974,402 | 2,974,402 | - | - |
| Total Investments in Securities: | 1,975,621,614 | 1,975,621,614 | - | - |
Fidelity® Blue Chip Growth ETF
Financial Statements
| Statement of Assets and Liabilities |
As of July 31, 2024 |
| Assets | | | | |
Investment in securities, at value - See accompanying schedule Unaffiliated issuers (cost $1,506,441,820): | | | $ | 1,975,621,614 |
| Foreign currency held at value (cost $156) | | | | 156 |
| Receivable for investments sold | | | | 3,507,963 |
| Receivable for fund shares sold | | | | 1,025,462 |
| Dividends receivable | | | | 268,536 |
Total assets | | | | 1,980,423,731 |
| Liabilities | | | | |
| Payable to custodian bank | $ | 2,612,722 | | |
| Payable for investments purchased | | 1,749,244 | | |
| Accrued management fee | | 986,453 | | |
| Other payables and accrued expenses | | 55,151 | | |
| Total liabilities | | | | 5,403,570 |
| Net Assets | | | $ | 1,975,020,161 |
| Net Assets consist of: | | | | |
| Paid in capital | | | $ | 1,603,441,839 |
| Total accumulated earnings (loss) | | | | 371,578,322 |
| Net Assets | | | $ | 1,975,020,161 |
Net Asset Value, offering price and redemption price per share ($1,975,020,161 ÷ 48,150,000 shares) | | | $ | 41.02 |
| Statement of Operations |
| Year ended July 31, 2024 |
| Investment Income | | | | |
| Dividends | | | $ | 6,081,881 |
| Expenses | | | | |
| Management fee | $ | 7,203,240 | | |
| Independent trustees' fees and expenses | | 4,959 | | |
| Miscellaneous | | 55,150 | | |
| Total expenses before reductions | | 7,263,349 | | |
| Expense reductions | | (21,968) | | |
| Total expenses after reductions | | | | 7,241,381 |
| Net Investment income (loss) | | | | (1,159,500) |
| Realized and Unrealized Gain (Loss) | | | | |
| Net realized gain (loss) on: | | | | |
| Investment Securities: | | | | |
| Redemptions in-kind | | 14,339,044 | | |
| Unaffiliated issuers | | (12,875,203) | | |
| Foreign currency transactions | | (1,498) | | |
| Futures contracts | | (104,397) | | |
| Total net realized gain (loss) | | | | 1,357,946 |
| Change in net unrealized appreciation (depreciation) on: | | | | |
| Investment Securities: | | | | |
| Unaffiliated issuers | | 329,820,676 | | |
| Assets and liabilities in foreign currencies | | (11) | | |
| Futures contracts | | 692 | | |
| Total change in net unrealized appreciation (depreciation) | | | | 329,821,357 |
| Net gain (loss) | | | | 331,179,303 |
| Net increase (decrease) in net assets resulting from operations | | | $ | 330,019,803 |
| Statement of Changes in Net Assets |
| |
| | Year ended July 31, 2024 | | Year ended July 31, 2023 |
| Increase (Decrease) in Net Assets | | | | |
| Operations | | | | |
| Net investment income (loss) | $ | (1,159,500) | $ | 17,382 |
| Net realized gain (loss) | | 1,357,946 | | (25,771,564) |
| Change in net unrealized appreciation (depreciation) | | 329,821,357 | | 168,911,281 |
| Net increase (decrease) in net assets resulting from operations | | 330,019,803 | | 143,157,099 |
| Distributions to shareholders | | (236,800) | | - |
| | | | | |
| Share transactions | | | | |
| Proceeds from sales of shares | | 933,997,799 | | 296,642,887 |
| Cost of shares redeemed | | (69,143,727) | | (22,813,838) |
| | | | | |
Net increase (decrease) in net assets resulting from share transactions | | 864,854,072 | | 273,829,049 |
| Total increase (decrease) in net assets | | 1,194,637,075 | | 416,986,148 |
| | | | | |
| Net Assets | | | | |
| Beginning of period | | 780,383,086 | | 363,396,938 |
| End of period | $ | 1,975,020,161 | $ | 780,383,086 |
| | | | | |
| Other Information | | | | |
| Shares | | | | |
| Sold | | 25,125,000 | | 11,300,000 |
| Redeemed | | (1,925,000) | | (925,000) |
| Net increase (decrease) | | 23,200,000 | | 10,375,000 |
| | | | | |
Financial Highlights
Fidelity® Blue Chip Growth ETF |
| |
| Years ended July 31, | | 2024 | | 2023 | | 2022 | | 2021 | | 2020 A |
Selected Per-Share Data | | | | | | | | | | |
| Net asset value, beginning of period | $ | 31.28 | $ | 24.93 | $ | 32.77 | $ | 22.74 | $ | 20.00 |
| Income from Investment Operations | | | | | | | | | | |
Net investment income (loss) B,C | | (.03) | | - D | | (.05) | | (.08) | | (.01) |
| Net realized and unrealized gain (loss) | | 9.78 | | 6.35 | | (7.79) | | 10.11 | | 2.75 |
| Total from investment operations | | 9.75 | | 6.35 | | (7.84) | | 10.03 | | 2.74 |
| Distributions from net investment income | | (.01) | | - | | - | | - D | | - |
| Total distributions | | (.01) | | - | | - | | - D | | - |
| Net asset value, end of period | $ | 41.02 | $ | 31.28 | $ | 24.93 | $ | 32.77 | $ | 22.74 |
Total Return E,F,G | | | | 25.44% | | (23.92)% | | 44.14% | | 13.68% |
Ratios to Average Net Assets C,H,I | | | | | | | | | | |
| Expenses before reductions | | .60% | | .59% | | .59% | | .59% | | .59% J |
| Expenses net of fee waivers, if any | | | | .59% | | .59% | | .59% | | .59% J |
| Expenses net of all reductions | | .59% | | .59% | | .59% | | .59% | | .59% J |
| Net investment income (loss) | | (.10)% | | -% K | | (.17)% | | (.27)% | | (.34)% J |
| Supplemental Data | | | | | | | | | | |
| Net assets, end of period (000 omitted) | $ | 1,975,020 | $ | 780,383 | $ | 363,397 | $ | 407,189 | $ | 41,494 |
Portfolio turnover rate L,M | | | | 30% | | 57% | | 63% | | 11% N |
AFor the period June 2, 2020 (commencement of operations) through July 31, 2020.
BCalculated based on average shares outstanding during the period.
CNet investment income (loss) is affected by the timing of the declaration of dividends by any underlying mutual funds or exchange-traded funds (ETFs). Net investment income (loss) of any mutual funds or ETFs is not included in the Fund's net investment income (loss) ratio.
DAmount represents less than $.005 per share.
ETotal returns for periods of less than one year are not annualized.
FTotal returns would have been lower if certain expenses had not been reduced during the applicable periods shown.
GBased on net asset value.
HFees and expenses of any underlying mutual funds or exchange-traded funds (ETFs) are not included in the Fund's expense ratio. The Fund indirectly bears its proportionate share of these expenses.
IExpense ratios reflect operating expenses of the class. Expenses before reductions do not reflect amounts reimbursed, waived, or reduced through arrangements with the investment adviser, brokerage services, or other offset arrangements, if applicable, and do not represent the amount paid by the class during periods when reimbursements, waivers or reductions occur.
JAnnualized.
KAmount represents less than .005%.
LPortfolio turnover rate excludes securities received or delivered in-kind.
MAmount does not include the portfolio activity of any underlying mutual funds or exchange-traded funds (ETFs).
NAmount not annualized.
Fidelity® Blue Chip Value ETF
Schedule of Investments July 31, 2024
Showing Percentage of Net Assets
| Common Stocks - 98.4% |
| | | Shares | Value ($) |
| COMMUNICATION SERVICES - 5.1% | | | |
| Entertainment - 2.3% | | | |
| The Walt Disney Co. | | 30,475 | 2,855,203 |
| Media - 2.8% | | | |
| Comcast Corp. Class A | | 87,046 | 3,592,388 |
TOTAL COMMUNICATION SERVICES | | | 6,447,591 |
| CONSUMER DISCRETIONARY - 4.4% | | | |
| Diversified Consumer Services - 1.8% | | | |
| H&R Block, Inc. | | 39,486 | 2,287,819 |
| Specialty Retail - 2.3% | | | |
| Lowe's Companies, Inc. | | 4,844 | 1,189,250 |
| Murphy U.S.A., Inc. | | 1,037 | 523,602 |
| Ross Stores, Inc. | | 8,354 | 1,196,543 |
| | | | 2,909,395 |
| Textiles, Apparel & Luxury Goods - 0.3% | | | |
| Tapestry, Inc. | | 8,446 | 338,600 |
TOTAL CONSUMER DISCRETIONARY | | | 5,535,814 |
| CONSUMER STAPLES - 10.4% | | | |
| Beverages - 3.8% | | | |
| Coca-Cola Europacific Partners PLC | | 12,172 | 897,928 |
| Diageo PLC sponsored ADR | | 5,706 | 711,824 |
| Keurig Dr. Pepper, Inc. | | 41,495 | 1,422,449 |
| The Coca-Cola Co. | | 24,949 | 1,665,096 |
| | | | 4,697,297 |
| Consumer Staples Distribution & Retail - 1.6% | | | |
| BJ's Wholesale Club Holdings, Inc. (a) | | 9,876 | 868,693 |
| U.S. Foods Holding Corp. (a) | | 21,175 | 1,151,708 |
| | | | 2,020,401 |
| Food Products - 1.4% | | | |
| Mondelez International, Inc. | | 13,031 | 890,669 |
| Tyson Foods, Inc. Class A | | 14,748 | 898,153 |
| | | | 1,788,822 |
| Household Products - 1.1% | | | |
| Procter & Gamble Co. | | 8,695 | 1,397,808 |
| Personal Care Products - 2.5% | | | |
| Haleon PLC ADR | | 120,320 | 1,100,928 |
| Kenvue, Inc. | | 108,773 | 2,011,213 |
| | | | 3,112,141 |
TOTAL CONSUMER STAPLES | | | 13,016,469 |
| ENERGY - 8.4% | | | |
| Oil, Gas & Consumable Fuels - 8.4% | | | |
| Antero Resources Corp. (a) | | 25,198 | 731,246 |
| Equinor ASA sponsored ADR | | 34,085 | 905,298 |
| Exxon Mobil Corp. | | 48,554 | 5,758,019 |
| Occidental Petroleum Corp. | | 14,407 | 876,234 |
| Ovintiv, Inc. | | 16,280 | 756,043 |
| Shell PLC ADR | | 20,813 | 1,523,928 |
| | | | 10,550,768 |
| FINANCIALS - 24.7% | | | |
| Banks - 12.7% | | | |
| Bank of America Corp. | | 91,519 | 3,689,131 |
| Cullen/Frost Bankers, Inc. | | 2,461 | 288,085 |
| JPMorgan Chase & Co. | | 23,873 | 5,080,174 |
| M&T Bank Corp. | | 6,985 | 1,202,607 |
| PNC Financial Services Group, Inc. | | 9,370 | 1,696,907 |
| U.S. Bancorp | | 24,836 | 1,114,640 |
| Wells Fargo & Co. | | 47,871 | 2,840,665 |
| | | | 15,912,209 |
| Capital Markets - 2.9% | | | |
| BlackRock, Inc. | | 2,826 | 2,476,989 |
| Northern Trust Corp. | | 12,458 | 1,104,402 |
| | | | 3,581,391 |
| Financial Services - 3.5% | | | |
| Apollo Global Management, Inc. | | 7,975 | 999,347 |
| Berkshire Hathaway, Inc. Class B (a) | | 7,775 | 3,409,338 |
| | | | 4,408,685 |
| Insurance - 5.6% | | | |
| Chubb Ltd. | | 7,906 | 2,179,368 |
| The Travelers Companies, Inc. | | 15,619 | 3,380,576 |
| Willis Towers Watson PLC | | 5,423 | 1,530,804 |
| | | | 7,090,748 |
TOTAL FINANCIALS | | | 30,993,033 |
| HEALTH CARE - 17.1% | | | |
| Health Care Providers & Services - 10.8% | | | |
| Centene Corp. (a) | | 36,922 | 2,840,040 |
| Cigna Group | | 10,382 | 3,619,892 |
| CVS Health Corp. | | 26,287 | 1,585,895 |
| Elevance Health, Inc. | | 3,399 | 1,808,370 |
| UnitedHealth Group, Inc. | | 6,242 | 3,596,391 |
| | | | 13,450,588 |
| Pharmaceuticals - 6.3% | | | |
| AstraZeneca PLC sponsored ADR | | 30,579 | 2,420,328 |
| Bristol-Myers Squibb Co. | | 42,615 | 2,026,769 |
| Johnson & Johnson | | 13,475 | 2,127,029 |
| Sanofi SA sponsored ADR | | 26,132 | 1,353,899 |
| | | | 7,928,025 |
TOTAL HEALTH CARE | | | 21,378,613 |
| INDUSTRIALS - 10.7% | | | |
| Aerospace & Defense - 3.4% | | | |
| L3Harris Technologies, Inc. | | 3,482 | 790,031 |
| Lockheed Martin Corp. | | 2,643 | 1,432,295 |
| Northrop Grumman Corp. | | 3,406 | 1,649,594 |
| The Boeing Co. (a) | | 1,891 | 360,425 |
| | | | 4,232,345 |
| Air Freight & Logistics - 1.2% | | | |
| C.H. Robinson Worldwide, Inc. | | 2,067 | 184,066 |
| FedEx Corp. | | 4,307 | 1,301,791 |
| | | | 1,485,857 |
| Building Products - 0.7% | | | |
| Johnson Controls International PLC | | 11,892 | 850,754 |
| Electrical Equipment - 1.0% | | | |
| GE Vernova LLC | | 1,856 | 330,813 |
| Regal Rexnord Corp. | | 6,166 | 990,753 |
| | | | 1,321,566 |
| Machinery - 3.4% | | | |
| Allison Transmission Holdings, Inc. | | 1,850 | 163,892 |
| Cummins, Inc. | | 1,428 | 416,690 |
| Deere & Co. | | 5,804 | 2,158,972 |
| Oshkosh Corp. | | 2,107 | 228,926 |
| Pentair PLC | | 14,602 | 1,283,078 |
| | | | 4,251,558 |
| Professional Services - 1.0% | | | |
| Genpact Ltd. | | 14,023 | 486,177 |
| Maximus, Inc. | | 8,279 | 769,036 |
| | | | 1,255,213 |
TOTAL INDUSTRIALS | | | 13,397,293 |
| INFORMATION TECHNOLOGY - 7.3% | | | |
| Communications Equipment - 2.1% | | | |
| Cisco Systems, Inc. | | 53,023 | 2,568,964 |
| Electronic Equipment, Instruments & Components - 0.2% | | | |
| TE Connectivity Ltd. | | 1,603 | 247,391 |
| IT Services - 2.5% | | | |
| Amdocs Ltd. | | 16,785 | 1,468,184 |
| Cognizant Technology Solutions Corp. Class A | | 22,665 | 1,715,287 |
| | | | 3,183,471 |
| Semiconductors & Semiconductor Equipment - 0.9% | | | |
| Broadcom, Inc. | | 1,380 | 221,738 |
| Micron Technology, Inc. | | 6,266 | 688,132 |
| NXP Semiconductors NV | | 813 | 213,949 |
| | | | 1,123,819 |
| Software - 1.6% | | | |
| Gen Digital, Inc. | | 63,808 | 1,658,370 |
| Open Text Corp. | | 11,042 | 348,154 |
| | | | 2,006,524 |
TOTAL INFORMATION TECHNOLOGY | | | 9,130,169 |
| MATERIALS - 2.4% | | | |
| Chemicals - 1.7% | | | |
| CF Industries Holdings, Inc. | | 15,061 | 1,150,510 |
| Nutrien Ltd. | | 19,232 | 984,678 |
| | | | 2,135,188 |
| Containers & Packaging - 0.7% | | | |
| Crown Holdings, Inc. | | 9,898 | 877,953 |
TOTAL MATERIALS | | | 3,013,141 |
| REAL ESTATE - 1.2% | | | |
| Equity Real Estate Investment Trusts (REITs) - 1.2% | | | |
| Crown Castle, Inc. | | 8,375 | 921,920 |
| Simon Property Group, Inc. | | 3,438 | 527,527 |
| | | | 1,449,447 |
| UTILITIES - 6.7% | | | |
| Electric Utilities - 4.7% | | | |
| Edison International | | 21,611 | 1,729,096 |
| NextEra Energy, Inc. | | 10,246 | 782,692 |
| PG&E Corp. | | 161,068 | 2,939,491 |
| Southern Co. | | 5,490 | 458,525 |
| | | | 5,909,804 |
| Independent Power and Renewable Electricity Producers - 0.5% | | | |
| The AES Corp. | | 36,229 | 644,514 |
| Multi-Utilities - 1.5% | | | |
| National Grid PLC sponsored ADR | | 15,011 | 967,459 |
| Sempra | | 10,741 | 859,924 |
| | | | 1,827,383 |
TOTAL UTILITIES | | | 8,381,701 |
| TOTAL COMMON STOCKS (Cost $106,038,173) | | | 123,294,039 |
| | | | |
| Money Market Funds - 1.6% |
| | | Shares | Value ($) |
State Street Institutional Treasury Plus Money Market Fund Trust Class 5.23% (b) (Cost $2,042,777) | | 2,042,777 | 2,042,777 |
| | | | |
| TOTAL INVESTMENT IN SECURITIES - 100.0% (Cost $108,080,950) | 125,336,816 |
NET OTHER ASSETS (LIABILITIES) - 0.0% | 20,468 |
| NET ASSETS - 100.0% | 125,357,284 |
| | |
Legend
| (b) | The rate quoted is the annualized seven-day yield of the fund at period end. |
Investment Valuation
The following is a summary of the inputs used, as of July 31, 2024, involving the Fund's assets and liabilities carried at fair value. The inputs or methodology used for valuing securities may not be an indication of the risk associated with investing in those securities. For more information on valuation inputs, and their aggregation into the levels used below, please refer to the Investment Valuation section in the accompanying Notes to Financial Statements.
| Valuation Inputs at Reporting Date: |
| Description | Total ($) | Level 1 ($) | Level 2 ($) | Level 3 ($) |
Investments in Securities: | | | | |
|
| Equities: | | | | |
Communication Services | 6,447,591 | 6,447,591 | - | - |
Consumer Discretionary | 5,535,814 | 5,535,814 | - | - |
Consumer Staples | 13,016,469 | 13,016,469 | - | - |
Energy | 10,550,768 | 10,550,768 | - | - |
Financials | 30,993,033 | 30,993,033 | - | - |
Health Care | 21,378,613 | 21,378,613 | - | - |
Industrials | 13,397,293 | 13,397,293 | - | - |
Information Technology | 9,130,169 | 9,130,169 | - | - |
Materials | 3,013,141 | 3,013,141 | - | - |
Real Estate | 1,449,447 | 1,449,447 | - | - |
Utilities | 8,381,701 | 8,381,701 | - | - |
|
| Money Market Funds | 2,042,777 | 2,042,777 | - | - |
| Total Investments in Securities: | 125,336,816 | 125,336,816 | - | - |
Fidelity® Blue Chip Value ETF
Financial Statements
| Statement of Assets and Liabilities |
As of July 31, 2024 |
| Assets | | | | |
Investment in securities, at value - See accompanying schedule Unaffiliated issuers (cost $108,080,950): | | | $ | 125,336,816 |
| Dividends receivable | | | | 99,461 |
Total assets | | | | 125,436,277 |
| Liabilities | | | | |
| Payable for investments purchased | $ | 9,917 | | |
| Accrued management fee | | 60,076 | | |
| Proxy fee payable | | 9,000 | | |
| Total liabilities | | | | 78,993 |
| Net Assets | | | $ | 125,357,284 |
| Net Assets consist of: | | | | |
| Paid in capital | | | $ | 110,066,185 |
| Total accumulated earnings (loss) | | | | 15,291,099 |
| Net Assets | | | $ | 125,357,284 |
Net Asset Value, offering price and redemption price per share ($125,357,284 ÷ 3,975,000 shares) | | | $ | 31.54 |
| Statement of Operations |
| Year ended July 31, 2024 |
| Investment Income | | | | |
| Dividends | | | $ | 2,943,407 |
| Expenses | | | | |
| Management fee | $ | 712,115 | | |
| Independent trustees' fees and expenses | | 596 | | |
| Miscellaneous | | 9,000 | | |
| Total expenses before reductions | | 721,711 | | |
| Expense reductions | | (5,813) | | |
| Total expenses after reductions | | | | 715,898 |
| Net Investment income (loss) | | | | 2,227,509 |
| Realized and Unrealized Gain (Loss) | | | | |
| Net realized gain (loss) on: | | | | |
| Investment Securities: | | | | |
| Redemptions in-kind | | 3,110,146 | | |
| Unaffiliated issuers | | 451,003 | | |
| Total net realized gain (loss) | | | | 3,561,149 |
| Change in net unrealized appreciation (depreciation) on investment securities | | | | 6,653,132 |
| Net gain (loss) | | | | 10,214,281 |
| Net increase (decrease) in net assets resulting from operations | | | $ | 12,441,790 |
| Statement of Changes in Net Assets |
| |
| | Year ended July 31, 2024 | | Year ended July 31, 2023 |
| Increase (Decrease) in Net Assets | | | | |
| Operations | | | | |
| Net investment income (loss) | $ | 2,227,509 | $ | 1,948,139 |
| Net realized gain (loss) | | 3,561,149 | | 2,342,593 |
| Change in net unrealized appreciation (depreciation) | | 6,653,132 | | 1,420,433 |
| Net increase (decrease) in net assets resulting from operations | | 12,441,790 | | 5,711,165 |
| Distributions to shareholders | | (2,193,525) | | (2,839,975) |
| | | | | |
| Share transactions | | | | |
| Proceeds from sales of shares | | 6,682,989 | | 32,169,213 |
| Cost of shares redeemed | | (20,072,077) | | (20,717,724) |
| | | | | |
Net increase (decrease) in net assets resulting from share transactions | | (13,389,088) | | 11,451,489 |
| Total increase (decrease) in net assets | | (3,140,823) | | 14,322,679 |
| | | | | |
| Net Assets | | | | |
| Beginning of period | | 128,498,107 | | 114,175,428 |
| End of period | $ | 125,357,284 | $ | 128,498,107 |
| | | | | |
| Other Information | | | | |
| Shares | | | | |
| Sold | | 225,000 | | 1,125,000 |
| Redeemed | | (700,000) | | (750,000) |
| Net increase (decrease) | | (475,000) | | 375,000 |
| | | | | |
Financial Highlights
Fidelity® Blue Chip Value ETF |
| |
| Years ended July 31, | | 2024 | | 2023 | | 2022 | | 2021 | | 2020 A |
Selected Per-Share Data | | | | | | | | | | |
| Net asset value, beginning of period | $ | 28.88 | $ | 28.02 | $ | 28.63 | $ | 20.23 | $ | 20.00 |
| Income from Investment Operations | | | | | | | | | | |
Net investment income (loss) B,C | | .54 | | .43 | | .39 | | .32 | | .03 |
| Net realized and unrealized gain (loss) | | 2.65 | | 1.04 | | (.03) | | 8.32 | | .21 |
| Total from investment operations | | 3.19 | | 1.47 | | .36 | | 8.64 | | .24 |
| Distributions from net investment income | | (.53) | | (.42) | | (.39) | | (.24) | | (.01) |
| Distributions from net realized gain | | - | | (.19) | | (.58) | | - | | - |
| Total distributions | | (.53) | | (.61) | | (.97) | | (.24) | | (.01) |
| Net asset value, end of period | $ | 31.54 | $ | 28.88 | $ | 28.02 | $ | 28.63 | $ | 20.23 |
Total Return D,E,F | | | | 5.35% | | 1.27% | | 42.83% | | 1.23% |
Ratios to Average Net Assets C,G,H | | | | | | | | | | |
| Expenses before reductions | | .60% | | .59% | | .59% | | .59% | | .59% I |
| Expenses net of fee waivers, if any | | | | .59% | | .59% | | .59% | | .59% I |
| Expenses net of all reductions | | .59% | | .59% | | .59% | | .58% | | .59% |
| Net investment income (loss) | | 1.84% | | 1.53% | | 1.36% | | 1.22% | | 1.02% I |
| Supplemental Data | | | | | | | | | | |
| Net assets, end of period (000 omitted) | $ | 125,357 | $ | 128,498 | $ | 114,175 | $ | 94,465 | $ | 8,093 |
Portfolio turnover rate J,K | | | | 35% | | 54% | | 97% | | 20% L |
AFor the period June 2, 2020 (commencement of operations) through July 31, 2020.
BCalculated based on average shares outstanding during the period.
CNet investment income (loss) is affected by the timing of the declaration of dividends by any underlying mutual funds or exchange-traded funds (ETFs). Net investment income (loss) of any mutual funds or ETFs is not included in the Fund's net investment income (loss) ratio.
DTotal returns for periods of less than one year are not annualized.
ETotal returns would have been lower if certain expenses had not been reduced during the applicable periods shown.
FBased on net asset value.
GFees and expenses of any underlying mutual funds or exchange-traded funds (ETFs) are not included in the Fund's expense ratio. The Fund indirectly bears its proportionate share of these expenses.
HExpense ratios reflect operating expenses of the class. Expenses before reductions do not reflect amounts reimbursed, waived, or reduced through arrangements with the investment adviser, brokerage services, or other offset arrangements, if applicable, and do not represent the amount paid by the class during periods when reimbursements, waivers or reductions occur.
IAnnualized.
JPortfolio turnover rate excludes securities received or delivered in-kind.
KAmount does not include the portfolio activity of any underlying mutual funds or exchange-traded funds (ETFs).
LAmount not annualized.
Fidelity® Fundamental Large Cap Core ETF
Schedule of Investments July 31, 2024
Showing Percentage of Net Assets
| Common Stocks - 99.4% |
| | | Shares | Value ($) |
| COMMUNICATION SERVICES - 9.8% | | | |
| Entertainment - 0.1% | | | |
| Universal Music Group NV | | 25,701 | 611,650 |
| Interactive Media & Services - 7.9% | | | |
| Alphabet, Inc. Class A | | 80,190 | 13,755,793 |
| Meta Platforms, Inc. Class A | | 35,165 | 16,697,397 |
| | | | 30,453,190 |
| Media - 1.8% | | | |
| Comcast Corp. Class A | | 168,165 | 6,940,170 |
TOTAL COMMUNICATION SERVICES | | | 38,005,010 |
| CONSUMER DISCRETIONARY - 7.4% | | | |
| Automobile Components - 0.7% | | | |
| Modine Manufacturing Co. (a) | | 21,756 | 2,559,811 |
| Broadline Retail - 3.2% | | | |
| Amazon.com, Inc. (a) | | 62,747 | 11,732,434 |
| MercadoLibre, Inc. (a) | | 277 | 462,285 |
| | | | 12,194,719 |
| Diversified Consumer Services - 0.7% | | | |
| H&R Block, Inc. | | 48,845 | 2,830,079 |
| Hotels, Restaurants & Leisure - 1.0% | | | |
| Airbnb, Inc. Class A (a) | | 8,735 | 1,219,057 |
| Hilton Worldwide Holdings, Inc. | | 8,738 | 1,875,786 |
| Marriott International, Inc. Class A | | 3,196 | 726,451 |
| | | | 3,821,294 |
| Specialty Retail - 1.8% | | | |
| Dick's Sporting Goods, Inc. | | 3,745 | 810,231 |
| Lowe's Companies, Inc. | | 16,261 | 3,992,238 |
| Williams-Sonoma, Inc. | | 14,019 | 2,168,459 |
| | | | 6,970,928 |
TOTAL CONSUMER DISCRETIONARY | | | 28,376,831 |
| CONSUMER STAPLES - 4.4% | | | |
| Beverages - 2.3% | | | |
| Diageo PLC | | 51,648 | 1,606,121 |
| Keurig Dr. Pepper, Inc. | | 110,943 | 3,803,126 |
| The Coca-Cola Co. | | 54,123 | 3,612,169 |
| | | | 9,021,416 |
| Consumer Staples Distribution & Retail - 0.7% | | | |
| Costco Wholesale Corp. | | 2,995 | 2,461,890 |
| Personal Care Products - 1.4% | | | |
| Haleon PLC | | 315,307 | 1,417,079 |
| Kenvue, Inc. | | 217,293 | 4,017,748 |
| | | | 5,434,827 |
TOTAL CONSUMER STAPLES | | | 16,918,133 |
| ENERGY - 5.4% | | | |
| Energy Equipment & Services - 0.1% | | | |
| Tidewater, Inc. (a) | | 3,322 | 328,745 |
| Oil, Gas & Consumable Fuels - 5.3% | | | |
| Antero Resources Corp. (a) | | 82,213 | 2,385,821 |
| Canadian Natural Resources Ltd. | | 28,185 | 1,000,004 |
| Exxon Mobil Corp. | | 102,077 | 12,105,311 |
| Imperial Oil Ltd. | | 5,933 | 425,041 |
| Shell PLC ADR | | 64,964 | 4,756,664 |
| | | | 20,672,841 |
TOTAL ENERGY | | | 21,001,586 |
| FINANCIALS - 12.5% | | | |
| Banks - 7.1% | | | |
| Bank of America Corp. | | 234,092 | 9,436,249 |
| JPMorgan Chase & Co. | | 9,441 | 2,009,045 |
| PNC Financial Services Group, Inc. | | 22,747 | 4,119,482 |
| U.S. Bancorp | | 85,490 | 3,836,791 |
| Wells Fargo & Co. | | 133,438 | 7,918,211 |
| | | | 27,319,778 |
| Capital Markets - 0.1% | | | |
| Moody's Corp. | | 1,128 | 514,909 |
| Financial Services - 3.0% | | | |
| Apollo Global Management, Inc. | | 12,343 | 1,546,701 |
| Fiserv, Inc. (a) | | 30,963 | 5,064,618 |
| Global Payments, Inc. | | 5,963 | 606,079 |
| MasterCard, Inc. Class A | | 1,580 | 732,662 |
| Visa, Inc. Class A | | 13,651 | 3,626,661 |
| | | | 11,576,721 |
| Insurance - 2.3% | | | |
| Arthur J. Gallagher & Co. | | 4,718 | 1,337,506 |
| Chubb Ltd. | | 9,298 | 2,563,087 |
| Marsh & McLennan Companies, Inc. | | 6,716 | 1,494,780 |
| The Travelers Companies, Inc. | | 15,471 | 3,348,543 |
| | | | 8,743,916 |
TOTAL FINANCIALS | | | 48,155,324 |
| HEALTH CARE - 12.6% | | | |
| Biotechnology - 1.4% | | | |
| AbbVie, Inc. | | 12,782 | 2,368,760 |
| Regeneron Pharmaceuticals, Inc. (a) | | 2,993 | 3,230,016 |
| | | | 5,598,776 |
| Health Care Equipment & Supplies - 1.3% | | | |
| Boston Scientific Corp. (a) | | 66,707 | 4,928,313 |
| Health Care Providers & Services - 4.4% | | | |
| Cencora, Inc. | | 6,935 | 1,649,698 |
| Cigna Group | | 15,482 | 5,398,109 |
| CVS Health Corp. | | 10,638 | 641,791 |
| Elevance Health, Inc. | | 5,001 | 2,660,682 |
| Humana, Inc. | | 1,067 | 385,838 |
| UnitedHealth Group, Inc. | | 10,909 | 6,285,329 |
| | | | 17,021,447 |
| Life Sciences Tools & Services - 1.3% | | | |
| Thermo Fisher Scientific, Inc. | | 7,952 | 4,877,280 |
| Pharmaceuticals - 4.2% | | | |
| Bristol-Myers Squibb Co. | | 100,700 | 4,789,292 |
| Eli Lilly & Co. | | 7,422 | 5,969,292 |
| GSK PLC sponsored ADR | | 30,448 | 1,180,469 |
| Novo Nordisk A/S Series B sponsored ADR | | 9,475 | 1,256,669 |
| Royalty Pharma PLC | | 111,893 | 3,152,026 |
| | | | 16,347,748 |
TOTAL HEALTH CARE | | | 48,773,564 |
| INDUSTRIALS - 11.7% | | | |
| Aerospace & Defense - 3.4% | | | |
| General Dynamics Corp. | | 5,261 | 1,571,513 |
| General Electric Co. | | 35,492 | 6,040,738 |
| Northrop Grumman Corp. | | 2,004 | 970,577 |
| Spirit AeroSystems Holdings, Inc. Class A (a) | | 24,110 | 873,988 |
| The Boeing Co. (a) | | 19,660 | 3,747,196 |
| | | | 13,204,012 |
| Air Freight & Logistics - 1.5% | | | |
| FedEx Corp. | | 8,798 | 2,659,196 |
| United Parcel Service, Inc. Class B | | 23,631 | 3,080,773 |
| | | | 5,739,969 |
| Commercial Services & Supplies - 0.3% | | | |
| GFL Environmental, Inc. | | 27,032 | 1,048,857 |
| Construction & Engineering - 0.4% | | | |
| Quanta Services, Inc. | | 6,238 | 1,655,440 |
| Electrical Equipment - 2.5% | | | |
| Eaton Corp. PLC | | 12,837 | 3,912,589 |
| GE Vernova LLC | | 12,505 | 2,228,891 |
| nVent Electric PLC | | 7,758 | 563,464 |
| Vertiv Holdings Co. | | 36,657 | 2,884,906 |
| | | | 9,589,850 |
| Ground Transportation - 1.2% | | | |
| Knight-Swift Transportation Holdings, Inc. | | 45,628 | 2,483,532 |
| Uber Technologies, Inc. (a) | | 33,542 | 2,162,453 |
| | | | 4,645,985 |
| Machinery - 0.8% | | | |
| Allison Transmission Holdings, Inc. | | 33,316 | 2,951,464 |
| Professional Services - 0.2% | | | |
| KBR, Inc. | | 13,281 | 884,382 |
| Trading Companies & Distributors - 1.4% | | | |
| United Rentals, Inc. | | 4,437 | 3,359,253 |
| Watsco, Inc. | | 4,387 | 2,147,393 |
| | | | 5,506,646 |
TOTAL INDUSTRIALS | | | 45,226,605 |
| INFORMATION TECHNOLOGY - 29.3% | | | |
| Communications Equipment - 1.1% | | | |
| Cisco Systems, Inc. | | 85,705 | 4,152,407 |
| Electronic Equipment, Instruments & Components - 0.7% | | | |
| Amphenol Corp. Class A | | 46,172 | 2,967,013 |
| IT Services - 0.7% | | | |
| Amdocs Ltd. | | 30,173 | 2,639,232 |
| Semiconductors & Semiconductor Equipment - 11.7% | | | |
| ASML Holding NV (depository receipt) | | 4,106 | 3,846,090 |
| Broadcom, Inc. | | 47,711 | 7,666,203 |
| Marvell Technology, Inc. | | 1,199 | 80,309 |
| Micron Technology, Inc. | | 40,743 | 4,474,396 |
| NVIDIA Corp. | | 206,247 | 24,135,024 |
| NXP Semiconductors NV | | 4,274 | 1,124,746 |
| Taiwan Semiconductor Manufacturing Co. Ltd. sponsored ADR | | 23,310 | 3,864,798 |
| | | | 45,191,566 |
| Software - 11.1% | | | |
| Gen Digital, Inc. | | 56,278 | 1,462,665 |
| Intuit, Inc. | | 6,747 | 4,367,670 |
| Microsoft Corp. | | 70,032 | 29,297,889 |
| Oracle Corp. | | 23,614 | 3,292,972 |
| SAP SE sponsored ADR | | 20,834 | 4,408,474 |
| | | | 42,829,670 |
| Technology Hardware, Storage & Peripherals - 4.0% | | | |
| Apple, Inc. | | 69,691 | 15,476,977 |
TOTAL INFORMATION TECHNOLOGY | | | 113,256,865 |
| MATERIALS - 1.2% | | | |
| Chemicals - 0.1% | | | |
| Linde PLC | | 1,151 | 521,979 |
| Construction Materials - 0.2% | | | |
| Martin Marietta Materials, Inc. | | 1,112 | 659,805 |
| Metals & Mining - 0.9% | | | |
| First Quantum Minerals Ltd. | | 93,443 | 1,143,799 |
| Freeport-McMoRan, Inc. | | 34,787 | 1,579,678 |
| Glencore PLC | | 140,237 | 774,851 |
| | | | 3,498,328 |
TOTAL MATERIALS | | | 4,680,112 |
| REAL ESTATE - 1.1% | | | |
| Equity Real Estate Investment Trusts (REITs) - 1.1% | | | |
| American Tower Corp. | | 7,628 | 1,681,211 |
| Crown Castle, Inc. | | 21,505 | 2,367,270 |
| Simon Property Group, Inc. | | 1,616 | 247,959 |
| | | | 4,296,440 |
| UTILITIES - 4.0% | | | |
| Electric Utilities - 4.0% | | | |
| Constellation Energy Corp. | | 17,040 | 3,234,192 |
| Edison International | | 62,339 | 4,987,743 |
| Southern Co. | | 83,705 | 6,991,042 |
| | | | 15,212,977 |
| TOTAL COMMON STOCKS (Cost $330,680,021) | | | 383,903,447 |
| | | | |
| Money Market Funds - 0.6% |
| | | Shares | Value ($) |
Fidelity Cash Central Fund 5.39% (b) (Cost $2,286,023) | | 2,285,566 | 2,286,023 |
| | | | |
| TOTAL INVESTMENT IN SECURITIES - 100.0% (Cost $332,966,044) | 386,189,470 |
NET OTHER ASSETS (LIABILITIES) - 0.0% | 155,160 |
| NET ASSETS - 100.0% | 386,344,630 |
| | |
Legend
| (b) | Affiliated fund that is generally available only to investment companies and other accounts managed by Fidelity Investments. The rate quoted is the annualized seven-day yield of the fund at period end. A complete unaudited listing of the fund's holdings as of its most recent quarter end is available upon request. In addition, each Fidelity Central Fund's financial statements, which are not covered by the Fund's Report of Independent Registered Public Accounting Firm, are available on the SEC's website or upon request. |
Affiliated Central Funds
Fiscal year to date information regarding the Fund's investments in Fidelity Central Funds, including the ownership percentage, is presented below.
| Affiliate | Value, beginning of period ($) | Purchases ($) | Sales Proceeds ($) | Dividend Income ($) | Realized Gain (loss) ($) | Change in Unrealized appreciation (depreciation) ($) | Value, end of period ($) | % ownership, end of period |
| Fidelity Cash Central Fund 5.39% | - | 97,142,359 | 94,856,332 | 88,677 | (4) | - | 2,286,023 | 0.0% |
| Total | - | 97,142,359 | 94,856,332 | 88,677 | (4) | - | 2,286,023 | |
| | | | | | | | | |
Amounts in the dividend income column in the above table include any capital gain distributions from underlying funds, which are presented in the corresponding line item in the Statement of Operations, if applicable.
Amounts included in the purchases and sales proceeds columns may include in-kind transactions, if applicable.
Investment Valuation
The following is a summary of the inputs used, as of July 31, 2024, involving the Fund's assets and liabilities carried at fair value. The inputs or methodology used for valuing securities may not be an indication of the risk associated with investing in those securities. For more information on valuation inputs, and their aggregation into the levels used below, please refer to the Investment Valuation section in the accompanying Notes to Financial Statements.
| Valuation Inputs at Reporting Date: |
| Description | Total ($) | Level 1 ($) | Level 2 ($) | Level 3 ($) |
Investments in Securities: | | | | |
|
| Equities: | | | | |
Communication Services | 38,005,010 | 38,005,010 | - | - |
Consumer Discretionary | 28,376,831 | 28,376,831 | - | - |
Consumer Staples | 16,918,133 | 16,918,133 | - | - |
Energy | 21,001,586 | 21,001,586 | - | - |
Financials | 48,155,324 | 48,155,324 | - | - |
Health Care | 48,773,564 | 48,773,564 | - | - |
Industrials | 45,226,605 | 45,226,605 | - | - |
Information Technology | 113,256,865 | 113,256,865 | - | - |
Materials | 4,680,112 | 4,680,112 | - | - |
Real Estate | 4,296,440 | 4,296,440 | - | - |
Utilities | 15,212,977 | 15,212,977 | - | - |
|
| Money Market Funds | 2,286,023 | 2,286,023 | - | - |
| Total Investments in Securities: | 386,189,470 | 386,189,470 | - | - |
Fidelity® Fundamental Large Cap Core ETF
Financial Statements
| Statement of Assets and Liabilities |
As of July 31, 2024 |
| Assets | | | | |
| Investment in securities, at value - See accompanying schedule: | | | | |
Unaffiliated issuers (cost $330,680,021) | $ | 383,903,447 | | |
Fidelity Central Funds (cost $2,286,023) | | 2,286,023 | | |
| | | | | |
| | | | | |
| Total Investment in Securities (cost $332,966,044) | | | $ | 386,189,470 |
| Foreign currency held at value (cost $1) | | | | 1 |
| Receivable for fund shares sold | | | | 1,091,367 |
| Dividends receivable | | | | 182,612 |
| Distributions receivable from Fidelity Central Funds | | | | 26,214 |
Total assets | | | | 387,489,664 |
| Liabilities | | | | |
| Payable for investments purchased | $ | 1,011,116 | | |
| Accrued management fee | | 119,518 | | |
| Other payables and accrued expenses | | 14,400 | | |
| Total liabilities | | | | 1,145,034 |
| Net Assets | | | $ | 386,344,630 |
| Net Assets consist of: | | | | |
| Paid in capital | | | $ | 337,116,542 |
| Total accumulated earnings (loss) | | | | 49,228,088 |
| Net Assets | | | $ | 386,344,630 |
Net Asset Value, offering price and redemption price per share ($386,344,630 ÷ 8,850,000 shares) | | | $ | 43.65 |
| Statement of Operations |
| Year ended July 31, 2024 |
| Investment Income | | | | |
| Dividends | | | $ | 2,693,083 |
| Income from Fidelity Central Funds | | | | 88,677 |
| Total income | | | | 2,781,760 |
| Expenses | | | | |
| Management fee | $ | 982,378 | | |
| Independent trustees' fees and expenses | | 828 | | |
| Miscellaneous | | 14,397 | | |
| Total expenses before reductions | | 997,603 | | |
| Expense reductions | | (8,446) | | |
| Total expenses after reductions | | | | 989,157 |
| Net Investment income (loss) | | | | 1,792,603 |
| Realized and Unrealized Gain (Loss) | | | | |
| Net realized gain (loss) on: | | | | |
| Investment Securities: | | | | |
| Unaffiliated issuers | | (1,459,939) | | |
| Redemptions in-kind | | 23,001,644 | | |
| Fidelity Central Funds | | (4) | | |
| Foreign currency transactions | | (2,022) | | |
| Futures contracts | | 913,965 | | |
| Total net realized gain (loss) | | | | 22,453,644 |
| Change in net unrealized appreciation (depreciation) on: | | | | |
| Investment Securities: | | | | |
| Unaffiliated issuers | | 33,456,245 | | |
| Assets and liabilities in foreign currencies | | (14) | | |
| Total change in net unrealized appreciation (depreciation) | | | | 33,456,231 |
| Net gain (loss) | | | | 55,909,875 |
| Net increase (decrease) in net assets resulting from operations | | | $ | 57,702,478 |
| Statement of Changes in Net Assets |
| |
| | Year ended July 31, 2024 | | Year ended July 31, 2023 |
| Increase (Decrease) in Net Assets | | | | |
| Operations | | | | |
| Net investment income (loss) | $ | 1,792,603 | $ | 825,760 |
| Net realized gain (loss) | | 22,453,644 | | 4,126,321 |
| Change in net unrealized appreciation (depreciation) | | 33,456,231 | | 13,991,450 |
| Net increase (decrease) in net assets resulting from operations | | 57,702,478 | | 18,943,531 |
| Distributions to shareholders | | (1,533,800) | | (1,058,225) |
| | | | | |
| Share transactions | | | | |
| Proceeds from sales of shares | | 303,260,878 | | 63,669,740 |
| Cost of shares redeemed | | (81,007,492) | | (29,908,118) |
| | | | | |
Net increase (decrease) in net assets resulting from share transactions | | 222,253,386 | | 33,761,622 |
| Total increase (decrease) in net assets | | 278,422,064 | | 51,646,928 |
| | | | | |
| Net Assets | | | | |
| Beginning of period | | 107,922,566 | | 56,275,638 |
| End of period | $ | 386,344,630 | $ | 107,922,566 |
| | | | | |
| Other Information | | | | |
| Shares | | | | |
| Sold | | 7,725,000 | | 2,150,000 |
| Redeemed | | (2,000,000) | | (975,000) |
| Net increase (decrease) | | 5,725,000 | | 1,175,000 |
| | | | | |
Financial Highlights
Fidelity® Fundamental Large Cap Core ETF |
| |
| Years ended July 31, | | 2024 | | 2023 | | 2022 | | 2021 | | 2020 A |
Selected Per-Share Data | | | | | | | | | | |
| Net asset value, beginning of period | $ | 34.54 | $ | 28.86 | $ | 29.11 | $ | 20.37 | $ | 20.00 |
| Income from Investment Operations | | | | | | | | | | |
Net investment income (loss) B,C | | .33 | | .30 | | .40 | | .36 | | .03 |
| Net realized and unrealized gain (loss) | | 9.03 | | 5.78 | | (.12) | | 8.75 | | .36 |
| Total from investment operations | | 9.36 | | 6.08 | | .28 | | 9.11 | | .39 |
| Distributions from net investment income | | (.25) | | (.33) | | (.53) | | (.37) | | (.02) |
| Distributions from net realized gain | | - | | (.07) | | - | | - | | - |
| Total distributions | | (.25) | | (.40) | | (.53) | | (.37) | | (.02) |
| Net asset value, end of period | $ | 43.65 | $ | 34.54 | $ | 28.86 | $ | 29.11 | $ | 20.37 |
Total Return D,E,F | | | | 21.36% | | 1.00% | | 45.03% | | 1.95% |
Ratios to Average Net Assets C,G,H | | | | | | | | | | |
| Expenses before reductions | | .47% | | .59% | | .59% | | .59% | | .59% I |
| Expenses net of fee waivers, if any | | | | .59% | | .59% | | .59% | | .59% I |
| Expenses net of all reductions | | .47% | | .59% | | .59% | | .58% | | .59% I |
| Net investment income (loss) | | .85% | | .99% | | 1.36% | | 1.33% | | 1.00% I |
| Supplemental Data | | | | | | | | | | |
| Net assets, end of period (000 omitted) | $ | 386,345 | $ | 107,923 | $ | 56,276 | $ | 60,407 | $ | 6,112 |
Portfolio turnover rate J,K | | | | 76% | | 36% | | 68% | | 10% L |
AFor the period June 2, 2020 (commencement of operations) through July 31, 2020.
BCalculated based on average shares outstanding during the period.
CNet investment income (loss) is affected by the timing of the declaration of dividends by any underlying mutual funds or exchange-traded funds (ETFs). Net investment income (loss) of any mutual funds or ETFs is not included in the Fund's net investment income (loss) ratio.
DTotal returns for periods of less than one year are not annualized.
ETotal returns would have been lower if certain expenses had not been reduced during the applicable periods shown.
FBased on net asset value.
GFees and expenses of any underlying mutual funds or exchange-traded funds (ETFs) are not included in the Fund's expense ratio. The Fund indirectly bears its proportionate share of these expenses.
HExpense ratios reflect operating expenses of the class. Expenses before reductions do not reflect amounts reimbursed, waived, or reduced through arrangements with the investment adviser, brokerage services, or other offset arrangements, if applicable, and do not represent the amount paid by the class during periods when reimbursements, waivers or reductions occur.
IAnnualized.
JPortfolio turnover rate excludes securities received or delivered in-kind.
KAmount does not include the portfolio activity of any underlying mutual funds or exchange-traded funds (ETFs).
LAmount not annualized.
Fidelity® Fundamental Large Cap Growth ETF
Schedule of Investments July 31, 2024
Showing Percentage of Net Assets
| Common Stocks - 99.8% |
| | | Shares | Value ($) |
| COMMUNICATION SERVICES - 15.5% | | | |
| Entertainment - 2.4% | | | |
| Netflix, Inc. (a) | | 9,392 | 5,901,463 |
| Roku, Inc. Class A (a) | | 16,655 | 969,488 |
| Sea Ltd. ADR Class A (a) | | 11,760 | 772,632 |
| | | | 7,643,583 |
| Interactive Media & Services - 12.3% | | | |
| Alphabet, Inc.: | | | |
| Class A | | 49,363 | 8,467,729 |
| Class C | | 79,804 | 13,818,063 |
| Meta Platforms, Inc. Class A | | 30,856 | 14,651,354 |
| Reddit, Inc. Class A (b) | | 5,918 | 360,110 |
| Snap, Inc. Class A (a) | | 127,827 | 1,702,656 |
| | | | 38,999,912 |
| Wireless Telecommunication Services - 0.8% | | | |
| T-Mobile U.S., Inc. | | 14,115 | 2,572,882 |
TOTAL COMMUNICATION SERVICES | | | 49,216,377 |
| CONSUMER DISCRETIONARY - 14.0% | | | |
| Automobiles - 0.2% | | | |
| Rivian Automotive, Inc. (a) | | 41,771 | 685,462 |
| Broadline Retail - 7.6% | | | |
| Amazon.com, Inc. (a) | | 126,301 | 23,615,761 |
| PDD Holdings, Inc. ADR (a) | | 4,434 | 571,498 |
| | | | 24,187,259 |
| Hotels, Restaurants & Leisure - 0.9% | | | |
| Airbnb, Inc. Class A (a) | | 13,482 | 1,881,548 |
| Domino's Pizza, Inc. | | 2,544 | 1,090,613 |
| | | | 2,972,161 |
| Household Durables - 0.7% | | | |
| TopBuild Corp. (a) | | 4,749 | 2,272,586 |
| Specialty Retail - 3.2% | | | |
| Carvana Co. Class A (a) | | 8,620 | 1,148,443 |
| Dick's Sporting Goods, Inc. | | 3,627 | 784,701 |
| Lowe's Companies, Inc. | | 19,121 | 4,694,397 |
| RH (a) | | 4,758 | 1,380,201 |
| TJX Companies, Inc. | | 17,694 | 1,999,776 |
| Wayfair LLC Class A (a) | | 1,821 | 99,117 |
| | | | 10,106,635 |
| Textiles, Apparel & Luxury Goods - 1.4% | | | |
| lululemon athletica, Inc. (a) | | 9,745 | 2,520,642 |
| LVMH Moet Hennessy Louis Vuitton SE | | 2,564 | 1,812,003 |
| | | | 4,332,645 |
TOTAL CONSUMER DISCRETIONARY | | | 44,556,748 |
| CONSUMER STAPLES - 2.0% | | | |
| Beverages - 1.2% | | | |
| Celsius Holdings, Inc. (a) | | 9,779 | 457,951 |
| Keurig Dr. Pepper, Inc. | | 48,496 | 1,662,443 |
| Monster Beverage Corp. (a) | | 33,017 | 1,698,725 |
| | | | 3,819,119 |
| Consumer Staples Distribution & Retail - 0.5% | | | |
| Target Corp. | | 1,565 | 235,392 |
| Walmart, Inc. | | 20,164 | 1,384,057 |
| | | | 1,619,449 |
| Tobacco - 0.3% | | | |
| Philip Morris International, Inc. | | 6,478 | 746,006 |
TOTAL CONSUMER STAPLES | | | 6,184,574 |
| ENERGY - 1.0% | | | |
| Oil, Gas & Consumable Fuels - 1.0% | | | |
| Exxon Mobil Corp. | | 15,067 | 1,786,796 |
| Range Resources Corp. | | 20,304 | 634,094 |
| Reliance Industries Ltd. GDR (c) | | 11,348 | 818,191 |
| | | | 3,239,081 |
| FINANCIALS - 3.4% | | | |
| Capital Markets - 1.0% | | | |
| Ares Management Corp. Class A, | | 5,058 | 774,886 |
| Coinbase Global, Inc. (a) | | 7,567 | 1,697,732 |
| Robinhood Markets, Inc. (a) | | 36,130 | 743,194 |
| | | | 3,215,812 |
| Financial Services - 2.4% | | | |
| Block, Inc. Class A (a) | | 4,666 | 288,732 |
| Flywire Corp. (a) | | 64,949 | 1,189,216 |
| MasterCard, Inc. Class A | | 13,060 | 6,056,053 |
| | | | 7,534,001 |
TOTAL FINANCIALS | | | 10,749,813 |
| HEALTH CARE - 9.8% | | | |
| Biotechnology - 2.5% | | | |
| Alnylam Pharmaceuticals, Inc. (a) | | 8,082 | 1,919,152 |
| Argenx SE ADR (a) | | 1,457 | 751,623 |
| Ideaya Biosciences, Inc. (a) | | 8,997 | 387,321 |
| Ionis Pharmaceuticals, Inc. (a) | | 13,062 | 646,047 |
| Legend Biotech Corp. ADR (a) | | 2,663 | 150,167 |
| Moderna, Inc. (a) | | 6,530 | 778,507 |
| Nuvalent, Inc. Class A (a) | | 5,230 | 418,086 |
| Regeneron Pharmaceuticals, Inc. (a) | | 1,866 | 2,013,769 |
| Roivant Sciences Ltd. (a) | | 29,146 | 316,234 |
| Vaxcyte, Inc. (a) | | 6,954 | 548,601 |
| | | | 7,929,507 |
| Health Care Equipment & Supplies - 2.3% | | | |
| Boston Scientific Corp. (a) | | 67,887 | 5,015,492 |
| DexCom, Inc. (a) | | 7,408 | 502,411 |
| Insulet Corp. (a) | | 5,907 | 1,148,025 |
| TransMedics Group, Inc. (a) | | 4,479 | 637,183 |
| | | | 7,303,111 |
| Health Care Providers & Services - 1.0% | | | |
| HealthEquity, Inc. (a) | | 13,449 | 1,055,478 |
| UnitedHealth Group, Inc. | | 3,483 | 2,006,765 |
| | | | 3,062,243 |
| Life Sciences Tools & Services - 1.7% | | | |
| Bruker Corp. | | 17,435 | 1,194,472 |
| Danaher Corp. | | 8,071 | 2,236,313 |
| Thermo Fisher Scientific, Inc. | | 3,033 | 1,860,260 |
| | | | 5,291,045 |
| Pharmaceuticals - 2.3% | | | |
| Eli Lilly & Co. | | 5,460 | 4,391,314 |
| Intra-Cellular Therapies, Inc. (a) | | 9,735 | 766,339 |
| Novo Nordisk A/S Series B sponsored ADR | | 10,661 | 1,413,968 |
| Teva Pharmaceutical Industries Ltd. sponsored ADR (a) | | 43,775 | 762,998 |
| | | | 7,334,619 |
TOTAL HEALTH CARE | | | 30,920,525 |
| INDUSTRIALS - 7.2% | | | |
| Aerospace & Defense - 1.3% | | | |
| General Electric Co. | | 15,787 | 2,686,947 |
| Howmet Aerospace, Inc. | | 16,488 | 1,577,902 |
| | | | 4,264,849 |
| Construction & Engineering - 1.4% | | | |
| Comfort Systems U.S.A., Inc. | | 6,131 | 2,038,067 |
| EMCOR Group, Inc. | | 6,152 | 2,309,707 |
| | | | 4,347,774 |
| Electrical Equipment - 2.3% | | | |
| Eaton Corp. PLC | | 12,161 | 3,706,551 |
| GE Vernova LLC | | 5,657 | 1,008,304 |
| Vertiv Holdings Co. | | 32,316 | 2,543,269 |
| | | | 7,258,124 |
| Ground Transportation - 2.2% | | | |
| Lyft, Inc. (a) | | 46,811 | 564,073 |
| Uber Technologies, Inc. (a) | | 97,395 | 6,279,056 |
| | | | 6,843,129 |
TOTAL INDUSTRIALS | | | 22,713,876 |
| INFORMATION TECHNOLOGY - 46.0% | | | |
| Electronic Equipment, Instruments & Components - 0.7% | | | |
| Flex Ltd. (a) | | 68,364 | 2,197,903 |
| IT Services - 0.8% | | | |
| MongoDB, Inc. Class A (a) | | 6,265 | 1,581,035 |
| Shopify, Inc. Class A (a) | | 17,821 | 1,091,474 |
| | | | 2,672,509 |
| Semiconductors & Semiconductor Equipment - 21.9% | | | |
| ASML Holding NV (depository receipt) | | 5,171 | 4,843,676 |
| Broadcom, Inc. | | 5,750 | 923,910 |
| First Solar, Inc. (a) | | 4,341 | 937,613 |
| Marvell Technology, Inc. | | 32,158 | 2,153,943 |
| Micron Technology, Inc. | | 23,355 | 2,564,846 |
| Monolithic Power Systems, Inc. | | 3,026 | 2,611,710 |
| NVIDIA Corp. | | 353,142 | 41,324,670 |
| NXP Semiconductors NV | | 19,038 | 5,010,040 |
| ON Semiconductor Corp. (a) | | 34,695 | 2,714,884 |
| Taiwan Semiconductor Manufacturing Co. Ltd. sponsored ADR | | 37,341 | 6,191,138 |
| | | | 69,276,430 |
| Software - 12.9% | | | |
| Cadence Design Systems, Inc. (a) | | 10,497 | 2,809,627 |
| HubSpot, Inc. (a) | | 4,302 | 2,138,223 |
| Microsoft Corp. | | 79,766 | 33,370,106 |
| Salesforce, Inc. | | 10,255 | 2,653,994 |
| | | | 40,971,950 |
| Technology Hardware, Storage & Peripherals - 9.7% | | | |
| Apple, Inc. | | 138,936 | 30,854,907 |
TOTAL INFORMATION TECHNOLOGY | | | 145,973,699 |
| MATERIALS - 0.2% | | | |
| Metals & Mining - 0.2% | | | |
| Freeport-McMoRan, Inc. | | 17,282 | 784,776 |
| REAL ESTATE - 0.4% | | | |
| Real Estate Management & Development - 0.4% | | | |
| CoStar Group, Inc. (a) | | 17,243 | 1,345,299 |
| UTILITIES - 0.3% | | | |
| Independent Power and Renewable Electricity Producers - 0.3% | | | |
| Vistra Corp. | | 10,034 | 794,893 |
| TOTAL COMMON STOCKS (Cost $237,254,975) | | | 316,479,661 |
| | | | |
| Money Market Funds - 0.2% |
| | | Shares | Value ($) |
| Fidelity Cash Central Fund 5.39% (d) | | 679,998 | 680,134 |
| Fidelity Securities Lending Cash Central Fund 5.39% (d)(e) | | 71,693 | 71,700 |
| TOTAL MONEY MARKET FUNDS (Cost $751,834) | | | 751,834 |
| | | | |
| TOTAL INVESTMENT IN SECURITIES - 100.0% (Cost $238,006,809) | 317,231,495 |
NET OTHER ASSETS (LIABILITIES) - 0.0% | (100,993) |
| NET ASSETS - 100.0% | 317,130,502 |
| | |
Legend
| (b) | Security or a portion of the security is on loan at period end. |
| (c) | Security exempt from registration under Rule 144A of the Securities Act of 1933. These securities may be resold in transactions exempt from registration, normally to qualified institutional buyers. At the end of the period, the value of these securities amounted to $818,191 or 0.3% of net assets. |
| (d) | Affiliated fund that is generally available only to investment companies and other accounts managed by Fidelity Investments. The rate quoted is the annualized seven-day yield of the fund at period end. A complete unaudited listing of the fund's holdings as of its most recent quarter end is available upon request. In addition, each Fidelity Central Fund's financial statements, which are not covered by the Fund's Report of Independent Registered Public Accounting Firm, are available on the SEC's website or upon request. |
| (e) | Investment made with cash collateral received from securities on loan. |
Affiliated Central Funds
Fiscal year to date information regarding the Fund's investments in Fidelity Central Funds, including the ownership percentage, is presented below.
| Affiliate | Value, beginning of period ($) | Purchases ($) | Sales Proceeds ($) | Dividend Income ($) | Realized Gain (loss) ($) | Change in Unrealized appreciation (depreciation) ($) | Value, end of period ($) | % ownership, end of period |
| Fidelity Cash Central Fund 5.39% | - | 69,390,554 | 68,710,424 | 39,042 | 4 | - | 680,134 | 0.0% |
| Fidelity Securities Lending Cash Central Fund 5.39% | - | 538,772 | 467,072 | 18 | - | - | 71,700 | 0.0% |
| Total | - | 69,929,326 | 69,177,496 | 39,060 | 4 | - | 751,834 | |
| | | | | | | | | |
Amounts in the dividend income column in the above table include any capital gain distributions from underlying funds, which are presented in the corresponding line item in the Statement of Operations, if applicable.
Amounts in the dividend income column for Fidelity Securities Lending Cash Central Fund represents the income earned on investing cash collateral, less rebates paid to borrowers and any lending agent fees associated with the loan, plus any premium payments received for lending certain types of securities.
Amounts included in the purchases and sales proceeds columns may include in-kind transactions, if applicable.
Investment Valuation
The following is a summary of the inputs used, as of July 31, 2024, involving the Fund's assets and liabilities carried at fair value. The inputs or methodology used for valuing securities may not be an indication of the risk associated with investing in those securities. For more information on valuation inputs, and their aggregation into the levels used below, please refer to the Investment Valuation section in the accompanying Notes to Financial Statements.
| Valuation Inputs at Reporting Date: |
| Description | Total ($) | Level 1 ($) | Level 2 ($) | Level 3 ($) |
Investments in Securities: | | | | |
|
| Equities: | | | | |
Communication Services | 49,216,377 | 49,216,377 | - | - |
Consumer Discretionary | 44,556,748 | 44,556,748 | - | - |
Consumer Staples | 6,184,574 | 6,184,574 | - | - |
Energy | 3,239,081 | 3,239,081 | - | - |
Financials | 10,749,813 | 10,749,813 | - | - |
Health Care | 30,920,525 | 30,920,525 | - | - |
Industrials | 22,713,876 | 22,713,876 | - | - |
Information Technology | 145,973,699 | 145,973,699 | - | - |
Materials | 784,776 | 784,776 | - | - |
Real Estate | 1,345,299 | 1,345,299 | - | - |
Utilities | 794,893 | 794,893 | - | - |
|
| Money Market Funds | 751,834 | 751,834 | - | - |
| Total Investments in Securities: | 317,231,495 | 317,231,495 | - | - |
Fidelity® Fundamental Large Cap Growth ETF
Financial Statements
| Statement of Assets and Liabilities |
As of July 31, 2024 |
| Assets | | | | |
| Investment in securities, at value (including securities loaned of $73,020) - See accompanying schedule: | | | | |
Unaffiliated issuers (cost $237,254,975) | $ | 316,479,661 | | |
Fidelity Central Funds (cost $751,834) | | 751,834 | | |
| | | | | |
| | | | | |
| Total Investment in Securities (cost $238,006,809) | | | $ | 317,231,495 |
| Cash | | | | 30,225 |
| Foreign currency held at value (cost $24) | | | | 24 |
| Dividends receivable | | | | 51,753 |
| Distributions receivable from Fidelity Central Funds | | | | 4,708 |
Total assets | | | | 317,318,205 |
| Liabilities | | | | |
| Accrued management fee | $ | 104,484 | | |
| Proxy fee payable | | 11,519 | | |
| Collateral on securities loaned | | 71,700 | | |
| Total liabilities | | | | 187,703 |
| Net Assets | | | $ | 317,130,502 |
| Net Assets consist of: | | | | |
| Paid in capital | | | $ | 260,140,111 |
| Total accumulated earnings (loss) | | | | 56,990,391 |
| Net Assets | | | $ | 317,130,502 |
Net Asset Value, offering price and redemption price per share ($317,130,502 ÷ 13,800,000 shares) | | | $ | 22.98 |
| Statement of Operations |
| Year ended July 31, 2024 |
| Investment Income | | | | |
| Dividends | | | $ | 1,040,123 |
| Income from Fidelity Central Funds (including $18 from security lending) | | | | 39,060 |
| Total income | | | | 1,079,183 |
| Expenses | | | | |
| Management fee | $ | 1,192,982 | | |
| Independent trustees' fees and expenses | | 1,088 | | |
| Miscellaneous | | 11,519 | | |
| Total expenses before reductions | | 1,205,589 | | |
| Expense reductions | | (4,819) | | |
| Total expenses after reductions | | | | 1,200,770 |
| Net Investment income (loss) | | | | (121,587) |
| Realized and Unrealized Gain (Loss) | | | | |
| Net realized gain (loss) on: | | | | |
| Investment Securities: | | | | |
| Unaffiliated issuers | | (1,833,358) | | |
| Redemptions in-kind | | 29,757,468 | | |
| Fidelity Central Funds | | 4 | | |
| Foreign currency transactions | | 1,715 | | |
| Futures contracts | | 713,548 | | |
| Total net realized gain (loss) | | | | 28,639,377 |
| Change in net unrealized appreciation (depreciation) on: | | | | |
| Investment Securities: | | | | |
| Unaffiliated issuers | | 37,218,587 | | |
| Assets and liabilities in foreign currencies | | 72 | | |
| Total change in net unrealized appreciation (depreciation) | | | | 37,218,659 |
| Net gain (loss) | | | | 65,858,036 |
| Net increase (decrease) in net assets resulting from operations | | | $ | 65,736,449 |
| Statement of Changes in Net Assets |
| |
| | Year ended July 31, 2024 | | Year ended July 31, 2023 |
| Increase (Decrease) in Net Assets | | | | |
| Operations | | | | |
| Net investment income (loss) | $ | (121,587) | $ | (76,527) |
| Net realized gain (loss) | | 28,639,377 | | (3,369,028) |
| Change in net unrealized appreciation (depreciation) | | 37,218,659 | | 44,562,111 |
| Net increase (decrease) in net assets resulting from operations | | 65,736,449 | | 41,116,556 |
| | | | | |
| Share transactions | | | | |
| Proceeds from sales of shares | | 135,430,154 | | 118,430,789 |
| Cost of shares redeemed | | (79,135,184) | | (26,758,280) |
| | | | | |
Net increase (decrease) in net assets resulting from share transactions | | 56,294,970 | | 91,672,509 |
| Total increase (decrease) in net assets | | 122,031,419 | | 132,789,065 |
| | | | | |
| Net Assets | | | | |
| Beginning of period | | 195,099,083 | | 62,310,018 |
| End of period | $ | 317,130,502 | $ | 195,099,083 |
| | | | | |
| Other Information | | | | |
| Shares | | | | |
| Sold | | 6,600,000 | | 8,550,000 |
| Redeemed | | (3,675,000) | | (1,975,000) |
| Net increase (decrease) | | 2,925,000 | | 6,575,000 |
| | | | | |
Financial Highlights
Fidelity® Fundamental Large Cap Growth ETF |
| |
| Years ended July 31, | | 2024 | | 2023 | | 2022 | | 2021 A |
Selected Per-Share Data | | | | | | | | |
| Net asset value, beginning of period | $ | 17.94 | $ | 14.49 | $ | 21.16 | $ | 20.00 |
| Income from Investment Operations | | | | | | | | |
Net investment income (loss) B,C | | (.01) | | (.01) | | (.03) | | (.03) |
| Net realized and unrealized gain (loss) | | 5.05 | | 3.46 | | (6.64) | | 1.19 |
| Total from investment operations | | 5.04 | | 3.45 | | (6.67) | | 1.16 |
| Net asset value, end of period | $ | 22.98 | $ | 17.94 | $ | 14.49 | $ | 21.16 |
Total Return D,E,F | | | | 23.80% | | (31.53)% | | 5.82% |
Ratios to Average Net Assets C,G,H | | | | | | | | |
| Expenses before reductions | | .49% | | .59% | | .59% | | .59% I |
| Expenses net of fee waivers, if any | | | | .59% | | .59% | | .59% I |
| Expenses net of all reductions | | .48% | | .59% | | .59% | | .59% I |
| Net investment income (loss) | | (.05)% | | (.07)% | | (.19)% | | (.33)% I |
| Supplemental Data | | | | | | | | |
| Net assets, end of period (000 omitted) | $ | 317,131 | $ | 195,099 | $ | 62,310 | $ | 39,679 |
Portfolio turnover rate J,K | | | | 78% | | 99% | | 49% L |
AFor the period February 2, 2021 (commencement of operations) through July 31, 2021.
BCalculated based on average shares outstanding during the period.
CNet investment income (loss) is affected by the timing of the declaration of dividends by any underlying mutual funds or exchange-traded funds (ETFs). Net investment income (loss) of any mutual funds or ETFs is not included in the Fund's net investment income (loss) ratio.
DTotal returns for periods of less than one year are not annualized.
ETotal returns would have been lower if certain expenses had not been reduced during the applicable periods shown.
FBased on net asset value.
GFees and expenses of any underlying mutual funds or exchange-traded funds (ETFs) are not included in the Fund's expense ratio. The Fund indirectly bears its proportionate share of these expenses. For additional expense information related to investments in Fidelity Central Funds, please refer to the "Investments in Fidelity Central Funds" note found in the Notes to Financial Statements section of the most recent Annual or Semi-Annual report.
HExpense ratios reflect operating expenses of the class. Expenses before reductions do not reflect amounts reimbursed, waived, or reduced through arrangements with the investment adviser, brokerage services, or other offset arrangements, if applicable, and do not represent the amount paid by the class during periods when reimbursements, waivers or reductions occur.
IAnnualized.
JAmount does not include the portfolio activity of any underlying mutual funds or exchange-traded funds (ETFs).
KPortfolio turnover rate excludes securities received or delivered in-kind.
LAmount not annualized.
Fidelity® Fundamental Large Cap Value ETF
Schedule of Investments July 31, 2024
Showing Percentage of Net Assets
| Common Stocks - 99.5% |
| | | Shares | Value ($) |
| COMMUNICATION SERVICES - 3.8% | | | |
| Diversified Telecommunication Services - 0.8% | | | |
| Cellnex Telecom SA (a) | | 388 | 13,513 |
| Media - 3.0% | | | |
| Comcast Corp. Class A | | 895 | 36,937 |
| Interpublic Group of Companies, Inc. | | 211 | 6,788 |
| Nexstar Media Group, Inc. | | 19 | 3,511 |
| | | | 47,236 |
TOTAL COMMUNICATION SERVICES | | | 60,749 |
| CONSUMER DISCRETIONARY - 4.5% | | | |
| Automobile Components - 0.4% | | | |
| Aptiv PLC (b) | | 91 | 6,314 |
| Automobiles - 0.3% | | | |
| Harley-Davidson, Inc. | | 130 | 4,875 |
| Diversified Consumer Services - 0.3% | | | |
| H&R Block, Inc. | | 76 | 4,403 |
| Household Durables - 0.6% | | | |
| Tempur Sealy International, Inc. | | 204 | 10,679 |
| Leisure Products - 0.9% | | | |
| BRP, Inc. | | 82 | 5,941 |
| Brunswick Corp. | | 115 | 9,367 |
| | | | 15,308 |
| Specialty Retail - 1.8% | | | |
| Advance Auto Parts, Inc. | | 78 | 4,940 |
| Lithia Motors, Inc. Class A (sub. vtg.) | | 25 | 6,908 |
| Lowe's Companies, Inc. | | 38 | 9,329 |
| Signet Jewelers Ltd. | | 39 | 3,281 |
| Upbound Group, Inc. | | 109 | 4,113 |
| | | | 28,571 |
| Textiles, Apparel & Luxury Goods - 0.2% | | | |
| Tapestry, Inc. | | 67 | 2,686 |
TOTAL CONSUMER DISCRETIONARY | | | 72,836 |
| CONSUMER STAPLES - 7.5% | | | |
| Beverages - 1.4% | | | |
| Keurig Dr. Pepper, Inc. | | 374 | 12,821 |
| The Coca-Cola Co. | | 137 | 9,143 |
| | | | 21,964 |
| Consumer Staples Distribution & Retail - 1.5% | | | |
| U.S. Foods Holding Corp. (b) | | 438 | 23,823 |
| Food Products - 2.5% | | | |
| Bunge Global SA | | 38 | 3,999 |
| Darling Ingredients, Inc. (b) | | 125 | 4,966 |
| Lamb Weston Holdings, Inc. | | 173 | 10,383 |
| The J.M. Smucker Co. | | 169 | 19,934 |
| | | | 39,282 |
| Personal Care Products - 1.9% | | | |
| Kenvue, Inc. | | 1,691 | 31,267 |
| Tobacco - 0.2% | | | |
| Philip Morris International, Inc. | | 30 | 3,455 |
TOTAL CONSUMER STAPLES | | | 119,791 |
| ENERGY - 10.1% | | | |
| Oil, Gas & Consumable Fuels - 10.1% | | | |
| Antero Resources Corp. (b) | | 110 | 3,192 |
| Canadian Natural Resources Ltd. | | 888 | 31,528 |
| Cenovus Energy, Inc. (Canada) | | 335 | 6,750 |
| Exxon Mobil Corp. | | 613 | 72,694 |
| Shell PLC ADR | | 469 | 34,340 |
| Targa Resources Corp. | | 99 | 13,393 |
| | | | 161,897 |
| FINANCIALS - 23.7% | | | |
| Banks - 10.7% | | | |
| Bank of America Corp. | | 932 | 37,569 |
| East West Bancorp, Inc. | | 24 | 2,109 |
| First Citizens Bancshares, Inc. Class B | | 1 | 1,905 |
| JPMorgan Chase & Co. | | 328 | 69,798 |
| KeyCorp | | 519 | 8,371 |
| Webster Financial Corp. | | 36 | 1,786 |
| Wells Fargo & Co. | | 834 | 49,490 |
| | | | 171,028 |
| Capital Markets - 1.6% | | | |
| Carlyle Group LP | | 180 | 8,953 |
| Raymond James Financial, Inc. | | 140 | 16,240 |
| | | | 25,193 |
| Consumer Finance - 1.0% | | | |
| Ally Financial, Inc. | | 193 | 8,687 |
| OneMain Holdings, Inc. | | 74 | 3,867 |
| SLM Corp. | | 196 | 4,447 |
| | | | 17,001 |
| Financial Services - 2.8% | | | |
| Apollo Global Management, Inc. | | 175 | 21,929 |
| Berkshire Hathaway, Inc. Class B (b) | | 38 | 16,663 |
| Global Payments, Inc. | | 70 | 7,115 |
| | | | 45,707 |
| Insurance - 7.6% | | | |
| American Financial Group, Inc. | | 106 | 13,882 |
| Chubb Ltd. | | 44 | 12,129 |
| First American Financial Corp. | | 100 | 6,058 |
| Hartford Financial Services Group, Inc. | | 376 | 41,706 |
| Old Republic International Corp. | | 348 | 12,048 |
| The Travelers Companies, Inc. | | 163 | 35,280 |
| | | | 121,103 |
TOTAL FINANCIALS | | | 380,032 |
| HEALTH CARE - 13.4% | | | |
| Health Care Providers & Services - 8.9% | | | |
| Cencora, Inc. | | 59 | 14,035 |
| Centene Corp. (b) | | 199 | 15,307 |
| Cigna Group | | 73 | 25,453 |
| CVS Health Corp. | | 320 | 19,306 |
| Elevance Health, Inc. | | 59 | 31,390 |
| Molina Healthcare, Inc. (b) | | 6 | 2,048 |
| UnitedHealth Group, Inc. | | 62 | 35,722 |
| | | | 143,261 |
| Life Sciences Tools & Services - 0.1% | | | |
| Fortrea Holdings, Inc. (b) | | 41 | 1,131 |
| Pharmaceuticals - 4.4% | | | |
| AstraZeneca PLC sponsored ADR | | 221 | 17,492 |
| Johnson & Johnson | | 206 | 32,517 |
| Merck & Co., Inc. | | 125 | 14,141 |
| Roche Holding AG (participation certificate) | | 9 | 2,930 |
| Sanofi SA sponsored ADR | | 52 | 2,694 |
| | | | 69,774 |
TOTAL HEALTH CARE | | | 214,166 |
| INDUSTRIALS - 14.2% | | | |
| Aerospace & Defense - 0.7% | | | |
| Lockheed Martin Corp. | | 20 | 10,838 |
| Air Freight & Logistics - 1.7% | | | |
| FedEx Corp. | | 90 | 27,203 |
| Building Products - 2.3% | | | |
| Johnson Controls International PLC | | 411 | 29,403 |
| UFP Industries, Inc. | | 56 | 7,388 |
| | | | 36,791 |
| Commercial Services & Supplies - 0.8% | | | |
| The Brink's Co. | | 87 | 9,569 |
| Vestis Corp. | | 273 | 3,541 |
| | | | 13,110 |
| Construction & Engineering - 0.9% | | | |
| Fluor Corp. (b) | | 228 | 10,967 |
| MDU Resources Group, Inc. | | 161 | 4,337 |
| | | | 15,304 |
| Electrical Equipment - 0.7% | | | |
| Regal Rexnord Corp. | | 69 | 11,087 |
| Ground Transportation - 1.4% | | | |
| U-Haul Holding Co. (b) | | 192 | 12,824 |
| XPO, Inc. (b) | | 81 | 9,306 |
| | | | 22,130 |
| Machinery - 3.4% | | | |
| Allison Transmission Holdings, Inc. | | 250 | 22,148 |
| Atmus Filtration Technologies, Inc. | | 216 | 6,661 |
| Gates Industrial Corp. PLC (b) | | 330 | 6,135 |
| Terex Corp. | | 53 | 3,353 |
| Timken Co. | | 183 | 15,912 |
| | | | 54,209 |
| Professional Services - 0.9% | | | |
| Concentrix Corp. | | 152 | 10,716 |
| Genpact Ltd. | | 122 | 4,230 |
| | | | 14,946 |
| Trading Companies & Distributors - 1.4% | | | |
| GMS, Inc. (b) | | 77 | 7,410 |
| Herc Holdings, Inc. | | 33 | 5,143 |
| WESCO International, Inc. | | 53 | 9,272 |
| | | | 21,825 |
TOTAL INDUSTRIALS | | | 227,443 |
| INFORMATION TECHNOLOGY - 9.2% | | | |
| Communications Equipment - 4.0% | | | |
| Ciena Corp. (b) | | 68 | 3,586 |
| Cisco Systems, Inc. | | 1,150 | 55,718 |
| Lumentum Holdings, Inc. (b) | | 90 | 4,660 |
| | | | 63,964 |
| Electronic Equipment, Instruments & Components - 0.6% | | | |
| TD SYNNEX Corp. | | 82 | 9,772 |
| IT Services - 1.5% | | | |
| Amdocs Ltd. | | 154 | 13,470 |
| GoDaddy, Inc. (b) | | 77 | 11,200 |
| | | | 24,670 |
| Semiconductors & Semiconductor Equipment - 1.8% | | | |
| Microchip Technology, Inc. | | 170 | 15,093 |
| Taiwan Semiconductor Manufacturing Co. Ltd. sponsored ADR | | 83 | 13,761 |
| | | | 28,854 |
| Software - 0.8% | | | |
| Gen Digital, Inc. | | 513 | 13,333 |
| Technology Hardware, Storage & Peripherals - 0.5% | | | |
| HP, Inc. | | 208 | 7,507 |
TOTAL INFORMATION TECHNOLOGY | | | 148,100 |
| MATERIALS - 3.3% | | | |
| Chemicals - 1.6% | | | |
| Olin Corp. | | 115 | 5,245 |
| The Chemours Co. LLC | | 203 | 4,907 |
| Westlake Corp. | | 109 | 16,117 |
| | | | 26,269 |
| Containers & Packaging - 1.3% | | | |
| Graphic Packaging Holding Co. | | 435 | 13,094 |
| Smurfit Westrock PLC | | 168 | 7,533 |
| | | | 20,627 |
| Paper & Forest Products - 0.4% | | | |
| Louisiana-Pacific Corp. | | 59 | 5,791 |
TOTAL MATERIALS | | | 52,687 |
| REAL ESTATE - 4.3% | | | |
| Equity Real Estate Investment Trusts (REITs) - 4.1% | | | |
| Camden Property Trust (SBI) | | 41 | 4,541 |
| Crown Castle, Inc. | | 20 | 2,202 |
| Prologis, Inc. | | 211 | 26,597 |
| Public Storage Operating Co. | | 35 | 10,357 |
| Welltower, Inc. | | 190 | 21,138 |
| | | | 64,835 |
| Real Estate Management & Development - 0.2% | | | |
| Compass, Inc. (b) | | 744 | 3,266 |
TOTAL REAL ESTATE | | | 68,101 |
| UTILITIES - 5.5% | | | |
| Electric Utilities - 3.6% | | | |
| Constellation Energy Corp. | | 44 | 8,351 |
| Edison International | | 317 | 25,363 |
| PG&E Corp. | | 1,311 | 23,926 |
| | | | 57,640 |
| Independent Power and Renewable Electricity Producers - 1.0% | | | |
| The AES Corp. | | 482 | 8,575 |
| Vistra Corp. | | 93 | 7,367 |
| | | | 15,942 |
| Multi-Utilities - 0.9% | | | |
| Sempra | | 179 | 14,331 |
TOTAL UTILITIES | | | 87,913 |
| TOTAL COMMON STOCKS (Cost $1,500,969) | | | 1,593,715 |
| | | | |
| TOTAL INVESTMENT IN SECURITIES - 99.5% (Cost $1,500,969) | 1,593,715 |
NET OTHER ASSETS (LIABILITIES) - 0.5% | 7,796 |
| NET ASSETS - 100.0% | 1,601,511 |
| | |
Legend
| (a) | Security exempt from registration under Rule 144A of the Securities Act of 1933. These securities may be resold in transactions exempt from registration, normally to qualified institutional buyers. At the end of the period, the value of these securities amounted to $13,513 or 0.8% of net assets. |
Affiliated Central Funds
Fiscal year to date information regarding the Fund's investments in Fidelity Central Funds, including the ownership percentage, is presented below.
| Affiliate | Value, beginning of period ($) | Purchases ($) | Sales Proceeds ($) | Dividend Income ($) | Realized Gain (loss) ($) | Change in Unrealized appreciation (depreciation) ($) | Value, end of period ($) | % ownership, end of period |
| Fidelity Cash Central Fund 5.39% | - | 53,844 | 53,844 | 20 | - | - | - | 0.0% |
| Total | - | 53,844 | 53,844 | 20 | - | - | - | |
| | | | | | | | | |
Amounts in the dividend income column in the above table include any capital gain distributions from underlying funds, which are presented in the corresponding line item in the Statement of Operations, if applicable.
Amounts included in the purchases and sales proceeds columns may include in-kind transactions, if applicable.
Investment Valuation
The following is a summary of the inputs used, as of July 31, 2024, involving the Fund's assets and liabilities carried at fair value. The inputs or methodology used for valuing securities may not be an indication of the risk associated with investing in those securities. For more information on valuation inputs, and their aggregation into the levels used below, please refer to the Investment Valuation section in the accompanying Notes to Financial Statements.
| Valuation Inputs at Reporting Date: |
| Description | Total ($) | Level 1 ($) | Level 2 ($) | Level 3 ($) |
Investments in Securities: | | | | |
|
| Equities: | | | | |
Communication Services | 60,749 | 60,749 | - | - |
Consumer Discretionary | 72,836 | 72,836 | - | - |
Consumer Staples | 119,791 | 119,791 | - | - |
Energy | 161,897 | 161,897 | - | - |
Financials | 380,032 | 380,032 | - | - |
Health Care | 214,166 | 214,166 | - | - |
Industrials | 227,443 | 227,443 | - | - |
Information Technology | 148,100 | 148,100 | - | - |
Materials | 52,687 | 52,687 | - | - |
Real Estate | 68,101 | 68,101 | - | - |
Utilities | 87,913 | 87,913 | - | - |
| | | | | |
| Total Investments in Securities: | 1,593,715 | 1,593,715 | - | - |
Fidelity® Fundamental Large Cap Value ETF
Financial Statements
| Statement of Assets and Liabilities |
As of July 31, 2024 |
| Assets | | | | |
Investment in securities, at value - See accompanying schedule Unaffiliated issuers (cost $1,500,969): | | | $ | 1,593,715 |
| Cash | | | | 8,106 |
| Foreign currency held at value (cost $2) | | | | 2 |
| Dividends receivable | | | | 424 |
| Distributions receivable from Fidelity Central Funds | | | | 2 |
Total assets | | | | 1,602,249 |
| Liabilities | | | | |
| Accrued management fee | $ | 498 | | |
| Proxy fee payable | | 240 | | |
| Total liabilities | | | | 738 |
| Net Assets | | | $ | 1,601,511 |
| Net Assets consist of: | | | | |
| Paid in capital | | | $ | 1,507,654 |
| Total accumulated earnings (loss) | | | | 93,857 |
| Net Assets | | | $ | 1,601,511 |
Net Asset Value, offering price and redemption price per share ($1,601,511 ÷ 75,000 shares) | | | $ | 21.35 |
| Statement of Operations |
| For the period February 22, 2024 (commencement of operations) through July 31, 2024 |
| Investment Income | | | | |
| Dividends | | | $ | 12,614 |
| Income from Fidelity Central Funds | | | | 20 |
| Total income | | | | 12,634 |
| Expenses | | | | |
| Management fee | $ | 2,281 | | |
| Independent trustees' fees and expenses | | 2 | | |
| Proxy fee | | 240 | | |
| Total expenses before reductions | | 2,523 | | |
| Expense reductions | | (228) | | |
| Total expenses after reductions | | | | 2,295 |
| Net Investment income (loss) | | | | 10,339 |
| Realized and Unrealized Gain (Loss) | | | | |
| Net realized gain (loss) on: | | | | |
| Investment Securities: | | | | |
| Unaffiliated issuers | | (411) | | |
| Foreign currency transactions | | 7 | | |
| Total net realized gain (loss) | | | | (404) |
| Change in net unrealized appreciation (depreciation) on investment securities | | | | 92,746 |
| Net gain (loss) | | | | 92,342 |
| Net increase (decrease) in net assets resulting from operations | | | $ | 102,681 |
| Statement of Changes in Net Assets |
| |
| | For the period February 22, 2024 (commencement of operations) through July 31, 2024 |
| Increase (Decrease) in Net Assets | | |
| Operations | | |
| Net investment income (loss) | $ | 10,339 |
| Net realized gain (loss) | | (404) |
| Change in net unrealized appreciation (depreciation) | | 92,746 |
| Net increase (decrease) in net assets resulting from operations | | 102,681 |
| Distributions to shareholders | | (8,825) |
| | | |
| Share transactions | | |
| Proceeds from sales of shares | | 1,507,655 |
| | | |
Net increase (decrease) in net assets resulting from share transactions | | 1,507,655 |
| Total increase (decrease) in net assets | | 1,601,511 |
| | | |
| Net Assets | | |
| Beginning of period | | - |
| End of period | $ | 1,601,511 |
| | | |
| Other Information | | |
| Shares | | |
| Sold | | 75,000 |
| Net increase (decrease) | | 75,000 |
| | | |
Financial Highlights
Fidelity® Fundamental Large Cap Value ETF |
| |
| Years ended July 31, | | 2024 A |
Selected Per-Share Data | | |
| Net asset value, beginning of period | $ | 20.13 |
| Income from Investment Operations | | |
Net investment income (loss) B,C | | .16 |
| Net realized and unrealized gain (loss) | | 1.19 |
| Total from investment operations | | 1.35 |
| Distributions from net investment income | | (.13) |
| Total distributions | | (.13) |
| Net asset value, end of period | $ | 21.35 |
Total Return D,E,F | | |
Ratios to Average Net Assets C,G,H | | |
| Expenses before reductions | | .40% I,J |
| Expenses net of fee waivers, if any | | |
| Expenses net of all reductions | | .38% I,J |
| Net investment income (loss) | | 1.72% I,J |
| Supplemental Data | | |
| Net assets, end of period (000 omitted) | $ | 1,602 |
Portfolio turnover rate K | | |
AFor the period February 22, 2024 (commencement of operations) through July 31, 2024.
BCalculated based on average shares outstanding during the period.
CNet investment income (loss) is affected by the timing of the declaration of dividends by any underlying mutual funds or exchange-traded funds (ETFs). Net investment income (loss) of any mutual funds or ETFs is not included in the Fund's net investment income (loss) ratio.
DTotal returns for periods of less than one year are not annualized.
ETotal returns would have been lower if certain expenses had not been reduced during the applicable periods shown.
FBased on net asset value.
GFees and expenses of any underlying mutual funds or exchange-traded funds (ETFs) are not included in the Fund's expense ratio. The Fund indirectly bears its proportionate share of these expenses. For additional expense information related to investments in Fidelity Central Funds, please refer to the "Investments in Fidelity Central Funds" note found in the Notes to Financial Statements section of the most recent Annual or Semi-Annual report.
HExpense ratios reflect operating expenses of the class. Expenses before reductions do not reflect amounts reimbursed, waived, or reduced through arrangements with the investment adviser, brokerage services, or other offset arrangements, if applicable, and do not represent the amount paid by the class during periods when reimbursements, waivers or reductions occur.
IAnnualized.
JProxy expenses are not annualized.
KAmount does not include the portfolio activity of any underlying mutual funds or exchange-traded funds (ETFs).
LAmount not annualized.
MPortfolio turnover rate excludes securities received or delivered in-kind.
Fidelity® Fundamental Small-Mid Cap ETF
Schedule of Investments July 31, 2024
Showing Percentage of Net Assets
| Common Stocks - 99.0% |
| | | Shares | Value ($) |
| COMMUNICATION SERVICES - 0.8% | | | |
| Media - 0.8% | | | |
| Nexstar Media Group, Inc. | | 3,504 | 647,504 |
| CONSUMER DISCRETIONARY - 13.7% | | | |
| Automobile Components - 0.8% | | | |
| LCI Industries | | 1,899 | 221,594 |
| Lear Corp. | | 2,177 | 265,681 |
| Patrick Industries, Inc. | | 1,087 | 139,201 |
| | | | 626,476 |
| Diversified Consumer Services - 0.3% | | | |
| Laureate Education, Inc. | | 13,952 | 216,256 |
| Hotels, Restaurants & Leisure - 1.0% | | | |
| Brinker International, Inc. (a) | | 4,674 | 312,270 |
| Churchill Downs, Inc. | | 3,040 | 436,422 |
| | | | 748,692 |
| Household Durables - 3.0% | | | |
| Helen of Troy Ltd. (a) | | 1,420 | 83,936 |
| KB Home | | 5,684 | 489,279 |
| SharkNinja, Inc. | | 7,819 | 600,890 |
| Tempur Sealy International, Inc. | | 20,553 | 1,075,950 |
| | | | 2,250,055 |
| Leisure Products - 1.0% | | | |
| BRP, Inc. | | 3,022 | 218,853 |
| Brunswick Corp. | | 6,922 | 563,797 |
| | | | 782,650 |
| Specialty Retail - 5.6% | | | |
| Academy Sports & Outdoors, Inc. | | 7,534 | 407,363 |
| Advance Auto Parts, Inc. | | 3,000 | 189,990 |
| AutoZone, Inc. (a) | | 342 | 1,071,722 |
| Boot Barn Holdings, Inc. (a) | | 4,147 | 553,542 |
| Dick's Sporting Goods, Inc. | | 3,104 | 671,550 |
| Murphy U.S.A., Inc. | | 2,116 | 1,068,411 |
| Upbound Group, Inc. | | 7,290 | 275,052 |
| | | | 4,237,630 |
| Textiles, Apparel & Luxury Goods - 2.0% | | | |
| Crocs, Inc. (a) | | 6,499 | 873,271 |
| Gildan Activewear, Inc. | | 6,025 | 245,037 |
| PVH Corp. | | 3,924 | 400,209 |
| | | | 1,518,517 |
TOTAL CONSUMER DISCRETIONARY | | | 10,380,276 |
| CONSUMER STAPLES - 4.3% | | | |
| Consumer Staples Distribution & Retail - 3.4% | | | |
| BJ's Wholesale Club Holdings, Inc. (a) | | 11,277 | 991,925 |
| Performance Food Group Co. (a) | | 11,299 | 779,631 |
| U.S. Foods Holding Corp. (a) | | 14,534 | 790,504 |
| | | | 2,562,060 |
| Food Products - 0.9% | | | |
| Lamb Weston Holdings, Inc. | | 4,755 | 285,395 |
| Nomad Foods Ltd. | | 19,418 | 371,078 |
| | | | 656,473 |
TOTAL CONSUMER STAPLES | | | 3,218,533 |
| ENERGY - 6.8% | | | |
| Energy Equipment & Services - 4.1% | | | |
| Cactus, Inc. | | 12,905 | 814,564 |
| Championx Corp. | | 8,923 | 305,702 |
| Expro Group Holdings NV (a) | | 6,289 | 146,031 |
| Liberty Energy, Inc. Class A | | 23,860 | 576,219 |
| TechnipFMC PLC | | 42,720 | 1,260,242 |
| | | | 3,102,758 |
| Oil, Gas & Consumable Fuels - 2.7% | | | |
| Antero Resources Corp. (a) | | 33,859 | 982,588 |
| Cheniere Energy, Inc. | | 3,872 | 707,182 |
| Northern Oil & Gas, Inc. | | 6,516 | 281,426 |
| Sitio Royalties Corp. | | 2,147 | 52,279 |
| | | | 2,023,475 |
TOTAL ENERGY | | | 5,126,233 |
| FINANCIALS - 16.3% | | | |
| Banks - 6.4% | | | |
| BOK Financial Corp. | | 3,428 | 352,536 |
| Cadence Bank | | 14,666 | 482,071 |
| Eastern Bankshares, Inc. | | 23,396 | 389,309 |
| First Bancorp, Puerto Rico | | 12,736 | 273,187 |
| First Citizens Bancshares, Inc. | | 267 | 557,413 |
| First Interstate Bancsystem, Inc. | | 9,878 | 311,848 |
| Independent Bank Group, Inc. | | 3,912 | 231,043 |
| M&T Bank Corp. | | 1,299 | 223,649 |
| Pinnacle Financial Partners, Inc. | | 5,669 | 546,038 |
| Synovus Financial Corp. | | 11,941 | 558,242 |
| Trico Bancshares | | 1,453 | 67,608 |
| Webster Financial Corp. | | 9,228 | 457,893 |
| Wintrust Financial Corp. | | 3,690 | 399,258 |
| | | | 4,850,095 |
| Capital Markets - 2.3% | | | |
| Houlihan Lokey | | 3,404 | 511,451 |
| LPL Financial | | 2,173 | 481,363 |
| Raymond James Financial, Inc. | | 3,186 | 369,576 |
| Stifel Financial Corp. | | 4,384 | 388,729 |
| | | | 1,751,119 |
| Consumer Finance - 1.6% | | | |
| Discover Financial Services | | 4,873 | 701,663 |
| FirstCash Holdings, Inc. | | 4,650 | 518,940 |
| | | | 1,220,603 |
| Insurance - 6.0% | | | |
| American Financial Group, Inc. | | 2,820 | 369,307 |
| Arch Capital Group Ltd. (a) | | 9,849 | 943,337 |
| Assurant, Inc. | | 3,463 | 605,575 |
| Enstar Group Ltd. (a) | | 795 | 257,898 |
| First American Financial Corp. | | 8,945 | 541,888 |
| Old Republic International Corp. | | 20,758 | 718,642 |
| Primerica, Inc. | | 1,775 | 446,892 |
| Reinsurance Group of America, Inc. | | 2,671 | 602,124 |
| | | | 4,485,663 |
TOTAL FINANCIALS | | | 12,307,480 |
| HEALTH CARE - 10.6% | | | |
| Biotechnology - 2.7% | | | |
| ALX Oncology Holdings, Inc. (a) | | 258 | 1,238 |
| AnaptysBio, Inc. (a) | | 2,453 | 85,463 |
| Arcellx, Inc. (a) | | 1,768 | 109,280 |
| Argenx SE ADR (a) | | 577 | 297,657 |
| Astria Therapeutics, Inc. (a) | | 6,812 | 79,564 |
| Autolus Therapeutics PLC ADR (a) | | 16,338 | 76,625 |
| Cargo Therapeutics, Inc. | | 2,644 | 45,027 |
| Celldex Therapeutics, Inc. (a) | | 2,368 | 90,244 |
| Crinetics Pharmaceuticals, Inc. (a) | | 2,807 | 149,108 |
| Cytokinetics, Inc. (a) | | 2,580 | 152,246 |
| Keros Therapeutics, Inc. (a) | | 244 | 12,239 |
| Madrigal Pharmaceuticals, Inc. (a) | | 553 | 157,417 |
| Merus BV (a) | | 1,169 | 62,004 |
| Moonlake Immunotherapeutics Class A (a) | | 1,120 | 46,648 |
| Nuvalent, Inc. Class A (a) | | 1,279 | 102,243 |
| Repligen Corp. (a) | | 1,021 | 170,864 |
| Vaxcyte, Inc. (a) | | 2,119 | 167,168 |
| Vericel Corp. (a) | | 2,084 | 105,284 |
| Viridian Therapeutics, Inc. (a) | | 4,966 | 83,677 |
| Xenon Pharmaceuticals, Inc. (a) | | 1,597 | 68,879 |
| Zentalis Pharmaceuticals, Inc. (a) | | 930 | 3,618 |
| | | | 2,066,493 |
| Health Care Equipment & Supplies - 2.3% | | | |
| Hologic, Inc. (a) | | 5,353 | 436,858 |
| Masimo Corp. (a) | | 2,227 | 238,244 |
| PROCEPT BioRobotics Corp. (a) | | 4,250 | 269,110 |
| TransMedics Group, Inc. (a) | | 5,714 | 812,874 |
| | | | 1,757,086 |
| Health Care Providers & Services - 3.6% | | | |
| AMN Healthcare Services, Inc. (a) | | 4,962 | 335,530 |
| Cardinal Health, Inc. | | 3,913 | 394,548 |
| Molina Healthcare, Inc. (a) | | 2,445 | 834,405 |
| Owens & Minor, Inc. (a) | | 7,231 | 118,733 |
| Universal Health Services, Inc. Class B | | 4,994 | 1,067,517 |
| | | | 2,750,733 |
| Life Sciences Tools & Services - 1.5% | | | |
| 10X Genomics, Inc. (a) | | 746 | 15,420 |
| Charles River Laboratories International, Inc. (a) | | 2,017 | 492,350 |
| ICON PLC (a) | | 267 | 87,693 |
| Medpace Holdings, Inc. (a) | | 1,295 | 495,363 |
| | | | 1,090,826 |
| Pharmaceuticals - 0.5% | | | |
| Arvinas Holding Co. LLC (a) | | 1,391 | 38,266 |
| Axsome Therapeutics, Inc. (a) | | 892 | 77,881 |
| Edgewise Therapeutics, Inc. (a) | | 4,656 | 79,292 |
| Longboard Pharmaceuticals, Inc. (a) | | 2,251 | 74,823 |
| Prestige Consumer Healthcare, Inc. (a) | | 680 | 48,151 |
| Structure Therapeutics, Inc. ADR (a) | | 917 | 34,287 |
| | | | 352,700 |
TOTAL HEALTH CARE | | | 8,017,838 |
| INDUSTRIALS - 22.4% | | | |
| Building Products - 1.5% | | | |
| AZZ, Inc. | | 3,173 | 253,713 |
| Hayward Holdings, Inc. (a) | | 25,623 | 378,964 |
| Tecnoglass, Inc. | | 9,122 | 490,855 |
| | | | 1,123,532 |
| Commercial Services & Supplies - 0.5% | | | |
| The Brink's Co. | | 3,720 | 409,163 |
| Construction & Engineering - 2.5% | | | |
| AECOM | | 4,903 | 444,261 |
| EMCOR Group, Inc. | | 3,201 | 1,201,783 |
| Granite Construction, Inc. | | 3,368 | 230,573 |
| | | | 1,876,617 |
| Electrical Equipment - 4.0% | | | |
| Acuity Brands, Inc. | | 2,262 | 568,554 |
| AMETEK, Inc. | | 3,332 | 578,035 |
| Atkore, Inc. | | 3,411 | 460,485 |
| Regal Rexnord Corp. | | 4,661 | 748,929 |
| Vertiv Holdings Co. | | 8,726 | 686,736 |
| | | | 3,042,739 |
| Ground Transportation - 2.1% | | | |
| ArcBest Corp. | | 2,143 | 270,125 |
| TFI International, Inc. | | 5,654 | 880,611 |
| XPO, Inc. (a) | | 3,980 | 457,262 |
| | | | 1,607,998 |
| Machinery - 5.5% | | | |
| Allison Transmission Holdings, Inc. | | 6,108 | 541,108 |
| Crane Co. | | 4,955 | 794,881 |
| Federal Signal Corp. | | 5,023 | 502,149 |
| Gates Industrial Corp. PLC (a) | | 14,442 | 268,477 |
| ITT, Inc. | | 6,113 | 864,745 |
| SPX Technologies, Inc. (a) | | 5,432 | 801,437 |
| Terex Corp. | | 6,256 | 395,755 |
| | | | 4,168,552 |
| Professional Services - 3.4% | | | |
| CACI International, Inc. (a) | | 1,635 | 754,520 |
| Concentrix Corp. | | 4,270 | 301,035 |
| Genpact Ltd. | | 13,032 | 451,819 |
| KBR, Inc. | | 6,371 | 424,245 |
| Kforce, Inc. | | 2,271 | 157,766 |
| Maximus, Inc. | | 4,998 | 464,264 |
| | | | 2,553,649 |
| Trading Companies & Distributors - 2.9% | | | |
| Applied Industrial Technologies, Inc. | | 2,998 | 654,134 |
| Beacon Roofing Supply, Inc. (a) | | 5,342 | 549,158 |
| Core & Main, Inc. (a) | | 8,270 | 442,197 |
| GMS, Inc. (a) | | 2,740 | 263,670 |
| Rush Enterprises, Inc. Class A | | 5,126 | 261,477 |
| | | | 2,170,636 |
TOTAL INDUSTRIALS | | | 16,952,886 |
| INFORMATION TECHNOLOGY - 11.6% | | | |
| Communications Equipment - 0.9% | | | |
| Ciena Corp. (a) | | 7,655 | 403,725 |
| Lumentum Holdings, Inc. (a) | | 5,418 | 280,544 |
| | | | 684,269 |
| Electronic Equipment, Instruments & Components - 5.4% | | | |
| Advanced Energy Industries, Inc. | | 4,802 | 558,809 |
| Crane NXT Co. | | 4,817 | 302,893 |
| Fabrinet (a) | | 3,922 | 865,036 |
| Flex Ltd. (a) | | 7,060 | 226,979 |
| Insight Enterprises, Inc. (a) | | 3,697 | 829,977 |
| TD SYNNEX Corp. | | 6,054 | 721,455 |
| Vontier Corp. | | 13,582 | 532,822 |
| | | | 4,037,971 |
| IT Services - 1.9% | | | |
| Amdocs Ltd. | | 8,133 | 711,394 |
| ASGN, Inc. (a) | | 5,342 | 505,727 |
| Wix.com Ltd. (a) | | 1,454 | 226,715 |
| | | | 1,443,836 |
| Semiconductors & Semiconductor Equipment - 1.8% | | | |
| Allegro MicroSystems LLC (a) | | 7,851 | 188,738 |
| Diodes, Inc. (a) | | 3,184 | 248,989 |
| MACOM Technology Solutions Holdings, Inc. (a) | | 3,954 | 399,038 |
| ON Semiconductor Corp. (a) | | 6,486 | 507,530 |
| | | | 1,344,295 |
| Software - 0.8% | | | |
| JFrog Ltd. (a) | | 6,401 | 246,823 |
| Tenable Holdings, Inc. (a) | | 8,369 | 384,304 |
| | | | 631,127 |
| Technology Hardware, Storage & Peripherals - 0.8% | | | |
| Seagate Technology Holdings PLC | | 5,846 | 597,286 |
TOTAL INFORMATION TECHNOLOGY | | | 8,738,784 |
| MATERIALS - 6.7% | | | |
| Chemicals - 2.5% | | | |
| Axalta Coating Systems Ltd. (a) | | 9,092 | 324,130 |
| Cabot Corp. | | 4,101 | 411,289 |
| Element Solutions, Inc. | | 15,520 | 418,264 |
| Olin Corp. | | 7,076 | 322,736 |
| The Chemours Co. LLC | | 17,906 | 432,788 |
| | | | 1,909,207 |
| Construction Materials - 1.1% | | | |
| Eagle Materials, Inc. | | 2,958 | 805,463 |
| Containers & Packaging - 1.1% | | | |
| Graphic Packaging Holding Co. | | 18,184 | 547,338 |
| International Paper Co. | | 5,769 | 268,143 |
| | | | 815,481 |
| Metals & Mining - 1.4% | | | |
| Commercial Metals Co. | | 8,343 | 501,414 |
| Constellium NV (a) | | 5,873 | 104,598 |
| Steel Dynamics, Inc. | | 3,395 | 452,282 |
| | | | 1,058,294 |
| Paper & Forest Products - 0.6% | | | |
| Louisiana-Pacific Corp. | | 4,711 | 462,432 |
TOTAL MATERIALS | | | 5,050,877 |
| REAL ESTATE - 4.0% | | | |
| Equity Real Estate Investment Trusts (REITs) - 1.2% | | | |
| Essential Properties Realty Trust, Inc. | | 12,550 | 371,355 |
| Ventas, Inc. | | 9,253 | 503,733 |
| | | | 875,088 |
| Real Estate Management & Development - 2.8% | | | |
| Colliers International Group, Inc. | | 5,720 | 770,312 |
| Compass, Inc. (a) | | 50,479 | 221,603 |
| Cushman & Wakefield PLC (a) | | 28,145 | 368,981 |
| Jones Lang LaSalle, Inc. (a) | | 3,105 | 779,045 |
| | | | 2,139,941 |
TOTAL REAL ESTATE | | | 3,015,029 |
| UTILITIES - 1.8% | | | |
| Electric Utilities - 0.7% | | | |
| PG&E Corp. | | 28,353 | 517,442 |
| Gas Utilities - 0.5% | | | |
| Brookfield Infrastructure Corp. A Shares | | 10,337 | 402,109 |
| Independent Power and Renewable Electricity Producers - 0.6% | | | |
| The AES Corp. | | 24,721 | 439,787 |
TOTAL UTILITIES | | | 1,359,338 |
| TOTAL COMMON STOCKS (Cost $60,545,660) | | | 74,814,778 |
| | | | |
| Money Market Funds - 1.3% |
| | | Shares | Value ($) |
State Street Institutional Treasury Plus Money Market Fund Trust Class 5.23% (b) (Cost $973,770) | | 973,770 | 973,770 |
| | | | |
| TOTAL INVESTMENT IN SECURITIES - 100.3% (Cost $61,519,430) | 75,788,548 |
NET OTHER ASSETS (LIABILITIES) - (0.3)% | (226,454) |
| NET ASSETS - 100.0% | 75,562,094 |
| | |
Legend
| (b) | The rate quoted is the annualized seven-day yield of the fund at period end. |
Investment Valuation
The following is a summary of the inputs used, as of July 31, 2024, involving the Fund's assets and liabilities carried at fair value. The inputs or methodology used for valuing securities may not be an indication of the risk associated with investing in those securities. For more information on valuation inputs, and their aggregation into the levels used below, please refer to the Investment Valuation section in the accompanying Notes to Financial Statements.
| Valuation Inputs at Reporting Date: |
| Description | Total ($) | Level 1 ($) | Level 2 ($) | Level 3 ($) |
Investments in Securities: | | | | |
|
| Equities: | | | | |
Communication Services | 647,504 | 647,504 | - | - |
Consumer Discretionary | 10,380,276 | 10,380,276 | - | - |
Consumer Staples | 3,218,533 | 3,218,533 | - | - |
Energy | 5,126,233 | 5,126,233 | - | - |
Financials | 12,307,480 | 12,307,480 | - | - |
Health Care | 8,017,838 | 8,017,838 | - | - |
Industrials | 16,952,886 | 16,952,886 | - | - |
Information Technology | 8,738,784 | 8,738,784 | - | - |
Materials | 5,050,877 | 5,050,877 | - | - |
Real Estate | 3,015,029 | 3,015,029 | - | - |
Utilities | 1,359,338 | 1,359,338 | - | - |
|
| Money Market Funds | 973,770 | 973,770 | - | - |
| Total Investments in Securities: | 75,788,548 | 75,788,548 | - | - |
Fidelity® Fundamental Small-Mid Cap ETF
Financial Statements
| Statement of Assets and Liabilities |
As of July 31, 2024 |
| Assets | | | | |
Investment in securities, at value - See accompanying schedule Unaffiliated issuers (cost $61,519,430): | | | $ | 75,788,548 |
| Cash | | | | 11,043 |
| Receivable for investments sold | | | | 77,072 |
| Dividends receivable | | | | 6,110 |
Total assets | | | | 75,882,773 |
| Liabilities | | | | |
| Payable for investments purchased | $ | 290,549 | | |
| Accrued management fee | | 25,325 | | |
| Other payables and accrued expenses | | 4,805 | | |
| Total liabilities | | | | 320,679 |
| Net Assets | | | $ | 75,562,094 |
| Net Assets consist of: | | | | |
| Paid in capital | | | $ | 65,642,537 |
| Total accumulated earnings (loss) | | | | 9,919,557 |
| Net Assets | | | $ | 75,562,094 |
Net Asset Value, offering price and redemption price per share ($75,562,094 ÷ 2,800,000 shares) | | | $ | 26.99 |
| Statement of Operations |
| Year ended July 31, 2024 |
| Investment Income | | | | |
| Dividends | | | $ | 520,890 |
| Expenses | | | | |
| Management fee | $ | 248,027 | | |
| Independent trustees' fees and expenses | | 210 | | |
| Miscellaneous | | 4,803 | | |
| Total expenses before reductions | | 253,040 | | |
| Expense reductions | | (3,482) | | |
| Total expenses after reductions | | | | 249,558 |
| Net Investment income (loss) | | | | 271,332 |
| Realized and Unrealized Gain (Loss) | | | | |
| Net realized gain (loss) on: | | | | |
| Investment Securities: | | | | |
| Redemptions in-kind | | 726,203 | | |
| Unaffiliated issuers | | (67,812) | | |
| Foreign currency transactions | | (9) | | |
| Futures contracts | | (12,575) | | |
| Total net realized gain (loss) | | | | 645,807 |
| Change in net unrealized appreciation (depreciation) on investment securities | | | | 9,368,604 |
| Net gain (loss) | | | | 10,014,411 |
| Net increase (decrease) in net assets resulting from operations | | | $ | 10,285,743 |
| Statement of Changes in Net Assets |
| |
| | Year ended July 31, 2024 | | Year ended July 31, 2023 |
| Increase (Decrease) in Net Assets | | | | |
| Operations | | | | |
| Net investment income (loss) | $ | 271,332 | $ | 173,574 |
| Net realized gain (loss) | | 645,807 | | (2,126,145) |
| Change in net unrealized appreciation (depreciation) | | 9,368,604 | | 4,570,740 |
| Net increase (decrease) in net assets resulting from operations | | 10,285,743 | | 2,618,169 |
| Distributions to shareholders | | (285,300) | | (192,175) |
| | | | | |
| Share transactions | | | | |
| Proceeds from sales of shares | | 32,802,983 | | 5,939,963 |
| Cost of shares redeemed | | (2,389,869) | | (964,910) |
| | | | | |
Net increase (decrease) in net assets resulting from share transactions | | 30,413,114 | | 4,975,053 |
| Total increase (decrease) in net assets | | 40,413,557 | | 7,401,047 |
| | | | | |
| Net Assets | | | | |
| Beginning of period | | 35,148,537 | | 27,747,490 |
| End of period | $ | 75,562,094 | $ | 35,148,537 |
| | | | | |
| Other Information | | | | |
| Shares | | | | |
| Sold | | 1,350,000 | | 275,000 |
| Redeemed | | (100,000) | | (50,000) |
| Net increase (decrease) | | 1,250,000 | | 225,000 |
| | | | | |
Financial Highlights
Fidelity® Fundamental Small-Mid Cap ETF |
| |
| Years ended July 31, | | 2024 | | 2023 | | 2022 | | 2021 A |
Selected Per-Share Data | | | | | | | | |
| Net asset value, beginning of period | $ | 22.68 | $ | 20.94 | $ | 22.84 | $ | 20.00 |
| Income from Investment Operations | | | | | | | | |
Net investment income (loss) B,C | | .13 | | .12 | | .10 | | .03 |
| Net realized and unrealized gain (loss) | | 4.32 | | 1.76 | | (1.89) | | 2.84 |
| Total from investment operations | | 4.45 | | 1.88 | | (1.79) | | 2.87 |
| Distributions from net investment income | | (.14) | | (.14) | | (.11) | | (.03) |
| Total distributions | | (.14) | | (.14) | | (.11) | | (.03) |
| Net asset value, end of period | $ | 26.99 | $ | 22.68 | $ | 20.94 | $ | 22.84 |
Total Return D,E,F | | | | 9.02% | | (7.88)% | | 14.36% |
Ratios to Average Net Assets C,G,H | | | | | | | | |
| Expenses before reductions | | .52% | | .60% | | .62% | | .64% I |
| Expenses net of fee waivers, if any | | | | .60% | | .62% | | .64% I |
| Expenses net of all reductions | | .51% | | .60% | | .62% | | .63% I |
| Net investment income (loss) | | .55% | | .59% | | .45% | | .22% I |
| Supplemental Data | | | | | | | | |
| Net assets, end of period (000 omitted) | $ | 75,562 | $ | 35,149 | $ | 27,747 | $ | 24,558 |
Portfolio turnover rate J,K | | | | 38% | | 42% | | 37% L |
AFor the period February 2, 2021 (commencement of operations) through July 31, 2021.
BCalculated based on average shares outstanding during the period.
CNet investment income (loss) is affected by the timing of the declaration of dividends by any underlying mutual funds or exchange-traded funds (ETFs). Net investment income (loss) of any mutual funds or ETFs is not included in the Fund's net investment income (loss) ratio.
DTotal returns for periods of less than one year are not annualized.
ETotal returns would have been lower if certain expenses had not been reduced during the applicable periods shown.
FBased on net asset value.
GFees and expenses of any underlying mutual funds or exchange-traded funds (ETFs) are not included in the Fund's expense ratio. The Fund indirectly bears its proportionate share of these expenses.
HExpense ratios reflect operating expenses of the class. Expenses before reductions do not reflect amounts reimbursed, waived, or reduced through arrangements with the investment adviser, brokerage services, or other offset arrangements, if applicable, and do not represent the amount paid by the class during periods when reimbursements, waivers or reductions occur.
IAnnualized.
JAmount does not include the portfolio activity of any underlying mutual funds or exchange-traded funds (ETFs).
KPortfolio turnover rate excludes securities received or delivered in-kind.
LAmount not annualized.
Schedule of Investments July 31, 2024
Showing Percentage of Net Assets
| Common Stocks - 98.9% |
| | | Shares | Value ($) |
| COMMUNICATION SERVICES - 8.4% | | | |
| Interactive Media & Services - 8.4% | | | |
| Alphabet, Inc.: | | | |
| Class A | | 22,556 | 3,869,256 |
| Class C | | 10,954 | 1,896,685 |
| Meta Platforms, Inc. Class A | | 8,378 | 3,978,126 |
| | | | 9,744,067 |
| CONSUMER DISCRETIONARY - 9.6% | | | |
| Broadline Retail - 4.8% | | | |
| Amazon.com, Inc. (a) | | 29,373 | 5,492,164 |
| Hotels, Restaurants & Leisure - 2.4% | | | |
| Hilton Worldwide Holdings, Inc. | | 6,965 | 1,495,177 |
| Marriott International, Inc. Class A | | 5,851 | 1,329,932 |
| | | | 2,825,109 |
| Specialty Retail - 2.4% | | | |
| AutoZone, Inc. (a) | | 444 | 1,391,358 |
| O'Reilly Automotive, Inc. (a) | | 1,274 | 1,434,957 |
| | | | 2,826,315 |
TOTAL CONSUMER DISCRETIONARY | | | 11,143,588 |
| CONSUMER STAPLES - 1.9% | | | |
| Consumer Staples Distribution & Retail - 1.9% | | | |
| Costco Wholesale Corp. | | 2,589 | 2,128,158 |
| FINANCIALS - 10.9% | | | |
| Capital Markets - 4.0% | | | |
| Ares Management Corp. Class A, | | 8,914 | 1,365,625 |
| Moody's Corp. | | 3,601 | 1,643,784 |
| S&P Global, Inc. | | 3,498 | 1,695,586 |
| | | | 4,704,995 |
| Financial Services - 4.1% | | | |
| MasterCard, Inc. Class A | | 5,028 | 2,331,534 |
| Visa, Inc. Class A | | 9,000 | 2,391,030 |
| | | | 4,722,564 |
| Insurance - 2.8% | | | |
| Arthur J. Gallagher & Co. | | 5,680 | 1,610,223 |
| Marsh & McLennan Companies, Inc. | | 7,151 | 1,591,598 |
| | | | 3,201,821 |
TOTAL FINANCIALS | | | 12,629,380 |
| HEALTH CARE - 9.9% | | | |
| Health Care Equipment & Supplies - 1.3% | | | |
| Boston Scientific Corp. (a) | | 19,947 | 1,473,684 |
| Health Care Providers & Services - 3.5% | | | |
| Cencora, Inc. | | 5,661 | 1,346,639 |
| UnitedHealth Group, Inc. | | 4,768 | 2,747,131 |
| | | | 4,093,770 |
| Life Sciences Tools & Services - 1.7% | | | |
| Thermo Fisher Scientific, Inc. | | 3,100 | 1,901,354 |
| Pharmaceuticals - 3.4% | | | |
| Eli Lilly & Co. | | 3,494 | 2,810,119 |
| Novo Nordisk A/S Series B sponsored ADR | | 8,689 | 1,152,422 |
| | | | 3,962,541 |
TOTAL HEALTH CARE | | | 11,431,349 |
| INDUSTRIALS - 16.0% | | | |
| Aerospace & Defense - 4.2% | | | |
| General Electric Co. | | 10,234 | 1,741,827 |
| HEICO Corp. Class A | | 8,087 | 1,537,420 |
| TransDigm Group, Inc. | | 1,233 | 1,595,773 |
| | | | 4,875,020 |
| Building Products - 1.2% | | | |
| Trane Technologies PLC | | 4,142 | 1,384,588 |
| Commercial Services & Supplies - 3.4% | | | |
| Cintas Corp. | | 1,817 | 1,388,079 |
| Copart, Inc. | | 24,350 | 1,274,236 |
| Waste Connections, Inc. (United States) | | 6,947 | 1,234,968 |
| | | | 3,897,283 |
| Construction & Engineering - 1.2% | | | |
| Quanta Services, Inc. | | 5,325 | 1,413,149 |
| Electrical Equipment - 2.4% | | | |
| AMETEK, Inc. | | 7,189 | 1,247,148 |
| Eaton Corp. PLC | | 4,840 | 1,475,184 |
| | | | 2,722,332 |
| Professional Services - 1.2% | | | |
| Verisk Analytics, Inc. | | 5,188 | 1,357,959 |
| Trading Companies & Distributors - 2.4% | | | |
| United Rentals, Inc. | | 1,933 | 1,463,474 |
| Watsco, Inc. | | 2,767 | 1,354,419 |
| | | | 2,817,893 |
TOTAL INDUSTRIALS | | | 18,468,224 |
| INFORMATION TECHNOLOGY - 35.7% | | | |
| Communications Equipment - 2.5% | | | |
| Arista Networks, Inc. (a) | | 4,064 | 1,408,379 |
| Motorola Solutions, Inc. | | 3,869 | 1,543,421 |
| | | | 2,951,800 |
| Electronic Equipment, Instruments & Components - 1.2% | | | |
| Amphenol Corp. Class A | | 21,811 | 1,401,575 |
| IT Services - 1.2% | | | |
| Gartner, Inc. (a) | | 2,865 | 1,435,909 |
| Semiconductors & Semiconductor Equipment - 15.2% | | | |
| Applied Materials, Inc. | | 7,656 | 1,624,603 |
| ASML Holding NV (depository receipt) | | 1,295 | 1,213,027 |
| Broadcom, Inc. | | 19,634 | 3,154,791 |
| KLA Corp. | | 2,142 | 1,763,016 |
| Lam Research Corp. | | 1,570 | 1,446,347 |
| NVIDIA Corp. | | 71,462 | 8,362,483 |
| | | | 17,564,267 |
| Software - 15.6% | | | |
| Cadence Design Systems, Inc. (a) | | 4,992 | 1,336,159 |
| Constellation Software, Inc. | | 430 | 1,356,756 |
| Intuit, Inc. | | 2,705 | 1,751,082 |
| Microsoft Corp. | | 21,790 | 9,115,845 |
| Oracle Corp. | | 13,260 | 1,849,107 |
| PTC, Inc. (a) | | 6,917 | 1,230,188 |
| Synopsys, Inc. (a) | | 2,488 | 1,389,100 |
| | | | 18,028,237 |
TOTAL INFORMATION TECHNOLOGY | | | 41,381,788 |
| MATERIALS - 5.3% | | | |
| Chemicals - 2.9% | | | |
| Linde PLC | | 4,018 | 1,822,163 |
| Sherwin-Williams Co. | | 4,489 | 1,574,741 |
| | | | 3,396,904 |
| Construction Materials - 2.4% | | | |
| Martin Marietta Materials, Inc. | | 2,432 | 1,443,027 |
| Vulcan Materials Co. | | 4,819 | 1,322,864 |
| | | | 2,765,891 |
TOTAL MATERIALS | | | 6,162,795 |
| UTILITIES - 1.2% | | | |
| Electric Utilities - 1.2% | | | |
| Constellation Energy Corp. | | 7,360 | 1,396,928 |
| TOTAL COMMON STOCKS (Cost $88,630,326) | | | 114,486,277 |
| | | | |
| Money Market Funds - 1.2% |
| | | Shares | Value ($) |
State Street Institutional Treasury Plus Money Market Fund Trust Class 5.23% (b) (Cost $1,417,056) | | 1,417,056 | 1,417,056 |
| | | | |
| TOTAL INVESTMENT IN SECURITIES - 100.1% (Cost $90,047,382) | 115,903,333 |
NET OTHER ASSETS (LIABILITIES) - (0.1)% | (80,543) |
| NET ASSETS - 100.0% | 115,822,790 |
| | |
Legend
| (b) | The rate quoted is the annualized seven-day yield of the fund at period end. |
Investment Valuation
The following is a summary of the inputs used, as of July 31, 2024, involving the Fund's assets and liabilities carried at fair value. The inputs or methodology used for valuing securities may not be an indication of the risk associated with investing in those securities. For more information on valuation inputs, and their aggregation into the levels used below, please refer to the Investment Valuation section in the accompanying Notes to Financial Statements.
| Valuation Inputs at Reporting Date: |
| Description | Total ($) | Level 1 ($) | Level 2 ($) | Level 3 ($) |
Investments in Securities: | | | | |
|
| Equities: | | | | |
Communication Services | 9,744,067 | 9,744,067 | - | - |
Consumer Discretionary | 11,143,588 | 11,143,588 | - | - |
Consumer Staples | 2,128,158 | 2,128,158 | - | - |
Financials | 12,629,380 | 12,629,380 | - | - |
Health Care | 11,431,349 | 11,431,349 | - | - |
Industrials | 18,468,224 | 18,468,224 | - | - |
Information Technology | 41,381,788 | 41,381,788 | - | - |
Materials | 6,162,795 | 6,162,795 | - | - |
Utilities | 1,396,928 | 1,396,928 | - | - |
|
| Money Market Funds | 1,417,056 | 1,417,056 | - | - |
| Total Investments in Securities: | 115,903,333 | 115,903,333 | - | - |
Fidelity® Magellan℠ ETF
Financial Statements
| Statement of Assets and Liabilities |
As of July 31, 2024 |
| Assets | | | | |
Investment in securities, at value - See accompanying schedule Unaffiliated issuers (cost $90,047,382): | | | $ | 115,903,333 |
| Receivable for investments sold | | | | 882,752 |
| Receivable for fund shares sold | | | | 8 |
| Dividends receivable | | | | 14,526 |
Total assets | | | | 116,800,619 |
| Liabilities | | | | |
| Payable for investments purchased | $ | 176,124 | | |
| Payable for fund shares redeemed | | 737,726 | | |
| Accrued management fee | | 57,722 | | |
| Other payables and accrued expenses | | 6,257 | | |
| Total liabilities | | | | 977,829 |
| Net Assets | | | $ | 115,822,790 |
| Net Assets consist of: | | | | |
| Paid in capital | | | $ | 98,009,229 |
| Total accumulated earnings (loss) | | | | 17,813,561 |
| Net Assets | | | $ | 115,822,790 |
Net Asset Value, offering price and redemption price per share ($115,822,790 ÷ 3,925,000 shares) | | | $ | 29.51 |
| Statement of Operations |
| Year ended July 31, 2024 |
| Investment Income | | | | |
| Dividends | | | $ | 550,177 |
| Expenses | | | | |
| Management fee | $ | 426,548 | | |
| Independent trustees' fees and expenses | | 301 | | |
| Miscellaneous | | 6,260 | | |
| Total expenses before reductions | | 433,109 | | |
| Expense reductions | | (4,289) | | |
| Total expenses after reductions | | | | 428,820 |
| Net Investment income (loss) | | | | 121,357 |
| Realized and Unrealized Gain (Loss) | | | | |
| Net realized gain (loss) on: | | | | |
| Investment Securities: | | | | |
| Redemptions in-kind | | 2,057,823 | | |
| Unaffiliated issuers | | 586,044 | | |
| Foreign currency transactions | | (79) | | |
| Futures contracts | | (344) | | |
| Total net realized gain (loss) | | | | 2,643,444 |
| Change in net unrealized appreciation (depreciation) on: | | | | |
| Investment Securities: | | | | |
| Unaffiliated issuers | | 16,965,600 | | |
| Assets and liabilities in foreign currencies | | 2 | | |
| Total change in net unrealized appreciation (depreciation) | | | | 16,965,602 |
| Net gain (loss) | | | | 19,609,046 |
| Net increase (decrease) in net assets resulting from operations | | | $ | 19,730,403 |
| Statement of Changes in Net Assets |
| |
| | Year ended July 31, 2024 | | Year ended July 31, 2023 |
| Increase (Decrease) in Net Assets | | | | |
| Operations | | | | |
| Net investment income (loss) | $ | 121,357 | $ | 134,575 |
| Net realized gain (loss) | | 2,643,444 | | (4,185,590) |
| Change in net unrealized appreciation (depreciation) | | 16,965,602 | | 7,292,125 |
| Net increase (decrease) in net assets resulting from operations | | 19,730,403 | | 3,241,110 |
| Distributions to shareholders | | (148,775) | | (144,575) |
| | | | | |
| Share transactions | | | | |
| Proceeds from sales of shares | | 54,131,752 | | 4,485,324 |
| Cost of shares redeemed | | (8,165,446) | | (3,834,411) |
| | | | | |
Net increase (decrease) in net assets resulting from share transactions | | 45,966,306 | | 650,913 |
| Total increase (decrease) in net assets | | 65,547,934 | | 3,747,448 |
| | | | | |
| Net Assets | | | | |
| Beginning of period | | 50,274,856 | | 46,527,408 |
| End of period | $ | 115,822,790 | $ | 50,274,856 |
| | | | | |
| Other Information | | | | |
| Shares | | | | |
| Sold | | 2,000,000 | | 225,000 |
| Redeemed | | (325,000) | | (200,000) |
| Net increase (decrease) | | 1,675,000 | | 25,000 |
| | | | | |
Financial Highlights
| Years ended July 31, | | 2024 | | 2023 | | 2022 | | 2021 A |
Selected Per-Share Data | | | | | | | | |
| Net asset value, beginning of period | $ | 22.34 | $ | 20.91 | $ | 23.12 | $ | 20.00 |
| Income from Investment Operations | | | | | | | | |
Net investment income (loss) B,C | | .04 | | .06 | | .01 | | - D |
| Net realized and unrealized gain (loss) | | 7.19 | | 1.44 | | (2.20) | | 3.13 |
| Total from investment operations | | 7.23 | | 1.50 | | (2.19) | | 3.13 |
| Distributions from net investment income | | (.06) | | (.07) | | (.02) | | (.01) |
| Total distributions | | (.06) | | (.07) | | (.02) | | (.01) |
| Net asset value, end of period | $ | 29.51 | $ | 22.34 | $ | 20.91 | $ | 23.12 |
Total Return E,F,G | | | | 7.21% | | (9.50)% | | 15.65% |
Ratios to Average Net Assets C,H,I | | | | | | | | |
| Expenses before reductions | | .60% | | .59% | | .59% | | .59% J |
| Expenses net of fee waivers, if any | | | | .59% | | .59% | | .59% J |
| Expenses net of all reductions | | .59% | | .59% | | .59% | | .59% J |
| Net investment income (loss) | | .17% | | .30% | | .05% | | .01% J |
| Supplemental Data | | | | | | | | |
| Net assets, end of period (000 omitted) | $ | 115,823 | $ | 50,275 | $ | 46,527 | $ | 35,842 |
Portfolio turnover rate K,L | | | | 89% | | 68% | | 41% M |
AFor the period February 2, 2021 (commencement of operations) through July 31, 2021.
BCalculated based on average shares outstanding during the period.
CNet investment income (loss) is affected by the timing of the declaration of dividends by any underlying mutual funds or exchange-traded funds (ETFs). Net investment income (loss) of any mutual funds or ETFs is not included in the Fund's net investment income (loss) ratio.
DAmount represents less than $.005 per share.
ETotal returns for periods of less than one year are not annualized.
FTotal returns would have been lower if certain expenses had not been reduced during the applicable periods shown.
GBased on net asset value.
HFees and expenses of any underlying mutual funds or exchange-traded funds (ETFs) are not included in the Fund's expense ratio. The Fund indirectly bears its proportionate share of these expenses.
IExpense ratios reflect operating expenses of the class. Expenses before reductions do not reflect amounts reimbursed, waived, or reduced through arrangements with the investment adviser, brokerage services, or other offset arrangements, if applicable, and do not represent the amount paid by the class during periods when reimbursements, waivers or reductions occur.
JAnnualized.
KPortfolio turnover rate excludes securities received or delivered in-kind.
LAmount does not include the portfolio activity of any underlying mutual funds or exchange-traded funds (ETFs).
MAmount not annualized.
Fidelity® Real Estate Investment ETF
Schedule of Investments July 31, 2024
Showing Percentage of Net Assets
| Common Stocks - 98.9% |
| | | Shares | Value ($) |
| Equity Real Estate Investment Trusts (REITs) - 92.8% | | | |
| REITs - Apartments - 13.2% | | | |
| American Homes 4 Rent Class A | | 7,236 | 261,147 |
| Camden Property Trust (SBI) | | 1,216 | 134,672 |
| Equity Residential (SBI) | | 5,016 | 349,264 |
| Invitation Homes, Inc. | | 5,478 | 193,209 |
| Mid-America Apartment Communities, Inc. | | 2,516 | 351,661 |
| UDR, Inc. | | 10,244 | 410,477 |
| | | | 1,700,430 |
| REITs - Diversified - 15.9% | | | |
| Crown Castle, Inc. | | 3,090 | 340,147 |
| Digital Realty Trust, Inc. | | 3,039 | 454,300 |
| Elme Communities (SBI) | | 3,337 | 54,927 |
| Equinix, Inc. | | 1,088 | 859,781 |
| Lamar Advertising Co. Class A | | 1,351 | 161,931 |
| SBA Communications Corp. Class A | | 776 | 170,363 |
| | | | 2,041,449 |
| REITs - Health Care - 8.2% | | | |
| Ventas, Inc. | | 13,276 | 722,745 |
| Welltower, Inc. | | 2,992 | 332,860 |
| | | | 1,055,605 |
| REITs - Hotels - 1.4% | | | |
| DiamondRock Hospitality Co. | | 14,045 | 115,590 |
| Ryman Hospitality Properties, Inc. | | 682 | 68,548 |
| | | | 184,138 |
| REITs - Industrial Buildings - 1.1% | | | |
| STAG Industrial, Inc. | | 3,291 | 134,306 |
| REITs - Management/Investment - 13.2% | | | |
| American Tower Corp. | | 5,220 | 1,150,488 |
| NNN (REIT), Inc. | | 10,401 | 466,901 |
| Weyerhaeuser Co. | | 2,651 | 84,196 |
| | | | 1,701,585 |
| REITs - Manufactured Homes - 3.5% | | | |
| Equity Lifestyle Properties, Inc. | | 783 | 53,776 |
| Sun Communities, Inc. | | 3,072 | 389,315 |
| | | | 443,091 |
| REITs - Regional Malls - 0.7% | | | |
| Tanger, Inc. | | 2,862 | 82,712 |
| REITs - Shopping Centers - 8.4% | | | |
| Acadia Realty Trust (SBI) | | 300 | 6,492 |
| Kimco Realty Corp. | | 23,399 | 508,460 |
| Phillips Edison & Co., Inc. | | 3,099 | 108,775 |
| Regency Centers Corp. | | 1,952 | 131,448 |
| SITE Centers Corp. | | 9,644 | 149,000 |
| Urban Edge Properties | | 8,886 | 180,386 |
| | | | 1,084,561 |
| REITs - Single Tenant - 0.8% | | | |
| Four Corners Property Trust, Inc. | | 3,850 | 104,489 |
| REITs - Storage - 12.4% | | | |
| CubeSmart | | 9,140 | 434,881 |
| Extra Space Storage, Inc. | | 1,488 | 237,515 |
| Iron Mountain, Inc. | | 2,251 | 230,863 |
| Public Storage Operating Co. | | 2,338 | 691,861 |
| | | | 1,595,120 |
| REITs - Warehouse/Industrial - 14.0% | | | |
| Americold Realty Trust | | 6,673 | 199,456 |
| Lineage, Inc. | | 958 | 84,189 |
| Prologis, Inc. | | 11,180 | 1,409,239 |
| Terreno Realty Corp. | | 1,520 | 103,983 |
| | | | 1,796,867 |
TOTAL EQUITY REAL ESTATE INVESTMENT TRUSTS (REITS) | | | 11,924,353 |
| Real Estate Management & Development - 6.1% | | | |
| Real Estate Services - 6.1% | | | |
| CBRE Group, Inc. (a) | | 4,596 | 518,015 |
| Compass, Inc. (a) | | 16,186 | 71,057 |
| CoStar Group, Inc. (a) | | 2,506 | 195,518 |
| | | | 784,590 |
| TOTAL COMMON STOCKS (Cost $12,250,010) | | | 12,708,943 |
| | | | |
| Money Market Funds - 1.1% |
| | | Shares | Value ($) |
State Street Institutional Treasury Plus Money Market Fund Trust Class 5.23% (b) (Cost $143,325) | | 143,325 | 143,325 |
| | | | |
| TOTAL INVESTMENT IN SECURITIES - 100.0% (Cost $12,393,335) | 12,852,268 |
NET OTHER ASSETS (LIABILITIES) - 0.0% | (318) |
| NET ASSETS - 100.0% | 12,851,950 |
| | |
Legend
| (b) | The rate quoted is the annualized seven-day yield of the fund at period end. |
Investment Valuation
The following is a summary of the inputs used, as of July 31, 2024, involving the Fund's assets and liabilities carried at fair value. The inputs or methodology used for valuing securities may not be an indication of the risk associated with investing in those securities. For more information on valuation inputs, and their aggregation into the levels used below, please refer to the Investment Valuation section in the accompanying Notes to Financial Statements.
| Valuation Inputs at Reporting Date: |
| Description | Total ($) | Level 1 ($) | Level 2 ($) | Level 3 ($) |
Investments in Securities: | | | | |
|
| Common Stocks | 12,708,943 | 12,708,943 | - | - |
|
| Money Market Funds | 143,325 | 143,325 | - | - |
| Total Investments in Securities: | 12,852,268 | 12,852,268 | - | - |
Fidelity® Real Estate Investment ETF
Financial Statements
| Statement of Assets and Liabilities |
As of July 31, 2024 |
| Assets | | | | |
Investment in securities, at value - See accompanying schedule Unaffiliated issuers (cost $12,393,335): | | | $ | 12,852,268 |
| Receivable for investments sold | | | | 152,346 |
| Dividends receivable | | | | 7,467 |
| Other receivables | | | | 4,484 |
Total assets | | | | 13,016,565 |
| Liabilities | | | | |
| Payable for investments purchased | $ | 154,186 | | |
| Accrued management fee | | 6,141 | | |
| Other payables and accrued expenses | | 4,288 | | |
| Total liabilities | | | | 164,615 |
| Net Assets | | | $ | 12,851,950 |
| Net Assets consist of: | | | | |
| Paid in capital | | | $ | 14,560,403 |
| Total accumulated earnings (loss) | | | | (1,708,453) |
| Net Assets | | | $ | 12,851,950 |
Net Asset Value, offering price and redemption price per share ($12,851,950 ÷ 575,000 shares) | | | $ | 22.35 |
| Statement of Operations |
| Year ended July 31, 2024 |
| Investment Income | | | | |
| Dividends | | | $ | 406,948 |
| Expenses | | | | |
| Management fee | $ | 76,515 | | |
| Independent trustees' fees and expenses | | 66 | | |
| Miscellaneous | | 2,901 | | |
| Total expenses before reductions | | 79,482 | | |
| Expense reductions | | (2,564) | | |
| Total expenses after reductions | | | | 76,918 |
| Net Investment income (loss) | | | | 330,030 |
| Realized and Unrealized Gain (Loss) | | | | |
| Net realized gain (loss) on: | | | | |
| Investment Securities: | | | | |
| Redemptions in-kind | | 162,839 | | |
| Unaffiliated issuers | | (1,074,043) | | |
| Total net realized gain (loss) | | | | (911,204) |
| Change in net unrealized appreciation (depreciation) on investment securities | | | | 1,728,386 |
| Net gain (loss) | | | | 817,182 |
| Net increase (decrease) in net assets resulting from operations | | | $ | 1,147,212 |
| Statement of Changes in Net Assets |
| |
| | Year ended July 31, 2024 | | Year ended July 31, 2023 |
| Increase (Decrease) in Net Assets | | | | |
| Operations | | | | |
| Net investment income (loss) | $ | 330,030 | $ | 408,264 |
| Net realized gain (loss) | | (911,204) | | (777,839) |
| Change in net unrealized appreciation (depreciation) | | 1,728,386 | | (1,729,975) |
| Net increase (decrease) in net assets resulting from operations | | 1,147,212 | | (2,099,550) |
| Distributions to shareholders | | (379,650) | | (452,000) |
| | | | | |
| Share transactions | | | | |
| Proceeds from sales of shares | | 26 | | 1,073,585 |
| Cost of shares redeemed | | (3,049,792) | | (3,644,415) |
| | | | | |
Net increase (decrease) in net assets resulting from share transactions | | (3,049,766) | | (2,570,830) |
| Total increase (decrease) in net assets | | (2,282,204) | | (5,122,380) |
| | | | | |
| Net Assets | | | | |
| Beginning of period | | 15,134,154 | | 20,256,534 |
| End of period | $ | 12,851,950 | $ | 15,134,154 |
| | | | | |
| Other Information | | | | |
| Shares | | | | |
| Sold | | - | | 50,000 |
| Redeemed | | (150,000) | | (175,000) |
| Net increase (decrease) | | (150,000) | | (125,000) |
| | | | | |
Financial Highlights
Fidelity® Real Estate Investment ETF |
| |
| Years ended July 31, | | 2024 | | 2023 | | 2022 | | 2021 A |
Selected Per-Share Data | | | | | | | | |
| Net asset value, beginning of period | $ | 20.87 | $ | 23.83 | $ | 24.79 | $ | 20.00 |
| Income from Investment Operations | | | | | | | | |
Net investment income (loss) B,C | | .52 | | .52 | | .39 | | .21 |
| Net realized and unrealized gain (loss) | | 1.56 | | (2.91) | | (.80) | | 4.79 |
| Total from investment operations | | 2.08 | | (2.39) | | (.41) | | 5.00 |
| Distributions from net investment income | | (.60) | | (.57) | | (.55) | | (.21) |
| Total distributions | | (.60) | | (.57) | | (.55) | | (.21) |
| Net asset value, end of period | $ | 22.35 | $ | 20.87 | $ | 23.83 | $ | 24.79 |
Total Return D,E,F | | | | (9.93)% | | (1.68)% | | 25.17% |
Ratios to Average Net Assets C,G,H | | | | | | | | |
| Expenses before reductions | | .61% | | .59% | | .59% | | .59% I |
| Expenses net of fee waivers, if any | | | | .59% | | .59% | | .59% I |
| Expenses net of all reductions | | .59% | | .59% | | .59% | | .58% I |
| Net investment income (loss) | | 2.54% | | 2.49% | | 1.58% | | 1.80% I |
| Supplemental Data | | | | | | | | |
| Net assets, end of period (000 omitted) | $ | 12,852 | $ | 15,134 | $ | 20,257 | $ | 16,735 |
Portfolio turnover rate J,K | | | | 33% | | 24% | | 23% L |
AFor the period February 2, 2021 (commencement of operations) through July 31, 2021.
BCalculated based on average shares outstanding during the period.
CNet investment income (loss) is affected by the timing of the declaration of dividends by any underlying mutual funds or exchange-traded funds (ETFs). Net investment income (loss) of any mutual funds or ETFs is not included in the Fund's net investment income (loss) ratio.
DTotal returns for periods of less than one year are not annualized.
ETotal returns would have been lower if certain expenses had not been reduced during the applicable periods shown.
FBased on net asset value.
GFees and expenses of any underlying mutual funds or exchange-traded funds (ETFs) are not included in the Fund's expense ratio. The Fund indirectly bears its proportionate share of these expenses.
HExpense ratios reflect operating expenses of the class. Expenses before reductions do not reflect amounts reimbursed, waived, or reduced through arrangements with the investment adviser, brokerage services, or other offset arrangements, if applicable, and do not represent the amount paid by the class during periods when reimbursements, waivers or reductions occur.
IAnnualized.
JPortfolio turnover rate excludes securities received or delivered in-kind.
KAmount does not include the portfolio activity of any underlying mutual funds or exchange-traded funds (ETFs).
LAmount not annualized.
Fidelity® Sustainable U.S. Equity ETF
Schedule of Investments July 31, 2024
Showing Percentage of Net Assets
| Common Stocks - 94.3% |
| | | Shares | Value ($) |
| COMMUNICATION SERVICES - 8.2% | | | |
| Entertainment - 3.0% | | | |
| Netflix, Inc. (a) | | 187 | 117,501 |
| The Walt Disney Co. | | 3,298 | 308,990 |
| | | | 426,491 |
| Interactive Media & Services - 3.5% | | | |
| Alphabet, Inc. Class A | | 2,930 | 502,612 |
| Media - 1.7% | | | |
| Comcast Corp. Class A | | 3,419 | 141,102 |
| TEGNA, Inc. | | 7,071 | 112,641 |
| | | | 253,743 |
TOTAL COMMUNICATION SERVICES | | | 1,182,846 |
| CONSUMER DISCRETIONARY - 10.3% | | | |
| Automobile Components - 0.5% | | | |
| Aptiv PLC (a) | | 992 | 68,835 |
| Automobiles - 1.0% | | | |
| Tesla, Inc. (a) | | 641 | 148,757 |
| Broadline Retail - 4.2% | | | |
| Amazon.com, Inc. (a) | | 3,200 | 598,336 |
| Hotels, Restaurants & Leisure - 1.8% | | | |
| Hilton Worldwide Holdings, Inc. | | 737 | 158,212 |
| Starbucks Corp. | | 1,264 | 98,529 |
| | | | 256,741 |
| Household Durables - 1.0% | | | |
| Taylor Morrison Home Corp. (a) | | 2,193 | 147,106 |
| Specialty Retail - 1.8% | | | |
| Lowe's Companies, Inc. | | 1,046 | 256,803 |
TOTAL CONSUMER DISCRETIONARY | | | 1,476,578 |
| CONSUMER STAPLES - 3.2% | | | |
| Consumer Staples Distribution & Retail - 0.1% | | | |
| Albertsons Companies, Inc. | | 94 | 1,864 |
| Sprouts Farmers Market LLC (a) | | 94 | 9,390 |
| | | | 11,254 |
| Household Products - 2.6% | | | |
| Procter & Gamble Co. | | 2,388 | 383,895 |
| Personal Care Products - 0.5% | | | |
| Estee Lauder Companies, Inc. Class A | | 694 | 69,129 |
TOTAL CONSUMER STAPLES | | | 464,278 |
| ENERGY - 2.8% | | | |
| Energy Equipment & Services - 1.8% | | | |
| Baker Hughes Co. Class A | | 6,710 | 259,811 |
| Oil, Gas & Consumable Fuels - 1.0% | | | |
| Cheniere Energy, Inc. | | 765 | 139,720 |
TOTAL ENERGY | | | 399,531 |
| FINANCIALS - 11.3% | | | |
| Banks - 1.4% | | | |
| Bank of America Corp. | | 2,321 | 93,560 |
| Citigroup, Inc. | | 1,683 | 109,193 |
| | | | 202,753 |
| Capital Markets - 4.7% | | | |
| BlackRock, Inc. | | 273 | 239,285 |
| Moody's Corp. | | 786 | 358,793 |
| Northern Trust Corp. | | 885 | 78,455 |
| | | | 676,533 |
| Consumer Finance - 2.6% | | | |
| American Express Co. | | 1,188 | 300,612 |
| Discover Financial Services | | 526 | 75,739 |
| | | | 376,351 |
| Financial Services - 2.5% | | | |
| MasterCard, Inc. Class A | | 602 | 279,153 |
| Voya Financial, Inc. | | 1,005 | 73,094 |
| | | | 352,247 |
| Insurance - 0.1% | | | |
| The Travelers Companies, Inc. | | 91 | 19,696 |
TOTAL FINANCIALS | | | 1,627,580 |
| HEALTH CARE - 12.7% | | | |
| Biotechnology - 2.3% | | | |
| Exact Sciences Corp. (a) | | 1,566 | 71,535 |
| Gilead Sciences, Inc. | | 2,338 | 177,828 |
| Moderna, Inc. (a) | | 654 | 77,970 |
| | | | 327,333 |
| Health Care Providers & Services - 4.6% | | | |
| BrightSpring Health Services, Inc. | | 11,753 | 145,620 |
| Centene Corp. (a) | | 2,139 | 164,532 |
| Cigna Group | | 1,031 | 359,479 |
| CVS Health Corp. | | 20 | 1,207 |
| | | | 670,838 |
| Life Sciences Tools & Services - 2.6% | | | |
| Danaher Corp. | | 751 | 208,087 |
| ICON PLC (a) | | 507 | 166,519 |
| | | | 374,606 |
| Pharmaceuticals - 3.2% | | | |
| Merck & Co., Inc. | | 3,096 | 350,250 |
| Zoetis, Inc. Class A | | 586 | 105,503 |
| | | | 455,753 |
TOTAL HEALTH CARE | | | 1,828,530 |
| INDUSTRIALS - 10.6% | | | |
| Air Freight & Logistics - 0.9% | | | |
| United Parcel Service, Inc. Class B | | 935 | 121,896 |
| Building Products - 1.1% | | | |
| Johnson Controls International PLC | | 2,279 | 163,040 |
| Commercial Services & Supplies - 1.2% | | | |
| Veralto Corp. | | 1,637 | 174,439 |
| Electrical Equipment - 2.7% | | | |
| Acuity Brands, Inc. | | 750 | 188,513 |
| Generac Holdings, Inc. (a) | | 534 | 83,133 |
| Regal Rexnord Corp. | | 718 | 115,368 |
| | | | 387,014 |
| Machinery - 2.3% | | | |
| Deere & Co. | | 343 | 127,589 |
| Ingersoll Rand, Inc. | | 1,350 | 135,540 |
| Timken Co. | | 826 | 71,821 |
| | | | 334,950 |
| Professional Services - 2.4% | | | |
| KBR, Inc. | | 3,580 | 238,392 |
| ManpowerGroup, Inc. | | 1,286 | 98,482 |
| UL Solutions, Inc. Class A | | 200 | 10,106 |
| | | | 346,980 |
TOTAL INDUSTRIALS | | | 1,528,319 |
| INFORMATION TECHNOLOGY - 27.5% | | | |
| Electronic Equipment, Instruments & Components - 0.7% | | | |
| CDW Corp. | | 443 | 96,623 |
| IT Services - 1.9% | | | |
| Accenture PLC Class A | | 838 | 277,060 |
| Semiconductors & Semiconductor Equipment - 8.5% | | | |
| Advanced Micro Devices, Inc. (a) | | 496 | 71,662 |
| First Solar, Inc. (a) | | 412 | 88,988 |
| NVIDIA Corp. | | 6,258 | 732,311 |
| NXP Semiconductors NV | | 268 | 70,527 |
| ON Semiconductor Corp. (a) | | 3,300 | 258,225 |
| | | | 1,221,713 |
| Software - 9.5% | | | |
| Gen Digital, Inc. | | 3,436 | 89,302 |
| Intuit, Inc. | | 181 | 117,170 |
| Microsoft Corp. | | 2,058 | 860,964 |
| Salesforce, Inc. | | 1,163 | 300,984 |
| | | | 1,368,420 |
| Technology Hardware, Storage & Peripherals - 6.9% | | | |
| Apple, Inc. | | 4,448 | 987,811 |
TOTAL INFORMATION TECHNOLOGY | | | 3,951,627 |
| MATERIALS - 4.3% | | | |
| Chemicals - 2.0% | | | |
| Linde PLC | | 632 | 286,612 |
| Containers & Packaging - 2.3% | | | |
| Avery Dennison Corp. | | 855 | 185,390 |
| Crown Holdings, Inc. | | 1,583 | 140,412 |
| | | | 325,802 |
TOTAL MATERIALS | | | 612,414 |
| REAL ESTATE - 1.5% | | | |
| Equity Real Estate Investment Trusts (REITs) - 1.5% | | | |
| Prologis, Inc. | | 1,686 | 212,520 |
| UTILITIES - 1.9% | | | |
| Electric Utilities - 1.4% | | | |
| NextEra Energy, Inc. | | 2,636 | 201,364 |
| Independent Power and Renewable Electricity Producers - 0.5% | | | |
| Clearway Energy, Inc. Class C | | 2,822 | 75,291 |
TOTAL UTILITIES | | | 276,655 |
| TOTAL COMMON STOCKS (Cost $11,036,208) | | | 13,560,878 |
| | | | |
| Money Market Funds - 5.7% |
| | | Shares | Value ($) |
State Street Institutional Treasury Plus Money Market Fund Trust Class 5.23% (b) (Cost $814,605) | | 814,605 | 814,605 |
| | | | |
| TOTAL INVESTMENT IN SECURITIES - 100.0% (Cost $11,850,813) | 14,375,483 |
NET OTHER ASSETS (LIABILITIES) - 0.0% | (1,259) |
| NET ASSETS - 100.0% | 14,374,224 |
| | |
Legend
| (b) | The rate quoted is the annualized seven-day yield of the fund at period end. |
Investment Valuation
The following is a summary of the inputs used, as of July 31, 2024, involving the Fund's assets and liabilities carried at fair value. The inputs or methodology used for valuing securities may not be an indication of the risk associated with investing in those securities. For more information on valuation inputs, and their aggregation into the levels used below, please refer to the Investment Valuation section in the accompanying Notes to Financial Statements.
| Valuation Inputs at Reporting Date: |
| Description | Total ($) | Level 1 ($) | Level 2 ($) | Level 3 ($) |
Investments in Securities: | | | | |
|
| Equities: | | | | |
Communication Services | 1,182,846 | 1,182,846 | - | - |
Consumer Discretionary | 1,476,578 | 1,476,578 | - | - |
Consumer Staples | 464,278 | 464,278 | - | - |
Energy | 399,531 | 399,531 | - | - |
Financials | 1,627,580 | 1,627,580 | - | - |
Health Care | 1,828,530 | 1,828,530 | - | - |
Industrials | 1,528,319 | 1,528,319 | - | - |
Information Technology | 3,951,627 | 3,951,627 | - | - |
Materials | 612,414 | 612,414 | - | - |
Real Estate | 212,520 | 212,520 | - | - |
Utilities | 276,655 | 276,655 | - | - |
|
| Money Market Funds | 814,605 | 814,605 | - | - |
| Total Investments in Securities: | 14,375,483 | 14,375,483 | - | - |
Fidelity® Sustainable U.S. Equity ETF
Financial Statements
| Statement of Assets and Liabilities |
As of July 31, 2024 |
| Assets | | | | |
Investment in securities, at value - See accompanying schedule Unaffiliated issuers (cost $11,850,813): | | | $ | 14,375,483 |
| Dividends receivable | | | | 7,407 |
Total assets | | | | 14,382,890 |
| Liabilities | | | | |
| Accrued management fee | $ | 6,950 | | |
| Proxy fee payable | | 1,716 | | |
| Total liabilities | | | | 8,666 |
| Net Assets | | | $ | 14,374,224 |
| Net Assets consist of: | | | | |
| Paid in capital | | | $ | 11,685,212 |
| Total accumulated earnings (loss) | | | | 2,689,012 |
| Net Assets | | | $ | 14,374,224 |
Net Asset Value, offering price and redemption price per share ($14,374,224 ÷ 550,000 shares) | | | $ | 26.13 |
| Statement of Operations |
| Year ended July 31, 2024 |
| Investment Income | | | | |
| Dividends | | | $ | 147,614 |
| Expenses | | | | |
| Management fee | $ | 69,263 | | |
| Independent trustees' fees and expenses | | 54 | | |
| Miscellaneous | | 1,716 | | |
| Total expenses before reductions | | 71,033 | | |
| Expense reductions | | (1,401) | | |
| Total expenses after reductions | | | | 69,632 |
| Net Investment income (loss) | | | | 77,982 |
| Realized and Unrealized Gain (Loss) | | | | |
| Net realized gain (loss) on: | | | | |
| Investment Securities: | | | | |
| Redemptions in-kind | | 238,645 | | |
| Unaffiliated issuers | | 714,931 | | |
| Total net realized gain (loss) | | | | 953,576 |
| Change in net unrealized appreciation (depreciation) on investment securities | | | | 1,327,852 |
| Net gain (loss) | | | | 2,281,428 |
| Net increase (decrease) in net assets resulting from operations | | | $ | 2,359,410 |
| Statement of Changes in Net Assets |
| |
| | Year ended July 31, 2024 | | Year ended July 31, 2023 |
| Increase (Decrease) in Net Assets | | | | |
| Operations | | | | |
| Net investment income (loss) | $ | 77,982 | $ | 82,581 |
| Net realized gain (loss) | | 953,576 | | (274,000) |
| Change in net unrealized appreciation (depreciation) | | 1,327,852 | | 1,506,035 |
| Net increase (decrease) in net assets resulting from operations | | 2,359,410 | | 1,314,616 |
| Distributions to shareholders | | (78,975) | | (79,775) |
| | | | | |
| Share transactions | | | | |
| Proceeds from sales of shares | | 2,943,126 | | 3,318,417 |
| Cost of shares redeemed | | (1,165,907) | | - |
| | | | | |
Net increase (decrease) in net assets resulting from share transactions | | 1,777,219 | | 3,318,417 |
| Total increase (decrease) in net assets | | 4,057,654 | | 4,553,258 |
| | | | | |
| Net Assets | | | | |
| Beginning of period | | 10,316,570 | | 5,763,312 |
| End of period | $ | 14,374,224 | $ | 10,316,570 |
| | | | | |
| Other Information | | | | |
| Shares | | | | |
| Sold | | 125,000 | | 175,000 |
| Redeemed | | (50,000) | | - |
| Net increase (decrease) | | 75,000 | | 175,000 |
| | | | | |
Financial Highlights
Fidelity® Sustainable U.S. Equity ETF |
| |
| Years ended July 31, | | 2024 | | 2023 | | 2022 | | 2021 A |
Selected Per-Share Data | | | | | | | | |
| Net asset value, beginning of period | $ | 21.72 | $ | 19.21 | $ | 20.80 | $ | 20.00 |
| Income from Investment Operations | | | | | | | | |
Net investment income (loss) B,C | | .15 | | .20 D | | .11 | | - E |
| Net realized and unrealized gain (loss) | | 4.42 | | 2.51 | | (1.57) | | .80 |
| Total from investment operations | | 4.57 | | 2.71 | | (1.46) | | .80 |
| Distributions from net investment income | | (.16) | | (.20) | | (.13) | | - |
| Total distributions | | (.16) | | (.20) | | (.13) | | - |
| Net asset value, end of period | $ | 26.13 | $ | 21.72 | $ | 19.21 | $ | 20.80 |
Total Return F,G | | | | 14.25% | | (7.01)% | | 3.99% |
Ratios to Average Net Assets C,I,J | | | | | | | | |
| Expenses before reductions | | .61% | | .59% | | .59% | | .59% K |
| Expenses net of fee waivers, if any | | | | .59% | | .59% | | .59% K |
| Expenses net of all reductions | | .59% | | .59% | | .59% | | .59% K |
| Net investment income (loss) | | .66% | | 1.06% D | | .56% | | (.07)% K |
| Supplemental Data | | | | | | | | |
| Net assets, end of period (000 omitted) | $ | 14,374 | $ | 10,317 | $ | 5,763 | $ | 3,120 |
Portfolio turnover rate L,M | | | | 45% | | 66% | | 23% N |
AFor the period June 15, 2021 (commencement of operations) through July 31, 2021.
BCalculated based on average shares outstanding during the period.
CNet investment income (loss) is affected by the timing of the declaration of dividends by any underlying mutual funds or exchange-traded funds (ETFs). Net investment income (loss) of any mutual funds or ETFs is not included in the Fund's net investment income (loss) ratio.
DNet investment income per share reflects one or more large, non-recurring dividend(s) which amounted to $.05 per share. Excluding such non-recurring dividend(s), the ratio of net investment income (loss) to average net assets would have been .80%.
EAmount represents less than $.005 per share.
FTotal returns for periods of less than one year are not annualized.
GBased on net asset value.
HTotal returns would have been lower if certain expenses had not been reduced during the applicable periods shown.
IFees and expenses of any underlying mutual funds or exchange-traded funds (ETFs) are not included in the Fund's expense ratio. The Fund indirectly bears its proportionate share of these expenses.
JExpense ratios reflect operating expenses of the class. Expenses before reductions do not reflect amounts reimbursed, waived, or reduced through arrangements with the investment adviser, brokerage services, or other offset arrangements, if applicable, and do not represent the amount paid by the class during periods when reimbursements, waivers or reductions occur.
KAnnualized.
LPortfolio turnover rate excludes securities received or delivered in-kind.
MAmount does not include the portfolio activity of any underlying mutual funds or exchange-traded funds (ETFs).
NAmount not annualized.
Fidelity® Women's Leadership ETF
Schedule of Investments July 31, 2024
Showing Percentage of Net Assets
| Common Stocks - 99.3% |
| | | Shares | Value ($) |
| COMMUNICATION SERVICES - 5.8% | | | |
| Entertainment - 2.6% | | | |
| Netflix, Inc. (a) | | 38 | 23,877 |
| The Walt Disney Co. | | 820 | 76,826 |
| | | | 100,703 |
| Interactive Media & Services - 3.2% | | | |
| Alphabet, Inc. Class C | | 638 | 110,470 |
| Pinterest, Inc. Class A (a) | | 491 | 15,687 |
| | | | 126,157 |
TOTAL COMMUNICATION SERVICES | | | 226,860 |
| CONSUMER DISCRETIONARY - 13.2% | | | |
| Automobiles - 0.7% | | | |
| General Motors Co. | | 637 | 28,232 |
| Broadline Retail - 5.2% | | | |
| Amazon.com, Inc. (a) | | 921 | 172,205 |
| Etsy, Inc. (a) | | 468 | 30,486 |
| | | | 202,691 |
| Hotels, Restaurants & Leisure - 1.8% | | | |
| Hilton Worldwide Holdings, Inc. | | 138 | 29,624 |
| Starbucks Corp. | | 311 | 24,242 |
| Vail Resorts, Inc. | | 102 | 18,565 |
| | | | 72,431 |
| Household Durables - 0.9% | | | |
| Taylor Morrison Home Corp. (a) | | 534 | 35,821 |
| Specialty Retail - 3.9% | | | |
| Aritzia, Inc. (a) | | 694 | 22,781 |
| Best Buy Co., Inc. | | 261 | 22,582 |
| Gap, Inc. | | 446 | 10,472 |
| Lowe's Companies, Inc. | | 137 | 33,635 |
| Ulta Beauty, Inc. (a) | | 48 | 17,515 |
| Warby Parker, Inc. (a) | | 1,269 | 20,900 |
| Williams-Sonoma, Inc. | | 159 | 24,594 |
| | | | 152,479 |
| Textiles, Apparel & Luxury Goods - 0.7% | | | |
| NIKE, Inc. Class B | | 124 | 9,283 |
| Tapestry, Inc. | | 447 | 17,920 |
| | | | 27,203 |
TOTAL CONSUMER DISCRETIONARY | | | 518,857 |
| CONSUMER STAPLES - 3.3% | | | |
| Consumer Staples Distribution & Retail - 0.5% | | | |
| Maplebear, Inc. (NASDAQ) | | 612 | 21,108 |
| Food Products - 1.1% | | | |
| Bunge Global SA | | 199 | 20,941 |
| The Hershey Co. | | 106 | 20,933 |
| | | | 41,874 |
| Household Products - 0.7% | | | |
| The Clorox Co. | | 207 | 27,310 |
| Personal Care Products - 1.0% | | | |
| elf Beauty, Inc. (a) | | 103 | 17,776 |
| Estee Lauder Companies, Inc. Class A | | 229 | 22,811 |
| | | | 40,587 |
TOTAL CONSUMER STAPLES | | | 130,879 |
| ENERGY - 3.0% | | | |
| Energy Equipment & Services - 1.1% | | | |
| Baker Hughes Co. Class A | | 1,169 | 45,264 |
| Oil, Gas & Consumable Fuels - 1.9% | | | |
| Antero Resources Corp. (a) | | 939 | 27,250 |
| EQT Corp. | | 584 | 20,154 |
| Occidental Petroleum Corp. | | 433 | 26,335 |
| | | | 73,739 |
TOTAL ENERGY | | | 119,003 |
| FINANCIALS - 12.5% | | | |
| Banks - 5.1% | | | |
| Bank of America Corp. | | 1,144 | 46,115 |
| Citigroup, Inc. | | 641 | 41,588 |
| Huntington Bancshares, Inc. | | 1,798 | 26,880 |
| JPMorgan Chase & Co. | | 290 | 61,712 |
| U.S. Bancorp | | 502 | 22,530 |
| | | | 198,825 |
| Capital Markets - 0.9% | | | |
| NASDAQ, Inc. | | 531 | 35,938 |
| Financial Services - 2.7% | | | |
| Fidelity National Information Services, Inc. | | 399 | 30,655 |
| MasterCard, Inc. Class A | | 90 | 41,734 |
| WEX, Inc. (a) | | 192 | 35,222 |
| | | | 107,611 |
| Insurance - 3.8% | | | |
| Hartford Financial Services Group, Inc. | | 465 | 51,578 |
| Marsh & McLennan Companies, Inc. | | 171 | 38,059 |
| Progressive Corp. | | 278 | 59,525 |
| | | | 149,162 |
TOTAL FINANCIALS | | | 491,536 |
| HEALTH CARE - 14.0% | | | |
| Biotechnology - 2.9% | | | |
| Alnylam Pharmaceuticals, Inc. (a) | | 149 | 35,382 |
| Exact Sciences Corp. (a) | | 365 | 16,673 |
| Moderna, Inc. (a) | | 174 | 20,744 |
| Sage Therapeutics, Inc. (a) | | 475 | 5,201 |
| Vertex Pharmaceuticals, Inc. (a) | | 52 | 25,777 |
| Zai Lab Ltd. ADR (a) | | 527 | 10,029 |
| | | | 113,806 |
| Health Care Equipment & Supplies - 3.8% | | | |
| Hologic, Inc. (a) | | 880 | 71,817 |
| Insulet Corp. (a) | | 192 | 37,315 |
| The Cooper Companies, Inc. | | 415 | 38,732 |
| | | | 147,864 |
| Health Care Providers & Services - 4.5% | | | |
| AMN Healthcare Services, Inc. (a) | | 345 | 23,329 |
| Centene Corp. (a) | | 612 | 47,075 |
| Cigna Group | | 199 | 69,385 |
| Elevance Health, Inc. | | 72 | 38,306 |
| | | | 178,095 |
| Life Sciences Tools & Services - 0.7% | | | |
| ICON PLC (a) | | 86 | 28,246 |
| Pharmaceuticals - 2.1% | | | |
| GSK PLC sponsored ADR | | 666 | 25,821 |
| Merck & Co., Inc. | | 243 | 27,491 |
| Zoetis, Inc. Class A | | 162 | 29,166 |
| | | | 82,478 |
TOTAL HEALTH CARE | | | 550,489 |
| INDUSTRIALS - 11.5% | | | |
| Air Freight & Logistics - 1.6% | | | |
| FedEx Corp. | | 115 | 34,759 |
| United Parcel Service, Inc. Class B | | 229 | 29,855 |
| | | | 64,614 |
| Commercial Services & Supplies - 0.4% | | | |
| Veralto Corp. | | 155 | 16,517 |
| Electrical Equipment - 3.5% | | | |
| Eaton Corp. PLC | | 116 | 35,356 |
| GE Vernova LLC | | 154 | 27,449 |
| nVent Electric PLC | | 296 | 21,498 |
| Regal Rexnord Corp. | | 172 | 27,637 |
| Sunrun, Inc. (a) | | 1,434 | 25,138 |
| | | | 137,078 |
| Ground Transportation - 0.4% | | | |
| ArcBest Corp. | | 127 | 16,008 |
| Machinery - 3.1% | | | |
| Deere & Co. | | 90 | 33,478 |
| Federal Signal Corp. | | 323 | 32,290 |
| Otis Worldwide Corp. | | 278 | 26,271 |
| Parker Hannifin Corp. | | 56 | 31,425 |
| | | | 123,464 |
| Professional Services - 2.5% | | | |
| Leidos Holdings, Inc. | | 236 | 34,078 |
| ManpowerGroup, Inc. | | 263 | 20,141 |
| Science Applications International Corp. | | 209 | 26,000 |
| UL Solutions, Inc. Class A | | 330 | 16,675 |
| | | | 96,894 |
TOTAL INDUSTRIALS | | | 454,575 |
| INFORMATION TECHNOLOGY - 29.0% | | | |
| Communications Equipment - 1.3% | | | |
| Arista Networks, Inc. (a) | | 150 | 51,983 |
| Electronic Equipment, Instruments & Components - 2.1% | | | |
| CDW Corp. | | 222 | 48,420 |
| Insight Enterprises, Inc. (a) | | 144 | 32,328 |
| | | | 80,748 |
| IT Services - 2.0% | | | |
| Accenture PLC Class A | | 234 | 77,365 |
| Semiconductors & Semiconductor Equipment - 9.3% | | | |
| Advanced Micro Devices, Inc. (a) | | 296 | 42,766 |
| First Solar, Inc. (a) | | 161 | 34,774 |
| Marvell Technology, Inc. | | 610 | 40,858 |
| Micron Technology, Inc. | | 342 | 37,558 |
| NVIDIA Corp. | | 1,090 | 127,552 |
| NXP Semiconductors NV | | 188 | 49,474 |
| SolarEdge Technologies, Inc. (a) | | 373 | 10,765 |
| Universal Display Corp. | | 111 | 24,711 |
| | | | 368,458 |
| Software - 10.1% | | | |
| Adobe, Inc. (a) | | 104 | 57,372 |
| Gen Digital, Inc. | | 1,389 | 36,100 |
| HubSpot, Inc. (a) | | 93 | 46,224 |
| Intuit, Inc. | | 56 | 36,252 |
| Microsoft Corp. | | 347 | 145,167 |
| Pagerduty, Inc. (a) | | 633 | 13,249 |
| Salesforce, Inc. | | 242 | 62,630 |
| | | | 396,994 |
| Technology Hardware, Storage & Peripherals - 4.2% | | | |
| Apple, Inc. | | 753 | 167,226 |
TOTAL INFORMATION TECHNOLOGY | | | 1,142,774 |
| MATERIALS - 4.0% | | | |
| Chemicals - 1.9% | | | |
| Cabot Corp. | | 284 | 28,482 |
| Celanese Corp. | | 170 | 23,996 |
| Eastman Chemical Co. | | 226 | 23,353 |
| | | | 75,831 |
| Construction Materials - 0.6% | | | |
| Summit Materials, Inc. (a) | | 597 | 24,943 |
| Containers & Packaging - 0.7% | | | |
| Ball Corp. | | 414 | 26,426 |
| Metals & Mining - 0.8% | | | |
| ATI, Inc. (a) | | 314 | 21,261 |
| Radius Recycling, Inc. Class A | | 535 | 9,694 |
| | | | 30,955 |
TOTAL MATERIALS | | | 158,155 |
| REAL ESTATE - 1.0% | | | |
| Equity Real Estate Investment Trusts (REITs) - 1.0% | | | |
| Ventas, Inc. | | 736 | 40,068 |
| UTILITIES - 2.0% | | | |
| Electric Utilities - 1.1% | | | |
| NextEra Energy, Inc. | | 598 | 45,681 |
| Gas Utilities - 0.9% | | | |
| Southwest Gas Holdings, Inc. | | 460 | 34,114 |
TOTAL UTILITIES | | | 79,795 |
| TOTAL COMMON STOCKS (Cost $3,252,755) | | | 3,912,991 |
| | | | |
| Money Market Funds - 0.8% |
| | | Shares | Value ($) |
State Street Institutional Treasury Plus Money Market Fund Trust Class 5.23% (b) (Cost $32,673) | | 32,673 | 32,673 |
| | | | |
| TOTAL INVESTMENT IN SECURITIES - 100.1% (Cost $3,285,428) | 3,945,664 |
NET OTHER ASSETS (LIABILITIES) - (0.1)% | (3,292) |
| NET ASSETS - 100.0% | 3,942,372 |
| | |
Legend
| (b) | The rate quoted is the annualized seven-day yield of the fund at period end. |
Investment Valuation
The following is a summary of the inputs used, as of July 31, 2024, involving the Fund's assets and liabilities carried at fair value. The inputs or methodology used for valuing securities may not be an indication of the risk associated with investing in those securities. For more information on valuation inputs, and their aggregation into the levels used below, please refer to the Investment Valuation section in the accompanying Notes to Financial Statements.
| Valuation Inputs at Reporting Date: |
| Description | Total ($) | Level 1 ($) | Level 2 ($) | Level 3 ($) |
Investments in Securities: | | | | |
|
| Equities: | | | | |
Communication Services | 226,860 | 226,860 | - | - |
Consumer Discretionary | 518,857 | 518,857 | - | - |
Consumer Staples | 130,879 | 130,879 | - | - |
Energy | 119,003 | 119,003 | - | - |
Financials | 491,536 | 491,536 | - | - |
Health Care | 550,489 | 550,489 | - | - |
Industrials | 454,575 | 454,575 | - | - |
Information Technology | 1,142,774 | 1,142,774 | - | - |
Materials | 158,155 | 158,155 | - | - |
Real Estate | 40,068 | 40,068 | - | - |
Utilities | 79,795 | 79,795 | - | - |
|
| Money Market Funds | 32,673 | 32,673 | - | - |
| Total Investments in Securities: | 3,945,664 | 3,945,664 | - | - |
Fidelity® Women's Leadership ETF
Financial Statements
| Statement of Assets and Liabilities |
As of July 31, 2024 |
| Assets | | | | |
Investment in securities, at value - See accompanying schedule Unaffiliated issuers (cost $3,285,428): | | | $ | 3,945,664 |
| Receivable for investments sold | | | | 16,037 |
| Dividends receivable | | | | 1,307 |
Total assets | | | | 3,963,008 |
| Liabilities | | | | |
| Payable for investments purchased | $ | 17,429 | | |
| Accrued management fee | | 2,022 | | |
| Proxy fee payable | | 1,185 | | |
| Total liabilities | | | | 20,636 |
| Net Assets | | | $ | 3,942,372 |
| Net Assets consist of: | | | | |
| Paid in capital | | | $ | 3,625,228 |
| Total accumulated earnings (loss) | | | | 317,144 |
| Net Assets | | | $ | 3,942,372 |
Net Asset Value, offering price and redemption price per share ($3,942,372 ÷ 175,000 shares) | | | $ | 22.53 |
| Statement of Operations |
| Year ended July 31, 2024 |
| Investment Income | | | | |
| Dividends | | | $ | 47,096 |
| Expenses | | | | |
| Management fee | $ | 21,836 | | |
| Independent trustees' fees and expenses | | 18 | | |
| Proxy fee | | 1,185 | | |
| Total expenses before reductions | | 23,039 | | |
| Expense reductions | | (1,087) | | |
| Total expenses after reductions | | | | 21,952 |
| Net Investment income (loss) | | | | 25,144 |
| Realized and Unrealized Gain (Loss) | | | | |
| Net realized gain (loss) on: | | | | |
| Investment Securities: | | | | |
| Redemptions in-kind | | 105,036 | | |
| Unaffiliated issuers | | 118,935 | | |
| Foreign currency transactions | | (2) | | |
| Total net realized gain (loss) | | | | 223,969 |
| Change in net unrealized appreciation (depreciation) on investment securities | | | | 318,376 |
| Net gain (loss) | | | | 542,345 |
| Net increase (decrease) in net assets resulting from operations | | | $ | 567,489 |
| Statement of Changes in Net Assets |
| |
| | Year ended July 31, 2024 | | Year ended July 31, 2023 |
| Increase (Decrease) in Net Assets | | | | |
| Operations | | | | |
| Net investment income (loss) | $ | 25,144 | $ | 32,192 |
| Net realized gain (loss) | | 223,969 | | (130,743) |
| Change in net unrealized appreciation (depreciation) | | 318,376 | | 583,271 |
| Net increase (decrease) in net assets resulting from operations | | 567,489 | | 484,720 |
| Distributions to shareholders | | (26,400) | | (31,525) |
| | | | | |
| Share transactions | | | | |
| Proceeds from sales of shares | | 531,073 | | 2,547,748 |
| Cost of shares redeemed | | (558,223) | | (2,199,862) |
| | | | | |
Net increase (decrease) in net assets resulting from share transactions | | (27,150) | | 347,886 |
| Total increase (decrease) in net assets | | 513,939 | | 801,081 |
| | | | | |
| Net Assets | | | | |
| Beginning of period | | 3,428,433 | | 2,627,352 |
| End of period | $ | 3,942,372 | $ | 3,428,433 |
| | | | | |
| Other Information | | | | |
| Shares | | | | |
| Sold | | 25,000 | | 150,000 |
| Redeemed | | (25,000) | | (125,000) |
| Net increase (decrease) | | - | | 25,000 |
| | | | | |
Financial Highlights
Fidelity® Women's Leadership ETF |
| |
| Years ended July 31, | | 2024 | | 2023 | | 2022 | | 2021 A |
Selected Per-Share Data | | | | | | | | |
| Net asset value, beginning of period | $ | 19.59 | $ | 17.52 | $ | 20.51 | $ | 20.00 |
| Income from Investment Operations | | | | | | | | |
Net investment income (loss) B,C | | .14 | | .16 | | .11 | | - D |
| Net realized and unrealized gain (loss) | | 2.95 | | 2.08 | | (3.01) | | .51 |
| Total from investment operations | | 3.09 | | 2.24 | | (2.90) | | .51 |
| Distributions from net investment income | | (.15) | | (.17) | | (.09) | | - |
| Total distributions | | (.15) | | (.17) | | (.09) | | - |
| Net asset value, end of period | $ | 22.53 | $ | 19.59 | $ | 17.52 | $ | 20.51 |
Total Return E,F,G | | | | 12.98% | | (14.14)% | | 2.53% |
Ratios to Average Net Assets C,H,I | | | | | | | | |
| Expenses before reductions | | .62% | | .59% | | .59% | | .59% J |
| Expenses net of fee waivers, if any | | | | .59% | | .59% | | .59% J |
| Expenses net of all reductions | | .59% | | .59% | | .59% | | .59% J |
| Net investment income (loss) | | .68% | | .91% | | .56% | | .08% J |
| Supplemental Data | | | | | | | | |
| Net assets, end of period (000 omitted) | $ | 3,942 | $ | 3,428 | $ | 2,627 | $ | 2,051 |
Portfolio turnover rate K,L | | | | 72% | | 64% | | 5% M |
AFor the period June 15, 2021 (commencement of operations) through July 31, 2021.
BCalculated based on average shares outstanding during the period.
CNet investment income (loss) is affected by the timing of the declaration of dividends by any underlying mutual funds or exchange-traded funds (ETFs). Net investment income (loss) of any mutual funds or ETFs is not included in the Fund's net investment income (loss) ratio.
DAmount represents less than $.005 per share.
ETotal returns for periods of less than one year are not annualized.
FTotal returns would have been lower if certain expenses had not been reduced during the applicable periods shown.
GBased on net asset value.
HFees and expenses of any underlying mutual funds or exchange-traded funds (ETFs) are not included in the Fund's expense ratio. The Fund indirectly bears its proportionate share of these expenses.
IExpense ratios reflect operating expenses of the class. Expenses before reductions do not reflect amounts reimbursed, waived, or reduced through arrangements with the investment adviser, brokerage services, or other offset arrangements, if applicable, and do not represent the amount paid by the class during periods when reimbursements, waivers or reductions occur.
JAnnualized.
KPortfolio turnover rate excludes securities received or delivered in-kind.
LAmount does not include the portfolio activity of any underlying mutual funds or exchange-traded funds (ETFs).
MAmount not annualized.
Notes to Financial Statements
For the period ended July 31, 2024
1. Organization.
Fidelity Blue Chip Growth ETF, Fidelity Blue Chip Value ETF, Fidelity Fundamental Large Cap Core ETF (formerly Fidelity New Millennium ETF), Fidelity Fundamental Large Cap Growth ETF (formerly Fidelity Growth Opportunities ETF), Fidelity Fundamental Large Cap Value ETF, Fidelity Fundamental Small-Mid Cap ETF (formerly Fidelity Small-Mid Cap Opportunities ETF), Fidelity Magellan ETF, Fidelity Real Estate Investment ETF, Fidelity Sustainable U.S. Equity ETF and Fidelity Women's Leadership ETF (the Funds) are exchange-traded funds of Fidelity Covington Trust (the Trust) and are authorized to issue an unlimited number of shares. Each Fund, with the exception of Fidelity Blue Chip Value ETF, Fidelity Fundamental Large Cap Core ETF, Fidelity Fundamental Small-Mid Cap ETF, Fidelity Sustainable U.S. Equity ETF and Fidelity Women's Leadership ETF, are non-diversified funds. The Trust is registered under the Investment Company Act of 1940, as amended (the 1940 Act), as an open-end management investment company organized as a Massachusetts business trust.
2. Investments in Fidelity Central Funds.
Funds may invest in Fidelity Central Funds, which are open-end investment companies generally available only to other investment companies and accounts managed by the investment adviser and its affiliates. The Schedule of Investments lists any Fidelity Central Funds held as an investment as of period end, but does not include the underlying holdings of each Fidelity Central Fund. An investing fund indirectly bears its proportionate share of the expenses of the underlying Fidelity Central Funds.
Based on its investment objective, each Fidelity Central Fund may invest or participate in various investment vehicles or strategies that are similar to those of the investing fund. These strategies are consistent with the investment objectives of the investing fund and may involve certain economic risks which may cause a decline in value of each of the Fidelity Central Funds and thus a decline in the value of the investing fund.
| Fidelity Central Fund | Investment Manager | Investment Objective | Investment Practices | Expense RatioA |
| Fidelity Money Market Central Funds | Fidelity Management & Research Company LLC (FMR) | Each fund seeks to obtain a high level of current income consistent with the preservation of capital and liquidity. | Short-term Investments | Less than .005% |
A Expenses expressed as a percentage of average net assets and are as of each underlying Central Fund's most recent annual or semi-annual shareholder report.
A complete unaudited list of holdings for each Fidelity Central Fund is available upon request or at the Securities and Exchange Commission website at www.sec.gov. In addition, the financial statements of the Fidelity Central Funds which contain the significant accounting policies (including investment valuation policies) of those funds, and are not covered by the Report of Independent Registered Public Accounting Firm, are available on the Securities and Exchange Commission website or upon request.
3. Significant Accounting Policies.
Each Fund is an investment company and applies the accounting and reporting guidance of the Financial Accounting Standards Board (FASB) Accounting Standards Codification Topic 946 Financial Services - Investment Companies. The financial statements have been prepared in conformity with accounting principles generally accepted in the United States of America (GAAP), which require management to make certain estimates and assumptions at the date of the financial statements. Actual results could differ from those estimates. Subsequent events, if any, through the date that the financial statements were issued have been evaluated in the preparation of the financial statements. Each Fund's Schedule of Investments lists any underlying mutual funds or exchange-traded funds (ETFs) but does not include the underlying holdings of these funds. The following summarizes the significant accounting policies of each Fund:
Investment Valuation. Investments are valued as of 4:00 p.m. Eastern time on the last calendar day of the period. The Board of Trustees (the Board) has designated each Fund's investment adviser as the valuation designee responsible for the fair valuation function and performing fair value determinations as needed. The investment adviser has established a Fair Value Committee (the Committee) to carry out the day-to-day fair valuation responsibilities and has adopted policies and procedures to govern the fair valuation process and the activities of the Committee. In accordance with these fair valuation policies and procedures, which have been approved by the Board, each Fund attempts to obtain prices from one or more third party pricing services or brokers to value its investments. When current market prices, quotations or currency exchange rates are not readily available or reliable, investments will be fair valued in good faith by the Committee, in accordance with the policies and procedures. Factors used in determining fair value vary by investment type and may include market or investment specific events, transaction data, estimated cash flows, and market observations of comparable investments. The frequency that the fair valuation procedures are used cannot be predicted and they may be utilized to a significant extent. The Committee manages each Fund's fair valuation practices and maintains the fair valuation policies and procedures. Each Fund's investment adviser reports to the Board information regarding the fair valuation process and related material matters.
Each Fund categorizes the inputs to valuation techniques used to value its investments into a disclosure hierarchy consisting of three levels as shown below:
Level 1 - unadjusted quoted prices in active markets for identical investments
Level 2 - other significant observable inputs (including quoted prices for similar investments, interest rates, prepayment speeds, etc.)
Level 3 - unobservable inputs (including the Fund's own assumptions based on the best information available)
Valuation techniques used to value each Fund's investments by major category are as follows:
Equity securities, including restricted securities, for which market quotations are readily available, are valued at the last reported sale price or official closing price as reported by a third party pricing service on the primary market or exchange on which they are traded and are categorized as Level 1 in the hierarchy. In the event there were no sales during the day or closing prices are not available, securities are valued at the last quoted bid price or may be valued using the last available price and are generally categorized as Level 2 in the hierarchy. For foreign equity securities, when market or security specific events arise, comparisons to the valuation of American Depositary Receipts (ADRs), futures contracts, Exchange-Traded Funds (ETFs) and certain indexes as well as quoted prices for similar securities may be used and would be categorized as Level 2 in the hierarchy. For equity securities, including restricted securities, where observable inputs are limited, assumptions about market activity and risk are used and these securities may be categorized as Level 3 in the hierarchy.
Investments in open-end mutual funds, including the Fidelity Central Funds, are valued at their closing net asset value (NAV) each business day and are categorized as Level 1 in the hierarchy. If an unaffiliated open-end mutual fund's NAV is unavailable, shares of that fund may be valued by another method that the Board believes reflects fair value in accordance with the Boards fair value pricing policies and is categorized as Level 2 in the hierarchy.
Changes in valuation techniques may result in transfers in or out of an assigned level within the disclosure hierarchy. The aggregate value of investments by input level as of July 31, 2024 is included at the end of each Fund's Schedule of Investments.
Foreign Currency. Certain Funds may use foreign currency contracts to facilitate transactions in foreign-denominated securities. Gains and losses from these transactions may arise from changes in the value of the foreign currency or if the counterparties do not perform under the contracts' terms.
Foreign-denominated assets, including investment securities, and liabilities are translated into U.S. dollars at the exchange rates at period end. Purchases and sales of investment securities, income and dividends received, and expenses denominated in foreign currencies are translated into U.S. dollars at the exchange rate in effect on the transaction date.
The effects of exchange rate fluctuations on investments are included with the net realized and unrealized gain (loss) on investment securities. Other foreign currency transactions resulting in realized and unrealized gain (loss) are disclosed separately.
Investment Transactions and Income. For financial reporting purposes, the Funds' investment holdings and NAV include trades executed through the end of the last business day of the period. The NAV per share for processing shareholder transactions is calculated as of the close of business (normally 4:00 p.m. Eastern time) of the New York Stock Exchange, Archipelago Exchange (NYSE Arca) for Fidelity Sustainable U.S. Equity ETF and Fidelity Women's Leadership ETF, and of the Cboe BZX Exchange, Inc. (CboeBZX) for all other funds; and includes trades executed through the end of the prior business day. Gains and losses on securities sold are determined on the basis of identified cost and may include proceeds received from litigation. Commissions paid to certain brokers with whom the investment adviser, or its affiliates, places trades on behalf of a fund include an amount in addition to trade execution, which may be rebated back to a fund. Any such rebates are included in net realized gain (loss) on investments in the Statement of Operations. Dividend income is recorded on the ex-dividend date, except for certain dividends from foreign securities where the ex-dividend date may have passed, which are recorded as soon as the Funds are informed of the ex-dividend date. Non-cash dividends included in dividend income, if any, are recorded at the fair market value of the securities received. Income and capital gain distributions from Fidelity Central Funds, if any, are recorded on the ex-dividend date. Certain distributions received by the Funds represent a return of capital or capital gain. The Funds determine the components of these distributions subsequent to the ex-dividend date, based upon receipt of tax filings or other correspondence relating to the underlying investment. These distributions are recorded as a reduction of cost of investments and/or as a realized gain. Investment income is recorded net of foreign taxes withheld where recovery of such taxes is uncertain. Funds may file withholding tax reclaims in certain jurisdictions to recover a portion of amounts previously withheld. Any withholding tax reclaims income is included in the Statement of Operations in dividends. Any receivables for withholding tax reclaims are included in the Statement of Assets and Liabilities in dividends receivable.
Expenses. Expenses directly attributable to a fund are charged to that fund. Expenses attributable to more than one fund are allocated among the respective funds on the basis of relative net assets or other appropriate methods. Expenses included in the accompanying financial statements reflect the expenses of that fund and do not include any expenses associated with any underlying mutual funds or exchange-traded funds. Although not included in a fund's expenses, a fund indirectly bears its proportionate share of these expenses through the net asset value of each underlying mutual fund or exchange-traded fund. Expense estimates are accrued in the period to which they relate and adjustments are made when actual amounts are known.
Income Tax Information and Distributions to Shareholders. Each year, each Fund intends to qualify as a regulated investment company under Subchapter M of the Internal Revenue Code, including distributing substantially all of its taxable income and realized gains. As a result, no provision for U.S. Federal income taxes is required. As of July 31, 2024, each Fund did not have any unrecognized tax benefits in the financial statements; nor is each Fund aware of any tax positions for which it is reasonably possible that the total amounts of unrecognized tax benefits will significantly change in the next twelve months. Each Fund files a U.S. federal tax return, in addition to state and local tax returns as required. Each Fund's federal income tax returns are subject to examination by the Internal Revenue Service (IRS) for a period of three fiscal years after they are filed. State and local tax returns may be subject to examination for an additional fiscal year depending on the jurisdiction. Realized gain or loss resulting from in-kind redemptions is not taxable to the Funds and is not distributed to shareholders of the Funds. Foreign taxes are provided for based on each Fund's understanding of the tax rules and rates that exist in the foreign markets in which it invests.
Distributions are declared and recorded on the ex-dividend date. Income and capital gain distributions are determined in accordance with income tax regulations, which may differ from GAAP.
Capital accounts within the financial statements are adjusted for permanent book-tax differences. These adjustments have no impact on net assets or the results of operations. Capital accounts are not adjusted for temporary book-tax differences which will reverse in a subsequent period.
Book-tax differences are primarily due to futures transactions, foreign currency transactions, passive foreign investment companies (PFIC), redemptions in-kind, net operating losses, capital loss carryforwards and losses deferred due to wash sales and excise tax regulations.
As of period end, the cost and unrealized appreciation (depreciation) in securities, and derivatives if applicable, for federal income tax purposes were as follows for each Fund:
| | Tax cost ($) | Gross unrealized appreciation ($) | Gross unrealized depreciation ($) | Net unrealized appreciation (depreciation)($) |
| Fidelity Blue Chip Growth ETF | 1,525,219,927 | 503,675,942 | (53,274,255) | 450,401,687 |
| Fidelity Blue Chip Value ETF | 108,417,050 | 21,054,007 | (4,134,241) | 16,919,766 |
Fidelity Fundamental Large Cap Core ETF | 333,496,557 | 57,963,040 | (5,270,127) | 52,692,913 |
Fidelity Fundamental Large Cap Growth ETF | 239,102,398 | 84,299,519 | (6,170,422) | 78,129,097 |
Fidelity Fundamental Large Cap Value ETF | 1,501,502 | 120,887 | (28,674) | 92,213 |
Fidelity Fundamental Small-Mid Cap ETF | 61,700,662 | 15,793,819 | (1,705,933) | 14,087,886 |
| Fidelity Magellan ETF | 90,188,930 | 26,451,726 | (737,323) | 25,714,403 |
| Fidelity Real Estate Investment ETF | 12,462,436 | 1,042,115 | (652,283) | 389,832 |
| Fidelity Sustainable U.S. Equity ETF | 11,906,993 | 2,795,634 | (327,144) | 2,468,490 |
| Fidelity Women's Leadership ETF | 3,323,795 | 806,544 | (184,675) | 621,869 |
The tax-based components of distributable earnings as of period end were as follows for each Fund:
| | Undistributed ordinary income ($) | Undistributed long-term capital gain ($) | Capital loss carryforward ($) | Net unrealized appreciation (depreciation) on securities and other investments ($) |
| Fidelity Blue Chip Growth ETF | 2,688,094 | - | (81,511,457) | 450,401,685 |
| Fidelity Blue Chip Value ETF | 148,794 | - | (1,777,461) | 16,919,766 |
Fidelity Fundamental Large Cap Core ETF | 355,590 | - | (3,820,415) | 52,692,913 |
Fidelity Fundamental Large Cap Growth ETF | - | - | (21,138,778) | 78,129,169 |
Fidelity Fundamental Large Cap Value ETF | 1,643 | - | - | 92,213 |
Fidelity Fundamental Small-Mid Cap ETF | - | - | (4,168,329) | 14,087,886 |
| Fidelity Magellan ETF | - | - | (7,900,844) | 25,714,405 |
| Fidelity Real Estate Investment ETF | - | - | (2,098,285) | 389,832 |
| Fidelity Sustainable U.S. Equity ETF | 13,696 | 206,827 | - | 2,468,490 |
| Fidelity Women's Leadership ETF | 424 | - | (305,149) | 621,869 |
Capital loss carryforwards are only available to offset future capital gains of the Funds to the extent provided by regulations and may be limited. The capital loss carryforward information presented below, including any applicable limitation, is estimated as of fiscal period end and is subject to adjustment.
| | Short-term ($) | Long-term ($) | Total capital loss carryforward ($) |
| Fidelity Blue Chip Growth ETF | (46,059,715) | (35,451,742) | (81,511,457) |
| Fidelity Blue Chip Value ETF | (1,777,461) | (-) | (1,777,461) |
Fidelity Fundamental Large Cap Core ETF | (2,471,893) | (1,348,522) | (3,820,415) |
Fidelity Fundamental Large Cap Growth ETF | (14,479,237) | (6,659,541) | (21,138,778) |
Fidelity Fundamental Small-Mid Cap ETF | (2,557,425) | (1,610,904) | (4,168,329) |
| Fidelity Magellan ETF | (6,828,350) | (1,072,494) | (7,900,844) |
| Fidelity Real Estate Investment ETF | (487,555) | (1,610,730) | (2,098,285) |
| Fidelity Women's Leadership ETF | (79,120) | (226,029) | (305,149) |
The tax character of distributions paid was as follows:
| July 31, 2024 | | | |
| | Ordinary Income ($) | Long-term Capital Gains ($) | Total ($) |
| Fidelity Blue Chip Growth ETF | 236,800 | - | 236,800 |
| Fidelity Blue Chip Value ETF | 2,193,525 | - | 2,193,525 |
Fidelity Fundamental Large Cap Core ETF | 1,533,800 | - | 1,533,800 |
Fidelity Fundamental Large Cap Growth ETF | - | - | - |
Fidelity Fundamental Large Cap Value ETF A | 8,825 | - | 8,825 |
Fidelity Fundamental Small-Mid Cap ETF | 285,300 | - | 285,300 |
| Fidelity Magellan ETF | 148,775 | - | 148,775 |
| Fidelity Real Estate Investment ETF | 379,650 | - | 379,650 |
| Fidelity Sustainable U.S. Equity ETF | 78,975 | - | 78,975 |
| Fidelity Women's Leadership ETF | 26,400 | - | 26,400 |
| July 31, 2023 | | | |
| | Ordinary Income ($) | Long-term Capital Gains ($) | Total ($) |
| Fidelity Blue Chip Growth ETF | - | - | - |
| Fidelity Blue Chip Value ETF | 1,923,675 | 916,300 | 2,839,975 |
Fidelity Fundamental Large Cap Core ETF | 924,275 | 133,950 | 1,058,225 |
Fidelity Fundamental Large Cap Growth ETF | - | - | - |
Fidelity Fundamental Small-Mid Cap ETF | 192,175 | - | 192,175 |
| Fidelity Magellan ETF | 144,575 | - | 144,575 |
| Fidelity Real Estate Investment ETF | 452,000 | - | 452,000 |
| Fidelity Sustainable U.S. Equity ETF | 79,775 | - | 79,775 |
| Fidelity Women's Leadership ETF | 31,525 | - | 31,525 |
A For the period February 22, 2024 (commencement of operations) through July 31, 2024.
Restricted Securities (including Private Placements). Funds may invest in securities that are subject to legal or contractual restrictions on resale. These securities generally may be resold in transactions exempt from registration or to the public if the securities are registered. Disposal of these securities may involve time-consuming negotiations and expense, and prompt sale at an acceptable price may be difficult. Information regarding restricted securities held at period end is included at the end of the Schedule of Investments, if applicable.
4. Derivative Instruments.
Risk Exposures and the Use of Derivative Instruments. Each Fund's investment objectives allow for various types of derivative instruments, including futures contracts. Derivatives are investments whose value is primarily derived from underlying assets, indices or reference rates and may be transacted on an exchange or over-the-counter (OTC). Derivatives may involve a future commitment to buy or sell a specified asset based on specified terms, to exchange future cash flows at periodic intervals based on a notional principal amount, or for one party to make one or more payments upon the occurrence of specified events in exchange for periodic payments from the other party.
Derivatives were used to increase returns and to manage exposure to certain risks as defined below. The success of any strategy involving derivatives depends on analysis of numerous economic factors, and if the strategies for investment do not work as intended, the objectives may not be achieved.
Derivatives were used to increase or decrease exposure to the following risk(s):
| | |
| Equity Risk | Equity risk relates to the fluctuations in the value of financial instruments as a result of changes in market prices (other than those arising from interest rate risk or foreign exchange risk), whether caused by factors specific to an individual investment, its issuer, or all factors affecting all instruments traded in a market or market segment. |
Funds are also exposed to additional risks from investing in derivatives, such as liquidity risk and counterparty credit risk. Liquidity risk is the risk that a fund will be unable to close out the derivative in the open market in a timely manner. Counterparty credit risk is the risk that the counterparty will not be able to fulfill its obligation to a fund. Counterparty credit risk related to exchange-traded contracts may be mitigated by the protection provided by the exchange on which they trade.
Investing in derivatives may involve greater risks than investing in the underlying assets directly and, to varying degrees, may involve risk of loss in excess of any initial investment and collateral received and amounts recognized in the Statement of Assets and Liabilities. In addition, there may be the risk that the change in value of the derivative contract does not correspond to the change in value of the underlying instrument.
Futures Contracts. A futures contract is an agreement between two parties to buy or sell a specified underlying instrument for a fixed price at a specified future date. Futures contracts were used to manage exposure to the stock market.
Upon entering into a futures contract, a fund is required to deposit either cash or securities (initial margin) with a clearing broker in an amount equal to a certain percentage of the face value of the contract. Futures contracts are marked-to-market daily and subsequent daily payments are made or received by a fund depending on the daily fluctuations in the value of the futures contracts and are recorded as unrealized appreciation or (depreciation). This receivable and/or payable, if any, is included in daily variation margin on futures contracts in the Statement of Assets and Liabilities. Realized gain or (loss) is recorded upon the expiration or closing of a futures contract. The net realized gain (loss) and change in net unrealized appreciation (depreciation) on futures contracts during the period is presented in the Statement of Operations.
Any open futures contracts at period end are presented in the Schedule of Investments under the caption "Futures Contracts". The notional amount at value reflects each contract's exposure to the underlying instrument or index at period end, and is representative of volume of activity during the period unless an average notional amount is presented. Any securities deposited to meet initial margin requirements are identified in the Schedule of Investments. Any cash deposited to meet initial margin requirements is presented as segregated cash with brokers for derivative instruments in the Statement of Assets and Liabilities.
5. Purchases and Sales of Investments.
Purchases and sales of securities, other than short-term securities and in-kind transactions, as applicable, are noted in the table below.
| | Purchases ($) | Sales ($) |
| Fidelity Blue Chip Growth ETF | 979,885,547 | 492,192,024 |
| Fidelity Blue Chip Value ETF | 40,054,191 | 39,038,870 |
| Fidelity Fundamental Large Cap Core ETF | 240,772,546 | 123,852,790 |
| Fidelity Fundamental Large Cap Growth ETF | 215,328,679 | 126,090,960 |
| Fidelity Fundamental Large Cap Value ETF | 431,005 | 328,364 |
| Fidelity Fundamental Small-Mid Cap ETF | 27,488,311 | 17,969,684 |
| Fidelity Magellan ETF | 47,580,245 | 42,508,059 |
| Fidelity Real Estate Investment ETF | 5,795,549 | 5,821,677 |
| Fidelity Sustainable U.S. Equity ETF | 5,774,011 | 5,932,307 |
| Fidelity Women's Leadership ETF | 2,225,216 | 2,132,231 |
Securities received and delivered in-kind through subscriptions and redemptions are noted in the table below.
| | In-Kind Subscriptions ($) | In-Kind Redemptions ($) |
| Fidelity Blue Chip Growth ETF | 422,033,505 | 36,249,364 |
| Fidelity Blue Chip Value ETF | 5,788,560 | 17,896,675 |
| Fidelity Fundamental Large Cap Core ETF | 183,627,120 | 79,219,990 |
| Fidelity Fundamental Large Cap Growth ETF | 46,206,734 | 78,977,380 |
| Fidelity Fundamental Large Cap Value ETF | 1,399,291 | - |
| Fidelity Fundamental Small-Mid Cap ETF | 22,398,471 | 1,882,526 |
| Fidelity Magellan ETF | 46,480,826 | 6,921,997 |
| Fidelity Real Estate Investment ETF | - | 2,979,494 |
| Fidelity Sustainable U.S. Equity ETF | 2,191,776 | 857,009 |
| Fidelity Women's Leadership ETF | 368,685 | 416,272 |
6. Fees and Other Transactions with Affiliates.
Management Fee. Fidelity Management & Research Company LLC (the investment adviser) provides the Funds with investment management related services for which the Funds pay a monthly management fee that is based on an annual rate of each Fund's average net assets as noted in the table below Under the management contract, the investment adviser pays all other expenses, except the compensation of the independent Trustees and certain miscellaneous expenses such as proxy and shareholder meeting expenses.
| | Fee Rate |
| Fidelity Blue Chip Growth ETF | .59% |
| Fidelity Blue Chip Value ETF | .59% |
| Fidelity Fundamental Large Cap Core ETF | .38%/.59%A |
| Fidelity Fundamental Large Cap Growth ETF | .38%/.59%A |
| Fidelity Fundamental Large Cap Value ETF | .38% |
| Fidelity Fundamental Small-Mid Cap ETF | .43%/.60%A |
| Fidelity Magellan ETF | .59% |
| Fidelity Real Estate Investment ETF | .59% |
| Fidelity Sustainable U.S. Equity ETF | .59% |
| Fidelity Women's Leadership ETF | .59% |
A Fee rate prior to February 26, 2024. | |
Brokerage Commissions. A portion of portfolio transactions were placed with brokerage firms which are affiliates of the investment adviser. Brokerage commissions are included in net realized gain (loss) and change in net unrealized appreciation (depreciation) in the Statement of Operations. The commissions paid to these affiliated firms were as follows:
| | Amount ($) |
| Fidelity Blue Chip Growth ETF | 8,654 |
| Fidelity Blue Chip Value ETF | 326 |
| Fidelity Fundamental Large Cap Core ETF | 1,022 |
| Fidelity Fundamental Large Cap Growth ETF | 1,193 |
| Fidelity Fundamental Large Cap Value ETF | 7 |
| Fidelity Fundamental Small-Mid Cap ETF | 474 |
| Fidelity Magellan ETF | 282 |
| Fidelity Real Estate Investment ETF | 132 |
| Fidelity Sustainable U.S. Equity ETF | 48 |
| Fidelity Women's Leadership ETF | 38 |
Interfund Trades. Funds may purchase from or sell securities to other Fidelity Funds under procedures adopted by the Board. The procedures have been designed to ensure these interfund trades are executed in accordance with Rule 17a-7 of the 1940 Act. Any interfund trades are included within the respective purchases and sales amounts shown in the Purchases and Sales of Investments note. Interfund trades during the period are noted in the table below.
| | Purchases ($) | Sales ($) | Realized Gain (Loss)($) |
| Fidelity Blue Chip Growth ETF | 37,659,784 | 16,874,875 | (280,337) |
| Fidelity Blue Chip Value ETF | 1,443,914 | 642,143 | 81,682 |
| Fidelity Fundamental Large Cap Core ETF | 16,662,954 | 10,819,253 | 201,577 |
| Fidelity Fundamental Large Cap Growth ETF | 17,278,850 | 13,141,838 | (547,956) |
| Fidelity Fundamental Large Cap Value ETF | 18,926 | 11,762 | 1,172 |
| Fidelity Fundamental Small-Mid Cap ETF | 1,008,442 | 1,440,312 | 204,547 |
| Fidelity Magellan ETF | 1,014,476 | 1,630,492 | 2,785 |
| Fidelity Real Estate Investment ETF | 63,746 | 69,360 | 23,280 |
| Fidelity Sustainable U.S. Equity ETF | 204,456 | 516,229 | 43,768 |
| Fidelity Women's Leadership ETF | 15,531 | 54,545 | (356) |
Other. During the period, the investment adviser reimbursed the Fund for certain losses as follows:
| | Amount ($) |
| Fidelity Fundamental Large Cap Core ETF | 17,603 |
Sub-Advisory Arrangements. Effective March 1, 2024, each Fund's sub-advisory agreements with FMR Investment Management (UK) Limited, Fidelity Management & Research (Hong Kong) Limited, and Fidelity Management & Research (Japan) Limited were amended to provide that the investment adviser pays each sub-adviser monthly fees equal to 110% of the sub-adviser's costs for providing sub-advisory services.
7. Security Lending.
Funds lend portfolio securities from time to time in order to earn additional income. Lending agents are used, including National Financial Services (NFS), an affiliate of the investment adviser. Pursuant to a securities lending agreement, NFS will receive a fee, which is capped at 9.9% of a fund's daily lending revenue, for its services as lending agent. A fund may lend securities to certain qualified borrowers, including NFS. On the settlement date of the loan, a fund receives collateral (in the form of U.S. Treasury obligations, letters of credit and/or cash) against the loaned securities and maintains collateral in an amount not less than 100% of the market value of the loaned securities during the period of the loan. The market value of the loaned securities is determined at the close of business of a fund and any additional required collateral is delivered to a fund on the next business day. A fund or borrower may terminate the loan at any time, and if the borrower defaults on its obligation to return the securities loaned because of insolvency or other reasons, a fund may apply collateral received from the borrower against the obligation. A fund may experience delays and costs in recovering the securities loaned. Any cash collateral received is invested in the Fidelity Securities Lending Cash Central Fund. Any loaned securities are identified as such in the Schedule of Investments, and the value of loaned securities and cash collateral at period end, as applicable, are presented in the Statement of Assets and Liabilities. Security lending income represents the income earned on investing cash collateral, less rebates paid to borrowers and any lending agent fees associated with the loan, plus any premium payments received for lending certain types of securities. Security lending income is presented in the Statement of Operations as a component of income from Fidelity Central Funds. Affiliated security lending activity, if any, was as follows:
| | Total Security Lending Fees Paid to NFS ($) | Security Lending Income From Securities Loaned to NFS ($) | Value of Securities Loaned to NFS at Period End ($) |
| Fidelity Fundamental Large Cap Growth ETF | 3 | - | - |
8. Expense Reductions.
The investment adviser contractually agreed to reimburse certain Funds to the extent proxy and shareholder meeting expenses exceeded 0.003% of average net assets. This reimbursement will remain in place through November 30, 2025. During the period this reimbursement reduced each applicable Fund's expenses as follows:
| | Reimbursement ($) |
| Fidelity Blue Chip Growth ETF | 21,390 |
| Fidelity Blue Chip Value ETF | 5,812 |
| Fidelity Fundamental Large Cap Core ETF | 8,432 |
| Fidelity Fundamental Large Cap Growth ETF | 4,741 |
| Fidelity Fundamental Large Cap Value ETF | 222 |
| Fidelity Fundamental Small-Mid Cap ETF | 3,456 |
| Fidelity Magellan ETF | 4,271 |
| Fidelity Real Estate Investment ETF | 2,561 |
| Fidelity Sustainable U.S. Equity ETF | 1,399 |
| Fidelity Women's Leadership ETF | 1,085 |
Through arrangements with each applicable Fund's custodian, credits realized as a result of certain uninvested cash balances were used to reduce each applicable Fund's expenses. All of the applicable expense reductions are noted in the table below.
| | Custodian credits ($) |
| Fidelity Blue Chip Growth ETF | 578 |
| Fidelity Blue Chip Value ETF | 1 |
Fidelity Fundamental Large Cap Core ETF | 14 |
Fidelity Fundamental Large Cap Growth ETF | 78 |
Fidelity Fundamental Large Cap Value ETF | 6 |
Fidelity Fundamental Small-Mid Cap ETF | 26 |
| Fidelity Magellan ETF | 18 |
| Fidelity Real Estate Investment ETF | 3 |
| Fidelity Sustainable U.S. Equity ETF | 2 |
| Fidelity Women's Leadership ETF | 2 |
9. Share Transactions.
Funds issue and redeem shares at NAV only with certain authorized participants in large increments known as Creation Units. Purchases of Creation Units are made by tendering a basket of designated securities to a fund and redemption proceeds are paid with a basket of securities from a fund's portfolio with a balancing cash component to equate the market value of the basket of securities delivered or redeemed to the NAV per Creation Unit on the transaction date. Cash may be substituted equivalent to the value of certain securities generally when they are not available in sufficient quantity for delivery. A fund's shares are available in smaller increments to investors in the secondary market at market prices and may be subject to commissions. Authorized participants pay a transaction fee to the shareholder servicing agent when purchasing and redeeming Creation Units of a fund. The transaction fee is used to offset the costs associated with the issuance and redemption of Creation Units.
To the extent the Funds permit the contribution of securities in exchange for the purchase of shares(contribution in-kind), shares may be issued in advance off receipt by the Funds of all or a portion of the applicable deposit securities. In these circumstances, the Authorized Participant provides collateral to the custodian, on behalf of the Funds, in an amount up to 105% of the daily mark-to-market value of the deposit securities not yet received.
10. Other.
A fund's organizational documents provide former and current trustees and officers with a limited indemnification against liabilities arising in connection with the performance of their duties to the fund. In the normal course of business, a fund may also enter into contracts that provide general indemnifications. A fund's maximum exposure under these arrangements is unknown as this would be dependent on future claims that may be made against a fund. The risk of material loss from such claims is considered remote.
11. Risk and Uncertainties.
Many factors affect a fund's performance. Developments that disrupt global economies and financial markets, such as pandemics, epidemics, outbreaks of infectious diseases, war, terrorism, and environmental disasters, may significantly affect a fund's investment performance. The effects of these developments to a fund will be impacted by the types of securities in which a fund invests, the financial condition, industry, economic sector, and geographic location of an issuer, and a fund's level of investment in the securities of that issuer. Significant concentrations in security types, issuers, industries, sectors, and geographic locations may magnify the factors that affect a fund's performance.
Report of Independent Registered Public Accounting Firm
To the Board of Trustees of Fidelity Covington Trust and Shareholders of each of the four funds listed in the table below
Opinions on the Financial Statements
We have audited the accompanying statements of assets and liabilities, including the schedules of investments, of each of the funds listed in the table below (four of the funds constituting Fidelity Covington Trust, hereafter collectively referred to as the "Funds") as of July 31, 2024, the related statements of operations and of changes in net assets for each of the periods indicated in the table below, including the related notes, and the financial highlights for each of the periods indicated in the table below (collectively referred to as the "financial statements"). In our opinion, the financial statements present fairly, in all material respects, the financial position of each of the Funds listed in the table below as of July 31, 2024, the results of each of their operations, the changes in each of their net assets and each of the financial highlights for each of the periods indicated in the table below, in conformity with accounting principles generally accepted in the United States of America.
| Fund | Statement of operations | Statement of changes in net assets | Financial highlights |
| Fidelity Blue Chip Growth ETF | For the year ended July 31, 2024 | For each of the two years in the period ended July 31, 2024 | For each of the four years in the period ended July 31, 2024, and for the period June 2, 2020 (commencement of operations) through July 31, 2020 |
| Fidelity Blue Chip Value ETF | For the year ended July 31, 2024 | For each of the two years in the period ended July 31, 2024 | For each of the four years in the period ended July 31, 2024, and for the period June 2, 2020 (commencement of operations) through July 31, 2020 |
| Fidelity Fundamental Large Cap Core ETF | For the year ended July 31, 2024 | For each of the two years in the period ended July 31, 2024 | For each of the four years in the period ended July 31, 2024, and for the period June 2, 2020 (commencement of operations) through July 31, 2020 |
| Fidelity Fundamental Large Cap Value ETF | For the period February 22, 2024 (commencement of operations) through July 31, 2024 | For the period February 22, 2024 (commencement of operations) through July 31, 2024 | For the period February 22, 2024 (commencement of operations) through July 31, 2024 |
Basis for Opinions
These financial statements are the responsibility of the Funds' management. Our responsibility is to express an opinion on the Funds' financial statements based on our audits. We are a public accounting firm registered with the Public Company Accounting Oversight Board (United States) (PCAOB) and are required to be independent with respect to the Funds in accordance with the U.S. federal securities laws and the applicable rules and regulations of the Securities and Exchange Commission and the PCAOB.
We conducted our audits of these financial statements in accordance with the standards of the PCAOB. Those standards require that we plan and perform the audit to obtain reasonable assurance about whether the financial statements are free of material misstatement, whether due to error or fraud.
Our audits included performing procedures to assess the risks of material misstatement of the financial statements, whether due to error or fraud, and performing procedures that respond to those risks. Such procedures included examining, on a test basis, evidence regarding the amounts and disclosures in the financial statements. Our audits also included evaluating the accounting principles used and significant estimates made by management, as well as evaluating the overall presentation of the financial statements. Our procedures included confirmation of securities owned as of July 31, 2024 by correspondence with the custodian and brokers; when replies were not received from brokers, we performed other auditing procedures. We believe that our audits provide a reasonable basis for our opinions.
/s/ PricewaterhouseCoopers LLP
Boston, Massachusetts
September 13, 2024
We have served as the auditor of one or more investment companies in the Fidelity group of funds since 1932.
Report of Independent Registered Public Accounting Firm
To the Board of Trustees of Fidelity Covington Trust and the Shareholders of Fidelity Fundamental Large Cap Growth ETF (formerly Fidelity Growth Opportunities ETF), Fidelity Magellan ETF, Fidelity Real Estate Investment ETF, Fidelity Fundamental Small-Mid Cap ETF (formerly Fidelity Small-Mid Cap Opportunities ETF), Fidelity Sustainable U.S. Equity ETF, and Fidelity Women's Leadership ETF:
Opinion on the Financial Statements and Financial Highlights
We have audited the accompanying statements of assets and liabilities of Fidelity Fundamental Large Cap Growth ETF (formerly Fidelity Growth Opportunities ETF), Fidelity Magellan ETF, Fidelity Real Estate Investment ETF, Fidelity Fundamental Small-Mid Cap ETF (formerly Fidelity Small-Mid Cap Opportunities ETF), Fidelity Sustainable U.S. Equity ETF, and Fidelity Women's Leadership ETF (the "Funds"), each a fund of Fidelity Covington Trust, including the schedules of investments, as of July 31, 2024, the related statements of operations for the year then ended, the statements of changes in net assets for each of the two years in the period then ended, the financial highlights for each of the three years in the period then ended and for the period from February 2, 2021 (commencement of operations) through July 31, 2021, except for the financial highlights for the Fidelity Sustainable U.S. Equity ETF and Fidelity Women's Leadership ETF, which are for the three years in the period then ended and for the period from June 15, 2021 (commencement of operations) through July 31, 2021, and the related notes. In our opinion, the financial statements and financial highlights present fairly, in all material respects, the financial position of each of the Funds as of July 31, 2024, and the results of their operations for the year then ended, the changes in their net assets for each of the two years in the period then ended, and the financial highlights for each of the three years in the period then ended and for the period from February 2, 2021 (commencement of operations) through July 31, 2021 (or for the period mentioned above), in conformity with accounting principles generally accepted in the United States of America.
Basis for Opinion
These financial statements and financial highlights are the responsibility of the Funds' management. Our responsibility is to express an opinion on the Funds' financial statements and financial highlights based on our audits. We are a public accounting firm registered with the Public Company Accounting Oversight Board (United States) (PCAOB) and are required to be independent with respect to the Funds in accordance with the U.S. federal securities laws and the applicable rules and regulations of the Securities and Exchange Commission and the PCAOB.
We conducted our audits in accordance with the standards of the PCAOB. Those standards require that we plan and perform the audit to obtain reasonable assurance about whether the financial statements and financial highlights are free of material misstatement, whether due to error or fraud. The Funds are not required to have, nor were we engaged to perform, an audit of their internal control over financial reporting. As part of our audits, we are required to obtain an understanding of internal control over financial reporting but not for the purpose of expressing an opinion on the effectiveness of the Funds' internal control over financial reporting. Accordingly, we express no such opinion.
Our audits included performing procedures to assess the risks of material misstatement of the financial statements and financial highlights, whether due to error or fraud, and performing procedures that respond to those risks. Such procedures included examining, on a test basis, evidence regarding the amounts and disclosures in the financial statements and financial highlights. Our audits also included evaluating the accounting principles used and significant estimates made by management, as well as evaluating the overall presentation of the financial statements and financial highlights. Our procedures included confirmation of securities owned as of July 31, 2024, by correspondence with the custodian and brokers; when replies were not received from brokers, we performed other auditing procedures. We believe that our audits provide a reasonable basis for our opinion.
/s/ Deloitte & Touche LLP
Boston, Massachusetts
September 13, 2024
We have served as the auditor of one or more of the Fidelity investment companies since 1999.
Distributions
(Unaudited)The dividend and capital gains distributions for the fund(s) are available on Fidelity.com or Institutional.Fidelity.com.
The funds hereby designate as capital gain dividend the amounts noted below for the taxable year ended July 31, 2024, or, if subsequently determined to be different, the net capital gain of such year.
| Fidelity Sustainable U.S. Equity ETF | $206,827 |
A percentage of the dividends distributed during the fiscal year for the following funds qualify for the dividends-received deduction for corporate shareholders:
| Fidelity Blue Chip Growth ETF | |
December 2023 | 100% |
| Fidelity Blue Chip Value ETF | |
September 2023 December 2023 March 2024 June 2024 | 100% 100% 100% 100% |
| Fidelity Fundamental Large Cap Core ETF | |
September 2023 December 2023 March 2024 June 2024 | 100% 100% 100% 100% |
| Fidelity Fundamental Large Cap Value ETF | |
March 2024 June 2024 | 100% 100% |
| Fidelity Fundamental Small-Mid Cap ETF | |
September 2023 December 2023 March 2024 June 2024 | 100% 100% 100% 100% |
| Fidelity Magellan ETF | |
September 2023 December 2023 March 2024 June 2024 | 100% 100% 100% 100% |
| Fidelity Sustainable U.S. Equity ETF | |
September 2023 December 2023 March 2024 June 2024 | 100% 100% 100% 100% |
| Fidelity Women's Leadership ETF | |
September 2023 December 2023 March 2024 June 2024 | 100% 100% 100% 100% |
A percentage of the dividends distributed during the fiscal year for the following funds may be taken into account as a dividend for purposes of the maximum rate under section 1(h)(11) of the Internal Revenue Code.
| Fidelity Blue Chip Growth ETF | |
December 2023 | 100% |
| Fidelity Blue Chip Value ETF | |
September 2023 December 2023 March 2024 June 2024 | 100% 100% 100% 100% |
| Fidelity Fundamental Large Cap Core ETF | |
September 2023 December 2023 March 2024 June 2024 | 100% 100% 100% 100% |
| Fidelity Fundamental Large Cap Value ETF | |
March 2024 June 2024 | 100% 100% |
| Fidelity Fundamental Small-Mid Cap ETF | |
September 2023 December 2023 March 2024 June 2024 | 100% 100% 100% 100% |
| Fidelity Magellan ETF | |
September 2023 December 2023 March 2024 June 2024 | 100% 100% 100% 100% |
| Fidelity Sustainable U.S. Equity ETF | |
September 2023 December 2023 March 2024 June 2024 | 100% 100% 100% 100% |
| Fidelity Women's Leadership ETF | |
September 2023 December 2023 March 2024 June 2024 | 100% 100% 100% 100% |
A percentage of the dividends distributed during the fiscal year for the following funds qualify as a section 199A dividend:
| Fidelity Real Estate Investment ETF | |
September 2023 December 2023 March 2024 June 2024 | 100% 100% 55.01% 55.01% |
The funds hereby designate the amounts noted below as distributions paid during the fiscal year ended 2024 as qualifying to be taxed as section 163(j) interest dividends:
| Fidelity Real Estate Investment ETF | $5,182 |
The funds will notify shareholders in January 2025 of amounts for use in preparing 2024 income tax returns.
Item 8: Changes in and Disagreements with Accountants for Open-End Management Investment Companies
Note: This is not applicable for any fund included in this document.
Item 9: Proxy Disclosures for Open-End Management Investment Companies
| A special meeting of shareholders was held on July 16, 2024. The results of votes taken among shareholders on the proposal before them are reported below. Each vote reported represents one dollar of net asset value held on the record date for the meeting. |
| Proposal 1 |
| To elect a Board of Trustees. |
| | # of Votes | % of Votes |
| Bettina Doulton |
| Affirmative | 38,080,283,823.03 | 97.17 |
| Withheld | 1,109,333,237.47 | 2.83 |
| TOTAL | 39,189,617,060.50 | 100.00 |
| Robert A. Lawrence |
| Affirmative | 37,781,807,251.33 | 96.41 |
| Withheld | 1,407,809,809.17 | 3.59 |
| TOTAL | 39,189,617,060.50 | 100.00 |
| Vijay C. Advani |
| Affirmative | 37,869,526,083.09 | 96.63 |
| Withheld | 1,320,090,977.41 | 3.37 |
| TOTAL | 39,189,617,060.50 | 100.00 |
| Thomas P. Bostick |
| Affirmative | 38,025,875,898.31 | 97.03 |
| Withheld | 1,163,741,162.19 | 2.97 |
| TOTAL | 39,189,617,060.50 | 100.00 |
| Donald F. Donahue |
| Affirmative | 37,825,198,238.79 | 96.52 |
| Withheld | 1,364,418,821.71 | 3.48 |
| TOTAL | 39,189,617,060.50 | 100.00 |
| Vicki L. Fuller |
| Affirmative | 38,031,768,119.99 | 97.05 |
| Withheld | 1,157,848,940.51 | 2.95 |
| TOTAL | 39,189,617,060.50 | 100.00 |
| Patricia L. Kampling |
| Affirmative | 38,062,391,881.90 | 97.12 |
| Withheld | 1,127,225,178.60 | 2.88 |
| TOTAL | 39,189,617,060.50 | 100.00 |
| Thomas A. Kennedy |
| Affirmative | 37,891,434,776.27 | 96.69 |
| Withheld | 1,298,182,284.23 | 3.31 |
| TOTAL | 39,189,617,060.50 | 100.00 |
| Oscar Munoz |
| Affirmative | 37,976,932,673.73 | 96.91 |
| Withheld | 1,212,684,386.77 | 3.09 |
| TOTAL | 39,189,617,060.50 | 100.00 |
| Karen B. Peetz |
| Affirmative | 38,011,822,212.28 | 96.99 |
| Withheld | 1,177,794,848.22 | 3.01 |
| TOTAL | 39,189,617,060.50 | 100.00 |
| David M. Thomas |
| Affirmative | 37,976,058,118.16 | 96.90 |
| Withheld | 1,213,558,942.34 | 3.10 |
| TOTAL | 39,189,617,060.50 | 100.00 |
| Susan Tomasky |
| Affirmative | 37,845,471,684.67 | 96.57 |
| Withheld | 1,344,145,375.83 | 3.43 |
| TOTAL | 39,189,617,060.50 | 100.00 |
| Michael E. Wiley |
| Affirmative | 37,736,569,620.69 | 96.29 |
| Withheld | 1,453,047,439.81 | 3.71 |
| TOTAL | 39,189,617,060.50 | 100.00 |
| | | |
| Proposal 1 reflects trust-wide proposal and voting results. |
Item 10: Remuneration Paid to Directors, Officers, and others of Open-End Management Investment Companies
Note: This information is disclosed as part of the financial statements for each Fund as part of Item 7: Financial Statements and Financial Highlights for Open-End Management Investment companies.
Item 11: Statement Regarding Basis for Approval of Investment Advisory Contract
Board Approval of Investment Advisory Contracts and Management Fees
Fidelity Blue Chip Growth ETF
Fidelity Blue Chip Value ETF
Fidelity Fundamental Large Cap Core ETF (formerly, Fidelity New Millennium ETF)
Fidelity Fundamental Large Cap Growth ETF (formerly, Fidelity Growth Opportunities ETF)
Fidelity Fundamental Large Cap Value ETF
Fidelity Fundamental Small-Mid Cap ETF (formerly, Fidelity Small-Mid Cap Opportunities ETF)
Fidelity Magellan ETF
Fidelity Real Estate Investment ETF
Fidelity Sustainable U.S. Equity ETF
Fidelity Women's Leadership ETF
Each year, the Board of Trustees, including the Independent Trustees (together, the Board), considers the renewal of each fund's management contract with Fidelity Management & Research Company LLC (FMR) and the sub-advisory agreements (together, the Advisory Contracts) for each fund. FMR and the sub-advisers are referred to herein as the Investment Advisers. The Board, assisted by the advice of fund counsel and Independent Trustees' counsel, requests and considers a broad range of information relevant to the renewal of the Advisory Contracts throughout the year.
The Board meets regularly and, at each of its meetings, covers an extensive agenda of topics and materials and considers factors that are relevant to its annual consideration of the renewal of each fund's Advisory Contracts, including the services and support provided to each fund and its shareholders. The Board, acting directly and through its Committees (each of which is composed of and chaired by Independent Trustees), requests and receives information concerning the annual consideration of the renewal of each fund's Advisory Contracts. The Board also meets as needed to review matters specifically related to the Board's annual consideration of the renewal of the Advisory Contracts. Members of the Board may also meet with trustees of other Fidelity funds through joint ad hoc committees to discuss certain matters relevant to all of the Fidelity funds.
At its May 2024 meeting, the Board unanimously determined to renew each fund's Advisory Contracts. In reaching its determination, the Board considered all factors it believed relevant, including (i) the nature, extent, and quality of the services provided to each fund and its shareholders (including the investment performance of each fund); (ii) the competitiveness relative to peer funds of each fund's management fee and total expense ratio; (iii) the total costs of the services provided by and the profits realized by FMR and its affiliates (Fidelity) from its relationships with each fund; and (iv) the extent to which, if any, economies of scale exist and are realized as each fund grows, and whether any economies of scale are appropriately shared with fund shareholders. The Board also considered the broad range of investment choices available to shareholders from FMR's competitors and that each fund's shareholders have chosen to invest in the fund, which is part of the Fidelity family of funds. The Board's decision to renew the Advisory Contracts was not based on any single factor.
The Board reached a determination, with the assistance of fund counsel and Independent Trustees' counsel and through the exercise of its business judgment, that the renewal of the Advisory Contracts was in the best interests of each fund and its shareholders and that the compensation payable under the Advisory Contracts was fair and reasonable in light of all of the surrounding circumstances.
Nature, Extent, and Quality of Services Provided. The Board considered staffing as it relates to the funds, including the backgrounds and experience of investment personnel of the Investment Advisers, and also considered the Investment Advisers' implementation of the funds' investment programs. The Independent Trustees also had discussions with senior management of Fidelity's investment operations and investment groups. The Board considered the structure of the investment personnel compensation program and whether this structure provides appropriate incentives to act in the best interests of each fund. Additionally, the Board considered the portfolio managers' investments, if any, in the funds that they manage.
Resources Dedicated to Investment Management and Support Services. The Board and the Fund Oversight and Research Committees reviewed the general qualifications and capabilities of Fidelity's investment staff, including its size, education, experience, and resources, as well as Fidelity's approach to recruiting, training, managing, and compensating investment personnel. The Board noted the resources devoted to Fidelity's global investment organization, and that Fidelity's analysts have extensive resources, tools, and capabilities that allow them to conduct sophisticated quantitative and fundamental analysis, as well as credit analysis of issuers, counterparties, and guarantors. Further, the Board considered that Fidelity's investment professionals have sufficient access to global information and data so as to provide competitive investment results over time, and that those professionals also have access to sophisticated tools that permit them to assess portfolio construction and risk and performance attribution characteristics continuously, as well as to transmit new information and research conclusions rapidly around the world. Additionally, in its deliberations, the Board considered Fidelity's trading, risk management, compliance, and technology and operations capabilities and resources, which are integral parts of the investment management process.
Shareholder and Administrative Services. The Board considered (i) the nature, extent, quality, and cost of advisory and administrative services provided by the Investment Advisers and their affiliates under the Advisory Contracts and under separate agreements covering pricing and bookkeeping services for each fund; (ii) the nature and extent of Fidelity's supervision of third party service providers, principally State Street Bank and Trust Company, each fund's transfer agent and custodian; and (iii) the resources devoted by Fidelity to, and the record of compliance with, each fund's compliance policies and procedures. The Board also reviewed the allocation of fund brokerage, including allocations to brokers affiliated with the Investment Advisers, the use of brokerage commissions to pay fund expenses, and the use of "soft" commission dollars to pay for research services. The Board also considered each fund's securities lending activities and any payments made to Fidelity relating to securities lending, under a separate agreement.
The Board noted that the growth of fund assets over time across the complex allows Fidelity to reinvest in the development of services designed to enhance the value and convenience of the Fidelity funds as investment vehicles. These services include 24-hour access to account information and market information over the Internet and through telephone representatives, investor education materials, and asset allocation tools. The Board also considered that it reviews customer service metrics such as telephone response times, continuity of services on the website and metrics addressing services at Fidelity Investor Centers.
Investment in a Large Fund Family. The Board considered the benefits to shareholders of investing in a fund that is part of a large family of funds offering a variety of investment disciplines and providing a large variety of fund investor services. The Board noted that Fidelity had taken, or had made recommendations that resulted in the Fidelity funds taking, a number of actions over the previous year that benefited particular funds and/or the Fidelity funds in general.
Investment Performance. The Board took into account discussions that occur with representatives of the Investment Advisers, and reports that it receives, at Board meetings throughout the year, relating to fund investment performance. In this regard, the Board noted that as part of regularly scheduled fund reviews and other reports to the Board on fund performance, the Board considered annualized return information for the fund for different time periods, measured against an appropriate securities market index (benchmark index) and an appropriate peer group of funds with similar objectives (peer group), if applicable. The Board also considered information about performance attribution. In its ongoing evaluation of fund investment performance, the Board gives particular attention to information indicating changes in performance of the funds over different time periods and discussed with the Investment Advisers the reasons for any overperformance or underperformance. The Board also considered information on each fund's bid-ask spread and premium/discount.
In addition to reviewing absolute and relative fund performance, the Independent Trustees periodically consider the appropriateness of fund performance metrics in evaluating the results achieved. The Independent Trustees generally give greater weight to fund performance over longer time periods than over shorter time periods. Depending on the circumstances, the Independent Trustees may be satisfied with a fund's performance notwithstanding that it lags its benchmark index or peer group for certain periods.
Based on its review, the Board concluded that the nature, extent, and quality of services provided to each fund under the Advisory Contracts should continue to benefit the shareholders of each fund.
Competitiveness of Management Fee and Total Expense Ratio. The Board was provided with information regarding industry trends in management fees and expenses. In its review of each fund's management fee and total expense ratio, the Board considered each fund's all-inclusive fee rate and also considered other expenses, such as transfer agent fees, pricing and bookkeeping fees, and custodial, legal, and audit fees, paid by FMR under each fund's all-inclusive arrangement. The Board noted that Fidelity may agree to waive fees or reimburse expenses from time to time, and the extent to which, if any, it has done so for each fund.
Comparisons of Management Fees and Total Expense Ratios. Among other things, the Board reviewed data for selected groups of competitive funds and classes (referred to as "mapped groups") that were compiled by Fidelity based on combining similar investment objective categories (as classified by Morningstar) that have comparable investment mandates. The data reviewed by the Board included (i) gross management fee comparisons (before taking into account expense reimbursements or caps) relative to the total universe of funds within the mapped group; (ii) gross management fee comparisons relative to a subset of non-Fidelity funds in the mapped group that are similar in size and management fee structure to each fund (referred to as the "asset size peer group"); (iii) total expense comparisons of each fund relative to funds and classes in the mapped group that have a similar load structure to the fund (referred to as the "similar load structure group"); and (iv) total expense comparisons of each fund relative to funds and classes in the similar load structure group that are similar in size and management fee structure to the fund (referred to as the "total expense asset size peer group"). The total expense asset size peer group comparison excludes performance adjustments and fund-paid 12b-1 fees to eliminate variability in fee structures.
For Fidelity Blue Chip Growth ETF, Fidelity Blue Chip Value ETF, Fidelity Magellan ETF, Fidelity Sustainable U.S. Equity ETF, and Fidelity Women's Leadership ETF, the information provided to the Board indicated that each fund's management fee rate ranked above the competitive median of the mapped group for the 12-month period ended September 30, 2023. For Fidelity Fundamental Large Cap Core ETF, Fidelity Fundamental Large Cap Growth ETF, Fidelity Fundamental Large Cap Value ETF, Fidelity Fundamental Small-Mid Cap ETF, Fidelity Real Estate Investment ETF, the information provided to the Board indicated that each fund's management fee rate ranked below the competitive median of the mapped group for the 12-month period ended September 30, 2023.
For each fund (except Fidelity Blue Chip Growth ETF, Fidelity Blue Chip Value ETF, and Fidelity Sustainable U.S. Equity ETF), the information provided to the Board indicated that each fund's management fee rate ranked below the competitive median of the asset size peer group for the 12-month period ended September 30, 2023. For Fidelity Blue Chip Growth ETF, Fidelity Blue Chip Value ETF, and Fidelity Sustainable U.S. Equity ETF, the information provided to the Board indicated that each fund's management fee rate ranked above the competitive median of the asset size peer group for the 12-month period ended September 30, 2023.
For Fidelity Blue Chip Growth ETF, Fidelity Blue Chip Value ETF, Fidelity Magellan ETF, Fidelity Sustainable U.S. Equity ETF, and Fidelity Women's Leadership ETF, the information provided to the Board indicated that the total expense ratio of each fund ranked above the competitive median of the similar load structure group for the 12-month period ended September 30, 2023. For Fidelity Fundamental Large Cap Core ETF, Fidelity Fundamental Large Cap Growth ETF, Fidelity Fundamental Large Cap Value ETF, Fidelity Fundamental Small-Mid Cap ETF, and Fidelity Real Estate Investment ETF, the information provided to the Board indicated that the total expense ratio of each fund ranked below the competitive median of the similar load structure group for the 12-month period ended September 30, 2023.
For each fund (except Fidelity Blue Chip Growth ETF, Fidelity Blue Chip Value ETF, and Fidelity Sustainable U.S. Equity ETF), the information provided to the Board indicated that the total expense ratio of the fund ranked below the competitive median of the total expense asset size peer group for the 12-month period ended September 30, 2023. For Fidelity Blue Chip Growth ETF, Fidelity Blue Chip Value ETF, and Fidelity Sustainable U.S. Equity ETF, the information provided to the Board indicated that the total expense ratio of the fund ranked above the competitive median of the total expense asset size peer group for the 12-month period ended September 30, 2023.
The Board noted that, when excluding competitor funds that leverage quantitative techniques in their portfolio management, Fidelity Blue Chip Growth ETF, Fidelity Blue Chip Value ETF, Fidelity Magellan ETF, Fidelity Sustainable U.S. Equity ETF, and Fidelity Women's Leadership ETF ranked at the similar sales load group median.
Fees Charged to Other Fidelity Clients. The Board also considered Fidelity fee structures and other information with respect to clients of Fidelity, such as other funds advised or subadvised by Fidelity, pension plan clients, and other institutional clients with similar mandates. The Board noted that a joint ad hoc committee created by it and the boards of other Fidelity funds periodically reviews and compares Fidelity's institutional investment advisory business with its business of providing services to the Fidelity funds and also noted the most recent findings of the committee. The Board noted that the committee's review included a consideration of the differences in services provided, fees charged, and costs incurred, as well as competition in the markets serving the different categories of clients.
Based on its review, the Board concluded that each fund's management fee is fair and reasonable in light of the services that the fund receives and the other factors considered. Further, based on its review of total expense ratios and fees charged to other Fidelity clients, the Board concluded that each fund's total expense ratio was reasonable in light of the services that the fund and its shareholders receive and the other factors considered.
Costs of the Services and Profitability. The Board considered the revenues earned and the expenses incurred by Fidelity in conducting the business of developing, marketing, distributing, managing, administering, and servicing each fund and servicing each fund's shareholders. The Board also considered the level of Fidelity's profits in respect of all the Fidelity funds.
On an annual basis, Fidelity presents to the Board information about the profitability of its relationships with each fund. Fidelity calculates profitability information for each fund, as well as aggregate profitability information for groups of Fidelity funds and all Fidelity funds, using a series of detailed revenue and cost allocation methodologies which originate with the books and records of Fidelity on which Fidelity's audited financial statements are based. The Audit Committee of the Board reviews any significant changes from the prior year's methodologies and the full Board approves such changes.
A public accounting firm has been engaged annually by the Board as part of the Board's assessment of Fidelity's profitability analysis. The engagement includes the review and assessment of the methodologies used by Fidelity in determining the revenues and expenses attributable to Fidelity's fund business, and completion of agreed-upon procedures in respect of the mathematical accuracy of certain fund profitability information and its conformity to established allocation methodologies. After considering the reports issued under the engagement and information provided by Fidelity, the Board concluded that while other allocation methods may also be reasonable, Fidelity's profitability methodologies are reasonable in all material respects.
The Board also reviewed Fidelity's non-fund businesses and potential indirect benefits such businesses may have received as a result of their association with Fidelity's fund business (i.e., fall-out benefits) as well as cases where Fidelity's affiliates may benefit from the funds' business. The Board considered areas where potential indirect benefits to the Fidelity funds from their relationships with Fidelity may exist. The Board's consideration of these matters was informed by the findings of a joint ad hoc committee created by it and the boards of other Fidelity funds to evaluate potential fall-out benefits.
The Board considered the costs of the services provided by and the profits realized by Fidelity in connection with the operation of each fund and was satisfied that the profitability was not excessive.
Economies of Scale. The Board considered whether there have been economies of scale in respect of the management of the Fidelity funds, whether the Fidelity funds (including each fund) have appropriately benefited from any such economies of scale, and whether there is potential for realization of any further economies of scale. The Board considered the extent to which each fund will benefit from economies of scale as assets grow through increased services to the fund, through waivers or reimbursements, or through fee or expense ratio reductions. The Board recognized that, due to each fund's current contractual arrangements, its expense ratio will not decline if the fund's operating costs decrease as assets grow, or rise as assets decrease. The Board also noted that a committee (the Economies of Scale Committee) created by it and the boards of other Fidelity funds periodically analyzes whether Fidelity attains economies of scale in respect of the management and servicing of the Fidelity funds, whether the Fidelity funds have appropriately benefited from such economies of scale, and whether there is potential for realization of any further economies of scale.
The Board concluded, taking into account the analysis of the committee, that economies of scale, if any, are being appropriately shared between fund shareholders and Fidelity.
Additional Information Requested by the Board. In order to develop fully the factual basis for consideration of the Fidelity funds' advisory contracts, the Board requested and received additional information on certain topics, including, but not limited to: (i) fund flow and performance trends, in particular the underperformance of certain funds and strategies, and Fidelity's long-term strategies for certain funds; (ii) the operation of performance fees and the rationale for implementing performance fees on certain categories of funds but not others; (iii) Fidelity's pricing philosophy compared to competitors; (iv) fund profitability methodology and data; (v) evaluation of competitive fund data and peer group classifications and fee and expense comparisons; (vi) the management fee and expense structures for different funds and classes and information about the differences between various fee and expense structures; (vii) the variable management fee implemented for certain funds effective March 1, 2024; and (viii) information regarding other accounts managed by Fidelity and the funds' sub-advisory arrangements.
Conclusion. Based on its evaluation of all of the conclusions noted above, and after considering all factors it believed relevant, the Board, including the Independent Trustees, concluded that the advisory and sub-advisory fee arrangements are fair and reasonable in light of all of the surrounding circumstances and that each fund's Advisory Contracts should be renewed through May 31, 2025.
Board Approval of Investment Advisory Contracts
Fidelity Fundamental Large Cap Value ETF
At its January 2024 meeting, the Board of Trustees, including the Independent Trustees (together, the Board), approved amended and restated sub-advisory agreements (the Sub-Advisory Contracts) for the fund, including the fund's sub-advisory agreements with FMR Investment Management (UK) Limited (FMR UK), Fidelity Management & Research (Hong Kong) Limited (FMR H.K.), and Fidelity Management & Research (Japan) Limited (FMR Japan). The Sub-Advisory Contracts will be effective March 1, 2024. The Board will consider the annual renewal of the funds' Sub-Advisory Contracts in May 2024, following its review of additional materials provided by FMR.
The Board considered the Sub-Advisory Contracts, which simplified the calculation of the fees paid by FMR to the sub-advisers under the agreements. The Board noted that the agreements with FMR UK, FMR H.K., and FMR Japan were amended to provide that FMR will compensate each sub-adviser at a fee rate equal to 110% of the sub-adviser's costs incurred in providing services under the agreement. The Board considered that, under the Sub-Advisory Contracts, FMR, and not the fund, will continue to pay the sub-advisory fees to each applicable sub-adviser, and that the management fee paid by the fund under the management contract with FMR will remain unchanged.
The Board further considered that the approval of the fund's Sub-Advisory Contracts will not result in any changes in the investment process or strategies employed in the management of the fund's assets or the day-to-day management of the fund or the persons primarily responsible for such management. Further, the Board considered that the Sub-Advisory Contracts would not change the obligations and services of FMR and its affiliates on behalf of the fund, and, in particular, there would be no change in the nature and level of services provided to the fund by FMR and its affiliates.
In connection with its consideration of future renewals of the fund's advisory contracts, the Board will consider: (i) the nature, extent and quality of services provided to the funds, including shareholder and administrative services and investment performance; (ii) the competitiveness of the management fee and total expenses for the fund; (iii) the costs of the services and profitability, including the revenues earned and the expenses incurred in conducting the business of developing, marketing, distributing, managing, administering, and servicing the fund and its shareholders, to the extent applicable; and (iv) whether there have been economies of scale in respect of the Fidelity funds, whether the Fidelity funds (including the fund) have appropriately benefited from any such economies of scale, and whether there is the potential for realization of any further economies.
Based on its evaluation of all of the conclusions noted above, and after considering all factors it believed relevant, the Board concluded that the fund's management fee structure is fair and reasonable, and that the fund's Sub-Advisory Contracts should be approved.
1.9897894.104
GTF-ANN-0924
Item 8.
Changes in and Disagreements with Accountants for Open-End Management Investment Companies
See Item 7.
Item 9.
Proxy Disclosures for Open-End Management Investment Companies
See Item 7.
Item 10.
Remuneration Paid to Directors, Officers, and Others of Open-End Management Investment Companies
See Item 7.
Item 11.
Statement Regarding Basis for Approval of Investment Advisory Contract
See Item 7.
Item 12.
Disclosure of Proxy Voting Policies and Procedures for Closed-End Management Investment Companies
Not applicable.
Item 13.
Portfolio Managers of Closed-End Management Investment Companies
Not applicable.
Item 14.
Purchase of Equity Securities by Closed-End Management Investment Company and Affiliated Purchasers
Not applicable.
Item 15.
Submission of Matters to a Vote of Security Holders
There were no material changes to the procedures by which shareholders may recommend nominees to the trust’s Board of Trustees.
Item 16.
Controls and Procedures
(a)(i) The President and Treasurer and the Chief Financial Officer have concluded that the trust’s disclosure controls and procedures (as defined in Rule 30a-3(c) under the Investment Company Act) provide reasonable assurances that material information relating to the trust is made known to them by the appropriate persons, based on their evaluation of these controls and procedures as of a date within 90 days of the filing date of this report.
(a)(ii) There was no change in the trust’s internal control over financial reporting (as defined in Rule 30a-3(d) under the Investment Company Act) that occurred during the period covered by this report that has materially affected, or is reasonably likely to materially affect, the trust’s internal control over financial reporting.
Item 17.
Disclosure of Securities Lending Activities for Closed-End Management Investment Companies
Not applicable.
Item 18.
Recovery of Erroneously Awarded Compensation
(a)
Not applicable.
(b)
Not applicable.
Item 19.
Exhibits
SIGNATURES
Pursuant to the requirements of the Securities Exchange Act of 1934 and the Investment Company Act of 1940, the registrant has duly caused this report to be signed on its behalf by the undersigned, thereunto duly authorized.
Fidelity Covington Trust
|
By: | /s/Stacie M. Smith |
| Stacie M. Smith |
| President and Treasurer (Principal Executive Officer) |
|
|
Date: | September 20, 2024 |
Pursuant to the requirements of the Securities Exchange Act of 1934 and the Investment Company Act of 1940, this report has been signed below by the following persons on behalf of the registrant and in the capacities and on the dates indicated.
|
By: | /s/Stacie M. Smith |
| Stacie M. Smith |
| President and Treasurer (Principal Executive Officer) |
|
|
Date: | September 20, 2024 |
|
By: | /s/John J. Burke III |
| John J. Burke III |
| Chief Financial Officer (Principal Financial Officer) |
|
|
Date: | September 20, 2024 |