UNITED STATES
SECURITIES AND EXCHANGE COMMISSION
Washington, D.C. 20549
FORM N-CSR
CERTIFIED SHAREHOLDER REPORT OF REGISTERED
MANAGEMENT INVESTMENT COMPANIES
Investment Company Act file number 811-07319
Fidelity Covington Trust
(Exact name of registrant as specified in charter)
245 Summer St., Boston, MA 02210
(Address of principal executive offices) (Zip code)
Nicole Macarchuk, Secretary
245 Summer St.
Boston, Massachusetts 02210
(Name and address of agent for service)
Registrant's telephone number, including area code:
617-563-7000
| |
Date of fiscal year end: | June 30 |
|
|
Date of reporting period: | December 31, 2024 |
Item 1.
Reports to Stockholders
| |
| | SEMI-ANNUAL SHAREHOLDER REPORT | AS OF DECEMBER 31, 2024 | |
| | Fidelity® Enhanced Large Cap Core ETF Fidelity® Enhanced Large Cap Core ETF : FELC Principal U.S. Listing Exchange :NYSEArca NYSE Arca, Inc. |
| | | |
This semi-annual shareholder report contains information about Fidelity® Enhanced Large Cap Core ETF for the period July 1, 2024 to December 31, 2024. You can find additional information about the Fund at fundresearch.fidelity.com/prospectus/sec. You can also request this information by contacting us at 1-800-FIDELITY or by sending an e-mail to fidfunddocuments@fidelity.com.
What were your Fund costs for the last six months?(based on hypothetical $10,000 investment)
| | Costs of a $10,000 investment | Costs paid as a percentage of a $10,000 investment | |
| Fidelity® Enhanced Large Cap Core ETF | $ 10 | 0.18% | |
Key Fund Statistics(as of December 31, 2024)
KEY FACTS | | |
| Fund Size | $4,261,062,790 | |
| Number of Holdings | 211 | |
| Portfolio Turnover | 55% | |
What did the Fund invest in?
(as of December 31, 2024)
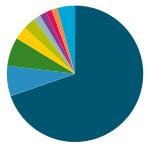
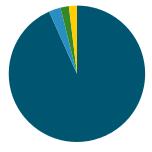
MARKET SECTORS (% of Fund's net assets) | | |
| Information Technology | 32.6 | |
| Financials | 14.2 | |
| Consumer Discretionary | 12.4 | |
| Communication Services | 10.8 | |
| Industrials | 10.0 | |
| Health Care | 9.2 | |
| Consumer Staples | 3.5 | |
| Energy | 2.8 | |
| Materials | 1.6 | |
| Real Estate | 1.0 | |
| Utilities | 0.9 | |
| |
| Common Stocks | 99.0 |
| Short-Term Investments and Net Other Assets (Liabilities) | 1.0 |
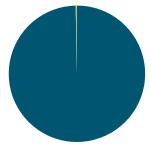
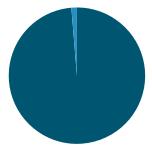
ASSET ALLOCATION (% of Fund's net assets) |
|
| | Common Stocks - 99.0 |
| | Short-Term Investments and Net Other Assets (Liabilities) - 1.0 |
| |
| United States | 99.9 |
| Mexico | 0.1 |
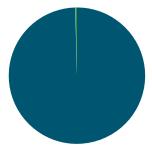
GEOGRAPHIC DIVERSIFICATION (% of Fund's net assets) |
|
| | United States - 99.9 |
| | Mexico - 0.1 |
| |
TOP HOLDINGS(% of Fund's net assets) | | |
| Apple Inc | 8.1 | |
| NVIDIA Corp | 7.1 | |
| Microsoft Corp | 5.8 | |
| Amazon.com Inc | 4.5 | |
| Meta Platforms Inc Class A | 3.0 | |
| Alphabet Inc Class A | 2.2 | |
| Berkshire Hathaway Inc Class B | 2.2 | |
| Broadcom Inc | 2.0 | |
| JPMorgan Chase & Co | 1.9 | |
| Alphabet Inc Class C | 1.9 | |
| | 38.7 | |
| Fidelity, the Fidelity Investments Logo and all other Fidelity trademarks or service marks used herein are trademarks or service marks of FMR LLC. Any third-party marks that are used herein are trademarks or service marks of their respective owners. © 2025 FMR LLC. All rights reserved. |
| | For additional information about the Fund; including its prospectus, financial information, holdings and proxy information, scan the QR code or visit fundresearch.fidelity.com/prospectus/sec 1.9915504.100 7541-TSRS-0325 |
| |
| | SEMI-ANNUAL SHAREHOLDER REPORT | AS OF DECEMBER 31, 2024 | |
| | Fidelity® Enhanced Small Cap ETF Fidelity® Enhanced Small Cap ETF : FESM Principal U.S. Listing Exchange :NYSEArca NYSE Arca, Inc. |
| | | |
This semi-annual shareholder report contains information about Fidelity® Enhanced Small Cap ETF for the period July 1, 2024 to December 31, 2024. You can find additional information about the Fund at fundresearch.fidelity.com/prospectus/sec. You can also request this information by contacting us at 1-800-FIDELITY or by sending an e-mail to fidfunddocuments@fidelity.com.
What were your Fund costs for the last six months?(based on hypothetical $10,000 investment)
| | Costs of a $10,000 investment | Costs paid as a percentage of a $10,000 investment | |
| Fidelity® Enhanced Small Cap ETF | $ 15 | 0.28% | |
Key Fund Statistics(as of December 31, 2024)
KEY FACTS | | |
| Fund Size | $1,166,157,388 | |
| Number of Holdings | 639 | |
| Portfolio Turnover | 61% | |
What did the Fund invest in?
(as of December 31, 2024)
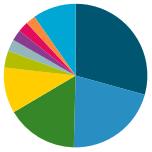
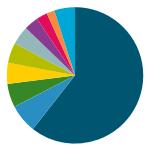
MARKET SECTORS (% of Fund's net assets) | | |
| Financials | 17.8 | |
| Industrials | 17.4 | |
| Health Care | 15.6 | |
| Information Technology | 15.5 | |
| Consumer Discretionary | 10.3 | |
| Energy | 5.3 | |
| Materials | 4.8 | |
| Real Estate | 4.4 | |
| Consumer Staples | 3.5 | |
| Communication Services | 2.9 | |
| Utilities | 0.8 | |
| |
| Common Stocks | 98.3 |
| Short-Term Investments and Net Other Assets (Liabilities) | 1.7 |
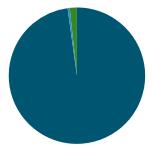
ASSET ALLOCATION (% of Fund's net assets) |
|
| | Common Stocks - 98.3 |
| | Short-Term Investments and Net Other Assets (Liabilities) - 1.7 |
| |
| United States | 98.2 |
| Thailand | 0.6 |
| Canada | 0.3 |
| Ireland | 0.3 |
| Puerto Rico | 0.3 |
| Monaco | 0.1 |
| Norway | 0.1 |
| Bermuda | 0.1 |
| Panama | 0.0 |
GEOGRAPHIC DIVERSIFICATION (% of Fund's net assets) |
|
| | United States - 98.2 |
| | Thailand - 0.6 |
| | Canada - 0.3 |
| | Ireland - 0.3 |
| | Puerto Rico - 0.3 |
| | Monaco - 0.1 |
| | Norway - 0.1 |
| | Bermuda - 0.1 |
| | Panama - 0.0 |
| |
TOP HOLDINGS(% of Fund's net assets) | | |
| Abercrombie & Fitch Co Class A | 0.9 | |
| Q2 Holdings Inc | 0.9 | |
| Sprouts Farmers Market Inc | 0.8 | |
| Carpenter Technology Corp | 0.7 | |
| SkyWest Inc | 0.7 | |
| Primo Brands Corp Class A | 0.7 | |
| EnerSys | 0.7 | |
| Payoneer Global Inc | 0.7 | |
| Fabrinet | 0.6 | |
| AvidXchange Holdings Inc | 0.6 | |
| | 7.3 | |
| Fidelity, the Fidelity Investments Logo and all other Fidelity trademarks or service marks used herein are trademarks or service marks of FMR LLC. Any third-party marks that are used herein are trademarks or service marks of their respective owners. © 2025 FMR LLC. All rights reserved. |
| | For additional information about the Fund; including its prospectus, financial information, holdings and proxy information, scan the QR code or visit fundresearch.fidelity.com/prospectus/sec 1.9914576.100 7545-TSRS-0325 |
| |
| | SEMI-ANNUAL SHAREHOLDER REPORT | AS OF DECEMBER 31, 2024 | |
| | Fidelity® Metaverse ETF Fidelity® Metaverse ETF : FMET Principal U.S. Listing Exchange :NASDAQ NASDAQ/NMS Global Market |
| | | |
This semi-annual shareholder report contains information about Fidelity® Metaverse ETF for the period July 1, 2024 to December 31, 2024. You can find additional information about the Fund at fundresearch.fidelity.com/prospectus/sec. You can also request this information by contacting us at 1-800-FIDELITY or by sending an e-mail to fidfunddocuments@fidelity.com.
What were your Fund costs for the last six months?(based on hypothetical $10,000 investment)
| | Costs of a $10,000 investment | Costs paid as a percentage of a $10,000 investment | |
| Fidelity® Metaverse ETF | $ 19 | 0.38% | |
Key Fund Statistics(as of December 31, 2024)
KEY FACTS | | |
| Fund Size | $31,268,552 | |
| Number of Holdings | 52 | |
| Portfolio Turnover | 34% | |
What did the Fund invest in?
(as of December 31, 2024)
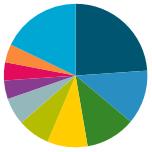
MARKET SECTORS (% of Fund's net assets) | | |
| Information Technology | 53.3 | |
| Communication Services | 37.6 | |
| Real Estate | 8.2 | |
| Industrials | 0.7 | |
| |
| Common Stocks | 99.8 |
| Short-Term Investments and Net Other Assets (Liabilities) | 0.2 |
ASSET ALLOCATION (% of Fund's net assets) |
|
| | Common Stocks - 99.8 |
| | Short-Term Investments and Net Other Assets (Liabilities) - 0.2 |
| |
| United States | 75.2 |
| Korea (South) | 10.8 |
| China | 6.9 |
| France | 3.1 |
| Japan | 1.4 |
| Sweden | 1.0 |
| Taiwan | 0.8 |
| United Kingdom | 0.8 |
GEOGRAPHIC DIVERSIFICATION (% of Fund's net assets) |
|
| | United States - 75.2 |
| | Korea (South) - 10.8 |
| | China - 6.9 |
| | France - 3.1 |
| | Japan - 1.4 |
| | Sweden - 1.0 |
| | Taiwan - 0.8 |
| | United Kingdom - 0.8 |
| |
TOP HOLDINGS(% of Fund's net assets) | | |
| Alphabet Inc Class A | 5.2 | |
| Apple Inc | 4.9 | |
| Meta Platforms Inc Class A | 4.5 | |
| QUALCOMM Inc | 4.5 | |
| Microsoft Corp | 4.5 | |
| Samsung Electronics Co Ltd | 4.5 | |
| NVIDIA Corp | 4.4 | |
| Equinix Inc | 4.3 | |
| Advanced Micro Devices Inc | 4.0 | |
| Adobe Inc | 3.9 | |
| | 44.7 | |
| Fidelity, the Fidelity Investments Logo and all other Fidelity trademarks or service marks used herein are trademarks or service marks of FMR LLC. Any third-party marks that are used herein are trademarks or service marks of their respective owners. © 2025 FMR LLC. All rights reserved. |
| | For additional information about the Fund; including its prospectus, financial information, holdings and proxy information, scan the QR code or visit fundresearch.fidelity.com/prospectus/sec 1.9915178.100 6566-TSRS-0325 |
| |
| | SEMI-ANNUAL SHAREHOLDER REPORT | AS OF DECEMBER 31, 2024 | |
| | Fidelity® Crypto Industry and Digital Payments ETF Fidelity® Crypto Industry and Digital Payments ETF : FDIG Principal U.S. Listing Exchange :NASDAQ NASDAQ/NMS Global Market |
| | | |
This semi-annual shareholder report contains information about Fidelity® Crypto Industry and Digital Payments ETF for the period July 1, 2024 to December 31, 2024. You can find additional information about the Fund at fundresearch.fidelity.com/prospectus/sec. You can also request this information by contacting us at 1-800-FIDELITY or by sending an e-mail to fidfunddocuments@fidelity.com.
What were your Fund costs for the last six months?(based on hypothetical $10,000 investment)
| | Costs of a $10,000 investment | Costs paid as a percentage of a $10,000 investment | |
| Fidelity® Crypto Industry and Digital Payments ETF | $ 21 | 0.38% | |
Key Fund Statistics(as of December 31, 2024)
KEY FACTS | | |
| Fund Size | $165,547,765 | |
| Number of Holdings | 49 | |
| Portfolio Turnover | 119% | |
What did the Fund invest in?
(as of December 31, 2024)
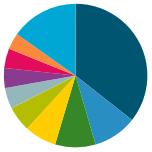
MARKET SECTORS (% of Fund's net assets) | | |
| Financials | 52.6 | |
| Information Technology | 43.8 | |
| Communication Services | 1.9 | |
| Industrials | 1.3 | |
| |
| Common Stocks | 99.6 |
| Short-Term Investments and Net Other Assets (Liabilities) | 0.4 |
ASSET ALLOCATION (% of Fund's net assets) |
|
| | Common Stocks - 99.6 |
| | Short-Term Investments and Net Other Assets (Liabilities) - 0.4 |
| |
| United States | 69.7 |
| Canada | 7.2 |
| Japan | 6.8 |
| Australia | 3.1 |
| Brazil | 2.9 |
| Netherlands | 1.7 |
| Germany | 1.6 |
| China | 1.4 |
| France | 1.4 |
| Others | 4.2 |
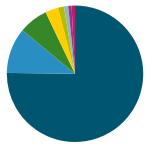
GEOGRAPHIC DIVERSIFICATION (% of Fund's net assets) |
|
| | United States - 69.7 |
| | Canada - 7.2 |
| | Japan - 6.8 |
| | Australia - 3.1 |
| | Brazil - 2.9 |
| | Netherlands - 1.7 |
| | Germany - 1.6 |
| | China - 1.4 |
| | France - 1.4 |
| | Others - 4.2 |
| |
TOP HOLDINGS(% of Fund's net assets) | | |
| Coinbase Global Inc Class A | 11.6 | |
| MARA Holdings Inc | 6.2 | |
| Riot Platforms Inc | 3.9 | |
| Block Inc Class A | 3.8 | |
| Cleanspark Inc | 3.7 | |
| Core Scientific Inc | 3.5 | |
| Bitdeer Technologies Group Class A | 3.2 | |
| IREN Ltd | 3.1 | |
| Terawulf Inc | 2.9 | |
| Hut 8 Corp (United States) | 2.8 | |
| | 44.7 | |
| Fidelity, the Fidelity Investments Logo and all other Fidelity trademarks or service marks used herein are trademarks or service marks of FMR LLC. Any third-party marks that are used herein are trademarks or service marks of their respective owners. © 2025 FMR LLC. All rights reserved. |
| | For additional information about the Fund; including its prospectus, financial information, holdings and proxy information, scan the QR code or visit fundresearch.fidelity.com/prospectus/sec 1.9915177.100 6565-TSRS-0325 |
| |
| | SEMI-ANNUAL SHAREHOLDER REPORT | AS OF DECEMBER 31, 2024 | |
| | Fidelity® Enhanced U.S. All-Cap Equity ETF Fidelity® Enhanced U.S. All-Cap Equity ETF : FEAC Principal U.S. Listing Exchange :NYSEArca NYSE Arca, Inc. |
| | | |
This semi-annual shareholder report contains information about Fidelity® Enhanced U.S. All-Cap Equity ETF for the period November 19, 2024 to December 31, 2024. You can find additional information about the Fund at fundresearch.fidelity.com/prospectus/sec. You can also request this information by contacting us at 1-800-FIDELITY or by sending an e-mail to fidfunddocuments@fidelity.com.
What were your Fund costs for the last six months?(based on hypothetical $10,000 investment)
| | Costs of a $10,000 investment | Costs paid as a percentage of a $10,000 investment | |
Fidelity® Enhanced U.S. All-Cap Equity ETF A | $ 2 | 0.18% | |
A Expenses for the full reporting period would be higher.
Key Fund Statistics(as of December 31, 2024)
KEY FACTS | | |
| Fund Size | $4,348,930 | |
| Number of Holdings | 360 | |
Portfolio TurnoverA | 16% | |
A Amount not annualized
What did the Fund invest in?
(as of December 31, 2024)
MARKET SECTORS (% of Fund's net assets) | | |
| Information Technology | 31.4 | |
| Financials | 15.5 | |
| Communication Services | 10.8 | |
| Consumer Discretionary | 10.3 | |
| Health Care | 10.1 | |
| Industrials | 9.9 | |
| Energy | 3.6 | |
| Consumer Staples | 3.6 | |
| Real Estate | 1.9 | |
| Materials | 1.8 | |
| Utilities | 0.2 | |
| |
| Common Stocks | 99.1 |
| Short-Term Investments and Net Other Assets (Liabilities) | 0.9 |
ASSET ALLOCATION (% of Fund's net assets) |
|
| | Common Stocks - 99.1 |
| | Short-Term Investments and Net Other Assets (Liabilities) - 0.9 |
| |
| United States | 99.7 |
| United Kingdom | 0.1 |
| Monaco | 0.1 |
| Thailand | 0.1 |
| Canada | 0.0 |
| Hong Kong | 0.0 |
GEOGRAPHIC DIVERSIFICATION (% of Fund's net assets) |
|
| | United States - 99.7 |
| | United Kingdom - 0.1 |
| | Monaco - 0.1 |
| | Thailand - 0.1 |
| | Canada - 0.0 |
| | Hong Kong - 0.0 |
| |
TOP HOLDINGS(% of Fund's net assets) | | |
| Apple Inc | 7.0 | |
| NVIDIA Corp | 6.2 | |
| Microsoft Corp | 4.8 | |
| Amazon.com Inc | 2.9 | |
| Meta Platforms Inc Class A | 2.9 | |
| Broadcom Inc | 2.5 | |
| Alphabet Inc Class A | 2.0 | |
| Exxon Mobil Corp | 1.5 | |
| Mastercard Inc Class A | 1.4 | |
| Walmart Inc | 1.4 | |
| | 32.6 | |
| Fidelity, the Fidelity Investments Logo and all other Fidelity trademarks or service marks used herein are trademarks or service marks of FMR LLC. Any third-party marks that are used herein are trademarks or service marks of their respective owners. © 2025 FMR LLC. All rights reserved. |
| | For additional information about the Fund; including its prospectus, financial information, holdings and proxy information, scan the QR code or visit fundresearch.fidelity.com/prospectus/sec 1.9918720.100 7725-TSRS-0325 |
| |
| | SEMI-ANNUAL SHAREHOLDER REPORT | AS OF DECEMBER 31, 2024 | |
| | Fidelity® Enhanced Emerging Markets ETF Fidelity® Enhanced Emerging Markets ETF : FEMR Principal U.S. Listing Exchange :NYSEArca NYSE Arca, Inc. |
| | | |
This semi-annual shareholder report contains information about Fidelity® Enhanced Emerging Markets ETF for the period November 19, 2024 to December 31, 2024. You can find additional information about the Fund at fundresearch.fidelity.com/prospectus/sec. You can also request this information by contacting us at 1-800-FIDELITY or by sending an e-mail to fidfunddocuments@fidelity.com.
What were your Fund costs for the last six months?(based on hypothetical $10,000 investment)
| | Costs of a $10,000 investment | Costs paid as a percentage of a $10,000 investment | |
Fidelity® Enhanced Emerging Markets ETF A | $ 4 | 0.38% | |
A Expenses for the full reporting period would be higher.
Key Fund Statistics(as of December 31, 2024)
KEY FACTS | | |
| Fund Size | $9,847,801 | |
| Number of Holdings | 172 | |
Portfolio TurnoverB | 0%A | |
A Amount represents less than 1%
B Amount not annualized
What did the Fund invest in?
(as of December 31, 2024)
MARKET SECTORS (% of Fund's net assets) | | |
| Information Technology | 27.7 | |
| Financials | 22.3 | |
| Consumer Discretionary | 15.8 | |
| Industrials | 7.6 | |
| Communication Services | 7.5 | |
| Consumer Staples | 5.5 | |
| Health Care | 5.4 | |
| Materials | 3.1 | |
| Real Estate | 2.4 | |
| Energy | 2.2 | |
| Utilities | 0.2 | |
| |
| Common Stocks | 99.6 |
| Preferred Stocks | 0.1 |
| Short-Term Investments and Net Other Assets (Liabilities) | 0.3 |
ASSET ALLOCATION (% of Fund's net assets) |
|
| | Common Stocks - 99.6 |
| | Preferred Stocks - 0.1 |
| | Short-Term Investments and Net Other Assets (Liabilities) - 0.3 |
| |
| China | 29.3 |
| Taiwan | 21.1 |
| India | 16.1 |
| Korea (South) | 10.3 |
| Brazil | 3.8 |
| Saudi Arabia | 2.7 |
| South Africa | 2.4 |
| United Arab Emirates | 2.4 |
| Mexico | 2.2 |
| Others | 9.7 |
GEOGRAPHIC DIVERSIFICATION (% of Fund's net assets) |
|
| | China - 29.3 |
| | Taiwan - 21.1 |
| | India - 16.1 |
| | Korea (South) - 10.3 |
| | Brazil - 3.8 |
| | Saudi Arabia - 2.7 |
| | South Africa - 2.4 |
| | United Arab Emirates - 2.4 |
| | Mexico - 2.2 |
| | Others - 9.7 |
| |
TOP HOLDINGS(% of Fund's net assets) | | |
| Taiwan Semiconductor Manufacturing Co Ltd | 11.3 | |
| Tencent Holdings Ltd | 5.2 | |
| ICICI Bank Ltd ADR | 2.6 | |
| Infosys Ltd ADR | 2.5 | |
| HDFC Bank Ltd/Gandhinagar ADR | 2.4 | |
| Samsung Electronics Co Ltd | 2.1 | |
| Meituan B Shares | 1.9 | |
| MediaTek Inc | 1.8 | |
| Wipro Ltd ADR | 1.7 | |
| State Bank of India GDR | 1.7 | |
| | 33.2 | |
| Fidelity, the Fidelity Investments Logo and all other Fidelity trademarks or service marks used herein are trademarks or service marks of FMR LLC. Any third-party marks that are used herein are trademarks or service marks of their respective owners. © 2025 FMR LLC. All rights reserved. |
| | For additional information about the Fund; including its prospectus, financial information, holdings and proxy information, scan the QR code or visit fundresearch.fidelity.com/prospectus/sec 1.9918718.100 7726-TSRS-0325 |
| |
| | SEMI-ANNUAL SHAREHOLDER REPORT | AS OF DECEMBER 31, 2024 | |
| | Fidelity® Enhanced Mid Cap ETF Fidelity® Enhanced Mid Cap ETF : FMDE Principal U.S. Listing Exchange :NYSEArca NYSE Arca, Inc. |
| | | |
This semi-annual shareholder report contains information about Fidelity® Enhanced Mid Cap ETF for the period July 1, 2024 to December 31, 2024. You can find additional information about the Fund at fundresearch.fidelity.com/prospectus/sec. You can also request this information by contacting us at 1-800-FIDELITY or by sending an e-mail to fidfunddocuments@fidelity.com.
What were your Fund costs for the last six months?(based on hypothetical $10,000 investment)
| | Costs of a $10,000 investment | Costs paid as a percentage of a $10,000 investment | |
| Fidelity® Enhanced Mid Cap ETF | $ 12 | 0.23% | |
Key Fund Statistics(as of December 31, 2024)
KEY FACTS | | |
| Fund Size | $2,128,597,717 | |
| Number of Holdings | 328 | |
| Portfolio Turnover | 48% | |
What did the Fund invest in?
(as of December 31, 2024)
MARKET SECTORS (% of Fund's net assets) | | |
| Financials | 18.3 | |
| Industrials | 17.6 | |
| Information Technology | 15.0 | |
| Consumer Discretionary | 12.4 | |
| Health Care | 8.3 | |
| Real Estate | 6.5 | |
| Materials | 5.5 | |
| Energy | 4.4 | |
| Utilities | 4.3 | |
| Consumer Staples | 3.7 | |
| Communication Services | 2.7 | |
| |
| Common Stocks | 98.7 |
| Short-Term Investments and Net Other Assets (Liabilities) | 1.3 |
ASSET ALLOCATION (% of Fund's net assets) |
|
| | Common Stocks - 98.7 |
| | Short-Term Investments and Net Other Assets (Liabilities) - 1.3 |
| |
| United States | 99.5 |
| Korea (South) | 0.4 |
| United Kingdom | 0.1 |
| Canada | 0.0 |
| Brazil | 0.0 |
GEOGRAPHIC DIVERSIFICATION (% of Fund's net assets) |
|
| | United States - 99.5 |
| | Korea (South) - 0.4 |
| | United Kingdom - 0.1 |
| | Canada - 0.0 |
| | Brazil - 0.0 |
| |
TOP HOLDINGS(% of Fund's net assets) | | |
| Williams Cos Inc/The | 1.2 | |
| Bank of New York Mellon Corp/The | 1.0 | |
| Allstate Corp/The | 0.9 | |
| Simon Property Group Inc | 0.9 | |
| Cummins Inc | 0.9 | |
| Block Inc Class A | 0.9 | |
| Howmet Aerospace Inc | 0.9 | |
| MSCI Inc | 0.9 | |
| AMETEK Inc | 0.8 | |
| Vistra Corp | 0.8 | |
| | 9.2 | |
| Fidelity, the Fidelity Investments Logo and all other Fidelity trademarks or service marks used herein are trademarks or service marks of FMR LLC. Any third-party marks that are used herein are trademarks or service marks of their respective owners. © 2025 FMR LLC. All rights reserved. |
| | For additional information about the Fund; including its prospectus, financial information, holdings and proxy information, scan the QR code or visit fundresearch.fidelity.com/prospectus/sec 1.9915508.100 7546-TSRS-0325 |
| |
| | SEMI-ANNUAL SHAREHOLDER REPORT | AS OF DECEMBER 31, 2024 | |
| | Fidelity® Enhanced International ETF Fidelity® Enhanced International ETF : FENI Principal U.S. Listing Exchange :NYSEArca NYSE Arca, Inc. |
| | | |
This semi-annual shareholder report contains information about Fidelity® Enhanced International ETF for the period July 1, 2024 to December 31, 2024. You can find additional information about the Fund at fundresearch.fidelity.com/prospectus/sec. You can also request this information by contacting us at 1-800-FIDELITY or by sending an e-mail to fidfunddocuments@fidelity.com.
What were your Fund costs for the last six months?(based on hypothetical $10,000 investment)
| | Costs of a $10,000 investment | Costs paid as a percentage of a $10,000 investment | |
| Fidelity® Enhanced International ETF | $ 14 | 0.28% | |
Key Fund Statistics(as of December 31, 2024)
KEY FACTS | | |
| Fund Size | $1,733,493,169 | |
| Number of Holdings | 291 | |
| Portfolio Turnover | 87% | |
What did the Fund invest in?
(as of December 31, 2024)
MARKET SECTORS (% of Fund's net assets) | | |
| Financials | 22.7 | |
| Industrials | 19.3 | |
| Health Care | 12.5 | |
| Information Technology | 10.8 | |
| Consumer Discretionary | 10.0 | |
| Materials | 7.5 | |
| Consumer Staples | 6.5 | |
| Utilities | 3.1 | |
| Communication Services | 3.1 | |
| Energy | 1.5 | |
| Real Estate | 1.3 | |
| |
| Common Stocks | 97.8 |
| Preferred Stocks | 0.5 |
| Short-Term Investments and Net Other Assets (Liabilities) | 1.7 |
ASSET ALLOCATION (% of Fund's net assets) |
|
| | Common Stocks - 97.8 |
| | Preferred Stocks - 0.5 |
| | Short-Term Investments and Net Other Assets (Liabilities) - 1.7 |
| |
| Japan | 23.9 |
| United States | 12.2 |
| United Kingdom | 11.2 |
| Germany | 9.1 |
| France | 7.2 |
| Australia | 6.1 |
| Switzerland | 4.2 |
| Spain | 4.1 |
| Netherlands | 4.1 |
| Others | 17.9 |
GEOGRAPHIC DIVERSIFICATION (% of Fund's net assets) |
|
| | Japan - 23.9 |
| | United States - 12.2 |
| | United Kingdom - 11.2 |
| | Germany - 9.1 |
| | France - 7.2 |
| | Australia - 6.1 |
| | Switzerland - 4.2 |
| | Spain - 4.1 |
| | Netherlands - 4.1 |
| | Others - 17.9 |
| |
TOP HOLDINGS(% of Fund's net assets) | | |
| SAP SE | 2.1 | |
| Novo Nordisk A/S Series B | 1.5 | |
| Novartis AG | 1.5 | |
| Roche Holding AG | 1.5 | |
| Siemens AG | 1.4 | |
| Sony Group Corp | 1.3 | |
| Schneider Electric SE | 1.3 | |
| ASML Holding NV | 1.3 | |
| HSBC Holdings PLC | 1.2 | |
| Recruit Holdings Co Ltd | 1.1 | |
| | 14.2 | |
| Fidelity, the Fidelity Investments Logo and all other Fidelity trademarks or service marks used herein are trademarks or service marks of FMR LLC. Any third-party marks that are used herein are trademarks or service marks of their respective owners. © 2025 FMR LLC. All rights reserved. |
| | For additional information about the Fund; including its prospectus, financial information, holdings and proxy information, scan the QR code or visit fundresearch.fidelity.com/prospectus/sec 1.9915507.100 7544-TSRS-0325 |
| |
| | SEMI-ANNUAL SHAREHOLDER REPORT | AS OF DECEMBER 31, 2024 | |
| | Fidelity® Clean Energy ETF Fidelity® Clean Energy ETF : FRNW Principal U.S. Listing Exchange :CboeBZX Cboe BZX Exchange, Inc. |
| | | |
This semi-annual shareholder report contains information about Fidelity® Clean Energy ETF for the period July 1, 2024 to December 31, 2024. You can find additional information about the Fund at fundresearch.fidelity.com/prospectus/sec. You can also request this information by contacting us at 1-800-FIDELITY or by sending an e-mail to fidfunddocuments@fidelity.com.
What were your Fund costs for the last six months?(based on hypothetical $10,000 investment)
| | Costs of a $10,000 investment | Costs paid as a percentage of a $10,000 investment | |
| Fidelity® Clean Energy ETF | $ 19 | 0.38% | |
Key Fund Statistics(as of December 31, 2024)
KEY FACTS | | |
| Fund Size | $24,294,307 | |
| Number of Holdings | 51 | |
| Portfolio Turnover | 51% | |
What did the Fund invest in?
(as of December 31, 2024)
MARKET SECTORS (% of Fund's net assets) | | |
| Utilities | 48.1 | |
| Industrials | 31.2 | |
| Information Technology | 20.5 | |
| |
| Common Stocks | 99.8 |
| Short-Term Investments and Net Other Assets (Liabilities) | 0.2 |
ASSET ALLOCATION (% of Fund's net assets) |
|
| | Common Stocks - 99.8 |
| | Short-Term Investments and Net Other Assets (Liabilities) - 0.2 |
| |
| United States | 35.6 |
| China | 9.9 |
| Canada | 9.1 |
| Denmark | 7.2 |
| Spain | 5.7 |
| Germany | 4.7 |
| New Zealand | 4.5 |
| France | 4.4 |
| Israel | 3.7 |
| Others | 15.2 |
GEOGRAPHIC DIVERSIFICATION (% of Fund's net assets) |
|
| | United States - 35.6 |
| | China - 9.9 |
| | Canada - 9.1 |
| | Denmark - 7.2 |
| | Spain - 5.7 |
| | Germany - 4.7 |
| | New Zealand - 4.5 |
| | France - 4.4 |
| | Israel - 3.7 |
| | Others - 15.2 |
| |
TOP HOLDINGS(% of Fund's net assets) | | |
| GE Vernova Inc | 4.6 | |
| First Solar Inc | 4.3 | |
| Vestas Wind Systems A/S | 4.1 | |
| Enphase Energy Inc | 3.5 | |
| EDP SA | 3.4 | |
| Orsted AS | 3.1 | |
| NEXTracker Inc Class A | 2.9 | |
| Verbund AG Class A | 2.9 | |
| Itron Inc | 2.7 | |
| Meridian Energy Ltd | 2.6 | |
| | 34.1 | |
| Fidelity, the Fidelity Investments Logo and all other Fidelity trademarks or service marks used herein are trademarks or service marks of FMR LLC. Any third-party marks that are used herein are trademarks or service marks of their respective owners. © 2025 FMR LLC. All rights reserved. |
| | For additional information about the Fund; including its prospectus, financial information, holdings and proxy information, scan the QR code or visit fundresearch.fidelity.com/prospectus/sec 1.9915173.100 6442-TSRS-0325 |
| |
| | SEMI-ANNUAL SHAREHOLDER REPORT | AS OF DECEMBER 31, 2024 | |
| | Fidelity® Cloud Computing ETF Fidelity® Cloud Computing ETF : FCLD Principal U.S. Listing Exchange :CboeBZX Cboe BZX Exchange, Inc. |
| | | |
This semi-annual shareholder report contains information about Fidelity® Cloud Computing ETF for the period July 1, 2024 to December 31, 2024. You can find additional information about the Fund at fundresearch.fidelity.com/prospectus/sec. You can also request this information by contacting us at 1-800-FIDELITY or by sending an e-mail to fidfunddocuments@fidelity.com.
What were your Fund costs for the last six months?(based on hypothetical $10,000 investment)
| | Costs of a $10,000 investment | Costs paid as a percentage of a $10,000 investment | |
| Fidelity® Cloud Computing ETF | $ 21 | 0.38% | |
Key Fund Statistics(as of December 31, 2024)
KEY FACTS | | |
| Fund Size | $85,108,801 | |
| Number of Holdings | 53 | |
| Portfolio Turnover | 38% | |
What did the Fund invest in?
(as of December 31, 2024)
MARKET SECTORS (% of Fund's net assets) | | |
| Information Technology | 88.2 | |
| Real Estate | 7.6 | |
| Consumer Discretionary | 2.2 | |
| Industrials | 1.8 | |
| |
| Common Stocks | 99.8 |
| Short-Term Investments and Net Other Assets (Liabilities) | 0.2 |
ASSET ALLOCATION (% of Fund's net assets) |
|
| | Common Stocks - 99.8 |
| | Short-Term Investments and Net Other Assets (Liabilities) - 0.2 |
| |
| United States | 93.3 |
| Israel | 2.8 |
| Taiwan | 2.0 |
| China | 1.9 |
GEOGRAPHIC DIVERSIFICATION (% of Fund's net assets) |
|
| | United States - 93.3 |
| | Israel - 2.8 |
| | Taiwan - 2.0 |
| | China - 1.9 |
| |
TOP HOLDINGS(% of Fund's net assets) | | |
| Microsoft Corp | 4.8 | |
| Servicenow Inc | 4.6 | |
| Salesforce Inc | 4.5 | |
| Oracle Corp | 4.4 | |
| Equinix Inc | 4.2 | |
| Workday Inc Class A | 3.5 | |
| Digital Realty Trust Inc | 3.4 | |
| Snowflake Inc Class A | 3.1 | |
| Datadog Inc Class A | 3.0 | |
| MicroStrategy Inc Class A | 2.9 | |
| | 38.4 | |
| Fidelity, the Fidelity Investments Logo and all other Fidelity trademarks or service marks used herein are trademarks or service marks of FMR LLC. Any third-party marks that are used herein are trademarks or service marks of their respective owners. © 2025 FMR LLC. All rights reserved. |
| | For additional information about the Fund; including its prospectus, financial information, holdings and proxy information, scan the QR code or visit fundresearch.fidelity.com/prospectus/sec 1.9915174.100 6443-TSRS-0325 |
| |
| | SEMI-ANNUAL SHAREHOLDER REPORT | AS OF DECEMBER 31, 2024 | |
| | Fidelity® Digital Health ETF Fidelity® Digital Health ETF : FDHT Principal U.S. Listing Exchange :CboeBZX Cboe BZX Exchange, Inc. |
| | | |
This semi-annual shareholder report contains information about Fidelity® Digital Health ETF for the period July 1, 2024 to December 31, 2024. You can find additional information about the Fund at fundresearch.fidelity.com/prospectus/sec. You can also request this information by contacting us at 1-800-FIDELITY or by sending an e-mail to fidfunddocuments@fidelity.com.
What were your Fund costs for the last six months?(based on hypothetical $10,000 investment)
| | Costs of a $10,000 investment | Costs paid as a percentage of a $10,000 investment | |
| Fidelity® Digital Health ETF | $ 20 | 0.38% | |
Key Fund Statistics(as of December 31, 2024)
KEY FACTS | | |
| Fund Size | $7,836,071 | |
| Number of Holdings | 51 | |
| Portfolio Turnover | 59% | |
What did the Fund invest in?
(as of December 31, 2024)
MARKET SECTORS (% of Fund's net assets) | | |
| Health Care | 86.4 | |
| Consumer Staples | 6.5 | |
| Information Technology | 5.1 | |
| Industrials | 2.0 | |
| |
| Common Stocks | 100.0 |
| Short-Term Investments and Net Other Assets (Liabilities) | 0.0 |
ASSET ALLOCATION (% of Fund's net assets) |
|
| | Common Stocks - 100.0 |
| | Short-Term Investments and Net Other Assets (Liabilities) - 0.0 |
| |
| United States | 60.6 |
| Australia | 6.8 |
| Netherlands | 5.6 |
| China | 5.0 |
| Germany | 4.8 |
| Switzerland | 4.4 |
| New Zealand | 3.4 |
| Japan | 2.6 |
| Denmark | 1.9 |
| Others | 4.9 |
GEOGRAPHIC DIVERSIFICATION (% of Fund's net assets) |
|
| | United States - 60.6 |
| | Australia - 6.8 |
| | Netherlands - 5.6 |
| | China - 5.0 |
| | Germany - 4.8 |
| | Switzerland - 4.4 |
| | New Zealand - 3.4 |
| | Japan - 2.6 |
| | Denmark - 1.9 |
| | Others - 4.9 |
| |
TOP HOLDINGS(% of Fund's net assets) | | |
| Dexcom Inc | 4.7 | |
| ResMed Inc | 4.5 | |
| Intuitive Surgical Inc | 4.5 | |
| Veeva Systems Inc Class A | 4.4 | |
| Koninklijke Philips NV | 4.1 | |
| Insulet Corp | 3.9 | |
| Sonova Holding AG | 3.7 | |
| Siemens Healthineers AG | 3.6 | |
| Fisher & Paykel Healthcare Corp Ltd | 3.4 | |
| Cochlear Ltd | 3.2 | |
| | 40.0 | |
| Fidelity, the Fidelity Investments Logo and all other Fidelity trademarks or service marks used herein are trademarks or service marks of FMR LLC. Any third-party marks that are used herein are trademarks or service marks of their respective owners. © 2025 FMR LLC. All rights reserved. |
| | For additional information about the Fund; including its prospectus, financial information, holdings and proxy information, scan the QR code or visit fundresearch.fidelity.com/prospectus/sec 1.9915175.100 6444-TSRS-0325 |
| |
| | SEMI-ANNUAL SHAREHOLDER REPORT | AS OF DECEMBER 31, 2024 | |
| | Fidelity® Electric Vehicles and Future Transportation ETF Fidelity® Electric Vehicles and Future Transportation ETF : FDRV Principal U.S. Listing Exchange :CboeBZX Cboe BZX Exchange, Inc. |
| | | |
This semi-annual shareholder report contains information about Fidelity® Electric Vehicles and Future Transportation ETF for the period July 1, 2024 to December 31, 2024. You can find additional information about the Fund at fundresearch.fidelity.com/prospectus/sec. You can also request this information by contacting us at 1-800-FIDELITY or by sending an e-mail to fidfunddocuments@fidelity.com.
What were your Fund costs for the last six months?(based on hypothetical $10,000 investment)
| | Costs of a $10,000 investment | Costs paid as a percentage of a $10,000 investment | |
| Fidelity® Electric Vehicles and Future Transportation ETF | $ 19 | 0.38% | |
Key Fund Statistics(as of December 31, 2024)
KEY FACTS | | |
| Fund Size | $28,162,666 | |
| Number of Holdings | 51 | |
| Portfolio Turnover | 78% | |
What did the Fund invest in?
(as of December 31, 2024)
MARKET SECTORS (% of Fund's net assets) | | |
| Consumer Discretionary | 57.0 | |
| Information Technology | 23.3 | |
| Industrials | 16.4 | |
| Materials | 3.2 | |
| |
| Common Stocks | 99.9 |
| Short-Term Investments and Net Other Assets (Liabilities) | 0.1 |
ASSET ALLOCATION (% of Fund's net assets) |
|
| | Common Stocks - 99.9 |
| | Short-Term Investments and Net Other Assets (Liabilities) - 0.1 |
| |
| United States | 40.5 |
| China | 29.7 |
| Japan | 6.6 |
| Bailiwick Of Jersey | 4.8 |
| Germany | 4.3 |
| Korea (South) | 3.1 |
| France | 2.7 |
| Israel | 2.2 |
| Belgium | 1.6 |
| Others | 4.5 |
GEOGRAPHIC DIVERSIFICATION (% of Fund's net assets) |
|
| | United States - 40.5 |
| | China - 29.7 |
| | Japan - 6.6 |
| | Bailiwick Of Jersey - 4.8 |
| | Germany - 4.3 |
| | Korea (South) - 3.1 |
| | France - 2.7 |
| | Israel - 2.2 |
| | Belgium - 1.6 |
| | Others - 4.5 |
| |
TOP HOLDINGS(% of Fund's net assets) | | |
| Tesla Inc | 4.9 | |
| Li Auto Inc A Shares | 4.9 | |
| Aptiv PLC | 4.8 | |
| BYD Co Ltd H Shares | 4.7 | |
| Rivian Automotive Inc Class A | 4.5 | |
| NXP Semiconductors NV | 4.3 | |
| Infineon Technologies AG | 4.3 | |
| Uber Technologies Inc | 4.2 | |
| NIO Inc A Shares | 3.8 | |
| XPeng Inc A Shares | 3.8 | |
| | 44.2 | |
| Fidelity, the Fidelity Investments Logo and all other Fidelity trademarks or service marks used herein are trademarks or service marks of FMR LLC. Any third-party marks that are used herein are trademarks or service marks of their respective owners. © 2025 FMR LLC. All rights reserved. |
| | For additional information about the Fund; including its prospectus, financial information, holdings and proxy information, scan the QR code or visit fundresearch.fidelity.com/prospectus/sec 1.9915176.100 6445-TSRS-0325 |
| |
| | SEMI-ANNUAL SHAREHOLDER REPORT | AS OF DECEMBER 31, 2024 | |
| | Fidelity® Enhanced Large Cap Growth ETF Fidelity® Enhanced Large Cap Growth ETF : FELG Principal U.S. Listing Exchange :NYSEArca NYSE Arca, Inc. |
| | | |
This semi-annual shareholder report contains information about Fidelity® Enhanced Large Cap Growth ETF for the period July 1, 2024 to December 31, 2024. You can find additional information about the Fund at fundresearch.fidelity.com/prospectus/sec. You can also request this information by contacting us at 1-800-FIDELITY or by sending an e-mail to fidfunddocuments@fidelity.com.
What were your Fund costs for the last six months?(based on hypothetical $10,000 investment)
| | Costs of a $10,000 investment | Costs paid as a percentage of a $10,000 investment | |
| Fidelity® Enhanced Large Cap Growth ETF | $ 10 | 0.18% | |
Key Fund Statistics(as of December 31, 2024)
KEY FACTS | | |
| Fund Size | $3,180,775,368 | |
| Number of Holdings | 96 | |
| Portfolio Turnover | 31% | |
What did the Fund invest in?
(as of December 31, 2024)
MARKET SECTORS (% of Fund's net assets) | | |
| Information Technology | 46.9 | |
| Consumer Discretionary | 17.6 | |
| Communication Services | 14.0 | |
| Health Care | 6.6 | |
| Industrials | 6.1 | |
| Financials | 5.8 | |
| Consumer Staples | 1.4 | |
| Energy | 0.5 | |
| Materials | 0.1 | |
| Real Estate | 0.1 | |
| Utilities | 0.0 | |
| |
| Common Stocks | 99.1 |
| Short-Term Investments and Net Other Assets (Liabilities) | 0.9 |
ASSET ALLOCATION (% of Fund's net assets) |
|
| | Common Stocks - 99.1 |
| | Short-Term Investments and Net Other Assets (Liabilities) - 0.9 |
| |
| United States | 99.6 |
| Brazil | 0.3 |
| Mexico | 0.1 |
GEOGRAPHIC DIVERSIFICATION (% of Fund's net assets) |
|
| | United States - 99.6 |
| | Brazil - 0.3 |
| | Mexico - 0.1 |
| |
TOP HOLDINGS(% of Fund's net assets) | | |
| Apple Inc | 12.7 | |
| NVIDIA Corp | 11.2 | |
| Microsoft Corp | 10.0 | |
| Amazon.com Inc | 7.3 | |
| Meta Platforms Inc Class A | 4.8 | |
| Tesla Inc | 4.3 | |
| Alphabet Inc Class A | 3.7 | |
| Broadcom Inc | 3.6 | |
| Alphabet Inc Class C | 2.7 | |
| Mastercard Inc Class A | 2.0 | |
| | 62.3 | |
| Fidelity, the Fidelity Investments Logo and all other Fidelity trademarks or service marks used herein are trademarks or service marks of FMR LLC. Any third-party marks that are used herein are trademarks or service marks of their respective owners. © 2025 FMR LLC. All rights reserved. |
| | For additional information about the Fund; including its prospectus, financial information, holdings and proxy information, scan the QR code or visit fundresearch.fidelity.com/prospectus/sec 1.9915506.100 7543-TSRS-0325 |
| |
| | SEMI-ANNUAL SHAREHOLDER REPORT | AS OF DECEMBER 31, 2024 | |
| | Fidelity® Enhanced Large Cap Value ETF Fidelity® Enhanced Large Cap Value ETF : FELV Principal U.S. Listing Exchange :NYSEArca NYSE Arca, Inc. |
| | | |
This semi-annual shareholder report contains information about Fidelity® Enhanced Large Cap Value ETF for the period July 1, 2024 to December 31, 2024. You can find additional information about the Fund at fundresearch.fidelity.com/prospectus/sec. You can also request this information by contacting us at 1-800-FIDELITY or by sending an e-mail to fidfunddocuments@fidelity.com.
What were your Fund costs for the last six months?(based on hypothetical $10,000 investment)
| | Costs of a $10,000 investment | Costs paid as a percentage of a $10,000 investment | |
| Fidelity® Enhanced Large Cap Value ETF | $ 9 | 0.18% | |
Key Fund Statistics(as of December 31, 2024)
KEY FACTS | | |
| Fund Size | $2,133,528,408 | |
| Number of Holdings | 383 | |
| Portfolio Turnover | 46% | |
What did the Fund invest in?
(as of December 31, 2024)
MARKET SECTORS (% of Fund's net assets) | | |
| Financials | 22.9 | |
| Industrials | 16.4 | |
| Health Care | 13.0 | |
| Information Technology | 9.8 | |
| Consumer Discretionary | 6.9 | |
| Consumer Staples | 6.9 | |
| Energy | 6.0 | |
| Communication Services | 4.7 | |
| Materials | 4.3 | |
| Real Estate | 3.9 | |
| Utilities | 3.8 | |
| |
| Common Stocks | 98.6 |
| Short-Term Investments and Net Other Assets (Liabilities) | 1.4 |
ASSET ALLOCATION (% of Fund's net assets) |
|
| | Common Stocks - 98.6 |
| | Short-Term Investments and Net Other Assets (Liabilities) - 1.4 |
| |
| United States | 99.3 |
| Ireland | 0.4 |
| United Kingdom | 0.2 |
| Finland | 0.1 |
| Mexico | 0.0 |
| Canada | 0.0 |
| Bailiwick Of Jersey | 0.0 |
GEOGRAPHIC DIVERSIFICATION (% of Fund's net assets) |
|
| | United States - 99.3 |
| | Ireland - 0.4 |
| | United Kingdom - 0.2 |
| | Finland - 0.1 |
| | Mexico - 0.0 |
| | Canada - 0.0 |
| | Bailiwick Of Jersey - 0.0 |
| |
TOP HOLDINGS(% of Fund's net assets) | | |
| Berkshire Hathaway Inc Class B | 3.8 | |
| JPMorgan Chase & Co | 2.9 | |
| Exxon Mobil Corp | 2.3 | |
| Walmart Inc | 2.1 | |
| Bank of America Corp | 1.6 | |
| Walt Disney Co/The | 1.3 | |
| UnitedHealth Group Inc | 1.3 | |
| Procter & Gamble Co/The | 1.3 | |
| Wells Fargo & Co | 1.2 | |
| Cisco Systems Inc | 1.2 | |
| | 19.0 | |
| Fidelity, the Fidelity Investments Logo and all other Fidelity trademarks or service marks used herein are trademarks or service marks of FMR LLC. Any third-party marks that are used herein are trademarks or service marks of their respective owners. © 2025 FMR LLC. All rights reserved. |
| | For additional information about the Fund; including its prospectus, financial information, holdings and proxy information, scan the QR code or visit fundresearch.fidelity.com/prospectus/sec 1.9915505.100 7542-TSRS-0325 |
Item 2.
Code of Ethics
Not applicable.
Item 3.
Audit Committee Financial Expert
Not applicable.
Item 4.
Principal Accountant Fees and Services
Not applicable.
Item 5.
Audit Committee of Listed Registrants
Not applicable.
Item 6.
Investments
(a)
Not applicable.
(b)
Not applicable
Item 7.
Financial Statements and Financial Highlights for Open-End Management Investment Companies
Fidelity® Enhanced International ETF
Fidelity® Enhanced Large Cap Core ETF
Fidelity® Enhanced Large Cap Growth ETF
Fidelity® Enhanced Large Cap Value ETF
Fidelity® Enhanced Mid Cap ETF
Semi-Annual Report
December 31, 2024
Contents
To view a fund's proxy voting guidelines and proxy voting record for the 12-month period ended June 30, visit http://www.fidelity.com/proxyvotingresults or visit the Securities and Exchange Commission's (SEC) web site at http://www.sec.gov.
You may also call 1-800-FIDELITY to request a free copy of the proxy voting guidelines.
Standard & Poor's, S&P and S&P 500 are registered service marks of The McGraw-Hill Companies, Inc. and have been licensed for use by Fidelity Distributors Corporation.
Other third-party marks appearing herein are the property of their respective owners.
All other marks appearing herein are registered or unregistered trademarks or service marks of FMR LLC or an affiliated company. © 2025 FMR LLC. All rights reserved.
This report and the financial statements contained herein are submitted for the general information of the shareholders of the Funds. This report is not authorized for distribution to prospective investors in the Funds unless preceded or accompanied by an effective prospectus.
A fund files its complete schedule of portfolio holdings with the SEC for the first and third quarters of each fiscal year on Form N-PORT. Forms N-PORT are available on the SEC's web site at http://www.sec.gov. A fund's Forms N-PORT may be reviewed and copied at the SEC's Public Reference Room in Washington, DC. Information regarding the operation of the SEC's Public Reference Room may be obtained by calling 1-800-SEC-0330.
For a complete list of a fund's portfolio holdings, view the most recent holdings listing, semiannual report, or annual report on Fidelity's web site at http://www.fidelity.com, http://www.institutional.fidelity.com, or http://www.401k.com, as applicable.
NOT FDIC INSURED •MAY LOSE VALUE •NO BANK GUARANTEE
Neither the Funds nor Fidelity Distributors Corporation is a bank.
Item 7: Financial Statements and Financial Highlights for Open-End Management Investment Companies (Semi-Annual Report)
Fidelity® Enhanced International ETF
Schedule of Investments December 31, 2024 (Unaudited)
Showing Percentage of Net Assets
| Common Stocks - 97.8% |
| | | Shares | Value ($) |
| AUSTRALIA - 6.1% | | | |
| Communication Services - 0.2% | | | |
| Diversified Telecommunication Services - 0.1% | | | |
| Telstra Group Ltd | | 693,793 | 1,721,987 |
| Interactive Media & Services - 0.1% | | | |
| CAR Group Ltd | | 1,367 | 30,485 |
| REA Group Ltd | | 10,245 | 1,479,452 |
| | | | 1,509,937 |
TOTAL COMMUNICATION SERVICES | | | 3,231,924 |
| | | | |
| Consumer Discretionary - 1.1% | | | |
| Broadline Retail - 0.8% | | | |
| Wesfarmers Ltd | | 304,626 | 13,486,857 |
| Hotels, Restaurants & Leisure - 0.3% | | | |
| Aristocrat Leisure Ltd | | 142,157 | 6,014,865 |
TOTAL CONSUMER DISCRETIONARY | | | 19,501,722 |
| | | | |
| Financials - 1.5% | | | |
| Banks - 1.4% | | | |
| ANZ Group Holdings Ltd | | 597,423 | 10,553,378 |
| Commonwealth Bank of Australia | | 84,137 | 7,980,738 |
| National Australia Bank Ltd | | 151,340 | 3,475,227 |
| Westpac Banking Corp | | 143,373 | 2,868,100 |
| | | | 24,877,443 |
| Insurance - 0.1% | | | |
| Medibank Pvt Ltd | | 211,952 | 497,201 |
| QBE Insurance Group Ltd | | 95,917 | 1,139,863 |
| | | | 1,637,064 |
TOTAL FINANCIALS | | | 26,514,507 |
| | | | |
| Health Care - 0.4% | | | |
| Health Care Technology - 0.4% | | | |
| Pro Medicus Ltd | | 43,617 | 6,752,425 |
| Industrials - 0.0% | | | |
| Trading Companies & Distributors - 0.0% | | | |
| Reece Ltd | | 24,303 | 336,648 |
| SGH Ltd | | 17,754 | 506,695 |
| | | | 843,343 |
| Materials - 2.9% | | | |
| Metals & Mining - 2.9% | | | |
| BHP Group Ltd | | 356,721 | 8,732,342 |
| Fortescue Ltd | | 886,558 | 10,014,415 |
| Northern Star Resources Ltd | | 542,575 | 5,185,166 |
| Rio Tinto Ltd | | 146,629 | 10,660,202 |
| Rio Tinto PLC | | 107,598 | 6,361,972 |
| Rio Tinto PLC ADR | | 149,201 | 8,774,511 |
| | | | 49,728,608 |
| Real Estate - 0.0% | | | |
| Diversified REITs - 0.0% | | | |
| GPT Group/The unit | | 138 | 373 |
| Utilities - 0.0% | | | |
| Electric Utilities - 0.0% | | | |
| Origin Energy Ltd | | 128 | 864 |
| TOTAL AUSTRALIA | | | 106,573,766 |
| AUSTRIA - 0.0% | | | |
| Financials - 0.0% | | | |
| Banks - 0.0% | | | |
| Erste Group Bank AG | | 23 | 1,421 |
| BELGIUM - 0.4% | | | |
| Financials - 0.3% | | | |
| Financial Services - 0.0% | | | |
| Groupe Bruxelles Lambert NV | | 5,341 | 365,420 |
| Insurance - 0.3% | | | |
| Ageas SA/NV | | 101,653 | 4,938,442 |
TOTAL FINANCIALS | | | 5,303,862 |
| | | | |
| Real Estate - 0.1% | | | |
| Industrial REITs - 0.1% | | | |
| Warehouses De Pauw CVA | | 73,541 | 1,447,371 |
| TOTAL BELGIUM | | | 6,751,233 |
| CHINA - 1.6% | | | |
| Consumer Discretionary - 0.9% | | | |
| Broadline Retail - 0.9% | | | |
| Prosus NV Class N | | 371,836 | 14,771,128 |
| Financials - 0.5% | | | |
| Banks - 0.5% | | | |
| BOC Hong Kong Holdings Ltd | | 2,553,500 | 8,202,999 |
| Industrials - 0.2% | | | |
| Machinery - 0.1% | | | |
| Yangzijiang Shipbuildling (Holdings) Ltd | | 1,022,300 | 2,238,258 |
| Marine Transportation - 0.1% | | | |
| SITC International Holdings Co Ltd | | 826,000 | 2,201,490 |
TOTAL INDUSTRIALS | | | 4,439,748 |
| | | | |
| TOTAL CHINA | | | 27,413,875 |
| DENMARK - 2.7% | | | |
| Consumer Discretionary - 0.0% | | | |
| Textiles, Apparel & Luxury Goods - 0.0% | | | |
| Pandora A/S | | 6,940 | 1,269,583 |
| Financials - 0.3% | | | |
| Banks - 0.3% | | | |
| Danske Bank A/S | | 165,973 | 4,696,175 |
| Health Care - 2.1% | | | |
| Biotechnology - 0.6% | | | |
| Genmab A/S (b) | | 31,054 | 6,437,951 |
| Genmab A/S ADR (b) | | 188,762 | 3,939,462 |
| | | | 10,377,413 |
| Pharmaceuticals - 1.5% | | | |
| Novo Nordisk A/S Class B ADR | | 5 | 430 |
| Novo Nordisk A/S Series B | | 301,568 | 26,147,176 |
| | | | 26,147,606 |
TOTAL HEALTH CARE | | | 36,525,019 |
| | | | |
| Industrials - 0.3% | | | |
| Building Products - 0.0% | | | |
| ROCKWOOL A/S Series B | | 1,858 | 658,631 |
| Marine Transportation - 0.3% | | | |
| AP Moller - Maersk A/S Series A | | 1,561 | 2,502,215 |
| AP Moller - Maersk A/S Series B | | 987 | 1,632,158 |
| | | | 4,134,373 |
TOTAL INDUSTRIALS | | | 4,793,004 |
| | | | |
| Materials - 0.0% | | | |
| Chemicals - 0.0% | | | |
| Novonesis (Novozymes) B Series B | | 17 | 962 |
| TOTAL DENMARK | | | 47,284,743 |
| FINLAND - 1.6% | | | |
| Financials - 0.2% | | | |
| Banks - 0.2% | | | |
| Nordea Bank Abp | | 231,247 | 2,515,141 |
| Nordea Bank Abp (Sweden) | | 63,236 | 687,581 |
| | | | 3,202,722 |
| Insurance - 0.0% | | | |
| Sampo Oyj A Shares | | 25,116 | 1,024,526 |
TOTAL FINANCIALS | | | 4,227,248 |
| | | | |
| Industrials - 1.0% | | | |
| Machinery - 1.0% | | | |
| Kone Oyj B Shares | | 188,064 | 9,155,886 |
| Wartsila OYJ Abp | | 437,958 | 7,762,102 |
| | | | 16,917,988 |
| Information Technology - 0.4% | | | |
| Communications Equipment - 0.4% | | | |
| Nokia Oyj | | 624,558 | 2,765,381 |
| Nokia Oyj ADR (c) | | 827,369 | 3,665,245 |
| | | | 6,430,626 |
| TOTAL FINLAND | | | 27,575,862 |
| FRANCE - 7.2% | | | |
| Consumer Discretionary - 0.8% | | | |
| Hotels, Restaurants & Leisure - 0.2% | | | |
| La Francaise des Jeux SACA (d)(e) | | 99,085 | 3,820,156 |
| Textiles, Apparel & Luxury Goods - 0.6% | | | |
| LVMH Moet Hennessy Louis Vuitton SE | | 15,640 | 10,295,542 |
TOTAL CONSUMER DISCRETIONARY | | | 14,115,698 |
| | | | |
| Consumer Staples - 0.3% | | | |
| Consumer Staples Distribution & Retail - 0.0% | | | |
| Carrefour SA | | 27,311 | 388,423 |
| Food Products - 0.3% | | | |
| Danone SA | | 68,703 | 4,634,330 |
| Personal Care Products - 0.0% | | | |
| L'Oreal SA | | 1,421 | 503,184 |
TOTAL CONSUMER STAPLES | | | 5,525,937 |
| | | | |
| Energy - 0.7% | | | |
| Oil, Gas & Consumable Fuels - 0.7% | | | |
| TotalEnergies SE | | 234,507 | 12,964,324 |
| Financials - 1.5% | | | |
| Banks - 1.1% | | | |
| BNP Paribas SA | | 235,047 | 14,418,497 |
| Credit Agricole SA | | 42,089 | 579,416 |
| Societe Generale SA Series A | | 113,475 | 3,192,470 |
| | | | 18,190,383 |
| Insurance - 0.4% | | | |
| AXA SA | | 209,355 | 7,442,648 |
TOTAL FINANCIALS | | | 25,633,031 |
| | | | |
| Industrials - 1.6% | | | |
| Aerospace & Defense - 0.3% | | | |
| Airbus SE | | 3,548 | 568,847 |
| Safran SA | | 20,586 | 4,522,822 |
| | | | 5,091,669 |
| Building Products - 0.2% | | | |
| Cie de Saint-Gobain SA | | 48,775 | 4,329,871 |
| Construction & Engineering - 0.6% | | | |
| Eiffage SA | | 93,213 | 8,180,114 |
| Vinci SA | | 22,648 | 2,339,894 |
| | | | 10,520,008 |
| Electrical Equipment - 0.4% | | | |
| Legrand SA | | 62,811 | 6,118,503 |
| Trading Companies & Distributors - 0.0% | | | |
| Rexel SA | | 26,383 | 672,289 |
| Transportation Infrastructure - 0.1% | | | |
| Getlink SE Series A | | 54,999 | 877,634 |
TOTAL INDUSTRIALS | | | 27,609,974 |
| | | | |
| Information Technology - 0.5% | | | |
| IT Services - 0.5% | | | |
| Capgemini SE | | 48,540 | 7,951,807 |
| Materials - 0.9% | | | |
| Chemicals - 0.9% | | | |
| Air Liquide SA | | 98,382 | 15,991,559 |
| Arkema SA | | 2,671 | 203,495 |
| | | | 16,195,054 |
| Real Estate - 0.3% | | | |
| Diversified REITs - 0.1% | | | |
| Covivio SA/France | | 39,902 | 2,015,372 |
| Office REITs - 0.2% | | | |
| Gecina SA | | 28,246 | 2,646,442 |
TOTAL REAL ESTATE | | | 4,661,814 |
| | | | |
| Utilities - 0.6% | | | |
| Multi-Utilities - 0.6% | | | |
| Engie SA | | 590,283 | 9,361,218 |
| Veolia Environnement SA | | 40,784 | 1,145,291 |
| | | | 10,506,509 |
| TOTAL FRANCE | | | 125,164,148 |
| GERMANY - 8.6% | | | |
| Communication Services - 0.1% | | | |
| Diversified Telecommunication Services - 0.1% | | | |
| Deutsche Telekom AG | | 65,055 | 1,946,817 |
| Interactive Media & Services - 0.0% | | | |
| Scout24 SE (d)(e) | | 2 | 176 |
TOTAL COMMUNICATION SERVICES | | | 1,946,993 |
| | | | |
| Consumer Discretionary - 0.8% | | | |
| Automobiles - 0.0% | | | |
| Mercedes-Benz Group AG | | 9,890 | 551,157 |
| Volkswagen AG | | 2,960 | 282,543 |
| | | | 833,700 |
| Specialty Retail - 0.0% | | | |
| Zalando SE (b)(d)(e) | | 13,305 | 446,398 |
| Textiles, Apparel & Luxury Goods - 0.8% | | | |
| adidas AG | | 51,294 | 12,581,869 |
TOTAL CONSUMER DISCRETIONARY | | | 13,861,967 |
| | | | |
| Financials - 2.7% | | | |
| Capital Markets - 0.8% | | | |
| Deutsche Bank AG | | 721,854 | 12,442,268 |
| Deutsche Boerse AG | | 3,103 | 714,848 |
| | | | 13,157,116 |
| Insurance - 1.9% | | | |
| Allianz SE | | 56,987 | 17,466,972 |
| Hannover Rueck SE | | 5,032 | 1,258,273 |
| Muenchener Rueckversicherungs-Gesellschaft AG in Muenchen | | 21,083 | 10,637,692 |
| Talanx AG | | 46,871 | 3,988,491 |
| | | | 33,351,428 |
TOTAL FINANCIALS | | | 46,508,544 |
| | | | |
| Industrials - 2.0% | | | |
| Air Freight & Logistics - 0.5% | | | |
| Deutsche Post AG | | 247,062 | 8,696,134 |
| Industrial Conglomerates - 1.4% | | | |
| Siemens AG | | 124,150 | 24,248,963 |
| Machinery - 0.1% | | | |
| Gea Group Ag | | 8 | 396 |
| Knorr-Bremse AG | | 20,160 | 1,469,100 |
| Rational AG | | 1,207 | 1,030,223 |
| | | | 2,499,719 |
TOTAL INDUSTRIALS | | | 35,444,816 |
| | | | |
| Information Technology - 2.1% | | | |
| Semiconductors & Semiconductor Equipment - 0.0% | | | |
| Infineon Technologies AG | | 132 | 4,293 |
| Software - 2.1% | | | |
| SAP SE | | 146,479 | 35,853,864 |
TOTAL INFORMATION TECHNOLOGY | | | 35,858,157 |
| | | | |
| Materials - 0.9% | | | |
| Chemicals - 0.4% | | | |
| Evonik Industries AG | | 205,665 | 3,564,127 |
| Symrise AG | | 24,157 | 2,568,614 |
| | | | 6,132,741 |
| Construction Materials - 0.5% | | | |
| Heidelberg Materials AG | | 73,098 | 9,033,225 |
TOTAL MATERIALS | | | 15,165,966 |
| | | | |
| TOTAL GERMANY | | | 148,786,443 |
| HONG KONG - 2.5% | | | |
| Communication Services - 0.0% | | | |
| Diversified Telecommunication Services - 0.0% | | | |
| HKT Trust & HKT Ltd unit | | 258,000 | 318,902 |
| Consumer Staples - 0.4% | | | |
| Food Products - 0.4% | | | |
| WH Group Ltd (d)(e) | | 9,151,455 | 7,081,592 |
| Financials - 1.2% | | | |
| Capital Markets - 0.3% | | | |
| Hong Kong Exchanges & Clearing Ltd | | 142,100 | 5,393,713 |
| Insurance - 0.9% | | | |
| AIA Group Ltd | | 1,808,832 | 13,112,120 |
TOTAL FINANCIALS | | | 18,505,833 |
| | | | |
| Industrials - 0.1% | | | |
| Industrial Conglomerates - 0.1% | | | |
| Jardine Matheson Holdings Ltd (Singapore) | | 44,700 | 1,831,359 |
| Swire Pacific Ltd A Shares | | 42,500 | 385,510 |
| | | | 2,216,869 |
| Real Estate - 0.3% | | | |
| Real Estate Management & Development - 0.3% | | | |
| Sun Hung Kai Properties Ltd | | 602,500 | 5,790,994 |
| Utilities - 0.5% | | | |
| Electric Utilities - 0.5% | | | |
| CLP Holdings Ltd | | 1,113,500 | 9,362,022 |
| TOTAL HONG KONG | | | 43,276,212 |
| ISRAEL - 0.7% | | | |
| Financials - 0.1% | | | |
| Banks - 0.1% | | | |
| Bank Leumi Le-Israel BM | | 102,406 | 1,221,098 |
| Information Technology - 0.6% | | | |
| IT Services - 0.6% | | | |
| Wix.com Ltd (b) | | 47,808 | 10,257,206 |
| TOTAL ISRAEL | | | 11,478,304 |
| ITALY - 2.2% | | | |
| Consumer Discretionary - 0.1% | | | |
| Textiles, Apparel & Luxury Goods - 0.1% | | | |
| Moncler SpA | | 23,014 | 1,215,315 |
| Consumer Staples - 0.6% | | | |
| Beverages - 0.6% | | | |
| Coca-Cola HBC AG | | 281,640 | 9,632,625 |
| Financials - 1.5% | | | |
| Banks - 1.5% | | | |
| Intesa Sanpaolo SpA | | 3,099,161 | 12,401,257 |
| UniCredit SpA | | 328,203 | 13,097,309 |
| | | | 25,498,566 |
| Insurance - 0.0% | | | |
| Generali | | 39,124 | 1,105,160 |
TOTAL FINANCIALS | | | 26,603,726 |
| | | | |
| Health Care - 0.0% | | | |
| Health Care Equipment & Supplies - 0.0% | | | |
| DiaSorin SpA | | 4,401 | 453,872 |
| Industrials - 0.0% | | | |
| Electrical Equipment - 0.0% | | | |
| Prysmian SpA | | 17 | 1,086 |
| Utilities - 0.0% | | | |
| Electric Utilities - 0.0% | | | |
| Enel SpA | | 2 | 14 |
| TOTAL ITALY | | | 37,906,638 |
| JAPAN - 23.9% | | | |
| Communication Services - 1.3% | | | |
| Entertainment - 0.1% | | | |
| Konami Group Corp | | 26,200 | 2,464,394 |
| Interactive Media & Services - 0.6% | | | |
| LY Corp | | 3,709,922 | 9,888,724 |
| Wireless Telecommunication Services - 0.6% | | | |
| SoftBank Corp | | 6,628,040 | 8,378,513 |
| SoftBank Group Corp | | 26,300 | 1,535,260 |
| | | | 9,913,773 |
TOTAL COMMUNICATION SERVICES | | | 22,266,891 |
| | | | |
| Consumer Discretionary - 4.6% | | | |
| Automobiles - 1.4% | | | |
| Honda Motor Co Ltd ADR | | 10 | 286 |
| Mazda Motor Corp | | 674,600 | 4,645,391 |
| Subaru Corp | | 266,658 | 4,780,846 |
| Suzuki Motor Corp | | 274,300 | 3,120,512 |
| Toyota Motor Corp | | 560,361 | 11,204,015 |
| | | | 23,751,050 |
| Broadline Retail - 0.0% | | | |
| Rakuten Group Inc (b) | | 159,400 | 870,118 |
| Household Durables - 2.0% | | | |
| Panasonic Holdings Corp | | 1,092,900 | 11,412,086 |
| Sony Group Corp | | 1,078,680 | 23,096,209 |
| | | | 34,508,295 |
| Specialty Retail - 0.9% | | | |
| Fast Retailing Co Ltd | | 43,942 | 15,030,401 |
| Textiles, Apparel & Luxury Goods - 0.3% | | | |
| Asics Corp | | 307,900 | 6,085,792 |
TOTAL CONSUMER DISCRETIONARY | | | 80,245,656 |
| | | | |
| Consumer Staples - 0.1% | | | |
| Consumer Staples Distribution & Retail - 0.1% | | | |
| Seven & i Holdings Co Ltd | | 101,200 | 1,599,570 |
| Financials - 3.4% | | | |
| Banks - 1.4% | | | |
| Japan Post Bank Co Ltd | | 278,000 | 2,640,510 |
| Mitsubishi UFJ Financial Group Inc | | 1,331,500 | 15,621,400 |
| Mitsubishi UFJ Financial Group Inc ADR | | 242 | 2,836 |
| Mizuho Financial Group Inc | | 134,300 | 3,305,754 |
| Sumitomo Mitsui Financial Group Inc | | 90,700 | 2,169,721 |
| | | | 23,740,221 |
| Capital Markets - 0.9% | | | |
| Daiwa Securities Group Inc | | 783,048 | 5,215,509 |
| Nomura Holdings Inc | | 1,906,000 | 11,281,311 |
| | | | 16,496,820 |
| Insurance - 1.1% | | | |
| Dai-ichi Life Holdings Inc | | 113,100 | 3,044,128 |
| Ms&Ad Insurance Group Holdings Inc | | 153,900 | 3,373,486 |
| Sompo Holdings Inc | | 162,400 | 4,251,331 |
| Tokio Marine Holdings Inc | | 234,100 | 8,522,195 |
| | | | 19,191,140 |
TOTAL FINANCIALS | | | 59,428,181 |
| | | | |
| Health Care - 2.2% | | | |
| Health Care Equipment & Supplies - 1.3% | | | |
| Hoya Corp | | 101,284 | 12,755,045 |
| Olympus Corp | | 169,300 | 2,550,609 |
| Terumo Corp | | 349,700 | 6,805,309 |
| | | | 22,110,963 |
| Pharmaceuticals - 0.9% | | | |
| Daiichi Sankyo Co Ltd | | 273,600 | 7,567,493 |
| Takeda Pharmaceutical Co Ltd | | 295,500 | 7,852,080 |
| | | | 15,419,573 |
TOTAL HEALTH CARE | | | 37,530,536 |
| | | | |
| Industrials - 6.7% | | | |
| Electrical Equipment - 0.9% | | | |
| Fujikura Ltd | | 88,000 | 3,662,169 |
| Mitsubishi Electric Corp | | 402,900 | 6,880,373 |
| NIDEC CORP | | 281,900 | 5,115,031 |
| | | | 15,657,573 |
| Ground Transportation - 0.5% | | | |
| Central Japan Railway Co | | 491,200 | 9,256,144 |
| Industrial Conglomerates - 0.9% | | | |
| Hitachi Ltd | | 657,700 | 16,456,607 |
| Machinery - 1.3% | | | |
| Daifuku Co Ltd | | 7,100 | 148,908 |
| FANUC Corp | | 284,600 | 7,551,590 |
| Komatsu Ltd | | 165,400 | 4,572,691 |
| Makita Corp | | 305,500 | 9,403,137 |
| | | | 21,676,326 |
| Marine Transportation - 0.4% | | | |
| Kawasaki Kisen Kaisha Ltd | | 540,600 | 7,745,926 |
| Professional Services - 1.1% | | | |
| Recruit Holdings Co Ltd | | 261,500 | 18,522,467 |
| Trading Companies & Distributors - 1.6% | | | |
| Mitsubishi Corp | | 48,100 | 796,037 |
| Mitsui & Co Ltd | | 682,700 | 14,366,009 |
| Toyota Tsusho Corp | | 571,000 | 10,262,722 |
| | | | 25,424,768 |
TOTAL INDUSTRIALS | | | 114,739,811 |
| | | | |
| Information Technology - 4.0% | | | |
| Electronic Equipment, Instruments & Components - 1.1% | | | |
| Murata Manufacturing Co Ltd | | 622,300 | 10,122,831 |
| TDK Corp | | 124,600 | 1,641,193 |
| Yokogawa Electric Corp | | 378,100 | 8,165,393 |
| | | | 19,929,417 |
| IT Services - 1.0% | | | |
| Fujitsu Ltd | | 595,200 | 10,589,866 |
| NEC Corp | | 71,200 | 6,208,421 |
| Obic Co Ltd | | 19,900 | 593,540 |
| | | | 17,391,827 |
| Semiconductors & Semiconductor Equipment - 1.9% | | | |
| Advantest Corp | | 232,800 | 13,608,913 |
| SCREEN Holdings Co Ltd | | 50,500 | 3,045,823 |
| Tokyo Electron Ltd | | 97,000 | 14,909,562 |
| | | | 31,564,298 |
TOTAL INFORMATION TECHNOLOGY | | | 68,885,542 |
| | | | |
| Materials - 1.0% | | | |
| Chemicals - 0.8% | | | |
| Asahi Kasei Corp | | 163,100 | 1,132,459 |
| Mitsubishi Chemical Group Corp | | 404,800 | 2,057,381 |
| Nitto Denko Corp | | 646,000 | 11,003,082 |
| | | | 14,192,922 |
| Metals & Mining - 0.2% | | | |
| Nippon Steel Corp | | 167,800 | 3,393,432 |
TOTAL MATERIALS | | | 17,586,354 |
| | | | |
| Real Estate - 0.3% | | | |
| Real Estate Management & Development - 0.3% | | | |
| Daito Trust Construction Co Ltd | | 46,600 | 5,205,091 |
| Utilities - 0.3% | | | |
| Electric Utilities - 0.1% | | | |
| Chubu Electric Power Co Inc | | 82,300 | 865,917 |
| Kansai Electric Power Co Inc/The | | 600 | 6,686 |
| | | | 872,603 |
| Gas Utilities - 0.2% | | | |
| Osaka Gas Co Ltd | | 101,900 | 2,240,770 |
| Tokyo Gas Co Ltd | | 71,300 | 1,980,241 |
| | | | 4,221,011 |
TOTAL UTILITIES | | | 5,093,614 |
| | | | |
| TOTAL JAPAN | | | 412,581,246 |
| NETHERLANDS - 4.1% | | | |
| Communication Services - 0.1% | | | |
| Diversified Telecommunication Services - 0.1% | | | |
| Koninklijke KPN NV | | 240,693 | 876,366 |
| Consumer Staples - 0.2% | | | |
| Consumer Staples Distribution & Retail - 0.2% | | | |
| Koninklijke Ahold Delhaize NV | | 128,336 | 4,186,181 |
| Financials - 0.8% | | | |
| Banks - 0.5% | | | |
| ABN AMRO Bank NV depository receipt (d)(e) | | 512,741 | 7,908,418 |
| Capital Markets - 0.0% | | | |
| Euronext NV (d)(e) | | 7,153 | 802,442 |
| Financial Services - 0.0% | | | |
| EXOR NV | | 5,970 | 547,595 |
| Insurance - 0.3% | | | |
| NN Group NV | | 120,881 | 5,267,778 |
TOTAL FINANCIALS | | | 14,526,233 |
| | | | |
| Health Care - 0.3% | | | |
| Biotechnology - 0.0% | | | |
| Argenx SE (b) | | 770 | 478,563 |
| Health Care Equipment & Supplies - 0.3% | | | |
| Koninklijke Philips NV | | 201,545 | 5,093,997 |
TOTAL HEALTH CARE | | | 5,572,560 |
| | | | |
| Industrials - 0.7% | | | |
| Professional Services - 0.7% | | | |
| Wolters Kluwer NV | | 75,978 | 12,623,771 |
| Information Technology - 2.0% | | | |
| Semiconductors & Semiconductor Equipment - 2.0% | | | |
| ASM International NV | | 21,111 | 12,219,743 |
| ASML Holding NV | | 29,269 | 20,577,026 |
| | | | 32,796,769 |
| TOTAL NETHERLANDS | | | 70,581,880 |
| NEW ZEALAND - 0.1% | | | |
| Utilities - 0.1% | | | |
| Independent Power and Renewable Electricity Producers - 0.1% | | | |
| Meridian Energy Ltd | | 661,532 | 2,187,451 |
| NORWAY - 0.5% | | | |
| Energy - 0.1% | | | |
| Oil, Gas & Consumable Fuels - 0.1% | | | |
| Equinor ASA | | 69,480 | 1,619,901 |
| Financials - 0.3% | | | |
| Banks - 0.1% | | | |
| DNB Bank ASA | | 45,305 | 903,043 |
| Insurance - 0.2% | | | |
| Gjensidige Forsikring ASA | | 184,082 | 3,250,390 |
TOTAL FINANCIALS | | | 4,153,433 |
| | | | |
| Industrials - 0.1% | | | |
| Aerospace & Defense - 0.1% | | | |
| Kongsberg Gruppen ASA | | 19,473 | 2,189,631 |
| TOTAL NORWAY | | | 7,962,965 |
| PORTUGAL - 0.0% | | | |
| Utilities - 0.0% | | | |
| Electric Utilities - 0.0% | | | |
| EDP SA | | 7 | 22 |
| SINGAPORE - 2.8% | | | |
| Communication Services - 0.7% | | | |
| Entertainment - 0.7% | | | |
| Sea Ltd Class A ADR (b) | | 121,522 | 12,893,484 |
| Financials - 1.5% | | | |
| Banks - 1.4% | | | |
| DBS Group Holdings Ltd | | 124,000 | 3,969,743 |
| Oversea-Chinese Banking Corp Ltd | | 747,200 | 9,131,745 |
| United Overseas Bank Ltd | | 396,855 | 10,557,422 |
| | | | 23,658,910 |
| Capital Markets - 0.1% | | | |
| Singapore Exchange Ltd | | 114,300 | 1,066,292 |
TOTAL FINANCIALS | | | 24,725,202 |
| | | | |
| Industrials - 0.4% | | | |
| Aerospace & Defense - 0.4% | | | |
| ST Engineering Financial I Ltd | | 1,964,300 | 6,702,770 |
| Real Estate - 0.2% | | | |
| Industrial REITs - 0.2% | | | |
| CapitaLand Ascendas REIT | | 1,910,200 | 3,594,782 |
| TOTAL SINGAPORE | | | 47,916,238 |
| SOUTH AFRICA - 0.0% | | | |
| Materials - 0.0% | | | |
| Metals & Mining - 0.0% | | | |
| Anglo American PLC | | 22,588 | 668,490 |
| SPAIN - 4.1% | | | |
| Consumer Discretionary - 0.8% | | | |
| Specialty Retail - 0.8% | | | |
| Industria de Diseno Textil SA | | 277,795 | 14,284,106 |
| Financials - 1.2% | | | |
| Banks - 1.2% | | | |
| Banco Bilbao Vizcaya Argentaria SA | | 1,045,227 | 10,233,665 |
| Banco Bilbao Vizcaya Argentaria SA ADR | | 242,597 | 2,358,043 |
| Banco Santander SA | | 1,945,836 | 8,998,620 |
| | | | 21,590,328 |
| Industrials - 0.5% | | | |
| Transportation Infrastructure - 0.5% | | | |
| Aena SME SA (d)(e) | | 42,118 | 8,612,153 |
| Utilities - 1.6% | | | |
| Electric Utilities - 1.6% | | | |
| Endesa SA | | 430,009 | 9,251,474 |
| Iberdrola SA | | 1,260,663 | 17,367,909 |
| | | | 26,619,383 |
| TOTAL SPAIN | | | 71,105,970 |
| SWEDEN - 2.8% | | | |
| Consumer Discretionary - 0.3% | | | |
| Automobiles - 0.3% | | | |
| Volvo Car AB (b)(c) | | 2,301,152 | 4,987,561 |
| Hotels, Restaurants & Leisure - 0.0% | | | |
| Evolution AB (d)(e) | | 5,747 | 442,978 |
TOTAL CONSUMER DISCRETIONARY | | | 5,430,539 |
| | | | |
| Consumer Staples - 0.2% | | | |
| Household Products - 0.2% | | | |
| Essity AB B Shares | | 127,012 | 3,394,609 |
| Financials - 0.3% | | | |
| Banks - 0.1% | | | |
| Svenska Handelsbanken AB A Shares | | 194,338 | 2,005,938 |
| Financial Services - 0.2% | | | |
| Industrivarden AB A Shares | | 76,398 | 2,412,674 |
| Industrivarden AB C Shares | | 19 | 600 |
| Investor AB B Shares | | 40 | 1,058 |
| | | | 2,414,332 |
TOTAL FINANCIALS | | | 4,420,270 |
| | | | |
| Health Care - 0.2% | | | |
| Biotechnology - 0.2% | | | |
| Swedish Orphan Biovitrum AB B Shares (b) | | 110,506 | 3,170,199 |
| Health Care Equipment & Supplies - 0.0% | | | |
| Getinge AB B Shares | | 30 | 492 |
TOTAL HEALTH CARE | | | 3,170,691 |
| | | | |
| Industrials - 1.0% | | | |
| Machinery - 1.0% | | | |
| Alfa Laval AB | | 39,271 | 1,641,993 |
| SKF AB B Shares | | 183,389 | 3,441,077 |
| Volvo AB B Shares | | 533,995 | 12,963,937 |
| | | | 18,047,007 |
| Information Technology - 0.8% | | | |
| Communications Equipment - 0.6% | | | |
| Telefonaktiebolaget LM Ericsson B Shares | | 889,518 | 7,226,226 |
| Telefonaktiebolaget LM Ericsson Class B ADR | | 458,733 | 3,697,388 |
| | | | 10,923,614 |
| Electronic Equipment, Instruments & Components - 0.2% | | | |
| Hexagon AB B Shares | | 373,832 | 3,568,076 |
TOTAL INFORMATION TECHNOLOGY | | | 14,491,690 |
| | | | |
| TOTAL SWEDEN | | | 48,954,806 |
| SWITZERLAND - 4.2% | | | |
| Financials - 2.0% | | | |
| Capital Markets - 0.9% | | | |
| UBS Group AG | | 533,235 | 16,292,884 |
| Insurance - 1.1% | | | |
| Zurich Insurance Group AG | | 30,660 | 18,202,422 |
TOTAL FINANCIALS | | | 34,495,306 |
| | | | |
| Industrials - 1.5% | | | |
| Electrical Equipment - 0.8% | | | |
| ABB Ltd | | 247,688 | 13,392,156 |
| Marine Transportation - 0.1% | | | |
| Kuehne + Nagel International AG | | 7,290 | 1,669,177 |
| Professional Services - 0.6% | | | |
| SGS SA | | 103,071 | 10,321,296 |
TOTAL INDUSTRIALS | | | 25,382,629 |
| | | | |
| Information Technology - 0.0% | | | |
| Technology Hardware, Storage & Peripherals - 0.0% | | | |
| Logitech International SA | | 25 | 2,066 |
| Materials - 0.7% | | | |
| Chemicals - 0.7% | | | |
| Givaudan SA | | 2,905 | 12,694,871 |
| Utilities - 0.0% | | | |
| Electric Utilities - 0.0% | | | |
| BKW AG | | 5,201 | 860,768 |
| TOTAL SWITZERLAND | | | 73,435,640 |
| UNITED KINGDOM - 11.2% | | | |
| Communication Services - 0.6% | | | |
| Wireless Telecommunication Services - 0.6% | | | |
| Vodafone Group PLC | | 6,673,421 | 5,706,093 |
| Vodafone Group PLC ADR (c) | | 581,848 | 4,939,890 |
| | | | 10,645,983 |
| Consumer Discretionary - 0.1% | | | |
| Broadline Retail - 0.1% | | | |
| Next PLC | | 11,058 | 1,314,857 |
| Specialty Retail - 0.0% | | | |
| Kingfisher PLC | | 317,297 | 987,896 |
TOTAL CONSUMER DISCRETIONARY | | | 2,302,753 |
| | | | |
| Consumer Staples - 3.9% | | | |
| Consumer Staples Distribution & Retail - 0.7% | | | |
| Tesco PLC | | 2,632,643 | 12,138,453 |
| Food Products - 0.3% | | | |
| Associated British Foods PLC | | 181,248 | 4,635,656 |
| Household Products - 0.4% | | | |
| Reckitt Benckiser Group PLC | | 118,737 | 7,184,102 |
| Personal Care Products - 1.3% | | | |
| Unilever PLC | | 153,022 | 8,712,523 |
| Unilever PLC ADR | | 223,345 | 12,663,662 |
| | | | 21,376,185 |
| Tobacco - 1.2% | | | |
| British American Tobacco PLC | | 103,660 | 3,737,432 |
| British American Tobacco PLC ADR (c) | | 359,153 | 13,044,438 |
| Imperial Brands PLC | | 123,706 | 3,953,768 |
| | | | 20,735,638 |
TOTAL CONSUMER STAPLES | | | 66,070,034 |
| | | | |
| Financials - 3.4% | | | |
| Banks - 2.6% | | | |
| Barclays PLC ADR | | 154,938 | 2,059,126 |
| HSBC Holdings PLC | | 1,999,743 | 19,659,815 |
| HSBC Holdings PLC ADR (c) | | 168,867 | 8,352,162 |
| Lloyds Banking Group PLC | | 2,823,970 | 1,936,652 |
| NatWest Group PLC | | 930,546 | 4,684,266 |
| NatWest Group PLC ADR | | 186,956 | 1,901,343 |
| Standard Chartered PLC | | 467,417 | 5,784,885 |
| | | | 44,378,249 |
| Capital Markets - 0.6% | | | |
| 3i Group PLC | | 150,504 | 6,715,145 |
| London Stock Exchange Group PLC | | 20,836 | 2,943,645 |
| | | | 9,658,790 |
| Financial Services - 0.0% | | | |
| M&G PLC | | 557,930 | 1,381,928 |
| Insurance - 0.2% | | | |
| Admiral Group PLC | | 16,059 | 531,557 |
| Aviva PLC | | 566,567 | 3,325,129 |
| | | | 3,856,686 |
TOTAL FINANCIALS | | | 59,275,653 |
| | | | |
| Health Care - 0.8% | | | |
| Pharmaceuticals - 0.8% | | | |
| Astrazeneca PLC | | 93,776 | 12,289,241 |
| Astrazeneca PLC ADR | | 20,834 | 1,365,044 |
| | | | 13,654,285 |
| Industrials - 1.9% | | | |
| Aerospace & Defense - 1.2% | | | |
| BAE Systems PLC | | 824,663 | 11,857,064 |
| Rolls-Royce Holdings PLC (b) | | 1,105,367 | 7,868,337 |
| | | | 19,725,401 |
| Professional Services - 0.2% | | | |
| RELX PLC ADR | | 90,476 | 4,109,420 |
| Trading Companies & Distributors - 0.5% | | | |
| Bunzl PLC | | 227,760 | 9,397,975 |
TOTAL INDUSTRIALS | | | 33,232,796 |
| | | | |
| Information Technology - 0.4% | | | |
| Electronic Equipment, Instruments & Components - 0.1% | | | |
| Halma PLC | | 47,934 | 1,613,631 |
| Software - 0.3% | | | |
| Sage Group PLC/The | | 300,311 | 4,785,962 |
TOTAL INFORMATION TECHNOLOGY | | | 6,399,593 |
| | | | |
| Real Estate - 0.1% | | | |
| Diversified REITs - 0.1% | | | |
| Land Securities Group PLC | | 311,085 | 2,274,372 |
| Utilities - 0.0% | | | |
| Electric Utilities - 0.0% | | | |
| SSE PLC | | 3 | 60 |
| TOTAL UNITED KINGDOM | | | 193,855,529 |
| UNITED STATES - 10.5% | | | |
| Communication Services - 0.1% | | | |
| Entertainment - 0.1% | | | |
| Spotify Technology SA (b) | | 4,402 | 1,969,367 |
| Consumer Staples - 0.8% | | | |
| Food Products - 0.8% | | | |
| Nestle SA | | 174,267 | 14,378,396 |
| Energy - 0.7% | | | |
| Oil, Gas & Consumable Fuels - 0.7% | | | |
| Shell PLC | | 392,053 | 12,152,484 |
| Financials - 0.0% | | | |
| Insurance - 0.0% | | | |
| Swiss Re AG | | 39 | 5,637 |
| Health Care - 6.5% | | | |
| Biotechnology - 0.8% | | | |
| CSL Ltd | | 77,047 | 13,428,055 |
| Life Sciences Tools & Services - 0.5% | | | |
| QIAGEN NV | | 217,359 | 9,691,639 |
| Pharmaceuticals - 5.2% | | | |
| GSK PLC | | 389,696 | 6,569,040 |
| GSK PLC ADR | | 251,773 | 8,514,963 |
| Novartis AG | | 266,751 | 26,071,086 |
| Novartis AG ADR | | 31,290 | 3,044,829 |
| Roche Holding AG | | 91,696 | 25,814,918 |
| Roche Holding AG | | 7,705 | 2,297,364 |
| Roche Holding AG ADR | | 76,538 | 2,669,646 |
| Sanofi SA | | 131,813 | 12,799,119 |
| Sanofi SA ADR | | 38,660 | 1,864,571 |
| | | | 89,645,536 |
TOTAL HEALTH CARE | | | 112,765,230 |
| | | | |
| Industrials - 1.3% | | | |
| Electrical Equipment - 1.3% | | | |
| Schneider Electric SE | | 91,883 | 22,928,141 |
| Materials - 1.1% | | | |
| Construction Materials - 1.1% | | | |
| CRH PLC (United Kingdom) | | 56,780 | 5,270,085 |
| Holcim AG | | 137,395 | 13,225,527 |
| | | | 18,495,612 |
| TOTAL UNITED STATES | | | 182,694,867 |
| TOTAL COMMON STOCKS (Cost $1,525,663,192) | | | 1,694,157,749 |
| | | | |
| Non-Convertible Preferred Stocks - 0.5% |
| | | Shares | Value ($) |
| GERMANY - 0.5% | | | |
| Consumer Discretionary - 0.5% | | | |
| Automobiles - 0.5% | | | |
| Volkswagen AG | | 98,124 | 9,050,181 |
| Consumer Staples - 0.0% | | | |
| Household Products - 0.0% | | | |
| Henkel AG & Co KGaA | | 4,407 | 386,655 |
| TOTAL GERMANY | | | 9,436,836 |
| TOTAL NON-CONVERTIBLE PREFERRED STOCKS (Cost $12,662,012) | | | 9,436,836 |
| | | | |
| U.S. Treasury Obligations - 0.1% |
| | | Yield (%) (f) | Principal Amount (a) | Value ($) |
| US Treasury Bills 0% 1/16/2025 | | 4.57 to 4.58 | 1,030,000 | 1,028,304 |
| US Treasury Bills 0% 2/13/2025 | | 4.45 | 60,000 | 59,703 |
| US Treasury Bills 0% 2/6/2025 | | 4.46 | 390,000 | 388,399 |
| US Treasury Bills 0% 3/6/2025 (g) | | 4.40 | 640,000 | 635,313 |
| TOTAL U.S. TREASURY OBLIGATIONS (Cost $2,111,074) | | | | 2,111,719 |
| | | | | |
| Money Market Funds - 2.0% |
| | | Yield (%) | Shares | Value ($) |
| Fidelity Cash Central Fund (h) | | 4.36 | 21,366,514 | 21,370,788 |
| Fidelity Securities Lending Cash Central Fund (h)(i) | | 4.35 | 13,396,866 | 13,398,206 |
| TOTAL MONEY MARKET FUNDS (Cost $34,768,994) | | | | 34,768,994 |
| | | | | |
| TOTAL INVESTMENT IN SECURITIES - 100.4% (Cost $1,575,205,272) | 1,740,475,298 |
NET OTHER ASSETS (LIABILITIES) - (0.4)% | (6,982,129) |
| NET ASSETS - 100.0% | 1,733,493,169 |
| | |
| Futures Contracts |
| | Number of contracts | Expiration Date | Notional Amount ($) | Value ($) | Unrealized Appreciation/ (Depreciation) ($) |
| Purchased | | | | | |
| | | | | | |
| Equity Contracts | | | | | |
| ICE MSCI EAFE Index Contracts (United States) | 111 | Mar 2025 | 12,584,625 | (324,188) | (324,188) |
| | | | | | |
| The notional amount of futures purchased as a percentage of Net Assets is 0.7% |
Legend
| (a) | Amount is stated in United States dollars unless otherwise noted. |
| (c) | Security or a portion of the security is on loan at period end. |
| (d) | Security exempt from registration under Rule 144A of the Securities Act of 1933. These securities may be resold in transactions exempt from registration, normally to qualified institutional buyers. At the end of the period, the value of these securities amounted to $29,114,313 or 1.7% of net assets. |
| (e) | Security is exempt from registration under Regulation S of the Securities Act of 1933 and may be resold to qualified foreign investors outside of the United States. At the end of the period, the value of securities amounted to $29,114,313 or 1.7% of net assets. |
| (f) | Yield represents either the annualized yield at the date of purchase, or the stated coupon rate, or, for floating and adjustable rate securities, the rate at period end. |
| (g) | Security or a portion of the security was pledged to cover margin requirements for futures contracts. At period end, the value of securities pledged amounted to $549,943. |
| (h) | Affiliated fund that is generally available only to investment companies and other accounts managed by Fidelity Investments. The rate quoted is the annualized seven-day yield of the fund at period end. A complete unaudited listing of the fund's holdings as of its most recent quarter end is available upon request. In addition, each Fidelity Central Fund's financial statements are available on the SEC's website or upon request. |
| (i) | Investment made with cash collateral received from securities on loan. |
Affiliated Central Funds
Fiscal year to date information regarding the Fund's investments in Fidelity Central Funds, including the ownership percentage, is presented below.
| Affiliate | Value, beginning of period ($) | Purchases ($) | Sales Proceeds ($) | Dividend Income ($) | Realized Gain (loss) ($) | Change in Unrealized appreciation (depreciation) ($) | Value, end of period ($) | Shares, end of period | % ownership, end of period |
| Fidelity Cash Central Fund | 15,818,673 | 303,126,988 | 297,574,873 | 614,349 | - | - | 21,370,788 | 21,366,514 | 0.0% |
| Fidelity Securities Lending Cash Central Fund | 10,015,523 | 135,005,540 | 131,622,857 | 117,984 | - | - | 13,398,206 | 13,396,866 | 0.1% |
| Total | 25,834,196 | 438,132,528 | 429,197,730 | 732,333 | - | - | 34,768,994 | 34,763,380 | |
| | | | | | | | | | |
Amounts in the dividend income column in the above table include any capital gain distributions from underlying funds, which are presented in the corresponding line item in the Statement of Operations, if applicable.
Amounts in the dividend income column for Fidelity Securities Lending Cash Central Fund represents the income earned on investing cash collateral, less rebates paid to borrowers and any lending agent fees associated with the loan, plus any premium payments received for lending certain types of securities.
Amounts included in the purchases and sales proceeds columns may include in-kind transactions, if applicable.
Investment Valuation
The following is a summary of the inputs used, as of December 31, 2024, involving the Fund's assets and liabilities carried at fair value. The inputs or methodology used for valuing securities may not be an indication of the risk associated with investing in those securities. For more information on valuation inputs, and their aggregation into the levels used below, please refer to the Investment Valuation section in the accompanying Notes to Financial Statements.
| Valuation Inputs at Reporting Date: |
| Description | Total ($) | Level 1 ($) | Level 2 ($) | Level 3 ($) |
Investments in Securities: | | | | |
|
| Common Stocks | | | | |
Communication Services | 54,149,910 | 54,149,910 | - | - |
Consumer Discretionary | 166,998,467 | 166,998,467 | - | - |
Consumer Staples | 111,868,944 | 111,868,944 | - | - |
Energy | 26,736,709 | 26,736,709 | - | - |
Financials | 390,038,687 | 390,038,687 | - | - |
Health Care | 216,424,618 | 216,424,618 | - | - |
Industrials | 336,725,537 | 336,725,537 | - | - |
Information Technology | 183,073,456 | 183,073,456 | - | - |
Materials | 130,535,917 | 130,535,917 | - | - |
Real Estate | 22,974,797 | 22,974,797 | - | - |
Utilities | 54,630,707 | 54,630,707 | - | - |
|
| Non-Convertible Preferred Stocks | | | | |
Consumer Discretionary | 9,050,181 | 9,050,181 | - | - |
Consumer Staples | 386,655 | 386,655 | - | - |
|
| U.S. Treasury Obligations | 2,111,719 | - | 2,111,719 | - |
|
| Money Market Funds | 34,768,994 | 34,768,994 | - | - |
| Total Investments in Securities: | 1,740,475,298 | 1,738,363,579 | 2,111,719 | - |
Derivative Instruments: Liabilities | | | | |
Futures Contracts | (324,188) | (324,188) | - | - |
| Total Liabilities | (324,188) | (324,188) | - | - |
| Total Derivative Instruments: | (324,188) | (324,188) | - | - |
Value of Derivative Instruments
The following table is a summary of the Fund's value of derivative instruments by primary risk exposure as of December 31, 2024. For additional information on derivative instruments, please refer to the Derivative Instruments section in the accompanying Notes to Financial Statements.
Primary Risk Exposure / Derivative Type | Value |
| Asset ($) | Liability ($) |
| Equity Risk | | |
Futures Contracts (a) | 0 | (324,188) |
| Total Equity Risk | 0 | (324,188) |
| Total Value of Derivatives | 0 | (324,188) |
(a)Reflects gross cumulative appreciation (depreciation) on futures contracts as presented in the Schedule of Investments. In the Statement of Assets and Liabilities, the period end daily variation margin is included in receivable or payable for daily variation margin on futures contracts, and the net cumulative appreciation (depreciation) is included in Total accumulated earnings (loss).
Fidelity® Enhanced International ETF
Financial Statements (Unaudited)
| Statement of Assets and Liabilities |
| As of December 31, 2024 (Unaudited) |
| Assets | | | | |
| Investment in securities, at value (including securities loaned of $12,865,808) - See accompanying schedule: | | | | |
Unaffiliated issuers (cost $1,540,436,278) | $ | 1,705,706,304 | | |
Fidelity Central Funds (cost $34,768,994) | | 34,768,994 | | |
| | | | | |
| | | | | |
| Total Investment in Securities (cost $1,575,205,272) | | | $ | 1,740,475,298 |
| Foreign currency held at value (cost $196,435) | | | | 195,574 |
| Dividends receivable | | | | 1,033,893 |
| Reclaims receivable | | | | 5,465,713 |
| Interest receivable | | | | 106 |
| Distributions receivable from Fidelity Central Funds | | | | 146,782 |
Total assets | | | | 1,747,317,366 |
| Liabilities | | | | |
| Payable to custodian bank | $ | 2,153 | | |
| Accrued management fee | | 407,959 | | |
| Payable for daily variation margin on futures contracts | | 15,747 | | |
| Other payables and accrued expenses | | 45 | | |
| Collateral on securities loaned | | 13,398,293 | | |
| Total liabilities | | | | 13,824,197 |
| Net Assets | | | $ | 1,733,493,169 |
| Net Assets consist of: | | | | |
| Paid in capital | | | $ | 1,638,163,232 |
| Total accumulated earnings (loss) | | | | 95,329,937 |
| Net Assets | | | $ | 1,733,493,169 |
Net Asset Value, offering price and redemption price per share ($1,733,493,169 ÷ 62,879,106 shares) | | | $ | 27.57 |
| Statement of Operations |
| | | | Six months ended December 31, 2024 (Unaudited) |
| Investment Income | | | | |
| Dividends | | | $ | 15,696,803 |
| Foreign Tax Reclaims | | | | 1,069,803 |
| Interest | | | | 42,045 |
| Income from Fidelity Central Funds (including $117,984 from security lending) | | | | 732,333 |
| Income before foreign taxes withheld | | | $ | 17,540,984 |
| Less foreign taxes withheld | | | | (1,204,718) |
| Total income | | | | 16,336,266 |
| Expenses | | | | |
| Management fee | | | $ | 2,363,474 |
| Independent trustees' fees and expenses | | | | 3,593 |
| Interest | | | | 1,543 |
| Miscellaneous | | | | - |
| Total expenses before reductions | | | | 2,368,610 |
| Expense reductions | | | | (378) |
| Total expenses after reductions | | | | 2,368,232 |
| Net Investment income (loss) | | | | 13,968,034 |
| Realized and Unrealized Gain (Loss) | | | | |
| Net realized gain (loss) on: | | | | |
| Investment Securities: | | | | |
| Unaffiliated issuers | | | | 36,975,135 |
| Redemptions in-kind | | | | 30,823,404 |
| Fidelity Central Funds | | | | - |
| Foreign currency transactions | | | | (322,677) |
| Futures contracts | | | | (3,360,187) |
| Total net realized gain (loss) | | | | 64,115,675 |
| Change in net unrealized appreciation (depreciation) on: | | | | |
| Investment Securities: | | | | |
| Unaffiliated issuers | | | | (108,029,772) |
| Assets and liabilities in foreign currencies | | | | (74,667) |
| Futures contracts | | | | (401,607) |
| Total change in net unrealized appreciation (depreciation) | | | | (108,506,046) |
| Net gain (loss) | | | | (44,390,371) |
| Net increase (decrease) in net assets resulting from operations | | | $ | (30,422,337) |
| Statement of Changes in Net Assets |
| | | |
| | Six months ended December 31, 2024 (Unaudited) | | Ten months ended June 30, 2024 | | Year ended August 31, 2023 |
| Increase (Decrease) in Net Assets | | | | | | |
| Operations | | | | | | |
| Net investment income (loss) | $ | 13,968,034 | $ | 34,933,456 | $ | 40,722,351 |
| Net realized gain (loss) | | 64,115,675 | | 99,267,722 | | (32,079,780) |
| Change in net unrealized appreciation (depreciation) | | (108,506,046) | | 58,817,853 | | 261,209,693 |
| Net increase (decrease) in net assets resulting from operations | | (30,422,337) | | 193,019,031 | | 269,852,264 |
| Distributions to shareholders | | (19,173,014) | | (71,077,009) | | (33,763,256) |
| | | | | | | |
| Share transactions | | | | | | |
| Proceeds from sales of shares | | 351,003,710 | | 229,678,767 | | 600,539,896 |
| Reinvestment of distributions | | - | | 30,814,353 | | 24,033,209 |
| Cost of shares redeemed | | (125,766,511) | | (389,696,365) | | (600,353,896) |
| | | | | | | |
Net increase (decrease) in net assets resulting from share transactions | | 225,237,199 | | (129,203,245) | | 24,219,209 |
| Total increase (decrease) in net assets | | 175,641,848 | | (7,261,223) | | 260,308,217 |
| | | | | | | |
| Net Assets | | | | | | |
| Beginning of period | | 1,557,851,321 | | 1,565,112,544 | | 1,304,804,327 |
| End of period | $ | 1,733,493,169 | $ | 1,557,851,321 | $ | 1,565,112,544 |
| | | | | | | |
| Other Information | | | | | | |
| Shares | | | | | | |
| Sold | | 12,200,000 | | 8,475,592 | | 26,342,964 |
| Issued in reinvestment of distributions | | - | | 1,276,109 | | 1,026,385 |
| Redeemed | | (4,400,000) | | (15,496,865) | | (25,639,395) |
| Net increase (decrease) | | 7,800,000 | | (5,745,164) | | 1,729,954 |
| | | | | | | |
See Organization and Prior Fiscal Year Reorganization information note regarding reorganization from mutual fund to exchange traded fund for the ten months ended June 30, 2024.
Share activity is further described in Organization and Prior Fiscal Year Reorganization information notes, amounts have been adjusted to reflect the impact of the change in capital structure associated with the reorganization. All financial information prior to the reorganization is that of the Predecessor Fund.
Financial Highlights
Fidelity® Enhanced International ETF |
| |
| | Six months ended (Unaudited) December 31, 2024 | | Years ended June 30, 2024 A | | 2023 B,C | | 2022 B,C | | 2021 B,C | | 2020 B,C | | 2019 B,C |
Selected Per-Share Data | | | | | | | | | | | | | | |
| Net asset value, beginning of period | $ | 28.28 | $ | 25.73 | $ | 22.08 | $ | 28.49 | $ | 22.68 | $ | 22.13 | $ | 24.23 |
| Income from Investment Operations | | | | | | | | | | | | | | |
Net investment income (loss) D,E | | .24 | | .65 | | .64 | | .76 | | .62 | | .47 | | .74 |
| Net realized and unrealized gain (loss) | | (.63) | | 3.19 | | 3.58 | | (6.43) | | 5.61 | | .79 | | (2.35) |
| Total from investment operations | | (.39) | | 3.84 | | 4.22 | | (5.67) | | 6.23 | | 1.26 | | (1.61) |
| Distributions from net investment income | | (.32) | | (1.29) | | (.57) | | (.74) | | (.42) | | (.71) | | (.49) |
| Total distributions | | (.32) | | (1.29) | | (.57) | | (.74) | | (.42) | | (.71) | | (.49) |
| Net asset value, end of period | $ | 27.57 | $ | 28.28 | $ | 25.73 | $ | 22.08 | $ | 28.49 | $ | 22.68 | $ | 22.13 |
Total Return F,G,H | | | | 15.53% | | 19.29% | | (20.35)% | | 27.77% | | 5.55% | | (6.51)% |
Ratios to Average Net Assets E,I,J | | | | | | | | | | | | | | |
| Expenses before reductions | | .28% K | | .36% K,L | | .55% | | .57% | | .59% | | .59% | | .59% |
| Expenses net of fee waivers, if any | | | | .36% K,L | | .55% | | .57% | | .59% | | .59% | | .59% |
| Expenses net of all reductions | | .28% K | | .36% K,L | | .55% | | .57% | | .59% | | .59% | | .59% |
| Net investment income (loss) | | 1.65% K | | 2.95% K,L | | 2.69% | | 2.99% | | 2.32% | | 2.13% | | 3.27% |
| Supplemental Data | | | | | | | | | | | | | | |
| Net assets, end of period (000 omitted) | $ | 1,733,493 | $ | 1,557,851 | $ | 1,565,113 | $ | 1,304,804 | $ | 1,679,091 | $ | 1,182,923 | $ | 1,505,889 |
Portfolio turnover rate M | | | | 109% K,N | | 105% | | 114% | | 82% | | 75% | | 103% |
AFor the ten month period ended June 30. The Fund changed its fiscal year end from August 31 to June 30, effective March 1, 2024.
BFor the year ended August 31.
CAs further described in Organization and Reorganization information notes, per share amounts have been adjusted to reflect the impact of the change in capital structure associated with the reorganization. All financial information prior to the reorganization is that of the Predecessor Fund.
DCalculated based on average shares outstanding during the period.
ENet investment income (loss) is affected by the timing of the declaration of dividends by any underlying mutual funds or exchange-traded funds (ETFs). Net investment income (loss) of any mutual funds or ETFs is not included in the Fund's net investment income (loss) ratio.
FBased on net asset value.
GTotal returns for periods of less than one year are not annualized.
HTotal returns would have been lower if certain expenses had not been reduced during the applicable periods shown.
IFees and expenses of any underlying mutual funds or exchange-traded funds (ETFs) are not included in the Fund's expense ratio. The Fund indirectly bears its proportionate share of these expenses. For additional expense information related to investments in Fidelity Central Funds, please refer to the "Investments in Fidelity Central Funds" note found in the Notes to Financial Statements section of the most recent Annual or Semi-Annual report.
JExpense ratios reflect operating expenses of the class. Expenses before reductions do not reflect amounts reimbursed, waived, or reduced through arrangements with the investment adviser, brokerage services, or other offset arrangements, if applicable, and do not represent the amount paid by the class during periods when reimbursements, waivers or reductions occur.
KAnnualized.
LProxy expenses are not annualized.
MAmount does not include the portfolio activity of any underlying mutual funds or exchange-traded funds (ETFs), derivatives or securities that mature within one year from acquisition.
NPortfolio turnover rate excludes securities received or delivered in-kind.
Fidelity® Enhanced Large Cap Core ETF
Schedule of Investments December 31, 2024 (Unaudited)
Showing Percentage of Net Assets
| Common Stocks - 99.0% |
| | | Shares | Value ($) |
| MEXICO - 0.1% | | | |
| Materials - 0.1% | | | |
| Metals & Mining - 0.1% | | | |
| Southern Copper Corp | | 31,020 | 2,826,853 |
| UNITED STATES - 98.9% | | | |
| Communication Services - 10.8% | | | |
| Diversified Telecommunication Services - 0.4% | | | |
| AT&T Inc | | 753,818 | 17,164,436 |
| Entertainment - 2.2% | | | |
| Netflix Inc (b) | | 62,234 | 55,470,409 |
| Playtika Holding Corp | | 144,492 | 1,002,774 |
| Walt Disney Co/The | | 341,710 | 38,049,409 |
| Warner Bros Discovery Inc (b) | | 2,220 | 23,465 |
| | | | 94,546,057 |
| Interactive Media & Services - 7.1% | | | |
| Alphabet Inc Class A | | 498,006 | 94,272,536 |
| Alphabet Inc Class C | | 420,216 | 80,025,935 |
| Meta Platforms Inc Class A | | 221,835 | 129,886,611 |
| | | | 304,185,082 |
| Media - 0.8% | | | |
| Comcast Corp Class A | | 859,630 | 32,261,914 |
| Wireless Telecommunication Services - 0.3% | | | |
| T-Mobile US Inc | | 48,314 | 10,664,349 |
TOTAL COMMUNICATION SERVICES | | | 458,821,838 |
| | | | |
| Consumer Discretionary - 12.4% | | | |
| Automobiles - 2.3% | | | |
| Ford Motor Co | | 2,415,052 | 23,909,015 |
| Tesla Inc (b) | | 182,754 | 73,803,375 |
| | | | 97,712,390 |
| Broadline Retail - 4.5% | | | |
| Amazon.com Inc (b) | | 872,307 | 191,375,434 |
| Hotels, Restaurants & Leisure - 1.8% | | | |
| Booking Holdings Inc | | 3,312 | 16,455,407 |
| Carnival Corp (b) | | 445,204 | 11,094,484 |
| Chipotle Mexican Grill Inc (b) | | 255,539 | 15,409,002 |
| DoorDash Inc Class A (b) | | 44,204 | 7,415,221 |
| Hilton Worldwide Holdings Inc | | 6 | 1,483 |
| International Game Technology PLC | | 686,328 | 12,120,552 |
| Light & Wonder Inc Class A (b) | | 136 | 11,748 |
| McDonald's Corp | | 6 | 1,739 |
| MGM Resorts International (b) | | 368,394 | 12,764,852 |
| Wendy's Co/The | | 48 | 782 |
| | | | 75,275,270 |
| Household Durables - 0.3% | | | |
| DR Horton Inc | | 10 | 1,398 |
| Garmin Ltd | | 47,837 | 9,866,860 |
| Leggett & Platt Inc | | 138 | 1,324 |
| TopBuild Corp (b) | | 13,411 | 4,175,381 |
| Tri Pointe Homes Inc (b) | | 43,245 | 1,568,064 |
| | | | 15,613,027 |
| Specialty Retail - 3.5% | | | |
| Abercrombie & Fitch Co Class A (b) | | 123,454 | 18,452,669 |
| Bath & Body Works Inc | | 319,854 | 12,400,740 |
| Carvana Co Class A (b) | | 93,438 | 19,001,552 |
| Gap Inc/The | | 429,637 | 10,152,322 |
| Home Depot Inc/The | | 133,983 | 52,118,047 |
| Ross Stores Inc | | 11,129 | 1,683,484 |
| TJX Cos Inc/The | | 222,446 | 26,873,701 |
| Ulta Beauty Inc (b) | | 20,797 | 9,045,239 |
| | | | 149,727,754 |
TOTAL CONSUMER DISCRETIONARY | | | 529,703,875 |
| | | | |
| Consumer Staples - 3.5% | | | |
| Beverages - 0.0% | | | |
| Boston Beer Co Inc/The Class A (b) | | 9 | 2,699 |
| PepsiCo Inc | | 14,544 | 2,211,561 |
| | | | 2,214,260 |
| Consumer Staples Distribution & Retail - 1.6% | | | |
| Costco Wholesale Corp | | 14,189 | 13,000,955 |
| Kroger Co/The | | 36,712 | 2,244,939 |
| Maplebear Inc (b) | | 16 | 663 |
| Target Corp | | 12 | 1,622 |
| Walmart Inc | | 590,348 | 53,337,942 |
| | | | 68,586,121 |
| Food Products - 0.0% | | | |
| General Mills Inc | | 144 | 9,183 |
| Mondelez International Inc | | 30 | 1,792 |
| | | | 10,975 |
| Household Products - 1.1% | | | |
| Clorox Co/The | | 31,644 | 5,139,302 |
| Colgate-Palmolive Co | | 22,668 | 2,060,748 |
| Procter & Gamble Co/The | | 226,197 | 37,921,927 |
| | | | 45,121,977 |
| Personal Care Products - 0.1% | | | |
| Estee Lauder Cos Inc/The Class A | | 81,051 | 6,077,204 |
| Tobacco - 0.7% | | | |
| Philip Morris International Inc | | 230,289 | 27,715,281 |
TOTAL CONSUMER STAPLES | | | 149,725,818 |
| | | | |
| Energy - 2.8% | | | |
| Oil, Gas & Consumable Fuels - 2.8% | | | |
| Cheniere Energy Inc | | 15,068 | 3,237,661 |
| Chevron Corp | | 16 | 2,317 |
| ConocoPhillips | | 134,805 | 13,368,612 |
| Devon Energy Corp | | 320,030 | 10,474,582 |
| EOG Resources Inc | | 195,029 | 23,906,655 |
| Exxon Mobil Corp | | 570,384 | 61,356,208 |
| Occidental Petroleum Corp | | 157,309 | 7,772,638 |
| Occidental Petroleum Corp warrants 8/3/2027 (b) | | 4,716 | 129,925 |
| | | | 120,248,598 |
| Financials - 14.2% | | | |
| Banks - 3.6% | | | |
| Bank of America Corp | | 1,070,850 | 47,063,858 |
| Citigroup Inc | | 83,750 | 5,895,162 |
| JPMorgan Chase & Co | | 336,332 | 80,622,144 |
| PNC Financial Services Group Inc/The | | 24,902 | 4,802,350 |
| Wells Fargo & Co | | 234,532 | 16,473,528 |
| | | | 154,857,042 |
| Capital Markets - 2.9% | | | |
| Blackrock Inc | | 36 | 36,904 |
| Charles Schwab Corp/The | | 412,502 | 30,529,274 |
| CME Group Inc Class A | | 94,291 | 21,897,199 |
| Goldman Sachs Group Inc/The | | 10,832 | 6,202,620 |
| LPL Financial Holdings Inc | | 4,524 | 1,477,131 |
| Morgan Stanley | | 97,214 | 12,221,744 |
| MSCI Inc | | 6,902 | 4,141,269 |
| S&P Global Inc | | 35,171 | 17,516,213 |
| SEI Investments Co | | 157,463 | 12,987,548 |
| T Rowe Price Group Inc | | 129,825 | 14,681,909 |
| Tradeweb Markets Inc Class A | | 10 | 1,309 |
| | | | 121,693,120 |
| Consumer Finance - 0.3% | | | |
| American Express Co | | 53,607 | 15,910,022 |
| Financial Services - 5.1% | | | |
| Berkshire Hathaway Inc Class B (b) | | 202,731 | 91,893,908 |
| Block Inc Class A (b) | | 245,114 | 20,832,239 |
| Global Payments Inc | | 5,969 | 668,885 |
| Mastercard Inc Class A | | 111,098 | 58,500,874 |
| PayPal Holdings Inc (b) | | 170,023 | 14,511,463 |
| Visa Inc Class A | | 99,547 | 31,460,834 |
| | | | 217,868,203 |
| Insurance - 2.3% | | | |
| Allstate Corp/The | | 44,166 | 8,514,763 |
| Aon PLC | | 31,788 | 11,416,978 |
| Cincinnati Financial Corp | | 57 | 8,191 |
| Globe Life Inc | | 82,235 | 9,170,847 |
| Hartford Financial Services Group Inc/The | | 99 | 10,831 |
| Loews Corp | | 32 | 2,710 |
| Markel Group Inc (b) | | 2,508 | 4,329,385 |
| Marsh & McLennan Cos Inc | | 54,938 | 11,669,381 |
| Progressive Corp/The | | 123,602 | 29,616,275 |
| Selective Insurance Group Inc | | 8 | 748 |
| The Travelers Companies, Inc. | | 24,067 | 5,797,500 |
| Unum Group | | 70,316 | 5,135,177 |
| Willis Towers Watson PLC | | 33,072 | 10,359,473 |
| | | | 96,032,259 |
TOTAL FINANCIALS | | | 606,360,646 |
| | | | |
| Health Care - 9.2% | | | |
| Biotechnology - 2.9% | | | |
| AbbVie Inc | | 274,369 | 48,755,372 |
| Amgen Inc | | 30,831 | 8,035,792 |
| Biogen Inc (b) | | 160 | 24,467 |
| Exelixis Inc (b) | | 512,576 | 17,068,781 |
| Gilead Sciences Inc | | 358,147 | 33,082,038 |
| Incyte Corp (b) | | 196,746 | 13,589,246 |
| Neurocrine Biosciences Inc (b) | | 14,060 | 1,919,190 |
| | | | 122,474,886 |
| Health Care Equipment & Supplies - 1.0% | | | |
| Abbott Laboratories | | 87,390 | 9,884,683 |
| Becton Dickinson & Co | | 118,079 | 26,788,583 |
| GE HealthCare Technologies Inc | | 19,270 | 1,506,529 |
| IDEXX Laboratories Inc (b) | | 6,150 | 2,542,656 |
| Solventum Corp | | 50,580 | 3,341,315 |
| Stryker Corp | | 4 | 1,439 |
| | | | 44,065,205 |
| Health Care Providers & Services - 1.3% | | | |
| Cardinal Health Inc | | 23,020 | 2,722,575 |
| Cigna Group/The | | 78,456 | 21,664,841 |
| CVS Health Corp | | 149,073 | 6,691,887 |
| McKesson Corp | | 6,055 | 3,450,805 |
| UnitedHealth Group Inc | | 38,618 | 19,535,301 |
| | | | 54,065,409 |
| Health Care Technology - 0.0% | | | |
| Veeva Systems Inc Class A (b) | | 15,946 | 3,352,646 |
| Life Sciences Tools & Services - 0.5% | | | |
| Agilent Technologies Inc | | 24,957 | 3,352,723 |
| Medpace Holdings Inc (b) | | 29,242 | 9,715,070 |
| Thermo Fisher Scientific Inc | | 17,290 | 8,994,777 |
| | | | 22,062,570 |
| Pharmaceuticals - 3.5% | | | |
| Bristol-Myers Squibb Co | | 497,357 | 28,130,512 |
| Eli Lilly & Co | | 37,885 | 29,247,220 |
| Johnson & Johnson | | 192,218 | 27,798,567 |
| Merck & Co Inc | | 435,607 | 43,334,184 |
| Pfizer Inc | | 719,605 | 19,091,121 |
| | | | 147,601,604 |
TOTAL HEALTH CARE | | | 393,622,320 |
| | | | |
| Industrials - 10.0% | | | |
| Aerospace & Defense - 3.2% | | | |
| GE Aerospace | | 94,105 | 15,695,772 |
| L3Harris Technologies Inc | | 109,411 | 23,006,945 |
| Lockheed Martin Corp | | 60,675 | 29,484,410 |
| Northrop Grumman Corp | | 52,515 | 24,644,764 |
| RTX Corp | | 155,633 | 18,009,851 |
| Textron Inc | | 264,469 | 20,229,234 |
| | | | 131,070,976 |
| Building Products - 1.2% | | | |
| A O Smith Corp | | 33 | 2,251 |
| Allegion plc | | 151,852 | 19,844,019 |
| Carlisle Cos Inc | | 4 | 1,475 |
| Masco Corp | | 48,173 | 3,495,915 |
| Trane Technologies PLC | | 74,695 | 27,588,599 |
| | | | 50,932,259 |
| Commercial Services & Supplies - 0.8% | | | |
| Cintas Corp | | 135,248 | 24,709,810 |
| Republic Services Inc | | 49,333 | 9,924,813 |
| Waste Management Inc | | 1 | 201 |
| | | | 34,634,824 |
| Construction & Engineering - 0.0% | | | |
| Valmont Industries Inc | | 4,961 | 1,521,390 |
| Electrical Equipment - 0.4% | | | |
| AMETEK Inc | | 99,014 | 17,848,264 |
| Ground Transportation - 1.8% | | | |
| CSX Corp | | 663,952 | 21,425,731 |
| Lyft Inc Class A (b) | | 520,038 | 6,708,490 |
| Norfolk Southern Corp | | 44,832 | 10,522,070 |
| Uber Technologies Inc (b) | | 85,129 | 5,134,981 |
| Union Pacific Corp | | 145,502 | 33,180,277 |
| | | | 76,971,549 |
| Industrial Conglomerates - 0.1% | | | |
| 3M Co | | 30,970 | 3,997,917 |
| Machinery - 1.0% | | | |
| Caterpillar Inc | | 63,583 | 23,065,369 |
| PACCAR Inc | | 196,350 | 20,424,327 |
| | | | 43,489,696 |
| Passenger Airlines - 0.2% | | | |
| SkyWest Inc (b) | | 89,021 | 8,913,673 |
| Professional Services - 1.1% | | | |
| Automatic Data Processing Inc | | 14,834 | 4,342,357 |
| Booz Allen Hamilton Holding Corp Class A | | 6,889 | 886,614 |
| CACI International Inc (b) | | 39,532 | 15,973,300 |
| Leidos Holdings Inc | | 132,782 | 19,128,575 |
| Maximus Inc | | 46,267 | 3,453,832 |
| SS&C Technologies Holdings Inc | | 33,922 | 2,570,609 |
| | | | 46,355,287 |
| Trading Companies & Distributors - 0.2% | | | |
| WW Grainger Inc | | 8,160 | 8,601,048 |
TOTAL INDUSTRIALS | | | 424,336,883 |
| | | | |
| Information Technology - 32.6% | | | |
| Communications Equipment - 1.7% | | | |
| Arista Networks Inc | | 148,121 | 16,371,814 |
| Cisco Systems Inc | | 491,271 | 29,083,244 |
| Motorola Solutions Inc | | 59,701 | 27,595,593 |
| | | | 73,050,651 |
| Electronic Equipment, Instruments & Components - 0.2% | | | |
| Zebra Technologies Corp Class A (b) | | 19,222 | 7,423,921 |
| IT Services - 0.1% | | | |
| Twilio Inc Class A (b) | | 52,364 | 5,659,500 |
| Semiconductors & Semiconductor Equipment - 11.8% | | | |
| Applied Materials Inc | | 170,474 | 27,724,187 |
| Broadcom Inc | | 374,302 | 86,778,176 |
| Cirrus Logic Inc (b) | | 12,583 | 1,253,015 |
| KLA Corp | | 38,458 | 24,233,155 |
| Lam Research Corp | | 266,719 | 19,265,113 |
| Micron Technology Inc | | 451 | 37,956 |
| NVIDIA Corp | | 2,250,986 | 302,284,910 |
| Qorvo Inc (b) | | 80,273 | 5,613,491 |
| QUALCOMM Inc | | 231,936 | 35,630,008 |
| | | | 502,820,011 |
| Software - 10.7% | | | |
| Adobe Inc (b) | | 80,442 | 35,770,949 |
| Alarm.com Holdings Inc (b) | | 160,716 | 9,771,533 |
| DocuSign Inc (b) | | 16 | 1,439 |
| Dropbox Inc Class A (b) | | 675,851 | 20,302,564 |
| Fortinet Inc (b) | | 164,218 | 15,515,317 |
| Intuit Inc | | 3,166 | 1,989,831 |
| Microsoft Corp | | 582,499 | 245,523,329 |
| Oracle Corp | | 8,225 | 1,370,614 |
| Pegasystems Inc | | 72 | 6,710 |
| Roper Technologies Inc | | 15,332 | 7,970,340 |
| Salesforce Inc | | 137,672 | 46,027,880 |
| Servicenow Inc (b) | | 23,480 | 24,891,618 |
| Tenable Holdings Inc (b) | | 18,943 | 745,975 |
| Teradata Corp (b) | | 500,927 | 15,603,876 |
| Workday Inc Class A (b) | | 26,312 | 6,789,285 |
| Zoom Communications Inc Class A (b) | | 275,261 | 22,464,050 |
| | | | 454,745,310 |
| Technology Hardware, Storage & Peripherals - 8.1% | | | |
| Apple Inc | | 1,383,671 | 346,498,892 |
TOTAL INFORMATION TECHNOLOGY | | | 1,390,198,285 |
| | | | |
| Materials - 1.5% | | | |
| Chemicals - 0.8% | | | |
| Axalta Coating Systems Ltd (b) | | 2,793 | 95,576 |
| Ecolab Inc | | 108,899 | 25,517,214 |
| PPG Industries Inc | | 59,360 | 7,090,552 |
| | | | 32,703,342 |
| Construction Materials - 0.5% | | | |
| CRH PLC | | 229,574 | 21,240,186 |
| Metals & Mining - 0.2% | | | |
| Nucor Corp | | 57,837 | 6,750,156 |
| Steel Dynamics Inc | | 18,708 | 2,134,022 |
| | | | 8,884,178 |
TOTAL MATERIALS | | | 62,827,706 |
| | | | |
| Real Estate - 1.0% | | | |
| Health Care REITs - 0.1% | | | |
| CareTrust REIT Inc | | 81,389 | 2,201,572 |
| Industrial REITs - 0.0% | | | |
| First Industrial Realty Trust Inc | | 30,910 | 1,549,518 |
| Retail REITs - 0.6% | | | |
| Simon Property Group Inc | | 139,286 | 23,986,443 |
| Specialized REITs - 0.3% | | | |
| American Tower Corp | | 64,728 | 11,871,763 |
| Public Storage Operating Co | | 5,912 | 1,770,289 |
| | | | 13,642,052 |
TOTAL REAL ESTATE | | | 41,379,585 |
| | | | |
| Utilities - 0.9% | | | |
| Electric Utilities - 0.9% | | | |
| Constellation Energy Corp | | 4 | 894 |
| Eversource Energy | | 9,255 | 531,515 |
| NextEra Energy Inc | | 466,378 | 33,434,639 |
| NRG Energy Inc | | 48,950 | 4,416,269 |
| | | | 38,383,317 |
| Independent Power and Renewable Electricity Producers - 0.0% | | | |
| AES Corp/The | | 32,787 | 421,969 |
| Vistra Corp | | 200 | 27,574 |
| | | | 449,543 |
| Multi-Utilities - 0.0% | | | |
| Public Service Enterprise Group Inc | | 38 | 3,210 |
TOTAL UTILITIES | | | 38,836,070 |
| | | | |
| TOTAL UNITED STATES | | | 4,216,061,624 |
| TOTAL COMMON STOCKS (Cost $3,399,130,778) | | | 4,218,888,477 |
| | | | |
| U.S. Treasury Obligations - 0.1% |
| | | Yield (%) (c) | Principal Amount (a) | Value ($) |
| US Treasury Bills 0% 1/2/2025 | | 4.55 | 1,080,000 | 1,080,000 |
| US Treasury Bills 0% 1/23/2025 | | 4.55 to 4.57 | 700,000 | 698,267 |
| US Treasury Bills 0% 1/9/2025 | | 4.58 | 810,000 | 809,337 |
| US Treasury Bills 0% 2/27/2025 (d) | | 4.41 | 1,430,000 | 1,420,611 |
| US Treasury Bills 0% 2/6/2025 | | 4.46 to 4.48 | 150,000 | 149,384 |
| US Treasury Bills 0% 3/20/2025 (d) | | 4.28 to 4.29 | 540,000 | 535,176 |
| TOTAL U.S. TREASURY OBLIGATIONS (Cost $4,691,619) | | | | 4,692,775 |
| | | | | |
| Money Market Funds - 0.8% |
| | | Yield (%) | Shares | Value ($) |
Fidelity Cash Central Fund (e) (Cost $35,245,338) | | 4.36 | 35,238,291 | 35,245,338 |
| | | | | |
| TOTAL INVESTMENT IN SECURITIES - 99.9% (Cost $3,439,067,735) | 4,258,826,590 |
NET OTHER ASSETS (LIABILITIES) - 0.1% | 2,236,200 |
| NET ASSETS - 100.0% | 4,261,062,790 |
| | |
| Futures Contracts |
| | Number of contracts | Expiration Date | Notional Amount ($) | Value ($) | Unrealized Appreciation/ (Depreciation) ($) |
| Purchased | | | | | |
| | | | | | |
| Equity Contracts | | | | | |
| CME E-mini S&P 500 Index Contracts (United States) | 119 | Mar 2025 | 35,317,713 | (1,128,634) | (1,128,634) |
| | | | | | |
| The notional amount of futures purchased as a percentage of Net Assets is 0.8% |
Legend
| (a) | Amount is stated in United States dollars unless otherwise noted. |
| (c) | Yield represents either the annualized yield at the date of purchase, or the stated coupon rate, or, for floating and adjustable rate securities, the rate at period end. |
| (d) | Security or a portion of the security was pledged to cover margin requirements for futures contracts. At period end, the value of securities pledged amounted to $1,837,568. |
| (e) | Affiliated fund that is generally available only to investment companies and other accounts managed by Fidelity Investments. The rate quoted is the annualized seven-day yield of the fund at period end. A complete unaudited listing of the fund's holdings as of its most recent quarter end is available upon request. In addition, each Fidelity Central Fund's financial statements are available on the SEC's website or upon request. |
Affiliated Central Funds
Fiscal year to date information regarding the Fund's investments in Fidelity Central Funds, including the ownership percentage, is presented below.
| Affiliate | Value, beginning of period ($) | Purchases ($) | Sales Proceeds ($) | Dividend Income ($) | Realized Gain (loss) ($) | Change in Unrealized appreciation (depreciation) ($) | Value, end of period ($) | Shares, end of period | % ownership, end of period |
| Fidelity Cash Central Fund | 23,491,496 | 389,569,739 | 377,815,897 | 662,314 | - | - | 35,245,338 | 35,238,291 | 0.1% |
| Fidelity Securities Lending Cash Central Fund | 562,500 | 51,842,785 | 52,405,285 | 1,339 | - | - | - | - | 0.0% |
| Total | 24,053,996 | 441,412,524 | 430,221,182 | 663,653 | - | - | 35,245,338 | 35,238,291 | |
| | | | | | | | | | |
Amounts in the dividend income column in the above table include any capital gain distributions from underlying funds, which are presented in the corresponding line item in the Statement of Operations, if applicable.
Amounts in the dividend income column for Fidelity Securities Lending Cash Central Fund represents the income earned on investing cash collateral, less rebates paid to borrowers and any lending agent fees associated with the loan, plus any premium payments received for lending certain types of securities.
Amounts included in the purchases and sales proceeds columns may include in-kind transactions, if applicable.
Investment Valuation
The following is a summary of the inputs used, as of December 31, 2024, involving the Fund's assets and liabilities carried at fair value. The inputs or methodology used for valuing securities may not be an indication of the risk associated with investing in those securities. For more information on valuation inputs, and their aggregation into the levels used below, please refer to the Investment Valuation section in the accompanying Notes to Financial Statements.
| Valuation Inputs at Reporting Date: |
| Description | Total ($) | Level 1 ($) | Level 2 ($) | Level 3 ($) |
Investments in Securities: | | | | |
|
| Common Stocks | | | | |
Communication Services | 458,821,838 | 458,821,838 | - | - |
Consumer Discretionary | 529,703,875 | 529,703,875 | - | - |
Consumer Staples | 149,725,818 | 149,725,818 | - | - |
Energy | 120,248,598 | 120,248,598 | - | - |
Financials | 606,360,646 | 606,360,646 | - | - |
Health Care | 393,622,320 | 393,622,320 | - | - |
Industrials | 424,336,883 | 424,336,883 | - | - |
Information Technology | 1,390,198,285 | 1,390,198,285 | - | - |
Materials | 65,654,559 | 65,654,559 | - | - |
Real Estate | 41,379,585 | 41,379,585 | - | - |
Utilities | 38,836,070 | 38,836,070 | - | - |
|
| U.S. Treasury Obligations | 4,692,775 | - | 4,692,775 | - |
|
| Money Market Funds | 35,245,338 | 35,245,338 | - | - |
| Total Investments in Securities: | 4,258,826,590 | 4,254,133,815 | 4,692,775 | - |
Derivative Instruments: Liabilities | | | | |
Futures Contracts | (1,128,634) | (1,128,634) | - | - |
| Total Liabilities | (1,128,634) | (1,128,634) | - | - |
| Total Derivative Instruments: | (1,128,634) | (1,128,634) | - | - |
Value of Derivative Instruments
The following table is a summary of the Fund's value of derivative instruments by primary risk exposure as of December 31, 2024. For additional information on derivative instruments, please refer to the Derivative Instruments section in the accompanying Notes to Financial Statements.
Primary Risk Exposure / Derivative Type | Value |
| Asset ($) | Liability ($) |
| Equity Risk | | |
Futures Contracts (a) | 0 | (1,128,634) |
| Total Equity Risk | 0 | (1,128,634) |
| Total Value of Derivatives | 0 | (1,128,634) |
(a)Reflects gross cumulative appreciation (depreciation) on futures contracts as presented in the Schedule of Investments. In the Statement of Assets and Liabilities, the period end daily variation margin is included in receivable or payable for daily variation margin on futures contracts, and the net cumulative appreciation (depreciation) is included in Total accumulated earnings (loss).
Fidelity® Enhanced Large Cap Core ETF
Financial Statements (Unaudited)
| Statement of Assets and Liabilities |
| As of December 31, 2024 (Unaudited) |
| Assets | | | | |
| Investment in securities, at value - See accompanying schedule: | | | | |
Unaffiliated issuers (cost $3,403,822,397) | $ | 4,223,581,252 | | |
Fidelity Central Funds (cost $35,245,338) | | 35,245,338 | | |
| | | | | |
| | | | | |
| Total Investment in Securities (cost $3,439,067,735) | | | $ | 4,258,826,590 |
| Cash | | | | 44 |
| Receivable for fund shares sold | | | | 6,584,067 |
| Dividends receivable | | | | 2,735,121 |
| Distributions receivable from Fidelity Central Funds | | | | 175,516 |
Total assets | | | | 4,268,321,338 |
| Liabilities | | | | |
| Payable for investments purchased | $ | 6,461,141 | | |
| Accrued management fee | | 640,640 | | |
| Payable for daily variation margin on futures contracts | | 136,850 | | |
| Other payables and accrued expenses | | 19,917 | | |
| Total liabilities | | | | 7,258,548 |
| Net Assets | | | $ | 4,261,062,790 |
| Net Assets consist of: | | | | |
| Paid in capital | | | $ | 3,306,077,801 |
| Total accumulated earnings (loss) | | | | 954,984,989 |
| Net Assets | | | $ | 4,261,062,790 |
Net Asset Value, offering price and redemption price per share ($4,261,062,790 ÷ 129,435,453 shares) | | | $ | 32.92 |
| Statement of Operations |
| | | | Six months ended December 31, 2024 (Unaudited) |
| Investment Income | | | | |
| Dividends | | | $ | 22,915,274 |
| Interest | | | | 91,175 |
| Income from Fidelity Central Funds (including $1,339 from security lending) | | | | 663,653 |
| Total income | | | | 23,670,102 |
| Expenses | | | | |
| Management fee | | | $ | 3,274,598 |
| Independent trustees' fees and expenses | | | | 7,195 |
| Interest | | | | - |
| Miscellaneous | | | | 19,178 |
| Total expenses before reductions | | | | 3,300,971 |
| Expense reductions | | | | (789) |
| Total expenses after reductions | | | | 3,300,182 |
| Net Investment income (loss) | | | | 20,369,920 |
| Realized and Unrealized Gain (Loss) | | | | |
| Net realized gain (loss) on: | | | | |
| Investment Securities: | | | | |
| Unaffiliated issuers | | | | (32,717,465) |
| Redemptions in-kind | | | | 235,960,049 |
| Fidelity Central Funds | | | | - |
| Futures contracts | | | | (2,428,001) |
| Total net realized gain (loss) | | | | 200,814,583 |
| Change in net unrealized appreciation (depreciation) on: | | | | |
| Investment Securities: | | | | |
| Unaffiliated issuers | | | | 50,386,511 |
| Futures contracts | | | | (1,203,473) |
| Total change in net unrealized appreciation (depreciation) | | | | 49,183,038 |
| Net gain (loss) | | | | 249,997,621 |
| Net increase (decrease) in net assets resulting from operations | | | $ | 270,367,541 |
| Statement of Changes in Net Assets |
| | | |
| | Six months ended December 31, 2024 (Unaudited) | | Ten months ended June 30, 2024 | | Year ended August 31, 2023 |
| Increase (Decrease) in Net Assets | | | | | | |
| Operations | | | | | | |
| Net investment income (loss) | $ | 20,369,920 | $ | 22,083,441 | $ | 24,807,007 |
| Net realized gain (loss) | | 200,814,583 | | 209,030,464 | | (3,624,422) |
| Change in net unrealized appreciation (depreciation) | | 49,183,038 | | 246,834,439 | | 223,258,386 |
| Net increase (decrease) in net assets resulting from operations | | 270,367,541 | | 477,948,344 | | 244,440,971 |
| Distributions to shareholders | | (20,507,762) | | (35,565,387) | | (22,292,999) |
| | | | | | | |
| Share transactions | | | | | | |
| Proceeds from sales of shares | | 1,938,906,553 | | 1,442,966,046 | | 629,039,473 |
| Reinvestment of distributions | | - | | 16,466,045 | | 18,530,259 |
| Cost of shares redeemed | | (838,937,917) | | (1,038,895,541) | | (1,283,514,169) |
| | | | | | | |
Net increase (decrease) in net assets resulting from share transactions | | 1,099,968,636 | | 420,536,550 | | (635,944,437) |
| Total increase (decrease) in net assets | | 1,349,828,415 | | 862,919,507 | | (413,796,465) |
| | | | | | | |
| Net Assets | | | | | | |
| Beginning of period | | 2,911,234,375 | | 2,048,314,868 | | 2,462,111,333 |
| End of period | $ | 4,261,062,790 | $ | 2,911,234,375 | $ | 2,048,314,868 |
| | | | | | | |
| Other Information | | | | | | |
| Shares | | | | | | |
| Sold | | 60,700,000 | | 50,966,892 | | 27,859,340 |
| Issued in reinvestment of distributions | | - | | 676,837 | | 875,246 |
| Redeemed | | (26,500,000) | | (38,273,623) | | (58,631,055) |
| Net increase (decrease) | | 34,200,000 | | 13,370,106 | | (29,896,469) |
| | | | | | | |
See Organization and Prior Fiscal Year Reorganization information note regarding reorganization from mutual fund to exchange traded fund for the ten months ended June 30, 2024.
Share activity is further described in Organization and Prior Fiscal Year Reorganization information notes, amounts have been adjusted to reflect the impact of the change in capital structure associated with the reorganization. All financial information prior to the reorganization is that of the Predecessor Fund.
Financial Highlights
Fidelity® Enhanced Large Cap Core ETF |
| |
| | Six months ended (Unaudited) December 31, 2024 | | Years ended June 30, 2024 A | | 2023 B,C | | 2022 B,C | | 2021 B,C | | 2020 B,C | | 2019 B,C |
Selected Per-Share Data | | | | | | | | | | | | | | |
| Net asset value, beginning of period | $ | 30.57 | $ | 25.02 | $ | 22.03 | $ | 27.89 | $ | 21.60 | $ | 18.13 | $ | 19.34 |
| Income from Investment Operations | | | | | | | | | | | | | | |
Net investment income (loss) D,E | | .18 | | .27 | | .29 | | .29 | | .26 | | .29 | | .32 |
| Net realized and unrealized gain (loss) | | 2.34 | | 5.71 | | 2.96 | | (2.48) | | 6.55 | | 3.64 | | (.32) |
| Total from investment operations | | 2.52 | | 5.98 | | 3.25 | | (2.19) | | 6.81 | | 3.93 | | - |
| Distributions from net investment income | | (.17) | | (.43) | | (.18) | | (.43) | | (.26) | | (.31) | | (.29) |
| Distributions from net realized gain | | - | | - | | (.10) | | (3.24) | | (.26) | | (.15) | | (.93) |
| Total distributions | | (.17) | | (.43) | | (.26) F | | (3.67) | | (.52) | | (.46) | | (1.21) F |
| Net asset value, end of period | $ | 32.92 | $ | 30.57 | $ | 25.02 | $ | 22.03 | $ | 27.89 | $ | 21.60 | $ | 18.13 |
Total Return G,H,I | | | | 24.20% | | 15.01% | | (9.41)% | | 32.14% | | 21.97% | | .65% |
Ratios to Average Net Assets E,J,K | | | | | | | | | | | | | | |
| Expenses before reductions | | .18% L | | .24% L,M | | .39% | | .39% | | .39% | | .39% | | .39% |
| Expenses net of fee waivers, if any | | | | .23% L,M | | .39% | | .39% | | .39% | | .39% | | .39% |
| Expenses net of all reductions | | .18% L | | .23% L,M | | .39% | | .39% | | .39% | | .39% | | .39% |
| Net investment income (loss) | | 1.12% L | | 1.20% L,M | | 1.26% | | 1.18% | | 1.09% | | 1.49% | | 1.81% |
| Supplemental Data | | | | | | | | | | | | | | |
| Net assets, end of period (000 omitted) | $ | 4,261,063 | $ | 2,911,234 | $ | 2,048,315 | $ | 2,462,111 | $ | 1,508,781 | $ | 1,087,245 | $ | 834,635 |
Portfolio turnover rate N | | | | 58% L,O | | 105% | | 104% | | 83% | | 63% | | 77% |
AFor the ten month period ended June 30. The Fund changed its fiscal year end from August 31 to June 30, effective March 1, 2024.
BFor the year ended August 31.
CAs further described in Organization and Reorganization information notes, per share amounts have been adjusted to reflect the impact of the change in capital structure associated with the reorganization. All financial information prior to the reorganization is that of the Predecessor Fund.
DCalculated based on average shares outstanding during the period.
ENet investment income (loss) is affected by the timing of the declaration of dividends by any underlying mutual funds or exchange-traded funds (ETFs). Net investment income (loss) of any mutual funds or ETFs is not included in the Fund's net investment income (loss) ratio.
FTotal distributions per share do not sum due to rounding.
GBased on net asset value.
HTotal returns for periods of less than one year are not annualized.
ITotal returns would have been lower if certain expenses had not been reduced during the applicable periods shown.
JFees and expenses of any underlying mutual funds or exchange-traded funds (ETFs) are not included in the Fund's expense ratio. The Fund indirectly bears its proportionate share of these expenses. For additional expense information related to investments in Fidelity Central Funds, please refer to the "Investments in Fidelity Central Funds" note found in the Notes to Financial Statements section of the most recent Annual or Semi-Annual report.
KExpense ratios reflect operating expenses of the class. Expenses before reductions do not reflect amounts reimbursed, waived, or reduced through arrangements with the investment adviser, brokerage services, or other offset arrangements, if applicable, and do not represent the amount paid by the class during periods when reimbursements, waivers or reductions occur.
LAnnualized.
MProxy expenses are not annualized.
NAmount does not include the portfolio activity of any underlying mutual funds or exchange-traded funds (ETFs), derivatives or securities that mature within one year from acquisition.
OPortfolio turnover rate excludes securities received or delivered in-kind.
Fidelity® Enhanced Large Cap Growth ETF
Schedule of Investments December 31, 2024 (Unaudited)
Showing Percentage of Net Assets
| Common Stocks - 99.1% |
| | | Shares | Value ($) |
| BRAZIL - 0.3% | | | |
| Financials - 0.3% | | | |
| Banks - 0.3% | | | |
| NU Holdings Ltd/Cayman Islands Class A (b) | | 850,355 | 8,809,678 |
| MEXICO - 0.1% | | | |
| Materials - 0.1% | | | |
| Metals & Mining - 0.1% | | | |
| Southern Copper Corp (c) | | 42,883 | 3,907,928 |
| UNITED STATES - 98.7% | | | |
| Communication Services - 14.0% | | | |
| Entertainment - 2.8% | | | |
| Netflix Inc (b) | | 64,428 | 57,425,965 |
| ROBLOX Corp Class A (b) | | 326,112 | 18,868,840 |
| Spotify Technology SA (b) | | 27,725 | 12,403,611 |
| | | | 88,698,416 |
| Interactive Media & Services - 11.2% | | | |
| Alphabet Inc Class A | | 627,632 | 118,810,738 |
| Alphabet Inc Class C | | 447,557 | 85,232,755 |
| Meta Platforms Inc Class A | | 260,173 | 152,333,893 |
| | | | 356,377,386 |
TOTAL COMMUNICATION SERVICES | | | 445,075,802 |
| | | | |
| Consumer Discretionary - 17.6% | | | |
| Automobiles - 4.3% | | | |
| Tesla Inc (b) | | 335,011 | 135,290,842 |
| Broadline Retail - 7.3% | | | |
| Amazon.com Inc (b) | | 1,062,497 | 233,101,217 |
| Hotels, Restaurants & Leisure - 2.1% | | | |
| Booking Holdings Inc | | 6,618 | 32,881,004 |
| Chipotle Mexican Grill Inc (b) | | 123 | 7,416 |
| DoorDash Inc Class A (b) | | 126,605 | 21,237,989 |
| Expedia Group Inc Class A (b) | | 75,975 | 14,156,422 |
| | | | 68,282,831 |
| Household Durables - 0.5% | | | |
| Garmin Ltd | | 77,370 | 15,958,336 |
| Specialty Retail - 3.4% | | | |
| Abercrombie & Fitch Co Class A (b) | | 118,592 | 17,725,946 |
| Bath & Body Works Inc | | 436,127 | 16,908,644 |
| Carvana Co Class A (b) | | 61,523 | 12,511,317 |
| Home Depot Inc/The | | 47,740 | 18,570,383 |
| TJX Cos Inc/The | | 197,254 | 23,830,256 |
| Ulta Beauty Inc (b) | | 43,059 | 18,727,651 |
| | | | 108,274,197 |
TOTAL CONSUMER DISCRETIONARY | | | 560,907,423 |
| | | | |
| Consumer Staples - 1.4% | | | |
| Beverages - 0.0% | | | |
| PepsiCo Inc | | 11,294 | 1,717,365 |
| Consumer Staples Distribution & Retail - 1.4% | | | |
| Costco Wholesale Corp | | 30,314 | 27,775,809 |
| Walmart Inc | | 171,260 | 15,473,341 |
| | | | 43,249,150 |
TOTAL CONSUMER STAPLES | | | 44,966,515 |
| | | | |
| Energy - 0.5% | | | |
| Oil, Gas & Consumable Fuels - 0.5% | | | |
| Cheniere Energy Inc | | 65,048 | 13,976,864 |
| Texas Pacific Land Corp | | 590 | 652,516 |
| | | | 14,629,380 |
| Financials - 5.5% | | | |
| Capital Markets - 1.5% | | | |
| Charles Schwab Corp/The | | 229,179 | 16,961,538 |
| LPL Financial Holdings Inc | | 7,208 | 2,353,484 |
| Morningstar Inc | | 14 | 4,715 |
| MSCI Inc | | 29,976 | 17,985,900 |
| Tradeweb Markets Inc Class A | | 73,883 | 9,672,762 |
| | | | 46,978,399 |
| Consumer Finance - 0.2% | | | |
| American Express Co | | 23,354 | 6,931,234 |
| Financial Services - 3.7% | | | |
| Block Inc Class A (b) | | 201,553 | 17,129,989 |
| Mastercard Inc Class A | | 119,176 | 62,754,507 |
| Visa Inc Class A | | 118,458 | 37,437,466 |
| | | | 117,321,962 |
| Insurance - 0.1% | | | |
| Allstate Corp/The | | 4,757 | 917,102 |
| Progressive Corp/The | | 17,843 | 4,275,361 |
| | | | 5,192,463 |
TOTAL FINANCIALS | | | 176,424,058 |
| | | | |
| Health Care - 6.6% | | | |
| Biotechnology - 3.0% | | | |
| AbbVie Inc | | 175,045 | 31,105,497 |
| Exelixis Inc (b) | | 494,370 | 16,462,521 |
| Gilead Sciences Inc | | 175,158 | 16,179,344 |
| Incyte Corp (b) | | 236,854 | 16,359,506 |
| Natera Inc (b) | | 100,256 | 15,870,525 |
| | | | 95,977,393 |
| Health Care Equipment & Supplies - 0.1% | | | |
| Intuitive Surgical Inc (b) | | 6,015 | 3,139,589 |
| Health Care Providers & Services - 0.0% | | | |
| Cardinal Health Inc | | 2 | 237 |
| Life Sciences Tools & Services - 0.1% | | | |
| Medpace Holdings Inc (b) | | 5,578 | 1,853,179 |
| Pharmaceuticals - 3.4% | | | |
| Bristol-Myers Squibb Co | | 293,046 | 16,574,681 |
| Eli Lilly & Co | | 64,550 | 49,832,600 |
| Merck & Co Inc | | 433,864 | 43,160,791 |
| | | | 109,568,072 |
TOTAL HEALTH CARE | | | 210,538,470 |
| | | | |
| Industrials - 6.1% | | | |
| Aerospace & Defense - 0.9% | | | |
| Axon Enterprise Inc (b) | | 12,383 | 7,359,465 |
| Lockheed Martin Corp | | 40,662 | 19,759,292 |
| Northrop Grumman Corp | | 34 | 15,956 |
| | | | 27,134,713 |
| Building Products - 0.9% | | | |
| Allegion plc | | 82,174 | 10,738,498 |
| Trane Technologies PLC | | 50,025 | 18,476,734 |
| | | | 29,215,232 |
| Commercial Services & Supplies - 0.6% | | | |
| Cintas Corp | | 112,146 | 20,489,074 |
| Republic Services Inc | | 76 | 15,290 |
| | | | 20,504,364 |
| Construction & Engineering - 0.4% | | | |
| EMCOR Group Inc | | 26,903 | 12,211,272 |
| Ground Transportation - 2.1% | | | |
| Lyft Inc Class A (b) | | 1,081,780 | 13,954,962 |
| Uber Technologies Inc (b) | | 480,437 | 28,979,960 |
| Union Pacific Corp | | 102,437 | 23,359,733 |
| | | | 66,294,655 |
| Machinery - 0.0% | | | |
| Caterpillar Inc | | 6,977 | 2,530,976 |
| Passenger Airlines - 0.1% | | | |
| United Airlines Holdings Inc (b) | | 26,702 | 2,592,764 |
| Professional Services - 0.6% | | | |
| Booz Allen Hamilton Holding Corp Class A | | 134,196 | 17,271,025 |
| Leidos Holdings Inc | | 12,965 | 1,867,738 |
| | | | 19,138,763 |
| Trading Companies & Distributors - 0.5% | | | |
| WW Grainger Inc | | 13,638 | 14,375,134 |
TOTAL INDUSTRIALS | | | 193,997,873 |
| | | | |
| Information Technology - 46.9% | | | |
| Communications Equipment - 0.9% | | | |
| Arista Networks Inc | | 79,876 | 8,828,694 |
| Motorola Solutions Inc | | 43,825 | 20,257,230 |
| | | | 29,085,924 |
| Electronic Equipment, Instruments & Components - 0.1% | | | |
| Zebra Technologies Corp Class A (b) | | 7,416 | 2,864,207 |
| Semiconductors & Semiconductor Equipment - 18.3% | | | |
| Applied Materials Inc | | 177,835 | 28,921,306 |
| Broadcom Inc | | 498,724 | 115,624,172 |
| KLA Corp | | 38,736 | 24,408,328 |
| Lam Research Corp | | 353,031 | 25,499,429 |
| Monolithic Power Systems Inc | | 13 | 7,692 |
| NVIDIA Corp | | 2,627,687 | 352,872,088 |
| QUALCOMM Inc | | 215,640 | 33,126,617 |
| | | | 580,459,632 |
| Software - 14.9% | | | |
| Adobe Inc (b) | | 83,351 | 37,064,523 |
| AppLovin Corp Class A (b) | | 31,688 | 10,261,525 |
| Dropbox Inc Class A (b) | | 69,053 | 2,074,352 |
| Fortinet Inc (b) | | 222,713 | 21,041,924 |
| Intuit Inc | | 4,756 | 2,989,146 |
| Microsoft Corp | | 755,544 | 318,461,796 |
| Oracle Corp | | 71,486 | 11,912,427 |
| Salesforce Inc | | 39,324 | 13,147,193 |
| Servicenow Inc (b) | | 16,487 | 17,478,198 |
| Teradata Corp (b) | | 197,690 | 6,158,044 |
| Workday Inc Class A (b) | | 83,420 | 21,524,863 |
| Zoom Communications Inc Class A (b) | | 126,481 | 10,322,114 |
| | | | 472,436,105 |
| Technology Hardware, Storage & Peripherals - 12.7% | | | |
| Apple Inc | | 1,618,886 | 405,401,432 |
TOTAL INFORMATION TECHNOLOGY | | | 1,490,247,300 |
| | | | |
| Real Estate - 0.1% | | | |
| Retail REITs - 0.1% | | | |
| Simon Property Group Inc | | 14,676 | 2,527,354 |
| Utilities - 0.0% | | | |
| Independent Power and Renewable Electricity Producers - 0.0% | | | |
| Vistra Corp | | 6,702 | 924,005 |
| TOTAL UNITED STATES | | | 3,140,238,180 |
| TOTAL COMMON STOCKS (Cost $1,821,650,609) | | | 3,152,955,786 |
| | | | |
| U.S. Treasury Obligations - 0.1% |
| | | Yield (%) (d) | Principal Amount (a) | Value ($) |
| US Treasury Bills 0% 1/16/2025 | | 4.58 | 380,000 | 379,374 |
| US Treasury Bills 0% 1/30/2025 | | 4.52 | 1,350,000 | 1,345,558 |
| US Treasury Bills 0% 2/13/2025 (e) | | 4.44 | 750,000 | 746,291 |
| US Treasury Bills 0% 2/6/2025 (e) | | 4.46 | 1,990,000 | 1,981,830 |
| TOTAL U.S. TREASURY OBLIGATIONS (Cost $4,451,711) | | | | 4,453,053 |
| | | | | |
| Money Market Funds - 0.8% |
| | | Yield (%) | Shares | Value ($) |
| Fidelity Cash Central Fund (f) | | 4.36 | 23,093,381 | 23,098,000 |
| Fidelity Securities Lending Cash Central Fund (f)(g) | | 4.35 | 1,168,633 | 1,168,750 |
| TOTAL MONEY MARKET FUNDS (Cost $24,266,750) | | | | 24,266,750 |
| | | | | |
| TOTAL INVESTMENT IN SECURITIES - 100.0% (Cost $1,850,369,070) | 3,181,675,589 |
NET OTHER ASSETS (LIABILITIES) - 0.0% | (900,221) |
| NET ASSETS - 100.0% | 3,180,775,368 |
| | |
| Futures Contracts |
| | Number of contracts | Expiration Date | Notional Amount ($) | Value ($) | Unrealized Appreciation/ (Depreciation) ($) |
| Purchased | | | | | |
| | | | | | |
| Equity Contracts | | | | | |
| CME E-mini S&P 500 Index Contracts (United States) | 76 | Mar 2025 | 22,555,850 | (709,955) | (709,955) |
| | | | | | |
| The notional amount of futures purchased as a percentage of Net Assets is 0.7% |
Legend
| (a) | Amount is stated in United States dollars unless otherwise noted. |
| (c) | Security or a portion of the security is on loan at period end. |
| (d) | Yield represents either the annualized yield at the date of purchase, or the stated coupon rate, or, for floating and adjustable rate securities, the rate at period end. |
| (e) | Security or a portion of the security was pledged to cover margin requirements for futures contracts. At period end, the value of securities pledged amounted to $1,177,513. |
| (f) | Affiliated fund that is generally available only to investment companies and other accounts managed by Fidelity Investments. The rate quoted is the annualized seven-day yield of the fund at period end. A complete unaudited listing of the fund's holdings as of its most recent quarter end is available upon request. In addition, each Fidelity Central Fund's financial statements are available on the SEC's website or upon request. |
| (g) | Investment made with cash collateral received from securities on loan. |
Affiliated Central Funds
Fiscal year to date information regarding the Fund's investments in Fidelity Central Funds, including the ownership percentage, is presented below.
| Affiliate | Value, beginning of period ($) | Purchases ($) | Sales Proceeds ($) | Dividend Income ($) | Realized Gain (loss) ($) | Change in Unrealized appreciation (depreciation) ($) | Value, end of period ($) | Shares, end of period | % ownership, end of period |
| Fidelity Cash Central Fund | 45,135,313 | 372,322,684 | 394,359,997 | 572,849 | - | - | 23,098,000 | 23,093,381 | 0.0% |
| Fidelity Securities Lending Cash Central Fund | 5,211,375 | 33,803,257 | 37,845,882 | 711 | - | - | 1,168,750 | 1,168,633 | 0.0% |
| Total | 50,346,688 | 406,125,941 | 432,205,879 | 573,560 | - | - | 24,266,750 | 24,262,014 | |
| | | | | | | | | | |
Amounts in the dividend income column in the above table include any capital gain distributions from underlying funds, which are presented in the corresponding line item in the Statement of Operations, if applicable.
Amounts in the dividend income column for Fidelity Securities Lending Cash Central Fund represents the income earned on investing cash collateral, less rebates paid to borrowers and any lending agent fees associated with the loan, plus any premium payments received for lending certain types of securities.
Amounts included in the purchases and sales proceeds columns may include in-kind transactions, if applicable.
Investment Valuation
The following is a summary of the inputs used, as of December 31, 2024, involving the Fund's assets and liabilities carried at fair value. The inputs or methodology used for valuing securities may not be an indication of the risk associated with investing in those securities. For more information on valuation inputs, and their aggregation into the levels used below, please refer to the Investment Valuation section in the accompanying Notes to Financial Statements.
| Valuation Inputs at Reporting Date: |
| Description | Total ($) | Level 1 ($) | Level 2 ($) | Level 3 ($) |
Investments in Securities: | | | | |
|
| Common Stocks | | | | |
Communication Services | 445,075,802 | 445,075,802 | - | - |
Consumer Discretionary | 560,907,423 | 560,907,423 | - | - |
Consumer Staples | 44,966,515 | 44,966,515 | - | - |
Energy | 14,629,380 | 14,629,380 | - | - |
Financials | 185,233,736 | 185,233,736 | - | - |
Health Care | 210,538,470 | 210,538,470 | - | - |
Industrials | 193,997,873 | 193,997,873 | - | - |
Information Technology | 1,490,247,300 | 1,490,247,300 | - | - |
Materials | 3,907,928 | 3,907,928 | - | - |
Real Estate | 2,527,354 | 2,527,354 | - | - |
Utilities | 924,005 | 924,005 | - | - |
|
| U.S. Treasury Obligations | 4,453,053 | - | 4,453,053 | - |
|
| Money Market Funds | 24,266,750 | 24,266,750 | - | - |
| Total Investments in Securities: | 3,181,675,589 | 3,177,222,536 | 4,453,053 | - |
Derivative Instruments: Liabilities | | | | |
Futures Contracts | (709,955) | (709,955) | - | - |
| Total Liabilities | (709,955) | (709,955) | - | - |
| Total Derivative Instruments: | (709,955) | (709,955) | - | - |
Value of Derivative Instruments
The following table is a summary of the Fund's value of derivative instruments by primary risk exposure as of December 31, 2024. For additional information on derivative instruments, please refer to the Derivative Instruments section in the accompanying Notes to Financial Statements.
Primary Risk Exposure / Derivative Type | Value |
| Asset ($) | Liability ($) |
| Equity Risk | | |
Futures Contracts (a) | 0 | (709,955) |
| Total Equity Risk | 0 | (709,955) |
| Total Value of Derivatives | 0 | (709,955) |
(a)Reflects gross cumulative appreciation (depreciation) on futures contracts as presented in the Schedule of Investments. In the Statement of Assets and Liabilities, the period end daily variation margin is included in receivable or payable for daily variation margin on futures contracts, and the net cumulative appreciation (depreciation) is included in Total accumulated earnings (loss).
Fidelity® Enhanced Large Cap Growth ETF
Financial Statements (Unaudited)
| Statement of Assets and Liabilities |
| As of December 31, 2024 (Unaudited) |
| Assets | | | | |
| Investment in securities, at value (including securities loaned of $1,139,125) - See accompanying schedule: | | | | |
Unaffiliated issuers (cost $1,826,102,320) | $ | 3,157,408,839 | | |
Fidelity Central Funds (cost $24,266,750) | | 24,266,750 | | |
| | | | | |
| | | | | |
| Total Investment in Securities (cost $1,850,369,070) | | | $ | 3,181,675,589 |
| Cash | | | | 1,470 |
| Receivable for fund shares sold | | | | 10,600,338 |
| Dividends receivable | | | | 555,923 |
| Distributions receivable from Fidelity Central Funds | | | | 98,061 |
Total assets | | | | 3,192,931,381 |
| Liabilities | | | | |
| Payable for investments purchased | $ | 10,417,410 | | |
| Accrued management fee | | 482,453 | | |
| Payable for daily variation margin on futures contracts | | 87,400 | | |
| Collateral on securities loaned | | 1,168,750 | | |
| Total liabilities | | | | 12,156,013 |
| Net Assets | | | $ | 3,180,775,368 |
| Net Assets consist of: | | | | |
| Paid in capital | | | $ | 1,656,033,976 |
| Total accumulated earnings (loss) | | | | 1,524,741,392 |
| Net Assets | | | $ | 3,180,775,368 |
Net Asset Value, offering price and redemption price per share ($3,180,775,368 ÷ 90,018,998 shares) | | | $ | 35.33 |
| Statement of Operations |
| | | | Six months ended December 31, 2024 (Unaudited) |
| Investment Income | | | | |
| Dividends | | | $ | 8,831,149 |
| Interest | | | | 84,195 |
| Income from Fidelity Central Funds (including $711 from security lending) | | | | 573,560 |
| Total income | | | | 9,488,904 |
| Expenses | | | | |
| Management fee | | | $ | 2,590,724 |
| Independent trustees' fees and expenses | | | | 6,029 |
| Interest | | | | 2,400 |
| Miscellaneous | | | | - |
| Total expenses before reductions | | | | 2,599,153 |
| Expense reductions | | | | (504) |
| Total expenses after reductions | | | | 2,598,649 |
| Net Investment income (loss) | | | | 6,890,255 |
| Realized and Unrealized Gain (Loss) | | | | |
| Net realized gain (loss) on: | | | | |
| Investment Securities: | | | | |
| Unaffiliated issuers | | | | (29,307,813) |
| Redemptions in-kind | | | | 228,272,894 |
| Fidelity Central Funds | | | | - |
| Foreign currency transactions | | | | - |
| Futures contracts | | | | (2,111,568) |
| Total net realized gain (loss) | | | | 196,853,513 |
| Change in net unrealized appreciation (depreciation) on: | | | | |
| Investment Securities: | | | | |
| Unaffiliated issuers | | | | 64,637,773 |
| Futures contracts | | | | (745,174) |
| Total change in net unrealized appreciation (depreciation) | | | | 63,892,599 |
| Net gain (loss) | | | | 260,746,112 |
| Net increase (decrease) in net assets resulting from operations | | | $ | 267,636,367 |
| Statement of Changes in Net Assets |
| | | |
| | Six months ended December 31, 2024 (Unaudited) | | Ten months ended June 30, 2024 | | Year ended August 31, 2023 |
| Increase (Decrease) in Net Assets | | | | | | |
| Operations | | | | | | |
| Net investment income (loss) | $ | 6,890,255 | $ | 11,344,510 | $ | 14,345,783 |
| Net realized gain (loss) | | 196,853,513 | | 260,568,152 | | 46,418,406 |
| Change in net unrealized appreciation (depreciation) | | 63,892,599 | | 368,592,605 | | 358,739,553 |
| Net increase (decrease) in net assets resulting from operations | | 267,636,367 | | 640,505,267 | | 419,503,742 |
| Distributions to shareholders | | (7,386,096) | | (21,679,293) | | (10,050,462) |
| | | | | | | |
| Share transactions | | | | | | |
| Proceeds from sales of shares | | 1,176,842,079 | | 1,183,970,024 | | 1,206,466,982 |
| Reinvestment of distributions | | - | | 11,773,276 | | 8,894,596 |
| Cost of shares redeemed | | (943,222,185) | | (1,496,108,622) | | (882,002,420) |
| | | | | | | |
Net increase (decrease) in net assets resulting from share transactions | | 233,619,894 | | (300,365,322) | | 333,359,158 |
| Total increase (decrease) in net assets | | 493,870,165 | | 318,460,652 | | 742,812,438 |
| | | | | | | |
| Net Assets | | | | | | |
| Beginning of period | | 2,686,905,203 | | 2,368,444,551 | | 1,625,632,113 |
| End of period | $ | 3,180,775,368 | $ | 2,686,905,203 | $ | 2,368,444,551 |
| | | | | | | |
| Other Information | | | | | | |
| Shares | | | | | | |
| Sold | | 35,100,000 | | 41,974,709 | | 56,403,387 |
| Issued in reinvestment of distributions | | - | | 488,957 | | 467,755 |
| Redeemed | | (28,400,000) | | (55,500,883) | | (39,305,302) |
| Net increase (decrease) | | 6,700,000 | | (13,037,217) | | 17,565,840 |
| | | | | | | |
See Organization and Prior Fiscal Year Reorganization information note regarding reorganization from mutual fund to exchange traded fund for the ten months ended June 30, 2024.
Share activity is further described in Organization and Prior Fiscal Year Reorganization information notes, amounts have been adjusted to reflect the impact of the change in capital structure associated with the reorganization. All financial information prior to the reorganization is that of the Predecessor Fund.
Financial Highlights
Fidelity® Enhanced Large Cap Growth ETF |
| |
| | Six months ended (Unaudited) December 31, 2024 | | Years ended June 30, 2024 A | | 2023 B,C | | 2022 B,C | | 2021 B,C | | 2020 B,C | | 2019 B,C |
Selected Per-Share Data | | | | | | | | | | | | | | |
| Net asset value, beginning of period | $ | 32.25 | $ | 24.58 | $ | 20.64 | $ | 28.47 | $ | 23.10 | $ | 16.82 | $ | 17.94 |
| Income from Investment Operations | | | | | | | | | | | | | | |
Net investment income (loss) D,E | | .08 | | .14 | | .15 | | .12 | | .12 | | .13 | | .17 |
| Net realized and unrealized gain (loss) | | 3.08 | | 7.78 | | 3.91 | | (4.19) | | 6.34 | | 6.72 | | (.13) |
| Total from investment operations | | 3.16 | | 7.92 | | 4.06 | | (4.07) | | 6.46 | | 6.85 | | .04 |
| Distributions from net investment income | | (.08) | | (.24) | | (.12) | | (.12) | | (.13) | | (.15) | | (.20) |
| Distributions from net realized gain | | - | | (.01) | | - | | (3.64) | | (.96) | | (.42) | | (.96) |
| Total distributions | | (.08) | | (.25) | | (.12) | | (3.76) | | (1.09) | | (.57) | | (1.16) |
| Net asset value, end of period | $ | 35.33 | $ | 32.25 | $ | 24.58 | $ | 20.64 | $ | 28.47 | $ | 23.10 | $ | 16.82 |
Total Return F,G,H | | | | 32.45% | | 19.85% | | (16.70)% | | 29.08% | | 41.73% | | 1.28% |
Ratios to Average Net Assets E,I,J | | | | | | | | | | | | | | |
| Expenses before reductions | | .18% K | | .24% K,L | | .39% | | .39% | | .39% | | .39% | | .39% |
| Expenses net of fee waivers, if any | | | | .24% K,L | | .39% | | .39% | | .39% | | .39% | | .39% |
| Expenses net of all reductions | | .18% K | | .24% K,L | | .39% | | .39% | | .39% | | .39% | | .39% |
| Net investment income (loss) | | .48% K | | .60% K,L | | .71% | | .52% | | .47% | | .74% | | 1.07% |
| Supplemental Data | | | | | | | | | | | | | | |
| Net assets, end of period (000 omitted) | $ | 3,180,775 | $ | 2,686,905 | $ | 2,368,445 | $ | 1,625,632 | $ | 1,784,746 | $ | 1,417,537 | $ | 1,106,497 |
Portfolio turnover rate M | | | | 58% K,N | | 108% | | 101% | | 84% | | 69% | | 85% |
AFor the ten month period ended June 30. The Fund changed its fiscal year end from August 31 to June 30, effective March 1, 2024.
BFor the year ended August 31.
CAs further described in Organization and Reorganization information notes, per share amounts have been adjusted to reflect the impact of the change in capital structure associated with the reorganization. All financial information prior to the reorganization is that of the Predecessor Fund.
DCalculated based on average shares outstanding during the period.
ENet investment income (loss) is affected by the timing of the declaration of dividends by any underlying mutual funds or exchange-traded funds (ETFs). Net investment income (loss) of any mutual funds or ETFs is not included in the Fund's net investment income (loss) ratio.
FTotal returns for periods of less than one year are not annualized.
GTotal returns would have been lower if certain expenses had not been reduced during the applicable periods shown.
HBased on net asset value.
IFees and expenses of any underlying mutual funds or exchange-traded funds (ETFs) are not included in the Fund's expense ratio. The Fund indirectly bears its proportionate share of these expenses. For additional expense information related to investments in Fidelity Central Funds, please refer to the "Investments in Fidelity Central Funds" note found in the Notes to Financial Statements section of the most recent Annual or Semi-Annual report.
JExpense ratios reflect operating expenses of the class. Expenses before reductions do not reflect amounts reimbursed, waived, or reduced through arrangements with the investment adviser, brokerage services, or other offset arrangements, if applicable, and do not represent the amount paid by the class during periods when reimbursements, waivers or reductions occur.
KAnnualized.
LProxy expenses are not annualized.
MAmount does not include the portfolio activity of any underlying mutual funds or exchange-traded funds (ETFs), derivatives or securities that mature within one year from acquisition.
NPortfolio turnover rate excludes securities received or delivered in-kind.
Fidelity® Enhanced Large Cap Value ETF
Schedule of Investments December 31, 2024 (Unaudited)
Showing Percentage of Net Assets
| Common Stocks - 98.6% |
| | | Shares | Value ($) |
| BAILIWICK OF JERSEY - 0.0% | | | |
| Consumer Discretionary - 0.0% | | | |
| Automobile Components - 0.0% | | | |
| Aptiv PLC | | 10,344 | 625,605 |
| CANADA - 0.0% | | | |
| Utilities - 0.0% | | | |
| Independent Power and Renewable Electricity Producers - 0.0% | | | |
| Brookfield Renewable Corp (United States) | | 23,801 | 658,336 |
| FINLAND - 0.1% | | | |
| Consumer Discretionary - 0.1% | | | |
| Textiles, Apparel & Luxury Goods - 0.1% | | | |
| Amer Sports Inc | | 56,669 | 1,584,465 |
| IRELAND - 0.4% | | | |
| Information Technology - 0.4% | | | |
| IT Services - 0.4% | | | |
| Accenture PLC Class A | | 22,251 | 7,827,679 |
| MEXICO - 0.0% | | | |
| Materials - 0.0% | | | |
| Metals & Mining - 0.0% | | | |
| Southern Copper Corp | | 8,777 | 799,848 |
| UNITED KINGDOM - 0.2% | | | |
| Energy - 0.2% | | | |
| Energy Equipment & Services - 0.2% | | | |
| TechnipFMC PLC | | 135,488 | 3,921,023 |
| UNITED STATES - 97.9% | | | |
| Communication Services - 4.7% | | | |
| Diversified Telecommunication Services - 1.1% | | | |
| AT&T Inc | | 711,198 | 16,193,978 |
| Verizon Communications Inc | | 168,840 | 6,751,912 |
| | | | 22,945,890 |
| Entertainment - 1.8% | | | |
| Electronic Arts Inc | | 25,367 | 3,711,192 |
| Netflix Inc (b) | | 4,517 | 4,026,092 |
| Playtika Holding Corp | | 107,089 | 743,198 |
| Walt Disney Co/The | | 254,642 | 28,354,387 |
| Warner Bros Discovery Inc (b) | | 218,652 | 2,311,152 |
| | | | 39,146,021 |
| Interactive Media & Services - 0.2% | | | |
| IAC Inc Class A (b) | | 20,816 | 898,002 |
| Meta Platforms Inc Class A | | 7,357 | 4,307,597 |
| | | | 5,205,599 |
| Media - 1.1% | | | |
| Comcast Corp Class A | | 570,352 | 21,405,311 |
| News Corp Class A | | 41,116 | 1,132,335 |
| News Corp Class B | | 21,982 | 668,911 |
| | | | 23,206,557 |
| Wireless Telecommunication Services - 0.5% | | | |
| T-Mobile US Inc | | 47,841 | 10,559,944 |
TOTAL COMMUNICATION SERVICES | | | 101,064,011 |
| | | | |
| Consumer Discretionary - 6.8% | | | |
| Automobile Components - 0.2% | | | |
| BorgWarner Inc | | 109,119 | 3,468,893 |
| Lear Corp | | 15,260 | 1,445,122 |
| | | | 4,914,015 |
| Automobiles - 0.3% | | | |
| Ford Motor Co | | 596,859 | 5,908,904 |
| Broadline Retail - 0.2% | | | |
| Amazon.com Inc (b) | | 16,327 | 3,581,981 |
| Macy's Inc | | 19,632 | 332,369 |
| | | | 3,914,350 |
| Diversified Consumer Services - 0.1% | | | |
| ADT Inc (c) | | 259,482 | 1,793,021 |
| Frontdoor Inc (b) | | 18 | 984 |
| | | | 1,794,005 |
| Hotels, Restaurants & Leisure - 2.4% | | | |
| Boyd Gaming Corp | | 17,268 | 1,252,621 |
| Carnival Corp (b) | | 107,398 | 2,676,358 |
| Chipotle Mexican Grill Inc (b) | | 23,725 | 1,430,618 |
| Darden Restaurants Inc | | 21,099 | 3,938,972 |
| DoorDash Inc Class A (b) | | 15,070 | 2,527,993 |
| Expedia Group Inc Class A (b) | | 25,455 | 4,743,030 |
| International Game Technology PLC | | 295,036 | 5,210,336 |
| Life Time Group Holdings Inc (b) | | 4,285 | 94,784 |
| Light & Wonder Inc Class A (b) | | 36,943 | 3,191,136 |
| Marriott Vacations Worldwide Corp | | 18,243 | 1,638,221 |
| McDonald's Corp | | 37,008 | 10,728,249 |
| MGM Resorts International (b) | | 269,123 | 9,325,112 |
| Royal Caribbean Cruises Ltd | | 13,164 | 3,036,803 |
| Travel + Leisure Co | | 2,271 | 114,572 |
| Wendy's Co/The (c) | | 91,805 | 1,496,422 |
| | | | 51,405,227 |
| Household Durables - 1.1% | | | |
| DR Horton Inc | | 7,291 | 1,019,428 |
| Garmin Ltd | | 10,644 | 2,195,431 |
| Leggett & Platt Inc | | 77,455 | 743,568 |
| M/I Homes Inc (b)(c) | | 13,751 | 1,828,195 |
| Newell Brands Inc | | 130,013 | 1,294,929 |
| NVR Inc (b) | | 133 | 1,087,794 |
| PulteGroup Inc | | 5,109 | 556,370 |
| Taylor Morrison Home Corp (b) | | 54,094 | 3,311,094 |
| Toll Brothers Inc | | 37,164 | 4,680,806 |
| TopBuild Corp (b) | | 6,097 | 1,898,240 |
| Tri Pointe Homes Inc (b)(c) | | 159,274 | 5,775,276 |
| | | | 24,391,131 |
| Specialty Retail - 2.3% | | | |
| Abercrombie & Fitch Co Class A (b) | | 25,463 | 3,805,955 |
| Bath & Body Works Inc | | 146,777 | 5,690,544 |
| Best Buy Co Inc (c) | | 10,245 | 879,021 |
| Carvana Co Class A (b) | | 37,592 | 7,644,709 |
| Five Below Inc (b) | | 8,660 | 908,954 |
| Gap Inc/The (c) | | 223,912 | 5,291,041 |
| Home Depot Inc/The | | 22,636 | 8,805,178 |
| Lowe's Cos Inc | | 6,063 | 1,496,348 |
| Petco Health & Wellness Co Inc Class A (b) | | 61,554 | 234,520 |
| Ross Stores Inc | | 15,782 | 2,387,343 |
| TJX Cos Inc/The | | 47,999 | 5,798,759 |
| Ulta Beauty Inc (b) | | 12,218 | 5,313,975 |
| | | | 48,256,347 |
| Textiles, Apparel & Luxury Goods - 0.2% | | | |
| Carter's Inc | | 24,670 | 1,336,868 |
| Kontoor Brands Inc | | 14,898 | 1,272,438 |
| NIKE Inc Class B | | 7,941 | 600,895 |
| Tapestry Inc | | 11,567 | 755,672 |
| VF Corp | | 48,794 | 1,047,119 |
| | | | 5,012,992 |
TOTAL CONSUMER DISCRETIONARY | | | 145,596,971 |
| | | | |
| Consumer Staples - 6.9% | | | |
| Beverages - 0.3% | | | |
| Boston Beer Co Inc/The Class A (b) | | 3,046 | 913,739 |
| Coca-Cola Consolidated Inc | | 225 | 283,498 |
| Keurig Dr Pepper Inc | | 72,494 | 2,328,507 |
| Molson Coors Beverage Co Class B (c) | | 51,543 | 2,954,445 |
| | | | 6,480,189 |
| Consumer Staples Distribution & Retail - 2.6% | | | |
| Dollar Tree Inc (b) | | 8,258 | 618,854 |
| Kroger Co/The | | 106,958 | 6,540,482 |
| Target Corp | | 6,131 | 828,789 |
| US Foods Holding Corp (b) | | 59,033 | 3,982,366 |
| Walmart Inc | | 473,025 | 42,737,809 |
| | | | 54,708,300 |
| Food Products - 0.8% | | | |
| Archer-Daniels-Midland Co | | 38,786 | 1,959,469 |
| Conagra Brands Inc | | 71,246 | 1,977,077 |
| General Mills Inc | | 17,340 | 1,105,772 |
| Ingredion Inc | | 5,493 | 755,617 |
| JM Smucker Co | | 21,192 | 2,333,663 |
| Kraft Heinz Co/The | | 79,554 | 2,443,103 |
| McCormick & Co Inc/MD | | 13,798 | 1,051,960 |
| Mondelez International Inc | | 44,776 | 2,674,470 |
| Post Holdings Inc (b) | | 1,713 | 196,069 |
| Tyson Foods Inc Class A | | 43,611 | 2,505,016 |
| | | | 17,002,216 |
| Household Products - 1.8% | | | |
| Clorox Co/The | | 29,660 | 4,817,081 |
| Colgate-Palmolive Co | | 48,360 | 4,396,408 |
| Kimberly-Clark Corp | | 20,625 | 2,702,700 |
| Procter & Gamble Co/The | | 162,879 | 27,306,664 |
| | | | 39,222,853 |
| Personal Care Products - 0.3% | | | |
| Estee Lauder Cos Inc/The Class A | | 66,417 | 4,979,947 |
| Kenvue Inc | | 34,562 | 737,898 |
| | | | 5,717,845 |
| Tobacco - 1.1% | | | |
| Altria Group Inc (c) | | 100,403 | 5,250,073 |
| Philip Morris International Inc | | 153,958 | 18,528,845 |
| | | | 23,778,918 |
TOTAL CONSUMER STAPLES | | | 146,910,321 |
| | | | |
| Energy - 5.8% | | | |
| Energy Equipment & Services - 0.2% | | | |
| Baker Hughes Co Class A | | 49,078 | 2,013,179 |
| Halliburton Co | | 83,730 | 2,276,619 |
| | | | 4,289,798 |
| Oil, Gas & Consumable Fuels - 5.6% | | | |
| Antero Midstream Corp | | 24,314 | 366,898 |
| California Resources Corp | | 37,042 | 1,922,109 |
| Cheniere Energy Inc | | 15,078 | 3,239,810 |
| Chevron Corp | | 74,670 | 10,815,203 |
| ConocoPhillips | | 194,851 | 19,323,374 |
| Coterra Energy Inc | | 37,456 | 956,626 |
| Devon Energy Corp | | 168,249 | 5,506,790 |
| Diamondback Energy Inc | | 18,701 | 3,063,785 |
| EOG Resources Inc | | 82,827 | 10,152,934 |
| Exxon Mobil Corp | | 439,725 | 47,301,218 |
| Kinder Morgan Inc | | 172,761 | 4,733,651 |
| Murphy Oil Corp | | 4,817 | 145,762 |
| Occidental Petroleum Corp | | 101,748 | 5,027,369 |
| Valero Energy Corp | | 562 | 68,896 |
| Williams Cos Inc/The | | 113,570 | 6,146,408 |
| | | | 118,770,833 |
TOTAL ENERGY | | | 123,060,631 |
| | | | |
| Financials - 22.9% | | | |
| Banks - 7.2% | | | |
| Bank of America Corp | | 761,509 | 33,468,321 |
| Citigroup Inc | | 174,222 | 12,263,487 |
| Huntington Bancshares Inc/OH | | 65,118 | 1,059,470 |
| JPMorgan Chase & Co | | 249,107 | 59,713,439 |
| KeyCorp | | 186,198 | 3,191,434 |
| PNC Financial Services Group Inc/The | | 68,585 | 13,226,617 |
| TFS Financial Corp | | 15 | 188 |
| Truist Financial Corp | | 103,927 | 4,508,353 |
| United Bankshares Inc/WV | | 2 | 75 |
| Wells Fargo & Co | | 378,911 | 26,614,709 |
| | | | 154,046,093 |
| Capital Markets - 4.9% | | | |
| Bank of New York Mellon Corp/The | | 124,079 | 9,532,990 |
| Blackrock Inc | | 7,210 | 7,391,043 |
| Cboe Global Markets Inc | | 5,630 | 1,100,102 |
| Charles Schwab Corp/The | | 219,813 | 16,268,360 |
| CME Group Inc Class A | | 41,813 | 9,710,233 |
| Federated Hermes Inc Class B | | 24,033 | 987,997 |
| Goldman Sachs Group Inc/The | | 20,575 | 11,781,657 |
| Intercontinental Exchange Inc | | 72,500 | 10,803,225 |
| Morgan Stanley | | 82,303 | 10,347,133 |
| MSCI Inc | | 1,572 | 943,215 |
| Raymond James Financial Inc | | 3,911 | 607,495 |
| S&P Global Inc | | 17,943 | 8,936,152 |
| SEI Investments Co | | 124,820 | 10,295,154 |
| State Street Corp | | 30,781 | 3,021,155 |
| T Rowe Price Group Inc | | 23,866 | 2,699,006 |
| | | | 104,424,917 |
| Consumer Finance - 1.4% | | | |
| American Express Co | | 44,710 | 13,269,481 |
| Capital One Financial Corp | | 54,058 | 9,639,623 |
| Discover Financial Services | | 5,386 | 933,016 |
| SoFi Technologies Inc Class A (b)(c) | | 110,892 | 1,707,737 |
| Synchrony Financial | | 55,887 | 3,632,655 |
| | | | 29,182,512 |
| Financial Services - 5.5% | | | |
| Berkshire Hathaway Inc Class B (b) | | 176,129 | 79,835,754 |
| Block Inc Class A (b) | | 139,247 | 11,834,603 |
| Enact Holdings Inc | | 23,229 | 752,155 |
| Euronet Worldwide Inc (b) | | 7,720 | 793,925 |
| Fidelity National Information Services Inc | | 6,412 | 517,897 |
| Global Payments Inc | | 15,886 | 1,780,185 |
| Mastercard Inc Class A | | 10,937 | 5,759,096 |
| PayPal Holdings Inc (b) | | 175,803 | 15,004,786 |
| | | | 116,278,401 |
| Insurance - 3.9% | | | |
| Allstate Corp/The | | 46,511 | 8,966,856 |
| Aon PLC | | 31,648 | 11,366,696 |
| Assurant Inc | | 7,780 | 1,658,852 |
| Cincinnati Financial Corp | | 28,719 | 4,126,920 |
| CNO Financial Group Inc | | 18,653 | 694,078 |
| Globe Life Inc (c) | | 83,346 | 9,294,746 |
| Loews Corp | | 57,911 | 4,904,483 |
| Markel Group Inc (b)(c) | | 2,028 | 3,500,794 |
| Marsh & McLennan Cos Inc | | 52,316 | 11,112,442 |
| MetLife Inc | | 48,965 | 4,009,254 |
| Progressive Corp/The | | 16,769 | 4,018,020 |
| Reinsurance Group of America Inc | | 2,573 | 549,669 |
| The Travelers Companies, Inc. | | 21,812 | 5,254,293 |
| Unum Group | | 100,806 | 7,361,862 |
| Willis Towers Watson PLC | | 19,474 | 6,100,036 |
| | | | 82,919,001 |
TOTAL FINANCIALS | | | 486,850,924 |
| | | | |
| Health Care - 13.0% | | | |
| Biotechnology - 3.1% | | | |
| AbbVie Inc | | 115,825 | 20,582,103 |
| Alkermes PLC (b) | | 23,740 | 682,761 |
| Amgen Inc | | 10,898 | 2,840,455 |
| Biogen Inc (b) | | 32,330 | 4,943,904 |
| BioMarin Pharmaceutical Inc (b) | | 37,681 | 2,476,772 |
| Exelixis Inc (b)(c) | | 128,251 | 4,270,758 |
| Gilead Sciences Inc | | 232,945 | 21,517,130 |
| Incyte Corp (b) | | 107,018 | 7,391,733 |
| Vertex Pharmaceuticals Inc (b) | | 4,108 | 1,654,292 |
| | | | 66,359,908 |
| Health Care Equipment & Supplies - 2.3% | | | |
| Abbott Laboratories | | 92,862 | 10,503,621 |
| Becton Dickinson & Co | | 73,605 | 16,698,766 |
| Boston Scientific Corp (b) | | 34,449 | 3,076,985 |
| DENTSPLY SIRONA Inc | | 35,202 | 668,134 |
| Edwards Lifesciences Corp (b) | | 16,968 | 1,256,141 |
| GE HealthCare Technologies Inc (c) | | 38,377 | 3,000,314 |
| Medtronic PLC | | 88,635 | 7,080,164 |
| Solventum Corp | | 35,035 | 2,314,412 |
| Stryker Corp | | 13,447 | 4,841,592 |
| | | | 49,440,129 |
| Health Care Providers & Services - 3.0% | | | |
| Cardinal Health Inc | | 31,233 | 3,693,927 |
| Centene Corp (b) | | 124,944 | 7,569,108 |
| Cigna Group/The | | 34,600 | 9,554,444 |
| CVS Health Corp | | 107,172 | 4,810,951 |
| Elevance Health Inc | | 2,916 | 1,075,712 |
| Guardant Health Inc (b) | | 21,311 | 651,051 |
| Humana Inc | | 10,718 | 2,719,264 |
| Labcorp Holdings Inc | | 6,849 | 1,570,613 |
| McKesson Corp | | 3,942 | 2,246,585 |
| Option Care Health Inc (b) | | 61,847 | 1,434,850 |
| Quest Diagnostics Inc | | 1,492 | 225,083 |
| Tenet Healthcare Corp (b) | | 5,360 | 676,593 |
| UnitedHealth Group Inc | | 54,223 | 27,429,247 |
| Universal Health Services Inc Class B | | 5,210 | 934,778 |
| | | | 64,592,206 |
| Health Care Technology - 0.3% | | | |
| Veeva Systems Inc Class A (b) | | 26,401 | 5,550,810 |
| Life Sciences Tools & Services - 1.5% | | | |
| Agilent Technologies Inc | | 13,802 | 1,854,161 |
| Bio-Rad Laboratories Inc Class A (b)(c) | | 1,553 | 510,175 |
| Danaher Corp | | 14,843 | 3,407,211 |
| Illumina Inc (b)(c) | | 16,506 | 2,205,697 |
| IQVIA Holdings Inc (b) | | 13,437 | 2,640,505 |
| Medpace Holdings Inc (b) | | 8,421 | 2,797,709 |
| QIAGEN NV (United States) | | 78,158 | 3,480,376 |
| Thermo Fisher Scientific Inc | | 29,739 | 15,471,120 |
| | | | 32,366,954 |
| Pharmaceuticals - 2.8% | | | |
| Bristol-Myers Squibb Co | | 285,286 | 16,135,776 |
| Johnson & Johnson | | 149,954 | 21,686,348 |
| Merck & Co Inc | | 45,192 | 4,495,700 |
| Organon & Co | | 31,747 | 473,665 |
| Pfizer Inc | | 604,225 | 16,030,089 |
| | | | 58,821,578 |
TOTAL HEALTH CARE | | | 277,131,585 |
| | | | |
| Industrials - 16.4% | | | |
| Aerospace & Defense - 3.8% | | | |
| Curtiss-Wright Corp | | 3,068 | 1,088,740 |
| GE Aerospace | | 120,335 | 20,070,675 |
| General Dynamics Corp | | 12,838 | 3,382,684 |
| L3Harris Technologies Inc | | 40,378 | 8,490,686 |
| Lockheed Martin Corp | | 24,904 | 12,101,850 |
| Northrop Grumman Corp | | 26,595 | 12,480,768 |
| RTX Corp | | 119,019 | 13,772,879 |
| Textron Inc | | 94,239 | 7,208,341 |
| | | | 78,596,623 |
| Air Freight & Logistics - 0.3% | | | |
| CH Robinson Worldwide Inc | | 2,083 | 215,216 |
| FedEx Corp | | 20,825 | 5,858,697 |
| | | | 6,073,913 |
| Building Products - 1.8% | | | |
| A O Smith Corp | | 4,875 | 332,524 |
| Allegion plc (c) | | 79,094 | 10,336,004 |
| Builders FirstSource Inc (b) | | 16,075 | 2,297,600 |
| Johnson Controls International plc | | 78,638 | 6,206,897 |
| Masco Corp | | 6,035 | 437,960 |
| Owens Corning | | 39,176 | 6,672,456 |
| Trane Technologies PLC | | 35,666 | 13,173,237 |
| | | | 39,456,678 |
| Commercial Services & Supplies - 1.1% | | | |
| Cintas Corp | | 44,214 | 8,077,898 |
| Republic Services Inc | | 63,747 | 12,824,622 |
| Veralto Corp | | 7,298 | 743,301 |
| Vestis Corp | | 93,682 | 1,427,714 |
| Waste Management Inc | | 12 | 2,421 |
| | | | 23,075,956 |
| Construction & Engineering - 0.4% | | | |
| Arcosa Inc (c) | | 23,127 | 2,237,306 |
| Valmont Industries Inc | | 19,657 | 6,028,212 |
| | | | 8,265,518 |
| Electrical Equipment - 1.7% | | | |
| Acuity Brands Inc | | 1,322 | 386,195 |
| AMETEK Inc | | 74,003 | 13,339,781 |
| Eaton Corp PLC | | 43,048 | 14,286,340 |
| EnerSys | | 22,878 | 2,114,614 |
| GE Vernova Inc | | 17,619 | 5,795,418 |
| | | | 35,922,348 |
| Ground Transportation - 1.3% | | | |
| CSX Corp | | 195,911 | 6,322,048 |
| Lyft Inc Class A (b) | | 149,891 | 1,933,594 |
| Norfolk Southern Corp | | 23,496 | 5,514,511 |
| Uber Technologies Inc (b) | | 66 | 3,981 |
| Union Pacific Corp | | 65,400 | 14,913,816 |
| | | | 28,687,950 |
| Industrial Conglomerates - 0.6% | | | |
| 3M Co | | 93,680 | 12,093,151 |
| Honeywell International Inc | | 7,165 | 1,618,502 |
| | | | 13,711,653 |
| Machinery - 3.4% | | | |
| Caterpillar Inc | | 37,362 | 13,553,439 |
| Cummins Inc | | 18,788 | 6,549,497 |
| Donaldson Co Inc | | 3,551 | 239,160 |
| Flowserve Corp | | 85,391 | 4,911,690 |
| Fortive Corp | | 88,784 | 6,658,800 |
| Illinois Tool Works Inc | | 8,897 | 2,255,923 |
| ITT Inc | | 49,253 | 7,037,269 |
| Mueller Water Products Inc Class A1 | | 4,416 | 99,360 |
| Oshkosh Corp | | 43,877 | 4,171,386 |
| PACCAR Inc | | 124,989 | 13,001,356 |
| Parker-Hannifin Corp | | 1,286 | 817,935 |
| Pentair PLC | | 36,069 | 3,629,984 |
| Westinghouse Air Brake Technologies Corp | | 46,975 | 8,905,990 |
| | | | 71,831,789 |
| Passenger Airlines - 0.2% | | | |
| SkyWest Inc (b) | | 38,168 | 3,821,762 |
| United Airlines Holdings Inc (b) | | 6,582 | 639,112 |
| | | | 4,460,874 |
| Professional Services - 1.5% | | | |
| Automatic Data Processing Inc | | 7,124 | 2,085,409 |
| Booz Allen Hamilton Holding Corp Class A | | 13,088 | 1,684,425 |
| CACI International Inc (b) | | 20,826 | 8,414,954 |
| Leidos Holdings Inc | | 85,122 | 12,262,675 |
| Maximus Inc | | 40,128 | 2,995,555 |
| SS&C Technologies Holdings Inc | | 69,522 | 5,268,377 |
| | | | 32,711,395 |
| Trading Companies & Distributors - 0.3% | | | |
| Applied Industrial Technologies Inc | | 2,887 | 691,350 |
| Boise Cascade Co | | 10,495 | 1,247,436 |
| Core & Main Inc Class A (b) | | 31,815 | 1,619,702 |
| Wesco International Inc | | 21,463 | 3,883,944 |
| | | | 7,442,432 |
TOTAL INDUSTRIALS | | | 350,237,129 |
| | | | |
| Information Technology - 9.4% | | | |
| Communications Equipment - 1.9% | | | |
| Cisco Systems Inc | | 448,211 | 26,534,091 |
| Extreme Networks Inc (b) | | 39,454 | 660,460 |
| Motorola Solutions Inc | | 30,187 | 13,953,337 |
| | | | 41,147,888 |
| Electronic Equipment, Instruments & Components - 0.7% | | | |
| Arrow Electronics Inc (b)(c) | | 10,946 | 1,238,212 |
| Corning Inc | | 53,937 | 2,563,086 |
| Trimble Inc (b) | | 13,549 | 957,372 |
| Zebra Technologies Corp Class A (b) | | 25,593 | 9,884,529 |
| | | | 14,643,199 |
| IT Services - 0.6% | | | |
| IBM Corporation | | 29,149 | 6,407,825 |
| Kyndryl Holdings Inc (b) | | 65,069 | 2,251,387 |
| Okta Inc Class A (b) | | 6,422 | 506,054 |
| Twilio Inc Class A (b) | | 47,986 | 5,186,327 |
| | | | 14,351,593 |
| Semiconductors & Semiconductor Equipment - 3.2% | | | |
| Analog Devices Inc | | 15,153 | 3,219,406 |
| Applied Materials Inc | | 44,909 | 7,303,551 |
| Astera Labs Inc (b) | | 1,108 | 146,755 |
| Broadcom Inc | | 34,780 | 8,063,395 |
| Cirrus Logic Inc (b)(c) | | 19,024 | 1,894,410 |
| Intel Corp | | 899,343 | 18,031,828 |
| KLA Corp | | 950 | 598,614 |
| Micron Technology Inc | | 40,924 | 3,444,164 |
| NVIDIA Corp | | 11,753 | 1,578,310 |
| Qorvo Inc (b) | | 54,595 | 3,817,828 |
| QUALCOMM Inc | | 75,392 | 11,581,719 |
| Skyworks Solutions Inc | | 31,158 | 2,763,091 |
| Texas Instruments Inc | | 26,277 | 4,927,200 |
| | | | 67,370,271 |
| Software - 2.3% | | | |
| Adobe Inc (b) | | 18,809 | 8,363,986 |
| Alarm.com Holdings Inc (b) | | 72,409 | 4,402,467 |
| ANSYS Inc (b) | | 723 | 243,889 |
| DocuSign Inc (b) | | 8,989 | 808,471 |
| Dropbox Inc Class A (b) | | 261,071 | 7,842,573 |
| Roper Technologies Inc | | 6,614 | 3,438,288 |
| Salesforce Inc | | 13,854 | 4,631,808 |
| SolarWinds Corp (c) | | 35,453 | 505,205 |
| Tenable Holdings Inc (b) | | 109,043 | 4,294,113 |
| Teradata Corp (b) | | 159,545 | 4,969,827 |
| Workday Inc Class A (b) | | 9,960 | 2,569,979 |
| Zoom Communications Inc Class A (b)(c) | | 74,401 | 6,071,866 |
| | | | 48,142,472 |
| Technology Hardware, Storage & Peripherals - 0.7% | | | |
| Apple Inc | | 17,184 | 4,303,217 |
| Hewlett Packard Enterprise Co | | 197,997 | 4,227,236 |
| HP Inc | | 54,740 | 1,786,166 |
| NetApp Inc | | 22,181 | 2,574,770 |
| Western Digital Corp (b) | | 43,077 | 2,568,682 |
| | | | 15,460,071 |
TOTAL INFORMATION TECHNOLOGY | | | 201,115,494 |
| | | | |
| Materials - 4.3% | | | |
| Chemicals - 2.2% | | | |
| Axalta Coating Systems Ltd (b) | | 12,898 | 441,369 |
| Dow Inc | | 220,317 | 8,841,321 |
| DuPont de Nemours Inc | | 133,911 | 10,210,714 |
| Ecolab Inc | | 35,856 | 8,401,778 |
| International Flavors & Fragrances Inc | | 32,758 | 2,769,689 |
| Linde PLC | | 20,937 | 8,765,694 |
| PPG Industries Inc | | 66,630 | 7,958,954 |
| | | | 47,389,519 |
| Construction Materials - 0.8% | | | |
| CRH PLC | | 179,917 | 16,645,921 |
| Vulcan Materials Co | | 222 | 57,105 |
| | | | 16,703,026 |
| Containers & Packaging - 0.4% | | | |
| Ardagh Metal Packaging SA | | 6,760 | 20,348 |
| Crown Holdings Inc | | 36,913 | 3,052,336 |
| Packaging Corp of America | | 5,696 | 1,282,340 |
| Sealed Air Corp (c) | | 141,383 | 4,782,987 |
| Sonoco Products Co | | 5,579 | 272,534 |
| | | | 9,410,545 |
| Metals & Mining - 0.7% | | | |
| Hecla Mining Co | | 222,951 | 1,094,689 |
| Newmont Corp | | 60,123 | 2,237,778 |
| Nucor Corp | | 46,601 | 5,438,803 |
| Steel Dynamics Inc (c) | | 45,341 | 5,172,048 |
| Worthington Steel Inc (c) | | 14,131 | 449,648 |
| | | | 14,392,966 |
| Paper & Forest Products - 0.2% | | | |
| Louisiana-Pacific Corp | | 24,413 | 2,527,966 |
| Magnera Corp (b)(c) | | 78,670 | 1,429,434 |
| | | | 3,957,400 |
TOTAL MATERIALS | | | 91,853,456 |
| | | | |
| Real Estate - 3.9% | | | |
| Health Care REITs - 0.3% | | | |
| CareTrust REIT Inc | | 56,699 | 1,533,708 |
| Healthpeak Properties Inc | | 220,365 | 4,466,799 |
| | | | 6,000,507 |
| Industrial REITs - 0.3% | | | |
| First Industrial Realty Trust Inc | | 106,182 | 5,322,904 |
| STAG Industrial Inc Class A | | 33,674 | 1,138,854 |
| | | | 6,461,758 |
| Office REITs - 0.0% | | | |
| Cousins Properties Inc | | 49 | 1,501 |
| Real Estate Management & Development - 0.6% | | | |
| CoStar Group Inc (b) | | 26,954 | 1,929,637 |
| Newmark Group Inc Class A | | 66,979 | 858,001 |
| Zillow Group Inc Class A (b) | | 65,219 | 4,620,766 |
| Zillow Group Inc Class C (b) | | 71,544 | 5,297,833 |
| | | | 12,706,237 |
| Residential REITs - 0.3% | | | |
| American Homes 4 Rent Class A | | 61,325 | 2,294,782 |
| Equity Residential | | 47,563 | 3,413,121 |
| Invitation Homes Inc | | 19,388 | 619,834 |
| | | | 6,327,737 |
| Retail REITs - 0.6% | | | |
| Brixmor Property Group Inc | | 282,738 | 7,871,426 |
| Regency Centers Corp | | 19,075 | 1,410,215 |
| Simon Property Group Inc | | 25,471 | 4,386,361 |
| | | | 13,668,002 |
| Specialized REITs - 1.8% | | | |
| American Tower Corp | | 16,138 | 2,959,871 |
| Crown Castle Inc | | 95,620 | 8,678,471 |
| Equinix Inc | | 15,687 | 14,791,116 |
| Gaming and Leisure Properties Inc | | 20,550 | 989,688 |
| Public Storage Operating Co | | 22,812 | 6,830,825 |
| VICI Properties Inc | | 156,492 | 4,571,131 |
| | | | 38,821,102 |
TOTAL REAL ESTATE | | | 83,986,844 |
| | | | |
| Utilities - 3.8% | | | |
| Electric Utilities - 3.0% | | | |
| American Electric Power Co Inc | | 17,892 | 1,650,179 |
| Constellation Energy Corp | | 15,330 | 3,429,474 |
| Duke Energy Corp | | 86,233 | 9,290,743 |
| Edison International | | 48,715 | 3,889,406 |
| Evergy Inc | | 47,773 | 2,940,428 |
| Eversource Energy | | 43,304 | 2,486,949 |
| Exelon Corp | | 179,053 | 6,739,555 |
| NextEra Energy Inc | | 248,027 | 17,781,056 |
| PG&E Corp | | 378,521 | 7,638,554 |
| Southern Co/The | | 62,638 | 5,156,360 |
| Xcel Energy Inc | | 26,309 | 1,776,384 |
| | | | 62,779,088 |
| Gas Utilities - 0.0% | | | |
| New Jersey Resources Corp | | 8,001 | 373,246 |
| Independent Power and Renewable Electricity Producers - 0.1% | | | |
| AES Corp/The | | 240,348 | 3,093,279 |
| Clearway Energy Inc Class C | | 1,589 | 41,314 |
| | | | 3,134,593 |
| Multi-Utilities - 0.7% | | | |
| Black Hills Corp | | 156 | 9,128 |
| CenterPoint Energy Inc | | 95,078 | 3,016,825 |
| CMS Energy Corp | | 51,123 | 3,407,348 |
| Consolidated Edison Inc | | 12,030 | 1,073,437 |
| DTE Energy Co | | 31,854 | 3,846,371 |
| Public Service Enterprise Group Inc | | 28,916 | 2,443,113 |
| | | | 13,796,222 |
TOTAL UTILITIES | | | 80,083,149 |
| | | | |
| TOTAL UNITED STATES | | | 2,087,890,515 |
| TOTAL COMMON STOCKS (Cost $1,942,238,117) | | | 2,103,307,471 |
| | | | |
| U.S. Treasury Obligations - 0.1% |
| | | Yield (%) (d) | Principal Amount (a) | Value ($) |
| US Treasury Bills 0% 1/16/2025 | | 4.57 | 470,000 | 469,225 |
| US Treasury Bills 0% 1/2/2025 | | 4.55 to 4.58 | 490,000 | 490,000 |
| US Treasury Bills 0% 1/30/2025 (e) | | 4.52 to 4.53 | 1,200,000 | 1,196,052 |
| US Treasury Bills 0% 2/27/2025 (e) | | 4.41 | 540,000 | 536,455 |
| TOTAL U.S. TREASURY OBLIGATIONS (Cost $2,691,003) | | | | 2,691,732 |
| | | | | |
| Money Market Funds - 1.2% |
| | | Yield (%) | Shares | Value ($) |
| Fidelity Cash Central Fund (f) | | 4.36 | 19,740,618 | 19,744,566 |
| Fidelity Securities Lending Cash Central Fund (f)(g) | | 4.35 | 4,884,628 | 4,885,116 |
| TOTAL MONEY MARKET FUNDS (Cost $24,629,682) | | | | 24,629,682 |
| | | | | |
| TOTAL INVESTMENT IN SECURITIES - 99.9% (Cost $1,969,558,802) | 2,130,628,885 |
NET OTHER ASSETS (LIABILITIES) - 0.1% | 2,899,523 |
| NET ASSETS - 100.0% | 2,133,528,408 |
| | |
| Futures Contracts |
| | Number of contracts | Expiration Date | Notional Amount ($) | Value ($) | Unrealized Appreciation/ (Depreciation) ($) |
| Purchased | | | | | |
| | | | | | |
| Equity Contracts | | | | | |
| CME E-mini S&P 500 Index Contracts (United States) | 47 | Mar 2025 | 13,949,013 | (426,028) | (426,028) |
| | | | | | |
| The notional amount of futures purchased as a percentage of Net Assets is 0.7% |
Legend
| (a) | Amount is stated in United States dollars unless otherwise noted. |
| (c) | Security or a portion of the security is on loan at period end. |
| (d) | Yield represents either the annualized yield at the date of purchase, or the stated coupon rate, or, for floating and adjustable rate securities, the rate at period end. |
| (e) | Security or a portion of the security was pledged to cover margin requirements for futures contracts. At period end, the value of securities pledged amounted to $947,099. |
| (f) | Affiliated fund that is generally available only to investment companies and other accounts managed by Fidelity Investments. The rate quoted is the annualized seven-day yield of the fund at period end. A complete unaudited listing of the fund's holdings as of its most recent quarter end is available upon request. In addition, each Fidelity Central Fund's financial statements are available on the SEC's website or upon request. |
| (g) | Investment made with cash collateral received from securities on loan. |
Affiliated Central Funds
Fiscal year to date information regarding the Fund's investments in Fidelity Central Funds, including the ownership percentage, is presented below.
| Affiliate | Value, beginning of period ($) | Purchases ($) | Sales Proceeds ($) | Dividend Income ($) | Realized Gain (loss) ($) | Change in Unrealized appreciation (depreciation) ($) | Value, end of period ($) | Shares, end of period | % ownership, end of period |
| Fidelity Cash Central Fund | 43,118,597 | 278,615,139 | 301,989,170 | 441,773 | - | - | 19,744,566 | 19,740,618 | 0.0% |
| Fidelity Securities Lending Cash Central Fund | 9,990,301 | 89,779,541 | 94,884,726 | 3,165 | - | - | 4,885,116 | 4,884,628 | 0.0% |
| Total | 53,108,898 | 368,394,680 | 396,873,896 | 444,938 | - | - | 24,629,682 | 24,625,246 | |
| | | | | | | | | | |
Amounts in the dividend income column in the above table include any capital gain distributions from underlying funds, which are presented in the corresponding line item in the Statement of Operations, if applicable.
Amounts in the dividend income column for Fidelity Securities Lending Cash Central Fund represents the income earned on investing cash collateral, less rebates paid to borrowers and any lending agent fees associated with the loan, plus any premium payments received for lending certain types of securities.
Amounts included in the purchases and sales proceeds columns may include in-kind transactions, if applicable.
Investment Valuation
The following is a summary of the inputs used, as of December 31, 2024, involving the Fund's assets and liabilities carried at fair value. The inputs or methodology used for valuing securities may not be an indication of the risk associated with investing in those securities. For more information on valuation inputs, and their aggregation into the levels used below, please refer to the Investment Valuation section in the accompanying Notes to Financial Statements.
| Valuation Inputs at Reporting Date: |
| Description | Total ($) | Level 1 ($) | Level 2 ($) | Level 3 ($) |
Investments in Securities: | | | | |
|
| Common Stocks | | | | |
Communication Services | 101,064,011 | 101,064,011 | - | - |
Consumer Discretionary | 147,807,041 | 147,807,041 | - | - |
Consumer Staples | 146,910,321 | 146,910,321 | - | - |
Energy | 126,981,654 | 126,981,654 | - | - |
Financials | 486,850,924 | 486,850,924 | - | - |
Health Care | 277,131,585 | 277,131,585 | - | - |
Industrials | 350,237,129 | 350,237,129 | - | - |
Information Technology | 208,943,173 | 208,943,173 | - | - |
Materials | 92,653,304 | 92,653,304 | - | - |
Real Estate | 83,986,844 | 83,986,844 | - | - |
Utilities | 80,741,485 | 80,741,485 | - | - |
|
| U.S. Treasury Obligations | 2,691,732 | - | 2,691,732 | - |
|
| Money Market Funds | 24,629,682 | 24,629,682 | - | - |
| Total Investments in Securities: | 2,130,628,885 | 2,127,937,153 | 2,691,732 | - |
Derivative Instruments: Liabilities | | | | |
Futures Contracts | (426,028) | (426,028) | - | - |
| Total Liabilities | (426,028) | (426,028) | - | - |
| Total Derivative Instruments: | (426,028) | (426,028) | - | - |
Value of Derivative Instruments
The following table is a summary of the Fund's value of derivative instruments by primary risk exposure as of December 31, 2024. For additional information on derivative instruments, please refer to the Derivative Instruments section in the accompanying Notes to Financial Statements.
Primary Risk Exposure / Derivative Type | Value |
| Asset ($) | Liability ($) |
| Equity Risk | | |
Futures Contracts (a) | 0 | (426,028) |
| Total Equity Risk | 0 | (426,028) |
| Total Value of Derivatives | 0 | (426,028) |
(a)Reflects gross cumulative appreciation (depreciation) on futures contracts as presented in the Schedule of Investments. In the Statement of Assets and Liabilities, the period end daily variation margin is included in receivable or payable for daily variation margin on futures contracts, and the net cumulative appreciation (depreciation) is included in Total accumulated earnings (loss).
Fidelity® Enhanced Large Cap Value ETF
Financial Statements (Unaudited)
| Statement of Assets and Liabilities |
| As of December 31, 2024 (Unaudited) |
| Assets | | | | |
| Investment in securities, at value (including securities loaned of $4,782,432) - See accompanying schedule: | | | | |
Unaffiliated issuers (cost $1,944,929,120) | $ | 2,105,999,203 | | |
Fidelity Central Funds (cost $24,629,682) | | 24,629,682 | | |
| | | | | |
| | | | | |
| Total Investment in Securities (cost $1,969,558,802) | | | $ | 2,130,628,885 |
| Cash | | | | 13 |
| Receivable for investments sold | | | | 558,939 |
| Receivable for fund shares sold | | | | 194,847,328 |
| Dividends receivable | | | | 1,829,572 |
| Distributions receivable from Fidelity Central Funds | | | | 98,815 |
Total assets | | | | 2,327,963,552 |
| Liabilities | | | | |
| Payable for investments purchased | $ | 189,068,082 | | |
| Accrued management fee | | 297,536 | | |
| Payable for daily variation margin on futures contracts | | 70,383 | | |
| Other payables and accrued expenses | | 117,028 | | |
| Collateral on securities loaned | | 4,882,115 | | |
| Total liabilities | | | | 194,435,144 |
| Net Assets | | | $ | 2,133,528,408 |
| Net Assets consist of: | | | | |
| Paid in capital | | | $ | 1,935,010,767 |
| Total accumulated earnings (loss) | | | | 198,517,641 |
| Net Assets | | | $ | 2,133,528,408 |
Net Asset Value, offering price and redemption price per share ($2,133,528,408 ÷ 70,078,976 shares) | | | $ | 30.44 |
| Statement of Operations |
| | | | Six months ended December 31, 2024 (Unaudited) |
| Investment Income | | | | |
| Dividends | | | $ | 18,270,393 |
| Interest | | | | 56,270 |
| Income from Fidelity Central Funds (including $3,165 from security lending) | | | | 444,938 |
| Total income | | | | 18,771,601 |
| Expenses | | | | |
| Management fee | | | $ | 1,730,521 |
| Independent trustees' fees and expenses | | | | 4,130 |
| Interest | | | | - |
| Miscellaneous | | | | - |
| Total expenses before reductions | | | | 1,734,651 |
| Expense reductions | | | | (666) |
| Total expenses after reductions | | | | 1,733,985 |
| Net Investment income (loss) | | | | 17,037,616 |
| Realized and Unrealized Gain (Loss) | | | | |
| Net realized gain (loss) on: | | | | |
| Investment Securities: | | | | |
| Unaffiliated issuers | | | | 5,726,432 |
| Redemptions in-kind | | | | 100,607,757 |
| Fidelity Central Funds | | | | - |
| Foreign currency transactions | | | | 889 |
| Futures contracts | | | | (1,402,903) |
| Total net realized gain (loss) | | | | 104,932,175 |
| Change in net unrealized appreciation (depreciation) on: | | | | |
| Investment Securities: | | | | |
| Unaffiliated issuers | | | | 11,869,577 |
| Assets and liabilities in foreign currencies | | | | (908) |
| Futures contracts | | | | (452,442) |
| Total change in net unrealized appreciation (depreciation) | | | | 11,416,227 |
| Net gain (loss) | | | | 116,348,402 |
| Net increase (decrease) in net assets resulting from operations | | | $ | 133,386,018 |
| Statement of Changes in Net Assets |
| | | |
| | Six months ended December 31, 2024 (Unaudited) | | Ten months ended June 30, 2024 | | Year ended August 31, 2023 |
| Increase (Decrease) in Net Assets | | | | | | |
| Operations | | | | | | |
| Net investment income (loss) | $ | 17,037,616 | $ | 38,826,940 | $ | 104,218,377 |
| Net realized gain (loss) | | 104,932,175 | | 453,402,154 | | 209,018,224 |
| Change in net unrealized appreciation (depreciation) | | 11,416,227 | | (574,650,497) | | 130,413,938 |
| Net increase (decrease) in net assets resulting from operations | | 133,386,018 | | (82,421,403) | | 443,650,539 |
| Distributions to shareholders | | (17,530,292) | | (175,458,721) | | (257,200,574) |
| | | | | | | |
| Share transactions | | | | | | |
| Proceeds from sales of shares | | 746,313,097 | | 996,838,223 | | 817,757,697 |
| Reinvestment of distributions | | - | | 143,727,046 | | 243,302,994 |
| Cost of shares redeemed | | (521,157,350) | | (4,621,932,538) | | (1,407,138,550) |
| | | | | | | |
Net increase (decrease) in net assets resulting from share transactions | | 225,155,747 | | (3,481,367,269) | | (346,077,859) |
| Total increase (decrease) in net assets | | 341,011,473 | | (3,739,247,393) | | (159,627,894) |
| | | | | | | |
| Net Assets | | | | | | |
| Beginning of period | | 1,792,516,935 | | 5,531,764,328 | | 5,691,392,222 |
| End of period | $ | 2,133,528,408 | $ | 1,792,516,935 | $ | 5,531,764,328 |
| | | | | | | |
| Other Information | | | | | | |
| Shares | | | | | | |
| Sold | | 24,300,000 | | 38,559,161 | | 32,117,183 |
| Issued in reinvestment of distributions | | - | | 5,858,095 | | 9,686,875 |
| Redeemed | | (17,000,000) | | (192,077,486) | | (55,489,324) |
| Net increase (decrease) | | 7,300,000 | | (147,660,230) | | (13,685,266) |
| | | | | | | |
See Organization and Prior Fiscal Year Reorganization information note regarding reorganization from mutual fund to exchange traded fund for the ten months ended June 30, 2024.
Share activity is further described in Organization and Prior Fiscal Year Reorganization information notes, amounts have been adjusted to reflect the impact of the change in capital structure associated with the reorganization. All financial information prior to the reorganization is that of the Predecessor Fund.
Financial Highlights
Fidelity® Enhanced Large Cap Value ETF |
| |
| | Six months ended (Unaudited) December 31, 2024 | | Years ended June 30, 2024 A | | 2023 B,C | | 2022 B,C | | 2021 B,C | | 2020 B,C | | 2019 B,C |
Selected Per-Share Data | | | | | | | | | | | | | | |
| Net asset value, beginning of period | $ | 28.55 | $ | 26.29 | $ | 25.40 | $ | 30.16 | $ | 22.04 | $ | 22.36 | $ | 24.10 |
| Income from Investment Operations | | | | | | | | | | | | | | |
Net investment income (loss) D,E | | .27 | | .40 | | .47 | | .49 | | .44 | | .49 | | .52 |
| Net realized and unrealized gain (loss) | | 1.90 | | 2.99 | | 1.59 | | (1.81) | | 8.08 | | - | | (.80) |
| Total from investment operations | | 2.17 | | 3.39 | | 2.06 | | (1.32) | | 8.52 | | .49 | | (.28) |
| Distributions from net investment income | | (.28) | | (.80) | | (.38) | | (.58) | | (.40) | | (.51) | | (.54) |
| Distributions from net realized gain | | - | | (.33) | | (.79) | | (2.86) | | - | | (.30) | | (.94) |
| Total distributions | | (.28) | | (1.13) | | (1.17) | | (3.44) | | (.40) | | (.81) | | (1.46) F |
| Net asset value, end of period | $ | 30.44 | $ | 28.55 | $ | 26.29 | $ | 25.40 | $ | 30.16 | $ | 22.04 | $ | 22.36 |
Total Return G,H,I | | | | 13.49% | | 8.30% | | (5.18)% | | 39.12% | | 1.95% | | (.77)% |
Ratios to Average Net Assets E,J,K | | | | | | | | | | | | | | |
| Expenses before reductions | | .18% L | | .28% L,M | | .39% | | .39% | | .39% | | .39% | | .39% |
| Expenses net of fee waivers, if any | | | | .28% L,M | | .39% | | .39% | | .39% | | .39% | | .39% |
| Expenses net of all reductions | | .18% L | | .28% L,M | | .39% | | .39% | | .39% | | .39% | | .39% |
| Net investment income (loss) | | 1.77% L | | 1.82% L,M | | 1.88% | | 1.76% | | 1.65% | | 2.21% | | 2.37% |
| Supplemental Data | | | | | | | | | | | | | | |
| Net assets, end of period (000 omitted) | $ | 2,133,528 | $ | 1,792,517 | $ | 5,531,764 | $ | 5,691,392 | $ | 6,187,508 | $ | 3,887,139 | $ | 3,757,353 |
Portfolio turnover rate N | | | | 90% L,O | | 88% | | 112% | | 75% | | 81% | | 94% |
AFor the ten month period ended June 30. The Fund changed its fiscal year end from August 31 to June 30, effective March 1, 2024.
BFor the year ended August 31.
CAs further described in Organization and Reorganization information notes, per share amounts have been adjusted to reflect the impact of the change in capital structure associated with the reorganization. All financial information prior to the reorganization is that of the Predecessor Fund.
DCalculated based on average shares outstanding during the period.
ENet investment income (loss) is affected by the timing of the declaration of dividends by any underlying mutual funds or exchange-traded funds (ETFs). Net investment income (loss) of any mutual funds or ETFs is not included in the Fund's net investment income (loss) ratio.
FTotal distributions per share do not sum due to rounding.
GTotal returns for periods of less than one year are not annualized.
HTotal returns would have been lower if certain expenses had not been reduced during the applicable periods shown.
IBased on net asset value.
JFees and expenses of any underlying mutual funds or exchange-traded funds (ETFs) are not included in the Fund's expense ratio. The Fund indirectly bears its proportionate share of these expenses. For additional expense information related to investments in Fidelity Central Funds, please refer to the "Investments in Fidelity Central Funds" note found in the Notes to Financial Statements section of the most recent Annual or Semi-Annual report.
KExpense ratios reflect operating expenses of the class. Expenses before reductions do not reflect amounts reimbursed, waived, or reduced through arrangements with the investment adviser, brokerage services, or other offset arrangements, if applicable, and do not represent the amount paid by the class during periods when reimbursements, waivers or reductions occur.
LAnnualized.
MProxy expenses are not annualized.
NAmount does not include the portfolio activity of any underlying mutual funds or exchange-traded funds (ETFs), derivatives or securities that mature within one year from acquisition.
OPortfolio turnover rate excludes securities received or delivered in-kind.
Fidelity® Enhanced Mid Cap ETF
Schedule of Investments December 31, 2024 (Unaudited)
Showing Percentage of Net Assets
| Common Stocks - 98.7% |
| | | Shares | Value ($) |
| BRAZIL - 0.0% | | | |
| Financials - 0.0% | | | |
| Capital Markets - 0.0% | | | |
| XP Inc Class A | | 29 | 343 |
| CANADA - 0.0% | | | |
| Utilities - 0.0% | | | |
| Independent Power and Renewable Electricity Producers - 0.0% | | | |
| Brookfield Renewable Corp (United States) | | 36,948 | 1,021,982 |
| KOREA (SOUTH) - 0.4% | | | |
| Consumer Discretionary - 0.4% | | | |
| Broadline Retail - 0.4% | | | |
| Coupang Inc Class A (b) | | 339,845 | 7,469,793 |
| UNITED KINGDOM - 0.1% | | | |
| Energy - 0.1% | | | |
| Energy Equipment & Services - 0.1% | | | |
| TechnipFMC PLC | | 88,005 | 2,546,865 |
| UNITED STATES - 98.2% | | | |
| Communication Services - 2.7% | | | |
| Entertainment - 1.8% | | | |
| Electronic Arts Inc | | 75,010 | 10,973,963 |
| Playtika Holding Corp | | 277,640 | 1,926,821 |
| ROBLOX Corp Class A (b) | | 286,313 | 16,566,070 |
| Warner Bros Discovery Inc (b) | | 738,075 | 7,801,453 |
| | | | 37,268,307 |
| Media - 0.9% | | | |
| New York Times Co/The Class A | | 180,380 | 9,388,778 |
| News Corp Class A | | 265,353 | 7,307,822 |
| News Corp Class B | | 145,765 | 4,435,629 |
| | | | 21,132,229 |
TOTAL COMMUNICATION SERVICES | | | 58,400,536 |
| | | | |
| Consumer Discretionary - 12.0% | | | |
| Broadline Retail - 0.3% | | | |
| eBay Inc | | 107,593 | 6,665,386 |
| Etsy Inc (b) | | 9,200 | 486,588 |
| | | | 7,151,974 |
| Diversified Consumer Services - 0.7% | | | |
| ADT Inc | | 546,678 | 3,777,545 |
| Duolingo Inc Class A (b) | | 25,676 | 8,324,929 |
| H&R Block Inc | | 47,751 | 2,523,163 |
| | | | 14,625,637 |
| Hotels, Restaurants & Leisure - 4.1% | | | |
| Carnival Corp (b) | | 565,772 | 14,099,039 |
| DoorDash Inc Class A (b) | | 19,454 | 3,263,409 |
| DraftKings Inc Class A (b) | | 270,477 | 10,061,744 |
| Expedia Group Inc Class A (b) | | 84,362 | 15,719,172 |
| Hilton Worldwide Holdings Inc | | 38,184 | 9,437,557 |
| International Game Technology PLC | | 421,050 | 7,435,743 |
| Light & Wonder Inc Class A (b) | | 101,062 | 8,729,736 |
| MGM Resorts International (b) | | 302,753 | 10,490,391 |
| Royal Caribbean Cruises Ltd | | 16,326 | 3,766,245 |
| Texas Roadhouse Inc | | 3,390 | 611,658 |
| Travel + Leisure Co | | 24,035 | 1,212,566 |
| Wendy's Co/The | | 174,457 | 2,843,649 |
| | | | 87,670,909 |
| Household Durables - 2.8% | | | |
| DR Horton Inc | | 41,205 | 5,761,283 |
| Garmin Ltd | | 66,737 | 13,765,174 |
| Leggett & Platt Inc | | 142,340 | 1,366,464 |
| Lennar Corp Class A | | 17,776 | 2,424,113 |
| Newell Brands Inc | | 177,298 | 1,765,888 |
| NVR Inc (b) | | 1,554 | 12,710,011 |
| PulteGroup Inc | | 8,279 | 901,582 |
| Toll Brothers Inc | | 85,478 | 10,765,954 |
| TopBuild Corp (b) | | 29,599 | 9,215,353 |
| | | | 58,675,822 |
| Specialty Retail - 3.6% | | | |
| Abercrombie & Fitch Co Class A (b) | | 66,760 | 9,978,617 |
| Bath & Body Works Inc | | 143,129 | 5,549,111 |
| Best Buy Co Inc | | 6,247 | 535,992 |
| Burlington Stores Inc (b) | | 5,917 | 1,686,700 |
| Carvana Co Class A (b) | | 69,395 | 14,112,167 |
| Dick's Sporting Goods Inc | | 20,809 | 4,761,932 |
| Five Below Inc (b) | | 9,915 | 1,040,678 |
| Gap Inc/The | | 483,647 | 11,428,579 |
| Ross Stores Inc | | 106,688 | 16,138,694 |
| Ulta Beauty Inc (b) | | 19,773 | 8,599,871 |
| Williams-Sonoma Inc | | 16,916 | 3,132,505 |
| | | | 76,964,846 |
| Textiles, Apparel & Luxury Goods - 0.5% | | | |
| Tapestry Inc | | 142,526 | 9,311,224 |
| VF Corp | | 20,349 | 436,689 |
| | | | 9,747,913 |
TOTAL CONSUMER DISCRETIONARY | | | 254,837,101 |
| | | | |
| Consumer Staples - 3.7% | | | |
| Beverages - 0.1% | | | |
| Boston Beer Co Inc/The Class A (b) | | 10,212 | 3,063,396 |
| Consumer Staples Distribution & Retail - 1.6% | | | |
| Kroger Co/The | | 267,503 | 16,357,808 |
| Maplebear Inc (b) | | 256,717 | 10,633,218 |
| Sysco Corp | | 21,569 | 1,649,166 |
| US Foods Holding Corp (b) | | 52,400 | 3,534,904 |
| | | | 32,175,096 |
| Food Products - 0.8% | | | |
| Archer-Daniels-Midland Co | | 27,587 | 1,393,695 |
| General Mills Inc | | 110,619 | 7,054,174 |
| Hershey Co/The | | 13,505 | 2,287,072 |
| Ingredion Inc | | 36,044 | 4,958,213 |
| Kellanova | | 12,409 | 1,004,757 |
| Post Holdings Inc (b) | | 3,483 | 398,663 |
| | | | 17,096,574 |
| Household Products - 1.0% | | | |
| Clorox Co/The | | 81,502 | 13,236,740 |
| Colgate-Palmolive Co | | 92,575 | 8,415,993 |
| Reynolds Consumer Products Inc | | 34 | 918 |
| | | | 21,653,651 |
| Personal Care Products - 0.2% | | | |
| Estee Lauder Cos Inc/The Class A | | 52,256 | 3,918,155 |
| Kenvue Inc | | 47,712 | 1,018,651 |
| | | | 4,936,806 |
TOTAL CONSUMER STAPLES | | | 78,925,523 |
| | | | |
| Energy - 4.3% | | | |
| Energy Equipment & Services - 0.0% | | | |
| Halliburton Co | | 16,214 | 440,859 |
| Oil, Gas & Consumable Fuels - 4.3% | | | |
| Antero Midstream Corp | | 533,298 | 8,047,467 |
| Cheniere Energy Inc | | 64,050 | 13,762,424 |
| Civitas Resources Inc | | 7,295 | 334,622 |
| ConocoPhillips | | 29,051 | 2,880,988 |
| Coterra Energy Inc | | 3,580 | 91,432 |
| Devon Energy Corp | | 160,663 | 5,258,500 |
| Diamondback Energy Inc | | 25,364 | 4,155,384 |
| Hess Corp | | 33,910 | 4,510,369 |
| HF Sinclair Corp | | 14,755 | 517,163 |
| Kinder Morgan Inc | | 236,583 | 6,482,374 |
| Matador Resources Co | | 102,199 | 5,749,716 |
| Ovintiv Inc | | 13,035 | 527,918 |
| Targa Resources Corp | | 54,138 | 9,663,633 |
| Texas Pacific Land Corp | | 2,245 | 2,482,880 |
| Viper Energy Inc Class A | | 57,857 | 2,839,043 |
| Williams Cos Inc/The | | 421,737 | 22,824,406 |
| | | | 90,128,319 |
TOTAL ENERGY | | | 90,569,178 |
| | | | |
| Financials - 18.3% | | | |
| Banks - 1.7% | | | |
| Citizens Financial Group Inc | | 103,258 | 4,518,570 |
| Commerce Bancshares Inc/MO | | 33,496 | 2,087,136 |
| Huntington Bancshares Inc/OH | | 185,662 | 3,020,721 |
| KeyCorp | | 721,024 | 12,358,351 |
| M&T Bank Corp | | 33,760 | 6,347,218 |
| PNC Financial Services Group Inc/The | | 8,672 | 1,672,395 |
| Prosperity Bancshares Inc | | 3,199 | 241,044 |
| Zions Bancorp NA | | 120,620 | 6,543,635 |
| | | | 36,789,070 |
| Capital Markets - 5.6% | | | |
| Ameriprise Financial Inc | | 12,462 | 6,635,143 |
| Bank of New York Mellon Corp/The | | 245,633 | 18,871,983 |
| Cboe Global Markets Inc | | 37,795 | 7,385,143 |
| Coinbase Global Inc Class A (b) | | 20,122 | 4,996,293 |
| Interactive Brokers Group Inc Class A | | 13,065 | 2,308,194 |
| Janus Henderson Group PLC | | 31,967 | 1,359,557 |
| LPL Financial Holdings Inc | | 6,186 | 2,019,791 |
| MarketAxess Holdings Inc | | 15,430 | 3,487,797 |
| Morningstar Inc | | 7,083 | 2,385,271 |
| MSCI Inc | | 29,631 | 17,778,896 |
| Nasdaq Inc | | 116,211 | 8,984,272 |
| Raymond James Financial Inc | | 100,641 | 15,632,567 |
| SEI Investments Co | | 62,391 | 5,146,010 |
| State Street Corp | | 146,621 | 14,390,851 |
| Stifel Financial Corp | | 20,262 | 2,149,393 |
| Tradeweb Markets Inc Class A | | 35,365 | 4,629,986 |
| Virtu Financial Inc Class A | | 112 | 3,995 |
| | | | 118,165,142 |
| Consumer Finance - 1.1% | | | |
| Ally Financial Inc | | 85,910 | 3,093,619 |
| Discover Financial Services | | 27,204 | 4,712,549 |
| SoFi Technologies Inc Class A (b)(c) | | 600,517 | 9,247,962 |
| Synchrony Financial | | 120,558 | 7,836,270 |
| | | | 24,890,400 |
| Financial Services - 4.2% | | | |
| Block Inc Class A (b) | | 223,210 | 18,970,618 |
| Corpay Inc (b) | | 17,987 | 6,087,161 |
| Equitable Holdings Inc | | 221,959 | 10,469,806 |
| Euronet Worldwide Inc (b) | | 78,831 | 8,106,980 |
| Fidelity National Information Services Inc | | 150,757 | 12,176,643 |
| Global Payments Inc | | 35,950 | 4,028,557 |
| PayPal Holdings Inc (b) | | 124,958 | 10,665,165 |
| Toast Inc Class A (b) | | 318,972 | 11,626,529 |
| Western Union Co/The | | 646,310 | 6,850,886 |
| | | | 88,982,345 |
| Insurance - 5.7% | | | |
| AFLAC Inc | | 3,423 | 354,075 |
| Allstate Corp/The | | 101,729 | 19,612,334 |
| Arch Capital Group Ltd | | 18,997 | 1,754,373 |
| Arthur J Gallagher & Co | | 11,801 | 3,349,714 |
| Assurant Inc | | 55,266 | 11,783,817 |
| Axis Capital Holdings Ltd | | 34 | 3,012 |
| Brown & Brown Inc | | 48,393 | 4,937,054 |
| Cincinnati Financial Corp | | 17,856 | 2,565,907 |
| Everest Group Ltd | | 3,261 | 1,181,982 |
| Globe Life Inc | | 118,553 | 13,221,031 |
| Hartford Financial Services Group Inc/The | | 70,869 | 7,753,069 |
| Loews Corp | | 3,066 | 259,660 |
| Markel Group Inc (b) | | 8,145 | 14,060,143 |
| Prudential Financial Inc | | 105,942 | 12,557,305 |
| Reinsurance Group of America Inc | | 24,674 | 5,271,107 |
| Unum Group | | 95,589 | 6,980,865 |
| Willis Towers Watson PLC | | 49,055 | 15,365,988 |
| | | | 121,011,436 |
TOTAL FINANCIALS | | | 389,838,393 |
| | | | |
| Health Care - 8.3% | | | |
| Biotechnology - 2.7% | | | |
| Biogen Inc (b) | | 5,108 | 781,115 |
| BioMarin Pharmaceutical Inc (b) | | 11,135 | 731,903 |
| Exact Sciences Corp (b) | | 53,036 | 2,980,093 |
| Exelixis Inc (b) | | 362,676 | 12,077,111 |
| Gilead Sciences Inc | | 123,460 | 11,404,000 |
| Incyte Corp (b) | | 182,373 | 12,596,503 |
| Natera Inc (b) | | 7,575 | 1,199,123 |
| Neurocrine Biosciences Inc (b) | | 52,783 | 7,204,880 |
| United Therapeutics Corp (b) | | 20,806 | 7,341,189 |
| | | | 56,315,917 |
| Health Care Equipment & Supplies - 1.5% | | | |
| ABIOMED Inc (b)(d) | | 3,289 | 7,104 |
| DENTSPLY SIRONA Inc | | 172,051 | 3,265,528 |
| Dexcom Inc (b) | | 75,053 | 5,836,872 |
| GE HealthCare Technologies Inc | | 47 | 3,674 |
| IDEXX Laboratories Inc (b) | | 30,737 | 12,707,906 |
| ResMed Inc | | 11,541 | 2,639,311 |
| Solventum Corp | | 122,100 | 8,065,926 |
| | | | 32,526,321 |
| Health Care Providers & Services - 2.0% | | | |
| Cardinal Health Inc | | 98,226 | 11,617,189 |
| Cencora Inc | | 44,088 | 9,905,692 |
| Centene Corp (b) | | 264,830 | 16,043,401 |
| Humana Inc | | 4,754 | 1,206,137 |
| Quest Diagnostics Inc | | 4,959 | 748,115 |
| Universal Health Services Inc Class B | | 13,080 | 2,346,814 |
| | | | 41,867,348 |
| Health Care Technology - 0.8% | | | |
| Doximity Inc Class A (b) | | 55,366 | 2,955,990 |
| Veeva Systems Inc Class A (b) | | 70,750 | 14,875,188 |
| | | | 17,831,178 |
| Life Sciences Tools & Services - 0.9% | | | |
| 10X Genomics Inc Class A (b) | | 84,236 | 1,209,629 |
| Agilent Technologies Inc | | 45,151 | 6,065,585 |
| IQVIA Holdings Inc (b) | | 9,316 | 1,830,687 |
| Medpace Holdings Inc (b) | | 30,697 | 10,198,465 |
| QIAGEN NV (United States) | | 8,328 | 370,846 |
| | | | 19,675,212 |
| Pharmaceuticals - 0.4% | | | |
| Bristol-Myers Squibb Co | | 134,427 | 7,603,191 |
| Elanco Animal Health Inc (b) | | 10,637 | 128,814 |
| Jazz Pharmaceuticals PLC (b) | | 4 | 493 |
| | | | 7,732,498 |
TOTAL HEALTH CARE | | | 175,948,474 |
| | | | |
| Industrials - 17.6% | | | |
| Aerospace & Defense - 3.5% | | | |
| Axon Enterprise Inc (b) | | 21,846 | 12,983,515 |
| BWX Technologies Inc | | 22,818 | 2,541,697 |
| Curtiss-Wright Corp | | 35,196 | 12,490,005 |
| Hexcel Corp | | 13,023 | 816,541 |
| Howmet Aerospace Inc | | 167,038 | 18,268,946 |
| Huntington Ingalls Industries Inc | | 22,261 | 4,206,661 |
| L3Harris Technologies Inc | | 20,561 | 4,323,567 |
| Northrop Grumman Corp | | 7,977 | 3,743,526 |
| Textron Inc | | 148,699 | 11,373,987 |
| Woodward Inc | | 20,142 | 3,352,032 |
| | | | 74,100,477 |
| Air Freight & Logistics - 0.1% | | | |
| GXO Logistics Inc (b) | | 49,291 | 2,144,159 |
| Building Products - 1.9% | | | |
| A O Smith Corp | | 34,908 | 2,381,075 |
| Allegion plc | | 96,065 | 12,553,774 |
| Builders FirstSource Inc (b) | | 23,475 | 3,355,282 |
| Carlisle Cos Inc | | 2,174 | 801,858 |
| Masco Corp | | 54,601 | 3,962,395 |
| Owens Corning | | 44,056 | 7,503,618 |
| Trane Technologies PLC | | 24,924 | 9,205,679 |
| | | | 39,763,681 |
| Commercial Services & Supplies - 0.6% | | | |
| Cintas Corp | | 50,699 | 9,262,708 |
| MSA Safety Inc | | 7 | 1,160 |
| Veralto Corp | | 21,298 | 2,169,201 |
| Vestis Corp | | 104,085 | 1,586,255 |
| | | | 13,019,324 |
| Construction & Engineering - 1.3% | | | |
| AECOM | | 33,744 | 3,604,534 |
| Comfort Systems USA Inc | | 17,715 | 7,512,223 |
| EMCOR Group Inc | | 13,026 | 5,912,501 |
| Valmont Industries Inc | | 38,041 | 11,666,034 |
| | | | 28,695,292 |
| Electrical Equipment - 1.7% | | | |
| Acuity Brands Inc | | 25,253 | 7,377,159 |
| AMETEK Inc | | 99,630 | 17,959,304 |
| Hubbell Inc | | 27,997 | 11,727,663 |
| | | | 37,064,126 |
| Ground Transportation - 0.5% | | | |
| Lyft Inc Class A (b) | | 872,509 | 11,255,366 |
| Norfolk Southern Corp | | 8 | 1,878 |
| | | | 11,257,244 |
| Machinery - 3.4% | | | |
| Allison Transmission Holdings Inc | | 41,406 | 4,474,332 |
| Cummins Inc | | 54,440 | 18,977,785 |
| Donaldson Co Inc | | 145,684 | 9,811,817 |
| Flowserve Corp | | 73,974 | 4,254,984 |
| Fortive Corp | | 152,280 | 11,421,001 |
| Gates Industrial Corp PLC (b) | | 234,749 | 4,828,787 |
| ITT Inc | | 16,511 | 2,359,092 |
| PACCAR Inc | | 72,156 | 7,505,667 |
| Stanley Black & Decker Inc | | 3,253 | 261,183 |
| Westinghouse Air Brake Technologies Corp | | 46,511 | 8,818,020 |
| | | | 72,712,668 |
| Passenger Airlines - 0.9% | | | |
| Delta Air Lines Inc | | 18,344 | 1,109,812 |
| Southwest Airlines Co | | 64,797 | 2,178,475 |
| United Airlines Holdings Inc (b) | | 165,841 | 16,103,161 |
| | | | 19,391,448 |
| Professional Services - 2.6% | | | |
| Booz Allen Hamilton Holding Corp Class A | | 104,623 | 13,464,980 |
| CACI International Inc (b) | | 23,011 | 9,297,825 |
| Leidos Holdings Inc | | 97,385 | 14,029,283 |
| Paylocity Holding Corp (b) | | 23,029 | 4,593,595 |
| SS&C Technologies Holdings Inc | | 170,476 | 12,918,671 |
| | | | 54,304,354 |
| Trading Companies & Distributors - 1.1% | | | |
| Core & Main Inc Class A (b) | | 53,573 | 2,727,401 |
| Wesco International Inc | | 66,341 | 12,005,067 |
| WW Grainger Inc | | 7,574 | 7,983,375 |
| | | | 22,715,843 |
TOTAL INDUSTRIALS | | | 375,168,616 |
| | | | |
| Information Technology - 15.0% | | | |
| Communications Equipment - 1.0% | | | |
| F5 Inc (b) | | 47,739 | 12,004,926 |
| Juniper Networks Inc | | 1,992 | 74,600 |
| Motorola Solutions Inc | | 22,886 | 10,578,596 |
| | | | 22,658,122 |
| Electronic Equipment, Instruments & Components - 1.6% | | | |
| Arrow Electronics Inc (b) | | 2,563 | 289,927 |
| CDW Corp/DE | | 30,104 | 5,239,300 |
| Corning Inc | | 90,853 | 4,317,335 |
| TD SYNNEX Corp | | 79,926 | 9,373,721 |
| Zebra Technologies Corp Class A (b) | | 36,587 | 14,130,631 |
| | | | 33,350,914 |
| IT Services - 1.2% | | | |
| Akamai Technologies Inc (b) | | 7,486 | 716,036 |
| GoDaddy Inc Class A (b) | | 33,345 | 6,581,303 |
| Kyndryl Holdings Inc (b) | | 116,105 | 4,017,233 |
| Twilio Inc Class A (b) | | 126,165 | 13,635,913 |
| | | | 24,950,485 |
| Semiconductors & Semiconductor Equipment - 2.4% | | | |
| Astera Labs Inc (b) | | 11,644 | 1,542,248 |
| Cirrus Logic Inc (b) | | 114,711 | 11,422,921 |
| KLA Corp | | 6,824 | 4,299,939 |
| Lattice Semiconductor Corp (b) | | 3,723 | 210,908 |
| Microchip Technology Inc | | 26,030 | 1,492,821 |
| Monolithic Power Systems Inc | | 17,149 | 10,147,063 |
| Qorvo Inc (b) | | 160,822 | 11,246,282 |
| Skyworks Solutions Inc | | 113,281 | 10,045,759 |
| | | | 50,407,941 |
| Software - 7.3% | | | |
| ANSYS Inc (b) | | 8,804 | 2,969,853 |
| AppLovin Corp Class A (b) | | 21,579 | 6,987,928 |
| BILL Holdings Inc (b) | | 62,683 | 5,309,877 |
| DocuSign Inc (b) | | 157,974 | 14,208,182 |
| Dropbox Inc Class A (b) | | 409,564 | 12,303,303 |
| Dynatrace Inc (b) | | 209,677 | 11,395,945 |
| Fortinet Inc (b) | | 28,367 | 2,680,114 |
| HubSpot Inc (b) | | 23,805 | 16,586,610 |
| Manhattan Associates Inc (b) | | 41,926 | 11,330,082 |
| Nutanix Inc Class A (b) | | 98,905 | 6,051,008 |
| Palantir Technologies Inc Class A (b) | | 210,609 | 15,928,359 |
| Pegasystems Inc (c) | | 111,971 | 10,435,697 |
| RingCentral Inc Class A (b) | | 206,471 | 7,228,550 |
| Roper Technologies Inc | | 3,785 | 1,967,632 |
| Teradata Corp (b) | | 348,388 | 10,852,286 |
| UiPath Inc Class A (b) | | 202,030 | 2,567,801 |
| Unity Software Inc (b) | | 54,854 | 1,232,569 |
| Workday Inc Class A (b) | | 4,892 | 1,262,283 |
| Zoom Communications Inc Class A (b) | | 178,425 | 14,561,264 |
| | | | 155,859,343 |
| Technology Hardware, Storage & Peripherals - 1.5% | | | |
| Hewlett Packard Enterprise Co | | 716,838 | 15,304,491 |
| HP Inc | | 67,755 | 2,210,846 |
| NetApp Inc | | 127,313 | 14,778,493 |
| | | | 32,293,830 |
TOTAL INFORMATION TECHNOLOGY | | | 319,520,635 |
| | | | |
| Materials - 5.5% | | | |
| Chemicals - 2.5% | | | |
| Axalta Coating Systems Ltd (b) | | 348,452 | 11,924,027 |
| CF Industries Holdings Inc | | 6,336 | 540,588 |
| Dow Inc | | 44,184 | 1,773,104 |
| DuPont de Nemours Inc | | 150,865 | 11,503,456 |
| Ecolab Inc | | 42,353 | 9,924,155 |
| International Flavors & Fragrances Inc | | 65,404 | 5,529,908 |
| PPG Industries Inc | | 106,616 | 12,735,281 |
| | | | 53,930,519 |
| Construction Materials - 0.9% | | | |
| CRH PLC | | 113,871 | 10,535,345 |
| Vulcan Materials Co | | 31,847 | 8,192,004 |
| | | | 18,727,349 |
| Containers & Packaging - 0.8% | | | |
| Crown Holdings Inc | | 112,632 | 9,313,540 |
| Sealed Air Corp | | 207,272 | 7,012,012 |
| Smurfit WestRock PLC | | 3 | 161 |
| | | | 16,325,713 |
| Metals & Mining - 1.0% | | | |
| ATI Inc (b) | | 40,276 | 2,216,791 |
| Nucor Corp | | 59,684 | 6,965,720 |
| Reliance Inc | | 19,059 | 5,131,826 |
| Steel Dynamics Inc | | 66,407 | 7,575,047 |
| | | | 21,889,384 |
| Paper & Forest Products - 0.3% | | | |
| Louisiana-Pacific Corp | | 48,696 | 5,042,471 |
| Magnera Corp (b) | | 40,055 | 727,799 |
| | | | 5,770,270 |
TOTAL MATERIALS | | | 116,643,235 |
| | | | |
| Real Estate - 6.5% | | | |
| Health Care REITs - 0.6% | | | |
| CareTrust REIT Inc | | 181,358 | 4,905,734 |
| Healthpeak Properties Inc | | 335,790 | 6,806,463 |
| | | | 11,712,197 |
| Industrial REITs - 0.1% | | | |
| EastGroup Properties Inc | | 6,047 | 970,483 |
| First Industrial Realty Trust Inc | | 22,822 | 1,144,067 |
| STAG Industrial Inc Class A | | 5,324 | 180,058 |
| | | | 2,294,608 |
| Real Estate Management & Development - 1.2% | | | |
| CBRE Group Inc Class A (b) | | 5,420 | 711,592 |
| CoStar Group Inc (b) | | 198,504 | 14,210,901 |
| Zillow Group Inc Class A (b) | | 70,193 | 4,973,174 |
| Zillow Group Inc Class C (b) | | 86,660 | 6,417,173 |
| | | | 26,312,840 |
| Residential REITs - 0.8% | | | |
| American Homes 4 Rent Class A | | 278,276 | 10,413,088 |
| Equity Residential | | 83,419 | 5,986,147 |
| UDR Inc | | 10 | 434 |
| | | | 16,399,669 |
| Retail REITs - 1.6% | | | |
| Brixmor Property Group Inc | | 433,419 | 12,066,385 |
| Regency Centers Corp | | 38,487 | 2,845,343 |
| Simon Property Group Inc | | 111,974 | 19,283,043 |
| | | | 34,194,771 |
| Specialized REITs - 2.2% | | | |
| American Tower Corp | | 19,414 | 3,560,722 |
| Crown Castle Inc | | 135,464 | 12,294,714 |
| EPR Properties | | 12,794 | 566,518 |
| Gaming and Leisure Properties Inc | | 113,976 | 5,489,084 |
| Public Storage Operating Co | | 28,832 | 8,633,454 |
| SBA Communications Corp Class A | | 21,443 | 4,370,083 |
| VICI Properties Inc | | 416,048 | 12,152,762 |
| | | | 47,067,337 |
TOTAL REAL ESTATE | | | 137,981,422 |
| | | | |
| Utilities - 4.3% | | | |
| Electric Utilities - 2.2% | | | |
| Edison International | | 119,442 | 9,536,249 |
| Evergy Inc | | 72,789 | 4,480,163 |
| Eversource Energy | | 67,709 | 3,888,528 |
| Exelon Corp | | 99,928 | 3,761,290 |
| NRG Energy Inc | | 147,270 | 13,286,700 |
| PG&E Corp | | 344,888 | 6,959,840 |
| Xcel Energy Inc | | 58,770 | 3,968,150 |
| | | | 45,880,920 |
| Independent Power and Renewable Electricity Producers - 1.0% | | | |
| AES Corp/The | | 192,303 | 2,474,940 |
| Clearway Energy Inc Class A | | 32,811 | 802,229 |
| Clearway Energy Inc Class C (c) | | 52,434 | 1,363,284 |
| Vistra Corp | | 121,276 | 16,720,322 |
| | | | 21,360,775 |
| Multi-Utilities - 1.1% | | | |
| CenterPoint Energy Inc | | 351,611 | 11,156,618 |
| CMS Energy Corp | | 154,885 | 10,323,085 |
| Consolidated Edison Inc | | 4,844 | 432,230 |
| DTE Energy Co | | 14,427 | 1,742,060 |
| | | | 23,653,993 |
| Water Utilities - 0.0% | | | |
| American Water Works Co Inc | | 4,908 | 610,996 |
TOTAL UTILITIES | | | 91,506,684 |
| | | | |
| TOTAL UNITED STATES | | | 2,089,339,797 |
| TOTAL COMMON STOCKS (Cost $1,861,642,953) | | | 2,100,378,780 |
| | | | |
| U.S. Treasury Obligations - 0.1% |
| | | Yield (%) (e) | Principal Amount (a) | Value ($) |
| US Treasury Bills 0% 1/2/2025 | | 4.55 to 4.59 | 90,000 | 90,000 |
| US Treasury Bills 0% 1/9/2025 (f) | | 4.57 to 4.58 | 1,980,000 | 1,978,380 |
| US Treasury Bills 0% 2/27/2025 (f) | | 4.41 | 210,000 | 208,621 |
| US Treasury Bills 0% 2/6/2025 (f) | | 4.46 | 140,000 | 139,425 |
| US Treasury Bills 0% 3/13/2025 (f) | | 4.31 | 230,000 | 228,131 |
| TOTAL U.S. TREASURY OBLIGATIONS (Cost $2,643,999) | | | | 2,644,557 |
| | | | | |
| Money Market Funds - 1.2% |
| | | Yield (%) | Shares | Value ($) |
| Fidelity Cash Central Fund (g) | | 4.36 | 17,577,281 | 17,580,796 |
| Fidelity Securities Lending Cash Central Fund (g)(h) | | 4.35 | 7,664,259 | 7,665,025 |
| TOTAL MONEY MARKET FUNDS (Cost $25,245,821) | | | | 25,245,821 |
| | | | | |
| TOTAL INVESTMENT IN SECURITIES - 100.0% (Cost $1,889,532,773) | 2,128,269,158 |
NET OTHER ASSETS (LIABILITIES) - 0.0% | 328,559 |
| NET ASSETS - 100.0% | 2,128,597,717 |
| | |
| Futures Contracts |
| | Number of contracts | Expiration Date | Notional Amount ($) | Value ($) | Unrealized Appreciation/ (Depreciation) ($) |
| Purchased | | | | | |
| | | | | | |
| Equity Contracts | | | | | |
| CME E-mini S&P MidCap 400 Index Contracts (United States) | 67 | Mar 2025 | 21,082,890 | (838,530) | (838,530) |
| | | | | | |
| The notional amount of futures purchased as a percentage of Net Assets is 1.0% |
Legend
| (a) | Amount is stated in United States dollars unless otherwise noted. |
| (c) | Security or a portion of the security is on loan at period end. |
| (e) | Yield represents either the annualized yield at the date of purchase, or the stated coupon rate, or, for floating and adjustable rate securities, the rate at period end. |
| (f) | Security or a portion of the security was pledged to cover margin requirements for futures contracts. At period end, the value of securities pledged amounted to $1,058,782. |
| (g) | Affiliated fund that is generally available only to investment companies and other accounts managed by Fidelity Investments. The rate quoted is the annualized seven-day yield of the fund at period end. A complete unaudited listing of the fund's holdings as of its most recent quarter end is available upon request. In addition, each Fidelity Central Fund's financial statements are available on the SEC's website or upon request. |
| (h) | Investment made with cash collateral received from securities on loan. |
Affiliated Central Funds
Fiscal year to date information regarding the Fund's investments in Fidelity Central Funds, including the ownership percentage, is presented below.
| Affiliate | Value, beginning of period ($) | Purchases ($) | Sales Proceeds ($) | Dividend Income ($) | Realized Gain (loss) ($) | Change in Unrealized appreciation (depreciation) ($) | Value, end of period ($) | Shares, end of period | % ownership, end of period |
| Fidelity Cash Central Fund | 79,628,655 | 247,494,714 | 309,542,572 | 421,791 | - | (1) | 17,580,796 | 17,577,281 | 0.0% |
| Fidelity Securities Lending Cash Central Fund | 10,080,342 | 71,687,430 | 74,102,747 | 125,827 | - | - | 7,665,025 | 7,664,259 | 0.0% |
| Total | 89,708,997 | 319,182,144 | 383,645,319 | 547,618 | - | (1) | 25,245,821 | 25,241,540 | |
| | | | | | | | | | |
Amounts in the dividend income column in the above table include any capital gain distributions from underlying funds, which are presented in the corresponding line item in the Statement of Operations, if applicable.
Amounts in the dividend income column for Fidelity Securities Lending Cash Central Fund represents the income earned on investing cash collateral, less rebates paid to borrowers and any lending agent fees associated with the loan, plus any premium payments received for lending certain types of securities.
Amounts included in the purchases and sales proceeds columns may include in-kind transactions, if applicable.
Investment Valuation
The following is a summary of the inputs used, as of December 31, 2024, involving the Fund's assets and liabilities carried at fair value. The inputs or methodology used for valuing securities may not be an indication of the risk associated with investing in those securities. For more information on valuation inputs, and their aggregation into the levels used below, please refer to the Investment Valuation section in the accompanying Notes to Financial Statements.
| Valuation Inputs at Reporting Date: |
| Description | Total ($) | Level 1 ($) | Level 2 ($) | Level 3 ($) |
Investments in Securities: | | | | |
|
| Common Stocks | | | | |
Communication Services | 58,400,536 | 58,400,536 | - | - |
Consumer Discretionary | 262,306,894 | 262,306,894 | - | - |
Consumer Staples | 78,925,523 | 78,925,523 | - | - |
Energy | 93,116,043 | 93,116,043 | - | - |
Financials | 389,838,736 | 389,838,736 | - | - |
Health Care | 175,948,474 | 175,941,370 | - | 7,104 |
Industrials | 375,168,616 | 375,168,616 | - | - |
Information Technology | 319,520,635 | 319,520,635 | - | - |
Materials | 116,643,235 | 116,643,235 | - | - |
Real Estate | 137,981,422 | 137,981,422 | - | - |
Utilities | 92,528,666 | 92,528,666 | - | - |
|
| U.S. Treasury Obligations | 2,644,557 | - | 2,644,557 | - |
|
| Money Market Funds | 25,245,821 | 25,245,821 | - | - |
| Total Investments in Securities: | 2,128,269,158 | 2,125,617,497 | 2,644,557 | 7,104 |
Derivative Instruments: Liabilities | | | | |
Futures Contracts | (838,530) | (838,530) | - | - |
| Total Liabilities | (838,530) | (838,530) | - | - |
| Total Derivative Instruments: | (838,530) | (838,530) | - | - |
Value of Derivative Instruments
The following table is a summary of the Fund's value of derivative instruments by primary risk exposure as of December 31, 2024. For additional information on derivative instruments, please refer to the Derivative Instruments section in the accompanying Notes to Financial Statements.
Primary Risk Exposure / Derivative Type | Value |
| Asset ($) | Liability ($) |
| Equity Risk | | |
Futures Contracts (a) | 0 | (838,530) |
| Total Equity Risk | 0 | (838,530) |
| Total Value of Derivatives | 0 | (838,530) |
(a)Reflects gross cumulative appreciation (depreciation) on futures contracts as presented in the Schedule of Investments. In the Statement of Assets and Liabilities, the period end daily variation margin is included in receivable or payable for daily variation margin on futures contracts, and the net cumulative appreciation (depreciation) is included in Total accumulated earnings (loss).
Fidelity® Enhanced Mid Cap ETF
Financial Statements (Unaudited)
| Statement of Assets and Liabilities |
| As of December 31, 2024 (Unaudited) |
| Assets | | | | |
| Investment in securities, at value (including securities loaned of $7,392,760) - See accompanying schedule: | | | | |
Unaffiliated issuers (cost $1,864,286,952) | $ | 2,103,023,337 | | |
Fidelity Central Funds (cost $25,245,821) | | 25,245,821 | | |
| | | | | |
| | | | | |
| Total Investment in Securities (cost $1,889,532,773) | | | $ | 2,128,269,158 |
| Cash | | | | 26,586 |
| Receivable for investments sold | | | | 61,869 |
| Receivable for fund shares sold | | | | 111,655,493 |
| Dividends receivable | | | | 1,204,902 |
| Distributions receivable from Fidelity Central Funds | | | | 81,595 |
| Receivable for daily variation margin on futures contracts | | | | 38,487 |
| Other receivables | | | | 15 |
Total assets | | | | 2,241,338,105 |
| Liabilities | | | | |
| Payable for investments purchased | $ | 104,676,951 | | |
| Accrued management fee | | 398,412 | | |
| Collateral on securities loaned | | 7,665,025 | | |
| Total liabilities | | | | 112,740,388 |
| Net Assets | | | $ | 2,128,597,717 |
| Net Assets consist of: | | | | |
| Paid in capital | | | $ | 1,803,554,911 |
| Total accumulated earnings (loss) | | | | 325,042,806 |
| Net Assets | | | $ | 2,128,597,717 |
Net Asset Value, offering price and redemption price per share ($2,128,597,717 ÷ 64,816,761 shares) | | | $ | 32.84 |
| Statement of Operations |
| | | | Six months ended December 31, 2024 (Unaudited) |
| Investment Income | | | | |
| Dividends | | | $ | 12,531,051 |
| Interest | | | | 68,523 |
| Income from Fidelity Central Funds (including $125,827 from security lending) | | | | 547,618 |
| Total income | | | | 13,147,192 |
| Expenses | | | | |
| Management fee | | | $ | 2,174,946 |
| Independent trustees' fees and expenses | | | | 3,936 |
| Interest | | | | 4,284 |
| Miscellaneous | | | | - |
| Total expenses before reductions | | | | 2,183,166 |
| Expense reductions | | | | (1,688) |
| Total expenses after reductions | | | | 2,181,478 |
| Net Investment income (loss) | | | | 10,965,714 |
| Realized and Unrealized Gain (Loss) | | | | |
| Net realized gain (loss) on: | | | | |
| Investment Securities: | | | | |
| Unaffiliated issuers | | | | (7,244,339) |
| Redemptions in-kind | | | | 153,177,586 |
| Fidelity Central Funds | | | | - |
| Foreign currency transactions | | | | - |
| Futures contracts | | | | 2,645,408 |
| Total net realized gain (loss) | | | | 148,578,655 |
| Change in net unrealized appreciation (depreciation) on: | | | | |
| Investment Securities: | | | | |
| Unaffiliated issuers | | | | 49,358,368 |
| Fidelity Central Funds | | | | (1) |
| Futures contracts | | | | (886,629) |
| Total change in net unrealized appreciation (depreciation) | | | | 48,471,738 |
| Net gain (loss) | | | | 197,050,393 |
| Net increase (decrease) in net assets resulting from operations | | | $ | 208,016,107 |
| Statement of Changes in Net Assets |
| | | |
| | Six months ended December 31, 2024 (Unaudited) | | Ten months ended June 30, 2024 | | Year ended August 31, 2023 |
| Increase (Decrease) in Net Assets | | | | | | |
| Operations | | | | | | |
| Net investment income (loss) | $ | 10,965,714 | $ | 15,169,494 | $ | 19,450,767 |
| Net realized gain (loss) | | 148,578,655 | | 178,466,399 | | 8,724,420 |
| Change in net unrealized appreciation (depreciation) | | 48,471,738 | | 13,844,200 | | 111,463,962 |
| Net increase (decrease) in net assets resulting from operations | | 208,016,107 | | 207,480,093 | | 139,639,149 |
| Distributions to shareholders | | (11,714,285) | | (25,950,215) | | (57,460,804) |
| | | | | | | |
| Share transactions | | | | | | |
| Proceeds from sales of shares | | 777,993,699 | | 655,066,382 | | 531,911,323 |
| Reinvestment of distributions | | - | | 14,294,274 | | 54,197,269 |
| Cost of shares redeemed | | (499,273,880) | | (833,830,134) | | (686,633,472) |
| | | | | | | |
Net increase (decrease) in net assets resulting from share transactions | | 278,719,819 | | (164,469,478) | | (100,524,880) |
| Total increase (decrease) in net assets | | 475,021,641 | | 17,060,400 | | (18,346,535) |
| | | | | | | |
| Net Assets | | | | | | |
| Beginning of period | | 1,653,576,076 | | 1,636,515,676 | | 1,654,862,211 |
| End of period | $ | 2,128,597,717 | $ | 1,653,576,076 | $ | 1,636,515,676 |
| | | | | | | |
| Other Information | | | | | | |
| Shares | | | | | | |
| Sold | | 24,100,000 | | 22,793,530 | | 21,113,682 |
| Issued in reinvestment of distributions | | - | | 584,792 | | 2,258,425 |
| Redeemed | | (15,400,000) | | (30,719,865) | | (27,059,804) |
| Net increase (decrease) | | 8,700,000 | | (7,341,543) | | (3,687,697) |
| | | | | | | |
See Organization and Prior Fiscal Year Reorganization information note regarding reorganization from mutual fund to exchange traded fund for the ten months ended June 30, 2024.
Share activity is further described in Organization and Prior Fiscal Year Reorganization information notes, amounts have been adjusted to reflect the impact of the change in capital structure associated with the reorganization. All financial information prior to the reorganization is that of the Predecessor Fund.
Financial Highlights
Fidelity® Enhanced Mid Cap ETF |
| |
| | Six months ended (Unaudited) December 31, 2024 | | Years ended June 30, 2024 A | | 2023 B,C | | 2022 B,C | | 2021 B,C | | 2020 B,C | | 2019 B,C |
Selected Per-Share Data | | | | | | | | | | | | | | |
| Net asset value, beginning of period | $ | 29.47 | $ | 25.79 | $ | 24.65 | $ | 32.17 | $ | 23.47 | $ | 22.59 | $ | 25.42 |
| Income from Investment Operations | | | | | | | | | | | | | | |
Net investment income (loss) D,E | | .19 | | .27 | | .28 | | .28 | | .22 | | .29 | | .33 |
| Net realized and unrealized gain (loss) | | 3.38 | | 3.86 | | 1.69 | | (3.81) | | 9.40 | | 1.50 | | (1.10) |
| Total from investment operations | | 3.57 | | 4.13 | | 1.97 | | (3.53) | | 9.62 | | 1.79 | | (.77) |
| Distributions from net investment income | | (.20) | | (.45) | | (.23) | | (.23) | | (.25) | | (.34) | | (.39) |
| Distributions from net realized gain | | - | | - | | (.57) | | (3.76) | | (.67) | | (.59) | | (1.69) |
| Total distributions | | (.20) | | (.45) | | (.83) F | | (3.99) | | (.92) | | (.91) F | | (2.06) F |
| Net asset value, end of period | $ | 32.84 | $ | 29.47 | $ | 25.79 | $ | 24.65 | $ | 32.17 | $ | 23.47 | $ | 22.59 |
Total Return G,H,I | | | | 16.23% | | 8.19% | | (12.36)% | | 41.82% | | 7.91% | | (2.19)% |
Ratios to Average Net Assets E,J,K | | | | | | | | | | | | | | |
| Expenses before reductions | | .23% L | | .29% L,M | | .45% | | .51% | | .59% | | .59% | | .59% |
| Expenses net of fee waivers, if any | | | | .29% L,M | | .45% | | .51% | | .59% | | .59% | | .59% |
| Expenses net of all reductions | | .23% L | | .29% L,M | | .45% | | .51% | | .59% | | .59% | | .59% |
| Net investment income (loss) | | 1.16% L | | 1.19% L,M | | 1.12% | | 1.00% | | .77% | | 1.33% | | 1.46% |
| Supplemental Data | | | | | | | | | | | | | | |
| Net assets, end of period (000 omitted) | $ | 2,128,598 | $ | 1,653,576 | $ | 1,636,516 | $ | 1,654,862 | $ | 2,042,347 | $ | 1,182,253 | $ | 1,263,319 |
Portfolio turnover rate N | | | | 73% L,O | | 104% | | 116% | | 70% | | 73% | | 90% |
AFor the ten month period ended June 30. The Fund changed its fiscal year end from August 31 to June 30, effective March 1, 2024.
BFor the year ended August 31.
CAs further described in Organization and Reorganization information notes, per share amounts have been adjusted to reflect the impact of the change in capital structure associated with the reorganization. All financial information prior to the reorganization is that of the Predecessor Fund.
DCalculated based on average shares outstanding during the period.
ENet investment income (loss) is affected by the timing of the declaration of dividends by any underlying mutual funds or exchange-traded funds (ETFs). Net investment income (loss) of any mutual funds or ETFs is not included in the Fund's net investment income (loss) ratio.
FTotal distributions per share do not sum due to rounding.
GBased on net asset value.
HTotal returns for periods of less than one year are not annualized.
ITotal returns would have been lower if certain expenses had not been reduced during the applicable periods shown.
JFees and expenses of any underlying mutual funds or exchange-traded funds (ETFs) are not included in the Fund's expense ratio. The Fund indirectly bears its proportionate share of these expenses. For additional expense information related to investments in Fidelity Central Funds, please refer to the "Investments in Fidelity Central Funds" note found in the Notes to Financial Statements section of the most recent Annual or Semi-Annual report.
KExpense ratios reflect operating expenses of the class. Expenses before reductions do not reflect amounts reimbursed, waived, or reduced through arrangements with the investment adviser, brokerage services, or other offset arrangements, if applicable, and do not represent the amount paid by the class during periods when reimbursements, waivers or reductions occur.
LAnnualized.
MProxy expenses are not annualized.
NAmount does not include the portfolio activity of any underlying mutual funds or exchange-traded funds (ETFs), derivatives or securities that mature within one year from acquisition.
OPortfolio turnover rate excludes securities received or delivered in-kind.
Notes to Financial Statements
(Unaudited)For the period ended December 31, 2024
1. Organization.
Fidelity Enhanced International ETF, Fidelity Enhanced Large Cap Core ETF, Fidelity Enhanced Large Cap Growth ETF, Fidelity Enhanced Large Cap Value ETF and Fidelity Enhanced Mid Cap ETF (the Funds) are exchange-traded funds of Fidelity Covington Trust (the Trust) and are authorized to issue an unlimited number of shares. Fidelity Enhanced Large Cap Growth ETF is a non-diversified fund. The Trust is registered under the Investment Company Act of 1940, as amended (the 1940 Act), as an open-end management investment company organized as a Massachusetts business trust.
Effective November 17, 2023, each Fidelity Enhanced Index Fund (Predecessor Fund) reorganized into the newly created exchange traded fund (ETF) as noted in the table below. Each Predecessor Fund was the accounting survivor in the reorganization, and, as such, the financial statements and financial highlights of each Fund reflect the financial information of each Predecessor Fund through November 17, 2023 (see Prior Fiscal Year Reorganization Information note).
| Current ETFs | Former Mutual Funds (Predecessor Funds) |
| Fidelity Enhanced International ETF | Fidelity International Enhanced Index Fund |
| Fidelity Enhanced Large Cap Core ETF | Fidelity Large Cap Core Enhanced Index Fund |
| Fidelity Enhanced Large Cap Growth ETF | Fidelity Large Cap Growth Enhanced Index Fund |
| Fidelity Enhanced Large Cap Value ETF | Fidelity Large Cap Value Enhanced Index Fund |
| Fidelity Enhanced Mid Cap ETF | Fidelity Mid Cap Enhanced Index Fund |
2. Investments in Fidelity Central Funds.
Funds may invest in Fidelity Central Funds, which are open-end investment companies generally available only to other investment companies and accounts managed by the investment adviser and its affiliates. The Schedule of Investments lists any Fidelity Central Funds held as an investment as of period end, but does not include the underlying holdings of each Fidelity Central Fund. An investing fund indirectly bears its proportionate share of the expenses of the underlying Fidelity Central Funds.
Based on its investment objective, each Fidelity Central Fund may invest or participate in various investment vehicles or strategies that are similar to those of the investing fund. These strategies are consistent with the investment objectives of the investing fund and may involve certain economic risks which may cause a decline in value of each of the Fidelity Central Funds and thus a decline in the value of the investing fund.
| Fidelity Central Fund | Investment Manager | Investment Objective | Investment Practices | Expense RatioA |
| Fidelity Money Market Central Funds | Fidelity Management & Research Company LLC (FMR) | Each fund seeks to obtain a high level of current income consistent with the preservation of capital and liquidity. | Short-term Investments | .005% |
A Expenses expressed as a percentage of average net assets and are as of each underlying Central Fund's most recent annual or semi-annual shareholder report.
A complete unaudited list of holdings for each Fidelity Central Fund is available upon request or at the Securities and Exchange Commission website at www.sec.gov. In addition, the financial statements of the Fidelity Central Funds, which are not covered by the Report of Independent Registered Public Accounting Firm, are available on the Securities and Exchange Commission website or upon request.
3. Significant Accounting Policies.
Each Fund is an investment company and applies the accounting and reporting guidance of the Financial Accounting Standards Board (FASB) Accounting Standards Codification Topic 946 Financial Services - Investment Companies. The financial statements have been prepared in conformity with accounting principles generally accepted in the United States of America (GAAP), which require management to make certain estimates and assumptions at the date of the financial statements. Actual results could differ from those estimates. Each Fund operates as a single operating segment. Each Fund's income, expenses, assets, and performance are regularly monitored and assessed as a whole by the investment adviser and other individuals responsible for oversight functions of the Trust, using the information presented in the financial statements and financial highlights. Subsequent events, if any, through the date that the financial statements were issued have been evaluated in the preparation of the financial statements. Each Fund's Schedule of Investments lists any underlying mutual funds or exchange-traded funds (ETFs) but does not include the underlying holdings of these funds. The following summarizes the significant accounting policies of each Fund:
Investment Valuation. Investments are valued as of 4:00 p.m. Eastern time on the last calendar day of the period. The Board of Trustees (the Board) has designated each Fund's investment adviser as the valuation designee responsible for the fair valuation function and performing fair value determinations as needed. The investment adviser has established a Fair Value Committee (the Committee) to carry out the day-to-day fair valuation responsibilities and has adopted policies and procedures to govern the fair valuation process and the activities of the Committee. In accordance with these fair valuation policies and procedures, which have been approved by the Board, each Fund attempts to obtain prices from one or more third party pricing services or brokers to value its investments. When current market prices, quotations or currency exchange rates are not readily available or reliable, investments will be fair valued in good faith by the Committee, in accordance with the policies and procedures. Factors used in determining fair value vary by investment type and may include market or investment specific events, transaction data, estimated cash flows, and market observations of comparable investments. The frequency that the fair valuation procedures are used cannot be predicted and they may be utilized to a significant extent. The Committee manages each Fund's fair valuation practices and maintains the fair valuation policies and procedures. Each Fund's investment adviser reports to the Board information regarding the fair valuation process and related material matters.
Each Fund categorizes the inputs to valuation techniques used to value its investments into a disclosure hierarchy consisting of three levels as shown below:
Level 1 - unadjusted quoted prices in active markets for identical investments
Level 2 - other significant observable inputs (including quoted prices for similar investments, interest rates, prepayment speeds, etc.)
Level 3 - unobservable inputs (including the Fund's own assumptions based on the best information available)
Valuation techniques used to value each Fund's investments by major category are as follows:
Equity securities, including restricted securities, for which market quotations are readily available, are valued at the last reported sale price or official closing price as reported by a third party pricing service on the primary market or exchange on which they are traded and are categorized as Level 1 in the hierarchy. In the event there were no sales during the day or closing prices are not available, securities are valued at the last quoted bid price or may be valued using the last available price and are generally categorized as Level 2 in the hierarchy. For foreign equity securities, when market or security specific events arise, comparisons to the valuation of American Depositary Receipts (ADRs), futures contracts, Exchange-Traded Funds (ETFs) and certain indexes as well as quoted prices for similar securities may be used and would be categorized as Level 2 in the hierarchy. For equity securities, including restricted securities, where observable inputs are limited, assumptions about market activity and risk are used and these securities may be categorized as Level 3 in the hierarchy.
Debt securities, including restricted securities, are valued based on evaluated prices received from third party pricing services or from brokers who make markets in such securities. U.S. government and government agency obligations are valued by pricing services who utilize matrix pricing which considers yield or price of bonds of comparable quality, coupon, maturity and type or by broker-supplied prices. When independent prices are unavailable or unreliable, debt securities may be valued utilizing pricing methodologies which consider similar factors that would be used by third party pricing services. Debt securities are generally categorized as Level 2 in the hierarchy but may be Level 3 depending on the circumstances.
Futures contracts are valued at the settlement price established each day by the board of trade or exchange on which they are traded and are categorized as Level 1 in the hierarchy. Investments in open-end mutual funds, including the Fidelity Central Funds, are valued at their closing net asset value (NAV) each business day and are categorized as Level 1 in the hierarchy.
Changes in valuation techniques may result in transfers in or out of an assigned level within the disclosure hierarchy. The aggregate value of investments by input level as of December 31, 2024 is included at the end of each Fund's Schedule of Investments.
Foreign Currency. Certain Funds may use foreign currency contracts to facilitate transactions in foreign-denominated securities. Gains and losses from these transactions may arise from changes in the value of the foreign currency or if the counterparties do not perform under the contracts' terms.
Foreign-denominated assets, including investment securities, and liabilities are translated into U.S. dollars at the exchange rates at period end. Purchases and sales of investment securities, income and dividends received, and expenses denominated in foreign currencies are translated into U.S. dollars at the exchange rate in effect on the transaction date.
The effects of exchange rate fluctuations on investments are included with the net realized and unrealized gain (loss) on investment securities. Other foreign currency transactions resulting in realized and unrealized gain (loss) are disclosed separately.
Investment Transactions and Income. For financial reporting purposes, the Funds' investment holdings and NAV include trades executed through the end of the last business day of the period. The NAV per share for processing shareholder transactions is calculated as of the close of business (normally 4:00 p.m. Eastern time) of the New York Stock Exchange, Archipelago Exchange (NYSE Arca) and includes trades executed through the end of the prior business day. Gains and losses on securities sold are determined on the basis of identified cost and for certain Funds include proceeds received from litigation. Commissions paid to certain brokers with whom the investment adviser, or its affiliates, places trades on behalf of a fund include an amount in addition to trade execution, which may be rebated back to a fund. Any such rebates are included in net realized gain (loss) on investments in the Statement of Operations. Dividend income is recorded on the ex-dividend date, except for certain dividends from foreign securities where the ex-dividend date may have passed, which are recorded as soon as the Funds are informed of the ex-dividend date. Non-cash dividends included in dividend income, if any, are recorded at the fair market value of the securities received. Income and capital gain distributions from Fidelity Central Funds, if any, are recorded on the ex-dividend date. Certain distributions received by the Funds represent a return of capital or capital gain. The Funds determine the components of these distributions subsequent to the ex-dividend date, based upon receipt of tax filings or other correspondence relating to the underlying investment. These distributions are recorded as a reduction of cost of investments and/or as a realized gain. Interest income is accrued as earned and includes coupon interest and amortization of premium and accretion of discount on debt securities as applicable. Investment income is recorded net of foreign taxes withheld where recovery of such taxes is uncertain. Funds may file withholding tax reclaims in certain jurisdictions to recover a portion of amounts previously withheld. Any withholding tax reclaims income is included in the Statement of Operations in dividends or foreign taxes withheld, as applicable. Any receivables for withholding tax reclaims are included in the Statement of Assets and Liabilities in dividends receivable or reclaims receivable, as applicable.
Expenses. Expenses directly attributable to a fund are charged to that fund. Expenses attributable to more than one fund are allocated among the respective funds on the basis of relative net assets or other appropriate methods. Expenses included in the accompanying financial statements reflect the expenses of that fund and do not include any expenses associated with any underlying mutual funds or exchange-traded funds. Although not included in a fund's expenses, a fund indirectly bears its proportionate share of these expenses through the net asset value of each underlying mutual fund or exchange-traded fund. Expense estimates are accrued in the period to which they relate and adjustments are made when actual amounts are known.
Income Tax Information and Distributions to Shareholders. Each year, each Fund intends to qualify as a regulated investment company under Subchapter M of the Internal Revenue Code, including distributing substantially all of its taxable income and realized gains. As a result, no provision for U.S. Federal income taxes is required. Each Fund files a U.S. federal tax return, in addition to state and local tax returns as required. Each Fund's federal income tax returns are subject to examination by the Internal Revenue Service (IRS) for a period of three fiscal years after they are filed. State and local tax returns may be subject to examination for an additional fiscal year depending on the jurisdiction. Realized gain or loss resulting from in-kind redemptions is not taxable to the Funds and is not distributed to shareholders of the Funds. Foreign taxes are provided for based on each Fund's understanding of the tax rules and rates that exist in the foreign markets in which it invests.
Distributions are declared and recorded on the ex-dividend date. Income and capital gain distributions are determined in accordance with income tax regulations, which may differ from GAAP.
Capital accounts within the financial statements are adjusted for permanent book-tax differences. These adjustments have no impact on net assets or the results of operations. Capital accounts are not adjusted for temporary book-tax differences which will reverse in a subsequent period.
Book-tax differences are primarily due to futures contracts, foreign currency transactions, passive foreign investment companies (PFIC), redemptions in-kind, capital loss carryforwards and losses deferred due to wash sales.
As of period end, the cost and unrealized appreciation (depreciation) in securities, and derivatives if applicable, for federal income tax purposes were as follows for each Fund:
| | Tax cost ($) | Gross unrealized appreciation ($) | Gross unrealized depreciation ($) | Net unrealized appreciation (depreciation)($) |
| Fidelity Enhanced International ETF | 1,588,859,288 | 217,605,628 | (66,313,807) | 151,291,821 |
| Fidelity Enhanced Large Cap Core ETF | 3,443,721,149 | 920,349,525 | (106,372,719) | 813,976,806 |
| Fidelity Enhanced Large Cap Growth ETF | 1,852,145,102 | 1,379,052,169 | (50,231,637) | 1,328,820,532 |
| Fidelity Enhanced Large Cap Value ETF | 1,976,719,887 | 241,941,966 | (88,457,974) | 153,483,992 |
| Fidelity Enhanced Mid Cap ETF | 1,892,251,742 | 303,167,569 | (67,150,153) | 236,017,416 |
Capital loss carryforwards are only available to offset future capital gains of the Funds to the extent provided by regulations and may be limited. The capital loss carryforward information presented below, including any applicable limitation, is estimated as of prior fiscal period end and is subject to adjustment.
| | Short-term ($) | Long-term ($) | Total capital loss carryforward ($) |
| Fidelity Enhanced International ETF | (124,949,980) | - | (124,949,980) |
| Fidelity Enhanced Large Cap Core ETF | (60,660,874) | - | (60,660,874) |
| Fidelity Enhanced Large Cap Growth ETF | (254,608) | - | (254,608) |
| Fidelity Enhanced Large Cap Value ETF | (31,743,490) | (22,912,179) | (54,655,669) |
| Fidelity Enhanced Mid Cap ETF | (57,983,678) | - | (57,983,678) |
Restricted Securities (including Private Placements). Funds may invest in securities that are subject to legal or contractual restrictions on resale. These securities generally may be resold in transactions exempt from registration or to the public if the securities are registered. Disposal of these securities may involve time-consuming negotiations and expense, and prompt sale at an acceptable price may be difficult. Information regarding restricted securities held at period end is included at the end of the Schedule of Investments, if applicable.
New Accounting Pronouncement. FASB Accounting Standards Update (ASU) 2023-07 Segment Reporting (Topic 280): Improvements to Reportable Segment Disclosures became effective in this reporting period. ASU 2023-07 enhances segment information disclosure in the notes to financial statements.
4. Derivative Instruments.
Risk Exposures and the Use of Derivative Instruments. Each Fund's investment objectives allow for various types of derivative instruments, including futures contracts. Derivatives are investments whose value is primarily derived from underlying assets, indices or reference rates and may be transacted on an exchange or over-the-counter (OTC). Derivatives may involve a future commitment to buy or sell a specified asset based on specified terms, to exchange future cash flows at periodic intervals based on a notional principal amount, or for one party to make one or more payments upon the occurrence of specified events in exchange for periodic payments from the other party.
Derivatives were used to increase returns and to manage exposure to certain risks as defined below. The success of any strategy involving derivatives depends on analysis of numerous economic factors, and if the strategies for investment do not work as intended, the objectives may not be achieved.
Derivatives were used to increase or decrease exposure to the following risk(s):
| | |
| Equity Risk | Equity risk relates to the fluctuations in the value of financial instruments as a result of changes in market prices (other than those arising from interest rate risk or foreign exchange risk), whether caused by factors specific to an individual investment, its issuer, or all factors affecting all instruments traded in a market or market segment. |
Funds are also exposed to additional risks from investing in derivatives, such as liquidity risk and counterparty credit risk. Liquidity risk is the risk that a fund will be unable to close out the derivative in the open market in a timely manner. Counterparty credit risk is the risk that the counterparty will not be able to fulfill its obligation to a fund. Counterparty credit risk related to exchange-traded contracts may be mitigated by the protection provided by the exchange on which they trade.
Investing in derivatives may involve greater risks than investing in the underlying assets directly and, to varying degrees, may involve risk of loss in excess of any initial investment and collateral received and amounts recognized in the Statement of Assets and Liabilities. In addition, there may be the risk that the change in value of the derivative contract does not correspond to the change in value of the underlying instrument.
Futures Contracts. A futures contract is an agreement between two parties to buy or sell a specified underlying instrument for a fixed price at a specified future date. Futures contracts were used to manage exposure to the stock market.
Upon entering into a futures contract, a fund is required to deposit either cash or securities (initial margin) with a clearing broker in an amount equal to a certain percentage of the face value of the contract. Futures contracts are marked-to-market daily and subsequent daily payments are made or received by a fund depending on the daily fluctuations in the value of the futures contracts and are recorded as unrealized appreciation or (depreciation). This receivable and/or payable, if any, is included in daily variation margin on futures contracts in the Statement of Assets and Liabilities. Realized gain or (loss) is recorded upon the expiration or closing of a futures contract. The net realized gain (loss) and change in net unrealized appreciation (depreciation) on futures contracts during the period is presented in the Statement of Operations.
Any open futures contracts at period end are presented in the Schedule of Investments under the caption "Futures Contracts". The notional amount at value reflects each contract's exposure to the underlying instrument or index at period end, and is representative of volume of activity during the period, unless an average notional amount is presented in the table below.
| | Average Notional Amount ($) |
| Fidelity Enhanced International ETF | 23,363,515 |
Any securities deposited to meet initial margin requirements are identified in the Schedule of Investments. Any cash deposited to meet initial margin requirements is presented as segregated cash with brokers for derivative instruments in the Statement of Assets and Liabilities.
5. Purchases and Sales of Investments.
Purchases and sales of securities, other than short-term securities, U.S. government securities and in-kind transactions, as applicable, are noted in the table below.
| | Purchases ($) | Sales ($) |
| Fidelity Enhanced International ETF | 910,072,715 | 714,383,718 |
| Fidelity Enhanced Large Cap Core ETF | 1,596,857,654 | 945,170,826 |
| Fidelity Enhanced Large Cap Growth ETF | 1,339,740,804 | 433,040,015 |
| Fidelity Enhanced Large Cap Value ETF | 1,076,955,609 | 443,292,412 |
| Fidelity Enhanced Mid Cap ETF | 997,130,195 | 447,249,520 |
Securities received and delivered in-kind through subscriptions and redemptions are noted in the table below.
| | In-Kind Subscriptions ($) | In-Kind Redemptions ($) |
| Fidelity Enhanced International ETF | 138,151,158 | 123,086,737 |
| Fidelity Enhanced Large Cap Core ETF | 1,255,827,048 | 825,571,983 |
| Fidelity Enhanced Large Cap Growth ETF | 229,682,999 | 917,892,514 |
| Fidelity Enhanced Large Cap Value ETF | 81,218,517 | 508,535,020 |
| Fidelity Enhanced Mid Cap ETF | 204,571,631 | 489,257,264 |
Prior Fiscal Year Unaffiliated Redemptions In-Kind. Shares that were redeemed in-kind for investments, including accrued interest and cash, if any, are shown in the table below; along with realized gain or loss on investments delivered through in-kind redemptions. The amount of the in-kind redemptions is included in share transactions in the accompanying Statement of Changes in Net Assets. There was no gain or loss for federal income tax purposes.
| | Shares | Total net realized gain or loss ($) | Total Proceeds ($) |
| Fidelity Enhanced Large Cap Growth ETF | 2,376,033 | 30,168,211 | 67,930,785 |
| Fidelity Enhanced Large Cap Value ETF | 269,891,296 | 408,600,213 | 3,633,326,017 |
| Fidelity Enhanced Mid Cap ETF | 2,515,337 | 10,553,430 | 40,748,466 |
6. Fees and Other Transactions with Affiliates.
Management Fee. Fidelity Management & Research Company LLC (the investment adviser) provides the Funds with investment management related services for which the Funds pay a monthly management fee that is based on an annual rate of each Fund's average net assets as noted in the table below. Under the management contract, the investment adviser pays all other expenses, except the compensation of the independent Trustees and certain miscellaneous expenses such as proxy and shareholder meeting expenses. The management fees are reduced by an amount equal to the fees and expenses paid by the Funds to the independent Trustees.
| | Fee Rate |
| Fidelity Enhanced International ETF | .28% |
| Fidelity Enhanced Large Cap Core ETF | .18% |
| Fidelity Enhanced Large Cap Growth ETF | .18% |
| Fidelity Enhanced Large Cap Value ETF | .18% |
| Fidelity Enhanced Mid Cap ETF | .23% |
Brokerage Commissions. A portion of portfolio transactions were placed with brokerage firms which are affiliates of the investment adviser. Brokerage commissions are included in net realized gain (loss) and change in net unrealized appreciation (depreciation) in the Statement of Operations. The commissions paid to these affiliated firms were as follows:
| | Amount ($) |
| Fidelity Enhanced International ETF | 1,719 |
| Fidelity Enhanced Large Cap Core ETF | 11,999 |
| Fidelity Enhanced Large Cap Growth ETF | 4,203 |
| Fidelity Enhanced Large Cap Value ETF | 3,886 |
| Fidelity Enhanced Mid Cap ETF | 8,316 |
Interfund Lending Program. Pursuant to an Exemptive Order issued by the Securities and Exchange Commission (the SEC), each Fund, along with other registered investment companies having management contracts with Fidelity Management & Research Company LLC (FMR), or other affiliated entities of FMR, may participate in an interfund lending program. This program provides an alternative credit facility allowing each Fund to borrow from, or lend money to, other participating affiliated funds at rates that are beneficial to both the borrowing and lending fund. Borrowings under the program are generally for temporary or emergency purposes, including meeting fund shareholder redemptions. The interfund loan rate is determined, as specified in the Exemptive Order, by averaging, (1) the higher of the overnight time deposit rate and the current overnight repurchase agreement rate, and (2) a benchmark rate representing the lowest bank loan rate available to the funds. At period end, there were no interfund loans outstanding. Activity in this program during the period for which loans were outstanding was as follows:
| | Borrower or Lender | Average Loan Balance ($) | Weighted Average Interest Rate | Interest Expense ($) |
| Fidelity Enhanced International ETF | Borrower | 4,978,000 | 5.58% | 1,543 |
Fidelity Enhanced Large Cap Growth ETF | Borrower | 17,022,000 | 5.08% | 2,400 |
| Fidelity Enhanced Mid Cap ETF | Borrower | 7,598,000 | 5.08% | 4,284 |
Interfund Trades. Funds may purchase from or sell securities to other Fidelity Funds under procedures adopted by the Board. The procedures have been designed to ensure these interfund trades are executed in accordance with Rule 17a-7 of the 1940 Act. Any interfund trades are included within the respective purchases and sales amounts shown in the Purchases and Sales of Investments note. Interfund trades during the period are noted in the table below. During the period, there were no interfund trades.
| | Purchases ($) | Sales ($) | Realized Gain (Loss) ($) |
| Fidelity Enhanced International ETF | 8,701,965 | 12,083,340 | 1,467,576 |
| Fidelity Enhanced Large Cap Core ETF | 52,610,266 | 49,054,725 | 1,173,233 |
| Fidelity Enhanced Large Cap Growth ETF | 57,761,775 | 16,563,656 | (431,409) |
| Fidelity Enhanced Large Cap Value ETF | 86,720,994 | 16,647,079 | (371,481) |
| Fidelity Enhanced Mid Cap ETF | 47,841,649 | 38,476,086 | (2,599,805) |
7. Security Lending.
Funds lend portfolio securities from time to time in order to earn additional income. Lending agents are used, including National Financial Services (NFS), an affiliate of the investment adviser. Pursuant to a securities lending agreement, NFS will receive a fee, which is capped at 9.9% of a fund's daily lending revenue, for its services as lending agent. A fund may lend securities to certain qualified borrowers, including NFS. On the settlement date of the loan, a fund receives collateral (in the form of U.S. Treasury obligations, letters of credit and/or cash) against the loaned securities and maintains collateral in an amount not less than 100% of the market value of the loaned securities during the period of the loan. The market value of the loaned securities is determined at the close of business of a fund and any additional required collateral is delivered to a fund on the next business day. A fund or borrower may terminate the loan at any time, and if the borrower defaults on its obligation to return the securities loaned because of insolvency or other reasons, a fund may apply collateral received from the borrower against the obligation. A fund may experience delays and costs in recovering the securities loaned. Any cash collateral received is invested in the Fidelity Securities Lending Cash Central Fund. Any loaned securities are identified as such in the Schedule of Investments, and the value of loaned securities and cash collateral at period end, as applicable, are presented in the Statement of Assets and Liabilities. Security lending income represents the income earned on investing cash collateral, less rebates paid to borrowers and any lending agent fees associated with the loan, plus any premium payments received for lending certain types of securities. Security lending income is presented in the Statement of Operations as a component of income from Fidelity Central Funds. Affiliated security lending activity, if any, was as follows:
| | Total Security Lending Fees Paid to NFS ($) | Security Lending Income From Securities Loaned to NFS ($) | Value of Securities Loaned to NFS at Period End ($) |
| Fidelity Enhanced International ETF | 12,736 | - | - |
| Fidelity Enhanced Large Cap Core ETF | 143 | 1 | - |
| Fidelity Enhanced Large Cap Growth ETF | 73 | - | - |
| Fidelity Enhanced Large Cap Value ETF | 326 | 1 | - |
| Fidelity Enhanced Mid Cap ETF | 13,672 | 9 | - |
8. Expense Reductions.
Through arrangements with each applicable Fund's custodian, credits realized as a result of certain uninvested cash balances were used to reduce each applicable Fund's expenses. All of the applicable expense reductions are noted in the table below.
| | Custodian credits ($) |
| Fidelity Enhanced International ETF | 378 |
Fidelity Enhanced Large Cap Core ETF | 789 |
Fidelity Enhanced Large Cap Growth ETF | 504 |
Fidelity Enhanced Large Cap Value ETF | 666 |
| Fidelity Enhanced Mid Cap ETF | 1,688 |
9. Share Transactions.
Funds issue and redeem shares at NAV only with certain authorized participants in large increments known as Creation Units. Purchases of Creation Units are made by tendering a basket of designated securities and/or cash to a fund and redemption proceeds are paid with a basket of securities from a fund's portfolio with a balancing cash component to equate the market value of the basket of securities delivered or redeemed to the NAV per Creation Unit on the transaction date. Cash may be substituted equivalent to the value of certain securities generally when they are not available in sufficient quantity for delivery. A fund's shares are available in smaller increments to investors in the secondary market at market prices and may be subject to commissions. Authorized participants pay a transaction fee to the shareholder servicing agent when purchasing and redeeming Creation Units of a fund. The transaction fee is used to offset the costs associated with the issuance and redemption of Creation Units.
To the extent the Funds permit the contribution of securities in exchange for the purchase of shares (contribution in-kind), shares may be issued in advance of receipt by the Funds of all or a portion of the applicable deposit securities. In these circumstances, the Authorized Participant provides collateral to the custodian, on behalf of the Funds, in an amount up to 115% of the daily mark to market value of the deposit securities not yet received.
10. Other.
A fund's organizational documents provide former and current trustees and officers with a limited indemnification against liabilities arising in connection with the performance of their duties to the fund. In the normal course of business, a fund may also enter into contracts that provide general indemnifications. A fund's maximum exposure under these arrangements is unknown as this would be dependent on future claims that may be made against a fund. The risk of material loss from such claims is considered remote.
11 . Prior Fiscal Year Reorganization Information.
On November 17, 2023 each Fund (Predecessor Fund) reorganized into a newly created exchange traded fund (ETF) pursuant an Agreement and Plan of Reorganization (the Agreement) approved by its Board of Trustees. Per the Agreement, shareholders of each Predecessor Fund received ETF shares equal in value to the shares of the Predecessor Fund they owned on the day the reorganization was effective. Each Predecessor Fund was the accounting survivor after the reorganization. As such, performance and financial history prior to the reorganization is that of each Predecessor Fund. Historical share transactions and per share information for the Predecessor Fund was retroactively adjusted to reflect the change in capital structure due to the reorganization. | Predecessor Funds | New ETFs |
| Fidelity International Enhanced Index Fund | Fidelity Enhanced International ETF |
| Fidelity Large Cap Core Enhanced Index Fund | Fidelity Enhanced Large Cap Core ETF |
| Fidelity Large Cap Growth Enhanced Index Fund | Fidelity Enhanced Large Cap Growth ETF |
| Fidelity Large Cap Value Enhanced Index Fund | Fidelity Enhanced Large Cap Value ETF |
| Fidelity Mid Cap Enhanced Index Fund | Fidelity Enhanced Mid Cap ETF |
For financial reporting purposes, the assets and liabilities of each Predecessor Fund and shares issued by each ETF were recorded at fair value; however, the cost basis of the investments received from each Predecessor Fund were carried forward and will be utilized for purposes of each ETF's ongoing reporting of realized and unrealized gains and losses to more closely align subsequent reporting of realized gains with amounts distributable to shareholders for tax purposes. The reorganization qualified as a tax-free reorganization for federal income tax purposes with no gain or loss recognized to each Predecessor Fund or their shareholders. Costs incurred in connection with the reorganization were paid by each Predecessor Fund.
| Predecessor Fund/Accounting Survivor | Investments $ | Unrealized appreciation (depreciation) $ | Net Assets $ | Shares Exchanged | Shares Exchanged Ratio |
| Fidelity International Enhanced Index Fund | 1,368,602,643 | 195,092,188 | 1,368,248,892 | 54,730,068 | .4057160000 |
| Fidelity Large Cap Core Enhanced Index Fund | 1,840,988,775 | 537,069,093 | 1,948,361,461 | 77,934,309 | .8388640000 |
| Fidelity Large Cap Growth Enhanced Index Fund | 2,012,959,825 | 875,152,421 | 2,145,716,375 | 85,828,689 | 1.2032280000 |
| Fidelity Large Cap Value Enhanced Index Fund | 1,827,644,613 | 392,942 | 2,004,099,301 | 80,163,716 | .5729240000 |
| Fidelity Mid Cap Enhanced Index Fund | 1,369,301,709 | 129,571,229 | 1,460,889,645 | 58,435,751 | .6458920000 |
| Acquiring ETF | Net Assets $ | Total net assets after the acquisition $ |
| Fidelity Enhanced International ETF | 25 | 1,368,248,917 |
| Fidelity Enhanced Large Cap Core ETF | 25 | 1,948,361,486 |
| Fidelity Enhanced Large Cap Growth ETF | 25 | 2,145,716,400 |
| Fidelity Enhanced Large Cap Value ETF | 25 | 2,004,099,326 |
| Fidelity Enhanced Mid Cap ETF | 25 | 1,460,889,670 |
Pro forma results of operations of the combined entity for the entire period ended June 30, 2024, as though the acquisition had occurred as of the beginning of the year (rather than on the actual acquisition date), are as follows:
| ETF name | Net investment income (loss) | Total net realized gain (loss) | Total change in net unrealized appreciation (depreciation) | Net increase (decrease) in net assets resulting from operations |
| Fidelity Enhanced International ETF | $35,812,169 | $99,267,722 | $58,817,853 | $193,897,744 |
| Fidelity Enhanced Large Cap Core ETF | 22,993,277 | 209,030,464 | 246,834,439 | 478,858,180 |
| Fidelity Enhanced Large Cap Growth ETF | 12,362,182 | 260,568,152 | 368,592,605 | 641,522,939 |
| Fidelity Enhanced Large Cap Value ETF | 40,907,004 | 453,402,154 | (574,650,497) | (80,341,339) |
| Fidelity Enhanced Mid Cap ETF | 15,874,097 | 178,466,399 | 13,844,200 | 208,184,696 |
Because the combined investment portfolios have been managed as a single portfolio since the acquisition was completed, it is not practicable to separate the amounts of revenue and earnings of each Predecessor Fund that has been included in each ETF's Statement of Operations since November 17, 2023.
12. Risk and Uncertainties.
Many factors affect a fund's performance. Developments that disrupt global economies and financial markets, such as pandemics, epidemics, outbreaks of infectious diseases, war, terrorism, and environmental disasters, may significantly affect a fund's investment performance. The effects of these developments to a fund will be impacted by the types of securities in which a fund invests, the financial condition, industry, economic sector, and geographic location of an issuer, and a fund's level of investment in the securities of that issuer. Significant concentrations in security types, issuers, industries, sectors, and geographic locations may magnify the factors that affect a fund's performance.
Item 8: Changes in and Disagreements with Accountants for Open-End Management Investment Companies
(Unaudited)
Note: This is not applicable for any fund included in this document.
Item 9: Proxy Disclosures for Open-End Management Investment Companies
(Unaudited)
| A special meeting of shareholders was held on July 16, 2024. The results of votes taken among shareholders on the proposal before them are reported below. Each vote reported represents one dollar of net asset value held on the record date for the meeting. |
| Proposal 1 |
| To elect a Board of Trustees. |
| | # of Votes | % of Votes |
| Bettina Doulton |
| Affirmative | 38,080,283,823.03 | 97.17 |
| Withheld | 1,109,333,237.47 | 2.83 |
| TOTAL | 39,189,617,060.50 | 100.00 |
| Robert A. Lawrence |
| Affirmative | 37,781,807,251.33 | 96.41 |
| Withheld | 1,407,809,809.17 | 3.59 |
| TOTAL | 39,189,617,060.50 | 100.00 |
| Vijay C. Advani |
| Affirmative | 37,869,526,083.09 | 96.63 |
| Withheld | 1,320,090,977.41 | 3.37 |
| TOTAL | 39,189,617,060.50 | 100.00 |
| Thomas P. Bostick |
| Affirmative | 38,025,875,898.31 | 97.03 |
| Withheld | 1,163,741,162.19 | 2.97 |
| TOTAL | 39,189,617,060.50 | 100.00 |
| Donald F. Donahue |
| Affirmative | 37,825,198,238.79 | 96.52 |
| Withheld | 1,364,418,821.71 | 3.48 |
| TOTAL | 39,189,617,060.50 | 100.00 |
| Vicki L. Fuller |
| Affirmative | 38,031,768,119.99 | 97.05 |
| Withheld | 1,157,848,940.51 | 2.95 |
| TOTAL | 39,189,617,060.50 | 100.00 |
| Patricia L. Kampling |
| Affirmative | 38,062,391,881.90 | 97.12 |
| Withheld | 1,127,225,178.60 | 2.88 |
| TOTAL | 39,189,617,060.50 | 100.00 |
| Thomas A. Kennedy |
| Affirmative | 37,891,434,776.27 | 96.69 |
| Withheld | 1,298,182,284.23 | 3.31 |
| TOTAL | 39,189,617,060.50 | 100.00 |
| Oscar Munoz |
| Affirmative | 37,976,932,673.73 | 96.91 |
| Withheld | 1,212,684,386.77 | 3.09 |
| TOTAL | 39,189,617,060.50 | 100.00 |
| Karen B. Peetz |
| Affirmative | 38,011,822,212.28 | 96.99 |
| Withheld | 1,177,794,848.22 | 3.01 |
| TOTAL | 39,189,617,060.50 | 100.00 |
| David M. Thomas |
| Affirmative | 37,976,058,118.16 | 96.90 |
| Withheld | 1,213,558,942.34 | 3.10 |
| TOTAL | 39,189,617,060.50 | 100.00 |
| Susan Tomasky |
| Affirmative | 37,845,471,684.67 | 96.57 |
| Withheld | 1,344,145,375.83 | 3.43 |
| TOTAL | 39,189,617,060.50 | 100.00 |
| Michael E. Wiley |
| Affirmative | 37,736,569,620.69 | 96.29 |
| Withheld | 1,453,047,439.81 | 3.71 |
| TOTAL | 39,189,617,060.50 | 100.00 |
| | | |
| Proposal 1 reflects trust-wide proposal and voting results. |
Item 10: Remuneration Paid to Directors, Officers, and others of Open-End Management Investment Companies
(Unaudited)
Note: This information is disclosed as part of the financial statements for each Fund as part of Item 7: Financial Statements and Financial Highlights for Open-End Management Investment companies.
Item 11: Statement Regarding Basis for Approval of Investment Advisory Contract
(Unaudited)
Note: This is not applicable for any fund included in this document.
1.9910054.101
EIE-SANN-0325
Fidelity® Clean Energy ETF
Fidelity® Cloud Computing ETF
Fidelity® Crypto Industry and Digital Payments ETF
Fidelity® Digital Health ETF
Fidelity® Electric Vehicles and Future Transportation ETF
Fidelity® Metaverse ETF
Semi-Annual Report
December 31, 2024
Contents
To view a fund's proxy voting guidelines and proxy voting record for the 12-month period ended June 30, visit http://www.fidelity.com/proxyvotingresults or visit the Securities and Exchange Commission's (SEC) web site at http://www.sec.gov.
You may also call 1-800-FIDELITY to request a free copy of the proxy voting guidelines.
The funds or securities referred to herein are not sponsored, endorsed, or promoted by Fidelity Product Services LLC (FPS), and FPS bears no liability with respect to any such funds or securities or any index on which such funds or securities are based. The prospectus contains a more detailed description of the relationship between FPS and any related funds.
The funds or securities referred to herein are not sponsored, endorsed, or promoted by MSCI, and MSCI bears no liability with respect to any such funds or securities or any index on which such funds or securities are based. The prospectus contains a more detailed description of the limited relationship MSCI has with Fidelity and any related funds.
Standard & Poor's, S&P and S&P 500 are registered service marks of The McGraw-Hill Companies, Inc. and have been licensed for use by Fidelity Distributors Corporation.
Other third-party marks appearing herein are the property of their respective owners.
All other marks appearing herein are registered or unregistered trademarks or service marks of FMR LLC or an affiliated company. © 2025 FMR LLC. All rights reserved.
This report and the financial statements contained herein are submitted for the general information of the shareholders of the Funds. This report is not authorized for distribution to prospective investors in the Funds unless preceded or accompanied by an effective prospectus.
A fund files its complete schedule of portfolio holdings with the SEC for the first and third quarters of each fiscal year on Form N-PORT. Forms N-PORT are available on the SEC's web site at http://www.sec.gov. A fund's Forms N-PORT may be reviewed and copied at the SEC's Public Reference Room in Washington, DC. Information regarding the operation of the SEC's Public Reference Room may be obtained by calling 1-800-SEC-0330.
For a complete list of a fund's portfolio holdings, view the most recent holdings listing, semiannual report, or annual report on Fidelity's web site at http://www.fidelity.com, http://www.institutional.fidelity.com, or http://www.401k.com, as applicable.
NOT FDIC INSURED •MAY LOSE VALUE •NO BANK GUARANTEE
Neither the Funds nor Fidelity Distributors Corporation is a bank.
Item 7: Financial Statements and Financial Highlights for Open-End Management Investment Companies (Semi-Annual Report)
Fidelity® Clean Energy ETF
Schedule of Investments December 31, 2024 (Unaudited)
Showing Percentage of Net Assets
| Common Stocks - 99.8% |
| | | Shares | Value ($) |
| AUSTRIA - 2.9% | | | |
| Utilities - 2.9% | | | |
| Electric Utilities - 2.9% | | | |
| Verbund AG Class A | | 9,554 | 692,522 |
| CANADA - 9.1% | | | |
| Information Technology - 1.2% | | | |
| Semiconductors & Semiconductor Equipment - 1.2% | | | |
| Canadian Solar Inc (a) | | 26,879 | 298,894 |
| Utilities - 7.9% | | | |
| Independent Power and Renewable Electricity Producers - 7.9% | | | |
| Boralex Inc Class A | | 22,544 | 450,034 |
| Brookfield Renewable Corp | | 20,769 | 574,462 |
| Innergex Renewable Energy Inc | | 61,486 | 344,154 |
| Northland Power Inc | | 43,194 | 537,597 |
| | | | 1,906,247 |
| TOTAL CANADA | | | 2,205,141 |
| CHINA - 9.9% | | | |
| Industrials - 1.5% | | | |
| Electrical Equipment - 1.5% | | | |
| Goldwind Science & Technology Co Ltd H Shares | | 427,600 | 360,005 |
| Information Technology - 4.8% | | | |
| Semiconductors & Semiconductor Equipment - 4.8% | | | |
| Flat Glass Group Co Ltd H Shares | | 243,000 | 341,604 |
| JinkoSolar Holding Co Ltd ADR | | 15,112 | 376,289 |
| Xinyi Solar Holdings Ltd | | 1,120,000 | 452,732 |
| | | | 1,170,625 |
| Utilities - 3.6% | | | |
| Independent Power and Renewable Electricity Producers - 3.6% | | | |
| China Datang Corp Renewable Power Co Ltd H Shares | | 1,239,000 | 331,763 |
| China Longyuan Power Group Corp Ltd H Shares | | 665,000 | 551,317 |
| | | | 883,080 |
| TOTAL CHINA | | | 2,413,710 |
| DENMARK - 7.2% | | | |
| Industrials - 4.1% | | | |
| Electrical Equipment - 4.1% | | | |
| Vestas Wind Systems A/S (a) | | 71,920 | 979,493 |
| Utilities - 3.1% | | | |
| Independent Power and Renewable Electricity Producers - 3.1% | | | |
| Orsted AS (a)(b)(c) | | 16,867 | 759,314 |
| TOTAL DENMARK | | | 1,738,807 |
| FRANCE - 4.4% | | | |
| Industrials - 2.1% | | | |
| Construction & Engineering - 2.1% | | | |
| Vinci SA | | 4,909 | 507,005 |
| Utilities - 2.3% | | | |
| Independent Power and Renewable Electricity Producers - 2.3% | | | |
| Neoen SA (b)(c) | | 13,868 | 570,392 |
| TOTAL FRANCE | | | 1,077,397 |
| GERMANY - 4.7% | | | |
| Industrials - 1.8% | | | |
| Electrical Equipment - 1.8% | | | |
| Nordex SE (a) | | 36,671 | 427,954 |
| Information Technology - 0.9% | | | |
| Semiconductors & Semiconductor Equipment - 0.9% | | | |
| SMA Solar Technology AG | | 16,463 | 231,163 |
| Utilities - 2.0% | | | |
| Multi-Utilities - 2.0% | | | |
| E.ON SE | | 41,430 | 482,419 |
| TOTAL GERMANY | | | 1,141,536 |
| INDIA - 1.2% | | | |
| Utilities - 1.2% | | | |
| Independent Power and Renewable Electricity Producers - 1.2% | | | |
| ReNew Energy Global PLC Class A (a) | | 46,014 | 314,275 |
| ISRAEL - 3.7% | | | |
| Utilities - 3.7% | | | |
| Independent Power and Renewable Electricity Producers - 3.7% | | | |
| Energix-Renewable Energies Ltd | | 109,658 | 376,196 |
| Enlight Renewable Energy Ltd (a) | | 29,894 | 517,288 |
| | | | |
| TOTAL ISRAEL | | | 893,484 |
| ITALY - 1.5% | | | |
| Utilities - 1.5% | | | |
| Independent Power and Renewable Electricity Producers - 1.5% | | | |
| ERG SpA | | 18,806 | 382,657 |
| JAPAN - 1.9% | | | |
| Industrials - 1.0% | | | |
| Construction & Engineering - 1.0% | | | |
| West Holdings Corp | | 20,800 | 239,949 |
| Utilities - 0.9% | | | |
| Independent Power and Renewable Electricity Producers - 0.9% | | | |
| RENOVA Inc (a) | | 45,000 | 221,335 |
| TOTAL JAPAN | | | 461,284 |
| KOREA (SOUTH) - 2.6% | | | |
| Industrials - 2.6% | | | |
| Electrical Equipment - 2.6% | | | |
| CS Wind Corp | | 11,965 | 340,545 |
| Doosan Fuel Cell Co Ltd (a) | | 25,903 | 280,822 |
| | | | |
| TOTAL KOREA (SOUTH) | | | 621,367 |
| NEW ZEALAND - 4.5% | | | |
| Utilities - 4.5% | | | |
| Electric Utilities - 1.9% | | | |
| Mercury NZ Ltd | | 142,039 | 465,528 |
| Independent Power and Renewable Electricity Producers - 2.6% | | | |
| Meridian Energy Ltd | | 188,559 | 624,333 |
| TOTAL NEW ZEALAND | | | 1,089,861 |
| PORTUGAL - 3.4% | | | |
| Utilities - 3.4% | | | |
| Electric Utilities - 3.4% | | | |
| EDP SA | | 257,120 | 822,972 |
| SPAIN - 5.7% | | | |
| Utilities - 5.7% | | | |
| Electric Utilities - 2.1% | | | |
| Acciona SA | | 4,597 | 517,433 |
| Independent Power and Renewable Electricity Producers - 3.6% | | | |
| EDP Renovaveis SA (a) | | 54,289 | 564,411 |
| Solaria Energia y Medio Ambiente SA (a) | | 37,334 | 302,123 |
| | | | 866,534 |
| TOTAL SPAIN | | | 1,383,967 |
| SWITZERLAND - 1.7% | | | |
| Information Technology - 1.7% | | | |
| Electronic Equipment, Instruments & Components - 1.7% | | | |
| Landis+Gyr Group AG | | 6,501 | 412,477 |
| UNITED STATES - 35.4% | | | |
| Industrials - 18.1% | | | |
| Construction & Engineering - 1.3% | | | |
| Ameresco Inc Class A (a) | | 13,413 | 314,937 |
| Electrical Equipment - 16.8% | | | |
| Array Technologies Inc (a) | | 60,805 | 367,262 |
| Bloom Energy Corp Class A (a) | | 26,495 | 588,454 |
| GE Vernova Inc | | 3,389 | 1,114,744 |
| NEXTracker Inc Class A (a) | | 18,992 | 693,778 |
| Plug Power Inc (a) | | 200,119 | 426,253 |
| Shoals Technologies Group Inc (a) | | 75,594 | 418,035 |
| Sunrun Inc (a) | | 49,826 | 460,891 |
| | | | 4,069,417 |
TOTAL INDUSTRIALS | | | 4,384,354 |
| | | | |
| Information Technology - 11.9% | | | |
| Electronic Equipment, Instruments & Components - 2.7% | | | |
| Itron Inc (a) | | 5,966 | 647,788 |
| Semiconductors & Semiconductor Equipment - 9.2% | | | |
| Enphase Energy Inc (a) | | 12,257 | 841,811 |
| First Solar Inc (a) | | 5,877 | 1,035,763 |
| SolarEdge Technologies Inc (a) | | 27,095 | 368,492 |
| | | | 2,246,066 |
TOTAL INFORMATION TECHNOLOGY | | | 2,893,854 |
| | | | |
| Utilities - 5.4% | | | |
| Independent Power and Renewable Electricity Producers - 5.4% | | | |
| Clearway Energy Inc Class C | | 20,477 | 532,401 |
| Ormat Technologies Inc | | 8,180 | 553,950 |
| Sunnova Energy International Inc (a) | | 67,034 | 229,926 |
| | | | 1,316,277 |
| TOTAL UNITED STATES | | | 8,594,485 |
| TOTAL COMMON STOCKS (Cost $34,620,830) | | | 24,245,942 |
| | | | |
| Money Market Funds - 0.1% |
| | | Yield (%) | Shares | Value ($) |
Fidelity Cash Central Fund (d) (Cost $20,859) | | 4.36 | 20,855 | 20,859 |
| | | | | |
| TOTAL INVESTMENT IN SECURITIES - 99.9% (Cost $34,641,689) | 24,266,801 |
NET OTHER ASSETS (LIABILITIES) - 0.1% | 27,506 |
| NET ASSETS - 100.0% | 24,294,307 |
| | |
| Futures Contracts |
| | Number of contracts | Expiration Date | Notional Amount ($) | Value ($) | Unrealized Appreciation/ (Depreciation) ($) |
| Purchased | | | | | |
| | | | | | |
| Equity Contracts | | | | | |
| CME Micro E-mini S&P 500 Index Contracts (United States) | 1 | Mar 2025 | 29,679 | (299) | (299) |
| | | | | | |
| The notional amount of futures purchased as a percentage of Net Assets is 0.1% |
Legend
| (b) | Security exempt from registration under Rule 144A of the Securities Act of 1933. These securities may be resold in transactions exempt from registration, normally to qualified institutional buyers. At the end of the period, the value of these securities amounted to $1,329,706 or 5.5% of net assets. |
| (c) | Security is exempt from registration under Regulation S of the Securities Act of 1933 and may be resold to qualified foreign investors outside of the United States. At the end of the period, the value of securities amounted to $1,329,706 or 5.5% of net assets. |
| (d) | Affiliated fund that is generally available only to investment companies and other accounts managed by Fidelity Investments. The rate quoted is the annualized seven-day yield of the fund at period end. A complete unaudited listing of the fund's holdings as of its most recent quarter end is available upon request. In addition, each Fidelity Central Fund's financial statements are available on the SEC's website or upon request. |
Affiliated Central Funds
Fiscal year to date information regarding the Fund's investments in Fidelity Central Funds, including the ownership percentage, is presented below.
| Affiliate | Value, beginning of period ($) | Purchases ($) | Sales Proceeds ($) | Dividend Income ($) | Realized Gain (loss) ($) | Change in Unrealized appreciation (depreciation) ($) | Value, end of period ($) | Shares, end of period | % ownership, end of period |
| Fidelity Cash Central Fund | 32,219 | 1,968,403 | 1,979,763 | 579 | - | - | 20,859 | 20,855 | 0.0% |
| Total | 32,219 | 1,968,403 | 1,979,763 | 579 | - | - | 20,859 | 20,855 | |
| | | | | | | | | | |
Amounts in the dividend income column in the above table include any capital gain distributions from underlying funds, which are presented in the corresponding line item in the Statement of Operations, if applicable.
Amounts included in the purchases and sales proceeds columns may include in-kind transactions, if applicable.
Investment Valuation
The following is a summary of the inputs used, as of December 31, 2024, involving the Fund's assets and liabilities carried at fair value. The inputs or methodology used for valuing securities may not be an indication of the risk associated with investing in those securities. For more information on valuation inputs, and their aggregation into the levels used below, please refer to the Investment Valuation section in the accompanying Notes to Financial Statements.
| Valuation Inputs at Reporting Date: |
| Description | Total ($) | Level 1 ($) | Level 2 ($) | Level 3 ($) |
Investments in Securities: | | | | |
|
| Common Stocks | | | | |
Industrials | 7,520,127 | 7,520,127 | - | - |
Information Technology | 5,007,013 | 5,007,013 | - | - |
Utilities | 11,718,802 | 11,718,802 | - | - |
|
| Money Market Funds | 20,859 | 20,859 | - | - |
| Total Investments in Securities: | 24,266,801 | 24,266,801 | - | - |
Derivative Instruments: Liabilities | | | | |
Futures Contracts | (299) | (299) | - | - |
| Total Liabilities | (299) | (299) | - | - |
| Total Derivative Instruments: | (299) | (299) | - | - |
Value of Derivative Instruments
The following table is a summary of the Fund's value of derivative instruments by primary risk exposure as of December 31, 2024. For additional information on derivative instruments, please refer to the Derivative Instruments section in the accompanying Notes to Financial Statements.
Primary Risk Exposure / Derivative Type | Value |
| Asset ($) | Liability ($) |
| Equity Risk | | |
Futures Contracts (a) | 0 | (299) |
| Total Equity Risk | 0 | (299) |
| Total Value of Derivatives | 0 | (299) |
(a)Reflects gross cumulative appreciation (depreciation) on futures contracts as presented in the Schedule of Investments. In the Statement of Assets and Liabilities, the period end daily variation margin is included in receivable or payable for daily variation margin on futures contracts, and the net cumulative appreciation (depreciation) is included in Total accumulated earnings (loss).
Fidelity® Clean Energy ETF
Financial Statements (Unaudited)
| Statement of Assets and Liabilities |
| As of December 31, 2024 (Unaudited) |
| Assets | | | | |
| Investment in securities, at value - See accompanying schedule: | | | | |
Unaffiliated issuers (cost $34,620,830) | $ | 24,245,942 | | |
Fidelity Central Funds (cost $20,859) | | 20,859 | | |
| | | | | |
| | | | | |
| Total Investment in Securities (cost $34,641,689) | | | $ | 24,266,801 |
| Segregated cash with brokers for derivative instruments | | | | 7,606 |
| Foreign currency held at value (cost $38,329) | | | | 38,187 |
| Receivable for investments sold | | | | 30 |
| Dividends receivable | | | | 14,158 |
| Reclaims receivable | | | | 20,634 |
| Distributions receivable from Fidelity Central Funds | | | | 469 |
Total assets | | | | 24,347,885 |
| Liabilities | | | | |
| Payable for investments purchased | $ | 45,136 | | |
| Accrued management fee | | 8,203 | | |
| Payable for daily variation margin on futures contracts | | 236 | | |
| Other payables and accrued expenses | | 3 | | |
| Total liabilities | | | | 53,578 |
| Net Assets | | | $ | 24,294,307 |
| Net Assets consist of: | | | | |
| Paid in capital | | | $ | 45,362,094 |
| Total accumulated earnings (loss) | | | | (21,067,787) |
| Net Assets | | | $ | 24,294,307 |
Net Asset Value, offering price and redemption price per share ($24,294,307 ÷ 1,800,000 shares) | | | $ | 13.50 |
| Statement of Operations |
Six months ended December 31, 2024 (Unaudited) |
| Investment Income | | | | |
| Dividends | | | $ | 181,822 |
| Interest | | | | 56 |
| Income from Fidelity Central Funds | | | | 579 |
| Income before foreign taxes withheld | | | $ | 182,457 |
| Less foreign taxes withheld | | | | (18,795) |
| Total income | | | | 163,662 |
| Expenses | | | | |
| Management fee | $ | 51,551 | | |
| Independent trustees' fees and expenses | | 59 | | |
| Miscellaneous | | 147 | | |
| Total expenses before reductions | | 51,757 | | |
| Expense reductions | | (170) | | |
| Total expenses after reductions | | | | 51,587 |
| Net Investment income (loss) | | | | 112,075 |
| Realized and Unrealized Gain (Loss) | | | | |
| Net realized gain (loss) on: | | | | |
| Investment Securities: | | | | |
| Unaffiliated issuers | | (1,513,184) | | |
| Foreign currency transactions | | 969 | | |
| Futures contracts | | 4,083 | | |
| Total net realized gain (loss) | | | | (1,508,132) |
| Change in net unrealized appreciation (depreciation) on: | | | | |
| Investment Securities: | | | | |
| Unaffiliated issuers | | (299,713) | | |
| Assets and liabilities in foreign currencies | | (753) | | |
| Futures contracts | | (567) | | |
| Total change in net unrealized appreciation (depreciation) | | | | (301,033) |
| Net gain (loss) | | | | (1,809,165) |
| Net increase (decrease) in net assets resulting from operations | | | $ | (1,697,090) |
| Statement of Changes in Net Assets |
| |
| | Six months ended December 31, 2024 (Unaudited) | | Year ended June 30, 2024 |
| Increase (Decrease) in Net Assets | | | | |
| Operations | | | | |
| Net investment income (loss) | $ | 112,075 | $ | 325,489 |
| Net realized gain (loss) | | (1,508,132) | | (5,958,967) |
| Change in net unrealized appreciation (depreciation) | | (301,033) | | (5,410,016) |
| Net increase (decrease) in net assets resulting from operations | | (1,697,090) | | (11,043,494) |
| Distributions to shareholders | | (144,000) | | (378,500) |
| | | | | |
| Share transactions | | | | |
| Proceeds from sales of shares | | 748,575 | | - |
| Cost of shares redeemed | | - | | (1,695,052) |
| | | | | |
Net increase (decrease) in net assets resulting from share transactions | | 748,575 | | (1,695,052) |
| Total increase (decrease) in net assets | | (1,092,515) | | (13,117,046) |
| | | | | |
| Net Assets | | | | |
| Beginning of period | | 25,386,822 | | 38,503,868 |
| End of period | $ | 24,294,307 | $ | 25,386,822 |
| | | | | |
| Other Information | | | | |
| Shares | | | | |
| Sold | | 50,000 | | - |
| Redeemed | | - | | (100,000) |
| Net increase (decrease) | | 50,000 | | (100,000) |
| | | | | |
Financial Highlights
Fidelity® Clean Energy ETF |
| |
| | Six months ended (Unaudited) December 31, 2024 | | Years ended June 30, 2024 | | 2023 | | 2022 A |
Selected Per-Share Data | | | | | | | | |
| Net asset value, beginning of period | $ | 14.51 | $ | 20.81 | $ | 20.95 | $ | 25.12 |
| Income from Investment Operations | | | | | | | | |
Net investment income (loss) B,C | | .06 | | .18 | | .15 | | .15 |
| Net realized and unrealized gain (loss) | | (.99) | | (6.27) | | (.12) | | (4.20) |
| Total from investment operations | | (.93) | | (6.09) | | .03 | | (4.05) |
| Distributions from net investment income | | (.08) | | (.21) | | (.17) | | (.12) |
| Total distributions | | (.08) | | (.21) | | (.17) | | (.12) |
| Net asset value, end of period | $ | 13.50 | $ | 14.51 | $ | 20.81 | $ | 20.95 |
Total Return D,E,F | | | | (29.37)% | | .10% | | (16.12)% |
Ratios to Average Net Assets C,G,H | | | | | | | | |
| Expenses before reductions | | .38% I | | .42% | | .39% | | .39% I |
| Expenses net of fee waivers, if any | | | | .40% | | .39% | | .39% I |
| Expenses net of all reductions | | .38% I | | .40% | | .39% | | .39% I |
| Net investment income (loss) | | .83% I | | 1.13% | | .69% | | .90% I |
| Supplemental Data | | | | | | | | |
| Net assets, end of period (000 omitted) | $ | 24,294 | $ | 25,387 | $ | 38,504 | $ | 28,288 |
Portfolio turnover rate J,K | | | | 45% | | 37% | | 30% L |
AFor the period October 5, 2021 (commencement of operations) through June 30, 2022.
BCalculated based on average shares outstanding during the period.
CNet investment income (loss) is affected by the timing of the declaration of dividends by any underlying mutual funds or exchange-traded funds (ETFs). Net investment income (loss) of any mutual funds or ETFs is not included in the Fund's net investment income (loss) ratio.
DTotal returns for periods of less than one year are not annualized.
ETotal returns would have been lower if certain expenses had not been reduced during the applicable periods shown.
FBased on net asset value.
GFees and expenses of any underlying mutual funds or exchange-traded funds (ETFs) are not included in the Fund's expense ratio. The Fund indirectly bears its proportionate share of these expenses. For additional expense information related to investments in Fidelity Central Funds, please refer to the "Investments in Fidelity Central Funds" note found in the Notes to Financial Statements section of the most recent Annual or Semi-Annual report.
HExpense ratios reflect operating expenses of the class. Expenses before reductions do not reflect amounts reimbursed, waived, or reduced through arrangements with the investment adviser, brokerage services, or other offset arrangements, if applicable, and do not represent the amount paid by the class during periods when reimbursements, waivers or reductions occur.
IAnnualized.
JAmount does not include the portfolio activity of any underlying mutual funds or exchange-traded funds (ETFs), derivatives or securities that mature within one year from acquisition.
KPortfolio turnover rate excludes securities received or delivered in-kind.
LAmount not annualized.
Fidelity® Cloud Computing ETF
Schedule of Investments December 31, 2024 (Unaudited)
Showing Percentage of Net Assets
| Common Stocks - 99.8% |
| | | Shares | Value ($) |
| CHINA - 1.9% | | | |
| Information Technology - 1.9% | | | |
| IT Services - 0.8% | | | |
| Vnet Group Inc Class A ADR (a) | | 137,618 | 652,309 |
| Software - 1.1% | | | |
| Kingdee International Software Group Co Ltd (a) | | 881,500 | 967,977 |
| TOTAL CHINA | | | 1,620,286 |
| ISRAEL - 2.8% | | | |
| Information Technology - 2.8% | | | |
| Software - 2.8% | | | |
| JFrog Ltd (a)(b) | | 31,308 | 920,768 |
| Nice Ltd (a) | | 8,659 | 1,476,259 |
| | | | |
| TOTAL ISRAEL | | | 2,397,027 |
| TAIWAN - 2.0% | | | |
| Information Technology - 2.0% | | | |
| Electronic Equipment, Instruments & Components - 2.0% | | | |
| Hon Hai Precision Industry Co Ltd | | 302,000 | 1,694,947 |
| UNITED STATES - 93.1% | | | |
| Consumer Discretionary - 2.2% | | | |
| Broadline Retail - 2.2% | | | |
| Amazon.com Inc (a) | | 8,399 | 1,842,657 |
| Industrials - 1.8% | | | |
| Professional Services - 1.8% | | | |
| Dayforce Inc (a) | | 21,533 | 1,564,157 |
| Information Technology - 81.5% | | | |
| IT Services - 8.8% | | | |
| DigitalOcean Holdings Inc (a)(b) | | 23,334 | 794,989 |
| Fastly Inc Class A (a) | | 72,695 | 686,240 |
| MongoDB Inc Class A (a) | | 6,510 | 1,515,593 |
| Snowflake Inc Class A (a) | | 17,138 | 2,646,279 |
| Twilio Inc Class A (a) | | 17,385 | 1,878,971 |
| | | | 7,522,072 |
| Software - 63.9% | | | |
| Atlassian Corp Class A (a) | | 9,922 | 2,414,816 |
| Box Inc Class A (a) | | 36,159 | 1,142,624 |
| C3.ai Inc Class A (a)(b) | | 29,583 | 1,018,543 |
| Commvault Systems Inc (a) | | 8,041 | 1,213,467 |
| Confluent Inc Class A (a) | | 43,205 | 1,208,012 |
| Datadog Inc Class A (a) | | 17,800 | 2,543,442 |
| DocuSign Inc (a) | | 22,625 | 2,034,893 |
| Dropbox Inc Class A (a) | | 46,448 | 1,395,298 |
| Dynatrace Inc (a) | | 32,534 | 1,768,223 |
| Elastic NV (a) | | 13,570 | 1,344,516 |
| Five9 Inc (a)(b) | | 23,943 | 973,044 |
| Gitlab Inc Class A (a) | | 21,072 | 1,187,407 |
| HubSpot Inc (a) | | 3,503 | 2,440,785 |
| Informatica Inc Class A (a) | | 32,734 | 848,793 |
| Klaviyo Inc Class A (a) | | 25,128 | 1,036,279 |
| Microsoft Corp | | 9,417 | 3,969,266 |
| MicroStrategy Inc Class A (a)(b) | | 8,445 | 2,445,841 |
| Nutanix Inc Class A (a) | | 27,484 | 1,681,471 |
| Oracle Corp | | 22,380 | 3,729,403 |
| PagerDuty Inc (a) | | 40,580 | 740,991 |
| Pegasystems Inc | | 11,647 | 1,085,500 |
| RingCentral Inc Class A (a) | | 26,071 | 912,746 |
| Rubrik Inc Class A (a) | | 18,329 | 1,197,983 |
| Salesforce Inc | | 11,534 | 3,856,162 |
| Servicenow Inc (a) | | 3,709 | 3,931,985 |
| SolarWinds Corp | | 41,829 | 596,063 |
| Teradata Corp (a) | | 30,880 | 961,912 |
| UiPath Inc Class A (a)(b) | | 88,544 | 1,125,394 |
| Verint Systems Inc (a) | | 26,486 | 727,041 |
| Vertex Inc Class A (a)(b) | | 17,369 | 926,636 |
| Workday Inc Class A (a) | | 11,495 | 2,966,055 |
| Zeta Global Holdings Corp Class A (a) | | 46,776 | 841,500 |
| | | | 54,266,091 |
| Technology Hardware, Storage & Peripherals - 8.8% | | | |
| NetApp Inc | | 17,414 | 2,021,417 |
| Pure Storage Inc Class A (a) | | 31,709 | 1,947,884 |
| Seagate Technology Holdings PLC | | 20,717 | 1,788,084 |
| Western Digital Corp (a) | | 29,706 | 1,771,369 |
| | | | 7,528,754 |
| Real Estate - 7.6% | | | |
| Specialized REITs - 7.6% | | | |
| Digital Realty Trust Inc | | 16,144 | 2,862,816 |
| Equinix Inc | | 3,816 | 3,598,068 |
| | | | 6,460,884 |
| TOTAL UNITED STATES | | | 79,184,615 |
| TOTAL COMMON STOCKS (Cost $74,539,692) | | | 84,896,875 |
| | | | |
| Money Market Funds - 5.7% |
| | | Yield (%) | Shares | Value ($) |
| Fidelity Cash Central Fund (c) | | 4.36 | 176,105 | 176,140 |
| Fidelity Securities Lending Cash Central Fund (c)(d) | | 4.35 | 4,738,251 | 4,738,725 |
| TOTAL MONEY MARKET FUNDS (Cost $4,914,865) | | | | 4,914,865 |
| | | | | |
| TOTAL INVESTMENT IN SECURITIES - 105.5% (Cost $79,454,557) | 89,811,740 |
NET OTHER ASSETS (LIABILITIES) - (5.5)% | (4,702,939) |
| NET ASSETS - 100.0% | 85,108,801 |
| | |
| Futures Contracts |
| | Number of contracts | Expiration Date | Notional Amount ($) | Value ($) | Unrealized Appreciation/ (Depreciation) ($) |
| Purchased | | | | | |
| | | | | | |
| Equity Contracts | | | | | |
| CME Micro NASDAQ 100 Index Contracts (United States) | 5 | Mar 2025 | 212,265 | (4,849) | (4,849) |
| | | | | | |
| The notional amount of futures purchased as a percentage of Net Assets is 0.2% |
Legend
| (b) | Security or a portion of the security is on loan at period end. |
| (c) | Affiliated fund that is generally available only to investment companies and other accounts managed by Fidelity Investments. The rate quoted is the annualized seven-day yield of the fund at period end. A complete unaudited listing of the fund's holdings as of its most recent quarter end is available upon request. In addition, each Fidelity Central Fund's financial statements are available on the SEC's website or upon request. |
| (d) | Investment made with cash collateral received from securities on loan. |
Affiliated Central Funds
Fiscal year to date information regarding the Fund's investments in Fidelity Central Funds, including the ownership percentage, is presented below.
| Affiliate | Value, beginning of period ($) | Purchases ($) | Sales Proceeds ($) | Dividend Income ($) | Realized Gain (loss) ($) | Change in Unrealized appreciation (depreciation) ($) | Value, end of period ($) | Shares, end of period | % ownership, end of period |
| Fidelity Cash Central Fund | - | 11,236,673 | 11,060,533 | 2,013 | - | - | 176,140 | 176,105 | 0.0% |
| Fidelity Securities Lending Cash Central Fund | - | 16,813,480 | 12,074,755 | 819 | - | - | 4,738,725 | 4,738,251 | 0.0% |
| Total | - | 28,050,153 | 23,135,288 | 2,832 | - | - | 4,914,865 | 4,914,356 | |
| | | | | | | | | | |
Amounts in the dividend income column in the above table include any capital gain distributions from underlying funds, which are presented in the corresponding line item in the Statement of Operations, if applicable.
Amounts in the dividend income column for Fidelity Securities Lending Cash Central Fund represents the income earned on investing cash collateral, less rebates paid to borrowers and any lending agent fees associated with the loan, plus any premium payments received for lending certain types of securities.
Amounts included in the purchases and sales proceeds columns may include in-kind transactions, if applicable.
Investment Valuation
The following is a summary of the inputs used, as of December 31, 2024, involving the Fund's assets and liabilities carried at fair value. The inputs or methodology used for valuing securities may not be an indication of the risk associated with investing in those securities. For more information on valuation inputs, and their aggregation into the levels used below, please refer to the Investment Valuation section in the accompanying Notes to Financial Statements.
| Valuation Inputs at Reporting Date: |
| Description | Total ($) | Level 1 ($) | Level 2 ($) | Level 3 ($) |
Investments in Securities: | | | | |
|
| Common Stocks | | | | |
Consumer Discretionary | 1,842,657 | 1,842,657 | - | - |
Industrials | 1,564,157 | 1,564,157 | - | - |
Information Technology | 75,029,177 | 75,029,177 | - | - |
Real Estate | 6,460,884 | 6,460,884 | - | - |
|
| Money Market Funds | 4,914,865 | 4,914,865 | - | - |
| Total Investments in Securities: | 89,811,740 | 89,811,740 | - | - |
Derivative Instruments: Liabilities | | | | |
Futures Contracts | (4,849) | (4,849) | - | - |
| Total Liabilities | (4,849) | (4,849) | - | - |
| Total Derivative Instruments: | (4,849) | (4,849) | - | - |
Value of Derivative Instruments
The following table is a summary of the Fund's value of derivative instruments by primary risk exposure as of December 31, 2024. For additional information on derivative instruments, please refer to the Derivative Instruments section in the accompanying Notes to Financial Statements.
Primary Risk Exposure / Derivative Type | Value |
| Asset ($) | Liability ($) |
| Equity Risk | | |
Futures Contracts (a) | 0 | (4,849) |
| Total Equity Risk | 0 | (4,849) |
| Total Value of Derivatives | 0 | (4,849) |
(a)Reflects gross cumulative appreciation (depreciation) on futures contracts as presented in the Schedule of Investments. In the Statement of Assets and Liabilities, the period end daily variation margin is included in receivable or payable for daily variation margin on futures contracts, and the net cumulative appreciation (depreciation) is included in Total accumulated earnings (loss).
Fidelity® Cloud Computing ETF
Financial Statements (Unaudited)
| Statement of Assets and Liabilities |
| As of December 31, 2024 (Unaudited) |
| Assets | | | | |
| Investment in securities, at value (including securities loaned of $4,512,741) - See accompanying schedule: | | | | |
Unaffiliated issuers (cost $74,539,692) | $ | 84,896,875 | | |
Fidelity Central Funds (cost $4,914,865) | | 4,914,865 | | |
| | | | | |
| | | | | |
| Total Investment in Securities (cost $79,454,557) | | | $ | 89,811,740 |
| Segregated cash with brokers for derivative instruments | | | | 11,556 |
| Foreign currency held at value (cost $1,668) | | | | 1,592 |
| Dividends receivable | | | | 51,924 |
| Distributions receivable from Fidelity Central Funds | | | | 2,048 |
Total assets | | | | 89,878,860 |
| Liabilities | | | | |
| Accrued management fee | $ | 29,436 | | |
| Payable for daily variation margin on futures contracts | | 1,898 | | |
| Collateral on securities loaned | | 4,738,725 | | |
| Total liabilities | | | | 4,770,059 |
| Net Assets | | | $ | 85,108,801 |
| Net Assets consist of: | | | | |
| Paid in capital | | | $ | 77,456,855 |
| Total accumulated earnings (loss) | | | | 7,651,946 |
| Net Assets | | | $ | 85,108,801 |
Net Asset Value, offering price and redemption price per share ($85,108,801 ÷ 3,100,000 shares) | | | $ | 27.45 |
| Statement of Operations |
Six months ended December 31, 2024 (Unaudited) |
| Investment Income | | | | |
| Dividends | | | $ | 176,678 |
| Interest | | | | 35 |
| Income from Fidelity Central Funds (including $819 from security lending) | | | | 2,832 |
| Total income | | | | 179,545 |
| Expenses | | | | |
| Management fee | $ | 152,468 | | |
| Independent trustees' fees and expenses | | 166 | | |
| Miscellaneous | | 242 | | |
| Total expenses before reductions | | 152,876 | | |
| Expense reductions | | (653) | | |
| Total expenses after reductions | | | | 152,223 |
| Net Investment income (loss) | | | | 27,322 |
| Realized and Unrealized Gain (Loss) | | | | |
| Net realized gain (loss) on: | | | | |
| Investment Securities: | | | | |
| Unaffiliated issuers | | (1,636,262) | | |
| Redemptions in-kind | | 5,406,471 | | |
| Foreign currency transactions | | (3,395) | | |
| Futures contracts | | 4,899 | | |
| Total net realized gain (loss) | | | | 3,771,713 |
| Change in net unrealized appreciation (depreciation) on: | | | | |
| Investment Securities: | | | | |
| Unaffiliated issuers | | 6,004,051 | | |
| Assets and liabilities in foreign currencies | | (217) | | |
| Futures contracts | | (4,819) | | |
| Total change in net unrealized appreciation (depreciation) | | | | 5,999,015 |
| Net gain (loss) | | | | 9,770,728 |
| Net increase (decrease) in net assets resulting from operations | | | $ | 9,798,050 |
| Statement of Changes in Net Assets |
| |
| | Six months ended December 31, 2024 (Unaudited) | | Year ended June 30, 2024 |
| Increase (Decrease) in Net Assets | | | | |
| Operations | | | | |
| Net investment income (loss) | $ | 27,322 | $ | 105,956 |
| Net realized gain (loss) | | 3,771,713 | | 5,343,110 |
| Change in net unrealized appreciation (depreciation) | | 5,999,015 | | 4,565,409 |
| Net increase (decrease) in net assets resulting from operations | | 9,798,050 | | 10,014,475 |
| Distributions to shareholders | | (32,000) | | (106,250) |
| | | | | |
| Share transactions | | | | |
| Proceeds from sales of shares | | 15,704,905 | | 44,981,125 |
| Cost of shares redeemed | | (17,483,715) | | (14,705,337) |
| | | | | |
Net increase (decrease) in net assets resulting from share transactions | | (1,778,810) | | 30,275,788 |
| Total increase (decrease) in net assets | | 7,987,240 | | 40,184,013 |
| | | | | |
| Net Assets | | | | |
| Beginning of period | | 77,121,561 | | 36,937,548 |
| End of period | $ | 85,108,801 | $ | 77,121,561 |
| | | | | |
| Other Information | | | | |
| Shares | | | | |
| Sold | | 550,000 | | 1,950,000 |
| Redeemed | | (650,000) | | (650,000) |
| Net increase (decrease) | | (100,000) | | 1,300,000 |
| | | | | |
Financial Highlights
Fidelity® Cloud Computing ETF |
| |
| | Six months ended (Unaudited) December 31, 2024 | | Years ended June 30, 2024 | | 2023 | | 2022 A |
Selected Per-Share Data | | | | | | | | |
| Net asset value, beginning of period | $ | 24.10 | $ | 19.44 | $ | 15.91 | $ | 25.20 |
| Income from Investment Operations | | | | | | | | |
Net investment income (loss) B,C | | .01 | | .04 D | | .04 | | .06 |
| Net realized and unrealized gain (loss) | | 3.35 | | 4.66 | | 3.53 | | (9.29) |
| Total from investment operations | | 3.36 | | 4.70 | | 3.57 | | (9.23) |
| Distributions from net investment income | | (.01) | | (.04) | | (.03) | | (.06) |
| Distributions from tax return of capital | | - | | - | | (.01) | | - |
| Total distributions | | (.01) | | (.04) | | (.04) | | (.06) |
| Net asset value, end of period | $ | 27.45 | $ | 24.10 | $ | 19.44 | $ | 15.91 |
Total Return E,F,G | | | | 24.16% | | 22.51% | | (36.69)% |
Ratios to Average Net Assets C,H,I | | | | | | | | |
| Expenses before reductions | | .38% J | | .41% | | .39% | | .39% J |
| Expenses net of fee waivers, if any | | | | .40% | | .39% | | .39% J |
| Expenses net of all reductions | | .38% J | | .40% | | .39% | | .39% J |
| Net investment income (loss) | | .07% J | | .18% D | | .23% | | .41% J |
| Supplemental Data | | | | | | | | |
| Net assets, end of period (000 omitted) | $ | 85,109 | $ | 77,122 | $ | 36,938 | $ | 18,293 |
Portfolio turnover rate K,L | | | | 33% | | 38% | | 31% M |
AFor the period October 5, 2021 (commencement of operations) through June 30, 2022.
BCalculated based on average shares outstanding during the period.
CNet investment income (loss) is affected by the timing of the declaration of dividends by any underlying mutual funds or exchange-traded funds (ETFs). Net investment income (loss) of any mutual funds or ETFs is not included in the Fund's net investment income (loss) ratio.
DNet investment income per share reflects one or more large, non-recurring dividend(s) which amounted to $.02 per share. Excluding such non-recurring dividend(s), the ratio of net investment income (loss) to average net assets would have been .10%.
ETotal returns for periods of less than one year are not annualized.
FTotal returns would have been lower if certain expenses had not been reduced during the applicable periods shown.
GBased on net asset value.
HFees and expenses of any underlying mutual funds or exchange-traded funds (ETFs) are not included in the Fund's expense ratio. The Fund indirectly bears its proportionate share of these expenses. For additional expense information related to investments in Fidelity Central Funds, please refer to the "Investments in Fidelity Central Funds" note found in the Notes to Financial Statements section of the most recent Annual or Semi-Annual report.
IExpense ratios reflect operating expenses of the class. Expenses before reductions do not reflect amounts reimbursed, waived, or reduced through arrangements with the investment adviser, brokerage services, or other offset arrangements, if applicable, and do not represent the amount paid by the class during periods when reimbursements, waivers or reductions occur.
JAnnualized.
KAmount does not include the portfolio activity of any underlying mutual funds or exchange-traded funds (ETFs), derivatives or securities that mature within one year from acquisition.
LPortfolio turnover rate excludes securities received or delivered in-kind.
MAmount not annualized.
Fidelity® Crypto Industry and Digital Payments ETF
Schedule of Investments December 31, 2024 (Unaudited)
Showing Percentage of Net Assets
| Common Stocks - 99.6% |
| | | Shares | Value ($) |
| AUSTRALIA - 3.1% | | | |
| Information Technology - 3.1% | | | |
| Software - 3.1% | | | |
| IREN Ltd (a)(b) | | 520,734 | 5,113,608 |
| BRAZIL - 2.9% | | | |
| Financials - 2.9% | | | |
| Financial Services - 2.9% | | | |
| Pagseguro Digital Ltd Class A (b) | | 366,397 | 2,293,645 |
| StoneCo Ltd Class A (b) | | 314,291 | 2,504,899 |
| | | | |
| TOTAL BRAZIL | | | 4,798,544 |
| CANADA - 7.2% | | | |
| Information Technology - 7.2% | | | |
| IT Services - 1.7% | | | |
| Shopify Inc Class A (b) | | 25,881 | 2,753,118 |
| Software - 5.5% | | | |
| Bitfarms Ltd/Canada (a)(b) | | 1,883,944 | 2,790,155 |
| Hive Digital Technologies Ltd (United States) (a)(b) | | 633,307 | 1,804,924 |
| Hut 8 Corp (United States) (b) | | 223,891 | 4,587,527 |
| | | | 9,182,606 |
| TOTAL CANADA | | | 11,935,724 |
| CHINA - 1.4% | | | |
| Information Technology - 1.4% | | | |
| Technology Hardware, Storage & Peripherals - 1.4% | | | |
| Canaan Inc Class A ADR (a)(b) | | 1,161,142 | 2,380,341 |
| FRANCE - 1.4% | | | |
| Financials - 1.4% | | | |
| Financial Services - 1.4% | | | |
| Edenred SE | | 71,515 | 2,351,208 |
| GERMANY - 1.6% | | | |
| Financials - 0.6% | | | |
| Capital Markets - 0.6% | | | |
| Bitcoin Group SE (a) | | 19,807 | 1,031,660 |
| Information Technology - 1.0% | | | |
| Software - 1.0% | | | |
| Northern Data AG (a)(b) | | 34,332 | 1,585,566 |
| TOTAL GERMANY | | | 2,617,226 |
| ITALY - 1.3% | | | |
| Financials - 1.3% | | | |
| Financial Services - 1.3% | | | |
| Nexi SpA (b)(c)(d) | | 388,963 | 2,158,854 |
| JAPAN - 6.8% | | | |
| Communication Services - 1.2% | | | |
| Media - 1.2% | | | |
| Ceres Inc/Japan | | 100,600 | 1,987,548 |
| Financials - 4.7% | | | |
| Capital Markets - 3.5% | | | |
| Monex Group Inc | | 379,200 | 2,323,553 |
| SBI Holdings Inc | | 132,800 | 3,364,785 |
| | | | 5,688,338 |
| Financial Services - 1.2% | | | |
| GMO Payment Gateway Inc | | 39,700 | 2,013,545 |
TOTAL FINANCIALS | | | 7,701,883 |
| | | | |
| Information Technology - 0.9% | | | |
| IT Services - 0.9% | | | |
| GMO internet group Inc | | 88,200 | 1,504,046 |
| TOTAL JAPAN | | | 11,193,477 |
| KOREA (SOUTH) - 0.7% | | | |
| Communication Services - 0.7% | | | |
| Entertainment - 0.7% | | | |
| Com2uS Holdings Corp (b) | | 47,595 | 1,091,146 |
| MALAYSIA - 1.3% | | | |
| Industrials - 1.3% | | | |
| Professional Services - 1.3% | | | |
| My EG Services Bhd | | 10,128,600 | 2,174,540 |
| NETHERLANDS - 1.7% | | | |
| Financials - 1.7% | | | |
| Financial Services - 1.7% | | | |
| Adyen NV (b)(c)(d) | | 1,884 | 2,803,417 |
| UNITED ARAB EMIRATES - 0.9% | | | |
| Information Technology - 0.9% | | | |
| Software - 0.9% | | | |
| Phoenix Group PLC | | 4,655,165 | 1,508,187 |
| UNITED STATES - 69.3% | | | |
| Financials - 40.0% | | | |
| Capital Markets - 16.4% | | | |
| Bakkt Holdings Inc Class A (a)(b) | | 88,556 | 2,193,532 |
| Coinbase Global Inc Class A (b) | | 77,458 | 19,232,821 |
| Galaxy Digital Holdings Ltd (a)(b) | | 119,727 | 2,080,363 |
| Robinhood Markets Inc Class A (b) | | 101,127 | 3,767,992 |
| | | | 27,274,708 |
| Financial Services - 23.6% | | | |
| Block Inc Class A (b) | | 71,363 | 6,065,142 |
| Corpay Inc (b) | | 8,032 | 2,718,189 |
| Fidelity National Information Services Inc | | 34,529 | 2,788,907 |
| Fiserv Inc (b) | | 14,471 | 2,972,633 |
| Flywire Corp (b) | | 112,554 | 2,320,863 |
| Global Payments Inc | | 25,482 | 2,855,513 |
| Marqeta Inc Class A (b) | | 595,246 | 2,255,982 |
| Mastercard Inc Class A | | 5,628 | 2,963,536 |
| Payoneer Global Inc (b) | | 235,284 | 2,362,251 |
| PayPal Holdings Inc (b) | | 33,152 | 2,829,523 |
| Shift4 Payments Inc Class A (a)(b) | | 28,956 | 3,005,055 |
| Visa Inc Class A | | 9,551 | 3,018,499 |
| WEX Inc (a)(b) | | 16,159 | 2,832,996 |
| | | | 38,989,089 |
TOTAL FINANCIALS | | | 66,263,797 |
| | | | |
| Information Technology - 29.3% | | | |
| IT Services - 6.0% | | | |
| Applied Digital Corp (a)(b) | | 541,296 | 4,135,501 |
| Core Scientific Inc | | 409,381 | 5,751,803 |
| | | | 9,887,304 |
| Software - 23.3% | | | |
| Bit Digital Inc (a)(b) | | 909,584 | 2,665,081 |
| Bitdeer Technologies Group Class A (a)(b) | | 241,340 | 5,229,838 |
| Cipher Mining Inc (a)(b) | | 639,398 | 2,966,807 |
| Cleanspark Inc (a)(b) | | 664,474 | 6,119,806 |
| MARA Holdings Inc (a)(b) | | 614,511 | 10,305,350 |
| Riot Platforms Inc (a)(b) | | 637,005 | 6,503,821 |
| Terawulf Inc (a)(b) | | 844,381 | 4,779,196 |
| | | | 38,569,899 |
TOTAL INFORMATION TECHNOLOGY | | | 48,457,203 |
| | | | |
| TOTAL UNITED STATES | | | 114,721,000 |
| TOTAL COMMON STOCKS (Cost $142,492,036) | | | 164,847,272 |
| | | | |
| Money Market Funds - 30.5% |
| | | Yield (%) | Shares | Value ($) |
Fidelity Securities Lending Cash Central Fund (e)(f) (Cost $50,597,733) | | 4.35 | 50,592,674 | 50,597,733 |
| | | | | |
| TOTAL INVESTMENT IN SECURITIES - 130.1% (Cost $193,089,769) | 215,445,005 |
NET OTHER ASSETS (LIABILITIES) - (30.1)% | (49,897,240) |
| NET ASSETS - 100.0% | 165,547,765 |
| | |
| Futures Contracts |
| | Number of contracts | Expiration Date | Notional Amount ($) | Value ($) | Unrealized Appreciation/ (Depreciation) ($) |
| Purchased | | | | | |
| | | | | | |
| Equity Contracts | | | | | |
| CME Micro NASDAQ 100 Index Contracts (United States) | 16 | Mar 2025 | 679,248 | (23,420) | (23,420) |
| | | | | | |
| The notional amount of futures purchased as a percentage of Net Assets is 0.4% |
Legend
| (a) | Security or a portion of the security is on loan at period end. |
| (c) | Security exempt from registration under Rule 144A of the Securities Act of 1933. These securities may be resold in transactions exempt from registration, normally to qualified institutional buyers. At the end of the period, the value of these securities amounted to $4,962,271 or 3.0% of net assets. |
| (d) | Security is exempt from registration under Regulation S of the Securities Act of 1933 and may be resold to qualified foreign investors outside of the United States. At the end of the period, the value of securities amounted to $4,962,271 or 3.0% of net assets. |
| (e) | Affiliated fund that is generally available only to investment companies and other accounts managed by Fidelity Investments. The rate quoted is the annualized seven-day yield of the fund at period end. A complete unaudited listing of the fund's holdings as of its most recent quarter end is available upon request. In addition, each Fidelity Central Fund's financial statements are available on the SEC's website or upon request. |
| (f) | Investment made with cash collateral received from securities on loan. |
Affiliated Central Funds
Fiscal year to date information regarding the Fund's investments in Fidelity Central Funds, including the ownership percentage, is presented below.
| Affiliate | Value, beginning of period ($) | Purchases ($) | Sales Proceeds ($) | Dividend Income ($) | Realized Gain (loss) ($) | Change in Unrealized appreciation (depreciation) ($) | Value, end of period ($) | Shares, end of period | % ownership, end of period |
| Fidelity Cash Central Fund | 40,485 | 15,903,238 | 15,943,723 | 5,592 | - | - | - | - | 0.0% |
| Fidelity Securities Lending Cash Central Fund | - | 93,726,869 | 43,129,136 | 58,327 | - | - | 50,597,733 | 50,592,674 | 0.2% |
| Total | 40,485 | 109,630,107 | 59,072,859 | 63,919 | - | - | 50,597,733 | 50,592,674 | |
| | | | | | | | | | |
Amounts in the dividend income column in the above table include any capital gain distributions from underlying funds, which are presented in the corresponding line item in the Statement of Operations, if applicable.
Amounts in the dividend income column for Fidelity Securities Lending Cash Central Fund represents the income earned on investing cash collateral, less rebates paid to borrowers and any lending agent fees associated with the loan, plus any premium payments received for lending certain types of securities.
Amounts included in the purchases and sales proceeds columns may include in-kind transactions, if applicable.
Investment Valuation
The following is a summary of the inputs used, as of December 31, 2024, involving the Fund's assets and liabilities carried at fair value. The inputs or methodology used for valuing securities may not be an indication of the risk associated with investing in those securities. For more information on valuation inputs, and their aggregation into the levels used below, please refer to the Investment Valuation section in the accompanying Notes to Financial Statements.
| Valuation Inputs at Reporting Date: |
| Description | Total ($) | Level 1 ($) | Level 2 ($) | Level 3 ($) |
Investments in Securities: | | | | |
|
| Common Stocks | | | | |
Communication Services | 3,078,694 | 3,078,694 | - | - |
Financials | 87,109,363 | 87,109,363 | - | - |
Industrials | 2,174,540 | 2,174,540 | - | - |
Information Technology | 72,484,675 | 72,484,675 | - | - |
|
| Money Market Funds | 50,597,733 | 50,597,733 | - | - |
| Total Investments in Securities: | 215,445,005 | 215,445,005 | - | - |
Derivative Instruments: Liabilities | | | | |
Futures Contracts | (23,420) | (23,420) | - | - |
| Total Liabilities | (23,420) | (23,420) | - | - |
| Total Derivative Instruments: | (23,420) | (23,420) | - | - |
Value of Derivative Instruments
The following table is a summary of the Fund's value of derivative instruments by primary risk exposure as of December 31, 2024. For additional information on derivative instruments, please refer to the Derivative Instruments section in the accompanying Notes to Financial Statements.
Primary Risk Exposure / Derivative Type | Value |
| Asset ($) | Liability ($) |
| Equity Risk | | |
Futures Contracts (a) | 0 | (23,420) |
| Total Equity Risk | 0 | (23,420) |
| Total Value of Derivatives | 0 | (23,420) |
(a)Reflects gross cumulative appreciation (depreciation) on futures contracts as presented in the Schedule of Investments. In the Statement of Assets and Liabilities, the period end daily variation margin is included in receivable or payable for daily variation margin on futures contracts, and the net cumulative appreciation (depreciation) is included in Total accumulated earnings (loss).
Fidelity® Crypto Industry and Digital Payments ETF
Financial Statements (Unaudited)
| Statement of Assets and Liabilities |
| As of December 31, 2024 (Unaudited) |
| Assets | | | | |
| Investment in securities, at value (including securities loaned of $47,642,886) - See accompanying schedule: | | | | |
Unaffiliated issuers (cost $142,492,036) | $ | 164,847,272 | | |
Fidelity Central Funds (cost $50,597,733) | | 50,597,733 | | |
| | | | | |
| | | | | |
| Total Investment in Securities (cost $193,089,769) | | | $ | 215,445,005 |
| Segregated cash with brokers for derivative instruments | | | | 36,565 |
| Cash | | | | 818,418 |
| Foreign currency held at value (cost $1,699,101) | | | | 1,699,211 |
| Receivable for investments sold | | | | 5,480,324 |
| Receivable for fund shares sold | | | | 577 |
| Dividends receivable | | | | 45,241 |
| Distributions receivable from Fidelity Central Funds | | | | 47,293 |
| Other receivables | | | | 10 |
Total assets | | | | 223,572,644 |
| Liabilities | | | | |
| Payable for investments purchased | $ | 2,462,811 | | |
| Payable for fund shares redeemed | | 4,869,118 | | |
| Distributions payable | | 31,500 | | |
| Accrued management fee | | 57,631 | | |
| Payable for daily variation margin on futures contracts | | 6,072 | | |
| Other payables and accrued expenses | | 14 | | |
| Collateral on securities loaned | | 50,597,733 | | |
| Total liabilities | | | | 58,024,879 |
| Net Assets | | | $ | 165,547,765 |
| Net Assets consist of: | | | | |
| Paid in capital | | | $ | 140,758,837 |
| Total accumulated earnings (loss) | | | | 24,788,928 |
| Net Assets | | | $ | 165,547,765 |
Net Asset Value, offering price and redemption price per share ($165,547,765 ÷ 5,100,000 shares) | | | $ | 32.46 |
| Statement of Operations |
Six months ended December 31, 2024 (Unaudited) |
| Investment Income | | | | |
| Dividends | | | $ | 68,521 |
| Special dividends | | | | 17,737 |
| Interest | | | | 525 |
| Income from Fidelity Central Funds (including $58,327 from security lending) | | | | 63,919 |
| Income before foreign taxes withheld | | | $ | 150,702 |
| Less foreign taxes withheld | | | | (7,632) |
| Total income | | | | 143,070 |
| Expenses | | | | |
| Management fee | $ | 233,374 | | |
| Independent trustees' fees and expenses | | 230 | | |
| Miscellaneous | | 283 | | |
| Total expenses before reductions | | 233,887 | | |
| Expense reductions | | (697) | | |
| Total expenses after reductions | | | | 233,190 |
| Net Investment income (loss) | | | | (90,120) |
| Realized and Unrealized Gain (Loss) | | | | |
| Net realized gain (loss) on: | | | | |
| Investment Securities: | | | | |
| Unaffiliated issuers | | (7,456,136) | | |
| Redemptions in-kind | | 15,404,076 | | |
| Foreign currency transactions | | (10,308) | | |
| Futures contracts | | 8,745 | | |
| Total net realized gain (loss) | | | | 7,946,377 |
| Change in net unrealized appreciation (depreciation) on: | | | | |
| Investment Securities: | | | | |
| Unaffiliated issuers | | (4,015,212) | | |
| Assets and liabilities in foreign currencies | | (319) | | |
| Futures contracts | | (23,500) | | |
| Total change in net unrealized appreciation (depreciation) | | | | (4,039,031) |
| Net gain (loss) | | | | 3,907,346 |
| Net increase (decrease) in net assets resulting from operations | | | $ | 3,817,226 |
| Statement of Changes in Net Assets |
| |
| | Six months ended December 31, 2024 (Unaudited) | | Year ended June 30, 2024 |
| Increase (Decrease) in Net Assets | | | | |
| Operations | | | | |
| Net investment income (loss) | $ | (90,120) | $ | (127,893) |
| Net realized gain (loss) | | 7,946,377 | | 8,999,521 |
| Change in net unrealized appreciation (depreciation) | | (4,039,031) | | 17,470,116 |
| Net increase (decrease) in net assets resulting from operations | | 3,817,226 | | 26,341,744 |
| Distributions to shareholders | | (1,957,600) | | (135,150) |
| | | | | |
| Share transactions | | | | |
| Proceeds from sales of shares | | 86,308,000 | | 51,747,447 |
| Cost of shares redeemed | | (26,412,381) | | (10,623,302) |
| | | | | |
Net increase (decrease) in net assets resulting from share transactions | | 59,895,619 | | 41,124,145 |
| Total increase (decrease) in net assets | | 61,755,245 | | 67,330,739 |
| | | | | |
| Net Assets | | | | |
| Beginning of period | | 103,792,520 | | 36,461,781 |
| End of period | $ | 165,547,765 | $ | 103,792,520 |
| | | | | |
| Other Information | | | | |
| Shares | | | | |
| Sold | | 2,350,000 | | 2,050,000 |
| Redeemed | | (800,000) | | (400,000) |
| Net increase (decrease) | | 1,550,000 | | 1,650,000 |
| | | | | |
Financial Highlights
Fidelity® Crypto Industry and Digital Payments ETF |
| |
| | Six months ended (Unaudited) December 31, 2024 | | Years ended June 30, 2024 | | 2023 | | 2022 A |
Selected Per-Share Data | | | | | | | | |
| Net asset value, beginning of period | $ | 29.24 | $ | 19.19 | $ | 12.39 | $ | 25.76 |
| Income from Investment Operations | | | | | | | | |
Net investment income (loss) B,C | | (.02) D | | (.04) | | (.03) | | (.01) |
| Net realized and unrealized gain (loss) | | 3.62 | | 10.14 | | 6.83 | | (13.36) |
| Total from investment operations | | 3.60 | | 10.10 | | 6.80 | | (13.37) |
| Distributions from net investment income | | (.38) | | (.05) | | - | | - |
| Total distributions | | (.38) | | (.05) | | - | | - |
| Net asset value, end of period | $ | 32.46 | $ | 29.24 | $ | 19.19 | $ | 12.39 |
Total Return E,F,G | | | | 52.67% | | 54.94% | | (51.92)% |
Ratios to Average Net Assets C,H,I | | | | | | | | |
| Expenses before reductions | | .38% J | | .42% | | .39% | | .39% J |
| Expenses net of fee waivers, if any | | | | .40% | | .39% | | .39% J |
| Expenses net of all reductions | | .38% J | | .40% | | .39% | | .39% J |
| Net investment income (loss) | | (.16)% D,J | | (.19)% | | (.19)% | | (.29)% J |
| Supplemental Data | | | | | | | | |
| Net assets, end of period (000 omitted) | $ | 165,548 | $ | 103,793 | $ | 36,462 | $ | 13,005 |
Portfolio turnover rate K,L | | | | 53% | | 55% | | 28% M |
AFor the period April 19, 2022 (commencement of operations) through June 30, 2022.
BCalculated based on average shares outstanding during the period.
CNet investment income (loss) is affected by the timing of the declaration of dividends by any underlying mutual funds or exchange-traded funds (ETFs). Net investment income (loss) of any mutual funds or ETFs is not included in the Fund's net investment income (loss) ratio.
DNet investment income per share reflects one or more large, non-recurring dividend(s) which amounted to less than $.005 per share. Such dividends are not annualized in the ratio of net investment income (loss) to average net assets. Excluding such non-recurring dividend(s) the ratio of net investment income (loss) to average net assets would have been (.18)%.
ETotal returns for periods of less than one year are not annualized.
FTotal returns would have been lower if certain expenses had not been reduced during the applicable periods shown.
GBased on net asset value.
HFees and expenses of any underlying mutual funds or exchange-traded funds (ETFs) are not included in the Fund's expense ratio. The Fund indirectly bears its proportionate share of these expenses. For additional expense information related to investments in Fidelity Central Funds, please refer to the "Investments in Fidelity Central Funds" note found in the Notes to Financial Statements section of the most recent Annual or Semi-Annual report.
IExpense ratios reflect operating expenses of the class. Expenses before reductions do not reflect amounts reimbursed, waived, or reduced through arrangements with the investment adviser, brokerage services, or other offset arrangements, if applicable, and do not represent the amount paid by the class during periods when reimbursements, waivers or reductions occur.
JAnnualized.
KAmount does not include the portfolio activity of any underlying mutual funds or exchange-traded funds (ETFs), derivatives or securities that mature within one year from acquisition.
LPortfolio turnover rate excludes securities received or delivered in-kind.
MAmount not annualized.
Fidelity® Digital Health ETF
Schedule of Investments December 31, 2024 (Unaudited)
Showing Percentage of Net Assets
| Common Stocks - 100.0% |
| | | Shares | Value ($) |
| AUSTRALIA - 6.8% | | | |
| Health Care - 5.9% | | | |
| Health Care Equipment & Supplies - 3.2% | | | |
| Cochlear Ltd | | 1,368 | 245,528 |
| Health Care Technology - 2.7% | | | |
| Pro Medicus Ltd | | 1,360 | 210,612 |
TOTAL HEALTH CARE | | | 456,140 |
| | | | |
| Information Technology - 0.9% | | | |
| Software - 0.9% | | | |
| Catapult Group International Ltd (a) | | 31,714 | 72,849 |
| TOTAL AUSTRALIA | | | 528,989 |
| CANADA - 1.2% | | | |
| Health Care - 1.2% | | | |
| Health Care Providers & Services - 1.2% | | | |
| Well Health Technologies Corp (a) | | 20,525 | 97,901 |
| CHINA - 5.0% | | | |
| Consumer Staples - 4.3% | | | |
| Consumer Staples Distribution & Retail - 4.3% | | | |
| Alibaba Health Information Technology Ltd (a) | | 308,000 | 131,638 |
| JD Health International Inc (a)(b)(c) | | 44,850 | 162,242 |
| Ping An Healthcare and Technology Co Ltd (b)(c) | | 51,400 | 41,025 |
| | | | 334,905 |
| Health Care - 0.7% | | | |
| Health Care Technology - 0.7% | | | |
| Yidu Tech Inc (a)(b)(c) | | 96,300 | 59,382 |
| TOTAL CHINA | | | 394,287 |
| DENMARK - 1.9% | | | |
| Health Care - 1.9% | | | |
| Health Care Equipment & Supplies - 1.9% | | | |
| Demant A/S (a) | | 4,077 | 149,570 |
| GERMANY - 4.8% | | | |
| Health Care - 4.8% | | | |
| Health Care Equipment & Supplies - 3.6% | | | |
| Siemens Healthineers AG (b)(c) | | 5,304 | 281,206 |
| Health Care Technology - 1.2% | | | |
| CompuGroup Medical SE & Co KgaA | | 4,108 | 92,563 |
| TOTAL GERMANY | | | 373,769 |
| JAPAN - 2.6% | | | |
| Health Care - 2.6% | | | |
| Health Care Equipment & Supplies - 1.7% | | | |
| Nihon Kohden Corp | | 9,600 | 131,698 |
| Health Care Technology - 0.9% | | | |
| JMDC Inc | | 3,000 | 74,942 |
| TOTAL JAPAN | | | 206,640 |
| KOREA (SOUTH) - 1.8% | | | |
| Health Care - 1.8% | | | |
| Health Care Equipment & Supplies - 0.6% | | | |
| Vuno Inc (a) | | 2,857 | 46,964 |
| Health Care Technology - 1.2% | | | |
| Lunit Inc | | 2,132 | 92,397 |
| TOTAL KOREA (SOUTH) | | | 139,361 |
| NETHERLANDS - 5.6% | | | |
| Consumer Staples - 1.5% | | | |
| Consumer Staples Distribution & Retail - 1.5% | | | |
| Redcare Pharmacy NV (a)(b)(c) | | 876 | 119,464 |
| Health Care - 4.1% | | | |
| Health Care Equipment & Supplies - 4.1% | | | |
| Koninklijke Philips NV | | 12,662 | 319,921 |
| TOTAL NETHERLANDS | | | 439,385 |
| NEW ZEALAND - 3.4% | | | |
| Health Care - 3.4% | | | |
| Health Care Equipment & Supplies - 3.4% | | | |
| Fisher & Paykel Healthcare Corp Ltd | | 12,295 | 264,510 |
| SWEDEN - 1.9% | | | |
| Health Care - 1.9% | | | |
| Health Care Technology - 1.9% | | | |
| Sectra AB B Shares (a) | | 5,889 | 147,448 |
| SWITZERLAND - 4.4% | | | |
| Consumer Staples - 0.7% | | | |
| Consumer Staples Distribution & Retail - 0.7% | | | |
| DocMorris AG (a) | | 2,343 | 51,656 |
| Health Care - 3.7% | | | |
| Health Care Equipment & Supplies - 3.7% | | | |
| Sonova Holding AG | | 892 | 291,641 |
| TOTAL SWITZERLAND | | | 343,297 |
| UNITED STATES - 60.6% | | | |
| Health Care - 54.4% | | | |
| Health Care Equipment & Supplies - 29.1% | | | |
| Axogen Inc (a) | | 5,522 | 91,003 |
| Dexcom Inc (a) | | 4,696 | 365,208 |
| Inspire Medical Systems Inc (a) | | 997 | 184,824 |
| Insulet Corp (a) | | 1,182 | 308,585 |
| Intuitive Surgical Inc (a) | | 677 | 353,367 |
| iRhythm Technologies Inc (a) | | 1,692 | 152,568 |
| Masimo Corp (a) | | 1,261 | 208,443 |
| Omnicell Inc (a) | | 2,623 | 116,776 |
| ResMed Inc | | 1,548 | 354,012 |
| Tandem Diabetes Care Inc (a) | | 4,123 | 148,510 |
| | | | 2,283,296 |
| Health Care Providers & Services - 9.5% | | | |
| Accolade Inc (a) | | 15,792 | 54,008 |
| Astrana Health Inc (a) | | 2,638 | 83,176 |
| Cigna Group/The | | 511 | 141,108 |
| CorVel Corp (a) | | 1,203 | 133,846 |
| Hims & Hers Health Inc Class A (a) | | 6,164 | 149,046 |
| Premier Inc Class A | | 5,674 | 120,289 |
| Talkspace Inc Class A (a) | | 20,846 | 64,414 |
| | | | 745,887 |
| Health Care Technology - 13.7% | | | |
| Doximity Inc Class A (a) | | 3,738 | 199,572 |
| Evolent Health Inc Class A (a) | | 8,693 | 97,796 |
| GoodRx Holdings Inc Class A (a) | | 13,933 | 64,788 |
| Health Catalyst Inc (a) | | 8,929 | 63,128 |
| HealthStream Inc | | 2,685 | 85,383 |
| Phreesia Inc (a) | | 4,786 | 120,416 |
| Teladoc Health Inc (a) | | 11,254 | 102,299 |
| Veeva Systems Inc Class A (a) | | 1,600 | 336,400 |
| | | | 1,069,782 |
| Life Sciences Tools & Services - 2.1% | | | |
| IQVIA Holdings Inc (a) | | 824 | 161,924 |
TOTAL HEALTH CARE | | | 4,260,889 |
| | | | |
| Industrials - 2.0% | | | |
| Professional Services - 2.0% | | | |
| Maximus Inc | | 2,171 | 162,065 |
| Information Technology - 4.2% | | | |
| IT Services - 2.0% | | | |
| Cognizant Technology Solutions Corp Class A | | 2,040 | 156,876 |
| Technology Hardware, Storage & Peripherals - 2.2% | | | |
| Apple Inc | | 678 | 169,785 |
TOTAL INFORMATION TECHNOLOGY | | | 326,661 |
| | | | |
| TOTAL UNITED STATES | | | 4,749,615 |
| TOTAL COMMON STOCKS (Cost $7,569,957) | | | 7,834,772 |
| | | | |
| Money Market Funds - 0.0% |
| | | Yield (%) | Shares | Value ($) |
Fidelity Cash Central Fund (d) (Cost $738) | | 4.36 | 738 | 737 |
| | | | | |
| TOTAL INVESTMENT IN SECURITIES - 100.0% (Cost $7,570,695) | 7,835,509 |
NET OTHER ASSETS (LIABILITIES) - 0.0% | 562 |
| NET ASSETS - 100.0% | 7,836,071 |
| | |
Legend
| (b) | Security exempt from registration under Rule 144A of the Securities Act of 1933. These securities may be resold in transactions exempt from registration, normally to qualified institutional buyers. At the end of the period, the value of these securities amounted to $663,319 or 8.5% of net assets. |
| (c) | Security is exempt from registration under Regulation S of the Securities Act of 1933 and may be resold to qualified foreign investors outside of the United States. At the end of the period, the value of securities amounted to $663,319 or 8.5% of net assets. |
| (d) | Affiliated fund that is generally available only to investment companies and other accounts managed by Fidelity Investments. The rate quoted is the annualized seven-day yield of the fund at period end. A complete unaudited listing of the fund's holdings as of its most recent quarter end is available upon request. In addition, each Fidelity Central Fund's financial statements are available on the SEC's website or upon request. |
Affiliated Central Funds
Fiscal year to date information regarding the Fund's investments in Fidelity Central Funds, including the ownership percentage, is presented below.
| Affiliate | Value, beginning of period ($) | Purchases ($) | Sales Proceeds ($) | Dividend Income ($) | Realized Gain (loss) ($) | Change in Unrealized appreciation (depreciation) ($) | Value, end of period ($) | Shares, end of period | % ownership, end of period |
| Fidelity Cash Central Fund | - | 690,518 | 689,780 | 131 | - | (1) | 737 | 738 | 0.0% |
| Total | - | 690,518 | 689,780 | 131 | - | (1) | 737 | 738 | |
| | | | | | | | | | |
Amounts in the dividend income column in the above table include any capital gain distributions from underlying funds, which are presented in the corresponding line item in the Statement of Operations, if applicable.
Amounts included in the purchases and sales proceeds columns may include in-kind transactions, if applicable.
Investment Valuation
The following is a summary of the inputs used, as of December 31, 2024, involving the Fund's assets and liabilities carried at fair value. The inputs or methodology used for valuing securities may not be an indication of the risk associated with investing in those securities. For more information on valuation inputs, and their aggregation into the levels used below, please refer to the Investment Valuation section in the accompanying Notes to Financial Statements.
| Valuation Inputs at Reporting Date: |
| Description | Total ($) | Level 1 ($) | Level 2 ($) | Level 3 ($) |
Investments in Securities: | | | | |
|
| Common Stocks | | | | |
Consumer Staples | 506,025 | 506,025 | - | - |
Health Care | 6,767,172 | 6,767,172 | - | - |
Industrials | 162,065 | 162,065 | - | - |
Information Technology | 399,510 | 399,510 | - | - |
|
| Money Market Funds | 737 | 737 | - | - |
| Total Investments in Securities: | 7,835,509 | 7,835,509 | - | - |
Fidelity® Digital Health ETF
Financial Statements (Unaudited)
| Statement of Assets and Liabilities |
| As of December 31, 2024 (Unaudited) |
| Assets | | | | |
| Investment in securities, at value - See accompanying schedule: | | | | |
Unaffiliated issuers (cost $7,569,957) | $ | 7,834,772 | | |
Fidelity Central Funds (cost $738) | | 737 | | |
| | | | | |
| | | | | |
| Total Investment in Securities (cost $7,570,695) | | | $ | 7,835,509 |
| Dividends receivable | | | | 116,697 |
| Distributions receivable from Fidelity Central Funds | | | | 122 |
Total assets | | | | 7,952,328 |
| Liabilities | | | | |
| Payable to custodian bank | $ | 112,783 | | |
| Payable for investments purchased | | 807 | | |
| Accrued management fee | | 2,667 | | |
| Total liabilities | | | | 116,257 |
| Net Assets | | | $ | 7,836,071 |
| Net Assets consist of: | | | | |
| Paid in capital | | | $ | 11,032,107 |
| Total accumulated earnings (loss) | | | | (3,196,036) |
| Net Assets | | | $ | 7,836,071 |
Net Asset Value, offering price and redemption price per share ($7,836,071 ÷ 400,000 shares) | | | $ | 19.59 |
| Statement of Operations |
Six months ended December 31, 2024 (Unaudited) |
| Investment Income | | | | |
| Dividends | | | $ | 13,755 |
| Special dividends | | | | 113,207 |
| Income from Fidelity Central Funds | | | | 131 |
| Total income | | | | 127,093 |
| Expenses | | | | |
| Management fee | $ | 16,118 | | |
| Independent trustees' fees and expenses | | 18 | | |
| Miscellaneous | | 22 | | |
| Total expenses before reductions | | 16,158 | | |
| Expense reductions | | (17) | | |
| Total expenses after reductions | | | | 16,141 |
| Net Investment income (loss) | | | | 110,952 |
| Realized and Unrealized Gain (Loss) | | | | |
| Net realized gain (loss) on: | | | | |
| Investment Securities: | | | | |
| Unaffiliated issuers | | (1,055,629) | | |
| Redemptions in-kind | | 245,641 | | |
| Foreign currency transactions | | (403) | | |
| Total net realized gain (loss) | | | | (810,391) |
| Change in net unrealized appreciation (depreciation) on: | | | | |
| Investment Securities: | | | | |
| Unaffiliated issuers | | 1,365,282 | | |
| Fidelity Central Funds | | (1) | | |
| Assets and liabilities in foreign currencies | | 54 | | |
| Total change in net unrealized appreciation (depreciation) | | | | 1,365,335 |
| Net gain (loss) | | | | 554,944 |
| Net increase (decrease) in net assets resulting from operations | | | $ | 665,896 |
| Statement of Changes in Net Assets |
| |
| | Six months ended December 31, 2024 (Unaudited) | | Year ended June 30, 2024 |
| Increase (Decrease) in Net Assets | | | | |
| Operations | | | | |
| Net investment income (loss) | $ | 110,952 | $ | 2,851 |
| Net realized gain (loss) | | (810,391) | | (938,755) |
| Change in net unrealized appreciation (depreciation) | | 1,365,335 | | 339,751 |
| Net increase (decrease) in net assets resulting from operations | | 665,896 | | (596,153) |
| Distributions to shareholders | | (115,200) | | (4,950) |
| | | | | |
| Share transactions | | | | |
| Cost of shares redeemed | | (978,653) | | (963,021) |
| | | | | |
Net increase (decrease) in net assets resulting from share transactions | | (978,653) | | (963,021) |
| Total increase (decrease) in net assets | | (427,957) | | (1,564,124) |
| | | | | |
| Net Assets | | | | |
| Beginning of period | | 8,264,028 | | 9,828,152 |
| End of period | $ | 7,836,071 | $ | 8,264,028 |
| | | | | |
| Other Information | | | | |
| Shares | | | | |
| Redeemed | | (50,000) | | (50,000) |
| Net increase (decrease) | | (50,000) | | (50,000) |
| | | | | |
Financial Highlights
Fidelity® Digital Health ETF |
| |
| | Six months ended (Unaudited) December 31, 2024 | | Years ended June 30, 2024 | | 2023 | | 2022 A |
Selected Per-Share Data | | | | | | | | |
| Net asset value, beginning of period | $ | 18.36 | $ | 19.66 | $ | 18.58 | $ | 25.10 |
| Income from Investment Operations | | | | | | | | |
Net investment income (loss) B,C | | .26 D | | .01 | | .03 E | | (.01) |
| Net realized and unrealized gain (loss) | | 1.26 | | (1.30) | | 1.08 | | (6.51) |
| Total from investment operations | | 1.52 | | (1.29) | | 1.11 | | (6.52) |
| Distributions from net investment income | | (.29) | | (.01) | | (.03) | | - |
| Total distributions | | (.29) | | (.01) | | (.03) | | - |
| Net asset value, end of period | $ | 19.59 | $ | 18.36 | $ | 19.66 | $ | 18.58 |
Total Return F,G,H | | | | (6.52)% | | 5.98% | | (25.99)% |
Ratios to Average Net Assets C,I,J | | | | | | | | |
| Expenses before reductions | | .38% K | | .42% | | .39% | | .39% K |
| Expenses net of fee waivers, if any | | | | .40% | | .39% | | .39% K |
| Expenses net of all reductions | | .38% K | | .40% | | .39% | | .39% K |
| Net investment income (loss) | | 1.32% D,K | | .03% | | .18% E | | (.05)% K |
| Supplemental Data | | | | | | | | |
| Net assets, end of period (000 omitted) | $ | 7,836 | $ | 8,264 | $ | 9,828 | $ | 9,289 |
Portfolio turnover rate L | | | | 42% M | | 36% | | 48% M,N |
AFor the period October 5, 2021 (commencement of operations) through June 30, 2022.
BCalculated based on average shares outstanding during the period.
CNet investment income (loss) is affected by the timing of the declaration of dividends by any underlying mutual funds or exchange-traded funds (ETFs). Net investment income (loss) of any mutual funds or ETFs is not included in the Fund's net investment income (loss) ratio.
DNet investment income per share reflects one or more large, non-recurring dividend(s) which amounted to $.27 per share. Such dividends are not annualized in the ratio of net investment income (loss) to average net assets. Excluding such non-recurring dividend(s) the ratio of net investment income (loss) to average net assets would have been (.05)%.
ENet investment income per share reflects one or more large, non-recurring dividend(s) which amounted to $.04 per share. Excluding such non-recurring dividend(s), the ratio of net investment income (loss) to average net assets would have been (.03)%.
FTotal returns for periods of less than one year are not annualized.
GTotal returns would have been lower if certain expenses had not been reduced during the applicable periods shown.
HBased on net asset value.
IFees and expenses of any underlying mutual funds or exchange-traded funds (ETFs) are not included in the Fund's expense ratio. The Fund indirectly bears its proportionate share of these expenses. For additional expense information related to investments in Fidelity Central Funds, please refer to the "Investments in Fidelity Central Funds" note found in the Notes to Financial Statements section of the most recent Annual or Semi-Annual report.
JExpense ratios reflect operating expenses of the class. Expenses before reductions do not reflect amounts reimbursed, waived, or reduced through arrangements with the investment adviser, brokerage services, or other offset arrangements, if applicable, and do not represent the amount paid by the class during periods when reimbursements, waivers or reductions occur.
KAnnualized.
LAmount does not include the portfolio activity of any underlying mutual funds or exchange-traded funds (ETFs), derivatives or securities that mature within one year from acquisition.
MPortfolio turnover rate excludes securities received or delivered in-kind.
NAmount not annualized.
Fidelity® Electric Vehicles and Future Transportation ETF
Schedule of Investments December 31, 2024 (Unaudited)
Showing Percentage of Net Assets
| Common Stocks - 99.9% |
| | | Shares | Value ($) |
| ARGENTINA - 0.9% | | | |
| Materials - 0.9% | | | |
| Chemicals - 0.9% | | | |
| Arcadium Lithium PLC | | 52,024 | 266,883 |
| AUSTRIA - 0.6% | | | |
| Information Technology - 0.6% | | | |
| Semiconductors & Semiconductor Equipment - 0.6% | | | |
| ams-OSRAM AG (a) | | 27,841 | 182,360 |
| BAILIWICK OF JERSEY - 4.8% | | | |
| Consumer Discretionary - 4.8% | | | |
| Automobile Components - 4.8% | | | |
| Aptiv PLC | | 22,265 | 1,346,587 |
| BELGIUM - 1.6% | | | |
| Information Technology - 1.6% | | | |
| Semiconductors & Semiconductor Equipment - 1.6% | | | |
| Melexis NV | | 7,633 | 446,574 |
| CANADA - 1.4% | | | |
| Industrials - 1.4% | | | |
| Machinery - 1.4% | | | |
| NFI Group Inc (a) | | 39,495 | 384,460 |
| CHINA - 29.7% | | | |
| Consumer Discretionary - 23.4% | | | |
| Automobile Components - 1.7% | | | |
| Hesai Group ADR (a)(b) | | 33,940 | 469,051 |
| Automobiles - 21.7% | | | |
| BYD Co Ltd H Shares | | 38,500 | 1,321,340 |
| Li Auto Inc A Shares (a) | | 114,400 | 1,383,619 |
| NIO Inc A Shares (a) | | 238,770 | 1,069,677 |
| XPeng Inc A Shares (a) | | 177,000 | 1,062,964 |
| Yadea Group Holdings Ltd (c)(d) | | 367,073 | 611,477 |
| Zhejiang Leapmotor Technology Co Ltd H Shares (a)(c)(d) | | 157,700 | 660,809 |
| | | | 6,109,886 |
TOTAL CONSUMER DISCRETIONARY | | | 6,578,937 |
| | | | |
| Information Technology - 5.6% | | | |
| Semiconductors & Semiconductor Equipment - 5.6% | | | |
| indie Semiconductor Inc Class A (a)(b) | | 87,753 | 355,400 |
| NXP Semiconductors NV | | 5,837 | 1,213,220 |
| | | | 1,568,620 |
| Materials - 0.7% | | | |
| Chemicals - 0.7% | | | |
| Ganfeng Lithium Group Co Ltd H Shares (c)(d) | | 80,280 | 207,729 |
| TOTAL CHINA | | | 8,355,286 |
| FRANCE - 2.7% | | | |
| Consumer Discretionary - 2.7% | | | |
| Automobile Components - 2.7% | | | |
| Forvia SE | | 56,268 | 505,745 |
| Valeo SE | | 27,491 | 265,084 |
| | | | |
| TOTAL FRANCE | | | 770,829 |
| GERMANY - 4.3% | | | |
| Information Technology - 4.3% | | | |
| Semiconductors & Semiconductor Equipment - 4.3% | | | |
| Infineon Technologies AG | | 37,082 | 1,205,710 |
| HONG KONG - 0.8% | | | |
| Consumer Discretionary - 0.8% | | | |
| Automobiles - 0.8% | | | |
| Polestar Automotive Holding UK PLC Class A ADR (a)(b) | | 223,988 | 235,187 |
| ISRAEL - 2.2% | | | |
| Consumer Discretionary - 2.2% | | | |
| Automobile Components - 2.2% | | | |
| Mobileye Global Inc Class A (a)(b) | | 31,144 | 620,388 |
| JAPAN - 6.6% | | | |
| Consumer Discretionary - 1.9% | | | |
| Household Durables - 1.9% | | | |
| JVCKenwood Corp | | 49,100 | 545,642 |
| Information Technology - 4.7% | | | |
| Electronic Equipment, Instruments & Components - 2.0% | | | |
| Alps Alpine Co Ltd | | 54,400 | 558,157 |
| Semiconductors & Semiconductor Equipment - 2.7% | | | |
| Allegro MicroSystems Inc (a)(b) | | 34,377 | 751,482 |
| TOTAL JAPAN | | | 1,855,281 |
| KOREA (SOUTH) - 3.1% | | | |
| Industrials - 1.4% | | | |
| Electrical Equipment - 1.4% | | | |
| Doosan Fuel Cell Co Ltd (a) | | 15,506 | 168,105 |
| LG Energy Solution Ltd (a) | | 943 | 222,915 |
| | | | 391,020 |
| Information Technology - 0.9% | | | |
| Electronic Equipment, Instruments & Components - 0.9% | | | |
| Samsung SDI Co Ltd | | 1,472 | 247,475 |
| Materials - 0.8% | | | |
| Chemicals - 0.8% | | | |
| LG Chem Ltd | | 1,389 | 235,879 |
| TOTAL KOREA (SOUTH) | | | 874,374 |
| SINGAPORE - 0.8% | | | |
| Information Technology - 0.8% | | | |
| Semiconductors & Semiconductor Equipment - 0.8% | | | |
| STMicroelectronics NV (Italy) | | 8,552 | 212,623 |
| UNITED STATES - 40.4% | | | |
| Consumer Discretionary - 21.2% | | | |
| Automobile Components - 7.9% | | | |
| Adient PLC (a) | | 27,295 | 470,293 |
| Gentex Corp | | 34,464 | 990,151 |
| Luminar Technologies Inc Class A (a)(b) | | 28,314 | 152,329 |
| Visteon Corp (a) | | 6,867 | 609,240 |
| | | | 2,222,013 |
| Automobiles - 12.6% | | | |
| Lucid Group Inc Class A (a)(b) | | 296,650 | 895,883 |
| Rivian Automotive Inc Class A (a)(b) | | 94,500 | 1,256,850 |
| Tesla Inc (a) | | 3,429 | 1,384,768 |
| | | | 3,537,501 |
| Specialty Retail - 0.7% | | | |
| EVgo Inc Class A (a)(b) | | 54,832 | 222,070 |
TOTAL CONSUMER DISCRETIONARY | | | 5,981,584 |
| | | | |
| Industrials - 13.6% | | | |
| Electrical Equipment - 5.1% | | | |
| Bloom Energy Corp Class A (a) | | 10,214 | 226,853 |
| ChargePoint Holdings Inc Class A (a)(b) | | 236,515 | 253,071 |
| Plug Power Inc (a)(b) | | 97,609 | 207,907 |
| Sensata Technologies Holding PLC | | 27,436 | 751,747 |
| | | | 1,439,578 |
| Ground Transportation - 6.9% | | | |
| Lyft Inc Class A (a) | | 59,992 | 773,897 |
| Uber Technologies Inc (a) | | 19,426 | 1,171,776 |
| | | | 1,945,673 |
| Machinery - 1.6% | | | |
| Blue Bird Corp (a)(b) | | 11,658 | 450,348 |
TOTAL INDUSTRIALS | | | 3,835,599 |
| | | | |
| Information Technology - 4.8% | | | |
| Semiconductors & Semiconductor Equipment - 4.8% | | | |
| Analog Devices Inc | | 780 | 165,719 |
| Diodes Inc (a) | | 4,245 | 261,789 |
| Lattice Semiconductor Corp (a) | | 4,590 | 260,024 |
| ON Semiconductor Corp (a) | | 2,553 | 160,966 |
| SiTime Corp (a) | | 1,191 | 255,505 |
| Skyworks Solutions Inc | | 2,812 | 249,368 |
| | | | 1,353,371 |
| Materials - 0.8% | | | |
| Chemicals - 0.8% | | | |
| Albemarle Corp | | 2,495 | 214,770 |
| TOTAL UNITED STATES | | | 11,385,324 |
| TOTAL COMMON STOCKS (Cost $33,664,802) | | | 28,141,866 |
| | | | |
| Money Market Funds - 21.3% |
| | | Yield (%) | Shares | Value ($) |
Fidelity Securities Lending Cash Central Fund (e)(f) (Cost $5,991,324) | | 4.35 | 5,990,725 | 5,991,325 |
| | | | | |
| TOTAL INVESTMENT IN SECURITIES - 121.2% (Cost $39,656,126) | 34,133,191 |
NET OTHER ASSETS (LIABILITIES) - (21.2)% | (5,970,525) |
| NET ASSETS - 100.0% | 28,162,666 |
| | |
Legend
| (b) | Security or a portion of the security is on loan at period end. |
| (c) | Security is exempt from registration under Regulation S of the Securities Act of 1933 and may be resold to qualified foreign investors outside of the United States. At the end of the period, the value of securities amounted to $1,480,015 or 5.3% of net assets. |
| (d) | Security exempt from registration under Rule 144A of the Securities Act of 1933. These securities may be resold in transactions exempt from registration, normally to qualified institutional buyers. At the end of the period, the value of these securities amounted to $1,480,015 or 5.3% of net assets. |
| (e) | Affiliated fund that is generally available only to investment companies and other accounts managed by Fidelity Investments. The rate quoted is the annualized seven-day yield of the fund at period end. A complete unaudited listing of the fund's holdings as of its most recent quarter end is available upon request. In addition, each Fidelity Central Fund's financial statements are available on the SEC's website or upon request. |
| (f) | Investment made with cash collateral received from securities on loan. |
Affiliated Central Funds
Fiscal year to date information regarding the Fund's investments in Fidelity Central Funds, including the ownership percentage, is presented below.
| Affiliate | Value, beginning of period ($) | Purchases ($) | Sales Proceeds ($) | Dividend Income ($) | Realized Gain (loss) ($) | Change in Unrealized appreciation (depreciation) ($) | Value, end of period ($) | Shares, end of period | % ownership, end of period |
| Fidelity Cash Central Fund | 8,184 | 1,940,049 | 1,948,233 | 276 | - | - | - | - | 0.0% |
| Fidelity Securities Lending Cash Central Fund | - | 11,735,502 | 5,744,178 | 16,706 | - | 1 | 5,991,325 | 5,990,725 | 0.0% |
| Total | 8,184 | 13,675,551 | 7,692,411 | 16,982 | - | 1 | 5,991,325 | 5,990,725 | |
| | | | | | | | | | |
Amounts in the dividend income column in the above table include any capital gain distributions from underlying funds, which are presented in the corresponding line item in the Statement of Operations, if applicable.
Amounts in the dividend income column for Fidelity Securities Lending Cash Central Fund represents the income earned on investing cash collateral, less rebates paid to borrowers and any lending agent fees associated with the loan, plus any premium payments received for lending certain types of securities.
Amounts included in the purchases and sales proceeds columns may include in-kind transactions, if applicable.
Investment Valuation
The following is a summary of the inputs used, as of December 31, 2024, involving the Fund's assets and liabilities carried at fair value. The inputs or methodology used for valuing securities may not be an indication of the risk associated with investing in those securities. For more information on valuation inputs, and their aggregation into the levels used below, please refer to the Investment Valuation section in the accompanying Notes to Financial Statements.
| Valuation Inputs at Reporting Date: |
| Description | Total ($) | Level 1 ($) | Level 2 ($) | Level 3 ($) |
Investments in Securities: | | | | |
|
| Common Stocks | | | | |
Consumer Discretionary | 16,079,154 | 16,079,154 | - | - |
Industrials | 4,611,079 | 4,611,079 | - | - |
Information Technology | 6,526,372 | 6,526,372 | - | - |
Materials | 925,261 | 925,261 | - | - |
|
| Money Market Funds | 5,991,325 | 5,991,325 | - | - |
| Total Investments in Securities: | 34,133,191 | 34,133,191 | - | - |
Fidelity® Electric Vehicles and Future Transportation ETF
Financial Statements (Unaudited)
| Statement of Assets and Liabilities |
| As of December 31, 2024 (Unaudited) |
| Assets | | | | |
| Investment in securities, at value (including securities loaned of $5,621,043) - See accompanying schedule: | | | | |
Unaffiliated issuers (cost $33,664,802) | $ | 28,141,866 | | |
Fidelity Central Funds (cost $5,991,324) | | 5,991,325 | | |
| | | | | |
| | | | | |
| Total Investment in Securities (cost $39,656,126) | | | $ | 34,133,191 |
| Foreign currency held at value (cost $132) | | | | 129 |
| Dividends receivable | | | | 21,518 |
| Distributions receivable from Fidelity Central Funds | | | | 9,182 |
Total assets | | | | 34,164,020 |
| Liabilities | | | | |
| Payable to custodian bank | $ | 336 | | |
| Accrued management fee | | 9,693 | | |
| Collateral on securities loaned | | 5,991,325 | | |
| Total liabilities | | | | 6,001,354 |
| Net Assets | | | $ | 28,162,666 |
| Net Assets consist of: | | | | |
| Paid in capital | | | $ | 61,320,923 |
| Total accumulated earnings (loss) | | | | (33,158,257) |
| Net Assets | | | $ | 28,162,666 |
Net Asset Value, offering price and redemption price per share ($28,162,666 ÷ 2,100,000 shares) | | | $ | 13.41 |
| Statement of Operations |
Six months ended December 31, 2024 (Unaudited) |
| Investment Income | | | | |
| Dividends | | | $ | 80,503 |
| Income from Fidelity Central Funds (including $16,706 from security lending) | | | | 16,982 |
| Income before foreign taxes withheld | | | $ | 97,485 |
| Less foreign taxes withheld | | | | (5,878) |
| Total income | | | | 91,607 |
| Expenses | | | | |
| Management fee | $ | 60,394 | | |
| Independent trustees' fees and expenses | | 70 | | |
| Miscellaneous | | 265 | | |
| Total expenses before reductions | | 60,729 | | |
| Expense reductions | | (158) | | |
| Total expenses after reductions | | | | 60,571 |
| Net Investment income (loss) | | | | 31,036 |
| Realized and Unrealized Gain (Loss) | | | | |
| Net realized gain (loss) on: | | | | |
| Investment Securities: | | | | |
| Unaffiliated issuers | | (6,914,884) | | |
| Redemptions in-kind | | 326,436 | | |
| Foreign currency transactions | | (2,368) | | |
| Total net realized gain (loss) | | | | (6,590,816) |
| Change in net unrealized appreciation (depreciation) on: | | | | |
| Investment Securities: | | | | |
| Unaffiliated issuers | | 6,686,556 | | |
| Fidelity Central Funds | | 1 | | |
| Assets and liabilities in foreign currencies | | (442) | | |
| Total change in net unrealized appreciation (depreciation) | | | | 6,686,115 |
| Net gain (loss) | | | | 95,299 |
| Net increase (decrease) in net assets resulting from operations | | | $ | 126,335 |
| Statement of Changes in Net Assets |
| |
| | Six months ended December 31, 2024 (Unaudited) | | Year ended June 30, 2024 |
| Increase (Decrease) in Net Assets | | | | |
| Operations | | | | |
| Net investment income (loss) | $ | 31,036 | $ | 190,710 |
| Net realized gain (loss) | | (6,590,816) | | (7,645,453) |
| Change in net unrealized appreciation (depreciation) | | 6,686,115 | | (8,068,367) |
| Net increase (decrease) in net assets resulting from operations | | 126,335 | | (15,523,110) |
| Distributions to shareholders | | (27,500) | | (178,200) |
| | | | | |
| Share transactions | | | | |
| Proceeds from sales of shares | | - | | 1,007,818 |
| Cost of shares redeemed | | (4,723,337) | | (6,914,724) |
| | | | | |
Net increase (decrease) in net assets resulting from share transactions | | (4,723,337) | | (5,906,906) |
| Total increase (decrease) in net assets | | (4,624,502) | | (21,608,216) |
| | | | | |
| Net Assets | | | | |
| Beginning of period | | 32,787,168 | | 54,395,384 |
| End of period | $ | 28,162,666 | $ | 32,787,168 |
| | | | | |
| Other Information | | | | |
| Shares | | | | |
| Sold | | - | | 50,000 |
| Redeemed | | (350,000) | | (450,000) |
| Net increase (decrease) | | (350,000) | | (400,000) |
| | | | | |
Financial Highlights
Fidelity® Electric Vehicles and Future Transportation ETF |
| |
| | Six months ended (Unaudited) December 31, 2024 | | Years ended June 30, 2024 | | 2023 | | 2022 A |
Selected Per-Share Data | | | | | | | | |
| Net asset value, beginning of period | $ | 13.38 | $ | 19.09 | $ | 17.82 | $ | 25.20 |
| Income from Investment Operations | | | | | | | | |
Net investment income (loss) B,C | | .01 | | .07 | | .05 | | .04 |
| Net realized and unrealized gain (loss) | | .03 | | (5.71) | | 1.27 | | (7.39) |
| Total from investment operations | | .04 | | (5.64) | | 1.32 | | (7.35) |
| Distributions from net investment income | | (.01) | | (.07) | | (.05) | | (.03) |
| Total distributions | | (.01) | | (.07) | | (.05) | | (.03) |
| Net asset value, end of period | $ | 13.41 | $ | 13.38 | $ | 19.09 | $ | 17.82 |
Total Return D,E,F | | | | (29.55)% | | 7.36% | | (29.15)% |
Ratios to Average Net Assets C,G,H | | | | | | | | |
| Expenses before reductions | | .38% I | | .42% | | .39% | | .39% I |
| Expenses net of fee waivers, if any | | | | .40% | | .39% | | .39% I |
| Expenses net of all reductions | | .38% I | | .40% | | .39% | | .39% I |
| Net investment income (loss) | | .20% I | | .44% | | .26% | | .25% I |
| Supplemental Data | | | | | | | | |
| Net assets, end of period (000 omitted) | $ | 28,163 | $ | 32,787 | $ | 54,395 | $ | 38,318 |
Portfolio turnover rate J,K | | | | 54% | | 62% | | 31% L |
AFor the period October 5, 2021 (commencement of operations) through June 30, 2022.
BCalculated based on average shares outstanding during the period.
CNet investment income (loss) is affected by the timing of the declaration of dividends by any underlying mutual funds or exchange-traded funds (ETFs). Net investment income (loss) of any mutual funds or ETFs is not included in the Fund's net investment income (loss) ratio.
DTotal returns for periods of less than one year are not annualized.
ETotal returns would have been lower if certain expenses had not been reduced during the applicable periods shown.
FBased on net asset value.
GFees and expenses of any underlying mutual funds or exchange-traded funds (ETFs) are not included in the Fund's expense ratio. The Fund indirectly bears its proportionate share of these expenses. For additional expense information related to investments in Fidelity Central Funds, please refer to the "Investments in Fidelity Central Funds" note found in the Notes to Financial Statements section of the most recent Annual or Semi-Annual report.
HExpense ratios reflect operating expenses of the class. Expenses before reductions do not reflect amounts reimbursed, waived, or reduced through arrangements with the investment adviser, brokerage services, or other offset arrangements, if applicable, and do not represent the amount paid by the class during periods when reimbursements, waivers or reductions occur.
IAnnualized.
JPortfolio turnover rate excludes securities received or delivered in-kind.
KAmount does not include the portfolio activity of any underlying mutual funds or exchange-traded funds (ETFs), derivatives or securities that mature within one year from acquisition.
LAmount not annualized.
Schedule of Investments December 31, 2024 (Unaudited)
Showing Percentage of Net Assets
| Common Stocks - 99.8% |
| | | Shares | Value ($) |
| CHINA - 6.9% | | | |
| Communication Services - 4.8% | | | |
| Entertainment - 2.7% | | | |
| Netease Inc | | 47,000 | 837,390 |
| Interactive Media & Services - 2.1% | | | |
| Hello Group Inc Class A ADR | | 30,997 | 238,987 |
| Meitu Inc (a)(b)(c) | | 580,000 | 221,757 |
| Weibo Corp Class A ADR | | 20,927 | 199,853 |
| | | | 660,597 |
TOTAL COMMUNICATION SERVICES | | | 1,497,987 |
| | | | |
| Information Technology - 2.1% | | | |
| Electronic Equipment, Instruments & Components - 1.5% | | | |
| Sunny Optical Technology Group Co Ltd | | 52,000 | 460,894 |
| IT Services - 0.6% | | | |
| Vnet Group Inc Class A ADR (d) | | 44,818 | 212,437 |
TOTAL INFORMATION TECHNOLOGY | | | 673,331 |
| | | | |
| TOTAL CHINA | | | 2,171,318 |
| FRANCE - 3.1% | | | |
| Communication Services - 0.8% | | | |
| Entertainment - 0.8% | | | |
| Ubisoft Entertainment SA (d) | | 18,262 | 248,670 |
| Information Technology - 2.3% | | | |
| Software - 2.3% | | | |
| Dassault Systemes SE | | 21,058 | 730,487 |
| TOTAL FRANCE | | | 979,157 |
| JAPAN - 1.4% | | | |
| Communication Services - 1.4% | | | |
| Entertainment - 1.4% | | | |
| Nexon Co Ltd | | 29,900 | 452,134 |
| KOREA (SOUTH) - 10.8% | | | |
| Communication Services - 6.3% | | | |
| Entertainment - 4.2% | | | |
| Kakao Games Corp (d) | | 13,316 | 148,162 |
| Krafton Inc (d) | | 2,023 | 429,432 |
| NCSoft Corp | | 2,044 | 254,224 |
| Netmarble Corp (a)(c)(d) | | 5,225 | 183,495 |
| Pearl Abyss Corp (d) | | 7,939 | 149,380 |
| Wemade Co Ltd (d) | | 5,682 | 135,667 |
| | | | 1,300,360 |
| Interactive Media & Services - 2.1% | | | |
| NAVER Corp | | 5,067 | 684,595 |
TOTAL COMMUNICATION SERVICES | | | 1,984,955 |
| | | | |
| Information Technology - 4.5% | | | |
| Technology Hardware, Storage & Peripherals - 4.5% | | | |
| Samsung Electronics Co Ltd | | 38,870 | 1,404,669 |
| TOTAL KOREA (SOUTH) | | | 3,389,624 |
| SWEDEN - 1.0% | | | |
| Communication Services - 1.0% | | | |
| Entertainment - 1.0% | | | |
| Embracer Group AB B Shares (d) | | 112,064 | 305,890 |
| TAIWAN - 0.8% | | | |
| Information Technology - 0.8% | | | |
| Semiconductors & Semiconductor Equipment - 0.8% | | | |
| Himax Technologies Inc ADR | | 31,913 | 256,580 |
| UNITED KINGDOM - 0.8% | | | |
| Information Technology - 0.8% | | | |
| IT Services - 0.8% | | | |
| Endava PLC Class A ADR (d) | | 8,194 | 253,194 |
| UNITED STATES - 75.0% | | | |
| Communication Services - 23.3% | | | |
| Entertainment - 7.9% | | | |
| Electronic Arts Inc | | 5,709 | 835,227 |
| ROBLOX Corp Class A (d) | | 14,409 | 833,705 |
| Take-Two Interactive Software Inc (d) | | 4,465 | 821,917 |
| | | | 2,490,849 |
| Interactive Media & Services - 15.4% | | | |
| Alphabet Inc Class A | | 8,545 | 1,617,569 |
| Meta Platforms Inc Class A | | 2,422 | 1,418,105 |
| Pinterest Inc Class A (d) | | 21,878 | 634,462 |
| Reddit Inc Class A | | 3,772 | 616,496 |
| Snap Inc Class A (d) | | 48,187 | 518,973 |
| | | | 4,805,605 |
TOTAL COMMUNICATION SERVICES | | | 7,296,454 |
| | | | |
| Industrials - 0.7% | | | |
| Professional Services - 0.7% | | | |
| Planet Labs PBC Class A (b)(d) | | 50,310 | 203,252 |
| Information Technology - 42.8% | | | |
| IT Services - 0.7% | | | |
| Fastly Inc Class A (d) | | 23,923 | 225,833 |
| Semiconductors & Semiconductor Equipment - 15.8% | | | |
| Advanced Micro Devices Inc (d) | | 10,435 | 1,260,444 |
| Ambarella Inc (d) | | 4,545 | 330,603 |
| Cirrus Logic Inc (d) | | 4,029 | 401,208 |
| Navitas Semiconductor Corp Class A (b)(d) | | 44,217 | 157,855 |
| NVIDIA Corp | | 10,169 | 1,365,595 |
| QUALCOMM Inc | | 9,197 | 1,412,843 |
| | | | 4,928,548 |
| Software - 19.3% | | | |
| Adobe Inc (d) | | 2,741 | 1,218,868 |
| Altair Engineering Inc Class A (b)(d) | | 4,160 | 453,898 |
| Autodesk Inc (d) | | 3,864 | 1,142,082 |
| Bentley Systems Inc Class B (b) | | 9,590 | 447,853 |
| Matterport Inc Class A (d) | | 51,123 | 242,323 |
| Microsoft Corp | | 3,333 | 1,404,860 |
| PTC Inc (d) | | 3,798 | 698,338 |
| Unity Software Inc (d) | | 17,532 | 393,944 |
| | | | 6,002,166 |
| Technology Hardware, Storage & Peripherals - 7.0% | | | |
| Apple Inc | | 6,069 | 1,519,799 |
| Super Micro Computer Inc (d) | | 17,390 | 530,047 |
| Turtle Beach Corp (d) | | 7,848 | 135,849 |
| | | | 2,185,695 |
TOTAL INFORMATION TECHNOLOGY | | | 13,342,242 |
| | | | |
| Real Estate - 8.2% | | | |
| Real Estate Management & Development - 0.6% | | | |
| eXp World Holdings Inc (b) | | 17,040 | 196,130 |
| Specialized REITs - 7.6% | | | |
| Digital Realty Trust Inc | | 5,873 | 1,041,459 |
| Equinix Inc | | 1,412 | 1,331,361 |
| | | | 2,372,820 |
TOTAL REAL ESTATE | | | 2,568,950 |
| | | | |
| TOTAL UNITED STATES | | | 23,410,898 |
| TOTAL COMMON STOCKS (Cost $29,021,180) | | | 31,218,795 |
| | | | |
| Money Market Funds - 4.7% |
| | | Yield (%) | Shares | Value ($) |
Fidelity Securities Lending Cash Central Fund (e)(f) (Cost $1,461,925) | | 4.35 | 1,461,779 | 1,461,925 |
| | | | | |
| TOTAL INVESTMENT IN SECURITIES - 104.5% (Cost $30,483,105) | 32,680,720 |
NET OTHER ASSETS (LIABILITIES) - (4.5)% | (1,412,168) |
| NET ASSETS - 100.0% | 31,268,552 |
| | |
| Futures Contracts |
| | Number of contracts | Expiration Date | Notional Amount ($) | Value ($) | Unrealized Appreciation/ (Depreciation) ($) |
| Purchased | | | | | |
| | | | | | |
| Equity Contracts | | | | | |
| CME Micro NASDAQ 100 Index Contracts (United States) | 1 | Mar 2025 | 42,453 | (1,409) | (1,409) |
| | | | | | |
| The notional amount of futures purchased as a percentage of Net Assets is 0.1% |
Legend
| (a) | Security exempt from registration under Rule 144A of the Securities Act of 1933. These securities may be resold in transactions exempt from registration, normally to qualified institutional buyers. At the end of the period, the value of these securities amounted to $405,252 or 1.3% of net assets. |
| (b) | Security or a portion of the security is on loan at period end. |
| (c) | Security is exempt from registration under Regulation S of the Securities Act of 1933 and may be resold to qualified foreign investors outside of the United States. At the end of the period, the value of securities amounted to $405,252 or 1.3% of net assets. |
| (e) | Investment made with cash collateral received from securities on loan. |
| (f) | Affiliated fund that is generally available only to investment companies and other accounts managed by Fidelity Investments. The rate quoted is the annualized seven-day yield of the fund at period end. A complete unaudited listing of the fund's holdings as of its most recent quarter end is available upon request. In addition, each Fidelity Central Fund's financial statements are available on the SEC's website or upon request. |
Affiliated Central Funds
Fiscal year to date information regarding the Fund's investments in Fidelity Central Funds, including the ownership percentage, is presented below.
| Affiliate | Value, beginning of period ($) | Purchases ($) | Sales Proceeds ($) | Dividend Income ($) | Realized Gain (loss) ($) | Change in Unrealized appreciation (depreciation) ($) | Value, end of period ($) | Shares, end of period | % ownership, end of period |
| Fidelity Cash Central Fund | - | 1,179,163 | 1,179,163 | 1,155 | - | - | - | - | 0.0% |
| Fidelity Securities Lending Cash Central Fund | - | 3,768,574 | 2,306,649 | 4,114 | - | - | 1,461,925 | 1,461,779 | 0.0% |
| Total | - | 4,947,737 | 3,485,812 | 5,269 | - | - | 1,461,925 | 1,461,779 | |
| | | | | | | | | | |
Amounts in the dividend income column in the above table include any capital gain distributions from underlying funds, which are presented in the corresponding line item in the Statement of Operations, if applicable.
Amounts in the dividend income column for Fidelity Securities Lending Cash Central Fund represents the income earned on investing cash collateral, less rebates paid to borrowers and any lending agent fees associated with the loan, plus any premium payments received for lending certain types of securities.
Amounts included in the purchases and sales proceeds columns may include in-kind transactions, if applicable.
Investment Valuation
The following is a summary of the inputs used, as of December 31, 2024, involving the Fund's assets and liabilities carried at fair value. The inputs or methodology used for valuing securities may not be an indication of the risk associated with investing in those securities. For more information on valuation inputs, and their aggregation into the levels used below, please refer to the Investment Valuation section in the accompanying Notes to Financial Statements.
| Valuation Inputs at Reporting Date: |
| Description | Total ($) | Level 1 ($) | Level 2 ($) | Level 3 ($) |
Investments in Securities: | | | | |
|
| Common Stocks | | | | |
Communication Services | 11,786,090 | 11,786,090 | - | - |
Industrials | 203,252 | 203,252 | - | - |
Information Technology | 16,660,503 | 16,660,503 | - | - |
Real Estate | 2,568,950 | 2,568,950 | - | - |
|
| Money Market Funds | 1,461,925 | 1,461,925 | - | - |
| Total Investments in Securities: | 32,680,720 | 32,680,720 | - | - |
Derivative Instruments: Liabilities | | | | |
Futures Contracts | (1,409) | (1,409) | - | - |
| Total Liabilities | (1,409) | (1,409) | - | - |
| Total Derivative Instruments: | (1,409) | (1,409) | - | - |
Value of Derivative Instruments
The following table is a summary of the Fund's value of derivative instruments by primary risk exposure as of December 31, 2024. For additional information on derivative instruments, please refer to the Derivative Instruments section in the accompanying Notes to Financial Statements.
Primary Risk Exposure / Derivative Type | Value |
| Asset ($) | Liability ($) |
| Equity Risk | | |
Futures Contracts (a) | 0 | (1,409) |
| Total Equity Risk | 0 | (1,409) |
| Total Value of Derivatives | 0 | (1,409) |
(a)Reflects gross cumulative appreciation (depreciation) on futures contracts as presented in the Schedule of Investments. In the Statement of Assets and Liabilities, the period end daily variation margin is included in receivable or payable for daily variation margin on futures contracts, and the net cumulative appreciation (depreciation) is included in Total accumulated earnings (loss).
Fidelity® Metaverse ETF
Financial Statements (Unaudited)
| Statement of Assets and Liabilities |
| As of December 31, 2024 (Unaudited) |
| Assets | | | | |
| Investment in securities, at value (including securities loaned of $1,368,608) - See accompanying schedule: | | | | |
Unaffiliated issuers (cost $29,021,180) | $ | 31,218,795 | | |
Fidelity Central Funds (cost $1,461,925) | | 1,461,925 | | |
| | | | | |
| | | | | |
| Total Investment in Securities (cost $30,483,105) | | | $ | 32,680,720 |
| Segregated cash with brokers for derivative instruments | | | | 6,910 |
| Cash | | | | 14,397 |
| Foreign currency held at value (cost $14,979) | | | | 14,944 |
| Dividends receivable | | | | 20,857 |
| Distributions receivable from Fidelity Central Funds | | | | 3,557 |
Total assets | | | | 32,741,385 |
| Liabilities | | | | |
| Accrued management fee | $ | 10,528 | | |
| Payable for daily variation margin on futures contracts | | 380 | | |
| Collateral on securities loaned | | 1,461,925 | | |
| Total liabilities | | | | 1,472,833 |
| Net Assets | | | $ | 31,268,552 |
| Net Assets consist of: | | | | |
| Paid in capital | | | $ | 31,149,991 |
| Total accumulated earnings (loss) | | | | 118,561 |
| Net Assets | | | $ | 31,268,552 |
Net Asset Value, offering price and redemption price per share ($31,268,552 ÷ 1,050,000 shares) | | | $ | 29.78 |
| Statement of Operations |
Six months ended December 31, 2024 (Unaudited) |
| Investment Income | | | | |
| Dividends | | | $ | 88,188 |
| Interest | | | | 171 |
| Income from Fidelity Central Funds (including $4,114 from security lending) | | | | 5,269 |
| Total income | | | | 93,628 |
| Expenses | | | | |
| Management fee | $ | 63,601 | | |
| Independent trustees' fees and expenses | | 72 | | |
| Miscellaneous | | 82 | | |
| Total expenses before reductions | | 63,755 | | |
| Expense reductions | | (1,222) | | |
| Total expenses after reductions | | | | 62,533 |
| Net Investment income (loss) | | | | 31,095 |
| Realized and Unrealized Gain (Loss) | | | | |
| Net realized gain (loss) on: | | | | |
| Investment Securities: | | | | |
| Unaffiliated issuers | | (1,368,788) | | |
| Redemptions in-kind | | 1,173,365 | | |
| Foreign currency transactions | | (4,094) | | |
| Futures contracts | | 8,213 | | |
| Total net realized gain (loss) | | | | (191,304) |
| Change in net unrealized appreciation (depreciation) on: | | | | |
| Investment Securities: | | | | |
| Unaffiliated issuers | | (567,022) | | |
| Assets and liabilities in foreign currencies | | (267) | | |
| Futures contracts | | (1,747) | | |
| Total change in net unrealized appreciation (depreciation) | | | | (569,036) |
| Net gain (loss) | | | | (760,340) |
| Net increase (decrease) in net assets resulting from operations | | | $ | (729,245) |
| Statement of Changes in Net Assets |
| |
| | Six months ended December 31, 2024 (Unaudited) | | Year ended June 30, 2024 |
| Increase (Decrease) in Net Assets | | | | |
| Operations | | | | |
| Net investment income (loss) | $ | 31,095 | $ | 83,882 |
| Net realized gain (loss) | | (191,304) | | 2,308,628 |
| Change in net unrealized appreciation (depreciation) | | (569,036) | | 2,049,101 |
| Net increase (decrease) in net assets resulting from operations | | (729,245) | | 4,441,611 |
| Distributions to shareholders | | (74,250) | | (100,500) |
| | | | | |
| Share transactions | | | | |
| Proceeds from sales of shares | | 2,946,466 | | 20,617,140 |
| Cost of shares redeemed | | (4,434,019) | | (8,087,398) |
| | | | | |
Net increase (decrease) in net assets resulting from share transactions | | (1,487,553) | | 12,529,742 |
| Total increase (decrease) in net assets | | (2,291,048) | | 16,870,853 |
| | | | | |
| Net Assets | | | | |
| Beginning of period | | 33,559,600 | | 16,688,747 |
| End of period | $ | 31,268,552 | $ | 33,559,600 |
| | | | | |
| Other Information | | | | |
| Shares | | | | |
| Sold | | 100,000 | | 750,000 |
| Redeemed | | (150,000) | | (300,000) |
| Net increase (decrease) | | (50,000) | | 450,000 |
| | | | | |
Financial Highlights
| | Six months ended (Unaudited) December 31, 2024 | | Years ended June 30, 2024 | | 2023 | | 2022 A |
Selected Per-Share Data | | | | | | | | |
| Net asset value, beginning of period | $ | 30.51 | $ | 25.67 | $ | 21.32 | $ | 25.28 |
| Income from Investment Operations | | | | | | | | |
Net investment income (loss) B,C | | .03 | | .10 | | .11 D | | - E |
| Net realized and unrealized gain (loss) | | (.69) | | 4.84 | | 4.36 | | (3.96) |
| Total from investment operations | | (.66) | | 4.94 | | 4.47 | | (3.96) |
| Distributions from net investment income | | (.07) | | (.10) | | (.12) | | - |
| Total distributions | | (.07) | | (.10) | | (.12) | | - |
| Net asset value, end of period | $ | 29.78 | $ | 30.51 | $ | 25.67 | $ | 21.32 |
Total Return F,G,H | | | | 19.25% | | 21.06% | | (15.67)% |
Ratios to Average Net Assets C,I,J | | | | | | | | |
| Expenses before reductions | | .38% K | | .42% | | .39% | | .39% K |
| Expenses net of fee waivers, if any | | | | .40% | | .39% | | .39% K |
| Expenses net of all reductions | | .37% K | | .40% | | .39% | | .39% K |
| Net investment income (loss) | | .19% K | | .35% | | .49% D | | .01% K |
| Supplemental Data | | | | | | | | |
| Net assets, end of period (000 omitted) | $ | 31,269 | $ | 33,560 | $ | 16,689 | $ | 10,658 |
Portfolio turnover rate L,M | | | | 52% | | 47% | | 8% N |
AFor the period April 19, 2022 (commencement of operations) through June 30, 2022.
BCalculated based on average shares outstanding during the period.
CNet investment income (loss) is affected by the timing of the declaration of dividends by any underlying mutual funds or exchange-traded funds (ETFs). Net investment income (loss) of any mutual funds or ETFs is not included in the Fund's net investment income (loss) ratio.
DNet investment income per share reflects one or more large, non-recurring dividend(s) which amounted to $.06 per share. Excluding such non-recurring dividend(s), the ratio of net investment income (loss) to average net assets would have been .22%.
EAmount represents less than $.005 per share.
FTotal returns for periods of less than one year are not annualized.
GTotal returns would have been lower if certain expenses had not been reduced during the applicable periods shown.
HBased on net asset value.
IFees and expenses of any underlying mutual funds or exchange-traded funds (ETFs) are not included in the Fund's expense ratio. The Fund indirectly bears its proportionate share of these expenses. For additional expense information related to investments in Fidelity Central Funds, please refer to the "Investments in Fidelity Central Funds" note found in the Notes to Financial Statements section of the most recent Annual or Semi-Annual report.
JExpense ratios reflect operating expenses of the class. Expenses before reductions do not reflect amounts reimbursed, waived, or reduced through arrangements with the investment adviser, brokerage services, or other offset arrangements, if applicable, and do not represent the amount paid by the class during periods when reimbursements, waivers or reductions occur.
KAnnualized.
LPortfolio turnover rate excludes securities received or delivered in-kind.
MAmount does not include the portfolio activity of any underlying mutual funds or exchange-traded funds (ETFs), derivatives or securities that mature within one year from acquisition.
NAmount not annualized.
Notes to Financial Statements
(Unaudited)For the period ended December 31, 2024
1. Organization.
Fidelity Clean Energy ETF, Fidelity Cloud Computing ETF, Fidelity Crypto Industry and Digital Payments ETF, Fidelity Digital Health ETF, Fidelity Electric Vehicles and Future Transportation ETF and Fidelity Metaverse ETF (the Funds) are exchange-traded funds of Fidelity Covington Trust (the Trust) and are authorized to issue an unlimited number of shares. Each Fund, with the exception of Fidelity Clean Energy ETF, Fidelity Cloud Computing ETF, Fidelity Digital Health ETF and Fidelity Electric Vehicles and Future Transportation ETF, is a non-diversified fund. The Trust is registered under the Investment Company Act of 1940, as amended (the 1940 Act), as an open-end management investment company organized as a Massachusetts business trust. Certain Funds' investments in emerging markets can be subject to social, economic, regulatory, and political uncertainties and can be extremely volatile.
For Fidelity Clean Energy ETF, clean energy companies are subject to various risks, including fluctuations in commodity prices and/or interest rates, obsolescence of existing technology, short product cycles, changes in governmental and environmental regulations and enforcement policies, changes in U.S. and foreign government policies, including tax incentives and government subsidies, reduced availability of clean energy sources or other commodities, and extreme weather or other natural disasters.
For Fidelity Cloud Computing ETF, cloud computing companies are subject to various risks, including those associated with limited operating history, product lines, markets, financial resources or personnel, changes in business cycles, intense competition, potentially rapid product obsolescence, disruptions in service, changes in regulation, and cybersecurity attacks and other types of theft.
For Fidelity Crypto Industry and Digital Payments ETF, cryptocurrency and blockchain companies are subject to various risks, including inability to develop digital asset applications or to capitalize on those applications, theft, loss, or destruction of cryptographic keys, the possibility that digital asset technologies may never be fully implemented, cybersecurity risk, conflicting intellectual property claims, and inconsistent and changing regulations. Digital payments processing companies are subject to various risks, including those associated with intense competition, changes in regulation, economic conditions, deterioration in credit markets, impairment of intellectual property rights, disruptions in service, and cybersecurity attacks and other types of theft.
For Fidelity Digital Health ETF, digital health companies are subject to various risks, including competition, potentially rapid product obsolescence, increasing regulatory scrutiny, changes in government regulatory requirements, regulatory approval for new drugs and medical products, changes in business cycles, vulnerability to cybersecurity breaches, and unexpected events such as pandemics.
For Fidelity Electric Vehicles and Future Transportation ETF, electric vehicles and future transportation companies are subject to various risks, including those associated with limited product lines, markets, financial resources or personnel, intense competition, production delays, changes in governmental regulation, and litigation based on product liability claims.
For Fidelity Metaverse ETF, metaverse companies are subject to various risks, including those associated with limited product lines, markets, financial resources or personnel, intense competition, potentially rapid product obsolescence, impairment of intellectual property rights, disruptions in service, cybersecurity attacks, and changes in regulation.
Although each Fund's underlying index uses a rules-based proprietary index methodology that seeks to identify such companies, there is no guarantee that this methodology will be successful.
2. Investments in Fidelity Central Funds.
Funds may invest in Fidelity Central Funds, which are open-end investment companies generally available only to other investment companies and accounts managed by the investment adviser and its affiliates. The Schedule of Investments lists any Fidelity Central Funds held as an investment as of period end, but does not include the underlying holdings of each Fidelity Central Fund. An investing fund indirectly bears its proportionate share of the expenses of the underlying Fidelity Central Funds.
Based on its investment objective, each Fidelity Central Fund may invest or participate in various investment vehicles or strategies that are similar to those of the investing fund. These strategies are consistent with the investment objectives of the investing fund and may involve certain economic risks which may cause a decline in value of each of the Fidelity Central Funds and thus a decline in the value of the investing fund.
| Fidelity Central Fund | Investment Manager | Investment Objective | Investment Practices | Expense RatioA |
| Fidelity Money Market Central Funds | Fidelity Management & Research Company LLC (FMR) | Each fund seeks to obtain a high level of current income consistent with the preservation of capital and liquidity. | Short-term Investments | Less than .005% |
A Expenses expressed as a percentage of average net assets and are as of each underlying Central Fund's most recent annual or semi-annual shareholder report.
A complete unaudited list of holdings for each Fidelity Central Fund is available upon request or at the Securities and Exchange Commission website at www.sec.gov. In addition, the financial statements of the Fidelity Central Funds which contain the significant accounting policies (including investment valuation policies) of those funds, and are not covered by the Report of Independent Registered Public Accounting Firm, are available on the Securities and Exchange Commission website or upon request.
3. Significant Accounting Policies.
Each Fund is an investment company and applies the accounting and reporting guidance of the Financial Accounting Standards Board (FASB) Accounting Standards Codification Topic 946 Financial Services - Investment Companies. The financial statements have been prepared in conformity with accounting principles generally accepted in the United States of America (GAAP), which require management to make certain estimates and assumptions at the date of the financial statements. Actual results could differ from those estimates. Each Fund operates as a single operating segment. Each Fund's income, expenses, assets, and performance are regularly monitored and assessed as a whole by the investment adviser and other individuals responsible for oversight functions of the Trust, using the information presented in the financial statements and financial highlights. Subsequent events, if any, through the date that the financial statements were issued have been evaluated in the preparation of the financial statements. Each Fund's Schedule of Investments lists any underlying mutual funds or exchange-traded funds (ETFs) but does not include the underlying holdings of these funds. The following summarizes the significant accounting policies of each Fund:
Investment Valuation. Investments are valued as of 4:00 p.m. Eastern time on the last calendar day of the period. The Board of Trustees (the Board) has designated each Fund's investment adviser as the valuation designee responsible for the fair valuation function and performing fair value determinations as needed. The investment adviser has established a Fair Value Committee (the Committee) to carry out the day-to-day fair valuation responsibilities and has adopted policies and procedures to govern the fair valuation process and the activities of the Committee. In accordance with these fair valuation policies and procedures, which have been approved by the Board, each Fund attempts to obtain prices from one or more third party pricing services or brokers to value its investments. When current market prices, quotations or currency exchange rates are not readily available or reliable, investments will be fair valued in good faith by the Committee, in accordance with the policies and procedures. Factors used in determining fair value vary by investment type and may include market or investment specific events, transaction data, estimated cash flows, and market observations of comparable investments. The frequency that the fair valuation procedures are used cannot be predicted and they may be utilized to a significant extent. The Committee manages each Fund's fair valuation practices and maintains the fair valuation policies and procedures. Each Fund's investment adviser reports to the Board information regarding the fair valuation process and related material matters.
Each Fund categorizes the inputs to valuation techniques used to value its investments into a disclosure hierarchy consisting of three levels as shown below:
Level 1 - unadjusted quoted prices in active markets for identical investments
Level 2 - other significant observable inputs (including quoted prices for similar investments, interest rates, prepayment speeds, etc.)
Level 3 - unobservable inputs (including the Fund's own assumptions based on the best information available)
Valuation techniques used to value each Fund's investments by major category are as follows:
Equity securities, including restricted securities, for which market quotations are readily available, are valued at the last reported sale price or official closing price as reported by a third party pricing service on the primary market or exchange on which they are traded and are categorized as Level 1 in the hierarchy. In the event there were no sales during the day or closing prices are not available, securities are valued at the last quoted bid price or may be valued using the last available price and are generally categorized as Level 2 in the hierarchy. For foreign equity securities, when market or security specific events arise, comparisons to the valuation of American Depositary Receipts (ADRs), futures contracts, Exchange-Traded Funds (ETFs) and certain indexes as well as quoted prices for similar securities may be used and would be categorized as Level 2 in the hierarchy. For equity securities, including restricted securities, where observable inputs are limited, assumptions about market activity and risk are used and these securities may be categorized as Level 3 in the hierarchy.
Futures contracts are valued at the settlement price established each day by the board of trade or exchange on which they are traded and are categorized as Level 1 in the hierarchy. Investments in open-end mutual funds, including the Fidelity Central Funds, are valued at their closing net asset value (NAV) each business day and are categorized as Level 1 in the hierarchy.
Changes in valuation techniques may result in transfers in or out of an assigned level within the disclosure hierarchy. The aggregate value of investments by input level as of December 31, 2024 is included at the end of each Fund's Schedule of Investments.
Foreign Currency. Certain Funds may use foreign currency contracts to facilitate transactions in foreign-denominated securities. Gains and losses from these transactions may arise from changes in the value of the foreign currency or if the counterparties do not perform under the contracts' terms.
Foreign-denominated assets, including investment securities, and liabilities are translated into U.S. dollars at the exchange rates at period end. Purchases and sales of investment securities, income and dividends received, and expenses denominated in foreign currencies are translated into U.S. dollars at the exchange rate in effect on the transaction date.
The effects of exchange rate fluctuations on investments are included with the net realized and unrealized gain (loss) on investment securities. Other foreign currency transactions resulting in realized and unrealized gain (loss) are disclosed separately.
Investment Transactions and Income. For financial reporting purposes, the Funds' investment holdings and NAV include trades executed through the end of the last business day of the period. The NAV per share for processing shareholder transactions is calculated as of the close of business (normally 4:00 p.m. Eastern time) of the Nasdaq Stock Market for Fidelity Crypto Industry and Digital Payments ETF and Fidelity Metaverse ETF, and of the Cboe BZX Exchange, Inc. (CboeBZX) for all other funds; and includes trades executed through the end of the prior business day. Gains and losses on securities sold are determined on the basis of identified cost and for certain Funds include proceeds received from litigation. Commissions paid to certain brokers with whom the investment adviser, or its affiliates, places trades on behalf of a fund include an amount in addition to trade execution, which may be rebated back to a fund. Any such rebates are included in net realized gain (loss) on investments in the Statement of Operations. Dividend income is recorded on the ex-dividend date, except for certain dividends from foreign securities where the ex-dividend date may have passed, which are recorded as soon as the Funds are informed of the ex-dividend date. Non-cash dividends included in dividend income, if any, are recorded at the fair market value of the securities received. Income and capital gain distributions from Fidelity Central Funds, if any, are recorded on the ex-dividend date. Certain distributions received by the Funds represent a return of capital or capital gain. The Funds determine the components of these distributions subsequent to the ex-dividend date, based upon receipt of tax filings or other correspondence relating to the underlying investment. These distributions are recorded as a reduction of cost of investments and/or as a realized gain. Large, non-recurring dividends recognized by the Funds are presented separately on the Statement of Operations as "Special Dividends" and the impact of these dividends is presented in the Financial Highlights. Interest income is accrued as earned and includes coupon interest and amortization of premium and accretion of discount on debt securities as applicable. Investment income is recorded net of foreign taxes withheld where recovery of such taxes is uncertain. Funds may file withholding tax reclaims in certain jurisdictions to recover a portion of amounts previously withheld. Any withholding tax reclaims income is included in the Statement of Operations in dividends or foreign taxes withheld. Any receivables for withholding tax reclaims are included in the Statement of Assets and Liabilities in dividends receivable or reclaims receivable, as applicable.
Expenses. Expenses directly attributable to a fund are charged to that fund. Expenses attributable to more than one fund are allocated among the respective funds on the basis of relative net assets or other appropriate methods. Expenses included in the accompanying financial statements reflect the expenses of that fund and do not include any expenses associated with any underlying mutual funds or exchange-traded funds. Although not included in a fund's expenses, a fund indirectly bears its proportionate share of these expenses through the net asset value of each underlying mutual fund or exchange-traded fund. Expense estimates are accrued in the period to which they relate and adjustments are made when actual amounts are known.
Income Tax Information and Distributions to Shareholders. Each year, each Fund intends to qualify as a regulated investment company under Subchapter M of the Internal Revenue Code, including distributing substantially all of its taxable income and realized gains. As a result, no provision for U.S. Federal income taxes is required. Each Fund files a U.S. federal tax return, in addition to state and local tax returns as required. Each Fund's federal income tax returns are subject to examination by the Internal Revenue Service (IRS) for a period of three fiscal years after they are filed. State and local tax returns may be subject to examination for an additional fiscal year depending on the jurisdiction. Realized gain or loss resulting from in-kind redemptions is not taxable to the Funds and is not distributed to shareholders of the Funds. Foreign taxes are provided for based on each Fund's understanding of the tax rules and rates that exist in the foreign markets in which it invests.
Distributions are declared and recorded on the ex-dividend date. Income and capital gain distributions are determined in accordance with income tax regulations, which may differ from GAAP.
Capital accounts within the financial statements are adjusted for permanent book-tax differences. These adjustments have no impact on net assets or the results of operations. Capital accounts are not adjusted for temporary book-tax differences which will reverse in a subsequent period.
Book-tax differences are primarily due to futures contracts, foreign currency transactions, passive foreign investment companies (PFIC), redemptions in-kind, capital loss carryforwards and losses deferred due to wash sales and excise tax regulations.
As of period end, the cost and unrealized appreciation (depreciation) in securities, and derivatives if applicable, for federal income tax purposes were as follows for each Fund:
| | Tax cost ($) | Gross unrealized appreciation ($) | Gross unrealized depreciation ($) | Net unrealized appreciation (depreciation)($) |
| Fidelity Clean Energy ETF | 35,068,685 | 1,886,018 | (12,688,201) | (10,802,183) |
| Fidelity Cloud Computing ETF | 80,492,051 | 13,696,836 | (4,381,996) | 9,314,840 |
Fidelity Crypto Industry and Digital Payments ETF | 194,833,023 | 31,020,613 | (10,432,051) | 20,588,562 |
| Fidelity Digital Health ETF | 7,667,251 | 1,060,658 | (892,400) | 168,258 |
Fidelity Electric Vehicles and Future Transportation ETF | 39,858,491 | 2,302,765 | (8,028,065) | (5,725,300) |
| Fidelity Metaverse ETF | 30,621,844 | 5,191,138 | (3,133,671) | 2,057,467 |
Capital loss carryforwards are only available to offset future capital gains of the Funds to the extent provided by regulations and may be limited. The capital loss carryforward information presented below, including any applicable limitation, is estimated as of prior fiscal period end and is subject to adjustment.
| | Short-term ($) | Long-term ($) | Total capital loss carryforward ($) |
| Fidelity Clean Energy ETF | (2,939,218) | (6,040,398) | (8,979,616) |
| Fidelity Cloud Computing ETF | (1,564,044) | (4,036,604) | (5,600,648) |
Fidelity Crypto Industry and Digital Payments ETF | (3,574,238) | (876,950) | (4,451,188) |
| Fidelity Digital Health ETF | (613,214) | (1,994,102) | (2,607,316) |
Fidelity Electric Vehicles and Future Transportation ETF | (9,148,744) | (11,751,854) | (20,900,598) |
| Fidelity Metaverse ETF | (815,493) | (819,150) | (1,634,643) |
| | | | |
Certain of the Funds elected to defer to the next fiscal year ordinary losses recognized during the period January 1, 2024 to June 30,2024. Loss deferrals were as follows:| | Ordinary losses ($) |
| Fidelity Clean Energy ETF | (585) |
| Fidelity Cloud Computing ETF | (78) |
Fidelity Electric Vehicles and Future Transportation ETF | (5,419) |
| Fidelity Metaverse ETF | (3,029) |
Restricted Securities (including Private Placements). Funds may invest in securities that are subject to legal or contractual restrictions on resale. These securities generally may be resold in transactions exempt from registration or to the public if the securities are registered. Disposal of these securities may involve time-consuming negotiations and expense, and prompt sale at an acceptable price may be difficult. Information regarding restricted securities held at period end is included at the end of the Schedule of Investments, if applicable.
New Accounting Pronouncement. FASB Accounting Standards Update (ASU) 2023-07 Segment Reporting (Topic 280): Improvements to Reportable Segment Disclosures became effective in this reporting period. ASU 2023-07 enhances segment information disclosure in the notes to financial statements.
4. Derivative Instruments.
Risk Exposures and the Use of Derivative Instruments. Each Fund's investment objectives allow for various types of derivative instruments, including futures contracts. Derivatives are investments whose value is primarily derived from underlying assets, indices or reference rates and may be transacted on an exchange or over-the-counter (OTC). Derivatives may involve a future commitment to buy or sell a specified asset based on specified terms, to exchange future cash flows at periodic intervals based on a notional principal amount, or for one party to make one or more payments upon the occurrence of specified events in exchange for periodic payments from the other party.
Derivatives were used to increase returns and to manage exposure to certain risks as defined below. The success of any strategy involving derivatives depends on analysis of numerous economic factors, and if the strategies for investment do not work as intended, the objectives may not be achieved.
Derivatives were used to increase or decrease exposure to the following risk(s):| | |
| Equity Risk | Equity risk relates to the fluctuations in the value of financial instruments as a result of changes in market prices (other than those arising from interest rate risk or foreign exchange risk), whether caused by factors specific to an individual investment, its issuer, or all factors affecting all instruments traded in a market or market segment. |
Funds are also exposed to additional risks from investing in derivatives, such as liquidity risk and counterparty credit risk. Liquidity risk is the risk that a fund will be unable to close out the derivative in the open market in a timely manner. Counterparty credit risk is the risk that the counterparty will not be able to fulfill its obligation to a fund. Counterparty credit risk related to exchange-traded contracts may be mitigated by the protection provided by the exchange on which they trade.
Investing in derivatives may involve greater risks than investing in the underlying assets directly and, to varying degrees, may involve risk of loss in excess of any initial investment and collateral received and amounts recognized in the Statement of Assets and Liabilities. In addition, there may be the risk that the change in value of the derivative contract does not correspond to the change in value of the underlying instrument.
Futures Contracts. A futures contract is an agreement between two parties to buy or sell a specified underlying instrument for a fixed price at a specified future date. Futures contracts were used to manage exposure to the stock market.
Upon entering into a futures contract, a fund is required to deposit either cash or securities (initial margin) with a clearing broker in an amount equal to a certain percentage of the face value of the contract. Futures contracts are marked-to-market daily and subsequent daily payments are made or received by a fund depending on the daily fluctuations in the value of the futures contracts and are recorded as unrealized appreciation or (depreciation). This receivable and/or payable, if any, is included in daily variation margin on futures contracts in the Statement of Assets and Liabilities. Realized gain or (loss) is recorded upon the expiration or closing of a futures contract. The net realized gain (loss) and change in net unrealized appreciation (depreciation) on futures contracts during the period is presented in the Statement of Operations.
Any open futures contracts at period end are presented in the Schedule of Investments under the caption "Futures Contracts". The notional amount at value reflects each contract's exposure to the underlying instrument or index at period end, and is representative of volume of activity during the period. Any securities deposited to meet initial margin requirements are identified in the Schedule of Investments. Any cash deposited to meet initial margin requirements is presented as segregated cash with brokers for derivative instruments in the Statement of Assets and Liabilities.
5. Purchases and Sales of Investments.
Purchases and sales of securities, other than short-term securities and in-kind transactions, as applicable, are noted in the table below.
| | Purchases ($) | Sales ($) |
| Fidelity Clean Energy ETF | 7,581,352 | 6,961,088 |
| Fidelity Cloud Computing ETF | 27,769,893 | 15,150,153 |
| Fidelity Crypto Industry and Digital Payments ETF | 83,760,826 | 66,939,098 |
| Fidelity Digital Health ETF | 2,844,480 | 2,488,002 |
| Fidelity Electric Vehicles and Future Transportation ETF | 12,399,840 | 12,953,102 |
| Fidelity Metaverse ETF | 5,901,425 | 5,585,385 |
Securities received and delivered in-kind through subscriptions and redemptions are noted in the table below.
| | In-Kind Subscriptions ($) | In-Kind Redemptions ($) |
| Fidelity Clean Energy ETF | 664,828 | - |
| Fidelity Cloud Computing ETF | 2,954,691 | 17,531,235 |
| Fidelity Crypto Industry and Digital Payments ETF | 66,861,475 | 26,446,696 |
| Fidelity Digital Health ETF | - | 972,902 |
| Fidelity Electric Vehicles and Future Transportation ETF | - | 4,111,570 |
| Fidelity Metaverse ETF | 2,647,672 | 4,298,485 |
6. Fees and Other Transactions with Affiliates.
Management Fee. Fidelity Management & Research Company LLC (the investment adviser) provides the Funds with investment management related services for which the Funds pay a monthly management fee that is based on an annual rate of each Fund's average net assets as noted in the table below. Under the management contract, the investment adviser pays all other expenses, except the compensation of the independent Trustees and certain miscellaneous expenses such as proxy and shareholder meeting expenses.
| | Fee Rate |
| Fidelity Clean Energy ETF | .39% |
| Fidelity Cloud Computing ETF | .39% |
| Fidelity Crypto Industry and Digital Payments ETF | .39% |
| Fidelity Digital Health ETF | .39% |
| Fidelity Electric Vehicles and Future Transportation ETF | .39% |
| Fidelity Metaverse ETF | .39% |
Sub-Adviser. Geode Capital Management, LLC (Geode) serves as sub-adviser for the Funds. Geode provides discretionary investment advisory services to the Funds and is paid by the investment adviser for providing these services.
Interfund Trades. Funds may purchase from or sell securities to other Fidelity Funds under procedures adopted by the Board. The procedures have been designed to ensure these interfund trades are executed in accordance with Rule 17a-7 of the 1940 Act. Any interfund trades are included within the respective purchases and sales amounts shown in the Purchases and Sales of Investments note. During the period, there were no interfund trades.
7. Security Lending.
Funds lend portfolio securities from time to time in order to earn additional income. Lending agents are used, including National Financial Services (NFS), an affiliate of the investment adviser. Pursuant to a securities lending agreement, NFS will receive a fee, which is capped at 9.9% of a fund's daily lending revenue, for its services as lending agent. A fund may lend securities to certain qualified borrowers, including NFS. On the settlement date of the loan, a fund receives collateral (in the form of U.S. Treasury obligations, letters of credit and/or cash) against the loaned securities and maintains collateral in an amount not less than 100% of the market value of the loaned securities during the period of the loan. The market value of the loaned securities is determined at the close of business of a fund and any additional required collateral is delivered to a fund on the next business day. A fund or borrower may terminate the loan at any time, and if the borrower defaults on its obligation to return the securities loaned because of insolvency or other reasons, a fund may apply collateral received from the borrower against the obligation. A fund may experience delays and costs in recovering the securities loaned. Any cash collateral received is invested in the Fidelity Securities Lending Cash Central Fund. Any loaned securities are identified as such in the Schedule of Investments, and the value of loaned securities and cash collateral at period end, as applicable, are presented in the Statement of Assets and Liabilities. Security lending income represents the income earned on investing cash collateral, less rebates paid to borrowers and any lending agent fees associated with the loan, plus any premium payments received for lending certain types of securities. Security lending income is presented in the Statement of Operations as a component of income from Fidelity Central Funds. Affiliated security lending activity, if any, was as follows:
| | Total Security Lending Fees Paid to NFS ($) | Security Lending Income From Securities Loaned to NFS ($) | Value of Securities Loaned to NFS at Period End ($) |
| Fidelity Cloud Computing ETF | 87 | - | - |
| Fidelity Crypto Industry and Digital Payments ETF | 6,618 | 424 | - |
| Fidelity Electric Vehicles and Future Transportation ETF | 1,832 | - | - |
| Fidelity Metaverse ETF | 453 | - | - |
8. Expense Reductions.
Through arrangements with each applicable Fund's custodian, credits realized as a result of certain uninvested cash balances were used to reduce each applicable Fund's expenses. All of the applicable expense reductions are noted in the table below.
| | Custodian credits ($) |
| Fidelity Clean Energy ETF | 170 |
| Fidelity Cloud Computing ETF | 653 |
Fidelity Crypto Industry and Digital Payments ETF | 697 |
| Fidelity Digital Health ETF | 17 |
Fidelity Electric Vehicles and Future Transportation ETF | 158 |
| Fidelity Metaverse ETF | 1,222 |
9. Share Transactions.
Funds issue and redeem shares at NAV only with certain authorized participants in large increments known as Creation Units. Purchases of Creation Units are made by tendering a basket of designated securities to a fund and redemption proceeds are paid with a basket of securities from a fund's portfolio with a balancing cash component to equate the market value of the basket of securities delivered or redeemed to the NAV per Creation Unit on the transaction date. Cash may be substituted equivalent to the value of certain securities generally when they are not available in sufficient quantity for delivery. A fund's shares are available in smaller increments to investors in the secondary market at market prices and may be subject to commissions. Authorized participants pay a transaction fee to the shareholder servicing agent when purchasing and redeeming Creation Units of a fund. The transaction fee is used to offset the costs associated with the issuance and redemption of Creation Units.
10. Other.
A fund's organizational documents provide former and current trustees and officers with a limited indemnification against liabilities arising in connection with the performance of their duties to the fund. In the normal course of business, a fund may also enter into contracts that provide general indemnifications. A fund's maximum exposure under these arrangements is unknown as this would be dependent on future claims that may be made against a fund. The risk of material loss from such claims is considered remote.
11. Risk and Uncertainties.
Many factors affect a fund's performance. Developments that disrupt global economies and financial markets, such as pandemics, epidemics, outbreaks of infectious diseases, war, terrorism, and environmental disasters, may significantly affect a fund's investment performance. The effects of these developments to a fund will be impacted by the types of securities in which a fund invests, the financial condition, industry, economic sector, and geographic location of an issuer, and a fund's level of investment in the securities of that issuer. Significant concentrations in security types, issuers, industries, sectors, and geographic locations may magnify the factors that affect a fund's performance.
Item 8: Changes in and Disagreements with Accountants for Open-End Management Investment Companies
(Unaudited)
Note: This is not applicable for any fund included in this document.
Item 9: Proxy Disclosures for Open-End Management Investment Companies
(Unaudited)
| A special meeting of shareholders was held on July 16, 2024. The results of votes taken among shareholders on the proposal before them are reported below. Each vote reported represents one dollar of net asset value held on the record date for the meeting. |
| Proposal 1 |
| To elect a Board of Trustees. |
| | # of Votes | % of Votes |
| Bettina Doulton |
| Affirmative | 38,080,283,823.03 | 97.17 |
| Withheld | 1,109,333,237.47 | 2.83 |
| TOTAL | 39,189,617,060.50 | 100.00 |
| Robert A. Lawrence |
| Affirmative | 37,781,807,251.33 | 96.41 |
| Withheld | 1,407,809,809.17 | 3.59 |
| TOTAL | 39,189,617,060.50 | 100.00 |
| Vijay C. Advani |
| Affirmative | 37,869,526,083.09 | 96.63 |
| Withheld | 1,320,090,977.41 | 3.37 |
| TOTAL | 39,189,617,060.50 | 100.00 |
| Thomas P. Bostick |
| Affirmative | 38,025,875,898.31 | 97.03 |
| Withheld | 1,163,741,162.19 | 2.97 |
| TOTAL | 39,189,617,060.50 | 100.00 |
| Donald F. Donahue |
| Affirmative | 37,825,198,238.79 | 96.52 |
| Withheld | 1,364,418,821.71 | 3.48 |
| TOTAL | 39,189,617,060.50 | 100.00 |
| Vicki L. Fuller |
| Affirmative | 38,031,768,119.99 | 97.05 |
| Withheld | 1,157,848,940.51 | 2.95 |
| TOTAL | 39,189,617,060.50 | 100.00 |
| Patricia L. Kampling |
| Affirmative | 38,062,391,881.90 | 97.12 |
| Withheld | 1,127,225,178.60 | 2.88 |
| TOTAL | 39,189,617,060.50 | 100.00 |
| Thomas A. Kennedy |
| Affirmative | 37,891,434,776.27 | 96.69 |
| Withheld | 1,298,182,284.23 | 3.31 |
| TOTAL | 39,189,617,060.50 | 100.00 |
| Oscar Munoz |
| Affirmative | 37,976,932,673.73 | 96.91 |
| Withheld | 1,212,684,386.77 | 3.09 |
| TOTAL | 39,189,617,060.50 | 100.00 |
| Karen B. Peetz |
| Affirmative | 38,011,822,212.28 | 96.99 |
| Withheld | 1,177,794,848.22 | 3.01 |
| TOTAL | 39,189,617,060.50 | 100.00 |
| David M. Thomas |
| Affirmative | 37,976,058,118.16 | 96.90 |
| Withheld | 1,213,558,942.34 | 3.10 |
| TOTAL | 39,189,617,060.50 | 100.00 |
| Susan Tomasky |
| Affirmative | 37,845,471,684.67 | 96.57 |
| Withheld | 1,344,145,375.83 | 3.43 |
| TOTAL | 39,189,617,060.50 | 100.00 |
| Michael E. Wiley |
| Affirmative | 37,736,569,620.69 | 96.29 |
| Withheld | 1,453,047,439.81 | 3.71 |
| TOTAL | 39,189,617,060.50 | 100.00 |
| | | |
| Proposal 1 reflects trust-wide proposal and voting results. |
Item 10: Remuneration Paid to Directors, Officers, and others of Open-End Management Investment Companies
(Unaudited)
Note: This information is disclosed as part of the financial statements for each Fund as part of Item 7: Financial Statements and Financial Highlights for Open-End Management Investment companies.
Item 11: Statement Regarding Basis for Approval of Investment Advisory Contract
(Unaudited)
Note: This is not applicable for any fund included in this document.
1.9903829.103
CEE-SANN-0325
Fidelity® Enhanced Emerging Markets ETF
Fidelity® Enhanced U.S. All-Cap Equity ETF
Semi-Annual Report
December 31, 2024
Contents
To view a fund's proxy voting guidelines and proxy voting record for the 12-month period ended June 30, visit http://www.fidelity.com/proxyvotingresults or visit the Securities and Exchange Commission's (SEC) web site at http://www.sec.gov.
You may also call 1-800-FIDELITY to request a free copy of the proxy voting guidelines.
Standard & Poor's, S&P and S&P 500 are registered service marks of The McGraw-Hill Companies, Inc. and have been licensed for use by Fidelity Distributors Corporation.
Other third-party marks appearing herein are the property of their respective owners.
All other marks appearing herein are registered or unregistered trademarks or service marks of FMR LLC or an affiliated company. © 2025 FMR LLC. All rights reserved.
This report and the financial statements contained herein are submitted for the general information of the shareholders of the Funds. This report is not authorized for distribution to prospective investors in the Funds unless preceded or accompanied by an effective prospectus.
A fund files its complete schedule of portfolio holdings with the SEC for the first and third quarters of each fiscal year on Form N-PORT. Forms N-PORT are available on the SEC's web site at http://www.sec.gov. A fund's Forms N-PORT may be reviewed and copied at the SEC's Public Reference Room in Washington, DC. Information regarding the operation of the SEC's Public Reference Room may be obtained by calling 1-800-SEC-0330.
For a complete list of a fund's portfolio holdings, view the most recent holdings listing, semiannual report, or annual report on Fidelity's web site at http://www.fidelity.com, http://www.institutional.fidelity.com, or http://www.401k.com, as applicable.
NOT FDIC INSURED •MAY LOSE VALUE •NO BANK GUARANTEE
Neither the Funds nor Fidelity Distributors Corporation is a bank.
Item 7: Financial Statements and Financial Highlights for Open-End Management Investment Companies (Semi-Annual Report)
Fidelity® Enhanced Emerging Markets ETF
Schedule of Investments December 31, 2024 (Unaudited)
Showing Percentage of Net Assets
| Common Stocks - 99.6% |
| | | Shares | Value ($) |
| BRAZIL - 3.8% | | | |
| Consumer Staples - 0.8% | | | |
| Food Products - 0.7% | | | |
| BRF SA ADR | | 15,800 | 64,306 |
| Personal Care Products - 0.1% | | | |
| Natura & Co Holding SA | | 7,100 | 14,665 |
TOTAL CONSUMER STAPLES | | | 78,971 |
| | | | |
| Energy - 0.0% | | | |
| Oil, Gas & Consumable Fuels - 0.0% | | | |
| Petroleo Brasileiro SA | | 600 | 3,515 |
| Financials - 1.7% | | | |
| Banks - 1.7% | | | |
| Banco do Brasil SA | | 17,100 | 66,902 |
| Itau Unibanco Holding SA | | 8,000 | 39,794 |
| NU Holdings Ltd/Cayman Islands Class A (b) | | 5,303 | 54,939 |
| | | | 161,635 |
| Industrials - 1.1% | | | |
| Aerospace & Defense - 0.7% | | | |
| Embraer SA ADR (b) | | 1,875 | 68,775 |
| Electrical Equipment - 0.4% | | | |
| WEG SA | | 5,200 | 44,417 |
TOTAL INDUSTRIALS | | | 113,192 |
| | | | |
| Utilities - 0.2% | | | |
| Water Utilities - 0.2% | | | |
| Cia de Saneamento Basico do Estado de Sao Paulo SABESP | | 1,200 | 17,190 |
| TOTAL BRAZIL | | | 374,503 |
| CHILE - 0.8% | | | |
| Consumer Discretionary - 0.5% | | | |
| Specialty Retail - 0.5% | | | |
| Empresas Copec SA | | 8,000 | 48,900 |
| Industrials - 0.3% | | | |
| Passenger Airlines - 0.3% | | | |
| Latam Airlines Group SA | | 2,461,683 | 33,985 |
| TOTAL CHILE | | | 82,885 |
| CHINA - 29.3% | | | |
| Communication Services - 5.6% | | | |
| Interactive Media & Services - 5.6% | | | |
| Bilibili Inc Z Shares (b) | | 620 | 11,335 |
| Kuaishou Technology B Shares (b)(c)(d) | | 4,900 | 26,088 |
| Tencent Holdings Ltd | | 9,600 | 515,435 |
| | | | 552,858 |
| Wireless Telecommunication Services - 0.0% | | | |
| China United Network Communications Ltd A Shares (China) | | 3,700 | 2,692 |
TOTAL COMMUNICATION SERVICES | | | 555,550 |
| | | | |
| Consumer Discretionary - 9.8% | | | |
| Automobile Components - 0.2% | | | |
| Huayu Automotive Systems Co Ltd A Shares (China) | | 7,500 | 18,094 |
| Automobiles - 2.3% | | | |
| BYD Co Ltd A Shares (China) | | 300 | 11,617 |
| BYD Co Ltd H Shares | | 3,000 | 102,979 |
| Geely Automobile Holdings Ltd | | 37,000 | 70,602 |
| Seres Group Co Ltd A Shares (China) | | 2,200 | 40,203 |
| | | | 225,401 |
| Broadline Retail - 3.2% | | | |
| Alibaba Group Holding Ltd | | 13,800 | 146,411 |
| JD.com Inc A Shares | | 6,750 | 118,198 |
| PDD Holdings Inc Class A ADR (b) | | 289 | 28,030 |
| Vipshop Holdings Ltd Class A ADR | | 1,904 | 25,647 |
| | | | 318,286 |
| Hotels, Restaurants & Leisure - 2.9% | | | |
| Meituan B Shares (b)(c)(d) | | 9,400 | 183,603 |
| Trip.com Group Ltd (b) | | 1,400 | 97,339 |
| | | | 280,942 |
| Household Durables - 0.4% | | | |
| Hisense Home Appliances Group Co Ltd A Shares (China) | | 4,500 | 17,816 |
| Hisense Home Appliances Group Co Ltd H Shares | | 6,000 | 18,966 |
| | | | 36,782 |
| Specialty Retail - 0.2% | | | |
| Pop Mart International Group Ltd (c)(d) | | 1,400 | 16,160 |
| Textiles, Apparel & Luxury Goods - 0.6% | | | |
| Bosideng International Holdings Ltd | | 124,000 | 61,947 |
TOTAL CONSUMER DISCRETIONARY | | | 957,612 |
| | | | |
| Energy - 0.8% | | | |
| Energy Equipment & Services - 0.3% | | | |
| CNOOC Energy Technology & Services Ltd A Shares (China) | | 44,100 | 25,798 |
| Oil, Gas & Consumable Fuels - 0.5% | | | |
| PetroChina Co Ltd H Shares | | 62,000 | 48,775 |
TOTAL ENERGY | | | 74,573 |
| | | | |
| Financials - 5.0% | | | |
| Banks - 0.5% | | | |
| China Construction Bank Corp H Shares | | 39,000 | 32,539 |
| Huaxia Bank Co Ltd A Shares (China) | | 17,500 | 19,203 |
| | | | 51,742 |
| Capital Markets - 1.1% | | | |
| China Galaxy Securities Co Ltd H Shares | | 14,000 | 12,780 |
| Guotai Junan Securities Co Ltd A Shares (China) | | 21,800 | 55,700 |
| Huatai Securities Co Ltd A Shares (China) | | 4,000 | 9,639 |
| Huatai Securities Co Ltd H Shares (c)(d) | | 6,600 | 11,150 |
| Shenwan Hongyuan Group Co Ltd A Shares (China) | | 25,600 | 18,763 |
| SooChow Securities Co Ltd A Shares (China) | | 2,700 | 2,885 |
| | | | 110,917 |
| Consumer Finance - 0.7% | | | |
| Qifu Technology Inc Class A ADR | | 1,792 | 68,777 |
| Insurance - 2.7% | | | |
| China Life Insurance Co Ltd H Shares | | 16,000 | 30,242 |
| China Taiping Insurance Holdings Co Ltd | | 23,200 | 34,710 |
| People's Insurance Co Group of China Ltd/The A Shares (China) | | 16,900 | 17,642 |
| People's Insurance Co Group of China Ltd/The H Shares | | 107,000 | 53,317 |
| Ping An Insurance Group Co of China Ltd A Shares (China) | | 1,700 | 12,262 |
| Ping An Insurance Group Co of China Ltd H Shares | | 18,500 | 109,691 |
| | | | 257,864 |
TOTAL FINANCIALS | | | 489,300 |
| | | | |
| Health Care - 2.8% | | | |
| Biotechnology - 0.8% | | | |
| Beigene Ltd H Shares (b) | | 5,600 | 78,737 |
| Health Care Equipment & Supplies - 0.4% | | | |
| Shenzhen Mindray Bio-Medical Electronics Co Ltd A Shares (China) | | 1,200 | 41,922 |
| Health Care Providers & Services - 0.8% | | | |
| Jointown Pharmaceutical Group Co Ltd A Shares (China) | | 5,400 | 3,787 |
| Shanghai Pharmaceuticals Holding Co Ltd A Shares (China) | | 6,900 | 19,851 |
| Shanghai Pharmaceuticals Holding Co Ltd H Shares | | 28,700 | 46,635 |
| Sinopharm Group Co Ltd H Shares | | 1,600 | 4,388 |
| | | | 74,661 |
| Life Sciences Tools & Services - 0.1% | | | |
| Wuxi Apptec Co Ltd A Shares (China) | | 900 | 6,786 |
| Wuxi Apptec Co Ltd H Shares (c)(d) | | 1,300 | 9,457 |
| | | | 16,243 |
| Pharmaceuticals - 0.7% | | | |
| China Resources Pharmaceutical Group Ltd (c)(d) | | 91,000 | 66,786 |
TOTAL HEALTH CARE | | | 278,349 |
| | | | |
| Industrials - 2.7% | | | |
| Air Freight & Logistics - 1.1% | | | |
| JD Logistics Inc (b)(c)(d) | | 36,200 | 59,660 |
| SF Holding Co Ltd A Shares (China) | | 8,500 | 46,929 |
| | | | 106,589 |
| Electrical Equipment - 0.9% | | | |
| Contemporary Amperex Technology Co Ltd A Shares (China) | | 1,500 | 54,662 |
| Shanghai Electric Group Co Ltd A Shares (China) (b) | | 27,400 | 30,443 |
| | | | 85,105 |
| Machinery - 0.2% | | | |
| Yutong Bus Co Ltd A Shares (China) | | 6,400 | 23,130 |
| Marine Transportation - 0.4% | | | |
| COSCO SHIPPING Holdings Co Ltd H Shares | | 25,000 | 41,202 |
| Passenger Airlines - 0.1% | | | |
| China Southern Airlines Co Ltd A Shares (China) (b) | | 12,700 | 11,292 |
TOTAL INDUSTRIALS | | | 267,318 |
| | | | |
| Information Technology - 1.2% | | | |
| Electronic Equipment, Instruments & Components - 0.5% | | | |
| BOE Technology Group Co Ltd A Shares (China) | | 81,000 | 48,715 |
| Technology Hardware, Storage & Peripherals - 0.7% | | | |
| Lenovo Group Ltd | | 28,000 | 36,340 |
| Xiaomi Corp B Shares (b)(c)(d) | | 6,800 | 30,206 |
| | | | 66,546 |
TOTAL INFORMATION TECHNOLOGY | | | 115,261 |
| | | | |
| Materials - 0.6% | | | |
| Chemicals - 0.1% | | | |
| Yunnan Yuntianhua Co Ltd A Shares (China) | | 3,500 | 10,692 |
| Metals & Mining - 0.5% | | | |
| China Hongqiao Group Ltd | | 28,000 | 42,397 |
| Xiamen Tungsten Co Ltd A Shares (China) | | 3,500 | 9,239 |
| | | | 51,636 |
TOTAL MATERIALS | | | 62,328 |
| | | | |
| Real Estate - 0.8% | | | |
| Real Estate Management & Development - 0.8% | | | |
| KE Holdings Inc ADR | | 4,318 | 79,538 |
| TOTAL CHINA | | | 2,879,829 |
| EGYPT - 0.0% | | | |
| Financials - 0.0% | | | |
| Banks - 0.0% | | | |
| Commercial International Bank - Egypt (CIB) | | 2,174 | 3,356 |
| GREECE - 0.4% | | | |
| Financials - 0.4% | | | |
| Banks - 0.4% | | | |
| Eurobank Ergasias Services and Holdings SA | | 15,597 | 36,028 |
| Utilities - 0.0% | | | |
| Electric Utilities - 0.0% | | | |
| Public Power Corp SA | | 188 | 2,403 |
| TOTAL GREECE | | | 38,431 |
| HUNGARY - 0.9% | | | |
| Energy - 0.1% | | | |
| Oil, Gas & Consumable Fuels - 0.1% | | | |
| MOL Hungarian Oil & Gas PLC Class A | | 793 | 5,450 |
| Financials - 0.8% | | | |
| Banks - 0.8% | | | |
| OTP Bank Nyrt | | 1,498 | 81,805 |
| TOTAL HUNGARY | | | 87,255 |
| INDIA - 16.1% | | | |
| Consumer Discretionary - 0.9% | | | |
| Automobiles - 0.9% | | | |
| Mahindra & Mahindra Ltd GDR (c) | | 2,580 | 91,332 |
| Energy - 0.2% | | | |
| Oil, Gas & Consumable Fuels - 0.2% | | | |
| Reliance Industries Ltd GDR (d) | | 278 | 15,790 |
| Financials - 7.9% | | | |
| Banks - 7.9% | | | |
| Axis Bank Ltd GDR (c) | | 1,963 | 122,099 |
| HDFC Bank Ltd/Gandhinagar ADR | | 3,720 | 237,559 |
| ICICI Bank Ltd ADR | | 8,458 | 252,556 |
| State Bank of India GDR (c) | | 1,784 | 165,198 |
| | | | 777,412 |
| Health Care - 1.6% | | | |
| Pharmaceuticals - 1.6% | | | |
| Dr Reddy's Laboratories Ltd ADR | | 10,158 | 160,395 |
| Industrials - 1.3% | | | |
| Construction & Engineering - 1.3% | | | |
| Larsen & Toubro Ltd GDR (c) | | 3,007 | 126,294 |
| Information Technology - 4.2% | | | |
| IT Services - 4.2% | | | |
| Infosys Ltd ADR | | 11,322 | 248,179 |
| Wipro Ltd ADR | | 47,684 | 168,801 |
| | | | 416,980 |
| TOTAL INDIA | | | 1,588,203 |
| INDONESIA - 1.2% | | | |
| Consumer Staples - 0.8% | | | |
| Food Products - 0.8% | | | |
| Indofood CBP Sukses Makmur Tbk PT | | 11,700 | 8,269 |
| Indofood Sukses Makmur Tbk PT | | 138,100 | 66,068 |
| | | | 74,337 |
| Energy - 0.4% | | | |
| Oil, Gas & Consumable Fuels - 0.4% | | | |
| Alamtri Resources Indonesia Tbk PT | | 183,100 | 27,644 |
| United Tractors Tbk PT | | 10,300 | 17,135 |
| | | | 44,779 |
| TOTAL INDONESIA | | | 119,116 |
| KOREA (SOUTH) - 10.2% | | | |
| Communication Services - 1.5% | | | |
| Interactive Media & Services - 1.0% | | | |
| NAVER Corp | | 675 | 90,822 |
| Wireless Telecommunication Services - 0.5% | | | |
| SK Telecom Co Ltd | | 1,428 | 53,324 |
TOTAL COMMUNICATION SERVICES | | | 144,146 |
| | | | |
| Consumer Discretionary - 2.3% | | | |
| Automobile Components - 1.4% | | | |
| Hankook Tire & Technology Co Ltd | | 2,508 | 65,149 |
| Hyundai Mobis Co Ltd | | 425 | 67,995 |
| | | | 133,144 |
| Automobiles - 0.6% | | | |
| Kia Corp | | 916 | 62,399 |
| Household Durables - 0.3% | | | |
| LG Electronics Inc | | 490 | 27,678 |
TOTAL CONSUMER DISCRETIONARY | | | 223,221 |
| | | | |
| Consumer Staples - 0.2% | | | |
| Food Products - 0.2% | | | |
| CJ CheilJedang Corp | | 150 | 25,926 |
| Financials - 1.2% | | | |
| Capital Markets - 0.5% | | | |
| Korea Investment Holdings Co Ltd | | 808 | 38,972 |
| NH Investment & Securities Co Ltd | | 1,353 | 12,768 |
| | | | 51,740 |
| Insurance - 0.7% | | | |
| DB Insurance Co Ltd | | 554 | 38,526 |
| Samsung Fire & Marine Insurance Co Ltd | | 1 | 243 |
| Samsung Life Insurance Co Ltd | | 378 | 24,241 |
| | | | 63,010 |
TOTAL FINANCIALS | | | 114,750 |
| | | | |
| Health Care - 0.8% | | | |
| Life Sciences Tools & Services - 0.8% | | | |
| Samsung Biologics Co Ltd (b)(c)(d) | | 117 | 75,111 |
| Industrials - 0.6% | | | |
| Aerospace & Defense - 0.4% | | | |
| Hanwha Aerospace Co Ltd | | 187 | 41,303 |
| Electrical Equipment - 0.0% | | | |
| HD Hyundai Electric Co Ltd | | 2 | 516 |
| Industrial Conglomerates - 0.2% | | | |
| GS Holdings Corp | | 690 | 18,344 |
TOTAL INDUSTRIALS | | | 60,163 |
| | | | |
| Information Technology - 3.6% | | | |
| Semiconductors & Semiconductor Equipment - 1.5% | | | |
| SK Hynix Inc | | 1,291 | 151,872 |
| Technology Hardware, Storage & Peripherals - 2.1% | | | |
| Samsung Electronics Co Ltd | | 5,510 | 198,297 |
TOTAL INFORMATION TECHNOLOGY | | | 350,169 |
| | | | |
| Utilities - 0.0% | | | |
| Electric Utilities - 0.0% | | | |
| Korea Electric Power Corp (b) | | 990 | 13,427 |
| TOTAL KOREA (SOUTH) | | | 1,006,913 |
| MALAYSIA - 0.2% | | | |
| Materials - 0.2% | | | |
| Chemicals - 0.2% | | | |
| Petronas Chemicals Group Bhd | | 17,500 | 20,234 |
| MEXICO - 2.2% | | | |
| Consumer Staples - 1.6% | | | |
| Beverages - 1.6% | | | |
| Arca Continental SAB de CV | | 8,700 | 72,075 |
| Coca-Cola Femsa SAB de CV unit | | 7,000 | 54,383 |
| Fomento Economico Mexicano SAB de CV unit | | 3,200 | 27,272 |
| | | | 153,730 |
| Industrials - 0.0% | | | |
| Industrial Conglomerates - 0.0% | | | |
| Alfa SAB de CV Series A | | 13,300 | 9,625 |
| Materials - 0.6% | | | |
| Construction Materials - 0.6% | | | |
| Cemex SAB de CV unit | | 92,000 | 51,535 |
| Metals & Mining - 0.0% | | | |
| Southern Copper Corp | | 38 | 3,463 |
TOTAL MATERIALS | | | 54,998 |
| | | | |
| TOTAL MEXICO | | | 218,353 |
| PHILIPPINES - 1.1% | | | |
| Consumer Discretionary - 0.2% | | | |
| Hotels, Restaurants & Leisure - 0.2% | | | |
| Jollibee Foods Corp | | 4,100 | 18,987 |
| Financials - 0.1% | | | |
| Banks - 0.1% | | | |
| BDO Unibank Inc | | 4,090 | 10,139 |
| Industrials - 0.8% | | | |
| Transportation Infrastructure - 0.8% | | | |
| International Container Terminal Services Inc | | 11,210 | 74,495 |
| TOTAL PHILIPPINES | | | 103,621 |
| POLAND - 1.3% | | | |
| Consumer Discretionary - 0.6% | | | |
| Textiles, Apparel & Luxury Goods - 0.6% | | | |
| LPP SA | | 16 | 60,239 |
| Financials - 0.7% | | | |
| Banks - 0.2% | | | |
| Bank Polska Kasa Opieki SA | | 681 | 22,737 |
| Insurance - 0.5% | | | |
| Powszechny Zaklad Ubezpieczen SA | | 4,328 | 48,036 |
TOTAL FINANCIALS | | | 70,773 |
| | | | |
| Utilities - 0.0% | | | |
| Electric Utilities - 0.0% | | | |
| PGE Polska Grupa Energetyczna SA (b) | | 446 | 655 |
| TOTAL POLAND | | | 131,667 |
| QATAR - 0.4% | | | |
| Financials - 0.4% | | | |
| Banks - 0.4% | | | |
| Qatar Islamic Bank QPSC | | 7,463 | 43,782 |
| SAUDI ARABIA - 2.7% | | | |
| Communication Services - 0.2% | | | |
| Diversified Telecommunication Services - 0.2% | | | |
| Saudi Telecom Co | | 1,723 | 18,342 |
| Consumer Discretionary - 0.0% | | | |
| Specialty Retail - 0.0% | | | |
| Jarir Marketing Co | | 1,299 | 4,377 |
| Energy - 0.3% | | | |
| Energy Equipment & Services - 0.1% | | | |
| Ades Holding Co | | 3,068 | 14,175 |
| Oil, Gas & Consumable Fuels - 0.2% | | | |
| Saudi Arabian Oil Co (c)(d) | | 2,083 | 15,550 |
TOTAL ENERGY | | | 29,725 |
| | | | |
| Financials - 1.8% | | | |
| Banks - 1.8% | | | |
| Al Rajhi Bank | | 4,743 | 119,414 |
| Saudi Awwal Bank | | 683 | 6,117 |
| Saudi National Bank/The | | 5,090 | 45,246 |
| | | | 170,777 |
| Materials - 0.4% | | | |
| Metals & Mining - 0.4% | | | |
| Saudi Arabian Mining Co (b) | | 3,103 | 41,540 |
| TOTAL SAUDI ARABIA | | | 264,761 |
| SOUTH AFRICA - 2.4% | | | |
| Consumer Discretionary - 0.2% | | | |
| Broadline Retail - 0.2% | | | |
| Woolworths Holdings Ltd/South Africa | | 6,447 | 21,301 |
| Specialty Retail - 0.0% | | | |
| Pepkor Holdings Ltd (c)(d) | | 2,126 | 3,261 |
TOTAL CONSUMER DISCRETIONARY | | | 24,562 |
| | | | |
| Consumer Staples - 0.0% | | | |
| Consumer Staples Distribution & Retail - 0.0% | | | |
| Bid Corp Ltd | | 185 | 4,221 |
| Financials - 0.9% | | | |
| Banks - 0.2% | | | |
| Nedbank Group Ltd | | 1,378 | 20,571 |
| Financial Services - 0.2% | | | |
| Remgro Ltd | | 2,737 | 22,495 |
| Insurance - 0.5% | | | |
| Sanlam Ltd | | 9,339 | 42,995 |
TOTAL FINANCIALS | | | 86,061 |
| | | | |
| Materials - 1.3% | | | |
| Chemicals - 0.6% | | | |
| Sasol Ltd | | 13,000 | 57,363 |
| Metals & Mining - 0.7% | | | |
| Harmony Gold Mining Co Ltd | | 8,000 | 63,877 |
TOTAL MATERIALS | | | 121,240 |
| | | | |
| TOTAL SOUTH AFRICA | | | 236,084 |
| TAIWAN - 21.1% | | | |
| Consumer Discretionary - 0.3% | | | |
| Textiles, Apparel & Luxury Goods - 0.3% | | | |
| Pou Chen Corp | | 28,000 | 31,503 |
| Consumer Staples - 0.8% | | | |
| Food Products - 0.8% | | | |
| Uni-President Enterprises Corp | | 31,000 | 76,467 |
| Financials - 1.0% | | | |
| Financial Services - 0.2% | | | |
| Yuanta Financial Holding Co Ltd | | 17,000 | 17,623 |
| Insurance - 0.8% | | | |
| Fubon Financial Holding Co Ltd | | 26,000 | 71,586 |
TOTAL FINANCIALS | | | 89,209 |
| | | | |
| Industrials - 0.4% | | | |
| Marine Transportation - 0.4% | | | |
| Evergreen Marine Corp Taiwan Ltd | | 6,000 | 41,163 |
| Passenger Airlines - 0.0% | | | |
| China Airlines Ltd | | 4,000 | 3,128 |
TOTAL INDUSTRIALS | | | 44,291 |
| | | | |
| Information Technology - 18.6% | | | |
| Electronic Equipment, Instruments & Components - 2.7% | | | |
| Delta Electronics Inc | | 8,000 | 105,010 |
| Hon Hai Precision Industry Co Ltd | | 27,000 | 151,477 |
| Zhen Ding Technology Holding Ltd | | 2,000 | 7,318 |
| | | | 263,805 |
| Semiconductors & Semiconductor Equipment - 14.8% | | | |
| ASE Technology Holding Co Ltd | | 16,000 | 79,032 |
| MediaTek Inc | | 4,000 | 172,577 |
| Realtek Semiconductor Corp | | 5,000 | 86,593 |
| Taiwan Semiconductor Manufacturing Co Ltd | | 34,000 | 1,114,431 |
| | | | 1,452,633 |
| Technology Hardware, Storage & Peripherals - 1.1% | | | |
| Asustek Computer Inc | | 2,000 | 37,564 |
| Compal Electronics Inc | | 62,000 | 71,174 |
| | | | 108,738 |
TOTAL INFORMATION TECHNOLOGY | | | 1,825,176 |
| | | | |
| TOTAL TAIWAN | | | 2,066,646 |
| THAILAND - 1.6% | | | |
| Communication Services - 0.2% | | | |
| Diversified Telecommunication Services - 0.2% | | | |
| True Corp PCL depository receipt (b) | | 45,000 | 14,548 |
| Wireless Telecommunication Services - 0.0% | | | |
| Advanced Info Service PCL depository receipt | | 300 | 2,507 |
TOTAL COMMUNICATION SERVICES | | | 17,055 |
| | | | |
| Consumer Discretionary - 0.6% | | | |
| Hotels, Restaurants & Leisure - 0.6% | | | |
| Minor International PCL depository receipt | | 74,400 | 56,339 |
| Consumer Staples - 0.6% | | | |
| Food Products - 0.6% | | | |
| Charoen Pokphand Foods PCL depository receipt | | 88,100 | 58,502 |
| Health Care - 0.2% | | | |
| Health Care Providers & Services - 0.2% | | | |
| Bangkok Dusit Medical Services PCL depository receipt | | 25,200 | 17,982 |
| Real Estate - 0.0% | | | |
| Real Estate Management & Development - 0.0% | | | |
| Central Pattana PCL depository receipt | | 7,500 | 12,451 |
| TOTAL THAILAND | | | 162,329 |
| TURKEY - 0.8% | | | |
| Consumer Staples - 0.0% | | | |
| Beverages - 0.0% | | | |
| Anadolu Efes Biracilik Ve Malt Sanayii AS | | 1,016 | 5,503 |
| Financials - 0.4% | | | |
| Banks - 0.4% | | | |
| Turkiye Is Bankasi AS Class C | | 102,815 | 39,358 |
| Industrials - 0.4% | | | |
| Industrial Conglomerates - 0.2% | | | |
| KOC Holding AS | | 2,940 | 14,845 |
| Passenger Airlines - 0.2% | | | |
| Turk Hava Yollari AO (b) | | 2,774 | 22,037 |
TOTAL INDUSTRIALS | | | 36,882 |
| | | | |
| TOTAL TURKEY | | | 81,743 |
| UNITED ARAB EMIRATES - 2.4% | | | |
| Consumer Discretionary - 0.4% | | | |
| Specialty Retail - 0.4% | | | |
| Abu Dhabi National Oil Co for Distribution PJSC | | 41,791 | 40,049 |
| Energy - 0.4% | | | |
| Energy Equipment & Services - 0.4% | | | |
| ADNOC Drilling Co PJSC | | 30,322 | 44,001 |
| Real Estate - 1.6% | | | |
| Real Estate Management & Development - 1.6% | | | |
| Aldar Properties PJSC | | 12,707 | 26,569 |
| Emaar Properties PJSC | | 35,477 | 124,115 |
| | | | 150,684 |
| TOTAL UNITED ARAB EMIRATES | | | 234,734 |
| UNITED STATES - 0.7% | | | |
| Consumer Staples - 0.7% | | | |
| Food Products - 0.7% | | | |
| JBS S/A | | 11,600 | 68,160 |
| TOTAL COMMON STOCKS (Cost $9,971,223) | | | 9,812,605 |
| | | | |
| Non-Convertible Preferred Stocks - 0.1% |
| | | Shares | Value ($) |
| KOREA (SOUTH) - 0.1% | | | |
| Information Technology - 0.1% | | | |
| Technology Hardware, Storage & Peripherals - 0.1% | | | |
Samsung Electronics Co Ltd (Cost $7,930) | | 229 | 6,847 |
| | | | |
| U.S. Treasury Obligations - 0.2% |
| | | Yield (%) (e) | Principal Amount (a) | Value ($) |
US Treasury Bills 0% 2/20/2025 (Cost $19,877) | | 4.47 | 20,000 | 19,886 |
| | | | | |
| Money Market Funds - 0.0% |
| | | Yield (%) | Shares | Value ($) |
Fidelity Cash Central Fund (f) (Cost $118) | | 4.36 | 118 | 118 |
| | | | | |
| TOTAL INVESTMENT IN SECURITIES - 99.9% (Cost $9,999,148) | 9,839,456 |
NET OTHER ASSETS (LIABILITIES) - 0.1% | 8,345 |
| NET ASSETS - 100.0% | 9,847,801 |
| | |
Legend
| (a) | Amount is stated in United States dollars unless otherwise noted. |
| (c) | Security is exempt from registration under Regulation S of the Securities Act of 1933 and may be resold to qualified foreign investors outside of the United States. At the end of the period, the value of securities amounted to $1,001,955 or 10.2% of net assets. |
| (d) | Security exempt from registration under Rule 144A of the Securities Act of 1933. These securities may be resold in transactions exempt from registration, normally to qualified institutional buyers. At the end of the period, the value of these securities amounted to $512,822 or 5.2% of net assets. |
| (e) | Yield represents either the annualized yield at the date of purchase, or the stated coupon rate, or, for floating and adjustable rate securities, the rate at period end. |
| (f) | Affiliated fund that is generally available only to investment companies and other accounts managed by Fidelity Investments. The rate quoted is the annualized seven-day yield of the fund at period end. A complete unaudited listing of the fund's holdings as of its most recent quarter end is available upon request. In addition, each Fidelity Central Fund's financial statements are available on the SEC's website or upon request. |
Affiliated Central Funds
Fiscal year to date information regarding the Fund's investments in Fidelity Central Funds, including the ownership percentage, is presented below.
| Affiliate | Value, beginning of period ($) | Purchases ($) | Sales Proceeds ($) | Dividend Income ($) | Realized Gain (loss) ($) | Change in Unrealized appreciation (depreciation) ($) | Value, end of period ($) | Shares, end of period | % ownership, end of period |
| Fidelity Cash Central Fund | - | 5,704,322 | 5,704,204 | 894 | - | - | 118 | 118 | 0.0% |
| Total | - | 5,704,322 | 5,704,204 | 894 | - | - | 118 | 118 | |
| | | | | | | | | | |
Amounts in the dividend income column in the above table include any capital gain distributions from underlying funds, which are presented in the corresponding line item in the Statement of Operations, if applicable.
Amounts included in the purchases and sales proceeds columns may include in-kind transactions, if applicable.
Investment Valuation
The following is a summary of the inputs used, as of December 31, 2024, involving the Fund's assets and liabilities carried at fair value. The inputs or methodology used for valuing securities may not be an indication of the risk associated with investing in those securities. For more information on valuation inputs, and their aggregation into the levels used below, please refer to the Investment Valuation section in the accompanying Notes to Financial Statements.
| Valuation Inputs at Reporting Date: |
| Description | Total ($) | Level 1 ($) | Level 2 ($) | Level 3 ($) |
Investments in Securities: | | | | |
|
| Common Stocks | | | | |
Communication Services | 735,093 | 735,093 | - | - |
Consumer Discretionary | 1,557,121 | 1,557,121 | - | - |
Consumer Staples | 545,817 | 545,817 | - | - |
Energy | 217,833 | 217,833 | - | - |
Financials | 2,174,385 | 2,174,385 | - | - |
Health Care | 531,837 | 531,837 | - | - |
Industrials | 766,245 | 766,245 | - | - |
Information Technology | 2,707,586 | 2,707,586 | - | - |
Materials | 300,340 | 300,340 | - | - |
Real Estate | 242,673 | 242,673 | - | - |
Utilities | 33,675 | 33,675 | - | - |
|
| Non-Convertible Preferred Stocks | | | | |
Information Technology | 6,847 | 6,847 | - | - |
|
| U.S. Treasury Obligations | 19,886 | - | 19,886 | - |
|
| Money Market Funds | 118 | 118 | - | - |
| Total Investments in Securities: | 9,839,456 | 9,819,570 | 19,886 | - |
Fidelity® Enhanced Emerging Markets ETF
Financial Statements (Unaudited)
| Statement of Assets and Liabilities |
| As of December 31, 2024 (Unaudited) |
| Assets | | | | |
| Investment in securities, at value - See accompanying schedule: | | | | |
Unaffiliated issuers (cost $9,999,030) | $ | 9,839,338 | | |
Fidelity Central Funds (cost $118) | | 118 | | |
| | | | | |
| | | | | |
| Total Investment in Securities (cost $9,999,148) | | | $ | 9,839,456 |
| Cash | | | | 1,375 |
| Foreign currency held at value (cost $75) | | | | 75 |
| Dividends receivable | | | | 10,020 |
| Distributions receivable from Fidelity Central Funds | | | | 58 |
Total assets | | | | 9,850,984 |
| Liabilities | | | | |
| Accrued management fee | $ | 3,183 | | |
| Total liabilities | | | | 3,183 |
| Net Assets | | | $ | 9,847,801 |
| Net Assets consist of: | | | | |
| Paid in capital | | | $ | 10,016,019 |
| Total accumulated earnings (loss) | | | | (168,218) |
| Net Assets | | | $ | 9,847,801 |
Net Asset Value, offering price and redemption price per share ($9,847,801 ÷ 400,000 shares) | | | $ | 24.62 |
| Statement of Operations |
For the period November 19, 2024 (commencement of operations) through December 31, 2024 (Unaudited)
|
| Investment Income | | | | |
| Dividends | | | $ | 28,086 |
| Interest | | | | 123 |
| Income from Fidelity Central Funds | | | | 894 |
| Total income | | | | 29,103 |
| Expenses | | | | |
| Management fee | $ | 4,444 | | |
| Independent trustees' fees and expenses | | 2 | | |
| Total expenses | | | | 4,446 |
| Net Investment income (loss) | | | | 24,657 |
| Realized and Unrealized Gain (Loss) | | | | |
| Net realized gain (loss) on: | | | | |
| Investment Securities: | | | | |
| Foreign currency transactions | | 3,723 | | |
| Futures contracts | | (761) | | |
| Total net realized gain (loss) | | | | 2,962 |
| Change in net unrealized appreciation (depreciation) on: | | | | |
| Investment Securities: | | | | |
| Unaffiliated issuers | | (159,692) | | |
| Assets and liabilities in foreign currencies | | (145) | | |
| Total change in net unrealized appreciation (depreciation) | | | | (159,837) |
| Net gain (loss) | | | | (156,875) |
| Net increase (decrease) in net assets resulting from operations | | | $ | (132,218) |
| Statement of Changes in Net Assets |
| |
| | For the period November 19, 2024 (commencement of operations) through December 31, 2024 (Unaudited) |
| Increase (Decrease) in Net Assets | | |
| Operations | | |
| Net investment income (loss) | $ | 24,657 |
| Net realized gain (loss) | | 2,962 |
| Change in net unrealized appreciation (depreciation) | | (159,837) |
| Net increase (decrease) in net assets resulting from operations | | (132,218) |
| Distributions to shareholders | | (36,000) |
| | | |
| Share transactions | | |
| Proceeds from sales of shares | | 10,016,019 |
| | | |
Net increase (decrease) in net assets resulting from share transactions | | 10,016,019 |
| Total increase (decrease) in net assets | | 9,847,801 |
| | | |
| Net Assets | | |
| Beginning of period | | - |
| End of period | $ | 9,847,801 |
| | | |
| Other Information | | |
| Shares | | |
| Sold | | 400,000 |
| Net increase (decrease) | | 400,000 |
| | | |
Financial Highlights
Fidelity® Enhanced Emerging Markets ETF |
| |
| | Six months ended (Unaudited) December 31, 2024 A |
Selected Per-Share Data | | |
| Net asset value, beginning of period | $ | 25.00 |
| Income from Investment Operations | | |
Net investment income (loss) B,C | | .06 |
| Net realized and unrealized gain (loss) | | (.35) |
| Total from investment operations | | (.29) |
| Distributions from net investment income | | (.09) |
| Total distributions | | (.09) |
| Net asset value, end of period | $ | 24.62 |
Total Return D,E | | |
Ratios to Average Net Assets C,F,G | | |
| Expenses before reductions | | .38% H |
| Expenses net of fee waivers, if any | | |
| Expenses net of all reductions | | .38% H |
| Net investment income (loss) | | 2.11% H |
| Supplemental Data | | |
| Net assets, end of period (000 omitted) | $ | 9,848 |
Portfolio turnover rate I | | |
AFor the period November 19, 2024 (commencement of operations) through December 31, 2024.
BCalculated based on average shares outstanding during the period.
CNet investment income (loss) is affected by the timing of the declaration of dividends by any underlying mutual funds or exchange-traded funds (ETFs). Net investment income (loss) of any mutual funds or ETFs is not included in the Fund's net investment income (loss) ratio.
DBased on net asset value.
ETotal returns for periods of less than one year are not annualized.
FFees and expenses of any underlying mutual funds or exchange-traded funds (ETFs) are not included in the Fund's expense ratio. The Fund indirectly bears its proportionate share of these expenses. For additional expense information related to investments in Fidelity Central Funds, please refer to the "Investments in Fidelity Central Funds" note found in the Notes to Financial Statements section of the most recent Annual or Semi-Annual report.
GExpense ratios reflect operating expenses of the class. Expenses before reductions do not reflect amounts reimbursed, waived, or reduced through arrangements with the investment adviser, brokerage services, or other offset arrangements, if applicable, and do not represent the amount paid by the class during periods when reimbursements, waivers or reductions occur.
HAnnualized.
IAmount does not include the portfolio activity of any underlying mutual funds or exchange-traded funds (ETFs), derivatives or securities that mature within one year from acquisition.
JAmount not annualized.
Fidelity® Enhanced U.S. All-Cap Equity ETF
Schedule of Investments December 31, 2024 (Unaudited)
Showing Percentage of Net Assets
| Common Stocks - 99.1% |
| | | Shares | Value ($) |
| CANADA - 0.0% | | | |
| Energy - 0.0% | | | |
| Oil, Gas & Consumable Fuels - 0.0% | | | |
| Teekay Tankers Ltd Class A | | 49 | 1,950 |
| HONG KONG - 0.0% | | | |
| Consumer Discretionary - 0.0% | | | |
| Distributors - 0.0% | | | |
| GigaCloud Technology Inc Class A (a) | | 98 | 1,815 |
| MONACO - 0.1% | | | |
| Energy - 0.1% | | | |
| Oil, Gas & Consumable Fuels - 0.1% | | | |
| Scorpio Tankers Inc | | 42 | 2,087 |
| Industrials - 0.0% | | | |
| Marine Transportation - 0.0% | | | |
| Costamare Inc | | 154 | 1,979 |
| TOTAL MONACO | | | 4,066 |
| THAILAND - 0.1% | | | |
| Information Technology - 0.1% | | | |
| Electronic Equipment, Instruments & Components - 0.1% | | | |
| Fabrinet (a) | | 14 | 3,078 |
| UNITED KINGDOM - 0.1% | | | |
| Energy - 0.1% | | | |
| Energy Equipment & Services - 0.1% | | | |
| TechnipFMC PLC | | 161 | 4,659 |
| UNITED STATES - 98.8% | | | |
| Communication Services - 10.8% | | | |
| Diversified Telecommunication Services - 1.0% | | | |
| AT&T Inc | | 1,883 | 42,876 |
| Bandwidth Inc Class A (a) | | 119 | 2,025 |
| | | | 44,901 |
| Entertainment - 2.9% | | | |
| Electronic Arts Inc | | 98 | 14,337 |
| Netflix Inc (a) | | 43 | 38,327 |
| Playstudios Inc Class A (a) | | 854 | 1,588 |
| ROBLOX Corp Class A (a) | | 35 | 2,025 |
| Spotify Technology SA (a) | | 56 | 25,053 |
| Walt Disney Co/The | | 407 | 45,320 |
| | | | 126,650 |
| Interactive Media & Services - 5.9% | | | |
| Alphabet Inc Class A | | 446 | 84,428 |
| Alphabet Inc Class C | | 215 | 40,944 |
| Meta Platforms Inc Class A | | 216 | 126,471 |
| Vimeo Inc Class A (a) | | 343 | 2,195 |
| Yelp Inc Class A (a) | | 63 | 2,438 |
| | | | 256,476 |
| Media - 1.0% | | | |
| Comcast Corp Class A | | 1,037 | 38,919 |
| News Corp Class A | | 70 | 1,928 |
| News Corp Class B | | 63 | 1,917 |
| | | | 42,764 |
TOTAL COMMUNICATION SERVICES | | | 470,791 |
| | | | |
| Consumer Discretionary - 10.3% | | | |
| Automobile Components - 0.1% | | | |
| Goodyear Tire & Rubber Co/The (a) | | 252 | 2,268 |
| Stoneridge Inc (a) | | 329 | 2,063 |
| | | | 4,331 |
| Automobiles - 2.2% | | | |
| Ford Motor Co | | 1,498 | 14,830 |
| General Motors Co | | 416 | 22,160 |
| Tesla Inc (a) | | 142 | 57,346 |
| | | | 94,336 |
| Broadline Retail - 2.9% | | | |
| Amazon.com Inc (a) | | 577 | 126,588 |
| Diversified Consumer Services - 0.4% | | | |
| ADT Inc | | 308 | 2,128 |
| Adtalem Global Education Inc (a) | | 28 | 2,544 |
| Carriage Services Inc | | 56 | 2,232 |
| Chegg Inc (a) | | 849 | 1,367 |
| Coursera Inc (a) | | 270 | 2,295 |
| Duolingo Inc Class A (a) | | 14 | 4,539 |
| Frontdoor Inc (a) | | 42 | 2,296 |
| | | | 17,401 |
| Hotels, Restaurants & Leisure - 3.2% | | | |
| Booking Holdings Inc | | 7 | 34,779 |
| Carnival Corp (a) | | 378 | 9,420 |
| Chipotle Mexican Grill Inc (a) | | 518 | 31,235 |
| DoorDash Inc Class A (a) | | 130 | 21,808 |
| El Pollo Loco Holdings Inc (a) | | 175 | 2,020 |
| Expedia Group Inc Class A (a) | | 46 | 8,571 |
| International Game Technology PLC | | 119 | 2,102 |
| Life Time Group Holdings Inc (a) | | 91 | 2,012 |
| MGM Resorts International (a) | | 84 | 2,911 |
| Monarch Casino & Resort Inc | | 21 | 1,656 |
| PlayAGS Inc (a) | | 189 | 2,179 |
| Royal Caribbean Cruises Ltd | | 88 | 20,301 |
| Wendy's Co/The | | 133 | 2,168 |
| | | | 141,162 |
| Household Durables - 0.5% | | | |
| Cricut Inc Class A | | 379 | 2,160 |
| Ethan Allen Interiors Inc | | 77 | 2,164 |
| M/I Homes Inc (a) | | 14 | 1,861 |
| Taylor Morrison Home Corp (a) | | 35 | 2,142 |
| Toll Brothers Inc | | 35 | 4,409 |
| TopBuild Corp (a) | | 11 | 3,425 |
| Tri Pointe Homes Inc (a) | | 56 | 2,031 |
| Worthington Enterprises Inc | | 53 | 2,126 |
| | | | 20,318 |
| Leisure Products - 0.1% | | | |
| Acushnet Holdings Corp | | 28 | 1,990 |
| Peloton Interactive Inc Class A (a) | | 248 | 2,158 |
| | | | 4,148 |
| Specialty Retail - 0.8% | | | |
| Abercrombie & Fitch Co Class A (a) | | 19 | 2,840 |
| Bath & Body Works Inc | | 84 | 3,257 |
| Carvana Co Class A (a) | | 39 | 7,931 |
| Five Below Inc (a) | | 24 | 2,519 |
| Gap Inc/The | | 112 | 2,647 |
| Home Depot Inc/The | | 3 | 1,166 |
| Petco Health & Wellness Co Inc Class A (a) | | 479 | 1,825 |
| Sally Beauty Holdings Inc (a) | | 209 | 2,184 |
| Ulta Beauty Inc (a) | | 18 | 7,829 |
| Upbound Group Inc | | 79 | 2,304 |
| | | | 34,502 |
| Textiles, Apparel & Luxury Goods - 0.1% | | | |
| Kontoor Brands Inc | | 29 | 2,477 |
| Tapestry Inc | | 26 | 1,698 |
| | | | 4,175 |
TOTAL CONSUMER DISCRETIONARY | | | 446,961 |
| | | | |
| Consumer Staples - 3.6% | | | |
| Beverages - 0.1% | | | |
| Boston Beer Co Inc/The Class A (a) | | 7 | 2,100 |
| Molson Coors Beverage Co Class B | | 63 | 3,611 |
| | | | 5,711 |
| Consumer Staples Distribution & Retail - 1.6% | | | |
| Costco Wholesale Corp | | 7 | 6,414 |
| US Foods Holding Corp (a) | | 84 | 5,667 |
| Walmart Inc | | 652 | 58,908 |
| | | | 70,989 |
| Food Products - 0.2% | | | |
| Fresh Del Monte Produce Inc | | 63 | 2,092 |
| Ingredion Inc | | 21 | 2,889 |
| WK Kellogg Co | | 113 | 2,033 |
| | | | 7,014 |
| Household Products - 1.5% | | | |
| Clorox Co/The | | 42 | 6,821 |
| Procter & Gamble Co/The | | 343 | 57,504 |
| | | | 64,325 |
| Personal Care Products - 0.2% | | | |
| Edgewell Personal Care Co | | 67 | 2,251 |
| Honest Co Inc/The (a) | | 315 | 2,183 |
| Nature's Sunshine Products Inc (a) | | 98 | 1,437 |
| Nu Skin Enterprises Inc Class A | | 287 | 1,977 |
| | | | 7,848 |
TOTAL CONSUMER STAPLES | | | 155,887 |
| | | | |
| Energy - 3.4% | | | |
| Energy Equipment & Services - 0.2% | | | |
| Baker Hughes Co Class A | | 154 | 6,317 |
| Bristow Group Inc (a) | | 56 | 1,921 |
| | | | 8,238 |
| Oil, Gas & Consumable Fuels - 3.2% | | | |
| Berry Corp | | 511 | 2,109 |
| Cheniere Energy Inc | | 86 | 18,479 |
| Crescent Energy Co Class A | | 162 | 2,367 |
| Dorian LPG Ltd | | 99 | 2,413 |
| EOG Resources Inc | | 217 | 26,600 |
| Exxon Mobil Corp | | 588 | 63,251 |
| FutureFuel Corp | | 420 | 2,222 |
| Occidental Petroleum Corp | | 141 | 6,967 |
| Targa Resources Corp | | 82 | 14,637 |
| | | | 139,045 |
TOTAL ENERGY | | | 147,283 |
| | | | |
| Financials - 15.5% | | | |
| Banks - 2.9% | | | |
| Amalgamated Financial Corp | | 5 | 167 |
| Bank of America Corp | | 1,162 | 51,070 |
| Central Pacific Financial Corp | | 70 | 2,034 |
| First Merchants Corp | | 49 | 1,955 |
| JPMorgan Chase & Co | | 91 | 21,814 |
| Northfield Bancorp Inc | | 161 | 1,871 |
| Northwest Bancshares Inc | | 171 | 2,255 |
| Pathward Financial Inc | | 16 | 1,177 |
| Third Coast Bancshares Inc (a) | | 14 | 475 |
| TrustCo Bank Corp NY | | 56 | 1,865 |
| Trustmark Corp | | 66 | 2,334 |
| Washington Trust Bancorp Inc | | 71 | 2,226 |
| Wells Fargo & Co | | 490 | 34,418 |
| WesBanco Inc | | 63 | 2,050 |
| | | | 125,711 |
| Capital Markets - 3.4% | | | |
| Bank of New York Mellon Corp/The | | 280 | 21,512 |
| Brightsphere Investment Group Inc | | 70 | 1,843 |
| Cboe Global Markets Inc | | 35 | 6,839 |
| Charles Schwab Corp/The | | 490 | 36,265 |
| CME Group Inc Class A | | 133 | 30,887 |
| Goldman Sachs Group Inc/The | | 46 | 26,341 |
| Janus Henderson Group PLC | | 56 | 2,382 |
| Morningstar Inc | | 7 | 2,357 |
| SEI Investments Co | | 35 | 2,887 |
| State Street Corp | | 112 | 10,993 |
| Tradeweb Markets Inc Class A | | 42 | 5,499 |
| WisdomTree Inc | | 196 | 2,057 |
| | | | 149,862 |
| Consumer Finance - 0.2% | | | |
| Dave Inc Class A (a) | | 25 | 2,173 |
| Lendingtree Inc (a) | | 49 | 1,899 |
| NerdWallet Inc Class A (a) | | 154 | 2,048 |
| PROG Holdings Inc | | 49 | 2,071 |
| | | | 8,191 |
| Financial Services - 4.0% | | | |
| AvidXchange Holdings Inc (a) | | 217 | 2,244 |
| Berkshire Hathaway Inc Class B (a) | | 78 | 35,356 |
| Block Inc Class A (a) | | 210 | 17,848 |
| Compass Diversified Holdings | | 98 | 2,262 |
| Euronet Worldwide Inc (a) | | 21 | 2,160 |
| Global Payments Inc | | 91 | 10,197 |
| Mastercard Inc Class A | | 112 | 58,976 |
| NMI Holdings Inc (a) | | 63 | 2,316 |
| Payoneer Global Inc (a) | | 231 | 2,319 |
| PayPal Holdings Inc (a) | | 381 | 32,518 |
| Priority Technology Holdings Inc (a) | | 161 | 1,891 |
| Visa Inc Class A | | 24 | 7,585 |
| | | | 175,672 |
| Insurance - 4.8% | | | |
| Allstate Corp/The | | 100 | 19,279 |
| American Coastal Insurance Corp | | 168 | 2,261 |
| Aon PLC | | 70 | 25,141 |
| Cincinnati Financial Corp | | 14 | 2,012 |
| CNO Financial Group Inc | | 63 | 2,344 |
| Globe Life Inc | | 34 | 3,792 |
| Hartford Financial Services Group Inc/The | | 110 | 12,034 |
| Heritage Insurance Holdings Inc (a) | | 182 | 2,202 |
| Loews Corp | | 63 | 5,335 |
| Marsh & McLennan Cos Inc | | 168 | 35,686 |
| MetLife Inc | | 224 | 18,341 |
| Oscar Health Inc Class A (a) | | 161 | 2,164 |
| Progressive Corp/The | | 161 | 38,578 |
| The Travelers Companies, Inc. | | 84 | 20,235 |
| Universal Insurance Holdings Inc | | 98 | 2,064 |
| Willis Towers Watson PLC | | 35 | 10,963 |
| | | | 202,431 |
| Mortgage Real Estate Investment Trusts (REITs) - 0.2% | | | |
| Chimera Investment Corp | | 154 | 2,156 |
| Rithm Capital Corp | | 238 | 2,578 |
| TPG RE Finance Trust Inc | | 252 | 2,142 |
| | | | 6,876 |
TOTAL FINANCIALS | | | 668,743 |
| | | | |
| Health Care - 10.1% | | | |
| Biotechnology - 3.8% | | | |
| AbbVie Inc | | 306 | 54,376 |
| ACADIA Pharmaceuticals Inc (a) | | 133 | 2,441 |
| ADMA Biologics Inc (a) | | 126 | 2,161 |
| Akebia Therapeutics Inc (a) | | 1,109 | 2,107 |
| Amicus Therapeutics Inc (a) | | 245 | 2,308 |
| Anika Therapeutics Inc (a) | | 126 | 2,074 |
| Biogen Inc (a) | | 56 | 8,564 |
| BioMarin Pharmaceutical Inc (a) | | 70 | 4,601 |
| CareDx Inc (a) | | 93 | 1,991 |
| Catalyst Pharmaceuticals Inc (a) | | 112 | 2,337 |
| Exact Sciences Corp (a) | | 70 | 3,933 |
| Exelixis Inc (a) | | 105 | 3,497 |
| Gilead Sciences Inc | | 420 | 38,795 |
| Incyte Corp (a) | | 60 | 4,144 |
| Kodiak Sciences Inc (a) | | 221 | 2,199 |
| Myriad Genetics Inc (a) | | 147 | 2,015 |
| Natera Inc (a) | | 42 | 6,649 |
| Neurocrine Biosciences Inc (a) | | 35 | 4,778 |
| Organogenesis Holdings Inc Class A (a) | | 567 | 1,813 |
| Puma Biotechnology Inc (a) | | 712 | 2,172 |
| Sarepta Therapeutics Inc (a) | | 35 | 4,256 |
| United Therapeutics Corp (a) | | 14 | 4,940 |
| Veracyte Inc (a) | | 57 | 2,257 |
| | | | 164,408 |
| Health Care Equipment & Supplies - 1.1% | | | |
| Avanos Medical Inc (a) | | 119 | 1,894 |
| Axogen Inc (a) | | 134 | 2,208 |
| Becton Dickinson & Co | | 107 | 24,276 |
| Dexcom Inc (a) | | 147 | 11,432 |
| Inogen Inc (a) | | 217 | 1,990 |
| iRadimed Corp | | 42 | 2,310 |
| Tactile Systems Technology Inc (a) | | 122 | 2,090 |
| | | | 46,200 |
| Health Care Providers & Services - 0.9% | | | |
| Cardinal Health Inc | | 91 | 10,763 |
| Centene Corp (a) | | 192 | 11,631 |
| Hims & Hers Health Inc Class A (a) | | 81 | 1,959 |
| Option Care Health Inc (a) | | 112 | 2,598 |
| Pediatrix Medical Group Inc (a) | | 154 | 2,020 |
| Talkspace Inc Class A (a) | | 721 | 2,228 |
| UnitedHealth Group Inc | | 14 | 7,082 |
| | | | 38,281 |
| Health Care Technology - 0.0% | | | |
| HealthStream Inc | | 70 | 2,226 |
| Life Sciences Tools & Services - 0.5% | | | |
| Agilent Technologies Inc | | 109 | 14,643 |
| ChromaDex Corp (a) | | 322 | 1,708 |
| Medpace Holdings Inc (a) | | 10 | 3,322 |
| Mesa Laboratories Inc | | 16 | 2,110 |
| | | | 21,783 |
| Pharmaceuticals - 3.8% | | | |
| Amneal Intermediate Inc Class A (a) | | 266 | 2,107 |
| Bristol-Myers Squibb Co | | 679 | 38,404 |
| Eli Lilly & Co | | 22 | 16,984 |
| Jazz Pharmaceuticals PLC (a) | | 21 | 2,586 |
| Merck & Co Inc | | 493 | 49,044 |
| Pacira BioSciences Inc (a) | | 120 | 2,261 |
| Pfizer Inc | | 1,580 | 41,917 |
| Phibro Animal Health Corp Class A | | 105 | 2,205 |
| Prestige Consumer Healthcare Inc (a) | | 32 | 2,499 |
| Royalty Pharma PLC Class A | | 147 | 3,750 |
| Viatris Inc | | 448 | 5,578 |
| | | | 167,335 |
TOTAL HEALTH CARE | | | 440,233 |
| | | | |
| Industrials - 9.9% | | | |
| Aerospace & Defense - 1.9% | | | |
| Ducommun Inc (a) | | 36 | 2,292 |
| Howmet Aerospace Inc | | 154 | 16,843 |
| L3Harris Technologies Inc | | 70 | 14,720 |
| Lockheed Martin Corp | | 63 | 30,614 |
| Northrop Grumman Corp | | 28 | 13,140 |
| Textron Inc | | 70 | 5,354 |
| | | | 82,963 |
| Air Freight & Logistics - 0.2% | | | |
| CH Robinson Worldwide Inc | | 44 | 4,546 |
| GXO Logistics Inc (a) | | 52 | 2,262 |
| | | | 6,808 |
| Building Products - 0.9% | | | |
| Allegion plc | | 31 | 4,051 |
| Apogee Enterprises Inc | | 28 | 1,999 |
| Griffon Corp | | 30 | 2,138 |
| Trane Technologies PLC | | 84 | 31,026 |
| | | | 39,214 |
| Commercial Services & Supplies - 1.0% | | | |
| ABM Industries Inc | | 47 | 2,405 |
| Cintas Corp | | 131 | 23,934 |
| Republic Services Inc | | 77 | 15,491 |
| Vestis Corp | | 147 | 2,240 |
| | | | 44,070 |
| Construction & Engineering - 0.5% | | | |
| AECOM | | 49 | 5,234 |
| Arcosa Inc | | 21 | 2,031 |
| Comfort Systems USA Inc | | 11 | 4,665 |
| EMCOR Group Inc | | 14 | 6,355 |
| MasTec Inc (a) | | 21 | 2,859 |
| Valmont Industries Inc | | 7 | 2,147 |
| | | | 23,291 |
| Electrical Equipment - 0.8% | | | |
| Acuity Brands Inc | | 10 | 2,921 |
| Allient Inc | | 91 | 2,209 |
| AMETEK Inc | | 87 | 15,683 |
| EnerSys | | 27 | 2,496 |
| Hubbell Inc | | 18 | 7,540 |
| LSI Industries Inc | | 105 | 2,039 |
| Preformed Line Products Co | | 14 | 1,789 |
| | | | 34,677 |
| Ground Transportation - 2.3% | | | |
| Covenant Logistics Group Inc Class A | | 35 | 1,907 |
| Lyft Inc Class A (a) | | 185 | 2,387 |
| Norfolk Southern Corp | | 85 | 19,950 |
| Uber Technologies Inc (a) | | 595 | 35,890 |
| Union Pacific Corp | | 176 | 40,135 |
| | | | 100,269 |
| Machinery - 0.4% | | | |
| Donaldson Co Inc | | 42 | 2,829 |
| Graham Corp (a) | | 51 | 2,268 |
| Hillman Solutions Corp Class A (a) | | 217 | 2,114 |
| ITT Inc | | 31 | 4,429 |
| Mueller Water Products Inc Class A1 | | 108 | 2,430 |
| Proto Labs Inc (a) | | 56 | 2,189 |
| Terex Corp | | 42 | 1,941 |
| | | | 18,200 |
| Marine Transportation - 0.0% | | | |
| Matson Inc | | 14 | 1,888 |
| Passenger Airlines - 0.4% | | | |
| SkyWest Inc (a) | | 25 | 2,503 |
| Sun Country Airlines Holdings Inc (a) | | 147 | 2,143 |
| United Airlines Holdings Inc (a) | | 119 | 11,555 |
| | | | 16,201 |
| Professional Services - 0.8% | | | |
| Booz Allen Hamilton Holding Corp Class A | | 49 | 6,306 |
| CACI International Inc (a) | | 8 | 3,232 |
| CSG Systems International Inc | | 42 | 2,147 |
| Heidrick & Struggles International Inc | | 50 | 2,216 |
| Huron Consulting Group Inc (a) | | 14 | 1,739 |
| IBEX Holdings Ltd (a) | | 112 | 2,407 |
| ICF International Inc | | 20 | 2,384 |
| Leidos Holdings Inc | | 51 | 7,347 |
| Maximus Inc | | 35 | 2,613 |
| Paycor HCM Inc (a) | | 115 | 2,136 |
| Willdan Group Inc (a) | | 49 | 1,866 |
| | | | 34,393 |
| Trading Companies & Distributors - 0.7% | | | |
| Applied Industrial Technologies Inc | | 14 | 3,353 |
| Core & Main Inc Class A (a) | | 73 | 3,716 |
| DXP Enterprises Inc/TX (a) | | 28 | 2,313 |
| Mrc Global Inc (a) | | 168 | 2,147 |
| Wesco International Inc | | 14 | 2,533 |
| WW Grainger Inc | | 14 | 14,758 |
| | | | 28,820 |
TOTAL INDUSTRIALS | | | 430,794 |
| | | | |
| Information Technology - 31.3% | | | |
| Communications Equipment - 1.7% | | | |
| Arista Networks Inc | | 349 | 38,576 |
| CommScope Holding Co Inc (a) | | 399 | 2,079 |
| Motorola Solutions Inc | | 63 | 29,120 |
| NetScout Systems Inc (a) | | 105 | 2,274 |
| Ribbon Communications Inc (a) | | 189 | 786 |
| | | | 72,835 |
| Electronic Equipment, Instruments & Components - 0.4% | | | |
| Arlo Technologies Inc (a) | | 176 | 1,969 |
| Benchmark Electronics Inc | | 49 | 2,225 |
| Methode Electronics Inc | | 180 | 2,122 |
| Plexus Corp (a) | | 14 | 2,191 |
| Zebra Technologies Corp Class A (a) | | 19 | 7,338 |
| | | | 15,845 |
| IT Services - 0.5% | | | |
| EPAM Systems Inc (a) | | 3 | 700 |
| GoDaddy Inc Class A (a) | | 7 | 1,382 |
| Hackett Group Inc/The | | 70 | 2,150 |
| Kyndryl Holdings Inc (a) | | 91 | 3,149 |
| Okta Inc Class A (a) | | 59 | 4,649 |
| Twilio Inc Class A (a) | | 58 | 6,269 |
| Unisys Corp (a) | | 332 | 2,102 |
| | | | 20,401 |
| Semiconductors & Semiconductor Equipment - 13.1% | | | |
| Applied Materials Inc | | 231 | 37,568 |
| Broadcom Inc | | 463 | 107,342 |
| Cirrus Logic Inc (a) | | 21 | 2,091 |
| Credo Technology Group Holding Ltd (a) | | 48 | 3,226 |
| KLA Corp | | 50 | 31,506 |
| Lam Research Corp | | 432 | 31,203 |
| Marvell Technology Inc | | 124 | 13,696 |
| Micron Technology Inc | | 294 | 24,743 |
| MKS Instruments Inc | | 21 | 2,192 |
| NVIDIA Corp | | 1,995 | 267,909 |
| Photronics Inc (a) | | 91 | 2,144 |
| Qorvo Inc (a) | | 35 | 2,448 |
| QUALCOMM Inc | | 273 | 41,938 |
| Ultra Clean Holdings Inc (a) | | 63 | 2,265 |
| | | | 570,271 |
| Software - 8.6% | | | |
| 8x8 Inc (a) | | 777 | 2,075 |
| Adobe Inc (a) | | 91 | 40,466 |
| Alarm.com Holdings Inc (a) | | 39 | 2,371 |
| Clear Secure Inc Class A | | 27 | 719 |
| Fortinet Inc (a) | | 238 | 22,486 |
| Gitlab Inc Class A (a) | | 42 | 2,367 |
| Intapp Inc (a) | | 36 | 2,307 |
| Microsoft Corp | | 500 | 210,751 |
| OneSpan Inc | | 119 | 2,206 |
| Ooma Inc (a) | | 43 | 605 |
| PagerDuty Inc (a) | | 129 | 2,356 |
| PROS Holdings Inc (a) | | 98 | 2,152 |
| Q2 Holdings Inc (a) | | 21 | 2,114 |
| Red Violet Inc | | 63 | 2,281 |
| Servicenow Inc (a) | | 42 | 44,525 |
| Tenable Holdings Inc (a) | | 56 | 2,205 |
| Teradata Corp (a) | | 77 | 2,399 |
| Workday Inc Class A (a) | | 77 | 19,868 |
| Xperi Inc (a) | | 231 | 2,372 |
| Zoom Communications Inc Class A (a) | | 99 | 8,079 |
| | | | 374,704 |
| Technology Hardware, Storage & Peripherals - 7.0% | | | |
| Apple Inc | | 1,208 | 302,507 |
| Diebold Nixdorf Inc (a) | | 49 | 2,109 |
| | | | 304,616 |
TOTAL INFORMATION TECHNOLOGY | | | 1,358,672 |
| | | | |
| Materials - 1.8% | | | |
| Chemicals - 0.8% | | | |
| AdvanSix Inc | | 70 | 1,994 |
| American Vanguard Corp | | 357 | 1,653 |
| Axalta Coating Systems Ltd (a) | | 84 | 2,874 |
| DuPont de Nemours Inc | | 30 | 2,288 |
| Ecolab Inc | | 93 | 21,793 |
| HB Fuller Co | | 28 | 1,889 |
| Minerals Technologies Inc | | 28 | 2,134 |
| Sensient Technologies Corp | | 28 | 1,995 |
| | | | 36,620 |
| Construction Materials - 0.6% | | | |
| CRH PLC | | 259 | 23,963 |
| United States Lime & Minerals Inc | | 14 | 1,858 |
| | | | 25,821 |
| Containers & Packaging - 0.1% | | | |
| Sealed Air Corp | | 70 | 2,368 |
| Metals & Mining - 0.3% | | | |
| Alpha Metallurgical Resources Inc | | 7 | 1,401 |
| Century Aluminum Co (a) | | 85 | 1,549 |
| Coeur Mining Inc (a) | | 394 | 2,254 |
| Hecla Mining Co | | 480 | 2,357 |
| Olympic Steel Inc | | 68 | 2,231 |
| Royal Gold Inc | | 24 | 3,164 |
| | | | 12,956 |
| Paper & Forest Products - 0.0% | | | |
| Louisiana-Pacific Corp | | 21 | 2,174 |
TOTAL MATERIALS | | | 79,939 |
| | | | |
| Real Estate - 1.9% | | | |
| Diversified REITs - 0.0% | | | |
| American Assets Trust Inc | | 84 | 2,206 |
| Health Care REITs - 0.2% | | | |
| CareTrust REIT Inc | | 95 | 2,570 |
| Community Healthcare Trust Inc | | 119 | 2,286 |
| Healthpeak Properties Inc | | 266 | 5,392 |
| | | | 10,248 |
| Hotel & Resort REITs - 0.1% | | | |
| RLJ Lodging Trust | | 224 | 2,287 |
| Real Estate Management & Development - 0.2% | | | |
| Anywhere Real Estate Inc (a) | | 479 | 1,581 |
| Compass Inc Class A (a) | | 371 | 2,170 |
| RE/MAX Holdings Inc Class A (a) | | 196 | 2,091 |
| St Joe Co/The | | 42 | 1,887 |
| | | | 7,729 |
| Retail REITs - 0.1% | | | |
| Brixmor Property Group Inc | | 112 | 3,118 |
| Specialized REITs - 1.3% | | | |
| American Tower Corp | | 175 | 32,097 |
| Crown Castle Inc | | 161 | 14,612 |
| VICI Properties Inc | | 392 | 11,450 |
| | | | 58,159 |
TOTAL REAL ESTATE | | | 83,747 |
| | | | |
| Utilities - 0.2% | | | |
| Gas Utilities - 0.1% | | | |
| New Jersey Resources Corp | | 54 | 2,519 |
| Independent Power and Renewable Electricity Producers - 0.1% | | | |
| AES Corp/The | | 266 | 3,423 |
| Vistra Corp | | 8 | 1,103 |
| | | | 4,526 |
| Multi-Utilities - 0.0% | | | |
| Avista Corp | | 63 | 2,308 |
TOTAL UTILITIES | | | 9,353 |
| | | | |
| TOTAL UNITED STATES | | | 4,292,403 |
| TOTAL COMMON STOCKS (Cost $4,390,842) | | | 4,307,971 |
| | | | |
| Money Market Funds - 0.6% |
| | | Yield (%) | Shares | Value ($) |
Fidelity Cash Central Fund (b) (Cost $29,969) | | 4.36 | 29,963 | 29,969 |
| | | | | |
| TOTAL INVESTMENT IN SECURITIES - 99.7% (Cost $4,420,811) | 4,337,940 |
NET OTHER ASSETS (LIABILITIES) - 0.3% | 10,990 |
| NET ASSETS - 100.0% | 4,348,930 |
| | |
Legend
| (b) | Affiliated fund that is generally available only to investment companies and other accounts managed by Fidelity Investments. The rate quoted is the annualized seven-day yield of the fund at period end. A complete unaudited listing of the fund's holdings as of its most recent quarter end is available upon request. In addition, each Fidelity Central Fund's financial statements are available on the SEC's website or upon request. |
Affiliated Central Funds
Fiscal year to date information regarding the Fund's investments in Fidelity Central Funds, including the ownership percentage, is presented below.
| Affiliate | Value, beginning of period ($) | Purchases ($) | Sales Proceeds ($) | Dividend Income ($) | Realized Gain (loss) ($) | Change in Unrealized appreciation (depreciation) ($) | Value, end of period ($) | Shares, end of period | % ownership, end of period |
| Fidelity Cash Central Fund | - | 84,942 | 54,973 | 172 | - | - | 29,969 | 29,963 | 0.0% |
| Total | - | 84,942 | 54,973 | 172 | - | - | 29,969 | 29,963 | |
| | | | | | | | | | |
Amounts in the dividend income column in the above table include any capital gain distributions from underlying funds, which are presented in the corresponding line item in the Statement of Operations, if applicable.
Amounts included in the purchases and sales proceeds columns may include in-kind transactions, if applicable.
Investment Valuation
The following is a summary of the inputs used, as of December 31, 2024, involving the Fund's assets and liabilities carried at fair value. The inputs or methodology used for valuing securities may not be an indication of the risk associated with investing in those securities. For more information on valuation inputs, and their aggregation into the levels used below, please refer to the Investment Valuation section in the accompanying Notes to Financial Statements.
| Valuation Inputs at Reporting Date: |
| Description | Total ($) | Level 1 ($) | Level 2 ($) | Level 3 ($) |
Investments in Securities: | | | | |
|
| Common Stocks | | | | |
Communication Services | 470,791 | 470,791 | - | - |
Consumer Discretionary | 448,776 | 448,776 | - | - |
Consumer Staples | 155,887 | 155,887 | - | - |
Energy | 155,979 | 155,979 | - | - |
Financials | 668,743 | 668,743 | - | - |
Health Care | 440,233 | 440,233 | - | - |
Industrials | 432,773 | 432,773 | - | - |
Information Technology | 1,361,750 | 1,361,750 | - | - |
Materials | 79,939 | 79,939 | - | - |
Real Estate | 83,747 | 83,747 | - | - |
Utilities | 9,353 | 9,353 | - | - |
|
| Money Market Funds | 29,969 | 29,969 | - | - |
| Total Investments in Securities: | 4,337,940 | 4,337,940 | - | - |
Fidelity® Enhanced U.S. All-Cap Equity ETF
Financial Statements (Unaudited)
| Statement of Assets and Liabilities |
| As of December 31, 2024 (Unaudited) |
| Assets | | | | |
| Investment in securities, at value - See accompanying schedule: | | | | |
Unaffiliated issuers (cost $4,390,842) | $ | 4,307,971 | | |
Fidelity Central Funds (cost $29,969) | | 29,969 | | |
| | | | | |
| | | | | |
| Total Investment in Securities (cost $4,420,811) | | | $ | 4,337,940 |
| Cash | | | | 9,381 |
| Dividends receivable | | | | 2,754 |
| Distributions receivable from Fidelity Central Funds | | | | 119 |
Total assets | | | | 4,350,194 |
| Liabilities | | | | |
| Distributions payable | $ | 700 | | |
| Accrued management fee | | 564 | | |
| Total liabilities | | | | 1,264 |
| Net Assets | | | $ | 4,348,930 |
| Net Assets consist of: | | | | |
| Paid in capital | | | $ | 4,438,379 |
| Total accumulated earnings (loss) | | | | (89,449) |
| Net Assets | | | $ | 4,348,930 |
Net Asset Value, offering price and redemption price per share ($4,348,930 ÷ 175,000 shares) | | | $ | 24.85 |
| Statement of Operations |
For the period November 19, 2024 (commencement of operations) through December 31, 2024 (Unaudited)
|
| Investment Income | | | | |
| Dividends | | | $ | 5,608 |
| Income from Fidelity Central Funds | | | | 172 |
| Total income | | | | 5,780 |
| Expenses | | | | |
| Management fee | $ | 716 | | |
| Independent trustees' fees and expenses | | 1 | | |
| Total expenses | | | | 717 |
| Net Investment income (loss) | | | | 5,063 |
| Realized and Unrealized Gain (Loss) | | | | |
| Net realized gain (loss) on: | | | | |
| Investment Securities: | | | | |
| Unaffiliated issuers | | (6,391) | | |
| Total net realized gain (loss) | | | | (6,391) |
| Change in net unrealized appreciation (depreciation) on investment securities | | | | (82,871) |
| Net gain (loss) | | | | (89,262) |
| Net increase (decrease) in net assets resulting from operations | | | $ | (84,199) |
| Statement of Changes in Net Assets |
| |
| | For the period November 19, 2024 (commencement of operations) through December 31, 2024 (Unaudited) |
| Increase (Decrease) in Net Assets | | |
| Operations | | |
| Net investment income (loss) | $ | 5,063 |
| Net realized gain (loss) | | (6,391) |
| Change in net unrealized appreciation (depreciation) | | (82,871) |
| Net increase (decrease) in net assets resulting from operations | | (84,199) |
| Distributions to shareholders | | (5,250) |
| | | |
| Share transactions | | |
| Proceeds from sales of shares | | 4,438,379 |
| | | |
Net increase (decrease) in net assets resulting from share transactions | | 4,438,379 |
| Total increase (decrease) in net assets | | 4,348,930 |
| | | |
| Net Assets | | |
| Beginning of period | | - |
| End of period | $ | 4,348,930 |
| | | |
| Other Information | | |
| Shares | | |
| Sold | | 175,000 |
| Net increase (decrease) | | 175,000 |
| | | |
Financial Highlights
Fidelity® Enhanced U.S. All-Cap Equity ETF |
| |
| | Six months ended (Unaudited) December 31, 2024 A |
Selected Per-Share Data | | |
| Net asset value, beginning of period | $ | 25.10 |
| Income from Investment Operations | | |
Net investment income (loss) B,C | | .04 |
| Net realized and unrealized gain (loss) | | (.26) |
| Total from investment operations | | (.22) |
| Distributions from net investment income | | (.03) |
| Total distributions | | (.03) |
| Net asset value, end of period | $ | 24.85 |
Total Return D,E | | |
Ratios to Average Net Assets C,F,G | | |
| Expenses before reductions | | .18% H |
| Expenses net of fee waivers, if any | | |
| Expenses net of all reductions | | .18% H |
| Net investment income (loss) | | 1.26% H |
| Supplemental Data | | |
| Net assets, end of period (000 omitted) | $ | 4,349 |
Portfolio turnover rate I | | |
AFor the period November 19, 2024 (commencement of operations) through December 31, 2024.
BCalculated based on average shares outstanding during the period.
CNet investment income (loss) is affected by the timing of the declaration of dividends by any underlying mutual funds or exchange-traded funds (ETFs). Net investment income (loss) of any mutual funds or ETFs is not included in the Fund's net investment income (loss) ratio.
DTotal returns for periods of less than one year are not annualized.
EBased on net asset value.
FFees and expenses of any underlying mutual funds or exchange-traded funds (ETFs) are not included in the Fund's expense ratio. The Fund indirectly bears its proportionate share of these expenses. For additional expense information related to investments in Fidelity Central Funds, please refer to the "Investments in Fidelity Central Funds" note found in the Notes to Financial Statements section of the most recent Annual or Semi-Annual report.
GExpense ratios reflect operating expenses of the class. Expenses before reductions do not reflect amounts reimbursed, waived, or reduced through arrangements with the investment adviser, brokerage services, or other offset arrangements, if applicable, and do not represent the amount paid by the class during periods when reimbursements, waivers or reductions occur.
HAnnualized.
IAmount does not include the portfolio activity of any underlying mutual funds or exchange-traded funds (ETFs), derivatives or securities that mature within one year from acquisition.
JAmount not annualized.
Notes to Financial Statements
(Unaudited)For the period ended December 31, 2024
1. Organization.
Fidelity Enhanced Emerging Markets ETF and Fidelity Enhanced U.S. All-Cap Equity ETF (the Funds) are exchange-traded funds of Fidelity Covington Trust (the Trust) and are authorized to issue an unlimited number of shares. The Trust is registered under the Investment Company Act of 1940, as amended (the 1940 Act), as an open-end management investment company organized as a Massachusetts business trust.
2. Investments in Fidelity Central Funds.
Funds may invest in Fidelity Central Funds, which are open-end investment companies generally available only to other investment companies and accounts managed by the investment adviser and its affiliates. The Schedule of Investments lists any Fidelity Central Funds held as an investment as of period end, but does not include the underlying holdings of each Fidelity Central Fund. An investing fund indirectly bears its proportionate share of the expenses of the underlying Fidelity Central Funds.
Based on its investment objective, each Fidelity Central Fund may invest or participate in various investment vehicles or strategies that are similar to those of the investing fund. These strategies are consistent with the investment objectives of the investing fund and may involve certain economic risks which may cause a decline in value of each of the Fidelity Central Funds and thus a decline in the value of the investing fund.
| Fidelity Central Fund | Investment Manager | Investment Objective | Investment Practices | Expense RatioA |
| Fidelity Money Market Central Funds | Fidelity Management & Research Company LLC (FMR) | Each fund seeks to obtain a high level of current income consistent with the preservation of capital and liquidity. | Short-term Investments | Less than .005% |
A Expenses expressed as a percentage of average net assets and are as of each underlying Central Fund's most recent annual or semi-annual shareholder report.
A complete unaudited list of holdings for each Fidelity Central Fund is available upon request or at the Securities and Exchange Commission website at www.sec.gov. In addition, the financial statements of the Fidelity Central Funds which contain the significant accounting policies (including investment valuation policies) of those funds, and are not covered by the Report of Independent Registered Public Accounting Firm, are available on the Securities and Exchange Commission website or upon request.
3. Significant Accounting Policies.
Each Fund is an investment company and applies the accounting and reporting guidance of the Financial Accounting Standards Board (FASB) Accounting Standards Codification Topic 946 Financial Services - Investment Companies. The financial statements have been prepared in conformity with accounting principles generally accepted in the United States of America (GAAP), which require management to make certain estimates and assumptions at the date of the financial statements. Actual results could differ from those estimates. Each Fund operates as a single operating segment. Each Fund's income, expenses, assets, and performance are regularly monitored and assessed as a whole by the investment adviser and other individuals responsible for oversight functions of the Trust, using the information presented in the financial statements and financial highlights. Subsequent events, if any, through the date that the financial statements were issued have been evaluated in the preparation of the financial statements. Each Fund's Schedule of Investments lists any underlying mutual funds or exchange-traded funds (ETFs) but does not include the underlying holdings of these funds. The following summarizes the significant accounting policies of each Fund:
Investment Valuation. Investments are valued as of 4:00 p.m. Eastern time on the last calendar day of the period. The Board of Trustees (the Board) has designated each Fund's investment adviser as the valuation designee responsible for the fair valuation function and performing fair value determinations as needed. The investment adviser has established a Fair Value Committee (the Committee) to carry out the day-to-day fair valuation responsibilities and has adopted policies and procedures to govern the fair valuation process and the activities of the Committee. In accordance with these fair valuation policies and procedures, which have been approved by the Board, each Fund attempts to obtain prices from one or more third party pricing services or brokers to value its investments. When current market prices, quotations or currency exchange rates are not readily available or reliable, investments will be fair valued in good faith by the Committee, in accordance with the policies and procedures. Factors used in determining fair value vary by investment type and may include market or investment specific events, transaction data, estimated cash flows, and market observations of comparable investments. The frequency that the fair valuation procedures are used cannot be predicted and they may be utilized to a significant extent. The Committee manages each Fund's fair valuation practices and maintains the fair valuation policies and procedures. Each Fund's investment adviser reports to the Board information regarding the fair valuation process and related material matters.
Each Fund categorizes the inputs to valuation techniques used to value its investments into a disclosure hierarchy consisting of three levels as shown below:
Level 1 - unadjusted quoted prices in active markets for identical investments
Level 2 - other significant observable inputs (including quoted prices for similar investments, interest rates, prepayment speeds, etc.)
Level 3 - unobservable inputs (including the Fund's own assumptions based on the best information available)
Valuation techniques used to value each Fund's investments by major category are as follows:
Equity securities, including restricted securities, for which market quotations are readily available, are valued at the last reported sale price or official closing price as reported by a third party pricing service on the primary market or exchange on which they are traded and are categorized as Level 1 in the hierarchy. In the event there were no sales during the day or closing prices are not available, securities are valued at the last quoted bid price or may be valued using the last available price and are generally categorized as Level 2 in the hierarchy. For foreign equity securities, when market or security specific events arise, comparisons to the valuation of American Depositary Receipts (ADRs), futures contracts, Exchange-Traded Funds (ETFs) and certain indexes as well as quoted prices for similar securities may be used and would be categorized as Level 2 in the hierarchy. For equity securities, including restricted securities, where observable inputs are limited, assumptions about market activity and risk are used and these securities may be categorized as Level 3 in the hierarchy.
Debt securities, including restricted securities, are valued based on evaluated prices received from third party pricing services or from brokers who make markets in such securities. U.S. government and government agency obligations are valued by pricing services who utilize matrix pricing which considers yield or price of bonds of comparable quality, coupon, maturity and type or by broker-supplied prices. When independent prices are unavailable or unreliable, debt securities may be valued utilizing pricing methodologies which consider similar factors that would be used by third party pricing services. Debt securities are generally categorized as Level 2 in the hierarchy but may be Level 3 depending on the circumstances. The Fund invests a significant portion of its assets in below investment grade securities. The value of these securities can be more volatile due to changes in the credit quality of the issuer and is sensitive to changes in economic, market and regulatory conditions. Exchange-Traded Funds (ETFs) are valued at their last sale price or official closing price as reported by a third party pricing service on the primary market or exchange on which they are traded and are categorized as Level 1 in the hierarchy. In the event there were no sales during the day but the exchange reports a closing bid level, ETFs are valued at the closing bid and would be categorized as Level 1 in the hierarchy. In the event there was no closing bid, ETFs may be valued by another method that the Board believes reflects fair value in accordance with the Board's fair value pricing policies and may be categorized as Level 2 in the hierarchy.
Investments in open-end mutual funds, including the Fidelity Central Funds, are valued at their closing net asset value (NAV) each business day and are categorized as Level 1 in the hierarchy.
Changes in valuation techniques may result in transfers in or out of an assigned level within the disclosure hierarchy. The aggregate value of investments by input level as of December 31, 2024 is included at the end of each Fund's Schedule of Investments.
Foreign Currency. Certain Funds may use foreign currency contracts to facilitate transactions in foreign-denominated securities. Gains and losses from these transactions may arise from changes in the value of the foreign currency or if the counterparties do not perform under the contracts' terms.
Foreign-denominated assets, including investment securities, and liabilities are translated into U.S. dollars at the exchange rates at period end. Purchases and sales of investment securities, income and dividends received, and expenses denominated in foreign currencies are translated into U.S. dollars at the exchange rate in effect on the transaction date.
The effects of exchange rate fluctuations on investments are included with the net realized and unrealized gain (loss) on investment securities. Other foreign currency transactions resulting in realized and unrealized gain (loss) are disclosed separately.
Investment Transactions and Income. For financial reporting purposes, the Funds' investment holdings and NAV include trades executed through the end of the last business day of the period. The NAV per share for processing shareholder transactions is calculated as of the close of business (normally 4:00 p.m. Eastern time) of the New York Stock Exchange, Archipelago Exchange (NYSE Arca), and includes trades executed through the end of the prior business day. Gains and losses on securities sold are determined on the basis of identified cost. Commissions paid to certain brokers with whom the investment adviser, or its affiliates, places trades on behalf of a fund include an amount in addition to trade execution, which may be rebated back to a fund. Any such rebates are included in net realized gain (loss) on investments in the Statement of Operations. Dividend income is recorded on the ex-dividend date, except for certain dividends from foreign securities where the ex-dividend date may have passed, which are recorded as soon as the Funds are informed of the ex-dividend date. Non-cash dividends included in dividend income, if any, are recorded at the fair market value of the securities received. Income and capital gain distributions from Fidelity Central Funds, if any, are recorded on the ex-dividend date. Certain distributions received by the Funds represent a return of capital or capital gain. The Funds determine the components of these distributions subsequent to the ex-dividend date, based upon receipt of tax filings or other correspondence relating to the underlying investment. These distributions are recorded as a reduction of cost of investments and/or as a realized gain. Interest income is accrued as earned and includes coupon interest and amortization of premium and accretion of discount on debt securities as applicable. Investment income is recorded net of foreign taxes withheld where recovery of such taxes is uncertain.
Expenses. Expenses directly attributable to a fund are charged to that fund. Expenses attributable to more than one fund are allocated among the respective funds on the basis of relative net assets or other appropriate methods. Expenses included in the accompanying financial statements reflect the expenses of that fund and do not include any expenses associated with any underlying mutual funds or exchange-traded funds. Although not included in a fund's expenses, a fund indirectly bears its proportionate share of these expenses through the net asset value of each underlying mutual fund or exchange-traded fund. Expense estimates are accrued in the period to which they relate and adjustments are made when actual amounts are known.
Income Tax Information and Distributions to Shareholders. Each year, each Fund intends to qualify as a regulated investment company under Subchapter M of the Internal Revenue Code, including distributing substantially all of its taxable income and realized gains. As a result, no provision for U.S. Federal income taxes is required. Each Fund files a U.S. federal tax return, in addition to state and local tax returns as required. Each Fund's federal income tax returns are subject to examination by the Internal Revenue Service (IRS) for a period of three fiscal years after they are filed. State and local tax returns may be subject to examination for an additional fiscal year depending on the jurisdiction. Foreign taxes are provided for based on each Fund's understanding of the tax rules and rates that exist in the foreign markets in which it invests.
Distributions are declared and recorded on the ex-dividend date. Income and capital gain distributions are determined in accordance with income tax regulations, which may differ from GAAP.
Capital accounts within the financial statements are adjusted for permanent book-tax differences. These adjustments have no impact on net assets or the results of operations. Capital accounts are not adjusted for temporary book-tax differences which will reverse in a subsequent period.
As of period end, the cost and unrealized appreciation (depreciation) in securities, and derivatives if applicable, for federal income tax purposes were as follows for each Fund:
| | Tax cost ($) | Gross unrealized appreciation ($) | Gross unrealized depreciation ($) | Net unrealized appreciation (depreciation)($) |
Fidelity Enhanced Emerging Markets ETF | 9,999,148 | 205,902 | (365,594) | (159,692) |
Fidelity Enhanced U.S. All-Cap Equity ETF | 4,421,121 | 79,322 | (162,503) | (83,181) |
Restricted Securities (including Private Placements). Funds may invest in securities that are subject to legal or contractual restrictions on resale. These securities generally may be resold in transactions exempt from registration or to the public if the securities are registered. Disposal of these securities may involve time-consuming negotiations and expense, and prompt sale at an acceptable price may be difficult. Information regarding restricted securities held at period end is included at the end of the Schedule of Investments, if applicable.
New Accounting Pronouncement. FASB Accounting Standards Update (ASU) 2023-07 Segment Reporting (Topic 280): Improvements to Reportable Segment Disclosures became effective in this reporting period. ASU 2023-07 enhances segment information disclosure in the notes to financial statements.
4. Derivative Instruments.
Risk Exposures and the Use of Derivative Instruments. Each Fund's investment objectives allow for various types of derivative instruments, including futures contracts. Derivatives are investments whose value is primarily derived from underlying assets, indices or reference rates and may be transacted on an exchange or over-the-counter (OTC). Derivatives may involve a future commitment to buy or sell a specified asset based on specified terms, to exchange future cash flows at periodic intervals based on a notional principal amount, or for one party to make one or more payments upon the occurrence of specified events in exchange for periodic payments from the other party.
Derivatives were used to increase returns and to manage exposure to certain risks as defined below. The success of any strategy involving derivatives depends on analysis of numerous economic factors, and if the strategies for investment do not work as intended, the objectives may not be achieved.
Derivatives were used to increase or decrease exposure to the following risk(s):
| | |
| Equity Risk | Equity risk relates to the fluctuations in the value of financial instruments as a result of changes in market prices (other than those arising from interest rate risk or foreign exchange risk), whether caused by factors specific to an individual investment, its issuer, or all factors affecting all instruments traded in a market or market segment. |
Funds are also exposed to additional risks from investing in derivatives, such as liquidity risk and counterparty credit risk. Liquidity risk is the risk that a fund will be unable to close out the derivative in the open market in a timely manner. Counterparty credit risk is the risk that the counterparty will not be able to fulfill its obligation to a fund. Counterparty credit risk related to exchange-traded contracts may be mitigated by the protection provided by the exchange on which they trade.
Investing in derivatives may involve greater risks than investing in the underlying assets directly and, to varying degrees, may involve risk of loss in excess of any initial investment and collateral received and amounts recognized in the Statement of Assets and Liabilities. In addition, there may be the risk that the change in value of the derivative contract does not correspond to the change in value of the underlying instrument.
Futures Contracts. A futures contract is an agreement between two parties to buy or sell a specified underlying instrument for a fixed price at a specified future date. Futures contracts were used to manage exposure to the stock market.
Upon entering into a futures contract, a fund is required to deposit either cash or securities (initial margin) with a clearing broker in an amount equal to a certain percentage of the face value of the contract. Futures contracts are marked-to-market daily and subsequent daily payments are made or received by a fund depending on the daily fluctuations in the value of the futures contracts and are recorded as unrealized appreciation or (depreciation). This receivable and/or payable, if any, is included in daily variation margin on futures contracts in the Statement of Assets and Liabilities. Realized gain or (loss) is recorded upon the expiration or closing of a futures contract. The net realized gain (loss) and change in net unrealized appreciation (depreciation) on futures contracts during the period is presented in the Statement of Operations.
Any open futures contracts at period end are presented in the Schedule of Investments under the caption "Futures Contracts". The notional amount at value reflects each contract's exposure to the underlying instrument or index at period end, and is representative of volume of activity during the period.
Any securities deposited to meet initial margin requirements are identified in the Schedule of Investments. Any cash deposited to meet initial margin requirements is presented as segregated cash with brokers for derivative instruments in the Statement of Assets and Liabilities.
5. Purchases and Sales of Investments.
Purchases and sales of securities, other than short-term securities, U.S. government securities and in-kind transactions, as applicable, are noted in the table below.
| | Purchases ($) | Sales ($) |
| Fidelity Enhanced Emerging Markets ETF | 9,979,153 | - |
| Fidelity Enhanced U.S. All-Cap Equity ETF | 288,744 | 202,728 |
Securities received and delivered in-kind through subscriptions and redemptions are noted in the table below.
| | In-Kind Subscriptions ($) | In-Kind Redemptions ($) |
| Fidelity Enhanced U.S. All-Cap Equity ETF | 4,311,233 | - |
6. Fees and Other Transactions with Affiliates.
Management Fee. Fidelity Management & Research Company LLC (the investment adviser) provides the Funds with investment management related services for which the Funds pay a monthly management fee that is based on an annual rate of each Fund's average net assets as noted in the table below. Under the management contract, the investment adviser pays all other expenses, except the compensation of the independent Trustees and certain miscellaneous expenses such as proxy and shareholder meeting expenses.
| | Fee Rate |
| Fidelity Enhanced Emerging Markets ETF | .38% |
| Fidelity Enhanced U.S. All-Cap Equity ETF | .18% |
Interfund Trades. Funds may purchase from or sell securities to other Fidelity Funds under procedures adopted by the Board. The procedures have been designed to ensure these interfund trades are executed in accordance with Rule 17a-7 of the 1940 Act. Any interfund trades are included within the respective purchases and sales amounts shown in the Purchases and Sales of Investments note. Interfund trades during the period are noted in the table below.
| | Purchases ($) | Sales ($) | Realized Gain (Loss) ($) |
| Fidelity Enhanced Emerging Markets ETF | 105,659 | - | - |
| Fidelity Enhanced U.S. All-Cap Equity ETF | - | - | - |
7. Share Transactions.
Funds issue and redeem shares at NAV only with certain authorized participants in large increments known as Creation Units. Purchases of Creation Units are made by tendering a basket of designated securities to a fund and redemption proceeds are paid with a basket of securities from a fund's portfolio with a balancing cash component to equate the market value of the basket of securities delivered or redeemed to the NAV per Creation Unit on the transaction date. Cash may be substituted equivalent to the value of certain securities generally when they are not available in sufficient quantity for delivery. A fund's shares are available in smaller increments to investors in the secondary market at market prices and may be subject to commissions. Authorized participants pay a transaction fee to the shareholder servicing agent when purchasing and redeeming Creation Units of a fund. The transaction fee is used to offset the costs associated with the issuance and redemption of Creation Units.
8. Other.
A fund's organizational documents provide former and current trustees and officers with a limited indemnification against liabilities arising in connection with the performance of their duties to the fund. In the normal course of business, a fund may also enter into contracts that provide general indemnifications. A fund's maximum exposure under these arrangements is unknown as this would be dependent on future claims that may be made against a fund. The risk of material loss from such claims is considered remote.
9. Risk and Uncertainties.
Many factors affect a fund's performance. Developments that disrupt global economies and financial markets, such as pandemics, epidemics, outbreaks of infectious diseases, war, terrorism, and environmental disasters, may significantly affect a fund's investment performance. The effects of these developments to a fund will be impacted by the types of securities in which a fund invests, the financial condition, industry, economic sector, and geographic location of an issuer, and a fund's level of investment in the securities of that issuer. Significant concentrations in security types, issuers, industries, sectors, and geographic locations may magnify the factors that affect a fund's performance.
Item 8: Changes in and Disagreements with Accountants for Open-End Management Investment Companies
(Unaudited)
Note: This is not applicable for any fund included in this document.
Item 9: Proxy Disclosures for Open-End Management Investment Companies
(Unaudited)
Note: This is not applicable for any fund included in this document.
Item 10: Remuneration Paid to Directors, Officers, and others of Open-End Management Investment Companies
(Unaudited)
Note: This information is disclosed as part of the financial statements for each Fund as part of Item 7: Financial Statements and Financial Highlights for Open-End Management Investment companies.
Item 11: Statement Regarding Basis for Approval of Investment Advisory Contract
(Unaudited)
Board Approval of Investment Advisory Contracts and Management Fees
Fidelity Enhanced Emerging Markets ETF
Fidelity Enhanced U.S. All Cap Equity ETF
At its June 2024 meeting, the Board of Trustees, including the Independent Trustees (together, the Board), voted to approve each fund's management contract with Fidelity Management & Research Company LLC (FMR) (the Advisory Contract). The Board, assisted by the advice of fund counsel and Independent Trustees' counsel, requested and considered a broad range of information.
Nature, Extent, and Quality of Services Provided. The Board considered Fidelity's staffing as it relates to the funds, including the backgrounds and experience of investment personnel of Fidelity, and also considered the funds' investment objectives, strategies, and related investment philosophies. The Board considered the structure of the investment personnel compensation program and whether this structure provides appropriate incentives to act in the best interests of each fund.
Resources Dedicated to Investment Management and Support Services. The Board and the Fund Oversight and Research Committees reviewed the general qualifications and capabilities of Fidelity's investment staff, including its size, education, experience, and resources, as well as Fidelity's approach to recruiting, training, managing, and compensating investment personnel. The Board noted the resources devoted to Fidelity's global investment organization and that Fidelity's analysts have extensive resources, tools and capabilities that allow them to conduct sophisticated quantitative and fundamental analysis, as well as credit analysis of issuers, counterparties and guarantors. Further, the Board considered that Fidelity's investment professionals have sufficient access to global information and data so as to provide competitive investment results over time, and that those professionals also have access to sophisticated tools that permit them to assess portfolio construction and risk and performance attribution characteristics continuously, as well as to transmit new information and research conclusions rapidly around the world. Additionally, in its deliberations, the Board considered Fidelity's trading, risk management, compliance, cybersecurity, and technology and operations capabilities and resources, which are integral parts of the investment management process.
Shareholder and Administrative Services. The Board considered the nature, extent, quality, and cost of advisory, administrative, and shareholder services to be performed by the Investment Adviser under the Advisory Contract and under separate agreements covering pricing and bookkeeping, and securities lending services for each fund. The Board also considered the nature and extent of the supervision of third-party service providers, principally transfer agents, custodians, subcustodians, and pricing vendors.
The Board noted that the growth of fund assets over time across the complex allows Fidelity to reinvest in the development of services designed to enhance the value and convenience of the Fidelity funds as investment vehicles. These services include 24-hour access to account information and market information over the Internet and through telephone representatives, investor education materials and asset allocation tools. The Board also considered that it reviews customer service metrics such as telephone response times, continuity of services on the website and metrics addressing services at Fidelity Investor Centers.
Investment Performance. Each fund is a new fund and therefore had no historical performance for the Board to review at the time it approved each fund's Advisory Contract. The Board considered the Investment Adviser's strength in fundamental, research-driven security selection, which the Board is familiar with through its supervision of other Fidelity funds. The Board also considered the fact that it oversees funds managed by FMR that have a similar investment process as the fund.
Based on its review, the Board concluded that the nature, extent, and quality of services to be provided to each fund under the Advisory Contract should benefit the shareholders of each fund.
Competitiveness of Management Fee and Total Expense Ratio. In reviewing the Advisory Contract, the Board considered each fund's proposed all-inclusive (subject to certain exceptions) fee rate. The Board also considered other expenses, such as transfer agent fees, pricing and bookkeeping fees, and custodial, legal, and audit fees, paid by Fidelity under the all-inclusive arrangement. The Board noted that each fund's proposed management fee rate is below the median fee rate of funds with similar Morningstar classifications, regardless of whether their management fee structures are comparable. The Board also considered that the projected total net expense ratio of each fund is below the median of those funds and classes used by the Board for management fee comparisons that have a similar sales load structure.
Based on its review, the Board concluded that the management fee and the projected total expenses of each fund were fair and reasonable in light of the services that the fund and its shareholders will receive, and the other factors considered.
Costs of the Services and Profitability. Each fund is a new fund and therefore no revenue, cost, or profitability data was available for the Board to review in respect of each fund at the time it approved the Advisory Contract. In connection with its consideration of future renewals of each fund's Advisory Contract, the Board will consider the revenues earned and the expenses incurred by Fidelity in conducting the business of developing, marketing, distributing, managing, administering and servicing each fund and servicing each fund's shareholders.
Economies of Scale. The Board will consider economies of scale when there is operating experience to permit assessment thereof. It noted that, notwithstanding the entrepreneurial risk associated with a new fund, the management fee for each fund was at a level normally associated, by comparison with competitors, with very high fund net assets, and Fidelity asserted to the Board that the level of the fee anticipated economies of scale at lower asset levels even before, if ever, economies of scale are achieved. The Board also noted that each fund and its shareholders would have access to the very considerable number and variety of services available through Fidelity and its affiliates.
Conclusion. Based on its evaluation of all of the conclusions noted above, and after considering all factors it believed relevant, the Board, including the Independent Trustees, concluded that the advisory fee arrangement is fair and reasonable in light of all of the surrounding circumstances and that each fund's Advisory Contract should be approved through May 2026.
1.9916457.100
EMU-SANN-0325
Fidelity® Enhanced Small Cap ETF
Semi-Annual Report
December 31, 2024
Contents
To view a fund's proxy voting guidelines and proxy voting record for the 12-month period ended June 30, visit http://www.fidelity.com/proxyvotingresults or visit the Securities and Exchange Commission's (SEC) web site at http://www.sec.gov.
You may also call 1-800-FIDELITY to request a free copy of the proxy voting guidelines.
Standard & Poor's, S&P and S&P 500 are registered service marks of The McGraw-Hill Companies, Inc. and have been licensed for use by Fidelity Distributors Corporation.
Other third-party marks appearing herein are the property of their respective owners.
All other marks appearing herein are registered or unregistered trademarks or service marks of FMR LLC or an affiliated company. © 2025 FMR LLC. All rights reserved.
This report and the financial statements contained herein are submitted for the general information of the shareholders of the Fund. This report is not authorized for distribution to prospective investors in the Fund unless preceded or accompanied by an effective prospectus.
A fund files its complete schedule of portfolio holdings with the SEC for the first and third quarters of each fiscal year on Form N-PORT. Forms N-PORT are available on the SEC's web site at http://www.sec.gov. A fund's Forms N-PORT may be reviewed and copied at the SEC's Public Reference Room in Washington, DC. Information regarding the operation of the SEC's Public Reference Room may be obtained by calling 1-800-SEC-0330.
For a complete list of a fund's portfolio holdings, view the most recent holdings listing, semiannual report, or annual report on Fidelity's web site at http://www.fidelity.com, http://www.institutional.fidelity.com, or http://www.401k.com, as applicable.
NOT FDIC INSURED •MAY LOSE VALUE •NO BANK GUARANTEE
Neither the Fund nor Fidelity Distributors Corporation is a bank.
Item 7: Financial Statements and Financial Highlights for Open-End Management Investment Companies (Semi-Annual Report)
Fidelity® Enhanced Small Cap ETF
Schedule of Investments December 31, 2024 (Unaudited)
Showing Percentage of Net Assets
| Common Stocks - 98.3% |
| | | Shares | Value ($) |
| BERMUDA - 0.1% | | | |
| Energy - 0.1% | | | |
| Oil, Gas & Consumable Fuels - 0.1% | | | |
| Teekay Corp Ltd | | 99,641 | 690,512 |
| CANADA - 0.3% | | | |
| Energy - 0.2% | | | |
| Oil, Gas & Consumable Fuels - 0.2% | | | |
| Teekay Tankers Ltd Class A | | 43,584 | 1,734,207 |
| Health Care - 0.1% | | | |
| Biotechnology - 0.1% | | | |
| Aurinia Pharmaceuticals Inc (b) | | 122,173 | 1,097,114 |
| Information Technology - 0.0% | | | |
| Software - 0.0% | | | |
| D-Wave Quantum Inc (b) | | 62,163 | 522,169 |
| TOTAL CANADA | | | 3,353,490 |
| IRELAND - 0.3% | | | |
| Energy - 0.0% | | | |
| Oil, Gas & Consumable Fuels - 0.0% | | | |
| Ardmore Shipping Corp | | 28,810 | 350,042 |
| Industrials - 0.3% | | | |
| Commercial Services & Supplies - 0.3% | | | |
| Cimpress PLC (b) | | 41,831 | 3,000,119 |
| TOTAL IRELAND | | | 3,350,161 |
| MONACO - 0.1% | | | |
| Energy - 0.1% | | | |
| Oil, Gas & Consumable Fuels - 0.1% | | | |
| Scorpio Tankers Inc | | 32,103 | 1,595,198 |
| NORWAY - 0.1% | | | |
| Energy - 0.1% | | | |
| Oil, Gas & Consumable Fuels - 0.1% | | | |
| SFL Corp Ltd | | 126,710 | 1,294,976 |
| PANAMA - 0.0% | | | |
| Financials - 0.0% | | | |
| Financial Services - 0.0% | | | |
| Banco Latinoamericano de Comercio Exterior SA Class E | | 2,600 | 92,482 |
| PUERTO RICO - 0.3% | | | |
| Financials - 0.3% | | | |
| Banks - 0.3% | | | |
| First BanCorp/Puerto Rico | | 138,552 | 2,575,682 |
| Ofg Bancorp | | 17,049 | 721,513 |
| | | | |
| TOTAL PUERTO RICO | | | 3,297,195 |
| THAILAND - 0.6% | | | |
| Information Technology - 0.6% | | | |
| Electronic Equipment, Instruments & Components - 0.6% | | | |
| Fabrinet (b) | | 33,415 | 7,347,291 |
| UNITED STATES - 96.5% | | | |
| Communication Services - 2.9% | | | |
| Diversified Telecommunication Services - 0.9% | | | |
| AST SpaceMobile Inc Class A (b)(c) | | 36,251 | 764,896 |
| Atn International Inc | | 40,319 | 677,762 |
| Bandwidth Inc Class A (b) | | 215,949 | 3,675,452 |
| IDT Corp Class B | | 6,265 | 297,713 |
| Lumen Technologies Inc (b) | | 888,606 | 4,718,498 |
| Shenandoah Telecommunications Co | | 24,393 | 307,596 |
| | | | 10,441,917 |
| Entertainment - 0.6% | | | |
| Cinemark Holdings Inc (b) | | 67,389 | 2,087,711 |
| Lions Gate Entertainment Corp Class A (b)(c) | | 68,237 | 582,744 |
| Lions Gate Entertainment Corp Class B (b) | | 112,887 | 852,297 |
| Madison Square Garden Entertainment Corp Class A (b) | | 79,907 | 2,844,689 |
| Marcus Corp/The | | 13,228 | 284,402 |
| | | | 6,651,843 |
| Interactive Media & Services - 1.2% | | | |
| TrueCar Inc (b) | | 264,845 | 987,872 |
| Vimeo Inc Class A (b)(c) | | 821,690 | 5,258,816 |
| Yelp Inc Class A (b) | | 182,495 | 7,062,557 |
| Zedge Inc Class B (b) | | 38,038 | 102,321 |
| ZipRecruiter Inc Class A (b) | | 54,411 | 393,936 |
| | | | 13,805,502 |
| Media - 0.0% | | | |
| Gannett Co Inc (b) | | 128,256 | 648,975 |
| Wireless Telecommunication Services - 0.2% | | | |
| Spok Holdings Inc | | 14,411 | 231,297 |
| Telephone and Data Systems Inc | | 74,246 | 2,532,531 |
| | | | 2,763,828 |
| Consumer Discretionary - 10.3% | | | |
| Automobile Components - 0.7% | | | |
| American Axle & Manufacturing Holdings Inc (b) | | 312,383 | 1,821,193 |
| Cooper-Standard Holdings Inc (b)(c) | | 106,419 | 1,443,042 |
| Goodyear Tire & Rubber Co/The (b)(c) | | 475,188 | 4,276,692 |
| Luminar Technologies Inc Class A (b)(c) | | 84,852 | 456,503 |
| | | | 7,997,430 |
| Automobiles - 0.6% | | | |
| Winnebago Industries Inc | | 139,285 | 6,655,037 |
| Diversified Consumer Services - 0.3% | | | |
| Chegg Inc (b) | | 366,487 | 590,044 |
| Coursera Inc (b) | | 69,354 | 589,509 |
| Frontdoor Inc (b) | | 15,446 | 844,433 |
| Graham Holdings Co Class B | | 1,676 | 1,461,338 |
| KinderCare Learning Cos Inc (b) | | 28,255 | 502,939 |
| | | | 3,988,263 |
| Hotels, Restaurants & Leisure - 1.9% | | | |
| Bloomin' Brands Inc | | 19,579 | 239,059 |
| Brinker International Inc (b) | | 22,651 | 2,996,501 |
| Dine Brands Global Inc | | 18,809 | 566,151 |
| International Game Technology PLC | | 186,801 | 3,298,906 |
| Life Time Group Holdings Inc (b) | | 115,512 | 2,555,125 |
| Light & Wonder Inc Class A (b) | | 31,423 | 2,714,319 |
| Monarch Casino & Resort Inc | | 14,873 | 1,173,480 |
| PlayAGS Inc (b) | | 94,078 | 1,084,719 |
| Red Rock Resorts Inc Class A | | 64,591 | 2,986,688 |
| Shake Shack Inc Class A (b) | | 20,097 | 2,608,591 |
| Texas Roadhouse Inc | | 2,638 | 475,974 |
| United Parks & Resorts Inc (b) | | 34,759 | 1,953,108 |
| | | | 22,652,621 |
| Household Durables - 2.4% | | | |
| Ethan Allen Interiors Inc (c) | | 69,541 | 1,954,798 |
| Flexsteel Industries Inc | | 28,389 | 1,542,658 |
| Installed Building Products Inc (c) | | 32,134 | 5,631,484 |
| KB Home | | 29,763 | 1,956,024 |
| M/I Homes Inc (b) | | 43,889 | 5,835,043 |
| Meritage Homes Corp | | 19,065 | 2,932,578 |
| Taylor Morrison Home Corp (b) | | 78,269 | 4,790,845 |
| Tri Pointe Homes Inc (b) | | 94,823 | 3,438,282 |
| | | | 28,081,712 |
| Leisure Products - 0.2% | | | |
| Peloton Interactive Inc Class A (b) | | 272,916 | 2,374,369 |
| Sturm Ruger & Co Inc | | 11,080 | 391,900 |
| | | | 2,766,269 |
| Specialty Retail - 3.8% | | | |
| Abercrombie & Fitch Co Class A (b) | | 62,231 | 9,301,668 |
| American Eagle Outfitters Inc | | 384,071 | 6,402,464 |
| Boot Barn Holdings Inc (b) | | 4,677 | 710,062 |
| Carparts Com Inc (b) | | 329,254 | 355,593 |
| Carvana Co Class A (b) | | 27,794 | 5,652,188 |
| EVgo Inc Class A (b)(c) | | 92,615 | 375,090 |
| ODP Corp/The (b) | | 67,378 | 1,532,176 |
| Petco Health & Wellness Co Inc Class A (b) | | 791,144 | 3,014,259 |
| RealReal Inc/The (b) | | 42,235 | 461,629 |
| Sally Beauty Holdings Inc (b) | | 388,699 | 4,061,905 |
| Sleep Number Corp (b)(c) | | 64,555 | 983,818 |
| Sonic Automotive Inc Class A (c) | | 27,214 | 1,724,007 |
| Upbound Group Inc | | 174,306 | 5,084,506 |
| Urban Outfitters Inc (b) | | 30,418 | 1,669,340 |
| Victoria's Secret & Co (b) | | 40,723 | 1,686,747 |
| | | | 43,015,452 |
| Textiles, Apparel & Luxury Goods - 0.4% | | | |
| G-III Apparel Group Ltd (b) | | 9,939 | 324,210 |
| Hanesbrands Inc (b) | | 97,041 | 789,914 |
| Kontoor Brands Inc | | 40,031 | 3,419,048 |
| Rocky Brands Inc | | 7,381 | 168,286 |
| | | | 4,701,458 |
TOTAL CONSUMER DISCRETIONARY | | | 119,858,242 |
| | | | |
| Consumer Staples - 3.5% | | | |
| Beverages - 1.0% | | | |
| Coca-Cola Consolidated Inc | | 3,037 | 3,826,590 |
| National Beverage Corp | | 5,943 | 253,588 |
| Primo Brands Corp Class A | | 255,081 | 7,848,842 |
| | | | 11,929,020 |
| Consumer Staples Distribution & Retail - 1.2% | | | |
| Natural Grocers by Vitamin Cottage Inc | | 33,779 | 1,341,702 |
| Sprouts Farmers Market Inc (b) | | 77,552 | 9,854,533 |
| United Natural Foods Inc (b) | | 86,042 | 2,349,807 |
| Weis Markets Inc (c) | | 11,670 | 790,292 |
| | | | 14,336,334 |
| Food Products - 0.9% | | | |
| Cal-Maine Foods Inc | | 21,495 | 2,212,265 |
| Fresh Del Monte Produce Inc | | 48,231 | 1,601,752 |
| Lancaster Colony Corp | | 30,981 | 5,364,050 |
| WK Kellogg Co (c) | | 64,833 | 1,166,346 |
| | | | 10,344,413 |
| Household Products - 0.2% | | | |
| Energizer Holdings Inc | | 62,365 | 2,175,915 |
| WD-40 Co | | 2,663 | 646,257 |
| | | | 2,822,172 |
| Personal Care Products - 0.2% | | | |
| Honest Co Inc/The (b) | | 227,964 | 1,579,791 |
| Medifast Inc (b) | | 17,340 | 305,530 |
| | | | 1,885,321 |
TOTAL CONSUMER STAPLES | | | 41,317,260 |
| | | | |
| Energy - 4.8% | | | |
| Energy Equipment & Services - 1.9% | | | |
| Archrock Inc | | 186,253 | 4,635,838 |
| Bristow Group Inc (b) | | 31,991 | 1,097,291 |
| ChampionX Corp | | 38,692 | 1,052,035 |
| Expro Group Holdings NV (b) | | 32,028 | 399,389 |
| Helix Energy Solutions Group Inc (b)(c) | | 256,759 | 2,392,994 |
| Helmerich & Payne Inc (c) | | 80,217 | 2,568,548 |
| Nabors Industries Ltd (b)(c) | | 61,311 | 3,505,150 |
| Nabors Industries Ltd warrants 6/11/2026 (b) | | 10,764 | 39,288 |
| Oil States International Inc (b) | | 108,700 | 550,022 |
| ProPetro Holding Corp (b) | | 52,672 | 491,430 |
| Tidewater Inc (b) | | 68,502 | 3,747,745 |
| Transocean Ltd (b)(c) | | 125,596 | 470,985 |
| Weatherford International PLC | | 17,220 | 1,233,469 |
| | | | 22,184,184 |
| Oil, Gas & Consumable Fuels - 2.9% | | | |
| Berry Corp | | 63,095 | 260,581 |
| California Resources Corp | | 42,886 | 2,225,355 |
| CNX Resources Corp (b) | | 90,374 | 3,314,015 |
| CONSOL Energy Inc | | 22,489 | 2,399,127 |
| Crescent Energy Co Class A (c) | | 481,930 | 7,040,997 |
| Delek US Holdings Inc | | 74,140 | 1,371,590 |
| Dorian LPG Ltd | | 20,286 | 494,370 |
| Excelerate Energy Inc Class A | | 21,438 | 648,500 |
| Green Plains Inc (b) | | 50,799 | 481,574 |
| International Seaways Inc | | 29,483 | 1,059,619 |
| Matador Resources Co | | 66,278 | 3,728,800 |
| Murphy Oil Corp | | 104,290 | 3,155,815 |
| Riley Exploration Permian Inc (c) | | 42,024 | 1,341,406 |
| Sitio Royalties Corp Class A | | 33,494 | 642,415 |
| Uranium Energy Corp (b)(c) | | 85,429 | 571,520 |
| World Kinect Corp (c) | | 165,054 | 4,540,636 |
| | | | 33,276,320 |
TOTAL ENERGY | | | 55,460,504 |
| | | | |
| Financials - 17.5% | | | |
| Banks - 8.0% | | | |
| 1st Source Corp | | 23,145 | 1,351,205 |
| Amalgamated Financial Corp | | 48,557 | 1,625,203 |
| Ameris Bancorp | | 59,162 | 3,701,766 |
| Associated Banc-Corp | | 74,166 | 1,772,567 |
| Atlantic Union Bankshares Corp (c) | | 20,243 | 766,805 |
| Axos Financial Inc (b) | | 48,362 | 3,378,086 |
| BancFirst Corp | | 39,177 | 4,590,761 |
| Bank of Hawaii Corp (c) | | 47,632 | 3,393,304 |
| Banner Corp | | 8,873 | 592,450 |
| Berkshire Hills Bancorp Inc | | 12,369 | 351,651 |
| Byline Bancorp Inc | | 18,420 | 534,180 |
| Cadence Bank | | 48,427 | 1,668,310 |
| Capital City Bank Group Inc | | 4,431 | 162,396 |
| Cathay General Bancorp | | 17,385 | 827,700 |
| Central Pacific Financial Corp | | 102,228 | 2,969,723 |
| Community Financial System Inc | | 61,788 | 3,811,084 |
| Community Trust Bancorp Inc | | 13,541 | 718,079 |
| CVB Financial Corp | | 27,376 | 586,120 |
| FB Financial Corp | | 51,087 | 2,631,491 |
| Financial Institutions Inc | | 28,654 | 781,968 |
| First Busey Corp | | 100,497 | 2,368,714 |
| First Commonwealth Financial Corp | | 46,317 | 783,684 |
| First Financial Bancorp | | 40,194 | 1,080,415 |
| First Financial Bankshares Inc | | 95,971 | 3,459,755 |
| First Merchants Corp | | 85,541 | 3,412,230 |
| Flagstar Financial Inc (c) | | 31,950 | 298,094 |
| Fulton Financial Corp | | 106,575 | 2,054,766 |
| Hancock Whitney Corp | | 13,263 | 725,751 |
| Independent Bank Corp | | 4,233 | 271,716 |
| Lakeland Financial Corp (c) | | 92,977 | 6,393,099 |
| Mercantile Bank Corp | | 6,380 | 283,846 |
| Midland States Bancorp Inc | | 16,791 | 409,700 |
| NB Bancorp Inc | | 155,786 | 2,813,495 |
| Nbt Bancorp Inc | | 15,421 | 736,507 |
| Northfield Bancorp Inc | | 125,368 | 1,456,776 |
| Northwest Bancshares Inc | | 448,926 | 5,921,334 |
| OceanFirst Financial Corp | | 20,008 | 362,145 |
| Old National Bancorp/IN | | 68,360 | 1,483,754 |
| Park National Corp (c) | | 9,999 | 1,714,129 |
| Peapack-Gladstone Financial Corp | | 21,499 | 689,043 |
| Provident Financial Services Inc | | 166,141 | 3,135,081 |
| Renasant Corp (c) | | 66,919 | 2,392,354 |
| S&T Bancorp Inc | | 13,684 | 523,002 |
| ServisFirst Bancshares Inc | | 21,585 | 1,829,113 |
| Sierra Bancorp | | 27,487 | 794,924 |
| Stellar Bancorp Inc | | 9,066 | 257,021 |
| TriCo Bancshares | | 4,764 | 208,187 |
| UMB Financial Corp | | 8,670 | 978,496 |
| United Bankshares Inc/WV | | 52,957 | 1,988,535 |
| Univest Financial Corp | | 10,072 | 297,225 |
| Veritex Holdings Inc | | 44,885 | 1,219,077 |
| WesBanco Inc | | 112,396 | 3,657,366 |
| Westamerica BanCorp | | 41,321 | 2,167,700 |
| | | | 92,381,883 |
| Capital Markets - 3.3% | | | |
| BGC Group Inc Class A | | 697,521 | 6,319,540 |
| Brightsphere Investment Group Inc | | 44,553 | 1,173,526 |
| DigitalBridge Group Inc Class A | | 150,665 | 1,699,501 |
| Federated Hermes Inc Class B | | 152,441 | 6,266,850 |
| Oppenheimer Holdings Inc Class A | | 9,308 | 596,550 |
| PJT Partners Inc Class A (c) | | 12,911 | 2,037,485 |
| StepStone Group Inc Class A | | 22,765 | 1,317,638 |
| Stifel Financial Corp | | 39,372 | 4,176,582 |
| StoneX Group Inc (b) | | 27,966 | 2,739,829 |
| Victory Capital Holdings Inc Class A | | 62,911 | 4,118,154 |
| Virtus Invt Partners Inc | | 6,868 | 1,514,943 |
| WisdomTree Inc (c) | | 621,868 | 6,529,614 |
| | | | 38,490,212 |
| Consumer Finance - 1.6% | | | |
| Bread Financial Holdings Inc | | 4,346 | 265,367 |
| Dave Inc Class A (b)(c) | | 40,782 | 3,544,771 |
| EZCORP Inc Class A (b) | | 253,844 | 3,101,974 |
| FirstCash Holdings Inc | | 25,893 | 2,682,515 |
| Lendingtree Inc (b)(c) | | 27,021 | 1,047,064 |
| NerdWallet Inc Class A (b) | | 74,036 | 984,679 |
| PRA Group Inc (b) | | 10,913 | 227,973 |
| PROG Holdings Inc | | 131,117 | 5,541,004 |
| Regional Management Corp | | 22,936 | 779,365 |
| | | | 18,174,712 |
| Financial Services - 2.4% | | | |
| AvidXchange Holdings Inc (b) | | 692,909 | 7,164,679 |
| Compass Diversified Holdings | | 221,637 | 5,115,382 |
| Flywire Corp (b) | | 48,946 | 1,009,267 |
| Jackson Financial Inc | | 14,262 | 1,241,935 |
| Marqeta Inc Class A (b) | | 51,155 | 193,876 |
| NMI Holdings Inc (b) | | 122,435 | 4,500,711 |
| Payoneer Global Inc (b) | | 764,308 | 7,673,652 |
| Remitly Global Inc (b) | | 32,689 | 737,791 |
| Waterstone Financial Inc | | 43,381 | 583,041 |
| | | | 28,220,334 |
| Insurance - 1.8% | | | |
| Amerisafe Inc | | 29,113 | 1,500,484 |
| CNO Financial Group Inc | | 78,819 | 2,932,855 |
| Genworth Financial Inc Class A (b) | | 413,454 | 2,890,043 |
| HCI Group Inc (c) | | 11,056 | 1,288,356 |
| Heritage Insurance Holdings Inc (b) | | 65,957 | 798,080 |
| Lemonade Inc (b)(c) | | 61,127 | 2,242,138 |
| Oscar Health Inc Class A (b) | | 125,313 | 1,684,207 |
| Root Inc/OH Class A (b)(c) | | 26,212 | 1,902,729 |
| Selective Insurance Group Inc | | 45,954 | 4,297,618 |
| Trupanion Inc (b) | | 26,228 | 1,264,190 |
| Universal Insurance Holdings Inc | | 22,660 | 477,219 |
| | | | 21,277,919 |
| Mortgage Real Estate Investment Trusts (REITs) - 0.4% | | | |
| Brightspire Capital Inc Class A | | 74,166 | 418,296 |
| Kkr Real Estate Finance Trust Inc | | 119,732 | 1,209,293 |
| Ladder Capital Corp Class A | | 97,852 | 1,094,964 |
| TPG RE Finance Trust Inc | | 223,014 | 1,895,619 |
| | | | 4,618,172 |
TOTAL FINANCIALS | | | 203,163,232 |
| | | | |
| Health Care - 15.5% | | | |
| Biotechnology - 7.2% | | | |
| 2seventy bio Inc (b)(c) | | 96,530 | 283,798 |
| 89bio Inc (b)(c) | | 57,912 | 452,872 |
| Absci Corp (b)(c) | | 91,286 | 239,169 |
| ACADIA Pharmaceuticals Inc (b) | | 83,492 | 1,532,078 |
| ACELYRIN Inc (b)(c) | | 100,519 | 315,630 |
| Adaptimmune Therapeutics Plc ADR (b) | | 185,723 | 100,049 |
| Adicet Bio Inc (b) | | 255,783 | 246,063 |
| ADMA Biologics Inc (b) | | 56,799 | 974,103 |
| Adverum Biotechnologies Inc (b)(c) | | 22,140 | 103,394 |
| Agenus Inc (b)(c) | | 58,414 | 160,054 |
| Agios Pharmaceuticals Inc (b) | | 12,987 | 426,753 |
| Akebia Therapeutics Inc (b) | | 488,046 | 927,287 |
| Akero Therapeutics Inc (b) | | 19,966 | 555,454 |
| Alkermes PLC (b) | | 85,450 | 2,457,542 |
| Allakos Inc (b) | | 388,827 | 470,481 |
| Allovir Inc (b) | | 138,777 | 58,286 |
| Altimmune Inc (b)(c) | | 29,785 | 214,750 |
| Amicus Therapeutics Inc (b) | | 189,966 | 1,789,480 |
| Anika Therapeutics Inc (b) | | 17,864 | 294,041 |
| Annexon Inc (b) | | 96,990 | 497,559 |
| Arbutus Biopharma Corp (b)(c) | | 63,624 | 208,050 |
| Arcellx Inc (b) | | 10,056 | 771,195 |
| Arcturus Therapeutics Holdings Inc (b) | | 17,588 | 298,468 |
| Arcutis Biotherapeutics Inc (b)(c) | | 106,977 | 1,490,190 |
| Arrowhead Pharmaceuticals Inc (b) | | 26,724 | 502,411 |
| Assembly Biosciences Inc (b) | | 13,553 | 213,866 |
| Atara Biotherapeutics Inc (b)(c) | | 10,448 | 139,063 |
| Atreca Inc Class A rights (b)(d) | | 1,051 | 0 |
| Avid Bioservices Inc (b)(c) | | 73,098 | 902,760 |
| Avidity Biosciences Inc (b) | | 47,672 | 1,386,302 |
| Beam Therapeutics Inc (b) | | 11,665 | 289,292 |
| BioCryst Pharmaceuticals Inc (b) | | 155,354 | 1,168,262 |
| Biohaven Ltd (b) | | 53,763 | 2,008,048 |
| Black Diamond Therapeutics Inc (b)(c) | | 136,893 | 292,951 |
| Bluebird Bio Inc (b)(c) | | 30,790 | 256,789 |
| Blueprint Medicines Corp (b) | | 19,723 | 1,720,240 |
| Bolt Biotherapeutics Inc (b) | | 94,258 | 50,437 |
| Bridgebio Pharma Inc (b) | | 35,267 | 967,726 |
| C4 Therapeutics Inc (b)(c) | | 123,548 | 444,773 |
| CareDx Inc (b) | | 54,713 | 1,171,405 |
| Caribou Biosciences Inc (b)(c) | | 107,751 | 171,324 |
| Carisma Therapeutics Inc rights (b)(d) | | 304,482 | 3 |
| Cartesian Therapeutics Inc rights (b)(d) | | 85,524 | 36,775 |
| Catalyst Pharmaceuticals Inc (b) | | 68,921 | 1,438,381 |
| Celldex Therapeutics Inc (b) | | 14,382 | 363,433 |
| Cogent Biosciences Inc (b) | | 61,684 | 481,135 |
| Crinetics Pharmaceuticals Inc (b) | | 25,236 | 1,290,317 |
| Cytokinetics Inc (b) | | 34,023 | 1,600,442 |
| CytomX Therapeutics Inc (b) | | 198,472 | 204,426 |
| Denali Therapeutics Inc (b) | | 28,188 | 574,471 |
| Design Therapeutics Inc (b)(c) | | 78,603 | 484,981 |
| Dynavax Technologies Corp (b) | | 16,353 | 208,828 |
| Dyne Therapeutics Inc (b) | | 12,689 | 298,953 |
| Eagle Pharmaceuticals Inc/DE (b) | | 21,928 | 10,964 |
| Editas Medicine Inc (b)(c) | | 131,699 | 167,258 |
| Emergent BioSolutions Inc (b) | | 94,334 | 901,833 |
| Enanta Pharmaceuticals Inc (b) | | 29,452 | 169,349 |
| Erasca Inc (b)(c) | | 215,551 | 541,033 |
| Fate Therapeutics Inc (b)(c) | | 165,104 | 272,422 |
| FibroGen Inc (b) | | 315,330 | 166,967 |
| Geron Corp (b) | | 115,310 | 408,197 |
| Halozyme Therapeutics Inc (b) | | 40,921 | 1,956,433 |
| Heron Therapeutics Inc (b)(c) | | 118,575 | 181,420 |
| Ideaya Biosciences Inc (b) | | 14,131 | 363,167 |
| Immunovant Inc (b) | | 4,217 | 104,455 |
| Inhibrx Biosciences Inc (c) | | 26,431 | 407,037 |
| Insmed Inc (b) | | 69,550 | 4,801,732 |
| Iovance Biotherapeutics Inc (b)(c) | | 49,282 | 364,687 |
| Ironwood Pharmaceuticals Inc Class A (b) | | 181,645 | 804,687 |
| Jasper Therapeutics Inc Class A (b) | | 24,857 | 531,443 |
| Jounce Therapeutics Inc rights (b)(d) | | 118,367 | 1 |
| KalVista Pharmaceuticals Inc (b)(c) | | 44,999 | 381,142 |
| Karyopharm Therapeutics Inc (b)(c) | | 315,210 | 213,177 |
| Kodiak Sciences Inc (b) | | 151,931 | 1,511,713 |
| Krystal Biotech Inc (b) | | 5,933 | 929,464 |
| Kura Oncology Inc (b) | | 65,569 | 571,106 |
| Kymera Therapeutics Inc (b) | | 6,040 | 242,989 |
| MacroGenics Inc (b) | | 102,626 | 333,535 |
| Madrigal Pharmaceuticals Inc (b)(c) | | 5,968 | 1,841,546 |
| Mersana Therapeutics Inc (b)(c) | | 111,987 | 160,141 |
| Myriad Genetics Inc (b) | | 67,577 | 926,481 |
| Neurogene Inc (b) | | 30,679 | 701,322 |
| Nkarta Inc (b) | | 88,321 | 219,919 |
| Novavax Inc (b)(c) | | 118,814 | 955,265 |
| Nurix Therapeutics Inc (b)(c) | | 16,589 | 312,537 |
| Nuvalent Inc Class A (b) | | 4,690 | 367,133 |
| Oncternal Therapeutics Inc rights (b)(d) | | 1,148 | 0 |
| Organogenesis Holdings Inc Class A (b) | | 159,492 | 510,374 |
| ORIC Pharmaceuticals Inc (b)(c) | | 74,902 | 604,459 |
| Precigen Inc (b)(c) | | 261,165 | 292,505 |
| Protagonist Therapeutics Inc (b) | | 10,127 | 390,902 |
| PTC Therapeutics Inc (b) | | 44,629 | 2,014,553 |
| Puma Biotechnology Inc (b) | | 88,901 | 271,148 |
| Q32 Bio Inc rights (b)(d) | | 40,603 | 0 |
| Recursion Pharmaceuticals Inc Class A (b)(c) | | 194,695 | 1,316,138 |
| Replimune Group Inc (b) | | 69,630 | 843,219 |
| REVOLUTION Medicines Inc (b) | | 59,478 | 2,601,568 |
| Rhythm Pharmaceuticals Inc (b) | | 34,232 | 1,916,307 |
| Rocket Pharmaceuticals Inc (b) | | 21,479 | 269,991 |
| Sage Therapeutics Inc (b) | | 93,834 | 509,519 |
| Sana Biotechnology Inc (b)(c) | | 111,328 | 181,465 |
| Sangamo Therapeutics Inc (b)(c) | | 329,682 | 336,276 |
| Savara Inc (b) | | 60,468 | 185,637 |
| Scholar Rock Holding Corp (b) | | 49,875 | 2,155,598 |
| Solid Biosciences Inc (b) | | 46,160 | 184,640 |
| SpringWorks Therapeutics Inc (b) | | 7,122 | 257,318 |
| Summit Therapeutics Inc (b) | | 7,079 | 126,325 |
| Surface Oncology Inc rights (b)(d) | | 60,289 | 1 |
| Sutro Biopharma Inc (b) | | 144,278 | 265,472 |
| Syndax Pharmaceuticals Inc (b) | | 40,823 | 539,680 |
| TG Therapeutics Inc (b) | | 39,157 | 1,178,626 |
| Tourmaline Bio Inc (b) | | 22,537 | 457,050 |
| Travere Therapeutics Inc (b) | | 96,442 | 1,680,020 |
| Twist Bioscience Corp (b) | | 36,607 | 1,701,127 |
| Vanda Pharmaceuticals Inc (b)(c) | | 109,487 | 524,443 |
| Vaxcyte Inc (b) | | 47,037 | 3,850,449 |
| Vera Therapeutics Inc Class A (b) | | 5,671 | 239,827 |
| Veracyte Inc (b) | | 44,408 | 1,758,557 |
| Vericel Corp (b) | | 7,111 | 390,465 |
| Voyager Therapeutics Inc (b)(c) | | 69,317 | 393,027 |
| XBiotech Inc (b) | | 24,063 | 95,049 |
| Xencor Inc (b) | | 934 | 21,463 |
| Y-mAbs Therapeutics Inc (b) | | 24,333 | 190,527 |
| Zentalis Pharmaceuticals Inc (b) | | 132,137 | 400,375 |
| | | | 84,009,195 |
| Health Care Equipment & Supplies - 3.0% | | | |
| Accuray Inc Del (b) | | 457,575 | 905,999 |
| AngioDynamics Inc (b) | | 24,746 | 226,673 |
| Artivion Inc (b) | | 32,597 | 931,948 |
| AtriCure Inc (b) | | 40,423 | 1,235,327 |
| Avanos Medical Inc (b) | | 107,477 | 1,711,034 |
| Axogen Inc (b) | | 180,591 | 2,976,140 |
| Bioventus Inc (b) | | 177,596 | 1,864,758 |
| Cerus Corp (b)(c) | | 385,550 | 593,747 |
| CONMED Corp (c) | | 14,128 | 966,920 |
| Glaukos Corp (b) | | 24,474 | 3,669,632 |
| Haemonetics Corp (b) | | 17,508 | 1,367,025 |
| Inari Medical Inc (b) | | 22,449 | 1,146,021 |
| iRhythm Technologies Inc (b) | | 57,290 | 5,165,839 |
| Lantheus Holdings Inc (b) | | 8,935 | 799,325 |
| LeMaitre Vascular Inc | | 3,737 | 344,327 |
| Merit Medical Systems Inc (b) | | 45,006 | 4,352,980 |
| Paragon 28 Inc (b) | | 32,188 | 332,502 |
| RxSight Inc (b) | | 17,225 | 592,196 |
| Tactile Systems Technology Inc (b)(c) | | 43,651 | 747,742 |
| Tandem Diabetes Care Inc (b)(c) | | 43,547 | 1,568,563 |
| Treace Medical Concepts Inc (b) | | 67,733 | 503,934 |
| Varex Imaging Corp (b)(c) | | 177,573 | 2,590,790 |
| Zimvie Inc (b) | | 16,054 | 223,952 |
| | | | 34,817,374 |
| Health Care Providers & Services - 2.4% | | | |
| 23andMe Holding Co Class A (b)(c) | | 38,915 | 126,474 |
| Addus HomeCare Corp (b) | | 9,441 | 1,183,429 |
| Alignment Healthcare Inc (b) | | 50,852 | 572,085 |
| BrightSpring Health Services Inc (b) | | 180,717 | 3,077,611 |
| Brookdale Senior Living Inc (b) | | 130,814 | 657,994 |
| Concentra Group Holdings Parent Inc (c) | | 16,259 | 321,603 |
| CorVel Corp (b) | | 3,865 | 430,020 |
| Ensign Group Inc/The | | 2,177 | 289,236 |
| Guardant Health Inc (b) | | 182,082 | 5,562,605 |
| HealthEquity Inc (b) | | 66,324 | 6,363,788 |
| Hims & Hers Health Inc Class A (b)(c) | | 15,167 | 366,738 |
| Option Care Health Inc (b) | | 122,148 | 2,833,834 |
| PACS Group Inc | | 40,424 | 529,959 |
| Patterson Cos Inc | | 111,194 | 3,431,447 |
| Progyny Inc (b) | | 99,744 | 1,720,584 |
| Talkspace Inc Class A (b) | | 87,759 | 271,175 |
| | | | 27,738,582 |
| Health Care Technology - 0.8% | | | |
| Health Catalyst Inc (b) | | 155,523 | 1,099,548 |
| HealthStream Inc (c) | | 80,071 | 2,546,258 |
| Phreesia Inc (b) | | 157,805 | 3,970,374 |
| Teladoc Health Inc (b) | | 156,196 | 1,419,822 |
| Veradigm Inc (b) | | 47,389 | 462,042 |
| | | | 9,498,044 |
| Life Sciences Tools & Services - 0.3% | | | |
| Adaptive Biotechnologies Corp (b) | | 173,284 | 1,038,838 |
| Codexis Inc (b)(c) | | 167,069 | 796,919 |
| Cytek Biosciences Inc (b)(c) | | 108,694 | 705,424 |
| Medpace Holdings Inc (b) | | 2,342 | 778,083 |
| NanoString Technologies Inc (b)(d) | | 84,939 | 6,098 |
| OmniAb Inc (b)(c) | | 119,975 | 424,711 |
| Quanterix Corp (b)(c) | | 48,455 | 515,076 |
| | | | 4,265,149 |
| Pharmaceuticals - 1.8% | | | |
| Amneal Intermediate Inc Class A (b) | | 155,236 | 1,229,469 |
| Amphastar Pharmaceuticals Inc (b) | | 16,570 | 615,244 |
| Atea Pharmaceuticals Inc (b) | | 72,911 | 244,252 |
| Avadel Pharmaceuticals PLC Class A (b) | | 52,922 | 556,210 |
| Axsome Therapeutics Inc (b) | | 7,823 | 661,904 |
| Cara Therapeutics Inc (b) | | 14,852 | 90,894 |
| Collegium Pharmaceutical Inc (b) | | 27,396 | 784,895 |
| Corcept Therapeutics Inc (b) | | 51,469 | 2,593,524 |
| Edgewise Therapeutics Inc (b) | | 51,773 | 1,382,339 |
| Evolus Inc (b) | | 60,631 | 669,366 |
| Harrow Inc (b) | | 7,071 | 237,232 |
| Ligand Pharmaceuticals Inc (b)(c) | | 11,630 | 1,246,155 |
| MBX Biosciences Inc | | 24,525 | 451,996 |
| Nektar Therapeutics (b) | | 182,787 | 169,992 |
| Nuvation Bio Inc Class A (b) | | 277,030 | 736,900 |
| Pacira BioSciences Inc (b) | | 53,799 | 1,013,573 |
| Phibro Animal Health Corp Class A (c) | | 34,974 | 734,454 |
| Pliant Therapeutics Inc (b) | | 30,240 | 398,261 |
| Prestige Consumer Healthcare Inc (b) | | 32,880 | 2,567,600 |
| Revance Therapeutics Inc (b) | | 160,258 | 487,184 |
| Septerna Inc | | 13,358 | 305,898 |
| Supernus Pharmaceuticals Inc (b) | | 37,708 | 1,363,521 |
| Tarsus Pharmaceuticals Inc (b) | | 20,200 | 1,118,474 |
| Terns Pharmaceuticals Inc (b) | | 62,982 | 348,920 |
| WaVe Life Sciences Ltd (b) | | 59,933 | 741,371 |
| | | | 20,749,628 |
TOTAL HEALTH CARE | | | 181,077,972 |
| | | | |
| Industrials - 17.1% | | | |
| Aerospace & Defense - 1.8% | | | |
| AAR Corp (b) | | 83,935 | 5,143,537 |
| Archer Aviation Inc Class A (b) | | 26,690 | 260,228 |
| Ducommun Inc (b) | | 42,985 | 2,736,425 |
| Intuitive Machines Inc Class A (b) | | 73,164 | 1,328,658 |
| Kratos Defense & Security Solutions Inc (b) | | 134,252 | 3,541,568 |
| Moog Inc Class A | | 13,237 | 2,605,571 |
| National Presto Industries Inc (c) | | 4,025 | 396,141 |
| Park Aerospace Corp | | 19,519 | 285,953 |
| Rocket Lab USA Inc Class A (b) | | 196,069 | 4,993,877 |
| | | | 21,291,958 |
| Building Products - 1.5% | | | |
| Apogee Enterprises Inc | | 60,954 | 4,352,726 |
| CSW Industrials Inc | | 4,639 | 1,636,639 |
| Gibraltar Industries Inc (b) | | 32,677 | 1,924,675 |
| Griffon Corp | | 77,346 | 5,512,450 |
| Resideo Technologies Inc (b) | | 172,929 | 3,986,013 |
| UFP Industries Inc | | 2,720 | 306,408 |
| | | | 17,718,911 |
| Commercial Services & Supplies - 1.7% | | | |
| ABM Industries Inc | | 65,319 | 3,343,026 |
| Brink's Co/The | | 29,423 | 2,729,572 |
| CECO Environmental Corp (b) | | 123,202 | 3,724,396 |
| GEO Group Inc/The (b) | | 17,256 | 482,823 |
| Healthcare Services Group Inc (b) | | 30,178 | 350,517 |
| HNI Corp | | 30,097 | 1,515,986 |
| Interface Inc | | 101,097 | 2,461,712 |
| OPENLANE Inc (b)(c) | | 129,069 | 2,560,729 |
| Pitney Bowes Inc | | 233,815 | 1,692,821 |
| Steelcase Inc Class A | | 43,489 | 514,040 |
| | | | 19,375,622 |
| Construction & Engineering - 2.1% | | | |
| Arcosa Inc | | 41,299 | 3,995,265 |
| Comfort Systems USA Inc | | 12,611 | 5,347,821 |
| Dycom Industries Inc (b) | | 9,044 | 1,574,199 |
| EMCOR Group Inc | | 13,739 | 6,236,132 |
| Fluor Corp (b) | | 73,602 | 3,630,051 |
| Granite Construction Inc | | 12,049 | 1,056,818 |
| Limbach Holdings Inc (b) | | 10,580 | 905,012 |
| Sterling Infrastructure Inc (b) | | 8,811 | 1,484,213 |
| | | | 24,229,511 |
| Electrical Equipment - 1.5% | | | |
| Array Technologies Inc (b) | | 95,383 | 576,113 |
| EnerSys | | 83,931 | 7,757,742 |
| Fluence Energy Inc Class A (b)(c) | | 98,503 | 1,564,228 |
| LSI Industries Inc | | 62,608 | 1,215,847 |
| NuScale Power Corp Class A (b)(c) | | 9,696 | 173,849 |
| Preformed Line Products Co | | 13,744 | 1,756,346 |
| Thermon Group Holdings Inc (b) | | 29,101 | 837,236 |
| Vicor Corp (b)(c) | | 70,502 | 3,406,657 |
| | | | 17,288,018 |
| Ground Transportation - 0.4% | | | |
| Marten Transport Ltd | | 235,871 | 3,681,946 |
| RXO Inc (b)(c) | | 23,531 | 560,979 |
| | | | 4,242,925 |
| Machinery - 3.0% | | | |
| Albany International Corp Class A | | 38,910 | 3,111,633 |
| Atmus Filtration Technologies Inc | | 147,170 | 5,766,121 |
| Blue Bird Corp (b) | | 10,340 | 399,434 |
| Enerpac Tool Group Corp Class A | | 53,164 | 2,184,509 |
| Federal Signal Corp | | 7,782 | 718,979 |
| Gorman-Rupp Co/The | | 9,361 | 354,969 |
| Hillman Solutions Corp Class A (b) | | 139,162 | 1,355,438 |
| Hurco Cos Inc | | 12,605 | 243,150 |
| Hyster-Yale Inc Class A (c) | | 40,312 | 2,053,090 |
| L B Foster Co Class A (b) | | 12,331 | 331,704 |
| Mueller Water Products Inc Class A1 | | 247,659 | 5,572,328 |
| Proto Labs Inc (b) | | 22,358 | 873,974 |
| Tennant CO | | 16,173 | 1,318,585 |
| Terex Corp | | 74,837 | 3,458,966 |
| Trinity Industries Inc | | 80,376 | 2,821,198 |
| Watts Water Technologies Inc Class A | | 21,638 | 4,399,005 |
| | | | 34,963,083 |
| Marine Transportation - 0.2% | | | |
| Matson Inc | | 27,672 | 3,731,292 |
| Passenger Airlines - 0.9% | | | |
| Allegiant Travel Co | | 10,203 | 960,306 |
| JetBlue Airways Corp (b) | | 108,554 | 853,234 |
| Joby Aviation Inc Class A (b) | | 27,024 | 219,705 |
| SkyWest Inc (b) | | 78,809 | 7,891,146 |
| Sun Country Airlines Holdings Inc (b) | | 40,165 | 585,606 |
| | | | 10,509,997 |
| Professional Services - 2.2% | | | |
| Barrett Business Services Inc | | 70,164 | 3,047,924 |
| CRA International Inc | | 12,587 | 2,356,286 |
| CSG Systems International Inc | | 135,894 | 6,945,543 |
| ExlService Holdings Inc (b) | | 133,153 | 5,909,331 |
| Heidrick & Struggles International Inc | | 6,203 | 274,855 |
| Huron Consulting Group Inc (b) | | 19,171 | 2,382,188 |
| ICF International Inc | | 2,562 | 305,416 |
| Insperity Inc | | 13,789 | 1,068,785 |
| Maximus Inc | | 2,800 | 209,020 |
| Parsons Corp (b) | | 25,171 | 2,322,025 |
| Planet Labs PBC Class A (b)(c) | | 194,088 | 784,116 |
| TriNet Group Inc | | 2,398 | 217,666 |
| | | | 25,823,155 |
| Trading Companies & Distributors - 1.8% | | | |
| Applied Industrial Technologies Inc | | 27,875 | 6,675,226 |
| Beacon Roofing Supply Inc (b) | | 4,371 | 444,006 |
| Boise Cascade Co | | 13,079 | 1,554,570 |
| DXP Enterprises Inc/TX (b) | | 35,989 | 2,973,411 |
| FTAI Aviation Ltd | | 39,302 | 5,661,060 |
| Global Industrial Co | | 24,663 | 611,396 |
| Mrc Global Inc (b) | | 71,324 | 911,521 |
| Rush Enterprises Inc Class A | | 35,908 | 1,967,399 |
| | | | 20,798,589 |
TOTAL INDUSTRIALS | | | 199,973,061 |
| | | | |
| Information Technology - 14.9% | | | |
| Communications Equipment - 0.7% | | | |
| CommScope Holding Co Inc (b) | | 536,770 | 2,796,572 |
| Extreme Networks Inc (b) | | 90,658 | 1,517,615 |
| Harmonic Inc (b) | | 84,998 | 1,124,524 |
| NetScout Systems Inc (b) | | 70,276 | 1,522,178 |
| Viavi Solutions Inc (b) | | 65,673 | 663,297 |
| | | | 7,624,186 |
| Electronic Equipment, Instruments & Components - 3.4% | | | |
| Arlo Technologies Inc (b) | | 164,000 | 1,835,160 |
| Badger Meter Inc | | 20,794 | 4,410,823 |
| Belden Inc | | 27,369 | 3,082,023 |
| Benchmark Electronics Inc | | 114,258 | 5,187,314 |
| Daktronics Inc (b) | | 17,825 | 300,530 |
| Insight Enterprises Inc (b) | | 28,288 | 4,302,605 |
| Itron Inc (b) | | 45,538 | 4,944,516 |
| Kimball Electronics Inc (b) | | 38,269 | 716,778 |
| Mirion Technologies Inc Class A (b) | | 196,305 | 3,425,522 |
| PC Connection Inc | | 29,611 | 2,051,154 |
| Plexus Corp (b) | | 30,380 | 4,753,862 |
| Sanmina Corp (b) | | 55,924 | 4,231,769 |
| | | | 39,242,056 |
| IT Services - 0.1% | | | |
| Core Scientific Inc | | 156,279 | 2,195,720 |
| Semiconductors & Semiconductor Equipment - 3.3% | | | |
| ACM Research Inc Class A (b) | | 54,750 | 826,725 |
| Alpha & Omega Semiconductor Ltd (b) | | 16,571 | 613,624 |
| Ambarella Inc (b) | | 64,273 | 4,675,218 |
| Axcelis Technologies Inc (b) | | 18,543 | 1,295,599 |
| Credo Technology Group Holding Ltd (b) | | 81,562 | 5,481,782 |
| Diodes Inc (b) | | 18,842 | 1,161,986 |
| Lattice Semiconductor Corp (b) | | 34,165 | 1,935,447 |
| MaxLinear Inc Class A (b) | | 253,329 | 5,010,848 |
| Onto Innovation Inc (b) | | 3,475 | 579,178 |
| PDF Solutions Inc (b)(c) | | 86,154 | 2,333,050 |
| Photronics Inc (b) | | 99,044 | 2,333,477 |
| Rambus Inc (b) | | 40,803 | 2,156,847 |
| Rigetti Computing Inc Class A (b) | | 34,422 | 525,280 |
| Semtech Corp (b) | | 45,171 | 2,793,826 |
| Ultra Clean Holdings Inc (b) | | 172,944 | 6,217,337 |
| | | | 37,940,224 |
| Software - 6.8% | | | |
| 8x8 Inc (b)(c) | | 1,161,561 | 3,101,368 |
| Alarm.com Holdings Inc (b) | | 45,249 | 2,751,139 |
| Altair Engineering Inc Class A (b) | | 11,700 | 1,276,587 |
| Appian Corp Class A (b) | | 16,556 | 546,017 |
| Aurora Innovation Inc Class A (b)(c) | | 202,778 | 1,277,501 |
| Blackbaud Inc (b) | | 15,505 | 1,146,130 |
| BlackLine Inc (b) | | 24,562 | 1,492,387 |
| Clear Secure Inc Class A | | 133,361 | 3,552,737 |
| Clearwater Analytics Holdings Inc Class A (b) | | 20,601 | 566,940 |
| Commvault Systems Inc (b) | | 40,150 | 6,059,037 |
| Domo Inc Class B (b) | | 189,566 | 1,342,127 |
| E2open Parent Holdings Inc Class A (b)(c) | | 115,894 | 308,278 |
| Intapp Inc (b) | | 34,337 | 2,200,658 |
| Jamf Holding Corp (b) | | 50,243 | 705,914 |
| LivePerson Inc (b)(c) | | 494,764 | 752,041 |
| LiveRamp Holdings Inc (b) | | 54,356 | 1,650,792 |
| Meridianlink Inc (b) | | 22,592 | 466,525 |
| ON24 Inc (b)(c) | | 29,350 | 189,601 |
| PagerDuty Inc (b) | | 123,661 | 2,258,050 |
| Progress Software Corp | | 43,983 | 2,865,492 |
| PROS Holdings Inc (b) | | 90,319 | 1,983,405 |
| Q2 Holdings Inc (b) | | 89,378 | 8,995,896 |
| Qualys Inc (b) | | 39,678 | 5,563,649 |
| SoundHound AI Inc Class A (b)(c) | | 83,077 | 1,648,248 |
| Sprinklr Inc Class A (b)(c) | | 56,307 | 475,794 |
| Sprout Social Inc Class A (b) | | 26,143 | 802,852 |
| SPS Commerce Inc (b) | | 33,958 | 6,247,932 |
| Tenable Holdings Inc (b) | | 175,993 | 6,930,604 |
| Upland Software Inc (b) | | 67,051 | 291,001 |
| Weave Communications Inc (b) | | 54,116 | 861,527 |
| Workiva Inc Class A (b) | | 35,451 | 3,881,885 |
| Xperi Inc (b) | | 284,072 | 2,917,419 |
| Yext Inc (b) | | 295,035 | 1,876,423 |
| Zuora Inc Class A (b) | | 237,185 | 2,352,875 |
| | | | 79,338,831 |
| Technology Hardware, Storage & Peripherals - 0.6% | | | |
| Diebold Nixdorf Inc (b) | | 56,854 | 2,446,996 |
| IonQ Inc (b)(c) | | 61,338 | 2,562,088 |
| Xerox Holdings Corp (c) | | 241,125 | 2,032,684 |
| | | | 7,041,768 |
TOTAL INFORMATION TECHNOLOGY | | | 173,382,785 |
| | | | |
| Materials - 4.8% | | | |
| Chemicals - 2.0% | | | |
| American Vanguard Corp | | 122,327 | 566,374 |
| Balchem Corp | | 6,093 | 993,129 |
| Hawkins Inc | | 37,359 | 4,582,829 |
| HB Fuller Co | | 80,048 | 5,401,639 |
| Minerals Technologies Inc | | 81,236 | 6,190,996 |
| Sensient Technologies Corp | | 62,666 | 4,465,579 |
| Trinseo PLC | | 72,878 | 371,677 |
| | | | 22,572,223 |
| Construction Materials - 0.5% | | | |
| Knife River Corp (b) | | 45,472 | 4,621,774 |
| United States Lime & Minerals Inc | | 12,935 | 1,716,992 |
| | | | 6,338,766 |
| Containers & Packaging - 0.3% | | | |
| Myers Industries Inc | | 66,285 | 731,786 |
| O-I Glass Inc (b) | | 212,869 | 2,307,500 |
| | | | 3,039,286 |
| Metals & Mining - 1.9% | | | |
| ATI Inc (b) | | 53,413 | 2,939,852 |
| Carpenter Technology Corp | | 51,468 | 8,734,635 |
| Coeur Mining Inc (b) | | 134,196 | 767,601 |
| Commercial Metals Co | | 23,529 | 1,167,038 |
| Hecla Mining Co | | 799,855 | 3,927,288 |
| Olympic Steel Inc | | 33,130 | 1,086,995 |
| SunCoke Energy Inc | | 258,610 | 2,767,127 |
| Worthington Steel Inc | | 33,114 | 1,053,687 |
| | | | 22,444,223 |
| Paper & Forest Products - 0.1% | | | |
| Sylvamo Corp | | 12,750 | 1,007,505 |
TOTAL MATERIALS | | | 55,402,003 |
| | | | |
| Real Estate - 4.4% | | | |
| Diversified REITs - 0.7% | | | |
| American Assets Trust Inc | | 150,563 | 3,953,784 |
| Empire State Realty Trust Inc Class A | | 376,821 | 3,888,793 |
| | | | 7,842,577 |
| Health Care REITs - 0.7% | | | |
| American Healthcare REIT Inc | | 84,252 | 2,394,442 |
| CareTrust REIT Inc | | 132,735 | 3,590,482 |
| Community Healthcare Trust Inc | | 18,685 | 358,939 |
| Global Medical REIT Inc | | 134,501 | 1,038,348 |
| Healthpeak Properties Inc | | 11,901 | 241,232 |
| Universal Health Realty Income Trust | | 13,212 | 491,619 |
| | | | 8,115,062 |
| Hotel & Resort REITs - 0.0% | | | |
| Ashford Hospitality Trust Inc (b)(c) | | 11,997 | 86,258 |
| Industrial REITs - 0.1% | | | |
| Terreno Realty Corp | | 25,384 | 1,501,210 |
| Office REITs - 0.3% | | | |
| COPT Defense Properties | | 61,702 | 1,909,677 |
| Easterly Government Properties Inc | | 68,023 | 772,741 |
| SL Green Realty Corp | | 20,242 | 1,374,837 |
| | | | 4,057,255 |
| Real Estate Management & Development - 1.1% | | | |
| Anywhere Real Estate Inc (b) | | 509,706 | 1,682,030 |
| Compass Inc Class A (b) | | 1,014,100 | 5,932,486 |
| eXp World Holdings Inc (c) | | 155,285 | 1,787,330 |
| Opendoor Technologies Inc Class A (b)(c) | | 457,859 | 732,574 |
| RE/MAX Holdings Inc Class A (b) | | 26,958 | 287,642 |
| Redfin Corp (b)(c) | | 182,748 | 1,438,227 |
| | | | 11,860,289 |
| Residential REITs - 0.1% | | | |
| Centerspace | | 5,486 | 362,899 |
| NexPoint Residential Trust Inc | | 9,880 | 412,490 |
| Veris Residential Inc | | 43,529 | 723,887 |
| | | | 1,499,276 |
| Retail REITs - 0.8% | | | |
| Alexander's Inc | | 2,111 | 422,327 |
| Macerich Co/The | | 133,718 | 2,663,663 |
| Phillips Edison & Co Inc | | 102,177 | 3,827,550 |
| Tanger Inc | | 34,748 | 1,185,949 |
| Whitestone REIT | | 101,331 | 1,435,860 |
| | | | 9,535,349 |
| Specialized REITs - 0.6% | | | |
| Outfront Media Inc | | 338,051 | 5,997,025 |
| Safehold Inc | | 12,763 | 235,860 |
| Uniti Group Inc | | 129,762 | 713,691 |
| | | | 6,946,576 |
TOTAL REAL ESTATE | | | 51,443,852 |
| | | | |
| Utilities - 0.8% | | | |
| Electric Utilities - 0.1% | | | |
| ALLETE Inc | | 17,024 | 1,103,155 |
| Gas Utilities - 0.6% | | | |
| New Jersey Resources Corp | | 71,992 | 3,358,427 |
| Southwest Gas Holdings Inc | | 46,027 | 3,254,569 |
| | | | 6,612,996 |
| Water Utilities - 0.1% | | | |
| Consolidated Water Co Ltd | | 12,623 | 326,809 |
| SJW Group | | 28,406 | 1,398,144 |
| | | | 1,724,953 |
TOTAL UTILITIES | | | 9,441,104 |
| | | | |
| TOTAL UNITED STATES | | | 1,124,832,080 |
| TOTAL COMMON STOCKS (Cost $1,061,229,011) | | | 1,145,853,385 |
| | | | |
| U.S. Treasury Obligations - 0.1% |
| | | Yield (%) (e) | Principal Amount (a) | Value ($) |
| US Treasury Bills 0% 3/27/2025 (f) | | 4.28 | 540,000 | 534,721 |
| US Treasury Bills 0% 3/6/2025 (f) | | 4.40 | 290,000 | 287,876 |
| TOTAL U.S. TREASURY OBLIGATIONS (Cost $822,365) | | | | 822,597 |
| | | | | |
| Money Market Funds - 5.2% |
| | | Yield (%) | Shares | Value ($) |
| Fidelity Cash Central Fund (g) | | 4.36 | 10,459,953 | 10,462,045 |
| Fidelity Securities Lending Cash Central Fund (g)(h) | | 4.35 | 50,488,562 | 50,493,611 |
| TOTAL MONEY MARKET FUNDS (Cost $60,955,656) | | | | 60,955,656 |
| | | | | |
| TOTAL INVESTMENT IN SECURITIES - 103.6% (Cost $1,123,007,032) | 1,207,631,638 |
NET OTHER ASSETS (LIABILITIES) - (3.6)% | (41,474,250) |
| NET ASSETS - 100.0% | 1,166,157,388 |
| | |
| Futures Contracts |
| | Number of contracts | Expiration Date | Notional Amount ($) | Value ($) | Unrealized Appreciation/ (Depreciation) ($) |
| Purchased | | | | | |
| | | | | | |
| Equity Contracts | | | | | |
| CME E-mini Russell 2000 Index Contracts (United States) | 55 | Mar 2025 | 6,186,950 | (196,220) | (196,220) |
| | | | | | |
| The notional amount of futures purchased as a percentage of Net Assets is 0.5% |
Legend
| (a) | Amount is stated in United States dollars unless otherwise noted. |
| (c) | Security or a portion of the security is on loan at period end. |
| (e) | Yield represents either the annualized yield at the date of purchase, or the stated coupon rate, or, for floating and adjustable rate securities, the rate at period end. |
| (f) | Security or a portion of the security was pledged to cover margin requirements for futures contracts. At period end, the value of securities pledged amounted to $822,597. |
| (g) | Affiliated fund that is generally available only to investment companies and other accounts managed by Fidelity Investments. The rate quoted is the annualized seven-day yield of the fund at period end. A complete unaudited listing of the fund's holdings as of its most recent quarter end is available upon request. In addition, each Fidelity Central Fund's financial statements are available on the SEC's website or upon request. |
| (h) | Investment made with cash collateral received from securities on loan. |
Affiliated Central Funds
Fiscal year to date information regarding the Fund's investments in Fidelity Central Funds, including the ownership percentage, is presented below.
| Affiliate | Value, beginning of period ($) | Purchases ($) | Sales Proceeds ($) | Dividend Income ($) | Realized Gain (loss) ($) | Change in Unrealized appreciation (depreciation) ($) | Value, end of period ($) | Shares, end of period | % ownership, end of period |
| Fidelity Cash Central Fund | 31,391,601 | 110,345,165 | 131,274,721 | 372,078 | - | - | 10,462,045 | 10,459,953 | 0.0% |
| Fidelity Securities Lending Cash Central Fund | 29,678,010 | 159,079,242 | 138,263,640 | 61,100 | - | (1) | 50,493,611 | 50,488,562 | 0.2% |
| Total | 61,069,611 | 269,424,407 | 269,538,361 | 433,178 | - | (1) | 60,955,656 | 60,948,515 | |
| | | | | | | | | | |
Amounts in the dividend income column in the above table include any capital gain distributions from underlying funds, which are presented in the corresponding line item in the Statement of Operations, if applicable.
Amounts in the dividend income column for Fidelity Securities Lending Cash Central Fund represents the income earned on investing cash collateral, less rebates paid to borrowers and any lending agent fees associated with the loan, plus any premium payments received for lending certain types of securities.
Amounts included in the purchases and sales proceeds columns may include in-kind transactions, if applicable.
Investment Valuation
The following is a summary of the inputs used, as of December 31, 2024, involving the Fund's assets and liabilities carried at fair value. The inputs or methodology used for valuing securities may not be an indication of the risk associated with investing in those securities. For more information on valuation inputs, and their aggregation into the levels used below, please refer to the Investment Valuation section in the accompanying Notes to Financial Statements.
| Valuation Inputs at Reporting Date: |
| Description | Total ($) | Level 1 ($) | Level 2 ($) | Level 3 ($) |
Investments in Securities: | | | | |
|
| Common Stocks | | | | |
Communication Services | 34,312,065 | 34,312,065 | - | - |
Consumer Discretionary | 119,858,242 | 119,858,242 | - | - |
Consumer Staples | 41,317,260 | 41,317,260 | - | - |
Energy | 61,125,439 | 61,125,439 | - | - |
Financials | 206,552,909 | 206,552,909 | - | - |
Health Care | 182,175,086 | 182,132,208 | - | 42,878 |
Industrials | 202,973,180 | 202,973,180 | - | - |
Information Technology | 181,252,245 | 181,252,245 | - | - |
Materials | 55,402,003 | 55,402,003 | - | - |
Real Estate | 51,443,852 | 51,443,852 | - | - |
Utilities | 9,441,104 | 9,441,104 | - | - |
|
| U.S. Treasury Obligations | 822,597 | - | 822,597 | - |
|
| Money Market Funds | 60,955,656 | 60,955,656 | - | - |
| Total Investments in Securities: | 1,207,631,638 | 1,206,766,163 | 822,597 | 42,878 |
Derivative Instruments: Liabilities | | | | |
Futures Contracts | (196,220) | (196,220) | - | - |
| Total Liabilities | (196,220) | (196,220) | - | - |
| Total Derivative Instruments: | (196,220) | (196,220) | - | - |
Value of Derivative Instruments
The following table is a summary of the Fund's value of derivative instruments by primary risk exposure as of December 31, 2024. For additional information on derivative instruments, please refer to the Derivative Instruments section in the accompanying Notes to Financial Statements.
Primary Risk Exposure / Derivative Type | Value |
| Asset ($) | Liability ($) |
| Equity Risk | | |
Futures Contracts (a) | 0 | (196,220) |
| Total Equity Risk | 0 | (196,220) |
| Total Value of Derivatives | 0 | (196,220) |
(a)Reflects gross cumulative appreciation (depreciation) on futures contracts as presented in the Schedule of Investments. In the Statement of Assets and Liabilities, the period end daily variation margin is included in receivable or payable for daily variation margin on futures contracts, and the net cumulative appreciation (depreciation) is included in Total accumulated earnings (loss).
Financial Statements (Unaudited)
| Statement of Assets and Liabilities |
| As of December 31, 2024 (Unaudited) |
| Assets | | | | |
| Investment in securities, at value (including securities loaned of $48,583,926) - See accompanying schedule: | | | | |
Unaffiliated issuers (cost $1,062,051,376) | $ | 1,146,675,982 | | |
Fidelity Central Funds (cost $60,955,656) | | 60,955,656 | | |
| | | | | |
| | | | | |
| Total Investment in Securities (cost $1,123,007,032) | | | $ | 1,207,631,638 |
| Cash | | | | 122,878 |
| Receivable for investments sold | | | | 9,165,712 |
| Receivable for fund shares sold | | | | 100,385,728 |
| Dividends receivable | | | | 886,271 |
| Distributions receivable from Fidelity Central Funds | | | | 64,505 |
| Receivable for daily variation margin on futures contracts | | | | 8,631 |
Total assets | | | | 1,318,265,363 |
| Liabilities | | | | |
| Payable for investments purchased | $ | 101,365,633 | | |
| Accrued management fee | | 254,876 | | |
| Collateral on securities loaned | | 50,487,466 | | |
| Total liabilities | | | | 152,107,975 |
| Net Assets | | | $ | 1,166,157,388 |
| Net Assets consist of: | | | | |
| Paid in capital | | | $ | 1,066,934,457 |
| Total accumulated earnings (loss) | | | | 99,222,931 |
| Net Assets | | | $ | 1,166,157,388 |
Net Asset Value, offering price and redemption price per share ($1,166,157,388 ÷ 36,021,356 shares) | | | $ | 32.37 |
| Statement of Operations |
| | | | Six months ended December 31, 2024 (Unaudited) |
| Investment Income | | | | |
| Dividends | | | $ | 5,244,951 |
| Interest | | | | 48,065 |
| Income from Fidelity Central Funds (including $61,100 from security lending) | | | | 433,178 |
| Total income | | | | 5,726,194 |
| Expenses | | | | |
| Management fee | | | $ | 1,285,898 |
| Independent trustees' fees and expenses | | | | 1,730 |
| Miscellaneous | | | | - |
| Total expenses before reductions | | | | 1,287,628 |
| Expense reductions | | | | (1,180) |
| Total expenses after reductions | | | | 1,286,448 |
| Net Investment income (loss) | | | | 4,439,746 |
| Realized and Unrealized Gain (Loss) | | | | |
| Net realized gain (loss) on: | | | | |
| Investment Securities: | | | | |
| Unaffiliated issuers | | | | (9,478,404) |
| Redemptions in-kind | | | | 52,226,402 |
| Fidelity Central Funds | | | | - |
| Futures contracts | | | | 705,192 |
| Total net realized gain (loss) | | | | 43,453,190 |
| Change in net unrealized appreciation (depreciation) on: | | | | |
| Investment Securities: | | | | |
| Unaffiliated issuers | | | | 31,913,317 |
| Fidelity Central Funds | | | | (1) |
| Futures contracts | | | | (356,939) |
| Total change in net unrealized appreciation (depreciation) | | | | 31,556,377 |
| Net gain (loss) | | | | 75,009,567 |
| Net increase (decrease) in net assets resulting from operations | | | $ | 79,449,313 |
| Statement of Changes in Net Assets |
| | | |
| | Six months ended December 31, 2024 (Unaudited) | | Four months ended June 30, 2024 | | Year ended February 29, 2024 |
| Increase (Decrease) in Net Assets | | | | | | |
| Operations | | | | | | |
| Net investment income (loss) | $ | 4,439,746 | $ | 2,182,494 | $ | 4,649,534 |
| Net realized gain (loss) | | 43,453,190 | | 28,074,517 | | 32,794,589 |
| Change in net unrealized appreciation (depreciation) | | 31,556,377 | | (29,968,000) | | 27,704,246 |
| Net increase (decrease) in net assets resulting from operations | | 79,449,313 | | 289,011 | | 65,148,369 |
| Distributions to shareholders | | (7,119,069) | | (2,247,305) | | (4,715,442) |
| | | | | | | |
| Share transactions | | | | | | |
| Proceeds from sales of shares | | 673,570,725 | | 113,489,919 | | 117,577,525 |
| Reinvestment of distributions | | - | | - | | 4,092,903 |
| Cost of shares redeemed | | (153,916,037) | | (43,439,075) | | (261,496,096) |
| | | | | | | |
Net increase (decrease) in net assets resulting from share transactions | | 519,654,688 | | 70,050,844 | | (139,825,668) |
| Total increase (decrease) in net assets | | 591,984,932 | | 68,092,550 | | (79,392,741) |
| | | | | | | |
| Net Assets | | | | | | |
| Beginning of period | | 574,172,456 | | 506,079,906 | | 585,472,647 |
| End of period | $ | 1,166,157,388 | $ | 574,172,456 | $ | 506,079,906 |
| | | | | | | |
| Other Information | | | | | | |
| Shares | | | | | | |
| Sold | | 21,000,000 | | 3,900,000 | | 4,564,341 |
| Issued in reinvestment of distributions | | - | | - | | 163,135 |
| Redeemed | | (4,700,000) | | (1,500,000) | | (10,287,720) |
| Net increase (decrease) | | 16,300,000 | | 2,400,000 | | (5,560,244) |
| | | | | | | |
See Organization and Prior Fiscal Year Reorganization information note regarding reorganization from mutual fund to exchange traded fund for the fiscal year ended February 29, 2024.
Share activity is further described in Organization and Prior Fiscal Year Reorganization information notes, and amounts for the prior fiscal years have been adjusted to reflect the impact of the change in capital structure associated with the reorganization. All financial information prior to the reorganization is that of the Predecessor Fund.
Financial Highlights
Fidelity® Enhanced Small Cap ETF |
| |
| | Six months ended (Unaudited) December 31, 2024 | | Years ended June 30, 2024 A | | 2024 B,C | | 2023 B,D | | 2022 B,D | | 2021 B,D | | 2020 B,C |
Selected Per-Share Data | | | | | | | | | | | | | | |
| Net asset value, beginning of period | $ | 29.11 | $ | 29.22 | $ | 25.58 | $ | 27.53 | $ | 34.05 | $ | 22.27 | $ | 24.75 |
| Income from Investment Operations | | | | | | | | | | | | | | |
Net investment income (loss) E,F | | .16 | | .11 | | .22 | | .24 | | .14 | | .16 | | .24 |
| Net realized and unrealized gain (loss) | | 3.33 | | (.10) | | 3.65 | | (.99) | | (.40) | | 11.80 | | (2.48) |
| Total from investment operations | | 3.49 | | .01 | | 3.87 | | (.75) | | (.26) | | 11.96 | | (2.24) |
| Distributions from net investment income | | (.23) | | (.12) | | (.23) | | (.22) | | (.14) | | (.18) | | (.24) |
| Distributions from net realized gain | | - | | - | | - | | (1.00) | | (6.12) | | - | | - |
| Total distributions | | (.23) | | (.12) | | (.23) | | (1.20) G | | (6.26) | | (.18) | | (.24) |
| Net asset value, end of period | $ | 32.37 | $ | 29.11 | $ | 29.22 | $ | 25.58 | $ | 27.53 | $ | 34.05 | $ | 22.27 |
Total Return H,I,J | | | | .06% | | 15.26% | | (2.62)% | | (1.64)% | | 53.78% | | (9.18)% |
Ratios to Average Net Assets F,K,L | | | | | | | | | | | | | | |
| Expenses before reductions | | .28% M | | .28% M,N | | .48% | | .55% | | .63% | | .64% | | .64% |
| Expenses net of fee waivers, if any | | | | .28% M,N | | .48% | | .55% | | .63% | | .64% | | .64% |
| Expenses net of all reductions | | .28% M | | .28% M,N | | .48% | | .55% | | .63% | | .64% | | .64% |
| Net investment income (loss) | | .97% M | | 1.20% M | | .87% | | .94% | | .41% | | .62% | | .94% |
| Supplemental Data | | | | | | | | | | | | | | |
| Net assets, end of period (000 omitted) | $ | 1,166,157 | $ | 574,172 | $ | 506,080 | $ | 585,473 | $ | 655,168 | $ | 689,131 | $ | 515,960 |
Portfolio turnover rate O | | | | 71% M,P | | 97% P | | 98% | | 96% | | 44% | | 79% |
AFor the four month period ended June 30. The Fund changed its fiscal year end from February 29 to June 30, effective March 1, 2024.
BAs further described in Organization and Reorganization information notes, per share amounts have been adjusted to reflect the impact of the change in capital structure associated with the reorganization. All financial information prior to the reorganization is that of the Predecessor Fund.
CFor the year ended February 29.
DFor the year ended February 28.
ECalculated based on average shares outstanding during the period.
FNet investment income (loss) is affected by the timing of the declaration of dividends by any underlying mutual funds or exchange-traded funds (ETFs). Net investment income (loss) of any mutual funds or ETFs is not included in the Fund's net investment income (loss) ratio.
GTotal distributions per share do not sum due to rounding.
HTotal returns for periods of less than one year are not annualized.
ITotal returns would have been lower if certain expenses had not been reduced during the applicable periods shown.
JBased on net asset value.
KFees and expenses of any underlying mutual funds or exchange-traded funds (ETFs) are not included in the Fund's expense ratio. The Fund indirectly bears its proportionate share of these expenses. For additional expense information related to investments in Fidelity Central Funds, please refer to the "Investments in Fidelity Central Funds" note found in the Notes to Financial Statements section of the most recent Annual or Semi-Annual report.
LExpense ratios reflect operating expenses of the class. Expenses before reductions do not reflect amounts reimbursed, waived, or reduced through arrangements with the investment adviser, brokerage services, or other offset arrangements, if applicable, and do not represent the amount paid by the class during periods when reimbursements, waivers or reductions occur.
MAnnualized.
NProxy expenses are not annualized.
OAmount does not include the portfolio activity of any underlying mutual funds or exchange-traded funds (ETFs), derivatives or securities that mature within one year from acquisition.
PPortfolio turnover rate excludes securities received or delivered in-kind.
Notes to Financial Statements
(Unaudited)For the period ended December 31, 2024
1. Organization.
Fidelity Enhanced Small Cap ETF (the Fund) is an exchange-traded fund of Fidelity Covington Trust (the Trust) and is authorized to issue an unlimited number of shares. The Trust is registered under the Investment Company Act of 1940, as amended (the 1940 Act), as an open-end management investment company organized as a Massachusetts business trust.
Effective November 17, 2023, Fidelity Small Cap Enhanced Index Fund (Predecessor Fund) reorganized into the newly created Fidelity Enhanced Small Cap ETF. The Predecessor Fund was the accounting survivor in the reorganization, and, as such, the financial statements and financial highlights for the fiscal year ended February 29, 2024 and prior reflect the financial information of the Predecessor Fund through November 17, 2023 (see Prior Fiscal Year Reorganization Information note).
2. Investments in Fidelity Central Funds.
Funds may invest in Fidelity Central Funds, which are open-end investment companies generally available only to other investment companies and accounts managed by the investment adviser and its affiliates. The Schedule of Investments lists any Fidelity Central Funds held as an investment as of period end, but does not include the underlying holdings of each Fidelity Central Fund. An investing fund indirectly bears its proportionate share of the expenses of the underlying Fidelity Central Funds.
Based on its investment objective, each Fidelity Central Fund may invest or participate in various investment vehicles or strategies that are similar to those of the investing fund. These strategies are consistent with the investment objectives of the investing fund and may involve certain economic risks which may cause a decline in value of each of the Fidelity Central Funds and thus a decline in the value of the investing fund.
| Fidelity Central Fund | Investment Manager | Investment Objective | Investment Practices | Expense RatioA |
| Fidelity Money Market Central Funds | Fidelity Management & Research Company LLC (FMR) | Each fund seeks to obtain a high level of current income consistent with the preservation of capital and liquidity. | Short-term Investments | Less than .005% |
A Expenses expressed as a percentage of average net assets and are as of each underlying Central Fund's most recent annual or semi-annual shareholder report.
A complete unaudited list of holdings for each Fidelity Central Fund is available upon request or at the Securities and Exchange Commission website at www.sec.gov. In addition, the financial statements of the Fidelity Central Funds, which are not covered by the Report of Independent Registered Public Accounting Firm, are available on the Securities and Exchange Commission website or upon request.
3. Significant Accounting Policies.
The Fund is an investment company and applies the accounting and reporting guidance of the Financial Accounting Standards Board (FASB) Accounting Standards Codification Topic 946 Financial Services - Investment Companies. The financial statements have been prepared in conformity with accounting principles generally accepted in the United States of America (GAAP), which require management to make certain estimates and assumptions at the date of the financial statements. Actual results could differ from those estimates. The Fund operates as a single operating segment. The Fund's income, expenses, assets, and performance are regularly monitored and assessed as a whole by the investment adviser and other individuals responsible for oversight functions of the Trust, using the information presented in the financial statements and financial highlights. Subsequent events, if any, through the date that the financial statements were issued have been evaluated in the preparation of the financial statements. The Fund's Schedule of Investments lists any underlying mutual funds or exchange-traded funds (ETFs) but does not include the underlying holdings of these funds. The following summarizes the significant accounting policies of the Fund:
Investment Valuation. Investments are valued as of 4:00 p.m. Eastern time on the last calendar day of the period. The Board of Trustees (the Board) has designated the Fund's investment adviser as the valuation designee responsible for the fair valuation function and performing fair value determinations as needed. The investment adviser has established a Fair Value Committee (the Committee) to carry out the day-to-day fair valuation responsibilities and has adopted policies and procedures to govern the fair valuation process and the activities of the Committee. In accordance with these fair valuation policies and procedures, which have been approved by the Board, the Fund attempts to obtain prices from one or more third party pricing services or brokers to value its investments. When current market prices, quotations or currency exchange rates are not readily available or reliable, investments will be fair valued in good faith by the Committee, in accordance with the policies and procedures. Factors used in determining fair value vary by investment type and may include market or investment specific events, transaction data, estimated cash flows, and market observations of comparable investments. The frequency that the fair valuation procedures are used cannot be predicted and they may be utilized to a significant extent. The Committee manages the Fund's fair valuation practices and maintains the fair valuation policies and procedures. The Fund's investment adviser reports to the Board information regarding the fair valuation process and related material matters.
The Fund categorizes the inputs to valuation techniques used to value its investments into a disclosure hierarchy consisting of three levels as shown below:
Level 1 - unadjusted quoted prices in active markets for identical investments
Level 2 - other significant observable inputs (including quoted prices for similar investments, interest rates, prepayment speeds, etc.)
Level 3 - unobservable inputs (including the Fund's own assumptions based on the best information available)
Valuation techniques used to value the Fund's investments by major category are as follows:
Equity securities, including restricted securities, for which market quotations are readily available, are valued at the last reported sale price or official closing price as reported by a third party pricing service on the primary market or exchange on which they are traded and are categorized as Level 1 in the hierarchy. In the event there were no sales during the day or closing prices are not available, securities are valued at the last quoted bid price or may be valued using the last available price and are generally categorized as Level 2 in the hierarchy. For foreign equity securities, when market or security specific events arise, comparisons to the valuation of American Depositary Receipts (ADRs), futures contracts, Exchange-Traded Funds (ETFs) and certain indexes as well as quoted prices for similar securities may be used and would be categorized as Level 2 in the hierarchy. For equity securities, including restricted securities, where observable inputs are limited, assumptions about market activity and risk are used and these securities may be categorized as Level 3 in the hierarchy.
Debt securities, including restricted securities, are valued based on evaluated prices received from third party pricing services or from brokers who make markets in such securities. U.S. government and government agency obligations are valued by pricing services who utilize matrix pricing which considers yield or price of bonds of comparable quality, coupon, maturity and type or by broker-supplied prices. When independent prices are unavailable or unreliable, debt securities may be valued utilizing pricing methodologies which consider similar factors that would be used by third party pricing services. Debt securities are generally categorized as Level 2 in the hierarchy but may be Level 3 depending on the circumstances.
Futures contracts are valued at the settlement price established each day by the board of trade or exchange on which they are traded and are categorized as Level 1 in the hierarchy. Investments in open-end mutual funds, including the Fidelity Central Funds, are valued at their closing net asset value (NAV) each business day and are categorized as Level 1 in the hierarchy.
Changes in valuation techniques may result in transfers in or out of an assigned level within the disclosure hierarchy. The aggregate value of investments by input level as of December 31, 2024 is included at the end of the Fund's Schedule of Investments.
Investment Transactions and Income. For financial reporting purposes, the Fund's investment holdings and NAV include trades executed through the end of the last business day of the period. The NAV per share for processing shareholder transactions is calculated as of the close of business of the New York Stock Exchange (NYSE) business (normally 4:00 p.m. Eastern time) of the New York Stock Exchange, Archipelago Exchange (NYSE Arca), normally 4:00 p.m. Eastern time and includes trades executed through the end of the prior business day. Gains and losses on securities sold are determined on the basis of identified cost and include proceeds received from litigation. Commissions paid to certain brokers with whom the investment adviser, or its affiliates, places trades on behalf of a fund include an amount in addition to trade execution, which may be rebated back to a fund. Any such rebates are included in net realized gain (loss) on investments in the Statement of Operations. Dividend income is recorded on the ex-dividend date, except for certain dividends from foreign securities where the ex-dividend date may have passed, which are recorded as soon as the Fund is informed of the ex-dividend date. Non-cash dividends included in dividend income, if any, are recorded at the fair market value of the securities received. Income and capital gain distributions from Fidelity Central Funds, if any, are recorded on the ex-dividend date. Certain distributions received by the Fund represent a return of capital or capital gain. The Fund determines the components of these distributions subsequent to the ex-dividend date, based upon receipt of tax filings or other correspondence relating to the underlying investment. These distributions are recorded as a reduction of cost of investments and/or as a realized gain. Interest income is accrued as earned and includes coupon interest and amortization of premium and accretion of discount on debt securities as applicable.
Expenses. Expenses directly attributable to a fund are charged to that fund. Expenses attributable to more than one fund are allocated among the respective funds on the basis of relative net assets or other appropriate methods. Expenses included in the accompanying financial statements reflect the expenses of that fund and do not include any expenses associated with any underlying mutual funds or exchange-traded funds. Although not included in a fund's expenses, a fund indirectly bears its proportionate share of these expenses through the net asset value of each underlying mutual fund or exchange-traded fund. Expense estimates are accrued in the period to which they relate and adjustments are made when actual amounts are known.
Income Tax Information and Distributions to Shareholders. Each year, the Fund intends to qualify as a regulated investment company under Subchapter M of the Internal Revenue Code, including distributing substantially all of its taxable income and realized gains. As a result, no provision for U.S. Federal income taxes is required. The Fund files a U.S. federal tax return, in addition to state and local tax returns as required. The Fund's federal income tax returns are subject to examination by the Internal Revenue Service (IRS) for a period of three fiscal years after they are filed. State and local tax returns may be subject to examination for an additional fiscal year depending on the jurisdiction. Realized gain or loss resulting from in-kind redemptions is not taxable to the Fund and is not distributed to shareholders of the Fund.
Distributions are declared and recorded on the ex-dividend date. Income and capital gain distributions are determined in accordance with income tax regulations, which may differ from GAAP.
Capital accounts within the financial statements are adjusted for permanent book-tax differences. These adjustments have no impact on net assets or the results of operations. Capital accounts are not adjusted for temporary book-tax differences which will reverse in a subsequent period.
Book-tax differences are primarily due to futures contracts, passive foreign investment companies (PFIC), redemptions in-kind, capital loss carryforwards and losses deferred due to wash sales.
As of period end, the cost and unrealized appreciation (depreciation) in securities, and derivatives if applicable, for federal income tax purposes were as follows:
| Gross unrealized appreciation | $160,665,319 |
| Gross unrealized depreciation | (79,029,768) |
| Net unrealized appreciation (depreciation) | $81,635,551 |
| Tax cost | $1,125,799,867 |
Capital loss carryforwards are only available to offset future capital gains of the Fund to the extent provided by regulations and may be limited. The capital loss carryforward information presented below, including any applicable limitation, is estimated as of prior fiscal period end and is subject to adjustment.
Short-term | $(23,183,857) |
| Total capital loss carryforward | $(23,183,857) |
New Accounting Pronouncement. FASB Accounting Standards Update (ASU) 2023-07 Segment Reporting (Topic 280): Improvements to Reportable Segment Disclosures became effective in this reporting period. ASU 2023-07 enhances segment information disclosure in the notes to financial statements.
4. Derivative Instruments.
Risk Exposures and the Use of Derivative Instruments. The Fund's investment objectives allow for various types of derivative instruments, including futures contracts. Derivatives are investments whose value is primarily derived from underlying assets, indices or reference rates and may be transacted on an exchange or over-the-counter (OTC). Derivatives may involve a future commitment to buy or sell a specified asset based on specified terms, to exchange future cash flows at periodic intervals based on a notional principal amount, or for one party to make one or more payments upon the occurrence of specified events in exchange for periodic payments from the other party.
Derivatives were used to increase returns and to manage exposure to certain risks as defined below. The success of any strategy involving derivatives depends on analysis of numerous economic factors, and if the strategies for investment do not work as intended, the objectives may not be achieved.
Derivatives were used to increase or decrease exposure to the following risk(s):
| Equity Risk | Equity risk relates to the fluctuations in the value of financial instruments as a result of changes in market prices (other than those arising from interest rate risk or foreign exchange risk), whether caused by factors specific to an individual investment, its issuer, or all factors affecting all instruments traded in a market or market segment. |
Funds are also exposed to additional risks from investing in derivatives, such as liquidity risk and counterparty credit risk. Liquidity risk is the risk that a fund will be unable to close out the derivative in the open market in a timely manner. Counterparty credit risk is the risk that the counterparty will not be able to fulfill its obligation to a fund. Counterparty credit risk related to exchange-traded contracts may be mitigated by the protection provided by the exchange on which they trade.
Investing in derivatives may involve greater risks than investing in the underlying assets directly and, to varying degrees, may involve risk of loss in excess of any initial investment and collateral received and amounts recognized in the Statement of Assets and Liabilities. In addition, there may be the risk that the change in value of the derivative contract does not correspond to the change in value of the underlying instrument.
Futures Contracts. A futures contract is an agreement between two parties to buy or sell a specified underlying instrument for a fixed price at a specified future date. Futures contracts were used to manage exposure to the stock market.
Upon entering into a futures contract, a fund is required to deposit either cash or securities (initial margin) with a clearing broker in an amount equal to a certain percentage of the face value of the contract. Futures contracts are marked-to-market daily and subsequent daily payments are made or received by a fund depending on the daily fluctuations in the value of the futures contracts and are recorded as unrealized appreciation or (depreciation). This receivable and/or payable, if any, is included in daily variation margin on futures contracts in the Statement of Assets and Liabilities. Realized gain or (loss) is recorded upon the expiration or closing of a futures contract. The net realized gain (loss) and change in net unrealized appreciation (depreciation) on futures contracts during the period is presented in the Statement of Operations.
Any open futures contracts at period end are presented in the Schedule of Investments under the caption "Futures Contracts". The notional amount at value reflects each contract's exposure to the underlying instrument or index at period end, and is representative of volume of activity during the period.
Any securities deposited to meet initial margin requirements are identified in the Schedule of Investments. Any cash deposited to meet initial margin requirements is presented as segregated cash with brokers for derivative instruments in the Statement of Assets and Liabilities.
5. Purchases and Sales of Investments.
Purchases and sales of securities, other than short-term securities and in-kind transactions, as applicable, are noted in the table below.
| | Purchases ($) | Sales ($) |
| Fidelity Enhanced Small Cap ETF | 490,308,963 | 255,683,890 |
Securities received and delivered in-kind through subscriptions and redemptions are noted in the table below.
| | In-Kind Subscriptions ($) | In-Kind Redemptions ($) |
| Fidelity Enhanced Small Cap ETF | 430,884,903 | 149,988,193 |
6. Fees and Other Transactions with Affiliates.
Management Fee. Fidelity Management & Research Company LLC (the investment adviser) provides the Fund with investment management related services for which the Funds pay a monthly management fee that is based on an annual rate of .28% of average net assets. Under the management contract, the investment adviser pays all other expenses, except the compensation of the independent Trustees and certain miscellaneous expenses such as proxy and shareholders meeting expenses. The management fee is reduced by an amount equal to the fees and expenses paid by the Fund to the independent Trustees.
Brokerage Commissions. A portion of portfolio transactions were placed with brokerage firms which are affiliates of the investment adviser. Brokerage commissions are included in net realized gain (loss) and change in net unrealized appreciation (depreciation) in the Statement of Operations. The commissions paid to these affiliated firms were as follows:
| | Amount ($) |
| Fidelity Enhanced Small Cap ETF | 10,349 |
Interfund Trades. Funds may purchase from or sell securities to other Fidelity Funds under procedures adopted by the Board. The procedures have been designed to ensure these interfund trades are executed in accordance with Rule 17a-7 of the 1940 Act. Any interfund trades are included within the respective purchases and sales amounts shown in the Purchases and Sales of Investments note. Interfund trades during the period are noted in the table below.
| | Purchases ($) | Sales ($) | Realized Gain (Loss) ($) |
| Fidelity Enhanced Small Cap ETF | 28,675,428 | 18,644,699 | (444,068) |
7. Security Lending.
Funds lend portfolio securities from time to time in order to earn additional income. Lending agents are used, including National Financial Services (NFS), an affiliate of the investment adviser. Pursuant to a securities lending agreement, NFS will receive a fee, which is capped at 9.9% of a fund's daily lending revenue, for its services as lending agent. A fund may lend securities to certain qualified borrowers, including NFS. On the settlement date of the loan, a fund receives collateral (in the form of U.S. Treasury obligations, letters of credit and/or cash) against the loaned securities and maintains collateral in an amount not less than 100% of the market value of the loaned securities during the period of the loan. The market value of the loaned securities is determined at the close of business of a fund and any additional required collateral is delivered to a fund on the next business day. A fund or borrower may terminate the loan at any time, and if the borrower defaults on its obligation to return the securities loaned because of insolvency or other reasons, a fund may apply collateral received from the borrower against the obligation. A fund may experience delays and costs in recovering the securities loaned. Any cash collateral received is invested in the Fidelity Securities Lending Cash Central Fund. Any loaned securities are identified as such in the Schedule of Investments, and the value of loaned securities and cash collateral at period end, as applicable, are presented in the Statement of Assets and Liabilities. Security lending income represents the income earned on investing cash collateral, less rebates paid to borrowers and any lending agent fees associated with the loan, plus any premium payments received for lending certain types of securities. Security lending income is presented in the Statement of Operations as a component of income from Fidelity Central Funds. Affiliated security lending activity, if any, was as follows:
| | Total Security Lending Fees Paid to NFS ($) | Security Lending Income From Securities Loaned to NFS ($) | Value of Securities Loaned to NFS at Period End ($) |
| Fidelity Enhanced Small Cap ETF | 6,398 | 673 | 676 |
8. Expense Reductions.
Through arrangements with the Fund's custodian, credits realized as a result of certain uninvested cash balances were used to reduce the Fund's expenses by $1,180.
9. Share Transactions.
Funds issue and redeem shares at NAV only with certain authorized participants in large increments known as Creation Units. Purchases of Creation Units are made by tendering a basket of designated securities to a fund and redemption proceeds are paid with a basket of securities from a fund's portfolio with a balancing cash component to equate the market value of the basket of securities delivered or redeemed to the NAV per Creation Unit on the transaction date. Cash may be substituted equivalent to the value of certain securities generally when they are not available in sufficient quantity for delivery. A fund's shares are available in smaller increments to investors in the secondary market at market prices and may be subject to commissions. Authorized participants pay a transaction fee to the shareholder servicing agent when purchasing and redeeming Creation Units of a fund. The transaction fee is used to offset the costs associated with the issuance and redemption of Creation Units.
10. Other.
A fund's organizational documents provide former and current trustees and officers with a limited indemnification against liabilities arising in connection with the performance of their duties to the fund. In the normal course of business, a fund may also enter into contracts that provide general indemnifications. A fund's maximum exposure under these arrangements is unknown as this would be dependent on future claims that may be made against a fund. The risk of material loss from such claims is considered remote.
11. Prior Fiscal Year Reorganization Information.
On November 17, 2023, Fidelity Small Cap Enhanced Index Fund (Predecessor Fund) reorganized into a newly created Fidelity Enhanced Small Cap ETF (ETF) pursuant an Agreement and Plan of Reorganization (the Agreement) approved by its Board of Trustees. Per the Agreement, shareholders of the Predecessor Fund received ETF shares equal in value to the shares of the Predecessor Fund they owned on the day the reorganization was effective. The Predecessor Fund was the accounting survivor after the reorganization. As such, performance and financial history prior to the reorganization is that of the Predecessor Fund. Historical share transactions and per share information for the Predecessor Fund was retroactively adjusted to reflect the change in capital structure due to the reorganization.
For financial reporting purposes, the assets and liabilities of the Predecessor Fund and shares issued by the ETF were recorded at fair value; however, the cost basis of the investments received from the Predecessor Fund were carried forward and will be utilized for purposes of the ETF's ongoing reporting of realized and unrealized gains and losses to more closely align subsequent reporting of realized gains with amounts distributable to shareholders for tax purposes. The reorganization qualified as a tax-free reorganization for federal income tax purposes with no gain or loss recognized to the funds or their shareholders. Costs incurred in connection with the reorganization were paid by the Predecessor Fund.
| Predecessor Fund/Accounting Survivor | Investments $ | Unrealized appreciation (depreciation) $ | Net Assets $ | Shares Exchanged | Shares Exchanged Ratio |
| Fidelity Small Cap Enhanced Index Fund | 510,635,061 | 30,515,551 | 511,993,789 | 20,479,785 | .5077880000 |
| Acquiring ETF | Net Assets $ | Total net assets after the acquisition $ |
| Fidelity Enhanced Small Cap ETF | 25 | 511,993,814 |
Pro forma results of operations of the combined entity for the entire period ended February 29, 2024, as though the acquisition had occurred as of the beginning of the year (rather than on the actual acquisition date), are as follows:
| Net investment income (loss) | $5,714,131 |
| Total net realized gain (loss) | 32,794,589 |
| Total change in net unrealized appreciation (depreciation) | 27,704,246 |
| Net increase (decrease) in net assets resulting from operations | $66,212,966 |
Because the combined investment portfolios have been managed as a single portfolio since the acquisition was completed, it is not practicable to separate the amounts of revenue and earnings of the Predecessor Fund that has been included in the ETF's Statement of Operations since November 17, 2023.
12. Risk and Uncertainties.
Many factors affect a fund's performance. Developments that disrupt global economies and financial markets, such as pandemics, epidemics, outbreaks of infectious diseases, war, terrorism, and environmental disasters, may significantly affect a fund's investment performance. The effects of these developments to a fund will be impacted by the types of securities in which a fund invests, the financial condition, industry, economic sector, and geographic location of an issuer, and a fund's level of investment in the securities of that issuer. Significant concentrations in security types, issuers, industries, sectors, and geographic locations may magnify the factors that affect a fund's performance.
Item 8: Changes in and Disagreements with Accountants for Open-End Management Investment Companies
(Unaudited)
Note: This is not applicable for any fund included in this document.
Item 9: Proxy Disclosures for Open-End Management Investment Companies
(Unaudited)
| A special meeting of shareholders was held on July 16, 2024. The results of votes taken among shareholders on the proposal before them are reported below. Each vote reported represents one dollar of net asset value held on the record date for the meeting. |
| Proposal 1 |
| To elect a Board of Trustees. |
| | # of Votes | % of Votes |
| Bettina Doulton |
| Affirmative | 38,080,283,823.03 | 97.17 |
| Withheld | 1,109,333,237.47 | 2.83 |
| TOTAL | 39,189,617,060.50 | 100.00 |
| Robert A. Lawrence |
| Affirmative | 37,781,807,251.33 | 96.41 |
| Withheld | 1,407,809,809.17 | 3.59 |
| TOTAL | 39,189,617,060.50 | 100.00 |
| Vijay C. Advani |
| Affirmative | 37,869,526,083.09 | 96.63 |
| Withheld | 1,320,090,977.41 | 3.37 |
| TOTAL | 39,189,617,060.50 | 100.00 |
| Thomas P. Bostick |
| Affirmative | 38,025,875,898.31 | 97.03 |
| Withheld | 1,163,741,162.19 | 2.97 |
| TOTAL | 39,189,617,060.50 | 100.00 |
| Donald F. Donahue |
| Affirmative | 37,825,198,238.79 | 96.52 |
| Withheld | 1,364,418,821.71 | 3.48 |
| TOTAL | 39,189,617,060.50 | 100.00 |
| Vicki L. Fuller |
| Affirmative | 38,031,768,119.99 | 97.05 |
| Withheld | 1,157,848,940.51 | 2.95 |
| TOTAL | 39,189,617,060.50 | 100.00 |
| Patricia L. Kampling |
| Affirmative | 38,062,391,881.90 | 97.12 |
| Withheld | 1,127,225,178.60 | 2.88 |
| TOTAL | 39,189,617,060.50 | 100.00 |
| Thomas A. Kennedy |
| Affirmative | 37,891,434,776.27 | 96.69 |
| Withheld | 1,298,182,284.23 | 3.31 |
| TOTAL | 39,189,617,060.50 | 100.00 |
| Oscar Munoz |
| Affirmative | 37,976,932,673.73 | 96.91 |
| Withheld | 1,212,684,386.77 | 3.09 |
| TOTAL | 39,189,617,060.50 | 100.00 |
| Karen B. Peetz |
| Affirmative | 38,011,822,212.28 | 96.99 |
| Withheld | 1,177,794,848.22 | 3.01 |
| TOTAL | 39,189,617,060.50 | 100.00 |
| David M. Thomas |
| Affirmative | 37,976,058,118.16 | 96.90 |
| Withheld | 1,213,558,942.34 | 3.10 |
| TOTAL | 39,189,617,060.50 | 100.00 |
| Susan Tomasky |
| Affirmative | 37,845,471,684.67 | 96.57 |
| Withheld | 1,344,145,375.83 | 3.43 |
| TOTAL | 39,189,617,060.50 | 100.00 |
| Michael E. Wiley |
| Affirmative | 37,736,569,620.69 | 96.29 |
| Withheld | 1,453,047,439.81 | 3.71 |
| TOTAL | 39,189,617,060.50 | 100.00 |
| | | |
| Proposal 1 reflects trust-wide proposal and voting results. |
Item 10: Remuneration Paid to Directors, Officers, and others of Open-End Management Investment Companies
(Unaudited)
Note: This information is disclosed as part of the financial statements for each Fund as part of Item 7: Financial Statements and Financial Highlights for Open-End Management Investment companies.
Item 11: Statement Regarding Basis for Approval of Investment Advisory Contract
(Unaudited)
Note: This is not applicable for any fund included in this document.
1.9910155.100
CPE-SANN-0325
Item 8.
Changes in and Disagreements with Accountants for Open-End Management Investment Companies
See Item 7.
Item 9.
Proxy Disclosures for Open-End Management Investment Companies
See Item 7.
Item 10.
Remuneration Paid to Directors, Officers, and Others of Open-End Management Investment Companies
See Item 7.
Item 11.
Statement Regarding Basis for Approval of Investment Advisory Contract
See Item 7.
Item 12.
Disclosure of Proxy Voting Policies and Procedures for Closed-End Management Investment Companies
Not applicable.
Item 13.
Portfolio Managers of Closed-End Management Investment Companies
Not applicable.
Item 14.
Purchases of Equity Securities by Closed-End Management Investment Company and Affiliated Purchasers
Not applicable.
Item 15.
Submission of Matters to a Vote of Security Holders
There were no material changes to the procedures by which shareholders may recommend nominees to the Fidelity Covington Trust’s Board of Trustees.
Item 16.
Controls and Procedures
(a)(i) The President and Treasurer and the Chief Financial Officer have concluded that the Fidelity Covington Trust’s (the “Trust”) disclosure controls and procedures (as defined in Rule 30a-3(c) under the Investment Company Act) provide reasonable assurances that material information relating to the Trust is made known to them by the appropriate persons, based on their evaluation of these controls and procedures as of a date within 90 days of the filing date of this report.
(a)(ii) There was no change in the Trust’s internal control over financial reporting (as defined in Rule 30a-3(d) under the Investment Company Act) that occurred during the period covered by this report that has materially affected, or is reasonably likely to materially affect, the Trust’s internal control over financial reporting.
Item 17.
Disclosure of Securities Lending Activities for Closed-End Management Investment Companies
Not applicable.
Item 18.
Recovery of Erroneously Awarded Compensation
(a)
Not applicable.
(b)
Not applicable.
Item 19.
Exhibits
SIGNATURES
Pursuant to the requirements of the Securities Exchange Act of 1934 and the Investment Company Act of 1940, the registrant has duly caused this report to be signed on its behalf by the undersigned, thereunto duly authorized.
Fidelity Covington Trust
|
By: | /s/Stacie M. Smith |
| Stacie M. Smith |
| President and Treasurer (Principal Executive Officer) |
|
|
Date: | February 21, 2025 |
Pursuant to the requirements of the Securities Exchange Act of 1934 and the Investment Company Act of 1940, this report has been signed below by the following persons on behalf of the registrant and in the capacities and on the dates indicated.
|
By: | /s/Stacie M. Smith |
| Stacie M. Smith |
| President and Treasurer (Principal Executive Officer) |
|
|
Date: | February 21, 2025 |
|
By: | /s/Stephanie Caron |
| Stephanie Caron |
| Chief Financial Officer (Principal Financial Officer) |
|
|
Date: | February 21, 2025 |