Table of Contents
UNITED STATES
SECURITIES AND EXCHANGE COMMISSION
Washington, D.C. 20549
FORM N-CSR
CERTIFIED SHAREHOLDER REPORT OF REGISTERED
MANAGEMENT INVESTMENT COMPANIES
Investment Company Act file number 811-07319
Fidelity Covington Trust
(Exact name of registrant as specified in charter)
245 Summer St., Boston, MA 02210
(Address of principal executive offices) (Zip code)
Marc Bryant, Secretary
245 Summer St.
Boston, Massachusetts 02210
(Name and address of agent for service)
Registrant’s telephone number, including area code: 617-563-7000
Date of fiscal year end: July 31
Date of reporting period: January 31, 2017
Table of Contents
| Item 1. | Reports to Stockholders |
Table of Contents
Fidelity® MSCI Consumer Discretionary Index ETF
Fidelity MSCI Consumer Staples Index ETF
Fidelity MSCI Energy Index ETF
Fidelity MSCI Financials Index ETF
Fidelity MSCI Health Care Index ETF
Fidelity MSCI Industrials Index ETF
Fidelity MSCI Information Technology Index ETF
Fidelity MSCI Materials Index ETF
Fidelity MSCI Real Estate Index ETF
Fidelity MSCI Telecommunication Services Index ETF
Fidelity MSCI Utilities Index ETF
Semiannual Report
January 31, 2017


Table of Contents
Contents
| Performance and Investment Summary | 3 | How each fund has done over time and a summary of each fund’s holdings. | ||||
| Shareholder Expense Example | 14 | An example of shareholder expenses. | ||||
| Investments | 16 | A complete list of each fund’s investments with their market values. | ||||
| Financial Statements | 56 | Statements of assets and liabilities, operations, and changes in net assets, as well as financial highlights. | ||||
| Notes | 79 | Notes to the financial statements. | ||||
| Board Approval of Investment Advisory Contracts and Management Fees | 83 | |||||
To view a fund’s proxy voting guidelines and proxy voting record for the period ended June, 30, visit http://www.fidelity.com/proxyvotingresults or visit the Securities and Exchange Commission’s (SEC) web site at http://www.sec.gov. You may also call 1-800-FIDELITY to request a free copy of the proxy voting guidelines.
The funds or securities referred to herein are not sponsored, endorsed, or promoted by MSCI, and MSCI bears no liability with respect to any such funds or securities or any index on which such funds or securities are based. The prospectus contains a more detailed description of the limited relationship MSCI has with Fidelity and any related funds.
Standard & Poor’s, S&P and S&P 500 are registered service marks of The McGraw-Hill Companies, Inc. and have been licensed for use by Fidelity Distributors Corporation.
Other third party marks appearing herein are the property of their respective owners.
All other marks appearing herein are registered or unregistered trademarks or service marks of FMR LLC or an affiliated company.
© 2017 FMR LLC. All Rights reserved.
This report and the financial statements contained herein are submitted for the general information of the shareholders of the funds. This report is not authorized for distribution to prospective investors in the funds unless preceded or accompanied by an effective prospectus.
A fund files its complete schedule of portfolio holdings with the SEC for the first and third quarters of each fiscal year on Form N-Q. Forms N-Q are available on the SEC’s web site at http://www.sec.gov. A fund’s Forms N-Q may be reviewed and copied at the SEC’s Public Reference Room in Washington, DC. Information regarding the operation of the SEC’s Public Reference Room may be obtained by calling 1-800-SEC-0330. For a complete list of a fund’s portfolio holdings, view the most recent holdings listing on Fidelity’s web site at http://www.fidelity.com, http://www.advisor.fidelity.com, or http://www.401k.com, as applicable.
NOT FDIC INSURED • MAY LOSE VALUE • NO BANK GUARANTEE
Neither the funds nor Fidelity Distributors Corporation is a bank..
| Semiannual Report | 2 |
Table of Contents
Fidelity® MSCI Consumer Discretionary Index ETF
The information provided in the tables below shows you the performance of Fidelity® MSCI Consumer Discretionary Index ETF, with comparisons over different time periods to the fund’s relevant benchmarks, including an appropriate broad-based market index. Seeing the returns over different time periods can help you assess the fund’s performance against relevant measurements. The performance information includes average annual total returns and is further explained in this section.*
The fund’s net asset value (NAV) performance is based on the NAV calculated each business day. It is calculated in accordance with the standard formula for valuing investment company shares as of the close of regular trading hours on NYSE Arca, Inc. (NYSE Arca) (normally 4:00 p.m. Eastern Time). The fund’s market price performance is based on the daily closing price of the shares of the fund on NYSE Arca. Since ETFs are bought and sold at prices set by the market – which can result in a premium or discount to NAV – the returns calculated using market price (market return) can differ from those calculated using NAV (NAV return). For information on these differences, please visit Fidelity.com or see the prospectus. The fund’s returns do not reflect the deduction of taxes that a shareholder would pay on fund distributions or the redemption or selling of fund shares. How a fund did yesterday is no guarantee of how it will do tomorrow.
Current performance may be higher or lower than the performance data quoted. For month-end performance figures, please visit fidelity.com/etfs/sector-etfs/overview or call Fidelity. The performance data featured represents past performance, which is no guarantee of future results. Investment return and principal value will fluctuate; therefore, you may have a gain or loss when you sell your shares.
| Fiscal Periods Ended January 31, 2017 | ||||||||
| Average Annual Total Returns | Past 1 Year | Life of fundA | ||||||
Fidelity MSCI Consumer Discretionary Index ETF – NAV | 17.38% | 10.42% | ||||||
Fidelity MSCI Consumer Discretionary Index ETF – Market Price | 17.49% | 10.44% | ||||||
MSCI USA IMI Consumer Discretionary Index | 17.54% | 10.57% | ||||||
S&P 500 Index | 20.04% | 10.77% | ||||||
Average annual total returns represent just that – the average return on an annual basis for Fidelity MSCI Consumer Discretionary Index ETF and the fund’s benchmarks, assuming consistent performance over the periods shown, based on the cumulative return and the length of the period. This information represents returns as of the end of the fund’s fiscal period.
| Periods Ended December 31, 2016 | ||||||||
| Average Annual Total Returns | Past 1 Year | Life of fundA | ||||||
Fidelity MSCI Consumer Discretionary Index ETF – NAV | 6.64 | % | 9.42 | % | ||||
Fidelity MSCI Consumer Discretionary Index ETF – Market Price | 6.61 | % | 9.42 | % | ||||
MSCI USA IMI Consumer Discretionary Index | 6.75 | % | 9.57 | % | ||||
S&P 500 Index | 11.96 | % | 10.43 | % | ||||
This information shows the returns of the fund and its indices for different time periods through the end of the most recent calendar quarter, as opposed to through the end of the fund’s fiscal period.
| A | From October 21, 2013. |
| * | Total returns are historical and include changes in share price and reinvestment of dividends and capital gains distributions, if any. |
The fund’s expense ratio is 0.084%. Expense ratio is the total annual operating expense ratio from the most recent prospectus. A fund’s net expenses paid may be different. Please refer to the most recent prospectus for more information on a fund’s expenses.
Investment Summary
| Top Ten Stocks as of January 31, 2017 | ||||
| % of fund’s net assets | ||||
Amazon.com, Inc. | 10.8 | |||
Comcast Corp. Class A | 5.9 | |||
The Home Depot, Inc. | 5.6 | |||
The Walt Disney Co. | 5.5 | |||
McDonald’s Corp. | 3.4 | |||
Starbucks Corp. | 2.7 | |||
The Priceline Group, Inc. | 2.5 | |||
Time Warner, Inc. | 2.5 | |||
NIKE, Inc. Class B | 2.3 | |||
Charter Communications, Inc. Class A | 2.3 | |||
|
| |||
| 43.5 | ||||
|
| |||
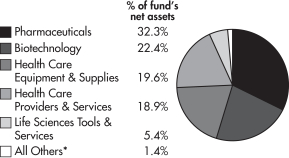
| Industries as of January 31, 2017 | ||||
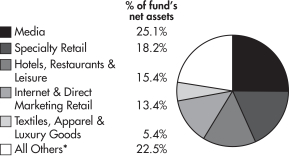
| * | Includes short-term investments and net other assets. |
| 3 | Semiannual Report |
Table of Contents
Fidelity® MSCI Consumer Staples Index ETF
Performance
The information provided in the tables below shows you the performance of Fidelity® MSCI Consumer Staples Index ETF, with comparisons over different time periods to the fund’s relevant benchmarks, including an appropriate broad-based market index. Seeing the returns over different time periods can help you assess the fund’s performance against relevant measurements. The performance information includes average annual total returns and is further explained in this section.*
The fund’s net asset value (NAV) performance is based on the NAV calculated each business day. It is calculated in accordance with the standard formula for valuing investment company shares as of the close of regular trading hours on NYSE Arca, Inc. (NYSE Arca) (normally 4:00 p.m. Eastern Time). The fund’s market price performance is based on the daily closing price of the shares of the fund on NYSE Arca. Since ETFs are bought and sold at prices set by the market – which can result in a premium or discount to NAV – the returns calculated using market price (market return) can differ from those calculated using NAV (NAV return). For information on these differences, please visit Fidelity.com or see the prospectus. The fund’s returns do not reflect the deduction of taxes that a shareholder would pay on fund distributions or the redemption or selling of fund shares. How a fund did yesterday is no guarantee of how it will do tomorrow.
Current performance may be higher or lower than the performance data quoted. For month-end performance figures, please visit fidelity.com/etfs/sector-etfs/overview or call Fidelity. The performance data featured represents past performance, which is no guarantee of future results. Investment return and principal value will fluctuate; therefore, you may have a gain or loss when you sell your shares.
| Fiscal Periods Ended January 31, 2017 | ||||||||
| Average Annual Total Returns | Past 1 Year | Life of fundA | ||||||
Fidelity MSCI Consumer Staples Index ETF – NAV | 7.02% | 10.17% | ||||||
Fidelity MSCI Consumer Staples Index ETF – Market Price | 6.99% | 10.17% | ||||||
MSCI USA IMI Consumer Staples Index | 7.22% | 10.35% | ||||||
S&P 500 Index | 20.04% | 10.77% | ||||||
Average annual total returns represent just that – the average return on an annual basis for Fidelity MSCI Consumer Staples Index ETF and the fund’s benchmarks, assuming consistent performance over the periods shown, based on the cumulative return and the length of the period. This information represents returns as of the end of the fund’s fiscal period.
| Periods Ended December 31, 2016 | ||||||||
| Average Annual Total Returns | Past 1 Year | Life of fundA | ||||||
Fidelity MSCI Consumer Staples Index ETF – NAV | 5.92% | 10.00% | ||||||
Fidelity MSCI Consumer Staples Index ETF – Market Price | 5.78% | 9.99% | ||||||
MSCI USA IMI Consumer Staples Index | 6.11% | 10.17% | ||||||
S&P 500 Index | 11.96% | 10.43% | ||||||
This information shows the returns of the fund and its indices for different time periods through the end of the most recent calendar quarter, as opposed to through the end of the fund’s fiscal period.
| A | From October 21, 2013. |
| * | Total returns are historical and include changes in share price and reinvestment of dividends and capital gains distributions, if any. |
The fund’s expense ratio is 0.084%. Expense ratio is the total annual operating expense ratio from the most recent prospectus. A fund’s net expenses paid may be different. Please refer to the most recent prospectus for more information on a fund’s expenses.
Investment Summary
| Top Ten Stocks as of January 31, 2017 | ||||
| % of fund’s net assets | ||||
The Procter & Gamble Co. | 11.2 | |||
The Coca-Cola Co. | 8.5 | |||
PepsiCo, Inc. | 7.5 | |||
Philip Morris International, Inc. | 7.5 | |||
Altria Group, Inc. | 7.0 | |||
Wal-Mart Stores, Inc. | 5.2 | |||
CVS Health Corp. | 4.2 | |||
Walgreens Boots Alliance, Inc. | 3.8 | |||
Costco Wholesale Corp. | 3.6 | |||
Mondelez International, Inc. Class A | 3.4 | |||
|
| |||
| 61.9 | ||||
|
| |||
| Industries as of January 31, 2017 | ||||
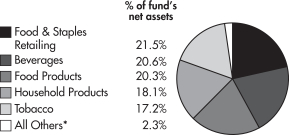
| * | Includes short-term investments and net other assets. |
| Semiannual Report | 4 |
Table of Contents
Fidelity® MSCI Energy Index ETF
Performance
The information provided in the tables below shows you the performance of Fidelity® MSCI Energy Index ETF, with comparisons over different time periods to the fund’s relevant benchmarks, including an appropriate broad-based market index. Seeing the returns over different time periods can help you assess the fund’s performance against relevant measurements. The performance information includes average annual total returns and is further explained in this section.*
The fund’s net asset value (NAV) performance is based on the NAV calculated each business day. It is calculated in accordance with the standard formula for valuing investment company shares as of the close of regular trading hours on NYSE Arca, Inc. (NYSE Arca) (normally 4:00 p.m. Eastern Time). The fund’s market price performance is based on the daily closing price of the shares of the fund on NYSE Arca. Since ETFs are bought and sold at prices set by the market – which can result in a premium or discount to NAV – the returns calculated using market price (market return) can differ from those calculated using NAV (NAV return). For information on these differences, please visit Fidelity.com or see the prospectus. The fund’s returns do not reflect the deduction of taxes that a shareholder would pay on fund distributions or the redemption or selling of fund shares. How a fund did yesterday is no guarantee of how it will do tomorrow.
Current performance may be higher or lower than the performance data quoted. For month-end performance figures, please visit fidelity.com/etfs/sector-etfs/overview or call Fidelity. The performance data featured represents past performance, which is no guarantee of future results. Investment return and principal value will fluctuate; therefore, you may have a gain or loss when you sell your shares.
| Fiscal Periods Ended January 31, 2017 | ||||||||
| Average Annual Total Returns | Past 1 Year | Life of fundA | ||||||
Fidelity MSCI Energy Index ETF – NAV | 27.47% | -3.80% | ||||||
Fidelity MSCI Energy Index ETF – Market Price | 27.53% | -3.79% | ||||||
MSCI USA IMI Energy Index | 27.90% | -3.69% | ||||||
S&P 500 Index | 20.04% | 10.77% | ||||||
Average annual total returns represent just that – the average return on an annual basis for Fidelity MSCI Energy Index ETF and the fund’s benchmarks, assuming consistent performance over the periods shown, based on the cumulative return and the length of the period. This information represents returns as of the end of the fund’s fiscal period.
| Periods Ended December 31, 2016 | ||||||||
| Average Annual Total Returns | Past 1 Year | Life of fundA | ||||||
Fidelity MSCI Energy Index ETF – NAV | 27.03% | -2.87% | ||||||
Fidelity MSCI Energy Index ETF – Market Price | 26.96% | -2.87% | ||||||
MSCI USA IMI Energy Index | 27.47% | -2.76% | ||||||
S&P 500 Index | 11.96% | 10.43% | ||||||
This information shows the returns of the fund and its indices for different time periods through the end of the most recent calendar quarter, as opposed to through the end of the fund’s fiscal period.
| A | From October 21, 2013. |
| * | Total returns are historical and include changes in share price and reinvestment of dividends and capital gains distributions, if any. |
The fund’s expense ratio is 0.084%. Expense ratio is the total annual operating expense ratio from the most recent prospectus. A fund’s net expenses paid may be different. Please refer to the most recent prospectus for more information on a fund’s expenses.
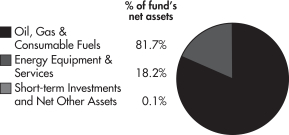
Investment Summary
| Top Ten Stocks as of January 31, 2017 | ||||
| % of fund’s net assets | ||||
Exxon Mobil Corp. | 21.7 | |||
Chevron Corp. | 13.1 | |||
Schlumberger Ltd. | 7.3 | |||
ConocoPhillips | 3.8 | |||
EOG Resources, Inc. | 3.6 | |||
Occidental Petroleum Corp. | 3.2 | |||
Halliburton Co. | 3.0 | |||
Kinder Morgan, Inc. | 2.6 | |||
Anadarko Petroleum Corp. | 2.4 | |||
Phillips 66 | 2.4 | |||
|
| |||
| 63.1 | ||||
|
| |||
| Industries as of January 31, 2017 | ||||
| 5 | Semiannual Report |
Table of Contents
Fidelity® MSCI Financials Index ETF
Performance
The information provided in the tables below shows you the performance of Fidelity® MSCI Financials Index ETF, with comparisons over different time periods to the fund’s relevant benchmarks, including an appropriate broad-based market index. Seeing the returns over different time periods can help you assess the fund’s performance against relevant measurements. The performance information includes average annual total returns and is further explained in this section.*
The fund’s net asset value (NAV) performance is based on the NAV calculated each business day. It is calculated in accordance with the standard formula for valuing investment company shares as of the close of regular trading hours on NYSE Arca, Inc. (NYSE Arca) (normally 4:00 p.m. Eastern Time). The fund’s market price performance is based on the daily closing price of the shares of the fund on NYSE Arca. Since ETFs are bought and sold at prices set by the market – which can result in a premium or discount to NAV – the returns calculated using market price (market return) can differ from those calculated using NAV (NAV return). For information on these differences, please visit Fidelity.com or see the prospectus. The fund’s returns do not reflect the deduction of taxes that a shareholder would pay on fund distributions or the redemption or selling of fund shares. How a fund did yesterday is no guarantee of how it will do tomorrow.
Current performance may be higher or lower than the performance data quoted. For month-end performance figures, please visit fidelity.com/etfs/sector-etfs/overview or call Fidelity. The performance data featured represents past performance, which is no guarantee of future results. Investment return and principal value will fluctuate; therefore, you may have a gain or loss when you sell your shares.
| Fiscal Periods Ended January 31, 2017 | ||||||||
| Average Annual Total Returns | Past 1 Year | Life of fundA | ||||||
Fidelity MSCI Financials Index ETF – NAV | 36.51% | 12.68% | ||||||
Fidelity MSCI Financials Index ETF – Market Price | 36.64% | 12.70% | ||||||
MSCI USA IMI Financials Index | 36.76% | 12.82% | ||||||
S&P 500 Index | 20.04% | 10.77% | ||||||
Average annual total returns represent just that – the average return on an annual basis for Fidelity MSCI Financials Index ETF and the fund’s benchmarks, assuming consistent performance over the periods shown, based on the cumulative return and the length of the period. This information represents returns as of the end of the fund’s fiscal period.
| Periods Ended December 31, 2016 | ||||||||
| Average Annual Total Returns | Past 1 Year | Life of fundA | ||||||
Fidelity MSCI Financials Index ETF – NAV | 24.74% | 12.96% | ||||||
Fidelity MSCI Financials Index ETF – Market Price | 24.84% | 13.00% | ||||||
MSCI USA IMI Financials Index | 24.93% | 13.09% | ||||||
S&P 500 Index | 11.96% | 10.43% | ||||||
This information shows the returns of the fund and its indices for different time periods through the end of the most recent calendar quarter, as opposed to through the end of the fund’s fiscal period.
| A | From October 21, 2013. |
| * | Total returns are historical and include changes in share price and reinvestment of dividends and capital gains distributions, if any. |
The fund’s expense ratio is 0.084%. Expense ratio is the total annual operating expense ratio from the most recent prospectus. A fund’s net expenses paid may be different. Please refer to the most recent prospectus for more information on a fund’s expenses.
Investment Summary
| Top Ten Stocks as of January 31, 2017 | ||||
| % of fund’s net assets | ||||
JPMorgan Chase & Co. | 8.7 | |||
Wells Fargo & Co. | 7.7 | |||
Bank of America Corp. | 6.6 | |||
Berkshire Hathaway, Inc. Class B | 5.7 | |||
Citigroup, Inc. | 4.6 | |||
US Bancorp | 2.6 | |||
The Goldman Sachs Group, Inc. | 2.4 | |||
American International Group, Inc. | 1.9 | |||
Chubb Ltd. | 1.7 | |||
Morgan Stanley | 1.7 | |||
|
| |||
| 43.6 | ||||
|
| |||
| Industries as of January 31, 2017 | ||||
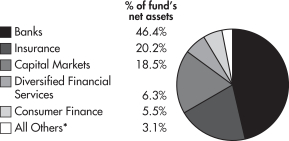
| * | Includes short-term investments and net other assets. |
| Semiannual Report | 6 |
Table of Contents
Fidelity® MSCI Health Care Index ETF
Performance
The information provided in the tables below shows you the performance of Fidelity® MSCI Health Care Index ETF, with comparisons over different time periods to the fund’s relevant benchmarks, including an appropriate broad-based market index. Seeing the returns over different time periods can help you assess the fund’s performance against relevant measurements. The performance information includes average annual total returns and is further explained in this section.*
The fund’s net asset value (NAV) performance is based on the NAV calculated each business day. It is calculated in accordance with the standard formula for valuing investment company shares as of the close of regular trading hours on NYSE Arca, Inc. (NYSE Arca) (normally 4:00 p.m. Eastern Time). The fund’s market price performance is based on the daily closing price of the shares of the fund on NYSE Arca. Since ETFs are bought and sold at prices set by the market – which can result in a premium or discount to NAV – the returns calculated using market price (market return) can differ from those calculated using NAV (NAV return). For information on these differences, please visit Fidelity.com or see the prospectus. The fund’s returns do not reflect the deduction of taxes that a shareholder would pay on fund distributions or the redemption or selling of fund shares. How a fund did yesterday is no guarantee of how it will do tomorrow.
Current performance may be higher or lower than the performance data quoted. For month-end performance figures, please visit fidelity.com/etfs/sector-etfs/overview or call Fidelity. The performance data featured represents past performance, which is no guarantee of future results. Investment return and principal value will fluctuate; therefore, you may have a gain or loss when you sell your shares.
| Fiscal Periods Ended January 31, 2017 | ||||||||
| Average Annual Total Returns | Past 1 Year | Life of fundA | ||||||
Fidelity MSCI Health Care Index ETF – NAV | 9.43% | 11.26% | ||||||
Fidelity MSCI Health Care Index ETF – Market Price | 9.37% | 11.22% | ||||||
MSCI USA IMI Health Care Index | 9.51% | 11.39% | ||||||
S&P 500 Index | 20.04% | 10.77% | ||||||
Average annual total returns represent just that – the average return on an annual basis for Fidelity MSCI Health Care Index ETF and the fund’s benchmarks, assuming consistent performance over the periods shown, based on the cumulative return and the length of the period. This information represents returns as of the end of the fund’s fiscal period.
| Periods Ended December 31, 2016 | ||||||||
| Average Annual Total Returns | Past 1 Year | Life of fundA | ||||||
Fidelity MSCI Health Care Index ETF – NAV | -3.33% | 10.62% | ||||||
Fidelity MSCI Health Care Index ETF – Market Price | -3.38% | 10.62% | ||||||
MSCI USA IMI Health Care Index | -3.28% | 10.75% | ||||||
S&P 500 Index | 11.96% | 10.43% | ||||||
This information shows the returns of the fund and its indices for different time periods through the end of the most recent calendar quarter, as opposed to through the end of the fund’s fiscal period.
| A | From October 21, 2013. |
| * | Total returns are historical and include changes in share price and reinvestment of dividends and capital gains distributions, if any. |
The fund’s expense ratio is 0.084%. Expense ratio is the total annual operating expense ratio from the most recent prospectus. A fund’s net expenses paid may be different. Please refer to the most recent prospectus for more information on a fund’s expenses.
Investment Summary
| Top Ten Stocks as of January 31, 2017 | ||||
| % of fund’s net assets | ||||
Johnson & Johnson | 9.8 | |||
Pfizer, Inc. | 6.1 | |||
Merck & Co., Inc. | 5.4 | |||
UnitedHealth Group, Inc. | 4.9 | |||
Amgen, Inc. | 3.7 | |||
Medtronic PLC | 3.4 | |||
AbbVie, Inc. | 3.2 | |||
Gilead Sciences, Inc. | 3.0 | |||
Celgene Corp. | 2.9 | |||
Allergan PLC | 2.8 | |||
|
| |||
| 45.2 | ||||
|
| |||
| Industries as of January 31, 2017 | ||||
| * | Includes short-term investments and net other assets. |
| 7 | Semiannual Report |
Table of Contents
Fidelity® MSCI Industrials Index ETF
Performance
The information provided in the tables below shows you the performance of Fidelity® MSCI Industrials Index ETF, with comparisons over different time periods to the fund’s relevant benchmarks, including an appropriate broad-based market index. Seeing the returns over different time periods can help you assess the fund’s performance against relevant measurements. The performance information includes average annual total returns and is further explained in this section.*
The fund’s net asset value (NAV) performance is based on the NAV calculated each business day. It is calculated in accordance with the standard formula for valuing investment company shares as of the close of regular trading hours on NYSE Arca, Inc. (NYSE Arca) (normally 4:00 p.m. Eastern Time). The fund’s market price performance is based on the daily closing price of the shares of the fund on NYSE Arca. Since ETFs are bought and sold at prices set by the market – which can result in a premium or discount to NAV – the returns calculated using market price (market return) can differ from those calculated using NAV (NAV return). For information on these differences, please visit Fidelity.com or see the prospectus. The fund’s returns do not reflect the deduction of taxes that a shareholder would pay on fund distributions or the redemption or selling of fund shares. How a fund did yesterday is no guarantee of how it will do tomorrow.
Current performance may be higher or lower than the performance data quoted. For month-end performance figures, please visit fidelity.com/etfs/sector-etfs/overview or call Fidelity. The performance data featured represents past performance, which is no guarantee of future results. Investment return and principal value will fluctuate; therefore, you may have a gain or loss when you sell your shares.
| Fiscal Periods Ended January 31, 2017 | ||||||||
| Average Annual Total Returns | Past 1 Year | Life of fundA | ||||||
Fidelity MSCI Industrials Index ETF – NAV | 30.48% | 10.20% | ||||||
Fidelity MSCI Industrials Index ETF – Market Price | 30.49% | 10.19% | ||||||
MSCI USA IMI Industrials Index | 30.67% | 10.32% | ||||||
S&P 500 Index | 20.04% | 10.77% | ||||||
Average annual total returns represent just that – the average return on an annual basis for Fidelity MSCI Industrials Index ETF and the fund’s benchmarks, assuming consistent performance over the periods shown, based on the cumulative return and the length of the period. This information represents returns as of the end of the fund’s fiscal period.
| Periods Ended December 31, 2016 | ||||||||
| Average Annual Total Returns | Past 1 Year | Life of fundA | ||||||
Fidelity MSCI Industrials Index ETF – NAV | 20.68% | 9.91% | ||||||
Fidelity MSCI Industrials Index ETF – Market Price | 20.51% | 9.90% | ||||||
MSCI USA IMI Industrials Index | 20.85% | 10.04% | ||||||
S&P 500 Index | 11.96% | 10.43% | ||||||
This information shows the returns of the fund and its indices for different time periods through the end of the most recent calendar quarter, as opposed to through the end of the fund’s fiscal period.
| A | From October 21, 2013. |
| * | Total returns are historical and include changes in share price and reinvestment of dividends and capital gains distributions, if any. |
The fund’s expense ratio is 0.084%. Expense ratio is the total annual operating expense ratio from the most recent prospectus. A fund’s net expenses paid may be different. Please refer to the most recent prospectus for more information on a fund’s expenses.
Investment Summary
| Top Ten Stocks as of January 31, 2017 | ||||
| % of fund’s net assets | ||||
General Electric Co. | 10.6 | |||
3M Co. | 4.2 | |||
The Boeing Co. | 3.9 | |||
Union Pacific Corp. | 3.6 | |||
United Technologies Corp. | 3.5 | |||
Honeywell International, Inc. | 3.4 | |||
United Parcel Service, Inc. Class B | 3.0 | |||
Lockheed Martin Corp. | 2.7 | |||
Caterpillar, Inc. | 2.2 | |||
FedEx Corp. | 1.9 | |||
|
| |||
| 39.0 | ||||
|
| |||
| Industries as of January 31, 2017 | ||
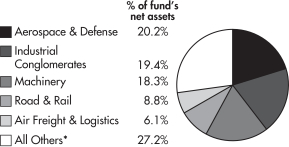
| * | Includes short-term investments and net other assets. |
| Semiannual Report | 8 |
Table of Contents
Fidelity® MSCI Information Technology Index ETF
Performance
The information provided in the tables below shows you the performance of Fidelity® MSCI Information Technology Index ETF, with comparisons over different time periods to the fund’s relevant benchmarks, including an appropriate broad-based market index. Seeing the returns over different time periods can help you assess the fund’s performance against relevant measurements. The performance information includes average annual total returns and is further explained in this section.*
The fund’s net asset value (NAV) performance is based on the NAV calculated each business day. It is calculated in accordance with the standard formula for valuing investment company shares as of the close of regular trading hours on NYSE Arca, Inc. (NYSE Arca) (normally 4:00 p.m. Eastern Time). The fund’s market price performance is based on the daily closing price of the shares of the fund on NYSE Arca. Since ETFs are bought and sold at prices set by the market – which can result in a premium or discount to NAV – the returns calculated using market price (market return) can differ from those calculated using NAV (NAV return). For information on these differences, please visit Fidelity.com or see the prospectus. The fund’s returns do not reflect the deduction of taxes that a shareholder would pay on fund distributions or the redemption or selling of fund shares. How a fund did yesterday is no guarantee of how it will do tomorrow.
Current performance may be higher or lower than the performance data quoted. For month-end performance figures, please visit fidelity.com/etfs/sector-etfs/overview or call Fidelity. The performance data featured represents past performance, which is no guarantee of future results. Investment return and principal value will fluctuate; therefore, you may have a gain or loss when you sell your shares.
| Fiscal Periods Ended January 31, 2017 | ||||||||
| Average Annual Total Returns | Past 1 Year | Life of fundA | ||||||
Fidelity MSCI Information Technology Index ETF – NAV | 25.96% | 15.15% | ||||||
Fidelity MSCI Information Technology Index ETF – Market Price | 26.08% | 15.15% | ||||||
MSCI USA IMI Information Technology Index | 26.10% | 15.27% | ||||||
S&P 500 Index | 20.04% | 10.77% | ||||||
Average annual total returns represent just that – the average return on an annual basis for Fidelity MSCI Information Technology Index ETF and the fund’s benchmarks, assuming consistent performance over the periods shown, based on the cumulative return and the length of the period. This information represents returns as of the end of the fund’s fiscal period.
| Periods Ended December 31, 2016 | ||||||||
| Average Annual Total Returns | Past 1 Year | Life of fundA | ||||||
Fidelity MSCI Information Technology Index ETF – NAV | 13.80% | 14.05% | ||||||
Fidelity MSCI Information Technology Index ETF – Market Price | 13.98% | 14.12% | ||||||
MSCI USA IMI Information Technology Index | 13.90% | 14.16% | ||||||
S&P 500 Index | 11.96% | 10.43% | ||||||
This information shows the returns of the fund and its indices for different time periods through the end of the most recent calendar quarter, as opposed to through the end of the fund’s fiscal period.
| A | From October 21, 2013. |
| * | Total returns are historical and include changes in share price and reinvestment of dividends and capital gains distributions, if any. |
The fund’s expense ratio is 0.084%. Expense ratio is the total annual operating expense ratio from the most recent prospectus. A fund’s net expenses paid may be different. Please refer to the most recent prospectus for more information on a fund’s expenses.
Investment Summary
| Top Ten Stocks as of January 31, 2017 | ||||
| % of fund’s net assets | ||||
Apple, Inc. | 13.3 | |||
Microsoft Corp. | 9.7 | |||
Facebook, Inc. Class A | 6.2 | |||
Alphabet, Inc. Class C | 5.0 | |||
Alphabet, Inc. Class A | 4.9 | |||
Intel Corp. | 3.5 | �� | ||
International Business Machines Corp. | 3.2 | |||
Visa, Inc. Class A | 3.2 | |||
Cisco Systems, Inc. | 3.2 | |||
Oracle Corp. | 2.5 | |||
|
| |||
| 54.7 | ||||
|
| |||
| Industries as of January 31, 2017 | ||
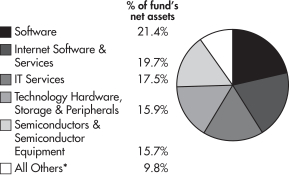
| * | Includes short-term investments and net other assets. |
| 9 | Semiannual Report |
Table of Contents
Fidelity® MSCI Materials Index ETF
Performance
The information provided in the tables below shows you the performance of Fidelity® MSCI Materials Index ETF, with comparisons over different time periods to the fund’s relevant benchmarks, including an appropriate broad-based market index. Seeing the returns over different time periods can help you assess the fund’s performance against relevant measurements. The performance information includes average annual total returns and is further explained in this section.*
The fund’s net asset value (NAV) performance is based on the NAV calculated each business day. It is calculated in accordance with the standard formula for valuing investment company shares as of the close of regular trading hours on NYSE Arca, Inc. (NYSE Arca) (normally 4:00 p.m. Eastern Time). The fund’s market price performance is based on the daily closing price of the shares of the fund on NYSE Arca. Since ETFs are bought and sold at prices set by the market – which can result in a premium or discount to NAV – the returns calculated using market price (market return) can differ from those calculated using NAV (NAV return). For information on these differences, please visit Fidelity.com or see the prospectus. The fund’s returns do not reflect the deduction of taxes that a shareholder would pay on fund distributions or the redemption or selling of fund shares. How a fund did yesterday is no guarantee of how it will do tomorrow.
Current performance may be higher or lower than the performance data quoted. For month-end performance figures, please visit fidelity.com/etfs/sector-etfs/overview or call Fidelity. The performance data featured represents past performance, which is no guarantee of future results. Investment return and principal value will fluctuate; therefore, you may have a gain or loss when you sell your shares.
| Fiscal Periods Ended January 31, 2017 | ||||||||
| Average Annual Total Returns | Past 1 Year | Life of fundA | ||||||
Fidelity MSCI Materials Index ETF – NAV | 41.22% | 7.92% | ||||||
Fidelity MSCI Materials Index ETF – Market Price | 41.44% | 7.95% | ||||||
MSCI USA IMI Materials Index | 41.42% | 8.00% | ||||||
S&P 500 Index | 20.04% | 10.77% | ||||||
Average annual total returns represent just that – the average return on an annual basis for Fidelity MSCI Materials Index ETF and the fund’s benchmarks, assuming consistent performance over the periods shown, based on the cumulative return and the length of the period. This information represents returns as of the end of the fund’s fiscal period.
| Periods Ended December 31, 2016 | ||||||||
| Average Annual Total Returns | Past 1 Year | Life of fundA | ||||||
Fidelity MSCI Materials Index ETF – NAV | 21.46% | 6.62% | ||||||
Fidelity MSCI Materials Index ETF – Market Price | 21.07% | 6.61% | ||||||
MSCI USA IMI Materials Index | 21.59% | 6.69% | ||||||
S&P 500 Index | 11.96% | 10.43% | ||||||
This information shows the returns of the fund and its indices for different time periods through the end of the most recent calendar quarter, as opposed to through the end of the fund’s fiscal period.
| A | From October 21, 2013. |
| * | Total returns are historical and include changes in share price and reinvestment of dividends and capital gains distributions, if any. |
The fund’s expense ratio is 0.084%. Expense ratio is the total annual operating expense ratio from the most recent prospectus. A fund’s net expenses paid may be different. Please refer to the most recent prospectus for more information on a fund’s expenses.
Investment Summary
| Top Ten Stocks as of January 31, 2017 | ||||
| % of fund’s net assets | ||||
The Dow Chemical Co. | 8.2 | |||
EI du Pont de Nemours & Co. | 8.1 | |||
Monsanto Co. | 5.8 | |||
Praxair, Inc. | 4.2 | |||
LyondellBasell Industries N.V. Class A | 4.0 | |||
Ecolab, Inc. | 3.9 | |||
Air Products & Chemicals, Inc. | 3.5 | |||
PPG Industries, Inc. | 3.3 | |||
The Sherwin-Williams Co. | 2.9 | |||
International Paper Co. | 2.7 | |||
|
| |||
| 46.6 | ||||
|
| |||
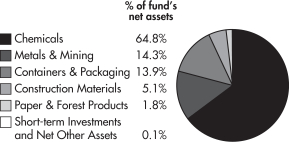
| Industries as of January 31, 2017 | ||
| Semiannual Report | 10 |
Table of Contents
Fidelity® MSCI Real Estate Index ETF
Performance
The information provided in the tables below shows you the performance of Fidelity® MSCI Real Estate Index ETF, with comparisons over different time periods to the fund’s relevant benchmarks, including an appropriate broad-based market index. Seeing the returns over different time periods can help you assess the fund’s performance against relevant measurements. The performance information includes average annual total returns and is further explained in this section.*
The fund’s net asset value (NAV) performance is based on the NAV calculated each business day. It is calculated in accordance with the standard formula for valuing investment company shares as of the close of regular trading hours on NYSE Arca, Inc. (NYSE Arca) (normally 4:00 p.m. Eastern Time). The fund’s market price performance is based on the daily closing price of the shares of the fund on NYSE Arca. Since ETFs are bought and sold at prices set by the market – which can result in a premium or discount to NAV – the returns calculated using market price (market return) can differ from those calculated using NAV (NAV return). For information on these differences, please visit Fidelity.com or see the prospectus. The fund’s returns do not reflect the deduction of taxes that a shareholder would pay on fund distributions or the redemption or selling of fund shares. How a fund did yesterday is no guarantee of how it will do tomorrow.
Current performance may be higher or lower than the performance data quoted. For month-end performance figures, please visit fidelity.com/etfs/sector-etfs/overview or call Fidelity. The performance data featured represents past performance, which is no guarantee of future results. Investment return and principal value will fluctuate; therefore, you may have a gain or loss when you sell your shares.
| Fiscal Periods Ended January 31, 2017 | ||||||||
| Average Annual Total Returns | Past 1 Year | Life of fundA | ||||||
Fidelity MSCI Real Estate Index ETF – NAV | 12.64% | 2.15% | ||||||
Fidelity MSCI Real Estate Index ETF – Market Price | 12.43% | 2.16% | ||||||
MSCI USA IMI Real Estate Index | 12.85% | 2.17% | ||||||
S&P 500 Index | 20.04% | 8.51% | ||||||
Average annual total returns represent just that – the average return on an annual basis for Fidelity MSCI Real Estate Index ETF and the fund’s benchmarks, assuming consistent performance over the periods shown, based on the cumulative return and the length of the period. This information represents returns as of the end of the fund’s fiscal period.
| Periods Ended December 31, 2016 | ||||||||
| Average Annual Total Returns | Past 1 Year | Life of fundA | ||||||
Fidelity MSCI Real Estate Index ETF – NAV | 8.06% | 2.20% | ||||||
Fidelity MSCI Real Estate Index ETF – Market Price | 7.86% | 2.28% | ||||||
MSCI USA IMI Real Estate Index | 8.19% | 2.22% | ||||||
S&P 500 Index | 11.96% | 7.84% | ||||||
This information shows the returns of the fund and its indices for different time periods through the end of the most recent calendar quarter, as opposed to through the end of the fund’s fiscal period.
| A | From February 2, 2015. |
| * | Total returns are historical and include changes in share price and reinvestment of dividends and capital gains distributions, if any. |
The fund’s expense ratio is 0.084%. Expense ratio is the total annual operating expense ratio from the most recent prospectus. A fund’s net expenses paid may be different. Please refer to the most recent prospectus for more information on a fund’s expenses.
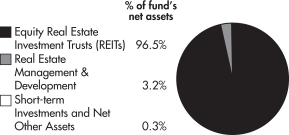
Investment Summary
| Top Ten Stocks as of January 31, 2017 | ||||
| % of fund’s net assets | ||||
Simon Property Group, Inc. | 6.0 | |||
American Tower Corp. | 4.6 | |||
Public Storage | 3.3 | |||
Crown Castle International Corp. | 3.1 | |||
Equinix, Inc. | 2.8 | |||
Prologis, Inc. | 2.7 | |||
AvalonBay Communities, Inc. | 2.5 | |||
Welltower, Inc. | 2.4 | |||
Weyerhaeuser Co. | 2.4 | |||
Equity Residential | 2.3 | |||
|
| |||
| 32.1 | ||||
|
| |||
| Industries as of January 31, 2017 | ||
| 11 | Semiannual Report |
Table of Contents
Fidelity® MSCI Telecommunication Services Index ETF
Performance
The information provided in the tables below shows you the performance of Fidelity® MSCI Telecommunication Services Index ETF, with comparisons over different time periods to the fund’s relevant benchmarks, including an appropriate broad-based market index. Seeing the returns over different time periods can help you assess the fund’s performance against relevant measurements. The performance information includes average annual total returns and is further explained in this section.*
The fund’s net asset value (NAV) performance is based on the NAV calculated each business day. It is calculated in accordance with the standard formula for valuing investment company shares as of the close of regular trading hours on NYSE Arca, Inc. (NYSE Arca) (normally 4:00 p.m. Eastern Time). The fund’s market price performance is based on the daily closing price of the shares of the fund on NYSE Arca. Since ETFs are bought and sold at prices set by the market – which can result in a premium or discount to NAV – the returns calculated using market price (market return) can differ from those calculated using NAV (NAV return). For information on these differences, please visit Fidelity.com or see the prospectus. The fund’s returns do not reflect the deduction of taxes that a shareholder would pay on fund distributions or the redemption or selling of fund shares. How a fund did yesterday is no guarantee of how it will do tomorrow.
Current performance may be higher or lower than the performance data quoted. For month-end performance figures, please visit fidelity.com/etfs/sector-etfs/overview or call Fidelity. The performance data featured represents past performance, which is no guarantee of future results. Investment return and principal value will fluctuate; therefore, you may have a gain or loss when you sell your shares.
| Fiscal Periods Ended January 31, 2017 | ||||||||
| Average Annual Total Returns | Past 1 Year | Life of fundA | ||||||
Fidelity MSCI Telecommunication Services Index ETF – NAV | 21.82% | 10.43% | ||||||
Fidelity MSCI Telecommunication Services Index ETF – Market Price | 21.74% | 10.42% | ||||||
MSCI USA IMI Telecommunication Services 25/50 Index | 22.12% | 10.47% | ||||||
S&P 500 Index | 20.04% | 10.77% | ||||||
Average annual total returns represent just that – the average return on an annual basis for Fidelity MSCI Telecommunication Services Index ETF and the fund’s benchmarks, assuming consistent performance over the periods shown, based on the cumulative return and the length of the period. This information represents returns as of the end of the fund’s fiscal period.
| Periods Ended December 31, 2016 | ||||||||
| Average Annual Total Returns | Past 1 Year | Life of fundA | ||||||
Fidelity MSCI Telecommunication Services Index ETF – NAV | 23.15% | 10.58% | ||||||
Fidelity MSCI Telecommunication Services Index ETF – Market Price | 23.04% | 10.61% | ||||||
MSCI USA IMI Telecommunication Services 25/50 Index | 23.39% | 10.60% | ||||||
S&P 500 Index | 11.96% | 10.43% | ||||||
This information shows the returns of the fund and its indices for different time periods through the end of the most recent calendar quarter, as opposed to through the end of the fund’s fiscal period.
| A | From October 21, 2013. |
| * | Total returns are historical and include changes in share price and reinvestment of dividends and capital gains distributions, if any. |
The fund’s expense ratio is 0.084%. Expense ratio is the total annual operating expense ratio from the most recent prospectus. A fund’s net expenses paid may be different. Please refer to the most recent prospectus for more information on a fund’s expenses.
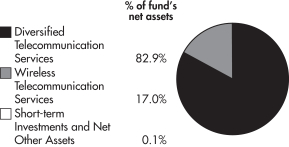
Investment Summary
| Top Ten Stocks as of January 31, 2017 | ||||
| % of fund’s net assets | ||||
AT&T, Inc. | 23.1 | |||
Verizon Communications, Inc. | 20.7 | |||
T-Mobile US, Inc. | 4.7 | |||
Level 3 Communications, Inc. | 4.5 | |||
SBA Communications Corp. | 3.5 | |||
CenturyLink, Inc. | 3.4 | |||
Sprint Corp. | 2.9 | |||
Telephone & Data Systems, Inc. | 1.9 | |||
Straight Path Communications, Inc. | 1.8 | |||
Cogent Communications Holdings, Inc. | 1.8 | |||
|
| |||
| 68.3 | ||||
|
| |||
| Industries as of January 31, 2017 | ||
| Semiannual Report | 12 |
Table of Contents
Fidelity® MSCI Utilities Index ETF
Performance
The information provided in the tables below shows you the performance of Fidelity® MSCI Utilities Index ETF, with comparisons over different time periods to the fund’s relevant benchmarks, including an appropriate broad-based market index. Seeing the returns over different time periods can help you assess the fund’s performance against relevant measurements. The performance information includes average annual total returns and is further explained in this section.*
The fund’s net asset value (NAV) performance is based on the NAV calculated each business day. It is calculated in accordance with the standard formula for valuing investment company shares as of the close of regular trading hours on NYSE Arca, Inc. (NYSE Arca) (normally 4:00 p.m. Eastern Time). The fund’s market price performance is based on the daily closing price of the shares of the fund on NYSE Arca. Since ETFs are bought and sold at prices set by the market – which can result in a premium or discount to NAV – the returns calculated using market price (market return) can differ from those calculated using NAV (NAV return). For information on these differences, please visit Fidelity.com or see the prospectus. The fund’s returns do not reflect the deduction of taxes that a shareholder would pay on fund distributions or the redemption or selling of fund shares. How a fund did yesterday is no guarantee of how it will do tomorrow.
Current performance may be higher or lower than the performance data quoted. For month-end performance figures, please visit fidelity.com/etfs/sector-etfs/overview or call Fidelity. The performance data featured represents past performance, which is no guarantee of future results. Investment return and principal value will fluctuate; therefore, you may have a gain or loss when you sell your shares.
| Fiscal Periods Ended January 31, 2017 | ||||||||
| Average Annual Total Returns | Past 1 Year | Life of fundA | ||||||
Fidelity MSCI Utilities Index ETF – NAV | 13.56% | 11.76% | ||||||
Fidelity MSCI Utilities Index ETF – Market Price | 13.48% | 11.76% | ||||||
MSCI USA IMI Utilities Index | 13.78% | 11.93% | ||||||
S&P 500 Index | 20.04% | 10.77% | ||||||
Average annual total returns represent just that – the average return on an annual basis for Fidelity MSCI Utilities Index ETF and the fund’s benchmarks, assuming consistent performance over the periods shown, based on the cumulative return and the length of the period. This information represents returns as of the end of the fund’s fiscal period.
| Periods Ended December 31, 2016 | ||||||||
| Average Annual Total Returns | Past 1 Year | Life of fundA | ||||||
Fidelity MSCI Utilities Index ETF – NAV | 17.42% | 11.67% | ||||||
Fidelity MSCI Utilities Index ETF – Market Price | 17.13% | 11.66% | ||||||
MSCI USA IMI Utilities Index | 17.67% | 11.83% | ||||||
S&P 500 Index | 11.96% | 10.43% | ||||||
This information shows the returns of the fund and its indices for different time periods through the end of the most recent calendar quarter, as opposed to through the end of the fund’s fiscal period.
| A | From October 21, 2013. |
| * | Total returns are historical and include changes in share price and reinvestment of dividends and capital gains distributions, if any. |
The fund’s expense ratio is 0.084%. Expense ratio is the total annual operating expense ratio from the most recent prospectus. A fund’s net expenses paid may be different. Please refer to the most recent prospectus for more information on a fund’s expenses.
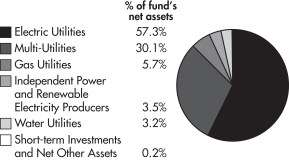
Investment Summary
| Top Ten Stocks as of January 31, 2017 | ||||
| % of fund’s net assets | ||||
NextEra Energy, Inc. | 7.7 | |||
Duke Energy Corp. | 7.2 | |||
The Southern Co. | 6.5 | |||
Dominion Resources, Inc. | 6.4 | |||
Exelon Corp. | 4.4 | |||
American Electric Power Co., Inc. | 4.2 | |||
PG&E Corp. | 4.2 | |||
Sempra Energy | 3.3 | |||
Edison International | 3.2 | |||
PPL Corp. | 3.2 | |||
|
| |||
| 50.3 | ||||
|
| |||
| Industries as of January 31, 2017 | ||
| 13 | Semiannual Report |
Table of Contents
As a shareholder of a Fund, you incur two types of costs: (1) transaction costs, and (2) ongoing costs, including management fees and other Fund expenses. This Example is intended to help you understand your ongoing costs (in dollars) of investing in a Fund and to compare these costs with the ongoing costs of investing in other funds.
The Example is based on an investment of $1,000 invested at the beginning of the period and held for the entire period (August 1, 2016 to January 31, 2017).
Actual Expenses
For each fund, the first line of the accompanying table provides information about actual account values and actual expenses. You may use the information in this line, together with the amount you invested, to estimate the expenses that you paid over the period. Simply divide your account value by $1,000.00 (for example, an $8,600 account value divided by $1,000.00 = 8.6), then multiply the result by the number in the first line for each Fund under the heading entitled “Expenses Paid During Period” to estimate the expenses you paid on your account during this period. In addition, each Fund, as a shareholder in the underlying money market fund, will indirectly bear its pro-rata share of the fees and expenses incurred by the underlying money market fund. These fees and expenses are not included in each Fund’s annualized expense ratio used to calculate the expense estimates in the table below.
Hypothetical Example for Comparison Purposes
For each fund, the second line of the accompanying table provides information about hypothetical account values and hypothetical expenses based on the Fund’s actual expense ratio and an assumed rate of return of 5% per year before expenses, which is not the Fund’s actual return. The hypothetical account values and expenses may not be used to estimate the actual ending account balance or expenses you paid for the period. You may use this information to compare the ongoing costs of investing in the Fund and other funds. To do so, compare this 5% hypothetical example with the 5% hypothetical examples that appear in the shareholder reports of the other funds. In addition, each Fund, as a shareholder in the underlying money market fund, will indirectly bear its pro-rata share of the fees and expenses incurred by the underlying money market fund. These fees and expenses are not included in each Fund’s annualized expense ratio used to calculate the expense estimates in the table below.
Please note that the expenses shown in the table are meant to highlight your ongoing costs only and do not reflect any transaction costs. Therefore, the second line of the table is useful in comparing ongoing costs only, and will not help you determine the relative total costs of owning different funds.
| Annualized Expense RatioA | Beginning Account Value August 1, 2016 | Ending Account Value January 31, 2017 | Expenses Paid During PeriodB August 1, 2016 to January 31, 2017 | |||||||||||||
Fidelity MSCI Consumer Discretionary Index ETF | ||||||||||||||||
Actual | .08% | $ | 1,000.00 | $ | 1,053.50 | $ | 0.41 | |||||||||
HypotheticalC | $ | 1,000.00 | $ | 1,024.80 | $ | 0.41 | ||||||||||
Fidelity MSCI Consumer Staples Index ETF | ||||||||||||||||
Actual | .08% | $ | 1,000.00 | $ | 976.20 | $ | 0.40 | |||||||||
HypotheticalC | $ | 1,000.00 | $ | 1,024.80 | $ | 0.41 | ||||||||||
Fidelity MSCI Energy Index ETF | ||||||||||||||||
Actual | .08% | $ | 1,000.00 | $ | 1,088.20 | $ | 0.42 | |||||||||
HypotheticalC | $ | 1,000.00 | $ | 1,024.80 | $ | 0.41 | ||||||||||
Fidelity MSCI Financials Index ETF | ||||||||||||||||
Actual | .08% | $ | 1,000.00 | $ | 1,220.50 | $ | 0.45 | |||||||||
HypotheticalC | $ | 1,000.00 | $ | 1,024.80 | $ | 0.41 | ||||||||||
Fidelity MSCI Health Care Index ETF | ||||||||||||||||
Actual | .08% | $ | 1,000.00 | $ | 954.50 | $ | 0.39 | |||||||||
HypotheticalC | $ | 1,000.00 | $ | 1,024.80 | $ | 0.41 | ||||||||||
Fidelity MSCI Industrials Index ETF | ||||||||||||||||
Actual | .08% | $ | 1,000.00 | $ | 1,098.70 | $ | 0.42 | |||||||||
HypotheticalC | $ | 1,000.00 | $ | 1,024.80 | $ | 0.41 | ||||||||||
Fidelity MSCI Information Technology Index ETF | ||||||||||||||||
Actual | .08% | $ | 1,000.00 | $ | 1,107.50 | $ | 0.42 | |||||||||
HypotheticalC | $ | 1,000.00 | $ | 1,024.80 | $ | 0.41 | ||||||||||
| Semiannual Report | 14 |
Table of Contents
| Annualized Expense RatioA | Beginning Account Value August 1, 2016 | Ending Account Value January 31, 2017 | Expenses Paid During PeriodB August 1, 2016 to January 31, 2017 | |||||||||||||
Fidelity MSCI Materials Index ETF | ||||||||||||||||
Actual | .08% | $ | 1,000.00 | $ | 1,099.20 | $ | 0.42 | |||||||||
HypotheticalC | $ | 1,000.00 | $ | 1,024.80 | $ | 0.41 | ||||||||||
Fidelity MSCI Real Estate Index ETF | ||||||||||||||||
Actual | .08% | $ | 1,000.00 | $ | 925.50 | $ | 0.39 | |||||||||
HypotheticalC | $ | 1,000.00 | $ | 1,024.80 | $ | 0.41 | ||||||||||
Fidelity MSCI Telecommunication Services Index ETF | ||||||||||||||||
Actual | .08% | $ | 1,000.00 | $ | 1,016.50 | $ | 0.41 | |||||||||
HypotheticalC | $ | 1,000.00 | $ | 1,024.80 | $ | 0.41 | ||||||||||
Fidelity MSCI Utilities Index ETF | ||||||||||||||||
Actual | .08% | $ | 1,000.00 | $ | 970.20 | $ | 0.40 | |||||||||
HypotheticalC | $ | 1,000.00 | $ | 1,024.80 | $ | 0.41 | ||||||||||
| A | Annualized expense ratio reflects expenses net of applicable fee waivers. |
| B | Expenses are equal to each Fund’s annualized expense ratio, multiplied by the average account value over the period, multiplied by 184/365 (to reflect the one-half year period). |
| C | 5% return per year before expenses. |
| 15 | Semiannual Report |
Table of Contents
Fidelity MSCI Consumer Discretionary Index ETF
Investments January 31, 2017 (Unaudited)
Showing Percentage of Net Assets
| Common Stocks – 99.9% | ||||||||
| Shares | Value | |||||||
AUTO COMPONENTS – 3.1% |
| |||||||
Auto Parts & Equipment – 2.7% | ||||||||
Adient PLC (a) | 7,293 | $ | 463,033 | |||||
American Axle & Manufacturing Holdings, Inc. (a) | 5,677 | 115,811 | ||||||
Autoliv, Inc. | 6,871 | 794,700 | ||||||
BorgWarner, Inc. | 16,659 | 680,187 | ||||||
Cooper-Standard Holding, Inc. (a) | 1,011 | 106,438 | ||||||
Dana, Inc. | 11,177 | 225,105 | ||||||
Delphi Automotive PLC | 21,260 | 1,489,476 | ||||||
Dorman Products, Inc. (a) | 2,467 | 170,272 | ||||||
Fox Factory Holding Corp. (a) | 2,235 | 57,886 | ||||||
Gentex Corp. | 22,404 | 468,019 | ||||||
Gentherm, Inc. (a) | 2,847 | 100,784 | ||||||
LCI Industries | 1,863 | 204,464 | ||||||
Lear Corp. | 5,585 | 793,573 | ||||||
Metaldyne Performance Group, Inc. | 1,297 | 30,609 | ||||||
Modine Manufacturing Co. (a) | 3,736 | 50,810 | ||||||
Motorcar Parts of America, Inc. (a) | 1,399 | 36,696 | ||||||
Standard Motor Products, Inc. | 1,560 | 77,797 | ||||||
Stoneridge, Inc. (a) | 2,026 | 33,247 | ||||||
Superior Industries International, Inc. | 1,639 | 37,779 | ||||||
Tenneco, Inc. (a) | 4,436 | 299,208 | ||||||
Tower International, Inc. | 1,632 | 42,758 | ||||||
Visteon Corp. (a) | 2,683 | 240,316 | ||||||
|
| |||||||
| 6,518,968 | ||||||||
|
| |||||||
Tires & Rubber – 0.4% |
| |||||||
Cooper Tire & Rubber Co. | 4,211 | 152,649 | ||||||
The Goodyear Tire & Rubber Co. | 20,406 | 660,950 | ||||||
|
| |||||||
| 813,599 | ||||||||
|
| |||||||
TOTAL AUTO COMPONENTS |
| 7,332,567 | ||||||
|
| |||||||
AUTOMOBILES – 4.7% |
| |||||||
Automobile Manufacturers – 4.4% | ||||||||
Ford Motor Co. | 288,793 | 3,569,481 | ||||||
General Motors Co. | 108,858 | 3,985,291 | ||||||
Tesla Motors, Inc. (a) | 10,025 | 2,525,598 | ||||||
Thor Industries, Inc. | 3,871 | 400,649 | ||||||
Winnebago Industries, Inc. | 2,064 | 64,810 | ||||||
|
| |||||||
| 10,545,829 | ||||||||
|
| |||||||
Motorcycle Manufacturers – 0.3% |
| |||||||
Harley-Davidson, Inc. | 13,903 | 793,027 | ||||||
|
| |||||||
TOTAL AUTOMOBILES |
| 11,338,856 | ||||||
|
| |||||||
DISTRIBUTORS – 1.0% |
| |||||||
Distributors – 1.0% | ||||||||
Core-Mark Holding Co., Inc. | 3,604 | 125,888 | ||||||
Genuine Parts Co. | 11,604 | 1,123,383 | ||||||
LKQ Corp. (a) | 23,984 | 765,329 | ||||||
Pool Corp. | 3,267 | 344,865 | ||||||
Weyco Group, Inc. | 494 | 13,921 | ||||||
|
| |||||||
TOTAL DISTRIBUTORS |
| 2,373,386 | ||||||
|
| |||||||
| Shares | Value | |||||||
DIVERSIFIED CONSUMER SERVICES – 1.2% |
| |||||||
Education Services – 0.5% | ||||||||
American Public Education, Inc. (a) | 1,208 | $ | 29,354 | |||||
Apollo Group, Inc. Class A (non-vtg.) (a) | 7,864 | 78,561 | ||||||
Bridgepoint Education, Inc. (a) | 1,510 | 16,066 | ||||||
Bright Horizons Family Solutions, Inc. (a) | 3,447 | 244,254 | ||||||
Capella Education Co. | 898 | 76,779 | ||||||
Career Education Corp. (a) | 5,214 | 50,941 | ||||||
Chegg, Inc. (a) | 4,489 | 32,276 | ||||||
DeVry Education Group, Inc. | 4,561 | 152,794 | ||||||
Graham Holdings Co. Class B | 344 | 178,725 | ||||||
Grand Canyon Education, Inc. (a) | 3,527 | 208,023 | ||||||
Houghton Mifflin Harcourt Co. (a) | 8,014 | 90,558 | ||||||
K12, Inc. (a) | 2,689 | 53,592 | ||||||
Strayer Education, Inc. (a) | 806 | 65,286 | ||||||
|
| |||||||
| 1,277,209 | ||||||||
|
| |||||||
Specialized Consumer Services – 0.7% |
| |||||||
Carriage Services, Inc. | 1,146 | 29,739 | ||||||
H&R Block, Inc. | 17,191 | 368,919 | ||||||
LifeLock, Inc. (a) | 6,837 | 163,815 | ||||||
Regis Corp. (a) | 2,859 | 39,797 | ||||||
Service Corp. International | 15,121 | 440,475 | ||||||
ServiceMaster Global Holdings, Inc. (a) | 10,525 | 389,214 | ||||||
Sotheby’s (a) | 2,788 | 110,711 | ||||||
Weight Watchers International, Inc. (a) | 2,204 | 27,440 | ||||||
|
| |||||||
| 1,570,110 | ||||||||
|
| |||||||
TOTAL DIVERSIFIED CONSUMER SERVICES |
| 2,847,319 | ||||||
|
| |||||||
HOTELS, RESTAURANTS & LEISURE – 15.4% |
| |||||||
Casinos & Gaming – 1.8% | ||||||||
Boyd Gaming Corp. (a) | 6,559 | 133,279 | ||||||
Caesars Acquisition Co. Class A (a) | 3,675 | 55,125 | ||||||
Caesars Entertainment Corp. (a) | 3,906 | 34,959 | ||||||
Churchill Downs, Inc. | 1,025 | 146,934 | ||||||
Eldorado Resorts, Inc. (a) | 1,795 | 27,822 | ||||||
Isle of Capri Casinos, Inc. (a) | 1,872 | 44,572 | ||||||
Las Vegas Sands Corp. | 34,051 | 1,790,402 | ||||||
MGM Resorts International (a) | 35,267 | 1,015,690 | ||||||
Monarch Casino & Resort, Inc. (a) | 815 | 19,364 | ||||||
Penn National Gaming, Inc. (a) | 5,857 | 80,709 | ||||||
Pinnacle Entertainment, Inc. (a) | 4,439 | 68,361 | ||||||
Red Rock Resorts, Inc. Class A | 2,444 | 57,385 | ||||||
Scientific Games Corp. Class A (a) | 4,012 | 68,204 | ||||||
Wynn Resorts Ltd. | 6,348 | 643,878 | ||||||
|
| |||||||
| 4,186,684 | ||||||||
|
| |||||||
Hotels, Resorts & Cruise Lines – 3.4% |
| |||||||
Belmond Ltd. Class A (a) | 7,160 | 99,166 | ||||||
Carnival Corp. | 27,894 | 1,544,770 | ||||||
Choice Hotels International, Inc. | 2,815 | 156,232 | ||||||
Extended Stay America, Inc. | 8,377 | 135,791 | ||||||
Hilton Grand Vacations, Inc. (a) | 4,617 | 135,417 | ||||||
See accompanying notes which are an integral part of the financial statements.
| Semiannual Report | 16 |
Table of Contents
| Common Stocks – continued | ||||||||
| Shares | Value | |||||||
HOTELS, RESTAURANTS & LEISURE – continued |
| |||||||
Hotels, Resorts & Cruise Lines – continued | ||||||||
Hilton Worldwide Holdings, Inc. | 15,392 | $ | 886,271 | |||||
ILG, Inc. | 8,757 | 165,945 | ||||||
La Quinta Holdings, Inc. (a) | 6,888 | 97,327 | ||||||
Lindblad Expeditions Holdings, Inc. (a) | 1,563 | 14,051 | ||||||
Marcus Corp. | 1,272 | 37,715 | ||||||
Marriott International, Inc. Class A | 25,761 | 2,179,381 | ||||||
Marriott Vacations Worldwide Corp. | 1,785 | 154,367 | ||||||
Norwegian Cruise Line Holdings Ltd. (a) | 12,416 | 583,552 | ||||||
Royal Caribbean Cruises Ltd. | 13,418 | 1,256,327 | ||||||
Wyndham Worldwide Corp. | 8,543 | 675,410 | ||||||
|
| |||||||
| 8,121,722 | ||||||||
|
| |||||||
Leisure Facilities – 0.5% | ||||||||
ClubCorp Holdings, Inc. | 5,016 | 82,764 | ||||||
Drive Shack, Inc. | 4,678 | 19,367 | ||||||
International Speedway Corp. Class A | 2,047 | 75,022 | ||||||
Intrawest Resorts Holdings, Inc. (a) | 1,067 | 21,991 | ||||||
Planet Fitness, Inc., Class A | 3,951 | 83,129 | ||||||
SeaWorld Entertainment, Inc. | 5,209 | 94,335 | ||||||
Six Flags Entertainment Corp. | 5,808 | 346,041 | ||||||
Speedway Motorsports, Inc. | 944 | 20,286 | ||||||
Vail Resorts, Inc. | 3,120 | 535,205 | ||||||
|
| |||||||
| 1,278,140 | ||||||||
|
| |||||||
Restaurants – 9.7% | ||||||||
Aramark | 18,022 | 609,865 | ||||||
Biglari Holdings, Inc. (a) | 92 | 40,774 | ||||||
BJ’s Restaurants, Inc. (a) | 1,466 | 52,116 | ||||||
Bloomin’ Brands, Inc. | 8,704 | 148,925 | ||||||
Bob Evans Farms, Inc. | 1,350 | 76,181 | ||||||
Bojangles’, Inc. (a) | 1,274 | 25,225 | ||||||
Brinker International, Inc. | 4,270 | 190,015 | ||||||
Buffalo Wild Wings, Inc. (a) | 1,422 | 214,722 | ||||||
Carrols Restaurant Group, Inc. (a) | 2,745 | 39,391 | ||||||
Chipotle Mexican Grill, Inc. (a) | 2,273 | 957,933 | ||||||
Chuys Holdings, Inc. (a) | 1,263 | 37,132 | ||||||
Cracker Barrel Old Country Store, Inc. | 1,496 | 236,458 | ||||||
Darden Restaurants, Inc. | 9,366 | 686,341 | ||||||
Dave & Buster’s Entertainment, Inc. (a) | 2,440 | 132,882 | ||||||
Del Frisco’s Restaurant Group, Inc. (a) | 1,759 | 30,783 | ||||||
Del Taco Restaurants, Inc. (a) | 2,638 | 35,982 | ||||||
Denny’s Corp. (a) | 5,819 | 70,817 | ||||||
DineEquity, Inc. | 1,271 | 87,165 | ||||||
Domino’s Pizza, Inc. | 3,753 | 655,049 | ||||||
Dunkin’ Brands Group, Inc. | 7,122 | 369,418 | ||||||
El Pollo Loco Holdings, Inc. (a) | 1,764 | 21,962 | ||||||
Fiesta Restaurant Group, Inc. (a) | 2,066 | 54,336 | ||||||
Jack in the Box, Inc. | 2,557 | 275,952 | ||||||
McDonald’s Corp. | 66,476 | 8,147,963 | ||||||
Panera Bread Co. Class A (a) | 1,732 | 362,092 | ||||||
Papa John’s International, Inc. | 2,157 | 183,820 | ||||||
Popeyes Louisiana Kitchen, Inc. (a) | 1,671 | 105,591 | ||||||
| Shares | Value | |||||||
Potbelly Corp. (a) | 1,795 | $ | 23,335 | |||||
Red Robin Gourmet Burgers, Inc. (a) | 1,035 | 49,214 | ||||||
Ruby Tuesday, Inc. (a) | 4,574 | 8,965 | ||||||
Ruth’s Hospitality Group, Inc. | 2,456 | 42,120 | ||||||
Shake Shack, Inc. Class A (a) | 1,120 | 39,547 | ||||||
Sonic Corp. | 3,683 | 91,707 | ||||||
Starbucks Corp. | 114,247 | 6,308,719 | ||||||
Texas Roadhouse, Inc. Class A | 5,241 | 244,440 | ||||||
The Cheesecake Factory, Inc. | 3,551 | 213,983 | ||||||
The Habit Restaurants, Inc. Class A (a) | 1,332 | 19,314 | ||||||
Wendy’s Co. | 16,382 | 221,649 | ||||||
Wingstop, Inc. | 2,187 | 62,264 | ||||||
Yum! Brands, Inc. | 28,853 | 1,890,737 | ||||||
Zoe’s Kitchen, Inc. (a) | 1,410 | 30,780 | ||||||
|
| |||||||
| 23,095,664 | ||||||||
|
| |||||||
TOTAL HOTELS, RESTAURANTS & LEISURE |
| 36,682,210 | ||||||
|
| |||||||
HOUSEHOLD DURABLES – 4.4% |
| |||||||
Consumer Electronics – 0.5% |
| |||||||
Garmin Ltd. | 8,849 | 427,318 | ||||||
GoPro, Inc. Class A (a) | 6,632 | 71,294 | ||||||
Harman International Industries, Inc. | 5,457 | 606,600 | ||||||
Universal Electronics, Inc. (a) | 1,110 | 66,045 | ||||||
|
| |||||||
| 1,171,257 | ||||||||
|
| |||||||
Home Furnishings – 0.8% | ||||||||
Ethan Allen Interiors, Inc. | 1,902 | 55,348 | ||||||
La-Z-Boy, Inc. | 3,813 | 109,052 | ||||||
Leggett & Platt, Inc. | 10,392 | 495,906 | ||||||
Mohawk Industries, Inc. (a) | 4,902 | 1,058,048 | ||||||
Tempur Sealy International, Inc. (a) | 4,560 | 196,080 | ||||||
|
| |||||||
| 1,914,434 | ||||||||
|
| |||||||
Homebuilding – 1.7% | ||||||||
Beazer Homes U.S.A., Inc. (a) | 2,485 | 35,436 | ||||||
CalAtlantic Group, Inc. | 6,052 | 211,033 | ||||||
Cavco Industries, Inc. (a) | 664 | 65,238 | ||||||
Century Communities, Inc. (a) | 1,129 | 25,685 | ||||||
D.R. Horton, Inc. | 27,604 | 825,636 | ||||||
Green Brick Partners, Inc. (a) | 1,221 | 11,722 | ||||||
Hovnanian Enterprises, Inc. Class A (a) | 8,723 | 20,673 | ||||||
Installed Building Products, Inc. (a) | 1,430 | 58,487 | ||||||
KB Home | 5,922 | 97,002 | ||||||
Lennar Corp. Class A | 14,298 | 638,406 | ||||||
LGI Homes, Inc. (a) | 1,176 | 36,526 | ||||||
M.D.C. Holdings, Inc. | 3,150 | 85,176 | ||||||
M/I Homes, Inc. (a) | 1,891 | 47,540 | ||||||
Meritage Homes Corp. (a) | 2,937 | 107,935 | ||||||
NVR, Inc. (a) | 289 | 536,962 | ||||||
PulteGroup, Inc. | 24,088 | 518,133 | ||||||
Taylor Morrison Home Corp. Class A (a) | 2,441 | 47,355 | ||||||
Toll Brothers, Inc. (a) | 12,250 | 384,160 | ||||||
TopBuild Corp. (a) | 3,002 | 111,404 | ||||||
See accompanying notes which are an integral part of the financial statements.
| 17 | Semiannual Report |
Table of Contents
Fidelity MSCI Consumer Discretionary Index ETF
Investments (Unaudited) – continued
| Common Stocks – continued | ||||||||
| Shares | Value | |||||||
HOUSEHOLD DURABLES – continued |
| |||||||
Homebuilding – continued | ||||||||
TRI Pointe Group, Inc. (a) | 11,792 | $ | 144,688 | |||||
WCI Communities, Inc. (a) | 1,730 | 40,482 | ||||||
William Lyon Homes Class A (a) | 1,923 | 33,941 | ||||||
|
| |||||||
| 4,083,620 | ||||||||
|
| |||||||
Household Appliances – 0.6% | ||||||||
Helen of Troy Ltd. (a) | 2,174 | 202,834 | ||||||
iRobot Corp. (a) | 1,896 | 114,822 | ||||||
NACCO Industries, Inc. Class A | 298 | 21,978 | ||||||
Whirlpool Corp. | 5,879 | 1,028,178 | ||||||
|
| |||||||
| 1,367,812 | ||||||||
|
| |||||||
Housewares & Specialties – 0.8% |
| |||||||
CSS Industries, Inc. | 631 | 15,535 | ||||||
Libbey, Inc. | 1,656 | 28,334 | ||||||
Newell Brands, Inc. | 33,807 | 1,600,086 | ||||||
Tupperware Brands Corp. | 3,955 | 238,724 | ||||||
|
| |||||||
| 1,882,679 | ||||||||
|
| |||||||
TOTAL HOUSEHOLD DURABLES |
| 10,419,802 | ||||||
|
| |||||||
INTERNET & CATALOG RETAIL – 3.5% |
| |||||||
Catalog Retail – 0.3% |
| |||||||
HSN, Inc. | 2,604 | 91,791 | ||||||
Liberty Interactive Corp. QVC Group Series A (a) | 33,028 | 633,477 | ||||||
|
| |||||||
| 725,268 | ||||||||
|
| |||||||
Internet Retail – 3.2% | ||||||||
1-800-FLOWERS.com, Inc. Class A (a) | 1,903 | 17,127 | ||||||
Blue Nile, Inc. | 870 | 35,418 | ||||||
Duluth Holdings, Inc. Class B (a) | 1,444 | 32,663 | ||||||
Etsy, Inc. (a) | 4,764 | 60,074 | ||||||
Expedia, Inc. | 9,614 | 1,168,966 | ||||||
FTD Cos., Inc. (a) | 1,373 | 31,551 | ||||||
Groupon, Inc. Class A (a) | 33,151 | 114,371 | ||||||
Lands’ End, Inc. (a) | 1,210 | 18,573 | ||||||
Liberty Expedia Holdings, Inc. Class A (a) | 4,178 | 183,874 | ||||||
Liberty TripAdvisor Holdings, Inc. Class A (a) | 5,345 | 95,943 | ||||||
Liberty Ventures Series A (a) | 6,329 | 276,261 | ||||||
Netflix, Inc. (a) | 33,397 | 4,699,292 | ||||||
NutriSystem, Inc. | 2,311 | 76,379 | ||||||
Overstock.com, Inc. (a) | 1,277 | 21,198 | ||||||
PetMed Express, Inc. | 1,583 | 33,544 | ||||||
Shutterfly, Inc. (a) | 2,508 | 128,736 | ||||||
TripAdvisor, Inc. (a) | 9,339 | 494,033 | ||||||
Wayfair, Inc. Class A (a) | 2,256 | 93,759 | ||||||
|
| |||||||
| 7,581,762 | ||||||||
|
| |||||||
TOTAL INTERNET & CATALOG RETAIL |
| 8,307,030 | ||||||
|
| |||||||
| Shares | Value | |||||||
INTERNET & DIRECT MARKETING RETAIL – 13.4% |
| |||||||
Internet & Direct Marketing Retail – 13.4% |
| |||||||
Amazon.com, Inc. (a) | 31,390 | $ | 25,849,037 | |||||
The Priceline Group, Inc. (a) | 3,850 | 6,064,251 | ||||||
|
| |||||||
TOTAL INTERNET & DIRECT MARKETING RETAIL |
| 31,913,288 | ||||||
|
| |||||||
LEISURE PRODUCTS – 1.1% |
| |||||||
Leisure Products – 1.1% |
| |||||||
American Outdoor Brands Corp. (a) | 4,513 | 96,127 | ||||||
Brunswick Corp. | 7,054 | 422,253 | ||||||
Callaway Golf Co. | 7,194 | 81,508 | ||||||
Hasbro, Inc. | 8,781 | 724,520 | ||||||
Mattel, Inc. | 26,602 | 697,238 | ||||||
Nautilus, Inc. (a) | 2,253 | 39,090 | ||||||
Polaris Industries, Inc. | 4,749 | 399,248 | ||||||
Sturm, Ruger & Co., Inc. | 1,454 | 76,699 | ||||||
Vista Outdoor, Inc. (a) | 4,772 | 137,481 | ||||||
|
| |||||||
TOTAL LEISURE PRODUCTS |
| 2,674,164 | ||||||
|
| |||||||
MEDIA – 25.1% |
| |||||||
Advertising – 1.0% |
| |||||||
Clear Channel Outdoor Holding, Inc. Class A | 2,466 | 12,207 | ||||||
Interpublic Group of Companies, Inc. | 31,295 | 736,371 | ||||||
MDC Partners, Inc. Class A | 3,947 | 25,261 | ||||||
National CineMedia, Inc. | 4,781 | 70,089 | ||||||
Omnicom Group, Inc. | 18,426 | 1,578,187 | ||||||
|
| |||||||
| 2,422,115 | ||||||||
|
| |||||||
Broadcasting – 2.0% | ||||||||
AMC Networks, Inc. Class A (a) | 4,658 | 267,136 | ||||||
CBS Corp. Class B (non-vtg.) | 31,695 | 2,044,011 | ||||||
Discovery Communications, Inc. Class A (a) | 11,710 | 331,979 | ||||||
Discovery Communications, Inc. Class C (non-vtg.) (a) | 17,693 | 490,273 | ||||||
E.W. Scripps Co. Class A (a) | 4,136 | 80,569 | ||||||
Entercom Communications Corp. Class A | 1,776 | 25,219 | ||||||
Entravision Communications Corp. Class A | 4,756 | 25,683 | ||||||
Gray Television, Inc. (a) | 5,044 | 59,772 | ||||||
Media General, Inc. (a) | 7,026 | 0 | ||||||
Nexstar Media Group, Inc. Class A | 3,468 | 226,807 | ||||||
Scripps Networks Interactive, Inc. Class A | 6,320 | 481,331 | ||||||
Sinclair Broadcast Group, Inc. Class A | 5,288 | 178,470 | ||||||
TEGNA, Inc. | 15,831 | 362,688 | ||||||
Tribune Media Co. Class A | 5,986 | 172,636 | ||||||
|
| |||||||
| 4,746,574 | ||||||||
|
| |||||||
Cable & Satellite – 10.8% | ||||||||
Cable One, Inc. | 381 | 240,937 | ||||||
See accompanying notes which are an integral part of the financial statements.
| Semiannual Report | 18 |
Table of Contents
| Common Stocks – continued | ||||||||
| Shares | Value | |||||||
MEDIA – continued |
| |||||||
Cable & Satellite – continued | ||||||||
Charter Communications, Inc. Class A (a) | 16,884 | $ | 5,469,572 | |||||
Comcast Corp. Class A | 187,143 | 14,114,325 | ||||||
DISH Network Corp. Class A (a) | 17,645 | 1,044,055 | ||||||
Liberty Broadband Corp. Class C (a) | 8,349 | 712,504 | ||||||
Liberty Global PLC LiLAC Series C (a) | 8,552 | 190,880 | ||||||
Liberty Global PLC Series A (a) | 19,527 | 712,345 | ||||||
Liberty Global PLC Series C (a) | 47,715 | 1,676,228 | ||||||
Liberty Media Corp. – Liberty SiriusXM | 7,206 | 261,145 | ||||||
Liberty Media Corp. – Liberty SiriusXM | 15,644 | 561,463 | ||||||
Loral Space & Communications Ltd. (a) | 1,048 | 42,706 | ||||||
MSG Networks, Inc. (a) | 4,795 | 111,244 | ||||||
Sirius XM Holdings, Inc. | 132,752 | 626,589 | ||||||
|
| |||||||
| 25,763,993 | ||||||||
|
| |||||||
Movies & Entertainment – 10.8% | ||||||||
AMC Entertainment Holdings, Inc. Class A | 2,250 | 75,938 | ||||||
Cinemark Holdings, Inc. | 8,136 | 345,780 | ||||||
Global Eagle Entertainment, Inc. (a) | 3,958 | 24,381 | ||||||
IMAX Corp. (a) | 4,702 | 153,285 | ||||||
Liberty Media Corp. – Liberty Braves | 762 | 15,202 | ||||||
Liberty Media Corp. – Liberty Braves | 2,870 | 57,343 | ||||||
Liberty Media Corp. – Liberty Formula One Class A (a) | 1,777 | 51,497 | ||||||
Liberty Media Corp. – Liberty Formula One Class C (a) | 3,904 | 112,201 | ||||||
Lions Gate Entertainment Corp. Class A | 4,074 | 117,209 | ||||||
Lions Gate Entertainment Corp. Class B (a) | 8,540 | 228,787 | ||||||
Live Nation Entertainment, Inc. (a) | 10,271 | 293,956 | ||||||
Regal Entertainment Group Class A | 8,746 | 198,184 | ||||||
The Madison Square Garden Co. (a) | 1,444 | 253,668 | ||||||
The Walt Disney Co. | 118,932 | 13,159,826 | ||||||
Time Warner, Inc. | 60,593 | 5,868,432 | ||||||
Twenty-First Century Fox, Inc. Class A | 82,885 | 2,600,931 | ||||||
Twenty-First Century Fox, Inc. Class B | 34,230 | 1,061,472 | ||||||
Viacom, Inc. Class B | 27,070 | 1,140,730 | ||||||
World Wrestling Entertainment, Inc. Class A | 2,766 | 54,158 | ||||||
|
| |||||||
| 25,812,980 | ||||||||
|
| |||||||
Publishing – 0.5% | ||||||||
Gannett Co., Inc. | 8,640 | 83,117 | ||||||
John Wiley & Sons, Inc. Class A | 3,599 | 198,305 | ||||||
Meredith Corp. | 3,068 | 188,068 | ||||||
New Media Investment Group, Inc. | 3,980 | 60,655 | ||||||
News Corp. Class A | 29,718 | 365,234 | ||||||
Scholastic Corp. | 2,041 | 93,437 | ||||||
| Shares | Value | |||||||
The New York Times Co. Class A | 9,984 | $ | 134,784 | |||||
Time, Inc. | 7,802 | 150,189 | ||||||
tronc, Inc. | 1,274 | 16,893 | ||||||
|
| |||||||
| 1,290,682 | ||||||||
|
| |||||||
TOTAL MEDIA |
| 60,036,344 | ||||||
|
| |||||||
MULTILINE RETAIL – 3.4% |
| |||||||
Department Stores – 0.8% | ||||||||
Dillard’s, Inc. Class A | 1,572 | 88,724 | ||||||
J.C. Penney Co., Inc. (a) | 24,128 | 160,451 | ||||||
Kohl’s Corp. | 14,318 | 570,286 | ||||||
Macy’s, Inc. | 23,985 | 708,517 | ||||||
Nordstrom, Inc. | 10,147 | 448,700 | ||||||
Sears Holdings Corp. (a) | 2,011 | 14,037 | ||||||
|
| |||||||
| 1,990,715 | ||||||||
|
| |||||||
General Merchandise Stores – 2.6% |
| |||||||
Big Lots, Inc. | 3,451 | 172,550 | ||||||
Dollar General Corp. | 21,948 | 1,620,201 | ||||||
Dollar Tree, Inc. (a) | 18,358 | 1,417,054 | ||||||
Fred’s, Inc. Class A | 2,764 | 40,272 | ||||||
Ollie’s Bargain Outlet Holdings, Inc. (a) | 3,837 | 117,220 | ||||||
Target Corp. | 42,542 | 2,743,108 | ||||||
Tuesday Morning Corp. (a) | 3,510 | 15,093 | ||||||
|
| |||||||
| 6,125,498 | ||||||||
|
| |||||||
TOTAL MULTILINE RETAIL |
| 8,116,213 | ||||||
|
| |||||||
SPECIALTY RETAIL – 18.2% |
| |||||||
Apparel Retail – 4.3% | ||||||||
Abercrombie & Fitch Co. Class A | 5,194 | 60,302 | ||||||
American Eagle Outfitters, Inc. | 13,460 | 203,381 | ||||||
Ascena Retail Group, Inc. (a) | 11,853 | 57,013 | ||||||
Burlington Stores, Inc. (a) | 5,572 | 466,376 | ||||||
Caleres, Inc. | 3,326 | 102,274 | ||||||
Chico’s FAS, Inc. | 9,843 | 132,782 | ||||||
Citi Trends, Inc. | 1,140 | 18,297 | ||||||
DSW, Inc. Class A | 5,509 | 116,570 | ||||||
Express, Inc. (a) | 5,418 | 57,593 | ||||||
Finish Line, Inc. Class A | 3,225 | 55,470 | ||||||
Foot Locker, Inc. | 10,568 | 724,331 | ||||||
Francescas Holdings Corp. (a) | 3,069 | 53,523 | ||||||
Gap, Inc. | 18,648 | 429,463 | ||||||
Genesco, Inc. (a) | 1,603 | 96,501 | ||||||
Guess?, Inc. | 4,797 | 61,258 | ||||||
L Brands, Inc. | 19,041 | 1,146,459 | ||||||
Ross Stores, Inc. | 31,121 | 2,057,409 | ||||||
Shoe Carnival, Inc. | 1,135 | 29,022 | ||||||
Stein Mart, Inc. | 2,266 | 8,294 | ||||||
Tailored Brands, Inc. | 3,355 | 71,294 | ||||||
The Buckle, Inc. | 2,211 | 46,763 | ||||||
The Cato Corp. Class A | 1,986 | 50,425 | ||||||
The Children’s Place Retail Stores, Inc. | 1,474 | 142,978 | ||||||
See accompanying notes which are an integral part of the financial statements.
| 19 | Semiannual Report |
Table of Contents
Fidelity MSCI Consumer Discretionary Index ETF
Investments (Unaudited) – continued
| Common Stocks – continued | ||||||||
| Shares | Value | |||||||
SPECIALTY RETAIL – continued |
| |||||||
Apparel Retail – continued | ||||||||
The TJX Companies, Inc. | 51,152 | $ | 3,832,308 | |||||
Urban Outfitters, Inc. (a) | 6,876 | 182,489 | ||||||
Zumiez, Inc. (a) | 1,486 | 29,794 | ||||||
|
| |||||||
| 10,232,369 | ||||||||
|
| |||||||
Automotive Retail – 3.0% | ||||||||
Advance Auto Parts, Inc. | 5,740 | 942,738 | ||||||
Asbury Automotive Group, Inc. (a) | 1,557 | 102,139 | ||||||
AutoNation, Inc. (a) | 5,633 | 299,225 | ||||||
AutoZone, Inc. (a) | 2,277 | 1,650,779 | ||||||
CarMax, Inc. (a) | 14,925 | 995,647 | ||||||
CST Brands, Inc. | 5,890 | 283,780 | ||||||
Group 1 Automotive, Inc. | 1,688 | 136,374 | ||||||
Lithia Motors, Inc. Class A | 1,819 | 187,575 | ||||||
Monro Muffler Brake, Inc. | 2,515 | 150,649 | ||||||
Murphy USA, Inc. (a) | 3,095 | 197,151 | ||||||
O’Reilly Automotive, Inc. (a) | 7,395 | 1,939,487 | ||||||
Penske Automotive Group, Inc. | 3,380 | 183,737 | ||||||
Sonic Automotive, Inc. Class A | 2,170 | 50,778 | ||||||
TravelCenters of America LLC (a) | 2,492 | 17,693 | ||||||
|
| |||||||
| 7,137,752 | ||||||||
|
| |||||||
Computer & Electronics Retail – 0.5% |
| |||||||
Best Buy Co., Inc. | 22,639 | 1,007,889 | ||||||
Conn’s, Inc. (a) | 1,349 | 14,232 | ||||||
GameStop Corp. Class A | 8,172 | 200,132 | ||||||
Rent-A-Center, Inc. | 4,070 | 36,467 | ||||||
|
| |||||||
| 1,258,720 | ||||||||
|
| |||||||
Home Improvement Retail – 7.7% |
| |||||||
Lowe’s Companies, Inc. | 68,629 | 5,015,407 | ||||||
Lumber Liquidators Holdings, Inc. (a) | 2,062 | 32,291 | ||||||
The Home Depot, Inc. | 96,250 | 13,242,075 | ||||||
Tile Shop Holdings, Inc. (a) | 2,560 | 48,896 | ||||||
|
| |||||||
| 18,338,669 | ||||||||
|
| |||||||
Homefurnishing Retail – 0.5% | ||||||||
Aarons, Inc. Class A | 5,113 | 158,196 | ||||||
At Home Group, Inc. (a) | 977 | 14,889 | ||||||
Bed Bath & Beyond, Inc. | 12,051 | 486,258 | ||||||
Haverty Furniture Companies, Inc. | 1,402 | 30,564 | ||||||
Kirkland’s, Inc. (a) | 1,081 | 15,004 | ||||||
Pier 1 Imports, Inc. | 6,517 | 47,379 | ||||||
RH (a) | 2,840 | 76,737 | ||||||
Select Comfort Corp. (a) | 3,573 | 72,103 | ||||||
Williams-Sonoma, Inc. | 6,615 | 318,909 | ||||||
|
| |||||||
| 1,220,039 | ||||||||
|
| |||||||
Specialty Stores – 2.2% | ||||||||
Barnes & Noble Education, Inc. (a) | 2,919 | 29,336 | ||||||
Barnes & Noble, Inc. | 4,564 | 46,553 | ||||||
Big 5 Sporting Goods Corp. | 1,364 | 21,006 | ||||||
Cabela’s, Inc. Class A (a) | 3,473 | 194,106 | ||||||
Dick’s Sporting Goods, Inc. | 6,897 | 355,885 | ||||||
| Shares | Value | |||||||
Five Below, Inc. (a) | 4,272 | $ | 170,239 | |||||
GNC Holdings, Inc. Class A | 5,225 | 46,346 | ||||||
Hibbett Sports, Inc. (a) | 1,752 | 57,816 | ||||||
MarineMax, Inc. (a) | 1,925 | 41,291 | ||||||
Office Depot, Inc. | 39,989 | 177,951 | ||||||
Party City Holdings, Inc. (a) | 2,259 | 32,642 | ||||||
Sally Beauty Holdings, Inc. (a) | 11,415 | 271,677 | ||||||
Signet Jewelers Ltd. | 5,608 | 435,573 | ||||||
Sportsman’s Warehouse Holdings, Inc. (a) | 2,354 | 17,514 | ||||||
Staples, Inc. | 50,553 | 465,088 | ||||||
The Container Store Group, Inc. (a) | 1,415 | 6,891 | ||||||
The Michaels Cos., Inc. (a) | 9,791 | 192,589 | ||||||
Tiffany & Co., Inc. | 9,743 | 766,969 | ||||||
Tractor Supply Co. | 10,401 | 766,242 | ||||||
Ulta Salon, Cosmetics & Fragrance, Inc. (a) | 4,620 | 1,257,934 | ||||||
Vitamin Shoppe, Inc. (a) | 1,770 | 38,320 | ||||||
Winmark Corp. | 168 | 18,606 | ||||||
|
| |||||||
| 5,410,574 | ||||||||
|
| |||||||
TOTAL SPECIALTY RETAIL |
| 43,598,123 | ||||||
|
| |||||||
TEXTILES, APPAREL & LUXURY GOODS – 5.4% |
| |||||||
Apparel, Accessories & Luxury Goods – 2.7% |
| |||||||
Carter’s, Inc. | 3,893 | 326,039 | ||||||
Coach, Inc. | 21,785 | 813,670 | ||||||
Columbia Sportswear Co. | 2,205 | 119,886 | ||||||
Fossil Group, Inc. (a) | 3,316 | 84,790 | ||||||
G-III Apparel Group Ltd. (a) | 3,155 | 82,850 | ||||||
Hanesbrands, Inc. | 29,395 | 696,955 | ||||||
Iconix Brand Group, Inc. (a) | 3,158 | 32,496 | ||||||
Kate Spade & Co. (a) | 10,101 | 186,970 | ||||||
lululemon athletica, Inc. (a) | 8,557 | 577,683 | ||||||
Michael Kors Holdings Ltd. (a) | 13,141 | 562,566 | ||||||
Movado Group, Inc. | 1,195 | 32,444 | ||||||
Oxford Industries, Inc. | 1,155 | 63,548 | ||||||
PVH Corp. | 6,315 | 592,410 | ||||||
Ralph Lauren Corp. | 4,412 | 390,153 | ||||||
Sequential Brands Group, Inc. (a) | 4,277 | 19,803 | ||||||
Under Armour, Inc. Class A (a) | 14,331 | 307,973 | ||||||
Under Armour, Inc. Class C (a) | 14,567 | 279,978 | ||||||
Vera Bradley, Inc. (a) | 1,584 | 18,153 | ||||||
VF Corp. | 25,846 | 1,330,552 | ||||||
|
| |||||||
| 6,518,919 | ||||||||
|
| |||||||
Footwear – 2.7% | ||||||||
Crocs, Inc. (a) | 5,517 | 40,274 | ||||||
Deckers Outdoor Corp. (a) | 2,375 | 136,800 | ||||||
NIKE, Inc. Class B | 105,060 | 5,557,674 | ||||||
Skechers U.S.A., Inc. Class A (a) | 10,423 | 261,826 | ||||||
Steven Madden Ltd. (a) | 4,288 | 150,938 | ||||||
Wolverine World Wide, Inc. | 7,870 | 184,866 | ||||||
|
| |||||||
| 6,332,378 | ||||||||
|
| |||||||
See accompanying notes which are an integral part of the financial statements.
| Semiannual Report | 20 |
Table of Contents
| Common Stocks – continued | ||||||||
| Shares | Value | |||||||
Textiles – 0.0% | ||||||||
Unifi, Inc. (a) | 1,142 | $ | 30,708 | |||||
|
| |||||||
TOTAL TEXTILES, APPAREL & LUXURY GOODS |
| 12,882,005 | ||||||
|
| |||||||
TOTAL COMMON STOCKS |
| 238,521,307 | ||||||
|
| |||||||
| Money Market Funds – 0.1% | ||||||||
State Street Institutional Treasury Plus Money Market Fund, Premier Class, 0.43% (b) | 183,803 | 183,803 | ||||||
|
| |||||||
TOTAL INVESTMENT PORTFOLIO – 100.0% (Cost $241,901,248) |
| 238,705,110 | ||||||
NET OTHER ASSETS (LIABILITIES) – 0.0% |
| 110,858 | ||||||
|
| |||||||
NET ASSETS – 100% |
| $ | 238,815,968 | |||||
|
| |||||||
Legend
| (a) | Non-income producing. |
| (b) | The rate quoted is the annualized seven-day yield of the fund at period end. |
Other Information
The following is a summary of the inputs used, as of January 31, 2017, involving the Fund’s assets and liabilities carried at fair value. The inputs or methodology used for valuing securities may not be an indication of the risk associated with investing in those securities. For more information on valuation inputs, and their aggregation into the levels used in the table below, please refer to the Investment Valuation section in the accompanying Notes to Financial Statements.
| Valuation Inputs at Reporting Date: | ||||||||||||||||
| Description | Total | Level 1 | Level 2 | Level 3 | ||||||||||||
Investments in Securities: | ||||||||||||||||
Common Stocks | $ | 238,521,307 | $ | 238,521,307 | $ | — | $ | — | ||||||||
Money Market Funds | 183,803 | 183,803 | — | — | ||||||||||||
|
|
|
|
|
|
|
| |||||||||
Total Investments in Securities: | $ | 238,705,110 | $ | 238,705,110 | $ | — | $ | — | ||||||||
|
|
|
|
|
|
|
| |||||||||
See accompanying notes which are an integral part of the financial statements.
| 21 | Semiannual Report |
Table of Contents
Fidelity MSCI Consumer Staples Index ETF
Investments January 31, 2017 (Unaudited)
Showing Percentage of Net Assets
| Common Stocks – 99.9% | ||||||||
| Shares | Value | |||||||
BEVERAGES – 20.6% |
| |||||||
Brewers – 1.0% | ||||||||
Molson Coors Brewing Co. Class B | 22,404 | $ | 2,162,434 | |||||
The Boston Beer Co., Inc. Class A (a) | 1,075 | 165,228 | ||||||
|
| |||||||
| 2,327,662 | ||||||||
|
| |||||||
Distillers & Vintners – 1.8% | ||||||||
Brown-Forman Corp. Class B | 25,130 | 1,145,928 | ||||||
Constellation Brands, Inc. Class A | 21,067 | 3,154,994 | ||||||
MGP Ingredients, Inc. | 1,403 | 59,473 | ||||||
|
| |||||||
| 4,360,395 | ||||||||
|
| |||||||
Soft Drinks – 17.8% | ||||||||
Coca-Cola Bottling Co. Consolidated | 596 | 100,629 | ||||||
Dr Pepper Snapple Group, Inc. | 22,049 | 2,010,869 | ||||||
Monster Beverage Corp. (a) | 47,539 | 2,025,161 | ||||||
National Beverage Corp. | 1,390 | 69,764 | ||||||
PepsiCo, Inc. | 171,146 | 17,761,532 | ||||||
The Coca-Cola Co. | 487,604 | 20,269,698 | ||||||
|
| |||||||
| 42,237,653 | ||||||||
|
| |||||||
TOTAL BEVERAGES |
| 48,925,710 | ||||||
|
| |||||||
FOOD & STAPLES RETAILING – 21.5% |
| |||||||
Drug Retail – 8.3% | ||||||||
CVS Health Corp. | 126,795 | 9,992,714 | ||||||
Rite Aid Corp. (a) | 124,744 | 701,061 | ||||||
Walgreens Boots Alliance, Inc. | 109,404 | 8,964,564 | ||||||
|
| |||||||
| 19,658,339 | ||||||||
|
| |||||||
Food Distributors – 1.8% | ||||||||
Performance Food Group Co. (a) | 6,768 | 149,911 | ||||||
SpartanNash Co. | 4,465 | 169,045 | ||||||
Sysco Corp. | 62,716 | 3,290,081 | ||||||
The Andersons, Inc. | 3,199 | 120,762 | ||||||
The Chefs’ Warehouse, Inc. (a) | 2,522 | 42,118 | ||||||
United Natural Foods, Inc. (a) | 5,996 | 274,017 | ||||||
US Foods Holding Corp. (a) | 11,810 | 321,232 | ||||||
|
| |||||||
| 4,367,166 | ||||||||
|
| |||||||
Food Retail – 2.5% | ||||||||
Casey’s General Stores, Inc. | 4,654 | 534,745 | ||||||
Ingles Markets, Inc. Class A | 1,424 | 64,436 | ||||||
Natural Grocers by Vitamin Cottage, Inc. (a) | 1,118 | 14,132 | ||||||
Smart & Final Stores, Inc. (a) | 3,522 | 50,541 | ||||||
Sprouts Farmers Market, Inc. (a) | 16,722 | 312,200 | ||||||
SUPERVALU, Inc. (a) | 31,597 | 123,860 | ||||||
The Kroger Co. | 107,213 | 3,640,953 | ||||||
Village Super Market, Inc. Class A | 888 | 26,897 | ||||||
Weis Markets, Inc. | 1,435 | 85,296 | ||||||
Whole Foods Market, Inc. | 37,913 | 1,145,731 | ||||||
|
| |||||||
| 5,998,791 | ||||||||
|
| |||||||
Hypermarkets & Super Centers – 8.9% |
| |||||||
Costco Wholesale Corp. | 52,095 | 8,540,976 | ||||||
PriceSmart, Inc. | 2,336 | 197,859 | ||||||
| Shares | Value | |||||||
Wal-Mart Stores, Inc. | 183,927 | $ | 12,275,288 | |||||
|
| |||||||
| 21,014,123 | ||||||||
|
| |||||||
TOTAL FOOD & STAPLES RETAILING |
| 51,038,419 | ||||||
|
| |||||||
FOOD PRODUCTS – 20.3% |
| |||||||
Agricultural Products – 2.5% | ||||||||
Archer-Daniels-Midland Co. | 69,184 | 3,062,084 | ||||||
Bunge Ltd. | 16,583 | 1,147,709 | ||||||
Darling Ingredients, Inc. (a) | 19,600 | 235,200 | ||||||
Fresh Del Monte Produce, Inc. | 3,942 | 225,679 | ||||||
Ingredion, Inc. | 8,584 | 1,100,383 | ||||||
|
| |||||||
| 5,771,055 | ||||||||
|
| |||||||
Packaged Foods & Meats – 17.8% |
| |||||||
AdvancePierre Foods Holdings, Inc. | 4,596 | 127,355 | ||||||
Amplify Snack Brands, Inc. (a) | 4,022 | 38,732 | ||||||
B&G Foods, Inc. | 7,905 | 350,587 | ||||||
Blue Buffalo Pet Products, Inc. (a) | 10,475 | 254,019 | ||||||
Cal-Maine Foods, Inc. | 3,641 | 151,830 | ||||||
Calavo Growers, Inc. | 1,871 | 103,466 | ||||||
Campbell Soup Co. | 23,858 | 1,484,683 | ||||||
Conagra Brands, Inc. | 49,635 | 1,940,232 | ||||||
Dean Foods Co. | 10,724 | 212,979 | ||||||
Farmer Bros Co. (a) | 1,004 | 34,939 | ||||||
Flowers Foods, Inc. | 22,170 | 445,839 | ||||||
Freshpet, Inc. (a) | 2,582 | 28,789 | ||||||
General Mills, Inc. | 71,299 | 4,454,761 | ||||||
Hormel Foods Corp. | 34,656 | 1,258,013 | ||||||
J&J Snack Foods Corp. | 1,771 | 225,926 | ||||||
John B Sanfilippo & Son, Inc. | 974 | 64,079 | ||||||
Kellogg Co. | 31,240 | 2,271,460 | ||||||
Lamb Weston Holdings, Inc. | 16,453 | 614,684 | ||||||
Lancaster Colony Corp. | 2,274 | 298,008 | ||||||
Landec Corp. (a) | 2,924 | 36,842 | ||||||
McCormick & Co., Inc. (non-vtg.) | 13,681 | 1,307,220 | ||||||
Mead Johnson Nutrition Co. | 21,959 | 1,547,231 | ||||||
Mondelez International, Inc. Class A | 184,986 | 8,191,180 | ||||||
Omega Protein Corp. (a) | 2,387 | 59,556 | ||||||
Pinnacle Foods, Inc. | 14,011 | 745,245 | ||||||
Post Holdings, Inc. (a) | 7,698 | 644,169 | ||||||
Sanderson Farms, Inc. | 2,414 | 219,674 | ||||||
Seaboard Corp. (a) | 35 | 134,750 | ||||||
Seneca Foods Corp. Class A (a) | 766 | 27,461 | ||||||
Snyders-Lance, Inc. | 9,131 | 350,448 | ||||||
The Hain Celestial Group, Inc. (a) | 12,266 | 485,243 | ||||||
The Hershey Co. | 17,237 | 1,817,986 | ||||||
The JM Smucker Co. | 13,844 | 1,880,707 | ||||||
The Kraft Heinz Co. | 72,403 | 6,464,864 | ||||||
The WhiteWave Foods Co. (a) | 21,076 | 1,160,445 | ||||||
Tootsie Roll Industries, Inc. | 2,286 | 85,611 | ||||||
TreeHouse Foods, Inc. (a) | 6,745 | 511,811 | ||||||
Tyson Foods, Inc. Class A | 35,373 | 2,221,071 | ||||||
|
| |||||||
| 42,251,895 | ||||||||
|
| |||||||
TOTAL FOOD PRODUCTS |
| 48,022,950 | ||||||
|
| |||||||
See accompanying notes which are an integral part of the financial statements.
| Semiannual Report | 22 |
Table of Contents
| Common Stocks – continued | ||||||||
| Shares | Value | |||||||
HOUSEHOLD PRODUCTS – 18.1% |
| |||||||
Household Products – 18.1% | ||||||||
Central Garden and Pet Co. (a) | 1,207 | $ | 39,650 | |||||
Central Garden and Pet Co. Class A (a) | 4,004 | 123,243 | ||||||
Church & Dwight Co., Inc. | 30,522 | 1,380,205 | ||||||
Colgate-Palmolive Co. | 100,716 | 6,504,239 | ||||||
Energizer Holdings, Inc. | 7,365 | 371,712 | ||||||
HRG Group, Inc. (a) | 13,110 | 220,641 | ||||||
Kimberly-Clark Corp. | 42,768 | 5,180,488 | ||||||
Spectrum Brands Holdings, Inc. | 3,168 | 422,580 | ||||||
The Clorox Co. | 15,397 | 1,847,640 | ||||||
The Procter & Gamble Co. | 304,067 | 26,636,269 | ||||||
WD-40 Co. | 1,689 | 177,598 | ||||||
|
| |||||||
TOTAL HOUSEHOLD PRODUCTS |
| 42,904,265 | ||||||
|
| |||||||
PERSONAL PRODUCTS – 2.2% |
| |||||||
Personal Products – 2.2% | ||||||||
Avon Products, Inc. (a) | 51,977 | 305,105 | ||||||
Coty, Inc. Class A | 57,649 | 1,106,861 | ||||||
Edgewell Personal Care Co. (a) | 7,020 | 553,457 | ||||||
Herbalife Ltd. (a) | 8,284 | 465,561 | ||||||
Inter Parfums, Inc. | 2,024 | 69,018 | ||||||
Medifast, Inc. | 1,060 | 44,700 | ||||||
Natural Health Trends Corp. | 886 | 22,221 | ||||||
Nu Skin Enterprises, Inc. Class A | 6,621 | 343,498 | ||||||
Revlon, Inc. Class A (a) | 1,574 | 52,650 | ||||||
The Estee Lauder Cos., Inc. Class A | 26,275 | 2,133,793 | ||||||
USANA Health Sciences, Inc. (a) | 1,284 | 79,993 | ||||||
|
| |||||||
TOTAL PERSONAL PRODUCTS |
| 5,176,857 | ||||||
|
| |||||||
| Shares | Value | |||||||
TOBACCO – 17.2% |
| |||||||
Tobacco – 17.2% | ||||||||
Altria Group, Inc. | 232,355 | $ | 16,539,029 | |||||
Philip Morris International, Inc. | 184,486 | 17,734,639 | ||||||
Reynolds American, Inc. | 101,845 | 6,123,940 | ||||||
Universal Corp. | 2,567 | 174,556 | ||||||
Vector Group Ltd. | 11,620 | 256,337 | ||||||
|
| |||||||
TOTAL TOBACCO |
| 40,828,501 | ||||||
|
| |||||||
TOTAL COMMON STOCKS |
| 236,896,702 | ||||||
|
| |||||||
| Money Market Funds – 0.0% | ||||||||
State Street Institutional Treasury Plus Money Market Fund, Premier Class, 0.43% (b) | 117,402 | 117,402 | ||||||
|
| |||||||
TOTAL INVESTMENT PORTFOLIO – 99.9% (Cost $232,320,375) |
| 237,014,104 | ||||||
NET OTHER ASSETS (LIABILITIES) – 0.1% |
| 216,882 | ||||||
|
| |||||||
NET ASSETS – 100% |
| $ | 237,230,986 | |||||
|
| |||||||
Legend
| (a) | Non-income producing. |
| (b) | The rate quoted is the annualized seven-day yield of the fund at period end. |
Other Information
The following is a summary of the inputs used, as of January 31, 2017, involving the Fund’s assets and liabilities carried at fair value. The inputs or methodology used for valuing securities may not be an indication of the risk associated with investing in those securities. For more information on valuation inputs, and their aggregation into the levels used in the table below, please refer to the Investment Valuation section in the accompanying Notes to Financial Statements.
| Valuation Inputs at Reporting Date: | ||||||||||||||||
| Description | Total | Level 1 | Level 2 | Level 3 | ||||||||||||
Investments in Securities: | ||||||||||||||||
Common Stocks | $ | 236,896,702 | $ | 236,896,702 | $ | — | $ | — | ||||||||
Money Market Funds | 117,402 | 117,402 | — | — | ||||||||||||
|
|
|
|
|
|
|
| |||||||||
Total Investments in Securities: | $ | 237,014,104 | $ | 237,014,104 | $ | — | $ | — | ||||||||
|
|
|
|
|
|
|
| |||||||||
See accompanying notes which are an integral part of the financial statements.
| 23 | Semiannual Report |
Table of Contents
Fidelity MSCI Energy Index ETF
Investments January 31, 2017 (Unaudited)
Showing Percentage of Net Assets
| Common Stocks – 99.9% | ||||||||
| Shares | Value | |||||||
ENERGY EQUIPMENT & SERVICES – 18.2% |
| |||||||
Oil & Gas Drilling – 2.0% |
| |||||||
Atwood Oceanics, Inc. | 24,267 | $ | 295,087 | |||||
Diamond Offshore Drilling, Inc. (a) | 22,227 | 364,078 | ||||||
Ensco PLC Class A | 97,644 | 1,066,272 | ||||||
Helmerich & Payne, Inc. | 35,016 | 2,491,739 | ||||||
Nabors Industries Ltd. | 91,824 | 1,492,140 | ||||||
Noble Corp. PLC | 79,354 | 535,640 | ||||||
Parker Drilling Co. (a) | 39,234 | 100,047 | ||||||
Patterson-UTI Energy, Inc. | 53,085 | 1,488,503 | ||||||
Rowan Cos. PLC Class A (a) | 38,910 | 697,267 | ||||||
Transocean Ltd. (a) | 125,754 | 1,756,783 | ||||||
Unit Corp. (a) | 16,679 | 433,654 | ||||||
|
| |||||||
| 10,721,210 | ||||||||
|
| |||||||
Oil & Gas Equipment & Services – 16.2% |
| |||||||
Archrock, Inc. | 21,489 | 313,739 | ||||||
Baker Hughes, Inc. | 131,720 | 8,308,898 | ||||||
Bristow Group, Inc. | 10,657 | 188,203 | ||||||
CARBO Ceramics, Inc. (a) | 6,661 | 94,586 | ||||||
Core Laboratories N.V. | 14,291 | 1,669,617 | ||||||
Dril-Quip, Inc. (a) | 12,262 | 762,696 | ||||||
Exterran Corp. (a) | 11,289 | 350,185 | ||||||
Fairmount Santrol Holdings, Inc. (a) | 46,919 | 587,426 | ||||||
Forum Energy Technologies, Inc. (a) | 19,394 | 420,850 | ||||||
Frank’s International N.V. | 12,861 | 152,274 | ||||||
Halliburton Co. | 278,868 | 15,775,563 | ||||||
Helix Energy Solutions Group, Inc. (a) | 44,712 | 379,158 | ||||||
Hornbeck Offshore Services, Inc. (a) | 10,467 | 75,886 | ||||||
Matrix Service Co. (a) | 8,796 | 197,030 | ||||||
McDermott International, Inc. (a) | 78,506 | 635,899 | ||||||
National Oilwell Varco, Inc. | 122,363 | 4,626,545 | ||||||
Natural Gas Services Group, Inc. (a) | 4,228 | 121,344 | ||||||
Newpark Resources, Inc. (a) | 27,061 | 204,311 | ||||||
Oceaneering International, Inc. | 31,775 | 884,934 | ||||||
Oil States International, Inc. (a) | 16,627 | 656,766 | ||||||
PHI, Inc. (non-vtg.) (a) | 4,019 | 63,701 | ||||||
RigNet, Inc. (a) | 4,421 | 87,315 | ||||||
RPC, Inc. | 21,329 | 459,000 | ||||||
Schlumberger Ltd. | 450,377 | 37,701,059 | ||||||
SEACOR Holdings, Inc. (a) | 5,390 | 396,542 | ||||||
Superior Energy Services, Inc. | 49,158 | 868,622 | ||||||
TechnipFMC PLC (a) | 142,876 | 4,803,491 | ||||||
Tesco Corp. (a) | 14,717 | 126,566 | ||||||
TETRA Technologies, Inc. (a) | 36,666 | 181,863 | ||||||
US Silica Holdings, Inc. | 25,805 | 1,526,108 | ||||||
Weatherford International PLC (a) | 302,221 | 1,574,571 | ||||||
|
| |||||||
| 84,194,748 | ||||||||
|
| |||||||
TOTAL ENERGY EQUIPMENT & SERVICES |
| 94,915,958 | ||||||
|
| |||||||
OIL, GAS & CONSUMABLE FUELS – 81.7% |
| |||||||
Coal & Consumable Fuels – 0.2% |
| |||||||
CONSOL Energy, Inc. | 59,442 | 1,006,947 | ||||||
|
| |||||||
| Shares | Value | |||||||
Integrated Oil & Gas – 38.0% |
| |||||||
Chevron Corp. | 610,950 | $ | 68,029,283 | |||||
Exxon Mobil Corp. | 1,342,894 | 112,655,378 | ||||||
Occidental Petroleum Corp. | 247,398 | 16,766,162 | ||||||
|
| |||||||
| 197,450,823 | ||||||||
|
| |||||||
Oil & Gas Exploration & Production – 27.5% |
| |||||||
Anadarko Petroleum Corp. | 179,289 | 12,465,964 | ||||||
Antero Resources Corp. (a) | 49,741 | 1,214,178 | ||||||
Apache Corp. | 122,943 | 7,354,450 | ||||||
Bill Barrett Corp. (a) | 24,178 | 158,366 | ||||||
Cabot Oil & Gas Corp. | 150,724 | 3,237,552 | ||||||
California Resources Corp. (a) | 13,493 | 289,020 | ||||||
Callon Petroleum Co. (a) | 65,107 | 994,835 | ||||||
Carrizo Oil & Gas, Inc. (a) | 20,193 | 714,024 | ||||||
Chesapeake Energy Corp. (a) | 226,582 | 1,461,454 | ||||||
Cimarex Energy Co. | 30,780 | 4,161,764 | ||||||
Clayton Williams Energy, Inc. (a) | 1,685 | 245,083 | ||||||
Cobalt International Energy, Inc. (a) | 109,762 | 107,655 | ||||||
Concho Resources, Inc. (a) | 45,619 | 6,361,113 | ||||||
ConocoPhillips | 401,090 | 19,557,148 | ||||||
Continental Resources, Inc. (a) | 30,343 | 1,473,456 | ||||||
Denbury Resources, Inc. (a) | 130,599 | 437,507 | ||||||
Devon Energy Corp. | 152,696 | 6,953,776 | ||||||
Diamondback Energy, Inc. (a) | 28,699 | 3,018,274 | ||||||
Eclipse Resources Corp. (a) | 28,667 | 70,521 | ||||||
Energen Corp. (a) | 31,453 | 1,695,002 | ||||||
EOG Resources, Inc. | 186,686 | 18,963,564 | ||||||
EQT Corp. | 55,975 | 3,393,764 | ||||||
EXCO Resources, Inc. (a) | 56,046 | 37,500 | ||||||
Gran Tierra Energy, Inc. (a) | 127,570 | 329,131 | ||||||
Gulfport Energy Corp. (a) | 50,028 | 1,045,585 | ||||||
Hess Corp. | 92,352 | 5,003,631 | ||||||
Jones Energy, Inc. Class A (a) | 15,141 | 67,377 | ||||||
Kosmos Energy Ltd. (a) | 62,623 | 409,554 | ||||||
Laredo Petroleum, Inc. (a) | 50,922 | 689,993 | ||||||
Marathon Oil Corp. | 274,534 | 4,598,445 | ||||||
Matador Resources Co. (a) | 29,002 | 763,623 | ||||||
Murphy Oil Corp. | 53,007 | 1,532,432 | ||||||
Newfield Exploration Co. (a) | 64,356 | 2,579,389 | ||||||
Noble Energy, Inc. | 139,227 | 5,535,666 | ||||||
Oasis Petroleum, Inc. (a) | 70,513 | 997,054 | ||||||
Parsley Energy, Inc. Class A (a) | 58,735 | 2,068,647 | ||||||
PDC Energy, Inc. (a) | 17,843 | 1,319,311 | ||||||
Pioneer Natural Resources Co. | 54,958 | 9,905,080 | ||||||
QEP Resources, Inc. (a) | 77,641 | 1,354,059 | ||||||
Range Resources Corp. | 60,112 | 1,944,022 | ||||||
Resolute Energy Corp. (a) | 3,830 | 176,142 | ||||||
Rice Energy, Inc. (a) | 44,720 | 886,798 | ||||||
Ring Energy, Inc. (a) | 15,097 | 199,280 | ||||||
RSP Permian, Inc. (a) | 32,053 | 1,364,176 | ||||||
Sanchez Energy Corp. (a) | 16,447 | 218,087 | ||||||
SM Energy Co. | 31,226 | 952,705 | ||||||
See accompanying notes which are an integral part of the financial statements.
| Semiannual Report | 24 |
Table of Contents
| Common Stocks – continued | ||||||||
| Shares | Value | |||||||
OIL, GAS & CONSUMABLE FUELS – continued |
| |||||||
Oil & Gas Exploration & Production – continued |
| |||||||
Southwestern Energy Co. (a) | 159,896 | $ | 1,440,663 | |||||
Synergy Resources Corp. (a) | 61,688 | 531,134 | ||||||
Whiting Petroleum Corp. (a) | 89,241 | 989,683 | ||||||
WPX Energy, Inc. (a) | 126,100 | 1,756,573 | ||||||
|
| |||||||
| 143,024,210 | ||||||||
|
| |||||||
Oil & Gas Refining & Marketing – 7.6% |
| |||||||
Alon USA Energy, Inc. | 8,938 | 100,642 | ||||||
Clean Energy Fuels Corp. (a) | 36,497 | 94,527 | ||||||
CVR Energy, Inc. | 5,463 | 121,333 | ||||||
Delek US Holdings, Inc. | 16,075 | 360,080 | ||||||
Green Plains, Inc. | 11,985 | 269,662 | ||||||
HollyFrontier Corp. | 54,339 | 1,574,201 | ||||||
Marathon Petroleum Corp. | 171,333 | 8,232,551 | ||||||
Par Pacific Holdings, Inc. (a) | 6,512 | 94,619 | ||||||
PBF Energy, Inc. Class A | 35,293 | 818,445 | ||||||
Phillips 66 | 152,436 | 12,441,826 | ||||||
Renewable Energy Group, Inc. (a) | 10,105 | 87,914 | ||||||
REX American Resources Corp. (a) | 1,869 | 155,183 | ||||||
Tesoro Corp. | 38,491 | 3,111,997 | ||||||
Valero Energy Corp. | 149,488 | 9,830,331 | ||||||
Western Refining, Inc. | 28,107 | 984,026 | ||||||
World Fuel Services Corp. | 22,814 | 1,014,767 | ||||||
|
| |||||||
| 39,292,104 | ||||||||
|
| |||||||
Oil & Gas Storage & Transportation – 8.4% |
| |||||||
Cheniere Energy, Inc. (a) | 64,917 | 3,093,295 | ||||||
Enbridge Energy Management LLC (a) | 21,469 | 404,476 | ||||||
EnLink Midstream LLC | 17,568 | 304,805 | ||||||
Gener8 Maritime, Inc. (a) | 13,675 | 69,059 | ||||||
| Shares | Value | |||||||
Kinder Morgan, Inc. | 614,498 | $ | 13,727,885 | |||||
ONEOK, Inc. | 68,184 | 3,757,620 | ||||||
Plains GP Holdings LP Class A | 30,863 | 1,001,504 | ||||||
SemGroup Corp. Class A | 21,508 | 853,867 | ||||||
Spectra Energy Corp. | 227,178 | 9,461,964 | ||||||
Tallgrass Energy GP LP | 16,746 | 451,640 | ||||||
Targa Resources Corp. | 53,993 | 3,111,077 | ||||||
The Williams Cos., Inc. | 264,422 | 7,625,930 | ||||||
|
| |||||||
| 43,863,122 | ||||||||
|
| |||||||
TOTAL OIL, GAS & CONSUMABLE FUELS |
| 424,637,206 | ||||||
|
| |||||||
TOTAL COMMON STOCKS |
| 519,553,164 | ||||||
|
| |||||||
| Money Market Funds – 0.1% | ||||||||
State Street Institutional Treasury Plus Money Market Fund, Premier Class, 0.43% (b) | 293,457 | 293,457 | ||||||
|
| |||||||
TOTAL INVESTMENT PORTFOLIO – 100.0% |
| 519,846,621 | ||||||
NET OTHER ASSETS (LIABILITIES) – 0.0% |
| 54,405 | ||||||
|
| |||||||
NET ASSETS – 100% |
| $ | 519,901,026 | |||||
|
| |||||||
Legend
| (a) | Non-income producing. |
| (b) | The rate quoted is the annualized seven-day yield of the fund at period end. |
Other Information
The following is a summary of the inputs used, as of January 31, 2017, involving the Fund’s assets and liabilities carried at fair value. The inputs or methodology used for valuing securities may not be an indication of the risk associated with investing in those securities. For more information on valuation inputs, and their aggregation into the levels used in the table below, please refer to the Investment Valuation section in the accompanying Notes to Financial Statements.
| Valuation Inputs at Reporting Date: | ||||||||||||||||
| Description | Total | Level 1 | Level 2 | Level 3 | ||||||||||||
Investments in Securities: | ||||||||||||||||
Common Stocks | $ | 519,553,164 | $ | 519,553,164 | $ | — | $ | — | ||||||||
Money Market Funds | 293,457 | 293,457 | — | — | ||||||||||||
|
|
|
|
|
|
|
| |||||||||
Total Investments in Securities: | $ | 519,846,621 | $ | 519,846,621 | $ | — | $ | — | ||||||||
|
|
|
|
|
|
|
| |||||||||
See accompanying notes which are an integral part of the financial statements.
| 25 | Semiannual Report |
Table of Contents
Fidelity MSCI Financials Index ETF
Investments January 31, 2017 (Unaudited)
Showing Percentage of Net Assets
| Common Stocks – 99.8% | ||||||||
| Shares | Value | |||||||
BANKS – 46.4% |
| |||||||
Diversified Banks – 30.4% |
| |||||||
Bank of America Corp. | 1,917,841 | $ | 43,419,920 | |||||
Citigroup, Inc. | 546,039 | 30,485,357 | ||||||
Comerica, Inc. | 32,868 | 2,219,576 | ||||||
JPMorgan Chase & Co. | 678,790 | 57,445,998 | ||||||
US Bancorp | 321,732 | 16,939,190 | ||||||
Wells Fargo & Co. | 900,804 | 50,742,289 | ||||||
|
| |||||||
| 201,252,330 | ||||||||
|
| |||||||
Regional Banks – 16.0% | ||||||||
1st Source Corp. | 3,386 | 152,742 | ||||||
Ameris Bancorp | 6,437 | 290,309 | ||||||
Arrow Financial Corp. | 2,542 | 89,733 | ||||||
Associated Banc-Corp | 28,613 | 723,909 | ||||||
Banc of California, Inc. | 8,461 | 133,684 | ||||||
Bancfirst Corp. | 1,471 | 138,789 | ||||||
BancorpSouth, Inc. | 16,345 | 485,446 | ||||||
Bank of Hawaii Corp. | 8,132 | 698,620 | ||||||
Bank of the Ozarks, Inc. | 19,447 | 1,067,057 | ||||||
BankUnited, Inc. | 19,783 | 755,711 | ||||||
Banner Corp. | 3,717 | 208,598 | ||||||
BB&T Corp. | 153,191 | 7,075,892 | ||||||
Berkshire Hills Bancorp, Inc. | 6,083 | 215,338 | ||||||
Blue Hills Bancorp, Inc. | 5,014 | 95,266 | ||||||
BNC Bancorp | 9,639 | 339,775 | ||||||
BOK Financial Corp. | 3,812 | 313,499 | ||||||
Boston Private Financial Holdings, Inc. | 16,079 | 265,303 | ||||||
Bridge Bancorp, Inc. | 4,197 | 151,722 | ||||||
Brookline Bancorp, Inc. | 13,718 | 216,058 | ||||||
Bryn Mawr Bank Corp. | 3,039 | 121,712 | ||||||
Camden National Corp. | 3,061 | 126,970 | ||||||
Capital Bank Financial Corp. Class A | 6,163 | 242,822 | ||||||
Cardinal Financial Corp. | 6,410 | 201,018 | ||||||
Cascade Bancorp (a) | 7,205 | 57,424 | ||||||
Cathay General Bancorp | 14,350 | 522,914 | ||||||
CenterState Banks, Inc. | 8,816 | 215,022 | ||||||
Central Pacific Financial Corp. | 6,084 | 190,612 | ||||||
Chemical Financial Corp. | 13,312 | 658,012 | ||||||
CIT Group, Inc. | 38,601 | 1,589,975 | ||||||
Citizens Financial Group, Inc. | 97,795 | 3,537,245 | ||||||
City Holding Co. | 3,000 | 195,270 | ||||||
CoBiz Financial, Inc. | 7,329 | 128,404 | ||||||
Columbia Banking System, Inc. | 11,060 | 439,746 | ||||||
Commerce Bancshares, Inc. | 17,337 | 980,061 | ||||||
Community Bank System, Inc. | 8,498 | 495,943 | ||||||
Community Trust Bancorp, Inc. | 3,083 | 142,589 | ||||||
ConnectOne Bancorp, Inc. | 5,711 | 141,062 | ||||||
CU Bancorp (a) | 4,107 | 148,879 | ||||||
Cullen/Frost Bankers, Inc. | 10,622 | 949,607 | ||||||
Customers Bancorp, Inc. (a) | 5,452 | 187,876 | ||||||
CVB Financial Corp. | 19,787 | 445,999 | ||||||
Eagle Bancorp, Inc. (a) | 5,853 | 358,496 | ||||||
| Shares | Value | |||||||
East West Bancorp, Inc. | 27,231 | $ | 1,400,763 | |||||
Enterprise Financial Services Corp. | 4,044 | 168,433 | ||||||
FCB Financial Holdings, Inc. Class A (a) | 6,576 | 308,743 | ||||||
Fidelity Southern Corp. | 4,177 | 97,115 | ||||||
Fifth Third Bancorp | 145,090 | 3,786,849 | ||||||
Financial Institutions, Inc. | 2,941 | 96,906 | ||||||
First BanCorp (a) | 28,200 | 189,504 | ||||||
First BanCorp/NC | 3,747 | 109,675 | ||||||
First Busey Corp. | 6,051 | 176,992 | ||||||
First Citizens BancShares, Inc. Class A | 1,368 | 501,700 | ||||||
First Commonwealth Financial Corp. | 17,206 | 242,949 | ||||||
First Community Bancshares, Inc. | 3,046 | 88,639 | ||||||
First Financial Bancorp | 11,843 | 326,275 | ||||||
First Financial Bankshares, Inc. | 10,177 | 434,049 | ||||||
First Financial Corp. | 1,891 | 91,430 | ||||||
First Hawaiian, Inc. | 6,067 | 200,150 | ||||||
First Horizon National Corp. | 43,918 | 878,360 | ||||||
First Interstate Bancsystem, Inc. Class A | 4,036 | 166,081 | ||||||
First Merchants Corp. | 7,566 | 290,005 | ||||||
First Midwest Bancorp, Inc. | 15,602 | 378,817 | ||||||
First NBC Bank Holding Co. (a) | 6,965 | 27,860 | ||||||
First Republic Bank | 28,534 | 2,691,612 | ||||||
Flushing Financial Corp. | 5,372 | 146,118 | ||||||
FNB Corp. | 40,143 | 599,736 | ||||||
Fulton Financial Corp. | 32,860 | 598,052 | ||||||
German American Bancorp, Inc. | 2,500 | 119,975 | ||||||
Glacier Bancorp, Inc. | 14,489 | 514,794 | ||||||
Great Southern Bancorp, Inc. | 1,931 | 96,647 | ||||||
Great Western Bancorp, Inc. | 11,281 | 482,263 | ||||||
Hancock Holding Co. | 13,990 | 641,441 | ||||||
Hanmi Financial Corp. | 6,371 | 211,199 | ||||||
HarborOne Bancorp, Inc. (a) | 4,088 | 76,119 | ||||||
Heartland Financial USA, Inc. | 4,288 | 200,678 | ||||||
Heritage Financial Corp. | 6,038 | 153,969 | ||||||
Hilltop Holdings, Inc. | 15,176 | 415,519 | ||||||
Home BancShares, Inc. | 23,994 | 646,398 | ||||||
HomeTrust Bancshares, Inc. (a) | 3,477 | 86,056 | ||||||
Hope Bancorp, Inc. | 24,409 | 510,392 | ||||||
Horizon Bancorp | 5,027 | 128,842 | ||||||
Huntington Bancshares, Inc. | 206,026 | 2,787,532 | ||||||
Iberiabank Corp. | 8,458 | 694,825 | ||||||
Independent Bank Corp. | 5,086 | 317,112 | ||||||
Independent Bank Group, Inc. | 2,256 | 140,210 | ||||||
International Bancshares Corp. | 10,692 | 396,673 | ||||||
Investors Bancorp, Inc. | 60,287 | 865,118 | ||||||
KeyCorp | 204,866 | 3,681,442 | ||||||
Lakeland Bancorp, Inc. | 8,368 | 155,226 | ||||||
Lakeland Financial Corp. | 4,918 | 218,458 | ||||||
LegacyTexas Financial Group, Inc. | 8,733 | 360,848 | ||||||
Live Oak Bancshares, Inc. | 3,777 | 77,240 | ||||||
M&T Bank Corp. | 26,564 | 4,318,509 | ||||||
MainSource Financial Group, Inc. | 4,553 | 149,612 | ||||||
MB Financial, Inc. | 13,318 | 593,051 | ||||||
See accompanying notes which are an integral part of the financial statements.
| Semiannual Report | 26 |
Table of Contents
| Common Stocks – continued | ||||||||
| Shares | Value | |||||||
BANKS – continued |
| |||||||
Regional Banks – continued |
| |||||||
Mercantile Bank Corp. | 3,363 | $ | 108,625 | |||||
National Bank Holdings Corp. Class A | 5,704 | 185,380 | ||||||
NBT Bancorp, Inc. | 8,327 | 339,242 | ||||||
OFG Bancorp | 8,782 | 116,362 | ||||||
Old National Bancorp | 24,433 | 433,686 | ||||||
Opus Bank | 4,857 | 98,840 | ||||||
Pacific Premier Bancorp, Inc. (a) | 5,359 | 210,877 | ||||||
PacWest Bancorp | 22,053 | 1,221,736 | ||||||
Park National Corp. | 2,600 | 288,054 | ||||||
Park Sterling Corp. | 11,529 | 134,889 | ||||||
People’s United Financial, Inc. | 58,829 | 1,103,044 | ||||||
Peoples Bancorp, Inc. | 3,089 | 95,913 | ||||||
Pinnacle Financial Partners, Inc. | 8,336 | 557,262 | ||||||
Popular, Inc. | 19,631 | 872,205 | ||||||
Preferred Bank | 2,335 | 129,382 | ||||||
PrivateBancorp, Inc. | 14,416 | 787,979 | ||||||
Prosperity Bancshares, Inc. | 12,550 | 911,506 | ||||||
QCR Holdings, Inc. | 3,011 | 126,311 | ||||||
Regions Financial Corp. | 237,160 | 3,417,476 | ||||||
Renasant Corp. | 8,185 | 325,763 | ||||||
Republic Bancorp, Inc. Class A | 2,213 | 76,680 | ||||||
S&T Bancorp, Inc. | 6,816 | 256,418 | ||||||
Sandy Spring Bancorp, Inc. | 4,793 | 196,369 | ||||||
Seacoast Banking Corp. of Florida (a) | 5,707 | 124,298 | ||||||
ServisFirst Bancshares, Inc. | 8,658 | 346,666 | ||||||
Signature Bank (a) | 10,303 | 1,622,929 | ||||||
Simmons First National Corp. Class A | 5,303 | 318,975 | ||||||
South State Corp. | 5,292 | 473,105 | ||||||
Southside Bancshares, Inc. | 5,239 | 178,964 | ||||||
State Bank Financial Corp. | 6,852 | 181,167 | ||||||
Sterling Bancorp/DE | 23,627 | 563,504 | ||||||
Stock Yards Bancorp, Inc. | 4,186 | 187,533 | ||||||
Stonegate Bank | 3,039 | 138,305 | ||||||
Suffolk Bancorp | 2,802 | 116,059 | ||||||
Sun Bancorp, Inc. | 2,255 | 56,375 | ||||||
SunTrust Banks, Inc. | 93,265 | 5,299,317 | ||||||
SVB Financial Group (a) | 9,898 | 1,704,733 | ||||||
Synovus Financial Corp. | 23,674 | 986,732 | ||||||
TCF Financial Corp. | 30,887 | 535,889 | ||||||
Texas Capital Bancshares, Inc. (a) | 9,329 | 769,642 | ||||||
The Bancorp, Inc. (a) | 11,011 | 65,956 | ||||||
The First of Long Island Corp. | 4,377 | 118,617 | ||||||
The PNC Financial Services Group, Inc. | 92,343 | 11,123,638 | ||||||
Tompkins Financial Corp. | 2,695 | 244,032 | ||||||
Towne Bank | 10,707 | 344,765 | ||||||
Trico Bancshares | 4,142 | 152,716 | ||||||
TriState Capital Holdings, Inc. (a) | 4,601 | 102,142 | ||||||
Trustmark Corp. | 12,934 | 434,841 | ||||||
UMB Financial Corp. | 8,000 | 617,120 | ||||||
Umpqua Holdings Corp. | 41,980 | 768,654 | ||||||
Union Bankshares Corp. | 8,405 | 308,968 | ||||||
| Shares | Value | |||||||
United Bankshares, Inc. | 15,435 | $ | 691,488 | |||||
United Community Banks, Inc. | 12,941 | 364,030 | ||||||
Univest Corp. of Pennsylvania | 4,965 | 139,765 | ||||||
Valley National Bancorp | 46,395 | 561,843 | ||||||
Washington Trust Bancorp, Inc. | 2,921 | 159,195 | ||||||
Webster Financial Corp. | 17,340 | 910,697 | ||||||
WesBanco, Inc. | 8,007 | 332,290 | ||||||
Westamerica BanCorp. | 4,934 | 280,004 | ||||||
Western Alliance Bancorp (a) | 18,346 | 905,925 | ||||||
Wintrust Financial Corp. | 9,860 | 705,976 | ||||||
Xenith Bankshares, Inc. (a) | 2,571 | 66,949 | ||||||
Yadkin Financial Corp. | 8,551 | 273,632 | ||||||
Zions BanCorp. | 39,263 | 1,656,506 | ||||||
|
| |||||||
| 105,460,011 | ||||||||
|
| |||||||
TOTAL BANKS |
| 306,712,341 | ||||||
|
| |||||||
CAPITAL MARKETS – 18.5% |
| |||||||
Asset Management & Custody Banks – 6.8% |
| |||||||
Affiliated Managers Group, Inc. | 10,267 | 1,564,280 | ||||||
Ameriprise Financial, Inc. | 30,603 | 3,435,799 | ||||||
Arlington Asset Investment Corp. Class A | 892 | 13,353 | ||||||
Artisan Partners Asset Management, Inc. Class A | 8,522 | 246,712 | ||||||
Associated Capital Group, Inc. Class A | 1,105 | 38,896 | ||||||
BlackRock, Inc. | 22,955 | 8,584,711 | ||||||
Cohen & Steers, Inc. | 4,120 | 143,747 | ||||||
Diamond Hill Investment Group, Inc. | 697 | 140,933 | ||||||
Eaton Vance Corp. | 21,383 | 896,589 | ||||||
Federated Investors, Inc. Class B | 5,697 | 148,179 | ||||||
Financial Engines, Inc. | 11,362 | 438,005 | ||||||
Franklin Resources, Inc. | 71,082 | 2,824,799 | ||||||
GAMCO Investors, Inc. Class A | 1,083 | 31,624 | ||||||
Invesco Ltd. | 77,998 | 2,255,702 | ||||||
Janus Capital Group, Inc. | 28,438 | 355,475 | ||||||
Legg Mason, Inc. | 17,540 | 555,842 | ||||||
Northern Trust Corp. | 40,529 | 3,362,286 | ||||||
OM Asset Management PLC | 11,472 | 161,755 | ||||||
Pzena Investment Management, Inc. Class A | 3,108 | 31,049 | ||||||
Safeguard Scientifics, Inc. (a) | 6,437 | 77,566 | ||||||
SEI Investments Co. | 25,940 | 1,258,349 | ||||||
State Street Corp. | 73,360 | 5,590,032 | ||||||
T Rowe Price Group, Inc. | 46,963 | 3,167,185 | ||||||
The Bank of New York Mellon Corp. | 200,770 | 8,980,442 | ||||||
Virtus Investment Partners, Inc. | 1,237 | 134,833 | ||||||
Waddell & Reed Financial, Inc. Class A | 14,792 | 266,996 | ||||||
Westwood Holdings Group, Inc. | 1,521 | 85,054 | ||||||
WisdomTree Investments, Inc. | 21,814 | 224,684 | ||||||
|
| |||||||
| 45,014,877 | ||||||||
|
| |||||||
Financial Exchanges & Data – 4.7% |
| |||||||
CBOE Holdings, Inc. | 15,365 | 1,223,361 | ||||||
CME Group, Inc. | 63,744 | 7,718,124 | ||||||
See accompanying notes which are an integral part of the financial statements.
| 27 | Semiannual Report |
Table of Contents
Fidelity MSCI Financials Index ETF
Investments (Unaudited) – continued
| Common Stocks – continued | ||||||||
| Shares | Value | |||||||
CAPITAL MARKETS – continued |
| |||||||
Financial Exchanges & Data – continued |
| |||||||
Donnelley Financial Solutions, Inc. (a) | 6,804 | $ | 163,840 | |||||
FactSet Research Systems, Inc. | 7,673 | 1,327,813 | ||||||
Intercontinental Exchange, Inc. | 112,061 | 6,539,880 | ||||||
MarketAxess Holdings, Inc. | 7,221 | 1,352,132 | ||||||
Moody’s Corp. | 32,842 | 3,404,730 | ||||||
Morningstar, Inc. | 3,763 | 286,553 | ||||||
MSCI, Inc. | 17,257 | 1,428,017 | ||||||
Nasdaq, Inc. | 22,128 | 1,560,909 | ||||||
S&P Global, Inc. | 49,690 | 5,971,744 | ||||||
|
| |||||||
| 30,977,103 | ||||||||
|
| |||||||
Investment Banking & Brokerage – 7.0% |
| |||||||
BGC Partners, Inc. Class A | 39,322 | 435,295 | ||||||
Cowen Group, Inc. Class A (a) | 4,899 | 73,485 | ||||||
E*TRADE Financial Corp. (a) | 52,349 | 1,960,470 | ||||||
Evercore Partners, Inc. Class A | 7,597 | 588,388 | ||||||
Greenhill & Co., Inc. | 6,433 | 190,095 | ||||||
Houlihan Lokey, Inc. | 2,603 | 80,953 | ||||||
Interactive Brokers Group, Inc. Class A | 12,681 | 473,508 | ||||||
INTL. FCStone, Inc. (a) | 3,080 | 113,590 | ||||||
Investment Technology Group, Inc. | 1,918 | 38,590 | ||||||
KCG Holdings, Inc. Class A (a) | 12,642 | 176,609 | ||||||
Ladenburg Thalmann Financial Services, Inc. (a) | 21,429 | 49,287 | ||||||
LPL Financial Holdings, Inc. | 14,448 | 567,806 | ||||||
Moelis & Co. Class A | 4,997 | 170,398 | ||||||
Morgan Stanley | 269,587 | 11,454,752 | ||||||
Piper Jaffray Cos. (a) | 3,077 | 216,928 | ||||||
PJT Partners, Inc. Class A | 4,102 | 130,238 | ||||||
Raymond James Financial, Inc. | 24,084 | 1,804,614 | ||||||
Stifel Financial Corp. (a) | 12,600 | 634,158 | ||||||
TD Ameritrade Holding Corp. | 49,657 | 2,291,671 | ||||||
The Charles Schwab Corp. | 223,899 | 9,233,595 | ||||||
The Goldman Sachs Group, Inc. | 68,606 | 15,732,728 | ||||||
Virtu Financial, Inc. Class A | 8,409 | 147,578 | ||||||
|
| |||||||
| 46,564,736 | ||||||||
|
| |||||||
TOTAL CAPITAL MARKETS |
| 122,556,716 | ||||||
|
| |||||||
CONSUMER FINANCE – 5.5% |
| |||||||
Consumer Finance – 5.5% | ||||||||
Ally Financial, Inc. | 83,184 | 1,756,846 | ||||||
American Express Co. | 147,623 | 11,275,445 | ||||||
Capital One Financial Corp. | 95,168 | 8,316,731 | ||||||
Credit Acceptance Corp. (a) | 1,479 | 303,609 | ||||||
Discover Financial Services | 75,947 | 5,261,608 | ||||||
Encore Capital Group, Inc. (a) | 2,508 | 77,623 | ||||||
Ezcorp, Inc. Class A (a) | 10,649 | 105,425 | ||||||
FirstCash, Inc. | 9,814 | 419,058 | ||||||
Green Dot Corp. Class A (a) | 8,724 | 233,803 | ||||||
LendingClub Corp. (a) | 48,569 | 299,671 | ||||||
Navient Corp. | 61,418 | 923,727 | ||||||
| Shares | Value | |||||||
Nelnet, Inc. Class A | 4,551 | $ | 223,136 | |||||
OneMain Holdings, Inc. (a) | 11,806 | 264,218 | ||||||
PRA Group, Inc. (a) | 8,992 | 357,882 | ||||||
SLM Corp. (a) | 80,930 | 961,448 | ||||||
Synchrony Financial | 156,889 | 5,619,764 | ||||||
World Acceptance Corp. (a) | 1,462 | 71,740 | ||||||
|
| |||||||
TOTAL CONSUMER FINANCE |
| 36,471,734 | ||||||
|
| |||||||
DIVERSIFIED FINANCIAL SERVICES – 6.3% |
| |||||||
Multi-Sector Holdings – 6.0% |
| |||||||
Berkshire Hathaway, Inc. Class B (a) | 228,963 | 37,581,987 | ||||||
FNFV Group (a) | 13,349 | 173,537 | ||||||
Leucadia National Corp. | 61,422 | 1,464,915 | ||||||
PICO Holdings, Inc. (a) | 4,612 | 65,721 | ||||||
Texas Pacific Land Trust | 1,547 | 491,203 | ||||||
|
| |||||||
| 39,777,363 | ||||||||
|
| |||||||
Other Diversified Financial Services – 0.3% |
| |||||||
Voya Financial, Inc. | 38,180 | 1,535,600 | ||||||
|
| |||||||
Specialized Finance – 0.0% | ||||||||
NewStar Financial, Inc. (a) | 4,605 | 40,892 | ||||||
On Deck Capital, Inc. (a) | 7,636 | 38,409 | ||||||
|
| |||||||
| 79,301 | ||||||||
|
| |||||||
TOTAL DIVERSIFIED FINANCIAL SERVICES |
| 41,392,264 | ||||||
|
| |||||||
INSURANCE – 20.2% |
| |||||||
Insurance Brokers – 2.8% | ||||||||
Aon PLC | 50,115 | 5,647,961 | ||||||
Arthur J Gallagher & Co. | 33,729 | 1,815,632 | ||||||
Brown & Brown, Inc. | 22,490 | 947,504 | ||||||
Crawford & Co. Class A | 6,226 | 57,528 | ||||||
Marsh & McLennan Cos., Inc. | 97,860 | 6,656,437 | ||||||
Willis Towers Watson PLC | 24,846 | 3,108,980 | ||||||
|
| |||||||
| 18,234,042 | ||||||||
|
| |||||||
Life & Health Insurance – 5.3% | ||||||||
Aflac, Inc. | 77,044 | 5,392,310 | ||||||
American Equity Investment Life Holding Co. | 5,207 | 122,885 | ||||||
Citizens, Inc. (a) | 9,886 | 91,544 | ||||||
CNO Financial Group, Inc. | 14,994 | 283,536 | ||||||
FBL Financial Group, Inc. Class A | 2,246 | 156,771 | ||||||
Fidelity & Guaranty Life | 2,660 | 63,707 | ||||||
Genworth Financial, Inc. Class A (a) | 62,755 | 210,857 | ||||||
Lincoln National Corp. | 43,849 | 2,960,246 | ||||||
MetLife, Inc. | 175,639 | 9,556,518 | ||||||
National Western Life Group, Inc. Class A | 500 | 146,575 | ||||||
Primerica, Inc. | 8,362 | 630,913 | ||||||
Principal Financial Group, Inc. | 54,610 | 3,117,685 | ||||||
Prudential Financial, Inc. | 82,176 | 8,637,519 | ||||||
Torchmark Corp. | 21,452 | 1,577,580 | ||||||
See accompanying notes which are an integral part of the financial statements.
| Semiannual Report | 28 |
Table of Contents
| Common Stocks – continued | ||||||||
| Shares | Value | |||||||
INSURANCE – continued |
| |||||||
Life & Health Insurance – continued |
| |||||||
Trupanion, Inc. (a) | 4,538 | $ | 72,563 | |||||
Unum Group | 44,675 | 2,029,585 | ||||||
|
| |||||||
| 35,050,794 | ||||||||
|
| |||||||
Multi-line Insurance – 3.4% |
| |||||||
American Financial Group, Inc. | 13,134 | 1,131,757 | ||||||
American International Group, Inc. | 201,286 | 12,934,639 | ||||||
American National Insurance Co. | 1,602 | 186,777 | ||||||
Assurant, Inc. | 11,730 | 1,139,335 | ||||||
Hartford Financial Services Group, Inc. | 72,660 | 3,539,269 | ||||||
Horace Mann Educators Corp. | 7,801 | 322,571 | ||||||
Kemper Corp. | 7,906 | 341,539 | ||||||
Loews Corp. | 54,098 | 2,519,885 | ||||||
National General Holdings Corp. | 11,380 | 278,696 | ||||||
|
| |||||||
| 22,394,468 | ||||||||
|
| |||||||
Property & Casualty Insurance – 7.7% |
| |||||||
Allied World Assurance Co. Holdings AG | 16,856 | 895,559 | ||||||
Ambac Financial Group, Inc. (a) | 2,596 | 54,308 | ||||||
AMERISAFE, Inc. | 3,520 | 221,936 | ||||||
Amtrust Financial Services, Inc. | 16,452 | 434,168 | ||||||
Arch Capital Group Ltd. (a) | 23,341 | 2,062,177 | ||||||
Argo Group International Holdings Ltd. | 5,755 | 368,032 | ||||||
Aspen Insurance Holdings Ltd. | 11,412 | 643,637 | ||||||
Assured Guaranty Ltd. | 25,270 | 983,256 | ||||||
Axis Capital Holdings Ltd. | 17,537 | 1,122,543 | ||||||
Baldwin & Lyons, Inc. Class B | 1,890 | 45,360 | ||||||
Chubb Ltd. | 87,443 | 11,497,880 | ||||||
Cincinnati Financial Corp. | 29,748 | 2,099,614 | ||||||
Donegal Group, Inc. Class A | 2,214 | 36,465 | ||||||
EMC Insurance Group, Inc. | 1,859 | 54,190 | ||||||
Employers Holdings, Inc. | 6,385 | 232,733 | ||||||
Erie Indemnity Co. Class A | 4,901 | 549,451 | ||||||
Federated National Holding Co. | 3,064 | 56,194 | ||||||
First American Financial Corp. | 20,623 | 775,012 | ||||||
FNF Group | 46,459 | 1,642,790 | ||||||
Global Indemnity Ltd. (a) | 1,881 | 74,318 | ||||||
HCI Group, Inc. | 1,012 | 41,856 | ||||||
Heritage Insurance Holdings, Inc. | 5,267 | 74,686 | ||||||
Infinity Property & Casualty Corp. | 2,227 | 193,415 | ||||||
James River Group Holdings Ltd. | 3,908 | 154,952 | ||||||
Kinsale Capital Group, Inc. | 2,931 | 86,025 | ||||||
Markel Corp. (a) | 2,663 | 2,463,275 | ||||||
MBIA, Inc. (a) | 25,146 | 256,489 | ||||||
Mercury General Corp. | 3,548 | 224,411 | ||||||
Old Republic International Corp. | 46,954 | 976,643 | ||||||
OneBeacon Insurance Group Ltd. Class A | 4,216 | 68,426 | ||||||
ProAssurance Corp. | 9,500 | 516,800 | ||||||
RLI Corp. | 7,890 | 468,824 | ||||||
Safety Insurance Group, Inc. | 823 | 59,009 | ||||||
| Shares | Value | |||||||
Selective Insurance Group, Inc. | 3,485 | $ | 145,325 | |||||
State Auto Financial Corp. | 3,410 | 86,137 | ||||||
State National Cos., Inc. | 6,139 | 84,473 | ||||||
Stewart Information Services Corp. | 4,489 | 196,080 | ||||||
The Allstate Corp. | 69,890 | 5,256,427 | ||||||
The Hanover Insurance Group, Inc. | 8,114 | 681,089 | ||||||
The Navigators Group, Inc. | 4,654 | 261,322 | ||||||
The Progressive Corp. | 109,694 | 4,106,943 | ||||||
The Travelers Cos., Inc. | 54,248 | 6,389,330 | ||||||
United Fire Group, Inc. | 3,271 | 154,391 | ||||||
United Insurance Holdings Corp. | 2,912 | 39,807 | ||||||
Universal Insurance Holdings, Inc. | 6,607 | 172,773 | ||||||
White Mountains Insurance Group Ltd. | 926 | 842,438 | ||||||
WR Berkley Corp. | 18,828 | 1,265,430 | ||||||
XL Group Ltd. | 52,591 | 1,975,844 | ||||||
|
| |||||||
| 51,092,243 | ||||||||
|
| |||||||
Reinsurance – 1.0% |
| |||||||
Alleghany Corp. (a) | 1,635 | 999,917 | ||||||
Endurance Specialty Holdings Ltd. | 12,291 | 1,139,253 | ||||||
Enstar Group Ltd. (a) | 2,167 | 419,639 | ||||||
Everest Re Group Ltd. | 3,702 | 814,181 | ||||||
Greenlight Capital Re Ltd. (a) | 6,096 | 137,770 | ||||||
Maiden Holdings Ltd. | 9,172 | 162,803 | ||||||
Reinsurance Group of America, Inc. | 11,432 | 1,434,373 | ||||||
RenaissanceRe Holdings Ltd. | 2,617 | 356,749 | ||||||
Third Point Reinsurance Ltd. (a) | 12,009 | 137,503 | ||||||
Validus Holdings Ltd. | 15,319 | 873,183 | ||||||
WMIH Corp. (a) | 45,722 | 70,869 | ||||||
|
| |||||||
| 6,546,240 | ||||||||
|
| |||||||
TOTAL INSURANCE |
| 133,317,787 | ||||||
|
| |||||||
MORTGAGE REAL ESTATE INVESTMENT TRUSTS (REITS) – 1.5% |
| |||||||
Mortgage REIT’s – 1.5% | ||||||||
AG Mortgage Investment Trust, Inc. | 4,653 | 81,521 | ||||||
AGNC Investment Corp. | 62,553 | 1,167,865 | ||||||
Altisource Residential Corp. | 10,731 | 130,274 | ||||||
Annaly Capital Management, Inc. | 187,146 | 1,912,632 | ||||||
Anworth Mortgage Asset Corp. | 16,243 | 83,327 | ||||||
Apollo Commercial Real Estate Finance, Inc. | 16,922 | 294,612 | ||||||
ARMOUR Residential REIT, Inc. | 7,209 | 151,533 | ||||||
Blackstone Mortgage Trust, Inc. Class A | 17,877 | 545,070 | ||||||
Capstead Mortgage Corp. | 18,647 | 198,963 | ||||||
Chimera Investment Corp. | 34,045 | 600,213 | ||||||
CYS Investments, Inc. | 29,866 | 226,086 | ||||||
Dynex Capital, Inc. | 9,540 | 63,727 | ||||||
Hannon Armstrong Sustainable Infrastructure Capital, Inc. | 9,896 | 180,899 | ||||||
Invesco Mortgage Capital, Inc. | 21,330 | 310,778 | ||||||
Ladder Capital Corp. | 11,076 | 150,191 | ||||||
MFA Financial, Inc. | 71,099 | 560,971 | ||||||
MTGE Investment Corp. | 8,145 | 129,506 | ||||||
See accompanying notes which are an integral part of the financial statements.
| 29 | Semiannual Report |
Table of Contents
Fidelity MSCI Financials Index ETF
Investments (Unaudited) – continued
| Common Stocks – continued | ||||||||
| Shares | Value | |||||||
MORTGAGE REAL ESTATE INVESTMENT TRUSTS (REITS) – continued |
| |||||||
Mortgage REIT’s – continued |
| |||||||
New Residential Investment Corp. | 47,329 | $ | 717,034 | |||||
New York Mortgage Trust, Inc. | 19,906 | 127,597 | ||||||
PennyMac Mortgage Investment Trust | 11,476 | 194,518 | ||||||
Redwood Trust, Inc. | 14,986 | 232,283 | ||||||
Resource Capital Corp. | 5,818 | 47,824 | ||||||
Starwood Property Trust, Inc. | 48,477 | 1,079,098 | ||||||
Two Harbors Investment Corp. | 66,451 | 582,775 | ||||||
Western Asset Mortgage Capital Corp. | 7,907 | 79,782 | ||||||
|
| |||||||
TOTAL MORTGAGE REAL ESTATE INVESTMENT TRUSTS (REITS) |
| 9,849,079 | ||||||
|
| |||||||
THRIFTS & MORTGAGE FINANCE – 1.4% |
| |||||||
Thrifts & Mortgage Finance – 1.4% |
| |||||||
Astoria Financial Corp. | 17,524 | 331,379 | ||||||
Bank Mutual Corp. | 8,819 | 84,221 | ||||||
Beneficial Bancorp, Inc. | 14,879 | 265,590 | ||||||
BofI Holding, Inc. (a) | 11,005 | 324,647 | ||||||
Capitol Federal Financial, Inc. | 25,228 | 389,773 | ||||||
Dime Community Bancshares, Inc. | 6,417 | 137,324 | ||||||
Essent Group Ltd. (a) | 12,525 | 432,989 | ||||||
EverBank Financial Corp. | 21,952 | 426,527 | ||||||
Federal Agricultural Mortgage Corp. Class C | 1,872 | 104,195 | ||||||
Flagstar Bancorp, Inc. (a) | 4,527 | 116,661 | ||||||
HomeStreet, Inc. (a) | 4,187 | 109,699 | ||||||
Kearny Financial Corp. | 17,943 | 273,631 | ||||||
LendingTree, Inc. (a) | 1,518 | 169,864 | ||||||
Meridian Bancorp, Inc. | 9,949 | 187,539 | ||||||
Meta Financial Group, Inc. | 1,622 | 142,493 | ||||||
MGIC Investment Corp. (a) | 64,517 | 687,106 | ||||||
Nationstar Mortgage Holdings, Inc. (a) | 8,044 | 145,918 | ||||||
New York Community Bancorp, Inc. | 91,995 | 1,397,404 | ||||||
NMI Holdings, Inc. Class A (a) | 9,577 | 103,432 | ||||||
Northfield Bancorp, Inc. | 8,452 | 152,559 | ||||||
Northwest Bancshares, Inc. | 18,763 | 320,284 | ||||||
| Shares | Value | |||||||
OceanFirst Financial Corp. | 6,163 | $ | 175,091 | |||||
Ocwen Financial Corp. (a) | 19,139 | 100,863 | ||||||
Oritani Financial Corp. | 7,603 | 131,912 | ||||||
PHH Corp. (a) | 10,803 | 157,508 | ||||||
Provident Financial Services, Inc. | 11,438 | 302,764 | ||||||
Radian Group, Inc. | 40,875 | 752,100 | ||||||
TFS Financial Corp. | 13,756 | 240,592 | ||||||
TrustCo Bank Corp. | 18,715 | 157,206 | ||||||
United Financial Bancorp, Inc. | 9,618 | 173,605 | ||||||
Walker & Dunlop, Inc. (a) | 5,381 | 169,017 | ||||||
Walter Investment Management Corp. (a) | 3,326 | 12,639 | ||||||
Washington Federal, Inc. | 17,221 | 565,710 | ||||||
Waterstone Financial, Inc. | 5,010 | 90,681 | ||||||
WSFS Financial Corp. | 5,512 | 249,694 | ||||||
|
| |||||||
TOTAL THRIFTS & MORTGAGE FINANCE |
| 9,582,617 | ||||||
|
| |||||||
TOTAL COMMON STOCKS |
| 659,882,538 | ||||||
|
| |||||||
| Money Market Funds – 0.2% | ||||||||
State Street Institutional Treasury Plus Money Market Fund, Premier Class, 0.43% (b) | 1,018,290 | 1,018,290 | ||||||
|
| |||||||
TOTAL INVESTMENT PORTFOLIO – 100.0% |
| 660,900,828 | ||||||
NET OTHER ASSETS (LIABILITIES) – 0.0% |
| 300,379 | ||||||
|
| |||||||
NET ASSETS – 100% |
| $ | 661,201,207 | |||||
|
| |||||||
Legend
| (a) | Non-income producing. |
| (b) | The rate quoted is the annualized seven-day yield of the fund at period end. |
Other Information
The following is a summary of the inputs used, as of January 31, 2017, involving the Fund’s assets and liabilities carried at fair value. The inputs or methodology used for valuing securities may not be an indication of the risk associated with investing in those securities. For more information on valuation inputs, and their aggregation into the levels used in the table below, please refer to the Investment Valuation section in the accompanying Notes to Financial Statements.
| Valuation Inputs at Reporting Date: | ||||||||||||||||
| Description | Total | Level 1 | Level 2 | Level 3 | ||||||||||||
Investments in Securities: | ||||||||||||||||
Common Stocks | $ | 659,882,538 | $ | 659,882,538 | $ | — | $ | — | ||||||||
Money Market Funds | 1,018,290 | 1,018,290 | — | — | ||||||||||||
|
|
|
|
|
|
|
| |||||||||
Total Investments in Securities: | $ | 660,900,828 | $ | 660,900,828 | $ | — | $ | — | ||||||||
|
|
|
|
|
|
|
| |||||||||
See accompanying notes which are an integral part of the financial statements.
| Semiannual Report | 30 |
Table of Contents
Fidelity MSCI Health Care Index ETF
Investments January 31, 2017 (Unaudited)
Showing Percentage of Net Assets
| Common Stocks – 99.8% | ||||||||
| Shares | Value | |||||||
BIOTECHNOLOGY – 22.4% | ||||||||
Biotechnology – 22.4% | ||||||||
AbbVie, Inc. | 325,988 | $ | 19,921,127 | |||||
ACADIA Pharmaceuticals, Inc. (a) | 19,327 | 668,521 | ||||||
Acceleron Pharma, Inc. (a) | 5,544 | 134,608 | ||||||
Achillion Pharmaceuticals, Inc. (a) | 21,727 | 90,602 | ||||||
Acorda Therapeutics, Inc. (a) | 9,168 | 187,944 | ||||||
Aduro Biotech, Inc. (a) | 4,497 | 53,289 | ||||||
Advaxis, Inc. (a) | 6,200 | 55,552 | ||||||
Agenus, Inc. (a) | 16,287 | 65,148 | ||||||
Agios Pharmaceuticals, Inc. (a) | 6,633 | 285,418 | ||||||
Aimmune Therapeutics, Inc. (a) | 3,781 | 69,117 | ||||||
Alder Biopharmaceuticals, Inc. (a) | 7,947 | 163,311 | ||||||
Alexion Pharmaceuticals, Inc. (a) | 44,881 | 5,865,049 | ||||||
Alkermes PLC (a) | 30,290 | 1,638,992 | ||||||
Alnylam Pharmaceuticals, Inc. (a) | 15,467 | 618,525 | ||||||
AMAG Pharmaceuticals, Inc. (a) | 6,833 | 164,675 | ||||||
Amgen, Inc. | 149,809 | 23,472,074 | ||||||
Amicus Therapeutics, Inc. (a) | 25,080 | 137,940 | ||||||
Ardelyx, Inc. (a) | 5,848 | 70,176 | ||||||
Arena Pharmaceuticals, Inc. (a) | 47,991 | 73,906 | ||||||
Ariad Pharmaceuticals, Inc. (a) | 34,738 | 827,459 | ||||||
Array BioPharma, Inc. (a) | 29,689 | 322,719 | ||||||
Arrowhead Pharmaceuticals, Inc. (a) | 11,431 | 22,176 | ||||||
Atara Biotherapeutics, Inc. (a) | 3,424 | 46,053 | ||||||
Avexis, Inc. (a) | 3,299 | 184,018 | ||||||
Axovant Sciences Ltd. (a) | 4,927 | 60,356 | ||||||
Bellicum Pharmaceuticals, Inc. (a) | 3,219 | 43,070 | ||||||
BioCryst Pharmaceuticals, Inc. (a) | 11,698 | 73,697 | ||||||
Biogen, Inc. (a) | 43,870 | 12,162,519 | ||||||
BioMarin Pharmaceutical, Inc. (a) | 34,193 | 2,996,333 | ||||||
Biotime, Inc. (a) | 12,918 | 40,433 | ||||||
Bluebird Bio, Inc. (a) | 8,120 | 604,940 | ||||||
Blueprint Medicines Corp. (a) | 4,853 | 165,390 | ||||||
Celgene Corp. (a) | 155,156 | 18,021,369 | ||||||
Celldex Therapeutics, Inc. (a) | 19,685 | 64,173 | ||||||
Chimerix, Inc. (a) | 8,207 | 44,646 | ||||||
Clovis Oncology, Inc. (a) | 6,862 | 444,658 | ||||||
Coherus Biosciences, Inc. (a) | 4,872 | 135,929 | ||||||
CoLucid Pharmaceuticals, Inc. (a) | 1,543 | 71,518 | ||||||
Concert Pharmaceuticals, Inc. (a) | 3,090 | 27,347 | ||||||
CytomX Therapeutics, Inc. (a) | 3,246 | 37,719 | ||||||
Dyax Corp. (a) | 31,822 | 79,555 | ||||||
Dynavax Technologies Corp. (a) | 7,253 | 29,737 | ||||||
Eagle Pharmaceuticals, Inc. (a) | 1,866 | 129,146 | ||||||
Editas Medicine, Inc. (a) | 3,767 | 65,621 | ||||||
Emergent Biosolutions, Inc. (a) | 6,555 | 198,420 | ||||||
Enanta Pharmaceuticals, Inc. (a) | 2,827 | 93,644 | ||||||
Epizyme, Inc. (a) | 7,962 | 83,601 | ||||||
Esperion Therapeutics, Inc. (a) | 2,687 | 32,566 | ||||||
Exact Sciences Corp. (a) | 21,664 | 410,533 | ||||||
Exelixis, Inc. (a) | 46,030 | 834,064 | ||||||
FibroGen, Inc. (a) | 9,941 | 225,164 | ||||||
| Shares | Value | |||||||
Five Prime Therapeutics, Inc. (a) | 5,175 | $ | 237,067 | |||||
Flexion Therapeutics, Inc. (a) | 3,970 | 77,018 | ||||||
Foundation Medicine, Inc. (a) | 2,734 | 53,450 | ||||||
Genomic Health, Inc. (a) | 3,615 | 99,340 | ||||||
Geron Corp. (a) | 31,619 | 65,768 | ||||||
Gilead Sciences, Inc. | 264,154 | 19,137,957 | ||||||
Global Blood Therapeutics, Inc. (a) | 4,021 | 64,939 | ||||||
Halozyme Therapeutics, Inc. (a) | 21,838 | 252,229 | ||||||
Heron Therapeutics, Inc. (a) | 8,756 | 113,828 | ||||||
ImmunoGen, Inc. (a) | 17,201 | 40,250 | ||||||
Immunomedics, Inc. (a) | 22,605 | 101,723 | ||||||
Incyte Corp. Ltd. (a) | 33,874 | 4,105,868 | ||||||
Inovio Pharmaceuticals, Inc. (a) | 13,821 | 91,219 | ||||||
Insmed, Inc. (a) | 11,727 | 173,208 | ||||||
Insys Therapeutics, Inc. (a) | 4,259 | 43,612 | ||||||
Intellia Therapeutics, Inc. (a) | 2,746 | 35,478 | ||||||
Intercept Pharmaceuticals, Inc. (a) | 3,479 | 381,820 | ||||||
Intrexon Corp. (a) | 11,643 | 246,366 | ||||||
Ionis Pharmaceuticals, Inc. (a) | 24,175 | 1,075,787 | ||||||
Ironwood Pharmaceuticals, Inc. (a) | 24,681 | 354,913 | ||||||
Juno Therapeutics, Inc. (a) | 12,812 | 273,408 | ||||||
Karyopharm Therapeutics, Inc. (a) | 4,311 | 44,619 | ||||||
Keryx Biopharmaceuticals, Inc. (a) | 15,752 | 78,602 | ||||||
Kite Pharma, Inc. (a) | 7,945 | 404,957 | ||||||
La Jolla Pharmaceutical Co. (a) | 2,907 | 56,541 | ||||||
Lexicon Pharmaceuticals, Inc. (a) | 9,276 | 132,925 | ||||||
Ligand Pharmaceuticals, Inc. (a) | 3,992 | 423,192 | ||||||
Lion Biotechnologies, Inc. (a) | 8,690 | 63,003 | ||||||
Loxo Oncology, Inc. (a) | 2,142 | 84,031 | ||||||
MacroGenics, Inc. (a) | 5,486 | 101,326 | ||||||
MannKind Corp. (a) | 57,009 | 40,134 | ||||||
Merrimack Pharmaceuticals, Inc. (a) | 24,137 | 75,066 | ||||||
MiMedx Group, Inc. (a) | 20,679 | 167,086 | ||||||
Minerva Neurosciences, Inc. (a) | 5,121 | 54,283 | ||||||
Momenta Pharmaceuticals, Inc. (a) | 13,481 | 254,791 | ||||||
Myriad Genetics, Inc. (a) | 14,008 | 226,649 | ||||||
NantKwest, Inc. (a) | 4,890 | 26,210 | ||||||
Natera, Inc. (a) | 4,576 | 41,001 | ||||||
Neurocrine Biosciences, Inc. (a) | 17,406 | 746,891 | ||||||
NewLink Genetics Corp. (a) | 4,267 | 51,929 | ||||||
Novavax, Inc. (a) | 53,852 | 70,546 | ||||||
OncoMed Pharmaceuticals, Inc. (a) | 3,961 | 32,718 | ||||||
Ophthotech Corp. (a) | 5,259 | 25,033 | ||||||
Opko Health, Inc. (a) | 67,132 | 583,377 | ||||||
Organovo Holdings, Inc. (a) | 20,881 | 77,051 | ||||||
Otonomy, Inc. (a) | 4,190 | 61,384 | ||||||
OvaScience, Inc. (a) | 5,824 | 9,202 | ||||||
PDL BioPharma, Inc. | 30,870 | 67,914 | ||||||
Portola Pharmaceuticals, Inc. (a) | 11,230 | 306,018 | ||||||
Progenics Pharmaceuticals, Inc. (a) | 13,908 | 124,059 | ||||||
Prothena Corp. PLC (a) | 5,812 | 284,556 | ||||||
PTC Therapeutics, Inc. (a) | 6,128 | 80,277 | ||||||
Puma Biotechnology, Inc. (a) | 6,565 | 212,706 | ||||||
See accompanying notes which are an integral part of the financial statements.
| 31 | Semiannual Report |
Table of Contents
Fidelity MSCI Health Care Index ETF
Investments (Unaudited) – continued
| Common Stocks – continued | ||||||||
| Shares | Value | |||||||
BIOTECHNOLOGY – continued |
| |||||||
Biotechnology – continued |
| |||||||
Radius Health, Inc. (a) | 5,989 | $ | 260,641 | |||||
Regeneron Pharmaceuticals, Inc. (a) | 15,529 | 5,579,414 | ||||||
REGENXBIO, Inc. (a) | 4,128 | 76,368 | ||||||
Repligen Corp. (a) | 6,701 | 201,298 | ||||||
Retrophin, Inc. (a) | 6,205 | 121,742 | ||||||
Sage Therapeutics, Inc. (a) | 6,175 | 296,277 | ||||||
Sangamo Therapeutics, Inc. (a) | 13,323 | 46,631 | ||||||
Sarepta Therapeutics, Inc. (a) | 10,040 | 311,842 | ||||||
Seattle Genetics, Inc. (a) | 19,844 | 1,195,403 | ||||||
Seres Therapeutics, Inc. (a) | 2,720 | 26,901 | ||||||
Sorrento Therapeutics, Inc. (a) | 9,750 | 52,650 | ||||||
Spark Therapeutics, Inc. (a) | 4,584 | 289,067 | ||||||
Spectrum Pharmaceuticals, Inc. (a) | 13,134 | 61,204 | ||||||
Synergy Pharmaceuticals, Inc. (a) | 35,758 | 252,809 | ||||||
TESARO, Inc. (a) | 7,181 | 1,169,354 | ||||||
TG Therapeutics, Inc. (a) | 8,644 | 41,491 | ||||||
Trevena, Inc. (a) | 6,744 | 47,073 | ||||||
Ultragenyx Pharmaceutical, Inc. (a) | 7,487 | 561,600 | ||||||
United Therapeutics Corp. (a) | 8,682 | 1,420,636 | ||||||
Vanda Pharmaceuticals, Inc. (a) | 7,716 | 109,181 | ||||||
Versartis, Inc. (a) | 4,984 | 71,271 | ||||||
Vertex Pharmaceuticals, Inc. (a) | 49,585 | 4,257,864 | ||||||
XBiotech, Inc. (a) | 3,521 | 40,139 | ||||||
Xencor, Inc. (a) | 7,773 | 185,231 | ||||||
ZIOPHARM Oncology, Inc. (a) | 20,940 | 123,965 | ||||||
|
| |||||||
TOTAL BIOTECHNOLOGY |
| 141,147,924 | ||||||
|
| |||||||
HEALTH CARE EQUIPMENT & SUPPLIES – 19.6% |
| |||||||
Health Care Equipment – 17.9% |
| |||||||
Abaxis, Inc. | 4,475 | 228,024 | ||||||
Abbott Laboratories | 344,525 | 14,390,809 | ||||||
ABIOMED, Inc. (a) | 8,213 | 873,617 | ||||||
Accuray, Inc. (a) | 16,093 | 92,535 | ||||||
Analogic Corp. | 2,474 | 192,106 | ||||||
AngioDynamics, Inc. (a) | 6,789 | 109,269 | ||||||
AtriCure, Inc. (a) | 6,586 | 107,154 | ||||||
Baxter International, Inc. | 96,884 | 4,641,712 | ||||||
Becton Dickinson and Co. | 42,616 | 7,555,391 | ||||||
Boston Scientific Corp. (a) | 272,377 | 6,553,391 | ||||||
Cantel Medical Corp. | 7,540 | 583,671 | ||||||
Cardiovascular Systems, Inc. (a) | 6,763 | 167,046 | ||||||
ConforMIS, Inc. (a) | 4,569 | 37,923 | ||||||
CONMED Corp. | 4,689 | 209,083 | ||||||
CR Bard, Inc. | 14,695 | 3,487,564 | ||||||
CryoLife, Inc. | 5,846 | 111,074 | ||||||
Cynosure, Inc. Class A (a) | 4,806 | 256,640 | ||||||
Danaher Corp. | 124,413 | 10,440,739 | ||||||
DexCom, Inc. (a) | 16,769 | 1,327,266 | ||||||
Edwards Lifesciences Corp. (a) | 42,607 | 4,100,498 | ||||||
Entellus Medical, Inc. (a) | 1,284 | 21,969 | ||||||
| Shares | Value | |||||||
Exactech, Inc. (a) | 2,107 | $ | 51,938 | |||||
GenMark Diagnostics, Inc. (a) | 8,001 | 97,052 | ||||||
Glaukos Corp. (a) | 2,263 | 93,281 | ||||||
Globus Medical, Inc. Class A (a) | 14,473 | 381,508 | ||||||
Hill-Rom Holdings, Inc. | 13,109 | 771,727 | ||||||
Hologic, Inc. (a) | 49,979 | 2,025,649 | ||||||
IDEXX Laboratories, Inc. (a) | 17,922 | 2,192,398 | ||||||
Inogen, Inc. (a) | 3,192 | 205,469 | ||||||
Insulet Corp. (a) | 11,552 | 480,563 | ||||||
Integer Holdings Corp. (a) | 5,512 | 178,589 | ||||||
Integra LifeSciences Holdings Corp. (a) | 11,984 | 500,092 | ||||||
Intuitive Surgical, Inc. (a) | 7,712 | 5,342,025 | ||||||
Invacare Corp. | 5,999 | 68,989 | ||||||
K2M Group Holdings, Inc. (a) | 6,423 | 130,515 | ||||||
LivaNova PLC (a) | 8,789 | 422,795 | ||||||
Masimo Corp. (a) | 9,369 | 689,371 | ||||||
Medtronic PLC | 278,947 | 21,205,551 | ||||||
Natus Medical, Inc. (a) | 6,591 | 257,379 | ||||||
Nevro Corp. (a) | 4,320 | 375,926 | ||||||
Novocure Ltd. (a) | 8,368 | 53,137 | ||||||
NuVasive, Inc. (a) | 10,040 | 710,531 | ||||||
NxStage Medical, Inc. (a) | 13,048 | 350,991 | ||||||
Orthofix International N.V. (a) | 3,629 | 130,426 | ||||||
Penumbra, Inc. (a) | 5,277 | 377,569 | ||||||
ResMed, Inc. | 28,116 | 1,898,955 | ||||||
Rockwell Medical, Inc. (a) | 9,735 | 56,560 | ||||||
STERIS PLC | 17,253 | 1,222,030 | ||||||
Stryker Corp. | 67,437 | 8,330,493 | ||||||
SurModics, Inc. (a) | 2,615 | 63,283 | ||||||
Teleflex, Inc. | 8,816 | 1,478,708 | ||||||
TransEnterix Inc. (a) | 11,419 | 16,786 | ||||||
Varex Imaging Corp. (a) | 7,426 | 213,498 | ||||||
Varian Medical Systems, Inc. (a) | 18,565 | 1,441,572 | ||||||
Wright Medical Group N.V. (a) | 18,663 | 469,934 | ||||||
Zeltiq Aesthetics, Inc. (a) | 7,198 | 319,159 | ||||||
Zimmer Biomet Holdings, Inc. | 40,030 | 4,736,750 | ||||||
|
| |||||||
| 112,828,680 | ||||||||
|
| |||||||
Health Care Supplies – 1.7% | ||||||||
Alere, Inc. (a) | 16,335 | 604,395 | ||||||
Align Technology, Inc. (a) | 14,428 | 1,322,903 | ||||||
Anika Therapeutics, Inc. (a) | 2,974 | 150,306 | ||||||
Atrion Corp. | 292 | 142,671 | ||||||
Cerus Corp. (a) | 19,192 | 81,758 | ||||||
DENTSPLY SIRONA, Inc. | 46,641 | 2,644,545 | ||||||
Endologix, Inc. (a) | 14,707 | 100,890 | ||||||
Haemonetics Corp. (a) | 10,278 | 409,681 | ||||||
Halyard Health, Inc. (a) | 9,284 | 357,156 | ||||||
ICU Medical, Inc. (a) | 3,084 | 422,816 | ||||||
Meridian Bioscience, Inc. | 8,363 | 109,555 | ||||||
Merit Medical Systems, Inc. (a) | 8,817 | 223,952 | ||||||
Neogen Corp. (a) | 7,554 | 498,866 | ||||||
OraSure Technologies, Inc. (a) | 11,040 | 97,373 | ||||||
See accompanying notes which are an integral part of the financial statements.
| Semiannual Report | 32 |
Table of Contents
| Common Stocks – continued | ||||||||
| Shares | Value | |||||||
HEALTH CARE EQUIPMENT & SUPPLIES – continued |
| |||||||
Health Care Supplies – continued |
| |||||||
Quidel Corp. (a) | 5,470 | $ | 103,821 | |||||
Staar Surgical Co. (a) | 5,943 | 58,836 | ||||||
The Cooper Cos., Inc. | 9,685 | 1,787,948 | ||||||
The Spectranetics Corp. (a) | 8,517 | 220,164 | ||||||
Vascular Solutions, Inc. (a) | 3,579 | 200,245 | ||||||
West Pharmaceutical Services, Inc. | 14,669 | 1,241,438 | ||||||
|
| |||||||
| 10,779,319 | ||||||||
|
| |||||||
TOTAL HEALTH CARE EQUIPMENT & SUPPLIES |
| 123,607,999 | ||||||
|
| |||||||
HEALTH CARE PROVIDERS & SERVICES – 18.9% |
| |||||||
Health Care Services – 3.6% | ||||||||
Adeptus Health, Inc. Class A (a) | 3,039 | 21,790 | ||||||
Air Methods Corp. (a) | 7,244 | 258,611 | ||||||
Almost Family, Inc. (a) | 1,697 | 80,183 | ||||||
Amedisys, Inc. (a) | 5,314 | 243,487 | ||||||
American Renal Associates Holdings, Inc. (a) | 2,580 | 49,588 | ||||||
AMN Healthcare Services, Inc. (a) | 9,558 | 342,654 | ||||||
BioTelemetry, Inc. (a) | 5,392 | 124,286 | ||||||
Chemed Corp. | 3,295 | 547,266 | ||||||
Civitas Solutions, Inc. (a) | 2,950 | 53,985 | ||||||
Corvel Corp. (a) | 2,145 | 82,261 | ||||||
Cross Country Healthcare, Inc. (a) | 6,557 | 94,880 | ||||||
DaVita Inc. (a) | 33,130 | 2,112,037 | ||||||
Diplomat Pharmacy, Inc. (a) | 7,872 | 108,161 | ||||||
Envision Healthcare Corp. (a) | 23,463 | 1,595,484 | ||||||
Express Scripts Holding Co. (a) | 126,147 | 8,689,005 | ||||||
Laboratory Corp. of America Holdings (a) | 20,480 | 2,748,621 | ||||||
Landauer, Inc. | 1,905 | 97,822 | ||||||
LHC Group, Inc. (a) | 3,038 | 152,295 | ||||||
MEDNAX, Inc. (a) | 18,746 | 1,281,289 | ||||||
National Research Corp. Class A | 1,871 | 32,649 | ||||||
Premier, Inc. Class A (a) | 9,415 | 299,962 | ||||||
Quest Diagnostics, Inc. | 27,836 | 2,558,685 | ||||||
Team Health Holdings, Inc. (a) | 14,860 | 645,816 | ||||||
Teladoc, Inc. (a) | 6,874 | 137,480 | ||||||
The Providence Service Corp. (a) | 2,505 | 96,818 | ||||||
Tivity Health, Inc. (a) | 6,747 | 173,061 | ||||||
|
| |||||||
| 22,628,176 | ||||||||
|
| |||||||
Health Care Distributors – 2.9% | ||||||||
Aceto Corp. | 5,887 | 112,383 | ||||||
AmerisourceBergen Corp. | 38,113 | 3,326,503 | ||||||
Cardinal Health, Inc. | 63,773 | 4,780,424 | ||||||
Henry Schein, Inc. (a) | 16,375 | 2,617,707 | ||||||
McKesson Corp. | 45,176 | 6,286,240 | ||||||
Owens & Minor, Inc. | 12,515 | 449,038 | ||||||
Patterson Cos., Inc. | 16,891 | 702,835 | ||||||
PharMerica Corp. (a) | 6,108 | 151,478 | ||||||
|
| |||||||
| 18,426,608 | ||||||||
|
| |||||||
| Shares | Value | |||||||
Health Care Facilities – 2.0% | ||||||||
AAC Holdings, Inc. (a) | 1,877 | $ | 14,922 | |||||
Acadia Healthcare Co., Inc. (a) | 14,964 | 574,169 | ||||||
Brookdale Senior Living, Inc. (a) | 37,435 | 560,402 | ||||||
Capital Senior Living Corp. (a) | 5,354 | 89,251 | ||||||
Community Health Systems, Inc. (a) | 22,629 | 144,826 | ||||||
Genesis Healthcare, Inc. (a) | 9,473 | 38,934 | ||||||
HCA Holdings, Inc. (a) | 60,645 | 4,868,581 | ||||||
HealthSouth Corp. | 17,903 | 694,994 | ||||||
Kindred Healthcare, Inc. | 16,932 | 112,598 | ||||||
LifePoint Health, Inc. (a) | 8,633 | 512,369 | ||||||
National HealthCare Corp. | 1,967 | 147,230 | ||||||
Select Medical Holdings Corp. (a) | 20,903 | 260,242 | ||||||
Surgery Partners, Inc. (a) | 3,850 | 71,225 | ||||||
Surgical Care Affiliates, Inc. (a) | 5,571 | 314,761 | ||||||
Tenet Healthcare Corp. (a) | 19,751 | 347,420 | ||||||
The Ensign Group, Inc. | 9,488 | 192,986 | ||||||
Universal Health Services, Inc. Class B | 18,033 | 2,031,057 | ||||||
US Physical Therapy, Inc. | 2,491 | 174,744 | ||||||
VCA, Inc. (a) | 16,274 | 1,474,424 | ||||||
|
| |||||||
| 12,625,135 | ||||||||
|
| |||||||
Managed Health Care – 10.4% | ||||||||
Aetna, Inc. | 70,214 | 8,328,083 | ||||||
Anthem, Inc. | 52,674 | 8,119,170 | ||||||
Centene Corp. (a) | 34,117 | 2,158,583 | ||||||
Cigna Corp. | 51,365 | 7,510,590 | ||||||
HealthEquity, Inc. (a) | 8,808 | 407,370 | ||||||
Humana, Inc. | 29,839 | 5,923,041 | ||||||
Magellan Health, Inc. (a) | 4,716 | 353,464 | ||||||
Molina Healthcare, Inc. (a) | 7,986 | 452,966 | ||||||
Triple-S Management Corp. Class B (a) | 4,737 | 90,524 | ||||||
UnitedHealth Group, Inc. | 190,639 | 30,902,582 | ||||||
Universal American Corp. (a) | 9,790 | 97,313 | ||||||
WellCare Health Plans, Inc. (a) | 8,891 | 1,293,996 | ||||||
|
| |||||||
| 65,637,682 | ||||||||
|
| |||||||
TOTAL HEALTH CARE PROVIDERS & SERVICES |
| 119,317,601 | ||||||
|
| |||||||
HEALTH CARE TECHNOLOGY – 1.2% |
| |||||||
Health Care Technology – 1.2% |
| |||||||
Allscripts Healthcare Solutions, Inc. (a) | 35,349 | 413,937 | ||||||
athenahealth, Inc. (a) | 7,871 | 991,667 | ||||||
Castlight Health, Inc. Class B (a) | 4,812 | 14,917 | ||||||
Cerner Corp. (a) | 60,837 | 3,267,555 | ||||||
Computer Programs & Systems, Inc. | 2,155 | 48,703 | ||||||
Evolent Health, Inc. (a) | 4,865 | 88,543 | ||||||
HealthStream, Inc. (a) | 5,013 | 115,099 | ||||||
HMS Holdings Corp. (a) | 17,079 | 310,155 | ||||||
Inovalon Holdings, Inc. Class A (a) | 13,311 | 153,742 | ||||||
Medidata Solutions, Inc. (a) | 11,510 | 570,205 | ||||||
Omnicell, Inc. (a) | 7,334 | 263,291 | ||||||
Quality Systems, Inc. | 9,092 | 136,471 | ||||||
See accompanying notes which are an integral part of the financial statements.
| 33 | Semiannual Report |
Table of Contents
Fidelity MSCI Health Care Index ETF
Investments (Unaudited) – continued
| Common Stocks – continued | ||||||||
| Shares | Value | |||||||
HEALTH CARE TECHNOLOGY – continued |
| |||||||
Health Care Technology – continued |
| |||||||
Veeva Systems, Inc. Class A (a) | 17,416 | $ | 737,219 | |||||
Vocera Communications, Inc. (a) | 4,747 | 98,500 | ||||||
|
| |||||||
TOTAL HEALTH CARE TECHNOLOGY |
| 7,210,004 | ||||||
|
| |||||||
LIFE SCIENCES TOOLS & SERVICES – 5.4% |
| |||||||
Life Sciences Tools & Services – 5.4% |
| |||||||
Accelerate Diagnostics, Inc. (a) | 6,103 | 127,858 | ||||||
Agilent Technologies, Inc. | 65,167 | 3,191,228 | ||||||
Albany Molecular Research, Inc. (a) | 5,654 | 104,034 | ||||||
Bio-Rad Laboratories, Inc. Class A (a) | 4,135 | 785,981 | ||||||
Bio-Techne Corp. | 7,456 | 758,648 | ||||||
Bruker Corp. | 22,768 | 540,285 | ||||||
Cambrex Corp. (a) | 6,470 | 339,351 | ||||||
Charles River Laboratories International, Inc. (a) | 9,459 | 764,287 | ||||||
Illumina, Inc. (a) | 29,352 | 4,699,255 | ||||||
INC Research Holdings, Inc. Class A (a) | 10,748 | 569,644 | ||||||
Luminex Corp. (a) | 7,761 | 156,927 | ||||||
Medpace Holdings, Inc. (a) | 1,705 | 59,487 | ||||||
Mettler-Toledo International, Inc. (a) | 5,298 | 2,260,286 | ||||||
NeoGenomics, Inc. (a) | 14,570 | 117,434 | ||||||
Pacific Biosciences of California, Inc. (a) | 17,452 | 84,119 | ||||||
PAREXEL International Corp. (a) | 10,606 | 751,859 | ||||||
Patheon N.V. (a) | 7,319 | 209,982 | ||||||
PerkinElmer, Inc. | 21,916 | 1,165,712 | ||||||
PRA Health Sciences, Inc. (a) | 7,962 | 466,494 | ||||||
Quintiles IMS Holdings Inc. (a) | 29,496 | 2,315,141 | ||||||
Thermo Fisher Scientific, Inc. | 78,929 | 12,027,990 | ||||||
VWR Corp. (a) | 18,557 | 480,812 | ||||||
Waters Corp. (a) | 16,124 | 2,283,965 | ||||||
|
| |||||||
TOTAL LIFE SCIENCES TOOLS & SERVICES |
| 34,260,779 | ||||||
|
| |||||||
PHARMACEUTICALS – 32.3% |
| |||||||
Pharmaceuticals – 32.3% |
| |||||||
Aclaris Therapeutics, Inc. (a) | 3,648 | 96,781 | ||||||
Aerie Pharmaceuticals, Inc. (a) | 5,391 | 236,665 | ||||||
Akorn, Inc. (a) | 15,215 | 290,606 | ||||||
Allergan PLC (a) | 79,248 | 17,346,595 | ||||||
Amphastar Pharmaceuticals, Inc. (a) | 7,134 | 112,361 | ||||||
ANI Pharmaceuticals, Inc. (a) | 1,719 | 103,914 | ||||||
Bristol-Myers Squibb Co. Class A | 334,465 | 16,442,299 | ||||||
Catalent, Inc. (a) | 25,043 | 670,151 | ||||||
Cempra, Inc. (a) | 8,475 | 26,696 | ||||||
Clearside Biomedical, Inc. (a) | 3,438 | 25,613 | ||||||
Collegium Pharmaceutical, Inc. (a) | 3,812 | 64,118 | ||||||
Corcept Therapeutics, Inc. (a) | 15,141 | 107,653 | ||||||
Depomed, Inc. (a) | 12,157 | 219,920 | ||||||
Dermira, Inc. (a) | 4,681 | 137,809 | ||||||
Eli Lilly & Co. | 198,859 | 15,318,109 | ||||||
| Common Stocks – continued | ||||||||
| Shares | Value | |||||||
Endo International PLC (a) | 42,431 | $ | 519,355 | |||||
Horizon Pharma PLC (a) | 29,073 | 475,925 | ||||||
Impax Laboratories, Inc. (a) | 12,473 | 164,020 | ||||||
Innoviva, Inc. (a) | 15,740 | 166,844 | ||||||
Intersect ENT, Inc. (a) | 4,215 | 56,903 | ||||||
Intra-Cellular Therapies, Inc. (a) | 6,445 | 93,066 | ||||||
Jazz Pharmaceuticals PLC (a) | 12,102 | 1,475,476 | ||||||
Johnson & Johnson | 547,640 | 62,020,230 | ||||||
Lannett Co., Inc. (a) | 5,880 | 118,482 | ||||||
Mallinckrodt PLC (a) | 21,579 | 1,051,545 | ||||||
Merck & Co., Inc. | 553,516 | 34,312,457 | ||||||
Mylan N.V. (a) | 91,013 | 3,463,045 | ||||||
MyoKardia, Inc. (a) | 2,877 | 32,222 | ||||||
Nektar Therapeutics (a) | 30,008 | 363,397 | ||||||
Omeros Corp. (a) | 8,086 | 78,353 | ||||||
Pacira Pharmaceuticals, Inc. (a) | 7,394 | 284,299 | ||||||
Paratek Pharmaceuticals, Inc. (a) | 3,059 | 46,191 | ||||||
Perrigo Co. PLC | 28,683 | 2,184,210 | ||||||
Pfizer, Inc. | 1,214,167 | 38,525,519 | ||||||
Phibro Animal Health Corp. Class A | 3,660 | 97,722 | ||||||
Prestige Brands Holdings, Inc. (a) | 10,604 | 559,467 | ||||||
Revance Therapeutics, Inc. (a) | 3,968 | 79,360 | ||||||
Sciclone Pharmaceuticals, Inc. (a) | 9,788 | 99,348 | ||||||
Sucampo Pharmaceuticals, Inc. Class A (a) | 4,473 | 49,874 | ||||||
Supernus Pharmaceuticals, Inc. (a) | 7,863 | 212,694 | ||||||
Teligent, Inc. (a) | 7,297 | 51,079 | ||||||
The Medicines Co. (a) | 14,129 | 509,350 | ||||||
TherapeuticsMD, Inc. (a) | 31,231 | 181,452 | ||||||
Theravance Biopharma, Inc. (a) | 7,847 | 235,096 | ||||||
WaVe Life Sciences Ltd. (a) | 1,317 | 37,864 | ||||||
Zoetis, Inc. | 94,131 | 5,171,557 | ||||||
|
| |||||||
TOTAL PHARMACEUTICALS |
| 203,915,692 | ||||||
|
| |||||||
TOTAL COMMON STOCKS |
| 629,459,999 | ||||||
|
| |||||||
| Money Market Funds – 0.1% | ||||||||
State Street Institutional Treasury Plus Money Market Fund, Premier Class, 0.43% (b) | 577,921 | 577,921 | ||||||
|
| |||||||
TOTAL INVESTMENT PORTFOLIO – 99.9% |
| 630,037,920 | ||||||
NET OTHER ASSETS (LIABILITIES) – 0.1% |
| 435,661 | ||||||
|
| |||||||
NET ASSETS – 100% |
| $ | 630,473,581 | |||||
|
| |||||||
Legend
| (a) | Non-income producing. |
| (b) | The rate quoted is the annualized seven-day yield of the fund at period end. |
See accompanying notes which are an integral part of the financial statements.
| Semiannual Report | 34 |
Table of Contents
Other Information
The following is a summary of the inputs used, as of January 31, 2017, involving the Fund’s assets and liabilities carried at fair value. The inputs or methodology used for valuing securities may not be an indication of the risk associated with investing in those securities. For more information on valuation inputs, and their aggregation into the levels used in the table below, please refer to the Investment Valuation section in the accompanying Notes to Financial Statements.
| Valuation Inputs at Reporting Date: | ||||||||||||||||
| Description | Total | Level 1 | Level 2 | Level 3 | ||||||||||||
Investments in Securities: | ||||||||||||||||
Common Stocks | $ | 629,459,999 | $ | 629,380,444 | $ | — | $ | 79,555 | ||||||||
Money Market Funds | 577,921 | 577,921 | — | — | ||||||||||||
|
|
|
|
|
|
|
| |||||||||
Total Investments in Securities: | $ | 630,037,920 | $ | 629,958,365 | $ | — | $ | 79,555 | ||||||||
|
|
|
|
|
|
|
| |||||||||
See accompanying notes which are an integral part of the financial statements.
| 35 | Semiannual Report |
Table of Contents
Fidelity MSCI Industrials Index ETF
Investments January 31, 2017 (Unaudited)
Showing Percentage of Net Assets
| Common Stocks – 99.8% | ||||||||
| Shares | Value | |||||||
AEROSPACE & DEFENSE – 20.2% |
| |||||||
Aerospace & Defense – 20.2% |
| |||||||
AAR Corp. | 4,002 | $ | 128,024 | |||||
Aerojet Rocketdyne Holdings, Inc. (a) | 6,592 | 119,381 | ||||||
Aerovironment, Inc. (a) | 2,550 | 66,784 | ||||||
Arconic, Inc. | 52,552 | 1,197,660 | ||||||
Astronics Corp. (a) | 2,408 | 79,006 | ||||||
B/E Aerospace, Inc. | 12,202 | 750,057 | ||||||
BWX Technologies, Inc. | 11,163 | 463,153 | ||||||
Cubic Corp. | 2,756 | 131,048 | ||||||
Curtiss-Wright Corp. | 5,060 | 496,184 | ||||||
DigitalGlobe, Inc. (a) | 7,456 | 209,141 | ||||||
Engility Holdings, Inc. (a) | 2,411 | 70,715 | ||||||
Esterline Technologies Corp. (a) | 3,325 | 284,786 | ||||||
General Dynamics Corp. | 31,094 | 5,630,501 | ||||||
HEICO Corp. | 2,407 | 185,219 | ||||||
HEICO Corp. Class A | 4,582 | 303,787 | ||||||
Hexcel Corp. | 11,053 | 567,572 | ||||||
Huntington Ingalls Industries, Inc. | 5,613 | 1,088,697 | ||||||
KLX, Inc. (a) | 6,338 | 310,499 | ||||||
Kratos Defense & Security Solutions, Inc. (a) | 7,111 | 58,595 | ||||||
L3 Technologies, Inc. | 9,258 | 1,469,152 | ||||||
Lockheed Martin Corp. | 31,637 | 7,951,327 | ||||||
Mercury Systems, Inc. (a) | 4,796 | 161,721 | ||||||
Moog, Inc. Class A (a) | 3,908 | 257,420 | ||||||
National Presto Industries, Inc. | 570 | 60,648 | ||||||
Northrop Grumman Corp. | 20,320 | 4,654,906 | ||||||
Orbital ATK, Inc. | 7,007 | 609,259 | ||||||
Raytheon Co. | 35,353 | 5,096,488 | ||||||
Rockwell Collins, Inc. | 15,551 | 1,411,409 | ||||||
Spirit AeroSystems Holdings, Inc. Class A | 15,439 | 927,112 | ||||||
Taser International, Inc. (a) | 6,372 | 159,173 | ||||||
Teledyne Technologies, Inc. (a) | 3,956 | 486,074 | ||||||
Textron, Inc. | 32,252 | 1,527,777 | ||||||
The Boeing Co. | 71,000 | 11,602,820 | ||||||
The KEYW Holding Corp. (a) | 4,454 | 44,584 | ||||||
TransDigm Group, Inc. | 6,378 | 1,380,199 | ||||||
Triumph Group, Inc. | 5,674 | 151,779 | ||||||
United Technologies Corp. | 95,261 | 10,447,274 | ||||||
Wesco Aircraft Holdings, Inc. (a) | 7,136 | 108,110 | ||||||
|
| |||||||
TOTAL AEROSPACE & DEFENSE |
| 60,648,041 | ||||||
|
| |||||||
AIR FREIGHT & LOGISTICS – 6.1% |
| |||||||
Air Freight & Logistics – 6.1% |
| |||||||
Air Transport Services Group, Inc. (a) | 1,830 | 29,518 | ||||||
Atlas Air Worldwide Holdings, Inc. (a) | 732 | 38,613 | ||||||
CH Robinson Worldwide, Inc. | 17,082 | 1,299,257 | ||||||
Echo Global Logistics, Inc. (a) | 3,146 | 74,718 | ||||||
Expeditors International of Washington, Inc. | 21,660 | 1,128,053 | ||||||
FedEx Corp. | 30,222 | 5,715,282 | ||||||
| Shares | Value | |||||||
Forward Air Corp. | 3,616 | $ | 174,255 | |||||
Hub Group, Inc. Class A (a) | 4,018 | 178,198 | ||||||
Park-Ohio Holdings Corp. | 953 | 42,742 | ||||||
United Parcel Service, Inc. Class B | 82,824 | 9,038,583 | ||||||
XPO Logistics, Inc. (a) | 13,215 | 591,239 | ||||||
|
| |||||||
TOTAL AIR FREIGHT & LOGISTICS |
| 18,310,458 | ||||||
|
| |||||||
AIRLINES – 1.3% |
| |||||||
Airlines – 1.3% |
| |||||||
Allegiant Travel Co. | 499 | 85,828 | ||||||
American Airlines Group, Inc. | 15,872 | 702,336 | ||||||
Delta Air Lines, Inc. | 22,432 | 1,059,688 | ||||||
Hawaiian Holdings, Inc. (a) | 1,628 | 82,947 | ||||||
SkyWest, Inc. | 1,598 | 56,569 | ||||||
Southwest Airlines Co. | 18,552 | 970,455 | ||||||
Spirit Airlines, Inc. (a) | 2,084 | 112,619 | ||||||
United Continental Holdings, Inc. (a) | 9,659 | 680,670 | ||||||
|
| |||||||
TOTAL AIRLINES |
| 3,751,112 | ||||||
|
| |||||||
BUILDING PRODUCTS – 4.5% |
| |||||||
Building Products – 4.5% |
| |||||||
AAON, Inc. | 5,112 | 173,552 | ||||||
Advanced Drainage Systems, Inc. | 4,939 | 119,030 | ||||||
Allegion PLC | 11,496 | 754,942 | ||||||
American Woodmark Corp. (a) | 1,758 | 125,170 | ||||||
AO Smith Corp. | 17,770 | 866,287 | ||||||
Apogee Enterprises, Inc. | 3,448 | 196,812 | ||||||
Armstrong Flooring, Inc. (a) | 2,383 | 50,114 | ||||||
Armstrong World Industries, Inc. (a) | 4,977 | 198,831 | ||||||
Builders FirstSource, Inc. (a) | 10,606 | 114,121 | ||||||
Continental Building Products, Inc. (a) | 4,792 | 111,414 | ||||||
CSW Industrials, Inc. (a) | 1,876 | 68,568 | ||||||
Fortune Brands Home & Security, Inc. | 18,455 | 1,017,424 | ||||||
Gibraltar Industries, Inc. (a) | 3,596 | 157,864 | ||||||
Griffon Corp. | 3,656 | 93,045 | ||||||
Insteel Industries, Inc. | 2,173 | 80,488 | ||||||
Johnson Controls International PLC | 111,922 | 4,922,330 | ||||||
Lennox International, Inc. | 4,695 | 736,223 | ||||||
Masco Corp. | 39,540 | 1,302,843 | ||||||
Masonite International Corp. (a) | 3,105 | 206,793 | ||||||
NCI Building Systems, Inc. (a) | 4,232 | 67,712 | ||||||
Owens Corning | 13,765 | 760,516 | ||||||
Patrick Industries, Inc. (a) | 1,542 | 126,058 | ||||||
PGT Innovations, Inc. (a) | 5,721 | 65,792 | ||||||
Ply Gem Holdings, Inc. (a) | 2,760 | 44,574 | ||||||
Quanex Building Products Corp. | 3,690 | 72,878 | ||||||
Simpson Manufacturing Co., Inc. | 4,909 | 213,640 | ||||||
Trex Co., Inc. (a) | 3,502 | 237,190 | ||||||
Universal Forest Products, Inc. | 2,412 | 245,325 | ||||||
USG Corp. (a) | 11,339 | 346,860 | ||||||
|
| |||||||
TOTAL BUILDING PRODUCTS |
| 13,476,396 | ||||||
|
| |||||||
See accompanying notes which are an integral part of the financial statements.
| Semiannual Report | 36 |
Table of Contents
| Common Stocks – continued | ||||||||
| Shares | Value | |||||||
COMMERCIAL SERVICES & SUPPLIES – 5.7% |
| |||||||
Commercial Printing – 0.4% |
| |||||||
Brady Corp. Class A | 5,627 | $ | 204,541 | |||||
Deluxe Corp. | 5,849 | 426,100 | ||||||
Ennis, Inc. | 3,135 | 52,982 | ||||||
InnerWorkings, Inc. (a) | 4,927 | 47,348 | ||||||
LSC Communications, Inc. | 3,300 | 86,526 | ||||||
Multi-Color Corp. | 1,634 | 126,145 | ||||||
Quad/Graphics, Inc. | 3,444 | 90,198 | ||||||
RR Donnelley & Sons Co. | 8,250 | 141,488 | ||||||
|
| |||||||
| 1,175,328 | ||||||||
|
| |||||||
Diversified Support Services – 1.3% |
| |||||||
Cintas Corp. | 9,994 | 1,160,403 | ||||||
Copart, Inc. (a) | 11,824 | 670,894 | ||||||
G&K Services, Inc. Class A | 2,368 | 227,470 | ||||||
Healthcare Services Group, Inc. | 8,711 | 346,262 | ||||||
KAR Auction Services, Inc. | 16,512 | 752,122 | ||||||
Matthews International Corp. Class A | 3,845 | 259,345 | ||||||
McGrath RentCorp | 2,727 | 104,390 | ||||||
Mobile Mini, Inc. | 5,317 | 173,068 | ||||||
UniFirst Corp. | 1,837 | 234,952 | ||||||
Viad Corp. | 2,414 | 105,854 | ||||||
VSE Corp. | 962 | 35,864 | ||||||
|
| |||||||
| 4,070,624 | ||||||||
|
| |||||||
Environmental & Facilities Services – 3.2% |
| |||||||
ABM Industries, Inc. | 6,375 | 257,486 | ||||||
Casella Waste Systems, Inc. Class A (a) | 4,369 | 50,506 | ||||||
Clean Harbors, Inc. (a) | 6,556 | 363,858 | ||||||
Covanta Holding Corp. | 14,082 | 226,720 | ||||||
Republic Services, Inc. | 28,732 | 1,648,642 | ||||||
Rollins, Inc. | 11,719 | 413,212 | ||||||
SP Plus Corp. (a) | 2,043 | 56,591 | ||||||
Stericycle, Inc. (a) | 10,113 | 780,117 | ||||||
Team, Inc. (a) | 3,341 | 112,258 | ||||||
Tetra Tech, Inc. | 6,908 | 301,880 | ||||||
US Ecology, Inc. | 2,590 | 132,737 | ||||||
Waste Connections, Inc. | 20,972 | 1,684,052 | ||||||
Waste Management, Inc. | 53,007 | 3,683,986 | ||||||
|
| |||||||
| 9,712,045 | ||||||||
|
| |||||||
Office Services & Supplies – 0.7% |
| |||||||
ACCO Brands Corp. (a) | 12,946 | 165,061 | ||||||
Essendant, Inc. | 4,527 | 94,569 | ||||||
Herman Miller, Inc. | 7,145 | 222,924 | ||||||
HNI Corp. | 5,321 | 268,232 | ||||||
Interface, Inc. | 7,716 | 140,431 | ||||||
Kimball International, Inc. Class B | 3,820 | 63,909 | ||||||
Knoll, Inc. | 5,890 | 153,788 | ||||||
MSA Safety, Inc. | 3,837 | 273,770 | ||||||
Pitney Bowes, Inc. | 22,212 | 353,615 | ||||||
Steelcase, Inc. Class A | 10,617 | 178,366 | ||||||
West Corp. | 5,468 | 132,708 | ||||||
|
| |||||||
| 2,047,373 | ||||||||
|
| |||||||
| Shares | Value | |||||||
Security & Alarm Services – 0.1% |
| |||||||
The Brink’s Co. | 5,303 | $ | 235,983 | |||||
|
| |||||||
TOTAL COMMERCIAL SERVICES & SUPPLIES |
| 17,241,353 | ||||||
|
| |||||||
CONSTRUCTION & ENGINEERING – 2.1% |
| |||||||
Construction & Engineering – 2.1% |
| |||||||
AECOM (a) | 18,425 | 680,435 | ||||||
Aegion Corp. (a) | 4,134 | 96,157 | ||||||
Argan, Inc. | 1,629 | 120,139 | ||||||
Chicago Bridge & Iron Co. N.V. | 12,366 | 410,675 | ||||||
Comfort Systems USA, Inc. | 4,544 | 153,814 | ||||||
Dycom Industries, Inc. (a) | 3,730 | 300,862 | ||||||
EMCOR Group, Inc. | 7,282 | 507,483 | ||||||
Fluor Corp. | 16,683 | 925,906 | ||||||
Granite Construction, Inc. | 4,739 | 266,000 | ||||||
Great Lakes Dredge & Dock Corp. (a) | 7,164 | 37,253 | ||||||
Jacobs Engineering Group, Inc. (a) | 14,516 | 849,912 | ||||||
KBR, Inc. | 17,045 | 289,935 | ||||||
MasTec, Inc. (a) | 7,887 | 293,791 | ||||||
MYR Group, Inc. (a) | 1,935 | 74,439 | ||||||
Primoris Services Corp. | 4,955 | 122,983 | ||||||
Quanta Services, Inc. (a) | 18,085 | 649,071 | ||||||
Tutor Perini Corp. (a) | 4,743 | 141,341 | ||||||
Valmont Industries, Inc. | 2,726 | 392,544 | ||||||
|
| |||||||
TOTAL CONSTRUCTION & ENGINEERING |
| 6,312,740 | ||||||
|
| |||||||
ELECTRICAL EQUIPMENT – 5.6% |
| |||||||
Electrical Components & Equipment – 5.5% |
| |||||||
Acuity Brands, Inc. | 5,263 | 1,090,651 | ||||||
AMETEK, Inc. | 27,862 | 1,423,748 | ||||||
Atkore International Group, Inc. (a) | 2,614 | 69,846 | ||||||
Eaton Corp. PLC | 54,461 | 3,854,750 | ||||||
Emerson Electric Co. | 77,107 | 4,523,097 | ||||||
Encore Wire Corp. | 2,368 | 100,048 | ||||||
EnerSys | 5,180 | 403,781 | ||||||
Generac Holdings, Inc. (a) | 7,913 | 318,577 | ||||||
General Cable Corp. | 5,902 | 119,811 | ||||||
Hubbell, Inc. | 6,280 | 766,662 | ||||||
Plug Power, Inc. (a) | 22,098 | 23,424 | ||||||
Powell Industries, Inc. | 1,110 | 42,713 | ||||||
Regal-Beloit Corp. | 5,366 | 389,572 | ||||||
Rockwell Automation, Inc. | 15,504 | 2,294,437 | ||||||
Sensata Technologies Holding N.V. (a) | 20,472 | 858,800 | ||||||
Sunrun, Inc. (a) | 6,768 | 35,803 | ||||||
Thermon Group Holdings, Inc. (a) | 3,839 | 79,698 | ||||||
Vicor Corp. (a) | 2,001 | 30,615 | ||||||
|
| |||||||
| 16,426,033 | ||||||||
|
| |||||||
Heavy Electrical Equipment – 0.1% |
| |||||||
AZZ, Inc. | 3,097 | 184,426 | ||||||
Babcock & Wilcox Enterprises, Inc. (a) | 5,489 | 91,337 | ||||||
|
| |||||||
| 275,763 | ||||||||
|
| |||||||
TOTAL ELECTRICAL EQUIPMENT |
| 16,701,796 | ||||||
|
| |||||||
See accompanying notes which are an integral part of the financial statements.
| 37 | Semiannual Report |
Table of Contents
Fidelity MSCI Industrials Index ETF
Investments (Unaudited) – continued
| Common Stocks – continued | ||||||||
| Shares | Value | |||||||
INDUSTRIAL CONGLOMERATES – 19.4% |
| |||||||
Industrial Conglomerates – 19.4% |
| |||||||
3M Co. | 72,414 | $ | 12,659,415 | |||||
Carlisle Cos., Inc. | 7,732 | 843,639 | ||||||
General Electric Co. | 1,073,588 | 31,885,564 | ||||||
Honeywell International, Inc. | 86,594 | 10,245,802 | ||||||
Raven Industries, Inc. | 4,338 | 108,667 | ||||||
Roper Industries, Inc. | 12,127 | 2,326,565 | ||||||
|
| |||||||
TOTAL INDUSTRIAL CONGLOMERATES |
| 58,069,652 | ||||||
|
| |||||||
MACHINERY – 18.3% |
| |||||||
Agricultural & Farm Machinery – 1.6% |
| |||||||
AGCO Corp. | 7,759 | 487,265 | ||||||
Deere & Co. | 31,992 | 3,424,744 | ||||||
Lindsay Corp. | 1,291 | 97,264 | ||||||
The Toro Co. | 13,111 | 772,631 | ||||||
Titan International, Inc. | 5,623 | 74,730 | ||||||
|
| |||||||
| 4,856,634 | ||||||||
|
| |||||||
Construction & Farm Machinery & Heavy Trucks – 5.9% |
| |||||||
Alamo Group, Inc. | 1,174 | 88,790 | ||||||
Allison Transmission Holdings, Inc. | 17,048 | 596,339 | ||||||
American Railcar Industries, Inc. | 1,079 | 48,059 | ||||||
Astec Industries, Inc. | 2,212 | 154,796 | ||||||
Caterpillar, Inc. | 69,984 | 6,694,669 | ||||||
Cummins, Inc. | 19,189 | 2,820,975 | ||||||
Douglas Dynamics, Inc. | 2,728 | 92,206 | ||||||
Federal Signal Corp. | 7,095 | 110,256 | ||||||
Joy Global, Inc. | 11,777 | 331,169 | ||||||
Meritor, Inc. (a) | 9,872 | 142,453 | ||||||
Navistar International Corp. (a) | 5,337 | 145,540 | ||||||
Oshkosh Corp. | 8,811 | 613,510 | ||||||
PACCAR, Inc. | 41,965 | 2,824,664 | ||||||
Terex Corp. | 12,985 | 412,923 | ||||||
The Greenbrier Cos., Inc. | 3,342 | 146,213 | ||||||
The Manitowoc Co., Inc. (a) | 15,530 | 106,070 | ||||||
Trinity Industries, Inc. | 18,245 | 502,467 | ||||||
Wabash National Corp. | 7,651 | 135,040 | ||||||
WABCO Holdings, Inc. (a) | 6,369 | 694,412 | ||||||
Wabtec Corp. | 10,802 | 935,885 | ||||||
|
| |||||||
| 17,596,436 | ||||||||
|
| |||||||
Industrial Machinery – 10.8% |
| |||||||
Actuant Corp. Class A | 7,104 | 185,770 | ||||||
Albany International Corp. Class A | 3,475 | 164,889 | ||||||
Altra Industrial Motion Corp. | 3,123 | 116,488 | ||||||
Barnes Group, Inc. | 6,142 | 295,614 | ||||||
Briggs & Stratton Corp. | 5,122 | 110,942 | ||||||
Chart Industries, Inc. (a) | 3,676 | 142,592 | ||||||
CIRCOR International, Inc. | 1,667 | 103,821 | ||||||
CLARCOR, Inc. | 5,855 | 484,852 | ||||||
Colfax Corp. (a) | 10,985 | 428,415 | ||||||
Columbus McKinnon Corp. | 2,321 | 63,804 | ||||||
Crane Co. | 5,609 | 404,072 | ||||||
| Shares | Value | |||||||
Donaldson Co., Inc. | 15,152 | $ | 640,172 | |||||
Dover Corp. | 18,590 | 1,445,372 | ||||||
Energy Recovery, Inc. (a) | 4,147 | 42,465 | ||||||
EnPro Industries, Inc. | 2,591 | 175,955 | ||||||
ESCO Technologies, Inc. | 3,061 | 178,150 | ||||||
Flowserve Corp. | 15,606 | 767,191 | ||||||
Fortive Corp. | 37,256 | 2,060,629 | ||||||
Franklin Electric Co., Inc. | 4,730 | 190,855 | ||||||
Global Brass & Copper Holdings, Inc. | 2,578 | 85,461 | ||||||
Graco, Inc. | 6,651 | 595,863 | ||||||
Harsco Corp. | 9,677 | 129,188 | ||||||
Hillenbrand, Inc. | 7,515 | 274,673 | ||||||
Hyster-Yale Materials Handling, Inc. | 1,059 | 65,150 | ||||||
IDEX Corp. | 9,126 | 822,800 | ||||||
Illinois Tool Works, Inc. | 38,276 | 4,868,707 | ||||||
Ingersoll-Rand PLC | 30,899 | 2,451,836 | ||||||
ITT, Inc. | 10,691 | 436,941 | ||||||
John Bean Technologies Corp. | 3,502 | 302,398 | ||||||
Kadant, Inc. | 1,302 | 80,203 | ||||||
Kennametal, Inc. | 9,550 | 341,317 | ||||||
Lincoln Electric Holdings, Inc. | 7,259 | 605,183 | ||||||
Lydall, Inc. (a) | 2,051 | 125,111 | ||||||
Manitowoc Foodservice, Inc. (a) | 15,565 | 298,537 | ||||||
Milacron Holdings Corp. (a) | 2,029 | 33,560 | ||||||
Mueller Industries, Inc. | 6,468 | 260,402 | ||||||
Mueller Water Products, Inc. Class A | 19,346 | 260,397 | ||||||
NN, Inc. | 3,101 | 60,004 | ||||||
Nordson Corp. | 6,172 | 700,707 | ||||||
Parker Hannifin Corp. | 16,044 | 2,360,554 | ||||||
Pentair PLC | 20,639 | 1,210,065 | ||||||
Proto Labs, Inc. (a) | 3,010 | 158,025 | ||||||
RBC Bearings, Inc. (a) | 2,863 | 265,200 | ||||||
Rexnord Corp. (a) | 12,254 | 270,691 | ||||||
Snap-on, Inc. | 6,964 | 1,264,175 | ||||||
SPX Corp. (a) | 4,983 | 124,326 | ||||||
SPX FLOW, Inc. (a) | 5,075 | 177,067 | ||||||
Standex International Corp. | 1,515 | 132,108 | ||||||
Stanley Black & Decker, Inc. | 18,002 | 2,232,248 | ||||||
Sun Hydraulics Corp. | 2,747 | 107,627 | ||||||
Tennant Co. | 2,019 | 139,816 | ||||||
The Gorman-Rupp Co. | 2,348 | 76,216 | ||||||
The Middleby Corp. (a) | 6,899 | 925,708 | ||||||
The Timken Co. | 8,434 | 374,470 | ||||||
Trimas Corp. (a) | 5,489 | 116,916 | ||||||
Watts Water Technologies, Inc. Class A | 3,150 | 207,900 | ||||||
Woodward, Inc. | 6,616 | 460,738 | ||||||
Xylem, Inc. | 21,468 | 1,058,587 | ||||||
|
| |||||||
| 32,462,923 | ||||||||
|
| |||||||
TOTAL MACHINERY |
| 54,915,993 | ||||||
|
| |||||||
See accompanying notes which are an integral part of the financial statements.
| Semiannual Report | 38 |
Table of Contents
| Common Stocks – continued | ||||||||
| Shares | Value | |||||||
MARINE – 0.1% |
| |||||||
Marine – 0.1% |
| |||||||
Kirby Corp. (a) | 1,635 | $ | 105,376 | |||||
Matson, Inc. | 1,294 | 46,144 | ||||||
|
| |||||||
TOTAL MARINE |
| 151,520 | ||||||
|
| |||||||
PROFESSIONAL SERVICES – 4.0% |
| |||||||
Human Resource & Employment Services – 1.0% |
| |||||||
GP Strategies Corp. (a) | 1,615 | 41,506 | ||||||
Heidrick & Struggles International, Inc. | 2,141 | 47,851 | ||||||
Insperity, Inc. | 1,817 | 129,915 | ||||||
Kelly Services, Inc. Class A | 3,670 | 82,171 | ||||||
Kforce, Inc. | 2,975 | 68,425 | ||||||
Korn/Ferry International | 6,328 | 183,828 | ||||||
ManpowerGroup, Inc. | 8,210 | 783,727 | ||||||
On Assignment, Inc. (a) | 6,068 | 274,759 | ||||||
Robert Half International, Inc. | 15,580 | 733,195 | ||||||
TriNet Group, Inc. (a) | 5,116 | 130,100 | ||||||
TrueBlue, Inc. (a) | 5,123 | 126,794 | ||||||
WageWorks, Inc. (a) | 4,377 | 315,801 | ||||||
|
| |||||||
| 2,918,072 | ||||||||
|
| |||||||
Research & Consulting Services – 3.0% |
| |||||||
CBIZ, Inc. (a) | 6,085 | 79,714 | ||||||
CEB, Inc. | 3,861 | 295,173 | ||||||
Equifax, Inc. | 14,302 | 1,677,339 | ||||||
Exponent, Inc. | 3,118 | 181,000 | ||||||
FTI Consulting, Inc. (a) | 5,006 | 210,953 | ||||||
Huron Consulting Group, Inc. (a) | 2,580 | 116,874 | ||||||
ICF International, Inc. (a) | 2,187 | 113,724 | ||||||
IHS Markit Ltd. (a) | 43,083 | 1,699,624 | ||||||
Mistras Group, Inc. (a) | 2,037 | 47,014 | ||||||
Navigant Consulting, Inc. (a) | 5,712 | 141,086 | ||||||
Nielsen Holdings PLC | 42,795 | 1,750,743 | ||||||
Resources Connection, Inc. | 3,339 | 55,761 | ||||||
RPX Corp. (a) | 6,071 | 65,931 | ||||||
The Advisory Board Co. (a) | 4,799 | 218,355 | ||||||
The Dun & Bradstreet Corp. | 4,353 | 533,765 | ||||||
TransUnion (a) | 10,950 | 345,253 | �� | |||||
Verisk Analytics, Inc. (a) | 19,212 | 1,587,680 | ||||||
|
| |||||||
| 9,119,989 | ||||||||
|
| |||||||
TOTAL PROFESSIONAL SERVICES |
| 12,038,061 | ||||||
|
| |||||||
ROAD & RAIL – 8.8% |
| |||||||
Railroads – 7.2% |
| |||||||
CSX Corp. | 113,353 | 5,258,445 | ||||||
Genesee & Wyoming, Inc. Class A (a) | 7,338 | 552,992 | ||||||
Kansas City Southern | 12,955 | 1,112,964 | ||||||
Norfolk Southern Corp. | 35,174 | 4,131,538 | ||||||
Union Pacific Corp. | 99,781 | 10,634,659 | ||||||
|
| |||||||
| 21,690,598 | ||||||||
|
| |||||||
| Shares | Value | |||||||
Trucking – 1.6% |
| |||||||
AMERCO | 814 | $ | 306,609 | |||||
ArcBest Corp. | 2,928 | 92,525 | ||||||
Avis Budget Group, Inc. (a) | 9,772 | 363,714 | ||||||
Celadon Group, Inc. | 3,343 | 25,407 | ||||||
Covenant Transportation Group, Inc. Class A (a) | 1,466 | 31,563 | ||||||
Heartland Express, Inc. | 5,507 | 113,444 | ||||||
Hertz Global Holdings, Inc. (a) | 8,610 | 180,552 | ||||||
JB Hunt Transport Services, Inc. | 10,805 | 1,070,559 | ||||||
Knight Transportation, Inc. | 7,665 | 256,011 | ||||||
Landstar System, Inc. | 5,054 | 427,568 | ||||||
Marten Transport Ltd. | 2,948 | 67,362 | ||||||
Old Dominion Freight Line, Inc. (a) | 7,450 | 657,686 | ||||||
Roadrunner Transportation Systems, Inc. (a) | 3,681 | 29,154 | ||||||
Ryder System, Inc. | 6,412 | 497,571 | ||||||
Saia, Inc. (a) | 2,991 | 143,718 | ||||||
Swift Transportation Co. (a) | 10,043 | 229,282 | ||||||
Universal Truckload Services, Inc. | 926 | 13,381 | ||||||
Werner Enterprises, Inc. | 5,625 | 158,062 | ||||||
YRC Worldwide, Inc. (a) | 3,441 | 51,374 | ||||||
|
| |||||||
| 4,715,542 | ||||||||
|
| |||||||
TOTAL ROAD & RAIL |
| 26,406,140 | ||||||
|
| |||||||
TRADING COMPANIES & DISTRIBUTORS – 3.5% |
| |||||||
Trading Companies & Distributors – 3.5% |
| |||||||
Air Lease Corp. | 11,689 | 425,246 | ||||||
Aircastle Ltd. | 7,083 | 157,951 | ||||||
Applied Industrial Technologies, Inc. | 4,425 | 267,491 | ||||||
Beacon Roofing Supply, Inc. (a) | 6,102 | 267,085 | ||||||
BMC Stock Holdings, Inc. (a) | 6,729 | 125,832 | ||||||
DXP Enterprises, Inc. (a) | 1,876 | 70,950 | ||||||
Fastenal Co. | 34,590 | 1,718,431 | ||||||
GATX Corp. | 4,582 | 264,931 | ||||||
GMS, Inc. (a) | 984 | 29,363 | ||||||
H&E Equipment Services, Inc. | 3,847 | 99,483 | ||||||
HD Supply Holdings, Inc. (a) | 24,041 | 1,016,934 | ||||||
Herc Holdings, Inc. (a) | 2,896 | 143,844 | ||||||
Kaman Corp. | 2,933 | 148,205 | ||||||
MRC Global, Inc. (a) | 11,541 | 237,168 | ||||||
MSC Industrial Direct Co., Inc. Class A | 5,311 | 542,519 | ||||||
Nexeo Solutions, Inc. (a) | 3,227 | 29,075 | ||||||
NOW, Inc. (a) | 12,919 | 274,658 | ||||||
Rush Enterprises, Inc. Class A (a) | 3,545 | 116,099 | ||||||
SiteOne Landscape Supply, Inc. (a) | 2,602 | 99,969 | ||||||
Titan Machinery, Inc. (a) | 2,171 | 29,982 | ||||||
Triton International Ltd. | 4,418 | 107,534 | ||||||
United Rentals, Inc. (a) | 10,308 | 1,304,065 | ||||||
Univar, Inc. (a) | 9,952 | 296,769 | ||||||
Veritiv Corp. (a) | 1,125 | 63,056 | ||||||
Watsco, Inc. | 3,095 | 472,730 | ||||||
See accompanying notes which are an integral part of the financial statements.
| 39 | Semiannual Report |
Table of Contents
Fidelity MSCI Industrials Index ETF
Investments (Unaudited) – continued
| Common Stocks – continued | ||||||||
| Shares | Value | |||||||
TRADING COMPANIES & DISTRIBUTORS – continued |
| |||||||
Trading Companies & Distributors – continued |
| |||||||
WESCO International, Inc. (a) | 5,064 | $ | 358,025 | |||||
WW Grainger, Inc. | 6,885 | 1,738,944 | ||||||
|
| |||||||
TOTAL TRADING COMPANIES & DISTRIBUTORS |
| 10,406,339 | ||||||
|
| |||||||
TRANSPORTATION INFRASTRUCTURE – 0.2% |
| |||||||
Airport Services – 0.2% |
| |||||||
Macquarie Infrastructure Corp. | 9,288 | 696,507 | ||||||
|
| |||||||
TOTAL COMMON STOCKS |
| 299,126,108 | ||||||
|
| |||||||
| Money Market Funds – 0.2% | ||||||||
| Shares | Value | |||||||
State Street Institutional Treasury Plus Money Market Fund, Premier Class, 0.43% (b) | 538,538 | $ | 538,538 | |||||
|
| |||||||
TOTAL INVESTMENT PORTFOLIO – 100.0% |
| 299,664,646 | ||||||
NET OTHER ASSETS (LIABILITIES) – 0.0% |
| 146,972 | ||||||
|
| |||||||
NET ASSETS – 100% |
| $ | 299,811,618 | |||||
|
| |||||||
Legend
| (a) | Non-income producing. |
| (b) | The rate quoted is the annualized seven-day yield of the fund at period end. |
Other Information
The following is a summary of the inputs used, as of January 31, 2017, involving the Fund’s assets and liabilities carried at fair value. The inputs or methodology used for valuing securities may not be an indication of the risk associated with investing in those securities. For more information on valuation inputs, and their aggregation into the levels used in the table below, please refer to the Investment Valuation section in the accompanying Notes to Financial Statements.
| Valuation Inputs at Reporting Date: | ||||||||||||||||
| Description | Total | Level 1 | Level 2 | Level 3 | ||||||||||||
Investments in Securities: | ||||||||||||||||
Common Stocks | $ | 299,126,108 | $ | 299,126,108 | $ | — | $ | — | ||||||||
Money Market Funds | 538,538 | 538,538 | — | — | ||||||||||||
|
|
|
|
|
|
|
| |||||||||
Total Investments in Securities: | $ | 299,664,646 | $ | 299,664,646 | $ | — | $ | — | ||||||||
|
|
|
|
|
|
|
| |||||||||
See accompanying notes which are an integral part of the financial statements.
| Semiannual Report | 40 |
Table of Contents
Fidelity MSCI Information Technology Index ETF
Investments January 31, 2017 (Unaudited)
Showing Percentage of Net Assets
| Common Stocks – 99.9% | ||||||||
| Shares | Value | |||||||
COMMUNICATIONS EQUIPMENT – 5.5% |
| |||||||
Communications Equipment – 5.5% |
| |||||||
ADTRAN, Inc. | 6,087 | $ | 133,305 | |||||
Arista Networks, Inc. (a) | 5,718 | 537,492 | ||||||
ARRIS International PLC (a) | 23,044 | 658,598 | ||||||
Brocade Communications Systems, Inc. | 50,690 | 632,104 | ||||||
CalAmp Corp. (a) | 4,541 | 68,206 | ||||||
Calix, Inc. (a) | 5,305 | 38,196 | ||||||
Ciena Corp. (a) | 17,534 | 426,778 | ||||||
Cisco Systems, Inc. | 636,416 | 19,550,700 | ||||||
CommScope Holding Co., Inc. (a) | 24,368 | 921,598 | ||||||
Comtech Telecommunications Corp. | 2,888 | 30,988 | ||||||
EchoStar Corp. Class A (a) | 5,846 | 297,737 | ||||||
Extreme Networks, Inc. (a) | 12,976 | 71,757 | ||||||
F5 Networks, Inc. (a) | 8,401 | 1,125,986 | ||||||
Finisar Corp. (a) | 13,939 | 412,176 | ||||||
Harmonic, Inc. (a) | 9,611 | 50,938 | ||||||
Harris Corp. | 15,695 | 1,612,033 | ||||||
Infinera Corp. (a) | 18,214 | 164,108 | ||||||
InterDigital, Inc. | 4,335 | 404,889 | ||||||
Ixia (a) | 7,415 | 144,222 | ||||||
Juniper Networks, Inc. | 43,745 | 1,171,491 | ||||||
Lumentum Holdings, Inc. (a) | 6,042 | 229,294 | ||||||
Mitel Networks Corp. (a) | 11,282 | 78,297 | ||||||
Motorola Solutions, Inc. | 18,994 | 1,533,006 | ||||||
NETGEAR, Inc. (a) | 4,158 | 236,590 | ||||||
Netscout Systems, Inc. (a) | 10,470 | 348,651 | ||||||
Oclaro, Inc. (a) | 21,067 | 206,667 | ||||||
Palo Alto Networks, Inc. (a) | 11,367 | 1,677,315 | ||||||
Plantronics, Inc. | 4,243 | 240,069 | ||||||
ShoreTel, Inc. (a) | 8,332 | 57,907 | ||||||
Sonus Networks, Inc. (a) | 6,163 | 39,320 | ||||||
Ubiquiti Networks, Inc. (a) | 3,669 | 228,946 | ||||||
ViaSat, Inc. (a) | 6,780 | 440,090 | ||||||
Viavi Solutions, Inc. (a) | 29,571 | 264,660 | ||||||
|
| |||||||
TOTAL COMMUNICATIONS EQUIPMENT |
| 34,034,114 | ||||||
|
| |||||||
ELECTRONIC EQUIPMENT, INSTRUMENTS & |
| |||||||
Electronic Components – 1.4% |
| |||||||
Amphenol Corp. Class A | 39,071 | 2,636,902 | ||||||
AVX Corp. | 6,207 | 100,553 | ||||||
Belden, Inc. | 5,370 | 410,644 | ||||||
Corning, Inc. | 131,200 | 3,475,488 | ||||||
Dolby Laboratories, Inc. Class A | 7,022 | 336,424 | ||||||
II-VI, Inc. (a) | 7,119 | 259,844 | ||||||
InvenSense, Inc. (a) | 11,009 | 139,374 | ||||||
Knowles Corp. (a) | 11,336 | 204,275 | ||||||
Littelfuse, Inc. | 2,850 | 449,473 | ||||||
Rogers Corp. (a) | 2,314 | 185,004 | ||||||
Universal Display Corp. (a) | 5,413 | 357,258 | ||||||
Vishay Intertechnology, Inc. | 17,221 | 285,869 | ||||||
|
| |||||||
| 8,841,108 | ||||||||
|
| |||||||
| Shares | Value | |||||||
Electronic Equipment & Instruments – 0.8% |
| |||||||
Badger Meter, Inc. | 3,777 | $ | 145,603 | |||||
Cognex Corp. | 10,233 | 691,341 | ||||||
Coherent, Inc. (a) | 3,099 | 488,805 | ||||||
Daktronics, Inc. | 4,608 | 46,817 | ||||||
FARO Technologies, Inc. (a) | 2,195 | 81,434 | ||||||
Fitbit, Inc. Class A (a) | 16,729 | 100,541 | ||||||
FLIR Systems, Inc. | 17,423 | 615,555 | ||||||
Itron, Inc. (a) | 4,567 | 281,784 | ||||||
Keysight Technologies, Inc. (a) | 21,622 | 801,528 | ||||||
Mesa Laboratories, Inc. | 395 | 47,060 | ||||||
MTS Systems Corp. | 2,129 | 123,695 | ||||||
National Instruments Corp. | 14,645 | 460,146 | ||||||
Novanta, Inc. (a) | 4,142 | 92,574 | ||||||
OSI Systems, Inc. (a) | 2,308 | 172,338 | ||||||
VeriFone Systems, Inc. (a) | 14,021 | 254,762 | ||||||
Zebra Technologies Corp. Class A (a) | 6,662 | 557,410 | ||||||
|
| |||||||
| 4,961,393 | ||||||||
|
| |||||||
Electronic Manufacturing Services – 1.3% |
| |||||||
Benchmark Electronics, Inc. (a) | 6,119 | 187,241 | ||||||
CTS Corp. | 3,862 | 83,033 | ||||||
Fabrinet (a) | 3,954 | 166,582 | ||||||
Flex Ltd. (a) | 69,320 | 1,086,244 | ||||||
IPG Photonics Corp. (a) | 4,709 | 541,488 | ||||||
Jabil Circuit, Inc. | 21,919 | 525,618 | ||||||
Kimball Electronics, Inc. (a) | 3,480 | 59,508 | ||||||
Methode Electronics, Inc. | 4,480 | 188,384 | ||||||
Park Electrochemical Corp. | 2,586 | 47,401 | ||||||
Plexus Corp. (a) | 4,245 | 230,504 | ||||||
Sanmina Corp. (a) | 9,365 | 364,767 | ||||||
TE Connectivity Ltd. | 44,991 | 3,345,081 | ||||||
Trimble, Inc. (a) | 31,662 | 937,828 | ||||||
TTM Technologies, Inc. (a) | 10,113 | 149,976 | ||||||
|
| |||||||
| 7,913,655 | ||||||||
|
| |||||||
Technology Distributors – 0.7% |
| |||||||
Anixter International, Inc. (a) | 3,808 | 325,584 | ||||||
Arrow Electronics, Inc. (a) | 11,558 | 849,744 | ||||||
Avnet, Inc. | 16,128 | 748,984 | ||||||
CDW Corp. | 18,578 | 956,953 | ||||||
ePlus, Inc. (a) | 875 | 98,044 | ||||||
Insight Enterprises, Inc. (a) | 4,544 | 168,719 | ||||||
PC Connection, Inc. | 1,511 | 41,220 | ||||||
ScanSource, Inc. (a) | 3,193 | 126,283 | ||||||
SYNNEX Corp. | 3,782 | 454,521 | ||||||
Tech Data Corp. (a) | 4,461 | 381,683 | ||||||
|
| |||||||
| 4,151,735 | ||||||||
|
| |||||||
TOTAL ELECTRONIC EQUIPMENT, INSTRUMENTS & COMPONENTS |
| 25,867,891 | ||||||
|
| |||||||
See accompanying notes which are an integral part of the financial statements.
| 41 | Semiannual Report |
Table of Contents
Fidelity MSCI Information Technology Index ETF
Investments (Unaudited) – continued
| Common Stocks – continued | ||||||||
| Shares | Value | |||||||
INTERNET SOFTWARE & SERVICES – 19.7% |
| |||||||
Internet Software & Services – 19.7% |
| |||||||
2U, Inc. (a) | 4,460 | $ | 151,818 | |||||
Actua Corp. (a) | 3,893 | 55,670 | ||||||
Akamai Technologies, Inc. (a) | 22,081 | 1,514,536 | ||||||
Alarm.com Holdings, Inc. (a) | 1,377 | 37,303 | ||||||
Alphabet, Inc. Class A (a) | 37,305 | 30,597,188 | ||||||
Alphabet, Inc. Class C (a) | 39,133 | 31,180,783 | ||||||
Angie’s List, Inc. (a) | 4,754 | 29,808 | ||||||
Bankrate, Inc. (a) | 6,720 | 73,248 | ||||||
Bazaarvoice, Inc. (a) | 8,666 | 40,730 | ||||||
Benefitfocus, Inc. (a) | 1,613 | 48,793 | ||||||
Blucora, Inc. (a) | 4,865 | 73,462 | ||||||
Box, Inc. Class A (a) | 5,717 | 97,589 | ||||||
Brightcove, Inc. (a) | 3,621 | 26,071 | ||||||
Carbonite, Inc. (a) | 2,409 | 41,555 | ||||||
ChannelAdvisor Corp. (a) | 2,858 | 39,583 | ||||||
Cimpress N.V. (a) | 3,034 | 256,039 | ||||||
CommerceHub, Inc. Series A (a) | 1,651 | 24,253 | ||||||
CommerceHub, Inc. Series C (a) | 3,689 | 53,786 | ||||||
comScore, Inc. (a) | 5,830 | 195,597 | ||||||
Cornerstone OnDemand, Inc. (a) | 6,763 | 275,186 | ||||||
CoStar Group, Inc. (a) | 4,141 | 836,896 | ||||||
DHI Group, Inc. (a) | 5,744 | 32,741 | ||||||
EarthLink Holdings Corp. | 13,004 | 83,356 | ||||||
eBay, Inc. (a) | 135,717 | 4,319,872 | ||||||
Endurance International Group Holdings, Inc. (a) | 8,709 | 67,059 | ||||||
Envestnet, Inc. (a) | 4,894 | 184,993 | ||||||
Facebook, Inc. Class A (a) | 293,926 | 38,304,436 | ||||||
Five9, Inc. (a) | 5,052 | 78,104 | ||||||
GoDaddy, Inc. Class A (a) | 6,401 | 228,708 | ||||||
Gogo, Inc. (a) | 6,892 | 63,062 | ||||||
GrubHub, Inc. (a) | 8,689 | 361,028 | ||||||
GTT Communications, Inc. (a) | 3,485 | 98,451 | ||||||
Hortonworks, Inc. (a) | 4,251 | 41,235 | ||||||
IAC/InterActiveCorp (a) | 9,364 | 644,337 | ||||||
Instructure, Inc. (a) | 1,607 | 35,033 | ||||||
j2 Global, Inc. | 5,756 | 482,410 | ||||||
LivePerson, Inc. (a) | 6,768 | 49,406 | ||||||
LogMeIn, Inc. | 3,187 | 344,515 | ||||||
Match Group, Inc. (a) | 5,399 | 93,781 | ||||||
MercadoLibre, Inc. | 5,011 | 928,989 | ||||||
MINDBODY, Inc. Class A (a) | 1,172 | 28,538 | ||||||
New Relic, Inc. (a) | 3,319 | 120,148 | ||||||
NIC, Inc. | 8,043 | 193,836 | ||||||
Pandora Media, Inc. (a) | 27,784 | 361,192 | ||||||
Q2 Holdings, Inc. (a) | 3,332 | 105,791 | ||||||
Quotient Technology, Inc. (a) | 8,698 | 92,634 | ||||||
RetailMeNot, Inc. (a) | 3,915 | 35,431 | ||||||
Shutterstock, Inc. (a) | 2,502 | 134,608 | ||||||
SPS Commerce, Inc. (a) | 2,193 | 151,317 | ||||||
Stamps.com, Inc. (a) | 2,068 | 251,365 | ||||||
| Shares | Value | |||||||
TrueCar, Inc. (a) | 5,736 | $ | 75,428 | |||||
Twilio, Inc. Class A (a) | 2,740 | 78,994 | ||||||
Twitter, Inc. (a) | 71,844 | 1,265,891 | ||||||
VeriSign, Inc. (a) | 12,167 | 975,915 | ||||||
Web.com Group, Inc. (a) | 5,391 | 102,159 | ||||||
WebMD Health Corp. (a) | 4,911 | 245,010 | ||||||
Xactly Corp. (a) | 2,559 | 31,092 | ||||||
XO Group, Inc. (a) | 3,147 | 59,258 | ||||||
Yahoo!, Inc. (a) | 114,408 | 5,041,961 | ||||||
Yelp, Inc. (a) | 8,790 | 367,246 | ||||||
Zillow Group, Inc. Class C (a) | 14,402 | 509,543 | ||||||
|
| |||||||
TOTAL INTERNET SOFTWARE & SERVICES |
| 122,318,767 | ||||||
|
| |||||||
IT SERVICES – 17.5% |
| |||||||
Data Processing & Outsourced Services – 11.1% |
| |||||||
Alliance Data Systems Corp. | 7,403 | 1,690,697 | ||||||
Automatic Data Processing, Inc. | 57,718 | 5,828,941 | ||||||
Black Knight Financial Services, Inc. Class A (a) | 3,135 | 114,271 | ||||||
Blackhawk Network Holdings, Inc. (a) | 7,126 | 254,398 | ||||||
Broadridge Financial Solutions, Inc. | 15,006 | 998,349 | ||||||
Cardtronics PLC Class A (a) | 5,386 | 293,968 | ||||||
Cass Information Systems, Inc. | 1,437 | 94,511 | ||||||
Conduent, Inc. (a) | 21,852 | 326,906 | ||||||
Convergys Corp. | 12,223 | 303,375 | ||||||
CoreLogic, Inc. (a) | 11,129 | 392,520 | ||||||
CSG Systems International, Inc. | 4,164 | 201,538 | ||||||
DST Systems, Inc. | 3,942 | 453,921 | ||||||
Euronet Worldwide, Inc. (a) | 6,273 | 448,645 | ||||||
EVERTEC, Inc. | 7,853 | 133,894 | ||||||
ExlService Holdings, Inc. (a) | 4,276 | 196,482 | ||||||
Fidelity National Information Services, Inc. | 39,413 | 3,130,180 | ||||||
First Data Corp. Class A (a) | 39,158 | 600,684 | ||||||
Fiserv, Inc. (a) | 27,816 | 2,988,273 | ||||||
FleetCor Technologies, Inc. (a) | 11,704 | 1,726,223 | ||||||
Global Payments, Inc. | 19,503 | 1,507,192 | ||||||
Jack Henry & Associates, Inc. | 9,986 | 896,543 | ||||||
Mastercard, Inc. Class A | 122,704 | 13,047,116 | ||||||
MAXIMUS, Inc. | 8,243 | 454,519 | ||||||
MoneyGram International, Inc. (a) | 4,005 | 50,864 | ||||||
Net 1 UEPS Technologies, Inc. (a) | 6,483 | 74,555 | ||||||
Paychex, Inc. | 41,062 | 2,475,628 | ||||||
PayPal Holdings, Inc. (a) | 137,439 | 5,467,323 | ||||||
Sabre Corp. | 26,524 | 649,838 | ||||||
Square, Inc. Class A (a) | 14,035 | 205,192 | ||||||
Sykes Enterprises, Inc. (a) | 4,968 | 138,756 | ||||||
Syntel, Inc. | 4,172 | 87,862 | ||||||
TeleTech Holdings, Inc. | 2,052 | 60,739 | ||||||
The Western Union Co. | 61,805 | 1,210,142 | ||||||
Total System Services, Inc. | 20,997 | 1,064,128 | ||||||
Travelport Worldwide Ltd. | 15,556 | 223,384 | ||||||
See accompanying notes which are an integral part of the financial statements.
| Semiannual Report | 42 |
Table of Contents
| Common Stocks – continued | ||||||||
| Shares | Value | |||||||
IT SERVICES – continued |
| |||||||
Data Processing & Outsourced Services – continued |
| |||||||
Vantiv, Inc. Class A (a) | 19,768 | $ | 1,230,360 | |||||
Visa, Inc. Class A | 238,700 | 19,742,877 | ||||||
WEX, Inc. (a) | 5,441 | 622,070 | ||||||
|
| |||||||
| 69,386,864 | ||||||||
|
| |||||||
IT Consulting & Other Services – 6.4% |
| |||||||
Accenture PLC Class A | 78,769 | 8,969,426 | ||||||
Acxiom Corp. (a) | 9,812 | 256,093 | ||||||
Booz Allen Hamilton Holding Corp. | 18,809 | 636,120 | ||||||
CACI International, Inc. Class A (a) | 3,100 | 380,680 | ||||||
Cognizant Technology Solutions Corp. Class A (a) | 76,797 | 4,038,754 | ||||||
Computer Sciences Corp. | 17,818 | 1,108,280 | ||||||
CSRA, Inc. | 21,063 | 653,374 | ||||||
EPAM Systems, Inc. (a) | 5,850 | 376,506 | ||||||
Forrester Research, Inc. | 1,215 | 49,572 | ||||||
Gartner, Inc. (a) | 10,477 | 1,040,995 | ||||||
International Business Machines Corp. | 114,905 | 20,053,221 | ||||||
Leidos Holdings, Inc. | 17,111 | 826,804 | ||||||
Lionbridge Technologies, Inc. (a) | 6,818 | 38,999 | ||||||
ManTech International Corp. Class A | 3,156 | 122,895 | ||||||
Perficient, Inc. (a) | 4,496 | 79,714 | ||||||
Science Applications International Corp. | 5,439 | 442,843 | ||||||
ServiceSource International, Inc. (a) | 7,414 | 39,294 | ||||||
Teradata Corp. (a) | 16,504 | 484,557 | ||||||
The Hackett Group, Inc. | 2,997 | 48,701 | ||||||
Unisys Corp. (a) | 5,876 | 75,507 | ||||||
Virtusa Corp. (a) | 3,531 | 89,970 | ||||||
|
| |||||||
| 39,812,305 | ||||||||
|
| |||||||
TOTAL IT SERVICES |
| 109,199,169 | ||||||
|
| |||||||
SEMICONDUCTORS & SEMICONDUCTOR EQUIPMENT – 15.7% |
| |||||||
Semiconductor Equipment – 2.0% |
| |||||||
Advanced Energy Industries, Inc. (a) | 5,056 | 297,495 | ||||||
Amkor Technology, Inc. (a) | 13,346 | 125,586 | ||||||
Applied Materials, Inc. | 136,766 | 4,684,236 | ||||||
Brooks Automation, Inc. | 8,862 | 154,376 | ||||||
Cabot Microelectronics Corp. | 3,112 | 210,091 | ||||||
Cohu, Inc. | 3,155 | 41,646 | ||||||
Entegris, Inc. (a) | 17,820 | 334,125 | ||||||
FormFactor, Inc. (a) | 8,576 | 106,771 | ||||||
KLA-Tencor Corp. | 19,718 | 1,678,199 | ||||||
Kulicke & Soffa Industries, Inc. (a) | 8,790 | 154,528 | ||||||
Lam Research Corp. | 20,284 | 2,329,820 | ||||||
MKS Instruments, Inc. | 6,758 | 445,352 | ||||||
Nanometrics, Inc. (a) | 2,882 | 74,096 | ||||||
PDF Solutions, Inc. (a) | 3,277 | 73,766 | ||||||
Photronics, Inc. (a) | 8,882 | 102,143 | ||||||
Rudolph Technologies, Inc. (a) | 3,617 | 83,010 | ||||||
SolarEdge Technologies, Inc. (a) | 2,657 | 34,408 | ||||||
Teradyne, Inc. | 25,724 | 730,047 | ||||||
Tessera Holding Corp. | 6,226 | 281,415 | ||||||
| Shares | Value | |||||||
Ultratech, Inc. (a) | 3,166 | $ | 82,063 | |||||
Veeco Instruments, Inc. (a) | 5,143 | 132,432 | ||||||
Versum Materials, Inc. (a) | 13,068 | 365,251 | ||||||
Xcerra Corp. (a) | 6,794 | 51,499 | ||||||
|
| |||||||
| 12,572,355 | ||||||||
|
| |||||||
Semiconductors – 13.7% |
| |||||||
Advanced Micro Devices, Inc. (a) | 96,585 | 1,001,586 | ||||||
Alpha & Omega Semiconductor Ltd. (a) | 2,388 | 48,596 | ||||||
Ambarella, Inc. (a) | 4,178 | 207,271 | ||||||
Analog Devices, Inc. | 38,904 | 2,915,466 | ||||||
Broadcom Ltd. | 50,038 | 9,982,581 | ||||||
Cavium, Inc. (a) | 8,400 | 556,164 | ||||||
Ceva, Inc. (a) | 2,725 | 96,329 | ||||||
Cirrus Logic, Inc. (a) | 7,919 | 477,674 | ||||||
Cree, Inc. (a) | 12,688 | 349,935 | ||||||
Cypress Semiconductor Corp. | 41,021 | 484,048 | ||||||
Diodes, Inc. (a) | 5,332 | 132,713 | ||||||
Exar Corp. (a) | 5,154 | 52,829 | ||||||
First Solar, Inc. (a) | 9,680 | 301,919 | ||||||
Impinj, Inc. (a) | 1,369 | 48,202 | ||||||
Inphi Corp. (a) | 4,628 | 212,055 | ||||||
Integrated Device Technology, Inc. (a) | 17,113 | 431,076 | ||||||
Intel Corp. | 597,484 | 21,999,361 | ||||||
Intersil Corp. Class A | 17,072 | 382,925 | ||||||
IXYS Corp. | 3,153 | 38,151 | ||||||
Lattice Semiconductor Corp. (a) | 15,677 | 112,718 | ||||||
Linear Technology Corp. | 30,327 | 1,914,544 | ||||||
MACOM Technology Solutions Holdings, Inc. (a) | 5,266 | 250,406 | ||||||
Marvell Technology Group Ltd. | 55,124 | 819,694 | ||||||
Maxim Integrated Products, Inc. | 35,972 | 1,600,035 | ||||||
MaxLinear, Inc. Class A (a) | 7,313 | 187,067 | ||||||
Mellanox Technologies Ltd. (a) | 5,452 | 258,152 | ||||||
Microchip Technology, Inc. | 27,223 | 1,833,469 | ||||||
Micron Technology, Inc. (a) | 131,398 | 3,168,006 | ||||||
Microsemi Corp. (a) | 14,295 | 759,779 | ||||||
Monolithic Power Systems, Inc. | 4,905 | 427,912 | ||||||
NeoPhotonics Corp. (a) | 3,588 | 39,289 | ||||||
NVE Corp. | 611 | 47,407 | ||||||
NVIDIA Corp. | 67,696 | 7,391,049 | ||||||
ON Semiconductor Corp. (a) | 52,489 | 699,153 | ||||||
Power Integrations, Inc. | 3,646 | 258,866 | ||||||
Qorvo, Inc. (a) | 16,185 | 1,039,239 | ||||||
QUALCOMM, Inc. | 186,473 | 9,963,252 | ||||||
Rambus, Inc. (a) | 14,151 | 183,680 | ||||||
Semtech Corp. (a) | 8,351 | 275,165 | ||||||
Silicon Laboratories, Inc. (a) | 5,062 | 330,042 | ||||||
Skyworks Solutions, Inc. | 23,720 | 2,176,073 | ||||||
SunPower Corp. (a) | 8,183 | 54,335 | ||||||
Synaptics, Inc. (a) | 4,412 | 248,749 | ||||||
Texas Instruments, Inc. | 126,942 | 9,589,199 | ||||||
Xilinx, Inc. | 32,057 | 1,865,717 | ||||||
|
| |||||||
| 85,211,878 | ||||||||
|
| |||||||
TOTAL SEMICONDUCTORS & SEMICONDUCTOR EQUIPMENT |
| 97,784,233 | ||||||
|
| |||||||
See accompanying notes which are an integral part of the financial statements.
| 43 | Semiannual Report |
Table of Contents
Fidelity MSCI Information Technology Index ETF
Investments (Unaudited) – continued
| Common Stocks – continued | ||||||||
| Shares | Value | |||||||
SOFTWARE – 21.4% |
| |||||||
Application Software – 6.0% |
| |||||||
8x8, Inc. (a) | 11,368 | $ | 180,183 | |||||
ACI Worldwide, Inc. (a) | 14,807 | 287,256 | ||||||
Adobe Systems, Inc. (a) | 63,057 | 7,149,403 | ||||||
ANSYS, Inc. (a) | 11,021 | 1,027,818 | ||||||
Aspen Technology, Inc. (a) | 10,087 | 535,721 | ||||||
Autodesk, Inc. (a) | 25,269 | 2,055,380 | ||||||
Blackbaud, Inc. | 6,048 | 396,809 | ||||||
Bottomline Technologies de, Inc. (a) | 5,320 | 136,830 | ||||||
BroadSoft, Inc. (a) | 3,768 | 158,256 | ||||||
Cadence Design Systems, Inc. (a) | 36,987 | 962,772 | ||||||
Callidus Software, Inc. (a) | 7,819 | 144,261 | ||||||
CDK Global, Inc. | 16,193 | 1,012,872 | ||||||
Citrix Systems, Inc. (a) | 19,695 | 1,795,987 | ||||||
Ebix, Inc. | 3,335 | 185,092 | ||||||
Ellie Mae, Inc. (a) | 4,224 | 349,494 | ||||||
Fair Isaac Corp. | 3,906 | 481,610 | ||||||
Glu Mobile, Inc. (a) | 13,930 | 32,039 | ||||||
Guidewire Software, Inc. (a) | 9,147 | 478,663 | ||||||
HubSpot, Inc. (a) | 2,948 | 151,232 | ||||||
Intuit, Inc. | 30,758 | 3,647,284 | ||||||
Jive Software, Inc. (a) | 4,771 | 18,130 | ||||||
Manhattan Associates, Inc. (a) | 9,050 | 463,903 | ||||||
Mentor Graphics Corp. | 11,713 | 432,327 | ||||||
MicroStrategy, Inc. Class A (a) | 1,195 | 240,553 | ||||||
MobileIron, Inc. (a) | 5,254 | 22,855 | ||||||
Monotype Imaging Holdings, Inc. | 5,071 | 111,055 | ||||||
Nuance Communications, Inc. (a) | 34,366 | 545,045 | ||||||
Paycom Software, Inc. (a) | 5,289 | 244,563 | ||||||
Paylocity Holding Corp. (a) | 2,958 | 91,284 | ||||||
Pegasystems, Inc. | 4,915 | 190,702 | ||||||
PROS Holdings, Inc. (a) | 3,221 | 72,086 | ||||||
PTC, Inc. (a) | 14,615 | 768,311 | ||||||
QAD, Inc. Class A | 1,382 | 39,940 | ||||||
RealPage, Inc. (a) | 7,142 | 218,545 | ||||||
RingCentral, Inc. Class A (a) | 6,466 | 150,981 | ||||||
Salesforce.com, Inc. (a) | 81,433 | 6,441,350 | ||||||
Silver Spring Networks, Inc. (a) | 4,125 | 52,717 | ||||||
Splunk, Inc. (a) | 16,799 | 971,990 | ||||||
SS&C Technologies Holdings, Inc. | 23,026 | 739,825 | ||||||
Synchronoss Technologies, Inc. (a) | 5,148 | 198,301 | ||||||
Synopsys, Inc. (a) | 19,140 | 1,203,715 | ||||||
Tangoe, Inc. (a) | 3,614 | 26,310 | ||||||
The Ultimate Software Group, Inc. (a) | 3,497 | 677,229 | ||||||
Tyler Technologies, Inc. (a) | 4,352 | 635,479 | ||||||
Verint Systems, Inc. (a) | 7,872 | 294,019 | ||||||
Workday, Inc. Class A (a) | 15,106 | 1,255,158 | ||||||
Workiva, Inc. (a) | 2,537 | 31,966 | ||||||
Zendesk, Inc. (a) | 9,600 | 229,728 | ||||||
|
| |||||||
| 37,537,029 | ||||||||
|
| |||||||
| Shares | Value | |||||||
Home Entertainment Software – 1.1% |
| |||||||
Activision Blizzard, Inc. | 75,062 | $ | 3,018,243 | |||||
Electronic Arts, Inc. (a) | 38,048 | 3,174,344 | ||||||
Take-Two Interactive Software, Inc. (a) | 10,901 | 584,839 | ||||||
Zynga, Inc. Class A (a) | 96,429 | 243,001 | ||||||
|
| |||||||
| 7,020,427 | ||||||||
|
| |||||||
Systems Software – 14.3% |
| |||||||
A10 Networks, Inc. (a) | 5,914 | 47,135 | ||||||
Barracuda Networks, Inc. (a) | 2,927 | 68,755 | ||||||
CA, Inc. | 39,867 | 1,246,641 | ||||||
CommVault Systems, Inc. (a) | 5,418 | 266,024 | ||||||
Dell Technologies, Inc. Class V (a) | 28,179 | 1,774,995 | ||||||
FireEye, Inc. (a) | 19,449 | 263,534 | ||||||
Fortinet, Inc. (a) | 18,616 | 619,168 | ||||||
Gigamon, Inc. (a) | 3,595 | 119,174 | ||||||
Imperva, Inc. (a) | 3,770 | 157,397 | ||||||
Microsoft Corp. | 936,703 | 60,557,849 | ||||||
Oracle Corp. | 391,252 | 15,693,118 | ||||||
Progress Software Corp. | 5,520 | 154,670 | ||||||
Proofpoint, Inc. (a) | 5,043 | 404,247 | ||||||
Qualys, Inc. (a) | 3,655 | 131,215 | ||||||
Rapid7, Inc. (a) | 1,848 | 23,045 | ||||||
Red Hat, Inc. (a) | 22,907 | 1,738,183 | ||||||
ServiceNow, Inc. (a) | 20,792 | 1,884,171 | ||||||
Symantec Corp. | 77,859 | 2,145,015 | ||||||
Tableau Software, Inc. Class A (a) | 7,178 | 343,396 | ||||||
The Rubicon Project, Inc. (a) | 4,204 | 35,608 | ||||||
TiVo Corp. (a) | 15,602 | 294,878 | ||||||
Varonis Systems, Inc. (a) | 1,499 | 44,820 | ||||||
VASCO Data Security International, Inc. (a) | 3,771 | 57,319 | ||||||
VMware, Inc. Class A (a) | 9,427 | 825,240 | ||||||
|
| |||||||
| 88,895,597 | ||||||||
|
| |||||||
TOTAL SOFTWARE |
| 133,453,053 | ||||||
|
| |||||||
TECHNOLOGY HARDWARE, STORAGE & PERIPHERALS – 15.9% |
| |||||||
Technology Hardware, Storage & Peripherals – 15.9% |
| |||||||
3D Systems Corp. (a) | 13,572 | 223,802 | ||||||
Apple, Inc. | 681,805 | 82,737,037 | ||||||
CPI Card Group, Inc. | 2,341 | 10,652 | ||||||
Cray, Inc. (a) | 5,081 | 87,139 | ||||||
Diebold Nixdorf, Inc. | 9,057 | 246,350 | ||||||
Eastman Kodak Co. (a) | 2,658 | 35,617 | ||||||
Electronics For Imaging, Inc. (a) | 5,941 | 266,989 | ||||||
Hewlett Packard Enterprise Co. | 210,261 | 4,768,719 | ||||||
HP, Inc. | 216,446 | 3,257,512 | ||||||
Immersion Corp. (a) | 3,568 | 36,715 | ||||||
NCR Corp. (a) | 15,680 | 674,554 | ||||||
NetApp, Inc. | 35,214 | 1,349,400 | ||||||
Nimble Storage, Inc. (a) | 7,337 | 62,878 | ||||||
Pure Storage, Inc. Class A (a) | 4,744 | 53,939 | ||||||
Seagate Technology PLC | 37,887 | 1,710,598 | ||||||
See accompanying notes which are an integral part of the financial statements.
| Semiannual Report | 44 |
Table of Contents
| Common Stocks – continued | ||||||||
| Shares | Value | |||||||
TECHNOLOGY HARDWARE, STORAGE & PERIPHERALS – continued |
| |||||||
Technology Hardware, Storage & Peripherals – continued |
| |||||||
Super Micro Computer, Inc. (a) | 5,000 | $ | 132,250 | |||||
Western Digital Corp. | 35,968 | 2,867,729 | ||||||
Xerox Corp. | 106,247 | 736,292 | ||||||
|
| |||||||
TOTAL TECHNOLOGY HARDWARE, STORAGE & PERIPHERALS |
| 99,258,172 | ||||||
|
| |||||||
TOTAL COMMON STOCKS |
| 621,915,399 | ||||||
|
| |||||||
| Money Market Funds – 0.1% | ||||||||
| Shares | Value | |||||||
State Street Institutional Treasury Plus Money Market Fund, Premier Class, 0.43% (b) | 828,442 | $ | 828,442 | |||||
TOTAL INVESTMENT PORTFOLIO – 100.0% |
| 622,743,841 | ||||||
NET OTHER ASSETS (LIABILITIES) – 0.0% |
| 126,601 | ||||||
|
| |||||||
NET ASSETS – 100% |
| $ | 622,870,442 | |||||
|
| |||||||
Legend
| (a) | Non-income producing. |
| (b) | The rate quoted is the annualized seven-day yield of the fund at period end. |
Other Information
The following is a summary of the inputs used, as of January 31, 2017, involving the Fund’s assets and liabilities carried at fair value. The inputs or methodology used for valuing securities may not be an indication of the risk associated with investing in those securities. For more information on valuation inputs, and their aggregation into the levels used in the table below, please refer to the Investment Valuation section in the accompanying Notes to Financial Statements.
| Valuation Inputs at Reporting Date: | ||||||||||||||||
| Description | Total | Level 1 | Level 2 | Level 3 | ||||||||||||
Investments in Securities: | ||||||||||||||||
Common Stocks | $ | 621,915,399 | $ | 621,915,399 | $ | — | $ | — | ||||||||
Money Market Funds | 828,442 | 828,442 | — | — | ||||||||||||
|
|
|
|
|
|
|
| |||||||||
Total Investments in Securities: | $ | 622,743,841 | $ | 622,743,841 | $ | — | $ | — | ||||||||
|
|
|
|
|
|
|
| |||||||||
See accompanying notes which are an integral part of the financial statements.
| 45 | Semiannual Report |
Table of Contents
Fidelity MSCI Materials Index ETF
Investments January 31, 2017 (Unaudited)
Showing Percentage of Net Assets
| Common Stocks – 99.9% | ||||||||
| Shares | Value | |||||||
CHEMICALS – 64.8% |
| |||||||
Commodity Chemicals – 5.9% | ||||||||
AdvanSix, Inc. (a) | 6,716 | $ | 172,534 | |||||
Cabot Corp. | 14,426 | 798,768 | ||||||
Calgon Carbon Corp. | 11,739 | 186,063 | ||||||
Hawkins, Inc. | 2,199 | 117,976 | ||||||
Koppers Holdings, Inc. (a) | 4,784 | 193,513 | ||||||
Kronos Worldwide, Inc. | 5,371 | 71,005 | ||||||
LyondellBasell Industries N.V. Class A | 81,650 | 7,615,496 | ||||||
Olin Corp. | 38,183 | 1,000,776 | ||||||
Tredegar Corp. | 4,956 | 110,271 | ||||||
Trinseo S.A. | 10,415 | 674,371 | ||||||
Tronox Ltd. Class A | 15,135 | 189,490 | ||||||
|
| |||||||
| 11,130,263 | ||||||||
|
| |||||||
Diversified Chemicals – 18.8% | ||||||||
Eastman Chemical Co. | 34,133 | 2,645,308 | ||||||
EI du Pont de Nemours & Co. | 202,031 | 15,253,340 | ||||||
Huntsman Corp. | 46,807 | 954,395 | ||||||
The Chemours Co. | 41,969 | 1,108,821 | ||||||
The Dow Chemical Co. | 260,378 | 15,526,340 | ||||||
|
| |||||||
| 35,488,204 | ||||||||
|
| |||||||
Fertilizers & Agricultural Chemicals – 9.6% |
| |||||||
AgroFresh Solutions, Inc. (a) | 5,220 | 13,728 | ||||||
American Vanguard Corp. | 6,101 | 104,937 | ||||||
CF Industries Holdings, Inc. | 53,868 | 1,901,002 | ||||||
FMC Corp. | 30,918 | 1,860,027 | ||||||
Monsanto Co. | 101,113 | 10,951,549 | ||||||
The Mosaic Co. | 76,873 | 2,411,506 | ||||||
The Scotts Miracle-Gro Co. Class A | 10,510 | 966,605 | ||||||
|
| |||||||
| 18,209,354 | ||||||||
|
| |||||||
Industrial Gases – 7.7% | ||||||||
Air Products & Chemicals, Inc. | 47,537 | 6,643,771 | ||||||
Praxair, Inc. | 65,910 | 7,806,380 | ||||||
|
| |||||||
| 14,450,151 | ||||||||
|
| |||||||
Specialty Chemicals – 22.8% | ||||||||
A Schulman, Inc. Class A | 6,789 | 234,221 | ||||||
Albemarle Corp. | 25,976 | 2,406,417 | ||||||
Ashland Global Holdings, Inc. | 14,352 | 1,708,319 | ||||||
Axalta Coating Systems Ltd. (a) | 49,731 | 1,442,199 | ||||||
Balchem Corp. | 7,298 | 622,082 | ||||||
Celanese Corp. Class A | 33,445 | 2,822,758 | ||||||
Chase Corp. | 1,605 | 141,240 | ||||||
Chemtura Corp. (a) | 13,859 | 458,733 | ||||||
Ecolab, Inc. | 60,644 | 7,285,164 | ||||||
Ferro Corp. (a) | 17,278 | 244,311 | ||||||
Flotek Industries, Inc. (a) | 12,414 | 131,216 | ||||||
FutureFuel Corp. | 5,507 | 71,536 | ||||||
GCP Applied Technologies, Inc. (a) | 16,384 | 441,549 | ||||||
HB Fuller Co. | 11,639 | 574,617 | ||||||
Ingevity Corp. (a) | 9,719 | 540,279 | ||||||
| Shares | Value | |||||||
Innophos Holdings, Inc. | 4,473 | $ | 217,567 | |||||
Innospec, Inc. | 5,545 | 395,636 | ||||||
International Flavors & Fragrances, Inc. | 18,391 | 2,155,609 | ||||||
Kraton Corp. (a) | 7,154 | 192,156 | ||||||
Minerals Technologies, Inc. | 8,049 | 645,127 | ||||||
NewMarket Corp. | 2,193 | 945,556 | ||||||
OMNOVA Solutions, Inc. (a) | 9,951 | 90,554 | ||||||
Platform Specialty Products Corp. (a) | 43,949 | 533,541 | ||||||
PolyOne Corp. | 19,400 | 661,734 | ||||||
PPG Industries, Inc. | 61,532 | 6,153,815 | ||||||
Quaker Chemical Corp. | 3,053 | 392,310 | ||||||
Rayonier Advanced Materials, Inc. | 9,753 | 132,348 | ||||||
RPM International, Inc. | 30,818 | 1,610,549 | ||||||
Sensient Technologies Corp. | 10,338 | 793,441 | ||||||
Stepan Co. | 4,647 | 362,977 | ||||||
The Sherwin-Williams Co. | 18,115 | 5,503,518 | ||||||
The Valspar Corp. | 17,401 | 1,925,769 | ||||||
WR Grace & Co. | 16,260 | 1,127,468 | ||||||
|
| |||||||
| 42,964,316 | ||||||||
|
| |||||||
TOTAL CHEMICALS |
| 122,242,288 | ||||||
|
| |||||||
CONSTRUCTION MATERIALS – 5.1% |
| |||||||
Construction Materials – 5.1% | ||||||||
Eagle Materials, Inc. | 11,150 | 1,166,067 | ||||||
Headwaters, Inc. (a) | 17,119 | 396,647 | ||||||
Martin Marietta Materials, Inc. | 13,923 | 3,196,721 | ||||||
Summit Materials, Inc. Class A (a) | 24,464 | 614,046 | ||||||
United States Lime & Minerals, Inc. | 511 | 38,836 | ||||||
US Concrete, Inc. (a) | 3,353 | 219,622 | ||||||
Vulcan Materials Co. | 30,751 | 3,946,276 | ||||||
|
| |||||||
TOTAL CONSTRUCTION MATERIALS |
| 9,578,215 | ||||||
|
| |||||||
CONTAINERS & PACKAGING – 13.9% |
| |||||||
Metal & Glass Containers – 4.7% |
| |||||||
Aptargroup, Inc. | 14,548 | 1,061,567 | ||||||
Ball Corp. | 38,249 | 2,916,869 | ||||||
Berry Plastics Group, Inc. (a) | 29,724 | 1,516,837 | ||||||
Crown Holdings, Inc. (a) | 32,275 | 1,748,337 | ||||||
Greif, Inc. Class A | 5,960 | 343,177 | ||||||
Myers Industries, Inc. | 5,497 | 75,859 | ||||||
Owens-Illinois, Inc. (a) | 35,615 | 673,123 | ||||||
Silgan Holdings, Inc. | 8,899 | 520,680 | ||||||
|
| |||||||
| 8,856,449 | ||||||||
|
| |||||||
Paper Packaging – 9.2% | ||||||||
Avery Dennison Corp. | 20,531 | 1,499,174 | ||||||
Bemis Co., Inc. | 21,894 | 1,066,676 | ||||||
Graphic Packaging Holding Co. | 73,790 | 923,113 | ||||||
International Paper Co. | 90,265 | 5,108,999 | ||||||
Multi Packaging Solutions International Ltd. (a) | 7,119 | 126,861 | ||||||
Packaging Corp. of America | 21,774 | 2,007,127 | ||||||
See accompanying notes which are an integral part of the financial statements.
| Semiannual Report | 46 |
Table of Contents
| Common Stocks – continued | ||||||||
| Shares | Value | |||||||
CONTAINERS & PACKAGING – continued | ||||||||
Paper Packaging – continued | ||||||||
Sealed Air Corp. | 45,453 | $ | 2,204,470 | |||||
Sonoco Products Co. | 23,166 | 1,272,972 | ||||||
WestRock Co. | 58,112 | 3,100,856 | ||||||
|
| |||||||
| 17,310,248 | ||||||||
|
| |||||||
TOTAL CONTAINERS & PACKAGING |
| 26,166,697 | ||||||
|
| |||||||
METALS & MINING – 14.3% | ||||||||
Aluminum – 0.9% | ||||||||
Alcoa Corp. | 33,728 | 1,229,385 | ||||||
Century Aluminum Co. (a) | 12,109 | 186,479 | ||||||
Kaiser Aluminum Corp. | 4,160 | 326,394 | ||||||
|
| |||||||
| 1,742,258 | ||||||||
|
| |||||||
Copper – 2.6% | ||||||||
Freeport-McMoRan, Inc. (a) | 291,581 | 4,854,824 | ||||||
|
| |||||||
Diversified Metals & Mining – 0.4% |
| |||||||
Compass Minerals International, Inc. | 7,794 | 651,578 | ||||||
Materion Corp. | 4,610 | 181,173 | ||||||
|
| |||||||
| 832,751 | ||||||||
|
| |||||||
Gold – 3.1% | ||||||||
McEwen Mining, Inc. | 52,090 | 204,714 | ||||||
Newmont Mining Corp. | 122,608 | 4,448,218 | ||||||
Royal Gold, Inc. | 15,093 | 1,089,262 | ||||||
|
| |||||||
| 5,742,194 | ||||||||
|
| |||||||
Precious Metals & Minerals – 0.3% |
| |||||||
Stillwater Mining Co. (a) | 27,947 | 475,099 | ||||||
|
| |||||||
Silver – 0.5% | ||||||||
Coeur Mining, Inc. (a) | 37,611 | 438,168 | ||||||
Hecla Mining Co. | 89,290 | 575,028 | ||||||
|
| |||||||
| 1,013,196 | ||||||||
|
| |||||||
Steel – 6.5% | ||||||||
AK Steel Holding Corp. (a) | 69,990 | 565,519 | ||||||
Allegheny Technologies, Inc. | 25,139 | 546,270 | ||||||
Carpenter Technology Corp. | 10,785 | 431,616 | ||||||
Cliffs Natural Resources, Inc. (a) | 50,142 | 439,745 | ||||||
Commercial Metals Co. | 26,458 | 540,537 | ||||||
Haynes International, Inc. | 2,908 | 119,548 | ||||||
Nucor Corp. | 73,566 | 4,273,449 | ||||||
Reliance Steel & Aluminum Co. | 16,762 | 1,335,093 | ||||||
Schnitzer Steel Industries, Inc. Class A | 6,087 | 143,957 | ||||||
Steel Dynamics, Inc. | 56,328 | 1,904,450 | ||||||
SunCoke Energy, Inc. (a) | 14,032 | 123,762 | ||||||
| Shares | Value | |||||||
TimkenSteel Corp. (a) | 8,667 | $ | 146,126 | |||||
United States Steel Corp. | 38,256 | 1,251,354 | ||||||
Worthington Industries, Inc. | 10,921 | 521,915 | ||||||
|
| |||||||
| 12,343,341 | ||||||||
|
| |||||||
TOTAL METALS & MINING |
| 27,003,663 | ||||||
|
| |||||||
PAPER & FOREST PRODUCTS – 1.8% |
| |||||||
Forest Products – 0.5% | ||||||||
Boise Cascade Co. (a) | 8,961 | 222,233 | ||||||
Deltic Timber Corp. | 2,533 | 192,432 | ||||||
Louisiana-Pacific Corp. (a) | 32,803 | 627,521 | ||||||
|
| |||||||
| 1,042,186 | ||||||||
|
| |||||||
Paper Products – 1.3% | ||||||||
Clearwater Paper Corp. (a) | 3,918 | 246,442 | ||||||
Domtar Corp. | 14,112 | 616,553 | ||||||
KapStone Paper and Packaging Corp. | 21,169 | 507,633 | ||||||
Mercer International, Inc. | 10,409 | 124,388 | ||||||
Neenah Paper, Inc. | 3,886 | 319,235 | ||||||
PH Glatfelter Co. | 10,086 | 246,199 | ||||||
Resolute Forest Products, Inc. (a) | 14,389 | 79,139 | ||||||
Schweitzer-Mauduit International, Inc. | 7,048 | 312,438 | ||||||
|
| |||||||
| 2,452,027 | ||||||||
|
| |||||||
TOTAL PAPER & FOREST PRODUCTS |
| 3,494,213 | ||||||
|
| |||||||
TOTAL COMMON STOCKS |
| 188,485,076 | ||||||
|
| |||||||
| Money Market Funds – 0.1% | ||||||||
State Street Institutional Treasury Plus Money Market Fund, Premier Class, 0.43% (b) | 115,517 | 115,517 | ||||||
|
| |||||||
TOTAL INVESTMENT PORTFOLIO – 100.0% |
| 188,600,593 | ||||||
NET OTHER ASSETS (LIABILITIES) – 0.0% |
| 83,639 | ||||||
|
| |||||||
NET ASSETS – 100% |
| $ | 188,684,232 | |||||
|
| |||||||
Legend
| (a) | Non-income producing. |
| (b) | The rate quoted is the annualized seven-day yield of the fund at period end. |
See accompanying notes which are an integral part of the financial statements.
| 47 | Semiannual Report |
Table of Contents
Fidelity MSCI Materials Index ETF
Investments (Unaudited) – continued
Other Information
The following is a summary of the inputs used, as of January 31, 2017, involving the Fund’s assets and liabilities carried at fair value. The inputs or methodology used for valuing securities may not be an indication of the risk associated with investing in those securities. For more information on valuation inputs, and their aggregation into the levels used in the table below, please refer to the Investment Valuation section in the accompanying Notes to Financial Statements.
| Valuation Inputs at Reporting Date: | ||||||||||||||||
| Description | Total | Level 1 | Level 2 | Level 3 | ||||||||||||
Investments in Securities: | ||||||||||||||||
Common Stocks | $ | 188,485,076 | $ | 188,485,076 | $ | — | $ | — | ||||||||
Money Market Funds | 115,517 | 115,517 | — | — | ||||||||||||
|
|
|
|
|
|
|
| |||||||||
Total Investments in Securities: | $ | 188,600,593 | $ | 188,600,593 | $ | — | $ | — | ||||||||
|
|
|
|
|
|
|
| |||||||||
See accompanying notes which are an integral part of the financial statements.
| Semiannual Report | 48 |
Table of Contents
Fidelity MSCI Real Estate Index ETF
Investments January 31, 2017 (Unaudited)
Showing Percentage of Net Assets
| Common Stocks – 99.7% | ||||||||
| Shares | Value | |||||||
EQUITY REAL ESTATE INVESTMENT TRUSTS (REITS) – 96.5% |
| |||||||
Diversified REIT’s – 6.6% |
| |||||||
American Assets Trust, Inc. | 9,328 | $ | 400,451 | |||||
Armada Hoffler Properties, Inc. | 9,485 | 130,703 | ||||||
Colony NorthStar, Inc. Class A | 140,748 | 1,959,212 | ||||||
Empire State Realty Trust, Inc. Class A | 33,525 | 686,927 | ||||||
First Potomac Realty Trust | 16,785 | 171,879 | ||||||
Forest City Realty Trust, Inc. Class A | 64,620 | 1,462,997 | ||||||
Gladstone Commercial Corp. | 6,684 | 131,274 | ||||||
Global Net Lease, Inc. | 45,194 | 350,254 | ||||||
Gramercy Property Trust | 38,129 | 1,004,318 | ||||||
Investors Real Estate Trust | 34,447 | 221,839 | ||||||
iStar, Inc. (a) | 19,788 | 222,021 | ||||||
Lexington Realty Trust | 58,100 | 622,832 | ||||||
Liberty Property Trust | 39,245 | 1,506,616 | ||||||
One Liberty Properties, Inc. | 3,943 | 91,320 | ||||||
PS Business Parks, Inc. | 5,531 | 619,693 | ||||||
RAIT Financial Trust | 14,292 | 49,450 | ||||||
Select Income REIT | 18,317 | 458,108 | ||||||
Spirit Realty Capital, Inc. | 128,306 | 1,349,779 | ||||||
STORE Capital Corp. | 41,567 | 983,475 | ||||||
VEREIT, Inc. | 258,185 | 2,202,318 | ||||||
Washington Real Estate Investment Trust | 20,047 | 630,478 | ||||||
WP Carey, Inc. | 26,867 | 1,664,142 | ||||||
|
| |||||||
| 16,920,086 | ||||||||
|
| |||||||
Health Care REIT’s – 9.9% |
| |||||||
Care Capital Properties, Inc. | 22,872 | 565,167 | ||||||
CareTrust REIT, Inc. | 17,002 | 257,750 | ||||||
HCP, Inc. | 125,081 | 3,792,456 | ||||||
Healthcare Realty Trust, Inc. | 31,437 | 949,712 | ||||||
Healthcare Trust of America, Inc. Class A | 37,400 | 1,087,218 | ||||||
LTC Properties, Inc. | 10,413 | 485,975 | ||||||
Medical Properties Trust, Inc. | 82,002 | 1,045,525 | ||||||
National Health Investors, Inc. | 10,643 | 787,475 | ||||||
New Senior Investment Group, Inc. | 22,174 | 221,962 | ||||||
Omega Healthcare Investors, Inc. | 51,741 | 1,659,334 | ||||||
Physicians Realty Trust | 36,602 | 678,967 | ||||||
Quality Care Properties, Inc. (a) | 25,547 | 471,598 | ||||||
Sabra Health Care REIT, Inc. | 17,857 | 453,568 | ||||||
Senior Housing Properties Trust | 54,077 | 1,030,167 | ||||||
Universal Health Realty Income Trust | 629 | 39,073 | ||||||
Ventas, Inc. | 93,980 | 5,795,747 | ||||||
Welltower, Inc. | 95,736 | 6,347,297 | ||||||
|
| |||||||
| 25,668,991 | ||||||||
|
| |||||||
Hotel & Resort REIT’s – 5.3% |
| |||||||
Apple Hospitality REIT, Inc. | 45,071 | 902,321 | ||||||
Ashford Hospitality Prime, Inc. | 7,060 | 94,886 | ||||||
Ashford Hospitality Trust, Inc. | 27,550 | 209,380 | ||||||
Chatham Lodging Trust | 9,635 | 194,049 | ||||||
Chesapeake Lodging Trust | 16,446 | 421,018 | ||||||
DiamondRock Hospitality Co. | 54,697 | 616,435 | ||||||
| Shares | Value | |||||||
FelCor Lodging Trust, Inc. | 35,127 | $ | 270,478 | |||||
Hersha Hospitality Trust | 12,033 | 240,540 | ||||||
Hospitality Properties Trust | 37,908 | 1,180,076 | ||||||
Host Hotels & Resorts, Inc. | 198,610 | 3,588,883 | ||||||
LaSalle Hotel Properties | 30,699 | 926,189 | ||||||
MGM Growth Properties LLC Class A | 15,767 | 407,104 | ||||||
Park Hotels & Resorts, Inc. | 29,408 | 798,133 | ||||||
Pebblebrook Hotel Trust | 19,633 | 587,223 | ||||||
RLJ Lodging Trust | 33,780 | 784,034 | ||||||
Ryman Hospitality Properties, Inc. | 12,481 | 763,588 | ||||||
Summit Hotel Properties, Inc. | 22,527 | 356,602 | ||||||
Sunstone Hotel Investors, Inc. | 58,823 | 865,874 | ||||||
Xenia Hotels & Resorts, Inc. | 29,019 | 532,499 | ||||||
|
| |||||||
| 13,739,312 | ||||||||
|
| |||||||
Industrial REIT’s – 5.0% |
| |||||||
DCT Industrial Trust, Inc. | 24,120 | 1,077,923 | ||||||
Duke Realty Corp. | 93,817 | 2,282,568 | ||||||
EastGroup Properties, Inc. | 7,569 | 535,658 | ||||||
First Industrial Realty Trust, Inc. | 31,716 | 819,859 | ||||||
Monmouth Real Estate Investment Corp. Class A | 16,847 | 245,966 | ||||||
Prologis, Inc. | 140,958 | 6,885,798 | ||||||
Rexford Industrial Realty, Inc. | 17,658 | 401,013 | ||||||
STAG Industrial, Inc. | 19,523 | 451,762 | ||||||
Terreno Realty Corp. | 12,618 | 343,083 | ||||||
|
| |||||||
| 13,043,630 | ||||||||
|
| |||||||
Office REIT’s – 11.5% |
| |||||||
Alexandria Real Estate Equities, Inc. | 20,860 | 2,311,705 | ||||||
Boston Properties, Inc. | 41,113 | 5,381,692 | ||||||
Brandywine Realty Trust | 47,597 | 766,312 | ||||||
Columbia Property Trust, Inc. | 31,911 | 710,020 | ||||||
Corporate Office Properties Trust | 25,746 | 819,238 | ||||||
Cousins Properties, Inc. | 96,143 | 817,215 | ||||||
Douglas Emmett, Inc. | 38,374 | 1,452,072 | ||||||
Easterly Government Properties, Inc. | 9,484 | 186,835 | ||||||
Equity Commonwealth (a) | 32,363 | 998,075 | ||||||
Franklin Street Properties Corp. | 27,018 | 344,480 | ||||||
Government Properties Income Trust | 1,943 | 37,422 | ||||||
Highwoods Properties, Inc. | 26,379 | 1,356,144 | ||||||
Hudson Pacific Properties, Inc. | 39,107 | 1,384,779 | ||||||
Kilroy Realty Corp. | 24,675 | 1,846,924 | ||||||
Mack-Cali Realty Corp. | 23,175 | 649,363 | ||||||
New York REIT, Inc. | 45,584 | 453,561 | ||||||
NorthStar Realty Europe Corp. | 17,337 | 208,217 | ||||||
Paramount Group, Inc. | 47,828 | 798,249 | ||||||
Parkway, Inc. (a) | 11,199 | 238,427 | ||||||
Piedmont Office Realty Trust, Inc. Class A | 39,446 | 856,767 | ||||||
SL Green Realty Corp. | 26,835 | 2,924,210 | ||||||
Tier REIT, Inc. | 13,221 | 240,754 | ||||||
Vornado Realty Trust | 45,451 | 4,831,896 | ||||||
|
| |||||||
| 29,614,357 | ||||||||
|
| |||||||
See accompanying notes which are an integral part of the financial statements.
| 49 | Semiannual Report |
Table of Contents
Fidelity MSCI Real Estate Index ETF
Investments (Unaudited) – continued
| Common Stocks – continued | ||||||||
| Shares | Value | |||||||
EQUITY REAL ESTATE INVESTMENT TRUSTS (REITS) – continued |
| |||||||
Residential REIT’s – 13.1% |
| |||||||
American Campus Communities, Inc. | 34,904 | $ | 1,697,032 | |||||
American Homes 4 Rent Class A | 57,232 | 1,275,129 | ||||||
Apartment Investment & Management Co. Class A | 41,794 | 1,841,862 | ||||||
AvalonBay Communities, Inc. | 36,731 | 6,365,850 | ||||||
Camden Property Trust | 23,378 | 1,953,699 | ||||||
Colony Starwood Homes | 18,010 | 566,414 | ||||||
Education Realty Trust, Inc. | 19,837 | 797,646 | ||||||
Equity Lifestyle Properties, Inc. | 21,682 | 1,603,167 | ||||||
Equity Residential | 97,776 | 5,941,847 | ||||||
Essex Property Trust, Inc. | 17,524 | 3,930,633 | ||||||
Independence Realty Trust, Inc. | 18,311 | 169,011 | ||||||
Mid-America Apartment Communities, Inc. | 30,368 | 2,883,442 | ||||||
Monogram Residential Trust, Inc. | 42,390 | 431,106 | ||||||
NexPoint Residential Trust, Inc. | 4,880 | 112,777 | ||||||
Silver Bay Realty Trust Corp. | 9,656 | 162,704 | ||||||
Sun Communities, Inc. | 18,406 | 1,449,657 | ||||||
UDR, Inc. | 71,439 | 2,496,793 | ||||||
|
| |||||||
| 33,678,769 | ||||||||
|
| |||||||
Retail REIT’s – 18.9% |
| |||||||
Acadia Realty Trust | 21,826 | 694,940 | ||||||
Agree Realty Corp. | 6,917 | 324,407 | ||||||
Alexander’s, Inc. | 649 | 274,404 | ||||||
Brixmor Property Group, Inc. | 81,401 | 1,964,206 | ||||||
CBL & Associates Properties, Inc. | 46,608 | 505,697 | ||||||
Cedar Realty Trust, Inc. | 19,995 | 120,170 | ||||||
DDR Corp. | 83,419 | 1,266,300 | ||||||
Equity One, Inc. | 25,393 | 792,008 | ||||||
Federal Realty Investment Trust | 19,108 | 2,683,336 | ||||||
Getty Realty Corp. | 7,738 | 199,563 | ||||||
GGP, Inc. | 153,825 | 3,821,013 | ||||||
Kimco Realty Corp. | 112,363 | 2,796,715 | ||||||
Kite Realty Group Trust | 21,667 | 520,441 | ||||||
National Retail Properties, Inc. | 39,356 | 1,715,922 | ||||||
Pennsylvania Real Estate Investment Trust | 19,124 | 342,511 | ||||||
Ramco-Gershenson Properties Trust | 22,078 | 358,988 | ||||||
Realty Income Corp. | 69,159 | 4,123,951 | ||||||
Regency Centers Corp. | 27,949 | 1,948,884 | ||||||
Retail Opportunity Investments Corp. | 27,428 | 581,474 | ||||||
Retail Properties of America, Inc. Class A | 64,417 | 964,323 | ||||||
Saul Centers, Inc. | 3,655 | 232,056 | ||||||
Seritage Growth Properties, Class A | 5,546 | 226,277 | ||||||
Simon Property Group, Inc. | 84,051 | 15,446,052 | ||||||
Tanger Factory Outlet Centers | 26,090 | 892,017 | ||||||
Taubman Centers, Inc. | 16,149 | 1,143,995 | ||||||
The Macerich Co. | 32,650 | 2,242,729 | ||||||
Urban Edge Properties | 26,814 | 749,988 | ||||||
Urstadt Biddle Properties, Inc. Class A | 4,372 | 98,151 | ||||||
| Shares | Value | |||||||
Washington Prime Group, Inc. | 50,556 | $ | 487,865 | |||||
Weingarten Realty Investors | 32,489 | 1,157,583 | ||||||
|
| |||||||
| 48,675,966 | ||||||||
|
| |||||||
Specialized REIT’s – 26.2% |
| |||||||
American Tower Corp. | 113,809 | 11,779,231 | ||||||
CatchMark Timber Trust, Inc. Class A | 11,448 | 117,800 | ||||||
Communications Sales & Leasing, Inc. (a) | 39,649 | 1,041,976 | ||||||
CoreCivic, Inc. | 31,691 | 920,307 | ||||||
CoreSite Realty Corp. | 9,225 | 794,549 | ||||||
Crown Castle International Corp. | 90,289 | 7,930,083 | ||||||
CubeSmart | 48,045 | 1,207,371 | ||||||
CyrusOne, Inc. | 20,388 | 981,886 | ||||||
Digital Realty Trust, Inc. | 42,622 | 4,587,406 | ||||||
DuPont Fabros Technology, Inc. | 20,501 | 973,387 | ||||||
EPR Properties | 17,014 | 1,258,526 | ||||||
Equinix, Inc. | 19,006 | 7,316,930 | ||||||
Extra Space Storage, Inc. | 33,927 | 2,444,440 | ||||||
Four Corners Property Trust, Inc. | 14,857 | 324,031 | ||||||
Gaming and Leisure Properties, Inc. | 52,126 | 1,648,745 | ||||||
InfraREIT, Inc. (a) | 11,287 | 186,010 | ||||||
Iron Mountain, Inc. | 66,894 | 2,394,805 | ||||||
Lamar Advertising Co. Class A | 22,165 | 1,673,901 | ||||||
Life Storage, Inc. | 12,405 | 1,010,387 | ||||||
National Storage Affiliates Trust | 11,395 | 253,539 | ||||||
Outfront Media, Inc. | 37,437 | 1,026,897 | ||||||
Potlatch Corp. | 10,835 | 446,402 | ||||||
Public Storage | 39,423 | 8,475,945 | ||||||
QTS Realty Trust, Inc. Class A | 12,761 | 643,027 | ||||||
Rayonier, Inc. | 33,370 | 930,689 | ||||||
The Geo Group, Inc. | 20,394 | 846,759 | ||||||
Weyerhaeuser Co. | 200,273 | 6,274,553 | ||||||
|
| |||||||
| 67,489,582 | ||||||||
|
| |||||||
TOTAL EQUITY REAL ESTATE INVESTMENT TRUSTS (REITS) |
| 248,830,693 | ||||||
|
| |||||||
REAL ESTATE MANAGEMENT & DEVELOPMENT – 3.2% |
| |||||||
Diversified Real Estate Activities – 0.4% |
| |||||||
Alexander & Baldwin, Inc. | 12,038 | 535,932 | ||||||
Tejon Ranch Co. (a) | 5,149 | 121,671 | ||||||
The RMR Group, Inc. Class A | 2,057 | 98,324 | ||||||
The St Joe Co. (a) | 13,253 | 223,313 | ||||||
|
| |||||||
| 979,240 | ||||||||
|
| |||||||
Real Estate Development – 0.5% |
| |||||||
Forestar Group, Inc. (a) | 7,550 | 98,528 | ||||||
The Howard Hughes Corp. (a) | 9,718 | 1,036,036 | ||||||
|
| |||||||
| 1,134,564 | ||||||||
|
| |||||||
Real Estate Operating Companies – 0.2% |
| |||||||
Kennedy-Wilson Holdings, Inc. | 25,573 | 522,968 | ||||||
|
| |||||||
See accompanying notes which are an integral part of the financial statements.
| Semiannual Report | 50 |
Table of Contents
| Common Stocks – continued | ||||||||
| Shares | Value | |||||||
REAL ESTATE MANAGEMENT & DEVELOPMENT – continued |
| |||||||
Real Estate Services – 2.1% |
| |||||||
Altisource Portfolio Solutions S.A. (a) | 3,877 | $ | 110,494 | |||||
CBRE Group, Inc. Class A (a) | 80,793 | 2,452,875 | ||||||
HFF, Inc. Class A | 10,149 | 301,222 | ||||||
Jones Lang LaSalle, Inc. | 12,086 | 1,245,221 | ||||||
Marcus & Millichap, Inc. (a) | 4,436 | 114,316 | ||||||
RE/MAX Holdings, Inc. Class A | 4,714 | 264,220 | ||||||
Realogy Holdings Corp. | 39,354 | 1,019,662 | ||||||
|
| |||||||
| 5,508,010 | ||||||||
|
| |||||||
TOTAL REAL ESTATE MANAGEMENT & DEVELOPMENT |
| 8,144,782 | ||||||
|
| |||||||
TOTAL COMMON STOCKS |
| 256,975,475 | ||||||
|
| |||||||
| Money Market Funds – 0.2% | ||||||||
| Shares | Value | |||||||
State Street Institutional Treasury Plus Money Market Fund, Premier Class, 0.43% (b) | 544,095 | $ | 544,095 | |||||
|
| |||||||
TOTAL INVESTMENT PORTFOLIO – 99.9% |
| 257,519,570 | ||||||
NET OTHER ASSETS (LIABILITIES) – 0.1% |
| 216,995 | ||||||
|
| |||||||
NET ASSETS – 100% |
| $ | 257,736,565 | |||||
|
| |||||||
Legend
| (a) | Non-income producing. |
| (b) | The rate quoted is the annualized seven-day yield of the fund at period end. |
Other Information
The following is a summary of the inputs used, as of January 31, 2017, involving the Fund’s assets and liabilities carried at fair value. The inputs or methodology used for valuing securities may not be an indication of the risk associated with investing in those securities. For more information on valuation inputs, and their aggregation into the levels used in the table below, please refer to the Investment Valuation section in the accompanying Notes to Financial Statements.
| Valuation Inputs at Reporting Date: | ||||||||||||||||
| Description | Total | Level 1 | Level 2 | Level 3 | ||||||||||||
Investments in Securities: | ||||||||||||||||
Common Stocks | $ | 256,975,475 | $ | 256,975,475 | $ | — | $ | — | ||||||||
Money Market Funds | 544,095 | 544,095 | — | — | ||||||||||||
|
|
|
|
|
|
|
| |||||||||
Total Investments in Securities: | $ | 257,519,570 | $ | 257,519,570 | $ | — | $ | — | ||||||||
|
|
|
|
|
|
|
| |||||||||
See accompanying notes which are an integral part of the financial statements.
| 51 | Semiannual Report |
Table of Contents
Fidelity MSCI Telecommunication Services Index ETF
Investments January 31, 2017 (Unaudited)
Showing Percentage of Net Assets
| Common Stocks – 99.9% | ||||||||
| Shares | Value | |||||||
DIVERSIFIED TELECOMMUNICATION SERVICES – 82.9% |
| |||||||
Alternative Carriers – 20.0% |
| |||||||
Cogent Communications Holdings, Inc. | 62,025 | $ | 2,592,645 | |||||
Globalstar, Inc. (a) | 1,505,116 | 2,378,083 | ||||||
Inteliquent, Inc. | 94,081 | 2,154,455 | ||||||
Iridium Communications, Inc. (a) | 239,394 | 2,417,880 | ||||||
Level 3 Communications, Inc. (a) | 108,678 | 6,461,994 | ||||||
Lumos Networks Corp. (a) | 138,045 | 2,135,556 | ||||||
ORBCOMM, Inc. (a) | 236,915 | 1,935,596 | ||||||
pdvWireless, Inc. (a) | 75,144 | 1,600,567 | ||||||
Straight Path Communications, Inc. (a) | 74,825 | 2,621,868 | ||||||
Vonage Holdings Corp. (a) | 341,403 | 2,420,547 | ||||||
Zayo Group Holdings, Inc. (a) | 70,753 | 2,261,266 | ||||||
|
| |||||||
| 28,980,457 | ||||||||
|
| |||||||
Integrated Telecommunication Services – 62.9% |
| |||||||
AT&T, Inc. | 793,690 | 33,461,970 | ||||||
ATN International, Inc. | 29,151 | 2,340,534 | ||||||
CenturyLink, Inc. | 193,419 | 5,001,815 | ||||||
Cincinnati Bell, Inc. (a) | 99,630 | 2,286,508 | ||||||
Consolidated Communications Holdings, Inc. | 79,504 | 2,091,750 | ||||||
FairPoint Communications, Inc. (a) | 121,647 | 2,250,470 | ||||||
Frontier Communications Corp. | 660,718 | 2,305,906 | ||||||
General Communication, Inc. Class A (a) | 120,495 | 2,424,359 | ||||||
IDT Corp. Class B | 89,123 | 1,711,162 | ||||||
SBA Communications Corp. (a) | 48,600 | 5,115,636 | ||||||
Verizon Communications, Inc. | 611,977 | 29,992,993 | ||||||
Windstream Holding, Inc. | 275,375 | 2,225,030 | ||||||
|
| |||||||
| 91,208,133 | ||||||||
|
| |||||||
TOTAL DIVERSIFIED TELECOMMUNICATION SERVICES |
| 120,188,590 | ||||||
|
| |||||||
| Shares | Value | |||||||
WIRELESS TELECOMMUNICATION SERVICES – 17.0% |
| |||||||
Wireless Telecommunication Services – 17.0% |
| |||||||
Boingo Wireless, Inc. (a) | 169,893 | $ | 1,987,748 | |||||
Contra Leap Wireless (a) | 18,242 | 59,834 | ||||||
NII Holdings, Inc. (a) | 807,795 | 2,282,021 | ||||||
Shenandoah Telecommunications Co. | 81,884 | 2,231,339 | ||||||
Spok Holdings, Inc. | 108,279 | 2,225,133 | ||||||
Sprint Corp. (a) | 457,955 | 4,226,925 | ||||||
T-Mobile US, Inc. (a) | 109,666 | 6,828,902 | ||||||
Telephone & Data Systems, Inc. | 88,662 | 2,717,490 | ||||||
United States Cellular Corp. (a) | 47,994 | 2,140,052 | ||||||
|
| |||||||
TOTAL WIRELESS TELECOMMUNICATION SERVICES |
| 24,699,444 | ||||||
|
| |||||||
TOTAL COMMON STOCKS |
| 144,888,034 | ||||||
|
| |||||||
| Money Market Funds – 0.1% | ||||||||
State Street Institutional Treasury Plus Money Market Fund, Premier Class, 0.43% (b) | 127,718 | 127,718 | ||||||
|
| |||||||
TOTAL INVESTMENT PORTFOLIO – 100.0% |
| 145,015,752 | ||||||
NET OTHER ASSETS (LIABILITIES) – (0.0%) |
| (65,388 | ) | |||||
|
| |||||||
NET ASSETS – 100% |
| $ | 144,950,364 | |||||
|
| |||||||
Legend
| (a) | Non-income producing. |
| (b) | The rate quoted is the annualized seven-day yield of the fund at period end. |
Other Information
The following is a summary of the inputs used, as of January 31, 2017, involving the Fund’s assets and liabilities carried at fair value. The inputs or methodology used for valuing securities may not be an indication of the risk associated with investing in those securities. For more information on valuation inputs, and their aggregation into the levels used in the table below, please refer to the Investment Valuation section in the accompanying Notes to Financial Statements.
| Valuation Inputs at Reporting Date: | ||||||||||||||||
| Description | Total | Level 1 | Level 2 | Level 3 | ||||||||||||
Investments in Securities: | ||||||||||||||||
Common Stocks | $ | 144,888,034 | $ | 144,828,200 | $ | — | $ | 59,834 | ||||||||
Money Market Funds | 127,718 | 127,718 | — | — | ||||||||||||
|
|
|
|
|
|
|
| |||||||||
Total Investments in Securities: | $ | 145,015,752 | $ | 144,955,918 | $ | — | $ | 59,834 | ||||||||
|
|
|
|
|
|
|
| |||||||||
See accompanying notes which are an integral part of the financial statements.
| Semiannual Report | 52 |
Table of Contents
Fidelity MSCI Utilities Index ETF
Investments January 31, 2017 (Unaudited)
Showing Percentage of Net Assets
| Common Stocks – 99.8% | ||||||||
| Shares | Value | |||||||
ELECTRIC UTILITIES – 57.3% |
| |||||||
Electric Utilities – 57.3% |
| |||||||
ALLETE, Inc. | 11,767 | $ | 768,973 | |||||
Alliant Energy Corp. | 57,042 | 2,147,631 | ||||||
American Electric Power Co., Inc. | 123,378 | 7,903,595 | ||||||
Duke Energy Corp. | 172,880 | 13,577,995 | ||||||
Edison International | 81,751 | 5,958,013 | ||||||
El Paso Electric Co. | 10,172 | 466,895 | ||||||
Entergy Corp. | 44,909 | 3,217,281 | ||||||
Eversource Energy | 79,591 | 4,402,974 | ||||||
Exelon Corp. | 231,561 | 8,308,409 | ||||||
FirstEnergy Corp. | 106,688 | 3,234,780 | ||||||
Great Plains Energy, Inc. | 52,039 | 1,433,675 | ||||||
Hawaiian Electric Industries, Inc. | 27,166 | 909,518 | ||||||
IDACORP, Inc. | 12,651 | 1,012,333 | ||||||
MGE Energy, Inc. | 8,698 | 553,628 | ||||||
NextEra Energy, Inc. | 115,921 | 14,341,746 | ||||||
OGE Energy Corp. | 50,107 | 1,680,589 | ||||||
Otter Tail Corp. | 8,772 | 332,020 | ||||||
PG&E Corp. | 126,464 | 7,826,857 | ||||||
Pinnacle West Capital Corp. | 27,894 | 2,165,411 | ||||||
PNM Resources, Inc. | 19,987 | 687,553 | ||||||
Portland General Electric Co. | 22,322 | 973,462 | ||||||
PPL Corp. | 170,142 | 5,927,747 | ||||||
The Southern Co. | 245,571 | 12,138,575 | ||||||
Westar Energy, Inc. | 35,564 | 1,944,995 | ||||||
Xcel Energy, Inc. | 127,451 | 5,266,275 | ||||||
|
| |||||||
TOTAL ELECTRIC UTILITIES |
| 107,180,930 | ||||||
|
| |||||||
GAS UTILITIES – 5.7% |
| |||||||
Gas Utilities – 5.7% |
| |||||||
Atmos Energy Corp. | 26,057 | 1,985,022 | ||||||
Chesapeake Utilities Corp. | 3,842 | 251,267 | ||||||
National Fuel Gas Co. | 18,130 | 1,017,999 | ||||||
New Jersey Resources Corp. | 21,596 | 814,169 | ||||||
Northwest Natural Gas Co. | 6,921 | 407,647 | ||||||
ONE Gas, Inc. | 13,092 | 846,005 | ||||||
South Jersey Industries, Inc. | 19,927 | 657,591 | ||||||
Southwest Gas Holdings, Inc. | 11,922 | 960,556 | ||||||
Spire, Inc. | 11,443 | 743,795 | ||||||
UGI Corp. | 43,471 | 2,015,750 | ||||||
WGL Holdings, Inc. | 12,817 | 1,050,225 | ||||||
|
| |||||||
TOTAL GAS UTILITIES |
| 10,750,026 | ||||||
|
| |||||||
INDEPENDENT POWER AND RENEWABLE ELECTRICITY PRODUCERS – 3.5% |
| |||||||
Independent Power Producers & Energy Traders – 2.6% |
| |||||||
AES Corp. | 165,373 | 1,891,867 | ||||||
Calpine Corp. (a) | 85,632 | 1,010,458 | ||||||
Dynegy, Inc. (a) | 24,928 | 238,063 | ||||||
NRG Energy, Inc. | 79,132 | 1,308,843 | ||||||
NRG Yield, Inc. Class A | 8,637 | 140,351 | ||||||
NRG Yield, Inc. Class C | 15,699 | 266,098 | ||||||
|
| |||||||
| 4,855,680 | ||||||||
|
| |||||||
| Shares | Value | |||||||
Renewable Electricity – 0.9% |
| |||||||
8Point3 Energy Partners LP | 6,846 | $ | 92,695 | |||||
NextEra Energy Partners LP | 13,246 | 417,646 | ||||||
Ormat Technologies, Inc. | 9,331 | 501,075 | ||||||
Pattern Energy Group, Inc. | 17,336 | 342,213 | ||||||
TerraForm Global, Inc. Class A (a) | 20,698 | 91,071 | ||||||
TerraForm Power, Inc. Class A (a) | 13,775 | 163,509 | ||||||
|
| |||||||
| 1,608,209 | ||||||||
|
| |||||||
TOTAL INDEPENDENT POWER AND RENEWABLE ELECTRICITY PRODUCERS |
| 6,463,889 | ||||||
|
| |||||||
MULTI-UTILITIES – 30.1% |
| |||||||
Multi-Utilities – 30.1% |
| |||||||
Ameren Corp. | 60,880 | 3,205,332 | ||||||
Avista Corp. | 15,985 | 617,660 | ||||||
Black Hills Corp. | 13,113 | 820,218 | ||||||
CenterPoint Energy, Inc. | 102,660 | 2,690,719 | ||||||
CMS Energy Corp. | 70,213 | 2,991,074 | ||||||
Consolidated Edison, Inc. | 76,382 | 5,679,002 | ||||||
Dominion Resources, Inc. | 157,574 | 12,019,745 | ||||||
DTE Energy Co. | 45,023 | 4,441,069 | ||||||
MDU Resources Group, Inc. | 46,554 | 1,366,360 | ||||||
NiSource, Inc. | 80,841 | 1,808,413 | ||||||
NorthWestern Corp. | 12,114 | 691,830 | ||||||
Public Service Enterprise Group, Inc. | 126,941 | 5,617,139 | ||||||
SCANA Corp. | 34,066 | 2,340,334 | ||||||
Sempra Energy | 59,545 | 6,096,813 | ||||||
Unitil Corp. | 3,327 | 152,277 | ||||||
Vectren Corp. | 20,786 | 1,140,943 | ||||||
WEC Energy Group, Inc. | 79,194 | 4,676,406 | ||||||
|
| |||||||
TOTAL MULTI-UTILITIES |
| 56,355,334 | ||||||
|
| |||||||
WATER UTILITIES – 3.2% |
| |||||||
Water Utilities – 3.2% |
| |||||||
American States Water Co. | 9,181 | 401,944 | ||||||
American Water Works Co., Inc. | 44,639 | 3,278,288 | ||||||
Aqua America, Inc. | 44,494 | 1,353,063 | ||||||
California Water Service Group | 12,051 | 415,759 | ||||||
Connecticut Water Service, Inc. | 2,829 | 152,879 | ||||||
Middlesex Water Co. | 4,071 | 153,925 | ||||||
SJW Group | 3,830 | 191,883 | ||||||
The York Water Co. | 3,219 | 115,240 | ||||||
|
| |||||||
TOTAL WATER UTILITIES |
| 6,062,981 | ||||||
|
| |||||||
TOTAL COMMON STOCKS |
| 186,813,160 | ||||||
|
| |||||||
See accompanying notes which are an integral part of the financial statements.
| 53 | Semiannual Report |
Table of Contents
Fidelity MSCI Utilities Index ETF
Investments (Unaudited) – continued
| Money Market Funds – 0.2% | ||||||||
| Shares | Value | |||||||
State Street Institutional Treasury Plus Money Market Fund, Premier Class, 0.43% (b) | 346,119 | $ | 346,119 | |||||
|
| |||||||
TOTAL INVESTMENT PORTFOLIO – 100.0% |
| 187,159,279 | ||||||
NET OTHER ASSETS (LIABILITIES) – 0.0% |
| 67,282 | ||||||
|
| |||||||
NET ASSETS – 100% |
| $ | 187,226,561 | |||||
|
| |||||||
Legend
| (a) | Non-income producing. |
| (b) | The rate quoted is the annualized seven-day yield of the fund at period end. |
Other Information
The following is a summary of the inputs used, as of January 31, 2017, involving the Fund’s assets and liabilities carried at fair value. The inputs or methodology used for valuing securities may not be an indication of the risk associated with investing in those securities. For more information on valuation inputs, and their aggregation into the levels used in the table below, please refer to the Investment Valuation section in the accompanying Notes to Financial Statements.
| Valuation Inputs at Reporting Date: | ||||||||||||||||
| Description | Total | Level 1 | Level 2 | Level 3 | ||||||||||||
Investments in Securities: | ||||||||||||||||
Common Stocks | $ | 186,813,160 | $ | 186,813,160 | $ | — | $ | — | ||||||||
Money Market Funds | 346,119 | 346,119 | — | — | ||||||||||||
|
|
|
|
|
|
|
| |||||||||
Total Investments in Securities: | $ | 187,159,279 | $ | 187,159,279 | $ | — | $ | — | ||||||||
|
|
|
|
|
|
|
| |||||||||
See accompanying notes which are an integral part of the financial statements.
| Semiannual Report | 54 |
Table of Contents
[THIS PAGE INTENTIONALLY LEFT BLANK]
| 55 | Semiannual Report |
Table of Contents
| Statements of Assets and Liabilities | ||||||||||||||||
| January 31, 2017 (Unaudited) | ||||||||||||||||
Fidelity MSCI Consumer Discretionary Index ETF | Fidelity MSCI Consumer Staples Index ETF | Fidelity MSCI Index ETF | Fidelity MSCI Financials Index ETF | |||||||||||||
Assets | ||||||||||||||||
Investments in securities, at value – See accompanying schedule | $ | 238,705,110 | $ | 237,014,104 | $ | 519,846,621 | $ | 660,900,828 | ||||||||
Cash | — | — | — | 41,790 | ||||||||||||
Receivable for investments sold | 24,810 | — | — | 52,013 | ||||||||||||
Receivable for fund shares sold | — | 3,593 | — | — | ||||||||||||
Dividends receivable | 144,495 | 372,781 | 240,369 | 343,483 | ||||||||||||
Interest receivable | 94 | 61 | 90 | 217 | ||||||||||||
|
|
|
|
|
|
|
| |||||||||
Total assets | 238,874,509 | 237,390,539 | 520,087,080 | 661,338,331 | ||||||||||||
|
|
|
|
|
|
|
| |||||||||
Liabilities | ||||||||||||||||
Payable for investments purchased | 41,139 | 142,280 | 147,704 | 91,816 | ||||||||||||
Accrued management fees | 17,402 | 17,273 | 38,350 | 45,308 | ||||||||||||
|
|
|
|
|
|
|
| |||||||||
Total liabilities | 58,541 | 159,553 | 186,054 | 137,124 | ||||||||||||
|
|
|
|
|
|
|
| |||||||||
Net Assets | $ | 238,815,968 | $ | 237,230,986 | $ | 519,901,026 | $ | 661,201,207 | ||||||||
|
|
|
|
|
|
|
| |||||||||
Net Assets consist of: | ||||||||||||||||
Paid in capital | $ | 241,044,931 | $ | 231,768,175 | $ | 560,274,460 | $ | 611,307,870 | ||||||||
Undistributed net investment income | 111,932 | 399,793 | 244,490 | 650,363 | ||||||||||||
Accumulated undistributed net realized gain (loss) on investments | 855,243 | 369,289 | (41,666,649 | ) | (2,674,036 | ) | ||||||||||
Net unrealized appreciation (depreciation) on investments | (3,196,138 | ) | 4,693,729 | 1,048,725 | 51,917,010 | |||||||||||
|
|
|
|
|
|
|
| |||||||||
Net Assets | $ | 238,815,968 | $ | 237,230,986 | $ | 519,901,026 | $ | 661,201,207 | ||||||||
|
|
|
|
|
|
|
| |||||||||
Shares outstanding | 7,150,000 | 7,500,000 | 25,400,000 | 19,100,000 | ||||||||||||
|
|
|
|
|
|
|
| |||||||||
Net Asset Value, offering price and redemption price per share | $ | 33.40 | $ | 31.63 | $ | 20.47 | $ | 34.62 | ||||||||
|
|
|
|
|
|
|
| |||||||||
Investments at cost | $ | 241,901,248 | $ | 232,320,375 | $ | 518,797,896 | $ | 608,983,818 | ||||||||
|
|
|
|
|
|
|
| |||||||||
See accompanying notes which are an integral part of the financial statements.
| Semiannual Report | 56 |
Table of Contents
| Statements of Assets and Liabilities | ||||||||||||||||
| January 31, 2017 (Unaudited) | ||||||||||||||||
Fidelity MSCI Health Care Index ETF | Fidelity MSCI Industrials Index ETF | Fidelity MSCI Information Technology Index ETF | Fidelity MSCI Materials Index ETF | |||||||||||||
Assets | ||||||||||||||||
Investments in securities, at value – See accompanying schedule | $ | 630,037,920 | $ | 299,664,646 | $ | 622,743,841 | $ | 188,600,593 | ||||||||
Cash | — | — | 32,266 | 435 | ||||||||||||
Receivable for fund shares sold | 43,881 | 22,690 | 21,929 | 20,334 | ||||||||||||
Dividends receivable | 436,446 | 144,432 | 115,868 | 75,374 | ||||||||||||
Interest receivable | 234 | 99 | 180 | 47 | ||||||||||||
|
|
|
|
|
|
|
| |||||||||
Total assets | 630,518,481 | 299,831,867 | 622,914,084 | 188,696,783 | ||||||||||||
|
|
|
|
|
|
|
| |||||||||
Liabilities | ||||||||||||||||
Accrued management fees | 44,900 | 20,249 | 43,642 | 12,551 | ||||||||||||
|
|
|
|
|
|
|
| |||||||||
Total liabilities | 44,900 | 20,249 | 43,642 | 12,551 | ||||||||||||
|
|
|
|
|
|
|
| |||||||||
Net Assets | $ | 630,473,581 | $ | 299,811,618 | $ | 622,870,442 | $ | 188,684,232 | ||||||||
|
|
|
|
|
|
|
| |||||||||
Net Assets consist of: | ||||||||||||||||
Paid in capital | $ | 651,686,608 | $ | 285,415,438 | $ | 564,691,986 | $ | 179,987,008 | ||||||||
Undistributed net investment income | 402,148 | 131,217 | 278,893 | 56,615 | ||||||||||||
Accumulated undistributed net realized gain (loss) on investments | (3,976,736 | ) | (1,450,252 | ) | (1,148,551 | ) | (737,273 | ) | ||||||||
Net unrealized appreciation (depreciation) on investments | (17,638,439 | ) | 15,715,215 | 59,048,114 | 9,377,882 | |||||||||||
|
|
|
|
|
|
|
| |||||||||
Net Assets | $ | 630,473,581 | $ | 299,811,618 | $ | 622,870,442 | $ | 188,684,232 | ||||||||
|
|
|
|
|
|
|
| |||||||||
Shares outstanding | 18,650,000 | 9,150,000 | 16,200,000 | 6,250,000 | ||||||||||||
|
|
|
|
|
|
|
| |||||||||
Net Asset Value, offering price and redemption price per share | $ | 33.81 | $ | 32.77 | $ | 38.45 | $ | 30.19 | ||||||||
|
|
|
|
|
|
|
| |||||||||
Investments at cost | $ | 647,676,359 | $ | 283,949,431 | $ | 563,695,727 | $ | 179,222,711 | ||||||||
|
|
|
|
|
|
|
| |||||||||
See accompanying notes which are an integral part of the financial statements.
| 57 | Semiannual Report |
Table of Contents
Financial Statements – continued
| Statements of Assets and Liabilities | ||||||||||||
| January 31, 2017 (Unaudited) | ||||||||||||
Fidelity MSCI Real Estate Index ETF | Fidelity MSCI Telecommunication Services Index ETF | Fidelity MSCI Utilities Index ETF | ||||||||||
Assets | ||||||||||||
Investments in securities, at value – See accompanying schedule | $ | 257,519,570 | $ | 145,015,752 | $ | 187,159,279 | ||||||
Receivable for fund shares sold | 84,232 | — | 9,379 | |||||||||
Dividends receivable | 265,676 | 754,444 | 71,338 | |||||||||
Interest receivable | 85 | 41 | 66 | |||||||||
|
|
|
|
|
| |||||||
Total assets | 257,869,563 | 145,770,237 | 187,240,062 | |||||||||
|
|
|
|
|
| |||||||
Liabilities | ||||||||||||
Payable for investments purchased | 115,535 | 809,219 | — | |||||||||
Accrued management fees | 17,463 | 10,654 | 13,501 | |||||||||
|
|
|
|
|
| |||||||
Total liabilities | 132,998 | 819,873 | 13,501 | |||||||||
|
|
|
|
|
| |||||||
Net Assets | $ | 257,736,565 | $ | 144,950,364 | $ | 187,226,561 | ||||||
|
|
|
|
|
| |||||||
Net Assets consist of: | ||||||||||||
Paid in capital | $ | 267,000,448 | $ | 126,666,737 | $ | 184,143,212 | ||||||
Undistributed net investment income | 708,160 | 1,050,787 | 97,868 | |||||||||
Accumulated undistributed net realized gain (loss) on investments | (332,390 | ) | 5,571,609 | 3,703,179 | ||||||||
Net unrealized appreciation (depreciation) on investments | (9,639,653 | ) | 11,661,231 | (717,698 | ) | |||||||
|
|
|
|
|
| |||||||
Net Assets | $ | 257,736,565 | $ | 144,950,364 | $ | 187,226,561 | ||||||
|
|
|
|
|
| |||||||
Shares outstanding | 11,000,000 | 4,500,000 | 5,850,000 | |||||||||
|
|
|
|
|
| |||||||
Net Asset Value, offering price and redemption price per share | $ | 23.43 | $ | 32.21 | $ | 32.00 | ||||||
|
|
|
|
|
| |||||||
Investments at cost | $ | 267,159,223 | $ | 133,354,521 | $ | 187,876,977 | ||||||
|
|
|
|
|
| |||||||
See accompanying notes which are an integral part of the financial statements.
| Semiannual Report | 58 |
Table of Contents
| Statements of Operations | ||||||||||||||||
| For the six months ended January 31, 2017 (Unaudited) | ||||||||||||||||
Fidelity MSCI Consumer Discretionary Index ETF | Fidelity MSCI Consumer Staples Index ETF | Fidelity MSCI Energy Index ETF | Fidelity MSCI Financials Index ETF | |||||||||||||
Investment Income | ||||||||||||||||
Dividends | $ | 2,340,697 | $ | 3,399,982 | $ | 5,584,753 | $ | 3,838,548 | ||||||||
Interest | 313 | 223 | 301 | 537 | ||||||||||||
|
|
|
|
|
|
|
| |||||||||
Total income | 2,341,010 | 3,400,205 | 5,585,054 | 3,839,085 | ||||||||||||
|
|
|
|
|
|
|
| |||||||||
Expenses | ||||||||||||||||
Management fees | 97,304 | 107,098 | 189,666 | 152,882 | ||||||||||||
Independent trustees’ compensation | 2,580 | 2,906 | 4,835 | 3,340 | ||||||||||||
|
|
|
|
|
|
|
| |||||||||
Total expenses | 99,884 | 110,004 | 194,501 | 156,222 | ||||||||||||
|
|
|
|
|
|
|
| |||||||||
Net investment income (loss) | 2,241,126 | 3,290,201 | 5,390,553 | 3,682,863 | ||||||||||||
|
|
|
|
|
|
|
| |||||||||
Realized and Unrealized Gain (Loss) | ||||||||||||||||
Net realized gain (loss) on investment securities | (1,530,877 | ) | (533,801 | ) | (10,644,413 | ) | (40,167 | ) | ||||||||
Net realized gain (loss) on In-kind redemptions | 5,811,387 | 4,787,282 | 3,561,870 | 493,146 | ||||||||||||
|
|
|
|
|
|
|
| |||||||||
Total net realized gain (loss) | 4,280,510 | 4,253,481 | (7,082,543 | ) | 452,979 | |||||||||||
|
|
|
|
|
|
|
| |||||||||
Change in net unrealized appreciation (depreciation) on investment securities | 4,223,354 | (15,787,058 | ) | 38,018,767 | 61,972,561 | |||||||||||
|
|
|
|
|
|
|
| |||||||||
Net gain (loss) | 8,503,864 | (11,533,577 | ) | 30,936,224 | 62,425,540 | |||||||||||
|
|
|
|
|
|
|
| |||||||||
Net increase (decrease) in net assets resulting from operations | $ | 10,744,990 | $ | (8,243,376 | ) | $ | 36,326,777 | $ | 66,108,403 | |||||||
|
|
|
|
|
|
|
| |||||||||
See accompanying notes which are an integral part of the financial statements.
| 59 | Semiannual Report |
Table of Contents
Financial Statements – continued
| Statements of Operations | ||||||||||||||||
| For the six months ended January 31, 2017 (Unaudited) | ||||||||||||||||
Fidelity MSCI Health Care Index ETF | Fidelity MSCI Industrials Index ETF | Fidelity MSCI Information Technology Index ETF | Fidelity MSCI Materials Index ETF | |||||||||||||
Investment Income | ||||||||||||||||
Dividends | $ | 4,580,066 | $ | 1,960,231 | $ | 3,493,398 | $ | 1,278,399 | ||||||||
Interest | 773 | 266 | 698 | 116 | ||||||||||||
|
|
|
|
|
|
|
| |||||||||
Total income | 4,580,839 | 1,960,497 | 3,494,096 | 1,278,515 | ||||||||||||
|
|
|
|
|
|
|
| |||||||||
Expenses | ||||||||||||||||
Management fees | 246,631 | 79,888 | 207,763 | 54,513 | ||||||||||||
Independent trustees’ compensation | 6,501 | 1,892 | 5,117 | 1,333 | ||||||||||||
|
|
|
|
|
|
|
| |||||||||
Total expenses | 253,132 | 81,780 | 212,880 | 55,846 | ||||||||||||
|
|
|
|
|
|
|
| |||||||||
Net investment income (loss) | 4,327,707 | 1,878,717 | 3,281,216 | 1,222,669 | ||||||||||||
|
|
|
|
|
|
|
| |||||||||
Realized and Unrealized Gain (Loss) | ||||||||||||||||
Net realized gain (loss) on investment securities | (324,592 | ) | (700,108 | ) | (234,392 | ) | (1,192,989 | ) | ||||||||
Net realized gain (loss) on In-kind redemptions | 4,642,811 | 1,379,464 | 4,313,041 | 2,664,958 | ||||||||||||
|
|
|
|
|
|
|
| |||||||||
Total net realized gain (loss) | 4,318,219 | 679,356 | 4,078,649 | 1,471,969 | ||||||||||||
|
|
|
|
|
|
|
| |||||||||
Change in net unrealized appreciation (depreciation) on investment securities | (38,953,646 | ) | 14,807,673 | 45,727,845 | 9,960,775 | |||||||||||
|
|
|
|
|
|
|
| |||||||||
Net gain (loss) | (34,635,427 | ) | 15,487,029 | 49,806,494 | 11,432,744 | |||||||||||
|
|
|
|
|
|
|
| |||||||||
Net increase (decrease) in net assets resulting from operations | $ | (30,307,720 | ) | $ | 17,365,746 | $ | 53,087,710 | $ | 12,655,413 | |||||||
|
|
|
|
|
|
|
| |||||||||
See accompanying notes which are an integral part of the financial statements.
| Semiannual Report | 60 |
Table of Contents
| Statements of Operations | ||||||||||||
| For the six months ended January 31, 2017 (Unaudited) | ||||||||||||
Fidelity MSCI Real Estate Index ETF | Fidelity MSCI Telecommunication Services Index ETF | Fidelity MSCI Utilities Index ETF | ||||||||||
Investment Income | ||||||||||||
Dividends | $ | 5,258,706 | $ | 2,242,047 | $ | 3,889,364 | ||||||
Interest | 303 | 122 | 330 | |||||||||
|
|
|
|
|
| |||||||
Total income | 5,259,009 | 2,242,169 | 3,889,694 | |||||||||
|
|
|
|
|
| |||||||
Expenses | ||||||||||||
Management fees | 90,484 | 59,420 | 89,267 | |||||||||
Independent trustees’ compensation | 2,215 | 1,611 | 2,517 | |||||||||
|
|
|
|
|
| |||||||
Total expenses | 92,699 | 61,031 | 91,784 | |||||||||
|
|
|
|
|
| |||||||
Net investment income (loss) | 5,166,310 | 2,181,138 | 3,797,910 | |||||||||
|
|
|
|
|
| |||||||
Realized and Unrealized Gain (Loss) | ||||||||||||
Net realized gain (loss) on investment securities | (2,021,881 | ) | (374,093 | ) | (266,112 | ) | ||||||
Net realized gain (loss) on In-kind redemptions | 2,524,186 | 7,519,593 | 6,391,031 | |||||||||
|
|
|
|
|
| |||||||
Total net realized gain (loss) | 502,305 | 7,145,500 | 6,124,919 | |||||||||
|
|
|
|
|
| |||||||
Change in net unrealized appreciation (depreciation) on investment securities | (22,801,724 | ) | (11,476,881 | ) | (21,509,386 | ) | ||||||
|
|
|
|
|
| |||||||
Net gain (loss) | (22,299,419 | ) | (4,331,381 | ) | (15,384,467 | ) | ||||||
|
|
|
|
|
| |||||||
Net increase (decrease) in net assets resulting from operations | $ | (17,133,109 | ) | $ | (2,150,243 | ) | $ | (11,586,557 | ) | |||
|
|
|
|
|
| |||||||
See accompanying notes which are an integral part of the financial statements.
| 61 | Semiannual Report |
Table of Contents
Financial Statements – continued
| Statements of Changes in Net Assets | ||||||||||||||||
Fidelity MSCI Consumer Discretionary Index ETF | Fidelity MSCI Consumer Staples Index ETF | |||||||||||||||
Six months ended January 31, 2017 (Unaudited) | Year ended July 31, 2016 | Six months ended January 31, 2017 (Unaudited) | Year ended July 31, 2016 | |||||||||||||
Increase (Decrease) in Net Assets | ||||||||||||||||
Operations | ||||||||||||||||
Net investment income (loss) | $ | 2,241,126 | $ | 3,672,372 | $ | 3,290,201 | $ | 6,013,205 | ||||||||
Net realized gain (loss) | 4,280,510 | 9,615,533 | 4,253,481 | 6,854,388 | ||||||||||||
Change in net unrealized appreciation (depreciation) | 4,223,354 | (22,169,428 | ) | (15,787,058 | ) | 12,152,519 | ||||||||||
|
|
|
|
|
|
|
| |||||||||
Net increase (decrease) in net assets resulting from operations | 10,744,990 | (8,881,523 | ) | (8,243,376 | ) | 25,020,112 | ||||||||||
|
|
|
|
|
|
|
| |||||||||
Distributions to shareholders from net investment income | (2,160,150 | ) | (3,868,300 | ) | (3,333,000 | ) | (5,920,950 | ) | ||||||||
|
|
|
|
|
|
|
| |||||||||
Share transactions | ||||||||||||||||
Proceeds from sales of shares | 26,096,737 | 202,257,883 | 20,866,649 | 220,278,658 | ||||||||||||
Cost of shares redeemed | (58,187,116 | ) | (226,980,453 | ) | (57,563,019 | ) | (158,470,480 | ) | ||||||||
|
|
|
|
|
|
|
| |||||||||
Net increase (decrease) in net assets resulting from share transactions | (32,090,379 | ) | (24,722,570 | ) | (36,696,370 | ) | 61,808,178 | |||||||||
|
|
|
|
|
|
|
| |||||||||
Total increase (decrease) in net assets | (23,505,539 | ) | (37,472,393 | ) | (48,272,746 | ) | 80,907,340 | |||||||||
Net Assets | ||||||||||||||||
Beginning of period | 262,321,507 | 299,793,900 | 285,503,732 | 204,596,392 | ||||||||||||
|
|
|
|
|
|
|
| |||||||||
End of period | $ | 238,815,968 | $ | 262,321,507 | $ | 237,230,986 | $ | 285,503,732 | ||||||||
|
|
|
|
|
|
|
| |||||||||
Undistributed net investment income included in net assets at end of period | $ | 111,932 | $ | 30,956 | $ | 399,793 | $ | 442,592 | ||||||||
|
|
|
|
|
|
|
| |||||||||
Other Information | ||||||||||||||||
Shares | ||||||||||||||||
Sold | 800,000 | 6,500,000 | 650,000 | 7,350,000 | ||||||||||||
Redeemed | (1,850,000 | ) | (7,650,000 | ) | (1,850,000 | ) | (5,400,000 | ) | ||||||||
|
|
|
|
|
|
|
| |||||||||
Net increase (decrease) | (1,050,000 | ) | (1,150,000 | ) | (1,200,000 | ) | 1,950,000 | |||||||||
|
|
|
|
|
|
|
| |||||||||
See accompanying notes which are an integral part of the financial statements.
| Semiannual Report | 62 |
Table of Contents
| Statements of Changes in Net Assets | ||||||||||||||||
| Fidelity MSCI Energy Index ETF | Fidelity MSCI Financials Index ETF | |||||||||||||||
Six months ended January 31, 2017 (Unaudited) | Year ended July 31, 2016 | Six months ended January 31, 2017 (Unaudited) | Year ended July 31, 2016 | |||||||||||||
Increase (Decrease) in Net Assets | ||||||||||||||||
Operations | ||||||||||||||||
Net investment income (loss) | $ | 5,390,553 | $ | 8,792,702 | $ | 3,682,863 | $ | 5,623,227 | ||||||||
Net realized gain (loss) | (7,082,543 | ) | (27,444,867 | ) | 452,979 | (5,681,305 | ) | |||||||||
Change in net unrealized appreciation (depreciation) | 38,018,767 | 29,635,964 | 61,972,561 | (18,501,301 | ) | |||||||||||
|
|
|
|
|
|
|
| |||||||||
Net increase (decrease) in net assets resulting from operations | 36,326,777 | 10,983,799 | 66,108,403 | (18,559,379 | ) | |||||||||||
|
|
|
|
|
|
|
| |||||||||
Distributions to shareholders from net investment income | (5,317,600 | ) | (8,829,100 | ) | (3,032,500 | ) | (5,983,150 | ) | ||||||||
|
|
|
|
|
|
|
| |||||||||
Share transactions | ||||||||||||||||
Proceeds from sales of shares | 74,353,625 | 180,786,099 | 372,081,530 | 121,969,148 | ||||||||||||
Cost of shares redeemed | (15,500,926 | ) | (9,300,501 | ) | (11,446,127 | ) | (203,948,262 | ) | ||||||||
|
|
|
|
|
|
|
| |||||||||
Net increase (decrease) in net assets resulting from share transactions | 58,852,699 | 171,485,598 | 360,635,403 | (81,979,114 | ) | |||||||||||
|
|
|
|
|
|
|
| |||||||||
Total increase (decrease) in net assets | 89,861,876 | 173,640,297 | 423,711,306 | (106,521,643 | ) | |||||||||||
Net Assets | ||||||||||||||||
Beginning of period | 430,039,150 | 256,398,853 | 237,489,901 | 344,011,544 | ||||||||||||
|
|
|
|
|
|
|
| |||||||||
End of period | $ | 519,901,026 | $ | 430,039,150 | $ | 661,201,207 | $ | 237,489,901 | ||||||||
|
|
|
|
|
|
|
| |||||||||
Undistributed net investment income included in net assets at end of period | $ | 244,490 | $ | 171,537 | $ | 650,363 | $ | — | ||||||||
|
|
|
|
|
|
|
| |||||||||
Other Information | ||||||||||||||||
Shares | ||||||||||||||||
Sold | 3,600,000 | 10,100,000 | 11,200,000 | 4,250,000 | ||||||||||||
Redeemed | (800,000 | ) | (500,000 | ) | (400,000 | ) | (7,500,000 | ) | ||||||||
|
|
|
|
|
|
|
| |||||||||
Net increase (decrease) | 2,800,000 | 9,600,000 | 10,800,000 | (3,250,000 | ) | |||||||||||
|
|
|
|
|
|
|
| |||||||||
See accompanying notes which are an integral part of the financial statements.
| 63 | Semiannual Report |
Table of Contents
Financial Statements – continued
| Statements of Changes in Net Assets | ||||||||||||||||
| Fidelity MSCI Health Care Index ETF | Fidelity MSCI Industrials Index ETF | |||||||||||||||
Six months ended January 31, 2017 (Unaudited) | Year ended July 31, 2016 | Six months ended January 31, 2017 (Unaudited) | Year ended July 31, 2016 | |||||||||||||
Increase (Decrease) in Net Assets | ||||||||||||||||
Operations | ||||||||||||||||
Net investment income (loss) | $ | 4,327,707 | $ | 8,578,853 | $ | 1,878,717 | $ | 2,444,926 | ||||||||
Net realized gain (loss) | 4,318,219 | 16,027,115 | 679,356 | (3,153,096 | ) | |||||||||||
Change in net unrealized appreciation (depreciation) | (38,953,646 | ) | (72,464,270 | ) | 14,807,673 | 7,067,172 | ||||||||||
|
|
|
|
|
|
|
| |||||||||
Net increase (decrease) in net assets resulting from operations | (30,307,720 | ) | (47,858,302 | ) | 17,365,746 | 6,359,002 | ||||||||||
|
|
|
|
|
|
|
| |||||||||
Distributions to shareholders from net investment income | (4,237,400 | ) | (8,760,450 | ) | (1,789,750 | ) | (2,441,900 | ) | ||||||||
|
|
|
|
|
|
|
| |||||||||
Share transactions | ||||||||||||||||
Proceeds from sales of shares | 72,759,098 | 166,181,657 | 139,732,260 | 164,215,380 | ||||||||||||
Cost of shares redeemed | (49,864,723 | ) | (268,151,563 | ) | (13,546,112 | ) | (153,116,895 | ) | ||||||||
|
|
|
|
|
|
|
| |||||||||
Net increase (decrease) in net assets resulting from share transactions | 22,894,375 | (101,969,906 | ) | 126,186,148 | 11,098,485 | |||||||||||
|
|
|
|
|
|
|
| |||||||||
Total increase (decrease) in net assets | (11,650,745 | ) | (158,588,658 | ) | 141,762,144 | 15,015,587 | ||||||||||
Net Assets | ||||||||||||||||
Beginning of period | 642,124,326 | 800,712,984 | 158,049,474 | 143,033,887 | ||||||||||||
|
|
|
|
|
|
|
| |||||||||
End of period | $ | 630,473,581 | $ | 642,124,326 | $ | 299,811,618 | $ | 158,049,474 | ||||||||
|
|
|
|
|
|
|
| |||||||||
Undistributed net investment income included in net assets at end of period | $ | 402,148 | $ | 311,841 | $ | 131,217 | $ | 42,250 | ||||||||
|
|
|
|
|
|
|
| |||||||||
Other Information | ||||||||||||||||
Shares | ||||||||||||||||
Sold | 2,150,000 | 4,850,000 | 4,350,000 | 5,900,000 | ||||||||||||
Redeemed | (1,500,000 | ) | (8,400,000 | ) | (450,000 | ) | (5,750,000 | ) | ||||||||
|
|
|
|
|
|
|
| |||||||||
Net increase (decrease) | 650,000 | (3,550,000 | ) | 3,900,000 | 150,000 | |||||||||||
|
|
|
|
|
|
|
| |||||||||
See accompanying notes which are an integral part of the financial statements.
| Semiannual Report | 64 |
Table of Contents
| Statements of Changes in Net Assets | ||||||||||||||||
| Fidelity MSCI Information Technology Index ETF | Fidelity MSCI Materials Index ETF | |||||||||||||||
Six months ended January 31, 2017 (Unaudited) | Year ended July 31, 2016 | Six months ended January 31, 2017 (Unaudited) | Year ended July 31, 2016 | |||||||||||||
Increase (Decrease) in Net Assets | ||||||||||||||||
Operations | ||||||||||||||||
Net investment income (loss) | $ | 3,281,216 | $ | 5,403,104 | $ | 1,222,669 | $ | 1,485,956 | ||||||||
Net realized gain (loss) | 4,078,649 | 16,910,614 | 1,471,969 | (15,531,042 | ) | |||||||||||
Change in net unrealized appreciation (depreciation) | 45,727,845 | (9,630,663 | ) | 9,960,775 | 12,480,147 | |||||||||||
|
|
|
|
|
|
|
| |||||||||
Net increase (decrease) in net assets resulting from operations | 53,087,710 | 12,683,055 | 12,655,413 | (1,564,939 | ) | |||||||||||
|
|
|
|
|
|
|
| |||||||||
Distributions to shareholders from net investment income | (3,125,700 | ) | (5,383,850 | ) | (1,225,950 | ) | (1,462,950 | ) | ||||||||
|
|
|
|
|
|
|
| |||||||||
Share transactions | ||||||||||||||||
Proceeds from sales of shares | 161,738,990 | 282,125,618 | 80,937,127 | 132,685,632 | ||||||||||||
Cost of shares redeemed | (20,221,926 | ) | (281,405,715 | ) | (27,007,010 | ) | (129,385,021 | ) | ||||||||
|
|
|
|
|
|
|
| |||||||||
Net increase (decrease) in net assets resulting from share transactions | 141,517,064 | 719,903 | 53,930,117 | 3,300,611 | ||||||||||||
|
|
|
|
|
|
|
| |||||||||
Total increase (decrease) in net assets | 191,479,074 | 8,019,108 | 65,359,580 | 272,722 | ||||||||||||
Net Assets | ||||||||||||||||
Beginning of period | 431,391,368 | 423,372,260 | 123,324,652 | 123,051,930 | ||||||||||||
|
|
|
|
|
|
|
| |||||||||
End of period | $ | 622,870,442 | $ | 431,391,368 | $ | 188,684,232 | $ | 123,324,652 | ||||||||
|
|
|
|
|
|
|
| |||||||||
Undistributed net investment income included in net assets at end of period | $ | 278,893 | $ | 123,377 | $ | 56,615 | $ | 59,896 | ||||||||
|
|
|
|
|
|
|
| |||||||||
Other Information | ||||||||||||||||
Shares | ||||||||||||||||
Sold | 4,400,000 | 8,600,000 | 2,800,000 | 5,250,000 | ||||||||||||
Redeemed | (550,000 | ) | (9,200,000 | ) | (1,000,000 | ) | (5,550,000 | ) | ||||||||
|
|
|
|
|
|
|
| |||||||||
Net increase (decrease) | 3,850,000 | (600,000 | ) | 1,800,000 | (300,000 | ) | ||||||||||
|
|
|
|
|
|
|
| |||||||||
See accompanying notes which are an integral part of the financial statements.
| 65 | Semiannual Report |
Table of Contents
Financial Statements – continued
| Statements of Changes in Net Assets | ||||||||||||||||
| Fidelity MSCI Real Estate Index ETF | Fidelity MSCI Telecommunication Services Index ETF | |||||||||||||||
Six months ended January 31, 2017 (Unaudited) | Year ended July 31, 2016 | Six months ended January 31, 2017 (Unaudited) | Year ended July 31, 2016 | |||||||||||||
Increase (Decrease) in Net Assets | ||||||||||||||||
Operations | ||||||||||||||||
Net investment income (loss) | $ | 5,166,310 | $ | 2,125,983 | $ | 2,181,138 | $ | 2,966,226 | ||||||||
Net realized gain (loss) | 502,305 | 884,846 | 7,145,500 | 1,476,206 | ||||||||||||
Change in net unrealized appreciation (depreciation) | (22,801,724 | ) | 14,803,602 | (11,476,881 | ) | 23,239,724 | ||||||||||
|
|
|
|
|
|
|
| |||||||||
Net increase (decrease) in net assets resulting from operations | (17,133,109 | ) | 17,814,431 | (2,150,243 | ) | 27,682,156 | ||||||||||
|
|
|
|
|
|
|
| |||||||||
Distributions to shareholders from net investment income | (4,458,150 | ) | (2,375,400 | ) | (1,834,050 | ) | (2,437,350 | ) | ||||||||
|
|
|
|
|
|
|
| |||||||||
Share transactions | ||||||||||||||||
Proceeds from sales of shares | 127,369,748 | 150,719,714 | 24,154,224 | 137,260,776 | ||||||||||||
Cost of shares redeemed | (31,436,166 | ) | (8,700,743 | ) | (50,159,106 | ) | (69,473,964 | ) | ||||||||
|
|
|
|
|
|
|
| |||||||||
Net increase (decrease) in net assets resulting from share transactions | 95,933,582 | 142,018,971 | (26,004,882 | ) | 67,786,812 | |||||||||||
|
|
|
|
|
|
|
| |||||||||
Total increase (decrease) in net assets | 74,342,323 | 157,458,002 | (29,989,175 | ) | 93,031,618 | |||||||||||
Net Assets | ||||||||||||||||
Beginning of period | 183,394,242 | 25,936,240 | 174,939,539 | 81,907,921 | ||||||||||||
|
|
|
|
|
|
|
| |||||||||
End of period | $ | 257,736,565 | $ | 183,394,242 | $ | 144,950,364 | $ | 174,939,539 | ||||||||
|
|
|
|
|
|
|
| |||||||||
Undistributed net investment income included in net assets at end of period | $ | 708,160 | $ | — | $ | 1,050,787 | $ | 703,699 | ||||||||
|
|
|
|
|
|
|
| |||||||||
Other Information | ||||||||||||||||
Shares | ||||||||||||||||
Sold | 5,250,000 | 6,300,000 | 750,000 | 5,050,000 | ||||||||||||
Redeemed | (1,350,000 | ) | (350,000 | ) | (1,700,000 | ) | (2,650,000 | ) | ||||||||
|
|
|
|
|
|
|
| |||||||||
Net increase (decrease) | 3,900,000 | 5,950,000 | (950,000 | ) | 2,400,000 | |||||||||||
|
|
|
|
|
|
|
| |||||||||
See accompanying notes which are an integral part of the financial statements.
| Semiannual Report | 66 |
Table of Contents
| Statements of Changes in Net Assets | ||||||||
| Fidelity MSCI Utilities Index ETF | ||||||||
Six months ended January 31, 2017 | Year ended July 31, 2016 | |||||||
Increase (Decrease) in Net Assets | ||||||||
Operations | ||||||||
Net investment income (loss) | $ | 3,797,910 | $ | 6,094,952 | ||||
Net realized gain (loss) | 6,124,919 | 2,515,706 | ||||||
Change in net unrealized appreciation (depreciation) | (21,509,386 | ) | 33,486,490 | |||||
|
|
|
| |||||
Net increase (decrease) in net assets resulting from operations | (11,586,557 | ) | 42,097,148 | |||||
|
|
|
| |||||
Distributions to shareholders from net investment income | (3,734,100 | ) | (6,073,050 | ) | ||||
|
|
|
| |||||
Share transactions | ||||||||
Proceeds from sales of shares | 6,288,966 | 257,957,666 | ||||||
Cost of shares redeemed | (87,411,093 | ) | (118,488,399 | ) | ||||
|
|
|
| |||||
Net increase (decrease) in net assets resulting from share transactions | (81,122,127 | ) | 139,469,267 | |||||
|
|
|
| |||||
Total increase (decrease) in net assets | (96,442,784 | ) | 175,493,365 | |||||
Net Assets | ||||||||
Beginning of period | 283,669,345 | 108,175,980 | ||||||
|
|
|
| |||||
End of period | $ | 187,226,561 | $ | 283,669,345 | ||||
|
|
|
| |||||
Undistributed (distributions in excess of) net investment income included in net assets at end of period | $ | 97,868 | $ | 34,058 | ||||
|
|
|
| |||||
Other Information | ||||||||
Shares | ||||||||
Sold | 200,000 | 8,750,000 | ||||||
Redeemed | (2,800,000 | ) | (4,150,000 | ) | ||||
|
|
|
| |||||
Net increase (decrease) | (2,600,000 | ) | 4,600,000 | |||||
|
|
|
| |||||
See accompanying notes which are an integral part of the financial statements.
| 67 | Semiannual Report |
Table of Contents
Financial Statements – continued
| Financial Highlights | ||||||||||||||||
| Fidelity MSCI Consumer Discretionary Index ETF | ||||||||||||||||
| Six months ended January 31, 2017 (Unaudited) | Year ended July 31, 2016 | Year ended July 31, 2015 | Year ended July 31, 2014A | |||||||||||||
Selected Per-Share Data | ||||||||||||||||
Net asset value, beginning of period | $ | 31.99 | $ | 32.06 | $ | 26.58 | $ | 25.17 | ||||||||
|
|
|
|
|
|
|
| |||||||||
Income from Investment Operations | ||||||||||||||||
Net investment income (loss)B | 0.30 | 0.43 | 0.37 | 0.25 | ||||||||||||
Net realized and unrealized gain (loss) | 1.40 | (0.06 | ) | 5.43 | 1.38 | |||||||||||
|
|
|
|
|
|
|
| |||||||||
Total from investment operations | 1.70 | 0.37 | 5.80 | 1.63 | ||||||||||||
|
|
|
|
|
|
|
| |||||||||
Distributions from net investment income | (0.29 | ) | (0.44 | ) | (0.32 | ) | (0.22 | ) | ||||||||
|
|
|
|
|
|
|
| |||||||||
Total distributions | (0.29 | ) | (0.44 | ) | (0.32 | ) | (0.22 | ) | ||||||||
|
|
|
|
|
|
|
| |||||||||
Net asset value, end of period | $ | 33.40 | $ | 31.99 | $ | 32.06 | $ | 26.58 | ||||||||
|
|
|
|
|
|
|
| |||||||||
Total ReturnC | 5.35 | % | 1.25 | % | 21.93 | % | 6.47 | % | ||||||||
Ratios to Average Net AssetsD | ||||||||||||||||
Expenses before reductions | .08 | %E | .12 | % | .12 | % | .12 | %E | ||||||||
Expenses net of fee waivers, if any | .08 | %E | .12 | % | .12 | % | .12 | %E | ||||||||
Expenses net of all reductions | .08 | %E | .12 | % | .12 | % | .12 | %E | ||||||||
Net investment income (loss) | 1.88 | %E | 1.41 | % | 1.25 | % | 1.20 | %E | ||||||||
Supplemental Data | ||||||||||||||||
Net assets, end of period (000 omitted) | $ | 238,816 | $ | 262,322 | $ | 299,794 | $ | 75,741 | ||||||||
Portfolio turnover rateF,G | 4 | %H | 5 | % | 8 | % | 5 | %H | ||||||||
| A | For the period October 21, 2013 (commencement of operations) to July 31, 2014. |
| B | Calculated based on average shares outstanding during the period. |
| C | Total returns for periods of less than one year are not annualized. |
| D | Expense ratios reflect operating expenses of the Fund. Expenses before reductions do not reflect amounts reimbursed by the investment adviser or reductions from brokerage service arrangements or reductions from other expense offset arrangements and do not represent the amount paid by the Fund during periods when reimbursements or reductions occur. Expenses net of fee waivers reflect expenses after reimbursement by the investment adviser but prior to reductions from brokerage service arrangements or other expense offset arrangements. Expenses net of all reductions represent the net expenses paid by the Fund but do not include expenses of the investment companies in which the fund invests. |
| E | Annualized. |
| F | Amount does not include the portfolio activity of any underlying funds. |
| G | Portfolio turnover rate excludes securities received or delivered in-kind. |
| H | Amount not annualized. |
See accompanying notes which are an integral part of the financial statements.
| Semiannual Report | 68 |
Table of Contents
| Financial Highlights | ||||||||||||||||
| Fidelity MSCI Consumer Staples Index ETF | ||||||||||||||||
| Six months ended January 31, 2017 (Unaudited) | Year ended July 31, 2016 | Year ended July 31, 2015 | Year ended July 31, 2014A | |||||||||||||
Selected Per-Share Data | ||||||||||||||||
Net asset value, beginning of period | $ | 32.82 | $ | 30.31 | $ | 26.16 | $ | 25.00 | ||||||||
|
|
|
|
|
|
|
| |||||||||
Income from Investment Operations | ||||||||||||||||
Net investment income (loss)B | 0.40 | 0.75 | 0.77 | 0.52 | ||||||||||||
Net realized and unrealized gain (loss) | (1.18 | ) | 2.56 | 4.16 | 1.09 | |||||||||||
|
|
|
|
|
|
|
| |||||||||
Total from investment operations | (0.78 | ) | 3.31 | 4.93 | 1.61 | |||||||||||
|
|
|
|
|
|
|
| |||||||||
Distributions from net investment income | (0.41 | ) | (0.80 | ) | (0.78 | ) | (0.45 | ) | ||||||||
|
|
|
|
|
|
|
| |||||||||
Total distributions | (0.41 | ) | (0.80 | ) | (0.78 | ) | (0.45 | ) | ||||||||
|
|
|
|
|
|
|
| |||||||||
Net asset value, end of period | $ | 31.63 | $ | 32.82 | $ | 30.31 | $ | 26.16 | ||||||||
|
|
|
|
|
|
|
| |||||||||
Total ReturnC | (2.38 | )% | 11.18 | % | 19.00 | % | 6.42 | % | ||||||||
Ratios to Average Net AssetsD | ||||||||||||||||
Expenses before reductions | .08 | %E | .12 | % | .12 | % | .12 | %E | ||||||||
Expenses net of fee waivers, if any | .08 | %E | .12 | % | .12 | % | .12 | %E | ||||||||
Expenses net of all reductions | .08 | %E | .12 | % | .12 | % | .12 | %E | ||||||||
Net investment income (loss) | 2.51 | %E | 2.45 | % | 2.63 | % | 2.51 | %E | ||||||||
Supplemental Data | ||||||||||||||||
Net assets, end of period (000 omitted) | $ | 237,231 | $ | 285,504 | $ | 204,596 | $ | 73,244 | ||||||||
Portfolio turnover rateF,G | 3 | %H | 10 | % | 10 | % | 3 | %H | ||||||||
| A | For the period October 21, 2013 (commencement of operations) to July 31, 2014. |
| B | Calculated based on average shares outstanding during the period. |
| C | Total returns for periods of less than one year are not annualized. |
| D | Expense ratios reflect operating expenses of the Fund. Expenses before reductions do not reflect amounts reimbursed by the investment adviser or reductions from brokerage service arrangements or reductions from other expense offset arrangements and do not represent the amount paid by the Fund during periods when reimbursements or reductions occur. Expenses net of fee waivers reflect expenses after reimbursement by the investment adviser but prior to reductions from brokerage service arrangements or other expense offset arrangements. Expenses net of all reductions represent the net expenses paid by the Fund but do not include expenses of the investment companies in which the fund invests. |
| E | Annualized. |
| F | Amount does not include the portfolio activity of any underlying funds. |
| G | Portfolio turnover rate excludes securities received or delivered in-kind. |
| H | Amount not annualized. |
See accompanying notes which are an integral part of the financial statements.
| 69 | Semiannual Report |
Table of Contents
Financial Statements – continued
| Financial Highlights | ||||||||||||||||
| Fidelity MSCI Energy Index ETF | ||||||||||||||||
| Six months ended January 31, 2017 (Unaudited) | Year ended July 31, 2016 | Year ended July 31, 2015 | Year ended July 31, 2014A | |||||||||||||
Selected Per-Share Data | ||||||||||||||||
Net asset value, beginning of period | $ | 19.03 | $ | 19.72 | $ | 27.97 | $ | 24.98 | ||||||||
|
|
|
|
|
|
|
| |||||||||
Income from Investment Operations | ||||||||||||||||
Net investment income (loss)B | 0.23 | 0.50 | 0.57 | 0.38 | ||||||||||||
Net realized and unrealized gain (loss) | 1.44 | (0.69 | )C | (8.31 | ) | 2.89 | ||||||||||
|
|
|
|
|
|
|
| |||||||||
Total from investment operations | 1.67 | (0.19 | ) | (7.74 | ) | 3.27 | ||||||||||
|
|
|
|
|
|
|
| |||||||||
Distributions from net investment income | (0.23 | ) | (0.50 | ) | (0.51 | ) | (0.28 | ) | ||||||||
|
|
|
|
|
|
|
| |||||||||
Total distributions | (0.23 | ) | (0.50 | ) | (0.51 | ) | (0.28 | ) | ||||||||
|
|
|
|
|
|
|
| |||||||||
Net asset value, end of period | $ | 20.47 | $ | 19.03 | $ | 19.72 | $ | 27.97 | ||||||||
|
|
|
|
|
|
|
| |||||||||
Total ReturnD | 8.82 | % | (0.75 | )% | (27.95 | )% | 13.16 | % | ||||||||
Ratios to Average Net AssetsE | ||||||||||||||||
Expenses before reductions | .08 | %F | .12 | % | .12 | % | .12 | %F | ||||||||
Expenses net of fee waivers, if any | .08 | %F | .12 | % | .12 | % | .12 | %F | ||||||||
Expenses net of all reductions | .08 | %F | .12 | % | .12 | % | .12 | %F | ||||||||
Net investment income (loss) | 2.33 | %F | 2.74 | % | 2.47 | % | 1.76 | %F | ||||||||
Supplemental Data | ||||||||||||||||
Net assets, end of period (000 omitted) | $ | 519,901 | $ | 430,039 | $ | 256,399 | $ | 145,425 | ||||||||
Portfolio turnover rateG,H | 5 | %I | 19 | % | 8 | % | 4 | %I | ||||||||
| A | For the period October 21, 2013 (commencement of operations) to July 31, 2014. |
| B | Calculated based on average shares outstanding during the period. |
| C | The amount shown for a share outstanding does not correspond with the aggregate net gain (loss) on investments for the period due to the timing of share transactions in relation to fluctuating market values of the investments of a Fund. |
| D | Total returns for periods of less than one year are not annualized. |
| E | Expense ratios reflect operating expenses of the Fund. Expenses before reductions do not reflect amounts reimbursed by the investment adviser or reductions from brokerage service arrangements or reductions from other expense offset arrangements and do not represent the amount paid by the Fund during periods when reimbursements or reductions occur. Expenses net of fee waivers reflect expenses after reimbursement by the investment adviser but prior to reductions from brokerage service arrangements or other expense offset arrangements. Expenses net of all reductions represent the net expenses paid by the Fund but do not include expenses of the investment companies in which the fund invests. |
| F | Annualized. |
| G | Amount does not include the portfolio activity of any underlying funds. |
| H | Portfolio turnover rate excludes securities received or delivered in-kind. |
| I | Amount not annualized. |
See accompanying notes which are an integral part of the financial statements.
| Semiannual Report | 70 |
Table of Contents
| Financial Highlights | ||||||||||||||||
| Fidelity MSCI Financials Index ETF | ||||||||||||||||
| Six months ended January 31, 2017 (Unaudited) | Year ended July 31, 2016 | Year ended July 31, 2015 | Year ended July 31, 2014A | |||||||||||||
Selected Per-Share Data | ||||||||||||||||
Net asset value, beginning of period | $ | 28.61 | $ | 29.78 | $ | 26.61 | $ | 25.00 | ||||||||
|
|
|
|
|
|
|
| |||||||||
Income from Investment Operations | ||||||||||||||||
Net investment income (loss)B | 0.32 | 0.63 | 0.58 | 0.41 | ||||||||||||
Net realized and unrealized gain (loss) | 5.96 | (1.11 | ) | 3.15 | 1.56 | |||||||||||
|
|
|
|
|
|
|
| |||||||||
Total from investment operations | 6.28 | (0.48 | ) | 3.73 | 1.97 | |||||||||||
|
|
|
|
|
|
|
| |||||||||
Distributions from net investment income | (0.27 | ) | (0.69 | ) | (0.56 | ) | (0.36 | ) | ||||||||
|
|
|
|
|
|
|
| |||||||||
Total distributions | (0.27 | ) | (0.69 | ) | (0.56 | ) | (0.36 | ) | ||||||||
|
|
|
|
|
|
|
| |||||||||
Net asset value, end of period | $ | 34.62 | $ | 28.61 | $ | 29.78 | $ | 26.61 | ||||||||
|
|
|
|
|
|
|
| |||||||||
Total ReturnC | 22.05 | % | (1.49 | )% | 14.08 | % | 7.89 | % | ||||||||
Ratios to Average Net AssetsD | ||||||||||||||||
Expenses before reductions | .08 | %E | .12 | % | .12 | % | .12 | %E | ||||||||
Expenses net of fee waivers, if any | .08 | %E | .12 | % | .12 | % | .12 | %E | ||||||||
Expenses net of all reductions | .08 | %E | .12 | % | .12 | % | .12 | %E | ||||||||
Net investment income (loss) | 2.00 | %E | 2.29 | % | 2.01 | % | 1.97 | %E | ||||||||
Supplemental Data | ||||||||||||||||
Net assets, end of period (000 omitted) | $ | 661,201 | $ | 237,490 | $ | 344,012 | $ | 126,397 | ||||||||
Portfolio turnover rateF,G | 21 | %H | 8 | % | 7 | % | 6 | %H | ||||||||
| A | For the period October 21, 2013 (commencement of operations) to July 31, 2014. |
| B | Calculated based on average shares outstanding during the period. |
| C | Total returns for periods of less than one year are not annualized. |
| D | Expense ratios reflect operating expenses of the Fund. Expenses before reductions do not reflect amounts reimbursed by the investment adviser or reductions from brokerage service arrangements or reductions from other expense offset arrangements and do not represent the amount paid by the Fund during periods when reimbursements or reductions occur. Expenses net of fee waivers reflect expenses after reimbursement by the investment adviser but prior to reductions from brokerage service arrangements or other expense offset arrangements. Expenses net of all reductions represent the net expenses paid by the Fund but do not include expenses of the investment companies in which the fund invests. |
| E | Annualized. |
| F | Amount does not include the portfolio activity of any underlying funds. |
| G | Portfolio turnover rate excludes securities received or delivered in-kind. |
| H | Amount not annualized. |
See accompanying notes which are an integral part of the financial statements.
| 71 | Semiannual Report |
Table of Contents
Financial Statements – continued
| Financial Highlights | ||||||||||||||||
| Fidelity MSCI Health Care Index ETF | ||||||||||||||||
| Six months ended January 31, 2017 (Unaudited) | Year ended July 31, 2016 | Year ended July 31, 2015 | Year ended July 31, 2014A | |||||||||||||
Selected Per-Share Data | ||||||||||||||||
Net asset value, beginning of period | $ | 35.67 | $ | 37.16 | $ | 29.05 | $ | 24.97 | ||||||||
|
|
|
|
|
|
|
| |||||||||
Income from Investment Operations | ||||||||||||||||
Net investment income (loss)B | 0.24 | 0.44 | 0.80 | C | 0.30 | |||||||||||
Net realized and unrealized gain (loss) | (1.86 | ) | (1.49 | ) | 7.99 | 3.99 | ||||||||||
|
|
|
|
|
|
|
| |||||||||
Total from investment operations | (1.62 | ) | (1.05 | ) | 8.79 | 4.29 | ||||||||||
|
|
|
|
|
|
|
| |||||||||
Distributions from net investment income | (0.24 | ) | (0.44 | ) | (0.68 | ) | (0.21 | ) | ||||||||
|
|
|
|
|
|
|
| |||||||||
Total distributions | (0.24 | ) | (0.44 | ) | (0.68 | ) | (0.21 | ) | ||||||||
|
|
|
|
|
|
|
| |||||||||
Net asset value, end of period | $ | 33.81 | $ | 35.67 | $ | 37.16 | $ | 29.05 | ||||||||
|
|
|
|
|
|
|
| |||||||||
Total ReturnD | (4.55 | )% | (2.73 | )% | 30.40 | % | 17.23 | % | ||||||||
Ratios to Average Net AssetsE | ||||||||||||||||
Expenses before reductions | .08 | %F | .12 | % | .12 | % | .12 | %F | ||||||||
Expenses net of fee waivers, if any | .08 | %F | .12 | % | .12 | % | .12 | %F | ||||||||
Expenses net of all reductions | .08 | %F | .12 | % | .12 | % | .12 | %F | ||||||||
Net investment income (loss) | 1.44 | %F | 1.30 | % | 2.31 | %C | 1.36 | %F | ||||||||
Supplemental Data | ||||||||||||||||
Net assets, end of period (000 omitted) | $ | 630,474 | $ | 642,124 | $ | 800,713 | $ | 187,382 | ||||||||
Portfolio turnover rateG,H | 2 | %I | 9 | % | 10 | % | 4 | %I | ||||||||
| A | For the period October 21, 2013 (commencement of operations) to July 31, 2014. |
| B | Calculated based on average shares outstanding during the period. |
| C | Investment income per share reflects a large, non-recurring dividend which amounted to $.17 per share. Excluding this non-recurring dividend, the ratio of net investment income (loss) to average net assets would have been 1.83%. |
| D | Total returns for periods of less than one year are not annualized. |
| E | Expense ratios reflect operating expenses of the Fund. Expenses before reductions do not reflect amounts reimbursed by the investment adviser or reductions from brokerage service arrangements or reductions from other expense offset arrangements and do not represent the amount paid by the Fund during periods when reimbursements or reductions occur. Expenses net of fee waivers reflect expenses after reimbursement by the investment adviser but prior to reductions from brokerage service arrangements or other expense offset arrangements. Expenses net of all reductions represent the net expenses paid by the Fund but do not include expenses of the investment companies in which the fund invests. |
| F | Annualized. |
| G | Amount does not include the portfolio activity of any underlying funds. |
| H | Portfolio turnover rate excludes securities received or delivered in-kind. |
| I | Amount not annualized. |
See accompanying notes which are an integral part of the financial statements.
| Semiannual Report | 72 |
Table of Contents
| Financial Highlights | ||||||||||||||||
| Fidelity MSCI Industrials Index ETF | ||||||||||||||||
| Six months ended January 31, 2017 (Unaudited) | Year ended July 31, 2016 | Year ended July 31, 2015 | Year ended July 31, 2014A | |||||||||||||
Selected Per-Share Data | ||||||||||||||||
Net asset value, beginning of period | $ | 30.10 | $ | 28.05 | $ | 26.85 | $ | 25.20 | ||||||||
|
|
|
|
|
|
|
| |||||||||
Income from Investment Operations | ||||||||||||||||
Net investment income (loss)B | 0.30 | 0.54 | 0.48 | 0.35 | ||||||||||||
Net realized and unrealized gain (loss) | 2.65 | 2.04 | 1.19 | 1.61 | ||||||||||||
|
|
|
|
|
|
|
| |||||||||
Total from investment operations | 2.95 | 2.58 | 1.67 | 1.96 | ||||||||||||
|
|
|
|
|
|
|
| |||||||||
Distributions from net investment income | (0.28 | ) | (0.53 | ) | (0.47 | ) | (0.31 | ) | ||||||||
|
|
|
|
|
|
|
| |||||||||
Total distributions | (0.28 | ) | (0.53 | ) | (0.47 | ) | (0.31 | ) | ||||||||
|
|
|
|
|
|
|
| |||||||||
Net asset value, end of period | $ | 32.77 | $ | 30.10 | $ | 28.05 | $ | 26.85 | ||||||||
|
|
|
|
|
|
|
| |||||||||
Total ReturnC | 9.87 | % | 9.41 | % | 6.18 | % | 7.75 | % | ||||||||
Ratios to Average Net AssetsD | ||||||||||||||||
Expenses before reductions | .08 | %E | .12 | % | .12 | % | .12 | %E | ||||||||
Expenses net of fee waivers, if any | .08 | %E | .12 | % | .12 | % | .12 | %E | ||||||||
Expenses net of all reductions | .08 | %E | .12 | % | .12 | % | .12 | %E | ||||||||
Net investment income (loss) | 1.94 | %E | 1.94 | % | 1.69 | % | 1.65 | %E | ||||||||
Supplemental Data | ||||||||||||||||
Net assets, end of period (000 omitted) | $ | 299,812 | $ | 158,049 | $ | 143,034 | $ | 100,706 | ||||||||
Portfolio turnover rateF,G | 4 | %H | 11 | % | 6 | % | 4 | %H | ||||||||
| A | For the period October 21, 2013 (commencement of operations) to July 31, 2014. |
| B | Calculated based on average shares outstanding during the period. |
| C | Total returns for periods of less than one year are not annualized. |
| D | Expense ratios reflect operating expenses of the Fund. Expenses before reductions do not reflect amounts reimbursed by the investment adviser or reductions from brokerage service arrangements or reductions from other expense offset arrangements and do not represent the amount paid by the Fund during periods when reimbursements or reductions occur. Expenses net of fee waivers reflect expenses after reimbursement by the investment adviser but prior to reductions from brokerage service arrangements or other expense offset arrangements. Expenses net of all reductions represent the net expenses paid by the Fund but do not include expenses of the investment companies in which the fund invests. |
| E | Annualized. |
| F | Amount does not include the portfolio activity of any underlying funds. |
| G | Portfolio turnover rate excludes securities received or delivered in-kind. |
| H | Amount not annualized. |
See accompanying notes which are an integral part of the financial statements.
| 73 | Semiannual Report |
Table of Contents
Financial Statements – continued
| Financial Highlights | ||||||||||||||||
| Fidelity MSCI Information Technology Index ETF | ||||||||||||||||
| Six months ended January 31, 2017 (Unaudited) | Year ended July 31, 2016 | Year ended July 31, 2015 | Year ended July 31, 2014A | |||||||||||||
Selected Per-Share Data | ||||||||||||||||
Net asset value, beginning of period | $ | 34.93 | $ | 32.69 | $ | 29.29 | $ | 25.18 | ||||||||
|
|
|
|
|
|
|
| |||||||||
Income from Investment Operations | ||||||||||||||||
Net investment income (loss)B | 0.24 | 0.46 | 0.39 | 0.25 | ||||||||||||
Net realized and unrealized gain (loss) | 3.50 | 2.24 | C | 3.40 | 4.06 | |||||||||||
|
|
|
|
|
|
|
| |||||||||
Total from investment operations | 3.74 | 2.70 | 3.79 | 4.31 | ||||||||||||
|
|
|
|
|
|
|
| |||||||||
Distributions from net investment income | (0.22 | ) | (0.46 | ) | (0.39 | ) | (0.20 | ) | ||||||||
|
|
|
|
|
|
|
| |||||||||
Total distributions | (0.22 | ) | (0.46 | ) | (0.39 | ) | (0.20 | ) | ||||||||
|
|
|
|
|
|
|
| |||||||||
Net asset value, end of period | $ | 38.45 | $ | 34.93 | $ | 32.69 | $ | 29.29 | ||||||||
|
|
|
|
|
|
|
| |||||||||
Total ReturnD | 10.75 | % | 8.41 | %C | 12.98 | % | 17.14 | % | ||||||||
Ratios to Average Net AssetsE | ||||||||||||||||
Expenses before reductions | .08 | %F | .12 | % | .12 | % | .12 | %F | ||||||||
Expenses net of fee waivers, if any | .08 | %F | .12 | % | .12 | % | .12 | %F | ||||||||
Expenses net of all reductions | .08 | %F | .12 | % | .12 | % | .12 | %F | ||||||||
Net investment income (loss) | 1.30 | %F | 1.42 | % | 1.23 | % | 1.14 | %F | ||||||||
Supplemental Data | ||||||||||||||||
Net assets, end of period (000 omitted) | $ | 622,870 | $ | 431,391 | $ | 423,372 | $ | 181,611 | ||||||||
Portfolio turnover rateG,H | 3 | %I | 5 | % | 6 | % | 4 | %I | ||||||||
| A | For the period October 21, 2013 (commencement of operations) to July 31, 2014. |
| B | Calculated based on average shares outstanding during the period. |
| C | Amount includes a reimbursement from the investment adviser for an operational error which amounted to $.01 per share. Excluding this reimbursement, the total return would have been 8.38%. |
| D | Total returns for periods of less than one year are not annualized. |
| E | Expense ratios reflect operating expenses of the Fund. Expenses before reductions do not reflect amounts reimbursed by the investment adviser or reductions from brokerage service arrangements or reductions from other expense offset arrangements and do not represent the amount paid by the Fund during periods when reimbursements or reductions occur. Expenses net of fee waivers reflect expenses after reimbursement by the investment adviser but prior to reductions from brokerage service arrangements or other expense offset arrangements. Expenses net of all reductions represent the net expenses paid by the Fund but do not include expenses of the investment companies in which the fund invests. |
| F | Annualized. |
| G | Amount does not include the portfolio activity of any underlying funds. |
| H | Portfolio turnover rate excludes securities received or delivered in-kind. |
| I | Amount not annualized. |
See accompanying notes which are an integral part of the financial statements.
| Semiannual Report | 74 |
Table of Contents
| Financial Highlights | ||||||||||||||||
| Fidelity MSCI Materials Index ETF | ||||||||||||||||
| Six months ended January 31, 2017 (Unaudited) | Year ended July 31, 2016 | Year ended July 31, 2015 | Year ended July 31, 2014A | |||||||||||||
Selected Per-Share Data | ||||||||||||||||
Net asset value, beginning of period | $ | 27.71 | $ | 25.91 | $ | 27.66 | $ | 24.95 | ||||||||
|
|
|
|
|
|
|
| |||||||||
Income from Investment Operations | ||||||||||||||||
Net investment income (loss)B | 0.26 | 0.50 | 0.50 | 0.35 | ||||||||||||
Net realized and unrealized gain (loss) | 2.47 | 1.83 | C | (1.75 | ) | 2.67 | ||||||||||
|
|
|
|
|
|
|
| |||||||||
Total from investment operations | 2.73 | 2.33 | (1.25 | ) | 3.02 | |||||||||||
|
|
|
|
|
|
|
| |||||||||
Distributions from net investment income | (0.25 | ) | (0.53 | ) | (0.50 | ) | (0.31 | ) | ||||||||
|
|
|
|
|
|
|
| |||||||||
Total distributions | (0.25 | ) | (0.53 | ) | (0.50 | ) | (0.31 | ) | ||||||||
|
|
|
|
|
|
|
| |||||||||
Net asset value, end of period | $ | 30.19 | $ | 27.71 | $ | 25.91 | $ | 27.66 | ||||||||
|
|
|
|
|
|
|
| |||||||||
Total ReturnD | 9.92 | % | 9.28 | % | (4.65 | )% | 12.15 | % | ||||||||
Ratios to Average Net AssetsE | ||||||||||||||||
Expenses before reductions | .08 | %F | .11 | % | .12 | % | .12 | %F | ||||||||
Expenses net of fee waivers, if any | .08 | %F | .11 | % | .12 | % | .12 | %F | ||||||||
Expenses net of all reductions | .08 | %F | .11 | % | .12 | % | .12 | %F | ||||||||
Net investment income (loss) | 1.85 | %F | 2.00 | % | 1.81 | % | 1.64 | %F | ||||||||
Supplemental Data | ||||||||||||||||
Net assets, end of period (000 omitted) | $ | 188,684 | $ | 123,325 | $ | 123,052 | $ | 94,042 | ||||||||
Portfolio turnover rateG,H | 3 | %I | 9 | % | 7 | % | 5 | %I | ||||||||
| A | For the period October 21, 2013 (commencement of operations) to July 31, 2014. |
| B | Calculated based on average shares outstanding during the period. |
| C | The amount shown for a share outstanding does not correspond with the aggregate net gain (loss) on investments for the period due to the timing of share transactions in relation to fluctuating market values of the investments of a Fund. |
| D | Total returns for periods of less than one year are not annualized. |
| E | Expense ratios reflect operating expenses of the Fund. Expenses before reductions do not reflect amounts reimbursed by the investment adviser or reductions from brokerage service arrangements or reductions from other expense offset arrangements and do not represent the amount paid by the Fund during periods when reimbursements or reductions occur. Expenses net of fee waivers reflect expenses after reimbursement by the investment adviser but prior to reductions from brokerage service arrangements or other expense offset arrangements. Expenses net of all reductions represent the net expenses paid by the Fund but do not include expenses of the investment companies in which the fund invests. |
| F | Annualized. |
| G | Amount does not include the portfolio activity of any underlying funds. |
| H | Portfolio turnover rate excludes securities received or delivered in-kind. |
| I | Amount not annualized. |
See accompanying notes which are an integral part of the financial statements.
| 75 | Semiannual Report |
Table of Contents
Financial Statements – continued
| Financial Highlights | ||||||||||||
| Fidelity MSCI Real Estate Index ETF | ||||||||||||
| Six months ended January 31, 2017 (Unaudited) | Year ended July 31, 2016 | Year ended July 31, 2015A | ||||||||||
Selected Per-Share Data | ||||||||||||
Net asset value, beginning of period | $ | 25.83 | $ | 22.55 | $ | 24.28 | ||||||
|
|
|
|
|
| |||||||
Income from Investment Operations | ||||||||||||
Net investment income (loss)B | 0.56 | 0.83 | 0.38 | |||||||||
Net realized and unrealized gain (loss) | (2.49 | ) | 3.37 | (1.70 | ) | |||||||
|
|
|
|
|
| |||||||
Total from investment operations | (1.93 | ) | 4.20 | (1.32 | ) | |||||||
|
|
|
|
|
| |||||||
Distributions from net investment income | (0.47 | ) | (0.92 | ) | (0.38 | ) | ||||||
Return of capital | – | – | (0.03 | ) | ||||||||
|
|
|
|
|
| |||||||
Total distributions | (0.47 | ) | (0.92 | ) | (0.41 | ) | ||||||
|
|
|
|
|
| |||||||
Net asset value, end of period | $ | 23.43 | $ | 25.83 | $ | 22.55 | ||||||
|
|
|
|
|
| |||||||
Total ReturnC | (7.45 | )% | 19.29 | % | (5.50 | )% | ||||||
Ratios to Average Net AssetsD | ||||||||||||
Expenses before reductions | .08 | %E | .11 | % | .12 | %E | ||||||
Expenses net of fee waivers, if any | .08 | %E | .11 | % | .12 | %E | ||||||
Expenses net of all reductions | .08 | %E | .11 | % | .12 | %E | ||||||
Net investment income (loss) | 4.69 | %E | 3.55 | % | 3.33 | %E | ||||||
Supplemental Data | ||||||||||||
Net assets, end of period (000 omitted) | $ | 257,737 | $ | 183,394 | $ | 25,936 | ||||||
Portfolio turnover rateF,G | 11 | %H | 10 | % | 10 | %H | ||||||
| A | For the period February 2, 2015 (commencement of operations) to July 31, 2015. |
| B | Calculated based on average shares outstanding during the period. |
| C | Total returns for periods of less than one year are not annualized. |
| D | Expense ratios reflect operating expenses of the Fund. Expenses before reductions do not reflect amounts reimbursed by the investment adviser or reductions from brokerage service arrangements or reductions from other expense offset arrangements and do not represent the amount paid by the Fund during periods when reimbursements or reductions occur. Expenses net of fee waivers reflect expenses after reimbursement by the investment adviser but prior to reductions from brokerage service arrangements or other expense offset arrangements. Expenses net of all reductions represent the net expenses paid by the Fund but do not include expenses of the investment companies in which the fund invests. |
| E | Annualized. |
| F | Amount does not include the portfolio activity of any underlying funds. |
| G | Portfolio turnover rate excludes securities received or delivered in-kind. |
| H | Amount not annualized. |
See accompanying notes which are an integral part of the financial statements.
| Semiannual Report | 76 |
Table of Contents
| Financial Highlights | ||||||||||||||||
| Fidelity MSCI Telecommunication Services Index ETF | ||||||||||||||||
| Six months ended January 31, 2017 (Unaudited) | Year ended July 31, 2016 | Year ended July 31, 2015 | Year ended July 31, 2014A | |||||||||||||
Selected Per-Share Data | ||||||||||||||||
Net asset value, beginning of period | $ | 32.10 | $ | 26.86 | $ | 26.98 | $ | 25.26 | ||||||||
|
|
|
|
|
|
|
| |||||||||
Income from Investment Operations | ||||||||||||||||
Net investment income (loss)B | 0.46 | 0.78 | 0.78 | 0.72 | ||||||||||||
Net realized and unrealized gain (loss) | 0.05 | C | 5.11 | (0.09 | ) | 1.42 | ||||||||||
|
|
|
|
|
|
|
| |||||||||
Total from investment operations | 0.51 | 5.89 | 0.69 | 2.14 | ||||||||||||
|
|
|
|
|
|
|
| |||||||||
Distributions from net investment income | (0.40 | ) | (0.65 | ) | (0.81 | ) | (0.42 | ) | ||||||||
|
|
|
|
|
|
|
| |||||||||
Total distributions | (0.40 | ) | (0.65 | ) | (0.81 | ) | (0.42 | ) | ||||||||
|
|
|
|
|
|
|
| |||||||||
Net asset value, end of period | $ | 32.21 | $ | 32.10 | $ | 26.86 | $ | 26.98 | ||||||||
|
|
|
|
|
|
|
| |||||||||
Total ReturnD | 1.65 | % | 22.36 | % | 2.56 | % | 8.57 | % | ||||||||
Ratios to Average Net AssetsE | ||||||||||||||||
Expenses before reductions | .08 | %F | .12 | % | .12 | % | .12 | %F | ||||||||
Expenses net of fee waivers, if any | .08 | %F | .12 | % | .12 | % | .12 | %F | ||||||||
Expenses net of all reductions | .08 | %F | .12 | % | .12 | % | .12 | %F | ||||||||
Net investment income (loss) | 3.00 | %F | 2.74 | % | 2.89 | % | 3.51 | %F | ||||||||
Supplemental Data | ||||||||||||||||
Net assets, end of period (000 omitted) | $ | 144,950 | $ | 174,940 | $ | 81,908 | $ | 67,447 | ||||||||
Portfolio turnover rateG,H | 10 | %I | 26 | % | 23 | % | 21 | %I | ||||||||
| A | For the period October 21, 2013 (commencement of operations) to July 31, 2014. |
| B | Calculated based on average shares outstanding during the period. |
| C | The amount shown for a share outstanding does not correspond with the aggregate net gain (loss) on investments for the period due to the timing of share transactions in relation to fluctuating market values of the investments of a Fund. |
| D | Total returns for periods of less than one year are not annualized. |
| E | Expense ratios reflect operating expenses of the Fund. Expenses before reductions do not reflect amounts reimbursed by the investment adviser or reductions from brokerage service arrangements or reductions from other expense offset arrangements and do not represent the amount paid by the Fund during periods when reimbursements or reductions occur. Expenses net of fee waivers reflect expenses after reimbursement by the investment adviser but prior to reductions from brokerage service arrangements or other expense offset arrangements. Expenses net of all reductions represent the net expenses paid by the Fund but do not include expenses of the investment companies in which the fund invests. |
| F | Annualized. |
| G | Amount does not include the portfolio activity of any underlying funds. |
| H | Portfolio turnover rate excludes securities received or delivered in-kind. |
| I | Amount not annualized. |
See accompanying notes which are an integral part of the financial statements.
| 77 | Semiannual Report |
Table of Contents
Financial Statements – continued
| Financial Highlights | ||||||||||||||||
| Fidelity MSCI Utilities Index ETF | ||||||||||||||||
| Six months ended January 31, 2017 (Unaudited) | Year ended July 31, 2016 | Year ended July 31, 2015 | Year ended July 31, 2014A | |||||||||||||
Selected Per-Share Data | ||||||||||||||||
Net asset value, beginning of period | $ | 33.57 | $ | 28.10 | $ | 26.88 | $ | 24.99 | ||||||||
|
|
|
|
|
|
|
| |||||||||
Income from Investment Operations | ||||||||||||||||
Net investment income (loss)B | 0.55 | 0.98 | 0.98 | 0.67 | ||||||||||||
Net realized and unrealized gain (loss) | (1.56 | ) | 5.48 | 1.47 | 1.85 | |||||||||||
|
|
|
|
|
|
|
| |||||||||
Total from investment operations | (1.01 | ) | 6.46 | 2.45 | 2.52 | |||||||||||
|
|
|
|
|
|
|
| |||||||||
Distributions from net investment income | (0.56 | ) | (0.99 | ) | (1.23 | ) | (0.63 | ) | ||||||||
|
|
|
|
|
|
|
| |||||||||
Total distributions | (0.56 | ) | (0.99 | ) | (1.23 | ) | (0.63 | ) | ||||||||
|
|
|
|
|
|
|
| |||||||||
Net asset value, end of period | $ | 32.00 | $ | 33.57 | $ | 28.10 | $ | 26.88 | ||||||||
|
|
|
|
|
|
|
| |||||||||
Total ReturnC | (2.98 | )% | 23.56 | % | 9.13 | % | 10.13 | % | ||||||||
Ratios to Average Net AssetsD | ||||||||||||||||
Expenses before reductions | .08 | %E | .12 | % | .12 | % | .12 | %E | ||||||||
Expenses net of fee waivers, if any | .08 | %E | .12 | % | .12 | % | .12 | %E | ||||||||
Expenses net of all reductions | .08 | %E | .12 | % | .12 | % | .12 | %E | ||||||||
Net investment income (loss) | 3.46 | %E | 3.25 | % | 3.37 | % | 3.15 | %E | ||||||||
Supplemental Data | ||||||||||||||||
Net assets, end of period (000 omitted) | $ | 187,227 | $ | 283,669 | $ | 108,176 | $ | 120,949 | ||||||||
Portfolio turnover rateF,G | 5 | %H | 9 | % | 7 | % | 6 | %H | ||||||||
| A | For the period October 21, 2013 (commencement of operations) to July 31, 2014. |
| B | Calculated based on average shares outstanding during the period. |
| C | Total returns for periods of less than one year are not annualized. |
| D | Expense ratios reflect operating expenses of the Fund. Expenses before reductions do not reflect amounts reimbursed by the investment adviser or reductions from brokerage service arrangements or reductions from other expense offset arrangements and do not represent the amount paid by the Fund during periods when reimbursements or reductions occur. Expenses net of fee waivers reflect expenses after reimbursement by the investment adviser but prior to reductions from brokerage service arrangements or other expense offset arrangements. Expenses net of all reductions represent the net expenses paid by the Fund but do not include expenses of the investment companies in which the fund invests. |
| E | Annualized. |
| F | Amount does not include the portfolio activity of any underlying funds. |
| G | Portfolio turnover rate excludes securities received or delivered in-kind. |
| H | Amount not annualized. |
See accompanying notes which are an integral part of the financial statements.
| Semiannual Report | 78 |
Table of Contents
For the period ended January 31, 2017 (Unaudited)
1. Organization.
Fidelity MSCI Consumer Discretionary Index ETF, Fidelity MSCI Consumer Staples Index ETF, Fidelity MSCI Energy Index ETF, Fidelity MSCI Financials Index ETF, Fidelity MSCI Health Care Index ETF, Fidelity MSCI Industrials Index ETF, Fidelity MSCI Information Technology Index ETF, Fidelity MSCI Materials Index ETF, Fidelity MSCI Real Estate Index ETF, Fidelity MSCI Telecommunication Services Index ETF and Fidelity MSCI Utilities Index ETF (the Funds) are exchange-traded funds of Fidelity Covington Trust (the Trust) and are authorized to issue an unlimited number of shares. Each Fund, with the exception of MSCI Industrials Index ETF, are non-diversified funds. The Trust is registered under the Investment Company Act of 1940, as amended (the 1940 Act), as an open-end management investment company organized as a Massachusetts business trust.
2. Significant Accounting Policies.
The financial statements have been prepared in conformity with accounting principles generally accepted in the United States of America (GAAP), which require management to make certain estimates and assumptions at the date of the financial statements. Actual results could differ from those estimates. Subsequent events, if any, through the date that the financial statements were issued have been evaluated in the preparation of the financial statements. The following summarizes the significant accounting policies of the Funds:
Investment Valuation. Investments are valued as of 4:00 p.m. Eastern time on the last calendar day of the period. The Board of Trustees (the Board) has delegated the day to day responsibility for the valuation of the Fund’s investments to the Fair Value Committee (the Committee) established by the Fund’s investment adviser. In accordance with valuation policies and procedures approved by the Board, each Fund attempts to obtain prices from one or more third party pricing vendors or brokers to value its investments. When current market prices, quotations or currency exchange rates are not readily available or reliable, investments will be fair valued in good faith by the Committee, in accordance with procedures adopted by the Board. Factors used in determining fair value vary by investment type and may include market or investment specific events. The frequency with which these procedures are used cannot be predicted and they may be utilized to a significant extent. The Committee oversees each Fund’s valuation policies and procedures and reports to the Board on the Committee’s activities and fair value determinations. The Board monitors the appropriateness of the procedures used in valuing each Fund’s investments and ratifies the fair value determinations of the Committee.
Each Fund categorizes the inputs to valuation techniques used to value its investments into a disclosure hierarchy consisting of three levels as shown below:
Level 1 – quoted prices in active markets for identical investments
Level 2 – other significant observable inputs (including quoted prices for similar investments, interest rates, prepayment speeds, etc.)
Level 3 – unobservable inputs (including the Fund’s own assumptions based on the best information available)
Valuation techniques used to value each Fund’s investments by major category are as follows:
Equity securities, including restricted securities, for which market quotations are readily available, are valued at the last reported sale price or official closing price as reported by a third party pricing vendor on the primary market or exchange on which they are traded and are categorized as Level 1 in the hierarchy. In the event there were no sales during the day or closing prices are not available, securities are valued at the last quoted bid price or may be valued using the last available price and are generally categorized as Level 2 in the hierarchy. For foreign equity securities, when market or security specific events arise, comparisons to the valuation of American Depositary Receipts (ADRs), futures contracts, Exchange-Traded Funds (ETFs) and certain indexes as well as quoted prices for similar securities may be used and would be categorized as Level 2 in the hierarchy in these circumstances. Utilizing these techniques may result in transfers between Level 1 and Level 2. For equity securities, including restricted securities, where observable inputs are limited, assumptions about market activity and risk are used and these securities may be categorized as Level 3 in the hierarchy.
Investments in open-end mutual funds (Underlying Funds) are valued at their closing net asset value (NAV) each business day and are categorized as Level 1 in the hierarchy. If an unaffiliated underlying fund’s NAV is unavailable, shares of that fund may be valued by another method that the Board believes reflects fair value in accordance with the Board’s fair value pricing policies and is categorized as Level 2 in the hierarchy.
Changes in valuation techniques may result in transfers in or out of an assigned level within the disclosure hierarchy. The aggregate value of investments by input level, as of January 31, 2017, is included at the end of each Fund’s Schedule of Investments.
Investment Transactions and Income. For financial reporting purposes, the Funds’ investment holdings and NAV include trades executed through the end of the last business day of the period. The NAV per share for processing shareholder transactions is calculated as of the close of business of NYSE Arca, normally 4:00 p.m. Eastern time and includes trades executed through the end of the prior business day. Gains and losses on securities sold are determined on the basis of identified cost and may include proceeds received from litigation. Dividend income is recorded on the ex-dividend date, except for certain dividends from foreign securities where the ex-dividend date may have passed, which are
| 79 | Semiannual Report |
Table of Contents
Notes to Financial Statements – continued
2. Significant Accounting Policies – continued
recorded as soon as a fund is informed of the ex-dividend date. Non-cash dividends included in dividend income, if any, are recorded at the fair market value of the securities received. Income and capital gain distributions from Underlying Funds, if any, are recorded on the ex-dividend date. Certain distributions received by the Funds represent a return of capital or capital gain. The Funds determine the components of these distributions subsequent to the ex-dividend date, based upon receipt of tax filings or other correspondence relating to the underlying investment. These distributions are recorded as a reduction of cost of investments and/or as a realized gain. Interest income is accrued as earned and includes coupon interest and amortization of premium and accretion of discount on debt securities as applicable.
Expenses. Expenses directly attributable to a fund are charged to that fund. Expenses attributable to more than one fund are allocated among the respective funds on the basis of relative net assets or other appropriate methods. Expenses included in the accompanying financial statements reflect the expenses of each Fund and do not include any expenses associated with the Underlying Funds. Expense estimates are accrued in the period to which they relate and adjustments are made when actual amounts are known.
Income Tax Information and Distributions to Shareholders. Each year, each Fund intends to qualify as a regulated investment company under Subchapter M of the Internal Revenue Code, including distributing substantially all of its taxable income and realized gains. As a result, no provision for U.S. Federal income taxes is required. Each Fund files a U.S. federal tax return, in addition to state and local tax returns as required. Each Fund’s federal income tax returns are subject to examination by the Internal Revenue Service (IRS) for a period of three fiscal years after they are filed. State and local tax returns may be subject to examination for an additional fiscal year depending on the jurisdiction. Realized gain or loss resulting from in-kind redemptions is not taxable to the Fund and is not distributed to shareholders of the Fund. Foreign taxes are provided for based on each Fund’s understanding of the tax rules and rates that exist in the foreign markets in which it invests.
Distributions are declared and recorded on the ex-dividend date. Income and capital gain distributions are determined in accordance with income tax regulations, which may differ from GAAP.
Capital accounts within the financial statements are adjusted for permanent book-tax differences. These adjustments have no impact on net assets or the results of operations. Capital accounts are not adjusted for temporary book-tax differences which will reverse in a subsequent period.
Book-tax differences are primarily due to passive foreign investment companies (PFIC), redemptions in kind, capital loss carryforwards, losses due to wash sales and excise tax regulations.
The federal tax cost of investment securities and unrealized appreciation (depreciation) as of period end were as follows for each Fund:
| Tax cost | Gross unrealized appreciation | Gross unrealized depreciation | Net unrealized appreciation (depreciation) on securities and other investments | |||||||||||||
Fidelity MSCI Consumer Discretionary Index ETF | $ | 242,190,231 | $ | 18,731,103 | $ | (22,216,224 | ) | $ | (3,485,121 | ) | ||||||
Fidelity MSCI Consumer Staples Index ETF | 234,175,427 | 12,858,526 | (10,019,849 | ) | 2,838,677 | |||||||||||
Fidelity MSCI Energy Index ETF | 547,743,598 | 27,816,602 | (55,713,579 | ) | (27,896,977 | ) | ||||||||||
Fidelity MSCI Financials Index ETF | 609,898,985 | 54,021,471 | (3,019,628 | ) | 51,001,843 | |||||||||||
Fidelity MSCI Health Care Index ETF | 649,673,298 | 44,323,271 | (63,958,649 | ) | (19,635,378 | ) | ||||||||||
Fidelity MSCI Industrials Index ETF | 284,432,980 | 19,525,099 | (4,293,433 | ) | 15,231,666 | |||||||||||
Fidelity MSCI Information Technology Index ETF | 564,566,170 | 67,939,999 | (9,762,328 | ) | 58,177,671 | |||||||||||
Fidelity MSCI Materials Index ETF | 179,647,821 | 11,316,578 | (2,363,806 | ) | 8,952,772 | |||||||||||
Fidelity MSCI Real Estate Index ETF | 268,212,569 | 4,749,500 | (15,442,499 | ) | (10,692,999 | ) | ||||||||||
Fidelity MSCI Telecommunication Services Index ETF | 134,309,165 | 16,127,109 | (5,420,522 | ) | 10,706,587 | |||||||||||
Fidelity MSCI Utilities Index ETF | 188,404,656 | 5,473,328 | (6,718,705 | ) | (1,245,377 | ) | ||||||||||
Capital loss carryforwards are only available to offset future capital gains of the Funds to the extent provided by regulations and may be limited. Under the Regulated Investment Company Modernization Act of 2010 (the Act), the Funds are permitted to carry forward capital losses incurred in taxable years beginning after December 22, 2010 for an unlimited period and such capital losses are required to be used prior to any
| Semiannual Report | 80 |
Table of Contents
2. Significant Accounting Policies – continued
losses that expire. The capital loss carryforward information presented below, including any applicable limitation, is estimated as of fiscal year end and is subject to adjustment.
| No-expiration Short-term | No-expiration Long-term | Total capital loss carryforward | ||||||||||
Fidelity MSCI Consumer Discretionary Index ETF | $ | (1,104,602 | ) | $ | (640,204 | ) | $ | (1,744,806 | ) | |||
Fidelity MSCI Consumer Staples Index ETF | (556,985 | ) | (180,000 | ) | (736,985 | ) | ||||||
Fidelity MSCI Energy Index ETF | (3,942,676 | ) | (1,209,534 | ) | (5,152,210 | ) | ||||||
Fidelity MSCI Financials Index ETF | (1,647,173 | ) | (64,105 | ) | (1,711,278 | ) | ||||||
Fidelity MSCI Health Care Index ETF | (1,064,324 | ) | — | (1,064,324 | ) | |||||||
Fidelity MSCI Industrials Index ETF | (915,997 | ) | (1,041,519 | ) | (1,957,516 | ) | ||||||
Fidelity MSCI Information Technology Index ETF | (1,912,779 | ) | (265,419 | ) | (2,178,198 | ) | ||||||
Fidelity MSCI Materials Index ETF | (1,222,963 | ) | (704,483 | ) | (1,927,446 | ) | ||||||
Fidelity MSCI Real Estate Index ETF | (161,019 | ) | — | (161,019 | ) | |||||||
Fidelity MSCI Telecommunication Services Index ETF | — | (274,274 | ) | (274,274 | ) | |||||||
Fidelity MSCI Utilities Index ETF | (1,048,742 | ) | (1,023,185 | ) | (2,071,927 | ) | ||||||
Certain of the Funds elected to defer to the next fiscal year capital losses recognized during the period November 1, 2015 to July 31, 2016. Loss deferrals were as follows:
| Capital losses | ||||
Fidelity MSCI Consumer Discretionary Index ETF | $ | (1,468,528 | ) | |
Fidelity MSCI Consumer Staples Index ETF | (988,734 | ) | ||
Fidelity MSCI Energy Index ETF | (5,453,683 | ) | ||
Fidelity MSCI Financials Index ETF | (1,192,572 | ) | ||
Fidelity MSCI Health Care Index ETF | (5,381,948 | ) | ||
Fidelity MSCI Information Technology Index ETF | (2,643,239 | ) | ||
Fidelity MSCI Real Estate Index ETF | (202,676 | ) | ||
3. Purchases and Sales of Investments.
Purchases and sales of securities, other than short-term securities and in-kind transactions, were as follows:
| Purchases | Sales | |||||||
Fidelity MSCI Consumer Discretionary Index ETF | $ | 10,751,435 | $ | 10,044,010 | ||||
Fidelity MSCI Consumer Staples Index ETF | 6,765,036 | 6,619,413 | ||||||
Fidelity MSCI Energy Index ETF | 23,523,093 | 22,973,649 | ||||||
Fidelity MSCI Financials Index ETF | 87,782,384 | 81,315,972 | ||||||
Fidelity MSCI Health Care Index ETF | 14,426,133 | 11,332,896 | ||||||
Fidelity MSCI Industrials Index ETF | 7,996,407 | 7,564,378 | ||||||
Fidelity MSCI Information Technology Index ETF | 18,119,430 | 13,300,495 | ||||||
Fidelity MSCI Materials Index ETF | 4,330,636 | 4,353,499 | ||||||
Fidelity MSCI Real Estate Index ETF | 26,961,231 | 24,569,002 | ||||||
Fidelity MSCI Telecommunication Services Index ETF | 14,605,681 | 14,314,499 | ||||||
Fidelity MSCI Utilities Index ETF | 10,188,962 | 10,323,535 | ||||||
Securities received or delivered in-kind through subscriptions and redemptions were as follows:
| In-kind Subscriptions | In-kind Redemptions | |||||||
Fidelity MSCI Consumer Discretionary Index ETF | $ | 25,969,504 | $ | 57,949,390 | ||||
Fidelity MSCI Consumer Staples Index ETF | 20,802,461 | 57,386,280 | ||||||
Fidelity MSCI Energy Index ETF | 73,846,359 | 15,437,147 | ||||||
Fidelity MSCI Financials Index ETF | 365,281,277 | 11,116,276 | ||||||
Fidelity MSCI Health Care Index ETF | 72,179,730 | 49,489,100 | ||||||
Fidelity MSCI Industrials Index ETF | 138,824,442 | 13,358,216 | ||||||
Fidelity MSCI Information Technology Index ETF | 161,060,240 | 20,133,927 | ||||||
Fidelity MSCI Materials Index ETF | 80,653,461 | 26,617,391 | ||||||
Fidelity MSCI Real Estate Index ETF | 124,295,770 | 30,536,382 | ||||||
Fidelity MSCI Telecommunication Services Index ETF | 24,071,300 | 50,100,051 | ||||||
Fidelity MSCI Utilities Index ETF | 6,276,840 | 87,015,730 | ||||||
| 81 | Semiannual Report |
Table of Contents
Notes to Financial Statements – continued
4. Fees and Other Transactions with Affiliates.
Management Fee. Fidelity SelectCo, LLC (SelectCo) provides the Funds with investment management related services for which the Funds pay a monthly management fee that is based on an annual rate of .084% of each Fund’s average net assets. Under the management contract, SelectCo pays all other expenses, except the compensation of the independent Trustees and certain other expenses such as interest expense. The management fee paid to SelectCo is reduced by an amount equal to the fees and expenses paid by each fund to the independent Trustees.
Sub-Adviser. BlackRock Fund Advisors (BFA), serves as sub-adviser for the Funds. BFA provides discretionary investment advisory services to the Funds and is paid by SelectCo for providing these services.
Interfund Trades. The Funds may purchase from or sell securities to other funds affiliated with the sub-adviser under procedures adopted by the Board. The procedures have been designed to ensure these interfund trades are executed in accordance with Rule 17a-7 of the 1940 Act. Interfund trades are included within the respective purchases and sales amounts shown in the Purchases and Sales of Investments note.
5. Share Transactions.
The Funds issue and redeem shares at NAV only with certain authorized participants in large increments known as Creation Units. Purchases of Creation Units are made by tendering a basket of designated stocks to a fund and redemption proceeds are paid with a basket of securities from a fund’s portfolio with a balancing cash component to equate the market value of the basket of securities delivered or redeemed to the NAV per Creation Unit on the transaction date. Cash may be substituted equivalent to the value of certain securities generally when they are not available in sufficient quantity for delivery. A fund’s shares are available in smaller increments to investors in the secondary market at market prices and may be subject to commissions. Authorized participants pay a transaction fee to the shareholder servicing agent when purchasing and redeeming Creation Units of a fund. The transaction fee is used to defray the costs associated with the issuance and redemption of Creation Units.
6. Other.
The Funds’ organizational documents provide former and current directors and officers with a limited indemnification against liabilities arising in connection with the performance of their duties to the Funds. In the normal course of business, the Funds may also enter into contracts that provide general indemnifications. The Funds’ maximum exposure under these arrangements is unknown as this would be dependent on future claims that may be made against the Funds. The risk of material loss from such claims is considered remote.
| Semiannual Report | 82 |
Table of Contents
Board Approval of Investment Advisory Contracts and Management Fees
Fidelity Sector ETFs
Each year, the Board of Trustees, including the Independent Trustees (together, the Board), votes on the renewal of the management contract with Fidelity SelectCo, LLC (SelectCo), an affiliate of Fidelity Management & Research Company (FMR), and the sub-advisory and ETF services agreement with respect to each fund (Sub-Advisory Agreement) with BlackRock Fund Advisors (BFA) (together, the Advisory Contracts). SelectCo and BFA are collectively referred to herein as the Investment Advisers. The Board, assisted by the advice of fund counsel and Independent Trustees’ counsel, requests and considers a broad range of information relevant to the renewal of the Advisory Contracts throughout the year.
The Board meets regularly and, at each of its meetings, covers an extensive agenda of topics and materials and considers factors that are relevant to its annual consideration of the renewal of each fund’s Advisory Contracts, including the services and support provided to each fund and its shareholders. The Board has established four standing committees (Committees) – Operations, Audit, Fair Valuation, and Governance and Nominating – each composed of and chaired by Independent Trustees with varying backgrounds, to which the Board has assigned specific subject matter responsibilities in order to enhance effective decision-making by the Board. The Operations Committee, of which all of the Independent Trustees are members, meets regularly throughout the year and considers, among other matters, information specifically related to the annual consideration of the renewal of each fund’s Advisory Contracts. The Board, acting directly and through its Committees, requests and receives information concerning the annual consideration of the renewal of each fund’s Advisory Contracts. The Board also meets as needed to consider matters specifically related to the Board’s annual consideration of the renewal of the Advisory Contracts. Members of the Board may also meet with trustees of other Fidelity funds through ad hoc joint committees to discuss certain matters relevant to all of the Fidelity funds.
At its January 2017 meeting, the Board unanimously determined to renew each fund’s Advisory Contracts. In reaching its determination, the Board considered all factors it believed relevant, including (i) the nature, extent, and quality of the services to be provided to each fund and its shareholders (including the investment performance of each fund); (ii) the competitiveness of each fund’s management fee and total expense ratio relative to peer funds; (iii) the total costs of the services to be provided by and the profits to be realized by Fidelity and BFA from their respective relationships with each fund; and (iv) the extent to which, if any, economies of scale exist and would be realized as each fund grows, and whether any economies of scale are appropriately shared with fund shareholders.
In considering whether to renew the Advisory Contracts for each fund, the Board reached a determination, with the assistance of fund counsel and Independent Trustees’ counsel and through the exercise of its business judgment, that the renewal of the Advisory Contracts was in the best interests of each fund and its shareholders and that the compensation payable under the Advisory Contracts was fair and reasonable. The Board’s decision to renew the Advisory Contracts was not based on any single factor, but rather was based on a comprehensive consideration of all the information provided to the Board at its meetings throughout the year. The Board, in reaching its determination to renew the Advisory Contracts, was aware that shareholders of each fund have a broad range of investment choices available to them, including a wide choice among funds offered by Fidelity’s competitors, and that each fund’s shareholders, who have the opportunity to review and weigh the disclosure provided by the fund in its prospectus and other public disclosures, have chosen to invest in that fund, which is part of the Fidelity family of funds.
Nature, Extent, and Quality of Services Provided. The Board considered the staffing of the Investment Advisers as it relates to the funds, including the backgrounds of investment personnel of the Investment Advisers, and also considered the funds’ investment objectives, strategies, and related investment philosophies. The Independent Trustees also had discussions with representatives of BFA and senior management of Fidelity’s investment operations and investment groups. The Board considered the structure of the investment personnel compensation programs of the Investment Advisers and whether these structures provide appropriate incentives to act in the best interests of each fund.
The Trustees also discussed with representatives of SelectCo, at meetings throughout the year, SelectCo’s role in, among other things, overseeing compliance with federal securities laws and other applicable requirements by BFA with respect to the funds and monitoring and overseeing the performance and investment capabilities of BFA. The Trustees considered that the Board had received from SelectCo periodic reports about its oversight and due diligence processes, as well as periodic reports regarding the performance of BFA.
The Board also considered the nature, extent and quality of services provided by BFA. The Trustees noted that under the Sub-Advisory Agreement, subject to oversight by SelectCo, BFA is responsible for, among other things, identifying investments, arranging for execution of portfolio transactions to implement each fund’s investment strategy, and performing certain ETF-related services. In addition, the Trustees noted that BFA is responsible for providing such reporting as may be requested by SelectCo to fulfill its oversight responsibilities discussed above.
Resources Dedicated to Investment Management and Support Services. The Board reviewed the general qualifications and capabilities of the Investment Advisers’ investment staffs, including their size, education, experience, and resources, as well as the Investment Advisers’ approach to recruiting, training, managing, and compensating investment personnel. The Board also noted that the Investment Advisers’ analysts have extensive resources, tools and capabilities so as to provide competitive investment results over time, and that those professionals also have access to sophisticated tools that permit them to assess portfolio construction and risk and performance attribution characteristics continuously. Additionally, in its deliberations, the Board considered the Investment Advisers’ trading, risk management, compliance, and technology and operations capabilities and resources, which are integral parts of the investment management process.
Shareholder and Administrative Services. The Board considered (i) the nature, extent, quality, and cost of advisory and administrative services provided by the Investment Advisers and their affiliates or agents under the Advisory Contracts and by SelectCo’s affiliates under separate
| 83 | Semiannual Report |
Table of Contents
Board Approval of Investment Advisory Contracts and Management Fees – continued
agreements covering pricing and bookkeeping services for each fund; (ii) the nature and extent of the supervision of third party service providers, principally State Street Bank and Trust Company, each fund’s transfer agent and custodian; and (iii) the resources devoted to, and the record of compliance with, each fund’s compliance policies and procedures. The Board also reviewed the allocation of fund brokerage, including allocations to brokers affiliated with certain of the Investment Advisers.
The Board noted that the growth of fund assets over time across the complex allows Fidelity to reinvest in the development of services designed to enhance the value or convenience of the Fidelity funds as investment vehicles. These services include 24-hour access to account information and market information through telephone representatives and over the Internet, investor education materials and asset allocation tools, and the expanded availability of Fidelity Investor Centers.
Investment in a Large Fund Family. The Board considered the benefits to shareholders of investing in a Fidelity fund, including the benefits of investing in a fund that is part of a large family of funds offering a variety of investment disciplines and providing a large variety of mutual fund investor services. The Board noted that Fidelity had taken, or had made recommendations that resulted in the Fidelity funds taking, a number of actions over the previous year that benefited particular funds, including (i) continuing to dedicate additional resources to investment research and to the support of the senior management team that oversees asset management; (ii) continuing efforts to enhance Fidelity’s global research capabilities; (iii) launching new funds and making other enhancements to meet client needs; (iv) broadening eligibility requirements for certain lower-priced share classes of, and streamlining the fee structure for, certain existing equity index funds; (v) lowering expense caps for certain existing funds and classes to reduce expenses paid by shareholders; (vi) continuing to launch dedicated lower cost underlying funds to meet portfolio construction needs related to expanding underlying fund options for Fidelity funds of funds, specifically for the Freedom Fund product lines; (vii) rationalizing product lines and gaining increased efficiencies through fund mergers and share class consolidations; (viii) continuing to develop, acquire and implement systems and technology to improve services to the funds and shareholders, strengthen information security, and increase efficiency; (ix) implementing investment enhancements to further strengthen Fidelity’s target date product line to increase investors’ probability of success in achieving their goals; and (x) accelerating the conversion of all remaining Class B shares to Class A shares, which have a lower expense structure.
Investment Performance. The Board considered whether each fund has operated in accordance with its investment objective, as well as its record of compliance with its investment restrictions and its performance history. The Board also considered the extent to which each fund has tracked its benchmark index since it commenced operations.
The Board took into account discussions with representatives of the Investment Advisers about fund investment performance that occur at Board meetings throughout the year. In this regard the Board noted that as part of regularly scheduled fund reviews and other reports to the Board on fund performance, the Board considers annualized return information for the fund, for different time periods, measured against the securities market index the fund seeks to track. The Board also periodically considers the fund’s tracking error versus its benchmark index. In its evaluation of fund investment performance at meetings throughout the year, the Board gave particular attention to information indicating underperformance of certain Fidelity funds for specific time periods and discussed with the Investment Advisers the reasons for such underperformance.
In addition to reviewing absolute and relative fund performance, the Independent Trustees periodically consider the appropriateness of fund performance metrics in evaluating the results achieved. In general, the Independent Trustees believe that fund performance should be evaluated based on net performance (after fees and expenses) compared to a fund’s benchmark index, over appropriate time periods taking into account relevant factors, including the following: general market conditions; the characteristics of the fund’s benchmark index; the extent to which statistical sampling is employed; securities lending revenues (if any); and fund cash drag and other factors.
The Independent Trustees recognize that shareholders evaluate performance on a net basis over their own holding periods, for which one-, three-, and five-year periods are often used as a proxy. For this reason, the performance information reviewed by the Board also included net cumulative total return information for the fund and an appropriate benchmark index for the most recent one- year period ended June 30, 2016.
Based on its review, the Board concluded that the nature, extent, and quality of services provided to each fund under the Advisory Contracts should continue to benefit the shareholders of each fund.
Competitiveness of Management Fee and Total Expense Ratio. The Board considered each fund’s management fee and total expense ratio compared to “mapped groups” of competitive funds created for the purpose of facilitating the Trustees’ analysis of the competitiveness of management fees and total expenses. Fidelity creates “mapped groups” by combining similar Lipper investment objective categories that have comparable investment mandates. For this purpose, all sector focused equity ETFs are grouped in the same mapped group. Combining Lipper investment objective categories aids the Board’s management fee and total expense ratio comparisons by broadening the competitive group used for comparison.
Management Fee. The Board considered two proprietary management fee comparisons for the 12-month (or shorter) periods ended June 30 shown in basis points (BP) in the charts below. The group of Lipper funds used by the Board for management fee comparisons is referred to below as the “Total Mapped Group.” The Total Mapped Group comparison focuses on a fund’s standing in terms of gross management fees before expense reimbursements or caps relative to the total universe of funds with comparable investment mandates (i.e., sector equities), regardless of whether their management fee structures also are comparable. Funds with comparable management fee structures have similar management fee contractual arrangements (e.g., flat rate charged for advisory services, all-inclusive fee rate, etc.). “TMG %” represents the percentage of funds in the Total Mapped Group that had management fees that were lower than a fund’s. For example, a hypothetical TMG % of 20% would
| Semiannual Report | 84 |
Table of Contents
mean that 80% of the funds in the Total Mapped Group had higher, and 20% had lower, management fees than a fund. The funds’ actual TMG %s and the number of funds in the Total Mapped Group are in the charts below. The “Asset-Size Peer Group” (ASPG) comparison focuses on a fund’s standing relative to a subset of non-Fidelity funds within the Total Mapped Group that are similar in size and management fee structure. For example, if a fund is in the first quartile of the ASPG, the fund’s management fee ranks in the least expensive or lowest 25% of funds in the ASPG. The ASPG represents at least 15% of the funds in the Total Mapped Group with comparable asset size and management fee structures, subject to a minimum of 50 funds (or all funds in the Total Mapped Group if fewer than 50). Additional information, such as the ASPG quartile in which a fund’s management fee rate ranked, is also considered by the Board.
Fidelity MSCI Consumer Discretionary Index ETF
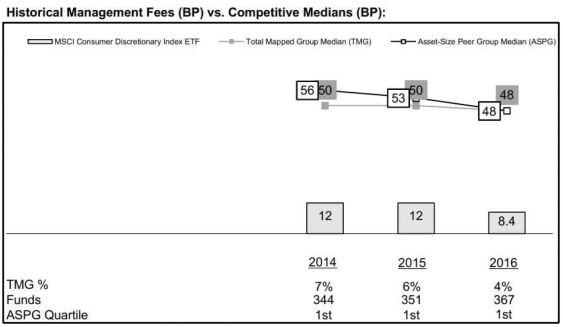
Fidelity MSCI Consumer Staples Index ETF
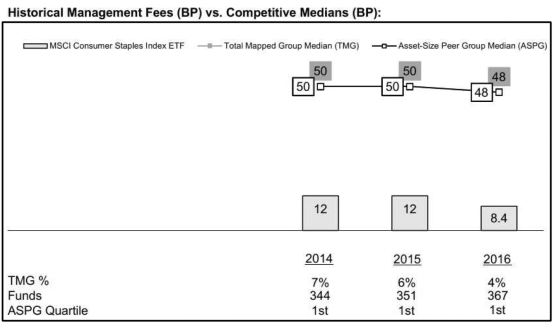
| 85 | Semiannual Report |
Table of Contents
Board Approval of Investment Advisory Contracts and Management Fees – continued
Fidelity MSCI Energy Index ETF
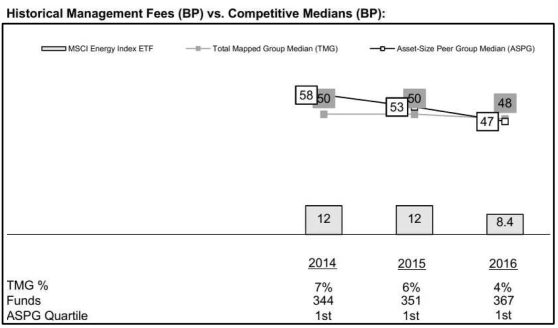
Fidelity MSCI Financials Index ETF
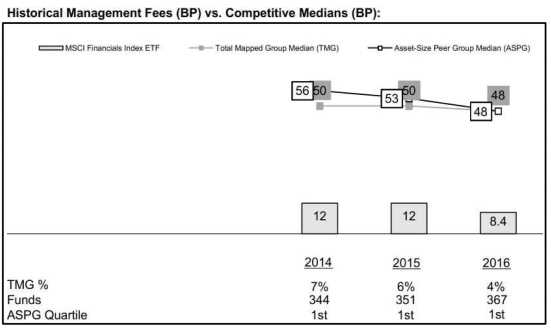
| Semiannual Report | 86 |
Table of Contents
Fidelity MSCI Health Care Index ETF
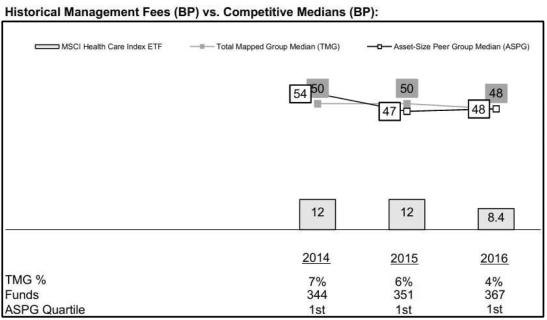
Fidelity MSCI Industrials Index ETF

| 87 | Semiannual Report |
Table of Contents
Board Approval of Investment Advisory Contracts and Management Fees – continued
Fidelity MSCI Information Technology Index ETF
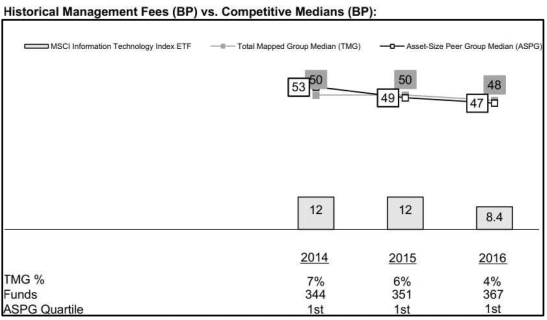
Fidelity MSCI Materials Index ETF
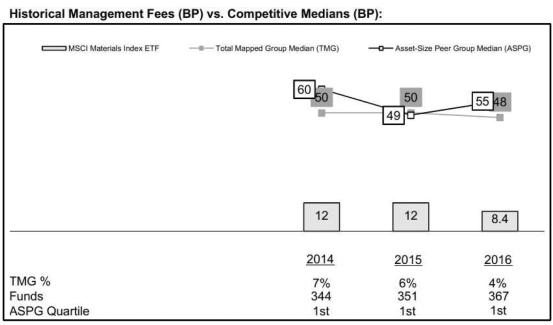
| Semiannual Report | 88 |
Table of Contents
Fidelity MSCI Real Estate Index ETF
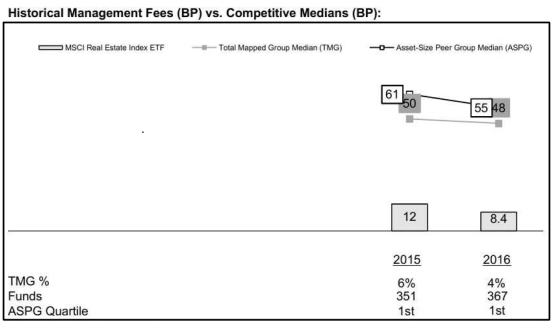
Fidelity MSCI Telecommunications Index ETF
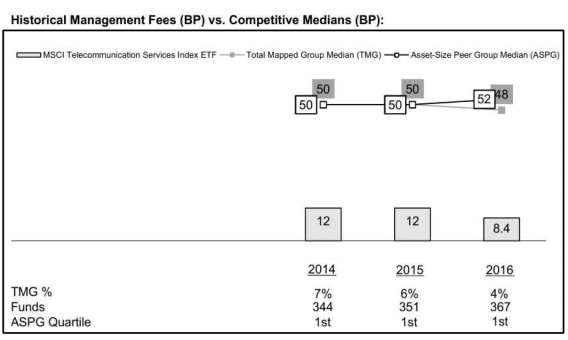
| 89 | Semiannual Report |
Table of Contents
Board Approval of Investment Advisory Contracts and Management Fees – continued
Fidelity MSCI Utilities Index ETF
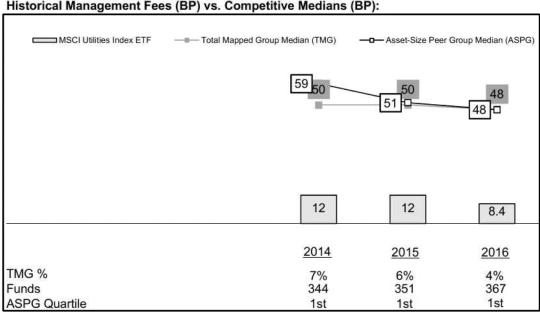
The Board noted that each fund’s management fee rate ranked below the median of its Total Mapped Group and below the median of its ASPG for the 12-month period ended June 30, 2016. The Board also noted that effective July 1, 2016, Fidelity reduced its all-inclusive management fee rate for the funds from 12 basis points to 8.4 basis points.
The Board noted that, in 2014, the ad hoc Committee on Group Fee was formed by it and the boards of other Fidelity funds to conduct an in-depth review of the “group fee” component of the management fee of funds with such management fee structures. The Committee’s focus included the mechanics of the group fee, the competitive landscape of group fee structures, Fidelity funds with no group fee component (such as the funds) and investment products not included in group fee assets. The Board also considered that, for funds subject to the group fee, FMR agreed to voluntarily waive fees over a specified period of time in amounts designed to account for assets converted from certain funds to certain collective investment trusts.
Based on its review, the Board concluded that each fund’s management fee is fair and reasonable in light of the services that each fund receives and the other factors considered.
Total Expense Ratio. In its review of each fund’s total expense ratio, the Board considered each fund’s all-inclusive fee rate. The Board also considered other expenses, such as transfer agent fees, pricing and bookkeeping fees, and custodial, legal, and audit fees, paid by SelectCo under the all-inclusive arrangement. The Board also noted that Fidelity may agree to waive fees and expenses from time to time, and the extent to which, if any, it has done so for each fund. As part of its review, the Board also considered the current and historical total expense ratios of each fund compared to competitive fund median expenses.
The Board noted that each fund’s total expense ratio ranked below the competitive median for the 12-month period ended June 30, 2016.
Fees Charged to Other Clients. The Board also considered fee structures applicable to the Investment Advisers’ other clients, such as other funds advised or subadvised by the Investment Advisers, pension plan clients, and other institutional clients with similar mandates. The Board noted that an ad hoc joint committee created by it and the boards of other Fidelity funds periodically (most recently in 2013) reviews and compares Fidelity’s institutional investment advisory business with its business of providing services to the Fidelity funds, including the differences in services provided, fees charged, and costs incurred, as well as competition in their respective marketplaces.
Based on its review of total expense ratios and fees charged to other Fidelity clients, the Board concluded that each fund’s total expense ratio was reasonable in light of the services that each fund and its shareholders receive and the other factors considered.
Costs of the Services and Profitability. The Board considered the revenues earned and the expenses incurred by Fidelity in conducting the business of developing, marketing, distributing, managing, administering and servicing each fund and servicing each fund’s shareholders. The Board also considered the level of Fidelity’s profits in respect of all the Fidelity funds.
| Semiannual Report | 90 |
Table of Contents
On an annual basis, Fidelity presents to the Board information about the profitability of its relationships with each fund. Fidelity calculates profitability information for each fund, as well as aggregate profitability information for groups of Fidelity funds and all Fidelity funds, using a series of detailed revenue and cost allocation methodologies which originate with the books and records of Fidelity on which Fidelity’s audited financial statements are based. The Audit Committee of the Board reviews any significant changes from the prior year’s methodologies.
PricewaterhouseCoopers LLP (PwC), independent registered public accounting firm and auditor to Fidelity and certain Fidelity funds, has been engaged annually by the Board as part of the Board’s assessment of the profitability analysis used by Fidelity. PwC’s engagement includes the review and assessment of Fidelity’s methodologies used in determining the revenues and expenses attributable to Fidelity’s mutual fund business, and completion of agreed-upon procedures in respect of the mathematical accuracy of the fund profitability information and its conformity to established allocation methodologies. After considering PwC’s reports issued under the engagement and information provided by Fidelity, the Board concluded that while other allocation methods may also be reasonable, Fidelity’s profitability methodologies are reasonable in all material respects.
The Board reviewed the Investment Advisers’ non-fund businesses and potential fall-out benefits related to the mutual fund business as well as cases where Fidelity’s and BFA’s affiliates may benefit from or be related to the funds’ business.
The Board considered the costs of the services provided by and the profits realized by Fidelity in connection with the operation of each fund and was satisfied that the profitability was not excessive.
The Board also considered information regarding the profitability of BFA’s relationship with each fund and BFA’s representation that it did not realize any fall-out benefits as a result of its relationship with each fund.
Economies of Scale. The Board considered whether there have been economies of scale in respect of the management of the Fidelity funds, whether the Fidelity funds (including each fund) have appropriately benefited from any such economies of scale, and whether there is potential for realization of any further economies of scale. The Board considered the extent to which each fund will benefit from economies of scale as assets grow through increased services to the fund, through waivers or reimbursements, or through fee or expense ratio reductions. The Board also noted that a committee (the Economies of Scale Committee) created by it and the boards of other Fidelity funds periodically (most recently in 2013) analyzes whether Fidelity attains economies of scale in respect of the management and servicing of the Fidelity funds, whether the Fidelity funds have appropriately benefited from such economies of scale, and whether there is potential for realization of any further economies of scale.
The Board concluded, taking into account the analysis of the Economies of Scale Committee, that economies of scale, if any, are being appropriately shared between fund shareholders and Fidelity.
Additional Information Requested by the Board. In order to develop fully the factual basis for consideration of the Fidelity funds’ advisory contracts, the Board requested and received additional information on certain topics, including: (i) Fidelity’s fund profitability methodology, profitability trends for certain funds, and the impact of certain factors on fund profitability results; (ii) portfolio manager changes that have occurred during the past year and the amount of the investment that each portfolio manager has made in the Fidelity fund(s) that he or she manages; (iii) Fidelity’s compensation structure for portfolio managers, research analysts, and other key personnel, including its effects on fund profitability; (iv) comparisons to institutional products; (v) the arrangements with and compensation paid to certain fund sub-advisers on behalf of the Fidelity funds; (vi) Fidelity’s long-term expectations for its offerings in the workplace investing channel; (vii) the competitive positioning of the Fidelity variable insurance product funds; (viii) the methodology with respect to competitive fund data and peer group classifications; (ix) Fidelity’s transfer agent fee, expense, and service structures for different funds and classes, and the impact of an internal reorganization, the increased use of omnibus accounts and lower pricing in the retirement channel; (x) fluctuations in trading expenses; (xi) explanations regarding the relative total expense ratios of certain funds and classes, total expense competitive trends and methodologies for total expense competitive comparisons, and actions that might be taken by Fidelity to reduce total expense ratios for certain funds and classes or to achieve further economies of scale; and (xii) matters relating to BFA’s sub-advisory and administrative services to the funds.
Based on its evaluation of all of the conclusions noted above, and after considering all factors it believed relevant, the Board concluded that the advisory fee structures are fair and reasonable, and that each fund’s Advisory Contracts should be renewed.
| 91 | Semiannual Report |
Table of Contents
Investment Adviser
Fidelity SelectCo, LLC
Denver, CO
Investment Sub-Advisers
BlackRock Fund Advisors
San Francisco, CA
General Distributor
Fidelity Distributors Corporation
Smithfield, RI
Transfer and Service Agents
State Street Bank and Trust Company
Boston, MA
Fidelity Service Company, Inc.
Boston, MA
Custodian
State Street Bank and Trust Company
Boston, MA
The Fidelity Telephone Connection
1-800-FIDELITY
| ||
EXT-SANN-0317 792753.1.0 1.9584798.103 | Corporate Headquarters 245 Summer St., Boston, MA 02210 www.fidelity.com |
Table of Contents
Fidelity® Core Dividend ETF
Fidelity Dividend ETF for Rising Rates
Fidelity Low Volatility Factor ETF
Fidelity Momentum Factor ETF
Fidelity Quality Factor ETF
Fidelity Value Factor ETF
Semiannual Report
January 31, 2017


Table of Contents
| Performance and Investment Summary | 3 | How each fund has done over time and a summary of each fund’s holdings. | ||||
| Shareholder Expense Example | 15 | An example of shareholder expenses. | ||||
| Investments | 16 | A complete list of each fund’s investments with their market values. | ||||
| Financial Statements | 36 | Statements of assets and liabilities, operations, and changes in net assets, as well as financial highlights. | ||||
| Notes | 44 | Notes to the financial statements. | ||||
| Board Approval of Investment Advisory Contracts and Management Fees | 48 | |||||
To view a fund’s proxy voting guidelines and proxy voting record for the period ended June, 30, visit http://www.fidelity.com/proxyvotingresults or visit the Securities and Exchange Commission’s (SEC) web site at http://www.sec.gov. You may also call 1-800-FIDELITY to request a free copy of the proxy voting guidelines.
Standard & Poor’s, S&P and S&P 500 are registered service marks of The McGraw-Hill Companies, Inc. and have been licensed for use by Fidelity Distributors Corporation.
Other third party marks appearing herein are the property of their respective owners.
All other marks appearing herein are registered or unregistered trademarks or service marks of FMR LLC or an affiliated company.
© 2017 FMR LLC. All Rights reserved.
This report and the financial statements contained herein are submitted for the general information of the shareholders of the funds. This report is not authorized for distribution to prospective investors in the funds unless preceded or accompanied by an effective prospectus.
A fund files its complete schedule of portfolio holdings with the SEC for the first and third quarters of each fiscal year on Form N-Q. Forms N-Q are available on the SEC’s web site at http://www.sec.gov. A fund’s Forms N-Q may be reviewed and copied at the SEC’s Public Reference Room in Washington, DC. Information regarding the operation of the SEC’s Public Reference Room may be obtained by calling 1-800-SEC-0330. For a complete list of a fund’s portfolio holdings, view the most recent holdings listing on Fidelity’s web site at http://www.fidelity.com, http://www.advisor.fidelity.com, or http://www.401k.com, as applicable.
NOT FDIC INSURED • MAY LOSE VALUE • NO BANK GUARANTEE
Neither the funds nor Fidelity Distributors Corporation is a bank.
| Semiannual Report | 2 |
Table of Contents
Fidelity® Core Dividend ETF
The information provided in the tables below shows you the performance of Fidelity® Core Dividend ETF, with comparisons over different time periods to the fund’s relevant benchmarks, including an appropriate broad-based market index. Seeing the returns over different time periods can help you assess the fund’s performance against relevant measurements. The performance information includes average annual total returns and is further explained in this section.*
The fund’s net asset value (NAV) performance is based on the NAV calculated each business day. It is calculated in accordance with the standard formula for valuing investment company shares as of the close of regular trading hours on NYSE Arca, Inc. (NYSE Arca) (normally 4:00 p.m. Eastern Time). The fund’s market price performance is based on the daily closing price of the shares of the fund on NYSE Arca. Since ETFs are bought and sold at prices set by the market – which can result in a premium or discount to NAV – the returns calculated using market price (market return) can differ from those calculated using NAV (NAV return). For information on these differences, please visit Fidelity.com or see the prospectus. The fund’s returns do not reflect the deduction of taxes that a shareholder would pay on fund distributions or the redemption or selling of fund shares. How a fund did yesterday is no guarantee of how it will do tomorrow.
Current performance may be higher or lower than the performance data quoted. For month-end performance figures, please visit fidelity.com/etfs/factor-etfs or call Fidelity. The performance data featured represents past performance, which is no guarantee of future results. Investment return and principal value will fluctuate; therefore, you may have a gain or loss when you sell your shares.
| Fiscal Period Ended January 31, 2017 | ||||
| Cumulative Total Returns | Life of fundA | |||
Fidelity Core Dividend ETF – NAV | 5.03% | |||
Fidelity Core Dividend ETF – Market Price | 5.82% | |||
Fidelity Core Dividend Index | 5.25% | |||
Cumulative total returns reflect performance over the period shown. This information represents returns as of the end of the fund’s fiscal period.
| Period Ended December 31, 2016 | ||||
| Cumulative Total Returns | Life of fundA | |||
Fidelity Core Dividend ETF – NAV | 4.35% | |||
Fidelity Core Dividend ETF – Market Price | 5.06% | |||
Fidelity Core Dividend Index | 4.57% | |||
This information shows the returns of the fund and its index for the applicable time period through the end of the most recent calendar quarter, as opposed to through the end of the fund’s fiscal period.
Average annual total returns take Fidelity Core Dividend ETF’s cumulative total return and show you what would have happened if Fidelity Core Dividend ETF’s shares had performed at a constant rate each year. These numbers will be reported once the fund is a year old.
| A | From September 12, 2016. |
| * | Total returns are historical and include changes in share price and reinvestment of dividends and capital gains distributions, if any. |
The fund’s expense ratio is 0.29%. Expense ratio is the total annual operating expense ratio from the most recent prospectus. A fund’s net expenses paid may be different. Please refer to the most recent prospectus for more information on a fund’s expenses.
Investment Summary
| Top Ten Stocks as of January 31, 2017 | ||||
| % of fund’s net assets | ||||
Targa Resources Corp. | 3.2 | |||
ONEOK, Inc. | 3.2 | |||
AT&T, Inc. | 2.8 | |||
Exxon Mobil Corp. | 2.7 | |||
JPMorgan Chase & Co. | 2.6 | |||
Chevron Corp. | 2.4 | |||
Verizon Communications, Inc. | 2.3 | |||
The Williams Cos., Inc. | 2.3 | |||
Apple, Inc. | 2.2 | |||
Wells Fargo & Co. | 2.2 | |||
|
| |||
| 25.9 | ||||
|
| |||
| Top Market Sectors as of January 31, 2017 | ||||
| % of fund’s net assets | ||||
Consumer Discretionary | 17.6 | |||
Energy | 17.3 | |||
Financials | 16.6 | |||
Information Technology | 12.7 | |||
Utilities | 9.9 | |||
Real Estate | 7.7 | |||
Telecommunication Services | 7.6 | |||
Health Care | 5.8 | |||
Industrials | 2.5 | |||
Consumer Staples | 1.7 | |||
| 3 | Semiannual Report |
Table of Contents
Fidelity® Core Dividend ETF
| Asset Allocation as of January 31, 2017 | ||
| ||

| * | Foreign investments – 6.8% |
| Semiannual Report | 4 |
Table of Contents
Fidelity® Dividend ETF for Rising Rates
Performance
The information provided in the tables below shows you the performance of Fidelity® Dividend ETF for Rising Rates, with comparisons over different time periods to the fund’s relevant benchmarks, including an appropriate broad-based market index. Seeing the returns over different time periods can help you assess the fund’s performance against relevant measurements. The performance information includes average annual total returns and is further explained in this section.*
The fund’s net asset value (NAV) performance is based on the NAV calculated each business day. It is calculated in accordance with the standard formula for valuing investment company shares as of the close of regular trading hours on NYSE Arca, Inc. (NYSE Arca) (normally 4:00 p.m. Eastern Time). The fund’s market price performance is based on the daily closing price of the shares of the fund on NYSE Arca. Since ETFs are bought and sold at prices set by the market – which can result in a premium or discount to NAV – the returns calculated using market price (market return) can differ from those calculated using NAV (NAV return). For information on these differences, please visit Fidelity.com or see the prospectus. The fund’s returns do not reflect the deduction of taxes that a shareholder would pay on fund distributions or the redemption or selling of fund shares. How a fund did yesterday is no guarantee of how it will do tomorrow.
Current performance may be higher or lower than the performance data quoted. For month-end performance figures, please visit fidelity.com/etfs/factor-etfs or call Fidelity. The performance data featured represents past performance, which is no guarantee of future results. Investment return and principal value will fluctuate; therefore, you may have a gain or loss when you sell your shares.
| Fiscal Period Ended January 31, 2017 | ||||
| Cumulative Total Returns | Life of fundA | |||
Fidelity Dividend ETF for Rising Rates – NAV | 6.60% | |||
Fidelity Dividend ETF for Rising Rates – Market Price | 7.06% | |||
Fidelity Dividend Index for Rising Rates | 6.80% | |||
Cumulative total returns reflect performance over the period shown. This information represents returns as of the end of the fund’s fiscal period.
| Period Ended December 31, 2016 | ||||
| Cumulative Total Returns | Life of fundA | |||
Fidelity Dividend ETF for Rising Rates – NAV | 4.86% | |||
Fidelity Dividend ETF for Rising Rates – Market Price | 5.55% | |||
Fidelity Dividend Index for Rising Rates | 5.03% | |||
This information shows the returns of the fund and its index for the applicable time period through the end of the most recent calendar quarter, as opposed to through the end of the fund’s fiscal period.
Average annual total returns take Fidelity Dividend ETF for Rising Rates’s cumulative total return and show you what would have happened if Fidelity Dividend ETF for Rising Rates’s shares had performed at a constant rate each year. These numbers will be reported once the fund is a year old.
| A | From September 12, 2016. |
| * | Total returns are historical and include changes in share price and reinvestment of dividends and capital gains distributions, if any. |
The fund’s expense ratio is 0.29%. Expense ratio is the total annual operating expense ratio from the most recent prospectus. A fund’s net expenses paid may be different. Please refer to the most recent prospectus for more information on a fund’s expenses.
Investment Summary
| Top Ten Stocks as of January 31, 2017 | ||||
| % of fund’s net assets | ||||
Apple, Inc. | 3.8 | |||
Microsoft Corp. | 3.1 | |||
Johnson & Johnson | 2.4 | |||
JPMorgan Chase & Co. | 2.2 | |||
Merck & Co., Inc. | 2.0 | |||
Pfizer, Inc. | 1.9 | |||
Exxon Mobil Corp. | 1.9 | |||
Wells Fargo & Co. | 1.8 | |||
The Procter & Gamble Co. | 1.6 | |||
Intel Corp. | 1.6 | |||
|
| |||
| 22.3 | ||||
|
| |||
| Top Market Sectors as of January 31, 2017 | ||||
| % of fund’s net assets | ||||
Information Technology | 21.4 | |||
Health Care | 13.1 | |||
Financials | 12.4 | |||
Consumer Discretionary | 11.4 | |||
Industrials | 11.1 | |||
Consumer Staples | 8.9 | |||
Energy | 7.2 | |||
Real Estate | 5.1 | |||
Utilities | 3.5 | |||
Materials | 3.3 | |||
| 5 | Semiannual Report |
Table of Contents
Fidelity® Dividend ETF for Rising Rates
| Asset Allocation as of January 31, 2017 | ||||
| ||||

| * | Foreign investments – 8.0% |
| Semiannual Report | 6 |
Table of Contents
Fidelity® Low Volatility Factor ETF
Performance
The information provided in the tables below shows you the performance of Fidelity® Low Volatility Factor ETF, with comparisons over different time periods to the fund’s relevant benchmarks, including an appropriate broad-based market index. Seeing the returns over different time periods can help you assess the fund’s performance against relevant measurements. The performance information includes average annual total returns and is further explained in this section.*
The fund’s net asset value (NAV) performance is based on the NAV calculated each business day. It is calculated in accordance with the standard formula for valuing investment company shares as of the close of regular trading hours on NYSE Arca, Inc. (NYSE Arca) (normally 4:00 p.m. Eastern Time). The fund’s market price performance is based on the daily closing price of the shares of the fund on NYSE Arca. Since ETFs are bought and sold at prices set by the market – which can result in a premium or discount to NAV – the returns calculated using market price (market return) can differ from those calculated using NAV (NAV return). For information on these differences, please visit Fidelity.com or see the prospectus. The fund’s returns do not reflect the deduction of taxes that a shareholder would pay on fund distributions or the redemption or selling of fund shares. How a fund did yesterday is no guarantee of how it will do tomorrow.
Current performance may be higher or lower than the performance data quoted. For month-end performance figures, please visit fidelity.com/etfs/factor-etfs or call Fidelity. The performance data featured represents past performance, which is no guarantee of future results. Investment return and principal value will fluctuate; therefore, you may have a gain or loss when you sell your shares.
| Fiscal Period Ended January 31, 2017 | ||||
| Cumulative Total Returns | Life of fundA | |||
Fidelity Low Volatility Factor ETF – NAV | 3.72% | |||
Fidelity Low Volatility Factor ETF – Market Price | 4.39% | |||
Fidelity U.S. Low Volatility Factor Index | 3.85% | |||
Cumulative total returns reflect performance over the period shown. This information represents returns as of the end of the fund’s fiscal period.
| Period Ended December 31, 2016 | ||||
| Cumulative Total Returns | Life of fundA | |||
Fidelity Low Volatility Factor ETF – NAV | 2.73% | |||
Fidelity Low Volatility Factor ETF – Market Price | 3.55% | |||
Fidelity U.S. Low Volatility Factor Index | 2.85% | |||
This information shows the returns of the fund and its index for the applicable time period through the end of the most recent calendar quarter, as opposed to through the end of the fund’s fiscal period.
Average annual total returns take Fidelity Low Volatility Factor ETF’s cumulative total return and show you what would have happened if Fidelity Low Volatility Factor ETF’s shares had performed at a constant rate each year. These numbers will be reported once the fund is a year old.
| A | From September 12, 2016. |
| * | Total returns are historical and include changes in share price and reinvestment of dividends and capital gains distributions, if any. |
The fund’s expense ratio is 0.29%. Expense ratio is the total annual operating expense ratio from the most recent prospectus. A fund’s net expenses paid may be different. Please refer to the most recent prospectus for more information on a fund’s expenses.
Investment Summary
| Top Ten Stocks as of January 31, 2017 | ||||
| % of fund’s net assets | ||||
Microsoft Corp. | 3.3 | |||
Alphabet, Inc. Class A | 3.1 | |||
Johnson & Johnson | 2.1 | |||
Berkshire Hathaway, Inc. Class B | 2.1 | |||
Wells Fargo & Co. | 1.8 | |||
Exxon Mobil Corp. | 1.8 | |||
Intel Corp. | 1.7 | |||
International Business Machines Corp. | 1.6 | |||
Merck & Co., Inc. | 1.6 | |||
Visa, Inc. Class A | 1.6 | |||
|
| |||
| 20.7 | ||||
|
| |||
| Top Market Sectors as of January 31, 2017 | ||||
| % of fund’s net assets | ||||
Information Technology | 21.6 | |||
Health Care | 13.8 | |||
Financials | 12.0 | |||
Consumer Discretionary | 12.0 | |||
Industrials | 10.5 | |||
Consumer Staples | 8.9 | |||
Energy | 6.8 | |||
Real Estate | 5.3 | |||
Utilities | 3.3 | |||
Materials | 3.1 | |||
| 7 | Semiannual Report |
Table of Contents
Fidelity® Low Volatility Factor ETF
| Asset Allocation as of January 31, 2017 | ||||
| ||||

| * | Foreign investments – 4.4% |
| Semiannual Report | 8 |
Table of Contents
Fidelity® Momentum Factor ETF
Performance
The information provided in the tables below shows you the performance of Fidelity® Momentum Factor ETF, with comparisons over different time periods to the fund’s relevant benchmarks, including an appropriate broad-based market index. Seeing the returns over different time periods can help you assess the fund’s performance against relevant measurements. The performance information includes average annual total returns and is further explained in this section.*
The fund’s net asset value (NAV) performance is based on the NAV calculated each business day. It is calculated in accordance with the standard formula for valuing investment company shares as of the close of regular trading hours on NYSE Arca, Inc. (NYSE Arca) (normally 4:00 p.m. Eastern Time). The fund’s market price performance is based on the daily closing price of the shares of the fund on NYSE Arca. Since ETFs are bought and sold at prices set by the market – which can result in a premium or discount to NAV – the returns calculated using market price (market return) can differ from those calculated using NAV (NAV return). For information on these differences, please visit Fidelity.com or see the prospectus. The fund’s returns do not reflect the deduction of taxes that a shareholder would pay on fund distributions or the redemption or selling of fund shares. How a fund did yesterday is no guarantee of how it will do tomorrow.
Current performance may be higher or lower than the performance data quoted. For month-end performance figures, please visit fidelity.com/etfs/factor-etfs or call Fidelity. The performance data featured represents past performance, which is no guarantee of future results. Investment return and principal value will fluctuate; therefore, you may have a gain or loss when you sell your shares.
| Fiscal Period Ended January 31, 2017 | ||||
| Cumulative Total Returns | Life of fundA | |||
Fidelity Momentum Factor ETF – NAV | 3.90% | |||
Fidelity Momentum Factor ETF – Market Price | 4.44% | |||
Fidelity U.S. Momentum Factor Index | 4.02% | |||
Cumulative total returns reflect performance over the period shown. This information represents returns as of the end of the fund’s fiscal period.
| Period Ended December 31, 2016 | ||||
| Cumulative Total Returns | Life of fundA | |||
Fidelity Momentum Factor ETF – NAV | 1.20% | |||
Fidelity Momentum Factor ETF – Market Price | 1.88% | |||
Fidelity U.S. Momentum Factor Index | 1.27% | |||
This information shows the returns of the fund and its index for the applicable time period through the end of the most recent calendar quarter, as opposed to through the end of the fund’s fiscal period.
Average annual total returns take Fidelity Momentum Factor ETF’s cumulative total return and show you what would have happened if Fidelity Momentum Factor ETF’s shares had performed at a constant rate each year. These numbers will be reported once the fund is a year old.
| A | From September 12, 2016. |
| * | Total returns are historical and include changes in share price and reinvestment of dividends and capital gains distributions, if any |
The fund’s expense ratio is 0.29%. Expense ratio is the total annual operating expense ratio from the most recent prospectus. A fund’s net expenses paid may be different. Please refer to the most recent prospectus for more information on a fund’s expenses.
Investment Summary
| Top Ten Stocks as of January 31, 2017 | ||||
| % of fund’s net assets | ||||
Microsoft Corp. | 3.1 | |||
Alphabet, Inc. Class A | 2.9 | |||
JPMorgan Chase & Co. | 2.2 | |||
Facebook, Inc. Class A | 2.2 | |||
Johnson & Johnson | 2.2 | |||
Berkshire Hathaway, Inc. Class B | 2.1 | |||
Amazon.com, Inc. | 2.0 | |||
Exxon Mobil Corp. | 1.8 | |||
General Electric Co. | 1.7 | |||
Pfizer, Inc. | 1.7 | |||
|
| |||
| 21.9 | ||||
|
| |||
| Top Market Sectors as of January 31, 2017 | ||||
| % of fund’s net assets | ||||
Information Technology | 22.5 | |||
Financials | 13.8 | |||
Health Care | 12.9 | |||
Consumer Discretionary | 12.9 | |||
Industrials | 9.8 | |||
Consumer Staples | 8.6 | |||
Energy | 6.8 | |||
Real Estate | 3.6 | |||
Materials | 3.2 | |||
Utilities | 3.2 | |||
| 9 | Semiannual Report |
Table of Contents
Fidelity® Momentum Factor ETF
| Asset Allocation as of January 31, 2017 | ||||
| ||||

| * | Foreign investments – 4.2% |
| Semiannual Report | 10 |
Table of Contents
Fidelity® Quality Factor ETF
Performance
The information provided in the tables below shows you the performance of Fidelity® Quality Factor ETF, with comparisons over different time periods to the fund’s relevant benchmarks, including an appropriate broad-based market index. Seeing the returns over different time periods can help you assess the fund’s performance against relevant measurements. The performance information includes average annual total returns and is further explained in this section.*
The fund’s net asset value (NAV) performance is based on the NAV calculated each business day. It is calculated in accordance with the standard formula for valuing investment company shares as of the close of regular trading hours on NYSE Arca, Inc. (NYSE Arca) (normally 4:00 p.m. Eastern Time). The fund’s market price performance is based on the daily closing price of the shares of the fund on NYSE Arca. Since ETFs are bought and sold at prices set by the market – which can result in a premium or discount to NAV – the returns calculated using market price (market return) can differ from those calculated using NAV (NAV return). For information on these differences, please visit Fidelity.com or see the prospectus. The fund’s returns do not reflect the deduction of taxes that a shareholder would pay on fund distributions or the redemption or selling of fund shares. How a fund did yesterday is no guarantee of how it will do tomorrow.
Current performance may be higher or lower than the performance data quoted. For month-end performance figures, please visit fidelity.com/etfs/factor-etfs or call Fidelity. The performance data featured represents past performance, which is no guarantee of future results. Investment return and principal value will fluctuate; therefore, you may have a gain or loss when you sell your shares.
| Fiscal Period Ended January 31, 2017 | ||||
| Cumulative Total Returns | Life of fundA | |||
Fidelity Quality Factor ETF – NAV | 6.24% | |||
Fidelity Quality Factor ETF – Market Price | 6.58% | |||
Fidelity U.S. Quality Factor Index | 6.42% | |||
Cumulative total returns reflect performance over the period shown. This information represents returns as of the end of the fund’s fiscal period.
| Period Ended December 31, 2016 | ||||
| Cumulative Total Returns | Life of fundA | |||
Fidelity Quality Factor ETF – NAV | 3.95% | |||
Fidelity Quality Factor ETF – Market Price | 4.27% | |||
Fidelity U.S. Quality Factor Index | 4.06% | |||
This information shows the returns of the fund and its index for the applicable time period through the end of the most recent calendar quarter, as opposed to through the end of the fund’s fiscal period.
Average annual total returns take Fidelity Quality Factor ETF’s cumulative total return and show you what would have happened if Fidelity Quality Factor ETF’s shares had performed at a constant rate each year. These numbers will be reported once the fund is a year old.
| A | From September 12, 2016. |
| * | Total returns are historical and include changes in share price and reinvestment of dividends and capital gains distributions, if any. |
The fund’s expense ratio is 0.29%. Expense ratio is the total annual operating expense ratio from the most recent prospectus. A fund’s net expenses paid may be different. Please refer to the most recent prospectus for more information on a fund’s expenses.
Investment Summary
| Top Ten Stocks as of January 31, 2017 | ||||
| % of fund’s net assets | ||||
Apple, Inc. | 3.7 | |||
Microsoft Corp. | 3.0 | |||
Alphabet, Inc. Class A | 2.7 | |||
Johnson & Johnson | 2.1 | |||
Facebook, Inc. Class A | 2.0 | |||
Exxon Mobil Corp. | 1.8 | |||
Merck & Co., Inc. | 1.6 | |||
Comcast Corp. Class A | 1.5 | |||
The Procter & Gamble Co. | 1.5 | |||
Pfizer, Inc. | 1.5 | |||
|
| |||
| 21.4 | ||||
|
| |||
| Top Market Sectors as of January 31, 2017 | ||||
| % of fund’s net assets | ||||
Information Technology | 21.3 | |||
Health Care | 13.6 | |||
Consumer Discretionary | 12.7 | |||
Financials | 11.7 | |||
Industrials | 10.6 | |||
Consumer Staples | 8.5 | |||
Energy | 6.6 | |||
Real Estate | 6.1 | |||
Materials | 3.3 | |||
Utilities | 3.1 | |||
| 11 | Semiannual Report |
Table of Contents
Fidelity® Quality Factor ETF
| Asset Allocation as of January 31, 2017 | ||||
| ||||

| * | Foreign investments – 3.0% |
| Semiannual Report | 12 |
Table of Contents
Fidelity® Value Factor ETF
Performance
The information provided in the tables below shows you the performance of Fidelity® Value Factor ETF, with comparisons over different time periods to the fund’s relevant benchmarks, including an appropriate broad-based market index. Seeing the returns over different time periods can help you assess the fund’s performance against relevant measurements. The performance information includes average annual total returns and is further explained in this section.*
The fund’s net asset value (NAV) performance is based on the NAV calculated each business day. It is calculated in accordance with the standard formula for valuing investment company shares as of the close of regular trading hours on NYSE Arca, Inc. (NYSE Arca) (normally 4:00 p.m. Eastern Time). The fund’s market price performance is based on the daily closing price of the shares of the fund on NYSE Arca. Since ETFs are bought and sold at prices set by the market – which can result in a premium or discount to NAV – the returns calculated using market price (market return) can differ from those calculated using NAV (NAV return). For information on these differences, please visit Fidelity.com or see the prospectus. The fund’s returns do not reflect the deduction of taxes that a shareholder would pay on fund distributions or the redemption or selling of fund shares. How a fund did yesterday is no guarantee of how it will do tomorrow.
Current performance may be higher or lower than the performance data quoted. For month-end performance figures, please visit fidelity.com/etfs/factor-etfs or call Fidelity. The performance data featured represents past performance, which is no guarantee of future results. Investment return and principal value will fluctuate; therefore, you may have a gain or loss when you sell your shares.
| Fiscal Period Ended January 31, 2017 | ||||
| Cumulative Total Returns | Life of fundA | |||
Fidelity Value Factor ETF – NAV | 10.07% | |||
Fidelity Value Factor ETF – Market Price | 10.63% | |||
Fidelity U.S. Value Factor Index | 10.20% | |||
Cumulative total returns reflect performance over the period shown. This information represents returns as of the end of the fund’s fiscal period.
| Period Ended December 31, 2016 | ||||
| Cumulative Total Returns | Life of fundA | |||
Fidelity Value Factor ETF – NAV | 8.33% | |||
Fidelity Value Factor ETF – Market Price | 8.56% | |||
Fidelity U.S. Value Factor Index | 8.43% | |||
This information shows the returns of the fund and its index for the applicable time period through the end of the most recent calendar quarter, as opposed to through the end of the fund’s fiscal period.
Average annual total returns take Fidelity Value Factor ETF’s cumulative total return and show you what would have happened if Fidelity Value Factor ETF’s shares had performed at a constant rate each year. These numbers will be reported once the fund is a year old.
| A | From September 12, 2016. |
| * | Total returns are historical and include changes in share price and reinvestment of dividends and capital gains distributions, if any. |
The fund’s expense ratio is 0.29%. Expense ratio is the total annual operating expense ratio from the most recent prospectus. A fund’s net expenses paid may be different. Please refer to the most recent prospectus for more information on a fund’s expenses.
Investment Summary
| Top Ten Stocks as of January 31, 2017 | ||||
| % of fund’s net assets | ||||
Apple, Inc. | 3.5 | |||
Microsoft Corp. | 2.8 | |||
Alphabet, Inc. Class A | 2.6 | |||
Johnson & Johnson | 2.0 | |||
JPMorgan Chase & Co. | 1.9 | |||
Berkshire Hathaway, Inc. Class B | 1.8 | |||
Bank of America Corp. | 1.7 | |||
Exxon Mobil Corp. | 1.7 | |||
Merck & Co., Inc. | 1.6 | |||
Wells Fargo & Co. | 1.6 | |||
|
| |||
| 21.2 | ||||
|
| |||
| Top Market Sectors as of January 31, 2017 | ||||
| % of fund’s net assets | ||||
Information Technology | 20.2 | |||
Financials | 17.4 | |||
Health Care | 13.4 | |||
Consumer Discretionary | 12.3 | |||
Industrials | 11.7 | |||
Consumer Staples | 8.2 | |||
Energy | 6.4 | |||
Materials | 3.4 | |||
Utilities | 3.0 | |||
Telecommunication Services | 2.2 | |||
| 13 | Semiannual Report |
Table of Contents
Fidelity® Value Factor ETF
Asset Allocation as of January 31, 2017 | ||
| ||
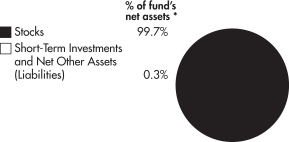
| * | Foreign investments – 2.4% |
| Semiannual Report | 14 |
Table of Contents
As a shareholder of a Fund, you incur two types of costs: (1) transaction costs, and (2) ongoing costs, including management fees and other Fund expenses. This Example is intended to help you understand your ongoing costs (in dollars) of investing in a Fund and to compare these costs with the ongoing costs of investing in other funds.
The actual expense Example is based on an investment of $1,000 invested at the beginning of the period and held for the entire period (September 12, 2016 to January 31, 2017). The hypothetical expense Example is based on an investment of $1,000 invested for the one-half year period (August 1, 2016 to January 31, 2017).
Actual Expenses
For each fund, the first line of the accompanying table provides information about actual account values and actual expenses. You may use the information in this line, together with the amount you invested, to estimate the expenses that you paid over the period. Simply divide your account value by $1,000.00 (for example, an $8,600 account value divided by $1,000.00 = 8.6), then multiply the result by the number in the first line for each Fund under the heading entitled “Expenses Paid During Period” to estimate the expenses you paid on your account during this period. In addition, each Fund, as a shareholder in the underlying Fidelity Central Funds, will indirectly bear its pro-rata share of the fees and expenses incurred by the underlying Fidelity Central Funds. These fees and expenses are not included in each Fund’s annualized expense ratio used to calculate the expense estimates in the table below.
Hypothetical Example for Comparison Purposes
For each fund, the second line of the accompanying table provides information about hypothetical account values and hypothetical expenses based on the Fund’s actual expense ratio and an assumed rate of return of 5% per year before expenses, which is not the Fund’s actual return. The hypothetical account values and expenses may not be used to estimate the actual ending account balance or expenses you paid for the period. You may use this information to compare the ongoing costs of investing in the Fund and other funds. To do so, compare this 5% hypothetical example with the 5% hypothetical examples that appear in the shareholder reports of the other funds. In addition, each Fund, as a shareholder in the underlying Fidelity Central Funds, will indirectly bear its pro-rata share of the fees and expenses incurred by the underlying Fidelity Central Funds. These fees and expenses are not included in each Fund’s annualized expense ratio used to calculate the expense estimates in the table below.
Please note that the expenses shown in the table are meant to highlight your ongoing costs only and do not reflect any transaction costs. Therefore, the second line of the table is useful in comparing ongoing costs only, and will not help you determine the relative total costs of owning different funds.
| Annualized Expense RatioA | Beginning Account Value | Ending Account Value | Expenses Paid During Period | |||||||||||||
Fidelity Core Dividend ETF | .29% | |||||||||||||||
Actual | $ | 1,000.00 | $ | 1,050.30 | $ | 1.16 | B | |||||||||
HypotheticalC | $ | 1,000.00 | $ | 1,023.74 | $ | 1.48 | D | |||||||||
Fidelity Dividend ETF for Rising Rates | .29% | |||||||||||||||
Actual | $ | 1,000.00 | $ | 1,066.00 | $ | 1.17 | B | |||||||||
HypotheticalC | $ | 1,000.00 | $ | 1,023.74 | $ | 1.48 | D | |||||||||
Fidelity Low Volatility Factor ETF | .29% | |||||||||||||||
Actual | $ | 1,000.00 | $ | 1,037.20 | $ | 1.15 | B | |||||||||
HypotheticalC | $ | 1,000.00 | $ | 1,023.74 | $ | 1.48 | D | |||||||||
Fidelity Momentum Factor ETF | .29% | |||||||||||||||
Actual | $ | 1,000.00 | $ | 1,039.00 | $ | 1.15 | B | |||||||||
HypotheticalC | $ | 1,000.00 | $ | 1,023.74 | $ | 1.48 | D | |||||||||
Fidelity Quality Factor ETF | .29% | |||||||||||||||
Actual | $ | 1,000.00 | $ | 1,062.40 | $ | 1.16 | B | |||||||||
HypotheticalC | $ | 1,000.00 | $ | 1,023.74 | $ | 1.48 | D | |||||||||
Fidelity Value Factor ETF | .29% | |||||||||||||||
Actual | $ | 1,000.00 | $ | 1,100.70 | $ | 1.19 | B | |||||||||
HypotheticalC | $ | 1,000.00 | $ | 1,023.74 | $ | 1.48 | D | |||||||||
| A | Annualized expense ratio reflects expenses net of applicable fee waivers. |
| B | Actual expenses are equal to the Fund’s annualized expense ratio, multiplied by the average account value over the period, multiplied by 142/365 (to reflect the period September 12, 2016 to January 31, 2017). |
| C | 5% return per year before expenses. |
| D | Hypothetical expenses are equal to the Fund’s annualized expense ratio, multiplied by the average account value over the period, multiplied by 184/365 (to reflect the one-half year period). |
| 15 | Semiannual Report |
Table of Contents
Fidelity Core Dividend ETF
Investments January 31, 2017 (Unaudited)
Showing Percentage of Net Assets
| Common Stocks – 99.4% | ||||||||
| Shares | Value | |||||||
CONSUMER DISCRETIONARY – 17.6% |
| |||||||
Automobiles – 2.2% |
| |||||||
Ford Motor Co. | 26,113 | $ | 322,757 | |||||
General Motors Co. | 10,558 | 386,528 | ||||||
|
| |||||||
| 709,285 | ||||||||
|
| |||||||
Hotels, Restaurants & Leisure – 4.0% |
| |||||||
Cracker Barrel Old Country Store, Inc. (a) | 1,808 | 285,772 | ||||||
Las Vegas Sands Corp. | 5,884 | 309,381 | ||||||
McDonald’s Corp. | 3,412 | 418,209 | ||||||
Sands China Ltd. | 71,200 | 313,277 | ||||||
|
| |||||||
| 1,326,639 | ||||||||
|
| |||||||
Household Durables – 0.9% |
| |||||||
Garmin Ltd. (a) | 6,327 | 305,531 | ||||||
|
| |||||||
Leisure Products – 0.7% |
| |||||||
Mattel, Inc. | 8,234 | 215,813 | ||||||
|
| |||||||
Media – 4.2% |
| |||||||
Pearson PLC | 22,188 | 172,978 | ||||||
The Walt Disney Co. | 4,735 | 523,928 | ||||||
Twenty-First Century Fox, Inc. Class A | 11,507 | 361,090 | ||||||
Viacom, Inc. Class B | 7,480 | 315,207 | ||||||
|
| |||||||
| 1,373,203 | ||||||||
|
| |||||||
Multiline Retail – 2.2% |
| |||||||
Kohl’s Corp. | 5,815 | 231,611 | ||||||
Nordstrom, Inc. (a) | 5,203 | 230,077 | ||||||
Target Corp. | 4,277 | 275,781 | ||||||
|
| |||||||
| 737,469 | ||||||||
|
| |||||||
Specialty Retail – 3.4% |
| |||||||
Best Buy Co., Inc. | 8,650 | 385,098 | ||||||
L Brands, Inc. | 3,292 | 198,211 | ||||||
The Home Depot, Inc. | 3,813 | 524,593 | ||||||
|
| |||||||
| 1,107,902 | ||||||||
|
| |||||||
TOTAL CONSUMER DISCRETIONARY |
| 5,775,842 | ||||||
|
| |||||||
CONSUMER STAPLES – 1.7% |
| |||||||
Beverages – 0.2% | ||||||||
The Coca-Cola Co. | 1,975 | 82,101 | ||||||
|
| |||||||
Food & Staples Retailing – 0.4% |
| |||||||
Costco Wholesale Corp. | 364 | 59,678 | ||||||
Wal-Mart Stores, Inc. | 990 | 66,072 | ||||||
|
| |||||||
| 125,750 | ||||||||
|
| |||||||
Food Products – 0.3% |
| |||||||
Archer-Daniels-Midland Co. | 1,266 | 56,033 | ||||||
Marine Harvest ASA (b) | 2,150 | 37,960 | ||||||
|
| |||||||
| 93,993 | ||||||||
|
| |||||||
Household Products – 0.3% |
| |||||||
The Procter & Gamble Co. | 1,233 | 108,011 | ||||||
|
| |||||||
| Shares | Value | |||||||
Tobacco – 0.5% |
| |||||||
Altria Group, Inc. | 1,200 | $ | 85,416 | |||||
Philip Morris International, Inc. | 850 | 81,711 | ||||||
|
| |||||||
| 167,127 | ||||||||
|
| |||||||
TOTAL CONSUMER STAPLES |
| 576,982 | ||||||
|
| |||||||
ENERGY – 17.3% |
| |||||||
Oil, Gas & Consumable Fuels – 17.3% |
| |||||||
Chevron Corp. | 7,089 | 789,360 | ||||||
ConocoPhillips | 13,375 | 652,165 | ||||||
Exxon Mobil Corp. | 10,503 | 881,097 | ||||||
Kinder Morgan, Inc. | 24,541 | 548,246 | ||||||
ONEOK, Inc. | 18,904 | 1,041,799 | ||||||
Targa Resources Corp. | 18,187 | 1,047,935 | ||||||
The Williams Cos., Inc. | 25,720 | 741,765 | ||||||
|
| |||||||
TOTAL ENERGY |
| 5,702,367 | ||||||
|
| |||||||
FINANCIALS – 16.6% |
| |||||||
Banks – 6.8% |
| |||||||
Citigroup, Inc. | 11,778 | 657,566 | ||||||
JPMorgan Chase & Co. | 10,209 | 863,987 | ||||||
Wells Fargo & Co. | 12,585 | 708,913 | ||||||
|
| |||||||
| 2,230,466 | ||||||||
|
| |||||||
Capital Markets – 1.8% |
| |||||||
Aberdeen Asset Management PLC | 86,505 | 286,285 | ||||||
T Rowe Price Group, Inc. | 4,555 | 307,189 | ||||||
|
| |||||||
| 593,474 | ||||||||
|
| |||||||
Consumer Finance – 1.4% |
| |||||||
Navient Corp. | 29,817 | 448,448 | ||||||
|
| |||||||
Insurance – 0.9% |
| |||||||
Phoenix Group Holdings | 30,337 | 287,184 | ||||||
|
| |||||||
Mortgage Real Estate Investment Trusts (REITs) – 5.7% |
| |||||||
Chimera Investment Corp. | 23,081 | 406,918 | ||||||
MFA Financial, Inc. | 45,242 | 356,959 | ||||||
New Residential Investment Corp. | 26,967 | 408,550 | ||||||
Starwood Property Trust, Inc. | 16,801 | 373,990 | ||||||
Two Harbors Investment Corp. | 39,659 | 347,810 | ||||||
|
| |||||||
| 1,894,227 | ||||||||
|
| |||||||
TOTAL FINANCIALS |
| 5,453,799 | ||||||
|
| |||||||
HEALTH CARE – 5.8% |
| |||||||
Biotechnology – 1.4% |
| |||||||
AbbVie, Inc. | 3,733 | 228,124 | ||||||
Amgen, Inc. | 1,450 | 227,186 | ||||||
|
| |||||||
| 455,310 | ||||||||
|
| |||||||
Health Care Equipment & Supplies – 0.6% |
| |||||||
Abbott Laboratories | 4,714 | 196,904 | ||||||
|
| |||||||
Health Care Providers & Services – 0.6% |
| |||||||
Anthem, Inc. | 1,303 | 200,844 | ||||||
|
| |||||||
See accompanying notes which are an integral part of the financial statements.
| Semiannual Report | 16 |
Table of Contents
| Common Stocks – continued | ||||||||
| Shares | Value | |||||||
HEALTH CARE – continued |
| |||||||
Pharmaceuticals – 3.2% |
| |||||||
GlaxoSmithKline PLC | 7,782 | $ | 150,387 | |||||
Johnson & Johnson | 3,102 | 351,302 | ||||||
Merck & Co., Inc. | 4,608 | 285,650 | ||||||
Pfizer, Inc. | 8,684 | 275,543 | ||||||
|
| |||||||
| 1,062,882 | ||||||||
|
| |||||||
TOTAL HEALTH CARE |
| 1,915,940 | ||||||
|
| |||||||
INDUSTRIALS – 2.5% | ||||||||
Aerospace & Defense – 0.5% | ||||||||
Lockheed Martin Corp. | 176 | 44,234 | ||||||
The Boeing Co. | 375 | 61,283 | ||||||
United Technologies Corp. | 457 | 50,119 | ||||||
|
| |||||||
| 155,636 | ||||||||
|
| |||||||
Air Freight & Logistics – 0.1% |
| |||||||
United Parcel Service, Inc. Class B | 456 | 49,763 | ||||||
|
| |||||||
Commercial Services & Supplies – 0.1% |
| |||||||
Pitney Bowes, Inc. | 1,250 | 19,900 | ||||||
|
| |||||||
Electrical Equipment – 0.2% |
| |||||||
Eaton Corp. PLC | 525 | 37,160 | ||||||
Emerson Electric Co. | 650 | 38,129 | ||||||
|
| |||||||
| 75,289 | ||||||||
|
| |||||||
Industrial Conglomerates – 0.6% |
| |||||||
3M Co. | 330 | 57,691 | ||||||
Honeywell International, Inc. | 442 | 52,297 | ||||||
Jardine Matheson Holdings Ltd. | 300 | 18,516 | ||||||
Jardine Strategic Holdings Ltd. | 700 | 26,649 | ||||||
Keppel Corp. Ltd. | 7,700 | 33,710 | ||||||
|
| |||||||
| 188,863 | ||||||||
|
| |||||||
Machinery – 0.5% |
| |||||||
Caterpillar, Inc. | 525 | 50,221 | ||||||
Cummins, Inc. | 263 | 38,664 | ||||||
Deere & Co. | 376 | 40,251 | ||||||
PACCAR, Inc. | 550 | 37,020 | ||||||
|
| |||||||
| 166,156 | ||||||||
|
| |||||||
Marine – 0.1% |
| |||||||
AP Moller – Maersk A/S Class B | 15 | 25,142 | ||||||
|
| |||||||
Road & Rail – 0.4% |
| |||||||
CSX Corp. | 1,150 | 53,348 | ||||||
Norfolk Southern Corp. | 365 | 42,873 | ||||||
Union Pacific Corp. | 531 | 56,594 | ||||||
|
| |||||||
| 152,815 | ||||||||
|
| |||||||
TOTAL INDUSTRIALS |
| 833,564 | ||||||
|
| |||||||
INFORMATION TECHNOLOGY – 12.7% |
| |||||||
Communications Equipment – 0.8% |
| |||||||
Cisco Systems, Inc. | 9,110 | 279,859 | ||||||
|
| |||||||
Electronic Equipment, Instruments & Components – 0.7% |
| |||||||
Corning, Inc. | 8,100 | 214,569 | ||||||
|
| |||||||
| Shares | Value | |||||||
IT Services – 1.4% |
| |||||||
International Business Machines Corp. | 1,760 | $ | 307,155 | |||||
The Western Union Co. | 7,675 | 150,277 | ||||||
|
| |||||||
| 457,432 | ||||||||
|
| |||||||
Semiconductors & Semiconductor Equipment – 2.9% |
| |||||||
Intel Corp. | 8,511 | 313,375 | ||||||
KLA-Tencor Corp. | 2,152 | 183,156 | ||||||
QUALCOMM, Inc. | 3,918 | 209,339 | ||||||
Texas Instruments, Inc. | 3,350 | 253,059 | ||||||
|
| |||||||
| 958,929 | ||||||||
|
| |||||||
Software – 2.6% |
| |||||||
Microsoft Corp. | 9,318 | 602,409 | ||||||
Oracle Corp. | 6,302 | 252,773 | ||||||
|
| |||||||
| 855,182 | ||||||||
|
| |||||||
Technology Hardware, Storage & Peripherals – 4.3% |
| |||||||
Apple, Inc. | 6,096 | 739,749 | ||||||
HP, Inc. | 14,201 | 213,725 | ||||||
Seagate Technology PLC (a) | 4,484 | 202,453 | ||||||
Western Digital Corp. | 3,167 | 252,505 | ||||||
|
| |||||||
| 1,408,432 | ||||||||
|
| |||||||
TOTAL INFORMATION TECHNOLOGY |
| 4,174,403 | ||||||
|
| |||||||
MATERIALS – 0.0% |
| |||||||
Chemicals – 0.0% |
| |||||||
AdvanSix, Inc. (b) | 11 | 283 | ||||||
|
| |||||||
REAL ESTATE – 7.7% |
| |||||||
Equity Real Estate Investment Trusts (REITs) – 6.7% |
| |||||||
Boston Properties, Inc. | 2,831 | 370,578 | ||||||
Gaming and Leisure Properties, Inc. | 11,652 | 368,553 | ||||||
Hospitality Properties Trust | 12,459 | 387,849 | ||||||
Iron Mountain, Inc. | 10,350 | 370,530 | ||||||
Senior Housing Properties Trust | 20,141 | 383,686 | ||||||
Taubman Centers, Inc. | 4,330 | 306,737 | ||||||
|
| |||||||
| 2,187,933 | ||||||||
|
| |||||||
Real Estate Management & Development – 1.0% |
| |||||||
Hongkong Land Holdings Ltd. | 50,400 | 340,200 | ||||||
|
| |||||||
TOTAL REAL ESTATE |
| 2,528,133 | ||||||
|
| |||||||
TELECOMMUNICATION SERVICES – 7.6% |
| |||||||
Diversified Telecommunication Services – 7.6% |
| |||||||
AT&T, Inc. | 21,875 | 922,250 | ||||||
CenturyLink, Inc. (a) | 17,016 | 440,034 | ||||||
Frontier Communications Corp. (a) | 111,057 | 387,589 | ||||||
Verizon Communications, Inc. | 15,242 | 747,010 | ||||||
|
| |||||||
TOTAL TELECOMMUNICATION SERVICES |
| 2,496,883 | ||||||
|
| |||||||
UTILITIES – 9.9% |
| |||||||
Electric Utilities – 5.1% |
| |||||||
American Electric Power Co., Inc. | 4,359 | 279,238 | ||||||
Duke Energy Corp. | 3,994 | 313,689 | ||||||
See accompanying notes which are an integral part of the financial statements.
| 17 | Semiannual Report |
Table of Contents
Fidelity Core Dividend ETF
Investments (Unaudited) – continued
| Common Stocks – continued | ||||||||
| Shares | Value | |||||||
UTILITIES – continued |
| |||||||
Electric Utilities – continued |
| |||||||
Exelon Corp. | 8,493 | $ | 304,729 | |||||
FirstEnergy Corp. | 7,403 | 224,459 | ||||||
PPL Corp. | 7,128 | 248,339 | ||||||
The Southern Co. | 5,959 | 294,553 | ||||||
|
| |||||||
| 1,665,007 | ||||||||
|
| |||||||
Independent Power and Renewable Electricity Producers – 2.0% |
| |||||||
AES Corp. | 24,813 | 283,860 | ||||||
NRG Energy, Inc. | 22,907 | 378,882 | ||||||
|
| |||||||
| 662,742 | ||||||||
|
| |||||||
Multi-Utilities – 2.8% | ||||||||
CenterPoint Energy, Inc. | 12,855 | 336,930 | ||||||
Dominion Resources, Inc. | 4,158 | 317,172 | ||||||
Public Service Enterprise Group, Inc. | 5,992 | 265,146 | ||||||
|
| |||||||
| 919,248 | ||||||||
|
| |||||||
TOTAL UTILITIES |
| 3,246,997 | ||||||
|
| |||||||
TOTAL COMMON STOCKS |
| 32,705,193 | ||||||
|
| |||||||
| Money Market Funds – 5.3% | ||||||||
| Shares | Value | |||||||
Fidelity Cash Central Fund, 0.62% (c) | 53,503 | $ | 53,514 | |||||
Fidelity Securities Lending Cash Central Fund, 0.65% (c)(d) | 1,689,491 | 1,689,829 | ||||||
|
| |||||||
TOTAL MONEY MARKET FUNDS |
| 1,743,343 | ||||||
|
| |||||||
TOTAL INVESTMENT PORTFOLIO – 104.7% |
| 34,448,536 | ||||||
NET OTHER ASSETS (LIABILITIES) – (4.7%) |
| (1,545,375 | ) | |||||
|
| |||||||
NET ASSETS – 100% |
| $ | 32,903,161 | |||||
|
| |||||||
Legend
| (a) | Security or a portion of the security is on loan at period end. |
| (b) | Non-income producing. |
| (c) | Affiliated fund that is generally available only to investment companies and other accounts managed by Fidelity Investments. The rate quoted is the annualized seven-day yield of the fund at period end. A complete unaudited listing of the fund’s holdings as of its most recent quarter end is available upon request. In addition, each Fidelity Central Fund’s financial statements are available on the SEC’s website or upon request. |
| (d) | Investment made with cash collateral received from securities on loan. |
Affiliated Central Funds
Information regarding fiscal year to date income earned by the Fund from investments in Fidelity Central Funds is as follows:
| Fund | Income earned | |||
Fidelity Cash Central Fund | $ | 62 | ||
Fidelity Securities Lending Cash Central Fund | 2,149 | |||
|
| |||
Total | $ | 2,211 | ||
|
| |||
Other Information
The following is a summary of the inputs used, as of January 31, 2017, involving the Fund’s assets and liabilities carried at fair value. The inputs or methodology used for valuing securities may not be an indication of the risk associated with investing in those securities. For more information on valuation inputs, and their aggregation into the levels used in the table below, please refer to the Investment Valuation section in the accompanying Notes to Financial Statements.
| Valuation Inputs at Reporting Date: | ||||||||||||||||
| Description | Total | Level 1 | Level 2 | Level 3 | ||||||||||||
Investments in Securities: | ||||||||||||||||
Equities: | ||||||||||||||||
Consumer Discretionary | $ | 5,775,842 | $ | 5,289,587 | $ | 486,255 | $ | — | ||||||||
Consumer Staples | 576,982 | 539,022 | 37,960 | — | ||||||||||||
Energy | 5,702,367 | 5,702,367 | — | — | ||||||||||||
Financials | 5,453,799 | 5,167,514 | 286,285 | — | ||||||||||||
Health Care | 1,915,940 | 1,765,553 | 150,387 | — | ||||||||||||
Industrials | 833,564 | 808,422 | 25,142 | — | ||||||||||||
Information Technology | 4,174,403 | 4,174,403 | — | — | ||||||||||||
Materials | 283 | 283 | — | — | ||||||||||||
Real Estate | 2,528,133 | 2,528,133 | — | — | ||||||||||||
Telecommunication Services | 2,496,883 | 2,496,883 | — | — | ||||||||||||
Utilities | 3,246,997 | 3,246,997 | — | — | ||||||||||||
Money Market Funds | 1,743,343 | 1,743,343 | — | — | ||||||||||||
|
|
|
|
|
|
|
| |||||||||
Total Investments in Securities: | $ | 34,448,536 | $ | 33,462,507 | $ | 986,029 | $ | — | ||||||||
|
|
|
|
|
|
|
| |||||||||
See accompanying notes which are an integral part of the financial statements.
| Semiannual Report | 18 |
Table of Contents
Fidelity Dividend ETF for Rising Rates
Investments January 31, 2017 (Unaudited)
Showing Percentage of Net Assets
| Common Stocks – 99.6% | ||||||||
| Shares | Value | |||||||
CONSUMER DISCRETIONARY – 11.4% |
| |||||||
Automobiles – 1.4% |
| |||||||
Ford Motor Co. | 33,840 | $ | 418,262 | |||||
General Motors Co. | 13,619 | 498,592 | ||||||
|
| |||||||
| 916,854 | ||||||||
|
| |||||||
Hotels, Restaurants & Leisure – 2.1% |
| |||||||
Las Vegas Sands Corp. | 7,104 | 373,528 | ||||||
McDonald’s Corp. | 4,945 | 606,109 | ||||||
Sands China Ltd. | 80,800 | 355,517 | ||||||
|
| |||||||
| 1,335,154 | ||||||||
|
| |||||||
Household Durables – 0.6% |
| |||||||
Garmin Ltd. | 7,320 | 353,483 | ||||||
|
| |||||||
Leisure Products – 0.4% | ||||||||
Mattel, Inc. | 9,750 | 255,547 | ||||||
|
| |||||||
Media – 2.8% | ||||||||
Pearson PLC | 24,576 | 191,595 | ||||||
The Walt Disney Co. | 7,185 | 795,020 | ||||||
Twenty-First Century Fox, Inc. Class A | 14,941 | 468,849 | ||||||
Viacom, Inc. Class B | 8,936 | 376,563 | ||||||
|
| |||||||
| 1,832,027 | ||||||||
|
| |||||||
Multiline Retail – 1.4% |
| |||||||
Kohl’s Corp. | 6,820 | 271,641 | ||||||
Nordstrom, Inc. (a) | 6,048 | 267,442 | ||||||
Target Corp. | 5,570 | 359,154 | ||||||
|
| |||||||
| 898,237 | ||||||||
|
| |||||||
Specialty Retail – 2.7% |
| |||||||
Best Buy Co., Inc. | 10,144 | 451,611 | ||||||
GameStop Corp. Class A | 10,223 | 250,361 | ||||||
L Brands, Inc. | 4,033 | 242,827 | ||||||
The Home Depot, Inc. | 5,815 | 800,028 | ||||||
|
| |||||||
| 1,744,827 | ||||||||
|
| |||||||
TOTAL CONSUMER DISCRETIONARY |
| 7,336,129 | ||||||
|
| |||||||
CONSUMER STAPLES – 8.9% |
| |||||||
Beverages – 1.2% |
| |||||||
The Coca-Cola Co. | 19,121 | 794,860 | ||||||
|
| |||||||
Food & Staples Retailing – 2.0% | ||||||||
Costco Wholesale Corp. | 3,648 | 598,090 | ||||||
Wal-Mart Stores, Inc. | 9,954 | 664,330 | ||||||
|
| |||||||
| 1,262,420 | ||||||||
|
| |||||||
Food Products – 1.6% |
| |||||||
Archer-Daniels-Midland Co. | 12,773 | 565,333 | ||||||
Marine Harvest ASA (b) | 25,155 | 444,133 | ||||||
|
| |||||||
| 1,009,466 | ||||||||
|
| |||||||
Household Products – 1.6% |
| |||||||
The Procter & Gamble Co. | 11,969 | 1,048,484 | ||||||
|
| |||||||
Tobacco – 2.5% |
| |||||||
Altria Group, Inc. | 11,410 | 812,164 | ||||||
| Shares | Value | |||||||
Philip Morris International, Inc. | 8,281 | $ | 796,052 | |||||
|
| |||||||
| 1,608,216 | ||||||||
|
| |||||||
TOTAL CONSUMER STAPLES |
| 5,723,446 | ||||||
|
| |||||||
ENERGY – 7.2% |
| |||||||
Oil, Gas & Consumable Fuels – 7.2% |
| |||||||
Chevron Corp. | 7,800 | 868,530 | ||||||
ConocoPhillips | 10,233 | 498,961 | ||||||
Exxon Mobil Corp. | 14,261 | 1,196,355 | ||||||
Kinder Morgan, Inc. | 17,970 | 401,450 | ||||||
Marathon Oil Corp. | 35,126 | 588,361 | ||||||
Targa Resources Corp. | 10,906 | 628,404 | ||||||
The Williams Cos., Inc. | 16,299 | 470,063 | ||||||
|
| |||||||
TOTAL ENERGY |
| 4,652,124 | ||||||
|
| |||||||
FINANCIALS – 12.4% |
| |||||||
Banks – 6.4% |
| |||||||
Banco Santander S.A. | 97,463 | 541,733 | ||||||
Citigroup, Inc. | 17,961 | 1,002,763 | ||||||
JPMorgan Chase & Co. | 16,754 | 1,417,891 | ||||||
Wells Fargo & Co. | 20,753 | 1,169,016 | ||||||
|
| |||||||
| 4,131,403 | ||||||||
|
| |||||||
Capital Markets – 1.2% |
| |||||||
Aberdeen Asset Management PLC | 111,230 | 368,111 | ||||||
T Rowe Price Group, Inc. | 6,201 | 418,195 | ||||||
|
| |||||||
| 786,306 | ||||||||
|
| |||||||
Consumer Finance – 0.9% |
| |||||||
Navient Corp. | 39,196 | 589,508 | ||||||
|
| |||||||
Mortgage Real Estate Investment Trusts (REITs) – 3.9% |
| |||||||
Chimera Investment Corp. | 30,177 | 532,021 | ||||||
MFA Financial, Inc. | 58,906 | 464,768 | ||||||
New Residential Investment Corp. | 35,258 | 534,159 | ||||||
Starwood Property Trust, Inc. | 22,062 | 491,100 | ||||||
Two Harbors Investment Corp. | 51,426 | 451,006 | ||||||
|
| |||||||
| 2,473,054 | ||||||||
|
| |||||||
TOTAL FINANCIALS |
| 7,980,271 | ||||||
|
| |||||||
HEALTH CARE – 13.1% |
| |||||||
Biotechnology – 3.1% |
| |||||||
AbbVie, Inc. | 16,280 | 994,871 | ||||||
Amgen, Inc. | 6,357 | 996,015 | ||||||
|
| |||||||
| 1,990,886 | ||||||||
|
| |||||||
Health Care Equipment & Supplies – 1.3% |
| |||||||
Abbott Laboratories | 20,744 | 866,477 | ||||||
|
| |||||||
Health Care Providers & Services – 1.4% |
| |||||||
Anthem, Inc. | 5,748 | 885,997 | ||||||
|
| |||||||
Pharmaceuticals – 7.3% |
| |||||||
GlaxoSmithKline PLC | 32,318 | 624,545 | ||||||
Johnson & Johnson | 13,843 | 1,567,720 | ||||||
Merck & Co., Inc. | 20,476 | 1,269,307 | ||||||
See accompanying notes which are an integral part of the financial statements.
| 19 | Semiannual Report |
Table of Contents
Fidelity Dividend ETF for Rising Rates
Investments (Unaudited) – continued
| Common Stocks – continued | ||||||||
| Shares | Value | |||||||
HEALTH CARE – continued |
| |||||||
Pharmaceuticals – continued |
| |||||||
Pfizer, Inc. | 38,761 | $ | 1,229,886 | |||||
|
| |||||||
| 4,691,458 | ||||||||
|
| |||||||
TOTAL HEALTH CARE |
| 8,434,818 | ||||||
|
| |||||||
INDUSTRIALS – 11.1% |
| |||||||
Aerospace & Defense – 2.1% |
| |||||||
Lockheed Martin Corp. | 1,541 | 387,300 | ||||||
The Boeing Co. | 3,265 | 533,566 | ||||||
United Technologies Corp. | 4,244 | 465,439 | ||||||
|
| |||||||
| 1,386,305 | ||||||||
|
| |||||||
Air Freight & Logistics – 0.6% |
| |||||||
United Parcel Service, Inc. Class B | 3,706 | 404,436 | ||||||
|
| |||||||
Electrical Equipment – 1.0% |
| |||||||
Eaton Corp. PLC | 4,377 | 309,804 | ||||||
Emerson Electric Co. | 5,429 | 318,465 | ||||||
|
| |||||||
| 628,269 | ||||||||
|
| |||||||
Industrial Conglomerates – 2.4% |
| |||||||
3M Co. | 2,827 | 494,216 | ||||||
Honeywell International, Inc. | 3,744 | 442,990 | ||||||
Jardine Matheson Holdings Ltd. | 2,900 | 178,988 | ||||||
Jardine Strategic Holdings Ltd. | 5,900 | 224,613 | ||||||
Keppel Corp. Ltd. | 45,500 | 199,195 | ||||||
|
| |||||||
| 1,540,002 | ||||||||
|
| |||||||
Machinery – 2.6% |
| |||||||
Caterpillar, Inc. | 4,245 | 406,077 | ||||||
Cummins, Inc. | 2,266 | 333,124 | ||||||
Deere & Co. | 3,114 | 333,354 | ||||||
PACCAR, Inc. | 4,368 | 294,010 | ||||||
Parker Hannifin Corp. | 2,114 | 311,033 | ||||||
|
| |||||||
| 1,677,598 | ||||||||
|
| |||||||
Marine – 0.4% |
| |||||||
AP Moller – Maersk A/S Class B | 141 | 236,334 | ||||||
|
| |||||||
Road & Rail – 2.0% |
| |||||||
CSX Corp. | 9,759 | 452,720 | ||||||
Norfolk Southern Corp. | 3,124 | 366,945 | ||||||
Union Pacific Corp. | 4,563 | 486,325 | ||||||
|
| |||||||
| 1,305,990 | ||||||||
|
| |||||||
TOTAL INDUSTRIALS |
| 7,178,934 | ||||||
|
| |||||||
INFORMATION TECHNOLOGY – 21.4% |
| |||||||
Communications Equipment – 1.5% |
| |||||||
Cisco Systems, Inc. | 30,492 | 936,714 | ||||||
|
| |||||||
IT Services – 3.6% |
| |||||||
International Business Machines Corp. | 5,765 | 1,006,108 | ||||||
Mastercard, Inc. Class A | 7,787 | 827,992 | ||||||
The Western Union Co. | 25,346 | 496,274 | ||||||
|
| |||||||
| 2,330,374 | ||||||||
|
| |||||||
| Shares | Value | |||||||
Semiconductors & Semiconductor Equipment – 6.0% |
| |||||||
Analog Devices, Inc. | 9,268 | $ | 694,544 | |||||
Intel Corp. | 28,257 | 1,040,423 | ||||||
KLA-Tencor Corp. | 7,073 | 601,983 | ||||||
QUALCOMM, Inc. | 13,013 | 695,284 | ||||||
Texas Instruments, Inc. | 11,128 | 840,609 | ||||||
|
| |||||||
| 3,872,843 | ||||||||
|
| |||||||
Software – 3.1% |
| |||||||
Microsoft Corp. | 30,611 | 1,979,001 | ||||||
|
| |||||||
Technology Hardware, Storage & Peripherals – 7.2% |
| |||||||
Apple, Inc. | 20,018 | 2,429,184 | ||||||
HP, Inc. | 47,286 | 711,654 | ||||||
Seagate Technology PLC (a) | 14,744 | 665,692 | ||||||
Western Digital Corp. | 10,532 | 839,717 | ||||||
|
| |||||||
| 4,646,247 | ||||||||
|
| |||||||
TOTAL INFORMATION TECHNOLOGY |
| 13,765,179 | ||||||
|
| |||||||
MATERIALS – 3.3% |
| |||||||
Chemicals – 2.2% |
| |||||||
AdvanSix, Inc. (b) | 145 | 3,725 | ||||||
CF Industries Holdings, Inc. | 4,046 | 142,783 | ||||||
EI du Pont de Nemours & Co. | 4,299 | 324,574 | ||||||
LyondellBasell Industries N.V. Class A | 2,419 | 225,620 | ||||||
Praxair, Inc. | 1,879 | 222,549 | ||||||
The Dow Chemical Co. | 5,543 | 330,529 | ||||||
The Mosaic Co. | 5,534 | 173,602 | ||||||
|
| |||||||
| 1,423,382 | ||||||||
|
| |||||||
Containers & Packaging – 0.8% |
| |||||||
International Paper Co. | 4,416 | 249,946 | ||||||
Packaging Corp. of America | 2,736 | 252,204 | ||||||
|
| |||||||
| 502,150 | ||||||||
|
| |||||||
Metals & Mining – 0.3% |
| |||||||
Nucor Corp. | 3,717 | 215,921 | ||||||
|
| |||||||
TOTAL MATERIALS |
| 2,141,453 | ||||||
|
| |||||||
REAL ESTATE – 5.1% |
| |||||||
Equity Real Estate Investment Trusts (REITs) – 4.4% |
| |||||||
Boston Properties, Inc. | 3,821 | 500,169 | ||||||
Gaming and Leisure Properties, Inc. | 15,131 | 478,593 | ||||||
Hospitality Properties Trust | 16,259 | 506,143 | ||||||
Iron Mountain, Inc. | 13,606 | 487,095 | ||||||
Senior Housing Properties Trust | 26,461 | 504,082 | ||||||
Taubman Centers, Inc. | 5,639 | 399,467 | ||||||
|
| |||||||
| 2,875,549 | ||||||||
|
| |||||||
Real Estate Management & Development – 0.7% |
| |||||||
Hongkong Land Holdings Ltd. | 65,200 | 440,100 | ||||||
|
| |||||||
TOTAL REAL ESTATE |
| 3,315,649 | ||||||
|
| |||||||
See accompanying notes which are an integral part of the financial statements.
| Semiannual Report | 20 |
Table of Contents
| Common Stocks – continued | ||||||||
| Shares | Value | |||||||
TELECOMMUNICATION SERVICES – 2.2% |
| |||||||
Diversified Telecommunication Services – 2.2% |
| |||||||
AT&T, Inc. | 17,772 | $ | 749,267 | |||||
CenturyLink, Inc. | 2,399 | 62,038 | ||||||
Frontier Communications Corp. (a) | 9,024 | 31,494 | ||||||
Verizon Communications, Inc. | 11,784 | 577,534 | ||||||
|
| |||||||
TOTAL TELECOMMUNICATION SERVICES |
| 1,420,333 | ||||||
|
| |||||||
UTILITIES – 3.5% |
| |||||||
Electric Utilities – 1.6% |
| |||||||
Duke Energy Corp. | 3,430 | 269,392 | ||||||
Exelon Corp. | 6,144 | 220,447 | ||||||
FirstEnergy Corp. | 4,640 | 140,685 | ||||||
PPL Corp. | 5,042 | 175,663 | ||||||
The Southern Co. | 4,859 | 240,180 | ||||||
|
| |||||||
| 1,046,367 | ||||||||
|
| |||||||
Independent Power and Renewable Electricity Producers – 0.6% |
| |||||||
AES Corp. | 13,824 | 158,147 | ||||||
NRG Energy, Inc. | 12,171 | 201,308 | ||||||
|
| |||||||
| 359,455 | ||||||||
|
| |||||||
Multi-Utilities – 1.3% |
| |||||||
CenterPoint Energy, Inc. | 7,296 | 191,228 | ||||||
Dominion Resources, Inc. | 3,264 | 248,978 | ||||||
MDU Resources Group, Inc. | 7,008 | 205,685 | ||||||
Public Service Enterprise Group, Inc. | 4,053 | 179,345 | ||||||
|
| |||||||
| 825,236 | ||||||||
|
| |||||||
TOTAL UTILITIES |
| 2,231,058 | ||||||
|
| |||||||
TOTAL COMMON STOCKS |
| 64,179,394 | ||||||
|
| |||||||
| Money Market Funds – 1.7% | ||||||||
| Shares | Value | |||||||
Fidelity Cash Central Fund, 0.62% (c) | 258,958 | $ | 259,012 | |||||
Fidelity Securities Lending Cash Central Fund, 0.65% (c)(d) | 860,444 | 860,616 | ||||||
|
| |||||||
TOTAL MONEY MARKET FUNDS |
| 1,119,628 | ||||||
|
| |||||||
TOTAL INVESTMENT PORTFOLIO – 101.3% |
| 65,299,022 | ||||||
NET OTHER ASSETS (LIABILITIES) – (1.3%) |
| (856,694 | ) | |||||
|
| |||||||
NET ASSETS – 100% |
| $ | 64,442,328 | |||||
|
| |||||||
Legend
| (a) | Security or a portion of the security is on loan at period end. |
| (b) | Non-income producing. |
| (c) | Affiliated fund that is generally available only to investment companies and other accounts managed by Fidelity Investments. The rate quoted is the annualized seven-day yield of the fund at period end. A complete unaudited listing of the fund’s holdings as of its most recent quarter end is available upon request. In addition, each Fidelity Central Fund’s financial statements are available on the SEC’s website or upon request. |
| (d) | Investment made with cash collateral received from securities on loan. |
Affiliated Central Funds
Information regarding fiscal year to date income earned by the Fund from investments in Fidelity Central Funds is as follows:
| Fund | Income earned | |||
Fidelity Cash Central Fund | $ | 69 | ||
Fidelity Securities Lending Cash Central Fund | 340 | |||
|
| |||
Total | $ | 409 | ||
|
| |||
See accompanying notes which are an integral part of the financial statements.
| 21 | Semiannual Report |
Table of Contents
Fidelity Dividend ETF for Rising Rates
Investments (Unaudited) – continued
Other Information
The following is a summary of the inputs used, as of January 31, 2017, involving the Fund’s assets and liabilities carried at fair value. The inputs or methodology used for valuing securities may not be an indication of the risk associated with investing in those securities. For more information on valuation inputs, and their aggregation into the levels used in the table below, please refer to the Investment Valuation section in the accompanying Notes to Financial Statements.
| Valuation Inputs at Reporting Date: | ||||||||||||||||
| Description | Total | Level 1 | Level 2 | Level 3 | ||||||||||||
Investments in Securities: | ||||||||||||||||
Equities: | ||||||||||||||||
Consumer Discretionary | $ | 7,336,129 | $ | 6,789,017 | $ | 547,112 | $ | — | ||||||||
Consumer Staples | 5,723,446 | 5,279,313 | 444,133 | — | ||||||||||||
Energy | 4,652,124 | 4,652,124 | — | — | ||||||||||||
Financials | 7,980,271 | 7,612,160 | 368,111 | — | ||||||||||||
Health Care | 8,434,818 | 7,810,273 | 624,545 | — | ||||||||||||
Industrials | 7,178,934 | 6,942,600 | 236,334 | — | ||||||||||||
Information Technology | 13,765,179 | 13,765,179 | — | — | ||||||||||||
Materials | 2,141,453 | 2,141,453 | — | — | ||||||||||||
Real Estate | 3,315,649 | 3,315,649 | — | — | ||||||||||||
Telecommunication Services | 1,420,333 | 1,420,333 | — | — | ||||||||||||
Utilities | 2,231,058 | 2,231,058 | — | — | ||||||||||||
Money Market Funds | 1,119,628 | 1,119,628 | — | — | ||||||||||||
|
|
|
|
|
|
|
| |||||||||
Total Investments in Securities: | $ | 65,299,022 | $ | 63,078,787 | $ | 2,220,235 | $ | — | ||||||||
|
|
|
|
|
|
|
| |||||||||
See accompanying notes which are an integral part of the financial statements.
| Semiannual Report | 22 |
Table of Contents
Fidelity Low Volatility Factor ETF
Investments January 31, 2017 (Unaudited)
Showing Percentage of Net Assets
| Common Stocks – 99.7% | ||||||||
| Shares | Value | |||||||
CONSUMER DISCRETIONARY – 12.0% |
| |||||||
Distributors – 0.7% |
| |||||||
Genuine Parts Co. | 901 | $ | 87,226 | |||||
|
| |||||||
Hotels, Restaurants & Leisure – 2.0% |
| |||||||
McDonald’s Corp. | 1,213 | 148,677 | ||||||
Yum China Holdings, Inc. (a) | 1,170 | 32,152 | ||||||
Yum! Brands, Inc. | 1,170 | 76,670 | ||||||
|
| |||||||
| 257,499 | ||||||||
|
| |||||||
Media – 1.5% | ||||||||
Comcast Corp. Class A | 2,671 | 201,447 | ||||||
|
| |||||||
Multiline Retail – 1.9% | ||||||||
Dollar General Corp. | 1,043 | 76,994 | ||||||
Dollar Tree, Inc. (a) | 990 | 76,418 | ||||||
Target Corp. | 1,455 | 93,819 | ||||||
|
| |||||||
| 247,231 | ||||||||
|
| |||||||
Specialty Retail – 4.4% | ||||||||
AutoZone, Inc. (a) | 118 | 85,547 | ||||||
O’Reilly Automotive, Inc. (a) | 340 | 89,172 | ||||||
Ross Stores, Inc. | 1,571 | 103,859 | ||||||
The Home Depot, Inc. | 1,340 | 184,357 | ||||||
The TJX Companies, Inc. | 1,400 | 104,888 | ||||||
|
| |||||||
| 567,823 | ||||||||
|
| |||||||
Textiles, Apparel & Luxury Goods – 1.5% |
| |||||||
NIKE, Inc. Class B | 2,292 | 121,247 | ||||||
VF Corp. | 1,541 | 79,330 | ||||||
|
| |||||||
| 200,577 | ||||||||
|
| |||||||
TOTAL CONSUMER DISCRETIONARY |
| 1,561,803 | ||||||
|
| |||||||
CONSUMER STAPLES – 8.9% | ||||||||
Beverages – 2.8% | ||||||||
Dr Pepper Snapple Group, Inc. | 690 | 62,928 | ||||||
PepsiCo, Inc. | 1,392 | 144,462 | ||||||
The Coca-Cola Co. | 3,630 | 150,899 | ||||||
|
| |||||||
| 358,289 | ||||||||
|
| |||||||
Food & Staples Retailing – 1.6% | ||||||||
Costco Wholesale Corp. | 600 | 98,370 | ||||||
Wal-Mart Stores, Inc. | 1,690 | 112,790 | ||||||
|
| |||||||
| 211,160 | ||||||||
|
| |||||||
Food Products – 1.0% | ||||||||
General Mills, Inc. | 1,156 | 72,227 | ||||||
The Hershey Co. | 590 | 62,227 | ||||||
|
| |||||||
| 134,454 | ||||||||
|
| |||||||
Household Products – 2.4% | ||||||||
Church & Dwight Co., Inc. | 1,260 | 56,977 | ||||||
The Clorox Co. | 501 | 60,120 | ||||||
The Procter & Gamble Co. | 2,261 | 198,064 | ||||||
|
| |||||||
| 315,161 | ||||||||
|
| |||||||
| Shares | Value | |||||||
Tobacco – 1.1% | ||||||||
Altria Group, Inc. | 2,020 | $ | 143,784 | |||||
|
| |||||||
TOTAL CONSUMER STAPLES |
| 1,162,848 | ||||||
|
| |||||||
ENERGY – 6.8% | ||||||||
Energy Equipment & Services – 1.1% |
| |||||||
Schlumberger Ltd. | 1,205 | 100,870 | ||||||
TechnipFMC PLC (a) | 1,330 | 44,715 | ||||||
|
| |||||||
| 145,585 | ||||||||
|
| |||||||
Oil, Gas & Consumable Fuels – 5.7% |
| |||||||
Chevron Corp. | 1,433 | 159,565 | ||||||
ConocoPhillips | 1,490 | 72,653 | ||||||
Exxon Mobil Corp. | 2,840 | 238,248 | ||||||
Kinder Morgan, Inc. | 2,580 | 57,637 | ||||||
ONEOK, Inc. | 790 | 43,537 | ||||||
Parsley Energy, Inc. Class A (a) | 1,020 | 35,924 | ||||||
Phillips 66 | 663 | 54,114 | ||||||
Spectra Energy Corp. | 1,220 | 50,813 | ||||||
World Fuel Services Corp. | 690 | 30,691 | ||||||
|
| |||||||
| 743,182 | ||||||||
|
| |||||||
TOTAL ENERGY |
| 888,767 | ||||||
|
| |||||||
FINANCIALS – 12.0% | ||||||||
Banks – 4.0% | ||||||||
The PNC Financial Services Group, Inc. | 1,150 | 138,529 | ||||||
US Bancorp | 2,670 | 140,576 | ||||||
Wells Fargo & Co. | 4,261 | 240,022 | ||||||
|
| |||||||
| 519,127 | ||||||||
|
| |||||||
Diversified Financial Services – 2.0% |
| |||||||
Berkshire Hathaway, Inc. Class B (a) | 1,631 | 267,712 | ||||||
|
| |||||||
Insurance – 5.4% | ||||||||
Arch Capital Group Ltd. (a) | 1,033 | 91,266 | ||||||
Chubb Ltd. | 850 | 111,766 | ||||||
Cincinnati Financial Corp. | 1,044 | 73,685 | ||||||
Everest Re Group Ltd. | 400 | 87,972 | ||||||
Marsh & McLennan Cos., Inc. | 1,375 | 93,527 | ||||||
ProAssurance Corp. | 1,370 | 74,528 | ||||||
RenaissanceRe Holdings Ltd. | 630 | 85,882 | ||||||
The Progressive Corp. | 2,470 | 92,477 | ||||||
|
| |||||||
| 711,103 | ||||||||
|
| |||||||
Mortgage Real Estate Investment Trusts (REITs) – 0.6% |
| |||||||
MFA Financial, Inc. | 9,440 | 74,482 | ||||||
|
| |||||||
TOTAL FINANCIALS |
| 1,572,424 | ||||||
|
| |||||||
HEALTH CARE – 13.8% |
| |||||||
Health Care Equipment & Supplies – 2.0% |
| |||||||
Medtronic PLC | 2,010 | 152,800 | ||||||
The Cooper Cos., Inc. | 581 | 107,258 | ||||||
|
| |||||||
| 260,058 | ||||||||
|
| |||||||
See accompanying notes which are an integral part of the financial statements.
| 23 | Semiannual Report |
Table of Contents
Fidelity Low Volatility Factor ETF
Investments (Unaudited) – continued
| Common Stocks – continued | ||||||||
| Shares | Value | |||||||
Health Care Providers & Services – 4.5% |
| |||||||
Aetna, Inc. | 1,072 | $ | 127,150 | |||||
Anthem, Inc. | 951 | 146,587 | ||||||
Cardinal Health, Inc. | 1,403 | 105,169 | ||||||
UnitedHealth Group, Inc. | 1,280 | 207,488 | ||||||
|
| |||||||
| 586,394 | ||||||||
|
| |||||||
Pharmaceuticals – 7.3% | ||||||||
Bristol-Myers Squibb Co. Class A | 2,343 | 115,182 | ||||||
Eli Lilly & Co. | 1,810 | 139,424 | ||||||
Johnson & Johnson | 2,472 | 279,954 | ||||||
Merck & Co., Inc. | 3,402 | 210,890 | ||||||
Pfizer, Inc. | 6,501 | 206,277 | ||||||
|
| |||||||
| 951,727 | ||||||||
|
| |||||||
TOTAL HEALTH CARE |
| 1,798,179 | ||||||
|
| |||||||
INDUSTRIALS – 10.5% | ||||||||
Aerospace & Defense – 3.3% | ||||||||
Lockheed Martin Corp. | 476 | 119,633 | ||||||
Northrop Grumman Corp. | 482 | �� | 110,417 | |||||
Raytheon Co. | 763 | 109,994 | ||||||
Rockwell Collins, Inc. | 1,050 | 95,298 | ||||||
|
| |||||||
| 435,342 | ||||||||
|
| |||||||
Air Freight & Logistics – 0.8% | ||||||||
CH Robinson Worldwide, Inc. | 1,280 | 97,357 | ||||||
|
| |||||||
Commercial Services & Supplies – 3.0% |
| |||||||
Republic Services, Inc. | 1,750 | 100,415 | ||||||
Rollins, Inc. | 3,020 | 106,485 | ||||||
Stericycle, Inc. (a) | 980 | 75,597 | ||||||
Waste Management, Inc. | 1,505 | 104,598 | ||||||
|
| |||||||
| 387,095 | ||||||||
|
| |||||||
Industrial Conglomerates – 1.1% |
| |||||||
3M Co. | 824 | 144,051 | ||||||
|
| |||||||
Machinery – 0.8% |
| |||||||
The Toro Co. | 1,860 | 109,610 | ||||||
|
| |||||||
Professional Services – 0.7% |
| |||||||
Verisk Analytics, Inc. (a) | 1,110 | 91,730 | ||||||
|
| |||||||
Trading Companies & Distributors – 0.8% |
| |||||||
WW Grainger, Inc. | 410 | 103,554 | ||||||
|
| |||||||
TOTAL INDUSTRIALS |
| 1,368,739 | ||||||
|
| |||||||
INFORMATION TECHNOLOGY – 21.6% |
| |||||||
Electronic Equipment, Instruments & Components – 1.0% |
| |||||||
FLIR Systems, Inc. | 3,570 | 126,128 | ||||||
|
| |||||||
Internet Software & Services – 3.1% | ||||||||
Alphabet, Inc. Class A (a) | 486 | 398,612 | ||||||
|
| |||||||
IT Services – 8.1% | ||||||||
Amdocs Ltd. | 1,950 | 114,485 | ||||||
Automatic Data Processing, Inc. | 1,522 | 153,707 | ||||||
Fiserv, Inc. (a) | 1,180 | 126,767 | ||||||
| Shares | Value | |||||||
International Business Machines Corp. | 1,210 | $ | 211,169 | |||||
Jack Henry & Associates, Inc. | 1,301 | 116,804 | ||||||
Paychex, Inc. | 2,083 | 125,584 | ||||||
Visa, Inc. Class A | 2,540 | 210,083 | ||||||
|
| |||||||
| 1,058,599 | ||||||||
|
| |||||||
Semiconductors & Semiconductor Equipment – 1.7% |
| |||||||
Intel Corp. | 6,015 | 221,472 | ||||||
Versum Materials, Inc. (a) | 153 | 4,277 | ||||||
|
| |||||||
| 225,749 | ||||||||
|
| |||||||
Software – 7.7% | ||||||||
CDK Global, Inc. | 2,000 | 125,100 | ||||||
Intuit, Inc. | 1,160 | 137,553 | ||||||
Microsoft Corp. | 6,653 | 430,116 | ||||||
Oracle Corp. | 4,570 | 183,303 | ||||||
Synopsys, Inc. (a) | 2,110 | 132,698 | ||||||
|
| |||||||
| 1,008,770 | ||||||||
|
| |||||||
TOTAL INFORMATION TECHNOLOGY |
| 2,817,858 | ||||||
|
| |||||||
MATERIALS – 3.1% | ||||||||
Chemicals – 2.4% | ||||||||
Air Products & Chemicals, Inc. | 313 | 43,745 | ||||||
Ecolab, Inc. | 400 | 48,052 | ||||||
International Flavors & Fragrances, Inc. | 263 | 30,826 | ||||||
Monsanto Co. | 540 | 58,488 | ||||||
Praxair, Inc. | 423 | 50,100 | ||||||
The Scotts Miracle-Gro Co. Class A | 400 | 36,788 | ||||||
The Sherwin-Williams Co. | 144 | 43,749 | ||||||
|
| |||||||
| 311,748 | ||||||||
|
| |||||||
Containers & Packaging – 0.7% |
| |||||||
Aptargroup, Inc. | 420 | 30,647 | ||||||
Bemis Co., Inc. | 640 | 31,181 | ||||||
Sonoco Products Co. | 640 | 35,168 | ||||||
|
| |||||||
| 96,996 | ||||||||
|
| |||||||
TOTAL MATERIALS |
| 408,744 | ||||||
|
| |||||||
REAL ESTATE – 5.3% | ||||||||
Equity Real Estate Investment Trusts (REITs) – 5.3% |
| |||||||
American Campus Communities, Inc. | 1,400 | 68,068 | ||||||
American Tower Corp. | 870 | 90,045 | ||||||
Crown Castle International Corp. | 941 | 82,648 | ||||||
Federal Realty Investment Trust | 473 | 66,423 | ||||||
National Retail Properties, Inc. | 1,450 | 63,220 | ||||||
Public Storage | 397 | 85,355 | ||||||
Realty Income Corp. | 1,180 | 70,363 | ||||||
Simon Property Group, Inc. | 510 | 93,723 | ||||||
Ventas, Inc. | 1,170 | 72,154 | ||||||
|
| |||||||
TOTAL REAL ESTATE |
| 691,999 | ||||||
|
| |||||||
See accompanying notes which are an integral part of the financial statements.
| Semiannual Report | 24 |
Table of Contents
| Common Stocks – continued | ||||||||
| Shares | Value | |||||||
TELECOMMUNICATION SERVICES – 2.4% |
| |||||||
Diversified Telecommunication Services – 2.4% |
| |||||||
AT&T, Inc. | 3,963 | $ | 167,080 | |||||
CenturyLink, Inc. | 690 | 17,843 | ||||||
Verizon Communications, Inc. | 2,660 | 130,367 | ||||||
|
| |||||||
TOTAL TELECOMMUNICATION SERVICES |
| 315,290 | ||||||
|
| |||||||
UTILITIES – 3.3% |
| |||||||
Electric Utilities – 2.1% |
| |||||||
American Electric Power Co., Inc. | 650 | 41,639 | ||||||
Duke Energy Corp. | 700 | 54,978 | ||||||
NextEra Energy, Inc. | 470 | 58,148 | ||||||
PPL Corp. | 1,070 | 37,279 | ||||||
The Southern Co. | 1,020 | 50,419 | ||||||
Xcel Energy, Inc. | 870 | 35,948 | ||||||
|
| |||||||
| 278,411 | ||||||||
|
| |||||||
Multi-Utilities – 1.0% | ||||||||
Consolidated Edison, Inc. | 482 | 35,837 | ||||||
| Shares | Value | |||||||
Dominion Resources, Inc. | 690 | $ | 52,633 | |||||
DTE Energy Co. | 360 | 35,510 | ||||||
|
| |||||||
| 123,980 | ||||||||
|
| |||||||
Water Utilities – 0.2% | ||||||||
American Water Works Co., Inc. | 410 | 30,111 | ||||||
|
| |||||||
TOTAL UTILITIES |
| 432,502 | ||||||
|
| |||||||
TOTAL COMMON STOCKS |
| 13,019,153 | ||||||
|
| |||||||
TOTAL INVESTMENT PORTFOLIO – 99.7% |
| 13,019,153 | ||||||
NET OTHER ASSETS (LIABILITIES) – 0.3% |
| 34,968 | ||||||
|
| |||||||
NET ASSETS – 100% |
| $ | 13,054,121 | |||||
|
| |||||||
Legend
| (a) | Non-income producing. |
Other Information
All investments are categorized as Level 1 under the Fair Value Hierarchy. The inputs or methodology used for valuing securities may not be an indication of the risk associated with investing in those securities. For more information on valuation inputs please refer to the Investment Valuation section in the accompanying Notes to Financial Statements.
See accompanying notes which are an integral part of the financial statements.
| 25 | Semiannual Report |
Table of Contents
Fidelity Momentum Factor ETF
Investments January 31, 2017 (Unaudited)
Showing Percentage of Net Assets
| Common Stocks – 99.7% | ||||||||
| Shares | Value | |||||||
CONSUMER DISCRETIONARY – 12.9% |
| |||||||
Hotels, Restaurants & Leisure – 3.1% |
| |||||||
Domino’s Pizza, Inc. | 518 | $ | 90,412 | |||||
McDonald’s Corp. | 1,266 | 155,174 | ||||||
Vail Resorts, Inc. | 540 | 92,631 | ||||||
Yum! Brands, Inc. | 1,564 | 102,489 | ||||||
|
| |||||||
| 440,706 | ||||||||
|
| |||||||
Household Durables – 0.7% | ||||||||
Newell Brands, Inc. | 2,003 | 94,802 | ||||||
|
| |||||||
Internet & Direct Marketing Retail – 2.0% |
| |||||||
Amazon.com, Inc. (a) | 358 | 294,806 | ||||||
|
| |||||||
Media – 4.3% | ||||||||
Charter Communications, Inc. Class A (a) | 464 | 150,313 | ||||||
Comcast Corp. Class A | 2,886 | 217,662 | ||||||
Liberty Broadband Corp. Class A (a) | 1,346 | 112,633 | ||||||
Time Warner, Inc. | 1,424 | 137,915 | ||||||
|
| |||||||
| 618,523 | ||||||||
|
| |||||||
Specialty Retail – 2.8% | ||||||||
Burlington Stores, Inc. (a) | 1,202 | 100,607 | ||||||
The Home Depot, Inc. | 1,469 | 202,105 | ||||||
Ulta Salon, Cosmetics & Fragrance, Inc. (a) | 386 | 105,100 | ||||||
|
| |||||||
| 407,812 | ||||||||
|
| |||||||
TOTAL CONSUMER DISCRETIONARY |
| 1,856,649 | ||||||
|
| |||||||
CONSUMER STAPLES – 8.6% | ||||||||
Beverages – 1.1% | ||||||||
PepsiCo, Inc. | 1,474 | 152,972 | ||||||
|
| |||||||
Food & Staples Retailing – 1.4% | ||||||||
Sysco Corp. | 1,540 | 80,788 | ||||||
Wal-Mart Stores, Inc. | 1,808 | 120,666 | ||||||
|
| |||||||
| 201,454 | ||||||||
|
| |||||||
Food Products – 1.5% | ||||||||
Ingredion, Inc. | 495 | 63,454 | ||||||
The Kraft Heinz Co. | 1,056 | 94,290 | ||||||
Tyson Foods, Inc. Class A | 1,016 | 63,795 | ||||||
|
| |||||||
| 221,539 | ||||||||
|
| |||||||
Household Products – 2.1% | ||||||||
Colgate-Palmolive Co. | 1,397 | 90,219 | ||||||
The Procter & Gamble Co. | 2,402 | 210,415 | ||||||
|
| |||||||
| 300,634 | ||||||||
|
| |||||||
Personal Products – 0.4% | ||||||||
Nu Skin Enterprises, Inc. Class A | 1,014 | 52,606 | ||||||
|
| |||||||
Tobacco – 2.1% | ||||||||
Altria Group, Inc. | 2,150 | 153,037 | ||||||
Philip Morris International, Inc. | 1,600 | 153,808 | ||||||
|
| |||||||
| 306,845 | ||||||||
|
| |||||||
TOTAL CONSUMER STAPLES |
| 1,236,050 | ||||||
|
| |||||||
| Shares | Value | |||||||
ENERGY – 6.8% | ||||||||
Energy Equipment & Services – 1.8% |
| |||||||
Halliburton Co. | 1,386 | $ | 78,406 | |||||
Schlumberger Ltd. | 1,382 | 115,687 | ||||||
US Silica Holdings, Inc. | 938 | 55,473 | ||||||
|
| |||||||
| 249,566 | ||||||||
|
| |||||||
Oil, Gas & Consumable Fuels – 5.0% |
| |||||||
Chevron Corp. | 1,585 | 176,490 | ||||||
CONSOL Energy, Inc. | 2,434 | 41,232 | ||||||
Exxon Mobil Corp. | 3,153 | 264,505 | ||||||
ONEOK, Inc. | 957 | 52,740 | ||||||
Parsley Energy, Inc. Class A (a) | 1,256 | 44,236 | ||||||
Rice Energy, Inc. (a) | 1,873 | 37,142 | ||||||
Spectra Energy Corp. | 1,421 | 59,185 | ||||||
WPX Energy, Inc. (a) | 3,487 | 48,574 | ||||||
|
| |||||||
| 724,104 | ||||||||
|
| |||||||
TOTAL ENERGY |
| 973,670 | ||||||
|
| |||||||
FINANCIALS – 13.8% | ||||||||
Banks – 2.2% | ||||||||
JPMorgan Chase & Co. | 3,712 | 314,146 | ||||||
|
| |||||||
Capital Markets – 4.0% | ||||||||
CME Group, Inc. | 1,123 | 135,973 | ||||||
MarketAxess Holdings, Inc. | 651 | 121,900 | ||||||
MSCI, Inc. | 1,236 | 102,279 | ||||||
Nasdaq, Inc. | 1,523 | 107,432 | ||||||
S&P Global, Inc. | 928 | 111,527 | ||||||
|
| |||||||
| 579,111 | ||||||||
|
| |||||||
Diversified Financial Services – 2.1% |
| |||||||
Berkshire Hathaway, Inc. Class B (a) | 1,871 | 307,106 | ||||||
|
| |||||||
Insurance – 4.1% | ||||||||
Aflac, Inc. | 1,618 | 113,244 | ||||||
Aon PLC | 1,039 | 117,095 | ||||||
Chubb Ltd. | 1,048 | 137,802 | ||||||
Cincinnati Financial Corp. | 1,445 | 101,988 | ||||||
Marsh & McLennan Cos., Inc. | 1,797 | 122,232 | ||||||
|
| |||||||
| 592,361 | ||||||||
|
| |||||||
Mortgage Real Estate Investment Trusts (REITs) – 1.4% |
| |||||||
AGNC Investment Corp. | 4,963 | 92,659 | ||||||
Annaly Capital Management, Inc. | 9,791 | 100,064 | ||||||
|
| |||||||
| 192,723 | ||||||||
|
| |||||||
TOTAL FINANCIALS |
| 1,985,447 | ||||||
|
| |||||||
HEALTH CARE – 12.9% | ||||||||
Health Care Equipment & Supplies – 5.9% |
| |||||||
Baxter International, Inc. | 2,685 | 128,638 | ||||||
Boston Scientific Corp. (a) | 6,023 | 144,914 | ||||||
Edwards Lifesciences Corp. (a) | 1,379 | 132,715 | ||||||
IDEXX Laboratories, Inc. (a) | 1,113 | 136,153 | ||||||
Intuitive Surgical, Inc. (a) | 189 | 130,919 | ||||||
See accompanying notes which are an integral part of the financial statements.
| Semiannual Report | 26 |
Table of Contents
| Common Stocks – continued | ||||||||
| Shares | Value | |||||||
HEALTH CARE – continued | ||||||||
Health Care Equipment & Supplies – continued |
| |||||||
Medtronic PLC | 2,255 | $ | 171,425 | |||||
|
| |||||||
| 844,764 | ||||||||
|
| |||||||
Health Care Providers & Services – 1.6% |
| |||||||
UnitedHealth Group, Inc. | 1,423 | 230,668 | ||||||
|
| |||||||
Pharmaceuticals – 5.4% | ||||||||
Johnson & Johnson | 2,739 | 310,192 | ||||||
Merck & Co., Inc. | 3,692 | 228,867 | ||||||
Pfizer, Inc. | 7,637 | 242,322 | ||||||
|
| |||||||
| 781,381 | ||||||||
|
| |||||||
TOTAL HEALTH CARE |
| 1,856,813 | ||||||
|
| |||||||
INDUSTRIALS – 9.8% | ||||||||
Aerospace & Defense – 2.7% | ||||||||
HEICO Corp. | 1,047 | 80,566 | ||||||
Lockheed Martin Corp. | 443 | 111,339 | ||||||
Northrop Grumman Corp. | 411 | 94,152 | ||||||
Raytheon Co. | 693 | 99,903 | ||||||
|
| |||||||
| 385,960 | ||||||||
|
| |||||||
Building Products – 0.7% | ||||||||
Johnson Controls International PLC | 2,258 | 99,307 | ||||||
|
| |||||||
Commercial Services & Supplies – 1.1% |
| |||||||
Copart, Inc. (a) | 1,355 | 76,883 | ||||||
Waste Management, Inc. | 1,323 | 91,948 | ||||||
|
| |||||||
| 168,831 | ||||||||
|
| |||||||
Industrial Conglomerates – 3.6% | ||||||||
3M Co. | 805 | 140,730 | ||||||
General Electric Co. | 8,184 | 243,065 | ||||||
Honeywell International, Inc. | 1,112 | 131,572 | ||||||
|
| |||||||
| 515,367 | ||||||||
|
| |||||||
Machinery – 1.2% | ||||||||
Illinois Tool Works, Inc. | 796 | 101,251 | ||||||
Xylem, Inc. | 1,541 | 75,987 | ||||||
|
| |||||||
| 177,238 | ||||||||
|
| |||||||
Professional Services – 0.5% | ||||||||
Equifax, Inc. | 621 | 72,831 | ||||||
|
| |||||||
TOTAL INDUSTRIALS |
| 1,419,534 | ||||||
|
| |||||||
INFORMATION TECHNOLOGY – 22.5% |
| |||||||
Communications Equipment – 1.5% | ||||||||
Cisco Systems, Inc. | 6,802 | 208,957 | ||||||
|
| |||||||
Electronic Equipment, Instruments & Components – 2.8% |
| |||||||
Coherent, Inc. (a) | 957 | 150,948 | ||||||
Corning, Inc. | 5,492 | 145,483 | ||||||
Dolby Laboratories, Inc. Class A | 2,351 | 112,636 | ||||||
|
| |||||||
| 409,067 | ||||||||
|
| |||||||
Internet Software & Services – 5.1% | ||||||||
Alphabet, Inc. Class A (a) | 513 | 420,757 | ||||||
| Shares | Value | |||||||
Facebook, Inc. Class A (a) | 2,403 | $ | 313,159 | |||||
|
| |||||||
| 733,916 | ||||||||
|
| |||||||
IT Services – 1.5% | ||||||||
International Business Machines Corp. | 1,268 | 221,291 | ||||||
|
| |||||||
Semiconductors & Semiconductor Equipment – 6.9% |
| |||||||
Advanced Micro Devices, Inc. (a) | 16,549 | 171,613 | ||||||
Applied Materials, Inc. | 4,510 | 154,468 | ||||||
Broadcom Ltd. | 877 | 174,962 | ||||||
Cirrus Logic, Inc. (a) | 2,002 | 120,761 | ||||||
NVIDIA Corp. | 1,930 | 210,717 | ||||||
Texas Instruments, Inc. | 2,234 | 168,756 | ||||||
|
| |||||||
| 1,001,277 | ||||||||
|
| |||||||
Software – 3.7% | ||||||||
Ellie Mae, Inc. (a) | 1,082 | 89,525 | ||||||
Microsoft Corp. | 6,859 | 443,434 | ||||||
|
| |||||||
| 532,959 | ||||||||
|
| |||||||
Technology Hardware, Storage & Peripherals – 1.0% |
| |||||||
Hewlett Packard Enterprise Co. | 6,017 | 136,466 | ||||||
|
| |||||||
TOTAL INFORMATION TECHNOLOGY |
| 3,243,933 | ||||||
|
| |||||||
MATERIALS – 3.2% | ||||||||
Chemicals – 2.1% | ||||||||
Air Products & Chemicals, Inc. | 330 | 46,121 | ||||||
Albemarle Corp. | 374 | 34,647 | ||||||
EI du Pont de Nemours & Co. | 929 | 70,140 | ||||||
Monsanto Co. | 539 | 58,379 | ||||||
Praxair, Inc. | 400 | 47,376 | ||||||
The Chemours Co. | 1,628 | 43,012 | ||||||
|
| |||||||
| 299,675 | ||||||||
|
| |||||||
Construction Materials – 0.2% | ||||||||
Martin Marietta Materials, Inc. | 172 | 39,491 | ||||||
|
| |||||||
Metals & Mining – 0.9% | ||||||||
Hecla Mining Co. | 4,262 | 27,447 | ||||||
Newmont Mining Corp. | 1,012 | 36,716 | ||||||
Royal Gold, Inc. | 378 | 27,280 | ||||||
Steel Dynamics, Inc. | 1,079 | 36,481 | ||||||
|
| |||||||
| 127,924 | ||||||||
|
| |||||||
TOTAL MATERIALS |
| 467,090 | ||||||
|
| |||||||
REAL ESTATE – 3.6% | ||||||||
Equity Real Estate Investment Trusts (REITs) – 3.6% |
| |||||||
American Campus Communities, Inc. | 455 | 22,122 | ||||||
American Tower Corp. | 433 | 44,815 | ||||||
Communications Sales & Leasing, Inc. (a) | 783 | 20,577 | ||||||
DCT Industrial Trust, Inc. | 478 | 21,362 | ||||||
Digital Realty Trust, Inc. | 300 | 32,289 | ||||||
Duke Realty Corp. | 969 | 23,576 | ||||||
EPR Properties | 316 | 23,375 | ||||||
Equinix, Inc. | 100 | 38,498 | ||||||
Equity Lifestyle Properties, Inc. | 301 | 22,256 | ||||||
Highwoods Properties, Inc. | 453 | 23,289 | ||||||
See accompanying notes which are an integral part of the financial statements.
| 27 | Semiannual Report |
Table of Contents
Fidelity Momentum Factor ETF
Investments (Unaudited) – continued
| Common Stocks – continued | ||||||||
| Shares | Value | |||||||
REAL ESTATE – continued | ||||||||
Equity Real Estate Investment Trusts (REITs) – continued |
| |||||||
National Retail Properties, Inc. | 518 | $ | 22,585 | |||||
Prologis, Inc. | 709 | 34,635 | ||||||
Realty Income Corp. | 488 | 29,099 | ||||||
Senior Housing Properties Trust | 1,093 | 20,822 | ||||||
Simon Property Group, Inc. | 302 | 55,499 | ||||||
Spirit Realty Capital, Inc. | 1,947 | 20,482 | ||||||
Ventas, Inc. | 521 | 32,130 | ||||||
Welltower, Inc. | 508 | 33,680 | ||||||
|
| |||||||
TOTAL REAL ESTATE |
| 521,091 | ||||||
|
| |||||||
TELECOMMUNICATION SERVICES – 2.4% |
| |||||||
Diversified Telecommunication Services – 2.2% |
| |||||||
AT&T, Inc. | 4,281 | 180,487 | ||||||
Verizon Communications, Inc. | 2,872 | 140,757 | ||||||
|
| |||||||
| 321,244 | ||||||||
|
| |||||||
Wireless Telecommunication Services – 0.2% |
| |||||||
T-Mobile US, Inc. (a) | 409 | 25,468 | ||||||
|
| |||||||
TOTAL TELECOMMUNICATION SERVICES |
| 346,712 | ||||||
|
| |||||||
UTILITIES – 3.2% | ||||||||
Electric Utilities – 1.9% | ||||||||
Duke Energy Corp. | 828 | 65,031 | ||||||
Edison International | 642 | 46,789 | ||||||
NextEra Energy, Inc. | 542 | 67,056 | ||||||
The Southern Co. | 1,225 | 60,552 | ||||||
Westar Energy, Inc. | 617 | 33,744 | ||||||
|
| |||||||
| 273,172 | ||||||||
|
| |||||||
Gas Utilities – 0.2% | ||||||||
UGI Corp. | 782 | 36,261 | ||||||
|
| |||||||
| Shares | Value | |||||||
Multi-Utilities – 0.8% | ||||||||
CenterPoint Energy, Inc. | 1,607 | $ | 42,119 | |||||
MDU Resources Group, Inc. | 1,291 | 37,891 | ||||||
SCANA Corp. | 518 | 35,587 | ||||||
|
| |||||||
| 115,597 | ||||||||
|
| |||||||
Water Utilities – 0.3% | ||||||||
American Water Works Co., Inc. | 530 | 38,923 | ||||||
|
| |||||||
TOTAL UTILITIES |
| 463,953 | ||||||
|
| |||||||
TOTAL COMMON STOCKS |
| 14,370,942 | ||||||
|
| |||||||
| Money Market Funds – 0.1% | ||||||||
Fidelity Cash Central Fund, 0.62% (b) | 17,703 | 17,707 | ||||||
|
| |||||||
TOTAL INVESTMENT PORTFOLIO – 99.8% |
| 14,388,649 | ||||||
NET OTHER ASSETS (LIABILITIES) – 0.2% |
| 26,206 | ||||||
|
| |||||||
NET ASSETS – 100% |
| $ | 14,414,855 | |||||
|
| |||||||
Legend
| (a) | Non-income producing. |
| (b) | Affiliated fund that is generally available only to investment companies and other accounts managed by Fidelity Investments. The rate quoted is the annualized seven-day yield of the fund at period end. A complete unaudited listing of the fund’s holdings as of its most recent quarter end is available upon request. In addition, each Fidelity Central Fund’s financial statements are available on the SEC’s website or upon request. |
Affiliated Central Funds
Information regarding fiscal year to date income earned by the Fund from investments in Fidelity Central Funds is as follows:
| Fund | Income earned | |||
Fidelity Cash Central Fund | $ | 6 | ||
|
| |||
Other Information
All investments are categorized as Level 1 under the Fair Value Hierarchy. The inputs or methodology used for valuing securities may not be an indication of the risk associated with investing in those securities. For more information on valuation inputs please refer to the Investment Valuation section in the accompanying Notes to Financial Statements.
See accompanying notes which are an integral part of the financial statements.
| Semiannual Report | 28 |
Table of Contents
Fidelity Quality Factor ETF
Investments January 31, 2017 (Unaudited)
Showing Percentage of Net Assets
| Common Stocks – 99.8% | ||||||||
| Shares | Value | |||||||
CONSUMER DISCRETIONARY – 12.7% |
| |||||||
Hotels, Restaurants & Leisure – 4.2% |
| |||||||
Domino’s Pizza, Inc. | 773 | $ | 134,920 | |||||
Marriott International, Inc. Class A | 1,644 | 139,082 | ||||||
McDonald’s Corp. | 1,641 | 201,137 | ||||||
Starbucks Corp. | 3,165 | 174,771 | ||||||
Yum China Holdings, Inc. (a) | 1,543 | 42,402 | ||||||
Yum! Brands, Inc. | 1,556 | 101,965 | ||||||
|
| |||||||
| 794,277 | ||||||||
|
| |||||||
Internet & Direct Marketing Retail – 1.0% |
| |||||||
The Priceline Group, Inc. (a) | 120 | 189,016 | ||||||
|
| |||||||
Media – 3.5% | ||||||||
Comcast Corp. Class A | 3,625 | 273,397 | ||||||
Sirius XM Holdings, Inc. | 27,104 | 127,931 | ||||||
The Walt Disney Co. | 2,377 | 263,015 | ||||||
|
| |||||||
| 664,343 | ||||||||
|
| |||||||
Specialty Retail – 3.5% | ||||||||
O’Reilly Automotive, Inc. (a) | 451 | 118,284 | ||||||
Ross Stores, Inc. | 2,077 | 137,310 | ||||||
The Home Depot, Inc. | 1,829 | 251,634 | ||||||
The TJX Companies, Inc. | 1,872 | 140,250 | ||||||
|
| |||||||
| 647,478 | ||||||||
|
| |||||||
Textiles, Apparel & Luxury Goods – 0.5% |
| |||||||
Michael Kors Holdings Ltd. (a) | 2,310 | 98,891 | ||||||
|
| |||||||
TOTAL CONSUMER DISCRETIONARY |
| 2,394,005 | ||||||
|
| |||||||
CONSUMER STAPLES – 8.5% | ||||||||
Beverages – 1.7% | ||||||||
Dr Pepper Snapple Group, Inc. | 1,051 | 95,851 | ||||||
The Coca-Cola Co. | 5,232 | 217,495 | ||||||
|
| |||||||
| 313,346 | ||||||||
|
| |||||||
Food Products – 0.4% | ||||||||
Mead Johnson Nutrition Co. | 1,150 | 81,029 | ||||||
|
| |||||||
Household Products – 3.8% | ||||||||
Church & Dwight Co., Inc. | 1,935 | 87,501 | ||||||
Colgate-Palmolive Co. | 1,906 | 123,089 | ||||||
Kimberly-Clark Corp. | 969 | 117,375 | ||||||
The Clorox Co. | 757 | 90,840 | ||||||
The Procter & Gamble Co. | 3,247 | 284,437 | ||||||
|
| |||||||
| 703,242 | ||||||||
|
| |||||||
Personal Products – 0.4% | ||||||||
Herbalife Ltd. (a) | 1,333 | 74,915 | ||||||
|
| |||||||
Tobacco – 2.2% | ||||||||
Altria Group, Inc. | 2,930 | 208,557 | ||||||
Philip Morris International, Inc. | 2,182 | 209,756 | ||||||
|
| |||||||
| 418,313 | ||||||||
|
| |||||||
TOTAL CONSUMER STAPLES |
| 1,590,845 | ||||||
|
| |||||||
| Shares | Value | |||||||
ENERGY – 6.6% | ||||||||
Energy Equipment & Services – 2.0% |
| |||||||
Baker Hughes, Inc. | 1,266 | $ | 79,859 | |||||
Core Laboratories N.V. | 406 | 47,433 | ||||||
National Oilwell Varco, Inc. | 1,610 | 60,874 | ||||||
Oceaneering International, Inc. | 1,596 | 44,449 | ||||||
Schlumberger Ltd. | 1,699 | 142,223 | ||||||
|
| |||||||
| 374,838 | ||||||||
|
| |||||||
Oil, Gas & Consumable Fuels – 4.6% |
| |||||||
Chevron Corp. | 2,001 | 222,811 | ||||||
Exxon Mobil Corp. | 3,959 | 332,121 | ||||||
Kinder Morgan, Inc. | 3,619 | 80,849 | ||||||
Marathon Petroleum Corp. | 1,487 | 71,450 | ||||||
Phillips 66 | 940 | 76,723 | ||||||
Valero Energy Corp. | 1,190 | 78,254 | ||||||
|
| |||||||
| 862,208 | ||||||||
|
| |||||||
TOTAL ENERGY |
| 1,237,046 | ||||||
|
| |||||||
FINANCIALS – 11.7% | ||||||||
Banks – 5.9% | ||||||||
Bank of Hawaii Corp. | 1,819 | 156,270 | ||||||
Bank of the Ozarks, Inc. | 3,460 | 189,850 | ||||||
East West Bancorp, Inc. | 3,682 | 189,402 | ||||||
Signature Bank (a) | 1,049 | 165,239 | ||||||
US Bancorp | 4,215 | 221,920 | ||||||
Western Alliance Bancorp (a) | 3,598 | 177,669 | ||||||
|
| |||||||
| 1,100,350 | ||||||||
|
| |||||||
Capital Markets – 4.9% | ||||||||
CBOE Holdings, Inc. | 1,812 | 144,272 | ||||||
FactSet Research Systems, Inc. | 728 | 125,980 | ||||||
Moody’s Corp. | 1,290 | 133,734 | ||||||
Morgan Stanley | 5,521 | 234,587 | ||||||
S&P Global, Inc. | 1,222 | 146,860 | ||||||
SEI Investments Co. | 2,739 | 132,869 | ||||||
|
| |||||||
| 918,302 | ||||||||
|
| |||||||
Consumer Finance – 0.9% | ||||||||
Synchrony Financial | 5,007 | 179,351 | ||||||
|
| |||||||
TOTAL FINANCIALS |
| 2,198,003 | ||||||
|
| |||||||
HEALTH CARE – 13.6% |
| |||||||
Biotechnology – 6.6% | ||||||||
AbbVie, Inc. | 3,505 | 214,191 | ||||||
Amgen, Inc. | 1,459 | 228,596 | ||||||
Biogen, Inc. (a) | 638 | 176,879 | ||||||
Celgene Corp. (a) | 1,882 | 218,594 | ||||||
Gilead Sciences, Inc. | 2,898 | 209,960 | ||||||
United Therapeutics Corp. (a) | 1,177 | 192,593 | ||||||
|
| |||||||
| 1,240,813 | ||||||||
|
| |||||||
Health Care Equipment & Supplies – 0.9% |
| |||||||
Intuitive Surgical, Inc. (a) | 238 | 164,860 | ||||||
|
| |||||||
See accompanying notes which are an integral part of the financial statements.
| 29 | Semiannual Report |
Table of Contents
Fidelity Quality Factor ETF
Investments (Unaudited) – continued
| Common Stocks – continued | ||||||||
| Shares | Value | |||||||
HEALTH CARE – continued |
| |||||||
Life Sciences Tools & Services – 0.9% |
| |||||||
Mettler-Toledo International, Inc. (a) | 384 | $ | 163,826 | |||||
|
| |||||||
Pharmaceuticals – 5.2% |
| |||||||
Johnson & Johnson | 3,462 | 392,071 | ||||||
Merck & Co., Inc. | 4,795 | 297,242 | ||||||
Pfizer, Inc. | 9,119 | 289,346 | ||||||
|
| |||||||
| 978,659 | ||||||||
|
| |||||||
TOTAL HEALTH CARE |
| 2,548,158 | ||||||
|
| |||||||
INDUSTRIALS – 10.6% | ||||||||
Aerospace & Defense – 1.9% | ||||||||
Lockheed Martin Corp. | 617 | 155,070 | ||||||
The Boeing Co. | 1,283 | 209,668 | ||||||
|
| |||||||
| 364,738 | ||||||||
|
| |||||||
Air Freight & Logistics – 0.6% |
| |||||||
Expeditors International of Washington, Inc. | 2,185 | 113,795 | ||||||
|
| |||||||
Airlines – 1.7% |
| |||||||
Alaska Air Group, Inc. | 1,680 | 157,618 | ||||||
Delta Air Lines, Inc. | 3,450 | 162,978 | ||||||
|
| |||||||
| 320,596 | ||||||||
|
| |||||||
Commercial Services & Supplies – 0.7% |
| |||||||
Rollins, Inc. | 3,796 | 133,847 | ||||||
|
| |||||||
Electrical Equipment – 0.8% |
| |||||||
Rockwell Automation, Inc. | 1,000 | 147,990 | ||||||
|
| |||||||
Industrial Conglomerates – 2.0% |
| |||||||
3M Co. | 1,085 | 189,680 | ||||||
Honeywell International, Inc. | 1,523 | 180,201 | ||||||
|
| |||||||
| 369,881 | ||||||||
|
| |||||||
Machinery – 0.8% | ||||||||
Illinois Tool Works, Inc. | 1,155 | 146,916 | ||||||
|
| |||||||
Professional Services – 1.1% | ||||||||
The Dun & Bradstreet Corp. | 761 | 93,314 | ||||||
Verisk Analytics, Inc. (a) | 1,390 | 114,869 | ||||||
|
| |||||||
| �� | 208,183 | |||||||
|
| |||||||
Road & Rail – 1.0% |
| |||||||
Union Pacific Corp. | 1,810 | 192,910 | ||||||
|
| |||||||
TOTAL INDUSTRIALS |
| 1,998,856 | ||||||
|
| |||||||
INFORMATION TECHNOLOGY – 21.3% |
| |||||||
Communications Equipment – 0.7% |
| |||||||
F5 Networks, Inc. (a) | 981 | 131,484 | ||||||
|
| |||||||
Internet Software & Services – 5.3% | ||||||||
Alphabet, Inc. Class A (a) | 629 | 515,899 | ||||||
Facebook, Inc. Class A (a) | 2,855 | 372,064 | ||||||
VeriSign, Inc. (a) | 1,430 | 114,700 | ||||||
|
| |||||||
| 1,002,663 | ||||||||
|
| |||||||
IT Services – 4.1% |
| |||||||
Accenture PLC Class A | 1,525 | 173,652 | ||||||
| Shares | Value | |||||||
Mastercard, Inc. Class A | 2,004 | $ | 213,085 | |||||
Paychex, Inc. | 2,214 | 133,482 | ||||||
Visa, Inc. Class A | 3,033 | 250,860 | ||||||
|
| |||||||
| 771,079 | ||||||||
|
| |||||||
Semiconductors & Semiconductor Equipment – 1.7% |
| |||||||
Linear Technology Corp. | 2,128 | 134,340 | ||||||
Texas Instruments, Inc. | 2,479 | 187,264 | ||||||
Versum Materials, Inc. (a) | 185 | 5,171 | ||||||
|
| |||||||
| 326,775 | ||||||||
|
| |||||||
Software – 5.8% |
| |||||||
Aspen Technology, Inc. (a) | 2,831 | 150,354 | ||||||
Check Point Software Technologies Ltd. (a) | 1,614 | 159,415 | ||||||
Microsoft Corp. | 8,587 | 555,149 | ||||||
Oracle Corp. | 5,378 | 215,712 | ||||||
|
| |||||||
| 1,080,630 | ||||||||
|
| |||||||
Technology Hardware, Storage & Peripherals – 3.7% |
| |||||||
Apple, Inc. | 5,664 | 687,326 | ||||||
|
| |||||||
TOTAL INFORMATION TECHNOLOGY |
| 3,999,957 | ||||||
|
| |||||||
MATERIALS – 3.3% |
| |||||||
Chemicals – 3.0% |
| |||||||
AdvanSix, Inc. (a) | 57 | 1,464 | ||||||
Air Products & Chemicals, Inc. | 384 | 53,668 | ||||||
Celanese Corp. Class A | 644 | 54,354 | ||||||
Ecolab, Inc. | 493 | 59,224 | ||||||
International Flavors & Fragrances, Inc. | 310 | 36,335 | ||||||
LyondellBasell Industries N.V. Class A | 733 | 68,367 | ||||||
Monsanto Co. | 680 | 73,651 | ||||||
Praxair, Inc. | 525 | 62,181 | ||||||
The Dow Chemical Co. | 1,568 | 93,500 | ||||||
The Sherwin-Williams Co. | 176 | 53,470 | ||||||
|
| |||||||
| 556,214 | ||||||||
|
| |||||||
Containers & Packaging – 0.3% |
| |||||||
International Paper Co. | 1,064 | 60,223 | ||||||
|
| |||||||
TOTAL MATERIALS |
| 616,437 | ||||||
|
| |||||||
REAL ESTATE – 6.1% |
| |||||||
Equity Real Estate Investment Trusts (REITs) – 6.1% |
| |||||||
AvalonBay Communities, Inc. | 774 | 134,142 | ||||||
Equity Residential | 2,114 | 128,468 | ||||||
Essex Property Trust, Inc. | 578 | 129,645 | ||||||
HCP, Inc. | 3,502 | 106,181 | ||||||
National Retail Properties, Inc. | 2,424 | 105,686 | ||||||
Prologis, Inc. | 2,662 | 130,039 | ||||||
Public Storage | 644 | 138,460 | ||||||
Quality Care Properties, Inc. (a) | 700 | 12,922 | ||||||
Realty Income Corp. | 1,943 | 115,861 | ||||||
Simon Property Group, Inc. | 803 | 147,567 | ||||||
|
| |||||||
TOTAL REAL ESTATE |
| 1,148,971 | ||||||
|
| |||||||
See accompanying notes which are an integral part of the financial statements.
| Semiannual Report | 30 |
Table of Contents
| Common Stocks – continued | ||||||||
| Shares | Value | |||||||
TELECOMMUNICATION SERVICES – 2.3% |
| |||||||
Diversified Telecommunication Services – 2.3% |
| |||||||
AT&T, Inc. | 5,517 | $ | 232,597 | |||||
SBA Communications Corp. (a) | 245 | 25,789 | ||||||
Verizon Communications, Inc. | 3,732 | 182,905 | ||||||
|
| |||||||
TOTAL TELECOMMUNICATION SERVICES |
| 441,291 | ||||||
|
| |||||||
UTILITIES – 3.1% |
| |||||||
Electric Utilities – 1.1% |
| |||||||
IDACORP, Inc. | 672 | 53,773 | ||||||
NextEra Energy, Inc. | 783 | 96,873 | ||||||
OGE Energy Corp. | 1,781 | 59,735 | ||||||
|
| |||||||
| 210,381 | ||||||||
|
| |||||||
Gas Utilities – 0.3% | ||||||||
UGI Corp. | 1,232 | 57,128 | ||||||
|
| |||||||
Independent Power and Renewable Electricity Producers – 0.3% |
| |||||||
AES Corp. | 4,592 | 52,532 | ||||||
|
| |||||||
Multi-Utilities – 1.4% | ||||||||
Ameren Corp. | 1,179 | 62,074 | ||||||
CenterPoint Energy, Inc. | 2,482 | 65,053 | ||||||
Consolidated Edison, Inc. | 902 | 67,064 | ||||||
WEC Energy Group, Inc. | 1,050 | 62,003 | ||||||
|
| |||||||
| 256,194 | ||||||||
|
| |||||||
TOTAL UTILITIES |
| 576,235 | ||||||
|
| |||||||
TOTAL COMMON STOCKS |
| 18,749,804 | ||||||
|
| |||||||
| Money Market Funds – 0.1% | ||||||||
| Shares | Value | |||||||
Fidelity Cash Central Fund, 0.62% (b) | 23,500 | $ | 23,505 | |||||
|
| |||||||
TOTAL INVESTMENT PORTFOLIO – 99.9% |
| 18,773,309 | ||||||
NET OTHER ASSETS (LIABILITIES) – 0.1% |
| 17,982 | ||||||
|
| |||||||
NET ASSETS – 100% |
| $ | 18,791,291 | |||||
|
| |||||||
Legend
| (a) | Non-income producing. |
| (b) | Affiliated fund that is generally available only to investment companies and other accounts managed by Fidelity Investments. The rate quoted is the annualized seven-day yield of the fund at period end. A complete unaudited listing of the fund’s holdings as of its most recent quarter end is available upon request. In addition, each Fidelity Central Fund’s financial statements are available on the SEC’s website or upon request. |
Affiliated Central Funds
Information regarding fiscal year to date income earned by the Fund from investments in Fidelity Central Funds is as follows:
| Fund | Income earned | |||
Fidelity Cash Central Fund | $ | 9 | ||
|
| |||
Other Information
All investments are categorized as Level 1 under the Fair Value Hierarchy. The inputs or methodology used for valuing securities may not be an indication of the risk associated with investing in those securities. For more information on valuation inputs please refer to the Investment Valuation section in the accompanying Notes to Financial Statements.
See accompanying notes which are an integral part of the financial statements.
| 31 | Semiannual Report |
Table of Contents
Fidelity Value Factor ETF
Investments January 31, 2017 (Unaudited)
Showing Percentage of Net Assets
| Common Stocks – 99.7% | ||||||||
| Shares | Value | |||||||
CONSUMER DISCRETIONARY – 12.3% |
| |||||||
Automobiles – 1.9% |
| |||||||
Ford Motor Co. | 13,920 | $ | 172,051 | |||||
General Motors Co. | 5,413 | 198,170 | ||||||
|
| |||||||
| 370,221 | ||||||||
|
| |||||||
Diversified Consumer Services – 0.6% |
| |||||||
H&R Block, Inc. | 5,604 | 120,262 | ||||||
|
| |||||||
Hotels, Restaurants & Leisure – 2.9% |
| |||||||
McDonald’s Corp. | 1,823 | 223,445 | ||||||
Royal Caribbean Cruises Ltd. | 1,893 | 177,242 | ||||||
Wyndham Worldwide Corp. | 1,952 | 154,325 | ||||||
|
| |||||||
| 555,012 | ||||||||
|
| |||||||
Media – 3.3% |
| |||||||
The Walt Disney Co. | 2,592 | 286,805 | ||||||
Time Warner, Inc. | 2,310 | 223,723 | ||||||
Viacom, Inc. Class B | 3,263 | 137,503 | ||||||
|
| |||||||
| 648,031 | ||||||||
|
| |||||||
Multiline Retail – 1.4% |
| |||||||
Kohl’s Corp. | 3,472 | 138,290 | ||||||
Target Corp. | 2,217 | 142,952 | ||||||
|
| |||||||
| 281,242 | ||||||||
|
| |||||||
Specialty Retail – 1.6% |
| |||||||
Bed Bath & Beyond, Inc. | 3,103 | 125,206 | ||||||
Best Buy Co., Inc. | 4,079 | 181,597 | ||||||
|
| |||||||
| 306,803 | ||||||||
|
| |||||||
Textiles, Apparel & Luxury Goods – 0.6% |
| |||||||
Michael Kors Holdings Ltd. (a) | 2,744 | 117,471 | ||||||
|
| |||||||
TOTAL CONSUMER DISCRETIONARY |
| 2,399,042 | ||||||
|
| |||||||
CONSUMER STAPLES – 8.2% |
| |||||||
Beverages – 2.1% |
| |||||||
PepsiCo, Inc. | 1,897 | 196,871 | ||||||
The Coca-Cola Co. | 4,948 | 205,688 | ||||||
|
| |||||||
| 402,559 | ||||||||
|
| |||||||
Food & Staples Retailing – 2.0% |
| |||||||
CVS Health Corp. | 1,667 | 131,376 | ||||||
The Kroger Co. | 3,123 | 106,057 | ||||||
Wal-Mart Stores, Inc. | 2,296 | 153,235 | ||||||
|
| |||||||
| 390,668 | ||||||||
|
| |||||||
Food Products – 1.4% |
| |||||||
Archer-Daniels-Midland Co. | 2,228 | 98,612 | ||||||
Bunge Ltd. | 1,277 | 88,381 | ||||||
Tyson Foods, Inc. Class A | 1,276 | 80,120 | ||||||
|
| |||||||
| 267,113 | ||||||||
|
| |||||||
Household Products – 1.4% |
| |||||||
The Procter & Gamble Co. | 3,083 | 270,071 | ||||||
|
| |||||||
Personal Products – 0.3% |
| |||||||
Herbalife Ltd. (a) | 1,176 | 66,091 | ||||||
|
| |||||||
| Shares | Value | |||||||
Tobacco – 1.0% |
| |||||||
Altria Group, Inc. | 2,760 | $ | 196,457 | |||||
|
| |||||||
TOTAL CONSUMER STAPLES |
| 1,592,959 | ||||||
|
| |||||||
ENERGY – 6.4% |
| |||||||
Energy Equipment & Services – 1.1% |
| |||||||
Baker Hughes, Inc. | 1,181 | 74,498 | ||||||
Schlumberger Ltd. | 1,627 | 136,196 | ||||||
|
| |||||||
| 210,694 | ||||||||
|
| |||||||
Oil, Gas & Consumable Fuels – 5.3% |
| |||||||
Chevron Corp. | 1,949 | 217,021 | ||||||
ConocoPhillips | 1,974 | 96,252 | ||||||
Exxon Mobil Corp. | 3,868 | 324,487 | ||||||
HollyFrontier Corp. | 1,654 | 47,916 | ||||||
Kinder Morgan, Inc. | 3,445 | 76,961 | ||||||
Marathon Petroleum Corp. | 1,386 | 66,597 | ||||||
Phillips 66 | 877 | 71,581 | ||||||
Tesoro Corp. | 616 | 49,804 | ||||||
Valero Energy Corp. | 1,109 | 72,928 | ||||||
|
| |||||||
| 1,023,547 | ||||||||
|
| |||||||
TOTAL ENERGY |
| 1,234,241 | ||||||
|
| |||||||
FINANCIALS – 17.4% |
| |||||||
Banks – 6.5% |
| |||||||
Bank of America Corp. | 14,406 | 326,152 | ||||||
Citigroup, Inc. | 4,410 | 246,210 | ||||||
JPMorgan Chase & Co. | 4,349 | 368,056 | ||||||
Wells Fargo & Co. | 5,642 | 317,814 | ||||||
|
| |||||||
| 1,258,232 | ||||||||
|
| |||||||
Capital Markets – 0.9% |
| |||||||
Morgan Stanley | 4,284 | 182,027 | ||||||
|
| |||||||
Consumer Finance – 3.5% |
| |||||||
Ally Financial, Inc. | 5,087 | 107,437 | ||||||
American Express Co. | 2,007 | 153,295 | ||||||
Capital One Financial Corp. | 1,726 | 150,835 | ||||||
Discover Financial Services | 1,868 | 129,415 | ||||||
Synchrony Financial | 3,783 | 135,507 | ||||||
|
| |||||||
| 676,489 | ||||||||
|
| |||||||
Diversified Financial Services – 2.5% |
| |||||||
Berkshire Hathaway, Inc. Class B (a) | 2,147 | 352,409 | ||||||
Voya Financial, Inc. | 3,333 | 134,053 | ||||||
|
| |||||||
| 486,462 | ||||||||
|
| |||||||
Insurance – 1.6% |
| |||||||
Lincoln National Corp. | 2,203 | 148,724 | ||||||
MetLife, Inc. | 3,094 | 168,345 | ||||||
|
| |||||||
| 317,069 | ||||||||
|
| |||||||
Mortgage Real Estate Investment Trusts (REITs) – 2.4% |
| |||||||
AGNC Investment Corp. | 4,657 | 86,946 | ||||||
Annaly Capital Management, Inc. | 8,652 | 88,424 | ||||||
Chimera Investment Corp. | 5,362 | 94,532 | ||||||
See accompanying notes which are an integral part of the financial statements.
| Semiannual Report | 32 |
Table of Contents
| Common Stocks – continued | ||||||||
| Shares | Value | |||||||
FINANCIALS – continued |
| |||||||
Mortgage Real Estate Investment Trusts (REITs) – continued |
| |||||||
New Residential Investment Corp. | 6,342 | $ | 96,081 | |||||
Starwood Property Trust, Inc. | 4,074 | 90,687 | ||||||
|
| |||||||
| 456,670 | ||||||||
|
| |||||||
TOTAL FINANCIALS |
| 3,376,949 | ||||||
|
| |||||||
HEALTH CARE – 13.4% |
| |||||||
Biotechnology – 3.4% | ||||||||
Amgen, Inc. | 1,501 | 235,177 | ||||||
Gilead Sciences, Inc. | 2,999 | 217,278 | ||||||
United Therapeutics Corp. (a) | 1,250 | 204,537 | ||||||
|
| |||||||
| 656,992 | ||||||||
|
| |||||||
Health Care Providers & Services – 4.9% |
| |||||||
Aetna, Inc. | 1,591 | 188,709 | ||||||
Anthem, Inc. | 1,416 | 218,262 | ||||||
Cigna Corp. | 1,392 | 203,538 | ||||||
McKesson Corp. | 969 | 134,836 | ||||||
WellCare Health Plans, Inc. (a) | 1,402 | 204,047 | ||||||
|
| |||||||
| 949,392 | ||||||||
|
| |||||||
Pharmaceuticals – 5.1% |
| |||||||
Johnson & Johnson | 3,504 | 396,828 | ||||||
Merck & Co., Inc. | 4,921 | 305,053 | ||||||
Pfizer, Inc. | 9,354 | 296,802 | ||||||
|
| |||||||
| 998,683 | ||||||||
|
| |||||||
TOTAL HEALTH CARE |
| 2,605,067 | ||||||
|
| |||||||
INDUSTRIALS – 11.7% |
| |||||||
Aerospace & Defense – 2.1% |
| |||||||
Spirit AeroSystems Holdings, Inc. Class A | 2,835 | 170,242 | ||||||
The Boeing Co. | 1,419 | 231,893 | ||||||
|
| |||||||
| 402,135 | ||||||||
|
| |||||||
Airlines – 3.8% |
| |||||||
Delta Air Lines, Inc. | 3,963 | 187,212 | ||||||
JetBlue Airways Corp. (a) | 7,368 | 144,486 | ||||||
Southwest Airlines Co. | 3,850 | 201,394 | ||||||
United Continental Holdings, Inc. (a) | 2,932 | 206,618 | ||||||
|
| |||||||
| 739,710 | ||||||||
|
| |||||||
Construction & Engineering – 0.6% |
| |||||||
Chicago Bridge & Iron Co. N.V. | 3,713 | 123,309 | ||||||
|
| |||||||
Machinery – 2.4% |
| |||||||
Cummins, Inc. | 1,113 | 163,622 | ||||||
PACCAR, Inc. | 2,408 | 162,083 | ||||||
Trinity Industries, Inc. | 5,410 | 148,991 | ||||||
|
| |||||||
| 474,696 | ||||||||
|
| |||||||
Professional Services – 0.9% |
| |||||||
ManpowerGroup, Inc. | 1,843 | 175,933 | ||||||
|
| |||||||
Trading Companies & Distributors – 1.9% |
| |||||||
AerCap Holdings N.V. (a) | 3,530 | 156,273 | ||||||
| Shares | Value | |||||||
United Rentals, Inc. (a) | 1,652 | $ | 208,994 | |||||
|
| |||||||
| 365,267 | ||||||||
|
| |||||||
TOTAL INDUSTRIALS |
| 2,281,050 | ||||||
|
| |||||||
INFORMATION TECHNOLOGY – 20.2% |
| |||||||
Communications Equipment – 1.3% |
| |||||||
Cisco Systems, Inc. | 7,941 | 243,948 | ||||||
|
| |||||||
Internet Software & Services – 3.4% |
| |||||||
Alphabet, Inc. Class A (a) | 623 | 510,978 | ||||||
eBay, Inc. (a) | 4,607 | 146,641 | ||||||
|
| |||||||
| 657,619 | ||||||||
|
| |||||||
IT Services – 2.7% |
| |||||||
Cognizant Technology Solutions Corp. Class A (a) | 2,466 | 129,687 | ||||||
Conduent, Inc. (a) | 2,520 | 37,699 | ||||||
International Business Machines Corp. | 1,445 | 252,181 | ||||||
Teradata Corp. (a) | 3,799 | 111,539 | ||||||
|
| |||||||
| 531,106 | ||||||||
|
| |||||||
Semiconductors & Semiconductor Equipment – 2.2% |
| |||||||
Intel Corp. | 7,270 | 267,682 | ||||||
QUALCOMM, Inc. | 3,109 | 166,114 | ||||||
|
| |||||||
| 433,796 | ||||||||
|
| |||||||
Software – 4.7% |
| |||||||
Microsoft Corp. | 8,527 | 551,270 | ||||||
Oracle Corp. | 5,407 | 216,875 | ||||||
VMware, Inc. Class A (a) | 1,711 | 149,781 | ||||||
|
| |||||||
| 917,926 | ||||||||
|
| |||||||
Technology Hardware, Storage & Peripherals – 5.9% |
| |||||||
Apple, Inc. | 5,621 | 682,108 | ||||||
HP, Inc. | 9,567 | 143,983 | ||||||
Western Digital Corp. | 2,842 | 226,593 | ||||||
Xerox Corp. | 12,602 | 87,332 | ||||||
|
| |||||||
| 1,140,016 | ||||||||
|
| |||||||
TOTAL INFORMATION TECHNOLOGY |
| 3,924,411 | ||||||
|
| |||||||
MATERIALS – 3.4% |
| |||||||
Chemicals – 1.8% |
| |||||||
Celanese Corp. Class A | 759 | 64,060 | ||||||
Eastman Chemical Co. | 756 | 58,590 | ||||||
LyondellBasell Industries N.V. Class A | 828 | 77,227 | ||||||
The Dow Chemical Co. | 1,694 | 101,013 | ||||||
The Mosaic Co. | 1,834 | 57,533 | ||||||
|
| |||||||
| 358,423 | ||||||||
|
| |||||||
Containers & Packaging – 0.7% |
| |||||||
International Paper Co. | 1,232 | 69,731 | ||||||
WestRock Co. | 1,148 | 61,258 | ||||||
|
| |||||||
| 130,989 | ||||||||
|
| |||||||
Metals & Mining – 0.9% |
| |||||||
Newmont Mining Corp. | 1,344 | 48,760 | ||||||
Nucor Corp. | 1,036 | 60,181 | ||||||
See accompanying notes which are an integral part of the financial statements.
| 33 | Semiannual Report |
Table of Contents
Fidelity Value Factor ETF
Investments (Unaudited) – continued
| Common Stocks – continued | ||||||||
| Shares | Value | |||||||
MATERIALS – continued |
| |||||||
Metals & Mining – continued |
| |||||||
Steel Dynamics, Inc. | 1,764 | $ | 59,641 | |||||
|
| |||||||
| 168,582 | ||||||||
|
| |||||||
TOTAL MATERIALS |
| 657,994 | ||||||
|
| |||||||
REAL ESTATE – 1.5% |
| |||||||
Equity Real Estate Investment Trusts (REITs) – 1.5% |
| |||||||
Equity Residential | 1,606 | 97,596 | ||||||
Host Hotels & Resorts, Inc. | 5,572 | 100,686 | ||||||
Sunstone Hotel Investors, Inc. | 6,776 | 99,743 | ||||||
|
| |||||||
TOTAL REAL ESTATE | 298,025 | |||||||
|
| |||||||
TELECOMMUNICATION SERVICES – 2.2% |
| |||||||
Diversified Telecommunication Services – 2.2% |
| |||||||
AT&T, Inc. | 5,452 | 229,856 | ||||||
CenturyLink, Inc. | 952 | 24,619 | ||||||
Verizon Communications, Inc. | 3,654 | 179,083 | ||||||
|
| |||||||
TOTAL TELECOMMUNICATION SERVICES |
| 433,558 | ||||||
|
| |||||||
UTILITIES – 3.0% |
| |||||||
Electric Utilities – 2.2% |
| |||||||
American Electric Power Co., Inc. | 996 | 63,804 | ||||||
Duke Energy Corp. | 1,042 | 81,839 | ||||||
Entergy Corp. | 647 | 46,351 | ||||||
Exelon Corp. | 1,862 | 66,808 | ||||||
FirstEnergy Corp. | 1,568 | 47,542 | ||||||
Great Plains Energy, Inc. | 1,498 | 41,270 | ||||||
NextEra Energy, Inc. | 700 | 86,604 | ||||||
|
| |||||||
| 434,218 | ||||||||
|
| |||||||
| Shares | Value | |||||||
Independent Power and Renewable Electricity Producers – 0.2% |
| |||||||
AES Corp. | 3,766 | $ | 43,083 | |||||
|
| |||||||
Multi-Utilities – 0.6% |
| |||||||
Consolidated Edison, Inc. | 759 | 56,431 | ||||||
Public Service Enterprise Group, Inc. | 1,316 | 58,233 | ||||||
|
| |||||||
| 114,664 | ||||||||
|
| |||||||
TOTAL UTILITIES |
| 591,965 | ||||||
|
| |||||||
TOTAL COMMON STOCKS |
| 19,395,261 | ||||||
|
| |||||||
| Money Market Funds – 0.1% | ||||||||
Fidelity Cash Central Fund, 0.62% (b) | 15,221 | 15,224 | ||||||
|
| |||||||
TOTAL INVESTMENT PORTFOLIO – 99.8% |
| 19,410,485 | ||||||
NET OTHER ASSETS (LIABILITIES) – 0.2% |
| 46,733 | ||||||
|
| |||||||
NET ASSETS – 100% |
| $ | 19,457,218 | |||||
|
| |||||||
Legend
| (a) | Non-income producing. |
| (b) | Affiliated fund that is generally available only to investment companies and other accounts managed by Fidelity Investments. The rate quoted is the annualized seven-day yield of the fund at period end. A complete unaudited listing of the fund’s holdings as of its most recent quarter end is available upon request. In addition, each Fidelity Central Fund’s financial statements are available on the SEC’s website or upon request. |
Affiliated Central Funds
Information regarding fiscal year to date income earned by the Fund from investments in Fidelity Central Funds is as follows:
| Fund | Income earned | |||
Fidelity Cash Central Fund | $ | 8 | ||
|
| |||
Other Information
All investments are categorized as Level 1 under the Fair Value Hierarchy. The inputs or methodology used for valuing securities may not be an indication of the risk associated with investing in those securities. For more information on valuation inputs please refer to the Investment Valuation section in the accompanying Notes to Financial Statements.
See accompanying notes which are an integral part of the financial statements.
| Semiannual Report | 34 |
Table of Contents
[THIS PAGE INTENTIONALLY LEFT BLANK]
| 35 | Semiannual Report |
Table of Contents
Financial Statements
See accompanying notes which are an integral part of the financial statements.
| Semiannual Report | 36 |
Table of Contents
| Statements of Assets and Liabilities | ||||||||
| January 31, 2017 (Unaudited) | ||||||||
| Fidelity Quality Factor ETF | Fidelity Value Factor ETF | |||||||
Assets | ||||||||
Investments in securities, at value – See accompanying schedule: | ||||||||
Unaffiliated issuers | $ | 18,749,804 | $ | 19,395,261 | ||||
Fidelity Central Funds | 23,505 | 15,224 | ||||||
|
|
|
| |||||
Total Investments | $ | 18,773,309 | $ | 19,410,485 | ||||
Cash | 3,860 | 31,739 | ||||||
Receivable for fund shares sold | — | 1,389,801 | ||||||
Dividends receivable | 18,646 | 12,331 | ||||||
|
|
|
| |||||
Total assets | 18,795,815 | 20,844,356 | ||||||
|
|
|
| |||||
Liabilities | ||||||||
Payable for investments purchased | — | 1,383,214 | ||||||
Accrued management fees | 4,524 | 3,924 | ||||||
|
|
|
| |||||
Total liabilities | 4,524 | 1,387,138 | ||||||
|
|
|
| |||||
Net Assets | $ | 18,791,291 | $ | 19,457,218 | ||||
|
|
|
| |||||
Net Assets consist of: | ||||||||
Paid in capital | $ | 17,856,740 | $ | 18,558,949 | ||||
Undistributed net investment income | 16,796 | 12,518 | ||||||
Accumulated undistributed net realized gain (loss) on investments | (648 | ) | (1,004 | ) | ||||
Net unrealized appreciation (depreciation) on investments | 918,403 | 886,755 | ||||||
|
|
|
| |||||
Net Assets | $ | 18,791,291 | $ | 19,457,218 | ||||
|
|
|
| |||||
Shares outstanding | 700,000 | 700,000 | ||||||
|
|
|
| |||||
Net Asset Value, offering price and redemption price per share | $ | 26.84 | $ | 27.80 | ||||
|
|
|
| |||||
Investments at cost – Unaffiliated issuers | $ | 17,831,401 | $ | 18,508,506 | ||||
Investments at cost – Fidelity Central Funds | 23,505 | 15,224 | ||||||
|
|
|
| |||||
Investments at cost | $ | 17,854,906 | $ | 18,523,730 | ||||
|
|
|
| |||||
See accompanying notes which are an integral part of the financial statements.
| 37 | Semiannual Report |
Table of Contents
Financial Statements – continued
| Statements of Operations | ||||||||||||||||
| For the period September 12, 2016 (commencement of operations) to January 31, 2017 (Unaudited) | ||||||||||||||||
| Fidelity Core Dividend ETF | Fidelity Dividend ETF for Rising Rates | Fidelity Low Volatility Factor ETF | Fidelity Momentum Factor ETF | |||||||||||||
Investment Income | ||||||||||||||||
Dividends | $ | 373,365 | $ | 419,436 | $ | 60,484 | $ | 65,388 | ||||||||
Income from Fidelity Central Funds | 2,211 | 409 | — | 6 | ||||||||||||
|
|
|
|
|
|
|
| |||||||||
Total income | 375,576 | 419,845 | 60,484 | 65,394 | ||||||||||||
|
|
|
|
|
|
|
| |||||||||
Expenses | ||||||||||||||||
Management fees | 26,585 | 38,589 | 8,300 | 9,160 | ||||||||||||
Independent trustees’ compensation | 120 | 162 | 36 | 43 | ||||||||||||
Miscellaneous | 32 | 32 | — | — | ||||||||||||
|
|
|
|
|
|
|
| |||||||||
Total expenses | 26,737 | 38,783 | 8,336 | 9,203 | ||||||||||||
|
|
|
|
|
|
|
| |||||||||
Net investment income (loss) | 348,839 | 381,062 | 52,148 | 56,191 | ||||||||||||
|
|
|
|
|
|
|
| |||||||||
Realized and Unrealized Gain (Loss) | ||||||||||||||||
Net realized gain (loss) on investment securities | (8,075 | ) | (3,202 | ) | 4,435 | (82,051 | ) | |||||||||
Net realized gain (loss) on Fidelity Central Funds | 3 | 12 | — | — | ||||||||||||
Net realized gain (loss) on foreign currency transactions | (632 | ) | (54 | ) | — | — | ||||||||||
|
|
|
|
|
|
|
| |||||||||
Total net realized gain (loss) | (8,704 | ) | (3,244 | ) | 4,435 | (82,051 | ) | |||||||||
|
|
|
|
|
|
|
| |||||||||
Change in net unrealized appreciation (depreciation) on investment securities | 638,029 | 1,674,664 | 197,925 | 452,695 | ||||||||||||
Change in net unrealized appreciation (depreciation) on assets and liabilities in foreign currencies | 99 | 100 | — | — | ||||||||||||
|
|
|
|
|
|
|
| |||||||||
Total change in net unrealized appreciation (depreciation) | 638,128 | 1,674,764 | 197,925 | 452,695 | ||||||||||||
|
|
|
|
|
|
|
| |||||||||
Net gain (loss) | 629,424 | 1,671,520 | 202,360 | 370,644 | ||||||||||||
|
|
|
|
|
|
|
| |||||||||
Net increase (decrease) in net assets resulting from operations | $ | 978,263 | $ | 2,052,582 | $ | 254,508 | $ | 426,835 | ||||||||
|
|
|
|
|
|
|
| |||||||||
See accompanying notes which are an integral part of the financial statements.
| Semiannual Report | 38 |
Table of Contents
| Statements of Operations | ||||||||
| For the period September 12, 2016 (commencement of operations) to January 31, 2017 (Unaudited) | ||||||||
| Fidelity Quality Factor ETF | Fidelity Value Factor ETF | |||||||
Investment Income | ||||||||
Dividends | $ | 91,375 | $ | 85,695 | ||||
Income from Fidelity Central Funds | 9 | 8 | ||||||
|
|
|
| |||||
Total income | 91,384 | 85,703 | ||||||
|
|
|
| |||||
Expenses | ||||||||
Management fees | 12,929 | 11,135 | ||||||
Independent trustees’ compensation | 59 | 50 | ||||||
|
|
|
| |||||
Total expenses | 12,988 | 11,185 | ||||||
|
|
|
| |||||
Net investment income (loss) | 78,396 | 74,518 | ||||||
|
|
|
| |||||
Realized and Unrealized Gain (Loss) | ||||||||
Net realized gain (loss) on investment securities | (648 | ) | (1,004 | ) | ||||
Change in net unrealized appreciation (depreciation) on investment securities | 918,403 | 886,755 | ||||||
|
|
|
| |||||
Net gain (loss) | 917,755 | 885,751 | ||||||
|
|
|
| |||||
Net increase (decrease) in net assets resulting from operations | $ | 996,151 | $ | 960,269 | ||||
|
|
|
| |||||
See accompanying notes which are an integral part of the financial statements.
| 39 | Semiannual Report |
Table of Contents
Financial Statements – continued
| Statements of Changes in Net Assets | ||||||||||||||||
| For the period September 12, 2016 (commencement of operations) to January 31, 2017 (Unaudited) | ||||||||||||||||
| Fidelity Core Dividend ETF | Fidelity Dividend ETF for Rising Rates | Fidelity Low Volatility Factor ETF | Fidelity Momentum Factor ETF | |||||||||||||
Increase (Decrease) in Net Assets | ||||||||||||||||
Operations | ||||||||||||||||
Net investment income (loss) | $ | 348,839 | $ | 381,062 | $ | 52,148 | $ | 56,191 | ||||||||
Net realized gain (loss) | (8,704 | ) | (3,244 | ) | 4,435 | (82,051 | ) | |||||||||
Change in net unrealized appreciation (depreciation) | 638,128 | 1,674,764 | 197,925 | 452,695 | ||||||||||||
|
|
|
|
|
|
|
| |||||||||
Net increase (decrease) in net assets resulting from operations | 978,263 | 2,052,582 | 254,508 | 426,835 | ||||||||||||
|
|
|
|
|
|
|
| |||||||||
Distributions to shareholders from net investment income | (260,250 | ) | (289,800 | ) | (43,950 | ) | (46,000 | ) | ||||||||
|
|
|
|
|
|
|
| |||||||||
Share transactions | ||||||||||||||||
Proceeds from sales of shares | 32,185,148 | 62,679,546 | 12,843,563 | 14,034,020 | ||||||||||||
|
|
|
|
|
|
|
| |||||||||
Net increase (decrease) in net assets resulting from share transactions | 32,185,148 | 62,679,546 | 12,843,563 | 14,034,020 | ||||||||||||
|
|
|
|
|
|
|
| |||||||||
Total increase (decrease) in net assets | 32,903,161 | 64,442,328 | 13,054,121 | 14,414,855 | ||||||||||||
Net Assets | ||||||||||||||||
Beginning of period | — | — | — | — | ||||||||||||
|
|
|
|
|
|
|
| |||||||||
End of period | $ | 32,903,161 | $ | 64,442,328 | $ | 13,054,121 | $ | 14,414,855 | ||||||||
|
|
|
|
|
|
|
| |||||||||
Undistributed net investment income included in net assets at end of period | $ | 88,589 | $ | 91,262 | $ | 8,198 | $ | 10,191 | ||||||||
|
|
|
|
|
|
|
| |||||||||
Other Information | ||||||||||||||||
Shares | ||||||||||||||||
Sold | 1,250,000 | 2,400,000 | 500,000 | 550,000 | ||||||||||||
Redeemed | — | — | — | — | ||||||||||||
|
|
|
|
|
|
|
| |||||||||
Net increase (decrease) | 1,250,000 | 2,400,000 | 500,000 | 550,000 | ||||||||||||
|
|
|
|
|
|
|
| |||||||||
See accompanying notes which are an integral part of the financial statements.
| Semiannual Report | 40 |
Table of Contents
| Statements of Changes in Net Assets | ||||||||
| For the period September 12, 2016 (commencement of operations) to January 31, 2017 (Unaudited) | ||||||||
| Fidelity Quality Factor ETF | Fidelity Value Factor ETF | |||||||
Increase (Decrease) in Net Assets | ||||||||
Operations | ||||||||
Net investment income (loss) | $ | 78,396 | $ | 74,518 | ||||
Net realized gain (loss) | (648 | ) | (1,004 | ) | ||||
Change in net unrealized appreciation (depreciation) | 918,403 | 886,755 | ||||||
|
|
|
| |||||
Net increase (decrease) in net assets resulting from operations | 996,151 | 960,269 | ||||||
|
|
|
| |||||
Distributions to shareholders from net investment income | (61,600 | ) | (62,000 | ) | ||||
|
|
|
| |||||
Share transactions | ||||||||
Proceeds from sales of shares | 17,856,740 | 18,558,949 | ||||||
|
|
|
| |||||
Net increase (decrease) in net assets resulting from share transactions | 17,856,740 | 18,558,949 | ||||||
|
|
|
| |||||
Total increase (decrease) in net assets | 18,791,291 | 19,457,218 | ||||||
Net Assets | ||||||||
Beginning of period | — | — | ||||||
|
|
|
| |||||
End of period | $ | 18,791,291 | $ | 19,457,218 | ||||
|
|
|
| |||||
Undistributed net investment income included in net assets at end of period | $ | 16,796 | $ | 12,518 | ||||
|
|
|
| |||||
Other Information | ||||||||
Shares | ||||||||
Sold | 700,000 | 700,000 | ||||||
Redeemed | — | — | ||||||
|
|
|
| |||||
Net increase (decrease) | 700,000 | 700,000 | ||||||
|
|
|
| |||||
See accompanying notes which are an integral part of the financial statements.
| 41 | Semiannual Report |
Table of Contents
Financial Statements – continued
| Financial Highlights | ||||||||||||||||
| (Unaudited) | Fidelity Core Dividend ETF | Fidelity Dividend ETF for Rising Rates | Fidelity Low Volatility Factor ETF | Fidelity Momentum Factor ETF | ||||||||||||
| Period ended January 31, | 2017A | 2017A | 2017A | 2017A | ||||||||||||
Selected Per-Share Data | ||||||||||||||||
Net asset value, beginning of period | $ | 25.32 | $ | 25.34 | $ | 25.31 | $ | 25.34 | ||||||||
|
|
|
|
|
|
|
| |||||||||
Income from Investment Operations | ||||||||||||||||
Net investment income (loss)B | 0.38 | 0.29 | 0.18 | 0.18 | ||||||||||||
Net realized and unrealized gain (loss) | 0.89 | 1.38 | 0.76 | 0.81 | ||||||||||||
|
|
|
|
|
|
|
| |||||||||
Total from investment operations | 1.27 | 1.67 | 0.94 | 0.99 | ||||||||||||
|
|
|
|
|
|
|
| |||||||||
Distributions from net investment income | (0.27 | ) | (0.16 | ) | (0.14 | ) | (0.12 | ) | ||||||||
|
|
|
|
|
|
|
| |||||||||
Total distributions | (0.27 | ) | (0.16 | ) | (0.14 | ) | (0.12 | ) | ||||||||
|
|
|
|
|
|
|
| |||||||||
Net asset value, end of period | $ | 26.32 | $ | 26.85 | $ | 26.11 | $ | 26.21 | ||||||||
|
|
|
|
|
|
|
| |||||||||
Total ReturnC | 5.03 | % | 6.60 | % | 3.72 | % | 3.90 | % | ||||||||
Ratios to Average Net AssetsD,E | ||||||||||||||||
Expenses before reductions | .29 | % | .29 | % | .29 | % | .29 | % | ||||||||
Expenses net of fee waivers, if any | .29 | % | .29 | % | .29 | % | .29 | % | ||||||||
Expenses net of all reductions | .29 | % | .29 | % | .29 | % | .29 | % | ||||||||
Net investment income (loss) | 3.80 | % | 2.87 | % | 1.83 | % | 1.78 | % | ||||||||
Supplemental Data | ||||||||||||||||
Net assets, end of period (000 omitted) | $ | 32,903 | $ | 64,442 | $ | 13,054 | $ | 14,415 | ||||||||
Portfolio turnover rateF,G,H | 1 | % | 0 | % | 0 | % | 35 | % | ||||||||
| A | For the period September 12, 2016 (commencement of operations) to January 31, 2017. |
| B | Calculated based on average shares outstanding during the period. |
| C | Total returns for periods of less than one year are not annualized. |
| D | Annualized. |
| E | Expense ratios reflect operating expenses of the Fund. Expenses before reductions do not reflect amounts reimbursed by the investment adviser or reductions from brokerage service arrangements or reductions from other expense offset arrangements and do not represent the amount paid by the Fund during periods when reimbursements or reductions occur. Expenses net of fee waivers reflect expenses after reimbursement by the investment adviser but prior to reductions from brokerage service arrangements or other expense offset arrangements. Expenses net of all reductions represent the net expenses paid by the Fund but do not include expenses of the investment companies in which the fund invests. |
| F | Amount does not include the portfolio activity of any underlying funds. |
| G | Amount not annualized. |
| H | Portfolio turnover rate excludes securities received or delivered in-kind. |
See accompanying notes which are an integral part of the financial statements.
| Semiannual Report | 42 |
Table of Contents
| Financial Highlights | ||||||||
| (Unaudited) | Fidelity Quality Factor ETF | Fidelity Value Factor ETF | ||||||
| Period ended January 31, | 2017A | 2017A | ||||||
Selected Per-Share Data | ||||||||
Net asset value, beginning of period | $ | 25.37 | $ | 25.37 | ||||
|
|
|
| |||||
Income from Investment Operations | ||||||||
Net investment income (loss)B | 0.18 | 0.20 | ||||||
Net realized and unrealized gain (loss) | 1.40 | 2.35 | ||||||
|
|
|
| |||||
Total from investment operations | 1.58 | 2.55 | ||||||
|
|
|
| |||||
Distributions from net investment income | (0.11 | ) | (0.12 | ) | ||||
|
|
|
| |||||
Total distributions | (0.11 | ) | (0.12 | ) | ||||
|
|
|
| |||||
Net asset value, end of period | $ | 26.84 | $ | 27.80 | ||||
|
|
|
| |||||
Total ReturnC | 6.24 | % | 10.07 | % | ||||
Ratios to Average Net AssetsD,E | ||||||||
Expenses before reductions | .29 | % | .29 | % | ||||
Expenses net of fee waivers, if any | .29 | % | .29 | % | ||||
Expenses net of all reductions | .29 | % | .29 | % | ||||
Net investment income (loss) | 1.76 | % | 1.94 | % | ||||
Supplemental Data | ||||||||
Net assets, end of period (000 omitted) | $ | 18,791 | $ | 19,457 | ||||
Portfolio turnover rateF,G,H | 1 | % | 1 | % | ||||
| A | For the period September 12, 2016 (commencement of operations) to January 31, 2017. |
| B | Calculated based on average shares outstanding during the period. |
| C | Total returns for periods of less than one year are not annualized. |
| D | Annualized. |
| E | Expense ratios reflect operating expenses of the Fund. Expenses before reductions do not reflect amounts reimbursed by the investment adviser or reductions from brokerage service arrangements or reductions from other expense offset arrangements and do not represent the amount paid by the Fund during periods when reimbursements or reductions occur. Expenses net of fee waivers reflect expenses after reimbursement by the investment adviser but prior to reductions from brokerage service arrangements or other expense offset arrangements. Expenses net of all reductions represent the net expenses paid by the Fund but do not include expenses of the investment companies in which the fund invests. |
| F | Amount does not include the portfolio activity of any underlying funds. |
| G | Amount not annualized. |
| H | Portfolio turnover rate excludes securities received or delivered in-kind. |
See accompanying notes which are an integral part of the financial statements.
| 43 | Semiannual Report |
Table of Contents
For the period ended January 31, 2017 (Unaudited)
1. Organization.
Fidelity Core Dividend ETF, Fidelity Dividend ETF for Rising Rates, Fidelity Low Volatility Factor ETF, Fidelity Momentum Factor ETF, Fidelity Quality Factor ETF and Fidelity Value Factor ETF (the Funds) are exchange-traded funds of Fidelity Covington Trust (the Trust) and are authorized to issue an unlimited number of shares. The Trust is registered under the Investment Company Act of 1940, as amended (the 1940 Act), as an open-end management investment company organized as a Massachusetts business trust.
2. Investments in Fidelity Central Funds.
The Funds may invest in Fidelity Central Funds, which are open-end investment companies generally available only to other investment companies and accounts managed by the investment adviser and its affiliates. Each Fund’s Schedule of Investments lists each of the Fidelity Central Funds held as of year end, if any, as an investment of the Fund, but does not include the underlying holdings of each Fidelity Central Fund. As an Investing Fund, each Fund indirectly bears its proportionate share of the expenses of the underlying Fidelity Central Funds.
The Money Market Central Funds seek preservation of capital and current income and are managed by Fidelity Investments Money Management Inc. (FIMM) an affiliate of Fidelity Management & Research Company (FMR). Annualized expenses of the Money Market Central Funds as of their most recent shareholder report date are less than .005%.
A complete unaudited list of holdings for each Fidelity Central Fund is available upon request or at the Securities and Exchange Commission (the SEC) website at www.sec.gov. In addition, the financial statements of the Fidelity Central Funds which are not covered by the Funds’ Report of Independent Registered Public Accounting Firm, are available on the SEC website or upon request.
3. Significant Accounting Policies.
The financial statements have been prepared in conformity with accounting principles generally accepted in the United States of America (GAAP), which require management to make certain estimates and assumptions at the date of the financial statements. Actual results could differ from those estimates. Subsequent events, if any, through the date that the financial statements were issued have been evaluated in the preparation of the financial statements. The following summarizes the significant accounting policies of the Funds:
Investment Valuation. Investments are valued as of 4:00 p.m. Eastern time on the last calendar day of the period. The Board of Trustees (the Board) has delegated the day to day responsibility for the valuation of the Fund’s investments to the Fidelity SelectCo, LLC (SelectCo) Fair Value Committee (the Committee). In accordance with valuation policies and procedures approved by the Board, each Fund attempts to obtain prices from one or more third party pricing vendors or brokers to value its investments. When current market prices, quotations or currency exchange rates are not readily available or reliable, investments will be fair valued in good faith by the Committee, in accordance with procedures adopted by the Board. Factors used in determining fair value vary by investment type and may include market or investment specific events. The frequency with which these procedures are used cannot be predicted and they may be utilized to a significant extent. The Committee oversees each Fund’s valuation policies and procedures and reports to the Board on the Committee’s activities and fair value determinations. The Board monitors the appropriateness of the procedures used in valuing each Fund’s investments and ratifies the fair value determinations of the Committee.
Each Fund categorizes the inputs to valuation techniques used to value its investments into a disclosure hierarchy consisting of three levels as shown below:
Level 1 – quoted prices in active markets for identical investments
Level 2 – other significant observable inputs (including quoted prices for similar investments, interest rates, prepayment speeds, etc.)
Level 3 – unobservable inputs (including the Fund’s own assumptions based on the best information available)
Valuation techniques used to value each Fund’s investments by major category are as follows:
Equity securities, including restricted securities, for which market quotations are readily available, are valued at the last reported sale price or official closing price as reported by a third party pricing vendor on the primary market or exchange on which they are traded and are categorized as Level 1 in the hierarchy. In the event there were no sales during the day or closing prices are not available, securities are valued at the last quoted bid price or may be valued using the last available price and are generally categorized as Level 2 in the hierarchy. For foreign equity securities, when market or security specific events arise, comparisons to the valuation of American Depositary Receipts (ADRs), futures contracts, Exchange-Traded Funds (ETFs) and certain indexes as well as quoted prices for similar securities may be used and would be categorized as Level 2 in the hierarchy in these circumstances. Utilizing these techniques may result in transfers between Level 1 and Level 2. For equity securities, including restricted securities, where observable inputs are limited, assumptions about market activity and risk are used and these securities may be categorized as Level 3 in the hierarchy.
Investments in open-end mutual funds, including Fidelity Central Funds, are valued at their closing net asset value (NAV) each business day and are categorized as Level 1 in the hierarchy.
| Semiannual Report | 44 |
Table of Contents
3. Significant Accounting Policies – continued
Changes in valuation techniques may result in transfers in or out of an assigned level within the disclosure hierarchy. The aggregate value of investments by input level, as of January 31, 2017, is included at the end of each applicable Fund’s Schedule of Investments.
Foreign Currency. The Funds may use foreign currency contracts to facilitate transactions in foreign-denominated securities. Gains and losses from these transactions may arise from changes in the value of the foreign currency or if the counterparties do not perform under the contracts’ terms.
Foreign-denominated assets, including investment securities, and liabilities are translated into U.S. dollars at the exchange rates at period end. Purchases and sales of investment securities, income and dividends received and expenses denominated in foreign currencies are translated into U.S. dollars at the exchange rate in effect on the transaction date.
The effects of exchange rate fluctuations on investments are included with the net realized and unrealized gain (loss) on investment securities. Other foreign currency transactions resulting in realized and unrealized gain (loss) are disclosed separately.
Investment Transactions and Income. For financial reporting purposes, the Funds’ investment holdings and NAV include trades executed through the end of the last business day of the period. The NAV per share for processing shareholder transactions is calculated as of the close of business of NYSE Arca, normally 4:00 p.m. Eastern time and includes trades executed through the end of the prior business day. Gains and losses on securities sold are determined on the basis of identified cost and may include proceeds received from litigation. Dividend income is recorded on the ex-dividend date, except for certain dividends from foreign securities where the ex-dividend date may have passed, which are recorded as soon as a fund is informed of the ex-dividend date. Non-cash dividends included in dividend income, if any, are recorded at the fair market value of the securities received. Income and capital gain distributions from Underlying Funds, if any, are recorded on the ex-dividend date. Investment income is recorded net of foreign taxes withheld where recovery of such taxes is uncertain.
Expenses. Expenses directly attributable to a fund are charged to that fund. Expenses attributable to more than one fund are allocated among the respective funds on the basis of relative net assets or other appropriate methods. Expenses included in the accompanying financial statements reflect the expenses of each Fund and do not include any expenses associated with the Underlying Funds. Expense estimates are accrued in the period to which they relate and adjustments are made when actual amounts are known.
Income Tax Information and Distributions to Shareholders. Each year, each Fund intends to qualify as a regulated investment company under Subchapter M of the Internal Revenue Code, including distributing substantially all of its taxable income and realized gains. As a result, no provision for U.S. Federal income taxes is required. Each Fund files a U.S. federal tax return, in addition to state and local tax returns as required. Each Fund’s federal income tax returns are subject to examination by the Internal Revenue Service (IRS) for a period of three fiscal years after they are filed. State and local tax returns may be subject to examination for an additional fiscal year depending on the jurisdiction. Realized gain or loss resulting from in-kind redemptions is not taxable to the Fund and is not distributed to shareholders of the Fund. Foreign taxes are provided for based on each Fund’s understanding of the tax rules and rates that exist in the foreign markets in which it invests.
Distributions are declared and recorded on the ex-dividend date. Income and capital gain distributions are determined in accordance with income tax regulations, which may differ from GAAP.
Capital accounts within the financial statements are adjusted for permanent book-tax differences. These adjustments have no impact on net assets or the results of operations. Capital accounts are not adjusted for temporary book-tax differences which will reverse in a subsequent period.
The federal tax cost of investment securities and unrealized appreciation (depreciation) as of period end were as follows for each Fund:
| Tax cost | Gross unrealized appreciation | Gross unrealized depreciation | Net unrealized appreciation (depreciation) on securities and other investments | |||||||||||||
Fidelity Core Dividend ETF | $ | 33,819,361 | $ | 1,463,626 | $ | (834,451 | ) | $ | 629,175 | |||||||
Fidelity Dividend ETF for Rising Rates | 63,627,754 | 2,694,205 | (1,022,937 | ) | 1,671,268 | |||||||||||
Fidelity Low Volatility Factor ETF | 12,821,461 | 362,793 | (165,101 | ) | 197,692 | |||||||||||
Fidelity Momentum Factor ETF | 13,936,894 | 562,802 | (111,047 | ) | 451,755 | |||||||||||
Fidelity Quality Factor ETF | 17,856,541 | 1,040,470 | (123,702 | ) | 916,768 | |||||||||||
Fidelity Value Factor ETF | 18,524,639 | 1,080,110 | (194,264 | ) | 885,846 | |||||||||||
| 45 | Semiannual Report |
Table of Contents
Notes to Financial Statements – continued
4. Purchases and Sales of Investments.
Purchases and sales of securities, other than short-term securities and in-kind transactions, were as follows:
| Purchases | Sales | |||||||
Fidelity Core Dividend ETF | $ | 1,372,181 | $ | 243,381 | ||||
Fidelity Dividend ETF for Rising Rates | 634,561 | 118,217 | ||||||
Fidelity Low Volatility Factor ETF | 56,487 | 24,435 | ||||||
Fidelity Momentum Factor ETF | 3,045,074 | 3,002,447 | ||||||
Fidelity Quality Factor ETF | 160,561 | 80,429 | ||||||
Fidelity Value Factor ETF | 83,569 | 55,287 | ||||||
Securities received or delivered in-kind through subscriptions and redemptions were as follows:
| In-kind Subscriptions | In-kind Redemptions | |||||||
Fidelity Core Dividend ETF | $ | 30,945,169 | $ | — | ||||
Fidelity Dividend ETF for Rising Rates | 61,990,033 | — | ||||||
Fidelity Low Volatility Factor ETF | 12,784,741 | — | ||||||
Fidelity Momentum Factor ETF | 13,957,672 | — | ||||||
Fidelity Quality Factor ETF | 17,751,917 | — | ||||||
Fidelity Value Factor ETF | 18,481,228 | — | ||||||
5. Fees and Other Transactions with Affiliates.
Management Fee. FMR Co., Inc. (FMRC), an affiliate of FMR, provides the Funds with investment management related services for which the Funds pay a monthly management fee that is based on an annual rate of .29% of each Fund’s average net assets. Under the management contract, FMRC pays all other expenses, except the compensation of the independent Trustees and certain other expenses such as interest expense. The management fee paid to FMRC is reduced by an amount equal to the fees and expenses paid by each fund to the independent Trustees.
Sub-Adviser. Geode Capital Management, LLC (Geode), serves as sub-adviser for the Funds. Geode provides discretionary investment advisory services to the Funds and is paid by the Adviser for providing these services.
Accounting and Security Lending Fees. Fidelity Service Company, Inc. (FSC), an affiliate of the investment adviser, maintains each Fund’s accounting records. The accounting fee is based on the level of average net assets for each month. Under a separate contract, FSC administers the security lending program. The security lending fee is based on the number and duration of lending transactions.
Interfund Trades. The Funds may purchase from or sell securities to other funds affiliated with the sub-adviser under procedures adopted by the Board. The procedures have been designed to ensure these interfund trades are executed in accordance with Rule 17a-7 of the 1940 Act. Interfund trades are included within the respective purchases and sales amounts shown in the Purchases and Sales of Investments note.
6. Security Lending.
Certain Funds lend portfolio securities through a lending agent from time to time in order to earn additional income. On the settlement date of the loan, each applicable Fund receives collateral (in the form of U.S. Treasury obligations, letters of credit and/or cash) against the loaned securities and maintains collateral in an amount not less than 100% of the market value of the loaned securities during the period of the loan. The market value of the loaned securities is determined at the close of business of the Funds and any additional required collateral is delivered to the Funds on the next business day. The Funds or borrower may terminate the loan at any time, and if the borrower defaults on its obligation to return the securities loaned because of insolvency or other reasons, the Funds may apply collateral received from the borrower against the obligation. The Funds may experience delays and costs in recovering the securities loaned. Any cash collateral received is invested in the Fidelity Securities Lending Cash Central Fund. The value of loaned securities at period end is disclosed on each applicable Fund’s Statement of Assets and Liabilities. Security lending income represents the income earned on investing cash collateral, less rebates paid to borrowers and any lending agent fees associated with the loan, plus any premium payments received for lending certain types of securities. Security lending income is presented on each applicable Fund’s Statement of Operations as a component of income from Fidelity Central Funds. Security lending activity was as follows:
| Total Security Lending Income | ||||
Fidelity Core Dividend ETF | $ | 2,149 | ||
Fidelity Dividend ETF for Rising Rates | 340 | |||
| Semiannual Report | 46 |
Table of Contents
7. Share Transactions.
The Funds issue and redeem shares at NAV only with certain authorized participants in large increments known as Creation Units. Purchases of Creation Units are made by tendering a basket of designated stocks to a fund and redemption proceeds are paid with a basket of securities from a fund’s portfolio with a balancing cash component to equate the market value of the basket of securities delivered or redeemed to the NAV per Creation Unit on the transaction date. Cash may be substituted equivalent to the value of certain securities generally when they are not available in sufficient quantity for delivery. A fund’s shares are available in smaller increments to investors in the secondary market at market prices and may be subject to commissions. Authorized participants pay a transaction fee to the shareholder servicing agent when purchasing and redeeming Creation Units of a fund. The transaction fee is used to defray the costs associated with the issuance and redemption of Creation Units.
8. Other.
The Funds’ organizational documents provide former and current directors and officers with a limited indemnification against liabilities arising in connection with the performance of their duties to the Funds. In the normal course of business, the Funds may also enter into contracts that provide general indemnifications. The Funds’ maximum exposure under these arrangements is unknown as this would be dependent on future claims that may be made against the Funds. The risk of material loss from such claims is considered remote.
| 47 | Semiannual Report |
Table of Contents
Board Approval of Investment Advisory Contracts and Management Fees
Fidelity Core Dividend ETF
Fidelity Dividend ETF for Rising Rates
Fidelity Low Volatility Factor ETF
Fidelity Momentum Factor ETF
Fidelity Quality Factor ETF
Fidelity Value Factor ETF
On July 27, 2016, the Board of Trustees, including the Independent Trustees (together, the Board), voted to approve the management contract with FMR Co., Inc. (FMRC) and the sub-advisory agreement with Geode Capital Management, LLC (Geode) (together, the Advisory Contracts) for each fund. The Board, assisted by the advice of fund counsel and Independent Trustees’ counsel, considered a broad range of information.
Nature, Extent, and Quality of Services Provided. The Board considered staffing as it relates to the funds, including the backgrounds of investment personnel of Fidelity and Geode, and also considered the funds’ investment objectives, strategies, and related investment philosophies.
Resources Dedicated to Investment Management and Support Services. The Board reviewed the general qualifications and capabilities of Fidelity’s and Geode’s investment staffs, including their size, education, experience, and resources, as well as Fidelity’s and Geode’s approach to recruiting, training, managing, and compensating investment personnel. The Board also considered the due diligence on Geode performed by Fidelity, which formed the basis for Fidelity’s recommendation that the Board approve the sub-advisory agreement with Geode. Additionally, in its deliberations, the Board considered Fidelity’s and Geode’s trading, risk management, compliance, and technology and operations capabilities and resources, which are integral parts of the investment management process.
Shareholder, Administrative and Other Services. The Board considered the nature, extent, quality, and cost of advisory, administrative, shareholder and other services to be performed by FMRC and Geode (the Investment Advisers), and FMRC’s affiliates and a third party service provider under the Advisory Contracts and under separate agreements covering transfer agency, pricing and bookkeeping and securities lending services for each fund. The Board also considered the nature and extent of the supervision of third party service providers.
The Board noted that the growth of fund assets over time across the complex allows Fidelity to reinvest in the development of services designed to enhance the value or convenience of the Fidelity funds as investment vehicles. These services include 24-hour access to account information and market information through telephone representatives and over the Internet, investor education materials and asset allocation tools, and the expanded availability of Fidelity Investor Centers.
Investment Performance. Each fund is a new fund and therefore had no historical performance for the Board to review at the time it approved the fund’s Advisory Contracts. The Board considered Geode’s experience in managing Fidelity’s existing equity index and enhanced index mutual funds.
Based on its review, the Board concluded that the nature, extent, and quality of services to be provided to each fund under the Advisory Contracts should benefit each fund’s shareholders.
Competitiveness of Management Fee and Total Expense Ratio. The Board considered each fund’s proposed management fee and projected total expense ratio in reviewing the Advisory Contracts, and the fact that the management contract provides that FMRC will be responsible for paying all operating expenses of the fund with the exception of fees and expenses of the independent Trustees, interest, taxes, brokerage commissions and non-recurring expenses. The Board noted that each fund’s proposed management fee rate is lower than the median fee rate of funds with similar Lipper investment objective categories and comparable investment mandates regardless of whether their management fee structures are comparable. The Board also considered that the projected total expense ratio of each fund is below the median of those funds and classes used by the Board for management fee comparisons.
Based on its review, the Board concluded that each fund’s management fee and projected total expense ratio were reasonable in light of the services that the fund and its shareholders will receive and the other factors considered.
Costs of the Services and Profitability. Each fund is new fund and therefore no revenue, cost, or profitability data was available for the Board to review in respect of the fund at the time it approved the Advisory Contracts. In connection with its future renewal of each fund’s Advisory Contracts, the Board will consider the revenues earned and the expenses incurred by Fidelity in conducting the business of developing, marketing, distributing, managing, administering and servicing each fund and servicing each fund’s shareholders.
Economies of Scale. The Board will consider economies of scale when there is operating experience to permit assessment thereof. It noted that, notwithstanding the entrepreneurial risk associated with a new fund, the management fee was at a level normally associated, by comparison with competitors, with very high fund net assets, and Fidelity asserted to the Board that the level of the fee anticipated economies of scale at lower asset levels even before, if ever, economies of scale are achieved. The Board also noted that each fund and especially shareholders that hold their shares through a Fidelity brokerage account, would have access to the very considerable number and variety of services available through Fidelity and its affiliates.
Based on its evaluation of all of the conclusions noted above, and after considering all factors it believed relevant, the Board concluded that the advisory fee structures are fair and reasonable, and that each fund’s Advisory Contracts should be approved.
| Semiannual Report | 48 |
Table of Contents
[THIS PAGE INTENTIONALLY LEFT BLANK]
| 49 | Semiannual Report |
Table of Contents
[THIS PAGE INTENTIONALLY LEFT BLANK]
| Semiannual Report | 50 |
Table of Contents
[THIS PAGE INTENTIONALLY LEFT BLANK]
| 51 | Semiannual Report |
Table of Contents
Investment Adviser
FMR Co., Inc.
Boston, MA
Investment Sub-Advisers
Geode Capital Management, LLC
Boston, MA
General Distributor
Fidelity Distributors Corporation
Smithfield, RI
Transfer and Service Agents
State Street Bank and Trust Company
Boston, MA
Fidelity Service Company, Inc.
Boston, MA
Custodian
State Street Bank and Trust Company
Boston, MA
The Fidelity Telephone Connection
1-800-FIDELITY
| ||
CPF-SANN-0317 792756.1.0 1.9881295.100 | Corporate Headquarters 245 Summer St., Boston, MA 02210 www.fidelity.com |
Table of Contents
| Item 2. | Code of Ethics |
Not applicable.
| Item 3. | Audit Committee Financial Expert |
Not applicable.
| Item 4. | Principal Accountant Fees and Services |
Not applicable.
| Item 5. | Audit Committee of Listed Registrants |
Not applicable.
| Item 6. | Investments |
| (a) | Not applicable. |
| (b) | Not applicable |
| Item 7. | Disclosure of Proxy Voting Policies and Procedures for Closed-End Management Investment Companies |
Not applicable.
| Item 8. | Portfolio Managers of Closed-End Management Investment Companies |
Not applicable.
| Item 9. | Purchase of Equity Securities by Closed-End Management Investment Company and Affiliated Purchasers |
Not applicable.
| Item 10. | Submission of Matters to a Vote of Security Holders |
There were no material changes to the procedures by which shareholders may recommend nominees to the Fidelity Covington Trust’s Board of Trustees.
| Item 11. | Controls and Procedures |
(a)(i) The President and Treasurer and the Chief Financial Officer have concluded that the Fidelity Covington Trust’s (the “Trust”) disclosure controls and procedures (as defined in Rule 30a-3(c) under the Investment Company Act) provide reasonable assurances that material information relating to the Trust is made known to them by the appropriate persons, based on their evaluation of these controls and procedures as of a date within 90 days of the filing date of this report.
Table of Contents
(a)(ii) There was no change in the Trust’s internal control over financial reporting (as defined in Rule 30a-3(d) under the Investment Company Act) that occurred during the second fiscal quarter of the period covered by this report that has materially affected, or is reasonably likely to materially affect, the Trust’s internal control over financial reporting.
| Item 12. | Exhibits |
| (a) | (1) | Not applicable. | ||
| (a) | (2) | Certification pursuant to Rule 30a-2(a) under the Investment Company Act of 1940 (17 CFR 270.30a-2(a)) is filed and attached hereto as Exhibit 99.CERT. | ||
| (a) | (3) | Not applicable. | ||
| (b) | Certification pursuant to Rule 30a-2(b) under the Investment Company Act of 1940 (17 CFR 270.30a-2(b)) is furnished and attached hereto as Exhibit 99.906CERT. | |||
Table of Contents
SIGNATURES
Pursuant to the requirements of the Securities Exchange Act of 1934 and the Investment Company Act of 1940, the registrant has duly caused this report to be signed on its behalf by the undersigned, thereunto duly authorized.
Fidelity Covington Trust
| By: | /s/Adrien E. Deberghes | |
| Adrien E. Deberghes | ||
| President and Treasurer | ||
| Date: | March 27, 2017 | |
Pursuant to the requirements of the Securities Exchange Act of 1934 and the Investment Company Act of 1940, this report has been signed below by the following persons on behalf of the registrant and in the capacities and on the dates indicated.
| By: | /s/Adrien E. Deberghes | |
| Adrien E. Deberghes | ||
| President and Treasurer | ||
| Date: | March 27, 2017 | |
| By: | /s/ Howard J. Galligan III | |
| Howard J. Galligan III | ||
| Chief Financial Officer | ||
| Date: | March 27, 2017 | |