Table of Contents
UNITED STATES
SECURITIES AND EXCHANGE COMMISSION
Washington, D.C. 20549
FORM N-CSR
CERTIFIED SHAREHOLDER REPORT OF REGISTERED
MANAGEMENT INVESTMENT COMPANIES
Investment Company Act file number 811-07319
Fidelity Covington Trust
(Exact name of registrant as specified in charter)
245 Summer St., Boston, MA 02210
(Address of principal executive offices) (Zip code)
Marc Bryant, Secretary
245 Summer St.
Boston, Massachusetts 02210
(Name and address of agent for service)
Registrant’s telephone number, including area code: 617-563-7000
Date of fiscal year end: October 31
Date of reporting period: April 30, 2018
Table of Contents
| Item 1. | Reports to Stockholders |
Table of Contents
Fidelity® International High Dividend ETF
Fidelity International Value Factor ETF
Semi-Annual Report
April 30, 2018


Table of Contents
| Performance and Investment Summary | 3 | |||||
| Investments | 7 | |||||
| Financial Statements | 14 | |||||
| Notes | 18 | |||||
| Shareholder Expense Example | 21 | |||||
| Board Approval of Investment Advisory Contracts and Management Fees | 22 | |||||
To view a fund’s proxy voting guidelines and proxy voting record for the period ended June, 30, visit http://www.fidelity.com/proxyvotingresults or visit the Securities and Exchange Commission’s (SEC) web site at http://www.sec.gov. You may also call 1-800-FIDELITY to request a free copy of the proxy voting guidelines.
Standard & Poor’s, S&P and S&P 500 are registered service marks of The McGraw-Hill Companies, Inc. and have been licensed for use by Fidelity Distributors Corporation.
Other third party marks appearing herein are the property of their respective owners.
All other marks appearing herein are registered or unregistered trademarks or service marks of FMR LLC or an affiliated company.
© 2018 FMR LLC. All Rights reserved.
This report and the financial statements contained herein are submitted for the general information of the shareholders of the funds. This report is not authorized for distribution to prospective investors in the funds unless preceded or accompanied by an effective prospectus.
A fund files its complete schedule of portfolio holdings with the SEC for the first and third quarters of each fiscal year on Form N-Q. Forms N-Q are available on the SEC’s web site at http://www.sec.gov. A fund’s Forms N-Q may be reviewed and copied at the SEC’s Public Reference Room in Washington, DC. Information regarding the operation of the SEC’s Public Reference Room may be obtained by calling 1-800-SEC-0330. For a complete list of a fund’s portfolio holdings, view the most recent holdings listing on Fidelity’s web site at http://www.fidelity.com, http://www.advisor.fidelity.com, or http://www.401k.com, as applicable.
NOT FDIC INSURED • MAY LOSE VALUE • NO BANK GUARANTEE
Neither the funds nor Fidelity Distributors Corporation is a bank.
| Semiannual Report | 2 |
Table of Contents
Fidelity® International High Dividend ETF
The information provided in the tables below shows you the performance of Fidelity® International High Dividend ETF, with comparisons over different time periods to the fund’s relevant benchmarks, including an appropriate broad-based market index. Seeing the returns over different time periods can help you assess the fund’s performance against relevant measurements. The performance information includes cumulative total returns and is further explained in this section.*
The fund’s net asset value (NAV) performance is based on the NAV calculated each business day. It is calculated in accordance with the standard formula for valuing investment company shares as of the close of regular trading hours on NYSE Arca, Inc. (NYSE Arca) (normally 4:00 p.m. Eastern Time). The fund’s market price performance is based on the daily closing price of the shares of the fund on NYSE Arca. Since ETFs are bought and sold at prices set by the market – which can result in a premium or discount to NAV – the returns calculated using market price (market return) can differ from those calculated using NAV (NAV return). For information on these differences, please visit Fidelity.com or see the prospectus. The fund’s returns do not reflect the deduction of taxes that a shareholder would pay on fund distributions or the redemption or selling of fund shares. How a fund did yesterday is no guarantee of how it will do tomorrow.
Current performance may be higher or lower than the performance data quoted. For month-end performance figures, please visit fidelity.com/etfs/factor-etfs/overview or call Fidelity. The performance data featured represents past performance, which is no guarantee of future results. Investment return and principal value will fluctuate; therefore, you may have a gain or loss when you sell your shares.
| Fiscal Period Ended April 30, 2018 | ||||
| Cumulative Total Returns | Life of fund | |||
Fidelity International High Dividend ETF – NAVA | -5.22% | |||
Fidelity International High Dividend ETF – Market PriceB | -5.94% | |||
Fidelity International High Dividend IndexA | -4.96% | |||
S&P 500 IndexA | -4.13% | |||
Cumulative total returns reflect performance over the period shown. This information represents returns as of the end of the fund’s fiscal period.
| Period Ended March 31, 2018 | ||||
| Cumulative Total Returns | Life of fund | |||
Fidelity International High Dividend ETF – NAVA | -7.96% | |||
Fidelity International High Dividend ETF – Market PriceB | -9.39% | |||
Fidelity International High Dividend IndexA | -8.31% | |||
S&P 500 IndexA | -4.50% | |||
This information shows the returns of the fund and its index for the applicable time period through the end of the most recent calendar quarter, as opposed to through the end of the fund’s fiscal period.
Average annual total returns take Fidelity International High Dividend ETF’s cumulative total return and show you what would have happened if Fidelity International High Dividend ETF’s shares had performed at a constant rate each year. These numbers will be reported once the fund is a year old.
| A | From January 16, 2018. |
| B | From January 18, 2018, date initially listed on the NYSE ARCA exchange. |
| * | Total returns are historical and include changes in share price and reinvestment of dividends and capital gains distributions, if any. |
The fund’s expense ratio is 0.39%. Expense ratio is the total annual operating expense ratio from the most recent prospectus. A fund’s net expenses paid may be different. Please refer to the most recent prospectus for more information on a fund’s expenses.
Investment Summary (Unaudited)
| Geographic Diversification as of April 30, 2018 | ||||
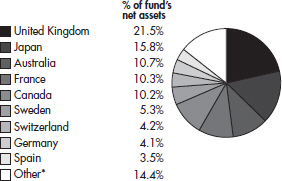
| * | Includes Net Other Assets (Liabilities). |
Percentages are based on country or territory of incorporation and are adjusted for the effect of futures contracts, if applicable.
| Asset Allocation as of April 30, 2018 | ||||
| % of funds’s net assets | ||||
Stocks | 99.4% | |||
Net Other Assets (Liabilities) | 0.6% | |||
| 3 | Semiannual Report |
Table of Contents
Fidelity® International High Dividend ETF
| Top Ten Stocks as of April 30, 2018 | ||||
| % of fund’s net assets | ||||
Vodafone Group PLC | 3.6 | |||
Telstra Corp. Ltd. | 3.3 | |||
BT Group PLC | 3.3 | |||
Royal Dutch Shell PLC Class B | 3.1 | |||
SSE PLC | 3.1 | |||
Engie S.A. | 3.0 | |||
TOTAL S.A. | 2.4 | |||
AGL Energy Ltd. | 2.3 | |||
BP PLC | 2.3 | |||
Toyota Motor Corp. | 2.2 | |||
|
| |||
| 28.6 | ||||
|
| |||
| Top Market Sectors as of April 30, 2018 | ||||
| % of fund’s net assets | ||||
Financials | 29.8 | |||
Consumer Discretionary | 19.0 | |||
Energy | 14.2 | |||
Telecommunication Services | 10.2 | |||
Utilities | 10.2 | |||
Industrials | 8.9 | |||
Consumer Staples | 3.3 | |||
Health Care | 2.6 | |||
Materials | 1.2 | |||
| Semiannual Report | 4 |
Table of Contents
Fidelity® International Value Factor ETF
Performance (Unaudited)
The information provided in the tables below shows you the performance of Fidelity® International Value Factor ETF, with comparisons over different time periods to the fund’s relevant benchmarks, including an appropriate broad-based market index. Seeing the returns over different time periods can help you assess the fund’s performance against relevant measurements. The performance information includes cumulative total returns and is further explained in this section.*
The fund’s net asset value (NAV) performance is based on the NAV calculated each business day. It is calculated in accordance with the standard formula for valuing investment company shares as of the close of regular trading hours on NYSE Arca, Inc. (NYSE Arca) (normally 4:00 p.m. Eastern Time). The fund’s market price performance is based on the daily closing price of the shares of the fund on NYSE Arca. Since ETFs are bought and sold at prices set by the market – which can result in a premium or discount to NAV – the returns calculated using market price (market return) can differ from those calculated using NAV (NAV return). For information on these differences, please visit Fidelity.com or see the prospectus. The fund’s returns do not reflect the deduction of taxes that a shareholder would pay on fund distributions or the redemption or selling of fund shares. How a fund did yesterday is no guarantee of how it will do tomorrow.
Current performance may be higher or lower than the performance data quoted. For month-end performance figures, please visit fidelity.com/etfs/factor-etfs/overview or call Fidelity. The performance data featured represents past performance, which is no guarantee of future results. Investment return and principal value will fluctuate; therefore, you may have a gain or loss when you sell your shares.
| Fiscal Period Ended April 30, 2018 | ||||
| Cumulative Total Returns | Life of fund | |||
Fidelity International Value Factor ETF – NAVA | -3.00% | |||
Fidelity International Value Factor ETF – Market PriceB | -4.04% | |||
Fidelity International Value Factor IndexA | -2.83% | |||
S&P 500 IndexA | -4.13% | |||
Cumulative total returns reflect performance over the period shown. This information represents returns as of the end of the fund’s fiscal period.
| Period Ended March 31, 2018 | ||||
| Cumulative Total Returns | Life of fund | |||
Fidelity International Value Factor ETF – NAVA | -5.40% | |||
Fidelity International Value Factor ETF – Market PriceB | -6.46% | |||
Fidelity International Value Factor IndexA | -5.88% | |||
S&P 500 IndexA | -4.50% | |||
This information shows the returns of the fund and its index for the applicable time period through the end of the most recent calendar quarter, as opposed to through the end of the fund’s fiscal period.
Average annual total returns take Fidelity International Value Factor ETF’s cumulative total return and show you what would have happened if Fidelity International Value Factor ETF’s shares had performed at a constant rate each year. These numbers will be reported once the fund is a year old.
| A | From January 16, 2018. |
| B | From January 18, 2018, date initially listed on the NYSE ARCA exchange. |
| * | Total returns are historical and include changes in share price and reinvestment of dividends and capital gains distributions, if any. |
The fund’s expense ratio is 0.39%. Expense ratio is the total annual operating expense ratio from the most recent prospectus. A fund’s net expenses paid may be different. Please refer to the most recent prospectus for more information on a fund’s expenses.
Investment Summary (Unaudited)
| Geographic Diversification as of April 30, 2018 | ||||
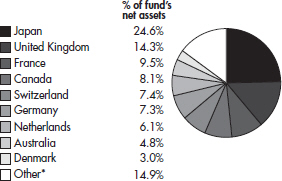
| * | Includes Net Other Assets (Liabilities). |
Percentages are based on country or territory of incorporation and are adjusted for the effect of futures contracts, if applicable.
| Asset Allocation as of April 30, 2018 | ||||
| % of funds’s net assets | ||||
Stocks | 99.3% | |||
Net Other Assets (Liabilities) | 0.7% | |||
| 5 | Semiannual Report |
Table of Contents
Fidelity® International Value Factor ETF
| Top Ten Stocks as of April 30, 2018 | ||||
| % of fund’s net assets | ||||
Royal Dutch Shell PLC Class B | 2.1 | |||
Nestle S.A. | 1.9 | |||
Toyota Motor Corp. | 1.6 | |||
Babcock International Group PLC | 1.6 | |||
Nippon Telegraph & Telephone Corp. | 1.5 | |||
Novartis AG | 1.5 | |||
SAP SE | 1.4 | |||
TOTAL S.A. | 1.3 | |||
The Bank of Nova Scotia | 1.3 | |||
Roche Holding AG | 1.3 | |||
|
| |||
| 15.5 | ||||
|
| |||
| Top Market Sectors as of April 30, 2018 | ||||
| % of fund’s net assets | ||||
Financials | 22.8 | |||
Industrials | 15.0 | |||
Consumer Discretionary | 11.8 | |||
Consumer Staples | 10.3 | |||
Health Care | 9.4 | |||
Materials | 7.3 | |||
Energy | 7.0 | |||
Information Technology | 6.1 | |||
Telecommunication Services | 3.6 | |||
Utilities | 3.2 | |||
Real Estate | 2.8 | |||
| Semiannual Report | 6 |
Table of Contents
Fidelity International High Dividend ETF
Investments April 30, 2018 (Unaudited)
Showing Percentage of Net Assets
| Common Stocks – 99.4% | ||||||||
| Shares | Value | |||||||
AUSTRALIA – 10.7% |
| |||||||
AGL Energy Ltd. | 16,594 | $ | 270,440 | |||||
BHP Billiton PLC | 810 | 17,271 | ||||||
Fortescue Metals Group Ltd. | 5,581 | 18,936 | ||||||
National Australia Bank Ltd. | 7,738 | 168,217 | ||||||
Sonic Healthcare Ltd. | 949 | 16,826 | ||||||
Telstra Corp. Ltd. | 164,458 | 391,019 | ||||||
Wesfarmers Ltd. | 1,034 | 34,018 | ||||||
Westpac Banking Corp. | 7,833 | 168,256 | ||||||
Woodside Petroleum Ltd. | 7,438 | 180,249 | ||||||
|
| |||||||
TOTAL AUSTRALIA |
| 1,265,232 | ||||||
|
| |||||||
BELGIUM – 0.3% | ||||||||
Anheuser-Busch InBev S.A. | 388 | 38,758 | ||||||
|
| |||||||
TOTAL BELGIUM |
| 38,758 | ||||||
|
| |||||||
CANADA – 10.2% | ||||||||
Canadian National Railway Co. | 717 | 55,380 | ||||||
Enbridge, Inc. | 6,980 | 211,419 | ||||||
Hydro One Ltd. | 13,879 | 220,408 | ||||||
Inter Pipeline Ltd. | 10,985 | 198,063 | ||||||
Methanex Corp. | 208 | 12,537 | ||||||
Power Financial Corp. | 4,968 | 128,887 | ||||||
Royal Bank of Canada | 2,573 | 195,668 | ||||||
The Bank of Nova Scotia | 2,860 | 175,794 | ||||||
|
| |||||||
TOTAL CANADA |
| 1,198,156 | ||||||
|
| |||||||
DENMARK – 0.6% |
| |||||||
ISS A/S | 2,103 | 73,626 | ||||||
|
| |||||||
TOTAL DENMARK |
| 73,626 | ||||||
|
| |||||||
FINLAND – 0.1% |
| |||||||
Orion Oyj Class B | 326 | 9,913 | ||||||
|
| |||||||
TOTAL FINLAND |
| 9,913 | ||||||
|
| |||||||
FRANCE – 10.3% |
| |||||||
BNP Paribas S.A. | 1,791 | 138,377 | ||||||
Bouygues S.A. | 1,152 | 58,776 | ||||||
Engie S.A. | 20,191 | 354,767 | ||||||
Eutelsat Communications S.A. | 7,856 | 170,195 | ||||||
Sanofi | 363 | 28,700 | ||||||
Societe Generale S.A. | 1,942 | 106,283 | ||||||
TOTAL S.A. | 4,492 | 282,330 | ||||||
Vinci S.A. | 762 | 76,188 | ||||||
|
| |||||||
TOTAL FRANCE |
| 1,215,616 | ||||||
|
| |||||||
GERMANY – 4.1% |
| |||||||
BASF SE | 225 | 23,410 | ||||||
Bayer AG | 256 | 30,597 | ||||||
Daimler AG | 2,404 | 190,151 | ||||||
| Shares | Value | |||||||
ProSiebenSat.1 Media SE | 4,147 | $ | 150,445 | |||||
Siemens AG | 647 | 82,166 | ||||||
|
| |||||||
TOTAL GERMANY |
| 476,769 | ||||||
|
| |||||||
HONG KONG – 1.6% |
| |||||||
Hang Seng Bank Ltd. | 5,700 | 144,380 | ||||||
Jardine Matheson Holdings Ltd. | 803 | 48,625 | ||||||
|
| |||||||
TOTAL HONG KONG |
| 193,005 | ||||||
|
| |||||||
ITALY – 1.4% |
| |||||||
Intesa Sanpaolo SpA | 44,617 | 169,721 | ||||||
|
| |||||||
TOTAL ITALY |
| 169,721 | ||||||
|
| |||||||
JAPAN – 15.8% |
| |||||||
Astellas Pharma, Inc. | 2,078 | 30,393 | ||||||
Honda Motor Co. Ltd. | 5,300 | 182,246 | ||||||
ITOCHU Corp. | 3,881 | 77,890 | ||||||
Japan Tobacco, Inc. | 1,400 | 37,606 | ||||||
Lawson, Inc. | 500 | 33,068 | ||||||
Marubeni Corp. | 9,100 | 68,608 | ||||||
Mitsubishi Chemical Holdings Corp. | 1,500 | 14,263 | ||||||
Mitsubishi Corp. | 2,900 | 80,299 | ||||||
Mitsubishi Heavy Industries Ltd. | 1,800 | 71,229 | ||||||
Mitsui & Co. Ltd. | 4,300 | 77,744 | ||||||
Mizuho Financial Group, Inc. | 80,348 | 145,369 | ||||||
MS&AD Insurance Group Holdings, Inc. | 3,900 | 130,999 | ||||||
Nissan Motor Co. Ltd. | 14,700 | 154,839 | ||||||
Sekisui House Ltd. | 8,100 | 148,522 | ||||||
Subaru Corp. | 4,700 | 158,171 | ||||||
Sumitomo Mitsui Financial Group, Inc. | 3,604 | 150,209 | ||||||
Takeda Pharmaceutical Co. Ltd. | 530 | 22,318 | ||||||
Teijin Ltd. | 700 | 13,197 | ||||||
Toyota Motor Corp. | 3,967 | 260,126 | ||||||
|
| |||||||
TOTAL JAPAN |
| 1,857,096 | ||||||
|
| |||||||
JERSEY – 1.0% |
| |||||||
Phoenix Group Holdings | 10,363 | 112,279 | ||||||
|
| |||||||
TOTAL JERSEY |
| 112,279 | ||||||
|
| |||||||
LUXEMBOURG – 1.5% |
| |||||||
SES S.A. | 11,079 | 171,251 | ||||||
|
| |||||||
TOTAL LUXEMBOURG |
| 171,251 | ||||||
|
| |||||||
MACAU – 1.6% |
| |||||||
Sands China Ltd. | 31,600 | 182,629 | ||||||
|
| |||||||
TOTAL MACAU |
| 182,629 | ||||||
|
| |||||||
See accompanying notes which are an integral part of the financial statements.
| 7 | Semiannual Report |
Table of Contents
Fidelity International High Dividend ETF
Investments (Unaudited) – continued
| Common Stocks – continued | ||||||||
| Shares | Value | |||||||
MEXICO – 0.1% |
| |||||||
Fresnillo PLC | 682 | $ | 11,971 | |||||
|
| |||||||
TOTAL MEXICO |
| 11,971 | ||||||
|
| |||||||
NETHERLANDS – 3.1% |
| |||||||
Royal Dutch Shell PLC Class B | 10,329 | 368,733 | ||||||
|
| |||||||
TOTAL NETHERLANDS |
| 368,733 | ||||||
|
| |||||||
NORWAY – 1.2% |
| |||||||
Gjensidige Forsikring ASA | 7,135 | 113,131 | ||||||
Marine Harvest ASA | 1,029 | 22,402 | ||||||
|
| |||||||
TOTAL NORWAY |
| 135,533 | ||||||
|
| |||||||
SINGAPORE – 1.3% |
| |||||||
Oversea-Chinese Banking Corp. Ltd. | 15,200 | 156,995 | ||||||
|
| |||||||
TOTAL SINGAPORE |
| 156,995 | ||||||
|
| |||||||
SPAIN – 3.5% |
| |||||||
Banco Bilbao Vizcaya Argentaria S.A. | 18,877 | 152,754 | ||||||
Enagas S.A. | 5,817 | 169,574 | ||||||
Siemens Gamesa Renewable Energy S.A. | 5,208 | 89,715 | ||||||
|
| |||||||
TOTAL SPAIN |
| 412,043 | ||||||
|
| |||||||
SWEDEN – 5.3% |
| |||||||
Hennes & Mauritz AB Class B | 9,271 | 159,316 | ||||||
Nordea Bank AB | 12,858 | 131,243 | ||||||
Skandinaviska Enskilda Banken AB Class A | 11,524 | 108,572 | ||||||
Skanska AB Class B | 3,322 | 64,986 | ||||||
Svenska Cellulosa AB SCA Class B | 1,461 | 16,237 | ||||||
Swedbank AB | 5,825 | 127,022 | ||||||
Swedish Match AB | 450 | 20,248 | ||||||
|
| |||||||
TOTAL SWEDEN |
| 627,624 | ||||||
|
| |||||||
SWITZERLAND – 4.2% |
| |||||||
LafargeHolcim Ltd. (a) | 281 | 15,698 | ||||||
Nestle S.A. | 953 | 73,829 | ||||||
| Shares | Value | |||||||
Novartis AG | 661 | $ | 50,880 | |||||
Roche Holding AG | 197 | 43,771 | ||||||
Swiss Re AG | 1,563 | 149,297 | ||||||
Zurich Insurance Group AG | 506 | 161,634 | ||||||
|
| |||||||
TOTAL SWITZERLAND |
| 495,109 | ||||||
|
| |||||||
UNITED KINGDOM – 21.5% |
| |||||||
Admiral Group PLC | 4,373 | 119,985 | ||||||
AstraZeneca PLC | 431 | 30,171 | ||||||
BAE Systems PLC | 12,387 | 103,930 | ||||||
BP PLC | 35,805 | 265,958 | ||||||
British American Tobacco PLC | 911 | 49,966 | ||||||
BT Group PLC | 112,886 | 387,463 | ||||||
GlaxoSmithKline PLC | 1,636 | 32,814 | ||||||
HSBC Holdings PLC | 24,668 | 245,594 | ||||||
Imperial Brands PLC | 828 | 29,689 | ||||||
ITV PLC | 65,793 | 137,360 | ||||||
Legal & General Group PLC | 32,676 | 121,460 | ||||||
SSE PLC | 18,825 | 357,272 | ||||||
Tate & Lyle PLC | 2,743 | 21,699 | ||||||
Unilever N.V. | 698 | 40,015 | ||||||
Vodafone Group PLC | 146,585 | 427,766 | ||||||
WPP PLC | 9,325 | 160,018 | ||||||
|
| |||||||
TOTAL UNITED KINGDOM |
| 2,531,160 | ||||||
|
| |||||||
TOTAL COMMON STOCKS |
| 11,703,219 | ||||||
|
| |||||||
TOTAL INVESTMENT PORTFOLIO – 99.4% |
| 11,703,219 | ||||||
NET OTHER ASSETS (LIABILITIES) – 0.6% |
| 73,268 | ||||||
|
| |||||||
NET ASSETS – 100.0% |
| $ | 11,776,487 | |||||
|
| |||||||
Categorizations in the Schedule of Investments are based on country or territory of incorporation. |
| |||||||
Legend
| (a) | Non-income producing. |
Affiliated Central Funds
Information regarding fiscal year to date income earned by the Fund from investments in Fidelity Central Funds is as follows:
| Fund | Income earned | |||
Fidelity Cash Central Fund | $ | 69 | ||
|
| |||
Amounts in the income column in the above table include any capital gain distributions from underlying funds, which are presented in the corresponding line-item in the Statement of Operations if applicable.
See accompanying notes which are an integral part of the financial statements.
| Semiannual Report | 8 |
Table of Contents
Investment Valuation
The following is a summary of the inputs used, as of April 30, 2018, involving the Fund’s assets and liabilities carried at fair value. The inputs or methodology used for valuing securities may not be an indication of the risk associated with investing in those securities. For more information on valuation inputs, and their aggregation into the levels used in the table below, please refer to the Investment Valuation section in the accompanying Notes to Financial Statements.
Valuation Inputs at Reporting Date:
| ||||||||||||||||
| Description | Total | Level 1 | Level 2 | Level 3 | ||||||||||||
Investments in Securities: | ||||||||||||||||
Equities: | ||||||||||||||||
Consumer Discretionary | $ | 2,225,269 | $ | 1,130,489 | $ | 1,094,780 | $ | — | ||||||||
Consumer Staples | 401,298 | 203,470 | 197,828 | — | ||||||||||||
Energy | 1,676,326 | 579,056 | 1,097,270 | — | ||||||||||||
Financials | 3,522,126 | 1,752,714 | 1,769,412 | — | ||||||||||||
Health Care | 296,383 | 9,913 | 286,470 | — | ||||||||||||
Industrials | 1,029,162 | 718,253 | 310,909 | — | ||||||||||||
Materials | 143,520 | 83,903 | 59,617 | — | ||||||||||||
Telecommunication Services | 1,206,248 | — | 1,206,248 | — | ||||||||||||
Utilities | 1,202,887 | 575,175 | 627,712 | — | ||||||||||||
|
|
|
|
|
|
|
| |||||||||
Total Investments in Securities: | $ | 11,703,219 | $ | 5,052,973 | $ | 6,650,246 | $ | — | ||||||||
|
|
|
|
|
|
|
| |||||||||
See accompanying notes which are an integral part of the financial statements.
| 9 | Semiannual Report |
Table of Contents
Fidelity International Value Factor ETF
Investments April 30, 2018 (Unaudited)
Showing Percentage of Net Assets
| Common Stocks – 99.3% | ||||||||
| Shares | Value | |||||||
AUSTRALIA – 4.8% |
| |||||||
Australia & New Zealand Banking Group Ltd. | 6,686 | $ | 134,403 | |||||
BHP Billiton PLC | 5,112 | 109,000 | ||||||
CSL Ltd. | 566 | 72,499 | ||||||
Fortescue Metals Group Ltd. | 35,206 | 119,449 | ||||||
National Australia Bank Ltd. | 6,473 | 140,717 | ||||||
|
| |||||||
TOTAL AUSTRALIA | 576,068 | |||||||
|
| |||||||
CANADA – 8.1% | ||||||||
Air Canada (a) | 5,279 | 103,775 | ||||||
Canadian Imperial Bank of Commerce | 1,400 | 121,938 | ||||||
Canadian Natural Resources Ltd. | 2,814 | 101,518 | ||||||
CGI Group, Inc. Class A (a) | 813 | 47,110 | ||||||
Fortis, Inc. | 745 | 25,008 | ||||||
Magna International, Inc. | 2,019 | 119,242 | ||||||
Manulife Financial Corp. | 6,484 | 122,363 | ||||||
Suncor Energy, Inc. | 3,123 | 119,428 | ||||||
Teck Resources Ltd. Class B | 2,761 | 69,307 | ||||||
The Bank of Nova Scotia | 2,482 | 152,560 | ||||||
|
| |||||||
TOTAL CANADA | 982,249 | |||||||
|
| |||||||
DENMARK – 3.0% | ||||||||
AP Moller – Maersk A/S Class B | 83 | 133,936 | ||||||
Novo Nordisk A/S Class B | 2,064 | 97,066 | ||||||
Vestas Wind Systems A/S | 2,100 | 135,853 | ||||||
|
| |||||||
TOTAL DENMARK | 366,855 | |||||||
|
| |||||||
FRANCE – 9.5% | ||||||||
Atos SE | 654 | 88,375 | ||||||
BNP Paribas S.A. | 1,361 | 105,154 | ||||||
Cie de Saint-Gobain | 2,131 | 111,930 | ||||||
Engie S.A. | 7,573 | 133,062 | ||||||
Peugeot S.A. | 4,843 | 119,424 | ||||||
Sanofi | 1,276 | 100,884 | ||||||
Societe Generale S.A. | 1,317 | 72,078 | ||||||
TOTAL S.A. | 2,555 | 160,586 | ||||||
Unibail-Rodamco SE | 498 | 119,615 | ||||||
Vinci S.A. | 1,303 | 130,279 | ||||||
|
| |||||||
TOTAL FRANCE | 1,141,387 | |||||||
|
| |||||||
GERMANY – 7.3% | ||||||||
BASF SE | 1,409 | 146,597 | ||||||
Bayer AG | 902 | 107,807 | ||||||
Daimler AG | 1,658 | 131,144 | ||||||
Deutsche Bank AG | 7,137 | 97,959 | ||||||
Deutsche Lufthansa AG | 4,736 | 138,233 | ||||||
ProSiebenSat.1 Media SE | 2,390 | 86,705 | ||||||
SAP SE | 1,536 | 170,658 | ||||||
|
| |||||||
TOTAL GERMANY | 879,103 | |||||||
|
| |||||||
| Shares | Value | |||||||
HONG KONG – 1.7% | ||||||||
CK Asset Holdings Ltd. | 9,000 | $ | 77,697 | |||||
Hongkong Land Holdings Ltd. | 4,200 | 30,354 | ||||||
Jardine Matheson Holdings Ltd. | 1,500 | 90,831 | ||||||
|
| |||||||
TOTAL HONG KONG | 198,882 | |||||||
|
| |||||||
ITALY – 2.7% | ||||||||
Banco BPM SpA | 28,927 | 105,373 | ||||||
Eni SpA | 4,195 | 82,006 | ||||||
UniCredit SpA (a) | 6,205 | 134,682 | ||||||
|
| |||||||
TOTAL ITALY | 322,061 | |||||||
|
| |||||||
JAPAN – 24.6% | ||||||||
Astellas Pharma, Inc. | 8,500 | 124,323 | ||||||
Daiwa House Industry Co. Ltd. | 3,100 | 113,712 | ||||||
FUJIFILM Holdings Corp. | 2,700 | 108,795 | ||||||
Fujitsu Ltd. | 18,000 | 109,643 | ||||||
Haseko Corp. | 5,000 | 78,897 | ||||||
Hitachi Ltd. | 16,000 | 117,322 | ||||||
Honda Motor Co. Ltd. | 3,400 | 116,912 | ||||||
ITOCHU Corp. | 6,900 | 138,480 | ||||||
Japan Tobacco, Inc. | 3,900 | 104,760 | ||||||
JXTG Holdings, Inc. | 10,500 | 68,617 | ||||||
Marubeni Corp. | 16,300 | 122,891 | ||||||
Mazda Motor Corp. | 5,900 | 82,115 | ||||||
Medipal Holdings Corp. | 5,000 | 107,528 | ||||||
Mitsubishi Chemical Holdings Corp. | 8,800 | 83,677 | ||||||
Mitsubishi Corp. | 5,200 | 143,985 | ||||||
Mitsui & Co. Ltd. | 7,700 | 139,216 | ||||||
Mizuho Financial Group, Inc. | 66,200 | 119,772 | ||||||
NH Foods Ltd. | 2,200 | 96,295 | ||||||
Nippon Steel & Sumitomo Metal Corp. | 3,900 | 85,085 | ||||||
Nippon Telegraph & Telephone Corp. | 3,800 | 180,330 | ||||||
Nomura Holdings, Inc. | 16,500 | 95,033 | ||||||
ORIX Corp. | 5,900 | 103,838 | ||||||
Subaru Corp. | 2,700 | 90,864 | ||||||
Sumitomo Corp. | 7,400 | 133,318 | ||||||
The Kansai Electric Power Co., Inc. | 7,300 | 102,168 | ||||||
Toyota Motor Corp. | 3,000 | 196,717 | ||||||
|
| |||||||
TOTAL JAPAN | 2,964,293 | |||||||
|
| |||||||
LUXEMBOURG – 1.7% | ||||||||
ArcelorMittal (a) | 2,874 | 97,508 | ||||||
SES S.A. | 6,708 | 103,687 | ||||||
|
| |||||||
TOTAL LUXEMBOURG | 201,195 | |||||||
|
| |||||||
MEXICO – 0.6% | ||||||||
Fresnillo PLC | 4,301 | 75,495 | ||||||
|
| |||||||
TOTAL MEXICO | 75,495 | |||||||
|
| |||||||
See accompanying notes which are an integral part of the financial statements.
| Semiannual Report | 10 |
Table of Contents
| Common Stocks – continued | ||||||||
| Shares | Value | |||||||
NETHERLANDS – 6.1% | ||||||||
Aegon N.V. | 16,148 | $ | 118,796 | |||||
Gemalto N.V. | 1,565 | 94,268 | ||||||
Koninklijke Ahold Delhaize N.V. | 3,493 | 84,384 | ||||||
Koninklijke Philips N.V. | 1,653 | 69,965 | ||||||
NN Group N.V. | 2,410 | 115,510 | ||||||
Royal Dutch Shell PLC Class B | 7,113 | 253,926 | ||||||
|
| |||||||
TOTAL NETHERLANDS | 736,849 | |||||||
|
| |||||||
NEW ZEALAND – 0.0% | ||||||||
Fletcher Building Ltd. | 500 | 2,220 | ||||||
|
| |||||||
TOTAL NEW ZEALAND | 2,220 | |||||||
|
| |||||||
NORWAY – 0.6% | ||||||||
Marine Harvest ASA | 3,559 | 77,481 | ||||||
|
| |||||||
TOTAL NORWAY | 77,481 | |||||||
|
| |||||||
SINGAPORE – 2.8% | ||||||||
DBS Group Holdings Ltd. | 5,200 | 119,975 | ||||||
Oversea-Chinese Banking Corp. Ltd. | 10,800 | 111,549 | ||||||
Wilmar International Ltd. | 43,400 | 106,175 | ||||||
|
| |||||||
TOTAL SINGAPORE | 337,699 | |||||||
|
| |||||||
SPAIN – 0.5% | ||||||||
Repsol S.A. | 3,162 | 60,522 | ||||||
|
| |||||||
TOTAL SPAIN | 60,522 | |||||||
|
| |||||||
SWEDEN – 2.8% | ||||||||
Essity AB Class B | 2,367 | 60,279 | ||||||
Hennes & Mauritz AB Class B | 5,467 | 93,947 | ||||||
Industrivarden AB Class A | 3,887 | 85,627 | ||||||
Volvo AB Class B | 5,882 | 100,220 | ||||||
|
| |||||||
TOTAL SWEDEN | 340,073 | |||||||
|
| |||||||
SWITZERLAND – 7.4% | ||||||||
Credit Suisse Group AG (a) | 7,018 | 118,367 | ||||||
LafargeHolcim Ltd. (a) | 1,761 | 98,374 | ||||||
Nestle S.A. | 2,886 | 223,579 | ||||||
| Shares | Value | |||||||
Novartis AG | 2,314 | $ | 178,118 | |||||
Roche Holding AG | 686 | 152,421 | ||||||
Swiss Re AG | 1,281 | 122,361 | ||||||
|
| |||||||
TOTAL SWITZERLAND | 893,220 | |||||||
|
| |||||||
UNITED KINGDOM – 14.3% | ||||||||
3i Group PLC | 7,300 | 94,630 | ||||||
Aviva PLC | 15,113 | 109,806 | ||||||
Babcock International Group PLC | 19,394 | 196,456 | ||||||
Barclays PLC | 43,179 | 123,108 | ||||||
BT Group PLC | 31,836 | 109,272 | ||||||
Centrica PLC | 63,500 | 134,453 | ||||||
GlaxoSmithKline PLC | 5,640 | 113,122 | ||||||
Imperial Brands PLC | 2,845 | 102,011 | ||||||
J Sainsbury PLC | 25,764 | 109,600 | ||||||
Lloyds Banking Group PLC | 141,277 | 125,305 | ||||||
Marks & Spencer Group PLC | 22,612 | 89,409 | ||||||
Unilever N.V. | 2,215 | 126,983 | ||||||
Unilever PLC | 2,477 | 138,940 | ||||||
Vodafone Group PLC | 49,887 | 145,581 | ||||||
|
| |||||||
TOTAL UNITED KINGDOM | 1,718,676 | |||||||
|
| |||||||
UNITED STATES – 0.8% | ||||||||
Carnival PLC | 1,452 | 94,373 | ||||||
|
| |||||||
TOTAL UNITED STATES | 94,373 | |||||||
|
| |||||||
TOTAL COMMON STOCKS |
| 11,968,701 | ||||||
|
| |||||||
TOTAL INVESTMENT PORTFOLIO – 99.3% |
| 11,968,701 | ||||||
NET OTHER ASSETS (LIABILITIES) – 0.7% |
| 83,649 | ||||||
|
| |||||||
NET ASSETS – 100.0% |
| $ | 12,052,350 | |||||
|
| |||||||
Categorizations in the Schedule of Investments are based on country or territory of incorporation.
Legend
| (a) | Non-income producing. |
Affiliated Central Funds
Information regarding fiscal year to date income earned by the Fund from investments in Fidelity Central Funds is as follows:
| Fund | Income earned | |||
Fidelity Cash Central Fund | $ | 359 | ||
|
| |||
Amounts in the income column in the above table include any capital gain distributions from underlying funds, which are presented in the corresponding line-item in the Statement of Operations if applicable.
See accompanying notes which are an integral part of the financial statements.
| 11 | Semiannual Report |
Table of Contents
Fidelity International Value Factor ETF
Investments (Unaudited) – continued
Investment Valuation
The following is a summary of the inputs used, as of April 30, 2018, involving the Fund’s assets and liabilities carried at fair value. The inputs or methodology used for valuing securities may not be an indication of the risk associated with investing in those securities. For more information on valuation inputs, and their aggregation into the levels used in the table below, please refer to the Investment Valuation section in the accompanying Notes to Financial Statements.
Valuation Inputs at Reporting Date:
| ||||||||||||||||
| Description | Total | Level 1 | Level 2 | Level 3 | ||||||||||||
Investments in Securities: | ||||||||||||||||
Equities: | ||||||||||||||||
Consumer Discretionary | $ | 1,403,436 | $ | 725,373 | $ | 678,063 | $ | — | ||||||||
Consumer Staples | 1,230,487 | 634,810 | 595,677 | — | ||||||||||||
Energy | 846,603 | 350,085 | 496,518 | — | ||||||||||||
Financials | 2,750,904 | 1,480,791 | 1,270,113 | — | ||||||||||||
Health Care | 1,123,733 | 107,528 | 1,016,205 | — | ||||||||||||
Industrials | 1,819,403 | 1,462,440 | 356,963 | — | ||||||||||||
Information Technology | 736,171 | 565,513 | 170,658 | — | ||||||||||||
Materials | 886,712 | 511,666 | 375,046 | — | ||||||||||||
Real Estate | 341,378 | 311,024 | 30,354 | — | ||||||||||||
Telecommunication Services | 435,183 | — | 435,183 | — | ||||||||||||
Utilities | 394,691 | 394,691 | — | — | ||||||||||||
|
|
|
|
|
|
|
| |||||||||
Total Investments in Securities: | $ | 11,968,701 | $ | 6,543,921 | $ | 5,424,780 | $ | — | ||||||||
|
|
|
|
|
|
|
| |||||||||
See accompanying notes which are an integral part of the financial statements.
| Semiannual Report | 12 |
Table of Contents
[THIS PAGE INTENTIONALLY LEFT BLANK]
| 13 | Semiannual Report |
Table of Contents
| Statements of Assets and Liabilities | ||||||||
| April 30, 2018 (Unaudited) | ||||||||
Fidelity Dividend ETF | Fidelity International Value Factor ETF | |||||||
Assets | ||||||||
Investments in securities, at value – See accompanying schedule | $ | 11,703,219 | $ | 11,968,701 | ||||
Cash | 6,386 | 7,153 | ||||||
Foreign currency held at value (cost $20,372 and $22,640, respectively) | 20,055 | 22,437 | ||||||
Dividends receivable | 53,939 | 57,944 | ||||||
|
|
|
| |||||
Total assets | 11,783,599 | 12,056,235 | ||||||
|
|
|
| |||||
Liabilities | ||||||||
Payable for investments purchased | 3,327 | — | ||||||
Accrued management fees | 3,785 | 3,885 | ||||||
|
|
|
| |||||
Total liabilities | 7,112 | 3,885 | ||||||
|
|
|
| |||||
Net Assets | $ | 11,776,487 | $ | 12,052,350 | ||||
|
|
|
| |||||
Net Assets consist of: | ||||||||
Paid in capital | 12,367,981 | 12,539,407 | ||||||
Undistributed net investment income | 67,431 | 49,051 | ||||||
Accumulated undistributed net realized gain (loss) on investments and foreign currency transactions | (204,574 | ) | (84,563 | ) | ||||
Net unrealized appreciation (depreciation) on investments and assets and liabilities in foreign currencies | (454,351 | ) | (451,545 | ) | ||||
|
|
|
| |||||
Net Assets | $ | 11,776,487 | $ | 12,052,350 | ||||
|
|
|
| |||||
Shares outstanding | 500,000 | 500,000 | ||||||
|
|
|
| |||||
Net Asset Value, offering price and redemption price per share | $ | 23.55 | $ | 24.10 | ||||
|
|
|
| |||||
Investments at cost | $ | 12,155,954 | $ | 12,418,573 | ||||
|
|
|
| |||||
See accompanying notes which are an integral part of the financial statements.
| Semiannual Report | 14 |
Table of Contents
| Statements of Operations | ||||||||
| For the period January 16, 2018 (commencement of operations) to April 30, 2018 (Unaudited) | ||||||||
| Fidelity International High Dividend ETF | Fidelity International Value Factor ETF | |||||||
Investment Income | ||||||||
Dividends | $ | 206,861 | $ | 149,459 | ||||
Income from Fidelity Central Funds | 69 | 359 | ||||||
|
|
|
| |||||
Income before foreign taxes withheld | 206,930 | 149,818 | ||||||
Less foreign taxes withheld | (20,440 | ) | (15,594 | ) | ||||
|
|
|
| |||||
Total income | 186,490 | 134,224 | ||||||
|
|
|
| |||||
Expenses | ||||||||
Management fees | 13,036 | 13,649 | ||||||
Independent trustees’ compensation | 23 | 24 | ||||||
|
|
|
| |||||
Total expenses | 13,059 | 13,673 | ||||||
|
|
|
| |||||
Net investment income (loss) | 173,431 | 120,551 | ||||||
|
|
|
| |||||
Realized and Unrealized Gain (Loss) | ||||||||
Net realized gain (loss) on investment securities | (205,226 | ) | (84,449 | ) | ||||
Net realized gain (loss) on foriegn currency transactions | 652 | (114 | ) | |||||
|
|
|
| |||||
Total net realized gain (loss) | (204,574 | ) | (84,563 | ) | ||||
|
|
|
| |||||
Change in net unrealized appreciation (depreciation) on investment securities | (452,735 | ) | (449,872 | ) | ||||
Change in net unrealized appreciation (depreciation) on assets and liabilities in foreign currencies | (1,616 | ) | (1,673 | ) | ||||
|
|
|
| |||||
Total change in net unrealized appreciation (depreciation) | (454,351 | ) | (451,545 | ) | ||||
|
|
|
| |||||
Net gain (loss) | (658,925 | ) | (536,108 | ) | ||||
|
|
|
| |||||
Net increase (decrease) in net assets resulting from operations | $ | (485,494 | ) | $ | (415,557 | ) | ||
|
|
|
| |||||
See accompanying notes which are an integral part of the financial statements.
| 15 | Semiannual Report |
Table of Contents
Financial Statements – continued
| Statements of Changes in Net Assets | ||||||||
| For the period January 16, 2018 (commencement of operations) to April 30, 2018 (Unaudited) | ||||||||
| Fidelity International High Dividend ETF | Fidelity International Value Factor ETF | |||||||
Increase (Decrease) in Net Assets | ||||||||
Operations | ||||||||
Net investment income (loss) | $ | 173,431 | $ | 120,551 | ||||
Net realized gain (loss) | (204,574 | ) | (84,563 | ) | ||||
Change in net unrealized appreciation (depreciation) | (454,351 | ) | (451,545 | ) | ||||
|
|
|
| |||||
Net increase (decrease) in net assets resulting from operations | (485,494 | ) | (415,557 | ) | ||||
|
|
|
| |||||
Distributions to shareholders from net investment income | (106,000 | ) | (71,500 | ) | ||||
|
|
|
| |||||
Share transactions | ||||||||
Proceeds from sales of shares | 12,367,981 | 12,539,407 | ||||||
|
|
|
| |||||
Net increase (decrease) in net assets resulting from share transactions | 12,367,981 | 12,539,407 | ||||||
|
|
|
| |||||
Total increase (decrease) in net assets | 11,776,487 | 12,052,350 | ||||||
Net Assets | ||||||||
Beginning of period | — | — | ||||||
|
|
|
| |||||
End of period | $ | 11,776,487 | $ | 12,052,350 | ||||
|
|
|
| |||||
Undistributed net investment income included in net assets at end of period | $ | 67,431 | $ | 49,051 | ||||
|
|
|
| |||||
Other Information | ||||||||
Shares | ||||||||
Sold | 500,000 | 500,000 | ||||||
Redeemed | — | — | ||||||
|
|
|
| |||||
Net increase (decrease) | 500,000 | 500,000 | ||||||
|
|
|
| |||||
See accompanying notes which are an integral part of the financial statements.
| Semiannual Report | 16 |
Table of Contents
| Financial Highlights | ||||||||
| (Unaudited) | Fidelity International High Dividend ETF | Fidelity International Value Factor ETF | ||||||
| Period ended April 30, | 2018A | 2018A | ||||||
Selected Per-Share Data | ||||||||
Net asset value, beginning of period | $ | 25.08 | $ | 25.00 | ||||
|
|
|
| |||||
Income from Investment Operations | ||||||||
Net investment income (loss)B | 0.36 | 0.25 | ||||||
Net realized and unrealized gain (loss) | (1.68 | ) | (1.01 | ) | ||||
|
|
|
| |||||
Total from investment operations | (1.32 | ) | (0.76 | ) | ||||
|
|
|
| |||||
Distributions from net investment income | (0.21 | ) | (0.14 | ) | ||||
|
|
|
| |||||
Total distributions | (0.21 | ) | (0.14 | ) | ||||
|
|
|
| |||||
Net asset value, end of period | $ | 23.55 | $ | 24.10 | ||||
|
|
|
| |||||
Total ReturnC | (5.22 | )% | (3.00 | )% | ||||
Ratios to Average Net AssetsD,E | ||||||||
Expense before reductions | .39 | % | .39 | % | ||||
Expenses net of fee waivers, if any | .39 | % | .39 | % | ||||
Expenses net of all reductions | .39 | % | .39 | % | ||||
Net investment income (loss) | 5.23 | % | 3.47 | % | ||||
Supplemental Data | ||||||||
Net assets, end of period (000 omitted) | $ | 11,776 | $ | 12,052 | ||||
Portfolio turnover rateF,G,H | 52 | % | 31 | % | ||||
| A | For the period January 16, 2018 (commencement of operations) to April 30, 2018. |
| B | Calculated based on average shares outstanding during the period. |
| C | Total returns for periods of less than one year are not annualized. |
| D | Annualized. |
| E | Expense ratios reflect operating expenses of the Fund. Expenses before reductions do not reflect amounts reimbursed by the investment adviser or reductions from brokerage service arrangements or reductions from other expense offset arrangements and do not represent the amount paid by the Fund during periods when reimbursements or reductions occur. Expenses net of fee waivers reflect expenses after reimbursement by the investment adviser but prior to the reductions from brokerage service arrangements or other expense offset arrangements. Expenses net of all reductions represent the net expenses paid by the Fund but do not include expenses of the investment companies in which the fund invests. |
| F | Amount does not include the portfolio activity of any underlying funds. |
| G | Amount not annualized. |
| H | Portfolio turnover rate excludes securities received or delivered in-kind. |
See accompanying notes which are an integral part of the financial statements.
| 17 | Semiannual Report |
Table of Contents
For the period ended April 30, 2018 (Unaudited)
1. Organization.
Fidelity International High Dividend ETF and Fidelity International Value Factor ETF (the Funds) are exchange-traded funds of Fidelity Covington Trust (the Trust) and are authorized to issue an unlimited number of shares. The Trust is registered under the Investment Company Act of 1940, as amended (the 1940 Act), as an open-end management investment company organized as a Massachusetts business trust.
2. Investments in Fidelity Central Funds.
The Funds invest in Fidelity Central Funds, which are open-end investment companies generally available only to other investment companies and accounts managed by the investment adviser and its affiliates. The Funds’ Schedules of Investments lists each of the Fidelity Central Funds held as of period end, if any, as an investment of the Fund, but do not include the underlying holdings of each Fidelity Central Fund. As an Investing Fund, each Fund indirectly bears its proportionate share of the expenses of the underlying Fidelity Central Funds.
The Money Market Central Funds seek preservation of capital and current income and are managed by Fidelity Investments Money Management, Inc. (FIMM), an affiliate of the investment adviser. Annualized expenses of the Money Market Central Funds as of their most recent shareholder report date are less than .005%.
A complete unaudited list of holdings for each Fidelity Central Fund is available upon request or at the Securities and Exchange Commission (the SEC) website at www.sec.gov. In addition, the financial statements of the Fidelity Central Funds are available on the SEC website or upon request.
3. Significant Accounting Policies.
Each Fund is an investment company and applies the accounting and reporting guidance of the Financial Accounting Standards Board (FASB) Accounting Standards Codification Topic 946 Financial Services – Investments Companies. The financial statements have been prepared in conformity with accounting principles generally accepted in the United States of America (GAAP), which require management to make certain estimates and assumptions at the date of the financial statements. Actual results could differ from those estimates. Subsequent events, if any, through the date that the financial statements were issued have been evaluated in the preparation of the financial statements. The following summarizes the significant accounting policies of the Fund:
Investment Valuation. Investments are valued as of 4:00 p.m. Eastern time on the last calendar day of the period. The Board of Trustees (the Board) has delegated the day to day responsibility for the valuation of each Fund’s investments to the Fair Value Committee (the Committee) established by each Fund’s investment adviser. In accordance with valuation policies and procedures approved by the Board, each Fund attempts to obtain prices from one or more third party pricing vendors or brokers to value its investments. When current market prices, quotations or currency exchange rates are not readily available or reliable, investments will be fair valued in good faith by the Committee, in accordance with procedures adopted by the Board. Factors used in determining fair value vary by investment type and may include market or investment specific events. The frequency with which these procedures are used cannot be predicted and they may be utilized to a significant extent. The Committee oversees each Fund’s valuation policies and procedures and reports to the Board on the Committee’s activities and fair value determinations. The Board monitors the appropriateness of the procedures used in valuing each Fund’s investments and ratifies the fair value determinations of the Committee.
Each Fund categorizes the inputs to valuation techniques used to value its investments into a disclosure hierarchy consisting of three levels as shown below:
Level 1 – quoted prices in active markets for identical investments
Level 2 – other significant observable inputs (including quoted prices for similar investments, interest rates, prepayment speeds, etc.)
Level 3 – unobservable inputs (including the Fund’s own assumptions based on the best information available)
Valuation techniques used to value each Fund’s investments by major category are as follows:
Equity securities, including restricted securities, for which market quotations are readily available, are valued at the last reported sale price or official closing price as reported by a third party pricing vendor on the primary market or exchange on which they are traded and are categorized as Level 1 in the hierarchy. In the event there were no sales during the day or closing prices are not available, securities are valued at the last quoted bid price or may be valued using the last available price and are generally categorized as Level 2 in the hierarchy. For foreign equity securities, when market or security specific events arise, comparisons to the valuation of American Depositary Receipts (ADRs), futures contracts, Exchange-Traded Funds (ETFs) and certain indexes as well as quoted prices for similar securities may be used and would be categorized as Level 2 in the hierarchy. Utilizing these techniques may result in transfers between Level 1 and Level 2. For equity securities, including restricted securities, where observable inputs are limited, assumptions about market activity and risk are used and these securities may be categorized as Level 3 in the hierarchy.
Investments in open-end mutual funds, including the Fidelity Central Funds, are valued at their closing net asset value (NAV) each business day and are categorized as Level 1 in the hierarchy.
| Semiannual Report | 18 |
Table of Contents
3. Significant Accounting Policies – continued
Changes in valuation techniques may result in transfers in or out of an assigned level within the disclosure hierarchy. The aggregate value of investments by input level, as of April 30, 2018, is included at the end of each applicable Fund’s Schedule of Investments.
Foreign Currency. The Funds may use foreign currency contracts to facilitate transactions in foreign-denominated securities. Gains and losses from these transactions may arise from changes in the value of the foreign currency or if the counterparties do not perform under the contracts’ terms.
Foreign-denominated assets, including investment securities, and liabilities are translated into U.S. dollars at the exchange rates at period end. Purchases and sales of investment securities, income and dividends received and expenses denominated in foreign currencies are translated into U.S. dollars at the exchange rate in effect on the transaction date.
The effects of exchange rate fluctuations on investments are included with the net realized and unrealized gain (loss) on investment securities. Other foreign currency transactions resulting in realized and unrealized gain (loss) are disclosed separately.
Investment Transactions and Income. For financial reporting purposes, the Funds’ investment holdings and NAV include trades executed through the end of the last business day of the period. The NAV per share for processing shareholder transactions is calculated as of the close of business of NYSE Arca, normally 4:00 p.m. Eastern time and includes trades executed through the end of the prior business day. Gains and losses on securities sold are determined on the basis of identified cost. Dividend income is recorded on the ex-dividend date, except for certain dividends from foreign securities where the ex-dividend date may have passed, which are recorded as soon as the Funds are informed of the ex-dividend date. Non-cash dividends included in dividend income, if any, are recorded at the fair market value of the securities received. Income and capital gain distributions from Fidelity Central Funds, if any, are recorded on the ex-dividend date. Investment income is recorded net of foreign taxes withheld where recovery of such taxes is uncertain.
Expenses. Expenses directly attributable to a fund are charged to that fund. Expenses attributable to more than one fund are allocated among the respective funds on the basis of relative net assets or other appropriate methods. Expense estimates are accrued in the period to which they relate and adjustments are made when actual amounts are known.
Income Tax Information and Distributions to Shareholders. Each year, each Fund intends to qualify as a regulated investment company under Subchapter M of the Internal Revenue Code, including distributing substantially all of its taxable income and realized gains. As a result, no provision for U.S. Federal income taxes is required. Each Fund files a U.S. federal tax return, in addition to state and local tax returns as required. Each Fund’s federal income tax returns are subject to examination by the Internal Revenue Service (IRS) for a period of three fiscal years after they are filed. State and local tax returns may be subject to examination for an additional fiscal year depending on the jurisdiction. Foreign taxes are provided for based on each Fund’s understanding of the tax rules and rates that exist in the foreign markets in which it invests.
Distributions are declared and recorded on the ex-dividend date. Income and capital gain distributions are determined in accordance with income tax regulations, which may differ from GAAP.
Capital accounts within the financial statements are adjusted for permanent book-tax differences. These adjustments have no impact on net assets or the results of operations. Capital accounts are not adjusted for temporary book-tax differences which will reverse in a subsequent period.
As of period end, the cost and unrealized appreciation (depreciation) in securities, and derivatives if applicable, for federal income tax purposes were as follows:
| Tax cost | Gross unrealized appreciation | Gross unrealized depreciation | Net unrealized appreciation (depreciation) on securities and other investments | |||||||||||||
Fidelity International High Dividend ETF | $ | 12,166,668 | $ | 208,977 | $ | (672,426 | ) | $ | (463,449 | ) | ||||||
Fidelity International Value Factor ETF | 12,421,662 | 229,843 | (682,804 | ) | (452,961 | ) | ||||||||||
4. Purchases and Sales of Investments.
Purchases and sales of securities, other than short-term securities and in-kind transactions, were as follows:
| Purchases | Sales | |||||||
Fidelity International High Dividend ETF | $ | 8,439,956 | $ | 5,799,798 | ||||
Fidelity International Value Factor ETF | 6,282,187 | 3,705,940 | ||||||
| 19 | Semiannual Report |
Table of Contents
Notes to Financial Statements – continued
4. Purchases and Sales of Investments – continued
Securities received or delivered in-kind through subscriptions and redemptions were as follows:
| In-kind Subscriptions | In-kind Redemptions | |||||||
Fidelity International High Dividend ETF | $ | 9,721,963 | $ | — | ||||
Fidelity International Value Factor ETF | 9,926,775 | — | ||||||
5. Fees and Other Transactions with Affiliates.
Management Fee. FMR Co., Inc. (FMRC), an affiliate of FMR provides the Funds with investment management related services for which the Funds pay a monthly management fee that is based on an annual rate of .39% of each Fund’s average net assets. Under the management contract, FMRC pays all other expenses, except the compensation of the independent Trustees and certain other expenses such as interest expense.
Sub-Adviser. Geode Capital Management, LLC (Geode), serves as sub-adviser for the Funds. Geode provides discretionary investment advisory services to the Funds and is paid by the investment adviser for providing these services.
Interfund Trades. The Funds may purchase from or sell securities to other Fidelity Funds under procedures adopted by the Board. The procedures have been designed to ensure these interfund trades are executed in accordance with Rule 17a-7 of the 1940 Act. Interfund trades are included within the respective purchases and sales amounts shown in the Purchases and Sales of Investments note.
6. Share Transactions.
The Funds issue and redeem shares at NAV only with certain authorized participants in large increments known as Creation Units. Purchases of Creation Units are made by tendering a basket of designated stocks to a fund and redemption proceeds are paid with a basket of securities from a fund’s portfolio with a balancing cash component to equate the market value of the basket of securities delivered or redeemed to the NAV per Creation Unit on the transaction date. Cash may be substituted equivalent to the value of certain securities generally when they are not available in sufficient quantity for delivery. A fund’s shares are available in smaller increments to investors in the secondary market at market prices and may be subject to commissions. Authorized participants pay a transaction fee to the shareholder servicing agent when purchasing and redeeming Creation Units of a fund. The transaction fee is used to defray the costs associated with the issuance and redemption of Creation Units.
7. Other.
The Funds’ organizational documents provide former and current trustees and officers with a limited indemnification against liabilities arising in connection with the performance of their duties to the Funds. In the normal course of business, the Funds may also enter into contracts that provide general indemnifications. The Funds’ maximum exposure under these arrangements is unknown as this would be dependent on future claims that may be made against the Funds. The risk of material loss from such claims is considered remote.
| Semiannual Report | 20 |
Table of Contents
Shareholder Expense Example (Unaudited)
As a shareholder of a Fund, you incur two types of costs: (1) transaction costs, and (2) ongoing costs, including management fees and other Fund expenses. This Example is intended to help you understand your ongoing costs (in dollars) of investing in a Fund and to compare these costs with the ongoing costs of investing in other funds.
The actual expense Example is based on an investment of $1,000 invested at the beginning of the period and held for the entire period
(January 16, 2018 to April 30, 2018). The hypothetical expense Example is based on an investment of $1,000 invested for the one-half year period (November 1, 2017 to April 30, 2018).
Actual Expenses
For each fund, the first line of the accompanying table provides information about actual account values and actual expenses. You may use the information in this line, together with the amount you invested, to estimate the expenses that you paid over the period. Simply divide your account value by $1,000.00 (for example, an $8,600 account value divided by $1,000.00 = 8.6), then multiply the result by the number in the first line for each Fund under the heading entitled “Expenses Paid During Period” to estimate the expenses you paid on your account during this period. In addition, each Fund, as a shareholder in the underlying Fidelity Central Funds, will indirectly bear its pro-rata share of the fees and expenses incurred by the underlying Fidelity Central Funds. These fees and expenses are not included in each Fund’s annualized expense ratio used to calculate the expense estimates in the table below.
Hypothetical Example for Comparison Purposes
For each fund, the second line of the accompanying table provides information about hypothetical account values and hypothetical expenses based on the Fund’s actual expense ratio and an assumed rate of return of 5% per year before expenses, which is not the Fund’s actual return. The hypothetical account values and expenses may not be used to estimate the actual ending account balance or expenses you paid for the period. You may use this information to compare the ongoing costs of investing in the Fund and other funds. To do so, compare this 5% hypothetical example with the 5% hypothetical examples that appear in the shareholder reports of the other funds. In addition, each Fund, as a shareholder in the underlying Fidelity Central Funds, will indirectly bear its pro-rata share of the fees and expenses incurred by the underlying Fidelity Central Funds. These fees and expenses are not included in each Fund’s annualized expense ratio used to calculate the expense estimates in the table below.
Please note that the expenses shown in the table are meant to highlight your ongoing costs only and do not reflect any transaction costs. Therefore, the second line of the table is useful in comparing ongoing costs only, and will not help you determine the relative total costs of owning different funds.
Annualized Expense RatioA | Beginning Account Value | Ending April 30, 2018 | Expenses Paid During Period | |||||||||||||
Fidelity International High Dividend ETF | 0.39% | |||||||||||||||
Actual | $ | 1,000.00 | $ | 947.80 | $ | 1.09 | B | |||||||||
HypotheticalC | $ | 1,000.00 | $ | 1,022.86 | $ | 1.96 | D | |||||||||
Fidelity International Value Factor ETF | 0.39% | |||||||||||||||
Actual | $ | 1,000.00 | $ | 970.00 | $ | 1.11 | B | |||||||||
HypotheticalC | $ | 1,000.00 | $ | 1,022.86 | $ | 1.96 | D | |||||||||
| A | Annualized expense ratio reflects expenses net of applicable fee waivers. |
| B | Actual expenses are equal to the Fund’s annualized expense ratio, multiplied by the average account value over the period, multiplied by 105/365 (to reflect the period January 16, 2018 to April 30, 2018). |
| C | 5% return per year before expenses. |
| D | Hypothetical expenses are equal to the Fund’s annualized expense ratio, multiplied by the average account value over the period, multiplied by 181/365 (to reflect the one-half year period). |
| 21 | Semiannual Report |
Table of Contents
Board Approval of Investment Advisory Contracts and Management Fees
Fidelity International High Dividend ETF
Fidelity International Value Factor ETF
On October 25, 2017, the Board of Trustees, including the Independent Trustees (together, the Board), voted to approve the management contract with FMR Co., Inc. (FMRC) and the sub-advisory agreement with Geode Capital Management, LLC (Geode) (together, the Advisory Contracts) for each fund. The Board, assisted by the advice of fund counsel and Independent Trustees’ counsel, considered a broad range of information.
Nature, Extent, and Quality of Services Provided. The Board considered staffing as it relates to the funds, including the backgrounds of investment personnel of Fidelity and Geode, and also considered the funds’ investment objectives, strategies, and related investment philosophies.
Resources Dedicated to Investment Management and Support Services. The Board reviewed the general qualifications and capabilities of Fidelity’s and Geode’s investment staff, including their size, education, experience, and resources, as well as Fidelity’s approach to recruiting, training, managing, and compensating investment personnel. The Board noted that Fidelity has continued to increase the resources devoted to non-U.S. offices, including expansion of Fidelity’s global investment organization. The Board also considered the due diligence on Geode performed by Fidelity, which formed the basis for Fidelity’s recommendation that the Board approve the sub-advisory agreement with Geode. Additionally, in its deliberations, the Board considered Fidelity’s and Geode’s trading, risk management, compliance, and technology and operations capabilities and resources, which are integral parts of the investment management process.
Shareholder, Administrative and Other Services. The Board considered the nature, extent, quality, and cost of advisory, administrative, shareholder and other services to be performed by FMRC and Geode (the Investment Advisers), their affiliates and a third party service provider under the Advisory Contracts and under separate agreements covering transfer agency, pricing and bookkeeping and securities lending services for each fund. The Board also considered the nature and extent of the supervision of third party service providers.
The Board noted that the growth of fund assets over time across the complex allows Fidelity to reinvest in the development of services designed to enhance the value or convenience of the Fidelity funds as investment vehicles. These services include 24-hour access to account information and market information through telephone representatives and over the Internet, investor education materials and asset allocation tools, and the expanded availability of Fidelity Investor Centers.
Investment Performance. Each fund is a new fund and therefore had no historical performance for the Board to review at the time it approved the fund’s Advisory Contracts. The Board considered Geode’s experience in managing Fidelity’s existing factor-based ETFs, equity index and enhanced index mutual funds.
Based on its review, the Board concluded that the nature, extent, and quality of services to be provided to each fund under the Advisory Contracts should benefit each fund’s shareholders.
Competitiveness of Management Fee and Total Expense Ratio. The Board considered each fund’s proposed management fee and projected total expense ratio in reviewing the Advisory Contracts, and the fact that the management contract provides that FMRC will be responsible for paying all operating expenses of the fund with the exception of fees and expenses of the independent Trustees, interest, taxes, brokerage commissions, proxy and shareholder meeting expenses, and non-recurring expenses. The Board noted that each fund’s proposed management fee rate is lower than the median fee rate of funds with similar Lipper investment objective categories and comparable investment mandates regardless of whether their management fee structures are comparable. The Board also considered that the projected total expense ratio of each fund is below the median of those funds and classes used by the Board for management fee comparisons.
Based on its review, the Board concluded that each fund’s management fee and projected total expense ratio were reasonable in light of the services that the fund and its shareholders will receive and the other factors considered.
Costs of the Services and Profitability. Each fund is a new fund and therefore no revenue, cost, or profitability data was available for the Board to review in respect of the fund at the time it approved the Advisory Contracts. In connection with its future renewal of each fund’s Advisory Contracts, the Board will consider the revenues earned and the expenses incurred by Fidelity in conducting the business of developing, marketing, distributing, managing, administering and servicing each fund and servicing each fund’s shareholders.
Economies of Scale. The Board will consider economies of scale when there is operating experience to permit assessment thereof. It noted that, notwithstanding the entrepreneurial risk associated with a new fund, the management fee was at a level normally associated, by comparison with competitors, with very high fund net assets, and Fidelity asserted to the Board that the level of the fee anticipated economies of scale at lower asset levels even before, if ever, economies of scale are achieved. The Board also noted that each fund and its shareholders would have access to the very considerable number and variety of services available through Fidelity and its affiliates.
Based on its evaluation of all of the conclusions noted above, and after considering all factors it believed relevant, the Board concluded that the advisory fee structures are fair and reasonable, and that each fund’s Advisory Contracts should be approved.
| Semiannual Report | 22 |
Table of Contents
[THIS PAGE INTENTIONALLY LEFT BLANK]
| 23 | Semiannual Report |
Table of Contents
| ||
IHD-IVE-SANN-0618 847285.1.0 1.9885305.100 |
Table of Contents
| Item 2. | Code of Ethics |
Not applicable.
| Item 3. | Audit Committee Financial Expert |
Not applicable.
| Item 4. | Principal Accountant Fees and Services |
Not applicable.
| Item 5. | Audit Committee of Listed Registrants |
Not applicable.
| Item 6. | Investments |
| (a) | Not applicable. |
| (b) | Not applicable |
| Item 7. | Disclosure of Proxy Voting Policies and Procedures for Closed-End Management Investment Companies |
Not applicable.
| Item 8. | Portfolio Managers of Closed-End Management Investment Companies |
Not applicable.
| Item 9. | Purchase of Equity Securities by Closed-End Management Investment Company and Affiliated Purchasers |
Not applicable.
| Item 10. | Submission of Matters to a Vote of Security Holders |
There were no material changes to the procedures by which shareholders may recommend nominees to the Fidelity Covington Trust’s Board of Trustees.
| Item 11. | Controls and Procedures |
(a)(i) The President and Treasurer and the Chief Financial Officer have concluded that the Fidelity Covington Trust’s (the “Trust”) disclosure controls and procedures (as
Table of Contents
defined in Rule 30a-3(c) under the Investment Company Act) provide reasonable assurances that material information relating to the Trust is made known to them by the appropriate persons, based on their evaluation of these controls and procedures as of a date within 90 days of the filing date of this report.
(a)(ii) There was no change in the Trust’s internal control over financial reporting (as defined in Rule 30a-3(d) under the Investment Company Act) that occurred during the period covered by this report that has materially affected, or is reasonably likely to materially affect, the Trust’s internal control over financial reporting.
| Item 12. | Disclosure of Securities Lending Activities for Closed-End Management Investment Companies |
Not applicable.
| Item 13. | Exhibits |
(a) | (1 | ) | Not applicable. | |||
(a) | (2 | ) | Certification pursuant to Rule 30a-2(a) under the Investment Company Act of 1940 (17 CFR 270.30a-2(a)) is filed and attached hereto as Exhibit 99.CERT. | |||
(a) | (3 | ) | Not applicable. | |||
(b) | Certification pursuant to Rule 30a-2(b) under the Investment Company Act of 1940 (17 CFR 270.30a-2(b)) is furnished and attached hereto as Exhibit 99.906CERT. | |||||
Table of Contents
SIGNATURES
Pursuant to the requirements of the Securities Exchange Act of 1934 and the Investment Company Act of 1940, the registrant has duly caused this report to be signed on its behalf by the undersigned, thereunto duly authorized.
Fidelity Covington Trust
| By: | /s/ Stacie M. Smith | |
| Stacie M. Smith | ||
President and Treasurer | ||
Date: | June 27, 2018 | |
Pursuant to the requirements of the Securities Exchange Act of 1934 and the Investment Company Act of 1940, this report has been signed below by the following persons on behalf of the registrant and in the capacities and on the dates indicated.
| By: | /s/ Stacie M. Smith | |
| Stacie M. Smith | ||
President and Treasurer | ||
Date: | June 27, 2018 | |
| By: | /s/ Howard J. Galligan III | |
| Howard J. Galligan III | ||
Chief Financial Officer | ||
Date: | June 27, 2018 | |