Table of Contents
UNITED STATES
SECURITIES AND EXCHANGE COMMISSION
Washington, D.C. 20549
FORMN-CSR
CERTIFIED SHAREHOLDER REPORT OF REGISTERED
MANAGEMENT INVESTMENT COMPANIES
Investment Company Act file number811-07319
Fidelity Covington Trust
(Exact name of registrant as specified in charter)
245 Summer St., Boston, MA 02210
(Address of principal executive offices) (Zip code)
Cynthia Lo Bessette, Secretary
245 Summer St.
Boston, Massachusetts 02210
(Name and address of agent for service)
Registrant’s telephone number, including area code:617-563-7000
Date of fiscal year end: October 31
Date of reporting period: April 30, 2020
Table of Contents
| Item 1. | Reports to Stockholders |
Table of Contents

about access to your fund’s shareholder reports.

Table of Contents
| Account Type | Website | Phone Number |
| Brokerage, Mutual Fund, or Annuity Contracts: | fidelity.com/mailpreferences | 1-800-343-3548 |
| Employer Provided Retirement Accounts: | netbenefits.fidelity.com/preferences (choose ‘no’ under Required Disclosures to continue print) | 1-800-343-0860 |
Table of Contents
| 3 |
Table of Contents
| 4 |
Table of Contents
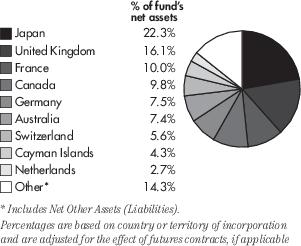
| % of fund's net assets | |
| Daito Trust Construction Co. Ltd. | 3.1 |
| Toyota Motor Corp. | 3.0 |
| E.ON SE | 2.9 |
| AGL Energy Ltd. | 2.7 |
| SSE PLC | 2.6 |
| Wharf Real Estate Investment Co. Ltd. | 2.4 |
| The Kansai Electric Power Co., Inc. | 2.2 |
| Honda Motor Co. Ltd. | 2.2 |
| Klepierre S.A. | 2.1 |
| Enbridge, Inc. | 2.1 |
| 25.3 |
| % of fund's net assets | ||
| Financials | 25.0 | |
| Consumer Discretionary | 18.3 | |
| Utilities | 15.0 | |
| Energy | 11.7 | |
| Industrials | 8.9 | |
| Real Estate | 8.1 | |
| Health Care | 6.4 | |
| Consumer Staples | 4.5 | |
| Materials | 0.5 | |
| Information Technology | 0.3 | |
| % of funds's net assets | ||
| Stocks and Equity Futures | 99.8% | |
| Short-Term Investments and Net Other Assets (Liabilities) | 0.2% | |
| 5 |
Table of Contents
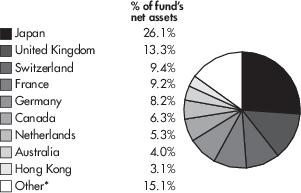
| % of fund's net assets | |
| Nestle S.A. | 3.0 |
| Roche Holding AG | 2.4 |
| Novartis AG | 2.0 |
| SAP SE | 1.8 |
| Sony Corp. | 1.6 |
| Astellas Pharma, Inc. | 1.5 |
| Schneider Electric SE | 1.4 |
| AIA Group Ltd. | 1.4 |
| Showa Denko KK | 1.4 |
| Shionogi & Co. Ltd. | 1.4 |
| 17.9 |
| % of fund's net assets | ||
| Financials | 17.9 | |
| Health Care | 14.2 | |
| Industrials | 13.8 | |
| Consumer Staples | 12.2 | |
| Consumer Discretionary | 9.4 | |
| Information Technology | 7.3 | |
| Materials | 6.8 | |
| Communication Services | 5.1 | |
| Energy | 4.8 | |
| Utilities | 4.0 | |
| Real Estate | 3.7 | |
| % of funds's net assets | ||
| Stocks and Equity Futures | 99.8% | |
| Net Other Assets (Liabilities) | 0.2% | |
| 6 |
Table of Contents
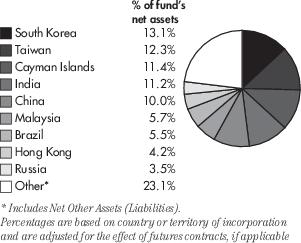
| % of fund's net assets | |
| Samsung Electronics Co. Ltd. | 3.7 |
| Taiwan Semiconductor Manufacturing Co. Ltd. | 3.2 |
| Divi's Laboratories Ltd. | 2.1 |
| Sino Biopharmaceutical Ltd. | 1.8 |
| Kalbe Farma Tbk PT | 1.7 |
| China Construction Bank Corp. Class H | 1.5 |
| China Resources Gas Group Ltd. | 1.5 |
| Guangdong Investment Ltd. | 1.4 |
| Hapvida Participacoes e Investimentos S.A. | 1.3 |
| Manila Electric Co. | 1.3 |
| 19.5 |
| % of fund's net assets | ||
| Financials | 21.6 | |
| Consumer Discretionary | 14.2 | |
| Information Technology | 12.8 | |
| Consumer Staples | 11.1 | |
| Industrials | 9.5 | |
| Communication Services | 8.8 | |
| Health Care | 8.1 | |
| Utilities | 7.9 | |
| Materials | 3.1 | |
| Energy | 2.5 | |
| % of funds's net assets | ||
| Stocks | 99.6% | |
| Net Other Assets (Liabilities) | 0.4% | |
| 7 |
Table of Contents
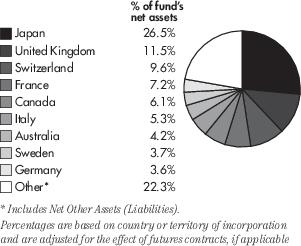
| % of fund's net assets | |
| Nestle S.A. | 2.7 |
| Link REIT | 1.3 |
| Sony Corp. | 1.3 |
| Roche Holding AG | 1.3 |
| CLP Holdings Ltd. | 1.2 |
| KDDI Corp. | 1.2 |
| Enel SpA | 1.2 |
| NTT DOCOMO, Inc. | 1.2 |
| Elisa Oyj | 1.2 |
| LVMH Moet Hennessy Louis Vuitton SE | 1.1 |
| 13.7 |
| % of fund's net assets | ||
| Consumer Staples | 17.3 | |
| Financials | 14.7 | |
| Consumer Discretionary | 13.7 | |
| Industrials | 10.6 | |
| Communication Services | 10.2 | |
| Health Care | 8.7 | |
| Utilities | 8.0 | |
| Real Estate | 6.5 | |
| Materials | 3.2 | |
| Energy | 3.2 | |
| Information Technology | 2.7 | |
| % of funds's net assets | ||
| Stocks and Equity Futures | 99.7% | |
| Net Other Assets (Liabilities) | 0.3% | |
| 8 |
Table of Contents
| Common Stocks – 98.7% | ||
| Shares | Value | |
| AUSTRALIA – 7.4% | ||
| AGL Energy Ltd. | 85,759 | $952,243 |
| Australia & New Zealand Banking Group Ltd. | 39,625 | 438,428 |
| BHP Group Ltd. | 1,123 | 23,785 |
| Sonic Healthcare Ltd. | 8,824 | 157,079 |
| Westpac Banking Corp. | 42,578 | 453,818 |
| Woodside Petroleum Ltd. | 34,257 | 503,510 |
| Woolworths Group Ltd. | 5,421 | 126,881 |
| TOTAL AUSTRALIA | 2,655,744 | |
| BERMUDA – 2.4% | ||
| Hongkong Land Holdings Ltd. | 162,525 | 684,230 |
| Jardine Matheson Holdings Ltd. | 3,782 | 166,257 |
| TOTAL BERMUDA | 850,487 | |
| CANADA – 9.8% | ||
| Canadian Apartment Properties REIT | 18,022 | 621,515 |
| Canadian Imperial Bank of Commerce | 6,908 | 410,218 |
| Enbridge, Inc. | 24,969 | 766,714 |
| Inter Pipeline Ltd. | 50,078 | 419,675 |
| Nutrien Ltd. | 597 | 21,366 |
| SNC-Lavalin Group, Inc. | 12,682 | 234,384 |
| The Bank of Nova Scotia | 11,907 | 478,355 |
| The Toronto-Dominion Bank | 13,457 | 563,490 |
| TOTAL CANADA | 3,515,717 | |
| CAYMAN ISLANDS – 4.3% | ||
| Sands China Ltd. | 169,200 | 696,238 |
| Wharf Real Estate Investment Co. Ltd. | 200,000 | 844,905 |
| TOTAL CAYMAN ISLANDS | 1,541,143 | |
| DENMARK – 0.5% | ||
| Novo Nordisk A/S Class B | 2,823 | 180,016 |
| TOTAL DENMARK | 180,016 | |
| FINLAND – 1.5% | ||
| Nordea Bank Abp | 76,687 | 496,528 |
| Orion Oyj Class B | 1,118 | 56,794 |
| TOTAL FINLAND | 553,322 | |
| FRANCE – 10.0% | ||
| Alstom S.A. | 6,165 | 252,275 |
| Bouygues S.A. | 7,886 | 242,801 |
| Danone S.A. | 1,622 | 112,386 |
| Klepierre S.A. | 38,175 | 771,660 |
| Peugeot S.A. | 38,779 | 555,356 |
| Renault S.A. | 21,399 | 424,374 |
| Sanofi | 1,921 | 187,662 |
| Societe Generale S.A. | 22,181 | 346,445 |
| | ||
| Shares | Value | |
| TOTAL S.A. | 19,629 | $706,263 |
| TOTAL FRANCE | 3,599,222 | |
| GERMANY – 7.5% | ||
| BASF SE | 410 | 20,965 |
| Bayer AG | 1,789 | 117,844 |
| Bayerische Motoren Werke AG | 11,641 | 689,158 |
| Daimler AG | 18,501 | 639,030 |
| Deutsche Lufthansa AG (a)(b) | 18,990 | 169,684 |
| E.ON SE | 104,121 | 1,043,044 |
| SAP SE | 226 | 26,967 |
| TOTAL GERMANY | 2,706,692 | |
| HONG KONG – 1.5% | ||
| BOC Hong Kong Holdings Ltd. | 173,000 | 532,232 |
| TOTAL HONG KONG | 532,232 | |
| ITALY – 1.1% | ||
| Intesa Sanpaolo SpA | 250,049 | 389,729 |
| TOTAL ITALY | 389,729 | |
| JAPAN – 22.3% | ||
| Asahi Group Holdings Ltd. | 3,600 | 125,908 |
| Astellas Pharma, Inc. | 14,900 | 248,926 |
| Canon, Inc. | 800 | 17,091 |
| Daito Trust Construction Co. Ltd. | 11,400 | 1,099,649 |
| Haseko Corp. | 54,000 | 596,886 |
| Honda Motor Co. Ltd. | 32,000 | 781,185 |
| Japan Post Holdings Co. Ltd. | 73,500 | 594,406 |
| Japan Tobacco, Inc. | 7,900 | 148,825 |
| JFE Holdings, Inc. | 2,800 | 18,957 |
| Komatsu Ltd. | 13,000 | 250,737 |
| Mitsubishi Corp. | 12,200 | 262,402 |
| Mitsui & Co. Ltd. | 17,000 | 240,688 |
| Nissan Motor Co. Ltd. | 135,600 | 468,929 |
| Otsuka Holdings Co. Ltd. | 5,500 | 218,848 |
| Sojitz Corp. | 80,500 | 189,704 |
| SUMCO Corp. | 1,100 | 15,944 |
| Sumitomo Corp. | 18,500 | 212,533 |
| Sumitomo Mitsui Financial Group, Inc. | 22,104 | 587,869 |
| The Kansai Electric Power Co., Inc. | 78,000 | 806,004 |
| Tokyo Electron Ltd. | 100 | 21,452 |
| Toyota Motor Corp. | 17,467 | 1,088,839 |
| TOTAL JAPAN | 7,995,782 | |
| JERSEY – 0.0% | ||
| Glencore PLC (a) | 7,847 | 14,560 |
| TOTAL JERSEY | 14,560 | |
| 9 |
Table of Contents
| Common Stocks – continued | ||
| Shares | Value | |
| NETHERLANDS – 2.7% | ||
| ASML Holding N.V. | 94 | $27,866 |
| BE Semiconductor Industries N.V. | 278 | 11,437 |
| ING Groep N.V. | 59,924 | 328,699 |
| Koninklijke Ahold Delhaize N.V. | 4,254 | 103,252 |
| Koninklijke Philips N.V. | 2,111 | 91,828 |
| Randstad N.V. | 6,696 | 268,649 |
| Unilever N.V. | 2,823 | 140,935 |
| TOTAL NETHERLANDS | 972,666 | |
| NORWAY – 0.2% | ||
| Mowi ASA | 3,631 | 62,355 |
| TOTAL NORWAY | 62,355 | |
| SINGAPORE – 1.4% | ||
| DBS Group Holdings Ltd. | 34,700 | 492,017 |
| Venture Corp. Ltd. | 900 | 10,133 |
| TOTAL SINGAPORE | 502,150 | |
| SPAIN – 2.6% | ||
| Banco Santander S.A. | 180,252 | 402,263 |
| International Consolidated Airlines Group S.A. | 31,922 | 89,348 |
| Repsol S.A. | 47,806 | 435,337 |
| TOTAL SPAIN | 926,948 | |
| SWEDEN – 1.8% | ||
| Swedbank AB Class A | 37,775 | 446,159 |
| Volvo AB Class B | 15,682 | 202,544 |
| TOTAL SWEDEN | 648,703 | |
| SWITZERLAND – 5.6% | ||
| Adecco Group AG | 3,614 | 158,429 |
| Nestle S.A. | 3,833 | 404,686 |
| Novartis AG | 3,716 | 316,716 |
| Roche Holding AG | 1,058 | 367,721 |
| UBS Group AG | 69,803 | 747,825 |
| TOTAL SWITZERLAND | 1,995,377 | |
| UNITED KINGDOM – 16.1% | ||
| AstraZeneca PLC | 2,128 | 223,375 |
| Aviva PLC | 97,379 | 297,001 |
| Babcock International Group PLC | 32,752 | 174,129 |
| | ||
| Shares | Value | |
| BHP Group PLC | 1,182 | $19,922 |
| BP PLC | 156,503 | 618,075 |
| British American Tobacco PLC | 4,730 | 183,788 |
| Centrica PLC | 1,056,740 | 531,835 |
| GlaxoSmithKline PLC | 8,375 | 175,465 |
| HSBC Holdings PLC | 121,919 | 630,509 |
| Imperial Brands PLC | 5,362 | 113,556 |
| Lloyds Banking Group PLC | 818,797 | 332,971 |
| Micro Focus International PLC | 1,209 | 7,346 |
| Persimmon PLC | 23,241 | 646,397 |
| Rio Tinto PLC | 488 | 22,680 |
| Royal Dutch Shell PLC Class B | 46,614 | 756,359 |
| SSE PLC | 58,906 | 928,764 |
| Wm Morrison Supermarkets PLC | 46,396 | 107,095 |
| TOTAL UNITED KINGDOM | 5,769,267 | |
| TOTAL COMMON STOCKS (Cost $48,080,141) | 35,412,112 | |
| Money Market Funds – 0.8% | ||
| Fidelity Cash Central Fund, 0.16% (c) | 102,549 | 102,580 |
| Fidelity Securities Lending Cash Central Fund, 0.11% (c)(d) | 179,844 | 179,862 |
| TOTAL MONEY MARKET FUNDS (Cost $282,432) | 282,442 | |
| TOTAL INVESTMENT IN SECURITIES – 99.5% (Cost $48,362,573) | 35,694,554 | |
| NET OTHER ASSETS (LIABILITIES) – 0.5% | 164,704 | |
| NET ASSETS – 100.0% | $35,859,258 | |
| Categorizations in the Schedule of Investments are based on country or territory of incorporation. | ||
| Legend | ||
| (a) | Non-income producing. | |
| (b) | Security or a portion of the security is on loan at period end. | |
| (c) | Affiliated fund that is generally available only to investment companies and other accounts managed by Fidelity Investments. The rate quoted is the annualized seven-day yield of the fund at period end. A complete unaudited listing of the fund's holdings as of its most recent quarter end is available upon request. In addition, each Fidelity Central Fund's financial statements are available on the SEC's website or upon request. | |
| (d) | Investment made with cash collateral received from securities on loan. | |
| 10 |
Table of Contents
| Futures Contracts | |||||
| Number of contracts | Expiration Date | Notional Amount | Value | Unrealized Appreciation/ (Depreciation) | |
| Purchased | |||||
| Equity Index Contract | |||||
| ICE MSCI EAFE Index Future Contracts | 5 | June 2020 | $409,575 | $30,725 | $30,725 |
| Fund | Income earned |
| Fidelity Cash Central Fund | $839 |
| Fidelity Securities Lending Cash Central Fund | 30 |
| Total | $869 |
| 11 |
Table of Contents
| Description | Total | Level 1 | Level 2 | Level 3 |
| Investments in Securities: | ||||||||
| Equities: | ||||||||
| Consumer Discretionary | $6,586,392 | $6,586,392 | $— | $— | ||||
| Consumer Staples | 1,629,667 | 1,629,667 | — | — | ||||
| Energy | 4,205,933 | 4,205,933 | — | — | ||||
| Financials | 8,968,962 | 8,968,962 | — | — | ||||
| Health Care | 2,342,274 | 2,342,274 | — | — | ||||
| Industrials | 3,114,564 | 3,114,564 | — | — | ||||
| Information Technology | 138,236 | 138,236 | — | — | ||||
| Materials | 142,235 | 142,235 | — | — | ||||
| Real Estate | 4,021,959 | 4,021,959 | — | — | ||||
| Utilities | 4,261,890 | 4,261,890 | — | — | ||||
| Money Market Funds | 282,442 | 282,442 | — | — | ||||
| Total Investments in Securities: | $35,694,554 | $35,694,554 | $— | $— |
| Derivative Instruments: | ||||||||
| Assets | ||||||||
| Futures Contracts | $30,725 | $30,725 | $— | $— | ||||
| Total Assets | $30,725 | $30,725 | — | $— | ||||
| Total Derivative Instruments: | $30,725 | $30,725 | $— | $— |
| Primary Risk/ Derivative Type | Value | ||
| Asset | Liabilities | ||
| Equity Risk | |||
| Futures Contracts(a) | $30,725 | $0 | |
| Total Equity Risk | 30,725 | 0 | |
| Total Value of Derivatives | $30,725 | $0 | |
| (a) | Reflects gross cumulative appreciation (depreciation) on futures contracts as presented in the Schedule of Investments. In the Statement of Assets and Liabilities, the period end daily variation margin is included in receivable or payable for daily variation margin on futures contracts, and the net cumulative appreciation (depreciation) is included in total accumulated earnings (loss). |
| 12 |
Table of Contents
| Common Stocks – 99.2% | ||
| Shares | Value | |
| AUSTRALIA – 4.0% | ||
| Australia & New Zealand Banking Group Ltd. | 11,547 | $127,761 |
| BHP Group Ltd. | 7,374 | 156,178 |
| CSL Ltd. | 739 | 149,714 |
| Macquarie Group Ltd. | 1,833 | 123,199 |
| TOTAL AUSTRALIA | 556,852 | |
| BERMUDA – 1.1% | ||
| Hongkong Land Holdings Ltd. | 9,589 | 40,370 |
| Jardine Matheson Holdings Ltd. | 2,423 | 106,515 |
| TOTAL BERMUDA | 146,885 | |
| CANADA – 6.3% | ||
| Air Canada (a) | 5,732 | 83,528 |
| Canadian Apartment Properties REIT | 258 | 8,898 |
| Canadian Natural Resources Ltd. | 4,800 | 80,556 |
| CGI, Inc. (a) | 1,184 | 75,671 |
| Fairfax Financial Holdings Ltd. | 244 | 66,302 |
| Manulife Financial Corp. | 7,035 | 88,789 |
| Suncor Energy, Inc. | 4,997 | 89,294 |
| Teck Resources Ltd. Class B | 11,878 | 104,930 |
| The Bank of Nova Scotia | 3,097 | 124,420 |
| The Toronto-Dominion Bank | 3,720 | 155,769 |
| TOTAL CANADA | 878,157 | |
| CAYMAN ISLANDS – 0.8% | ||
| CK Asset Holdings Ltd. | 17,000 | 107,451 |
| TOTAL CAYMAN ISLANDS | 107,451 | |
| DENMARK – 2.1% | ||
| Novo Nordisk A/S Class B | 2,620 | 167,071 |
| Pandora A/S | 3,442 | 122,253 |
| TOTAL DENMARK | 289,324 | |
| FRANCE – 9.2% | ||
| Atos SE | 1,495 | 106,534 |
| Capgemini SE | 1,120 | 105,180 |
| Cie de Saint-Gobain | 4,875 | 129,271 |
| Peugeot S.A. | 7,966 | 114,082 |
| Publicis Groupe S.A. | 4,442 | 131,996 |
| Renault S.A. | 4,323 | 85,732 |
| Sanofi | 1,775 | 173,399 |
| Schneider Electric SE | 2,157 | 197,180 |
| Societe Generale S.A. | 6,147 | 96,010 |
| TOTAL S.A. | 3,813 | 137,194 |
| TOTAL FRANCE | 1,276,578 | |
| GERMANY – 8.2% | ||
| Allianz SE | 958 | 177,205 |
| | ||
| Shares | Value | |
| Bayer AG | 1,691 | $111,388 |
| Deutsche Lufthansa AG (a) | 12,242 | 109,388 |
| Fresenius Medical Care AG & Co. KGaA | 902 | 70,797 |
| Fresenius SE & Co. KGaA | 1,469 | 63,765 |
| Merck KGaA | 545 | 63,335 |
| RWE AG | 4,383 | 125,970 |
| SAP SE | 2,045 | 244,014 |
| Vonovia SE | 3,552 | 175,267 |
| TOTAL GERMANY | 1,141,129 | |
| HONG KONG – 3.1% | ||
| AIA Group Ltd. | 21,200 | 196,758 |
| BOC Hong Kong Holdings Ltd. | 28,500 | 87,680 |
| CLP Holdings Ltd. | 14,000 | 149,529 |
| TOTAL HONG KONG | 433,967 | |
| ITALY – 3.0% | ||
| Assicurazioni Generali SpA | 7,633 | 108,811 |
| Enel SpA | 22,900 | 156,414 |
| Eni SpA | 6,571 | 62,717 |
| UniCredit SpA (a) | 11,146 | 85,811 |
| TOTAL ITALY | 413,753 | |
| JAPAN – 26.1% | ||
| Astellas Pharma, Inc. | 12,800 | 213,842 |
| Chubu Electric Power Co., Inc. | 4,500 | 61,376 |
| Daiwa House Industry Co. Ltd. | 6,700 | 172,771 |
| FUJIFILM Holdings Corp. | 3,100 | 148,977 |
| Fujitsu Ltd. | 1,300 | 128,073 |
| Haseko Corp. | 11,500 | 127,115 |
| Hitachi Ltd. | 4,600 | 139,417 |
| Honda Motor Co. Ltd. | 7,600 | 185,531 |
| ITOCHU Corp. | 8,200 | 162,950 |
| Japan Tobacco, Inc. | 8,000 | 150,708 |
| JXTG Holdings, Inc. | 20,800 | 74,439 |
| KDDI Corp. | 5,600 | 162,813 |
| Kirin Holdings Co. Ltd. | 7,400 | 143,834 |
| Marubeni Corp. | 23,200 | 113,684 |
| Mitsubishi Corp. | 7,600 | 163,464 |
| Mitsubishi UFJ Financial Group, Inc. | 44,100 | 179,105 |
| Mitsui & Co. Ltd. | 10,600 | 150,076 |
| MS&AD Insurance Group Holdings, Inc. | 5,200 | 151,816 |
| Nikon Corp. | 12,500 | 117,712 |
| Nippon Telegraph & Telephone Corp. | 6,000 | 137,074 |
| Shionogi & Co. Ltd. | 3,500 | 194,057 |
| Showa Denko KK | 8,800 | 195,446 |
| Sony Corp. | 3,500 | 226,886 |
| Sumitomo Corp. | 11,600 | 133,264 |
| TOTAL JAPAN | 3,634,430 | |
| 13 |
Table of Contents
| Common Stocks – continued | ||
| Shares | Value | |
| JERSEY – 0.7% | ||
| Glencore PLC (a) | 54,855 | $101,781 |
| TOTAL JERSEY | 101,781 | |
| LUXEMBOURG – 0.7% | ||
| ArcelorMittal S.A. | 9,085 | 99,528 |
| TOTAL LUXEMBOURG | 99,528 | |
| NETHERLANDS – 5.3% | ||
| Fiat Chrysler Automobiles N.V. | 13,980 | 122,743 |
| Heineken Holding N.V. | 964 | 75,072 |
| Koninklijke Ahold Delhaize N.V. | 4,598 | 111,602 |
| NN Group N.V. | 3,845 | 111,224 |
| Randstad N.V. | 4,308 | 172,841 |
| Unilever N.V. | 2,979 | 148,723 |
| TOTAL NETHERLANDS | 742,205 | |
| NORWAY – 0.4% | ||
| Equinor ASA | 4,128 | 57,944 |
| TOTAL NORWAY | 57,944 | |
| SINGAPORE – 2.6% | ||
| Genting Singapore Ltd. | 264,400 | 147,442 |
| Singapore Telecommunications Ltd. | 40,900 | 82,224 |
| Singapore Telecommunications Ltd. | 600 | 1,193 |
| Wilmar International Ltd. | 53,500 | 135,679 |
| TOTAL SINGAPORE | 366,538 | |
| SPAIN – 1.2% | ||
| Banco Santander S.A. | 47,840 | 106,763 |
| International Consolidated Airlines Group S.A. | 20,552 | 57,524 |
| TOTAL SPAIN | 164,287 | |
| SWEDEN – 1.7% | ||
| Essity AB Class B (a) | 3,217 | 104,574 |
| Volvo AB Class B | 10,104 | 130,500 |
| TOTAL SWEDEN | 235,074 | |
| | ||
| Shares | Value | |
| SWITZERLAND – 9.4% | ||
| Adecco Group AG | 2,322 | $101,791 |
| Credit Suisse Group AG | 20,013 | 180,939 |
| Nestle S.A. | 3,945 | 416,511 |
| Novartis AG | 3,302 | 281,430 |
| Roche Holding AG | 938 | 326,014 |
| TOTAL SWITZERLAND | 1,306,685 | |
| UNITED KINGDOM – 13.3% | ||
| Aviva PLC | 32,698 | 99,727 |
| Babcock International Group PLC | 21,101 | 112,185 |
| Barclays PLC | 84,621 | 113,034 |
| BHP Group PLC | 8,244 | 138,946 |
| British American Tobacco PLC | 4,272 | 165,992 |
| Carnival PLC | 4,969 | 68,662 |
| Centrica PLC | 124,941 | 62,880 |
| GlaxoSmithKline PLC | 7,733 | 162,014 |
| Imperial Brands PLC | 4,456 | 94,370 |
| Legal & General Group PLC | 43,696 | 112,767 |
| Micro Focus International PLC | 12,400 | 75,342 |
| Rio Tinto PLC | 3,448 | 160,244 |
| Royal Dutch Shell PLC Class B | 10,650 | 172,807 |
| Unilever PLC | 2,604 | 134,733 |
| Vodafone Group PLC | 125,991 | 178,212 |
| TOTAL UNITED KINGDOM | 1,851,915 | |
| TOTAL COMMON STOCKS (Cost $16,591,504) | 13,804,483 | |
| TOTAL INVESTMENT IN SECURITIES – 99.2% (Cost $16,591,504) | 13,804,483 | |
| NET OTHER ASSETS (LIABILITIES) – 0.8% | 105,361 | |
| NET ASSETS – 100.0% | $13,909,844 | |
| Categorizations in the Schedule of Investments are based on country or territory of incorporation. | ||
| Legend | ||
| (a) | Non-income producing. | |
| Futures Contracts | |||||
| Number of contracts | Expiration Date | Notional Amount | Value | Unrealized Appreciation/ (Depreciation) | |
| Purchased | |||||
| Equity Index Contract | |||||
| ICE MSCI EAFE Index Future Contracts | 1 | June 2020 | $81,915 | $8,050 | $8,050 |
| 14 |
Table of Contents
| Fund | Income earned |
| Fidelity Cash Central Fund | $163 |
| Description | Total | Level 1 | Level 2 | Level 3 |
| Investments in Securities: | ||||||||
| Equities: | ||||||||
| Communication Services | $693,512 | $693,512 | $— | $— | ||||
| Consumer Discretionary | 1,318,158 | 1,318,158 | — | — | ||||
| Consumer Staples | 1,681,798 | 1,681,798 | — | — | ||||
| Energy | 674,951 | 674,951 | — | — | ||||
| Financials | 2,493,890 | 2,493,890 | — | — | ||||
| Health Care | 1,976,826 | 1,976,826 | — | — | ||||
| Industrials | 1,924,161 | 1,924,161 | — | — | ||||
| Information Technology | 1,023,208 | 1,023,208 | — | — | ||||
| Materials | 957,053 | 957,053 | — | — | ||||
| Real Estate | 504,757 | 504,757 | — | — | ||||
| Utilities | 556,169 | 556,169 | — | — | ||||
| Total Investments in Securities: | $13,804,483 | $13,804,483 | $— | $— |
| Derivative Instruments: | ||||||||
| Assets | ||||||||
| Futures Contracts | $8,050 | $8,050 | $— | $— | ||||
| Total Assets | $8,050 | $8,050 | — | $— | ||||
| Total Derivative Instruments: | $8,050 | $8,050 | $— | $— |
| Primary Risk/ Derivative Type | Value | ||
| Asset | Liabilities | ||
| Equity Risk | |||
| Futures Contracts(a) | $8,050 | $0 | |
| Total Equity Risk | 8,050 | 0 | |
| Total Value of Derivatives | $8,050 | $0 | |
| (a) | Reflects gross cumulative appreciation (depreciation) on futures contracts as presented in the Schedule of Investments. In the Statement of Assets and Liabilities, the period end daily variation margin is included in receivable or payable for daily variation margin on futures contracts, and the net cumulative appreciation (depreciation) is included in total accumulated earnings (loss). |
| 15 |
Table of Contents
| Common Stocks – 98.1% | ||
| Shares | Value | |
| BERMUDA – 1.6% | ||
| China Resources Gas Group Ltd. | 22,000 | $124,298 |
| Cosan Ltd. Class A (a) | 1,002 | 13,366 |
| TOTAL BERMUDA | 137,664 | |
| BRAZIL – 4.0% | ||
| Ambev S.A. | 25,300 | 53,000 |
| B3 S.A. - Brasil Bolsa Balcao | 5,700 | 40,455 |
| BB Seguridade Participacoes S.A. | 4,800 | 23,542 |
| Cosan S.A. | 1,200 | 13,376 |
| Ez Tec Empreendimentos e Participacoes S.A. | 4,700 | 26,229 |
| Hapvida Participacoes e Investimentos S.A. (b) | 11,400 | 110,435 |
| IRB Brasil Resseguros S/A | 3,800 | 7,174 |
| Lojas Renner S.A. | 5,570 | 39,501 |
| Vale S.A. | 3,200 | 26,518 |
| TOTAL BRAZIL | 340,230 | |
| CAYMAN ISLANDS – 11.4% | ||
| ANTA Sports Products Ltd. | 9,000 | 75,983 |
| Autohome, Inc. ADR | 311 | 25,549 |
| Bosideng International Holdings Ltd. | 196,000 | 53,346 |
| Fu Shou Yuan International Group Ltd. | 73,000 | 65,727 |
| Hengan International Group Co. Ltd. | 10,500 | 93,659 |
| Momo, Inc. ADR | 802 | 19,312 |
| NetEase, Inc. ADR | 137 | 47,259 |
| New Oriental Education & Technology Group, Inc. ADR (a) | 618 | 78,894 |
| Shenzhou International Group Holdings Ltd. | 5,800 | 67,596 |
| SINA Corp. (a) | 565 | 19,080 |
| Sino Biopharmaceutical Ltd. | 107,000 | 156,518 |
| TAL Education Group ADR (a) | 1,668 | 90,389 |
| Vipshop Holdings Ltd. ADR (a) | 4,691 | 74,728 |
| Want Want China Holdings Ltd. | 100,000 | 71,720 |
| Zhen Ding Technology Holding Ltd. | 4,000 | 14,528 |
| TOTAL CAYMAN ISLANDS | 954,288 | |
| CHILE – 1.0% | ||
| Banco de Credito e Inversiones S.A. | 764 | 28,329 |
| Cia Cervecerias Unidas S.A. | 8,055 | 57,813 |
| TOTAL CHILE | 86,142 | |
| CHINA – 10.0% | ||
| Agricultural Bank of China Ltd. Class H | 81,000 | 34,062 |
| Anhui Conch Cement Co. Ltd. Class H | 3,500 | 27,540 |
| Bank of China Ltd. Class H | 144,000 | 55,168 |
| China Construction Bank Corp. Class H | 156,000 | 127,177 |
| China Merchants Bank Co. Ltd. Class H | 9,500 | 45,525 |
| | ||
| Shares | Value | |
| China Minsheng Banking Corp. Ltd. Class H | 25,000 | $18,704 |
| China Pacific Insurance Group Co. Ltd. Class H | 7,400 | 24,532 |
| China Shenhua Energy Co. Ltd. Class H | 11,500 | 20,560 |
| Guotai Junan Securities Co. Ltd. Class H (b) | 7,600 | 10,941 |
| Industrial & Commercial Bank of China Ltd. Class H | 135,000 | 91,772 |
| Jiangsu Expressway Co. Ltd. Class H | 80,000 | 95,455 |
| New China Life Insurance Co. Ltd. Class H | 3,900 | 13,533 |
| PICC Property & Casualty Co. Ltd. Class H | 18,000 | 17,252 |
| Ping An Insurance Group Co. of China Ltd. Class H | 10,000 | 102,807 |
| Postal Savings Bank of China Co. Ltd. Class H (b) | 27,000 | 16,195 |
| Shenzhen Expressway Co. Ltd. Class H | 80,000 | 91,121 |
| The People's Insurance Co. Group of China Ltd. Class H | 36,000 | 11,795 |
| TravelSky Technology Ltd. Class H | 21,000 | 37,111 |
| TOTAL CHINA | 841,250 | |
| COLOMBIA – 0.3% | ||
| Bancolombia S.A. | 3,522 | 22,751 |
| TOTAL COLOMBIA | 22,751 | |
| CYPRUS – 0.8% | ||
| Globaltrans Investment PLC GDR | 11,181 | 63,284 |
| TOTAL CYPRUS | 63,284 | |
| EGYPT – 0.4% | ||
| Commercial International Bank Egypt SAE | 7,380 | 29,965 |
| TOTAL EGYPT | 29,965 | |
| GREECE – 0.7% | ||
| JUMBO S.A. | 3,986 | 62,388 |
| TOTAL GREECE | 62,388 | |
| HONG KONG – 4.2% | ||
| China Everbright Ltd. | 6,000 | 9,179 |
| China Mobile Ltd. | 9,000 | 72,501 |
| China Resources Pharmaceutical Group Ltd. (b) | 152,500 | 96,390 |
| CNOOC Ltd. | 22,000 | 24,945 |
| Guangdong Investment Ltd. | 58,000 | 120,603 |
| Hua Hong Semiconductor Ltd. (b) | 17,000 | 33,025 |
| TOTAL HONG KONG | 356,643 | |
| 16 |
Table of Contents
| Common Stocks – continued | ||
| Shares | Value | |
| INDIA – 11.2% | ||
| Bajaj Auto Ltd. | 1,106 | $38,636 |
| Coal India Ltd. | 7,356 | 14,546 |
| Divi's Laboratories Ltd. | 5,691 | 176,797 |
| Eicher Motors Ltd. | 183 | 35,842 |
| Federal Bank Ltd. | 20,920 | 13,595 |
| HCL Technologies Ltd. | 2,251 | 16,293 |
| HDFC Bank Ltd. | 7,251 | 96,731 |
| HDFC Life Insurance Co. Ltd. (b) | 3,625 | 24,187 |
| Hero MotoCorp Ltd. | 1,482 | 42,760 |
| Hindustan Unilever Ltd. | 3,453 | 100,930 |
| ICICI Lombard General Insurance Co. Ltd. (b) | 1,409 | 24,215 |
| ICICI Prudential Life Insurance Co. Ltd. (b) | 4,076 | 22,360 |
| Indiabulls Housing Finance Ltd. | 6,643 | 11,739 |
| Info Edge India Ltd. | 621 | 21,067 |
| Infosys Ltd. | 5,478 | 52,194 |
| Kotak Mahindra Bank Ltd. | 2,201 | 39,779 |
| Nestle India Ltd. | 333 | 79,485 |
| NMDC Ltd. | 9,744 | 10,452 |
| Oil & Natural Gas Corp. Ltd. | 12,732 | 13,547 |
| Petronet LNG Ltd. | 4,735 | 15,322 |
| Pidilite Industries Ltd. | 768 | 15,617 |
| Power Finance Corp. Ltd. | 14,801 | 18,803 |
| SBI Life Insurance Co. Ltd. (b) | 2,221 | 21,497 |
| Tata Consultancy Services Ltd. | 1,400 | 37,555 |
| TOTAL INDIA | 943,949 | |
| INDONESIA – 3.1% | ||
| Adaro Energy Tbk PT | 175,600 | 10,861 |
| Bank Central Asia Tbk PT | 23,900 | 41,534 |
| Bank Rakyat Indonesia Persero Tbk PT | 134,200 | 24,630 |
| Kalbe Farma Tbk PT | 1,451,600 | 140,524 |
| Telekomunikasi Indonesia Persero Tbk PT | 137,500 | 32,353 |
| United Tractors Tbk PT | 12,600 | 13,807 |
| TOTAL INDONESIA | 263,709 | |
| JERSEY – 0.3% | ||
| Polymetal International PLC | 678 | 13,961 |
| WNS Holdings Ltd. ADR (a) | 267 | 13,043 |
| TOTAL JERSEY | 27,004 | |
| LUXEMBOURG – 0.1% | ||
| Ternium S.A. ADR | 534 | 7,257 |
| TOTAL LUXEMBOURG | 7,257 | |
| MALAYSIA – 5.7% | ||
| DiGi.Com Bhd | 25,600 | 27,624 |
| Genting Bhd | 53,700 | 52,077 |
| | ||
| Shares | Value | |
| Malayan Banking Bhd | 18,900 | $33,273 |
| Nestle Malaysia Bhd | 2,100 | 68,421 |
| Petronas Chemicals Group Bhd | 13,500 | 17,581 |
| Petronas Gas Bhd | 30,300 | 108,516 |
| PPB Group Bhd | 16,100 | 61,629 |
| Telekom Malaysia Bhd | 26,000 | 24,367 |
| Westports Holdings Bhd | 97,800 | 84,154 |
| TOTAL MALAYSIA | 477,642 | |
| MEXICO – 2.4% | ||
| Gentera SAB de CV | 27,800 | 11,186 |
| Grupo Aeroportuario del Pacifico SAB de CV Class B | 8,300 | 52,498 |
| Grupo Aeroportuario del Sureste SAB de CV Class B | 5,335 | 54,087 |
| Kimberly-Clark de Mexico SAB de CV Class A | 36,800 | 52,611 |
| Megacable Holdings SAB de CV | 10,400 | 26,238 |
| Orbia Advance Corp. SAB de CV | 5,100 | 6,092 |
| TOTAL MEXICO | 202,712 | |
| PHILIPPINES – 1.5% | ||
| BDO Unibank, Inc. | 8,980 | 17,992 |
| Manila Electric Co. | 21,680 | 109,411 |
| TOTAL PHILIPPINES | 127,403 | |
| POLAND – 0.4% | ||
| Asseco Poland S.A. | 975 | 15,751 |
| Cyfrowy Polsat S.A. | 2,319 | 14,313 |
| TOTAL POLAND | 30,064 | |
| QATAR – 0.7% | ||
| Qatar National Bank QPSC | 11,548 | 54,648 |
| TOTAL QATAR | 54,648 | |
| RUSSIA – 3.5% | ||
| Gazprom PJSC | 9,650 | 24,794 |
| Inter RAO UES PJSC | 1,487,000 | 100,543 |
| LUKOIL PJSC | 338 | 22,061 |
| MMC Norilsk Nickel PJSC | 69 | 19,107 |
| Novatek PJSC | 893 | 12,525 |
| Rostelecom PJSC (a) | 11,340 | 12,590 |
| Sberbank of Russia PJSC | 24,130 | 64,364 |
| Surgutneftegas PJSC | 14,600 | 7,328 |
| Tatneft PJSC | 1,524 | 11,335 |
| VTB Bank PJSC | 45,380,000 | 21,417 |
| TOTAL RUSSIA | 296,064 | |
| SAUDI ARABIA – 1.2% | ||
| Jarir Marketing Co. | 1,932 | 75,942 |
| 17 |
Table of Contents
| Common Stocks – continued | ||
| Shares | Value | |
| SAUDI ARABIA – continued | ||
| Southern Province Cement Co. | 1,710 | $24,364 |
| TOTAL SAUDI ARABIA | 100,306 | |
| SOUTH AFRICA – 2.3% | ||
| Absa Group Ltd. | 4,277 | 21,263 |
| AVI Ltd. | 14,211 | 60,899 |
| Capitec Bank Holdings Ltd. | 427 | 20,972 |
| Kumba Iron Ore Ltd. | 749 | 14,385 |
| Momentum Metropolitan Holdings | 23,316 | 22,218 |
| Motus Holdings Ltd. (a) | 14,030 | 22,918 |
| Sappi Ltd. (a) | 7,434 | 9,108 |
| Vodacom Group Ltd. | 2,583 | 17,331 |
| TOTAL SOUTH AFRICA | 189,094 | |
| SOUTH KOREA – 13.1% | ||
| Cheil Worldwide, Inc. | 1,392 | 20,221 |
| DB Insurance Co. Ltd. | 1,362 | 49,351 |
| Doosan Bobcat, Inc. | 3,790 | 73,097 |
| Douzone Bizon Co. Ltd. | 25 | 1,803 |
| Hyundai Marine & Fire Insurance Co. Ltd. | 2,601 | 55,715 |
| Iljin Materials Co. Ltd. | 28 | 916 |
| Kakao Corp. | 229 | 34,582 |
| Kangwon Land, Inc. | 2,555 | 52,528 |
| Kia Motors Corp. | 2,075 | 50,493 |
| KMW Co. Ltd. (a) | 35 | 1,752 |
| KT&G Corp. | 1,071 | 71,286 |
| LG Display Co. Ltd. (a) | 287 | 2,603 |
| LG Innotek Co. Ltd. | 18 | 1,950 |
| LG Uplus Corp. | 2,316 | 25,375 |
| Medy-Tox, Inc. | 7 | 664 |
| NAVER Corp. | 316 | 51,221 |
| NCSoft Corp. | 60 | 31,663 |
| Pearl Abyss Corp. (a) | 160 | 25,252 |
| S-1 Corp. | 1,271 | 90,231 |
| Samsung Electro-Mechanics Co. Ltd. | 75 | 6,986 |
| Samsung Electronics Co. Ltd. | 7,548 | 309,738 |
| Samsung SDI Co. Ltd. | 71 | 16,665 |
| Samsung SDS Co. Ltd. | 51 | 6,802 |
| SK Hynix, Inc. | 697 | 47,880 |
| SK Telecom Co. Ltd. | 160 | 27,773 |
| WONIK IPS Co. Ltd. (a) | 43 | 983 |
| Woongjin Coway Co. Ltd. | 823 | 41,473 |
| TOTAL SOUTH KOREA | 1,099,003 | |
| TAIWAN – 12.3% | ||
| Catcher Technology Co. Ltd. | 3,000 | 23,002 |
| Chicony Electronics Co. Ltd. | 6,000 | 17,029 |
| Chunghwa Telecom Co. Ltd. | 11,000 | 40,506 |
| | ||
| Shares | Value | |
| E.Sun Financial Holding Co. Ltd. | 59,550 | $54,671 |
| Far EasTone Telecommunications Co. Ltd. | 12,000 | 26,795 |
| Formosa Plastics Corp. | 9,000 | 26,604 |
| Foxconn Technology Co. Ltd. | 9,000 | 17,433 |
| Lite-On Technology Corp. | 12,000 | 18,765 |
| Nanya Technology Corp. | 7,000 | 15,301 |
| Novatek Microelectronics Corp. | 3,000 | 18,815 |
| Pou Chen Corp. | 59,000 | 55,951 |
| Radiant Opto-Electronics Corp. | 5,000 | 16,612 |
| Sino-American Silicon Products, Inc. | 5,000 | 14,982 |
| Taichung Commercial Bank Co. Ltd. | 103,784 | 39,962 |
| Taiwan Business Bank | 106,900 | 39,005 |
| Taiwan Cement Corp. | 16,000 | 23,244 |
| Taiwan Cooperative Financial Holding Co. Ltd. | 71,070 | 48,039 |
| Taiwan Mobile Co. Ltd. | 8,000 | 28,921 |
| Taiwan Semiconductor Manufacturing Co. Ltd. | 26,000 | 266,238 |
| Tripod Technology Corp. | 4,000 | 14,326 |
| Uni-President Enterprises Corp. | 36,000 | 84,139 |
| United Microelectronics Corp. | 41,000 | 21,440 |
| Voltronic Power Technology Corp. | 4,150 | 99,087 |
| Yageo Corp. | 2,000 | 26,298 |
| TOTAL TAIWAN | 1,037,165 | |
| THAILAND – 2.2% | ||
| Advanced Info Service PCL | 4,600 | 28,150 |
| Airports of Thailand PCL | 45,200 | 86,963 |
| Airports of Thailand PCL | 700 | 1,347 |
| Intouch Holdings PCL Class F | 14,300 | 23,646 |
| The Siam Cement PCL | 1,700 | 18,180 |
| The Siam Cement PCL | 100 | 1,069 |
| Tisco Financial Group PCL | 9,600 | 21,808 |
| TOTAL THAILAND | 181,163 | |
| TURKEY – 1.6% | ||
| Akbank T.A.S. (a) | 24,362 | 20,530 |
| BIM Birlesik Magazalar AS | 9,630 | 76,260 |
| Turkiye Garanti Bankasi AS (a) | 16,991 | 20,274 |
| Turkiye Is Bankasi AS Class C (a) | 25,068 | 17,753 |
| TOTAL TURKEY | 134,817 | |
| UNITED ARAB EMIRATES – 1.0% | ||
| Abu Dhabi Islamic Bank PJSC | 19,919 | 19,469 |
| Dubai Islamic Bank PJSC | 20,995 | 20,977 |
| Emirates NBD Bank PJSC | 9,647 | 22,587 |
| Emirates Telecommunications Group Co. PJSC | 5,254 | 22,171 |
| TOTAL UNITED ARAB EMIRATES | 85,204 | |
| 18 |
Table of Contents
| Common Stocks – continued | ||
| Shares | Value | |
| UNITED STATES OF AMERICA – 1.1% | ||
| Yum China Holdings, Inc. | 1,869 | $90,572 |
| TOTAL UNITED STATES OF AMERICA | 90,572 | |
| TOTAL COMMON STOCKS (Cost $9,373,271) | 8,242,381 | |
| Preferred Stock – 1.5% | ||
| BRAZIL – 1.5% | ||
| Cia de Transmissao de Energia Eletrica Paulista | 27,700 | 99,424 |
| Itausa - Investimentos Itau S.A. | 16,900 | 28,097 |
| TOTAL BRAZIL | 127,521 | |
| RUSSIA – 0.0% | ||
| Transneft PJSC | 2 | 3,692 |
| TOTAL RUSSIA | 3,692 | |
| TOTAL PREFERRED STOCKS (Cost $201,133) | 131,213 | |
| TOTAL INVESTMENT IN SECURITIES – 99.6% (Cost $9,574,404) | 8,373,594 | |
| NET OTHER ASSETS (LIABILITIES) – 0.4% | 30,129 | |
| NET ASSETS – 100.0% | $8,403,723 | |
| Categorizations in the Schedule of Investments are based on country or territory of incorporation. | ||
| Legend | ||
| (a) | Non-income producing. | |
| (b) | Security is exempt from registration under Rule 144A of the Securities Act of 1933. These securities may be resold in transactions exempt from registration, normally to qualified institutional buyers. At the end of the period, the value of these securities amounted to $359,245 or 4.3% of net assets. | |
| 19 |
Table of Contents
| Common Stocks – 98.8% | ||
| Shares | Value | |
| AUSTRALIA – 4.2% | ||
| Aristocrat Leisure Ltd. | 2,855 | $47,645 |
| ASX Ltd. | 611 | 32,622 |
| Caltex Australia Ltd. | 636 | 10,376 |
| Coca-Cola Amatil Ltd. | 7,910 | 44,951 |
| Commonwealth Bank of Australia | 1,410 | 57,871 |
| Fortescue Metals Group Ltd. | 2,959 | 23,169 |
| Magellan Financial Group Ltd. | 724 | 24,184 |
| Medibank Pvt Ltd. | 15,798 | 27,926 |
| Rio Tinto Ltd. | 384 | 22,000 |
| Sonic Healthcare Ltd. | 1,509 | 26,862 |
| Wesfarmers Ltd. | 2,711 | 66,896 |
| TOTAL AUSTRALIA | 384,502 | |
| AUSTRIA – 0.1% | ||
| OMV AG | 119 | 3,897 |
| TOTAL AUSTRIA | 3,897 | |
| BELGIUM – 1.3% | ||
| Aedifica S.A. | 907 | 87,721 |
| Sofina S.A. | 139 | 32,733 |
| TOTAL BELGIUM | 120,454 | |
| BERMUDA – 0.5% | ||
| Jardine Matheson Holdings Ltd. | 577 | 25,365 |
| Jardine Strategic Holdings Ltd. | 910 | 19,610 |
| TOTAL BERMUDA | 44,975 | |
| CANADA – 6.1% | ||
| Air Canada (a) | 1,311 | 19,104 |
| Alimentation Couche-Tard, Inc. Class B | 2,381 | 66,581 |
| BCE, Inc. | 2,382 | 96,535 |
| Boyd Group Services, Inc. | 255 | 35,957 |
| Canadian Apartment Properties REIT | 1,711 | 59,007 |
| CI Financial Corp. | 2,039 | 21,712 |
| Constellation Software, Inc. | 20 | 19,274 |
| Great-West Lifeco, Inc. | 1,493 | 24,637 |
| Imperial Oil Ltd. | 570 | 9,230 |
| Intact Financial Corp. | 384 | 36,624 |
| Kirkland Lake Gold Ltd. | 550 | 22,785 |
| Manulife Financial Corp. | 2,770 | 34,960 |
| Parkland Fuel Corp. | 384 | 9,104 |
| Power Corp. of Canada | 1,560 | 25,001 |
| Sun Life Financial, Inc. | 1,041 | 35,758 |
| Suncor Energy, Inc. | 681 | 12,169 |
| Wheaton Precious Metals Corp. | 749 | 28,521 |
| TOTAL CANADA | 556,959 | |
| DENMARK – 2.1% | ||
| Coloplast A/S Class B | 115 | 18,185 |
| | ||
| Shares | Value | |
| Genmab A/S (a) | 63 | $15,147 |
| Novo Nordisk A/S Class B | 817 | 52,098 |
| Novozymes A/S Class B | 297 | 14,548 |
| Pandora A/S | 1,428 | 50,720 |
| SimCorp A/S | 125 | 11,563 |
| Tryg A/S | 1,069 | 28,300 |
| TOTAL DENMARK | 190,561 | |
| FAROE ISLANDS – 0.4% | ||
| Bakkafrost P/F | 650 | 32,215 |
| TOTAL FAROE ISLANDS | 32,215 | |
| FINLAND – 1.6% | ||
| Elisa Oyj | 1,733 | 105,234 |
| Kone Oyj Class B | 488 | 29,569 |
| Orion Oyj Class B | 225 | 11,430 |
| TOTAL FINLAND | 146,233 | |
| FRANCE – 7.2% | ||
| Air Liquide S.A. | 213 | 27,086 |
| BNP Paribas S.A. | 1,159 | 36,402 |
| Bureau Veritas S.A. | 1,097 | 22,757 |
| Dassault Systemes SE | 105 | 15,359 |
| Edenred | 287 | 11,559 |
| Eiffage S.A. | 259 | 21,191 |
| EssilorLuxottica S.A. | 478 | 58,978 |
| Hermes International | 80 | 58,515 |
| Legrand S.A. | 445 | 29,985 |
| L'Oreal S.A. | 312 | 90,662 |
| LVMH Moet Hennessy Louis Vuitton SE | 270 | 104,231 |
| Sanofi | 560 | 54,706 |
| Sodexo S.A. | 479 | 38,037 |
| Teleperformance | 128 | 28,671 |
| TOTAL S.A. | 537 | 19,322 |
| Vinci S.A. | 468 | 38,291 |
| TOTAL FRANCE | 655,752 | |
| GERMANY – 3.6% | ||
| Allianz SE | 329 | 60,856 |
| Beiersdorf AG | 454 | 47,529 |
| Carl Zeiss Meditec AG | 82 | 8,079 |
| Covestro AG (b) | 352 | 11,829 |
| Deutsche Boerse AG | 279 | 43,317 |
| Knorr-Bremse AG | 387 | 35,971 |
| Merck KGaA | 118 | 13,713 |
| MTU Aero Engines AG | 159 | 21,647 |
| Muenchener Rueckversicherungs-Gesellschaft AG in Muenchen | 176 | 38,709 |
| 20 |
Table of Contents
| Common Stocks – continued | ||
| Shares | Value | |
| GERMANY – continued | ||
| SAP SE | 371 | $44,268 |
| TOTAL GERMANY | 325,918 | |
| HONG KONG – 2.5% | ||
| CLP Holdings Ltd. | 10,500 | 112,147 |
| Link REIT | 13,200 | 118,508 |
| TOTAL HONG KONG | 230,655 | |
| ISRAEL – 0.7% | ||
| Bank Leumi Le-Israel BM | 5,040 | 27,430 |
| Israel Discount Bank Ltd. Class A | 7,421 | 24,310 |
| Nice Ltd. (a) | 86 | 14,378 |
| TOTAL ISRAEL | 66,118 | |
| ITALY – 5.3% | ||
| Atlantia SpA | 988 | 16,076 |
| Enel SpA | 15,952 | 108,957 |
| Eni SpA | 773 | 7,378 |
| Hera SpA | 21,723 | 80,373 |
| Italgas SpA | 14,879 | 83,196 |
| Moncler SpA | 1,720 | 64,618 |
| Poste Italiane SpA (b) | 2,853 | 24,224 |
| Recordati SpA | 234 | 10,167 |
| Snam SpA | 19,076 | 85,415 |
| TOTAL ITALY | 480,404 | |
| JAPAN – 26.5% | ||
| Asahi Kasei Corp. | 2,600 | 18,600 |
| Astellas Pharma, Inc. | 2,200 | 36,754 |
| Bandai Namco Holdings, Inc. | 1,300 | 66,024 |
| Central Japan Railway Co. | 200 | 31,804 |
| Daito Trust Construction Co. Ltd. | 900 | 86,814 |
| Electric Power Development Co. Ltd. | 4,300 | 86,857 |
| FUJIFILM Holdings Corp. | 500 | 24,029 |
| Haseko Corp. | 5,400 | 59,689 |
| Hikari Tsushin, Inc. | 300 | 58,886 |
| Hoya Corp. | 400 | 36,905 |
| ITOCHU Corp. | 2,100 | 41,731 |
| Japan Airlines Co. Ltd. | 1,200 | 21,770 |
| Japan Exchange Group, Inc. | 1,900 | 35,749 |
| Japan Prime Realty Investment Corp. | 24 | 67,106 |
| Kajima Corp. | 2,700 | 28,531 |
| Kakaku.com, Inc. | 3,200 | 65,834 |
| Kao Corp. | 1,200 | 93,320 |
| KDDI Corp. | 3,800 | 110,480 |
| Kintetsu Group Holdings Co. Ltd. | 700 | 33,778 |
| Kobayashi Pharmaceutical Co. Ltd. | 900 | 83,658 |
| M3, Inc. | 1,000 | 36,377 |
| Mitsui & Co. Ltd. | 2,700 | 38,227 |
| | ||
| Shares | Value | |
| MS&AD Insurance Group Holdings, Inc. | 1,100 | $32,115 |
| Nippon Building Fund, Inc. | 14 | 84,182 |
| Nippon Telegraph & Telephone Corp. | 4,100 | 93,667 |
| Nissan Chemical Corp. | 600 | 23,229 |
| Nomura Research Institute Ltd. | 900 | 22,169 |
| NTT Data Corp. | 1,700 | 17,567 |
| NTT DOCOMO, Inc. | 3,700 | 108,922 |
| Obayashi Corp. | 3,300 | 29,379 |
| Obic Co. Ltd. | 200 | 30,336 |
| Oriental Land Co. Ltd. | 700 | 89,550 |
| ORIX Corp. | 2,300 | 27,724 |
| Santen Pharmaceutical Co. Ltd. | 1,500 | 26,708 |
| Secom Co. Ltd. | 500 | 42,105 |
| Sekisui House Ltd. | 3,600 | 62,567 |
| Shionogi & Co. Ltd. | 500 | 27,723 |
| Skylark Holdings Co. Ltd. | 3,800 | 56,928 |
| Sohgo Security Services Co. Ltd. | 700 | 33,843 |
| Sony Corp. | 1,800 | 116,684 |
| Sony Financial Holdings, Inc. | 1,300 | 25,116 |
| Suntory Beverage & Food Ltd. | 1,600 | 60,672 |
| Tokio Marine Holdings, Inc. | 900 | 42,806 |
| Toppan Printing Co. Ltd. | 1,800 | 27,134 |
| Toyo Suisan Kaisha Ltd. | 1,600 | 77,206 |
| Trend Micro, Inc. | 400 | 20,461 |
| USS Co. Ltd. | 4,000 | 63,964 |
| TOTAL JAPAN | 2,405,680 | |
| JERSEY – 0.6% | ||
| Experian PLC | 1,056 | 31,648 |
| Ferguson PLC | 346 | 25,033 |
| TOTAL JERSEY | 56,681 | |
| NETHERLANDS – 3.1% | ||
| ASR Nederland N.V. | 876 | 23,555 |
| Euronext N.V. (b) | 389 | 32,637 |
| Heineken Holding N.V. | 517 | 40,262 |
| Heineken N.V. | 562 | 47,780 |
| Koninklijke DSM N.V. | 153 | 18,727 |
| SBM Offshore N.V. | 303 | 3,835 |
| Unilever N.V. | 1,696 | 84,671 |
| Wolters Kluwer N.V. | 380 | 27,936 |
| TOTAL NETHERLANDS | 279,403 | |
| NEW ZEALAND – 1.1% | ||
| Meridian Energy Ltd. | 28,246 | 78,245 |
| Ryman Healthcare Ltd. | 2,859 | 21,360 |
| TOTAL NEW ZEALAND | 99,605 | |
| NORWAY – 1.6% | ||
| Equinor ASA | 444 | 6,232 |
| 21 |
Table of Contents
| Common Stocks – continued | ||
| Shares | Value | |
| NORWAY – continued | ||
| Orkla ASA | 5,026 | $45,610 |
| Telenor ASA | 6,060 | 93,246 |
| TOTAL NORWAY | 145,088 | |
| PORTUGAL – 0.1% | ||
| Galp Energia SGPS S.A. | 385 | 4,434 |
| TOTAL PORTUGAL | 4,434 | |
| SINGAPORE – 2.3% | ||
| Mapletree Commercial Trust | 57,400 | 79,920 |
| Oversea-Chinese Banking Corp. Ltd. | 6,756 | 43,386 |
| Singapore Exchange Ltd. | 6,600 | 45,244 |
| United Overseas Bank Ltd. | 2,700 | 39,013 |
| TOTAL SINGAPORE | 207,563 | |
| SPAIN – 3.1% | ||
| Aena SME S.A. (b) | 137 | 17,331 |
| Amadeus IT Group S.A. | 262 | 12,604 |
| Enagas S.A. | 3,766 | 87,819 |
| Endesa S.A. | 3,769 | 83,596 |
| Grifols S.A. | 368 | 12,519 |
| Industria de Diseno Textil S.A. | 2,740 | 69,776 |
| TOTAL SPAIN | 283,645 | |
| SWEDEN – 3.7% | ||
| Atlas Copco AB Class A | 1,199 | 41,652 |
| Epiroc AB Class A | 2,787 | 27,998 |
| Hennes & Mauritz AB Class B | 3,766 | 52,515 |
| ICA Gruppen AB | 1,022 | 44,596 |
| Industrivarden AB Class A (a) | 1,385 | 28,757 |
| Swedish Match AB | 900 | 55,803 |
| Telia Co. AB | 24,870 | 85,937 |
| TOTAL SWEDEN | 337,258 | |
| SWITZERLAND – 9.6% | ||
| Baloise Holding AG | 221 | 33,088 |
| Cembra Money Bank AG | 324 | 30,800 |
| EMS-Chemie Holding AG | 21 | 13,610 |
| Galenica AG (b) | 142 | 10,159 |
| Geberit AG | 61 | 27,373 |
| Givaudan S.A. | 6 | 20,099 |
| Kuehne + Nagel International AG | 173 | 24,745 |
| Nestle S.A. | 2,318 | 244,733 |
| Novartis AG | 1,147 | 97,759 |
| Partners Group Holding AG | 48 | 37,787 |
| PSP Swiss Property AG | 847 | 98,465 |
| Roche Holding AG | 327 | 113,653 |
| Sonova Holding AG | 56 | 10,113 |
| Swisscom AG | 197 | 102,424 |
| | ||
| Shares | Value | |
| Tecan Group AG | 34 | $10,970 |
| TOTAL SWITZERLAND | 875,778 | |
| UNITED KINGDOM – 11.5% | ||
| 3i Group PLC | 2,864 | 28,322 |
| Admiral Group PLC | 1,297 | 38,118 |
| AstraZeneca PLC | 628 | 65,921 |
| BHP Group PLC | 1,148 | 19,349 |
| British American Tobacco PLC | 2,289 | 88,941 |
| Compass Group PLC | 4,019 | 67,727 |
| Diageo PLC | 2,396 | 83,110 |
| Direct Line Insurance Group PLC | 8,575 | 29,474 |
| GlaxoSmithKline PLC | 2,438 | 51,079 |
| Halma PLC | 524 | 13,814 |
| Howden Joinery Group PLC | 2,725 | 18,052 |
| IG Group Holdings PLC | 4,237 | 40,323 |
| Legal & General Group PLC | 11,737 | 30,290 |
| London Stock Exchange Group PLC | 488 | 45,894 |
| Next PLC | 920 | 54,842 |
| Reckitt Benckiser Group PLC | 911 | 76,185 |
| RELX PLC | 1,781 | 40,358 |
| Rightmove PLC | 11,630 | 72,995 |
| Rio Tinto PLC | 501 | 23,284 |
| Royal Dutch Shell PLC Class B | 1,575 | 25,556 |
| Smith & Nephew PLC | 721 | 14,169 |
| Tate & Lyle PLC | 3,854 | 34,622 |
| The Sage Group PLC | 1,498 | 12,093 |
| Unilever PLC | 1,360 | 70,367 |
| TOTAL UNITED KINGDOM | 1,044,885 | |
| TOTAL COMMON STOCKS (Cost $9,764,910) | 8,978,663 | |
| Money Market Fund – 0.1% | ||
| Fidelity Cash Central Fund, 0.16% (c) (Cost $7,006) | 7,004 | 7,006 |
| TOTAL INVESTMENT IN SECURITIES – 98.9% (Cost $9,771,916) | 8,985,669 | |
| NET OTHER ASSETS (LIABILITIES) – 1.1% | 101,796 | |
| NET ASSETS – 100.0% | $9,087,465 | |
| 22 |
Table of Contents
| Categorizations in the Schedule of Investments are based on country or territory of incorporation. | ||
| Legend | ||
| (a) | Non-income producing. | |
| (b) | Security is exempt from registration under Rule 144A of the Securities Act of 1933. These securities may be resold in transactions exempt from registration, normally to qualified institutional buyers. At the end of the period, the value of these securities amounted to $96,180 or 1.1% of net assets. | |
| (c) | Affiliated fund that is generally available only to investment companies and other accounts managed by Fidelity Investments. The rate quoted is the annualized seven-day yield of the fund at period end. A complete unaudited listing of the fund's holdings as of its most recent quarter end is available upon request. In addition, each Fidelity Central Fund's financial statements are available on the SEC's website or upon request. | |
| Futures Contracts | |||||
| Number of contracts | Expiration Date | Notional Amount | Value | Unrealized Appreciation/ (Depreciation) | |
| Purchased | |||||
| Equity Index Contract | |||||
| ICE MSCI EAFE Index Future Contracts | 1 | June 2020 | $81,915 | $3,543 | $3,543 |
| Fund | Income earned |
| Fidelity Cash Central Fund | $19 |
| 23 |
Table of Contents
| Description | Total | Level 1 | Level 2 | Level 3 |
| Investments in Securities: | ||||||||
| Equities: | ||||||||
| Communication Services | $935,274 | $935,274 | $— | $— | ||||
| Consumer Discretionary | 1,308,792 | 1,308,792 | — | — | ||||
| Consumer Staples | 1,513,474 | 1,513,474 | — | — | ||||
| Energy | 111,533 | 111,533 | — | — | ||||
| Financials | 1,327,774 | 1,327,774 | — | — | ||||
| Health Care | 782,556 | 782,556 | — | — | ||||
| Industrials | 954,622 | 954,622 | — | — | ||||
| Information Technology | 269,474 | 269,474 | — | — | ||||
| Materials | 286,836 | 286,836 | — | — | ||||
| Real Estate | 681,723 | 681,723 | — | — | ||||
| Utilities | 806,605 | 806,605 | — | — | ||||
| Money Market Fund | 7,006 | 7,006 | — | — | ||||
| Total Investments in Securities: | $8,985,669 | $8,985,669 | $— | $— |
| Derivative Instruments: | ||||||||
| Assets | ||||||||
| Futures Contracts | $3,543 | $3,543 | $— | $— | ||||
| Total Assets | $3,543 | $3,543 | — | $— | ||||
| Total Derivative Instruments: | $3,543 | $3,543 | $— | $— |
| Primary Risk/ Derivative Type | Value | ||
| Asset | Liabilities | ||
| Equity Risk | |||
| Futures Contracts(a) | $3,543 | $0 | |
| Total Equity Risk | 3,543 | 0 | |
| Total Value of Derivatives | $3,543 | $0 | |
| (a) | Reflects gross cumulative appreciation (depreciation) on futures contracts as presented in the Schedule of Investments. In the Statement of Assets and Liabilities, the period end daily variation margin is included in receivable or payable for daily variation margin on futures contracts, and the net cumulative appreciation (depreciation) is included in total accumulated earnings (loss). |
| 24 |
Table of Contents
| 25 |
Table of Contents
| Fidelity International High Dividend ETF | Fidelity International Value Factor ETF | Fidelity Targeted Emerging Markets Factor ETF | Fidelity Targeted International Factor ETF | ||||
| Assets | |||||||
| Investments in securities, at value (including securities loaned of $166,199, $—, $— and $—, respectively) – See accompanying schedule: | |||||||
| Unaffiliated issuers | $35,412,112 | $13,804,483 | $8,373,594 | $8,978,663 | |||
| Fidelity Central Funds | 282,442 | — | — | 7,006 | |||
| Total Investments in Securities | $35,694,554 | $13,804,483 | $8,373,594 | $8,985,669 | |||
| Segregated cash with brokers for derivative instruments | 47,000 | 9,400 | — | 9,400 | |||
| Cash | 22,760 | — | 2,566 | 28,266 | |||
| Foreign currency held at value (cost $40,518, $11,719, $12,473 and $14,337, respectively) | 40,814 | 11,782 | 12,542 | 14,533 | |||
| Dividends receivable | 254,833 | 93,341 | 18,722 | 54,122 | |||
| Distributions receivable from Fidelity Central Funds | 5 | — | — | 1 | |||
| Receivable from investment adviser for expense reductions | — | 902 | 858 | 817 | |||
| Total assets | 36,059,966 | 13,919,908 | 8,408,282 | 9,092,808 | |||
| Liabilities | |||||||
| Payable to custodian bank | — | 288 | — | — | |||
| Payable for investments purchased | — | 3,512 | — | — | |||
| Accrued management fees | 11,052 | 3,731 | 2,954 | 2,822 | |||
| Payable for daily variation margin on futures contracts | 8,675 | 1,735 | — | 1,735 | |||
| Proxy fees payable | 1,119 | 798 | 811 | 786 | |||
| Other payables and accrued expenses | — | — | 794 | — | |||
| Collateral on securities loaned, at value | 179,862 | — | — | — | |||
| Total liabilities | 200,708 | 10,064 | 4,559 | 5,343 | |||
| Net Assets | $35,859,258 | $13,909,844 | $8,403,723 | $9,087,465 | |||
| Net Assets consist of: | |||||||
| Paid in capital | 50,372,495 | 18,216,595 | 10,008,903 | 10,020,760 | |||
| Total accumulated earnings (loss) | (14,513,237) | (4,306,751) | (1,605,180) | (933,295) | |||
| Net Assets | $35,859,258 | $13,909,844 | $8,403,723 | $9,087,465 | |||
| Shares outstanding | 2,300,000 | 800,000 | 400,000 | 400,000 | |||
| Net Asset Value, offering price and redemption price per share | $15.59 | $17.39 | $21.01 | $22.72 | |||
| Investments at cost – Unaffiliated issuers | $48,080,141 | $16,591,504 | $9,574,404 | $9,764,910 | |||
| Investments at cost – Fidelity Central Funds | 282,432 | — | — | 7,006 | |||
| Investments at cost | $48,362,573 | $16,591,504 | $9,574,404 | $9,771,916 |
| 26 |
Table of Contents
| Fidelity International High Dividend ETF | Fidelity International Value Factor ETF | Fidelity Targeted Emerging Markets Factor ETF | Fidelity Targeted International Factor ETF | ||||
| Investment Income | |||||||
| Dividends | $ 717,832 | $ 188,075 | $ 126,158 | $ 153,566 | |||
| Non-Cash dividends | 61,251 | — | — | — | |||
| Interest | 97 | 31 | 7 | — | |||
| Income from Fidelity Central Funds (including $30, $—, $— and $—, from security lending, respectively) | 869 | 163 | — | 19 | |||
| Income before foreign taxes withheld | 780,049 | 188,269 | 126,165 | 153,585 | |||
| Less foreign taxes withheld | (51,735) | (15,996) | (14,435) | (18,788) | |||
| Total income | 728,314 | 172,273 | 111,730 | 134,797 | |||
| Expenses | |||||||
| Management fees | 84,989 | 24,474 | 20,989 | 19,401 | |||
| Independent trustees' compensation | 133 | 38 | 29 | 31 | |||
| Proxy | 1,390 | 902 | 858 | 817 | |||
| Total expenses before reductions | 86,512 | 25,414 | 21,876 | 20,249 | |||
| Expense reductions | (88) | (977) | (1,005) | (838) | |||
| Total expenses | 86,424 | 24,437 | 20,871 | 19,411 | |||
| Net investment income (loss) | 641,890 | 147,836 | 90,859 | 115,386 | |||
| Realized and Unrealized Gain (Loss) | |||||||
| Net realized gain (loss) on investment securities | (2,645,186) | (25,135) | (139,506) | (644) | |||
| Net realized gain (loss) on Fidelity Central Funds | 14 | — | — | — | |||
| Net realized gain (loss) on In-kind redemptions | 2,558,805 | — | — | — | |||
| Net realized gain (loss) on futures contracts | (67,888) | (21,539) | 746 | 2 | |||
| Net realized gain (loss) on foreign currency transactions | (2,141) | (602) | (1,648) | (196) | |||
| Total net realized gain (loss) | (156,396) | (47,276) | (140,408) | (838) | |||
| Change in net unrealized appreciation (depreciation) on investment securities (net of decrease in deferred foreign taxes of $-, $-, $15,814 and $-, respectively.) | (12,139,891) | (2,474,763) | (1,320,852) | (1,368,549) | |||
| Change in net unrealized appreciation (depreciation) on Fidelity Central Funds | 10 | — | — | — | |||
| Change in net unrealized appreciation (depreciation) on futures contracts | 23,805 | 6,164 | (248) | 3,543 | |||
| Change in net unrealized appreciation (depreciation) on assets and liabilities in foreign currencies | 256 | 513 | (700) | 366 | |||
| Total change in net unrealized appreciation (depreciation) | (12,115,820) | (2,468,086) | (1,321,800) | (1,364,640) | |||
| Net gain (loss) | (12,272,216) | (2,515,362) | (1,462,208) | (1,365,478) | |||
| Net increase (decrease) in net assets resulting from operations | $(11,630,326) | $(2,367,526) | $(1,371,349) | $(1,250,092) |
| 27 |
Table of Contents
| Fidelity International High Dividend ETF | Fidelity International Value Factor ETF | ||||||
| Six months ended April 30, 2020 (Unaudited) | Year ended October 31, 2019 | Six months ended April 30, 2020 (Unaudited) | Year ended October 31, 2019 | ||||
| Increase (Decrease) in Net Assets | |||||||
| Operations | |||||||
| Net investment income (loss) | $641,890 | $1,658,285 | $147,836 | $477,322 | |||
| Net realized gain (loss) | (156,396) | (1,337,575) | (47,276) | (928,086) | |||
| Change in net unrealized appreciation (depreciation) | (12,115,820) | 2,188,190 | (2,468,086) | 1,562,648 | |||
| Net increase (decrease) in net assets resulting from operations | (11,630,326) | 2,508,900 | (2,367,526) | 1,111,884 | |||
| Distributions to shareholders | (843,800) | (1,635,200) | (146,400) | (508,200) | |||
| Share transactions | |||||||
| Proceeds from sales of shares | 21,235,010 | 24,648,439 | 3,288,407 | — | |||
| Cost of shares redeemed | (16,923,945) | — | — | — | |||
| Net increase (decrease) in net assets resulting from share transactions | 4,311,065 | 24,648,439 | 3,288,407 | — | |||
| Total increase (decrease) in net assets | (8,163,061) | 25,522,139 | 774,481 | 603,684 | |||
| Net Assets | |||||||
| Beginning of period | 44,022,319 | 18,500,180 | 13,135,363 | 12,531,679 | |||
| End of period | $35,859,258 | $44,022,319 | $13,909,844 | $13,135,363 | |||
| Other Information | |||||||
| Shares | |||||||
| Sold | 1,000,000 | 1,200,000 | 200,000 | — | |||
| Redeemed | (800,000) | — | — | — | |||
| Net increase (decrease) | 200,000 | 1,200,000 | 200,000 | — | |||
| 28 |
Table of Contents
| Fidelity Targeted Emerging Markets Factor ETF | Fidelity Targeted International Factor ETF | ||||||
| Six months ended April 30, 2020 (Unaudited) | Year ended October 31, 2019A | Six months ended April 30, 2020 (Unaudited) | Year ended October 31, 2019A | ||||
| Increase (Decrease) in Net Assets | |||||||
| Operations | |||||||
| Net investment income (loss) | $90,859 | $201,202 | $115,386 | $219,486 | |||
| Net realized gain (loss) | (140,408) | (267,226) | (838) | (135,315) | |||
| Change in net unrealized appreciation (depreciation) | (1,321,800) | 119,793 | (1,364,640) | 582,626 | |||
| Net increase (decrease) in net assets resulting from operations | (1,371,349) | 53,769 | (1,250,092) | 666,797 | |||
| Distributions to shareholders | (97,200) | (190,400) | (135,600) | (214,400) | |||
| Share transactions | |||||||
| Proceeds from sales of shares | — | 10,008,903 | — | 10,020,760 | |||
| Cost of shares redeemed | — | — | — | — | |||
| Net increase (decrease) in net assets resulting from share transactions | — | 10,008,903 | — | 10,020,760 | |||
| Total increase (decrease) in net assets | (1,468,549) | 9,872,272 | (1,385,692) | 10,473,157 | |||
| Net Assets | |||||||
| Beginning of period | 9,872,272 | — | 10,473,157 | — | |||
| End of period | $8,403,723 | $9,872,272 | $9,087,465 | $10,473,157 | |||
| Other Information | |||||||
| Shares | |||||||
| Sold | — | 400,000 | — | 400,000 | |||
| Redeemed | — | — | — | — | |||
| Net increase (decrease) | — | 400,000 | — | 400,000 | |||
| A | For the period February 26, 2019 (commencement of operations) to October 31, 2019. |
| 29 |
Table of Contents
| Fidelity International High Dividend ETF | |||||
| Six months ended April 30, 2020 (Unaudited) | Year ended October 31, 2019 | Year ended October 31, 2018A | |||
| Selected Per-Share Data | |||||
| Net asset value, beginning of period | $20.96 | $20.56 | $25.08 | ||
| Income from Investment Operations | |||||
| Net investment income (loss)B | 0.28 | 1.04 | 0.82 | ||
| Net realized and unrealized gain (loss) | (5.28) | 0.31 | (4.63) | ||
| Total from investment operations | (5.00) | 1.35 | (3.81) | ||
| Distributions from net investment income | (0.37) | (0.95) | (0.71) | ||
| Total distributions | (0.37) | (0.95) | (0.71) | ||
| Net asset value, end of period | $15.59 | $20.96 | $20.56 | ||
| Total ReturnC,D | (23.81)% | 6.84% | (15.44)% | ||
| Ratios to Average Net AssetsE,F | |||||
| Expenses before reductions | .39%G,H | .39% | .39%G | ||
| Expenses net of fee waivers, if any | .39%G,H | .39% | .39%G | ||
| Expenses net of all reductions | .39%G,H | .39% | .39%G | ||
| Net investment income (loss) | 2.95%G,H | 5.07% | 4.59%G | ||
| Supplemental Data | |||||
| Net assets, end of period (000 omitted) | $35,859 | $44,022 | $18,500 | ||
| Portfolio turnover rateI,J | 59%K | 47% | 42%K | ||
| A | For the period January 16, 2018 (commencement of operations) to October 31, 2018. |
| B | Calculated based on average shares outstanding during the period. |
| C | Total returns for periods of less than one year are not annualized. |
| D | Total returns would have been lower if certain expenses had not been reduced during the applicable periods shown. |
| E | Expense ratios reflect operating expenses of the Fund. Expenses before reductions do not reflect amounts reimbursed by the investment adviser or reductions from brokerage service arrangements or reductions from other expense offset arrangements and do not represent the amount paid by the Fund during periods when reimbursements or reductions occur. Expenses net of fee waivers reflect expenses after reimbursement by the investment adviser but prior to the reductions from brokerage service arrangements or other expense offset arrangements. Expenses net of all reductions represent the net expenses paid by the Fund but do not include expenses of the investment companies in which the fund invests. |
| F | Fees and expenses of any underlying Fidelity Central Funds are not included in the Funds' expense ratio. Each Fund indirectly bears its proportionate share of expenses of any underlying Fidelity Central Funds. |
| G | Annualized. |
| H | Proxy expenses are not annualized. |
| I | Amount does not include the portfolio activity of any underlying funds. |
| J | Portfolio turnover rate excludes securities received or delivered in-kind. |
| K | Amount not annualized. |
| 30 |
Table of Contents
| Fidelity International Value Factor ETF | |||||
| Six months ended April 30, 2020 (Unaudited) | Year ended October 31, 2019 | Year ended October 31, 2018A | |||
| Selected Per-Share Data | |||||
| Net asset value, beginning of period | $21.89 | $20.89 | $25.00 | ||
| Income from Investment Operations | |||||
| Net investment income (loss)B | 0.24 | 0.80 | 0.62 | ||
| Net realized and unrealized gain (loss) | (4.50) | 1.05 | (4.18) | ||
| Total from investment operations | (4.26) | 1.85 | (3.56) | ||
| Distributions from net investment income | (0.24) | (0.85) | (0.55) | ||
| Total distributions | (0.24) | (0.85) | (0.55) | ||
| Net asset value, end of period | $17.39 | $21.89 | $20.89 | ||
| Total ReturnC,D | (19.39)% | 9.04% | (14.46)% | ||
| Ratios to Average Net AssetsE,F | |||||
| Expenses before reductions | .40%G,H | .39% | .39%G | ||
| Expenses net of fee waivers, if any | .39%G,H | .39% | .39%G | ||
| Expenses net of all reductions | .39%G,H | .39% | .39%G | ||
| Net investment income (loss) | 2.35%G,H | 3.74% | 3.38%G | ||
| Supplemental Data | |||||
| Net assets, end of period (000 omitted) | $13,910 | $13,135 | $12,532 | ||
| Portfolio turnover rateI | 24%J,K | 56% | 65%J,K | ||
| A | For the period January 16, 2018 (commencement of operations) to October 31, 2018. |
| B | Calculated based on average shares outstanding during the period. |
| C | Total returns for periods of less than one year are not annualized. |
| D | Total returns would have been lower if certain expenses had not been reduced during the applicable periods shown. |
| E | Expense ratios reflect operating expenses of the Fund. Expenses before reductions do not reflect amounts reimbursed by the investment adviser or reductions from brokerage service arrangements or reductions from other expense offset arrangements and do not represent the amount paid by the Fund during periods when reimbursements or reductions occur. Expenses net of fee waivers reflect expenses after reimbursement by the investment adviser but prior to the reductions from brokerage service arrangements or other expense offset arrangements. Expenses net of all reductions represent the net expenses paid by the Fund but do not include expenses of the investment companies in which the fund invests. |
| F | Fees and expenses of any underlying Fidelity Central Funds are not included in the Funds' expense ratio. Each Fund indirectly bears its proportionate share of expenses of any underlying Fidelity Central Funds. |
| G | Annualized. |
| H | Proxy expenses are not annualized. |
| I | Amount does not include the portfolio activity of any underlying funds. |
| J | Amount not annualized. |
| K | Portfolio turnover rate excludes securities received or delivered in-kind. |
| 31 |
Table of Contents
| Fidelity Targeted Emerging Markets Factor ETF | |||
| Six months ended April 30, 2020 (Unaudited) | Year ended October 31, 2019A | ||
| Selected Per-Share Data | |||
| Net asset value, beginning of period | $24.68 | $25.00 | |
| Income from Investment Operations | |||
| Net investment income (loss)B | 0.23 | 0.50 | |
| Net realized and unrealized gain (loss) | (3.66) | (0.34) | |
| Total from investment operations | (3.43) | 0.16 | |
| Distributions from net investment income | (0.24) | (0.48) | |
| Total distributions | (0.24) | (0.48) | |
| Net asset value, end of period | $21.01 | $24.68 | |
| Total ReturnC,D | (13.94)% | 0.66% | |
| Ratios to Average Net AssetsE,F,G | |||
| Expenses before reductions | .46%H | .45% | |
| Expenses net of fee waivers, if any | .45%H | .45% | |
| Expenses net of all reductions | .45%H | .45% | |
| Net investment income (loss) | 1.94%H | 3.05% | |
| Supplemental Data | |||
| Net assets, end of period (000 omitted) | $8,404 | $9,872 | |
| Portfolio turnover rateI,J | 25%K | 34% | |
| A | For the period February 26, 2019 (commencement of operations) to October 31, 2019. |
| B | Calculated based on average shares outstanding during the period. |
| C | Total returns for periods of less than one year are not annualized. |
| D | Total returns would have been lower if certain expenses had not been reduced during the applicable periods shown. |
| E | Annualized. |
| F | Expense ratios reflect operating expenses of the Fund. Expenses before reductions do not reflect amounts reimbursed by the investment adviser or reductions from brokerage service arrangements or reductions from other expense offset arrangements and do not represent the amount paid by the Fund during periods when reimbursements or reductions occur. Expenses net of fee waivers reflect expenses after reimbursement by the investment adviser but prior to the reductions from brokerage service arrangements or other expense offset arrangements. Expenses net of all reductions represent the net expenses paid by the Fund but do not include expenses of the investment companies in which the fund invests. |
| G | Fees and expenses of any underlying Fidelity Central Funds are not included in the Funds' expense ratio. Each Fund indirectly bears its proportionate share of expenses of any underlying Fidelity Central Funds. |
| H | Proxy expenses are not annualized. |
| I | Amount does not include the portfolio activity of any underlying funds. |
| J | Amount not annualized. |
| K | Portfolio turnover rate excludes securities received or delivered in-kind. |
| 32 |
Table of Contents
| Fidelity Targeted International Factor ETF | |||
| Six months ended April 30, 2020 (Unaudited) | Year ended October 31, 2019A | ||
| Selected Per-Share Data | |||
| Net asset value, beginning of period | $26.18 | $25.05 | |
| Income from Investment Operations | |||
| Net investment income (loss)B | 0.29 | 0.55 | |
| Net realized and unrealized gain (loss) | (3.41) | 1.12 | |
| Total from investment operations | (3.12) | 1.67 | |
| Distributions from net investment income | (0.34) | (0.54) | |
| Total distributions | (0.34) | (0.54) | |
| Net asset value, end of period | $22.72 | $26.18 | |
| Total ReturnC,D | (11.96)% | 6.72% | |
| Ratios to Average Net AssetsE,F,G | |||
| Expenses before reductions | .40%H | .39% | |
| Expenses net of fee waivers, if any | .39%H | .39% | |
| Expenses net of all reductions | .39%H | .39% | |
| Net investment income (loss) | 2.31%H | 3.18% | |
| Supplemental Data | |||
| Net assets, end of period (000 omitted) | $9,087 | $10,473 | |
| Portfolio turnover rateI,J | 33% | 35%K | |
| A | For the period February 26, 2019 (commencement of operations) to October 31, 2019. |
| B | Calculated based on average shares outstanding during the period. |
| C | Total returns for periods of less than one year are not annualized. |
| D | Total returns would have been lower if certain expenses had not been reduced during the applicable periods shown. |
| E | Annualized. |
| F | Expense ratios reflect operating expenses of the Fund. Expenses before reductions do not reflect amounts reimbursed by the investment adviser or reductions from brokerage service arrangements or reductions from other expense offset arrangements and do not represent the amount paid by the Fund during periods when reimbursements or reductions occur. Expenses net of fee waivers reflect expenses after reimbursement by the investment adviser but prior to the reductions from brokerage service arrangements or other expense offset arrangements. Expenses net of all reductions represent the net expenses paid by the Fund but do not include expenses of the investment companies in which the fund invests. |
| G | Fees and expenses of any underlying Fidelity Central Funds are not included in the Funds' expense ratio. Each Fund indirectly bears its proportionate share of expenses of any underlying Fidelity Central Funds. |
| H | Proxy expenses are not annualized. |
| I | Amount does not include the portfolio activity of any underlying funds. |
| J | Amount not annualized. |
| K | Portfolio turnover rate excludes securities received or delivered in-kind. |
| 33 |
Table of Contents
For the period ended April 30, 2020 (Unaudited)
| 34 |
Table of Contents
Changes in valuation techniques may result in transfers in or out of an assigned level within the disclosure hierarchy. The aggregate value of investments by input level, as of April 30, 2020, is included at the end of each applicable Fund’s Schedule of Investments.
| Tax cost | Gross unrealized appreciation | Gross unrealized depreciation | Net unrealized appreciation (depreciation) on securities and other investments | |
| Fidelity International High Dividend ETF | $48,875,844 | $199,288 | $(13,349,853) | $(13,150,565) |
| Fidelity International Value Factor ETF | 16,734,952 | 500,268 | (3,422,687) | (2,922,419) |
| Fidelity Targeted Emerging Markets Factor ETF | 9,600,893 | 445,487 | (1,672,786) | (1,227,299) |
| Fidelity Targeted International Factor ETF | 9,824,185 | 431,306 | (1,266,279) | (834,973) |
| 35 |
Table of Contents
Capital loss carryforwards are only available to offset future capital gains of the Funds to the extent provided by regulations and may be limited. The capital loss carryforward information presented below, including any applicable limitation, is estimated as of fiscal period end and is subject to adjustment.
| No-expiration Short-term | No-expiration Long-term | Total capital loss carryforward | |
| Fidelity International High Dividend ETF | $(910,768) | $(402,560) | $(1,313,328) |
| Fidelity International Value Factor ETF | (892,341) | (537,050) | (1,429,391) |
| Fidelity Targeted Emerging Markets Factor ETF | (265,413) | (747) | (266,160) |
| Fidelity Targeted International Factor ETF | (137,693) | — | (137,693) |
| 36 |
Table of Contents
| Purchases | Sales | |
| Fidelity International High Dividend ETF | $25,264,683 | $25,224,113 |
| Fidelity International Value Factor ETF | 3,186,123 | 3,071,681 |
| Fidelity Targeted Emerging Markets Factor ETF | 2,369,334 | 2,338,433 |
| Fidelity Targeted International Factor ETF | 3,232,678 | 3,303,764 |
| In-kind Subscriptions | In-kind Redemptions | |
| Fidelity International High Dividend ETF | $20,493,109 | $16,629,654 |
| Fidelity International Value Factor ETF | 3,154,106 | — |
| Fidelity Targeted Emerging Markets Factor ETF | — | — |
| Fidelity Targeted International Factor ETF | — | — |
| 37 |
Table of Contents
| Amount | |
| Fidelity International High Dividend ETF | $88 |
| Fidelity International Value Factor ETF | 75 |
| Fidelity Targeted Emerging Markets Factor ETF | 147 |
| Fidelity Targeted International Factor ETF | 21 |
| Fund-Level Amount | |
| Fidelity International Value Factor ETF | $902 |
| Fidelity Targeted Emerging Markets Factor ETF | 858 |
| Fidelity Targeted International Factor ETF | 817 |
| 38 |
Table of Contents
| Annualized Expense RatioA | Beginning Account Value November 1, 2019 | Ending Account Value April 30, 2020 | Expenses Paid During PeriodB November 1, 2019 to April 30, 2020 | |
| Fidelity International High Dividend ETF | 0.39% | |||
| Actual | $1,000.00 | $761.90 | $1.71 | |
| HypotheticalC | $1,000.00 | $1,022.92 | $1.96 | |
| Fidelity International Value Factor ETF | 0.39% | |||
| Actual | $1,000.00 | $806.10 | $1.75 | |
| HypotheticalC | $1,000.00 | $1,022.92 | $1.96 | |
| Fidelity Targeted Emerging Markets Factor ETF | 0.45% | |||
| Actual | $1,000.00 | $860.60 | $2.08 | |
| HypotheticalC | $1,000.00 | $1,022.63 | $2.26 | |
| Fidelity Targeted International Factor ETF | 0.39% | |||
| Actual | $1,000.00 | $880.40 | $1.82 | |
| HypotheticalC | $1,000.00 | $1,022.92 | $1.96 |
| A | Annualized expense ratio reflects expenses net of applicable fee waivers. |
| B | Expenses are equal to each Fund's annualized expense ratio, multiplied by the average account value over the period, multiplied by 182/366 (to reflect the one-half year period). |
| C | 5% return per year before expenses. |
| 39 |
Table of Contents
| 40 |
Table of Contents
| 41 |
Table of Contents
| 42 |
Table of Contents
| 43 |
Table of Contents
| 44 |
Table of Contents
| 45 |
Table of Contents
| 46 |
Table of Contents
| 47 |
Table of Contents
Table of Contents
| Item 2. | Code of Ethics |
Not applicable.
| Item 3. | Audit Committee Financial Expert |
Not applicable.
| Item 4. | Principal Accountant Fees and Services |
Not applicable.
| Item 5. | Audit Committee of Listed Registrants |
Not applicable.
| Item 6. | Investments |
| (a) | Not applicable. |
| (b) | Not applicable |
| Item 7. | Disclosure of Proxy Voting Policies and Procedures forClosed-End Management Investment Companies |
Not applicable.
| Item 8. | Portfolio Managers ofClosed-End Management Investment Companies |
Not applicable.
| Item 9. | Purchase of Equity Securities byClosed-End Management Investment Company and Affiliated Purchasers |
Not applicable.
| Item 10. | Submission of Matters to a Vote of Security Holders |
There were no material changes to the procedures by which shareholders may recommend nominees to the Fidelity Covington Trust’s Board of Trustees.
| Item 11. | Controls and Procedures |
(a)(i) The President and Treasurer and the Chief Financial Officer have concluded that the Fidelity Covington Trust’s (the “Trust”) disclosure controls and procedures (as defined in Rule30a-3(c) under the Investment Company Act) provide reasonable assurances that material information relating to the Trust is made known to them by the appropriate persons, based on their evaluation of these controls and procedures as of a date within 90 days of the filing date of this report.
Table of Contents
(a)(ii) There was no change in the Trust’s internal control over financial reporting (as defined in Rule30a-3(d) under the Investment Company Act) that occurred during the period covered by this report that has materially affected, or is reasonably likely to materially affect, the Trust’s internal control over financial reporting.
| Item 12. | Disclosure of Securities Lending Activities forClosed-End ManagementInvestment Companies |
Not applicable.
| Item 13. | Exhibits |
Table of Contents
SIGNATURES
Pursuant to the requirements of the Securities Exchange Act of 1934 and the Investment Company Act of 1940, the registrant has duly caused this report to be signed on its behalf by the undersigned, thereunto duly authorized.
Fidelity Covington Trust
| By: | /s/ Stacie M. Smith | |
| Stacie M. Smith | ||
| President and Treasurer | ||
| Date: | June 18, 2020 | |
Pursuant to the requirements of the Securities Exchange Act of 1934 and the Investment Company Act of 1940, this report has been signed below by the following persons on behalf of the registrant and in the capacities and on the dates indicated.
| By: | /s/ Stacie M. Smith | |
| Stacie M. Smith | ||
| President and Treasurer | ||
| Date: | June 18, 2020 | |
| By: | /s/ John J. Burke III | |
| John J. Burke III | ||
| Chief Financial Officer | ||
| Date: | June 18, 2020 | |