UNITED STATES
SECURITIES AND EXCHANGE COMMISSION
Washington, D.C. 20549
FORM N-CSR
CERTIFIED SHAREHOLDER REPORT OF REGISTERED
MANAGEMENT INVESTMENT COMPANIES
Investment Company Act file number 811-07319
Fidelity Covington Trust
(Exact name of registrant as specified in charter)
245 Summer St., Boston, Massachusetts 02210
(Address of principal executive offices) (Zip code)
Cynthia Lo Bessette, Secretary
245 Summer St.
Boston, Massachusetts 02210
(Name and address of agent for service)
Registrant’s telephone number, including area code: 617-563-7000
Date of fiscal year end: August 31
Date of reporting period: August 31, 2020
| Item 1. | Reports to Stockholders |

about access to your fund’s shareholder reports.

| Account Type | Website | Phone Number |
| Brokerage, Mutual Fund, or Annuity Contracts: | fidelity.com/mailpreferences | 1-800-343-3548 |
| Employer Provided Retirement Accounts: | netbenefits.fidelity.com/preferences (choose ‘no’ under Required Disclosures to continue print) | 1-800-343-0860 |
| 3 |
| 4 |
| 5 |
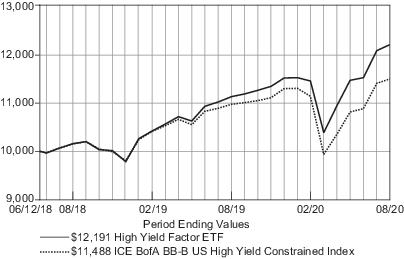
| Average Annual Total Returns | Past 1 Year | Life of fund |
| Fidelity High Yield Factor ETF – NAVA | 9.61% | 9.33% |
| Fidelity High Yield Factor ETF – Market PriceB | 9.19% | 9.18% |
| ICE BofA BB-B US High Yield Constrained IndexA | 4.77% | 6.44% |
| ICE BofA US High Yield Master II IndexA | 3.71% | 5.30% |
| B | From June 14, 2018, date initially listed on the NYSE ARCA exchange. |
| * | Total returns are historical and include changes in share price and reinvestment of dividends and capital gains distributions, if any. |
| 6 |
| 7 |
| (by issuer, excluding cash equivalents) | % of fund’s net assets |
| CCO Holdings LLC / CCO Holdings Capital Corp. | 4.3 |
| SBA Communications Corp. | 2.7 |
| TransDigm, Inc. | 2.5 |
| Molina Healthcare, Inc. | 1.9 |
| Fair Isaac Corp. | 1.9 |
| 13.3 |
| % of fund's net assets | ||
| Energy | 15.7 | |
| Financials | 13.0 | |
| Communication Services | 11.8 | |
| Industrials | 11.7 | |
| Consumer Discretionary | 11.5 | |

| 8 |
| Nonconvertible Bonds – 94.1% | ||
| Principal Amount | Value | |
| COMMUNICATION SERVICES – 11.8% | ||
| Diversified Telecommunication Services – 0.4% | ||
| Level 3 Financing, Inc. 3.625% 1/15/29 (a) | $ 500,000 | $ 501,300 |
| Entertainment – 0.9% | ||
| Live Nation Entertainment, Inc. 4.875% 11/1/24 (a) | 977,000 | 960,000 |
| Powdr Corp. 6.00% 8/1/25 (a) | 70,000 | 72,275 |
| 1,032,275 | ||
| Interactive Media & Services – 1.4% | ||
| Match Group, Inc. 4.625% 6/1/28 (a) | 500,000 | 526,505 |
| TripAdvisor, Inc. 7.00% 7/15/25 (a) | 1,000,000 | 1,055,000 |
| 1,581,505 | ||
| Media – 9.1% | ||
| CCO Holdings LLC / CCO Holdings Capital Corp.: | ||
4.25% 2/1/31 (a) | 1,000,000 | 1,044,715 |
4.50% 8/15/30 (a) | 1,185,000 | 1,253,137 |
4.75% 3/1/30 (a) | 1,157,000 | 1,243,023 |
5.375% 6/1/29 (a) | 1,285,000 | 1,412,176 |
| Cimpress PLC 7.00% 6/15/26 (a) | 650,000 | 646,750 |
| Clear Channel International BV 6.625% 8/1/25 (a) | 200,000 | 207,000 |
| CSC Holdings LLC 4.625% 12/1/30 (a) | 500,000 | 511,355 |
| Diamond Sports Group LLC / Diamond Sports Finance Co. 12.75% 12/1/26 (a) | 140,000 | 119,000 |
| DISH DBS Corp.: | ||
5.875% 11/15/24 | 308,000 | 325,548 |
7.375% 7/1/28 (a) | 600,000 | 636,180 |
| Lamar Media Corp.: | ||
3.75% 2/15/28 (a) | 1,000,000 | 998,750 |
4.875% 1/15/29 (a) | 90,000 | 94,275 |
| Sable International Finance Ltd. 5.75% 9/7/27 (a) | 255,000 | 268,668 |
| Virgin Media Secured Finance PLC 4.50% 8/15/30 (a) | 500,000 | 525,000 |
| Virgin Media Vendor Financing Notes IV DAC 5.00% 7/15/28 (a) | 290,000 | 300,571 |
| Windstream Escrow LLC / Windstream Escrow Finance Corp. 7.75% 8/15/28 (a) | 150,000 | 150,032 |
| WMG Acquisition Corp. 3.00% 2/15/31 (a) | 500,000 | 497,500 |
| | ||
| Principal Amount | Value | |
| Zayo Group Holdings, Inc. 4.00% 3/1/27 (a) | $ 175,000 | $ 173,031 |
| 10,406,711 | ||
| TOTAL COMMUNICATION SERVICES | 13,521,791 | |
| CONSUMER DISCRETIONARY – 11.5% | ||
| Automobiles – 0.1% | ||
| Winnebago Industries, Inc. 6.25% 7/15/28 (a) | 90,000 | 96,274 |
| Hotels, Restaurants & Leisure – 10.2% | ||
| 1011778 BC ULC / New Red Finance, Inc.: | ||
3.875% 1/15/28 (a) | 50,000 | 51,250 |
4.375% 1/15/28 (a) | 1,800,000 | 1,849,500 |
5.00% 10/15/25 (a) | 1,090,000 | 1,119,332 |
| Carnival Corp.: | ||
9.875% 8/1/27 (a) | 275,000 | 277,219 |
10.50% 2/1/26 (a) | 120,000 | 126,000 |
| Churchill Downs, Inc. 4.75% 1/15/28 (a) | 1,000,000 | 1,020,000 |
| Colt Merger Sub, Inc.: | ||
5.75% 7/1/25 (a) | 200,000 | 209,500 |
6.25% 7/1/25 (a) | 400,000 | 423,380 |
| Hilton Domestic Operating Co., Inc. 5.125% 5/1/26 | 308,000 | 318,019 |
| Hilton Worldwide Finance LLC / Hilton Worldwide Finance Corp.: | ||
4.625% 4/1/25 | 229,000 | 231,290 |
4.875% 4/1/27 | 1,178,000 | 1,207,450 |
| International Game Technology PLC 5.25% 1/15/29 (a) | 300,000 | 307,500 |
| NCL Corp. Ltd. 10.25% 2/1/26 (a) | 200,000 | 201,000 |
| Royal Caribbean Cruises Ltd.: | ||
9.125% 6/15/23 (a) | 165,000 | 173,663 |
11.50% 6/1/25 (a) | 205,000 | 237,699 |
| SeaWorld Parks & Entertainment, Inc. 9.50% 8/1/25 (a) | 90,000 | 94,950 |
| Vail Resorts, Inc. 6.25% 5/15/25 (a) | 1,065,000 | 1,140,881 |
| Wyndham Hotels & Resorts, Inc. 4.375% 8/15/28 (a) | 300,000 | 302,310 |
| Wynn Las Vegas LLC / Wynn Las Vegas Capital Corp. 5.50% 3/1/25 (a) | 1,056,000 | 1,045,440 |
| Wynn Resorts Finance LLC / Wynn Resorts Capital Corp. 7.75% 4/15/25 (a) | 230,000 | 241,500 |
| Yum! Brands, Inc.: | ||
4.75% 1/15/30 (a) | 1,000,000 | 1,102,500 |
| 9 |
| Nonconvertible Bonds – continued | ||
| Principal Amount | Value | |
| CONSUMER DISCRETIONARY – continued | ||
| Hotels, Restaurants & Leisure – continued | ||
7.75% 4/1/25 (a) | $ 40,000 | $ 44,650 |
| 11,725,033 | ||
| Internet & Direct Marketing Retail – 0.1% | ||
| Netflix, Inc. 5.875% 2/15/25 | 98,000 | 113,190 |
| Specialty Retail – 0.2% | ||
| Burlington Coat Factory Warehouse Corp. 6.25% 4/15/25 (a) | 35,000 | 37,231 |
| L Brands, Inc. 9.375% 7/1/25 (a) | 75,000 | 87,360 |
| Lithia Motors, Inc. 4.625% 12/15/27 (a) | 35,000 | 36,925 |
| Murphy Oil USA, Inc. 4.75% 9/15/29 | 40,000 | 43,243 |
| 204,759 | ||
| Textiles, Apparel & Luxury Goods – 0.9% | ||
| The William Carter Co. 5.50% 5/15/25 (a) | 1,000,000 | 1,066,240 |
| TOTAL CONSUMER DISCRETIONARY | 13,205,496 | |
| CONSUMER STAPLES – 1.9% | ||
| Personal Products – 1.3% | ||
| HLF Financing Sarl LLC / Herbalife International, Inc. 7.25% 8/15/26 (a) | 1,422,000 | 1,485,990 |
| Tobacco – 0.6% | ||
| Vector Group Ltd.: | ||
6.125% 2/1/25 (a) | 386,000 | 391,790 |
10.50% 11/1/26 (a) | 308,000 | 320,077 |
| 711,867 | ||
| TOTAL CONSUMER STAPLES | 2,197,857 | |
| ENERGY – 15.7% | ||
| Energy Equipment & Services – 0.9% | ||
| KLX Energy Services Holdings, Inc. 11.50% 11/1/25 (a) | 15,000 | 7,725 |
| USA Compression Partners LP / USA Compression Finance Corp. 6.875% 4/1/26 | 1,000,000 | 1,030,000 |
| 1,037,725 | ||
| Oil, Gas & Consumable Fuels – 14.8% | ||
| Aker BP ASA 4.75% 6/15/24 (a) | 500,000 | 514,973 |
| Antero Midstream Partners LP / Antero Midstream Finance Corp. 5.375% 9/15/24 | 460,000 | 424,350 |
| | ||
| Principal Amount | Value | |
| Apache Corp. 4.875% 11/15/27 | $ 500,000 | $ 510,920 |
| Buckeye Partners LP 4.125% 3/1/25 (a) | 800,000 | 803,984 |
| Cenovus Energy, Inc. 5.375% 7/15/25 | 1,000,000 | 1,017,543 |
| Cheniere Energy Partners LP 5.25% 10/1/25 | 232,000 | 237,392 |
| CITGO Petroleum Corp. 7.00% 6/15/25 (a) | 260,000 | 261,300 |
| CNX Midstream Partners LP / CNX Midstream Finance Corp. 6.50% 3/15/26 (a) | 400,000 | 400,592 |
| CNX Resources Corp. 7.25% 3/14/27 (a) | 154,000 | 160,160 |
| Comstock Resources, Inc. 9.75% 8/15/26 to 8/15/26 | 727,000 | 770,865 |
| CVR Energy, Inc.: | ||
5.25% 2/15/25 (a) | 600,000 | 567,510 |
5.75% 2/15/28 (a) | 600,000 | 544,500 |
| DCP Midstream LP 7.375% (b)(c) | 115,000 | 84,525 |
| Enviva Partners LP / Enviva Partners Finance Corp. 6.50% 1/15/26 (a) | 165,000 | 175,690 |
| EQM Midstream Partners LP: | ||
5.50% 7/15/28 | 300,000 | 310,848 |
6.00% 7/1/25 (a) | 95,000 | 100,819 |
6.50% 7/1/27 (a) | 135,000 | 147,825 |
| Harvest Midstream I LP 7.50% 9/1/28 (a) | 175,000 | 181,150 |
| Hess Midstream Operating LP 5.125% 6/15/28 (a) | 108,000 | 111,037 |
| Holly Energy Partners LP / Holly Energy Finance Corp. 5.00% 2/1/28 (a) | 65,000 | 65,039 |
| Laredo Petroleum, Inc. 9.50% 1/15/25 | 40,000 | 28,625 |
| MEG Energy Corp. 7.00% 3/31/24 (a) | 300,000 | 297,750 |
| New Fortress Energy, Inc. 6.75% 9/15/25 (a)(d) | 315,000 | 318,997 |
| NGL Energy Partners LP / NGL Energy Finance Corp. 7.50% 11/1/23 | 700,000 | 511,000 |
| Occidental Petroleum Corp.: | ||
6.625% 9/1/30 | 300,000 | 310,434 |
8.50% 7/15/27 | 800,000 | 885,500 |
| Par Petroleum LLC / Par Petroleum Finance Corp. 7.75% 12/15/25 (a) | 617,000 | 567,640 |
| 10 |
| Nonconvertible Bonds – continued | ||
| Principal Amount | Value | |
| ENERGY – continued | ||
| Oil, Gas & Consumable Fuels – continued | ||
| Parkland Fuel Corp. 5.875% 7/15/27 (a) | $ 360,000 | $ 384,300 |
| Parsley Energy LLC / Parsley Finance Corp. 5.375% 1/15/25 (a) | 380,000 | 387,125 |
| PBF Holding Co. LLC / PBF Finance Corp. 6.00% 2/15/28 (a) | 220,000 | 185,515 |
| PBF Logistics LP / PBF Logistics Finance Corp. 6.875% 5/15/23 | 606,000 | 601,085 |
| PDC Energy, Inc. 6.125% 9/15/24 | 600,000 | 612,750 |
| Range Resources Corp.: | ||
5.00% 3/15/23 | 205,000 | 204,227 |
9.25% 2/1/26 (a)(d) | 700,000 | 737,100 |
| Rattler Midstream LP 5.625% 7/15/25 (a) | 100,000 | 105,750 |
| Southwestern Energy Co.: | ||
7.50% 4/1/26 | 154,000 | 154,770 |
8.375% 9/15/28 | 500,000 | 517,500 |
| Tallgrass Energy Partners LP / Tallgrass Energy Finance Corp. 6.00% 3/1/27 (a) | 1,000,000 | 935,000 |
| Targa Resources Partners LP / Targa Resources Partners Finance Corp. 5.50% 3/1/30 (a) | 514,000 | 542,108 |
| W&T Offshore, Inc. 9.75% 11/1/23 (a) | 566,000 | 410,463 |
| Warrior Met Coal, Inc. 8.00% 11/1/24 (a) | 822,000 | 843,578 |
| 16,932,239 | ||
| TOTAL ENERGY | 17,969,964 | |
| FINANCIALS – 13.0% | ||
| Capital Markets – 3.3% | ||
| LPL Holdings, Inc. 4.625% 11/15/27 (a) | 1,542,000 | 1,603,680 |
| MSCI, Inc.: | ||
3.875% 2/15/31 (a) | 1,000,000 | 1,056,250 |
4.00% 11/15/29 (a) | 1,028,000 | 1,099,960 |
| 3,759,890 | ||
| Consumer Finance – 5.6% | ||
| Credit Acceptance Corp. 6.625% 3/15/26 | 257,000 | 274,990 |
| Enova International, Inc. 8.50% 9/15/25 (a) | 50,000 | 47,640 |
| FirstCash, Inc. 4.625% 9/1/28 (a) | 1,700,000 | 1,747,073 |
| | ||
| Principal Amount | Value | |
| Ford Motor Credit Co. LLC 4.125% 8/17/27 | $ 2,000,000 | $ 1,996,820 |
| goeasy Ltd. 5.375% 12/1/24 (a) | 411,000 | 423,330 |
| Nationstar Mortgage Holdings, Inc. 5.50% 8/15/28 (a) | 1,000,000 | 1,051,750 |
| PRA Group, Inc. 7.375% 9/1/25 (a) | 800,000 | 852,720 |
| 6,394,323 | ||
| Diversified Financial Services – 3.1% | ||
| Compass Group Diversified Holdings LLC 8.00% 5/1/26 (a) | 1,000,000 | 1,057,500 |
| Icahn Enterprises LP / Icahn Enterprises Finance Corp.: | ||
4.75% 9/15/24 | 708,000 | 731,010 |
6.25% 5/15/26 | 591,000 | 630,892 |
| INTL FCStone, Inc. 8.625% 6/15/25 (a) | 1,000,000 | 1,082,500 |
| 3,501,902 | ||
| Thrifts & Mortgage Finance – 1.0% | ||
| MGIC Investment Corp. 5.25% 8/15/28 | 80,000 | 83,918 |
| NMI Holdings, Inc. 7.375% 6/1/25 (a) | 1,000,000 | 1,079,610 |
| 1,163,528 | ||
| TOTAL FINANCIALS | 14,819,643 | |
| HEALTH CARE – 6.1% | ||
| Biotechnology – 0.0% | ||
| Emergent BioSolutions, Inc. 3.875% 8/15/28 (a) | 70,000 | 71,064 |
| Health Care Equipment & Supplies – 0.2% | ||
| Teleflex, Inc.: | ||
4.25% 6/1/28 (a) | 65,000 | 68,575 |
4.625% 11/15/27 | 115,000 | 122,187 |
| 190,762 | ||
| Health Care Providers & Services – 3.7% | ||
| Centene Corp. 4.75% 1/15/25 | 65,000 | 66,858 |
| CHS / Community Health Systems, Inc. 6.25% 3/31/23 | 205,000 | 205,513 |
| DaVita, Inc.: | ||
3.75% 2/15/31 (a) | 500,000 | 493,510 |
4.625% 6/1/30 (a) | 230,000 | 241,787 |
| Encompass Health Corp. 4.75% 2/1/30 | 1,000,000 | 1,043,310 |
| Molina Healthcare, Inc. 4.375% 6/15/28 (a) | 2,075,000 | 2,168,375 |
| 4,219,353 | ||
| 11 |
| Nonconvertible Bonds – continued | ||
| Principal Amount | Value | |
| HEALTH CARE – continued | ||
| Life Sciences Tools & Services – 0.2% | ||
| IQVIA, Inc. 5.00% 5/15/27 (a) | $ 200,000 | $ 210,521 |
| Pharmaceuticals – 2.0% | ||
| AdaptHealth LLC 6.125% 8/1/28 (a) | 1,100,000 | 1,152,250 |
| Herbalife Nutrition Ltd. / HLF Financing, Inc. 7.875% 9/1/25 (a) | 1,000,000 | 1,102,500 |
| 2,254,750 | ||
| TOTAL HEALTH CARE | 6,946,450 | |
| INDUSTRIALS – 11.7% | ||
| Aerospace & Defense – 2.5% | ||
| TransDigm, Inc.: | ||
6.25% 3/15/26 (a) | 2,542,000 | 2,682,344 |
8.00% 12/15/25 (a) | 220,000 | 239,250 |
| 2,921,594 | ||
| Airlines – 0.6% | ||
| American Airlines, Inc. 11.75% 7/15/25 (a) | 200,000 | 192,052 |
| Mileage Plus Holdings LLC / Mileage Plus Intellectual Property Assets Ltd. 6.50% 6/20/27 (a) | 300,000 | 312,750 |
| Western Global Airlines LLC 10.375% 8/15/25 (a) | 200,000 | 203,250 |
| 708,052 | ||
| Building Products – 1.8% | ||
| Griffon Corp. 5.75% 3/1/28 | 1,000,000 | 1,061,250 |
| Williams Scotsman International, Inc. 4.625% 8/15/28 (a) | 1,000,000 | 1,010,625 |
| 2,071,875 | ||
| Commercial Services & Supplies – 2.5% | ||
| Avis Budget Car Rental LLC / Avis Budget Finance, Inc. 5.75% 7/15/27 (a) | 200,000 | 191,500 |
| GFL Environmental, Inc. 3.75% 8/1/25 (a) | 2,000,000 | 2,013,760 |
| Ritchie Bros Auctioneers, Inc. 5.375% 1/15/25 (a) | 115,000 | 118,737 |
| Sabre GLBL, Inc. 7.375% 9/1/25 (a) | 300,000 | 313,395 |
| Tervita Corp. 7.625% 12/1/21 (a) | 205,000 | 172,200 |
| 2,809,592 | ||
| Electrical Equipment – 0.9% | ||
| EnerSys 4.375% 12/15/27 (a) | 1,000,000 | 1,028,750 |
| | ||
| Principal Amount | Value | |
| Machinery – 2.0% | ||
| Ashtead Capital, Inc. 4.00% 5/1/28 (a) | $ 1,000,000 | $ 1,037,500 |
| BWX Technologies, Inc. 4.125% 6/30/28 (a) | 105,000 | 109,463 |
| FXI Holdings, Inc. 12.25% 11/15/26 (a) | 202,000 | 220,497 |
| Meritor, Inc. 6.25% 6/1/25 (a) | 250,000 | 264,762 |
| RBS Global, Inc. / Rexnord LLC 4.875% 12/15/25 (a) | 205,000 | 209,869 |
| United Rentals North America, Inc. 3.875% 2/15/31 | 400,000 | 411,500 |
| 2,253,591 | ||
| Road & Rail – 0.9% | ||
| Uber Technologies, Inc. 7.50% 5/15/25 (a) | 1,000,000 | 1,049,710 |
| Trading Companies & Distributors – 0.5% | ||
| Fortress Transportation and Infrastructure Investors LLC 9.75% 8/1/27 (a) | 500,000 | 533,135 |
| TOTAL INDUSTRIALS | 13,376,299 | |
| INFORMATION TECHNOLOGY – 9.2% | ||
| Communications Equipment – 0.2% | ||
| ViaSat, Inc. 5.625% 4/15/27 (a) | 154,000 | 163,240 |
| IT Services – 3.1% | ||
| Black Knight InfoServ LLC 3.625% 9/1/28 (a) | 115,000 | 116,474 |
| Booz Allen Hamilton, Inc. 3.875% 9/1/28 (a) | 105,000 | 108,906 |
| Camelot Finance S.A. 4.50% 11/1/26 (a) | 1,077,000 | 1,114,394 |
| CDW LLC / CDW Finance Corp. 3.25% 2/15/29 | 500,000 | 510,690 |
| Gartner, Inc. 4.50% 7/1/28 (a) | 180,000 | 188,100 |
| Science Applications International Corp. 4.875% 4/1/28 (a) | 1,500,000 | 1,554,375 |
| 3,592,939 | ||
| Semiconductors & Semiconductor Equipment – 0.9% | ||
| Microchip Technology, Inc. 4.25% 9/1/25 (a) | 1,000,000 | 1,041,279 |
| Software – 5.0% | ||
| Fair Isaac Corp. 4.00% 6/15/28 (a) | 2,087,000 | 2,160,045 |
| Logan Merger Sub, Inc. 5.50% 9/1/27 (a) | 1,500,000 | 1,543,125 |
| 12 |
| Nonconvertible Bonds – continued | ||
| Principal Amount | Value | |
| INFORMATION TECHNOLOGY – continued | ||
| Software – continued | ||
| Open Text Corp. 3.875% 2/15/28 (a) | $ 180,000 | $ 185,141 |
| Open Text Holdings, Inc. 4.125% 2/15/30 (a) | 1,000,000 | 1,036,770 |
| PTC, Inc.: | ||
3.625% 2/15/25 (a) | 55,000 | 56,100 |
4.00% 2/15/28 (a) | 55,000 | 56,941 |
| SS&C Technologies, Inc. 5.50% 9/30/27 (a) | 606,000 | 649,087 |
| 5,687,209 | ||
| TOTAL INFORMATION TECHNOLOGY | 10,484,667 | |
| MATERIALS – 7.7% | ||
| Chemicals – 0.1% | ||
| The Scotts Miracle-Gro Co. 4.50% 10/15/29 | 97,000 | 103,784 |
| Construction Materials – 0.6% | ||
| Forterra Finance LLC / FRTA Finance Corp. 6.50% 7/15/25 (a) | 500,000 | 531,875 |
| Summit Materials LLC / Summit Materials Finance Corp. 5.25% 1/15/29 (a) | 110,000 | 115,234 |
| 647,109 | ||
| Containers & Packaging – 1.9% | ||
| Intelligent Packaging Ltd. Finco, Inc. / Intelligent Packaging Ltd. Co-Issuer LLC 6.00% 9/15/28 (a)(d) | 40,000 | 40,800 |
| Intertape Polymer Group, Inc. 7.00% 10/15/26 (a) | 452,000 | 474,600 |
| Silgan Holdings, Inc. 4.125% 2/1/28 | 1,645,000 | 1,704,631 |
| 2,220,031 | ||
| Metals & Mining – 4.2% | ||
| Cleveland-Cliffs, Inc. 6.75% 3/15/26 (a) | 400,000 | 408,500 |
| Compass Minerals International, Inc. 6.75% 12/1/27 (a) | 195,000 | 213,161 |
| FMG Resources August 2006 Pty Ltd.: | ||
4.50% 9/15/27 (a) | 514,000 | 555,120 |
| 5.125% 3/15/23 to 5/15/24 (a) | 548,000 | 580,609 |
| Infrabuild Australia Pty Ltd. 12.00% 10/1/24 (a) | 205,000 | 194,750 |
| Kaiser Aluminum Corp. 4.625% 3/1/28 (a) | 1,234,000 | 1,220,574 |
| Mineral Resources Ltd. 8.125% 5/1/27 (a) | 617,000 | 681,816 |
| | ||
| Principal Amount | Value | |
| New Gold, Inc. 7.50% 7/15/27 (a) | $ 700,000 | $759,500 |
| United States Steel Corp. 12.00% 6/1/25 (a) | 200,000 | 212,000 |
| 4,826,030 | ||
| Paper & Forest Products – 0.9% | ||
| Boise Cascade Co. 4.875% 7/1/30 (a) | 170,000 | 184,025 |
| Norbord, Inc. 5.75% 7/15/27 (a) | 822,000 | 877,485 |
| 1,061,510 | ||
| TOTAL MATERIALS | 8,858,464 | |
| REAL ESTATE – 5.2% | ||
| Equity Real Estate Investment Trusts (REITs) – 4.1% | ||
| HAT Holdings I LLC / HAT Holdings II LLC 6.00% 4/15/25 (a) | 860,000 | 922,350 |
| SBA Communications Corp. 3.875% 2/15/27 (a) | 3,000,000 | 3,113,850 |
| The GEO Group, Inc.: | ||
5.125% 4/1/23 | 400,000 | 330,000 |
6.00% 4/15/26 | 514,000 | 394,158 |
| 4,760,358 | ||
| Real Estate Management & Development – 1.1% | ||
| Kennedy-Wilson, Inc. 5.875% 4/1/24 | 916,000 | 927,157 |
| The Howard Hughes Corp. 5.375% 8/1/28 (a) | 300,000 | 304,518 |
| 1,231,675 | ||
| TOTAL REAL ESTATE | 5,992,033 | |
| UTILITIES – 0.3% | ||
| Multi-Utilities – 0.3% | ||
| Calpine Corp. 5.00% 2/1/31 (a) | 300,000 | 313,566 |
| TOTAL NONCONVERTIBLE BONDS (Cost $104,070,865) | 107,686,230 | |
| Money Market Fund – 6.0% | ||
| Shares | ||
| Fidelity Cash Central Fund, 0.12% (e) (Cost $6,883,841) | 6,882,464 | 6,883,841 |
| TOTAL INVESTMENT IN SECURITIES – 100.1% (Cost $110,954,706) | 114,570,071 | |
| NET OTHER ASSETS (LIABILITIES) – (0.1%) | (148,850) | |
| NET ASSETS – 100.0% | $ 114,421,221 | |
| 13 |
| Legend | ||
| (a) | Security is exempt from registration under Rule 144A of the Securities Act of 1933. These securities may be resold in transactions exempt from registration, normally to qualified institutional buyers. At the end of the period, the value of these securities amounted to $86,636,488 or 75.7% of net assets. | |
| (b) | Security is perpetual in nature with no stated maturity date. | |
| (c) | Coupon rates for floating and adjustable rate securities reflect the rates in effect at period end. | |
| (d) | Security or a portion of the security purchased on a delayed delivery or when-issued basis. | |
| (e) | Affiliated fund that is generally available only to investment companies and other accounts managed by Fidelity Investments. The rate quoted is the annualized seven-day yield of the fund at period end. A complete unaudited listing of the fund's holdings as of its most recent quarter end is available upon request. In addition, each Fidelity Central Fund's financial statements, which are not covered by the Fund's Report of Independent Registered Public Accounting Firm, are available on the SEC's website or upon request. | |
| Fund | Income earned |
| Fidelity Cash Central Fund | $80,430 |
| Description | Total | Level 1 | Level 2 | Level 3 |
| Investments in Securities: | ||||||||
| Corporate Bonds | $ 107,686,230 | $ — | $ 107,686,230 | $ — | ||||
| Money Market Funds | 6,883,841 | 6,883,841 | — | — | ||||
| Total Investments in Securities: | $ 114,570,071 | $ 6,883,841 | $ 107,686,230 | $ — |
| United States of America | 84.6 |
| Canada | 8.5 |
| Australia | 1.8 |
| Luxembourg | 1.0 |
| Multi-National | 1.0 |
| Others (Individually Less Than 1%) | 3.2 |
| 100.1% |
| 14 |
| Assets | |
| Investments in securities, at value – See accompanying schedule: | |
| Unaffiliated issuers | $107,686,230 |
| Fidelity Central Funds | 6,883,841 |
| Total Investments in Securities | $114,570,071 |
| Cash | 155 |
| Receivable for investments sold | |
| Regular delivery | 10,911 |
| Distributions receivable from Fidelity Central Funds | 792 |
| Interest receivable | 1,396,640 |
| Total assets | 115,978,569 |
| Liabilities | |
| Payable for investments purchased | |
| Delayed delivery | 1,060,396 |
| Distributions payable | 455,700 |
| Accrued management fees | 41,252 |
| Total liabilities | 1,557,348 |
| Net Assets | $114,421,221 |
| Net Assets consist of: | |
| Paid in capital | 109,322,937 |
| Total accumulated earnings (loss) | 5,098,284 |
| Net Assets | $114,421,221 |
| Shares outstanding | 2,100,000 |
| Net Asset Value, offering price and redemption price per share | $ 54.49 |
| Investments at cost – Unaffiliated issuers | $104,070,865 |
| Investments at cost – Fidelity Central Funds | 6,883,841 |
| Investments at cost | $110,954,706 |
| 16 |
| Investment Income | |
| Interest | $ 5,181,714 |
| Income from Fidelity Central Funds | 80,430 |
| Total income | 5,262,144 |
| Expenses | |
| Management fees | 446,720 |
| Independent trustees' compensation | 550 |
| Proxy | 696 |
| Total expenses before reductions | 447,966 |
| Expense reductions | (1,754) |
| Total expenses | 446,212 |
| Net investment income (loss) | 4,815,932 |
| Realized and Unrealized Gain (Loss) | |
| Net realized gain (loss) on investment securities | 1,566,822 |
| Net realized gain (loss) on Fidelity Central Funds | 2,249 |
| Net realized gain (loss) on In-kind redemptions | 49,091 |
| Total net realized gain (loss) | 1,618,162 |
| Change in net unrealized appreciation (depreciation) on investment securities | 2,199,562 |
| Net gain (loss) | 3,817,724 |
| Net increase (decrease) in net assets resulting from operations | $ 8,633,656 |
| 17 |
| Year ended August 31, 2020 | Year ended August 31, 2019 | ||
| Increase (Decrease) in Net Assets | |||
| Operations | |||
| Net investment income (loss) | $ 4,815,932 | $ 1,568,523 | |
| Net realized gain (loss) | 1,618,162 | 253,191 | |
| Change in net unrealized appreciation (depreciation) | 2,199,562 | 1,413,919 | |
| Net increase (decrease) in net assets resulting from operations | 8,633,656 | 3,235,633 | |
| Distributions to shareholders | (5,165,200) | (1,563,200) | |
| Share transactions | |||
| Proceeds from sales of shares | 52,988,374 | 53,790,556 | |
| Cost of shares redeemed | (10,051,764) | — | |
| Net increase (decrease) in net assets resulting from share transactions | 42,936,610 | 53,790,556 | |
| Total increase (decrease) in net assets | 46,405,066 | 55,462,989 | |
| Net Assets | |||
| Beginning of year | 68,016,155 | 12,553,166 | |
| End of year | $114,421,221 | $68,016,155 | |
| Other Information | |||
| Shares | |||
| Sold | 1,000,000 | 1,050,000 | |
| Redeemed | (200,000) | — | |
| Net increase (decrease) | 800,000 | 1,050,000 |
| 18 |
| Year ended August 31, 2020 | Year ended August 31, 2019 | Year ended August 31, 2018A | |||
| Selected Per-Share Data | |||||
| Net asset value, beginning of period | $ 52.32 | $ 50.21 | $ 50.00 | ||
| Income from Investment Operations | |||||
| Net investment income (loss)B | 2.518 | 2.589 | 0.578 | ||
| Net realized and unrealized gain (loss) | 2.323 | 2.006 | 0.209 | ||
| Total from investment operations | 4.841 | 4.595 | 0.787 | ||
| Distributions from net investment income | (2.429) | (2.485) | (0.577) | ||
| Distributions from net realized gain | (0.242) | — | — | ||
| Total distributions | (2.671) | (2.485) | (0.577) | ||
| Net asset value, end of period | $ 54.49 | $ 52.32 | $ 50.21 | ||
| Total ReturnC,D | 9.61% | 9.48% | 1.59% | ||
| Ratios to Average Net AssetsE,F | |||||
| Expenses before reductions | .45% | .44% G | .45% H | ||
| Expenses net of fee waivers, if any | .45% | .44% G | .45% H | ||
| Expenses net of all reductions | .45% | .44% G | .45% H | ||
| Net investment income (loss) | 4.84% | 5.03% | 5.21% H | ||
| Supplemental Data | |||||
| Net assets, end of period (000 omitted) | $114,421 | $68,016 | $12,553 | ||
| Portfolio turnover rateI | 179% J | 76% | 8% K |
| A | For the period June 12, 2018 (commencement of operations) to August 31, 2018. |
| B | Calculated based on average shares outstanding during the period. |
| C | Total returns for periods of less than one year are not annualized. |
| D | Total returns would have been lower if certain expenses had not been reduced during the applicable periods shown. |
| E | Expense ratios reflect operating expenses of the class. Expenses before reductions do not reflect amounts reimbursed, waived, or reduced through arrangements with the investment advisor, brokerage services, or other offset arrangements, if applicable, and do not represent the amount paid by the class during periods when reimbursements, waivers or reductions occur. |
| F | Fees and expenses of any underlying mutual funds or exchange-traded funds (ETFs) are not included in the Fund’s expense ratio. The Fund indirectly bears its proportionate share of these expenses. For additional expense information related to investments in Fidelity Central Funds, please refer to the "Investments in Fidelity Central Funds" note found in the Notes to Financial Statements section of the most recent Annual or Semi-Annual report. |
| G | The size and fluctuation of net assets and expense amounts may cause ratios to differ from contractual rates. |
| H | Annualized. |
| I | Amount does not include the portfolio activity of any underlying funds. |
| J | Portfolio turnover rate excludes securities received or delivered in-kind. |
| K | Amount not annualized. |
| 19 |
For the year ended August 31, 2020
| 20 |
Investment Transactions and Income. For financial reporting purposes, the Fund's investment holdings and NAV include trades executed through the end of the last business day of the period. The NAV per share for processing shareholder transactions is calculated as of the close of business of NYSE Arca, normally 4:00 p.m. Eastern time. Gains and losses on securities sold are determined on the basis of identified cost and may include proceeds received from litigation. Income and capital gain distributions from Fidelity Central Funds, if any, are recorded on the ex-dividend date. Interest income is accrued as earned and includes coupon interest and amortization of premium and accretion of discount on debt securities as applicable. Debt obligations may be placed on non-accrual status and related interest income may be reduced by ceasing current accruals and writing off interest receivables when the collection of all or a portion of interest has become doubtful based on consistently applied procedures. A debt obligation is removed from non-accrual status when the issuer resumes interest payments or when collectability of interest is reasonably assured.
| Tax cost | Gross unrealized appreciation | Gross unrealized depreciation | Net unrealized appreciation (depreciation) on securities and other investments | |
| Fidelity High Yield Factor ETF | $ 110,927,725 | $ 4,349,185 | $ (706,839) | $ 3,642,346 |
| Undistributed ordinary income | Undistributed capital gains | Capital loss carryforward | Net unrealized appreciation (depreciation) | |
| Fidelity High Yield Factor ETF | $ 1,051,073 | $ 404,865 | $ — | $ 3,642,346 |
| August 31, 2020 | ||||
| Ordinary Income | Long-Term Capital Gain | Tax Return Of Capital | Total | |
| Fidelity High Yield Factor ETF | $ 5,128,450 | $ 36,750 | $ — | $ 5,165,200 |
| August 31, 2019 | ||||
| Fidelity High Yield Factor ETF | $ 1,563,200 | $ — | $ — | $ 1,563,200 |
| 21 |
Delayed Delivery Transactions and When-Issued Securities. During the period, certain Funds transacted in securities on a delayed delivery or when-issued basis. Payment and delivery may take place after the customary settlement period for that security. The price of the underlying securities and the date when the securities will be delivered and paid for are fixed at the time the transaction is negotiated. Securities purchased on a delayed delivery or when-issued basis are identified as such in the Schedule of Investments. Compensation for interest forgone in the purchase of a delayed delivery or when-issued debt security may be received. With respect to purchase commitments, each applicable Fund identifies securities as segregated in its records with a value at least equal to the amount of the commitment. Payables and receivables associated with the purchases and sales of delayed delivery securities having the same coupon, settlement date and broker are offset. Delayed delivery or when-issued securities that have been purchased from and sold to different brokers are reflected as both payables and receivables in the Statement of Assets and Liabilities under the caption "Delayed delivery", as applicable. Losses may arise due to changes in the value of the underlying securities or if the counterparty does not perform under the contract’s terms, or if the issuer does not issue the securities due to political, economic, or other factors.
| 22 |
| 23 |
| 24 |
| Fidelity High Yield Factor ETF | ||||
| Period Ended August 31, 2020 | ||||
| From commencement of operations * to August 31, 2020 | Closing Price Below NAV | Closing Price Above or Equal to NAV | ||
| Basis Point Differential | Number of Days | % of Total Days | Number of Days | % of Total Days |
| 0 - <25 | 39 | 6.99% | 89 | 15.95% |
| 25 - <50 | 28 | 5.02% | 149 | 26.70% |
| 50 - <75 | 11 | 1.97% | 198 | 35.48% |
| 75 - <100 | 3 | 0.54% | 27 | 4.84% |
| 100 or above | 8 | 1.43% | 6 | 1.08% |
| Total | 89 | 15.95% | 469 | 84.05% |
| 25 |
| 26 |
| 27 |
| 28 |
| 29 |
| 30 |
| 31 |
| 32 |
| Annualized Expense RatioA | Beginning Account Value March 1, 2020 | Ending Account Value August 31, 2020 | Expenses Paid During PeriodB March 1, 2020 to August 31, 2020 | |
| Fidelity High Yield Factor ETF | 0.45% | |||
| Actual | $ 1,000.00 | $ 1,065.20 | $ 2.34 | |
| Hypothetical C | $ 1,000.00 | $ 1,022.87 | $ 2.29 |
| A | Annualized expense ratio reflects expenses net of applicable fee waivers. |
| B | Expenses are equal to the annualized expense ratio, multiplied by the average account value over the period, multiplied by 184/366 (to reflect the one-half year period). The fees and expenses of any Underlying Funds are not included in each annualized expense ratio. |
| C | 5% return per year before expenses. |
| 33 |
| 34 |
| # of Votes | % of Votes | |
| Dennis J. Dirks | ||
| Affirmative | 9,282,142,479.280 | 96.563 |
| Withheld | 330,428,349.514 | 3.437 |
| TOTAL | 9,612,570,828.794 | 100.000 |
| Donald F. Donahue | ||
| Affirmative | 9,291,214,667.254 | 96.657 |
| Withheld | 321,356,161.540 | 3.343 |
| TOTAL | 9,612,570,828.794 | 100.000 |
| Bettina Doulton | ||
| Affirmative | 9,305,383,119.035 | 96.804 |
| Withheld | 307,187,709.760 | 3.196 |
| TOTAL | 9,612,570,828.794 | 100.000 |
| Vicki L. Fuller | ||
| Affirmative | 9,309,945,465.761 | 96.852 |
| Withheld | 302,625,363.033 | 3.148 |
| TOTAL | 9,612,570,828.794 | 100.000 |
| Patricia L. Kampling | ||
| Affirmative | 9,313,717,969.953 | 96.891 |
| Withheld | 298,852,858.841 | 3.109 |
| TOTAL | 9,612,570,828.794 | 100.000 |
| Alan J. Lacy | ||
| Affirmative | 9,286,152,312.666 | 96.604 |
| Withheld | 326,418,516.129 | 3.396 |
| TOTAL | 9,612,570,828.794 | 100.000 |
| Ned C. Lautenbach | ||
| Affirmative | 8,527,074,727.936 | 88.708 |
| Withheld | 1,085,496,100.858 | 11.292 |
| TOTAL | 9,612,570,828.794 | 100.000 |
| Robert A. Lawrence | ||
| Affirmative | 9,292,882,256.101 | 96.674 |
| Withheld | 319,688,572.693 | 3.326 |
| TOTAL | 9,612,570,828.794 | 100.000 |
| Joseph Mauriello | ||
| Affirmative | 9,271,962,598.733 | 96.457 |
| Withheld | 340,608,230.062 | 3.543 |
| TOTAL | 9,612,570,828.794 | 100.000 |
| Cornelia M. Small | ||
| Affirmative | 9,282,431,158.269 | 96.566 |
| Withheld | 330,139,670.526 | 3.434 |
| TOTAL | 9,612,570,828.794 | 100.000 |
| Garnett A. Smith | ||
| Affirmative | 9,276,917,476.273 | 96.508 |
| Withheld | 335,653,352.521 | 3.492 |
| TOTAL | 9,612,570,828.794 | 100.000 |
| # of Votes | % of Votes | |
| David M. Thomas | ||
| Affirmative | 9,285,446,239.314 | 96.597 |
| Withheld | 327,124,589.481 | 3.403 |
| TOTAL | 9,612,570,828.794 | 100.000 |
| Susan Tomasky | ||
| Affirmative | 9,307,387,519.373 | 96.825 |
| Withheld | 305,183,309.422 | 3.175 |
| TOTAL | 9,612,570,828.794 | 100.000 |
| Michael E. Wiley | ||
| Affirmative | 9,279,381,945.378 | 96.534 |
| Withheld | 333,188,883.417 | 3.466 |
| TOTAL | 9,612,570,828.794 | 100.000 |
| 35 |
| Item 2. | Code of Ethics |
As of the end of the period, August 31, 2020, Fidelity Covington Trust (the trust) has adopted a code of ethics, as defined in Item 2 of Form N-CSR, that applies to its President and Treasurer and its Chief Financial Officer. A copy of the code of ethics is filed as an exhibit to this Form N-CSR.
| Item 3. | Audit Committee Financial Expert |
The Board of Trustees of the trust has determined that Joseph Mauriello is an audit committee financial expert, as defined in Item 3 of Form N-CSR. Mr. Mauriello is independent for purposes of Item 3 of Form N-CSR.
| Item 4. | Principal Accountant Fees and Services |
Fees and Services
The following table presents fees billed by PricewaterhouseCoopers LLP (“PwC”) in each of the last two fiscal years for services rendered to Fidelity High Yield Factor ETF (the “Fund”):
Services Billed by PwC
August 31, 2020 FeesA
| Audit Fees | Audit- Related Fees | Tax Fees | All Other Fees | |||||||||||||
Fidelity High Yield Factor ETF | $ | 36,200 | $ | — | $ | 7,200 | $ | 1,400 | ||||||||
August 31, 2019 FeesA
| Audit Fees | Audit- Related Fees | Tax Fees | All Other Fees | |||||||||||||
Fidelity High Yield Factor ETF | $ | 41,000 | $ | — | $ | 3,400 | $ | 1,500 | ||||||||
| A | Amounts may reflect rounding. |
The following table(s) present(s) fees billed by PwC that were required to be approved by the Audit Committee for services that relate directly to the operations and financial reporting of the Fund(s) and that are rendered on behalf of Fidelity Management & Research Company LLC (“FMR”) and entities controlling, controlled by, or under common control with FMR (not including any sub-adviser whose role is primarily
portfolio management and is subcontracted with or overseen by another investment adviser) that provide ongoing services to the Fund(s) (“Fund Service Providers”):
Services Billed by PwC
| August 31, 2020A | August 31, 2019A | |||||||
Audit-Related Fees | $ | 9,030,200 | $ | 7,890,000 | ||||
Tax Fees | $ | 20,800 | $ | 10,000 | ||||
All Other Fees | $ | — | $ | — | ||||
| A | Amounts may reflect rounding. |
“Audit-Related Fees” represent fees billed for assurance and related services that are reasonably related to the performance of the fund audit or the review of the fund’s financial statements and that are not reported under Audit Fees.
“Tax Fees” represent fees billed for tax compliance, tax advice or tax planning that relate directly to the operations and financial reporting of the fund.
“All Other Fees” represent fees billed for services provided to the fund or Fund Service Provider, a significant portion of which are assurance related, that relate directly to the operations and financial reporting of the fund, excluding those services that are reported under Audit Fees, Audit-Related Fees or Tax Fees.
Assurance services must be performed by an independent public accountant.
* * *
The aggregate non-audit fees billed by PwC for services rendered to the Fund(s), FMR (not including any sub-adviser whose role is primarily portfolio management and is subcontracted with or overseen by another investment adviser), and any Fund Service Provider for each of the last two fiscal years of the Fund(s) are as follows:
Billed By | August 31, 2020A | August 31, 2019A | ||||||
PwC | $ | 14,107,200 | $ | 12,575,000 | ||||
| A | Amounts may reflect rounding. |
The trust’s Audit Committee has considered non-audit services that were not pre-approved that were provided by PwC to Fund Service Providers to be compatible with maintaining the independence of PwC in its(their) audit of the Fund(s), taking into account representations from PwC, in accordance with Public Company Accounting Oversight Board rules, regarding its independence from the Fund(s) and its(their) related entities and FMR’s review of the appropriateness and permissibility under applicable law of such non-audit services prior to their provision to the Fund(s) Service Providers.
Audit Committee Pre-Approval Policies and Procedures
The trust’s Audit Committee must pre-approve all audit and non-audit services provided by a fund’s independent registered public accounting firm relating to the operations or financial reporting of the fund. Prior to the commencement of any audit or non-audit services to a fund, the Audit Committee reviews the services to determine whether they are appropriate and permissible under applicable law.
The Audit Committee has adopted policies and procedures to, among other purposes, provide a framework for the Committee’s consideration of non-audit services by the audit firms that audit the Fidelity funds. The policies and procedures require that any non-audit service provided by a fund audit firm to a Fidelity fund and any non-audit service provided by a fund auditor to a Fund Service Provider that relates directly to the operations and financial reporting of a Fidelity fund (“Covered Service”) are subject to approval by the Audit Committee before such service is provided.
All Covered Services must be approved in advance of provision of the service either: (i) by formal resolution of the Audit Committee, or (ii) by oral or written approval of the service by the Chair of the Audit Committee (or if the Chair is unavailable, such other member of the Audit Committee as may be designated by the Chair to act in the Chair’s absence). The approval contemplated by (ii) above is permitted where the Treasurer determines that action on such an engagement is necessary before the next meeting of the Audit Committee.
Non-audit services provided by a fund audit firm to a Fund Service Provider that do not relate directly to the operations and financial reporting of a Fidelity fund are reported to the Audit Committee periodically.
Non-Audit Services Approved Pursuant to Rule 2-01(c)(7)(i)(C) and (ii) of Regulation S-X (“De Minimis Exception”)
There were no non-audit services approved or required to be approved by the Audit Committee pursuant to the De Minimis Exception during the Fund’s(s’) last two fiscal years relating to services provided to (i) the Fund(s) or (ii) any Fund Service Provider that relate directly to the operations and financial reporting of the Fund(s).
| Item 5. | Audit Committee of Listed Registrants |
The Audit Committee is a separately-designated standing audit committee in accordance with Section 3(a)(58)(A) of the Securities Exchange Act of 1934. As of August 31, 2020, the members of the Audit Committee were Joseph Mauriello, Donald F. Donahue, Patricia L. Kampling, Alan J. Lacy, Garnett A. Smith and Susan Tomansky.
| Item 6. | Investments |
| (a) | Not applicable. |
| (b) | Not applicable. |
| Item 7. | Disclosure of Proxy Voting Policies and Procedures for Closed-End Management Investment Companies |
Not applicable.
| Item 8. | Portfolio Managers of Closed-End Management Investment Companies |
Not applicable.
| Item 9. | Purchase of Equity Securities by Closed-End Management Investment Company and Affiliated Purchasers |
Not applicable.
| Item 10. | Submission of Matters to a Vote of Security Holders |
There were no material changes to the procedures by which shareholders may recommend nominees to the trust’s Board of Trustees.
| Item 11. | Controls and Procedures |
(a)(i) The President and Treasurer and the Chief Financial Officer have concluded that the trust’s disclosure controls and procedures (as defined in Rule 30a-3(c) under the Investment Company Act) provide reasonable assurances that material information relating to the trust is made known to them by the appropriate persons, based on their evaluation of these controls and procedures as of a date within 90 days of the filing date of this report.
(a)(ii) There was no change in the trust’s internal control over financial reporting (as defined in Rule 30a-3(d) under the Investment Company Act) that occurred during the period covered by this report that has materially affected, or is reasonably likely to materially affect, the trust’s internal control over financial reporting.
| Item 12. | Disclosure of Securities Lending Activities for Closed-End Management Investment Companies |
Not applicable.
| Item 13. | Exhibits |
SIGNATURES
Pursuant to the requirements of the Securities Exchange Act of 1934 and the Investment Company Act of 1940, the registrant has duly caused this report to be signed on its behalf by the undersigned, thereunto duly authorized.
Fidelity Covington Trust
| By: | /s/ Stacie M. Smith | |
| Stacie M. Smith | ||
| President and Treasurer | ||
| Date: | October 20, 2020 | |
Pursuant to the requirements of the Securities Exchange Act of 1934 and the Investment Company Act of 1940, this report has been signed below by the following persons on behalf of the registrant and in the capacities and on the dates indicated.
By: | /s/ Stacie M. Smith | |
| Stacie M. Smith | ||
| President and Treasurer | ||
Date: | October 20, 2020 | |
By: | /s/ John J. Burke III | |
| John J. Burke III | ||
| Chief Financial Officer | ||
Date: | October 20, 2020 | |