UNITED STATES
SECURITIES AND EXCHANGE COMMISSION
Washington, D.C. 20549
FORM N-CSR
CERTIFIED SHAREHOLDER REPORT OF REGISTERED
MANAGEMENT INVESTMENT COMPANIES
Investment Company Act file number 811-07319
Fidelity Covington Trust
(Exact name of registrant as specified in charter)
245 Summer St., Boston, Massachusetts 02210
(Address of principal executive offices) (Zip code)
Cynthia Lo Bessette, Secretary
245 Summer St.
Boston, Massachusetts 02210
(Name and address of agent for service)
Registrant’s telephone number, including area code: 617-563-7000
Date of fiscal year end: October 31
Date of reporting period: October 31, 2020
| Item 1. | Reports to Stockholders |

about access to your fund’s shareholder reports.

| Account Type | Website | Phone Number |
| Brokerage, Mutual Fund, or Annuity Contracts: | fidelity.com/mailpreferences | 1-800-343-3548 |
| Employer Provided Retirement Accounts: | netbenefits.fidelity.com/preferences (choose ‘no’ under Required Disclosures to continue print) | 1-800-343-0860 |
| 3 | Annual Report |
| Annual Report | 4 |
| 5 | Annual Report |
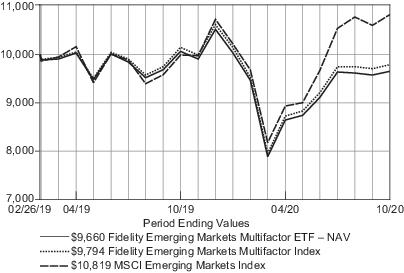
| Average Annual Total Returns | Past 1 Year | Life of fund |
| Fidelity Emerging Markets Multifactor ETF – NAVA | -4.03% | -2.04% |
| Fidelity Emerging Markets Multifactor ETF – Market PriceB | -3.40% | -1.41% |
| Fidelity Emerging Markets Multifactor IndexA | -3.54% | -1.23% |
| MSCI Emerging Markets IndexA | 8.27% | 4.80% |
| B | From February 28, 2019, date initially listed on the CboeBZX exchange. |
| * | Total returns are historical and include changes in share price and reinvestment of dividends and capital gains distributions, if any. |
| Annual Report | 6 |
| 7 | Annual Report |
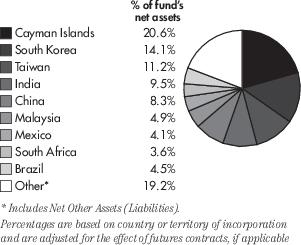
| % of fund's net assets | |
| Alibaba Group Holding Ltd. ADR | 5.8 |
| Tencent Holdings Ltd. | 4.8 |
| Taiwan Semiconductor Manufacturing Co. Ltd. | 3.6 |
| Samsung Electronics Co. Ltd. | 3.5 |
| Divi's Laboratories Ltd. | 1.4 |
| Manila Electric Co. | 1.3 |
| Kumho Petrochemical Co. Ltd. | 1.3 |
| Pidilite Industries Ltd. | 1.2 |
| Petronas Gas Bhd | 1.1 |
| Lotte Chemical Corp. | 1.1 |
| 25.1 |
| % of fund's net assets | ||
| Financials | 15.4 | |
| Consumer Discretionary | 14.4 | |
| Information Technology | 14.2 | |
| Materials | 12.1 | |
| Consumer Staples | 9.5 | |
| Communication Services | 9.5 | |
| Industrials | 9.1 | |
| Health Care | 8.1 | |
| Utilities | 6.3 | |
| Energy | 1.2 | |
| % of funds's net assets | ||
| Stocks | 99.8% | |
| Net Other Assets (Liabilities) | 0.2% | |
| Annual Report | 8 |
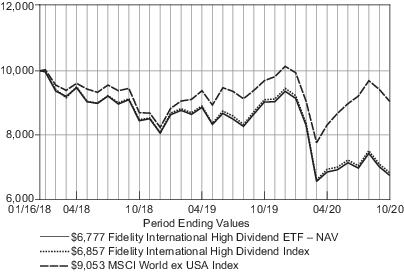
| Average Annual Total Returns | Past 1 Year | Life of fund |
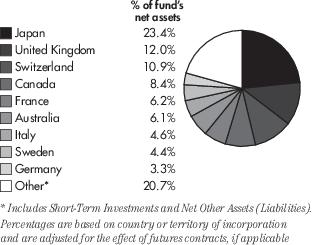
| Fidelity International High Dividend ETF – NAVA | -24.98% | -13.01% |
| Fidelity International High Dividend ETF – Market PriceB | -24.25% | -13.24% |
| Fidelity International High Dividend IndexA | -24.70% | -12.64% |
| MSCI World ex USA IndexA | -6.60% | -3.50% |
| B | From January 18, 2018, date initially listed on the NYSE ARCA exchange. |
| * | Total returns are historical and include changes in share price and reinvestment of dividends and capital gains distributions, if any. |
| 9 | Annual Report |
| Annual Report | 10 |
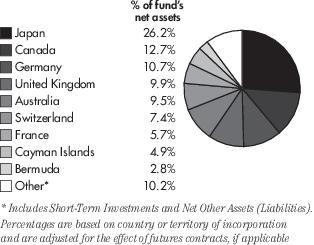
| % of fund's net assets | |
| Toyota Motor Corp. | 4.1 |
| E.ON SE | 3.9 |
| Daito Trust Construction Co. Ltd. | 3.7 |
| Daimler AG | 3.5 |
| SSE PLC | 3.5 |
| UBS Group AG | 2.9 |
| Bayerische Motoren Werke AG | 2.9 |
| Wharf Real Estate Investment Co. Ltd. | 2.7 |
| AGL Energy Ltd. | 2.7 |
| Honda Motor Co. Ltd. | 2.7 |
| 32.6 |
| % of fund's net assets | ||
| Financials | 22.9 | |
| Consumer Discretionary | 17.5 | |
| Utilities | 12.7 | |
| Real Estate | 12.6 | |
| Energy | 12.3 | |
| Health Care | 7.5 | |
| Industrials | 7.3 | |
| Consumer Staples | 5.7 | |
| Materials | 0.5 | |
| Information Technology | 0.4 | |
| % of funds's net assets | ||
| Stocks and Equity Futures | 100.0% | |
| Short-Term Investments and Net Other Assets (Liabilities) | 0.0% | |
| 11 | Annual Report |
| Average Annual Total Returns | Past 1 Year | Life of fund |
| Fidelity International Multifactor ETF – NAVA | -5.73% | 0.36% |
| Fidelity International Multifactor ETF – Market PriceB | -5.34% | 0.79% |
| Fidelity International Multifactor IndexA | -5.37% | 0.91% |
| MSCI World ex USA IndexA | -6.60% | -3.50% |
| B | From February 28, 2019, date initially listed on the CboeBZX exchange. |
| * | Total returns are historical and include changes in share price and reinvestment of dividends and capital gains distributions, if any. |

| Annual Report | 12 |
| 13 | Annual Report |
| % of fund's net assets | |
| Nestle S.A. | 2.6 |
| CLP Holdings Ltd. | 1.4 |
| PSP Swiss Property AG | 1.4 |
| Daito Trust Construction Co. Ltd. | 1.4 |
| Enel SpA | 1.3 |
| NTT DOCOMO, Inc. | 1.3 |
| Aedifica S.A. | 1.2 |
| Northland Power, Inc. | 1.1 |
| Roche Holding AG | 1.1 |
| Nippon Building Fund, Inc. | 1.1 |
| 13.9 |
| % of fund's net assets | ||
| Consumer Staples | 16.0 | |
| Financials | 12.5 | |
| Materials | 12.5 | |
| Industrials | 11.0 | |
| Communication Services | 10.8 | |
| Utilities | 8.6 | |
| Health Care | 8.5 | |
| Real Estate | 8.0 | |
| Consumer Discretionary | 6.7 | |
| Information Technology | 4.0 | |
| Energy | 0.0 | |
| % of funds's net assets | ||
| Stocks and Equity Futures | 99.8% | |
| Short-Term Investments and Net Other Assets (Liabilities) | 0.2% | |
| Annual Report | 14 |
| Average Annual Total Returns | Past 1 Year | Life of fund |
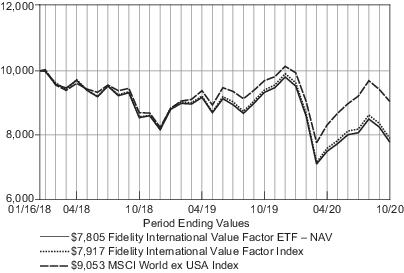
| Fidelity International Value Factor ETF – NAVA | -16.32% | -8.49% |
| Fidelity International Value Factor ETF – Market PriceB | -15.69% | -8.81% |
| Fidelity International Value Factor IndexA | -15.82% | -8.03% |
| MSCI World ex USA IndexA | -6.60% | -3.50% |
| B | From January 18, 2018, date initially listed on the NYSE ARCA exchange. |
| * | Total returns are historical and include changes in share price and reinvestment of dividends and capital gains distributions, if any. |
| 15 | Annual Report |
| Annual Report | 16 |
| % of fund's net assets | |
| Nestle S.A. | 2.7 |
| Roche Holding AG | 2.0 |
| Nutrien Ltd. | 1.8 |
| Novartis AG | 1.7 |
| Sony Corp. | 1.6 |
| Fiat Chrysler Automobiles N.V. | 1.4 |
| Shin-Etsu Chemical Co. Ltd. | 1.4 |
| Volvo AB Class B | 1.4 |
| UBS Group AG | 1.4 |
| AIA Group Ltd. | 1.3 |
| 16.7 |
| % of fund's net assets | ||
| Financials | 17.4 | |
| Industrials | 15.9 | |
| Health Care | 12.7 | |
| Consumer Staples | 11.1 | |
| Consumer Discretionary | 11.0 | |
| Materials | 8.5 | |
| Information Technology | 7.7 | |
| Communication Services | 4.7 | |
| Utilities | 3.8 | |
| Energy | 3.6 | |
| Real Estate | 2.9 | |
| % of funds's net assets | ||
| Stocks and Equity Futures | 99.9% | |
| Net Other Assets (Liabilities) | 0.1% | |
| 17 | Annual Report |
| Common Stocks – 98.4% | ||
| Shares | Value | |
| BERMUDA – 1.0% | ||
| China Resources Gas Group Ltd. | 20,000 | $ 86,656 |
| Cosan Ltd. Class A | 403 | 5,533 |
| TOTAL BERMUDA | 92,189 | |
| BRAZIL – 3.1% | ||
| Ambev S.A. | 34,700 | 73,300 |
| B3 S.A. - Brasil Bolsa Balcao | 4,800 | 42,497 |
| BB Seguridade Participacoes S.A. | 6,200 | 25,462 |
| Cosan S.A. | 500 | 5,636 |
| Lojas Renner S.A. | 5,970 | 38,775 |
| Vale S.A. | 9,500 | 99,762 |
| TOTAL BRAZIL | 285,432 | |
| CAYMAN ISLANDS – 20.6% | ||
| Alibaba Group Holding Ltd. ADR (a) | 1,750 | 533,207 |
| ANTA Sports Products Ltd. | 5,000 | 54,998 |
| Arco Platform Ltd. Class A (a) | 26 | 886 |
| Autohome, Inc. ADR | 295 | 28,187 |
| Baozun, Inc. ADR (a) | 46 | 1,683 |
| China Medical System Holdings Ltd. | 74,000 | 77,484 |
| China Meidong Auto Holdings Ltd. | 12,000 | 48,976 |
| China Yuhua Education Corp. Ltd. (b) | 34,000 | 26,876 |
| Fu Shou Yuan International Group Ltd. | 32,000 | 32,929 |
| GSX Techedu, Inc. (a) | 23 | 1,528 |
| Hengan International Group Co. Ltd. | 10,000 | 69,311 |
| Huazhu Group Ltd. ADR | 122 | 4,835 |
| JD.com, Inc. ADR (a) | 975 | 79,482 |
| Kingboard Laminates Holdings Ltd. | 30,500 | 48,533 |
| Kingdee International Software Group Co. Ltd. (a) | 14,000 | 36,738 |
| NetEase, Inc. ADR | 615 | 53,376 |
| New Oriental Education & Technology Group, Inc. ADR (a) | 133 | 21,331 |
| NIO, Inc. ADR (a) | 910 | 27,828 |
| Parade Technologies Ltd. | 1,000 | 38,107 |
| Pinduoduo, Inc. ADR (a) | 405 | 36,442 |
| SINA Corp. (a) | 594 | 25,453 |
| TAL Education Group ADR (a) | 433 | 28,777 |
| Tencent Holdings Ltd. | 5,800 | 442,020 |
| Topsports International Holdings Ltd. (b) | 28,000 | 38,273 |
| Trip.com Group Ltd. ADR (a) | 477 | 13,719 |
| Vipshop Holdings Ltd. ADR (a) | 432 | 9,245 |
| Want Want China Holdings Ltd. | 112,000 | 73,946 |
| XD, Inc. (a) | 800 | 3,869 |
| Yadea Group Holdings Ltd. (b) | 34,000 | 48,491 |
| TOTAL CAYMAN ISLANDS | 1,906,530 | |
| CHINA – 8.3% | ||
| Agricultural Bank of China Ltd. Class H | 97,000 | 32,772 |
| | ||
| Shares | Value | |
| A-Living Services Co. Ltd. Class H (b) | 16,250 | $ 68,102 |
| Anhui Conch Cement Co. Ltd. Class H | 11,500 | 71,700 |
| Bank of China Ltd. Class H | 152,000 | 48,021 |
| China Construction Bank Corp. Class H | 139,000 | 95,895 |
| China Minsheng Banking Corp. Ltd. Class H | 37,000 | 20,230 |
| China Pacific Insurance Group Co. Ltd. Class H | 10,000 | 31,142 |
| China Shenhua Energy Co. Ltd. Class H | 7,500 | 12,960 |
| China Telecom Corp. Ltd. Class H | 26,000 | 8,181 |
| GF Securities Co. Ltd. Class H | 17,000 | 21,900 |
| Guotai Junan Securities Co. Ltd. Class H (b) | 12,600 | 16,378 |
| Industrial & Commercial Bank of China Ltd. Class H | 128,000 | 71,965 |
| Jiangsu Expressway Co. Ltd. Class H | 88,000 | 87,945 |
| Livzon Pharmaceutical Group, Inc. Class H | 18,700 | 82,470 |
| PICC Property & Casualty Co. Ltd. Class H | 30,000 | 20,271 |
| Postal Savings Bank of China Co. Ltd. Class H (b) | 44,000 | 21,561 |
| The People's Insurance Co. Group of China Ltd. Class H | 63,000 | 18,685 |
| TravelSky Technology Ltd. Class H | 18,000 | 37,788 |
| TOTAL CHINA | 767,966 | |
| EGYPT – 0.3% | ||
| Commercial International Bank Egypt SAE | 7,121 | 27,690 |
| TOTAL EGYPT | 27,690 | |
| GREECE – 0.2% | ||
| JUMBO S.A. | 1,617 | 22,603 |
| TOTAL GREECE | 22,603 | |
| HONG KONG – 2.5% | ||
| China Everbright Ltd. | 12,000 | 15,815 |
| China Mobile Ltd. | 6,000 | 36,480 |
| China Resources Pharmaceutical Group Ltd. (b) | 157,500 | 78,599 |
| CNOOC Ltd. | 15,000 | 13,617 |
| Guangdong Investment Ltd. | 60,000 | 88,822 |
| TOTAL HONG KONG | 233,333 | |
| HUNGARY – 1.0% | ||
| Richter Gedeon Nyrt | 4,437 | 90,507 |
| TOTAL HUNGARY | 90,507 | |
| INDIA – 9.5% | ||
| Bajaj Auto Ltd. | 464 | 18,075 |
| Annual Report | 18 |
| Common Stocks – continued | ||
| Shares | Value | |
| INDIA – continued | ||
| Coal India Ltd. | 6,476 | $ 9,980 |
| Divi's Laboratories Ltd. | 3,117 | 132,156 |
| Eicher Motors Ltd. | 620 | 17,449 |
| HCL Technologies Ltd. | 2,025 | 23,006 |
| HDFC Bank Ltd. (a) | 6,197 | 98,971 |
| HDFC Life Insurance Co. Ltd. (a)(b) | 2,920 | 23,237 |
| Hero MotoCorp Ltd. | 521 | 19,684 |
| Hindustan Unilever Ltd. | 3,306 | 92,403 |
| ICICI Lombard General Insurance Co. Ltd. (b) | 1,136 | 18,947 |
| ICICI Prudential Life Insurance Co. Ltd. (b) | 3,417 | 18,598 |
| Infosys Ltd. | 4,740 | 67,837 |
| Kotak Mahindra Bank Ltd. (a) | 2,320 | 48,443 |
| Nestle India Ltd. | 317 | 73,410 |
| Oil & Natural Gas Corp. Ltd. | 10,785 | 9,445 |
| Pidilite Industries Ltd. | 5,258 | 111,421 |
| Power Finance Corp. Ltd. | 17,636 | 20,728 |
| SBI Life Insurance Co. Ltd. (a)(b) | 2,002 | 20,778 |
| Tata Consultancy Services Ltd. | 1,387 | 49,875 |
| TOTAL INDIA | 874,443 | |
| INDONESIA – 2.2% | ||
| Adaro Energy Tbk PT | 136,600 | 10,508 |
| Bank Central Asia Tbk PT | 23,300 | 46,122 |
| Bank Rakyat Indonesia Persero Tbk PT | 165,900 | 38,114 |
| Kalbe Farma Tbk PT | 970,300 | 101,177 |
| Telekomunikasi Indonesia Persero Tbk PT | 64,300 | 11,519 |
| TOTAL INDONESIA | 207,440 | |
| JERSEY – 0.7% | ||
| Polymetal International PLC | 2,226 | 47,188 |
| WNS Holdings Ltd. ADR (a) | 300 | 17,292 |
| TOTAL JERSEY | 64,480 | |
| MALAYSIA – 4.9% | ||
| DiGi.Com Bhd | 6,900 | 6,261 |
| Genting Bhd | 35,300 | 25,147 |
| Malayan Banking Bhd | 18,400 | 30,999 |
| Maxis Bhd | 5,200 | 6,007 |
| Nestle Malaysia Bhd | 2,000 | 67,100 |
| Petronas Chemicals Group Bhd | 37,800 | 53,220 |
| Petronas Dagangan Bhd | 2,200 | 9,128 |
| Petronas Gas Bhd | 27,400 | 103,797 |
| PPB Group Bhd | 15,200 | 68,775 |
| Telekom Malaysia Bhd | 4,600 | 4,639 |
| Westports Holdings Bhd | 82,600 | 77,531 |
| TOTAL MALAYSIA | 452,604 | |
| | ||
| Shares | Value | |
| MEXICO – 4.1% | ||
| America Movil S.A.B. de C.V. | 42,600 | $ 25,847 |
| Bolsa Mexicana de Valores S.A.B. de C.V. | 13,300 | 26,953 |
| Grupo Aeroportuario del Pacifico SAB de CV Class B | 11,800 | 97,900 |
| Grupo Aeroportuario del Sureste SAB de CV Class B (a) | 7,935 | 91,375 |
| Kimberly-Clark de Mexico SAB de CV Class A | 46,100 | 68,313 |
| Orbia Advance Corp. SAB de CV | 36,400 | 64,169 |
| TOTAL MEXICO | 374,557 | |
| PHILIPPINES – 1.4% | ||
| Globe Telecom, Inc. | 110 | 4,614 |
| Manila Electric Co. | 19,370 | 120,062 |
| TOTAL PHILIPPINES | 124,676 | |
| POLAND – 0.3% | ||
| Asseco Poland S.A. | 939 | 15,185 |
| Cyfrowy Polsat S.A. | 2,471 | 15,386 |
| TOTAL POLAND | 30,571 | |
| QATAR – 0.5% | ||
| Qatar National Bank QPSC | 9,539 | 46,372 |
| TOTAL QATAR | 46,372 | |
| RUSSIA – 3.0% | ||
| Gazprom PJSC | 4,790 | 9,341 |
| Inter RAO UES PJSC (a) | 1,457,000 | 93,189 |
| LUKOIL PJSC | 161 | 8,193 |
| MMC Norilsk Nickel PJSC | 261 | 61,934 |
| Mobile TeleSystems PJSC | 2,706 | 21,161 |
| Novatek PJSC | 437 | 5,250 |
| Sberbank of Russia PJSC | 20,720 | 52,403 |
| Surgutneftegas PJSC | 8,300 | 3,441 |
| Tatneft PJSC | 780 | 4,028 |
| VTB Bank PJSC | 47,810,000 | 19,695 |
| TOTAL RUSSIA | 278,635 | |
| SAUDI ARABIA – 1.3% | ||
| Jarir Marketing Co. | 775 | 35,792 |
| Southern Province Cement Co. | 4,848 | 86,740 |
| TOTAL SAUDI ARABIA | 122,532 | |
| SOUTH AFRICA – 3.6% | ||
| Anglo American Platinum Ltd. | 960 | 62,946 |
| AVI Ltd. | 16,067 | 72,727 |
| Capitec Bank Holdings Ltd. (a) | 1,085 | 76,123 |
| Kumba Iron Ore Ltd. | 2,174 | 64,263 |
| 19 | Annual Report |
| Common Stocks – continued | ||
| Shares | Value | |
| SOUTH AFRICA – continued | ||
| Mr Price Group Ltd. | 4,129 | $ 31,223 |
| Vodacom Group Ltd. | 3,082 | 23,241 |
| TOTAL SOUTH AFRICA | 330,523 | |
| SOUTH KOREA – 14.1% | ||
| Chong Kun Dang Pharmaceutical Corp. | 696 | 93,540 |
| Com2uSCorp | 42 | 4,131 |
| Daelim Industrial Co. Ltd. | 1,230 | 84,551 |
| DB HiTek Co. Ltd. | 52 | 1,464 |
| DB Insurance Co. Ltd. | 900 | 35,097 |
| Douzone Bizon Co. Ltd. | 25 | 2,197 |
| Hyundai Marine & Fire Insurance Co. Ltd. | 1,778 | 36,510 |
| Iljin Materials Co. Ltd. | 28 | 1,054 |
| Kangwon Land, Inc. | 1,943 | 36,130 |
| KMW Co. Ltd. (a) | 35 | 1,922 |
| KT&G Corp. | 1,235 | 88,160 |
| Kumho Petrochemical Co. Ltd. | 997 | 116,860 |
| LEENO Industrial, Inc. | 14 | 1,499 |
| LG Innotek Co. Ltd. | 18 | 2,411 |
| Lotte Chemical Corp. | 499 | 102,465 |
| NAVER Corp. | 160 | 40,892 |
| NCSoft Corp. | 21 | 14,361 |
| Pearl Abyss Corp. (a) | 28 | 4,948 |
| S-1 Corp. | 1,110 | 79,824 |
| Samsung Electro-Mechanics Co. Ltd. | 69 | 8,118 |
| Samsung Electronics Co. Ltd. | 6,559 | 327,170 |
| Samsung SDI Co. Ltd. | 63 | 24,540 |
| Samsung SDS Co. Ltd. | 42 | 6,237 |
| Seegene, Inc. | 436 | 100,864 |
| SK Hynix, Inc. | 602 | 42,390 |
| SK Telecom Co. Ltd. | 49 | 9,241 |
| WONIK IPS Co. Ltd. (a) | 47 | 1,327 |
| Woongjin Coway Co. Ltd. | 589 | 36,024 |
| TOTAL SOUTH KOREA | 1,303,927 | |
| TAIWAN – 11.2% | ||
| Catcher Technology Co. Ltd. | 3,000 | 18,931 |
| Cathay Financial Holding Co. Ltd. | 31,000 | 41,617 |
| Chicony Electronics Co. Ltd. | 5,000 | 15,051 |
| Chunghwa Telecom Co. Ltd. | 5,000 | 18,704 |
| E.Sun Financial Holding Co. Ltd. | 46,295 | 39,330 |
| Elan Microelectronics Corp. | 3,000 | 14,159 |
| Far EasTone Telecommunications Co. Ltd. | 4,000 | 8,391 |
| Formosa Plastics Corp. | 24,000 | 66,370 |
| Foxconn Technology Co. Ltd. | 8,000 | 14,012 |
| Lite-On Technology Corp. | 10,000 | 16,274 |
| Novatek Microelectronics Corp. | 2,000 | 18,669 |
| Pegatron Corp. | 9,000 | 19,351 |
| | ||
| Shares | Value | |
| Pou Chen Corp. | 34,000 | $ 29,954 |
| Powertech Technology, Inc. | 5,000 | 14,754 |
| Radiant Opto-Electronics Corp. | 4,000 | 15,732 |
| Simplo Technology Co. Ltd. | 1,000 | 11,135 |
| Sino-American Silicon Products, Inc. | 5,000 | 17,411 |
| Taichung Commercial Bank Co. Ltd. | 77,620 | 29,443 |
| Taiwan Cement Corp. | 38,800 | 55,005 |
| Taiwan Cooperative Financial Holding Co. Ltd. | 52,202 | 35,040 |
| Taiwan Mobile Co. Ltd. | 3,000 | 10,247 |
| Taiwan Semiconductor Manufacturing Co. Ltd. | 22,000 | 332,267 |
| Tripod Technology Corp. | 4,000 | 15,872 |
| Uni-President Enterprises Corp. | 35,000 | 75,008 |
| United Microelectronics Corp. | 27,000 | 28,979 |
| Voltronic Power Technology Corp. | 2,257 | 77,328 |
| TOTAL TAIWAN | 1,039,034 | |
| THAILAND – 1.7% | ||
| Advanced Info Service PCL | 1,200 | 6,642 |
| Airports of Thailand PCL | 61,000 | 101,283 |
| Intouch Holdings PCL Class F | 2,200 | 3,776 |
| The Siam Cement PCL | 4,100 | 44,463 |
| TOTAL THAILAND | 156,164 | |
| TURKEY – 1.9% | ||
| Akbank T.A.S. (a) | 37,047 | 21,080 |
| BIM Birlesik Magazalar AS | 7,843 | 62,497 |
| Enka Insaat ve Sanayi AS | 78,769 | 67,747 |
| Turkiye Garanti Bankasi AS (a) | 26,826 | 21,120 |
| TOTAL TURKEY | 172,444 | |
| UNITED ARAB EMIRATES – 0.8% | ||
| Dubai Islamic Bank PJSC | 21,888 | 24,789 |
| Emirates NBD Bank PJSC | 9,922 | 25,662 |
| Emirates Telecommunications Group Co. PJSC | 5,380 | 24,724 |
| TOTAL UNITED ARAB EMIRATES | 75,175 | |
| UNITED STATES OF AMERICA – 0.2% | ||
| Yum China Holdings, Inc. | 419 | 22,303 |
| TOTAL UNITED STATES OF AMERICA | 22,303 | |
| TOTAL COMMON STOCKS (Cost $9,263,497) | 9,102,130 | |
| Preferred Stock – 1.4% | ||
| BRAZIL – 1.4% | ||
| Cia Paranaense de Energia | 8,900 | 95,329 |
| Annual Report | 20 |
| Preferred Stock – continued | ||
| Shares | Value | |
| BRAZIL – continued | ||
| Itausa - Investimentos Itau S.A. | 20,200 | $ 31,845 |
| TOTAL BRAZIL | 127,174 | |
| RUSSIA – 0.0% | ||
| Transneft PJSC | 1 | 1,662 |
| TOTAL RUSSIA | 1,662 | |
| TOTAL PREFERRED STOCKS (Cost $159,615) | 128,836 | |
| TOTAL INVESTMENT IN SECURITIES – 99.8% (Cost $9,423,112) | 9,230,966 | |
| NET OTHER ASSETS (LIABILITIES) – 0.2% | 17,930 | |
| NET ASSETS – 100.0% | $ 9,248,896 | |
| Categorizations in the Schedule of Investments are based on country or territory of incorporation. | ||
| Legend | ||
| (a) | Non-income producing. | |
| (b) | Security is exempt from registration under Rule 144A of the Securities Act of 1933. These securities may be resold in transactions exempt from registration, normally to qualified institutional buyers. At the end of the period, the value of these securities amounted to $379,840 or 4.1% of net assets. | |
| Description | Total | Level 1 | Level 2 | Level 3 |
| Investments in Securities: | ||||||||
| Equities: | ||||||||
| Communication Services | $ 862,298 | $ 862,298 | $ — | $ — | ||||
| Consumer Discretionary | 1,342,665 | 1,342,665 | — | — | ||||
| Consumer Staples | 884,950 | 884,950 | — | — | ||||
| Energy | 107,060 | 107,060 | — | — | ||||
| Financials | 1,406,455 | 1,406,455 | — | — | ||||
| Health Care | 756,797 | 756,797 | — | — | ||||
| Industrials | 833,586 | 833,586 | — | — | ||||
| Information Technology | 1,307,287 | 1,307,287 | — | — | ||||
| Materials | 1,108,506 | 1,108,506 | — | — | ||||
| Utilities | 492,526 | 492,526 | — | — | ||||
| Preferred Stock | 128,836 | 128,836 | — | — | ||||
| Total Investments in Securities: | $ 9,230,966 | $ 9,230,966 | $ — | $ — |
| 21 | Annual Report |
| Common Stocks – 99.4% | ||
| Shares | Value | |
| AUSTRALIA – 9.5% | ||
| AGL Energy Ltd. | 140,120 | $ 1,228,023 |
| Australia & New Zealand Banking Group Ltd. | 64,706 | 854,723 |
| BHP Group Ltd. | 1,863 | 44,194 |
| Sonic Healthcare Ltd. | 14,391 | 351,894 |
| Westpac Banking Corp. | 69,544 | 874,676 |
| Woodside Petroleum Ltd. | 56,420 | 694,159 |
| Woolworths Group Ltd. | 8,804 | 235,928 |
| TOTAL AUSTRALIA | 4,283,597 | |
| BERMUDA – 2.8% | ||
| Hongkong Land Holdings Ltd. | 265,525 | 974,477 |
| Jardine Matheson Holdings Ltd. | 6,182 | 274,419 |
| TOTAL BERMUDA | 1,248,896 | |
| CANADA – 12.7% | ||
| Canadian Apartment Properties REIT | 29,475 | 946,799 |
| Canadian Imperial Bank of Commerce | 11,300 | 842,235 |
| Enbridge, Inc. | 40,773 | 1,122,569 |
| Inter Pipeline Ltd. | 81,813 | 727,718 |
| Nutrien Ltd. | 964 | 39,157 |
| SNC-Lavalin Group, Inc. | 20,719 | 289,648 |
| The Bank of Nova Scotia | 19,488 | 808,985 |
| The Toronto-Dominion Bank | 22,025 | 970,960 |
| TOTAL CANADA | 5,748,071 | |
| CAYMAN ISLANDS – 4.9% | ||
| Sands China Ltd. | 274,400 | 960,684 |
| Wharf Real Estate Investment Co. Ltd. | 324,000 | 1,242,964 |
| TOTAL CAYMAN ISLANDS | 2,203,648 | |
| DENMARK – 0.6% | ||
| Novo Nordisk A/S Class B | 4,606 | 295,863 |
| TOTAL DENMARK | 295,863 | |
| FINLAND – 0.2% | ||
| Orion Oyj Class B | 1,834 | 78,510 |
| TOTAL FINLAND | 78,510 | |
| FRANCE – 5.7% | ||
| Bouygues S.A. | 12,889 | 422,637 |
| Danone S.A. | 2,648 | 146,206 |
| Klepierre S.A. (a) | 62,443 | 791,012 |
| Sanofi | 3,135 | 282,540 |
| TOTAL S.A. | 32,052 | 964,009 |
| TOTAL FRANCE | 2,606,404 | |
| GERMANY – 10.7% | ||
| BASF SE | 676 | 37,065 |
| | ||
| Shares | Value | |
| Bayer AG | 2,918 | $ 137,185 |
| Bayerische Motoren Werke AG | 19,041 | 1,301,516 |
| Daimler AG | 30,262 | 1,565,130 |
| E.ON SE | 170,373 | 1,776,604 |
| SAP SE | 370 | 39,432 |
| TOTAL GERMANY | 4,856,932 | |
| HONG KONG – 1.7% | ||
| BOC Hong Kong Holdings Ltd. | 277,500 | 769,357 |
| TOTAL HONG KONG | 769,357 | |
| JAPAN – 26.2% | ||
| Asahi Group Holdings Ltd. | 5,500 | 169,567 |
| Astellas Pharma, Inc. | 24,300 | 333,561 |
| Canon, Inc. | 1,000 | 17,223 |
| Daito Trust Construction Co. Ltd. | 18,600 | 1,688,483 |
| Haseko Corp. | 88,000 | 1,049,703 |
| Honda Motor Co. Ltd. | 52,100 | 1,213,540 |
| Japan Post Holdings Co. Ltd. | 119,500 | 817,204 |
| Japan Tobacco, Inc. | 12,700 | 239,325 |
| Komatsu Ltd. | 21,200 | 474,739 |
| Mitsubishi Corp. | 19,600 | 436,003 |
| Mitsui & Co. Ltd. | 27,600 | 430,342 |
| Otsuka Holdings Co. Ltd. | 9,000 | 331,883 |
| Sojitz Corp. | 131,000 | 286,962 |
| SUMCO Corp. | 1,600 | 24,259 |
| Sumitomo Corp. | 30,200 | 330,629 |
| Sumitomo Mitsui Financial Group, Inc. | 36,104 | 994,984 |
| The Kansai Electric Power Co., Inc. | 127,300 | 1,157,926 |
| Tokyo Electron Ltd. | 100 | 26,688 |
| Toyota Motor Corp. | 28,367 | 1,845,999 |
| TOTAL JAPAN | 11,869,020 | |
| NETHERLANDS – 2.6% | ||
| ASML Holding N.V. | 154 | 55,969 |
| BE Semiconductor Industries N.V. | 450 | 18,184 |
| ING Groep N.V. (b) | 97,953 | 668,515 |
| Koninklijke Ahold Delhaize N.V. | 6,954 | 191,087 |
| Unilever N.V. | 4,610 | 260,711 |
| TOTAL NETHERLANDS | 1,194,466 | |
| NORWAY – 0.2% | ||
| Mowi ASA | 5,957 | 93,884 |
| TOTAL NORWAY | 93,884 | |
| SINGAPORE – 1.9% | ||
| DBS Group Holdings Ltd. | 56,100 | 836,057 |
| Venture Corp. Ltd. | 1,100 | 15,515 |
| TOTAL SINGAPORE | 851,572 | |
| Annual Report | 22 |
| Common Stocks – continued | ||
| Shares | Value | |
| SPAIN – 2.4% | ||
| Banco Santander S.A. (b) | 295,150 | $ 588,182 |
| Repsol S.A. | 78,075 | 485,650 |
| TOTAL SPAIN | 1,073,832 | |
| SWITZERLAND – 7.4% | ||
| Adecco Group AG | 5,901 | 289,722 |
| Nestle S.A. | 6,263 | 704,506 |
| Novartis AG | 6,069 | 473,376 |
| Roche Holding AG | 1,726 | 555,058 |
| UBS Group AG | 114,225 | 1,326,633 |
| TOTAL SWITZERLAND | 3,349,295 | |
| UNITED KINGDOM – 9.9% | ||
| AstraZeneca PLC | 3,476 | 349,041 |
| Babcock International Group PLC | 53,798 | 151,086 |
| BHP Group PLC | 1,906 | 36,725 |
| BP PLC | 255,581 | 649,697 |
| British American Tobacco PLC | 7,713 | 244,137 |
| GlaxoSmithKline PLC | 13,659 | 228,146 |
| Imperial Brands PLC | 8,803 | 139,319 |
| Rio Tinto PLC | 801 | 45,125 |
| Royal Dutch Shell PLC Class B | 76,152 | 914,736 |
| SSE PLC | 96,372 | 1,563,843 |
| Wm Morrison Supermarkets PLC | 76,214 | 160,529 |
| TOTAL UNITED KINGDOM | 4,482,384 | |
| TOTAL COMMON STOCKS (Cost $55,074,759) | 45,005,731 | |
| Money Market Funds – 2.1% | ||
| Shares | Value | |
| Fidelity Cash Central Fund, 0.10% (c) | 10,117 | $ 10,119 |
| Fidelity Securities Lending Cash Central Fund, 0.11% (c)(d) | 933,207 | 933,300 |
| TOTAL MONEY MARKET FUNDS (Cost $943,419) | 943,419 | |
| TOTAL INVESTMENT IN SECURITIES – 101.5% (Cost $56,018,178) | 45,949,150 | |
| NET OTHER ASSETS (LIABILITIES) – (1.5%) | (658,788) | |
| NET ASSETS – 100.0% | $ 45,290,362 | |
| Categorizations in the Schedule of Investments are based on country or territory of incorporation. | ||
| Legend | ||
| (a) | Security or a portion of the security is on loan at period end. | |
| (b) | Non-income producing. | |
| (c) | Affiliated fund that is generally available only to investment companies and other accounts managed by Fidelity Investments. The rate quoted is the annualized seven-day yield of the fund at period end. A complete unaudited listing of the fund's holdings as of its most recent quarter end is available upon request. In addition, each Fidelity Central Fund's financial statements, which are not covered by the Fund's Report of Independent Registered Public Accounting Firm, are available on the SEC's website or upon request. | |
| (d) | Investment made with cash collateral received from securities on loan. | |
| Futures Contracts | |||||
| Number of contracts | Expiration Date | Notional Amount | Value | Unrealized Appreciation/ (Depreciation) | |
| Purchased | |||||
| Equity Index Contract | |||||
| ICE MSCI EAFE Index Future Contracts | 3 | December 2020 | $267,585 | $(14,963) | $(14,963) |
| Fund | Income earned |
| Fidelity Cash Central Fund | $ 864 |
| Fidelity Securities Lending Cash Central Fund | 11,137 |
| Total | $12,001 |
| 23 | Annual Report |
| Description | Total | Level 1 | Level 2 | Level 3 |
| Investments in Securities: | ||||||||
| Equities: | ||||||||
| Consumer Discretionary | $ 7,936,572 | $ 7,936,572 | $ — | $ — | ||||
| Consumer Staples | 2,585,199 | 2,585,199 | — | — | ||||
| Energy | 5,558,538 | 5,558,538 | — | — | ||||
| Financials | 10,352,511 | 10,352,511 | — | — | ||||
| Health Care | 3,417,057 | 3,417,057 | — | — | ||||
| Industrials | 3,386,187 | 3,386,187 | — | — | ||||
| Information Technology | 197,270 | 197,270 | — | — | ||||
| Materials | 202,266 | 202,266 | — | — | ||||
| Real Estate | 5,643,735 | 5,643,735 | — | — | ||||
| Utilities | 5,726,396 | 5,726,396 | — | — | ||||
| Money Market Funds | 943,419 | 943,419 | — | — | ||||
| Total Investments in Securities: | $ 45,949,150 | $ 45,949,150 | $ — | $ — |
| Derivative Instruments: | ||||||||
| Liabilities | ||||||||
| Futures Contracts | $ (14,963) | $ (14,963) | $ — | $ — | ||||
| Total Liabilities | $ (14,963) | $ (14,963) | $ — | $ — | ||||
| Total Derivative Instruments: | $ (14,963) | $ (14,963) | $ — | $ — |
| Primary Risk/ Derivative Type | Value | ||
| Asset | Liabilities | ||
| Equity Risk | |||
| Futures Contracts(a) | $0 | $(14,963) | |
| Total Equity Risk | 0 | (14,963) | |
| Total Value of Derivatives | $0 | $(14,963) | |
| (a) | Reflects gross cumulative appreciation (depreciation) on futures contracts as presented in the Schedule of Investments. In the Statement of Assets and Liabilities, the period end daily variation margin is included in receivable or payable for daily variation margin on futures contracts, and the net cumulative appreciation (depreciation) is included in total accumulated earnings (loss). |
| Annual Report | 24 |
| Common Stocks – 98.6% | ||
| Shares | Value | |
| AUSTRALIA – 6.1% | ||
| Ampol Ltd. | 22 | $ 401 |
| ASX Ltd. | 344 | 19,237 |
| BHP Group Ltd. | 2,714 | 64,381 |
| Coca-Cola Amatil Ltd. | 8,201 | 71,586 |
| Coles Group Ltd. | 4,128 | 51,455 |
| Commonwealth Bank of Australia | 945 | 45,803 |
| Fortescue Metals Group Ltd. | 3,466 | 42,279 |
| JB Hi-Fi Ltd. | 477 | 15,888 |
| Magellan Financial Group Ltd. | 423 | 16,368 |
| Medibank Pvt Ltd. | 9,040 | 16,950 |
| Rio Tinto Ltd. | 630 | 40,893 |
| Sonic Healthcare Ltd. | 1,093 | 26,726 |
| Wesfarmers Ltd. | 769 | 24,820 |
| TOTAL AUSTRALIA | 436,787 | |
| BELGIUM – 2.0% | ||
| Aedifica S.A. | 837 | 84,238 |
| Etablissements Franz Colruyt N.V. | 499 | 29,540 |
| Sofina S.A. | 77 | 20,002 |
| UCB S.A. | 96 | 9,471 |
| TOTAL BELGIUM | 143,251 | |
| BERMUDA – 0.6% | ||
| Jardine Matheson Holdings Ltd. | 477 | 21,174 |
| Jardine Strategic Holdings Ltd. | 910 | 19,738 |
| TOTAL BERMUDA | 40,912 | |
| CANADA – 8.4% | ||
| Barrick Gold Corp. | 2,412 | 64,436 |
| BCE, Inc. | 1,886 | 75,731 |
| Canadian Apartment Properties REIT | 1,535 | 49,307 |
| Canadian Pacific Railway Ltd. | 137 | 40,908 |
| CI Financial Corp. | 1,731 | 20,162 |
| Constellation Software, Inc. | 20 | 20,979 |
| Enbridge, Inc. | 24 | 661 |
| Great-West Lifeco, Inc. | 1,383 | 28,161 |
| Imperial Oil Ltd. | 21 | 279 |
| Intact Financial Corp. | 278 | 28,693 |
| Kirkland Lake Gold Ltd. | 918 | 41,791 |
| Manulife Financial Corp. | 2,337 | 31,654 |
| Northland Power, Inc. | 2,559 | 82,700 |
| Parkland Corp. | 12 | 293 |
| Power Corp. of Canada | 1,469 | 27,951 |
| Stantec, Inc. | 786 | 22,554 |
| TMX Group Ltd. | 260 | 25,244 |
| Wheaton Precious Metals Corp. | 1,012 | 46,405 |
| TOTAL CANADA | 607,909 | |
| | ||
| Shares | Value | |
| DENMARK – 2.3% | ||
| Coloplast A/S Class B | 78 | $ 11,384 |
| Novo Nordisk A/S Class B | 630 | 40,468 |
| Novozymes A/S Class B | 850 | 51,081 |
| Pandora A/S | 312 | 24,710 |
| SimCorp A/S | 145 | 17,287 |
| Tryg A/S | 721 | 20,001 |
| TOTAL DENMARK | 164,931 | |
| FINLAND – 1.4% | ||
| Elisa Oyj | 1,152 | 56,682 |
| Kone Oyj Class B | 413 | 32,877 |
| Orion Oyj Class B | 182 | 7,791 |
| TOTAL FINLAND | 97,350 | |
| FRANCE – 6.2% | ||
| Air Liquide S.A. | 493 | 72,071 |
| BioMerieux | 54 | 8,039 |
| BNP Paribas S.A. (a) | 868 | 30,186 |
| Bureau Veritas S.A. (a) | 780 | 17,127 |
| Dassault Systemes SE | 121 | 20,656 |
| Edenred | 366 | 17,070 |
| Eiffage S.A. (a) | 193 | 14,010 |
| Hermes International | 21 | 19,545 |
| La Francaise des Jeux SAEM (b) | 294 | 11,021 |
| Legrand S.A. | 267 | 19,743 |
| L'Oreal S.A. | 200 | 64,696 |
| LVMH Moet Hennessy Louis Vuitton SE | 100 | 46,862 |
| Sanofi | 439 | 39,565 |
| Sartorius Stedim Biotech | 29 | 10,999 |
| Sodexo S.A. | 159 | 10,205 |
| Teleperformance | 68 | 20,412 |
| TOTAL S.A. | 23 | 692 |
| Vinci S.A. | 342 | 27,018 |
| TOTAL FRANCE | 449,917 | |
| GERMANY – 3.3% | ||
| Allianz SE | 241 | 42,407 |
| Beiersdorf AG | 291 | 30,474 |
| Deutsche Boerse AG | 180 | 26,492 |
| Fresenius Medical Care AG & Co. KGaA | 147 | 11,229 |
| Knorr-Bremse AG | 207 | 23,975 |
| Merck KGaA | 92 | 13,626 |
| Muenchener Rueckversicherungs-Gesellschaft AG in Muenchen | 126 | 29,472 |
| Scout24 AG (b) | 774 | 62,345 |
| TOTAL GERMANY | 240,020 | |
| 25 | Annual Report |
| Common Stocks – continued | ||
| Shares | Value | |
| HONG KONG – 3.3% | ||
| BOC Hong Kong Holdings Ltd. | 7,000 | $ 19,407 |
| CLP Holdings Ltd. | 11,000 | 101,137 |
| Hong Kong Exchanges & Clearing Ltd. | 800 | 38,190 |
| Sino Land Co. Ltd. | 68,000 | 80,322 |
| TOTAL HONG KONG | 239,056 | |
| ISRAEL – 0.6% | ||
| Bank Leumi Le-Israel BM | 4,680 | 22,187 |
| Nice Ltd. (a) | 85 | 19,472 |
| TOTAL ISRAEL | 41,659 | |
| ITALY – 4.6% | ||
| Enel SpA | 11,700 | 93,139 |
| Eni SpA | 39 | 273 |
| Hera SpA | 19,975 | 62,823 |
| Italgas SpA | 11,711 | 67,690 |
| Moncler SpA (a) | 542 | 21,693 |
| Recordati Industria Chimica e Farmaceutica SpA | 159 | 8,240 |
| Snam SpA | 15,289 | 74,621 |
| TOTAL ITALY | 328,479 | |
| JAPAN – 23.4% | ||
| Astellas Pharma, Inc. | 1,800 | 24,708 |
| Central Japan Railway Co. | 200 | 24,077 |
| Dai Nippon Printing Co. Ltd. | 1,200 | 22,257 |
| Daito Trust Construction Co. Ltd. | 1,100 | 99,856 |
| Daiwa Securities Group, Inc. | 6,000 | 24,163 |
| FUJIFILM Holdings Corp. | 500 | 25,435 |
| Haseko Corp. | 1,500 | 17,893 |
| Hikari Tsushin, Inc. | 100 | 23,350 |
| Hisamitsu Pharmaceutical Co., Inc. | 500 | 23,795 |
| Hoya Corp. | 300 | 33,863 |
| ITOCHU Corp. | 1,500 | 35,871 |
| Japan Exchange Group, Inc. | 1,100 | 26,753 |
| Kajima Corp. | 2,100 | 22,338 |
| Kakaku.com, Inc. | 2,700 | 71,568 |
| Kao Corp. | 900 | 63,880 |
| KDDI Corp. | 2,500 | 66,781 |
| Kobayashi Pharmaceutical Co. Ltd. | 600 | 58,370 |
| K's Holdings Corp. | 1,400 | 17,865 |
| M3, Inc. | 500 | 33,609 |
| Mitsui & Co. Ltd. | 1,900 | 29,625 |
| Nexon Co. Ltd. | 2,300 | 64,221 |
| Nippon Building Fund, Inc. | 16 | 80,811 |
| Nippon Telegraph & Telephone Corp. | 3,000 | 63,019 |
| Nissan Chemical Corp. | 1,200 | 63,363 |
| Nomura Research Institute Ltd. | 800 | 23,685 |
| NTT DOCOMO, Inc. | 2,500 | 92,955 |
| | ||
| Shares | Value | |
| Obayashi Corp. | 2,400 | $ 19,973 |
| Obic Co. Ltd. | 100 | 17,744 |
| Oji Holdings Corp. | 15,200 | 63,830 |
| Oracle Corp. Japan | 100 | 10,006 |
| ORIX Corp. | 2,400 | 27,905 |
| Otsuka Corp. | 400 | 18,443 |
| Pan Pacific International Holdings Corp. | 900 | 19,129 |
| Rinnai Corp. | 200 | 19,705 |
| Secom Co. Ltd. | 300 | 25,239 |
| Sekisui House Ltd. | 1,100 | 18,167 |
| Shionogi & Co. Ltd. | 500 | 23,551 |
| Skylark Holdings Co. Ltd. | 1,200 | 17,069 |
| Sohgo Security Services Co. Ltd. | 500 | 23,221 |
| Sony Corp. | 600 | 49,784 |
| Sumitomo Mitsui Trust Holdings, Inc. | 1,000 | 26,626 |
| Suntory Beverage & Food Ltd. | 1,500 | 51,655 |
| Taisei Corp. | 800 | 24,833 |
| Toppan Printing Co. Ltd. | 1,500 | 18,983 |
| Toyo Suisan Kaisha Ltd. | 800 | 39,793 |
| Trend Micro, Inc. | 300 | 16,788 |
| USS Co. Ltd. | 1,200 | 21,925 |
| TOTAL JAPAN | 1,688,480 | |
| JERSEY – 0.7% | ||
| Centamin PLC | 13,308 | 21,328 |
| Experian PLC | 832 | 30,305 |
| TOTAL JERSEY | 51,633 | |
| NETHERLANDS – 2.8% | ||
| ASM International N.V. | 116 | 16,593 |
| Euronext N.V. (b) | 204 | 21,280 |
| Heineken Holding N.V. | 387 | 29,910 |
| Koninklijke Ahold Delhaize N.V. | 1,399 | 38,443 |
| Unilever N.V. | 1,159 | 65,545 |
| Wolters Kluwer N.V. | 371 | 30,070 |
| TOTAL NETHERLANDS | 201,841 | |
| NEW ZEALAND – 0.4% | ||
| Fisher & Paykel Healthcare Corp. Ltd. | 1,114 | 25,768 |
| TOTAL NEW ZEALAND | 25,768 | |
| NORWAY – 0.4% | ||
| Equinor ASA | 20 | 254 |
| Orkla ASA | 3,122 | 29,421 |
| TOTAL NORWAY | 29,675 | |
| PORTUGAL – 0.0% | ||
| Galp Energia SGPS S.A. | 21 | 170 |
| TOTAL PORTUGAL | 170 | |
| Annual Report | 26 |
| Common Stocks – continued | ||
| Shares | Value | |
| SINGAPORE – 1.6% | ||
| Mapletree Industrial Trust | 34,500 | $ 76,807 |
| Oversea-Chinese Banking Corp. Ltd. | 3,795 | 23,401 |
| Singapore Exchange Ltd. | 2,800 | 17,757 |
| TOTAL SINGAPORE | 117,965 | |
| SPAIN – 3.2% | ||
| Aena SME S.A. (a)(b) | 186 | 25,046 |
| Amadeus IT Group S.A. | 402 | 19,194 |
| Enagas S.A. | 3,037 | 65,553 |
| Industria de Diseno Textil S.A. (a) | 1,005 | 24,807 |
| Red Electrica Corp. S.A. | 4,001 | 70,491 |
| Viscofan S.A. | 398 | 26,866 |
| TOTAL SPAIN | 231,957 | |
| SWEDEN – 4.4% | ||
| Atlas Copco AB Class A | 816 | 36,019 |
| Epiroc AB Class A | 1,891 | 28,255 |
| Essity AB Class B | 1,106 | 32,045 |
| Evolution Gaming Group AB (b) | 289 | 21,461 |
| Hennes & Mauritz AB Class B | 1,383 | 22,467 |
| Holmen AB Class B | 1,333 | 50,528 |
| Industrivarden AB Class A (a) | 900 | 24,206 |
| L E Lundbergforetagen AB Class B (a) | 434 | 19,532 |
| Svenska Cellulosa AB SCA Class B (a) | 3,922 | 53,204 |
| Swedish Match AB | 436 | 32,848 |
| TOTAL SWEDEN | 320,565 | |
| SWITZERLAND – 10.9% | ||
| Banque Cantonale Vaudoise | 221 | 21,412 |
| Belimo Holding AG | 3 | 22,323 |
| Cembra Money Bank AG | 216 | 23,967 |
| EMS-Chemie Holding AG | 55 | 48,366 |
| Galenica AG (b) | 114 | 7,202 |
| Geberit AG | 53 | 30,185 |
| Givaudan S.A. | 14 | 57,066 |
| Kuehne + Nagel International AG | 144 | 28,767 |
| Nestle S.A. | 1,651 | 185,716 |
| Novartis AG | 884 | 68,951 |
| Partners Group Holding AG | 34 | 30,663 |
| PSP Swiss Property AG | 833 | 100,791 |
| Roche Holding AG | 255 | 82,005 |
| Swisscom AG | 134 | 68,173 |
| Tecan Group AG | 20 | 9,492 |
| TOTAL SWITZERLAND | 785,079 | |
| UNITED KINGDOM – 12.0% | ||
| Admiral Group PLC | 729 | 25,921 |
| AstraZeneca PLC | 478 | 47,998 |
| Auto Trader Group PLC (b) | 9,270 | 69,400 |
| | ||
| Shares | Value | |
| Avast PLC (b) | 2,163 | $ 13,268 |
| BHP Group PLC | 2,580 | 49,712 |
| British American Tobacco PLC | 1,984 | 62,799 |
| Diageo PLC | 1,989 | 64,269 |
| Direct Line Insurance Group PLC | 5,295 | 18,040 |
| GlaxoSmithKline PLC | 1,953 | 32,621 |
| Halma PLC | 629 | 19,259 |
| Hikma Pharmaceuticals PLC | 288 | 9,347 |
| Howden Joinery Group PLC (a) | 3,088 | 25,426 |
| IG Group Holdings PLC | 2,286 | 22,494 |
| Legal & General Group PLC | 9,192 | 21,964 |
| London Stock Exchange Group PLC | 300 | 32,110 |
| Next PLC | 267 | 20,162 |
| Persimmon PLC | 636 | 19,210 |
| RELX PLC | 1,566 | 30,929 |
| Rightmove PLC (a) | 8,836 | 70,606 |
| Rio Tinto PLC | 1,112 | 62,646 |
| Royal Dutch Shell PLC Class B | 71 | 853 |
| Smith & Nephew PLC | 620 | 10,714 |
| Tate & Lyle PLC | 3,711 | 28,560 |
| The Sage Group PLC | 1,857 | 15,261 |
| Unilever PLC | 1,046 | 59,563 |
| Wm Morrison Supermarkets PLC | 13,227 | 27,860 |
| TOTAL UNITED KINGDOM | 860,992 | |
| TOTAL COMMON STOCKS (Cost $7,223,678) | 7,104,396 | |
| Money Market Fund – 0.1% | ||
| Fidelity Cash Central Fund, 0.10% (c) (Cost $3,691) | 3,691 | 3,691 |
| TOTAL INVESTMENT IN SECURITIES – 98.7% (Cost $7,227,369) | 7,108,087 | |
| NET OTHER ASSETS (LIABILITIES) – 1.3% | 93,592 | |
| NET ASSETS – 100.0% | $ 7,201,679 | |
| 27 | Annual Report |
| Categorizations in the Schedule of Investments are based on country or territory of incorporation. | ||
| Legend | ||
| (a) | Non-income producing. | |
| (b) | Security is exempt from registration under Rule 144A of the Securities Act of 1933. These securities may be resold in transactions exempt from registration, normally to qualified institutional buyers. At the end of the period, the value of these securities amounted to $231,023 or 3.2% of net assets. | |
| (c) | Affiliated fund that is generally available only to investment companies and other accounts managed by Fidelity Investments. The rate quoted is the annualized seven-day yield of the fund at period end. A complete unaudited listing of the fund's holdings as of its most recent quarter end is available upon request. In addition, each Fidelity Central Fund's financial statements, which are not covered by the Fund's Report of Independent Registered Public Accounting Firm, are available on the SEC's website or upon request. | |
| Futures Contracts | |||||
| Number of contracts | Expiration Date | Notional Amount | Value | Unrealized Appreciation/ (Depreciation) | |
| Purchased | |||||
| Equity Index Contract | |||||
| ICE MSCI EAFE Index Future Contracts | 1 | December 2020 | $89,195 | $(3,797) | $(3,797) |
| Fund | Income earned |
| Fidelity Cash Central Fund | $34 |
| Annual Report | 28 |
| Description | Total | Level 1 | Level 2 | Level 3 |
| Investments in Securities: | ||||||||
| Equities: | ||||||||
| Communication Services | $ 761,481 | $ 761,481 | $ — | $ — | ||||
| Consumer Discretionary | 487,738 | 487,738 | — | — | ||||
| Consumer Staples | 1,145,294 | 1,145,294 | — | — | ||||
| Energy | 3,876 | 3,876 | — | — | ||||
| Financials | 916,761 | 916,761 | — | — | ||||
| Health Care | 621,162 | 621,162 | — | — | ||||
| Industrials | 793,278 | 793,278 | — | — | ||||
| Information Technology | 291,140 | 291,140 | — | — | ||||
| Materials | 893,380 | 893,380 | — | — | ||||
| Real Estate | 572,132 | 572,132 | — | — | ||||
| Utilities | 618,154 | 618,154 | — | — | ||||
| Money Market Fund | 3,691 | 3,691 | — | — | ||||
| Total Investments in Securities: | $ 7,108,087 | $ 7,108,087 | $ — | $ — |
| Derivative Instruments: | ||||||||
| Liabilities | ||||||||
| Futures Contracts | $ (3,797) | $ (3,797) | $ — | $ — | ||||
| Total Liabilities | $ (3,797) | $ (3,797) | $ — | $ — | ||||
| Total Derivative Instruments: | $ (3,797) | $ (3,797) | $ — | $ — |
| Primary Risk/ Derivative Type | Value | ||
| Asset | Liabilities | ||
| Equity Risk | |||
| Futures Contracts(a) | $0 | $(3,797) | |
| Total Equity Risk | 0 | (3,797) | |
| Total Value of Derivatives | $0 | $(3,797) | |
| (a) | Reflects gross cumulative appreciation (depreciation) on futures contracts as presented in the Schedule of Investments. In the Statement of Assets and Liabilities, the period end daily variation margin is included in receivable or payable for daily variation margin on futures contracts, and the net cumulative appreciation (depreciation) is included in total accumulated earnings (loss). |
| 29 | Annual Report |
| Common Stocks – 99.3% | ||
| Shares | Value | |
| AUSTRALIA – 4.5% | ||
| Australia & New Zealand Banking Group Ltd. | 11,586 | $ 153,043 |
| CSL Ltd. | 799 | 161,349 |
| Macquarie Group Ltd. | 1,566 | 139,390 |
| Rio Tinto Ltd. | 2,838 | 184,212 |
| TOTAL AUSTRALIA | 637,994 | |
| AUSTRIA – 1.1% | ||
| ams AG (a) | 5,403 | 115,836 |
| OMV AG | 1,766 | 40,525 |
| TOTAL AUSTRIA | 156,361 | |
| BERMUDA – 0.8% | ||
| Jardine Matheson Holdings Ltd. | 2,675 | 118,743 |
| TOTAL BERMUDA | 118,743 | |
| CANADA – 8.5% | ||
| Canadian Apartment Properties REIT | 199 | 6,392 |
| Canadian National Railway Co. | 1,808 | 179,464 |
| CGI, Inc. (a) | 1,461 | 90,585 |
| Enbridge, Inc. | 6,000 | 165,193 |
| Fortis, Inc. | 1,321 | 52,143 |
| iA Financial Corp., Inc. | 3,684 | 128,257 |
| Manulife Financial Corp. | 10,647 | 144,212 |
| Nutrien Ltd. | 6,420 | 260,777 |
| The Bank of Nova Scotia | 4,257 | 176,716 |
| TOTAL CANADA | 1,203,739 | |
| CAYMAN ISLANDS – 0.7% | ||
| CK Asset Holdings Ltd. | 20,500 | 94,902 |
| TOTAL CAYMAN ISLANDS | 94,902 | |
| DENMARK – 2.0% | ||
| AP Moller - Maersk A/S Class B | 78 | 124,601 |
| Novo Nordisk A/S Class B | 2,466 | 158,402 |
| TOTAL DENMARK | 283,003 | |
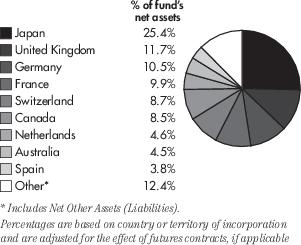
| FRANCE – 9.9% | ||
| Atos SE (a) | 1,192 | 81,366 |
| BNP Paribas S.A. (a) | 3,912 | 136,046 |
| Bouygues S.A. | 3,972 | 130,244 |
| Capgemini SE | 884 | 102,087 |
| Carrefour S.A. | 3,938 | 61,285 |
| Cie de Saint-Gobain (a) | 4,094 | 159,758 |
| Danone S.A. | 1,456 | 80,391 |
| Engie S.A. (a) | 10,073 | 121,853 |
| Peugeot S.A. (a) | 8,462 | 152,093 |
| Sanofi | 1,674 | 150,868 |
| Sodexo S.A. | 1,945 | 124,836 |
| | ||
| Shares | Value | |
| TOTAL S.A. | 3,873 | $ 116,486 |
| TOTAL FRANCE | 1,417,313 | |
| GERMANY – 10.5% | ||
| Allianz SE | 973 | 171,211 |
| BASF SE | 2,910 | 159,554 |
| Bayer AG | 1,814 | 85,282 |
| Deutsche Post AG | 3,130 | 138,693 |
| Fresenius Medical Care AG & Co. KGaA | 868 | 66,307 |
| Fresenius SE & Co. KGaA | 1,625 | 60,269 |
| HeidelbergCement AG | 2,087 | 119,413 |
| Merck KGaA | 550 | 81,461 |
| SAP SE | 1,660 | 176,910 |
| Siemens AG | 1,497 | 175,599 |
| Uniper SE | 3,369 | 100,699 |
| Vonovia SE | 2,474 | 157,982 |
| TOTAL GERMANY | 1,493,380 | |
| HONG KONG – 1.9% | ||
| AIA Group Ltd. | 20,000 | 188,398 |
| BOC Hong Kong Holdings Ltd. | 30,000 | 83,174 |
| TOTAL HONG KONG | 271,572 | |
| ITALY – 1.1% | ||
| Enel SpA | 19,953 | 158,838 |
| TOTAL ITALY | 158,838 | |
| JAPAN – 25.4% | ||
| Alfresa Holdings Corp. | 7,100 | 129,789 |
| Central Japan Railway Co. | 1,200 | 144,461 |
| Chubu Electric Power Co., Inc. | 9,700 | 108,700 |
| Daiwa House Industry Co. Ltd. | 5,700 | 149,152 |
| Fujitsu Ltd. | 1,200 | 140,329 |
| Hitachi Ltd. | 5,000 | 167,496 |
| Honda Motor Co. Ltd. | 6,600 | 153,731 |
| Inpex Corp. | 10,000 | 47,063 |
| ITOCHU Corp. | 7,000 | 167,400 |
| Japan Tobacco, Inc. | 8,000 | 150,756 |
| KDDI Corp. | 6,000 | 160,274 |
| Medipal Holdings Corp. | 7,100 | 126,461 |
| Mitsubishi Corp. | 7,600 | 169,062 |
| Mitsubishi UFJ Financial Group, Inc. | 42,200 | 165,587 |
| NEC Corp. | 2,800 | 140,616 |
| Nippon Telegraph & Telephone Corp. | 7,000 | 147,044 |
| Obayashi Corp. | 14,100 | 117,343 |
| ORIX Corp. | 10,900 | 126,736 |
| Otsuka Holdings Co. Ltd. | 3,500 | 129,065 |
| Panasonic Corp. | 16,500 | 151,631 |
| Sekisui House Ltd. | 7,100 | 117,258 |
| Seven & i Holdings Co. Ltd. | 4,900 | 149,006 |
| Annual Report | 30 |
| Common Stocks – continued | ||
| Shares | Value | |
| JAPAN – continued | ||
| Shin-Etsu Chemical Co. Ltd. | 1,500 | $ 199,302 |
| Sony Corp. | 2,800 | 232,324 |
| Taisei Corp. | 4,100 | 127,267 |
| TOTAL JAPAN | 3,617,853 | |
| NETHERLANDS – 4.6% | ||
| Fiat Chrysler Automobiles N.V. (a) | 16,358 | 200,874 |
| ING Groep N.V. (a) | 19,020 | 129,809 |
| Koninklijke Ahold Delhaize N.V. | 2,825 | 77,627 |
| NN Group N.V. | 3,214 | 112,090 |
| Unilever N.V. | 2,340 | 132,335 |
| TOTAL NETHERLANDS | 652,735 | |
| SINGAPORE – 2.3% | ||
| Genting Singapore Ltd. | 269,500 | 127,300 |
| Singapore Telecommunications Ltd. | 50,100 | 74,480 |
| Singapore Telecommunications Ltd. | 600 | 896 |
| Wilmar International Ltd. | 42,400 | 125,446 |
| TOTAL SINGAPORE | 328,122 | |
| SPAIN – 3.8% | ||
| ACS Actividades de Construccion y Servicios S.A. | 4,077 | 96,882 |
| Banco Bilbao Vizcaya Argentaria S.A. | 44,480 | 127,562 |
| Industria de Diseno Textil S.A. (a) | 7,346 | 181,323 |
| Telefonica S.A. | 41,864 | 136,835 |
| TOTAL SPAIN | 542,602 | |
| SWEDEN – 1.8% | ||
| Essity AB Class B | 2,225 | 64,467 |
| Volvo AB Class B (a) | 10,095 | 196,373 |
| TOTAL SWEDEN | 260,840 | |
| SWITZERLAND – 8.7% | ||
| LafargeHolcim Ltd. (a) | 2,903 | 124,634 |
| | ||
| Shares | Value | |
| Nestle S.A. | 3,382 | $ 380,431 |
| Novartis AG | 3,107 | 242,343 |
| Roche Holding AG | 878 | 282,353 |
| Siemens Energy AG (a) | 743 | 16,271 |
| UBS Group AG | 16,902 | 196,303 |
| TOTAL SWITZERLAND | 1,242,335 | |
| UNITED KINGDOM – 11.7% | ||
| Aviva PLC | 45,606 | 151,844 |
| BAE Systems PLC | 16,412 | 84,246 |
| BHP Group PLC | 8,902 | 171,526 |
| Compass Group PLC | 8,675 | 118,337 |
| Dialog Semiconductor PLC (a) | 2,019 | 77,093 |
| GlaxoSmithKline PLC | 7,661 | 127,962 |
| Imperial Brands PLC | 11,462 | 181,401 |
| J Sainsbury PLC | 71,890 | 187,395 |
| M&G PLC | 77,156 | 146,302 |
| RELX PLC | 5,956 | 117,635 |
| Royal Dutch Shell PLC Class B | 11,607 | 139,423 |
| Vodafone Group PLC | 126,034 | 167,851 |
| TOTAL UNITED KINGDOM | 1,671,015 | |
| TOTAL COMMON STOCKS (Cost $15,237,700) | 14,151,347 | |
| TOTAL INVESTMENT IN SECURITIES – 99.3% (Cost $15,237,700) | 14,151,347 | |
| NET OTHER ASSETS (LIABILITIES) – 0.7% | 102,204 | |
| NET ASSETS – 100.0% | $ 14,253,551 | |
| Categorizations in the Schedule of Investments are based on country or territory of incorporation. | ||
| Legend | ||
| (a) | Non-income producing. | |
| Futures Contracts | |||||
| Number of contracts | Expiration Date | Notional Amount | Value | Unrealized Appreciation/ (Depreciation) | |
| Purchased | |||||
| Equity Index Contract | |||||
| ICE MSCI EAFE Index Future Contracts | 1 | December 2020 | $89,195 | $(5,736) | $(5,736) |
| 31 | Annual Report |
| Fund | Income earned |
| Fidelity Cash Central Fund | $163 |
| Description | Total | Level 1 | Level 2 | Level 3 |
| Investments in Securities: | ||||||||
| Equities: | ||||||||
| Communication Services | $ 687,380 | $ 687,380 | $ — | $ — | ||||
| Consumer Discretionary | 1,559,707 | 1,559,707 | — | — | ||||
| Consumer Staples | 1,590,540 | 1,590,540 | — | — | ||||
| Energy | 508,690 | 508,690 | — | — | ||||
| Financials | 2,476,680 | 2,476,680 | — | — | ||||
| Health Care | 1,801,911 | 1,801,911 | — | — | ||||
| Industrials | 2,264,042 | 2,264,042 | — | — | ||||
| Information Technology | 1,092,318 | 1,092,318 | — | — | ||||
| Materials | 1,219,418 | 1,219,418 | — | — | ||||
| Real Estate | 408,428 | 408,428 | — | — | ||||
| Utilities | 542,233 | 542,233 | — | — | ||||
| Total Investments in Securities: | $ 14,151,347 | $ 14,151,347 | $ — | $ — |
| Derivative Instruments: | ||||||||
| Liabilities | ||||||||
| Futures Contracts | $ (5,736) | $ (5,736) | $ — | $ — | ||||
| Total Liabilities | $ (5,736) | $ (5,736) | $ — | $ — | ||||
| Total Derivative Instruments: | $ (5,736) | $ (5,736) | $ — | $ — |
| Primary Risk/ Derivative Type | Value | ||
| Asset | Liabilities | ||
| Equity Risk | |||
| Futures Contracts(a) | $0 | $(5,736) | |
| Total Equity Risk | 0 | (5,736) | |
| Total Value of Derivatives | $0 | $(5,736) | |
| (a) | Reflects gross cumulative appreciation (depreciation) on futures contracts as presented in the Schedule of Investments. In the Statement of Assets and Liabilities, the period end daily variation margin is included in receivable or payable for daily variation margin on futures contracts, and the net cumulative appreciation (depreciation) is included in total accumulated earnings (loss). |
| Annual Report | 32 |
| Fidelity Emerging Markets Multifactor ETF | Fidelity International High Dividend ETF | Fidelity International Multifactor ETF | Fidelity International Value Factor ETF | ||||
| Assets | |||||||
| Investments in securities, at value (including securities loaned of $—, $772,732, $— and $—, respectively) – See accompanying schedule: | |||||||
| Unaffiliated issuers | $ 9,230,966 | $ 45,005,731 | $7,104,396 | $14,151,347 | |||
| Fidelity Central Funds | — | 943,419 | 3,691 | — | |||
| Total Investments in Securities | $ 9,230,966 | $ 45,949,150 | $7,108,087 | $14,151,347 | |||
| Segregated cash with brokers for derivative instruments | — | 23,760 | 7,920 | 7,920 | |||
| Cash | 16,644 | 1,455 | 35,095 | — | |||
| Foreign currency held at value (cost $16,736, $39,250, $5,594 and $11,625, respectively) | 16,766 | 38,784 | 5,564 | 11,554 | |||
| Dividends receivable | 6,170 | 224,350 | 48,457 | 90,201 | |||
| Receivable from investment adviser for expense reductions | 114 | — | 75 | 155 | |||
| Distributions receivable from Fidelity Central Funds | — | 412 | 1 | — | |||
| Total assets | 9,270,660 | 46,237,911 | 7,205,199 | 14,261,177 | |||
| Liabilities | |||||||
| Payable to custodian bank | — | — | — | 2,078 | |||
| Accrued management fees | 3,499 | 12,719 | 2,935 | 4,883 | |||
| Payable for daily variation margin on futures contracts | — | 1,530 | 510 | 510 | |||
| Other payables and accrued expenses | 18,265 | — | 75 | 155 | |||
| Collateral on securities loaned, at value | — | 933,300 | — | — | |||
| Total liabilities | 21,764 | 947,549 | 3,520 | 7,626 | |||
| Net Assets | $ 9,248,896 | $ 45,290,362 | $7,201,679 | $14,253,551 | |||
| Net Assets consist of: | |||||||
| Paid in capital | 10,008,903 | 64,077,989 | 7,702,851 | 18,216,595 | |||
| Total accumulated earnings (loss) | (760,007) | (18,787,627) | (501,172) | (3,963,044) | |||
| Net Assets | $ 9,248,896 | $ 45,290,362 | $7,201,679 | $14,253,551 | |||
| Shares outstanding | 400,000 | 3,000,000 | 300,000 | 800,000 | |||
| Net Asset Value per share | $ 23.12 | $ 15.10 | $ 24.01 | $ 17.82 | |||
| Investments at cost – Unaffiliated issuers | $ 9,423,112 | $ 55,074,759 | $7,223,678 | $15,237,700 | |||
| Investments at cost – Fidelity Central Funds | — | 943,419 | 3,691 | — | |||
| Investments at cost | $ 9,423,112 | $ 56,018,178 | $7,227,369 | $15,237,700 |
| Annual Report | 34 |
| Fidelity Emerging Markets Multifactor ETF | Fidelity International High Dividend ETF | Fidelity International Multifactor ETF | Fidelity International Value Factor ETF | ||||
| Investment Income | |||||||
| Dividends | $ 296,282 | $ 1,504,563 | $ 295,554 | $ 427,736 | |||
| Non-Cash dividends | — | 117,297 | — | 23,850 | |||
| Interest | 7 | 112 | — | 31 | |||
| Income from Fidelity Central Funds (including $—, $11,137, $— and $—, from security lending, respectively) | — | 12,001 | 34 | 163 | |||
| Income before foreign taxes withheld | 296,289 | 1,633,973 | 295,588 | 451,780 | |||
| Less foreign taxes withheld | (35,128) | (118,770) | (32,208) | (38,285) | |||
| Total income | 261,161 | 1,515,203 | 263,380 | 413,495 | |||
| Expenses | |||||||
| Management fees | 41,381 | 156,687 | 38,283 | 53,770 | |||
| Independent trustees' compensation | 53 | 234 | 57 | 77 | |||
| Proxy | 114 | 649 | 75 | 155 | |||
| Total expenses before reductions | 41,548 | 157,570 | 38,415 | 54,002 | |||
| Expense reductions | (264) | (112) | (120) | (246) | |||
| Total expenses | 41,284 | 157,458 | 38,295 | 53,756 | |||
| Net investment income (loss) | 219,877 | 1,357,745 | 225,085 | 359,739 | |||
| Realized and Unrealized Gain (Loss) | |||||||
| Net realized gain (loss) on investment securities | (299,750) | (7,312,325) | (233,899) | (1,405,829) | |||
| Net realized gain (loss) on Fidelity Central Funds | — | 11 | — | — | |||
| Net realized gain (loss) on In-kind redemptions | — | 2,742,067 | 209,011 | — | |||
| Net realized gain (loss) on futures contracts | 746 | 10,979 | 17,342 | 144 | |||
| Net realized gain (loss) on foreign currency transactions | 583 | 7,205 | 1,316 | 1,581 | |||
| Total net realized gain (loss) | (298,421) | (4,552,063) | (6,230) | (1,404,104) | |||
| Change in net unrealized appreciation (depreciation) on investment securities (net of decrease in deferred foreign taxes of $(1,575), $-, $- and $-, respectively.) | (329,577) | (9,540,890) | (701,584) | (774,095) | |||
| Change in net unrealized appreciation (depreciation) on futures contracts | (248) | (21,883) | (3,797) | (7,622) | |||
| Change in net unrealized appreciation (depreciation) on assets and liabilities in foreign currencies | (207) | 2,963 | 923 | 2,263 | |||
| Total change in net unrealized appreciation (depreciation) | (330,032) | (9,559,810) | (704,458) | (779,454) | |||
| Net gain (loss) | (628,453) | (14,111,873) | (710,688) | (2,183,558) | |||
| Net increase (decrease) in net assets resulting from operations | $ (408,576) | $(12,754,128) | $ (485,603) | $(1,823,819) |
| 35 | Annual Report |
| Fidelity Emerging Markets Multifactor ETF | Fidelity International High Dividend ETF | ||||||
| Year ended October 31, 2020 | Year ended October 31, 2019A | Year ended October 31, 2020 | Year ended October 31, 2019 | ||||
| Increase (Decrease) in Net Assets | |||||||
| Operations | |||||||
| Net investment income (loss) | $ 219,877 | $ 201,202 | $ 1,357,745 | $ 1,658,285 | |||
| Net realized gain (loss) | (298,421) | (267,226) | (4,552,063) | (1,337,575) | |||
| Change in net unrealized appreciation (depreciation) | (330,032) | 119,793 | (9,559,810) | 2,188,190 | |||
| Net increase (decrease) in net assets resulting from operations | (408,576) | 53,769 | (12,754,128) | 2,508,900 | |||
| Distributions to shareholders | (214,800) | (190,400) | (1,450,300) | (1,635,200) | |||
| Share transactions | |||||||
| Proceeds from sales of shares | — | 10,008,903 | 34,025,327 | 24,648,439 | |||
| Cost of shares redeemed | — | — | (18,552,856) | — | |||
| Net increase (decrease) in net assets resulting from share transactions | — | 10,008,903 | 15,472,471 | 24,648,439 | |||
| Total increase (decrease) in net assets | (623,376) | 9,872,272 | 1,268,043 | 25,522,139 | |||
| Net Assets | |||||||
| Beginning of year | 9,872,272 | — | 44,022,319 | 18,500,180 | |||
| End of year | $9,248,896 | $ 9,872,272 | $ 45,290,362 | $44,022,319 | |||
| Other Information | |||||||
| Shares | |||||||
| Sold | — | 400,000 | 1,800,000 | 1,200,000 | |||
| Redeemed | — | — | (900,000) | — | |||
| Net increase (decrease) | — | 400,000 | 900,000 | 1,200,000 | |||
| A | For the period February 26, 2019 (commencement of operations) to October 31, 2019. |
| Annual Report | 36 |
| Fidelity International Multifactor ETF | Fidelity International Value Factor ETF | ||||||
| Year ended October 31, 2020 | Year ended October 31, 2019A | Year ended October 31, 2020 | Year ended October 31, 2019 | ||||
| Increase (Decrease) in Net Assets | |||||||
| Operations | |||||||
| Net investment income (loss) | $ 225,085 | $ 219,486 | $ 359,739 | $ 477,322 | |||
| Net realized gain (loss) | (6,230) | (135,315) | (1,404,104) | (928,086) | |||
| Change in net unrealized appreciation (depreciation) | (704,458) | 582,626 | (779,454) | 1,562,648 | |||
| Net increase (decrease) in net assets resulting from operations | (485,603) | 666,797 | (1,823,819) | 1,111,884 | |||
| Distributions to shareholders | (266,800) | (214,400) | (346,400) | (508,200) | |||
| Share transactions | |||||||
| Proceeds from sales of shares | — | 10,020,760 | 3,288,407 | — | |||
| Cost of shares redeemed | (2,519,075) | — | — | — | |||
| Net increase (decrease) in net assets resulting from share transactions | (2,519,075) | 10,020,760 | 3,288,407 | — | |||
| Total increase (decrease) in net assets | (3,271,478) | 10,473,157 | 1,118,188 | 603,684 | |||
| Net Assets | |||||||
| Beginning of year | 10,473,157 | — | 13,135,363 | 12,531,679 | |||
| End of year | $ 7,201,679 | $10,473,157 | $14,253,551 | $13,135,363 | |||
| Other Information | |||||||
| Shares | |||||||
| Sold | — | 400,000 | 200,000 | — | |||
| Redeemed | (100,000) | — | — | — | |||
| Net increase (decrease) | (100,000) | 400,000 | 200,000 | — | |||
| A | For the period February 26, 2019 (commencement of operations) to October 31, 2019. |
| 37 | Annual Report |
| Fidelity Emerging Markets Multifactor ETF | |||
| Year ended October 31, 2020 | Year ended October 31, 2019A | ||
| Selected Per-Share Data | |||
| Net asset value, beginning of period | $24.68 | $25.00 | |
| Income from Investment Operations | |||
| Net investment income (loss)B | 0.55 | 0.50 | |
| Net realized and unrealized gain (loss) | (1.57) | (0.34) | |
| Total from investment operations | (1.02) | 0.16 | |
| Distributions from net investment income | (0.54) | (0.48) | |
| Total distributions | (0.54) | (0.48) | |
| Net asset value, end of period | $23.12 | $24.68 | |
| Total ReturnC,D,E | (4.03)% | 0.66% | |
| Ratios to Average Net AssetsF,G | |||
| Expenses before reductions | .45% | .45% H | |
| Expenses net of fee waivers, if any | .45% | .45% H | |
| Expenses net of all reductions | .45% | .45% H | |
| Net investment income (loss) | 2.39% | 3.05% H | |
| Supplemental Data | |||
| Net assets, end of period (000 omitted) | $9,249 | $9,872 | |
| Portfolio turnover rateI | 66% | 34% J | |
| A | For the period February 26, 2019 (commencement of operations) to October 31, 2019. |
| B | Calculated based on average shares outstanding during the period. |
| C | Based on net asset value. |
| D | Total returns for periods of less than one year are not annualized. |
| E | Total returns would have been lower if certain expenses had not been reduced during the applicable periods shown. |
| F | Expense ratios reflect operating expenses of the class. Expenses before reductions do not reflect amounts reimbursed, waived, or reduced through arrangements with the investment advisor, brokerage services, or other offset arrangements, if applicable, and do not represent the amount paid by the class during periods when reimbursements, waivers or reductions occur. |
| G | Fees and expenses of any underlying mutual funds or exchange-traded funds (ETFs) are not included in the Fund’s expense ratio. The Fund indirectly bears its proportionate share of these expenses. For additional expense information related to investments in Fidelity Central Funds, please refer to the "Investments in Fidelity Central Funds" note found in the Notes to Financial Statements section of the most recent Annual or Semi-Annual report. |
| H | Annualized. |
| I | Amount does not include the portfolio activity of any underlying mutual funds or exchange-traded funds (ETFs). |
| J | Amount not annualized. |
| Annual Report | 38 |
| Fidelity International High Dividend ETF | |||||
| Year ended October 31, 2020 | Year ended October 31, 2019 | Year ended October 31, 2018A | |||
| Selected Per-Share Data | |||||
| Net asset value, beginning of period | $ 20.96 | $ 20.56 | $ 25.08 | ||
| Income from Investment Operations | |||||
| Net investment income (loss)B | 0.60 | 1.04 | 0.82 | ||
| Net realized and unrealized gain (loss) | (5.81) | 0.31 | (4.63) | ||
| Total from investment operations | (5.21) | 1.35 | (3.81) | ||
| Distributions from net investment income | (0.65) | (0.95) | (0.71) | ||
| Total distributions | (0.65) | (0.95) | (0.71) | ||
| Net asset value, end of period | $ 15.10 | $ 20.96 | $ 20.56 | ||
| Total ReturnC,D,E | (24.98)% | 6.84% | (15.44)% | ||
| Ratios to Average Net AssetsF,G | |||||
| Expenses before reductions | .39% | .39% | .39% H | ||
| Expenses net of fee waivers, if any | .39% | .39% | .39% H | ||
| Expenses net of all reductions | .39% | .39% | .39% H | ||
| Net investment income (loss) | 3.38% | 5.07% | 4.59% H | ||
| Supplemental Data | |||||
| Net assets, end of period (000 omitted) | $45,290 | $44,022 | $18,500 | ||
| Portfolio turnover rateI,J | 82% | 47% | 42% K | ||
| A | For the period January 16, 2018 (commencement of operations) to October 31, 2018. |
| B | Calculated based on average shares outstanding during the period. |
| C | Based on net asset value. |
| D | Total returns for periods of less than one year are not annualized. |
| E | Total returns would have been lower if certain expenses had not been reduced during the applicable periods shown. |
| F | Expense ratios reflect operating expenses of the class. Expenses before reductions do not reflect amounts reimbursed, waived, or reduced through arrangements with the investment advisor, brokerage services, or other offset arrangements, if applicable, and do not represent the amount paid by the class during periods when reimbursements, waivers or reductions occur. |
| G | Fees and expenses of any underlying mutual funds or exchange-traded funds (ETFs) are not included in the Fund’s expense ratio. The Fund indirectly bears its proportionate share of these expenses. For additional expense information related to investments in Fidelity Central Funds, please refer to the "Investments in Fidelity Central Funds" note found in the Notes to Financial Statements section of the most recent Annual or Semi-Annual report. |
| H | Annualized. |
| I | Amount does not include the portfolio activity of any underlying mutual funds or exchange-traded funds (ETFs). |
| J | Portfolio turnover rate excludes securities received or delivered in-kind. |
| K | Amount not annualized. |
| 39 | Annual Report |
| Fidelity International Multifactor ETF | |||
| Year ended October 31, 2020 | Year ended October 31, 2019A | ||
| Selected Per-Share Data | |||
| Net asset value, beginning of period | $26.18 | $ 25.05 | |
| Income from Investment Operations | |||
| Net investment income (loss)B | 0.57 | 0.55 | |
| Net realized and unrealized gain (loss) | (2.07) | 1.12 | |
| Total from investment operations | (1.50) | 1.67 | |
| Distributions from net investment income | (0.67) | (0.54) | |
| Total distributions | (0.67) | (0.54) | |
| Net asset value, end of period | $24.01 | $ 26.18 | |
| Total ReturnC,D,E | (5.73)% | 6.72% | |
| Ratios to Average Net AssetsF,G | |||
| Expenses before reductions | .39% | .39% H | |
| Expenses net of fee waivers, if any | .39% | .39% H | |
| Expenses net of all reductions | .39% | .39% H | |
| Net investment income (loss) | 2.29% | 3.18% H | |
| Supplemental Data | |||
| Net assets, end of period (000 omitted) | $7,202 | $10,473 | |
| Portfolio turnover rateI,J | 69% | 35% K | |
| A | For the period February 26, 2019 (commencement of operations) to October 31, 2019. |
| B | Calculated based on average shares outstanding during the period. |
| C | Based on net asset value. |
| D | Total returns for periods of less than one year are not annualized. |
| E | Total returns would have been lower if certain expenses had not been reduced during the applicable periods shown. |
| F | Expense ratios reflect operating expenses of the class. Expenses before reductions do not reflect amounts reimbursed, waived, or reduced through arrangements with the investment advisor, brokerage services, or other offset arrangements, if applicable, and do not represent the amount paid by the class during periods when reimbursements, waivers or reductions occur. |
| G | Fees and expenses of any underlying mutual funds or exchange-traded funds (ETFs) are not included in the Fund’s expense ratio. The Fund indirectly bears its proportionate share of these expenses. For additional expense information related to investments in Fidelity Central Funds, please refer to the "Investments in Fidelity Central Funds" note found in the Notes to Financial Statements section of the most recent Annual or Semi-Annual report. |
| H | Annualized. |
| I | Amount does not include the portfolio activity of any underlying mutual funds or exchange-traded funds (ETFs). |
| J | Portfolio turnover rate excludes securities received or delivered in-kind. |
| K | Amount not annualized. |
| Annual Report | 40 |
| Fidelity International Value Factor ETF | |||||
| Year ended October 31, 2020 | Year ended October 31, 2019 | Year ended October 31, 2018A | |||
| Selected Per-Share Data | |||||
| Net asset value, beginning of period | $ 21.89 | $ 20.89 | $ 25.00 | ||
| Income from Investment Operations | |||||
| Net investment income (loss)B | 0.51 | 0.80 | 0.62 | ||
| Net realized and unrealized gain (loss) | (4.09) | 1.05 | (4.18) | ||
| Total from investment operations | (3.58) | 1.85 | (3.56) | ||
| Distributions from net investment income | (0.49) | (0.85) | (0.55) | ||
| Total distributions | (0.49) | (0.85) | (0.55) | ||
| Net asset value, end of period | $ 17.82 | $ 21.89 | $ 20.89 | ||
| Total ReturnC,D,E | (16.32)% | 9.04% | (14.46)% | ||
| Ratios to Average Net AssetsF,G | |||||
| Expenses before reductions | .39% | .39% | .39% H | ||
| Expenses net of fee waivers, if any | .39% | .39% | .39% H | ||
| Expenses net of all reductions | .39% | .39% | .39% H | ||
| Net investment income (loss) | 2.60% | 3.74% | 3.38% H | ||
| Supplemental Data | |||||
| Net assets, end of period (000 omitted) | $14,254 | $13,135 | $12,532 | ||
| Portfolio turnover rateI | 76% J | 56% | 65% J,K | ||
| A | For the period January 16, 2018 (commencement of operations) to October 31, 2018. |
| B | Calculated based on average shares outstanding during the period. |
| C | Based on net asset value. |
| D | Total returns for periods of less than one year are not annualized. |
| E | Total returns would have been lower if certain expenses had not been reduced during the applicable periods shown. |
| F | Expense ratios reflect operating expenses of the class. Expenses before reductions do not reflect amounts reimbursed, waived, or reduced through arrangements with the investment advisor, brokerage services, or other offset arrangements, if applicable, and do not represent the amount paid by the class during periods when reimbursements, waivers or reductions occur. |
| G | Fees and expenses of any underlying mutual funds or exchange-traded funds (ETFs) are not included in the Fund’s expense ratio. The Fund indirectly bears its proportionate share of these expenses. For additional expense information related to investments in Fidelity Central Funds, please refer to the "Investments in Fidelity Central Funds" note found in the Notes to Financial Statements section of the most recent Annual or Semi-Annual report. |
| H | Annualized. |
| I | Amount does not include the portfolio activity of any underlying mutual funds or exchange-traded funds (ETFs). |
| J | Portfolio turnover rate excludes securities received or delivered in-kind. |
| K | Amount not annualized. |
| 41 | Annual Report |
For the period ended October 31, 2020
| Annual Report | 42 |
contracts, Exchange-Traded Funds (ETFs) and certain indexes as well as quoted prices for similar securities may be used and would be categorized as Level 2 in the hierarchy. For equity securities, including restricted securities, where observable inputs are limited, assumptions about market activity and risk are used and these securities may be categorized as Level 3 in the hierarchy.
| 43 | Annual Report |
As of period end, the cost and unrealized appreciation (depreciation) in securities, and derivatives if applicable, for federal income tax purposes were as follows for each Fund:
| Tax cost | Gross unrealized appreciation | Gross unrealized depreciation | Net unrealized appreciation (depreciation) on securities and other investments | |
| Fidelity Emerging Markets Multifactor ETF | $ 9,445,511 | $ 893,994 | $ (1,108,539) | $ (214,545) |
| Fidelity International High Dividend ETF | 56,562,648 | 230,302 | (10,843,800) | (10,613,498) |
| Fidelity International Multifactor ETF | 7,270,297 | 537,787 | (699,997) | (162,210) |
| Fidelity International Value Factor ETF | 15,311,728 | 680,118 | (1,840,499) | (1,160,381) |
| Undistributed ordinary income | Undistributed capital gains | Capital loss carryforward | Net unrealized appreciation (depreciation) | |
| Fidelity Emerging Markets Multifactor ETF | $ 23,561 | $ — | $ (550,930) | $ (232,638) |
| Fidelity International High Dividend ETF | 62,682 | — | (8,241,124) | (10,609,184) |
| Fidelity International Multifactor ETF | 711 | — | (340,920) | (160,963) |
| Fidelity International Value Factor ETF | 40,869 | — | (2,845,663) | (1,158,249) |
| No-expiration Short-term | No-expiration Long-term | Total capital loss carryforward | |
| Fidelity Emerging Markets Multifactor ETF | $ (451,257) | $ (99,673) | $ (550,930) |
| Fidelity International High Dividend ETF | (4,434,825) | (3,806,299) | (8,241,124) |
| Fidelity International Multifactor ETF | (268,778) | (72,142) | (340,920) |
| Fidelity International Value Factor ETF | (912,557) | (1,933,106) | (2,845,663) |
| October 31, 2020 | ||||
| Ordinary Income | Long-Term Capital Gain | Tax Return Of Capital | Total | |
| Fidelity Emerging Markets Multifactor ETF | $ 214,800 | $ — | $ — | $ 214,800 |
| Fidelity International High Dividend ETF | 1,450,300 | — | — | 1,450,300 |
| Fidelity International Multifactor ETF | 266,800 | — | — | 266,800 |
| Fidelity International Value Factor ETF | 346,400 | — | — | 346,400 |
| October 31, 2019 | ||||
| Fidelity Emerging Markets Multifactor ETF | $ 190,400 | $ — | $ — | $ 190,400 |
| Fidelity International High Dividend ETF | 1,635,200 | — | — | 1,635,200 |
| Fidelity International Multifactor ETF | 214,400 | — | — | 214,400 |
| Fidelity International Value Factor ETF | 508,200 | — | — | 508,200 |
| Annual Report | 44 |
| Purchases | Sales | |
| Fidelity Emerging Markets Multifactor ETF | $ 6,038,962 | $ 6,003,204 |
| Fidelity International High Dividend ETF | 34,005,138 | 32,755,017 |
| Fidelity International Multifactor ETF | 6,669,640 | 6,824,592 |
| Fidelity International Value Factor ETF | 10,493,714 | 10,352,380 |
| In-kind Subscriptions | In-kind Redemptions | |
| Fidelity Emerging Markets Multifactor ETF | $ — | $ — |
| Fidelity International High Dividend ETF | 32,310,857 | 18,209,237 |
| Fidelity International Multifactor ETF | — | 2,433,124 |
| Fidelity International Value Factor ETF | 3,154,106 | — |
| 45 | Annual Report |
| Total Security Lending Income Fees Paid to NFS | Security Lending Income From Securities Loaned to NFS | Value of Securities Loaned to NFS at Period End | ||
| Fidelity International High Dividend ETF | $ — | $ — | $ — |
| Amount | |
| Fidelity Emerging Markets Multifactor ETF | $ 150 |
| Fidelity International High Dividend ETF | 112 |
| Fidelity International Multifactor ETF | 45 |
| Fidelity International Value Factor ETF | 91 |
| Fund-Level Amount | |
| Fidelity Emerging Markets Multifactor ETF | $ 114 |
| Fidelity International Multifactor ETF | 75 |
| Fidelity International Value Factor ETF | 155 |
| Annual Report | 46 |
| 47 | Annual Report |
| Annual Report | 48 |
| Fidelity Emerging Markets Multifactor ETF | ||||
| Period Ended October 31, 2020 | ||||
| From commencement of operations * to October 31, 2020 | Closing Price Below NAV | Closing Price Above or Equal to NAV | ||
| Basis Point Differential | Number of Days | % of Total Days | Number of Days | % of Total Days |
| 0 - <25 | 30 | 7.08% | 51 | 12.03% |
| 25 - <50 | 14 | 3.30% | 123 | 29.01% |
| 50 - <75 | 8 | 1.89% | 110 | 25.94% |
| 75 - <100 | 5 | 1.18% | 38 | 8.96% |
| 100 or above | 9 | 2.12% | 36 | 8.49% |
| Total | 66 | 15.57% | 358 | 84.43% |
| Fidelity International High Dividend ETF | ||||
| Period Ended October 31, 2020 | ||||
| From commencement of operations * to October 31, 2020 | Closing Price Below NAV | Closing Price Above or Equal to NAV | ||
| Basis Point Differential | Number of Days | % of Total Days | Number of Days | % of Total Days |
| 0 - <25 | 80 | 11.38% | 139 | 19.77% |
| 25 - <50 | 36 | 5.12% | 174 | 24.75% |
| 50 - <75 | 16 | 2.28% | 146 | 20.77% |
| 75 - <100 | 11 | 1.56% | 63 | 8.96% |
| 100 or above | 14 | 1.99% | 24 | 3.41% |
| Total | 157 | 22.33% | 546 | 77.67% |
| Fidelity International Multifactor ETF | ||||
| Period Ended October 31, 2020 | ||||
| From commencement of operations * to October 31, 2020 | Closing Price Below NAV | Closing Price Above or Equal to NAV | ||
| Basis Point Differential | Number of Days | % of Total Days | Number of Days | % of Total Days |
| 0 - <25 | 54 | 12.74% | 129 | 30.42% |
| 25 - <50 | 16 | 3.77% | 121 | 28.54% |
| 50 - <75 | 8 | 1.89% | 50 | 11.79% |
| 75 - <100 | 6 | 1.42% | 20 | 4.72% |
| 100 or above | 6 | 1.42% | 14 | 3.30% |
| Total | 90 | 21.23% | 334 | 78.77% |
| 49 | Annual Report |
| Fidelity International Value Factor ETF | ||||
| Period Ended October 31, 2020 | ||||
| From commencement of operations * to October 31, 2020 | Closing Price Below NAV | Closing Price Above or Equal to NAV | ||
| Basis Point Differential | Number of Days | % of Total Days | Number of Days | % of Total Days |
| 0 - <25 | 121 | 17.21% | 199 | 28.31% |
| 25 - <50 | 33 | 4.69% | 158 | 22.48% |
| 50 - <75 | 14 | 1.99% | 103 | 14.65% |
| 75 - <100 | 6 | 0.85% | 31 | 4.41% |
| 100 or above | 13 | 1.85% | 25 | 3.56% |
| Total | 187 | 26.60% | 516 | 73.40% |
| Annual Report | 50 |
| 51 | Annual Report |
| Annual Report | 52 |
| 53 | Annual Report |
| Annual Report | 54 |
| 55 | Annual Report |
| Annual Report | 56 |
| 57 | Annual Report |
| Annual Report | 58 |
| Annualized Expense RatioA | Beginning Account Value May 1, 2020 | Ending Account Value October 31, 2020 | Expenses Paid During PeriodB May 1, 2020 to October 31, 2020 | |
| Fidelity Emerging Markets Multifactor ETF | 0.45% | |||
| Actual | $ 1,000.00 | $ 1,115.10 | $ 2.39 | |
| Hypothetical C | $ 1,000.00 | $ 1,022.87 | $ 2.29 | |
| Fidelity International High Dividend ETF | 0.39% | |||
| Actual | $ 1,000.00 | $ 984.60 | $ 1.95 | |
| Hypothetical C | $ 1,000.00 | $ 1,023.18 | $ 1.98 | |
| Fidelity International Multifactor ETF | 0.39% | |||
| Actual | $ 1,000.00 | $ 1,070.70 | $ 2.03 | |
| Hypothetical C | $ 1,000.00 | $ 1,023.18 | $ 1.98 | |
| Fidelity International Value Factor ETF | 0.39% | |||
| Actual | $ 1,000.00 | $ 1,038.10 | $ 2.00 | |
| Hypothetical C | $ 1,000.00 | $ 1,023.18 | $ 1.98 |
| A | Annualized expense ratio reflects expenses net of applicable fee waivers. |
| B | Expenses are equal to the annualized expense ratio, multiplied by the average account value over the period, multiplied by 184/366 (to reflect the one-half year period). The fees and expenses of any Underlying Funds are not included in each annualized expense ratio. |
| C | 5% return per year before expenses. |
| 59 | Annual Report |
| December 2019 | March 2020 | June 2020 | September 2020 | |
| Fidelity Emerging Markets Multifactor ETF | 100% | 75% | 75% | 75% |
| Fidelity International High Dividend ETF | 100% | 98% | 98% | 98% |
| Fidelity International Multifactor ETF | 100% | 96% | 96% | 96% |
| Fidelity International Value Factor ETF | 100% | 100% | 100% | 100% |
| Ex-Date | Income | Taxes | ||
| Fidelity Emerging Markets Multifactor ETF | 12/20/2019 | $ 0.7399 | $ 0.1018 | |
| 3/20/2020 | $ 0.7399 | $ 0.1018 | ||
| 6/19/2020 | $ 0.7399 | $ 0.1018 | ||
| 9/18/2020 | $ 0.7399 | $ 0.1018 | ||
| Fidelity International High Dividend ETF | 12/20/2019 | $ 0.5406 | $ 0.0417 | |
| 3/20/2020 | $ 0.5406 | $ 0.0417 | ||
| 6/19/2020 | $ 0.5406 | $ 0.0417 | ||
| 9/18/2020 | $ 0.5406 | $ 0.0417 | ||
| Fidelity International Multifactor ETF | 12/20/2019 | $ 0.9852 | $ 0.1072 | |
| 3/20/2020 | $ 0.9852 | $ 0.1072 | ||
| 6/19/2020 | $ 0.9852 | $ 0.1072 | ||
| 9/18/2020 | $ 0.9852 | $ 0.1072 | ||
| Fidelity International Value Factor ETF | 12/20/2019 | $ 0.5644 | $ 0.0476 | |
| 3/20/2020 | $ 0.5644 | $ 0.0476 | ||
| 6/19/2020 | $ 0.5644 | $ 0.0476 | ||
| 9/18/2020 | $ 0.5644 | $ 0.0476 |
| Annual Report | 60 |
| Item 2. | Code of Ethics |
As of the end of the period, October 31, 2020, Fidelity Covington Trust (the trust) has adopted a code of ethics, as defined in Item 2 of Form N-CSR, that applies to its President and Treasurer and its Chief Financial Officer. A copy of the code of ethics is filed as an exhibit to this Form N-CSR.
| Item 3. | Audit Committee Financial Expert |
The Board of Trustees of the trust has determined that Joseph Mauriello is an audit committee financial expert, as defined in Item 3 of Form N-CSR. Mr. Mauriello is independent for purposes of Item 3 of Form N-CSR.
| Item 4. | Principal Accountant Fees and Services |
Fees and Services
The following table presents fees billed by Deloitte & Touche LLP, the member firms of Deloitte Touche Tohmatsu, and their respective affiliates (collectively, “Deloitte Entities”) in each of the last two fiscal years for services rendered to Fidelity Emerging Markets Multifactor ETF, Fidelity International High Dividend ETF, Fidelity International Multifactor ETF and Fidelity International Value Factor ETF (the “Fund(s)”):
Services Billed by Deloitte Entities
October 31, 2020 FeesA
| Audit Fees | Audit- Related Fees | Tax Fees | All Other Fees | |||||||||||||
Fidelity Emerging Markets Multifactor ETF | $ | 16,500 | $ | — | $ | 3,500 | $ | 400 | ||||||||
Fidelity International High Dividend ETF | $ | 16,500 | $ | — | $ | 3,500 | $ | 400 | ||||||||
Fidelity International Multifactor ETF | $ | 16,500 | $ | — | $ | 3,500 | $ | 400 | ||||||||
Fidelity International Value Factor ETF | $ | 16,500 | $ | — | $ | 3,500 | $ | 400 | ||||||||
October 31, 2019 FeesA,B
| Audit Fees | Audit- Related Fees | Tax Fees | All Other Fees | |||||||||||||
Fidelity Emerging Markets Multifactor ETF | $ | 15,000 | $ | — | $ | 2,500 | $ | 300 | ||||||||
Fidelity International High Dividend ETF | $ | 18,000 | $ | — | $ | 2,500 | $ | 300 | ||||||||
Fidelity International Multifactor ETF | $ | 15,000 | $ | — | $ | 2,500 | $ | 300 | ||||||||
Fidelity International Value Factor ETF | $ | 18,000 | $ | — | $ | 2,500 | $ | 300 |
| A | Amounts may reflect rounding. |
| B | Fidelity Emerging Markets Multifactor ETF and Fidelity International Multifactor ETF commenced operations on February 26, 2019. |
The following table(s) present(s) fees billed by Deloitte Entities that were required to be approved by the Audit Committee for services that relate directly to the operations and financial reporting of the Fund(s) and that are rendered on behalf of Fidelity Management & Research Company LLC (“FMR”) and entities controlling, controlled by, or under common control with FMR (not including any sub-adviser whose role is primarily portfolio management and is subcontracted with or overseen by another investment adviser) that provide ongoing services to the Fund(s) (“Fund Service Providers”):
Services Billed by Deloitte Entities
| October 31, 2020A | October 31, 2019A,B | |||||||
Audit-Related Fees | $ | — | $ | 290,000 | ||||
Tax Fees | $ | — | $ | 5,000 | ||||
All Other Fees | $ | — | $ | — | ||||
| A | Amounts may reflect rounding. |
| B | May include amounts billed prior to the Fidelity Emerging Markets Multifactor ETF and Fidelity International Multifactor ETFs’ commencement of operations. |
“Audit-Related Fees” represent fees billed for assurance and related services that are reasonably related to the performance of the fund audit or the review of the fund’s financial statements and that are not reported under Audit Fees.
“Tax Fees” represent fees billed for tax compliance, tax advice or tax planning that relate directly to the operations and financial reporting of the fund.
“All Other Fees” represent fees billed for services provided to the fund or Fund Service Provider, a significant portion of which are assurance related, that relate directly to the operations and financial reporting of the fund, excluding those services that are reported under Audit Fees, Audit-Related Fees or Tax Fees.
Assurance services must be performed by an independent public accountant.
* * *
The aggregate non-audit fees billed by Deloitte Entities for services rendered to the Fund(s), FMR (not including any sub-adviser whose role is primarily portfolio management and is subcontracted with or overseen by another investment adviser), and any Fund Service Provider for each of the last two fiscal years of the Fund(s) are as follows:
Billed By | October 31, 2020A | October 31, 2019A,B | ||||||
Deloitte Entities | $ | 517,200 | $ | 585,000 | ||||
| A | Amounts may reflect rounding. |
| B | May include amounts billed prior to the Fidelity Emerging Markets Multifactor ETF and Fidelity International Multifactor ETFs’ commencement of operations. |
The trust’s Audit Committee has considered non-audit services that were not pre-approved that were provided by Deloitte Entities to Fund Service Providers to be compatible with maintaining the independence of Deloitte Entities in its(their) audit of the Fund(s), taking into account representations from Deloitte Entities, in accordance with Public Company Accounting Oversight Board rules, regarding its independence from the Fund(s) and its(their) related entities and FMR’s review of the appropriateness and permissibility under applicable law of such non-audit services prior to their provision to the Fund(s) Service Providers.
Audit Committee Pre-Approval Policies and Procedures
The trust’s Audit Committee must pre-approve all audit and non-audit services provided by a fund’s independent registered public accounting firm relating to the operations or financial reporting of the fund. Prior to the commencement of any audit or non-audit services to a fund, the Audit Committee reviews the services to determine whether they are appropriate and permissible under applicable law.
The Audit Committee has adopted policies and procedures to, among other purposes, provide a framework for the Committee’s consideration of non-audit services by the audit firms that audit the Fidelity funds. The policies and procedures require that any non-audit service provided by a fund audit firm to a Fidelity fund and any non-audit service provided by a fund auditor to a Fund Service Provider that relates directly to the operations and financial reporting of a Fidelity fund (“Covered Service”) are subject to approval by the Audit Committee before such service is provided.
All Covered Services must be approved in advance of provision of the service either: (i) by formal resolution of the Audit Committee, or (ii) by oral or written approval of the service by the Chair of the Audit Committee (or if the Chair is unavailable, such other member of the Audit Committee as may be designated by the Chair to act in the Chair’s absence). The approval contemplated by (ii) above is permitted where the Treasurer determines that action on such an engagement is necessary before the next meeting of the Audit Committee.
Non-audit services provided by a fund audit firm to a Fund Service Provider that do not relate directly to the operations and financial reporting of a Fidelity fund are reported to the Audit Committee periodically.
Non-Audit Services Approved Pursuant to Rule 2-01(c)(7)(i)(C) and (ii) of Regulation S-X (“De Minimis Exception”)
There were no non-audit services approved or required to be approved by the Audit Committee pursuant to the De Minimis Exception during the Fund’s(s’) last two fiscal years relating to services provided to (i) the Fund(s) or (ii) any Fund Service Provider that relate directly to the operations and financial reporting of the Fund(s).
| Item 5. | Audit Committee of Listed Registrants |
The Audit Committee is a separately-designated standing audit committee in accordance with Section 3(a)(58)(A) of the Securities Exchange Act of 1934. As of October 31, 2020, the members of the Audit Committee were Joseph Mauriello, Donald F. Donahue, Patricia L. Kampling, Alan J. Lacy, Garnett A. Smith and Susan Tomasky.
| Item 6. | Investments |
| (a) | Not applicable. |
| (b) | Not applicable. |
| Item 7. | Disclosure of Proxy Voting Policies and Procedures for Closed-End Management Investment Companies |
Not applicable.
| Item 8. | Portfolio Managers of Closed-End Management Investment Companies |
Not applicable.
| Item 9. | Purchase of Equity Securities by Closed-End Management Investment Company and Affiliated Purchasers |
Not applicable.
| Item 10. | Submission of Matters to a Vote of Security Holders |
There were no material changes to the procedures by which shareholders may recommend nominees to the trust’s Board of Trustees.
| Item 11. | Controls and Procedures |
(a)(i) The President and Treasurer and the Chief Financial Officer have concluded that the trust’s disclosure controls and procedures (as defined in Rule 30a-3(c) under the Investment Company Act) provide reasonable assurances that material information relating to the trust is made known to them by the appropriate persons, based on their evaluation of these controls and procedures as of a date within 90 days of the filing date of this report.
(a)(ii) There was no change in the trust’s internal control over financial reporting (as defined in Rule 30a-3(d) under the Investment Company Act) that occurred during the period covered by this report that has materially affected, or is reasonably likely to materially affect, the trust’s internal control over financial reporting.
| Item 12. | Disclosure of Securities Lending Activities for Closed-End Management Investment Companies |
Not applicable.
| Item 13. | Exhibits |
SIGNATURES
Pursuant to the requirements of the Securities Exchange Act of 1934 and the Investment Company Act of 1940, the registrant has duly caused this report to be signed on its behalf by the undersigned, thereunto duly authorized.
Fidelity Covington Trust
By: | /s/Stacie M. Smith | |
| Stacie M. Smith | ||
| President and Treasurer | ||
Date: | December 18, 2020 |
Pursuant to the requirements of the Securities Exchange Act of 1934 and the Investment Company Act of 1940, this report has been signed below by the following persons on behalf of the registrant and in the capacities and on the dates indicated.
By: | /s/Stacie M. Smith | |
| Stacie M. Smith | ||
| President and Treasurer | ||
Date: | December 18, 2020 |
By: | /s/John J. Burke III | |
| John J. Burke III | ||
| Chief Financial Officer | ||
Date: | December 18, 2020 |