The Board also considered the nature, extent and quality of services provided by BFA. The Trustees noted that under the Sub-Advisory Agreement, subject to oversight by Fidelity, BFA is responsible for, among other things, identifying investments, arranging for execution of portfolio transactions to implement each fund’s investment strategy, and performing certain ETF-related services. In addition, the Trustees noted that BFA is responsible for providing such reporting as may be requested by Fidelity to fulfill its oversight responsibilities discussed above.
Resources Dedicated to Investment Management and Support Services. The Board and the Fund Oversight and Research Committees reviewed the general qualifications and capabilities of Fidelity’s and BFA’s investment staffs, including their size, education, experience, and resources, as well as Fidelity’s and BFA’s approach to recruiting, training, managing, and compensating investment personnel. The Board considered that Fidelity’s and BFA’s investment professionals have extensive resources, tools and capabilities so as to provide competitive investment results over time, and that those professionals also have access to sophisticated tools that permit them to assess portfolio construction and risk and performance attribution characteristics continuously. Additionally, in its deliberations, the Board considered Fidelity’s and BFA’s trading, risk management, compliance, and technology and operations capabilities and resources, which are integral parts of the investment management process.
Shareholder and Administrative Services. The Board considered (i) the nature, extent, quality, and cost of advisory and administrative services provided by the Investment Advisers and their affiliates under the Advisory Contracts and by FMR’s affiliates under a separate agreement covering pricing and bookkeeping services for each fund; (ii) the nature and extent of Fidelity’s supervision of third party service providers, principally State Street Bank and Trust Company, each fund’s transfer agent and custodian; and (iii) the resources devoted by Fidelity to, and the record of compliance with, each fund’s compliance policies and procedures. The Board also reviewed the allocation of fund brokerage, including allocations to brokers affiliated with the Investment Advisers. The Board also considered each fund’s securities lending activities and any payments made to Fidelity relating to securities lending, under a separate agreement.
The Board noted that the growth of fund assets over time across the complex allows Fidelity to reinvest in the development of services designed to enhance the value and convenience of the Fidelity funds as investment vehicles. These services include 24-hour access to account information and market information over the Internet and through telephone representatives, investor education materials, and asset allocation tools. The Board also considered that it reviews customer service metrics such as telephone response times, continuity of services on the website and metrics addressing services at Fidelity Investor Centers.
Investment in a Large Fund Family. The Board considered the benefits to shareholders of investing in a fund that is part of a large family of funds offering a variety of investment disciplines and providing a large variety of fund investor services. The Board noted that Fidelity had taken, or had made recommendations that resulted in the Fidelity funds taking, a number of actions over the previous year that benefited particular funds and/or the Fidelity funds in general.
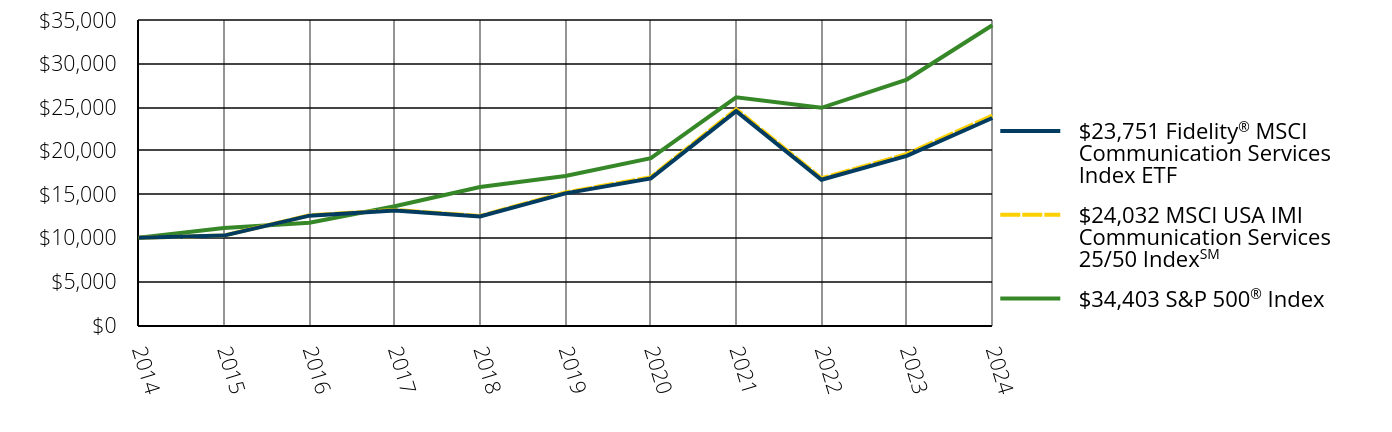
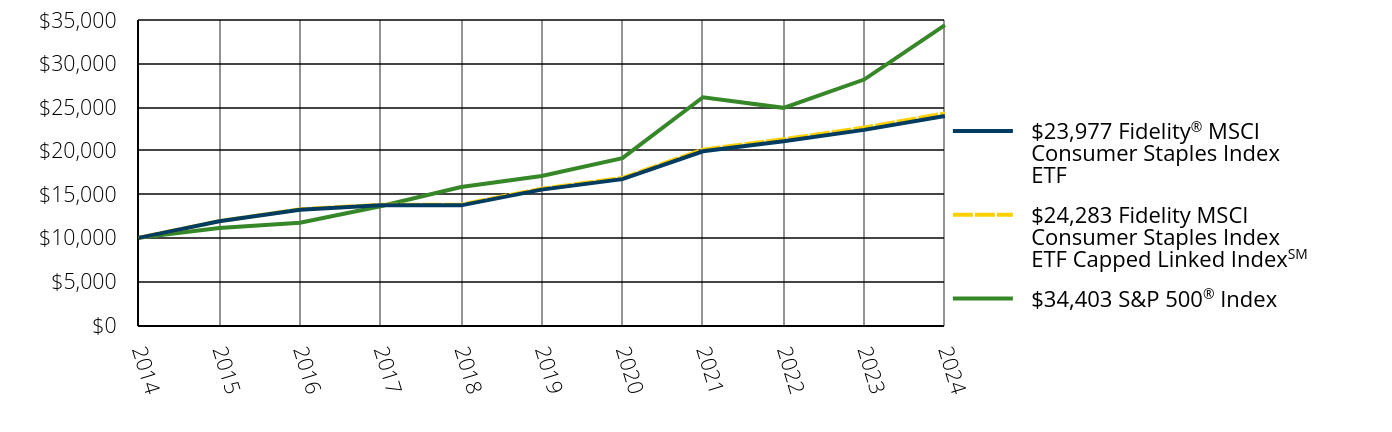
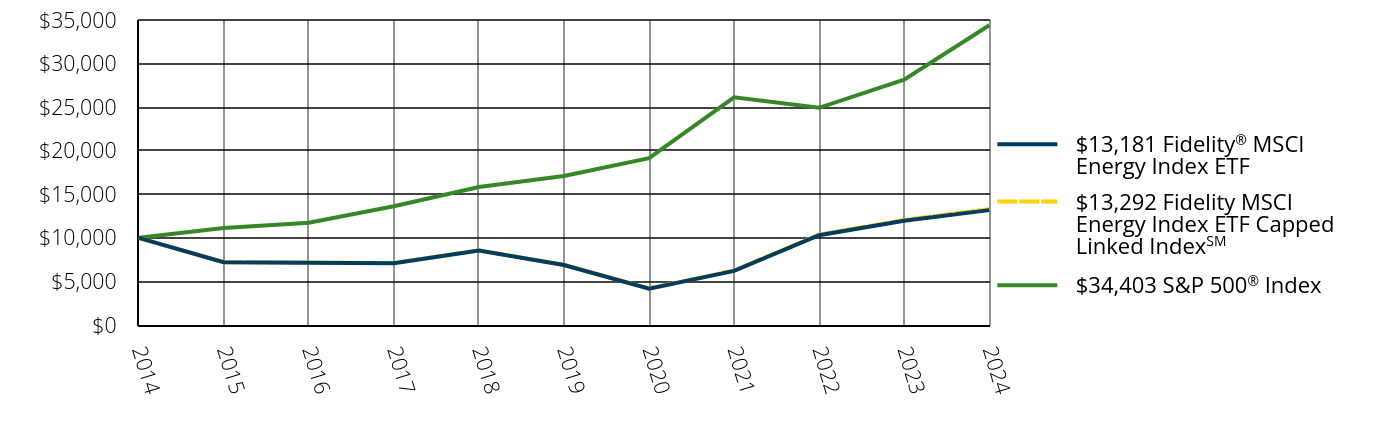
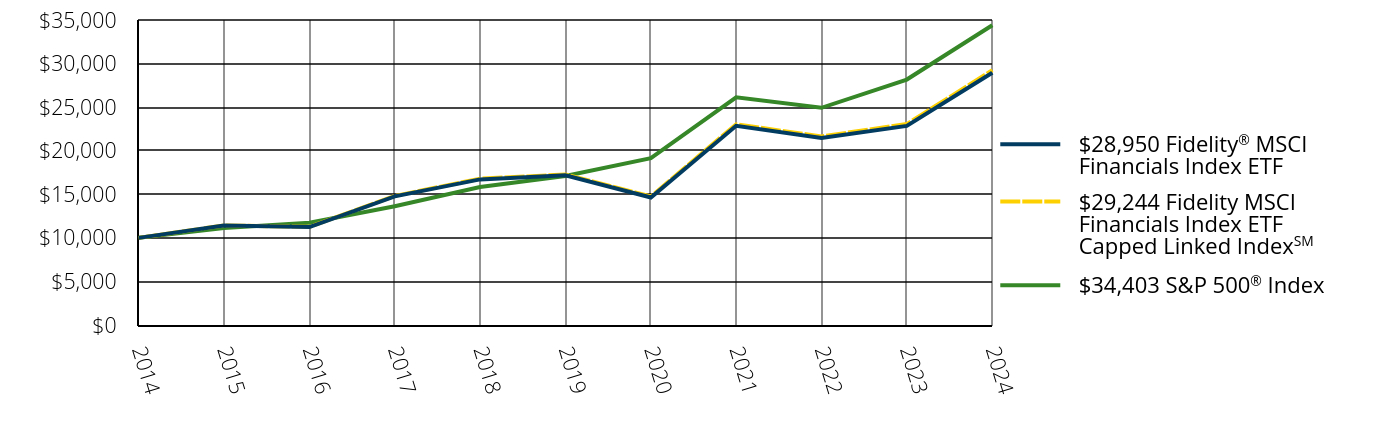
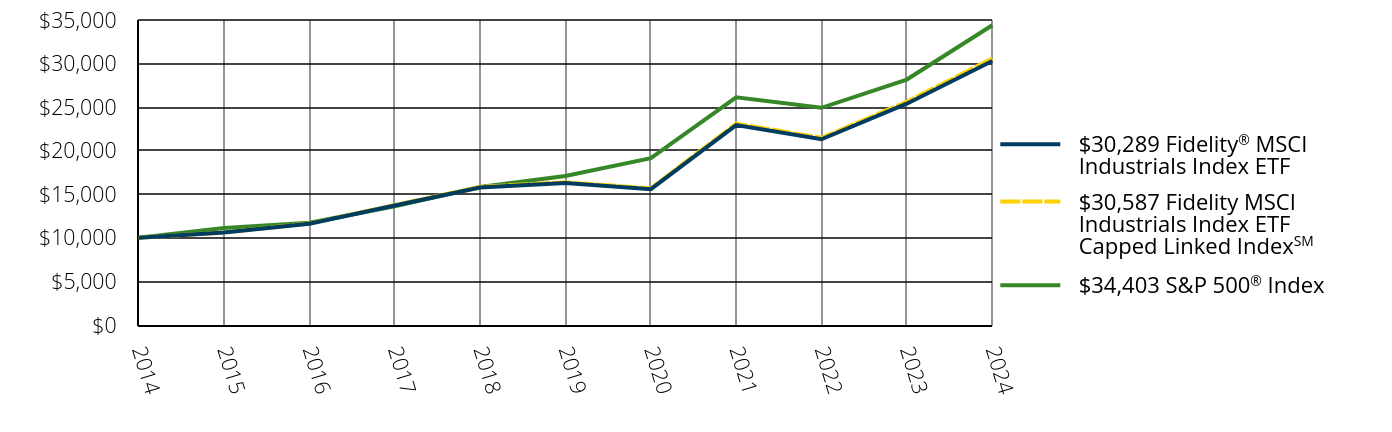
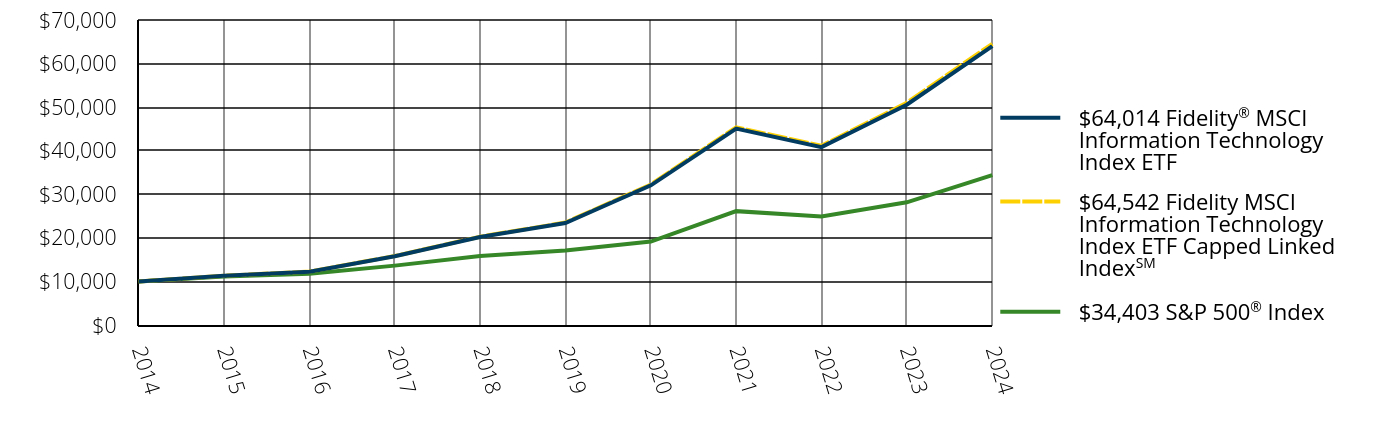
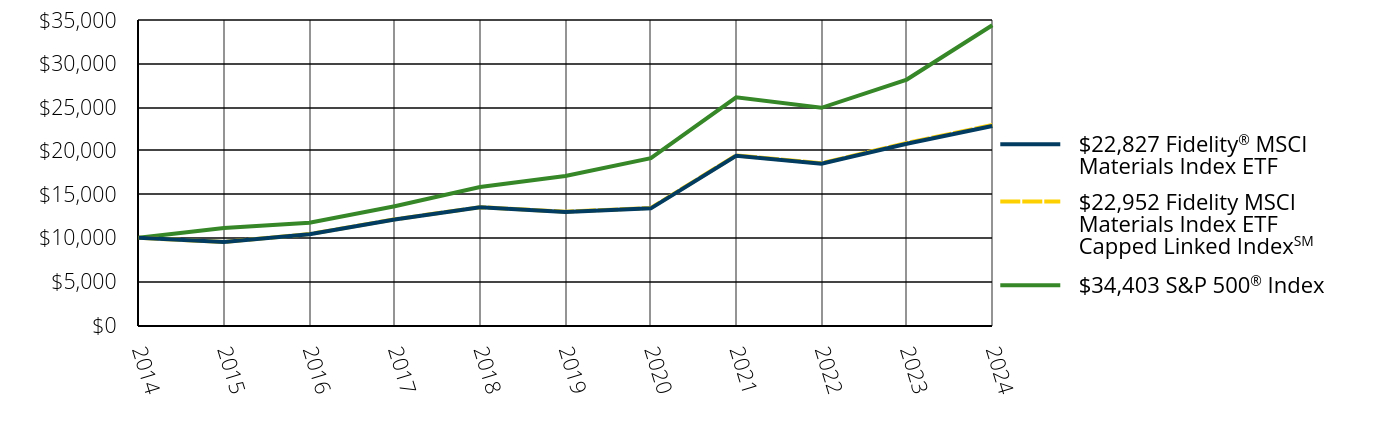
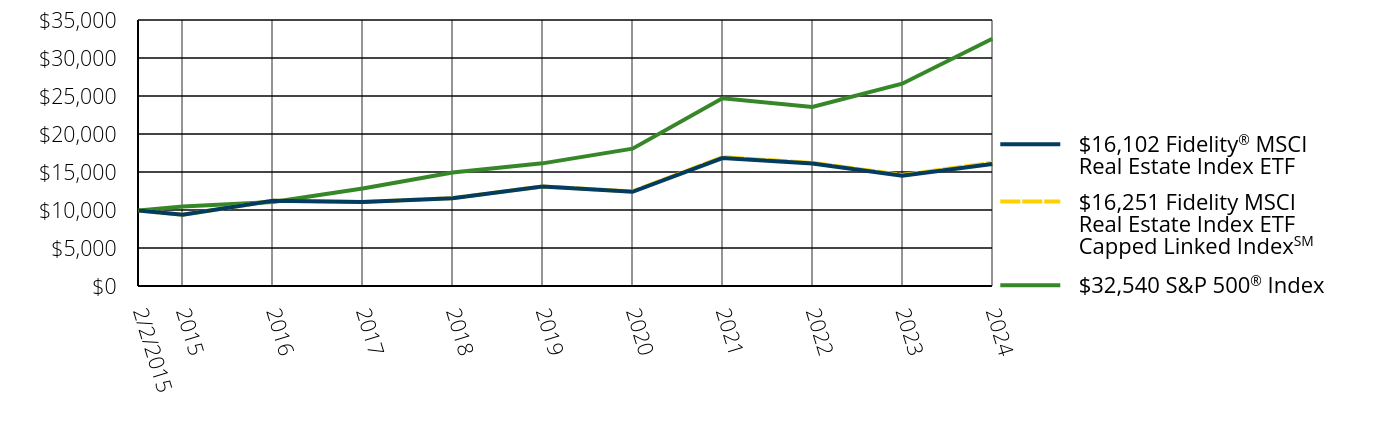
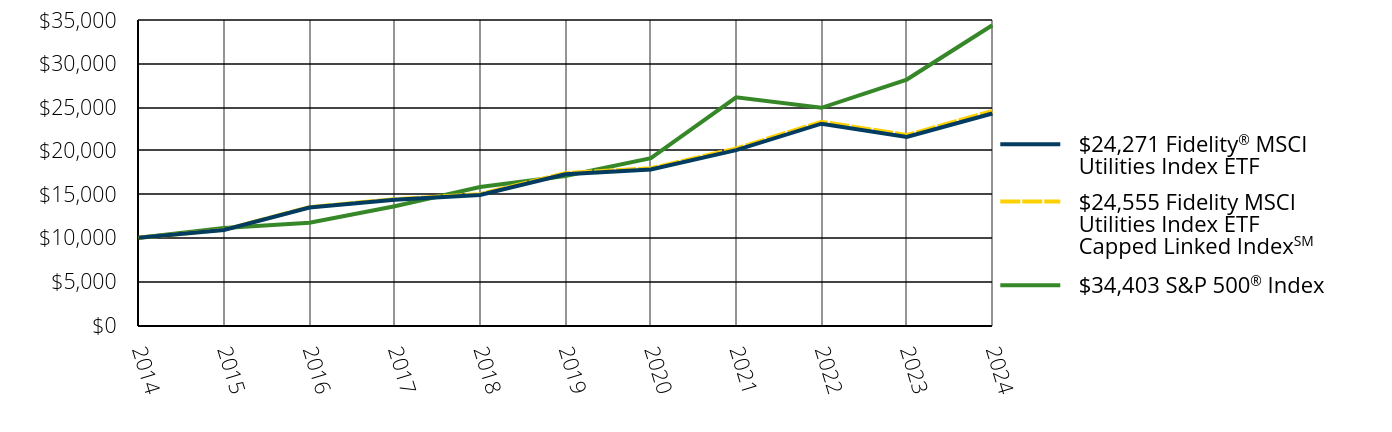
Investment Performance. The Board took into account discussions that occur with representatives of the Investment Advisers, and reports that it receives, at Board meetings throughout the year relating to fund investment performance. In this regard the Board noted that as part of regularly scheduled fund reviews and other reports to the Board on fund performance, the Board considered annualized return information for each fund for different time periods, measured against the securities market index the fund seeks to track. The Board also periodically considered each fund’s tracking error versus its benchmark index. In its ongoing evaluation of fund investment performance, the Board gives particular attention to information indicating changes in performance of the funds over different time periods and discussed with the Investment Advisers the reasons for any overperformance or underperformance. The Board also considered information on each fund’s bid-ask spread and premium/discount.
In addition to reviewing absolute and relative fund performance, the Independent Trustees periodically consider the appropriateness of fund performance metrics in evaluating the results achieved. In general, the Independent Trustees believe that an index fund’s performance should be evaluated based on net performance (after fees and expenses) of the fund compared to a fund’s benchmark index, over appropriate time periods taking into account relevant factors including the following: general market conditions; the characteristics of the fund’s benchmark index; the extent to which statistical sampling is employed; any securities lending revenues; and fund cash flows and other factors.
Based on its review, the Board concluded that the nature, extent, and quality of services provided to each fund under the Advisory Contracts should continue to benefit the shareholders of each fund.
Competitiveness of Management Fee and Total Expense Ratio. The Board was provided with information regarding industry trends in management fees and expenses. In its review of each fund’s management fee and total expense ratio, the Board considered each fund’s all-inclusive fee rate and also considered other expenses, such as transfer agent fees, pricing and bookkeeping fees, and custodial, legal, and audit fees, paid by FMR under each fund’s all-inclusive arrangement. The Board noted that Fidelity may agree to waive fees or reimburse expenses from time to time, and the extent to which, if any, it has done so for each fund.
Comparisons of Management Fees and Total Expense Ratios. Among other things, the Board reviewed data for selected groups of competitive funds and classes (referred to as “mapped groups”) that were compiled by Fidelity based on combining similar investment objective categories (as classified by Morningstar) that have comparable investment mandates. The data reviewed by the Board included (i) gross management fee comparisons (before taking into account expense reimbursements or caps) relative to the total universe of funds within the mapped group; (ii) gross management fee comparisons relative to a subset of non-Fidelity funds in the mapped group that are similar in size and management fee structure to each fund (referred to as the “asset size peer group”); (iii) total expense comparisons of each fund relative to funds and classes