UNITED STATES
SECURITIES AND EXCHANGE COMMISSION
WASHINGTON, D.C. 20549
FORM 10-Q
(Mark One)
S QUARTERLY REPORT PURSUANT TO SECTION 13 OR 15(d) OF THE SECURITIES EXCHANGE ACT OF 1934
For the quarterly period ended September 30, 2008
OR
£ TRANSITION REPORT PURSUANT TO SECTION 13 OR 15(d) OF THE SECURITIES EXCHANGE ACT OF 1934
FOR THE TRANSITION PERIOD FROM TO
Commission file number: 33-92990; 333-149862
TIAA REAL ESTATE ACCOUNT
(Exact name of registrant as specified in its charter)
NEW YORK
(State or other jurisdiction of
incorporation or organization)
NOT APPLICABLE
(I.R.S. Employer Identification No.)
C/O TEACHERS INSURANCE AND
ANNUITY ASSOCIATION OF AMERICA
730 THIRD AVENUE
NEW YORK, NEW YORK 10017-3206
(Address of principal executive offices, including zip code)
Registrant’s telephone number, including area code: (212) 490-9000
Indicate by check mark whether the Registrant (1) has filed all reports required to be filed by Section 13 or 15(d) of the Securities Exchange Act of 1934 during the preceding 12 months (or for such shorter period that the Registrant was required to file such reports), and (2) has been subject to such filing requirements for the past 90 days.
YESS NO£
Indicate by check mark whether the registrant is a large accelerated filer, an accelerated filer, a non-accelerated filer, or smaller reporting company. See the definitions of “large accelerated filer,” “accelerated filer” and “smaller reporting company” in Rule 12b-2 of the Exchange Act. (Check one):
| | |
Large accelerated filer£ | | Accelerated filer£ |
Non-accelerated filerS | | Smaller Reporting Company£ |
(Do not check if a smaller reporting company)
Indicate by check mark whether the registrant is a shell company (as defined in Rule 12b-2 of the Exchange Act).
YES£ NOS
PART I. FINANCIAL INFORMATION
ITEM 1. FINANCIAL STATEMENTS.
INDEX TO UNAUDITED FINANCIAL STATEMENTS
TIAA REAL ESTATE ACCOUNT
SEPTEMBER 30, 2008
2
TIAA REAL ESTATE ACCOUNT
STATEMENTS OF ASSETS AND LIABILITIES
(In thousands, except per accumulation unit amounts)
| | | | |
| | September 30,
2008 | | December 31,
2007 |
| | (Unaudited) | | |
ASSETS | | | | |
Investments, at fair value: | | | | |
Real estate properties
(cost: $10,035,579 and $9,804,489) | | | $ | | 11,783,941 | | | | $ | | 11,983,715 | |
Real estate joint ventures and limited partnerships
(cost: $2,314,650 and $2,260,919) | | | | 2,960,646 | | | | | 3,158,870 | |
Marketable securities: | | | | |
Real estate related
(cost: $0 and $439,154) | | | | — | | | | | 426,630 | |
Other
(cost: $1,620,965 and $3,371,896) | | | | 1,619,761 | | | | | 3,371,866 | |
Mortgage loan receivable
(cost: $75,000 and $75,000) | | | | 71,428 | | | | | 72,520 | |
| | | | |
Total investments
(cost: $14,046,194 and $15,951,458) | | | | 16,435,776 | | | | | 19,013,601 | |
Cash | | | | 305,055 | | | | | 6,144 | |
Due from investment advisor | | | | — | | | | | 11,196 | |
Other | | | | 556,443 | | | | | 201,826 | |
| | | | |
TOTAL ASSETS | | | | 17,297,274 | | | | | 19,232,767 | |
| | | | |
LIABILITIES | | | | |
Mortgage loans payable—Note 5
(principal outstanding: $1,748,870 and $1,427,857) | | | | 1,697,506 | | | | | 1,392,093 | |
Payable for securities transactions | | | | 11 | | | | | 866 | |
Due to investment advisor | | | | 38,298 | | | | | — | |
Accrued real estate property level expenses | | | | 198,297 | | | | | 154,639 | |
Security deposits held | | | | 24,331 | | | | | 24,632 | |
| | | | |
TOTAL LIABILITIES | | | | 1,958,443 | | | | | 1,572,230 | |
| | | | |
NET ASSETS | | | | |
Accumulation Fund | | | | 14,849,709 | | | | | 17,160,703 | |
Annuity Fund | | | | 489,122 | | | | | 499,834 | |
| | | | |
TOTAL NET ASSETS | | | $ | | 15,338,831 | | | | $ | | 17,660,537 | |
| | | | |
NUMBER OF ACCUMULATION UNITS OUTSTANDING—
Notes 6 and 7 | | | | 48,226 | | | | | 55,106 | |
| | | | |
NET ASSET VALUE, PER ACCUMULATION UNIT—Note 6 | | | $ | | 307.92 | | | | $ | | 311.41 | |
| | | | |
See notes to the financial statements.
3
TIAA REAL ESTATE ACCOUNT
STATEMENTS OF OPERATIONS
(In thousands)
(Unaudited)
| | | | | | | | |
| | For the Three Months
Ended September 30, | | For the Nine Months
Ended September 30, |
| | 2008 | | 2007 | | 2008 | | 2007 |
INVESTMENT INCOME | | | | | | | | |
Real estate income, net: | | | | | | | | |
Rental income | | | $ | | 245,433 | | | | $ | | 247,367 | | | | $ | | 739,241 | | | | $ | | 744,644 | |
| | | | | | | | |
Real estate property level expenses and taxes: | | | | | | | | |
Operating expenses | | | | 66,322 | | | | | 60,951 | | | | | 194,258 | | | | | 187,232 | |
Real estate taxes | | | | 33,843 | | | | | 31,290 | | | | | 100,594 | | | | | 95,810 | |
Interest expense | | | | 21,489 | | | | | 20,955 | | | | | 63,275 | | | | | 62,624 | |
| | | | | | | | |
Total real estate property level expenses and taxes | | | | 121,654 | | | | | 113,196 | | | | | 358,127 | | | | | 345,666 | |
| | | | | | | | |
Real estate income, net | | | | 123,779 | | | | | 134,171 | | | | | 381,114 | | | | | 398,978 | |
Income from real estate joint ventures and limited partnerships | | | | 25,088 | | | | | 21,830 | | | | | 93,712 | | | | | 68,270 | |
Interest | | | | 17,809 | | | | | 36,066 | | | | | 71,988 | | | | | 86,780 | |
Dividends | | | | — | | | | | 3,836 | | | | | 5,079 | | | | | 8,836 | |
| | | | | | | | |
TOTAL INVESTMENT INCOME | | | | 166,676 | | | | | 195,903 | | | | | 551,893 | | | | | 562,864 | |
| | | | | | | | |
Expenses—Note 2: | | | | | | | | |
Investment advisory charges | | | | 12,386 | | | | | 14,005 | | | | | 38,988 | | | | | 39,230 | |
Administrative and distribution charges | | | | 18,724 | | | | | 17,313 | | | | | 62,651 | | | | | 48,256 | |
Mortality and expense risk charges | | | | 2,074 | | | | | 2,104 | | | | | 6,421 | | | | | 5,861 | |
Liquidity guarantee charges | | | | 4,147 | | | | | 6,716 | | | | | 16,335 | | | | | 12,397 | |
| | | | | | | | |
TOTAL EXPENSES | | | | 37,331 | | | | | 40,138 | | | | | 124,395 | | | | | 105,744 | |
| | | | | | | | |
INVESTMENT INCOME, NET | | | | 129,345 | | | | | 155,765 | | | | | 427,498 | | | | | 457,120 | |
| | | | | | | | |
REALIZED AND UNREALIZED GAIN (LOSS) ON INVESTMENTS AND MORTGAGE LOANS PAYABLE | | | | | | | | |
Net realized gain (loss) on investments: | | | | | | | | |
Real estate properties | | | | (14,118 | ) | | | | | 31,853 | | | | | (9,489 | ) | | | | | 97,905 | |
Real estate joint ventures and limited partnerships | | | | — | | | | | 69,967 | | | | | (17 | ) | | | | | 69,356 | |
Marketable securities | | | | 23 | | | | | 14,305 | | | | | (11,189 | ) | | | | | 37,550 | |
| | | | | | | | |
Total realized (loss) gain on investments | | | | (14,095 | ) | | | | | 116,125 | | | | | (20,695 | ) | | | | | 204,811 | |
| | | | | | | | |
Net change in unrealized appreciation (depreciation) on: | | | | | | | | |
Real estate properties | | | | (381,986 | ) | | | | | 291,661 | | | | | (430,864 | ) | | | | | 824,423 | |
Real estate joint ventures and limited partnerships | | | | (100,120 | ) | | | | | 39,938 | | | | | (193,380 | ) | | | | | 246,542 | |
Marketable securities | | | | (595 | ) | | | | | (11,708 | ) | | | | | 14,607 | | | | | (68,938 | ) | |
Mortgage loan receivable | | | | (293 | ) | | | | | (131 | ) | | | | | (1,092 | ) | | | | | (17 | ) | |
Mortgage loans payable | | | | 34,270 | | | | | 7,030 | | | | | 38,624 | | | | | 28,462 | |
| | | | | | | | |
Net change in unrealized (depreciation) appreciation
on investments and mortgage loans payable | | | | (448,724 | ) | | | | | 326,790 | | | | | (572,105 | ) | | | | | 1,030,472 | |
| | | | | | | | |
NET REALIZED AND UNREALIZED
(LOSS) GAIN ON INVESTMENTS AND
MORTGAGE LOANS PAYABLE | | | | (462,819 | ) | | | | | 442,915 | | | | | (592,800 | ) | | | | | 1,235,283 | |
| | | | | | | | |
NET (DECREASE) INCREASE IN NET ASSETS
RESULTING FROM OPERATIONS | | | $ | | (333,474 | ) | | | | $ | | 598,680 | | | | $ | | (165,302 | ) | | | | $ | | 1,692,403 | |
| | | | | | | | |
See notes to the financial statements.
4
TIAA REAL ESTATE ACCOUNT
STATEMENTS OF CHANGES IN NET ASSETS
(In thousands)
(Unaudited)
| | | | | | | | |
| | For the Three Months
Ended September 30, | | For the Nine Months
Ended September 30, |
| | 2008 | | 2007 | | 2008 | | 2007 |
FROM OPERATIONS | | | | | | | | |
Investment income, net | | | $ | | 129,345 | | | | $ | | 155,765 | | | | $ | | 427,498 | | | | $ | | 457,120 | |
Net realized (loss) gain on investments | | | | (14,095 | ) | | | | | 116,125 | | | | | (20,695 | ) | | | | | 204,811 | |
Net change in unrealized (depreciation) appreciation on investments and mortgage loans payable | | | | (448,724 | ) | | | | | 326,790 | | | | | (572,105 | ) | | | | | 1,030,472 | |
| | | | | | | | |
NET (DECREASE) INCREASE IN NET ASSETS RESULTING FROM OPERATIONS | | | | (333,474 | ) | | | | | 598,680 | | | | | (165,302 | ) | | | | | 1,692,403 | |
| | | | | | | | |
FROM PARTICIPANT TRANSACTIONS | | | | | | | | |
Premiums | | | | 242,917 | | | | | 287,416 | | | | | 793,052 | | | | | 894,584 | |
Net transfers (to) from TIAA | | | | (670,036 | ) | | | | | 29,117 | | | | | (1,046,677 | ) | | | | | 138,917 | |
Net transfers (to) from CREF Accounts | | | | (723,306 | ) | | | | | 162,521 | | | | | (1,244,786 | ) | | | | | 806,742 | |
Net transfers (to) from TIAA-CREF Institutional Mutual Funds | | | | (49,651 | ) | | | | | 8,830 | | | | | (131,000 | ) | | | | | (19,745 | ) | |
Annuity and other periodic payments | | | | (21,796 | ) | | | | | (26,101 | ) | | | | | (68,725 | ) | | | | | (62,826 | ) | |
Withdrawals and death benefits | | | | (167,420 | ) | | | | | (147,394 | ) | | | | | (458,268 | ) | | | | | (419,734 | ) | |
| | | | | | | | |
NET (DECREASE) INCREASE IN NET
ASSETS RESULTING FROM
PARTICIPANT TRANSACTIONS | | | | (1,389,292 | ) | | | | | 314,389 | | | | | (2,156,404 | ) | | | | | 1,337,938 | |
| | | | | | | | |
NET (DECREASE) INCREASE IN
NET ASSETS | | | | (1,722,766 | ) | | | | | 913,069 | | | | | (2,321,706 | ) | | | | | 3,030,341 | |
NET ASSETS | | | | | | | | |
Beginning of period | | | | 17,061,597 | | | | | 16,249,965 | | | | | 17,660,537 | | | | | 14,132,693 | |
| | | | | | | | |
End of period | | | $ | | 15,338,831 | | | | $ | | 17,163,034 | | | | $ | | 15,338,831 | | | | $ | | 17,163,034 | |
| | | | | | | | |
See notes to the financial statements.
5
TIAA REAL ESTATE ACCOUNT
STATEMENTS OF CASH FLOWS
(In thousands)
(Unaudited)
| | | | |
| | For the Nine Months
Ended September 30, |
| | 2008 | | 2007 |
CASH FLOWS FROM OPERATING ACTIVITIES | | | | |
Net (decrease) increase in net assets resulting from operations | | | $ | | (165,302 | ) | | | | $ | | 1,692,403 | |
Adjustments to reconcile net increase in net assets resulting from operations to net cash provided by (used in) operating activities: | | | | |
Purchase of real estate properties | | | | (164,087 | ) | | | | | (402,345 | ) | |
Amortization of discount on debt | | | | — | | | | | 397 | |
Capital improvements on real estate properties | | | | (122,130 | ) | | | | | (88,682 | ) | |
Proceeds from sale of real estate properties | | | | 45,638 | | | | | 432,870 | |
Decrease (increase) in other investments | | | | 2,186,981 | | | | | (1,745,897 | ) | |
Increase in other assets | | | | (354,618 | ) | | | | | (3,514 | ) | |
Increase in accrued real estate property level expenses and taxes | | | | 43,658 | | | | | 5,263 | |
(Decrease) increase in security deposits held | | | | (301 | ) | | | | | 5,922 | |
Decrease in payable for securities transactions | | | | (855 | ) | | | | | (1,028 | ) | |
Change in due to (from) investment advisor | | | | 49,494 | | | | | (790 | ) | |
Net realized loss (gain) on total investments | | | | 20,695 | | | | | (204,811 | ) | |
Unrealized loss (gain) on total investments and mortgage loans payable | | | | 572,105 | | | | | (1,030,472 | ) | |
| | | | |
NET CASH PROVIDED BY (USED IN)
OPERATING ACTIVITIES | | | | 2,111,278 | | | | | (1,340,684 | ) | |
| | | | |
CASH FLOWS FROM FINANCING ACTIVITIES | | | | |
Mortgage loans proceeds received | | | | 344,582 | | | | | — | |
Principal payments of mortgage loans payable | | | | (545 | ) | | | | | (404 | ) | |
Premiums | | | | 793,052 | | | | | 894,584 | |
Net transfers (to) from TIAA | | | | (1,046,677 | ) | | | | | 138,917 | |
Net transfers (to) from CREF Accounts | | | | (1,244,786 | ) | | | | | 806,742 | |
Net transfers to TIAA-CREF Institutional Mutual Funds | | | | (131,000 | ) | | | | | (19,745 | ) | |
Annuity and other periodic payments | | | | (68,725 | ) | | | | | (62,826 | ) | |
Withdrawals and death benefits | | | | (458,268 | ) | | | | | (419,734 | ) | |
| | | | |
NET CASH (USED IN) PROVIDED BY
FINANCING ACTIVITIES | | | | (1,812,367 | ) | | | | | 1,337,534 | |
| | | | |
NET INCREASE (DECREASE) IN CASH | | | | 298,911 | | | | | (3,150 | ) | |
CASH | | | | |
Beginning of period | | | | 6,144 | | | | | 3,585 | |
| | | | |
End of period | | | $ | | 305,055 | | | | $ | | 435 | |
| | | | |
SUPPLEMENTAL DISCLOSURES: | | | | |
Cash paid for interest | | | $ | | 63,121 | | | | $ | | 62,195 | |
| | | | |
See notes to the financial statements.
6
TIAA REAL ESTATE ACCOUNT
NOTES TO THE FINANCIAL STATEMENTS
Note 1—Organization and Significant Accounting Policies
Business: The TIAA Real Estate Account (“Account”) is a segregated investment account of Teachers Insurance and Annuity Association of America (“TIAA”) and was established by resolution of TIAA’s Board of Trustees (the “Board”) on February 22, 1995, under the insurance laws of the State of New York, for the purpose of funding variable annuity contracts issued by TIAA. The investment objective of the Account is a favorable long-term rate of return primarily through rental income and capital appreciation from real estate investments owned by the Account. The Account holds real estate properties directly and through wholly-owned subsidiaries. The Account also holds interests in real estate joint ventures and limited partnerships in which the Account does not hold a controlling interest; as such, such interests are not consolidated for financial statement purposes. The Account also invests in mortgage loans receivable collateralized by commercial real estate properties. The Account also invests in publicly-traded securities and other instruments to maintain adequate liquidity levels for operating expenses, capital expenditures and to fund benefit payments (withdrawals, transfers and related transactions).
The financial statements were prepared in accordance with accounting principles generally accepted in the United States of America which may require the use of estimates made by management. Actual results may vary from those estimates. The following is a summary of the significant accounting policies of the Account.
Basis of Presentation:The accompanying financial statements include the Account and those subsidiaries wholly-owned by TIAA for the benefit of the Account. All significant intercompany accounts and transactions have been eliminated in consolidation.
Accounting Pronouncements Adopted:In September 2006, the Financial Accounting Standards Board (“FASB”) issued Statement No. 157, “Fair Value Measurements.” This Statement defines fair value, establishes a framework for measuring fair value under generally accepted accounting principles in the United States, and requires additional disclosures about fair value measurements. This Statement does not require any new fair value measurements. This Statement was effective as of January 1, 2008 for the Account. The adoption of Statement No. 157 did not have a material impact on the Account’s financial position or results of operations.
In February 2007, FASB issued Statement No. 159,“The Fair Value Option for Financial Assets and Financial Liabilities.” This Statement permits entities to choose to measure financial instruments and certain other items at fair value and is expected to expand the use of fair value measurement when warranted. The Account adopted Statement No. 159 on January 1, 2008 and reports all existing and plans to report all future mortgage loans payable at fair value using this Statement. Historically, the Account recorded mortgage loans payable at fair value. The adoption of Statement 159 did not have a material impact on the Account’s financial position or results of operations.
Valuation Hierarchy:In accordance with FASB Statement No. 157, “Fair Value Measurements”, the Account groups financial assets and certain financial liabilities measured at fair value into three levels, based on the markets in which the assets and liabilities are traded, if any, and the observability of the assumptions used to determine fair value. These levels are:
Level 1—Valuations using unadjusted quoted prices for assets traded in active markets, such as stocks listed on the New York Stock Exchange. Active markets are defined as having the following characteristics for the measured asset or liability: (i) many transactions, (ii) current prices, (iii) price quotes not varying substantially among market makers, (iv) narrow bid/ask spreads and (v) most information regarding the issuer is publicly available. Level 1 assets and liabilities includes real estate related marketable securities.
Level 2—Valuations for assets and liabilities traded in less active, dealer or broker markets. Fair values are primarily obtained from third party pricing services for identical or comparable assets or liabilities. Level 2 inputs for fair value measurements are inputs, other than quoted prices included within Level 1, that are observable for the asset or liability, either directly or indirectly. Level 2 inputs include:
a. Quoted prices for similar assets or liabilities in active markets;
7
b. Quoted prices for identical or similar assets or liabilities in markets that are not active (that is, markets in which there are few transactions for the asset (or liability), the prices are not current, price quotations vary substantially either over time or among market makers (for example, some brokered markets), or in which little information is released publicly);
c. Inputs other than quoted prices that are observable within the market for the asset (or liability) (for example, interest rates and yield curves, volatilities, prepayment speeds, loss severities, credit risks, and default rates that are observable at commonly quoted intervals); and
d. Inputs that are derived principally from or corroborated by observable market data by correlation or other means (for example, market-corroborated inputs).
Examples of securities which may be held by the Account and included in Level 2 include Certificates of Deposit, Commercial Paper, Government Agency Bonds and Variable Notes.
Level 3—Valuations for assets and liabilities that are derived from other valuation methodologies, including pricing models, discounted cash flow models and similar techniques, and are not based on market exchange, dealer, or broker-traded transactions. Level 3 valuations incorporate certain assumptions and projections that are not observable in the market, and require significant professional judgment in determining the fair value assigned to such assets or liabilities.
An investment’s categorization within the valuation hierarchy described above is based upon the lowest level of input that is significant to the fair value measurement.
The Account’s investments and mortgage loans payable are stated at fair value. Effective January 1, 2008, in connection with the adoption of SFAS No. 159, “The Fair Value Option for Financial Assets and Liabilities”, the Account reports all existing and plans to report all future mortgage loans payable at fair value. Fair value is based upon quoted market prices, where available. If listed prices or quotes are not available, fair value is based upon vendor-provided, evaluated prices or internally-developed models that primarily use market-based or independently-sourced market data, including interest rate yield curves, market spreads, and currency rates. Valuation adjustments will be made to reflect changes in credit quality, the Account’s creditworthiness, liquidity, and other observable and unobservable data that are applied consistently over time.
The methods described above are considered to produce fair values that represent a good faith estimate of what an unaffiliated buyer in the marketplace would pay to purchase the asset or would receive to transfer the liability. Since fair value calculations involve significant professional judgment in the application of both observable and unobservable attributes, actual realizable values or future fair values may differ from amounts reported.
The following is a description of the valuation methodologies used for investments measured at fair value.
Valuation of Real Estate Properties:Investments in real estate properties are stated at fair value, as determined in accordance with procedures approved by the Investment Committee of the Board and in accordance with the responsibilities of the Board as a whole; accordingly, the Account does not record depreciation. The Account’s real estate properties are generally classified within Level 3 of the valuation hierarchy. Fair value for real estate properties is defined as the most probable price for which a property will sell in a competitive market under all conditions requisite to a fair sale. Determination of fair value involves judgment because the actual market value of real estate can be determined only by negotiation between the parties in a sales transaction. The Account intends that the overarching principle when valuing its real estate investments will be to produce a valuation that represents a fair and accurate estimate of the fair value of its investments. Implicit in the Account’s definition of fair value is the consummation of a sale as of a specified date and the passing of title from seller to buyer under conditions whereby:
|
• | | | | Buyer and seller are typically motivated; |
|
• | | | | Both parties are well informed or well advised, and acting in what they consider their best interests; |
|
• | | | | A reasonable time is allowed for exposure in the open market; |
|
• | | | | Payment is made in terms of cash or in terms of financial arrangements comparable thereto; and |
8
|
• | | | | The price represents the normal consideration for the property sold unaffected by special or creative financing or sales concessions granted by anyone associated with the sale. |
Real estate properties owned by the Account are initially valued based on an independent appraisal at the time of the closing of the purchase, which may result in a potential unrealized gain or loss reflecting the difference between an investment’s fair value (i.e., exit price) and its cost basis (which is inclusive of transaction costs).
Subsequently, each property is valued each quarter with an independent third party appraisal completed for each real estate property at least once a year. In general, the Account obtains appraisals for each real estate property throughout the quarter and the Account’s independent fiduciary (discussed below) oversees the appraisal process. Further, management reserves the right to order an appraisal and/or conduct another valuation outside of the normal quarterly process when facts or circumstances at a specific property change (for example, under certain circumstances a valuation adjustment could be made when bids are obtained for properties held for sale). An independent fiduciary, Real Estate Research Corporation, has been appointed by a special subcommittee of the Investment Committee of the Board to, among other things, oversee the appraisal process. The independent fiduciary must approve all independent appraisers used by the Account. TIAA’s appraisal staff performs the other quarterly valuations for each real estate property and updates the property value as appropriate. The appraisals are performed in accordance with Uniform Standards of Professional Appraisal Practices (“USPAP”), the real estate appraisal industry standards created by The Appraisal Foundation. Real estate appraisals are estimates of property values based on a professional’s opinion. The Account’s retained independent appraisers, each of whom has been approved by the independent fiduciary; prepare the initial and subsequent annual third-party appraisals. These independent appraisers are always expected to be MAI-designated members (or its European equivalent, RICS) of the Appraisal Institute and state certified appraisers from national or regional firms with relevant property type experience and market knowledge.
The independent fiduciary can require additional appraisals if a property’s value has changed materially and such change is not reflected in the quarterly valuation review, or otherwise to ensure that the Account is valued appropriately. The independent fiduciary must also approve any valuation change where a property’s value changed by more than 6% from the most recent independent annual appraisal, or if the value of the Account would change by more than 4% within any calendar quarter or more than 2% since the prior month. When a real estate property is subject to a mortgage, the mortgage is valued independently of the property and its fair value is reported separately. The independent fiduciary reviews and approves mortgage valuation adjustments which exceed the prescribed limits discussed above before such adjustments are recorded by the Account. The Account continues to use the revised value for each real estate property and mortgage loan payable to calculate the Account’s daily net asset value until the next valuation review or appraisal.
Valuation of Real Estate Joint Ventures and Limited Partnerships: Real estate joint ventures and certain limited partnerships are stated at the fair value of the Account’s ownership interests of the underlying entities. The Account’s ownership interests are valued based on the fair value of the underlying real estate, any related mortgage loans payable, and other factors, such as ownership percentage, ownership rights, buy/sell agreements, distribution provisions and capital call obligations. Upon the disposition of all real estate investments by an investee entity, the Account will continue to state its equity in the remaining net assets of the investee entity during the wind down period, if any, that occurs prior to the dissolution of the investee entity.
Certain limited partnership interests for which market quotations are not readily available are valued at fair value as determined in good faith under the direction of the Investment Committee of the Board and in accordance with the responsibilities of the Board as a whole. These investments are generally classified within level 3 of the valuation hierarchy.
Valuation of Marketable Securities: Equity securities listed or traded on any national market or exchange are valued at the last sale price as of the close of the principal securities exchange on which such securities are traded or, if there is no sale, at the mean of the last bid and asked prices on such exchange, exclusive of transaction costs. Such marketable securities are classified within level 1 of the valuation hierarchy.
Debt securities, other than money market instruments, are generally valued at the most recent bid price or the equivalent quoted yield for such securities (or those of comparable maturity, quality and type). Money
9
market instruments, with maturities of one year or less, are valued in the same manner as debt securities or derived from a pricing matrix. Debt securities are generally classified within level 2 of the valuation hierarchy.
Valuation of Mortgage Loan Receivable: The mortgage loan receivable is stated at fair value. The mortgage loan receivable is valued quarterly based on market factors, such as market interest rates and spreads for comparable loans, and the performance of the underlying collateral. The Account’s mortgage loan receivable is classified within level 3 of the valuation hierarchy.
Valuation of Mortgage Loans Payable: Mortgage loans payable are stated at fair value. The estimated fair value of mortgage loans payable is based on the amount at which the liability could be transferred exclusive of transaction costs. Mortgage loans payable are valued quarterly based on market factors, such as market interest rates and spreads for comparable loans, the performance of the underlying collateral, and the credit quality of the Account. The Account’s mortgage loans payable are generally classified within level 3 of the valuation hierarchy. Interest expense for mortgage loans payable is recorded on the accrual basis taking into account the outstanding principal and contractual interest rates.
Foreign currency transactions and translation: Portfolio investments and other assets and liabilities denominated in foreign currencies are translated into U.S. dollars at the exchange rates prevailing at the end of the period. Purchases and sales of securities, income receipts and expense payments made in foreign currencies are translated into U.S. dollars at the exchange rates prevailing on the respective dates of the transactions. The effect of any changes in foreign currency exchange rates on portfolio investments and mortgage loans payable is included in net realized and unrealized gains and losses on investments and mortgage loans payable. Net realized gains and losses on foreign currency transactions include maturities of forward foreign currency contracts, disposition of foreign currencies, and currency gains and losses between the accrual and receipt dates of portfolio investment income and between the trade and settlement dates of portfolio investment transactions.
Accumulation and Annuity Funds: The accumulation fund represents the net assets attributable to participants in the accumulation phase of their investment (“Accumulation Fund”). The annuity fund represents the net assets attributable to the participants currently receiving annuity payments (“Annuity Fund”). The net increase or decrease in net assets from investment operations is apportioned between the accounts based upon their relative daily net asset values. Once an Account participant begins receiving lifetime annuity income benefits, monthly payment levels cannot be reduced as a result of the Account’s adverse mortality experience. In addition, the contracts are required to stipulate the maximum expense charge for all expenses that can be assessed, which is equal to 2.50% of average net assets per year. The Account pays a fee to TIAA to assume these mortality and expense risks.
Accounting for Investments: Real estate transactions are accounted for as of the date on which the purchase or sale transactions for the real estate properties close (settlement date). The Account recognizes a realized gain on the sale of a real estate property to the extent that the contract sales price exceeds the cost-to-date of the property being sold. A realized loss occurs when the cost-to-date exceeds the sales price. Any accumulated unrealized gains and losses are reversed in the calculation of realized gains and losses.
Rent from real estate properties consists of all amounts earned under tenant operating leases, including base rent, recoveries of real estate taxes and other expenses and charges for miscellaneous services provided to tenants. Rental income is recognized in accordance with the billing terms of the lease agreements. The Account bears the direct expenses of the real estate properties owned. These expenses include, but are not limited to, fees to local property management companies, property taxes, utilities, maintenance, repairs, insurance, and other operating and administrative costs. An estimate of the net operating income earned from each real estate property is accrued by the Account on a daily basis and such estimates are adjusted when actual operating results are determined.
The Account has limited ownership interests in various real estate funds (limited partnerships and one limited liability corporation) and a private real estate investment trust (collectively, the “limited partnerships”). The Account records its contributions as increases to the investments, and distributions from the investments are treated as either income or return of capital, as determined by the management of the limited partnerships. Unrealized gains and losses are calculated and recorded when the financial statements of the limited partnerships are received by the Account.
10
Income from real estate joint ventures is recorded based on the Account’s proportional interest of the income distributed by the joint venture. Income earned by the joint venture, but not yet distributed to the Account by the joint venture investment, is recorded as unrealized gains and losses on real estate joint ventures.
Transactions in marketable securities are accounted for as of the date the securities are purchased or sold (trade date). Interest income is recorded as earned. Dividend income is recorded on the ex-dividend date or as soon as the Account is informed of the dividend. Realized gains and losses on securities transactions are accounted for on the specific identification method.
Cash:The Account maintains cash in bank deposit accounts which, at times, exceeds federally insured limits. No losses have been recognized related to such accounts.
Federal Income Taxes: Based on provisions of the Internal Revenue Code, Section 817, the Account is taxed as a segregated asset account of TIAA and as such, the Account should incur no material federal income tax attributable to the net investment activity of the Account.
Reclassifications:Certain prior period amounts have been reclassified to conform to the current presentation. These reclassifications did not affect the total assets, total net assets or net increase in net assets previously reported.
Note 2—Management Agreements and Arrangements
Investment advisory services for the Account are provided by TIAA employees, under the direction of the Board and its Investment Committee, pursuant to investment management procedures adopted by TIAA for the Account. TIAA’s investment management decisions for the Account are subject to review by the Account’s independent fiduciary. TIAA also provides all portfolio accounting and related services for the Account.
Through December 31, 2007, administrative and distribution services for the Account were provided by TIAA-CREF Individual & Institutional Services, LLC (“Services”) pursuant to a combined Distribution and Administrative Services Agreement with the Account. Services, a wholly-owned subsidiary of TIAA, is a registered broker-dealer and a member of the Financial Industry Regulatory Authority. Effective January 1, 2008, the Account entered into theDistribution Agreement for the Contracts Funded by the TIAA Real Estate Account (the “New Distribution Agreement”), dated January 1, 2008, by and among TIAA, for itself and on behalf of the Account, and Services. Pursuant to the New Distribution Agreement, Services performs distribution services for the Account which include, among other things, (i) distribution of annuity contracts issued by TIAA and funded by the Account, (ii) advising existing annuity contract owners in connection with their accumulations and (iii) helping employers implement and manage retirement plans. Also effective January 1, 2008, TIAA performs administrative functions previously performed for the Account by Services, which include, among other things, (i) computing the Account’s daily unit value, (ii) maintaining accounting records and performing accounting services, (iii) receiving and allocating premiums, (iv) calculating and making annuity payments, (v) processing withdrawal requests, (vi) providing regulatory compliance and reporting services, (vii) maintaining the Account’s records of contract ownership, and (viii) otherwise assisting generally in all aspects of the Account’s operations.
The New Distribution Agreement is terminable by either party upon 60 days written notice and terminates automatically upon any assignment thereof.
TIAA and Services provide their services at cost. TIAA and Services receive payments from the Account on a daily basis according to formulas established each year with the objective of keeping the payments as close as possible to the Account’s expenses actually incurred. Any differences between actual expenses and the amounts paid by the Account are adjusted quarterly.
Both distribution services (pursuant to the New Distribution Agreement) and administrative services continue to be provided to the Account by Services and TIAA, as applicable, on an at cost basis.
TIAA also provides a liquidity guarantee to the Account, for a fee, to ensure that sufficient funds are available to meet participant transfer and cash withdrawal requests in the event that the Account’s cash flows and liquid investments are insufficient to fund such requests. TIAA would fund any such transfer and withdrawal requests by purchasing accumulation units in the Account as necessary.
11
If the liquidity guarantee were executed, the independent fiduciary would monitor and oversee, among other things, TIAA’s ownership interest in the Account and may require TIAA to eventually redeem some of its liquidity units, particularly when the Account has uninvested cash or liquid investments available. TIAA also receives a fee for assuming certain mortality and expense risks.
The expenses for the services noted above that are provided to the Account by TIAA and Services are identified in the accompanying Statements of Operations and are reflected in the Condensed Financial Information disclosed in Note 6.
Note 3—Assets and Liabilities Measured at Fair Value on a Recurring Basis
The following are the major categories of assets and liabilities measured at fair value on a recurring basis as of September 30, 2008, using unadjusted quoted prices in active markets for identical assets (Level 1); significant other observable inputs (Level 2); and significant unobservable inputs (Level 3) (in thousands, unaudited):
| | | | | | | | |
Description | | Level 1:
Quoted
Prices in
Active Markets
for Identical
Assets | | Level 2:
Significant
Other
Observable
Inputs | | Level 3:
Significant
Unobservable
Inputs | | Total at
September 30,
2008 |
Real estate properties | | | $ | | — | | | | $ | | — | | | | $ | | 11,783,941 | | | | $ | | 11,783,941 | |
Real Estate joint ventures and limited partnerships | | | | — | | | | | — | | | | | 2,960,646 | | | | | 2,960,646 | |
Marketable securities—other | | | | — | | | | | 1,619,761 | | | | | — | | | | | 1,619,761 | |
Mortgage loan receivable | | | | — | | | | | — | | | | | 71,428 | | | | | 71,428 | |
| | | | | | | | |
Total Investments | | | $ | | — | | | | $ | | 1,619,761 | | | | $ | | 14,816,015 | | | | $ | | 16,435,776 | |
| | | | | | | | |
Mortgage loans payable | | | $ | | — | | | | $ | | — | | | | $ | | 1,697,506 | | | | $ | | 1,697,506 | |
| | | | | | | | |
The following is a reconciliation of the beginning and ending balances for assets measured at fair value on a recurring basis using significant unobservable inputs (Level 3) during the three and nine month periods ended September 30, 2008 (in thousands, unaudited):
| | | | | | | | | | |
| | Real Estate
Properties | | Real Estate
Joint Ventures
and Limited
Partnerships | | Mortgage
Loan
Receivable | | Total
Level 3
Investments | | Mortgage
Loans
Payable |
For the three months ended September 30, 2008: | | | | | | | | | | |
Beginning balance July 1, 2008 | | | $ | | 12,159,259 | | | | $ | | 3,064,686 | | | | $ | | 71,721 | | | | $ | | 15,295,666 | | | | $ | | (1,387,376 | ) | |
Total realized and unrealized gains (losses) included in changes in net assets | | | | (396,103 | ) | | | | | (100,120 | ) | | | | | (293 | ) | | | | | (496,516 | ) | | | | | 34,270 | |
Purchases, issuances, and
settlements(1) | | | | 20,785 | | | | | (3,920 | ) | | | | | — | | | | | 16,865 | | | | | (344,400 | ) | |
| | | | | | | | | | |
Ending balance September 30, 2008 | | | $ | | 11,783,941 | | | | $ | | 2,960,646 | | | | $ | | 71,428 | | | | $ | | 14,816,015 | | | | $ | | (1,697,506 | ) | |
| | | | | | | | | | |
For the nine months ended September 30, 2008: | | | | | | | | | | |
Beginning balance January 1, 2008 | | | $ | | 11,983,715 | | | | $ | | 3,158,870 | | | | $ | | 72,520 | | | | $ | | 15,215,105 | | | | $ | | (1,392,093 | ) | |
Total realized and unrealized gains (losses) included in changes in net assets | | | | (440,353 | ) | | | | | (193,397 | ) | | | | | (1,092 | ) | | | | | (634,842 | ) | | | | | 38,624 | |
Purchases, issuances, and
settlements(1) | | | | 240,579 | | | | | (4,827 | ) | | | | | — | | | | | 235,752 | | | | | (344,037 | ) | |
| | | | | | | | | | |
Ending balance September 30, 2008 | | | $ | | 11,783,941 | | | | $ | | 2,960,646 | | | | $ | | 71,428 | | | | $ | | 14,816,015 | | | | $ | | (1,697,506 | ) | |
| | | | | | | | | | |
|
(1) | | | | This line includes the net of contributions, distributions and accrued operating income for real estate joint ventures and limited partnerships as well as principal payments on mortgage loans payable. |
12
The amount of total gains (losses) included in changes in net assets attributable to the change in unrealized gains (losses) relating to Investments and Mortgage Loans Payable using significant unobservable inputs still held as of the reporting date is as follows (in thousands, unaudited):
| | | | | | | | | | | | Real Estate
Properties | | Real Estate
Joint Ventures
and Limited
Partnerships | | Mortgage
Loan
Receivable | | Total
Level 3
Investments | | Mortgage
Loans
Payable |
For the three months ended September 30, 2008 | | | $ | | (395,665 | ) | | | | $ | | (100,120 | ) | | | | $ | | (293 | ) | | | | $ | | (496,078 | ) | | | | $ | | 34,270 | |
| | | | | | | | | | |
For the nine months ended September 30, 2008 | | | $ | | (438,887 | ) | | | | $ | | (193,380 | ) | | | | $ | | (1,092 | ) | | | | $ | | (633,359 | ) | | | | $ | | 38,624 | |
| | | | | | | | | | |
Note 4—Investments in Joint Ventures and Limited Partnerships
The Account owns interests in several real estate properties through joint ventures and receives distributions and allocations of profits and losses from the joint ventures based on the Account’s ownership interest percentages. Several of these joint ventures have mortgage loans payable on the properties owned. At September 30, 2008, the Account held 12 investments in joint ventures (and one remaining equity interest in a joint venture) with non-controlling ownership interest percentages that ranged from 50% to 85%. Certain joint ventures and limited partnerships are subject to adjusted distribution percentages when earnings in the investment reach a pre-determined threshold. The Account’s allocated portion of the mortgage loans payable was $1.93 billion and $1.99 billion at September 30, 2008 and December 31, 2007, respectively. The Account’s equity in the joint ventures at September 30, 2008 and December 31, 2007 was $2.63 billion and $2.83 billion, respectively. A condensed summary of the financial position and results of operations of the joint ventures is shown below (in thousands).
| | | | |
| | September 30, 2008 | | December 31, 2007 |
| | (Unaudited) | | |
Assets | | | | |
Real estate properties, at value | | | $ | | 6,695,150 | | | | $ | | 7,001,688 | |
Other assets | | | | 95,963 | | | | | 99,798 | |
| | | | |
Total assets | | | $ | | 6,791,113 | | | | $ | | 7,101,486 | |
| | | | |
Liabilities and Equity | | | | |
Mortgage loans payable, at value | | | $ | | 2,628,101 | | | | $ | | 2,707,161 | |
Other liabilities | | | | 72,304 | | | | | 64,738 | |
| | | | |
Total liabilities | | | | 2,700,405 | | | | | 2,771,899 | |
Equity | | | | 4,090,708 | | | | | 4,329,587 | |
| | | | |
Total liabilities and equity | | | $ | | 6,791,113 | | | | $ | | 7,101,486 | |
| | | | |
| | | | |
| | For the Nine
Months Ended
September 30, 2008 | | Year Ended
December 31, 2007 |
| | (Unaudited) | | |
Operating Revenues and Expenses | | | | |
Revenues | | | $ | | 419,144 | | | | $ | | 534,469 | |
Expenses | | | | 250,066 | | | | | 315,077 | |
| | | | |
Excess of revenues over expenses | | | $ | | 169,078 | | | | $ | | 219,392 | |
| | | | |
The Account invests in limited partnerships that own real estate properties and receives distributions from the limited partnerships based on the Account’s ownership interest percentages. At September 30, 2008, the Account held four limited partnership investments and one private real estate equity investment trust (all of which featured non-controlling ownership interests) with ownership interest percentages that ranged from 5.27% to 18.46%. The Account’s investment in limited partnerships was $333.68 million and $331.36 million at September 30, 2008 and December 31, 2007, respectively.
13
Note 5—Mortgage Loans Payable
At September 30, 2008, the Account had outstanding mortgage loans payable secured by the following properties (in thousands):
| | | | | | |
Property | | Interest Rate and
Payment Frequency | | Amount
September 30, 2008 | | Maturity |
| | | | (Unaudited) | | |
701 Brickell(a) | | 4.49% paid monthly(e) | | | $ | | 126,000 | | | | | October 1, 2010 | |
Four Oaks Place(b) | | 4.49% paid monthly(e) | | | | 200,000 | | | | | October 1, 2010 | |
Ontario Industrial Portfolio(c) | | 7.42% paid monthly | | | | 8,758 | | | | | May 1, 2011 | |
1 & 7 Westferry Circus(d) | | 5.40% paid quarterly | | | | 239,247 | | | | | November 15, 2012 | |
Reserve at Sugarloaf(c) | | 5.49% paid monthly | | | | 25,624 | | | | | June 1, 2013 | |
South Frisco Village | | 5.85% paid monthly | | | | 26,251 | | | | | June 1, 2013 | |
50 Fremont | | 6.40% paid monthly | | | | 135,000 | | | | | August 21, 2013 | |
Fourth & Madison | | 6.40% paid monthly | | | | 145,000 | | | | | August 21, 2013 | |
1001 Pennsylvania Ave | | 6.40% paid monthly | | | | 210,000 | | | | | August 21, 2013 | |
Pacific Plaza(c) | | 5.55% paid monthly | | | | 8,790 | | | | | September 1, 2013 | |
Wilshire Rodeo Plaza | | 5.28% paid monthly | | | | 112,700 | | | | | April 11, 2014 | |
1401 H Street | | 5.97% paid monthly | | | | 115,000 | | | | | December 7, 2014 | |
Preston Sherry Plaza | | 5.85% paid monthly | | | | 23,500 | | | | | September 1, 2015 | |
99 High Street | | 5.52% paid monthly | | | | 185,000 | | | | | November 11, 2015 | |
Lincoln Centre | | 5.51% paid monthly | | | | 153,000 | | | | | February 1, 2016 | |
Publix at Weston Commons | | 5.08% paid monthly | | | | 35,000 | | | | | January 1, 2036 | |
| | | | | | |
Total principal outstanding | | | | | | 1,748,870 | | | |
Fair value adjustment | | | | | | (51,364 | ) | | | |
| | | | | | |
Total mortgage loans payable | | | | | $ | | 1,697,506 | | | |
| | | | | | |
|
(a) | | | | The Account entered into a debt agreement that included an interest rate cap with its lender to reduce its exposure to the variability of changes in interest rates until maturity of the underlying debt. The interest rate on the entire $126 million mortgage is capped at 6.50%. |
|
(b) | | | | The Account entered into a debt agreement that included an interest rate cap with its lender to reduce its exposure to the variability of changes in interest rates until maturity of the underlying debt. The interest rate on the entire $200 million mortgage is capped at 6.50%. |
|
(c) | | | | The mortgage is adjusted monthly for principal payments. |
|
(d) | | | | The mortgage is denominated in British pounds and the principal has been converted to U.S. dollars using the exchange rate as of September 30, 2008. The quarterly payments are interest only, with a balloon payment at maturity. The interest rate is fixed. The cumulative foreign currency translation adjustment was an unrealized loss of $6.7 million. |
|
(e) | | | | The interest rate for these mortgages is a variable rate at the one month London Interbank Offered Rate (“LIBOR”) plus 200 basis points. The stated rates are as of September 30, 2008. |
14
Note 6—Condensed Financial Information
Selected condensed financial information for an Accumulation Unit of the Account is presented below.
| | | | | | | | | | |
| | For the
Nine Months
Ended
September 30,
2008(1) | | Years Ended December 31, |
| | 2007 | | 2006 | | 2005 | | 2004 |
| | (Unaudited) | | | | | | | | |
Per Accumulation Unit data: | | | | | | | | | | |
Rental income | | | $ | | 13.568 | | | | $ | | 17.975 | | | | $ | | 16.717 | | | | $ | | 15.604 | | | | $ | | 13.422 | |
Real estate property level expenses and taxes | | | | 6.573 | | | | | 8.338 | | | | | 7.807 | | | | | 7.026 | | | | | 5.331 | |
| | | | | | | | | | |
Real estate income, net | | | | 6.995 | | | | | 9.637 | | | | | 8.910 | | | | | 8.578 | | | | | 8.091 | |
Other income | | | | 3.134 | | | | | 4.289 | | | | | 3.931 | | | | | 3.602 | | | | | 3.341 | |
| | | | | | | | | | |
Total income | | | | 10.129 | | | | | 13.926 | | | | | 12.841 | | | | | 12.180 | | | | | 11.432 | |
Expense charges(2) | | | | 2.283 | | | | | 2.554 | | | | | 1.671 | | | | | 1.415 | | | | | 1.241 | |
| | | | | | | | | | |
Investment income, net | | | | 7.846 | | | | | 11.372 | | | | | 11.170 | | | | | 10.765 | | | | | 10.191 | |
Net realized and unrealized gain (loss) on investments and mortgage loans payable | | | | (11.338 | ) | | | | | 26.389 | | | | | 22.530 | | | | | 18.744 | | | | | 13.314 | |
| | | | | | | | | | |
Net (decrease) increase in Accumulation Unit Value | | | | (3.492 | ) | | | | | 37.761 | | | | | 33.700 | | | | | 29.509 | | | | | 23.505 | |
Accumulation Unit Value: | | | | | | | | | | |
Beginning of period | | | | 311.414 | | | | | 273.653 | | | | | 239.953 | | | | | 210.444 | | | | | 186.939 | |
| | | | | | | | | | |
End of period | | | $ | | 307.922 | | | | $ | | 311.414 | | | | $ | | 273.653 | | | | $ | | 239.953 | | | | $ | | 210.444 | |
| | | | | | | | | | |
Total return | | | | (1.12 | )% | | | | | 13.80% | | | | | 14.04% | | | | | 14.02% | | | | | 12.57% | |
Ratios to Average Net Assets: | | | | | | | | | | |
Expenses(2) | | | | 0.73% | | | | | 0.87% | | | | | 0.67% | | | | | 0.63% | | | | | 0.63% | |
Investment income, net | | | | 2.50% | | | | | 3.88% | | | | | 4.49% | | | | | 4.82% | | | | | 5.17% | |
Portfolio turnover rate: | | | | | | | | | | |
Real estate properties | | | | 0.31% | | | | | 5.59% | | | | | 3.62% | | | | | 6.72% | | | | | 2.32% | |
Marketable securities | | | | 19.75% | | | | | 13.03% | | | | | 51.05% | | | | | 77.63% | | | | | 143.47% | |
Accumulation Units outstanding at end of period (in thousands) | | | | 48,226 | | | | | 55,106 | | | | | 50,146 | | | | | 42,623 | | | | | 33,338 | |
Net assets end of period (in thousands) | | | $ | | 15,338,831 | | | | $ | | 17,660,537 | | | | $ | | 14,132,693 | | | | $ | | 10,548,711 | | | | $ | | 7,245,550 | |
|
(1) | | | | Per share amounts and percentages for the interim period have not been annualized. |
|
(2) | | | | Expense charges per Accumulation Unit and the Ratio of Expenses to Average Net Assets reflect Account-level expenses and exclude real estate property level expenses which are included in net real estate income. If the real estate property level expenses were included, the expense charge per Accumulation Unit for the nine months ended September 30, 2008 would be $8.856 ($10.892, $9.478, $8.441, and $6.572, for the years ended December 31, 2007, 2006, 2005, and 2004, respectively), and the Ratio of Expenses to Average Net Assets for the nine months ended September 30, 2008 would be 2.82% (3.71%, 3.81%, 3.78%, and 3.33% for the years ended December 31, 2007, 2006, 2005, and 2004, respectively). |
15
Note 7—Accumulation Units
Changes in the number of Accumulation Units outstanding were as follows (in thousands):
| | | | |
| | For the
Nine Months
Ended
September 30, 2008 | | For the Year Ended
December 31, 2007 |
| | (Unaudited) | | |
Credited for premiums | | | | 2,538 | | | | | 3,795 | |
Net units credited (cancelled) for transfers, net disbursements and amounts applied to the Annuity Fund | | | | (9,418 | ) | | | | | 1,165 | |
Outstanding: | | | | |
Beginning of period | | | | 55,106 | | | | | 50,146 | |
| | | | |
End of period | | | | 48,226 | | | | | 55,106 | |
| | | | |
Note 8—Commitments and Subsequent Events
As of September 30, 2008, the Account had outstanding commitments to purchase interests in five limited partnerships and shares in a private real estate equity investment trust. Approximately $86.6 million remains to be funded under these commitments.
On October 17, 2008, the Account entered into a mortgage loan agreement in the principal amount of $87.9 million secured by an apartment property, The Colorado, located in New York, New York, with a fixed interest rate of 5.65% for a period of 7 years.
On November 13, 2008, the Account entered into a mortgage loan agreement in the principal amount of $42 million secured by an apartment property, The Caruth, located in Dallas, Texas, with a fixed interest rate of 5.71% for a period of 7 years.
During the normal course of business, the Account enters into discussions and agreements to purchase or sell real estate properties. On November 7, 2008, the Account sold a pool of industrial properties in Crofton, Maryland and Chicago, Illinois for approximately $47.5 million and realized a loss of $8.6 million.
The Account is party to various other claims and routine litigation arising in the ordinary course of business. Management of the Account does not believe that the results of any such claims or litigation, individually, or in the aggregate, will have a material effect on the Account’s business, financial position, or results of operations.
Note 9—New Accounting Pronouncements
In September 2006, FASB issued Statement No. 157, “Fair Value Measurements.” This Statement defines fair value, establishes a framework for measuring fair value under generally accepted accounting principles in the United States, and requires additional disclosures about fair value measurements. This Statement was effective as of January 1, 2008 for the Account. The adoption of Statement No. 157 did not have a material impact on the Account’s financial position or results of operations.
In February 2007, FASB issued Statement No. 159, “The Fair Value Option for Financial Assets and Financial Liabilities.” This Statement permits entities to choose to measure financial instruments and certain other items at fair value and is expected to expand the use of fair value measurement when warranted. The Account adopted Statement No. 159 on January 1, 2008 and reports all existing and plans to report all future mortgage loans payable at fair value using this Statement. Historically, the Account recorded mortgage loans payable at fair value. The adoption of Statement 159 did not have a material impact on the Account’s financial position or results of operations.
In June 2007, the Accounting Standards Executive Committee (“ACSEC”) of the American Institute of Certified Public Accountants (“AICPA”) issued Statement of Position (“SOP”) 07-1, “Clarification of the Scope of the Audit and Accounting Guide, Investment Companies and Accounting by Parent Companies and Equity Method Investors for Investments in Investment Companies.” The SOP clarifies which entities are required to apply the provisions of the Investment Companies Audit and Accounting Guide (“Guide”) and
16
provides guidance on accounting by parent companies and equity method investors for investments in investment companies. SOP 07-1 was effective for fiscal years beginning on or after December 15, 2007. In February 2008, FASB issued Staff Position (“FSP”) SOP 07-1-1 indefinitely delaying the effective date of SOP 07-1 to allow FASB time to consider significant issues related to the implementation of SOP 07-1. Management of the Account will continue to monitor FASB developments and will evaluate the financial reporting implications to the Account, as necessary.
In December 2007, FASB issued Statement No. 141(R), “Business Combinations,” which establishes principles and requirements for how the acquirer shall recognize and measure in its financial statements the identifiable assets acquired, liabilities assumed, any noncontrolling interest in the acquiree and goodwill acquired in a business combination or a gain from a bargain purchase. This Statement is effective for business combinations for which the acquisition date is on or after the beginning of the first annual reporting period beginning on or after December 15, 2008. The Account reports all investments in real estate at fair value and therefore does not account for the acquisition of real estate investment as a business combination under this statement.
In December 2007, FASB issued Statement No. 160, “Noncontrolling Interests in Consolidated Financial Statements—an Amendment of ARB No. 51,” which establishes and expands accounting and reporting standards for minority interests, which will be recharacterized as noncontrolling interests, in a subsidiary and the deconsolidation of a subsidiary. This Statement is effective for fiscal years beginning on or after December 15, 2008. The adoption of Statement No. 160 does not impact the financial position or results of operations of the Account.
In May 2008, FASB issued Statement No. 162, “The Hierarchy of Generally Accepted Accounting Principles” (“GAAP Hierarchy”), which identifies the sources of accounting principles and the framework for selecting the principles to be used in the preparation of financial statements of nongovernmental entities that are presented in conformity with generally accepted accounting principles in the United States. This statement is effective 60 days following the Securities and Exchange Commission’s approval of the Public Company Accounting Oversight Board amendments to AU Section 411, “The Meaning of Presented Fairly in Conformity with Generally Accepted Accounting Principles” (the approval occurred on September 16, 2008). This amendment removes the GAAP Hierarchy from auditing literature and places it in the accounting literature and appropriately directs the requirement to comply with the GAAP Hierarchy to the reporting entity. The Account has assessed the impact of the standard and does not anticipate any changes in the application of the Account’s accounting principles will occur.
In October 2008, FASB issued FSP FAS 157-3, “Determining the Fair Value of a Financial Asset When the Market for That Asset is Not Active.” This FSP clarifies the application of Statement No. 157 in a market that is not active and applies to financial assets within the scope of accounting pronouncements that require or permit fair value measurements in accordance with Statement No. 157. The FSP is effective upon issuance, including prior periods for which financial statements have not been issued. Accordingly, the Account adopted this guidance effective September 30, 2008. The adoption of this guidance did not have a material effect on the financial position or results operations of the Account.
17
TIAA REAL ESTATE ACCOUNT
STATEMENT OF INVESTMENTS
September 30, 2008 and December 31, 2007
(Dollar values shown in thousands)
REAL ESTATE PROPERTIES—71.70% and 63.04%
| | | | | | |
Location/Description | | | | Value |
| | 2008 | | 2007 |
| | | | (Unaudited) | | |
Alabama: | | | | | | |
Inverness Center | | Office | | | $ | | 115,282 | | | | $ | | 125,522 | |
Arizona: | | | | | | |
Camelback Center | | Office | | | | 67,400 | | | | | 80,000 | |
Kierland Apartment Portfolio | | Apartments | | | | 164,863 | | | | | 170,084 | |
Phoenix Apartment Portfolio | | Apartments | | | | 140,600 | | | | | 156,110 | |
California: | | | | | | |
3 Hutton Centre Drive | | Office | | | | 54,743 | | | | | 64,200 | |
50 Fremont | | Office | | | | 464,100 | (1) | | | | | 478,000 | (1) | |
88 Kearny Street | | Office | | | | 118,634 | | | | | 123,822 | |
275 Battery | | Office | | | | 261,591 | | | | | 271,917 | |
980 9th Street and 1010 8th Street | | Office | | | | 157,100 | | | | | 178,000 | |
Rancho Cucamonga Industrial Portfolio | | Industrial | | | | 130,000 | | | | | 133,000 | |
Capitol Place | | Office | | | | 53,200 | | | | | 53,539 | |
Centerside I | | Office | | | | 55,209 | | | | | 67,500 | |
Centre Pointe and Valley View | | Industrial | | | | 34,400 | | | | | 34,143 | |
Great West Industrial Portfolio | | Industrial | | | | 119,500 | | | | | — | |
Larkspur Courts | | Apartments | | | | 91,000 | | | | | 97,000 | |
Northern CA RA Industrial Portfolio | | Industrial | | | | 67,719 | | | | | 69,602 | |
Ontario Industrial Portfolio | | Industrial | | | | 351,400 | (1) | | | | | 355,399 | (1) | |
Pacific Plaza | | Office | | | | 123,995 | (1) | | | | | 127,130 | (1) | |
Regents Court | | Apartments | | | | 69,000 | | | | | 69,000 | |
Southern CA RA Industrial Portfolio | | Industrial | | | | 110,467 | | | | | 110,718 | |
The Legacy at Westwood | | Apartments | | | | 121,621 | | | | | 126,580 | |
Wellpoint | | Office | | | | 48,500 | | | | | 51,000 | |
Westcreek | | Apartments | | | | 37,433 | | | | | 39,190 | |
West Lake North Business Park | | Office | | | | 62,000 | | | | | 68,622 | |
Westwood Marketplace | | Retail | | | | 100,600 | | | | | 96,562 | |
Wilshire Rodeo Plaza | | Office | | | | 232,988 | (1) | | | | | 230,439 | (1) | |
Colorado: | | | | | | |
Palomino Park | | Apartments | | | | 196,000 | | | | | 194,001 | |
The Lodge at Willow Creek | | Apartments | | | | 45,500 | | | | | 43,500 | |
The Market at Southpark | | Retail | | | | 29,000 | | | | | 35,800 | |
Connecticut: | | | | | | |
Ten & Twenty Westport Road | | Office | | | | 195,000 | | | | | 183,006 | |
Florida: | | | | | | |
701 Brickell | | Office | | | | 304,523 | (1) | | | | | 275,942 | |
4200 West Cypress Street | | Office | | | | 41,064 | | | | | 48,044 | |
Plantation Grove | | Retail | | | | 14,500 | | | | | 15,400 | |
Pointe on Tampa Bay | | Office | | | | 58,300 | | | | | 60,972 | |
Publix at Weston Commons | | Industrial | | | | 55,226 | (1) | | | | | 55,200 | (1) | |
Quiet Waters at Coquina Lakes | | Apartments | | | | 26,023 | | | | | 26,205 | |
Royal St George | | Apartments | | | | — | | | | | 27,000 | |
See notes to the financial statements.
18
TIAA REAL ESTATE ACCOUNT
STATEMENT OF INVESTMENTS
September 30, 2008 and December 31, 2007
(Dollar values shown in thousands)
| | | | | | |
Location/Description | | | | Value |
| | 2008 | | 2007 |
| | | | (Unaudited) | | |
Florida: (continued) | | | | | | |
Seneca Industrial Park | | Industrial | | | $ | | 114,645 | | | | $ | | 122,334 | |
South Florida Apartment Portfolio | | Apartments | | | | 71,000 | | | | | 68,249 | |
Suncrest Village | | Retail | | | | 17,000 | | | | | 19,500 | |
The Fairways of Carolina | | Apartments | | | | 27,022 | | | | | 27,208 | |
The North 40 Office Complex | | Office | | | | 65,070 | | | | | 67,004 | |
Urban Centre | | Office | | | | 131,882 | | | | | 135,577 | |
France: | | | | | | |
Printemps de L’Homme | | Retail | | | | 266,785 | | | | | 279,078 | |
Georgia: | | | | | | |
1050 Lenox Park | | Apartments | | | | 70,000 | | | | | 85,500 | |
Atlanta Industrial Portfolio | | Industrial | | | | 55,051 | | | | | 58,300 | |
Glenridge Walk | | Apartments | | | | 46,200 | | | | | 52,900 | |
Reserve at Sugarloaf | | Apartments | | | | 44,900 | (1) | | | | | 52,000 | (1) | |
Shawnee Ridge Industrial Portfolio | | Industrial | | | | 73,800 | | | | | 76,742 | |
Illinois: | | | | | | |
Chicago Caleast Industrial Portfolio | | Industrial | | | | 73,495 | | | | | 77,643 | |
Chicago Industrial Portfolio | | Industrial | | | | 83,000 | | | | | 86,421 | |
East North Central RA Industrial Portfolio | | Industrial | | | | 30,530 | | | | | 38,016 | |
Oak Brook Regency Towers | | Office | | | | 85,119 | | | | | 86,892 | |
Parkview Plaza | | Office | | | | 68,397 | | | | | 66,067 | |
Maryland: | | | | | | |
Broadlands Business Park | | Industrial | | | | 30,000 | | | | | 35,500 | |
FEDEX Distribution Facility | | Industrial | | | | 10,350 | | | | | 9,900 | |
GE Appliance East Coast Distribution Facility | | Industrial | | | | 42,000 | | | | | 48,000 | |
Massachusetts: | | | | | | |
99 High Street | | Office | | | | 389,556 | (1) | | | | | 344,688 | (1) | |
Needham Corporate Center | | Office | | | | 34,065 | | | | | 33,275 | |
Northeast RA Industrial Portfolio | | Industrial | | | | 31,610 | | | | | 33,300 | |
The Newbry | | Office | | | | 361,972 | | | | | 389,880 | |
Minnesota: | | | | | | |
Champlin Marketplace | | Retail | | | | 17,750 | | | | | 18,375 | |
Nevada: | | | | | | |
UPS Distribution Facility | | Industrial | | | | 15,100 | | | | | 15,900 | |
New Jersey: | | | | | | |
Konica Photo Imaging Headquarters | | Industrial | | | | 22,100 | | | | | 23,500 | |
Marketfair | | Retail | | | | 92,046 | | | | | 95,500 | |
Morris Corporate Center III | | Office | | | | 103,636 | | | | | 119,600 | |
NJ Caleast Industrial Portfolio | | Industrial | | | | 50,475 | | | | | 42,225 | |
Plainsboro Plaza | | Retail | | | | 37,000 | | | | | 51,000 | |
South River Road Industrial | | Industrial | | | | 50,000 | | | | | 53,400 | |
See notes to the financial statements.
19
TIAA REAL ESTATE ACCOUNT
STATEMENT OF INVESTMENTS
September 30, 2008 and December 31, 2007
(Dollar values shown in thousands)
| | | | | | |
Location/Description | | | | Value |
| | 2008 | | 2007 |
| | | | (Unaudited) | | |
New York: | | | | | | |
780 Third Avenue | | Office | | | $ | | 380,000 | | | | $ | | 375,000 | |
The Colorado | | Apartments | | | | 163,831 | | | | | 113,033 | |
Ohio: | | | | | | |
Columbus Portfolio | | Office | | | | — | | | | | 26,315 | |
Pennsylvania: | | | | | | |
Lincoln Woods | | Apartments | | | | 37,533 | | | | | 37,917 | |
Tennessee: | | | | | | |
Airways Distribution Center | | Industrial | | | | 17,532 | | | | | 24,300 | |
Summit Distribution Center | | Industrial | | | | 22,317 | | | | | 27,500 | |
Texas: | | | | | | |
Dallas Industrial Portfolio | | Industrial | | | | 158,098 | | | | | 154,056 | |
Four Oaks Place | | Office | | | | 482,128 | (1) | | | | | 419,270 | |
Houston Apartment Portfolio | | Apartments | | | | 283,639 | | | | | 296,241 | |
Lincoln Centre | | Office | | | | 316,049 | (1) | | | | | 305,000 | (1) | |
Park Place on Turtle Creek | | Office | | | | 47,012 | | | | | 48,283 | |
Pinnacle Industrial/DFW Trade Center | | Industrial | | | | 44,000 | | | | | 46,700 | |
Preston Sherry Plaza | | Office | | | | 46,000 | (1) | | | | | 45,500 | |
South Frisco Village | | Retail | | | | 46,000 | (1) | | | | | 48,500 | (1) | |
The Caruth | | Apartments | | | | 69,769 | | | | | 65,427 | |
The Maroneal | | Apartments | | | | 41,784 | | | | | 40,034 | |
United Kingdom: | | | | | | |
1 & 7 Westferry Circus | | Office | | | | 327,321 | (1) | | | | | 436,127 | (1) | |
Virginia: | | | | | | |
8270 Greensboro Drive | | Office | | | | 61,000 | | | | | 63,500 | |
Ashford Meadows | | Apartments | | | | 88,111 | | | | | 94,060 | |
One Virginia Square | | Office | | | | 55,000 | | | | | 59,539 | |
The Ellipse at Ballston | | Office | | | | 91,010 | | | | | 92,504 | |
Washington: | | | | | | |
Creeksides at Centerpoint | | Office | | | | 33,000 | | | | | 42,000 | |
Fourth & Madison | | Office | | | | 450,000 | (1) | | | | | 487,000 | (1) | |
Millennium Corporate Park | | Office | | | | 173,997 | | | | | 158,000 | |
Northwest RA Industrial Portfolio | | Industrial | | | | 24,505 | | | | | 23,402 | |
Rainier Corporate Park | | Industrial | | | | 82,374 | | | | | 81,161 | |
Regal Logistics Campus | | Industrial | | | | 69,000 | | | | | 71,000 | |
Washington DC: | | | | | | |
1001 Pennsylvania Avenue | | Office | | | | 636,051 | (1) | | | | | 640,150 | (1) | |
1401 H Street, NW | | Office | | | | 229,157 | (1) | | | | | 224,573 | (1) | |
1900 K Street | | Office | | | | 287,500 | | | | | 285,000 | |
Mazza Gallerie | | Retail | | | | 90,186 | | | | | 97,000 | |
| | | | | | |
TOTAL REAL ESTATE PROPERTIES | | | | | | |
(Cost $10,035,579 and $9,804,489) | | | | | | 11,783,941 | | | | | 11,983,715 | |
| | | | | | |
See notes to the financial statements.
20
TIAA REAL ESTATE ACCOUNT
STATEMENT OF INVESTMENTS
September 30, 2008 and December 31, 2007
(Dollar values shown in thousands)
OTHER REAL ESTATE-RELATED INVESTMENTS—18.01% and 16.61%
| | | | |
Location/Description | | Value |
| | 2008 | | 2007 |
| | (Unaudited) | | |
REAL ESTATE JOINT VENTURES—15.98% and 14.87% | | |
CA—Colorado Center LP | | | | |
Yahoo Center (50% Account Interest) | | | $ | | 357,222 | (2) | | | | $ | | 369,402 | (2) | |
CA—Treat Towers LP | | | | |
Treat Towers (75% Account Interest) | | | | 111,065 | | | | | 118,997 | |
GA—Buckhead LLC | | | | |
Prominence in Buckhead (75% Account Interest) | | | | 88,208 | | | | | 115,427 | |
Florida Mall Associates, Ltd | | | | |
The Florida Mall (50% Account Interest) | | | | 291,443 | (2) | | | | | 296,486 | (2) | |
IL—161 Clark Street LLC | | | | |
161 North Clark Street (75% Account Interest) | | | | 733 | (3) | | | | | 3,151 | (3) | |
MA—One Boston Place REIT | | | | |
One Boston Place (50.25% Account Interest) | | | | 233,647 | | | | | 246,440 | |
DDR TC LLC | | | | |
DDR Joint Venture—Various (85% Account Interest) | | | | 917,820 | (2,4) | | | | | 1,028,297 | (2,4) | |
Storage Portfolio I, LLC | | | | |
Storage Portfolio (75% Account Interest) | | | | 71,977 | (2,4) | | | | | 81,943 | (2,4) | |
Strategic Ind Portfolio I, LLC | | | | |
IDI Nationwide Industrial Portfolio (60% Account Interest) | | | | 71,393 | (2,4) | | | | | 76,536 | (2,4) | |
Teachers REA IV, LLC | | | | |
Tyson’s Executive Plaza II (50% Account Interest) | | | | 43,940 | | | | | 44,178 | |
TREA Florida Retail, LLC | | | | |
Florida Retail Portfolio (80% Account Interest) | | | | 257,728 | | | | | 260,879 | |
West Dade Associates | | | | |
Miami International Mall (50% Account Interest) | | | | 106,409 | (2) | | | | | 109,945 | (2) | |
West Town Mall, LLC | | | | |
West Town Mall (50% Account Interest) | | | | 75,378 | (2) | | | | | 75,827 | (2) | |
| | | | |
TOTAL REAL ESTATE JOINT VENTURES | | | | |
(Cost $2,060,836 and $2,005,340) | | | | 2,626,963 | | | | | 2,827,508 | |
| | | | |
LIMITED PARTNERSHIPS—2.03% and 1.74% | | | | |
Cobalt Industrial REIT (10.998% Account Interest) | | | | 31,189 | | | | | 32,840 | |
Colony Realty Partners LP (5.27% Account Interest) | | | | 30,937 | | | | | 32,505 | |
Heitman Value Partners Fund (8.43% Account Interest) | | | | 24,140 | | | | | 24,489 | |
Lion Gables Apartment Fund (18.46% Account Interest) | | | | 216,337 | | | | | 205,162 | |
MONY/Transwestern Mezz RP II (16.67% Account Interest) | | | | 31,080 | | | | | 36,366 | |
| | | | |
TOTAL LIMITED PARTNERSHIPS | | | | |
(Cost $253,814 and $255,579) | | | | 333,683 | | | | | 331,362 | |
| | | | |
TOTAL REAL ESTATE JOINT VENTURES AND
LIMITED PARTNERSHIPS | | | | |
(Cost $2,314,650 and $2,260,919) | | | | 2,960,646 | | | | | 3,158,870 | |
| | | | |
See notes to the financial statements.
21
TIAA REAL ESTATE ACCOUNT
STATEMENT OF INVESTMENTS
September 30, 2008 and December 31, 2007
(Dollar values shown in thousands)
MARKETABLE SECURITIES—9.86% and 19.97%
REAL ESTATE-RELATED MARKETABLE SECURITIES—0.00% and 2.24%
| | | | | | | | |
Shares | | Issuer | | Value |
2008 | | 2007 | | 2008 | | 2007 |
| | | | | | | (Unaudited) | | |
| | — | | | | | 51,200 | | | Acadia Realty Trust | | | $ | | — | | | | $ | | 1,311 | |
| | — | | | | | 3,300 | | | Alexander’s Inc. | | | | — | | | | | 1,166 | |
| | — | | | | | 53,100 | | | Alexandria Real Estate Equities Inc. | | | | — | | | | | 5,399 | |
| | — | | | | | 164,585 | | | AMB Property Corp. | | | | — | | | | | 9,474 | |
| | — | | | | | 45,100 | | | American Campus Communities Inc. | | | | — | | | | | 1,211 | |
| | — | | | | | 214,600 | | | American Financial Realty Trust | | | | — | | | | | 1,721 | |
| | — | | | | | 159,700 | | | Apartment Investment & Management Co. | | | | — | | | | | 5,546 | |
| | — | | | | | 200,000 | | | Ashford Hospitality Trust Inc. | | | | — | | | | | 1,438 | |
| | — | | | | | 27,500 | | | Associated Estates Realty Corp. | | | | — | | | | | 260 | |
| | — | | | | | 132,200 | | | AvalonBay Communities Inc. | | | | — | | | | | 12,445 | |
| | — | | | | | 109,100 | | | BioMed Realty Trust Inc. | | | | — | | | | | 2,528 | |
| | — | | | | | 198,600 | | | Boston Properties Inc. | | | | — | | | | | 18,233 | |
| | — | | | | | 148,100 | | | Brandywine Realty Trust | | | | — | | | | | 2,655 | |
| | — | | | | | 86,500 | | | BRE Properties Inc. | | | | — | | | | | 3,506 | |
| | — | | | | | 341,650 | | | Brookfield Properties Corp. | | | | — | | | | | 6,577 | |
| | — | | | | | 93,500 | | | Camden Property Trust | | | | — | | | | | 4,502 | |
| | — | | | | | 110,900 | | | CBL & Associates Properties Inc. | | | | — | | | | | 2,652 | |
| | — | | | | | 74,900 | | | Cedar Shopping Centers Inc. | | | | — | | | | | 766 | |
| | — | | | | | 75,400 | | | Colonial Properties Trust | | | | — | | | | | 1,706 | |
| | — | | | | | 79,500 | | | Corporate Office Properties Trust | | | | — | | | | | 2,504 | |
| | — | | | | | 71,100 | | | Cousins Properties Inc. | | | | — | | | | | 1,571 | |
| | — | | | | | 281,100 | | | DCT Industrial Trust Inc. | | | | — | | | | | 2,617 | |
| | — | | | | | 205,000 | | | Developers Diversified Realty Corp. | | | | — | | | | | 7,849 | |
| | — | | | | | 157,000 | | | DiamondRock Hospitality Co. | | | | — | | | | | 2,352 | |
| | — | | | | | 99,000 | | | Digital Realty Trust Inc. | | | | — | | | | | 3,799 | |
| | — | | | | | 164,400 | | | Douglas Emmett Inc. | | | | — | | | | | 3,717 | |
| | — | | | | | 243,000 | | | Duke Realty Corp. | | | | — | | | | | 6,337 | |
| | — | | | | | 51,700 | | | Dupont Fabros Technology | | | | — | | | | | 1,013 | |
| | — | | | | | 39,400 | | | EastGroup Properties Inc. | | | | — | | | | | 1,649 | |
| | — | | | | | 49,900 | | | Education Realty Trust Inc. | | | | — | | | | | 561 | |
| | — | | | | | 37,300 | | | Equity Lifestyle Properties Inc. | | | | — | | | | | 1,703 | |
| | — | | | | | 60,800 | | | Equity One Inc. | | | | — | | | | | 1,400 | |
| | — | | | | | 452,300 | | | Equity Residential | | | | — | | | | | 16,495 | |
| | — | | | | | 42,000 | | | Essex Property Trust Inc. | | | | — | | | | | 4,095 | |
| | — | | | | | 108,700 | | | Extra Space Storage Inc. | | | | — | | | | | 1,553 | |
| | — | | | | | 93,700 | | | Federal Realty Investment Trust | | | | — | | | | | 7,697 | |
| | — | | | | | 101,300 | | | FelCor Lodging Trust Inc. | | | | — | | | | | 1,579 | |
| | — | | | | | 74,700 | | | First Industrial Realty Trust Inc. | | | | — | | | | | 2,585 | |
| | — | | | | | 41,600 | | | First Potomac Realty Trust | | | | — | | | | | 719 | |
| | — | | | | | 384,500 | | | General Growth Properties Inc. | | | | — | | | | | 15,834 | |
| | — | | | | | 62,700 | | | Glimcher Realty Trust | | | | — | | | | | 896 | |
| | — | | | | | 64,200 | | | GMH Communities Trust | | | | — | | | | | 354 | |
| | — | | | | | 360,900 | | | HCP Inc | | | | — | | | | | 12,552 | |
| | — | | | | | 141,700 | | | Health Care REIT Inc | | | | — | | | | | 6,333 | |
| | — | | | | | 84,600 | | | Healthcare Realty Trust Inc | | | | — | | | | | 2,148 | |
| | — | | | | | 70,900 | | | Hersha Hospitality Trust | | | | — | | | | | 674 | |
| | — | | | | | 96,300 | | | Highwoods Properties Inc. | | | | — | | | | | 2,829 | |
| | — | | | | | 55,500 | | | Home Properties Inc. | | | | — | | | | | 2,489 | |
See notes to the financial statements.
22
TIAA REAL ESTATE ACCOUNT
STATEMENT OF INVESTMENTS
September 30, 2008 and December 31, 2007
(Dollar values shown in thousands)
| | | | | | | | |
Shares | | Issuer | | Value |
2008 | | 2007 | | 2008 | | 2007 |
| | | | | | | (Unaudited) | | |
| | — | | | | | 155,800 | | | Hospitality Properties Trust | | | $ | | — | | | | $ | | 5,020 | |
| | — | | | | | 869,070 | | | Host Hotels & Resorts Inc. | | | | — | | | | | 14,809 | |
| | — | | | | | 375,400 | | | HRPT Properties Trust | | | | — | | | | | 2,902 | |
| | — | | | | | 95,300 | | | Inland Real Estate Corp. | | | | — | | | | | 1,349 | |
| | — | | | | | 54,100 | | | Kilroy Realty Corp. | | | | — | | | | | 2,973 | |
| | — | | | | | 365,921 | | | Kimco Realty Corp. | | | | — | | | | | 13,320 | |
| | — | | | | | 47,600 | | | Kite Realty Group Trust | | | | — | | | | | 727 | |
| | — | | | | | 66,600 | | | LaSalle Hotel Properties | | | | — | | | | | 2,125 | |
| | — | | | | | 151,900 | | | Liberty Property Trust | | | | — | | | | | 4,376 | |
| | — | | | | | 121,000 | | | Macerich Co./The | | | | — | | | | | 8,598 | |
| | — | | | | | 111,900 | | | Mack-Cali Realty Corp. | | | | — | | | | | 3,805 | |
| | — | | | | | 59,900 | | | Maguire Properties Inc. | | | | — | | | | | 1,765 | |
| | — | | | | | 42,300 | | | Mid-America Apartment Communities | | | | — | | | | | 1,808 | |
| | — | | | | | 155,200 | | | Nationwide Health Properties Inc. | | | | — | | | | | 4,869 | |
| | — | | | | | 25,400 | | | Parkway Properties Inc./Md | | | | — | | | | | 939 | |
| | — | | | | | 65,900 | | | Pennsylvania Real Estate Investment Trust | | | | — | | | | | 1,956 | |
| | — | | | | | 72,200 | | | Post Properties Inc. | | | | — | | | | | 2,536 | |
| | — | | | | | 427,900 | | | Prologis | | | | — | | | | | 27,120 | |
| | — | | | | | 26,900 | | | PS Business Parks Inc. | | | | — | | | | | 1,414 | |
| | — | | | | | 214,614 | | | Public Storage Inc. | | | | — | | | | | 15,755 | |
| | — | | | | | 31,500 | | | Ramco-Gershenson Properties | | | | — | | | | | 673 | |
| | — | | | | | 115,100 | | | Regency Centers Corp. | | | | — | | | | | 7,423 | |
| | — | | | | | 19,300 | | | Saul Centers Inc. | | | | — | | | | | 1,031 | |
| | — | | | | | 139,600 | | | Senior Housing Properties Trust | | | | — | | | | | 3,166 | |
| | — | | | | | 373,221 | | | Simon Property Group Inc. | | | | — | | | | | 32,418 | |
| | — | | | | | 98,507 | | | SL Green Realty Corp. | | | | — | | | | | 9,207 | |
| | — | | | | | 36,500 | | | Sovran Self Storage Inc. | | | | — | | | | | 1,464 | |
| | — | | | | | 124,300 | | | Strategic Hotels & Resorts Inc. | | | | — | | | | | 2,080 | |
| | — | | | | | 27,800 | | | Sun Communities Inc. | | | | — | | | | | 586 | |
| | — | | | | | 98,200 | | | Sunstone Hotel Investors Inc. | | | | — | | | | | 1,796 | |
| | — | | | | | 52,300 | | | Tanger Factory Outlet Centers | | | | — | | | | | 1,972 | |
| | — | | | | | 88,800 | | | Taubman Centers Inc. | | | | — | | | | | 4,368 | |
| | — | | | | | 224,000 | | | UDR, Inc. | | | | — | | | | | 4,446 | |
| | — | | | | | 17,000 | | | Universal Health Realty Income Trust | | | | — | | | | | 602 | |
| | — | | | | | 78,500 | | | U-Store-It Trust | | | | — | | | | | 719 | |
| | — | | | | | 221,800 | | | Ventas Inc. | | | | — | | | | | 10,037 | |
| | — | | | | | 237,100 | | | Vornado Realty Trust | | | | — | | | | | 20,853 | |
| | — | | | | | 77,700 | | | Washington Real Estate Investment | | | | — | | | | | 2,441 | |
| | — | | | | | 133,000 | | | Weingarten Realty Investors | | | | — | | | | | 4,182 | |
| | | | | | | | | |
TOTAL REAL ESTATE EQUITY SECURITIES | | |
(Cost $0 and $439,154) | | | | — | | | | | 426,630 | |
| | | | | | | | | |
TOTAL REAL ESTATE-RELATED MARKETABLE SECURITIES | | |
(Cost $0 and $439,154) | | | | — | | | | | 426,630 | |
| | | | | | | | | |
See notes to the financial statements.
23
TIAA REAL ESTATE ACCOUNT
STATEMENT OF INVESTMENTS
September 30, 2008 and December 31, 2007
(Dollar values shown in thousands)
OTHER MARKETABLE SECURITIES—9.86% and 17.73%
BANKERS ACCEPTANCE—0.27% and 0.20%
| | | | | | | | |
Principal | | Issuer, Maturity Date and Yield(5) | | Value |
2008 | | 2007 | | 2008 | | 2007 |
| | | | | | | (Unaudited) | | |
| $ | | 17,952 | | | | $ | | — | | | Bank of America Corp
10/6/08 2.674% | | | $ | | 17,938 | | | | $ | | — | |
| | 15,000 | | | | | — | | | Bank of America Corp
12/5/08 2.893% | | | | 14,880 | | | | | — | |
| | 10,825 | | | | | — | | | JPMorgan Chase Bank
10/20/08 2.674% | | | | 10,797 | | | | | — | |
| | — | | | | | 4,359 | | | JPMorgan Chase Bank
1/18/08 4.400% | | | | — | | | | | 4,349 | |
| | — | | | | | 10,000 | | | Wachovia Bank
4/21/08 4.441% | | | | — | | | | | 9,851 | |
| | — | | | | | 25,000 | | | Wachovia Bank
5/7/08 4.360% | | | | — | | | | | 24,570 | |
| | | | | | | | | |
TOTAL BANKERS ACCEPTANCE | | | | |
Cost $43,679 and $38,836) | | | | 43,615 | | | | | 38,770 | |
| | | | | | | | | |
CERTIFICATES OF DEPOSIT—0.61% and 2.22% | | | | |
| | | | | Issuer, Maturity Date and Interest Rate | | | | |
| | — | | | | | 20,000 | | | American Express Centurion Bank
2/5/08 4.750% | | | | — | | | | | 20,002 | |
| | — | | | | | 25,000 | | | American Express Centurion Bank
2/4/08 4.750% | | | | — | | | | | 25,002 | |
| | — | | | | | 10,000 | | | Bank of Montreal
2/14/08 5.030% | | | | — | | | | | 10,004 | |
| | — | | | | | 45,000 | | | Bank of Montreal
3/7/08 5.100% | | | | — | | | | | 45,031 | |
| | — | | | | | 25,000 | | | Bank of Nova Scotia
1/16/08 5.060% | | | | — | | | | | 25,004 | |
| | — | | | | | 25,000 | | | Barclays Bank
2/27/08 4.990% | | | | — | | | | | 25,013 | |
| | 20,000 | | | | | — | | | Calyon
10/1/08 2.780% | | | | 19,999 | | | | | — | |
| | — | | | | | 10,000 | | | Calyon
1/31/08 4.820% | | | | — | | | | | 10,001 | |
| | — | | | | | 50,000 | | | Calyon
3/12/08 5.050% | | | | — | | | | | 50,033 | |
| | — | | | | | 25,000 | | | Deutsche Bank
1/24/08 4.950% | | | | — | | | | | 25,004 | |
| | — | | | | | 20,000 | | | Dexia Banque SA
3/25/08 4.880% | | | | — | | | | | 20,008 | |
| | — | | | | | 32,000 | | | Dexia Banque SA
3/10/08 4.990% | | | | — | | | | | 32,017 | |
| | 20,000 | | | | | — | | | Dexia Banque SA
11/3/08 2.650% | | | | 19,965 | | | | | — | |
| | 25,000 | | | | | — | | | Lloyds TSB Bank PLC
10/2/08 2.700% | | | | 24,997 | | | | | — | |
| | — | | | | | 30,000 | | | Rabobank Nederland
3/5/08 5.020% | | | | — | | | | | 30,016 | |
| | — | | | | | 30,000 | | | Royal Bank of Canada
1/25/08 5.060% | | | | — | | | | | 30,007 | |
See notes to the financial statements.
24
TIAA REAL ESTATE ACCOUNT
STATEMENT OF INVESTMENTS
September 30, 2008 and December 31, 2007
(Dollar values shown in thousands)
| | | | | | | | |
Principal | | Issuer, Maturity Date and Interest Rate | | Value |
2008 | | 2007 | | 2008 | | 2007 |
| | | | | | | (Unaudited) | | |
| $ | | 10,000 | | | | $ | | — | | | Societe Generale
12/5/08 2.790% | | | $ | | 9,969 | | | | $ | | — | |
| | — | | | | | 20,000 | | | SunTrust Banks, Inc.
1/28/08 4.845% | | | | — | | | | | 19,999 | |
| | — | | | | | 15,000 | | | Toronto Dominion Bank
2/26/08 5.040% | | | | — | | | | | 15,009 | |
| | — | | | | | 40,000 | | | Toronto Dominion Bank
1/22/08 5.300% | | | | — | | | | | 40,014 | |
| | 25,000 | | | | | — | | | Toronto Dominion Bank
10/20/08 2.720% | | | | 24,971 | | | | | — | |
| | | | | | | | | |
TOTAL CERTIFICATES OF DEPOSIT
(Cost $100,000 and $422,007) | | | | 99,901 | | | | | 422,164 | |
| | | | | | | | | |
COMMERCIAL PAPER—5.09% and 9.23% | | | | |
| | | | | Issuer, Maturity Date and Yield(5) | | | | |
| | — | | | | | 10,000 | | | Abbey National North America LLC
1/8/08 4.670% | | | | — | | | | | 9,990 | |
| | — | | | | | 20,000 | | | Abbey National North America LLC
1/9/08 4.930% | | | | — | | | | | 19,977 | |
| | 15,000 | | | | | — | | | Abbey National North America LLC
10/31/08 2.891% | | | | 14,952 | | | | | — | |
| | 30,000 | | | | | — | | | Abbey National North America LLC
12/17/08 3.119% | | | | 29,747 | | | | | — | |
| | — | | | | | 50,000 | | | American Express Credit Corp.
1/14/08 4.510% | | | | — | | | | | 49,908 | |
| | — | | | | | 2,137 | | | American Honda Finance Corp.
1/4/08 4.380% | | | | — | | | | | 2,136 | |
| | — | | | | | 7,050 | | | American Honda Finance Corp.
2/28/08 4.250% | | | | — | | | | | 6,997 | |
| | — | | | | | 15,438 | | | American Honda Finance Corp.
2/11/08 4.310% | | | | — | | | | | 15,356 | |
| | — | | | | | 32,490 | | | American Honda Finance Corp.
1/29/08 4.500-4.510% | | | | — | | | | | 32,370 | |
| | — | | | | | 13,200 | | | Bank of America Corp
3/6/08 4.780% | | | | — | | | | | 13,088 | |
| | — | | | | | 30,000 | | | Bank of America Corp
4/8/08 4.800% | | | | — | | | | | 29,604 | |
| | — | | | | | 20,000 | | | Bank of America Corp
1/15/08 4.970% | | | | — | | | | | 19,961 | |
| | 10,000 | | | | | — | | | Bank of Nova Scotia
10/3/08 2.799% | | | | 9,997 | | | | | — | |
| | — | | | | | 27,400 | | | Bank of Scotland
2/26/08 4.710% | | | | — | | | | | 27,201 | |
| | — | | | | | 34,525 | | | Bank of Scotland
2/29/08 4.720% | | | | — | | | | | 34,260 | |
| | — | | | | | 20,000 | | | Canadian Imperial Holdings, Inc.
1/29/08 4.703% | | | | — | | | | | 19,926 | |
| | 30,128 | | | | | — | | | Ciesco LLC
11/4/08 2.840% | | | | 29,998 | | | | | — | |
See notes to the financial statements.
25
TIAA REAL ESTATE ACCOUNT
STATEMENT OF INVESTMENTS
September 30, 2008 and December 31, 2007
(Dollar values shown in thousands)
| | | | | | | | |
Principal | | Issuer, Maturity Date and Yield(5) | | Value |
2008 | | 2007 | | 2008 | | 2007 |
| | | | | | | (Unaudited) | | |
| $ | | — | | | | $ | | 25,000 | | | Citigroup Funding Inc.
2/7/08 4.650% | | | $ | | — | | | | $ | | 24,880 | |
| | — | | | | | 25,000 | | | Citigroup Funding Inc.
2/12/08 4.650% | | | | — | | | | | 24,865 | |
| | — | | | | | 40,000 | | | Citigroup Funding Inc.
1/23/08 4.850% | | | | — | | | | | 39,881 | |
| | 10,000 | | | | | — | | | Citigroup Funding Inc.
10/6/08 2.774% | | | | 9,994 | | | | | — | |
| | — | | | | | 5,255 | | | Coca Cola Co.
2/15/08 4.200% | | | | — | | | | | 5,224 | |
| | — | | | | | 13,000 | | | Coca Cola Co.
2/25/08 4.390% | | | | — | | | | | 12,907 | |
| | — | | | | | 20,000 | | | Coca Cola Co.
2/19/08 4.430% | | | | — | | | | | 19,873 | |
| | 19,988 | | | | | — | | | Corporate Asset Funding Co. Inc.
11/4/08 2.807% | | | | 19,902 | | | | | — | |
| | 33,885 | | | | | — | | | Corporate Asset Funding Co. Inc.
1/20/09 3.086% | | | | 33,430 | | | | | — | |
| | 20,000 | | | | | — | | | Danske Corp.
11/21/08 2.692% | | | | 19,891 | | | | | — | |
| | 25,000 | | | | | — | | | Danske Corp.
10/31/08 2.791% | | | | 24,919 | | | | | — | |
| | — | | | | | 30,000 | | | Danske Corp.
3/6/08 4.920% | | | | — | | | | | 29,746 | |
| | 10,000 | | | | | — | | | Dexia Delaware LLC
10/10/08 2.892% | | | | 9,990 | | | | | — | |
| | — | | | | | 20,000 | | | Edison Asset Securitization, LLC
3/11/08 4.740% | | | | — | | | | | 19,790 | |
| | — | | | | | 30,000 | | | General Electric Capital Corp.
4/8/08 4.580% | | | | — | | | | | 29,607 | |
| | — | | | | | 15,340 | | | General Electric Capital Corp.
2/20/08 4.550% | | | | — | | | | | 15,241 | |
| | — | | | | | 20,460 | | | General Electric Capital Corp.
2/19/08 4.510% | | | | — | | | | | 20,331 | |
| | 17,000 | | | | | — | | | General Electric Capital Corp.
10/9/08 2.466% | | | | 16,990 | | | | | — | |
| | 50,000 | | | | | — | | | General Electric Capital Corp.
10/24/08 2.659% | | | | 49,915 | | | | | — | |
| | — | | | | | 30,540 | | | General Electric Co.
3/4/08 4.540% | | | | — | | | | | 30,290 | |
| | 32,000 | | | | | — | | | General Electric Co.
10/1/08 2.180% | | | | 31,998 | | | | | — | |
| | — | | | | | 13,200 | | | Goldman Sachs Group Inc
1/8/08 5.200% | | | | — | | | | | 13,186 | |
| | — | | | | | 12,000 | | | Govco Incorporated
1/28/08 4.680% | | | | — | | | | | 11,948 | |
| | — | | | | | 20,000 | | | Govco Incorporated
2/12/08 5.400% | | | | — | | | | | 19,870 | |
| | — | | | | | 29,000 | | | Govco Incorporated
3/13/08 4.850% | | | | — | | | | | 28,688 | |
| | — | | | | | 37,860 | | | Govco Incorporated
2/20/08 5.100% | | | | — | | | | | 37,571 | |
See notes to the financial statements.
26
TIAA REAL ESTATE ACCOUNT
STATEMENT OF INVESTMENTS
September 30, 2008 and December 31, 2007
(Dollar values shown in thousands)
| | | | | | | | |
Principal | | Issuer, Maturity Date and Yield(5) | | Value |
2008 | | 2007 | | 2008 | | 2007 |
| | | | | | | (Unaudited) | | |
| $ | | 10,000 | | | | $ | | — | | | Govco LLC
12/8/08 3.134% | | | $ | | 9,918 | | | | $ | | — | |
| | 12,000 | | | | | — | | | Govco LLC
11/17/08 2.828% | | | | 11,932 | | | | | — | |
| | 21,700 | | | | | — | | | Govco LLC
1/26/09 2.974% | | | | 21,393 | | | | | — | |
| | — | | | | | 35,140 | | | Greenwich Capital Holdings
4/14/08 4.850% | | | | — | | | | | 34,650 | |
| | — | | | | | 6,990 | | | Harley-Davidson Funding
2/21/08 4.480% | | | | — | | | | | 6,944 | |
| | — | | | | | 30,000 | | | HSBC Finance Corporation
2/21/08 4.700% | | | | — | | | | | 29,757 | |
| | — | | | | | 5,420 | | | IBM (International Business Machine Corp.)
1/3/08 4.230% | | | | — | | | | | 5,418 | |
| | — | | | | | 25,000 | | | IBM Capital Inc
3/10/08 4.250% | �� | | | — | | | | | 24,773 | |
| | — | | | | | 10,000 | | | IBM International Group
1/14/08 4.725% | | | | — | | | | | 9,982 | |
| | — | | | | | 18,900 | | | IBM International Group
1/15/08 4.725% | | | | — | | | | | 18,863 | |
| | — | | | | | 20,000 | | | IBM International Group
2/27/08 4.220% | | | | — | | | | | 19,852 | |
| | — | | | | | 20,000 | | | ING (US) Finance
1/30/08 4.730% | | | | — | | | | | 19,924 | |
| | — | | | | | 25,000 | | | ING (US) Finance
2/22/08 4.820% | | | | — | | | | | 24,832 | |
| | 40,000 | | | | | — | | | ING (US) Funding LLC
10/15/08 2.736-2.742% | | | | 39,936 | | | | | — | |
| | 20,000 | | | | | — | | | JPMorgan Chase & Co
11/24/08 2.814% | | | | 19,884 | | | | | — | |
| | 26,740 | | | | | — | | | JPMorgan Chase & Co
11/19/08 2.814% | | | | 26,600 | | | | | — | |
| | — | | | | | 22,904 | | | Kitty Hawk Funding Corp
3/14/08 5.030% | | | | — | | | | | 22,653 | |
| | 14,201 | | | | | — | | | Kitty Hawk Funding Corp
10/2/08 4.411% | | | | 14,197 | | | | | — | |
| | 7,000 | | | | | — | | | Nestle Capital Corp
3/12/09 2.462% | | | | 6,906 | | | | | — | |
| | 30,000 | | | | | — | | | Nestle Capital Corp
12/11/08 2.213% | | | | 29,851 | | | | | — | |
| | — | | | | | 14,500 | | | Nestle Capital Corp
3/11/08 5.090% | | | | — | | | | | 14,367 | |
| | — | | | | | 20,000 | | | Nestle Capital Corp
2/6/08 4.740% | | | | — | | | | | 19,907 | |
| | — | | | | | 20,000 | | | Nestle Capital Corp
3/5/08 5.210% | | | | — | | | | | 19,834 | |
| | 10,000 | | | | | — | | | Old Line Funding LLC
1/6/09 3.010% | | | | 9,883 | | | | | — | |
| | — | | | | | 9,300 | | | Paccar Financial Corp
1/14/08 4.730% | | | | — | | | | | 9,283 | |
| | — | | | | | 10,000 | | | Paccar Financial Corp
2/11/08 4.490% | | | | — | | | | | 9,947 | |
See notes to the financial statements.
27
TIAA REAL ESTATE ACCOUNT
STATEMENT OF INVESTMENTS
September 30, 2008 and December 31, 2007
(Dollar values shown in thousands)
| | | | | | | | |
Principal | | Issuer, Maturity Date and Yield(5) | | Value |
2008 | | 2007 | | 2008 | | 2007 |
| | | | | | | (Unaudited) | | |
| $ | | — | | | | $ | | 15,300 | | | Paccar Financial Corp
2/28/08 4.500% | | | $ | | — | | | | $ | | 15,185 | |
| | — | | | | | 10,000 | | | Park Avenue Receivables Corp
3/18/08 4.650% | | | | — | | | | | 9,884 | |
| | 27,100 | | | | | — | | | Park Avenue Receivables Corp
10/30/08 2.647% | | | | 26,997 | | | | | — | |
| | — | | | | | 19,645 | | | Pfizer Inc
5/15/08 4.410% | | | | — | | | | | 19,286 | |
| | — | | | | | 1,500 | | | Private Export Funding Corporation
1/31/08 4.530% | | | | — | | | | | 1,494 | |
| | — | | | | | 10,000 | | | Private Export Funding Corporation
2/11/08 4.680% | | | | — | | | | | 9,947 | |
| | — | | | | | 10,000 | | | Private Export Funding Corporation
3/3/08 4.680% | | | | — | | | | | 9,919 | |
| | — | | | | | 20,000 | | | Private Export Funding Corporation
2/5/08 4.740% | | | | — | | | | | 19,909 | |
| | — | | | | | 28,000 | | | Private Export Funding Corporation
1/30/08 4.640-4.750% | | | | — | | | | | 27,893 | |
| | 6,175 | | | | | — | | | Procter & Gamble International Funding SCA
10/30/08 2.223% | | | | 6,161 | | | | | — | |
| | — | | | | | 4,665 | | | Procter & Gamble International S.C.
1/4/08 4.750% | | | | — | | | | | 4,663 | |
| | — | | | | | 8,000 | | | Procter & Gamble International S.C.
3/12/08 4.350% | | | | — | | | | | 7,926 | |
| | — | | | | | 9,000 | | | Procter & Gamble International S.C.
3/14/08 4.190% | | | | — | | | | | 8,914 | |
| | — | | | | | 10,000 | | | Procter & Gamble International S.C.
1/16/08 4.740% | | | | — | | | | | 9,979 | |
| | — | | | | | 10,000 | | | Procter & Gamble International S.C.
1/18/08 4.750% | | | | — | | | | | 9,977 | |
| | — | | | | | 10,000 | | | Procter & Gamble International S.C.
1/31/08 4.200% | | | | — | | | | | 9,961 | |
| | — | | | | | 17,000 | | | Procter & Gamble International S.C.
2/1/08 4.600% | | | | — | | | | | 16,931 | |
| | — | | | | | 30,000 | | | Procter & Gamble International S.C.
2/14/08 4.740% | | | | — | | | | | 29,831 | |
| | 20,000 | | | | | — | | | Rabobank USA Financial Corp
10/10/08 2.695% | | | | 19,979 | | | | | — | |
| | — | | | | | 12,000 | | | Ranger Funding Company LLC
1/10/08 5.110% | | | | — | | | | | 11,982 | |
| | — | | | | | 31,573 | | | Ranger Funding Company LLC
1/18/08 5.080-5.580% | | | | — | | | | | 31,486 | |
| | 2,205 | | | | | — | | | Ranger Funding Company LLC
1/14/09 2.940% | | | | 2,177 | | | | | — | |
| | 10,000 | | | | | — | | | Ranger Funding Company LLC
10/9/08 2.755% | | | | 9,988 | | | | | — | |
| | — | | | | | 25,000 | | | Royal Bank of Scotland
2/8/08 4.740% | | | | — | | | | | 24,877 | |
| | 30,000 | | | | | — | | | Royal Bank of Scotland
12/2/08 2.819% | | | | 29,799 | | | | | — | |
| | — | | | | | 10,000 | | | Shell International Financial
3/28/08 4.470% | | | | — | | | | | 9,884 | |
See notes to the financial statements.
28
TIAA REAL ESTATE ACCOUNT
STATEMENT OF INVESTMENTS
September 30, 2008 and December 31, 2007
(Dollar values shown in thousands)
| | | | | | | | |
Principal | | Issuer, Maturity Date and Yield(5) | | Value |
2008 | | 2007 | | 2008 | | 2007 |
| | | | | | | (Unaudited) | | |
| $ | | — | | | | $ | | 17,420 | | | Societe Generale North America, Inc.
4/4/08 4.640% | | | $ | | — | | | | $ | | 17,201 | |
| | — | | | | | 15,000 | | | Societe Generale North America, Inc.
2/1/08 4.780% | | | | — | | | | | 14,940 | |
| | — | | | | | 20,000 | | | Societe Generale North America, Inc.
1/10/08 5.155% | | | | — | | | | | 19,974 | |
| | — | | | | | 25,000 | | | Societe Generale North America, Inc.
3/26/08 4.830% | | | | — | | | | | 24,718 | |
| | — | | | | | 10,000 | | | Swedish Export Credit
4/9/08 4.720% | | | | — | | | | | 9,868 | |
| | — | | | | | 16,000 | | | Swedish Export Credit
3/12/08 4.370% | | | | — | | | | | 15,851 | |
| | — | | | | | 17,800 | | | Swedish Export Credit
1/15/08 4.860% | | | | — | | | | | 17,765 | |
| | — | | | | | 18,505 | | | Swedish Export Credit
1/14/08 4.720-4.820% | | | | — | | | | | 18,471 | |
| | — | | | | | 36,000 | | | Swedish Export Credit
1/17/08 4.740% | | | | — | | | | | 35,920 | |
| | 10,000 | | | | | — | | | Swedish Export Credit
10/2/08 2.417% | | | | 9,998 | | | | | — | |
| | — | | | | | 10,000 | | | Toronto-Dominion Holdings USA Inc.
1/31/08 5.060% | | | | — | | | | | 9,961 | |
| | — | | | | | 25,000 | | | Toronto-Dominion Holdings USA Inc.
2/11/08 4.710% | | | | — | | | | | 24,868 | |
| | 4,035 | | | | | — | | | Toronto-Dominion Holdings USA Inc.
11/25/08 2.746% | | | | 4,011 | | | | | — | |
| | — | | | | | 19,000 | | | Toyota Motor Credit Corp.
1/8/08 4.520% | | | | — | | | | | 18,980 | |
| | — | | | | | 20,000 | | | Toyota Motor Credit Corp.
2/28/08 4.530% | | | | — | | | | | 19,850 | |
| | — | | | | | 30,000 | | | Toyota Motor Credit Corp.
2/15/08 4.880% | | | | — | | | | | 29,827 | |
| | — | | | | | 30,000 | | | Toyota Motor Credit Corp.
2/25/08 4.740% | | | | — | | | | | 29,787 | |
| | 10,000 | | | | | — | | | Toyota Motor Credit Corp.
10/27/08 2.680% | | | | 9,980 | | | | | — | |
| | 20,000 | | | | | — | | | Toyota Motor Credit Corp.
10/17/08 2.623% | | | | 19,977 | | | | | — | |
| | 20,000 | | | | | — | | | Toyota Motor Credit Corp.
12/1/08 2.664% | | | | 19,900 | | | | | — | |
| | 40,000 | | | | | — | | | Toyota Motor Credit Corp.
10/22/08 2.762% | | | | 39,939 | | | | | — | |
| | — | | | | | 25,000 | | | UBS Finance, (Delaware) Inc.
4/7/08 4.910% | | | | — | | | | | 24,676 | |
| | — | | | | | 17,215 | | | UBS Finance, (Delaware) Inc.
2/21/08 5.000% | | | | — | | | | | 17,102 | |
| | — | | | | | 20,000 | | | UBS Finance, (Delaware) Inc.
2/13/08 5.030% | | | | — | | | | | 19,889 | |
| | — | | | | | 3,970 | | | Unilever Capital Corp
1/11/08 4.230% | | | | — | | | | | 3,964 | |
| | — | | | | | 20,000 | | | United Parcel Service Inc
4/1/08 4.380% | | | | — | | | | | 19,758 | |
See notes to the financial statements.
29
TIAA REAL ESTATE ACCOUNT
STATEMENT OF INVESTMENTS
September 30, 2008 and December 31, 2007
(Dollar values shown in thousands)
| | | | | | | | |
Principal | | Issuer, Maturity Date and Yield(5) | | Value |
2008 | | 2007 | | 2008 | | 2007 |
| | | | | | | (Unaudited) | | |
| $ | | — | | | | $ | | 20,000 | | | United Parcel Service Inc
4/28/08 4.340% | | | $ | | — | | | | $ | | 19,681 | |
| | — | | | | | 20,000 | | | United Parcel Service Inc
4/29/08 4.340% | | | | — | | | | | 19,678 | |
| | — | | | | | 10,000 | | | United Parcel Service Inc
3/18/08 4.300% | | | | — | | | | | 9,899 | |
| | — | | | | | 30,000 | | | United Parcel Service Inc
3/31/08 4.400% | | | | — | | | | | 29,640 | |
| | — | | | | | 7,831 | | | Variable Funding Capital Corporation
4/25/08 4.640% | | | | — | | | | | 7,694 | |
| | 15,000 | | | | | — | | | Wells Fargo & Co
11/5/08 2.627% | | | | 14,948 | | | | | — | |
| | 20,000 | | | | | — | | | Wells Fargo & Co
11/25/08 2.662% | | | | 19,890 | | | | | — | |
| | 23,740 | | | | | — | | | Wells Fargo & Co
11/17/08 2.631% | | | | 23,629 | | | | | — | |
| | 35,000 | | | | | — | | | Wells Fargo & Co
11/13/08 2.639% | | | | 34,850 | | | | | — | |
| | — | | | | | 30,000 | | | Yorktown Capital, LLC
4/15/08 4.875% | | | | — | | | | | 29,528 | |
| | 12,420 | | | | | — | | | Yorktown Capital, LLC
10/9/08 2.489% | | | | 12,405 | | | | | — | |
| | 15,000 | | | | | — | | | Yorktown Capital, LLC
10/23/08 2.799% | | | | 14,957 | | | | | — | |
| | 25,000 | | | | | — | | | Yorktown Capital, LLC
11/18/08 2.819% | | | | 24,853 | | | | | — | |
| | | | | | | | | |
TOTAL COMMERCIAL PAPER
(Cost $837,706 and $1,755,528) | | | | 836,661 | | | | | 1,755,076 | |
| | | | | | | | | |
GOVERNMENT AGENCY NOTES—2.98% and 5.82% | | |
| | | | | Issuer, Maturity Date and Yield(5) | | | | |
| | — | | | | | 44,000 | | | Fannie Mae Discount Notes
3/6/08 4.260% | | | | — | | | | | 43,678 | |
| | — | | | | | 41,650 | | | Fannie Mae Discount Notes
4/30/08 4.150-4.180% | | | | — | | | | | 41,086 | |
| | — | | | | | 32,465 | | | Fannie Mae Discount Notes
1/4/08 4.330% | | | | — | | | | | 32,458 | |
| | — | | | | | 31,901 | | | Fannie Mae Discount Notes
5/28/08 4.100% | | | | — | | | | | 31,360 | |
| | — | | | | | 30,000 | | | Fannie Mae Discount Notes
4/24/08 4.220% | | | | — | | | | | 29,614 | |
| | — | | | | | 30,000 | | | Fannie Mae Discount Notes
3/21/08 4.280% | | | | — | | | | | 29,729 | |
| | — | | | | | 29,045 | | | Fannie Mae Discount Notes
3/20/08 4.190-4.280% | | | | — | | | | | 28,786 | |
| | — | | | | | 25,000 | | | Fannie Mae Discount Notes
2/22/08 4.270% | | | | — | | | | | 24,854 | |
| | — | | | | | 23,725 | | | Fannie Mae Discount Notes
3/5/08 4.170% | | | | — | | | | | 23,554 | |
| | — | | | | | 22,518 | | | Fannie Mae Discount Notes
3/27/08 4.190-4.240% | | | | — | | | | | 22,299 | |
See notes to the financial statements.
30
TIAA REAL ESTATE ACCOUNT
STATEMENT OF INVESTMENTS
September 30, 2008 and December 31, 2007
(Dollar values shown in thousands)
| | | | | | | | |
Principal | | Issuer, Maturity Date and Yield(5) | | Value |
2008 | | 2007 | | 2008 | | 2007 |
| | | | | | | (Unaudited) | | |
| $ | | — | | | | $ | | 20,000 | | | Fannie Mae Discount Notes
2/19/08 4.200% | | | $ | | — | | | | $ | | 19,890 | |
| | — | | | | | 18,990 | | | Fannie Mae Discount Notes
2/15/08 4.230% | | | | — | | | | | 18,894 | |
| | — | | | | | 17,890 | | | Fannie Mae Discount Notes
3/28/08 4.270% | | | | — | | | | | 17,714 | |
| | — | | | | | 16,600 | | | Fannie Mae Discount Notes
2/21/08 4.280% | | | | — | | | | | 16,505 | |
| | — | | | | | 12,840 | | | Fannie Mae Discount Notes
3/26/08 4.285% | | | | — | | | | | 12,717 | |
| | 26,000 | | | | | — | | | Fannie Mae Discount Notes
12/1/08 2.139% | | | | 25,890 | | | | | — | |
| | 2,030 | | | | | — | | | Fannie Mae Discount Notes
12/5/08 2.667% | | | | 2,021 | | | | | — | |
| | 15,000 | | | | | — | | | Fannie Mae Discount Notes
12/30/08 2.753% | | | | 14,906 | | | | | — | |
| | 15,000 | | | | | — | | | Fannie Mae Discount Notes
12/31/08 2.753% | | | | 14,905 | | | | | — | |
| | 7,885 | | | | | — | | | Fannie Mae Discount Notes
12/10/08 2.581% | | | | 7,847 | | | | | — | |
| | 13,835 | | | | | — | | | Fannie Mae Discount Notes
10/6/08 2.431% | | | | 13,834 | | | | | — | |
| | 14,410 | | | | | — | | | Fannie Mae Discount Notes
10/2/08 2.257% | | | | 14,410 | | | | | — | |
| | 23,500 | | | | | — | | | Fannie Mae Discount Notes
10/1/08 2.267% | | | | 23,500 | | | | | — | |
| | 50,000 | | | | | — | | | Fannie Mae Discount Notes
10/7/08 2.461% | | | | 49,996 | | | | | — | |
| | 55,270 | | | | | — | | | Fannie Mae Discount Notes
10/8/08 2.462% | | | | 55,265 | | | | | — | |
| | 28,970 | | | | | — | | | Federal Home Loan Bank Discount Notes
10/1/08 0.253% | | | | 28,970 | | | | | — | |
| | 71,238 | | | | | — | | | Federal Home Loan Bank Discount Notes
10/6/08 2.232% | | | | 71,233 | | | | | — | |
| | 56,685 | | | | | — | | | Federal Home Loan Bank Discount Notes
12/9/08 2.556% | | | | 56,413 | | | | | — | |
| | 70,306 | | | | | — | | | Federal Home Loan Bank Discount Notes
10/3/08 2.076% | | | | 70,304 | | | | | — | |
| | — | | | | | 85,900 | | | Federal Home Loan Banks
3/24/08 4.260% | | | | — | | | | | 85,096 | |
| | — | | | | | 77,800 | | | Federal Home Loan Banks
1/16/08 4.280-4.290% | | | | — | | | | | 77,681 | |
| | — | | | | | 43,830 | | | Federal Home Loan Banks
1/28/08 4.300% | | | | — | | | | | 43,706 | |
| | — | | | | | 41,450 | | | Federal Home Loan Banks
1/11/08 4.260-4.900% | | | | — | | | | | 41,409 | |
| | — | | | | | 34,945 | | | Federal Home Loan Banks
1/7/08 4.450% | | | | — | | | | | 34,926 | |
| | — | | | | | 32,500 | | | Federal Home Loan Banks
1/25/08 4.260% | | | | — | | | | | 32,419 | |
| | — | | | | | 30,000 | | | Federal Home Loan Banks
3/17/08 4.270% | | | | — | | | | | 29,743 | |
See notes to the financial statements.
31
TIAA REAL ESTATE ACCOUNT
STATEMENT OF INVESTMENTS
September 30, 2008 and December 31, 2007
(Dollar values shown in thousands)
| | | | | | | | |
Principal | | Issuer, Maturity Date and Yield(5) | | Value |
2008 | | 2007 | | 2008 | | 2007 |
| | | | | | | (Unaudited) | | |
| $ | | — | | | | $ | | 28,850 | | | Federal Home Loan Banks
1/4/08 4.661% | | | $ | | — | | | | $ | | 28,844 | |
| | — | | | | | 25,000 | | | Federal Home Loan Banks
1/2/08 4.450% | | | | — | | | | | 25,000 | |
| | — | | | | | 25,000 | | | Federal Home Loan Banks
1/3/08 4.450% | | | | — | | | | | 24,997 | |
| | — | | | | | 25,000 | | | Federal Home Loan Banks
2/13/08 4.200% | | | | — | | | | | 24,880 | |
| | — | | | | | 23,694 | | | Federal Home Loan Banks
3/12/08 4.250% | | | | — | | | | | 23,505 | |
| | — | | | | | 20,000 | | | Federal Home Loan Banks
3/19/08 4.270% | | | | — | | | | | 19,824 | |
| | 15,000 | | | | | 15,000 | | | Federal Home Loan Banks
11/20/08 4.700% | | | | 14,994 | | | | | 14,992 | |
| | — | | | | | 2,000 | | | Federal Home Loan Banks
2/1/08 4.480% | | | | — | | | | | 1,993 | |
| | 25,000 | | | | | — | | | Freddie Mac Discount Note
1/16/09 2.769% | | | | 25,151 | | | | | — | |
| | — | | | | | 10,000 | | | Freddie Mac Discount Note
2/21/08 4.320% | | | | — | | | | | 9,943 | |
| | — | | | | | 32,470 | | | Freddie Mac Discount Note
1/31/08 4.320% | | | | — | | | | | 32,367 | |
| | — | | | | | 30,000 | | | Freddie Mac Discount Note
1/24/08 4.330% | | | | — | | | | | 29,928 | |
| | — | | | | | 26,735 | | | Freddie Mac Discount Note
4/10/08 4.145% | | | | — | | | | | 26,434 | |
| | — | | | | | 25,487 | | | Freddie Mac Discount Note
2/20/08 4.210% | | | | — | | | | | 25,344 | |
| | — | | | | | 22,400 | | | Freddie Mac Discount Note
2/14/08 4.220% | | | | — | | | | | 22,290 | |
| | — | | | | | 20,817 | | | Freddie Mac Discount Note
4/18/08 4.175% | | | | — | | | | | 20,563 | |
| | — | | | | | 17,925 | | | Freddie Mac Discount Note
3/31/08 4.120% | | | | — | | | | | 17,738 | |
| | — | | | | | 10,795 | | | Freddie Mac Discount Note
4/25/08 4.180% | | | | — | | | | | 10,657 | |
| | — | | | | | 8,500 | | | Freddie Mac Discount Note
3/3/08 4.240% | | | | — | | | | | 8,441 | |
| | | | | | | | | |
TOTAL GOVERNMENT AGENCY NOTES
(Cost $489,607 and $1,105,525) | | | | 489,639 | | | | | 1,105,858 | |
| | | | | | | | | |
UNITED STATES TREASURY BILLS—0.91% and 0.00% | | |
| | 150,000 | | | | | — | | | United States Treasury Bills
10/30/08 0.223% | | | | 149,945 | | | | | — | |
| | | | | | | | | |
TOTAL UNITED STATES TREASURY BILLS
(Cost $149,973 and $0) | | | | 149,945 | | | | | — | |
| | | | | | | | | |
| | | | | | | | | |
| | | | | | | | |
See notes to the financial statements.
32
TIAA REAL ESTATE ACCOUNT
STATEMENT OF INVESTMENTS
September 30, 2008 and December 31, 2007
(Dollar values shown in thousands)
| | | | | | | | |
Principal | | Issuer, Maturity Date and Yield(5) | | Value |
2008 | | 2007 | | 2008 | | 2007 |
| | | | | | | (Unaudited) | | |
VARIABLE NOTES—0.00% and 0.26% | | | | |
| $ | | — | | | | $ | | 25,000 | | | Wells Fargo Bank
1/7/08 4.600% | | | $ | | — | | | | $ | | 24,999 | |
| | — | | | | | 25,000 | | | Wells Fargo Bank
1/8/08 4.600% | | | | — | | | | | 24,999 | |
| | | | | | | | | |
TOTAL VARIABLE NOTES
(Cost $0 and $50,000) | | | | — | | | | | 49,998 | |
| | | | | | | | | |
TOTAL OTHER MARKETABLE SECURITIES
(Cost $1,620,965 and $3,371,896) | | | | 1,619,761 | | | | | 3,371,866 | |
| | | | | | | | | |
TOTAL MARKETABLE SECURITIES
(Cost $1,620,965 and $3,811,050) | | | | 1,619,761 | | | | | 3,798,496 | |
| | | | | | | | | |
MORTGAGE LOAN RECEIVABLE—0.43% and 0.38% | | | | |
| | | | | | | | |
| | | | | | | | | |
| | | | Borrower, Maturity Date and Current Rate | | | | |
| | 75,000 | | | | | 75,000 | | | Klingle Corporation
7/10/11 3.260%(6) | | | | 71,428 | | | | | 72,520 | |
| | | | | | | | | |
TOTAL MORTGAGE LOAN RECEIVABLE
(Cost $75,000 and $75,000) | | | | 71,428 | | | | | 72,520 | |
| | | | | | | | | |
TOTAL INVESTMENTS
(Cost $14,046,194 and $15,951,458) | | | $ | | 16,435,776 | | | | $ | | 19,013,601 | |
| | | | | | | | | |
|
(1) | | | | The investment has a mortgage loan payable outstanding, as indicated in Note 5. |
|
(2) | | | | The market value reflects the Account’s interest in the joint venture, net of any debt. |
|
(3) | | | | The market value reflects the final settlement due to the Account. The investment was sold on August 24, 2007. |
|
(4) | | | | Located throughout the US. |
|
(5) | | | | Yield represents the annualized yield at the date of purchase. |
|
(6) | | | | Current rate represents the interest rate on this investment at September 30, 2008. At December 31, 2007, the interest rate on this investment was 5.46%. |
See notes to the financial statements.
33
ITEM 2. MANAGEMENT’S DISCUSSION AND ANALYSIS OF FINANCIAL CONDITION AND RESULTS OF OPERATIONS.
The following discussion and analysis of our financial condition and results of operations should be read together with our financial statements and notes contained in this report and with consideration to the sub-section entitled “Forward-Looking Statements,” which begins below, and the section of the Account’s Annual Report on Form 10-K for the year ended December 31, 2007 (the “Form 10-K”) entitled “Item 1A. Risk Factors.” The past performance of the Account is not indicative of future results.
Forward-Looking Statements
Some statements in this Form 10-Q which are not historical facts may be “forward-looking statements” within the meaning of Section 27A of the Securities Act of 1933, Section 21E of the Securities Exchange Act of 1934 and the Private Securities Litigation Reform Act of 1995. Forward-looking statements include statements about management’s expectations, beliefs, intentions or strategies for the future, include the assumptions underlying these forward-looking statements, and are based on current expectations, estimates and projections about the real estate industry, markets in which the Account operates, general economic conditions and the strength of the capital and credit markets, management’s beliefs, assumptions made by management and the transactions described in this Form 10-Q. While management believes the assumptions underlying any of its forward-looking statements and information to be reasonable, such information may be subject to uncertainties and may involve certain risks which may be difficult to predict and are beyond management’s control. These risks and uncertainties could cause actual results to differ materially from those contained in any forward-looking statement. These risks and uncertainties include, but are not limited to, the following:
|
• | | | | The risks associated with acquiring, owning and selling real property, including general economic and real estate market conditions, the availability of financing (both for the Account and potential purchasers of the Account’s properties), disruptions in the credit markets, competition for real estate properties, leasing risk (including tenant defaults), and the risk of uninsured losses at properties (including due to terrorism and acts of violence); |
|
• | | | | The risks associated with property valuations, including the fact that appraisals can be subjective in a number of respects and the fact that the Account’s appraisals are generally obtained on a quarterly basis and in the interim the realizable value of a property may not always be reflected in the Account’s daily net asset value calculation; |
|
• | | | | Risks associated with borrowing activity by the Account, including the ability to obtain financing on favorable terms (or at all), which may be aggravated by general disruptions in credit markets; |
|
• | | | | Investment risk associated with participant transactions, including the fact that significant net participant transfers out of the Account may impair its ability to consummate every new investment opportunity that is otherwise attractive to the Account; |
|
• | | | | The risks associated with joint venture partnerships, including the risks that a co-venturer may have interests or goals inconsistent with the Account’s and the risk that the Account has limited rights with respect to operation of the property and transfer of the Account’s interest; |
|
• | | | | Uncertainties associated with environmental and other regulatory matters; and |
|
• | | | | Other factors, including the risk factors discussed in “Item 1A. Risk Factors” in the Form 10-K. |
More detailed discussions of certain of those risk factors are contained in the section of the Form 10-K entitled “Item 1A. Risk Factors,” elsewhere in this Form 10-Q including in the section entitled “Item 3. Quantitative and Qualitative Disclosures About Market Risk” that could cause actual results to differ materially from historical experience or management’s present expectations.
Caution should be taken not to place undue reliance on management’s forward-looking statements, which represent management’s views only as of the date that this report is filed. Neither management nor the Account undertake any obligation to update publicly or revise any forward-looking statement, whether as a result of new information, changed assumptions, future events or otherwise.
34
THIRD QUARTER 2008 U.S. ECONOMIC AND COMMERCIAL REAL ESTATE OVERVIEW
The TIAA Real Estate Account (the “Account”) invests primarily in high-quality, core commercial real estate in order to meet its investment objective of obtaining favorable long-term returns through rental income and the appreciation of its real estate holdings. The Account does not directly invest in either single-family residential real estate or residential mortgage-backed securities.
Economic and Capital Markets Overview and Outlook
Global credit and equity markets were highly volatile during the third quarter of 2008. Credit markets seized up as a “credit crunch” curtailed virtually all types of lending activity, except that the most credit-worthy corporations, businesses, and individuals generally were able to secure funds for their short and long-term needs. Inter-bank lending, a critical component of the U.S. financial system, was also reduced dramatically as the failure and sale of major banks induced other banks to preserve cash. The credit and banking crisis also spread to Europe which further exacerbated conditions. As a result of the turmoil in the credit markets, investors traded in and out of stocks, that lead to significant volatility and declines in the major indices. For the quarter ended September 30, 2008, the Dow Jones Industrial Average declined 4.7% and the S&P 500 declined 9.4%. The financial sector was particularly hard hit. Further declines and volatility in major indices occurred in October, portending a weak fourth quarter in the equity markets.
The turmoil in the credit markets was due in large part to ongoing write-downs of the value of residential mortgage-backed securities held by banks, insurance companies, and investment banks, which intensified concerns about the values of other structured securities and assets, including the most liquid types of investments such as money market funds. The contagion caused unprecedented volatility in credit spreads and the stock prices of several major U.S. institutions. By the time the third quarter was over, Lehman Brothers had declared bankruptcy, Bank of America had agreed to purchase Merrill Lynch, and AIG was rescued by an $85 billion federal government bailout. Other healthier financial institutions, such as Goldman Sachs and Morgan Stanley, obtained equity infusions from Berkshire Hathaway and foreign sources. In particular, the conditions at Lehman Brothers and AIG exacerbated a crisis of confidence and ultimately forced governments around the globe to intervene in order to calm panicked markets.
Economic conditions in the U.S., and across much of the globe, weakened during the third quarter. Economic data, as summarized in the table below, suggest that the downturn in the U.S. economy is accelerating. U.S. payroll employment declined by approximately 299,000 during the third quarter which was on the heels of a decline of approximately 214,000 in the second quarter. Similarly, U.S. gross domestic product (GDP) fell 0.3% during the third quarter as compared to growth of 2.8% in the second quarter. The drop in third quarter GDP growth was due largely to a decline in personal consumption, housing construction and business investment in equipment and software. In addition, exports and government spending, which had bolstered growth in the second quarter, slowed sharply.
Economic Indicators*
| | | | | | | | | | | | | | |
| | 2007 | | 2008Q1 | | 2008Q2 | | 2008Q3 | | Forecasted
2008 | | Forecasted
2009 | | |
Economy (% Growth)(1) | | | | | | | | | | | | | | |
Gross Domestic Product (GDP) | | | | 2.0 | % | | | | | 0.9 | % | | | | | 2.8 | % | | | | | -0.3 | % | | | | | 1.5 | % | | | | | 0.5 | % | | | |
Inflation (Consumer Price Index) | | | | 4.1 | % | | | | | 3.1 | % | | | | | 5.5 | % | | | | | 4.5 | % | | | | | 4.4 | % | | | | | 2.5 | % | | | |
Employment Growth (Thousands) | | | | 1,096 | | | | | -247 | | | | | -214 | | | | | -299 | | | | | N/A | | | | | N/A | | | |
Interest Rates(2) | | | | | | | | | | | | | | |
10 Year Treasury | | | | 4.63 | % | | | | | 3.66 | % | | | | | 3.89 | % | | | | | 3.86 | % | | | | | 3.80 | % | | | | | 3.90 | % | | | |
Federal Funds Rate(3) | | | | 4.25 | % | | | | | 2.25 | % | | | | | 2.00 | % | | | | | 2.00 | %(3) | | | | | N/A | | | | | N/A | | | |
Sources: BEA, BLS, Federal Reserve, Blue Chip Consensus Forecasts
|
* | | | | Data subject to revision |
|
(1) | | | | GDP growth rates are annual rates; inflation rates are annualized rates; employment growth is a quarterly change. |
35
|
(2) | | | | The Treasury rates are an average over the stated time period. The Federal Funds rates are as of the end of the stated time period. |
|
(3) | | | | The Federal Funds rate was reduced to 1.5% on October 8th and again to 1.0% on October 29th. |
N/A indicates Not Available.
Other broad economic indicators which underscored the weakness of the U.S. economy and worsened the turmoil in the credit and stock markets is summarized in the table below. In particular, the single family housing market continued to deteriorate as home prices, housing starts, and home sales plummeted. Consumer confidence fell to a 40 year low in October and has been accompanied by a significant decline in consumer spending. Ongoing job losses, stock market declines and volatility, declining home values, and inaccessibility to credit are the primary reasons for the declines in spending and consumer confidence. The drop in oil prices from their recent highs may provide some relief to household budgets, but is unlikely to reverse the downward trend in consumer spending in the near term.
Broad Economic Indicators *
| | | | | | | | |
Index 1985=100 | | Full Year
2007 | | July
2008 | | Aug
2008 | | Sept
2008 |
Consumer Confidence(1) | | | | 103.6 | | | | | 51.9 | | | | | 58.5 | | | | | 61.4 | |
% Change(2) | | | | | | | | |
Retail Sales(3) | | | | 5.1 | % | | | | | 0.1 | % | | | | | -0.6 | % | | | | | -0.7 | % | |
Housing Starts(4) | | | | -25 | % | | | | | -31 | % | | | | | -35 | % | | | | | -31 | % | |
New Home Sales(4) | | | | -26 | % | | | | | -35 | % | | | | | -36 | % | | | | | -33 | % | |
|
* | | | | Data subject to revision |
|
(1) | | | | The Conference Board reported that the consumer confidence index fell to 38.0 in October 2008. |
|
(2) | | | | Retail sales monthly figures represent the change from the preceding month; |
|
(3) | | | | Retail sales exclude auto, auto parts and gas. |
|
(4) | | | | Housing numbers are the percentage change from the same month in the previous year. |
Sources: Conference Board, Census Bureau, Economy.com
Regional economic activity was characterized in the Federal Reserve’s October 2008 Beige Book as having weakened since September’s publication. Consumer spending declined in most Federal Reserve Districts (“Districts”) as consumers were noted to have cut back spending on discretionary and big-ticket items. Residential real estate markets did not improve in September and several Districts noted that tighter credit conditions have limited sales activity. Commercial real estate activity was noted to have slowed in most Districts, with some Districts experiencing increases in vacancy rates and sublease space due to weaker labor market conditions. Several Districts reported an increasing number of delays and/or cancellations of commercial construction projects in response to tight credit markets and economic uncertainty, which could help offset weaker demand going forward.
Prospects for the U.S. economy and the credit and equity markets for the rest of 2008 and 2009 depend largely on the impact of the $700 billion Emergency Economic Stabilization Act (“the Act”). The Act authorizes the Treasury Department to make equity investments in U.S. banks, to purchase illiquid and troubled assets from banks and financial institutions, and is intended to restore liquidity and confidence to the banking system and financial markets. The Federal Reserve created a Commercial Paper Funding Facility to purchase short-term commercial paper directly from corporate issuers to restore liquidity in this key market. In addition, the limit on federal deposit insurance coverage was raised from $100,000 to $250,000 in order to maintain depositors’ confidence in U.S. banks and thrift institutions. In mid-October, the Treasury Department also announced plans to inject $250 billion into the banking system. The level of government actions and broad array of measures undertaken are indicative of the level of stress on capital and financial markets. Similar measures were undertaken in Europe where the crisis also intensified. It is hoped that the programs enacted by U.S. and European governments will ultimately stabilize capital and financial markets, and that banks and financial institutions will resume normal lending activity after illiquid assets are removed
36
from their balance sheets. However, banks and financial institutions are likely to have very stringent lending criteria given their recent experiences and current economic conditions, and economic growth is likely to remain weak.
Debate continues and opinions vary as to how quickly the U.S. economy and capital markets will recover, but most economists expect significantly slower growth over the short term. Economists surveyed as part of the October 2008 Blue Chip Economic Indicators publication (“Blue Chip”) have greatly reduced their expectations for economic growth in 2009 and the majority believe that the U.S. economy is currently in recession. The consensus of Blue Chip economists is that U.S. economic activity will contract further during the fourth quarter of 2008 and the first quarter of 2009 and the overwhelming majority believe that the downturn will last longer than the recessions of 1990-1991 and 2001. For the year, the Blue Chip consensus forecast calls for GDP growth of a meager 0.5% in 2009. Blue Chip economists expect that growth will begin to increase appreciably by the third quarter of 2009, but will remain well below its inherent growth potential of 2.5-3.0%.
Considerable uncertainty remains as significant turmoil in the financial and capital markets has persisted and led the Federal Open Market Committee (“FOCM”) to lower the target federal funds rate to 1.5% in an unscheduled meeting on October 8, 2008 and again to 1.0% at the FOMC meeting on October 29, 2008. In announcing the most recent cut, the committee noted that “Incoming economic data suggest that “The pace of economic activity appears to have slowed markedly, owing importantly to a decline in consumer expenditures” and that “the intensification of financial market turmoil is likely to exert additional restraint on spending, partly by further reducing the ability of households and businesses to obtain credit.” The unsettled nature of economic and capital market conditions make it difficult to predict when conditions will measurably improve.
Real Estate Market Conditions and Outlook
(Commercial real estate market statistics discussed in this section are obtained by the Account from sources that management considers reliable, but some of the data are preliminary for the quarter ended September 30, 2008 and may be subsequently revised. Prior period data may have been adjusted to reflect updated calculations. Investors should not rely exclusively on the data presented below in forming a judgment regarding the current or prospective performance of the commercial real estate market generally).
Commercial real estate property sales activity has declined sharply due largely to the credit crunch, which has severely constrained all types of lending activity including commercial mortgage real estate financing. Preliminary data from Real Capital Analytics (“RCA”), a frequently cited industry source of commercial real estate transactions data, indicate that sales activity for the first three quarters of 2008 totaled roughly $105 billion, which is a decline of 70% compared to totals for the first three quarters of 2007. Sales volumes declined each quarter, with third quarter sales registering just $28 billion versus $42 billion in the first quarter. RCA notes that there were several notable distressed sales during the third quarter, and that more such sales are expected in the coming quarters.
RCA attributes the slowdown in transactions to three factors: (1) scarce and expensive financing, (2) economic uncertainty and volatility, and (3) a wide pricing gap between buyers and sellers. Financing has become scarce in large part because of the shutdown of the commercial mortgage-backed securities (“CMBS”) market as the contagion effect from defaulted sub-prime residential mortgage-backed securities has made investors wary about all types of structured securities. The delinquency rate on commercial mortgage loans held in CMBS remains very low at 0.53% as compared to 9.1% for residential mortgage delinquencies and foreclosures, though CMBS delinquencies are expected to rise in the future as overleveraged owners face pressure from weak economic conditions. Economic uncertainty and volatility have also moved many prospective buyers and sellers to the sidelines and contributed to widening bid-ask spreads. The lack of mortgage financing and increasing economic uncertainty have also led prospective buyers to back out of deals and/or attempt to renegotiate deals immediately prior to closing, with both contributing to the decline in sales activity.
With mortgage lending constrained and sales activity slumping, active buyers are more able to drive hard bargains, especially with highly-motivated or distressed sellers. As a result, commercial property prices have begun to decline. Prices have held up better in the ten largest commercial real estate markets, with large
37
declines more prevalent in secondary markets and for lesser quality properties as indicated by the data from, Moody’s/REAL Commercial Property Index (“CPPI”) provided below.
| | | | |
| | 3Q07 to 2Q08 |
| | National | | Top 10 MSAs* |
Apartment | | | | -10.3 | % | | | | | -5.1 | % | |
Office | | | | -8.0 | % | | | | | -2.9 | % | |
Retail | | | | -7.8 | % | | | | | -0.6 | % | |
Industrial | | | | -7.6 | % | | | | | -2.9 | % | |
|
* | | | | Based on total value of property sold in Metropolian Statistical Area (“MSA”). |
Source: Moody’s/REAL CPPI and Real Capital Analytics.
Appraised property values have also begun to decline as appraisers see a shrinking pool of potential buyers and deteriorating economic conditions and have factored these considerations into their valuation models. This is evidenced by the 1.4% decline in the appreciation component of the NCREIF Property Index (“NPI”) in the third quarter of 2008, which is the second consecutive quarterly decline in the appreciation component and continues to be the first decline since early in 2003. With economic conditions weakening, and financial stresses on businesses and consumers intensifying, additional declines in property values seem likely to occur.
The ongoing slowdown in U.S. economic activity contributed to rising vacancy rates across real estate property markets during the third quarter of 2008. The table below summarizes the top five markets in which the Account has exposure as of September 30, 2008. The top five markets account for more than one-third of the Account’s total real estate portfolio in terms of value and, despite rising vacancy rates nationally, occupancy in each of the top five markets has held up well.
| | | | | | | | Metropolitan Area | | Weighted
Leased | | # of Property
Investments | | Metro Areas as a
% of Total Real
Estate Portfolio | | Metro Area as a
% of Total
Investments |
|
Washington-Arlington-
Alexandria DC-VA-MD-WV | | | | 99.0% | | | | | 9 | | | | | 10.98% | | | | | 9.63% | |
Los Angeles-Long Beach-Glendale CA | | | | 92.1% | | | | | 8 | | | | | 7.41% | | | | | 6.50% | |
Boston-Quincy MA | | | | 98.1% | | | | | 5 | | | | | 7.29% | | | | | 6.39% | |
San Francisco-San Mateo-Redwood City CA | | | | 94.4% | | | | | 4 | | | | | 6.49% | | | | | 5.69% | |
Houston-Bay Town-Sugar Land TX | | | | 97.4% | | | | | 3 | | | | | 5.60% | | | | | 4.91% | |
Account Office Property and Market Conditions
For office markets, employment growth or declines in key office-using sectors tends to drive the demand for space, though typically with a lag due to the longer term nature of leasing cycles. The third quarter contraction in both professional and business services and financial activities resulted in an up-tick in the national office vacancy rate to 13.5%. By comparison, the vacancy rate of the Account’s office portfolio was 5.5% during the third quarter of 2008. Though most metropolitan area vacancies drifted up or remained steady (Boston posted a minimal decline), vacancies in each of the Account’s top office markets remained below the national average. The table below compares the average vacancy rate of properties in the Account’s top office markets with their respective metropolitan area averages.
38
| | | | | | | | | | |
| | | | Real Estate Account | | MSA |
| | | | | | | | | | | | | | | | | | | | | | | | | | | | | | |
OFFICE | | Total Sector | | % of Total | | Account Average
Weighted Vacancy | | Vacancy* |
| | Metropolitan Statistical Area (MSA) | | by MSA ($M) | | Investments | | 2008Q3 | | 2008Q3 |
|
| | National | | | | | | | | 5.5% | | | | | 13.5% | |
|
1 | | Washington-Arlington-
Alexandria DC-VA-MD-WV | | | $ | | 1,403.7 | | | | | 8.5% | | | | | 0.7% | | | | | 11.7% | |
2 | | Boston-Quincy MA | | | $ | | 1,019.2 | | | | | 6.2% | | | | | 2.0% | | | | | 11.0% | |
3 | | San Francisco-San Mateo-Redwood City CA | | | $ | | 844.3 | | | | | 5.1% | | | | | 6.0% | | | | | 9.7% | |
4 | | Los Angeles-Long Beach-Glendale CA | | | $ | | 700.7 | | | | | 4.3% | | | | | 8.4% | | | | | 11.7% | |
5 | | Seattle-Bellevue-Everett WA | | | $ | | 657.0 | | | | | 4.0% | | | | | 3.2% | | | | | 9.9% | |
|
* | | | | Source: Torto Wheaton Research |
Account Industrial Property and Market Conditions
Conditions in the industrial market are impacted by national economic factors such as industrial production, international trade flows, and employment growth in the manufacturing, wholesale trade and transportation and warehousing industries. Indications of a global slowdown intensified during the third quarter of 2008, which negatively affected industrial market conditions as indicated in the table below. The national vacancy rate for industrial properties increased to 10.7% in the third quarter, which is slightly below the average vacancy rate of 12.3% for the Account’s industrial portfolio. Conditions in Atlanta and Chicago remained largely stable, but new supply increased the market vacancy rate in Dallas. Riverside-San Bernardino, the Account’s top industrial market, saw vacancies rise sharply due in large part to slumping imports. Los Angeles market conditions remained stable, but the average vacancy in the Account’s properties increased. The Riverside-San Bernardino market, and to a lesser degree, the Los Angeles market are driven by activity at the Ports of Los Angeles and Long Beach which both saw significant declines in imports. The table below compares the average vacancy rate of properties in the Account’s top industrial markets to their respective metropolitan area averages.
| | | | | | | | | | | | | | Real Estate Account | | MSA |
| | | | | | | | | | | | | | | | | | | | | | | | | | | | | | |
INDUSTRIAL | | Total Sector | | % of Total | | Account Average
Weighted Vacancy | | Vacancy* |
| | Metropolitan Statistical Area (MSA) | | by MSA ($M) | | Investments | | 2008Q3 | | 2008Q3 |
|
| | National | | | | | | | | 12.3% | | | | | 10.7% | |
|
1 | | Riverside-San Bernardino-Ontario CA | | | $ | | 600.9 | | | | | 3.7% | | | | | 21.1% | | | | | 13.7% | |
2 | | Dallas-Plano-Irving TX | | | $ | | 202.1 | | | | | 1.2% | | | | | 5.5% | | | | | 13.0% | |
3 | | Chicago-Naperville-Joliet IL | | | $ | | 187.0 | | | | | 1.1% | | | | | 2.9% | | | | | 12.0% | |
4 | | Los Angeles-Long Beach-Glendale CA | | | $ | | 144.9 | | | | | 0.9% | | | | | 9.7% | | | | | 5.4% | |
5 | | Atlanta-Sandy Springs-Marietta GA | | | $ | | 128.9 | | | | | 0.8% | | | | | 1.3% | | | | | 13.5% | |
|
* | | | | Source: Torto Wheaton Research |
Account Apartment Property and Market Conditions
National apartment market conditions weakened during the third quarter of 2008, as national vacancy rates edged up to 5.7%, as compared to 5.6% in the second quarter. A year-over-year comparison shows vacancy rates increasing to 5.7% in the third quarter of 2008 up from 4.4% in the third quarter of 2007. While supply in many markets has materially increased due to single-family homes and condominiums being offered for rent, completions of traditional apartment units also edged up during the quarter, exerting additional upward pressure on vacancy rates. The average vacancy rate for the Account’s apartment portfolio was 4.3% during the third quarter of 2008, an increase over the prior quarter, but still lower than the national average. The table below compares the average vacancy rate of properties in the Account’s top apartment markets with their respective metropolitan area averages.
39
| | | | | | | | | | | | | | Real Estate Account | | MSA |
| | | | | | | | | | | | | | | | | | | | | | | | | | | | | | |
APARTMENT | | Total Sector | | % of Total | | Account Average
Weighted Vacancy | | Vacancy* |
| | Metropolitan Statistical Area (MSA) | | by MSA ($M) | | Investments | | 2008Q3 | | 2008Q3 |
|
| | National | | | | | | | | 4.3% | | | | | 5.7% | |
|
1 | | Houston-Bay Town-Sugar Land TX | | | $ | | 325.4 | | | | | 2.0% | | | | | 3.4% | | | | | 7.5% | |
2 | | Phoenix-Mesa-Scottsdale AZ | | | $ | | 305.5 | | | | | 1.9% | | | | | 5.5% | | | | | 9.7% | |
3 | | Denver-Aurora CO | | | $ | | 241.5 | | | | | 1.5% | | | | | 6.8% | | | | | 4.9% | |
4 | | New York-Wayne-White Plains
NY-NJ | | | $ | | 163.8 | | | | | 1.0% | | | | | 2.0% | | | | | 6.2% | |
5 | | Atlanta-Sandy Springs-Marietta GA | | | $ | | 161.1 | | | | | 1.0% | | | | | 3.0% | | | | | 8.5% | |
|
* | | | | Source: Torto Wheaton Research |
Vacancies in neighborhood and community centers throughout the U.S. increased to 10.1% in the third quarter of 2008, up from 9.6% in the second quarter. In comparison, the average vacancy rate for the Account’s retail portfolio stood at 5.4% as of the third quarter of 2008. U.S. retail market conditions reflect the sharp slowdown in consumer spending. While the nation’s retailers are bracing for a dismal holiday season, the full impact of the cutback in consumer spending will likely not be evident until next year, as retailers will typically keep stores open through the holiday season in order to maximize sales and reduce inventory. Store closures and company failures often occur in the first or second quarters of the year, making it likely that retail vacancies will rise in 2009.
Looking ahead, real estate market conditions will be affected by the economic slowdown, and new construction. While economic conditions are likely to remain weak well into 2009, the construction of new space is relatively modest comared with prior cycles. For example, office construction is expected to total 58 million square feet in 2008 and 2009 compared to an average of 92 million square feet in 1999-2001, when construction last peaked. Similarly, industrial construction is expected to fall well short of prior cyclical peaks.
Torto Wheaton’s forecasts of 2009 construction may prove excessive as the pipeline of office and industrial construction is shrinking quickly as developers cancel projects due to a lack of construction financing and weaker demand. Apartment construction and permit issuances for new units, an indicator of future supply, are also dropping rapidly. Retail construction is also slowing as retailers are drastically cutting back on new store openings.
While commercial real estate markets are under stress from the softening U.S. economy, management believes that certain features of the Account may help to mitigate the effect of economic and market weakness. With 110 real estate investments and a mix of office, industrial, retail and apartment properties that are located across the U.S. and internationally (two properties), the Account’s property portfolio is highly diversified and not overly exposed to a particular region of the country or property type. The Account is conservatively managed, utilizing a “core” investment strategy of holding primarily stabilized institutional quality assets with strong occupancy and minimal near term lease rollover, with locations in many primary markets. Currently, the Account employs relatively modest leverage (approximately 24% of total net assets as of September 30, 2008). Moreover, the Account’s properties are approximately 94% leased, and the long-term nature of most of these leases should generate cash flow both to service existing debt and to generate stable income return. As indicated below, the income return from real estate investments has been, and continues to be, a significant and stabilizing component of the Account’s total return.
40
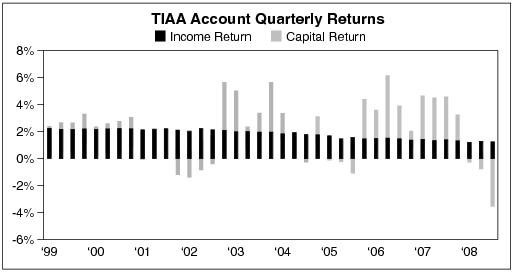
Although the Account is susceptible to the decline in property values that has occurred across the commercial real estate sectors, data from the Moody’s/REAL Commercial Property Index, which was shown previously, indicate that values have held up best in top markets, where the Account’s properties are primarily located. While the Account may experience additional declines in value if economic conditions and real estate sales activity remain weak, management believes that by virtue of its high-quality core nature, the portfolio is likely to be less affected by fluctuating market conditions over the long term. Management also believes that the portfolio’s geographic and property type diversification, high occupancy and low leverage may serve as a mitigant against the challenging economic conditions expected over the near term.
Investments as of September 30, 2008
As of September 30, 2008, the Account had total net assets in the amount of $15.3 billion, a 10.6% decrease from $17.1 billion at September 30, 2007, and a 13.1% decrease from December 31, 2007. The decrease in the Account’s net assets as of September 30, 2008 as compared to September 30, 2007 and December 31, 2007 was primarily driven by net participant transfers out of the Account and, to a lesser extent, the depreciation in value of some of the Account’s wholly-owned real estate properties, as well as those owned in joint venture investments.
As of September 30, 2008, the Account owned a total of 110 real estate property investments (98 of which were wholly-owned, 12 of which were held in joint ventures) and one remaining equity interest in a joint venture, which sold its real estate investments during the third quarter of 2007, representing 87.7% of the Account’s total investment portfolio. The real estate portfolio included 45 office property investments (five of which were held in joint ventures and one located in London, England), 28 industrial property investments (including one held in a joint venture), 20 apartment complexes, 16 retail property investments (including five held in joint ventures and one located in Paris, France), and a 75% joint venture interest in a portfolio of storage facilities. Of the 110 real estate property investments, 23 are subject to debt (including seven joint venture property investments).
Total debt on the Account’s wholly-owned real estate portfolio as of September 30, 2008 was $1.7 billion, representing 11.1% of Total Net Assets. The Account’s share of joint venture debt ($1.9 billion) is netted against the underlying properties when determining the joint venture values shown on the Statement of Investments. When the joint venture debt is also considered, total debt on the Account’s portfolio as of September 30, 2008 was $3.6 billion, representing 23.7% of Total Net Assets. The Account currently has no Account-level debt.
During the third quarter of 2008, the Account sold the Columbus Office Portfolio located in Columbus, Ohio. This office portfolio investment was comprised of three buildings and sold for an approximate net sales price of $21.6 million and recognized a realized loss of $14.3 million. This transaction is discussed in more detail below in the section titled “Recent Transactions”.
41
Management believes that the Account’s real estate portfolio is diversified by location and property type. The largest investment, DDR Joint Venture, is comprised of 65 properties in 13 states and represented 5.58% of Total Investments and 6.37% of total real estate investments. No single property investment represents more than 3.87% of Total Investments or more than 4.41% of total real estate investments. As discussed in the Account’s prospectus, the Account does not intend to buy and sell its real estate investments simply to make short-term profits. Rather, the Account’s general strategy in selling real estate investments is to dispose of those assets that have either maximized in value, no longer fit into the Account’s profile, underperformed, or represent properties that will need significant capital infusions in the future. The Account will reinvest any sale proceeds that it does not need to pay operating expenses or to meet redemption requests (e.g., cash withdrawals or transfers).
The following charts reflect the diversification of the Account’s real estate assets by region and property type and lists its ten largest investments. All information is based on the values of the properties at September 30, 2008.
Diversification by Market Value
| | | | | | | | | | | | | | | | | | Number of
Property
Investments | | East
(27) | | West
(37) | | South
(35) | | Midwest
(6) | | Various*
(3) | | Foreign**
(2) | | Total
(110) |
Office | | | | (45 | ) | | | | | 21.4 | % | | | | | 19.5 | % | | | | | 11.8 | % | | | | | 1.1 | % | | | | | 0.0 | % | | | | | 2.3 | % | | | | | 56.1 | % | |
Apartment | | | | (20 | ) | | | | | 2.0 | % | | | | | 6.0 | % | | | | | 4.7 | % | | | | | 0.0 | % | | | | | 0.0 | % | | | | | 0.0 | % | | | | | 12.7 | % | |
Industrial | | | | (28 | ) | | | | | 1.6 | % | | | | | 7.0 | % | | | | | 3.4 | % | | | | | 1.3 | % | | | | | 0.5 | % | | | | | 0.0 | % | | | | | 13.8 | % | |
Retail | | | | (16 | ) | | | | | 1.5 | % | | | | | 1.0 | % | | | | | 6.0 | % | | | | | 0.1 | % | | | | | 6.4 | % | | | | | 1.9 | % | | | | | 16.9 | % | |
Other | | | | (1 | )*** | | | | | 0.0 | % | | | | | 0.0 | % | | | | | 0.0 | % | | | | | 0.0 | % | | | | | 0.5 | % | | | | | 0.0 | % | | | | | 0.5 | % | |
| | | | | | | | | | | | | | | | |
Total | | | | (110 | ) | | | | | 26.5 | % | | | | | 33.5 | % | | | | | 25.9 | % | | | | | 2.5 | % | | | | | 7.4 | % | | | | | 4.2 | % | | | | | 100 | % | |
| | | | | | | | | | | | | | | | |
|
* | | | | Represents a portfolio of storage facilities, a portfolio of industrial properties, and a portfolio of retail properties located in various regions across the U.S. |
|
** | | | | Represents real estate investments in the United Kingdom and France. |
|
*** | | | | Represents a portfolio of storage facilities. |
Properties in the “East” region are located in: ME, NH, VT, MA, RI, CT, NY, NJ, PA, DE, MD, DC, WV, VA, NC, SC, KY
Properties in the “Midwest” region are located in: WI, MI, OH, IN, IL, MN, IA, MO, KS, NE, ND, SD
Properties in the “South” region are located in: TN, MS, AL, GA, FL, OK, AR, LA, TX
Properties in the “West” region are located in: MT, ID, WY, CO, NM, AZ, UT, NV, WA, OR, CA, AK, HI
Top Ten Largest Real Estate Investments
| | | | | | | | | | | | |
Property Name | | City | | State | | Type | | Market
Value ($M)(a) | | % of Total
Real Estate(b)
Portfolio | | % of Total
Investments |
DDR Joint Venture | | Various | | Various | | Retail | | | | 917.8 | | | | | 6.37 | | | | | 5.58 | (c) | |
1001 Pennsylvania Avenue | | Washington | | DC | | Office | | | | 636.1 | | | | | 4.41 | | | | | 3.87 | (d) | |
Four Oaks Place | | Houston | | TX | | Office | | | | 482.1 | | | | | 3.35 | | | | | 2.93 | (e) | |
50 Fremont | | San Francisco | | CA | | Office | | | | 464.1 | | | | | 3.22 | | | | | 2.82 | (f) | |
Fourth and Madison | | Seattle | | WA | | Office | | | | 450.0 | | | | | 3.12 | | | | | 2.74 | (g) | |
99 High Street | | Boston | | MA | | Office | | | | 389.6 | | | | | 2.70 | | | | | 2.37 | (h) | |
780 Third Avenue | | New York City | | NY | | Office | | | | 380.0 | | | | | 2.64 | | | | | 2.31 | |
The Newbry | | Boston | | MA | | Office | | | | 362.0 | | | | | 2.51 | | | | | 2.20 | |
Yahoo Center | | Santa Monica | | CA | | Office | | | | 357.2 | | | | | 2.48 | | | | | 2.17 | |
Ontario Industrial Portfolio | | Ontario | | CA | | Industrial | | | | 351.4 | | | | | 2.44 | | | | | 2.14 | (i) | |
42
|
(a) | | | | Value as reported in the September 30, 2008 Statement of Investments. Investments owned 100% by TIAA are reported based on fair value. Investments in joint ventures are reported based on the equity method of accounting. |
|
(b) | | | | Total Real Estate Portfolio excludes the mortgage loan receivable. |
|
(c) | | | | This property is held in a 85%/15% joint venture with Developers Diversified Realty Corporation (“DDR”), consists of 65 retail properties located in 13 states and is shown net of debt. |
|
(d) | | | | This property is shown gross of debt. The value of the Account’s interest less leverage is $426.6 million. |
|
(e) | | | | This property is shown gross of debt. The value of the Account’s interest less leverage is $282.6 million. |
|
(f) | | | | This property is shown gross of debt. The value of the Account’s interest less leverage is $330.1 million. |
|
(g) | | | | This property is shown gross of debt. The value of the Account’s interest less leverage is $306.1 million. |
|
(h) | | | | This property is shown gross of debt. The value of the Account’s interest less leverage is $216.3 million. |
|
(i) | | | | This property is shown gross of debt. The value of the Account’s interest less leverage is $342.4 million. |
As of September 30, 2008, the Account also held investments in government agency notes, representing 2.98% of Total Investments, commercial paper representing 5.09% of Total Investments, certificates of deposit representing 0.61% of Total Investments, real estate limited partnerships, representing 2.03% of Total Investments, bankers acceptance representing 0.27% of Total Investments, United States Treasury Bills representing 0.91% of Total Investments, and a mortgage loan receivable representing 0.43% of Total Investments.
Results of Operations
Nine months ended September 30, 2008 compared to nine months ended September 30, 2007
Performance
The Account’s total return was negative 1.12% for the nine months ended September 30, 2008. This was a significant decline compared to the positive return of 11.4% for the nine months ended September 30, 2007. The Account’s performance during the nine months ended September 30, 2008 reflects a decline in the aggregate net asset value of the Account’s real estate property investments, including investments owned in joint ventures, as well as lower income from marketable securities.
After several years of increasing investor demand for commercial real estate and historic capital appreciation, the weakened economy and faltering financial markets have brought transaction activity to historically low levels, bringing a halt to capital appreciation in many markets. The number of individual property investments with valuation decreases has increased, as evidenced by the Net Realized and Unrealized Gains and Losses on Investments and Mortgage Loans Payable. Management believes that real estate is an investment which should be considered from a long term perspective. The Account’s annualized total returns (after expenses) over the past one, three, five and 10-year periods ended September 30, 2008 were 1.00%, 9.85%, 10.83% and 9.00%, respectively. As of September 30, 2008, the Account’s annualized total return since inception was 8.93%.
The Account’s total net assets decreased from $17.2 billion at September 30, 2007 to $15.3 billion at September 30, 2008. The primary drivers of this 10.63% decrease were the net participant transfers out of the Account and depreciation of the Account’s value in its wholly owned and joint venture real estate investments.
Income and Expenses
The Account’s net investment income, after deduction of all expenses, was 6.48% lower for the nine months ended September 30, 2008, as compared to the same period in 2007.
The Account’s real estate holdings, including real estate joint ventures and limited partnerships, generated approximately 86% and 83% of the Account’s total investment income (before deducting Account level expenses) during the nine months ended September 30, 2008 and 2007, respectively. The 6.5% decrease in the Account’s total investment income was due to a 42.5% decrease in the Account’s dividend income and a 17.0% decrease in interest income generated from a decrease in investments in marketable securities,
43
including real estate equity securities, commercial paper, government bonds, United States Treasury Bills, and an investment in a commercial mortgage loan receivable.
Gross real estate rental income decreased approximately 0.7% in the nine months ended September 30, 2008, as compared to the same period in 2007. This decrease is primarily due to a decrease in the number of wholly-owned real estate investment property investments held by the Account. The number of wholly-owned properties decreased from 100 as of September 30, 2007 to 98 as of September 30, 2008.
Income from real estate joint ventures and limited partnerships was $93.7 million for the nine months ended September 30, 2008, as compared to $68.3 million for the nine months ended September 30, 2007. This 37.3% increase was due to an increase in gross rental income from properties owned in joint ventures, which increased substantially with the acquisition of the joint venture interest in the DDR Retail Portfolio in the first quarter of 2007. Investment income on the Account’s investments in marketable securities decreased by 19.4%, from $95.6 million for the nine months ended September 30, 2007 to $77.1 million for the comparable period in 2008. The variance was due to the decrease of the Account’s investments in marketable securities from $3.6 billion as of September 30, 2007 to $1.6 billion as of September 30, 2008 and a decrease in rates of return on the marketable securities.
Total real estate property level expenses and taxes for wholly-owned property investments for the nine months ended September 30, 2008 increased to $358.1 million as compared to $345.7 million for the nine months ended September 30, 2007. The overall change in expenses was primarily due to a 3.8% increase in operating expenses and a 5.0% increase in real estate taxes. The increase in real estate taxes is due to higher property assessments in 2008 resulting from the valuation increases seen during 2007. In the nine months ended September 30, 2008, operating expenses and real estate taxes represented 54% and 28% of the total property level expenses, respectively, with the remaining 18% representing interest payments on mortgages which is comparable to the same period of 2007.
The Account incurred overall Account level expenses for the nine months ended September 30, 2008 of $124.4 million which represents a 17.6% increase from $105.7 million for the same period in 2007. The overall net change in expenses was primarily due to the increase of the Account’s average net assets during 2008 when compared to the same period in 2007 (average net assets increased by approximately 9.1% from September 30, 2007 to September 30, 2008), the increase in actual administrative and distribution expenses associated with managing and distributing the Account, due in part to adjustments made to the allocation methodology, and adjustments in certain Account expense deduction rates both in May 2007 and May 2008. Total administrative and distribution expenses increased to $62.7 million for the nine month period ended September 30, 2008, as compared to $48.3 million for the nine month period ended September 30, 2007. This increase in expenses primarily resulted from larger allocated operational expenses including costs associated with new technology investments. In addition, the direct administrative and distribution charges associated with the Account increased with the general growth of the Account’s average net assets. Also, liquidity guarantee charges increased to $16.3 million for the nine month period ended September 30, 2008 as compared to $12.4 million for the nine months ended September 30, 2007, due to changes to the liquidity guarantee expense deduction rate from 0.035% of annual net assets between January 1, 2007 and April 30, 2007 to 0.160% of annual net assets for the period May 1, 2007 to April 30, 2008 and 0.100% of annual net assets effective for the period May 1, 2008 to April 30, 2009.
Net Realized and Unrealized Gains and Losses on Investments and Mortgage Loans Payable
The Account had net realized and unrealized losses on investments and mortgage loans payable of $592.8 million for the nine months ended September 30, 2008, as compared to a net realized and unrealized gain of $1.2 billion for the nine months ended September 30, 2007, a 148% year over year decrease. The overall variance was driven by two factors. First, the decrease in net realized and unrealized gains and losses on investments and mortgage loans payable was primarily driven by a net realized and unrealized loss on the Account’s wholly-owned real estate property investments of $440.4 million for the nine months ended September 30, 2008 compared to a gain of $922.3 million during the same period in 2007. Second, the Account’s interests in joint ventures and limited partnerships posted a net realized and unrealized loss of $193.4 million for the nine months ended September 30, 2008 as compared to a substantial net realized and unrealized gain of $315.9 million for the nine months ended September 30, 2007. The variance in the net realized and unrealized gains and losses on wholly-owned real estate property investments and those held in joint ventures was due to the decline in value of the Account’s existing real estate assets, which reflected the
44
net effects of a weaker overall economy and continued shortage of liquidity in the commercial real estate markets during the period ended September 30, 2008.
The Account also posted a net realized and unrealized gain on its marketable securities of $3.4 million for the nine months ended September 30, 2008, as compared to a net realized and unrealized loss of $31.4 million in the same period of 2007. The net gains on the Account’s marketable securities in the nine months ended September 30, 2008 were primarily due to the reversal of the unrealized loss as a result of the sale of the Account’s investments in marketable real estate equity securities (“REIT stocks”). The sale of these securities was executed over several days for total proceeds of $477.4 million, and the Account realized a loss of $11.2 million. The disposition of these REIT stocks was a decision by the Account’s management to reduce risk within its marketable securities investment portfolio. As circumstances warrant and in continued furtherance of its investment objective and strategy, the Account may invest in REIT stocks in the future.
The Account had unrealized gains on its mortgage loans payable in the amount of $38.6 million and unrealized losses on its mortgage loan receivable of approximately $1.1 million for the nine months ended September 30, 2008, as compared to net unrealized gains of $28.5 million and approximately $0.02 million, respectively, for the same period in 2007. The net unrealized gain or loss on mortgage loans payable and mortgage loans receivable for the period reflected the fluctuations in the U.S. Treasury rates and commercial real estate mortgage loan spreads during the nine months ended September 30, 2008, which are used as a basis to value the commercial mortgage loans on the wholly-owned real estate property investments. For a mortgage loan payable, a negative fair value adjustment decreases the value of the payable and therefore results in an unrealized gain. Conversely, for a mortgage loan receivable, a negative fair value adjustment decreases the value of the receivable and results in an unrealized loss.
During the nine months ended September 30, 2008, the Account sold one apartment property investment for net proceeds of $22.8 million and recognized a net gain of $4.4 million and one office portfolio investment for net proceeds of $21.6 million and recognized a net loss of $14.3 million.
Three months ended September 30, 2008 compared to three months ended September 30, 2007
Performance
The Account’s total return was negative 2.07% for the three months ended September 30, 2008. This was 573 basis points lower than the return of 3.66% for the three months ended September 30, 2007. The Account’s performance in the third quarter of 2008 reflects a decline in the aggregate net asset value of the Account’s real estate property investments, including investments owned in joint ventures, as well as lower income from marketable securities.
Income and Expenses
The Account’s net investment income, after deduction of all expenses, was 17.0% lower for the three months ended September 30, 2008, as compared to the same period in 2007.
The Account’s real estate holdings, including real estate joint ventures and limited partnerships, generated approximately 89.3% and 79.6% of the Account’s total investment income (before deducting Account level expenses) during the three months ended September 30, 2008 and 2007, respectively. The 14.9% decrease in the Account’s total investment income was due to a 7.8% decrease in the Account’s income from its wholly-owned real estate property investments and a 55.4% decrease in income from its investments in marketable securities, including real estate equity securities, commercial paper, government bonds, United States Treasury Bills, and an investment in a commercial mortgage loan receivable.
Gross real estate rental income decreased approximately 0.8% during the three months ended September 30, 2008, as compared to the same period in 2007. This decrease is primarily due to a decrease in the number of wholly-owned real estate property investments by the Account.
Income from real estate joint ventures and limited partnerships was $25.1 million for the three months ended September 30, 2008, as compared to $21.8 million for the three months ended September 30, 2007. This 14.9% increase is primarily due to increased distributed income related to the DDR Retail Portfolio offset by less income as a result of the sale of a joint venture investment in the fourth quarter of 2007. Investment income on the Account’s investments in marketable securities decreased by 55.4%, from $39.9 million for the three months ended September 30, 2007 to $17.8 million for the comparable period in 2008.
45
The variance is largely due to the decline in interest rates during the third quarter of 2008, the liquidation of the Account’s real estate related securities portfolio in June 2008, and the decline in marketable securities during the third quarter of 2008.
The decrease in income from its investments in marketable securities is primarily due to the decline in the investment balance in the three months ended September 30, 2008 compared to the same period in 2007.
Total real estate property level expenses and taxes for wholly-owned property investments for the three months ended September 30, 2008 increased to $121.7 million as compared to $113.2 million for the same period in 2007. The overall increase was primarily due to an 8.8% increase in operating expenses and an 8.2% increase in real estate taxes. The increase in real estate property level expenses is principally due to inflation, an increase in bad debt expense, and an increase in real estate tax assessments. For the three months ended September 30, 2008, operating expenses and real estate taxes represented 54% and 28% of the total property level expenses, respectively, with the remaining 18% comprised of interest payments on mortgages. In comparison, operating expenses, real estate taxes, and interest expense for the same period of 2007 were consistent at 54%, 28% and 18% of total property level expenses, respectively.
The Account incurred overall Account level expenses for the three months ended September 30, 2008 of $37.3 million, which represents a 7% decrease from $40.1 million for the same period in 2007. The overall change in expenses was primarily due to a 1.6% decrease of average net assets for these comparative periods which was slightly offset by increased actual administrative and distribution expenses associated with managing and distributing the Account, due in part to increases in certain Account expense deduction rates that became effective on May 1, 2008. This increase in administrative and distribution expenses primarily resulted from larger allocated operational expenses, including costs associated with new technology investments. Liquidity guarantee charges decreased from $6.7 million during the three months ended September 30, 2007 to $4.1 million during the same period in 2008, due to a decrease to the liquidity guarantee charge deduction rate from 0.160% of annual net assets for the period May 1, 2007 to April 30, 2008 to 0.100% of annual net assets effective May 1, 2008.
Net Realized and Unrealized Gains and Losses on Investments and Mortgage Loans Payable
The Account had net realized and unrealized losses on investments and mortgage loans payable of $462.8 million for the three months ended September 30, 2008, as compared to net realized and unrealized gains of $442.9 million for the three months ended September 30, 2007, a 204% year over year decrease. The overall decrease was driven by two factors. First, there were net realized and unrealized losses on the Account’s real estate property investments of $396.1 million for the three months ended September 30, 2008, compared to a substantial net realized and unrealized gain of $323.5 million for the three months ended September 30, 2007. Second, the Account’s interests in joint ventures and limited partnerships posted net realized and unrealized losses of $100.1 million for the three months ended September 30, 2008, which was comprised of $31.9 million of unrealized gains on the joint venture investments’ underlying mortgage loans payable and $132.0 million of unrealized losses and undistributed income on the joint venture underlying properties and limited partnerships. The net realized and unrealized gains of $109.9 million for the three months ended September 30, 2007, was comprised of $18.8 million of unrealized losses on the joint venture investments’ underlying mortgage loans payable, $58.7 million of unrealized gains and undistributed income on the joint venture underlying properties and limited partnerships and $70.0 million of realized gains related to the sale of the 161 North Clark joint venture. The variance in the net realized and unrealized gains and losses on the wholly-owned real estate property investments and those held in joint ventures was a reflection of the decline in value of the many of the Account’s real estate assets, the direct net effect of a weaker overall economy, and substantial slowdown in commercial real estate market transactional activity, as compared to the strong capital appreciation seen in 2007.
The Account also posted net realized and unrealized losses on its marketable securities of $0.6 million for the three months ended September 30, 2008, which was lower than the gains of $2.6 million during the same period in 2007. The lower net losses on the Account’s marketable securities in the three months ended September 30, 2008 were primarily due to the Account’s investments in REIT stocks that were sold in the third quarter of 2007.
The net realized and unrealized losses on investments and mortgage loans payable was offset by the unrealized gains on its mortgage loans payable in the amount of $34.3 million and unrealized losses on its mortgage loan receivable of $0.3 million for the three months ended September 30, 2008, The Account had
46
net unrealized gains of approximately $7.0 million and unrealized losses on its mortgage loan receivable of $0.1 million, respectively, for the three months ended September 30, 2007. The net unrealized gains or loss on mortgage loans payable and mortgage loans receivable in the current period reflected the fluctuations in the U.S. Treasury rates and commercial real estate mortgage loan spreads during the three months ended September 30, 2008 which are used as a basis to value the commercial mortgage loans on the wholly-owned real estate properties. For a mortgage loan payable, a negative fair value adjustment decreases the value of the payable and therefore results in an unrealized gain. Conversely, for a mortgage loan receivable, a negative fair value adjustment decreases the value of the receivable and results in an unrealized loss.
During the three months ended September 30, 2008, the Account also sold one office portfolio investment for net proceeds of $21.6 million, and realized a loss of approximately $14.3 million.
Liquidity and Capital Resources
As of September 30, 2008 and 2007, the Account’s liquid assets (i.e., cash, marketable securities, and receivables for short-term securities sold) had a value of $1.9 billion and $3.6 billion, respectively (approximately 11.7% and 19.7% of the Account’s total investments at such dates, respectively). As of June 30, 2008, the Account’s liquid assets had a value of $3.2 billion (approximately 17.2% of the Account’s total investments). The decrease in the Account’s liquid assets as of September 30, 2008 compared both to September 30, 2007 and June 30, 2008 was due primarily to sustained net participant transfers out of the Account and in particular, during the three months ended September 30, 2008.Further, as of November 13, 2008, the Account’s liquid assets had a value of approximately $1.2 billion.
During the nine months ended September 30, 2008, the Account received $793 million in premiums and had outflows of $2.4 billion in net participant transfers to TIAA, the CREF accounts, and TIAA-CREF affiliated mutual funds, while, during the nine months ended September 30, 2007, the Account received $895 million in premiums and had inflows of $926 million in net participant transfers from TIAA, the CREF accounts, and TIAA-CREF affiliated mutual funds. In the three months ended September 30, 2008, the Account received $242.9 million in premiums and had an outflow of $1.4 billion in net participant transfers to TIAA, the CREF accounts, and TIAA-CREF affiliated mutual funds.
Management believes that the significant recent net negative outflow may be a reflection of participant concerns with the downturn in the U.S. and global economy, the turmoil in the capital and credit markets, and their current and potential future net effect on commercial real estate in particular. Management cannot predict whether the net outflows will continue at the same rate, a higher rate, or at all in the future. If net outflows were to continue at the same or at a higher rate, it could have a negative impact on the Account’s operations and returns.
While the Account’s liquid investments have dropped below 15% of its total investments during this recent period of significant net participant outflows, the Account’s investment strategy remains to invest between 75% and 85% of its assets directly in real estate or real estate-related investments with the goal of producing favorable long-term returns primarily through rental income and appreciation.
The Account’s liquid assets continue to be available to purchase additional suitable real estate properties and to meet the Account’s expense needs and participant redemption requests (i.e., cash withdrawals, benefit payments, or transfers). In the event that the Account’s liquid assets and its cash flow from operating activities and participant transactions are not sufficient to meet participant transfer or cash withdrawal requests, TIAA’s general account will be required to purchase liquidity units as necessary in accordance with TIAA’s liquidity guarantee to the Account. As discussed in the Account’s prospectus, in accordance with this liquidity guarantee obligation, TIAA guarantees that all participants in the Account may redeem their accumulation units at their accumulation unit value next determined after their transfer or cash withdrawal request is received in good order. If this guarantee were executed, the independent fiduciary would monitor the Account to ensure, among other things, that TIAA does not own too much of the Account and may require TIAA to redeem some of its liquidity units, particularly when the Account has uninvested cash or liquid investments available. Management cannot predict with precision when, and to what extent, this liquidity guarantee would need to be exercised. Nonetheless, the exercise of the liquidity guarantee could occur during the fourth quarter of 2008 if participant redemptions continue to reduce the Account’s liquid assets.
The Account’s net investment income continues to be a source of liquidity for the Account and it decreased from $155.8 million for the three months ended September 30, 2007 to $129.3 million for the three
47
months ended September 30, 2008. It also decreased from $457.1 million for the nine months ended September 30, 2007 to $427.5 million for the nine months ended September 30, 2008.
As discussed above in the “Results of Operations” section, during the nine months ended September 30, 2008, the Account liquidated its REIT stock portfolio, which represented 2.28% of the Account’s investments as of March 31, 2008, for approximately $477.4 million and the Account recognized a cumulative net loss of $11.2 million. The disposition of these REIT stocks was a decision by the Account’s management to reduce risk within its marketable securities investment portfolio. The sale of these REIT stocks resulted in an increased position in less volatile, high quality marketable securities, which can be readily converted to cash to honor redemptions and transfers, purchase or improve properties, or cover other Account expenses. As circumstances warrant and in continued furtherance of its investment objective and strategy, the Account may invest in REIT stocks in the future.
The Account, under certain conditions more fully described in the Account’s prospectus, including on page 11 of the prospectus under “Borrowing” (as supplemented from time to time), may borrow money and assume or obtain a mortgage on a property (i.e., to make leveraged real estate investments). Also, to meet any short-term cash needs, the Account may obtain a line of credit that may be unsecured and/or contain terms that may require the Account to secure the loan with one or more of its properties. As of September 30, 2008, the Account’s total borrowings, including the debt on investments in joint ventures, represented 23.7% of the Account’s Total Net Assets. As referenced in Note 5 to the Account’s financial statements and discussed in more detail below, the Account obtained mortgages on three office properties (Preston Sherry Plaza and Four Oaks Place in Texas, and 701 Brickell Avenue in Florida) during the third quarter of 2008 in the aggregate principal amount of $350 million. Also, as discussed in Note 8 to the Account’s financial statements, the Account obtained mortgages secured by two apartment buildings (the Colorado in New York and the Caruth in Texas) in the aggregate principal amount of $129.9 million in the fourth quarter of 2008, which brought the Account’s total borrowings, including the debt on investments in joint ventures to 27.2% of Total Net Assets as of November 13, 2008.
The Account’s total borrowings may not exceed 30% of the Account’s Total Net Assets at the time of incurrence. As the Account’s Total Net Assets fluctuate from time to time (whether due to valuation adjustments on the underlying assets or otherwise), the Account’s total borrowings may exceed 30% of Total Net Assets, even without the incurrence of additional leverage at such time. At any time when the Account has total borrowings in excess of 30% of Total Net Assets, it may not incur additional debt. In calculating this limit, only the Account’s actual percentage interest in any borrowings is included, and not that of any joint venture partner. Further, the Account may only borrow up to 70% of the then-current value of a property, although construction loans may be for 100% of the costs incurred in developing a property.
Recent Transactions
The following describes property transactions by the Account in the third quarter of 2008. Except as noted, the expenses for operating the properties purchased are either borne or reimbursed, in whole or in part, by the property tenants, although the terms vary under each lease. The Account is responsible for operating expenses not reimbursed under the terms of a lease. All rental rates are quoted on an annual basis unless otherwise noted.
Purchases
None.
Sales
Columbus Office Portfolio–Columbus, OH
On July 11, 2008, the Account sold an office portfolio investment comprised of three office buildings located in Columbus, Ohio for net sales proceeds of approximately $21.6 million and realized a loss of approximately $14.3 million. The Account purchased the property investment on November 30, 1999. The original investment in this property was $30.2 million. At the time of sale, the property had a market value of $22.7 million and a cost to date of $36.3 million according to the records of the Account.
48
Financings
Preston Sherry Plaza–Dallas, TX
On August 28, 2008, the Account entered into a mortgage agreement in the principal amount of $23.5 million with a fixed interest rate of 5.85% for a period of 7 years. Payment under this loan is interest only for the first three years.
701 Brickell Avenue–Miami, FL
On September 16, 2008, the Account entered into a mortgage agreement in the principal amount of $126 million maturing October 2010. Interest is stated at LIBOR plus 200 basis points and, pursuant to the terms of the agreement, the interest rate is capped at 6.50%.
Four Oaks Place–Houston, TX
On September 16, 2008, the Account entered into a mortgage agreement in the principal amount of $200 million maturing October 2010. Interest is stated at LIBOR plus 200 basis points and, pursuant to the terms of the agreement, the interest rate is capped at 6.50%.
Critical Accounting Policies
The financial statements of the Account are prepared in conformity with accounting principles generally accepted in the United States of America.
In preparing the Account’s financial statements, management is required to make estimates and judgments that affect the reported amounts of assets, liabilities, revenues, and expenses. Management bases its estimates on historical experience and assumptions that are believed to be reasonable under the circumstances, the results of which form the basis for making judgments about the carrying value of assets and liabilities that are not readily apparent from other sources. Actual results may differ from these estimates.
Accounting Pronouncements Adopted
In September 2006, Financial Accounting Standards Board (“FASB”) issued Statement No. 157, “Fair Value Measurements.” This Statement defines fair value, establishes a framework for measuring fair value under generally accepted accounting principles in the United States, and requires additional disclosures about fair value measurements. This Statement does not require any new fair value measurements. This statement was effective as of January 1, 2008 for the Account. The adoption of Statement No. 157 did not have a material impact on the Account’s financial position or results of operations.
In February 2007, FASB issued Statement No. 159, “The Fair Value Option for Financial Assets and Financial Liabilities.” This Statement permits entities to choose to measure financial instruments and certain other items at fair value and is expected to expand the use of fair value measurement when warranted. The Account effectively adopted Statement 159 on January 1, 2008 and reports all existing and plans to report all future mortgage loans payable at fair value using this Statement. Historically, the Account recorded mortgage loans payable at fair value. The adoption of Statement No. 159 did not have a material impact on the Account’s financial position or results of operations.
Valuation Hierarchy
In accordance with FASB Statement No.157, “Fair Value Measurements”, the Account groups financial assets and certain financial liabilities measured at fair value into three levels, based on the markets in which the assets and liabilities are traded, if any, and the observability of the assumptions used to determine fair value. These levels are:
Level 1—Valuations using unadjusted quoted prices for assets traded in active exchange markets, such as stocks listed on the New York Stock Exchange. Active markets are defined as having the following characteristics for the measured asset or liability: (i) many transactions, (ii) current prices, (iii) price quotes not varying substantially among market makers, (iv) narrow bid/ask spreads and (v) most information regarding the issuer is publicly available. Level 1 assets and liabilities includes Real Estate related Marketable Securities.
49
Level 2—Valuations for assets and liabilities traded in less active, dealer or broker markets. Fair values are primarily obtained from third party pricing services for identical or comparable assets or liabilities. Level 2 inputs for fair value measurements are inputs, other than quoted prices included within Level 1, that are observable for the asset or liability, either directly or indirectly. Level 2 inputs include:
|
a. | | | | Quoted prices for similar assets or liabilities in active markets; |
|
b. | | | | Quoted prices for identical or similar assets or liabilities in markets that are not active (that is, markets in which there are few transactions for the asset (or liability), the prices are not current, price quotations vary substantially either over time or among market makers (for example, some brokered markets), or in which little information is released publicly); |
|
c. | | | | Inputs other than quoted prices that are observable within the market for the asset (or liability) (for example, interest rates and yield curves, volatilities, prepayment speeds, loss severities, credit risks, and default rates that are observable at commonly quoted intervals); and |
|
d. | | | | Inputs that are derived principally from or corroborated by observable market data by correlation or other means (for example, market-corroborated inputs). |
Examples of securities which may be held by the account and included in Level 2 include Certificate of Deposits, Commercial Paper, Government Agency Bonds and Variable Notes.
Level 3—Valuations for assets and liabilities that are derived from other valuation methodologies, including pricing models, discounted cash flow models and similar techniques, and are not based on market exchange, dealer, or broker-traded transactions. Level 3 valuations incorporate certain assumptions and projections that are not observable in the market, and require significant professional judgment in determining the fair value assigned to such assets or liabilities.
An investment’s categorization within the valuation hierarchy described above is based upon the lowest level of input that is significant to the fair value measurement.
The Account’s investments and mortgage loans payable are stated at fair value. Effective January 1, 2008, in connection with the adoption of SFAS No. 159,“The Fair Value Option for Financial Assets and Liabilities”, the Account reports all existing and plans to report all future mortgage loans payable and will continue to report these payables at fair value. Fair value is based upon quoted market prices, where available. If listed prices or quotes are not available, fair value is based upon vendor-provided, evaluated prices or internally-developed models that primarily use market-based or independently-sourced market data, including interest rate yield curves, market spreads, and currency rates. Valuation adjustments will be made to reflect credit quality, the Account’s creditworthiness, liquidity, and other observable and unobservable data that are applied consistently over time.
The methods described above are considered to produce fair values that represent a good faith estimate of what an unaffiliated buyer in the marketplace would pay to purchase the asset or would receive to transfer the liability. Since fair value calculations involve significant professional judgment in the application of both observable and unobservable attributes, actual realizable values or future fair values may differ from amounts reported. Furthermore, while the Account believes its valuation methods are appropriate and consistent with other market participants, the use of different methodologies or assumptions to determine the fair value of certain financial instruments, while reasonable, could result in different estimates of fair value at the reporting date.
The following is a description of the valuation methodologies used for investments measured at fair value.
Valuation of Real Estate Properties
Investments in real estate properties are stated at fair value, as determined in accordance with procedures approved by the Investment Committee of the TIAA Board of Trustees (“Board”) and in accordance with the responsibilities of the Board as a whole; accordingly, the Account does not record depreciation. The Account’s real estate properties are generally classified within Level 3 of the valuation hierarchy. Fair value for real estate properties is defined as the most probable price for which a property will sell in a competitive market under all conditions requisite to a fair sale. Determination of fair value involves judgment because the actual market value of real estate can be determined only by negotiation between the parties in a sales transaction. The Account intends that the overarching principle when valuing its real estate
50
investments will be to produce a valuation that represents a fair and accurate estimate of the fair value of its investments. Implicit in the Account’s definition of fair value are the consummation of a sale as of a specified date and the passing of title from seller to buyer under conditions whereby:
|
• | | | | Buyer and seller are typically motivated; |
|
• | | | | Both parties are well informed or well advised, and acting in what they consider their best interests; |
|
• | | | | A reasonable time is allowed for exposure in the open market; |
|
• | | | | Payment is made in terms of cash or in terms of financial arrangements comparable thereto; and |
|
• | | | | The price represents the normal consideration for the property sold unaffected by special or creative financing or sales concessions granted by anyone associated with the sale. |
Real estate properties owned by the Account are initially valued based on an independent appraisal at the time of the closing of the purchase, which may result in a potential unrealized gain or loss reflecting the difference between an investment’s fair value (i.e., exit price) and its cost basis (which is inclusive of transaction costs).
Subsequently, each property is valued each quarter with an independent third party appraisal completed for each real estate property at least once a year. In general, the Account obtains appraisals for each real estate property throughout the quarter and the Account’s independent fiduciary (discussed below) oversees the appraisal process. Further, management reserves the right to order an appraisal and/or conduct another valuation outside of the normal quarterly process when facts or circumstances at a specific property change (for example, under certain circumstances a valuation adjustment could be made when bids are obtained for properties held for sale). An independent fiduciary, Real Estate Research Corporation, has been appointed by a special subcommittee of the Investment Committee of the Board to, among other things, oversee the appraisal process. The independent fiduciary must approve all independent appraisers used by the Account. TIAA’s appraisal staff performs the other quarterly valuations for each real estate property and updates the property value as appropriate. All appraisals are performed in accordance with Uniform Standards of Professional Appraisal Practices (“USPAP”), the real estate appraisal industry standards created by The Appraisal Foundation. Real estate appraisals are estimates of property values based on a professional’s opinion. The Account’s retained independent appraisers, each of whom have been approved by the independent fiduciary, prepare the initial and subsequent annual third-party appraisals. These independent appraisers are always expected to be MAI-designated members (or it’s European equivalent, RICS) of the Appraisal Institute and state certified appraisers from national or regional firms with relevant property type experience and market knowledge.
The independent fiduciary can require additional appraisals if a property’s value has changed materially and such change is not reflected in the quarterly valuation review, or otherwise to ensure that the Account is valued appropriately. The independent fiduciary must also approve any valuation change where a property’s value changed by more than 6% from the most recent independent annual appraisal, or if the value of the Account would change by more than 4% within any calendar quarter or more than 2% since the prior month. When a real estate property is subject to a mortgage, the mortgage is valued independently of the property and its fair value is reported separately. The independent fiduciary reviews and approves mortgage valuation adjustments which exceed the prescribed limits discussed above before such adjustments are recorded by the Account. The Account continues to use the revised value for each real estate property and mortgage loan payable to calculate the Account’s daily net asset value until the next valuation review or appraisal.
Valuation of Real Estate Joint Ventures and Limited Partnerships
Real estate joint ventures and certain limited partnerships are stated at the fair value of the Account’s ownership interests of the underlying entities. The Account’s ownership interests are valued based on the fair value of the underlying real estate, any related mortgage loans payable, and other factors, such as ownership percentage, ownership rights, buy/sell agreements, distribution provisions and capital call obligations. Upon the disposition of all real estate investments by an investee entity, the Account will continue to state its equity in the remaining net assets of the investee entity during the wind down period, if any, that occurs prior to the dissolution of the investee entity. The Account’s real estate joint ventures and limited partnerships are generally classified within level 3 of the valuation hierarchy.
51
Valuation of Marketable Securities
Equity securities listed or traded on any national market or exchange are valued at the last sale price as of the close of the principal securities exchange on which such securities are traded or, if there is no sale, at the mean of the last bid and asked prices on such exchange, exclusive of transaction costs. Such marketable securities are classified within level 1 of the valuation hierarchy.
Debt securities, other than money market instruments, are generally valued at the most recent bid price or the equivalent quoted yield for such securities (or those of comparable maturity, quality and type). Money market instruments, with maturities of one year or less, are valued in the same manner as debt securities or derived from a pricing matrix. Debt securities are generally classified within level 2 of the valuation hierarchy.
Certain limited partnership interests for which market quotations are not readily available are valued at fair value as determined in good faith under the direction of the Investment Committee of the Board and in accordance with the responsibilities of the Board as a whole. These investments are generally classified within level 3 of the valuation hierarchy.
Valuation of Mortgage Loan Receivable
The mortgage loan receivable is stated at fair value. The mortgage loan receivable is valued quarterly based on market factors, such as market interest rates and spreads for comparable loans, and the performance of the underlying collateral. The Account’s mortgage loan receivable is classified within level 3 of the valuation hierarchy.
Valuation of Mortgage Loans Payable
Mortgage loans payable are stated at fair value. The estimated fair value of mortgage loans payable is based on the amount at which the liability could be transferred exclusive of transaction costs. Mortgage loans payable are valued quarterly based on market factors, such as market interest rates and spreads for comparable loans, the performance of the underlying collateral, and the credit quality of the Account. The Account’s mortgage loans payable are generally classified within level 3 of the valuation hierarchy. Interest expense for mortgage loans payable is recorded on the accrual basis taking into account the outstanding principal and contractual interest rates.
Foreign currency transactions and translation
Portfolio investments and other assets and liabilities denominated in foreign currencies are translated into U.S. dollars at the exchange rates prevailing at the end of the period. Purchases and sales of securities, income receipts and expense payments made in foreign currencies are translated into U.S. dollars at the exchange rates prevailing on the respective dates of the transactions. The effect of any changes in foreign currency exchange rates on portfolio investments and mortgage loans payable is included in net realized and unrealized gains and losses on investments and mortgage loans payable. Net realized gains and losses on foreign currency transactions include maturities of forward foreign currency contracts, disposition of foreign currencies, and currency gains and losses between the accrual and receipt dates of portfolio investment income and between the trade and settlement dates of portfolio investment transactions.
Accumulation and Annuity Funds
The Accumulation Fund represents the net assets attributable to participants in the accumulation phase of their investment (“Accumulation Fund”). The Annuity Fund represents the net assets attributable to the participants currently receiving annuity payments (“Annuity Fund”). The net increase or decrease in net assets from investment operations is apportioned between the accounts based upon their relative daily net asset values. Once an Account participant begins receiving lifetime annuity income benefits, monthly payment levels cannot be reduced as a result of the Account’s adverse mortality experience. In addition, the contracts are required to stipulate the maximum expense charge for all expenses that can be assessed, which is equal to 2.50% of average net assets per year. The Account pays a fee to TIAA to assume these mortality and expense risks.
52
Accounting for Investments
Real estate transactions are accounted for as of the date on which the purchase or sale transactions for the real estate properties close (settlement date). The Account recognizes a realized gain on the sale of a real estate property to the extent that the contract sales price exceeds the cost-to-date of the property being sold. A realized loss occurs when the cost-to-date exceeds the sales price. Any accumulated unrealized gains and losses are reversed in the calculation of realized gains and losses.
Rent from real estate properties consists of all amounts earned under tenant operating leases, including base rent, recoveries of real estate taxes and other expenses and charges for miscellaneous services provided to tenants. Rental income is recognized in accordance with the billing terms of the lease agreements. The Account bears the direct expenses of the real estate properties owned. These expenses include, but are not limited to, fees to local property management companies, property taxes, utilities, maintenance, repairs, insurance, and other operating and administrative costs. An estimate of the net operating income earned from each real estate property is accrued by the Account on a daily basis and such estimates are adjusted when actual operating results are determined.
The Account has limited ownership interests in various real estate funds (limited partnerships and one limited liability corporation) and a private real estate investment trust (collectively, the “limited partnerships”). The Account records its contributions as increases to the investments, and distributions from the investments are treated as either income or return of capital, as determined by the management of the limited partnerships. Unrealized gains and losses are calculated and recorded when the financial statements of the limited partnerships are received by the Account.
Income from real estate joint ventures is recorded based on the Account’s proportional interest of the income distributed by the joint venture. Income earned by the joint venture, but not yet distributed to the Account by the joint venture investment, is recorded as unrealized gains and losses on real estate joint ventures.
Transactions in marketable securities are accounted for as of the date the securities are purchased or sold (trade date). Interest income is recorded as earned. Dividend income is recorded on the ex-dividend date or as soon as the Account is informed of the dividend. Realized gains and losses on securities transactions are accounted for on the specific identification method.
New Accounting Pronouncements
In June 2007, the Accounting Standards Executive Committee (“ACSEC”) of the American Institute of Certified Public Accountants (“AICPA”) issued Statement of Position (“SOP”) 07-1, “Clarification of the Scope of the Audit and Accounting Guide, Investment Companies, and Accounting by Parent Companies and Equity Method Investors for Investments in Investment Companies.” The SOP clarifies which entities are required to apply the provisions of the Investment Companies Audit and Accounting Guide (“Guide”) and provides guidance on accounting by parent companies and equity method investors for investments in investment companies. The SOP is effective for fiscal years beginning on or after December 15, 2007. In February 2008, FASB issued Staff Position (“FSP”) SOP 07-1 indefinitely delaying the effective date of SOP 07-1 to allow FASB time to consider significant issues related to the implementation of SOP 07-1. Management of the Account will continue to monitor FASB developments and will evaluate the financial reporting implications to the Account, as necessary.
In December 2007, FASB issued Statement No. 141(R), “Business Combinations,” which establishes principles and requirements for how the acquirer shall recognize and measure in its financial statements the identifiable assets acquired, liabilities assumed, any noncontrolling interest in the acquiree, and goodwill acquired in a business combination or a gain from a bargain purchase. This Statement is effective for business combinations for which the acquisition date is on or after the beginning of the first annual reporting period beginning on or after December 15, 2008. The Account reports all investment in real estate at fair value and therefore does not account for the acquisition of real estate investment as a business combination under this statement.
In December 2007, FASB issued Statement No. 160, “Noncontrolling Interests in Consolidated Financial Statements—an Amendment of ARB No. 51,” which establishes and expands accounting and reporting standards for minority interests, which will be recharacterized as noncontrolling interests, in a subsidiary and the deconsolidation of a subsidiary. This Statement is effective for fiscal years beginning on or after
53
December 15, 2008. The Adoption of Statement No. 160 is not expected to have a material impact on the financial position or results of operations of the Account.
In May 2008, FASB issued Statement No. 162, “The Hierarchy of Generally Accepted Accounting Principles” (“GAAP Hierarchy”), which identifies the sources of accounting principles and the framework for selecting the principles to be used in the preparation of financial statements of nongovernmental entities that are presented in conformity with generally accepted accounting principles in the United States. This statement is effective 60 days following the Securities and Exchange Commission’s approval of the Public Company Accounting Oversight Board amendments to AU Section 411, “The Meaning of Presented Fairly in Conformity with Generally Accepted Accounting Principles” (the approval occurred on September 16, 2008). This amendment removes the GAAP Hierarchy from auditing literature and places it in the accounting literature and appropriately directs the requirement to comply with the GAAP Hierarchy to the reporting entity. The Account/Fund has assessed the impact of the standard and does not anticipate any changes in the application of the Account’s accounting principles will occur.
In October 2008, FASB issued FSP FAS 157-3, “Determining the Fair Value of a Financial Asset When the Market for That Asset is Not Active.” This FSP clarifies the application of Statement No. 157 in a market that is not active and applies to financial assets within the scope of accounting pronouncements that require or permit fair value measurements in accordance with Statement No. 157. The FSP is effective upon issuance, including prior periods for which financial statements have not been issued. Accordingly, the Account adopted this guidance effective September 30, 2008. The adoption of this guidance did not have a material effect on the financial position or results operations of the Account.
ITEM 3. QUANTITATIVE AND QUALITATIVE DISCLOSURES ABOUT MARKET RISK.
The Account’s real estate holdings, including real estate joint ventures and limited partnerships, which, as of September 30, 2008, represented 89.71% of the Account’s total investments, expose the Account to a variety of risks. These risks include, but are not limited to:
|
• | | | | General Real Estate Risk—The risk that the Account’s property values or rental and occupancy rates could go down due to general economic conditions, a weak market for real estate generally, disruptions in the credit and/or capital markets or changing supply and demand for certain types of properties; |
|
• | | | | Appraisal Risk—The risk that the sale price of an Account property (i.e., the value that would be determined by negotiations between independent parties) might differ substantially from its estimated or appraised value, leading to losses or reduced profits to the Account upon sale; |
|
• | | | | Risk Relating to Property Sales—The risk that the Account might not be able to sell a property at a particular time for its full value, particularly in a poor market. This might make it difficult to raise cash quickly and also could lead to Account losses; |
|
• | | | | Risks of Borrowing—The risk that interest rate changes may impact Account returns if the Account takes out a mortgage on a property, buys a property subject to a mortgage or holds a property subject to a mortgage; and |
|
• | | | | Foreign Currency Risk—The risk that the value of the Account’s foreign investments, related debt or rental income could increase or decrease due to changes in foreign currency exchange rates or foreign currency exchange control regulations, and hedging against such changes, if undertaken by the Account, may entail additional costs and be unsuccessful. |
Other risks inherent to, and associated with, the acquisition, ownership and sale of real estate related investments are detailed elsewhere in this Form 10-Q, including in “Management’s Discussion and Analysis of Financial Condition and Results of Operations” and the risk factors discussed in “Item 1A. Risk Factors” in the Form 10-K.
As of September 30, 2008, 10.29% of the Account’s total investments were in market risk sensitive instruments, comprised of marketable securities and an adjustable rate mortgage loan receivable. As of September 30, 2008, marketable securities include high-quality short-term debt instruments (i.e., commercial paper and government agency bonds). The Statement of Investments for the Account sets forth the general financial terms of these instruments, along with their fair values, as determined in accordance with procedures described in Note 1 to the Account’s financial statements. Other than the interest rate cap agreements contained in two mortgage loans payable the Account entered into during the third quarter of
54
2008, the Account does not invest in derivative financial instruments, nor does the Account engage in any hedging activity. These interest rate cap agreements (which cap the interest rate on each mortgage loan payable at 6.50%) are discussed in more detail in Note 5 to the Account’s unaudited financial statements contained herein.
The Account’s investments in cash equivalents, marketable securities and mortgage loans receivable are subject to the following general risks:
|
• | | | | Financial Risk—The risk, for debt securities, that the issuer will not be able to pay principal and interest when due (and/or declare bankruptcy or be subject to receivership) and, for common or preferred stock, that the issuer’s current earnings will fall or that its overall financial soundness will decline, reducing the security’s value. |
|
• | | | | Market Risk—The risk that the Account’s investments will experience price volatility due to changing conditions in the financial markets and, particularly for debt securities, changes in overall interest rates. |
|
• | | | | Interest Rate Volatility—The risk that interest rate volatility may affect the Account’s current income from an investment. |
|
• | | | | Deposit Risk—The risk that, to the extent the Account’s cash held in bank deposit accounts exceeds federally insured limits as to that bank, the Account could experience losses if banks fail. The Account does not believe it has exposure to significant concentrations of deposit risk. |
In addition, to the extent the Account were to hold mortgage-backed securities (including commercial mortgage-backed securities (“CMBS”) these securities are subject to prepayment risk or extension risk (i.e., the risk that borrowers will repay the loans earlier or later than anticipated). If the underlying mortgage assets experience faster than anticipated repayments of principal, the Account could fail to recoup some or all of its initial investment in these securities, since the original price paid by the Account was based in part on assumptions regarding the receipt of interest payments. If the underlying mortgage assets are repaid later than anticipated, the Account could lose the opportunity to reinvest the anticipated cash flows at a time when interest rates might be rising. The rate of prepayment depends on a variety of geographic, social and other functions, including prevailing market interest rates and general economic factors. The market value of these securities is also highly sensitive to changes in interest rates. Note that the potential for appreciation, which could otherwise be expected to result from a decline in interest rates, may be limited by any increased prepayments. These securities may be harder to sell than other securities.
In addition to these risks, real estate equity securities (such as REIT stocks) and mortgage-backed securities would be subject to many of the same general risks inherent in real estate investing, making mortgage loans and investing in debt securities. For more information on the risks associated with all of the Account’s investments, see the Account’s most recent prospectus.
ITEM 4. CONTROLS AND PROCEDURES.
(a) The registrant maintains a system of disclosure controls and procedures that are designed to provide reasonable assurance that the information required to be disclosed in the registrant’s reports under the Securities Exchange Act of 1934, as amended (the “Exchange Act”), is recorded, processed, summarized and reported within the time periods specified in the SEC’s rules and forms, and that such information is accumulated and communicated to management, including the registrant’s Chief Executive Officer (“CEO”) and Chief Financial Officer (“CFO”), as appropriate, to allow timely decisions regarding required disclosure.
Under the supervision and participation of the registrant’s management, including the registrant’s CEO and CFO, the registrant conducted an evaluation of the effectiveness of the registrant’s disclosure controls and procedures as defined in Rule 13a-15(e) under the Exchange Act as of September 30, 2008. Based upon the management’s review, the CEO and the CFO concluded that the registrant’s disclosure controls and procedures were effective as of September 30, 2008.
(b)Changes in internal control over financial reporting.There have been no changes in the registrant’s internal control over financial reporting that occurred during the registrant’s last fiscal quarter that materially affected, or are reasonable likely to materially affect, the registrant’s internal control over financial reporting.
55
PART II. OTHER INFORMATION
ITEM 1. LEGAL PROCEEDINGS.
There are no material legal proceedings to which the Account is a party, or to which the Account’s assets are subject.
ITEM 1A. RISK FACTORS.
There have been no material changes from our risk factors as previously reported in the Account’s Annual Report on Form 10-K for the year ended December 31, 2007, as updated in the Account’s Quarterly Report on Form 10-Q for the three months ended March 31, 2008.
ITEM 2. UNREGISTERED SALES OF EQUITY SECURITIES AND USE OF PROCEEDS.
Not applicable.
ITEM 3. DEFAULTS UPON SENIOR SECURITIES.
Not applicable.
ITEM 4. SUBMISSION OF MATTERS TO A VOTE OF SECURITY HOLDERS.
Not applicable.
ITEM 5. OTHER INFORMATION.
The Code of Ethics for TIAA’s senior financial officers, including its principal executive officer, principal financial officer, principal accounting officer, or controller, and persons performing similar functions, has been filed as an exhibit to the Form 10-K and can also be found on the following two web sites, http://www.tiaa-cref.org/prospectuses/index.html and http://www.tiaa-cref.org/about/governance/corporate/ topics/ annual_reports.html. Information included in such websites is expressly not incorporated by reference into this Quarterly Report on Form 10-Q.
56
ITEM 6. EXHIBITS.
| | | | |
(1) | | (A) | | Distribution Agreement for the Contracts Funded by the TIAA Real Estate Account, dated as of January 1, 2008, by and among Teachers Insurance and Annuity Association of America, for itself and on behalf of the Account, and TIAA-CREF Individual & Institutional Services, LLC.(7) |
(3) | | (A) | | Charter of TIAA (as amended).(1) |
| | (B) | | Bylaws of TIAA (as amended).(6) |
(4) | | (A) | | Forms of RA, GRA, GSRA, SRA, IRA Real Estate Account Endorsements(3), Keogh Contract,(4) Retirement Select and Retirement Select Plus Contracts and Endorsements(2) and Retirement Choice and Retirement Choice Plus Contracts.(4) |
| | (B) | | Forms of Income-Paying Contracts.(3) |
(10) | | (A) | | Independent Fiduciary Agreement, dated February 22, 2006, by and among TIAA, the Registrant, and Real Estate Research Corporation(5) |
| | (B) | | Custodian Agreement, dated as of March 3, 2008, by and between TIAA, on behalf of the Registrant, and State Street Bank and Trust Company, N.A.(8) |
(14) | | | | Code of Ethics of TIAA.(9) |
(31)* | | Certificates of Principal Executive Officer and Principal Financial Officer pursuant to Section 302 of Sarbanes-Oxley Act of 2002. |
(32)* | | Certificate Pursuant to Section 906 of Sarbanes-Oxley Act of 2002. |
|
* | | | | Filed herewith. |
|
(1) | | | | Previously filed and incorporated herein by reference to the Account’s Pre-Effective Amendment No. 1 to the Registration Statement on Form S-1 filed December 21, 2004 (File No. 333-121493). |
|
(2) | | | | Previously filed and incorporated herein by reference to the Account’s Pre-Effective Amendment No. 1 to the Registration Statement on Form S-1 filed April 29, 2004 (File No. 333-113602). |
|
(3) | | | | Previously filed and incorporated herein by reference to the Account’s Post-Effective Amendment No. 2 to the Registration Statement on Form S-1 filed April 30, 1996 (File No. 33-92990). |
|
(4) | | | | Previously filed and incorporated herein by reference to the Account’s Post-Effective Amendment No. 1 to the Registration Statement on Form S-1 filed May 2, 2005 (File No. 333-121493). |
|
(5) | | | | Previously filed and incorporated herein by reference to Exhibit 10.(a) to the Annual Report on Form 10-K of the Account filed on March 15, 2006. |
|
(6) | | | | Previously filed and incorporated herein by reference to Exhibit 3(B) to the Account’s Quarterly Report on Form 10-Q for the period ended September 30, 2006 and filed with the Commission on November 14, 2006. |
|
(7) | | | | Previously filed and incorporated herein by reference to the Account’s Current Report on Form 8-K, filed with the Commission on January 7, 2008. |
|
(8) | | | | Previously filed and incorporated herein by reference to Exhibit 10.(b) to the Annual Report on Form 10-K of the Account filed on March 20, 2008. |
|
(9) | | | | Previously filed and incorporated herein by reference to Exhibit 14 to the Annual Report on Form 10-K of the Account filed on March 20, 2008. |
57
SIGNATURES
Pursuant to the requirements of the Securities Exchange Act of 1934, as amended, the registrant, TIAA Real Estate Account, has duly caused this Report to be signed on its behalf by the undersigned, thereunto duly authorized, in New York, New York, on the 14th day of November, 2008.
| | | | |
| | TIAA REAL ESTATE ACCOUNT |
| | | | |
| | By: | | TEACHERS INSURANCE AND ANNUITY
ASSOCIATION OF AMERICA |
| | | | |
Date: November 14, 2008 | | By: | | /s/ Roger W. Ferguson, Jr.
|
| | | | Roger W. Ferguson, Jr.
President and
Chief Executive Officer |
| | | | |
Date: November 14, 2008 | | By: | | /s/ Georganne C. Proctor
|
| | | | Georganne C. Proctor
Executive Vice President and
Chief Financial Officer |
58