UNITED STATES
SECURITIES AND EXCHANGE COMMISSION
Washington, D.C. 20549
FORM 10-Q
(Mark One)
S QUARTERLY REPORT PURSUANT TO SECTION 13 OR 15(d) OF THE SECURITIES EXCHANGE ACT OF 1934
For the quarterly period ended September 30, 2009
OR
£ TRANSITION REPORT PURSUANT TO SECTION 13 OR 15(d) OF THE SECURITIES EXCHANGE ACT OF 1934
FOR THE TRANSITION PERIOD FROM TO
Commission file number: 33-92990; 333-158136
TIAA REAL ESTATE ACCOUNT
(Exact name of registrant as specified in its charter)
NEW YORK
(State or other jurisdiction of
incorporation or organization)
NOT APPLICABLE
(I.R.S. Employer Identification No.)
C/O TEACHERS INSURANCE AND
ANNUITY ASSOCIATION OF AMERICA
730 THIRD AVENUE
NEW YORK, NEW YORK 10017-3206
(Address of principal executive offices, including zip code)
Registrant’s telephone number, including area code: (212) 490-9000
Indicate by check mark whether the Registrant (1) has filed all reports required to be filed by Section 13 or 15(d) of the Securities Exchange Act of 1934 during the preceding 12 months (or for such shorter period that the Registrant was required to file such reports), and (2) has been subject to such filing requirements for the past 90 days.
YESS NO£
Indicate by check mark whether the registrant has submitted electronically and posted on its corporate Web site, if any, every Interactive Data File required to be submitted and posted pursuant to Rule 405 of Regulation S-T (§232.405 of this chapter) during the preceding 12 months (or for such shorter period that the registrant was required to submit and post such files).
YES£ NO£
Indicate by check mark whether the registrant is a large accelerated filer, an accelerated filer, a non-accelerated filer, or smaller reporting company. See the definitions of “large accelerated filer,” “accelerated filer” and “smaller reporting company” in Rule 12b-2 of the Exchange Act. (Check one):
| | |
Large accelerated filer£ | | Accelerated filer£ |
Non-accelerated filerS | | Smaller Reporting Company£ |
(Do not check if a smaller reporting company) | | |
Indicate by check mark whether the registrant is a shell company (as defined in Rule 12b-2 of the Exchange Act).
YES£ NOS
PART I. FINANCIAL INFORMATION
ITEM 1. FINANCIAL STATEMENTS.
INDEX TO UNAUDITED FINANCIAL STATEMENTS
TIAA REAL ESTATE ACCOUNT
SEPTEMBER 30, 2009
2
TIAA REAL ESTATE ACCOUNT
STATEMENTS OF ASSETS AND LIABILITIES
(In thousands, except per accumulation unit amounts)
| | | | |
| | September 30,
2009 | | December 31,
2008 |
| | (Unaudited) | | |
ASSETS | | | | |
Investments, at fair value: | | | | |
Real estate properties
(cost: $10,003,893 and $10,031,744) | | | $ | | 8,128,127 | | | | $ | | 10,305,040 | |
Real estate joint ventures and limited partnerships
(cost: $2,386,257 and $2,329,850) | | | | 1,624,000 | | | | | 2,463,196 | |
Marketable securities: | | | | |
Other
(cost: $393,243 and $511,703) | | | | 393,275 | | | | | 511,711 | |
Mortgage loan receivable
(cost: $75,000 and $75,000) | | | | 68,965 | | | | | 71,767 | |
| | | | |
Total investments
(cost: $12,858,393 and $12,948,297) | | | | 10,214,367 | | | | | 13,351,714 | |
Cash and cash equivalents | | | | 17,701 | | | | | 22,127 | |
Due from investment advisor | | | | 5,260 | | | | | — | |
Other | | | | 189,961 | | | | | 203,113 | |
| | | | |
TOTAL ASSETS | | | | 10,427,289 | | | | | 13,576,954 | |
| | | | |
LIABILITIES | | | | |
Mortgage loans payable—Note 7
(principal outstanding: $1,929,363 and $1,910,121) | | | | 1,850,340 | | | | | 1,830,040 | |
Payable for securities transactions | | | | 1 | | | | | 108 | |
Due to investment advisor | | | | — | | | | | 9,892 | |
Accrued real estate property level expenses | | | | 165,226 | | | | | 203,874 | |
Security deposits held | | | | 24,079 | | | | | 24,116 | |
| | | | |
TOTAL LIABILITIES | | | | 2,039,646 | | | | | 2,068,030 | |
| | | | |
NET ASSETS | | | | |
Accumulation Fund | | | | 8,120,895 | | | | | 11,106,246 | |
Annuity Fund | | | | 266,748 | | | | | 402,678 | |
| | | | |
TOTAL NET ASSETS | | | $ | | 8,387,643 | | | | $ | | 11,508,924 | |
| | | | |
NUMBER OF ACCUMULATION UNITS OUTSTANDING—
Notes 8 and 9 | | | | 39,858 | | | | | 41,542 | |
| | | | |
NET ASSET VALUE, PER ACCUMULATION UNIT—Note 8 | | | $ | | 203.75 | | | | $ | | 267.35 | |
| | | | |
See notes to the financial statements.
3
TIAA REAL ESTATE ACCOUNT
STATEMENTS OF OPERATIONS
(In thousands)
(Unaudited)
| | | | | | | | |
| | For the Three Months
Ended September 30, | | For the Nine Months
Ended September 30, |
| | 2009 | | 2008 | | 2009 | | 2008 |
INVESTMENT INCOME | | | | | | | | |
Real estate income, net: | | | | | | | | |
Rental income | | | $ | | 239,152 | | | | $ | | 245,433 | | | | $ | | 719,641 | | | | $ | | 739,241 | |
| | | | | | | | |
Real estate property level expenses and taxes: | | | | | | | | |
Operating expenses | | | | 59,138 | | | | | 66,322 | | | | | 180,516 | | | | | 194,258 | |
Real estate taxes | | | | 30,975 | | | | | 33,843 | | | | | 98,929 | | | | | 100,594 | |
Interest expense | | | | 25,159 | | | | | 21,489 | | | | | 76,827 | | | | | 63,275 | |
| | | | | | | | |
Total real estate property level expenses and taxes | | | | 115,272 | | | | | 121,654 | | | | | 356,272 | | | | | 358,127 | |
| | | | | | | | |
Real estate income, net | | | | 123,880 | | | | | 123,779 | | | | | 363,369 | | | | | 381,114 | |
Income from real estate joint ventures and limited partnerships | | | | 35,163 | | | | | 25,088 | | | | | 95,407 | | | | | 93,712 | |
Interest | | | | 406 | | | | | 17,809 | | | | | 1,402 | | | | | 71,988 | |
Dividends | | | | — | | | | | — | | | | | — | | | | | 5,079 | |
| | | | | | | | |
TOTAL INVESTMENT INCOME | | | | 159,449 | | | | | 166,676 | | | | | 460,178 | | | | | 551,893 | |
| | | | | | | | |
Expenses—Note 2: | | | | | | | | |
Investment advisory charges | | | | 11,304 | | | | | 12,386 | | | | | 32,325 | | | | | 38,988 | |
Administrative and distribution charges | | | | 8,161 | | | | | 18,724 | | | | | 29,373 | | | | | 62,651 | |
Mortality and expense risk charges | | | | 1,112 | | | | | 2,074 | | | | | 3,717 | | | | | 6,421 | |
Liquidity guarantee charges | | | | 3,336 | | | | | 4,147 | | | | | 9,356 | | | | | 16,335 | |
| | | | | | | | |
TOTAL EXPENSES | | | | 23,913 | | | | | 37,331 | | | | | 74,771 | | | | | 124,395 | |
| | | | | | | | |
INVESTMENT INCOME, NET | | | | 135,536 | | | | | 129,345 | | | | | 385,407 | | | | | 427,498 | |
| | | | | | | | |
REALIZED AND UNREALIZED (LOSS) GAIN ON
INVESTMENTS AND MORTGAGE LOANS PAYABLE | | | | | | | | |
Net realized (loss) gain on investments: | | | | | | | | |
Real estate properties | | | | (12,741 | ) | | | | | (14,118 | ) | | | | | (29,628 | ) | | | | | (9,489 | ) | |
Real estate joint ventures and limited partnerships | | | | — | | | | | — | | | | | — | | | | | (17 | ) | |
Marketable securities | | | | — | | | | | 23 | | | | | 1 | | | | | (11,189 | ) | |
| | | | | | | | |
Total realized loss on investments | | | | (12,741 | ) | | | | | (14,095 | ) | | | | | (29,627 | ) | | | | | (20,695 | ) | |
| | | | | | | | |
Net change in unrealized (depreciation) appreciation on: | | | | | | | | |
Real estate properties | | | | (647,226 | ) | | | | | (381,986 | ) | | | | | (2,149,064 | ) | | | | | (430,864 | ) | |
Real estate joint ventures and limited partnerships | | | | (169,738 | ) | | | | | (100,120 | ) | | | | | (872,821 | ) | | | | | (193,380 | ) | |
Marketable securities | | | | 4 | | | | | (595 | ) | | | | | 23 | | | | | 14,607 | |
Mortgage loan receivable | | | | 686 | | | | | (293 | ) | | | | | (2,802 | ) | | | | | (1,092 | ) | |
Mortgage loans payable | | | | (7,436 | ) | | | | | 34,270 | | | | | (22,758 | ) | | | | | 38,624 | |
| | | | | | | | |
Net change in unrealized depreciation on
investments and mortgage loans payable | | | | (823,710 | ) | | | | | (448,724 | ) | | | | | (3,047,422 | ) | | | | | (572,105 | ) | |
| | | | | | | | |
NET REALIZED AND UNREALIZED
LOSS ON INVESTMENTS AND
MORTGAGE LOANS PAYABLE | | | | (836,451 | ) | | | | | (462,819 | ) | | | | | (3,077,049 | ) | | | | | (592,800 | ) | |
| | | | | | | | |
NET DECREASE IN NET ASSETS
RESULTING FROM OPERATIONS | | | $ | | (700,915 | ) | | | | $ | | (333,474 | ) | | | | $ | | (2,691,642 | ) | | | | $ | | (165,302 | ) | |
| | | | | | | | |
See notes to the financial statements.
4
TIAA REAL ESTATE ACCOUNT
STATEMENTS OF CHANGES IN NET ASSETS
(In thousands)
(Unaudited)
| | | | | | | | |
| | For the Three Months
Ended September 30, | | For the Nine Months
Ended September 30, |
| | 2009 | | 2008 | | 2009 | | 2008 |
FROM OPERATIONS | | | | | | | | |
Investment income, net | | | $ | | 135,536 | | | | $ | | 129,345 | | | | $ | | 385,407 | | | | $ | | 427,498 | |
Net realized loss on investments | | | | (12,741 | ) | | | | | (14,095 | ) | | | | | (29,627 | ) | | | | | (20,695 | ) | |
Net change in unrealized depreciation on investments and mortgage loans payable | | | | (823,710 | ) | | | | | (448,724 | ) | | | | | (3,047,422 | ) | | | | | (572,105 | ) | |
| | | | | | | | |
NET DECREASE IN NET ASSETS
RESULTING FROM OPERATIONS | | | | (700,915 | ) | | | | | (333,474 | ) | | | | | (2,691,642 | ) | | | | | (165,302 | ) | |
| | | | | | | | |
FROM PARTICIPANT TRANSACTIONS | | | | | | | | |
Premiums | | | | 164,894 | | | | | 242,917 | | | | | 534,759 | | | | | 793,052 | |
Purchase of Liquidity Units by TIAA | | | | — | | | | | — | | | | | 1,058,700 | | | | | — | |
Net transfers to TIAA | | | | (56,629 | ) | | | | | (670,036 | ) | | | | | (509,819 | ) | | | | | (1,046,677 | ) | |
Net transfers to CREF Accounts | | | | (204,060 | ) | | | | | (723,306 | ) | | | | | (1,089,686 | ) | | | | | (1,244,786 | ) | |
Net transfers to TIAA-CREF Institutional Mutual Funds | | | | (36,938 | ) | | | | | (49,651 | ) | | | | | (133,317 | ) | | | | | (131,000 | ) | |
Annuity and other periodic payments | | | | (8,911 | ) | | | | | (21,796 | ) | | | | | (34,224 | ) | | | | | (68,725 | ) | |
Withdrawals and death benefits | | | | (72,247 | ) | | | | | (167,420 | ) | | | | | (256,052 | ) | | | | | (458,268 | ) | |
| | | | | | | | |
NET DECREASE IN NET
ASSETS RESULTING FROM
PARTICIPANT TRANSACTIONS | | | | (213,891 | ) | | | | | (1,389,292 | ) | | | | | (429,639 | ) | | | | | (2,156,404 | ) | |
| | | | | | | | |
NET DECREASE IN NET ASSETS | | | | (914,806 | ) | | | | | (1,722,766 | ) | | | | | (3,121,281 | ) | | | | | (2,321,706 | ) | |
NET ASSETS | | | | | | | | |
Beginning of period | | | | 9,302,449 | | | | | 17,061,597 | | | | | 11,508,924 | | | | | 17,660,537 | |
| | | | | | | | |
End of period | | | $ | | 8,387,643 | | | | $ | | 15,338,831 | | | | $ | | 8,387,643 | | | | $ | | 15,338,831 | |
| | | | | | | | |
See notes to the financial statements.
5
TIAA REAL ESTATE ACCOUNT
STATEMENTS OF CASH FLOWS
(In thousands)
(Unaudited)
| | | | |
| | For the Nine Months
Ended September 30, |
| | 2009 | | 2008 |
CASH FLOWS FROM OPERATING ACTIVITIES | | | | |
Net decrease in net assets resulting from operations | | | $ | | (2,691,642 | ) | | | | $ | | (165,302 | ) | |
Adjustments to reconcile net increase in net assets resulting from operations to net cash provided by operating activities: | | | | |
Purchase of real estate properties | | | | — | | | | | (164,087 | ) | |
Capital improvements on real estate properties | | | | (104,164 | ) | | | | | (92,325 | ) | |
Proceeds from sale of real estate properties | | | | 50,883 | | | | | 45,638 | |
Purchases of long term investments | | | | (38,454 | ) | | | | | (53,369 | ) | |
Proceeds from sale of long term investments | | | | — | | | | | 480,283 | |
Decrease in other investments | | | | 123,288 | | | | | 1,760,067 | |
Decrease in payable for securities transactions | | | | (107 | ) | | | | | (855 | ) | |
Change in due (from) to investment advisor | | | | (15,152 | ) | | | | | 49,494 | |
Decrease (increase) in other assets | | | | 13,152 | | | | | (354,618 | ) | |
Increase in accrued real estate property level expenses | | | | 12,855 | | | | | 13,853 | |
Decrease in security deposits held | | | | (37 | ) | | | | | (301 | ) | |
Net realized loss on investments | | | | 29,627 | | | | | 20,695 | |
Net unrealized loss on investments and mortgage loans payable | | | | 3,047,422 | | | | | 572,105 | |
| | | | |
NET CASH PROVIDED BY OPERATING ACTIVITIES | | | | 427,671 | | | | | 2,111,278 | |
| | | | |
CASH FLOWS FROM FINANCING ACTIVITIES | | | | |
Mortgage loans proceeds received | | | | — | | | | | 344,582 | |
Principal payments of mortgage loans payable | | | | (2,458 | ) | | | | | (545 | ) | |
Premiums | | | | 534,759 | | | | | 793,052 | |
Purchase of Liquidity Units by TIAA | | | | 1,058,700 | | | | | — | |
Net transfers to TIAA | | | | (509,819 | ) | | | | | (1,046,677 | ) | |
Net transfers to CREF Accounts | | | | (1,089,686 | ) | | | | | (1,244,786 | ) | |
Net transfers to TIAA-CREF Institutional Mutual Funds | | | | (133,317 | ) | | | | | (131,000 | ) | |
Annuity and other periodic payments | | | | (34,224 | ) | | | | | (68,725 | ) | |
Withdrawals and death benefits | | | | (256,052 | ) | | | | | (458,268 | ) | |
| | | | |
NET CASH USED IN FINANCING ACTIVITIES | | | | (432,097 | ) | | | | | (1,812,367 | ) | |
| | | | |
NET (DECREASE) INCREASE IN CASH | | | | (4,426 | ) | | | | | 298,911 | |
CASH | | | | |
Beginning of period | | | | 22,127 | | | | | 6,144 | |
| | | | |
End of period | | | $ | | 17,701 | | | | $ | | 305,055 | |
| | | | |
SUPPLEMENTAL DISCLOSURES: | | | | |
Cash paid for interest | | | $ | | 76,772 | | | | $ | | 63,121 | |
| | | | |
See notes to the financial statements.
6
TIAA REAL ESTATE ACCOUNT
NOTES TO THE FINANCIAL STATEMENTS
Note 1—Organization and Significant Accounting Policies
Business:The TIAA Real Estate Account (“Account”) is a segregated investment account of Teachers Insurance and Annuity Association of America (“TIAA”) and was established by resolution of TIAA’s Board of Trustees (the “Board”) on February 22, 1995, under the insurance laws of the State of New York, for the purpose of funding variable annuity contracts issued by TIAA. The Account offers individual and group accumulating annuity contracts (with contributions made on a pre-tax or after-tax basis), as well as individual lifetime and term-certain variable payout annuity contracts (including the payment of death benefits to beneficiaries). Investors are entitled to transfer funds to or from the Account, and make withdrawals from the Account on a daily basis under certain circumstances. Funds invested in the Account for each category of contract are expressed in terms of units, and unit values will fluctuate depending on the Account’s performance.
The investment objective of the Account is a favorable long-term rate of return primarily through rental income and capital appreciation from real estate investments owned by the Account. The Account holds real estate properties directly and through wholly-owned subsidiaries. The Account also holds interests in real estate joint ventures and limited partnerships in which the Account does not hold a controlling interest; as such, such interests are not consolidated for financial statement purposes. The Account also invests in mortgage loans receivable collateralized by commercial real estate properties. The Account also invests in publicly-traded securities and other instruments to maintain adequate liquidity levels for operating expenses, capital expenditures and to fund benefit payments (withdrawals, transfers and related transactions).
The financial statements were prepared in accordance with accounting principles generally accepted in the United States of America which may require the use of estimates made by management. Actual results may vary from those estimates. The following is a summary of the significant accounting policies of the Account.
Basis of Presentation:The accompanying financial statements include the Account and those subsidiaries wholly-owned by TIAA for the benefit of the Account. All significant intercompany accounts and transactions between the Account and such subsidiaries have been eliminated.
Accounting for Investments at Fair Value:The Financial Accounting Standards Board (“FASB”) has provided authoritative guidance for fair value measurements and disclosures. Additionally, the guidance defines fair value, establishes a framework for measuring fair value under generally accepted accounting principles in the United States, and requires certain disclosures about fair value measurements. This guidance indicates, among other things, that a fair value measurement under an exit price model assumes that the transaction to sell an asset or transfer a liability occurs in the principal market for the asset or liability or, in the absence of a principal market, the most advantageous market for the asset or liability.
This guidance also permits entities to elect to measure financial instruments and for certain financial assets and liabilities at fair value and expand the use of fair value measurements when warranted. The Account reports all investments and mortgage loans payable at fair value.
Valuation Hierarchy:The Account groups financial assets and certain financial liabilities measured at fair value into three levels, based on the markets in which the assets and liabilities are traded, if any, and the observability of the assumptions used to determine fair value. These levels are:
Level 1—Valuations using unadjusted quoted prices for assets traded in active markets, such as stocks listed on the New York Stock Exchange. Active markets are defined as having the following characteristics for the measured asset or liability: (i) many transactions, (ii) current prices, (iii) price quotes not varying substantially among market makers, (iv) narrow bid/ask spreads and (v) most information regarding the issuer is publicly available. Level 1 assets, which may be held by the Account from time to time, include real estate related marketable securities (such as publicly traded REIT stocks).
Level 2—Valuations for assets and liabilities traded in less active, dealer or broker markets. Fair values are primarily obtained from third party pricing services for identical or comparable assets or liabilities. Level 2 inputs for fair value measurements are inputs, other than quoted prices included within Level 1, that are observable for the asset or liability, either directly or indirectly. Level 2 inputs include:
7
a. Quoted prices for similar assets or liabilities in active markets;
b. Quoted prices for identical or similar assets or liabilities in markets that are not active (that is, markets in which there are few transactions for the asset (or liability), the prices are not current, price quotations vary substantially either over time or among market makers (for example, some brokered markets), or in which little information is released publicly);
c. Inputs other than quoted prices that are observable within the market for the asset (or liability) (for example, interest rates and yield curves, volatilities, prepayment speeds, loss severities, credit risks, and default rates that are observable at commonly quoted intervals); and
d. Inputs that are derived principally from or corroborated by observable market data by correlation or other means (for example, market-corroborated inputs).
Examples of securities which may be held by the Account and included in Level 2 include Certificates of Deposit, Commercial Paper, Government Agency Notes and Variable Notes.
Level 3—Valuations for assets and liabilities that are derived from other valuation methodologies, including pricing models, discounted cash flow models and similar techniques, and are not based on market exchange, dealer, or broker-traded transactions. Level 3 valuations incorporate certain assumptions and projections that are not observable in the market, and require significant professional judgment in determining the fair value assigned to such assets or liabilities. Examples of Level 3 assets and liabilities which may be held by the Account from time to time include investments in real estate, investments in joint ventures and limited partnerships, mortgage loan receivable and mortgage loans payable.
An investment’s categorization within the valuation hierarchy described above is based upon the lowest level of input that is significant to the fair value measurement.
The Account’s investments and mortgage loans payable are stated at fair value. Fair value is based upon quoted market prices, where available. If listed prices or quotes are not available, fair value is based upon vendor-provided, evaluated prices or internally-developed models that primarily use market-based or independently-sourced market data, including interest rate yield curves, market spreads, and currency rates. Valuation adjustments will be made to reflect changes in credit quality, counterparty’s creditworthiness, the Account’s creditworthiness, liquidity, and other observable and unobservable inputs that are applied consistently over time.
The methods described above are considered to produce fair values that represent a good faith estimate of what an unaffiliated buyer in the marketplace would pay to purchase the asset or would receive to transfer the liability. Since fair value calculations involve significant professional judgment in the application of both observable and unobservable attributes, actual realizable values or future fair values may differ from amounts reported. Furthermore, while the Account believes its valuation methods are appropriate and consistent with other market participants, the use of different methodologies or assumptions to determine the fair value of certain financial instruments, while reasonable, could result in different estimates of fair value at the reporting date. As discussed below in more detail, as the Account generally obtains independent external appraisals on a quarterly basis, there may be circumstances in the interim in which the true realizable value of a property is not reflected in the Account’s daily net asset value calculation or in the Account’s periodic financial statements. This disparity may be more apparent when the commercial and/or residential real estate markets experience an overall and possibly dramatic decline (or increase) in property values in a relatively short period of time between appraisals.
The following is a description of the valuation methodologies used for investments measured at fair value.
Valuation of Real Estate Properties:Investments in real estate properties are stated at fair value, as determined in accordance with policies and procedures reviewed by the Investment Committee of the Board and in accordance with the responsibilities of the Board as a whole. Accordingly, the Account does not record depreciation. The Account’s real estate properties are generally classified within Level 3 of the valuation hierarchy. Fair value for real estate properties is defined as the most probable price for which a property will sell in a competitive market under all conditions requisite to a fair sale. Determination of fair value involves judgment because the actual market value of real estate can be determined only by negotiation between the parties in a sales transaction. The Account’s primary objective when valuing its real estate investments will be to produce a valuation that represents a fair and accurate estimate of the fair value
8
of its investments. Implicit in the Account’s definition of fair value is the consummation of a sale as of a specified date and the passing of title from seller to buyer under conditions whereby:
| | | | |
• | | | | Buyer and seller are typically motivated; |
|
• | | | | Both parties are well informed or well advised, and acting in what they consider their best interests; |
|
• | | | | A reasonable time is allowed for exposure in the open market; |
|
• | | | | Payment is made in terms of cash or in terms of financial arrangements comparable thereto; and |
|
• | | | | The price represents the normal consideration for the property sold unaffected by special or creative financing or sales concessions granted by anyone associated with the sale. |
Property and investment values are affected by, among other things, the availability of capital, occupancy rates, rental rates, and interest and inflation rates. As a result, determining real estate and investment values involves many assumptions. Amounts ultimately realized from each investment may vary significantly from the market value presented. Actual results could differ significantly from those estimates.
Real estate properties owned by the Account are initially valued based on an independent appraisal at the time of the closing of the purchase, which may result in a potential unrealized gain or loss reflecting the difference between an investment’s fair value (i.e., exit price) and its cost basis (which is inclusive of transaction costs).
Subsequently, each property is appraised each quarter by an independent external appraiser. In general, the Account obtains appraisals of its real estate properties spread out throughout the quarter, which is intended to result in appraisal adjustments, and thus, adjustments to the valuations of its holdings (to the extent such adjustments are made) that happen regularly throughout each quarter and not on one specific day in each period.
Further, management reserves the right to order an appraisal and/or conduct another valuation outside of the normal quarterly process when facts or circumstances at a specific property change. For example, under certain circumstances, a valuation adjustment could be made when bids are obtained for properties held for sale by the Account, or when a contract for the sale of a property is executed. In addition, adjustments may be made for events or circumstances indicating an impairment of a tenant’s ability to pay amounts due to the Account under a lease (including bankruptcy filing of that tenant). TIAA’s internal appraisal staff oversees the entire appraisal process, in conjunction with the Account’s independent fiduciary (the independent fiduciary is more fully described in the paragraph below). Any differences in the conclusions of TIAA’s internal appraisal staff and the independent appraiser will be reviewed by the independent fiduciary, which will make a final determination on the matter (which may include ordering a subsequent independent appraisal).
An independent fiduciary, Real Estate Research Corporation, has been appointed by a special subcommittee of the Investment Committee of the Board to, among other things, oversee the appraisal process. The independent fiduciary must approve all independent appraisers used by the Account. All appraisals are performed in accordance with Uniform Standards of Professional Appraisal Practices (“USPAP”), the real estate appraisal industry standards created by The Appraisal Foundation. Real estate appraisals are estimates of property values based on a professional’s opinion. Appraisals of properties held outside of the U.S. are performed in accordance with industry standards commonly applied in the applicable jurisdiction. These independent appraisers are always expected to be MAI-designated members of the Appraisal Institute (or its European equivalent, RICS) and state certified appraisers from national or regional firms with relevant property type experience and market knowledge.
Also, the independent fiduciary can require additional appraisals if factors or events have occurred that could materially change a property’s value and such change is not reflected in the quarterly valuation review, or otherwise to ensure that the Account is valued appropriately. The independent fiduciary must also approve any valuation change of real estate related assets where a property’s value changed by more than 6% from the most recent independent annual appraisal, or if the value of the Account would change by more than 4% within any calendar quarter or more than 2% since the prior calendar month. When a real estate property is subject to a mortgage, the property is valued independently of the mortgage and the property and mortgage fair values are reported separately (see—“Valuation of Mortgage Loans Payable” below). The independent
9
fiduciary reviews and approves all mortgage valuation adjustments before such adjustments are recorded by the Account. The Account continues to use the revised value for each real estate property and mortgage loan payable to calculate the Account’s daily net asset value until the next valuation review or appraisal.
Valuation of Real Estate Joint Ventures and Limited Partnerships:Real estate joint ventures are stated at the fair value of the Account’s ownership interests of the underlying entities. The Account’s ownership interests are valued based on the fair value of the underlying real estate, any related mortgage loans payable, and other factors, such as ownership percentage, ownership rights, buy/sell agreements, distribution provisions and capital call obligations. Upon the disposition of all real estate investments by an investee entity, the Account will continue to state its equity in the remaining net assets of the investee entity during the wind down period, if any, which occurs prior to the dissolution of the investee entity. The Account’s real estate joint ventures are generally classified within level 3 of the valuation hierarchy.
Limited partnership interests for which market quotations are not readily available are valued at fair value as determined in good faith under the direction of the Investment Committee of the Board and in accordance with the responsibilities of the Board as a whole. These investments are generally classified within level 3 of the valuation hierarchy.
Valuation of Marketable Securities:Equity securities listed or traded on any national market or exchange are valued at the last sale price as of the close of the principal securities market or exchange on which such securities are traded or, if there is no sale, at the mean of the last bid and asked prices on such market or exchange, exclusive of transaction costs. Such marketable securities are generally classified within level 1 of the valuation hierarchy.
Debt securities, other than money market instruments, are generally valued at the most recent bid price or the equivalent quoted yield for such securities (or those of comparable maturity, quality and type). Money market instruments, with maturities of one year or less, are valued in the same manner as debt securities or derived from a pricing matrix. Debt securities are generally classified within level 2 of the valuation hierarchy.
Equity and fixed income securities traded on a foreign exchange or in foreign markets are valued using their closing values under the valuation methods generally accepted in the country where traded, as of the valuation date. This value is converted to U.S. dollars at the exchange rate in effect on the valuation day. Under certain circumstances (for example, if there are significant movements in the United States markets and there is an expectation the securities traded on foreign markets will adjust based on such movements when the foreign markets open the next day), the Account may adjust the value of equity or fixed income securities that trade on a foreign exchange or market after the foreign exchange or market has closed. Equity securities traded on a foreign exchange or in foreign markets are generally classified within level 1 of the valuation hierarchy. Fixed income securities traded on a foreign exchange or in foreign markets are generally classified within level 2 of the valuation hierarchy. Equity and fixed income securities traded in foreign markets that are adjusted based upon significant movements in the United States markets are generally classified within level 2 of the valuation hierarchy.
Valuation of Mortgage Loan Receivable:The mortgage loan receivable is stated at fair value. The mortgage loan receivable is valued at least quarterly based on market factors, such as market interest rates and spreads for comparable loans, the performance of the underlying collateral, and the credit quality of the counterparty. The Account’s mortgage loan receivable is classified within level 3 of the valuation hierarchy.
Valuation of Mortgage Loans Payable:Mortgage loans payable are stated at fair value. The estimated fair value of mortgage loans payable is based on the amount at which the liability could be transferred to a third party exclusive of transaction costs. Mortgage loans payable are valued at least quarterly based on market factors, such as market interest rates and spreads for comparable loans, the performance of the underlying collateral (such as the loan-to-value ratio and the cash flow of the underlying collateral), the maturity date of the loan, the return demands of the market, and the credit quality of the Account. The Account’s mortgage loans payable are generally classified within level 3 of the valuation hierarchy. Interest expense for mortgage loans payable is recorded on the accrual basis taking into account the outstanding principal and contractual interest rates.
Foreign currency transactions and translation:Portfolio investments and other assets and liabilities denominated in foreign currencies are translated into U.S. dollars at the exchange rates prevailing at the
10
end of the period. Purchases and sales of securities, income receipts and expense payments made in foreign currencies are translated into U.S. dollars at the exchange rates prevailing on the respective dates of the transactions. The effect of any changes in foreign currency exchange rates on portfolio investments and mortgage loans payable is included in net realized and unrealized gains and losses on investments and mortgage loans payable. Net realized gains and losses on foreign currency transactions include currency gains and losses between the accrual and receipt dates of portfolio investment income and between the trade and settlement dates of portfolio investment transactions and, when applicable, include maturities of forward foreign currency contracts.
Accumulation and Annuity Funds:The Accumulation Fund represents the net assets attributable to participants in the accumulation phase of their investment (“Accumulation Fund”). The Annuity Fund represents the net assets attributable to the participants currently receiving annuity payments (“Annuity Fund”). The net increase or decrease in net assets from investment operations is apportioned between the accounts based upon their relative daily net asset values. Once an Account participant begins receiving lifetime annuity income benefits, monthly payment levels cannot be reduced as a result of the Account’s adverse mortality experience. In addition, the contracts pursuant to which the Account is offered are required to stipulate the maximum expense charge for all Account level expenses that can be assessed, which is equal to 2.50% of average net assets per year. The Account pays a fee to TIAA to assume these mortality and expense risks.
Accounting for Investments:Real estate transactions are accounted for as of the date on which the purchase or sale transactions for the real estate properties close (settlement date). The Account recognizes a realized gain on the sale of a real estate property to the extent that the contract sales price exceeds the cost-to-date of the property being sold. A realized loss occurs when the cost-to-date exceeds the sales price. Any accumulated unrealized gains and losses are reversed in the calculation of realized gains and losses.
Rent from real estate properties consists of all amounts earned under tenant operating leases, including base rent, recoveries of real estate taxes and other expenses and charges for miscellaneous services provided to tenants. Rental income is recognized in accordance with the billing terms of the lease agreements. The Account bears the direct expenses of the real estate properties owned. These expenses include, but are not limited to, fees to local property management companies, property taxes, utilities, maintenance, repairs, insurance, and other operating and administrative costs. An estimate of the net operating income earned from each real estate property is accrued by the Account on a daily basis and such estimates are adjusted when actual operating results are determined.
The Account has limited ownership interests in various private real estate funds (limited partnerships and one limited liability corporation) and a private real estate investment trust (collectively, the “limited partnerships”). The Account records its contributions as increases to the investments, and distributions from the investments are treated as either income or return of capital, as determined by the management of the limited partnerships. Unrealized gains and losses are calculated and recorded when the financial statements of the limited partnerships are received by the Account; however as circumstances warrant, prior to the receipt of financial statements of the limited partnership, the Account will estimate the value of its interests in good faith and will from time to time seek input from the issuer or the sponsor of the investment vehicle. Changes in value based on such estimates are recorded by the Account as unrealized gains and losses.
Income from real estate joint ventures is recorded based on the Account’s proportional interest of the income distributed by the joint venture. Income earned by the joint venture, but not yet distributed to the Account by the joint venture investment, is recorded as unrealized gains and losses on real estate joint ventures.
Transactions in marketable securities are accounted for as of the date the securities are purchased or sold (trade date). Interest income is recorded as earned. Dividend income is recorded on the ex-dividend date or as soon as the Account is informed of the dividend. Realized gains and losses on securities transactions are accounted for on the specific identification method.
The Account’s net assets as of the close of each valuation day are valued by taking the sum of:
|
• | | | | the value of the Account’s cash, cash equivalents, and investments in short-term and other debt instruments; |
|
• | | | | the value of the Account’s other securities and other assets; |
11
|
• | | | | the value of the individual real properties (based on the most recent valuation of that property) and other real estate-related investments owned by the Account; |
|
• | | | | an estimate of the net operating income accrued by the Account from its properties, other real estate-related investments and non real estate-related investments (including short-term marketable securities); and |
|
• | | | | actual net operating income received from the Account’s properties, other real estate-related investments and non real estate-related investments (only to the extent any such item of income differs from the estimated income accrued for on such investments). |
and then reducing the sum by the Account’s liabilities, including the daily investment management fee and certain other expenses attributable to operating the Account.
After the end of every quarter, the Account reconciles the amount of expenses deducted from the Account (which is established in order to approximate the costs that the Account will incur) with the expenses the Account actually incurred. If there is a difference, the Account adds it to or deducts it from the Account in equal daily installments over the remaining days of the following quarter. Material differences may be repaid in the current calendar quarter. The Account’s at-cost deductions are based on projections of Account assets and overall expenses, and the size of any adjusting payments will be directly affected by the difference between management’s projections and the Account’s actual assets or expenses.
Cash:The Account maintains cash balances in bank deposit accounts which, at times, exceed federally insured limits. The Account’s management monitors these balances to mitigate the exposure of risk due to concentration and has not experienced any losses from such concentration.
Federal Income Taxes:Based on provisions of the Internal Revenue Code, Section 817, the Account is taxed as a segregated asset account of TIAA and as such, the Account should incur no material federal income tax attributable to the net investment activity of the Account.
Due to/from Investment Advisor:Due to/from investment advisor represents amounts that were paid or received by TIAA on behalf of the Account. Amounts generally are paid or received by the Account within one or two business days and no interest is charged on these amounts.
Reclassifications:Certain prior period amounts have been reclassified to conform to the current presentation. These reclassifications did not affect the total assets, total net assets or net increase in net assets previously reported.
Note 2—Management Agreements and Arrangements
Investment advisory services for the Account are provided by TIAA employees, under the direction of the Board and its Investment Committee, pursuant to investment management procedures adopted by TIAA for the Account. TIAA’s investment management decisions for the Account are subject to review by the Account’s independent fiduciary. TIAA also provides all portfolio accounting and related services for the Account.
Effective January 1, 2008, the Account entered into theDistribution Agreement for the Contracts Funded by the TIAA Real Estate Account(the “Distribution Agreement”), dated January 1, 2008, by and among TIAA, for itself and on behalf of the Account, and TIAA-CREF Individual and Institutional Services, LLC (“Services”), a wholly- owned subsidiary of TIAA, a registered broker-dealer and a member of the Financial Industry Regulatory Authority. Pursuant to the Distribution Agreement, Services performs distribution services for the Account which include, among other things, (i) distribution of annuity contracts issued by TIAA and funded by the Account, (ii) advising existing annuity contract owners in connection with their accumulations and (iii) helping employers implement and manage retirement plans. Also effective January 1, 2008, TIAA performs administrative functions for the Account, which include, among other things, (i) computing the Account’s daily unit value, (ii) maintaining accounting records and performing accounting services, (iii) receiving and allocating premiums, (iv) calculating and making annuity payments, (v) processing withdrawal requests, (vi) providing regulatory compliance and reporting services, (vii) maintaining the Account’s records of contract ownership and (viii) otherwise assisting generally in all aspects of the Account’s operations. Both distribution services (pursuant to the Distribution Agreement) and administrative services are provided to the Account by Services and TIAA, as applicable, on an at cost basis.
12
The Distribution Agreement is terminable by either party upon 60 days written notice and terminates automatically upon any assignment thereof.
TIAA and Services provide their services at cost. TIAA and Services receive payments from the Account on a daily basis according to formulas established each year and adjusted periodically with the objective of keeping the payments as close as possible to the Account’s expenses actually incurred. Any differences between actual expenses and the amounts paid by the Account are adjusted quarterly.
TIAA also provides a liquidity guarantee to the Account, for a fee, to ensure that sufficient funds are available to meet participant transfer and cash withdrawal requests in the event that the Account’s cash flows and liquid investments are insufficient to fund such requests. TIAA ensures sufficient funds are available for such transfer and withdrawal requests by purchasing accumulation units of the Account. See Note 3—Related Party Transactions below.
To the extent TIAA owns accumulation units issued pursuant to the liquidity guarantee, the independent fiduciary monitors and oversees, among other things, TIAA’s ownership interest in the Account and may require TIAA to eventually redeem some of its units, particularly when the Account has uninvested cash or liquid investments available. TIAA also receives a fee for assuming certain mortality and expense risks.
The expenses for the services noted above that are provided to the Account by TIAA and Services are identified in the accompanying Statements of Operations and are reflected in Note 8—Condensed Financial Information.
Note 3—Related Party Transactions
Pursuant to its existing liquidity guarantee obligation, as of September 30, 2009, the TIAA General Account owned 4.7 million accumulation units (which are generally referred to as “Liquidity Units”) issued by the Account. Since December 2008 and through September 30, 2009, TIAA has paid an aggregate of $1.2 billion to purchase these Liquidity Units in multiple transactions (approximately $1.1 billion since the beginning of 2009).
In accordance with this liquidity guarantee obligation, TIAA guarantees that all participants in the Account may redeem their accumulation units at their accumulation unit value next determined after their transfer or cash withdrawal request is received in good order. Liquidity Units owned by TIAA are valued in the same manner as accumulation units owned by the Account’s participants. Management believes that TIAA has the ability to meet its obligations under the liquidity guarantee.
As discussed in the Account’s prospectus and in accordance with a prohibited transaction exemption from the U.S. Department of Labor (PTE 96-76), the Account’s independent fiduciary, Real Estate Research Corporation, has certain responsibilities with respect to the Account that it has undertaken or is currently undertaking with respect to TIAA’s purchase of Liquidity Units, including among other things, reviewing the purchase and redemption of Liquidity Units by TIAA to ensure the Account uses the correct unit values. In addition, as set forth in PTE 96-76, the independent fiduciary’s responsibilities include:
|
• | | | | establishing the percentage of total accumulation units that TIAA’s ownership should not exceed (the “trigger point”) and creating a method for changing the trigger point; |
|
• | | | | approving any adjustment of TIAA’s ownership interest in the Account and, in its discretion, requiring an adjustment if TIAA’s ownership of Liquidity Units reaches the trigger point; and |
|
• | | | | once the trigger point has been reached, participating in any program to reduce TIAA’s ownership in the Account by utilizing cash flow or liquid investments in the Account, or by utilizing the proceeds from asset sales. The independent fiduciary’s role in participating in any such asset sales program would include (i) participating in the selection of properties for sale, (ii) providing sales guidelines and (iii) approving those sales if, in the independent fiduciary’s opinion, such sales are desirable to reduce TIAA’s ownership of Liquidity Units. |
The independent fiduciary, which has the right to adjust the trigger point, has established the trigger point at 45% of the outstanding accumulation units and it will continue to monitor TIAA’s ownership interest in the Account and provide further recommendations as necessary. As of September 30, 2009, TIAA owned 11.8% of the outstanding accumulation units of the Account.
13
From October 1, 2009 through November 13, 2009, pursuant to this liquidity guarantee obligation, TIAA has not made any additional purchases of Liquidity Units.
As discussed in Note 2—Management Agreements and Arrangements, TIAA and Services provide services to the Account on an at cost basis. See Note 8—Condensed Financial Information for details of the expense charge and expense ratio.
Note 4—Credit Risk Concentrations
Concentrations of credit risk arise when a number of properties or tenants are located in a similar geographic region such that the economic conditions of that region could impact tenants’ obligations to meet their contractual obligations or cause the values of individual properties to decline. The Account has no significant concentrations of tenants as no single tenant has annual contract rent that makes up more than 2% of the Rental Income of the Account.
The substantial majority of the Account’s wholly-owned real estate investments and investments in joint ventures are located in the United States. The following table represents the diversification of the Account’s portfolio by region and property type:
Diversification by Fair Value(1)
| | | | | | | | | | | | |
| | East | | West | | South | | Midwest | | Foreign(2) | | Total |
Office | | | | 22.3 | % | | | | | 18.8 | % | | | | | 12.7 | % | | | | | 1.1 | % | | | | | 2.4 | % | | | | | 57.3 | % | |
Apartment | | | | 2.2 | % | | | | | 6.1 | % | | | | | 5.3 | % | | | | | 0.0 | % | | | | | 0.0 | % | | | | | 13.6 | % | |
Industrial | | | | 1.7 | % | | | | | 6.2 | % | | | | | 4.0 | % | | | | | 1.3 | % | | | | | 0.0 | % | | | | | 13.2 | % | |
Retail | | | | 3.4 | % | | | | | 0.8 | % | | | | | 8.3 | % | | | | | 0.5 | % | | | | | 2.2 | % | | | | | 15.2 | % | |
Storage(3) | | | | 0.2 | % | | | | | 0.2 | % | | | | | 0.2 | % | | | | | 0.1 | % | | | | | 0.0 | % | | | | | 0.7 | % | |
| | | | | | | | | | | | |
Total | | | | 29.8 | % | | | | | 32.1 | % | | | | | 30.5 | % | | | | | 3.0 | % | | | | | 4.6 | % | | | | | 100.0 | % | |
| | | | | | | | | | | | |
|
(1) | | | | Fair values for wholly-owned properties are reflected gross of any debt, while fair values for joint venture investments are reflected net of any debt. |
|
(2) | | | | Represents real estate investments in the United Kingdom and France. |
|
(3) | | | | Represents a portfolio of storage facilities. |
Properties in the “East” region are located in: CT, DC, DE, KY, MA, MD, ME, NC, NH, NJ, NY, PA, RI, SC, VA, VT, WV
Properties in the “West” region are located in: AK, AZ, CA, CO, HI, ID, MT, NM, NV, OR, UT, WA, WY
Properties in the “South” region are located in: AL, AR, FL, GA, LA, MS, OK, TN, TX
Properties in the “Midwest” region are located in: IA, IL, IN, KS, MI, MN, MO, ND, NE, OH, SD, WI
Note 5—Assets and Liabilities Measured at Fair Value on a Recurring Basis
The following tables show the major categories of assets and liabilities measured at fair value on a recurring basis as of September 30, 2009 and December 31, 2008, using unadjusted quoted prices in active markets for identical assets (Level 1); significant other observable inputs (Level 2); and significant unobservable inputs (Level 3) (in thousands):
14
| | | | | | | | |
Description | | Level 1:
Quoted
Prices in
Active Markets
for Identical
Assets | | Level 2:
Significant
Other
Observable
Inputs | | Level 3:
Significant
Unobservable
Inputs | | Total at
September 30,
2009 |
Real estate properties | | | $ | | — | | | | $ | | — | | | | $ | | 8,128,127 | | | | $ | | 8,128,127 | |
Real Eestate joint ventures and limited partnerships | | | | — | | | | | — | | | | | 1,624,000 | | | | | 1,624,000 | |
Marketable securities—other | | | | — | | | | | 393,275 | | | | | — | | | | | 393,275 | |
Mortgage loan receivable | | | | — | | | | | — | | | | | 68,965 | | | | | 68,965 | |
| | | | | | | | |
Total Investments at September 30, 2009 | | | $ | | — | | | | $ | | 393,275 | | | | $ | | 9,821,092 | | | | $ | | 10,214,367 | |
| | | | | | | | |
Mortgage loans payable | | | $ | | — | | | | $ | | — | | | | $ | | (1,850,340 | ) | | | | $ | | (1,850,340 | ) | |
| | | | | | | | |
| | | | | | | | |
Description | | Level 1:
Quoted
Prices in
Active Markets
for Identical
Assets | | Level 2:
Significant
Other
Observable
Inputs | | Level 3:
Significant
Unobservable
Inputs | | Total at
December 31,
2008 |
Real estate properties | | | $ | | — | | | | $ | | — | | | | $ | | 10,305,040 | | | | $ | | 10,305,040 | |
Real Eestate joint ventures and limited partnerships | | | | — | | | | | — | | | | | 2,463,196 | | | | | 2,463,196 | |
Marketable securities—other | | | | — | | | | | 511,711 | | | | | — | | | | | 511,711 | |
Mortgage loan receivable | | | | — | | | | | — | | | | | 71,767 | | | | | 71,767 | |
| | | | | | | | |
Total Investments at December 31, 2008 | | | $ | | — | | | | $ | | 511,711 | | | | $ | | 12,840,003 | | | | $ | | 13,351,714 | |
| | | | | | | | |
Mortgage loans payable | | | $ | | — | | | | $ | | — | | | | $ | | (1,830,040 | ) | | | | $ | | (1,830,040 | ) | |
| | | | | | | | |
The following tables show the reconciliation of the beginning and ending balances for assets and liabilities measured at fair value on a recurring basis using significant unobservable inputs (Level 3) during the three and nine months ended September 30, 2009 and September 30, 2008 (in thousands):
| | | | | | | | | | |
| | Real Estate
Properties | | Real Estate
Joint Ventures
and Limited
Partnerships | | Mortgage
Loan
Receivable | | Total
Level 3
Investments | | Mortgage
Loans
Payable |
For the three months ended
September 30, 2009: | | | | | | | | | | |
Beginning balance July 1, 2009 | | | $ | | 8,779,353 | | | | $ | | 1,762,729 | | | | $ | | 68,279 | | | | $ | | 10,610,361 | | | | $ | | (1,843,707 | ) | |
Total realized and unrealized gains (losses) included in changes in net assets | | | | (659,967 | ) | | | | | (169,738 | ) | | | | | 686 | | | | | (829,019 | ) | | | | | (7,436 | ) | |
Purchases, issuances, and settlements(1) | | | | 8,741 | | | | | 31,009 | | | | | — | | | | | 39,750 | | | | | 803 | |
| | | | | | | | | | |
Ending balance September 30, 2009 | | | $ | | 8,128,127 | | | | $ | | 1,624,000 | | | | $ | | 68,965 | | | | $ | | 9,821,092 | | | | $ | | (1,850,340 | ) | |
| | | | | | | | | | |
For the nine months ended
September 30, 2009: | | | | | | | | | | |
Beginning balance January 1, 2009 | | | $ | | 10,305,040 | | | | $ | | 2,463,196 | | | | $ | | 71,767 | | | | $ | | 12,840,003 | | | | $ | | (1,830,040 | ) | |
Total realized and unrealized gains (losses) included in changes in net assets | | | | (2,178,692 | ) | | | | | (872,821 | ) | | | | | (2,802 | ) | | | | | (3,054,315 | ) | | | | | (22,758 | ) | |
Purchases, issuances, and settlements(1) | | | | 1,779 | | | | | 33,625 | | | | | — | | | | | 35,404 | | | | | 2,458 | |
| | | | | | | | | | |
Ending balance September 30, 2009 | | | $ | | 8,128,127 | | | | $ | | 1,624,000 | | | | $ | | 68,965 | | | | $ | | 9,821,092 | | | | $ | | (1,850,340 | ) | |
| | | | | | | | | | |
15
| | | | | | | | | | |
| | Real Estate
Properties | | Real Estate
Joint Ventures
and Limited
Partnerships | | Mortgage
Loan
Receivable | | Total
Level 3
Investments | | Mortgage
Loans
Payable |
For the three months ended
September 30, 2008: | | | | | | | | | | |
Beginning balance July 1, 2008 | | | $ | | 12,159,259 | | | | $ | | 3,064,686 | | | | $ | | 71,721 | | | | $ | | 15,295,666 | | | | $ | | (1,387,376 | ) | |
Total realized and unrealized gains (losses) included in changes in net assets | | | | (396,103 | ) | | | | | (100,120 | ) | | | | | (293 | ) | | | | | (496,516 | ) | | | | | 34,270 | |
Purchases, issuances, and settlements(1) | | | | 20,785 | | | | | (3,920 | ) | | | | | — | | | | | 16,865 | | | | | (344,400 | ) | |
| | | | | | | | | | |
Ending balance September 30, 2008 | | | $ | | 11,783,941 | | | | $ | | 2,960,646 | | | | $ | | 71,428 | | | | $ | | 14,816,015 | | | | $ | | (1,697,506 | ) | |
| | | | | | | | | | |
For the nine months ended
September 30, 2008: | | | | | | | | | | |
Beginning balance January 1, 2008 | | | $ | | 11,983,715 | | | | $ | | 3,158,870 | | | | $ | | 72,520 | | | | $ | | 15,215,105 | | | | $ | | (1,392,093 | ) | |
Total realized and unrealized gains (losses) included in changes in net assets | | | | (440,353 | ) | | | | | (193,397 | ) | | | | | (1,092 | ) | | | | | (634,842 | ) | | | | | 38,624 | |
Purchases, issuances, and settlements(1) | | | | 240,579 | | | | | (4,827 | ) | | | | | — | | | | | 235,752 | | | | | (344,037 | ) | |
| | | | | | | | | | |
Ending balance September 30, 2008 | | | $ | | 11,783,941 | | | | $ | | 2,960,646 | | | | $ | | 71,428 | | | | $ | | 14,816,015 | | | | $ | | (1,697,506 | ) | |
| | | | | | | | | | |
|
(1) | | | | This line includes the net of contributions, distributions, and accrued operating income for real estate joint ventures and limited partnerships as well as principal payments on mortgage loans payable. |
The amount of total gains (losses) included in changes in net assets attributable to the change in unrealized gains (losses) relating to investments and mortgage loans payable using significant unobservable inputs still held as of the reporting date is as follows (in thousands):
| | | | | | | | | | | | Real Estate
Properties | | Real Estate
Joint Ventures
and Limited
Partnerships | | Mortgage
Loan
Receivable | | Total
Level 3
Investments | | Mortgage
Loans
Payable |
For the three months ended
September 30, 2009 | | | $ | | (659,689 | ) | | | | $ | | (169,738 | ) | | | | $ | | 686 | | | | $ | | (828,741 | ) | | | | $ | | (7,436 | ) | |
| | | | | | | | | | |
For the nine months ended
September 30, 2009 | | | $ | | (2,178,153 | ) | | | | $ | | (872,821 | ) | | | | $ | | (2,802 | ) | | | | $ | | (3,053,776 | ) | | | | $ | | (22,758 | ) | |
| | | | | | | | | | |
| | | | | | | | | | |
| | Real Estate
Properties | | Real Estate
Joint Ventures
and Limited
Partnerships | | Mortgage
Loan
Receivable | | Total
Level 3
Investments | | Mortgage
Loans
Payable |
For the three months ended
September 30, 2008 | | | $ | | (395,665 | ) | | | | $ | | (100,120 | ) | | | | $ | | (293 | ) | | | | $ | | (496,078 | ) | | | | $ | | 34,270 | |
| | | | | | | | | | |
For the nine months ended
September 30, 2008 | | | $ | | (438,887 | ) | | | | $ | | (193,380 | ) | | | | $ | | (1,092 | ) | | | | $ | | (633,359 | ) | | | | $ | | 38,624 | |
| | | | | | | | | | |
Note 6—Investments in Joint Ventures and Limited Partnerships
The Account owns interests in several real estate properties through joint ventures and receives distributions and allocations of profits and losses from the joint ventures based on the Account’s ownership interest percentages. Several of these joint ventures have mortgage loans payable on the properties owned. At September 30, 2009, the Account held 12 investments in joint ventures with non-controlling ownership interest percentages that ranged from 50% to 85%. Certain joint ventures and limited partnerships are subject to adjusted distribution percentages when earnings in the investment reach a pre-determined threshold. The Account’s equity in the joint ventures at September 30, 2009 and December 31, 2008 was $1.4 billion and $2.2 billion, respectively.
16
The Account’s allocated portion of the mortgage loans payable within the joint venture investments at fair value was approximately $1.9 billion at September 30, 2009 and December 31, 2008, respectively. The Account’s interest in the outstanding principal of the mortgage loans payable on joint ventures was approximately $2.0 billion at September 30, 2009 and December 31, 2008, respectively. A condensed summary of the financial position and results of operations of the joint ventures is shown below (in thousands).
| | | | | | |
| | September 30, 2009 | | September 30, 2008 | | December 31, 2008 |
| | (Unaudited) | | (Unaudited) | | |
Assets | | | | | | |
Real estate properties, at fair value | | | $ | | 4,838,397 | | | | $ | | 6,695,150 | | | | $ | | 5,947,028 | |
Other assets | | | | 93,054 | | | | | 95,963 | | | | | 95,411 | |
| | | | | | |
Total assets | | | $ | | 4,931,451 | | | | $ | | 6,791,113 | | | | $ | | 6,042,439 | |
| | | | | | |
Liabilities and Equity | | | | | | |
Mortgage loans payable, at fair value | | | $ | | 2,579,618 | | | | $ | | 2,628,101 | | | | $ | | 2,571,843 | |
Other liabilities | | | | 69,247 | | | | | 72,304 | | | | | 58,378 | |
| | | | | | |
Total liabilities | | | | 2,648,865 | | | | | 2,700,405 | | | | | 2,630,221 | |
Equity | | | | 2,282,586 | | | | | 4,090,708 | | | | | 3,412,218 | |
| | | | | | |
Total liabilities and equity | | | $ | | 4,931,451 | | | | $ | | 6,791,113 | | | | $ | | 6,042,439 | |
| | | | | | |
| | | | | | |
| | For the Nine
Months Ended
September 30, 2009 | | For the Nine
Months Ended
September 30, 2008 | | Year Ended
December 31, 2008 |
| | (Unaudited) | | (Unaudited) | | |
Operating Revenues and Expenses | | | | | | |
Revenues | | | $ | | 401,874 | | | | $ | | 419,144 | | | | $ | | 562,031 | |
Expenses | | | | 241,602 | | | | | 250,066 | | | | | 333,700 | |
| | | | | | |
Excess of revenues over expenses | | | $ | | 160,272 | | | | $ | | 169,078 | | | | $ | | 228,331 | |
| | | | | | |
Management of the Account monitors the financial position of the Account’s joint venture partners. To the extent that Management of the Account determines that a joint venture partner has financial or liquidity concerns, Management will evaluate all actions and remedies available to the Account under the applicable joint venture agreement to minimize any potential adverse implications to the Account.
The Account invests in limited partnerships that own real estate properties and other real estate related assets and receives distributions from the limited partnerships based on the Account’s ownership interest percentages. At September 30, 2009, the Account held five limited partnership investments and one private real estate equity investment trust (all of which featured non-controlling ownership interests) with ownership interest percentages that ranged from 5.27% to 18.46%. The Account’s ownership interest in limited partnerships was $216.2 million and $286.5 million at September 30, 2009 and December 31, 2008, respectively.
17
Note 7—Mortgage Loans Payable
At September 30, 2009, the Account had outstanding mortgage loans payable secured by the following properties (in thousands):
| | | | | | |
Property | | Interest Rate and
Payment Frequency(e) | | Principal
Amounts as of
September 30, 2009 | | Maturity |
| | | | (Unaudited) | | |
701 Brickell(a) | | 2.25% paid monthly(f) | | | $ | | 126,000 | | | | | October 1, 2010 | |
Four Oaks Place(b) | | 2.25% paid monthly(f) | | | | 200,000 | | | | | October 1, 2010 | |
Ontario Industrial Portfolio(c) | | 7.42% paid monthly | | | | 8,529 | | | | | May 1, 2011 | |
1 & 7 Westferry Circus(d) | | 5.40% paid quarterly | | | | 214,674 | | | | | November 15, 2012 | |
Reserve at Sugarloaf(c) | | 5.49% paid monthly | | | | 25,244 | | | | | June 1, 2013 | |
South Frisco Village | | 5.85% paid monthly | | | | 26,251 | | | | | June 1, 2013 | |
Fourth & Madison | | 6.40% paid monthly | | | | 145,000 | | | | | August 21, 2013 | |
1001 Pennsylvania Avenue | | 6.40% paid monthly | | | | 210,000 | | | | | August 21, 2013 | |
50 Fremont | | 6.40% paid monthly | | | | 135,000 | | | | | August 21, 2013 | |
Pacific Plaza(c) | | 5.55% paid monthly | | | | 8,622 | | | | | September 1, 2013 | |
Wilshire Rodeo Plaza | | 5.28% paid monthly | | | | 112,700 | | | | | April 11, 2014 | |
1401 H Street | | 5.97% paid monthly | | | | 115,000 | | | | | December 7, 2014 | |
Preston Sherry Plaza | | 5.85% paid monthly | | | | 23,500 | | | | | September 1, 2015 | |
The Colorado(c) | | 5.65% paid monthly | | | | 87,000 | | | | | November 1, 2015 | |
99 High Street | | 5.52% paid monthly | | | | 185,000 | | | | | November 11, 2015 | |
The Legacy at Westwood(c) | | 5.95% paid monthly | | | | 41,641 | | | | | December 1, 2015 | |
Regents Court(c) | | 5.76% paid monthly | | | | 35,580 | | | | | December 1, 2015 | |
The Caruth(c) | | 5.71% paid monthly | | | | 41,622 | | | | | December 1, 2015 | |
Lincoln Centre | | 5.51% paid monthly | | | | 153,000 | | | | | February 1, 2016 | |
Publix at Weston Commons | | 5.08% paid monthly | | | | 35,000 | | | | | January 1, 2036 | |
| | | | | | |
Total Principal Outstanding | | | | | | 1,929,363 | | | |
Fair Value Adjustment | | | | | | (79,023 | ) | | | |
| | | | | | |
Total mortgage loans payable | | | | | $ | | 1,850,340 | | | |
| | | | | | |
|
(a) | | | | The Account entered into a debt agreement that included an interest rate cap with its lender to reduce its exposure to the variability of changes in interest rates until maturity of the underlying debt. The interest rate on the entire $126 million mortgage is capped at 6.50%. |
|
(b) | | | | The Account entered into a debt agreement that included an interest rate cap with its lender to reduce its exposure to the variability of changes in interest rates until maturity of the underlying debt. The interest rate on the entire $200 million mortgage is capped at 6.50%. |
|
(c) | | | | The mortgage is adjusted monthly for principal payments. |
|
(d) | | | | The mortgage is denominated in British pounds and the principal amount has been converted to U.S. dollars using the exchange rate as of September 30, 2009. The quarterly payments are interest only, with a balloon payment at maturity. The interest rate is fixed. The cumulative foreign currency translation adjustment (since inception) was an unrealized gain of $18 million. |
|
(e) | | | | Interest rates are fixed, unless stated otherwise. |
|
(f) | | | | The interest rate for these mortgages is a variable rate at the one month London Interbank Offered Rate (“LIBOR”) plus 200 basis points and is reset monthly. |
18
Note 8—Condensed Financial Information
Selected condensed financial information for an Accumulation Unit of the Account is presented below.
| | | | | | | | | | |
| | For the
Nine Months
Ended
September 30,
2009 | | Years Ended December 31, |
| | 2008 | | 2007 | | 2006 | | 2005 |
| | (Unaudited) | | | | | | | | |
Per Accumulation Unit data: | | | | | | | | | | |
Rental income | | | $ | | 17.047 | | | | $ | | 18.794 | | | | $ | | 17.975 | | | | $ | | 16.717 | | | | $ | | 15.604 | |
Real estate property level expenses and taxes | | | | 8.440 | | | | | 9.190 | | | | | 8.338 | | | | | 7.807 | | | | | 7.026 | |
| | | | | | | | | | |
Real estate income, net | | | | 8.607 | | | | | 9.604 | | | | | 9.637 | | | | | 8.910 | | | | | 8.578 | |
Other income | | | | 2.294 | | | | | 3.808 | | | | | 4.289 | | | | | 3.931 | | | | | 3.602 | |
| | | | | | | | | | |
Total income | | | | 10.901 | | | | | 13.412 | | | | | 13.926 | | | | | 12.841 | | | | | 12.180 | |
Expense charges(1) | | | | 1.771 | | | | | 2.937 | | | | | 2.554 | | | | | 1.671 | | | | | 1.415 | |
| | | | | | | | | | |
Investment income, net | | | | 9.130 | | | | | 10.475 | | | | | 11.372 | | | | | 11.170 | | | | | 10.765 | |
Net realized and unrealized gain (loss) on investments and mortgage loans payable | | | | (72.730 | ) | | | | | (54.541 | ) | | | | | 26.389 | | | | | 22.530 | | | | | 18.744 | |
| | | | | | | | | | |
Net (decrease) increase in Accumulation Unit Value | | | | (63.600 | ) | | | | | (44.066 | ) | | | | | 37.761 | | | | | 33.700 | | | | | 29.509 | |
Accumulation Unit Value: | | | | | | | | | | |
Beginning of period | | | | 267.348 | | | | | 311.414 | | | | | 273.653 | | | | | 239.953 | | | | | 210.444 | |
| | | | | | | | | | |
End of period | | | $ | | 203.748 | | | | $ | | 267.348 | | | | $ | | 311.414 | | | | $ | | 273.653 | | | | $ | | 239.953 | |
| | | | | | | | | | |
Total return | | | | (23.79 | )% | | | | | (14.15 | )% | | | | | 13.80 | % | | | | | 14.04 | % | | | | | 14.02 | % | |
Ratios to Average net Assets: | | | | | | | | | | |
Expenses(1) | | | | 0.75 | % | | | | | 0.95 | % | | | | | 0.87 | % | | | | | 0.67 | % | | | | | 0.63 | % | |
Investment income, net | | | | 3.88 | % | | | | | 3.38 | % | | | | | 3.88 | % | | | | | 4.49 | % | | | | | 4.82 | % | |
Portfolio turnover rate: | | | | | | | | | | |
Real estate properties | | | | 0.29 | % | | | | | 0.64 | % | | | | | 5.59 | % | | | | | 3.62 | % | | | | | 6.72 | % | |
Marketable securities | | | | — | | | | | 25.67 | % | | | | | 13.03 | % | | | | | 51.05 | % | | | | | 77.63 | % | |
Accumulation Units outstanding at end of period (in thousands): | | | | 39,858 | | | | | 41,542 | | | | | 55,106 | | | | | 50,146 | | | | | 42,623 | |
Net assets end of period (in thousands) | | | $ | | 8,387,643 | | | | $ | | 11,508,924 | | | | $ | | 17,660,537 | | | | $ | | 14,132,693 | | | | $ | | 10,548,711 | |
|
(1) | | | | Expense charges per Accumulation Unit and the Ratio of Expenses to Average net Assets reflect Account-level expenses and exclude real estate property level expenses which are included in net real estate income. If the real estate property level expenses were included, the expense charge per Accumulation Unit for the nine months ended September 30, 2009 would be $10.211 ($12.127, $10.892, $9.478, and $8.441, for the years ended December 31, 2008, 2007, 2006 and 2005, respectively), and the Ratio of Expenses to Average Net Assets for the nine months ended September 30, 2009 would be 4.34% (3.91%, 3.71%, 3.81% and 3.78% for the years ended December 31, 2008, 2007, 2006, and 2005, respectively). |
19
Note 9—Accumulation Units
Changes in the number of Accumulation Units outstanding were as follows (in thousands):
| | | | | | For the
Nine Months
Ended
September 30, 2009 | | For the Year Ended
December 31, 2008 |
| | (Unaudited) | | |
Outstanding: | | | | |
Beginning of period | | | | 41,542 | | | | | 55,106 | |
Credited for premiums | | | | 2,288 | | | | | 3,271 | |
Credited for Purchase of units by TIAA (see Note 3) | | | | 4,139 | | | | | 577 | |
Net units credited (cancelled) for transfers, net disbursements and amounts applied to the Annuity Fund | | | | (8,111 | ) | | | | | (17,412 | ) | |
| | | | |
End of period | | | | 39,858 | | | | | 41,542 | |
| | | | |
Note 10—Commitments and Subsequent Events
As of September 30, 2009, the Account had outstanding commitments to purchase interests in four limited partnerships. As of September 30, 2009, approximately $46.1 million remains to be funded under these commitments.
The Account is party to various claims and routine litigation arising in the ordinary course of business. Management of the Account does not believe that the results of any such claims or litigation, individually, or in the aggregate, will have a material effect on the Account’s business, financial position, or results of operations.
The Account has evaluated subsequent events through November 13, 2009, the date these financial statements were filed with the Securities and Exchange Commission.
During the normal course of business, the Account enters into discussions and agreements to purchase or sell real estate properties. On October 1, 2009, the Account sold an industrial investment portfolio in Monroe and Brunswick, New Jersey for a sales price of $25.5 million and realized a loss of approximately $17.1 million. On October 30, 2009, the Account completed a partial sale of an apartment investment portfolio in Chandler, Arizona for a sales price of $47.8 million and realized a loss of approximately $35.8 million. On November 5, 2009, the Account completed two partial sales of two apartment investment portfolios in Phoenix, Arizona for a combined sales price of $53.2 million and realized a loss of approximately $41.6 million.
Pursuant to the liquidity guarantee obligation, TIAA has made no additional purchases of Liquidity Units subsequent to September 30, 2009. See Note 3—Related Party Transactions for further discussion of these transactions.
Note 11—New Accounting Pronouncements
In June 2007, the Accounting Standards Executive Committee (“AcSEC”) of the American Institute of Certified Public Accountants (“AICPA”) issued a Statement of Position (“SOP”) which clarifies which entities are required to apply the provisions of the Investment Companies Audit and Accounting Guide (“Guide”) and provides guidance on accounting by parent companies and equity method investors for investments in investment companies. In February 2008, FASB indefinitely delayed the effective date of the SOP to allow time to consider significant issues related to the implementation of the SOP.
In February 2009, the Emerging Issues Task Force (“EITF”) added an issue to their agenda related to the application of the Investment Company Guide by Real Estate Investment Companies, which will be discussed at a future meeting. The FASB staff anticipates the creation of a Working Group to assist the EITF in addressing this issue. Management of the Account will continue to monitor FASB and EITF developments and will evaluate the financial reporting implications to the Account, as necessary.
20
In December 2007, FASB issued new accounting guidance on business combinations. The new guidance establishes principles and requirements for how the acquirer shall recognize and measure in its financial statements the identifiable assets acquired, liabilities assumed, any noncontrolling interest in the acquiree and goodwill acquired in a business combination or a gain from a bargain purchase. It is expected that more transactions will constitute a business under the new guidance. These revisions are effective for business combinations for which the acquisition date is on or after the beginning of the first annual reporting period beginning on or after December 15, 2008. The Account reports all investments in real estate at fair value and therefore does not account for the acquisition of real estate investments as a business combination.
In December 2007, FASB issued new accounting guidance that establishes and expands accounting and reporting standards for minority interests, which will be recharacterized as noncontrolling interests in a subsidiary and the accounting for the deconsolidation of a subsidiary. The revised reporting standards for noncontrolling interests in a subsidiary are effective for fiscal years beginning on or after December 15, 2008, and did not impact the financial position or results of operations of the Account.
In April 2009, FASB issued additional guidance for determining fair value when the volume of activity for an asset or liability has significantly decreased. This additional guidance also provides directions on identifying circumstances that indicate a transaction is not orderly. This additional guidance is effective for periods ending after June 15, 2009 with early adoption permitted. The adoption of this guidance did not have a material impact to the financial position or results of operations of the Account.
In May 2009, FASB issued new accounting guidance that establishes and expands accounting and disclosure requirements of subsequent events. A reporting entity is required to disclose the date through which an entity has evaluated subsequent events and the basis for that date. The revised reporting standards are effective for interim and annual reporting periods ending after June 15, 2009. This adoption did not have a material impact on the financial statements or results of operations of the Account. The required disclosure of the date through which subsequent events has been evaluated is provided in Note 10 of the Notes to the Financial Statements.
In June 2009, the FASB issued Statement of Financial Accounting Standards No. 167, Amendments to FASB Interpretation No. 46(R), which amends guidance related to the identification of a variable interest entity, variable interests, the primary beneficiary, and expands required note disclosures to provide greater transparency to the users of financial statements. This standard is effective on January 1, 2010 and management of the Account is currently evaluating the impact of adopting this standard.
In June 2009, FASB Accounting Standards Codification (“Codification”) was established as the source of authoritative accounting principles to be applied with equal authority by nongovernmental entities in the preparation of financial statements in conformity with U.S. GAAP. Codification was effective for financial statements issued for reporting periods ending after September 15, 2009 and the related changes have been reflected in the September 30, 2009 financial statements and footnotes.
In August 2009, the FASB issued Accounting Standards Update (“ASU”) No. 2009-05, “Measuring Liabilities at Fair Value.” This ASU clarifies the application of certain valuation techniques in circumstances in which a quoted price in an active market for the identical liability is not available and clarifies that inputs to the valuation should not be adjusted when estimating the fair value of a liability in which contractual terms restrict transferability. This ASU becomes effective on October 1, 2009. The Account is evaluating the impact of adopting this ASU and anticipates that it will not have a significant impact to the Account’s financial position or results of operations.
In September 2009, the FASB issued ASU No. 2009-12, “Investments in Certain Entities That Calculate Net Asset Value per Share (or Its Equivalent).” This ASU permits, as a practical expedient, an investor the ability to estimate the fair value of an investment in certain entities on the basis of the net asset value per share of the investment (or its equivalent) determined as of the reporting entity’s measurement date. The investee must satisfy specific requirements before the investor is permitted to utilize this practical expedient as a method of valuation. The amendments in this ASU are effective for interim and annual periods ending after December 15, 2009. Early application is permitted. The Account is currently evaluating the impact of adopting this ASU and anticipates that it will not have a significant impact to the Account’s financial position or results of operations.
21
TIAA REAL ESTATE ACCOUNT
STATEMENT OF INVESTMENTS
September 30, 2009 and December 31, 2008
(Dollar values shown in thousands)
REAL ESTATE PROPERTIES—79.57% and 77.18%
| | | | | | |
Location/Description | | Type | | Value |
| | 2009 | | 2008 |
| | | | (Unaudited) | | |
Alabama: | | | | | | |
Inverness Center | | Office | | | $ | | 90,026 | | | | $ | | 102,891 | |
Arizona: | | | | | | |
Camelback Center | | Office | | | | 48,200 | | | | | 58,000 | |
Kierland Apartment Portfolio | | Apartments | | | | 112,536 | | | | | 146,830 | |
Phoenix Apartment Portfolio | | Apartments | | | | 84,642 | | | | | 129,244 | |
California: | | | | | | |
3 Hutton Centre Drive | | Office | | | | 31,787 | | | | | 45,710 | |
50 Fremont Street | | Office | | | | 303,209 | (1) | | | | | 386,600 | (1) | |
88 Kearny Street | | Office | | | | 66,570 | | | | | 99,815 | |
275 Battery Street | | Office | | | | 167,128 | | | | | 220,025 | |
980 9th Street and 1010 8th Street | | Office | | | | 132,204 | | | | | 151,600 | |
Rancho Cucamonga Industrial Portfolio | | Industrial | | | | 57,170 | | | | | 102,300 | |
Capitol Place | | Office | | | | 42,052 | | | | | 50,000 | |
Centerside I | | Office | | | | 30,011 | | | | | 46,400 | |
Centre Pointe and Valley View | | Industrial | | | | 20,004 | | | | | 29,000 | |
Great West Industrial Portfolio | | Industrial | | | | 74,000 | | | | | 93,600 | |
Larkspur Courts | | Apartments | | | | 56,146 | | | | | 71,500 | |
Northern CA RA Industrial Portfolio | | Industrial | | | | 46,003 | | | | | 63,456 | |
Ontario Industrial Portfolio | | Industrial | | | | 177,000 | (1) | | | | | 278,000 | (1) | |
Pacific Plaza | | Office | | | | 68,806 | (1) | | | | | 104,970 | (1) | |
Regents Court | | Apartments | | | | 52,113 | (1) | | | | | 59,000 | (1) | |
Southern CA RA Industrial Portfolio | | Industrial | | | | 77,043 | | | | | 107,218 | |
The Legacy at Westwood | | Apartments | | | | 75,468 | (1) | | | | | 89,224 | (1) | |
Wellpoint | | Office | | | | 36,900 | | | | | 46,000 | |
Westcreek | | Apartments | | | | 23,935 | | | | | 31,500 | |
West Lake North Business Park | | Office | | | | 32,712 | | | | | 54,425 | |
Westwood Marketplace | | Retail | | | | 79,000 | | | | | 95,100 | |
Wilshire Rodeo Plaza | | Office | | | | 158,919 | (1) | | | | | 213,783 | (1) | |
Colorado: | | | | | | |
Palomino Park | | Apartments | | | | 145,022 | | | | | 173,000 | |
The Lodge at Willow Creek | | Apartments | | | | 33,127 | | | | | 40,000 | |
The Market at Southpark | | Retail | | | | — | | | | | 29,000 | |
Connecticut: | | | | | | |
Ten & Twenty Westport Road | | Office | | | | 136,557 | | | | | 174,400 | |
Florida: | | | | | | |
701 Brickell Avenue | | Office | | | | 228,775 | (1) | | | | | 255,000 | (1) | |
4200 West Cypress Street | | Office | | | | 25,011 | | | | | 41,568 | |
North 40 Office Complex | | Office | | | | 45,655 | | | | | 64,398 | |
Plantation Grove | | Retail | | | | 9,650 | | | | | 11,950 | |
Pointe on Tampa Bay | | Office | | | | 34,411 | | | | | 49,700 | |
Publix at Weston Commons | | Retail | | | | 45,200 | (1) | | | | | 50,987 | (1) | |
Quiet Waters at Coquina Lakes | | Apartments | | | | 20,843 | | | | | 21,810 | |
See notes to the financial statements.
22
TIAA REAL ESTATE ACCOUNT
STATEMENT OF INVESTMENTS
September 30, 2009 and December 31, 2008
(Dollar values shown in thousands)
| | | | | | |
Location/Description | | Type | | Value |
| | 2009 | | 2008 |
| | | | (Unaudited) | | |
Florida: (continued) | | | | | | |
Seneca Industrial Park | | Industrial | | | $ | | 62,828 | | | | $ | | 101,296 | |
South Florida Apartment Portfolio | | Apartments | | | | 55,473 | | | | | 62,155 | |
Suncrest Village Shopping Center | | Retail | | | | 12,407 | | | | | 15,800 | |
The Fairways of Carolina | | Apartments | | | | 19,619 | | | | | 20,942 | |
Urban Centre | | Office | | | | 85,706 | | | | | 113,274 | |
France: | | | | | | |
Printemps de L’Homme | | Retail | | | | 213,208 | | | | | 247,621 | |
Georgia: | | | | | | |
Atlanta Industrial Portfolio | | Industrial | | | | 43,775 | | | | | 54,001 | |
Glenridge Walk | | Apartments | | | | 30,304 | | | | | 37,575 | |
Reserve at Sugarloaf | | Apartments | | | | 38,006 | (1) | | | | | 44,900 | (1) | |
Shawnee Ridge Industrial Portfolio | | Industrial | | | | 55,326 | | | | | 69,000 | |
Windsor at Lenox Park | | Apartments | | | | 48,636 | | | | | 57,550 | |
Illinois: | | | | | | |
Chicago Caleast Industrial Portfolio | | Industrial | | | | 48,444 | | | | | 63,932 | |
Chicago Industrial Portfolio | | Industrial | | | | 64,541 | | | | | 78,022 | |
Oak Brook Regency Towers | | Office | | | | 64,516 | | | | | 75,937 | |
Parkview Plaza | | Office | | | | 40,322 | | | | | 65,846 | |
Maryland: | | | | | | |
Broadlands Business Park | | Industrial | | | | 25,500 | | | | | 27,520 | |
GE Appliance East Coast Distribution Facility | | Industrial | | | | 32,000 | | | | | 40,500 | |
Massachusetts: | | | | | | |
99 High Street | | Office | | | | 247,711 | (1) | | | | | 320,107 | (1) | |
Needham Corporate Center | | Office | | | | 17,687 | | | | | 32,494 | |
Northeast RA Industrial Portfolio | | Industrial | | | | 28,400 | | | | | 30,794 | |
The Newbry | | Office | | | | 252,345 | | | | | 315,600 | |
Minnesota: | | | | | | |
Champlin Marketplace | | Retail | | | | 14,007 | | | | | 17,101 | |
Nevada: | | | | | | |
UPS Distribution Facility | | Industrial | | | | 7,200 | | | | | 12,100 | |
New Jersey: | | | | | | |
Konica Photo Imaging Headquarters | | Industrial | | | | 16,800 | | | | | 18,300 | |
Marketfair | | Retail | | | | 69,784 | | | | | 90,759 | |
Morris Corporate Center III | | Office | | | | 73,817 | | | | | 94,955 | |
NJ Caleast Industrial Portfolio | | Industrial | | | | 25,421 | | | | | 49,000 | |
Plainsboro Plaza | | Retail | | | | 25,750 | | | | | 33,500 | |
South River Road Industrial | | Industrial | | | | 30,649 | | | | | 43,872 | |
New York: | | | | | | |
780 Third Avenue | | Office | | | | 239,985 | | | | | 341,000 | |
The Colorado | | Apartments | | | | 112,146 | (1) | | | | | 153,006 | (1) | |
Pennsylvania: | | | | | | |
Lincoln Woods | | Apartments | | | | 29,348 | | | | | 32,025 | |
See notes to the financial statements.
23
TIAA REAL ESTATE ACCOUNT
STATEMENT OF INVESTMENTS
September 30, 2009 and December 31, 2008
(Dollar values shown in thousands)
| | | | | | |
Location/Description | | Type | | Value |
| | 2009 | | 2008 |
| | | | (Unaudited) | | |
Tennessee: | | | | | | |
Airways Distribution Center | | Industrial | | | $ | | 15,000 | | | | $ | | 17,400 | |
Summit Distribution Center | | Industrial | | | | 14,600 | | | | | 22,700 | |
Texas: | | | | | | |
Dallas Industrial Portfolio | | Industrial | | | | 125,000 | | | | | 141,328 | |
Four Oaks Place | | Office | | | | 406,623 | (1) | | | | | 438,000 | (1) | |
Houston Apartment Portfolio | | Apartments | | | | 212,517 | | | | | 267,468 | |
Lincoln Centre | | Office | | | | 206,962 | (1) | | | | | 269,000 | (1) | |
Park Place on Turtle Creek | | Office | | | | 25,552 | | | | | 40,094 | |
Pinnacle Industrial Portfolio | | Industrial | | | | 34,045 | | | | | 38,733 | |
Preston Sherry Plaza | | Office | | | | 33,506 | (1) | | | | | 38,400 | (1) | |
South Frisco Village | | Retail | | | | 26,500 | (1) | | | | | 36,300 | (1) | |
The Caruth | | Apartments | | | | 52,123 | (1) | | | | | 61,349 | (1) | |
The Maroneal | | Apartments | | | | 31,541 | | | | | 38,456 | |
United Kingdom: | | | | | | |
1 & 7 Westferry Circus | | Office | | | | 227,464 | (1) | | | | | 232,802 | (1) | |
Virginia: | | | | | | |
8270 Greensboro Drive | | Office | | | | 34,500 | | | | | 57,000 | |
Ashford Meadows Apartments | | Apartments | | | | 70,820 | | | | | 79,319 | |
One Virginia Square | | Office | | | | 39,702 | | | | | 51,797 | |
The Ellipse at Ballston | | Office | | | | 67,347 | | | | | 84,018 | |
Washington: | | | | | | |
Creeksides at Centerpoint | | Office | | | | 20,907 | | | | | 27,200 | |
Fourth and Madison | | Office | | | | 306,087 | (1) | | | | | 407,500 | (1) | |
Millennium Corporate Park | | Office | | | | 125,500 | | | | | 162,193 | |
Northwest RA Industrial Portfolio | | Industrial | | | | 18,400 | | | | | 24,100 | |
Rainier Corporate Park | | Industrial | | | | 66,033 | | | | | 81,035 | |
Regal Logistics Campus | | Industrial | | | | 51,400 | | | | | 67,000 | |
Washington DC: | | | | | | |
1001 Pennsylvania Avenue | | Office | | | | 478,693 | (1) | | | | | 550,757 | (1) | |
1401 H Street, NW | | Office | | | | 143,891 | (1) | | | | | 194,600 | (1) | |
1900 K Street, NW | | Office | | | | 223,000 | | | | | 245,000 | |
Mazza Gallerie | | Retail | | | | 70,918 | | | | | 83,003 | |
| | | | | | |
TOTAL REAL ESTATE PROPERTIES | | | | | | |
(Cost $10,003,893 and $10,031,744) | | | | | | 8,128,127 | | | | | 10,305,040 | |
| | | | | | |
See notes to the financial statements.
24
TIAA REAL ESTATE ACCOUNT
STATEMENT OF INVESTMENTS
September 30, 2009 and December 31, 2008
(Dollar values shown in thousands)
OTHER REAL ESTATE-RELATED INVESTMENTS—15.90% and 18.45%
REAL ESTATE JOINT VENTURES—13.78% and 16.30%
| | | | |
Location/Description | | Value |
| | 2009 | | 2008 |
| | (Unaudited) | | |
California: | | | | |
CA—Colorado Center LP | | | | |
Yahoo Center (50% Account Interest) | | | $ | | 149,257 | (2) | | | | $ | | 239,748 | (2) | |
CA—Treat Towers LP | | | | |
Treat Towers (75% Account Interest) | | | | 68,792 | | | | | 105,074 | |
Florida: | | | | |
Florida Mall Associates, Ltd | | | | |
The Florida Mall (50% Account Interest) | | | | 263,537 | (2) | | | | | 281,941 | (2) | |
TREA Florida Retail, LLC | | | | |
Florida Retail Portfolio (80% Account Interest) | | | | 178,384 | | | | | 196,202 | |
West Dade Associates | | | | |
Miami International Mall (50% Account Interest) | | | | 86,633 | (2) | | | | | 105,312 | (2) | |
Georgia: | | | | |
GA—Buckhead LLC | | | | |
Prominence in Buckhead (75% Account Interest) | | | | 33,352 | | | | | 78,209 | |
Massachusetts: | | | | |
MA—One Boston Place REIT | | | | |
One Boston Place (50.25% Account Interest) | | | | 142,328 | | | | | 212,083 | |
Tennessee: | | | | |
West Town Mall, LLC | | | | |
West Town Mall (50% Account Interest) | | | | 39,566 | (2) | | | | | 73,969 | (2) | |
Virginia: | | | | |
Teachers REA IV, LLC | | | | |
Tyson’s Executive Plaza II (50% Account Interest) | | | | 29,840 | | | | | 36,048 | |
Various: | | | | |
DDR TC LLC | | | | |
DDR Joint Venture (85% Account Interest) | | | | 319,695 | (2,3) | | | | | 712,773 | (2,3) | |
Storage Portfolio I, LLC | | | | |
Storage Portfolio (75% Account Interest) | | | | 50,346 | (2,3) | | | | | 67,621 | (2,3) | |
Strategic Ind Portfolio I, LLC | | | | |
IDI Nationwide Industrial Portfolio (60% Account Interest) | | | | 46,076 | (2,3) | | | | | 67,731 | (2,3) | |
| | | | |
TOTAL REAL ESTATE JOINT VENTURES
(Cost $2,092,235 and $2,068,714) | | | | 1,407,806 | | | | | 2,176,711 | |
| | | | |
LIMITED PARTNERSHIPS—2.12% and 2.15% | | | | |
Cobalt Industrial REIT (10.998% Account Interest) | | | | 26,201 | | | | | 31,784 | |
Colony Realty Partners LP (5.27% Account Interest) | | | | 13,841 | | | | | 29,000 | |
Heitman Value Partners Fund (8.43% Account Interest) | | | | 13,807 | | | | | 16,334 | |
Lion Gables Apartment Fund (18.46% Account Interest) | | | | 145,910 | | | | | 186,471 | |
MONY/Transwestern Mezz RP II (16.67% Account Interest) | | | | 13,364 | | | | | 17,710 | |
Transwestern Mezz Realty Partners III, LLC (11.708% Account Interest) | | | | 3,071 | | | | | 5,186 | |
| | | | |
TOTAL LIMITED PARTNERSHIPS | | | | |
(Cost $294,022 and $261,136) | | | | 216,194 | | | | | 286,485 | |
| | | | |
TOTAL REAL ESTATE JOINT VENTURES AND LIMITED PARTNERSHIPS | | |
(Cost $2,386,257 and $2,329,850) | | | | 1,624,000 | | | | | 2,463,196 | |
| | | | |
See notes to the financial statements.
25
TIAA REAL ESTATE ACCOUNT
STATEMENT OF INVESTMENTS
September 30, 2009 and December 31, 2008
(Dollar values shown in thousands)
MARKETABLE SECURITIES—3.85% and 3.83%
COMMERCIAL PAPER—0.15% and 1.84%
| | | | | | | | | | | | |
Principal | | Issuer | | Yield(4) | | Maturity
Date | | Value |
2009 | | 2008 | | 2009 | | 2008 |
| | | | | | | | | | | (Unaudited) | | |
| $ | | — | | | | $ | | 50,000 | | | Abbey National North America LLC | | | | 0.071% | | | | | 1/5/09 | | | | $ | | — | | | | $ | | 49,998 | |
| | — | | | | | 40,000 | | | Bank of Nova Scotia | | | | 0.193% | | | | | 1/2/09 | | | | | — | | | | | 39,999 | |
| | — | | | | | 50,000 | | | HSBC Finance Corporation | | | | 0.304% | | | | | 1/7/09 | | | | | — | | | | | 49,997 | |
| | — | | | | | 50,000 | | | Rabobank USA Financial Corp | | | | 0.122% | | | | | 1/5/09 | | | | | — | | | | | 49,999 | |
| | — | | | | | 25,000 | | | Societe Generale North America, Inc. | | | | 0.243% | | | | | 1/13/09 | | | | | — | | | | | 24,997 | |
| | 15,000 | | | | | — | | | Societe Generale North America, Inc. | | | | 0.030% | | | | | 10/1/09 | | | | | 15,000 | | | | | — | |
| | — | | | | | 22,400 | | | Toyota Motor Credit Corp. | | | | 0.406% | | | | | 1/23/09 | | | | | — | | | | | 22,395 | |
| | — | | | | | 8,200 | | | Toyota Motor Credit Corp. | | | | 0.659% | | | | | 2/4/09 | | | | | — | | | | | 8,196 | |
| | | | | | | | | | | | | |
TOTAL COMMERCIAL PAPER | | | | | | | | |
(Cost $15,000 and $245,585) | | | | | | | | 15,000 | | | | | 245,581 | |
| | | | | | | | | | | | | |
GOVERNMENT AGENCY NOTES—1.47% and 1.99% | | | | | | |
| | — | | | | | 25,000 | | | Fannie Mae Discount Notes | | | | 0.030% | | | | | 1/6/09 | | | | | — | | | | | 25,000 | |
| | — | | | | | 14,200 | | | Fannie Mae Discount Notes | | | | 0.081% | | | | | 1/30/09 | | | | | — | | | | | 14,200 | |
| | — | | | | | 33,400 | | | Fannie Mae Discount Notes | | | | 0.152% | | | | | 2/3/09 | | | | | — | | | | | 33,400 | |
| | 30,000 | | | | | — | | | Fannie Mae Discount Notes | | | | 0.112% | | | | | 11/16/09 | | | | | 29,998 | | | | | — | |
| | — | | | | | 18,100 | | | Federal Home Loan Bank Discount Notes | | | | 0.071% | | | | | 1/5/09 | | | | | — | | | | | 18,100 | |
| | — | | | | | 50,000 | | | Federal Home Loan Bank Discount Notes | | | | 0.041% | | | | | 1/12/09 | | | | | — | | | | | 50,000 | |
| | — | | | | | 11,330 | | | Federal Home Loan Bank Discount Notes | | | | 0.051% | | | | | 1/21/09 | | | | | — | | | | | 11,330 | |
| | — | | | | | 100,000 | | | Federal Home Loan Bank Discount Notes | | | | 0.081% | | | | | 1/22/09 | | | | | — | | | | | 100,000 | |
| | 14,000 | | | | | — | | | Federal Home Loan Bank Discount Notes | | | | 0.061% | | | | | 10/23/09 | | | | | 14,000 | | | | | — | |
| | 15,000 | | | | | — | | | Federal Home Loan Bank Discount Notes | | | | 0.071% | | | | | 10/28/09 | | | | | 15,000 | | | | | — | |
| | 25,500 | | | | | — | | | Federal Home Loan Bank Discount Notes | | | | 0.101%-0.152% | | | | | 11/4/09 | | | | | 25,499 | | | | | — | |
| | 44,015 | | | | | — | | | Federal Home Loan Bank Discount Notes | | | | 0.152% | | | | | 12/16/09 | | | | | 44,010 | | | | | — | |
| | — | | | | | 14,100 | | | Freddie Mac Discount Notes | | | | 0.203% | | | | | 1/5/09 | | | | | — | | | | | 14,100 | |
| | 7,700 | | | | | — | | | Freddie Mac Discount Notes | | | | 0.122% | | | | | 11/16/09 | | | | | 7,700 | | | | | — | |
| | 13,805 | | | | | — | | | Freddie Mac Discount Notes | | | | 0.137% | | | | | 12/14/09 | | | | | 13,804 | | | | | — | |
| | | | | | | | | | | | | |
TOTAL GOVERNMENT AGENCY NOTES
(Cost $149,992 and $266,118) | | | | | | | | 150,011 | | | | | 266,130 | |
| | | | | | | | | | | | | |
See notes to the financial statements.
26
TIAA REAL ESTATE ACCOUNT
STATEMENT OF INVESTMENTS
September 30, 2009 and December 31, 2008
(Dollar values shown in thousands)
| | | | | | | | | | | | |
Principal | | Issuer | | Yield(4) | | Maturity
Date | | Value |
2009 | | 2008 | | 2009 | | 2008 |
| | | | | | | | | | (Unaudited) | | |
UNITED STATES TREASURY BILLS—2.23% and 0.00% | | | | | | |
$83,340 | | $— | | United States Treasury Bills | | | | 0.223%-0.269% | | | | | 10/8/09 | | | | $ | | 83,340 | | | | $ | | — | |
16,000 | | — | | United States Treasury Bills | | | | 0.183% | | | | | 10/15/09 | | | | | 16,000 | | | | | — | |
74,725 | | — | | United States Treasury Bills | | | | 0.172%-0.223% | | | | | 10/22/09 | | | | | 74,723 | | | | | — | |
35,200 | | — | | United States Treasury Bills | | | | 0.127%-0.152% | | | | | 10/29/09 | | | | | 35,198 | | | | | — | |
19,015 | | — | | United States Treasury Bills | | | | 0.152% | | | | | 2/25/10 | | | | | 19,003 | | | | | — | |
| | | | | | | | | | | | |
TOTAL UNITED STATES TREASURY BILLS
(Cost $228,251 and $0) | | | | | | | | 228,264 | | | | | — | |
| | | | | | | | | | | | |
TOTAL MARKETABLE SECURITIES
(Cost $393,243 and $511,703) | | | | | | | | 393,275 | | | | | 511,711 | |
| | | | | | | | | | | | |
MORTGAGE LOAN RECEIVABLE—0.68% and 0.54% | | | | | | |
| | | | | | | | | | | | |
| | | | Borrower | | Current
Rate(5) | | Maturity
Date | | | | |
| | | | | | | | | | | | |
75,000 | | 75,000 | | Klingle Corporation | | | | 0.800% | | | | | 7/10/11 | | | | | 68,965 | | | | | 71,767 | |
| | | | | | | | | | | | |
TOTAL MORTGAGE LOAN RECEIVABLE
(Cost $75,000 and $75,000) | | | | | | | | 68,965 | | | | | 71,767 | |
| | | | | | | | | | | | |
TOTAL INVESTMENTS
(Cost $12,858,393 and $12,948,297) | | | | | | | $ | | 10,214,367 | | | | $ | | 13,351,714 | |
| | | | | | | | | | | | |
|
(1) | | | | The investment has a mortgage loan payable outstanding, as indicated in Note 7. |
|
(2) | | | | The market value reflects the Account’s interest in the joint venture and is net of debt. |
|
(3) | | | | Properties within this investment are located throughout the United States. |
|
(4) | | | | Yield represents the annualized yield at the date of purchase. |
|
(5) | | | | Current rate represents the interest rate on this investment at September 30, 2009. At December 31, 2008, the interest rate on this investment was 2.57%. |
See notes to the financial statements.
27
ITEM 2 MANAGEMENT’S DISCUSSION AND ANALYSIS OF FINANCIAL CONDITION AND RESULTS OF OPERATIONS
The following discussion and analysis of our financial condition and results of operations should be read together with our financial statements and notes contained in this report and with consideration to the sub-section entitled “Forward-Looking Statements,” which begins below, the section of the Account’s Annual Report on Form 10-K for the year ended December 31, 2008 (the “Form 10-K”) entitled “Item 1A. Risk Factors” and the section of the Account’s Form 10-Q for the quarter ended March 31, 2009 entitled “Item 1A. Risk Factors” in Part II thereof. The past performance of the Account is not indicative of future results.
Forward-Looking Statements
Some statements in this Form 10-Q which are not historical facts may be “forward-looking statements” within the meaning of Section 27A of the Securities Act of 1933, Section 21E of the Securities Exchange Act of 1934 and the Private Securities Litigation Reform Act of 1995. Forward-looking statements include statements about management’s expectations, beliefs, intentions or strategies for the future, include the assumptions underlying these forward-looking statements, and are based on current expectations, estimates and projections about the real estate industry, markets in which the Account operates, general economic conditions and the strength of the capital and credit markets, management’s beliefs, assumptions made by management and the transactions described in this Form 10-Q. While management believes the assumptions underlying any of its forward-looking statements and information to be reasonable, such information may be subject to uncertainties and may involve certain risks which may be difficult to predict and are beyond management’s control. These risks and uncertainties could cause actual results to differ materially from those contained in any forward-looking statement. These risks and uncertainties include, but are not limited to, the following:
|
• | | | | The risks associated with acquiring, owning and selling real property, including general economic and real estate market conditions, the availability of financing (both for the Account and potential purchasers of the Account’s properties), disruptions in the credit and capital markets, competition for real estate properties, leasing risk (including tenant defaults), and the risk of uninsured losses at properties (including due to terrorism and acts of violence); |
|
• | | | | The risks associated with property valuations, including the fact that appraisals can be subjective in a number of respects, the fact that the Account’s appraisals are generally obtained on a quarterly basis and there may be periods in between appraisals of a property in which the value attributed to the property for the purpose of the Account’s daily accumulation unit value may be more or less than the actual realizable value of the property; |
|
• | | | | Risks associated with borrowing activity by the Account, including the risk that the Account may not have the ability to obtain financing on favorable terms (or at all), which may be aggravated by general disruptions in credit and capital markets; |
|
• | | | | Investment risk associated with participant transactions, including the fact that significant net participant transfers out of the Account may impair its ability to pursue or consummate new investment opportunities that are otherwise attractive to the Account; |
|
• | | | | The risks associated with joint venture partnerships, including the risks that a co-venturer may have interests or goals inconsistent with the Account’s and the risk that the Account may have limited rights with respect to operation of the property and transfer of the Account’s interest; |
|
• | | | | Uncertainties associated with environmental and other regulatory matters; and |
|
• | | | | Other factors, including the risk factors discussed in “Item 1A. Risk Factors” in the Form 10-K. |
More detailed discussions of certain of those risk factors are contained in the section of the Form 10-K entitled “Item 1A. Risk Factors” and elsewhere in this Form 10-Q including in the section entitled “Item 3. Quantitative and Qualitative Disclosures About Market Risk” and the section of the Account’s Form 10-Q for the quarter ended March 31, 2009 entitled “Item 1A. Risk Factors” in Part II thereof.
Caution should be taken not to place undue reliance on management’s forward-looking statements, which represent management’s views only as of the date that this report is filed. Neither management nor the Account undertake any obligation to update publicly or revise any forward-looking statement, whether as a result of new information, changed assumptions, future events or otherwise.
28
Commercial real estate market statistics discussed in this section are obtained by the Account from sources that management considers reliable, but some of the data is preliminary for the period ended September 30, 2009 and may be subsequently revised. Prior period data may have been adjusted to reflect updated calculations. All of the Account’s vacancy data are calculated as a percent leased based on a market value-weighted basis. Industry sources such as Torto Wheaton Research calculate vacancy data based on square footage. Investors should not rely exclusively on the data presented below in forming a judgment regarding the current or prospective performance of the commercial real estate market generally.
THIRD QUARTER 2009 U.S. ECONOMIC AND COMMERCIAL REAL ESTATE OVERVIEW
The TIAA Real Estate Account (the “Account”) invests primarily in high-quality, core commercial real estate in order to meet its investment objective of obtaining favorable long-term returns through rental income and the appreciation of its real estate holdings. The Account does not directly invest in either single-family residential real estate or residential mortgage-backed securities.
Economic and Capital Markets Overview and Outlook
In comments made in early September, Federal Reserve Chairman Ben Bernanke stated that “from a technical perspective, the recession is very likely over.” However, he remained cautious about near term prospects for the U.S. economy in that “. . . it is going to feel like a very weak economy for some time as many people find that their employment status and job security is not what they wish it was.” The U.S. labor market shed 768,000 jobs during the third quarter, but job losses eased as compared to the 2.1 and 1.3 million jobs lost during the first and second quarters of the year. Even with the ongoing job losses, most economists believe that U.S. Gross Domestic Product (“GDP”) grew at approximately 3.0% during the third quarter. The growth was due to an increase in consumer spending, a very modest recovery in trade flows, and an increase in industrial production which helped to replenish depleted inventories. Housing market conditions have also improved, though the gains have been accompanied by rising foreclosures and aggregate price declines of 30-40% in many of the major U.S. markets. Recent gains in the stock market, which is considered a harbinger of future economic activity, also portend an economic recovery. The Dow Jones Industrial Average (“DJIA”) and the broader S&P 500 each gained 15% during the quarter and the DJIA recently broke the psychologically important 10,000 mark. Financial market conditions continue to provide support for the nation’s banks and businesses. After various mid-year “stress tests” of the nation’s banks helped assuage investor concerns, credit spreads narrowed significantly, and the subsequent strong rally in the corporate bond market allowed credit-worthy firms to access capital at attractive rates. While credit to consumers and small businesses remains constrained, aggregate lending activity has modestly recovered. However, the commercial mortgage-backed securities market (“CMBS”), which had fueled much of the sales boom of 2006 and 2007, remains stagnant with virtually no new issuance in 2009. Similarly, commercial banks are struggling with increased defaults of real estate loans and are unwilling to allocate additional funds to the sector. Notwithstanding a modest increase in commercial real estate sales during the third quarter as reported by Real Capital Analytics, transaction activity has been limited in 2009 by a lack of commercial mortgage lending. One hopeful sign of improving liquidity for the industry was Goldman Sachs’ $400 million mortgage financing of 28 shopping centers owned by Developers Diversified Realty. Goldman Sachs is working with the Federal Reserve to make the loan eligible for the Term Asset-Backed Loan Security facility (“TALF”). If Goldman Sachs is successful, other owners and lenders currently considering the program would be likely to try to secure additional TALF funds in the coming quarters.
While there are signs that the U.S. economy is coming out of recession, the recovery will likely be hampered by lackluster consumer spending, excess labor and production capacity, and the heavily indebted consumer and business sectors. While fundamental weaknesses remain, gains to date have been largely a product of fiscal policies implemented as part of the $787 billion stimulus program. The auto and housing sectors have been two of the biggest beneficiaries, but some economists believe that activity will slow when programs supporting the two sectors expire. In order to assist the recovery, the Federal Reserve signaled that it will keep the federal funds rate at its 0.0%-0.25% target for the foreseeable future, which should keep interest rates low for consumers and businesses. Additionally, it reaffirmed plans to purchase $1.25 trillion of residential mortgage-backed securities (“RMBS”) and $200 billion of Fannie Mae and Freddie Mac debt which would provide ongoing support for the housing market. Evidence of an increased appetite for higher returns among the private sector was provided by the commitment of five investment funds to buy troubled
29
or illiquid legacy assets as part of the Treasury’s Public-Private Investment Program (“PPIP”). As part of the program, the Treasury Department matched the funds’ $3 billion commitment and will provide an additional $6 billion in debt financing.
The table below summarizes headline economic indicators and provides indications of the start of a tentative recovery. For example, preliminary estimates from the Bureau of Economic Analysis show that GDP increased by 3.5% in the third quarter, the first expansion of the U.S. economy in more than a year. The fiscal stimulus program helped bolster economic activity during the quarter when consumer spending rose along with business inventories, investment in housing, and federal government spending. Demand for goods and services increased both at home and abroad, but the increase in exports was offset by a larger increase in imports. Although job losses slowed during the quarter, job growth is not expected until 2010.
Economic Indicators*
| | | | | | | | | | | | |
| | 2008 | | 2009Q1 | | 2009Q2 | | 2009Q3 | | 2009F | | 2010F |
Economy(1) | | | | | | | | | | | | |
Gross Domestic Product (GDP) | | | | 0.4 | % | | | | | -6.4 | % | | | | | -0.7 | % | | | | | 3.5 | % | | | | | -2.5 | % | | | | | 2.5 | % | |
Employment Growth (Thousands) | | | | -3,078 | | | | | -2,074 | | | | | -1,285 | | | | | -768 | | | | | N/A | | | | | N/A | |
Interest Rates(2) | | | | | | | | | | | | |
10 Year Treasury | | | | 3.66 | % | | | | | 2.74 | % | | | | | 3.31 | % | | | | | 3.52 | % | | | | | 3.30 | % | | | | | 4.00 | % | |
Federal Funds Rate | | | | 0.0-0.25 | % | | | | | 0.0-0.25 | % | | | | | 0.0-0.25 | % | | | | | 0.0-0.25 | % | | | | | N/A | | | | | N/A | |
Sources: BEA, BLS, Federal Reserve, Blue Chip Consensus Forecasts
|
* | | | | Data subject to revision |
|
(1) | | | | GDP growth rates are annual rates; employment numbers are monthly changes. |
|
(2) | | | | The Treasury rates are an average over the stated time period. The Federal Funds rates are as of the end of the stated time period. |
N/A indicates data not available.
The data in the table below show that broad economic indicators continue to reflect lackluster economic activity. The tentative nature of the recovery, as indicated by monthly fluctuations in the data, suggest that it will take time for a recovery to gain momentum. For example, consumer confidence, which had inched upward, slipped again in September. Retail sales excluding automobiles, gained some ground during the last two months of the quarter, but were still 6.6% below 2008 levels. Home sales received a boost from the first-time home buyer program, but gains are likely to taper off once the program’s November expiration date passes. While sales of existing homes are above 2008 levels, the market remains weak, as foreclosures and first-time home buyers accounted for a significant portion of all sales. In addition, prices generally continue to fall, though they show signs of stabilizing in a number of markets. New home sales retreated in September after healthy increases in the five prior months, as new homes compete with a sizeable inventory of existing homes being offered for sale. Single-family construction began to pick up during the quarter, but remains approximately 70% below levels at the market peak. As also indicated below, anemic economic conditions have kept inflation in check. Prices rose in September, but the overall consumer price index as of September 2009 was 1.3% below that of September 2008. The decline was due to a large drop in energy cost. Core inflation, which excludes the more volatile costs of food and energy, increased at a modest 1.5% annual rate.
Other Economic Indicators*
| | | | | | | | |
Index 1985=100 | | 2008 | | Jul-09 | | Aug-09 | | Sep-09 |
Consumer Confidence | | | | 57.9 | | | | | 47.4 | | | | | 54.5 | | | | | 53.1 | |
% Change(1) | | | | | | | | |
Inflation (Consumer Price Index) | | | | 0.1 | % | | | | | 0.0 | % | | | | | 0.4 | % | | | | | 0.2 | % | |
Retail Sales (excl. auto, parts & gas) | | | | 1.6 | % | | | | | -0.3 | % | | | | | 0.6 | % | | | | | 0.4 | % | |
Existing Home Sales | | | | -13 | % | | | | | 7.2 | % | | | | | -2.9 | % | | | | | 9.4 | % | |
New Home Sales | | | | -38.0 | % | | | | | 3.5 | % | | | | | 1.0 | % | | | | | -3.6 | % | |
Single-family Housing Starts | | | | -41.0 | % | | | | | 5.9 | % | | | | | -4.7 | % | | | | | 3.9 | % | |
Unemployment Rate | | | | 5.8 | % | | | | | 9.4 | % | | | | | 9.7 | % | | | | | 9.8 | % | |
|
* | | | | Data subject to revision |
|
(1) | | | | Monthly figures represent change from the preceding month; |
Sources: Conference Board, Census Bureau, Bureau of Labor Statistics
30
In the Federal Reserve Bank’s October 2009 Beige Book, which reported on regional economic conditions in the twelve Federal Reserve Districts (“Districts”) through mid-October, economic conditions were widely reported to have stabilized, or shown modest improvement, in most Districts. In particular, the beleaguered housing and manufacturing sectors were bright spots. Tax credits for first-time home-buyers were thought to have had a positive impact on lending in most Districts, but outside of this, lending activity by commercial banks was generally noted to be weak or declining. Some concern was expressed about the strength of home sales following expiration of the tax credit program, particularly since many Districts noted that sales had been increasing among homes in the low- to medium-price ranges. Labor markets were characterized as weak across all Districts, although potential signs of improvement were evident in some. There was little or no upward pressure on either prices or wages. Consumer spending remained weak in all Districts, with virtually all Districts expecting flat to declining sales for the holiday season. Commercial real estate was consistently characterized as weak or worsening across the twelve Districts, as rising vacancy rates put added pressure on rents and landlords. Commercial real estate sales activity slowed further, primarily due to a lack of available mortgage financing.
Economists’ views on the prospects for 2010 have improved significantly over the course of the year. The overall consensus is that fiscal and monetary policy actions taken in the early part of the year have helped the economy stabilize, and that the pick-up of economic activity during the third quarter of 2009 will continue into the fourth quarter. The economy should be poised to generate solid but measured growth in 2010. Expectations are modest because recoveries in the past have typically been attributable to a rebound in consumer spending, construction spending, and home sales; however, these are sectors of the economy that remain weak. Given the current backdrop, the consensus view of economists surveyed as part of the October 2009 Blue Chip Economic Indicators publication is that U.S. GDP will grow 2.5% in 2010. Members of the Federal Open Market Committee (“FOMC”) have similar expectations of positive GDP growth for the remainder of 2009, with growth strengthening over the course of 2010 and 2011. FOMC members expect growth to be accompanied by improved financial and housing market conditions. While Federal Reserve economists expect economic growth to be above trend initially, employment growth will lag and the unemployment rate is expected to remain at or above 9% through the end of 2010. While economic conditions appear to be improving considerable downside risks remain. Credit markets are still challenging as small businesses and consumers lack ready access to credit. Similarly, consumer spending, which accounts for roughly 70% of economic activity, remains weak and will need to improve significantly before more businesses begin hiring. Further, the fiscal and monetary policy actions that helped stabilize the economy will have to be unwound at a rate that does not undermine the recovery or spur inflation fears.
Real Estate Market Conditions and Outlook
Preliminary data from Real Capital Analytics (“RCA”), a frequently cited industry source of commercial real estate transactions data, indicate that $12 billion of property was sold during the third quarter of 2009. Sales are down 64% from the third quarter of 2008; however, the pace of sales has increased 24% since the second quarter of 2009. The numbers of distressed properties continue to rise, but some of these distressed situations are being resolved, either through property sales or payoffs of the underlying mortgages at a discount. RCA estimates that distressed assets represented approximately 17% of the closed transactions during the third quarter. Further, distressed sales are estimated to have accounted for 7% of the 40% total decline in the commercial property prices as estimated by Moody’s/REAL Commercial Property Index. According to the Moody’s/REAL Commercial Property Index, prices have declined 41% from the October 2007 peak. As of August 2009, prices had declined 33% compared to August 2008. The price declines have affected all property types, with each experiencing declines of over 20% in the second quarter of 2009 as compared to the second quarter of 2008. Properties in the most active metropolitan markets, which had previously held up better than those in other areas, now show less favorable comparisons.
The NCREIF National Property Index (“NPI”) declined 3.32% during the third quarter, and a total of 22.1% over the last four quarters. Declines in the index are due to the ongoing revaluation of commercial real estate property, as the capital value component of the index declined 4.88% for the quarter, and 26.7% over the last four quarters. Income returns were 1.56% for the quarter and 5.8% over the last four quarters, but have been more than offset by declines in the capital value component.
Though many economists expect that the recession likely ended during the third quarter, commercial real estate fundamentals continued to deteriorate in the quarter. Vacancy rates for all property types
31
continued to rise, although the rate of increase appears to be moderating. Economic output is expected to be healthy over the remainder of 2009 and into 2010, but businesses will likely wait until there is clear evidence that the economy has progressed before increasing hiring of employees. As they wait for conditions to improve, businesses will be watching rent and occupancy costs closely, and reducing such costs when possible, which will keep pressure on landlords who are struggling to retain tenants and maintain income streams. Consequently, vacancy rates for most property sectors are likely to rise further over the coming quarters. The table below summarizes the top five markets in which the Account had exposure as of September 30, 2009. The top five markets represent nearly 40% of the Account’s total real estate portfolio in terms of value, and, despite rising vacancy rates nationally; the Account’s properties in each of these markets remain well leased.
| | | | | | | | |
Metro Area | | Percent
Leased
(Weighted) | | # of Property
Investments | | Metro Areas as a
% of Total Real
Estate Portfolio | | Metro Area as a
% of Total
Investments |
|
Washington-Arlington-
Alexandria DC-VA-MD-WV | | | | 94.8% | | | | | 9 | | | | | 12.2% | | | | | 11.3% | |
Boston-Quincy MA | | | | 90.8% | | | | | 5 | | | | | 7.2% | | | | | 6.7% | |
Houston-Bay Town-Sugar Land TX | | | | 95.2% | | | | | 3 | | | | | 6.8% | | | | | 6.4% | |
Los Angeles-Long Beach-Glendale CA | | | | 92.9% | | | | | 8 | | | | | 6.6% | | | | | 6.2% | |
San Francisco-San Mateo-Redwood City CA | | | | 94.5% | | | | | 4 | | | | | 6.2% | | | | | 5.8% | |
Office
Demand for office space depends upon employment growth in office-using sectors such as finance and professional and business services, but typically with a lag due to the longer term nature of the leasing cycle. During the third quarter, job losses in both sectors moderated to total 49,000 in finance and 58,000 in professional and business services. Nonetheless, indications are that businesses continued to shed space as the national office vacancy rate increased to an average of 16.1% in third quarter of 2009 as compared to 15.5% during the second quarter of 2009. The vacancy rate of the Account’s office portfolio was 8.3% as of the third quarter. Preliminary data from Torto Wheaton Research (“TWR”) show that vacancy rates increased in most of the Account’s top office markets in the third quarter. The only exception was Houston, where the vacancy rate inched down. Similarly, vacancy rates in most of the Account’s top office markets remained below the national average. Seattle was the only exception, as the addition of three million square feet of new space over the course of the year helped push the vacancy rate slightly above the national average. By comparison, the Account’s properties in Seattle have remained well-leased, despite the new supply. The table below compares the average vacancy rate of properties in the Account’s top office markets with their respective metropolitan area averages.
| | | | | | | | | | | | | | |
| | | | | | | | Account
Weighted
Average
Vacancy | | Metro Area Vacancy* |
| | | | | | | | | | | | | | | | | | | | | | | | | | | | | | | |
Sector | | Metropolitan Area | | Total Sector
by Metro Area
($M) | | % of Total
Investments | | 2009Q2 | | 2009Q3 | | 2009Q2 | | 2009Q3 |
|
Office | | National | | | | | | | | 7.8% | | | | | 8.3% | | | | | 15.5% | | | | | 16.1% | |
|
1 | | Washington-Arlington-Alexandria DC-VA-MD-WV | | | $ | | 1,017.0 | | | | | 10.0% | | | | | 6.1% | | | | | 5.5% | | | | | 13.8% | | | | | 14.4% | |
2 | | Boston-Quincy MA | | | $ | | 660.1 | | | | | 6.5% | | | | | 7.9% | | | | | 8.6% | | | | | 12.3% | | | | | 12.8% | |
3 | | San Francisco-San Mateo-
Redwood City CA | | | $ | | 536.9 | | | | | 5.3% | | | | | 4.3% | | | | | 5.8% | | | | | 12.6% | | | | | 13.9% | |
4 | | Seattle-Bellevue-Everett WA | | | $ | | 452.5 | | | | | 4.4% | | | | | 5.0% | | | | | 4.9% | | | | | 14.7% | | | | | 16.2% | |
5 | | Houston-Bay Town-
Sugar Land TX | | | $ | | 406.6 | | | | | 4.0% | | | | | 5.0% | | | | | 5.0% | | | | | 15.4% | | | | | 15.3% | |
|
* | | | | Source: Torto Wheaton Research |
32
Industrial
Industrial market conditions weakened further even though key drivers of the industrial market showed modest improvement. Demand for industrial space depends upon industrial production, international trade flows, inventory growth, and employment growth in the manufacturing, wholesale trade, and warehousing industries. Industrial production increased during the third quarter as trade flows began to recover and inventories dwindled. Nonetheless, the national vacancy rate rose for the eighth consecutive quarter to an average of 13.5% during the third quarter, up from 13.0% in the second quarter of 2009. The vacancy rate for the Account’s industrial portfolio drifted up slightly to 12.1% during the third quarter, but still compares favorably to the national average. Metropolitan area vacancy rates in each of the Account’s top industrial markets increased during the third quarter of 2009 as they did in nearly every market tracked by TWR. Los Angeles, the nation’s second largest industrial market, once again recorded the lowest vacancy rate, despite a rise in vacancy to 8.0%. While vacancy rates in Atlanta, Dallas, and Chicago were still above the national average, the Account’s properties in these markets were almost fully leased. The Account’s above-average vacancy rate in the West Coast markets of Los Angeles and Riverside are reflective of the difficult leasing environment there. Global trade flows have fallen approximately 20%, which has accompanied a roughly similar drop in cargo volumes at the Ports of Long Beach and Los Angeles. The table below compares the average vacancy rate of properties in the Account’s top industrial markets to their respective metropolitan area averages.
| | | | | | | | | | | | | | | | | | | | | | Account
Weighted
Average
Vacancy | | Metro Area
Vacancy* |
| | | | | | | | | | | | | | | | | | | | | | | | | | | | | | |
Sector | | Metropolitan Area | | Total Sector
by Metro Area
($M) | | % of Total
Investments | | 2009Q2 | | 2009Q3 | | 2009Q2 | | 2009Q3 |
|
Industrial | | National | | | | | | | | 11.3% | | | | | 12.1% | | | | | 13.0% | | | | | 13.5% | |
|
1 | | Riverside-San Bernardino-Ontario CA | | | $ | | 308.2 | | | | | 3.0% | | | | | 20.2% | | | | | 19.7% | | | | | 15.5% | | | | | 16.0% | |
2 | | Dallas-Plano-Irving TX | | | $ | | 159.0 | | | | | 1.6% | | | | | 4.7% | | | | | 4.7% | | | | | 15.3% | | | | | 15.7% | |
3 | | Chicago-Naperville-Joliet IL | | | $ | | 113.0 | | | | | 1.1% | | | | | 0.9% | | | | | 0.9% | | | | | 14.1% | | | | | 14.3% | |
4 | | Atlanta-Sandy Springs-
Marietta GA | | | $ | | 99.1 | | | | | 1.0% | | | | | 0.0% | | | | | 2.2% | | | | | 17.1% | | | | | 17.5% | |
5 | | Los Angeles-Long Beach-
Glendale CA | | | $ | | 97.0 | | | | | 1.0% | | | | | 15.9% | | | | | 13.2% | | | | | 7.5% | | | | | 8.0% | |
|
* | | | | Source: Torto Wheaton Research |
Multi-Family
Apartment vacancies have drifted up over the course of the year and currently average 7.4% nationally versus 5.8% in the third quarter of 2008 (a year-over-year comparison is necessary to reflect the seasonality inherent in apartment leasing). Demand for apartments has been hurt by continuing job losses as well as increased competition from vacant single-family homes and condominium units offered for rent. The Account’s apartment buildings have remained well-leased, with the average vacancy rate for the Account’s apartment portfolio at 3.8% as of the third quarter of 2009. The table below shows that the average vacancy rate for the Account’s properties in each of its top metropolitan markets is lower than both the national average and the average for the respective metropolitan market. The Account’s properties in Denver and New York experienced an increase in leasing activity during the third quarter.
33
| | | | | | | | | | | | | | | | | | | | | | Account
Weighted
Average
Vacancy | | Metro Area
Vacancy* |
| | | | | | | | | | | | | | | | | | | | | | | | | | | | | | |
Sector | | Metropolitan Statistical Area | | Total Sector
by Metro Area
($M) | | % of Total
Investments | | 2009Q2 | | 2009Q3 | | 2009Q2 | | 2009Q3 |
|
Apartment | | National | | | | | | | | 4.4% | | | | | 3.8% | | | | | 7.3% | | | | | 7.4% | |
|
1 | | Houston-Bay Town-Sugar Land TX | | | $ | | 244.1 | | | | | 2.4% | | | | | 5.0% | | | | | 4.4% | | | | | 9.1% | | | | | 9.9% | |
2 | | Phoenix-Mesa-Scottsdale AZ | | | $ | | 197.2 | | | | | 1.9% | | | | | 5.6% | | | | | 4.9% | | | | | 11.6% | | | | | 11.5% | |
3 | | Denver-Aurora CO | | | $ | | 178.1 | | | | | 1.7% | | | | | 6.0% | | | | | 2.8% | | | | | 8.0% | | | | | 6.8% | |
4 | | Atlanta-Sandy Springs-
Marietta GA | | | $ | | 116.9 | | | | | 1.1% | | | | | 1.3% | | | | | 2.8% | | | | | 10.8% | | | | | 11.0% | |
5 | | New York-Wayne-
White Plains NY-NJ | | | $ | | 112.1 | | | | | 1.1% | | | | | 5.0% | | | | | 2.0% | | | | | 6.4% | | | | | 6.5% | |
|
* | | | | Source: Torto Wheaton Research |
Retail
Vacancies in U.S. neighborhood and community centers increased to an average of 12.3% in the third quarter of 2009, up from 12.0% in the second quarter. Maintaining occupancy levels has been challenging due to the departure of big box tenants such as Circuit City and Linens ‘N Things, which went bankrupt and closed all of their stores. In addition, a number of small “mom & pop” retailers have closed stores as a result of the downturn in consumer spending. Nonetheless, vacancies in the Account’s retail portfolio remained stable at 7.0% as of the third quarter of 2009. However, the portfolio’s overall occupancy rate was 89.5%, with the 10.5% “availability rate” including space that is vacant but is still under lease to tenants. The Account’s retail exposure is heavily concentrated in its joint ventures which have been impacted by the same issues facing the sector. Prospects in the retail market depend largely on consumer spending, which remains lackluster. Most of the recent increase in overall consumer spending is attributable to the “cash for clunkers” program, which has had little direct benefit to commercial real estate. Retailers are cautious heading into the holiday season, with most hoping for modest gains over 2008’s weak holiday sales. In addition to anemic consumer spending, shopping center owners are struggling to fill large blocks of space vacated by retailers which filed for bankruptcy earlier in the year. Retailers are currently looking to close marginal and underperforming stores rather than open new stores.
Commercial Real Estate Outlook
The tentative signs of an economic recovery have yet to benefit commercial real estate, as the sector typically lags economic cycles. Commercial real estate market conditions will remain weak through the rest of 2009 and into 2010. Market conditions are likely not to show material improvement until the U.S. economy has experienced several consecutive quarters of growth. Fortunately, the industry downturn has not been coupled with significant overbuilding which would have exacerbated problems. Construction of all types of commercial property is expected to decline sharply over the next several years. Office construction, for example, is expected to be roughly on par with that of the period following the real estate decline of the early-1990’s. A prolonged slowdown in construction coupled with a recovery in employment growth could establish conditions for a healthy recovery in commercial real estate market conditions in the future.
Management remains focused on maintaining the high occupancy rate of the Account’s portfolio. While current market conditions necessitate concessions to retain tenants, management believes selective rental discounts are a less expensive alternative to finding new tenants for vacant space and help to preserve the net operating income of the portfolio. The Account’s portfolio of high-quality properties has faced significant economic headwinds but remains 92% leased, and the long-term nature of most tenants’ leases are expected to generate cash flow to both service existing debt on encumbered properties and generate a steady income return. As shown below, the income return has historically been a major component of the Account’s total return, and Management believes that income returns will continue to offset a portion of the future fluctuations in capital returns that may occur as the market begins to stabilize.
34
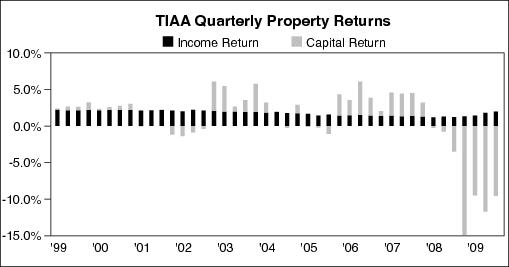
Management has initiated a targeted sales program to rebalance the portfolio by way of property type concentrations, and reallocate exposure towards selected major markets. Management believes that rebalancing the portfolio will better position the Account to achieve stronger returns in the future, and particularly when economic and real estate market conditions improve. While the sales market is highly competitive, available data indicate that investor interest and activity is beginning to increase and that commercial mortgage funding is becoming more available, albeit modestly. The Account completed one sales transaction during the third quarter of 2009 and two early in the fourth quarter, with additional sales planned by year-end, assuming market conditions and the terms of any such sale are appropriate. Management believes that this sales program will rebalance the Account’s portfolio, resulting in properties, markets and liquid asset holdings that management feels will appropriately align with the Account’s overall investment strategy. Management believes that once economic and capital market conditions stabilize (or improve) for an extended period of time, the Account should also benefit from this reallocation of exposure, as well as its conservative “core” investment strategy combined with a focus on institutional quality properties, markets and locations, in particular stabilized assets with strong historical occupancy and staggered lease expirations. Management cannot predict the amount of property sales that will occur, or the timing of such sales, with any precision.
Investments as of September 30, 2009
As of September 30, 2009, the Account had total net assets of $8.4 billion, a 27.1% decrease from December 31, 2008, and a 45.3% decrease from September 30, 2008. The decrease in the Account’s net assets from September 30, 2008 to September 30, 2009 was primarily caused by the depreciation in value of the Account’s wholly-owned real estate properties and those owned in joint venture investments (approximately 65% of the decrease), while net participant transfers out of the Account accounted for approximately 35% of the decrease.
As of September 30, 2009, the Account owned a total of 107 real estate property investments (95 of which were wholly-owned, 12 of which were held in joint ventures). The real estate portfolio included 45 office property investments (five of which were held in joint ventures and one located in London, England), 26 industrial property investments (including one held in a joint venture), 20 apartment complexes, 15 retail property investments (including five held in joint ventures and one located in Paris, France), and a 75% joint venture interest in a portfolio of storage facilities. Of the 107 real estate property investments, 27 are subject to debt (including seven joint venture property investments).
Total debt on the Account’s wholly-owned real estate portfolio as of September 30, 2009 was $1.9 billion, representing 22.1% of total net assets. The Account’s share of joint venture debt ($1.9 billion) is netted against the underlying properties when determining the joint venture values shown on the Statement of Investments. When the joint venture debt is also considered, total debt on the Account’s portfolio as of September 30, 2009 was $3.7 billion, representing 44.6% of total net assets. The Account currently has no Account-level debt.
35
Management believes that the Account’s real estate portfolio is diversified by location and property type. The Account’s largest investment, 1001 Pennsylvania Avenue located in Washington, DC represented 5.02% of total real estate investments and 4.69% of total investments. As discussed in the Account’s prospectus, the Account does not intend to buy and sell its real estate investments simply to make short-term profits. Rather, the Account’s general strategy in selling real estate investments is to dispose of those assets that management believes (i) have either maximized in value, (ii) have underperformed or face deteriorating property-specific or market conditions, (iii) need significant capital infusions in the future, (iv) are appropriate to dispose of in order to remain consistent with its intent to diversify the Account by property type and geographic location, or to reallocate the Account’s exposure to or away from certain property types in certain geographic locations. The Account could reinvest any sale proceeds that it does not need to pay operating expenses or to meet debt service or redemption requests (e.g., cash withdrawals or transfers, and any redemption of TIAA’s liquidity units in the future).
The following charts reflect the diversification of the Account’s real estate assets by region and property type and list its ten largest investments. All information is based on the fair values of the investments at September 30, 2009.
Diversification by Fair Value(1)
| | | | | | | | | | | | | | East | | West | | South | | Midwest | | Foreign(2) | | Total |
Office | | | | 22.3 | % | | | | | 18.8 | % | | | | | 12.7 | % | | | | | 1.1 | % | | | | | 2.4 | % | | | | | 57.3 | % | |
Apartment | | | | 2.2 | % | | | | | 6.1 | % | | | | | 5.3 | % | | | | | 0.0 | % | | | | | 0.0 | % | | | | | 13.6 | % | |
Industrial | | | | 1.7 | % | | | | | 6.2 | % | | | | | 4.0 | % | | | | | 1.3 | % | | | | | 0.0 | % | | | | | 13.2 | % | |
Retail | | | | 3.4 | % | | | | | 0.8 | % | | | | | 8.3 | % | | | | | 0.5 | % | | | | | 2.2 | % | | | | | 15.2 | % | |
Storage(3) | | | | 0.2 | % | | | | | 0.2 | % | | | | | 0.2 | % | | | | | 0.1 | % | | | | | 0.0 | % | | | | | 0.7 | % | |
| | | | | | | | | | | | |
Total | | | | 29.8 | % | | | | | 32.1 | % | | | | | 30.5 | % | | | | | 3.0 | % | | | | | 4.6 | % | | | | | 100.0 | % | |
| | | | | | | | | | | | |
|
(1) | | | | Fair values for wholly-owned properties are reflected gross of any debt, while fair values for joint venture investments are reflected net of any debt. |
|
(2) | | | | Represents real estate investments in the United Kingdom and France. |
|
(3) | | | | Represents a portfolio of storage facilities. |
Properties in the “East” region are located in: CT, DC, DE, KY, MA, MD, ME, NC, NH, NJ, NY, PA, RI, SC, VA, VT, WV
Properties in the “West” region are located in: AK, AZ, CA, CO, HI, ID, MT, NM, NV, OR, UT, WA, WY
Properties in the “South” region are located in: AL, AR, FL, GA, LA, MS, OK, TN, TX
Properties in the “Midwest” region are located in: IA, IL, IN, KS, MI, MN, MO, ND, NE, OH, SD, WI
36
Top Ten Largest Real Estate Investments
| | | | | | | | | | | | |
Property or Joint Venture Name | | City | | State | | Type | | Value ($M)(a) | | Property as a
% of Total
Real Estate
Portfolio(b) | | Property as a
% of Total
Investments |
1001 Pennsylvania Avenue | | Washington | | DC | | Office | | | | 478.7 | (c) | | | | | 5.02 | | | | | 4.69 | |
Four Oaks Place | | Houston | | TX | | Office | | | | 406.6 | (d) | | | | | 4.26 | | | | | 3.98 | |
DDR Joint Venture | | various | | USA | | Retail | | | | 319.7 | (e) | | | | | 3.35 | | | | | 3.13 | |
Fourth and Madison | | Seattle | | WA | | Office | | | | 306.1 | (f) | | | | | 3.21 | | | | | 3.00 | |
50 Fremont | | San Francisco | | CA | | Office | | | | 303.2 | (g) | | | | | 3.18 | | | | | 2.97 | |
The Florida Mall | | Orlando | | FL | | Retail | | | | 263.5 | | | | | 2.76 | | | | | 2.58 | |
The Newbry | | Boston | | MA | | Office | | | | 252.3 | | | | | 2.65 | | | | | 2.47 | |
99 High Street | | Boston | | MA | | Office | | | | 247.7 | (h) | | | | | 2.60 | | | | | 2.43 | |
780 Third Avenue | | New York City | | NY | | Office | | | | 240.0 | | | | | 2.52 | | | | | 2.35 | |
701 Brickell | | Miami | | FL | | Office | | | | 228.8 | (i) | | | | | 2.40 | | | | | 2.24 | |
|
(a) | | | | Value as reported in the September 30, 2009 Statement of Investments. Investments owned 100% by the Account are reported based on fair value. Investments in joint ventures are reported at fair value and are presented at the Account’s ownership interest. |
|
(b) | | | | Total Real Estate Portfolio excludes the mortgage loan receivable. |
|
(c) | | | | This property is shown gross of debt. The value of the Account’s interest less leverage is $270.0M. |
|
(d) | | | | This property is shown gross of debt. The value of the Account’s interest less leverage is $234.9M. |
|
(e) | | | | This property is held in a 85%/15% joint venture with Developers Diversified Realty Corporation (“DDR”), and consists of 65 retail properties located in 13 states and is shown net of debt of $1.4 billion. |
|
(f) | | | | This property is shown gross of debt. The value of the Account’s interest less leverage is $164.8M. |
|
(g) | | | | This property is shown gross of debt. The value of the Account’s interest less leverage is $170.2M. |
|
(h) | | | | This property is shown gross of debt. The value of the Account’s interest less leverage is $60.7M. |
|
(i) | | | | This property is shown gross of debt. The value of the Account’s interest less leverage is $110.9M. |
As of September 30, 2009, the Account also held investments in commercial paper representing 0.15% of total investments, a mortgage loan receivable representing 0.68% of total investments, government agency notes representing 1.47% of total investments, real estate limited partnerships representing 2.12% of total investments, and U.S. Treasury Bills representing 2.23% of total investments.
Results of Operations
Nine months ended September 30, 2009 compared to nine months ended September 30, 2008
Performance
The Account’s total return was -23.79% for the nine months ended September 30, 2009 as compared to -1.12% for the nine months ended September 30, 2008. The Account’s performance in the third quarter of 2009 reflects a continued decline in the aggregate net asset value of the Account’s real estate property investments, including investments owned in joint ventures and limited partnerships, lower income from marketable securities and unrealized losses from the mortgage loans payable. The nine months of 2009 saw continued valuation declines resulting from the weakened economy and tightened financial and credit markets. Transaction activity continued to remain at historically low levels and capital depreciation occurred in most markets.
The Account’s annualized total returns (after expenses) over the past one, three, five, and ten year periods ended September 30, 2009 were
- -33.83%, -8.75%, 0.02%, and 3.86% respectively. As of September 30, 2009, the Account’s annualized total return since inception was 5.12%.
The Account’s total net assets decreased from $15.3 billion at September 30, 2008 to $8.4 billion at September 30, 2009. The primary driver of this 45.32% decrease were depreciation in value of the Account’s wholly owned, joint venture, limited partnership real estate investments (approximately 65% of the decrease), while net participant transfers out of the Account accounted for approximately 35% of the decrease.
37
Income and Expenses
The Account’s real estate holdings, including real estate joint ventures and limited partnerships, generated approximately 99.7% and 86.0% of the Account’s total investment income (before deducting Account level expenses) during the nine months ended September 30, 2009 and 2008, respectively. The 16.6% decrease in the Account’s total investment income was due to a 98.2% decrease in the Account’s interest and dividend income and a 4.7% decrease in net real estate income.
The 4.7%, or $17.7 million, decrease of net real estate income for the nine months ended September 30, 2009, as compared to the same period in 2008, is due to less rental income ($19.6 million lower when compared to the same period in 2008) and an increase in interest expense ($13.6 million), while offset by reductions in property operating expenses of approximately $13.7 million. The decline in rental income for the nine months ended September 30, 2009 is due primarily to lower income as a result of the properties that were sold and lease termination income that was earned during 2008. Property operating expense reductions are the result of lower insurance costs (approximately $3.4 million), lower utility costs (approximately $2.6 million), a decrease in general maintenance and repairs ($4.5 million) and reductions in various other property operating expenses. In addition, there was a reduction of approximately $3.2 million in total expenses related to the sales of properties throughout 2008 and 2009. Interest expense increased during the nine month period in 2009 due to the $557.3 million of additional debt that was incurred during the second half of 2008.
Income from real estate joint ventures and limited partnerships was $95.4 million for the nine months ended September 30, 2009, as compared to $93.7 million for the nine months ended September 30, 2008. This slight 1.8% increase is attributable to various joint ventures distributing less cash in 2008 in anticipation of capital projects in 2008 and 2009. As the economic situation of various tenants declined in late 2008 and early 2009, the need for the joint ventures to retain the capital decreased thereby allowing the joint ventures to distribute the cash to the Account.
The decrease in interest income is due to a lower marketable security balance during the first nine months of 2009 compared to the same period in 2008, along with a decrease in yields earned on those securities. Also, during the second quarter of 2008, the Account sold its real estate equity securities holdings and did not hold any of those securities in 2009, which resulted in no dividend income for the first nine months of 2009, compared with dividend income of $5.1 million in the same period during 2008.
The Account incurred overall Account level expenses of $74.8 million for the nine months ended September 30, 2009, which represents a 39.9% decrease from $124.4 million for the same period in 2008. The decreases in investment advisory and administrative and distribution charges are due to two factors. First, during the first quarter of 2008, there were increased costs allocated to the Account associated with new technology investments that have been reduced significantly during the nine months ended September 30, 2009. The other factor is the general decline in the costs allocated to manage and distribute the Account and is consistent with the reduction in the average net assets of the Account. Investment advisory charges will not decline at the same rate as net assets as certain portions of these costs are not directly associated to the net asset value of the Account. Mortality and expense risk expenses and liquidity guarantee expenses declined during the nine months ended September 30, 2009 primarily due to lower net assets as compared to the same period in 2008. The decline of the liquidity guarantee expenses resulting from the decline in net assets was partially offset by the increase in the fees that TIAA charges to provide the liquidity guarantee from 10 basis points to 15 basis points effective May 1, 2009.
Net Realized and Unrealized Gains and Losses on Investments and Mortgage Loans Payable
The Account had net realized and unrealized losses on investments and mortgage loans payable of $3.1 billion for the nine months ended September 30, 2009, a significant increase when compared to a net realized and unrealized loss of $592.8 million for the nine months ended September 30, 2008. The increase in net realized and unrealized gains and losses on investments and mortgage loans payable was primarily driven by net realized and unrealized losses on the Account’s wholly-owned real estate property investments of $2.2 billion for the nine months ended September 30, 2009 compared to a loss of $440.4 million during the same period in 2008. The Account’s interests in joint ventures and limited partnerships posted a net realized and unrealized loss of $872.8 million and $193.4 million for the nine months ended September 30, 2009 and September 30, 2008, respectively.
38
The net realized and unrealized losses on wholly-owned real estate property investments and those held in joint ventures and limited partnerships were due to the decline in value of the Account’s existing real estate assets, which reflected the net effects of a weaker overall economy, a decline in value of the underlying property investments within the joint ventures and the limited partnership funds, and continued shortage of liquidity in the commercial real estate markets during the nine months ended September 30, 2009. Real estate market values have declined throughout 2009 due to increasing vacancy rates, lower market rents, and higher capitalization rates.
The Account also posted a net realized and unrealized gain on its marketable securities of $24 thousand dollars for the nine months ended September 30, 2009, as compared to a net realized and unrealized gain of $3.4 million during the same period in 2008. The net gain on the Account’s marketable securities in the nine months ended September 30, 2008 was primarily due to the sale of the real estate related marketable securities during the second quarter of 2008.
Mortgage loans payable experienced an unrealized loss of approximately $22.8 million during the nine months ended September 30, 2009 compared to an unrealized gain of $38.6 million in the same period in 2008. Valuation adjustments associated with mortgage loans payable are highly dependent upon interest rates, spreads, investment return demands, the performance of the underlying real estate investment, and where applicable, foreign exchange. Of the $22.8 million unrealized loss, foreign exchange fluctuations (due to a weakening U.S. dollar during the nine months ended 2009) accounted for approximately $21.7 million of the total year-to-date loss. The remaining $1.1 million loss related to mortgage payable values is reflected in the fluctuations in the U.S. treasury rates and higher loan to value ratios on the Account’s underlying properties (as a result of the significant declines in property values).
During the nine months ended September 30, 2009, the Account also sold two partial apartment property investments and one retail property investment for a total sales price of approximately $50.9 million and realized a loss of $29.6 million.
During the nine months ended September 30, 2008, the Account sold one apartment property investment for a sales price of $23.2 million and recognized a net gain of $4.4 million and one office portfolio investment for a sales price of $22.0 million and recognized a net loss of $14.3 million.
Three months ended September 30, 2009 compared to three months ended September 30, 2008
Performance
The Account’s total return was -7.64% for the three months ended September 30, 2009 as compared to -2.07% for the three months ended September 30, 2008. The Account’s performance in the third quarter of 2009 reflects a continued decline in the aggregate net asset value of the Account’s real estate property investments, including investments owned in joint ventures and limited partnerships, as well as lower income from marketable securities and unrealized losses from the mortgage loans payable.
Income and Expenses
The Account’s real estate holdings, including real estate joint ventures and limited partnerships, generated approximately 99.7% and 89.3% of the Account’s total investment income (before deducting Account level expenses) during the three months ended September 30, 2009 and 2008, respectively. The 4.3% decrease in the Account’s total investment income was primarily due to a 97.7% decrease in interest from marketable securities, while offset by a 40.2% increase in the Account’s income from real estate joint ventures and limited partnerships.
Net real estate income increased approximately 0.1% in the three months ended September 30, 2009, as compared to the same period in 2008. This slight increase in net real estate income is due to a 2.6%, or $6.3 million decrease in rental income ($239.2 million in 2009 as compared to $245.4 million in 2008), a 10.8% and 8.5% decrease in operating and real estate tax expenses, respectively, offset by a 17.1% increase in interest expense due to the acquisition of $557.3 million in new debt during the second half of 2008. The Account’s sold properties accounted for approximately $2.7 million of the decline in rental income with the remaining variance being attributable to vacancies and contractual rent concessions. Property operating expense declines of $7.1 million are the result of lower insurance costs (approximately $ 2.6 million), lower utility costs (approximately $1.2 million), a reduction in professional fees (approximately $1.2 million) and various other
39
property operating expenses including a $1.1 million decrease in expense related to properties disposed of since 2008 through the period ended September 30, 2009. The decline in rental income for the three months ended September 30, 2009 of $6.3 million is due primarily to the net decrease in number of properties between 2008 and 2009.
Income from real estate joint ventures and limited partnerships was $35.2 million for the three months ended September 30, 2009, as compared to $25.1 million for the three months ended September 30, 2008. This $10.1 million or 40.2% increase is primarily attributable to an increase in distributed income from the joint ventures, which is due to various joint ventures reserving cash in 2008 for future anticipated projects in 2008 and 2009. As the economic situation of various tenants declined in late 2008 and early 2009, the need for the joint ventures to retain the capital decreased thereby allowing the joint ventures to distribute the cash to the Account in 2009.
The decrease in interest income is due to a lower marketable security balance during the third quarter of 2009 as compared to the same period in 2008, along with a decrease in yields earned on those securities.
The Account incurred overall Account level expenses of $23.9 million for the three months ended September 30, 2009, which represents a 35.9% decrease from $37.3 million for the same period in 2008. The decreases in investment advisory and administrative and distribution charges are due to the general decline in the costs allocated to manage and distribute the Account, which is consistent with the reduction in the average net assets of the Account. Investments advisory charges will not decline at the same rate as net assets as certain portions of these costs are not directly associated to the net asset value of the Account. Mortality and expense risk expenses and liquidity guarantee expenses continued to decline during the third quarter of 2009 primarily due to the lower net assets as compared to the same period in 2008. The decline of the liquidity guarantee expenses resulting from the decline in net assets was partially offset by the increase in the fees that TIAA charges to provide the liquidity guarantee from 10 basis points to 15 basis points effective May 1, 2009.
Net Realized and Unrealized Gains and Losses on Investments and Mortgage Loans Payable
The Account had net realized and unrealized losses on investments and mortgage loans payable of $836.5 million for the three months ended September 30, 2009, compared to net realized and unrealized loss of $462.8 million for the three months ended September 30, 2008. The increase in net realized and unrealized gains and losses on investments and mortgage loans payable was primarily driven by a net realized and unrealized loss on the Account’s wholly-owned real estate property investments of $659.9 million for the three months ended September 30, 2009 compared to a loss of $396.1 million during the same period in 2008. The Account’s interests in joint ventures and limited partnerships posted a net realized and unrealized loss of $169.7 million and $100.1 million for the three months ended September 30, 2009 and September 30, 2008, respectively.
The variance in the net realized and unrealized gains and losses on wholly-owned real estate property investments and those held in joint ventures and limited partnerships was due to the decline in value of the Account’s existing real estate assets, which reflected the net effects of a weaker overall economy, a decline in value of the underlying property investments within the joint ventures and the limited partnership funds, and continued shortage of liquidity in the commercial real estate markets during the three months ended September 30, 2009. The declines in property values were seen in all property types and were due to increasing vacancy rates, lower market rents, and higher capitalization rates.
Mortgage loans payable experienced an unrealized loss of approximately $7.4 million during the third quarter of 2009 compared to an unrealized gain of $34.3 million in the same period in 2008. Valuation adjustments associated with mortgage loans payable are highly dependent upon interest rates, spreads, investment return demands, the performance of the underlying real estate investment, and where applicable, foreign exchange. Of the $7.4 million unrealized loss, $13.8 million was primarily due to changes in management’s evaluation of the assumptions related to interest rate spreads, risk premiums, and increased returns on net equity demanded by the market associated with the performance of the Account’s underlying properties. Foreign exchange fluctuations offset these losses (due to a stronger U.S. dollar during the third quarter of 2009) and accounted for an unrealized gain of approximately $6.4 million.
During the three months ended September 30, 2009, the Account sold one retail property investment for a sales price of approximately $22.0 million and realized a loss of $12.7 million.
40
During the three months ended September 30, 2008, the Account also sold one office portfolio investment for a sales price of $22.0 million, and realized a loss of approximately $14.3 million.
Liquidity and Capital Resources
As of September 30, 2009 and 2008, the Account’s liquid assets (i.e., cash, marketable securities, and receivables for short-term securities sold) had a value of $0.4 billion and $1.9 billion, respectively (approximately 4.0% and 11.7% of the Account’s total investments at such dates, respectively). The decrease in the Account’s liquid assets as of September 30, 2009 compared to September 30, 2008 was due primarily to sustained net participant transfers out of the Account since early 2008 and in particular, during the six months ended December 31, 2008. When compared to December 31, 2008, the Account’s liquid assets have remained relatively stable as a result of Liquidity Units (accumulation units purchased by TIAA are generally referred to as Liquidity Units) purchased by TIAA during the first half of 2009 to respond to net participant transfer activity out of the Account during this period.
During the nine months ended September 30, 2009, the Account received $534.8 million in premiums and had an outflow of $1.7 billion in net participant transfers to TIAA, the CREF accounts, and TIAA-CREF affiliated mutual funds (excluding the $1.1 billion of purchases of Liquidity Units by TIAA), while, during the nine months ended September 30, 2008, the Account received $793.0 million in premiums and had an outflow of $2.4 billion in net participant transfers to TIAA, the CREF accounts, and TIAA-CREF affiliated mutual funds. During the three months ended September 30, 2009, the Account received $164.9 million in premiums and had an outflow of $297.6 million in net participant transfers to TIAA, the CREF accounts, and TIAA-CREF affiliated mutual funds, while, during the three months ended September 30, 2008, the Account received $242.9 million in premiums and had an outflow of $1.4 billion in net participant transfers to TIAA, the CREF accounts, and TIAA-CREF affiliated mutual funds.
Primarily as a result of significant net participant transfers, on December 24, 2008, pursuant to TIAA’s existing liquidity guarantee obligation, the TIAA general account purchased $155.6 million of Liquidity Units issued by the Account. Subsequent to December 24, 2008 and through June 1, 2009, the TIAA general account has purchased an additional $1.059 billion in the aggregate of Liquidity Units in a number of separate transactions. During the period June 1, 2009 through November 13, 2009, the TIAA general account did not purchase any Liquidity Units. As disclosed under “Establishing and Managing the Account—the Role of TIAA—Liquidity Guarantee” in the Account’s prospectus, in accordance with this liquidity guarantee obligation, TIAA guarantees that all participants in the Account may redeem their accumulation units at their accumulation unit value next determined after their transfer or cash withdrawal request is received in good order. While net redemption activity has significantly slowed since the first quarter of 2009, management cannot predict the extent to which future TIAA Liquidity Unit purchases, if any, will be required under this liquidity guarantee, nor can management predict when such Liquidity Units will be redeemed by the Account in part, or in full. Management believes that TIAA has the ability to meet its obligations under this liquidity guarantee.
TIAA’s obligation to provide Account participants liquidity through purchases of Liquidity Units is not subject to an express regulatory or contractual limitation, although as described in the paragraph below, the independent fiduciary may (but is not obligated to) require the reduction of TIAA’s interest through sales of assets from the Account if TIAA’s interest exceeds the trigger point. Even if the independent fiduciary so requires, TIAA’s obligation to provide liquidity under the guarantee, which is required by the New York State Insurance Department, will continue. While the independent fiduciary is vested with oversight and approval over any redemption of TIAA’s Liquidity Units, it is expected that, unless the trigger point has been reached, redemptions of TIAA owned Liquidity Units would occur once the Account has experienced net participant inflows for an extended period of time and maintains an adequate level of cash or liquid investments.
Whenever TIAA owns Liquidity Units, the duties of the Account’s independent fiduciary, as part of its monitoring of the Account, include reviewing the purchase and redemption of Liquidity Units by TIAA to ensure the Account uses the correct accumulation unit values. In addition, the independent fiduciary’s responsibilities include:
|
• | | | | establishing the percentage of total accumulation units that TIAA’s ownership should not exceed (the “trigger point”) and creating a method for reviewing the trigger point; |
41
|
• | | | | approving any adjustment of TIAA’s ownership interest in the Account and, in its discretion, requiring an adjustment if TIAA’s ownership of Liquidity Units reaches the trigger point; and |
|
• | | | | once the trigger point has been reached, participating in a program, if any, to reduce TIAA’s ownership in the Account by utilizing cash flow or liquid investments in the Account, or by utilizing the proceeds from asset sales. If the independent fiduciary were to determine that TIAA’s ownership should be reduced following the trigger point, its role in participating in any asset sales program would include (i) participating in the selection of properties for sale, (ii) providing sales guidelines and (iii) approving those sales if, in the independent fiduciary’s opinion, such sales are desirable to reduce TIAA’s ownership of Liquidity Units. |
As of the date of this Form 10-Q, the independent fiduciary, which has the right to adjust the trigger point, has established the trigger point at 45% of the outstanding accumulation units and it will continue to monitor TIAA’s ownership interest in the Account and provide further recommendations as necessary. As of September 30, 2009, TIAA owned 11.8% of the outstanding accumulation units of the Account. In establishing the appropriate trigger point, including whether or not to require certain actions once the trigger point has been reached, the independent fiduciary will assess, among other things and to the extent consistent with the Prohibited Transaction Exemption (PTE 96-76) issued by the U.S. Department of Labor in 1996 with respect to the liquidity guarantee and the independent fiduciary’s duties under ERISA, the risk that a conflict of interest could arise due to the level of TIAA’s ownership interest in the Account.
Management continues to believe that the significant recent net negative outflow may be a reflection of participant concerns with the downturn in the U.S. and global economy, the turmoil in the capital and credit markets, and their current and potential future net effect on commercial real estate in particular. While net outflow activity has decreased significantly over the past six months, management cannot predict whether the net outflows will continue at an increasingly higher rate, or at all in the future. If net outflows were to continue at the same or at a higher rate, it could have a negative impact on the Account’s operations and returns. Additionally, continued net outflow activity could require TIAA to purchase additional Liquidity Units, perhaps to a significant degree.
The Account’s net investment income continues to be an additional source of liquidity for the Account even though it has decreased from $427.5 million for the nine months ended September 30, 2008 to $385.4 million for the nine months ended September 30, 2009.
While the Account’s liquid investments have dropped below 15% of its total investments during this recent period of significant net participant outflows, the Account’s investment strategy remains to invest between 75% and 85% of its assets directly in real estate or real estate-related investments with the goal of producing favorable long-term returns primarily through rental income and appreciation. In the near term, the Account’s cash and marketable securities will likely comprise less than 10% of the Account’s investments, but management intends to increase the Account’s holdings in cash and short-term marketable securities to the extent practicable, consistent with its investment strategy and objective.
The Account’s liquid assets continue to be available to purchase additional suitable real estate properties and to meet the Account’s debt obligations, expense needs and participant redemption requests (i.e., cash withdrawals, benefit payments, or transfers). The Account’s debt maturities in 2010 for wholly- owned and investments in joint ventures are approximately $739 million. Management believes that the Account will have the ability to address these obligations in a number of ways, including among others, refinancing such debt or repaying the principal due at maturity.
Leverage
The Account, under certain conditions more fully described in the Account’s prospectus (as supplemented from time to time), dated May 1, 2009 under “Borrowing", may borrow money and assume or obtain a mortgage on a property (i.e., to make leveraged real estate investments). Also, to meet any short- term cash needs, the Account may obtain a line of credit that may be unsecured and/or contain terms that may require the Account to secure the loan with one or more of its properties.
The Account’s investment guidelines as in effect on September 30, 2009 and which remained in place until November 1, 2009, provided that the Account may not incur indebtedness such that the ratio of the Account’s outstanding debt to the Account’s total net asset value exceeds 30%, measured at the time of
42
incurrence. Under the Account’s investment guidelines effective as of November 1, 2009, the Account is authorized to incur and/or maintain indebtedness on its properties in an aggregate principal amount not to exceed the aggregate principal amount of debt outstanding as of the date of adoption of such guidelines (approximately $4.0 billion). Also, at the time the Account (or a joint venture in which the Account is a partner) enters into a revolving line of credit, management deems the maximum amount which may be drawn under that line of credit as fully incurred, regardless of whether the maximum amount available has been drawn from time to time. Such incurrences of debt from time to time may include:
| | | placing new debt on properties; | |
• | | | | refinancing outstanding debt; |
|
• | | | | assuming debt on acquired properties or interests in the Account’s properties; and/or |
|
• | | | | extending the maturity date of outstanding debt. |
In calculating this limit, only the Account’s actual percentage interest in any borrowings is included, and not that of any joint venture partner. Further, the Account may only borrow up to 70% of the then-current value of a property, although construction loans may be for 100% of the costs incurred in developing a property. As of September 30, 2009 the Account did not have any construction loans.
In addition, by December 31, 2011, management intends to reduce the Account’s ratio of outstanding principal amount of debt to total gross asset value (i.e., a “loan to value ratio”) to be 30% or less and thereafter intends to maintain its loan to value ratio at or below 30% (measured at the time of incurrence and after giving effect thereto).
As of September 30, 2009, the Account’s total borrowings on a loan to value ratio was approximately 32.1%. The Account’s total borrowings (on a fair value basis), including debt on the Account’s wholly owned investments and the Account’s share of debt on investments in joint ventures (including the undrawn principal portion of a line of credit), represented 44.6% of the Account’s Total Net Assets.
Recent Transactions
The following describes property transactions by the Account in the third quarter of 2009. Except as noted, the expenses for operating the properties purchased are either borne or reimbursed, in whole or in part, by the property tenants, although the terms vary under each lease. The Account is responsible for operating expenses not reimbursed under the terms of a lease. All rental rates are quoted on an annual basis unless otherwise noted.
Purchases
None.
Sales
The Market at Southpark—Littleton, CO
On August 11, 2009, the Account sold a retail complex in Littleton, Colorado for a sales price of approximately $22.0 million and realized a loss of approximately $12.7 million. The Account purchased the property investment on September 17, 2004. The original investment in this property was $33.4 million. At the time of sale, the property had a fair value of $22.3 million and a cost to date of $34.7 million according to the records of the Account.
Financings
None.
43
Critical Accounting Policies
The financial statements of the Account are prepared in conformity with accounting principles generally accepted in the United States of America.
In preparing the Account’s financial statements, management is required to make estimates and judgments that affect the reported amounts of assets, liabilities, revenues, and expenses. Management bases its estimates on historical experience and assumptions that are believed to be reasonable under the circumstances, the results of which form the basis for making judgments about the carrying value of assets and liabilities that are not readily apparent from other sources. Actual results may differ from these estimates.
Accounting for Investments at Fair Value
Accounting for Investments at Fair Value:The Financial Accounting Standards Board (“FASB”) has provided authoritative guidance for fair value measurements and disclosures. Additionally, the guidance defines fair value, establishes a framework for measuring fair value under generally accepted accounting principles in the United States, and requires certain disclosures about fair value measurements. This guidance indicates, among other things, that a fair value measurement under an exit price model assumes that the transaction to sell an asset or transfer a liability occurs in the principal market for the asset or liability or, in the absence of a principal market, the most advantageous market for the asset or liability.
This guidance also permits entities to elect to measure financial instruments and for certain financial assets and liabilities at fair value and expanded the use of fair value measurements when warranted. The Account reports all investments and mortgage loans payable at fair value.
Valuation Hierarchy:The Account groups financial assets and certain financial liabilities measured at fair value into three levels, based on the markets in which the assets and liabilities are traded, if any, and the observability of the assumptions used to determine fair value. These levels are:
Level 1—Valuations using unadjusted quoted prices for assets traded in active markets, such as stocks listed on the New York Stock Exchange. Active markets are defined as having the following characteristics for the measured asset or liability: (i)many transactions, (ii) current prices, (iii) price quotes not varying substantially among market makers, (iv) narrow bid/ask spreads and (v) most information regarding the issuer is publicly available. Level 1 assets which may be held by the Account from time to time include Real Estate related Marketable Securities (such as publicly traded REIT stocks).
Level 2—Valuations for assets and liabilities traded in less active, dealer or broker markets. Fair values are primarily obtained from third party pricing services for identical or comparable assets or liabilities. Level 2 inputs for fair value measurements are inputs, other than quoted prices included within Level 1, that are observable for the asset or liability, either directly or indirectly. Level 2 inputs include:
|
a. | | | | Quoted prices for similar assets or liabilities in active markets; |
|
b. | | | | Quoted prices for identical or similar assets or liabilities in markets that are not active (that is, markets in which there are few transactions for the asset (or liability), the prices are not current, price quotations vary substantially either over time or among market makers (for example, some brokered markets), or in which little information is released publicly); |
|
c. | | | | Inputs other than quoted prices that are observable within the market for the asset (or liability) (for example, interest rates and yield curves, volatilities, prepayment speeds, loss severities, credit risks, and default rates that are observable at commonly quoted intervals); and |
|
d. | | | | Inputs that are derived principally from or corroborated by observable market data by correlation or other means (for example, market-corroborated inputs). |
Examples of securities which may be held by the account and included in Level 2 include Certificate of Deposits, Commercial Paper, Government Agency Bonds and Variable Notes.
Level 3—Valuations for assets and liabilities that are derived from other valuation methodologies, including pricing models, discounted cash flow models and similar techniques, and are not based on market exchange, dealer, or broker-traded transactions. Level 3 valuations incorporate certain assumptions and projections that are not observable in the market, and require significant professional judgment in
44
determining the fair value assigned to such assets or liabilities. Examples of Level 3 assets and liabilities which may be held by the Account from time to time include investments in real estate, investments in joint ventures and limited partnerships, mortgage loan receivable and mortgage loans payable.
An investment’s categorization within the valuation hierarchy described above is based upon the lowest level of input that is significant to the fair value measurement.
The Account’s investments and mortgage loans payable are stated at fair value. Fair value is based upon quoted market prices, where available. If listed prices or quotes are not available, fair value is based upon vendor-provided, evaluated prices or internally-developed models that primarily use market-based or independently-sourced market data, including interest rate yield curves, market spreads, and currency rates. Valuation adjustments will be made to reflect changes in credit quality, counterparty’s creditworthiness, the Account’s creditworthiness, liquidity, and other observable and unobservable inputs that are applied consistently over time.
The methods described above are considered to produce fair values that represent a good faith estimate of what an unaffiliated buyer in the marketplace would pay to purchase the asset or would receive to transfer the liability. Since fair value calculations involve significant professional judgment in the application of both observable and unobservable attributes, actual realizable values or future fair values may differ from amounts reported. Furthermore, while the Account believes its valuation methods are appropriate and consistent with other market participants, the use of different methodologies or assumptions to determine the fair value of certain financial instruments, while reasonable, could result in different estimates of fair value at the reporting date.
The following is a description of the valuation methodologies used for investments measured at fair value.
Valuation of Real Estate Properties
Investments in real estate properties are stated at fair value, as determined in accordance with policies and procedures reviewed by the Investment Committee of the Board and in accordance with the responsibilities of the Board as a whole. Accordingly, the Account does not record depreciation. The Account’s real estate properties are generally classified within Level 3 of the valuation hierarchy. Fair value for real estate properties is defined as the most probable price for which a property will sell in a competitive market under all conditions requisite to a fair sale. Determination of fair value involves judgment because the actual market value of real estate can be determined only by negotiation between the parties in a sales transaction. The Account’s primary objective when valuing its real estate investments will be to produce a valuation that represents a fair and accurate estimate of the fair value of its investments. Implicit in the Account’s definition of fair value is the consummation of a sale as of a specified date and the passing of title from seller to buyer under conditions whereby:
|
• | | | | Buyer and seller are typically motivated; |
|
• | | | | Both parties are well informed or well advised, and acting in what they consider their best interests; |
|
• | | | | A reasonable time is allowed for exposure in the open market; |
|
• | | | | Payment is made in terms of cash or in terms of financial arrangements comparable thereto; and |
|
• | | | | The price represents the normal consideration for the property sold unaffected by special or creative financing or sales concessions granted by anyone associated with the sale. |
Property and investment values are affected by, among other things, the availability of capital, occupancy rates, rental rates, and interest and inflation rates. As a result, determining real estate and investment values involves many assumptions. Amounts ultimately realized from each investment may vary significantly from the market value presented. Actual results could differ significantly from those estimates.
Real estate properties owned by the Account are initially valued based on an independent appraisal at the time of the closing of the purchase, which may result in a potential unrealized gain or loss reflecting the difference between an investment’s fair value (i.e., exit price) and its cost basis (which is inclusive of transaction costs).
45
Subsequently, each property is appraised each quarter by an independent external appraiser. In general, the Account obtains appraisals of its real estate properties spread out throughout the quarter, which is intended to result in appraisal adjustments, and thus, adjustments to the valuations of its holdings (to the extent such adjustments are made) that happen regularly throughout each quarter and not on one specific day in each period.
Further, management reserves the right to order an appraisal and/or conduct another valuation outside of the normal quarterly process when facts or circumstances at a specific property change. For example, under certain circumstances, a valuation adjustment could be made when bids are obtained for properties held for sale by the Account or when a contract for the sale of a property is executed. In addition, adjustments may be made for events or circumstances indicating an impairment of a tenant’s ability to pay amounts due to the Account under a lease (including bankruptcy filing of that tenant). TIAA’s internal appraisal staff oversees the entire appraisal process, in conjunction with the Account’s independent fiduciary (the independent fiduciary is more fully described in the paragraph below). Any differences in the conclusions of TIAA’s internal appraisal staff and the independent appraiser will be reviewed by the independent fiduciary, which will make a final determination on the matter (which may include ordering a subsequent independent appraisal).
An independent fiduciary, Real Estate Research Corporation, has been appointed by a special subcommittee of the Investment Committee of the Board to, among other things, oversee the appraisal process. The independent fiduciary must approve all independent appraisers used by the Account. All appraisals are performed in accordance with Uniform Standards of Professional Appraisal Practices (“USPAP”), the real estate appraisal industry standards created by The Appraisal Foundation. Real estate appraisals are estimates of property values based on a professional’s opinion. Appraisals of properties held outside of the U.S. are performed in accordance with industry standards commonly applied in the applicable jurisdiction. These independent appraisers are always expected to be MAI-designated members of the Appraisal Institute (or its European equivalent, RICS) and state certified appraisers from national or regional firms with relevant property type experience and market knowledge.
Also, the independent fiduciary can require additional appraisals if factors or events have occurred that could materially change a property’s value and such change is not reflected in the quarterly valuation review, or otherwise to ensure that the Account is valued appropriately. The independent fiduciary must also approve any valuation change of real estate related assets where a property’s value changed by more than 6% from the most recent independent annual appraisal, or if the value of the Account would change by more than 4% within any calendar quarter or more than 2% since the prior calendar month. When a real estate property is subject to a mortgage, the mortgage is valued independently of the property and its fair value is reported separately. The independent fiduciary reviews and approves all mortgage valuation adjustments before such adjustments are recorded by the Account. The Account continues to use the revised value for each real estate property and mortgage loan payable to calculate the Account’s daily net asset value until the next valuation review or appraisal.
Valuation of Real Estate Joint Ventures and Limited Partnerships
Real estate joint ventures are stated at the fair value of the Account’s ownership interests of the underlying entities. The Account’s ownership interests are valued based on the fair value of the underlying real estate, any related mortgage loans payable, and other factors, such as ownership percentage, ownership rights, buy/sell agreements, distribution provisions and capital call obligations. Upon the disposition of all real estate investments by an investee entity, the Account will continue to state its equity in the remaining net assets of the investee entity during the wind down period, if any, which occurs prior to the dissolution of the investee entity. The Account’s real estate joint ventures are generally classified within level 3 of the valuation hierarchy.
Limited partnership interests for which market quotations are not readily available are valued at fair value as determined in good faith under the direction of the Investment Committee of the Board and in accordance with the responsibilities of the Board as a whole. These investments are generally classified within level 3 of the valuation hierarchy.
46
Valuation of Marketable Securities
Equity securities listed or traded on any national market or exchange are valued at the last sale price as of the close of the principal securities market or exchange on which such securities are traded or, if there is no sale, at the mean of the last bid and asked prices on such market or exchange, exclusive of transaction costs. Such marketable securities are generally classified within level 1 of the valuation hierarchy.
Debt securities, other than money market instruments, are generally valued at the most recent bid price or the equivalent quoted yield for such securities (or those of comparable maturity, quality and type). Money market instruments, with maturities of one year or less, are valued in the same manner as debt securities or derived from a pricing matrix. Debt securities are generally classified within level 2 of the valuation hierarchy.
Equity and fixed income securities traded on a foreign exchange or in foreign markets are valued using their closing values under the valuation methods generally accepted in the country where traded, as of the valuation date. This value is converted to U.S. dollars at the exchange rate in effect on the valuation day. Under certain circumstances (for example, if there are significant movements in the United States markets and there is an expectation the securities traded on foreign markets will adjust based on such movements when the foreign markets open the next day), the Account may adjust the value of equity or fixed income securities that trade on a foreign exchange or market after the foreign exchange or market has closed. Equity securities traded on a foreign exchange or in foreign markets are generally classified within level 1 of the valuation hierarchy. Fixed income securities traded on a foreign exchange or in foreign markets are generally classified within level 2 of the valuation hierarchy. Equity and fixed income securities traded in foreign markets that are adjusted based upon significant movements in the United States markets are generally classified within level 2 of the valuation hierarchy.
Valuation of Mortgage Loan Receivable
The mortgage loan receivable is stated at fair value. The mortgage loan receivable is valued based on market factors, such as market interest rates and spreads for comparable loans, and the performance of the underlying collateral. The Account’s mortgage loan receivable is classified within level 3 of the valuation hierarchy.
Valuation of Mortgage Loans Payable
Mortgage loans payable are stated at fair value. The estimated fair value of mortgage loans payable is based on the amount at which the liability could be transferred exclusive of transaction costs. Mortgage loans payable are valued based on market factors, such as market interest rates and spreads for comparable loans, the performance of the underlying collateral, and the credit quality of the Account. The Account’s mortgage loans payable are generally classified within level 3 of the valuation hierarchy. Interest expense for mortgage loans payable is recorded on the accrual basis taking into account the outstanding principal and contractual interest rates.
Foreign currency transactions and translation
Portfolio investments and other assets and liabilities denominated in foreign currencies are translated into U.S. dollars at the exchange rates prevailing at the end of the period. Purchases and sales of securities, income receipts and expense payments made in foreign currencies are translated into U.S. dollars at the exchange rates prevailing on the respective dates of the transactions. The effect of any changes in foreign currency exchange rates on portfolio investments and mortgage loans payable is included in net realized and unrealized gains and losses on investments and mortgage loans payable. Net realized gains and losses on foreign currency transactions include disposition of foreign currencies, and currency gains and losses between the accrual and receipt dates of portfolio investment income and between the trade and settlement dates of portfolio investment transactions and, when applicable, include maturities of forward foreign currency contracts.
47
Accumulation and Annuity Funds
The Accumulation Fund represents the net assets attributable to participants in the accumulation phase of their investment (“Accumulation Fund”). The Annuity Fund represents the net assets attributable to the participants currently receiving annuity payments (“Annuity Fund”). The net increase or decrease in net assets from investment operations is apportioned between the accounts based upon their relative daily net asset values. Once an Account participant begins receiving lifetime annuity income benefits, monthly payment levels cannot be reduced as a result of the Account’s adverse mortality experience. In addition, the contracts pursuant to which the Account is offered are required to stipulate the maximum expense charge for all Account-level expenses that can be assessed, which is equal to 2.50% of average net assets per year. The Account pays a fee to TIAA to assume these mortality and expense risks.
Accounting for Investments
Real estate transactions are accounted for as of the date on which the purchase or sale transactions for the real estate properties close (settlement date). The Account recognizes a realized gain on the sale of a real estate property to the extent that the contract sales price exceeds the cost-to-date of the property being sold. A realized loss occurs when the cost-to-date exceeds the sales price. Any accumulated unrealized gains and losses are reversed in the calculation of realized gains and losses.
Rent from real estate properties consists of all amounts earned under tenant operating leases, including base rent, recoveries of real estate taxes and other expenses and charges for miscellaneous services provided to tenants. Rental income is recognized in accordance with the billing terms of the lease agreements. The Account bears the direct expenses of the real estate properties owned. These expenses include, but are not limited to, fees to local property management companies, property taxes, utilities, maintenance, repairs, insurance, and other operating and administrative costs. An estimate of the net operating income earned from each real estate property is accrued by the Account on a daily basis and such estimates are adjusted when actual operating results are determined.
The Account has limited ownership interests in various real estate funds (limited partnerships and one limited liability corporation) and a private real estate investment trust (collectively, the “limited partnerships”). The Account records its contributions as increases to the investments, and distributions from the investments are treated as either income or return of capital, as determined by the management of the limited partnerships. Unrealized gains and losses are calculated and recorded when the financial statements of the limited partnerships are received by the Account. As circumstances warrant, prior to the receipt of financial statements of the limited partnership, the Account will estimate the value of its interests in good faith and will from time to time seek input from the issuer or the sponsor of the investment vehicle. Changes in value based on such estimates are recorded by the Account as unrealized gains and losses.
Income from real estate joint ventures is recorded based on the Account’s proportional interest of the income distributed by the joint venture. Income earned by the joint venture, but not yet distributed to the Account by the joint venture investment, is recorded as unrealized gains and losses on real estate joint ventures.
Transactions in marketable securities are accounted for as of the date the securities are purchased or sold (trade date). Interest income is recorded as earned. Dividend income is recorded on the ex-dividend date or as soon as the Account is informed of the dividend. Realized gains and losses on securities transactions are accounted for on the specific identification method.
New Accounting Pronouncements
In June 2007, the Accounting Standards Executive Committee (“AcSEC”) of the American Institute of Certified Public Accountants (“AICPA”) issued a Statement of Position (“SOP”) which clarifies which entities are required to apply the provisions of the Investment Companies Audit and Accounting Guide (“Guide”) and provides guidance on accounting by parent companies and equity method investors for investments in investment companies. In February 2008, FASB indefinitely delayed the effective date of the SOP to allow time to consider significant issues related to the implementation of the SOP.
In February 2009, the Emerging Issues Task Force (“EITF”) added an issue to their agenda related to the application of the Investment Company Guide by Real Estate Investment Companies, which will be
48
discussed at a future meeting. The FASB staff anticipates the creation of a Working Group to assist the EITF in addressing this issue. Management of the Account will continue to monitor FASB and EITF developments and will evaluate the financial reporting implications to the Account, as necessary.
In December 2007, FASB issued new accounting guidance on business combinations. The new guidance establishes principles and requirements for how the acquirer shall recognize and measure in its financial statements the identifiable assets acquired, liabilities assumed, any noncontrolling interest in the acquiree and goodwill acquired in a business combination or a gain from a bargain purchase. It is expected that more transactions will constitute a business under the new guidance. These revisions are effective for business combinations for which the acquisition date is on or after the beginning of the first annual reporting period beginning on or after December 15, 2008. The Account reports all investments in real estate at fair value and therefore does not account for the acquisition of real estate investments as a business combination.
In December 2007, FASB issued new accounting guidance that establishes and expands accounting and reporting standards for minority interests, which will be recharacterized as noncontrolling interests in a subsidiary and the accounting for the deconsolidation of a subsidiary. The revised reporting standards for noncontrolling interests in a subsidiary are effective for fiscal years beginning on or after December 15, 2008, and did not impact the financial position or results of operations of the Account.
In April 2009, FASB issued additional guidance for determining fair value when the volume of activity for an asset or liability have significantly decreased. This additional guidance also provides direction on identifying circumstances that indicate a transaction is not orderly. This additional guidance is effective for periods ending after June 15, 2009 with early adoption permitted. The adoption did not have a material impact to the financial position or results of operations of the Account.
In May 2009, FASB issued new accounting guidance that establishes and expands accounting and disclosure requirements of subsequent events. A reporting entity is required to disclose the date through which an entity has evaluated subsequent events and the basis for that date. The revised reporting standards are effective for interim and annual reporting periods ending after June 15, 2009. This adoption did not have a material impact on the financial statements or results of operations of the Account. The required disclosure of the date through which subsequent events has been evaluated is provided in Note 10 of the Notes to the Financial Statements.
In June 2009, the FASB issued Statement of Financial Accounting Standards No. 167, Amendments to FASB Interpretation No. 46(R), which amends guidance related to the identification of a variable interest entity, variable interests, the primary beneficiary, and expands required note disclosures to provide greater transparency to the users of financial statements. This standard is effective on January 1, 2010 and management of the Account is currently evaluating the impact of adopting this standard.
In June 2009, FASB Accounting Standards Codification (“Codification”) was established as the source of authoritative accounting principles to be applied with equal authority by nongovernmental entities in the preparation of financial statements in conformity with U.S. GAAP. Codification was effective for financial statements issued for reporting periods ending after September 15, 2009 and the related changes have been reflected in the September 30, 2009 financial statements and footnotes.
In August 2009, the FASB issued Accounting Standards Update (“ASU”) No. 2009-05, “Measuring Liabilities at Fair Value.” This ASU clarifies the application of certain valuation techniques in circumstances in which a quoted price in an active market for the identical liability is not available and clarifies that inputs to the valuation should not be adjusted when estimating the fair value of a liability in which contractual terms restrict transferability. This ASU becomes effective on October 1, 2009. The Account is evaluating the impact of adopting this ASU and anticipates that it will not have a significant impact to the Account’s financial position or results of operations.
In September 2009, the FASB issued ASU No. 2009-12, “Investments in Certain Entities That Calculate Net Asset Value per Share (or Its Equivalent).” This ASU permits, as a practical expedient, an investor the ability to estimate the fair value of an investment in certain entities on the basis of the net asset value per share of the investment (or its equivalent) determined as of the reporting entity’s measurement date. The investee must satisfy specific requirements before the investor is permitted to utilize this practical expedient as a method of valuation. The amendments in this ASU are effective for interim and annual periods ending after December 15, 2009. Early application is permitted. The Account is currently evaluating the impact of
49
adopting this ASU and anticipates that it will not have a significant impact to the Account’s financial position or results of operations.
ITEM 3. QUANTITATIVE AND QUALITATIVE DISCLOSURES ABOUT MARKET RISK.
The Account’s real estate holdings, including real estate joint ventures and limited partnerships, which, as of September 30, 2009, represented 95.5% of the Account’s total investments, expose the Account to a variety of risks. These risks include, but are not limited to:
|
• | | | | General Real Estate Risk—The risk that the Account’s property values or rental and occupancy rates could go down due to general economic conditions, a weak market for real estate generally, disruptions in the credit and/or capital markets, or changing supply and demand for certain types of properties; |
|
• | | | | Appraisal Risk—The risk that the sale price of an Account property (i.e., the value that would be determined by negotiations between independent parties) might differ substantially from its estimated or appraised value, leading to losses or reduced profits to the Account upon sale; |
|
• | | | | Risk Relating to Property Sales—The risk that the Account might not be able to sell a property at a particular time for its full value, particularly in a poor market. This might make it difficult to raise cash quickly and also could lead to Account losses; |
|
• | | | | Risks of Borrowing—The risk that interest rate changes may impact Account returns if the Account takes out a mortgage on a property, buys a property subject to a mortgage or holds a property subject to a mortgage; and |
|
• | | | | Foreign Currency Risk—The risk that the value of the Account’s foreign investments, related debt, or rental income could increase or decrease due to changes in foreign currency exchange rates or foreign currency exchange control regulations, and hedging against such changes, if undertaken by the Account, may entail additional costs and be unsuccessful. |
Given the significant concentration (95.5% as of September 30, 2009) of the Account’s total investments being held in real estate and real estate related assets, the Account’s net asset value will experience a more pronounced impact from valuation adjustments to its real properties than it would during periods in which the Account held between 75% and 85% of its investments in real estate and real estate related assets. The Account believes the diversification of its real estate portfolio, both geographically and by sector, along with its quarterly valuation procedure, helps manage the real estate and appraisal risks described above.
As of September 30, 2009, 4.5% of the Account’s total investments were comprised of marketable securities and an adjustable rate mortgage loan receivable. As of September 30, 2009, marketable securities include high-quality short-term debt instruments (i.e., commercial paper and government agency notes). The Statement of Investments for the Account sets forth the general financial terms of these instruments, along with their fair values, as determined in accordance with procedures described in Note 1 to the Account’s financial statements. The Account’s marketable securities other than its mortgage loan receivable are considered held for trading purposes. Currently, the Account does not invest in derivative financial investments, nor does the Account engage in any hedging activity other than the interest rate cap agreements contained in two mortgage loans payable the Account entered into during the third quarter of 2008. These interest rate cap agreements (which cap the interest rate on each mortgage loan payable at 6.50%) are discussed in Note 7 to the Account’s financial statements contained herein.
The Account’s investments in cash equivalents, marketable securities (whether debt or equity), and mortgage loans receivable are subject to the following general risks:
|
• | | | | Financial/Credit Risk—The risk, for debt securities, that the issuer will not be able to pay principal and interest when due (and/or declare bankruptcy or be subject to receivership) and, for equity securities such as common or preferred stock, that the issuer’s current earnings will fall or that its overall financial soundness will decline, reducing the security’s value. |
|
• | | | | Market Volatility Risk—The risk that the Account’s investments will experience price volatility due to changing conditions in the financial markets regardless of the credit quality or financial condition of the underlying issuer. This risk is particularly acute to the extent the Account holds equity securities, |
50
| | | | which have experienced significant short-term price volatility over the past year. Also, to the extent the Account holds debt securities; changes in overall interest rates can cause price fluctuations. |
|
• | | | | Interest Rate Volatility—The risk that interest rate volatility may affect the Account’s current income from an investment. |
|
• | | | | Deposit/Money Market Risk—The risk that, to the extent the Account’s cash held in bank deposit accounts exceeds federally insured limits as to that bank, the Account could experience losses if banks fail. The Account does not believe it has exposure to significant concentration of deposit risk. In addition, there is some risk that investments held in money market accounts can suffer losses. |
In addition, to the extent the Account were to hold mortgage-backed securities (including commercial mortgage-backed securities (“CMBS”), these securities are subject to prepayment risk or extension risk (i.e., the risk that borrowers will repay the loans earlier or later than anticipated). If the underlying mortgage assets experience faster than anticipated repayments of principal, the Account could fail to recoup some or all of its initial investment in these securities, since the original price paid by the Account was based in part on assumptions regarding the receipt of interest payments. If the underlying mortgage assets are repaid later than anticipated, the Account could lose the opportunity to reinvest the anticipated cash flows at a time when interest rates might be rising. The rate of prepayment depends on a variety of geographic, social and other functions, including prevailing market interest rates and general economic factors. The market value of these securities is also highly sensitive to changes in interest rates. Note that the potential for appreciation, which could otherwise be expected to result from a decline in interest rates, may be limited by any increased prepayments. These securities may be harder to sell than other securities.
In addition to these risks, real estate equity securities (such as REIT stocks) and mortgage-backed securities would be subject to many of the same general risks inherent in real estate investing, making mortgage loans and investing in debt securities.
Other risks inherent to, and associated with, the acquisition, ownership and sale of real estate and real estate related investments and other investments the Account makes from time to time are detailed elsewhere in this Form 10-Q, including in Part I, Item 2. “Management’s Discussion and Analysis of Financial Condition and Results of Operations” and the risk factors discussed in both “Item 1A. Risk Factors” in the Form 10-K and in Part II, Item 1A, in the Account’s Form 10-Q for its quarter ended March 31, 2009.
ITEM 4. CONTROLS AND PROCEDURES.
(a) The registrant maintains a system of disclosure controls and procedures that are designed to provide reasonable assurance that information required to be disclosed in the registrant’s reports under the Securities Exchange Act of 1934, as amended (the “Exchange Act”), is recorded, processed, summarized and reported within the time periods specified in the SEC’s rules and forms, and that such information is accumulated and communicated to management, including the registrant’s Chief Executive Officer and the Chief Financial Officer, as appropriate, to allow timely decisions regarding required disclosure.
Under the supervision and participation of the registrant’s management, including the registrant’s CEO and CFO, the registrant conducted an evaluation of the effectiveness of the registrant’s disclosure controls and procedures as defined in Rule 13a-15(e) under the Exchange Act as of September 30, 2009. Based upon management’s review, the CEO and the CFO concluded that the registrant’s disclosure controls and procedures were effective as of September 30, 2009.
(b)Changes in internal control over financial reporting. There have been no changes in the registrant’s internal control over financial reporting that occurred during the registrant’s last fiscal quarter that materially affected, or are reasonably likely to materially affect, the registrant’s internal control over financial reporting.
51
PART II. OTHER INFORMATION
ITEM 1. LEGAL PROCEEDINGS.
There are no material legal proceedings to which the Account is a party, or to which the Account’s assets are subject.
ITEM 1A. RISK FACTORS.
There have been no material changes from our risk factors as previously reported in the Account’s Annual Report on Form 10-K for the year ended December 31, 2008, as updated in the Account’s Quarterly Report on Form 10-Q for the three months ended March 31, 2009.
ITEM 2. UNREGISTERED SALES OF EQUITY SECURITIES AND USE OF PROCEEDS.
Not applicable.
ITEM 3. DEFAULTS UPON SENIOR SECURITIES.
Not applicable.
ITEM 4. SUBMISSION OF MATTERS TO A VOTE OF SECURITY HOLDERS.
Not applicable.
ITEM 5. OTHER INFORMATION.
The Code of Ethics for TIAA’s senior financial officers, including its principal executive officer, principal financial officer, principal accounting officer, or controller, and persons performing similar functions, has been filed as an exhibit to the Form 10-K and can also be found on the following two web sites, http://www.tiaa-cref.org/prospectuses/index.html and http://www.tiaa-cref.org/about/governance/corporate/
topics/annual_reports.html. Information included in such websites is expressly not incorporated by reference into this Quarterly Report on Form 10-Q.
52
ITEM 6. EXHIBITS
| | | | |
(1) | | (A) | | Distribution Agreement for the Contracts Funded by the TIAA Real Estate Account, dated as of January 1, 2008, by and among Teachers Insurance and Annuity Association of America, for itself and on behalf of the Account, and TIAA-CREF Individual & Institutional Services, LLC.(5) |
(3) | | (A) | | Charter of TIAA.(9) |
| | (B) | | Restated Bylaws of TIAA (as amended).(10) |
(4) | | (A) | | Forms of RA, GRA, GSRA, SRA, IRA Real Estate Account Endorsements(2), Keogh Contract,(3) Retirement Select and Retirement Select Plus Contracts and Endorsements1 and Retirement Choice and Retirement Choice Plus Contracts.(3) |
| | (B) | | Forms of Income-Paying Contracts(2) |
(10) | | (A) | | Independent Fiduciary Agreement, dated February 22, 2006, by and among TIAA, the Registrant, and Real Estate Research Corporation(4) |
| | (B) | | Amendment to Independent Fiduciary Agreement, dated December 17, 2008, between TIAA, on behalf of the Registrant, and Real Estate Research Corporation(6) |
| | (C) | | Custodian Agreement, dated as of March 3, 2008, by and between TIAA, on behalf of the Registrant, and State Street Bank and Trust Company, N.A.(7) |
(14) | | | | Code of Ethics of TIAA(8) |
(31)* | | | | Rule 13a-15(e)/15d-15(e) Certifications |
(32)* | | | | Section 1350 Certifications |
|
* | | | | Filed herewith. |
|
(1) | | | | Previously filed and incorporated herein by reference to the Account’s Pre-Effective Amendment No. 1 to the Registration Statement on Form S-1 filed April 29, 2004 (File No. 333-113602). |
|
(2) | | | | Previously filed and incorporated herein by reference to the Account’s Post-Effective Amendment No. 2 to the Registration Statement on Form S-1 filed April 30, 1996 (File No. 33-92990). |
|
(3) | | | | Previously filed and incorporated herein by reference to the Account’s Post-Effective Amendment No. 1 to the Registration Statement on Form S-1 filed May 2, 2005 (File No. 333-121493). |
|
(4) | | | | Previously filed and incorporated herein by reference to Exhibit 10.(a) to the Annual Report on Form 10-K of the Account for the period ended December 31, 2005, filed with the Commission on March 15, 2006 (File No. 33-92990). |
|
(5) | | | | Previously filed and incorporated herein by reference to the Account’s Current Report on Form 8-K, filed with the Commission on January 7, 2008 (File No. 33-92990). |
|
(6) | | | | Previously filed and incorporated herein by reference to the Account’s Current Report on Form 8-K, filed with the Commission on December 22, 2008 (File No. 33-92990). |
|
(7) | | | | Previously filed and incorporated herein by reference to Exhibit 10.(b) to the Annual Report on Form 10-K of the Account for the fiscal year ended December 31, 2007 and filed with the Commission on March 20, 2008 (File No. 33-92990). |
|
(8) | | | | Previously filed and incorporated herein by reference to Exhibit 14 to the Annual Report on Form 10-K of the Account for the year ended December 31, 2008 and filed with the Commission on March 20, 2009 (File No. 33-92990). |
|
(9) | | | | Previously filed and incorporated by reference to Exhibit 3(A) to the Account’s Quarterly Report on Form 10-Q for the quarter ended June 30, 2009 and filed with the Commission on August 13, 2009 (File No. 33-92990). |
|
(10) | | | | Previously filed and incorporated by reference to Exhibit 3(B) to the Account’s Quarterly Report on Form 10-Q for the quarter ended June 30, 2009 and filed with the Commission on August 13, 2009 (File No. 33-92990). |
53
SIGNATURES
Pursuant to the requirements of the Securities Exchange Act of 1934, as amended, the registrant, TIAA Real Estate Account, has duly caused this Report to be signed on its behalf by the undersigned, thereunto duly authorized, in New York, New York, on the 13th day of November, 2009.
| | | | |
| | TIAA REAL ESTATE ACCOUNT |
| | | | |
| | By: | | TEACHERS INSURANCE AND ANNUITY
ASSOCIATION OF AMERICA |
| | | | |
November 13, 2009 | | By: | | /s/ Roger W. Ferguson, Jr.
|
| | | | Roger W. Ferguson, Jr.
President and
Chief Executive Officer |
| | | | |
November 13, 2009 | | By: | | /s/ Georganne C. Proctor
|
| | | | Georganne C. Proctor
Executive Vice President and
Chief Financial Officer |
54