Exhibit 99.1
| TIAA Retirement Annuity Accounts | |
| | | | |
| | | | |
| | | | |
| TIAA Real Estate Account |
| | | | |
| | | | |
| | | | |
| Real Estate | | | As of 9/30/2013 |
| | | | |
| Account Net Assets | Inception Date | Estimated Annual Expenses12 | |
| $16.5 Billion | 10/02/1995 | 0.90% | |
| | | | |
Portfolio Strategies
This variable annuity account seeks favorable long-term returns primarily through rental income and appreciation of real estate and real estate-related investments owned by the Account. The Account will also invest in non-real estate-related publicly traded securities and short-term higher quality liquid investments that are easily converted to cash to enable the Account to meet participant redemption requests, purchase or improve properties or cover other expenses. The Account intends to have between 75% and 85% of its net assets invested directly in real estate or real estate-related assets with the goal of producing favorable long-term returns. The Account’s principal strategy is to purchase direct ownership interests in income-producing real estate, primarily office, industrial, retail and multi-family residential properties. The Account may also make foreign real estate investments. Under the Account’s investment guidelines, investments in direct foreign real estate, together with foreign real estate-related securities and foreign non-real estate-related liquid investments may not comprise more than 25% of the Account’s net assets. The Account will invest the remaining portion of its assets (targeted between 15% and 25% of net assets) in publicly traded, liquid investments.
Learn More
For more information please contact:
800 842-2252
Weekdays 8 a.m. to 10 p.m. ET,
Saturdays 9 a.m. to 6 p.m. ET,
orvisit tiaa-cref.org
Performance
| | | Total Return | | | | Average Annual Total Return |
| | | 3 Months | | YTD | | 1 Year | | 3 Years | | 5 Years | | 10 Years | | Since
Inception |
| TIAA Real Estate Account | | 3.29% | | 7.90% | | 10.10% | | 12.35% | | -0.91% | | 4.80% | | 6.10% |
The returns quoted represent past performance, which is no guarantee of future results. Returns and the principal value of your investment will fluctuate. Current performance may be higher or lower than that shown, and you may have a gain or a loss when you redeem your mutual fund shares. For current performance information, including performance to the most recent month-end, please visit tiaa-cref.org, or call 800 842-2252. Performance may reflect waivers or reimbursements of certain expenses. Absent these waivers or reimbursement arrangements, performance may be lower.
| 1 | Expenses are estimated each year based on projected expense and asset levels. Differences between actual expenses and the estimate are adjusted quarterly and are reflected in current investment results. Historically, adjustments have been small. |
| 2 | The Account’s total annual expense deduction appears in the Account's prospectus, and may be different than that shown herein due to rounding. Please refer to the prospectus for further details. |
Hypothetical Growth of $10,000
| The chart illustrates the performance of a hypothetical $10,000 investment on September 30, 2003 and redeemed on September 30, 2013. | | 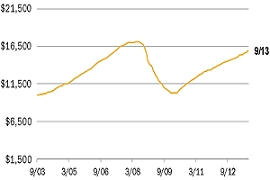 |
| | | |
| — TIAA Real Estate Account | $15,982 | |
| | | |
| | | |
| | | |
| | | |
| | | |
| | | |
| | | | |
The total returns are not adjusted to reflect sales charges, the effects of taxation or redemption fees, but are adjusted to reflect actual ongoing expenses, and assume reinvestment of dividends and capital gains, net of all recurring costs.
| Properties by Type | (As of 9/30/2013) | | Properties by Region | (As of 9/30/2013) |
| % of Real Estate Investments3 4 | | % of Real Estate Investments3 5 |
| Office | 43.2 | | East | 37.8 |
| Apartment | 21.9 | | West | 35.2 |
| Retail | 17.6 | | South | 23.9 |
| Industrial | 13.4 | | Foreign | 1.6 |
| Other | 3.9 | | Midwest | 1.5 |
 | 3 | Wholly-owned properties are represented at fair value and gross of any debt, while joint venture properties are represented at the net equity value. |
| 4 | Other properties represents interest in Storage Portfolio investment, a fee interest encumbered by a ground lease real estate investment and undeveloped land. |
| 5 | Foreign property represents real estate investment in France. |
| | |
| | |
Please refer to the next page for important disclosure information.
| | |
| TIAA Retirement Annuity Accounts | |
| TIAA Real Estate Account | |
| | |
| | |
| Real Estate | As of 9/30/2013 |
| Portfolio Composition | (As of 9/30/13) |
| Investments by Type | % of Net Assets |
| Real Estate Properties | | 54.0% |
| Short Term Investments | | 19.2% |
| Real Estate Joint Venture And LimitedPartnerships | | 17.2% |
| Marketable Securities Real EstateRelated | | 9.2% |
| Other (Net Receivable/Liability) | | 0.4% |
| Top 10 Holdings6 | (As of 9/30/13) |
| % of Total Investments7 |
| 1001 Pennsylvania Avenue | | 3.9% |
| 50 Fremont Street | | 2.6% |
| The Florida Mall | | 2.4% |
| Fourth and Madison | | 2.3% |
| 99 High Street | | 2.3% |
| DDR | | 2.2% |
| 425 Park Avenue | | 2.1% |
| 780 Third Avenue | | 1.9% |
| 501 Boylston Street | | 1.9% |
| Ontario Industrial Portfolio | | 1.7% |
Market Recap
Real estate market conditions remain favorable despite slowing economic growth
The partial shutdown of the U.S. Federal Government in October has affected the collection and availability of economic data. Consequently, the Bureau of Labor Statistics had not released the September 2013 employment report at the time of this real estate market update. Preliminary data indicates that 273,000 new jobs were added in July and August. Moody’s Analytics, a widely quoted source of economic data, predicts that the U.S. economy ultimately added 478,000 new jobs in the third quarter of 2013, compared with 547,000 during the second quarter. At the end of August, the unemployment rate had declined to 7.3% versus 7.6% at the end of June.
Employment trends in financial and professional and business services are a primary driver of office space demand. Although these sectors continued to expand through the first two months of the third quarter, they did so at a slower pace. During July and August, the financial services sector added 12,000 new jobs while the professional and business services sector added 55,000 jobs. By comparison, these sectors added 21,000 and 139,000 new jobs, respectively, during the first two months of second quarter.
The recovery in the U.S. office market has recently been challenged by the slowing pace of economic growth and the uncertainty resulting from the U.S. Federal Government shutdown. Nonetheless, the office market continued along a path of slow but consistent improvement during third quarter. According to CB Richard Ellis Econometric Advisors (CBRE-EA), a frequently cited source of real estate market data, the national office vacancy rate ticked down to 15.1% in the quarter compared to 15.2% at the end of June. Significant improvements were reported in markets with very high vacancy rates. Overall, vacancies declined in 38 of the 63 markets tracked by CBRE-EA.
Industrial market conditions posted the largest improvement of the four major property types during the third quarter. Based on preliminary data from CBRE-EA, the national availability rate declined to 11.7% compared to 12.0% in the second quarter. The industrial availability rate has now declined in 13 consecutive quarters, with the largest declines occurring during the last four. Availability rates fell in 42 of the 61 markets tracked by CBRE-EA.
The ongoing recovery in apartment market sector paused in the third quarter. Preliminary data from CBRE-EA indicated that the national vacancy rates inched up to 4.6% compared with 4.5% in the third quarter of 2012. (A year-over-year comparison is necessary to take into account the effects of seasonal leasing patterns in the apartment sector). This year-over-year vacancy rate increase, although very modest, is the first since 2009. CBRE-EA noted that as the maturing cycle progresses, additional substantial declines in vacancy rates appear unlikely particularly with current vacancy rates still well-below their long-term historical averages. Effective rent growth held steady around 3.0% on a year-over-year basis, but CBRE-EA warned that increasing construction is likely to temper rental growth moving forward.
The partial government shutdown also affected the release of retail sales data from the U.S. Census Bureau. Retail sales (excluding motor vehicles and parts) increased a modest 0.1% in August compared with the previous month. CBRE-EA reports that the availability rate among neighborhood and community centers declined modestly to 12.2% in the third quarter, down from 12.3% at the end of the previous quarter. Retailers remain cautious when considering expansion plans prior to an uncertain holiday season.
| | Important Information |
| | |
| 6 | The top 10 holdings are subject to change and may not be representative of the account’s current or future investments. The holdings listed only include the account’s long-term investments. Money market instruments and/or futures contracts, if applicable, are excluded. The holdings do not include the account’s entire investment portfolio and should not be considered a recommendation to buy or sell a particular security. |
| 7 | Value as reported in the September 30, 2013 Statement of Investments. Investments owned 100% by the Account are reported based on fair value. Investments in joint ventures are reported at fair value and are presented at the Account's ownership interest. |
| | |
| This property,1001 Pennsylvania Avenue,is presented gross of debt. The value of the Account's interest less the fair value of leverage is $409.8 million.
This property,50 Fremont Street,is presented gross of debt. The value of the Account's interest less the fair value of leverage is $294.0 million. |
| This property,The Florida Mall,is a 50% / 50% joint venture with Simon Property Group, L.P. and is presented net of debt. As of September 30, 2013 this debt had a fair value of $191.3 million. |
| This property,Fourth and Madison,is presented gross of debt. The value of the Account's interest less the fair value of leverage is $243.2 million.
This property,99 High Street,is presented gross of debt. The value of the Account's interest less the fair value of leverage is $240.1 million. |
| This property is held in a 85% / 15% joint venture withDevelopers Diversified Realty Corporation("DDR"), and consists of 31 retail properties located in 13 states and is presented net of debt. As of September 30, 2013 this debt had a fair value of $766.5 million. |
| This property,780 Third Avenue,is presented gross of debt. The value of the Account's interest less the fair value of leverage is $207.6 million. |
Continued on next page…
| | |
| TIAA Retirement Annuity Accounts | |
| TIAA Real Estate Account | |
| | |
| | |
| Real Estate | As of 9/30/2013 |
Real estate investment portfolio turnover rate was 10.22% for the year ended 12/31/2012. Real estate investment portfolio turnover rate is calculated by dividing the lesser of purchases or sales of real estate property investments (including contributions to, or return of capital distributions received from, existing joint venture and limited partnership investments) by the average value of the portfolio of real estate investments held during the period.
Marketable securities portfolio turnover rate was 21.92% for the period ending 12/31/2012. Marketable securities portfolio turnover rate is calculated by dividing the lesser of purchases or sales of securities, excluding securities having maturity dates at acquisition of one year or less, by the average value of the portfolio securities held during the period.
Teachers Insurance and Annuity Association of America (TIAA), New York, NY, issues annuity contracts and certificates.
Investment, insurance and annuity products: are not FDIC insured, are not bank guaranteed, are not deposits, are not insured by any federal government agency, are not a condition to any banking service or activity and may lose value.
TIAA-CREF Individual & Institutional Services, LLC and Teachers Personal investors Services, Inc., members FINRA, distribute securities products.
THIS MATERIAL MUST BE PRECEDED OR ACCOMPANIED BY A CURRENT PROSPECTUS FOR THE TIAA REAL ESTATE ACCOUNT. PLEASE CAREFULLY CONSIDER THE INVESTMENT OBJECTIVES, RISKS, CHARGES, AND EXPENSES BEFORE INVESTING AND CAREFULLY READ THE PROSPECTUS. ADDITIONAL COPIES OF THE PROSPECTUS CAN BE OBTAINED BY CALLING 877-518-9161.
A Note About Risks
In general, the value of the TIAA Real Estate Account will fluctuate based on the underlying value of the direct real estate or real estate-related securities in which it invests.
The risks associated with investing in the Real Estate Account include the risks associated with real estate ownership including among other things fluctuations in property values, higher expenses or lower income than expected, risks associated with borrowing and potential environmental problems and liability, as well as risks associated with participant flows and conflicts of interest. For a more complete discussion of these and other risks, please consult the prospectus.
©2013 Teachers Insurance and Annuity Association-College Retirement Equities Fund (TIAA-CREF), 730 Third Avenue, New York, NY 10017.