PROVISION FOR INCOME TAXES
Reported total income and other taxes increased $92 million, or 3%, compared with the prior year, reflecting an increase in income tax expense of $110 million, or 5%, and a decrease in other taxes of $18 million, or 1%. Adjusted total income and other taxes were up $92 million from the prior year, reflecting an increase in income tax expense of $110 million, or 5%.
The Bank's reported effective tax rate was 18.3% for 2017, compared with 20.1% in the prior year. The year-over-year decrease was largely due to highertax-exempt dividend income, and anon-taxable dilution gain on the Scottrade transaction. For a reconciliation of the Bank's effective income tax rate with the Canadian statutory income tax rate, refer to Note 25 of the 2017 Consolidated Financial Statements.
The Bank's adjusted effective income tax rate for 2017 was 18.9%, compared with 20.2% in the prior year. The year-over-year decrease was largely due to highertax-exempt dividend income.
The Bank reports its investment in TD Ameritrade using the equity method of accounting. TD Ameritrade's tax expense of $268 million in 2017, compared with $214 million in the prior year, was not part of the Bank's effective tax rate.
BALANCE SHEET
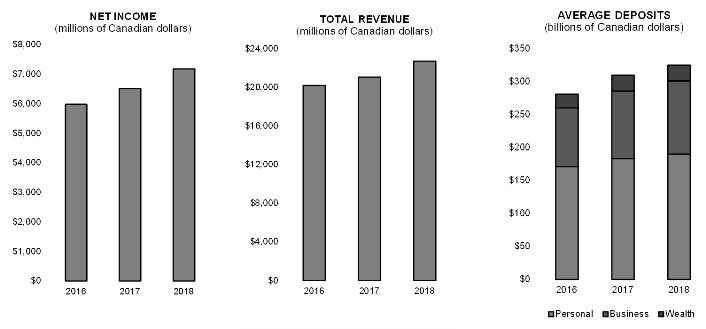
Total assets were $1,279 billion as at October 31, 2017, an increase of $102 billion, or 9%, from October 31, 2016. The increase was primarily in securities purchased under reverse repurchase agreements of $48 billion,available-for-sale securities of $39 billion, loans net of allowances for loan losses of $27 billion, other amounts received from brokers, dealers, and clients of $13 billion, trading loans, securities, and other of $5 billion, partially offset by a decrease in derivatives of $16 billion andheld-to-maturity securities of $13 billion. The foreign currency translation impact on total assets as at October 31, 2017, primarily in the U.S. Retail segment, was a decrease of approximately $20 billion, or 2%.
Total liabilities were $1,204 billion as at October 31, 2017, an increase of $101 billion, or 9%, from October 31, 2016. The increase was primarily due to an increase in deposits of $59 billion, obligations related to securities sold under repurchase agreements of $40 billion, amounts payable to brokers, dealers, and clients of $15 billion, partially offset by a decrease in derivatives of $14 billion. The foreign currency translation impact on total liabilities as at October 31, 2017, primarily in the U.S. Retail segment, was a decrease of approximately $20 billion, or 2%.
Equitywas $75 billion as at October 31, 2017, an increase of $1 billion, or 1%, from October 31, 2016. The increase was primarily due to higher retained earnings, partially offset by a decrease in other comprehensive income due to losses on cash flow hedges and foreign exchange translation.
2017 FINANCIAL RESULTS OVERVIEW
2017 Financial Performance by Business Line
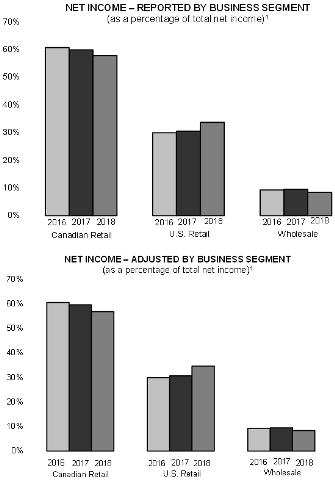
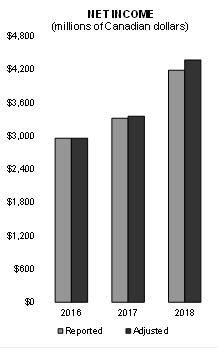
Canadian Retail net income for the year was $6,525 million, an increase of $537 million, or 9%, compared with last year. The increase in earnings reflected revenue growth, lower insurance claims and PCL, partially offset by highernon-interest expenses. The ROE for the year was 45.2%, compared with 41.9% last year.
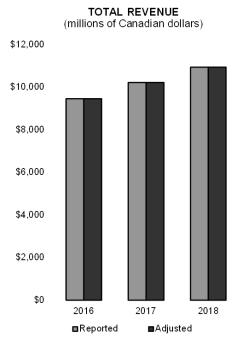
Canadian Retail revenue is derived from the Canadian personal and commercial banking, wealth, and insurance businesses. Revenue for the year was $21,062 million, an increase of $853 million, or 4%, compared with last year.
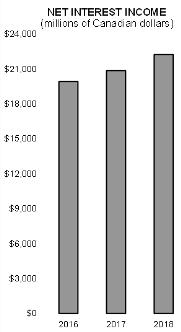
Net interest income increased $632 million, or 6%, reflecting deposit and loan volume growth. Average loan volumes increased $16 billion, or 5%, compared with last year, comprised of 4% growth in personal loan volumes and 9% growth in business loan volumes. Average deposit volumes increased $29 billion, or 10%, compared with last year, comprised of 7% growth in personal deposit volumes, 15% growth in business deposit volumes and 15% growth in wealth deposit volumes. Margin on average earning assets was 2.83%, a 5 bps increase, primarily due to rising interest rates and favourable balance sheet mix.
Non-interest income increased $221 million, or 2%, reflecting higherfee-based revenue in the banking businesses and wealth asset growth, partially offset by a decrease in the fair value of investments supporting claims liabilities which resulted in a similar decrease in insurance claims and higher liabilities associated with increased customer engagement in credit card loyalty programs.
AUA were $387 billion as at October 31, 2017, an increase of $8 billion, or 2%, and AUM were $283 billion as at October 31, 2017, an increase of $12 billion, or 4%, compared with last year, both reflecting new asset growth and increases in market value.
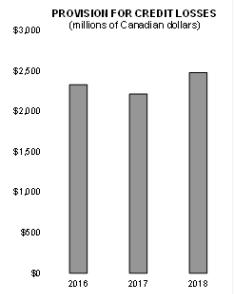
PCL for the year was $986 million, a decrease of $25 million, or 2% compared with last year. Personal banking PCL was $952 million, a decrease of $18 million, or 2%. Business banking PCL was $34 million, a decrease of $7 million. Annualized PCL as a percentage of credit volume was 0.26%, or a decrease of 2 bps, compared with last year. Net impaired loans were $555 million, a decrease of $150 million, or 21%, compared with last year.
Insurance claims and related expenses for the year were $2,246 million, a decrease of $216 million, or 9%, compared with last year, reflecting a decrease in the fair value of investments supporting claims liabilities which resulted in a similar decrease innon-interest income, less weather related events, and more favourable prior years' claims development, partially offset by higher current year claims.
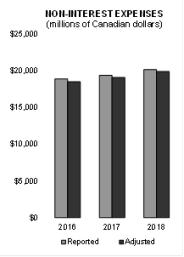
Non-interest expenses for the year were $8,934 million, an increase of $377 million, or 4%, compared with last year. The increase reflected higher employee-related expenses including revenue-based variable expenses in the wealth business, and higher investment in technology initiatives, partially offset by productivity savings and the sale of the Direct Investing business in Europe.
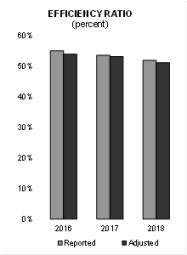
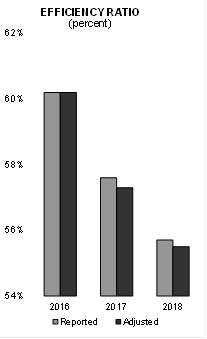
The efficiency ratio was 42.4%, compared with 42.3% last year.
U.S. Retail reported net income for the year was $3,322 million (US$2,536 million), an increase of $363 million (US$302 million), or 12% (14% in U.S. dollars), compared with the prior year. On an adjusted basis, net income for the year was $3,358 million (US$2,565 million), an increase of $399 million (US$331 million), or 13% (15% in U.S. dollars). The reported and adjusted ROE for the year was 9.7% and 9.8%, respectively, compared with 8.8% in the prior year.
U.S. Retail net income includes contributions from the U.S. Retail Bank and the Bank's investment in TD Ameritrade. Reported net income for the year from the U.S. Retail Bank and the Bank's investment in TD Ameritrade were $2,880 million (US$2,200 million) and $442 million (US$336 million), respectively. On an adjusted basis for the year, the U.S. Retail Bank and the Bank's investment in TD Ameritrade contributed net income of $2,896 million (US$2,213 million) and $462 million (US$352 million), respectively.
The reported contribution from TD Ameritrade of US$336 million increased US$8 million, or 2%, compared with the prior year, primarily due to higher asset-based revenue, partially offset by higher operating expenses and charges associated with the Scottrade transaction. On an adjusted basis, the contribution from TD Ameritrade increased US$24 million, or 7%.
| | | | |
| TD BANK GROUP• 2018 ANNUAL REPORT• MANAGEMENT'S DISCUSSION & ANALYSIS | | | Page 28 | |