Exhibit 99.1
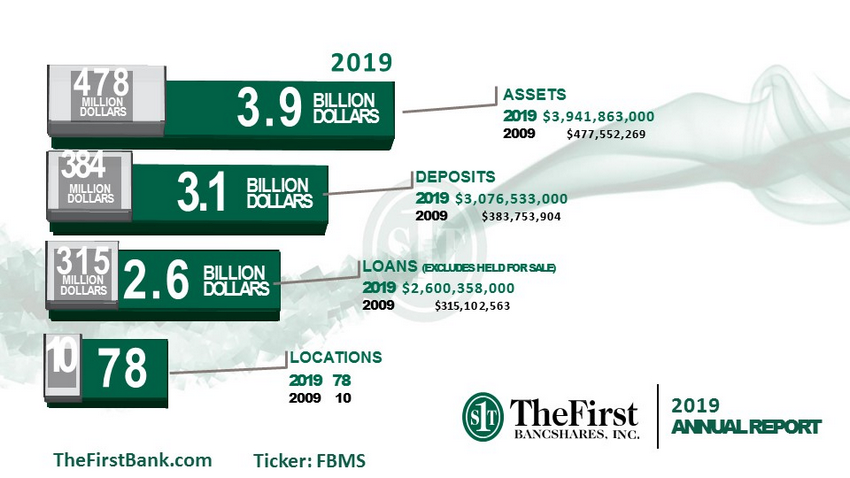
ASSETS 2019 $ 3,941,863,000 2009 $477,552,269 2019 2009 3.9 3.1 2.6 78 BILLION DOLLARS BILLION DOLLARS BILLION DOLLARS 478 MILLION DOLLARS 384 MILLION DOLLARS 315 MILLION DOLLARS 10 DEPOSITS 2019 $ 3,076,533,000 2009 $ 383,753,904 LOANS (EXCLUDES HELD FOR SALE) 2019 $ 2,600,358,000 2009 $ 315,102,563 LOCATIONS 2019 ANNUAL REPORT 2019 78 2009 10 TheFirstBank.com Ticker: FBMS
2 Forward Looking Statements This slide presentation and certain of our other filings with the Securities and Exchange Commission contain statements that co nstitute “forward - looking statements” within the meaning of, and subject to the protections of, Section 27A of the Securities Act of 1933, as a men ded, and Section 21E of the Securities Exchange Act of 1934, as amended. All statements other than statements of historical fact are forward - looking statements. Such statements can generally be identified by such words as “believes,” “anticipates,” “expects,” “may,” “will,” “assumes,” “shou ld, ” “predicts,” “could,” “would,” “intends,” “targets,” “estimates,” “projects,” “plans,” “potential” and other similar words and expressions of the f utu re or otherwise regarding the outlook for the Company’s future business and financial performance and/or the performance of the banking indus try and economy in general. Prospective investors are cautioned that any such forward - looking statements are not guarantees of future performance and involve known and unknown risks and uncertainties which may cause the actual results, performance or achievements of the Company to be mate ria lly different from the future results, performance or achievements expressed or implied by such forward - looking statements. Forward - looking st atements are based on the information known to, and current beliefs and expectations of, the Company’s management and are subject to signi fic ant risks and uncertainties. Actual results may differ materially from those contemplated by such forward - looking statements. Factors that mig ht cause such differences include, but are not limited to: (1) competitive pressures among financial institutions increasing significantly; (2 ) changes in economic or political conditions, either nationally or locally, particularly in areas in which the Company conducts operations; (3) inter est rate risk; (4) changes in applicable laws, rules, or regulations, including changes to statutes, regulations or regulatory policies or practices as a r esu lt of, or in response to COVID - 19; (5) risks related to the Company’s recently completed acquisitions, including that the anticipated benefits from the r ecently completed acquisitions are not realized in the time frame anticipated or at all as a result of changes in general economic and market c ond itions or other unexpected factors or events; (6) changes in management’s plans for the future; (7) credit risk associated with our lending a cti vities; changes in interest rates, loan demand, real estate values, or competition; (8) changes in accounting principles, policies, or guideline s; (9) adverse results from current or future litigation, regulatory examinations or other legal and/or regulatory actions, including as a result of the Com pany’s participation in and execution of government programs related to the COVID - 19 pandemic; (10) the impact of the COVID - 19 pandemic on the Company’s assets, business, cash flows, financial condition, liquidity, prospects and results of operations; (11) potential increases in the pr ovi sion for loan losses resulting from the COVID - 19 pandemic; and (12) other general competitive, economic, political, and market factors, including tho se affecting our business, operations, pricing, products, or services. These and other factors that could cause results to differ materially fro m those described in the forward - looking statements, as well as a discussion of the risks and uncertainties that may affect our business, can be found in our Annual Report on Form 10 - K and in other filings we make with the Securities and Exchange Commission, which are available on the SEC’s website, http://www.sec.gov . Undue reliance should not be placed on forward - looking statements. The Company disclaims any obligation to update such factors or to publicly announce the results of any revisions to any of the forward - looking statements included herein to reflect future events or devel opments. Statements about the potential effects of the COVID - 19 pandemic on the Company’s assets, business, liquidity, financial condition, prospect s, and results of operations may constitute forward - looking statements and are subject to the risks that the actual effects may differ, possibly m aterially, from what is reflected in these forward - looking statements due to factors and future developments that are uncertain, unpredictable and in ma ny cases beyond our control, including the depth, dispersion and duration of the pandemic, actions taken by governmental authorities in respo nse to the pandemic, and the direct and indirect impact of the pandemic on customers, employees, third parties and the Company.
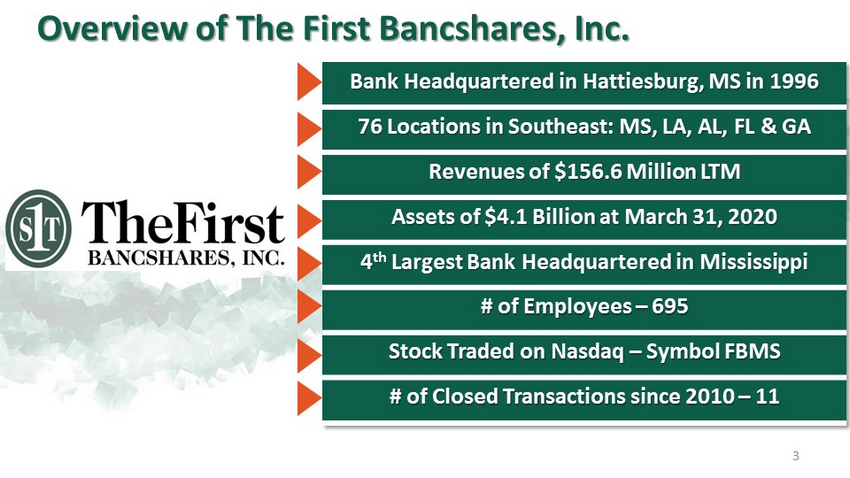
Overview of The First Bancshares, Inc. 3 Bank Headquartered in Hattiesburg, MS in 1996 76 Locations in Southeast: MS, LA, AL, FL & GA Revenues of $156.6 Million LTM Assets of $4.1 Billion at March 31, 2020 4 th Largest Bank Headquartered in Mississippi # of Employees – 695 Stock Traded on Nasdaq – Symbol FBMS # of Closed Transactions since 2010 – 11

Franchise Footprint FBMS Branch (68) SGB (8) FBMS LPO (2) FFB (6)

New Orleans Mobile Baton Rouge Jackson Tallahassee Montgomery Shreveport Columbus $503 $500 $540 $571 $647 $698 $830 $986 $1,080 $1,184 $1,304 $181 $181 $370 $447 $447 $447 $827 $1,924 $2,758 $2,758 $681 $721 $941 $1,094 $1,145 $1,277 $1,813 $3,004 $3,942 $4,062 $0 $600 $1,200 $1,800 $2,400 $3,000 $3,600 $4,200 $4,800 2010 2011 2012 2013 2014 2015 2016 2017 2018 2019 Q1 '20 Acquired Organic New Orleans Mobile Baton Rouge Jackson Tallahassee Montgomery Shreveport Columbus Organic and Acquisitive Growth 5 December 31, 2009 March 31 , 2020 Total Assets ($mm) Source: S&P Global Market Intelligence Data as of 12/31 of each year, respectively; Q1 ’20 data as of 3/31/20 FBMS Branch (9) FBMS Branch ( 74 ) FBMS LPO (2)
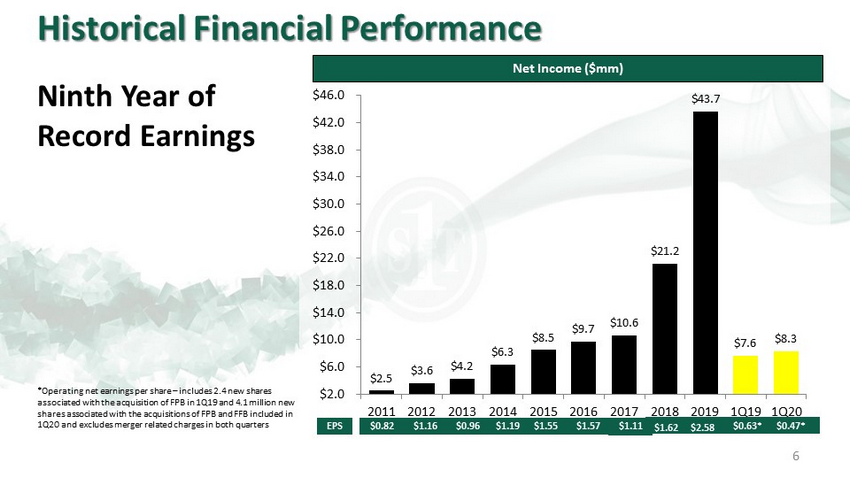
Historical Financial Performance Ninth Year of Record Earnings 6 $2.5 $3.6 $4.2 $6.3 $8.5 $9.7 $10.6 $21.2 $43.7 $7.6 $8.3 $2.0 $6.0 $10.0 $14.0 $18.0 $22.0 $26.0 $30.0 $34.0 $38.0 $42.0 $46.0 2011 2012 2013 2014 2015 2016 2017 2018 2019 1Q19 1Q20 $2.58 $1.62 $0.82 $1.16 $0.96 $1.19 $1.55 $1.57 $1.11 $0.63* $0.47* EPS Net Income ($mm) *Operating net earnings per share – includes 2.4 new shares associated with the acquisition of FPB in 1Q19 and 4.1 million new shares associated with the acquisitions of FPB and FFB included in 1Q20 and excludes merger related charges in both quarters
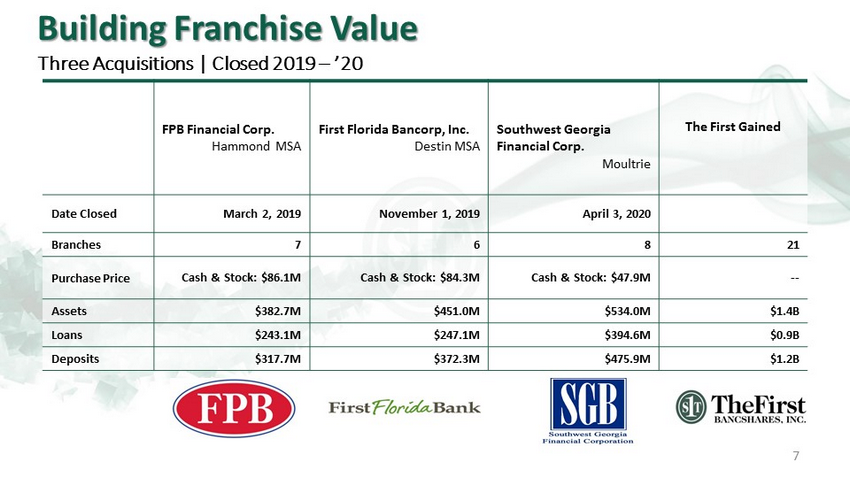
7 FPB Financial Corp. Hammond MSA First Florida Bancorp, Inc. Destin MSA Southwest Georgia Financial Corp. Moultrie The First Gained Date Closed March 2, 2019 November 1, 2019 April 3 , 2020 Branches 7 6 8 21 Purchase Price Cash & Stock: $86.1M Cash & Stock: $84.3M Cash & Stock: $47.9M -- Assets $382.7M $451.0M $534.0M $1.4B Loans $243.1M $247.1M $394.6M $0.9B Deposits $317.7M $372.3M $475.9M $1.2B Building Franchise Value Three Acquisitions | Closed 2019 – ’20
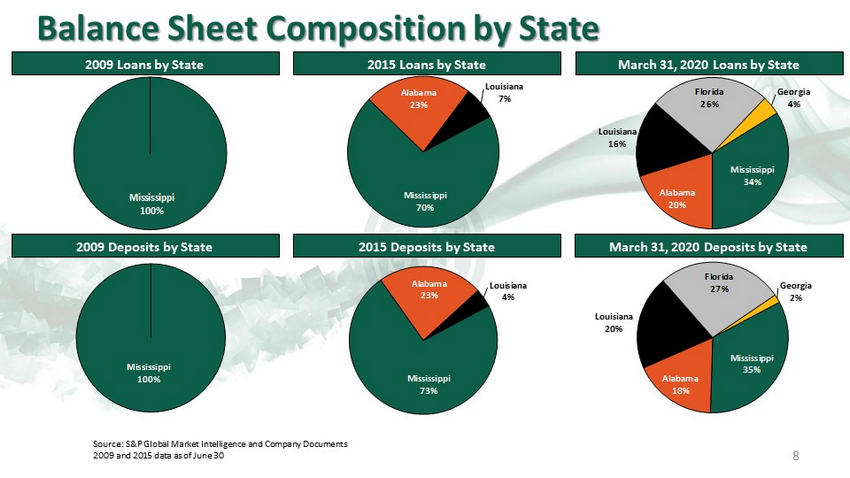
Mississippi 73% Alabama 23% Louisiana 4% Mississippi 100% Balance Sheet Composition by State 8 2015 Deposits by State March 31, 2020 Deposits by State Source : S&P Global Market Intelligence and Company Documents 2009 and 2015 data as of June 30 2015 Loans by State March 31, 2020 Loans by State 2009 Loans by State 2009 Deposits by State Mississippi 35% Alabama 18% Louisiana 20% Florida 27% Georgia 2% Mississippi 100% Mississippi 70% Alabama 23% Louisiana 7% Mississippi 34% Alabama 20% Louisiana 16% Florida 26% Georgia 4%
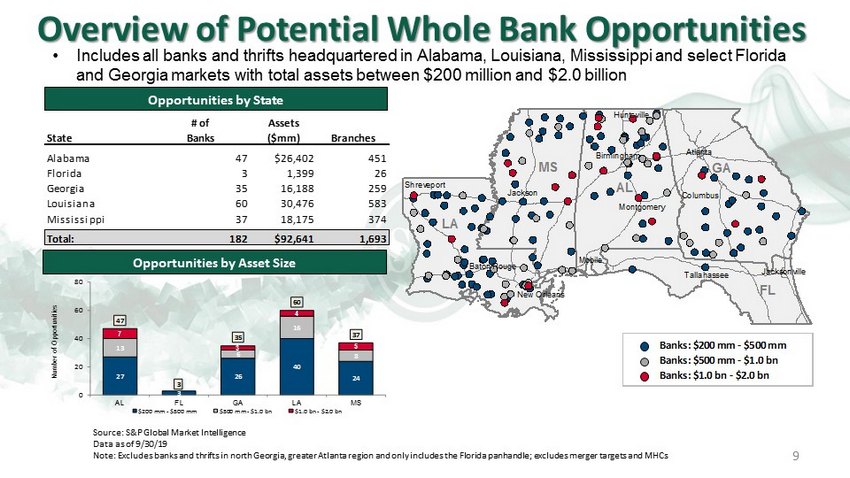
27 3 26 40 24 13 6 16 8 7 3 4 5 47 3 35 60 37 0 20 40 60 80 AL FL GA LA MS Number of Opportunities $200 mm - $500 mm $500 mm - $1.0 bn $1.0 bn - $2.0 bn Banks: $200 mm - $500 mm Banks: $500 mm - $1.0 bn Banks: $1.0 bn - $2.0 bn 9 Overview of Potential Whole Bank Opportunities Source: S&P Global Market Intelligence Data as of 9 /30/19 Note: Excludes banks and thrifts in north Georgia, greater Atlanta region and only includes the Florida panhandle; e xcludes merger targets and MHCs Opportunities by State Opportunities by Asset Size • Includes all banks and thrifts headquartered in Alabama, Louisiana, Mississippi and select Florida and Georgia markets with total assets between $200 million and $2.0 billion # of Assets State Banks ($mm) Branches Alabama 47 $26,402 451 Florida 3 1,399 26 Georgia 35 16,188 259 Louisiana 60 30,476 583 Mississippi 37 18,175 374 Total: 182 $92,641 1,693 GA AL LA FL MS Atlanta Columbus Birmingham Montgomery New Orleans Tallahassee Jackson Baton Rouge Mobile Shreveport Huntsville Jacksonville St. Petersburg Tampa Orlando
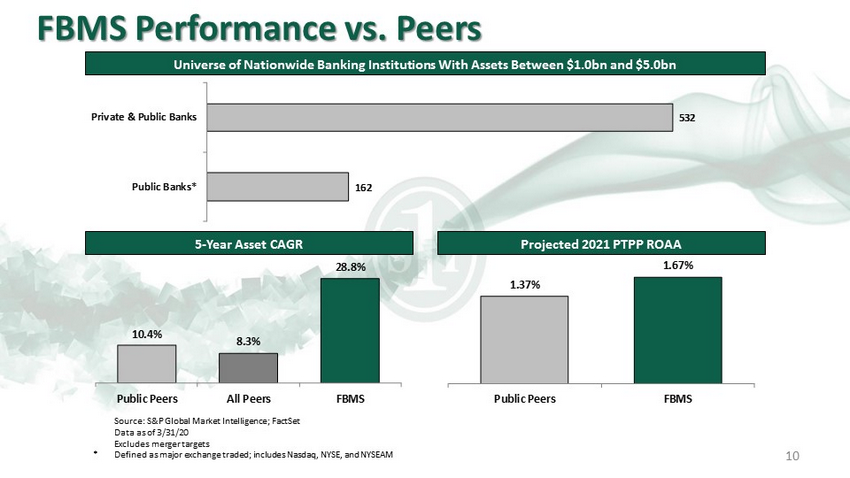
10.4% 8.3% 28.8% Public Peers All Peers FBMS FBMS Performance vs. Peers 10 Universe of Nationwide Banking Institutions With Assets Between $1.0bn and $5.0bn 5 - Year Asset CAGR Projected 2021 PTPP ROAA Source : S&P Global Market Intelligence; FactSet Data as of 3/31/20 Excludes merger targets * Defined as major exchange traded; includes Nasdaq, NYSE, and NYSEAM 162 532 Public Banks* Private & Public Banks 1.37% 1.67% Public Peers FBMS
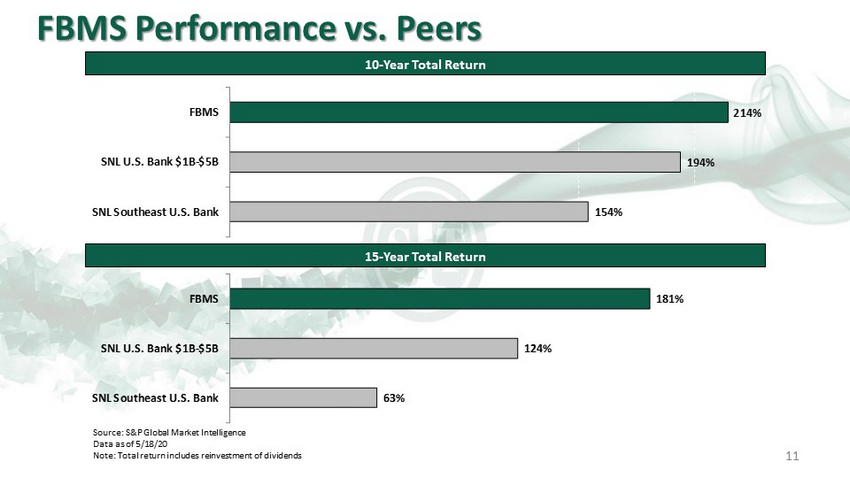
63% 124% 181% SNL Southeast U.S. Bank SNL U.S. Bank $1B-$5B FBMS 154% 194% 214% SNL Southeast U.S. Bank SNL U.S. Bank $1B-$5B FBMS FBMS Performance vs. Peers 11 Source: S&P Global Market Intelligence Data as of 5/18/20 Note: Total return includes reinvestment of dividends 15 - Year Total Return 10 - Year Total Return
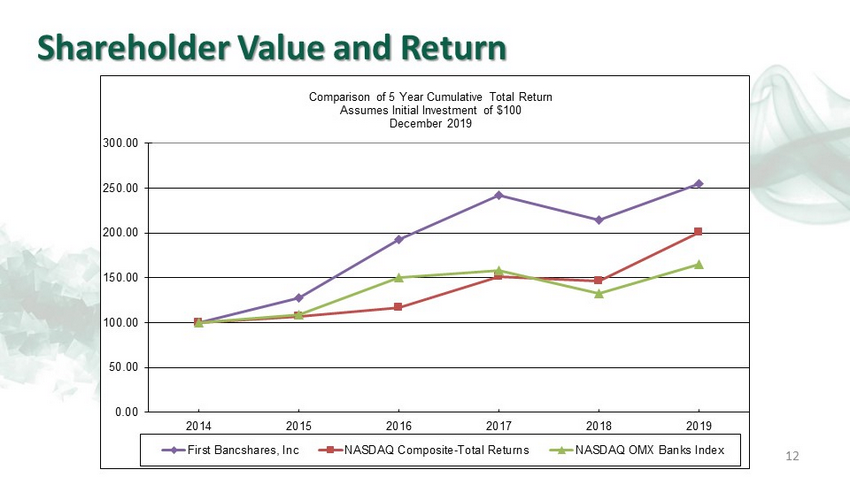
12 Shareholder Value and Return 0.00 50.00 100.00 150.00 200.00 250.00 300.00 2014 2015 2016 2017 2018 2019 Comparison of 5 Year Cumulative Total Return Assumes Initial Investment of $100 December 2019 First Bancshares, Inc NASDAQ Composite-Total Returns NASDAQ OMX Banks Index
13 Response to Covid - 19 Enacted the Pandemic section of our internal Business Continuity Plan Informed employees of CDC and internal recommendations, procedures and protocols concerning: social distancing, business travel, sanitation and disinfection; weekly system wide calls to re - enforce procedures and keep team members up to date on current developments Distributed inventory of masks, sanitizers and disinfectants system - wide Increased the frequency of facility janitorial services Restricted access to lobbies to “by appointment only” and maintained full drive thru service THE FIRST ACTED QUICKLY TO ENSURE SAFETY OF EMPLOYEES AND CLIENTS
14 Response to Covid - 19 Continued Moved as many as practical employees to work by remote access Rotated access as much as practical for employees who’s function could not be performed remotely Provided lunch daily to on site personnel to limit their off premise exposure during the day; rotate purchasing our meals to our restaurant clients in each market to help support them during this emergency Improved and upgraded electronic delivery and execution of documents system wide to limit in person exposure but maintain business volume
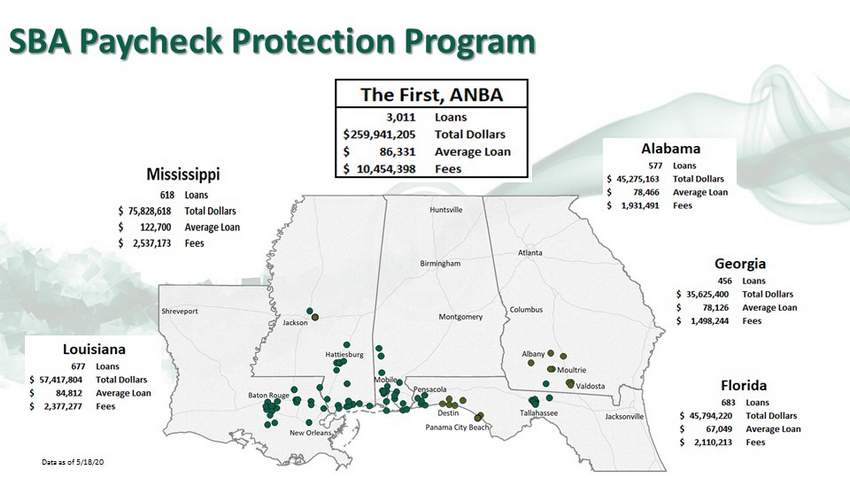
SBA Paycheck Protection Program Data as of 5/18/20
16 NASDAQ: FBMS