UNITED STATES
SECURITIES AND EXCHANGE COMMISSION
Washington, D.C. 20549
FORM N-CSR
CERTIFIED SHAREHOLDER REPORT OF REGISTERED
MANAGEMENT INVESTMENT COMPANIES
| Investment Company Act file number | 811-9082 |
| M Fund, Inc. |
| (Exact name of registrant as specified in charter) |
M Financial Plaza 1125 NW Couch Street, Suite 900, Portland, Oregon | 97209 |
| (Address of principal executive offices) | (Zip code) |
Bridget McNamara-Fenesy, President, M Fund, Inc.
M Financial Plaza, 1125 NW Couch Street, Suite 900, Portland, Oregon 97209 |
| (Name and address of agent for service) |
with a Copy to:
Cynthia Beyea
Eversheds Sutherland LLP
700 Sixth Street, N.W.
Washington, D.C. 20001-3980
| Registrant's telephone number, including area code: | (503) 232-6960 | |
| Date of fiscal year end: | 12/31 | |
| | | |
| Date of reporting period: | 12/31/2021 | |
Item 1. Reports to Stockholders.
| (a) | A copy of the report transmitted to stockholders pursuant to Rule 30e-1 under the Investment Company Act of 1940, as amended (the “1940 Act”), for the period January 1, 2021 through December 31, 2021 is filed herewith. |
M FUND, INC.
M International Equity Fund
M Large Cap Growth Fund
M Capital Appreciation Fund
M Large Cap Value Fund
Annual Report
December 31, 2021

M Fund, Inc.
PRESIDENT'S LETTER
Dear Contract Owners:
We are pleased to share the financial condition of M Fund, Inc. (the "Corporation") as presented in the following Annual Report dated December 31, 2021. Total assets under management at year end 2021 were $884.6 million.
Sub-Advisers to the portfolios, under the direction of M Financial Investment Advisers, Inc., the investment adviser to the Corporation, have prepared the attached discussion of results for each portfolio of the Corporation for the year ended December 31, 2021.
Sub-Advisers to the portfolios of the Corporation are: DFA LP for the M International Equity Fund, DSM Capital Partners LLC for the M Large Cap Growth Fund, Frontier Capital Management Company, LLC for the M Capital Appreciation Fund and Brandywine Global Investment Management, LLC for the M Large Cap Value Fund.
On behalf of the Corporation's Board of Directors, M Financial Investment Advisers, Inc. and the Corporation's participating insurance carriers, we thank you for your business and remain committed to providing opportunities that add value to our investors in the upcoming year.
Sincerely,
BRIDGET MCNAMARA-FENESY
President
M Fund, Inc.
M INTERNATIONAL EQUITY FUND
Performance
For the twelve months ended December 31, 2021, the M International Equity Fund had a return of 11.05% (net of management fees) versus a total return (including reinvestment of dividends) of 7.82% for its benchmark, the MSCI ACWI (All Country World Index) ex USA Index1.
Market Environment/Conditions
In US dollar terms, global ex US equity markets returned 8.53%, as reflected by the MSCI All Country World ex USA IMI (net dividends), for the year. Developed ex US markets returned 12.40% as measured by the MSCI World ex USA IMI (net dividends) and emerging markets returned -0.28% as measured by the MSCI Emerging Markets IMI (net dividends). In developed markets, most currencies depreciated versus the US dollar. In emerging markets, most currencies also depreciated versus the US dollar, but some, notably the Chinese renminbi and the Taiwan dollar, appreciated.
Theoretical and empirical research suggests that investors can systematically pursue higher expected returns by targeting the size, relative price, and profitability dimensions in equity markets. Dimensional Fund Advisors integrates these dimensions to emphasize stocks with smaller market capitalizations, lower relative prices, and higher profitability.
Along the market capitalization dimension, small caps (MSCI All Country World ex USA Small Cap Index, net dividends) outperformed large caps (MSCI All Country World ex USA Index, net dividends) by 5.10% for the year. Mid caps (MSCI All Country World ex USA Mid Cap Index, net dividends), a subset of the MSCI All Country World ex USA Index universe, underperformed small caps (MSCI All Country World ex USA Small Cap Index, net dividends) by 5.02% and performed in line with large caps (MSCI All Country World ex USA Index, net dividends).
Along the relative price dimension, large cap value stocks (MSCI All Country World ex USA Value Index, net dividends) outperformed large cap growth stocks (MSCI All Country World ex USA Growth Index, net dividends) by 5.36%%, and small cap value stocks (MSCI All Country World ex USA Small Cap Value Index, net dividends) outperformed small cap growth stocks (MSCI All Country World ex USA Small Cap Growth Index, net dividends) by 2.63%.
High profitability stocks outperformed low profitability stocks within both large caps and small caps.2
Performance of the premiums may vary depending on the particular segment of the market under analysis.
Fund Review/Current Positioning
The M International Equity Fund outperformed the MSCI All Country World ex USA Index (net dividends) by 3.23% for the period. The Fund's inclusion of and emphasis on small cap stocks had a positive impact on performance relative to the benchmark (which is composed primarily of large and mid cap stocks), as small caps outperformed large caps. With low relative price (value) stocks outperforming high relative price (growth) stocks, the Fund's greater emphasis on value stocks also contributed positively to performance relative to the benchmark. Additionally, the Fund's emphasis on high profitability stocks contributed positively to performance relative to the benchmark.
2
Dimensional Fund Advisors LP
Investment Sub-Adviser to the M International Equity Fund
Performance represented is net of fees. The foregoing reflects the thoughts and opinions of Dimensional Fund Advisors LP exclusively and is subject to change without notice. The information provided in this material should not be considered a recommendation to purchase or sell any particular security. It should not be assumed that any security transactions, holdings, or sectors discussed were or will be profitable, or that the investment recommendations or decisions we make in the future will be profitable or will equal the investment performance discussed herein. Strategies discussed are subject to change at any time by the investment manager in its discretion due to market conditions or opportunities. Market conditions may impact performance. The performance results presented were achieved in particular market conditions which may not be repeated. Moreover, the current market volatility and uncertain regulatory environment may have a negative impact on future performance. Portfolio characteristics are as of December 31, 2021. Please note that all indices are unmanaged and are not available for direct investment.
This commentary may include statements that constitute "forward looking statements" under the U.S. securities laws. Forward-looking statements include, among other things, projections, estimates, and information about possible or future results related to the Fund, market or regulatory developments.The views expressed above are not guarantees of future performance or economic results and involve certain risks, uncertainties and assumptions that could cause actual outcomes and results to differ materially from the views expressed herein. The views expressed above are subject to change at any time based upon economic, market, or other conditions and the subadvisory firm undertakes no obligation to update the views expressed herein. Any discussions of specific securities should not be considered a recommendation to buy or sell those securities. The views expressed above (including any forward-looking statement) may not be relied upon as investment advice or as an indication of the Fund's trading intent. Information about the Fund's holdings, asset allocation or country diversification is historical and is not an indication of future Fund composition, which may vary. Direct investment in any index is not possible. The performance of any index mentioned in this commentary has not been adjusted for ongoing management, distribution and operating expenses, and sales charges applicable to mutual fund investments. In addition, the returns do not reflect additional fees charged by separate accounts or variable insurance contracts that an investor in the Fund may pay. If these additional fees were reflected, performance would have been lower.
3
COMPARISON OF CHANGE IN VALUE OF $10,000 INVESTMENT IN
THE M INTERNATIONAL EQUITY FUND, MSCI AC WORLD ex USA
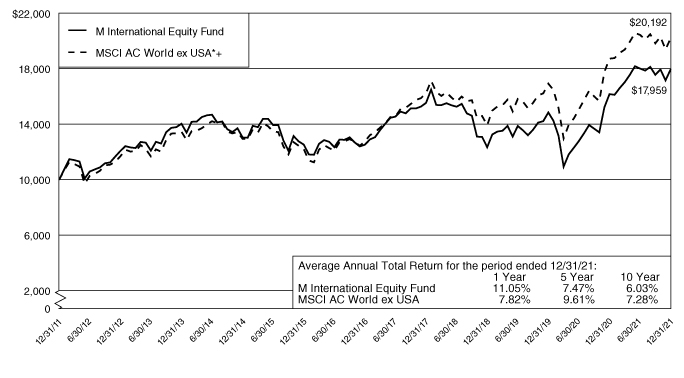
The M International Equity Fund's total return is calculated net of Investment Advisory Fees and operating expenses. Performance figures represent past performance and are not indicative of future performance of the M International Equity Fund or Index. Share value will fluctuate so that an investor's shares, when redeemed, may be worth more or less than the original investment. Please note that all indices are unmanaged, do not incur expenses, and are not available for direct investment. Persons who invest in the M International Equity Fund through a variable annuity or variable life insurance contract should note this graph does not reflect separate account expenses deducted by the insurance company.
* 12/31/11 to 12/31/21
+ MSCI EAFE—Effective May 1, 2014, the Fund changed its benchmark index from the MSCI EAFE Index to the MSCI AC World ex US Index. The MSCI AC World ex US Index is more representative of the Fund's investment portfolio than its previous index.
MSCI ACWI (ALL COUNTRY WORLD INDEX) ex USA INDEX
1 The MSCI ACWI (All Country World Index) ex USA Index is a free float-adjusted market capitalization weighted index that is designed to measure the equity market performance of developed and emerging markets excluding the US. Investors cannot invest directly in an Index.
2 Profitability is measured as operating income before depreciation and amortization minus interest expense, scaled by book.
4
M LARGE CAP GROWTH FUND
Performance
For the twelve months ended December 31, 2021, the M Large Cap Growth Fund had a return of 21.5% (net of management fees) versus a total return (including reinvestment of dividends) of 27.6% for its benchmark, the Russell 1000 Growth Index1.
Market Environment/Conditions
In 2021 the strong performance of major US and global developed market equity indices continued. Once again, US markets led the way driven by the strength of "New Era" technology companies such as Apple, Meta Platforms (Facebook), Alphabet (Google), Microsoft, Netflix, NVIDIA and Tesla. These US-based, New Era technology companies are among the largest businesses in the world. They continue to grow as they opportunistically enter new markets, often of their own creation. It is readily apparent that the technological revolution is ongoing and will remain a critical driver of global economies and equity markets.
Many investors anticipate a return to Value's outperformance of Growth. However, DSM believes the ongoing competitive dynamics of digital/internet technologies will prove a disadvantage to both Value and most non-US businesses, as revenue and profit pressures build from competing new digital technologies. Additionally, Value stocks are generally more cyclical, operate in more competitive industries and have greater capital requirements. Finally, in a very low interest rate world, Value stocks in both Europe and the US often have high P/Es due to their dividend yield, yet these valuations are often not justified by the underlying business fundamentals of those companies.
Similarly, investors seem to expect a return to EU and/or EM outperformance over the United States. DSM continues to believe that America's technology-laden indices will outperform the Rest-of-World indices which generally exclude New Era technology giants, with the notable exception of China. In short, DSM believes Growth/United States will outperform Value/Rest-of-World going forward.
While "Old Era" Value names may recover and possibly outperform Growth over a limited period of time, DSM believes this trend will be short-lived. Similarly, a rally in bank stocks caused by a significant rise in interest rates as the global economy recovers would be a big plus for the Russell 1000 Value Index, the MSCI Europe and EM indices, all of which are more heavily exposed to financials than Growth indices. However, DSM believes this too would not last.
In recent years America's technology leadership has been challenged by Chinese technology companies such as Alibaba, Tencent and JD.com who have proved themselves to be credible competitors and technology innovators. Without question, Chinese companies will continue to challenge the US's dominance in tech going forward. However, it is possible that the punitive regulatory actions instituted by the Chinese government over this past year may cause China's leading technology companies to be less competitive going forward, while also disincentivizing the risk taking and entrepreneurial psychology of China's entrepreneurs across their entire economy. As a result, American technology companies may well find themselves better positioned on a relative basis.
Fund Review/Current Positioning
Over the last several quarters earnings have been quite strong across the Fund's holdings, however, turnover has increased. One of the factors behind the increased turnover is the risk of persistently higher inflation. If inflation remains above 3% for an extended period of time, interest rates may rise higher than currently expected. If rates do go up more than expected, DSM believes positions with loftier P/Es will be at a greater risk of a significant correction. Accordingly, DSM has trimmed or sold higher P/E names and purchased or added to positions with
5
lower P/Es. The majority of the Fund is invested in the information technology and communication services sectors, with smaller weightings in health care, financials, consumer discretionary, consumer staples, industrials and materials.
For the year, the M Large Cap Growth Fund underperformed the benchmark primarily as a result of stock selection in the consumer discretionary and information technology sectors. DSM's stock selection in financials and underweight of the industrials sector versus the benchmark benefitted performance. By security, the top five contributors to the Fund's performance for the year included Alphabet, Microsoft, NVIDIA, Intuit and EPAM Systems. The five positions which contributed the least in the period were Alibaba Group, Global Payments, PayPal Holdings, Tencent Holdings and JD.com. It is worth noting that the performance of the benchmark in 2021 was again helped by holding Apple, whose long-term growth prospects DSM sees as moderate, and Tesla, which has an extremely high valuation.
Given its reasonable valuation, solid expected revenue and earnings growth, and a recovering global economy, DSM believes the portfolio has significant appreciation potential. Over time, businesses appreciate in value as their earnings grow. Portfolio earnings have grown largely as expected before the pandemic, remained strong (albeit a bit less than expected) during the pandemic and DSM believes growth in the mid-to-high teens or perhaps more is possible in the years ahead.
DSM Capital Partners LLC
Investment Sub-Adviser to the M Large Cap Growth Fund
Performance represented is net of fees. The foregoing reflects the thoughts and opinions of DSM Capital Partners LLC exclusively and is subject to change without notice. The information provided in this material should not be considered a recommendation to purchase or sell any particular security. It should not be assumed that any security transactions, holdings, or sectors discussed were or will be profitable, or that the investment recommendations or decisions we make in the future will be profitable or will equal the investment performance discussed herein. Strategies discussed are subject to change at any time by the investment manager in its discretion due to market conditions or opportunities. Market conditions may impact performance. The performance results presented were achieved in particular market conditions which may not be repeated. Moreover, the current market volatility and uncertain regulatory environment may have a negative impact on future performance. Portfolio characteristics are as of 12/31/21. Please note that all indices are unmanaged and are not available for direct investment.
This commentary may include statements that constitute "forward looking statements" under the U.S. securities laws. Forward-looking statements include, among other things, projections, estimates, and information about possible or future results related to the Fund, market or regulatory developments. The views expressed above are not guarantees of future performance or economic results and involve certain risks, uncertainties and assumptions that could cause actual outcomes and results to differ materially from the views expressed herein. The views expressed above are subject to change at any time based upon economic, market, or other conditions and the subadvisory firm undertakes no obligation to update the views expressed herein. Any discussions of specific securities should not be considered a recommendation to buy or sell those securities. The views expressed above (including any forward-looking statement) may not be relied upon as investment advice or as an indication of the Fund's trading intent. Information about the Fund's holdings, asset allocation or country diversification is historical and is not an indication of future Fund composition, which may vary. Direct investment in any index is not possible. The performance of any index mentioned in this commentary has not been adjusted for ongoing management, distribution and operating expenses, and sales charges applicable to mutual fund investments. In addition, the returns do not reflect additional fees charged by separate accounts or variable insurance contracts that an investor in the Fund may pay. If these additional fees were reflected, performance would have been lower.
6
COMPARISON OF CHANGE IN VALUE OF $10,000 INVESTMENT IN
THE M LARGE CAP GROWTH FUND AND THE RUSSELL 1000 GROWTH INDEX (Unaudited)

The M Large Cap Growth Fund's total return is calculated net of Investment Advisory Fees and operating expenses. Performance figures represent past performance and are not indicative of future performance of the M Large Cap Growth Fund or Index. Share value will fluctuate so that an investor's shares, when redeemed, may be worth more or less than the original investment. Please note that all indices are unmanaged, do not incur expenses, and are not available for direct investment. Persons who invest in the M Large Cap Growth Fund through a variable annuity or variable life insurance contract should note this graph does not reflect separate account expenses deducted by the insurance company.
* 12/31/11 to 12/31/21
RUSSELL 1000 GROWTH INDEX
1 The Russell 1000 Growth Total Return Index includes dividends reinvested in the Russell 1000 Growth Index as reported by the Russell Company. The Russell 1000 Growth Index is a capitalization weighted index containing over 600 widely held securities with growth characteristics. DSM uses the Russell 1000 Growth Index as a benchmark because its average market capitalization is similar to that of the M Large Cap Growth Fund, and it is an industry standard. Characteristics of any benchmark may differ materially from accounts managed by DSM. Investors cannot invest directly in an Index.
7
M CAPITAL APPRECIATION FUND
Performance
For the twelve months ended December 31, 2021, the M Capital Appreciation Fund had a return of 17.7% (net of management fees) versus a total return (including reinvestment of dividends) of 18.2% for its benchmark, the Russell 2500® Index1.
Market Environment/Conditions
U.S. equities ended the year with a record setting rally. Value stocks led the market with a Russell 2500® Value Index return of 27.8% compared to the Russell 2500® Growth return of 5.0% for 2021. Toward the end of 2020, we noted a shift in behavior of the market away from "Growth At Any Price" investing to more fundamental drivers and that shift continued in earnest in 2021. In general, a market focused on stock fundamentals as opposed to price momentum is positive for Capital Appreciation's performance.
As the world began to stabilize and recover from the initial impact of the COVID-19 pandemic, equity markets faced a number of opportunities and hurdles. Year-over-year comparisons of earnings and revenue growth were robust as pent-up demand coupled with extraordinary fiscal and monetary stimulus drove results higher than expectations across most industries. Many areas of the market continued to rebound from their prior lows with the growing evidence that the global economy was returning to some sense of normalcy. While the unexpected emergence of the Delta and Omicron variants created some temporary setbacks, stocks with exposure to a global reopening largely outperformed expensive, story-driven stocks that had dominated the markets in prior years. Growth did not come without its challenges, however, as supply and labor shortages constrained the ability of most companies to meet demand. Furthermore, these shortages combined with the magnitude of monetary stimulus drove inflation to multi-year highs culminating with the Federal Reserve's admission toward the end of 2021 that inflation pressures are no longer "transitory" and an expectation that rates are likely to be raised sooner than originally anticipated as a countermeasure.
As we enter 2022, we are encouraged by the behavior of the equity markets and the return to a focus on stock fundamentals. While inflationary pressures continue to be an area of concern, the Fund is well positioned by owning companies with pricing power at valuations less susceptible to multiple compression as rates increase. We believe the broadening of the market and flight from excessive valuations should be good for relative performance of the Fund. We remain focused on purchasing stocks that will generate long-term earnings power selling at an attractive valuation.
Fund Review/Current Positioning
The Fund's outperformance for the year can be attributed almost entirely to stock selection. Industry allocation was mostly neutral as the positive effect of being overweight industrials and basic materials was offset by the Fund's overweight position in technology, and underweight positions in real estate and energy.
Technology generated the largest amount of stock selection, gaining 24% versus 12% for the index, and represented three of the top ten contributors for the year. The Fund's semiconductor holdings, most notably MACOM Technology (+42%), performed well with strong fundamentals across the board. The sector continues to capitalize on the long-term benefits of consolidation, increasing technological complexity and secular demand trends across a broad spectrum of end markets from automobiles to data centers. Global supply chain issues and manufacturing bottlenecks also highlighted the value of contract manufacturers such as Jabil Inc. (+66%), that were able to emerge essentially unscathed due to global reach and scale. Finally, Rogers Corporation (+76%), a long-term holding of
8
the Fund, was acquired by Dupont for a 46% premium to its 1-month volume weighted average share price. The company has long been a natural acquisition target given its dominant niche in the specialty materials markets.
Health care was the second-best performing industry in the Fund, returning 3% versus a decline of 7% for the index. While we had a number of outperforming stocks in the group, none of the Fund's health care holdings was a top contributor for the year. What the Fund did not own had a much more pronounced impact on the overall results. For example, biotechnology stocks were down over 20% for the year. We entered the year materially underweight this group and remain underweight as they are typically binary outcome investments and subject to heavy speculation.
Positive industrial stock selection can primarily be attributed to the performance of Builders FirstSource (+110%), a building products distributor and the largest position in the Fund. In addition to reporting better-than-expected earnings and guidance throughout the year, Builders has continued to make meaningful strides toward structurally improving the profitability of the business by growing its services and value-added product sales. The building products distribution market is highly fragmented, which should set the stage for Builders to grow profitably well into the future. KBR, Inc. (+56%), a government services provider, also was a top contributor as the company delivered on its multi-year strategy of diversifying away from fixed price engineering and construction (E&C) to more predictable, recurring revenue government contracts. In addition to registering important customer wins, KBR has developed its proprietary technologies business, which is being accessed increasingly by the market for the development of hydrogen and ammonia based renewable energy.
Positive stock selection from these three areas was partially offset by weakness in consumer discretionary and basic materials stocks. The combination of labor shortages, supply chain bottlenecks and the uncertainties associated with the emergence of COVID-19 variants through the course of the year resulted in some volatility in both production and demand, particularly among consumer discretionary stocks. For example, Cheesecake Factory (-37%) and Azul (-42%) both traded down despite what we believe to be a structural improvement in their competitive positions during the pandemic as demand for leisure activities was disrupted. We therefore added to both of these positions. 2U, Inc. (-50%) witnessed a sudden decline in enrollment for online education programs as the tight labor market resulted in fewer people looking to return to school in the short term. And Cardlytics (-54%) experienced a slowing in advertising spend by its customer base as brand owners attempted to balance promotion with the ability to meet the needs of customers. In each of these cases, we believe these companies are well positioned for long-term secular growth as the world normalizes.
Finally, after strong performance in the prior 12 months, Pan American Silver Corp (-27%) gave back some of its returns as investors began to focus on the growing likelihood of interest rate increases in 2022. While precious metals have been a safe haven against inflationary pressures, they are also negatively correlated to speculation on interest rates, as higher rates increase holding cost. We lowered the size of our position entering 2021 but have maintained ownership as the company is beginning to harvest the value of the portfolio it has built over the past several years, and controls some of the lowest cost gold and silver deposits in the world. The mining industry also has become more disciplined with capital deployment in recent years, which should result in accruing value to equity holders over time.
9
Frontier Capital Management Co., LLC
Investment Sub-Adviser to the M Capital Appreciation Fund
Performance represented is net of fees. The foregoing reflects the thoughts and opinions of Frontier Capital Management Co., LLC exclusively and is subject to change without notice. The information provided in this material should not be considered a recommendation to purchase or sell any particular security. It should not be assumed that any security transactions, holdings, or sectors discussed were or will be profitable, or that the investment recommendations or decisions we make in the future will be profitable or will equal the investment performance discussed herein. Strategies discussed are subject to change at any time by the investment manager in its discretion due to market conditions or opportunities. Market conditions may impact performance. The performance results presented were achieved in particular market conditions which may not be repeated. Moreover, the current market volatility and uncertain regulatory environment may have a negative impact on future performance. Portfolio characteristics are as of December 31, 2021. Please note that all indices are unmanaged and are not available for direct investment.
This commentary may include statements that constitute "forward looking statements" under the U.S. securities laws. Forward-looking statements include, among other things, projections, estimates, and information about possible or future results related to the Fund, market or regulatory developments. The views expressed above are not guarantees of future performance or economic results and involve certain risks, uncertainties and assumptions that could cause actual outcomes and results to differ materially from the views expressed herein. The views expressed above are subject to change at any time based upon economic, market, or other conditions and the subadvisory firm undertakes no obligation to update the views expressed herein. Any discussions of specific securities should not be considered a recommendation to buy or sell those securities. The views expressed above (including any forward-looking statement) may not be relied upon as investment advice or as an indication of the Fund's trading intent. Information about the Fund's holdings, asset allocation or country diversification is historical and is not an indication of future Fund composition, which may vary. Direct investment in any index is not possible. The performance of any index mentioned in this commentary has not been adjusted for ongoing management, distribution and operating expenses, and sales charges applicable to mutual fund investments. In addition, the returns do not reflect additional fees charged by separate accounts or variable insurance contracts that an investor in the Fund may pay. If these additional fees were reflected, performance would have been lower.
10
COMPARISON OF CHANGE IN VALUE OF $10,000 INVESTMENT IN
THE M CAPITAL APPRECIATION FUND AND RUSSELL 2500 STOCK INDEX (Unaudited)

The M Capital Appreciation Fund's total return is calculated net of Investment Advisory Fees and operating expenses. Performance figures represent past performance and are not indicative of future performance of the M Capital Appreciation Fund or Index. Share value will fluctuate so that an investor's shares, when redeemed, may be worth more or less than the original investment. Please note that all indices are unmanaged, do not incur expenses, and are not available for direct investment. Persons who invest in the M Capital Appreciation Fund through a variable annuity or variable life insurance contract should note this graph does not reflect separate account expenses deducted by the insurance company.
* 12/31/11 to 12/31/21
RUSSELL 2500® INDEX
1 The Russell 2500® Index measures the performance of the small to mid-cap segment of the U.S. equity universe, commonly referred to as "smid" cap. The Russell 2500® Index is a subset of the Russell 3000® Index. It includes approximately 2500 of the smallest securities based on a combination of their market cap and current index membership. Investors cannot invest directly in an Index.
11
M LARGE CAP VALUE FUND
Performance
For the twelve months ended December 31, 2021, the Fund had a return of 30.0% (net of management fees) versus a total return of 25.2% for its benchmark, the Russell 1000® Value Index1.
Market Environment/Conditions
Broad U.S. equity markets posted another strong year despite surging COVID-19 infections. Virus fears receded in part as data from earlier affected regions suggested the more highly transmissible omicron variant is milder and is positive for broader immunity. Therefore, this current infection wave has the potential to hasten the transition from epidemic to endemic. The continued expansion of the economy, evidenced by solid corporate earnings and economic data, also helped drive strong returns for a second consecutive year as profit margins at many companies expanded further despite inflationary pressures. Unemployment claims, recently falling below pre-pandemic levels, showed that the labor market continued to tighten throughout the year. Job creation has been less than expected, the recently released December unemployment report also reflected a tight labor market as the unemployment rate fell to 3.9% and wages rose 4.7% for the year. Consumer confidence ended the year substantially higher despite the Omicron variant and persistent inflation. On the negative side, consumer prices rose at the fastest annual rate since 1982 as consumer demand remained high and supply chain disruptions continued. Additionally, more forward-looking pending home sales weakened as very low inventory and elevated prices weighed on sales.
The highest levels of inflation in nearly 40 years and a strong economy are pressuring the Federal Reserve (Fed) to accelerate the pace of tapering monthly bond purchases and tightening the monetary policy. The odds of a rate hike earlier in the year are rising. In addition to supply chain bottlenecks, energy prices were another source of inflation in 2021. Globally, the more transmissible variant is making it difficult for China to maintain its zero COVID policy, which further exacerbates the global supply chain with shipping ports as regional flare-ups lead to manufacturing shutdowns.
Fund Review/Current Positioning
The Fund outperformed during another year of robust equity returns. In large cap equities, growth showed up strong enough to flip the script for the full year ending with another year of growth outperforming. Value factors were weaker among large caps to end the year but generally did better among smaller companies. Interestingly growth did not work as well within value as higher valuation and negative earning companies underperformed. From a factor perspective, price momentum was a tailwind during the year and the factor with the biggest positive impact for the portfolio. Share change was strong for the full year and as expected given the annual returns, higher beta stocks did well for the year.
The biggest detraction to the strategy was from real estate and health care. Self-storage and residential REITs were particularly strong performers that led the sector higher during the year. We do not invest in REITs in this strategy. Within the healthcare sector the shortfall was from being overweight some of the poorer performing biotechnology stocks. We bought Biogen late in the summer after the stock dropped approximately 30% from the highs. However increased scrutiny and challenges to its recently approved and highly touted blockbuster Alzheimer's drug has sent the stock lower. Amgen was sold earlier in the year at much higher levels than where the stock ended the year which helped avoid further losses, however we were substantially overweight versus the benchmark when we held the position. There was also a small detraction within the energy sector from a small underweight in the best performing sector as crude oil rose sharply, up over 50% for the year.
12
The biggest relative benefit to the portfolio was from higher momentum consumer discretionary holdings in auto manufacturing as well as home improvement and auto retailing. We added substantially to a slight overweight versus the benchmark at the start of the year and maintained more than twice the benchmark weight since the annual rebalance of the benchmark in June despite consistently selling out of some of the poorer sector performers from the price momentum factor discipline.The majority of the benefit to the portfolio was from strong stock selection within specialty retailers such as Lowe's, AutoZone and O'Reilly Auto as well as Ford and General Motors. This sector accounted for forty percent of the overall outperformance for the year.
Telecommunication and wireless companies languished running into delays with the very expensive roll out of 5G technology while at-home entertainment companies continued to underperform throughout the year after performing so well at the beginning of the pandemic shutdowns in 2020. We continued to avoid owning Disney which lost nearly 15% of its value during a very strong year for equities. Both industries weighed down the communication services sector which was big benefit to our strategy from being markedly underweight over the past 15 months. After starting the year off with a strong first quarter, the technology sector consistently lagged thereafter and yet the portfolio holdings managed to continue to outperform consistently throughout the year. Despite being overweight in a lagging sector, outperformance was derived from system software companies which led the sector for the first three quarters, hardware and equipment companies came on stronger near the end of the year and semiconductor equipment companies which benefited from the global chip shortage.
For the first time in six years the portfolio was underweight in health care. We sold underperforming biotech companies and outperforming health care providers that rose in value quicker than their earnings were growing. It was short lived and are back to being essentially in line with the benchmark. We currently have large overweights in consumer discretionary and the financial sector. The underperformance over the last three quarters in the Technology sector, not surprisingly led to many lower valuation holdings being sold from the price momentum factor. We ended the year underweight the sector for the first time in 8 years and it is no longer among the four largest sectors from an absolute basis. We consistently added food companies to the consumer staples sector throughout the year. The relative underweight was essentially cut in half in both this sector as well as the industrials sector from a combination of new positions and adding to existing holdings. Finally, new positions in the utilities sector brought the portfolio to be nearly in line with the benchmark effectively ending a 14 year stretch of maintaining a substantial underweight. We begin the new year with five other sectors with larger underweights than what we have in utilities. We began the year discussing how periods of narrow market leadership eventually give way to a broadening out and a return to focusing on valuations. We closed 2021 with a rally in small cap value and higher quality and a strong performance reversal. Personal, business, and economic anxiety over COVID still remains even after broad vaccination in the US. While COVID infections are high, the hospitalization and survivability are greatly improved. The past year of high-quality value outperformance supports our research and belief in maintaining high quality companies in our portfolios even when low quality surges for a short period. Last year we also questioned the temporary nature of the pronounced inflation from both the changes in government policies and supply chain challenges. We currently see on the economic front mixed concerns and expectations of increased interest rates, inflation, labor challenges and market volatility. While we do not have clarity as to what these factors will deliver by year end 2022, we trust that our disciplined investment process will guide us to the proper value portfolio for the long term. We thank you for your continued support and wish you a healthy and prosperous year ahead.
13
Brandywine Global Investment Management, LLC
Investment Sub-Adviser to M Large Cap Value Fund
Performance represented is net of fees. The foregoing reflects the thoughts and opinions of Brandywine Global Investment Management, LLC exclusively and is subject to change without notice. The information provided in this material should not be considered a recommendation to purchase or sell any particular security. It should not be assumed that any security transactions, holdings, or sectors discussed were or will be profitable, or that the investment recommendations or decisions we make in the future will be profitable or will equal the investment performance discussed herein. Strategies discussed are subject to change at any time by the investment manager in its discretion due to market conditions or opportunities. Market conditions may impact performance. The performance results presented were achieved in particular market conditions which may not be repeated. Moreover, the current market volatility and uncertain regulatory environment may have a negative impact on future performance. Portfolio characteristics are as of December 31, 2021. Please note that all indices are unmanaged and are not available for direct investment.
This commentary may include statements that constitute "forward looking statements" under the U.S. securities laws. Forward-looking statements include, among other things, projections, estimates, and information about possible or future results related to the Fund, market or regulatory developments. The views expressed above are not guarantees of future performance or economic results and involve certain risks, uncertainties and assumptions that could cause actual outcomes and results to differ materially from the views expressed herein. The views expressed above are subject to change at any time based upon economic, market, or other conditions and the subadvisory firm undertakes no obligation to update the views expressed herein. Any discussions of specific securities should not be considered a recommendation to buy or sell those securities. The views expressed above (including any forward-looking statement) may not be relied upon as investment advice or as an indication of the Fund's trading intent. Information about the Fund's holdings, asset allocation or country diversification is historical and is not an indication of future Fund composition, which may vary. Direct investment in any index is not possible. The performance of any index mentioned in this commentary has not been adjusted for ongoing management, distribution and operating expenses, and sales charges applicable to mutual fund investments. In addition, the returns do not reflect additional fees charged by separate accounts or variable insurance contracts that an investor in the Fund may pay. If these additional fees were reflected, performance would have been lower.
14
COMPARISON OF CHANGE IN VALUE OF $10,000 INVESTMENT IN
THE M LARGE CAP VALUE FUND AND THE RUSSELL 1000 VALUE INDEX (Unaudited)
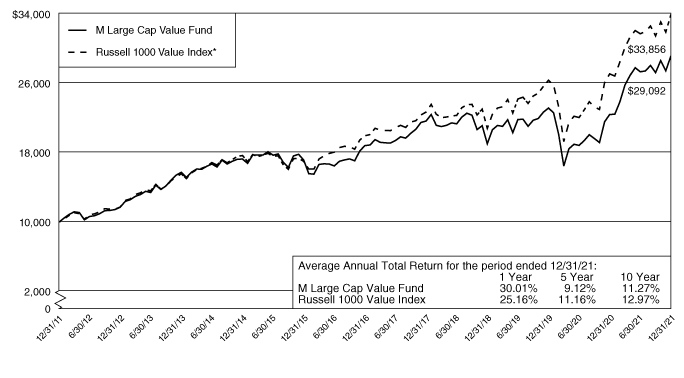
The M Large Cap Value Fund's total return is calculated net of Investment Advisory Fees and operating expenses. Performance figures represent past performance and are not indicative of future performance of the M Large Cap Value Fund or Index. Share value will fluctuate so that an investor's shares, when redeemed, may be worth more or less than the original investment. Please note that all indices are unmanaged, do not incur expenses, and are not available for direct investment. Persons who invest in the M Large Cap Value Fund through a variable annuity or variable life insurance contract should note this graph does not reflect separate account expenses deducted by the insurance company.
* 12/31/11 to 12/31/21
RUSSELL 1000 VALUE INDEX
1 Russell 1000 companies with lower price-to-book ratios and lower forecasted growth. Investors cannot invest directly in an Index.
15
M International Equity Fund
SCHEDULE OF INVESTMENTS
December 31, 2021
Shares | | | | Value
(Note 1) | |
| | | COMMON STOCKS—69.8% | |
| | | Australia—4.4% | |
| | 5,596 | | | Adbri Ltd. | | $ | 11,481 | | |
| | 271 | | | Afterpay Ltd.* | | | 16,367 | | |
| | 3,733 | | | AGL Energy Ltd. | | | 16,676 | | |
| | 4,474 | | | Allkem Ltd.* | | | 33,853 | | |
| | 5,481 | | | ALS Ltd. | | | 52,159 | | |
| | 1,335 | | | Altium Ltd. | | | 43,892 | | |
| | 23,001 | | | Alumina Ltd. | | | 31,210 | | |
| | 24,812 | | | AMP Ltd.* | | | 18,232 | | |
| | 2,797 | | | Ampol Ltd. | | | 60,357 | | |
| | 1,231 | | | Ansell Ltd. | | | 28,221 | | |
| | 8,493 | | | APA Group† | | | 62,162 | | |
| | 1,172 | | | ARB Corp. Ltd. | | | 44,775 | | |
| | 16,116 | | | Ardent Leisure Group Ltd.*,† | | | 15,829 | | |
| | 3,393 | | | Aristocrat Leisure Ltd. | | | 107,556 | | |
| | 785 | | | ASX Ltd. | | | 53,058 | | |
| | 5,956 | | | Atlas Arteria Ltd. | | | 29,986 | | |
| | 1,347 | | | AUB Group Ltd. | | | 25,245 | | |
| | 27,196 | | | Aurizon Holdings Ltd. | | | 69,055 | | |
| | 16,206 | | | AusNet Services Ltd. | | | 30,302 | | |
| | 9,677 | | | Austal Ltd.† | | | 13,729 | | |
| | 16,565 | | | Australia & New Zealand Banking
Group Ltd. | | | 331,547 | | |
| | 2,559 | | | Australian Ethical Investment Ltd. | | | 25,674 | | |
| | 23,353 | | | Australian Pharmaceutical
Industries Ltd. | | | 29,394 | | |
| | 10,095 | | | Bank of Queensland Ltd. | | | 59,418 | | |
| | 5,183 | | | Bapcor Ltd. | | | 26,434 | | |
| | 36,897 | | | Beach Energy Ltd.† | | | 33,824 | | |
| | 4,696 | | | Bega Cheese Ltd.† | | | 19,372 | | |
| | 6,079 | | | Bendigo & Adelaide Bank Ltd.† | | | 40,247 | | |
| | 19,147 | | | BHP Group Ltd.† | | | 578,112 | | |
| | 1,146 | | | BHP Group Ltd., ADR† | | | 69,161 | | |
| | 177 | | | Blackmores Ltd.† | | | 11,755 | | |
| | 7,397 | | | BlueScope Steel Ltd. | | | 112,477 | | |
| | 12,498 | | | Brambles Ltd. | | | 96,658 | | |
| | 849 | | | Breville Group Ltd.† | | | 19,581 | | |
| | 1,779 | | | Brickworks Ltd. | | | 31,271 | | |
| | 2,848 | | | carsales.com Ltd. | | | 51,988 | | |
| | 6,463 | | | Challenger Ltd. | | | 30,705 | | |
| | 2,711 | | | Champion Iron Ltd.* | | | 10,730 | | |
| | 5,238 | | | City Chic Collective Ltd.* | | | 20,960 | | |
| | 16,096 | | | Cleanaway Waste Management Ltd. | | | 36,654 | | |
| | 444 | | | Cochlear Ltd. | | | 69,814 | | |
| | 748 | | | Codan Ltd. | | | 5,077 | | |
Shares | | | | Value
(Note 1) | |
| | | Australia (Continued) | |
| | 8,123 | | | Coles Group Ltd. | | $ | 106,023 | | |
| | 9,619 | | | Commonwealth Bank of Australia | | | 706,829 | | |
| | 5,942 | | | Computershare Ltd. | | | 86,462 | | |
| | 34,520 | | | Cooper Energy Ltd.*,† | | | 7,032 | | |
| | 1,259 | | | Corporate Travel
Management Ltd.*,† | | | 20,161 | | |
| | 5,529 | | | Costa Group Holdings Ltd. | | | 12,189 | | |
| | 496 | | | Credit Corp. Group Ltd. | | | 12,082 | | |
| | 2,419 | | | Crown Resorts Ltd.*,† | | | 21,049 | | |
| | 2,681 | | | CSL Ltd. | | | 567,067 | | |
| | 9,383 | | | CSR Ltd. | | | 40,140 | | |
| | 2,536 | | | Data#3 Ltd. | | | 10,849 | | |
| | 4,714 | | | Deterra Royalties Ltd.† | | | 14,748 | | |
| | 617 | | | Domino's Pizza Enterprises Ltd. | | | 52,983 | | |
| | 8,535 | | | Downer EDI Ltd. | | | 37,009 | | |
| | 4,688 | | | Eagers Automotive Ltd. | | | 45,841 | | |
| | 13,551 | | | Eclipx Group Ltd.* | | | 21,788 | | |
| | 2,597 | | | Elders Ltd. | | | 23,165 | | |
| | 9,649 | | | Endeavour Group Ltd. | | | 47,316 | | |
| | 7,109 | | | Estia Health Ltd.† | | | 11,896 | | |
| | 1,597 | | | EVENT Hospitality and
Entertainment Ltd.*,† | | | 17,173 | | |
| | 13,941 | | | Evolution Mining Ltd. | | | 41,180 | | |
| | 1,312 | | | Flight Centre Travel
Group Ltd.*,† | | | 16,819 | | |
| | 17,313 | | | Fortescue Metals Group Ltd. | | | 241,971 | | |
| | 20,944 | | | G8 Education Ltd.* | | | 16,914 | | |
| | 9,874 | | | Genworth Mortgage Insurance
Australia Ltd. | | | 16,666 | | |
| | 10,754 | | | Gold Road Resources Ltd. | | | 12,284 | | |
| | 3,873 | | | GrainCorp Ltd., Class A | | | 23,275 | | |
| | 9,346 | | | GWA Group Ltd. | | | 18,699 | | |
| | 7,543 | | | Harvey Norman Holdings Ltd.† | | | 27,110 | | |
| | 15,902 | | | Healius Ltd. | | | 61,087 | | |
| | 10,246 | | | Humm Group Ltd.*,† | | | 6,709 | | |
| | 877 | | | IDP Education Ltd. | | | 22,109 | | |
| | 9,401 | | | IGO Ltd. | | | 78,451 | | |
| | 4,268 | | | Iluka Resources Ltd. | | | 31,362 | | |
| | 11,076 | | | Imdex Ltd. | | | 23,772 | | |
| | 21,765 | | | Incitec Pivot Ltd. | | | 51,306 | | |
| | 11,778 | | | Infomedia Ltd. | | | 13,111 | | |
| | 5,200 | | | Inghams Group Ltd.† | | | 13,241 | | |
| | 10,589 | | | Insurance Australia Group Ltd. | | | 32,819 | | |
| | 1,626 | | | InvoCare Ltd.† | | | 13,912 | | |
| | 15,570 | | | IOOF Holdings Ltd. | | | 41,007 | | |
The accompanying notes are an integral part of these financial statements.
16
M International Equity Fund
SCHEDULE OF INVESTMENTS (Continued)
December 31, 2021
Shares | | | | Value
(Note 1) | |
| | | Australia (Continued) | |
| | 2,813 | | | IPH Ltd. | | $ | 17,969 | | |
| | 3,090 | | | IRESS Ltd. | | | 28,102 | | |
| | 2,351 | | | James Hardie Industries PLC | | | 94,589 | | |
| | 2,408 | | | JB Hi-Fi Ltd. | | | 84,654 | | |
| | 2,838 | | | Johns Lyng Group Ltd. | | | 18,851 | | |
| | 5,029 | | | Lendlease Corp. Ltd. | | | 39,113 | | |
| | 1,418 | | | Lifestyle Communities Ltd. | | | 21,438 | | |
| | 10,522 | | | Link Administration Holdings Ltd. | | | 42,640 | | |
| | 1,516 | | | Lovisa Holdings Ltd. | | | 22,159 | | |
| | 7,511 | | | Lynas Rare Earths Ltd.* | | | 55,575 | | |
| | 2,554 | | | Macquarie Group Ltd. | | | 381,667 | | |
| | 1,209 | | | Magellan Financial Group Ltd.† | | | 18,683 | | |
| | 22,423 | | | Mayne Pharma Group Ltd.*,† | | | 4,813 | | |
| | 1,182 | | | McMillan Shakespeare Ltd. | | | 10,388 | | |
| | 33,345 | | | Medibank Pvt Ltd. | | | 81,272 | | |
| | 13,978 | | | Metcash Ltd.† | | | 45,764 | | |
| | 1,851 | | | Mineral Resources Ltd.† | | | 75,415 | | |
| | 1,365 | | | Monadelphous Group Ltd.† | | | 9,583 | | |
| | 21,227 | | | National Australia Bank Ltd. | | | 445,396 | | |
| | 879 | | | Netwealth Group Ltd. | | | 11,313 | | |
| | 10,216 | | | New Hope Corp. Ltd.† | | | 16,575 | | |
| | 6,467 | | | Newcrest Mining Ltd. | | | 115,180 | | |
| | 2,652 | | | NEXTDC Ltd.* | | | 24,678 | | |
| | 5,984 | | | nib holdings Ltd. | | | 30,519 | | |
| | 932 | | | Nick Scali Ltd. | | | 10,408 | | |
| | 33,934 | | | Nine Entertainment Co.
Holdings Ltd. | | | 71,844 | | |
| | 10,155 | | | Northern Star Resources Ltd. | | | 69,524 | | |
| | 12,393 | | | NRW Holdings Ltd. | | | 15,914 | | |
| | 6,389 | | | Nufarm Ltd. | | | 22,544 | | |
| | 11,530 | | | oOh!media Ltd.* | | | 14,177 | | |
| | 1,802 | | | Orica Ltd. | | | 17,948 | | |
| | 13,491 | | | Origin Energy Ltd. | | | 51,433 | | |
| | 7,294 | | | Orora Ltd. | | | 18,574 | | |
| | 6,797 | | | OZ Minerals Ltd. | | | 139,552 | | |
| | 38,627 | | | Paladin Energy Ltd.* | | | 24,731 | | |
| | 3,852 | | | Pendal Group Ltd. | | | 15,610 | | |
| | 12,923 | | | Perenti Global Ltd.† | | | 8,697 | | |
| | 1,594 | | | Perpetual Ltd. | | | 41,715 | | |
| | 43,898 | | | Perseus Mining Ltd.* | | | 51,740 | | |
| | 1,933 | | | Pinnacle Investment Management
Group Ltd. | | | 21,953 | | |
| | 3,992 | | | Platinum Asset Management Ltd. | | | 7,842 | | |
| | 2,030 | | | Premier Investments Ltd. | | | 44,780 | | |
| | 1,044 | | | Pro Medicus Ltd.† | | | 47,427 | | |
Shares | | | | Value
(Note 1) | |
| | | Australia (Continued) | |
| | 4,109 | | | Qantas Airways Ltd.* | | $ | 14,977 | | |
| | 8,115 | | | QBE Insurance Group Ltd. | | | 67,011 | | |
| | 10,685 | | | Qube Holdings Ltd. | | | 24,643 | | |
| | 17,985 | | | Ramelius Resources Ltd. | | | 20,543 | | |
| | 1,186 | | | Ramsay Health Care Ltd. | | | 61,695 | | |
| | 355 | | | REA Group Ltd. | | | 43,298 | | |
| | 1,390 | | | Reece Ltd. | | | 27,335 | | |
| | 10,111 | | | Regis Resources Ltd. | | | 14,345 | | |
| | 6,796 | | | Reliance Worldwide Corp. Ltd. | | | 31,002 | | |
| | 26,531 | | | Resolute Mining Ltd.* | | | 7,528 | | |
| | 3,796 | | | Rio Tinto Ltd. | | | 276,482 | | |
| | 10,554 | | | Sandfire Resources Ltd. | | | 50,525 | | |
| | 32,253 | | | Santos Ltd. | | | 148,068 | | |
| | 2,007 | | | SEEK Ltd. | | | 47,865 | | |
| | 3,220 | | | Select Harvests Ltd. | | | 14,548 | | |
| | 6,012 | | | Senex Energy Ltd.† | | | 20,208 | | |
| | 1,184 | | | Seven Group Holdings Ltd. | | | 18,607 | | |
| | 62,916 | | | Seven West Media Ltd.* | | | 29,525 | | |
| | 11,474 | | | Silver Lake Resources Ltd.* | | | 14,818 | | |
| | 4,361 | | | Sims Ltd.† | | | 50,956 | | |
| | 4,280 | | | SmartGroup Corp. Ltd. | | | 24,133 | | |
| | 4,234 | | | Sonic Healthcare Ltd. | | | 143,641 | | |
| | 21,815 | | | South32 Ltd. | | | 63,645 | | |
| | 3,457 | | | Southern Cross Media Group Ltd. | | | 4,879 | | |
| | 9,141 | | | SpeedCast International Ltd.*,†,§ | | | — | | |
| | 9,514 | | | St. Barbara Ltd. | | | 10,141 | | |
| | 13,525 | | | Star Entertainment Grp Ltd.* | | | 36,212 | | |
| | 10,471 | | | Steadfast Group Ltd. | | | 39,995 | | |
| | 7,077 | | | Suncorp Group Ltd. | | | 56,998 | | |
| | 4,830 | | | Super Retail Group Ltd. | | | 43,785 | | |
| | 24,332 | | | Superloop Ltd.* | | | 21,066 | | |
| | 9,346 | | | Sydney Airport* | | | 59,021 | | |
| | 14,863 | | | Tabcorp Holdings Ltd. | | | 54,284 | | |
| | 6,444 | | | Tassal Group Ltd. | | | 16,362 | | |
| | 4,562 | | | Technology One Ltd. | | | 42,517 | | |
| | 48,961 | | | Telstra Corp. Ltd. | | | 148,898 | | |
| | 2,964 | | | TPG Telecom Ltd. | | | 12,702 | | |
| | 14,998 | | | Transurban Group | | | 150,801 | | |
| | 5,229 | | | Treasury Wine Estates Ltd. | | | 47,098 | | |
| | 4,434 | | | United Malt Grp Ltd. | | | 14,065 | | |
| | 5,028 | | | Uniti Group Ltd.* | | | 16,279 | | |
| | 14,458 | | | Viva Energy Group Ltd.# | | | 24,719 | | |
| | 3,525 | | | Webjet Ltd.*,† | | | 13,259 | | |
| | 6,301 | | | Wesfarmers Ltd. | | | 271,849 | | |
| | 24,722 | | | West African Resources Ltd.* | | | 23,742 | | |
The accompanying notes are an integral part of these financial statements.
17
M International Equity Fund
SCHEDULE OF INVESTMENTS (Continued)
December 31, 2021
Shares | | | | Value
(Note 1) | |
| | | Australia (Continued) | |
| | 7,396 | | | Western Areas Ltd.* | | $ | 18,457 | | |
| | 22,518 | | | Westpac Banking Corp. | | | 349,776 | | |
| | 19,506 | | | Whitehaven Coal Ltd.* | | | 37,040 | | |
| | 7,694 | | | Woodside Petroleum Ltd. | | | 122,759 | | |
| | 9,649 | | | Woolworths Group Ltd. | | | 266,835 | | |
| | 4,639 | | | Worley Ltd. | | | 35,877 | | |
| | 647 | | | Xero Ltd.* | | | 66,579 | | |
| | | | 10,754,746 | | |
| | | Austria—0.3% | |
| | 984 | | | ANDRITZ AG | | | 50,839 | | |
| | 1,218 | | | AT&S Austria Technologie &
Systemtechnik AG | | | 60,044 | | |
| | 371 | | | BAWAG Group AG*,# | | | 22,893 | | |
| | 133 | | | DO & Co. AG* | | | 11,220 | | |
| | 1,848 | | | Erste Group Bank AG | | | 86,998 | | |
| | 614 | | | EVN AG | | | 18,594 | | |
| | 1,377 | | | FACC AG*,† | | | 11,052 | | |
| | 1,233 | | | IMMOFINANZ AG† | | | 31,641 | | |
| | 332 | | | Lenzing AG* | | | 46,114 | | |
| | 463 | | | Oesterreichische Post AG† | | | 19,925 | | |
| | 1,311 | | | OMV AG | | | 74,554 | | |
| | 3,082 | | | Raiffeisen Bank International AG | | | 90,809 | | |
| | 1,417 | | | S IMMO AG | | | 35,088 | | |
| | 127 | | | Schoeller-Bleckmann Oilfield
Equipment AG* | | | 4,475 | | |
| | 1,874 | | | Telekom Austria AG* | | | 16,258 | | |
| | 4,149 | | | UNIQA Insurance Group AG | | | 38,120 | | |
| | 252 | | | Verbund AG | | | 28,375 | | |
| | 884 | | | Vienna Insurance Group AG
Wiener Versicherung Gruppe | | | 25,060 | | |
| | 1,881 | | | voestalpine AG | | | 68,529 | | |
| | 921 | | | Wienerberger AG | | | 33,910 | | |
| | | | 774,498 | | |
| | | Belgium—0.6% | |
| | 366 | | | Ackermans & van Haaren NV | | | 70,296 | | |
| | 2,082 | | | Ageas SA/NV | | | 107,970 | | |
| | 5,568 | | | AGFA-Gevaert NV* | | | 24,025 | | |
| | 5,947 | | | Anheuser-Busch InBev SA/NV | | | 359,996 | | |
| | 127 | | | Argenx SE* | | | 45,589 | | |
| | 851 | | | Barco NV | | | 18,563 | | |
| | 1,086 | | | Bekaert SA | | | 48,393 | | |
| | 991 | | | bpost SA* | | | 8,654 | | |
| | 105 | | | Cie d'Entreprises CFE | | | 14,680 | | |
Shares | | | | Value
(Note 1) | |
| | | Belgium (Continued) | |
| | 333 | | | D'ieteren Group | | $ | 65,057 | | |
| | 196 | | | Elia Group SA/NV | | | 25,818 | | |
| | 609 | | | Etablissements Franz Colruyt NV | | | 25,834 | | |
| | 1,410 | | | Euronav NV | | | 12,521 | | |
| | 2,756 | | | Euronav SA*,† | | | 24,501 | | |
| | 548 | | | EVS Broadcast Equipment SA | | | 12,915 | | |
| | 1,400 | | | Fagron | | | 23,590 | | |
| | 415 | | | Gimv NV | | | 25,183 | | |
| | 1,602 | | | KBC Group NV | | | 137,630 | | |
| | 9 | | | Lotus Bakeries NV | | | 57,278 | | |
| | 216 | | | Melexis NV | | | 25,772 | | |
| | 2,034 | | | Ontex Group NV*,† | | | 16,187 | | |
| | 1,080 | | | Orange Belgium SA | | | 24,468 | | |
| | 1,637 | | | Proximus SADP | | | 31,944 | | |
| | 207 | | | Shurgard Self Storage SA | | | 13,551 | | |
| | 214 | | | Sipef NV | | | 13,863 | | |
| | 1,145 | | | Solvay SA | | | 133,226 | | |
| | 449 | | | Telenet Group Holding NV | | | 16,388 | | |
| | 688 | | | Tessenderlo Group SA* | | | 26,123 | | |
| | 852 | | | UCB SA | | | 97,340 | | |
| | 1,277 | | | Umicore SA | | | 51,975 | | |
| | | | 1,559,330 | | |
| | | Canada—7.6% | |
| | 1,800 | | | Absolute Software Corp.† | | | 16,877 | | |
| | 757 | | | Aclara Resources, Inc.* | | | 862 | | |
| | 6,700 | | | Advantage Energy Ltd.*,† | | | 39,248 | | |
| | 1,679 | | | Aecon Group, Inc.† | | | 22,405 | | |
| | 607 | | | Ag Growth International, Inc. | | | 15,202 | | |
| | 1,651 | | | Agnico-Eagle Mines Ltd. | | | 87,728 | | |
| | 5,042 | | | Aimia, Inc.* | | | 19,730 | | |
| | 1,100 | | | Air Canada*,† | | | 18,375 | | |
| | 7,338 | | | Alamos Gold, Inc., Class A | | | 56,444 | | |
| | 891 | | | Algonquin Power & Utilities Corp. | | | 12,869 | | |
| | 5,308 | | | Alimentation Couche-Tard, Inc. | | | 222,399 | | |
| | 2,174 | | | AltaGas Ltd.† | | | 46,936 | | |
| | 685 | | | Altus Group Ltd.† | | | 38,432 | | |
| | 18,656 | | | ARC Resources Ltd.† | | | 169,607 | | |
| | 989 | | | Aritzia, Inc.* | | | 40,930 | | |
| | 700 | | | Atco Ltd., Class I | | | 23,629 | | |
| | 600 | | | ATS Automation Tooling
Systems, Inc.* | | | 23,830 | | |
| | 84 | | | Aurora Cannabis, Inc.*,† | | | 455 | | |
| | 16,677 | | | B2Gold Corp. | | | 65,656 | | |
The accompanying notes are an integral part of these financial statements.
18
M International Equity Fund
SCHEDULE OF INVESTMENTS (Continued)
December 31, 2021
Shares | | | | Value
(Note 1) | |
| | | Canada (Continued) | |
| | 850 | | | Badger Infrastructure
Solutions Ltd.† | | $ | 21,362 | | |
| | 5,855 | | | Bank of Montreal | | | 630,397 | | |
| | 8,200 | | | Bank of Nova Scotia | | | 580,505 | | |
| | 12,285 | | | Barrick Gold Corp. | | | 233,443 | | |
| | 3,183 | | | Bausch Health Cos., Inc.* | | | 87,920 | | |
| | 1,208 | | | BCE, Inc. | | | 62,847 | | |
| | 9,500 | | | Birchcliff Energy Ltd.† | | | 48,516 | | |
| | 4,601 | | | BlackBerry Ltd.*,† | | | 42,993 | | |
| | 7,300 | | | Bombardier, Inc., Class B* | | | 9,695 | | |
| | 862 | | | Boralex, Inc., Class A† | | | 23,633 | | |
| | 18 | | | Brookfield Asset Management
Reinsurance Partners Ltd.,
Class A*,† | | | 1,129 | | |
| | 1,680 | | | Brookfield Asset Management, Inc.,
Class A | | | 101,455 | | |
| | 1,336 | | | Brookfield Asset Management, Inc.,
Class A† | | | 80,668 | | |
| | 717 | | | Brookfield Infrastructure Corp.,
Class A† | | | 48,934 | | |
| | 785 | | | BRP, Inc.† | | | 68,760 | | |
| | 4,802 | | | Cameco Corp. | | | 104,699 | | |
| | 1,985 | | | Canaccord Genuity Group, Inc. | | | 23,664 | | |
| | 400 | | | Canada Goose Holdings, Inc.*,† | | | 14,824 | | |
| | 4,735 | | | Canadian Imperial Bank of
Commerce | | | 551,929 | | |
| | 4,408 | | | Canadian National Railway Co.† | | | 541,456 | | |
| | 14,634 | | | Canadian Natural Resources Ltd. | | | 618,354 | | |
| | 4,315 | | | Canadian Pacific Railway Ltd. | | | 310,351 | | |
| | 532 | | | Canadian Tire Corp. Ltd., Class A | | | 76,308 | | |
| | 1,300 | | | Canadian Utilities Ltd., Class A | | | 37,707 | | |
| | 1,880 | | | Canadian Western Bank | | | 53,950 | | |
| | 1,876 | | | Canfor Corp.* | | | 47,547 | | |
| | 700 | | | Canopy Growth Corp.*,† | | | 6,111 | | |
| | 2,194 | | | Capital Power Corp.† | | | 68,442 | | |
| | 4,800 | | | Capstone Mining Corp.* | | | 21,174 | | |
| | 6,100 | | | Cardinal Energy Ltd.*,† | | | 20,591 | | |
| | 6,100 | | | Cascades, Inc. | | | 67,368 | | |
| | 1,637 | | | CCL Industries, Inc., Class B† | | | 87,780 | | |
| | 6,166 | | | Celestica, Inc.* | | | 68,730 | | |
| | 6,625 | | | Cenovus Energy, Inc. | | | 81,231 | | |
| | 5,235 | | | Centerra Gold, Inc. | | | 40,350 | | |
| | 9,000 | | | CES Energy Solutions Corp.† | | | 14,443 | | |
| | 1,621 | | | CGI, Inc.* | | | 143,333 | | |
| | 2,739 | | | CI Financial Corp. | | | 57,251 | | |
Shares | | | | Value
(Note 1) | |
| | | Canada (Continued) | |
| | 190 | | | Cogeco Communications, Inc.† | | $ | 15,130 | | |
| | 300 | | | Cogeco, Inc. | | | 19,265 | | |
| | 325 | | | Colliers International Group, Inc. | | | 48,400 | | |
| | 122 | | | Constellation Software, Inc. | | | 226,354 | | |
| | 5,812 | | | Corus Entertainment, Inc.,
Class B† | | | 21,871 | | |
| | 3,354 | | | Crescent Point Energy Corp. | | | 17,898 | | |
| | 322 | | | Descartes Systems Group, Inc.* | | | 26,623 | | |
| | 1,840 | | | Dollarama, Inc. | | | 92,091 | | |
| | 1,821 | | | Dorel Industries, Inc., Class B* | | | 29,497 | | |
| | 1,100 | | | DREAM Unlimited Corp.,
Class A† | | | 33,767 | | |
| | 6,100 | | | Dundee Precious Metals, Inc. | | | 37,711 | | |
| | 4,100 | | | ECN Capital Corp. | | | 17,308 | | |
| | 3,501 | | | Eldorado Gold Corp.* | | | 32,825 | | |
| | 9,925 | | | Element Fleet Management Corp.† | | | 101,059 | | |
| | 2,163 | | | Emera, Inc. | | | 108,103 | | |
| | 879 | | | Empire Co. Ltd., Class A | | | 26,781 | | |
| | 9,507 | | | Enbridge, Inc. | | | 371,435 | | |
| | 3,515 | | | Endeavour Mining PLC† | | | 77,055 | | |
| | 2,494 | | | Enerflex Ltd. | | | 15,103 | | |
| | 7,134 | | | Enerplus Corp. | | | 75,234 | | |
| | 882 | | | Enghouse Systems Ltd.† | | | 33,768 | | |
| | 7,100 | | | Ensign Energy Services, Inc.* | | | 9,430 | | |
| | 700 | | | ERO Copper Corp.* | | | 10,680 | | |
| | 700 | | | Exchange Income Corp.† | | | 23,319 | | |
| | 4,400 | | | Extendicare, Inc.† | | | 25,392 | | |
| | 316 | | | Fairfax Financial Holdings Ltd. | | | 155,443 | | |
| | 2,600 | | | Fiera Capital Corp.† | | | 21,561 | | |
| | 2,098 | | | Finning International, Inc. | | | 52,875 | | |
| | 4,880 | | | First Quantum Minerals Ltd. | | | 116,777 | | |
| | 547 | | | FirstService Corp. | | | 107,502 | | |
| | 3,042 | | | Fortis, Inc.† | | | 146,767 | | |
| | 10,041 | | | Fortuna Silver Mines, Inc.*,† | | | 39,213 | | |
| | 406 | | | Franco-Nevada Corp. | | | 56,147 | | |
| | 3,500 | | | Freehold Royalties Ltd.† | | | 32,234 | | |
| | 1,045 | | | George Weston Ltd. | | | 121,159 | | |
| | 1,500 | | | Gibson Energy, Inc.† | | | 26,586 | | |
| | 1,871 | | | Gildan Activewear, Inc. | | | 79,316 | | |
| | 5,700 | | | Gran Tierra Energy, Inc.* | | | 4,326 | | |
| | 1,406 | | | Great-West Lifeco, Inc. | | | 42,193 | | |
| | 1,700 | | | Home Capital Group, Inc.*,† | | | 52,507 | | |
| | 7,321 | | | Hudbay Minerals, Inc.† | | | 53,014 | | |
| | 2,998 | | | Hydro One Ltd.# | | | 77,998 | | |
| | 1,352 | | | iA Financial Corp., Inc. | | | 77,361 | | |
The accompanying notes are an integral part of these financial statements.
19
M International Equity Fund
SCHEDULE OF INVESTMENTS (Continued)
December 31, 2021
Shares | | | | Value
(Note 1) | |
| | | Canada (Continued) | |
| | 3,400 | | | IAMGOLD Corp.*,† | | $ | 10,590 | | |
| | 511 | | | IGM Financial, Inc. | | | 18,429 | | |
| | 800 | | | Imperial Oil Ltd. | | | 28,852 | | |
| | 600 | | | Imperial Oil Ltd.† | | | 21,660 | | |
| | 1,017 | | | Innergex Renewable Energy, Inc.† | | | 14,954 | | |
| | 706 | | | Intact Financial Corp. | | | 91,767 | | |
| | 2,045 | | | Interfor Corp. | | | 65,491 | | |
| | 2,087 | | | Intertape Polymer Group, Inc.† | | | 43,424 | | |
| | 1,600 | | | Invesque, Inc.*,† | | | 3,280 | | |
| | 3,868 | | | Ivanhoe Mines Ltd., Class A* | | | 31,557 | | |
| | 700 | | | Jamieson Wellness, Inc.#,† | | | 22,213 | | |
| | 500 | | | K-Bro Linen, Inc. | | | 13,518 | | |
| | 7,152 | | | Kelt Exploration Ltd.*,† | | | 27,252 | | |
| | 2,848 | | | Keyera Corp.† | | | 64,234 | | |
| | 17,698 | | | Kinross Gold Corp. | | | 102,694 | | |
| | 4,203 | | | Kirkland Lake Gold Ltd. | | | 176,134 | | |
| | 3,700 | | | Knight Therapeutics, Inc.* | | | 15,503 | | |
| | 600 | | | Labrador Iron Ore Royalty Corp.† | | | 17,801 | | |
| | 800 | | | Laurentian Bank of Canada† | | | 25,405 | | |
| | 562 | | | LifeWorks, Inc. | | | 11,343 | | |
| | 889 | | | Linamar Corp. | | | 52,660 | | |
| | 1,322 | | | Loblaw Cos. Ltd. | | | 108,314 | | |
| | 8,900 | | | Lucara Diamond Corp.*,† | | | 4,151 | | |
| | 13,050 | | | Lundin Mining Corp. | | | 101,928 | | |
| | 3,572 | | | Magna International, Inc. | | | 289,019 | | |
| | 4,800 | | | Major Drilling Group
International, Inc.* | | | 31,344 | | |
| | 10,315 | | | Manulife Financial Corp. | | | 196,627 | | |
| | 1,530 | | | Maple Leaf Foods, Inc.† | | | 35,391 | | |
| | 1,800 | | | Martinrea International, Inc. | | | 16,364 | | |
| | 1,895 | | | Medical Facilities Corp.† | | | 14,007 | | |
| | 4,700 | | | MEG Energy Corp.* | | | 43,472 | | |
| | 1,000 | | | Methanex Corp.† | | | 39,559 | | |
| | 1,382 | | | Metro, Inc. | | | 73,549 | | |
| | 470 | | | MTY Food Group, Inc.† | | | 23,512 | | |
| | 2,700 | | | Mullen Group Ltd.† | | | 24,824 | | |
| | 2,600 | | | National Bank of Canada† | | | 198,224 | | |
| | 14,800 | | | New Gold, Inc.* | | | 22,113 | | |
| | 1,740 | | | NFI Group, Inc.† | | | 27,869 | | |
| | 721 | | | North American Construction
Group Ltd.† | | | 10,938 | | |
| | 1,126 | | | North West Co., Inc. | | | 30,479 | | |
| | 2,509 | | | Northland Power, Inc.† | | | 75,273 | | |
| | 6,090 | | | Nutrien Ltd. | | | 457,945 | | |
| | 11,800 | | | OceanaGold Corp.*,† | | | 20,523 | | |
Shares | | | | Value
(Note 1) | |
| | | Canada (Continued) | |
| | 793 | | | Onex Corp. | | $ | 62,239 | | |
| | 2,715 | | | Open Text Corp. | | | 128,866 | | |
| | 1,829 | | | Osisko Gold Royalties Ltd. | | | 22,383 | | |
| | 3,696 | | | Pan American Silver Corp.† | | | 92,214 | | |
| | 4,549 | | | Parex Resources, Inc.† | | | 77,714 | | |
| | 700 | | | Park Lawn Corp. | | | 22,965 | | |
| | 1,907 | | | Parkland Corp. | | | 52,418 | | |
| | 1,760 | | | Pason Systems, Inc. | | | 16,056 | | |
| | 1,360 | | | Pembina Pipeline Corp.† | | | 41,253 | | |
| | 2,624 | | | Pembina Pipeline Corp. | | | 79,586 | | |
| | 4,630 | | | Peyto Exploration &
Development Corp.† | | | 34,589 | | |
| | 900 | | | PrairieSky Royalty Ltd.† | | | 9,698 | | |
| | 580 | | | Precision Drilling Corp.* | | | 20,491 | | |
| | 300 | | | Premium Brands Holdings Corp.† | | | 29,987 | | |
| | 1,959 | | | Primo Water Corp.† | | | 34,566 | | |
| | 1,764 | | | Quebecor, Inc., Class B | | | 39,814 | | |
| | 1,200 | | | Real Matters, Inc.* | | | 7,874 | | |
| | 700 | | | Recipe Unlimited Corp.* | | | 9,806 | | |
| | 1,900 | | | Restaurant Brands International, Inc. | | | 115,224 | | |
| | 1,345 | | | Richelieu Hardware Ltd. | | | 46,391 | | |
| | 1,489 | | | Ritchie Bros Auctioneers, Inc.† | | | 91,121 | | |
| | 3,204 | | | Rogers Communications, Inc.,
Class B | | | 152,565 | | |
| | 5,300 | | | Rogers Sugar, Inc.† | | | 24,930 | | |
| | 12,900 | | | Royal Bank of Canada | | | 1,369,086 | | |
| | 1,740 | | | Russel Metals, Inc.† | | | 46,260 | | |
| | 2,900 | | | Sandstorm Gold Ltd.*,† | | | 17,980 | | |
| | 1,204 | | | Saputo, Inc.† | | | 27,127 | | |
| | 4,547 | | | Secure Energy Services, Inc. | | | 18,908 | | |
| | 4,613 | | | Shaw Communications, Inc.,
Class B | | | 140,000 | | |
| | 1,968 | | | ShawCor Ltd.*,† | | | 7,639 | | |
| | 170 | | | Shopify, Inc., Class A* | | | 239,595 | | |
| | 1,794 | | | Sienna Senior Living, Inc.† | | | 21,316 | | |
| | 1,359 | | | Sleep Country Canada
Holdings, Inc.# | | | 40,320 | | |
| | 1,519 | | | SNC-Lavalin Group, Inc.† | | | 37,118 | | |
| | 4,381 | | | SSR Mining, Inc. | | | 77,545 | | |
| | 1,600 | | | Stantec, Inc.† | | | 89,894 | | |
| | 700 | | | Stelco Holdings, Inc. | | | 22,810 | | |
| | 1,100 | | | Stella-Jones, Inc. | | | 34,793 | | |
| | 999 | | | Sun Life Financial, Inc.† | | | 55,607 | | |
| | 1,100 | | | Sun Life Financial, Inc. | | | 61,259 | | |
| | 16,316 | | | Suncor Energy, Inc. | | | 408,317 | | |
The accompanying notes are an integral part of these financial statements.
20
M International Equity Fund
SCHEDULE OF INVESTMENTS (Continued)
December 31, 2021
Shares | | | | Value
(Note 1) | |
| | | Canada (Continued) | |
| | 3,579 | | | Superior Plus Corp. | | $ | 36,782 | | |
| | 7,700 | | | Tamarack Valley Energy Ltd.*,† | | | 23,436 | | |
| | 2,442 | | | TC Energy Corp.† | | | 113,572 | | |
| | 3,539 | | | TC Energy Corp. | | | 164,705 | | |
| | 3,772 | | | Teck Resources Ltd., Class B | | | 108,648 | | |
| | 1,544 | | | TFI International, Inc. | | | 173,167 | | |
| | 287 | | | Thomson Reuters Corp. | | | 34,321 | | |
| | 3,200 | | | Timbercreek Financial Corp.† | | | 24,311 | | |
| | 698 | | | TMX Group Ltd. | | | 70,768 | | |
| | 2,171 | | | Torex Gold Resources, Inc.* | | | 22,569 | | |
| | 1,339 | | | Toromont Industries Ltd. | | | 121,055 | | |
| | 11,275 | | | Toronto-Dominion Bank | | | 864,421 | | |
| | 5,111 | | | Tourmaline Oil Corp. | | | 165,013 | | |
| | 7,036 | | | TransAlta Corp. | | | 78,150 | | |
| | 2,812 | | | TransAlta Renewables, Inc.† | | | 41,681 | | |
| | 3,800 | | | Transcontinental, Inc., Class A† | | | 61,013 | | |
| | 12,242 | | | Trican Well Service Ltd.* | | | 26,808 | | |
| | 3,001 | | | Tricon Residentia, Inc. | | | 45,930 | | |
| | 1,570 | | | Turquoise Hill Resources Ltd.* | | | 25,816 | | |
| | 1,000 | | | Uni-Select, Inc.* | | | 20,349 | | |
| | 2,344 | | | Vermilion Energy, Inc.* | | | 29,463 | | |
| | 1,800 | | | Wajax Corp. | | | 34,536 | | |
| | 872 | | | Waste Connections, Inc. | | | 118,833 | | |
| | 2,200 | | | Wesdome Gold Mines Ltd.* | | | 20,018 | | |
| | 2,070 | | | West Fraser Timber Co. Ltd. | | | 197,484 | | |
| | 12,500 | | | Western Forest Products, Inc. | | | 20,851 | | |
| | 1,100 | | | Westshore Terminals
Investment Corp.† | | | 23,323 | | |
| | 1,533 | | | Wheaton Precious Metals Corp. | | | 65,782 | | |
| | 18,463 | | | Whitecap Resources, Inc.† | | | 109,323 | | |
| | 400 | | | Winpak Ltd.† | | | 11,754 | | |
| | 752 | | | WSP Global, Inc. | | | 109,166 | | |
| | 19,921 | | | Yamana Gold, Inc. | | | 83,782 | | |
| | | | 18,459,882 | | |
| | | Denmark—1.7% | |
| | 102 | | | ALK-Abello A/S* | | | 53,560 | | |
| | 24,690 | | | Alm Brand A/S | | | 48,155 | | |
| | 827 | | | Ambu A/S, Class B | | | 21,903 | | |
| | 20 | | | AP Moller—Maersk A/S, Class A | | | 66,687 | | |
| | 30 | | | AP Moller—Maersk A/S, Class B | | | 107,700 | | |
| | 2,721 | | | Bang & Olufsen A/S* | | | 11,622 | | |
| | 713 | | | Bavarian Nordic A/S* | | | 29,341 | | |
| | 749 | | | Carlsberg AS, Class B | | | 129,515 | | |
| | 930 | | | Chr Hansen Holding A/S | | | 73,380 | | |
Shares | | | | Value
(Note 1) | |
| | | Denmark (Continued) | |
| | 568 | | | Coloplast A/S, Class B | | $ | 100,086 | | |
| | 805 | | | D/S Norden A/S | | | 20,507 | | |
| | 3,111 | | | Danske Bank A/S | | | 53,794 | | |
| | 816 | | | Demant A/S* | | | 41,861 | | |
| | 778 | | | Dfds A/S* | | | 41,568 | | |
| | 68 | | | Drilling Co. of 1972 A/S* | | | 2,667 | | |
| | 1,168 | | | DSV A/S | | | 273,133 | | |
| | 1,244 | | | FLSmidth & Co. A/S | | | 46,526 | | |
| | 330 | | | Genmab A/S* | | | 132,868 | | |
| | 1,611 | | | GN Store Nord A/S | | | 101,439 | | |
| | 771 | | | H Lundbeck A/S | | | 19,930 | | |
| | 818 | | | H+H International A/S, Class B* | | | 28,803 | | |
| | 3,142 | | | ISS A/S* | | | 60,127 | | |
| | 958 | | | Jyske Bank A/S, Registered* | | | 49,425 | | |
| | 1,970 | | | Matas A/S | | | 37,548 | | |
| | 432 | | | Netcompany Group A/S# | | | 46,592 | | |
| | 266 | | | Nilfisk Holding A/S* | | | 8,755 | | |
| | 257 | | | NKT A/S* | | | 12,417 | | |
| | 362 | | | NNIT A/S# | | | 6,362 | | |
| | 12,082 | | | Novo Nordisk A/S, Class B | | | 1,359,492 | | |
| | 1,696 | | | Novozymes A/S, Class B | | | 139,480 | | |
| | 831 | | | Orsted A/S# | | | 106,253 | | |
| | 1,611 | | | Pandora A/S | | | 201,102 | | |
| | 376 | | | Per Aarsleff Holding A/S | | | 17,585 | | |
| | 576 | | | Ringkjoebing Landbobank A/S | | | 77,423 | | |
| | 80 | | | Rockwool International A/S,
Class A | | | 29,393 | | |
| | 137 | | | Rockwool International A/S,
Class B | | | 59,984 | | |
| | 1,007 | | | Royal Unibrew A/S | | | 113,649 | | |
| | 1,644 | | | Scandinavian Tobacco Group A/S,
Class A# | | | 34,556 | | |
| | 336 | | | Schouw & Co. A/S | | | 29,269 | | |
| | 638 | | | SimCorp A/S | | | 69,816 | | |
| | 1,256 | | | Spar Nord Bank A/S | | | 16,075 | | |
| | 1,818 | | | Sydbank A/S | | | 57,557 | | |
| | 676 | | | Topdanmark A/S | | | 37,981 | | |
| | 1,813 | | | Tryg A/S | | | 44,825 | | |
| | 6,155 | | | Vestas Wind Systems A/S | | | 188,455 | | |
| | 615 | | | Zealand Pharma A/S* | | | 13,661 | | |
| | | | 4,222,827 | | |
The accompanying notes are an integral part of these financial statements.
21
M International Equity Fund
SCHEDULE OF INVESTMENTS (Continued)
December 31, 2021
Shares | | | | Value
(Note 1) | |
| | | Finland—1.0% | |
| | 510 | | | Cargotec Oyj, Class B | | $ | 25,455 | | |
| | 1,769 | | | Elisa Oyj | | | 108,998 | | |
| | 25,135 | | | Finnair Oyj*,† | | | 17,032 | | |
| | 425 | | | Fiskars Oyj Abp | | | 11,129 | | |
| | 2,973 | | | Fortum Oyj | | | 91,355 | | |
| | 971 | | | Huhtamaki Oyj | | | 42,992 | | |
| | 1,799 | | | Kemira Oyj | | | 27,302 | | |
| | 1,396 | | | Kesko Oyj, Class A | | | 43,151 | | |
| | 3,349 | | | Kesko Oyj, Class B | | | 111,869 | | |
| | 2,038 | | | Kojamo Oyj | | | 49,282 | | |
| | 1,938 | | | Kone Oyj, Class B | | | 139,092 | | |
| | 1,119 | | | Konecranes Oyj | | | 44,793 | | |
| | 3,137 | | | Metsa Board Oyj, Class B | | | 30,750 | | |
| | 9,643 | | | Metso Outotec Oyj | | | 102,627 | | |
| | 3,866 | | | Neles Oyj | | | 137,881 | | |
| | 14,612 | | | Nokia Oyj* | | | 92,728 | | |
| | 19,449 | | | Nokia Oyj, ADR* | | | 120,973 | | |
| | 1,922 | | | Nokian Renkaat Oyj | | | 72,867 | | |
| | 12,077 | | | Nordea Bank Abp | | | 148,304 | | |
| | 281 | | | Olvi Oyj, Class A | | | 16,380 | | |
| | 7,100 | | | Oriola Oyj, Class B | | | 16,207 | | |
| | 727 | | | Orion Oyj, Class A | | | 29,880 | | |
| | 1,558 | | | Orion Oyj, Class B | | | 64,778 | | |
| | 10,116 | | | Outokumpu Oyj* | | | 63,344 | | |
| | 7,476 | | | Raisio Oyj , Class V† | | | 28,683 | | |
| | 873 | | | Revenio Group Oyj | | | 55,212 | | |
| | 2,447 | | | Sampo Oyj, Class A | | | 122,747 | | |
| | 7,584 | | | Stora Enso Oyj, Class R | | | 139,359 | | |
| | 1,519 | | | Terveystalo Oyj# | | | 20,476 | | |
| | 1,860 | | | TietoEVRY Oyj | | | 58,192 | | |
| | 1,633 | | | Tokmanni Group Corp. | | | 36,533 | | |
| | 4,923 | | | UPM-Kymmene Oyj | | | 187,538 | | |
| | 775 | | | Uponor Oyj | | | 18,476 | | |
| | 559 | | | Vaisala Oyj, Class A† | | | 33,921 | | |
| | 1,446 | | | Valmet Oyj | | | 62,097 | | |
| | 5,634 | | | Wartsila Oyj Abp | | | 79,281 | | |
| | 6,293 | | | YIT Oyj† | | | 30,908 | | |
| | | | 2,482,592 | | |
| | | France—6.1% | |
| | 1,053 | | | Accor SA* | | | 34,107 | | |
| | 162 | | | Aeroports de Paris*,† | | | 20,897 | | |
| | 3,054 | | | Air Liquide SA | | | 533,090 | | |
| | 3,566 | | | Airbus SE* | | | 456,169 | | |
| | 370 | | | Akka Technologies* | | | 20,346 | | |
Shares | | | | Value
(Note 1) | |
| | | France (Continued) | |
| | 947 | | | Albioma SA | | $ | 36,959 | | |
| | 660 | | | ALD SA# | | | 9,723 | | |
| | 972 | | | Alstom SA | | | 34,549 | | |
| | 476 | | | Alten SA | | | 85,895 | | |
| | 272 | | | Amundi SA# | | | 22,467 | | |
| | 1,234 | | | Arkema SA | | | 173,998 | | |
| | 820 | | | Atos SE† | | | 34,906 | | |
| | 368 | | | Aubay | | | 26,227 | | |
| | 10,652 | | | AXA SA | | | 317,553 | | |
| | 1,320 | | | Beneteau SA* | | | 21,400 | | |
| | 234 | | | BioMerieux | | | 33,274 | | |
| | 5,566 | | | BNP Paribas SA | | | 385,093 | | |
| | 5,145 | | | Bollore SA | | | 28,819 | | |
| | 541 | | | Bonduelle SCA | | | 12,842 | | |
| | 3,865 | | | Bouygues SA | | | 138,565 | | |
| | 3,079 | | | Bureau Veritas SA | | | 102,289 | | |
| | 1,394 | | | Capgemini SE | | | 342,013 | | |
| | 11,676 | | | Carrefour SA | | | 214,086 | | |
| | 20,011 | | | CGG SA* | | | 14,499 | | |
| | 5,818 | | | Cie de Saint-Gobain | | | 409,814 | | |
| | 1,659 | | | Cie Generale des Etablissements
Michelin SCA | | | 272,266 | | |
| | 585 | | | Cie Plastic Omnium SA | | | 15,225 | | |
| | 1,598 | | | CNP Assurances | | | 39,570 | | |
| | 2,606 | | | Coface SA | | | 37,176 | | |
| | 5,863 | | | Credit Agricole SA | | | 83,772 | | |
| | 4,080 | | | Danone SA | | | 253,575 | | |
| | 150 | | | Dassault Aviation SA | | | 16,224 | | |
| | 1,755 | | | Dassault Systemes SE | | | 104,519 | | |
| | 5,436 | | | Derichebourg SA* | | | 62,817 | | |
| | 3,064 | | | Edenred | | | 141,523 | | |
| | 1,777 | | | Eiffage SA | | | 183,011 | | |
| | 3,878 | | | Electricite de France SA | | | 45,608 | | |
| | 1,532 | | | Elior Group SA*,# | | | 11,102 | | |
| | 4,742 | | | Elis SA* | | | 82,169 | | |
| | 13,413 | | | Engie SA | | | 198,733 | | |
| | 601 | | | Eramet SA* | | | 49,231 | | |
| | 1,110 | | | EssilorLuxottica SA | | | 236,622 | | |
| | 450 | | | Eurazeo SE | | | 39,347 | | |
| | 1,550 | | | Eurofins Scientific SE | | | 191,997 | | |
| | 1,033 | | | Euronext NV# | | | 107,316 | | |
| | 4,666 | | | Eutelsat Communications SA | | | 57,027 | | |
| | 2,843 | | | Faurecia SE | | | 135,067 | | |
| | 539 | | | Fnac Darty SA | | | 35,285 | | |
| | 451 | | | Gaztransport Et Technigaz SA | | | 42,232 | | |
The accompanying notes are an integral part of these financial statements.
22
M International Equity Fund
SCHEDULE OF INVESTMENTS (Continued)
December 31, 2021
Shares | | | | Value
(Note 1) | |
| | | France (Continued) | |
| | 950 | | | Getlink SE | | $ | 15,748 | | |
| | 173 | | | Hermes International | | | 302,531 | | |
| | 77 | | | ID Logistics Group* | | | 32,217 | | |
| | 743 | | | Imerys SA | | | 30,909 | | |
| | 186 | | | Interparfums SA | | | 15,564 | | |
| | 632 | | | Ipsen SA | | | 57,922 | | |
| | 1,041 | | | IPSOS | | | 48,889 | | |
| | 530 | | | Jacquet Metals SACA | | | 12,671 | | |
| | 614 | | | JCDecaux SA* | | | 15,379 | | |
| | 685 | | | Kaufman & Broad SA | | | 28,816 | | |
| | 486 | | | Kering SA | | | 391,135 | | |
| | 1,540 | | | Korian SA† | | | 48,812 | | |
| | 976 | | | L'Oreal SA | | | 463,305 | | |
| | 433 | | | La Francaise des Jeux SAEM# | | | 19,196 | | |
| | 880 | | | Lagardere SA* | | | 24,426 | | |
| | 1,064 | | | Lectra | | | 50,877 | | |
| | 2,297 | | | Legrand SA | | | 269,097 | | |
| | 1,624 | | | LVMH Moet Hennessy Louis
Vuitton SE | | | 1,344,167 | | |
| | 971 | | | Maisons du Monde SA#,† | | | 22,508 | | |
| | 444 | | | Mersen SA | | | 18,653 | | |
| | 529 | | | Metropole Television SA | | | 10,335 | | |
| | 812 | | | Nexans SA | | | 79,365 | | |
| | 1,338 | | | Nexity SA | | | 62,974 | | |
| | 31,311 | | | Orange SA | | | 335,550 | | |
| | 676 | | | Orpea SA | | | 67,804 | | |
| | 829 | | | Pernod-Ricard SA | | | 199,617 | | |
| | 3,228 | | | Publicis Groupe SA | | | 217,565 | | |
| | 993 | | | Quadient SA | | | 21,638 | | |
| | 101 | | | Remy Cointreau SA | | | 24,608 | | |
| | 2,261 | | | Renault SA* | | | 78,627 | | |
| | 5,791 | | | Rexel SA | | | 117,554 | | |
| | 931 | | | Rothschild & Co. | | | 42,769 | | |
| | 995 | | | Rubis SCA | | | 29,747 | | |
| | 1,284 | | | Safran SA | | | 157,381 | | |
| | 3,224 | | | Sanofi | | | 325,135 | | |
| | 174 | | | Sartorius Stedim Biotech | | | 95,563 | | |
| | 200 | | | Savencia SA | | | 13,935 | | |
| | 1,900 | | | Schneider Electric SE | | | 373,057 | | |
| | 2,540 | | | SCOR SE | | | 79,351 | | |
| | 432 | | | SEB SA | | | 67,332 | | |
| | 6,297 | | | SES SA | | | 49,983 | | |
| | 411 | | | Societe BIC SA | | | 22,142 | | |
| | 4,495 | | | Societe Generale SA | | | 154,576 | | |
Shares | | | | Value
(Note 1) | |
| | | France (Continued) | |
| | 4 | | | Societe pour l'Informatique
Industrielle | | $ | 219 | | |
| | 832 | | | Sodexo SA | | | 72,994 | | |
| | 206 | | | SOITEC* | | | 50,471 | | |
| | 109 | | | Somfy SA | | | 21,866 | | |
| | 344 | | | Sopra Steria Group SACA | | | 61,684 | | |
| | 1,621 | | | SPIE SA | | | 41,930 | | |
| | 3,434 | | | STMicroelectronics NV | | | 169,560 | | |
| | 2,436 | | | Suez SA | | | 54,941 | | |
| | 889 | | | Technicolor SA, Registered* | | | 2,866 | | |
| | 2,141 | | | Technip Energies NV* | | | 31,249 | | |
| | 606 | | | Teleperformance | | | 270,453 | | |
| | 2,268 | | | Television Francaise 1 | | | 22,529 | | |
| | 943 | | | Thales SA | | | 80,306 | | |
| | 491 | | | Tikehau Capital SCA | | | 12,997 | | |
| | 21,146 | | | TotalEnergies SE | | | 1,074,454 | | |
| | 198 | | | Trigano SA | | | 38,547 | | |
| | 956 | | | Ubisoft Entertainment SA* | | | 46,878 | | |
| | 3,512 | | | Valeo | | | 106,278 | | |
| | 1,461 | | | Vallourec SA* | | | 14,637 | | |
| | 3,814 | | | Veolia Environnement SA | | | 140,081 | | |
| | 1,229 | | | Verallia SA# | | | 43,320 | | |
| | 436 | | | Vicat SA | | | 17,870 | | |
| | 86 | | | Vilmorin & Cie SA | | | 5,248 | | |
| | 3,938 | | | Vinci SA | | | 416,554 | | |
| | 95 | | | Virbac SA | | | 45,913 | | |
| | 2,749 | | | Vivendi SE | | | 37,213 | | |
| | 1,284 | | | Worldline SA*,# | | | 71,644 | | |
| | | | 14,743,126 | | |
| | | Germany—5.1% | |
| | 696 | | | 1&1 AG | | | 19,033 | | |
| | 1,887 | | | Aareal Bank AG | | | 61,787 | | |
| | 1,127 | | | adidas AG | | | 324,878 | | |
| | 1,932 | | | ADVA Optical Networking SE* | | | 30,970 | | |
| | 718 | | | AIXTRON SE | | | 14,608 | | |
| | 1,882 | | | Allianz SE, Registered | | | 444,923 | | |
| | 52 | | | Amadeus Fire AG | | | 10,775 | | |
| | 10,081 | | | Aroundtown SA | | | 61,059 | | |
| | 90 | | | Atoss Software AG | | | 22,235 | | |
| | 408 | | | Aurubis AG | | | 40,905 | | |
| | 5,797 | | | BASF SE | | | 407,741 | | |
| | 461 | | | Bauer AG* | | | 5,196 | | |
| | 8,019 | | | Bayer AG, Registered | | | 429,093 | | |
| | 4,607 | | | Bayerische Motoren Werke AG | | | 464,136 | | |
The accompanying notes are an integral part of these financial statements.
23
M International Equity Fund
SCHEDULE OF INVESTMENTS (Continued)
December 31, 2021
Shares | | | | Value
(Note 1) | |
| | | Germany (Continued) | |
| | 474 | | | BayWa AG | | $ | 20,803 | | |
| | 1,107 | | | Bechtle AG | | | 79,324 | | |
| | 592 | | | Befesa SA# | | | 45,427 | | |
| | 435 | | | Beiersdorf AG | | | 44,760 | | |
| | 1,136 | | | Bilfinger SE | | | 38,671 | | |
| | 1,628 | | | Borussia Dortmund GmbH & Co.
KGaA* | | | 8,044 | | |
| | 1,982 | | | Brenntag SE | | | 179,573 | | |
| | 603 | | | CANCOM SE | | | 40,655 | | |
| | 226 | | | Carl Zeiss Meditec AG | | | 47,562 | | |
| | 3,791 | | | CECONOMY AG* | | | 16,358 | | |
| | 159 | | | Cewe Stiftung & Co. KGAA | | | 23,243 | | |
| | 13,940 | | | Commerzbank AG* | | | 106,159 | | |
| | 270 | | | CompuGroup Medical SE & Co.
KgaA | | | 21,871 | | |
| | 1,121 | | | Continental AG* | | | 118,832 | | |
| | 612 | | | Corestate Capital Holding SA*,† | | | 7,859 | | |
| | 2,616 | | | Covestro AG# | | | 161,425 | | |
| | 857 | | | CTS Eventim AG & Co. KGaA* | | | 62,796 | | |
| | 9,667 | | | Daimler AG, Registered | | | 743,887 | | |
| | 4,833 | | | Daimler Truck Holding AG* | | | 177,671 | | |
| | 272 | | | Delivery Hero SE*,# | | | 30,348 | | |
| | 11,171 | | | Deutsche Bank AG, Registered* | | | 140,129 | | |
| | 730 | | | Deutsche Beteiligungs AG | | | 33,120 | | |
| | 1,312 | | | Deutsche Boerse AG | | | 219,725 | | |
| | 696 | | | Deutsche EuroShop AG | | | 11,601 | | |
| | 6,296 | | | Deutsche Lufthansa AG,
Registered* | | | 44,298 | | |
| | 3,746 | | | Deutsche Pfandbriefbank AG# | | | 45,079 | | |
| | 7,000 | | | Deutsche Post AG, Registered | | | 450,595 | | |
| | 36,590 | | | Deutsche Telekom AG, Registered | | | 679,021 | | |
| | 3,473 | | | Deutz AG* | | | 25,978 | | |
| | 889 | | | Duerr AG | | | 40,607 | | |
| | 28,452 | | | E.ON SE | | | 394,930 | | |
| | 465 | | | Eckert & Ziegler Strahlen- und
Medizintechnik AG | | | 49,817 | | |
| | 1,130 | | | Encavis AG | | | 20,018 | | |
| | 1,524 | | | Evonik Industries AG | | | 49,398 | | |
| | 280 | | | Evotec SE* | | | 13,548 | | |
| | 334 | | | Fielmann AG | | | 22,492 | | |
| | 472 | | | flatexDEGIRO AG* | | | 10,876 | | |
| | 479 | | | Fraport AG Frankfurt Airport
Services Worldwide* | | | 32,273 | | |
| | 2,143 | | | Freenet AG | | | 56,774 | | |
Shares | | | | Value
(Note 1) | |
| | | Germany (Continued) | |
| | 1,934 | | | Fresenius Medical Care AG & Co.
KGaA | | $ | 125,814 | | |
| | 3,491 | | | Fresenius SE & Co. KGaA | | | 140,697 | | |
| | 496 | | | FUCHS PETROLUB SE | | | 17,438 | | |
| | 2,073 | | | GEA Group AG | | | 113,498 | | |
| | 425 | | | Gerresheimer AG | | | 40,983 | | |
| | 287 | | | Gesco AG* | | | 8,332 | | |
| | 455 | | | GFT Technologies SE | | | 23,907 | | |
| | 1,489 | | | Grand City Properties SA | | | 35,396 | | |
| | 336 | | | Hannover Rueck SE | | | 63,941 | | |
| | 243 | | | Hapag-Lloyd AG# | | | 76,634 | | |
| | 1,117 | | | HeidelbergCement AG | | | 75,692 | | |
| | 6,593 | | | Heidelberger Druckmaschinen AG* | | | 19,854 | | |
| | 524 | | | Hella GmbH & Co. KGaA | | | 35,556 | | |
| | 1,225 | | | HelloFresh SE* | | | 94,195 | | |
| | 462 | | | Henkel AG & Co. KGaA | | | 36,135 | | |
| | 461 | | | Hornbach Holding AG & Co. KGaA | | | 69,542 | | |
| | 1,048 | | | HUGO BOSS AG | | | 63,833 | | |
| | 38 | | | Hypoport SE* | | | 22,107 | | |
| | 721 | | | Indus Holding AG | | | 26,883 | | |
| | 9,796 | | | Infineon Technologies AG | | | 454,586 | | |
| | 790 | | | Instone Real Estate Group SE# | | | 14,966 | | |
| | 788 | | | Jenoptik AG | | | 33,320 | | |
| | 6,571 | | | K+S AG, Registered* | | | 113,600 | | |
| | 828 | | | KION Group AG | | | 90,950 | | |
| | 2,961 | | | Kloeckner & Co. SE* | | | 36,138 | | |
| | 165 | | | Knorr-Bremse AG | | | 16,324 | | |
| | 434 | | | Koenig & Bauer AG* | | | 15,466 | | |
| | 326 | | | Krones AG | | | 35,593 | | |
| | 131 | | | KWS Saat SE & Co. KGaA | | | 10,887 | | |
| | 730 | | | LANXESS AG | | | 45,295 | | |
| | 698 | | | LEG Immobilien SE | | | 97,506 | | |
| | 685 | | | Merck KGaA | | | 177,031 | | |
| | 3,251 | | | METRO AG | | | 34,126 | | |
| | 2,085 | | | MLP SE | | | 20,343 | | |
| | 373 | | | MTU Aero Engines AG | | | 76,184 | | |
| | 675 | | | Muenchener Rueckversicherungs-
Gesellschaft AG in Muenchen,
Registered | | | 200,191 | | |
| | 147 | | | Nagarro SE* | | | 33,807 | | |
| | 772 | | | Nemetschek SE | | | 99,142 | | |
| | 33 | | | New Work SE | | | 8,172 | | |
| | 188 | | | Nexus AG | | | 15,325 | | |
| | 1,039 | | | Norma Group SE | | | 40,077 | | |
| | 390 | | | OHB SE | | | 15,985 | | |
The accompanying notes are an integral part of these financial statements.
24
M International Equity Fund
SCHEDULE OF INVESTMENTS (Continued)
December 31, 2021
Shares | | | | Value
(Note 1) | |
| | | Germany (Continued) | |
| | 471 | | | PATRIZIA AG | | $ | 10,993 | | |
| | 1,490 | | | ProSiebenSat.1 Media SE | | | 23,766 | | |
| | 656 | | | Puma SE | | | 80,287 | | |
| | 458 | | | PVA TePla AG* | | | 21,848 | | |
| | 1,192 | | | QIAGEN NV* | | | 66,484 | | |
| | 51 | | | Rational AG | | | 52,280 | | |
| | 824 | | | Rheinmetall AG | | | 77,921 | | |
| | 641 | | | RTL Group SA* | | | 34,022 | | |
| | 3,858 | | | RWE AG | | | 156,894 | | |
| | 959 | | | S&T AG | | | 16,006 | | |
| | 1,686 | | | SAF-Holland SE* | | | 23,610 | | |
| | 523 | | | Salzgitter AG* | | | 18,709 | | |
| | 4,060 | | | SAP SE | | | 577,326 | | |
| | 826 | | | Scout24 AG# | | | 57,759 | | |
| | 2,889 | | | Siemens AG, Registered | | | 502,184 | | |
| | 2,640 | | | Siemens Energy AG* | | | 67,597 | | |
| | 524 | | | Siemens Healthineers AG# | | | 39,266 | | |
| | 279 | | | Siltronic AG | | | 44,660 | | |
| | 185 | | | Sixt SE* | | | 32,773 | | |
| | 435 | | | Software AG | | | 17,373 | | |
| | 638 | | | Stabilus SA | | | 46,887 | | |
| | 286 | | | STRATEC SE | | | 44,869 | | |
| | 324 | | | Stroeer SE & Co. KGaA | | | 25,563 | | |
| | 1,626 | | | Suedzucker AG | | | 24,528 | | |
| | 731 | | | Symrise AG | | | 108,441 | | |
| | 1,795 | | | TAG Immobilien AG | | | 50,293 | | |
| | 1,202 | | | Takkt AG | | | 21,020 | | |
| | 315 | | | Talanx AG* | | | 15,256 | | |
| | 685 | | | TeamViewer AG*,# | | | 9,218 | | |
| | 420 | | | Technotrans SE | | | 14,106 | | |
| | 21,504 | | | Telefonica Deutschland
Holding AG | | | 59,761 | | |
| | 2,041 | | | thyssenkrupp AG* | | | 22,502 | | |
| | 1,060 | | | Uniper SE | | | 50,445 | | |
| | 1,410 | | | United Internet AG, Registered | | | 56,089 | | |
| | 426 | | | VERBIO Vereinigte
BioEnergie AG | | | 29,246 | | |
| | 224 | | | Vitesco Technologies Group AG* | | | 11,017 | | |
| | 542 | | | Volkswagen AG | | | 159,450 | | |
| | 4,905 | | | Vonovia SE | | | 270,841 | | |
| | 257 | | | Vossloh AG | | | 13,211 | | |
| | 236 | | | Wacker Chemie AG | | | 35,359 | | |
| | 904 | | | Wacker Neuson SE | | | 25,977 | | |
| | 209 | | | Washtec AG | | | 13,087 | | |
Shares | | | | Value
(Note 1) | |
| | | Germany (Continued) | |
| | 959 | | | Wuestenrot &
Wuerttembergische AG | | $ | 19,282 | | |
| | 284 | | | Zalando SE*,# | | | 23,002 | | |
| | 117 | | | Zeal Network SE | | | 5,302 | | |
| | | | 12,504,847 | | |
| | | Hong Kong—1.7% | |
| | 86,000 | | | AIA Group Ltd. | | | 866,888 | | |
| | 2,500 | | | ASM Pacific Technology Ltd. | | | 27,012 | | |
| | 9,400 | | | Bank of East Asia Ltd. | | | 13,502 | | |
| | 4,100 | | | BOC Aviation Ltd.# | | | 30,023 | | |
| | 18,000 | | | BOC Hong Kong Holdings Ltd. | | | 58,980 | | |
| | 9,600 | | | Budweiser Brewing Co.
APAC Ltd.# | | | 25,177 | | |
| | 10,000 | | | Cafe de Coral Holdings Ltd. | | | 17,826 | | |
| | 26,181 | | | Cathay Pacific Airways Ltd.* | | | 21,455 | | |
| | 15,000 | | | Chow Sang Sang Holdings
International Ltd. | | | 20,968 | | |
| | 10,200 | | | Chow Tai Fook Jewellery
Group Ltd. | | | 18,340 | | |
| | 56,000 | | | CITIC Telecom International
Holdings Ltd. | | | 18,888 | | |
| | 8,906 | | | CK Asset Holdings Ltd. | | | 56,137 | | |
| | 22,500 | | | CK Hutchison Holdings Ltd. | | | 145,142 | | |
| | 6,000 | | | CK Infrastructure Holdings Ltd. | | | 38,204 | | |
| | 11,000 | | | CLP Holdings Ltd. | | | 111,093 | | |
| | 6,000 | | | Dah Sing Banking Group Ltd. | | | 5,125 | | |
| | 4,800 | | | Dah Sing Financial Holdings Ltd. | | | 14,528 | | |
| | 78,750 | | | Esprit Holdings Ltd.* | | | 7,170 | | |
| | 7,400 | | | ESR Cayman Ltd.#,* | | | 25,007 | | |
| | 55,258 | | | Far East Consortium
International Ltd. | | | 20,126 | | |
| | 58,000 | | | First Pacific Co. Ltd. | | | 21,348 | | |
| | 5,000 | | | Galaxy Entertainment Group Ltd.* | | | 25,906 | | |
| | 40,000 | | | Giordano International Ltd. | | | 7,643 | | |
| | 7,138 | | | Great Eagle Holdings Ltd. | | | 19,956 | | |
| | 142,000 | | | Guotai Junan International
Holdings Ltd. | | | 19,668 | | |
| | 108,000 | | | Haitong International Securities
Group Ltd. | | | 23,269 | | |
| | 8,000 | | | Hang Lung Group Ltd. | | | 17,093 | | |
| | 11,000 | | | Hang Lung Properties Ltd. | | | 22,628 | | |
| | 8,300 | | | Hang Seng Bank Ltd. | | | 151,895 | | |
The accompanying notes are an integral part of these financial statements.
25
M International Equity Fund
SCHEDULE OF INVESTMENTS (Continued)
December 31, 2021
Shares | | | | Value
(Note 1) | |
| | | Hong Kong (Continued) | |
| | 8,500 | | | Henderson Land
Development Co. Ltd. | | $ | 36,191 | | |
| | 11,000 | | | HK Electric Investments &
HK Electric Investments Ltd. | | | 10,792 | | |
| | 7,500 | | | HKBN Ltd. | | | 9,205 | | |
| | 19,200 | | | HKR International Ltd. | | | 7,633 | | |
| | 56,000 | | | HKT Trust & HKT Ltd. | | | 75,265 | | |
| | 50,457 | | | Hong Kong & China Gas Co. Ltd. | | | 78,556 | | |
| | 7,706 | | | Hong Kong Exchanges &
Clearing Ltd. | | | 450,053 | | |
| | 19,000 | | | Hong Kong Technology Venture Co.
Ltd. | | | 20,712 | | |
| | 14,179 | | | Hongkong & Shanghai Hotels Ltd.* | | | 12,456 | | |
| | 50,000 | | | Hutchison Telecommunications
Hong Kong Holdings Ltd. | | | 8,015 | | |
| | 2,800 | | | Hygeia Healthcare Holdings Co.
Ltd.# | | | 17,523 | | |
| | 9,000 | | | Hysan Development Co. Ltd. | | | 27,816 | | |
| | 41,000 | | | IGG, Inc. | | | 36,438 | | |
| | 5,602 | | | Johnson Electric Holdings Ltd. | | | 11,868 | | |
| | 11,000 | | | JS Global Lifestyle Co. Ltd.# | | | 18,537 | | |
| | 37,000 | | | K Wah International Holdings Ltd. | | | 14,283 | | |
| | 7,000 | | | Kerry Logistics Network Ltd. | | | 17,110 | | |
| | 6,000 | | | Kerry Properties Ltd. | | | 15,620 | | |
| | 9,000 | | | Kowloon Development Co. Ltd. | | | 11,888 | | |
| | 5,750 | | | L'Occitane International SA | | | 23,265 | | |
| | 38,400 | | | Landing International
Development Ltd.* | | | 1,138 | | |
| | 15,500 | | | Lifestyle International
Holdings Ltd.* | | | 8,528 | | |
| | 6,000 | | | Luk Fook Holdings
International Ltd. | | | 16,159 | | |
| | 26,800 | | | Man Wah Holdings Ltd. | | | 41,519 | | |
| | 480,000 | | | Mason Group Holdings Ltd.* | | | 1,231 | | |
| | 11,000 | | | Melco International
Development Ltd.* | | | 13,416 | | |
| | 6,185 | | | MTR Corp. Ltd. | | | 33,195 | | |
| | 10,000 | | | NagaCorp Ltd. | | | 8,721 | | |
| | 9,000 | | | New World Development Co. Ltd. | | | 35,607 | | |
| | 44,000 | | | NewOcean Energy Holdings Ltd.* | | | 310 | | |
| | 17,000 | | | NWS Holdings Ltd. | | | 15,937 | | |
| | 1,000 | | | Orient Overseas International Ltd. | | | 24,533 | | |
| | 87,000 | | | Pacific Basin Shipping Ltd. | | | 31,910 | | |
| | 7,128 | | | Pacific Century Premium
Developments Ltd.* | | | 548 | | |
Shares | | | | Value
(Note 1) | |
| | | Hong Kong (Continued) | |
| | 29,000 | | | Pacific Textiles Holdings Ltd. | | $ | 13,686 | | |
| | 59,789 | | | PCCW Ltd. | | | 30,287 | | |
| | 10,000 | | | Power Assets Holdings Ltd. | | | 62,327 | | |
| | 4,800 | | | PRADA SpA | | | 30,717 | | |
| | 39,000 | | | Razer, Inc.#,* | | | 12,104 | | |
| | 6,900 | | | Samsonite International SA*,# | | | 14,017 | | |
| | 9,600 | | | Sands China Ltd.* | | | 22,358 | | |
| | 12,000 | | | Shangri-La Asia Ltd.* | | | 10,019 | | |
| | 100,000 | | | Shun Tak Holdings Ltd.* | | | 27,573 | | |
| | 138,000 | | | Singamas Container Holdings Ltd. | | | 20,706 | | |
| | 35,483 | | | Sino Land Co. Ltd. | | | 44,186 | | |
| | 23,000 | | | SITC International Holdings Co.
Ltd. | | | 83,180 | | |
| | 25,000 | | | SJM Holdings Ltd.* | | | 16,832 | | |
| | 13,500 | | | SmarTone Telecommunications
Holdings Ltd. | | | 7,185 | | |
| | 7,000 | | | Sun Hung Kai Properties Ltd. | | | 84,924 | | |
| | 27,000 | | | SUNeVision Holdings Ltd. | | | 25,554 | | |
| | 4,500 | | | Swire Pacific Ltd., Class A | | | 25,595 | | |
| | 15,000 | | | Swire Pacific Ltd., Class B | | | 14,697 | | |
| | 6,200 | | | Swire Properties Ltd. | | | 15,537 | | |
| | 8,000 | | | Techtronic Industries Co. Ltd. | | | 159,229 | | |
| | 12,000 | | | Television Broadcasts Ltd.* | | | 7,248 | | |
| | 7,600 | | | Transport International
Holdings Ltd. | | | 12,476 | | |
| | 30,000 | | | United Laboratories International
Holdings Ltd. | | | 16,774 | | |
| | 32,000 | | | Value Partners Group Ltd. | | | 15,964 | | |
| | 12,000 | | | Vitasoy International Holdings Ltd. | | | 24,223 | | |
| | 24,000 | | | VSTECS Holdings Ltd. | | | 22,499 | | |
| | 1,300 | | | VTech Holdings Ltd. | | | 10,178 | | |
| | 135,326 | | | WH Group Ltd.# | | | 84,866 | | |
| | 11,000 | | | Wharf Real Estate Investment Co.
Ltd. | | | 55,864 | | |
| | 27,000 | | | Xinyi Glass Holdings Ltd. | | | 67,521 | | |
| | 14,500 | | | Yue Yuen Industrial Holdings Ltd.* | | | 24,249 | | |
| | 29,000 | | | Zensun Enterprises Ltd. | | | 14,356 | | |
| | | | 4,063,906 | | |
| | | Ireland—0.5% | |
| | 5,093 | | | AIB Group PLC*,† | | | 12,408 | | |
| | 10,939 | | | Bank of Ireland Group PLC* | | | 62,096 | | |
| | 10,801 | | | Cairn Homes PLC* | | | 13,896 | | |
| | 3,828 | | | CRH PLC | | | 202,742 | | |
| | 6,465 | | | CRH PLC, ADR | | | 341,352 | | |
The accompanying notes are an integral part of these financial statements.
26
M International Equity Fund
SCHEDULE OF INVESTMENTS (Continued)
December 31, 2021
Shares | | | | Value
(Note 1) | |
| | | Ireland (Continued) | |
| | 563 | | | Flutter Entertainment PLC* | | $ | 89,096 | | |
| | 763 | | | Glanbia Plc | | | 10,685 | | |
| | 1,946 | | | Irish Continental Group PLC* | | | 10,025 | | |
| | 526 | | | Kerry Group PLC, Class A | | | 67,820 | | |
| | 2,044 | | | Kingspan Group PLC | | | 244,345 | | |
| | 4,366 | | | Smurfit Kappa Group PLC | | | 240,780 | | |
| | | | 1,295,245 | | |
| | | Israel—0.7% | |
| | 182 | | | AFI Properties Ltd. | | | 12,059 | | |
| | 734 | | | Airport City Ltd.* | | | 16,453 | | |
| | 568 | | | Alony Hetz Properties &
Investments Ltd. | | | 10,584 | | |
| | 160 | | | Alrov Properties and Lodgings Ltd.* | | | 9,830 | | |
| | 2,317 | | | Amot Investments Ltd. | | | 18,840 | | |
| | 471 | | | Ashtrom Group Ltd. | | | 12,786 | | |
| | 735 | | | AudioCodes Ltd.† | | | 25,534 | | |
| | 2,639 | | | Azorim-Investment Development &
Construction Co. Ltd.* | | | 15,797 | | |
| | 154 | | | Azrieli Group Ltd. | | | 14,712 | | |
| | 9,207 | | | Bank Hapoalim BM | | | 95,063 | | |
| | 15,548 | | | Bank Leumi Le-Israel BM | | | 167,285 | | |
| | 22,557 | | | Bezeq The Israeli
Telecommunication Corp. Ltd.* | | | 37,286 | | |
| | 92 | | | Big Shopping Centers Ltd. | | | 15,033 | | |
| | 2,356 | | | Cellcom Israel Ltd.* | | | 13,247 | | |
| | 1,006 | | | Clal Insurance Enterprises
Holdings Ltd.* | | | 25,822 | | |
| | 66 | | | Danel Adir Yeoshua Ltd. | | | 14,945 | | |
| | 442 | | | Delek Group Ltd.* | | | 36,268 | | |
| | 611 | | | Delta Galil Industries Ltd. | | | 42,057 | | |
| | 187 | | | Elbit Systems Ltd.† | | | 32,562 | | |
| | 58 | | | Electra Ltd. | | | 40,259 | | |
| | 4,030 | | | Energix-Renewable Energies Ltd. | | | 17,175 | | |
| | 4,121 | | | Enlight Renewable Energy Ltd.* | | | 10,146 | | |
| | 464 | | | Equital Ltd.* | | | 17,775 | | |
| | 432 | | | First International Bank of
Israel Ltd. | | | 17,994 | | |
| | 122 | | | Formula Systems 1985 Ltd., ADR† | | | 14,933 | | |
| | 375 | | | Fox Wizel Ltd. | | | 67,535 | | |
| | 2,500 | | | Gav-Yam Lands Corp. Ltd. | | | 30,879 | | |
| | 2,147 | | | Harel Insurance Investments &
Financial Services Ltd. | | | 24,405 | | |
Shares | | | | Value
(Note 1) | |
| | | Israel (Continued) | |
| | 5,268 | | | ICL Group Ltd. | | $ | 50,851 | | |
| | 275 | | | IDI Insurance Co. Ltd. | | | 10,040 | | |
| | 2,482 | | | Inrom Construction Industries Ltd. | | | 12,310 | | |
| | 464 | | | Isracard Ltd. | | | 2,289 | | |
| | 2,814 | | | Israel Canada T.R Ltd. | | | 18,148 | | |
| | 10,514 | | | Israel Discount Bank Ltd., Class A | | | 70,816 | | |
| | 302 | | | Kenon Holdings Ltd. | | | 15,348 | | |
| | 500 | | | Magic Software Enterprises Ltd. | | | 10,465 | | |
| | 1,175 | | | Matrix IT Ltd. | | | 35,697 | | |
| | 1,507 | | | Maytronics Ltd. | | | 37,227 | | |
| | 252 | | | Mega or Holdings Ltd. | | | 11,575 | | |
| | 298 | | | Melisron Ltd.* | | | 27,797 | | |
| | 526 | | | Menora Mivtachim Holdings Ltd. | | | 12,456 | | |
| | 12,957 | | | Migdal Insurance & Financial
Holdings Ltd. | | | 21,384 | | |
| | 1,212 | | | Mizrahi Tefahot Bank Ltd. | | | 46,781 | | |
| | 2,005 | | | Naphtha Israel Petroleum Corp.
Ltd.* | | | 14,433 | | |
| | 156 | | | Nice Ltd.* | | | 47,754 | | |
| | 12 | | | Nice Ltd., ADR*,† | | | 3,643 | | |
| | 417 | | | Nova Ltd.* | | | 60,184 | | |
| | 21,016 | | | Oil Refineries Ltd.* | | | 6,043 | | |
| | 1,134 | | | OPC Energy Ltd.* | | | 12,730 | | |
| | 2,397 | | | Partner Communications Co. Ltd.* | | | 19,545 | | |
| | 134 | | | Paz Oil Co. Ltd.* | | | 16,667 | | |
| | 3,099 | | | Phoenix Holdings Ltd. | | | 40,101 | | |
| | 282 | | | Rami Levy Chain Stores Hashikma
Marketing 2006 Ltd. | | | 21,162 | | |
| | 1,415 | | | Shapir Engineering and
Industry Ltd. | | | 12,525 | | |
| | 4,878 | | | Shikun & Binui Ltd.* | | | 31,271 | | |
| | 700 | | | Strauss Group Ltd. | | | 21,840 | | |
| | 1,314 | | | Summit Real Estate Holdings Ltd.* | | | 27,692 | | |
| | 526 | | | Tera Light Ltd.* | | | 1,266 | | |
| | 9,256 | | | Teva Pharmaceutical Industries Ltd.,
ADR* | | | 74,141 | | |
| | 862 | | | Tower Semiconductor Ltd.* | | | 34,204 | | |
| | 171 | | | YH Dimri Construction &
Development Ltd. | | | 16,627 | | |
| | | | 1,702,276 | | |
The accompanying notes are an integral part of these financial statements.
27
M International Equity Fund
SCHEDULE OF INVESTMENTS (Continued)
December 31, 2021
Shares | | | | Value
(Note 1) | |
| | | | | Italy—1.8% | | | |
| | 23,194 | | | A2A SpA | | $ | 45,419 | | |
| | 548 | | | ACEA SpA | | | 11,704 | | |
| | 1,290 | | | Amplifon SpA | | | 69,688 | | |
| | 6,692 | | | Anima Holding SpA# | | | 34,209 | | |
| | 7,266 | | | Assicurazioni Generali SpA | | | 154,114 | | |
| | 3,923 | | | Atlantia SpA* | | | 77,960 | | |
| | 1,709 | | | Azimut Holding SpA | | | 48,020 | | |
| | 623 | | | Banca Generali SpA* | | | 27,485 | | |
| | 2,201 | | | Banca Mediolanum SpA | | | 21,751 | | |
| | 9,396 | | | Banca Popolare di Sondrio SCPA | | | 39,559 | | |
| | 30,073 | | | Banco BPM SpA | | | 90,389 | | |
| | 2,332 | | | BFF Bank SpA# | | | 18,824 | | |
| | 26,017 | | | BPER Banca† | | | 53,998 | | |
| | 732 | | | Brunello Cucinelli SpA* | | | 50,586 | | |
| | 1,230 | | | Buzzi Unicem SpA | | | 26,572 | | |
| | 3,016 | | | Cairo Communication SpA | | | 7,005 | | |
| | 1,300 | | | Carel Industries SpA# | | | 39,369 | | |
| | 27,159 | | | CIR SpA-Compagnie Industriali* | | | 14,533 | | |
| | 12,944 | | | CNH Industrial NV | | | 251,556 | | |
| | 3,914 | | | Credito Emiliano SpA | | | 25,934 | | |
| | 660 | | | Danieli & C Officine
Meccaniche SpA | | | 20,326 | | |
| | 1,563 | | | Davide Campari-Milano NV | | | 22,875 | | |
| | 253 | | | DiaSorin SpA | | | 48,232 | | |
| | 44,294 | | | Enel SpA | | | 355,321 | | |
| | 21,397 | | | Eni SpA | | | 297,685 | | |
| | 806 | | | ERG SpA | | | 26,097 | | |
| | 741 | | | Ferrari NV | | | 191,925 | | |
| | 18,781 | | | Fincantieri SpA*,† | | | 12,904 | | |
| | 4,947 | | | FinecoBank Banca Fineco SpA | | | 86,932 | | |
| | 1,583 | | | Freni Brembo SpA | | | 22,582 | | |
| | 725 | | | Gruppo MutuiOnline SpA | | | 36,566 | | |
| | 12,089 | | | Hera SpA | | | 50,387 | | |
| | 1,991 | | | Infrastrutture Wireless Italiane
SpA# | | | 24,209 | | |
| | 1,134 | | | Interpump Group SpA | | | 83,209 | | |
| | 88,627 | | | Intesa Sanpaolo SpA | | | 229,451 | | |
| | 9,018 | | | Iren SpA | | | 27,249 | | |
| | 7,345 | | | Italgas SpA | | | 50,608 | | |
| | 2,260 | | | Leonardo SpA* | | | 16,210 | | |
| | 8,088 | | | MediaForEurope NV, Class A*,† | | | 8,246 | | |
| | 8,088 | | | MediaForEurope NV, Class B† | | | 11,464 | | |
| | 7,518 | | | Mediobanca Banca di Credito
Finanziario SpA | | | 86,534 | | |
Shares | | | | Value
(Note 1) | |
| | | Italy (Continued) | |
| | 1,242 | | | Moncler SpA | | $ | 90,525 | | |
| | 9,750 | | | OVS SpA*,# | | | 28,417 | | |
| | 1,752 | | | Pirelli & C SpA# | | | 12,183 | | |
| | 3,814 | | | Poste Italiane SpA# | | | 50,109 | | |
| | 1,079 | | | Prysmian SpA | | | 40,674 | | |
| | 442 | | | Recordati Industria Chimica e
Farmaceutica SpA | | | 28,432 | | |
| | 61 | | | Reply SpA | | | 12,410 | | |
| | 5,199 | | | Saipem SpA*,† | | | 10,921 | | |
| | 10,551 | | | Saras SpA*,† | | | 6,616 | | |
| | 103 | | | Sesa SpA | | | 20,334 | | |
| | 9,270 | | | Snam SpA | | | 55,936 | | |
| | 575 | | | SOL SpA | | | 13,846 | | |
| | 32,679 | | | Stellantis NV | | | 620,803 | | |
| | 3,313 | | | Tamburi Investment Partners SpA | | | 37,454 | | |
| | 2,650 | | | Technogym SpA# | | | 25,509 | | |
| | 180,478 | | | Telecom Italia SpA | | | 88,672 | | |
| | 1,807 | | | Tenaris SA | | | 18,947 | | |
| | 1,050 | | | Tenaris SA, ADR | | | 21,903 | | |
| | 9,476 | | | Terna—Rete Elettrica Nazionale | | | 76,749 | | |
| | 7,682 | | | UniCredit SpA | | | 118,455 | | |
| | 7,073 | | | Unipol Gruppo SpA | | | 38,483 | | |
| | 9,399 | | | UnipolSai Assicurazioni SpA† | | | 26,538 | | |
| | | | 4,261,603 | | |
| | | Japan—15.1% | |
| | 1,200 | | | 77 Bank Ltd. | | | 13,927 | | |
| | 600 | | | ABC-Mart, Inc. | | | 25,715 | | |
| | 4,900 | | | Acom Co. Ltd. | | | 14,100 | | |
| | 1,200 | | | Adastria Co. Ltd. | | | 16,858 | | |
| | 1,500 | | | ADEKA Corp. | | | 33,474 | | |
| | 1,500 | | | Advantest Corp. | | | 142,137 | | |
| | 4,700 | | | Aeon Co. Ltd. | | | 110,687 | | |
| | 1,400 | | | AEON Financial Service Co. Ltd. | | | 15,116 | | |
| | 2,100 | | | Aeon Mall Co. Ltd. | | | 29,958 | | |
| | 2,100 | | | AGC, Inc. | | | 100,226 | | |
| | 700 | | | Aica Kogyo Co. Ltd. | | | 20,234 | | |
| | 2,900 | | | Aida Engineering Ltd. | | | 26,950 | | |
| | 8,600 | | | Aiful Corp. | | | 26,616 | | |
| | 300 | | | Ain Holdings, Inc. | | | 14,944 | | |
| | 2,300 | | | Air Water, Inc. | | | 35,511 | | |
| | 2,200 | | | Aisin Corp. | | | 84,343 | | |
| | 2,900 | | | Ajinomoto Co., Inc. | | | 88,162 | | |
| | 1,200 | | | Alconix Corp. | | | 13,989 | | |
| | 1,400 | | | Alfresa Holdings Corp. | | | 18,658 | | |
The accompanying notes are an integral part of these financial statements.
28
M International Equity Fund
SCHEDULE OF INVESTMENTS (Continued)
December 31, 2021
Shares | | | | Value
(Note 1) | |
| | | Japan (Continued) | |
| | 3,500 | | | Alps Alpine Co. Ltd. | | $ | 33,013 | | |
| | 2,700 | | | Amada Co. Ltd. | | | 26,735 | | |
| | 1,000 | | | Amano Corp. | | | 23,011 | | |
| | 1,600 | | | ANA Holdings, Inc.* | | | 33,445 | | |
| | 1,500 | | | Anritsu Corp.† | | | 23,172 | | |
| | 1,100 | | | AOKI Holdings, Inc.† | | | 5,900 | | |
| | 600 | | | Aomori Bank Ltd. | | | 9,248 | | |
| | 900 | | | Aoyama Trading Co. Ltd.* | | | 5,234 | | |
| | 700 | | | Aozora Bank Ltd. | | | 15,323 | | |
| | 500 | | | Arata Corp. | | | 19,147 | | |
| | 1,000 | | | Arcs Co. Ltd. | | | 18,543 | | |
| | 400 | | | Argo Graphics, Inc. | | | 11,214 | | |
| | 1,400 | | | Arisawa Manufacturing Co. Ltd. | | | 12,013 | | |
| | 900 | | | Aruhi Corp. | | | 8,176 | | |
| | 1,800 | | | Asahi Diamond Industrial Co. Ltd. | | | 10,218 | | |
| | 3,400 | | | Asahi Group Holdings Ltd. | | | 132,240 | | |
| | 2,000 | | | Asahi Holdings, Inc. | | | 35,643 | | |
| | 1,600 | | | Asahi Intecc Co. Ltd. | | | 34,370 | | |
| | 15,000 | | | Asahi Kasei Corp. | | | 140,963 | | |
| | 1,400 | | | Asics Corp. | | | 31,035 | | |
| | 1,400 | | | ASKUL Corp. | | | 18,670 | | |
| | 7,700 | | | Astellas Pharma, Inc. | | | 125,210 | | |
| | 1,600 | | | Autobacs Seven Co. Ltd. | | | 19,515 | | |
| | 800 | | | Avex, Inc. | | | 10,029 | | |
| | 800 | | | Awa Bank Ltd. | | | 15,106 | | |
| | 400 | | | Axial Retailing, Inc. | | | 11,719 | | |
| | 1,100 | | | Azbil Corp. | | | 50,109 | | |
| | 1,100 | | | Bandai Namco Holdings, Inc. | | | 86,007 | | |
| | 600 | | | Bank of Kyoto Ltd. | | | 27,801 | | |
| | 1,300 | | | Bank of the Ryukyus Ltd. | | | 8,623 | | |
| | 300 | | | Belc Co. Ltd. | | | 14,683 | | |
| | 1,300 | | | Bell System24 Holdings, Inc. | | | 14,138 | | |
| | 1,300 | | | Belluna Co. Ltd. | | | 8,013 | | |
| | 1,000 | | | Benefit One, Inc. | | | 42,902 | | |
| | 800 | | | Benesse Holdings, Inc. | | | 15,711 | | |
| | 1,500 | | | Bic Camera, Inc. | | | 12,558 | | |
| | 500 | | | BML, Inc. | | | 15,539 | | |
| | 5,000 | | | Bridgestone Corp. | | | 215,118 | | |
| | 4,000 | | | Broadleaf Co. Ltd.† | | | 15,161 | | |
| | 1,400 | | | Brother Industries Ltd. | | | 26,910 | | |
| | 3,200 | | | Bunka Shutter Co. Ltd. | | | 29,877 | | |
| | 400 | | | C Uyemura & Co. Ltd. | | | 21,490 | | |
| | 700 | | | Calbee, Inc. | | | 16,242 | | |
| | 900 | | | Canon Electronics, Inc. | | | 12,409 | | |
| | 1,200 | | | Canon Marketing Japan, Inc. | | | 23,900 | | |
Shares | | | | Value
(Note 1) | |
| | | Japan (Continued) | |
| | 5,600 | | | Canon, Inc.† | | $ | 136,361 | | |
| | 1,600 | | | Capcom Co. Ltd. | | | 37,667 | | |
| | 1,600 | | | Casio Computer Co. Ltd. | | | 20,572 | | |
| | 900 | | | Central Japan Railway Co. | | | 120,060 | | |
| | 3,700 | | | Chiba Bank Ltd. | | | 21,197 | | |
| | 7,600 | | | Chiyoda Corp.* | | | 23,257 | | |
| | 3,800 | | | Chubu Electric Power Co., Inc. | | | 40,038 | | |
| | 700 | | | Chudenko Corp. | | | 12,937 | | |
| | 3,200 | | | Chugai Pharmaceutical Co. Ltd. | | | 103,903 | | |
| | 3,900 | | | Chugoku Electric Power Co., Inc. | | | 31,565 | | |
| | 2,300 | | | Chugoku Marine Paints Ltd. | | | 18,995 | | |
| | 5,400 | | | Citizen Watch Co. Ltd. | | | 23,378 | | |
| | 800 | | | Coca-Cola Bottlers Japan
Holdings, Inc. | | | 9,180 | | |
| | 900 | | | COMSYS Holdings Corp. | | | 20,037 | | |
| | 8,000 | | | Concordia Financial Group Ltd. | | | 29,071 | | |
| | 1,200 | | | Cosmo Energy Holdings Co. Ltd. | | | 23,451 | | |
| | 200 | | | Cosmos Pharmaceutical Corp.† | | | 29,436 | | |
| | 600 | | | Create SD Holdings Co. Ltd. | | | 16,613 | | |
| | 1,900 | | | Credit Saison Co. Ltd. | | | 19,970 | | |
| | 3,600 | | | CyberAgent, Inc. | | | 59,901 | | |
| | 1,700 | | | Dai Nippon Printing Co. Ltd. | | | 42,755 | | |
| | 500 | | | Dai-Dan Co. Ltd. | | | 9,989 | | |
| | 4,700 | | | Dai-ichi Life Holdings, Inc. | | | 95,017 | | |
| | 2,100 | | | Daicel Corp. | | | 14,514 | | |
| | 3,700 | | | Daido Metal Co. Ltd. | | | 19,492 | | |
| | 600 | | | Daido Steel Co. Ltd. | | | 21,751 | | |
| | 700 | | | Daifuku Co. Ltd. | | | 57,202 | | |
| | 500 | | | Daihen Corp. | | | 20,755 | | |
| | 700 | | | Daiho Corp.† | | | 24,189 | | |
| | 300 | | | Daiichi Jitsugyo Co. Ltd. | | | 12,910 | | |
| | 2,700 | | | Daiichi Sankyo Co. Ltd. | | | 68,656 | | |
| | 1,200 | | | Daikin Industries Ltd. | | | 272,172 | | |
| | 1,400 | | | Daikyonishikawa Corp. | | | 7,120 | | |
| | 1,900 | | | Daio Paper Corp. | | | 31,548 | | |
| | 1,080 | | | Daiseki Co. Ltd. | | | 47,977 | | |
| | 400 | | | Daishi Hokuetsu Financial
Group, Inc. | | | 8,832 | | |
| | 500 | | | Daito Trust Construction Co. Ltd. | | | 57,246 | | |
| | 5,300 | | | Daiwa House Industry Co. Ltd. | | | 152,416 | | |
| | 9,500 | | | Daiwa Securities Group, Inc. | | | 53,574 | | |
| | 2,500 | | | Daiwabo Holdings Co. Ltd. | | | 39,990 | | |
| | 2,200 | | | DCM Holdings Co. Ltd. | | | 20,369 | | |
| | 1,200 | | | DeNA Co. Ltd. | | | 18,475 | | |
| | 1,300 | | | Denka Co. Ltd. | | | 42,493 | | |
The accompanying notes are an integral part of these financial statements.
29
M International Equity Fund
SCHEDULE OF INVESTMENTS (Continued)
December 31, 2021
Shares | | | | Value
(Note 1) | |
| | | Japan (Continued) | |
| | 1,800 | | | Denso Corp. | | $ | 149,111 | | |
| | 1,500 | | | Dentsu Group, Inc.† | | | 53,464 | | |
| | 300 | | | Descente Ltd.* | | | 11,045 | | |
| | 1,700 | | | Dexerials Corp. | | | 61,406 | | |
| | 1,200 | | | DIC Corp. | | | 30,211 | | |
| | 400 | | | Digital Arts, Inc. | | | 29,349 | | |
| | 300 | | | Digital Garage, Inc. | | | 12,766 | | |
| | 700 | | | Dip Corp. | | | 23,824 | | |
| | 100 | | | Disco Corp. | | | 30,557 | | |
| | 1,800 | | | DMG Mori Co. Ltd. | | | 30,936 | | |
| | 1,100 | | | Doutor Nichires Holdings Co. Ltd. | | | 15,319 | | |
| | 1,100 | | | Dowa Holdings Co. Ltd. | | | 46,236 | | |
| | 600 | | | DTS Corp. | | | 13,165 | | |
| | 1,000 | | | Duskin Co. Ltd. | | | 24,420 | | |
| | 1,100 | | | Eagle Industry Co. Ltd. | | | 10,557 | | |
| | 300 | | | Earth Corp. | | | 15,987 | | |
| | 1,900 | | | East Japan Railway Co. | | | 116,828 | | |
| | 1,100 | | | Ebara Corp. | | | 61,106 | | |
| | 2,100 | | | EDION Corp.† | | | 19,589 | | |
| | 500 | | | Eiken Chemical Co. Ltd. | | | 8,389 | | |
| | 900 | | | Eisai Co. Ltd. | | | 51,099 | | |
| | 300 | | | Eizo Corp. | | | 10,523 | | |
| | 600 | | | Elecom Co. Ltd. | | | 7,892 | | |
| | 900 | | | Electric Power
Development Co. Ltd. | | | 11,947 | | |
| | 700 | | | en-Japan, Inc. | | | 19,777 | | |
| | 39,000 | | | ENEOS Holdings, Inc. | | | 145,890 | | |
| | 1,000 | | | Exedy Corp. | | | 14,474 | | |
| | 1,000 | | | EXEO Group, Inc. | | | 21,073 | | |
| | 500 | | | Ezaki Glico Co. Ltd. | | | 15,909 | | |
| | 900 | | | Fancl Corp. | | | 26,836 | | |
| | 500 | | | FANUC Corp. | | | 105,972 | | |
| | 400 | | | Fast Retailing Co. Ltd. | | | 227,106 | | |
| | 1,100 | | | FCC Co. Ltd. | | | 14,315 | | |
| | 1,100 | | | Ferrotec Holdings Corp. | | | 40,498 | | |
| | 1,300 | | | Food & Life Cos. Ltd. | | | 49,161 | | |
| | 900 | | | Foster Electric Co. Ltd. | | | 5,704 | | |
| | 800 | | | FP Corp. | | | 27,262 | | |
| | 1,100 | | | Fudo Tetra Corp. | | | 16,008 | | |
| | 1,600 | | | Fuji Corp. | | | 35,914 | | |
| | 1,400 | | | Fuji Electric Co. Ltd. | | | 76,432 | | |
| | 700 | | | Fuji Oil Holdings, Inc. | | | 14,118 | | |
| | 700 | | | Fuji Seal International, Inc. | | | 12,889 | | |
| | 500 | | | Fuji Soft, Inc. | | | 24,124 | | |
| | 400 | | | Fujibo Holdings, Inc. | | | 14,275 | | |
Shares | | | | Value
(Note 1) | |
| | | Japan (Continued) | |
| | 700 | | | Fujicco Co. Ltd. | | $ | 11,447 | | |
| | 900 | | | FUJIFILM Holdings Corp. | | | 66,708 | | |
| | 7,900 | | | Fujikura Ltd.* | | | 38,803 | | |
| | 500 | | | Fujimori Kogyo Co. Ltd. | | | 17,865 | | |
| | 600 | | | Fujitsu General Ltd. | | | 14,245 | | |
| | 2,000 | | | Fujitsu Ltd. | | | 343,041 | | |
| | 200 | | | Fukuda Denshi Co. Ltd. | | | 14,935 | | |
| | 1,000 | | | Fukuoka Financial Group, Inc. | | | 17,135 | | |
| | 600 | | | Fukuyama Transporting Co. Ltd. | | | 20,473 | | |
| | 900 | | | Furukawa Co. Ltd. | | | 9,937 | | |
| | 1,200 | | | Furukawa Electric Co. Ltd. | | | 24,223 | | |
| | 1,200 | | | Furuno Electric Co. Ltd. | | | 12,633 | | |
| | 800 | | | Futaba Corp. | | | 4,861 | | |
| | 500 | | | Fuyo General Lease Co. Ltd. | | | 34,643 | | |
| | 800 | | | G-7 Holdings, Inc. | | | 11,740 | | |
| | 800 | | | Geo Holdings Corp. | | | 8,617 | | |
| | 1,000 | | | Glory Ltd. | | | 19,030 | | |
| | 900 | | | GMO internet, Inc. | | | 21,242 | | |
| | 700 | | | Goldcrest Co. Ltd. | | | 9,852 | | |
| | 400 | | | Goldwin, Inc. | | | 23,159 | | |
| | 1,000 | | | GS Yuasa Corp. | | | 22,238 | | |
| | 1,100 | | | GungHo Online Entertainment, Inc. | | | 24,748 | | |
| | 4,900 | | | Gunma Bank Ltd. | | | 14,994 | | |
| | 600 | | | Gunze Ltd. | | | 21,073 | | |
| | 900 | | | H.U. Group Holdings, Inc. | | | 22,846 | | |
| | 1,700 | | | H2O Retailing Corp. | | | 11,971 | | |
| | 5,000 | | | Hachijuni Bank Ltd. | | | 17,083 | | |
| | 2,400 | | | Hakuhodo DY Holdings, Inc.† | | | 39,976 | | |
| | 800 | | | Hamakyorex Co. Ltd. | | | 20,196 | | |
| | 500 | | | Hamamatsu Photonics KK | | | 31,905 | | |
| | 2,200 | | | Hankyu Hanshin Holdings, Inc. | | | 62,445 | | |
| | 800 | | | Hanwa Co. Ltd. | | | 22,672 | | |
| | 5,200 | | | Haseko Corp. | | | 64,463 | | |
| | 3,500 | | | Hazama Ando Corp. | | | 26,319 | | |
| | 1,200 | | | Heiwa Corp. | | | 19,758 | | |
| | 600 | | | Heiwa Real Estate Co. Ltd. | | | 20,186 | | |
| | 900 | | | Heiwado Co. Ltd. | | | 15,108 | | |
| | 200 | | | Hikari Tsushin, Inc. | | | 30,792 | | |
| | 2,600 | | | Hino Motors Ltd. | | | 21,427 | | |
| | 3,100 | | | Hirogin Holdings, Inc. | | | 18,568 | | |
| | 400 | | | Hisamitsu Pharmaceutical Co., Inc. | | | 13,822 | | |
| | 1,100 | | | Hitachi Construction
Machinery Co. Ltd. | | | 31,796 | | |
| | 8,600 | | | Hitachi Ltd. | | | 465,774 | | |
| | 2,000 | | | Hitachi Metals Ltd.* | | | 37,051 | | |
The accompanying notes are an integral part of these financial statements.
30
M International Equity Fund
SCHEDULE OF INVESTMENTS (Continued)
December 31, 2021
Shares | | | | Value
(Note 1) | |
| | | Japan (Continued) | |
| | 600 | | | Hitachi Transport System Ltd. | | $ | 28,167 | | |
| | 6,400 | | | Hitachi Zosen Corp. | | | 44,399 | | |
| | 400 | | | Hogy Medical Co. Ltd. | | | 11,336 | | |
| | 2,900 | | | Hokkaido Electric Power Co., Inc. | | | 12,933 | | |
| | 700 | | | Hokkoku Financial Holdings, Inc.* | | | 15,518 | | |
| | 3,000 | | | Hokuetsu Corp. | | | 18,752 | | |
| | 1,800 | | | Hokuhoku Financial Group, Inc. | | | 14,302 | | |
| | 2,300 | | | Hokuriku Electric Power Co. | | | 11,697 | | |
| | 1,200 | | | Hokuto Corp. | | | 19,904 | | |
| | 8,800 | | | Honda Motor Co. Ltd. | | | 247,101 | | |
| | 1,904 | | | Honda Motor Co. Ltd., ADR | | | 54,169 | | |
| | 500 | | | Horiba Ltd. | | | 29,384 | | |
| | 300 | | | Hoshizaki Corp. | | | 22,559 | | |
| | 3,100 | | | Hosiden Corp. | | | 31,073 | | |
| | 600 | | | House Foods Group, Inc. | | | 15,132 | | |
| | 2,400 | | | Hoya Corp. | | | 356,985 | | |
| | 4,100 | | | Hulic Co. Ltd. | | | 38,922 | | |
| | 3,000 | | | Hyakugo Bank Ltd. | | | 8,972 | | |
| | 1,100 | | | Ibiden Co. Ltd. | | | 65,409 | | |
| | 6,700 | | | Ichigo, Inc. | | | 16,309 | | |
| | 600 | | | Idec Corp. | | | 14,537 | | |
| | 3,200 | | | Idemitsu Kosan Co. Ltd. | | | 81,704 | | |
| | 3,000 | | | IDOM, Inc. | | | 18,856 | | |
| | 2,200 | | | IHI Corp. | | | 44,295 | | |
| | 1,100 | | | Iida Group Holdings Co. Ltd. | | | 25,590 | | |
| | 900 | | | Inabata & Co. Ltd. | | | 13,121 | | |
| | 1,300 | | | Infocom Corp. | | | 24,660 | | |
| | 4,200 | | | Infomart Corp. | | | 34,175 | | |
| | 400 | | | Information Services International-
Dentsu Ltd. | | | 13,475 | | |
| | 4,712 | | | INFRONEER Holdings, Inc.*,† | | | 42,929 | | |
| | 10,100 | | | Inpex Corp. | | | 87,979 | | |
| | 1,100 | | | Intage Holdings, Inc. | | | 16,811 | | |
| | 300 | | | IR Japan Holdings Ltd. | | | 17,917 | | |
| | 300 | | | Iriso Electronics Co. Ltd. | | | 11,306 | | |
| | 5,000 | | | Isetan Mitsukoshi Holdings Ltd. | | | 36,947 | | |
| | 1,600 | | | Ishihara Sangyo Kaisha Ltd. | | | 16,552 | | |
| | 3,200 | | | Isuzu Motors Ltd. | | | 39,809 | | |
| | 500 | | | Ito En Ltd. | | | 26,254 | | |
| | 9,900 | | | ITOCHU Corp. | | | 302,775 | | |
| | 1,200 | | | Itochu Enex Co. Ltd. | | | 10,401 | | |
| | 700 | | | Itochu Techno-Solutions Corp. | | | 22,516 | | |
| | 3,400 | | | Itoham Yonekyu Holdings, Inc. | | | 19,449 | | |
| | 700 | | | Iwatani Corp. | | | 35,295 | | |
| | 4,100 | | | Iyo Bank Ltd. | | | 20,530 | | |
Shares | | | | Value
(Note 1) | |
| | | Japan (Continued) | |
| | 500 | | | Izumi Co. Ltd. | | $ | 14,018 | | |
| | 2,300 | | | J Trust Co. Ltd.† | | | 11,377 | | |
| | 700 | | | J-Oil Mills, Inc. | | | 10,163 | | |
| | 1,600 | | | J. Front Retailing Co. Ltd. | | | 14,563 | | |
| | 1,300 | | | Jaccs Co. Ltd. | | | 33,475 | | |
| | 700 | | | JAFCO Group Co. Ltd. | | | 40,285 | | |
| | 1,400 | | | Japan Airlines Co. Ltd.* | | | 26,727 | | |
| | 500 | | | Japan Airport Terminal Co. Ltd.* | | | 20,864 | | |
| | 1,800 | | | Japan Aviation Electronics
Industry Ltd. | | | 31,155 | | |
| | 1,100 | | | Japan Elevator Service Holdings Co.
Ltd. | | | 20,541 | | |
| | 3,600 | | | Japan Exchange Group, Inc. | | | 78,804 | | |
| | 1,500 | | | Japan Lifeline Co. Ltd. | | | 14,292 | | |
| | 1,100 | | | Japan Petroleum Exploration Co.
Ltd. | | | 23,964 | | |
| | 7,000 | | | Japan Post Holdings Co. Ltd.* | | | 54,574 | | |
| | 1,000 | | | Japan Post Insurance Co. Ltd. | | | 16,083 | | |
| | 600 | | | Japan Pulp & Paper Co. Ltd. | | | 21,490 | | |
| | 3,000 | | | Japan Securities Finance Co. Ltd. | | | 25,037 | | |
| | 1,300 | | | Japan Steel Works Ltd. | | | 43,623 | | |
| | 10,300 | | | Japan Tobacco, Inc.† | | | 207,961 | | |
| | 1,700 | | | Japan Wool Textile Co. Ltd. | | | 13,523 | | |
| | 600 | | | JCR Pharmaceuticals Co. Ltd. | | | 11,600 | | |
| | 400 | | | JCU Corp. | | | 19,021 | | |
| | 5,400 | | | JFE Holdings, Inc. | | | 68,867 | | |
| | 2,700 | | | JGC Holdings Corp. | | | 22,557 | | |
| | 400 | | | JINS Holdings, Inc.† | | | 24,376 | | |
| | 600 | | | Joshin Denki Co. Ltd. | | | 11,162 | | |
| | 700 | | | JSR Corp. | | | 26,624 | | |
| | 3,800 | | | JTEKT Corp. | | | 33,200 | | |
| | 800 | | | Juroku Financial Group, Inc.* | | | 15,078 | | |
| | 8,900 | | | JVCKenwood Corp. | | | 13,617 | | |
| | 2,200 | | | K's Holdings Corp. | | | 21,382 | | |
| | 800 | | | Kadokawa Corp. | | | 20,843 | | |
| | 700 | | | Kaga Electronics Co. Ltd. | | | 19,899 | | |
| | 800 | | | Kagome Co. Ltd.† | | | 20,808 | | |
| | 4,900 | | | Kajima Corp. | | | 56,271 | | |
| | 1,100 | | | Kakaku.com, Inc. | | | 29,358 | | |
| | 500 | | | Kaken Pharmaceutical Co. Ltd. | | | 18,300 | | |
| | 1,000 | | | Kamigumi Co. Ltd. | | | 18,934 | | |
| | 1,300 | | | Kanamoto Co. Ltd. | | | 27,236 | | |
| | 2,200 | | | Kandenko Co. Ltd. | | | 16,391 | | |
| | 600 | | | Kaneka Corp. | | | 19,691 | | |
| | 1,700 | | | Kanematsu Corp. | | | 18,932 | | |
The accompanying notes are an integral part of these financial statements.
31
M International Equity Fund
SCHEDULE OF INVESTMENTS (Continued)
December 31, 2021
Shares | | | | Value
(Note 1) | |
| | | Japan (Continued) | |
| | 700 | | | Kanematsu Electronics Ltd. | | $ | 24,159 | | |
| | 4,400 | | | Kansai Electric Power Co., Inc. | | | 41,081 | | |
| | 1,200 | | | Kansai Paint Co. Ltd. | | | 26,080 | | |
| | 3,100 | | | Kao Corp. | | | 162,209 | | |
| | 400 | | | Katitas Co. Ltd. | | | 15,387 | | |
| | 400 | | | Kato Sangyo Co. Ltd. | | | 11,649 | | |
| | 300 | | | KAWADA TECHNOLOGIES, Inc. | | | 11,162 | | |
| | 2,100 | | | Kawasaki Heavy Industries Ltd. | | | 37,936 | | |
| | 17,100 | | | KDDI Corp. | | | 499,784 | | |
| | 1,200 | | | Keihan Holdings Co. Ltd. | | | 27,603 | | |
| | 1,500 | | | Keikyu Corp. | | | 14,996 | | |
| | 700 | | | Keio Corp. | | | 30,853 | | |
| | 600 | | | Keisei Electric Railway Co. Ltd. | | | 16,222 | | |
| | 2,500 | | | Keiyo Bank Ltd. | | | 10,128 | | |
| | 900 | | | Kewpie Corp. | | | 19,404 | | |
| | 400 | | | Keyence Corp. | | | 251,343 | | |
| | 1,100 | | | KH Neochem Co. Ltd. | | | 30,409 | | |
| | 300 | | | Ki-Star Real Estate Co. Ltd. | | | 23,290 | | |
| | 400 | | | Kikkoman Corp. | | | 33,626 | | |
| | 1,200 | | | Kinden Corp. | | | 18,027 | | |
| | 900 | | | Kintetsu Group Holdings Co. Ltd.* | | | 25,154 | | |
| | 1,700 | | | Kintetsu World Express, Inc. | | | 44,188 | | |
| | 5,200 | | | Kirin Holdings Co. Ltd. | | | 83,495 | | |
| | 800 | | | Kissei Pharmaceutical Co. Ltd. | | | 15,676 | | |
| | 1,500 | | | Kito Corp. | | | 25,898 | | |
| | 2,600 | | | Kitz Corp. | | | 16,093 | | |
| | 1,600 | | | Kiyo Bank Ltd. | | | 19,626 | | |
| | 300 | | | Kobayashi Pharmaceutical Co. Ltd. | | | 23,576 | | |
| | 1,300 | | | Kobe Bussan Co. Ltd. | | | 50,348 | | |
| | 4,400 | | | Kobe Steel Ltd. | | | 22,071 | | |
| | 500 | | | Koei Tecmo Holdings Co. Ltd. | | | 19,669 | | |
| | 900 | | | Kohnan Shoji Co. Ltd. | | | 26,484 | | |
| | 1,300 | | | Koito Manufacturing Co. Ltd. | | | 68,826 | | |
| | 1,500 | | | Kokuyo Co. Ltd. | | | 22,351 | | |
| | 7,600 | | | Komatsu Ltd. | | | 177,959 | | |
| | 1,100 | | | KOMEDA Holdings Co. Ltd. | | | 19,604 | | |
| | 1,000 | | | Komeri Co. Ltd. | | | 22,229 | | |
| | 1,400 | | | Komori Corp. | | | 8,361 | | |
| | 700 | | | Konami Holdings Corp. | | | 33,591 | | |
| | 6,900 | | | Konica Minolta, Inc. | | | 31,432 | | |
| | 700 | | | Konishi Co. Ltd. | | | 10,540 | | |
| | 1,200 | | | Konoike Transport Co. Ltd. | | | 12,852 | | |
| | 100 | | | Kose Corp. | | | 11,345 | | |
| | 4,900 | | | Kubota Corp. | | | 108,773 | | |
| | 400 | | | Kumagai Gumi Co. Ltd. | | | 9,983 | | |
Shares | | | | Value
(Note 1) | |
| | | Japan (Continued) | |
| | 4,700 | | | Kuraray Co. Ltd.† | | $ | 40,818 | | |
| | 400 | | | Kureha Corp. | | | 28,584 | | |
| | 700 | | | Kurita Water Industries Ltd. | | | 33,226 | | |
| | 400 | | | Kusuri no Aoki Holdings Co. Ltd. | | | 25,350 | | |
| | 1,400 | | | Kyocera Corp. | | | 87,471 | | |
| | 1,500 | | | Kyoei Steel Ltd. | | | 18,452 | | |
| | 1,700 | | | Kyokuto Kaihatsu Kogyo Co. Ltd. | | | 22,582 | | |
| | 500 | | | KYORIN Holdings, Inc. | | | 8,024 | | |
| | 600 | | | Kyudenko Corp. | | | 18,517 | | |
| | 2,400 | | | Kyushu Electric Power Co., Inc. | | | 17,881 | | |
| | 5,000 | | | Kyushu Financial Group, Inc. | | | 18,169 | | |
| | 1,200 | | | Kyushu Railway Co. | | | 24,954 | | |
| | 600 | | | Lasertec Corp. | | | 184,074 | | |
| | 400 | | | Lawson, Inc. | | | 18,952 | | |
| | 1,000 | | | Lintec Corp. | | | 22,907 | | |
| | 1,900 | | | Lion Corp. | | | 25,387 | | |
| | 200 | | | LITALICO, Inc. | | | 7,024 | | |
| | 2,600 | | | Lixil Corp. | | | 69,278 | | |
| | 500 | | | M&A Capital Partners Co. Ltd.* | | | 22,907 | | |
| | 2,800 | | | M3, Inc. | | | 141,010 | | |
| | 700 | | | Mabuchi Motor Co. Ltd.† | | | 23,124 | | |
| | 1,300 | | | Macnica Fuji Electronics
Holdings, Inc. | | | 31,101 | | |
| | 900 | | | Macromill, Inc. | | | 8,661 | | |
| | 800 | | | Maeda Kosen Co. Ltd.† | | | 27,297 | | |
| | 600 | | | Makino Milling Machine Co. Ltd. | | | 21,438 | | |
| | 900 | | | Makita Corp. | | | 38,205 | | |
| | 1,800 | | | Mandom Corp. | | | 22,158 | | |
| | 500 | | | Mani, Inc. | | | 6,933 | | |
| | 9,300 | | | Marubeni Corp. | | | 90,510 | | |
| | 800 | | | Marudai Food Co. Ltd.† | | | 10,599 | | |
| | 700 | | | Maruha Nichiro Corp. | | | 14,635 | | |
| | 2,200 | | | Marui Group Co. Ltd. | | | 41,407 | | |
| | 700 | | | Maruichi Steel Tube Ltd. | | | 15,499 | | |
| | 2,200 | | | Marusan Securities Co. Ltd. | | | 9,926 | | |
| | 200 | | | Maruwa Co. Ltd. | | | 28,340 | | |
| | 900 | | | Matsui Securities Co. Ltd. | | | 6,189 | | |
| | 1,040 | | | MatsukiyoCocokara & Co. | | | 38,515 | | |
| | 1,700 | | | Maxell Ltd. | | | 20,217 | | |
| | 4,100 | | | Mazda Motor Corp.* | | | 31,544 | | |
| | 500 | | | McDonald's Holdings Co.
Japan Ltd. | | | 22,125 | | |
| | 9,000 | | | Mebuki Financial Group, Inc. | | | 18,543 | | |
| | 1,600 | | | Medipal Holdings Corp. | | | 29,975 | | |
| | 1,000 | | | Megachips Corp. | | | 44,771 | | |
The accompanying notes are an integral part of these financial statements.
32
M International Equity Fund
SCHEDULE OF INVESTMENTS (Continued)
December 31, 2021
Shares | | | | Value
(Note 1) | |
| | | Japan (Continued) | |
| | 1,000 | | | Megmilk Snow Brand Co. Ltd. | | $ | 17,300 | | |
| | 1,700 | | | Meidensha Corp. | | | 40,494 | | |
| | 1,000 | | | MEIJI Holdings Co. Ltd. | | | 59,637 | | |
| | 1,200 | | | Meiko Electronics Co. Ltd. | | | 49,657 | | |
| | 500 | | | Meitec Corp. | | | 29,427 | | |
| | 400 | | | Mercari, Inc.* | | | 20,377 | | |
| | 600 | | | Milbon Co. Ltd. | | | 29,731 | | |
| | 1,200 | | | Mimasu Semiconductor
Industry Co. Ltd. | | | 27,645 | | |
| | 2,200 | | | MINEBEA MITSUMI, Inc. | | | 62,445 | | |
| | 1,600 | | | Mirait Holdings Corp. | | | 26,386 | | |
| | 1,000 | | | MISUMI Group, Inc. | | | 41,033 | | |
| | 15,300 | | | Mitsubishi Chemical Holdings
Corp. | | | 113,323 | | |
| | 5,500 | | | Mitsubishi Corp. | | | 174,615 | | |
| | 13,000 | | | Mitsubishi Electric Corp. | | | 164,831 | | |
| | 5,800 | | | Mitsubishi Estate Co. Ltd. | | | 80,397 | | |
| | 3,000 | | | Mitsubishi Gas Chemical Co., Inc. | | | 50,804 | | |
| | 13,800 | | | Mitsubishi HC Capital, Inc. | | | 68,262 | | |
| | 2,900 | | | Mitsubishi Heavy Industries Ltd. | | | 67,036 | | |
| | 900 | | | Mitsubishi Logistics Corp. | | | 22,572 | | |
| | 1,000 | | | Mitsubishi Materials Corp. | | | 17,169 | | |
| | 5,200 | | | Mitsubishi Motors Corp.* | | | 14,511 | | |
| | 51,700 | | | Mitsubishi UFJ Financial
Group, Inc. | | | 280,860 | | |
| | 7,000 | | | Mitsui & Co. Ltd. | | | 165,735 | | |
| | 2,500 | | | Mitsui Chemicals, Inc. | | | 67,156 | | |
| | 2,100 | | | Mitsui E&S Holdings Co. Ltd.* | | | 6,956 | | |
| | 4,700 | | | Mitsui Fudosan Co. Ltd. | | | 93,097 | | |
| | 300 | | | Mitsui High-Tec, Inc. | | | 29,392 | | |
| | 1,900 | | | Mitsui Mining & Smelting Co. Ltd. | | | 51,782 | | |
| | 800 | | | Mitsui OSK Lines Ltd. | | | 59,393 | | |
| | 800 | | | Mitsui-Soko Holdings Co. Ltd. | | | 17,289 | | |
| | 1,000 | | | Miura Co. Ltd. | | | 34,426 | | |
| | 1,000 | | | Mixi, Inc. | | | 17,517 | | |
| | 700 | | | Miyazaki Bank Ltd. | | | 12,658 | | |
| | 11,590 | | | Mizuho Financial Group, Inc. | | | 147,407 | | |
| | 1,000 | | | Mizuho Leasing Co. Ltd. | | | 27,732 | | |
| | 300 | | | Mochida Pharmaceutical Co. Ltd. | | | 9,076 | | |
| | 400 | | | Modec, Inc. | | | 4,788 | | |
| | 3,300 | | | Monex Group, Inc. | | | 20,110 | | |
| | 300 | | | Money Forward, Inc.* | | | 18,047 | | |
| | 600 | | | Monogatari Corp.† | | | 35,208 | | |
| | 1,600 | | | MonotaRO Co. Ltd. | | | 28,834 | | |
| | 400 | | | Morinaga & Co. Ltd. | | | 13,075 | | |
Shares | | | | Value
(Note 1) | |
| | | Japan (Continued) | |
| | 700 | | | Morinaga Milk Industry Co. Ltd. | | $ | 33,226 | | |
| | 2,100 | | | Morita Holdings Corp. | | | 23,879 | | |
| | 1,800 | | | MS&AD Insurance Group
Holdings, Inc. | | | 55,535 | | |
| | 3,300 | | | Murata Manufacturing Co. Ltd. | | | 262,698 | | |
| | 2,000 | | | Musashi Seimitsu Industry Co. Ltd. | | | 33,296 | | |
| | 1,000 | | | Musashino Bank Ltd. | | | 15,639 | | |
| | 1,200 | | | Nabtesco Corp. | | | 35,521 | | |
| | 600 | | | Nachi-Fujikoshi Corp. | | | 21,490 | | |
| | 1,500 | | | Nagase & Co. Ltd. | | | 24,294 | | |
| | 1,300 | | | Nagoya Railroad Co. Ltd.* | | | 19,777 | | |
| | 300 | | | Nakanishi, Inc. | | | 5,524 | | |
| | 1,200 | | | Nankai Electric Railway Co. Ltd. | | | 22,690 | | |
| | 800 | | | Nanto Bank Ltd. | | | 13,499 | | |
| | 2,600 | | | NEC Corp. | | | 120,021 | | |
| | 1,600 | | | NEC Networks & System Integration
Corp. | | | 25,107 | | |
| | 1,100 | | | NET One Systems Co. Ltd. | | | 29,644 | | |
| | 1,900 | | | Nexon Co. Ltd. | | | 36,735 | | |
| | 1,100 | | | Nextage Co. Ltd. | | | 22,731 | | |
| | 2,000 | | | NGK Insulators Ltd. | | | 33,800 | | |
| | 2,500 | | | NGK Spark Plug Co. Ltd. | | | 43,532 | | |
| | 1,000 | | | NH Foods Ltd. | | | 35,991 | | |
| | 2,400 | | | NHK Spring Co. Ltd. | | | 20,405 | | |
| | 1,300 | | | Nichi-iko Pharmaceutical Co. Ltd. | | | 7,967 | | |
| | 1,200 | | | Nichias Corp. | | | 28,939 | | |
| | 1,400 | | | Nichicon Corp. | | | 15,372 | | |
| | 900 | | | Nichiden Corp. | | | 18,394 | | |
| | 700 | | | Nichiha Corp. | | | 18,591 | | |
| | 1,500 | | | Nichirei Corp. | | | 34,726 | | |
| | 1,600 | | | Nidec Corp. | | | 188,055 | | |
| | 1,600 | | | Nifco, Inc. | | | 50,213 | | |
| | 700 | | | Nihon Kohden Corp. | | | 19,199 | | |
| | 2,000 | | | Nihon M&A Center Holdings, Inc. | | | 49,048 | | |
| | 1,800 | | | Nihon Parkerizing Co. Ltd. | | | 17,604 | | |
| | 900 | | | Nihon Unisys Ltd. | | | 25,272 | | |
| | 1,700 | | | Nikkiso Co. Ltd.† | | | 11,882 | | |
| | 1,300 | | | Nikkon Holdings Co. Ltd. | | | 24,479 | | |
| | 3,000 | | | Nikon Corp. | | | 32,339 | | |
| | 800 | | | Nintendo Co. Ltd. | | | 373,120 | | |
| | 900 | | | Nippn Corp. | | | 12,957 | | |
| | 600 | | | Nippon Carbon Co. Ltd.† | | | 21,751 | | |
| | 600 | | | Nippon Chemi-Con Corp.* | | | 9,326 | | |
| | 700 | | | Nippon Densetsu Kogyo Co. Ltd. | | | 10,114 | | |
| | 900 | | | Nippon Electric Glass Co. Ltd.† | | | 23,073 | | |
The accompanying notes are an integral part of these financial statements.
33
M International Equity Fund
SCHEDULE OF INVESTMENTS (Continued)
December 31, 2021
Shares | | | | Value
(Note 1) | |
| | | Japan (Continued) | |
| | 1,200 | | | Nippon Express Co. Ltd.*,§ | | $ | 71,095 | | |
| | 1,800 | | | Nippon Gas Co. Ltd. | | | 23,863 | | |
| | 800 | | | Nippon Kayaku Co. Ltd. | | | 8,234 | | |
| | 400 | | | Nippon Koei Co. Ltd. | | | 11,093 | | |
| | 1,520 | | | Nippon Light Metal
Holdings Co. Ltd. | | | 22,781 | | |
| | 2,700 | | | Nippon Paint Holdings Co. Ltd. | | | 29,434 | | |
| | 1,200 | | | Nippon Paper Industries Co. Ltd. | | | 11,329 | | |
| | 200 | | | Nippon Road Co. Ltd. | | | 14,327 | | |
| | 1,200 | | | Nippon Sanso Holdings Corp. | | | 26,216 | | |
| | 1,200 | | | Nippon Seiki Co. Ltd. | | | 12,112 | | |
| | 5,100 | | | Nippon Sheet Glass Co. Ltd.* | | | 22,745 | | |
| | 300 | | | Nippon Shinyaku Co. Ltd. | | | 20,890 | | |
| | 400 | | | Nippon Shokubai Co. Ltd. | | | 18,500 | | |
| | 2,600 | | | Nippon Signal Company Ltd. | | | 20,682 | | |
| | 900 | | | Nippon Soda Co. Ltd. | | | 25,898 | | |
| | 5,500 | | | Nippon Steel Corp. | | | 89,818 | | |
| | 500 | | | Nippon Steel Trading Corp. | | | 21,820 | | |
| | 3,600 | | | Nippon Suisan Kaisha Ltd. | | | 16,994 | | |
| | 8,000 | | | Nippon Telegraph &
Telephone Corp. | | | 219,073 | | |
| | 530 | | | Nippon Yakin Kogyo Co. Ltd. | | | 10,445 | | |
| | 1,800 | | | Nippon Yusen KK | | | 137,077 | | |
| | 2,200 | | | Nipro Corp. | | | 20,828 | | |
| | 2,000 | | | Nishi-Nippon Financial
Holdings, Inc. | | | 12,936 | | |
| | 900 | | | Nishi-Nippon Railroad Co. Ltd. | | | 20,413 | | |
| | 1,000 | | | Nishimatsu Construction Co. Ltd. | | | 31,687 | | |
| | 1,600 | | | Nishimatsuya Chain Co. Ltd.† | | | 19,209 | | |
| | 700 | | | Nishio Rent All Co. Ltd. | | | 17,477 | | |
| | 800 | | | Nissan Chemical Corp. | | | 46,457 | | |
| | 17,300 | | | Nissan Motor Co. Ltd.* | | | 83,590 | | |
| | 600 | | | Nissei ASB Machine Co. Ltd. | | | 16,535 | | |
| | 1,100 | | | Nissha Co. Ltd.† | | | 15,970 | | |
| | 800 | | | Nisshin Oillio Group Ltd. | | | 20,162 | | |
| | 1,400 | | | Nisshin Seifun Group, Inc. | | | 20,179 | | |
| | 5,700 | | | Nisshinbo Holdings, Inc. | | | 43,358 | | |
| | 400 | | | Nissin Foods Holdings Co. Ltd. | | | 29,175 | | |
| | 500 | | | Nitori Holdings Co. Ltd. | | | 74,872 | | |
| | 1,200 | | | Nitto Denko Corp. | | | 92,741 | | |
| | 700 | | | Nitto Kogyo Corp. | | | 9,676 | | |
| | 300 | | | Noevir Holdings Co. Ltd.† | | | 14,057 | | |
| | 700 | | | NOF Corp. | | | 35,356 | | |
| | 1,100 | | | Nojima Corp. | | | 23,027 | | |
| | 1,500 | | | NOK Corp. | | | 16,326 | | |
Shares | | | | Value
(Note 1) | |
| | | Japan (Continued) | |
| | 100 | | | Nomura Co. Ltd. | | $ | 828 | | |
| | 18,800 | | | Nomura Holdings, Inc. | | | 81,996 | | |
| | 1,500 | | | Nomura Real Estate Holdings, Inc. | | | 34,517 | | |
| | 1,500 | | | Nomura Research Institute Ltd. | | | 64,353 | | |
| | 300 | | | Noritake Co. Ltd. | | | 13,092 | | |
| | 700 | | | Noritsu Koki Co. Ltd. | | | 16,510 | | |
| | 7,800 | | | North Pacific Bank Ltd. | | | 16,952 | | |
| | 800 | | | NSD Co. Ltd. | | | 14,535 | | |
| | 2,900 | | | NSK Ltd. | | | 18,606 | | |
| | 10,800 | | | NTN Corp.* | | | 22,533 | | |
| | 4,900 | | | NTT Data Corp. | | | 105,046 | | |
| | 600 | | | Obara Group, Inc.† | | | 18,047 | | |
| | 6,000 | | | Obayashi Corp. | | | 46,423 | | |
| | 500 | | | OBIC Business Consultants Co. Ltd. | | | 21,081 | | |
| | 200 | | | Obic Co. Ltd. | | | 37,555 | | |
| | 2,100 | | | Odakyu Electric Railway Co. Ltd. | | | 38,995 | | |
| | 1,100 | | | Ogaki Kyoritsu Bank Ltd. | | | 18,485 | | |
| | 800 | | | Oisix ra daichi, Inc.* | | | 21,525 | | |
| | 13,300 | | | Oji Holdings Corp. | | | 64,401 | | |
| | 1,000 | | | Okamura Corp. | | | 11,180 | | |
| | 4,600 | | | Okasan Securities Group, Inc. | | | 15,236 | | |
| | 1,800 | | | Oki Electric Industry Co. Ltd. | | | 14,146 | | |
| | 500 | | | Okinawa Cellular Telephone Co. | | | 22,212 | | |
| | 1,155 | | | Okinawa Electric Power Co., Inc. | | | 14,609 | | |
| | 500 | | | OKUMA Corp. | | | 22,255 | | |
| | 700 | | | Okumura Corp. | | | 19,625 | | |
| | 8,100 | | | Olympus Corp. | | | 186,568 | | |
| | 500 | | | Omron Corp. | | | 49,813 | | |
| | 2,000 | | | Ono Pharmaceutical Co. Ltd. | | | 49,657 | | |
| | 3,700 | | | Onward Holdings Co. Ltd. | | | 9,617 | | |
| | 1,200 | | | Open House Co. Ltd. | | | 62,801 | | |
| | 1,000 | | | Optex Group Co. Ltd.† | | | 14,283 | | |
| | 200 | | | Oracle Corp. | | | 15,196 | | |
| | 200 | | | Organo Corp. | | | 15,040 | | |
| | 8,100 | | | Orient Corp. | | | 8,802 | | |
| | 400 | | | Oriental Land Co. Ltd. | | | 67,443 | | |
| | 13,200 | | | ORIX Corp. | | | 269,382 | | |
| | 2,000 | | | Osaka Gas Co. Ltd. | | | 33,052 | | |
| | 1,100 | | | OSG Corp. | | | 17,079 | | |
| | 700 | | | Otsuka Corp. | | | 33,409 | | |
| | 1,700 | | | Otsuka Holdings Co. Ltd. | | | 61,613 | | |
| | 1,900 | | | Outsourcing, Inc.† | | | 25,602 | | |
| | 1,600 | | | Pacific Industrial Co. Ltd. | | | 16,900 | | |
| | 900 | | | Pacific Metals Co. Ltd. | | | 16,673 | | |
| | 300 | | | PALTAC Corp. | | | 12,349 | | |
The accompanying notes are an integral part of these financial statements.
34
M International Equity Fund
SCHEDULE OF INVESTMENTS (Continued)
December 31, 2021
Shares | | | | Value
(Note 1) | |
| | | Japan (Continued) | |
| | 3,600 | | | Pan Pacific International Holdings
Corp. | | $ | 49,667 | | |
| | 28,200 | | | Panasonic Corp. | | | 310,119 | | |
| | 700 | | | Paramount Bed Holdings Co. Ltd. | | | 11,873 | | |
| | 1,500 | | | Park24 Co. Ltd. | | | 20,551 | | |
| | 3,900 | | | Penta-Ocean Construction Co. Ltd. | | | 22,038 | | |
| | 800 | | | PeptiDream, Inc.* | | | 17,700 | | |
| | 1,300 | | | Persol Holdings Co. Ltd. | | | 37,747 | | |
| | 2,200 | | | Pigeon Corp.† | | | 42,038 | | |
| | 500 | | | Pilot Corp. | | | 19,125 | | |
| | 1,100 | | | Piolax, Inc. | | | 16,811 | | |
| | 900 | | | Pola Orbis Holdings, Inc.† | | | 14,999 | | |
| | 2,500 | | | Press Kogyo Co. Ltd. | | | 8,476 | | |
| | 600 | | | Pressance Corp. | | | 10,928 | | |
| | 2,100 | | | Prestige International, Inc. | | | 12,195 | | |
| | 1,100 | | | Prima Meat Packers Ltd. | | | 23,754 | | |
| | 1,000 | | | Proto Corp. | | | 11,936 | | |
| | 1,300 | | | Qol Holdings Co. Ltd. | | | 15,822 | | |
| | 900 | | | Raito Kogyo Co. Ltd. | | | 15,499 | | |
| | 3,300 | | | Rakuten Group, Inc.† | | | 33,106 | | |
| | 7,700 | | | Recruit Holdings Co. Ltd. | | | 466,699 | | |
| | 1,200 | | | Relia, Inc. | | | 10,171 | | |
| | 900 | | | Relo Group, Inc. | | | 16,266 | | |
| | 6,700 | | | Renesas Electronics Corp.* | | | 82,884 | | |
| | 2,800 | | | Rengo Co. Ltd. | | | 21,177 | | |
| | 500 | | | RENOVA, Inc.* | | | 9,050 | | |
| | 10,600 | | | Resona Holdings, Inc. | | | 41,228 | | |
| | 1,100 | | | Resorttrust, Inc. | | | 17,968 | | |
| | 5,100 | | | Ricoh Co. Ltd. | | | 47,484 | | |
| | 400 | | | Ricoh Leasing Co. Ltd. | | | 13,423 | | |
| | 400 | | | Rinnai Corp. | | | 36,095 | | |
| | 4,000 | | | Riso Kyoiku Co. Ltd. | | | 13,666 | | |
| | 100 | | | Rohm Co. Ltd. | | | 9,102 | | |
| | 700 | | | Rohto Pharmaceutical Co. Ltd. | | | 21,147 | | |
| | 300 | | | Roland Corp. | | | 10,250 | | |
| | 300 | | | Rorze Corp. | | | 32,365 | | |
| | 500 | | | Ryobi Ltd. | | | 4,764 | | |
| | 2,000 | | | Ryohin Keikaku Co. Ltd. | | | 30,496 | | |
| | 200 | | | Ryosan Co. Ltd. | | | 3,952 | | |
| | 600 | | | S Foods, Inc. | | | 18,152 | | |
| | 1,300 | | | Sakata INX Corp.† | | | 11,234 | | |
| | 2,700 | | | Sala Corp. | | | 14,834 | | |
| | 1,800 | | | SAMTY Co. Ltd. | | | 34,379 | | |
| | 300 | | | San-A Co. Ltd. | | | 10,902 | | |
| | 2,100 | | | San-Ai Oil Co. Ltd. | | | 24,372 | | |
Shares | | | | Value
(Note 1) | |
| | | Japan (Continued) | |
| | 3,000 | | | San-In Godo Bank Ltd. | | $ | 16,900 | | |
| | 1,200 | | | Sangetsu Corp. | | | 16,931 | | |
| | 600 | | | Sanken Electric Co. Ltd. | | | 32,913 | | |
| | 1,300 | | | Sanki Engineering Co. Ltd. | | | 16,263 | | |
| | 600 | | | Sankyo Co. Ltd. | | | 15,549 | | |
| | 500 | | | Sankyu, Inc. | | | 20,734 | | |
| | 2,200 | | | Santen Pharmaceutical Co. Ltd. | | | 26,910 | | |
| | 2,300 | | | Sanwa Holdings Corp. | | | 24,534 | | |
| | 500 | | | Sanyo Chemical Industries Ltd. | | | 23,211 | | |
| | 300 | | | Sanyo Denki Co. Ltd. | | | 15,726 | | |
| | 1,200 | | | Sapporo Holdings Ltd.† | | | 22,773 | | |
| | 900 | | | Sato Holdings Corp. | | | 17,221 | | |
| | 400 | | | Sawai Group Holdings Co. Ltd. | | | 15,283 | | |
| | 2,800 | | | SBI Holdings, Inc. | | | 76,311 | | |
| | 300 | | | SCREEN Holdings Co. Ltd. | | | 32,261 | | |
| | 600 | | | SCSK Corp. | | | 11,939 | | |
| | 1,300 | | | Secom Co. Ltd. | | | 90,253 | | |
| | 2,100 | | | Sega Sammy Holdings, Inc. | | | 32,989 | | |
| | 3,000 | | | Seibu Holdings, Inc.* | | | 28,062 | | |
| | 1,000 | | | Seikagaku Corp. | | | 8,180 | | |
| | 4,500 | | | Seiko Epson Corp. | | | 81,018 | | |
| | 700 | | | Seiko Holdings Corp. | | | 13,649 | | |
| | 1,600 | | | Seino Holdings Co. Ltd. | | | 16,204 | | |
| | 1,400 | | | Seiren Co. Ltd. | | | 30,634 | | |
| | 4,200 | | | Sekisui Chemical Co. Ltd. | | | 70,176 | | |
| | 3,700 | | | Sekisui House Ltd. | | | 79,417 | | |
| | 8,500 | | | Senshu Ikeda Holdings, Inc. | | | 12,562 | | |
| | 600 | | | Seria Co. Ltd. | | | 17,395 | | |
| | 6,900 | | | Seven & i Holdings Co. Ltd. | | | 303,281 | | |
| | 7,000 | | | Seven Bank Ltd. | | | 14,483 | | |
| | 1,800 | | | SG Holdings Co. Ltd. | | | 42,140 | | |
| | 1,900 | | | Sharp Corp. | | | 21,820 | | |
| | 600 | | | Shibuya Corp. | | | 15,596 | | |
| | 1,000 | | | Shiga Bank Ltd. | | | 17,987 | | |
| | 900 | | | Shikoku Chemicals Corp. | | | 11,040 | | |
| | 1,700 | | | Shikoku Electric Power Co., Inc. | | | 11,971 | | |
| | 900 | | | Shima Seiki Manufacturing Ltd. | | | 15,453 | | |
| | 1,000 | | | Shimadzu Corp. | | | 42,206 | | |
| | 200 | | | Shimamura Co. Ltd. | | | 16,796 | | |
| | 300 | | | Shimano, Inc. | | | 79,962 | | |
| | 3,500 | | | Shimizu Corp. | | | 21,694 | | |
| | 1,600 | | | Shin-Etsu Chemical Co. Ltd. | | | 277,076 | | |
| | 2,000 | | | Shin-Etsu Polymer Co. Ltd. | | | 19,247 | | |
| | 1,100 | | | Shinko Electric Industries Co. Ltd. | | | 52,499 | | |
| | 1,700 | | | Shinmaywa Industries Ltd. | | | 12,931 | | |
The accompanying notes are an integral part of these financial statements.
35
M International Equity Fund
SCHEDULE OF INVESTMENTS (Continued)
December 31, 2021
Shares | | | | Value
(Note 1) | |
| | | Japan (Continued) | |
| | 1,000 | | | Shionogi & Co. Ltd. | | $ | 70,634 | | |
| | 1,200 | | | Ship Healthcare Holdings, Inc. | | | 27,958 | | |
| | 600 | | | Shiseido Co. Ltd. | | | 33,456 | | |
| | 4,800 | | | Shizuoka Bank Ltd.† | | | 34,301 | | |
| | 2,800 | | | Shizuoka Gas Co. Ltd. | | | 23,976 | | |
| | 300 | | | SHO-BOND Holdings Co. Ltd. | | | 13,483 | | |
| | 300 | | | Shoei Co. Ltd. | | | 11,814 | | |
| | 3,000 | | | Showa Denko KK† | | | 62,984 | | |
| | 1,000 | | | Siix Corp.† | | | 12,310 | | |
| | 1,100 | | | Sinfonia Technology Co. Ltd. | | | 12,546 | | |
| | 3,900 | | | SKY Perfect JSAT Holdings, Inc. | | | 14,240 | | |
| | 2,600 | | | Skylark Holdings Co. Ltd.† | | | 34,153 | | |
| | 200 | | | SMC Corp. | | | 134,904 | | |
| | 1,300 | | | SMS Co. Ltd. | | | 51,195 | | |
| | 2,700 | | | Sodick Co. Ltd.† | | | 19,224 | | |
| | 11,900 | | | SoftBank Corp. | | | 150,470 | | |
| | 17,800 | | | SoftBank Group Corp. | | | 840,869 | | |
| | 500 | | | Sohgo Security Services Co. Ltd. | | | 19,864 | | |
| | 1,560 | | | Sojitz Corp. | | | 23,435 | | |
| | 900 | | | Solasto Corp. | | | 9,663 | | |
| | 2,000 | | | Sompo Holdings, Inc. | | | 84,482 | | |
| | 8,500 | | | Sony Group Corp. | | | 1,069,612 | | |
| | 800 | | | Sotetsu Holdings, Inc. | | | 14,647 | | |
| | 400 | | | Square Enix Holdings Co. Ltd. | | | 20,516 | | |
| | 800 | | | Stanley Electric Co. Ltd. | | | 20,023 | | |
| | 1,600 | | | Star Micronics Co. Ltd. | | | 21,546 | | |
| | 800 | | | Starts Corp., Inc. | | | 17,463 | | |
| | 6,000 | | | Subaru Corp. | | | 107,294 | | |
| | 200 | | | Sugi Holdings Co. Ltd. | | | 12,119 | | |
| | 3,600 | | | SUMCO Corp.† | | | 73,515 | | |
| | 18,100 | | | Sumitomo Chemical Co. Ltd. | | | 85,284 | | |
| | 5,400 | | | Sumitomo Corp. | | | 79,829 | | |
| | 1,500 | | | Sumitomo Dainippon
Pharma Co. Ltd. | | | 17,278 | | |
| | 7,000 | | | Sumitomo Electric Industries Ltd. | | | 91,250 | | |
| | 1,600 | | | Sumitomo Forestry Co. Ltd. | | | 30,962 | | |
| | 1,700 | | | Sumitomo Heavy Industries Ltd. | | | 41,218 | | |
| | 1,100 | | | Sumitomo Metal Mining Co. Ltd. | | | 41,598 | | |
| | 3,600 | | | Sumitomo Mitsui Construction Co.
Ltd. | | | 13,395 | | |
| | 5,600 | | | Sumitomo Mitsui Financial
Group, Inc. | | | 191,957 | | |
| | 1,900 | | | Sumitomo Mitsui Trust
Holdings, Inc. | | | 63,476 | | |
Shares | | | | Value
(Note 1) | |
| | | Japan (Continued) | |
| | 900 | | | Sumitomo Osaka Cement Co. Ltd. | | $ | 27,658 | | |
| | 2,400 | | | Sumitomo Realty &
Development Co. Ltd. | | | 70,583 | | |
| | 3,700 | | | Sumitomo Rubber Industries Ltd.† | | | 37,698 | | |
| | 400 | | | Sumitomo Seika Chemicals Co. Ltd. | | | 10,902 | | |
| | 900 | | | Sumitomo Warehouse Co. Ltd. | | | 15,194 | | |
| | 2,600 | | | Sun Frontier Fudousan Co. Ltd. | | | 22,671 | | |
| | 700 | | | Sundrug Co. Ltd. | | | 18,287 | | |
| | 1,100 | | | Suntory Beverage & Food Ltd. | | | 39,781 | | |
| | 400 | | | Suzuken Co. Ltd. | | | 11,545 | | |
| | 2,700 | | | Suzuki Motor Corp. | | | 103,958 | | |
| | 900 | | | Sysmex Corp. | | | 121,664 | | |
| | 6,800 | | | Systena Corp. | | | 25,419 | | |
| | 800 | | | T Hasegawa Co. Ltd. | | | 18,806 | | |
| | 2,400 | | | T&D Holdings, Inc. | | | 30,712 | | |
| | 700 | | | Tachi-S Co. Ltd. | | | 7,692 | | |
| | 2,200 | | | Tadano Ltd. | | | 21,191 | | |
| | 1,800 | | | Taiheiyo Cement Corp. | | | 35,568 | | |
| | 2,500 | | | Taisei Corp. | | | 75,958 | | |
| | 600 | | | Taisho Pharmaceutical
Holdings Co. Ltd. | | | 27,593 | | |
| | 600 | | | Taiyo Holdings Co. Ltd. | | | 18,152 | | |
| | 1,600 | | | Taiyo Yuden Co. Ltd. | | | 92,080 | | |
| | 1,300 | | | Takara Holdings, Inc. | | | 13,799 | | |
| | 1,600 | | | Takashimaya Co. Ltd. | | | 14,883 | | |
| | 18,700 | | | Takeda Pharmaceutical Co. Ltd. | | | 509,970 | | |
| | 1,200 | | | Takeuchi Manufacturing Co. Ltd. | | | 28,469 | | |
| | 700 | | | Takuma Co. Ltd. | | | 8,672 | | |
| | 2,100 | | | Tamura Corp.† | | | 12,213 | | |
| | 4,200 | | | TDK Corp. | | | 163,940 | | |
| | 1,800 | | | TechnoPro Holdings, Inc. | | | 54,612 | | |
| | 4,200 | | | Teijin Ltd. | | | 51,665 | | |
| | 400 | | | Tekken Corp. | | | 6,231 | | |
| | 3,300 | | | Terumo Corp. | | | 139,425 | | |
| | 1,300 | | | THK Co. Ltd. | | | 31,339 | | |
| | 1,200 | | | TIS, Inc. | | | 35,730 | | |
| | 200 | | | TKC Corp. | | | 6,007 | | |
| | 3,100 | | | Toagosei Co. Ltd. | | | 31,154 | | |
| | 1,500 | | | Tobu Railway Co. Ltd. | | | 34,191 | | |
| | 2,200 | | | Tocalo Co. Ltd. | | | 28,210 | | |
| | 3,500 | | | Toda Corp. | | | 22,151 | | |
| | 600 | | | Toho Co. Ltd. | | | 25,689 | | |
| | 500 | | | Toho Gas Co. Ltd. | | | 12,731 | | |
| | 1,500 | | | Toho Holdings Co. Ltd. | | | 22,885 | | |
| | 3,300 | | | Tohoku Electric Power Co., Inc. | | | 23,410 | | |
The accompanying notes are an integral part of these financial statements.
36
M International Equity Fund
SCHEDULE OF INVESTMENTS (Continued)
December 31, 2021
Shares | | | | Value
(Note 1) | |
| | | Japan (Continued) | |
| | 3,600 | | | Tokai Carbon Co. Ltd.† | | $ | 37,806 | | |
| | 1,300 | | | TOKAI Holdings Corp. | | | 9,821 | | |
| | 1,300 | | | Tokai Rika Co. Ltd. | | | 17,495 | | |
| | 4,800 | | | Tokai Tokyo Financial
Holdings, Inc. | | | 16,483 | | |
| | 200 | | | Token Corp. | | | 16,431 | | |
| | 3,800 | | | Tokio Marine Holdings, Inc. | | | 211,159 | | |
| | 1,100 | | | Tokuyama Corp. | | | 17,481 | | |
| | 700 | | | Tokyo Century Corp. | | | 33,956 | | |
| | 17,400 | | | Tokyo Electric Power Co.
Holdings, Inc.* | | | 44,926 | | |
| | 1,100 | | | Tokyo Electron Ltd. | | | 633,817 | | |
| | 2,400 | | | Tokyo Gas Co. Ltd. | | | 43,022 | | |
| | 1,400 | | | Tokyo Kiraboshi Financial
Group, Inc. | | | 18,475 | | |
| | 500 | | | Tokyo Ohka Kogyo Co. Ltd. | | | 29,558 | | |
| | 800 | | | Tokyo Seimitsu Co. Ltd. | | | 35,469 | | |
| | 2,000 | | | Tokyo Steel Manufacturing Co.
Ltd. | | | 23,942 | | |
| | 2,700 | | | Tokyo Tatemono Co. Ltd. | | | 39,433 | | |
| | 400 | | | Tokyotokeiba Co. Ltd.† | | | 14,831 | | |
| | 1,700 | | | Tokyu Construction Co. Ltd. | | | 9,843 | | |
| | 3,000 | | | Tokyu Corp. | | | 39,850 | | |
| | 9,700 | | | Tokyu Fudosan Holdings Corp. | | | 54,222 | | |
| | 5,300 | | | TOMONY Holdings, Inc. | | | 14,606 | | |
| | 1,900 | | | Tomy Co. Ltd. | | | 18,153 | | |
| | 500 | | | Topcon Corp. | | | 7,211 | | |
| | 1,500 | | | TOPPAN, Inc. | | | 28,114 | | |
| | 1,100 | | | Topre Corp. | | | 11,389 | | |
| | 500 | | | Topy Industries Ltd. | | | 4,847 | | |
| | 14,600 | | | Toray Industries, Inc. | | | 86,536 | | |
| | 1,100 | | | Toridoll Holdings Corp. | | | 23,773 | | |
| | 1,300 | | | Tosei Corp. | | | 11,414 | | |
| | 1,800 | | | Toshiba Corp. | | | 74,015 | | |
| | 500 | | | Toshiba TEC Corp. | | | 20,451 | | |
| | 3,600 | | | Tosoh Corp. | | | 53,391 | | |
| | 600 | | | TOTO Ltd. | | | 27,593 | | |
| | 900 | | | Towa Pharmaceutical Co. Ltd. | | | 22,408 | | |
| | 3,100 | | | Toyo Construction Co. Ltd. | | | 15,658 | | |
| | 500 | | | Toyo Ink SC Holdings Co. Ltd. | | | 8,367 | | |
| | 1,000 | | | Toyo Seikan Group Holdings Ltd. | | | 11,936 | | |
| | 800 | | | Toyo Suisan Kaisha Ltd. | | | 33,904 | | |
| | 1,600 | | | Toyo Tire Corp. | | | 24,954 | | |
| | 2,500 | | | Toyobo Co. Ltd. | | | 27,297 | | |
| | 1,600 | | | Toyoda Gosei Co. Ltd. | | | 34,801 | | |
Shares | | | | Value
(Note 1) | |
| | | Japan (Continued) | |
| | 700 | | | Toyota Industries Corp. | | $ | 55,925 | | |
| | 101,500 | | | Toyota Motor Corp. | | | 1,857,848 | | |
| | 1,900 | | | Toyota Tsusho Corp. | | | 87,542 | | |
| | 600 | | | TPR Co. Ltd. | | | 7,438 | | |
| | 1,200 | | | Trend Micro, Inc. | | | 66,661 | | |
| | 800 | | | Tri Chemical Laboratories, Inc. | | | 25,350 | | |
| | 300 | | | Trusco Nakayama Corp. | | | 7,122 | | |
| | 1,600 | | | TS Tech Co. Ltd. | | | 19,668 | | |
| | 600 | | | Tsubakimoto Chain Co. | | | 16,483 | | |
| | 1,900 | | | Tsugami Corp. | | | 29,021 | | |
| | 700 | | | Tsumura & Co. | | | 19,930 | | |
| | 200 | | | Tsuruha Holdings, Inc. | | | 19,195 | | |
| | 700 | | | TV Asahi Holdings Corp. | | | 8,720 | | |
| | 1,000 | | | UACJ Corp.* | | | 23,116 | | |
| | 2,000 | | | Ube Industries Ltd. | | | 34,739 | | |
| | 500 | | | Ulvac, Inc. | | | 31,296 | | |
| | 1,500 | | | Unicharm Corp. | | | 65,187 | | |
| | 800 | | | Unipres Corp. | | | 5,592 | | |
| | 1,100 | | | United Super Markets
Holdings, Inc. | | | 10,108 | | |
| | 2,000 | | | Ushio, Inc. | | | 33,209 | | |
| | 1,300 | | | USS Co. Ltd. | | | 20,297 | | |
| | 600 | | | UT Group Co. Ltd. | | | 22,559 | | |
| | 400 | | | V Technology Co. Ltd. | | | 12,501 | | |
| | 1,200 | | | Valor Holdings Co. Ltd. | | | 22,387 | | |
| | 1,000 | | | Valqua Ltd. | | | 23,576 | | |
| | 1,400 | | | Vital KSK Holdings, Inc. | | | 9,822 | | |
| | 3,800 | | | VT Holdings Co. Ltd. | | | 15,427 | | |
| | 800 | | | Wacoal Holdings Corp. | | | 14,848 | | |
| | 3,000 | | | Wacom Co. Ltd. | | | 23,889 | | |
| | 800 | | | Welcia Holdings Co. Ltd. | | | 24,967 | | |
| | 500 | | | West Holdings Corp. | | | 24,907 | | |
| | 1,000 | | | West Japan Railway Co. | | | 41,815 | | |
| | 300 | | | Workman Co. Ltd.† | | | 14,344 | | |
| | 1,000 | | | Xebio Holdings Co. Ltd. | | | 8,015 | | |
| | 400 | | | Yakult Honsha Co. Ltd. | | | 20,864 | | |
| | 9,500 | | | Yamada Holdings Co. Ltd. | | | 32,457 | | |
| | 2,100 | | | Yamaguchi Financial Group, Inc. | | | 12,286 | | |
| | 500 | | | Yamaha Corp. | | | 24,646 | | |
| | 4,200 | | | Yamaha Motor Co. Ltd.† | | | 100,737 | | |
| | 2,400 | | | Yamato Holdings Co. Ltd. | | | 56,396 | | |
| | 900 | | | Yamato Kogyo Co. Ltd. | | | 29,145 | | |
| | 1,200 | | | Yamazaki Baking Co. Ltd.† | | | 15,940 | | |
| | 400 | | | Yaoko Co. Ltd. | | | 24,307 | | |
| | 500 | | | Yaskawa Electric Corp. | | | 24,515 | | |
The accompanying notes are an integral part of these financial statements.
37
M International Equity Fund
SCHEDULE OF INVESTMENTS (Continued)
December 31, 2021
Shares | | | | Value
(Note 1) | |
| | | Japan (Continued) | |
| | 1,200 | | | Yellow Hat Ltd. | | $ | 17,244 | | |
| | 600 | | | Yokogawa Bridge Holdings Corp. | | | 11,454 | | |
| | 2,000 | | | Yokogawa Electric Corp. | | | 36,060 | | |
| | 2,100 | | | Yokohama Rubber Co. Ltd.† | | | 33,646 | | |
| | 2,500 | | | Yokorei Co. Ltd. | | | 18,147 | | |
| | 1,100 | | | Yoshinoya Holdings Co. Ltd. | | | 22,195 | | |
| | 10,500 | | | Z Holdings Corp. | | | 60,921 | | |
| | 700 | | | Zenkoku Hosho Co. Ltd. | | | 30,488 | | |
| | 900 | | | Zensho Holdings Co. Ltd. | | | 21,156 | | |
| | 2,300 | | | Zeon Corp. | | | 26,533 | | |
| | 600 | | | ZOZO, Inc. | | | 18,726 | | |
| | | | 36,842,689 | | |
| | | Netherlands—2.6% | |
| | 1,275 | | | Aalberts NV | | | 84,569 | | |
| | 2,824 | | | ABN AMRO Bank NV, CVA# | | | 41,527 | | |
| | 722 | | | Accell Group NV* | | | 39,456 | | |
| | 78 | | | Adyen NV*,# | | | 205,268 | | |
| | 14,340 | | | Aegon NV | | | 71,720 | | |
| | 1,266 | | | Akzo Nobel NV | | | 139,089 | | |
| | 95 | | | Alfen Beheer BV#,* | | | 9,545 | | |
| | 580 | | | AMG Advanced Metallurgical
Group NV | | | 18,608 | | |
| | 576 | | | Amsterdam Commodities NV* | | | 16,329 | | |
| | 889 | | | APERAM SA | | | 48,218 | | |
| | 2,093 | | | Arcadis NV | | | 100,891 | | |
| | 5,174 | | | ArcelorMittal SA | | | 165,791 | | |
| | 802 | | | ASM International NV | | | 354,913 | | |
| | 2,066 | | | ASML Holding NV | | | 1,662,258 | | |
| | 129 | | | ASML Holding NV, ADR | | | 102,702 | | |
| | 2,865 | | | ASR Nederland NV | | | 132,103 | | |
| | 894 | | | Basic-Fit NV#,*,† | | | 42,748 | | |
| | 1,008 | | | BE Semiconductor Industries NV | | | 86,094 | | |
| | 1,770 | | | Boskalis Westminster | | | 51,628 | | |
| | 1,415 | | | Coca-Cola European Partners PLC | | | 79,067 | | |
| | 988 | | | Corbion NV | | | 46,613 | | |
| | 691 | | | Flow Traders# | | | 25,332 | | |
| | 2,215 | | | Fugro NV*,† | | | 17,362 | | |
| | 2,032 | | | Heineken NV | | | 228,706 | | |
| | 561 | | | IMCD NV | | | 124,355 | | |
| | 16,312 | | | ING Groep NV | | | 227,349 | | |
| | 2,027 | | | Intertrust NV*,# | | | 45,232 | | |
| | 339 | | | JDE Peet's NV† | | | 10,459 | | |
| | 12,095 | | | Koninklijke Ahold Delhaize NV | | | 414,964 | | |
| | 7,677 | | | Koninklijke BAM Groep NV* | | | 23,511 | | |
Shares | | | | Value
(Note 1) | |
| | | Netherlands (Continued) | |
| | 824 | | | Koninklijke DSM NV | | $ | 185,748 | | |
| | 56,357 | | | Koninklijke KPN NV | | | 175,163 | | |
| | 3,491 | | | Koninklijke Philips NV | | | 130,225 | | |
| | 899 | | | Koninklijke Vopak NV | | | 31,524 | | |
| | 1,600 | | | NN Group NV | | | 86,726 | | |
| | 1,110 | | | OCI NV* | | | 29,091 | | |
| | 4,749 | | | Ordina NV | | | 22,168 | | |
| | 11,571 | | | PostNL NV | | | 50,415 | | |
| | 2,746 | | | Prosus NV* | | | 229,878 | | |
| | 1,606 | | | Randstad NV | | | 109,779 | | |
| | 3,497 | | | SBM Offshore NV | | | 52,136 | | |
| | 2,451 | | | Signify NV# | | | 113,795 | | |
| | 839 | | | Sligro Food Group NV* | | | 20,346 | | |
| | 1,271 | | | TKH Group NV | | | 80,310 | | |
| | 1,381 | | | TomTom NV*,† | | | 14,323 | | |
| | 2,749 | | | Universal Music Group NV | | | 77,555 | | |
| | 388 | | | Van Lanschot Kempen NV | | | 9,718 | | |
| | 2,640 | | | Wolters Kluwer NV | | | 311,384 | | |
| | | | 6,346,691 | | |
| | | New Zealand—0.3% | |
| | 5,589 | | | a2 Milk Co. Ltd.* | | | 22,699 | | |
| | 15,320 | | | Air New Zealand Ltd.*,† | | | 15,844 | | |
| | 11,578 | | | Arvida Group Ltd.† | | | 15,622 | | |
| | 3,965 | | | Auckland International
Airport Ltd.* | | | 20,910 | | |
| | 7,155 | | | Chorus Ltd. | | | 35,136 | | |
| | 5,950 | | | Contact Energy Ltd. | | | 33,009 | | |
| | 1,680 | | | EBOS Group Ltd. | | | 47,406 | | |
| | 2,488 | | | Fisher & Paykel Healthcare
Corp. Ltd. | | | 55,824 | | |
| | 3,726 | | | Fletcher Building Ltd. | | | 18,706 | | |
| | 3,759 | | | Freightways Ltd. | | | 33,083 | | |
| | 4,572 | | | Genesis Energy Ltd. | | | 8,956 | | |
| | 12,176 | | | Heartland Group Holdings Ltd.† | | | 21,015 | | |
| | 13,666 | | | Infratil Ltd. | | | 74,879 | | |
| | 7,008 | | | Kathmandu Holdings Ltd. | | | 7,296 | | |
| | 1,307 | | | Mainfreight Ltd. | | | 84,056 | | |
| | 5,888 | | | Meridian Energy Ltd. | | | 19,558 | | |
| | 11,637 | | | Oceania Healthcare Ltd. | | | 10,680 | | |
| | 1,991 | | | Port of Tauranga Ltd. | | | 9,095 | | |
| | 8,615 | | | Pushpay Holdings Ltd.*,† | | | 7,789 | | |
| | 684 | | | Restaurant Brands
New Zealand Ltd.* | | | 6,465 | | |
| | 1,854 | | | Ryman Healthcare Ltd. | | | 15,555 | | |
The accompanying notes are an integral part of these financial statements.
38
M International Equity Fund
SCHEDULE OF INVESTMENTS (Continued)
December 31, 2021
Shares | | | | Value
(Note 1) | |
| | | New Zealand (Continued) | |
| | 9,536 | | | SKYCITY Entertainment
Group Ltd. | | $ | 20,377 | | |
| | 15,590 | | | Spark New Zealand Ltd. | | | 48,263 | | |
| | 4,050 | | | Summerset Group Holdings Ltd. | | | 37,946 | | |
| | 6,133 | | | Z Energy Ltd. | | | 14,912 | | |
| | | | 685,081 | | |
| | | Norway—0.6% | |
| | 21,108 | | | ABG Sundal Collier Holding ASA | | | 22,123 | | |
| | 785 | | | Adevinta ASA* | | | 10,456 | | |
| | 751 | | | Aker BP ASA | | | 23,161 | | |
| | 4,348 | | | Aker Solutions ASA* | | | 11,543 | | |
| | 593 | | | Atea ASA* | | | 11,043 | | |
| | 629 | | | Atlantic Sapphire ASA*,† | | | 3,018 | | |
| | 2,299 | | | Austevoll Seafood ASA | | | 27,776 | | |
| | 11,411 | | | B2Holding ASA | | | 13,424 | | |
| | 438 | | | Bakkafrost P/F | | | 29,026 | | |
| | 480 | | | Bonheur ASA | | | 19,349 | | |
| | 1,580 | | | Borregaard ASA | | | 39,830 | | |
| | 1,094 | | | BW Energy Ltd.* | | | 2,497 | | |
| | 6,229 | | | BW LPG Ltd.# | | | 35,401 | | |
| | 5,362 | | | BW Offshore Ltd. | | | 16,196 | | |
| | 968 | | | Crayon Group Holding ASA#,* | | | 20,115 | | |
| | 4,966 | | | DNB Bank ASA | | | 113,908 | | |
| | 12,792 | | | DNO ASA | | | 15,187 | | |
| | 6,672 | | | Elkem ASA# | | | 22,592 | | |
| | 12,646 | | | Equinor ASA | | | 338,747 | | |
| | 4,440 | | | Europris ASA# | | | 35,544 | | |
| | 1,329 | | | FLEX LNG Ltd. | | | 29,729 | | |
| | 1,401 | | | Gjensidige Forsikring ASA | | | 34,045 | | |
| | 768 | | | Grieg Seafood ASA*,† | | | 7,247 | | |
| | 2,196 | | | Mowi ASA | | | 52,041 | | |
| | 864 | | | Nordic Semiconductor ASA* | | | 29,197 | | |
| | 13,327 | | | Norsk Hydro ASA | | | 105,205 | | |
| | 5,186 | | | Odfjell Drilling Ltd.* | | | 11,895 | | |
| | 4,229 | | | Orkla ASA | | | 42,431 | | |
| | 10,139 | | | PGS ASA* | | | 4,225 | | |
| | 1,686 | | | Protector Forsikring ASA | | | 20,753 | | |
| | 397 | | | Salmar ASA | | | 27,409 | | |
| | 1,776 | | | Sbanken ASA# | | | 18,896 | | |
| | 1,104 | | | Scatec ASA# | | | 19,149 | | |
| | 614 | | | Schibsted ASA, Class A | | | 23,712 | | |
| | 404 | | | Schibsted ASA, Class B | | | 13,625 | | |
| | 1,199 | | | SpareBank 1 SR-Bank ASA | | | 18,135 | | |
| | 3,149 | | | Storebrand ASA | | | 31,653 | | |
Shares | | | | Value
(Note 1) | |
| | | Norway (Continued) | |
| | 2,103 | | | Subsea 7 SA | | $ | 15,087 | | |
| | 4,815 | | | Telenor ASA | | | 75,780 | | |
| | 1,294 | | | TGS ASA | | | 12,428 | | |
| | 888 | | | TOMRA Systems ASA | | | 63,626 | | |
| | 1,273 | | | Veidekke ASA | | | 19,139 | | |
| | 2,083 | | | Wallenius Wilhelmsen ASA* | | | 11,968 | | |
| | 1,410 | | | Yara International ASA | | | 71,248 | | |
| | | | 1,569,559 | | |
| | | Portugal—0.2% | |
| | 3,185 | | | Altri SGPS SA† | | | 20,343 | | |
| | 2,841 | | | CTT-Correios de Portugal SA | | | 14,733 | | |
| | 1,808 | | | EDP Renovaveis SA | | | 45,079 | | |
| | 18,638 | | | Energias de Portugal SA | | | 102,532 | | |
| | 6,892 | | | Galp Energia SGPS SA | | | 66,852 | | |
| | 57 | | | Greenvolt-Energias Renovaveis SA* | | | 412 | | |
| | 1,861 | | | Jeronimo Martins SGPS SA† | | | 42,587 | | |
| | 5,953 | | | Navigator Co. SA† | | | 22,705 | | |
| | 3,482 | | | NOS SGPS SA† | | | 13,518 | | |
| | 10,709 | | | Redes Energeticas Nacionais
SGPS SA | | | 31,029 | | |
| | 20,529 | | | Sonae SGPS SA | | | 23,442 | | |
| | | | 383,232 | | |
| | | Singapore—0.6% | |
| | 23,500 | | | Ascendas India Trust | | | 24,763 | | |
| | 14,400 | | | Capitaland Investment Ltd.* | | | 36,438 | | |
| | 3,400 | | | City Developments Ltd. | | | 17,182 | | |
| | 23,400 | | | ComfortDelGro Corp. Ltd. | | | 24,310 | | |
| | 3,900 | | | Dairy Farm International
Holdings Ltd. | | | 11,154 | | |
| | 10,322 | | | DBS Group Holdings Ltd. | | | 250,161 | | |
| | 18,300 | | | First Resources Ltd. | | | 20,505 | | |
| | 35,400 | | | Genting Singapore Ltd. | | | 20,358 | | |
| | 132,400 | | | Golden Agri-Resources Ltd. | | | 24,071 | | |
| | 800 | | | Great Eastern Holdings Ltd. | | | 11,962 | | |
| | 11,200 | | | GuocoLand Ltd. | | | 12,550 | | |
| | 1,300 | | | Haw Par Corp. Ltd. | | | 10,949 | | |
| | 5,500 | | | Hongkong Land Holdings Ltd. | | | 28,600 | | |
| | 1,900 | | | iFAST Corp. Ltd. | | | 11,843 | | |
| | 1,000 | | | Jardine Cycle & Carriage Ltd. | | | 15,286 | | |
| | 9,600 | | | Keppel Corp. Ltd. | | | 36,474 | | |
| | 57,577 | | | Keppel Infrastructure Trust | | | 23,286 | | |
| | 14,800 | | | NetLink NBN Trust | | | 10,983 | | |
The accompanying notes are an integral part of these financial statements.
39
M International Equity Fund
SCHEDULE OF INVESTMENTS (Continued)
December 31, 2021
Shares | | | | Value
(Note 1) | |
| | | Singapore (Continued) | |
| | 21,139 | | | Oversea-Chinese Banking
Corp. Ltd. | | $ | 178,825 | | |
| | 3,200 | | | SATS Ltd.* | | | 9,237 | | |
| | 10,100 | | | Sembcorp Industries Ltd. | | | 14,990 | | |
| | 19,200 | | | Sheng Siong Group Ltd. | | | 20,801 | | |
| | 9,299 | | | Singapore Airlines Ltd.*,† | | | 34,433 | | |
| | 5,400 | | | Singapore Exchange Ltd. | | | 37,266 | | |
| | 32,900 | | | Singapore Post Ltd. | | | 15,869 | | |
| | 33,100 | | | Singapore Press Holdings Ltd.† | | | 57,230 | | |
| | 8,200 | | | Singapore Technologies
Engineering Ltd. | | | 22,879 | | |
| | 35,400 | | | Singapore Telecommunications Ltd. | | | 60,944 | | |
| | 22,000 | | | StarHub Ltd. | | | 22,202 | | |
| | 9,500 | | | UMS Holdings Ltd. | | | 10,715 | | |
| | 8,100 | | | United Overseas Bank Ltd. | | | 161,687 | | |
| | 6,300 | | | UOL Group Ltd. | | | 33,146 | | |
| | 1,800 | | | Venture Corp. Ltd. | | | 24,457 | | |
| | 23,900 | | | Wilmar International Ltd. | | | 73,424 | | |
| | 15,000 | | | Wing Tai Holdings Ltd. | | | 19,924 | | |
| | 29,500 | | | Yangzijiang Shipbuilding
Holdings Ltd. | | | 29,334 | | |
| | | | 1,418,238 | | |
| | | Spain—1.4% | |
| | 375 | | | Acciona SA† | | | 71,768 | | |
| | 2,154 | | | Acerinox SA | | | 27,920 | | |
| | 3,335 | | | ACS Actividades de Construccion y
Servicios SA | | | 89,493 | | |
| | 334 | | | Aena SME SA*,# | | | 52,780 | | |
| | 1,148 | | | Almirall SA | | | 14,769 | | |
| | 1,469 | | | Amadeus IT Group SA* | | | 99,745 | | |
| | 4,833 | | | Applus Services SA | | | 44,487 | | |
| | 30,522 | | | Banco Bilbao Vizcaya
Argentaria SA | | | 182,434 | | |
| | 13,416 | | | Banco Bilbao Vizcaya
Argentaria SA, ADR | | | 78,752 | | |
| | 71,163 | | | Banco de Sabadell SA* | | | 47,947 | | |
| | 116,729 | | | Banco Santander SA | | | 390,780 | | |
| | 5,075 | | | Bankinter SA | | | 26,053 | | |
| | 18,312 | | | CaixaBank SA | | | 50,328 | | |
| | 996 | | | Cellnex Telecom SA# | | | 58,035 | | |
| | 796 | | | Cia de Distribucion Integral Logista
Holdings SA | | | 15,886 | | |
Shares | | | | Value
(Note 1) | |
| | | Spain (Continued) | |
| | 861 | | | CIE Automotive SA† | | $ | 26,820 | | |
| | 318 | | | Construcciones y Auxiliar de
Ferrocarriles SA | | | 13,251 | | |
| | 1,692 | | | Ebro Foods SA | | | 32,517 | | |
| | 3,909 | | | Enagas SA† | | | 90,788 | | |
| | 3,301 | | | Endesa SA† | | | 75,915 | | |
| | 4,660 | | | Ercros SA* | | | 15,757 | | |
| | 3,991 | | | Faes Farma SA | | | 15,803 | | |
| | 1,171 | | | Ferrovial SA | | | 36,743 | | |
| | 598 | | | Fluidra SA | | | 23,965 | | |
| | 3,465 | | | Gestamp Automocion SA*,# | | | 17,555 | | |
| | 4,339 | | | Global Dominion Access SA# | | | 23,144 | | |
| | 1,891 | | | Grifols SA† | | | 36,330 | | |
| | 364 | | | Grupo Catalana Occidente SA | | | 12,432 | | |
| | 51,856 | | | Iberdrola SA | | | 614,586 | | |
| | 4,293 | | | Indra Sistemas SA* | | | 46,530 | | |
| | 6,499 | | | Industria de Diseno Textil SA | | | 211,097 | | |
| | 147 | | | Laboratorios Farmaceuticos
Rovi SA | | | 12,351 | | |
| | 5,075 | | | Linea Directa Aseguradora SA
Cia de Seguros y Reaseguros† | | | 9,294 | | |
| | 7,728 | | | Mapfre SA† | | | 15,885 | | |
| | 1,581 | | | Mediaset Espana
Comunicacion SA* | | | 7,398 | | |
| | 4,190 | | | Melia Hotels International SA* | | | 28,631 | | |
| | 2,459 | | | Prosegur Cia de Seguridad SA† | | | 6,467 | | |
| | 3,850 | | | Red Electrica Corp. SA | | | 83,391 | | |
| | 13,780 | | | Repsol SA | | | 163,725 | | |
| | 10,298 | | | Sacyr SA | | | 26,802 | | |
| | 826 | | | Siemens Gamesa Renewable
Energy SA* | | | 19,814 | | |
| | 867 | | | Solaria Energia y Medio
Ambiente SA*,† | | | 16,899 | | |
| | 62,679 | | | Telefonica SA† | | | 274,879 | | |
| | 3,839 | | | Tubacex SA*,† | | | 6,565 | | |
| | 15,835 | | | Unicaja Banco SA# | | | 15,666 | | |
| | 179 | | | Vidrala SA† | | | 17,648 | | |
| | 582 | | | Viscofan SA | | | 37,702 | | |
| | 1,480 | | | Zardoya Otis SA | | | 11,980 | | |
| | | | 3,299,507 | | |
The accompanying notes are an integral part of these financial statements.
40
M International Equity Fund
SCHEDULE OF INVESTMENTS (Continued)
December 31, 2021
Shares | | | | Value
(Note 1) | |
| | | Sweden—2.4% | |
| | 984 | | | AAK AB | | $ | 21,267 | | |
| | 1,552 | | | AcadeMedia AB# | | | 9,532 | | |
| | 576 | | | AddLife AB, Class B | | | 24,312 | | |
| | 1,041 | | | AddNode Group AB | | | 49,422 | | |
| | 2,288 | | | AddTech AB, Class B | | | 54,692 | | |
| | 1,023 | | | AFRY AB | | | 28,869 | | |
| | 1,926 | | | Alfa Laval AB | | | 77,669 | | |
| | 933 | | | Alimak Group AB# | | | 11,812 | | |
| | 556 | | | Annehem Fastigheter AB, Class B* | | | 2,295 | | |
| | 3,735 | | | Arjo AB, Class B | | | 45,798 | | |
| | 2,763 | | | Assa Abloy AB, Class B | | | 84,454 | | |
| | 5,277 | | | Atlas Copco AB, Class A | | | 365,457 | | |
| | 1,616 | | | Atlas Copco AB, Class B | | | 95,177 | | |
| | 3,696 | | | Attendo AB*,# | | | 15,747 | | |
| | 1,217 | | | Avanza Bank Holding AB | | | 44,741 | | |
| | 1,206 | | | Axfood AB | | | 34,754 | | |
| | 1,079 | | | Beijer Alma AB | | | 32,778 | | |
| | 2,259 | | | Betsson AB, Class B* | | | 13,662 | | |
| | 1,218 | | | Bilia AB, Class A | | | 21,594 | | |
| | 1,635 | | | BillerudKorsnas AB | | | 30,886 | | |
| | 475 | | | BioGaia AB, Class B | | | 27,229 | | |
| | 981 | | | Biotage AB | | | 28,444 | | |
| | 3,089 | | | Boliden AB* | | | 119,647 | | |
| | 1,253 | | | Bonava AB, Class B | | | 10,850 | | |
| | 1,482 | | | Bravida Holding AB# | | | 20,829 | | |
| | 1,399 | | | Bure Equity AB | | | 67,843 | | |
| | 1,751 | | | Castellum AB† | | | 47,243 | | |
| | 447 | | | Catena AB | | | 27,900 | | |
| | 7,868 | | | Cloetta AB, Class B | | | 22,813 | | |
| | 1,370 | | | Coor Service Management
Holding AB# | | | 12,531 | | |
| | 14,402 | | | Corem Property Group AB, Class B | | | 52,038 | | |
| | 2,643 | | | Dios Fastigheter AB | | | 34,748 | | |
| | 2,657 | | | Dometic Group AB# | | | 34,976 | | |
| | 2,823 | | | Dustin Group AB†,# | | | 33,147 | | |
| | 2,954 | | | Electrolux AB*,† | | | 71,756 | | |
| | 3,376 | | | Electrolux Professional AB,
Class B* | | | 23,444 | | |
| | 1,639 | | | Elekta AB, Class B† | | | 20,777 | | |
| | 4,082 | | | Epiroc AB, Class A | | | 103,538 | | |
| | 1,112 | | | Epiroc AB, Class B | | | 23,591 | | |
| | 4,623 | | | Essity AB, Class B | | | 151,129 | | |
| | 645 | | | Evolution AB# | | | 91,808 | | |
| | 1,567 | | | Fabege AB | | | 26,281 | | |
Shares | | | | Value
(Note 1) | |
| | | Sweden (Continued) | |
| | 2,158 | | | Fagerhult AB | | $ | 14,544 | | |
| | 612 | | | Fastighets AB Balder, Class B* | | | 44,145 | | |
| | 79 | | | Fenix Outdoor International AG | | | 10,718 | | |
| | 703 | | | GARO AB | | | 16,804 | | |
| | 2,139 | | | Getinge AB, Class B | | | 93,526 | | |
| | 1,494 | | | Granges AB | | | 17,542 | | |
| | 6,778 | | | Hennes & Mauritz AB, Class B | | | 133,577 | | |
| | 4,452 | | | Hexagon AB, Class B | | | 70,774 | | |
| | 280 | | | Hexatronic Group AB | | | 15,617 | | |
| | 3,325 | | | Hexpol AB | | | 44,634 | | |
| | 3,175 | | | Hoist Finance AB*,#,† | | | 10,260 | | |
| | 833 | | | Holmen AB, Class B | | | 40,073 | | |
| | 690 | | | Hufvudstaden AB, Class A | | | 10,324 | | |
| | 4,148 | | | Husqvarna AB, Class B | | | 66,492 | | |
| | 104 | | | Industrivarden AB, Class A | | | 3,319 | | |
| | 2,319 | | | Indutrade AB | | | 71,139 | | |
| | 293 | | | Instalco AB† | | | 14,085 | | |
| | 631 | | | Intrum AB | | | 16,298 | | |
| | 3,518 | | | Inwido AB | | | 72,881 | | |
| | 1,080 | | | JM AB | | | 48,836 | | |
| | 1,855 | | | Kindred Group PLC, | | | 22,109 | | |
| | 1,219 | | | KNOW IT AB | | | 50,656 | | |
| | 4,367 | | | Lagercrantz Group AB, Class B | | | 64,324 | | |
| | 1,140 | | | Lifco AB, Class B | | | 34,151 | | |
| | 1,567 | | | Lindab International AB | | | 55,735 | | |
| | 981 | | | Loomis AB | | | 26,131 | | |
| | 1,353 | | | Lundin Energy AB | | | 48,588 | | |
| | 2,179 | | | Mekonomen AB* | | | 37,883 | | |
| | 1,754 | | | Millicom International Cellular SA,
SDR* | | | 49,944 | | |
| | 302 | | | MIPS AB | | | 39,671 | | |
| | 1,742 | | | Modern Times Group MTG AB,
Class B* | | | 17,813 | | |
| | 432 | | | Mycronic AB | | | 10,087 | | |
| | 669 | | | NCC AB, Class B | | | 12,416 | | |
| | 2,452 | | | Nibe Industrier AB, Class B | | | 37,108 | | |
| | 3,170 | | | Nobia AB | | | 19,119 | | |
| | 1,697 | | | Nobina AB# | | | 20,095 | | |
| | 3,940 | | | Nolato AB, Class B | | | 47,047 | | |
| | 700 | | | Nordic Entertainment Group AB,
Class B* | | | 36,347 | | |
| | 2,599 | | | Nordic Waterproofing Holding AB | | | 64,139 | | |
| | 1,681 | | | Nyfosa AB | | | 29,021 | | |
| | 507 | | | OEM International AB* | | | 10,402 | | |
| | 609 | | | Pandox AB* | | | 9,840 | | |
The accompanying notes are an integral part of these financial statements.
41
M International Equity Fund
SCHEDULE OF INVESTMENTS (Continued)
December 31, 2021
Shares | | | | Value
(Note 1) | |
| | | Sweden (Continued) | |
| | 2,782 | | | Peab AB, Class B | | $ | 35,159 | | |
| | 1,578 | | | Platzer Fastigheter Holding AB,
Class B | | | 23,680 | | |
| | 4,394 | | | Ratos AB, Class B | | | 28,179 | | |
| | 5,625 | | | Resurs Holding AB# | | | 23,667 | | |
| | 528 | | | Saab AB, Class B | | | 13,457 | | |
| | 700 | | | Sagax AB, Class B | | | 23,627 | | |
| | 6,434 | | | Samhallsbyggnadsbolaget i
Norden AB† | | | 47,293 | | |
| | 5,931 | | | Sandvik AB | | | 165,797 | | |
| | 2,495 | | | Scandi Standard AB | | | 11,321 | | |
| | 1,030 | | | Sectra AB* | | | 22,820 | | |
| | 4,432 | | | Securitas AB, Class B | | | 61,137 | | |
| | 1,240 | | | Sinch AB*,# | | | 15,795 | | |
| | 7,990 | | | Skandinaviska Enskilda Banken AB,
Class A | | | 111,279 | | |
| | 2,555 | | | Skanska AB, Class B | | | 66,220 | | |
| | 426 | | | SKF AB, Class A | | | 10,348 | | |
| | 3,291 | | | SKF AB, Class B | | | 78,121 | | |
| | 1,180 | | | SkiStar AB | | | 22,200 | | |
| | 562 | | | Solid Forsakring AB* | | | 3,654 | | |
| | 4,349 | | | SSAB AB, Class A* | | | 25,239 | | |
| | 7,778 | | | SSAB AB, Class B* | | | 39,259 | | |
| | 3,850 | | | Svenska Cellulosa AB SCA,
Class B | | | 68,490 | | |
| | 6,847 | | | Svenska Handelsbanken AB,
Class A | | | 74,151 | | |
| | 1,170 | | | Sweco AB, Class B | | | 22,037 | | |
| | 4,970 | | | Swedbank AB, Class A | | | 100,157 | | |
| | 10,480 | | | Swedish Match AB | | | 83,527 | | |
| | 987 | | | Swedish Orphan Biovitrum AB* | | | 20,218 | | |
| | 5,725 | | | Tele2 AB, Class B | | | 81,793 | | |
| | 24,797 | | | Telefonaktiebolaget LM Ericsson,
Class A | | | 273,901 | | |
| | 37,302 | | | Telia Co. AB | | | 146,154 | | |
| | 1,057 | | | Thule Group AB# | | | 64,102 | | |
| | 2,299 | | | Trelleborg AB, Class B | | | 60,501 | | |
| | 353 | | | Troax Group AB | | | 18,107 | | |
| | 2,450 | | | Volvo AB, Class A | | | 57,643 | | |
| | 15,083 | | | Volvo AB, Class B | | | 349,943 | | |
| | 811 | | | Wallenstam AB, Class B | | | 15,078 | | |
| | 1,004 | | | Wihlborgs Fastigheter AB | | | 22,822 | | |
| | | | 5,962,570 | | |
Shares | | | | Value
(Note 1) | |
| | | Switzerland—5.8% | |
| | 8,096 | | | ABB Ltd., Registered | | $ | 310,086 | | |
| | 1,613 | | | Adecco Group AG, Registered | | | 82,491 | | |
| | 2,917 | | | Alcon, Inc. | | | 258,471 | | |
| | 309 | | | Allreal Holding AG, Registered | | | 68,501 | | |
| | 137 | | | ALSO Holding AG, Registered* | | | 45,105 | | |
| | 3,338 | | | ams AG* | | | 60,792 | | |
| | 47 | | | APG SGA SA* | | | 10,264 | | |
| | 1,914 | | | Arbonia AG | | | 43,271 | | |
| | 14,351 | | | Aryzta AG* | | | 17,970 | | |
| | 590 | | | Ascom Holding AG, Registered* | | | 7,615 | | |
| | 119 | | | Autoneum Holding AG*,† | | | 22,162 | | |
| | 38 | | | Bachem Holding AG, Registered
Class B | | | 29,860 | | |
| | 605 | | | Baloise Holding AG, Registered | | | 98,996 | | |
| | 243 | | | Banque Cantonale Vaudoise,
Registered | | | 18,881 | | |
| | 23 | | | Barry Callebaut AG, Registered | | | 55,935 | | |
| | 80 | | | Belimo Holding AG, Registered | | | 50,922 | | |
| | 35 | | | Bell Food Group AG, Registered | | | 11,216 | | |
| | 76 | | | Berner Kantonalbank AG,
Registered | | | 16,890 | | |
| | 301 | | | BKW AG | | | 39,178 | | |
| | 157 | | | Bobst Group SA, Registered* | | | 14,284 | | |
| | 127 | | | Bossard Holding AG, Registered
Class A | | | 45,785 | | |
| | 85 | | | Bucher Industries AG, Registered | | | 42,071 | | |
| | 50 | | | Burckhardt Compression
Holding AG | | | 23,678 | | |
| | 137 | | | Burkhalter Holding AG | | | 9,472 | | |
| | 40 | | | Bystronic AG | | | 56,277 | | |
| | 456 | | | Cembra Money Bank AG | | | 33,254 | | |
| | 1 | | | Chocoladefabriken Lindt &
Spruengli AG, Registered | | | 134,109 | | |
| | 2,436 | | | Cie Financiere Richemont SA,
Registered Class A | | | 366,122 | | |
| | 2,253 | | | Clariant AG, Registered* | | | 46,979 | | |
| | 205 | | | Coltene Holding AG, Registered* | | | 25,288 | | |
| | 3,490 | | | Credit Suisse Group AG, ADR† | | | 33,644 | | |
| | 5,213 | | | Credit Suisse Group AG, Registered | | | 50,757 | | |
| | 93 | | | Daetwyler Holding AG | | | 41,029 | | |
| | 514 | | | DKSH Holding AG | | | 42,476 | | |
| | 66 | | | dormakaba Holding AG | | | 43,713 | | |
| | 661 | | | Dufry AG, Registered* | | | 32,753 | | |
The accompanying notes are an integral part of these financial statements.
42
M International Equity Fund
SCHEDULE OF INVESTMENTS (Continued)
December 31, 2021
Shares | | | | Value
(Note 1) | |
| | | Switzerland (Continued) | |
| | 1,608 | | | EFG International AG* | | $ | 12,265 | | |
| | 25 | | | Emmi AG, Registered | | | 29,521 | | |
| | 41 | | | EMS-Chemie Holding AG,
Registered | | | 45,941 | | |
| | 399 | | | Flughafen Zurich AG, Registered* | | | 71,857 | | |
| | 20 | | | Forbo Holding AG, Registered | | | 41,045 | | |
| | 1,069 | | | Galenica AG# | | | 80,421 | | |
| | 5,107 | | | GAM Holding AG* | | | 7,622 | | |
| | 223 | | | Geberit AG, Registered | | | 182,374 | | |
| | 50 | | | Georg Fischer AG, Registered | | | 75,999 | | |
| | 37 | | | Givaudan SA, Registered | | | 194,583 | | |
| | 566 | | | Helvetia Holding AG, Registered | | | 66,712 | | |
| | 136 | | | Hiag Immobilien Holding AG | | | 14,179 | | |
| | 3,017 | | | Holcim Ltd.* | | | 153,995 | | |
| | 298 | | | Huber + Suhner AG, Registered | | | 28,453 | | |
| | 547 | | | Implenia AG, Registered*,† | | | 12,462 | | |
| | 109 | | | Ina Invest Holding AG* | | | 2,237 | | |
| | 36 | | | Inficon Holding AG, Registered | | | 52,862 | | |
| | 16 | | | Interroll Holding AG, Registered | | | 72,081 | | |
| | 16 | | | Intershop Holding AG | | | 10,746 | | |
| | 2,363 | | | Julius Baer Group Ltd. | | | 158,657 | | |
| | 80 | | | Jungfraubahn Holding AG,
Registered* | | | 11,782 | | |
| | 223 | | | Kardex Holding AG, Registered | | | 73,420 | | |
| | 90 | | | Komax Holding AG, Registered* | | | 24,989 | | |
| | 427 | | | Kuehne + Nagel International AG,
Registered | | | 137,960 | | |
| | 580 | | | Landis+Gyr Group AG* | | | 39,305 | | |
| | 167 | | | Liechtensteinische Landesbank AG | | | 9,640 | | |
| | 667 | | | Logitech International SA,
Registered† | | | 55,014 | | |
| | 765 | | | Logitech International SA,
Registered | | | 64,545 | | |
| | 267 | | | Lonza Group AG, Registered | | | 223,164 | | |
| | 63 | | | Luzerner Kantonalbank AG,
Registered | | | 28,693 | | |
| | 636 | | | Medmix AG*,# | | | 31,521 | | |
| | 2 | | | Metall Zug AG, Registered Class B | | | 4,521 | | |
| | 1,480 | | | Mobilezone Holding AG,
Registered | | | 22,122 | | |
| | 219 | | | Mobimo Holding AG, Registered* | | | 73,425 | | |
| | 22,264 | | | Nestle SA, Registered | | | 3,113,832 | | |
| | 12,302 | | | Novartis AG, Registered | | | 1,083,850 | | |
Shares | | | | Value
(Note 1) | |
| | | Switzerland (Continued) | |
| | 3,319 | | | OC Oerlikon Corp. AG, Registered | | $ | 34,112 | | |
| | 136 | | | Orior AG | | | 13,418 | | |
| | 124 | | | Partners Group Holding AG | | | 205,827 | | |
| | 699 | | | PSP Swiss Property AG, Registered | | | 87,222 | | |
| | 78 | | | Rieter Holding AG, Registered* | | | 15,151 | | |
| | 5,133 | | | Roche Holding AG | | | 2,142,109 | | |
| | 140 | | | Schindler Holding AG, Registered | | | 37,550 | | |
| | 25 | | | Schweiter Technologies AG | | | 37,094 | | |
| | 206 | | | SFS Group AG | | | 28,531 | | |
| | 32 | | | SGS SA, Registered | | | 107,006 | | |
| | 73 | | | Siegfried Holding AG, Registered* | | | 71,261 | | |
| | 2,660 | | | SIG Combibloc Group AG* | | | 74,324 | | |
| | 910 | | | Sika AG, Registered | | | 379,699 | | |
| | 373 | | | Softwareone Holding AG* | | | 8,089 | | |
| | 326 | | | Sonova Holding AG, Registered | | | 128,010 | | |
| | 88 | | | St. Galler Kantonalbank AG,
Registered | | | 42,011 | | |
| | 52 | | | Straumann Holding AG, Registered | | | 110,540 | | |
| | 636 | | | Sulzer AG, Registered | | | 62,714 | | |
| | 225 | | | Swatch Group AG | | | 68,893 | | |
| | 384 | | | Swatch Group AG, Registered | | | 22,525 | | |
| | 253 | | | Swiss Life Holding AG, Registered | | | 155,210 | | |
| | 1,182 | | | Swiss Prime Site AG, Registered | | | 116,293 | | |
| | 1,421 | | | Swiss Re AG | | | 140,759 | | |
| | 379 | | | Swisscom AG, Registered | | | 214,040 | | |
| | 247 | | | Swissquote Group Holding SA,
Registered | | | 54,350 | | |
| | 108 | | | Tecan Group AG, Registered | | | 65,841 | | |
| | 634 | | | Temenos AG, Registered | | | 87,704 | | |
| | 276 | | | u-blox Holding AG* | | | 21,339 | | |
| | 11,952 | | | UBS Group AG, Registered | | | 215,377 | | |
| | 94 | | | Valora Holding AG, Registered* | | | 16,072 | | |
| | 228 | | | VAT Group AG# | | | 113,700 | | |
| | 400 | | | Vetropack Holding AG, Registered | | | 25,285 | | |
| | 545 | | | Vifor Pharma AG | | | 97,044 | | |
| | 706 | | | Vontobel Holding AG, Registered | | | 61,907 | | |
| | 77 | | | VP Bank AG, Class A | | | 8,163 | | |
| | 104 | | | Zehnder Group AG | | | 10,626 | | |
| | 828 | | | Zurich Insurance Group AG | | | 363,840 | | |
| | | | 14,045,728 | | |
The accompanying notes are an integral part of these financial statements.
43
M International Equity Fund
SCHEDULE OF INVESTMENTS (Continued)
December 31, 2021
Shares | | | | Value
(Note 1) | |
| | | | | United Kingdom—9.3% | | | |
| | 7,379 | | | 3i Group PLC | | $ | 144,724 | | |
| | 217 | | | 4imprint Group PLC† | | | 8,283 | | |
| | 2,172 | | | 888 Holdings PLC | | | 8,849 | | |
| | 23,301 | | | Abrdn PLC | | | 75,978 | | |
| | 2,010 | | | Admiral Group PLC | | | 85,890 | | |
| | 2,092 | | | AJ Bell Plc | | | 10,743 | | |
| | 12,432 | | | Alliance Pharma PLC | | | 18,308 | | |
| | 9,763 | | | Anglo American PLC | | | 398,556 | | |
| | 5,917 | | | Anglo Pacific Group PLC† | | | 10,796 | | |
| | 2,896 | | | Antofagasta PLC | | | 52,468 | | |
| | 4,535 | | | Ascential PLC*,† | | | 24,701 | | |
| | 3,862 | | | Ashtead Group PLC | | | 310,613 | | |
| | 355 | | | ASOS PLC*,† | | | 11,489 | | |
| | 2,639 | | | Associated British Foods PLC | | | 71,726 | | |
| | 7,325 | | | AstraZeneca PLC | | | 860,402 | | |
| | 8,970 | | | Auto Trader Group PLC# | | | 89,846 | | |
| | 3,592 | | | Avast PLC# | | | 29,522 | | |
| | 26,339 | | | Aviva PLC | | | 146,312 | | |
| | 835 | | | Avon Protection PLC | | | 12,670 | | |
| | 11,488 | | | B&M European Value Retail SA | | | 98,584 | | |
| | 7,505 | | | Babcock International
Group PLC*,† | | | 32,365 | | |
| | 26,412 | | | BAE Systems PLC | | | 196,553 | | |
| | 9,792 | | | Balfour Beatty PLC | | | 34,725 | | |
| | 617 | | | Bank of Georgia Group PLC | | | 13,930 | | |
| | 108,396 | | | Barclays PLC | | | 274,365 | | |
| | 5,771 | | | Barratt Developments PLC | | | 58,429 | | |
| | 3,269 | | | Beazley PLC* | | | 20,633 | | |
| | 1,306 | | | Bellway PLC | | | 58,972 | | |
| | 678 | | | Berkeley Group Holdings PLC* | | | 43,820 | | |
| | 12,902 | | | BHP Group PLC† | | | 384,110 | | |
| | 998 | | | BHP Group PLC, ADR† | | | 59,650 | | |
| | 4,891 | | | Biffa PLC# | | | 23,733 | | |
| | 1,176 | | | Bodycote PLC | | | 13,777 | | |
| | 8,370 | | | boohoo Group PLC* | | | 13,958 | | |
| | 172,287 | | | BP PLC | | | 770,723 | | |
| | 9,231 | | | Breedon Group PLC | | | 11,870 | | |
| | 8,187 | | | Brewin Dolphin Holdings PLC | | | 41,002 | | |
| | 9,634 | | | British American Tobacco PLC | | | 356,451 | | |
| | 589 | | | British American Tobacco PLC,
ADR† | | | 22,034 | | |
| | 4,032 | | | Britvic PLC | | | 50,209 | | |
| | 105,509 | | | BT Group PLC† | | | 242,137 | | |
Shares | | | | Value
(Note 1) | |
| | | United Kingdom (Continued) | |
| | 3,731 | | | Bunzl PLC | | $ | 145,695 | | |
| | 2,743 | | | Burberry Group PLC | | | 67,480 | | |
| | 3,634 | | | Burford Capital Ltd. | | | 37,924 | | |
| | 4,589 | | | C&C Group PLC* | | | 14,423 | | |
| | 40,000 | | | Capita PLC* | | | 19,762 | | |
| | 11,065 | | | Capricorn Energy PLC | | | 28,202 | | |
| | 7,460 | | | Card Factory PLC* | | | 6,028 | | |
| | 510 | | | Carnival PLC* | | | 9,551 | | |
| | 756 | | | Cazoo Group Ltd.* | | | 4,559 | | |
| | 21,596 | | | Centamin PLC | | | 25,963 | | |
| | 6,675 | | | Central Asia Metals PLC | | | 23,400 | | |
| | 102,113 | | | Centrica PLC* | | | 98,824 | | |
| | 2,609 | | | Chesnara PLC | | | 10,065 | | |
| | 20,533 | | | Cineworld Group PLC*,† | | | 8,891 | | |
| | 577 | | | Clarkson PLC | | | 30,303 | | |
| | 2,322 | | | Clinigen Group PLC† | | | 28,774 | | |
| | 1,083 | | | Clipper Logistics Plc | | | 10,642 | | |
| | 2,800 | | | Close Brothers Group PLC | | | 53,211 | | |
| | 3,114 | | | CMC Markets PLC# | | | 11,106 | | |
| | 33,791 | | | Coats Group PLC | | | 31,651 | | |
| | 1,369 | | | Coca-Cola HBC AG* | | | 47,344 | | |
| | 5,788 | | | Compass Group PLC* | | | 129,345 | | |
| | 865 | | | Computacenter PLC | | | 34,071 | | |
| | 15,897 | | | ConvaTec Group PLC# | | | 41,561 | | |
| | 3,254 | | | Countryside Properties PLC*,# | | | 19,820 | | |
| | 634 | | | Cranswick PLC | | | 31,769 | | |
| | 4,845 | | | Crest Nicholson Holdings PLC | | | 24,396 | | |
| | 1,039 | | | Croda International PLC | | | 142,321 | | |
| | 21,706 | | | Currys PLC | | | 33,611 | | |
| | 914 | | | CVS Group PLC | | | 27,712 | | |
| | 829 | | | DCC PLC | | | 67,887 | | |
| | 2,945 | | | De La Rue PLC*,† | | | 6,195 | | |
| | 498 | | | Dechra Pharmaceuticals PLC | | | 35,894 | | |
| | 5,029 | | | Devro PLC | | | 14,022 | | |
| | 6,669 | | | DFS Furniture PLC | | | 23,921 | | |
| | 12,494 | | | Diageo PLC | | | 682,538 | | |
| | 2,596 | | | Diploma PLC | | | 118,556 | | |
| | 21,750 | | | Direct Line Insurance Group PLC | | | 82,137 | | |
| | 3,416 | | | Domino's Pizza Group PLC | | | 21,214 | | |
| | 10,792 | | | Drax Group PLC | | | 88,375 | | |
| | 15,945 | | | DS Smith PLC | | | 82,833 | | |
| | 1,117 | | | Dunelm Group PLC | | | 20,880 | | |
| | 2,569 | | | easyJet PLC* | | | 19,334 | | |
The accompanying notes are an integral part of these financial statements.
44
M International Equity Fund
SCHEDULE OF INVESTMENTS (Continued)
December 31, 2021
Shares | | | | Value
(Note 1) | |
| | | United Kingdom (Continued) | |
| | 8,196 | | | Electrocomponents PLC | | $ | 133,790 | | |
| | 13,055 | | | Elementis PLC* | | | 23,254 | | |
| | 1,355 | | | EMIS Group PLC | | | 24,943 | | |
| | 886 | | | Energean Plc* | | | 10,254 | | |
| | 74,403 | | | EnQuest PLC*,† | | | 18,853 | | |
| | 2,921 | | | Entain PLC* | | | 66,541 | | |
| | 7,801 | | | Esken Ltd.*,† | | | 1,493 | | |
| | 5,759 | | | Essentra PLC† | | | 26,893 | | |
| | 1,262 | | | Euromoney Institutional
Investor PLC | | | 15,801 | | |
| | 3,432 | | | Evraz PLC | | | 27,947 | | |
| | 6,412 | | | Experian PLC | | | 315,220 | | |
| | 1,729 | | | FDM Group Holdings PLC | | | 29,768 | | |
| | 1,779 | | | Ferguson PLC | | | 315,564 | | |
| | 5,122 | | | Ferrexpo PLC | | | 20,757 | | |
| | 11,197 | | | Firstgroup PLC* | | | 15,489 | | |
| | 5,744 | | | Frasers Group PLC* | | | 59,944 | | |
| | 896 | | | Fresnillo Plc | | | 10,828 | | |
| | 2,798 | | | Galliford Try Holdings PLC | | | 6,809 | | |
| | 445 | | | Games Workshop Group PLC | | | 60,052 | | |
| | 1,706 | | | Gamma Communications PLC | | | 38,101 | | |
| | 2,857 | | | Genuit Group PLC | | | 22,661 | | |
| | 26,092 | | | GlaxoSmithKline PLC | | | 567,400 | | |
| | 81,942 | | | Glencore PLC* | | | 415,867 | | |
| | 1,404 | | | Go-Ahead Group PLC* | | | 12,676 | | |
| | 2,026 | | | Grafton Group PLC | | | 33,812 | | |
| | 3,970 | | | Grainger PLC | | | 16,927 | | |
| | 6,489 | | | Greencore Group PLC* | | | 11,374 | | |
| | 2,159 | | | Greggs PLC | | | 97,518 | | |
| | 9,789 | | | Gulf Keystone Petroleum Ltd. | | | 23,770 | | |
| | 4,549 | | | Gym Group PLC*,# | | | 15,670 | | |
| | 6,271 | | | Halfords Group PLC | | | 29,318 | | |
| | 1,732 | | | Halma PLC | | | 75,019 | | |
| | 2,284 | | | Hargreaves Lansdown PLC | | | 41,890 | | |
| | 21,097 | | | Hays PLC | | | 41,749 | | |
| | 1,995 | | | Headlam Group PLC | | | 11,557 | | |
| | 3,050 | | | Helical PLC | | | 18,743 | | |
| | 1,984 | | | Hikma Pharmaceuticals PLC | | | 59,590 | | |
| | 2,154 | | | Hill & Smith Holdings PLC | | | 52,363 | | |
| | 2,081 | | | Hilton Food Group PLC | | | 32,111 | | |
| | 3,163 | | | Hiscox Ltd. | | | 36,853 | | |
| | 5,513 | | | Hochschild Mining PLC† | | | 9,708 | | |
| | 3,986 | | | Hollywood Bowl Group PLC* | | | 12,895 | | |
Shares | | | | Value
(Note 1) | |
| | | United Kingdom (Continued) | |
| | 2,726 | | | HomeServe PLC | | $ | 32,267 | | |
| | 14,041 | | | Howden Joinery Group PLC | | | 171,275 | | |
| | 61,234 | | | HSBC Holdings PLC | | | 371,856 | | |
| | 6,071 | | | HSBC Holdings PLC, ADR | | | 183,041 | | |
| | 3,532 | | | Hunting PLC | | | 8,089 | | |
| | 4,879 | | | Ibstock PLC# | | | 13,459 | | |
| | 2,586 | | | IG Group Holdings PLC | | | 28,457 | | |
| | 4,126 | | | IMI PLC | | | 96,951 | | |
| | 910 | | | Impax Asset Management
Group Plc | | | 18,131 | | |
| | 12,148 | | | Imperial Brands PLC | | | 265,800 | | |
| | 5,149 | | | Inchcape PLC | | | 63,387 | | |
| | 14,920 | | | Indivior PLC* | | | 51,901 | | |
| | 6,450 | | | Informa PLC* | | | 45,101 | | |
| | 3,740 | | | IntegraFin Holdings PLC | | | 28,374 | | |
| | 605 | | | InterContinental Hotels
Group PLC* | | | 39,151 | | |
| | 390 | | | InterContinental Hotels
Group PLC, ADR*,† | | | 25,432 | | |
| | 1,391 | | | Intermediate Capital Group PLC | | | 41,308 | | |
| | 10,061 | | | International Consolidated Airlines
Group SA* | | | 19,403 | | |
| | 4,161 | | | International Personal Finance PLC | | | 7,265 | | |
| | 1,064 | | | Intertek Group PLC | | | 81,082 | | |
| | 8,515 | | | Investec PLC | | | 46,390 | | |
| | 3,042 | | | iomart Group PLC | | | 7,000 | | |
| | 35,770 | | | IP Group PLC | | | 59,940 | | |
| | 38,511 | | | ITV PLC* | | | 57,626 | | |
| | 6,460 | | | IWG PLC* | | | 25,445 | | |
| | 22,063 | | | J. Sainsbury PLC | | | 82,363 | | |
| | 2,074 | | | J.D. Wetherspoon PLC*,† | | | 26,978 | | |
| | 1,083 | | | James Fisher & Sons PLC* | | | 5,416 | | |
| | 1,809 | | | James Halstead PLC | | | 14,055 | | |
| | 27,745 | | | JD Sports Fashion PLC* | | | 81,793 | | |
| | 1,084 | | | JET2 PLC*,† | | | 16,360 | | |
| | 1,637 | | | John Menzies PLC* | | | 6,869 | | |
| | 10,403 | | | John Wood Group PLC* | | | 26,909 | | |
| | 1,891 | | | Johnson Matthey PLC | | | 52,369 | | |
| | 7,194 | | | Johnson Service Group PLC*,† | | | 14,372 | | |
| | 897 | | | JTC Plc# | | | 11,121 | | |
| | 8,912 | | | Jupiter Fund Management PLC | | | 30,929 | | |
| | 588 | | | Just Eat Takeaway.com NV*,# | | | 32,444 | | |
| | 30,973 | | | Just Group PLC* | | | 35,048 | | |
The accompanying notes are an integral part of these financial statements.
45
M International Equity Fund
SCHEDULE OF INVESTMENTS (Continued)
December 31, 2021
Shares | | | | Value
(Note 1) | |
| | | United Kingdom (Continued) | |
| | 2,164 | | | Kainos Group PLC | | $ | 56,150 | | |
| | 1,556 | | | Keller Group PLC | | | 20,745 | | |
| | 24,636 | | | Kingfisher PLC | | | 112,810 | | |
| | 1,402 | | | Lancashire Holdings Ltd. | | | 10,058 | | |
| | 32,778 | | | Legal & General Group PLC | | | 131,991 | | |
| | 399,205 | | | Lloyds Banking Group PLC | | | 258,284 | | |
| | 5,505 | | | Lloyds Banking Group PLC, ADR | | | 14,038 | | |
| | 1,030 | | | London Stock Exchange
Group PLC | | | 96,615 | | |
| | 24,005 | | | M&G PLC | | | 64,821 | | |
| | 20,939 | | | Man Group PLC | | | 64,450 | | |
| | 28,984 | | | Marks & Spencer Group PLC* | | | 90,781 | | |
| | 1,885 | | | Marshalls PLC | | | 17,669 | | |
| | 18,395 | | | Marston's PLC* | | | 19,172 | | |
| | 3,805 | | | Mears Group PLC | | | 9,708 | | |
| | 5,349 | | | Mediclinic International PLC* | | | 23,197 | | |
| | 7,048 | | | Meggitt PLC* | | | 70,404 | | |
| | 31,313 | | | Melrose Industries PLC | | | 67,772 | | |
| | 3,713 | | | Micro Focus International PLC | | | 21,003 | | |
| | 8,089 | | | Mitchells & Butlers PLC* | | | 28,029 | | |
| | 24,076 | | | Mitie Group PLC | | | 21,019 | | |
| | 150 | | | MJ Gleeson PLC | | | 1,535 | | |
| | 4,996 | | | Mondi PLC | | | 123,480 | | |
| | 5,751 | | | Moneysupermarket.com
Group PLC | | | 16,814 | | |
| | 7,506 | | | Morgan Advanced Materials PLC | | | 36,423 | | |
| | 1,378 | | | Morgan Sindall Group PLC | | | 47,003 | | |
| | 10,029 | | | National Express Group PLC* | | | 34,914 | | |
| | 3,843 | | | National Grid PLC | | | 55,128 | | |
| | 2,136 | | | National Grid PLC, ADR | | | 154,475 | | |
| | 8,261 | | | NatWest Group PLC | | | 25,237 | | |
| | 8,127 | | | NatWest Group PLC, ADR | | | 49,656 | | |
| | 900 | | | Next PLC | | | 99,283 | | |
| | 4,257 | | | Ninety One PLC | | | 15,972 | | |
| | 537 | | | NMC Health PLC*,§ | | | — | | |
| | 624 | | | Ocado Group PLC* | | | 14,173 | | |
| | 4,680 | | | On the Beach Group PLC*,# | | | 18,054 | | |
| | 4,865 | | | OSB Group PLC | | | 36,514 | | |
| | 1,080 | | | Oxford Instruments PLC | | | 38,446 | | |
| | 8,188 | | | Pagegroup PLC | | | 70,210 | | |
| | 5,714 | | | Paragon Banking Group PLC | | | 43,814 | | |
| | 1,213 | | | PayPoint PLC | | | 10,918 | | |
| | 3,815 | | | Pearson PLC | | | 31,664 | | |
Shares | | | | Value
(Note 1) | |
| | | United Kingdom (Continued) | |
| | 41,805 | | | Pendragon PLC* | | $ | 13,128 | | |
| | 3,518 | | | Pennon Group PLC | | | 55,570 | | |
| | 2,597 | | | Persimmon PLC | | | 100,393 | | |
| | 4,723 | | | Petrofac Ltd.* | | | 7,371 | | |
| | 12,892 | | | Pets at Home Group PLC | | | 81,142 | | |
| | 2,200 | | | Phoenix Group Holdings PLC | | | 19,451 | | |
| | 11,392 | | | Photo-Me International PLC* | | | 9,714 | | |
| | 8,181 | | | Playtech PLC* | | | 81,113 | | |
| | 2,561 | | | Plus500 Ltd. | | | 47,161 | | |
| | 1,124 | | | Polar Capital Holdings PLC | | | 12,065 | | |
| | 14,328 | | | Premier Foods PLC | | | 21,682 | | |
| | 6,783 | | | Provident Financial PLC*,† | | | 32,979 | | |
| | 9,625 | | | Prudential PLC | | | 166,041 | | |
| | 520 | | | Prudential PLC, ADR† | | | 17,904 | | |
| | 4,468 | | | QinetiQ Group PLC | | | 16,087 | | |
| | 22,363 | | | Quilter PLC# | | | 44,950 | | |
| | 351 | | | Rathbone Brothers PLC | | | 9,426 | | |
| | 3,205 | | | Reach PLC | | | 12,255 | | |
| | 2,971 | | | Reckitt Benckiser Group PLC† | | | 255,037 | | |
| | 3,003 | | | Redde Northgate PLC | | | 17,742 | | |
| | 3,865 | | | Redrow PLC | | | 36,662 | | |
| | 10,683 | | | RELX PLC | | | 347,329 | | |
| | 1,210 | | | RELX PLC, ADR | | | 39,458 | | |
| | 2,776 | | | Renew Holdings PLC | | | 31,375 | | |
| | 214 | | | Renishaw PLC | | | 13,846 | | |
| | 18,010 | | | Rentokil Initial PLC | | | 142,364 | | |
| | 787 | | | RHI Magnesita NV | | | 35,217 | | |
| | 10,927 | | | Rightmove PLC | | | 117,582 | | |
| | 10,431 | | | Rio Tinto PLC | | | 690,696 | | |
| | 40,824 | | | Rolls-Royce Holdings PLC* | | | 67,900 | | |
| | 9,205 | | | Rotork PLC | | | 44,505 | | |
| | 4,678 | | | Royal Dutch Shell PLC, ADR,
Class B | | | 202,791 | | |
| | 41,803 | | | Royal Dutch Shell PLC, Class B | | | 917,994 | | |
| | 12,048 | | | Royal Mail PLC | | | 82,516 | | |
| | 159 | | | RPS Group Plc | | | 266 | | |
| | 3,036 | | | Sabre Insurance Group PLC# | | | 7,553 | | |
| | 948 | | | Saga PLC*,† | | | 3,657 | | |
| | 8,113 | | | Sage Group PLC | | | 93,627 | | |
| | 5,321 | | | Savills PLC | | | 101,408 | | |
| | 1,046 | | | Schroders PLC | | | 45,035 | | |
| | 5,266 | | | Senior PLC* | | | 10,478 | | |
| | 5,813 | | | Serco Group PLC | | | 10,591 | | |
The accompanying notes are an integral part of these financial statements.
46
M International Equity Fund
SCHEDULE OF INVESTMENTS (Continued)
December 31, 2021
Shares | | | | Value
(Note 1) | |
| | | United Kingdom (Continued) | |
| | 11,630 | | | Severfield PLC | | $ | 10,704 | | |
| | 2,120 | | | Severn Trent PLC | | | 84,565 | | |
| | 9,302 | | | SIG PLC*,† | | | 5,988 | | |
| | 11,766 | | | Sirius Real Estate Ltd. | | | 22,519 | | |
| | 4,652 | | | Smith & Nephew PLC | | | 81,448 | | |
| | 650 | | | Smith & Nephew PLC, ADR | | | 22,503 | | |
| | 2,936 | | | Smiths Group PLC | | | 62,770 | | |
| | 399 | | | Softcat PLC | | | 9,743 | | |
| | 1,263 | | | Spectris PLC | | | 62,535 | | |
| | 12,936 | | | Speedy Hire PLC | | | 11,101 | | |
| | 525 | | | Spirax-Sarco Engineering PLC | | | 114,053 | | |
| | 7,170 | | | Spire Healthcare Group PLC*,# | | | 24,262 | | |
| | 10,386 | | | Spirent Communications PLC | | | 38,828 | | |
| | 11,916 | | | SSE PLC | | | 265,966 | | |
| | 7,895 | | | SSP Group PLC* | | | 25,658 | | |
| | 3,870 | | | St. James's Place PLC | | | 88,186 | | |
| | 5,772 | | | Stagecoach Group PLC* | | | 7,012 | | |
| | 18,943 | | | Standard Chartered PLC | | | 114,971 | | |
| | 4,177 | | | SThree PLC | | | 26,234 | | |
| | 8,653 | | | Synthomer PLC | | | 46,802 | | |
| | 6,411 | | | Tate & Lyle PLC | | | 57,394 | | |
| | 19,770 | | | Taylor Wimpey PLC | | | 46,963 | | |
| | 510 | | | TBC Bank Group Plc | | | 11,390 | | |
| | 978 | | | Telecom Plus PLC | | | 20,995 | | |
| | 51,448 | | | Tesco PLC | | | 201,879 | | |
| | 5,954 | | | TI Fluid Systems PLC# | | | 20,551 | | |
| | 16,738 | | | TP ICAP Group PLC | | | 34,595 | | |
| | 4,467 | | | Travis Perkins PLC | | | 93,990 | | |
| | 42,736 | | | Tullow Oil PLC* | | | 26,869 | | |
| | 4,191 | | | Tyman PLC | | | 22,663 | | |
| | 1,424 | | | Ultra Electronics Holdings PLC | | | 61,293 | | |
| | 17,156 | | | Unilever PLC | | | 917,812 | | |
Shares | | | | Value
(Note 1) | |
| | | United Kingdom (Continued) | |
| | 7,319 | | | United Utilities Group PLC | | $ | 107,883 | | |
| | 5,245 | | | Vesuvius PLC | | | 31,961 | | |
| | 13,688 | | | Virgin Money UK PLC* | | | 32,942 | | |
| | 5,666 | | | Vistry Group PLC | | | 90,803 | | |
| | 386 | | | Vitec Group PLC | | | 7,419 | | |
| | 255,851 | | | Vodafone Group PLC | | | 388,764 | | |
| | 6,400 | | | Volution Group PLC | | | 47,905 | | |
| | 2,625 | | | Watches of Switzerland
Group PLC*,# | | | 50,454 | | |
| | 5,138 | | | Watkin Jones PLC | | | 18,186 | | |
| | 2,590 | | | Weir Group PLC | | | 60,000 | | |
| | 1,764 | | | WH Smith PLC* | | | 35,337 | | |
| | 1,264 | | | Whitbread PLC* | | | 51,241 | | |
| | 5,006 | | | Wickes Group PLC | | | 16,059 | | |
| | 11,755 | | | WPP PLC | | | 178,123 | | |
| | 510 | | | XP Power Ltd. | | | 35,206 | | |
| | 589 | | | Young & Co's Brewery PLC,
Class A | | | 12,437 | | |
| | | | 22,736,477 | | |
| | | United States—0.0% | |
| | 265 | | | Jackson Financial, Inc., Class A† | | | 11,085 | | |
| | | | | TOTAL COMMON STOCKS
(Cost $134,445,122) | | | 170,125,735 | | |
| | | AFFILIATED INVESTMENT COMPANY—29.0% | |
| | | United States—29.0% | |
| | 2,827,266 | | | DFA Emerging Markets Core
Equity Portfolio, Class I‡‡
(Cost $57,689,620) | | | 70,794,732 | | |
| |
| |
| | Expiration
Date | |
| |
| | | WARRANTS—0.0% | |
| | | Canada—0.0% | |
| | 384 | | | Cenovus Energy, Inc.* | | | | | | 01/01/2026 | | $ | 2,887 | | |
| | | TOTAL WARRANTS (Cost $1,434) | | | | | | | | | | | 2,887 | | |
| | | RIGHTS—0.0% | |
| | | Austria—0.0% | |
| | 658 | | | CA Immobilien Anlagen AG§ | | | | | | 07/26/2021 | | | 0 | | |
The accompanying notes are an integral part of these financial statements.
47
M International Equity Fund
SCHEDULE OF INVESTMENTS (Continued)
December 31, 2021
Shares | |
| |
| | Expiration
Date | | Value
(Note 1) | |
| | | Spain—0.0% | |
| | 3,991 | | | Faes Farma SA* | | | | | | 01/22/2022 | | $ | 827 | | |
| | | | | TOTAL RIGHTS (Cost $770) | | | | | | | | | | | 827 | | |
| | | PREFERRED STOCKS—0.5% | |
| | | Germany—0.5% | |
| | 621 | | | Bayerische Motoren Werke AG, 2.62% | | | | | | | | | | | 51,824 | | |
| | 387 | | | Draegerwerk AG & Co. KGaA, 0.34% | | | | | | | | | | | 24,343 | | |
| | 1,083 | | | FUCHS PETROLUB SE, 2.48% | | | | | | | | | | | 49,221 | | |
| | 720 | | | Henkel AG & Co. KGaA, 2.60% | | | | | | | | | | | 58,315 | | |
| | 949 | | | Jungheinrich AG, 0.96% | | | | | | | | | | | 48,490 | | |
| | 917 | | | Porsche Automobil Holding SE, 2.64% | | | | | | | | | | | 87,112 | | |
| | 273 | | | Sartorius AG, 0.19% | | | | | | | | | | | 184,995 | | |
| | 252 | | | Sixt SE, 0.06% | | | | | | | | | | | 24,903 | | |
| | 173 | | | STO SE & Co. KGaA, 2.26% | | | | | | | | | | | 43,528 | | |
| | 2,501 | | | Volkswagen AG, 2.74% | | | | | | | | | | | 505,354 | | |
| | | | | | | | | | | | 1,078,085 | | |
| | | Italy—0.0% | |
| | 1,392 | | | Danieli & C Officine Meccaniche SpA, 1.11% | | | | | | | | | | | 27,258 | | |
| | | | | TOTAL PREFERRED STOCK (Cost $946,977) | | | | | | | | | | | 1,105,343 | | |
| | | | | 7-Day
Yield | |
| |
| |
| | | SHORT-TERM INVESTMENTS—0.9% | |
| | 2,284,564 | | | State Street Navigator Securities Lending Prime Portfolio (Money Market)
(Cost $2,284,564)†† | | | 0.07 | % | | | | | | | 2,284,564 | | |
| | | | | TOTAL INVESTMENTS, AT VALUE—100.2%
(Cost $195,368,487) | | | | | | | | | | | 244,314,088 | | |
| | | | | Liabilities in Excess of Other Assets—(0.2)% | | | | | | | | | | | (593,297 | ) | |
| | | | | NET ASSETS—100.0% | | | | | | | | | | $ | 243,720,791 | | |
Notes to the Schedule of Investments:
ADR—American Depositary Receipt
* Non-income producing security
# Security exempt from registration under Rule 144A of the Securities Act of 1933. These securities may be resold in transactions exempt from registration, normally to qualified institutional buyers. The aggregate value of securities exempt from registration under Rule 144A of the Securities Act of 1933 at December 31, 2021, amounts to approximately $3,519,240, and represents 1.44% of net assets.
† Denotes all or a portion of security on loan. As of December 31, 2021, the market value of the securities on loan was $7,458,744 (Note 1).
The accompanying notes are an integral part of these financial statements.
48
M International Equity Fund
SCHEDULE OF INVESTMENTS (Continued)
December 31, 2021
‡‡ Affiliated issuer. Assets with a total aggregate market value of $70,794,732 or 29.0% of net assets, were affiliated with the Fund as of December 31, 2021 (Note 2).
§ Fair valued security—Represents fair value as measured based on the Portfolio Valuation policies specified in Note 1. As of December 31 2021, the total value of the fair valued securities was $71,095.
†† Represents cash collateral received from securities lending transactions. Non-cash collateral amounted to $5,585,235.
Percentages indicated are based on net assets.
The accompanying notes are an integral part of these financial statements.
49
M International Equity Fund
SCHEDULE OF INVESTMENTS (Continued)
December 31, 2021
At December 31, 2021, industry diversification of the M International Equity Fund's investments as a percentage of net assets was as follows:
Summary of Industry Classifications (Unaudited) | | Percentage
of Net
Assets | |
Mutual Funds | | | 29.0 | % | |
Banks | | | 5.8 | % | |
Pharmaceuticals | | | 3.8 | % | |
Oil, Gas and Consumable Fuels | | | 3.5 | % | |
Metals and Mining | | | 3.3 | % | |
Machinery | | | 2.9 | % | |
Chemicals | | | 2.7 | % | |
Insurance | | | 2.7 | % | |
Automobiles | | | 2.3 | % | |
Food Products | | | 2.3 | % | |
Capital Markets | | | 2.0 | % | |
Semiconductors and Semiconductor Equipment | | | 2.0 | % | |
Textiles, Apparel and Luxury Goods | | | 1.7 | % | |
Real Estate Management and Development | | | 1.5 | % | |
Diversified Telecommunication Services | | | 1.4 | % | |
Food and Staples Retailing | | | 1.4 | % | |
IT Services | | | 1.4 | % | |
Trading Companies and Distributors | | | 1.4 | % | |
Professional Services | | | 1.3 | % | |
Electric Utilities | | | 1.2 | % | |
Health Care Equipment and Supplies | | | 1.2 | % | |
Household Durables | | | 1.2 | % | |
Construction and Engineering | | | 1.1 | % | |
Auto Components | | | 1.0 | % | |
Beverages | | | 1.0 | % | |
Building Products | | | 1.0 | % | |
Electrical Equipment | | | 1.0 | % | |
Electronic Equipment, Instruments & Components | | | 1.0 | % | |
Specialty Retail | | | 1.0 | % | |
Wireless Telecommunication Services | | | 1.0 | % | |
Hotels, Restaurants & Leisure | | | 0.9 | % | |
Road and Rail | | | 0.9 | % | |
Software | | | 0.9 | % | |
Personal Products | | | 0.8 | % | |
Commercial Services & Supplies | | | 0.7 | % | |
Industrial Conglomerates | | | 0.7 | % | |
Media | | | 0.7 | % | |
Aerospace & Defense | | | 0.6 | % | |
Health Care Providers and Services | | | 0.6 | % | |
Multi-Utilities | | | 0.6 | % | |
Air Freight and Logistics | | | 0.5 | % | |
Construction Materials | | | 0.5 | % | |
The accompanying notes are an integral part of these financial statements.
50
M International Equity Fund
SCHEDULE OF INVESTMENTS (Continued)
December 31, 2021
Summary of Industry Classifications (Unaudited) | | Percentage
of Net
Assets | |
Paper and Forest Products | | | 0.5 | % | |
Biotechnology | | | 0.4 | % | |
Containers and Packaging | | | 0.4 | % | |
Diversified Financial Services | | | 0.4 | % | |
Entertainment | | | 0.4 | % | |
Life Sciences Tools and Services | | | 0.4 | % | |
Multiline Retail | | | 0.4 | % | |
Tobacco | | | 0.4 | % | |
Gas Utilities | | | 0.3 | % | |
Household Products | | | 0.3 | % | |
Independent Power and Renewable Electricity Producers | | | 0.3 | % | |
Marine | | | 0.3 | % | |
Technology Hardware, Storage & Peripherals | | | 0.3 | % | |
Transportation Infrastructure | | | 0.3 | % | |
Communications Equipment | | | 0.2 | % | |
Energy Equipment and Services | | | 0.2 | % | |
Interactive Media & Services | | | 0.2 | % | |
Internet and Catalog Retail | | | 0.2 | % | |
Leisure Equipment and Products | | | 0.2 | % | |
Airlines | | | 0.1 | % | |
Consumer Finance | | | 0.1 | % | |
Distributors | | | 0.1 | % | |
Diversified Consumer Services | | | 0.1 | % | |
Health Care Technology | | | 0.1 | % | |
Thrifts and Mortgage Finance | | | 0.1 | % | |
Water Utilities | | | 0.1 | % | |
Short-Term Investments | | | 0.9 | % | |
Total | | | 100.2 | % | |
The accompanying notes are an integral part of these financial statements.
51
M Large Cap Growth Fund
SCHEDULE OF INVESTMENTS
December 31, 2021
Shares | |
| | Value
(Note 1) | |
| | | COMMON STOCKS—98.3% | |
| | | Air Freight and Logistics—2.8% | |
| | 35,950 | | | United Parcel Service, Inc.,
Class B | | $ | 7,705,523 | | |
| | | Beverages—4.6% | |
| | 133,350 | | | Keurig Dr. Pepper, Inc. | | | 4,915,281 | | |
| | 79,100 | | | Monster Beverage Corp.* | | | 7,596,764 | | |
| | | | 12,512,045 | | |
| | | Biotechnology—1.9% | |
| | 59,700 | | | Neurocrine Biosciences, Inc.* | | | 5,084,649 | | |
| | | Capital Markets—5.0% | |
| | 161,700 | | | Charles Schwab Corp. | | | 13,598,970 | | |
| | | Chemicals—2.3% | |
| | 18,000 | | | Linde PLC | | | 6,235,740 | | |
| | | Entertainment—4.5% | |
| | 20,500 | | | Netflix, Inc.* | | | 12,350,020 | | |
| | | Health Care Equipment and
Supplies—2.5% | |
| | 163,000 | | | Boston Scientific Corp.* | | | 6,924,240 | | |
| | | Health Care Providers and
Services—3.4% | |
| | 18,625 | | | UnitedHealth Group, Inc. | | | 9,352,357 | | |
| | | Insurance—3.3% | |
| | 21,650 | | | Aon PLC, Class A | | | 6,507,124 | | |
| | 11,000 | | | Willis Towers Watson PLC | | | 2,612,390 | | |
| | | | 9,119,514 | | |
Shares | |
| | Value
(Note 1) | |
| | | Interactive Media &
Services—15.8% | |
| | 9,940 | | | Alphabet, Inc., Class A* | | $ | 28,796,578 | | |
| | 42,800 | | | Meta Platforms, Inc., Class A* | | | 14,395,780 | | |
| | | | 43,192,358 | | |
| | | Internet and Catalog Retail—6.1% | |
| | 4,955 | | | Amazon.com, Inc.* | | | 16,521,655 | | |
| | | IT Services—19.4% | |
| | 29,400 | | | Automatic Data Processing, Inc. | | | 7,249,452 | | |
| | 43,400 | | | Fiserv, Inc.* | | | 4,504,486 | | |
| | 26,550 | | | FleetCor Technologies, Inc.* | | | 5,942,952 | | |
| | 52,650 | | | Global Payments, Inc. | | | 7,117,227 | | |
| | 21,200 | | | Mastercard, Inc., Class A | | | 7,617,584 | | |
| | 65,700 | | | PayPal Holdings, Inc.* | | | 12,389,706 | | |
| | 37,000 | | | Visa, Inc., Class A | | | 8,018,270 | | |
| | | | 52,839,677 | | |
| | | Pharmaceuticals—2.4% | |
| | 27,050 | | | Zoetis, Inc. | | | 6,601,012 | | |
| | | Semiconductors and
Semiconductor Equipment—3.8% | |
| | 34,850 | | | NVIDIA Corp. | | | 10,249,733 | | |
| | | Software—20.5% | |
| | 22,050 | | | Adobe, Inc.* | | | 12,503,673 | | |
| | 16,900 | | | Intuit, Inc. | | | 10,870,418 | | |
| | 97,164 | | | Microsoft Corp. | | | 32,678,196 | | |
| | | | 56,052,287 | | |
| | | | | TOTAL COMMON STOCKS
(Cost $150,215,847) | | | 268,339,780 | | |
TOTAL INVESTMENTS, AT VALUE—98.3%
(Cost $150,215,847) | | | 268,339,780 | | |
Other Assets in Excess of Liabilities—1.7% | | | 4,745,646 | | |
NET ASSETS—100.0% | | $ | 273,085,426 | | |
Notes to the Schedule of Investments:
* Non-income producing security
Percentages indicated are based on net assets.
The accompanying notes are an integral part of these financial statements.
52
M Large Cap Growth Fund
SCHEDULE OF INVESTMENTS (Continued)
December 31, 2021
At December 31, 2021, industry sector diversification of the M Large Cap Growth Fund's investments as a percentage of net assets was as follows:
Summary of Sector Classifications (Unaudited) | | Percentage
of Net
Assets | |
Information Technology | | | 43.7 | % | |
Communication Services | | | 20.3 | % | |
Health Care | | | 10.2 | % | |
Financials | | | 8.3 | % | |
Consumer Discretionary | | | 6.1 | % | |
Consumer Staples | | | 4.6 | % | |
Industrials | | | 2.8 | % | |
Materials | | | 2.3 | % | |
Total | | | 98.3 | % | |
The accompanying notes are an integral part of these financial statements.
53
M Capital Appreciation Fund
SCHEDULE OF INVESTMENTS
December 31, 2021
Shares | |
| | Value
(Note 1) | |
| | | COMMON STOCKS—98.2% | |
| | | Aerospace & Defense—1.0% | |
| | 48,766 | | | Kratos Defense & Security
Solutions, Inc.* | | $ | 946,060 | | |
| | 68,728 | | | Triumph Group, Inc.* | | | 1,273,530 | | |
| | | | 2,219,590 | | |
| | | Airlines—3.1% | |
| | 26,691 | | | Alaska Air Group, Inc.* | | | 1,390,601 | | |
| | 112,245 | | | Azul SA, ADR*,† | | | 1,481,634 | | |
| | 177,682 | | | Controladora Vuela Cia de Aviacion
SAB de CV, ADR* | | | 3,192,946 | | |
| | 81,726 | | | JetBlue Airways Corp.* | | | 1,163,778 | | |
| | | | 7,228,959 | | |
| | | Auto Components—3.3% | |
| | 38,547 | | | BorgWarner, Inc. | | | 1,737,313 | | |
| | 164,753 | | | Dana, Inc. | | | 3,759,664 | | |
| | 93,231 | | | Modine Manufacturing Co.* | | | 940,701 | | |
| | 67,918 | | | Stoneridge, Inc.* | | | 1,340,701 | | |
| | | | 7,778,379 | | |
| | | Banks—5.7% | |
| | 102,613 | | | Bancorp, Inc.* | | | 2,597,135 | | |
| | 19,696 | | | BankUnited, Inc. | | | 833,338 | | |
| | 169,441 | | | First BanCorp | | | 2,334,897 | | |
| | 18,884 | | | Pinnacle Financial Partners, Inc. | | | 1,803,422 | | |
| | 24,938 | | | Popular, Inc. | | | 2,045,914 | | |
| | 31,098 | | | Webster Financial Corp. | | | 1,736,512 | | |
| | 21,111 | | | Wintrust Financial Corp. | | | 1,917,301 | | |
| | | | 13,268,519 | | |
| | | Biotechnology—2.7% | |
| | 31,802 | | | ACADIA Pharmaceuticals, Inc.* | | | 742,259 | | |
| | 15,058 | | | BioMarin Pharmaceutical, Inc.* | | | 1,330,374 | | |
| | 13,839 | | | Exact Sciences Corp.* | | | 1,077,089 | | |
| | 11,079 | | | Incyte Corp.* | | | 813,199 | | |
| | 38,268 | | | Iovance Biotherapeutics, Inc.* | | | 730,536 | | |
| | 91,976 | | | Karyopharm Therapeutics, Inc.*,† | | | 591,406 | | |
| | 4,595 | | | United Therapeutics Corp.* | | | 992,887 | | |
| | | | 6,277,750 | | |
| | | Building Products—4.8% | |
| | 81,320 | | | Builders FirstSource, Inc.* | | | 6,969,937 | | |
| | 77,672 | | | Caesarstone Ltd. | | | 880,801 | | |
Shares | |
| | Value
(Note 1) | |
| | | Building Products (Continued) | |
| | 5,865 | | | Masonite International Corp.* | | $ | 691,777 | | |
| | 19,377 | | | Trex Co., Inc.* | | | 2,616,476 | | |
| | | | 11,158,991 | | |
| | | Capital Markets—3.6% | |
| | 29,856 | | | Carlyle Group, Inc. | | | 1,639,094 | | |
| | 10,122 | | | Evercore Inc., Class A | | | 1,375,074 | | |
| | 21,391 | | | LPL Financial Holdings, Inc. | | | 3,424,485 | | |
| | 19,374 | | | Raymond James Financial, Inc. | | | 1,945,150 | | |
| | | | 8,383,803 | | |
| | | Chemicals—3.9% | |
| | 13,354 | | | Albemarle Corp. | | | 3,121,765 | | |
| | 26,607 | | | FMC Corp. | | | 2,923,843 | | |
| | 46,904 | | | Livent Corp.*,† | | | 1,143,519 | | |
| | 74,695 | | | Tronox Holdings PLC, Class A | | | 1,794,921 | | |
| | | | 8,984,048 | | |
| | | Commercial Services &
Supplies—1.1% | |
| | 112,318 | | | Interface, Inc. | | | 1,791,472 | | |
| | 103,333 | | | Pitney Bowes, Inc. | | | 685,098 | | |
| | | | 2,476,570 | | |
| | | Construction and
Engineering—4.8% | |
| | 28,951 | | | AECOM* | | | 2,239,360 | | |
| | 37,702 | | | Granite Construction, Inc. | | | 1,459,067 | | |
| | 23,356 | | | MasTec, Inc.* | | | 2,155,292 | | |
| | 21,839 | | | Quanta Services, Inc. | | | 2,504,060 | | |
| | 221,649 | | | Tutor Perini Corp.* | | | 2,741,798 | | |
| | | | 11,099,577 | | |
| | | Construction Materials—2.1% | |
| | 17,041 | | | Eagle Materials, Inc. | | | 2,836,645 | | |
| | 53,786 | | | Summit Materials, Inc., Class A* | | | 2,158,970 | | |
| | | | 4,995,615 | | |
| | | Consumer Finance—0.3% | |
| | 21,887 | | | Green Dot Corp., Class A* | | | 793,185 | | |
| | | Containers and Packaging—0.7% | |
| | 31,375 | | | Graphic Packaging Holding Co. | | | 611,812 | | |
| | 77,551 | | | Pactiv Evergreen, Inc. | | | 983,347 | | |
| | | | 1,595,159 | | |
The accompanying notes are an integral part of these financial statements.
54
M Capital Appreciation Fund
SCHEDULE OF INVESTMENTS (Continued)
December 31, 2021
Shares | |
| | Value
(Note 1) | |
| | | Diversified Consumer
Services—2.2% | |
| | 83,302 | | | 2U, Inc.*,† | | $ | 1,671,871 | | |
| | 53,401 | | | Adtalem Global Education, Inc.* | | | 1,578,534 | | |
| | 149,825 | | | Perdoceo Education Corp.* | | | 1,761,942 | | |
| | | | 5,012,347 | | |
| | | Diversified Telecommunication
Services—0.6% | |
| | 93,575 | | | Radius Global Infrastructure, Inc.,
Class A* | | | 1,506,557 | | |
| | | Electrical Equipment—1.2% | |
| | 115,008 | | | Array Technologies, Inc.* | | | 1,804,476 | | |
| | 11,872 | | | EnerSys | | | 938,600 | | |
| | | | 2,743,076 | | |
| | | Electronic Equipment,
Instruments & Components—4.0% | |
| | 12,143 | | | Fabrinet* | | | 1,438,582 | | |
| | 109,843 | | | Flex Ltd.* | | | 2,013,422 | | |
| | 43,576 | | | II-VI, Inc.* | | | 2,977,548 | | |
| | 42,172 | | | Jabil, Inc. | | | 2,966,800 | | |
| | | | 9,396,352 | | |
| | | Equity Real Estate Investment
Trusts (REITs)—2.2% | |
| | 9,676 | | | Agree Realty Corp. | | | 690,479 | | |
| | 59,846 | | | Corporate Office Properties Trust | | | 1,673,893 | | |
| | 34,823 | | | NETSTREIT Corp. | | | 797,447 | | |
| | 63,616 | | | SITE Centers Corp. | | | 1,007,041 | | |
| | 17,633 | | | STAG Industrial, Inc. | | | 845,679 | | |
| | | | 5,014,539 | | |
| | | Health Care Equipment
and Supplies—6.5% | |
| | 2,472 | | | ABIOMED, Inc.* | | | 887,868 | | |
| | 31,718 | | | AngioDynamics, Inc.* | | | 874,783 | | |
| | 7,730 | | | Cooper Cos., Inc. | | | 3,238,406 | | |
| | 16,179 | | | Hologic, Inc.* | | | 1,238,664 | | |
| | 12,775 | | | Insulet Corp.* | | | 3,399,044 | | |
| | 9,582 | | | Merit Medical Systems, Inc.* | | | 596,959 | | |
| | 14,922 | | | Novocure, Ltd.* | | | 1,120,344 | | |
| | 18,063 | | | NuVasive, Inc.* | | | 947,946 | | |
| | 9,481 | | | Tandem Diabetes Care, Inc.* | | | 1,427,080 | | |
| | 44,388 | | | Varex Imaging Corp.* | | | 1,400,441 | | |
| | | | 15,131,535 | | |
Shares | |
| | Value
(Note 1) | |
| | | Health Care Providers and
Services—1.6% | |
| | 17,904 | | | Acadia Healthcare Co., Inc.* | | $ | 1,086,773 | | |
| | 58,308 | | | Covetrus, Inc.* | | | 1,164,410 | | |
| | 4,537 | | | Molina Healthcare, Inc.* | | | 1,443,129 | | |
| | | | 3,694,312 | | |
| | | Hotels, Restaurants &
Leisure—4.4% | |
| | 24,349 | | | Boyd Gaming Corp.* | | | 1,596,564 | | |
| | 40,287 | | | Caesars Entertainment, Inc.* | | | 3,768,043 | | |
| | 49,280 | | | Cheesecake Factory, Inc.* | | | 1,929,312 | | |
| | 31,334 | | | Planet Fitness, Inc., Class A* | | | 2,838,234 | | |
| | | | 10,132,153 | | |
| | | Insurance—3.0% | |
| | 33,194 | | | Argo Group International
Holdings Ltd. | | | 1,928,903 | | |
| | 5,176 | | | Everest Re Group Ltd. | | | 1,417,810 | | |
| | 8,615 | | | Trupanion, Inc.* | | | 1,137,439 | | |
| | 30,328 | | | WR Berkley Corp. | | | 2,498,724 | | |
| | | | 6,982,876 | | |
| | | Internet and Catalog Retail—0.3% | |
| | 30,893 | | | Lands' End, Inc.* | | | 606,430 | | |
| | | IT Services—3.5% | |
| | 11,832 | | | Alliance Data Systems Corp. | | | 787,656 | | |
| | 91,729 | | | Brightcove, Inc.* | | | 937,470 | | |
| | 30,227 | | | Genpact Ltd. | | | 1,604,449 | | |
| | 15,466 | | | LiveRamp Holdings, Inc.* | | | 741,595 | | |
| | 131,320 | | | Paya Holdings, Inc.* | | | 832,569 | | |
| | 28,275 | | | Paymentus Holdings, Inc., Class A* | | | 989,059 | | |
| | 44,187 | | | Switch, Inc., Class A | | | 1,265,516 | | |
| | 7,605 | | | WEX, Inc.* | | | 1,067,666 | | |
| | | | 8,225,980 | | |
| | | Leisure Equipment and
Products—1.1% | |
| | 115,315 | | | Mattel, Inc.* | | | 2,486,191 | | |
| | | Life Sciences Tools and
Services—1.1% | |
| | 20,088 | | | QIAGEN NV* | | | 1,116,491 | | |
| | 13,642 | | | Quanterix Corp.* | | | 578,421 | | |
| | 41,123 | | | Sotera Health Co.* | | | 968,446 | | |
| | | | 2,663,358 | | |
The accompanying notes are an integral part of these financial statements.
55
M Capital Appreciation Fund
SCHEDULE OF INVESTMENTS (Continued)
December 31, 2021
Shares | |
| | Value
(Note 1) | |
| | | Machinery—1.1% | |
| | 32,701 | | | CIRCOR International, Inc.* | | $ | 888,813 | | |
| | 69,539 | | | Meritor, Inc.* | | | 1,723,177 | | |
| | | | 2,611,990 | | |
| | | Marine—0.3% | |
| | 12,006 | | | Kirby Corp.* | | | 713,396 | | |
| | | Media—1.8% | |
| | 32,612 | | | Cardlytics, Inc.*,† | | | 2,155,327 | | |
| | 83,584 | | | Integral Ad Science
Holding Corp.* | | | 1,856,401 | | |
| | 4,733 | | | Loyalty Ventures, Inc.* | | | 142,321 | | |
| | | | 4,154,049 | | |
| | | Metals and Mining—2.3% | |
| | 112,577 | | | Alamos Gold, Inc., Class A | | | 865,717 | | |
| | 102,559 | | | Allegheny Technologies, Inc.* | | | 1,633,765 | | |
| | 37,334 | | | Carpenter Technology Corp. | | | 1,089,780 | | |
| | 68,091 | | | Pan American Silver Corp. | | | 1,700,232 | | |
| | | | 5,289,494 | | |
| | | Oil, Gas and Consumable
Fuels—1.3% | |
| | 45,648 | | | Devon Energy Corp. | | | 2,010,794 | | |
| | 123,564 | | | Navigator Holdings Ltd.* | | | 1,096,013 | | |
| | | | 3,106,807 | | |
| | | Pharmaceuticals—1.6% | |
| | 36,264 | | | Amphastar Pharmaceuticals, Inc.* | | | 844,589 | | |
| | 27,987 | | | Pacira BioSciences, Inc.* | | | 1,683,978 | | |
| | 43,565 | | | Supernus Pharmaceuticals, Inc.* | | | 1,270,355 | | |
| | | | 3,798,922 | | |
| | | Professional Services—2.1% | |
| | 90,572 | | | KBR, Inc. | | | 4,313,038 | | |
| | 16,599 | | | Willdan Group, Inc.* | | | 584,285 | | |
| | | | 4,897,323 | | |
| | | Road and Rail—1.5% | |
| | 36,190 | | | Knight-Swift Transportation
Holdings, Inc. | | | 2,205,419 | | |
| | 16,293 | | | XPO Logistics, Inc.* | | | 1,261,567 | | |
| | | | 3,466,986 | | |
Shares | |
| | Value
(Note 1) | |
| | | Semiconductors and
Semiconductor Equipment—9.5% | |
| | 65,022 | | | MACOM Technology Solutions
Holdings, Inc.* | | $ | 5,091,223 | | |
| | 32,755 | | | MaxLinear, Inc.* | | | 2,469,399 | | |
| | 2,925 | | | Monolithic Power Systems, Inc. | | | 1,442,990 | | |
| | 15,931 | | | Qorvo, Inc.* | | | 2,491,449 | | |
| | 32,275 | | | Semtech Corp.* | | | 2,870,216 | | |
| | 7,259 | | | Silicon Laboratories, Inc.* | | | 1,498,403 | | |
| | 3,487 | | | SiTime Corp.* | | | 1,020,087 | | |
| | 6,790 | | | Universal Display Corp. | | | 1,120,554 | | |
| | 37,842 | | | Wolfspeed, Inc.* | | | 4,229,600 | | |
| | | | 22,233,921 | | |
| | | Software—3.5% | |
| | 12,634 | | | CommVault Systems, Inc.* | | | 870,735 | | |
| | 20,474 | | | Couchbase, Inc.* | | | 511,031 | | |
| | 19,308 | | | Model N, Inc.* | | | 579,819 | | |
| | 33,982 | | | NCR Corp.* | | | 1,366,076 | | |
| | 8,092 | | | Pegasystems, Inc. | | | 904,848 | | |
| | 20,773 | | | SS&C Technologies Holdings, Inc. | | | 1,702,971 | | |
| | 8,463 | | | Workiva, Inc.* | | | 1,104,337 | | |
| | 65,209 | | | Zuora, Inc., Class A* | | | 1,218,104 | | |
| | | | 8,257,921 | | |
| | | Specialty Retail—1.9% | |
| | 4,132 | | | Advance Auto Parts, Inc. | | | 991,184 | | |
| | 10,312 | | | Floor & Decor Holdings, Inc.,
Class A* | | | 1,340,663 | | |
| | 83,756 | | | Leslie's, Inc.* | | | 1,981,667 | | |
| | | | 4,313,514 | | |
| | | Thrifts and Mortgage
Finance—0.5% | |
| | 48,434 | | | NMI Holdings, Inc., Class A* | | | 1,058,283 | | |
| | | Trading Companies and
Distributors—2.0% | |
| | 28,775 | | | Beacon Roofing Supply, Inc.* | | | 1,650,247 | | |
| | 268,291 | | | MRC Global, Inc.* | | | 1,845,842 | | |
| | 9,436 | | | WESCO International, Inc.* | | | 1,241,683 | | |
| | | | 4,737,772 | | |
| | | | | TOTAL COMMON STOCKS
(Cost $148,465,176) | | | 228,496,229 | | |
The accompanying notes are an integral part of these financial statements.
56
M Capital Appreciation Fund
SCHEDULE OF INVESTMENTS (Continued)
December 31, 2021
Shares | |
| |
| | Expiration
Date | | Value
(Note 1) | |
| | | RIGHTS—0.2% | |
| | | Metals and Mining—0.2% | |
| | 714,382 | | | Pan American Silver Corp., CVR* | | | | | | 02/22/2029 | | $ | 556,289 | | |
| | | TOTAL RIGHTS (Cost $172,502) | | | | | | | | | | | 556,289 | | |
| |
| |
| | 7-Day
Yield | |
| |
| | | SHORT-TERM INVESTMENTS—0.6% | |
| | 1,490,305 | | | State Street Navigator Securities Lending Prime Portfolio (Money Market)
(Cost $1,490,305)†† | | | | | | | 0.07 | % | | | 1,490,305 | | |
| | | TOTAL INVESTMENTS, AT VALUE—99.0%
(Cost $150,127,983) | | | | | | | | | | | 230,542,823 | | |
| | | Other Assets in Excess of Liabilities—1.0% | | | | | | | | | | | 2,215,421 | | |
| | | NET ASSETS—100.0% | | | | | | | | | | $ | 232,758,244 | | |
Notes to the Schedule of Investments:
ADR—American Depositary Receipt
CVR—Contingent Voting Rights
REIT—Real Estate Investment Trust
* Non-income producing security
† Denotes all or a portion of security on loan. As of December 31, 2021, the market value of the securities on loan was $3,324,698 (Note 1).
†† Represents cash collateral received from securities lending transactions. Non-cash collateral amounted to $1,928,259.
Percentages indicated are based on net assets.
The accompanying notes are an integral part of these financial statements.
57
M Capital Appreciation Fund
SCHEDULE OF INVESTMENTS (Continued)
December 31, 2021
At December 31, 2021, industry sector diversification of the M Capital Appreciation Fund's investments as a percentage of net assets was as follows:
Summary of Sector Classifications (Unaudited) | | Percentage
of Net
Assets | |
Industrials | | | 22.9 | % | |
Information Technology | | | 20.7 | % | |
Health Care | | | 13.6 | % | |
Financials | | | 13.1 | % | |
Consumer Discretionary | | | 13.0 | % | |
Materials | | | 9.2 | % | |
Communication Services | | | 2.4 | % | |
Real Estate | | | 2.2 | % | |
Energy | | | 1.3 | % | |
Short-Term Investments | | | 0.6 | % | |
Total | | | 99.0 | % | |
The accompanying notes are an integral part of these financial statements.
58
M Large Cap Value Fund
SCHEDULE OF INVESTMENTS
December 31, 2021
Shares | |
| | Value
(Note 1) | |
| | | COMMON STOCKS—98.7% | |
| | | Aerospace & Defense—3.1% | |
| | 5,200 | | | General Dynamics Corp. | | $ | 1,084,044 | | |
| | 600 | | | Huntington Ingalls Industries, Inc. | | | 112,044 | | |
| | 2,800 | | | L3Harris Technologies, Inc. | | | 597,072 | | |
| | 3,600 | | | Lockheed Martin Corp. | | | 1,279,476 | | |
| | 2,200 | | | Northrop Grumman Corp. | | | 851,554 | | |
| | 4,100 | | | Textron, Inc. | | | 316,520 | | |
| | | | 4,240,710 | | |
| | | Air Freight and Logistics—1.9% | |
| | 1,700 | | | C.H. Robinson Worldwide, Inc. | | | 182,971 | | |
| | 2,200 | | | Expeditors International of
Washington, Inc. | | | 295,438 | | |
| | 9,600 | | | United Parcel Service, Inc., Class B | | | 2,057,664 | | |
| | | | 2,536,073 | | |
| | | Auto Components—0.2% | |
| | 1,500 | | | BorgWarner, Inc. | | | 67,605 | | |
| | 800 | | | Lear Corp. | | | 146,360 | | |
| | | | 213,965 | | |
| | | Automobiles—2.0% | |
| | 69,900 | | | Ford Motor Co. | | | 1,451,823 | | |
| | 20,100 | | | General Motors Co.* | | | 1,178,463 | | |
| | | | 2,630,286 | | |
| | | Banks—12.9% | |
| | 118,900 | | | Bank of America Corp. | | | 5,289,861 | | |
| | 6,100 | | | Citizens Financial Group, Inc. | | | 288,225 | | |
| | 1,900 | | | Comerica, Inc. | | | 165,300 | | |
| | 1,643 | | | Commerce Bancshares, Inc. | | | 112,940 | | |
| | 700 | | | Cullen/Frost Bankers, Inc. | | | 88,249 | | |
| | 2,000 | | | East West Bancorp, Inc. | | | 157,360 | | |
| | 10,100 | | | Fifth Third Bancorp | | | 439,855 | | |
| | 7,600 | | | First Horizon National Corp. | | | 124,108 | | |
| | 38,700 | | | JPMorgan Chase & Co. | | | 6,128,145 | | |
| | 13,800 | | | KeyCorp | | | 319,194 | | |
| | 1,600 | | | M&T Bank Corp. | | | 245,728 | | |
| | 6,000 | | | PNC Financial Services Group, Inc. | | | 1,203,120 | | |
| | 13,600 | | | Regions Financial Corp. | | | 296,480 | | |
| | 18,700 | | | Truist Financial Corp. | | | 1,094,885 | | |
| | 20,889 | | | U.S. Bancorp | | | 1,173,335 | | |
| | 1,300 | | | Western Alliance Bancorp | | | 139,945 | | |
| | 2,200 | | | Zions Bancorp NA | | | 138,952 | | |
| | | | 17,405,682 | | |
Shares | |
| | Value
(Note 1) | |
| | | Beverages—0.0% | |
| | 1,300 | | | Molson Coors Beverage Co.,
Class B | | $ | 60,255 | | |
| | | Biotechnology—4.2% | |
| | 23,200 | | | AbbVie, Inc. | | | 3,141,280 | | |
| | 1,800 | | | Biogen, Inc.* | | | 431,856 | | |
| | 16,500 | | | Gilead Sciences, Inc. | | | 1,198,065 | | |
| | 1,500 | | | Regeneron Pharmaceuticals, Inc.* | | | 947,280 | | |
| | | | 5,718,481 | | |
| | | Building Products—0.6% | |
| | 2,600 | | | Fortune Brands Home &
Security, Inc. | | | 277,940 | | |
| | 4,800 | | | Masco Corp. | | | 337,056 | | |
| | 1,900 | | | Owens Corning | | | 171,950 | | |
| | | | 786,946 | | |
| | | Capital Markets—3.5% | |
| | 1,600 | | | Ameriprise Financial, Inc. | | | 482,656 | | |
| | 12,600 | | | Bank of New York Mellon Corp. | | | 731,808 | | |
| | 4,800 | | | Goldman Sachs Group, Inc. | | | 1,836,240 | | |
| | 6,500 | | | Invesco Ltd. | | | 149,630 | | |
| | 3,800 | | | Jefferies Financial Group, Inc. | | | 147,440 | | |
| | 2,900 | | | Northern Trust Corp. | | | 346,869 | | |
| | 3,000 | | | Raymond James Financial, Inc. | | | 301,200 | | |
| | 2,100 | | | SEI Investments Co. | | | 127,974 | | |
| | 3,300 | | | T. Rowe Price Group, Inc. | | | 648,912 | | |
| | | | 4,772,729 | | |
| | | Chemicals—1.2% | |
| | 2,200 | | | Celanese Corp. | | | 369,732 | | |
| | 6,800 | | | DuPont de Nemours, Inc. | | | 549,304 | | |
| | 2,500 | | | Eastman Chemical Co. | | | 302,275 | | |
| | 1,700 | | | FMC Corp. | | | 186,813 | | |
| | 6,900 | | | Mosaic Co. | | | 271,101 | | |
| | | | 1,679,225 | | |
| | | Communications Equipment—2.8% | |
| | 59,100 | | | Cisco Systems, Inc. | | | 3,745,167 | | |
| | | Construction and
Engineering—0.2% | |
| | 1,800 | | | Quanta Services, Inc. | | | 206,388 | | |
| | | Consumer Finance—3.0% | |
| | 5,300 | | | Ally Financial, Inc. | | | 252,333 | | |
| | 10,800 | | | American Express Co. | | | 1,766,880 | | |
The accompanying notes are an integral part of these financial statements.
59
M Large Cap Value Fund
SCHEDULE OF INVESTMENTS (Continued)
December 31, 2021
Shares | |
| | Value
(Note 1) | |
| | | Consumer Finance (Continued) | |
| | 6,500 | | | Capital One Financial Corp. | | $ | 943,085 | | |
| | 200 | | | Credit Acceptance Corp.* | | | 137,536 | | |
| | 4,100 | | | Discover Financial Services | | | 473,796 | | |
| | 1,700 | | | OneMain Holdings, Inc. | | | 85,068 | | |
| | 8,300 | | | Synchrony Financial | | | 385,037 | | |
| | | | 4,043,735 | | |
| | | Containers and Packaging—1.1% | |
| | 28,300 | | | Amcor PLC | | | 339,883 | | |
| | 1,500 | | | Berry Global Group, Inc.* | | | 110,670 | | |
| | 2,500 | | | Crown Holdings, Inc. | | | 276,550 | | |
| | 7,200 | | | International Paper Co. | | | 338,256 | | |
| | 1,600 | | | Packaging Corp. of America | | | 217,840 | | |
| | 2,800 | | | Sealed Air Corp. | | | 188,916 | | |
| | | | 1,472,115 | | |
| | | Distributors—0.5% | |
| | 2,700 | | | Genuine Parts Co. | | | 378,540 | | |
| | 5,500 | | | LKQ Corp. | | | 330,165 | | |
| | | | 708,705 | | |
| | | Diversified Consumer
Services—0.2% | |
| | 3,200 | | | Service Corp. International | | | 227,168 | | |
| | | Diversified Financial
Services—0.2% | |
| | 6,300 | | | Equitable Holdings, Inc. | | | 206,577 | | |
| | 1,800 | | | Voya Financial, Inc. | | | 119,358 | | |
| | | | 325,935 | | |
| | | Electric Utilities—3.2% | |
| | 3,500 | | | Alliant Energy Corp. | | | 215,145 | | |
| | 5,000 | | | Edison International | | | 341,250 | | |
| | 2,800 | | | Entergy Corp. | | | 315,420 | | |
| | 3,200 | | | Evergy, Inc. | | | 219,552 | | |
| | 4,500 | | | Eversource Energy | | | 409,410 | | |
| | 17,600 | | | Exelon Corp. | | | 1,016,576 | | |
| | 7,700 | | | FirstEnergy Corp. | | | 320,243 | | |
| | 3,200 | | | NRG Energy, Inc. | | | 137,856 | | |
| | 9,900 | | | PPL Corp. | | | 297,594 | | |
| | 14,900 | | | Southern Co. | | | 1,021,842 | | |
| | | | 4,294,888 | | |
| | | Electrical Equipment—0.1% | |
| | 2,000 | | | Sensata Technologies Holding PLC* | | | 123,380 | | |
Shares | |
| | Value
(Note 1) | |
| | | Electronic Equipment, Instruments &
Components—0.3% | |
| | 1,300 | | | Arrow Electronics, Inc.* | | $ | 174,551 | | |
| | 2,700 | | | Jabil, Inc. | | | 189,945 | | |
| | | | 364,496 | | |
| | | Food and Staples Retailing—0.9% | |
| | 1,900 | | | BJ's Wholesale Club Holdings, Inc.* | | | 127,243 | | |
| | 10,400 | | | Kroger Co. | | | 470,704 | | |
| | 12,100 | | | Walgreens Boots Alliance, Inc. | | | 631,136 | | |
| | | | 1,229,083 | | |
| | | Food Products—2.7% | |
| | 10,100 | | | Archer-Daniels-Midland Co. | | | 682,659 | | |
| | 2,600 | | | Bunge Ltd. | | | 242,736 | | |
| | 1,000 | | | Darling Ingredients, Inc.* | | | 69,290 | | |
| | 8,500 | | | General Mills, Inc. | | | 572,730 | | |
| | 1,500 | | | JM Smucker Co. | | | 203,730 | | |
| | 4,500 | | | Kellogg Co. | | | 289,890 | | |
| | 17,200 | | | Kraft Heinz Co. | | | 617,480 | | |
| | 8,900 | | | Mondelez International, Inc.,
Class A | | | 590,159 | | |
| | 4,100 | | | Tyson Foods, Inc., Class A | | | 357,356 | | |
| | | | 3,626,030 | | |
| | | Gas Utilities—0.1% | |
| | 3,600 | | | UGI Corp. | | | 165,276 | | |
| | | Health Care Equipment and
Supplies—0.2% | |
| | 3,300 | | | Hologic, Inc.* | | | 252,648 | | |
| | | Health Care Providers and
Services—7.4% | |
| | 3,700 | | | AmerisourceBergen Corp. | | | 491,693 | | |
| | 4,600 | | | Anthem, Inc. | | | 2,132,284 | | |
| | 7,700 | | | Centene Corp.* | | | 634,480 | | |
| | 4,800 | | | Cigna Corp. | | | 1,102,224 | | |
| | 17,510 | | | CVS Health Corp. | | | 1,806,331 | | |
| | 2,100 | | | DaVita, Inc.* | | | 238,896 | | |
| | 6,200 | | | HCA Healthcare, Inc. | | | 1,592,904 | | |
| | 2,000 | | | Henry Schein, Inc.* | | | 155,060 | | |
| | 1,700 | | | Laboratory Corp. of America
Holdings* | | | 534,157 | | |
| | 2,800 | | | McKesson Corp. | | | 695,996 | | |
| | 2,500 | | | Quest Diagnostics, Inc. | | | 432,525 | | |
The accompanying notes are an integral part of these financial statements.
60
M Large Cap Value Fund
SCHEDULE OF INVESTMENTS (Continued)
December 31, 2021
Shares | |
| | Value
(Note 1) | |
| | | Health Care Providers and
Services (Continued) | |
| | 1,400 | | | Universal Health Services, Inc.,
Class B | | $ | 181,524 | | |
| | | | 9,998,074 | | |
| | | Household Durables—1.9% | |
| | 6,700 | | | DR Horton, Inc. | | | 726,615 | | |
| | 5,000 | | | Lennar Corp., Class A | | | 580,800 | | |
| | 1,200 | | | Mohawk Industries, Inc.* | | | 218,616 | | |
| | 40 | | | NVR, Inc.* | | | 236,355 | | |
| | 4,900 | | | PulteGroup, Inc. | | | 280,084 | | |
| | 2,800 | | | Tempur Sealy International, Inc. | | | 131,684 | | |
| | 1,600 | | | Toll Brothers, Inc. | | | 115,824 | | |
| | 1,100 | | | Whirlpool Corp. | | | 258,126 | | |
| | | | 2,548,104 | | |
| | | Household Products—0.2% | |
| | 2,200 | | | Kimberly-Clark Corp. | | | 314,424 | | |
| | | Independent Power and Renewable
Electricity Producers—0.1% | |
| | 6,300 | | | Vistra Energy Corp. | | | 143,451 | | |
| | | Industrial Conglomerates—1.4% | |
| | 10,500 | | | 3M Co. | | | 1,865,115 | | |
| | | Insurance—6.8% | |
| | 9,900 | | | Aflac, Inc. | | | 578,061 | | |
| | 200 | | | Alleghany Corp.* | | | 133,518 | | |
| | 4,300 | | | Allstate Corp. | | | 505,895 | | |
| | 1,200 | | | American Financial Group, Inc. | | | 164,784 | | |
| | 5,700 | | | Arch Capital Group Ltd.* | | | 253,365 | | |
| | 800 | | | Assurant, Inc. | | | 124,688 | | |
| | 6,400 | | | Chubb Ltd. | | | 1,237,184 | | |
| | 2,300 | | | Cincinnati Financial Corp. | | | 262,039 | | |
| | 600 | | | Everest Re Group Ltd. | | | 164,352 | | |
| | 4,000 | | | Fidelity National Financial, Inc. | | | 208,720 | | |
| | 1,500 | | | First American Financial Corp. | | | 117,345 | | |
| | 1,300 | | | Globe Life, Inc. | | | 121,836 | | |
| | 5,100 | | | Hartford Financial Services
Group, Inc. | | | 352,104 | | |
| | 2,800 | | | Lincoln National Corp. | | | 191,128 | | |
| | 3,700 | | | Loews Corp. | | | 213,712 | | |
| | 200 | | | Markel Corp.* | | | 246,800 | | |
| | 12,700 | | | MetLife, Inc. | | | 793,623 | | |
| | 3,000 | | | Old Republic International Corp. | | | 73,740 | | |
| | 3,800 | | | Principal Financial Group, Inc. | | | 274,854 | | |
Shares | |
| | Value
(Note 1) | |
| | | Insurance (Continued) | |
| | 8,300 | | | Progressive Corp. | | $ | 851,995 | | |
| | 5,600 | | | Prudential Financial, Inc. | | | 606,144 | | |
| | 600 | | | RenaissanceRe Holdings, Ltd. | | | 101,598 | | |
| | 6,500 | | | Travelers Cos., Inc. | | | 1,016,795 | | |
| | 1,800 | | | Willis Towers Watson PLC | | | 427,482 | | |
| | 2,500 | | | WR Berkley Corp. | | | 205,975 | | |
| | | | 9,227,737 | | |
| | | Internet and Catalog Retail—0.6% | |
| | 12,500 | | | eBay, Inc. | | | 831,250 | | |
| | | IT Services—1.3% | |
| | 3,400 | | | Genpact Ltd. | | | 180,472 | | |
| | 11,800 | | | International Business
Machines Corp. | | | 1,577,188 | | |
| | | | 1,757,660 | | |
| | | Leisure Equipment and
Products—0.1% | |
| | 1,300 | | | Brunswick Corp. | | | 130,949 | | |
| | | Life Sciences Tools and
Services—0.2% | |
| | 400 | | | Bio-Rad Laboratories, Inc.,
Class A* | | | 302,228 | | |
| | | Machinery—2.3% | |
| | 4,300 | | | Deere & Co. | | | 1,474,427 | | |
| | 2,700 | | | Dover Corp. | | | 490,320 | | |
| | 800 | | | Oshkosh Corp. | | | 90,168 | | |
| | 1,800 | | | Parker-Hannifin Corp. | | | 572,616 | | |
| | 1,000 | | | Snap-on, Inc. | | | 215,380 | | |
| | 3,400 | | | Westinghouse Air Brake
Technologies Corp. | | | 313,174 | | |
| | | | 3,156,085 | | |
| | | Media—2.9% | |
| | 64,200 | | | Comcast Corp., Class A | | | 3,231,186 | | |
| | 6,200 | | | Fox Corp., Class A | | | 228,780 | | |
| | 4,100 | | | Interpublic Group of Cos., Inc. | | | 153,545 | | |
| | 3,900 | | | Omnicom Group, Inc. | | | 285,753 | | |
| | | | 3,899,264 | | |
| | | Metals and Mining—1.3% | |
| | 10,500 | | | Newmont Corp. | | | 651,210 | | |
| | 5,500 | | | Nucor Corp. | | | 627,825 | | |
| | 1,100 | | | Reliance Steel & Aluminum Co. | | | 178,442 | | |
The accompanying notes are an integral part of these financial statements.
61
M Large Cap Value Fund
SCHEDULE OF INVESTMENTS (Continued)
December 31, 2021
Shares | |
| | Value
(Note 1) | |
| | | Metals and Mining (Continued) | |
| | 3,800 | | | Steel Dynamics, Inc. | | $ | 235,866 | | |
| | | | 1,693,343 | | |
| | | Multi-Utilities—1.1% | |
| | 11,300 | | | Dominion Energy, Inc. | | | 887,728 | | |
| | 9,600 | | | Public Service Enterprise
Group, Inc. | | | 640,608 | | |
| | | | 1,528,336 | | |
| | | Multiline Retail—1.5% | |
| | 9,000 | | | Target Corp. | | | 2,082,960 | | |
| | | Oil, Gas and Consumable
Fuels—5.1% | |
| | 4,800 | | | APA Corp. | | | 129,072 | | |
| | 10,600 | | | EOG Resources, Inc. | | | 941,598 | | |
| | 59,300 | | | Exxon Mobil Corp. | | | 3,628,567 | | |
| | 31,700 | | | Kinder Morgan, Inc. | | | 502,762 | | |
| | 10,235 | | | Marathon Oil Corp. | | | 168,059 | | |
| | 5,900 | | | ONEOK, Inc. | | | 346,684 | | |
| | 3,400 | | | Ovintiv, Inc. | | | 114,580 | | |
| | 5,700 | | | Valero Energy Corp. | | | 428,127 | | |
| | 21,800 | | | Williams Cos., Inc. | | | 567,672 | | |
| | | | 6,827,121 | | |
| | | Pharmaceuticals—6.4% | |
| | 34,600 | | | Johnson & Johnson | | | 5,919,022 | | |
| | 35,500 | | | Merck & Co., Inc. | | | 2,720,720 | | |
| | | | 8,639,742 | | |
| | | Professional Services—0.1% | |
| | 1,800 | | | Booz Allen Hamilton Holding Corp. | | | 152,622 | | |
| | | Real Estate Management and
Development—0.4% | |
| | 2,100 | | | CBRE Group, Inc., Class A* | | | 227,871 | | |
| | 900 | | | Jones Lang LaSalle, Inc.* | | | 242,406 | | |
| | | | 470,277 | | |
| | | Road and Rail—0.3% | |
| | 400 | | | AMERCO | | | 290,492 | | |
| | 2,300 | | | Knight-Swift Transportation
Holdings, Inc. | | | 140,162 | | |
| | | | 430,654 | | |
Shares | |
| | Value
(Note 1) | |
| | | Semiconductors and Semiconductor Equipment—0.1% | |
| | 1,500 | | | First Solar, Inc.* | | $ | 130,740 | | |
| | | Software—3.6% | |
| | 7,400 | | | NortonLifeLock, Inc. | | | 192,252 | | |
| | 52,800 | | | Oracle Corp. | | | 4,604,688 | | |
| | | | 4,796,940 | | |
| | | Specialty Retail—4.6% | |
| | 1,200 | | | Advance Auto Parts, Inc. | | | 287,856 | | |
| | 1,500 | | | AutoNation, Inc.* | | | 175,275 | | |
| | 310 | | | AutoZone, Inc.* | | | 649,881 | | |
| | 2,300 | | | CarMax, Inc.* | | | 299,529 | | |
| | 800 | | | Dick's Sporting Goods, Inc.† | | | 91,992 | | |
| | 13,300 | | | Lowe's Cos., Inc. | | | 3,437,784 | | |
| | 1,300 | | | O'Reilly Automotive, Inc.* | | | 918,099 | | |
| | 1,100 | | | Penske Automotive Group, Inc. | | | 117,942 | | |
| | 1,000 | | | Williams-Sonoma, Inc. | | | 169,130 | | |
| | | | 6,147,488 | | |
| | | Technology Hardware, Storage &
Peripherals—0.9% | |
| | 23,300 | | | Hewlett Packard Enterprise Co. | | | 367,441 | | |
| | 23,200 | | | HP, Inc. | | | 873,944 | | |
| | | | 1,241,385 | | |
| | | Textiles, Apparel and Luxury
Goods—0.3% | |
| | 2,000 | | | Capri Holdings, Ltd.* | | | 129,820 | | |
| | 900 | | | PVH Corp. | | | 95,985 | | |
| | 1,600 | | | Skechers U.S.A., Inc., Class A* | | | 69,440 | | |
| | 1,800 | | | Tapestry, Inc. | | | 73,080 | | |
| | | | 368,325 | | |
| | | Tobacco—2.4% | |
| | 25,800 | | | Altria Group, Inc. | | | 1,222,662 | | |
| | 21,800 | | | Philip Morris International, Inc. | | | 2,071,000 | | |
| | | | 3,293,662 | | |
| | | Trading Companies and
Distributors—0.2% | |
| | 1,000 | | | United Rentals, Inc.* | | | 332,290 | | |
The accompanying notes are an integral part of these financial statements.
62
M Large Cap Value Fund
SCHEDULE OF INVESTMENTS (Continued)
December 31, 2021
Shares | |
| | Value
(Note 1) | |
| | | Water Utilities—0.1% | |
| | 3,000 | | | Essential Utilities, Inc. | | $ | 161,070 | | |
| | | TOTAL COMMON STOCKS
(Cost $101,047,215) | | | 133,300,662 | | |
Shares | |
| | Value
(Note 1) | |
| | | EXCHANGE-TRADED
FUND—1.0% | |
| | 7,700 | | | iShares Russell 1000 Value ETF
(Cost $1,275,345) | | $ | 1,293,061 | | |
| |
| |
| | 7-Day
Yield | |
| |
| | | SHORT-TERM INVESTMENTS—0.1% | |
| | 79,900 | | | State Street Navigator Securities Lending Prime Portfolio (Money Market)
(Cost $79,900)†† | | | | | | | 0.07 | % | | | 79,900 | | |
| | | TOTAL INVESTMENTS, AT VALUE—99.8%
(Cost $102,402,460) | | | | | | | | | | | 134,673,623 | | |
| | | Other Assets in Excess of Liabilities—0.2% | | | | | | | | | | | 332,414 | | |
| | | NET ASSETS—100.0% | | | | | | | | | | $ | 135,006,037 | | |
Notes to the Schedule of Investments:
* Non-income producing security
† Denotes all or a portion of security on loan. As of December 31, 2021, the market value of the securities on loan was $78,193 (Note 1).
†† Represents cash collateral received from securities lending transactions. Non-cash collateral amounted to $0.
Percentages indicated are based on net assets.
The accompanying notes are an integral part of these financial statements.
63
M Large Cap Value Fund
SCHEDULE OF INVESTMENTS (Continued)
December 31, 2021
At December 31, 2021, industry sector diversification of the M Large Cap Value Fund's investments as a percentage of net assets was as follows:
Summary of Sector Classifications (Unaudited) | | Percentage
of Net
Assets | |
Financials | | | 27.5 | % | |
Health Care | | | 18.4 | % | |
Consumer Discretionary | | | 11.8 | % | |
Industrials | | | 10.2 | % | |
Information Technology | | | 8.9 | % | |
Consumer Staples | | | 6.3 | % | |
Energy | | | 5.1 | % | |
Utilities | | | 4.7 | % | |
Materials | | | 3.6 | % | |
Communication Services | | | 2.9 | % | |
Real Estate | | | 0.3 | % | |
Short-Term Investments | | | 0.1 | % | |
Total | | | 99.8 | % | |
The accompanying notes are an integral part of these financial statements.
64
M Fund, Inc.
STATEMENTS OF ASSETS AND LIABILITIES
December 31, 2021
| | | M International
Equity Fund | | M Large Cap
Growth Fund | | M Capital
Appreciation
Fund | | M Large Cap
Value Fund | |
Assets: | |
Investments, at value (Note 1)*/**—see accompanying
Schedule of Investments | | $ | 173,519,356 | | | $ | 268,339,780 | | | $ | 230,542,823 | | | $ | 134,673,623 | | |
Affiliated investment company, at value (Note 1)***—see
accompanying Schedule of Investments | | | 70,794,732 | | | | — | | | | — | | | | — | | |
Cash (Note 1) | | | 1,338,760 | | | | 4,965,132 | | | | 3,110,882 | | | | 124,300 | | |
Cash denominated in foreign currencies**** | | | 287,419 | | | | — | | | | — | | | | — | | |
Receivable from: | |
Securities sold | | | 42,176 | | | | — | | | | 834,837 | | | | 269,406 | | |
Capital stock subscriptions | | | 43,132 | | | | 8,288 | | | | 3,781 | | | | 2,626 | | |
Dividends and interest | | | 639,498 | | | | 44,594 | | | | 118,584 | | | | 155,314 | | |
Total assets | | | 246,665,073 | | | | 273,357,794 | | | | 234,610,907 | | | | 135,225,269 | | |
Liabilities: | |
Payable for: | |
Securities purchased | | | 390,278 | | | | — | | | | 74,471 | | | | — | | |
Investment Adviser, net (Note 2) | | | 75,631 | | | | 132,207 | | | | 164,211 | | | | 48,293 | | |
Capital stock redemptions | | | 30,619 | | | | 17,336 | | | | 9,416 | | | | 3,535 | | |
Payable upon return of securities loaned (Note 1) | | | 2,284,564 | | | | — | | | | 1,490,305 | | | | 79,900 | | |
Accrued expenses and other liabilities | | | 163,190 | | | | 122,825 | | | | 114,260 | | | | 87,504 | | |
Total liabilities | | | 2,944,282 | | | | 272,368 | | | | 1,852,663 | | | | 219,232 | | |
Net assets | | $ | 243,720,791 | | | $ | 273,085,426 | | | $ | 232,758,244 | | | $ | 135,006,037 | | |
Net assets consist of: | |
Paid-in capital | | $ | 264,295,118 | | | $ | 148,226,739 | | | $ | 148,496,374 | | | $ | 101,820,410 | | |
Total distributable earnings (loss) | | | (20,574,327 | ) | | | 124,858,687 | | | | 84,261,870 | | | | 33,185,627 | | |
Net assets | | $ | 243,720,791 | | | $ | 273,085,426 | | | $ | 232,758,244 | | | $ | 135,006,037 | | |
Shares outstanding# | | | 16,863,254 | | | | 8,062,217 | | | | 8,225,644 | | | | 8,771,187 | | |
Net asset value, offering price and redemption price per share | | $ | 14.45 | | | $ | 33.87 | | | $ | 28.30 | | | $ | 15.39 | | |
| * Cost of investments | | $ | 137,678,867 | | | $ | 150,215,847 | | | $ | 150,127,983 | | | $ | 102,402,460 | | |
| ** Includes securities on loan with market values of | | $ | 7,458,744 | | | $ | — | | | $ | 3,324,698 | | | $ | 78,193 | | |
| *** Cost of affiliated investment | | $ | 57,689,620 | | | $ | — | | | $ | — | | | $ | — | | |
| **** Cost of cash denominated in foreign currencies | | $ | 284,967 | | | $ | — | | | $ | — | | | $ | — | | |
# The number of authorized shares with a par value of $0.001 per share, for each of the M International Equity Fund, the M Large Cap Growth Fund, the M Capital Appreciation Fund and the M Large Cap Value Fund is 100,000,000.
The accompanying notes are an integral part of these financial statements.
65
M Fund, Inc.
STATEMENTS OF OPERATIONS
For the Year Ended December 31, 2021
| | | M International
Equity Fund | | M Large Cap
Growth Fund | | M Capital
Appreciation
Fund | | M Large Cap
Value Fund | |
Investment income: | |
Dividends-Unaffiliated* | | $ | 4,572,049 | | | $ | 977,538 | | | $ | 1,305,314 | | | $ | 2,845,103 | | |
Dividends-Affiliated | | | 1,756,590 | | | | — | | | | — | | | | — | | |
Securities lending income | | | 34,758 | | | | 6,461 | | | | 23,866 | | | | 233 | | |
Total investment income | | | 6,363,397 | | | | 983,999 | | | | 1,329,180 | | | | 2,845,336 | | |
Expenses: | |
Investment advisory fee (Note 2) | | | 733,682 | | | | 1,508,719 | | | | 1,957,732 | | | | 528,305 | | |
Custody, fund accounting, transfer agent and
administration fees | | | 416,597 | | | | 248,752 | | | | 256,871 | | | | 162,873 | | |
Professional fees | | | 57,062 | | | | 42,990 | | | | 39,823 | | | | 33,126 | | |
Directors' fees and expenses | | | 43,902 | | | | 51,906 | | | | 43,249 | | | | 24,944 | | |
Printing and shareholder reporting | | | 22,425 | | | | 21,688 | | | | 20,189 | | | | 17,150 | | |
Compliance expenses | | | 21,849 | | | | 24,635 | | | | 21,853 | | | | 11,663 | | |
Other | | | 45,170 | | | | 50,364 | | | | 45,970 | | | | 21,533 | | |
Total expenses | | | 1,340,687 | | | | 1,949,054 | | | | 2,385,687 | | | | 799,594 | | |
Less: Expenses waived/reimbursed by the Adviser (Note 2) | | | (32,474 | ) | | | — | | | | — | | | | — | | |
Net expenses | | | 1,308,213 | | | | 1,949,054 | | | | 2,385,687 | | | | 799,594 | | |
Net investment income (loss) | | | 5,055,184 | | | | (965,055 | ) | | | (1,056,507 | ) | | | 2,045,742 | | |
Realized and unrealized gain (loss): | |
Net realized gain (loss) on: | |
Unaffiliated investment transactions | | | 4,081,152 | | | | 48,290,835 | | | | 41,866,634 | | | | 12,810,644 | | |
Affiliated investment transactions | | | 1,501,591 | | | | — | | | | — | | | | — | | |
Foreign currency transactions | | | (3,608 | ) | | | — | | | | — | | | | — | | |
Net realized gain | | | 5,579,135 | | | | 48,290,835 | | | | 41,866,634 | | | | 12,810,644 | | |
Net change in unrealized appreciation (depreciation) on: | |
Unaffiliated investments | | | 12,086,864 | | | | 2,567,288 | | | | (4,017,610 | ) | | | 15,633,481 | | |
Affiliated investments | | | 459,821 | | | | — | | | | — | | | | — | | |
Foreign currency translation | | | (38,028 | ) | | | — | | | | — | | | | — | | |
Net change in unrealized appreciation (depreciation) | | | 12,508,657 | | | | 2,567,288 | | | | (4,017,610 | ) | | | 15,633,481 | | |
Net realized and unrealized gain | | | 18,087,792 | | | | 50,858,123 | | | | 37,849,024 | | | | 28,444,125 | | |
Net increase in net assets resulting from operations | | $ | 23,142,976 | | | $ | 49,893,068 | | | $ | 36,792,517 | | | $ | 30,489,867 | | |
| * Net of foreign taxes withheld of: | | $ | 436,080 | | | $ | — | | | $ | 34,822 | | | $ | — | | |
The accompanying notes are an integral part of these financial statements.
66
M Fund, Inc.
STATEMENTS OF CHANGES IN NET ASSETS
| | | M International
Equity Fund | | M Large Cap
Growth Fund | |
| | | Year Ended
December 31,
2021 | | Year Ended
December 31,
2020 | | Year Ended
December 31,
2021 | | Year Ended
December 31,
2020 | |
Increase (decrease) in net assets from: | |
Operations: | |
Net investment income (loss) | | $ | 5,055,184 | | | $ | 3,083,090 | | | $ | (965,055 | ) | | $ | (814,592 | ) | |
Net realized gain on investments and foreign currency
transactions | | | 5,579,135 | | | | 1,908,587 | | | | 48,290,835 | | | | 29,598,504 | | |
Net change in unrealized appreciation on investments
and foreign currency | | | 12,508,657 | | | | 12,558,535 | | | | 2,567,288 | | | | 25,934,642 | | |
Net increase in net assets resulting from operations | | | 23,142,976 | | | | 17,550,212 | | | | 49,893,068 | | | | 54,718,554 | | |
Distributions to shareholders | | | (5,778,411 | ) | | | (3,020,968 | ) | | | (46,706,905 | ) | | | (26,882,948 | ) | |
Tax return of capital | | | (9,041 | ) | | | — | | | | — | | | | — | | |
Total distributions to shareholders | | | (5,787,452 | ) | | | (3,020,968 | ) | | | (46,706,905 | ) | | | (26,882,948 | ) | |
Fund share transactions (Note 4): | |
Proceeds from shares sold | | | 36,442,359 | | | | 17,865,249 | | | | 21,205,923 | | | | 15,187,273 | | |
Net asset value of shares issued on reinvestment of
distributions | | | 5,787,452 | | | | 3,020,968 | | | | 46,706,905 | | | | 26,882,948 | | |
Cost of shares repurchased | | | (25,790,986 | ) | | | (21,461,880 | ) | | | (34,035,704 | ) | | | (44,498,570 | ) | |
Net increase (decrease) in net assets resulting from
Fund share transactions | | | 16,438,825 | | | | (575,663 | ) | | | 33,877,124 | | | | (2,428,349 | ) | |
Total change in net assets | | | 33,794,349 | | | | 13,953,581 | | | | 37,063,287 | | | | 25,407,257 | | |
Net assets: | |
Beginning of year | | | 209,926,442 | | | | 195,972,861 | | | | 236,022,139 | | | | 210,614,882 | | |
End of year | | $ | 243,720,791 | | | $ | 209,926,442 | | | $ | 273,085,426 | | | $ | 236,022,139 | | |
The accompanying notes are an integral part of these financial statements.
67
M Fund, Inc.
STATEMENTS OF CHANGES IN NET ASSETS (Continued)
| | | M Capital
Appreciation Fund | | M Large Cap
Value Fund | |
| | | Year Ended
December 31,
2021 | | Year Ended
December 31,
2020 | | Year Ended
December 31,
2021 | | Year Ended
December 31,
2020 | |
Increase (decrease) in net assets from: | |
Operations: | |
Net investment income (loss) | | $ | (1,056,507 | ) | | $ | (310,837 | ) | | $ | 2,045,742 | | | $ | 1,774,852 | | |
Net realized gain (loss) on investments and foreign currency
transactions | | | 41,866,634 | | | | 3,766,804 | | | | 12,810,644 | | | | (11,815,864 | ) | |
Net change in unrealized appreciation (depreciation) on
investments and foreign currency | | | (4,017,610 | ) | | | 30,852,530 | | | | 15,633,481 | | | | 6,932,860 | | |
Net increase (decrease) in net assets resulting from
operations | | | 36,792,517 | | | | 34,308,497 | | | | 30,489,867 | | | | (3,108,152 | ) | |
Distributions to shareholders | | | (38,615,861 | ) | | | (4,405,395 | ) | | | (2,054,256 | ) | | | (2,730,257 | ) | |
Total distributions to shareholders | | | (38,615,861 | ) | | | (4,405,395 | ) | | | (2,054,256 | ) | | | (2,730,257 | ) | |
Fund share transactions (Note 4): | |
Proceeds from shares sold | | | 22,561,242 | | | | 24,481,431 | | | | 23,868,898 | | | | 11,851,096 | | |
Net asset value of shares issued on reinvestment of
distributions | | | 38,615,861 | | | | 4,405,395 | | | | 2,054,256 | | | | 2,730,257 | | |
Cost of shares repurchased | | | (40,886,502 | ) | | | (25,874,157 | ) | | | (17,237,564 | ) | | | (10,748,201 | ) | |
Net increase in net assets resulting from Fund share
transactions | | | 20,290,601 | | | | 3,012,669 | | | | 8,685,590 | | | | 3,833,152 | | |
Total change in net assets | | | 18,467,257 | | | | 32,915,771 | | | | 37,121,201 | | | | (2,005,257 | ) | |
Net assets: | |
Beginning of year | | | 214,290,987 | | | | 181,375,216 | | | | 97,884,836 | | | | 99,890,093 | | |
End of year | | $ | 232,758,244 | | | $ | 214,290,987 | | | $ | 135,006,037 | | | $ | 97,884,836 | | |
The accompanying notes are an integral part of these financial statements.
68
M Fund, Inc.
FINANCIAL HIGHLIGHTS
(FOR A SHARE OUTSTANDING THROUGHOUT EACH YEAR)
| | | M International Equity Fund | |
| | | Year Ended
December 31,
2021 | | Year Ended
December 31,
2020 | | Year Ended
December 31,
2019 | | Year Ended
December 31,
2018 | | Year Ended
December 31,
2017 | |
Net asset value, beginning of year | | $ | 13.33 | | | $ | 12.42 | | | $ | 10.60 | | | $ | 13.58 | | | $ | 11.12 | | |
Income from investment operations: | |
Net investment income‡ | | | 0.32 | | | | 0.20 | | | | 0.27 | | | | 0.19 | | | | 0.17 | | |
Net realized and unrealized gain (loss) on
investments | | | 1.15 | | | | 0.90 | | | | 1.88 | | | | (2.99 | ) | | | 2.50 | | |
Total from investment operations | | | 1.47 | | | | 1.10 | | | | 2.15 | | | | (2.80 | ) | | | 2.67 | | |
Less distributions to shareholders: | |
From net investment income | | | (0.35 | ) | | | (0.19 | ) | | | (0.30 | ) | | | (0.18 | ) | | | (0.21 | ) | |
From return of capital | | | 0.00 | * | | | — | | | | (0.03 | ) | | | — | | | | — | | |
Total distributions | | | (0.35 | ) | | | (0.19 | ) | | | (0.33 | ) | | | (0.18 | ) | | | (0.21 | ) | |
Net asset value, end of year | | $ | 14.45 | | | $ | 13.33 | | | $ | 12.42 | | | $ | 10.60 | | | $ | 13.58 | | |
Total Return+ | | | 11.05 | % | | | 8.90 | % | | | 20.32 | % | | | (20.57 | )% | | | 24.05 | % | |
Ratios/Supplemental Data: | |
Net assets, end of year (000's) | | $ | 243,721 | | | $ | 209,926 | | | $ | 195,973 | | | $ | 169,923 | | | $ | 244,167 | | |
Net expenses to average daily net assets | | | 0.57 | %• | | | 0.62 | %• | | | 0.63 | %• | | | 0.92 | %• | | | 0.90 | % | |
Net investment income to average daily net assets | | | 2.20 | %• | | | 1.77 | %• | | | 2.34 | %• | | | 1.50 | %• | | | 1.33 | % | �� |
Without the waiver/reimbursement of expenses by
the adviser, the ratios of net expenses and net
investment income to average daily net assets
would have been: | |
Expenses | | | 0.58 | %• | | | 0.65 | %• | | | 0.68 | %• | | | 0.98 | %• | | | N/A | | |
Net investment income | | | 2.19 | %• | | | 1.74 | %• | | | 2.30 | %• | | | 1.43 | %• | | | N/A | | |
Portfolio turnover rate | | | 9 | % | | | 10 | % | | | 13 | % | | | 117 | %? | | | 10 | % | |
* Represents amounts less than $0.005 per share.
‡ Calculation based on average shares outstanding.
+ Does not reflect additional fees charged by separate accounts or variable insurance contracts that an investor in the Fund may pay. If these additional fees were reflected, performance would have been lower.
• In addition to the fees and expenses which the Fund bears directly, it also indirectly bears a pro-rata share of the fees and expenses of the underlying fund in which it invests. Such indirect expenses are not included in the above expense ratios.
? The increase in portfolio turnover rate during the period was primarily attributable to portfolio adjustments made in response to a change in the Fund's sub-adviser.
The accompanying notes are an integral part of these financial statements.
69
M Fund, Inc.
FINANCIAL HIGHLIGHTS
(FOR A SHARE OUTSTANDING THROUGHOUT EACH YEAR)
| | | M Large Cap Growth Fund | |
| | | Year Ended
December 31,
2021 | | Year Ended
December 31,
2020 | | Year Ended
December 31,
2019 | | Year Ended
December 31,
2018 | | Year Ended
December 31,
2017 | |
Net asset value, beginning of year | | $ | 33.48 | | | $ | 29.33 | | | $ | 22.85 | | | $ | 27.01 | | | $ | 19.97 | | |
Income from investment operations: | |
Net investment loss‡ | | | (0.14 | ) | | | (0.12 | ) | | | (0.07 | ) | | | (0.03 | ) | | | (0.05 | ) | |
Net realized and unrealized gain (loss) on
investments | | | 7.32 | | | | 8.46 | | | | 8.31 | | | | (1.12 | ) | | | 7.83 | | |
Total from investment operations | | | 7.18 | | | | 8.34 | | | | 8.24 | | | | (1.15 | ) | | | 7.78 | | |
Less distributions to shareholders: | |
From net realized capital gains | | | (6.79 | ) | | | (4.19 | ) | | | (1.76 | ) | | | (3.01 | ) | | | (0.74 | ) | |
Net asset value, end of year | | $ | 33.87 | | | $ | 33.48 | | | $ | 29.33 | | | $ | 22.85 | | | $ | 27.01 | | |
Total Return+ | | | 21.49 | % | | | 28.89 | % | | | 36.09 | % | | | (4.95 | )% | | | 38.97 | % | |
Ratios/Supplemental Data: | |
Net assets, end of year (000's) | | $ | 273,085 | | | $ | 236,022 | | | $ | 210,615 | | | $ | 168,222 | | | $ | 193,379 | | |
Net expenses to average daily net assets | | | 0.75 | % | | | 0.78 | % | | | 0.77 | % | | | 0.75 | % | | | 0.73 | % | |
Net investment loss to average daily net assets | | | (0.37 | )% | | | (0.38 | )% | | | (0.25 | )% | | | (0.11 | )% | | | (0.20 | )% | |
Portfolio turnover rate | | | 32 | % | | | 31 | % | | | 22 | % | | | 34 | % | | | 49 | % | |
‡ Calculation based on average shares outstanding.
+ Does not reflect additional fees charged by separate accounts or variable insurance contracts that an investor in the Fund may pay. If these additional fees were reflected, performance would have been lower.
The accompanying notes are an integral part of these financial statements.
70
M Fund, Inc.
FINANCIAL HIGHLIGHTS
(FOR A SHARE OUTSTANDING THROUGHOUT EACH YEAR)
| | | M Capital Appreciation Fund | |
| | | Year Ended
December 31,
2021 | | Year Ended
December 31,
2020 | | Year Ended
December 31,
2019 | | Year Ended
December 31,
2018 | | Year Ended
December 31,
2017 | |
Net asset value, beginning of year | | $ | 28.77 | | | $ | 25.05 | | | $ | 21.14 | | | $ | 31.24 | | | $ | 29.28 | | |
Income from investment operations: | |
Net investment loss‡ | | | (0.15 | ) | | | (0.04 | ) | | | (0.04 | ) | | | (0.05 | ) | | | (0.01 | ) | |
Net realized and unrealized gain (loss) on
investments | | | 5.24 | | | | 4.35 | | | | 6.11 | | | | (4.23 | ) | | | 5.55 | | |
Total from investment operations | | | 5.09 | | | | 4.31 | | | | 6.07 | | | | (4.28 | ) | | | 5.54 | | |
Less distributions to shareholders: | |
From net investment income | | | — | | | | — | | | | — | | | | (0.09 | ) | | | — | | |
From net realized capital gains | | | (5.56 | ) | | | (0.59 | ) | | | (2.16 | ) | | | (5.73 | ) | | | (3.58 | ) | |
Total distributions | | | (5.56 | ) | | | (0.59 | ) | | | (2.16 | ) | | | (5.82 | ) | | | (3.58 | ) | |
Net asset value, end of year | | $ | 28.30 | | | $ | 28.77 | | | $ | 25.05 | | | $ | 21.14 | | | $ | 31.24 | | |
Total Return+ | | | 17.74 | % | | | 17.73 | % | | | 28.85 | % | | | (14.15 | )% | | | 19.02 | % | |
Ratios/Supplemental Data: | |
Net assets, end of year (000's) | | $ | 232,758 | | | $ | 214,291 | | | $ | 181,375 | | | $ | 156,007 | | | $ | 209,284 | | |
Net expenses to average daily net assets | | | 1.04 | % | | | 1.10 | % | | | 1.10 | % | | | 1.07 | % | | | 1.05 | % | |
Net investment loss to average daily net assets | | | (0.46 | )% | | | (0.19 | )% | | | (0.15 | )% | | | (0.15 | )% | | | (0.04 | )% | |
Portfolio turnover rate | | | 38 | % | | | 32 | % | | | 20 | % | | | 26 | % | | | 20 | % | |
‡ Calculation based on average shares outstanding.
+ Does not reflect additional fees charged by separate accounts or variable insurance contracts that an investor in the Fund may pay. If these additional fees were reflected, performance would have been lower.
The accompanying notes are an integral part of these financial statements.
71
M Fund, Inc.
FINANCIAL HIGHLIGHTS
(FOR A SHARE OUTSTANDING THROUGHOUT EACH YEAR)
| | | M Large Cap Value Fund | |
| | | Year Ended
December 31,
2021 | | Year Ended
December 31,
2020 | | Year Ended
December 31,
2019 | | Year Ended
December 31,
2018 | | Year Ended
December 31,
2017 | |
Net asset value, beginning of year | | $ | 12.02 | | | $ | 12.80 | | | $ | 11.06 | | | $ | 13.93 | | | $ | 12.89 | | |
Income from investment operations: | |
Net investment income‡ | | | 0.24 | | | | 0.23 | | | | 0.22 | | | | 0.20 | | | | 0.21 | | |
Net realized and unrealized gain (loss) on
investments | | | 3.37 | | | | (0.66 | ) | | | 2.16 | | | | (1.88 | ) | | | 1.73 | | |
Total from investment operations | | | 3.61 | | | | (0.43 | ) | | | 2.38 | | | | (1.68 | ) | | | 1.94 | | |
Less distributions to shareholders: | |
From net investment income | | | (0.24 | ) | | | (0.22 | ) | | | (0.22 | ) | | | (0.20 | ) | | | (0.21 | ) | |
From net realized capital gains | | | — | | | | (0.13 | ) | | | (0.42 | ) | | | (0.99 | ) | | | (0.69 | ) | |
Total distributions | | | (0.24 | ) | | | (0.35 | ) | | | (0.64 | ) | | | (1.19 | ) | | | (0.90 | ) | |
Net asset value, end of year | | $ | 15.39 | | | $ | 12.02 | | | $ | 12.80 | | | $ | 11.06 | | | $ | 13.93 | | |
Total Return+ | | | 30.01 | % | | | (3.16 | )% | | | 21.52 | % | | | (12.07 | )% | | | 14.99 | % | |
Ratios/Supplemental Data: | |
Net assets, end of year (000's) | | $ | 135,006 | | | $ | 97,885 | | | $ | 99,890 | | | $ | 85,437 | | | $ | 99,501 | | |
Net expenses to average daily net assets | | | 0.65 | % | | | 0.68 | % | | | 0.68 | % | | | 0.64 | % | | | 0.64 | % | |
Net investment income to average daily net assets | | | 1.67 | % | | | 2.09 | % | | | 1.73 | % | | | 1.47 | % | | | 1.57 | % | |
Without the waiver/reimbursement of expenses by
the adviser, the ratios of net expenses and net
investment income to average daily net assets
would have been: | |
Expenses | | | N/A | | | | 0.72 | % | | | 0.69 | % | | | 0.66 | % | | | 0.64 | % | |
Net investment income | | | N/A | | | | 2.06 | % | | | 1.72 | % | | | 1.45 | % | | | 1.56 | % | |
Portfolio turnover rate | | | 61 | % | | | 157 | %? | | | 107 | % | | | 82 | % | | | 75 | % | |
‡ Calculation based on average shares outstanding.
+ Does not reflect additional fees charged by separate accounts or variable insurance contracts that an investor in the Fund may pay. If these additional fees were reflected, performance would have been lower.
? The increase in portfolio turnover rate during the period was primarily attributable to portfolio adjustments made in response to a change in the Fund's sub-adviser.
The accompanying notes are an integral part of these financial statements.
72
M Fund, Inc.
NOTES TO FINANCIAL STATEMENTS
M Fund, Inc. (the "Corporation") was incorporated in Maryland on August 11, 1995 and is registered under the Investment Company Act of 1940, as amended (the "1940 Act"), as an open-end management investment company. As of December 31, 2021, the Corporation consisted of four separate diversified investment portfolios: M International Equity Fund, M Large Cap Growth Fund, M Capital Appreciation Fund and M Large Cap Value Fund (each singularly a "Fund" or collectively the "Funds"), each of which is a separate mutual fund.
The Corporation offers shares of the Funds to certain insurance company separate accounts, which serve as the underlying funding vehicles for certain variable annuity and variable life insurance policies. These annuities and insurance policies are offered primarily by members of M Financial Holdings Incorporated ("M Financial Group") and are issued by certain life insurance companies.
M International Equity Fund
M International Equity Fund seeks to achieve its investment objective through exposure to a broad and diverse group of securities of non-U.S. companies in countries with developed and emerging markets. The Fund invests in companies of all sizes, with increased exposure to smaller capitalization, lower relative price, and/or higher profitability companies as compared to their representation in the Non-U.S. Universe. For purposes of the Fund, Dimensional Fund Advisors LP ("DFA") defines the Non-U.S. Universe as a market capitalization weighted set (e.g., the larger the company, the greater the proportion of the Non-U.S. Universe it represents) of non-U.S. companies in developed and emerging markets that have been authorized for investment as approved markets by Dimensional's Investment Committee. The Fund may pursue its investment objective by investing its assets directly and/or indirectly by investing its assets in the DFA Emerging Markets Core Equity Portfolio of DFA Investment Dimensions Group Inc. (the "Underlying Fund"). The Underlying Fund purchases a broad and diverse group of securities associated with emerging markets, which may include frontier markets (emerging market countries in an earlier stage of development), The Underlying Fund invests in companies of all sizes, with increased exposure to smaller capitalization, lower relative price, and/or higher profitability companies. As of the date of this Annual Report, it is anticipated that a significant portion of the Fund's assets will be invested indirectly through the Underlying Fund.
The Fund's increased exposure to smaller capitalization, lower relative price, and/or higher profitability companies may be achieved by decreasing the allocation of the Fund's assets to larger capitalization, higher relative price, and/or lower profitability companies relative to their weight in the Non-U.S. Universe. An equity issuer is considered to have a high relative price (i.e., a growth stock) primarily because it has a high price in relation to its book value. An equity issuer is considered to have a low relative price (i.e., a value stock) primarily because it has a low price in relation to its book value. In assessing relative price, DFA may consider additional factors such as price-to-cash flow or price-to-earnings ratios. In assessing profitability, DFA considers different ratios, such as that of earnings or profits from operations relative to book value or assets. The criteria DFA uses for assessing relative price and profitability are subject to change from time to time. DFA determines company size on a country or region-specific basis and based primarily on market capitalization. DFA may adjust the representation in the Fund of an eligible company, or exclude a company, after considering such factors as free float, momentum, trading strategies, liquidity, size, relative price, profitability, investment characteristics, and other factors that DFA determines to be appropriate. In assessing a company's investment characteristics, DFA considers ratios such as recent changes in assets divided by total assets. The criteria DFA uses for assessing a company's investment characteristics are subject to change from time to time.
73
M Fund, Inc.
NOTES TO FINANCIAL STATEMENTS (Continued)
The Fund will normally invest at least 80% of its total assets in equity securities of issuers located in at least three countries other than the United States. These countries may include, but are not limited to, the nations of Western Europe, North and South America, Australia, Africa and Asia. This strategy is not fundamental (it may be changed without shareholder approval), but should the Fund decide to change this strategy, it will provide shareholders with at least 60 days' notice. The Fund may invest up to 40% of its total assets in emerging markets.
The Fund may gain exposure to companies associated with approved markets by purchasing equity securities in the form of depositary receipts, which may be listed or traded outside the issuer's domicile country. The Fund may purchase or sell futures contracts and options on futures contracts for foreign or U.S. equity securities and indices, to adjust market exposure based on actual or expected cash inflows to or outflows from the Fund.
M Large Cap Growth Fund
M Large Cap Growth Fund will normally invest at least 80% of its total assets in domestic equity securities of U.S. large capitalization securities. Domestic equity securities, as determined by DSM Capital Partners LLC ("DSM"), the Fund's sub-adviser, in its discretion, include, but are not limited to common stocks, preferred stocks, securities convertible into common stocks, rights and warrants. Shares of foreign domiciled issuers that primarily trade on a U.S. exchange are generally considered by DSM to be domestic equity securities. Also, as determined by DSM, issuers that issue domestic equity securities may be domiciled and/or headquartered anywhere in the world. The Fund may generally invest up to 20% of its assets in equity securities of foreign issuers, including American Depositary Receipts and similar securities. DSM defines "large cap" as capitalizations of $10 billion or more. The Fund will generally contain 25 to 35 equity securities.
This strategy to invest at least 80% of its total assets in domestic equity securities of U.S. large capitalization securities is not fundamental (it may be changed without shareholder approval), but should the Fund decide to change this strategy, it will provide shareholders with at least 60 days' notice.
DSM uses a "bottom-up," idea-driven approach and focuses on a long-term (e.g., three-year minimum) investment horizon.
DSM seeks to invest in growing businesses with solid fundamentals, attractive profitability and successful management. Candidate companies will typically have projected revenue and earnings growth in excess of 10% and will often have higher returns on equity and assets than average S&P 500 companies. Generally, these businesses will be generating free cash flow and will have financial returns that are stable or rising, driven by improving business fundamentals, all as determined by DSM.
In its stock valuation work, DSM focuses primarily on P/E ratios. P/E is the ratio of a company's share price to its per-share earnings. DSM will generally only buy a stock that it believes has a forward four-quarter P/E ratio that will rise over the next three years. To accomplish this, a target P/E ratio that DSM believes is reasonable and rational and is reflective of a fair valued stock three years from now is selected. DSM will typically buy when the company's stock clears two hurdles: 1. it must have attractive fundamental business characteristics that translate into a reasonably predictable and growing stream of earnings and 2. it must have a P/E on forward four quarters earnings that is normally 8% to 10% below the target P/E three years from the calculation point. In order to determine a target P/E, DSM takes into consideration a number of qualitative and quantitative factors. Among the qualitative factors are barriers to entry, number of competitors, economic cyclicality, customer loyalty, price competition, global reach,
74
M Fund, Inc.
NOTES TO FINANCIAL STATEMENTS (Continued)
government involvement and management quality. Among the quantitative factors are historic revenue and EPS growth, projected revenue and EPS growth, margins, return on assets, return on equity, capital expenditures relative to net income and the historic range of P/E over the last five years. Once a target P/E has been agreed upon, it may occasionally be adjusted.
M Capital Appreciation Fund
M Capital Appreciation Fund principally invests in common stock of U.S. companies of all sizes, with emphasis on stocks of companies with capitalizations that are consistent with the capitalizations of those companies found in the Russell 2500® Index. As of December 31, 2021, the market capitalization range of companies in the Russell 2500® Index was between approximately $0.03 billion and $38.9 billion. The Fund may invest up to 15% of the value of its total assets in equity securities of foreign issuers.
The Fund's sub-adviser, Frontier Capital Management Company, LLC ("Frontier") seeks long-term capital appreciation by employing a Growth-At-A-Reasonable-Price approach to identify, in its view, the best risk/reward investment ideas in the U.S. small- and mid-capitalization equity universe. Frontier purchases companies that, in its view, have above-average earnings growth potential and are available at reasonable valuations. Frontier's philosophy combines rigorous bottom-up fundamental analysis with a proven investment process.
Frontier may sell stocks for a number of reasons, including when price objectives are reached, fundamental conditions have changed so that future earnings progress is likely to be adversely affected, or a stock is fully invested and an attractive, new opportunity causes the sale of a current holding with less appreciation potential. Frontier does not sell stocks solely on changes to a company's market capitalization.
M Large Cap Value Fund
M Large Cap Value Fund invests at least 80% of its net assets, plus the amount of borrowings for investment purposes, if any, in issuers domiciled, or having their principal activities, in the United States, at the time of investment or other instruments with similar economic characteristics. In addition, the Fund normally invests at least 80% of its net assets in equity securities of large capitalization companies. Brandywine Global Investment Management, LLC ("Brandywine"), the Fund's sub-adviser, defines "large capitalization" companies as those companies with market capitalizations similar to companies in the Russell 1000® Index (the "Index"). As of December 31, 2021, the market capitalization range of companies in the Index was between approximately $435.8 million to $2.9 trillion. This strategy is not fundamental (it may be changed without shareholder approval), but should the Fund decide to change this strategy, it will provide shareholders with at least 60 days' notice.
The Fund invests primarily in equity securities that, in Brandywine's opinion, are undervalued or out of favor. Brandywine invests in securities that meet its value criteria, primarily price-to-earnings, price-to-book, price momentum and share change and quality, based on both quantitative and fundamental analysis. The Fund expects to hold approximately 175-250 stocks under normal market conditions.
Brandywine bases portfolio price targets on quantitative criteria determined in its sell process. Brandywine's systems update these quantitatively determined buy and sell limits on a daily basis. Buy candidates must have a price that qualifies the stock as a value such that the price-to-earnings ratio is in the lower 40% of its universe or the price-to-book is in the lower 25% of its universe at time of purchase. Additionally, the current price compared to the price
75
M Fund, Inc.
NOTES TO FINANCIAL STATEMENTS (Continued)
nine months ago must place it above the lower quartile of other universe stocks when ranked by nine month price momentum and the change in shares outstanding over the past year must place it below the upper quartile.
Sell candidates will have a price that when compared to earnings and book place the stock above the median on a price-to-earnings basis and above the 40th percentile on a price-to-book basis. If a stock's price declines relative to the universe such that it falls to the lower 10% of stocks as ranked on nine month price momentum or the company issues sufficient shares to rank among the top 10% largest issuers (as a percentage of shares outstanding) in the year, the holding will be a sell candidate. Additionally, a stock will be sold if the capitalization falls 20% below the minimum purchase capitalization criteria.
Brandywine may modify buy and sell trigger points and decisions only due to tracking error considerations, trading opportunities or limitations such as position, industry or sector size. Brandywine does not violate its buy and sell rules based on analyst affinity for the stock. Its investment process requires disciplined buy and sell decisions rules with carefully outlined exceptions.
If a security experiences a severe fundamental deterioration event that is not captured in the price change, share change or valuation rules, Brandywine will initiate a sell. The rank order of the most common occurrences are price momentum, valuation expansion into the sell range, share issuance or fundamental deterioration.
1. Significant Accounting Policies
The following is a summary of significant accounting policies for the Funds. Such policies are in conformity with accounting principles generally accepted in the United States of America ("GAAP") for investment companies and are consistently followed by the Funds in the preparation of the financial statements.
Use of Estimates
Each Fund is an investment company and accordingly follows the investment company accounting and reporting guidance of the Financial Accounting Standards Board ("FASB") Accounting Standard Codification Topic 946 Financial Services—Investment Companies. The preparation of financial statements in accordance with GAAP requires management to make estimates and assumptions that affect the reported amounts of assets and liabilities and disclosure of contingent assets and liabilities at the date of the financial statements and the reported amounts of increases and decreases in net assets from operations during the reporting period. Actual results could differ from those estimates.
Portfolio Valuation
Equity securities and other similar investments traded on a recognized U.S. securities exchange (other than the National Association of Securities Dealers Automated Quotation System "NASDAQ") are valued at the last sale price on the exchange on which the securities are traded. If no sale occurs, equity securities and other similar investments traded on a U.S. exchange (other than NASDAQ) are valued at the most recent bid price. Equity securities and other similar investments traded on NASDAQ are valued at the NASDAQ Official Closing Price. If no sale occurs, equity securities and other similar investments traded on NASDAQ are valued at the most recent bid price. Equity securities and other similar investments traded on a non-U.S. exchange are generally valued according
76
M Fund, Inc.
NOTES TO FINANCIAL STATEMENTS (Continued)
1. Significant Accounting Policies (Continued)
to the latest closing values on that exchange prior to the close of the New York Stock Exchange. However, if an event which may change the value of a security occurs after the time that the closing value on the non-U.S. exchange was determined, the Board of Directors may decide to value the security based on fair value. The Board of Directors has approved the use of an independent fair value service for foreign securities, which may provide a fair value price on trading days when the S&P 500 Index moves more than 0.5%. The use of a fair value price may cause the value of the security on the books of the Fund to be significantly different from the closing value on the non-U.S. exchange and may affect the calculation of the Fund's NAV. Over-the-counter securities are valued at the last sale price on the valuation date or, if no sale occurs, at the most recent bid price. Short-term obligations maturing in sixty days or less are valued at amortized cost, which approximates market value.
Amortized cost valuation involves initially valuing a security at its cost, and thereafter, assuming a constant accretion or amortization to maturity of any discount or premium, regardless of the impact of fluctuating interest rates on the market value of the security. Securities for which a pricing service supplies no quotations or quotations are not deemed to be representative of market value or for which there are no readily available market quotations are valued at fair value as determined in good faith by the Pricing Committee appointed by the Board of Directors (excluding debt securities with a remaining maturity of sixty days or less). Investments in mutual funds, including money market funds, are valued at their respective NAVs as of the close of the Exchange on the valuation date. These securities are generally categorized as Level 1 in the fair value hierarchy.
Fair value is defined as the price that the Funds would receive upon selling an investment in a timely transaction to an independent buyer in the principal or most advantageous market for the investment. A three-tier hierarchy is utilized to maximize the use of observable data inputs and minimize the use of unobservable data inputs and to establish classification of fair value measurements for disclosure purposes. Inputs refer broadly to the assumptions that market participants would use to price the asset or liability, including assumptions about risk. Observable inputs are inputs that reflect the assumptions market participants would use to price the asset or liability based on market data obtained from sources independent of the reporting entity. Unobservable inputs are inputs that reflect the reporting entity's own assumptions about the assumptions market participants would use to price the asset or liability based on the best information available in the circumstances. The three-tier hierarchy of inputs is summarized in the three broad Levels listed below.
• Level 1—quoted prices in active markets for identical investments;
• Level 2—quoted prices in markets that are not active or other significant observable inputs (including quoted prices for similar investments, interest rates, prepayment speeds, credit risk, etc.); and
• Level 3—significant unobservable inputs (including the Fund's own assumptions used to determine the fair value of investments).
The valuation techniques used by the Funds to measure fair value during the year ended December 31, 2021 maximized the use of observable inputs and minimized the use of unobservable inputs.
The availability of observable inputs can vary from security to security and is affected by a wide variety of factors, including, for example, the type of security, whether the security is new and not yet established in the marketplace,
77
M Fund, Inc.
NOTES TO FINANCIAL STATEMENTS (Continued)
1. Significant Accounting Policies (Continued)
the liquidity of markets, and other characteristics particular to the security. To the extent that valuation is based on models or inputs that are less observable or unobservable in the market, the determination of fair value requires more judgment. Accordingly, the degree of judgment exercised in determining fair value is greatest for instruments categorized in Level 3.
The inputs used to measure fair value may fall into different levels of the fair value hierarchy. In such cases, for disclosure purposes, the level in the fair value hierarchy within which the fair value measurement falls in its entirety is determined based on the lowest level input that is significant to the fair value measurement in its entirety.
As of December 31, 2021, the M Large Cap Growth Fund, M Capital Appreciation Fund and M Large Cap Value Fund, had (i) all long-term investments classified as Level 1, as represented on the Schedule of Investments; and (ii) all short-term investments classified as Level 2.
The following is a summary of the inputs used as of December 31, 2021 in valuing the M International Equity Fund investments:
Assets Valuation Input
Description | | Quoted Prices
in Active
Markets for
Identical
Assets
(Level 1) | | Significant
Other
Observable
Inputs
(Level 2) | | Significant
Unobservable
Inputs
(Level 3) | | Total | |
Common Stocks | |
Australia | | $ | 10,754,746 | | | $ | — | | | $ | — | | | $ | 10,754,746 | | |
Austria | | | 774,498 | | | | — | | | | — | | | | 774,498 | | |
Belgium | | | 1,559,330 | | | | — | | | | — | | | | 1,559,330 | | |
Canada | | | 18,459,882 | | | | — | | | | — | | | | 18,459,882 | | |
Denmark | | | 4,222,827 | | | | — | | | | — | | | | 4,222,827 | | |
Finland | | | 2,482,592 | | | | — | | | | — | | | | 2,482,592 | | |
France | | | 14,743,126 | | | | — | | | | — | | | | 14,743,126 | | |
Germany | | | 12,504,847 | | | | — | | | | — | | | | 12,504,847 | | |
Hong Kong | | | 4,063,906 | | | | — | | | | — | | | | 4,063,906 | | |
Ireland | | | 1,295,245 | | | | — | | | | — | | | | 1,295,245 | | |
Israel | | | 1,702,276 | | | | — | | | | — | | | | 1,702,276 | | |
Italy | | | 4,261,603 | | | | — | | | | — | | | | 4,261,603 | | |
Japan | | | 36,771,594 | | | | 71,095 | | | | — | | | | 36,842,689 | | |
Netherlands | | | 6,346,691 | | | | — | | | | — | | | | 6,346,691 | | |
New Zealand | | | 685,081 | | | | — | | | | — | | | | 685,081 | | |
Norway | | | 1,569,559 | | | | — | | | | — | | | | 1,569,559 | | |
Portugal | | | 383,232 | | | | — | | | | — | | | | 383,232 | | |
Singapore | | | 1,418,238 | | | | — | | | | — | | | | 1,418,238 | | |
78
M Fund, Inc.
NOTES TO FINANCIAL STATEMENTS (Continued)
1. Significant Accounting Policies (Continued)
Description | | Quoted Prices
in Active
Markets for
Identical
Assets
(Level 1) | | Significant
Other
Observable
Inputs
(Level 2) | | Significant
Unobservable
Inputs
(Level 3) | | Total | |
Spain | | $ | 3,299,507 | | | $ | — | | | $ | — | | | $ | 3,299,507 | | |
Sweden | | | 5,962,570 | | | | — | | | | — | | | | 5,962,570 | | |
Switzerland | | | 14,045,728 | | | | — | | | | — | | | | 14,045,728 | | |
United Kingdom | | | 22,736,477 | | | | — | | | | — | | | | 22,736,477 | | |
United States | | | 11,085 | | | | — | | | | — | | | | 11,085 | | |
Total Common Stocks | | | 170,054,640 | | | | 71,095 | | | | — | | | | 170,125,735 | | |
Affiliated Investment Company | |
United States | | | 70,794,732 | | | | — | | | | — | | | | 70,794,732 | | |
Warrants | |
Canada | | | 2,887 | | | | — | | | | — | | | | 2,887 | | |
Rights | |
Austria | | | — | | | | — | | | | — | | | | — | | |
Spain | | | 827 | | | | — | | | | — | | | | 827 | | |
Total Rights | | | 827 | | | | — | | | | — | | | | 827 | | |
Preferred Stocks | |
Germany | | | 1,078,085 | | | | — | | | | — | | | | 1,078,085 | | |
Italy | | | 27,258 | | | | — | | | | — | | | | 27,258 | | |
Total Preferred Stocks | | | 1,105,343 | | | | — | | | | — | | | | 1,105,343 | | |
Short-Term Investments | |
Investments in Security Lending Collateral | | | — | | | | 2,284,564 | | | | — | | | | 2,284,564 | | |
Total | | $ | 241,958,429 | | | $ | 2,355,659 | | | $ | — | | | $ | 244,314,088 | | |
At December 31, 2021, Level 2 Common Stocks were priced based upon a fair value determination by the Valuation Committee.
Securities Transactions, Investment Income and Expenses
Securities transactions are recorded as of the trade date. Realized gains or losses from securities sold are recorded on the identified cost basis. Interest income is recorded on the accrual basis and consists of interest accrued and, if applicable, discount earned less premiums amortized. Dividend income is recorded on the ex-dividend date, except that certain dividends from foreign securities are recorded as soon as the Fund is informed of the ex-dividend date. Investment income is recorded net of foreign taxes withheld where the recovery of such taxes is uncertain. Non-cash dividends included in dividend income, if any, are recorded at the fair market value of the securities received. Expenses of the Corporation that can be directly attributed to a particular fund are charged to that Fund. Expenses that cannot be directly attributed are apportioned among Funds by the Corporation based on average net assets of each Fund.
79
M Fund, Inc.
NOTES TO FINANCIAL STATEMENTS (Continued)
1. Significant Accounting Policies (Continued)
Additionally, the Funds may invest in mutual funds, which are subject to management fees and other fees that may increase the costs of investing in mutual funds versus the costs of owning the underlying securities directly. These indirect expenses of mutual funds are not included in the amounts shown as expenses in the Funds' Statements of Operations or in the expense ratios included in the financial highlights.
Dividends and Distributions to Shareholders
Each Fund declares and pays dividends from net investment income, if any, and distributes net short-term capital gains, if any, on an annual basis. Each Fund also distributes, at least annually, substantially all of the long-term capital gains in excess of available capital losses, if any, which it realizes for each taxable year. Distributions are recorded on the ex-dividend date. Income distributions and capital gain distributions are determined in accordance with income tax regulations, which may differ from GAAP.
Securities Lending
The Funds participate in a securities lending program under the terms of a Securities Lending Agency Agreement with State Street Bank and Trust Company, which serves as the Funds' securities lending agent. Each Fund may loan its portfolio securities in an amount up to 33 1/3 of its total assets. The Funds receive cash (U.S. currency) and non-cash (U.S. Treasuries and Agencies) as collateral against the loaned securities. Cash collateral is invested by the securities lending agent in a money market mutual fund that meets the quality and diversification requirements in accordance with Rule 2a-7 under the 1940 Act. All collateral received will be in an amount at least equal to 102% (for loans of U.S. securities) or 105% (for loans of non-U.S. securities) of the market value of the loaned securities at the inception of each loan. The market value of the loaned securities is determined each day at the close of business of the Funds and any change in the amount of collateral is delivered to or paid by the Fund the next day. The collateral value does not include the calculated mark, which is the amount charged/returned to the borrower daily to maintain 102% or 105% of market value. There is a day lag in receiving the mark, which may at times result in a collateral percentage above or below 102% or 105%.
The collateral received is recorded on a lending Fund's statement of assets and liabilities, along with the related obligation to return the collateral. A Fund may also record realized gain or loss on securities deemed sold due to a borrower's inability to return securities on loan. Upon an event of default under the Securities Agency Lending Agreement, there is a risk of delay in the recovery of the securities or loss of rights in the collateral. If the borrower fails to return loaned securities and collateral is insufficient to cover the value of loaned securities (provided that the insufficiency is not due to investment losses), the securities lending agent has agreed, at its option, to pay the amount of any shortfall in collateral to the Funds; or to replace the securities. Any dividends or interest payable by the issuers of the loaned portfolio securities, during the time that the securities are on loan, are paid to the borrowers of those securities. Dividend or interest payments that are made to borrowers of the loaned securities are reimbursed by the borrowers to the Funds. Such reimbursement amounts do not comprise qualified dividend income under the Internal Revenue Code of 1986, as amended.
Income generated from the investment of collateral, less negotiated rebate fees paid to the borrower through the securities lending agent, is the source of the Fund's securities lending income, 70% of which is paid to the Fund, 30% of which is paid to the custodian as securities lending agent.
80
M Fund, Inc.
NOTES TO FINANCIAL STATEMENTS (Continued)
1. Significant Accounting Policies (Continued)
The following table presents financial instruments that are subject to enforceable netting arrangements as of December 31, 2021.
| | | Gross | | Gross
Amounts
Offset in the | | Net Amounts
of Assets
Presented
in the | | Gross Amount Not Offset
in the Statement
of Assets and Liabilities | | | |
Fund | | Amounts of
Recognized
Assets | | Statement
Assets
and Liabilities | | Statement
Assets
and Liabilities | | Financial
Instruments | | Cash
Collateral
Received | | Net
Amount | |
M International Equity Fund | | $ | 2,284,564 | | | $ | — | | | $ | 2,284,564 | | | $ | — | | | $ | 2,284,564 | | | $ | — | | |
M Capital Appreciation Fund | | | 1,490,305 | | | | — | | | | 1,490,305 | | | | — | | | | 1,490,305 | | | | — | | |
M Large Cap Value Fund | | | 79,900 | | | | — | | | | 79,900 | | | | — | | | | 79,900 | | | | — | | |
The following table presents the remaining contractual maturity of the Securities Lending Agency Agreement as of December 31, 2021.
Fund | | Security Type | | Overnight and
Continuous | | Up to 30
days | | 30-90
days | | Greater
Than 90
days | | Total | |
M International Equity Fund | | Common Stocks | | $ | 2,284,564 | | | $ | — | | | $ | — | | | $ | — | | | $ | 2,284,564 | | |
M Capital Appreciation Fund | | Common Stocks | | | 1,490,305 | | | | — | | | | — | | | | — | | | | 1,490,305 | | |
M Large Cap Value Fund | | Common Stocks | | | 79,900 | | | | — | | | | — | | | | — | | | | 79,900 | | |
In addition, the Funds received non-cash collateral in the form of U.S. Government obligations, which the Funds cannot sell or repledge, and accordingly are not reflected in the Schedules of Investments as follows:
Fund | | Value of Securities
Loaned with
Non-Cash Collateral | | Value of Non-Cash
Collateral | |
M International Equity Fund | | $ | 5,267,536 | | | $ | 5,585,235 | | |
M Capital Appreciation Fund | | | 1,883,636 | | | | 1,928,259 | | |
Federal Income Taxes
Each Fund intends to continue to qualify as a regulated investment company by complying with the requirements under Subchapter M of the Internal Revenue Code of 1986, as amended, applicable to regulated investment companies and by distributing substantially all of its earnings to its shareholders. Therefore, no provision for federal income or excise tax is necessary.
The Funds evaluate the Funds' tax positions to determine if the tax positions taken meet the minimum recognition threshold in connection with accounting for uncertainties in income tax positions taken or expected to be taken for the purposes of measuring and recognizing tax liabilities in the financial statements. Recognition of tax benefits of an uncertain tax position is permitted only to the extent the position is "more likely than not" to be sustained
81
M Fund, Inc.
NOTES TO FINANCIAL STATEMENTS (Continued)
1. Significant Accounting Policies (Continued)
assuming examination by taxing authorities. The Funds did not have any unrecognized tax benefits as of December 31, 2021, nor were there any increases or decreases in unrecognized tax benefits for the year then ended. The Funds recognize interest and penalties, if any, related to unrecognized tax benefits as an income tax expense in the Statements of Operations. During the year ended December 31, 2021, the Funds did not incur any such interest or penalties. The Funds' tax returns are subject to examination by U.S. federal and state tax authorities for returns filed for the prior three fiscal years, December 2018 through December 2020. No examination of any of the Funds' tax filings is currently in progress.
Significant Concentrations
The Funds maintain a demand deposit in excess of Federal Deposit Insurance Company ("FDIC") Insurance limits. As a result, the Fund is exposed to credit risk in the event of insolvency or other failure of the institution to meet its obligations. The Funds manage this risk by dealing with a major financial institution and monitoring its credit worthiness.
2. Advisory Fee and Other Transactions with Affiliates
The Corporation has entered into an investment advisory agreement (the "Advisory Agreement") with M Financial Investment Advisers, Inc. (the "Adviser"), a wholly-owned subsidiary of M Financial Group. The Advisory Agreement provides that the Funds will pay the Adviser a fee at an annual rate of the value of each Fund's average daily net assets as follows:
Fund | | Total Advisory Fees | |
M International Equity Fund | | For the period January 1, 2021 through | |
| | | February 28, 2021: | |
| | | 0.15% on all assets plus (and only with | |
| | | respect to Fund assets which are not invested | |
| | | in a mutual fund that is advised by the Fund's | |
| | | sub-adviser): | |
| | | 0.32% on the first $100 million | |
| | | 0.27% on the amounts thereafter | |
| | | For the period March 1, 2021 through | |
| | | December 31, 2021: | |
| | | 0.15% on all assets plus (and only with | |
| | | respect to Fund assets which are not invested | |
| | | in a mutual fund that is advised by the Fund's | |
| | | sub-adviser): | |
| | | 0.25% on the first $100 million | |
| | | 0.20% on the amounts thereafter | |
M Large Cap Growth Fund | | 0.65% of the first $50 million | |
| | | 0.60% of the next $50 million | |
| | | 0.55% on the amounts thereafter | |
82
M Fund, Inc.
NOTES TO FINANCIAL STATEMENTS (Continued)
2. Advisory Fee and Other Transactions with Affiliates (Continued)
Fund | | Total Advisory Fees | |
M Capital Appreciation Fund | | 0.90% on the first $125 million | |
| | | 0.80% on the amounts thereafter | |
M Large Cap Value Fund | | 0.43% | |
Prior to May 1, 2021 and for the period May 1, 2021 to April 30, 2022, the Adviser has contractually agreed to reimburse each Fund for any expenses (other than advisory fees, brokerage or other portfolio transaction expenses or expenses for litigation, indemnification, taxes or other extraordinary expenses) to the extent that such expenses exceed 0.25% of a Fund's annualized average daily net assets. For the year ended December 31, 2021, the Adviser reimbursed $32,474 of other expenses for the M International Equity Fund.
The Adviser has engaged Dimensional Fund Advisors LP, DSM Capital Partners LLC, Frontier Capital Management Company, LLC and Brandywine Global Investment Management, LLC to act as sub-advisers to provide day-to-day portfolio management for the M International Equity Fund, the M Large Cap Growth Fund, the M Capital Appreciation Fund and the M Large Cap Value Fund, respectively.
As compensation for their services, each sub-adviser receives a fee based on the average daily net assets of the applicable Fund at the following annual rates:
Fund | | Total Sub-Advisory Fees | |
M International Equity Fund | | For the period January 1, 2021 through | |
| | | February 28, 2021: | |
| | | 0.32% on the first $100 million | |
| | | 0.27% on the amounts thereafter | |
| | | For the period March 1, 2021 through | |
| | | December 31, 2021: | |
| | | 0.25% on the first $100 million | |
| | | 0.20% on the amounts thereafter | |
| | | Sub-adviser shall not receive any sub-
advisory fee for its sub-advisory services to
the M International Equity Fund with respect
to assets of the M International Equity Fund
invested in any other mutual fund advised by
the Sub-Adviser. | |
M Large Cap Growth Fund | | 0.50% on the first $50 million | |
| | | 0.45% on the next $50 million | |
| | | 0.40% on the amounts thereafter | |
M Capital Appreciation Fund | | 0.75% on the first $125 million | |
| | | 0.65% on the amounts thereafter | |
M Large Cap Value Fund | | 0.28% | |
83
M Fund, Inc.
NOTES TO FINANCIAL STATEMENTS (Continued)
2. Advisory Fee and Other Transactions with Affiliates (Continued)
The sub-advisory fees are paid by the Adviser out of the investment advisory fees disclosed above.
M Holdings Securities, Inc. acts as distributor (the "Distributor") for each of the Funds. The Distributor is a wholly-owned subsidiary of M Financial Group. No fees are charged by the Distributor for its services.
The Corporation pays no compensation to its officers. As of December 31, 2021, the Corporation pays each Non-Interested Director $1,500 per meeting attended. The Corporation pays each non-interested Director an annual retainer of $25,000. Each member of the Audit Committee and each member of the Nominating and Corporate Governance Committee receives $1,500 per meeting of the Audit Committee or Nominating and Corporate Governance Committee that he or she attends. The Chairman of the Board and Audit Committee Chair receive an additional $10,000 annually.
An affiliated company is a company in which a Fund has ownership of at least 5% of the voting securities or is under common management. The Company which is an affiliate of the M International Equity Fund as of December 31, 2021, is noted in the Fund's Schedule of Investments. During the year ended December 31, 2021, purchases and sales transactions, income earned from investments and shares held of investment companies managed by Dimensional Fund Advisors LP for the M International Equity Fund were as follows:
Affiliated Investment
Company | | Value,
Beginning
of Period | | Purchases
at Cost | | Proceeds
from Sales | | Net Realized
Gain
on Sales | | Change in
Unrealized
(Depreciation) | | Value,
End of
Period | | Dividend
Income | | Shares
End of
Period | |
DFA Emerging
Markets Core
Equity Portfolio | | $ | 64,116,944 | | | $ | 10,717,538 | | | $ | (6,001,162 | ) | | $ | 1,501,591 | | | $ | 459,821 | | | $ | 70,794,732 | | | $ | 1,756,590 | | | | 2,827,266 | | |
The DFA Emerging Markets Core Equity Portfolio is registered under the 1940 Act as an open-end management investment company. The M International Equity Fund may redeem its investment from the DFA Emerging Markets Core Equity Portfolio at any time if the Adviser determines that it is in the best interest of the M International Equity Fund and its shareholders to do so.
The performance of the M International Equity Fund will be directly affected by the performance of the DFA Emerging Markets Core Equity Portfolio. The financial statements of the DFA Emerging Markets Core Equity Portfolio, including the portfolio of investments, can be found at the Securities and Exchange Commission's website www.sec.gov and should be read in conjunction with the M International Equity Fund's financial statements. As of December 31, 2021, the percentage of M International Equity Fund net assets invested in the DFA Emerging Markets Core Equity Portfolio was 29.0%.
84
M Fund, Inc.
NOTES TO FINANCIAL STATEMENTS (Continued)
3. Purchases and Sales of Securities
Cost of purchases and proceeds from sales of investment securities, excluding short-term investments, for the year ended December 31, 2021, were as follows:
| | | Non-U.S.
Government Securities | |
| | | Purchases | | Sales | |
M International Equity Fund | | $ | 36,028,477 | | | $ | 20,425,655 | | |
M Large Cap Growth Fund | | | 83,103,635 | | | | 100,294,712 | | |
M Capital Appreciation Fund | | | 85,131,793 | | | | 103,509,643 | | |
M Large Cap Value Fund | | | 82,644,826 | | | | 73,834,385 | | |
4. Paid-in Capital
Changes in the capital shares outstanding were as follows:
| | | M International Equity Fund | | M Large Cap Growth Fund | |
| | | Year Ended
December 31,
2021 | | Year Ended
December 31,
2020 | | Year Ended
December 31,
2021 | | Year Ended
December 31,
2020 | |
Shares sold | | | 2,512,137 | | | | 1,612,840 | | | | 567,120 | | | | 495,406 | | |
Shares repurchased | | | (1,796,681 | ) | | | (1,871,283 | ) | | | (909,133 | ) | | | (1,441,807 | ) | |
Distributions reinvested | | | 401,110 | | | | 227,140 | | | | 1,353,645 | | | | 816,854 | | |
Net increase (decrease) | | | 1,116,566 | | | | (31,303 | ) | | | 1,011,632 | | | | (129,547 | ) | |
Fund Shares: | |
Beginning of year | | | 15,746,688 | | | | 15,777,991 | | | | 7,050,585 | | | | 7,180,132 | | |
End of year | | | 16,863,254 | | | | 15,746,688 | | | | 8,062,217 | | | | 7,050,585 | | |
| | | M Capital Appreciation Fund | | M Large Cap Value Fund | |
| | | Year Ended
December 31,
2021 | | Year Ended
December 31,
2020 | | Year Ended
December 31,
2021 | | Year Ended
December 31,
2020 | |
Shares sold | | | 695,986 | | | | 1,183,802 | | | | 1,673,572 | | | | 1,095,070 | | |
Shares repurchased | | | (1,273,756 | ) | | | (1,160,096 | ) | | | (1,177,618 | ) | | | (998,357 | ) | |
Distributions reinvested | | | 1,353,989 | | | | 186,379 | | | | 133,245 | | | | 241,561 | | |
Net increase | | | 776,219 | | | | 210,085 | | | | 629,199 | | | | 338,274 | | |
Fund Shares: | |
Beginning of year | | | 7,449,425 | | | | 7,239,340 | | | | 8,141,988 | | | | 7,803,714 | | |
End of year | | | 8,225,644 | | | | 7,449,425 | | | | 8,771,187 | | | | 8,141,988 | | |
85
M Fund, Inc.
NOTES TO FINANCIAL STATEMENTS (Continued)
Foreign Investments and Foreign Currency
Each of the Funds may invest in securities of companies that are organized under the laws of a foreign country and (i) are unlisted or listed primarily on a non-U.S. exchange; or (ii) are listed on a U.S. exchange or over-the-counter as a sponsored or unsponsored American Depositary Receipt ("foreign issuers"). M International Equity Fund may also invest in non-U.S. dollar denominated securities and securities of foreign issuers represented by European Depositary Receipts ("EDRs"), International Depositary Receipts ("IDRs") and Global Depositary Receipts ("GDRs"). The value of all assets and liabilities expressed in foreign currencies are translated into U.S. dollars at the exchange rates captured as of twelve noon Eastern Time each business day other than market holidays or early closures. Purchases and sales of investment securities, income receipts and expense payments are translated into U.S. dollars at the prevailing exchange rate on the respective dates of such transactions. Net realized foreign currency gains and losses result from changes in exchange rates, including foreign currency gains and losses between trade date and settlement date on investment securities transactions, foreign currency transactions and the difference between the amounts of interest and dividends recorded on the books of the Funds and the amount actually received. The portion of foreign currency gains and losses related to fluctuation in exchange rates between the initial trade date and subsequent sale trade date is included in realized gains and losses on investment transactions. M International Equity Fund does not isolate that portion of the results for changes in foreign currency exchange rates from the fluctuations arising from changes in market prices of securities held at year end.
Investments in non-U.S. dollar denominated securities or in the securities of foreign issuers may be affected by changes in currency rates, changes in foreign or U.S. laws or restrictions applicable to such investments and in exchange control regulations (e.g., currency blockage). Some foreign stock markets may have substantially less volume than, for example, the New York Stock Exchange, and securities of some foreign issuers may be less liquid than securities of comparable domestic issuers. Commissions and dealer mark-ups on transactions in foreign investments may be higher than for similar transactions in the United States. In addition, clearance and settlement procedures for such securities may be different in foreign countries and, in certain markets, on certain occasions such procedures have been unable to keep pace with the volume of securities transactions.
Foreign issuers are not generally subject to uniform accounting, auditing and financial reporting standards comparable to those applicable to domestic companies. There may be less publicly available information about a foreign issuer than about a domestic one. In addition, there is generally less government regulation of stock exchanges, brokers, and listed and unlisted issuers in foreign countries than in the United States. Furthermore, with respect to certain foreign countries, there is a possibility of expropriation or confiscatory taxation, imposition of withholding taxes on dividend or interest payments, limitations on the removal of funds or other assets of the Funds, or political or social instability or diplomatic developments which could affect investments in those countries. Individual foreign economies also may differ favorably or unfavorably from the United States economy in such respects as growth of gross national product, rate of inflation, capital reinvestment and resource self-sufficiency.
Because investment in foreign issuers will usually involve currencies of foreign countries, and because the Funds may be exposed to currency exposure independent of their securities positions, the value of the assets of the Funds invested in foreign issuers as measured in U.S. dollars will be affected by changes in foreign currency exchange rates. To the extent that a Fund's assets consist of investments denominated in a particular currency, the Fund is at risk of adverse developments affecting the value of such currency.
86
M Fund, Inc.
NOTES TO FINANCIAL STATEMENTS (Continued)
5. Financial Instruments (Continued)
Currency exchange rates may fluctuate significantly over short periods of time causing, along with other factors, a Fund's net asset value to fluctuate as well. Currency exchange rates generally are determined by the forces of supply and demand in the foreign exchange markets and the relative merits of investments in different countries, actual or anticipated changes in interest rates and other complex factors, as seen from an international perspective. Currency exchange rates also can be affected unpredictably by intervention by U.S. or foreign governments or central banks, or the failure to intervene, or by currency controls or political developments in the U.S. or abroad. To the extent that a substantial portion of a Fund's total assets, adjusted to reflect the Fund's net position after giving effect to currency transactions, is denominated in the currencies of foreign countries, the Fund will be more susceptible to the risk of adverse economic and political developments within those countries.
Risks Related to COVID-19 Pandemic
Beginning in January 2020, global financial markets experienced, and may continue to experience, significant volatility resulting from the spread of a virus known as COVID-19. The extent of the impact from the COVID-19 outbreak on the financial performance of the Funds continues to depend on developments, including duration and spread of the outbreak, related advisories and restrictions, and the impact of COVID-19 on the financial markets and the overall economy, all of which are highly uncertain and cannot be predicted. Adverse market conditions may be prolonged and may not have the same impact on all types of securities. These disruptions could prevent a Fund from executing advantageous investment decisions in a timely manner and could negatively impact the Fund's ability to achieve its investment objective. If the financial markets and/or the overall economy continue to be impacted for an extended period of time, the Funds' results of operations may be materially adversely affected.
6. Beneficial Interest
Shares of the Funds are owned by insurance companies through their separate accounts that are used primarily to fund variable annuity contracts and variable life insurance contracts. As of December 31, 2021 John Hancock Variable Life Insurance Co., Pacific Life Insurance Co., Pruco Life Insurance Co. of Arizona and Security Life of Denver (an indirect, wholly owned subsidiary of Voya Financial, Inc.) each owned 5% or more of the Funds' shares. John Hancock Variable Life Insurance Co. and Pacific Life Insurance Co. may each be deemed a control person of each Fund because their separate accounts hold more than 25% of the shares of each Fund.
As of December 31, 2021 the ownership of each Fund was as follows:
| | | Percentage of Ownership(1) | |
| | | John Hancock
Variable Life
Insurance Co. | | Pacific Life
Insurance Co. | | Pruco Life
Insurance Co.
Of Arizona | | Voya-Security
Life of
Denver | |
M International Equity Fund | | | 38.7 | % | | | 43.2 | % | | | 5.2 | % | | | 5.2 | % | |
M Large Cap Growth Fund | | | 51.8 | % | | | 32.0 | % | | | 6.2 | % | | | 1.4 | % | |
M Capital Appreciation Fund | | | 48.2 | % | | | 36.5 | % | | | 1.8 | % | | | 6.6 | % | |
M Large Cap Value Fund | | | 52.4 | % | | | 32.0 | % | | | 5.0 | % | | | 1.3 | % | |
(1) The balance of the Funds' shares are owned by shareholders with less than 5% beneficial interest.
87
M Fund, Inc.
NOTES TO FINANCIAL STATEMENTS (Continued)
At December 31, 2021, aggregated gross unrealized appreciation for investment securities in which there is an excess of value over tax cost and aggregate gross unrealized depreciation for investment securities in which there is an excess of tax cost over value were as follows:
| | | Federal
Income Tax
Cost | | Tax Basis
Unrealized
Appreciation | | Tax Basis
Unrealized
Depreciation | | Tax Basis
Net Unrealized
Appreciation/
Depreciation | |
M International Equity Fund | | $ | 196,112,696 | | | $ | 57,882,801 | | | $ | (9,681,410 | ) | | $ | 48,201,391 | | |
M Large Cap Growth Fund | | | 150,254,669 | | | | 121,506,360 | | | | (3,421,249 | ) | | | 118,085,111 | | |
M Capital Appreciation Fund | | | 151,435,218 | | | | 88,809,110 | | | | (9,701,505 | ) | | | 79,107,605 | | |
M Large Cap Value Fund | | | 102,994,307 | | | | 32,664,113 | | | | (984,797 | ) | | | 31,679,316 | | |
The tax character of distributions paid during 2021 and 2020 was as follows:
| | | December 31,
2021
Amount | | December 31,
2020
Amount | |
M International Equity Fund | |
Distributions paid from: | |
Ordinary Income | | $ | 5,778,411 | | | $ | 3,020,968 | | |
Return Of Capital | | | 9,041 | | | | — | | |
Total Distributions | | $ | 5,787,452 | | | $ | 3,020,968 | | |
M Large Cap Growth Fund | |
Distributions paid from: | |
Ordinary Income | | $ | 5,014,895 | | | $ | — | | |
Long-Term Capital Gain | | | 41,692,010 | | | | 26,882,948 | | |
Total Distributions | | $ | 46,706,905 | | | $ | 26,882,948 | | |
M Capital Appreciation Fund | |
Distributions paid from: | |
Ordinary Income | | $ | 3,387,174 | | | $ | — | | |
Long-Term Capital Gain | | | 35,228,687 | | | | 4,405,395 | | |
Total Distributions | | $ | 38,615,861 | | | $ | 4,405,395 | | |
M Large Cap Value Fund | |
Distributions paid from: | |
Ordinary Income | | $ | 2,053,448 | | | $ | 1,757,583 | | |
Long-Term Capital Gain | | | 808 | | | | 972,674 | | |
Total Distributions | | $ | 2,054,256 | | | $ | 2,730,257 | | |
88
M Fund, Inc.
NOTES TO FINANCIAL STATEMENTS (Continued)
7. Tax Information (Continued)
At December 31, 2021, the components of distributable earnings on a tax basis were as follows:
| | | Undistributed
Ordinary
Income | | Undistributed
Long-Term
Gain | | Capital Loss
Carryforwards | | Late Year
Ordinary and
Post October
Loss
Deferrals | | Unrealized
Appreciation/
Depreciation | | Total
Distributable
Earnings | |
M International
Equity Fund | | $ | — | | | $ | — | | | $ | (68,748,033 | ) | | $ | (39,151 | ) | | $ | 48,212,857 | | | $ | (20,574,327 | ) | |
M Large Cap
Growth Fund | | | 805,532 | | | | 5,968,044 | | | | — | | | | — | | | | 118,085,111 | | | | 124,858,687 | | |
M Capital Appreciation
Fund | | | — | | | | 5,154,265 | | | | — | | | | — | | | | 79,107,605 | | | | 84,261,870 | | |
M Large Cap
Value Fund | | | — | | | | 1,506,311 | | | | — | | | | — | | | | 31,679,316 | | | | 33,185,627 | | |
Net capital loss carryforwards may be applied against any net realized taxable gains in each succeeding year, or until their respective expirations dates, whichever occurs first. At December 31, 2021, M International Equity Fund had available, for federal tax purposes, unused short-term capital losses of $16,770,271 and unused long-term capital losses of $51,977,762 permitted to be carried for an unlimited period. In addition, at December 31, 2021 M International Equity Fund used capital loss carryforwards of $5,401,131.
M Large Cap Value Fund used capital loss carryforwards of $11,136,063.
Dividends and distributions from net investment income and net realized capital gains are determined in accordance with federal income tax regulations, which may differ from GAAP. These "book/tax" differences are considered either temporary or permanent in nature. To the extent these differences are permanent in nature, such amounts are reclassified within the capital accounts based on their federal tax-basis treatment. Temporary differences do not require reclassification.
During the year ended December 31, 2021, the Funds reclassified for book purposes, amounts arising from permanent book/tax difference primarily relating to realized foreign currency gains and losses, return of capital distributions from non-REIT securities, capital gain distributions from REITs, ordinary losses, partnerships and passive foreign investment company gains and losses.
8. Disclosure of Certain Commitments and Contingencies
In the normal course of business, the Corporation may enter into contracts and agreements that contain a variety of representations and warranties that provide general indemnifications. The maximum exposure to the Corporation under these arrangements is unknown, as it involves future claims that may be made against the Corporation that have not yet occurred. However, based on experience, the Corporation believes that the current risk of loss is remote.
9. Subsequent Events
The Funds have evaluated subsequent events through the date of issuance of the Funds' financial statements and have determined there is no material impact to the Funds' financial statements.
89
Report of Independent Registered Public Accounting Firm
To the Board of Directors of M Fund, Inc.
and the Shareholders of
M International Equity Fund,
M Large Cap Growth Fund,
M Capital Appreciation Fund and
M Large Cap Value Fund
Opinion on the Financial Statements
We have audited the accompanying statements of assets and liabilities of M International Equity Fund, M Large Cap Growth Fund, M Capital Appreciation Fund and M Large Cap Value Fund, each a series of shares of beneficial interest in M Fund, Inc. (the "Funds"), including the schedules of investments, as of December 31, 2021, and the related statements of operations for the year then ended, the statements of changes in net assets for each of the years in the two-year period then ended, the financial highlights for each of the years in the five-year period then ended, and the related notes (collectively referred to as the "financial statements"). In our opinion, the financial statements present fairly, in all material respects, the financial position of the Funds as of December 31, 2021, and the results of their operations for the year then ended, the changes in their net assets for each of the years in the two-year period then ended and their financial highlights for each of the years in the five-year period then ended, in conformity with accounting principles generally accepted in the United States of America.
Basis for Opinion
These financial statements are the responsibility of the Funds' management. Our responsibility is to express an opinion on the Funds' financial statements based on our audits. We are a public accounting firm registered with the Public Company Accounting Oversight Board (United States) ("PCAOB") and are required to be independent with respect to the Funds in accordance with the U.S. federal securities law and the applicable rules and regulations of the Securities and Exchange Commission and the PCAOB.
We conducted our audits in accordance with the standards of the PCAOB. Those standards require that we plan and perform the audits to obtain reasonable assurance about whether the financial statements are free of material misstatement, whether due to error or fraud. The Funds are not required to have, nor were we engaged to perform, an audit of their internal control over financial reporting. As part of our audits we are required to obtain an understanding of internal control over financial reporting but not for the purpose of expressing an opinion on the effectiveness of the Funds' internal control over financial reporting. Accordingly, we express no such opinion.
Our audits included performing procedures to assess the risk of material misstatement of the financial statements, whether due to error or fraud, and performing procedures that respond to those risks. Such procedures included examining, on a test basis, evidence regarding the amounts and disclosures in the financial statements. Our procedures included confirmation of securities owned as of December 31, 2021 by correspondence with the custodian, brokers, or by other appropriate auditing procedures where replies from brokers were not received. Our audits also included evaluating the accounting principles used and significant estimates made by management, as well as evaluating the overall presentation of the financial statements. We believe that our audits provide a reasonable basis for our opinion.

BBD, LLP
We have served as the auditor of one or more of the Funds in the M Fund, Inc. since 2008.
Philadelphia, Pennsylvania
February 22, 2022
90
M Fund, Inc.
SUPPLEMENTAL INFORMATION (Unaudited)
Shareholder Meeting Results
A Special Meeting of Shareholders of the Corporation (the "Shareholder Meeting") was held on September 21, 2021. The purpose of the Shareholder Meeting was to ask shareholders to approve the election of Directors. The results of the votes of the Shareholder Meeting are as set forth below.
M International Equity Fund
Director | | Votes cast
"for" | | Votes cast
"withheld" | |
Wayne Pierson | | | 15,220,134.530 | | | | 342,495.342 | | |
Bruce Madding | | | 15,222,941.920 | | | | 339,687.952 | | |
Nancy Crouse | | | 15,238,503.452 | | | | 324,126.420 | | |
Mary Zeven | | | 15,222,941.920 | | | | 339,687.952 | | |
Peter Mullin | | | 15,220,134.530 | | | | 342,495.342 | | |
Malcolm "Skip" Cowen II | | | 15,238,503.452 | | | | 324,126.420 | | |
James Kaplan | | | 15,238,503.452 | | | | 324,126.420 | | |
M Large Cap Growth Fund
Director | | Votes cast
"for" | | Votes cast
"withheld" | |
Wayne Pierson | | | 6,927,733.304 | | | | 12,599.669 | | |
Bruce Madding | | | 6,929,109.363 | | | | 11,223.610 | | |
Nancy Crouse | | | 6,929,109.363 | | | | 11,223.610 | | |
Mary Zeven | | | 6,929,109.363 | | | | 11,223.610 | | |
Peter Mullin | | | 6,927,733.304 | | | | 12,599.669 | | |
Malcolm "Skip" Cowen II | | | 6,929,109.363 | | | | 11,223.610 | | |
James Kaplan | | | 6,929,109.363 | | | | 11,223.610 | | |
M Capital Appreciation Fund
Director | | Votes cast
"for" | | Votes cast
"withheld" | |
Wayne Pierson | | | 6,756,523.017 | | | | 165,766.592 | | |
Bruce Madding | | | 6,757,255.708 | | | | 165,033.901 | | |
Nancy Crouse | | | 6,757,255.708 | | | | 165,033.901 | | |
Mary Zeven | | | 6,757,255.708 | | | | 165,033.901 | | |
Peter Mullin | | | 6,756,523.017 | | | | 165,766.592 | | |
Malcolm "Skip" Cowen II | | | 6,757,255.708 | | | | 165,033.901 | | |
James Kaplan | | | 6,757,255.708 | | | | 165,033.901 | | |
91
M Fund, Inc.
SUPPLEMENTAL INFORMATION (Unaudited) (Continued)
Shareholder Meeting Results (Continued)
M Large Cap Value Fund
Director | | Votes cast
"for" | | Votes cast
"withheld" | |
Wayne Pierson | | | 8,221,166.344 | | | | 127,833.481 | | |
Bruce Madding | | | 8,222,757.907 | | | | 126,241.918 | | |
Nancy Crouse | | | 8,222,757.907 | | | | 126,241.918 | | |
Mary Zeven | | | 8,222,757.907 | | | | 126,241.918 | | |
Peter Mullin | | | 8,221,166.344 | | | | 127,833.481 | | |
Malcolm "Skip" Cowen II | | | 8,222,757.907 | | | | 126,241.918 | | |
James Kaplan | | | 8,222,757.907 | | | | 126,241.918 | | |
92
M Fund, Inc.
SUPPLEMENTAL INFORMATION (Unaudited) (Continued)
Director's and Officer's Tables
Interested Directors:
Name, Address, and Age | | Position(s)
Held with
Fund | | Term of Office(1)
and Length of
Time Served | | Principal Occupation(s)
During Past 5 Years | | Number of
Portfolios
in Fund Complex
Overseen by
Director | | Other
Directorships
Held by
Director
for the Past 5
Years | |
Peter W. Mullin(2)
1125 NW Couch St.,
Suite 900
Portland, OR 97209
81 | | Director | | Indefinite 26 Years | | Chairman Emeritus, MullinTBG, Inc. (insurance agency), 2008 to 2021. Founding Chairman, Mullin, Barens, Sanford (life insurance & executive benefits), 2012 to present. | | | 4 | | | N/A | |
Malcolm L. "Skip" Cowen II(2)
1125 NW Couch St.,
Suite 900
Portland, OR 97209
62 | | Director | | Indefinite Since September 2021 | | President, Cornerstone Advisors Asset Management, LLC and Cornerstone Institutional Investors, LLC, 2002 to present. | | | 4 | | | M Financial Investment Advisers, Inc, 1999 to present; and Gettysburg College Board of Trustees, 2012 to present. | |
James "Jim" Kaplan(2)
1125 NW Couch St.,
Suite 900
Portland, OR 97209
60 | | Director | | Indefinite Since September 2021 | | Chief Executive Officer-KB Financial Companies, LLC-2016 to present; and Principal-KB Financial Partners, LLC-2009 to present. | | | 4 | | | M Financial Investment Advisers, Inc, 2021 to present; and M Financial Holdings, Inc., 2019 to present; M Life Insurance Company, 2019 to present; and The Mariano Rivera Foundation, April 2021 to present. | |
93
M Fund, Inc.
SUPPLEMENTAL INFORMATION (Unaudited) (Continued)
Director's and Officer's Tables (Continued)
(1) In accordance with the Corporation's current by-laws, each Director serves for an indefinite term until the date such Director resigns, retires or is removed by the Board of Directors or shareholders in accordance with the Corporation's Articles of Incorporation.
(2) Messrs. Mullin, Cowen, and Kaplan are deemed to be Interested Persons as defined by the 1940 Act, for the following reasons:
• Mr. Mullin has the power to vote 16.5% of the stock of M Financial Group, which controls the Adviser.
• Mr. Cowen is a Director of the Adviser.
• Mr. Kaplan is a Director of the Adviser and of M Financial Group.
94
M Fund, Inc.
SUPPLEMENTAL INFORMATION (Unaudited) (Continued)
Director's and Officer's Tables (Continued)
Independent Directors:
Name, Address, and Age | | Position(s)
Held with
Fund | | Term of Office(1)
and Length of
Time Served | | Principal Occupation(s)
During Past 5 Years | | Number of
Portfolios
in Fund Complex
Overseen by
Director | | Other
Directorships
Held by
Director
for the Past 5
Years | |
Wayne Pierson
1125 NW Couch St.,
Suite 900
Portland, OR 97209
71 | | Director, Chair of the Board and Nominating and Corporate Governance Committee Chair | | Indefinite
Nine Years | | President, Acorn Investors LLC (investment holding
company), 2005 to present; Principal, Clifford
Capital Partners LLC (investment manager), 2010 to present. | | | 4 | | | Director, Oaktree Capital Group,
2007 to 2019 (investment manager). | |
Bruce W. Madding
1125 NW Couch St.,
Suite 900
Portland, OR 97209
70 | | Director and Audit Committee Chair | | Indefinite
13 Years | | Retired. Chief Executive Officer, C.M.Capital Corp., 2010 to February 2021; Chief Investment Officer, C.M. Capital Corp., 2011 to 2018. | | | 4 | | | Vice-Chair and Director, C.M. Capital Corp., February 2021 to present. | |
Nancy Crouse
1125 NW Couch St.,
Suite 900
Portland, OR 97209
63 | | Director | | Indefinite
Two Years | | Retired. Senior Vice President and Portfolio Manager,
Nuveen Investments (investment manager), 2005 to 2016. | | | 4 | | | Director, Women's Economic Ventures (non-profit), 2016 to present; and Treasurer, Women's Economic Ventures (non-profit), 2018 to present. | |
Mary Moran Zeven
1125 NW Couch St.,
Suite 900
Portland, OR 97209
60 | | Director | | Indefinite
Two Years | | Director, Graduate Program in Banking and Financial Law, Boston University School of Law, 2019 to present; Senior Vice President and Senior Managing Counsel, State Street Bank and Trust Company (custodial bank), 2000 to 2019. | | | 4 | | | N/A | |
95
M Fund, Inc.
SUPPLEMENTAL INFORMATION (Unaudited) (Continued)
Director's and Officer's Tables (Continued)
(1) In accordance with the Corporation's current by-laws, each Director serves for an indefinite term until the date such Director resigns, retires or is removed by the Board of Directors or shareholders in accordance with the Corporation's Articles of Incorporation
96
M Fund, Inc.
SUPPLEMENTAL INFORMATION (Unaudited) (Continued)
Director's and Officer's Tables (Continued)
The Officers of the Corporation are listed below together with their respective positions with the Corporation, their principal occupations during the past five years and any positions held with affiliates of the Corporation:
Name, Address and Age | | Position(s)
Held with the
Fund | | Term of Office
and Length of
Time Served | | Principal Occupation(s)
During Past 5 Years | |
Bridget McNamara-Fenesy
125 NW Couch St., Suite 900
Portland, OR 97209
63 | | President | | One Year
Five Years | | President and CEO, M Securities Holdings, Inc. 2017 to present; President, M Financial Investment Advisers, Inc., 2016 to present; Vice President, M Holdings Securities, Inc. 2016 to 2017; Interim Chief Compliance Officer, M Holdings Securities, Inc., March 2016 to September 2016; and President, Two Gaits Consulting 2001 to 2016. | |
Valerie Pimenta
1125 NW Couch St.,
Suite 900
Portland, OR 97209
44 | | Vice President | | One Year
Four Years | | Vice President and Chief Operation Officer, M Holdings Securities, Inc., 2017 to present; Vice President, M Financial Investment Advisers, Inc., 2018 to present; and Vice President of Legal and Compliance, Fisher Investments, 2002 to 2017. | |
David Lees
1125 NW Couch St.,
Suite 900
Portland, OR 97209
56 | | Secretary
and Treasurer | | One Year
15 Years | | Accounting Director, M Financial Group, 1999 to present; Secretary and Treasurer, M Financial Investment Advisers, Inc., 2007 to present; Secretary and Treasurer, M Financial Asset Management, Inc., 2016 to present. | |
97
M Fund, Inc.
SUPPLEMENTAL INFORMATION (Unaudited) (Continued)
Schedules of Portfolio Holdings
The Funds file their complete schedules of portfolio holdings with the SEC for the first and third quarters of each fiscal year on Form N-PORT. The Funds' Form N-PORT is available on the Corporation's website at www.mfin.com/m-funds and on the SEC's website at www.sec.gov. The Funds' Form N-PORT may also be reviewed and copied at the SEC's Public Reference Room in Washington, D.C., and information on the operation of the Public Reference Room may be obtained by calling 1-800-SEC-0330.
Proxy Voting Policies and Procedures and Proxy Voting Record
A description of the Corporation's proxy voting policies and procedures and the Corporation's proxy voting record for the most recent twelve-month period ending June 30 are available (1) without charge, upon request, by calling the Corporation toll-free at 1-888-736-2878; and (2) on Form N-PX on the SEC's website at www.sec.gov.
Tax Disclosures
For corporate shareholders, a portion of the ordinary dividends paid during the Fund's year ended December 31, 2021 qualified for the dividends received deduction as follows.
Fund | | Dividend Received
Deduction | |
M International Equity Fund | | | 0.01 | % | |
M Large Cap Growth Fund | | | 13.65 | % | |
M Capital Appreciation Fund | | | 25.33 | % | |
M Large Cap Value Fund | | | 100.00 | % | |
Pursuant to Internal Revenue Section 852(b), M Large Cap Growth Fund, M Capital Appreciation Fund and M Large Cap Value Fund paid $41,692,010, $35,228,687 and $808, respectively, which have been designated as capital gains distributions for the fiscal year ended December 31, 2021.
M International Equity Fund
In accordance with federal tax law, the Fund elects to provide each shareholder with their portion of the Fund's foreign taxes paid and the income sourced from foreign securities. Accordingly, the Fund made the following designations regarding its fiscal year ended December 31, 2021:
• the total amount of foreign taxes creditable was $297,734
• the total amount of income sourced from foreign countries was $5,006,935
98
M Fund, Inc.
SUPPLEMENTAL INFORMATION (Unaudited) (Continued)
ANNUAL REPORT OF LIQUIDITY RISK MANAGEMENT PROGRAM ADMINISTRATOR
Rule 22e-4 of the 1940 Act (the "Rule") requires that the Liquidity Risk Management Program Administrator (the "LPA") for the Fund periodically, but no less frequently than annually, review and provide the Board a written report that assesses the adequacy of the Liquidity Risk Management Program (the "Program") and the effectiveness of its implementation including, if applicable, the operation of the Highly Liquid Investment Minimum (the "HLIM") for each Fund and any material changes to the Program.
At a meeting of the Board held on November 18, 2021 the LPA presented and the Board reviewed a written report covering the period October 1, 2020 through September 30, 2021 (the "Review Period"). The LPA conducted various liquidity risk assessments during the Review Period, including an annual Liquidity Needs Assessment ("LNA") of each Fund as of June 30, 2021 to assess the liquidity risk of each Fund and assist in the determination as to whether any material changes should be made to the components of the Program. The following factors were reviewed by the LPA in its assessment of each Fund's liquidity risk and evaluation on the adequacy of the Program: (i) investment strategy, portfolio concentration and the liquidity of portfolio investments; (ii) holdings of cash and cash equivalents; (iii) short-term and long-term cash flows; (iv) redemption volatility and stressed conditions; and (v) other funding sources.
Liquidity Risk Assessment
1.) Investment Strategy and Liquidity of Portfolio Investments
The LPA evaluated each Fund's investment objective and portfolio strategy, including portfolio concentration, liquidity classifications and any known or identifiable risks to liquidity. For all Funds, other than M Large Cap Growth Fund, the LPA noted that the Funds were highly diversified with relatively low concentration of holdings. The M Large Cap Growth Fund's investment strategy is to hold between 25 and 35 equity securities and as a result is highly concentrated. However, the LPA recognized that the M Large Cap Growth Fund holds larger capitalization, highly liquid securities where daily trading volumes appear adequate for the Fund to dispose of holdings in a fast and efficient manner in order to meet redemptions if necessary.
Each Fund's portfolio liquidity was monitored by the Funds' Chief Compliance Officer (the "CCO"). Liquidity classifications for each security holding were provided to the CCO by the Funds' administrator, State Street Bank and Trust Company ("State Street Bank"), using its TruView analytics system on a monthly basis. Each Fund held at least 99.9% of its investments in Highly Liquid Investments during the Review Period. As a result, all Funds met the 15% limit on Illiquid Securities during the Review Period. No material liquidity risks were identified by the LPA during the Review Period relating to each Fund's investment strategy, portfolio concentration or portfolio liquidity. The LPA reasonably expects these trends to continue and believes that each Fund's investment strategy is appropriate and manageable for an open-end fund during both normal and stressed market conditions.
2.) Holdings of Cash and Cash Equivalents
All Funds are primarily invested in securities and hold a low percentage of their assets in cash and cash equivalents. In addition, the Funds do not maintain any type of borrowing arrangement or credit facility. It is the Funds' investment adviser's belief that based upon the high liquidity of each Fund's portfolio and that historical redemption activity was not material from a liquidity perspective for any Fund, a line of credit or other borrowing arrangements
99
M Fund, Inc.
SUPPLEMENTAL INFORMATION (Unaudited) (Continued)
are not necessary. The LPA did not identify any material liquidity risks during the Review Period with respect to holdings of cash and cash equivalents.
3.) Short-Term and Long-Term Cash Flows and Redemption Volatility and Stressed Conditions
To meet various obligations under the variable annuity or variable life insurance contracts, insurance company separate accounts may redeem Fund shares to generate cash. Proceeds from the redemptions are usually sent to the separate account on the next business day. The Funds may suspend redemptions of shares or postpone payment dates when the New York Stock Exchange ("NYSE") is closed (other than weekends or holidays), when trading on the NYSE is restricted, or as otherwise permitted by the SEC.
The LPA reviewed historical subscription and redemption activity for each Fund. The LPA found that redemption activity was not material from a liquidity perspective for any Fund during either normal or stressed market conditions. The LPA also reviewed shareholder concentration, noting that Fund ownership is highly concentrated amongst approximately 10 insurance carriers. Shares are held in omnibus accounts, which means that Fund ownership is spread out amongst a larger number of underlying contract owners that beneficially own Fund shares. This reduces the risk of larger redemptions in shorter timeframes, which has provided the Funds with stable cash flow and lower redemption volatility over the Review Period.
Since cash flows do not appear to be significant during normal or stressed conditions and the shareholder base of each Fund appears stable, the LPA did not identify any material liquidity risks during the Review Period.
4.) Other Funding Sources
The Funds currently do not have any borrowing or other credit arrangements, nor have they utilized cross transactions, all of which could provide additional liquidity. The LPA believes that these factors do not appear to cause any liquidity concerns given each Fund's highly liquid portfolio and stable cash flow history.
Program Management
The Program allows the LPA to delegate certain responsibilities and engage one or more third parties to assist with its implementation, subject in each case to the appropriate oversight by the LPA. The LPA still maintains the responsibility of overseeing and supervising any person that has been delegated liquidity risk management responsibilities under the Program.
The LPA has delegated certain responsibilities under the Program to the CCO. On a monthly basis, State Street Bank provides the CCO with liquidity reports that characterize each Fund's holdings into one of four liquidity categories. Liquidity reports are generated by State Street Bank using the liquidity analytics system, TruView. The CCO reports any issues or concerns to the LPA. No material issues were reported to the LPA during the Review Period.
Quarterly, the LPA conducts a formal meeting in order to review the Program. The CCO provides the LPA with a summary of the results from his monitoring of the Program, including liquidity classifications, compliance with the 15% Illiquid Securities Limit, an evaluation of the effectiveness of State Street Bank's responsibilities under the Program, and a determination of whether the Program has operated effectively and whether the Funds have met the
100
M Fund, Inc.
SUPPLEMENTAL INFORMATION (Unaudited) (Continued)
applicable requirements under the Rule and the Program. All minutes of the LPA meetings are provided to the Board. The CCO reported no material issues to the LPA during the quarterly meetings within the Review Period.
At least annually, the CCO provides the LPA with a Liquidity Needs Assessment in order to assess each Fund's Liquidity Risk and evaluate whether any material changes are needed to the Program. The results of the Liquidity Needs Assessments were addressed earlier in this report.
The Program's administration process, as outlined above, appears to be functioning effectively in all material respects and no changes are recommended at this time.
Highly Liquid Investment Minimum
Although the Rule requires the LPA to determine a HLIM for each Fund, the LPA has determined that each Fund qualifies as an Excluded Fund (as defined in the Program). The SEC in its guidance has suggested that a HLIM would not be required if a Fund, under normal circumstances, primarily holds at least 50% of its assets in Highly Liquid Investments. The LPA has determined that all Funds within the Review Period were considered to primarily hold at least 50% of their assets in this category and that all Funds will continue to be excluded from determining a HLIM.
Conclusion
There were no material changes to the Program during the Review Period. No significant liquidity events impacting any Funds were noted during the Review Period. It is the LPA's assessment that the Program is adequately designed and has been effective in managing each Fund's liquidity risk and in implementing the requirements of the Rule.
101
M Fund, Inc.
HYPOTHETICAL EXPENSE EXAMPLE (Unaudited)
As an indirect shareholder of a Fund, you incur ongoing costs, including management fees and other Fund expenses. The following example is intended to help you understand your ongoing costs (in dollars and cents) of investing in a Fund and to compare these costs with the ongoing costs of investing in other mutual funds.
The example is based on an investment of $1,000 invested at the beginning of the period and held for the entire period from July 1, 2021 to December 31, 2021.
Actual Expenses
The first line under each Fund in the table below provides information about actual account values and actual expenses. You may use the information in this line, together with the amount you invested, to estimate the expenses that you paid over the period. Simply divide your account value by $1,000 (for example, an $8,600 account value divided by $1,000 = 8.6), then multiply the result by the number in the first line for your Fund under the heading entitled "Expenses Paid During Period" to estimate the expenses you paid on your account during this period.
Hypothetical Example for Comparison Purposes
The second line under each Fund in the table below provides information about hypothetical account values and hypothetical expenses based on the Fund's actual expense ratio and an assumed rate of return of 5% per year before expenses, which is not the Fund's actual return. The hypothetical account values and expenses may not be used to estimate the actual ending account balance or expenses you paid for the period. You may use this information to compare the ongoing costs of investing in your Fund and other funds. To do so, compare this 5% hypothetical example with the 5% hypothetical examples that appear in the shareholder reports of the other funds.
Please note that the expenses shown in the table are meant to highlight your ongoing Fund costs only. As an indirect shareholder of a Fund, you do not incur any transactional costs, such as sales charges (loads), redemption fees or exchange fees. However, you do incur such transactional costs, as well as other fees and charges as an owner of a variable annuity contract or variable life insurance policy. If these transactional and other insurance company fees and charges were included, your costs would have been higher. Therefore, the second line under each Fund in the table is useful in comparing ongoing Fund costs only, and will not help you determine the relative total costs of owning different variable annuities or variable life insurance policies.
102
M Fund, Inc.
HYPOTHETICAL EXPENSE EXAMPLE (Unaudited) (Continued)
| | | Beginning
Account Value
July 1, 2021 | | Ending
Account Value
December 31,
2021 | | Annualized
Expense
Ratio | | Expenses
Paid During
Period*
(July 1, 2021 to
December 31, 2021) | |
M International Equity Fund | |
Actual | | $ | 1,000.00 | | | $ | 996.70 | | | | 0.57 | % | | $ | 2.87 | | |
Hypothetical (5% return before expenses) | | | 1,000.00 | | | | 1,022.30 | | | | 0.57 | % | | | 2.91 | | |
M Large Cap Growth Fund | |
Actual | | $ | 1,000.00 | | | $ | 1,042.40 | | | | 0.74 | % | | $ | 3.81 | | |
Hypothetical (5% return before expenses) | | | 1,000.00 | | | | 1,021.50 | | | | 0.74 | % | | | 3.77 | | |
M Capital Appreciation Fund | |
Actual | | $ | 1,000.00 | | | $ | 1,030.40 | | | | 1.06 | % | | $ | 5.42 | | |
Hypothetical (5% return before expenses) | | | 1,000.00 | | | | 1,019.90 | | | | 1.06 | % | | | 5.40 | | |
M Large Cap Value Fund | |
Actual | | $ | 1,000.00 | | | $ | 1,066.60 | | | | 0.66 | % | | $ | 3.44 | | |
Hypothetical (5% return before expenses) | | | 1,000.00 | | | | 1,021.90 | | | | 0.66 | % | | | 3.36 | | |
* Expenses are calculated using each Fund's annualized expense ratio (as disclosed in the table), multiplied by the average account value for the period, multiplied by the number of days in the period (184 days), and divided by the number of days in the year (365 days). In addition to the fees and expenses which the Fund bears directly, it also indirectly bears a pro-rata share of the fees and expenses of the underlying fund in which it invests. Such indirect expenses are not included in the above expense ratios.
103
Item 2. Code of Ethics.
As of December 31, 2021, the Registrant has adopted a code of ethics that applies to the Registrant’s President/Principal Executive Officer and Treasurer/Principal Financial and Accounting Officer. For the year ended December 31, 2021, there were no amendments to a provision of its code of ethics, nor were there any waivers (including implicit waivers) granted from a provision of the code of ethics. A copy of the registrant’s code of ethics is filed with this Form N-CSR under Item 13(a)(1).
Item 3. Audit Committee Financial Expert.
The Registrant’s Board of Directors has determined that the Registrant has two audit committee financial experts serving on its audit committee. The audit committee financial experts serving on the Registrant’s audit committee are Bruce W. Madding and Wayne Pierson, who are “independent” as defined in Item 3 of Form N-CSR. Mr. Madding serves as the Chairman of the Registrant’s audit committee.
Item 4. Principal Accountant Fees and Services.
BBD, LLP served as the principal accountant for the Registrant for the fiscal years ended December 31, 2020 and December 31, 2021.
| (a) | AUDIT FEES: The aggregate fees billed for professional services rendered by its principal accountant, BBD, LLP for the audit of the Registrant’s annual financial statements for the fiscal years ended December 31, 2020 and December 31, 2021 were $86,500 and $88,000, respectively. |
| (b) | AUDIT RELATED FEES: No such fees were billed to the Registrant by BBD, LLP for the fiscal years ended December 31, 2020 and December 31, 2021. |
| (c) | TAX FEES: The aggregate fees billed for professional services rendered by BBD, LLP for tax compliance, tax advice, and tax planning for the fiscal years ended December 31, 2020 and December 31, 2021 were $10,500 and $12,500, respectively. Such services included the review of the Fund’s tax and excise returns. |
| (d) | ALL OTHER FEES: No such fees were billed to the Registrant by BBD, LLP for the fiscal years ended December 31, 2020 and December 31, 2021. |
| (e) | (1) The Registrant’s audit committee pre-approves all audit and non-audit services to be performed by the Registrant’s accountant before the accountant is engaged by the Registrant to perform such services. |
| | | |
| | | (2) The percentage of services described in each of paragraphs (b) through (d) of this Item that were approved by the audit committee pursuant to paragraph (c)(7)(i)(C) of Rule 2-01 of Regulation S-X are as follows: |
(b) Not applicable
(c) 100%
(d) Not applicable
| (g) | The aggregate fees billed by the Registrant’s principal accountant, BBD, LLP, for non-audit services rendered to the Registrant, the Registrant’s investment adviser (not including any sub-adviser whose role is primarily portfolio management and is subcontracted with or overseen by another investment adviser), and any entities controlling, controlled by, or under common control with the Registrant’s investment adviser that provides ongoing services to the Registrant for the fiscal years ended December 31, 2020 and December 31, 2021 were $10,500 and $12,500, respectively. |
Item 5. Audit Committee of Listed Registrants.
Not applicable.
Item 6. Investments.
| (a) | A schedule of investments is contained in the Registrant’s annual report, which is attached to this report in response to Item 1. |
Item 7. Disclosure of Proxy Voting Policies and Procedures for Closed-End Management Investment Companies.
Not applicable.
Item 8. Portfolio Managers of Closed-End Management Investment Companies.
Not applicable.
Item 9. Purchases of Equity Securities by Closed-End Management Investment Company and Affiliated Purchasers.
Not applicable.
Item 10. Submission of Matters to a Vote of Security Holders.
Not applicable.
Item 11. Controls and Procedures.
(a) The Registrant's Principal Executive Officer and Principal Financial Officer concluded that the Registrant's disclosure controls and procedures (as defined in Rule 30a-3(c) under the 1940 Act (17 CFR 270.30a-3(c))) were effective as of a date within 90 days prior to the filing date of this report (the "Evaluation Date"), based on their evaluation of the effectiveness of the Registrant's disclosure controls and procedures required by Rule 30a-3(b) under the 1940 Act (17 CFR 270.30a-3(b)) and Rules 13a-15(b) or 15d-15(b) under the Securities Exchange Act of 1934 (17 CFR 240.13a-15(b) or 240.15d-15(b)) (the “1934 Act”) as of the Evaluation Date.
(b) There were no changes in the Registrant’s internal control over financial reporting (as defined in Rule 30a-3(d) under the 1940 Act (17 CFR 270.30a-3(d)) that occurred during the period covered by this report that has materially affected, or is reasonably likely to materially affect, the Registrant’s internal control over financial reporting.
Item 12. Disclosure of Securities Lending Activities for Closed-End Management Investment Companies.
Not applicable.
Item 13. Exhibits.
(a)(1) Code of Ethics as described in Item 2 is attached hereto as Exhibit 13(a)(1).
(a)(2) Certifications of Principal Executive Officer and Principal Financial Officer of the Registrant as required by Rule 30a-2(a) under the 1940 Act (17 CFR 270.30a-2(a)) is attached hereto as Exhibit 13(a)(2).
(a)(3) Not applicable to this filing.
(a)(4) Not applicable.
(b) Certification pursuant to Section 906 of the Sarbanes-Oxley Act of 2002 as required by Rule 30a-2(b), under the 1940 Act (17 CFR 270.30a-2(b)), Rule 13a-14(b) or Rule 15d-14(b) under the Securities Exchange Act of 1934 (17 CFR 240.13a – 14(b) or 240.15d-14(b)) and Section 1350 of Chapter 63 of Title 18 of the United States Code (18 U.S.C. 1350) is attached hereto as Exhibit 13(b).
SIGNATURES
Pursuant to the requirements of the Securities Exchange Act of 1934 and the Investment Company Act of 1940, the registrant has duly caused this report to be signed on its behalf by the undersigned, thereunto duly authorized. |
| | M Fund, Inc. | |
| | | |
| | By: | /s/ Bridget McNamara-Fenesy | |
| | | Bridget McNamara-Fenesy | |
| | | President/Principal Executive Officer | |
| Date: | March 8, 2022 | |
| | |
Pursuant to the requirements of the Securities Exchange Act of 1934 and the Investment Company Act of 1940, this report has been signed below by the following persons on behalf of the registrant and in the capacities and on the dates indicated. |
| | By: | /s/ Bridget McNamara-Fenesy | |
| | | Bridget McNamara-Fenesy | |
| | | President/Principal Executive Officer | |
| | | |
| | Date: March 8, 2022 | |
| | | |
| | By: | /s/ David Lees | |
| | | David Lees | |
| | | Treasurer/Principal Financial | |
| | | and Accounting Officer | |
Date: March 8, 2022