UNITED STATES
SECURITIES AND EXCHANGE COMMISSION
Washington, D.C. 20549
FORM N-CSR
CERTIFIED SHAREHOLDER REPORT OF REGISTERED
MANAGEMENT INVESTMENT COMPANIES
Investment Company Act file number | 811-9082 |
|
M Fund, Inc. |
(Exact name of registrant as specified in charter) |
|
M Financial Plaza 1125 NW Couch Street, Suite 900 Portland, Oregon | | 97209 |
(Address of principal executive offices) | | (Zip code) |
|
Bridget McNamara-Fenesy, President, M Fund, Inc. M Financial Plaza, 1125 NW Couch Street, Suite 900 Portland, Oregon 97209 |
(Name and address of agent for service) |
|
with a Copy to: Cynthia Beyea Eversheds Sutherland LLP 700 Sixth Street, N.W. Washington, D.C. 20001-3980 |
|
Registrant’s telephone number, including area code: | (503) 232-6960 | |
|
Date of fiscal year end: | 12/31 | |
|
Date of reporting period: | 12/31/2019 | |
| | | | | | | | |
Item 1. Reports to Stockholders.
The annual report for the period January 1, 2019 through December 31, 2019 is filed herewith.
M FUND, INC.
M International Equity Fund
M Large Cap Growth Fund
M Capital Appreciation Fund
M Large Cap Value Fund
Annual Report
December 31, 2019

Beginning in February 2021, as permitted by regulations adopted by the Securities and Exchange Commission, paper copies of the Funds' shareholder reports like this one will no longer be sent by mail, unless you specifically request paper copies of the reports from the Funds or from your financial intermediary, such as a broker-dealer or bank. Instead, the reports will be made available on a website, and you will be notified by mail each time a report is posted and provided with a website link to access the report.
If you already elected to receive shareholder reports electronically, you will not be affected by this change and you need not take any action. You may elect to receive shareholder reports and other communications from the Funds electronically by calling your insurance company. If you own these shares through a financial intermediary, you may contact your financial intermediary.
You may elect to receive all future reports in paper free of charge. You can inform the Funds that you wish to continue receiving paper copies of your shareholder reports by sending a request in writing to your insurance company or to your financial intermediary. Your election to receive reports in paper will apply to all funds held with the fund complex.
M Fund, Inc.
PRESIDENT'S LETTER
Dear Contract Owners:
We are pleased to share the financial condition of M Fund, Inc. (the "Corporation") as presented in the following Annual Report dated December 31, 2019. Total assets under management at year end 2019 were $687.9 million.
Sub-Advisers to the portfolios, under the direction of M Financial Investment Advisers, Inc., the investment adviser to the Corporation, have prepared the attached discussion of results for each portfolio of the Corporation for the year ended December 31, 2019.
Sub-Advisers to the portfolios of the Corporation are: DFA LP for the M International Equity Fund, DSM Capital Partners LLC for the M Large Cap Growth Fund, Frontier Capital Management Company, LLC for the M Capital Appreciation Fund and AJO, LP for the M Large Cap Value Fund.
On behalf of the Corporation's Board of Directors, M Financial Investment Advisers, Inc. and the Corporation's participating insurance carriers, we thank you for your business and remain committed to providing opportunities that add value to our investors in the upcoming year.
Sincerely,
BRIDGET MCNAMARA-FENESY
President
M Fund, Inc.
M INTERNATIONAL EQUITY FUND
Performance
For the twelve months ended December 31, 2019, the M International Equity Fund had a return of 20.3% (net of all fees) versus a total return (including reinvestment of dividends) of 21.5% for its benchmark, the MSCI ACWI (All Country World Index) ex USA Index1.
Market Environment/Conditions
In US dollar terms, global ex US equity markets returned +21.6%, as reflected by the MSCI All Country World ex USA IMI (net dividends), for the year. Developed ex US markets returned +22.9% as measured by the MSCI World ex USA IMI (net dividends) and emerging markets returned +17.6% as measured by the MSCI Emerging Markets IMI (net dividends).
Some currencies, like the Canadian dollar and the British pound, appreciated relative to the US dollar, while others, like the euro, depreciated. Overall, currency movements had a positive impact on the US dollar-denominated returns of the global equity market.
Theoretical and empirical research suggests that investors can systematically pursue higher expected returns by targeting the size, relative price, and profitability dimensions in equity markets. Dimensional Fund Advisors integrates these dimensions to emphasize stocks with smaller market capitalizations, lower relative prices, and higher profitability.
Along the market capitalization dimension, small caps (MSCI All Country World ex USA Small Cap Index, net dividends) outperformed large caps (MSCI All Country World ex USA Index, net dividends) by 0.9% for the year. Mid-caps (MSCI All Country World ex USA Mid Cap Index, net dividends), a subset of the MSCI All Country World ex USA Index universe, underperformed small caps by 0.1% and outperformed large caps by 0.8%.
Along the relative price dimension, large cap value stocks (MSCI All Country World ex USA Value Index, net dividends) underperformed large cap growth stocks (MSCI All Country World ex USA Growth Index, net dividends) by 11.6%, and small cap value stocks (MSCI All Country World ex USA Small Cap Value Index, net dividends) underperformed small cap growth stocks (MSCI All Country World ex USA Small Cap Growth Index, net dividends) by 4.3%.
Among both large and small caps, stocks with higher profitability outperformed stocks with lower profitability.
Performance of the premiums may vary depending on the particular segment of the market under analysis.
Fund Review/Current Positioning
The M International Equity Fund underperformed the MSCI ACWI (All Country World Index) ex USA Index (net dividends) by 1.2% for the period.
With low relative price (value) stocks underperforming high relative price (growth) stocks in developed ex US and emerging markets for the period, the Fund's greater emphasis on value stocks detracted from performance relative to the benchmark. Conversely, the Fund's inclusion of and emphasis on small cap stocks had a positive impact on performance relative to the benchmark (which is composed primarily of large and mid-cap stocks), as small caps outperformed large caps in developed ex US markets.
2
Dimensional Fund Advisors LP
Investment Sub-Adviser to the M International Equity Fund
Performance represented is net of fees. The foregoing reflects the thoughts and opinions of Dimensional Fund Advisors LP exclusively and is subject to change without notice. The information provided in this material should not be considered a recommendation to purchase or sell any particular security. It should not be assumed that any security transactions, holdings, or sectors discussed were or will be profitable, or that the investment recommendations or decisions we make in the future will be profitable or will equal the investment performance discussed herein. Strategies discussed are subject to change at any time by the investment manager in its discretion due to market conditions or opportunities. Market conditions may impact performance. The performance results presented were achieved in particular market conditions which may not be repeated. Moreover, the current market volatility and uncertain regulatory environment may have a negative impact on future performance. Portfolio characteristics are as of December 31, 2019. Please note that all indices are unmanaged and are not available for direct investment.
The views expressed above are not guarantees of future performance or economic results and involve certain risks, uncertainties and assumptions that could cause actual outcomes and results to differ materially from the views expressed herein. The views expressed above are subject to change at any time based upon economic, market, or other conditions and the subadvisory firm undertakes no obligation to update the views expressed herein. Any discussions of specific securities should not be considered a recommendation to buy or sell those securities. The views expressed above (including any forward-looking statement) may not be relied upon as investment advice or as an indication of the Fund's trading intent. Information about the Fund's holdings, asset allocation or country diversification is historical and is not an indication of future Fund composition, which may vary. Direct investment in any index is not possible. The performance of any index mentioned in this commentary has not been adjusted for ongoing management, distribution and operating expenses, and sales charges applicable to mutual fund investments. In addition, the returns do not reflect additional fees charged by separate accounts or variable insurance contracts that an investor in the Fund may pay. If these additional fees were reflected, performance would have been lower.
3
COMPARISON OF CHANGE IN VALUE OF $10,000 INVESTMENT IN
THE M INTERNATIONAL EQUITY FUND, MSCI AC WORLD ex USA

The M International Equity Fund's total return is calculated net of Investment Advisory Fees and operating expenses. Performance figures represent past performance and are not indicative of future performance of the M International Equity Fund or Index. Share value will fluctuate so that an investor's shares, when redeemed, may be worth more or less than the original investment. Please note that all indices are unmanaged, do not incur expenses, and are not available for direct investment. Persons who invest in the M International Equity Fund through a variable annuity or variable life insurance contract should note this graph does not reflect separate account expenses deducted by the insurance company.
* 12/31/09 to 12/31/19
+ MSCI EAFE—Effective May 1, 2014, the Fund changed its benchmark index from the MSCI EAFE Index to the MSCI AC World ex US Index. The MSCI AC World ex US Index is more representative of the Fund's investment portfolio than its previous index.
MSCI ACWI (ALL COUNTRY WORLD INDEX) ex US INDEX
1 The MSCI ACWI (All Country World Index) ex USA Index is a free float-adjusted market capitalization weighted index that is designed to measure the equity market performance of developed and emerging markets excluding the US.
2 Profitability is measured as operating income before depreciation and amortization minus interest expense, scaled by book.
4
M LARGE CAP GROWTH FUND
Performance
For the twelve months ended December 31, 2019, the M Large Cap Growth Fund had a return of 36.1% (net of all fees) versus a total return (including reinvestment of dividends) of 36.4% for its benchmark, the Russell 1000 Growth Index1.
Market Environment/Conditions
In 2019, the Fund experienced strong absolute and relative returns, made possible by earnings growth of approximately 17%. Importantly, strong and growing earnings, when combined with reasonable valuations, typically drive stock prices higher. DSM continues to project a mid-to-high teens earnings growth rate going forward, and believes it is possible that earnings growth may be higher than that target over the near-term. Furthermore, DSM believes the stock market will continue its upward trend in 2020, likely approaching a more normal historic total return of 5% to 10%, depending on the geopolitical and economic environment.
Over the past ninety-two years, the market, as measured by the S&P 500, has appreciated in excess of 10% in fifty-three of those years, and in excess of 20% in thirty-five of those fifty-three years. In contrast, the market has declined in excess of 10% just thirteen times in the past ninety-two years, and of those, only six times was the decline worse than 20%. Logically, investors are focused on avoiding downside risk, but given the history, DSM believes investors should be equally focused on capturing the upside.
In 2020, DSM sees concerns over global trade wars receding further as a result of the US trade agreements with China, Japan and Mexico/Canada. Accordingly, the global economic outlook should brighten in North America and Asia, while Europe, given the EU's structural issues and extreme overreliance on monetary policy, will likely continue to struggle. Against this mixed global economic backdrop, DSM believes global earnings growth will continue to be solid and when complemented by an improving economic outlook, should provide a solid foundation for the market.
Fund Review/Current Positioning
During the last half of 2018 and into 2019, DSM made changes to the portfolio based on the opportunities created by last year's downdraft in global equity markets, as well as earnings results, stock specific appreciation/valuations and new investment ideas. The Fund's portfolio remains focused on unique businesses that have been identified and are continuously subjected to analysis by DSM's investment team. The majority of the Fund is invested in the technology, communication services, health care and consumer discretionary sectors, with a smaller weighting in the consumer staples sector.
For the year, the M Large Cap Growth Fund slightly underperformed the benchmark primarily as a result of stock selection in the technology sector. DSM's stock selections in financials and consumer discretionary benefitted performance versus the benchmark. By security, the top five contributors to the Fund's performance for the year included Alibaba Group, Microsoft, Adobe, Facebook and Visa. The five positions which contributed the least were Regeneron Pharmaceuticals, Elanco Animal Health, Palo Alto Networks, Toronto-Dominion Bank and Boston Scientific.
DSM remains focused on earnings because they believe that earnings are the primary factor that will "grow" the value of a business over time. DSM expects earnings to continue to grow at a mid-to-high-teens rate through 2023, while the Fund portfolio remains attractively valued at approximately 25.3x next twelve months of earnings
5
through December of 2020. The positive scenario of ongoing and perhaps improving global economic growth, moderate global inflation, low albeit rising interest rates, healthy global corporate earnings, continues to form the foundation of an upwardly driven global equity market.
DSM Capital Partners LLC
Investment Sub-Adviser to the M Large Cap Growth Fund
Performance represented is net of fees. The foregoing reflects the thoughts and opinions of DSM Capital Partners LLC exclusively and is subject to change without notice. The information provided in this material should not be considered a recommendation to purchase or sell any particular security. It should not be assumed that any security transactions, holdings, or sectors discussed were or will be profitable, or that the investment recommendations or decisions we make in the future will be profitable or will equal the investment performance discussed herein. Strategies discussed are subject to change at any time by the investment manager in its discretion due to market conditions or opportunities. Market conditions may impact performance. The performance results presented were achieved in particular market conditions which may not be repeated. Moreover, the current market volatility and uncertain regulatory environment may have a negative impact on future performance. Portfolio characteristics are as of December 31, 2019. Please note that all indices are unmanaged and are not available for direct investment.
This commentary may include statements that constitute "forward looking statements" under the U.S. securities laws. Forward-looking statements include, among other things, projections, estimates, and information about possible or future results related to the Fund, market or regulatory developments. The views expressed above are not guarantees of future performance or economic results and involve certain risks, uncertainties and assumptions that could cause actual outcomes and results to differ materially from the views expressed herein. The views expressed above are subject to change at any time based upon economic, market, or other conditions and the subadvisory firm undertakes no obligation to update the views expressed herein. Any discussions of specific securities should not be considered a recommendation to buy or sell those securities. The views expressed above (including any forward-looking statement) may not be relied upon as investment advice or as an indication of the Fund's trading intent. Information about the Fund's holdings, asset allocation or country diversification is historical and is not an indication of future Fund composition, which may vary. Direct investment in any index is not possible. The performance of any index mentioned in this commentary has not been adjusted for ongoing management, distribution and operating expenses, and sales charges applicable to mutual fund investments. In addition, the returns do not reflect additional fees charged by separate accounts or variable insurance contracts that an investor in the Fund may pay. If these additional fees were reflected, performance would have been lower.
6
COMPARISON OF CHANGE IN VALUE OF $10,000 INVESTMENT IN
THE M LARGE CAP GROWTH FUND AND THE RUSSELL 1000 GROWTH INDEX (Unaudited)

The M Large Cap Growth Fund's total return is calculated net of Investment Advisory Fees and operating expenses. Performance figures represent past performance and are not indicative of future performance of the M Large Cap Growth Fund or Index. Share value will fluctuate so that an investor's shares, when redeemed, may be worth more or less than the original investment. Please note that all indices are unmanaged, do not incur expenses, and are not available for direct investment. Persons who invest in the M Large Cap Growth Fund through a variable annuity or variable life insurance contract should note this graph does not reflect separate account expenses deducted by the insurance company.
* 12/31/09 to 12/31/19
RUSSELL 1000 GROWTH INDEX
1 The Russell 1000 Growth Total Return Index includes dividends reinvested in the Russell 1000 Growth Index as reported by the Russell Company. The Russell 1000 Growth Index is a capitalization weighted index containing over 600 widely held securities with growth characteristics. DSM uses the Russell 1000 Growth Index as a benchmark because its average market capitalization is similar to that of the M Large Cap Growth Fund, and it is an industry standard. Characteristics of any benchmark may differ materially from accounts managed by DSM. Investors cannot invest directly in an Index.
7
M CAPITAL APPRECIATION FUND
Performance
For the twelve months ended December 31, 2019, the M Capital Appreciation Fund had a return of 28.9% (net of all fees) versus a total return (including reinvestment of dividends) of 27.8% for its benchmark, the Russell 2500® Index1.
Market Environment/Conditions
U.S. equities ended 2019 with a record setting rally into year end. Growth stocks led the market with a Russell 2500® Growth Index return of 32.7% versus a Russell 2500® Value return of 23.6%. While growth has continued to outperform, the market has started to shift moderately away from "Growth at Any Price" to more fundamental drivers. The Fund stands to benefit from such a shift given our disciplined valuation overlay and focus on fundamental research. For the year, the Fund increased midway between the Russell 2500® Index (27.8%), and the Russell 2500® Growth Index (32.7%). Given our Growth at a Reasonable Price approach and the market environment in 2019, the Fund performed as we would expect.
Macroeconomic headlines continued to dominate the direction of the markets. Despite the strong equity performance for the period, investor sentiment remains trapped in a tug of war between those who believe a recession is imminent, and those who expect a global reacceleration. Prospects for resolution of the trade dispute between the United States and China ebbed and flowed throughout the year with a couple of failed attempts early on leading to escalation of tariffs on both sides and increased economic uncertainty globally. Late Q3 news of a Phase One trade agreement between the United States and China drove a year end rally in equities. Furthermore, in early December, investors gained visibility on the direction of Brexit as Boris Johnson's Conservative party established a clear majority in the general election, removing another overhang on market sentiment. Johnson has promised the exit from the European Union will be complete by the end of January 2020. On the domestic front, comments from the Federal Reserve indicated they are unlikely to raise rates for the foreseeable future.
As we enter 2020, we are encouraged by the potential for increased visibility on a global basis with near-term de-escalation of the U.S.-China trade conflict, resolution of the Brexit impasse and a more dovish Federal Reserve. Expectations are high, as recent strength in the equity markets shows we are not alone in our growing enthusiasm, but we continue to find new investment ideas that fit our criteria of generating long-term earnings power selling at an attractive valuation.
Fund Review/Current Positioning
Sector allocation accounted for roughly two-thirds of the Fund's outperformance with positive allocation effect across eight of the nine sectors. The Fund's meaningful overweight position in the technology sector contributed the most to performance with sector returns of 40.4% versus the Russell 2500® Index average of 27.8%. Notable contributions also came from the portfolio's overweight position in producer durables, and underweight position in utilities and consumer staples. The portfolio's slight overweight position in energy produced the only negative allocation effect as that group declined 5.6%.
Positive stock selection drove the remaining outperformance with strong results in consumer discretionary, utilities, materials & processing and health care, offset partially by weak selection in producer durables and energy.
Holdings in the materials & processing sector gained 34.6% versus the index return of 27.3%, and generated the largest contribution to stock selection, principally due to the performance of Pan American Silver (+68%) and
8
FMC Corporation (+59%). We have held a position in Pan American Silver after accepting stock for their acquisition of Tahoe Resources in February 2019. As part of Pan American Silver, Tahoe Resources offered a more diversified investment in silver production while retaining the potential upside of the restart of their Escobal mine in Guatemala, arguably one of the premier assets globally in the silver mining industry. Since taking ownership of Tahoe, Pan American has beaten production expectations on top of an increase in the price of silver, which itself was up 15.3% for the year with a rally in precious metals. FMC, a producer of specialty fertilizers and pesticides, has begun to monetize years of investment through new product introductions. While the farm economy continues to languish worldwide, FMC has been gaining share, growing revenues at 7.1% and earnings 14.5% for the year. We believe the company is well positioned to generate material free cash flow over the coming years, which we believe will be used to reduce share count aggressively. We continue to hold both stocks.
Our consumer discretionary holdings increased 34.0% compared to an index return of 23.5%, largely driven by the contribution from Cardlytics (+480%). Cardlytics reported a material beat to consensus expectations driven by rapid user growth. The company is an innovative digital marketing firm that has carved a highly defensible niche analyzing credit and debit card purchase data for some of the largest card issuing banks domestically. The company's ability to close the loop between digital marketing spend and consumer buying behavior has the potential to drive tremendous value for its clients. Most recently, the rollout of new bank partners Wells Fargo and Chase—two of the four largest U.S. banks—drove monthly active user count to 128M individuals as of Q3 up from 65M at the end of 2018, and management expects to surpass 150M in 2020, or almost half the population of the United States.We have taken some profits on this holding, but it remains a core position as we believe the company has a differentiated offering, and both user growth and revenue per user will drive estimates higher.
Following robust performance in 2018, companies in the business of treating diabetes once again drove stock selection in the health care sector with average returns of 38.7% vs. the index return 32.2%. Insulet Corporation (+116%), Dexcom (+83%) and Tandem Diabetes (+57%) all generated better-than-expected revenue and earnings growth for the year as physician and consumer adoption of insulin pumps and continuous glucose monitors (CGM) accelerated. We see further penetration of both monitors and pumps as the combined technology is being used increasingly as an artificial pancreas and continue to hold these stocks.
The Fund's holdings in producer durables and energy partially offset the gains from other sectors, returning 26.1% and -19.0%, versus the index returns of 33.3% and -5.6%, respectively. Tutor Perini (-19%), a leading U.S. construction company, had a volatile year as the company failed to collect fees on a number of large projects that were under dispute. The fundamental story behind Tutor Perini remains favorable as it is one of only a few remaining competitors in its space and has a rapidly growing backlog. As these payment disputes are resolved, we expect Tutor's stock performance to reverse course in suit, particularly if a federal infrastructure spending bill were to take shape following the Presidential election. We added to the position on weakness. On the energy side, Centennial Resource Development (-58%) had the largest negative impact on the sector. As a small shale-based exploration and production (E&P) company, Centennial has suffered from both the near-term impact of lower cash flows, and from a medium-to-long term reduction in expected production growth. While oil experienced a meaningful rebound in price, investors have not yet been willing to fund E&P companies that lack scale and produce free cash flow in excess of their drilling demands. We continue to believe that Centennial's underlying assets are sound, and management has a history of creating value, most recently at the helm of EOG Resources. As part of a larger energy company, access to capital could unlock material value, or should current energy prices build on their recent gains, Centennial could begin to grow again and would likely experience a substantial revaluation upward.
9
Frontier Capital Management Co., LLC
Investment Sub-Adviser to the M Capital Appreciation Fund
Performance represented is net of fees. The foregoing reflects the thoughts and opinions of Frontier exclusively and is subject to change without notice. The information provided in this material should not be considered a recommendation to purchase or sell any particular security. It should not be assumed that any security transactions, holdings, or sectors discussed were or will be profitable, or that the investment recommendations or decisions we make in the future will be profitable or will equal the investment performance discussed herein. Strategies discussed are subject to change at any time by the investment manager in its discretion due to market conditions or opportunities. Market conditions may impact performance. The performance results presented were achieved in particular market conditions which may not be repeated. Moreover, the current market volatility and uncertain regulatory environment may have a negative impact on future performance. Portfolio characteristics are as of December 31, 2019. Please note that all indices are unmanaged and are not available for direct investment.
This commentary may include statements that constitute "forward looking statements" under the U.S. securities laws. Forward-looking statements include, among other things, projections, estimates, and information about possible or future results related to the Fund, market or regulatory developments. The views expressed above are not guarantees of future performance or economic results and involve certain risks, uncertainties and assumptions that could cause actual outcomes and results to differ materially from the views expressed herein. The views expressed above are subject to change at any time based upon economic, market, or other conditions and the subadvisory firm undertakes no obligation to update the views expressed herein. Any discussions of specific securities should not be considered a recommendation to buy or sell those securities. The views expressed above (including any forward-looking statement) may not be relied upon as investment advice or as an indication of the Fund's trading intent. Information about the Fund's holdings, asset allocation or country diversification is historical and is not an indication of future Fund composition, which may vary. Direct investment in any index is not possible. The performance of any index mentioned in this commentary has not been adjusted for ongoing management, distribution and operating expenses, and sales charges applicable to mutual fund investments. In addition, the returns do not reflect additional fees charged by separate accounts or variable insurance contracts that an investor in the Fund may pay. If these additional fees were reflected, performance would have been lower
10
COMPARISON OF CHANGE IN VALUE OF $10,000 INVESTMENT IN
THE M CAPITAL APPRECIATION FUND AND RUSSELL 2500 STOCK INDEX (Unaudited)
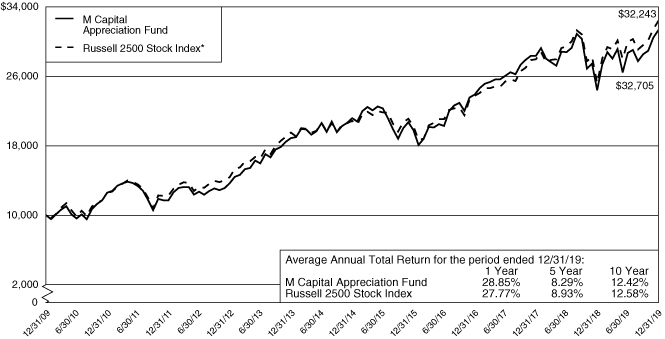
The M Capital Appreciation Fund's total return is calculated net of Investment Advisory Fees and operating expenses. Performance figures represent past performance and are not indicative of future performance of the M Capital Appreciation Fund or Index. Share value will fluctuate so that an investor's shares, when redeemed, may be worth more or less than the original investment. Please note that all indices are unmanaged, do not incur expenses, and are not available for direct investment. Persons who invest in the M Capital Appreciation Fund through a variable annuity or variable life insurance contract should note this graph does not reflect separate account expenses deducted by the insurance company.
* 12/31/09 to 12/31/19
RUSSELL 2500® INDEX
1 The Russell 2500® Index measures the performance of the small to mid-cap segment of the U.S. equity universe, commonly referred to as "smid" cap. The Russell 2500® Index is a subset of the Russell 3000® Index. It includes approximately 2500 of the smallest securities based on a combination of their market cap and current index membership.
11
M LARGE CAP VALUE FUND
Performance
For the twelve months ended December 31, 2019, the M Large Cap Value Fund had a return of 21.5% (net of all fees) versus a total return (including reinvestment of dividends) of 26.5% for its benchmark, the Russell 1000 Value Index1.
Market Environment/Conditions
All major U.S. equity indexes finished up for the year, and up big, with the Russell 3000 Index posting a 31% gain. Top-cap stocks outpaced small- and micro-cap stocks, and growth stocks continued to prevail over value stocks. While equities across the globe ended the year with double-digit gains, they couldn't keep up with those in U.S. markets (with the exception of China A equities).
Fund Review/Current Positioning
The Fund is fully invested in U.S. equities with no broad sector bets, and only modest industry-level and stock specific bets. The goal is to outperform the benchmark, the Russell 1000 Value Index, with incremental gains across many holdings. Using bottom-up, quantitatively-driven stock selection, AJO evaluates companies relative to their industry peers using four broad categories of measures: value, management, momentum, and sentiment. Value means the somewhat traditional ratios of price to fundamental value; management means evidence that a company's executive team has and will continue to emphasize earning power; momentum indicates when stocks might begin to rise toward full valuation; and sentiment captures the buying and selling behavior of key investor segments in various markets. When considering new investments, AJO, LP strongly focuses on minimizing transaction costs, which helps maximize profits for the Fund.
The Fund trailed its benchmark in 2019 by 5.0%. AJO describes the reasons behind negative relative returns using the framework of their investment process described above:
• All four pillars we use to assess a company's attractiveness—value, management, momentum, and sentiment—underperformed.
• While the Fund remained sector-neutral to its Russell 1000 Value benchmark, it can (and does) emphasize industries with the most attractive valuation (and avoid the contrary)—a result of its bottom-up stock picking. Industry bets distracted this year, primarily a result of bets within the consumer discretionary sector (emphasizing the underperforming internet & catalog retail industry).
• Stock selection was least effective among names in the health care, industrials, and communication services sectors.
• Successful stock picks include Citizens Financial Group, CBRE Group, and Tyson Foods.
• The Fund was negatively impacted from underweight positions that outperformed, including JPMorgan Chase, AT&T, and Procter & Gamble.
AJO strongly believes that superior results can be achieved through a consistent, systematic approach that focuses on low-priced companies with proven management, earnings power, and favorable sentiment.
12
AJO, LP
Investment Sub-Adviser to M Large Cap Value Fund
Performance represented is net of fees. The foregoing reflects the thoughts and opinions of AJO exclusively and is subject to change without notice. The information provided in this material should not be considered a recommendation to purchase or sell any particular security. It should not be assumed that any security transactions, holdings, or sectors discussed were or will be profitable, or that the investment recommendations or decisions we make in the future will be profitable or will equal the investment performance discussed herein. Strategies discussed are subject to change at any time by the investment manager in its discretion due to market conditions or opportunities. Market conditions may impact performance. The performance results presented were achieved in particular market conditions which may not be repeated. Moreover, the current market volatility and uncertain regulatory environment may have a negative impact on future performance. Portfolio characteristics are as of December 31, 2019. Please note that all indices are unmanaged and are not available for direct investment.
This commentary may include statements that constitute "forward looking statements" under the U.S. securities laws. Forward-looking statements include, among other things, projections, estimates, and information about possible or future results related to the Fund, market or regulatory developments. The views expressed above are not guarantees of future performance or economic results and involve certain risks, uncertainties and assumptions that could cause actual outcomes and results to differ materially from the views expressed herein. The views expressed above are subject to change at any time based upon economic, market, or other conditions and the subadvisory firm undertakes no obligation to update the views expressed herein. Any discussions of specific securities should not be considered a recommendation to buy or sell those securities. The views expressed above (including any forward-looking statement) may not be relied upon as investment advice or as an indication of the Fund's trading intent. Information about the Fund's holdings, asset allocation or country diversification is historical and is not an indication of future Fund composition, which may vary. Direct investment in any index is not possible. The performance of any index mentioned in this commentary has not been adjusted for ongoing management, distribution and operating expenses, and sales charges applicable to mutual fund investments. In addition, the returns do not reflect additional fees charged by separate accounts or variable insurance contracts that an investor in the Fund may pay. If these additional fees were reflected, performance would have been lower.
13
COMPARISON OF CHANGE IN VALUE OF $10,000 INVESTMENT IN
THE M LARGE CAP VALUE FUND AND THE RUSSELL 1000 VALUE INDEX (Unaudited)

The M Large Cap Value Fund's total return is calculated net of Investment Advisory Fees and operating expenses. Performance figures represent past performance and are not indicative of future performance of the M Large Cap Value Fund or Index. Share value will fluctuate so that an investor's shares, when redeemed, may be worth more or less than the original investment. Please note that all indices are unmanaged, do not incur expenses, and are not available for direct investment. Persons who invest in the M Large Cap Value Fund through a variable annuity or variable life insurance contract should note this graph does not reflect separate account expenses deducted by the insurance company.
* 12/31/09 to 12/31/19
RUSSELL 1000 VALUE INDEX
4 The Russell 1000® Value Index is a market capitalization-weighted index that measures the performance of those Russell 1000 companies with lower price-to-book ratios and lower forecasted growth.
14
M International Equity Fund
SCHEDULE OF INVESTMENTS
December 31, 2019
Shares | |
| | Value
(Note 1) | |
| | | COMMON STOCKS—72.9% | |
| | | Australia—4.3% | |
| | 5,596 | | | Adelaide Brighton, Ltd. | | $ | 13,587 | | |
| | 3,702 | | | AGL Energy, Ltd. | | | 53,334 | | |
| | 8,035 | | | ALS, Ltd. | | | 51,762 | | |
| | 1,335 | | | Altium, Ltd. | | | 32,527 | | |
| | 24,812 | | | AMP, Ltd. | | | 33,344 | | |
| | 1,231 | | | Ansell, Ltd. | | | 25,078 | | |
| | 4,688 | | | AP Eagers, Ltd. | | | 33,688 | | |
| | 2,943 | | | APA Group | | | 22,924 | | |
| | 820 | | | Appen, Ltd. | | | 12,924 | | |
| | 16,116 | | | Ardent Leisure Group, Ltd.*,† | | | 14,702 | | |
| | 4,576 | | | Aristocrat Leisure, Ltd. | | | 108,121 | | |
| | 487 | | | ASX, Ltd. | | | 26,797 | | |
| | 5,529 | | | Atlas Arteria, Ltd. | | | 30,380 | | |
| | 27,196 | | | Aurizon Holdings, Ltd. | | | 99,813 | | |
| | 9,677 | | | Austal, Ltd. | | | 25,941 | | |
| | 16,565 | | | Australia & New Zealand Banking
Group, Ltd. | | | 286,311 | | |
| | 24,262 | | | Australian Agricultural Co., Ltd.†,* | | | 18,728 | | |
| | 23,353 | | | Australian Pharmaceutical
Industries, Ltd. | | | 21,960 | | |
| | 7,187 | | | Bank of Queensland, Ltd.† | | | 36,565 | | |
| | 4,533 | | | Bapcor, Ltd. | | | 20,359 | | |
| | 19,836 | | | Beach Energy, Ltd. | | | 34,939 | | |
| | 3,363 | | | Bega Cheese, Ltd.† | | | 10,195 | | |
| | 5,610 | | | Bendigo & Adelaide Bank, Ltd. | | | 38,502 | | |
| | 23,935 | | | BHP Group, Ltd. | | | 653,715 | | |
| | 5,632 | | | Bingo Industries, Ltd.† | | | 11,224 | | |
| | 165 | | | Blackmores, Ltd.† | | | 9,819 | | |
| | 9,483 | | | BlueScope Steel, Ltd. | | | 100,220 | | |
| | 8,539 | | | Boral, Ltd. | | | 26,845 | | |
| | 9,097 | | | Brambles, Ltd. | | | 74,818 | | |
| | 1,774 | | | Breville Group, Ltd. | | | 21,736 | | |
| | 1,742 | | | Brickworks, Ltd. | | | 22,835 | | |
| | 1,732 | | | Caltex Australia, Ltd. | | | 41,264 | | |
| | 2,491 | | | carsales.com, Ltd. | | | 29,035 | | |
| | 5,928 | | | Challenger, Ltd. | | | 33,654 | | |
| | 16,096 | | | Cleanaway Waste Management, Ltd. | | | 22,704 | | |
| | 6,210 | | | Coca-Cola Amatil, Ltd. | | | 48,198 | | |
| | 400 | | | Cochlear, Ltd. | | | 63,082 | | |
| | 8,123 | | | Coles Group, Ltd. | | | 84,593 | | |
| | 13,861 | | | Commonwealth Bank of Australia | | | 777,184 | | |
| | 3,340 | | | Computershare, Ltd. | | | 39,330 | | |
| | 34,520 | | | Cooper Energy, Ltd.†,* | | | 14,656 | | |
| | 983 | | | Corporate Travel Management, Ltd.† | | | 14,141 | | |
Shares | |
| | Value
(Note 1) | |
| | | Australia (Continued) | |
| | 4,775 | | | Costa Group Holdings, Ltd.† | | $ | 8,277 | | |
| | 2,419 | | | Crown Resorts, Ltd. | | | 20,387 | | |
| | 3,152 | | | CSL, Ltd. | | | 609,958 | | |
| | 9,383 | | | CSR, Ltd. | | | 29,960 | | |
| | 14,019 | | | Domain Holdings Australia, Ltd.† | | | 36,400 | | |
| | 4,400 | | | Downer EDI, Ltd. | | | 25,227 | | |
| | 5,205 | | | Elders, Ltd.† | | | 23,632 | | |
| | 7,109 | | | Estia Health, Ltd. | | | 12,173 | | |
| | 13,141 | | | Evolution Mining, Ltd. | | | 35,042 | | |
| | 7,807 | | | FlexiGroup, Ltd.† | | | 10,081 | | |
| | 669 | | | Flight Centre Travel Group, Ltd.† | | | 20,685 | | |
| | 24,562 | | | Fortescue Metals Group, Ltd. | | | 184,257 | | |
| | 11,060 | | | G8 Education, Ltd. | | | 14,747 | | |
| | 9,874 | | | Genworth Mortgage Insurance
Australia, Ltd. | | | 25,291 | | |
| | 3,873 | | | GrainCorp, Ltd., Class A* | | | 20,602 | | |
| | 9,317 | | | GWA Group, Ltd.† | | | 21,707 | | |
| | 7,543 | | | Harvey Norman Holdings, Ltd.† | | | 21,544 | | |
| | 4,591 | | | Healius, Ltd. | | | 8,892 | | |
| | 18,350 | | | Incitec Pivot, Ltd. | | | 40,949 | | |
| | 7,352 | | | Independence Group NL | | | 32,194 | | |
| | 5,200 | | | Inghams Group, Ltd.† | | | 12,261 | | |
| | 14,639 | | | Insurance Australia Group Ltd. | | | 78,691 | | |
| | 1,394 | | | InvoCare, Ltd.† | | | 12,903 | | |
| | 8,432 | | | IOOF Holdings, Ltd.† | | | 46,509 | | |
| | 2,857 | | | IRESS, Ltd. | | | 26,144 | | |
| | 2,408 | | | JB Hi-Fi, Ltd.† | | | 63,655 | | |
| | 86,962 | | | Jupiter Mines, Ltd. | | | 17,087 | | |
| | 2,512 | | | LendLease Group† | | | 31,025 | | |
| | 10,414 | | | Link Administration Holdings, Ltd. | | | 42,825 | | |
| | 2,407 | | | Macquarie Group, Ltd. | | | 232,844 | | |
| | 1,204 | | | Magellan Financial Group, Ltd. | | | 48,117 | | |
| | 22,423 | | | Mayne Pharma Group, Ltd.†,* | | | 6,845 | | |
| | 1,182 | | | McMillan Shakespeare, Ltd. | | | 10,866 | | |
| | 12,504 | | | Metcash, Ltd. | | | 22,551 | | |
| | 1,851 | | | Mineral Resources, Ltd.† | | | 21,433 | | |
| | 1,365 | | | Monadelphous Group, Ltd.† | | | 15,978 | | |
| | 19,807 | | | National Australia Bank, Ltd. | | | 342,346 | | |
| | 10,216 | | | New Hope Corp., Ltd.† | | | 14,768 | | |
| | 447 | | | Newcrest Mining, Ltd. | | | 9,489 | | |
| | 5,029 | | | NEXTDC, Ltd.†,* | | | 23,222 | | |
| | 5,984 | | | NIB holdings, Ltd. | | | 26,329 | | |
| | 33,934 | | | Nine Entertainment Co.
Holdings, Ltd.† | | | 42,626 | | |
| | 8,096 | | | Northern Star Resources, Ltd. | | | 64,256 | | |
The accompanying notes are an integral part of these financial statements.
15
M International Equity Fund
SCHEDULE OF INVESTMENTS (Continued)
December 31, 2019
Shares | |
| | Value
(Note 1) | |
| | | Australia (Continued) | |
| | 12,393 | | | NRW Holdings, Ltd. | | $ | 28,091 | | |
| | 6,389 | | | Nufarm, Ltd.* | | | 25,959 | | |
| | 4,065 | | | Oil Search, Ltd. | | | 20,681 | | |
| | 4,936 | | | oOh!media, Ltd. | | | 12,608 | | |
| | 1,697 | | | Orica, Ltd. | | | 26,175 | | |
| | 10,538 | | | Origin Energy, Ltd. | | | 62,488 | | |
| | 9,118 | | | Orora, Ltd. | | | 20,347 | | |
| | 6,746 | | | OZ Minerals, Ltd. | | | 49,944 | | |
| | 3,547 | | | Pendal Group, Ltd. | | | 21,381 | | |
| | 12,821 | | | Perenti Global, Ltd. | | | 14,575 | | |
| | 555 | | | Perpetual, Ltd.† | | | 16,015 | | |
| | 43,898 | | | Perseus Mining, Ltd.* | | | 35,734 | | |
| | 2,030 | | | Premier Investments, Ltd. | | | 26,725 | | |
| | 1,044 | | | Pro Medicus, Ltd.† | | | 16,374 | | |
| | 10,651 | | | Qantas Airways, Ltd. | | | 53,143 | | |
| | 7,304 | | | QBE Insurance Group, Ltd. | | | 66,018 | | |
| | 1,072 | | | Ramsay Health Care, Ltd. | | | 54,563 | | |
| | 6,758 | | | Regis Resources, Ltd. | | | 20,582 | | |
| | 25,575 | | | Resolute Mining, Ltd.* | | | 22,614 | | |
| | 3,594 | | | Rio Tinto, Ltd. | | | 253,218 | | |
| | 4,596 | | | Sandfire Resources NL | | | 19,287 | | |
| | 12,603 | | | Santos, Ltd. | | | 72,345 | | |
| | 13,467 | | | Saracen Mineral Holdings, Ltd.†,* | | | 31,281 | | |
| | 3,349 | | | SEEK, Ltd. | | | 52,996 | | |
| | 2,605 | | | Select Harvests, Ltd. | | | 15,337 | | |
| | 47,993 | | | Senex Energy, Ltd.* | | | 11,619 | | |
| | 62,916 | | | Seven West Media, Ltd.†,* | | | 14,570 | | |
| | 4,361 | | | Sims Metal Management, Ltd.† | | | 32,654 | | |
| | 2,601 | | | Sonic Healthcare, Ltd. | | | 52,476 | | |
| | 21,815 | | | South32, Ltd. | | | 41,333 | | |
| | 10,287 | | | Southern Cross Media Group, Ltd. | | | 5,992 | | |
| | 12,721 | | | Spark Infrastructure Group | | | 18,657 | | |
| | 9,141 | | | SpeedCast International, Ltd. | | | 6,030 | | |
| | 8,938 | | | St Barbara, Ltd. | | | 17,061 | | |
| | 6,536 | | | Star Entertainment Grp, Ltd. (The) | | | 21,099 | | |
| | 11,526 | | | Steadfast Group, Ltd. | | | 28,148 | | |
| | 2,942 | | | Suncorp Group, Ltd. | | | 26,757 | | |
| | 4,226 | | | Super Retail Group, Ltd.† | | | 30,012 | | |
| | 4,242 | | | Sydney Airport | | | 25,779 | | |
| | 13,624 | | | Tabcorp Holdings, Ltd. | | | 43,310 | | |
| | 6,258 | | | Tassal Group, Ltd. | | | 18,269 | | |
| | 4,562 | | | Technology One, Ltd. | | | 26,539 | | |
| | 32,411 | | | Telstra Corp., Ltd. | | | 80,515 | | |
| | 5,355 | | | Transurban Group | | | 56,030 | | |
| | 1,963 | | | Treasury Wine Estates, Ltd. | | | 22,371 | | |
Shares | |
| | Value
(Note 1) | |
| | | Australia (Continued) | |
| | 12,616 | | | Vocus Group, Ltd.* | | $ | 25,320 | | |
| | 1,394 | | | Webjet, Ltd.† | | | 12,737 | | |
| | 8,107 | | | Wesfarmers, Ltd. | | | 235,528 | | |
| | 6,437 | | | Western Areas, Ltd. | | | 13,687 | | |
| | 25,658 | | | Westpac Banking Corp. | | | 436,273 | | |
| | 19,506 | | | Whitehaven Coal, Ltd. | | | 36,137 | | |
| | 6,285 | | | Woodside Petroleum, Ltd. | | | 151,633 | | |
| | 7,616 | | | Woolworths Group, Ltd. | | | 193,258 | | |
| | 4,639 | | | Worley, Ltd. | | | 49,840 | | |
| | | | 8,328,424 | | |
| | | Austria—0.3% | |
| | 984 | | | ANDRITZ AG | | | 42,384 | | |
| | 1,218 | | | AT&S Austria Technologie &
Systemtechnik AG | | | 27,407 | | |
| | 658 | | | CA Immobilien Anlagen AG | | | 27,641 | | |
| | 133 | | | DO & Co. AG | | | 12,815 | | |
| | 2,245 | | | Erste Group Bank AG* | | | 84,511 | | |
| | 1,172 | | | EVN AG | | | 22,743 | | |
| | 1,377 | | | FACC AG | | | 17,207 | | |
| | 1,233 | | | Immofianz AG* | | | 33,055 | | |
| | 211 | | | Lenzing AG | | | 19,597 | | |
| | 1,814 | | | OMV AG | | | 101,901 | | |
| | 3,082 | | | Raiffeisen Bank International AG | | | 77,404 | | |
| | 589 | | | S IMMO AG | | | 14,733 | | |
| | 127 | | | Schoeller-Bleckmann Oilfield
Equipment AG | | | 7,166 | | |
| | 1,874 | | | Telekom Austria AG* | | | 15,303 | | |
| | 4,149 | | | UNIQA Insurance Group AG | | | 42,328 | | |
| | 884 | | | Vienna Insurance Group AG Wiener
Versicherung Gruppe | | | 25,186 | | |
| | 773 | | | voestalpine AG | | | 21,555 | | |
| | | | 592,936 | | |
| | | Belgium—0.8% | |
| | 366 | | | Ackermans & van Haaren NV | | | 57,353 | | |
| | 2,424 | | | Ageas | | | 143,237 | | |
| | 5,568 | | | AGFA-Gevaert NV* | | | 28,842 | | |
| | 5,947 | | | Anheuser-Busch InBev SA/NV | | | 485,030 | | |
| | 156 | | | Argenx SE* | | | 25,128 | | |
| | 1,086 | | | Bekaert SA | | | 32,281 | | |
| | 991 | | | bpost SA | | | 11,450 | | |
| | 105 | | | Cie d'Entreprises CFE | | | 11,460 | | |
| | 609 | | | Colruyt SA | | | 31,751 | | |
| | 833 | | | D'ieteren SA/NV | | | 58,492 | | |
The accompanying notes are an integral part of these financial statements.
16
M International Equity Fund
SCHEDULE OF INVESTMENTS (Continued)
December 31, 2019
Shares | |
| | Value
(Note 1) | |
| | | Belgium (Continued) | |
| | 196 | | | Elia System Operator SA/NV | | $ | 17,390 | | |
| | 1,410 | | | Euronav NV | | | 17,366 | | |
| | 2,756 | | | Euronav NV* | | | 34,560 | | |
| | 548 | | | EVS Broadcast Equipment SA | | | 13,370 | | |
| | 202 | | | Galapagos NV†,* | | | 42,258 | | |
| | 197 | | | Gimv NV | | | 12,110 | | |
| | 1,847 | | | KBC Group NV | | | 138,934 | | |
| | 216 | | | Melexis NV | | | 16,245 | | |
| | 796 | | | Ontex Group NV | | | 16,741 | | |
| | 1,080 | | | Orange Belgium SA | | | 25,077 | | |
| | 1,637 | | | Proximus SADP | | | 46,860 | | |
| | 214 | | | Sipef NV | | | 13,154 | | |
| | 256 | | | Solvay SA | | | 29,663 | | |
| | 449 | | | Telenet Group Holding NV | | | 20,176 | | |
| | 688 | | | Tessenderlo Group SA* | | | 24,271 | | |
| | 1,442 | | | UCB SA | | | 114,680 | | |
| | 523 | | | Umicore SA | | | 25,437 | | |
| | | | 1,493,316 | | |
| | | Canada—7.0% | |
| | 1,800 | | | Absolute Software Corp. | | | 12,060 | | |
| | 6,700 | | | Advantage Oil & Gas, Ltd.†,* | | | 14,189 | | |
| | 1,679 | | | Aecon Group, Inc. | | | 22,653 | | |
| | 607 | | | Ag Growth International, Inc.† | | | 21,708 | | |
| | 278 | | | Agnico Eagle Mines, Ltd. | | | 17,123 | | |
| | 5,042 | | | Aimia, Inc.* | | | 13,978 | | |
| | 1,100 | | | Air Canada* | | | 41,093 | | |
| | 6,200 | | | Alacer Gold Corp.* | | | 32,944 | | |
| | 7,223 | | | Alamos Gold, Inc., Class A | | | 43,553 | | |
| | 900 | | | Alaris Royalty Corp.† | | | 15,199 | | |
| | 868 | | | Algonquin Power & Utilities Corp.† | | | 12,279 | | |
| | 5,308 | | | Alimentation Couche-Tard, Inc.,
Class B | | | 168,451 | | |
| | 1,600 | | | AltaGas, Ltd. | | | 24,372 | | |
| | 1,185 | | | Altus Group, Ltd.† | | | 34,641 | | |
| | 7,137 | | | ARC Resources, Ltd.† | | | 44,958 | | |
| | 989 | | | Aritzia, Inc.* | | | 14,509 | | |
| | 700 | | | Atco, Ltd., Class I | | | 26,829 | | |
| | 1,022 | | | Aurora Cannabis, Inc.†,* | | | 2,196 | | |
| | 16,677 | | | B2Gold Corp. | | | 66,911 | | |
| | 6,464 | | | Bank of Montreal | | | 500,972 | | |
| | 8,200 | | | Bank of Nova Scotia (The) | | | 463,186 | | |
| | 1,452 | | | Barrick Gold Corp. | | | 26,993 | | |
| | 2,209 | | | Barrick Gold Corp. | | | 41,031 | | |
| | 3,183 | | | Bausch Health Cos., Inc.* | | | 95,278 | | |
Shares | |
| | Value
(Note 1) | |
| | | Canada (Continued) | |
| | 11,400 | | | Baytex Energy Corp.* | | $ | 16,417 | | |
| | 1,608 | | | BCE, Inc. | | | 74,496 | | |
| | 9,500 | | | Birchcliff Energy, Ltd. | | | 18,948 | | |
| | 7,292 | | | BlackBerry, Ltd.* | | | 46,889 | | |
| | 11,300 | | | Bombardier, Inc., Class B* | | | 16,795 | | |
| | 16,000 | | | Bonavista Energy Corp.† | | | 7,516 | | |
| | 2,062 | | | Boralex, Inc., Class A | | | 38,841 | | |
| | 1,120 | | | Brookfield Asset Management, Inc.,
Class A | | | 64,713 | | |
| | 785 | | | BRP, Inc. | | | 35,763 | | |
| | 3,678 | | | CAE, Inc. | | | 97,378 | | |
| | 4,802 | | | Cameco Corp. | | | 42,675 | | |
| | 1,985 | | | Canaccord Genuity Group, Inc. | | | 7,399 | | |
| | 400 | | | Canada Goose Holdings, Inc.†,* | | | 14,481 | | |
| | 3,635 | | | Canadian Imperial Bank of
Commerce | | | 302,490 | | |
| | 4,408 | | | Canadian National Railway Co. | | | 398,758 | | |
| | 14,634 | | | Canadian Natural Resources, Ltd.† | | | 473,319 | | |
| | 863 | | | Canadian Pacific Railway, Ltd.† | | | 219,998 | | |
| | 732 | | | Canadian Tire Corp., Ltd., Class A | | | 78,778 | | |
| | 500 | | | Canadian Utilities, Ltd., Class A | | | 15,082 | | |
| | 2,480 | | | Canadian Western Bank† | | | 60,904 | | |
| | 1,876 | | | Canfor Corp.* | | | 17,539 | | |
| | 2,194 | | | Capital Power Corp. | | | 58,105 | | |
| | 6,100 | | | Cardinal Energy, Ltd.† | | | 12,214 | | |
| | 6,100 | | | Cascades, Inc. | | | 52,659 | | |
| | 1,637 | | | CCL Industries, Inc., Class B† | | | 69,738 | | |
| | 6,166 | | | Celestica, Inc.* | | | 51,140 | | |
| | 1,967 | | | Cenovus Energy, Inc. | | | 19,995 | | |
| | 5,235 | | | Centerra Gold, Inc.* | | | 41,645 | | |
| | 9,000 | | | CES Energy Solutions Corp.† | | | 16,149 | | |
| | 1,621 | | | CGI, Inc.* | | | 135,654 | | |
| | 4,339 | | | CI Financial Corp. | | | 72,542 | | |
| | 2,372 | | | Cineplex, Inc. | | | 61,832 | | |
| | 490 | | | Cogeco Communications, Inc. | | | 42,715 | | |
| | 300 | | | Cogeco, Inc. | | | 24,048 | | |
| | 825 | | | Colliers International Group, Inc. | | | 64,231 | | |
| | 122 | | | Constellation Software, Inc. | | | 118,487 | | |
| | 5,812 | | | Corus Entertainment, Inc., Class B | | | 23,811 | | |
| | 2,837 | | | Cott Corp. | | | 38,757 | | |
| | 3,354 | | | Crescent Point Energy Corp.† | | | 14,955 | | |
| | 3,330 | | | CRH Medical Corp.* | | | 11,540 | | |
| | 4,912 | | | Detour Gold Corp.* | | | 95,097 | | |
| | 500 | | | Dollarama, Inc. | | | 17,185 | | |
| | 1,821 | | | Dorel Industries, Inc., Class B | | | 8,386 | | |
The accompanying notes are an integral part of these financial statements.
17
M International Equity Fund
SCHEDULE OF INVESTMENTS (Continued)
December 31, 2019
Shares | |
| | Value
(Note 1) | |
| | | Canada (Continued) | |
| | 2,200 | | | DREAM Unlimited Corp., Class A | | $ | 19,822 | | |
| | 6,100 | | | Dundee Precious Metals, Inc.* | | | 26,212 | | |
| | 4,100 | | | ECN Capital Corp. | | | 15,124 | | |
| | 4,401 | | | Eldorado Gold Corp.* | | | 35,349 | | |
| | 9,925 | | | Element Fleet Management Corp. | | | 84,762 | | |
| | 663 | | | Emera, Inc. | | | 28,485 | | |
| | 3,519 | | | Enbridge, Inc. | | | 139,925 | | |
| | 7,600 | | | Encana Corp.† | | | 35,584 | | |
| | 2,494 | | | Enerflex, Ltd. | | | 23,489 | | |
| | 7,134 | | | Enerplus Corp. | | | 50,818 | | |
| | 882 | | | Enghouse Systems, Ltd. | | | 32,725 | | |
| | 7,100 | | | Ensign Energy Services, Inc.† | | | 15,583 | | |
| | 4,400 | | | Extendicare, Inc.† | | | 28,598 | | |
| | 281 | | | Fairfax Financial Holdings, Ltd. | | | 131,945 | | |
| | 2,600 | | | Fiera Capital Corp. | | | 23,446 | | |
| | 3,098 | | | Finning International, Inc. | | | 60,359 | | |
| | 2,677 | | | First Capital Real Estate Investment
Trust | | | 42,612 | | |
| | 4,882 | | | First Majestic Silver Corp.†,* | | | 59,890 | | |
| | 3,380 | | | First Quantum Minerals, Ltd. | | | 34,280 | | |
| | 547 | | | FirstService Corp. | | | 50,924 | | |
| | 2,952 | | | Fortis, Inc.† | | | 122,486 | | |
| | 10,041 | | | Fortuna Silver Mines, Inc.*,† | | | 40,905 | | |
| | 206 | | | Franco-Nevada Corp. | | | 21,272 | | |
| | 3,500 | | | Freehold Royalties, Ltd.† | | | 19,649 | | |
| | 787 | | | Genworth MI Canada, Inc.† | | | 34,436 | | |
| | 1,045 | | | George Weston, Ltd. | | | 82,905 | | |
| | 1,500 | | | Gibson Energy, Inc. | | | 30,715 | | |
| | 1,871 | | | Gildan Activewear, Inc. | | | 55,314 | | |
| | 5,700 | | | Gran Tierra Energy, Inc.* | | | 7,418 | | |
| | 1,337 | | | Great Canadian Gaming Corp.†,* | | | 44,314 | | |
| | 806 | | | Great-West Lifeco, Inc. | | | 20,644 | | |
| | 1,700 | | | Home Capital Group, Inc.†,* | | | 43,150 | | |
| | 7,321 | | | Hudbay Minerals, Inc.† | | | 30,331 | | |
| | 5,928 | | | Husky Energy, Inc. | | | 47,568 | | |
| | 2,998 | | | Hydro One, Ltd.# | | | 57,903 | | |
| | 1,537 | | | Ia Financial Corp., Inc. | | | 84,428 | | |
| | 3,400 | | | IAMGOLD Corp.†,* | | | 12,699 | | |
| | 800 | | | Imperial Oil, Ltd. | | | 21,162 | | |
| | 2,417 | | | Innergex Renewable Energy, Inc.† | | | 31,382 | | |
| | 159 | | | Intact Financial Corp. | | | 17,194 | | |
| | 4,565 | | | Inter Pipeline, Ltd. | | | 79,238 | | |
| | 2,045 | | | Interfor Corp.*,† | | | 23,103 | | |
| | 2,087 | | | Intertape Polymer Group, Inc. | | | 26,711 | | |
Shares | |
| | Value
(Note 1) | |
| | | Canada (Continued) | |
| | 1,600 | | | Invesque, Inc.† | | $ | 10,768 | | |
| | 19,814 | | | Ivanhoe Mines, Ltd., Class A* | | | 64,849 | | |
| | 700 | | | Jamieson Wellness, Inc.† | | | 13,881 | | |
| | 500 | | | K-Bro Linen, Inc. | | | 16,191 | | |
| | 7,152 | | | Kelt Exploration, Ltd.†,* | | | 26,822 | | |
| | 3,848 | | | Keyera Corp. | | | 100,812 | | |
| | 17,698 | | | Kinross Gold Corp.* | | | 83,955 | | |
| | 2,070 | | | Kirkland Lake Gold, Ltd. | | | 91,245 | | |
| | 3,700 | | | Knight Therapeutics, Inc.* | | | 21,598 | | |
| | 800 | | | Laurentian Bank of Canada† | | | 27,372 | | |
| | 1,289 | | | Linamar Corp. | | | 48,769 | | |
| | 1,322 | | | Loblaw Cos., Ltd. | | | 68,210 | | |
| | 8,900 | | | Lucara Diamond Corp.† | | | 5,826 | | |
| | 13,050 | | | Lundin Mining Corp.† | | | 77,985 | | |
| | 8,872 | | | Magna International, Inc. | | | 486,455 | | |
| | 4,800 | | | Major Drilling Group
International, Inc.* | | | 20,959 | | |
| | 8,035 | | | Manulife Financial Corp. | | | 163,107 | | |
| | 1,530 | | | Maple Leaf Foods, Inc. | | | 30,493 | | |
| | 7,300 | | | Martinrea International, Inc. | | | 80,446 | | |
| | 1,895 | | | Medical Facilities Corp. | | | 7,005 | | |
| | 4,700 | | | MEG Energy Corp.* | | | 26,748 | | |
| | 1,000 | | | Methanex Corp. | | | 38,620 | | |
| | 1,982 | | | Metro, Inc. | | | 81,795 | | |
| | 562 | | | Morneau Shepell, Inc.† | | | 14,624 | | |
| | 470 | | | MTY Food Group, Inc. | | | 20,084 | | |
| | 2,700 | | | Mullen Group, Ltd. | | | 19,275 | | |
| | 4,527 | | | National Bank of Canada† | | | 251,285 | | |
| | 14,800 | | | New Gold, Inc.* | | | 13,107 | | |
| | 1,740 | | | NFI Group, Inc. | | | 35,710 | | |
| | 1,156 | | | Norbord, Inc. | | | 30,917 | | |
| | 1,126 | | | North West Co., Inc. (The)† | | | 23,698 | | |
| | 2,067 | | | Northland Power, Inc. | | | 43,296 | | |
| | 1,500 | | | Nutrien, Ltd.† | | | 71,865 | | |
| | 664 | | | Nutrien, Ltd. | | | 31,790 | | |
| | 11,800 | | | OceanaGold Corp. | | | 23,172 | | |
| | 793 | | | Onex Corp. | | | 50,180 | | |
| | 2,715 | | | Open Text Corp. | | | 119,635 | | |
| | 3,312 | | | Osisko Gold Royalties, Ltd.† | | | 32,188 | | |
| | 4,296 | | | Pan American Silver Corp.† | | | 101,763 | | |
| | 4,549 | | | Parex Resources, Inc.* | | | 84,601 | | |
| | 700 | | | Park Lawn Corp. | | | 15,789 | | |
| | 1,907 | | | Parkland Fuel Corp. | | | 70,065 | | |
| | 1,760 | | | Pason Systems, Inc. | | | 17,769 | | |
| | 377 | | | Pembina Pipeline Corp.† | | | 13,972 | | |
The accompanying notes are an integral part of these financial statements.
18
M International Equity Fund
SCHEDULE OF INVESTMENTS (Continued)
December 31, 2019
Shares | |
| | Value
(Note 1) | |
| | | Canada (Continued) | |
| | 1,361 | | | Pembina Pipeline Corp.† | | $ | 50,427 | | |
| | 4,630 | | | Peyto Exploration &
Development Corp.† | | | 13,549 | | |
| | 900 | | | PrairieSky Royalty, Ltd.† | | | 10,556 | | |
| | 11,600 | | | Precision Drilling Corp.* | | | 16,169 | | |
| | 300 | | | Premium Brands Holdings Corp. | | | 21,014 | | |
| | 1,000 | | | Quebecor, Inc., Class B | | | 25,521 | | |
| | 700 | | | Recipe Unlimited Corp. | | | 10,501 | | |
| | 1,500 | | | Restaurant Brands International, Inc. | | | 95,622 | | |
| | 1,345 | | | Richelieu Hardware, Ltd.† | | | 28,100 | | |
| | 1,489 | | | Ritchie Bros Auctioneers, Inc. | | | 63,892 | | |
| | 2,204 | | | Rogers Communications, Inc.,
Class B | | | 109,440 | | |
| | 5,300 | | | Rogers Sugar, Inc.† | | | 20,081 | | |
| | 12,100 | | | Royal Bank of Canada | | | 957,433 | | |
| | 1,740 | | | Russel Metals, Inc. | | | 29,707 | | |
| | 1,204 | | | Saputo, Inc. | | | 37,273 | | |
| | 4,547 | | | Secure Energy Services, Inc. | | | 17,718 | | |
| | 11,834 | | | SEMAFO, Inc.* | | | 24,606 | | |
| | 2,897 | | | Seven Generations Energy, Ltd.,
Class A* | | | 18,896 | | |
| | 5,767 | | | Shaw Communications, Inc.,
Class B | | | 117,023 | | |
| | 1,968 | | | ShawCor, Ltd. | | | 18,990 | | |
| | 40 | | | Shopify, Inc., Class A* | | | 15,904 | | |
| | 1,794 | | | Sienna Senior Living, Inc. | | | 25,227 | | |
| | 1,359 | | | Sleep Country Canada
Holdings, Inc.†,# | | | 21,151 | | |
| | 1,519 | | | SNC-Lavalin Group, Inc.† | | | 35,034 | | |
| | 737 | | | Spin Master Corp.*,# | | | 22,441 | | |
| | 3,369 | | | SSR Mining, Inc.* | | | 64,835 | | |
| | 1,600 | | | Stantec, Inc. | | | 45,220 | | |
| | 400 | | | Stella-Jones, Inc.† | | | 11,558 | | |
| | 649 | | | Sun Life Financial, Inc. | | | 29,592 | | |
| | 17,263 | | | Suncor Energy, Inc. | | | 565,795 | | |
| | 3,579 | | | Superior Plus Corp. | | | 34,617 | | |
| | 7,700 | | | Tamarack Valley Energy, Ltd.* | | | 11,859 | | |
| | 546 | | | TC Energy Corp. | | | 29,080 | | |
| | 439 | | | TC Energy Corp. | | | 23,403 | | |
| | 8,602 | | | Teck Resources, Ltd., Class B | | | 149,179 | | |
| | 3,900 | | | Teranga Gold Corp.* | | | 21,084 | | |
| | 1,944 | | | TFI International, Inc. | | | 65,526 | | |
| | 287 | | | Thomson Reuters Corp.† | | | 20,530 | | |
| | 3,200 | | | Timbercreek Financial Corp.† | | | 24,470 | | |
| | 801 | | | TMX Group, Ltd. | | | 69,364 | | |
Shares | |
| | Value
(Note 1) | |
| | | Canada (Continued) | |
| | 6,950 | | | TORC Oil & Gas, Ltd. | | $ | 24,031 | | |
| | 2,171 | | | Torex Gold Resources, Inc.* | | | 34,307 | | |
| | 1,339 | | | Toromont Industries, Ltd.† | | | 72,789 | | |
| | 11,126 | | | Toronto-Dominion Bank (The) | | | 624,009 | | |
| | 5,111 | | | Tourmaline Oil Corp. | | | 59,905 | | |
| | 7,036 | | | TransAlta Corp. | | | 50,282 | | |
| | 2,812 | | | TransAlta Renewables, Inc.† | | | 33,608 | | |
| | 3,800 | | | Transcontinental, Inc., Class A | | | 46,441 | | |
| | 12,242 | | | Trican Well Service, Ltd.†,* | | | 10,747 | | |
| | 3,001 | | | Tricon Capital Group, Inc.† | | | 24,566 | | |
| | 15,700 | | | Turquoise Hill Resources, Ltd.†,* | | | 11,486 | | |
| | 1,000 | | | Uni-Select, Inc. | | | 8,771 | | |
| | 2,344 | | | Vermilion Energy, Inc.† | | | 38,322 | | |
| | 1,800 | | | Wajax Corp. | | | 20,515 | | |
| | 272 | | | Waste Connections, Inc. | | | 24,706 | | |
| | 1,290 | | | West Fraser Timber Co., Ltd.† | | | 56,903 | | |
| | 12,500 | | | Western Forest Products, Inc.† | | | 11,744 | | |
| | 1,510 | | | Wheaton Precious Metals Corp. | | | 44,932 | | |
| | 14,502 | | | Whitecap Resources, Inc.† | | | 61,982 | | |
| | 400 | | | Winpak, Ltd. | | | 14,472 | | |
| | 452 | | | WSP Global, Inc.† | | | 30,864 | | |
| | 25,721 | | | Yamana Gold, Inc.† | | | 101,810 | | |
| | | | 13,810,304 | | |
| | | Denmark—1.3% | |
| | 189 | | | ALK-Abello A/S* | | | 46,386 | | |
| | 2,469 | | | Alm Brand A/S | | | 21,922 | | |
| | 11 | | | AP Moller—Maersk A/S, Class A | | | 14,910 | | |
| | 23 | | | AP Moller—Maersk A/S, Class B | | | 33,172 | | |
| | 907 | | | Bang & Olufsen A/S†,* | | | 4,765 | | |
| | 641 | | | Carlsberg A/S, Class B | | | 95,623 | | |
| | 555 | | | Chr Hansen Holding A/S | | | 44,104 | | |
| | 568 | | | Coloplast A/S, Class B | | | 70,460 | | |
| | 805 | | | D/S Norden A/S | | | 12,893 | | |
| | 1,040 | | | Danske Bank A/S | | | 16,829 | | |
| | 1,375 | | | Demant A/S†,* | | | 43,303 | | |
| | 534 | | | Dfds A/S† | | | 26,051 | | |
| | 2,368 | | | DSV PANALPINA A/S | | | 272,920 | | |
| | 595 | | | FLSmidth & Co. A/S | | | 23,704 | | |
| | 196 | | | Genmab A/S* | | | 43,588 | | |
| | 1,611 | | | GN Store Nord A/S | | | 75,764 | | |
| | 818 | | | H+H International A/S, Class B* | | | 15,324 | | |
| | 3,142 | | | ISS A/S | | | 75,392 | | |
| | 1,765 | | | Jyske Bank A/S, Registered* | | | 64,407 | | |
| | 68 | | | Maersk Drilling A/S* | | | 4,497 | | |
The accompanying notes are an integral part of these financial statements.
19
M International Equity Fund
SCHEDULE OF INVESTMENTS (Continued)
December 31, 2019
Shares | |
| | Value
(Note 1) | |
| | | Denmark (Continued) | |
| | 1,970 | | | Matas A/S | | $ | 16,294 | | |
| | 266 | | | Nilfisk Holding A/S* | | | 5,822 | | |
| | 362 | | | NNIT A/S# | | | 6,064 | | |
| | 12,082 | | | Novo Nordisk A/S, Class B | | | 701,232 | | |
| | 2,254 | | | Novozymes A/S, Class B | | | 110,300 | | |
| | 727 | | | Orsted A/S# | | | 75,190 | | |
| | 841 | | | Pandora A/S | | | 36,585 | | |
| | 376 | | | Per Aarsleff Holding A/S | | | 12,107 | | |
| | 633 | | | Ringkjoebing Landbobank A/S | | | 48,840 | | |
| | 44 | | | Rockwool International A/S,
Class A | | | 9,511 | | |
| | 186 | | | Rockwool International A/S,
Class B | | | 44,058 | | |
| | 1,104 | | | Royal Unibrew A/S | | | 101,089 | | |
| | 1,644 | | | Scandinavian Tobacco Group A/S,
Class A# | | | 20,051 | | |
| | 336 | | | Schouw & Co. A/S | | | 28,244 | | |
| | 638 | | | SimCorp A/S | | | 72,545 | | |
| | 1,256 | | | Spar Nord Bank A/S | | | 12,198 | | |
| | 555 | | | Sydbank A/S | | | 11,647 | | |
| | 676 | | | Topdanmark A/S | | | 33,324 | | |
| | 837 | | | Tryg A/S | | | 24,814 | | |
| | 2,306 | | | Vestas Wind Systems A/S | | | 233,028 | | |
| | | | 2,608,957 | | |
| | | Finland—1.1% | |
| | 1,559 | | | Cargotec Oyj, Class B | | | 52,882 | | |
| | 1,720 | | | Cramo Oyj | | | 25,544 | | |
| | 2,156 | | | Elisa OyJ | | | 119,106 | | |
| | 2,285 | | | Finnair Oyj | | | 15,071 | | |
| | 3,720 | | | Fortum Oyj | | | 91,800 | | |
| | 1,730 | | | Huhtamaki Oyj | | | 80,300 | | |
| | 1,799 | | | Kemira Oyj | | | 26,758 | | |
| | 239 | | | Kesko Oyj, Class A | | | 15,763 | | |
| | 970 | | | Kesko Oyj, Class B | | | 68,634 | | |
| | 2,212 | | | Kone Oyj, Class B | | | 144,604 | | |
| | 1,119 | | | Konecranes Oyj | | | 34,392 | | |
| | 3,137 | | | Metsa Board Oyj | | | 21,095 | | |
| | 1,568 | | | Metso Oyj | | | 61,876 | | |
| | 3,273 | | | Neste Oyj | | | 113,884 | | |
| | 9,209 | | | Nokia Oyj* | | | 34,047 | | |
| | 1,922 | | | Nokian Renkaat Oyj | | | 55,256 | | |
| | 12,077 | | | Nordea Bank Abp | | | 98,079 | | |
| | 281 | | | Olvi Oyj, Class A | | | 12,986 | | |
| | 7,100 | | | Oriola Oyj, Class B | | | 16,127 | | |
Shares | |
| | Value
(Note 1) | |
| | | Finland (Continued) | |
| | 727 | | | Orion Oyj, Class A | | $ | 33,394 | | |
| | 1,558 | | | Orion Oyj, Class B | | | 72,124 | | |
| | 5,228 | | | Outokumpu Oyj† | | | 16,455 | | |
| | 2,902 | | | Outotec Oyj* | | | 18,743 | | |
| | 7,476 | | | Raisio Oyj , Class V | | | 28,512 | | |
| | 873 | | | Revenio Group Oyj | | | 25,705 | | |
| | 3,539 | | | Sampo Oyj, Class A | | | 154,461 | | |
| | 8,204 | | | Stora Enso Oyj, Class R | | | 119,309 | | |
| | 390 | | | TietoEvry Oyj | | | 12,126 | | |
| | 1,160 | | | Tikkurila Oyj | | | 18,685 | | |
| | 2,646 | | | Tokmanni Group Corp. | | | 37,456 | | |
| | 8,944 | | | UPM-Kymmene Oyj | | | 310,104 | | |
| | 559 | | | Vaisala Oyj, Class A | | | 19,908 | | |
| | 2,116 | | | Valmet Oyj | | | 50,698 | | |
| | 5,634 | | | Wartsila Oyj Abp | | | 62,249 | | |
| | 3,372 | | | YIT Oyj† | | | 22,543 | | |
| | | | 2,090,676 | | |
| | | France—6.2% | |
| | 969 | | | Accor SA | | | 45,379 | | |
| | 292 | | | Aeroports de Paris | | | 57,679 | | |
| | 3,912 | | | Air France-KLM* | | | 43,547 | | |
| | 3,527 | | | Air Liquide SA | | | 499,277 | | |
| | 3,566 | | | Airbus SE | | | 521,918 | | |
| | 337 | | | Akka Technologies† | | | 24,760 | | |
| | 317 | | | Albioma SA | | | 9,245 | | |
| | 966 | | | Alstom SA | | | 45,759 | | |
| | 476 | | | Alten SA | | | 60,067 | | |
| | 272 | | | Amundi SA# | | | 21,327 | | |
| | 1,401 | | | Arkema SA | | | 148,821 | | |
| | 625 | | | Atos SE | | | 52,103 | | |
| | 368 | | | Aubay | | | 13,808 | | |
| | 10,652 | | | AXA SA | | | 300,023 | | |
| | 1,320 | | | Beneteau SA | | | 16,035 | | |
| | 570 | | | BioMerieux | | | 50,734 | | |
| | 3,404 | | | BNP Paribas SA | | | 201,719 | | |
| | 29 | | | Bollore SA* | | | 123 | | |
| | 5,116 | | | Bollore SA | | | 22,323 | | |
| | 3,865 | | | Bouygues SA | | | 164,224 | | |
| | 3,079 | | | Bureau Veritas SA | | | 80,333 | | |
| | 1,394 | | | Capgemini SE | | | 170,281 | | |
| | 5,318 | | | Carrefour SA | | | 89,180 | | |
| | 20,011 | | | CGG SA* | | | 64,982 | | |
| | 6,743 | | | Cie de St-Gobain | | | 276,072 | | |
The accompanying notes are an integral part of these financial statements.
20
M International Equity Fund
SCHEDULE OF INVESTMENTS (Continued)
December 31, 2019
Shares | |
| | Value
(Note 1) | |
| | | France (Continued) | |
| | 3,063 | | | Cie Generale des Etablissements
Michelin SCA | | $ | 374,842 | | |
| | 585 | | | Cie Plastic Omnium SA | | | 16,339 | | |
| | 961 | | | CNP Assurances | | | 19,112 | | |
| | 2,606 | | | Coface SA | | | 32,067 | | |
| | 874 | | | Credit Agricole SA | | | 12,671 | | |
| | 4,080 | | | Danone SA | | | 338,206 | | |
| | 74 | | | Dassault Systemes SE | | | 12,165 | | |
| | 5,436 | | | Derichebourg SA | | | 22,256 | | |
| | 106 | | | Devoteam SA† | | | 11,236 | | |
| | 2,947 | | | Edenred | | | 152,390 | | |
| | 1,777 | | | Eiffage SA | | | 203,313 | | |
| | 6,771 | | | Electricite de France SA | | | 75,403 | | |
| | 1,532 | | | Elior Group SA# | | | 22,512 | | |
| | 4,742 | | | Elis SA | | | 98,403 | | |
| | 11,071 | | | Engie SA | | | 178,824 | | |
| | 601 | | | Eramet† | | | 30,903 | | |
| | 478 | | | EssilorLuxottica SA | | | 72,812 | | |
| | 155 | | | Eurofins Scientific SE† | | | 85,923 | | |
| | 993 | | | Euronext NV# | | | 80,921 | | |
| | 1,237 | | | Europcar Mobility Group†,# | | | 6,014 | | |
| | 4,666 | | | Eutelsat Communications SA | | | 75,839 | | |
| | 178 | | | Fnac Darty SA* | | | 10,542 | | |
| | 180 | | | Gaztransport Et Technigaz SA | | | 17,243 | | |
| | 218 | | | Hermes International | | | 162,906 | | |
| | 77 | | | ID Logistics Group* | | | 15,581 | | |
| | 454 | | | Iliad SA† | | | 58,844 | | |
| | 688 | | | Imerys SA | | | 29,079 | | |
| | 825 | | | Ingenico Group SA | | | 89,579 | | |
| | 308 | | | Ipsen SA | | | 27,293 | | |
| | 1,041 | | | IPSOS | | | 33,805 | | |
| | 530 | | | Jacquet Metal Service SA† | | | 9,167 | | |
| | 614 | | | JCDecaux SA | | | 18,926 | | |
| | 685 | | | Kaufman & Broad SA | | | 28,430 | | |
| | 488 | | | Kering SA | | | 320,332 | | |
| | 1,206 | | | Korian SA | | | 56,708 | | |
| | 948 | | | L'Oreal SA | | | 280,730 | | |
| | 1,721 | | | Lagardere SCA | | | 37,509 | | |
| | 1,064 | | | Lectra | | | 26,675 | | |
| | 2,297 | | | Legrand SA | | | 187,160 | | |
| | 1,684 | | | LVMH Moet Hennessy Louis
Vuitton SE | | | 782,400 | | |
| | 971 | | | Maisons du Monde SA# | | | 14,127 | | |
| | 444 | | | Mersen SA | | | 17,008 | | |
| | 1,630 | | | Natixis SA | | | 7,237 | | |
Shares | |
| | Value
(Note 1) | |
| | | France (Continued) | |
| | 812 | | | Nexans SA | | $ | 39,612 | | |
| | 927 | | | Nexity SA | | | 46,563 | | |
| | 31,311 | | | Orange SA | | | 460,795 | | |
| | 525 | | | Orpea | | | 67,310 | | |
| | 200 | | | Pernod-Ricard SA | | | 35,760 | | |
| | 13,186 | | | Peugeot SA | | | 315,043 | | |
| | 3,240 | | | Publicis Groupe SA | | | 146,681 | | |
| | 993 | | | Quadient SAS | | | 24,037 | | |
| | 2,261 | | | Renault SA | | | 106,975 | | |
| | 5,791 | | | Rexel SA | | | 76,942 | | |
| | 931 | | | Rothschild & Co. | | | 26,734 | | |
| | 907 | | | Rubis SCA | | | 55,702 | | |
| | 1,755 | | | Safran SA | | | 270,976 | | |
| | 2,028 | | | Sanofi | | | 203,868 | | |
| | 174 | | | Sartorius Stedim Biotech | | | 28,827 | | |
| | 3,125 | | | Schneider Electric SE | | | 320,736 | | |
| | 2,540 | | | SCOR SE | | | 106,614 | | |
| | 393 | | | SEB SA | | | 58,366 | | |
| | 6,297 | | | SES SA, ADR | | | 88,292 | | |
| | 411 | | | Societe BIC SA | | | 28,583 | | |
| | 2,627 | | | Societe Generale SA | | | 91,392 | | |
| | 1,132 | | | Sodexo SA† | | | 134,151 | | |
| | 206 | | | SOITEC* | | | 21,651 | | |
| | 93 | | | Sopra Steria Group | | | 14,970 | | |
| | 1,621 | | | SPIE SA | | | 33,020 | | |
| | 5,033 | | | STMicroelectronics NV | | | 135,323 | | |
| | 3,853 | | | Suez | | | 58,281 | | |
| | 24,023 | | | Technicolor SA, Registered†,* | | | 18,445 | | |
| | 606 | | | Teleperformance | | | 147,778 | | |
| | 2,268 | | | Television Francaise 1 | | | 18,826 | | |
| | 943 | | | Thales SA | | | 97,864 | | |
| | 18,666 | | | Total SA | | | 1,030,132 | | |
| | 198 | | | Trigano SA | | | 20,899 | | |
| | 1,226 | | | Ubisoft Entertainment SA* | | | 84,685 | | |
| | 3,814 | | | Veolia Environnement SA | | | 101,435 | | |
| | 436 | | | Vicat SA | | | 19,734 | | |
| | 3,269 | | | Vinci SA | | | 363,017 | | |
| | 95 | | | Virbac SA* | | | 25,202 | | |
| | 1,081 | | | Vivendi SA | | | 31,308 | | |
| | 328 | | | Worldline SA/France*,# | | | 23,234 | | |
| | | | 12,112,914 | | |
| | | Germany—5.2% | |
| | 696 | | | 1&1 Drillisch AG | | | 17,862 | | |
| | 1,211 | | | Aareal Bank AG | | | 41,091 | | |
The accompanying notes are an integral part of these financial statements.
21
M International Equity Fund
SCHEDULE OF INVESTMENTS (Continued)
December 31, 2019
Shares | |
| | Value
(Note 1) | |
| | | Germany (Continued) | |
| | 1,377 | | | adidas AG | | $ | 447,620 | | |
| | 210 | | | ADO Properties SA# | | | 7,561 | | |
| | 1,932 | | | ADVA Optical Networking SE* | | | 17,532 | | |
| | 1,604 | | | Allianz SE, Registered | | | 392,947 | | |
| | 136 | | | Amadeus Fire AG | | | 22,547 | | |
| | 8,773 | | | Aroundtown SA | | | 78,568 | | |
| | 408 | | | Aurubis AG | | | 25,043 | | |
| | 8,846 | | | BASF SE | | | 668,284 | | |
| | 333 | | | Bauer AG | | | 5,640 | | |
| | 4,586 | | | Bayer AG, Registered | | | 374,543 | | |
| | 4,607 | | | Bayerische Motoren Werke AG, | | | 377,963 | | |
| | 474 | | | BayWa AG | | | 15,020 | | |
| | 261 | | | Bechtle AG | | | 36,654 | | |
| | 196 | | | Beiersdorf AG | | | 23,447 | | |
| | 1,136 | | | Bilfinger SE | | | 44,064 | | |
| | 1,357 | | | Borussia Dortmund GmbH & Co.
KGaA | | | 13,395 | | |
| | 2,718 | | | Brenntag AG | | | 147,805 | | |
| | 603 | | | CANCOM SE | | | 35,578 | | |
| | 159 | | | Cewe Stiftung & Co. KGAA | | | 18,869 | | |
| | 6,421 | | | Commerzbank AG | | | 39,736 | | |
| | 270 | | | CompuGroup Medical SE | | | 19,307 | | |
| | 1,367 | | | Continental AG | | | 176,736 | | |
| | 612 | | | Corestate Capital Holding SA* | | | 25,743 | | |
| | 1,506 | | | Covestro AG# | | | 70,021 | | |
| | 1,019 | | | CTS Eventim AG & Co. KGaA | | | 64,066 | | |
| | 10,083 | | | Daimler AG, Registered | | | 558,380 | | |
| | 414 | | | Delivery Hero SE#,* | | | 32,767 | | |
| | 9,056 | | | Deutsche Bank AG, Registered | | | 70,264 | | |
| | 584 | | | Deutsche Beteiligungs AG | | | 25,843 | | |
| | 1,312 | | | Deutsche Boerse AG | | | 206,255 | | |
| | 696 | | | Deutsche EuroShop AG | | | 20,626 | | |
| | 5,519 | | | Deutsche Lufthansa AG | | | 101,589 | | |
| | 3,746 | | | Deutsche Pfandbriefbank AG# | | | 61,179 | | |
| | 10,000 | | | Deutsche Post AG, Registered | | | 381,490 | | |
| | 27,548 | | | Deutsche Telekom AG, Registered | | | 450,222 | | |
| | 2,787 | | | Deutsche Wohnen SE | | | 113,855 | | |
| | 3,473 | | | Deutz AG | | | 21,699 | | |
| | 821 | | | Dialog Semiconductor Plc* | | | 41,543 | | |
| | 507 | | | Duerr AG | | | 17,277 | | |
| | 28,452 | | | E.ON SE | | | 303,955 | | |
| | 298 | | | Eckert & Ziegler Strahlen- und
Medizintechnik AG | | | 63,711 | | |
| | 601 | | | Elmos Semiconductor AG | | | 19,213 | | |
| | 2,150 | | | Evonik Industries AG | | | 65,621 | | |
Shares | |
| | Value
(Note 1) | |
| | | Germany (Continued) | |
| | 1,117 | | | Evotec SE* | | $ | 28,880 | | |
| | 334 | | | Fielmann AG | | | 26,975 | | |
| | 479 | | | Fraport AG Frankfurt Airport
Services Worldwide | | | 40,716 | | |
| | 2,143 | | | Freenet AG | | | 49,134 | | |
| | 2,283 | | | Fresenius Medical Care AG & Co.
KGaA | | | 168,913 | | |
| | 2,593 | | | Fresenius SE & Co. KGaA | | | 145,952 | | |
| | 305 | | | FUCHS PETROLUB SE | | | 13,668 | | |
| | 2,497 | | | GEA Group AG | | | 82,570 | | |
| | 620 | | | Gerresheimer AG | | | 47,986 | | |
| | 287 | | | Gesco AG | | | 6,072 | | |
| | 1,432 | | | Grand City Properties SA | | | 34,342 | | |
| | 153 | | | Hannover Rueck SE | | | 29,570 | | |
| | 243 | | | Hapag-Lloyd AG# | | | 20,852 | | |
| | 417 | | | HeidelbergCement AG | | | 30,385 | | |
| | 6,593 | | | Heidelberger Druckmaschinen AG* | | | 8,505 | | |
| | 524 | | | Hella GmbH & Co. KGaA | | | 29,001 | | |
| | 443 | | | Henkel AG & Co. KGaA | | | 41,741 | | |
| | 160 | | | HOCHTIEF AG | | | 20,406 | | |
| | 461 | | | Hornbach Holding AG & Co.
KGaA | | | 33,353 | | |
| | 1,048 | | | HUGO BOSS AG | | | 50,854 | | |
| | 721 | | | Indus Holding AG | | | 31,420 | | |
| | 14,412 | | | Infineon Technologies AG | | | 328,330 | | |
| | 4,300 | | | K+S AG, Registered | | | 53,611 | | |
| | 578 | | | KION Group AG | | | 39,912 | | |
| | 2,961 | | | Kloeckner & Co. SE | | | 20,858 | | |
| | 434 | | | Koenig & Bauer AG | | | 13,602 | | |
| | 730 | | | LANXESS AG | | | 48,983 | | |
| | 874 | | | LEG Immobilien AG | | | 103,478 | | |
| | 746 | | | Merck KGaA | | | 88,156 | | |
| | 4,159 | | | METRO AG | | | 66,945 | | |
| | 456 | | | MTU Aero Engines AG | | | 130,227 | | |
| | 600 | | | Muenchener Rueckversicherungs-
Gesellschaft AG in Muenchen,
Registered | | | 177,004 | | |
| | 1,083 | | | Nemetschek SE | | | 71,430 | | |
| | 397 | | | Norma Group SE | | | 16,922 | | |
| | 390 | | | OHB SE | | | 19,030 | | |
| | 1,631 | | | OSRAM Licht AG* | | | 74,186 | | |
| | 471 | | | PATRIZIA AG | | | 10,492 | | |
| | 1,490 | | | ProSiebenSat.1 Media SE | | | 23,248 | | |
| | 400 | | | Puma SE | | | 30,667 | | |
| | 1,192 | | | QIAGEN NV* | | | 40,727 | | |
The accompanying notes are an integral part of these financial statements.
22
M International Equity Fund
SCHEDULE OF INVESTMENTS (Continued)
December 31, 2019
Shares | |
| | Value
(Note 1) | |
| | | Germany (Continued) | |
| | 19 | | | Rational AG | | $ | 15,281 | | |
| | 1,056 | | | Rheinmetall AG | | | 121,294 | | |
| | 549 | | | RHOEN-KLINIKUM AG | | | 10,764 | | |
| | 1,227 | | | Rocket Internet SE*,# | | | 30,417 | | |
| | 641 | | | RTL Group SA | | | 31,622 | | |
| | 2,164 | | | RWE AG | | | 66,388 | | |
| | 959 | | | S&T AG | | | 22,891 | | |
| | 1,686 | | | SAF-Holland SA | | | 13,995 | | |
| | 523 | | | Salzgitter AG | | | 11,592 | | |
| | 3,020 | | | SAP SE | | | 407,588 | | |
| | 963 | | | Scout24 AG# | | | 63,678 | | |
| | 2,581 | | | Siemens AG, Registered | | | 337,396 | | |
| | 279 | | | Siltronic AG | | | 28,078 | | |
| | 185 | | | Sixt SE | | | 18,604 | | |
| | 435 | | | Software AG | | | 15,175 | | |
| | 286 | | | STRATEC SE | | | 19,569 | | |
| | 324 | | | Stroeer SE & Co. KGaA | | | 26,185 | | |
| | 1,626 | | | Suedzucker AG | | | 29,930 | | |
| | 1,073 | | | Symrise AG | | | 112,896 | | |
| | 1,795 | | | TAG Immobilien AG* | | | 44,618 | | |
| | 1,202 | | | Takkt AG | | | 16,961 | | |
| | 315 | | | Talanx AG* | | | 15,610 | | |
| | 420 | | | Technotrans SE | | | 8,810 | | |
| | 5,253 | | | Telefonica Deutschland Holding AG | | | 15,226 | | |
| | 2,041 | | | thyssenkrupp AG | | | 27,564 | | |
| | 1,100 | | | TLG Immobilien AG | | | 35,104 | | |
| | 1,060 | | | Uniper SE | | | 35,087 | | |
| | 2,405 | | | United Internet AG, Registered | | | 78,988 | | |
| | 542 | | | Volkswagen AG | | | 105,329 | | |
| | 4,022 | | | Vonovia SE | | | 216,551 | | |
| | 257 | | | Vossloh AG | | | 10,666 | | |
| | 236 | | | Wacker Chemie AG | | | 17,906 | | |
| | 904 | | | Wacker Neuson SE | | | 17,289 | | |
| | 209 | | | Washtec AG | | | 12,589 | | |
| | 815 | | | Wirecard AG | | | 98,275 | | |
| | 767 | | | Zeal Network SE* | | | 17,852 | | |
| | | | 10,220,002 | | |
| | | Hong Kong—1.8% | |
| | 145,000 | | | Agritrade Resources, Ltd. | | | 10,793 | | |
| | 76,800 | | | AIA Group, Ltd. | | | 806,211 | | |
| | 2,500 | | | ASM Pacific Technology, Ltd. | | | 34,682 | | |
| | 9,400 | | | Bank of East Asia, Ltd. | | | 20,990 | | |
| | 2,700 | | | BOC Aviation, Ltd.# | | | 27,460 | | |
| | 13,000 | | | BOC Hong Kong Holdings, Ltd. | | | 45,128 | | |
Shares | |
| | Value
(Note 1) | |
| | | Hong Kong (Continued) | |
| | 10,000 | | | Cafe de Coral Holdings, Ltd. | | $ | 23,690 | | |
| | 16,000 | | | Cathay Pacific Airways, Ltd. | | | 23,654 | | |
| | 15,000 | | | Chow Sang Sang Holdings
International, Ltd. | | | 18,653 | | |
| | 56,000 | | | CITIC Telecom International
Holdings, Ltd. | | | 20,410 | | |
| | 6,500 | | | CK Asset Holdings, Ltd. | | | 46,921 | | |
| | 19,000 | | | CK Hutchison Holdings, Ltd. | | | 181,166 | | |
| | 2,000 | | | CK Infrastructure Holdings, Ltd. | | | 14,232 | | |
| | 8,500 | | | CLP Holdings, Ltd. | | | 89,338 | | |
| | 6,000 | | | Dah Sing Banking Group, Ltd. | | | 8,023 | | |
| | 4,800 | | | Dah Sing Financial Holdings, Ltd. | | | 18,911 | | |
| | 52,500 | | | Esprit Holdings, Ltd.* | | | 10,578 | | |
| | 51,000 | | | Far East Consortium
International, Ltd. | | | 24,936 | | |
| | 111,000 | | | FIH Mobile, Ltd.* | | | 21,510 | | |
| | 58,000 | | | First Pacific Co., Ltd. | | | 19,725 | | |
| | 20,000 | | | Galaxy Entertainment Group, Ltd. | | | 147,325 | | |
| | 40,000 | | | Giordano International, Ltd. | | | 12,063 | | |
| | 7,000 | | | Great Eagle Holdings, Ltd. | | | 23,581 | | |
| | 142,000 | | | Guotai Junan International
Holdings, Ltd. | | | 25,148 | | |
| | 108,000 | | | Haitong International Securities
Group, Ltd. | | | 32,848 | | |
| | 4,000 | | | Hang Lung Group, Ltd. | | | 9,887 | | |
| | 6,000 | | | Hang Lung Properties, Ltd. | | | 13,167 | | |
| | 8,300 | | | Hang Seng Bank, Ltd. | | | 171,490 | | |
| | 5,500 | | | Henderson Land Development
Co., Ltd. | | | 26,998 | | |
| | 7,500 | | | HKBN, Ltd. | | | 12,570 | | |
| | 19,200 | | | HKR International, Ltd. | | | 7,983 | | |
| | 21,000 | | | HKT Trust & HKT, Ltd. | | | 29,591 | | |
| | 23,100 | | | Hong Kong & China Gas Co., Ltd. | | | 45,119 | | |
| | 7,602 | | | Hong Kong Exchanges &
Clearing, Ltd. | | | 246,821 | | |
| | 14,000 | | | Hongkong & Shanghai
Hotels, Ltd. (The) | | | 15,002 | | |
| | 50,000 | | | Hutchison Telecommunications
Hong Kong Holdings, Ltd. | | | 10,074 | | |
| | 9,000 | | | Hysan Development Co., Ltd. | | | 35,285 | | |
| | 41,000 | | | IGG, Inc. | | | 30,254 | | |
| | 5,500 | | | Johnson Electric Holdings, Ltd. | | | 12,507 | | |
| | 7,000 | | | Kerry Logistics Network, Ltd. | | | 12,020 | | |
| | 6,000 | | | Kerry Properties, Ltd. | | | 19,057 | | |
| | 5,750 | | | L'Occitane International SA | | | 13,622 | | |
The accompanying notes are an integral part of these financial statements.
23
M International Equity Fund
SCHEDULE OF INVESTMENTS (Continued)
December 31, 2019
Shares | |
| | Value
(Note 1) | |
| | | Hong Kong (Continued) | |
| | 38,400 | | | Landing International
Development, Ltd.* | | $ | 4,337 | | |
| | 92,000 | | | Li & Fung, Ltd. | | | 10,036 | | |
| | 15,500 | | | Lifestyle International
Holdings, Ltd. | | | 17,783 | | |
| | 6,000 | | | Luk Fook Holdings
International, Ltd. | | | 17,286 | | |
| | 51,600 | | | Man Wah Holdings, Ltd. | | | 36,752 | | |
| | 480,000 | | | Mason Group Holdings, Ltd. | | | 3,573 | | |
| | 11,000 | | | Melco International
Development, Ltd. | | | 30,915 | | |
| | 4,079 | | | MTR Corp., Ltd. | | | 24,106 | | |
| | 68,000 | | | New World Development Co., Ltd. | | | 93,200 | | |
| | 44,000 | | | NewOcean Energy Holdings, Ltd.* | | | 6,663 | | |
| | 17,000 | | | NWS Holdings, Ltd. | | | 23,824 | | |
| | 181,000 | | | Pacific Basin Shipping, Ltd. | | | 38,094 | | |
| | 29,000 | | | Pacific Textiles Holdings, Ltd. | | | 19,911 | | |
| | 66,000 | | | PCCW, Ltd. | | | 39,046 | | |
| | 3,000 | | | Power Assets Holdings, Ltd. | | | 21,945 | | |
| | 63,195 | | | Sa Sa International Holdings, Ltd. | | | 14,273 | | |
| | 6,900 | | | Samsonite International SA# | | | 16,559 | | |
| | 12,800 | | | Sands China, Ltd. | | | 68,416 | | |
| | 12,000 | | | Shangri-La Asia, Ltd. | | | 12,535 | | |
| | 100,000 | | | Shun Tak Holdings, Ltd. | | | 47,739 | | |
| | 138,000 | | | Singamas Container Holdings, Ltd. | | | 15,230 | | |
| | 8,000 | | | Sino Land Co., Ltd. | | | 11,622 | | |
| | 23,000 | | | SITC International Holdings
Co., Ltd. | | | 28,040 | | |
| | 13,500 | | | SmarTone Telecommunications
Holdings, Ltd. | | | 10,395 | | |
| | 5,500 | | | Sun Hung Kai Properties, Ltd. | | | 84,205 | | |
| | 27,000 | | | SUNeVision Holdings, Ltd. | | | 18,260 | | |
| | 4,500 | | | Swire Pacific, Ltd., Class A | | | 41,810 | | |
| | 15,000 | | | Swire Pacific, Ltd., Class B | | | 22,445 | | |
| | 3,000 | | | Swire Properties, Ltd. | | | 9,952 | | |
| | 8,000 | | | Techtronic Industries Co., Ltd. | | | 65,244 | | |
| | 12,000 | | | Television Broadcasts, Ltd. | | | 18,849 | | |
| | 30,000 | | | United Laboratories International
Holdings, Ltd. (The) | | | 21,868 | | |
| | 4,000 | | | Vitasoy International Holdings, Ltd. | | | 14,501 | | |
| | 1,300 | | | VTech Holdings, Ltd. | | | 12,846 | | |
| | 105,500 | | | WH Group, Ltd.# | | | 108,989 | | |
| | 2,000 | | | Wharf Real Estate Investment
Co., Ltd. | | | 12,204 | | |
| | 3,000 | | | Wheelock & Co., Ltd. | | | 20,000 | | |
Shares | |
| | Value
(Note 1) | |
| | | Hong Kong (Continued) | |
| | 9,200 | | | Wynn Macau, Ltd. | | $ | 22,669 | | |
| | 34,000 | | | Xinyi Glass Holdings, Ltd. | | | 45,029 | | |
| | 6,000 | | | Yue Yuen Industrial Holdings, Ltd. | | | 17,710 | | |
| | | | 3,568,284 | | |
| | | Ireland—0.5% | |
| | 5,093 | | | AIB Group Plc | | | 17,744 | | |
| | 10,939 | | | Bank of Ireland Group Plc | | | 59,903 | | |
| | 10,801 | | | Cairn Homes Plc* | | | 15,266 | | |
| | 3,828 | | | CRH Plc* | | | 153,162 | | |
| | 5,700 | | | CRH Plc, SP ADR | | | 229,881 | | |
| | 1,025 | | | Flutter Entertainment Plc | | | 124,575 | | |
| | 3,273 | | | Glanbia Plc | | | 37,668 | | |
| | 1,946 | | | Irish Continental Group Plc | | | 10,565 | | |
| | 700 | | | Kerry Group Plc, Class A | | | 87,235 | | |
| | 1,950 | | | Kingspan Group Plc | | | 119,099 | | |
| | 2,108 | | | Smurfit Kappa Group Plc | | | 81,009 | | |
| | | | 936,107 | | |
| | | Israel—0.4% | |
| | 734 | | | Airport City, Ltd.* | | | 13,778 | | |
| | 568 | | | Alony Hetz Properties &
Investments, Ltd. | | | 8,981 | | |
| | 2,317 | | | Amot Investments, Ltd. | | | 16,821 | | |
| | 9,376 | | | Bank Hapoalim BM | | | 77,787 | | |
| | 9,084 | | | Bank Leumi Le-Israel BM | | | 66,131 | | |
| | 25 | | | Bayside Land Corp. | | | 19,213 | | |
| | 22,557 | | | Bezeq The Israeli Telecommunication
Corp., Ltd.* | | | 18,126 | | |
| | 2,356 | | | Cellcom Israel, Ltd.* | | | 7,498 | | |
| | 1,006 | | | Clal Insurance Enterprises
Holdings, Ltd.* | | | 15,113 | | |
| | 187 | | | Elbit Systems, Ltd. | | | 28,996 | | |
| | 58 | | | Electra, Ltd. | | | 25,748 | | |
| | 432 | | | First Intl Bank Israel | | | 12,496 | | |
| | 501 | | | Fox Wizel, Ltd. | | | 22,821 | | |
| | 2,147 | | | Harel Insurance Investments &
Financial Services, Ltd. | | | 16,755 | | |
| | 275 | | | IDI Insurance Co., Ltd. | | | 10,034 | | |
| | 7,565 | | | Israel Chemicals, Ltd. | | | 35,598 | | |
| | 6,033 | | | Israel Discount Bank, Ltd., Class A | | | 27,970 | | |
| | 1,175 | | | Matrix IT, Ltd. | | | 23,651 | | |
| | 2,083 | | | Maytronics, Ltd. | | | 17,402 | | |
| | 1,106 | | | Menora Mivtachim Holdings, Ltd. | | | 16,145 | | |
| | 1,212 | | | Mizrahi Tefahot Bank, Ltd. | | | 32,289 | | |
The accompanying notes are an integral part of these financial statements.
24
M International Equity Fund
SCHEDULE OF INVESTMENTS (Continued)
December 31, 2019
Shares | |
| | Value
(Note 1) | |
| | | Israel (Continued) | |
| | 2,005 | | | Naphtha Israel Petroleum Corp., Ltd. | | $ | 12,036 | | |
| | 156 | | | Nice, Ltd.* | | | 24,195 | | |
| | 324 | | | Nice, Ltd., SP ADR* | | | 50,269 | | |
| | 417 | | | Nova Measuring Instruments, Ltd.* | | | 15,867 | | |
| | 21,016 | | | Oil Refineries, Ltd. | | | 10,553 | | |
| | 2,397 | | | Partner Communications Co., Ltd.* | | | 10,669 | | |
| | 134 | | | Paz Oil Co., Ltd. | | | 18,971 | | |
| | 403 | | | Rami Levy Chain Stores Hashikma
Marketing 2006, Ltd. | | | 23,177 | | |
| | 6,488 | | | Shikun & Binui, Ltd. | | | 29,854 | | |
| | 700 | | | Strauss Group, Ltd. | | | 21,466 | | |
| | 1,314 | | | Summit Real Estate Holdings, Ltd. | | | 17,553 | | |
| | 3,070 | | | Teva Pharmaceutical Industries, Ltd.,
SP ADR* | | | 30,086 | | |
| | 862 | | | Tower Semiconductor, Ltd.* | | | 20,740 | | |
| | | | 798,789 | | |
| | | Italy—1.9% | |
| | 23,194 | | | A2A SpA | | | 43,500 | | |
| | 548 | | | ACEA SpA | | | 11,335 | | |
| | 1,290 | | | Amplifon SpA | | | 37,101 | | |
| | 6,692 | | | Anima Holding SpA# | | | 34,545 | | |
| | 9,605 | | | Assicurazioni Generali SpA | | | 198,186 | | |
| | 2,754 | | | Atlantia SpA | | | 64,224 | | |
| | 1,521 | | | Autogrill SpA | | | 15,918 | | |
| | 1,709 | | | Azimut Holding SpA | | | 40,793 | | |
| | 2,332 | | | Banca Farmafactoring SpA# | | | 13,968 | | |
| | 623 | | | Banca Generali SpA | | | 20,238 | | |
| | 1,606 | | | Banca IFIS SpA | | | 25,220 | | |
| | 9,396 | | | Banca Popolare di Sondrio SCPA | | | 22,217 | | |
| | 30,073 | | | Banco BPM SpA* | | | 68,410 | | |
| | 10,009 | | | BPER Banca | | | 50,331 | | |
| | 1,912 | | | Brembo SpA | | | 23,720 | | |
| | 1,230 | | | Buzzi Unicem SpA | | | 30,974 | | |
| | 3,016 | | | Cairo Communication SpA | | | 9,185 | | |
| | 1,408 | | | Cerved Group SpA | | | 13,732 | | |
| | 13,512 | | | CIR-Compagnie Industriali
Riunite SpA | | | 16,490 | | |
| | 8,425 | | | CNH Industrial NV | | | 92,519 | | |
| | 3,914 | | | Credito Emiliano SpA | | | 22,786 | | |
| | 248,243 | | | Credito Valtellinese SpA* | | | 19,826 | | |
| | 2,404 | | | Davide Campari-Milano SpA | | | 21,950 | | |
| | 253 | | | DiaSorin SpA | | | 32,749 | | |
| | 59,059 | | | Enel SpA | | | 468,495 | | |
| | 28,467 | | | Eni SpA | | | 442,123 | | |
Shares | |
| | Value
(Note 1) | |
| | | Italy (Continued) | |
| | 806 | | | ERG SpA | | $ | 17,377 | | |
| | 8,133 | | | Falck Renewables SpA | | | 43,424 | | |
| | 1,143 | | | Ferrari NV | | | 189,623 | | |
| | 211 | | | Ferrari NV | | | 34,929 | | |
| | 22,449 | | | Fiat Chrysler Automobiles NV | | | 332,239 | | |
| | 18,781 | | | Fincantieri SpA†,* | | | 19,402 | | |
| | 6,697 | | | FinecoBank Banca Fineco SpA | | | 80,304 | | |
| | 725 | | | Gruppo MutuiOnline SpA | | | 16,305 | | |
| | 6,924 | | | Hera SpA | | | 30,290 | | |
| | 192 | | | IMA Industria Macchine
Automatiche SpA | | | 13,805 | | |
| | 1,134 | | | Interpump Group SpA | | | 35,922 | | |
| | 57,274 | | | Intesa Sanpaolo SpA | | | 150,878 | | |
| | 9,018 | | | Iren SpA | | | 27,939 | | |
| | 7,345 | | | Italgas SpA | | | 44,853 | | |
| | 2,260 | | | Leonardo SpA | | | 26,491 | | |
| | 7,518 | | | Mediobanca Banca di Credito
Finanziario SpA | | | 82,761 | | |
| | 7,618 | | | OVS SpA†,#,* | | | 17,142 | | |
| | 1,752 | | | Pirelli & C SpA# | | | 10,101 | | |
| | 2,693 | | | Poste Italiane SpA# | | | 30,570 | | |
| | 5,199 | | | Saipem SpA* | | | 25,403 | | |
| | 1,080 | | | Salvatore Ferragamo SpA | | | 22,714 | | |
| | 10,551 | | | Saras SpA | | | 16,971 | | |
| | 14,612 | | | Snam SpA | | | 76,805 | | |
| | 5,594 | | | Societa Cattolica di
Assicurazioni SC | | | 45,618 | | |
| | 3,313 | | | Tamburi Investment Partners SpA | | | 25,344 | | |
| | 151,273 | | | Telecom Italia SpA/Milano* | | | 94,412 | | |
| | 1,807 | | | Tenaris SA | | | 20,370 | | |
| | 12,686 | | | Terna Rete Elettrica Nazionale SpA | | | 84,725 | | |
| | 7,682 | | | UniCredit SpA | | | 112,192 | | |
| | 22,877 | | | Unione di Banche Italiane SpA | | | 74,725 | | |
| | 15,391 | | | Unipol Gruppo SpA | | | 88,254 | | |
| | 9,399 | | | UnipolSai Assicurazioni SpA | | | 27,306 | | |
| | | | 3,759,729 | | |
| | | Japan—17.6% | |
| | 1,200 | | | 77 Bank, Ltd. (The) | | | 20,233 | | |
| | 400 | | | ABC-Mart, Inc. | | | 27,389 | | |
| | 5,900 | | | Acom Co., Ltd. | | | 26,987 | | |
| | 1,200 | | | Adastria Co., Ltd. | | | 27,489 | | |
| | 1,500 | | | ADEKA Corp. | | | 22,861 | | |
| | 2,500 | | | Advantest Corp. | | | 141,733 | | |
| | 4,700 | | | Aeon Co., Ltd. | | | 97,564 | | |
The accompanying notes are an integral part of these financial statements.
25
M International Equity Fund
SCHEDULE OF INVESTMENTS (Continued)
December 31, 2019
Shares | |
| | Value
(Note 1) | |
| | | Japan (Continued) | |
| | 1,400 | | | AEON Financial Service Co., Ltd. | | $ | 22,252 | | |
| | 2,100 | | | AGC, Inc. | | | 75,956 | | |
| | 700 | | | Aica Kogyo Co., Ltd. | | | 23,354 | | |
| | 2,900 | | | Aida Engineering, Ltd. | | | 26,236 | | |
| | 8,600 | | | Aiful Corp.* | | | 20,104 | | |
| | 300 | | | Ain Holdings, Inc. | | | 19,134 | | |
| | 2,300 | | | Air Water, Inc. | | | 33,869 | | |
| | 2,300 | | | Aisin Seiki Co., Ltd. | | | 86,153 | | |
| | 2,900 | | | Ajinomoto Co., Inc. | | | 48,442 | | |
| | 1,200 | | | Alconix Corp.† | | | 15,892 | | |
| | 800 | | | Alfresa Holdings Corp. | | | 16,404 | | |
| | 2,600 | | | Alps Alpine Co., Ltd. | | | 59,631 | | |
| | 2,700 | | | Amada Holdings Co., Ltd. | | | 31,062 | | |
| | 1,000 | | | Amano Corp. | | | 30,693 | | |
| | 700 | | | ANA Holdings, Inc. | | | 23,463 | | |
| | 1,500 | | | Anritsu Corp.† | | | 29,930 | | |
| | 1,100 | | | AOKI Holdings, Inc. | | | 11,450 | | |
| | 900 | | | Aoyama Trading Co., Ltd. | | | 12,731 | | |
| | 700 | | | Aozora Bank, Ltd. | | | 18,625 | | |
| | 500 | | | Arata Corp. | | | 20,846 | | |
| | 2,000 | | | Arcland Sakamoto Co., Ltd. | | | 23,009 | | |
| | 1,000 | | | Arcs Co., Ltd. | | | 21,232 | | |
| | 1,400 | | | Arisawa Manufacturing Co., Ltd. | | | 13,039 | | |
| | 1,800 | | | Asahi Diamond Industrial Co., Ltd. | | | 10,685 | | |
| | 3,400 | | | Asahi Group Holdings, Ltd. | | | 155,927 | | |
| | 1,000 | | | Asahi Holdings, Inc. | | | 24,905 | | |
| | 1,600 | | | Asahi Intecc Co., Ltd. | | | 47,122 | | |
| | 15,000 | | | Asahi Kasei Corp. | | | 170,356 | | |
| | 10,900 | | | Astellas Pharma, Inc. | | | 187,594 | | |
| | 2,400 | | | Atom Corp.† | | | 22,420 | | |
| | 1,600 | | | Avex, Inc. | | | 18,539 | | |
| | 800 | | | Awa Bank, Ltd. (The) | | | 18,031 | | |
| | 1,100 | | | Azbil Corp. | | | 31,232 | | |
| | 2,000 | | | Bandai Namco Holdings, Inc. | | | 122,056 | | |
| | 600 | | | Bank of Kyoto, Ltd. (The) | | | 25,954 | | |
| | 1,300 | | | Bank of the Ryukyus, Ltd. | | | 14,369 | | |
| | 1,300 | | | Bell System24 Holdings, Inc. | | | 20,579 | | |
| | 1,300 | | | Belluna Co., Ltd. | | | 8,519 | | |
| | 800 | | | Benesse Holdings, Inc. | | | 21,161 | | |
| | 1,500 | | | Bic Camera, Inc. | | | 17,201 | | |
| | 800 | | | BML, Inc. | | | 23,156 | | |
| | 7,200 | | | Bridgestone Corp. | | | 269,698 | | |
| | 4,000 | | | Broadleaf Co., Ltd.† | | | 24,555 | | |
| | 1,400 | | | Brother Industries, Ltd. | | | 29,261 | | |
| | 3,200 | | | Bunka Shutter Co., Ltd. | | | 28,391 | | |
Shares | |
| | Value
(Note 1) | |
| | | Japan (Continued) | |
| | 700 | | | Calbee, Inc. | | $ | 22,903 | | |
| | 900 | | | Canon Electronics, Inc. | | | 17,411 | | |
| | 4,600 | | | Canon, Inc.† | | | 126,436 | | |
| | 1,200 | | | Capcom Co., Ltd. | | | 33,464 | | |
| | 1,600 | | | Casio Computer Co., Ltd. | | | 32,264 | | |
| | 1,300 | | | Cawachi, Ltd. | | | 26,477 | | |
| | 1,100 | | | Central Glass Co., Ltd. | | | 27,142 | | |
| | 900 | | | Central Japan Railway Co. | | | 182,228 | | |
| | 3,700 | | | Chiba Bank, Ltd. (The) | | | 21,555 | | |
| | 1,100 | | | Chofu Seisakusho Co., Ltd. | | | 24,945 | | |
| | 3,800 | | | Chubu Electric Power Co., Inc. | | | 53,911 | | |
| | 700 | | | Chudenko Corp. | | | 16,312 | | |
| | 400 | | | Chugai Pharmaceutical Co., Ltd. | | | 37,108 | | |
| | 1,700 | | | Chugoku Electric Power
Co., Inc. (The)† | | | 22,374 | | |
| | 2,300 | | | Chugoku Marine Paints, Ltd. | | | 22,120 | | |
| | 5,400 | | | Citizen Watch Co., Ltd. | | | 29,670 | | |
| | 1,000 | | | CKD Corp. | | | 16,916 | | |
| | 3,900 | | | CMK Corp. | | | 24,192 | | |
| | 800 | | | Coca-Cola Bottlers Japan
Holdings, Inc.† | | | 20,549 | | |
| | 600 | | | cocokara fine, Inc. | | | 35,010 | | |
| | 1,000 | | | Colowide Co., Ltd. | | | 20,809 | | |
| | 900 | | | COMSYS Holdings Corp. | | | 25,967 | | |
| | 5,100 | | | Concordia Financial Group, Ltd. | | | 21,216 | | |
| | 2,000 | | | Cosmo Energy Holdings Co., Ltd. | | | 46,293 | | |
| | 1,900 | | | Credit Saison Co., Ltd. | | | 33,242 | | |
| | 900 | | | CyberAgent, Inc. | | | 31,600 | | |
| | 1,700 | | | Dai Nippon Printing Co., Ltd. | | | 46,312 | | |
| | 3,600 | | | Dai-ichi Life Holdings, Inc. | | | 60,185 | | |
| | 2,100 | | | Daicel Corp. | | | 20,274 | | |
| | 3,700 | | | Daido Metal Co., Ltd. | | | 25,982 | | |
| | 600 | | | Daido Steel Co., Ltd. | | | 26,534 | | |
| | 700 | | | Daifuku Co., Ltd. | | | 42,906 | | |
| | 1,000 | | | Daihen Corp. | | | 33,316 | | |
| | 700 | | | Daiho Corp. | | | 18,548 | | |
| | 400 | | | Daiichi Sankyo Co., Ltd. | | | 26,609 | | |
| | 600 | | | Daiichikosho Co., Ltd. | | | 31,641 | | |
| | 1,500 | | | Daikin Industries, Ltd. | | | 213,290 | | |
| | 1,400 | | | Daikyonishikawa Corp. | | | 11,017 | | |
| | 800 | | | Dainichiseika Color & Chemicals
Manufacturing Co., Ltd. | | | 23,340 | | |
| | 1,900 | | | Daio Paper Corp. | | | 26,142 | | |
| | 900 | | | Daiseki Co., Ltd. | | | 26,216 | | |
The accompanying notes are an integral part of these financial statements.
26
M International Equity Fund
SCHEDULE OF INVESTMENTS (Continued)
December 31, 2019
Shares | |
| | Value
(Note 1) | |
| | | Japan (Continued) | |
| | 400 | | | Daishi Hokuetsu Financial
Group, Inc. | | $ | 11,228 | | |
| | 500 | | | Daito Trust Construction Co., Ltd. | | | 62,031 | | |
| | 5,300 | | | Daiwa House Industry Co., Ltd. | | | 165,358 | | |
| | 9,500 | | | Daiwa Securities Group, Inc. | | | 48,350 | | |
| | 500 | | | Daiwabo Holdings Co., Ltd. | | | 30,970 | | |
| | 2,200 | | | DCM Holdings Co., Ltd. | | | 21,523 | | |
| | 1,200 | | | DeNA Co., Ltd. | | | 19,382 | | |
| | 1,300 | | | Denka Co., Ltd. | | | 39,124 | | |
| | 3,100 | | | Denso Corp. | | | 141,683 | | |
| | 200 | | | Dentsu, Inc.† | | | 6,949 | | |
| | 2,400 | | | Dexerials Corp. | | | 24,363 | | |
| | 1,200 | | | DIC Corp. | | | 33,519 | | |
| | 400 | | | Digital Arts, Inc. | | | 20,542 | | |
| | 1,800 | | | DMG Mori Co., Ltd.† | | | 27,997 | | |
| | 1,100 | | | Doutor Nichires Holdings Co., Ltd. | | | 21,928 | | |
| | 1,100 | | | Dowa Holdings Co., Ltd. | | | 41,254 | | |
| | 600 | | | DTS Corp. | | | 14,059 | | |
| | 1,000 | | | Duskin Co., Ltd. | | | 27,840 | | |
| | 500 | | | DyDo Group Holdings, Inc.† | | | 21,191 | | |
| | 1,100 | | | Eagle Industry Co., Ltd. | | | 11,511 | | |
| | 1,900 | | | East Japan Railway Co. | | | 172,382 | | |
| | 1,100 | | | Ebara Corp. | | | 33,662 | | |
| | 2,100 | | | EDION Corp. | | | 23,444 | | |
| | 300 | | | Eisai Co., Ltd. | | | 22,652 | | |
| | 600 | | | Eizo Corp. | | | 21,508 | | |
| | 800 | | | Elecom Co., Ltd. | | | 32,543 | | |
| | 900 | | | Electric Power Development
Co., Ltd. | | | 21,925 | | |
| | 1,000 | | | Exedy Corp. | | | 22,871 | | |
| | 900 | | | Fancl Corp., Class C | | | 24,120 | | |
| | 200 | | | FANUC Corp. | | | 37,421 | | |
| | 400 | | | Fast Retailing Co., Ltd. | | | 239,289 | | |
| | 1,100 | | | FCC Co., Ltd. | | | 24,064 | | |
| | 2,700 | | | Ferrotec Holdings Corp. | | | 22,961 | | |
| | 2,100 | | | Financial Products Group Co., Ltd. | | | 20,352 | | |
| | 900 | | | Foster Electric Co., Ltd. | | | 15,962 | | |
| | 400 | | | FP Corp. | | | 23,892 | | |
| | 1,100 | | | Fudo Tetra Corp. | | | 17,443 | | |
| | 1,600 | | | Fuji Corp/Aichi | | | 29,613 | | |
| | 1,400 | | | Fuji Electric Co., Ltd. | | | 43,100 | | |
| | 1,500 | | | Fuji Media Holdings, Inc. | | | 21,481 | | |
| | 700 | | | Fuji Oil Holdings, Inc. | | | 18,915 | | |
| | 700 | | | Fuji Seal International, Inc. | | | 15,610 | | |
| | 900 | | | FUJIFILM Holdings Corp. | | | 43,321 | | |
Shares | |
| | Value
(Note 1) | |
| | | Japan (Continued) | |
| | 7,900 | | | Fujikura, Ltd. | | $ | 32,864 | | |
| | 1,600 | | | Fujitsu General, Ltd. | | | 36,210 | | |
| | 2,800 | | | Fujitsu, Ltd. | | | 264,654 | | |
| | 1,000 | | | Fukuoka Financial Group, Inc. | | | 19,373 | | |
| | 600 | | | Fukuyama Transporting Co., Ltd. | | | 22,033 | | |
| | 1,400 | | | Funai Soken Holdings, Inc. | | | 31,967 | | |
| | 900 | | | Furukawa Co., Ltd. | | | 11,977 | | |
| | 1,200 | | | Furukawa Electric Co., Ltd. | | | 31,144 | | |
| | 1,200 | | | Furuno Electric Co., Ltd. | | | 14,932 | | |
| | 800 | | | Futaba Corp. | | | 9,984 | | |
| | 500 | | | Fuyo General Lease Co., Ltd. | | | 33,915 | | |
| | 800 | | | Geo Holdings Corp. | | | 9,925 | | |
| | 1,000 | | | Glory, Ltd. | | | 30,463 | | |
| | 1,700 | | | GMO internet, Inc. | | | 32,465 | | |
| | 700 | | | Goldcrest Co., Ltd.† | | | 13,420 | | |
| | 400 | | | Goldwin, Inc. | | | 29,525 | | |
| | 5,100 | | | Gree, Inc. | | | 23,140 | | |
| | 2,200 | | | GS Yuasa Corp. | | | 47,885 | | |
| | 4,900 | | | Gunma Bank, Ltd. (The) | | | 17,407 | | |
| | 600 | | | Gunze, Ltd. | | | 27,003 | | |
| | 1,700 | | | H2O Retailing Corp. | | | 19,197 | | |
| | 5,000 | | | Hachijuni Bank, Ltd. (The) | | | 21,996 | | |
| | 2,400 | | | Hakuhodo DY Holdings, Inc. | | | 39,052 | | |
| | 700 | | | Hamamatsu Photonics KK | | | 28,959 | | |
| | 2,200 | | | Hankyu Hanshin Holdings, Inc. | | | 94,759 | | |
| | 800 | | | Hanwa Co., Ltd. | | | 21,183 | | |
| | 400 | | | Harmonic Drive Systems, Inc.† | | | 19,401 | | |
| | 5,200 | | | Haseko Corp. | | | 70,399 | | |
| | 3,500 | | | Hazama Ando Corp. | | | 30,666 | | |
| | 1,200 | | | Heiwa Corp. | | | 25,247 | | |
| | 600 | | | Heiwa Real Estate Co., Ltd. | | | 16,566 | | |
| | 900 | | | Heiwado Co., Ltd. | | | 17,146 | | |
| | 200 | | | Hikari Tsushin, Inc. | | | 50,490 | | |
| | 3,100 | | | Hiroshima Bank, Ltd. (The) | | | 15,292 | | |
| | 900 | | | HIS Co., Ltd. | | | 25,967 | | |
| | 400 | | | Hisamitsu Pharmaceutical Co., Inc. | | | 19,695 | | |
| | 1,000 | | | Hitachi Capital Corp. | | | 26,497 | | |
| | 1,200 | | | Hitachi Chemical Co., Ltd. | | | 50,527 | | |
| | 1,900 | | | Hitachi Construction Machinery
Co., Ltd. | | | 57,443 | | |
| | 2,000 | | | Hitachi Metals, Ltd. | | | 29,690 | | |
| | 6,400 | | | Hitachi Zosen Corp. | | | 24,268 | | |
| | 11,500 | | | Hitachi, Ltd. | | | 489,614 | | |
| | 400 | | | Hogy Medical Co., Ltd. | | | 13,179 | | |
| | 2,900 | | | Hokkaido Electric Power Co., Inc. | | | 14,146 | | |
The accompanying notes are an integral part of these financial statements.
27
M International Equity Fund
SCHEDULE OF INVESTMENTS (Continued)
December 31, 2019
Shares | |
| | Value
(Note 1) | |
| | | Japan (Continued) | |
| | 700 | | | Hokkoku Bank, Ltd. (The) | | $ | 22,387 | | |
| | 3,000 | | | Hokuetsu Corp. | | | 15,600 | | |
| | 1,800 | | | Hokuhoku Financial Group, Inc. | | | 19,084 | | |
| | 2,300 | | | Hokuriku Electric Power Co.* | | | 16,850 | | |
| | 1,200 | | | Hokuto Corp. | | | 21,845 | | |
| | 11,600 | | | Honda Motor Co., Ltd.† | | | 330,849 | | |
| | 500 | | | Horiba, Ltd. | | | 33,731 | | |
| | 3,100 | | | Hosiden Corp. | | | 39,543 | | |
| | 600 | | | House Foods Group, Inc. | | | 20,597 | | |
| | 2,400 | | | Hoya Corp. | | | 230,822 | | |
| | 2,300 | | | Hulic Co., Ltd. | | | 27,857 | | |
| | 3,000 | | | Hyakugo Bank, Ltd. (The) | | | 9,608 | | |
| | 1,400 | | | Ibiden Co., Ltd. | | | 33,565 | | |
| | 6,700 | | | Ichigo, Inc. | | | 28,427 | | |
| | 600 | | | Idec Corp. | | | 12,491 | | |
| | 3,300 | | | Idemitsu Kosan Co., Ltd. | | | 92,025 | | |
| | 2,200 | | | IHI Corp. | | | 52,117 | | |
| | 1,100 | | | Iida Group Holdings Co., Ltd. | | | 19,428 | | |
| | 900 | | | Inabata & Co., Ltd. | | | 13,576 | | |
| | 7,300 | | | Inpex Corp. | | | 76,356 | | |
| | 1,000 | | | Internet Initiative Japan, Inc. | | | 27,104 | | |
| | 600 | | | Iriso Electronics Co., Ltd. | | | 26,727 | | |
| | 1,900 | | | Isetan Mitsukoshi Holdings, Ltd. | | | 17,207 | | |
| | 1,600 | | | Ishihara Sangyo Kaisha, Ltd. | | | 15,403 | | |
| | 1,500 | | | Isuzu Motors, Ltd. | | | 17,933 | | |
| | 500 | | | Ito En, Ltd. | | | 25,217 | | |
| | 2,500 | | | ITOCHU Corp. | | | 58,315 | | |
| | 3,400 | | | Itoham Yonekyu Holdings, Inc. | | | 22,061 | | |
| | 700 | | | Iwatani Corp. | | | 23,934 | | |
| | 4,100 | | | Iyo Bank, Ltd. (The) | | | 23,395 | | |
| | 500 | | | Izumi Co., Ltd. | | | 18,108 | | |
| | 1,600 | | | J Front Retailing Co., Ltd. | | | 22,530 | | |
| | 2,300 | | | J Trust Co., Ltd.† | | | 9,081 | | |
| | 1,300 | | | Jaccs Co., Ltd. | | | 33,501 | | |
| | 700 | | | Jafco Co., Ltd. | | | 27,702 | | |
| | 1,400 | | | Japan Airlines Co., Ltd. | | | 43,770 | | |
| | 1,800 | | | Japan Aviation Electronics
Industry, Ltd. | | | 36,744 | | |
| | 4,900 | | | Japan Exchange Group, Inc. | | | 87,037 | | |
| | 1,500 | | | Japan Lifeline Co., Ltd. | | | 20,611 | | |
| | 1,100 | | | Japan Petroleum Exploration
Co., Ltd. | | | 29,916 | | |
| | 4,300 | | | Japan Post Holdings Co., Ltd. | | | 40,604 | | |
| | 600 | | | Japan Pulp & Paper Co., Ltd. | | | 23,193 | | |
| | 3,000 | | | Japan Securities Finance Co., Ltd. | | | 14,413 | | |
Shares | |
| | Value
(Note 1) | |
| | | Japan (Continued) | |
| | 1,300 | | | Japan Steel Works, Ltd. (The) | | $ | 25,807 | | |
| | 10,300 | | | Japan Tobacco, Inc. | | | 230,590 | | |
| | 2,800 | | | Japan Wool Textile Co., Ltd. (The) | | | 29,094 | | |
| | 1,100 | | | JCU Corp. | | | 32,801 | | |
| | 3,600 | | | JFE Holdings, Inc. | | | 46,750 | | |
| | 1,500 | | | JGC Holding Corp. | | | 24,228 | | |
| | 400 | | | JINS Holdings, Inc. | | | 27,169 | | |
| | 600 | | | Joshin Denki Co., Ltd. | | | 14,385 | | |
| | 700 | | | JSR Corp. | | | 12,962 | | |
| | 3,800 | | | JTEKT Corp. | | | 45,500 | | |
| | 1,600 | | | Juki Corp.† | | | 12,988 | | |
| | 800 | | | Juroku Bank, Ltd. (The) | | | 18,915 | | |
| | 8,900 | | | JVCKenwood Corp. | | | 22,444 | | |
| | 45,900 | | | JXTG Holdings, Inc. | | | 210,332 | | |
| | 2,200 | | | K's Holdings Corp. | | | 28,974 | | |
| | 1,900 | | | Kadokawa Dwango* | | | 36,564 | | |
| | 800 | | | Kaga Electronics Co., Ltd. | | | 18,569 | | |
| | 800 | | | Kagome Co., Ltd. | | | 19,276 | | |
| | 7,500 | | | Kajima Corp. | | | 100,640 | | |
| | 1,100 | | | Kakaku.com, Inc. | | | 28,276 | | |
| | 500 | | | Kaken Pharmaceutical Co., Ltd. | | | 27,794 | | |
| | 1,000 | | | Kamigumi Co., Ltd. | | | 22,079 | | |
| | 1,300 | | | Kanamoto Co., Ltd. | | | 33,752 | | |
| | 2,200 | | | Kandenko Co., Ltd. | | | 21,240 | | |
| | 600 | | | Kaneka Corp. | | | 19,438 | | |
| | 1,700 | | | Kanematsu Corp. | | | 23,046 | | |
| | 4,400 | | | Kansai Electric Power
Co., Inc. (The) | | | 51,206 | | |
| | 1,200 | | | Kansai Paint Co., Ltd. | | | 29,565 | | |
| | 3,100 | | | Kao Corp. | | | 257,489 | | |
| | 400 | | | Kato Sangyo Co., Ltd. | | | 13,290 | | |
| | 300 | | | KAWADA TECHNOLOGIES, Inc. | | | 18,554 | | |
| | 2,100 | | | Kawasaki Heavy Industries, Ltd. | | | 46,540 | | |
| | 1,600 | | | Kawasaki Kisen Kaisha, Ltd.* | | | 27,434 | | |
| | 15,300 | | | KDDI Corp. | | | 458,064 | | |
| | 1,200 | | | Keihan Holdings Co., Ltd. | | | 58,534 | | |
| | 1,300 | | | Keihin Corp. | | | 30,689 | | |
| | 1,500 | | | Keikyu Corp. | | | 29,129 | | |
| | 700 | | | Keio Corp. | | | 42,584 | | |
| | 200 | | | Keisei Electric Railway Co., Ltd. | | | 7,805 | | |
| | 2,500 | | | Keiyo Bank, Ltd. (The) | | | 14,564 | | |
| | 4,600 | | | Kenedix, Inc. | | | 24,089 | | |
| | 900 | | | Kewpie Corp. | | | 20,318 | | |
| | 1,000 | | | Keyence Corp. | | | 354,240 | | |
| | 1,100 | | | KH Neochem Co., Ltd. | | | 23,649 | | |
The accompanying notes are an integral part of these financial statements.
28
M International Equity Fund
SCHEDULE OF INVESTMENTS (Continued)
December 31, 2019
Shares | |
| | Value
(Note 1) | |
| | | Japan (Continued) | |
| | 400 | | | Kikkoman Corp. | | $ | 19,769 | | |
| | 1,400 | | | Kintetsu Group Holdings Co., Ltd. | | | 76,278 | | |
| | 1,700 | | | Kintetsu World Express, Inc. | | | 29,852 | | |
| | 6,400 | | | Kirin Holdings Co., Ltd. | | | 140,776 | | |
| | 800 | | | Kissei Pharmaceutical Co., Ltd. | | | 22,972 | | |
| | 1,500 | | | Kito Corp. | | | 23,772 | | |
| | 2,600 | | | Kitz Corp. | | | 18,521 | | |
| | 1,600 | | | Kiyo Bank, Ltd. (The) | | | 24,444 | | |
| | 1,900 | | | Koa Corp. | | | 23,904 | | |
| | 900 | | | Kobe Bussan Co., Ltd. | | | 31,062 | | |
| | 4,400 | | | Kobe Steel, Ltd. | | | 23,852 | | |
| | 900 | | | Kohnan Shoji Co., Ltd. | | | 21,238 | | |
| | 1,500 | | | Koito Manufacturing Co., Ltd. | | | 70,406 | | |
| | 1,500 | | | Kokuyo Co., Ltd. | | | 22,558 | | |
| | 11,000 | | | Komatsu, Ltd. | | | 267,470 | | |
| | 1,100 | | | KOMEDA Holdings Co., Ltd. | | | 21,523 | | |
| | 1,000 | | | Komeri Co., Ltd. | | | 21,600 | | |
| | 1,400 | | | Komori Corp. | | | 14,560 | | |
| | 700 | | | Konami Holdings Corp. | | | 28,894 | | |
| | 6,900 | | | Konica Minolta, Inc. | | | 45,278 | | |
| | 1,200 | | | Konoike Transport Co., Ltd. | | | 18,333 | | |
| | 300 | | | Kose Corp. | | | 44,177 | | |
| | 500 | | | Kotobuki Spirits Co., Ltd. | | | 37,044 | | |
| | 4,600 | | | Kubota Corp. | | | 73,072 | | |
| | 400 | | | Kumagai Gumi Co., Ltd. | | | 12,259 | | |
| | 3,100 | | | Kumiai Chemical Industry Co., Ltd. | | | 28,616 | | |
| | 2,700 | | | Kuraray Co., Ltd. | | | 33,074 | | |
| | 400 | | | Kureha Corp. | | | 24,223 | | |
| | 1,100 | | | Kurita Water Industries, Ltd. | | | 32,953 | | |
| | 1,100 | | | KYB Corp.* | | | 32,902 | | |
| | 500 | | | Kyocera Corp. | | | 34,421 | | |
| | 1,500 | | | Kyoei Steel, Ltd. | | | 29,529 | | |
| | 1,700 | | | Kyokuto Kaihatsu Kogyo Co., Ltd. | | | 25,174 | | |
| | 500 | | | KYORIN Holdings, Inc. | | | 8,785 | | |
| | 500 | | | Kyoritsu Maintenance Co., Ltd. | | | 23,837 | | |
| | 1,000 | | | Kyowa Exeo Corp. | | | 25,466 | | |
| | 1,100 | | | Kyowa Kirin Co. Ltd. | | | 26,048 | | |
| | 600 | | | Kyudenko Corp. | | | 17,864 | | |
| | 2,400 | | | Kyushu Electric Power Co., Inc. | | | 20,873 | | |
| | 5,000 | | | Kyushu Financial Group, Inc. | | | 21,720 | | |
| | 1,200 | | | Kyushu Railway Co. | | | 40,311 | | |
| | 1,600 | | | Lasertec Corp. | | | 81,874 | | |
| | 400 | | | Lawson, Inc. | | | 22,788 | | |
| | 2,600 | | | Leopalace21 Corp.†,* | | | 8,495 | | |
| | 1,000 | | | Life Corp. | | | 23,911 | | |
Shares | |
| | Value
(Note 1) | |
| | | Japan (Continued) | |
| | 100 | | | LINE Corp.* | | $ | 4,924 | | |
| | 1,000 | | | Lintec Corp. | | | 22,493 | | |
| | 1,100 | | | Lion Corp. | | | 21,513 | | |
| | 2,600 | | | LIXIL Group Corp. | | | 45,202 | | |
| | 1,400 | | | LIXIL VIVA Corp. | | | 25,228 | | |
| | 3,900 | | | M3, Inc. | | | 118,628 | | |
| | 700 | | | Mabuchi Motor Co., Ltd. | | | 26,736 | | |
| | 1,300 | | | Macnica Fuji Electronics
Holdings, Inc. | | | 22,481 | | |
| | 900 | | | Macromill, Inc. | | | 8,697 | | |
| | 3,800 | | | Maeda Corp. | | | 37,386 | | |
| | 800 | | | Maeda Kosen Co., Ltd. | | | 16,073 | | |
| | 1,100 | | | Maeda Road Construction Co., Ltd. | | | 27,071 | | |
| | 600 | | | Makino Milling Machine Co., Ltd. | | | 27,721 | | |
| | 900 | | | Makita Corp. | | | 31,559 | | |
| | 6,900 | | | Marubeni Corp. | | | 51,476 | | |
| | 800 | | | Marudai Food Co., Ltd. | | | 16,765 | | |
| | 700 | | | Maruha Nichiro Corp. | | | 18,007 | | |
| | 1,100 | | | Marui Group Co., Ltd. | | | 27,010 | | |
| | 2,200 | | | Marusan Securities Co., Ltd. | | | 9,881 | | |
| | 400 | | | Maruwa Co., Ltd. | | | 31,255 | | |
| | 1,900 | | | Matsui Securities Co., Ltd.† | | | 15,143 | | |
| | 1,700 | | | Maxell Holdings, Ltd. | | | 23,109 | | |
| | 6,700 | | | Mazda Motor Corp. | | | 57,840 | | |
| | 500 | | | McDonald's Holdings Co.
Japan, Ltd.† | | | 24,113 | | |
| | 9,000 | | | Mebuki Financial Group, Inc. | | | 23,193 | | |
| | 1,000 | | | Medipal Holdings Corp. | | | 22,208 | | |
| | 1,000 | | | Megachips Corp. | | | 17,266 | | |
| | 1,000 | | | Megmilk Snow Brand Co., Ltd. | | | 22,935 | | |
| | 1,700 | | | Meidensha Corp. | | | 37,894 | | |
| | 700 | | | MEIJI Holdings Co., Ltd. | | | 47,545 | | |
| | 1,200 | | | Meiko Electronics Co., Ltd. | | | 27,191 | | |
| | 500 | | | Meitec Corp. | | | 28,301 | | |
| | 600 | | | Milbon Co., Ltd. | | | 34,237 | | |
| | 1,200 | | | Mimasu Semiconductor Industry
Co., Ltd. | | | 24,286 | | |
| | 5,500 | | | MINEBEA MITSUMI, Inc. | | | 115,259 | | |
| | 900 | | | Miraca Holdings, Inc. | | | 22,224 | | |
| | 1,600 | | | Mirait Holdings Corp. | | | 24,312 | | |
| | 1,000 | | | MISUMI Group, Inc. | | | 25,052 | | |
| | 15,300 | | | Mitsubishi Chemical
Holdings Corp. | | | 115,114 | | |
| | 3,600 | | | Mitsubishi Corp. | | | 96,084 | | |
| | 13,000 | | | Mitsubishi Electric Corp. | | | 179,288 | | |
The accompanying notes are an integral part of these financial statements.
29
M International Equity Fund
SCHEDULE OF INVESTMENTS (Continued)
December 31, 2019
Shares | |
| | Value
(Note 1) | |
| | | Japan (Continued) | |
| | 4,500 | | | Mitsubishi Estate Co., Ltd. | | $ | 86,538 | | |
| | 1,700 | | | Mitsubishi Gas Chemical Co., Inc. | | | 26,191 | | |
| | 1,000 | | | Mitsubishi Heavy Industries, Ltd. | | | 39,096 | | |
| | 900 | | | Mitsubishi Logistics Corp. | | | 23,582 | | |
| | 1,000 | | | Mitsubishi Materials Corp. | | | 27,399 | | |
| | 5,200 | | | Mitsubishi Motors Corp. | | | 21,919 | | |
| | 1,500 | | | Mitsubishi Tanabe Pharma Corp. | | | 27,721 | | |
| | 43,600 | | | Mitsubishi UFJ Financial
Group, Inc. | | | 238,033 | | |
| | 8,700 | | | Mitsubishi UFJ Lease &
Finance Co., Ltd. | | | 56,529 | | |
| | 4,900 | | | Mitsui & Co., Ltd. | | | 87,758 | | |
| | 3,000 | | | Mitsui Chemicals, Inc. | | | 73,996 | | |
| | 2,100 | | | Mitsui E&S Holdings Co., Ltd.* | | | 17,201 | | |
| | 800 | | | Mitsui Fudosan Co., Ltd. | | | 19,673 | | |
| | 1,900 | | | Mitsui Mining & Smelting Co., Ltd. | | | 51,131 | | |
| | 1,900 | | | Mitsui OSK Lines, Ltd. | | | 52,897 | | |
| | 800 | | | Mitsui-Soko Holdings Co., Ltd. | | | 15,189 | | |
| | 900 | | | Miura Co., Ltd. | | | 31,476 | | |
| | 1,000 | | | Mixi, Inc. | | | 19,051 | | |
| | 700 | | | Miyazaki Bank, Ltd. (The) | | | 17,601 | | |
| | 84,900 | | | Mizuho Financial Group, Inc. | | | 131,505 | | |
| | 1,000 | | | Mizuho Leasing Co., Ltd. | | | 31,522 | | |
| | 300 | | | Mochida Pharmaceutical Co., Ltd. | | | 12,176 | | |
| | 400 | | | Modec, Inc. | | | 9,811 | | |
| | 7,000 | | | Monex Group, Inc. | | | 17,266 | | |
| | 300 | | | Monogatari Corp. (The)† | | | 23,358 | | |
| | 1,100 | | | MonotaRO Co., Ltd. | | | 29,592 | | |
| | 700 | | | Morinaga Milk Industry Co., Ltd. | | | 28,669 | | |
| | 1,800 | | | MS&AD Insurance Group
Holdings, Inc. | | | 59,821 | | |
| | 4,200 | | | Murata Manufacturing Co., Ltd. | | | 260,763 | | |
| | 2,000 | | | Musashi Seimitsu Industry Co., Ltd. | | | 27,739 | | |
| | 1,000 | | | Musashino Bank, Ltd. (The) | | | 17,348 | | |
| | 1,200 | | | Nabtesco Corp. | | | 36,059 | | |
| | 600 | | | Nachi-Fujikoshi Corp. | | | 26,589 | | |
| | 1,500 | | | Nagase & Co., Ltd. | | | 22,502 | | |
| | 1,300 | | | Nagoya Railroad Co., Ltd. | | | 40,560 | | |
| | 1,200 | | | Nankai Electric Railway Co., Ltd. | | | 32,757 | | |
| | 800 | | | Nanto Bank, Ltd. (The) | | | 20,491 | | |
| | 2,600 | | | NEC Corp. | | | 108,159 | | |
| | 1,100 | | | NET One Systems Co., Ltd. | | | 28,316 | | |
| | 2,000 | | | NGK Insulators, Ltd. | | | 35,047 | | |
| | 2,500 | | | NGK Spark Plug Co., Ltd. | | | 49,100 | | |
| | 700 | | | NH Foods, Ltd. | | | 29,055 | | |
Shares | |
| | Value
(Note 1) | |
| | | Japan (Continued) | |
| | 2,400 | | | NHK Spring Co., Ltd. | | $ | 21,978 | | |
| | 1,300 | | | Nichi-iko Pharmaceutical Co., Ltd. | | | 16,284 | | |
| | 1,200 | | | Nichias Corp. | | | 30,758 | | |
| | 2,800 | | | Nichicon Corp. | | | 29,429 | | |
| | 2,200 | | | NichiiGakkan Co., Ltd. | | | 33,469 | | |
| | 800 | | | Nichirei Corp. | | | 18,775 | | |
| | 1,000 | | | Nidec Corp. | | | 138,098 | | |
| | 1,600 | | | Nifco, Inc. | | | 44,177 | | |
| | 700 | | | Nihon Kohden Corp. | | | 19,520 | | |
| | 1,000 | | | Nihon M&A Center, Inc. | | | 34,651 | | |
| | 1,800 | | | Nihon Parkerizing Co., Ltd. | | | 19,482 | | |
| | 900 | | | Nihon Unisys, Ltd. | | | 28,370 | | |
| | 1,700 | | | Nikkiso Co., Ltd. | | | 22,546 | | |
| | 1,300 | | | Nikkon Holdings Co., Ltd. | | | 32,854 | | |
| | 3,000 | | | Nikon Corp. | | | 37,108 | | |
| | 200 | | | Nintendo Co., Ltd. | | | 80,935 | | |
| | 1,200 | | | Nippo Corp. | | | 25,998 | | |
| | 600 | | | Nippon Carbon Co., Ltd.† | | | 22,668 | | |
| | 1,500 | | | Nippon Chemi-Con Corp. | | | 28,991 | | |
| | 700 | | | Nippon Densetsu Kogyo Co., Ltd. | | | 14,573 | | |
| | 900 | | | Nippon Electric Glass Co., Ltd. | | | 20,219 | | |
| | 1,200 | | | Nippon Express Co., Ltd. | | | 70,903 | | |
| | 900 | | | Nippon Flour Mills Co., Ltd. | | | 13,998 | | |
| | 600 | | | Nippon Gas Co., Ltd. | | | 19,355 | | |
| | 15,200 | | | Nippon Light Metal Holdings
Co., Ltd. | | | 33,015 | | |
| | 1,200 | | | Nippon Paper Industries Co., Ltd. | | | 20,410 | | |
| | 1,200 | | | Nippon Seiki Co., Ltd. | | | 19,758 | | |
| | 2,600 | | | Nippon Sheet Glass Co., Ltd. | | | 16,655 | | |
| | 400 | | | Nippon Shokubai Co., Ltd. | | | 24,997 | | |
| | 2,600 | | | Nippon Signal Company, Ltd. | | | 34,960 | | |
| | 900 | | | Nippon Soda Co., Ltd. | | | 24,559 | | |
| | 5,500 | | | Nippon Steel Corp. | | | 83,724 | | |
| | 500 | | | Nippon Steel Trading Corp. | | | 24,343 | | |
| | 3,600 | | | Nippon Suisan Kaisha, Ltd. | | | 21,602 | | |
| | 8,000 | | | Nippon Telegraph &
Telephone Corp. | | | 202,991 | | |
| | 4,900 | | | Nippon Thompson Co., Ltd. | | | 23,450 | | |
| | 530 | | | Nippon Yakin Kogyo Co., Ltd. | | | 11,399 | | |
| | 1,800 | | | Nippon Yusen KK | | | 32,818 | | |
| | 2,200 | | | Nipro Corp.† | | | 26,626 | | |
| | 2,000 | | | Nishi-Nippon Financial
Holdings, Inc. | | | 15,775 | | |
| | 900 | | | Nishi-Nippon Railroad Co., Ltd. | | | 20,873 | | |
| | 1,000 | | | Nishimatsu Construction Co., Ltd. | | | 22,732 | | |
The accompanying notes are an integral part of these financial statements.
30
M International Equity Fund
SCHEDULE OF INVESTMENTS (Continued)
December 31, 2019
Shares | |
| | Value
(Note 1) | |
| | | Japan (Continued) | |
| | 700 | | | Nishio Rent All Co., Ltd. | | $ | 20,068 | | |
| | 1,300 | | | Nissan Chemical Corp. | | | 54,977 | | |
| | 27,700 | | | Nissan Motor Co., Ltd. | | | 162,164 | | |
| | 2,700 | | | Nissan Shatai Co., Ltd. | | | 25,967 | | |
| | 1,100 | | | Nissha Co., Ltd. | | | 11,349 | | |
| | 800 | | | Nisshin Oillio Group, Ltd. (The) | | | 27,868 | | |
| | 5,700 | | | Nisshinbo Holdings, Inc. | | | 54,820 | | |
| | 400 | | | Nissin Foods Holdings Co., Ltd. | | | 29,893 | | |
| | 1,600 | | | Nissin Kogyo Co., Ltd. | | | 32,691 | | |
| | 500 | | | Nitori Holdings Co., Ltd. | | | 79,265 | | |
| | 1,300 | | | Nitto Boseki Co., Ltd.† | | | 55,635 | | |
| | 1,400 | | | Nitto Denko Corp. | | | 79,628 | | |
| | 700 | | | Nitto Kogyo Corp. | | | 16,377 | | |
| | 500 | | | Noevir Holdings Co., Ltd. | | | 26,920 | | |
| | 700 | | | NOF Corp. | | | 23,515 | | |
| | 1,100 | | | Nojima Corp. | | | 23,123 | | |
| | 1,500 | | | NOK Corp. | | | 22,654 | | |
| | 1,800 | | | Nomura Co., Ltd. | | | 24,104 | | |
| | 9,400 | | | Nomura Holdings, Inc. | | | 48,741 | | |
| | 1,100 | | | Nomura Real Estate Holdings, Inc. | | | 26,524 | | |
| | 1,500 | | | Nomura Research Institute, Ltd. | | | 32,276 | | |
| | 300 | | | Noritake Co., Ltd. | | | 12,922 | | |
| | 700 | | | Noritsu Koki Co., Ltd. | | | 9,754 | | |
| | 1,100 | | | Noritz Corp.† | | | 14,801 | | |
| | 7,800 | | | North Pacific Bank, Ltd. | | | 17,588 | | |
| | 2,200 | | | NSD Co., Ltd. | | | 36,405 | | |
| | 5,200 | | | NSK, Ltd. | | | 49,820 | | |
| | 10,800 | | | NTN Corp. | | | 34,292 | | |
| | 5,900 | | | NTT Data Corp. | | | 79,659 | | |
| | 11,900 | | | NTT DOCOMO, Inc. | | | 332,725 | | |
| | 600 | | | Obara Group, Inc. | | | 20,404 | | |
| | 6,000 | | | Obayashi Corp. | | | 67,204 | | |
| | 300 | | | Obic Co., Ltd. | | | 40,753 | | |
| | 2,100 | | | Odakyu Electric Railway Co., Ltd. | | | 49,304 | | |
| | 1,100 | | | Ogaki Kyoritsu Bank, Ltd. (The) | | | 24,165 | | |
| | 12,000 | | | Oji Holdings Corp. | | | 65,713 | | |
| | 1,000 | | | Okamura Corp. | | | 10,253 | | |
| | 4,600 | | | Okasan Securities Group, Inc. | | | 16,638 | | |
| | 1,800 | | | Oki Electric Industry Co., Ltd. | | | 25,164 | | |
| | 1,100 | | | Okinawa Electric Power
Co., Inc. (The) | | | 20,734 | | |
| | 500 | | | OKUMA Corp. | | | 26,690 | | |
| | 700 | | | Okumura Corp. | | | 19,392 | | |
| | 12,400 | | | Olympus Corp. | | | 192,753 | | |
| | 2,400 | | | Omron Corp. | | | 141,807 | | |
Shares | |
| | Value
(Note 1) | |
| | | Japan (Continued) | |
| | 3,700 | | | Onward Holdings Co., Ltd. | | $ | 22,202 | | |
| | 1,200 | | | Open House Co., Ltd. | | | 34,568 | | |
| | 400 | | | Oracle Corp. Japan | | | 36,630 | | |
| | 8,100 | | | Orient Corp. | | | 12,300 | | |
| | 400 | | | Oriental Land Co., Ltd. | | | 54,779 | | |
| | 15,600 | | | ORIX Corp. | | | 260,012 | | |
| | 2,000 | | | Osaka Gas Co., Ltd. | | | 38,489 | | |
| | 1,100 | | | OSG Corp. | | | 21,159 | | |
| | 700 | | | Otsuka Corp. | | | 28,186 | | |
| | 200 | | | Otsuka Holdings Co., Ltd. | | | 8,988 | | |
| | 1,900 | | | Outsourcing, Inc. | | | 20,249 | | |
| | 1,600 | | | Pacific Industrial Co., Ltd. | | | 22,015 | | |
| | 900 | | | Pacific Metals Co., Ltd. | | | 21,238 | | |
| | 3,600 | | | Pan Pacific International
Holdings Corp. | | | 60,003 | | |
| | 31,300 | | | Panasonic Corp. | | | 296,566 | | |
| | 3,900 | | | Penta-Ocean Construction Co., Ltd. | | | 24,300 | | |
| | 800 | | | PeptiDream, Inc.* | | | 41,231 | | |
| | 1,300 | | | Persol Holdings Co., Ltd. | | | 24,539 | | |
| | 1,000 | | | Pigeon Corp.† | | | 36,952 | | |
| | 500 | | | Pilot Corp. | | | 20,340 | | |
| | 1,100 | | | Piolax, Inc. | | | 21,462 | | |
| | 2,500 | | | Press Kogyo Co., Ltd. | | | 10,055 | | |
| | 1,600 | | | Pressance Corp. | | | 19,703 | | |
| | 1,100 | | | Prima Meat Packers, Ltd. | | | 25,684 | | |
| | 1,300 | | | Qol Holdings Co., Ltd. | | | 18,306 | | |
| | 1,600 | | | Raito Kogyo Co., Ltd. | | | 23,325 | | |
| | 8,000 | | | Rakuten, Inc. | | | 68,842 | | |
| | 7,700 | | | Recruit Holdings Co., Ltd. | | | 290,482 | | |
| | 900 | | | Relo Group, Inc. | | | 25,263 | | |
| | 11,000 | | | Renesas Electronics Corp.* | | | 75,928 | | |
| | 2,800 | | | Rengo Co., Ltd. | | | 21,492 | | |
| | 4,900 | | | Resona Holdings, Inc. | | | 21,601 | | |
| | 1,100 | | | Resorttrust, Inc. | | | 18,780 | | |
| | 3,000 | | | Ricoh Co., Ltd. | | | 32,911 | | |
| | 400 | | | Ricoh Leasing Co., Ltd. | | | 15,186 | | |
| | 400 | | | Rinnai Corp. | | | 31,476 | | |
| | 4,000 | | | Riso Kyoiku Co., Ltd. | | | 14,210 | | |
| | 100 | | | Rohm Co., Ltd. | | | 8,081 | | |
| | 1,100 | | | Round One Corp. | | | 10,711 | | |
| | 900 | | | Royal Holdings Co., Ltd.† | | | 20,476 | | |
| | 500 | | | Ryobi, Ltd. | | | 8,992 | | |
| | 2,000 | | | Ryohin Keikaku Co., Ltd. | | | 47,048 | | |
| | 200 | | | Ryosan Co., Ltd. | | | 5,202 | | |
| | 600 | | | S Foods, Inc. | | | 15,743 | | |
The accompanying notes are an integral part of these financial statements.
31
M International Equity Fund
SCHEDULE OF INVESTMENTS (Continued)
December 31, 2019
Shares | |
| | Value
(Note 1) | |
| | | Japan (Continued) | |
| | 800 | | | Saizeriya Co., Ltd. | | $ | 19,607 | | |
| | 1,300 | | | Sakata INX Corp. | | | 14,214 | | |
| | 2,700 | | | Sala Corp. | | | 15,879 | | |
| | 1,800 | | | SAMTY Co., Ltd. | | | 37,208 | | |
| | 2,100 | | | San-Ai Oil Co., Ltd. | | | 23,077 | | |
| | 3,000 | | | San-In Godo Bank, Ltd. (The) | | | 18,499 | | |
| | 1,200 | | | Sangetsu Corp. | | | 22,817 | | |
| | 1,200 | | | Sanken Electric Co., Ltd. | | | 37,053 | | |
| | 1,300 | | | Sanki Engineering Co., Ltd. | | | 18,461 | | |
| | 600 | | | Sankyo Co., Ltd. | | | 20,017 | | |
| | 500 | | | Sankyu, Inc. | | | 25,309 | | |
| | 2,200 | | | Santen Pharmaceutical Co., Ltd. | | | 42,236 | | |
| | 2,300 | | | Sanwa Holdings Corp. | | | 26,015 | | |
| | 500 | | | Sanyo Chemical Industries, Ltd. | | | 24,941 | | |
| | 300 | | | Sanyo Denki Co., Ltd. | | | 14,992 | | |
| | 1,200 | | | Sapporo Holdings, Ltd. | | | 28,483 | | |
| | 900 | | | Sato Holdings Corp. | | | 28,411 | | |
| | 400 | | | Sawai Pharmaceutical Co., Ltd. | | | 25,475 | | |
| | 1,000 | | | SBI Holdings, Inc. | | | 21,306 | | |
| | 600 | | | SCREEN Holdings Co., Ltd. | | | 41,360 | | |
| | 600 | | | SCSK Corp. | | | 31,310 | | |
| | 1,000 | | | Secom Co., Ltd. | | | 89,982 | | |
| | 3,000 | | | Seibu Holdings, Inc. | | | 49,561 | | |
| | 1,000 | | | Seikagaku Corp. | | | 11,357 | | |
| | 4,500 | | | Seiko Epson Corp. | | | 68,543 | | |
| | 1,100 | | | Seiko Holdings Corp. | | | 29,592 | | |
| | 1,600 | | | Seino Holdings Co., Ltd. | | | 21,750 | | |
| | 1,400 | | | Seiren Co., Ltd. | | | 20,332 | | |
| | 6,200 | | | Sekisui Chemical Co., Ltd. | | | 108,645 | | |
| | 6,000 | | | Sekisui House, Ltd. | | | 128,857 | | |
| | 8,500 | | | Senshu Ikeda Holdings, Inc. | | | 16,272 | | |
| | 600 | | | Seria Co., Ltd. | | | 16,401 | | |
| | 5,900 | | | Seven & I Holdings Co., Ltd. | | | 217,364 | | |
| | 7,000 | | | Seven Bank, Ltd. | | | 23,064 | | |
| | 1,900 | | | Sharp Corp. | | | 29,465 | | |
| | 600 | | | Shibuya Corp.† | | | 16,925 | | |
| | 1,000 | | | Shiga Bank, Ltd. (The) | | | 25,650 | | |
| | 1,700 | | | Shikoku Electric Power Co., Inc. | | | 16,866 | | |
| | 900 | | | Shima Seiki Manufacturing, Ltd. | | | 21,147 | | |
| | 1,300 | | | Shimachu Co., Ltd. | | | 35,690 | | |
| | 1,000 | | | Shimadzu Corp. | | | 31,660 | | |
| | 300 | | | Shimamura Co., Ltd. | | | 22,972 | | |
| | 100 | | | Shimano, Inc. | | | 16,355 | | |
| | 3,500 | | | Shimizu Corp. | | | 35,949 | | |
| | 1,400 | | | Shin-Etsu Chemical Co., Ltd. | | | 155,391 | | |
Shares | |
| | Value
(Note 1) | |
| | | Japan (Continued) | |
| | 3,100 | | | Shin-Etsu Polymer Co., Ltd. | | $ | 31,783 | | |
| | 2,800 | | | Shinko Electric Industries Co., Ltd. | | | 33,243 | | |
| | 1,700 | | | Shinmaywa Industries, Ltd. | | | 23,172 | | |
| | 1,800 | | | Shinsei Bank, Ltd. | | | 27,748 | | |
| | 1,600 | | | Shionogi & Co., Ltd. | | | 99,647 | | |
| | 600 | | | Ship Healthcare Holdings, Inc. | | | 27,886 | | |
| | 2,600 | | | Shiseido Co., Ltd. | | | 186,215 | | |
| | 2,200 | | | Shizuoka Bank, Ltd. (The) | | | 16,563 | | |
| | 2,800 | | | Shizuoka Gas Co., Ltd. | | | 24,507 | | |
| | 600 | | | SHO-BOND Holdings Co., Ltd. | | | 25,070 | | |
| | 1,000 | | | Showa Corp. | | | 20,910 | | |
| | 2,700 | | | Showa Denko KK† | | | 72,038 | | |
| | 1,000 | | | Siix Corp. | | | 14,017 | | |
| | 2,200 | | | Sinfonia Technology Co., Ltd. | | | 27,962 | | |
| | 3,900 | | | SKY Perfect JSAT Holdings, Inc. | | | 17,408 | | |
| | 2,600 | | | Skylark Holdings Co., Ltd.† | | | 51,088 | | |
| | 200 | | | SMC Corp. | | | 92,568 | | |
| | 1,300 | | | SMS Co., Ltd. | | | 36,193 | | |
| | 2,700 | | | Sodick Co., Ltd. | | | 24,203 | | |
| | 15,400 | | | SoftBank Group Corp. | | | 674,082 | | |
| | 500 | | | Sohgo Security Services Co., Ltd. | | | 27,242 | | |
| | 7,800 | | | Sojitz Corp. | | | 25,269 | | |
| | 1,400 | | | Sompo Holdings, Inc. | | | 55,405 | | |
| | 10,500 | | | Sony Corp. | | | 715,204 | | |
| | 1,100 | | | Sony Financial Holdings, Inc. | | | 26,605 | | |
| | 800 | | | Sotetsu Holdings, Inc. | | | 21,831 | | |
| | 400 | | | Stanley Electric Co., Ltd. | | | 11,707 | | |
| | 1,600 | | | Star Micronics Co., Ltd. | | | 23,193 | | |
| | 800 | | | Starts Corp., Inc. | | | 20,505 | | |
| | 7,300 | | | Subaru Corp. | | | 182,307 | | |
| | 3,200 | | | SUMCO Corp. | | | 53,778 | | |
| | 13,500 | | | Sumitomo Chemical Co., Ltd. | | | 61,875 | | |
| | 3,800 | | | Sumitomo Corp. | | | 56,796 | | |
| | 700 | | | Sumitomo Dainippon Pharma
Co., Ltd. | | | 13,722 | | |
| | 5,300 | | | Sumitomo Electric Industries, Ltd. | | | 80,582 | | |
| | 1,600 | | | Sumitomo Forestry Co., Ltd. | | | 23,782 | | |
| | 1,700 | | | Sumitomo Heavy Industries, Ltd. | | | 48,972 | | |
| | 1,100 | | | Sumitomo Metal Mining Co., Ltd. | | | 35,879 | | |
| | 3,600 | | | Sumitomo Mitsui Construction
Co., Ltd. | | | 21,039 | | |
| | 4,200 | | | Sumitomo Mitsui Financial
Group, Inc. | | | 156,087 | | |
| | 1,200 | | | Sumitomo Mitsui Trust
Holdings, Inc. | | | 47,898 | | |
The accompanying notes are an integral part of these financial statements.
32
M International Equity Fund
SCHEDULE OF INVESTMENTS (Continued)
December 31, 2019
Shares | |
| | Value
(Note 1) | |
| | | Japan (Continued) | |
| | 900 | | | Sumitomo Osaka Cement Co., Ltd. | | $ | 39,552 | | |
| | 1,700 | | | Sumitomo Realty & Development
Co., Ltd. | | | 59,642 | | |
| | 3,700 | | | Sumitomo Rubber Industries, Ltd. | | | 45,528 | | |
| | 400 | | | Sumitomo Seika Chemicals
Co., Ltd. | | | 13,050 | | |
| | 900 | | | Sumitomo Warehouse
Co., Ltd. (The) | | | 12,184 | | |
| | 2,600 | | | Sun Frontier Fudousan Co., Ltd. | | | 31,323 | | |
| | 700 | | | Sundrug Co., Ltd. | | | 25,480 | | |
| | 1,100 | | | Suntory Beverage & Food, Ltd. | | | 46,013 | | |
| | 400 | | | Sushiro Global Holdings, Ltd. | | | 34,494 | | |
| | 400 | | | Suzuken Co., Ltd. | | | 16,437 | | |
| | 3,200 | | | Suzuki Motor Corp. | | | 134,503 | | |
| | 1,200 | | | Sysmex Corp. | | | 82,268 | | |
| | 1,700 | | | Systena Corp. | | | 27,787 | | |
| | 800 | | | T Hasegawa Co., Ltd. | | | 15,690 | | |
| | 2,400 | | | T&D Holdings, Inc. | | | 30,813 | | |
| | 700 | | | Tachi-S Co., Ltd. | | | 9,238 | | |
| | 2,200 | | | Tadano, Ltd. | | | 20,268 | | |
| | 1,800 | | | Taiheiyo Cement Corp. | | | 53,260 | | |
| | 3,200 | | | Taisei Corp. | | | 133,855 | | |
| | 2,000 | | | Taiyo Yuden Co., Ltd.† | | | 61,755 | | |
| | 1,600 | | | Takashimaya Co., Ltd. | | | 18,083 | | |
| | 2,100 | | | Takeda Pharmaceutical Co., Ltd. | | | 83,726 | | |
| | 1,200 | | | Takeuchi Manufacturing Co., Ltd. | | | 18,179 | | |
| | 2,100 | | | Tamura Corp. | | | 13,819 | | |
| | 2,100 | | | TDK Corp. | | | 239,464 | | |
| | 600 | | | TechnoPro Holdings, Inc. | | | 42,244 | | |
| | 4,200 | | | Teijin, Ltd. | | | 79,048 | | |
| | 400 | | | Tekken Corp. | | | 10,389 | | |
| | 4,200 | | | Terumo Corp. | | | 150,173 | | |
| | 1,600 | | | THK Co., Ltd. | | | 43,705 | | |
| | 800 | | | TIS, Inc. | | | 47,342 | | |
| | 3,100 | | | Toagosei Co., Ltd. | | | 36,234 | | |
| | 1,500 | | | Tobu Railway Co., Ltd. | | | 54,599 | | |
| | 2,200 | | | Tocalo Co., Ltd. | | | 22,758 | | |
| | 3,500 | | | Toda Corp. | | | 23,386 | | |
| | 200 | | | Toei Co., Ltd. | | | 29,893 | | |
| | 500 | | | Toho Gas Co., Ltd. | | | 20,524 | | |
| | 1,500 | | | Toho Holdings Co., Ltd. | | | 33,505 | | |
| | 900 | | | Toho Zinc Co., Ltd. | | | 17,171 | | |
| | 3,300 | | | Tohoku Electric Power Co., Inc. | | | 32,862 | | |
| | 3,600 | | | Tokai Carbon Co., Ltd.† | | | 36,280 | | |
| | 1,300 | | | Tokai Rika Co., Ltd. | | | 25,688 | | |
Shares | |
| | Value
(Note 1) | |
| | | Japan (Continued) | |
| | 4,800 | | | Tokai Tokyo Financial
Holdings, Inc. | | $ | 14,446 | | |
| | 200 | | | Token Corp. | | | 13,566 | | |
| | 1,100 | | | Tokio Marine Holdings, Inc. | | | 61,947 | | |
| | 1,100 | | | Tokuyama Corp. | | | 28,984 | | |
| | 1,300 | | | Tokyo Broadcasting System
Holdings, Inc. | | | 22,326 | | |
| | 700 | | | Tokyo Century Corp. | | | 37,688 | | |
| | 1,500 | | | Tokyo Dome Corp. | | | 14,992 | | |
| | 9,100 | | | Tokyo Electric Power Co.
Holdings, Inc.* | | | 39,112 | | |
| | 1,100 | | | Tokyo Electron, Ltd. | | | 242,212 | | |
| | 2,400 | | | Tokyo Gas Co., Ltd. | | | 58,567 | | |
| | 1,400 | | | Tokyo Kiraboshi Financial
Group, Inc. | | | 19,701 | | |
| | 800 | | | Tokyo Ohka Kogyo Co., Ltd. | | | 31,513 | | |
| | 2,000 | | | Tokyo Steel Manufacturing
Co., Ltd. | | | 14,541 | | |
| | 2,700 | | | Tokyo Tatemono Co., Ltd. | | | 42,467 | | |
| | 1,700 | | | Tokyu Construction Co., Ltd. | | | 12,219 | | |
| | 2,900 | | | Tokyu Corp. | | | 53,887 | | |
| | 6,100 | | | Tokyu Fudosan Holdings Corp. | | | 42,386 | | |
| | 5,300 | | | TOMONY Holdings, Inc. | | | 20,292 | | |
| | 1,900 | | | Tomy Co., Ltd. | | | 24,778 | | |
| | 1,500 | | | Topcon Corp. | | | 19,645 | | |
| | 2,600 | | | Toppan Forms Co., Ltd. | | | 29,337 | | |
| | 1,500 | | | Toppan Printing Co., Ltd. | | | 31,213 | | |
| | 1,100 | | | Topre Corp. | | | 17,929 | | |
| | 500 | | | Topy Industries, Ltd. | | | 9,286 | | |
| | 16,200 | | | Toray Industries, Inc. | | | 110,495 | | |
| | 1,200 | | | Toridoll Holdings Corp. | | | 31,122 | | |
| | 900 | | | Torii Pharmaceutical Co., Ltd. | | | 25,346 | | |
| | 1,300 | | | Tosei Corp. | | | 17,851 | | |
| | 1,100 | | | Toshiba Machine Co., Ltd. | | | 29,966 | | |
| | 900 | | | Toshiba TEC Corp. | | | 37,440 | | |
| | 6,500 | | | Tosoh Corp. | | | 101,399 | | |
| | 600 | | | TOTO, Ltd. | | | 25,622 | | |
| | 900 | | | Towa Pharmaceutical Co., Ltd. | | | 23,574 | | |
| | 3,100 | | | Toyo Construction Co., Ltd. | | | 14,922 | | |
| | 500 | | | Toyo Ink SC Holdings Co., Ltd. | | | 12,273 | | |
| | 1,000 | | | Toyo Seikan Group Holdings, Ltd. | | | 17,395 | | |
| | 1,600 | | | Toyo Tire Corp. | | | 23,193 | | |
| | 2,500 | | | Toyobo Co., Ltd. | | | 38,332 | | |
| | 1,200 | | | Toyoda Gosei Co., Ltd. | | | 30,316 | | |
| | 700 | | | Toyota Industries Corp. | | | 40,780 | | |
The accompanying notes are an integral part of these financial statements.
33
M International Equity Fund
SCHEDULE OF INVESTMENTS (Continued)
December 31, 2019
Shares | |
| | Value
(Note 1) | |
| | | Japan (Continued) | |
| | 22,300 | | | Toyota Motor Corp. | | $ | 1,583,196 | | |
| | 1,400 | | | Toyota Tsusho Corp. | | | 49,735 | | |
| | 600 | | | TPR Co., Ltd. | | | 11,939 | | |
| | 1,200 | | | Trend Micro, Inc. | | | 61,847 | | |
| | 300 | | | Trusco Nakayama Corp. | | | 7,736 | | |
| | 800 | | | TS Tech Co., Ltd. | | | 25,217 | | |
| | 600 | | | Tsubakimoto Chain Co. | | | 21,343 | | |
| | 2,600 | | | Tsugami Corp. | | | 26,776 | | |
| | 700 | | | Tsumura & Co. | | | 20,680 | | |
| | 700 | | | TV Asahi Holdings Corp. | | | 13,059 | | |
| | 1,000 | | | UACJ Corp. | | | 22,990 | | |
| | 2,000 | | | Ube Industries, Ltd. | | | 43,790 | | |
| | 900 | | | Ulvac, Inc. | | | 35,990 | | |
| | 2,300 | | | Unicharm Corp. | | | 78,321 | | |
| | 800 | | | Unipres Corp. | | | 11,353 | | |
| | 800 | | | United Arrows, Ltd. | | | 22,751 | | |
| | 1,100 | | | United Super Markets Holdings, Inc. | | | 9,729 | | |
| | 1,100 | | | Unizo Holdings Co., Ltd. | | | 51,834 | | |
| | 2,000 | | | Ushio, Inc. | | | 29,893 | | |
| | 1,300 | | | USS Co., Ltd. | | | 24,719 | | |
| | 400 | | | V Technology Co., Ltd.† | | | 20,505 | | |
| | 1,200 | | | Valor Holdings Co., Ltd. | | | 23,590 | | |
| | 1,000 | | | Valqua, Ltd. | | | 24,159 | | |
| | 1,400 | | | Vital KSK Holdings, Inc. | | | 13,516 | | |
| | 800 | | | Wacoal Holdings Corp. | | | 21,624 | | |
| | 2,000 | | | Wakita & Co., Ltd. | | | 20,579 | | |
| | 400 | | | Welcia Holdings Co., Ltd. | | | 25,586 | | |
| | 1,000 | | | West Japan Railway Co. | | | 86,890 | | |
| | 1,000 | | | Xebio Holdings Co., Ltd. | | | 12,149 | | |
| | 400 | | | Yakult Honsha Co., Ltd. | | | 22,199 | | |
| | 4,400 | | | Yamada Denki Co., Ltd. | | | 23,406 | | |
| | 2,100 | | | Yamaguchi Financial Group, Inc. | | | 14,379 | | |
| | 500 | | | Yamaha Corp. | | | 27,978 | | |
| | 5,600 | | | Yamaha Motor Co., Ltd. | | | 113,541 | | |
| | 2,400 | | | Yamato Holdings Co., Ltd. | | | 41,239 | | |
| | 900 | | | Yamato Kogyo Co., Ltd. | | | 22,712 | | |
| | 1,200 | | | Yamazaki Baking Co., Ltd. | | | 21,525 | | |
| | 400 | | | Yaoko Co., Ltd. | | | 20,542 | | |
| | 2,300 | | | Yaskawa Electric Corp. | | | 88,270 | | |
| | 1,200 | | | Yellow Hat, Ltd. | | | 21,624 | | |
| | 1,800 | | | Yokogawa Bridge Holdings Corp. | | | 33,199 | | |
| | 1,200 | | | Yokogawa Electric Corp. | | | 21,304 | | |
| | 2,500 | | | Yokohama Reito Co., Ltd. | | | 23,009 | | |
| | 2,100 | | | Yokohama Rubber Co., Ltd. (The) | | | 41,186 | | |
| | 19,800 | | | Z Holdings Corp. | | | 84,007 | | |
Shares | |
| | Value
(Note 1) | |
| | | Japan (Continued) | |
| | 700 | | | Zenkoku Hosho Co., Ltd. | | $ | 29,957 | | |
| | 900 | | | Zensho Holdings Co., Ltd. | | | 20,451 | | |
| | 2,300 | | | Zeon Corp. | | | 28,915 | | |
| | 600 | | | ZOZO, Inc. | | | 11,525 | | |
| | | | 34,507,089 | | |
| | | Netherlands—2.1% | |
| | 1,275 | | | Aalberts NV | | | 57,221 | | |
| | 1,069 | | | ABN AMRO Group NV, ADR
CVA# | | | 19,449 | | |
| | 13,492 | | | Aegon NV | | | 61,550 | | |
| | 1,266 | | | Akzo Nobel NV | | | 128,715 | | |
| | 5,987 | | | Altice Europe NV* | | | 38,601 | | |
| | 580 | | | AMG Advanced Metallurgical
Group NV† | | | 14,196 | | |
| | 576 | | | Amsterdam Commodities NV | | | 13,407 | | |
| | 1,679 | | | APERAM SA | | | 53,694 | | |
| | 2,059 | | | Arcadis NV | | | 47,993 | | |
| | 8,063 | | | ArcelorMittal SA | | | 141,470 | | |
| | 802 | | | ASM International NV | | | 90,095 | | |
| | 2,296 | | | ASML Holding NV | | | 679,139 | | |
| | 2,865 | | | ASR Nederland NV | | | 107,208 | | |
| | 331 | | | Basic-Fit NV*,# | | | 12,568 | | |
| | 1,008 | | | BE Semiconductor Industries NV | | | 38,963 | | |
| | 1,770 | | | Boskalis Westminster | | | 45,267 | | |
| | 954 | | | Coca-Cola European Partners PLC | | | 7,780 | | |
| | 900 | | | Corbion NV | | | 28,388 | | |
| | 691 | | | Flow Traders# | | | 16,696 | | |
| | 2,407 | | | Fugro NV, ADR CVA* | | | 26,940 | | |
| | 490 | | | GrandVision NV# | | | 15,071 | | |
| | 2,149 | | | Heineken NV | | | 228,808 | | |
| | 531 | | | IMCD NV | | | 46,339 | | |
| | 14,743 | | | ING Groep NV | | | 176,750 | | |
| | 1,133 | | | Intertrust NV# | | | 21,999 | | |
| | 9,237 | | | Koninklijke Ahold Delhaize NV | | | 231,002 | | |
| | 7,677 | | | Koninklijke BAM Groep NV | | | 23,130 | | |
| | 812 | | | Koninklijke DSM NV | | | 105,746 | | |
| | 54,875 | | | Koninklijke KPN NV | | | 161,947 | | |
| | 2,981 | | | Koninklijke Philips NV | | | 145,522 | | |
| | 899 | | | Koninklijke Vopak NV | | | 48,736 | | |
| | 1,412 | | | NN Group NV | | | 53,566 | | |
| | 1,110 | | | OCI NV* | | | 23,345 | | |
| | 10,631 | | | PostNL NV† | | | 23,993 | | |
| | 1,610 | | | Randstad NV | | | 98,315 | | |
| | 4,503 | | | SBM Offshore NV | | | 83,796 | | |
The accompanying notes are an integral part of these financial statements.
34
M International Equity Fund
SCHEDULE OF INVESTMENTS (Continued)
December 31, 2019
Shares | |
| | Value
(Note 1) | |
| | | Netherlands (Continued) | |
| | 2,451 | | | Signify NV# | | $ | 76,595 | | |
| | 239 | | | Takeaway.com NV*,†,# | | | 22,037 | | |
| | 640 | | | TKH Group NV, ADR | | | 35,823 | | |
| | 1,381 | | | Tomtom NV* | | | 14,592 | | |
| | 9,584 | | | Unilever NV | | | 550,742 | | |
| | 388 | | | Van Lanschot Kempen NV, ADR | | | 8,726 | | |
| | 2,640 | | | Wolters Kluwer NV | | | 192,543 | | |
| | | | 4,058,463 | | |
| | | New Zealand—0.2% | |
| | 15,320 | | | Air New Zealand, Ltd. | | | 30,218 | | |
| | 3,369 | | | Auckland International Airport, Ltd. | | | 19,845 | | |
| | 6,850 | | | Chorus, Ltd. | | | 28,499 | | |
| | 5,590 | | | Contact Energy, Ltd. | | | 26,831 | | |
| | 1,449 | | | EBOS Group, Ltd. | | | 23,655 | | |
| | 2,488 | | | Fisher & Paykel Healthcare
Corp., Ltd. | | | 37,183 | | |
| | 3,641 | | | Freightways, Ltd. | | | 20,835 | | |
| | 10,832 | | | Heartland Group Holdings, Ltd. | | | 13,490 | | |
| | 12,658 | | | Infratil, Ltd. | | | 42,948 | | |
| | 684 | | | Restaurant Brands
New Zealand, Ltd.* | | | 6,424 | | |
| | 5,933 | | | SKYCITY Entertainment
Group, Ltd. | | | 15,857 | | |
| | 3,942 | | | Summerset Group Holdings, Ltd. | | | 23,618 | | |
| | 14,615 | | | Spark New Zealand, Ltd. | | | 42,602 | | |
| | 4,896 | | | Z Energy, Ltd. | | | 14,502 | | |
| | | | 346,507 | | |
| | | Norway—0.6% | |
| | 404 | | | Adevinta ASA,* | | | 4,786 | | |
| | 751 | | | Aker BP ASA | | | 24,636 | | |
| | 4,348 | | | Aker Solutions ASA* | | | 12,243 | | |
| | 2,299 | | | Austevoll Seafood ASA | | | 23,581 | | |
| | 11,411 | | | B2Holding ASA† | | | 12,419 | | |
| | 438 | | | Bakkafrost P/F | | | 32,429 | | |
| | 480 | | | Bonheur ASA | | | 10,880 | | |
| | 1,580 | | | Borregaard ASA | | | 17,097 | | |
| | 6,229 | | | BW LPG, Ltd.# | | | 52,397 | | |
| | 5,362 | | | BW Offshore, Ltd.* | | | 40,310 | | |
| | 4,966 | | | DNB ASA | | | 92,767 | | |
| | 12,792 | | | DNO ASA | | | 16,858 | | |
| | 12,646 | | | Equinor ASA† | | | 252,796 | | |
| | 4,440 | | | Europris ASA# | | | 17,448 | | |
| | 1,329 | | | FLEX LNG, Ltd.† | | | 13,760 | | |
Shares | |
| | Value
(Note 1) | |
| | | Norway (Continued) | |
| | 1,365 | | | Gjensidige Forsikring ASA | | $ | 28,647 | | |
| | 768 | | | Grieg Seafood ASA | | | 12,273 | | |
| | 2,876 | | | Hoegh LNG Holdings, Ltd. | | | 10,974 | | |
| | 3,161 | | | Mowi ASA† | | | 82,164 | | |
| | 13,327 | | | Norsk Hydro ASA | | | 49,548 | | |
| | 1,595 | | | Norwegian Finans Holding ASA* | | | 17,314 | | |
| | 5,186 | | | Odfjell Drilling, Ltd.* | | | 19,328 | | |
| | 5,133 | | | Orkla ASA | | | 52,012 | | |
| | 10,139 | | | PGS ASA†,* | | | 19,864 | | |
| | 397 | | | Salmar ASA | | | 20,317 | | |
| | 1,776 | | | Sbanken ASA# | | | 15,091 | | |
| | 2,544 | | | Scatec Solar ASA# | | | 35,961 | | |
| | 404 | | | Schibsted ASA, Class B | | | 11,587 | | |
| | 1,199 | | | SpareBank 1 SR-Bank ASA | | | 13,657 | | |
| | 1,656 | | | Stolt-Nielsen, Ltd. | | | 21,503 | | |
| | 4,353 | | | Storebrand ASA | | | 34,222 | | |
| | 2,103 | | | Subsea 7 SA | | | 25,140 | | |
| | 4,815 | | | Telenor ASA | | | 86,353 | | |
| | 1,294 | | | TGS NOPEC Geophysical Co. ASA | | | 39,369 | | |
| | 888 | | | Tomra Systems ASA | | | 28,159 | | |
| | 518 | | | Yara International ASA | | | 21,548 | | |
| | | | 1,269,438 | | |
| | | Portugal—0.1% | |
| | 3,185 | | | Altri SGPS SA† | | | 20,292 | | |
| | 2,841 | | | CTT-Correios de Portugal SA† | | | 10,166 | | |
| | 932 | | | EDP Renovaveis SA | | | 10,977 | | |
| | 5,615 | | | Galp Energia SGPS SA | | | 93,845 | | |
| | 3,085 | | | Jeronimo Martins SGPS SA | | | 50,747 | | |
| | 5,953 | | | Navigator Co. SA (The)† | | | 23,959 | | |
| | 3,482 | | | NOS SGPS SA | | | 18,748 | | |
| | 20,529 | | | Sonae SGPS SA | | | 20,955 | | |
| | | | 249,689 | | |
| | | Singapore—0.6% | |
| | 35,700 | | | Accordia Golf Trust | | | 17,784 | | |
| | 23,500 | | | Ascendas India Trust | | | 27,083 | | |
| | 4,700 | | | CapitaLand, Ltd. | | | 13,105 | | |
| | 62,200 | | | CITIC Envirotech, Ltd. | | | 25,205 | | |
| | 3,400 | | | City Developments, Ltd. | | | 27,681 | | |
| | 13,900 | | | ComfortDelGro Corp., Ltd. | | | 24,597 | | |
| | 3,900 | | | Dairy Farm International
Holdings, Ltd. | | | 22,269 | | |
| | 8,000 | | | DBS Group Holdings, Ltd. | | | 153,939 | | |
| | 18,300 | | | First Resources, Ltd. | | | 25,852 | | |
The accompanying notes are an integral part of these financial statements.
35
M International Equity Fund
SCHEDULE OF INVESTMENTS (Continued)
December 31, 2019
Shares | |
| | Value
(Note 1) | |
| | | Singapore (Continued) | |
| | 132,400 | | | Golden Agri-Resources, Ltd. | | $ | 23,134 | | |
| | 11,200 | | | GuocoLand, Ltd. | | | 16,322 | | |
| | 1,300 | | | Haw Par Corp., Ltd. | | | 12,363 | | |
| | 5,500 | | | Hongkong Land Holdings, Ltd. | | | 31,625 | | |
| | 1,000 | | | Jardine Cycle & Carriage, Ltd. | | | 22,380 | | |
| | 4,800 | | | Keppel Corp., Ltd. | | | 24,162 | | |
| | 57,577 | | | Keppel Infrastructure Trust | | | 23,117 | | |
| | 14,800 | | | NetLink NBN Trust | | | 10,399 | | |
| | 20,445 | | | Oversea-Chinese Banking
Corp., Ltd. | | | 166,910 | | |
| | 3,200 | | | SATS, Ltd. | | | 12,039 | | |
| | 10,100 | | | Sembcorp Industries, Ltd. | | | 17,197 | | |
| | 18,500 | | | Sembcorp Marine, Ltd.* | | | 18,157 | | |
| | 9,000 | | | Singapore Airlines, Ltd. | | | 60,493 | | |
| | 4,000 | | | Singapore Exchange, Ltd. | | | 26,350 | | |
| | 32,900 | | | Singapore Post, Ltd. | | | 22,872 | | |
| | 33,100 | | | Singapore Press Holdings, Ltd.† | | | 53,651 | | |
| | 8,200 | | | Singapore Technologies
Engineering, Ltd. | | | 24,022 | | |
| | 12,000 | | | United Overseas Bank, Ltd. | | | 235,637 | | |
| | 6,300 | | | UOL Group, Ltd. | | | 38,972 | | |
| | 1,800 | | | Venture Corp., Ltd. | | | 21,681 | | |
| | 6,700 | | | Wilmar International, Ltd. | | | 20,524 | | |
| | 15,000 | | | Wing Tai Holdings, Ltd. | | | 22,529 | | |
| | 29,500 | | | Yangzijiang Shipbuilding
Holdings, Ltd. | | | 24,566 | | |
| | | | 1,266,617 | | |
| | | Spain—1.7% | |
| | 229 | | | Acciona SA† | | | 24,094 | | |
| | 2,154 | | | Acerinox SA | | | 24,270 | | |
| | 3,592 | | | ACS Actividades de Construccion y
Servicios SA | | | 143,639 | | |
| | 723 | | | Aena SME SA# | | | 138,274 | | |
| | 3,239 | | | Amadeus IT Group SA | | | 264,496 | | |
| | 1,736 | | | Applus Services SA | | | 22,199 | | |
| | 10,337 | | | Banco Bilbao Vizcaya
Argentaria SA | | | 57,778 | | |
| | 71,163 | | | Banco de Sabadell SA | | | 83,016 | | |
| | 111,866 | | | Banco Santander SA | | | 468,041 | | |
| | 6,635 | | | Bankia SA | | | 14,159 | | |
| | 5,075 | | | Bankinter SA | | | 37,184 | | |
| | 1,016 | | | Bolsas y Mercados Espanoles
SHMSF SA | | | 39,181 | | |
| | 13,771 | | | CaixaBank SA | | | 43,221 | | |
Shares | |
| | Value
(Note 1) | |
| | | Spain (Continued) | |
| | 2,864 | | | Cellnex Telecom SA# | | $ | 123,266 | | |
| | 796 | | | Cia de Distribucion Integral Logista
Holdings SA | | | 17,947 | | |
| | 861 | | | CIE Automotive SA | | | 20,359 | | |
| | 535 | | | Ebro Foods SA | | | 11,576 | | |
| | 3,909 | | | Enagas SA | | | 99,709 | | |
| | 1,943 | | | Endesa SA† | | | 51,849 | | |
| | 4,660 | | | Ercros SA† | | | 13,381 | | |
| | 1,575 | | | Euskaltel SA# | | | 15,847 | | |
| | 3,705 | | | Faes Farma SA | | | 20,780 | | |
| | 1,123 | | | Ferrovial SA | | | 33,973 | | |
| | 4,339 | | | Global Dominion Access SA*,# | | | 17,765 | | |
| | 3,334 | | | Grifols SA | | | 117,540 | | |
| | 364 | | | Grupo Catalana Occidente SA | | | 12,719 | | |
| | 41,714 | | | Iberdrola SA | | | 429,538 | | |
| | 1,575 | | | Indra Sistemas SA†,* | | | 17,985 | | |
| | 6,499 | | | Industria de Diseno Textil SA | | | 229,268 | | |
| | 21,228 | | | Liberbank SA† | | | 7,977 | | |
| | 7,728 | | | Mapfre SA | | | 20,458 | | |
| | 719 | | | Masmovil Ibercom SA* | | | 16,404 | | |
| | 1,581 | | | Mediaset Espana Comunicacion SA | | | 10,037 | | |
| | 1,460 | | | Melia Hotels International SA | | | 12,872 | | |
| | 2,330 | | | Naturgy Energy Group SA | | | 58,544 | | |
| | 2,459 | | | Prosegur Cia de Seguridad SA | | | 10,150 | | |
| | 3,850 | | | Red Electrica Corp. SA | | | 77,410 | | |
| | 3,329 | | | Repsol SA | | | 52,017 | | |
| | 9,458 | | | Sacyr SA† | | | 27,584 | | |
| | 41,030 | | | Telefonica SA | | | 286,587 | | |
| | 3,839 | | | Tubacex SA† | | | 12,187 | | |
| | 8,173 | | | Unicaja Banco SA# | | | 8,874 | | |
| | 165 | | | Vidrala SA | | | 17,326 | | |
| | 582 | | | Viscofan SA | | | 30,748 | | |
| | 1,480 | | | Zardoya Otis SA | | | 11,662 | | |
| | | | 3,253,891 | | |
| | | Sweden—1.8% | |
| | 984 | | | AAK AB | | | 18,700 | | |
| | 1,720 | | | Adapteo Oyj* | | | 21,114 | | |
| | 1,041 | | | AddNode Group AB | | | 19,839 | | |
| | 572 | | | AddTech AB, Class B | | | 18,504 | | |
| | 1,023 | | | AF Poyry AB | | | 23,876 | | |
| | 1,926 | | | Alfa Laval AB | | | 48,508 | | |
| | 933 | | | Alimak Group AB# | | | 13,906 | | |
| | 5,483 | | | Arjo AB, Class B | | | 26,378 | | |
| | 1,391 | | | Assa Abloy AB, Class B | | | 32,524 | | |
The accompanying notes are an integral part of these financial statements.
36
M International Equity Fund
SCHEDULE OF INVESTMENTS (Continued)
December 31, 2019
Shares | |
| | Value
(Note 1) | |
| | | Sweden (Continued) | |
| | 5,277 | | | Atlas Copco AB, Class A | | $ | 210,486 | | |
| | 996 | | | Atlas Copco AB, Class B | | | 34,581 | | |
| | 1,217 | | | Avanza Bank Holding AB | | | 12,707 | | |
| | 1,206 | | | Axfood AB | | | 26,833 | | |
| | 1,079 | | | Beijer Alma AB | | | 18,040 | | |
| | 2,259 | | | Betsson AB* | | | 10,535 | | |
| | 1,218 | | | Bilia AB, Class A | | | 13,823 | | |
| | 1,635 | | | BillerudKorsnas AB | | | 19,315 | | |
| | 475 | | | BioGaia AB, Class B | | | 21,528 | | |
| | 981 | | | Biotage AB | | | 12,987 | | |
| | 2,318 | | | Boliden AB | | | 61,499 | | |
| | 1,253 | | | Bonava AB, Class B | | | 13,311 | | |
| | 1,482 | | | Bravida Holding AB# | | | 14,391 | | |
| | 1,916 | | | Bure Equity AB | | | 43,367 | | |
| | 1,751 | | | Castellum AB | | | 41,128 | | |
| | 447 | | | Catena AB | | | 19,734 | | |
| | 7,868 | | | Cloetta AB, Class B | | | 26,629 | | |
| | 1,370 | | | Coor Service Management
Holding AB# | | | 12,053 | | |
| | 3,565 | | | Dios Fastigheter AB | | | 32,657 | | |
| | 2,657 | | | Dometic Group AB# | | | 26,756 | | |
| | 2,421 | | | Dustin Group AB# | | | 19,425 | | |
| | 2,954 | | | Electrolux AB, Series B | | | 72,507 | | |
| | 1,639 | | | Elekta AB, Class B | | | 21,585 | | |
| | 5,178 | | | Epiroc AB, Class A | | | 63,216 | | |
| | 4,623 | | | Essity AB, Class B | | | 148,961 | | |
| | 1,567 | | | Fabege AB | | | 26,049 | | |
| | 2,158 | | | Fagerhult AB | | | 13,709 | | |
| | 367 | | | Fastighets AB Balder, Class B* | | | 16,974 | | |
| | 2,139 | | | Getinge AB, Class B | | | 39,736 | | |
| | 1,098 | | | Granges AB | | | 11,600 | | |
| | 1,286 | | | Hemfosa Fastigheter AB† | | | 16,654 | | |
| | 5,892 | | | Hennes & Mauritz AB, Class B | | | 119,823 | | |
| | 950 | | | Hexagon AB, Class B | | | 53,249 | | |
| | 1,573 | | | Hexpol AB | | | 15,417 | | |
| | 3,175 | | | Hoist Finance AB†,#,* | | | 16,929 | | |
| | 1,048 | | | Holmen AB, Class B | | | 31,911 | | |
| | 690 | | | Hufvudstaden AB, Class A | | | 13,636 | | |
| | 1,656 | | | Humana AB | | | 10,767 | | |
| | 2,679 | | | Husqvarna AB, Class B | | | 21,458 | | |
| | 588 | | | ICA Gruppen AB | | | 27,447 | | |
| | 773 | | | Indutrade AB | | | 27,664 | | |
| | 631 | | | Intrum AB | | | 18,823 | | |
| | 3,518 | | | Inwido AB | | | 27,081 | | |
| | 1,080 | | | JM AB† | | | 31,986 | | |
Shares | |
| | Value
(Note 1) | |
| | | Sweden (Continued) | |
| | 13,093 | | | Klovern AB, Class B | | $ | 32,123 | | |
| | 1,219 | | | KNOW IT AB | | | 27,136 | | |
| | 1,646 | | | Kungsleden AB | | | 17,292 | | |
| | 1,742 | | | Lagercrantz Group AB, Class B | | | 27,228 | | |
| | 1,567 | | | Lindab International AB | | | 20,009 | | |
| | 981 | | | Loomis AB, Class B | | | 40,617 | | |
| | 801 | | | Lundin Petroleum AB | | | 27,221 | | |
| | 2,179 | | | Mekonomen AB* | | | 21,647 | | |
| | 755 | | | Millicom International Cellular SA,
ADR | | | 36,161 | | |
| | 1,742 | | | Modern Times Group MTG AB* | | | 20,765 | | |
| | 3,284 | | | New Wave Group AB, Class B | | | 20,967 | | |
| | 1,997 | | | Nibe Industrier AB, Class B | | | 34,625 | | |
| | 3,170 | | | Nobia AB | | | 23,624 | | |
| | 1,697 | | | Nobina AB# | | | 11,677 | | |
| | 2,599 | | | Nordic Waterproofing Holding AS# | | | 26,694 | | |
| | 1,681 | | | Nyfosa AB* | | | 14,537 | | |
| | 609 | | | Pandox AB | | | 13,784 | | |
| | 2,782 | | | Peab AB, Class B | | | 27,846 | | |
| | 1,578 | | | Platzer Fastigheter Holding AB,
Class B | | | 18,532 | | |
| | 4,394 | | | Ratos AB, Class B | | | 15,678 | | |
| | 1,168 | | | Recipharm AB, Class B | | | 18,581 | | |
| | 5,625 | | | Resurs Holding AB# | | | 36,123 | | |
| | 9,448 | | | Sandvik AB | | | 184,242 | | |
| | 5,565 | | | SAS AB* | | | 9,073 | | |
| | 2,495 | | | Scandi Standard AB | | | 19,819 | | |
| | 2,511 | | | Scandic Hotels Group AB# | | | 27,988 | | |
| | 2,942 | | | Securitas AB, Class B | | | 50,712 | | |
| | 11,213 | | | Skandinaviska Enskilda Banken AB,
Class A | | | 105,446 | | |
| | 1,322 | | | Skanska AB, Class B | | | 29,880 | | |
| | 3,291 | | | SKF AB, Class B | | | 66,548 | | |
| | 1,698 | | | SkiStar AB | | | 21,537 | | |
| | 7,778 | | | SSAB AB, Class B | | | 25,344 | | |
| | 2,726 | | | Svenska Cellulosa AB SCA,
Class B | | | 27,649 | | |
| | 6,847 | | | Svenska Handelsbanken AB,
Class A | | | 73,760 | | |
| | 7,351 | | | Swedbank AB, Class A | | | 109,445 | | |
| | 1,048 | | | Swedish Match AB | | | 54,020 | | |
| | 987 | | | Swedish Orphan Biovitrum AB* | | | 16,281 | | |
| | 3,409 | | | Tele2 AB, Class B | | | 49,444 | | |
| | 3,317 | | | Telefonaktiebolaget LM Ericsson,
Class B | | | 28,884 | | |
The accompanying notes are an integral part of these financial statements.
37
M International Equity Fund
SCHEDULE OF INVESTMENTS (Continued)
December 31, 2019
Shares | |
| | Value
(Note 1) | |
| | | Sweden (Continued) | |
| | 22,676 | | | Telia Co. AB | | $ | 97,446 | | |
| | 458 | | | Thule Group AB (The)# | | | 10,562 | | |
| | 1,377 | | | Trelleborg AB, Class B | | | 24,779 | | |
| | 1,704 | | | Volvo AB, Class A | | | 28,781 | | |
| | 9,905 | | | Volvo AB, Class B | | | 165,923 | | |
| | 1,004 | | | Wihlborgs Fastigheter AB | | | 18,491 | | |
| | | | 3,541,237 | | |
| | | Switzerland—5.8% | |
| | 10,661 | | | ABB, Ltd., Registered | | | 257,437 | | |
| | 2,548 | | | Adecco Group AG, Registered | | | 161,179 | | |
| | 2,917 | | | Alcon, Inc.* | | | 165,170 | | |
| | 309 | | | Allreal Holding AG, Registered* | | | 61,430 | | |
| | 137 | | | ALSO Holding AG, Registered* | | | 23,131 | | |
| | 579 | | | ams AG* | | | 23,494 | | |
| | 47 | | | APG SGA SA | | | 13,792 | | |
| | 1,914 | | | Arbonia AG* | | | 24,919 | | |
| | 14,351 | | | Aryzta AG* | | | 16,044 | | |
| | 1,516 | | | Ascom Holding AG, Registered | | | 16,479 | | |
| | 119 | | | Autoneum Holding AG† | | | 14,288 | | |
| | 766 | | | Baloise Holding AG, Registered | | | 138,510 | | |
| | 44 | | | Banque Cantonale Vaudoise,
Registered | | | 35,917 | | |
| | 13 | | | Barry Callebaut AG, Registered | | | 28,719 | | |
| | 7 | | | Belimo Holding AG, Registered | | | 52,728 | | |
| | 35 | | | Bell Food Group AG, Registered* | | | 9,475 | | |
| | 76 | | | Berner Kantonalbank AG,
Registered | | | 17,433 | | |
| | 301 | | | BKW AG | | | 22,206 | | |
| | 157 | | | Bobst Group SA, Registered† | | | 9,141 | | |
| | 127 | | | Bossard Holding AG, Registered | | | 22,925 | | |
| | 149 | | | Bucher Industries AG, Registered | | | 52,315 | | |
| | 137 | | | Burkhalter Holding AG | | | 10,773 | | |
| | 456 | | | Cembra Money Bank AG | | | 49,944 | | |
| | 1 | | | Chocoladefabriken Lindt &
Spruengli AG, Registered | | | 88,345 | | |
| | 1,569 | | | Cie Financiere Richemont SA,
Registered | | | 123,309 | | |
| | 2,253 | | | Clariant AG, Registered* | | | 50,284 | | |
| | 205 | | | Coltene Holding AG, Registered* | | | 18,810 | | |
| | 28 | | | Conzzeta AG, Registered | | | 33,445 | | |
| | 5,213 | | | Credit Suisse Group AG,
Registered* | | | 70,589 | | |
| | 147 | | | Daetwyler Holding AG | | | 28,312 | | |
| | 514 | | | DKSH Holding AG | | | 27,989 | | |
Shares | |
| | Value
(Note 1) | |
| | | Switzerland (Continued) | |
| | 66 | | | dormakaba Holding AG* | | $ | 47,226 | | |
| | 224 | | | Dufry AG, Registered* | | | 22,224 | | |
| | 1,608 | | | EFG International AG* | | | 10,617 | | |
| | 15 | | | Emmi AG, Registered | | | 13,058 | | |
| | 41 | | | EMS-Chemie Holding AG,
Registered | | | 26,965 | | |
| | 456 | | | Flughafen Zurich AG, Registered | | | 83,256 | | |
| | 20 | | | Forbo Holding AG, Registered | | | 34,057 | | |
| | 5,107 | | | GAM Holding AG* | | | 14,796 | | |
| | 349 | | | Geberit AG, Registered | | | 195,884 | | |
| | 50 | | | Georg Fischer AG | | | 50,785 | | |
| | 65 | | | Givaudan SA, Registered | | | 203,570 | | |
| | 566 | | | Helvetia Holding AG | | | 80,005 | | |
| | 136 | | | Hiag Immobilien Holding AG | | | 15,177 | | |
| | 298 | | | Huber + Suhner AG | | | 23,648 | | |
| | 36 | | | Inficon Holding AG, Registered | | | 28,586 | | |
| | 11 | | | Interroll Holding AG | | | 24,721 | | |
| | 1,729 | | | Julius Baer Group, Ltd.* | | | 89,201 | | |
| | 80 | | | Jungfraubahn Holding AG | | | 13,639 | | |
| | 223 | | | Kardex AG, Registered | | | 37,558 | | |
| | 90 | | | Komax Holding AG, Registered† | | | 21,984 | | |
| | 427 | | | Kuehne + Nagel International AG,
Registered | | | 72,005 | | |
| | 2,019 | | | LafargeHolcim, Ltd., Registered* | | | 112,028 | | |
| | 1,247 | | | Logitech International SA,
Registered | | | 59,051 | | |
| | 667 | | | Logitech International SA,
Registered† | | | 31,456 | | |
| | 742 | | | Lonza Group AG, Registered* | | | 270,794 | | |
| | 63 | | | Luzerner Kantonalbank AG,
Registered | | | 27,308 | | |
| | 1,480 | | | Mobimo Holding AG, Registered* | | | 16,608 | | |
| | 150 | | | Mobimo Holding AG, Registered* | | | 44,715 | | |
| | 22,264 | | | Nestle SA, Registered | | | 2,410,438 | | |
| | 13,215 | | | Novartis AG, Registered | | | 1,254,865 | | |
| | 5,439 | | | OC Oerlikon Corp. AG, Registered | | | 63,843 | | |
| | 136 | | | Orior AG* | | | 12,577 | | |
| | 156 | | | Partners Group Holding AG† | | | 143,040 | | |
| | 786 | | | PSP Swiss Property AG, Registered | | | 108,503 | | |
| | 78 | | | Rieter Holding AG | | | 11,130 | | |
| | 4,932 | | | Roche Holding AG | | | 1,600,174 | | |
| | 201 | | | Roche Holding AG | | | 63,885 | | |
| | 140 | | | Schindler Holding AG, Registered | | | 34,313 | | |
| | 25 | | | Schweiter Technologies AG | | | 31,670 | | |
| | 123 | | | SFS Group AG | | | 11,832 | | |
The accompanying notes are an integral part of these financial statements.
38
M International Equity Fund
SCHEDULE OF INVESTMENTS (Continued)
December 31, 2019
Shares | |
| | Value
(Note 1) | |
| | | Switzerland (Continued) | |
| | 50 | | | SGS SA, Registered | | $ | 136,960 | | |
| | 97 | | | Siegfried Holding AG, Registered* | | | 47,007 | | |
| | 910 | | | Sika AG, Registered | | | 170,989 | | |
| | 324 | | | Sonova Holding AG, Registered | | | 74,154 | | |
| | 47 | | | St Galler Kantonalbank AG,
Registered | | | 21,878 | | |
| | 79 | | | Straumann Holding AG, Registered | | | 77,580 | | |
| | 346 | | | Sulzer AG, Registered | | | 38,611 | | |
| | 681 | | | Sunrise Communications
Group AG*,# | | | 53,513 | | |
| | 76 | | | Swatch Group AG (The)† | | | 21,203 | | |
| | 384 | | | Swatch Group AG (The),
Registered | | | 20,295 | | |
| | 151 | | | Swiss Life Holding AG, Registered | | | 75,796 | | |
| | 1,182 | | | Swiss Prime Site AG, Registered* | | | 136,666 | | |
| | 1,421 | | | Swiss Re AG | | | 159,602 | | |
| | 379 | | | Swisscom AG, Registered | | | 200,739 | | |
| | 247 | | | Swissquote Group Holding SA,
Registered | | | 12,383 | | |
| | 493 | | | Temenos AG, Registered* | | | 78,040 | | |
| | 276 | | | u-blox Holding AG* | | | 27,891 | | |
| | 10,729 | | | UBS Group AG, Registered* | | | 135,526 | | |
| | 94 | | | Valora Holding AG, Registered* | | | 26,224 | | |
| | 228 | | | VAT Group AG*,# | | | 38,530 | | |
| | 8 | | | Vetropack Holding AG | | | 25,129 | | |
| | 451 | | | Vifor Pharma AG | | | 82,320 | | |
| | 706 | | | Vontobel Holding AG, Registered | | | 50,444 | | |
| | 77 | | | VP Bank AG, Registered | | | 12,332 | | |
| | 593 | | | Zehnder Group AG | | | 27,940 | | |
| | 1,165 | | | Zurich Insurance Group AG | | | 478,014 | | |
| | | | 11,315,490 | | |
| | | United Kingdom—11.6% | |
| | 6,126 | | | 3i Group Plc | | | 89,097 | | |
| | 1,677 | | | Admiral Group Plc | | | 51,291 | | |
| | 3,921 | | | Aggreko Plc | | | 43,243 | | |
| | 12,432 | | | Alliance Pharma Plc | | | 13,849 | | |
| | 12,069 | | | Anglo American Plc | | | 347,389 | | |
| | 5,917 | | | Anglo Pacific Group Plc | | | 15,048 | | |
| | 2,109 | | | Antofagasta Plc | | | 25,612 | | |
| | 4,535 | | | Ascential Plc# | | | 23,536 | | |
| | 2,310 | | | Ashmore Group Plc† | | | 15,850 | | |
| | 6,474 | | | Ashtead Group Plc | | | 207,012 | | |
| | 1,721 | | | Associated British Foods Plc | | | 59,225 | | |
Shares | |
| | Value
(Note 1) | |
| | | United Kingdom (Continued) | |
| | 7,627 | | | AstraZeneca Plc | | $ | 768,514 | | |
| | 2,395 | | | AstraZeneca Plc, SP ADR | | | 119,415 | | |
| | 12,101 | | | Auto Trader Group Plc# | | | 95,308 | | |
| | 28,447 | | | Aviva Plc | | | 157,770 | | |
| | 835 | | | Avon Rubber Plc | | | 23,116 | | |
| | 18,848 | | | B&M European Value Retail SA | | | 102,261 | | |
| | 5,299 | | | Babcock International Group Plc | | | 44,178 | | |
| | 19,453 | | | BAE Systems Plc | | | 145,534 | | |
| | 12,620 | | | Balfour Beatty Plc | | | 43,697 | | |
| | 617 | | | Bank of Georgia Group Plc | | | 13,281 | | |
| | 81,962 | | | Barclays Plc | | | 195,029 | | |
| | 7,150 | | | Barratt Developments Plc | | | 70,710 | | |
| | 3,269 | | | Beazley Plc | | | 24,075 | | |
| | 3,721 | | | Bellway Plc | | | 187,641 | | |
| | 2,008 | | | Berkeley Group Holdings Plc (The) | | | 129,239 | | |
| | 13,667 | | | BHP Group Plc | | | 321,660 | | |
| | 4,891 | | | Biffa Plc# | | | 17,751 | | |
| | 1,176 | | | Bodycote Plc | | | 14,830 | | |
| | 8,370 | | | boohoo Group Plc* | | | 33,028 | | |
| | 4,425 | | | Bovis Homes Group Plc | | | 79,597 | | |
| | 202,870 | | | BP Plc | | | 1,267,291 | | |
| | 8,187 | | | Brewin Dolphin Holdings Plc | | | 40,385 | | |
| | 8,878 | | | British American Tobacco Plc | | | 380,018 | | |
| | 589 | | | British American Tobacco Plc,
SP ADR | | | 25,009 | | |
| | 4,032 | | | Britvic Plc | | | 48,307 | | |
| | 82,890 | | | BT Group Plc | | | 211,292 | | |
| | 3,731 | | | Bunzl Plc | | | 102,054 | | |
| | 3,700 | | | Burberry Group Plc | | | 108,067 | | |
| | 3,052 | | | Burford Capital, Ltd.† | | | 28,784 | | |
| | 3,640 | | | C&C Group Plc | | | 19,600 | | |
| | 13,077 | | | Cairn Energy Plc* | | | 35,510 | | |
| | 7,081 | | | Capital & Counties Properties Plc | | | 24,546 | | |
| | 7,460 | | | Card Factory Plc | | | 14,615 | | |
| | 993 | | | Carnival Plc | | | 47,931 | | |
| | 21,596 | | | Centamin Plc | | | 36,330 | | |
| | 6,675 | | | Central Asia Metals Plc | | | 19,452 | | |
| | 77,567 | | | Centrica Plc | | | 91,751 | | |
| | 2,609 | | | Chesnara Plc | | | 10,921 | | |
| | 14,330 | | | Cineworld Group Plc† | | | 41,588 | | |
| | 577 | | | Clarkson Plc | | | 23,120 | | |
| | 2,800 | | | Close Brothers Group Plc | | | 59,268 | | |
| | 14,824 | | | Coats Group Plc | | | 14,648 | | |
| | 25,655 | | | Cobham Plc | | | 55,816 | | |
The accompanying notes are an integral part of these financial statements.
39
M International Equity Fund
SCHEDULE OF INVESTMENTS (Continued)
December 31, 2019
Shares | |
| | Value
(Note 1) | |
| | | United Kingdom (Continued) | |
| | 1,999 | | | Coca-Cola HBC AG* | | $ | 67,918 | | |
| | 11,710 | | | Compass Group Plc | | | 293,159 | | |
| | 865 | | | Computacenter Plc | | | 20,315 | | |
| | 23,805 | | | ConvaTec Group Plc# | | | 62,575 | | |
| | 3,254 | | | Countryside Properties Plc# | | | 19,620 | | |
| | 621 | | | Cranswick Plc | | | 27,885 | | |
| | 4,845 | | | Crest Nicholson Holdings Plc | | | 27,712 | | |
| | 1,039 | | | Croda International Plc | | | 70,464 | | |
| | 1,316 | | | Daily Mail & General Trust Plc | | | 14,451 | | |
| | 1,084 | | | Dart Group Plc | | | 24,324 | | |
| | 593 | | | DCC Plc | | | 51,402 | | |
| | 2,049 | | | De La Rue Plc | | | 3,865 | | |
| | 5,029 | | | Devro Plc | | | 11,884 | | |
| | 6,669 | | | DFS Furniture Plc | | | 25,530 | | |
| | 12,494 | | | Diageo Plc | | | 529,668 | | |
| | 2,860 | | | Diploma Plc | | | 76,676 | | |
| | 26,929 | | | Direct Line Insurance Group Plc | | | 111,469 | | |
| | 21,706 | | | Dixons Carphone Plc | | | 41,460 | | |
| | 3,416 | | | Domino's Pizza Group Plc | | | 14,488 | | |
| | 6,832 | | | Drax Group Plc | | | 28,416 | | |
| | 1,548 | | | easyJet Plc | | | 29,209 | | |
| | 8,674 | | | EI Group Plc* | | | 32,607 | | |
| | 9,500 | | | Electrocomponents Plc | | | 85,267 | | |
| | 13,055 | | | Elementis Plc | | | 30,954 | | |
| | 1,355 | | | EMIS Group Plc | | | 19,887 | | |
| | 70,446 | | | EnQuest Plc* | | | 20,100 | | |
| | 4,422 | | | Equiniti Group Plc# | | | 12,090 | | |
| | 489 | | | Euromoney Institutional Investor Plc | | | 8,433 | | |
| | 3,432 | | | Evraz Plc | | | 18,366 | | |
| | 7,845 | | | Experian Plc | | | 265,191 | | |
| | 3,093 | | | Ferguson Plc | | | 280,644 | | |
| | 1,881 | | | Fevertree Drinks Plc | | | 52,149 | | |
| | 39,520 | | | Firstgroup Plc* | | | 65,645 | | |
| | 5,744 | | | Frasers Group Plc* | | | 34,893 | | |
| | 9,131 | | | G4S Plc | | | 26,367 | | |
| | 2,798 | | | Galliford Try Plc | | | 31,855 | | |
| | 642 | | | Games Workshop Group Plc | | | 51,916 | | |
| | 928 | | | Gamesys Group PLC*,† | | | 8,691 | | |
| | 26,092 | | | GlaxoSmithKline Plc | | | 614,848 | | |
| | 4,280 | | | GlaxoSmithKline Plc, SP ADR | | | 201,117 | | |
| | 101,056 | | | Glencore Plc* | | | 315,037 | | |
| | 1,404 | | | Go-Ahead Group Plc (The) | | | 41,063 | | |
| | 1,480 | | | Grafton Group Plc | | | 16,997 | | |
| | 3,970 | | | Grainger Plc | | | 16,470 | | |
| | 795 | | | Greencore Group Plc | | | 2,821 | | |
Shares | |
| | Value
(Note 1) | |
| | | United Kingdom (Continued) | |
| | 2,521 | | | Greggs Plc | | $ | 76,737 | | |
| | 9,789 | | | Gulf Keystone Petroleum, Ltd. | | | 27,554 | | |
| | 2,921 | | | GVC Holdings Plc | | | 34,211 | | |
| | 4,549 | | | Gym Group Plc (The)# | | | 17,414 | | |
| | 6,271 | | | Halfords Group Plc | | | 14,063 | | |
| | 4,048 | | | Halma Plc | | | 113,459 | | |
| | 2,848 | | | Hargreaves Lansdown Plc | | | 72,997 | | |
| | 25,710 | | | Hays Plc | | | 61,845 | | |
| | 1,995 | | | Headlam Group Plc | | | 14,138 | | |
| | 3,050 | | | Helical Plc | | | 19,150 | | |
| | 11,962 | | | Highland Gold Mining, Ltd. | | | 31,119 | | |
| | 1,984 | | | Hikma Pharmaceuticals Plc | | | 52,324 | | |
| | 734 | | | Hill & Smith Holdings Plc | | | 14,321 | | |
| | 916 | | | Hilton Food Group Plc | | | 13,444 | | |
| | 1,266 | | | Hiscox, Ltd. | | | 23,880 | | |
| | 3,986 | | | Hollywood Bowl Group Plc | | | 15,048 | | |
| | 4,561 | | | HomeServe Plc | | | 76,365 | | |
| | 14,041 | | | Howden Joinery Group Plc | | | 125,095 | | |
| | 61,234 | | | HSBC Holdings Plc | | | 480,093 | | |
| | 3,532 | | | Hunting Plc | | | 19,528 | | |
| | 4,879 | | | Ibstock Plc# | | | 20,358 | | |
| | 1,762 | | | IG Group Holdings Plc | | | 16,221 | | |
| | 5,710 | | | IMI Plc | | | 89,173 | | |
| | 8,898 | | | Imperial Brands Plc | | | 220,286 | | |
| | 3,234 | | | Inchcape Plc | | | 30,243 | | |
| | 3,716 | | | Informa Plc | | | 42,183 | | |
| | 1,175 | | | InterContinental Hotels Group Plc | | | 81,058 | | |
| | 390 | | | InterContinental Hotels Group Plc,
ADR | | | 26,781 | | |
| | 1,391 | | | Intermediate Capital Group Plc | | | 29,665 | | |
| | 10,061 | | | International Consolidated Airlines
Group SA | | | 83,292 | | |
| | 4,161 | | | International Personal Finance Plc | | | 8,874 | | |
| | 1,524 | | | Intertek Group Plc | | | 118,134 | | |
| | 8,515 | | | Investec Plc | | | 49,977 | | |
| | 7,770 | | | IP Group Plc* | | | 7,307 | | |
| | 52,819 | | | ITV Plc | | | 105,646 | | |
| | 4,101 | | | IWG Plc | | | 23,657 | | |
| | 2,074 | | | J D Wetherspoon Plc | | | 45,686 | | |
| | 11,978 | | | J Sainsbury Plc | | | 36,476 | | |
| | 485 | | | James Fisher & Sons Plc | | | 13,009 | | |
| | 7,633 | | | JD Sports Fashion Plc | | | 84,667 | | |
| | 8,054 | | | John Laing Group Plc# | | | 40,540 | | |
| | 1,637 | | | John Menzies Plc | | | 10,256 | | |
| | 10,403 | | | John Wood Group Plc | | | 54,913 | | |
The accompanying notes are an integral part of these financial statements.
40
M International Equity Fund
SCHEDULE OF INVESTMENTS (Continued)
December 31, 2019
Shares | |
| | Value
(Note 1) | |
| | | United Kingdom (Continued) | |
| | 1,891 | | | Johnson Matthey Plc | | $ | 75,044 | | |
| | 7,194 | | | Johnson Service Group Plc | | | 18,677 | | |
| | 2,812 | | | Jupiter Fund Management Plc | | | 15,257 | | |
| | 2,888 | | | Just Eat Plc* | | | 31,935 | | |
| | 30,973 | | | Just Group Plc* | | | 32,411 | | |
| | 2,164 | | | Kainos Group Plc | | | 21,269 | | |
| | 1,556 | | | Keller Group Plc | | | 15,458 | | |
| | 32,972 | | | Kingfisher Plc | | | 94,774 | | |
| | 1,402 | | | Lancashire Holdings, Ltd. | | | 14,244 | | |
| | 63,390 | | | Legal & General Group Plc | | | 254,418 | | |
| | 430,679 | | | Lloyds Banking Group Plc | | | 356,548 | | |
| | 2,044 | | | London Stock Exchange Group Plc | | | 209,830 | | |
| | 9,625 | | | M&G Plc* | | | 30,241 | | |
| | 26,048 | | | Man Group Plc | | | 54,515 | | |
| | 28,984 | | | Marks & Spencer Group Plc | | | 81,967 | | |
| | 1,885 | | | Marshalls Plc | | | 21,473 | | |
| | 18,395 | | | Marston's Plc | | | 30,994 | | |
| | 8,666 | | | McCarthy & Stone Plc# | | | 17,104 | | |
| | 3,805 | | | Mears Group Plc | | | 14,818 | | |
| | 5,349 | | | Mediclinic International Plc | | | 29,163 | | |
| | 7,048 | | | Meggitt Plc | | | 61,317 | | |
| | 22,767 | | | Melrose Industries Plc | | | 72,407 | | |
| | 2,240 | | | Micro Focus International Plc | | | 31,564 | | |
| | 5,825 | | | Mitchells & Butlers Plc* | | | 35,454 | | |
| | 7,524 | | | Mitie Group Plc | | | 14,451 | | |
| | 150 | | | MJ Gleeson Plc | | | 1,897 | | |
| | 4,012 | | | Mondi Plc | | | 94,196 | | |
| | 5,751 | | | Moneysupermarket.com Group Plc | | | 25,184 | | |
| | 7,506 | | | Morgan Advanced Materials Plc | | | 31,518 | | |
| | 1,378 | | | Morgan Sindall Group Plc | | | 29,570 | | |
| | 6,750 | | | National Express Group Plc | | | 41,987 | | |
| | 3,646 | | | National Grid Plc | | | 45,605 | | |
| | 1,154 | | | Next Plc | | | 107,276 | | |
| | 537 | | | NMC Health Plc† | | | 12,569 | | |
| | 3,003 | | | Northgate Plc | | | 12,371 | | |
| | 4,680 | | | On the Beach Group Plc# | | | 30,215 | | |
| | 4,865 | | | OneSavings Bank Plc | | | 27,929 | | |
| | 1,080 | | | Oxford Instruments Plc | | | 22,031 | | |
| | 8,188 | | | Pagegroup Plc | | | 56,724 | | |
| | 5,714 | | | Paragon Banking Group Plc | | | 40,796 | | |
| | 1,213 | | | PayPoint Plc | | | 16,260 | | |
| | 3,815 | | | Pearson Plc | | | 32,190 | | |
| | 41,805 | | | Pendragon Plc† | | | 7,199 | | |
| | 6,124 | | | Pennon Group Plc | | | 83,146 | | |
| | 3,326 | | | Persimmon Plc | | | 118,731 | | |
Shares | |
| | Value
(Note 1) | |
| | | United Kingdom (Continued) | |
| | 3,779 | | | Petrofac, Ltd. | | $ | 19,167 | | |
| | 14,508 | | | Pets at Home Group Plc | | | 53,732 | | |
| | 1,116 | | | Phoenix Group Holdings Plc | | | 11,072 | | |
| | 11,392 | | | Photo-Me International Plc | | | 14,637 | | |
| | 1,840 | | | Playtech Plc | | | 9,676 | | |
| | 1,113 | | | Plus500, Ltd. | | | 13,062 | | |
| | 2,857 | | | Polypipe Group Plc | | | 20,436 | | |
| | 33,266 | | | Premier Oil Plc†,* | | | 43,271 | | |
| | 9,625 | | | Prudential Plc | | | 184,737 | | |
| | 37,344 | | | Quilter Plc# | | | 79,665 | | |
| | 351 | | | Rathbone Brothers Plc | | | 9,903 | | |
| | 2,486 | | | Reckitt Benckiser Group Plc | | | 201,825 | | |
| | 3,865 | | | Redrow Plc | | | 38,141 | | |
| | 10,683 | | | RELX Plc | | | 269,642 | | |
| | 3,910 | | | RELX Plc, SP ADR† | | | 98,806 | | |
| | 2,776 | | | Renew Holdings Plc | | | 20,077 | | |
| | 214 | | | Renishaw Plc | | | 10,681 | | |
| | 18,010 | | | Rentokil Initial Plc | | | 108,068 | | |
| | 10,927 | | | Rightmove Plc | | | 91,707 | | |
| | 7,931 | | | Rio Tinto Plc | | | 473,058 | | |
| | 13,976 | | | Rolls-Royce Holdings Plc* | | | 126,478 | | |
| | 13,857 | | | Rotork Plc | | | 61,489 | | |
| | 8,261 | | | Royal Bank of Scotland Group Plc | | | 26,295 | | |
| | 8,858 | | | Royal Dutch Shell Plc, ADR,
Class B† | | | 531,214 | | |
| | 37,262 | | | Royal Dutch Shell Plc, Class A | | | 1,103,134 | | |
| | 10,328 | | | Royal Dutch Shell Plc, Class B | | | 306,374 | | |
| | 9,433 | | | Royal Mail Plc | | | 28,276 | | |
| | 4,095 | | | RSA Insurance Group Plc | | | 30,679 | | |
| | 14,231 | | | Saga Plc | | | 9,991 | | |
| | 12,605 | | | Sage Group Plc (The) | | | 125,057 | | |
| | 2,391 | | | Savills Plc | | | 35,947 | | |
| | 927 | | | Schroders Plc | | | 40,938 | | |
| | 11,630 | | | Severfield Plc | | | 12,940 | | |
| | 2,767 | | | Severn Trent Plc | | | 92,179 | | |
| | 7,442 | | | SIG Plc | | | 12,125 | | |
| | 5,193 | | | Signature Aviation Plc | | | 21,819 | | |
| | 7,497 | | | Smith & Nephew Plc | | | 181,977 | | |
| | 2,377 | | | Smiths Group Plc | | | 53,116 | | |
| | 1,795 | | | Spectris Plc | | | 69,095 | | |
| | 12,936 | | | Speedy Hire Plc | | | 13,194 | | |
| | 734 | | | Spirax-Sarco Engineering Plc | | | 86,434 | | |
| | 7,170 | | | Spire Healthcare Group Plc# | | | 13,486 | | |
| | 10,386 | | | Spirent Communications Plc | | | 34,600 | | |
| | 14,542 | | | SSE Plc | | | 277,089 | | |
The accompanying notes are an integral part of these financial statements.
41
M International Equity Fund
SCHEDULE OF INVESTMENTS (Continued)
December 31, 2019
Shares | |
| | Value
(Note 1) | |
| | | United Kingdom (Continued) | |
| | 8,123 | | | SSP Group Plc | | $ | 69,938 | | |
| | 3,870 | | | St James's Place Plc | | | 59,695 | | |
| | 2,024 | | | St Modwen Properties Plc | | | 13,324 | | |
| | 5,772 | | | Stagecoach Group Plc | | | 12,233 | | |
| | 20,666 | | | Standard Chartered Plc | | | 195,014 | | |
| | 7,141 | | | Standard Life Aberdeen Plc | | | 31,035 | | |
| | 4,177 | | | SThree Plc | | | 20,969 | | |
| | 6,120 | | | Stobart Group, Ltd.† | | | 8,739 | | |
| | 7,781 | | | Stock Spirits Group Plc | | | 21,283 | | |
| | 2,853 | | | Synthomer Plc | | | 13,370 | | |
| | 8,202 | | | TalkTalk Telecom Group Plc | | | 12,614 | | |
| | 6,411 | | | Tate & Lyle Plc | | | 64,556 | | |
| | 65,697 | | | Taylor Wimpey Plc | | | 168,301 | | |
| | 978 | | | Telecom Plus Plc | | | 19,458 | | |
| | 40,356 | | | Tesco Plc | | | 136,419 | | |
| | 11,956 | | | TP ICAP Plc | | | 64,725 | | |
| | 5,006 | | | Travis Perkins Plc | | | 106,228 | | |
| | 1,888 | | | TUI AG | | | 23,853 | | |
| | 42,736 | | | Tullow Oil Plc | | | 36,229 | | |
| | 4,191 | | | Tyman Plc | | | 15,072 | | |
| | 7,733 | | | U & I Group Plc | | | 18,110 | | |
| | 632 | | | Ultra Electronics Holdings Plc | | | 17,697 | | |
| | 8,051 | | | Unilever Plc | | | 463,953 | | |
| | 7,319 | | | United Utilities Group Plc | | | 91,460 | | |
| | 2,533 | | | Urban & Civic Plc | | | 11,575 | | |
Shares | |
| | Value
(Note 1) | |
| | | United Kingdom (Continued) | |
| | 20,856 | | | Vectura Group Plc | | $ | 25,609 | | |
| | 5,245 | | | Vesuvius Plc | | | 34,738 | | |
| | 1,157 | | | Victrex Plc | | | 38,222 | | |
| | 13,688 | | | Virgin Money UK Plc | | | 34,186 | | |
| | 386 | | | Vitec Group Plc (The) | | | 5,624 | | |
| | 207,108 | | | Vodafone Group Plc | | | 402,614 | | |
| | 6,400 | | | Volution Group Plc | | | 21,787 | | |
| | 5,138 | | | Watkin Jones Plc | | | 16,538 | | |
| | 2,286 | | | Weir Group Plc (The) | | | 45,708 | | |
| | 1,764 | | | WH Smith Plc | | | 60,751 | | |
| | 1,204 | | | Whitbread Plc | | | 77,285 | | |
| | 28,949 | | | WM Morrison Supermarkets Plc | | | 76,615 | | |
| | 13,599 | | | WPP Plc | | | 192,111 | | |
| | | | 22,796,828 | | |
| | | | | TOTAL COMMON STOCKS
(Cost $124,746,906) | | | 142,925,687 | | |
| | | AFFILIATED INVESTMENT COMPANY—25.7% | |
| | | United States—25.7% | |
| | 2,309,102 | | | DFA Emerging Markets Core
Equity Portfolio‡‡
(Cost $44,691,967) | | | 50,269,148 | | |
| |
| |
| | Expiration
Date | |
| |
| | | RIGHTS—0.0% | |
| | | Spain—0.0% | |
| 3,329
3,705 | | | Repsol SA
Faes Farma SA | | | | | | 01/21/2020
12/16/2020 | | | 1,579
594 | | |
| | | | | | | | | | | | 2,173 | | |
| | | | | TOTAL RIGHTS (Cost $2,158) | | | | | | | | | | | 2,173 | | |
| | | PREFERRED STOCKS—0.5% | |
| | | Germany—0.5% | |
| | 462 | | | Bayerische Motoren Werke AG, 6.21% | | | | | | | | | | | 28,528 | | |
| | 387 | | | Draegerwerk AG & Co. KGaA, 0.34% | | | | | | | | | | | 24,179 | | |
| | 1,051 | | | FUCHS PETROLUB SE, 2.10% | | | | | | | | | | | 52,061 | | |
| | 963 | | | Henkel AG & Co. KGaA, 1.97% | | | | | | | | | | | 99,594 | | |
| | 949 | | | Jungheinrich AG, 2.30% | | | | | | | | | | | 22,887 | | |
The accompanying notes are an integral part of these financial statements.
42
M International Equity Fund
SCHEDULE OF INVESTMENTS (Continued)
December 31, 2019
Shares | |
| |
| |
| | Value
(Note 1) | |
| | | Germany (Continued) | |
| | 717 | | | Porsche Automobil Holding SE, 3.20% | | | | | | | | | | $ | 53,596 | | |
| | 422 | | | Sartorius AG, 0.32% | | | | | | | | | | | 90,317 | | |
| | 252 | | | Sixt SE, 3.47% | | | | | | | | | | | 18,458 | | |
| | 173 | | | STO SE & Co. KgaA, 0.00% | | | | | | | | | | | 22,122 | | |
| | 3,099 | | | Volkswagen AG, 2.61% | | | | | | | | | | | 612,636 | | |
| | | | | | | | | | | | 1,024,378 | | |
| | | | | TOTAL PREFERRED STOCK (Cost $896,743) | | | | | | | | | | | 1,024,378 | | |
| | |
| | 7-Day
Yield | |
| | | |
| | | SHORT-TERM INVESTMENTS—2.9% | |
| | 5,624,362 | | | State Street Navigator Securities Lending Prime Portfolio (Money Market)
(Cost $5,624,362)†† | | | 1.620 | % | | | | | | | 5,624,362 | | |
| | | | | TOTAL INVESTMENTS, AT VALUE—102.0%
(Cost $175,962,136) | | | | | | | | | | | 199,845,748 | | |
| | | | | Liabilities in Excess of Other Assets—(2.0)% | | | | | | | | | | | (3,872,887 | ) | |
| | | | | NET ASSETS—100.0% | | | | | | | | | | $ | 195,972,861 | | |
Notes to the Schedule of Investments:
ADR—American Depositary Receipt
SP ADR—Sponsored American Depositary Receipt
* Non-income producing security
# Security exempt from registration under Rule 144A of the Securities Act of 1933. These securities may be resold in transactions exempt from registration, normally to qualified institutional buyers. The aggregate value of securities exempt from registration under Rule 144A of the Securities Act of 1933 at December 31, 2019, amounts to approximately $2,284,291, and represents 1.17% of net assets.
† Denotes all or a portion of security on loan. As of December 31, 2019, the market value of the securities on loan was $5,363,040 (Note 1)
†† Represents collateral received from securities lending transactions
‡‡ Affiliated issuer. Assets with a total aggregate market value of $50,269,148, or 25.7% of net assets, were affiliated with the Fund as of December 31, 2019 (see Note 2).
Percentages indicated are based on net assets.
The accompanying notes are an integral part of these financial statements.
43
M International Equity Fund
SCHEDULE OF INVESTMENTS (Continued)
December 31, 2019
At December 31, 2019, industry diversification of the M International Equity Fund's investments as a percentage of net assets was as follows:
Summary of Industry Classifications (Unaudited) | | Percentage
of Net
Assets | |
Mutual Funds | | | 25.7 | % | |
Banks | | | 6.0 | % | |
Oil, Gas and Consumable Fuels | | | 4.7 | % | |
Pharmaceuticals | | | 3.8 | % | |
Metals and Mining | | | 3.1 | % | |
Insurance | | | 3.0 | % | |
Chemicals | | | 2.8 | % | |
Automobiles | | | 2.7 | % | |
Machinery | | | 2.6 | % | |
Food Products | | | 2.4 | % | |
Capital Markets | | | 1.8 | % | |
Real Estate Management and Development | | | 1.7 | % | |
Diversified Telecommunication Services | | | 1.6 | % | |
Electronic Equipment, Instruments & Components | | | 1.6 | % | |
Household Durables | | | 1.5 | % | |
Auto Components | | | 1.4 | % | |
Hotels, Restaurants & Leisure | | | 1.4 | % | |
Construction and Engineering | | | 1.3 | % | |
Professional Services | | | 1.3 | % | |
Textiles, Apparel and Luxury Goods | | | 1.3 | % | |
Beverages | | | 1.2 | % | |
Electric Utilities | | | 1.2 | % | |
Food and Staples Retailing | | | 1.2 | % | |
Road and Rail | | | 1.2 | % | |
Semiconductors and Semiconductor Equipment | | | 1.2 | % | |
Trading Companies and Distributors | | | 1.2 | % | |
Health Care Equipment and Supplies | | | 1.1 | % | |
Specialty Retail | | | 1.1 | % | |
Wireless Telecommunication Services | | | 1.1 | % | |
Electrical Equipment | | | 1.0 | % | |
IT Services | | | 1.0 | % | |
Personal Products | | | 1.0 | % | |
Aerospace & Defense | | | 0.9 | % | |
Commercial Services & Supplies | | | 0.9 | % | |
Building Products | | | 0.8 | % | |
Media | | | 0.8 | % | |
Software | | | 0.8 | % | |
Multi-Utilities | | | 0.6 | % | |
Air Freight and Logistics | | | 0.5 | % | |
Biotechnology | | | 0.5 | % | |
Diversified Financial Services | | | 0.5 | % | |
Health Care Providers and Services | | | 0.5 | % | |
The accompanying notes are an integral part of these financial statements.
44
M International Equity Fund
SCHEDULE OF INVESTMENTS (Continued)
December 31, 2019
Summary of Industry Classifications (Unaudited) | | Percentage
of Net
Assets | |
Industrial Conglomerates | | | 0.5 | % | |
Multiline Retail | | | 0.5 | % | |
Paper and Forest Products | | | 0.5 | % | |
Tobacco | | | 0.5 | % | |
Construction Materials | | | 0.4 | % | |
Energy Equipment and Services | | | 0.4 | % | |
Airlines | | | 0.3 | % | |
Containers and Packaging | | | 0.3 | % | |
Entertainment | | | 0.3 | % | |
Gas Utilities | | | 0.3 | % | |
Household Products | | | 0.3 | % | |
Life Sciences Tools and Services | | | 0.3 | % | |
Technology Hardware, Storage & Peripherals | | | 0.3 | % | |
Transportation Infrastructure | | | 0.3 | % | |
Consumer Finance | | | 0.2 | % | |
Independent Power and Renewable Electricity Producers | | | 0.2 | % | |
Interactive Media & Services | | | 0.2 | % | |
Internet and Catalog Retail | | | 0.2 | % | |
Leisure Equipment and Products | | | 0.2 | % | |
Marine | | | 0.2 | % | |
Thrifts and Mortgage Finance | | | 0.2 | % | |
Communications Equipment | | | 0.1 | % | |
Distributors | | | 0.1 | % | |
Health Care Technology | | | 0.1 | % | |
Water Utilities | | | 0.1 | % | |
Diversified Consumer Services | | | 0.1 | % | |
Short-Term Investments | | | 2.9 | % | |
Total | | | 102.0 | % | |
The accompanying notes are an integral part of these financial statements.
45
M Large Cap Growth Fund
SCHEDULE OF INVESTMENTS
December 31, 2019
Shares | |
| | Value
(Note 1) | |
| | | COMMON STOCKS—99.6% | |
| | | Beverages—1.6% | |
| | 52,300 | | | Monster Beverage Corp.* | | $ | 3,323,665 | | |
| | | Biotechnology—1.1% | |
| | 22,300 | | | Neurocrine Biosciences, Inc.* | | | 2,397,027 | | |
| | | Health Care Equipment and
Supplies—7.9% | |
| | 63,250 | | | Abbott Laboratories | | | 5,493,895 | | |
| | 29,425 | | | Becton, Dickinson & Co. | | | 8,002,717 | | |
| | 71,100 | | | Boston Scientific Corp.* | | | 3,215,142 | | |
| | | | 16,711,754 | | |
| | | Hotels, Restaurants &
Leisure—2.2% | |
| | 34,300 | | | Royal Caribbean Cruises, Ltd. | | | 4,579,393 | | |
| | | Interactive Media &
Services—17.3% | |
| | 10,600 | | | Alphabet, Inc., Class A* | | | 14,197,534 | | |
| | 55,400 | | | Facebook, Inc., Class A* | | | 11,370,850 | | |
| | 225,700 | | | Tencent Holdings, Ltd., ADR† | | | 10,835,857 | | |
| | | | 36,404,241 | | |
| | | Internet and Catalog Retail—14.2% | |
| | 69,700 | | | Alibaba Group Holding, Ltd.,
SP ADR* | | | 14,783,370 | | |
| | 4,955 | | | Amazon.com, Inc.* | | | 9,156,047 | | |
| | 2,880 | | | Booking Holdings, Inc.* | | | 5,914,743 | | |
| | | | 29,854,160 | | |
Shares | |
| | Value
(Note 1) | |
| | | IT Services—20.0% | |
| | 56,575 | | | Automatic Data Processing, Inc. | | $ | 9,646,038 | | |
| | 27,100 | | | EPAM Systems, Inc.* | | | 5,749,536 | | |
| | 26,600 | | | Global Payments, Inc. | | | 4,856,096 | | |
| | 84,100 | | | PayPal Holdings, Inc.* | | | 9,097,097 | | |
| | 67,700 | | | Visa, Inc., Class A | | | 12,720,830 | | |
| | | | 42,069,597 | | |
| | | Life Sciences Tools and
Services—3.1% | |
| | 19,900 | | | Thermo Fisher Scientific, Inc. | | | 6,464,913 | | |
| | | Media—2.3% | |
| | 695,700 | | | Sirius XM Holdings, Inc.† | | | 4,974,255 | | |
| | | Pharmaceuticals—7.0% | |
| | 193,200 | | | Elanco Animal Health, Inc.* | | | 5,689,740 | | |
| | 67,800 | | | Zoetis, Inc. | | | 8,973,330 | | |
| | | | 14,663,070 | | |
| | | Software—20.8% | |
| | 49,650 | | | Adobe, Inc.* | | | 16,375,066 | | |
| | 21,800 | | | Intuit, Inc. | | | 5,710,074 | | |
| | 97,164 | | | Microsoft Corp. | | | 15,322,763 | | |
| | 28,100 | | | Palo Alto Networks, Inc.* | | | 6,498,125 | | |
| | | | 43,906,028 | | |
| | | Specialty Retail—2.1% | |
| | 19,400 | | | Burlington Stores, Inc.* | | | 4,423,782 | | |
| | | | | TOTAL COMMON STOCKS
(Cost $120,149,882) | | | 209,771,885 | | |
| | |
| |
| | 7-Day
Yield | |
| |
| | | SHORT-TERM INVESTMENTS—4.7% | |
| | 9,978,417 | | | State Street Navigator Securities Lending Prime Portfolio (Money Market)
(Cost $9,978,417)†† | | | | | | | 1.620 | % | | | 9,978,417 | | |
| | | TOTAL INVESTMENTS, AT VALUE—104.3%
(Cost $130,128,299) | | | | | | | | | | | 219,750,302 | | |
| | | Liabilities in Excess of Other Assets—(4.3)% | | | | | | | | | | | (9,135,420 | ) | |
| | | NET ASSETS—100.0% | | | | | | | | | | $ | 210,614,882 | | |
The accompanying notes are an integral part of these financial statements.
46
M Large Cap Growth Fund
SCHEDULE OF INVESTMENTS (Continued)
December 31, 2019
Notes to the Schedule of Investments:
ADR—American Depositary Receipt
SP ADR—Sponsored American Depositary Receipt
* Non-income producing security
† Denotes all or a portion of security on loan. As of December 31, 2019, the market value of the securities on loan was $9,703,145 (Note 1)
†† Represents collateral received from securities lending transactions
Percentages indicated are based on net assets.
The accompanying notes are an integral part of these financial statements.
47
M Large Cap Growth Fund
SCHEDULE OF INVESTMENTS (Continued)
December 31, 2019
At December 31, 2019, industry sector diversification of the M Large Cap Growth Fund's investments as a percentage of net assets was as follows:
Summary of Sector Classifications (Unaudited) | | Percentage
of Net
Assets | |
Information Technology | | | 40.8 | % | |
Communication Services | | | 19.6 | % | |
Health Care | | | 19.1 | % | |
Consumer Discretionary | | | 18.5 | % | |
Consumer Staples | | | 1.6 | % | |
Short-Term Investments | | | 4.7 | % | |
Total | | | 104.3 | % | |
The accompanying notes are an integral part of these financial statements.
48
M Capital Appreciation Fund
SCHEDULE OF INVESTMENTS
December 31, 2019
Shares | |
| | Value
(Note 1) | |
| | | COMMON STOCKS—98.7% | |
| | | Aerospace & Defense—0.2% | |
| | 19,091 | | | Kratos Defense & Security
Solutions, Inc.* | | $ | 343,829 | | |
| | | Airlines—9.1% | |
| | 10,183 | | | Alaska Air Group, Inc. | | | 689,898 | | |
| | 104,823 | | | American Airlines Group, Inc. | | | 3,006,324 | | |
| | 65,536 | | | Azul SA, ADR*,† | | | 2,804,941 | | |
| | 219,499 | | | Controladora Vuela Cia de Aviacion
SAB de CV, ADR* | | | 2,287,180 | | |
| | 78,964 | | | JetBlue Airways Corp.* | | | 1,478,206 | | |
| | 90,858 | | | Mesa Air Group, Inc.* | | | 812,270 | | |
| | 61,365 | | | United Airlines Holdings, Inc.* | | | 5,405,643 | | |
| | | | 16,484,462 | | |
| | | Auto Components—2.1% | |
| | 22,645 | | | BorgWarner, Inc. | | | 982,340 | | |
| | 118,513 | | | Dana, Inc. | | | 2,156,937 | | |
| | 31,913 | | | Modine Manufacturing Co.* | | | 245,730 | | |
| | 14,543 | | | Stoneridge, Inc.* | | | 426,401 | | |
| | | | 3,811,408 | | |
| | | Banks—3.1% | |
| | 114,595 | | | First BanCorp/Puerto Rico | | | 1,213,561 | | |
| | 9,675 | | | IBERIABANK Corp. | | | 723,980 | | |
| | 24,897 | | | Popular, Inc. | | | 1,462,699 | | |
| | 13,981 | | | Texas Capital Bancshares, Inc.* | | | 793,701 | | |
| | 16,415 | | | Webster Financial Corp. | | | 875,905 | | |
| | 7,848 | | | Wintrust Financial Corp. | | | 556,423 | | |
| | | | 5,626,269 | | |
| | | Biotechnology—1.0% | |
| | 58,805 | | | Myriad Genetics, Inc.* | | | 1,601,260 | | |
| | 23,857 | | | Sangamo Therapeutics, Inc.* | | | 199,683 | | |
| | | | 1,800,943 | | |
| | | Building Products—1.1% | |
| | 22,938 | | | Trex Co., Inc.* | | | 2,061,667 | | |
| | | Capital Markets—2.4% | |
| | 29,820 | | | Artisan Partners Asset
Management, Inc., Class A | | | 963,783 | | |
| | 22,276 | | | LPL Financial Holdings, Inc. | | | 2,054,961 | | |
| | 14,522 | | | Raymond James Financial, Inc. | | | 1,299,138 | | |
| | | | 4,317,882 | | |
Shares | |
| | Value
(Note 1) | |
| | | Chemicals—3.4% | |
| | 10,663 | | | Albemarle Corp. | | $ | 778,825 | | |
| | 29,674 | | | FMC Corp. | | | 2,962,059 | | |
| | 12,170 | | | Huntsman Corp. | | | 294,027 | | |
| | 51,404 | | | Kraton Corp.* | | | 1,301,549 | | |
| | 73,459 | | | Tronox Holdings Plc Class A | | | 838,902 | | |
| | | | 6,175,362 | | |
| | | Commercial Services &
Supplies—1.7% | |
| | 23,659 | | | Aqua Metals, Inc.*,† | | | 17,870 | | |
| | 77,449 | | | Covanta Holding Corp. | | | 1,149,343 | | |
| | 113,047 | | | Interface, Inc. | | | 1,875,450 | | |
| | | | 3,042,663 | | |
| | | Communications Equipment—0.9% | |
| | 24,107 | | | Acacia Communications, Inc.* | | | 1,634,696 | | |
| | | Construction and
Engineering—4.3% | |
| | 8,940 | | | AECOM* | | | 385,582 | | |
| | 37,398 | | | Granite Construction, Inc. | | | 1,034,803 | | |
| | 41,678 | | | MasTec, Inc.* | | | 2,674,060 | | |
| | 290,015 | | | Tutor Perini Corp.* | | | 3,729,593 | | |
| | | | 7,824,038 | | |
| | | Construction Materials—1.1% | |
| | 7,108 | | | Eagle Materials, Inc. | | | 644,411 | | |
| | 4,684 | | | Martin Marietta Materials, Inc. | | | 1,309,834 | | |
| | | | 1,954,245 | | |
| | | Consumer Finance—0.9% | |
| | 24,154 | | | Green Dot Corp., Class A* | | | 562,788 | | |
| | 29,080 | | | PRA Group, Inc.* | | | 1,055,604 | | |
| | | | 1,618,392 | | |
| | | Containers and Packaging—0.5% | |
| | 54,235 | | | Graphic Packaging Holding Co. | | | 903,013 | | |
| | | Diversified Consumer
Services—1.3% | |
| | 21,263 | | | Adtalem Global Education, Inc.* | | | 743,567 | | |
| | 89,965 | | | Perdoceo Education Corp.* | | | 1,654,456 | | |
| | | | 2,398,023 | | |
The accompanying notes are an integral part of these financial statements.
49
M Capital Appreciation Fund
SCHEDULE OF INVESTMENTS (Continued)
December 31, 2019
Shares | |
| | Value
(Note 1) | |
| | | Diversified Financial Services—0.5% | |
| | 43,002 | | | Jefferies Financial Group, Inc. | | $ | 918,953 | | |
| | | Diversified Telecommunication
Services—1.7% | |
| | 47,880 | | | Cogent Communications
Holdings, Inc. | | | 3,150,983 | | |
| | | Electrical Equipment—0.6% | |
| | 13,826 | | | Encore Wire Corp. | | | 793,612 | | |
| | 4,901 | | | EnerSys | | | 366,742 | | |
| | | | 1,160,354 | | |
| | | Electronic Equipment,
Instruments & Components—4.8% | |
| | 13,355 | | | Fabrinet* | | | 865,938 | | |
| | 123,156 | | | Flex, Ltd.* | | | 1,554,229 | | |
| | 28,008 | | | Itron, Inc.* | | | 2,351,272 | | |
| | 53,131 | | | Jabil, Inc. | | | 2,195,904 | | |
| | 13,713 | | | Rogers Corp.* | | | 1,710,422 | | |
| | | | 8,677,765 | | |
| | | Energy Equipment and
Services—2.2% | |
| | 8,019 | | | Dril-Quip, Inc.* | | | 376,171 | | |
| | 147,851 | | | Noble Corp. Plc* | | | 180,378 | | |
| | 37,329 | | | TechnipFMC Plc | | | 800,334 | | |
| | 275,243 | | | Transocean, Ltd.* | | | 1,893,672 | | |
| | 107,525 | | | Valaris Plc*,† | | | 705,364 | | |
| | | | 3,955,919 | | |
| | | Entertainment—0.6% | |
| | 444,394 | | | Global Eagle Entertainment, Inc.* | | | 222,197 | | |
| | 89,233 | | | Lions Gate Entertainment Corp.,
Class B* | | | 886,084 | | |
| | | | 1,108,281 | | |
| | | Equity Real Estate Investment
Trusts (REITs)—0.9% | |
| | 53,272 | | | Corporate Office Properties Trust,
REIT | | | 1,565,131 | | |
| | | Food Products—0.7% | |
| | 41,957 | | | Darling Ingredients, Inc.* | | | 1,178,153 | | |
Shares | |
| | Value
(Note 1) | |
| | | Health Care Equipment and
Supplies—9.0% | |
| | 1,701 | | | ABIOMED, Inc.* | | $ | 290,173 | | |
| | 38,080 | | | Cardiovascular Systems, Inc.* | | | 1,850,307 | | |
| | 9,863 | | | Cooper Cos., Inc. (The) | | | 3,168,883 | | |
| | 14,351 | | | Dexcom, Inc.* | | | 3,139,138 | | |
| | 5,590 | | | Edwards Lifesciences Corp.* | | | 1,304,091 | | |
| | 22,723 | | | Insulet Corp.* | | | 3,890,178 | | |
| | 10,540 | | | Merit Medical Systems, Inc.* | | | 329,059 | | |
| | 24,671 | | | Neuronetics, Inc.* | | | 110,773 | | |
| | 7,610 | | | STERIS Plc | | | 1,159,916 | | |
| | 16,624 | | | Tandem Diabetes Care, Inc.* | | | 990,957 | | |
| | | | 16,233,475 | | |
| | | Health Care Providers and
Services—0.7% | |
| | 40,373 | | | Acadia Healthcare Co., Inc.* | | | 1,341,191 | | |
| | | Hotels, Restaurants &
Leisure—1.5% | |
| | 31,885 | | | Eldorado Resorts, Inc.*,† | | | 1,901,621 | | |
| | 11,826 | | | Planet Fitness, Inc., Class A* | | | 883,166 | | |
| | | | 2,784,787 | | |
| | | Household Durables—1.7% | |
| | 25,762 | | | Century Communities, Inc.* | | | 704,591 | | |
| | 12,493 | | | LGI Homes, Inc.* | | | 882,630 | | |
| | 29,919 | | | Universal Electronics, Inc.* | | | 1,563,567 | | |
| | | | 3,150,788 | | |
| | | Insurance—1.9% | |
| | 8,275 | | | Argo Group International
Holdings, Ltd. | | | 544,081 | | |
| | 5,745 | | | Everest Re Group, Ltd. | | | 1,590,446 | | |
| | 17,722 | | | WR Berkley Corp. | | | 1,224,590 | | |
| | | | 3,359,117 | | |
| | | IT Services—5.3% | |
| | 13,014 | | | Alliance Data Systems Corp. | | | 1,460,171 | | |
| | 158,526 | | | Brightcove, Inc.* | | | 1,377,591 | | |
| | 10,094 | | | Euronet Worldwide, Inc.* | | | 1,590,411 | | |
| | 10,207 | | | Global Payments, Inc. | | | 1,863,390 | | |
| | 106,155 | | | KBR, Inc. | | | 3,237,727 | | |
| | | | 9,529,290 | | |
The accompanying notes are an integral part of these financial statements.
50
M Capital Appreciation Fund
SCHEDULE OF INVESTMENTS (Continued)
December 31, 2019
Shares | |
| | Value
(Note 1) | |
| | | Leisure Equipment and
Products—0.3% | |
| | 70,450 | | | Vista Outdoor, Inc.* | | $ | 526,966 | | |
| | | Life Sciences Tools and
Services—0.4% | |
| | 23,506 | | | QIAGEN NV* | | | 794,503 | | |
| | | Machinery—1.4% | |
| | 78,023 | | | Meritor, Inc.* | | | 2,043,422 | | |
| | 4,153 | | | WABCO Holdings, Inc.* | | | 562,732 | | |
| | | | 2,606,154 | | |
| | | Marine—0.6% | |
| | 12,442 | | | Kirby Corp.* | | | 1,113,932 | | |
| | | Media—1.1% | |
| | 31,588 | | | Cardlytics, Inc.* | | | 1,985,622 | | |
| | | Metals and Mining—5.0% | |
| | 23,826 | | | Agnico-Eagle Mines, Ltd.† | | | 1,467,920 | | |
| | 138,891 | | | Allegheny Technologies, Inc.* | | | 2,869,488 | | |
| | 7,561 | | | Carpenter Technology Corp. | | | 376,386 | | |
| | 12,384 | | | Compass Minerals International, Inc. | | | 754,929 | | |
| | 265,265 | | | Ferroglobe Plc—ENT*,§ | | | — | | |
| | 151,640 | | | Pan American Silver Corp. | | | 3,592,352 | | |
| | | | 9,061,075 | | |
| | | Oil, Gas and Consumable
Fuels—4.2% | |
| | 131,980 | | | Centennial Resource Development,
Inc., Class A* | | | 609,748 | | |
| | 123,575 | | | Euronav NV | | | 1,549,631 | | |
| | 98,827 | | | GasLog, Ltd. | | | 967,516 | | |
| | 25,724 | | | Golar LNG, Ltd. | | | 365,795 | | |
| | 130,032 | | | Navigator Holdings, Ltd.* | | | 1,751,531 | | |
| | 55,389 | | | Noble Energy, Inc. | | | 1,375,863 | | |
| | 26,465 | | | PDC Energy, Inc.* | | | 692,589 | | |
| | 33,526 | | | SM Energy Co. | | | 376,832 | | |
| | | | 7,689,505 | | |
| | | Pharmaceuticals—2.0% | |
| | 33,661 | | | Aerie Pharmaceuticals, Inc.*,† | | | 813,586 | | |
| | 10,892 | | | Nektar Therapeutics* | | | 235,104 | | |
| | 34,858 | | | Pacira BioSciences, Inc.* | | | 1,579,068 | | |
| | 433,988 | | | TherapeuticsMD, Inc.*,† | | | 1,050,251 | | |
| | | | 3,678,009 | | |
Shares | |
| | Value
(Note 1) | |
| | | Road and Rail—0.8% | |
| | 37,758 | | | Knight-Swift Transportation
Holdings, Inc. | | $ | 1,353,247 | | |
| | | Semiconductors and Semiconductor
Equipment—9.1% | |
| | 20,824 | | | Advanced Micro Devices, Inc.* | | | 954,989 | | |
| | 24,396 | | | Cree, Inc.* | | | 1,125,875 | | |
| | 65,390 | | | MACOM Technology Solutions
Holdings, Inc.* | | | 1,739,374 | | |
| | 40,388 | | | Marvell Technology Group, Ltd. | | | 1,072,705 | | |
| | 5,592 | | | MKS Instruments, Inc. | | | 615,176 | | |
| | 18,522 | | | Monolithic Power Systems, Inc. | | | 3,297,286 | | |
| | 21,091 | | | Qorvo, Inc.* | | | 2,451,407 | | |
| | 37,012 | | | Semtech Corp.* | | | 1,957,935 | | |
| | 6,805 | | | Silicon Laboratories, Inc.* | | | 789,244 | | |
| | 14,980 | | | Ultra Clean Holdings, Inc.* | | | 351,581 | | |
| | 10,404 | | | Universal Display Corp. | | | 2,143,952 | | |
| | | | 16,499,524 | | |
| | | Software—4.3% | |
| | 35,935 | | | 2u, Inc.* | | | 862,081 | | |
| | 60,524 | | | Benefitfocus, Inc.* | | | 1,327,896 | | |
| | 11,137 | | | Cerence, Inc.* | | | 252,030 | | |
| | 21,237 | | | Model N, Inc.* | | | 744,782 | | |
| | 89,100 | | | Nuance Communications, Inc.* | | | 1,588,653 | | |
| | 22,848 | | | SS&C Technologies Holdings, Inc. | | | 1,402,867 | | |
| | 178,729 | | | TiVo Corp. | | | 1,515,622 | | |
| | | | 7,693,931 | | |
| | | Specialty Retail—0.4% | |
| | 42,535 | | | At Home Group, Inc.* | | | 233,942 | | |
| | 8,592 | | | Floor & Decor Holdings, Inc.,
Class A* | | | 436,560 | | |
| | | | 670,502 | | |
| | | Textiles, Apparel and
Luxury Goods—0.3% | |
| | 15,069 | | | Capri Holdings, Ltd.* | | | 574,882 | | |
| | | Trading Companies and
Distributors—2.7% | |
| | 32,293 | | | Beacon Roofing Supply, Inc.* | | | 1,032,730 | | |
| | 47,271 | | | BMC Stock Holdings, Inc.* | | | 1,356,205 | | |
| | 22,013 | | | DXP Enterprises, Inc./TX* | | | 876,338 | | |
The accompanying notes are an integral part of these financial statements.
51
M Capital Appreciation Fund
SCHEDULE OF INVESTMENTS (Continued)
December 31, 2019
Shares | |
| | Value
(Note 1) | |
| | | Trading Companies and
Distributors (Continued) | |
| | 34,935 | | | MRC Global, Inc.* | | $ | 476,513 | | |
| | 6,816 | | | Watsco, Inc. | | | 1,227,902 | | |
| | | | 4,969,688 | | |
| | | Transportation Infrastructure—0.4% | |
| | 17,430 | | | Macquarie Infrastructure Corp. | | | 746,701 | | |
Shares | |
| | Value
(Note 1) | |
| | | Wireless Telecommunication
Services—0.5% | |
| | 134,081 | | | Gogo, Inc.*,† | | $ | 858,118 | | |
| | | TOTAL COMMON STOCKS
(Cost $125,141,117) | | | 178,933,438 | | |
| |
| |
| | Expiration
Date | |
| |
| | | RIGHTS—0.0% | |
| | 862,686 | | | Pan American Silver Corp.*,§
(Cost $212,401) | | | | | | 02/22/2029 | | | 0 | | |
| | |
| |
| | 7-Day
Yield | |
| |
| | | SHORT-TERM INVESTMENTS—2.8% | |
| | 5,103,782 | | | State Street Navigator Securities Lending Prime Portfolio (Money Market)
(Cost $5,103,782)†† | | | | | | | 1.620 | % | | | 5,103,782 | | |
| | | TOTAL INVESTMENTS, AT VALUE—101.5%
(Cost $130,457,300) | | | | | | | | | | | 184,037,220 | | |
| | | Liabilities in Excess of Other Assets—(1.5)% | | | | | | | | | | | (2,662,004 | ) | |
| | | NET ASSETS—100.0% | | | | | | | | | | $ | 181,375,216 | | |
Notes to the Schedule of Investments:
ADR—American Depositary Receipt
ENT—Entitlement
REIT—Real Estate Investment Trust
* Non-income producing security
§ Fair valued security—Represents fair value as measured based on the Portfolio Valuation policies specified in Note 1. As of December 31, 2019, the total value of the fair valued securities was $0.
† Denotes all or a portion of security on loan. As of December 31, 2019, the market value of the securities on loan was $4,961,995 (Note 1)
†† Represents collateral received from securities lending transactions
Percentages indicated are based on net assets.
The accompanying notes are an integral part of these financial statements.
52
M Capital Appreciation Fund
SCHEDULE OF INVESTMENTS (Continued)
December 31, 2019
At December 31, 2019, industry sector diversification of the M Capital Appreciation Fund's investments as a percentage of net assets was as follows:
Summary of Sector Classifications (Unaudited) | | Percentage
of Net
Assets | |
Information Technology | | | 24.4 | % | |
Industrials | | | 22.9 | % | |
Health Care | | | 13.1 | % | |
Materials | | | 10.0 | % | |
Financials | | | 8.8 | % | |
Consumer Discretionary | | | 7.6 | % | |
Energy | | | 6.4 | % | |
Communication Services | | | 3.9 | % | |
Real Estate | | | 0.9 | % | |
Consumer Staples | | | 0.7 | % | |
Short-Term Investments | | | 2.8 | % | |
Total | | | 101.5 | % | |
The accompanying notes are an integral part of these financial statements.
53
M Large Cap Value Fund
SCHEDULE OF INVESTMENTS
December 31, 2019
Shares | |
| | Value
(Note 1) | |
| | | COMMON STOCKS—98.1% | |
| | | Aerospace & Defense—0.9% | |
| | 6,095 | | | Curtiss-Wright Corp. | | $ | 858,725 | | |
| | | Airlines—2.7% | |
| | 65,146 | | | JetBlue Airways Corp.* | | | 1,219,533 | | |
| | 5,349 | | | Southwest Airlines Co. | | | 288,739 | | |
| | 13,568 | | | United Airlines Holdings, Inc.* | | | 1,195,205 | | |
| | | | 2,703,477 | | |
| | | Banks—8.2% | |
| | 4,643 | | | BankUnited, Inc. | | | 169,748 | | |
| | 1,935 | | | CIT Group, Inc. | | | 88,294 | | |
| | 31,769 | | | Citigroup, Inc. | | | 2,538,025 | | |
| | 34,549 | | | Citizens Financial Group, Inc. | | | 1,403,035 | | |
| | 2,148 | | | Comerica, Inc. | | | 154,119 | | |
| | 232 | | | First Citizens BancShares, Inc./NC,
Class A | | | 123,473 | | |
| | 28,258 | | | First Hawaiian, Inc. | | | 815,243 | | |
| | 16,937 | | | Popular, Inc. | | | 995,049 | | |
| | 15,816 | | | U.S. Bancorp | | | 937,731 | | |
| | 13,057 | | | Wintrust Financial Corp. | | | 925,741 | | |
| | | | 8,150,458 | | |
| | | Beverages—1.4% | |
| | 10,190 | | | PepsiCo, Inc. | | | 1,392,667 | | |
| | | Biotechnology—1.2% | |
| | 59,141 | | | Exelixis, Inc.* | | | 1,042,064 | | |
| | 1,999 | | | Gilead Sciences, Inc. | | | 129,895 | | |
| | | | 1,171,959 | | |
| | | Building Products—1.1% | |
| | 944 | | | Armstrong World Industries, Inc. | | | 88,708 | | |
| | 6,292 | | | Fortune Brands Home & Security, Inc. | | | 411,119 | | |
| | 9,259 | | | Masco Corp. | | | 444,339 | | |
| | 1,923 | | | Owens Corning | | | 125,226 | | |
| | 443 | | | Simpson Manufacturing Co., Inc. | | | 35,542 | | |
| | | | 1,104,934 | | |
| | | Capital Markets—1.4% | |
| | 13,044 | | | Bank of New York Mellon Corp. | | | 656,505 | | |
| | 14,193 | | | Morgan Stanley | | | 725,546 | | |
| | | | 1,382,051 | | |
| | | Chemicals—1.9% | |
| | 7,216 | | | Cabot Corp. | | | 342,904 | | |
| | 52,915 | | | Huntsman Corp. | | | 1,278,427 | | |
Shares | |
| | Value
(Note 1) | |
| | | Chemicals (Continued) | |
| | 543 | | | NewMarket Corp. | | $ | 264,180 | | |
| | | | 1,885,511 | | |
| | | Construction and Engineering—0.8% | |
| | 9,357 | | | EMCOR Group, Inc. | | | 807,509 | | |
| | | Consumer Finance—2.1% | |
| | 40,159 | | | Ally Financial, Inc. | | | 1,227,259 | | |
| | 1,978 | | | Capital One Financial Corp. | | | 203,556 | | |
| | 48,640 | | | Navient Corp. | | | 665,395 | | |
| | | | 2,096,210 | | |
| | | Containers and Packaging—0.1% | |
| | 2,824 | | | Silgan Holdings, Inc. | | | 87,770 | | |
| | | Diversified Consumer Services—0.2% | |
| | 309 | | | Graham Holdings Co., Class B | | | 197,448 | | |
| | | Diversified Financial Services—2.8% | |
| | 54,423 | | | AXA Equitable Holdings, Inc. | | | 1,348,602 | | |
| | 485 | | | Berkshire Hathaway, Inc., Class B* | | | 109,853 | | |
| | 21,498 | | | Voya Financial, Inc. | | | 1,310,948 | | |
| | | | 2,769,403 | | |
| | | Diversified Telecommunication
Services—3.4% | |
| | 11,013 | | | AT&T, Inc. | | | 430,388 | | |
| | 48,425 | | | Verizon Communications, Inc. | | | 2,973,295 | | |
| | | | 3,403,683 | | |
| | | Electric Utilities—3.4% | |
| | 33,117 | | | Exelon Corp. | | | 1,509,804 | | |
| | 5,991 | | | IDACORP, Inc. | | | 639,839 | | |
| | 4,456 | | | PNM Resources, Inc. | | | 225,964 | | |
| | 18,308 | | | Portland General Electric Co. | | | 1,021,403 | | |
| | | | 3,397,010 | | |
| | | Electrical Equipment—0.1% | |
| | 3,481 | | | nVent Electric Plc | | | 89,044 | | |
| | | Electronic Equipment, Instruments &
Components—0.9% | |
| | 2,580 | | | Arrow Electronics, Inc.* | | | 218,629 | | |
| | 3,024 | | | Avnet, Inc. | | | 128,339 | | |
| | 14,128 | | | Jabil, Inc. | | | 583,910 | | |
| | | | 930,878 | | |
The accompanying notes are an integral part of these financial statements.
54
M Large Cap Value Fund
SCHEDULE OF INVESTMENTS (Continued)
December 31, 2019
Shares | |
| | Value
(Note 1) | |
| | | Entertainment—2.5% | |
| | 11,999 | | | Electronic Arts, Inc.* | | $ | 1,290,012 | | |
| | 9,960 | | | Take-Two Interactive Software, Inc.* | | | 1,219,403 | | |
| | | | 2,509,415 | | |
| | | Equity Real Estate Investment
Trusts (REITs)—2.8% | |
| | 14,466 | | | American Campus Communities, Inc.,
REIT | | | 680,336 | | |
| | 21,210 | | | Corporate Office Properties Trust,
REIT | | | 623,150 | | |
| | 5,172 | | | Douglas Emmett, Inc., REIT | | | 227,051 | | |
| | 28,428 | | | Gaming and Leisure Properties, Inc.,
REIT | | | 1,223,825 | | |
| | | | 2,754,362 | | |
| | | Food Products—4.4% | |
| | 11,826 | | | Ingredion, Inc. | | | 1,099,227 | | |
| | 31,321 | | | Mondelez International, Inc., Class A | | | 1,725,160 | | |
| | 8,105 | | | Pilgrim's Pride Corp.* | | | 265,155 | | |
| | 14,770 | | | Tyson Foods, Inc., Class A | | | 1,344,661 | | |
| | | | 4,434,203 | | |
| | | Health Care Equipment and
Supplies—2.5% | |
| | 12,150 | | | Hologic, Inc.* | | | 634,352 | | |
| | 6,858 | | | Medtronic Plc | | | 778,040 | | |
| | 7,649 | | | Varian Medical Systems, Inc.* | | | 1,086,234 | | |
| | | | 2,498,626 | | |
| | | Health Care Providers and
Services—1.3% | |
| | 9,481 | | | McKesson Corp. | | | 1,311,412 | | |
| | | Hotels, Restaurants & Leisure—1.4% | |
| | 5,760 | | | Norwegian Cruise Line Holdings, Ltd.* | | | 336,442 | | |
| | 7,677 | | | Starbucks Corp. | | | 674,962 | | |
| | 6,661 | | | Wyndham Destinations, Inc. | | | 344,307 | | |
| | | | 1,355,711 | | |
| | | Household Durables—1.8% | |
| | 5,764 | | | DR Horton, Inc. | | | 304,051 | | |
| | 28,522 | | | Pulte Group, Inc. | | | 1,106,654 | | |
| | 9,691 | | | Toll Brothers, Inc. | | | 382,891 | | |
| | | | 1,793,596 | | |
Shares | |
| | Value
(Note 1) | |
| | | Household Products—2.2% | |
| | 1,442 | | | Colgate-Palmolive Co. | | $ | 99,267 | | |
| | 16,596 | | | Procter & Gamble Co. (The) | | | 2,072,841 | | |
| | | | 2,172,108 | | |
| | | Independent Power and Renewable
Electricity Producers—1.4% | |
| | 63,366 | | | AES Corp./VA | | | 1,260,983 | | |
| | 3,538 | | | NRG Energy, Inc. | | | 140,636 | | |
| | | | 1,401,619 | | |
| | | Industrial Conglomerates—0.2% | |
| | 1,232 | | | Carlisle Cos., Inc. | | | 199,387 | | |
| | | Insurance—7.6% | |
| | 965 | | | Alleghany Corp.* | | | 771,585 | | |
| | 11,528 | | | Arch Capital Group, Ltd.* | | | 494,436 | | |
| | 675 | | | Assured Guaranty, Ltd. | | | 33,089 | | |
| | 1,448 | | | Brighthouse Financial, Inc.* | | | 56,805 | | |
| | 5,397 | | | Hanover Insurance Group, Inc. | | | 737,608 | | |
| | 20,083 | | | Hartford Financial Services Group, Inc. | | | 1,220,444 | | |
| | 1,413 | | | Lincoln National Corp. | | | 83,381 | | |
| | 29,919 | | | MetLife, Inc. | | | 1,524,971 | | |
| | 41,820 | | | Old Republic International Corp. | | | 935,513 | | |
| | 10,194 | | | Principal Financial Group, Inc. | | | 560,670 | | |
| | 7,358 | | | Reinsurance Group of America, Inc. | | | 1,199,796 | | |
| | | | 7,618,298 | | |
| | | Interactive Media & Services—0.6% | |
| | 285 | | | Alphabet, Inc., Class A* | | | 381,726 | | |
| | 1,220 | | | Facebook, Inc., Class A* | | | 250,405 | | |
| | | | 632,131 | | |
| | | Internet and Catalog Retail—1.9% | |
| | 327 | | | Booking Holdings, Inc.* | | | 671,570 | | |
| | 33,198 | | | eBay, Inc. | | | 1,198,780 | | |
| | | | 1,870,350 | | |
| | | IT Services—0.6% | |
| | 5,157 | | | Amdocs, Ltd. | | | 372,284 | | |
| | 1,258 | | | Booz Allen Hamilton Holding Corp. | | | 89,481 | | |
| | 4,334 | | | Genpact, Ltd. | | | 182,765 | | |
| | | | 644,530 | | |
| | | Life Sciences Tools and Services—0.6% | |
| | 10,893 | | | Bruker Corp. | | | 555,216 | | |
The accompanying notes are an integral part of these financial statements.
55
M Large Cap Value Fund
SCHEDULE OF INVESTMENTS (Continued)
December 31, 2019
Shares | |
| | Value
(Note 1) | |
| | | Machinery—2.9% | |
| | 13,863 | | | Allison Transmission Holdings, Inc. | | $ | 669,860 | | |
| | 5,365 | | | Crane Co. | | | 463,429 | | |
| | 5,625 | | | Oshkosh Corp. | | | 532,406 | | |
| | 15,186 | | | PACCAR, Inc. | | | 1,201,213 | | |
| | | | 2,866,908 | | |
| | | Media—0.2% | |
| | 4,939 | | | AMC Networks, Inc., Class A* | | | 195,091 | | |
| | | Metals and Mining—1.8% | |
| | 7,688 | | | Reliance Steel & Aluminum Co. | | | 920,715 | | |
| | 24,997 | | | Steel Dynamics, Inc. | | | 850,898 | | |
| | | | 1,771,613 | | |
| | | Multi-Utilities—0.8% | |
| | 1,514 | | | DTE Energy Co. | | | 196,623 | | |
| | 10,612 | | | Public Service Enterprise Group, Inc. | | | 626,639 | | |
| | | | 823,262 | | |
| | | Oil, Gas and Consumable Fuels—6.9% | |
| | 16,924 | | | Chevron Corp. | | | 2,039,511 | | |
| | 7,711 | | | ConocoPhillips | | | 501,446 | | |
| | 24,365 | | | HollyFrontier Corp. | | | 1,235,549 | | |
| | 3,608 | | | Marathon Petroleum Corp. | | | 217,382 | | |
| | 16,251 | | | PBF Energy, Inc., Class A | | | 509,794 | | |
| | 13,307 | | | Phillips 66 | | | 1,482,533 | | |
| | 10,252 | | | Valero Energy Corp. | | | 960,100 | | |
| | | | 6,946,315 | | |
| | | Pharmaceuticals—8.4% | |
| | 9,828 | | | Eli Lilly & Co. | | | 1,291,694 | | |
| | 1,246 | | | Jazz Pharmaceuticals Plc* | | | 186,003 | | |
| | 23,843 | | | Johnson & Johnson | | | 3,477,978 | | |
| | 14,529 | | | Merck & Co., Inc. | | | 1,321,413 | | |
| | 55,357 | | | Pfizer, Inc. | | | 2,168,887 | | |
| | | | 8,445,975 | | |
| | | Professional Services—1.2% | |
| | 12,852 | | | ManpowerGroup, Inc. | | | 1,247,929 | | |
Shares | |
| | Value
(Note 1) | |
| | | Real Estate Management and
Development—1.6% | |
| | 22,612 | | | CBRE Group, Inc., Class A* | | $ | 1,385,889 | | |
| | 1,322 | | | Jones Lang LaSalle, Inc. | | | 230,147 | | |
| | | | 1,616,036 | | |
| | | Semiconductors and Semiconductor
Equipment—0.9% | |
| | 10,215 | | | Intel Corp. | | | 611,368 | | |
| | 4,889 | | | Micron Technology, Inc.* | | | 262,930 | | |
| | | | 874,298 | | |
| | | Software—3.6% | |
| | 17,287 | | | Cadence Design Systems, Inc.* | | | 1,199,026 | | |
| | 21,886 | | | Oracle Corp. | �� | | 1,159,520 | | |
| | 8,594 | | | Synopsys, Inc.* | | | 1,196,285 | | |
| | | | 3,554,831 | | |
| | | Specialty Retail—0.6% | |
| | 4,232 | | | AutoNation, Inc.* | | | 205,802 | | |
| | 159 | | | AutoZone, Inc.* | | | 189,418 | | |
| | 609 | | | Best Buy Co., Inc. | | | 53,470 | | |
| | 2,157 | | | Dick's Sporting Goods, Inc. | | | 106,750 | | |
| | 1,266 | | | Foot Locker, Inc. | | | 49,362 | | |
| | | | 604,802 | | |
| | | Technology Hardware, Storage &
Peripherals—1.4% | |
| | 68,059 | | | HP, Inc. | | | 1,398,612 | | |
| | | Textiles, Apparel and Luxury
Goods—0.6% | |
| | 3,261 | | | Deckers Outdoor Corp.* | | | 550,652 | | |
| | 1,124 | | | Skechers U.S.A., Inc., Class A* | | | 48,546 | | |
| | | | 599,198 | | |
| | | Thrifts and Mortgage Finance—1.9% | |
| | 78,928 | | | MGIC Investment Corp. | | | 1,118,410 | | |
| | 31,641 | | | Radian Group, Inc. | | | 796,087 | | |
| | | | 1,914,497 | | |
| | | Tobacco—0.2% | |
| | 2,634 | | | Philip Morris International, Inc. | | | 224,127 | | |
The accompanying notes are an integral part of these financial statements.
56
M Large Cap Value Fund
SCHEDULE OF INVESTMENTS (Continued)
December 31, 2019
Shares | |
| | Value
(Note 1) | |
| | | Wireless Telecommunication
Services—0.7% | |
| | 28,650 | | | Telephone & Data Systems, Inc. | | $ | 728,570 | | |
| | | TOTAL COMMON STOCKS
(Cost $88,286,943) | | | 97,991,765 | | |
| | | TOTAL INVESTMENTS,
AT VALUE—98.1%
(Cost $88,286,943) | | | 97,991,765 | | |
| | | Other Assets in Excess of
Liabilities—1.9% | | | 1,898,328 | | |
| | | NET ASSETS—100.0% | | $ | 99,890,093 | | |
Notes to the Schedule of Investments:
REIT—Real Estate Investment Trust
* Non-income producing security
Percentages indicated are based on net assets.
The accompanying notes are an integral part of these financial statements.
57
M Large Cap Value Fund
SCHEDULE OF INVESTMENTS (Continued)
December 31, 2019
At December 31, 2019, industry sector diversification of the M Large Cap Value Fund's investments as a percentage of net assets was as follows:
Summary of Sector Classifications (Unaudited) | | Percentage
of Net
Assets | |
Financials | | | 24.0 | % | |
Health Care | | | 14.0 | % | |
Industrials | | | 9.9 | % | |
Consumer Staples | | | 8.2 | % | |
Communication Services | | | 7.4 | % | |
Information Technology | | | 7.4 | % | |
Energy | | | 6.9 | % | |
Consumer Discretionary | | | 6.5 | % | |
Utilities | | | 5.6 | % | |
Real Estate | | | 4.4 | % | |
Materials | | | 3.8 | % | |
Total | | | 98.1 | % | |
The accompanying notes are an integral part of these financial statements.
58
M Fund, Inc.
STATEMENTS OF ASSETS AND LIABILITIES
December 31, 2019
| | | M International
Equity Fund | | M Large Cap
Growth Fund | | M Capital
Appreciation
Fund | | M Large Cap
Value Fund | |
Assets: | |
Investments, at value (Note 1)*/**—see accompanying
Schedule of Investments | | $ | 149,576,600 | | | $ | 219,750,302 | | | $ | 184,037,220 | | | $ | 97,991,765 | | |
Affiliated investment company, at value (Note 1)***—see
accompanying Schedule of Investments | | | 50,269,148 | | | | — | | | | — | | | | — | | |
Cash | | | 185,405 | | | | 921,120 | | | | 2,666,719 | | | | 1,816,660 | | |
Cash denominated in foreign currencies**** | | | 855,988 | | | | — | | | | — | | | | — | | |
Receivable from: | |
Securities sold | | | 852 | | | | — | | | | 24,695 | | | | 12,619 | | |
Capital stock subscriptions | | | 112,059 | | | | 10,914 | | | | 31,512 | | | | 15,211 | | |
Dividends and interest | | | 770,548 | | | | 88,364 | | | | 111,193 | | | | 140,324 | | |
Prepaid expenses | | | 40,223 | | | | 43,457 | | | | 39,696 | | | | 21,168 | | |
Total assets | | | 201,810,823 | | | | 220,814,157 | | | | 186,911,035 | | | | 99,997,747 | | |
Liabilities: | |
Payable for: | |
Securities purchased | | | — | | | | — | | | | 98,217 | | | | — | | |
Capital stock redemptions | | | 8,295 | | | | 31,858 | | | | 113,180 | | | | 6,609 | | |
Investment Adviser, net (Note 2) | | | 64,466 | | | | 102,388 | | | | 135,797 | | | | 35,750 | | |
Payable upon return of securities loaned (Note 1) | | | 5,624,362 | | | | 9,978,417 | | | | 5,103,782 | | | | — | | |
Accrued expenses and other liabilities | | | 140,839 | | | | 86,612 | | | | 84,843 | | | | 65,295 | | |
Total liabilities | | | 5,837,962 | | | | 10,199,275 | | | | 5,535,819 | | | | 107,654 | | |
Net assets | | $ | 195,972,861 | | | $ | 210,614,882 | | | $ | 181,375,216 | | | $ | 99,890,093 | | |
Net assets consist of: | |
| Paid-in capital | | $ | 248,441,243 | | | $ | 117,592,556 | | | $ | 125,547,523 | | | $ | 89,301,668 | | |
| Total distributable earnings (loss) | | | (52,468,382 | ) | | | 93,022,326 | | | | 55,827,693 | | | | 10,588,425 | | |
Net assets | | $ | 195,972,861 | | | $ | 210,614,882 | | | $ | 181,375,216 | | | $ | 99,890,093 | | |
Shares outstanding# | | | 15,777,991 | | | | 7,180,132 | | | | 7,239,340 | | | | 7,803,714 | | |
Net asset value, offering price and redemption price per share | | $ | 12.42 | | | $ | 29.33 | | | $ | 25.05 | | | $ | 12.80 | | |
| * Cost of investments | | $ | 131,270,169 | | | $ | 130,128,299 | | | $ | 130,457,300 | | | $ | 88,286,943 | | |
| ** Includes securities on loan with market values of | | $ | 5,363,040 | | | $ | 9,703,145 | | | $ | 4,961,995 | | | $ | — | | |
| *** Cost of affiliated investment | | $ | 44,691,967 | | | $ | — | | | $ | — | | | $ | — | | |
| **** Cost of cash denominated in foreign currencies | | $ | 839,648 | | | $ | — | | | $ | — | | | $ | — | | |
# The number of authorized shares with a par value of $0.001 per share, for each of the M International Equity Fund, the M Large Cap Growth Fund, the M Capital Appreciation Fund and the M Large Cap Value Fund is 100,000,000.
The accompanying notes are an integral part of these financial statements.
59
M Fund, Inc.
STATEMENTS OF OPERATIONS
December 31, 2019
| | | M International
Equity Fund | | M Large Cap
Growth Fund | | M Capital
Appreciation
Fund | | M Large Cap
Value Fund | |
Investment income: | |
Dividends-Unaffiliated* | | $ | 4,125,955 | | | $ | 1,007,289 | | | $ | 1,594,203 | | | $ | 2,267,967 | | |
Dividends-Affiliated | | | 1,165,494 | | | | — | | | | — | | | | — | | |
Securities lending income | | | 40,135 | | | | 4,131 | | | | 74,173 | | | | 714 | | |
Interest | | | 1,944 | | | | 3,998 | | | | 9,302 | | | | 3,517 | | |
Total investment income | | | 5,333,528 | | | | 1,015,418 | | | | 1,677,678 | | | | 2,272,198 | | |
Expenses: | |
Investment advisory fee (Note 2) | | | 681,273 | | | | 1,146,779 | | | | 1,588,367 | | | | 424,684 | | |
Custody, fund accounting, transfer agent and
administration fees | | | 361,626 | | | | 185,102 | | | | 188,569 | | | | 127,329 | | |
Professional fees | | | 44,623 | | | | 41,395 | | | | 39,429 | | | | 31,897 | | |
Printing and shareholder reporting | | | 34,344 | | | | 27,186 | | | | 27,124 | | | | 19,177 | | |
Compliance expenses (Note 2) | | | 11,912 | | | | 13,208 | | | | 11,885 | | | | 6,306 | | |
Directors' fees and expenses | | | 38,846 | | | | 41,678 | | | | 37,922 | | | | 20,264 | | |
Other | | | 44,502 | | | | 45,566 | | | | 42,085 | | | | 23,645 | | |
Total expenses | | | 1,217,126 | | | | 1,500,914 | | | | 1,935,381 | | | | 653,302 | | |
Less: Expenses waived/reimbursed by the Adviser (Note 2) | | | (87,634 | ) | | | — | | | | — | | | | (15,976 | ) | |
Net expenses | | | 1,129,492 | | | | 1,500,914 | | | | 1,935,381 | | | | 637,326 | | |
Net investment income (loss) | | | 4,204,036 | | | | (485,496 | ) | | | (257,703 | ) | | | 1,634,872 | | |
Realized and unrealized gain (loss): | |
Net realized gain (loss) on: | |
Unaffiliated investment transactions | | | 634,798 | | | | 14,506,878 | | | | 16,144,156 | | | | 5,147,314 | | |
Affiliated investment transactions | | | 278,850 | | | | — | | | | — | | | | — | | |
Foreign currency transactions | | | (2,870 | ) | | | 413 | | | | — | | | | — | | |
Net realized gain | | | 910,778 | | | | 14,507,291 | | | | 16,144,156 | | | | 5,147,314 | | |
Net change in unrealized appreciation (depreciation) on: | |
Unaffiliated investments | | | 23,240,391 | | | | 44,563,814 | | | | 27,749,423 | | | | 11,297,879 | | |
Affiliated investments | | | 5,358,595 | | | | — | | | | — | | | | — | | |
Foreign currency translation | | | 22,890 | | | | 10 | | | | — | | | | — | | |
Net change in unrealized appreciation | | | 28,621,876 | | | | 44,563,824 | | | | 27,749,423 | | | | 11,297,879 | | |
Net realized and unrealized gain | | | 29,532,654 | | | | 59,071,115 | | | | 43,893,579 | | | | 16,445,193 | | |
Net increase in net assets resulting from operations | | $ | 33,736,690 | | | $ | 58,585,619 | | | $ | 43,635,876 | | | $ | 18,080,065 | | |
| * Net of foreign taxes withheld of: | | $ | 527,188 | | | $ | 7,259 | | | $ | 12,788 | | | $ | 2,260 | | |
The accompanying notes are an integral part of these financial statements.
60
M Fund, Inc.
STATEMENTS OF CHANGES IN NET ASSETS
| | | M International
Equity Fund | | M Large Cap
Growth Fund | |
| | | Year Ended
December 31,
2019 | | Year Ended
December 31,
2018 | | Year Ended
December 31,
2019 | | Year Ended
December 31,
2018 | |
Increase (decrease) in net assets from: | |
Operations: | |
Net investment income (loss) | | $ | 4,204,036 | | | $ | 3,197,738 | | | $ | (485,496 | ) | | $ | (220,775 | ) | |
Net realized gain on investments and foreign currency
transactions | | | 910,778 | | | | 4,049,201 | | | | 14,507,291 | | | | 12,484,721 | | |
Net change in unrealized appreciation (depreciation) on
investments and foreign currency | | | 28,621,876 | | | | (51,505,741 | ) | | | 44,563,824 | | | | (19,727,540 | ) | |
Net increase (decrease) in net assets resulting from
operations | | | 33,736,690 | | | | (44,258,802 | ) | | | 58,585,619 | | | | (7,463,594 | ) | |
Distributions to shareholders: | |
From net investment income | | | (4,603,394 | ) | | | (2,892,319 | ) | | | (12,037,996 | ) | | | (20,800,775 | ) | |
From return of capital | | | (534,529 | ) | | | — | | | | — | | | | — | | |
Total distributions to shareholders | | | (5,137,923 | ) | | | (2,892,319 | ) | | | (12,037,996 | ) | | | (20,800,775 | ) | |
Fund share transactions (Note 4): | |
Proceeds from shares sold | | | 23,231,173 | | | | 23,957,439 | | | | 15,225,573 | | | | 24,766,078 | | |
Net asset value of shares issued on reinvestment of
distributions | | | 5,137,923 | | | | 2,892,319 | | | | 12,037,996 | | | | 20,800,774 | | |
Cost of shares repurchased | | | (30,917,677 | ) | | | (53,942,909 | ) | | | (31,418,526 | ) | | | (42,459,412 | ) | |
Net increase (decrease) in net assets resulting from
Fund share transactions | | | (2,548,581 | ) | | | (27,093,151 | ) | | | (4,154,957 | ) | | | 3,107,440 | | |
Total change in net assets | | | 26,050,186 | | | | (74,244,272 | ) | | | 42,392,666 | | | | (25,156,929 | ) | |
Net assets: | |
Beginning of year | | | 169,922,675 | | | | 244,166,947 | | | | 168,222,216 | | | | 193,379,145 | | |
End of year | | $ | 195,972,861 | | | $ | 169,922,675 | | | $ | 210,614,882 | | | $ | 168,222,216 | | |
The accompanying notes are an integral part of these financial statements.
61
M Fund, Inc.
STATEMENTS OF CHANGES IN NET ASSETS (Continued)
| | | M Capital
Appreciation Fund | | M Large Cap
Value Fund | |
| | | Year Ended
December 31,
2019 | | Year Ended
December 31,
2018 | | Year Ended
December 31,
2019 | | Year Ended
December 31,
2018 | |
Increase (decrease) in net assets from: | |
Operations: | |
Net investment income (loss) | | $ | (257,703 | ) | | $ | (287,987 | ) | | $ | 1,634,872 | | | $ | 1,412,592 | | |
Net realized gain on investments and foreign currency
transactions | | | 16,144,156 | | | | 30,145,749 | | | | 5,147,314 | | | | 5,251,745 | | |
Net change in unrealized appreciation (depreciation) on
investments and foreign currency | | | 27,749,423 | | | | (54,755,163 | ) | | | 11,297,879 | | | | (18,210,129 | ) | |
Net increase (decrease) in net assets resulting from
operations | | | 43,635,876 | | | | (24,897,401 | ) | | | 18,080,065 | | | | (11,545,792 | ) | |
Distributions to shareholders | | | (14,576,865 | ) | | | (35,192,975 | ) | | | (4,761,268 | ) | | | (8,355,547 | ) | |
Total distributions to shareholders | | | (14,576,865 | ) | | | (35,192,975 | ) | | | (4,761,268 | ) | | | (8,355,547 | ) | |
Fund share transactions (Note 4): | |
Proceeds from shares sold | | | 17,731,442 | | | | 16,496,331 | | | | 10,052,063 | | | | 12,484,184 | | |
Net asset value of shares issued on reinvestment of
distributions | | | 14,576,865 | | | | 35,192,975 | | | | 4,761,268 | | | | 8,355,547 | | |
Cost of shares repurchased | | | (35,999,356 | ) | | | (44,875,896 | ) | | | (13,678,914 | ) | | | (15,002,622 | ) | |
Net increase (decrease) in net assets resulting from
Fund share transactions | | | (3,691,049 | ) | | | 6,813,410 | | | | 1,134,417 | | | | 5,837,109 | | |
Total change in net assets | | | 25,367,962 | | | | (53,276,966 | ) | | | 14,453,214 | | | | (14,064,230 | ) | |
Net assets: | |
Beginning of year | | | 156,007,254 | | | | 209,284,220 | | | | 85,436,879 | | | | 99,501,109 | | |
End of year | | $ | 181,375,216 | | | $ | 156,007,254 | | | $ | 99,890,093 | | | $ | 85,436,879 | | |
The accompanying notes are an integral part of these financial statements.
62
M Fund, Inc.
FINANCIAL HIGHLIGHTS
(FOR A SHARE OUTSTANDING THROUGHOUT EACH YEAR)
| | | M International Equity Fund | |
| | | Year Ended
December 31,
2019 | | Year Ended
December 31,
2018 | | Year Ended
December 31,
2017 | | Year Ended
December 31,
2016 | | Year Ended
December 31,
2015 | |
Net asset value, beginning of year | | $ | 10.60 | | | $ | 13.58 | | | $ | 11.12 | | | $ | 11.26 | | | $ | 11.93 | | |
Income from investment operations: | |
Net investment income‡ | | | 0.27 | | | | 0.19 | | | | 0.17 | | | | 0.17 | | | | 0.19 | | |
Net realized and unrealized gain (loss) on
investments | | | 1.88 | | | | (2.99 | ) | | | 2.50 | | | | (0.18 | ) | | | (0.66 | ) | |
Total from investment operations | | | 2.15 | | | | (2.80 | ) | | | 2.67 | | | | (0.01 | ) | | | (0.47 | ) | |
Less distributions to shareholders: | |
From net investment income | | | (0.30 | ) | | | (0.18 | ) | | | (0.21 | ) | | | (0.13 | ) | | | (0.20 | ) | |
From return of capital | | | (0.03 | ) | | | — | | | | — | | | | — | | | | — | | |
Total distributions | | | (0.33 | ) | | | (0.18 | ) | | | (0.21 | ) | | | (0.13 | ) | | | (0.20 | ) | |
Net asset value, end of year | | $ | 12.42 | | | $ | 10.60 | | | $ | 13.58 | | | $ | 11.12 | | | $ | 11.26 | | |
Total Return+ | | | 20.32 | % | | | (20.57 | )% | | | 24.05 | % | | | (0.05 | )% | | | (3.94 | )% | |
Ratios/Supplemental Data: | |
Net assets, end of year (000's) | | $ | 195,973 | | | $ | 169,923 | | | $ | 244,167 | | | $ | 193,909 | | | $ | 228,015 | | |
Net expenses to average daily net assets | | | 0.63 | %• | | | 0.92 | %• | | | 0.90 | % | | | 0.94 | % | | | 0.95 | % | |
Net investment income to average daily net assets | | | 2.34 | % | | | 1.50 | % | | | 1.33 | % | | | 1.51 | % | | | 1.51 | % | |
Without the waiver/reimbursement of expenses by
the adviser, the ratios of net expenses and net
investment income to average daily net assets
would have been: | |
Expenses | | | 0.68 | %• | | | 0.98 | %• | | | N/A | | | | 0.97 | % | | | 0.96 | % | |
Net investment income | | | 2.30 | % | | | 1.43 | % | | | N/A | | | | 1.48 | % | | | 1.50 | % | |
Portfolio turnover rate | | | 13 | % | | | 117 | %? | | | 10 | % | | | 20 | % | | | 27 | % | |
‡ Calculation based on average shares outstanding.
+ Does not reflect additional fees charged by separate accounts or variable insurance contracts that an investor in the Fund may pay. If these additional fees were reflected, performance would have been lower.
• In addition to the fees and expenses which the Fund bears directly, it also indirectly bears a pro-rata share of the fees and expenses of the underlying fund in which it invests. Such indirect expenses are not included in the above expense ratios.
? The increase in portfolio turnover rate during the year was primarily attributable to portfolio adjustments made in response to a change in the Fund's sub-adviser.
The accompanying notes are an integral part of these financial statements.
63
M Fund, Inc.
FINANCIAL HIGHLIGHTS
(FOR A SHARE OUTSTANDING THROUGHOUT EACH YEAR)
| | | M Large Cap Growth Fund | |
| | | Year Ended
December 31,
2019 | | Year Ended
December 31,
2018 | | Year Ended
December 31,
2017 | | Year Ended
December 31,
2016 | | Year Ended
December 31,
2015 | |
Net asset value, beginning of year | | $ | 22.85 | | | $ | 27.01 | | | $ | 19.97 | | | $ | 21.66 | | | $ | 23.95 | | |
Income from investment operations: | |
Net investment loss‡ | | | (0.07 | ) | | | (0.03 | ) | | | (0.05 | ) | | | (0.05 | ) | | | (0.05 | ) | |
Net realized and unrealized gain (loss) on
investments | | | 8.31 | | | | (1.12 | ) | | | 7.83 | | | | (0.45 | ) | | | 1.96 | | |
Total from investment operations | | | 8.24 | | | | (1.15 | ) | | | 7.78 | | | | (0.50 | ) | | | 1.91 | | |
Less distributions to shareholders: | |
From net investment income | | | — | | | | — | | | | — | | | | — | | | | (0.01 | ) | |
From net realized capital gains | | | (1.76 | ) | | | (3.01 | ) | | | (0.74 | ) | | | (1.19 | ) | | | (4.19 | ) | |
Total distributions | | | (1.76 | ) | | | (3.01 | ) | | | (0.74 | ) | | | (1.19 | ) | | | (4.20 | ) | |
Net asset value, end of year | | $ | 29.33 | | | $ | 22.85 | | | $ | 27.01 | | | $ | 19.97 | | | $ | 21.66 | | |
Total Return+ | | | 36.09 | % | | | (4.95 | )% | | | 38.97 | % | | | (2.32 | )% | | | 7.70 | % | |
Ratios/Supplemental Data: | |
Net assets, end of year (000's) | | $ | 210,615 | | | $ | 168,222 | | | $ | 193,379 | | | $ | 157,766 | | | $ | 180,624 | | |
Net expenses to average daily net assets | | | 0.77 | % | | | 0.75 | % | | | 0.73 | % | | | 0.78 | % | | | 0.76 | % | |
Net investment loss to average daily net assets | | | (0.25 | )% | | | (0.11 | )% | | | (0.20 | )% | | | (0.26 | )% | | | (0.20 | )% | |
Portfolio turnover rate | | | 22 | % | | | 34 | % | | | 49 | % | | | 36 | % | | | 69 | % | |
‡ Calculation based on average shares outstanding.
+ Does not reflect additional fees charged by separate accounts or variable insurance contracts that an investor in the Fund may pay. If these additional fees were reflected, performance would have been lower.
The accompanying notes are an integral part of these financial statements.
64
M Fund, Inc.
FINANCIAL HIGHLIGHTS
(FOR A SHARE OUTSTANDING THROUGHOUT EACH YEAR)
| | | M Capital Appreciation Fund | |
| | | Year Ended
December 31,
2019 | | Year Ended
December 31,
2018 | | Year Ended
December 31,
2017 | | Year Ended
December 31,
2016 | | Year Ended
December 31,
2015 | |
Net asset value, beginning of year | | $ | 21.14 | | | $ | 31.24 | | | $ | 29.28 | | | $ | 25.15 | | | $ | 30.22 | | |
Income from investment operations: | |
Net investment loss‡ | | | (0.04 | ) | | | (0.05 | ) | | | (0.01 | ) | | | (0.09 | ) | | | (0.10 | ) | |
Net realized and unrealized gain (loss) on
investments | | | 6.11 | | | | (4.23 | ) | | | 5.55 | | | | 5.38 | | | | (1.77 | ) | |
Total from investment operations | | | 6.07 | | | | (4.28 | ) | | | 5.54 | | | | 5.29 | | | | (1.87 | ) | |
Less distributions to shareholders: | |
From net investment income | | | — | | | | (0.09 | ) | | | — | | | | — | | | | — | | |
From net realized capital gains | | | (2.16 | ) | | | (5.73 | ) | | | (3.58 | ) | | | (1.16 | ) | | | (3.20 | ) | |
Total distributions | | | (2.16 | ) | | | (5.82 | ) | | | (3.58 | ) | | | (1.16 | ) | | | (3.20 | ) | |
Net asset value, end of year | | $ | 25.05 | | | $ | 21.14 | | | $ | 31.24 | | | $ | 29.28 | | | $ | 25.15 | | |
Total Return+ | | | 28.85 | % | | | (14.15 | )% | | | 19.02 | % | | | 21.06 | % | | | (6.58 | )% | |
Ratios/Supplemental Data: | |
Net assets, end of year (000's) | | $ | 181,375 | | | $ | 156,007 | | | $ | 209,284 | | | $ | 197,217 | | | $ | 182,298 | | |
Net expenses to average daily net assets | | | 1.10 | % | | | 1.07 | % | | | 1.05 | % | | | 1.08 | % | | | 1.07 | % | |
Net investment loss to average daily net assets | | | (0.15 | )% | | | (0.15 | )% | | | (0.04 | )% | | | (0.35 | )% | | | (0.34 | )% | |
Portfolio turnover rate | | | 20 | % | | | 26 | % | | | 20 | % | | | 19 | % | | | 23 | % | |
‡ Calculation based on average shares outstanding.
+ Does not reflect additional fees charged by separate accounts or variable insurance contracts that an investor in the Fund may pay. If these additional fees were reflected, performance would have been lower.
The accompanying notes are an integral part of these financial statements.
65
M Fund, Inc.
FINANCIAL HIGHLIGHTS
(FOR A SHARE OUTSTANDING THROUGHOUT EACH YEAR)
| | | M Large Cap Value Fund | |
| | | Year Ended
December 31,
2019 | | Year Ended
December 31,
2018 | | Year Ended
December 31,
2017 | | Year Ended
December 31,
2016 | | Year Ended
December 31,
2015 | |
Net asset value, beginning of year | | $ | 11.06 | | | $ | 13.93 | | | $ | 12.89 | | | $ | 11.96 | | | $ | 13.36 | | |
Income from investment operations: | |
Net investment income‡ | | | 0.22 | | | | 0.20 | | | | 0.21 | | | | 0.22 | | | | 0.18 | | |
Net realized and unrealized gain (loss) on
investments | | | 2.16 | | | | (1.88 | ) | | | 1.73 | | | | 0.94 | | | | (0.24 | ) | |
Total from investment operations | | | 2.38 | | | | (1.68 | ) | | | 1.94 | | | | 1.16 | | | | (0.06 | ) | |
Less distributions to shareholders: | |
From net investment income | | | (0.22 | ) | | | (0.20 | ) | | | (0.21 | ) | | | (0.23 | ) | | | (0.17 | ) | |
From return of capital | | | — | | | | — | | | | — | | | | — | | | | (0.01 | ) | |
From net realized capital gains | | | (0.42 | ) | | | (0.99 | ) | | | (0.69 | ) | | | — | | | | (1.16 | ) | |
Total distributions | | | (0.64 | ) | | | (1.19 | ) | | | (0.90 | ) | | | (0.23 | ) | | | (1.34 | ) | |
Net asset value, end of year | | $ | 12.80 | | | $ | 11.06 | | | $ | 13.93 | | | $ | 12.89 | | | $ | 11.96 | | |
Total Return+ | | | 21.52 | % | | | (12.07 | )% | | | 14.99 | % | | | 9.73 | %# | | | (0.66 | )% | |
Ratios/Supplemental Data: | |
Net assets, end of year (000's) | | $ | 99,890 | | | $ | 85,437 | | | $ | 99,501 | | | $ | 91,189 | | | $ | 95,170 | | |
Net expenses to average daily net assets | | | 0.68 | % | | | 0.64 | % | | | 0.64 | % | | | 0.68 | % | | | 0.69 | % | |
Net investment income to average daily net assets | | | 1.73 | % | | | 1.47 | % | | | 1.57 | % | | | 1.85 | % | | | 1.32 | % | |
Without the waiver/reimbursement of expenses by
the adviser, the ratios of net expenses and net
investment income to average daily net
assets would have been: | |
Expenses | | | 0.69 | % | | | 0.66 | % | | | 0.64 | % | | | 0.68 | % | | | N/A | | |
Net investment income | | | 1.72 | % | | | 1.45 | % | | | 1.56 | % | | | 1.85 | % | | | N/A | | |
Portfolio turnover rate | | | 107 | % | | | 82 | % | | | 75 | % | | | 54 | % | | | 66 | % | |
‡ Calculation based on average shares outstanding.
+ Does not reflect additional fees charged by separate accounts or variable insurance contracts that an investor in the Fund may pay. If these additional fees were reflected, performance would have been lower.
# Includes adjustments in accordance with accounting principles generally accepted in the United States and consequently, the net asset value for financial reporting purposes and the returns based upon those net asset values may differ from the net asset values and returns for shareholder processing.
The accompanying notes are an integral part of these financial statements.
66
M Fund, Inc.
NOTES TO FINANCIAL STATEMENTS
M Fund, Inc. (the "Corporation") was incorporated in Maryland on August 11, 1995 and is registered under the Investment Company Act of 1940, as amended (the "1940 Act"), as an open-end management investment company. As of December 31, 2019, the Corporation consisted of four separate diversified investment portfolios: M International Equity Fund, M Large Cap Growth Fund, M Capital Appreciation Fund and M Large Cap Value Fund (each singularly a "Fund" or collectively the "Funds"), each of which is a separate mutual fund.
The Corporation offers shares of the Funds to certain insurance company separate accounts, which serve as the underlying funding vehicles for certain variable annuity and variable life insurance policies. These annuities and insurance policies are offered primarily by members of M Financial Holdings Incorporated ("M Financial Group") and are issued by certain life insurance companies.
M International Equity Fund
M International Equity Fund seeks to achieve its investment objective through exposure to a broad and diverse group of securities of non-U.S. companies in countries with developed and emerging markets with a greater emphasis on small capitalization, value and high profitability companies as compared to their representation in the Non-U.S. Universe. For purposes of the Fund, Dimensional Fund Advisors LP ("DFA") defines the Non-U.S. Universe as a market capitalization weighted portfolio of non-U.S. companies in developed and emerging markets that have been authorized for investment as approved markets by DFA's Investment Committee. The Fund may pursue its investment objective by investing its assets directly and/or indirectly by investing its assets in the DFA Emerging Markets Core Equity Portfolio of DFA Investment Dimensions Group Inc. (the "Underlying Fund").
M Large Cap Growth Fund
M Large Cap Growth Fund will normally invest at least 80% of its total assets in large-cap equity securities, including, but not limited to, common stocks, preferred stocks and American Depositary Receipts. The Fund may invest up to 20% of its assets in equity securities of foreign issuers. DSM Capital Partners LLC ("DSM"), the Fund's sub-adviser defines "large-cap" as capitalizations of $10 billion or more. The Fund will generally contain 25 to 35 equity securities. This strategy is not fundamental (it may be changed without shareholder approval), but should the Fund decide to change this strategy, it will provide shareholders with at least 60 days' notice. DSM uses a "bottom-up," idea-driven approach and focuses on a long-term (e.g., three-year minimum) investment horizon. DSM seeks to invest in growing businesses with solid fundamentals, attractive profitability and successful management. Candidate companies will typically have projected revenue and earnings growth in excess of 10% and will often have higher returns on equity and assets than average S&P 500 companies. Generally, these businesses will be generating free cash flow and will have financial returns that are stable or rising, driven by improving business fundamental all as determined by DSM.
M Capital Appreciation Fund
M Capital Appreciation Fund invests in common stock of U.S. companies of all sizes, with emphasis on stocks of companies with capitalizations that are consistent with the capitalizations of those companies found in the Russell 2500 Index. The Fund's sub-adviser, Frontier Capital Management Company, LLC ("Frontier") seeks to invest in companies with unrecognized earnings potential. Earnings per share, growth and price appreciation are important factors. Wall Street analysts do not usually widely follow small to mid-sized companies like those in
67
M Fund, Inc.
NOTES TO FINANCIAL STATEMENTS (Continued)
which the Fund invests and institutional investors usually do not own a large percentage of them. The cornerstone of Frontier's investment process is internally generated fundamental research. Stocks are sold if earnings growth potential is realized, when the fundamental reasons for purchase are no longer valid, or when a more attractive situation is identified.
M Large Cap Value Fund
M Large Cap Value Fund will normally invest at least 80% of its total assets in the large-capitalization segment of the U.S. stock market. AJO, LP ("AJO"), the Fund's sub-adviser, defines "large-capitalization" as capitalizations of $5 billion or more. This strategy is not fundamental (it may be changed without shareholder approval), but should the Fund decide to change this strategy, it will provide shareholders with at least 60 days' notice. AJO uses a systematic, disciplined, quantitative investment process. AJO is value-oriented, but believes superior results are best achieved by combining value, management, momentum and sentiment. AJO focuses on well-managed companies with quality cash profits, relatively low market valuations, positive price and earnings momentum and favorable investor sentiment. It optimizes portfolios to diversify multi-faceted risk. The Fund is fully invested, sector-neutral and well diversified in terms of industry, fundamental characteristics and various statistical measures of risk. AJO seeks to minimize implementation shortfall, defined as the difference between valuation price and execution price, including commissions, spreads, market impact and opportunity cost.
1. Significant Accounting Policies
The following is a summary of significant accounting policies for the Funds. Such policies are in conformity with accounting principles generally accepted in the United States of America ("GAAP") for investment companies and are consistently followed by the Funds in the preparation of the financial statements.
Use of Estimates
Each Fund is an investment company and accordingly follows the investment company accounting and reporting guidance of the Financial Accounting Standards Board ("FASB") Accounting Standard Codification Topic 946 Financial Services—Investment Companies. The preparation of financial statements in accordance with GAAP requires management to make estimates and assumptions that affect the reported amounts of assets and liabilities and disclosure of contingent assets and liabilities at the date of the financial statements and the reported amounts of increases and decreases in net assets from operations during the reporting period. Actual results could differ from those estimates.
Portfolio Valuation
Equity securities and other similar investments traded on a recognized U.S. securities exchange (other than the National Association of Securities Dealers Automated Quotation System "NASDAQ") are valued at the last sale price on the exchange on which the securities are traded. If no sale occurs, equity securities and other similar investments traded on a U.S. exchange (other than NASDAQ) are valued at the most recent bid price. Equity securities and other similar investments traded on NASDAQ are valued at the NASDAQ Official Closing Price. If no sale occurs, equity securities and other similar investments traded on NASDAQ are valued at the most recent bid price. Equity securities and other similar investments traded on a non-U.S. exchange are generally valued according
68
M Fund, Inc.
NOTES TO FINANCIAL STATEMENTS (Continued)
1. Significant Accounting Policies (Continued)
to the latest closing values on that exchange prior to the close of the New York Stock Exchange. However, if an event which may change the value of a security occurs after the time that the closing value on the non-U.S. exchange was determined, the Board of Directors may decide to value the security based on fair value. The Board of Directors has approved the use of an independent fair value service for foreign securities, which may provide a fair value price on trading days when the S&P 500 Index moves more than 1%. The use of a fair value price may cause the value of the security on the books of the Fund to be significantly different from the closing value on the non-U.S. exchange and may affect the calculation of the Fund's NAV. Over-the-counter securities are valued at the last sale price on the valuation date or, if no sale occurs, at the most recent bid price. Short-term obligations maturing in sixty days or less are valued at amortized cost, which approximates market value. Amortized cost valuation involves initially valuing a security at its cost, and thereafter, assuming a constant accretion or amortization to maturity of any discount or premium, regardless of the impact of fluctuating interest rates on the market value of the security. Securities for which a pricing service supplies no quotations or quotations are not deemed to be representative of market value or for which there are no readily available market quotations are valued at fair value as determined in good faith by the Pricing Committee appointed by the Board of Directors (excluding debt securities with a remaining maturity of sixty days or less). Investments in mutual funds, including money market funds, are valued at their respective NAVs as of the close of the Exchange on the valuation date. These securities are generally categorized as Level 1 in the fair value hierarchy.
Fair value is defined as the price that the Funds would receive upon selling an investment in a timely transaction to an independent buyer in the principal or most advantageous market for the investment. A three-tier hierarchy is utilized to maximize the use of observable data inputs and minimize the use of unobservable data inputs and to establish classification of fair value measurements for disclosure purposes. Inputs refer broadly to the assumptions that market participants would use to price the asset or liability, including assumptions about risk. Observable inputs are inputs that reflect the assumptions market participants would use to price the asset or liability based on market data obtained from sources independent of the reporting entity. Unobservable inputs are inputs that reflect the reporting entity's own assumptions about the assumptions market participants would use to price the asset or liability based on the best information available in the circumstances. The three-tier hierarchy of inputs is summarized in the three broad Levels listed below.
• Level 1—quoted prices in active markets for identical investments;
• Level 2—quoted prices in markets that are not active or other significant observable inputs (including quoted prices for similar investments, interest rates, prepayment speeds, credit risk, etc.); and
• Level 3—significant unobservable inputs (including the Fund's own assumptions used to determine the fair value of investments).
The valuation techniques used by the Funds to measure fair value during the year ended December 31, 2019 maximized the use of observable inputs and minimized the use of unobservable inputs.
The availability of observable inputs can vary from security to security and is affected by a wide variety of factors, including, for example, the type of security, whether the security is new and not yet established in the marketplace, the liquidity of markets, and other characteristics particular to the security. To the extent that valuation is based on models or inputs that are less observable or unobservable in the market, the determination of fair value requires
69
M Fund, Inc.
NOTES TO FINANCIAL STATEMENTS (Continued)
1. Significant Accounting Policies (Continued)
more judgment. Accordingly, the degree of judgment exercised in determining fair value is greatest for instruments categorized in Level 3.
The inputs used to measure fair value may fall into different levels of the fair value hierarchy. In such cases, for disclosure purposes, the level in the fair value hierarchy within which the fair value measurement falls in its entirety is determined based on the lowest level input that is significant to the fair value measurement in its entirety.
As of December 31, 2019, the M International Equity Fund, the M Large Cap Growth Fund and the M Large Cap Value Fund had (i) all long-term investments classified as Level 1, as represented on the Schedule of Investments; and (ii) all short-term investments classified as Level 2.
As of December 31, 2019, the M Capital Appreciation Fund had: (i) all long-term investments classified as Level 1, as represented on the Schedule of Investments, with the exception of Ferroglobe Plc—ENT which was classified as Level 2 and had no value, (ii) the Pan American Silver Corp rights, which were classified as Level 2 and had no value, and (iii) all short-term investments classified as Level 2.
Securities Transactions, Investment Income and Expenses
Securities transactions are recorded as of the trade date. Realized gains or losses from securities sold are recorded on the identified cost basis. Interest income is recorded on the accrual basis and consists of interest accrued and, if applicable, discount earned less premiums amortized. Dividend income is recorded on the ex-dividend date, except that certain dividends from foreign securities are recorded as soon as the Fund is informed of the ex-dividend date. Investment income is recorded net of foreign taxes withheld where the recovery of such taxes is uncertain. Non-cash dividends included in dividend income, if any, are recorded at the fair market value of the securities received. Expenses of the Corporation that can be directly attributed to a particular Fund are charged to that Fund. Expenses that cannot be directly attributed are apportioned among the Funds by the Corporation based on the average net assets of each Fund.
Additionally, the Funds may invest in mutual funds, which are subject to management fees and other fees that may increase the costs of investing in mutual funds versus the costs of owning the underlying securities directly. These indirect expenses of mutual funds are not included in the amounts shown as expenses in the Funds' Statements of Operations or in the expense ratios included in the financial highlights.
Dividends and Distributions to Shareholders
Each Fund declares and pays dividends from net investment income, if any, and distributes net short-term capital gains, if any, on an annual basis. Each Fund also distributes, at least annually, substantially all of the long-term capital gains in excess of available capital losses, if any, which it realizes for each taxable year. Distributions are recorded on the ex-dividend date. Income distributions and capital gain distributions are determined in accordance with income tax regulations, which may differ from GAAP.
70
M Fund, Inc.
NOTES TO FINANCIAL STATEMENTS (Continued)
1. Significant Accounting Policies (Continued)
Securities Lending
The Funds participate in a securities lending program under the terms of a Securities Lending Agency Agreement with State Street Bank and Trust Company, which serves as the Funds' securities lending agent. Each Fund may loan its portfolio securities in an amount up to 33 1/3 of its total assets. The Funds receive cash (U.S. currency) as collateral against the loaned securities. Such collateral is invested by the securities lending agent in a money market mutual fund that meets the quality and diversification requirements in accordance with Rule 2a-7 under the 1940 Act. All collateral received will be in an amount at least equal to 102% (for loans of U.S. securities) or 105% (for loans of non-U.S. securities) of the market value of the loaned securities at the inception of each loan. The market value of the loaned securities is determined each day at the close of business of the Funds and any change in the amount of collateral is delivered to or paid by the Fund the next day. The collateral value does not include the calculated mark, which is the amount charged/returned to the borrower daily to maintain 102%/105% of market value. There is a day lag in receiving the mark, which may at times result in a collateral percentage above or below 102%/105%.
The collateral received is recorded on a lending Fund's statement of assets and liabilities, along with the related obligation to return the collateral. A Fund may also record realized gain or loss on securities deemed sold due to a borrower's inability to return securities on loan. Upon an event of default under the Securities Agency Lending Agreement, there is a risk of delay in the recovery of the securities or loss of rights in the collateral. If the borrower fails to return loaned securities and cash collateral is insufficient to cover the value of loaned securities (provided that the insufficiency is not due to investment losses), the securities lending agent has agreed, at its option, to pay the amount of any shortfall in collateral to the Funds; or to replace the securities. Any dividends or interest payable by the issuers of the loaned portfolio securities, during the time that the securities are on loan, are paid to the borrowers of those securities. Dividend or interest payments that are made to borrowers of the loaned securities are reimbursed by the borrowers to the Funds. Such reimbursement amounts do not comprise qualified dividend income under the Internal Revenue Code of 1986, as amended.
Income generated from the investment of cash collateral, less negotiated rebate fees paid to the borrower through the securities lending agent, is the source of the Fund's securities lending income, 70% of which is paid to the Fund, 30% of which is paid to the custodian as securities lending agent.
The following table presents financial instruments that are subject to enforceable netting arrangements as of December 31, 2019.
| | | Gross | | Gross
Amounts
Offset in the | | Net Amounts
of Assets
Presented
in the | | Gross Amount Not Offset
in the Statements
of Assets and Liabilities | | | |
Fund | | Amounts of
Recognized
Assets | | Statements
of Assets
and Liabilities | | Statements
of Assets
and Liabilities | | Financial
Instruments | | Cash
Collateral
Received | | Net
Amount | |
M International Equity Fund | | $ | 5,624,362 | | | $ | — | | | $ | 5,624,362 | | | $ | — | | | $ | 5,624,362 | | | $ | — | | |
| M Large Cap Growth Fund | | | 9,978,417 | | | | — | | | | 9,978,417 | | | | — | | | | 9,978,417 | | | | — | | |
| M Capital Appreciation Fund | | | 5,103,782 | | | | — | | | | 5,103,782 | | | | — | | | | 5,103,782 | | | | — | | |
71
M Fund, Inc.
NOTES TO FINANCIAL STATEMENTS (Continued)
1. Significant Accounting Policies (Continued)
The following table presents the remaining contractual maturity of the Securities Lending Agency Agreement as of December 31, 2019.
Fund | | Security Type | | Overnight and
Continuous | | Up to 30
days | | 31-90
days | | Greater
Than 90
days | | Total | |
M International
Equity Fund | | Common Stocks | | $ | 5,624,362 | | | $ | — | | | $ | — | | | $ | — | | | $ | 5,624,362 | | |
M Large Cap
Growth Fund | | Common Stocks | | | 9,978,417 | | | | — | | | | — | | | | — | | | | 9,978,417 | | |
M Capital Appreciation
Fund | | Common Stocks | | | 5,103,782 | | | | — | | | | — | | | | — | | | | 5,103,782 | | |
Federal Income Taxes
Each Fund intends to continue to qualify as a regulated investment company by complying with the requirements under Subchapter M of the Internal Revenue Code of 1986, as amended, applicable to regulated investment companies and by distributing substantially all of its earnings to its shareholders. Therefore, no provision for federal income or excise tax is necessary.
The Funds evaluate the Funds' tax positions to determine if the tax positions taken meet the minimum recognition threshold in connection with accounting for uncertainties in income tax positions taken or expected to be taken for the purposes of measuring and recognizing tax liabilities in the financial statements. Recognition of tax benefits of an uncertain tax position is permitted only to the extent the position is "more likely than not" to be sustained assuming examination by taxing authorities. The Funds did not have any unrecognized tax benefits as of December 31, 2019, nor were there any increases or decreases in unrecognized tax benefits for the year then ended. The Funds recognize interest and penalties, if any, related to unrecognized tax benefits as an income tax expense in the Statements of Operations. During the year ended December 31, 2019, the Funds did not incur any such interest or penalties. The Funds' tax returns are subject to examination by U.S. federal and state tax authorities for returns filed for the prior three fiscal years, December 2016 through December 2018. No examination of any of the Funds' tax filings is currently in progress.
72
M Fund, Inc.
NOTES TO FINANCIAL STATEMENTS (Continued)
2. Advisory Fee and Other Transactions with Affiliates
The Corporation has entered into an investment advisory agreement (the "Advisory Agreement") with M Financial Investment Advisers, Inc. (the "Adviser"), a wholly-owned subsidiary of M Financial Group. The Advisory Agreement provides that the Funds will pay the Adviser a fee at an annual rate of the value of each Fund's average daily net assets as follows:
Fund | | Total Advisory Fees | |
M International Equity Fund | | 0.15% on all assets plus (and only with | |
| | | respect to Fund assets which are not invested
in a mutual fund that is advised by the
Fund's sub-adviser): | |
| | | 0.32% on the first $100 million | |
| | | 0.27% on the amounts thereafter | |
M Large Cap Growth Fund | | 0.65% of the first $50 million | |
| | | 0.60% of the next $50 million | |
| | | 0.55% on the amounts thereafter | |
M Capital Appreciation Fund | | 0.90% | |
M Large Cap Value Fund* | | 0.45% of the first $250 million | |
| | | 0.35% of the next $250 million | |
| | | 0.30% of the next $250 million | |
| | | 0.275% on the amounts thereafter | |
* Beginning on October 1, 2016, the Sub-Adviser for the Fund has waived 5% of its sub-advisory fee. Beginning on October 1, 2019, the Sub-Adviser for the Fund waived an additional 2.5% of its sub-advisory fee for a total waiver of 7.5%. Consequently, the Adviser waived a portion of the fee payable by the Fund. For the period January 1, 2019 through September 30, 2019, the fee payable to the Adviser for the Fund was 0.435% on the first $250 million, 0.34% on the next $250 million, 0.2925% on the next $250 million and 0.2688% on the amounts thereafter on the Fund's average daily net assets. For the period October 1, 2019 through December 31, 2019, the fee payable to the Adviser for the Fund was 0.4275% on the first $250 million, 0.335% on the next $250 million, 0.2888% on the next $250 million and 0.2656% on the amounts thereafter on the Fund's average daily net assets. For the year ended December 31, 2019, the Advisor waived $15,976 otherwise payable by M Large Cap Value Fund.
Prior to May 1, 2019 and for the period May 1, 2019 to April 30, 2020, the Adviser has contractually agreed to reimburse each Fund for any expenses (other than advisory fees, brokerage or other portfolio transaction expenses or expenses for litigation, indemnification, taxes or other extraordinary expenses) to the extent that such expenses exceed 0.25% of a Fund's annualized average daily net assets. For the year ended December 31, 2019, the Adviser reimbursed $87,634 of other expenses for the M International Equity Fund.
73
M Fund, Inc.
NOTES TO FINANCIAL STATEMENTS (Continued)
2. Advisory Fee and Other Transactions with Affiliates (Continued)
The Adviser has engaged Dimensional Fund Advisors LP, DSM Capital Partners LLC, Frontier Capital Management Company, LLC and AJO, LP to act as sub-advisers to provide day-to-day portfolio management for the M International Equity Fund, the M Large Cap Growth Fund, the M Capital Appreciation Fund and the M Large Cap Value Fund, respectively.
As compensation for their services, each sub-adviser receives a fee based on the average daily net assets of the applicable Fund at the following annual rates:
Fund | | Total Sub-Advisory Fees | |
M International Equity Fund | | 0.32% on the first $100 million | |
| | | 0.27% on the amounts thereafter | |
| | | The Sub-adviser shall not receive any sub-
advisory fee for its sub-advisory services to
the M International Equity Fund with respect
to assets of the M International Equity Fund
invested in any other mutual fund advised by
the Sub-Adviser. | |
M Large Cap Growth Fund | | 0.50% on the first $50 million | |
| | | 0.45% on the next $50 million | |
| | | 0.40% on the amounts thereafter | |
M Capital Appreciation Fund | | 0.75% | |
M Large Cap Value Fund* | | 0.30% on the first $250 million | |
| | | 0.20% on the next $250 million | |
| | | 0.15% on the next $250 million | |
| | | 0.125% on the amounts thereafter | |
* Beginning on October 1, 2016, the Sub-Adviser has waived 5% of its sub-advisory fee. Beginning on October 1, 2019, the Sub-Adviser for the Fund waived an additional 2.5% of its sub-advisory fee for a total waiver of 7.5%. For the period January 1, 2019 through September 30, 2019, the fee payable to the Sub-Adviser for the Fund was 0.285% on the first $250 million, 0.19% on the next $250 million, 0.1425% on the next $250 million and 0.1188% on the amounts thereafter on the Fund's average daily net assets. For the period October 1, 2019 through December 31, 2019, the fee payable to the Sub-Adviser for the Fund was 0.2775% on the first $250 million, 0.185% on the next $250 million, 0.1388% on the next $250 million and 0.1156% on the amounts thereafter on the Fund's average daily net assets. For the year ended December 31, 2019, the Sub-Adviser waived $15,976 otherwise payable by the Adviser.
The sub-advisory fees are paid by the Adviser out of the investment advisory fees disclosed above.
M Holdings Securities, Inc. acts as distributor (the "Distributor") for each of the Funds. The Distributor is a wholly-owned subsidiary of M Financial Group. No fees are charged by the Distributor for its services.
The Corporation pays no compensation to its officers. At December 31, 2019, the Corporation pays each Non-Interested Director $1,500 per meeting attended. The Corporation pays each non-interested Director an annual retainer of $20,000. Each member of the Audit Committee receives $1,500 per meeting of the Audit Committee
74
M Fund, Inc.
NOTES TO FINANCIAL STATEMENTS (Continued)
2. Advisory Fee and Other Transactions with Affiliates (Continued)
that he or she attends. The Chairman of the Board and Audit Committee Chair receive an additional $10,000 annually. For the period January 1, 2019 through July 3, 2019, CCO compensation of $15,725 was paid to M Financial Group pursuant to an employee leasing agreement between the Corporation and M Financial Group and is included under compliance expenses on the Funds' Statements of Operations. For the remainder of the year, CCO services were provided to the Corporation by an external party.
An affiliated company is a company in which a Fund has ownership of at least 5% of the voting securities or is under common management. The company which is an affiliate of the M International Equity Fund as of December 31, 2019 is noted in the Fund's Schedule of Investments. During the year ended December 31, 2019, purchases and sales transactions, income earned from investments and shares held of investment companies managed by Dimensional Fund Advisors LP for the M International Equity Fund were as follows:
Affiliated
Investment
Company | | Value,
Beginning
of Year | | Purchases
at Cost | | Proceeds
from Sales | | Net Realized
Gain
on Sales | | Change in
Unrealized
Appreciation | | Value,
End of
Year | | Dividend
Income | | Shares
End of
Year | |
DFA Emerging
Markets
Core Equity
Portfolio | | $ | 40,791,410 | | | $ | 8,548,293 | | | $ | (4,708,000 | ) | | $ | 278,850 | | | $ | 5,358,595 | | | $ | 50,269,148 | | | $ | 1,165,494 | | | $ | 2,309,102 | | |
The DFA Emerging Markets Core Equity Portfolio is registered under the 1940 Act as an open-end management investment company. The M International Equity Fund may redeem its investment from the DFA Emerging Markets Core Equity Portfolio at any time if the Advisor determines that it is in the best interest of the M International Equity Fund and its shareholders to do so.
The performance of the M International Equity Fund will be directly affected by the performance of the DFA Emerging Markets Core Equity Portfolio. The financial statements of the DFA Emerging Markets Core Equity Portfolio, including the portfolio of investments, can be found at the Securities and Exchange Commission's website (www.sec.gov) and should be read in conjunction with the M International Equity Fund's financial statements. As of December 31, 2019, the percentage of M International Equity Fund net assets invested in the DFA Emerging Markets Core Equity Portfolio was 25.7%.
3. Purchases and Sales of Securities
Cost of purchases and proceeds from sales of investment securities, excluding short-term investments, for the year ended December 31, 2019, were as follows:
| | | Non-U.S.
Government Securities | |
| | | Purchases | | Sales | |
M International Equity Fund | | $ | 22,399,127 | | | $ | 25,732,470 | | |
M Large Cap Growth Fund | | | 43,148,535 | | | | 59,532,169 | | |
M Capital Appreciation Fund | | | 34,465,156 | | | | 54,990,886 | | |
M Large Cap Value Fund | | | 98,670,328 | | | | 100,887,295 | | |
75
M Fund, Inc.
NOTES TO FINANCIAL STATEMENTS (Continued)
Changes in the capital shares outstanding were as follows:
| | | M International Equity Fund | | M Large Cap Growth Fund | |
| | | Year Ended
December 31,
2019 | | Year Ended
December 31,
2018 | | Year Ended
December 31,
2019 | | Year Ended
December 31,
2018 | |
Shares sold | | | 1,996,591 | | | | 1,891,021 | | | | 579,461 | | | | 912,017 | | |
Shares repurchased | | | (2,663,562 | ) | | | (4,116,778 | ) | | | (1,172,776 | ) | | | (1,535,156 | ) | |
Distributions reinvested | | | 413,399 | | | | 277,574 | | | | 409,857 | | | | 828,020 | | |
Net increase (decrease) | | | (253,572 | ) | | | (1,948,183 | ) | | | (183,458 | ) | | | 204,881 | | |
Fund Shares: | |
Beginning of year | | | 16,031,563 | | | | 17,979,746 | | | | 7,363,590 | | | | 7,158,709 | | |
End of year | | | 15,777,991 | | | | 16,031,563 | | | | 7,180,132 | | | | 7,363,590 | | |
| | | M Capital Appreciation Fund | | M Large Cap Value Fund | |
| | | Year Ended
December 31,
2019 | | Year Ended
December 31,
2018 | | Year Ended
December 31,
2019 | | Year Ended
December 31,
2018 | |
Shares sold | | | 738,415 | | | | 543,866 | | | | 808,025 | | | | 928,969 | | |
Shares repurchased | | | (1,465,804 | ) | | | (1,438,588 | ) | | | (1,097,583 | ) | | | (1,099,557 | ) | |
Distributions reinvested | | | 586,370 | | | | 1,576,310 | | | | 371,525 | | | | 748,428 | | |
Net increase (decrease) | | | (141,019 | ) | | | 681,588 | | | | 81,967 | | | | 577,840 | | |
Fund Shares: | |
Beginning of year | | | 7,380,359 | | | | 6,698,771 | | | | 7,721,747 | | | | 7,143,907 | | |
End of year | | | 7,239,340 | | | | 7,380,359 | | | | 7,803,714 | | | | 7,721,747 | | |
5. Financial Instruments
Foreign Investments and Foreign Currency
Each of the Funds may invest in securities of companies that are organized under the laws of a foreign country and (i) are unlisted or listed primarily on a non-U.S. exchange; or (ii) are listed on a U.S. exchange or over-the-counter as a sponsored or unsponsored American Depositary Receipt ("foreign issuers"). M International Equity Fund may also invest in non-U.S. dollar denominated securities and securities of foreign issuers represented by European Depositary Receipts ("EDRs"), International Depositary Receipts ("IDRs") and Global Depositary Receipts ("GDRs"). The value of all assets and liabilities expressed in foreign currencies are translated into U.S. dollars at the exchange rates captured as of twelve noon Eastern Time each business day other than market holidays or early closures. Purchases and sales of investment securities, income receipts and expense payments are translated into U.S. dollars at the prevailing exchange rate on the respective dates of such transactions. Net realized foreign currency gains and losses result from changes in exchange rates, including foreign currency gains and losses between trade date and settlement date on investment securities transactions, foreign currency transactions and the difference
76
M Fund, Inc.
NOTES TO FINANCIAL STATEMENTS (Continued)
5. Financial Instruments (Continued)
between the amounts of interest and dividends recorded on the books of the Funds and the amount actually received. The portion of foreign currency gains and losses related to fluctuation in exchange rates between the initial trade date and subsequent sale trade date is included in realized gains and losses on investment transactions. M International Equity Fund does not isolate that portion of the results for changes in foreign currency exchange rates from the fluctuations arising from changes in market prices of securities held at year end.
Investments in non-U.S. dollar denominated securities or in the securities of foreign issuers may be affected by changes in currency rates, changes in foreign or U.S. laws or restrictions applicable to such investments and in exchange control regulations (e.g., currency blockage). Some foreign stock markets may have substantially less volume than, for example, the New York Stock Exchange, and securities of some foreign issuers may be less liquid than securities of comparable domestic issuers. Commissions and dealer mark-ups on transactions in foreign investments may be higher than for similar transactions in the United States. In addition, clearance and settlement procedures for such securities may be different in foreign countries and, in certain markets, on certain occasions such procedures have been unable to keep pace with the volume of securities transactions.
Foreign issuers are not generally subject to uniform accounting, auditing and financial reporting standards comparable to those applicable to domestic companies. There may be less publicly available information about a foreign issuer than about a domestic one. In addition, there is generally less government regulation of stock exchanges, brokers, and listed and unlisted issuers in foreign countries than in the United States. Furthermore, with respect to certain foreign countries, there is a possibility of expropriation or confiscatory taxation, imposition of withholding taxes on dividend or interest payments, limitations on the removal of funds or other assets of the Funds, or political or social instability or diplomatic developments which could affect investments in those countries. Individual foreign economies also may differ favorably or unfavorably from the United States economy in such respects as growth of gross national product, rate of inflation, capital reinvestment and resource self-sufficiency.
Because investment in foreign issuers will usually involve currencies of foreign countries, and because the Funds may be exposed to currency exposure independent of their securities positions, the value of the assets of the Funds invested in foreign issuers as measured in U.S. dollars will be affected by changes in foreign currency exchange rates. To the extent that a Fund's assets consist of investments denominated in a particular currency, the Fund is at risk of adverse developments affecting the value of such currency.
Currency exchange rates may fluctuate significantly over short periods of time causing, along with other factors, a Fund's net asset value to fluctuate as well. Currency exchange rates generally are determined by the forces of supply and demand in the foreign exchange markets and the relative merits of investments in different countries, actual or anticipated changes in interest rates and other complex factors, as seen from an international perspective. Currency exchange rates also can be affected unpredictably by intervention by U.S. or foreign governments or central banks, or the failure to intervene, or by currency controls or political developments in the U.S. or abroad. To the extent that a substantial portion of a Fund's total assets, adjusted to reflect the Fund's net position after giving effect to currency transactions, is denominated in the currencies of foreign countries, the Fund will be more susceptible to the risk of adverse economic and political developments within those countries.
77
M Fund, Inc.
NOTES TO FINANCIAL STATEMENTS (Continued)
Shares of the Funds are owned by insurance companies through their separate accounts that are used primarily to fund variable annuity contracts and variable life insurance contracts. As of December 31, 2019, John Hancock Variable Life Insurance Co., Pacific Life Insurance Co., Pruco Life Insurance Co. of Arizona and Security Life of Denver (an indirect, wholly owned subsidiary of Voya Financial, Inc.) each owned 5% or more of the Funds' shares. John Hancock Variable Life Insurance Co. and Pacific Life Insurance Co. may each be deemed a control person of each Fund because their separate accounts hold more than 25% of the shares of each Fund.
As of December 31, 2019 the ownership of each Fund was as follows:
| | | Percentage of Ownership(1) | |
| | | John Hancock
Variable Life
Insurance Co. | | Pacific Life
Insurance Co. | | Pruco Life
Insurance Co.
Of Arizona | | Voya-Security
Life of
Denver | |
M International Equity Fund | | | 40.6 | % | | | 39.3 | % | | | 6.4 | % | | | 6.1 | % | |
M Large Cap Growth Fund | | | 51.9 | % | | | 32.4 | % | | | 5.7 | % | | | 1.5 | % | |
M Capital Appreciation Fund | | | 46.9 | % | | | 37.8 | % | | | 2.1 | % | | | 5.6 | % | |
M Large Cap Value Fund | | | 53.1 | % | | | 29.8 | % | | | 5.9 | % | | | 1.8 | % | |
(1) The balance of the Funds' shares are owned by shareholders with less than 5% beneficial interest.
7. Tax Information
At December 31, 2019, aggregated gross unrealized appreciation for investment securities in which there is an excess of value over tax cost and aggregate gross unrealized depreciation for investment securities in which there is an excess of tax cost over value were as follows:
| | | Federal
Income Tax
Cost | | Tax Basis
Unrealized
Appreciation | | Tax Basis
Unrealized
Depreciation | | Tax Basis
Net Unrealized
Appreciation | |
M International Equity Fund | | $ | 176,344,741 | | | $ | 28,068,279 | | | $ | (4,567,272 | ) | | $ | 23,501,007 | | |
M Large Cap Growth Fund | | | 130,226,069 | | | | 89,950,524 | | | | (426,291 | ) | | | 89,524,233 | | |
M Capital Appreciation Fund | | | 130,864,625 | | | | 70,300,771 | | | | (17,128,176 | ) | | | 53,172,595 | | |
M Large Cap Value Fund | | | 88,376,444 | | | | 10,504,102 | | | | (888,781 | ) | | | 9,615,321 | | |
78
M Fund, Inc.
NOTES TO FINANCIAL STATEMENTS (Continued)
7. Tax Information (Continued)
The tax character of distributions paid during 2019 and 2018 was as follows:
| | | December 31,
2019
Amount | | December 31,
2018
Amount | |
M International Equity Fund | |
Distributions paid from: | |
Ordinary Income | | $ | 4,603,394 | | | $ | 2,892,319 | | |
Return Of Capital | | | 534,529 | | | | — | | |
Total Distributions | | $ | 5,137,923 | | | $ | 2,892,319 | | |
M Large Cap Growth Fund | |
Distributions paid from: | |
Ordinary Income | | $ | — | | | $ | 1,322,751 | | |
Long-Term Capital Gain | | | 12,037,996 | | | | 19,478,024 | | |
Total Distributions | | $ | 12,037,996 | | | $ | 20,800,775 | | |
M Capital Appreciation Fund | |
Distributions paid from: | |
Ordinary Income | | $ | 482,485 | | | $ | 3,766,650 | | |
Long-Term Capital Gain | | | 14,094,380 | | | | 31,426,325 | | |
Total Distributions | | $ | 14,576,865 | | | $ | 35,192,975 | | |
M Large Cap Value Fund | |
Distributions paid from: | |
Ordinary Income | | $ | 1,603,328 | | | $ | 1,798,576 | | |
Long-Term Capital Gain | | | 3,157,940 | | | | 6,556,971 | | |
Total Distributions | | $ | 4,761,268 | | | $ | 8,355,547 | | |
At December 31, 2019, the components of distributable earnings on a tax basis were as follows:
| | | Undistributed
Ordinary
Income | | Undistributed
Long-Term
Gain | | Capital Loss
Carryforwards | | Unrealized
Appreciation | | Total
Distributable
Earnings | |
M International Equity
Fund | | $ | — | | | $ | — | | | $ | (75,975,651 | ) | | $ | 23,507,269 | | | $ | (52,468,382 | ) | |
M Large Cap Growth
Fund | | | — | | | | 3,498,093 | | | | — | | | | 89,524,233 | | | | 93,022,326 | | |
M Capital Appreciation
Fund | | | — | | | | 2,655,098 | | | | — | | | | 53,172,595 | | | | 55,827,693 | | |
M Large Cap Value
Fund | | | — | | | | 973,104 | | | | — | | | | 9,615,321 | | | | 10,588,425 | | |
79
M Fund, Inc.
NOTES TO FINANCIAL STATEMENTS (Continued)
7. Tax Information (Continued)
Net capital loss carryforwards may be applied against any net realized taxable gains in each succeeding year, or until their respective expiration dates, whichever occurs first. At December 31, 2019, M International Equity Fund had available, for federal tax purposes, unused short-term capital losses of $17,072,201 and unused long-term capital losses of $58,903,450 permitted to be carried for an unlimited period. In addition at December 31, 2019 M International Equity Fund had no short-term capital loss carryforwards expire unused.
Dividends and distributions from net investment income and net realized capital gains are determined in accordance with federal income tax regulations, which may differ from GAAP. These "book/tax" differences are considered either temporary or permanent in nature. To the extent these differences are permanent in nature, such amounts are reclassified within the capital accounts based on their federal tax-basis treatment. Temporary differences do not require reclassification.
During the year ended December 31, 2019, the Funds reclassified for book purposes, amounts arising from permanent book/tax difference primarily relating to realized foreign currency gains and losses, return of capital distributions from non-REIT securities, capital gain distributions from REITs, ordinary losses offsetting net short-term gains, dividend re-designations, partnerships and passive foreign investment company gains and losses.
Permanent differences incurred during the year ended December 31, 2019, resulting from differences in book and tax accounting, have been reclassified at year-end between undistributed net investment income (loss), undistributed (accumulated) net realized gain (loss) and paid-in capital as follows, with no impact to the net asset value per share:
| | | Total
Distributable
Earnings | | Paid-in Capital | |
| M International Equity Fund | | $ | — | | | $ | — | | |
M Large Cap Growth Fund | | | 485,083 | | | | (485,083 | ) | |
M Capital Appreciation Fund | | | — | | | | — | | |
M Large Cap Value Fund | | | — | | | | — | | |
8. Disclosure of Certain Commitments and Contingencies
In the normal course of business, the Corporation may enter into contracts and agreements that contain a variety of representations and warranties that provide general indemnifications. The maximum exposure to the Corporation under these arrangements is unknown, as it involves future claims that may be made against the Corporation that have not yet occurred. However, based on experience, the Corporation believes that the current risk of loss is remote.
9. Subsequent Events
The Funds have evaluated subsequent events through the date of issuance of the Funds' financial statements and have determined there is no material impact to the Funds' financial statements.
80
Report of Independent Registered Public Accounting Firm
To the Board of Directors of M Fund, Inc.
and the Shareholders of
M International Equity Fund,
M Large Cap Growth Fund,
M Capital Appreciation Fund and
M Large Cap Value Fund
Opinion on the Financial Statements
We have audited the accompanying statements of assets and liabilities of M International Equity Fund, M Large Cap Growth Fund, M Capital Appreciation Fund and M Large Cap Value Fund, each a series of shares of M Fund, Inc. (the "Funds"), including the schedules of investments, as of December 31, 2019, and the related statements of operations for the year then ended, the statements of changes in net assets for each of the years in the two-year period then ended, and the financial highlights for each of the years in the five-year period then ended, and the related notes (collectively referred to as the "financial statements"). In our opinion, the financial statements present fairly, in all material respects, the financial position of the Funds as of December 31, 2019, and the results of their operations for the year then ended, the changes in their net assets for each of the years in the two-year period then ended and their financial highlights for each of the years in the five-year period then ended, in conformity with accounting principles generally accepted in the United States of America.
Basis for Opinion
These financial statements are the responsibility of the Funds' management. Our responsibility is to express an opinion on the Funds' financial statements based on our audits. We are a public accounting firm registered with the Public Company Accounting Oversight Board (United States) ("PCAOB") and are required to be independent with respect to the Funds in accordance with the U.S. federal securities law and the applicable rules and regulations of the Securities and Exchange Commission and the PCAOB.
We conducted our audits in accordance with the standards of the PCAOB. Those standards require that we plan and perform the audits to obtain reasonable assurance about whether the financial statements are free of material misstatement, whether due to error or fraud. The Funds are not required to have, nor were we engaged to perform, an audit of their internal control over financial reporting. As part of our audits we are required to obtain an understanding of internal control over financial reporting but not for the purpose of expressing an opinion on the effectiveness of the Funds' internal control over financial reporting. Accordingly, we express no such opinion.
Our audits included performing procedures to assess the risk of material misstatement of the financial statements, whether due to error or fraud, and performing procedures that respond to those risks. Such procedures included examining, on a test basis, evidence regarding the amounts and disclosures in the financial statements. Our procedures included confirmation of securities owned as of December 31, 2019 by correspondence with the custodian, other appropriate parties and brokers and by other appropriate auditing procedures where replies from brokers were not received. Our audits also included evaluating the accounting principles used and significant estimates made by management, as well as evaluating the overall presentation of the financial statements. We believe that our audits provide a reasonable basis for our opinion.

BBD, LLP
We have served as the auditor of one or more of the Funds in the M Fund, Inc. since 2008.
Philadelphia, Pennsylvania
February 27, 2020
81
M Fund, Inc.
SUPPLEMENTAL INFORMATION (Unaudited)
Director's and Officer's Tables
Interested Directors:
Name, Address, and Age | | Position(s)
Held with
Fund | | Term of Office(1)
and Length of
Time Served | | Principal Occupation(s)
During Past 5 Years | | Number of
Portfolios
in Fund Complex
Overseen by
Director | | Other
Directorships
Held by
Director
for the
Past 5 Years | |
Peter W. Mullin(2)
1125 NW Couch St.,
Suite 900
Portland, OR 97209
79 | | Director | | Indefinite
24 Years | | Chairman Emeritus, MullinTBG, Inc. (insurance agency) from 2008 to Present.
Founding Chairman, Mullin, Barens, Sanford (life insurance & executive benefits) from 2012 to Present. | | | 4 | | | N/A | |
Lawton Nease(2)
Nease Lagana Eden & Culley, Inc.
1125 NW Couch St.,
Suite 900
Portland, OR 97209
76 | | Director | | Indefinite
10 Years | | President, Nease, Lagana, Eden & Culley (life insurance advisory firm) from 1988 to present. | | | 4 | | | NLEC (specialty insurance). | |
(1) In accordance with the Corporation's current by-laws, each Director serves for an indefinite term until the date such Director resigns, retires or is removed by the Board of Directors or shareholders in accordance with the Corporation's Articles of Incorporation.
(2) Messrs. Mullin and Nease are deemed to be Interested Persons as defined by the 1940 Act, for the following reasons:
• Mr. Mullin has the power to vote 17.3% of the stock of M Financial Group, which controls the Adviser;
• Mr. Nease owns 1.7% of the stock of M Financial Group;
• Messrs. Mullin and Nease are Directors of M Financial Group; and
• Mr. Nease is a Director of the Adviser.
82
M Fund, Inc.
SUPPLEMENTAL INFORMATION (Unaudited) (Continued)
Director's and Officer's Tables (Continued)
Independent Directors:
Name, Address, and Age | | Position(s)
Held with
Fund | | Term of Office(1)
and Length of
Time Served | | Principal Occupation(s)
During Past 5 Years | | Number of
Portfolios
in Fund Complex
Overseen by
Director | | Other
Directorships
Held by
Director
for the
Past 5 Years | |
Wayne Pierson
1125 NW Couch St.,
Suite 900
Portland, OR 97209
69 | | Director, Chair of the Board and Governance Committee Chair | | Indefinite
Seven Years | | Chief Financial Officer, Chief Investment Officer, Meyer Memorial Trust, 1982 to 2014 (private foundation); President (2005 to present) and Director (2004-2015), Acorn Investors LLC (investment holding company); Principal Clifford Capital Partners LLC, 2010 to present (investment manager). | | | 4 | | | Director, Oaktree Capital Group, 2007 to present (investment manager). | |
Bruce W. Madding
1125 NW Couch St.,
Suite 900
Portland, OR 97209
68 | | Director and Audit Committee Chair | | Indefinite
11 Years | | Chief Executive Officer, C.M. Capital Corp., 2011 to present; Chief Investment Officer, C.M. Capital Corp., 2011 to 2018. | | | 4 | | | N/A | |
Nancy Crouse
1125 NW Couch St.,
Suite 900
Portland, OR 97209
61 | | Director | | Indefinite Since July 2019 | | Senior Vice president and Portfolio Manager, Nuveen Investments, 2005 to 2016 (investment manager). | | | 4 | | | Director and Treasurer, Women's Economic Ventures (non-profit). | |
Mary Moran Zeven
1125 NW Couch St.,
Suite 900
Portland, OR 97209
58 | | Director | | Indefinite Since September 2019 | | Director, Graduate Program in Banking University School of Law, 2019 to president; Senior Vice President and senior Managing Counsel, State Street Bank and trust Company 2000 to 2019 (custodial bank). | | | 4 | | | State Street Foundation, 2011 to 2016 (non-profit). | |
(1) In accordance with the Corporation's current by-laws, each Director serves for an indefinite term until the date such Director resigns, retires or is removed by the Board of Directors or shareholders in accordance with the Corporation's Articles of Incorporation.
83
M Fund, Inc.
SUPPLEMENTAL INFORMATION (Unaudited) (Continued)
Director's and Officer's Tables (Continued)
The Officers of the Corporation are listed below together with their respective positions with the Corporation, their principal occupations during the past five years and any positions held with affiliates of the Corporation:
Name, Address and Age | | Position(s)
Held with the
Fund | | Term of Office
and Length of
Time Served | | Principal Occupation(s)
During Past 5 Years | |
Bridget McNamara-Fenesy
1125 NW Couch St.,
Suite 900
Portland, OR 97209
61 | | President | | One Year
Three Years | | President and CEO, M Securities Holdings, Inc. 2017-present; Vice President, M Securities Holdings, Inc. 2016-2017; Interim Chief Compliance Officer, M Securities Holdings, Inc. March 2016-September 2016; President, Two Gaits Consulting 2001-2016. | |
Valerie Pimenta
1125 NW Couch St.,
Suite 900
Portland, OR 97209
42 | | Vice President | | One Year
Two Years | | Vice President and Chief Operation Officer, M Holdings Securities, Inc., 2017-present; Vice President of Legal and Compliance, Fisher Investments, 2002-2017. | |
David Lees
1125 NW Couch St.,
Suite 900
Portland, OR 97209
54 | | Secretary and
Treasurer | | One Year
13 Years | | Accounting Director, M Financial Group, 2007-present; Secretary and Treasurer, M Financial Investment Advisers, Inc., 2007 to present; Secretary and Treasurer, M Financial Wealth Partners, Inc., and M Financial Asset Management, Inc., 2016-present. | |
Dean Beckley
1125 NW Couch St.,
Suite 900
Portland, OR 97209
48 | | Chief Information
Security Officer | | One Year
Three Years | | Director, Cyber Security & IT Operations, M Financial Group, 2016-present; Director, Technology of M Benefit Solutions, 2013-2016; Senior Project Manager of M Financial Group, 2009-2013. | |
84
M Fund, Inc.
SUPPLEMENTAL INFORMATION (Unaudited) (Continued)
Quarterly Form N-Q Portfolio Schedule
Each Fund will file its complete schedule of portfolio holdings with the Securities and Exchange Commission ("SEC") on Form N-Q at the end of the first and third fiscal quarters within 60 days of the end of the quarter to which it relates. The Corporation's Form N-Q will be available on the Corporation's website at www.mfin.com and on the SEC's website at www.sec.gov and may also be reviewed and copied at the SEC's Public Reference Room in Washington, D.C. Information on the operation of the Public Reference Room may be obtained by calling 1-800-SEC-0330.
Proxy Voting Policies and Procedures and Proxy Voting Record
A description of the Corporation's proxy voting policies and procedures and the Corporation's proxy voting record for the most recent twelve-month period ending June 30 are available (1) without charge, upon request, by calling the Corporation toll-free at 1-888-736-2878; and (2) on Form N-PX on the SEC's website at www.sec.gov.
Tax Disclosures
For corporate shareholders, a portion of the ordinary dividends paid during the Fund's year ended December 31, 2019 qualified for the dividends received deduction as follows.
Fund | | Dividend Received
Deduction | |
M International Equity Fund | | | 0.23 | % | |
M Large Cap Growth Fund | | | 0.00 | % | |
M Capital Appreciation Fund | | | 100.00 | % | |
M Large Cap Value Fund | | | 100.00 | % | |
Pursuant to Internal Revenue Section 852(b), M Large Cap Growth Fund, M Capital Appreciation Fund and M Large Cap Value Fund paid $12,037,996, $14,094,380 and $3,157,940, respectively, which have been designated as capital gains distributions for the fiscal year ended December 31, 2019.
M International Equity Fund
In accordance with federal tax law, the Fund elects to provide each shareholder with their portion of the Fund's foreign taxes paid and the income sourced from foreign securities. Accordingly, the Fund made the following designations regarding its fiscal year ended December 31, 2019:
• the total amount of foreign taxes creditable was $432,108
• the total amount of income sourced from foreign countries was $4,652,321
85
M Fund, Inc.
HYPOTHETICAL EXPENSE EXAMPLE (Unaudited)
As an indirect shareholder of a Fund, you incur ongoing costs, including management fees and other Fund expenses. The following example is intended to help you understand your ongoing costs (in dollars and cents) of investing in a Fund and to compare these costs with the ongoing costs of investing in other mutual funds.
The example is based on an investment of $1,000 invested at the beginning of the period and held for the entire period from July 1, 2019 to December 31, 2019.
Actual Expenses
The first line under each Fund in the table below provides information about actual account values and actual expenses. You may use the information in this line, together with the amount you invested, to estimate the expenses that you paid over the period. Simply divide your account value by $1,000 (for example, an $8,600 account value divided by $1,000 = 8.6), then multiply the result by the number in the first line for your Fund under the heading entitled "Expenses Paid During Period" to estimate the expenses you paid on your account during this period.
Hypothetical Example for Comparison Purposes
The second line under each Fund in the table below provides information about hypothetical account values and hypothetical expenses based on the Fund's actual expense ratio and an assumed rate of return of 5% per year before expenses, which is not the Fund's actual return. The hypothetical account values and expenses may not be used to estimate the actual ending account balance or expenses you paid for the period. You may use this information to compare the ongoing costs of investing in your Fund and other funds. To do so, compare this 5% hypothetical example with the 5% hypothetical examples that appear in the shareholder reports of the other funds.
Please note that the expenses shown in the table are meant to highlight your ongoing Fund costs only. As an indirect shareholder of a Fund, you do not incur any transactional costs, such as sales charges (loads), redemption fees or exchange fees. However, you do incur such transactional costs, as well as other fees and charges as an owner of a variable annuity contract or variable life insurance policy. If these transactional and other insurance company fees and charges were included, your costs would have been higher. Therefore, the second line under each Fund in the table is useful in comparing ongoing Fund costs only, and will not help you determine the relative total costs of owning different variable annuities or variable life insurance policies.
86
M Fund, Inc.
HYPOTHETICAL EXPENSE EXAMPLE (Unaudited) (Continued)
| | | Beginning
Account Value
July 1, 2019 | | Ending
Account Value
December 31,
2019 | | Annualized
Expense
Ratio | | Expenses
Paid During
Period*
(July 1, 2019 to
December 31, 2019) | |
M International Equity Fund | |
Actual | | $ | 1,000.00 | | | $ | 1,070.50 | | | | 0.63 | % | | $ | 3.29 | | |
Hypothetical (5% return before expenses) | | | 1,000.00 | | | | 1,022.00 | | | | 0.63 | % | | | 3.21 | | |
M Large Cap Growth Fund | |
Actual | | | 1,000.00 | | | | 1,099.20 | | | | 0.79 | % | | | 4.18 | | |
Hypothetical (5% return before expenses) | | | 1,000.00 | | | | 1,021.20 | | | | 0.79 | % | | | 4.02 | | |
M Capital Appreciation Fund | |
Actual | | | 1,000.00 | | | | 1,092.80 | | | | 1.11 | % | | | 5.86 | | |
Hypothetical (5% return before expenses) | | | 1,000.00 | | | | 1,019.60 | | | | 1.11 | % | | | 5.65 | | |
M Large Cap Value Fund | |
Actual | | | 1,000.00 | | | | 1,060.30 | | | | 0.69 | % | | | 3.58 | | |
Hypothetical (5% return before expenses) | | | 1,000.00 | | | | 1,021.70 | | | | 0.69 | % | | | 3.52 | | |
* Expenses are calculated using each Fund's annualized expense ratio (as disclosed in the table), multiplied by the average account value for the period, multiplied by the number of days in the period (184 days), and divided by the number of days in the year (365 days). In addition to the fees and expenses which the Fund bears directly, it also indirectly bears a pro-rata share of the fees and expenses of the underlying fund in which it invests. Such indirect expenses are not included in the above expense ratios.
87
Item 2. Code of Ethics.
As of December 31, 2019, the Registrant has adopted a code of ethics that applies to the Registrant’s President/Principal Executive Officer and Treasurer/Principal Financial and Accounting Officer. For the year ended December 31, 2019, there were no amendments to a provision of its code of ethics, nor were there any waivers (including implicit waivers) granted from a provision of the code of ethics. A copy of the registrant’s code of ethics is filed with this Form N-CSR under Item 13(a)(1).
Item 3. Audit Committee Financial Expert.
The Registrant’s Board of Directors has determined that the Registrant has two audit committee financial experts serving on its audit committee. The audit committee financial experts serving on the Registrant’s audit committee are Bruce Madding and Wayne Pierson, who are “independent” as defined in Item 3 of Form N-CSR. Mr. Madding serves as the Chairman of the Registrant’s audit committee.
Item 4. Principal Accountant Fees and Services.
BBD, LLP served as the principal accountant for the Registrant for the fiscal years ended December 31, 2018 and December 31, 2019.
(a) AUDIT FEES: The aggregate fees billed for professional services rendered by its principal accountant, BBD, LLP for the audit of the Registrant’s annual financial statements for the fiscal years ended December 31, 2018 and December 31, 2019 were $84,500 and $86,500, respectively.
(b) AUDIT RELATED FEES: No such fees were billed to the Registrant by BBD, LLP for the fiscal years ended December 31, 2018 and December 31, 2019.
(c) TAX FEES: The aggregate fees billed for professional services rendered by BBD, LLP for tax compliance, tax advice, and tax planning for the fiscal years ended December 31, 2018 and December 31, 2019 were $10,500 and $10,500, respectively. Such services included the review of the Fund’s tax and excise returns.
(d) ALL OTHER FEES: No such fees were billed to the Registrant by BBD, LLP for the fiscal years ended December 31, 2018 and December 31, 2019.
(e) (1) The Registrant’s audit committee pre-approves all audit and non-audit services to be performed by the Registrant’s accountant before the accountant is engaged by the Registrant to perform such services.
(2) The percentage of services described in each of paragraphs (b) through (d) of this Item that were approved by the audit committee pursuant to paragraph (c)(7)(i)(C) of Rule 2-01 of Regulation S-X are as follows:
(b) Not applicable
(c) 100%
(d) Not applicable
(f) Not applicable.
(g) The aggregate fees billed by the Registrant’s principal accountant, BBD, LLP, for non-audit services rendered to the Registrant, the Registrant’s investment adviser (not including any sub-adviser whose role is primarily portfolio management and is subcontracted with or overseen by another investment adviser), and any entities controlling, controlled by, or under common control with the Registrant’s investment adviser that provides ongoing services to the Registrant for the fiscal years ended December 31, 2018 and December 31, 2019 were $10,500 and $10,500, respectively.
(h) Not applicable.
Item 5. Audit Committee of Listed Registrants.
Not applicable.
Item 6. Investments.
(a) A schedule of investments is contained in the Registrant’s annual report, which is attached to this report in response to Item 1.
(b) Not applicable.
Item 7. Disclosure of Proxy Voting Policies and Procedures for Closed-End Management Investment Companies.
Not applicable.
Item 8. Portfolio Managers of Closed-End Management Investment Companies.
Not applicable.
Item 9. Purchases of Equity Securities by Closed-End Management Investment Company and Affiliated Purchasers.
Not applicable.
Item 10. Submission of Matters to a Vote of Security Holders.
Not applicable.
Item 11. Controls and Procedures.
(a) The Registrant’s Principal Executive Officer and Principal Financial Officer concluded that the Registrant’s disclosure controls and procedures (as defined in Rule 30a-3(c) under the Investment Company Act of 1940 (17 CFR 270.30a-3(c))) (the “1940 Act”) were effective as of a date within 90 days prior to the filing date of this report (the “Evaluation Date”), based on their evaluation of the effectiveness of the Registrant’s disclosure controls and procedures required by Rule 30a-3(b) under the 1940 Act (17 CFR 270.30a-3(b)) and Rules 13a-15(b) or 15d-15(b) under the Securities Exchange Act of 1934 (17 CFR 240.13a-15(b) or 240.15d-15(b)) (the “1934 Act”) as of the Evaluation Date.
(b) There were no changes in the Registrant’s internal control over financial reporting (as defined in Rule 30a-3(d) under the 1940 Act (17 CFR 270.30a-3(d)) that occurred during the Registrant’s most recent fiscal quarter of the period covered by this report that has materially affected, or is reasonably likely to materially affect, the Registrant’s internal control over financial reporting.
Item 12. Disclosure of Securities Lending Activities for Closed-End Management Investment Companies.
Not applicable.
Item 13. Exhibits.
(a)(1) Code of Ethics as described in Item 2 is attached hereto as Exhibit 13(a)(1).
(a)(2) Certifications of Principal Executive Officer and Principal Financial Officer of the Registrant as required by Rule 30a-2(a) under the Investment Company Act of 1940 (17 CFR 270.30a-2(a)) is attached hereto as Exhibit 13(a)(2).
(a)(3) Not applicable to this filing.
(a)(4) Not applicable.
(b) Certification pursuant to Section 906 of the Sarbanes-Oxley Act of 2002 as required by Rule 30a-2(b), under the Investment Company Act of 1940 (17 CFR 270.30a-2(b)), Rule 13a-14(b) or Rule 15d-14(b) under the Securities Exchange Act of 1934 (17 CFR 240.13a — 14(b) or 240.15d-14(b)) and Section 1350 of Chapter 63 of Title 18 of the United States Code (18 U.S.C. 1350) is attached hereto as Exhibit 13(b).
SIGNATURES
Pursuant to the requirements of the Securities Exchange Act of 1934 and the Investment Company Act of 1940, the registrant has duly caused this report to be signed on its behalf by the undersigned, thereunto duly authorized.
M Fund, Inc. | |
| |
| |
By: | /s/ Bridget McNamara-Fenesy | |
| Bridget McNamara-Fenesy | |
| President/Principal Executive Officer | |
| |
Date: March 4, 2020 | |
Pursuant to the requirements of the Securities Exchange Act of 1934 and the Investment Company Act of 1940, this report has been signed below by the following persons on behalf of the registrant and in the capacities and on the dates indicated.
| |
By: | /s/ Bridget McNamara-Fenesy | |
| Bridget McNamara-Fenesy | |
| President/Principal Executive Officer | |
| |
Date: March 4, 2020 | |
| |
| |
By: | /s/ David Lees | |
| David Lees | |
| Treasurer/Principal Financial and Accounting Officer | |
| |
Date: March 4, 2020 | |