FILED BY NORANDA INC.
PURSUANT TO RULE 425 UNDER THE SECURITIES
ACT OF 1933
SUBJECT COMPANY: FALCONBRIDGE LIMITED
COMMISSION FILE NO: 33-95280
Link to searchable text of slide shown above
Link to searchable text of slide shown above
Link to searchable text of slide shown above

Link to searchable text of slide shown above
Link to searchable text of slide shown above
Link to searchable text of slide shown above
Link to searchable text of slide shown above
Link to searchable text of slide shown above
Link to searchable text of slide shown above
Link to searchable text of slide shown above
Link to searchable text of slide shown above
Link to searchable text of slide shown above
Link to searchable text of slide shown above

Link to searchable text of slide shown above

Link to searchable text of slide shown above
Link to searchable text of slide shown above
Link to searchable text of slide shown above

Link to searchable text of slide shown above
Link to searchable text of slide shown above
Link to searchable text of slide shown above
Link to searchable text of slide shown above
Link to searchable text of slide shown above
Link to searchable text of slide shown above
Link to searchable text of slide shown above
Link to searchable text of slide shown above
Link to searchable text of slide shown above
Link to searchable text of slide shown above

Link to searchable text of slide shown above
Link to searchable text of slide shown above
Link to searchable text of slide shown above

Link to searchable text of slide shown above
Link to searchable text of slide shown above
Link to searchable text of slide shown above
Link to searchable text of slide shown above
Link to searchable text of slide shown above
Link to searchable text of slide shown above
Link to searchable text of slide shown above
Link to searchable text of slide shown above
Link to searchable text of slide shown above
Link to searchable text of slide shown above
Link to searchable text of slide shown above
Link to searchable text of slide shown above
Link to searchable text of slide shown above
Link to searchable text of slide shown above
Link to searchable text of slide shown above
Link to searchable text of slide shown above
Link to searchable text of slide shown above
Link to searchable text of slide shown above
Link to searchable text of slide shown above

Link to searchable text of slide shown above

Link to searchable text of slide shown above
Link to searchable text of slide shown above
Link to searchable text of slide shown above
Link to searchable text of slide shown above
Link to searchable text of slide shown above

Link to searchable text of slide shown above
Link to searchable text of slide shown above
Link to searchable text of slide shown above

Link to searchable text of slide shown above
Link to searchable text of slide shown above
Searchable text section of graphics shown above
[GRAPHIC] |
| [LOGO] |
Scotia Capital
Materials Conference
June 1, 2005
[GRAPHIC] |
|
|
Forward-Looking Statements |
| [LOGO] |
NorandaFalconbridge cautions that statements made to describe the Company’s intentions, expectations or predictions may be “forward-looking statements” within the meaning of securities laws. The Company cautions that, by their nature, forward-looking statements involve risk and uncertainty and that the Company’s actual results could differ materially from those expressed or implied in such statements. Reference should be made to the Company’s most recent Annual Information Form filed with Canadian securities regulatory authorities (and available at www.sedar.com) for a description of the major risk factors.
All dollar amounts expressed in U.S. dollars
All production volumes and reserves and resources in metric tonnes
Investor Information |
|
|
• This communication is being made in respect of the proposed amalgamation (the “Amalgamation”) involving Noranda and Falconbridge. In connection with the Amalgamation, a registration statement under the U.S. Securities Act of 1933 will be prepared and filed with the U.S. Securities and Exchange Commission (the “SEC”), containing a joint management information circular to be delivered to Noranda and Falconbridge shareholders. If required, other documents will be filed with the SEC regarding the Amalgamation.
• INVESTORS ARE URGED TO READ CAREFULLY THE JOINT MANAGEMENT INFORMATION CIRCULAR WHEN IT BECOMES AVAILABLE AND ANY OTHER RELEVANT DOCUMENTS FILED OR TO BE FILED WITH THE SEC BECAUSE THEY WILL CONTAIN IMPORTANT INFORMATION.
• Investors will be able to obtain the documents filed with the SEC free of charge at the SEC’s website (www.sec.gov). In addition, documents filed with the SEC by Noranda may be obtained free of charge by contacting Noranda at 416-982-7111.
Agenda |
|
|
1 |
|
| |
|
|
|
|
2 |
|
| |
|
|
|
|
3 |
|
| |
|
|
|
|
4 |
|
| |
|
|
|
|
5 |
|
|
NorandaFalconbridge |
|
|
Company Overview
[GRAPHIC] |
|
|
NorandaFalconbridge |
|
|
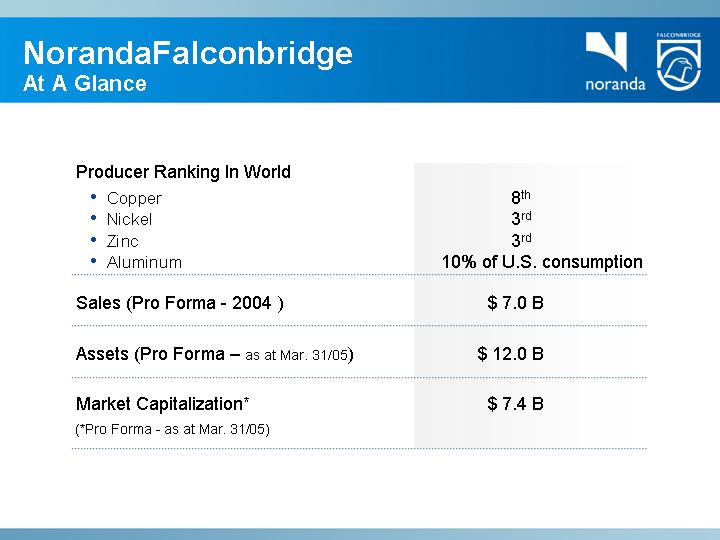
Producer Ranking In World |
| ||||
|
|
|
|
|
|
• Copper |
| 8th |
| ||
• Nickel |
| 3rd |
| ||
• Zinc |
| 3rd |
| ||
• Aluminum |
| 10% of U.S. consumption |
| ||
|
|
|
| ||
Sales (Pro Forma - 2004) |
| $ 7.0 B |
| ||
|
|
|
| ||
Assets (Pro Forma – as at Mar. 31/05) |
| $ 12.0 B |
| ||
|
|
|
| ||
Market Capitalization* |
| $ 7.4 B |
| ||
(*Pro Forma - as at Mar. 31/05)
NorandaFalconbridge
A Leading Base Metals Company
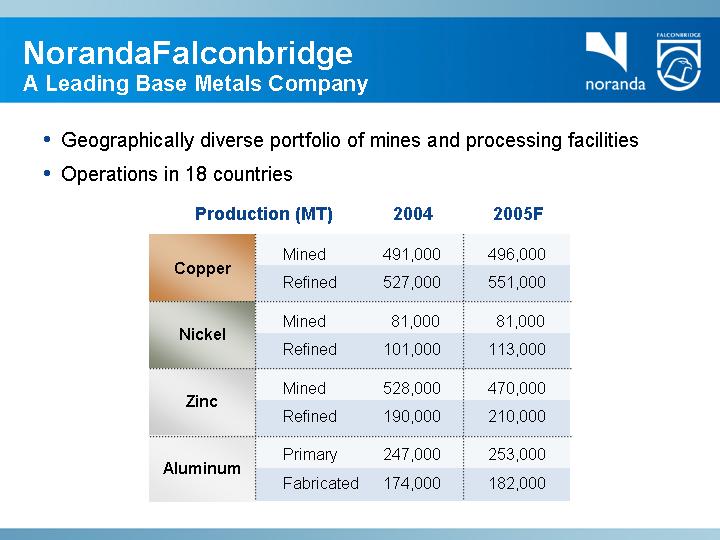
• Geographically diverse portfolio of mines and processing facilities
• Operations in 18 countries
Production (MT) |
| 2004 |
| 2005F |
| ||
|
|
|
|
|
| ||
Copper |
| Mined |
| 491,000 |
| 496,000 |
|
Refined |
| 527,000 |
| 551,000 |
| ||
|
|
|
|
|
|
|
|
Nickel |
| Mined |
| 81,000 |
| 81,000 |
|
Refined |
| 101,000 |
| 113,000 |
| ||
|
|
|
|
|
|
|
|
Zinc |
| Mined |
| 528,000 |
| 470,000 |
|
Refined |
| 190,000 |
| 210,000 |
| ||
|
|
|
|
|
|
|
|
Aluminum |
| Primary |
| 247,000 |
| 253,000 |
|
Fabricated |
| 174,000 |
| 182,000 |
| ||
Solid Financial Results
Better prices | ||||
• Copper | ||||
• Nickel | ||||
• Zinc | ||||
• Aluminum | ||||
| ||||
|
|
| Dramatic |
|
|
|
| improvement |
|
| + | = | in financial |
|
|
|
| results |
|
| ||||
Own efforts | ||||
• Efficient operations | ||||
• Reduced costs | ||||
• Increased production | ||||
• On-time and on-budget expansions | ||||
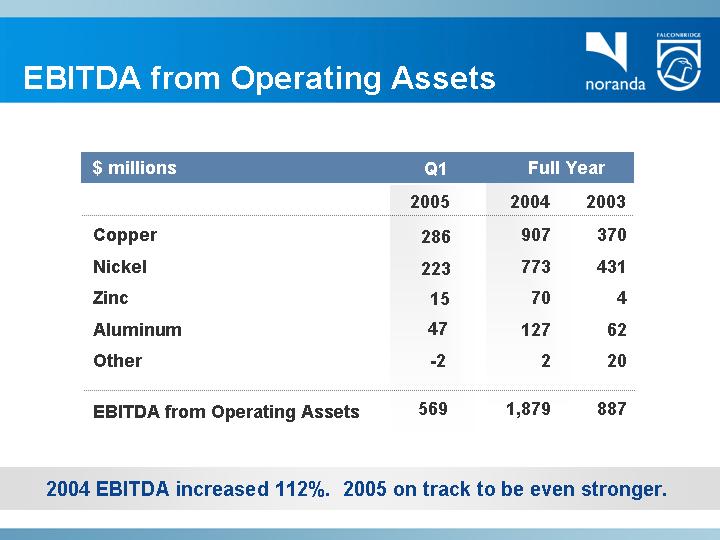
EBITDA from Operating Assets
|
| Q1 |
| Full Year |
| ||
$ millions |
| 2005 |
| 2004 |
| 2003 |
|
Copper |
| 286 |
| 907 |
| 370 |
|
Nickel |
| 223 |
| 773 |
| 431 |
|
Zinc |
| 15 |
| 70 |
| 4 |
|
Aluminum |
| 47 |
| 127 |
| 62 |
|
Other |
| -2 |
| 2 |
| 20 |
|
EBITDA from Operating Assets |
| 569 |
| 1,879 |
| 887 |
|
2004 EBITDA increased 112%. 2005 on track to be even stronger.
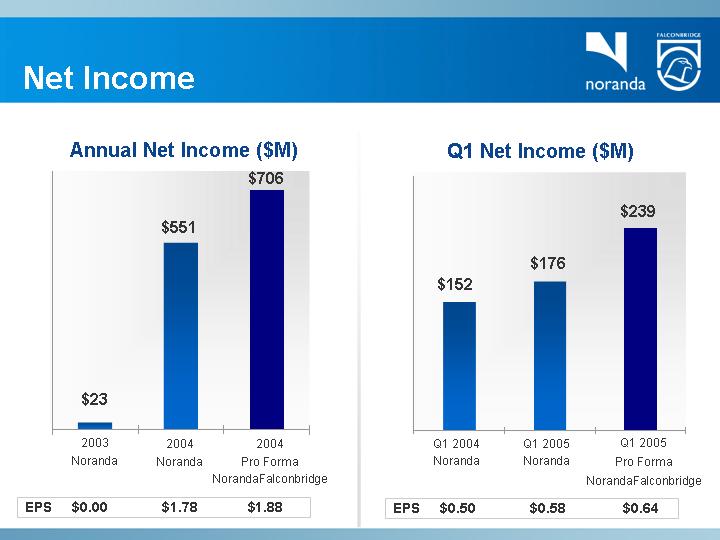
Net Income
Annual Net Income ($M)
[CHART]
EPS |
| $ | 0.00 |
| $ | 1.78 |
| $ | 1.88 |
|
Q1 Net Income ($M)
[CHART]
EPS |
| $ | 0.50 |
| $ | 0.58 |
| $ | 0.64 |
|
NorandaFalconbridge
Noranda & Falconbridge
Merger
[GRAPHIC]
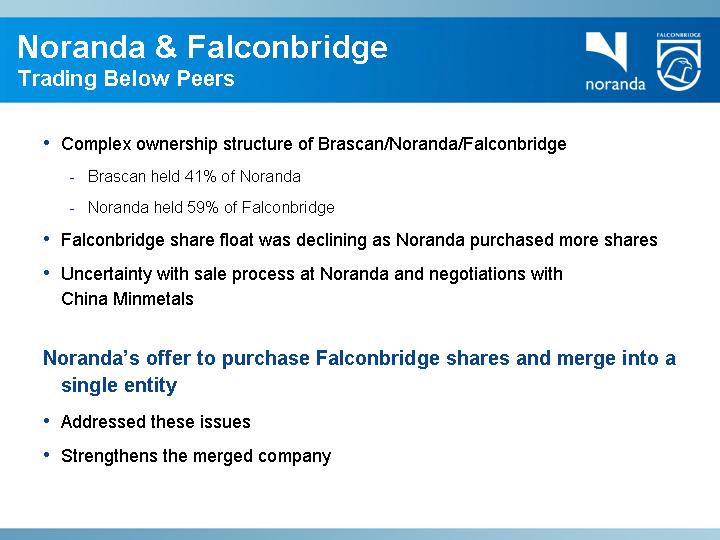
Noranda & Falconbridge
Trading Below Peers
• Complex ownership structure of Brascan/Noranda/Falconbridge
• Brascan held 41% of Noranda
• Noranda held 59% of Falconbridge
• Falconbridge share float was declining as Noranda purchased more shares
• Uncertainty with sale process at Noranda and negotiations with China Minmetals
Noranda’s offer to purchase Falconbridge shares and merge into a single entity
• Addressed these issues
• Strengthens the merged company
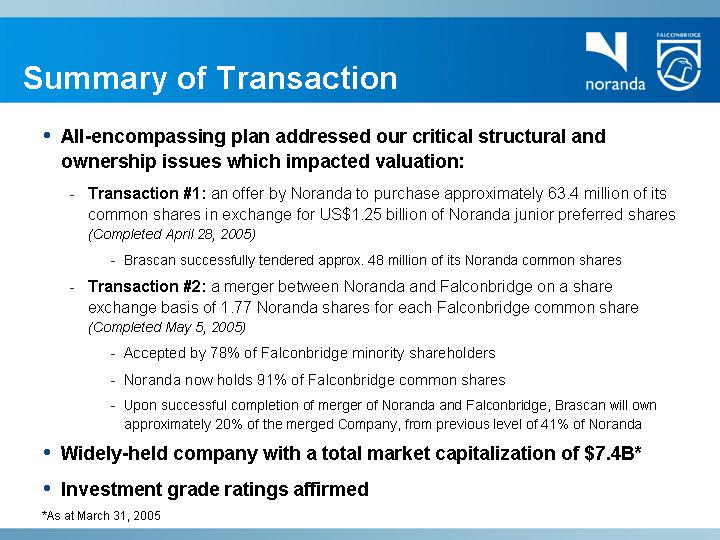
Summary of Transaction
• All-encompassing plan addressed our critical structural and ownership issues which impacted valuation:
• Transaction #1: an offer by Noranda to purchase approximately 63.4 million of its common shares in exchange for US$1.25 billion of Noranda junior preferred shares (Completed April 28, 2005)
• Brascan successfully tendered approx. 48 million of its Noranda common shares
• Transaction #2: a merger between Noranda and Falconbridge on a share exchange basis of 1.77 Noranda shares for each Falconbridge common share (Completed May 5, 2005)
• Accepted by 78% of Falconbridge minority shareholders
• Noranda now holds 91% of Falconbridge common shares
• Upon successful completion of merger of Noranda and Falconbridge, Brascan will own approximately 20% of the merged Company, from previous level of 41% of Noranda
• Widely-held company with a total market capitalization of $7.4B*
• Investment grade ratings affirmed
*As at March 31, 2005
NorandaFalconbridge
to be one of the World’s Largest Mining Companies
Mid-Tier Base Metal Companies – Total Enterprise Value(1)
[CHART]
(1) Source – Bloomberg. Total Enterprise Value calculated as market capitalization (including convertible securities and preferred shares), plus minority interest plus net debt.
(2) Illustrative of total enterprise value if NorandaFalconbridge trades up to multiples ½ way between Noranda current multiples and multiples for mid-tier group.
(3) Illustrative of total enterprise value if NorandaFalconbridge trades up to full multiples for Mid-tier group.
(4) Currently subject to a cash take-over bid by BHP Billiton.
(As at March 18, 2005)
Investor Benefits
• Widely-held company with increased stock float and liquidity
• Clarity of ownership and simplified corporate structure
• Removal of sale process overhang
• Potential realignment of shares to peer group multiples
• Greater financial strength and capacity
• Lower cost of capital in the long term
• Increased scale, reducing concentration risk of any one project or operation
• Increased leverage to strong market fundamentals for base metals
• Proven senior management team focused on operating results and growth
NorandaFalconbridge
Strategic Focus &
Market Review
[GRAPHIC]
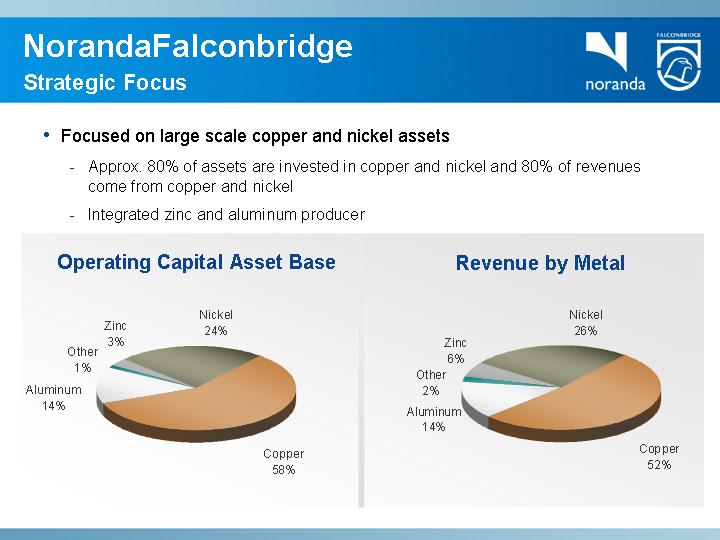
NorandaFalconbridge
Strategic Focus
• Focused on large scale copper and nickel assets
• Approx. 80% of assets are invested in copper and nickel and 80% of revenues come from copper and nickel
• Integrated zinc and aluminum producer
Operating Capital Asset Base |
| Revenue by Metal |
|
|
|
[CHART] |
| [CHART] |
Global I.P. & OECD Leading Indicator
OECD Leading Indicator and W. World Industrial Production
[CHART]
Source: Economy.com
OECD leading indicator remains positive, albeit at lower rate of projected growth
China Industrial Production
[CHART]
Source: National Bureau of Statistics China, Economy.com
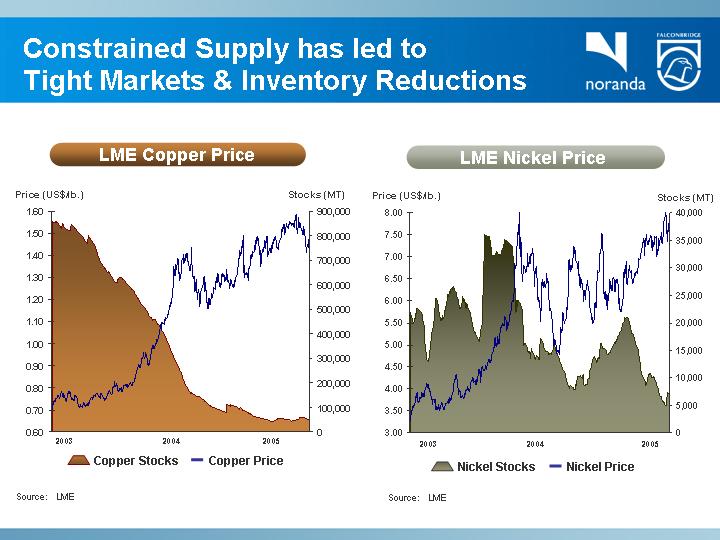
Constrained Supply has led to
Tight Markets & Inventory Reductions
LME Copper Price |
| LME Nickel Price |
|
|
|
[CHART] |
| [CHART] |
|
|
|
Source: LME |
| Source: LME |
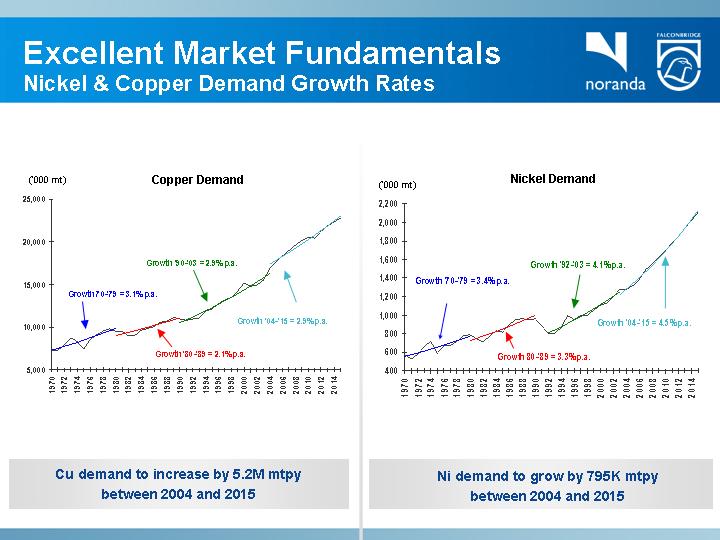
Excellent Market Fundamentals
Nickel & Copper Demand Growth Rates
Copper Demand |
| Nickel Demand |
|
|
|
[CHART] |
| [CHART] |
|
|
|
Cu demand to increase by 5.2M mtpy |
| Ni demand to grow by 795K mtpy |
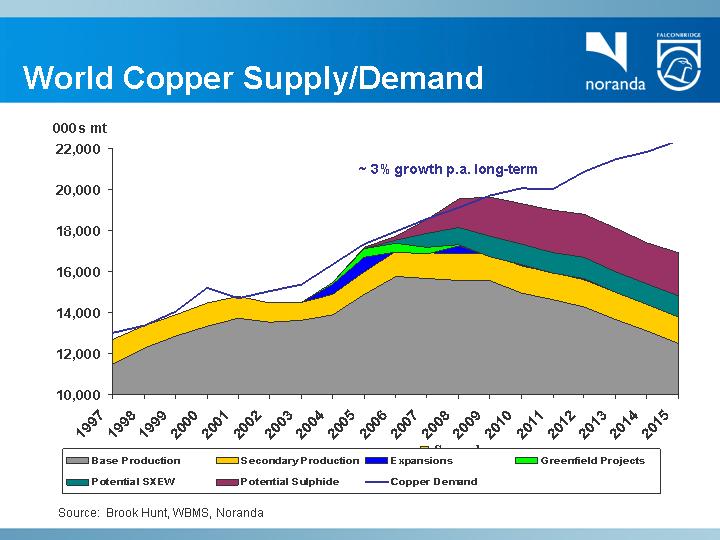
World Copper Supply/Demand
[CHART]
Source: Brook Hunt, WBMS, Noranda
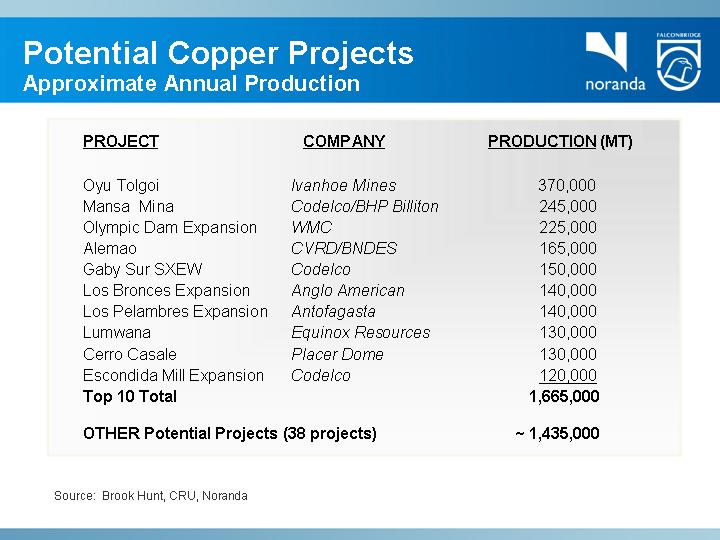
Potential Copper Projects
Approximate Annual Production
PROJECT |
| COMPANY |
| PRODUCTION (MT) |
|
|
|
|
|
|
|
Oyu Tolgoi |
| Ivanhoe Mines |
| 370,000 |
|
Mansa Mina |
| Codelco/BHP Billiton |
| 245,000 |
|
Olympic Dam Expansion |
| WMC |
| 225,000 |
|
Alemao |
| CVRD/BNDES |
| 165,000 |
|
Gaby Sur SXEW |
| Codelco |
| 150,000 |
|
Los Bronces Expansion |
| Anglo American |
| 140,000 |
|
Los Pelambres Expansion |
| Antofagasta |
| 140,000 |
|
Lumwana |
| Equinox Resources |
| 130,000 |
|
Cerro Casale |
| Placer Dome |
| 130,000 |
|
Escondida Mill Expansion |
| Codelco |
| 120,000 |
|
Top 10 Total |
|
|
| 1,665,000 |
|
|
|
|
|
|
|
OTHER Potential Projects (38 projects) |
|
|
| ~ 1,435,000 |
|
Source: Brook Hunt, CRU, Noranda
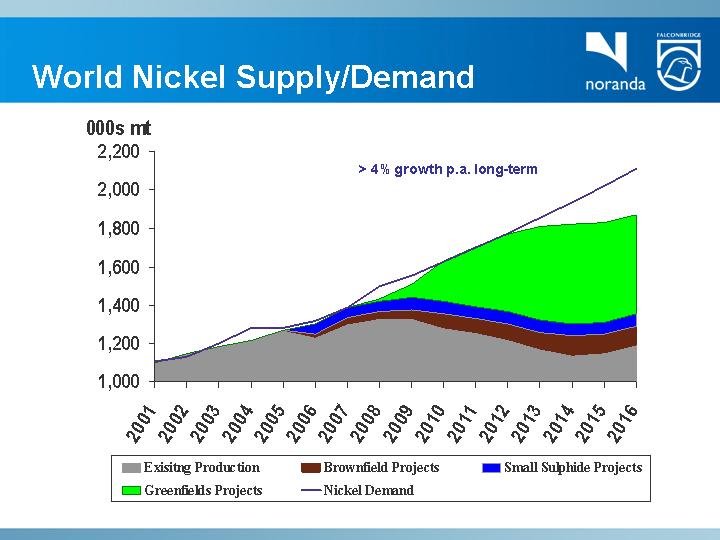
World Nickel Supply/Demand
[CHART]
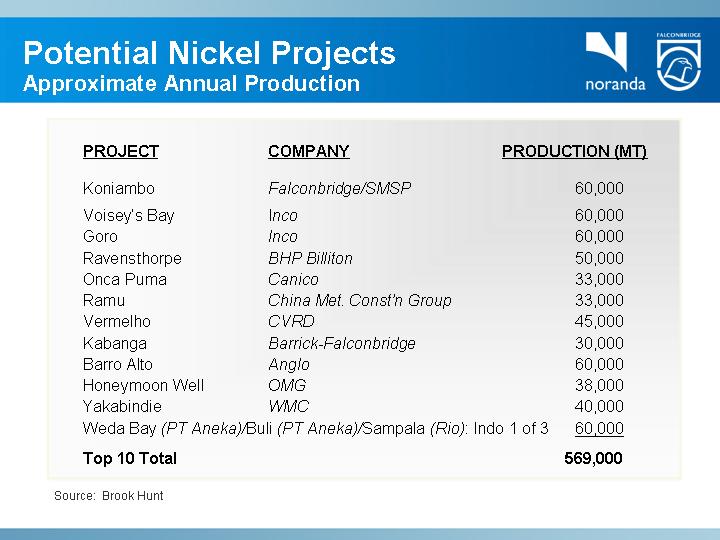
Potential Nickel Projects
Approximate Annual Production
PROJECT |
| COMPANY |
| PRODUCTION (MT) |
|
|
|
|
|
|
|
Koniambo |
| Falconbridge/SMSP |
| 60,000 |
|
Voisey’s Bay |
| Inco |
| 60,000 |
|
Goro |
| Inco |
| 60,000 |
|
Ravensthorpe |
| BHP Billiton |
| 50,000 |
|
Onca Puma |
| Canico |
| 33,000 |
|
Ramu |
| China Met. Const’n Group |
| 33,000 |
|
Vermelho |
| CVRD |
| 45,000 |
|
Kabanga |
| Barrick-Falconbridge |
| 30,000 |
|
Barro Alto |
| Anglo |
| 60,000 |
|
Honeymoon Well |
| OMG |
| 38,000 |
|
Yakabindie |
| WMC |
| 40,000 |
|
Weda Bay (PT Aneka)/Buli (PT Aneka)/Sampala (Rio): Indo 1 of 3 |
|
|
| 60,000 |
|
|
|
|
|
|
|
Top 10 Total |
|
|
| 569,000 |
|
Source: Brook Hunt
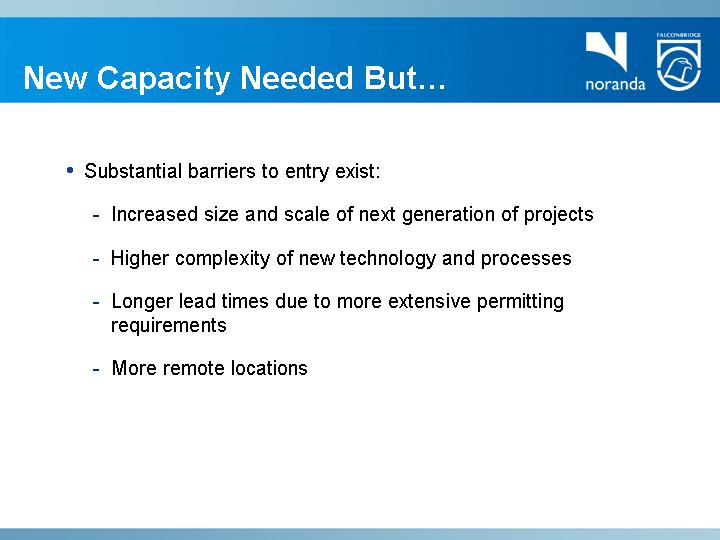
New Capacity Needed But…
• Substantial barriers to entry exist:
• Increased size and scale of next generation of projects
• Higher complexity of new technology and processes
• Longer lead times due to more extensive permitting requirements
• More remote locations
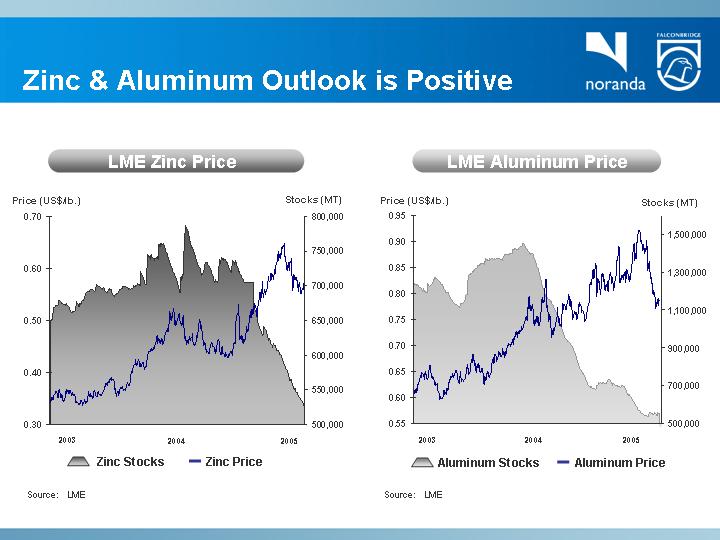
Zinc & Aluminum Outlook is Positive
LME Zinc Price |
| LME Aluminum Price |
|
|
|
[CHART] |
| [CHART] |
|
|
|
Source: LME |
| Source: LME |
Market Outlook
Conclusions
Strong Fundamentals For Base Metals:
• Positive demand growth rates
• Additional supply needed to meet growing demand
• New supply likely; however:
• Long lead times
• Projects are more capital intensive, more complex
• Longer permitting process
• Metal prices to remain volatile
Favourable price environment projected to continue
NorandaFalconbridge
Review of Operations &
Growth Opportunities
[GRAPHIC]
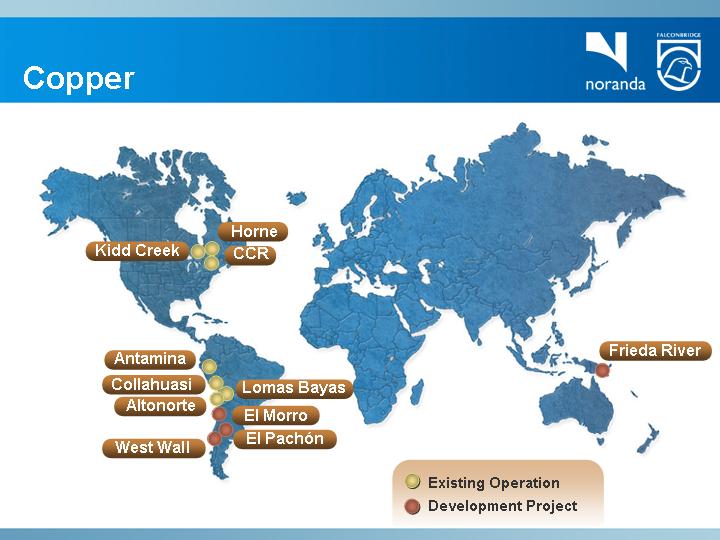
Copper
[GRAPHIC]
Copper
World-Class Assets
• Long-life, low-cost mines located primarily in South America
• Technologically advanced processing facilities, including Altonorte smelter in northern Chile
• Technology produces high margins from the treatment of complex feeds
• Integrated operations drive benefits:
• Mitigate market volatility in treatment costs
• Create freight cost arbitrage
• 2004 net operating cash cost of $0.38/lb. versus $0.40/lb. in 2003
NorandaFalconbridge Total
Mined Copper Output
[CHART]
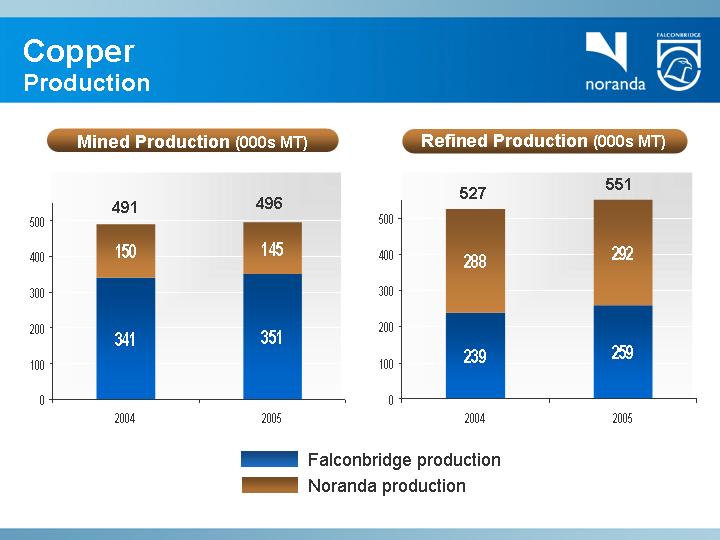
Copper
Production
Mined Production (000s MT) |
| Refined Production (000s MT) |
|
|
|
[CHART] |
| [CHART] |
Copper
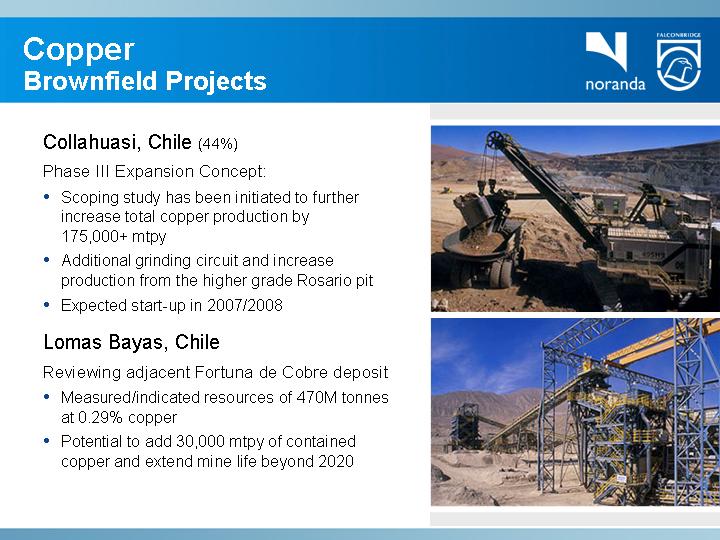
Brownfield Projects
Collahuasi, Chile (44%)
Phase III Expansion Concept:
• Scoping study has been initiated to further increase total copper production by 175,000+ mtpy
• Additional grinding circuit and increase production from the higher grade Rosario pit
• Expected start-up in 2007/2008
[GRAPHIC]
Lomas Bayas, Chile
Reviewing adjacent Fortuna de Cobre deposit
• Measured/indicated resources of 470M tonnes at 0.29% copper
• Potential to add 30,000 mtpy of contained copper and extend mine life beyond 2020
[GRAPHIC]
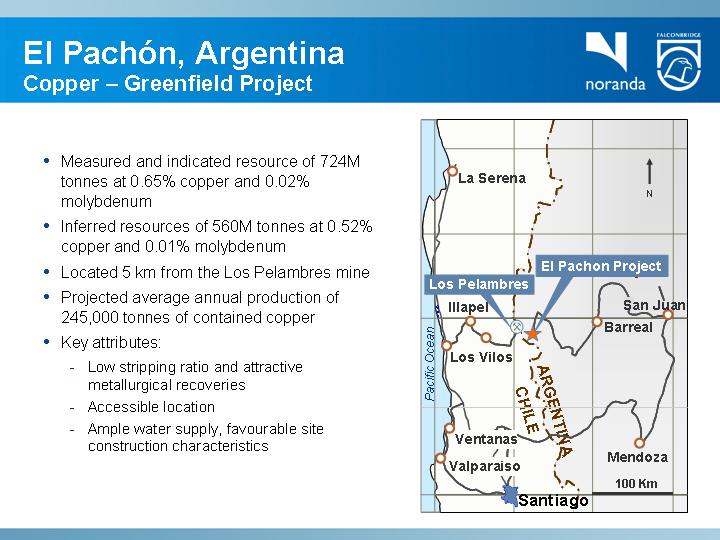
El Pachón, Argentina
Copper – Greenfield Project
• Measured and indicated resource of 724M tonnes at 0.65% copper and 0.02% molybdenum
• Inferred resources of 560M tonnes at 0.52% copper and 0.01% molybdenum
• Located 5 km from the Los Pelambres mine
• Projected average annual production of 245,000 tonnes of contained copper
• Key attributes:
• Low stripping ratio and attractive metallurgical recoveries
• Accessible location
• Ample water supply, favourable site construction characteristics
[GRAPHIC]
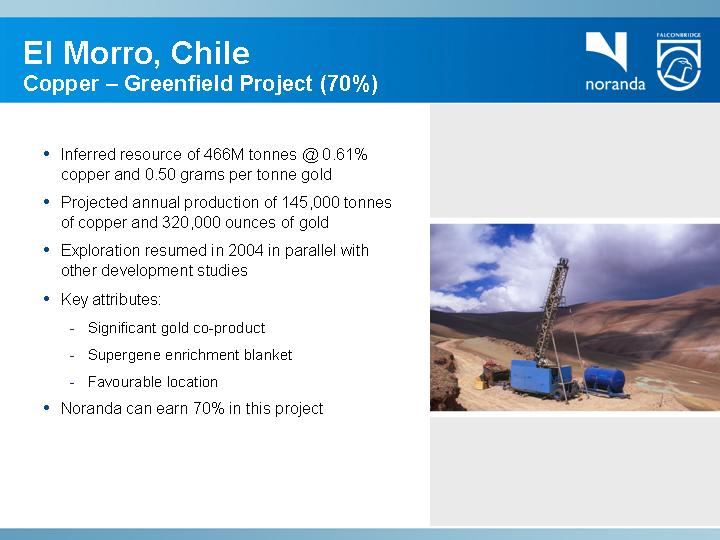
El Morro, Chile
Copper – Greenfield Project (70%)
• Inferred resource of 466M tonnes @ 0.61% copper and 0.50 grams per tonne gold
• Projected annual production of 145,000 tonnes of copper and 320,000 ounces of gold
• Exploration resumed in 2004 in parallel with other development studies
• Key attributes:
• Significant gold co-product
• Supergene enrichment blanket
• Favourable location
• Noranda can earn 70% in this project
[GRAPHIC]
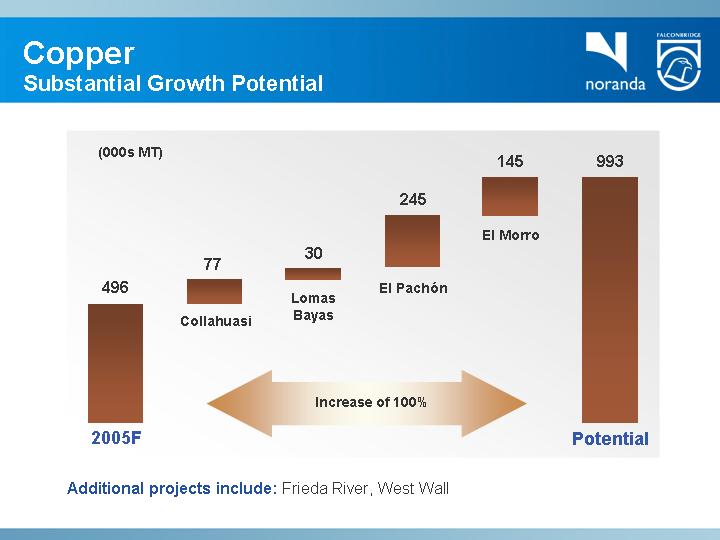
Copper
Substantial Growth Potential
[CHART]
Additional projects include: Frieda River, West Wall
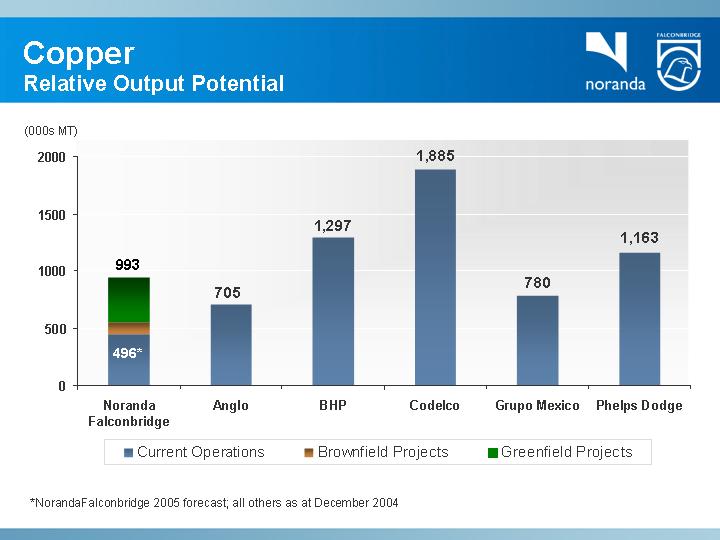
Copper
Relative Output Potential
[CHART]
*NorandaFalconbridge 2005 forecast; all others as at December 2004
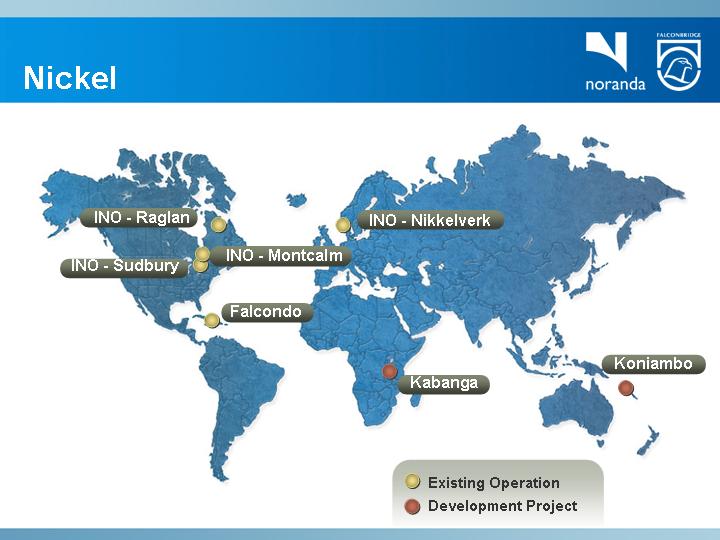
Nickel
[GRAPHIC]
Nickel
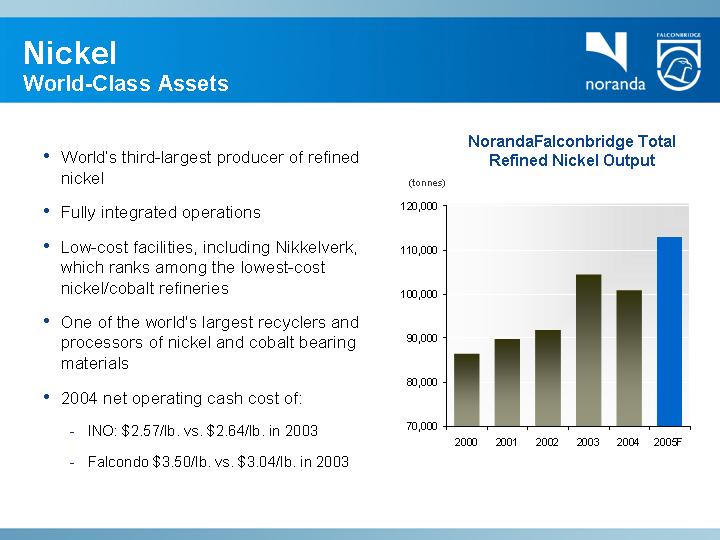
World-Class Assets
• World’s third-largest producer of refined nickel
• Fully integrated operations
• Low-cost facilities, including Nikkelverk, which ranks among the lowest-cost nickel/cobalt refineries
• One of the world’s largest recyclers and processors of nickel and cobalt bearing materials
• 2004 net operating cash cost of:
• INO: $2.57/lb. vs. $2.64/lb. in 2003
• Falcondo $3.50/lb. vs. $3.04/lb. in 2003
NorandaFalconbridge Total
Refined Nickel Output
[CHART]
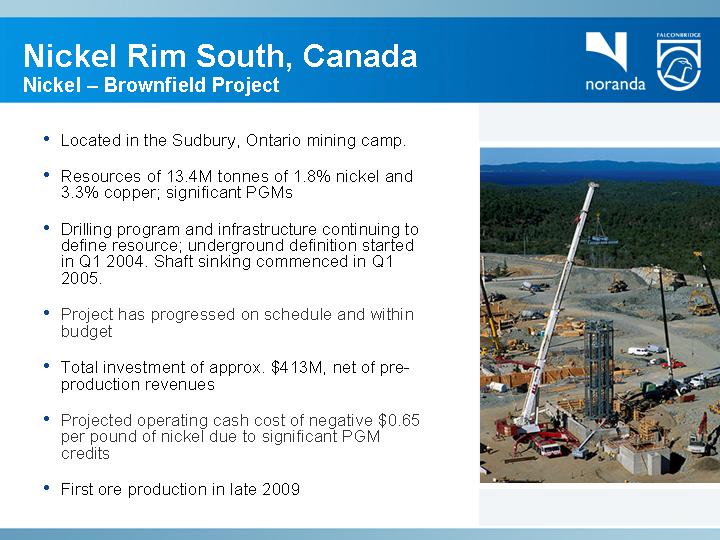
Nickel Rim South, Canada
Nickel – Brownfield Project
• Located in the Sudbury, Ontario mining camp.
• Resources of 13.4M tonnes of 1.8% nickel and 3.3% copper; significant PGMs
• Drilling program and infrastructure continuing to define resource; underground definition started in Q1 2004. Shaft sinking commenced in Q1 2005.
• Project has progressed on schedule and within budget
• Total investment of approx. $413M, net of pre-production revenues
• Projected operating cash cost of negative $0.65 per pound of nickel due to significant PGM credits
• First ore production in late 2009
[GRAPHIC]
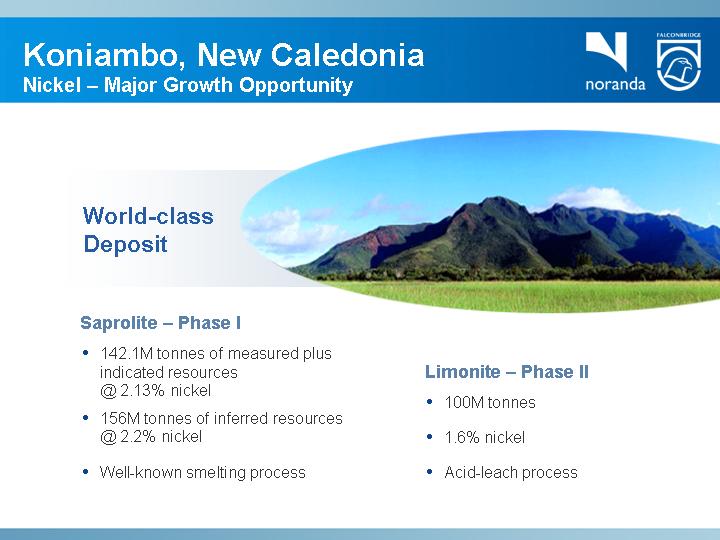
Koniambo, New Caledonia
Nickel – Major Growth Opportunity
World-class Deposit | [GRAPHIC] |
Saprolite – Phase I
• 142.1M tonnes of measured plus indicated resources
@ 2.13% nickel
• 156M tonnes of inferred resources
@ 2.2% nickel
• Well-known smelting process
Limonite – Phase II
• 100M tonnes
• 1.6% nickel
• Acid-leach process
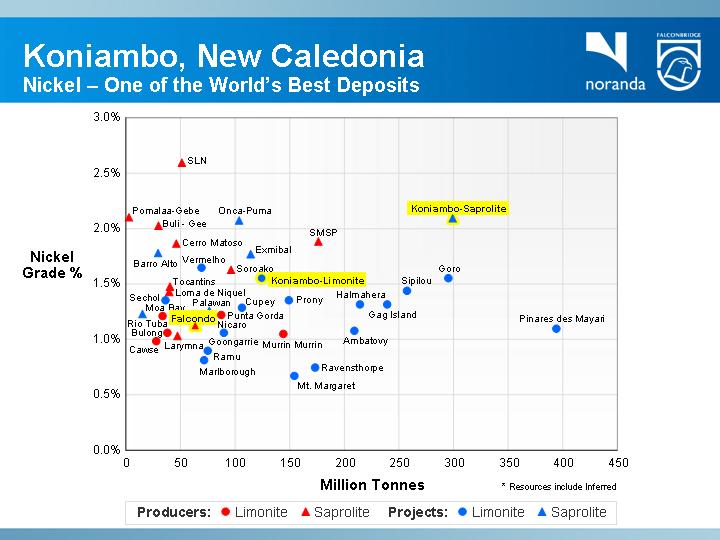
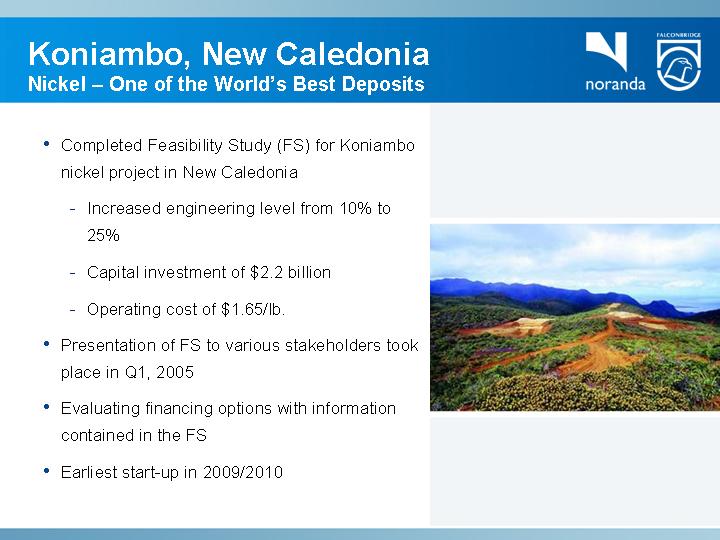
Koniambo, New Caledonia
Nickel – One of the World’s Best Deposits
[CHART]
* Resources include Inferred
• Completed Feasibility Study (FS) for Koniambo nickel project in New Caledonia
• Increased engineering level from 10% to 25%
• Capital investment of $2.2 billion
• Operating cost of $1.65/lb.
• Presentation of FS to various stakeholders took place in Q1, 2005
• Evaluating financing options with information contained in the FS
• Earliest start-up in 2009/2010
[GRAPHIC]
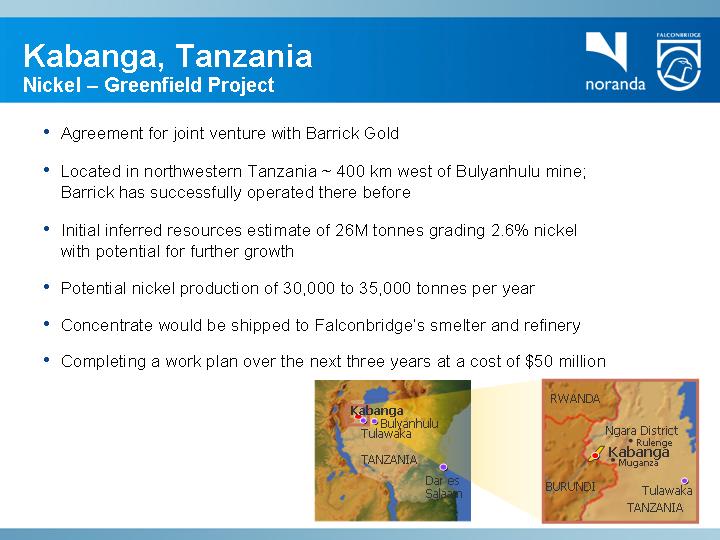
Kabanga, Tanzania
Nickel – Greenfield Project
• Agreement for joint venture with Barrick Gold
• Located in northwestern Tanzania ~ 400 km west of Bulyanhulu mine; Barrick has successfully operated there before
• Initial inferred resources estimate of 26M tonnes grading 2.6% nickel with potential for further growth
• Potential nickel production of 30,000 to 35,000 tonnes per year
• Concentrate would be shipped to Falconbridge’s smelter and refinery
• Completing a work plan over the next three years at a cost of $50 million
[GRAPHIC]
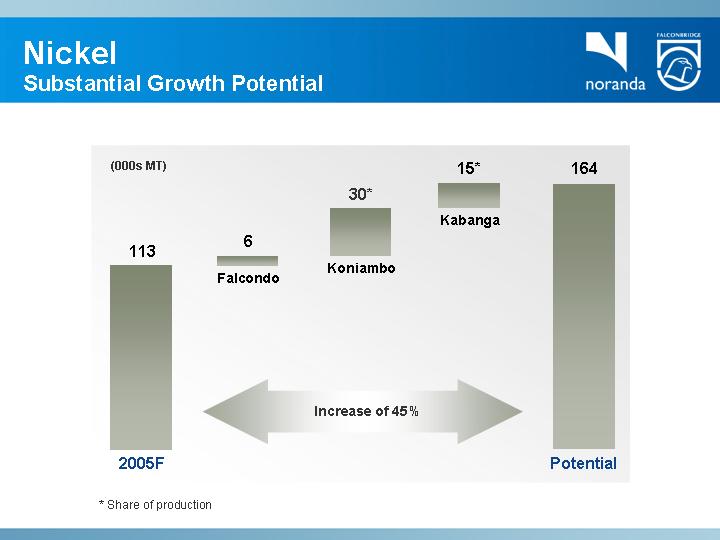
Nickel
Substantial Growth Potential
[CHART]
* Share of production
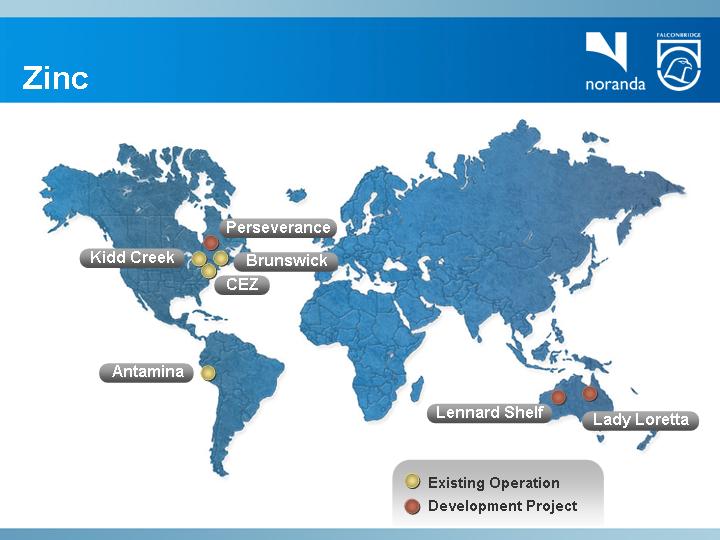
Zinc
[GRAPHIC]
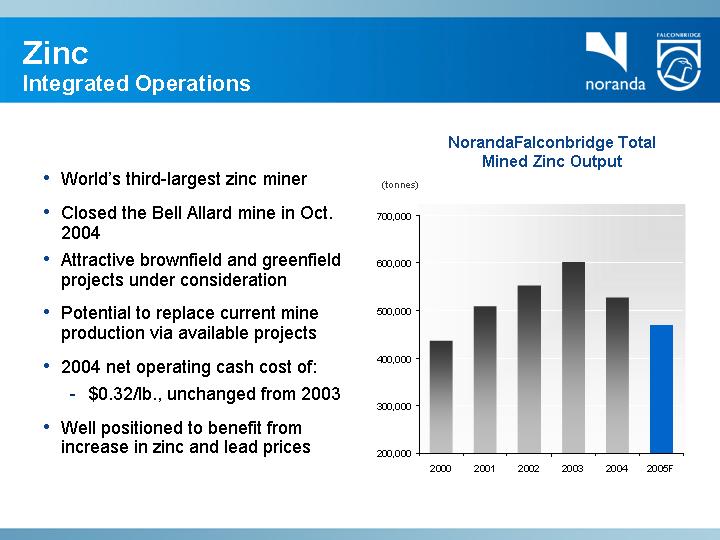
Zinc
Integrated Operations
• World’s third-largest zinc miner
• Closed the Bell Allard mine in Oct. 2004
• Attractive brownfield and greenfield projects under consideration
• Potential to replace current mine production via available projects
• 2004 net operating cash cost of:
• $0.32/lb., unchanged from 2003
• Well positioned to benefit from increase in zinc and lead prices
NorandaFalconbridge Total
Mined Zinc Output
[CHART]
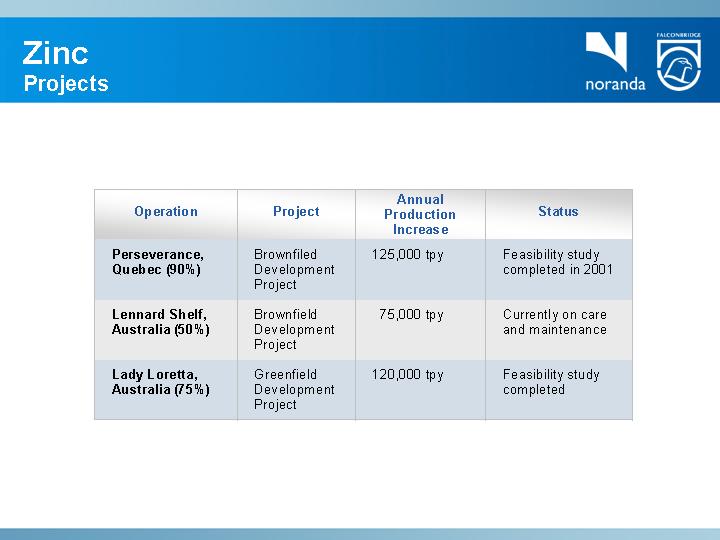
Zinc
Projects
Operation |
| Project |
| Annual |
| Status |
|
Perseverance, |
| Brownfiled Development Project |
| 125,000 tpy |
| Feasibility study completed in 2001 |
|
|
|
|
|
|
|
|
|
Lennard Shelf, |
| Brownfield Development Project |
| 75,000 tpy |
| Currently on care and maintenance |
|
|
|
|
|
|
|
|
|
Lady Loretta, |
| Greenfield Development Project |
| 120,000 tpy |
| Feasibility study completed |
|
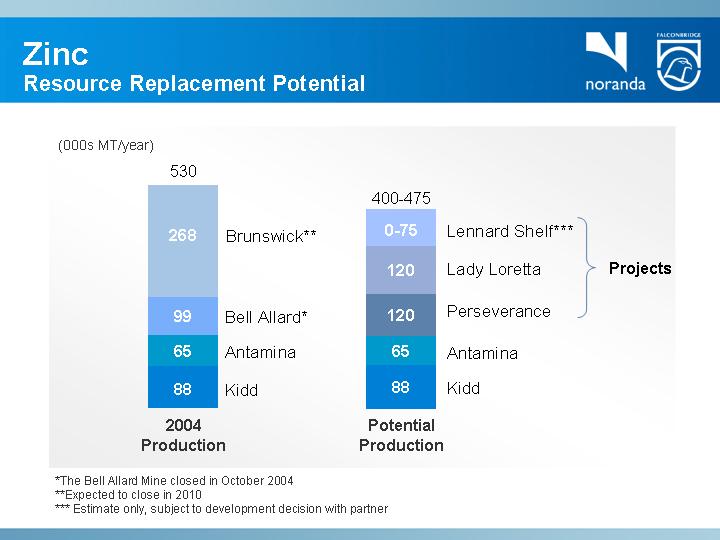
Zinc
Resource Replacement Potential
[CHART] | [CHART] |
|
|
2004 | Potential |
*The Bell Allard Mine closed in October 2004
**Expected to close in 2010
*** Estimate only, subject to development decision with partner
Aluminum
[GRAPHIC]
Aluminum
Smelting and Fabricating Operations
• Primary aluminum smelter located in Missouri
• Supplies approximately 10% of U.S. primary aluminum consumption
• Long-term alumina supply secured via St. Ann bauxite mine and Gramercy Alumina refinery acquisition
• New 15-year power supply contract secured
• Renegotiation of five-year collective agreement completed in 2004
• Renewed operating permit will allow up to 6,000 tonnes per year of additional output
Primary Aluminum Smelter Output
[CHART]
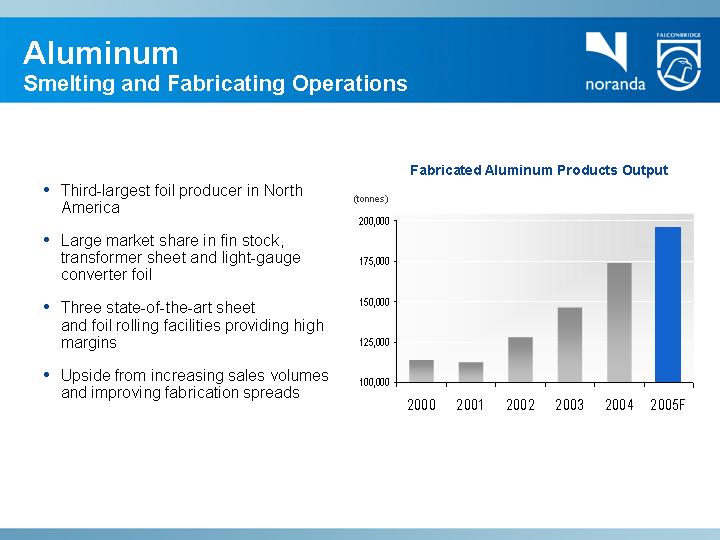
Aluminum
Smelting and Fabricating Operations
• Third-largest foil producer in North America
• Large market share in fin stock, transformer sheet and light-gauge converter foil
• Three state-of-the-art sheet and foil rolling facilities providing high margins
• Upside from increasing sales volumes and improving fabrication spreads
Fabricated Aluminum Products Output
[CHART]
NorandaFalconbridge
Positioned for Growth
[GRAPHIC]
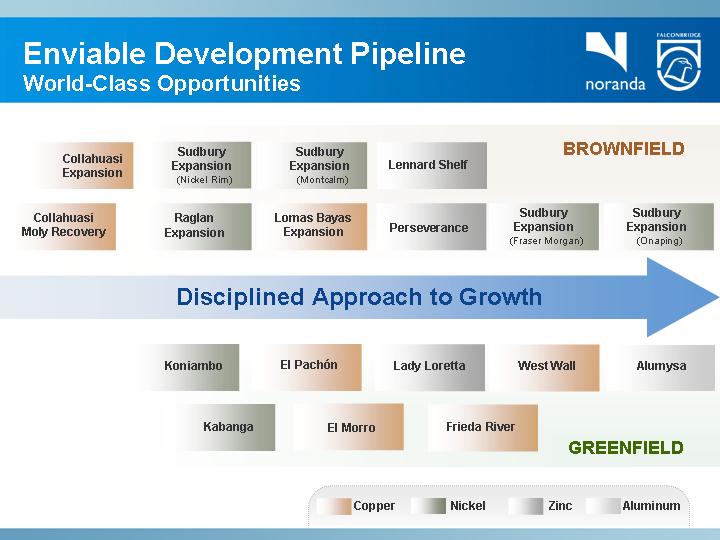
Enviable Development Pipeline
World-Class Opportunities
Collahuasi |
| Sudbury |
| Sudbury |
| Lennard Shelf |
| BROWNFIELD | |||||||
|
|
|
|
|
|
|
|
| |||||||
Collahuasi |
|
| Raglan |
| Lomas Bayas |
| Perseverance |
| Sudbury |
| Sudbury | ||||
|
|
|
|
|
|
|
|
|
|
|
| ||||
Disciplined Approach to Growth | |||||||||||||||
|
|
|
|
|
|
|
|
|
|
| |||||
|
| Koniambo |
| El Pachón |
| Lady Loretta |
| West Wall |
| Alumysa | |||||
|
|
|
|
|
|
|
|
|
|
| |||||
|
| Kabanga | El Morro | Frieda River | GREENFIELD |
| |||||||||
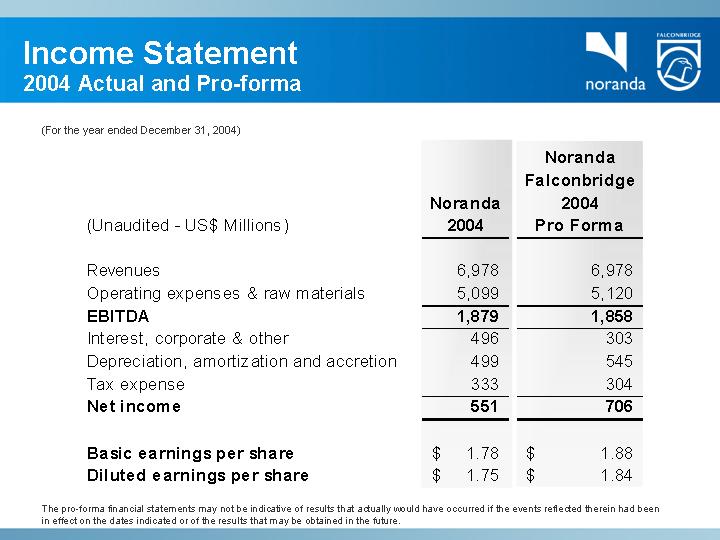
Income Statement
2004 Actual and Pro-forma
(For the year ended December 31, 2004)
(Unaudited - US$ Millions) |
| Noranda |
| Noranda |
| ||
|
|
|
|
|
| ||
Revenues |
| 6,978 |
| 6,978 |
| ||
Operating expenses & raw materials |
| 5,099 |
| 5,120 |
| ||
EBITDA |
| 1,879 |
| 1,858 |
| ||
Interest, corporate & other |
| 496 |
| 303 |
| ||
Depreciation, amortization and accretion |
| 499 |
| 545 |
| ||
Tax expense |
| 333 |
| 304 |
| ||
Net income |
| 551 |
| 706 |
| ||
|
|
|
|
|
| ||
Basic earnings per share |
| $ | 1.78 |
| $ | 1.88 |
|
Diluted earnings per share |
| $ | 1.75 |
| $ | 1.84 |
|
The pro-forma financial statements may not be indicative of results that actually would have occurred if the events reflected therein had been in effect on the dates indicated or of the results that may be obtained in the future.
Income Statement
Q1 Actual and Pro-forma
(For the quarter ended March 31, 2005)
(Unaudited - US$ Millions) |
| Noranda |
| Noranda |
| Noranda |
| |||
|
|
|
|
|
|
|
| |||
Revenues |
| 1,976 |
| 1,653 |
| 1,976 |
| |||
Operating expenses & raw materials |
| 1,403 |
| 1,175 |
| 1,402 |
| |||
EBITDA |
| 573 |
| 478 |
| 574 |
| |||
Interest, corporate & other |
| 156 |
| 123 |
| 85 |
| |||
Depreciation, amortization and accretion |
| 118 |
| 117 |
| 131 |
| |||
Tax expense |
| 123 |
| 86 |
| 119 |
| |||
Net income |
| 176 |
| 152 |
| 239 |
| |||
|
|
|
|
|
|
|
| |||
Basic earnings per share |
| $ | 0.58 |
| $ | 0.50 |
| $ | 0.64 |
|
Diluted earnings per share |
| $ | 0.57 |
| $ | 0.49 |
| $ | 0.63 |
|
* Restated for accounting rule changes adopted Jan. 1, 2005
The pro-forma financial statements may not be indicative of results that actually would have occurred if the events reflected therein had been in effect on the dates indicated or of the results that may be obtained in the future.
Balance Sheet
Q1 Actual and Pro-forma
(For the quarter ended March 31, 2005)
(Unaudited - US$ Millions) |
| Noranda |
| Noranda |
| Noranda |
|
|
|
|
|
|
|
|
|
ASSETS |
|
|
|
|
|
|
|
Cash and cash equivalents |
| 1,000 |
| 884 |
| 981 |
|
Accounts receivable and inventories |
| 2,428 |
| 2,384 |
| 2,503 |
|
Capital assets, projects and other assets |
| 6,354 |
| 6,360 |
| 8,540 |
|
Total Assets |
| 9,782 |
| 9,628 |
| 12,024 |
|
|
|
|
|
|
|
|
|
LIABILITIES AND EQUITY |
|
|
|
|
|
|
|
Current liabilities |
| 1,833 |
| 1,835 |
| 1,839 |
|
Long-term debt |
| 2,574 |
| 2,736 |
| 2,570 |
|
Preferred share liabilities |
| 121 |
| 122 |
| 1,371 |
|
Other |
| 971 |
| 899 |
| 1,718 |
|
Stockholders’ interests |
| 4,283 |
| 4,036 |
| 4,526 |
|
Total Liabilities and Equity |
| 9,782 |
| 9,628 |
| 12,024 |
|
* Restated for accounting rule changes adopted Jan. 1, 2005
The pro-forma financial statements may not be indicative of results that actually would have occurred if the events reflected therein had been in effect on the dates indicated or of the results that may be obtained in the future.
• Industry fundamentals are exceptionally strong with the demand shock from Asia and specifically China
• China has now become the world’s largest consumer of most major commodities as it continues to industrialize its economy
• The base metals industry is challenged to add supply due to the increased size, complexity and time required to develop new projects
• NorandaFalconbridge is very well positioned as one of the world’s largest base metal producers with one of the best pipelines of development projects
• The Company’s financial capacity will further increase, based on the expectation of the continuing strong metal price environment
• Simplified organizational structure and increased share float enhance investment appeal
[GRAPHIC]
Scotia Capital
Materials Conference
June 1, 2005
[GRAPHIC]
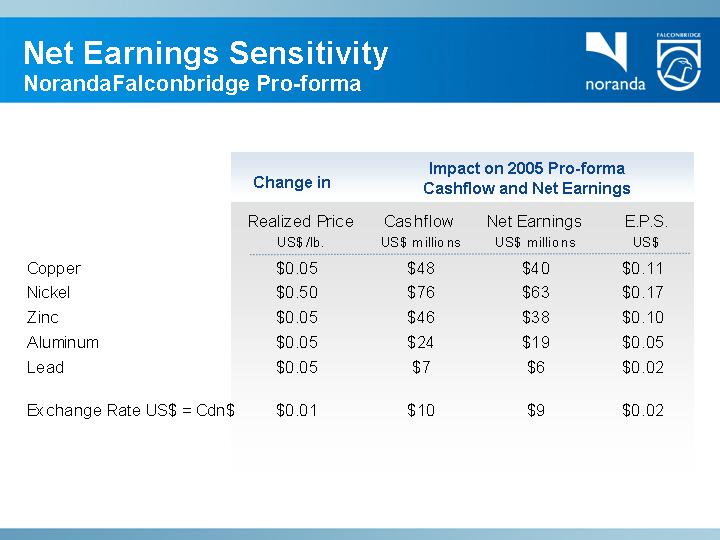
Net Earnings Sensitivity
NorandaFalconbridge Pro-forma
|
| Change in |
| Impact on 2005 Pro-forma |
| ||||||||
|
| Realized Price |
| Cashflow |
| Net Earnings |
| E.P.S. |
| ||||
Copper |
| $ | 0.05 |
| $ | 48 |
| $ | 40 |
| $ | 0.11 |
|
Nickel |
| $ | 0.50 |
| $ | 76 |
| $ | 63 |
| $ | 0.17 |
|
Zinc |
| $ | 0.05 |
| $ | 46 |
| $ | 38 |
| $ | 0.10 |
|
Aluminum |
| $ | 0.05 |
| $ | 24 |
| $ | 19 |
| $ | 0.05 |
|
Lead |
| $ | 0.05 |
| $ | 7 |
| $ | 6 |
| $ | 0.02 |
|
|
|
|
|
|
|
|
|
|
| ||||
Exchange Rate US$ = Cdn$ |
| $ | 0.01 |
| $ | 10 |
| $ | 9 |
| $ | 0.02 |
|