Exhibit 99.2
Investor Supplement Fourth Quarter 2012 Update

31 Forward-Looking Statements & Non-GAAP Financial Measures Certain statements made by Meadowbrook Insurance Group, Inc. in this release may constitute forward-looking statements including, but not limited to, those statements that include the words “believes,” “expects,” “anticipates,” “estimates,” or similar expressions. Please refer to the Company's most recent 10-K, 10-Q, and other filings with the Securities and Exchange Commission for more information on risk factors. Actual results could differ materially. These forward-looking statements involve risks and uncertainties including, but not limited to the following: premium volume and operating leverage, the frequency and severity of claims; uncertainties inherent in reserve estimates; catastrophic events; a change in the demand for, pricing of, availability or collectibility of reinsurance; increased rate pressure on premiums and on underwriting criteria; ability to obtain rate increases in current market conditions; investment rate of return and losses (whether realized or unrealized) in the Company’s investment portfolio; changes in and adherence to insurance or other regulation; actions taken by regulators, rating agencies or lenders, including possible downgrade of the company’s current A- financial strength rating; attainment of certain processing efficiencies; changing rates of inflation; impairment of intangibles; general economic conditions; the Company’s possible ability to implement its capital raising and capital preservation strategies in a timely manner; and other risks identified in the Company’s reports and registration statements filed with the Securities and Exchange Commission, any of which may have a material and adverse effect on the Company’s results of operations and financial condition. Meadowbrook is not under any obligation to (and expressly disclaims any such obligation to) update or alter its forward-looking statements whether as a result of new information, future events or otherwise. Notes on Non-GAAP Financial Measures (1)Net operating income is a non-GAAP measure defined as net income excluding after-tax realized gains and losses. (2)Accident year combined ratio is a non-GAAP measure that represents the impact of any adverse or favorable development on prior year loss reserves. (3)Statutory surplus is a non-GAAP measure with the most directly comparable financial GAAP measure being shareholders’ equity. These non-GAAP metrics are common measurements for property and casualty insurance companies. We believe this presentation enhances the understanding of our results by highlighting the underlying profitability of our insurance business. Additionally, these measures are key internal management performance standards.

33 4Q 2011 vs. 4Q 2012 Underwriting and Investing Activities •Top line earned premium growth driven primarily by rate increases and maturation of existing business. Net Commissions & Fees •Revenue increase driven primarily by a Michigan agency that was acquired in 4Q 2011. Other Expenses •The 2011 results reflect a reduction in the accrual for variable compensation and the 2012 results reflect the write off of an intangible asset related to the Public Entity Excess Liability program that we terminated; excluding these items other expenses for 2012 were in line with 2011. Taxes •The 2012 GAAP federal effective tax rate for the fourth quarter was 26.6%, primarily due to a tax benefit on underwriting losses and tax expense from the security sales that generated $52M in realized gains. Capital Gains •During the quarter of 2012 we initiated a security sales program in an effort to enhance our statutory surplus.

34 4Q 2011 vs. 4Q 2012 Combined Ratio Analysis Loss and LAE Ratio •The 2012 loss and LAE ratio includes 1.8 points of adverse development compared to 3.8 points of adverse development in 2011. •The 2012 accident year loss and LAE ratio increased 6.2 points to 71.6% from 65.4% in 2011; the 2012 accident year loss ratio reflects the impact of Super Storm Sandy, which added 3.1 points and an increase in our 2012 forecasted loss ratio based upon the increase in net ultimate loss estimates for the 2009, 2010 and 2011 accident years. Expense Ratio •The 2012 expense ratio improved 1.0 points in comparison to the prior year. The decrease reflects a lower level of technology expenses and leveraging of fixed costs over a larger premium base.

35 Full Year 2011 vs. 2012 Underwriting and Investing Activities •Top line earned premium growth driven primarily by rate increases and maturation of existing business. Net Commissions & Fees •Revenue increase driven primarily by a Michigan agency that was acquired in 4Q 2011. Other Expenses •The 2011 results reflect a reduction in the accrual for variable compensation and the 2012 results reflect the write off of an intangible asset related to the Public Entity Excess Liability program that we terminated; excluding these items other expenses for 2012 were in line with 2011 Taxes •The GAAP federal effective tax rate for the year was approximately -794.3%, refer to slide 37 for additional details. Capital Gains •During the fourth quarter of 2012 we initiated a security sales program in an effort to enhance our statutory surplus.
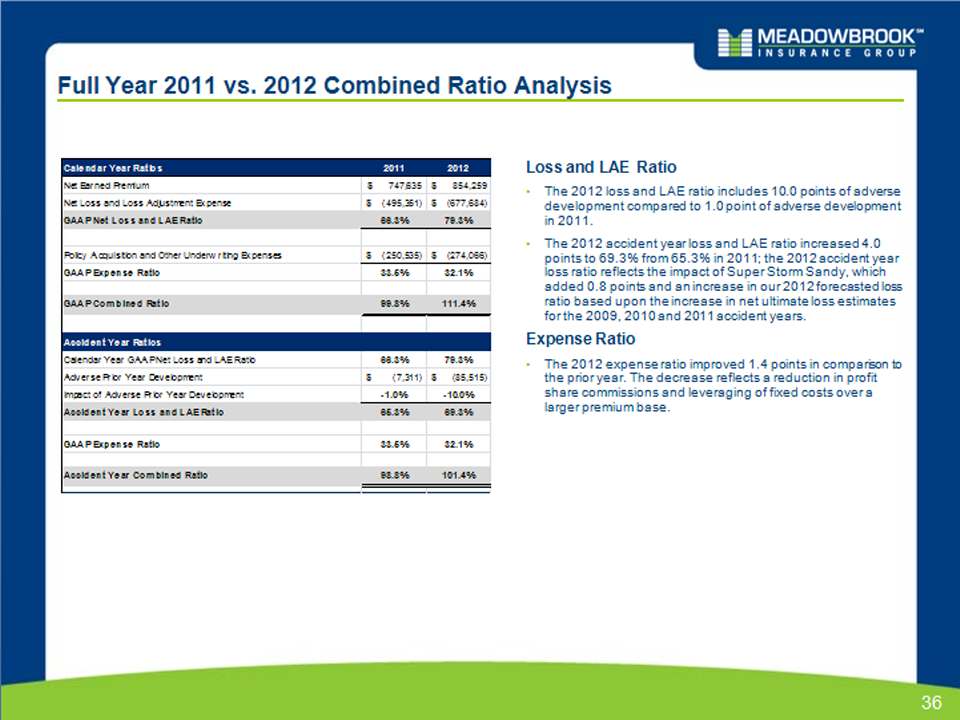
36 Full Year 2011 vs. 2012 Combined Ratio Analysis Loss and LAE Ratio •The 2012 loss and LAE ratio includes 10.0 points of adverse development compared to 1.0 point of adverse development in 2011. •The 2012 accident year loss and LAE ratio increased 4.0 points to 69.3% from 65.3% in 2011; the 2012 accident year loss ratio reflects the impact of Super Storm Sandy, which added 0.8 points and an increase in our 2012 forecasted loss ratio based upon the increase in net ultimate loss estimates for the 2009, 2010 and 2011 accident years. Expense Ratio •The 2012 expense ratio improved 1.4 points in comparison to the prior year. The decrease reflects a reduction in profit share commissions and leveraging of fixed costs over a larger premium base. Full Year 2011 vs. 2012 2012 federal Effective Tax rate reflects benefit from capital loss carry forwards

37 •Rate on Net Investment Income – 24.6%, tax expense of $13.4 million •Rate on Fee Based and Underwriting Income – 42.1%, tax benefit of $1.8 million •Rate on Capital Gains – 8.6%, tax expense of $0.3 million •Total federal tax rate of 22.3% 2011 ($ in millions) 24.6% 42.1% 8.6% Effective Tax Rate: 22.3% •Rate on Net Investment Income – 25.7%, tax expense of $13.7 million •Rate on Fee Based and Underwriting Income – 34.3%, tax benefit of $(36.9) million •Rate on Capital Gains – 27.4%, tax expense of $15.2 million •Total federal tax rate of – negative 794.3% 2012 Actual ($ in millions) 25.7% 34.3% 27.4% Effective Tax Rate: -794.3%

38 Reserves Reserves Overview History of Favorable indications through 2010 •Cumulative favorable loss & LAE development of $76.4 million in calendars years 2008 – 2010. •2008 AY loss & LAE ratio has remained stable since 12/31/2010 estimate Historic claim data pattern changed for accident years 2009, 2010, & 2011, result is strengthening reserves by $85.5 million in 2012. In Q2 2012, reserve review we identified average case reserve acceleration driven primarily by three major factors (1) Claims department “Top Ten Exposure” program - Auto Liability and Liability Occurrence (2) Normalization of average case load per adjuster in CA workers’ compensation claims office (3) Public Entity Excess case reserve strengthening / acceleration Prior accident year incurred claim activity stabilized in the fourth quarter •This leveling off of prior year reserves reflects an expected trend toward a lower (than the first three quarters of 2012), historical level of claim emergence as the impacts of the factors above dissipate over time •We expect this to lead to more stable claim development patterns as well Reserves are recorded above the midpoint of our range of estimates in consideration of volatility inherent with disruptions of historical claim development patterns
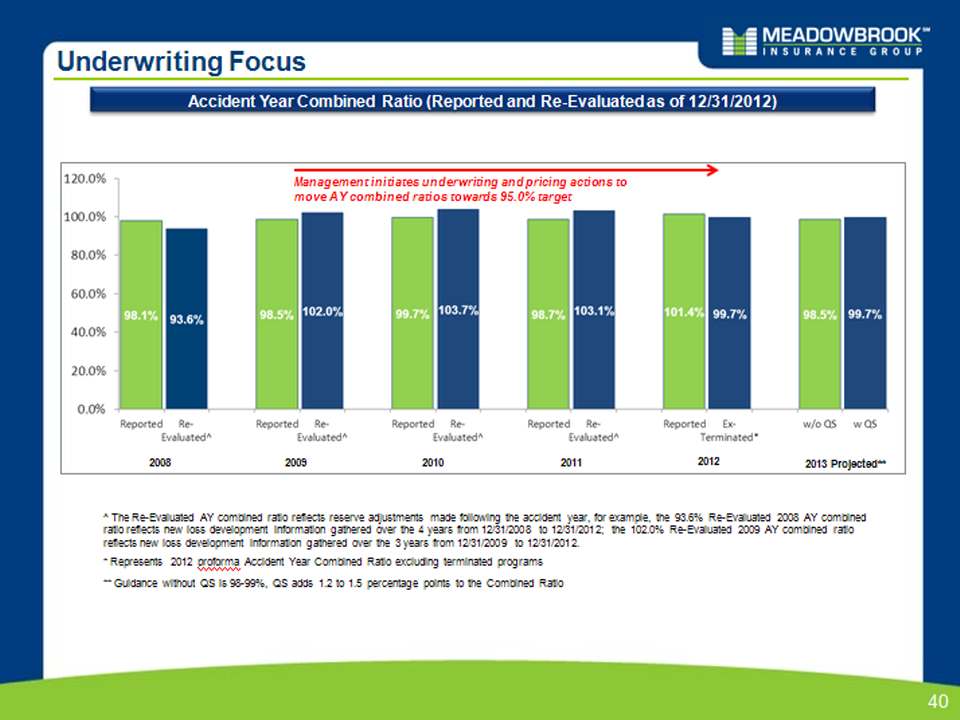
40 Underwriting Focus Accident Year Combined Ratio (Reported and Re-Evaluated as of 12/31/2012) ^ The Re-Evaluated AY combined ratio reflects reserve adjustments made following the accident year, for example, the 93.6% Re-Evaluated 2008 AY combined ratio reflects new loss development information gathered over the 4 years from 12/31/2008 to 12/31/2012; the 102.0% Re-Evaluated 2009 AY combined ratio reflects new loss development information gathered over the 3 years from 12/31/2009 to 12/31/2012. Management initiates underwriting and pricing actions to move AY combined ratios towards 95.0% target 2008 2009 2010 2011 2012 2013 Projected** * Represents 2012 proforma Accident Year Combined Ratio excluding terminated programs ** Guidance without QS is 98-99%, QS adds 1.2 to 1.5 percentage points to the Combined Ratio

41 Underwriting Focus Accident Year Combined Ratio (Re-Evaluated as of 12/31/2012) 2008 2009 2010 2011 ^ The Re-Evaluated AY combined ratio reflects reserve adjustments made following the accident year, for example, the 93.6% Re-Evaluated 2008 AY combined ratio reflects new loss development information gathered over the 4 years from 12/31/2008 to 12/31/2012 2012 * Represents 2009 - 2012 proforma GAAP and Accident Year Combined Ratio excluding terminated programs ** Guidance without QS is 98-99%, QS adds 1.2 to 1.5 percentage points to the Combined Ratio 2013 Projected** 5.8% 4.1% 4.4% 1.7% Terminated Programs
42 Underwriting Focus GAAP Combined Ratio 2008 2009 2010 2011 2012 * Represents 2009 - 2012 proforma GAAP and Accident Year Combined Ratio excluding terminated programs 2013 Projected** ** Guidance without QS is 98-99%, QS adds 1.2 to 1.5 percentage points to the Combined Ratio
43 2012 Reserve Development on Prior Accident Years 10 Year Reserve Development on Prior Accident Years Percent of Prior Year Reserves 1.5% 2.4% (4.5 %) 0.9 % 9.7 % 2.2% (1.0%) (2.3%) (4.9%) (4.6%) 2012 Quarterly Development on Prior Accident Years Reserve Development Adverse / (Favorable) ($m)

44 2012 Reserve Development – YTD 12/31/12* Continued Synergistic Expansion 2012 Reserve Development & Net Reserves at 12/31/2011 ($ in ‘000s) $85.5M Development by Accident Year ($ in ‘000s) The vast majority of the 2012 reserve development relates to the 2009-2011 accident years. Total Development: $85.5M 12/31/2011 Net Reserves: $879.1M As % of Reserves: 9.7% * Loss & LAE prior year development as presented in financials Remainder of reserve-related slides focus on Loss & ALAE (i.e. excl. Allowances and ULAE) Sources of Development – YTD Loss & ALAE Loss & ALAE – Adverse Development (1) Auto Liability: $19.8 million (primarily AY 2010 – 2011) (2) Liability Occurrence: $18.4 million (primarily AY 2009 – 2011) (3) California Workers' Compensation: $30.0 million (primarily AY 2009 – 2011) (4) Excess Lines : $15.3 million (primarily driven by Public Entity Excess 2007 – prior) Other Lines, ULAE & Allowances •$2.0 million adverse Loss & LAE Total •$85.5 million adverse Which lines caused the prior year development?

45 What Happened? In Q2 2012, case incurred loss & ALAE (excluding IBNR) increased $23.9 million from $114.7 million in Q1 to $138.6 million in Q2 •21% higher than first quarter In Q2 2012, reserve review we identified average case reserve acceleration driven primarily by three major factors (1) Claims department “Top Ten Exposure” program - Auto Liability and Liability Occurrence (2) Normalization of average case load per adjuster CA workers’ compensation claims office (3) Public Entity Excess case reserve strengthening / acceleration After Q2 2012 analysis, we expected 3rd quarter incurred loss ratio to drop to normal levels after the spike in 2nd quarter. It came down but not as much as expected so we strengthened reserves an additional $42.9 million in Q3 In Q4, the reported loss ratio continued to show a downward trend back to more ‘normal’ levels. The Q4 adverse development of $4.2 million driven by run-off of terminated Public Entity program. What caused the prior year development?

46 * Excludes Public Entity Excess, 63.5% with Public Entity Excess “Top Ten Exposure” Program: Overview Cause: •Claims department program was announced to the claim adjusters in November 2011 •Goal of program was to identify (but not necessarily change reserves on) high exposure claims earlier in the claims process to improve communication with claims management and to improve claim outcomes by focusing on complex issues •Each claim adjuster was required to report their “Top Ten Exposure” claims to their manager, with the first report due Feb 15, 2012 •Managers presented their "Top Ten Exposure" lists up the line to Corporate Claims •Eventually escalated approximately 750 claims to the corporate claims department Unintentional Effect: •Accelerated the development patterns of the claims towards ultimate probable cost –Especially pronounced in Auto Liability and Liability Occurrence How did it work?

47 “Top Ten Exposure” Program: Observations Verification of “Top Ten Exposure” acceleration impact •In Q2, the actuarial team learned of the “Top Ten Exposure” project •In Q2, they gave some credit to the “Top Ten Exposure” acceleration in our ultimate loss selections, but not full weight •Throughout Q3, we worked with our external advisers to analyze the impact and confirmed that claim acceleration had occurred on these claims •In Q3, we gave even less weight to the acceleration resulting in a stronger reserve position, particularly in Auto Liability and General Liability •If it was more of an acceleration than we gave weight to, then our reserves are even stronger •We expect the claim handling process and reported loss ratio activity to gradually return to more normal levels as the impact of the acceleration dissipates over time •In Q4, we continued to see evidence that the claim activity in 2012 was attributable to an acceleration in the claim handling process. Therefore, we continued to place the same weight on this assumption in the fourth quarter as in the third quarter •Reserves stabilized in the fourth quarter

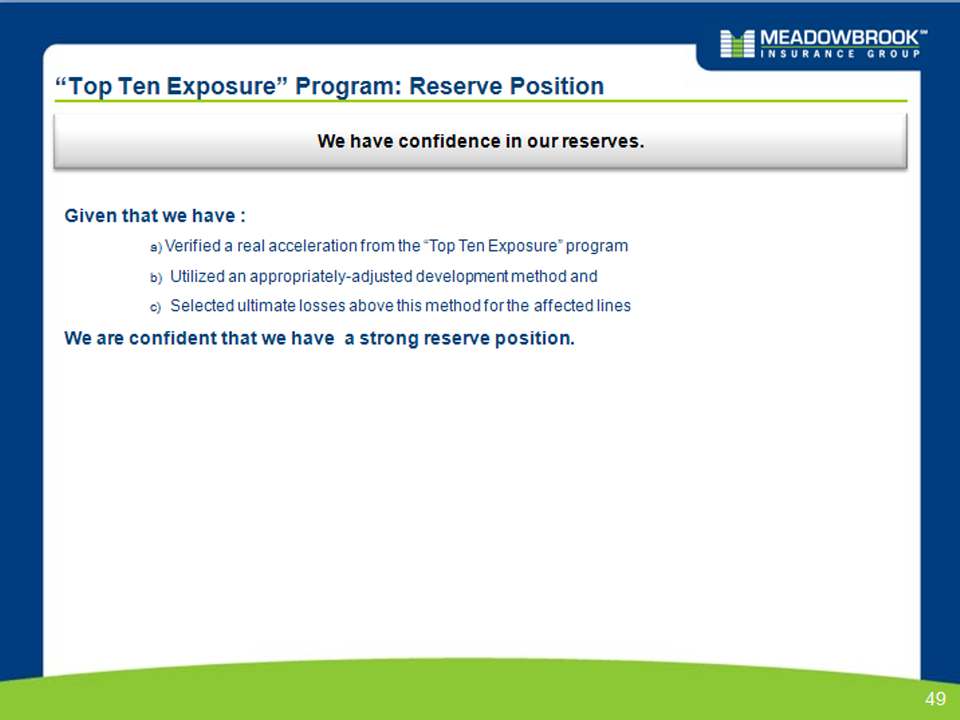
48 “Top Ten Exposure” Program: Reserve Position Given that we have : a) Verified a real acceleration from the “Top Ten Exposure” program b) Utilized an appropriately-adjusted development method and c) Selected ultimate losses above this method for the affected lines We are confident that we have a strong reserve position.
49 We have confidence in our reserves. California Workers’ Compensation Reserve Development •As planned, we hired new claim adjusters to manage increased claim volume due to the growth of our California workers’ compensation business in recent years. As we hired new adjusters, the case load per adjuster went down •Result: Case reserve strengthening and an acceleration of the closing pattern •While individual case reserve strengthening alone does not automatically lead to adverse development, the strengthening led us to utilize development factors that are higher than the industry and record higher loss ratios on this business than we had previously estimated •Led to IBNR strengthening of $22.8 million year-to-date (Workers’ Comp Western) •We achieved cumulative written and earned rates increases of 33% and 23% from 2010 through 2012, respectively •California WC AY Combined Ratios are trending favorably with rate increases in excess of loss ratio trend

50 Positioned to Manage Insurance Cycles – CA WC Low Hazard Mix of Business
51 How does our business mix compare to California workers’ compensation industry? •Low hazard group mix •We write 71% of our premium in hazard groups 1 & 2 vs. 55% for the industry •Almost no premium in hazard groups 6 & 7 vs. 5% for the industry •Industry group mix favorable •We write 67% of our premium in the goods and services industry vs. 37% for the industry •We write 3% of our premium in the construction industry vs. 12% for the industry •Our construction business is approximately 50% landscape contractors •Earned rate levels are now above industry (according to WCIRB) •Experience mods are almost 10% better than the industry benchmark Positioned to Manage Insurance Cycles – CA WC Low Hazard Mix of Business (Continued) We write our premium in less hazardous groups and more favorable CA WC industries Hazard Group Distribution Meadowbrook Industry

52 6 & 7 1 & 2 3, 4 & 5 3, 4 & 5 1 & 2 6 & 7 Positioned to Manage Insurance Cycles – CA WC Low Hazard Mix of Business (Continued) We write our premium in less hazardous groups and more favorable CA WC industries Meadowbrook Industry Industry Group Distribution

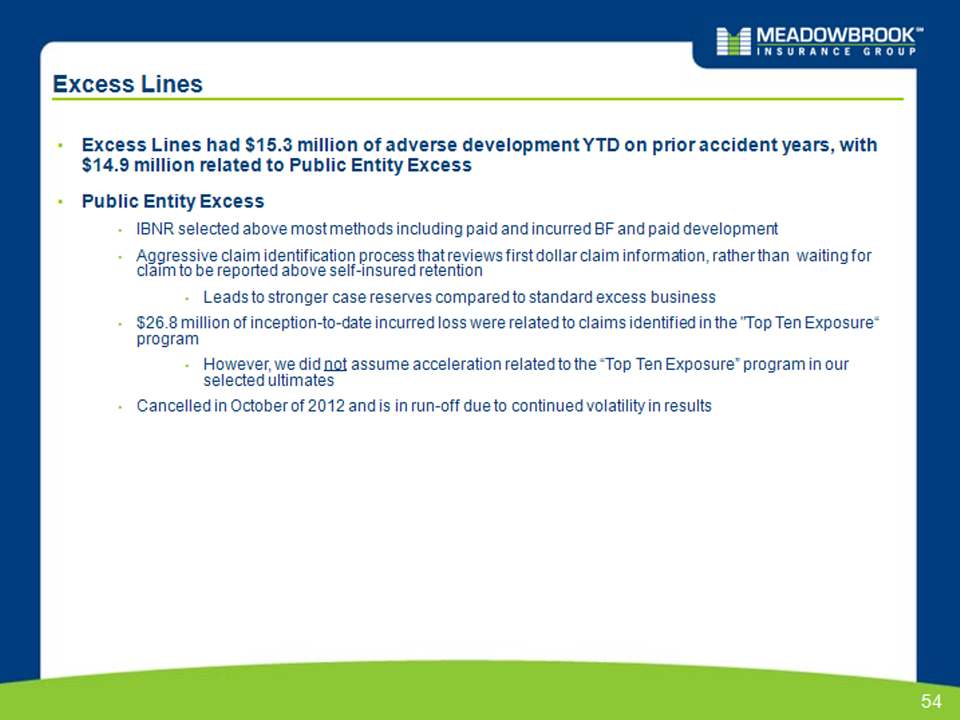
53 Manufacturing Goods and Services Goods and Services Manufacturing Office & Clerical Office & Clerical Construction Construction Other Other Excess Lines •Excess Lines had $15.3 million of adverse development YTD on prior accident years, with $14.9 million related to Public Entity Excess •Public Entity Excess •IBNR selected above most methods including paid and incurred BF and paid development •Aggressive claim identification process that reviews first dollar claim information, rather than waiting for claim to be reported above self-insured retention •Leads to stronger case reserves compared to standard excess business •$26.8 million of inception-to-date incurred loss were related to claims identified in the "Top Ten Exposure“ program •However, we did not assume acceleration related to the “Top Ten Exposure” program in our selected ultimates •Cancelled in October of 2012 and is in run-off due to continued volatility in results
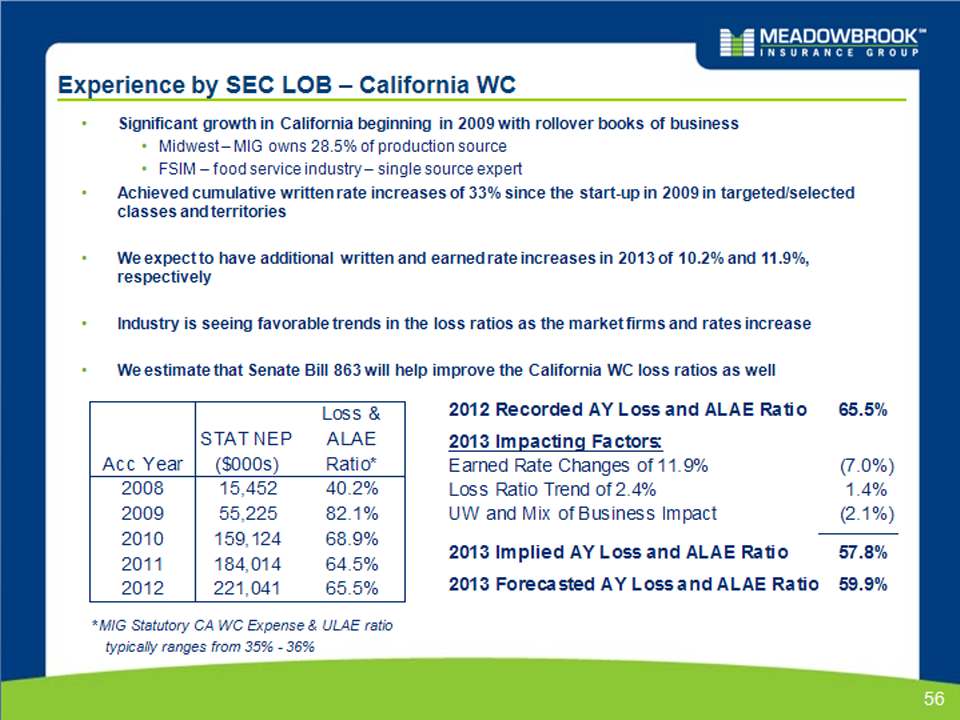
55 SEC Line of Business Detail: Experience and Projections Experience by SEC LOB – California WC •Significant growth in California beginning in 2009 with rollover books of business •Midwest – MIG owns 28.5% of production source •FSIM – food service industry – single source expert •Achieved cumulative written rate increases of 33% since the start-up in 2009 in targeted/selected classes and territories •We expect to have additional written and earned rate increases in 2013 of 10.2% and 11.9%, respectively •Industry is seeing favorable trends in the loss ratios as the market firms and rates increase •We estimate that Senate Bill 863 will help improve the California WC loss ratios as well
56 * MIG Statutory CA WC Expense & ULAE ratio typically ranges from 35% - 36% Experience by SEC LOB – Auto •We terminated underperforming classes of Auto and transportation •Transportation book was one of the primary causes of the poor Auto performance in 2009 - 2012 –It added 4.8 of the 10.3 point impact on the loss & ALAE ratio from now-terminated business •We terminated three other Auto books of business –They added the remaining 5.5 points of the terminated business impact on the 2012 loss & ALAE ratio •For the entire Auto segment, written rate increases were 9.7% from 2010 – 2012. Target increase is 9.1% for 2013 •Expected UW improvements as well in 2013 from UW actions such as reduced writings in New York

57 * MIG Statutory Auto Expense & ULAE ratio typically ranges from 34% - 36% Experience by SEC LOB – CMP / GL (excluding Public Entity Excess) •Historically a very profitable line of business for Meadowbrook •There was a spike in incurred loss activity in 2011 •Continued area to target for profitable growth •We believe this line of business was most impacted by the claim handling acceleration observed in calendar year 2012 (“Top Ten Exposure” program) •We have achieved written rate increases of 3.4% in 2012 •Rate changes were negative in 2010 and 2011 for this line of business, so they are now moving the in the right direction •We expect to have written and earned rate increases in 2013 of 7.1% and 5.4%, respectively •These are in excess of the 4% loss ratio trend
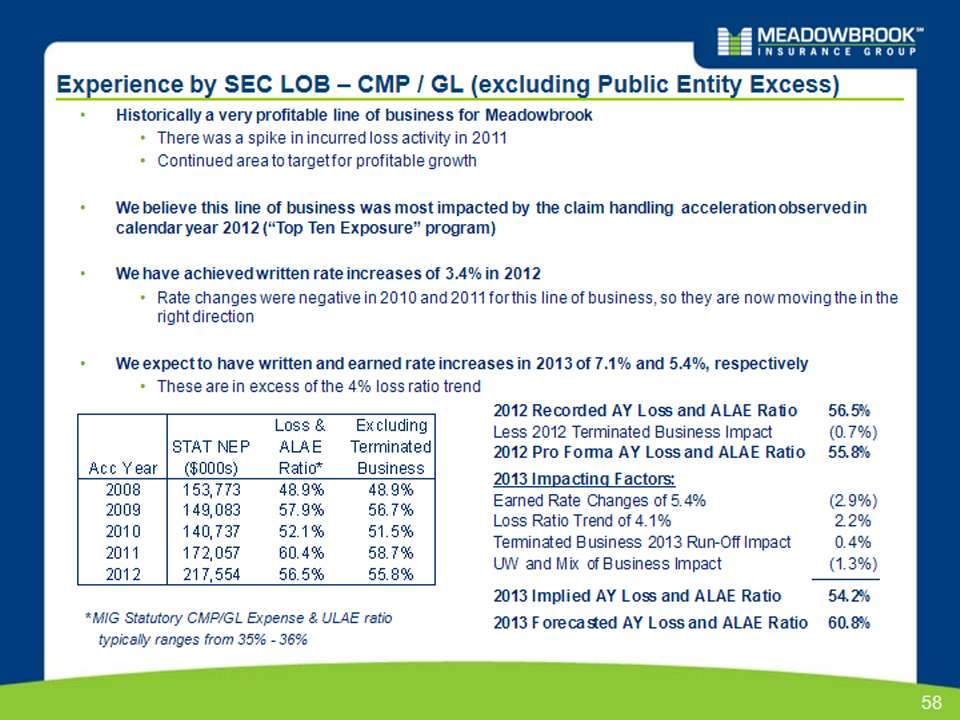
58 * MIG Statutory CMP/GL Expense & ULAE ratio typically ranges from 35% - 36% Experience by SEC LOB – Property: 2012 - 2013 •We have historically had limited exposure to property risks •The Property segment of Meadowbrook and its subsidiaries made up 12% of the 2012 NEP •We generally structure our insurance programs to avoid geographic concentration that could result in large losses due to catastrophes •Our reinsurance structure protects us as well with our maximum net retention at $7 million (pre-tax) for a single catastrophe ($4 million + 50% x [$10 million - $4 million]) •We have achieved rate increases of 4.9% from 2010 to 2012 •We expect to have written and earned rate increases in 2013 of 10.7% and 7.3%, respectively •These are well in excess of the 1.3% loss ratio trend
60 Rates, Loss RatioTrends & Loss Ratios Rates, Loss Ratio Trends, and Loss Ratios
61 Rates, Loss Ratio Trends, and Loss Ratios (cont.)
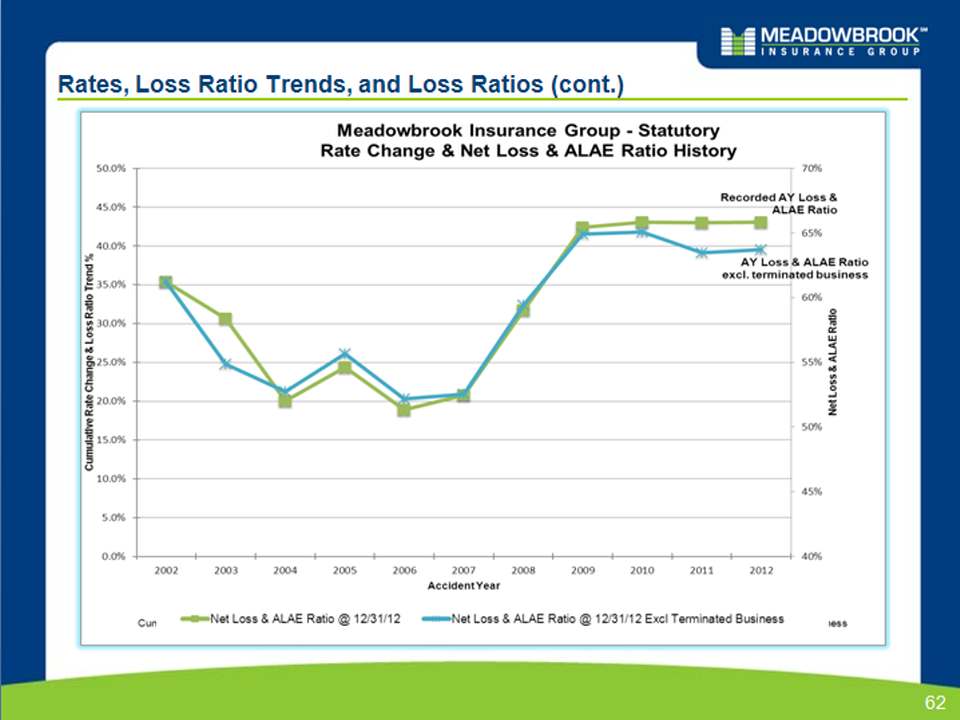
62 Rates, Loss Ratio Trends, and Loss Ratios (cont.)


Investment Portfolio Review We continue to maintain a high-quality, low-risk investment portfolio. Portfolio Allocation and Quality Low equity risk exposure •98% fixed income •2% equity High credit quality •99% of bonds are investment grade •Average Moody’s rating of Aa3 / S&P rating of AA- Duration •Fixed income effective duration is 5.1 •Duration on Reserves is approximately 3.8 $’s in (000’s) % Allocation 12/31/2012 Fair Value Net Unrealized Gain Position Avg. Moody's Avg. S&P Fixed Income US Government and Agencies 2% $ 27,685 $ 896 Aaa AA+ Corporate 39% $ 507,001 $ 24,711 A3 A- Mortgage and Asset Backed 9% $ 120,968 $ 7,272 Aa1 AA+ Municipal 48% $ 628,973 $ 41,697 Aa2 AA+ Preferred Stock Debt 0% $ 2,179 $ 436 Ba2 BB Total Fixed Income 98% $1,286,806 $ 75,012 Aa3 AA- Equities Preferred Stock 1% $ 8,508 $ 1,578 Mutual Funds 1% $ 14,154 $ 695 Total Equities 2% $ 22,661 $ 2,273 Cash and Short term (1) $ 260,000 65 (1) Remainder of proceeds received from the gain harvesting program to be re-invested during 1Q 2013. As of 2/26/13 $228m has been reinvested in accordance with our investment strategy.
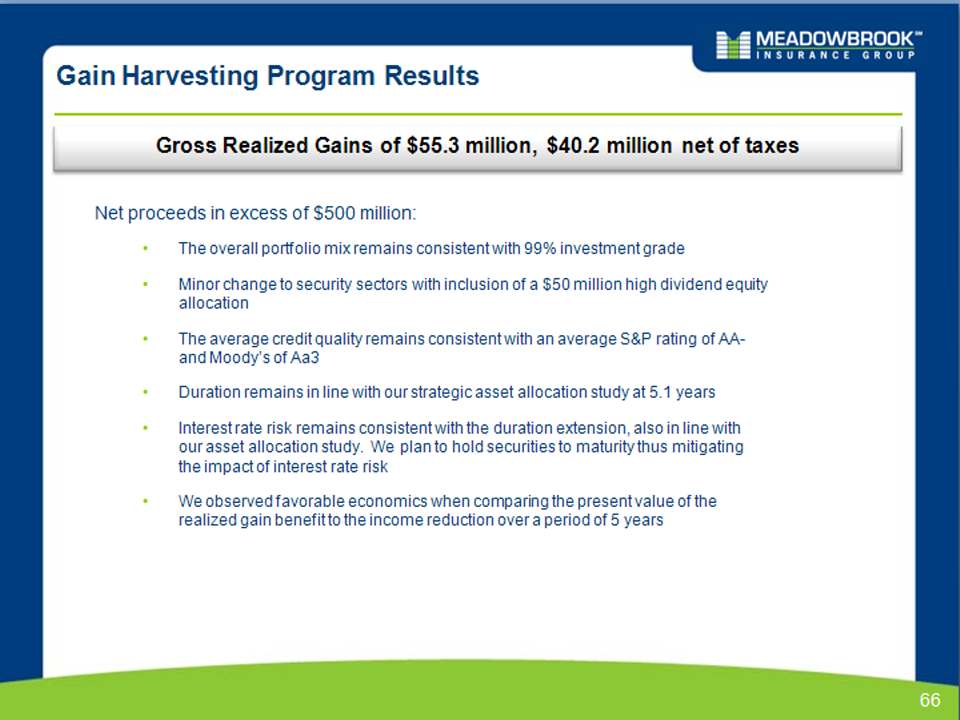
66 Gain Harvesting Program Results Gross Realized Gains of $55.3 million, $40.2 million net of taxes Net proceeds in excess of $500 million: •The overall portfolio mix remains consistent with 99% investment grade •Minor change to security sectors with inclusion of a $50 million high dividend equity allocation •The average credit quality remains consistent with an average S&P rating of AA- and Moody’s of Aa3 •Duration remains in line with our strategic asset allocation study at 5.1 years •Interest rate risk remains consistent with the duration extension, also in line with our asset allocation study. We plan to hold securities to maturity thus mitigating the impact of interest rate risk •We observed favorable economics when comparing the present value of the realized gain benefit to the income reduction over a period of 5 years

67 Government and Agency – December 31, 2012 Profile Summary Profile •$27.7 M market value; approximately 2% of the managed portfolio •Rated Aaa by Moody’s and AA+ by S&P •December 31, 2012 net unrealized gain was $0.9M •Average investment yield: 1.46% Government & Agency vs. Entire Portfolio 2% 98% Government & Agency All Other
68 Corporate Fixed Income – December 31, 2012 Profile Summary Profile •$507.0M market value; 39% of the investment portfolio •December 31, 2012 net unrealized gain was $24.7M. •Average investment yield: 3.15% Quality Indicators Corporate vs. Entire Portfolio Corporate Profile Corporates Average Quality A- Investment Grade 100% A-/A3 or Better 66% AII BBB and Baa 34% Not Rated 0% Non Investment Grade 0% Consumer Non-Cyclical 16.3% Capital Goods 13.3% Technology 9.1% Consumer Cyclical 8.8% Energy 8.2% Basic Industry 7.3% Electric 7.0% REITs 6.6% Banking 6.5% Communications 4.0% All Other Sectors 12.9% 39% 61% Corporates All Other

69 Municipal Bonds – December 31, 2012 Profile Summary Profile •$629.0M market value; 48% of the investment portfolio •December 31, 2012 net unrealized gain was $41.7M •Tax exempt unrealized gain $37.6M •Taxable unrealized gain $ 4.1M •Average tax equivalent yield: 4.93% Quality Indicators & Geographic Distribution Municipals vs. Entire Portfolio 45% 3% 52% Municipals Taxable Municipals All Other State % of Municipal Allocation Texas 9.7% New York 6.3% Washington 5.4% Colorado 5.1% Arizona 4.0% Nevada 4.0% Virginia 3.4% Missouri 3.3% Massachusetts 3.3% Indiana 3.2% All other 52.3%

70 Structured Securities – December 31, 2012 Profile Summary Profile •$121.0M market value; 9% of the investment portfolio •December 31, 2012 Net unrealized gain was $7.3M •RMBS unrealized gain $ 4.4M •CMBS unrealized loss $ 1.8M •ABS unrealized loss $ 1.1M •Average investment yield: 4.08% Quality Indicators Structured vs. Entire Portfolio 4% 42% 45% 9% Non-Agency Freddi Mac Fannie Mae Ginnie Mae Structured Profile 6% 2% 1% 91% MBS CMBS ABS All Other
71 Equities – December 31, 2012 Profile Summary Profile •$22.7 million market value; 2% of the managed portfolio •December 31, 2012 net unrealized gain was $2.3M •Preferred stock unrealized gain $1.6M •Bond mutual fund unrealized gain $0.7M •Average tax equivalent yield: 7.1% Equities vs. Entire Portfolio Equity Mix 2% 98% Equities All Other 37% 63% Preferred Stock Mutual Fund
