Exhibit 99.2

Investor SupplementFirst Quarter 2013 Update


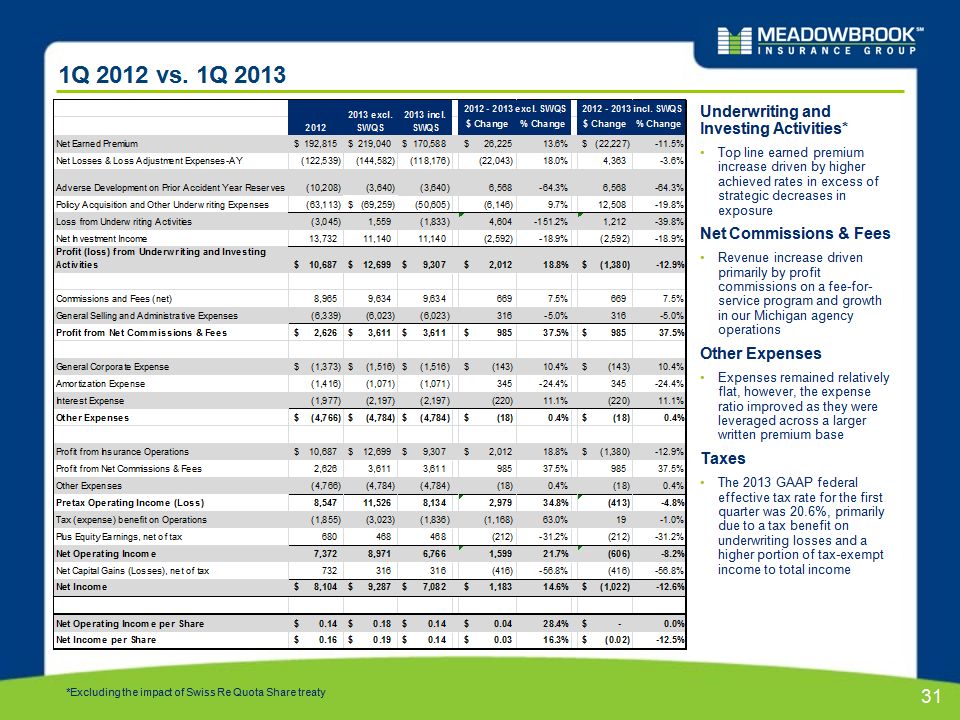
* Financial Results


* Reserves


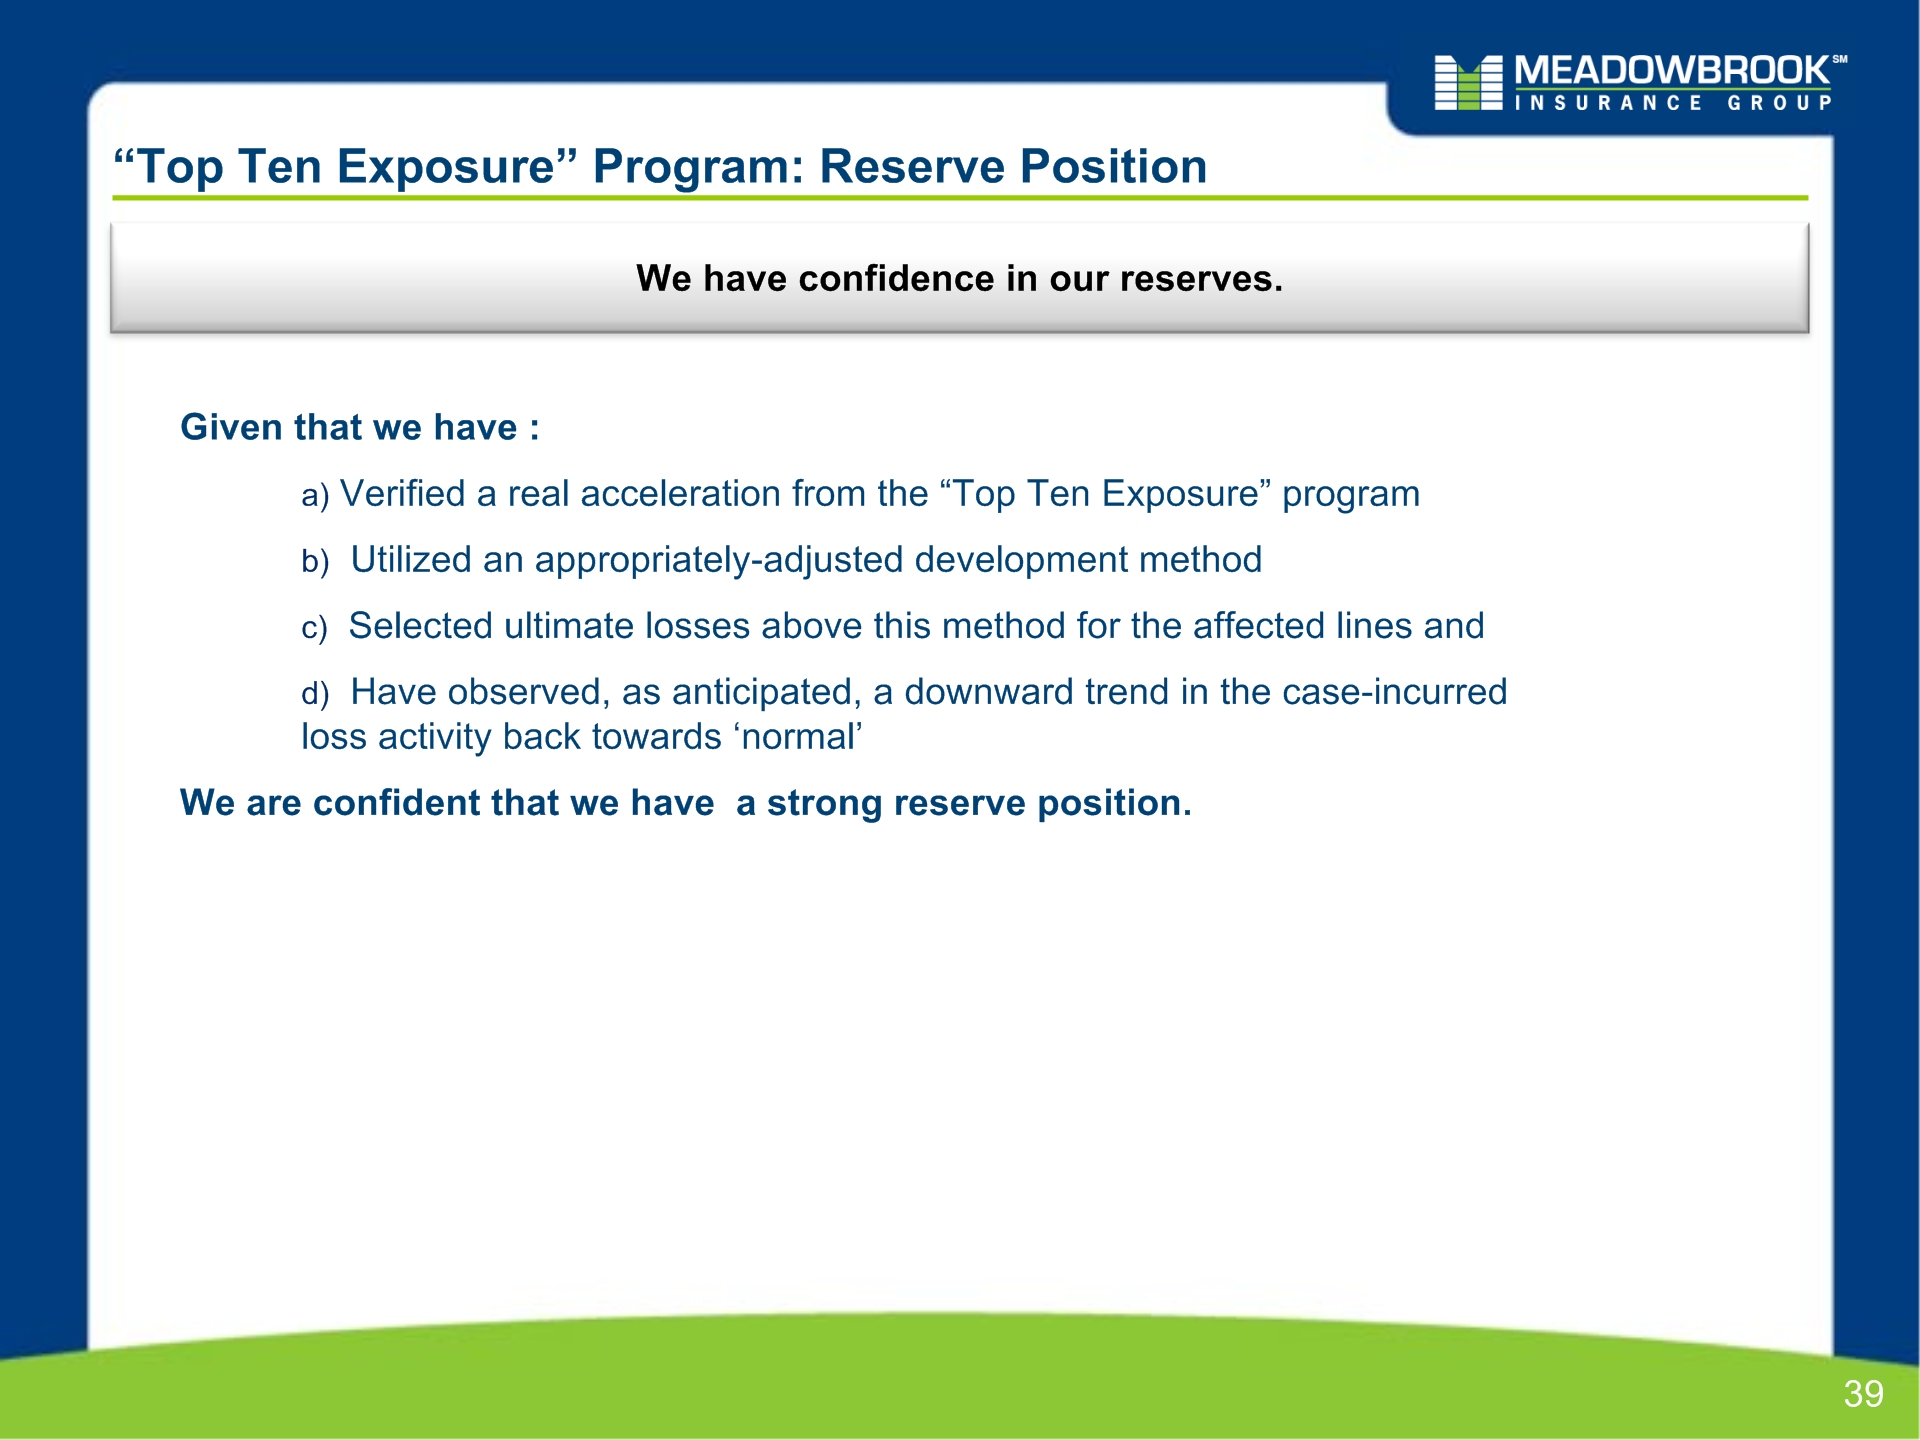
“Top Ten Exposure” Program: Reserve Position Given that we have : Verified a real acceleration from the “Top Ten Exposure” program Utilized an appropriately-adjusted development method Selected ultimate losses above this method for the affected lines and Have observed, as anticipated, a downward trend in the case-incurred loss activity back towards ‘normal’We are confident that we have a strong reserve position. * We have confidence in our reserves.


Positioned to Manage Insurance Cycles – CA WCLow Hazard Mix of Business (Continued) We write our premium in less hazardous groups and more favorable CA WC industries Hazard Group Distribution Meadowbrook Industry * 6 & 7 1 & 2 3, 4 & 5 3, 4 & 5 1 & 2 6 & 7

Positioned to Manage Insurance Cycles – CA WCLow Hazard Mix of Business (Continued) We write our premium in less hazardous groups and more favorable CA WC industries Meadowbrook Industry Industry Group Distribution * Manufacturing Goods andServices Goods andServices Manufacturing Office & Clerical Office & Clerical Construction Construction Other Other


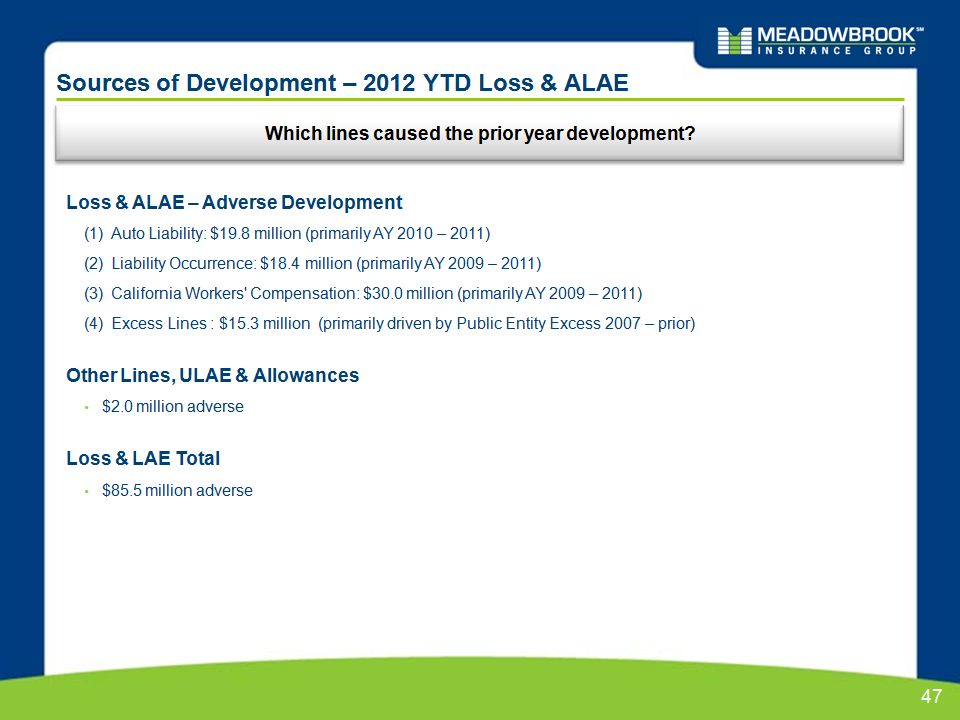
* Reserve Development on Prior Accident Years 11 Year Reserve Development on Prior Accident Years Percent of Prior Year Reserves 1.5% 2.4% (4.5 %) 0.9 % 9.7 % 2.2% (1.0%) (2.3%) (4.9%) (4.6%) 2012 Quarterly Development on Prior Accident Years Reserve Development Adverse / (Favorable) ($m) 0.3 % (1) Related to the Public Entity Excess Terminated Program (1) (1)


* Underwriting Focus Accident Year Combined Ratio (Reported and Re-Evaluated as of 12/31/2012) ^ The Re-Evaluated AY combined ratio reflects reserve adjustments made following the accident year, for example, the 93.6% Re-Evaluated 2008 AY combined ratio reflects new loss development information gathered over the 4 years from 12/31/2008 to 12/31/2012; the 102.0% Re-Evaluated 2009 AY combined ratio reflects new loss development information gathered over the 3 years from 12/31/2009 to 12/31/2012. Management initiates underwriting and pricing actions to move AY combined ratios towards 95.0% target 2008 2009 2010 2011 2012 2013 Projected** * Represents 2012 proforma Accident Year Combined Ratio excluding terminated programs ** Guidance without QS is 98-99%, QS adds 1.2 to 1.5 percentage points to the Combined Ratio


* Underwriting Focus GAAP Combined Ratio 2008 2009 2010 2011 2012 * Represents 2009 - 2012 proforma GAAP and Accident Year Combined Ratio excluding terminated programs 2013 Projected** ** Guidance without QS is 98-99%, QS adds 1.2 to 1.5 percentage points to the Combined Ratio

* SEC Line of Business Detail:Experience and Projections


* Rates, Loss Ratio Trends & Loss Ratios

Rates, Loss Ratio Trends, and Loss Ratios *

Rates, Loss Ratio Trends, and Loss Ratios (cont.) *

Rates, Loss Ratio Trends, and Loss Ratios (cont.) *

* Investments

Investment Portfolio Review - December 31, 2012 We continue to maintain a high-quality, low-risk investment portfolio. Portfolio Allocation and Quality Low equity risk exposure98% fixed income 2% equityHigh credit quality99% of bonds are investment gradeAverage Moody’s rating of Aa3 / S&P rating of AA-DurationFixed income effective duration is 5.1Duration on Reserves is approximately 3.8 $’s in (000’s) % Allocation 12/31/2012 Fair Value NetUnrealized Gain Position Avg. Moody's Avg. S&P Fixed Income US Government and Agencies 2% $ 27,685 $ 896 Aaa AA+ Corporate 39% $ 507,001 $ 24,711 A3 A- Mortgage and Asset Backed 9% $ 120,968 $ 7,272 Aa1 AA+ Municipal 48% $ 628,973 $ 41,697 Aa2 AA+ Preferred Stock Debt 0% $ 2,179 $ 436 Ba2 BB Total Fixed Income 98% $1,286,806 $ 75,012 Aa3 AA- Equities Preferred Stock 1% $ 8,508 $ 1,578 Mutual Funds 1% $ 14,154 $ 695 Total Equities 2% $ 22,661 $ 2,273 Cash and Short term (1) $ 260,000 * (1) Remainder of proceeds received from the gain harvesting program to be re-invested during 1Q 2013. As of 2/26/13 $228m has been reinvested in accordance with our investment strategy.

* Q4 2012 Gain Harvesting Program Results Gross Realized Gains of $51m, $37m net of taxes Net proceeds in excess of $500 million:The overall portfolio mix remains consistent with 99% investment gradeMinor change to security sectors with inclusion of a $50 million high dividend equity allocationThe average credit quality remains consistent with an average S&P rating of AA- and Moody’s of Aa3The tax-adjusted duration remains in line with our strategic asset allocation study at 4.7 years at Q1 2013Interest rate risk remains consistent with the duration extension, also in line with our asset allocation study. We plan to hold securities to maturity thus mitigating the impact of interest rate riskWe observed favorable economics when comparing the present value of the realized gain benefit to the income reduction over a period of 5 yearsThe book yield excluding cash & cash equivalents at Q1 2013 is 3.8% (3.3% pre-tax)


* Accounting for Convertible Debt Offering The following was recorded in Q1 2013 related to the convertible debt offering (in millions) * Gross proceeds of $100m was bifurcated into $87.1m of debt and $12.9m of derivative liability related to the conversion feature. The $12.9m will accrete to the $100m face value over the life of the loan through a charge to interest expense.The total interest expense impacting the P&L will consist of the 5% coupon payment (paid in cash) and the accretion of the conversion feature noted above of approximately 2.4% (non-cash), or 7.4% total.^ A bond hedge (derivative asset) was purchased to offset the derivative liability recorded related to the conversion feature. The two are marked to market each quarter with no P&L impact as they directly off-set one another.