QuickLinks -- Click here to rapidly navigate through this document
UNITED STATES
SECURITIES AND EXCHANGE COMMISSION
Washington, D.C. 20549
FORM 10-K
| (Mark One): | |
ý |
ANNUAL REPORT PURSUANT TO SECTION 13 OR 15(d) OF THE SECURITIES EXCHANGE ACT OF 1934 |
For the fiscal year ended January 1, 2008 |
OR |
o |
TRANSITION REPORT UNDER SECTION 13 OR 15(d) OF THE SECURITIES EXCHANGE ACT OF 1934 |
For the transition period from to |
Commission File Number 0-27148
EINSTEIN NOAH RESTAURANT GROUP, INC.
(Exact Name of Registrant as Specified in its Charter)
| Delaware | | 13-3690261 |
(State or other jurisdiction
of incorporation or organization) | | (I.R.S. Employer
Identification No.) |
|
|
|
| 555 Zang Street, Suite 300, Lakewood, Colorado | | 80228 |
| (Address of principal executive offices) | | (Zip Code) |
Registrant's telephone number, including area code:(303) 568-8000
Securities registered pursuant to Section 12(b) of the Act:
Title of each class:
| | Name of each exchange on which registered:
|
|---|
| Common Stock, $.001 par value | | The NASDAQ Global Market |
Securities registered pursuant to Section 12(g) of the Act:None
Indicate by check mark if the registrant is a well-known seasoned issuer, as defined in Rule 405 of the Securities Act. Yes o No ý
Indicate by check mark if the registrant is not required to file reports pursuant to Section 13 or Section 15(d) of the Act. Yes o No ý
Indicate by check mark whether the registrant: (1) has filed all reports required to be filed by Section 13 or 15(d) of the Securities Exchange Act of 1934 during the preceding 12 months (or for such shorter period that the registrant was required to file such reports), and (2) has been subject to such filing requirements for the past 90 days. Yes ý No o
Indicate by check mark if disclosure of delinquent filers pursuant to Item 405 of Regulation S-K is not contained herein, and will not be contained, to the best of the registrant's knowledge, in definitive proxy or information statements incorporated by reference in Part III of this Form 10-K or any amendments of this Form 10-K. o
Indicate by check mark whether the registrant is a large accelerated filer, an accelerated filer, a non-accelerated filer, or a smaller reporting company. See definitions of "large accelerated filer," "accelerated filer," and "smaller reporting company" in Rule 12b-2 of the Exchange Act. (Check one):
| Large accelerated filer o | | Accelerated filer ý | | Non-accelerated filer o
(Do not check if a smaller reporting company) | | Smaller reporting company o |
Indicate by check mark whether the registrant is a shell company (as defined in Rule 12b-2 of the Exchange Act). Yes o No ý
The aggregate market value of the voting common equity held by non-affiliates of the registrant as of the last business day of the second fiscal quarter, July 3, 2007 was $85,204,828 (computed by reference to the closing sale price as reported on the NASDAQ Global Market). As of February 25, 2008 there were 15,888,977 shares of the registrant's Common Stock, par value of $0.001 per share outstanding.
DOCUMENTS INCORPORATED BY REFERENCE
The information required by Part III is incorporated herein by reference from the registrant's definitive proxy statement for the 2008 annual meeting of stockholders, which will be filed with the SEC within 120 days after the close of the 2007 fiscal year.
EINSTEIN NOAH RESTAURANT GROUP, INC.
FORM 10-K
TABLE OF CONTENTS
| | | PART I | | |
ITEM 1. |
|
BUSINESS |
|
2 |
| ITEM 1A. | | RISK FACTORS | | 17 |
| ITEM 1B. | | UNRESOLVED STAFF COMMENTS | | 25 |
| ITEM 2. | | PROPERTIES | | 26 |
| ITEM 3. | | LEGAL PROCEEDINGS | | 28 |
| ITEM 4. | | SUBMISSION OF MATTERS TO A VOTE OF SECURITY HOLDERS | | 29 |
|
|
PART II |
|
|
ITEM 5. |
|
MARKET FOR REGISTRANT'S COMMON EQUITY, RELATED STOCKHOLDER MATTERS AND ISSUER PURCHASES OF EQUITY SECURITIES |
|
30 |
| ITEM 6. | | SELECTED FINANCIAL DATA | | 32 |
| ITEM 7. | | MANAGEMENT'S DISCUSSION AND ANALYSIS OF FINANCIAL CONDITION AND RESULTS OF OPERATION | | 34 |
| ITEM 7A. | | QUANTITATIVE AND QUALITATIVE DISCLOSURES ABOUT MARKET RISK | | 56 |
| ITEM 8. | | FINANCIAL STATEMENTS AND SUPPLEMENTARY DATA | | 58 |
| ITEM 9. | | CHANGES IN AND DISAGREEMENTS WITH ACCOUNTANTS ON ACCOUNTING AND FINANCIAL DISCLOSURE | | 100 |
| ITEM 9A. | | CONTROLS AND PROCEDURES | | 100 |
| ITEM 9B. | | OTHER INFORMATION | | 101 |
|
|
PART III |
|
|
ITEM 10. |
|
DIRECTORS, EXECUTIVE OFFICERS AND CORPORATE GOVERNANCE |
|
102 |
| ITEM 11. | | EXECUTIVE COMPENSATION | | 102 |
| ITEM 12. | | SECURITY OWNERSHIP OF CERTAIN BENEFICIAL OWNERS AND MANAGEMENT AND RELATED STOCKHOLDER MATTERS | | 102 |
| ITEM 13. | | CERTAIN RELATIONSHIPS AND RELATED TRANSACTIONS, AND DIRECTOR INDEPENDENCE | | 102 |
| ITEM 14. | | PRINCIPAL ACCOUNTANT FEES AND SERVICES | | 102 |
|
|
PART IV |
|
|
ITEM 15. |
|
EXHIBITS AND FINANCIAL STATEMENT SCHEDULES |
|
103 |
1
PART I
ITEM 1. BUSINESS
Our Company
Einstein Noah Restaurant Group, Inc. (the "Company") is the largest owner/operator, franchisor and licensor of bagel specialty restaurants in the United States. As of January 2, 2008, we have 612 restaurants in 35 states plus the District of Columbia primarily under the Einstein Bros. Bagels ("Einstein Bros."), Noah's New York Bagels ("Noah's") and Manhattan Bagel Company ("Manhattan Bagel") brands. As a leading fast-casual restaurant chain, our restaurants specialize in high-quality foods for breakfast, lunch and afternoon snacks in a café atmosphere with a neighborhood emphasis. Collectively, our concepts span the nation with Einstein Bros. restaurants in 32 states and in the District of Columbia, Noah's restaurants in three states on the west coast and Manhattan Bagel restaurants concentrated in the Northeast. Currently, our Einstein Bros. and Noah's restaurants are company-owned or licensed, while Manhattan Bagel restaurants are predominantly franchised, with one company-owned location.
Our product offerings include fresh bagels and other bakery items baked on-site, made-to-order breakfast and lunch sandwiches on a variety of bagels and breads, gourmet soups and salads, assorted pastries, premium coffees and an assortment of snacks. Our manufacturing and commissary operations prepare and assemble consistent, high-quality ingredients that are delivered fresh to our restaurants through our network of independent distributors.
Our History
We commenced operations as an operator and franchisor of coffee cafes in 1993. Substantial growth in our restaurant counts occurred through a series of acquisitions. In 1998, we acquired the stock of Manhattan Bagel Company. In 1999, we acquired the assets of Chesapeake Bagel Bakery. Our largest acquisition was in 2001 when we acquired substantially all the assets of Einstein/Noah Bagel Corp. in an auction conducted by the bankruptcy court. To consummate this acquisition, we engaged in several rounds of financing that included the issuance of $165.0 million of debt and $65.0 million of mandatorily redeemable preferred stock. In mid-2003, we recapitalized our balance sheets with the issuance of $160.0 million of indentures and the issuance of $57.0 million of mandatorily redeemable preferred stock. In late 2003, our current management team assumed their respective roles. This team focused on our core business, the operation of company-owned restaurants and the improvements necessary to generate positive operating income and cash flow. Our management team has focused on streamlining our restaurant operations and capital structure and since 2003, we have closed 74 company-owned restaurants and 174 franchised and licensed restaurants primarily because they did not meet our performance standards. Einstein Bros., Noah's and Manhattan Bagel are our core brands and we have taken steps to enhance these brands, improve our margins and diversify our menus.
Our Industry and Segment of the Industry
We compete in the fast-casual segment of the restaurant industry. Fast-casual restaurants are a hybrid between traditional fast-food restaurants and full-service restaurants, offering key attributes of both categories. Fast-casual restaurants offer accessibility, lower prices (with average checks under $10) and faster service, similar to fast-food restaurants. However, fast-casual restaurants also offer higher quality food, made-to-order products and upscale décor more in keeping with full-service restaurants. Fast-casual restaurants tend to do their highest sales volume during the day, as opposed to dinner-centric full-service restaurants, and have higher average checks than traditional fast-food restaurants. The fast-casual segment has been growing more rapidly than the overall restaurant industry. A 2007 study by Technomic, Inc., an independent national consulting and research firm, reported that the fast-casual segment grew by approximately 14.4% over the 2005-2006 period, where the limited service
2
segment, which includes the fast-casual and quick service segments, grew at 5.8%, and the full service segment grew at 5.9%.
We compete in the breakfast, lunch and afternoon dayparts. Within the breakfast daypart, we believe the guest seeking a high-quality and convenient product is underserved, as few fast-casual restaurants are focused on this daypart. We believe premium coffee shops typically lack a fresh, appealing and broad enough food menu, and while traditional fast-food restaurants have renewed their focus on breakfast, they fail to offer the quality of food these guests desire. We believe these industry dynamics and competitive landscape provide a significant growth opportunity for a fast-casual chain like ours.
Our Competitive Strengths
Our restaurants offer a wide variety of made-to-order menu items using high-quality, fresh ingredients. In keeping with our baking heritage, the menu at a typical Einstein Bros. or Noah's company-owned restaurant features a wide variety of fresh baked bagels, breads, muffins and cookies. These products are baked on site at each restaurant to ensure the freshest products for our guests. In addition, each restaurant offers made-to order breakfast and hot (i.e. paninis, grilled sandwiches) and cold (signature, deli) sandwiches using high quality, fresh ingredients. We also offer a variety of hand tossed salads, bagel dog meals, pizza bagels and appetizing soups. We attempt to source produce locally and, when possible, use natural products to help ensure the freshness and quality of our menu offerings.
To ensure our menu remains distinctive and innovative, our product development team continually evaluates and tests new products. Our development team has enabled us to successfully expand our menu offerings to include a line of frozen drinks, specialty coffees, and creative seasonal and holiday offerings such as the red heart bagel (Valentine's Day), green bagel (St. Patrick's Day), the pumpkin bagel and pumpkin cheesecake cream cheese, and the candy cane bagel (winter holidays). We have also developed limited time offers to address the changes in guest preferences throughout the year. We strive to have a robust product pipeline so we can have a wide assortment of products ready to launch and offer a diverse menu with broad appeal.
Our Manhattan Bagel brand follows a similar menu strategy as Einstein Bros. and Noah's.
We are a leader among fast-casual restaurant companies serving the breakfast daypart, based on both size and guest preference. We are the largest owner/operator, franchisor and licensor of bagel specialty restaurants in the United States. In 2007, over 63% of our sales were made during the breakfast daypart. We believe our success has been driven by our fresh, innovative offerings and more sophisticated alternatives for breakfast than those provided by fast-food restaurants or coffee cafés. For example, a typical Einstein Bros. company-owned restaurant offers approximately 20 varieties of bagels, approximately 12 different breakfast sandwiches, 6 varieties of muffins including our seasonal offerings, pastries and cookies and traditional breakfast beverages, such as specialty coffees and juices.
We serve a variety of coffee products to accompany breakfast or any meal. Einstein Bros. offerDarn Good Coffee® with five daily blends. Noah's offers four daily blends with a seasonal blend as the fifth. Manhattan Bagel offers regular and flavored coffees. In addition to the regular coffee served, all brands offer espresso and specialty coffees in selected stores.
3
Einstein Bros., Noah's and Manhattan Bagel are well-established brands that collectively span the nation. In an unaided awareness study commissioned by us and conducted in September 2007, when respondents were asked to name a "bagel place," 49% of those who answered the survey named Einstein Bros. Despite our large size, we believe our restaurants maintain a comfortable and cozy neighborhood atmosphere valued by our guests. We strive to create a warm and inviting environment in which our guests want to relax and "hang-out." To that end, we outfit our restaurants with fixtures and materials that are distinct for each brand and that reflect the brands' personalities, heritage and strong neighborhood identities.
Our financial performance has improved rapidly since the fourth quarter of 2003, when we began a restructuring program that included closing under-performing restaurants, enhancing our core brands, improving our margins and expanding our menus.
- •
- We have reported thirteen consecutive quarters of positive comparable store sales.
- •
- Since 2003, our average company-owned restaurant sales have increased by 18.5% from approximately $767,000 to approximately $909,000.
In addition to operational improvements that have helped our financial performance, in the second quarter of 2007, we completed a secondary offering and a debt refinancing, using the proceeds of our offering to pay down debt. These actions resulted in cash interest savings of approximately $6.4 million for 2007, and we expect to realize approximately $11.7 million in cash interest savings on an annualized basis for 2008.
A Disciplined, Results-Oriented Team
We have assembled a seasoned management team with significant operating experience. Our management team has:
- •
- employed a "back-to-the basics" approach to our financial performance, with a focus on sales and profitability;
- •
- successfully improved restaurant operations through quality service checklists at all units, a focus on hospitality, improved ordering systems and enhanced training programs;
- •
- implemented new management information systems which provide profit management and optimization tools;
- •
- created a low cost supply chain with strategically located commissary and manufacturing operations; and
- •
- formed a new supervisor role and organized our associates to fit this role based on their strengths and leadership abilities.
Our Strategy
Enhanced Menu to Capture Multiple Dayparts. We have enhanced our menu offerings at Einstein Bros., Noah's and Manhattan Bagel restaurants to attract more guests to our restaurants across multiple dayparts. In addition to leveraging popular menu items across concepts, we have introduced 2 new breakfast sandwiches, 8 lunch items, and 10 items for the afternoon daypart in the past year. We continue to enhance our breakfast offerings, including offering any breakfast sandwich in new
4
"commuter friendly" whole wheat wraps to cater to the increasing number of our customers who consume breakfast on the go. To expand our sales during the lunch daypart, we regularly test and introduce new sandwiches, soups and salads, as well as expand the availability of items popular at one of our restaurant concepts, such as Noah's pressed panini sandwiches, across the entire company-owned restaurant base. For the afternoon daypart, we have developed a line of frozen drinks for our Einstein Bros. restaurants, which we introduced to Noah's in the Fall of 2007 and Manhattan Bagel in the Spring of 2007. We also developed the pizza bagel at our Einstein Bros. restaurants in the Spring of 2007, which is a popular lunch item as well as a snack between traditional meal times, and introduced it to Noah's in January 2008. Manhattan Bagel offered a new line of grilled chicken sandwiches in the Fall of 2007. As we have expanded our menu, we have refined its layout to simplify the presentation while highlighting the breadth of our offerings by featuring large food images to help highlight our food categories. We believe the enhanced offering at each daypart will help us capture new guests and encourage current guests to visit us more frequently.
Increased Focus on Guest Service and Hospitality. We believe exceptional guest service will foster repeat business and increase the frequency of return visits. We have implemented an improved ordering system that reduces the time our guests wait in line before they receive their food. Using wireless technology, this system allows our associates to take orders from a mobile ordering pad. The system tracks the time from when the order is taken to completion and alerts our associates to orders that have exceeded our acceptable completion time. Additionally, we believe that this system improves production accuracy compared to our current paper tickets process and helps to reduce waste. During 2007, we implemented this system into 111 of our restaurants and for 2008, we plan to implement it in approximately 60 to 70 of our restaurants where we believe waiting time has been a limiting factor to increasing sales.
We also encourage superior hospitality through the creation of area hospitality manager positions. We train our general managers to be out in the front of our restaurants greeting guests and making them feel welcome. We have developed a variety of programs to test our success at providing exceptional guest service.
Upgraded Selected Restaurants. Our new Einstein Bros. restaurant prototype provides superior merchandising and improved functionality, resulting in increased throughput in our restaurants. This new restaurant format provides better service flow for our guests, including a new, more user-friendly menu layout, new self-service coolers to drive impulse purchases, an expanded coffee bar and a separate station for quick "to go" items. We also upgraded our furniture, lighting and other decorative items, such as artwork, to update the look and feel of our restaurants. We upgraded 36 restaurants in 2007 at a total cost of approximately $3.5 million. Our upgraded restaurants have experienced an average 4.7% increase in sales following the upgrade, excluding the Phoenix, Arizona market, which has experienced a recent decline in their local economy. Including the Phoenix market, we experienced an average 2.0% increase in sales following the upgrade. We expect to upgrade at least 45 more restaurants in 2008 at a total cost of approximately $5.0 million, and to continue to upgrade additional restaurants in future years. We believe that there are a significant number of additional restaurants in our system which would show improved operating results after this type of upgrade is completed.
Increased Restaurant Sales through Catering. We believe catering is an effective way to leverage our existing restaurant infrastructure with little or no additional capital investment and to expose more people to our food and our brands. We recognize that an effective catering program requires different skills for effectively selling to businesses that frequently utilize catering. Accordingly, we have assembled a dedicated staff of catering managers and coordinators to perform this function. We have catering operations in 20 major markets and plan on adding a catering manager in one additional market during 2008. We are also moving towards centralization of the ordering process to ensure the order is routed to the restaurant best positioned to fulfill it in a timely manner.
5
Company-owned Restaurants. We are planning to open new company-owned restaurants under the Einstein Bros. and Noah's brands within existing markets. Our expansion plans are intended to increase penetration of our restaurants in our most attractive markets. For Einstein Bros., we have selected Atlanta, Baltimore, Chicago, Las Vegas, Phoenix, Tucson, and various cities in Florida and Texas for development. For Noah's, we intend to focus our development efforts on Portland, Seattle and various cities in California. In 2007, we opened 8 new Einstein Bros. and 4 new Noah's company-owned restaurants, and acquired a Manhattan Bagel restaurant from one of our franchisees. Recently opened restaurants that follow our new prototype typically generate higher average unit volume than our existing restaurant base. In 2008, we plan to open a total of at least 18 new company-owned restaurants.
Franchised and Licensed Restaurants. We are planning to expand our presence through a significant expansion of franchised and licensed restaurants. This strategy allows us to generate additional revenues without incurring significant additional expense, capital commitments or many of the other risks associated with opening new company-owned restaurants. We also expect to increase our geographic footprint and guest recognition of our brands.
Licensed Restaurants. At the end of 2007, we had 124 licensed restaurants throughout the United States, located primarily in airports, colleges and universities, office buildings, hospitals and military bases and on turnpikes. We have license relationships with Aramark, Sodexho, AAFES, HMS Host, Compass, CA1 and Creative Host. We opened 31 new licensed restaurants in 2007 and currently are planning to open at least 35 new licensed restaurants in 2008.
Franchised Restaurants. At the end of 2007, we had 72 franchised locations throughout the United States. We intend to leverage our franchising experience with the Manhattan Bagel brand to begin franchising our Einstein Bros. brand and expand the current Manhattan Bagel franchise system. We have identified specific markets in which we intend to grow through franchising and are currently in discussions with several parties to develop in these markets. With respect to the Manhattan Bagel brand, we are working towards granting additional franchise rights to current franchisees and entering into development agreements with new franchisees in 2008. We opened 2 franchise restaurants in 2007, and currently are planning to open at least 5 new franchise restaurants in 2008.
Restaurant Concepts
Einstein Bros. offers a menu that specializes in high-quality foods for breakfast and lunch, including fresh-baked bagels and hot breakfast sandwiches, cream cheese and other spreads, specialty coffees and teas, creative soups, salads and sandwiches, and other unique menu offerings. The average Einstein Bros. restaurant is approximately 2,200 square feet in size with approximately 40 seats and is generally located in a neighborhood or regional shopping center. We design each restaurant to create a comfortable, casual environment that is consumer friendly, inviting and reflective of the brand's personality and strong neighborhood identity. We intend to design and build restaurants consistent with the layout of our new restaurants which are approximately 2,500 square feet in size. This will allow for additional seating as well as the improved menu displays and ordering system. During 2005, 2006 and 2007, Einstein Bros. company-owned restaurants generated approximately 80% of our total company-owned restaurant sales.
6
Noah's is a neighborhood-based, deli-inspired restaurant that serves a variety of signature sandwiches, fresh baked breads, home-style soups, tempting sweets and our award-winning bagels. Noah's offers a menu that specializes in high-quality foods for breakfast and lunch, including fresh-baked bagels and other baked goods, made-to-order deli-style sandwiches, including such favorites as pastrami, corned beef and roast beef on fresh breads and bagels baked on premises daily, hearty soups, innovative salads, desserts, fresh brewed premium coffees and other café beverages. The average Noah's restaurant is approximately 1,800 square feet in size with approximately 12 seats and is located in urban neighborhoods or regional shopping centers. We use elaborate tile work and wood accents in the brand's design to create an environment reminiscent of a Lower East Side New York deli, which reinforces the brand's urban focus with an emphasis on the authenticity of a New York deli experience. We intend to build new restaurants of approximately 2,500 square feet that will incorporate more seating than our current restaurants. During 2005, 2006 and 2007, Noah's company-owned restaurants generated approximately 20% of our total restaurant sales.
Manhattan Bagel offers over 17 varieties of fresh-baked bagels, as well as freshly baked muffins and other pastries, and up to 15 flavors of cream cheese, a variety of breakfast and lunch sandwiches, salads, soups, coffees and café beverages and desserts. The average Manhattan Bagel restaurant is approximately 1,400 to 2,400 square feet with 24 to 50 seats and is primarily located in suburban neighborhoods or regional shopping centers. Our prototype for new Manhattan Bagel franchised restaurants is approximately 2,500 square feet that will incorporate more seating than the current restaurants. Manhattan Bagel restaurants are designed to combine the authentic atmosphere of a bagel bakery with the comfortable setting of a neighborhood meeting place.
Our Menu
Einstein Bros., Noah's and Manhattan Bagel have a variety of offerings for the breakfast, lunch and afternoon dayparts, although all items are available anytime. While the menus differ slightly at each concept, the core strategy behind the menus is similar.
Our fresh baked bagels are the signature item at all of our restaurants. We offer over 20 varieties of bagels that include classic and creative flavors, such as wild blueberry, cinnamon raisin, cranberry, sesame, egg, potato, poppy seed, jalapeno, chocolate chip, sun-dried tomato and plain. Noah's Original Fruit & Nut bagels are high in protein and, at Einstein Bros., our gourmet bagels are unique options to traditional bagels and include premium flavors such as Dutch Apple and Spinach Florentine.
To complement our bagel offerings, our restaurants offer a number of cream cheese "shmears" in both savory and sweet flavors such as plain, onion & chive, smoked salmon, jalapeno salsa and honey almond. Our spreads include hummus, whipped butter, preserves, honey butter and peanut butter. Shmears and spreads can be put on a bagel by our associates or purchased in tubs for take-out. To complement our bagels and shmears we offer premium products such as Nova Lox and our custom-blended orange juice. In addition, we offer a selection of other breakfast pastries, such as muffins and coffee cake, which are all baked fresh at the restaurant each day.
All of our restaurants offer a broad selection of egg sandwiches such as spinach, mushroom and Swiss, bacon and cheddar and turkey sausage and cheddar. These sandwiches are served on the guest's choice of a bagel, fresh baked bread, whole wheat wrap, challah bread, or foccacia bread. At Einstein Bros., the line of traditional egg sandwiches is complemented with a line of fresh grilled paninis which
7
include the spinach and bacon Panini as well as the southwest turkey sausage. The line of hot breakfast sandwiches is complemented with a line of egg wraps, such as the Santa Fe and Spicy Elmo.
The cornerstone of the Noah's breakfast menu is our line of Egg Mits, which are served on the guest's choice of bagel and include items such as the tomato and cheese, turkey sausage and cheddar and Nova Lox and scallions. Noah's hot breakfast menu is rounded out with the addition of a line of paninis that includes a vegetable Panini and a spinach and bacon Panini. The Manhattan Bagel breakfast menu features grilled egg sandwiches.
To accompany our breakfast items, Einstein Bros. offers premiumDarn Good Coffee® with five different flavors daily in each restaurant, such as our Neighborhood Blend and our Vanilla Hazelnut Bakery Blend. Noah's offers four daily coffee blends including its Midtown, Chelsea, Soho and Gramercy blends, as well as a fifth seasonal flavor. Our restaurants also offer a selection of hot teas, chai teas and iced teas. Selected locations also serve espresso and specialty coffee.
In addition, we created a "bundle" program to support our seasonal offerings or signature items.
Our lunch offerings at Einstein Bros. Noah's and Manhattan are natural extensions of our heritage as bakers. All of our concepts offer a line of both hot and cold sandwiches as well as a line of soups and salads. We turn our sandwiches into meals with the addition of regular and premium sides. At Einstein Bros, our premium sides include a cup of soup, fresh cut fruit, or a small green salad. In addition to our traditional Einstein Bros. favorites, such as the Tasty Turkey, Veg Out®, and Italian Chicken Panini, we have recently introduced a line of melts, wraps and Noah's-inspired deli sandwiches, the Reuben and Rachel. We also reintroduced our popular mix and match product offering that allows our guests to choose between a small soup, salad and half a deli sandwich on their choice of fresh baked bread. Manhattan Bagel offers all sandwiches on a choice of bagel, wrap, roll or freshly baked foccacia bread.
Noah's menu continues the heritage of a New York deli with popular grilled sandwiches made with corned beef, pastrami, turkey or chicken. These hot offerings are complemented with traditional cold deli sandwiches including roast beef, roast turkey breast, and both tuna and chicken salad. We also introduced the pizza bagel product offerings to Noah's in early 2008.
In addition to our breakfast and lunch items, we also offer products designed for consumption between traditional meal times, including four varieties of pizza bagels, cookies and frozen drinks. Each company owned restaurant offers four types of cookies that may be enjoyed by our guests throughout the course of the day. Einstein Bros. has a line of frozen drinks calledBros. Blenders™, and the flavors include Café Caramel, Café Mocha, Strawberry, and more recently added a fat-free fruit-based option. In the Spring of 2007 we rolled these new product offerings to Noah's and Manhattan Bagel.
Site Selection Process
We consider our site selection process critical to our long-term success. Our site selection process focuses on identifying markets, trade areas and specific sites based on several factors, including visibility, ready accessibility (particularly for morning and lunch time traffic), parking, signage and adaptability of any current structures. We then determine the availability of the site and the related costs. Our site selection strategy emphasizes high visibility locations with good parking in neighborhood shopping centers and power centers with easy access from high-traffic roads. Neighborhood shopping centers are locations with other retailers such as a grocery store anchored center, along with other
8
smaller retailers. A power center is a large exterior shopping center with usually two or more big box retailers, and then several smaller retailers and restaurant pads in front.
Our average unit volume goal for a new restaurant is at least $1.0 million calculated on an annualized basis based on sales at the end of the first full year of operations. We believe by leveraging and implementing the key attributes of our new restaurant design, as well as understanding the characteristics driving the performance of our strongest restaurants, we will be able to open restaurants that operate at this level. Excluding tenant improvement allowances, the cost of a new restaurant is approximately $550,000, but can vary based upon square footage, layout and location. The cost includes equipment, leasehold improvements, furniture and fixtures, and other related capital. In our experience opening new company-owned restaurants in 2007, tenant improvement allowances have averaged approximately $50,000 per restaurant, however, the amount of the allowance can vary widely depending on the location of the restaurant and other terms of the lease. To the extent available, we plan to open locations with greater visibility, drive-through windows and/or units at the end of a retail center (end-cap units). Adding a drive-through window system increases our lease and construction costs by approximately $50,000 per restaurant, but we generally see an increase in our restaurant revenues by more than $150,000 per year per restaurant.
Support of Our Restaurant Operations
We believe controlling the development, sourcing, manufacturing and distribution of our key products is an important element in ensuring both quality and profitability. To support this strategy, we have developed proprietary formulations, invested in processing technology and manufacturing capacity, and aligned ourselves with strategic suppliers.
Our purchasing programs provide our company-owned restaurants and our franchised and licensed restaurants with high quality ingredients at competitive prices from reliable sources. Consistent product specifications, as well as purchasing guidelines, help to ensure freshness and quality. Because we utilize fresh ingredients in most of our menu offerings, inventory at our distributors and company-owned restaurants is maintained at modest levels. We negotiate price agreements and contracts depending on supply and demand for our products and commodity pressures. These agreements can range in duration from six months to five years. Additionally, in late 2007, we contracted with a subsidiary of Cargill, Incorporated to manage our flour purchases for our company-owned production facility, and to advise us on commodity related purchases for our third-party contracted facility.
Key Ingredients—Bagel Dough, Cream Cheese and Coffee
We have developed or use proprietary recipes and production processes for our bagel dough, cream cheese and coffee to help ensure product consistency. We believe this system provides a variety of consistent, superior quality products at competitive market prices to our company-owned, franchised and licensed restaurants.
Frozen bagel dough is shipped to all of our company-owned, franchised and licensed Einstein Bros., Noah's and Manhattan Bagel restaurants and baked on-site. Our significant know-how and technical expertise for manufacturing and freezing mass quantities of raw dough produces a high-quality product more commonly associated with smaller bakeries.
Our cream cheese is manufactured to our specifications utilizing proprietary recipes. Our cream cheese and certain other cheese products are purchased from one supplier under a contract that is currently under renegotiation that we anticipate extending through the end of 2010. We also have developed proprietary coffee blends for sale at our Einstein Bros., Noah's and Manhattan Bagel
9
company-owned, franchised and licensed restaurants. In 2007, we purchased 100% of our coffee from one supplier.
We purchase other ingredients used in our restaurants, such as meat, lettuce, tomatoes and condiments, from a select group of third party suppliers. Our chicken products come from naturally raised chickens that are cared for in strict accordance with established animal care guidelines and without the use of growth accelerators such as antibiotics, steroids or hormones. Our roast beef is United States Department of Agriculture ("USDA") Choice, Grade A, and comes only from corn-fed, domestic cattle. Where available, we buy high quality fruits, vegetables and specialty produce from local farmers and shippers through distributors.
We currently operate a bagel dough manufacturing facility in Whittier, California and have a supply contract with Harlan Bagel Supply LLC and Harlan Bakeries Inc. in Avon, Indiana to produce bagel dough to our specifications. These facilities provide frozen dough and partially-baked frozen bagels for our company-owned restaurants, franchisees and licensees. We use excess capacity to produce bagels for sale to resellers, such as Costco Wholesale Corporation and Super Target.
We have long-standing relationships with Costco, Super Target, and Albertsons. Costco sells our bagels, which are co-branded with the Kirkland® brand, Super Target sells both bagels and cream cheese in retail kiosks, and we sell our branded cream cheese to Albertsons in certain regions. We also sell frozen dough in the U.S. to a third party foreign entity who sells that product under our Einstein Bros. brand in the far east.
Currently we operate five USDA approved commissaries geographically located to best serve our existing company-owned and licensed restaurants. We believe our commissary system provides a competitive cost advantage by buying in bulk and assembling or repacking the product into store-friendly sizes for use at our company-owned restaurants, franchised and licensed restaurants. These operations primarily provide our restaurants with critical food products such as sliced meats, cheeses, and pre-portioned kits that create our various salads. Our commissaries assure consistent quality, supply fresh products and improve efficiencies by reducing labor and inventory requirements at the restaurants. We distribute commissary products primarily through our regional distribution partners.
Our USDA approved commissaries have sufficient capacity to supply all of our existing company-owned, franchised and licensed restaurants' needs. We aim to leverage the fixed cost of our commissary network by focusing on outside sales in areas located near our commissaries. We have various supplier relationships, typically with conventional grocery stores as the end user, for the sale of bagels, cream cheese, salad toppers and salads. These products are sold either through a private label program or under the Einstein Bros. or Noah's brands.
We currently utilize a network of independent distributors to distribute restaurant products to our restaurants. By contracting with distributors, we are able to eliminate investment in distribution systems and focus our managerial and financial resources on our restaurant operations. We contract for virtually all food products and supplies for our company-owned restaurant operations (other than Noah's frozen bagel dough), including cream cheese, coffee, meats and paper goods. Our vendors and commissaries deliver the products to our distributors for delivery to each restaurant. The individual restaurants order directly from the distributors and commissaries one to three times per week.
10
We have implemented a quality assurance and food safety program that is designed to provide our restaurants and guests with high quality and safe foods. Quality and food safety programs and procedures include regular and comprehensive vendor and distribution inspections, process control assessments, food performance and sensory evaluations. The inspections and assessments are based on the federal Hazard Analysis of Critical Control Points principle and prioritized to monitor those foods that have the most potential for food safety and performance risk. Furthermore, our quality assurance program has developed a detailed specification and nutritional database that provides our restaurants and guests with current nutritional information on our menu items.
Supplementing the corporate quality assurance program is our restaurant Quality Service Cleanliness survey that is done by regional training persons, internal food safety and handling programs for our general managers and our toll-free customer call-in number. All of these measures provide us with information that is used to assess the effectiveness of our internal quality surveillance programs.
Licensing and Franchising Segment
Licensing and franchising our brands allows us to increase our geographic footprint and brand recognition. We also generate additional revenues without incurring significant additional expense, capital commitments and many of the other risks associated with opening new company-owned restaurants.
At the end of 2007, we had 124 licensed restaurants throughout the United States located primarily in airports, colleges and universities, office buildings, hospitals and military bases and on turnpikes. We have license relationships with Aramark, Sodexho, AAFES, HMS Host, Compass, CA-1 and Creative Host. Our typical license has a five-year term and provides that the licensee pays us an up-front license fee of $12,500 and a royalty fee of 7.5%. Our licensed restaurants generally have average unit volumes of approximately $445,000. We opened 31 new licensed restaurants in 2007 and currently are planning to open at least 35 new licensed restaurants in 2008.
We believe we can more efficiently grow our Einstein Bros. brand through franchising to qualified area developers. As of January 1, 2008, we are registered to offer Einstein Bros. franchises in all 50 states. During 2007, we actively marketed the Einstein Bros. brand franchise rights and signed two multi-location deals with two separate parties. The first Einstein Bros. franchise location is expected to open during the first half of 2008.
Unlike past Manhattan Bagel franchises, which were sold as single franchised units, we plan to utilize a franchise area development model for the Einstein Bros. brand in which we will assign exclusive rights to develop restaurants within a defined geographic region within a specified period of time. We are targeting franchise area developers who have the existing infrastructure, operational experience and financial strength to develop several restaurants in a designated market. The franchise agreement requires an up-front fee of $35,000 per restaurant and a 5% royalty based on gross sales.
We intend to enter into franchise area development agreements in geographic markets where we either currently do not have Einstein Bros. restaurants or in markets that can support both franchised and company-owned restaurants. In markets where we have limited market penetration, we may also consider selling existing Einstein Bros. restaurants to a franchise area developer. In these instances, we plan to require the franchise area developer to open a minimum number of additional restaurants within a designated period of time.
11
We currently have a franchise base in our Manhattan Bagel brand that generates a recurring revenue stream through royalty fee payments and revenue from the sale to our franchisees of products made from our proprietary recipes. Our Manhattan Bagel franchise base provides us with the ability to grow this brand with minimal commitment of capital by us, and creates a built-in customer base for our manufacturing operations. The core market for this brand is the northeastern United States with the majority of the Manhattan Bagel restaurants located in New Jersey, New York, Pennsylvania and Delaware.
We look for franchisee candidates with appropriate operational experience and financial stability, including specific net worth and liquidity requirements. We typically receive continuing royalties on sales from each franchised restaurant. Our Manhattan Bagel franchisees are not required to buy all of their non-proprietary products directly from us, but rather their product sources must be approved by us. The typical Manhattan Bagel franchise agreement requires an up-front fee of $25,000 per restaurant and a 5% royalty based on sales.
Over the past three years, we have terminated our relationships with certain franchisees for failure to comply with the requirements of their franchise agreements. Additionally, we have allowed certain franchisees to terminate their franchise agreements in locations that are outside our core markets. In 2007, we opened 2 new Manhattan Bagel restaurants. One restaurant was opened by an existing Manhattan Bagel franchisee and the second was opened by a new franchisee. Both are located in our core markets for this brand.
In late 2007, we acquired a location from one of our franchisees, which will make it our only company-owned Manhattan Bagel restaurant. We intend to use this location for employee and manager training, and to test out new products and services before they are rolled out system-wide.
Marketing and Advertising
Our 2008 marketing and advertising strategy focuses on publicizing and increasing awareness of our food, beverages, seasonal and retail offerings.
From a media standpoint, we typically utilize outdoor, radio and internet advertising, as well as a cohesive in-store point of purchase display program and our merchandise displays. We are also developing a new packaging program to strengthen each brand's identity.
We have an annual marketing calendar that is divided into three trimesters with specific products supporting our overall objective of reinforcing our strength in the breakfast daypart while building the lunch and afternoon dayparts. Our first trimester is focused on core breakfast products: egg sandwiches, breakfast paninis and ourDarn Good Coffee®, including two seasonal flavors in each brand.
Training
We strive to maintain quality, consistency and a positive experience for our guests in each of our restaurants through training and supervision. Our restaurant general managers and assistant managers undergo an intensive, seven-week training program, including training in the classroom and in specially designated training restaurants. We have initiated a program that provides economic incentives for our training restaurants and general managers to provide a consistent training experience for our new general managers and assistant managers. Each new associate undergoes a one-week training period in the restaurant. Also, as part of our associate training program, each associate is assigned a mentor during his or her orientation and training period.
In late 2007, we launched "Development Days" training programs for our Einstein Bros. and Noah's general managers. These programs provide communication on new initiatives, training on food
12
preparation, hospitality and other topics, refocus our managers on our vision; and align our managers with our goals. These meetings are held every few months, and focus on two to three key relevant topics, including operational initiatives, specific training on menu items, product-specific information, associate motivation, suggestive selling, and other methods aimed at enhancing the guest experience.
Associates
As of January 1, 2008, we had 7,190 associates, of whom 6,786 were restaurant personnel, 177 were plant and support services personnel, and 227 were corporate personnel. Most restaurant personnel work part-time and are paid on an hourly basis. We have never experienced a work stoppage and our associates are not represented by a labor organization. We believe we have good working relationships with our associates.
Management Information Systems
Each Einstein Bros. and Noah's company-owned restaurant uses point-of-sale computers designed specifically for the fast-casual restaurant industry. The system provides a touch screen interface, a graphical order confirmation display, and integrated high-speed credit card and gift card processing. The point-of-sale system is used to collect daily transaction data, which is used to generate information about daily sales, product mix and average check. All products sold and prices are programmed into the system from our corporate office.
During 2007 we installed an improved ordering system in 111 of our higher volume restaurants where we believe waiting time has been a limiting factor to increasing sales. This system uses wireless technology to reduce the time our guests wait in line before they receive their food. This system, which utilizes both a tablet PC as well as a traditional ordering station, allows our associates to create a second ordering station for our guests. The system tracks the time from when the order is taken to completion and alerts our associates to orders that have exceeded our acceptable completion time. Additionally, we believe that this system provides for a higher level of production accuracy than our current paper tickets and helps to reduce waste. In addition, we deployed the latest generation of payment technologies, contact-less payment credit card readers, to all Einstein Bros and Noah's company-owned restaurants. This adds to our speed of service by allowing customers with contact-less credit and debit cards to make payments quickly and securely by just tapping their card on the contact-less payment reader.
Our in-restaurant back office computer system is designed to assist in the management of our restaurants. The back office restaurant management application provides labor and food cost management tools. These tools provide corporate and retail operations management quick access to detailed business data and reduces restaurant managers' administrative time. The system provides our restaurant managers the ability to submit orders electronically with our distribution network. The system also supplies sales, bank deposit and variance data to our accounting department on a daily basis. We use this data to generate daily sales information and weekly consolidated reports regarding sales and other key measures, as well as preliminary weekly detailed profit and loss statements for each location with final reports following the end of each fiscal period.
Trademarks and Service Marks
Our rights in our trademarks and service marks are a significant part of our business. We are the owners of the federal registration rights to the "Einstein Bros.," "Noah's New York Bagels" and "Manhattan Bagel" marks, as well as several related word marks and word and design marks related to our core brands. We license the rights to use certain trademarks we own or license to our franchisees and licensees in connection with their operations. Many of our core brand trademarks are also registered in numerous foreign countries. We are party to a co-existence agreement with the Hebrew
13
University of Jerusalem ("HUJ") which sets forth the terms under which we can use the name Einstein Bros. and the terms under which HUJ could use the name and likenesses associated with the Estate of Albert Einstein. We also own numerous other trademarks and service marks related to our other business. We are aware of a number of companies that use various combinations of words in our marks, some of which may have senior rights to ours for such use, but we do not consider any of these uses, either individually or in the aggregate, to materially impair the use of our marks. It is our policy to defend our marks and their associated goodwill against encroachment by others.
Seasonality and Quarterly Results
Our business is subject to seasonal fluctuations. Significant portions of our net revenues and results of operations are realized during the fourth quarter of the fiscal year, which includes the December holiday season. Because of the seasonality of the business and the industry, results for any quarter are not necessarily indicative of the results that may be achieved for any other quarter or the full fiscal year.
Consumer Spending Habits
Our results depend on consumer spending, which is influenced by consumer confidence and disposable income. In particular, the effects of higher energy and food costs, an increase in minimum balances payable on consumer debt and increasing interest rates, among other things, may impact discretionary consumer spending in restaurants. Accordingly, we believe we experience declines in comparable store sales during economic downturns or during periods of economic uncertainty. Any material decline in the amount of discretionary spending could have a material adverse effect on our sales and income.
Impact of Agricultural Commodities
Our cost of sales consist of cost of goods sold, which is made up of food and product costs, compensation costs, and operating costs. Wheat, butter, and cheese are our primary agricultural commodities and represent 8.0%, 3.5% and 2.3% of our cost of goods sold, respectively. In addition, coffee, chicken and turkey are the other major agricultural commodities and represent 4.7% of our cost of goods sold. For the last few years, cost increases in one or more of our agricultural commodities were generally modest in relation to our total cost of sales. In the third quarter of 2007, however the price for a bushel of wheat began to rise at a rapid rate and reached new price levels that were, and still are unprecedented. The increase is due to substantially lower harvests due to lower plantings, unfavorable weather conditions, and lost acreage to other competing crops. This situation was exacerbated by growing demand both domestically and internationally which has resulted in low levels of wheat inventory. Because of the increasing commodity costs, we raised our prices twice at both Einstein Bros. and Noah's during in 2007 and again in late January 2008 for Einstein Bros.
Early in the fourth quarter of 2007, we entered into an agreement with a Cargill, Incorporated subsidiary to assist us in managing the price of our purchases of wheat. Through this relationship we have secured our wheat requirements as well as established the price for wheat for virtually all of our needs in fiscal 2008. To offset the impact of higher wheat prices, we implemented a price increase in early 2008 at our Einstein Bros. restaurants and we are contemplating a price increase in 2008 for our Noah's restaurants.
Impact of Inflation on Other Elements of Cost
We have experienced only a modest impact from inflation. However, the impact of inflation on labor, food and occupancy costs could, in the future, significantly affect our operations. We pay many of our employee's hourly rates slightly above the applicable federal, state or municipal "living wage"
14
rates. Recent changes in minimum wage laws may create pressure to increase the pay scale for our associates, which would increase our labor costs. Costs for construction, taxes, repairs, maintenance and insurance all impact our occupancy costs. We believe our current strategy, which is to seek to maintain operating margins through a combination of menu price increases, cost controls, efficient purchasing practices and careful evaluation of property and equipment needs, has been an effective tool for dealing with inflation.
Competition
The restaurant industry is intensely competitive. The industry is often affected by changes in demographics, consumers' eating habits and preferences, local and national economic conditions affecting consumer spending habits, population trends, and local traffic patterns.
We experience competition from numerous sources in our trade areas. Our restaurants compete based on guests' needs for breakfast, lunch and afternoon "chill-out" (the period after lunch and before dinner). Our competitors are different for each daypart. The competitive factors include brand awareness, advertising effectiveness, location and attractiveness of facilities, hospitality, environment, quality and speed of guest service and the price/value of products offered. Certain of our competitors may have substantially greater financial, marketing and operating resources. We compete in the fast-casual segment of the restaurant industry, but we also consider other restaurants in the fast-food, specialty food and full-service segments to be our competitors.
Government Regulation
Each of our restaurants is subject to licensing and regulation by a number of governmental authorities, which include health, safety, labor, sanitation, building and fire agencies in the state, county, or municipality in which the restaurant is located. A failure to comply with one or more regulations could result in the imposition of sanctions, including the closing of restaurants for an indeterminate period of time, fines or third party litigation. Our manufacturing, commissary and distribution facilities are licensed and subject to regulation by either federal, state or local health and fire codes, and the operation of our trucks are subject to Department of Transportation regulations. We are also subject to federal and state environmental regulations.
Our franchise operations are subject to Federal Trade Commission (the "FTC") regulation and various state laws which regulate the offer and sale of franchises. Several state laws also regulate substantive aspects of the franchisor/franchisee relationship. The FTC requires us to furnish to prospective franchisees a franchise disclosure documents containing prescribed information. A number of states in which we might consider franchising also regulate the sale of franchises and require registration of the disclosure document with state authorities. Our ability to sell franchises in those states is dependent upon obtaining approval of our disclosure document by those authorities.
Executive Officers
Name
| | Age
| | Position
|
|---|
| Paul J.B. Murphy III | | 53 | | President, Chief Executive Officer and Director |
| Daniel J. Dominguez | | 62 | | Chief Operating Officer |
| Richard P. Dutkiewicz | | 52 | | Chief Financial Officer |
| Jill B.W. Sisson | | 60 | | General Counsel and Secretary |
| James W. Hood | | 55 | | Chief Marketing Officer |
Paul J.B. Murphy III. Mr. Murphy was appointed President, Chief Executive Officer and Acting Chairman of the Board in October 2003. He served as Acting Chairman until October 2004. Mr. Murphy joined us in December 1997 as Senior Vice President—Operations and served as
15
Executive Vice President—Operations from March 1998 to April 2002 when he was appointed our Chief Operating Officer. From July 1996 until December 1997, Mr. Murphy was Chief Operating Officer of one of our former area developers. From August 1992 until July 1996, Mr. Murphy was Director of Operations of R&A Foods, L.L.C., and an area developer of Boston Chicken. Mr. Murphy has a B.A. degree from Washington and Lee University.
Daniel J. Dominguez. Mr. Dominguez was appointed Chief Operating Officer in December 2005. Mr. Dominguez joined us in November 1995 and served as Senior Vice President of Operations for Noah's New York Bagels from April 1998 to December 2005. From 1995 to April 1998, Mr. Dominguez served as the Director of Operations for Einstein Bros. Midwest. Prior to joining us, Mr. Dominguez was Executive Vice President of JB Patt America, Beverly Hills, CA, dba Koo Koo Roo Restaurants, from July 1994 to October 1995. From May 1987 to July 1994, he was the Divisional Vice President of Food Services for Carter Hawley Hale in San Francisco, CA from November 1976 to May 1987 he was the Vice President of Operations for Bakers Square Restaurants in California.
Richard P. Dutkiewicz. Mr. Dutkiewicz joined us in October 2003 as Chief Financial Officer. From May 2003 to October 2003, Mr. Dutkiewicz was Vice President—Information Technology of Sirenza Microdevices, Inc. In May 2003, Sirenza Microdevices, Inc. acquired Vari-L Company, Inc. From January 2001 to May 2003, Mr. Dutkiewicz was Vice President—Finance, and Chief Financial Officer of Vari-L Company, Inc. From April 1995 to January 2001, Mr. Dutkiewicz was Vice President—Finance, Chief Financial Officer, Secretary and Treasurer of Coleman Natural Products, Inc., located in Denver, Colorado. Mr. Dutkiewicz's previous experience includes senior financial management positions at Tetrad Corporation, MicroLithics Corporation and various divisions of United Technologies Corporation. Mr. Dutkiewicz began his career as an Audit Manager at KPMG LLP. Mr. Dutkiewicz received a B.B.A. degree from Loyola University of Chicago.
Jill B. W. Sisson. Ms. Sisson joined us as a consultant in December 2003. She most recently served as General Counsel and Secretary of Graphic Packaging International Corporation from September 1992 until its merger with Riverwood Holding, Inc. in August 2003. From 1974 to September 1992, she engaged in private law practice in Denver, Colorado. She has a B.A. degree from Middlebury College and received her J.D. degree from the University of Colorado Law School.
James W. Hood. Mr. Hood was appointed Chief Marketing Officer in May 2007, and was previously appointed to our board of directors in June 2005. He is the co-founder and partner in Bray+Hood+Associates (B+H+A), a marketing innovations consulting firm headquartered in Essex, Connecticut. Prior to establishing B+H+A in 2001, Mr. Hood spent twenty years in executive positions with Young & Rubicam, Inc. His roles there included chief executive officer of The Lord Group, a joint venture between Y&R and Dentsu, and director of business development at Y&R Advertising. From 2004 until 2006, Mr. Hood also served as Chief Executive Officer of Hip Cricket Inc., a company specializing in interactive mobile marketing campaigns. He also served as vice president and director of marketing at Lehman Brothers Kuhn Loeb and later held the same position at The First Boston Corporation. He received a B.A. degree from Cornell University and holds an M.B.A. degree in Marketing and Finance from the Harvard Business School.
Available Information
We are subject to the informational requirements of the Exchange Act. We therefore file periodic reports, proxy statements and other information with the SEC. Such reports may be obtained by visiting the Public Reference Room of the Securities Exchange Commission (the "SEC") at 100 F Street, N.E., Washington, D.C. 20549, or by calling the SEC at 1-800-SEC-0330. In addition, the SEC maintains an internet site (www.sec.gov) that contains reports, proxy and information statements and other information regarding issuers that file electronically.
16
Additionally, copies of our reports on Forms 10-K, 10-Q and 8-K and any amendments to such reports are available for viewing and copying through our internet site (www.einsteinnoah.com), free of charge, as soon as reasonably practicable after filing such material with, or furnishing it to the SEC.
We also make available on our website and in print to any stockholder who requests it, the Charters for our Audit and Compensation Committees, as well as the Code of Conduct that applies to all directors, officers, and associates of our company. Amendments to these documents or waivers related to the Code of Conduct will be made available on our website as soon as reasonably practicable after their execution.
ITEM 1A. RISK FACTORS
We wish to caution our readers that the following important factors, among others, could cause the actual results to differ materially from those indicated by forward-looking statements made in this report and from time to time in news releases, reports, proxy statements, registration statements and other written communications, as well as verbal forward-looking statements made from time to time by representatives of the company. Such forward-looking statements involve risks and uncertainties that may cause our actual results, performance or achievements to be materially different from any future performance or achievements expressed or implied by these forward-looking statements. Factors that might cause actual events or results to differ materially from those indicated by these forward-looking statements may include matters such as future economic performance, restaurant openings or closings, operating margins, the availability of acceptable real estate locations, the sufficiency of our cash balances and cash generated from operating and financing activities for our future liquidity and capital resource needs, and other matters, and are generally accompanied by words such as: believes, anticipates, plans, intends, estimates, predicts, targets, expects, contemplates and similar expressions that convey the uncertainty of future events or outcomes. An expanded discussion of some of these risk factors follows.
Risk Factors Relating to Our Business and Our Industry
Failure to protect food supplies and adhere to food safety standards could result in food-borne illnesses and/or injuries to our guests. Damage to our reputation for serving high quality, safe food could adversely affect our results.
Food safety and reputation for quality is the most significant risk to any company that operates in the restaurant industry. Food safety is the focus of increased government regulatory initiatives at the local, state and federal levels.
Failure to protect our food supply or enforce food safety policies, such as proper food temperatures and adherence to shelf life dates, could result in food-borne illnesses and/or injuries to our guests. Also, our reputation of providing high quality food is an important factor in choosing our restaurants. Instances of food borne illness, including listeriosis, salmonella and e-coli, whether or not traced to our restaurants, could reduce demand for our menu offerings. If any of our guests become ill from consuming our products, the affected restaurants may be forced to close. An instance of food contamination originating from one of our restaurants, our commissaries or suppliers, or our manufacturing plant could have far-reaching effects, as the contamination, or the perception of contamination could affect substantially all of our restaurants. In addition, publicity related to either product contamination or recalls may cause our guests to cease frequenting our restaurants based on fear of such illnesses.
Changes in consumer preferences and discretionary spending priorities could harm our financial results.
Numerous factors including changes in consumer tastes and discretionary spending priorities often affect restaurants. Shifts in consumer preferences away from our type of cuisine and/or the fast-casual
17
style could have a material adverse effect on our results of operations. Dietary trends, such as the consumption of food low in carbohydrate content have, in the past, and may, in the future, negatively impact our sales.
Changes in our guests' spending habits could also have a material adverse effect on our sales. A variety of factors could affect discretionary consumer spending, including national, regional and local economic conditions, weather, inflation, consumer confidence, the effect of credit, including mortgage markets, and energy costs. Adverse changes in any of these factors could reduce consumers' discretionary spending which in turn could reduce our guest traffic or average check. For example, traffic to restaurants industry-wide was adversely affected in 2006 and 2007 as a result of reduced consumer spending due to rising fuel and energy costs. Widespread national and international concern over instability in the credit markets has exacerbated the decline in consumer spending. The conditions experienced during 2007 included, among other things: reduced consumer confidence; on-going concerns about the housing market and concerns over higher-risk mortgage loan products, such as sub-prime mortgage loans. Adverse changes in consumer preferences or consumer discretionary spending, each of which could be affected by many different factors which are out of our control, could harm our business prospects, financial condition, operating results and cash flows. Our continued success will depend in part on our ability to anticipate, identify and respond to changing consumer preferences and economic and other conditions.
Increasing commodity prices would adversely affect our gross profit.
Recent global demand for commodities such as wheat has resulted in higher prices for flour and has increased our costs. The prices of our main ingredients are directly associated with the changing weather conditions as well as economic factors such as supply and demand of certain commodities within the United States and other countries. Our ability to forecast and manage our commodities could significantly affect our gross margins.
Due to increased demand for ethanol, the cost of corn has increased substantially, which has increased the cost of corn-sourced ingredients as well as other commodities such as wheat, the primary ingredient in most of our products. We expect that this demand and these commodity pressures to continue for 2008 and into 2009 as well. Any increase in the prices of the ingredients most critical to our products, such as wheat, could adversely affect our operating results.
Additionally, in the event of massive culling of specific animals such as chickens or turkeys to prevent the spread of disease, the supply and availability of ingredients may become limited. This could dramatically increase the price of certain menu items which could decrease sales of those items or could force us to eliminate those items from our menus entirely. All of these factors could adversely affect our business, reputation and financial results.
We may not be successful in implementing any or all of the initiatives of our business strategy.
Our success depends in part on our ability to understand and satisfy the needs of our guests, franchisees and licensees. Our business strategy consists of several initiatives:
- •
- expand sales at our existing company-owned restaurants;
- •
- open new company-owned restaurants; and
- •
- open new franchised and licensed restaurants.
Our ability to achieve any or all of these initiatives is uncertain. Our success in expanding sales at company-owned restaurants through various sub-initiatives including: developing new menu offerings and broadening our offerings across multiple dayparts, improving our ordering and production systems, expanding our catering program and upgrading our restaurants is dependent in part on our ability to
18
predict and satisfy consumer preferences. Our success in growing our business through opening new company-owned restaurants is dependent on a number of factors, including our ability to: find suitable locations, reach acceptable lease terms, have adequate capital, find available contractors, obtain licenses and permits, locate and train appropriate staff and properly manage the new restaurant. Our success in opening new franchised and licensed restaurants is dependent upon, among other factors, our ability to: attract quality businesses to invest in our core brands, maintain the effectiveness of our franchise disclosure documents in target states, offer restaurant solutions for a variety of location types and the ability of our franchisees and licensees to: find suitable locations, reach acceptable lease terms, have adequate capital, find available contractors, obtain licenses and permits, locate and train staff appropriately and properly manage the new restaurants. Accordingly, we may not be able to open or upgrade as many restaurants or grant as many franchises or licenses as we project or otherwise execute on our strategy. If we are not successful in implementing any or all of the initiatives of our business strategy, it could have a material adverse effect on our business, results of operations, and financial condition.
Our sales and profit growth could be adversely affected if comparable store sales are less than we expect.
The level of growth in comparable store sales significantly affects our overall sales growth and will be a critical factor affecting profit growth. Our ability to increase comparable store sales depends in part on our ability to offer hospitality and attractive menu items, and successfully implement our initiatives to increase throughput, such as increasing the speed at which our employees serve each guest. Factors such as traffic patterns, local demographics and the type, number and location of competing restaurants may adversely affect the performance of individual restaurants. It is possible that we will not achieve our targeted comparable store sales growth or that the change in comparable store sales could be negative and could adversely impact our sales and profit growth.
Competition in the restaurant industry is intense, and we may fall short of our revenue and profitability targets if we are unable to compete successfully.
Our industry is highly competitive and there are many well-established competitors with substantially greater financial and other resources than we have. Although we operate in the fast-casual segment of the restaurant industry, we also consider restaurants in the fast-food and full-service segments to be our competitors. Several fast-casual and fast-food chains have announced their intentions to focus more on breakfast offerings and look to expand their coffee offerings. This could further increase competition in the breakfast daypart. In addition to current competitors, one or more new major competitors with substantially greater financial, marketing and operating resources could enter the market at any time and compete directly against us. Also, in virtually every major metropolitan area in which we operate or expect to enter, local or regional competitors already exist. This may make it more difficult to obtain real estate and advertising space, and to attract and retain guests and personnel.
We occupy our company-owned restaurants under long-term non-cancelable leases, and we may be unable to renew leases at the end of their lease periods or obtain new leases on acceptable terms.
We do not own any real property, and all of our company-owned restaurants are located in leased premises. Many of our current leases are non-cancelable and typically have terms ranging from five to ten years with two three- to five-year renewal options. We believe leases that we enter into in the future likely will also be long-term and non-cancelable and have similar renewal options. Most of our leases provide that the landlord may increase the rent over the term of the lease, and require us to pay our proportionate share of the cost of insurance, taxes, maintenance and utilities. If we close a restaurant, we generally remain committed to perform our obligations under the applicable lease, which would include, among other things, payment of the base rent for the balance of the lease term. In some
19
instances, we may be unable to close an underperforming restaurant due to continuous operation clauses in our lease agreements. Our obligation to continue making rental payments in respect of leases for closed or underperforming restaurants could have a material adverse effect on our business and results of operations.
Alternatively, at the end of the lease term and any renewal period for a restaurant, we may be unable to renew the lease without substantial additional cost, if at all. If we are unable to renew our restaurant leases, we may be forced to close or relocate a restaurant, which could subject us to construction and other costs and risks, and could have a material adverse effect on our business and results of operations. For example, closing a restaurant, even during the time of relocation, will reduce the sales that the restaurant would have contributed to our revenues. Additionally, the revenue and profit, if any, generated at a relocated restaurant may not equal the revenue and profit generated at the existing restaurant. We also face competition from both restaurants and other retailers for suitable sites for new restaurants. As a result, we may not be able to secure or renew leases for adequate sites at acceptable rent levels.
The cost of natural resources, such as energy, together with the cost, availability and quality of our raw ingredients affect our results of operations.
The cost, availability and quality of the ingredients that we use to prepare our food are subject to a range of factors, many of which are beyond our control. Fluctuations in economic and political conditions, product demand weather, crops planted, and natural resources such as electricity, water, and fuel could adversely affect the cost of our ingredients. We have limited control over changes in the price and quality of these natural resources, since we typically do not enter into long-term pricing agreements for our ingredients and production costs, such as energy and fuel. We may not be able to pass through any future cost increases by increasing menu prices, as we have done in the past. We and our franchisees and licensees are dependent on a constant supply of energy, frequent deliveries of fresh ingredients, and regular consumption of fuel, thereby subjecting us to the risk of shortages or interruptions in supply of any of these items.
The cost of energy impacts our results of operations in several ways. We have seen our cost of electricity gradually increase over time. Distribution costs related to fuel have impacted our operations negatively. Additionally, travel costs, primarily airline fares, have been steadily increasing nationwide. These costs impact our results of operation currently and could impact us negatively in the future.
Our operations may be negatively impacted by adverse weather conditions and natural disasters.
Adverse weather conditions and natural disasters could seriously affect regions in which our company-owned, franchised and licensed restaurants are located or regions that produce raw ingredients for our restaurants. If adverse weather conditions or natural disasters such as fires and hurricanes affect our restaurants, we could experience closures, repair and restoration costs, food spoilage, and other significant reopening costs as well as increased food costs and delayed supply shipments, any of which would adversely affect our business. Additionally, during periods of extreme temperatures (either hot or cold) or precipitation, many individuals choose to stay inside. This negatively impacts transaction counts in our restaurants and over extended periods of time could adversely affect our business and results of operations.
The effects of hurricanes, fires, freezes and other adverse weather conditions are likely to affect supply of and costs for raw ingredients and natural resources, near-term construction costs for our new restaurants as well as sales in our restaurants going forward. If we are not able to anticipate or react to changing costs of food and other raw materials by adjusting our purchasing practices or menu prices, our operating margins would likely deteriorate.
20
We have single suppliers for most of our key ingredients, and the failure of any of these suppliers to perform could harm our business.
We currently purchase our raw materials from various suppliers; however, we have only one supplier for each of our key ingredients. We purchase a majority of our frozen bagel dough from a single supplier, who utilizes our proprietary processes and on whom we are dependent in the short-term. All of our remaining frozen bagel dough is produced at our dough manufacturing facility in Whittier, California. Additionally, we purchase all of our cream cheese and coffee from a single source. Although to date we have not experienced significant difficulties with our suppliers, our reliance on a single supplier for each of our key ingredients subjects us to a number of risks, including possible delays or interruption in supplies, diminished control over quality and a potential lack of adequate raw material capacity. Any disruption in the supply or degradation in the quality of the materials provided by our suppliers could have a material adverse effect on our business, operating results and financial condition. In addition, any such disruptions in supply or degradations in quality could have a long-term detrimental impact on our efforts to maintain a strong brand identity and a loyal consumer base.
Failure of our distributors to perform adequately or any disruption in our distributor relationships could adversely affect our business and reputation.
We depend on our network of independent regional distributors to distribute frozen bagel dough and other products and materials to our company-owned, franchised and licensed restaurants. Any failure by one or more of our distributors to perform as anticipated, or any disruption in any of our distribution relationships for any reason, would subject us to a number of risks, including inadequate products delivered to our restaurants, diminished control over quality of products delivered, and increased operating costs to prevent delays in deliveries. Any of these events could harm our relationships with our franchisees or licensees, or diminish the reputation of our menu offerings or our brands in the marketplace. In addition, a negative change in the volume of products ordered from our distributors by our company-owned, franchised and/or licensed restaurants could increase our distribution costs. These risks could have a material adverse effect on our business, financial condition and results of operations.
In early 2008, one of our distributors announced its intention to relocate part of its distribution network in the southeast. If this transition or relocation does not go smoothly, this could adversely affect our operations.
Increasing labor costs could adversely affect our results of operations and cash flows.
We are dependent upon an available labor pool of associates, many of whom are hourly employees whose wages may be affected by increases in the federal, state or municipal "living wage" rates. Numerous increases have been made on federal, state and local levels to increase minimum wage levels. Increases in state minimum hourly wage rates in some of the states in which we operate became effective January 2008, and the federal government has recently enacted minimum wage increases for 2008 and we expect the minimum wage will be raised again in 2009. Increases in the minimum wage may create pressure to increase the pay scale for our associates, which would increase our labor costs and those of our franchisees and licensees.
A shortage in the labor pool or other general inflationary pressures or changes could also increase labor costs. In addition, changes in labor laws or reclassifications of associates from management to hourly employees could affect our labor cost. An increase in labor costs could have a material adverse effect on our income from operations and decrease our profitability and cash flows if we are unable to recover these increases by raising the prices we charge our guests.
21
We may not be able to generate sufficient cash flow to make payments on our substantial amount of debt and mandatorily redeemable preferred stock.
We have a considerable amount debt and are substantially leveraged. As of January 1, 2008, we had $89.8 million in term loans outstanding. We also have $57.0 million of mandatorily redeemable preferred stock due June 30, 2009. In addition, we may, subject to certain restrictions, incur substantial additional indebtedness in the future. Our high level of debt, among other things, could:
- •
- make it difficult for us to satisfy our obligations under our indebtedness;
- •
- limit our ability to obtain additional financing for working capital, capital expenditures, acquisitions and general corporate purposes;
- •
- increase our vulnerability to downturns in our business or the economy generally;
- •
- increase our vulnerability to volatility in interest rates; and
- •
- limit our ability to withstand competitive pressures from our less leveraged competitors.
Economic, financial, competitive, legislative and other factors beyond our control may affect our ability to generate cash flow from operations to make payments on our indebtedness and to fund necessary working capital. A significant reduction in operating cash flow would likely increase the need for alternative sources of liquidity. If were unable to generate sufficient cash flow to make payments on our debt, we will have to pursue one or more alternatives, such as reducing or delaying capital expenditures, refinancing our debt on terms that are not favorable to us, selling assets or issuing additional equity securities. We may not be able to accomplish any of these alternatives on satisfactory terms, if at all, and even if accomplished, they may not yield sufficient funds to service our debt.
We must comply with certain covenants inherent in our debt agreements to avoid defaulting under those agreements.
Our current debt agreements contain certain covenants, which, among others, include certain financial covenants such as limitations on capital expenditures, maintenance of the business, use of proceeds from sales of assets and consolidated leverage and fixed charge coverage ratios as defined in the agreements. The covenants also preclude the declaration and payment of dividends or other distributions to holders of our common stock. We are subject to multiple economic, financial, competitive, legal and other risks that are beyond our control and could harm our future financial results. Any adverse effect on our business or financial results could affect our ability to maintain compliance with our debt covenants, and any failure by us to comply with these covenants could result in an event of default. If we were to default under our covenants and such default were not cured or waived, our indebtedness could become immediately due and payable, which could render us insolvent.
We face the risk of adverse publicity and litigation in connection with our operations.
We are from time to time the subject of complaints or litigation from our consumers alleging illness, injury or other food quality, health or operational concerns. Adverse publicity resulting from these allegations may materially adversely affect us, regardless of whether the allegations are valid or whether we are liable. In addition, employee claims against us based on, among other things, discrimination, harassment or wrongful termination or improper classification of management employees as exempt employees may divert financial and management resources that would otherwise be used to benefit our future performance. There is also a risk of litigation from our franchisees with regard to the terms of our franchise arrangements. We have been subject to a variety of these and other claims from time to time, and although these claims have not historically had a material impact on our operations, a significant increase in the number of these claims or the number that are
22
successful could materially adversely affect our business, prospects, financial condition, operating results or cash flows.
A regional or global health pandemic could severely affect our business.
A health pandemic is a disease that spreads rapidly and widely by infection and affects many individuals in an area or population at the same time. In 2004, 2005 and 2006, Asian and European countries experienced outbreaks of avian flu and it is possible that it will continue to migrate to the United States where our restaurants are located. If a regional or global health pandemic were to occur, depending upon its duration and severity, our business could be severely affected. We have positioned ourselves as a "neighborhood atmosphere" between home and work where people can gather for human connection and high quality food. Customers might avoid public gathering places in the event of a health pandemic, and local, regional or national governments might limit or ban public gatherings to halt or delay the spread of disease. A regional or global pandemic might also adversely impact our business by disrupting or delaying production and delivery of products and materials in our supply chain and causing staff shortages in our restaurants. The impact of a health pandemic might be disproportionately greater on us than on other companies that depend less on the gathering of people in a neighborhood atmosphere.
Our franchisees and licensees may not help us develop our business as we expect, or could actually harm our business.
We rely in part on our franchisees and licensees and the manner in which they operate their restaurants to develop and promote our business. Although we have developed criteria to evaluate and screen prospective candidates, the candidates may not have the business acumen or financial resources necessary to operate successful restaurants in their respective areas. In addition, franchisees and licensees are subject to business risks similar to what we face such as competition, consumer acceptance, fluctuations in the cost, availability and quality of raw ingredients, and increasing labor costs. The failure of franchisees and licensees to operate successfully could have a material adverse effect on us, our reputation, our ability to collect royalties, our brands and our ability to attract prospective candidates. Potential franchisees and licensees may have difficulty obtaining proper financing as a result of the downturn in the credit markets. As we offer and grant franchises for our Einstein Bros. brand, our reliance on our franchisees is expected to increase in proportion to growth of the franchisee base. With respect to franchising our Einstein Bros. brand, we may not be able to identify franchisees that meet our criteria, or to enter into franchise area development agreements with prospective franchisee candidates that we identify. As a result, our franchise program for the Einstein Bros. brand may not grow at the rate we currently expect, or at all.
Our restaurants and products are subject to numerous and changing government regulations. Failure to comply could negatively affect our sales, increase our costs or result in fines or other penalties against us.
Each of our restaurants is subject to licensing and regulation by the health, sanitation, safety, labor, building and fire agencies of the respective states, counties, cities and municipalities in which it is located. A failure to comply with one or more regulations could result in the imposition of sanctions, including the closing of facilities for an indeterminate period of time, or third party litigation, any of which could have a material adverse effect on us and our results of operations.
Many recent government bodies have begun to legislate or regulate high-fat and high sodium foods as a way of combating concerns about obesity and health. Several municipalities are requiring restaurants and other food service establishments to phase-out artificial trans-fat by certain dates in 2008, including New York City, New York, Philadelphia, Pennsylvania, and King County (Seattle), Washington. Many other states are considering laws banning trans-fat in restaurant food. Because we do use trans-fat in a few of our products, federal, state or local regulations in the future may limit sales
23
of certain of our foods or ingredients. Public interest groups have also focused attention on the marketing of high-fat and high-sodium foods to children in a stated effort to combat childhood obesity. Additional cities or states may propose or adopt similar regulations. The cost of complying with these regulations could increase our expenses and the negative publicity arising from such legislative initiatives could reduce our future sales.
Our franchising operations are subject to regulation by the Federal Trade Commission. We must also comply with state franchising laws and a wide range of other state and local rules and regulations applicable to our business. The failure to comply with federal, state and local rules and regulations would have an adverse effect on us.
Under various federal, state and local laws, an owner or operator of real estate may be liable for the costs of removal or remediation of certain hazardous or toxic substances on or in such property. Such liability may be imposed without regard to whether the owner or operator knew of, or was responsible for, the presence of such hazardous or toxic substances. Although we are not aware of any environmental conditions that require remediation by us under federal, state or local law at our properties, we have not conducted a comprehensive environmental review of our properties or operations. We may not have identified all of the potential environmental liabilities at our properties, and any such liabilities that are identified in the future may have a material adverse effect on our financial condition.
We may not be able to protect our trademarks, service marks and other proprietary rights.
We believe our trademarks, service marks and other proprietary rights are important to our success and our competitive position. Accordingly, we devote substantial resources to the establishment and protection of our trademarks, service marks and proprietary rights. However, the actions we take may be inadequate to prevent imitation of our products and concepts by others or to prevent others from claiming violations of their trademarks and proprietary rights by us. In addition, others may assert rights in our trademarks, service marks and other proprietary rights.
Our ability to use net operating loss carryforwards to offset future taxable income for U.S. federal income tax purposes is subject to limitation.
In general, under Section 382 of the Internal Revenue Code, a corporation that undergoes an "ownership change" is subject to limitations on its ability to utilize its pre-change net operating losses, or NOLs, to offset future taxable income. A corporation generally undergoes an "ownership change" when the stock ownership percentage (by value) of its "5 percent stockholders" increases by more than 50 percentage points over any three-year testing period.
As of January 1, 2008, our net operating loss carryforwards for U.S. federal income tax purposes were approximately $148.8 million. As a result of prior ownership changes, approximately $102.2 million of our NOL carryforwards are subject to an annual usage limitation of $4.7 million. Due to transactions involving the sale or other transfer of our stock from the date of our last ownership change through the date of the secondary public offering of our common stock, and changes in the value of our stock during that period, such offering may result in an additional ownership change for purposes of Section 382 or will significantly increase the likelihood that we will undergo an additional ownership change in the future (which could occur as a result of transactions involving our stock that are outside of our control). In either event, the occurrence of an additional ownership change would limit our ability to utilize the approximately $46.6 million of our NOLs that are not currently subject to limitation, and could further limit our ability to utilize our remaining NOLs and possibly other tax attributes. Limitations imposed on our ability to use NOLs and other tax attributes to offset future taxable income could cause us to pay U.S. federal income taxes earlier than we otherwise would if such limitations were not in effect, and could cause such NOLs and other tax attributes to expire unused, in
24
each case reducing or eliminating the benefit of such NOLs and other tax attributes to us and adversely affecting our future cash flow. We are in the process of filing a request with the Internal Revenue Service to review our methodology for determining ownership changes in accordance with Internal Revenue Code Section 382. Upon acceptance of our request, we believe that our NOLs will be available for utilization. In the event that our request is not accepted, approximately $17.9 million of NOLs will be at risk to expire prior to utilization. There can be no assurance that we will realize any U.S. federal income tax benefit from any of our net operating loss carryforwards. Similar rules and limitations may apply for state income tax purposes as well.
Risk Factors Relating to Our Common Stock
We have a majority stockholder.
Greenlight Capital, L.L.C. and its affiliates beneficially own approximately 67.6% of our common stock. As a result, Greenlight has sufficient voting power, without the vote of any other stockholders, to determine what matters will be submitted for approval by our stockholders, to approve actions by written consent without the approval of any other stockholders, to elect all of the members of our board of directors, and to determine whether a change in control of our company occurs. Greenlight's interests on matters submitted to stockholders may be different from those of other stockholders. Greenlight is not involved in our day-to-day operations, but Greenlight has voted its shares to elect our current board of directors. The chairman of our board of directors is a current employee of Greenlight.
We have listed our common stock on the NASDAQ Global Market. NASDAQ rules will require us to have an audit committee consisting entirely of independent directors. However, under NASDAQ rules, if a single stockholder holds more that 50% of the voting power of a listed company, that company is considered a controlled company, and is exempt from several other corporate governance rules, including the requirement that companies have a majority of independent directors and independent director involvement in the selection of director nominees and in the determination of executive compensation. As a result, our stockholders will not have, and may never have, the protections that these rules are intended to provide. The Company currently has a majority of independent directors on the board of directors.
Future sales of shares of our common stock by our stockholders could cause our stock price to fall.
If a substantial number of shares of our common stock are sold in the public market, the market price of our common stock could fall. The perception among investors that these sales will occur could also produce this effect. Our majority stockholder, Greenlight, beneficially owns approximately 67.6% of our common stock and sales by Greenlight or a perception that Greenlight will sell could cause a decrease in the market price of our common stock.
ITEM 1B. UNRESOLVED STAFF COMMENTS
None
25
ITEM 2. PROPERTIES
Our Current Restaurants
The following table details our restaurant openings and closings for each respective fiscal year:
| | Fiscal
2005
| | Fiscal
2006
| | Fiscal
2007
| |
|---|
| Einstein Bros. Bagels | | | | | | | |
| | Company-owned beginning balance | | 371 | | 360 | | 341 | |
| | | Opened restaurants | | 4 | | 3 | | 8 | |
| | | Closed restaurants | | (15 | ) | (22 | ) | (12 | ) |
| | |
| |
| |
| |
| | Company-owned ending balance | | 360 | | 341 | | 337 | |
| | |
| |
| |
| |
| | Licensed beginning balance | | 54 | | 67 | | 93 | |
| | | Opened restaurants | | 16 | | 28 | | 31 | |
| | | Closed restaurants | | (3 | ) | (2 | ) | (3 | ) |
| | |
| |
| |
| |
| | Licensed ending balance * | | 67 | | 93 | | 121 | |
| | |
| |
| |
| |
| Noah's | | | | | | | |
| | Company-owned beginning balance | | 78 | | 73 | | 73 | |
| | | Opened restaurants | | — | | 2 | | 4 | |
| | | Closed restaurants | | (5 | ) | (2 | ) | — | |
| | |
| |
| |
| |
| | Company-owned ending balance | | 73 | | 73 | | 77 | |
| | |
| |
| |
| |
| | Licensed beginning balance | | 3 | | 3 | | 3 | |
| | | Opened restaurants | | — | | 1 | | — | |
| | | Closed restaurants | | — | | (1 | ) | — | |
| | |
| |
| |
| |
| | Licensed ending balance | | 3 | | 3 | | 3 | |
| | |
| |
| |
| |
| Manhattan Bagel | | | | | | | |
| | Company-owned beginning balance | | — | | — | | — | |
| | | Opened restaurants | | — | | — | | 1 | |
| | | Closed restaurants | | — | | — | | — | |
| | |
| |
| |
| |
| | Company-owned ending balance | | — | | — | | 1 | |
| | |
| |
| |
| |
| | Franchised beginning balance | | 145 | | 109 | | 80 | |
| | | Opened restaurants | | — | | 2 | | 2 | |
| | | Closed restaurants | | (36 | ) | (31 | ) | (13 | ) |
| | |
| |
| |
| |
| | Franchised ending balance | | 109 | | 80 | | 69 | |
| | |
| |
| |
| |
| Non-Core Brands | | | | | | | |
| | Company-owned beginning balance | | 4 | | 2 | | 2 | |
| | | Opened restaurants | | — | | — | | — | |
| | | Closed restaurants | | (2 | ) | — | | (1 | ) |
| | |
| |
| |
| |
| | Company-owned ending balance | | 2 | | 2 | | 1 | |
| | |
| |
| |
| |
| | Franchised beginning balance | | 34 | | 12 | | 6 | |
| | | Opened restaurants | | — | | — | | — | |
| | | Closed restaurants | | (22 | ) | (6 | ) | (3 | ) |
| | |
| |
| |
| |
| | Franchised ending balance | | 12 | | 6 | | 3 | |
| | |
| |
| |
| |
| Consolidated Total | | | | | | | |
| | Total beginning balance | | 689 | | 626 | | 598 | |
| | | Opened restaurants | | 20 | | 36 | | 46 | |
| | | Closed restaurants | | (83 | ) | (64 | ) | (32 | ) |
| | |
| |
| |
| |
| | Total ending balance | | 626 | | 598 | | 612 | |
| | |
| |
| |
| |
- *
- We use franchise agreements to contract with qualified disadvantaged business enterprises, non-profit and other entities, either as licensees, fractional franchisees, or franchisees under a traditional franchise
26
agreement, who do not meet the fractional franchise exemption to open restaurants in our traditional licensee venues. As of January 1, 2008, we had 5 franchisees operating Einstein Bros. restaurants in airport locations which operationally fall under our licensing group.
As of January 1, 2008, our company-owned facilities, franchisees and licensees operated in various states and in the District of Columbia as follows:
Location
| | Company
Operated
| | Franchised
or Licensed
| | Total
|
|---|
| Alabama | | — | | 2 | | 2 |
| Arizona | | 23 | | 4 | | 27 |
| California | | 79 | | 11 | | 90 |
| Colorado | | 31 | | 5 | | 36 |
| Connecticut | | 1 | | 1 | | 2 |
| Delaware | | 1 | | 1 | | 2 |
| District of Columbia | | 1 | | 3 | | 4 |
| Florida | | 54 | | 19 | | 73 |
| Georgia | | 14 | | 11 | | 25 |
| Illinois | | 27 | | 4 | | 31 |
| Indiana | | 10 | | 1 | | 11 |
| Kansas | | 6 | | 1 | | 7 |
| Kentucky | | — | | 3 | | 3 |
| Louisiana | | — | | 2 | | 2 |
| Maryland | | 11 | | 2 | | 13 |
| Massachusetts | | 2 | | 3 | | 5 |
| Michigan | | 15 | | 5 | | 20 |
| Minnesota | | 5 | | 3 | | 8 |
| Mississippi | | — | | 2 | | 2 |
| Missouri | | 12 | | 4 | | 16 |
| Nevada | | 11 | | — | | 11 |
| New Hampshire | | 1 | | — | | 1 |
| New Jersey | | 5 | | 28 | | 33 |
| New Mexico | | 5 | | — | | 5 |
| New York | | 1 | | 7 | | 8 |
| North Carolina | | 2 | | 5 | | 7 |
| Ohio | | 11 | | 9 | | 20 |
| Oregon | | 9 | | 1 | | 10 |
| Pennsylvania | | 10 | | 27 | | 37 |
| South Carolina | | — | | 4 | | 4 |
| Tennessee | | — | | 6 | | 6 |
| Texas | | 23 | | 9 | | 32 |
| Utah | | 18 | | — | | 18 |
| Virginia | | 12 | | 10 | | 22 |
| Washington | | 6 | | 1 | | 7 |
| Wisconsin | | 10 | | 2 | | 12 |
| | |
| |
| |
|
| | Total | | 416 | | 196 | | 612 |
| | |
| |
| |
|
Our Properties
All of our restaurants are located on leased premises. As of January 1, 2008, leases for approximately 26 restaurants are set to expire within the next 12 months and most of these leases contain a renewal option, usually with modified pricing terms to reflect current market rents. Lease
27
terms are usually five to 10 years, with either two, three or five year renewal option periods, for total lease terms that average approximately 11 to 20 years. Our leases generally require us to pay a proportionate share of real estate taxes, insurance, common charges and other operating costs.
We have identified approximately 10 to 15 company-owned restaurants that we anticipate closing over the next three years as their leases expire. Generally, these restaurants have an average unit volume of less than $650,000 and contribute negligible cash flow. Additionally, there are four restaurants with average unit volumes greater than $650,000 that we anticipate closing over the next three years as they are either in areas being taken over by eminent domain or the landlord is completely redeveloping the area and will not renew our lease.
The average Einstein Bros. restaurant is approximately 2,200 square feet in size with approximately 40 seats and is generally located in a neighborhood or regional shopping center. We design each restaurant to create a comfortable, casual environment that is consumer friendly, inviting and reflective of the brand's personality and strong neighborhood identity.
The average Noah's restaurant is approximately 1,800 square feet in size with approximately 12 seats and is located in urban neighborhoods or regional shopping centers. We use elaborate tile work and wood accents in the brand's design to create an environment reminiscent of a Lower East Side New York deli, which reinforces the brand's urban focus with an emphasis on the authenticity of a New York deli experience.
Information with respect to our headquarters, training, production and commissary facilities is presented below:
Location
| | Facility
| | Square
Feet
| | Lease
Expiration
|
|---|
| Lakewood, Colorado | | Headquarters, Support Center, Test Kitchen | | 44,574 | | 5/31/2017 |
| Hamilton, New Jersey(1) | | Franchise Support Center, Training Facility | | 6,637 | | 10/31/2008 |
| Whittier, California | | Production Facility and USDA Approved Commissary | | 54,640 | | 11/30/2008 |
| Walnut Creek, California(2) | | Administration Office-Noah's | | 2,190 | | 2/29/2008 |
| Walnut Creek, California(2) | | Administration Office-Noah's | | 1,672 | | 2/28/2013 |
| Carrolton, Texas | | USDA Approved Commissary | | 26,820 | | 7/31/2011 |
| Orlando, Florida | | USDA Approved Commissary | | 7,422 | | 10/31/2010 |
| Denver, Colorado | | USDA Approved Commissary | | 9,200 | | 10/13/2008 |
| Grove City, Ohio | | USDA Approved Commissary | | 20,644 | | 8/31/2012 |
- (1)
- This facility was closed in March 2007, but we still have obligations under the lease and have sub-leased the space to a third party.
- (2)
- Effective March 1, 2008, our Noah's Administration Office will be relocated to a new building in Walnut Creek, California.
ITEM 3. LEGAL PROCEEDINGS
We are subject to claims and legal actions in the ordinary course of our business, including claims by or against our franchisees, licensees and employees or former employees and/or contract disputes. We do not believe any currently pending or threatened matter, other than as described below, would have a material adverse effect on our business, results of operations or financial condition.
On August 31, 2007, the Company was served in an action brought by Fiera Foods Company in the Superior Court of Justice of Ontario, Canada. Fiera claims that the Company failed to negotiate in good faith for a frozen bagel dough supply agreement, which was not concluded, and made misrepresentations in the negotiations. Fiera is seeking damages of $17.0 million (Canadian) as well as interest and costs. The Company believes that these claims are not valid and is defending this action.
28
On September 18, 2007, Eric Mathistad, a former store manager, filed a putative class action against the Company in the Superior Court of California for the State of California, County of San Diego. The plaintiff alleges that defendants failed to pay overtime wages to "salaried restaurant employees" of its California stores who were improperly designated as exempt employees, and that these employees were deprived of mandated meal periods and rest breaks. Plaintiff alleges that these actions were in violation of the California Labor Code Sections 1194, et seq., 500, et seq., California Business and Professions Code Section 17200, et seq., and applicable wage order(s) issued by the Industrial Welfare Commission. Plaintiff seeks injunctive relief, declaratory relief, attorney's fees, restitution and an unspecified amount of damages for unpaid overtime and for missed meal and/or rest periods. The Company filed a Demurrer on October 18, 2007 claiming that, inter alia, plaintiff fails to state a claim against the Company; plaintiff does not state a claim for a joint venture, partnership, common enterprise, or aiding and abetting; plaintiff's definition of the class is deficient and plaintiff's claims for declaratory judgment regarding Labor Code violations should be dismissed. On November 14, 2007, Bernadette Mejia, another former store manager, filed a similar case. The Company filed a Demurrer on December 14, 2007 claiming that, inter alia, that another case, (the Mathistad case) was pending between the same putative parties on the same causes of action. It is the Company's understanding that Ms. Mejia and Mr. Mathistad have agreed to consolidate their actions. Because limited discovery has been conducted, no class certification proceeding has occurred and because the cases are in their infancy, we cannot predict the outcome of this matter.
ITEM 4. SUBMISSION OF MATTERS TO A VOTE OF SECURITY HOLDERS
No items were submitted to a vote of security holders in the fourth quarter of the fiscal year ended January 1, 2008
29
PART II
ITEM 5. MARKET FOR REGISTRANT'S COMMON EQUITY, ELATED STOCKHOLDER MATTERS AND ISSUER PURCHASES OF EQUITY SECURITIES
Our common stock was quoted on the Pink Sheets OTC market under the symbol "NWRG.PK" through June 12, 2007. Our common stock was moved to the NASDAQ Global Market under the symbol "BAGL" as part of our secondary public offering, which was completed on June 13, 2007. The following table sets forth the high and low bid information for our common stock for each fiscal quarter during the periods indicated. Bid information quoted reflects inter-dealer prices without retail mark-up, markdown or commission and may not necessarily represent actual transactions.
Year ended January 1, 2008 (fiscal 2007):
| | High
| | Low
|
|---|
| First Quarter | | $ | 11.00 | | $ | 5.05 |
| Second Quarter | | $ | 25.00 | | $ | 10.95 |
| Third Quarter | | $ | 19.77 | | $ | 14.08 |
| Fourth Quarter | | $ | 24.90 | | $ | 15.74 |
Year ended January 2, 2007 (fiscal 2006):
| | High
| | Low
|
|---|
| First Quarter | | $ | 9.00 | | $ | 3.50 |
| Second Quarter | | $ | 10.25 | | $ | 4.10 |
| Third Quarter | | $ | 13.00 | | $ | 4.15 |
| Fourth Quarter | | $ | 9.00 | | $ | 6.00 |
As of February 25, 2008, there were 329 holders of record of our common stock. This number does not include individual stockholders who own common stock registered in the name of a nominee under nominee security listings.
We have not declared or paid any cash dividends on our common stock since our inception. We do not intend to pay any cash dividends in the foreseeable future, and we are precluded from paying cash dividends on our common stock under our financing agreements.
30
Performance Graph
The included performance graph covers the fiscal five-year period from December 31, 2002 through January 1, 2008. The graph compares the total return of our common stock ("BAGL") to our current peer group of companies ("PGI") and the NASDAQ Composite Index. The PGI was selected representing our competitive peer group, comprised of multi-concept companies and/or companies with a similar organizational structure. The companies selected are participants of the restaurant industry with a sufficient period of operating history for continuous inclusion in the Index.
Fiver Year Performance Graph
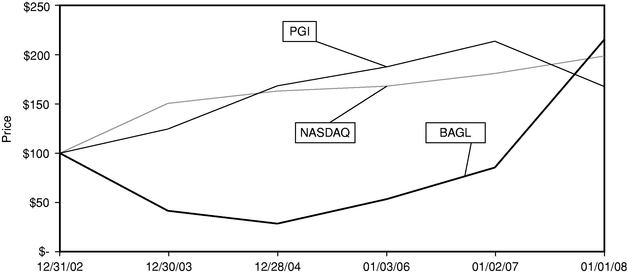
Measurement Period—Five Years(1)(2)
| | 12/31/2002
| | 12/30/2003
| | 12/28/2004
| | 1/3/2006
| | 1/2/2007
| | 1/1/2008
|
|---|
| BAGL | | $ | 100.00 | | $ | 41.52 | | $ | 28.47 | | $ | 53.38 | | $ | 85.41 | | $ | 215.30 |
| PGI(3) | | $ | 100.00 | | $ | 124.51 | | $ | 168.33 | | $ | 187.63 | | $ | 213.62 | | $ | 167.60 |
| NASDAQ | | $ | 100.00 | | $ | 150.50 | | $ | 163.02 | | $ | 168.01 | | $ | 180.85 | | $ | 198.60 |
- (1)
- Assumes all distributions to stockholders are reinvested on the payment dates.
- (2)
- Assumes $100 initial investment on December 31, 2002 in BAGL, the PGI, and the NASDAQ Composite Index.
- (3)
- The PGI is a price-weighted index. The index includes:
- •
- Panera Bread Company
- •
- Starbucks Corporation
- •
- Sonic Corporation
- •
- Jack in the Box Incorporated
- •
- CKE Restaurants Incorporated (Hardee's, Carl's Jr., La Salsa, and Green Burrito restaurant chains)
- •
- AFC Enterprises Incorporated (Popeyes Chicken and Biscuits restaurant chain)
- •
- YUM! Brands, Incorporated (A&W, KFC, Long John Silver's, Pizza Hut and Taco Bell restaurant chains)
31
ITEM 6. SELECTED FINANCIAL DATA
The following selected financial data for each fiscal year was extracted or derived from our consolidated financial statements which have been audited by Grant Thornton LLP, our independent registered public accounting firm.
| | Fiscal years ended(1):
| |
|---|
| | Dec 30, 2003
(52 weeks)
| | Dec 28, 2004
(52 weeks)
| | Jan 3, 2006
(53 weeks)
| | Jan 2, 2007
(52 weeks)
| | Jan 1, 2008
(52 weeks)
| |
|---|
| | (in thousands of dollars, except per share data and as otherwise indicated)
| |
|---|
| Statements of Operations Data: | | | | | | | | | | | | | | | | |
| | Revenues | | $ | 383,306 | | $ | 373,860 | | $ | 389,093 | | $ | 389,962 | | $ | 402,902 | |
| | Cost of sales | | | 317,690 | | | 306,661 | | | 315,391 | | | 311,330 | | | 321,972 | |
| | |
| |
| |
| |
| |
| |
| | Gross profit | | | 65,616 | | | 67,199 | | | 73,702 | | | 78,632 | | | 80,930 | |
| | Gross profit as percent of sales | | | 17.1 | % | | 18.0 | % | | 18.9 | % | | 20.2 | % | | 20.1 | % |
| | General and administrative expenses | | | 41,794 | | | 32,755 | | | 36,096 | | | 37,484 | | | 40,635 | |
| | Depreciation and amortization | | | 34,013 | | | 27,848 | | | 26,316 | | | 16,949 | | | 11,192 | |
| | Loss (gain) on sale, disposal or abandonment of assets, net | | | (558 | ) | | 1,557 | | | 314 | | | 493 | | | 601 | |
| | Charges (adjustments) for integration and reorganization costs | | | 2,132 | | | (869 | ) | | 5 | | | — | | | — | |
| | Impairment charges and other related costs | | | 5,292 | | | 450 | | | 1,603 | | | 2,268 | | | 236 | |
| | |
| |
| |
| |
| |
| |
| | Income (loss) from operations | | | (17,057 | ) | | 5,458 | | | 9,368 | | | 21,438 | | | 28,266 | |
| |
Interest expense, net(2) |
|
|
34,184 |
|
|
23,196 |
|
|
23,698 |
|
|
19,555 |
|
|
12,387 |
|
| | Write-off of debt discount upon redemption of senior notes | | | — | | | — | | | — | | | — | | | 528 | |
| | Prepayment penalty upon redemption of senior notes | | | — | | | — | | | — | | | 4,800 | | | 240 | |
| | Write-off of debt issuance costs upon redemption of senior notes | | | — | | | — | | | — | | | 3,956 | | | 2,071 | |
| | Cumulative change in the fair value of derivatives | | | (993 | ) | | — | | | — | | | — | | | — | |
| | Gain on sale of debt securities | | | (374 | ) | | — | | | — | | | — | | | — | |
| | Loss on exchange of Series F due to Equity Recap | | | 23,007 | | | — | | | — | | | — | | | — | |
| | Other income | | | (172 | ) | | (284 | ) | | (312 | ) | | (5 | ) | | — | |
| | |
| |
| |
| |
| |
| |
| | Income (loss) before income taxes | | | (72,709 | ) | | (17,454 | ) | | (14,018 | ) | | (6,868 | ) | | 13,040 | |
| | Provision (benefit) for income taxes | | | 812 | | | (49 | ) | | — | | | — | | | 454 | |
| | |
| |
| |
| |
| |
| |
| | Net income (loss) | | | (73,521 | ) | | (17,405 | ) | | (14,018 | ) | | (6,868 | ) | | 12,586 | |
| | Dividends and accretion on Preferred Stock | | | (14,423 | ) | | — | | | — | | | — | | | — | |
| | |
| |
| |
| |
| |
| |
| | Net income (loss) available to common stockholders | | $ | (87,944 | ) | $ | (17,405 | ) | $ | (14,018 | ) | $ | (6,868 | ) | $ | 12,586 | |
| | |
| |
| |
| |
| |
| |
| Per share data: | | | | | | | | | | | | | | | | |
| | Weighted average number of common shares outstanding— | | | | | | | | | | | | | | | | |
| | | Basic | | | 3,873,284 | | | 9,842,414 | | | 9,878,665 | | | 10,356,415 | | | 13,497,841 | |
| | | Diluted | | | 3,873,284 | | | 9,842,414 | | | 9,878,665 | | | 10,356,415 | | | 14,235,625 | |
| | Net income (loss) availabe to common stockholders per share— | | | | | | | | | | | | | | | | |
| | | Basic | | $ | (22.71 | ) | $ | (1.77 | ) | $ | (1.42 | ) | $ | (0.66 | ) | $ | 0.93 | |
| | | Diluted | | $ | (22.71 | ) | $ | (1.77 | ) | $ | (1.42 | ) | $ | (0.66 | ) | $ | 0.88 | |
| | Cash dividends declared | | $ | — | | $ | — | | $ | — | | $ | — | | $ | — | |
32
| | As of:
| |
|---|
| | Dec 30, 2003
| | Dec 28, 2004
| | Jan 3, 2006
| | Jan 2, 2007
| | Jan 1, 2008
| |
|---|
| | (in thousands of dollars, except per share data and as otherwise indicated)
| |
|---|
| Selected Balance Sheet Data: | | | | | | | | | | | | | | | | |
| | Cash and cash equivalents | | $ | 9,575 | | $ | 9,752 | | $ | 1,556 | | $ | 5,477 | | $ | 9,436 | |
| | Property, plant and equipment, net | | | 54,513 | | | 41,855 | | | 33,359 | | | 33,889 | | | 47,714 | |
| | Total assets | | | 181,738 | | | 158,456 | | | 130,924 | | | 133,154 | | | 148,562 | |
| | Short-term debt, capital leases and current portion of long-term debt | | | 2,285 | | | 311 | | | 299 | | | 3,681 | | | 1,035 | |
| | Mandatorily redeemable Series Z preferred stock, $.001 par value, $1,000 per share liquidation value(3) | | | 57,000 | | | 57,000 | | | 57,000 | | | 57,000 | | | 57,000 | |
| | Senior notes, capital leases and other long-term debt, net of discount | | | 161,149 | | | 160,871 | | | 160,589 | | | 166,680 | | | 88,942 | |
| | | $1,000 per share liquidation value (temporary equity) | | | — | | | — | | | — | | | — | | | — | |
| | Total stockholders' deficit | | | (95,153 | ) | | (112,483 | ) | | (126,211 | ) | | (132,231 | ) | | (33,607 | ) |
Other Data: |
|
|
|
|
|
|
|
|
|
|
|
|
|
|
|
|
| | Capital expenditures(4) | | $ | 6,921 | | $ | 9,393 | | $ | 10,264 | | $ | 13,172 | | $ | 25,869 | |
| | Number of locations at end of period | | | 736 | | | 690 | | | 626 | | | 598 | | | 612 | |
| | | Franchised and licensed | | | 272 | | | 237 | | | 191 | | | 182 | | | 196 | |
| | | Company-owned and operated | | | 464 | | | 453 | | | 435 | | | 416 | | | 416 | |
| | Percent Increase (decrease) in comparable store sales for company-owned restaurants(5) | | | (3.5 | )% | | (1.9 | )% | | 5.2 | % | | 4.5 | % | | 3.7 | % |
- (1)
- We have a 52/53-week fiscal year ending on the Tuesday closest to December 31. Fiscal years 2003, 2004, 2006 and 2007 which ended on December 30, 2003, December 28, 2004, January 2, 2007 and January 1, 2008, respectively, contained 52 weeks, while fiscal year 2005, which ended on January 3, 2006, contained 53 weeks.
- (2)
- Net interest expense is comprised of interest paid or payable in cash and non-cash interest expense resulting from the amortization of debt discount, notes paid-in-kind, debt issuance costs and the amortization of warrants issued in connection with debt financings, and interest income from our money market cash accounts.
- (3)
- The adoption of Statement of Financial Accounting Standard No. 150Accounting for Certain Financial Instruments with Characteristics of Both Liabilities and Equity resulted in the Series Z Preferred Stock being presented as a liability rather than the historical mezzanine presentation of the Series F.
- (4)
- Excludes fixed asset purchases for which payment had not occurred as of each year end.
- (5)
- Comparable store sales represent sales at restaurants open for one full year that have not been relocated or closed during the current year. Comparable store sales include company-owned restaurants only and represent the change in period-over-period sales for the comparable restaurant base. A restaurant becomes comparable in its 13th full month of operation.
33
ITEM 7. MANAGEMENT'S DISCUSSION AND ANALYSIS OF FINANCIAL CONDITION AND RESULTS OF OPERATION
Overview
We are a leading fast-casual restaurant chain, specializing in high-quality foods for breakfast and lunch in a café atmosphere with a neighborhood emphasis. As of January 1, 2008, we owned and operated, franchised or licensed 612 restaurants in 35 states and in the District of Columbia, primarily under the Einstein Bros., Noah's and Manhattan Bagel brands. Einstein Bros. is a national fast-casual restaurant chain. Noah's is a regional fast-casual restaurant chain operated exclusively on the West Coast and Manhattan Bagel is a regional fast casual chain operated predominantly in the Northeast. Our product offerings include fresh bagels and other goods baked on-site, made-to-order sandwiches on a variety of bagels and breads, gourmet soups and salads, decadent desserts, premium coffees and other café beverages. Our manufacturing and commissary operations prepare and assemble consistent, high-quality ingredients and we deliver them to our restaurants quickly and efficiently through our network of independent distributors. These operations support our main business focus, restaurant operations, by exposing our brands to new product channels as well as enabling sales of our products to third parties.
We commenced operations as an operator and franchisor of coffee cafes in 1993. Substantial growth in our restaurant counts occurred through a series of acquisitions. In 1998, we acquired the stock of Manhattan Bagel Company. In 1999, we acquired the assets of Chesapeake Bagel Bakery. Our largest acquisition was in 2001 when we acquired substantially all the assets of Einstein/Noah Bagel Corp. in an auction conducted by the bankruptcy court. To consummate this acquisition, we engaged in several rounds of financing that included the issuance of $165.0 million of debt and $65.0 million of mandatorily redeemable preferred stock. In mid-2003, we recapitalized our balance sheets with the issuance of $160.0 million of indentures and the issuance of $57.0 million of mandatorily redeemable preferred stock. In late 2003, our current management team assumed their respective roles. This team focused on our core business, the operation of company-owned restaurants and the improvements necessary to generate positive operating income and cash flow. In early 2006, based on our improved financial condition and favorable market conditions, we redeemed the $160.0 million indenture and replaced it with a new debt structure.
In June 2007, we completed a $90 million secondary public offering of 5 million shares of our common stock. The net proceeds were used to repay our $65.0 million Second Lien Term Loan, repay a portion of our $25 million Subordinated Note and to pay for the offering costs. We also amended our debt facility to increase it to $110 million, comprised of a $20 million revolving credit facility and a modified term loan with a principal amount of $90 million. The increase was used to repay the remaining portion of the $25 million Subordinated Note. In addition, we obtained a commitment for an incremental term loan in an aggregate principal amount of up to $57.0 million to be used by us, if needed, solely for the purpose of redeeming the mandatorily redeemable preferred stock due in June 2009.
In February 2007, we granted options to purchase 124,250 shares of our common stock relating to the secondary public offering described above. The option awards vested upon closing of the offering and we recognized $651,000 in stock-based compensation expense.
Current Restaurant Base
As of January 1, 2008, we owned and operated, franchised or licensed 612 restaurants. Our current base of company-owned restaurants under our core brands includes 337 Einstein Bros. restaurants, 77 Noah's restaurants and one Manhattan Bagel restaurant. Also, we franchise 69 Manhattan Bagel restaurants and license 121 Einstein Bros. restaurants and three Noah's restaurants. In addition, we have four restaurants which we operate under our non-core brands.
34
Our company-owned restaurants vary in their unit volume, profitability and recent comparable store sales performance. As of January 1, 2008, we have 119 restaurants that generate an average unit volume in excess of $1 million. These restaurants have an average unit volume of approximately $1.2 million and an average gross profit of $324,000. In the aggregate, these restaurants contribute approximately 38% of total restaurant sales and 51% of total restaurant operating profit.
The following table includes only restaurants that have been open for one full year and have not been relocated or closed during the current year. It summarizes our financial performance since 2004 by reporting company-owned restaurants by sales level and the related revenue (in thousands of dollars) and gross margin percentage:
| | Fiscal 2005
| | Fiscal 2006
| | Fiscal 2007
| |
|---|
Sales Level:
| | Number of
Restaurants
| | Net Revenue
| | Gross Profit
| | Number of
Restaurants
| | Net Revenue
| | Gross Profit
| | Number of
Restaurants
| | Net Revenue
| | Gross Profit
| |
|---|
| greater than $1,000 | | 81 | | $ | 96,700 | | 27.9 | % | 96 | | $ | 115,000 | | 28.5 | % | 119 | | $ | 143,000 | | 26.9 | % |
| $900 - $1,000 | | 53 | | $ | 50,100 | | 22.4 | % | 57 | | $ | 54,300 | | 23.2 | % | 63 | | $ | 59,800 | | 21.2 | % |
| $800 - $900 | | 78 | | $ | 66,300 | | 19.0 | % | 76 | | $ | 64,600 | | 19.7 | % | 72 | | $ | 61,100 | | 18.7 | % |
| $700 - $800 | | 83 | | $ | 62,400 | | 15.5 | % | 73 | | $ | 55,200 | | 16.7 | % | 74 | | $ | 55,700 | | 14.9 | % |
| $600 - $700 | | 82 | | $ | 52,700 | | 11.2 | % | 72 | | $ | 46,700 | | 12.6 | % | 49 | | $ | 32,100 | | 11.5 | % |
| less than $600 | | 54 | | $ | 28,100 | | 2.8 | % | 35 | | $ | 18,700 | | 4.8 | % | 25 | | $ | 13,700 | | 3.6 | % |
| | |
| |
| |
| |
| |
| |
| |
| |
| |
| |
| Totals | | 431 | | $ | 356,300 | | 18.9 | % | 409 | | $ | 354,500 | | 20.9 | % | 402 | | $ | 365,400 | | 20.6 | % |
| | |
| |
| |
| |
| |
| |
| |
| |
| |
| |
Since 2003, as part of our efforts to improve financial performance, we completed a thorough evaluation of our restaurant base. At the end of 2003, we had 736 restaurants across 33 states and the District of Columbia. Since that time, we have closed 74 company-owned restaurants and 174 franchised and licensed restaurants. Most of our closed company-owned restaurants were either located in inferior real estate locations, had an average unit volume below $650,000 or were unprofitable or marginally profitable. Substantially all of the franchised restaurants that were closed either:
- •
- Involved the failure of the franchisee to conform with the requirements of the franchise agreement;
- •
- Were geographically located outside Manhattan Bagel's core market; or
- •
- Were restaurants operating under our non-core brands, Chesapeake Bagel Bakery and New World Coffee.
As of January 1, 2008, we have identified approximately 10 to 15 company-owned restaurants that we anticipate closing over the next three years as their leases expire. Generally, these restaurants have an average unit volume of less than $650,000 and contribute negligible cash flow. Additionally, there are four restaurants with average unit volumes greater than $650,000 that we anticipate closing over the next three years as they are either in areas being taken over by eminent domain or the landlord is completely redeveloping the area and will not renew our lease.
We have recently implemented a number of initiatives in an effort to drive sales and improve profitability including quality service checklists, secret shopper inspections, improved ordering systems and enhanced training programs. These initiatives have led to our positive comparable store sales over the past nine quarters, which reversed a two-year negative trend. In addition, we have started to upgrade restaurants where we have the opportunity to improve sales. The upgrades are intended to provide superior merchandising, enhance our guests' experience and increase the speed of service while maintaining the neighborhood feel of the restaurants. We are upgrading our Einstein Bros. restaurants based on sales volume, demographic traits and the related cost of the upgrade. Only those restaurants that offer the potential for a superior return on investment are considered for an upgrade. During
35
2007, we upgraded 36 restaurants at a total cost of $3.5 million. The upgrades that have been completed averaged $98,000 per restaurant. We anticipate the costs of upgrades in the near future to average $110,000 per restaurant.
Using the knowledge gained from our upgrade program, we plan to pursue a measured approach to new company-owned restaurant openings. During 2005, 2006 and 2007, we opened 4, 5 and 12 new company-owned restaurants, respectively. Our ability to open new restaurants during those years was limited by the capital expenditure restrictions of the debt agreements in place at that time. Our current plan is to open new company-owned restaurants in existing markets where we have an established brand name. Our site selection process focuses on identifying markets, trade areas and specific sites based on several factors, including visibility, ready accessibility (particularly for morning and lunch time traffic), parking, signage and adaptability of any current structures.
In 2008, we plan to open at least 18 new company-owned restaurants. For Einstein Bros., we have targeted Atlanta,, Baltimore, Chicago, Las Vegas, Phoenix, Tucson, and various cities in Florida and Texas for development. For Noah's, we intend to focus our development efforts on Portland, Seattle and various cities in California. We are also in the process of identifying new restaurant sites for 2009 to ensure that we achieve our development goals.
During 2007 we opened 31 license restaurants and 2 franchise restaurants. We plan to open at least 35 license restaurants and at least 5 franchise restaurants in 2008. The license restaurants will be located primarily in airports, colleges and universities, office buildings, hospitals and military bases and on turnpikes.
Our Sources of Revenue
The components of our revenue are restaurant sales, manufacturing and commissary revenue and franchise and license revenue.
Over 93% of our revenue is generated by restaurant sales at our Einstein Bros. and Noah's company-owned restaurants. Restaurant sales also include catering sales where the food is prepared at the restaurant and either delivered to or held for pick-up by the guest. The principal factors that affect our restaurant sales in the aggregate are:
- •
- the number of restaurants in operation for the period,
- •
- the average unit volume of the restaurants, and
- •
- the change in comparable store sales.
For the year to date period ended January 1, 2008, approximately 63% of our revenues were generated from restaurant sales during the breakfast hours, 29% were generated during the lunch hours and 8% were generated during the late afternoon hours.
Approximately 6% of our 2007 total revenue was generated by our manufacturing and commissary operations. Our manufacturing revenue is primarily derived from the sale of frozen bagel dough to our franchisees, licensees and third party accounts. Our commissaries generate revenue from the sale of sliced meats (turkey, ham and beef), dairy products (cheese), and pre-portioned salad kits to our licensees. Additionally, our commissaries sell bagels, cream cheese, salad toppers and salads through various supplier relationships, typically with conventional grocery store chains as the customer. These
36
products are resold either through a private label program or under the Einstein Bros. or Noah's brand to the consumer.
The principal factors affecting manufacturing and commissary revenue are:
Franchise and license revenue consists of a license or franchise fee that is recorded in deferred revenue and recognized as income upon the fulfillment of certain start up support obligations, such as training and ongoing royalty payments based on a percentage of the restaurant's gross sales. Our costs associated with licensing and franchising are minimal compared with the costs associated with company-owned restaurants. For 2007, we generated approximately 1% of our total revenue from these fees. The principal factors affecting franchise and license revenue are the number of franchised and licensed restaurants as well as the level of sales at those restaurants.
Our Primary Expenses
Food, Beverage and Packaging Costs. Food, beverage and packaging costs represent one of the largest expense elements at our company-owned restaurants. The most important factor that affects the cost of these products is the underlying cost of the agricultural commodities such as flour, cheese, coffee, turkey and other products. In order to mitigate the impact of rising commodity costs, our suppliers enter into agreements to fix the cost of these products for a specified period of time that is generally one year or less. We do not engage in the practice of buying futures contracts and therefore we do not have derivative accounting. Packaging and distribution costs are primarily affected by the cost of oil because petroleum-based material is often used to package products for distribution as well as the cost of fuel to transport our food staples. Although we have generally been able to increase our retail prices at our company-owned restaurants to offset the increased costs of these items, we may not be able to do so in the future.
Compared to 2007, we expect that most of our commodity-based food costs will increase in 2008 with the greatest impact in the first half of the year. Flour represents the most significant raw ingredient we purchase. The cost of wheat and the cost of flour increased substantially in the last half of 2007 and are expected to stay at record levels during 2008. To mitigate this risk of increasing prices, we have contracted with a subsidiary of Cargill, Incorporated to manage our wheat purchases for our company-owned production facility. We will continue work with Cargill, Incorporated to strategically source our key ingredient. However, there can be no assurance that we will benefit from a decline in the cost of any of the commodity-based products that we purchase.
Compensation Costs. Compensation costs reflect the hourly wages, salary, bonus, taxes and insurance that we pay our associates at each restaurant. Compensation costs tend to vary by geographic region based upon the labor market, local minimum wages, and the supply and demand of workers. Also, compensation costs tend to be semi-variable in nature and increase or decrease somewhat based upon the volume of products sold.
There is significant competition for personnel and decreasing availability in the labor pool. In most of the states in which we operate, increases in state minimum hourly wage rates became effective in January 2007, and the federal government has recently enacted federal wage rate increases for 2008
37
and we expect minimum wage rates to increase again in 2009. Accordingly, we have seen increases in hourly wages in 2007 and this trend will continue into 2008. The increase in compensation costs directly related to mandatory minimum wage increases in 2008 will be approximately $0.3 million. We continue to focus on labor efficiencies that may help to offset a portion of the increases in labor costs.
Other Operating Costs. Other operating costs consist of utilities, restaurant and other supplies, repairs and maintenance, laundry and uniforms, bank charges and other costs related to the operation of company-owned restaurants. Certain of these costs generally tend to be fixed in nature and are only modestly impacted by changes in the volume of products sold. Utilities, distribution costs and other expenses impacted by fuel price fluctuations are not fixed and are contingent upon contract rates negotiated by third parties outside of our control. Many of our contracts are re-priced quarterly based on the prior quarter's market fluctuations resulting in a delayed effect upon our operating costs. During periods of uncertainty and significant market fluctuations, we cannot be certain of the impact on our future operating results. If we are unable to leverage cost increases with operating efficiencies or price increases, it may negatively impact our operating results.
Facility, Marketing and Other Costs. Facility, marketing and other costs include rent, common area costs, property taxes and insurance, liability insurance, delivery fees and allocated marketing expenses. We exclude depreciation and amortization expense from company-owned restaurant expenses. Changes in these costs are generally the result of changes in our rent and other related facility costs. Accordingly, these costs are predominantly fixed in nature and are modestly impacted by changes in the volume of products sold.
Certain states and local governments have increased both the rate and nature of taxes on businesses in their regions. These increased taxes include real estate and property taxes, state and local income taxes, and various employment taxes, negatively affecting our facility and other overhead costs.
Manufacturing costs are comprised of raw materials such as flour, dairy products and meats, compensation costs and the related taxes and employee benefits, rents, supplies and repairs and maintenance. These costs are directly related to the manufacturing revenue they produce. Some of the raw materials used are commodity-based products and are subject to the same market fluctuations previously mentioned. We purchase certain raw materials under volume-based pricing agreements and, as manufacturing production increases we experience more favorable pricing arrangements. Fixed overhead costs, such as rent, property taxes and manager salaries, are proportionately allocated based on total units produced. Operating results from our manufacturing operations consist of third party sales whose profitability can be significantly impacted by the allocation of fixed overhead costs. Results can also be negatively impacted by rapidly increasing variable costs until such time as we are able to pass increased costs to our customers.
General and administrative expenses include corporate and administrative functions that support our company-owned restaurants as well as our manufacturing and franchise and license operations. These costs include employee wages, taxes and related benefits, travel costs, information systems, recruiting and training costs, corporate rent, and general insurance costs.
Depreciation and amortization are periodic non-cash charges that represent the reduction in usefulness and value of our tangible and intangible assets. The majority of our depreciation and amortization relates to equipment and leasehold improvements located in our company-owned restaurants. Based on our current purchases of capital assets, our existing base of assets, and our projections for new purchases of fixed assets, we believe depreciation expense for 2008 will be approximately $15.6 million.
38
Results of Operations for fiscal year 2007 as compared to fiscal year 2006
| | For the year ended
(in thousands of dollars)
| | Increase/
(Decrease)
| | For the year ended
(percent of total revenue)
| |
|---|
| | January 2,
2007
| | January 1,
2008
| | 2006
vs. 2007
| | January 2,
2007
| | January 1,
2008
| |
|---|
| Revenues: | | | | | | | | | | | | | |
| | Company-owned restaurant sales | | $ | 363,699 | | $ | 372,997 | | 2.6 | % | 93.3 | % | 92.6 | % |
| | Manufacturing and commissary revenues | | | 21,076 | | | 24,204 | | 14.8 | % | 5.4 | % | 6.0 | % |
| | Franchise and license related revenues | | | 5,187 | | | 5,701 | | 9.9 | % | 1.3 | % | 1.4 | % |
| | |
| |
| |
| |
| |
| |
| Total revenues | | | 389,962 | | | 402,902 | | 3.3 | % | 100.0 | % | 100.0 | % |
Cost of sales: |
|
|
|
|
|
|
|
|
|
|
|
|
|
| | Company-owned restaurant costs | | | 290,176 | | | 297,180 | | 2.4 | % | 74.4 | % | 73.80 | % |
| | Manufacturing and commissary costs | | | 21,154 | | | 24,792 | | 17.2 | % | 5.4 | % | 6.20 | % |
| | |
| |
| |
| |
| |
| |
| Total cost of sales | | | 311,330 | | | 321,972 | | 3.4 | % | 79.8 | % | 80.0 | % |
Gross profit: |
|
|
|
|
|
|
|
|
|
|
|
|
|
| | Company-owned restaurant | | | 73,523 | | | 75,817 | | 3.1 | % | 18.9 | % | 18.8 | % |
| | Manufacturing and commissary | | | (78 | ) | | (588 | ) | (653.8 | )% | 0.0 | % | (0.1 | )% |
| | Franchise and license | | | 5,187 | | | 5,701 | | 9.9 | % | 1.3 | % | 1.4 | % |
| | |
| |
| |
| |
| |
| |
| Total gross profit | | | 78,632 | | | 80,930 | | 2.9 | % | 20.2 | % | 20.1 | % |
Operating expenses: |
|
|
|
|
|
|
|
|
|
|
|
|
|
| | General and administrative expenses | | | 37,484 | | | 40,635 | | 8.4 | % | 9.6 | % | 10.1 | % |
| | Depreciation and amortization | | | 16,949 | | | 11,192 | | (34.0 | )% | 4.3 | % | 2.8 | % |
| | Loss on sale, disposal or abandonment of assets, net | | | 493 | | | 601 | | 21.9 | % | 0.1 | % | 0.1 | % |
| | Impairment charges and other related costs | | | 2,268 | | | 236 | | (89.6 | )% | 0.6 | % | 0.1 | % |
| | |
| |
| |
| |
| |
| |
| Income from operations | | | 21,438 | | | 28,266 | | 31.8 | % | 5.5 | % | 7.0 | % |
Other expense: |
|
|
|
|
|
|
|
|
|
|
|
|
|
| | Interest expense, net | | | 19,555 | | | 12,387 | | (36.7 | )% | 5.0 | % | 3.1 | % |
| | Write-off of debt discount upon redemption of senior notes | | | — | | | 528 | | * | | 0.0 | % | 0.1 | % |
| | Prepayment penalty upon redemption of senior notes | | | 4,800 | | | 240 | | (95.0 | )% | 1.2 | % | 0.1 | % |
| | Write-off of debt issuance costs upon redemption of senior notes | | | 3,956 | | | 2,071 | | (47.6 | )% | 1.0 | % | 0.5 | % |
| | Other, net | | | (5 | ) | | — | | * | | 0.0 | % | 0.0 | % |
| | |
| |
| |
| |
| |
| |
| Income (loss) before taxes | | | (6,868 | ) | | 13,040 | | * | | (1.8 | )% | 3.2 | % |
| | Provision for income taxes | | | — | | | 454 | | * | | 0.0 | % | 0.1 | % |
| | |
| |
| |
| |
| |
| |
| Net income (loss) | | $ | (6,868 | ) | $ | 12,586 | | * | | (1.8 | )% | 3.1 | % |
| | |
| |
| |
| |
| |
| |
- *
- not meaningful
Total Revenues, Cost of Sales and Gross Profit
Total revenues increased 3.3% to $402.9 million from $390.0 million. Total cost of sales increased 3.4% to $322.0 million from $311.3 million. Total gross profit increased 2.9% to $80.9 million from $78.6 million.
39
We have a 52/53-week fiscal year ending on the Tuesday closest to December 31. Fiscal years 2006 and 2007, which ended on January 2, 2007 and January 1, 2008, respectively, contained 52 weeks.
Restaurant sales for 2007 improved 2.6% when compared to 2006. Our 2007 comparable store sales increased 3.7% over 2006 due primarily to a system-wide price increase, a slight shift in product mix to higher priced items, partially offset by a decrease in the volume of units sold. Additionally, restaurant sales for 2007 benefited from $1.3 million in gift card breakage, which relates to unredeemed balances from 2003 through 2006. We expect the benefit that will be received in future years will be considerably less than this amount.
Comparable store sales represent sales at restaurants open for one full year that have not been relocated or closed during the current year. Comparable store sales include company-owned restaurants only and represent the change in period-over-period sales for the comparable restaurant base. A restaurant becomes comparable in its 13th full month of operation.
Comparable store sales for each quarter in fiscal 2006 and 2007 are as follows:
| | Fiscal 2006
| | Fiscal 2007
| |
|---|
| First Quarter | | 6.2 | % | 1.0 | % |
| Second Quarter | | 3.6 | % | 5.2 | % |
| Third Quarter | | 3.2 | % | 5.2 | % |
| Fourth Quarter | | 4.7 | % | 3.2 | % |
Our restaurant gross profit increased $2.3 million, or 3.1%, in 2007 compared to 2006. Our restaurant margins are impacted by various restaurant-level operating and non-operating expenses such as the cost of products sold, salaries and benefits, insurance, supplies, repair and maintenance expenses, advertising, rent, utilities and property taxes. Because certain elements of cost of sales such as rent, utilities, property taxes and manager salaries are fixed in nature, incremental sales positively impact gross profit. Depreciation, amortization and income taxes do not impact our restaurant contribution margins.
Our restaurant gross profit margins (company-owned restaurant gross profit divided by company-owned restaurant sales) improved slightly to 20.3% from 20.2% in 2007 compared to 2006. Price increases implemented in 2007 and $1.3 million of gift card breakage were offset primarily by higher commodities costs, labor and labor related costs, and other store level expenses. The cost of flour, cheese, coffee and butter collectively increased $3.4 million. Wheat and, in turn, flour have reached unprecedented price levels and volatility over the past year. Increased wage rates, including mandatory minimum wage rate increases, raised our labor costs by approximately $2 million in 2007 compared to 2006. In addition, increased staffing due to extended hours in company-owned stores increased our labor costs in 2007 compared to 2006 by approximately an incremental $2.2 million. Labor related costs increased by approximately $1 million for health care coverage and workers compensation claims. Additionally, in 2007 we spent more for taxes, maintenance and insurance related to our company-owned stores.
Our manufacturing operations, which include our USDA approved commissaries, predominantly support our company-owned restaurants and generate revenue from the sale of food products to franchisees, licensees, third-party distributors and other third parties. All inter-company transactions have been eliminated during consolidation.
During 2007, our manufacturing operations experienced negative margins primarily due to increases in raw material costs, freight costs and incremental start-up costs associated with new
40
products and customers. Additionally, our margins declined in recent months due to the increases in the price of wheat.
In addition, we incurred one-time charges of approximately $0.5 million associated with our closed commissaries and write-down of inventory associated with conversion from an old inventory system to the current information technology system.
Revenues for the franchised and licensed operations consist primarily of initial fees and royalty income earned as a result of sales within franchised and licensed restaurants. Overall, licensee and franchisee royalty income improved 9.9%, or $0.5 million in 2007 as compared to 2006. The percentage increase was predominantly due to improved comparable sales in the Manhattan Bagel and Einstein Bros. brands and an increase in the number of Einstein Bros. licensed restaurants and Manhattan Bagel franchises of 31 and 2, respectively. This was offset by the closure of 2 Einstein Bros. license restaurants, 12 Manhattan Bagel franchises, and one Manhattan Bagel restaurant that was sold to the Company. The initial franchise and license fees that were recognized for 2007 and 2006 were $0.6 million and $0.5 million, respectively.
Our general and administrative expenses increased 8.4%, or $3.2 million, in 2007 when compared to 2006. As a percentage of sales, our general and administrative expenses were 10.1% in 2007 compared to 9.6% in 2006. Predominantly contributing to the increase was approximately $1.0 million in increased stock-based compensation expense, of which $0.7 million was from the additional options that were granted related to the completion of our secondary public offering; $1.0 million related to increased travel costs; $2.9 million in increased costs in salaries and benefits, which was a function of merit increases, increased salaries related to our field training program, an expanded headcount in our franchise and license department to support future growth and an increase in recruiting expenses; and increase of $1.0 million related to sales and use tax assessments, some of which remain under protest. These increases were off set by a $2.6 million decrease in bonus expense for 2007 as compared to 2006, and a decrease in other expenses of $0.1 million.
Depreciation and amortization expenses decreased 34.0%, or $5.8 million, in 2007 compared to 2006. The decrease is primarily due to all of our amortizing intangible assets becoming fully amortized in the second quarter of 2006, which represents $3.9 million of the decrease, and a substantial portion of our leasehold improvements becoming fully depreciated in 2006 and 2007. Through 2006, depreciation and amortization expense was predominantly related to the assets of Einstein/Noah Bagel Corp. that we acquired in bankruptcy proceedings in June 2001. As most of these assets had five year lives, they had become fully depreciated in 2006. From this point forward, the depreciation expense will be related to assets that were purchased subsequent to the acquisition.
Loss on the Disposal, Sale or Abandonment of Assets
Loss on the disposal, sale or abandonment of assets represents the excess of book value over proceeds received, if any, over the net book value of an asset. We establish estimated useful lives for our assets, which range from three to fifteen years, and depreciate using the straight-line method. Leasehold improvements are limited to the lesser of the useful life or the non-cancelable lease term. The useful lives of the assets are based upon our expectations of the period of time that the asset will be used to generate revenue. We periodically review the assets for changes in circumstances, which may
41
impact their useful lives. During 2007, we recorded a $0.6 million loss on the disposal of assets, compared to $0.5 million recorded in 2006.
Impairment losses are non-cash charges recorded on long-lived assets, goodwill, trademarks and our other intangible assets, and other related costs are typically costs associated with closing a company-owned restaurant. Generally, an indicator of impairment would include significant change in an asset's ability to generate positive cash flow in the future or in the fair value of an asset. Whenever impairment indicators are determined to be present, the amount of impairment is measured as the excess of the carrying amount of the asset over its fair value. During 2007, we recorded $0.2 million in impairment charges and other related costs compared to $0.1 million in 2006 which excludes the write down of equipment that was subsequently sold to our bagel dough supplier.
Until early 2007, we owned certain manufacturing equipment which was located at the plant of Harlan Bakeries, Inc., our frozen bagel dough supplier. In late 2006, we were notified of Harlan's intent, under the terms of the contract, to purchase the equipment and we agreed to sell the equipment to Harlan for $1.1 million. In order to adjust the assets down to their mutually agreed-upon fair value, we recorded an impairment charge of $2.2 million during the quarter ended January 2, 2007. The assets were classified as held for sale on the consolidated balance sheet as of January 2, 2007 and sold in the first quarter of 2007.
During 2007, we wrote off $2.1 million of debt issuance costs and paid a $0.2 million redemption premium related to the $65 Million Second Lien Term Loan, and wrote off a $0.5 million discount related to the $25 Million Subordinated Note. During 2006, we wrote off $4.0 million of debt issuance costs and paid a 3% redemption premium on the $160 Million Notes in the amount of $4.8 million.
In 2007, there was a 35.2% decrease in interest expense, or $7.0 million compared to 2006, which related to the amendment of our first lien indebtedness that occurred in June 2007.
Interest income increased 61.0% to $483,000 in 2007 from $300,000 in 2006. This is directly related to our increase in our interest-earning cash and cash equivalents in 2007 from 2006.
For our financial statements prepared in accordance with generally accepted accounting principles ("GAAP"), we reported net income for 2007 of $12.6 million, versus the net loss of $6.9 million we reported for 2006. This increase is due to improved operations, the result of the interest savings from the reduction of the principal and the interest rate on our debt facility which we amended during 2007, the reduction of depreciation expense as many of our assets became fully depreciated in 2006, and the reduction of expense on our amortizing intangible assets became fully amortized in 2006.
For tax purposes, our net operating loss carryforward reduced our federal and state income tax liability incurred for 2007. We have recorded a provision for income taxes in the amount of $0.5 million for 2007 as a result of our estimate of state income tax and alternative minimum tax, and there was no provision recorded for 2006.
42
As of January 1, 2008, our net operating loss carryforwards for U.S. federal income tax purposes were $148.8 million, $102.2 million of which are subject to an annual usage limitation of $4.7 million, and were subject to the following expiration schedule (in thousands of dollars):
Net Operating Loss
Carryforwards
| | Expiration Date
|
|---|
| $ | 6,058 | | 12/31/2012 |
| | 14,553 | | 12/31/2018 |
| | 6,862 | | 12/31/2019 |
| | 10,424 | | 12/31/2020 |
| | 10,515 | | 12/31/2021 |
| | 35,688 | | 12/31/2022 |
| | 42,362 | | 12/31/2023 |
| | 12,003 | | 12/31/2024 |
| | 5,413 | | 12/31/2025 |
| | 4,900 | | 12/31/2026 |
| | |
| $ | 148,778 | | |
| | |
Our ability to utilize the approximately $46.6 million of our net operating losses that are not currently subject to limitation could become limited, and our ability to utilize our remaining net operating losses could be limited further, in the event that we undergo an "ownership change" as that term is defined for purposes of Section 382 of the Internal Revenue Code. We are in the process of filing a request with the Internal Revenue Service to review our methodology for determining ownership changes in accordance with Internal Revenue Code Section 382. Upon acceptance of our request, we believe that our NOLs will be available for utilization. In the event that our request is not accepted, approximately $17.9 million of NOLs will be at risk to expire prior to utilization.
Our net operating loss carryforwards are one of our deferred income tax assets; however, the ultimate realization of these deferred income tax assets is dependent upon generation of future taxable income. We made $12.6 million in net income for fiscal 2007 and we expect to continue to be profitable in fiscal 2008. However, due to the uncertainty of future taxable income, deferred tax assets resulting from these net operating losses have been fully reserved. In accordance with SFAS No. 109, "Accounting for Income Taxes," ("SFAS No. 109") we will assess each quarter of 2008 whether there is a continuing need for a valuation allowance that results from uncertainty regarding our ability to realize the benefits of our deferred tax assets.
43
Results of Operations for fiscal year 2006 as compared to fiscal year 2005
| | For the year ended:
(in thousands of dollars)
| | Increase/
(Decrease)
| | For the year ended:
(percent of total revenue)
| |
|---|
| | January 3,
2006
| | January 2,
2007
| | 2005
vs. 2006
| | January 3,
2006
| | January 2,
2007
| |
|---|
| Revenues: | | | | | | | | | | | | | |
| | Company-owned restaurant sales | | $ | 363,044 | | $ | 363,699 | | 0.2 | % | 93.3 | % | 93.3 | % |
| | Manufacturing and commissary revenues | | | 20,786 | | | 21,076 | | 1.4 | % | 5.3 | % | 5.4 | % |
| | Franchise and license related revenues | | | 5,263 | | | 5,187 | | (1.4 | )% | 1.4 | % | 1.3 | % |
| | |
| |
| |
| |
| |
| |
| Total revenues | | | 389,093 | | | 389,962 | | 0.2 | % | 100.0 | % | 100.0 | % |
Cost of sales: |
|
|
|
|
|
|
|
|
|
|
|
|
|
| | Company-owned restaurant costs | | | 296,610 | | | 290,176 | | (2.2 | )% | 76.2 | % | 74.4 | % |
| | Manufacturing and commissary costs | | | 18,781 | | | 21,154 | | 12.6 | % | 4.8 | % | 5.4 | % |
| | |
| |
| |
| |
| |
| |
| Total cost of sales | | | 315,391 | | | 311,330 | | (1.3 | )% | 81.0 | % | 79.8 | % |
Gross profit: |
|
|
|
|
|
|
|
|
|
|
|
|
|
| | Company-owned restaurant | | | 66,434 | | | 73,523 | | 10.7 | % | 17.1 | % | 18.9 | % |
| | Manufacturing and commissary | | | 2,005 | | | (78 | ) | * | | 0.5 | % | 0.0 | % |
| | Franchise and license | | | 5,263 | | | 5,187 | | (1.4 | )% | 1.4 | % | 1.3 | % |
| | |
| |
| |
| |
| |
| |
| Total gross profit | | | 73,702 | | | 78,632 | | 6.7 | % | 19.0 | % | 20.2 | % |
Operating expenses: |
|
|
|
|
|
|
|
|
|
|
|
|
|
| | General and administrative expenses | | | 36,096 | | | 37,484 | | 3.8 | % | 9.3 | % | 9.6 | % |
| | Depreciation and amortization | | | 26,316 | | | 16,949 | | (35.6 | )% | 6.8 | % | 4.3 | % |
| | Loss on sale, disposal or abandonment of assets, net | | | 314 | | | 493 | | 57.0 | % | 0.1 | % | 0.1 | % |
| | Charges of integration and reorganization cost | | | 5 | | | — | | * | | 0.0 | % | 0.0 | % |
| | Impairment charges and other related costs | | | 1,603 | | | 2,268 | | 41.5 | % | 0.4 | % | 0.6 | % |
| | |
| |
| |
| |
| |
| |
| Income from operations | | | 9,368 | | | 21,438 | | 128.8 | % | 2.4 | % | 5.5 | % |
Other expense: |
|
|
|
|
|
|
|
|
|
|
|
|
|
| | Interest expense, net | | | 23,698 | | | 19,555 | | (17.5 | )% | 6.1 | % | 5.0 | % |
| | Write-off of debt discount upon redemption of senior notes | | | — | | | — | | * | | 0.0 | % | 0.0 | % |
| | Prepayment penalty upon redemption of senior notes | | | — | | | 4,800 | | * | | 0.0 | % | 1.2 | % |
| | Write-off of debt issuance costs upon redemption of senior notes | | | — | | | 3,956 | | * | | 0.0 | % | 1.0 | % |
| | Other, net | | | (312 | ) | | (5 | ) | 98.4 | % | (0.1 | )% | 0.0 | % |
| | |
| |
| |
| |
| |
| |
| Income (loss) before taxes | | | (14,018 | ) | | (6,868 | ) | 51.0 | % | (3.6 | )% | (1.8 | )% |
| | Provision for income taxes | | | — | | | — | | * | | 0.0 | % | 0.0 | % |
| | |
| |
| |
| |
| |
| |
| Net income (loss) | | $ | (14,018 | ) | $ | (6,868 | ) | 51.0 | % | (3.6 | )% | (1.8 | )% |
| | |
| |
| |
| |
| |
| |
- *
- not meaningful
44
We have a 52/53-week fiscal year ending on the Tuesday closest to December 31. Fiscal year 2006 ended on January 2, 2007 contained 52 weeks, while fiscal year 2005, which ended on January 3, 2006, contained 53 weeks.
Restaurant sales for 2006 improved 0.2% when compared to 2005. Our 2006 restaurant sales increased 1.9% when calculated on a comparative 52-week basis for both fiscal 2005 and 2006. Our 2006 comparable store sales increased 4.5% over 2005 partially due to a system-wide price increase, a slight shift in product mix to higher priced items, and an increase in the volume of units sold resulting from suggestive selling techniques. We also see growth in markets in which we offer catering by our company-owned restaurants. Our catering business contributed 1.1% of the increase to our comparable store sales.
Comparable store sales represent sales at restaurants open for one full year that have not been relocated or closed during the current year. Comparable store sales include company-owned restaurants only and represent the change in period-over-period sales for the comparable restaurant base. A restaurant becomes comparable in its 13th full month of operation.
Comparable store sales for each quarter in fiscal 2005 and 2006 are as follows:
| | Fiscal 2005
| | Fiscal 2006
| |
|---|
| First Quarter | | 4.6 | % | 6.2 | % |
| Second Quarter | | 6.3 | % | 3.6 | % |
| Third Quarter | | 5.9 | % | 3.2 | % |
| Fourth Quarter | | 3.9 | % | 4.7 | % |
Our restaurant gross profit increased $7.1 million, or 10.7%, in 2006 compared to the 2005 period, which included an extra week. Our restaurant margins are impacted by various restaurant-level operating and non-operating expenses such as the cost of products sold, salaries and benefits, insurance, supplies, repair and maintenance expenses, advertising, rent, utilities and property taxes. Because certain elements of cost of sales such as rent, utilities, property taxes and manager salaries are fixed in nature, incremental sales positively impact gross profit. Depreciation, amortization and income taxes do not impact our restaurant contribution margins.
In analyzing 2006 against a comparable 52-week basis for 2005, our restaurant contribution margins improved to 20.2% from 18.1% primarily due to price increases and product mix shifts positively impacting revenue, improved control over food waste, labor hours, and supplies spending partially offset by increases in food costs, wage rates, utilities, lease and lease related expenses. In comparing the reported 52-week period for 2006 against the reported 53-week period in 2005, the $7.1 million increase in gross profit was primarily due to revenue of $14.5 million driven by price increases and product mix shifts. Our margins were also favorably impacted by approximately $1.8 million reduction in marketing expense as a result of a shift to more targeted marketing, $0.6 million savings in real estate taxes that included the settlement of a real estate tax dispute and $0.6 million in decreased workers' compensation loss reserves. These improvements, reductions and savings were partially offset by increases of approximately $2.7 million in salaries and wages, $2.3 million in food costs and distribution expenses, $1.9 million in energy and utility costs, $1.2 million in lease and lease related expenses (consisting of increased costs of lease renewals substantially offset by cost savings due to restaurant closures), and $0.5 million in installation costs and monthly fees for DSL service in our company-owned restaurants. The extra week in the 53-week period in 2005 period contributed $1.8 million in gross profit.
45
Our manufacturing operations, which include our USDA approved commissaries, predominantly support our company-owned restaurants and generate revenue from the sale of food products to franchisees, licensees, third-party distributors and other third parties. All inter-company transactions have been eliminated during consolidation.
During 2006, our manufacturing operations experienced negative margins primarily due to increases in raw materials and freight costs and incremental start-up costs associated with new products and customers. During the fourth quarter of 2006, our margins improved slightly partially due to implemented price increases to some of our third party customers. We also opened two new commissary locations, aggregating our commissary system to five locations, which will increase our current production capacity. Finally, we engaged a third party consulting firm to assist us in developing manufacturing cost models. We believe these initiatives will allow us to become more operationally efficient in the future and positively impact our manufacturing operations.
Revenues for the franchised and licensed operations consist primarily of initial fees and royalty income earned as a result of sales within franchised and licensed restaurants. Overall, licensee and franchisee royalty income declined slightly by 1.4% in 2006 as compared to 2005, which included an extra week of royalty income. On a comparable 52-week basis and excluding $0.3 million in accelerated royalties due to an early termination of a franchise agreement in the 2005 period, licensee and franchisee royalty income improved 6.4% or $0.3 million in the 2006 period. The percentage increase was predominantly due to improved comparable sales in the Manhattan Bagel and Einstein Bros. brands and an increase in the number of Einstein Bros. licensed restaurants, offset by the closure of several Manhattan Bagel franchises.
Our general and administrative expenses increased 3.8%, or $1.4 million, in 2006 when compared to 2005. As a percentage of sales, our general and administrative expenses were 9.3% in 2005 compared to 9.6% in 2006. Predominantly contributing to the increase was approximately $0.7 million in stock based compensation expense and $0.7 million for our 2006 annual leadership summits for our Einstein Bros. and Noah's general managers and our Manhattan Bagel franchisees.
Depreciation and amortization expenses decreased 35.6%, or $9.4 million, in 2006 compared to 2005. The decrease is primarily due to all of our amortizing intangible assets becoming fully amortized and a substantial portion of our other assets becoming fully depreciated within the second and third quarters of fiscal 2006. Depreciation and amortization expense is predominantly related to the assets of Einstein/Noah Bagel Corp. that we acquired in bankruptcy proceedings in June 2001.
Loss on the Disposal, Sale or Abandonment of Assets
Loss on the disposal, sale or abandonment of assets represents the excess of book value over proceeds received, if any, over the net book value of an asset. We establish estimated useful lives for our assets, which range from three to eight years, and depreciate using the straight-line method. Leasehold improvements are limited to the lesser of the useful life or the non-cancelable lease term. The useful lives of the assets are based upon our expectations of the period of time that the asset will be used to generate revenue. We periodically review the assets for changes in circumstances, which may impact their useful lives.
46
Impairment losses are non-cash charges recorded on long-lived assets, goodwill, trademarks and our other intangible assets. Generally, an indicator of impairment would include significant change in an asset's ability to generate positive cash flow in the future or in the fair value of an asset. Whenever impairment indicators are determined to be present, the amount of impairment is measured as the excess of the carrying amount of the asset over its fair value. During 2006, we recorded $0.2 million in impairment charges related to company-owned restaurants compared to $0.2 million in 2005. In addition, during 2005 we recorded $1.2 million in impairment charges related to our Chesapeake trademarks.
Some of our manufacturing equipment is located at the plant of Harlan Bakeries, Inc., our frozen bagel dough supplier. In late 2006, we were notified of Harlan's intent, under the terms of the contract, to purchase the equipment and we agreed to sell the equipment to Harlan for $1.1 million. In order to adjust the assets down to their mutually agreed-upon fair value, we recorded an impairment charge of $2.2 million during the quarter ended January 2, 2007. The assets have been classified as held for sale on the consolidated balance sheet as of January 2, 2007.
On February 28, 2006, we completed a debt refinancing that redeemed our $160 million notes and retired our $15.0 million AmSouth Revolver. We replaced this debt with $170.0 million in new term loans and a $15.0 million revolving credit facility. It reduced our effective interest rate from 13.9% to a weighted-average effective interest rate of 10.27% as of January 2, 2007. In 2006, we incurred $19.6 million in net interest expense compared to $23.7 million in 2005. In connection with refinancing our $160 million notes, we wrote off $4.0 million of debt issuance costs and paid a 3% redemption premium in the amount of $4.8 million during the first quarter ended 2006.
For our financial statements prepared in accordance with GAAP, we reported a net loss for 2006 of $6.9 million, which was a 51.0% decrease from the net loss of $14.0 million we reported for 2005. Due to improved operations and as a result of a reduction in our depreciation and amortization expense, as well as a savings from the reduction in the interest rate on our debt facility, we achieved net income of $0.8 million and $6.0 million during the third and fourth quarters of 2006, respectively.
For tax purposes, net operating losses generated in 2006 will result in no federal or state income tax liability for 2006 and also will result in an estimated net operating loss carryforward for U.S. federal income tax purposes of $1.6 million, which expires on December 31, 2026. Net operating losses generated in 2005 from continuing operations resulted in no federal or state income tax liability for 2005 and also resulted in a net operating loss carryforward for U.S. federal income tax purposes of $5.4 million, which expires on December 31, 2025. As of January 2, 2007, our net operating loss carryforwards for U.S. federal income tax purposes were $156.8 million, $97.0 million of which are
47
subject to an annual usage limitation of $4.7 million, and were subject to the following expiration schedule (in thousands of dollars):
Net Operating Loss
CarryForwards
| | Expiration Date
|
|---|
| $ | 865 | | 12/31/2009 |
| | 2,148 | | 12/31/2010 |
| | 4,862 | | 12/31/2011 |
| | 9,589 | | 12/31/2012 |
| | 14,553 | | 12/31/2018 |
| | 6,862 | | 12/31/2019 |
| | 10,424 | | 12/31/2020 |
| | 10,515 | | 12/31/2021 |
| | 35,688 | | 12/31/2022 |
| | 42,362 | | 12/31/2023 |
| | 12,003 | | 12/31/2024 |
| | 5,413 | | 12/31/2025 |
| | 1,552 | | 12/31/2026 |
| | |
| $ | 156,836 | | |
| | |
Our net operating losses are one of our deferred income tax assets; however, the ultimate realization of these deferred income tax assets is dependent upon generation of future taxable income. Due to the uncertainty of future taxable income, deferred tax assets resulting from these net operating losses have been fully reserved. In accordance with SFAS No. 109 we will assess the continuing need for a valuation allowance that results from uncertainty regarding our ability to realize the benefits of our deferred tax assets.
Financial Condition, Liquidity and Capital Resources
The restaurant industry is predominantly a cash business where cash is received at the time of the transaction. We believe we will generate sufficient cash flow and have sufficient availability under our Revolving Facility to fund operations, capital expenditures and required debt and interest payments. Our inventory turns frequently since our products are perishable. Accordingly, our investment in inventory is minimal. Our accounts payable are on terms that we believe are consistent with those of other companies within the industry.
The primary driver of our operating cash flow is our restaurant operations, specifically the gross margin from our company-owned restaurants. Therefore, we focus on the elements of those operations including comparable store sales and cash flows to ensure a steady stream of operating profits that enable us to meet our cash obligations. On a weekly basis, we review our company-owned restaurant performance compared with the same period in the prior year and our operating plan.
Based upon our projections for 2008 and 2009, we believe our various sources of capital, including availability under existing debt facilities, and cash flow from operating activities of continuing operations, are adequate to finance operations as well as the repayment of current debt obligations.
We completed a debt refinancing on July 8, 2003, when we issued $160.0 million of 13% senior secured notes due 2008, or the $160 million notes. We used the net proceeds of the offering, among other things, to refinance the increasing rate notes which were issued in connection with the Einstein Bros./Noah's acquisition that occurred in 2001. Also on July 8, 2003, we entered into a three-year, $15.0 million senior secured revolving credit facility with AmSouth Bank, or the AmSouth Revolver.
48
On February 28, 2006, we completed the refinancing of our AmSouth Revolver and $160 million notes. Our new financing consisted of a:
- •
- $15.0 million revolving credit facility maturing on March 31, 2011;
- •
- $80.0 million first lien term loan maturing on March 31, 2011;
- •
- $65.0 million second lien term loan maturing on February 28, 2012; and
- •
- $25.0 million subordinated note maturing on February 28, 2013.
Each of the loans required the payment of interest in arrears on a quarterly basis commencing on March 31, 2006. Additionally, the first lien term loan requires quarterly scheduled minimum principal reductions commencing June 30, 2006. In the event that we have not extended the maturity date of the mandatorily redeemable Series Z preferred stock to a date that is on or after July 26, 2012 (July 26, 2013 for the subordinated note) or redeemed the Series Z by various dates in 2008 and 2009, then each of the loans have various accelerated maturity dates beginning in December 2008.
On June 13, 2007, we completed a $90 million secondary public offering of our common stock. After stock issuance costs of $6.7 million related to the offering, we received net proceeds of $83.3 million. The net proceeds were used to repay our $65.0 million Second Lien Term Loan, repay a portion of our $25 million Subordinated Note held by Greenlight Capital, L.L.C. ("Greenlight") and to pay for the offering costs. Additionally, on June 28, 2007, we repaid the remaining portion of the $25 million Subordinated Note held by Greenlight by using a portion of the incremental debt proceeds under the amended debt facility.
In June 2007, we amended our debt facility from $95.0 million to $110.0 million. Our amended financing consisted of a:
- •
- $20.0 million credit facility maturing on June 28, 2012.
- •
- $90.0 million first lien term loan maturing on June 28, 2012.
As part of this amendment we increased the amount of our existing revolving credit facility from $15.0 million to $20.0 million and modified our term loan from a principal amount of $80.0 million to $90.0 million and repaid the remaining amount of the $25 Million Subordinated Note as noted above. The revolving credit facility remains available, subject to certain conditions, to finance our ongoing working capital, capital expenditure and general corporate needs. In addition, all of the revolving credit facility is available for letters of credit. We are required to pay an unused credit line fee of 0.5% per annum on the average daily unused amount. The unused line fee is payable quarterly in arrears. Additionally, we are required to pay a letter of credit fee based on the ending daily undrawn face amount for each letter of credit issued, being based on our consolidated leverage ratio with an applicable margin of 2.00% plus a 0.5% arranger fee payable quarterly. Letters of credit reduce our availability under the Revolving Facility. At January 1, 2008, we had $6.7 million in letters of credit outstanding. The letters of credit expire on various dates during 2008, are automatically renewable for one additional year and are payable upon demand in the event that we fail to pay the underlying obligation. Our availability under the revolving facility was $13.3 million as of January 1, 2008.
In addition, we have obtained a commitment for an incremental term loan in an aggregate principal amount of up to $57.0 million which may be used if needed, solely for the purpose of redeeming the zero coupon Series Z preferred stock, which is not due until June 2009. Availability of
49
the incremental term loan is subject to customary borrowing conditions, including absence of any default or material adverse change, and to a requirement of successful syndication of this incremental term loan.
We may prepay amounts outstanding under the senior secured credit facility and may terminate commitments in whole at any time without penalty or premium upon prior written notice.
On January 1, 2008, we had unrestricted cash of $9.4 million and restricted cash of $1.2 million. Under the Revolving Facility, there were no outstanding borrowings, $6.7 million in letters of credit outstanding and borrowing availability of $13.3 million. Our working capital deficit improved $11.6 million to a working capital surplus of $3.7 million in 2007 compared to a working capital deficit of $8.0 million in 2006, primarily due to the increased cash flow stemming from an increase in profitability at our company-owned restaurants and lower interest expense under our new debt structure, a decrease in accrued expenses related to lower accrued bonuses, a reduction in the gift card liability for estimated breakage and lower accrual for property, plant and equipment that has been received but not paid, partially offset by the sale of equipment to Harlan. Short-term debt and the current portion of long-term debt decreased by $2.6 million.
On January 2, 2007, we had unrestricted cash of $5.5 million and restricted cash of $2.7 million. Under the Revolving Facility, there were no outstanding borrowings, $6.7 million in letters of credit outstanding and borrowing availability of $8.3 million. Our working capital deficit improved $3.7 million to $8.0 million in 2006 compared to $11.7 million in 2005, primarily due to the increased profitability at our company-owned restaurants, partially offset by the short-term classification of principal payments due under our first lien term loan.
Due to increased profitability at our company-owned restaurants and the reduction of interest expense related to our debt redemption, net cash generated by operating activities was $24.9 million for 2007 compared to $14.0 million for 2006. Cash provided by operations for 2007 includes a $0.2 million cash prepayment penalty incurred upon redemption of the $65 million second lien term loan. Cash provided by operations for 2006 includes a $4.8 million cash prepayment penalty incurred upon redemption of the $160 million notes.
During the year to date period ended January 1, 2008, we used approximately $25.9 million of cash to purchase additional property and equipment that included $6.8 million to open 13 new restaurants in 2007, $0.7 million in payments for four restaurants that opened in 2006, and $0.2 million towards 13 restaurants that are currently under construction; $3.4 million for upgrading existing restaurants in 2007, $0.2 million in 2006 and $0.1 million in 2008; $9.1 million for replacement of equipment at our existing company-owned restaurants, $1.1 million for our manufacturing operations, $1.8 million for general corporate purposes, and $2.5 for leasehold improvements and build-out related to our new corporate headquarters.
We anticipate that the majority of our capital expenditures for fiscal 2008 will be focused on the addition of at least 18 new company-owned restaurants during at an average capital investment of approximately $550,000 per restaurant. We also intend to upgrade at least 45 of our current restaurants to the new dining room configuration during 2008. This upgrade includes new self service coolers, an expanded coffee bar, and a separate station for quick "to go" items. Finally, we plan to acquire additional equipment for new menu items and an improved ordering system that uses wireless technology to reduce the time our guests wait in line before they receive their food.
50
During 2006, we used approximately $13.2 million of cash to purchase additional property and equipment that included $1.7 million for new restaurants, $2.6 million for upgrading existing restaurants, $3.8 million for replacement and new equipment at our existing company-owned restaurants, $3.0 million for our manufacturing operations and $2.1 million for general corporate purposes.
On January 1, 2008, we purchased a restaurant from a Manhattan Bagel franchisee for $382,000. We made a $375,000 cash payment in 2007, and the remaining $7,000 will be paid in 2008.
As a result of our June 13, 2007 secondary public offering of common stock, we received $90.0 million in cash, and incurred $6.7 million in stock issuance costs. Concurrent with our June 28, 2007 amendment to our First Lien Term Loan, we drew down an additional $11.9 million in debt and incurred an additional $0.9 million in debt issuance costs. The funds from these two transactions were used to pay off the $65.0 million Second Lien Term Loan and the $25.0 Million Subordinated Note and $2.5 million of related paid-in-kind interest on the Subordinated Note.
As a result of our refinancing of our $160 million notes with $170.0 million in new term loans in February 2006, we borrowed $169.4 million in term loans and incurred approximately $5.0 million in debt issuance costs. Upon closing of our new debt facility, we began amortizing these costs and the debt issuance costs related to our $160 million notes and AmSouth Revolver were written-off.
Contractual Obligations
The following table summarizes the amounts of payments due under specified contractual obligations as of January 1, 2008:
| | Payments Due by Fiscal Period
|
|---|
| | 2008
| | 2009 to 2011
| | 2012 to 2013
| | 2014 and
thereafter
| | Total
|
|---|
| | (in thousands of dollars)
|
|---|
| Accounts payable and accrued expenses | | $ | 24,351 | | $ | — | | $ | — | | $ | — | | $ | 24,351 |
| Debt | | | 955 | | | 2,925 | | | 85,950 | | | — | | | 89,830 |
| Estimated interest expense on our debt facility(a) | | | 6,793 | | | 20,232 | | | 3,780 | | | — | | | 30,805 |
| Manditorily redeemable series Z | | | — | | | 57,000 | | | — | | | — | | | 57,000 |
| Minimum lease payments under capital leases | | | 92 | | | 73 | | | — | | | — | | | 165 |
| Minimum lease payments under operating leases | | | 25,969 | | | 58,380 | | | 9,821 | | | 9,552 | | | 103,722 |
| Purchase obligations(b) | | | 20,138 | | | 9,359 | | | — | | | — | | | 29,497 |
| Other long-term obligations(c) | | | — | | | 750 | | | 500 | | | 5,630 | | | 6,880 |
| | |
| |
| |
| |
| |
|
| | Total | | $ | 78,298 | | $ | 148,719 | | $ | 100,051 | | $ | 15,182 | | $ | 342,250 |
| | |
| |
| |
| |
| |
|
- (a)
- Calculated as of January 1, 2008, using the LIBOR and U.S. Prime rates, plus the applicable margin in effect. Because the interest rates on the first lien term loan facility and the revolving credit facility are variable, actual payments could differ materially.
- (b)
- Purchase obligations consist of non-cancelable minimum purchases of frozen dough and certain other raw ingredients that are used in our products.
- (c)
- Other long-term obligations primarily consist of the remaining liability related to minimum future purchase commitments with a supplier that advanced us $10.0 million in 1996.
51
We are insured for losses related to health, general liability and workers' compensation under large deductible policies. The insurance liability represents an estimate of the ultimate cost of claims incurred and unpaid as of the balance sheet date. The estimated liability is established based on actuarial estimates, is discounted at 10% based upon a discrete analysis of actual claims and historical data and is reviewed on a quarterly basis to ensure that the liability is appropriate. If actual trends, including the severity or frequency of claims, differ from our estimates our financial results could be favorably or unfavorably impacted. The estimated liability is included in accrued expenses in our consolidated balance sheets.
Off-Balance Sheet Arrangements
Prior to 2001, we would occasionally guarantee leases for the benefit of certain of our franchisees. None of the guarantees have been modified since their inception and we have since discontinued this practice. Current franchisees are the primary lessees under the vast majority of these leases. Under the lease guarantees, we may be required by the lessor to make all of the remaining monthly rental payments or property tax and common area maintenance payments if the franchisee does not make the required payments in a timely manner. However, we believe that most, if not all, of the franchised restaurants could be subleased to third parties minimizing our potential exposure. Additionally, we have indemnification agreements with our franchisees under which the franchisees would be obligated to reimburse us for any amounts paid under such guarantees. Historically, we have not been required to make such payments in significant amounts. As of January 1, 2008, we have a liability of $36,000 for our exposure under the guarantees in accordance with Financial Accounting Standards Board ("FASB") Interpretation ("FIN") No. 45,Guarantor's Accounting and Disclosure Requirements for Guarantees, Including Indirect Guarantees of Indebtedness of Others, following a probability related approach. Minimum future rental payments for all remaining guaranteed leases that expire on various dates through July 2012 were approximately $1.3 million as of January 1, 2008. We believe the ultimate disposition of these matters will not have a material adverse effect on our financial position or results of operations.
We have $6.7 million in letters of credit outstanding under our Revolving Facility at January 1, 2008. The letters of credit expire on various dates during 2008, are automatically renewable for one additional year and are payable upon demand in the event that we fail to pay the underlying obligation related to certain workers compensation claims.
Recent Accounting Pronouncements
In September 2006, the FASB issued SFAS No. 157,Fair Value Measurements ("SFAS No. 157"), which defines fair value, establishes a framework for measuring fair value in accordance with GAAP and expands disclosures about fair value measurements. SFAS No. 157 is effective for fiscal years beginning after November 15, 2007. We do not believe such adoption will have a material impact on our consolidated financial statements.
In February 2007, the FASB issued SFAS No. 159,The Fair Value Option for Financial Assets and Financial Liabilities—Including an Amendment of SFAS No. 115 ("SFAS No. 159"), which becomes effective for fiscal periods beginning after November 15, 2007. Under SFAS No. 159, companies may elect to measure specified financial instruments and warranty and insurance contracts at fair value on a contract-by-contract basis, with changes in fair value recognized in earnings each reporting period. This election, called the "fair value option", will enable some companies to reduce volatility in reported
52
earnings caused by measuring related assets and liabilities differently. We do not expect the impact of adoption to have a material impact on our consolidated financial statements.
In December 2007, the FASB issued SFAS 141 (revised 2007),Business Combinations, ("SFAS 141R"). SFAS 141R establishes principles and requirements for how an acquirer recognizes and measures in its financial statements the identifiable assets acquired, including goodwill, the liabilities assumed and any non-controlling interest in the acquiree. The Statement also establishes disclosure requirements to enable users of the financial statements to evaluate the nature and financial effects of the business combination. SFAS 141R is effective for business combinations for which the acquisition date is on or after the beginning of the first annual reporting period beginning on or after December 15, 2008. The impact of adopting SFAS 141R will be dependent on the future business combinations that the Company may pursue after its effective date.
In December 2007, the SEC issued SAB 110Share-Based Payment. SAB 110 amends and replaces Question 6 of Section D.2 of Topic 14, "Share-Based Payment," of the Staff Accounting Bulletin series. Question 6 of Section D.2 of Topic 14 expresses the views of the staff regarding the use of the "simplified" method in developing an estimate of the expected term of "plain vanilla" share options and allows usage of the "simplified" method for share option grants prior to December 31, 2007. SAB 110 allows public companies which do not have historically sufficient experience to provide a reasonable estimate to continue use of the "simplified" method for estimating the expected term of "plain vanilla" share option grants after December 31, 2007. SAB 110 is effective January 1, 2008. We currently use the "simplified" method to estimate the expected term for share option grants as we do not have enough historical experience to provide a reasonable estimate. We will continue to use the "simplified" method until we have enough historical experience to provide a reasonable estimate of expected term in accordance with SAB 110. The Company does not expect SAB 110 will have a material impact on its consolidated balance sheets, statements of operations and cash flows.
We have considered all other recently issued accounting pronouncements and do not believe the adoption of such pronouncements will have a material impact on our consolidated financial statements.
Critical Accounting Policies and Estimates
The discussion and analysis of our financial condition and results of operations are based upon our consolidated financial statements, which have been prepared in accordance with accounting principles generally accepted in the United States of America. The preparation of these consolidated financial statements requires us to make estimates and judgments that affect the reported amounts of assets, liabilities, revenues and expenses. On an on-going basis, we evaluate our estimates based on historical experience and on various other assumptions that are believed to be reasonable under the circumstances, the results of which form the basis for making judgments about the carrying value of assets and liabilities that are not readily apparent from other sources. Actual results may differ from these estimates under different assumptions or conditions.
We believe the following critical accounting policies impact our more significant judgments and estimates used in the preparation of our consolidated financial statements. Our significant accounting policies are discussed in Note 2 to our consolidated financial statements set forth in Item 8 of this report.
We review property and equipment and amortizing intangible assets for impairment when events or circumstances indicate that the carrying amount of a restaurant's assets may not be recoverable. We test for impairment using historical cash flows and other relevant facts and circumstances as the primary basis for our estimate of future cash flows. Relevant facts and circumstances may include, but are not limited to, local competition in the area, the ability of existing restaurant management, the
53
necessity of tiered pricing structures and the impact that upgrading our restaurants may have on our estimates. This process requires the use of estimates and assumptions, which are subject to high degree of judgment. In the event that these estimates and assumptions change in the future, we may be required to record impairment charges for these assets. Given a substantial portion of our property and equipment (related to the assets of Einstein/Noah Bagel Corp. that we acquired in bankruptcy proceedings in June 2001) became fully depreciated within the second and third quarters of fiscal 2006, and considering the improvement in the profitability and cash flows from each of our restaurants, we believe a significant change in any of the aforementioned assumptions would not have a material impact to our consolidated financial statements. As of January 2, 2007, all amortizing intangible assets have been fully amortized and a change in any of the aforementioned assumptions would have no impact to our consolidated financial statements.
At least annually, we assess the recoverability of goodwill and other intangible assets not subject to amortization related to our restaurant concepts. These impairment tests require us to estimate the fair values of our restaurant concepts by making assumptions regarding future profits and cash flows, expected growth rates, terminal values, discount rates and other factors. As of January 1, 2008, the fair value of goodwill and other intangible assets not subject to amortization sufficiently exceeded the carrying values. A much greater than inconsequential movement in any of the aforementioned assumptions would not have a material impact to our consolidated financial statements. The assumptions used in the estimate of fair value are generally consistent with the past performance of each reporting unit and other intangible assets and are also consistent with the projections and assumptions that are used in current operating plans. These assumptions are subject to change as a result of changing economic and competitive conditions. In the event that these assumptions change in the future, we may be required to record impairment charges for these assets.
We are insured for certain losses related to health, general liability and workers' compensation under large deductible policies. The insurance liability represents an estimate of the ultimate cost of claims incurred and unpaid as of the balance sheet date. The estimated liability is established and discounted at 10% based upon analysis of historical data and actuarial estimates and is reviewed on a quarterly basis to ensure that the liability is appropriate. A 300 basis point decrease in the discount factor would increase our net loss by approximately $0.1 million annually. If actual trends, including the severity or frequency of claims differ from our estimates, our financial results could be favorably or unfavorably impacted.
In December 2004, the FASB issued SFAS No. 123R, Share-Based Payment. SFAS No. 123R is a revision of SFAS No. 123, Accounting for Stock-Based Compensation, and supersedes Accounting Principles Board Opinion ("APB") No. 25, Accounting for Stock Issued to Employees and its related implementation guidance. SFAS No. 123R focuses primarily on accounting for transactions in which an entity obtains employee services in share-based payment transactions. The Statement requires entities to recognize compensation expense for awards of equity instruments to employees based on the fair value of those awards on the date of grant (with limited exceptions).
Effective January 4, 2006, we adopted the provisions of SFAS No. 123R using the modified prospective transition method. Prior to the adoption of SFAS No. 123R, we applied the intrinsic value-based method of accounting prescribed by APB No. 25 and related interpretations, in accounting for our fixed award stock options to our employees. As such, compensation expense was recorded only if the current market price of the underlying common stock exceeded the exercise price of the option on the date of grant. We applied the fair value basis of accounting as prescribed by SFAS No. 123 in
54
accounting for our fixed award stock options to our consultants. Under SFAS No. 123, compensation expense was recognized based on the fair value of stock options granted.
Historically, we adopted only the pro forma disclosure provisions of SFAS No. 123. Since adoption of SFAS No. 123R, we are recognizing compensation costs relating to the unvested portion of awards granted prior to the date of adoption using the same estimates and attributions used to determine the pro forma disclosures under SFAS No. 123, except that forfeiture rates are estimated for all options, as required by SFAS No. 123R.
We use the Black-Scholes model to estimate the fair value of our option awards. The Black-Scholes model requires estimates of the expected term of the option, as well as future volatility and the risk-free interest rate. Our stock options generally vest over a period of 6 months to 3 years and have contractual terms to exercise of 5 to 10 years. The expected term of options is based upon evaluations of historical and expected future exercise behavior. The risk-free interest rate is based on the U.S. Treasury rates at the date of grant with maturity dates approximately equal to the expected life at the grant date. Implied volatility is based on the mean reverting average of our stock's historical volatility and that of an industry peer group. The use of mean reversion is supported by evidence of a correlation between stock price volatility and a company's leverage combined with the effects mandatory principal payments will have on our capital structure, as defined under our new debt facility. We have not historically paid any dividends and are precluded from doing so under our debt covenants.
There is a risk that our estimates of the fair values of our share-based compensation awards on the grant dates may differ from the actual values realized upon the exercise, expiration, early termination or forfeiture of those share-based payments in the future. Certain share-based payments, such as employee stock options, may expire worthless or otherwise result in zero intrinsic value as compared to the fair values originally estimated on the grant date and reported in our financial statements. Alternatively, value may be realized from these instruments that are significantly in excess of the fair values originally estimated on the grant date and reported in our financial statements. Although the fair value of our share-based awards is determined in accordance with SFAS 123R and the Securities and Exchange Commission's Staff Accounting Bulletin No. 107 ("SAB 107") using an option-pricing model, that value may not be indicative of the fair value observed in a willing buyer/willing seller market transaction.
Estimates of share-based compensation expenses do have an impact on our financial statements, but these expenses are based on the aforementioned option valuation model and will never result in the payment of cash by us. For this reason, and because we do not view share-based compensation as related to our operational performance, we exclude estimated share-based compensation expense when evaluating our performance.
Proceeds from the sale of gift cards are recorded as deferred revenue and recognized as income when redeemed by the holder. While we will continue to honor all gift cards presented for payment, we may determine the likelihood of redemption to be remote for certain gift card balances due to the age of the unredeemed balance. In these circumstances, to the extent we determine there is no requirement for remitting balances to government agencies under unclaimed property laws, gift card balances may be recognized as gift card breakage and is recorded as a reduction to deferred revenue and an increase to company-owned restaurant revenues. For the fiscal year ended January 1, 2008, we recognized $1.3 million in gift card breakage representing our estimate of breakage for gift cards sold in fiscal years 2003 through 2006. There was no gift card breakage recognized on unredeemed gift cards in fiscal years 2006 or 2005.
55
As of January 1, 2008, net operating loss carryforwards of $148.8 million were available to be utilized against future taxable income for years through fiscal 2026, subject in part to annual limitations. Our net operating loss carryforwards are one of our deferred income tax assets; however, the ultimate realization of these deferred income tax assets is dependent upon the generation of future taxable income. Due to the uncertainty of future taxable income, deferred tax assets resulting from these net operating losses have been fully reserved.
In accordance with SFAS No. 109 we will assess the continuing need for a valuation allowance that results from uncertainty regarding our ability to realize the benefits of our deferred tax assets. We achieved net income of $12.6 million for fiscal 2007 and we expect to continue to be profitable in fiscal 2008. However, we will continue to review various qualitative and quantitative data, including events within the restaurant industry, the cyclical nature of our business, our future forecasts and historical trending. If we conclude that our prospects for the realization of our deferred tax assets are more likely than not, we will then reduce our valuation allowance as appropriate and credit income tax expense after considering the following factors:
- •
- The level of historical taxable income and projections for future taxable income over periods in which the deferred tax assets would be deductible, and
- •
- Accumulation of net income before tax utilizing a look-back period of three years.
The amount of the deferred tax asset considered realizable, however, could be reduced if estimates of future taxable income during the carryforward periods are reduced.
On January 3, 2007, we adopted the provisions of FASB Interpretation No. 48,Accounting for Uncertainty in Income Taxes ("FIN 48"). Previously, we accounted for tax contingencies in accordance with Statement of Financial Accounting Standards 5,Accounting for Contingencies. As Required by FIN 48, which clarifies SFAS No. 109, we recognize the financial statement benefit of a tax position only after determining that the relevant tax authority would more likely than not sustain the position following an audit. For tax positions meeting the more-likely-than-not threshold, the amount recognized in the financial statements is the largest benefit that has a greater than 50% likelihood of being realized upon ultimate settlement with the relevant tax authority. At the adoption date, we applied FIN 48 to all tax positions for which the statute of limitations remained open. We adopted FIN 48 in the first quarter of fiscal 2007. At the adoption date, we applied FIN 48 to all tax positions for which the statute of limitations remained open. As a result of the implementation, we recorded a reduction of approximately $1.8 million of the gross deferred tax asset and a corresponding reduction of the valuation allowance. Due to the completion and the filing of Forms 3115, Application for Change in Accounting Method, it is highly certain that approximately $1.5 million of the unrecognized tax benefits will be realized. Additionally, we have refined our estimate of the unrecognized tax benefits related to the remaining $0.3 million. Accordingly, in Quarter 4, 2007, we recorded an increase of approximately $1.8 million in our gross deferred tax asset and a corresponding increase in our valuation allowance. There was no net effect to the financial statements and none of the unrecognized tax benefits impacted our effective tax rate.
ITEM 7A. QUANTITATIVE AND QUALITATIVE DISCLOSURES ABOUT MARKET RISK
During fiscal 2007 and fiscal 2006, our results of operations, financial position and cash flows have not been materially affected by changes in the relative values of non-U.S. currencies to the U.S. dollar. We do not use derivative financial instruments to limit our foreign currency risk exposure since virtually all of our business is conducted in the United States.
Our manufacturing operations sell bagels to a wholesaler and a distributor who take possession in the United States and sell outside of the United States. As the product is shipped FOB domestic dock,
56
there are no international risks of loss or foreign exchange currency issues. Sales shipped internationally are included in manufacturing and commissary revenue. Approximately $3.3 million and $2.2 million for 2007 and 2006, respectively, were included in manufacturing revenue for these international shipments.
Our debt as of January 1, 2008 was principally comprised of the amended Revolving Facility and First Lien Term Loan. For fixed rate debt, interest rate changes affect the fair market value of such debt but do not impact earnings or cash flows. Conversely for variable rate debt, including borrowings under our revolving facility, first lien term loan and second lien term loan, interest rate changes generally do not affect the fair market value of such debt, but do impact future earnings and cash flows, assuming other factors are held constant. A 100 basis point increase in short-term effective interest rates would increase our interest expense by approximately $0.9 million annually, assuming no change in the size or composition of debt at January 1, 2008, and presuming the utilization of our accumulated net operating losses would minimize the tax implications for the next several years. Currently, the interest rates on our revolving facility, first lien term loan and second lien term loan are predominantly at LIBOR rates plus an applicable margin through short-term fixed rate financing. The estimated increase in interest expense incorporates the fixed interest financing into its assumptions.
On an annual basis, we purchase a substantial amount of agricultural products that are subject to fluctuations in price based upon market conditions. Our purchase arrangements may contain contractual features that limit the price paid by establishing certain price floors or caps. We do not use financial instruments to hedge commodity prices. We have recently contracted with a subsidiary of Cargill, Incorporated to manage our wheat purchases for our company-owned production facility. In addition to wheat, we have established contracts and entered into commitments with our vendors for butter, cheese, coffee and turkey.
This market risk discussion contains forward-looking statements. Actual results may differ materially from this discussion based upon general market conditions and changes in domestic and global financial markets.
57
ITEM 8. FINANCIAL STATEMENTS AND SUPPLEMENTARY DATA
| | Page
|
|---|
| Audited Annual Financial Statements | | |
| | Report of Independent Registered Public Accounting Firm | | 59 |
| | Consolidated Balance Sheets as of January 2, 2007 and January 1, 2008 | | 61 |
| | Consolidated Statements of Operations for the Years Ended January 3, 2006, January 2, 2007 and January 1, 2008 | | 62 |
| | Consolidated Statements of Changes in Stockholders' Deficit for the Years Ended January 3, 2006, January 2, 2007 and January 1, 2008 | | 63 |
| | Consolidated Statements of Cash Flows for the Years Ended January 3, 2006, January 2, 2007 and January 1, 2008 | | 64 |
| | Notes to Consolidated Financial Statements | | 65 |
58
REPORT OF INDEPENDENT REGISTERED PUBLIC ACCOUNTING FIRM
Board of Directors and Stockholders
Einstein Noah Restaurant Group, Inc.
We have audited the accompanying balance sheets of Einstein Noah Restaurant Group, Inc. ("Einstein Noah") (a Delaware corporation) as of January 1, 2008 and January 2, 2007, and the related statements of operations, stockholders' deficit, and cash flows for each of the three years in the period ended January 1, 2008. We also have audited Einstein Noah's internal control over financial reporting as of January 1, 2008, based on criteria established inInternal Control—Integrated Framework issued by the Committee of Sponsoring Organizations of the Treadway Commission (COSO). Einstein Noah's management is responsible for these financial statements, for maintaining effective internal control over financial reporting, and for its assessment of the effectiveness of internal control over financial reporting, included in the accompanying Management's Annual Report on Internal Control Over Financial Reporting included in Item 9A. Our responsibility is to express an opinion on these financial statements and an opinion on Einstein Noah's internal control over financial reporting based on our audits.
We conducted our audits in accordance with the standards of the Public Company Accounting Oversight Board (United States). Those standards require that we plan and perform the audits to obtain reasonable assurance about whether the financial statements are free of material misstatement and whether effective internal control over financial reporting was maintained in all material respects. Our audits of the financial statements included examining, on a test basis, evidence supporting the amounts and disclosures in the financial statements, assessing the accounting principles used and significant estimates made by management, and evaluating the overall financial statement presentation. Our audit of internal control over financial reporting included obtaining an understanding of internal control over financial reporting, assessing the risk that a material weakness exists, and testing and evaluating the design and operating effectiveness of internal control based on the assessed risk. Our audits also included performing such other procedures as we considered necessary in the circumstances. We believe that our audits provide a reasonable basis for our opinions.
A company's internal control over financial reporting is a process designed to provide reasonable assurance regarding the reliability of financial reporting and the preparation of financial statements for external purposes in accordance with generally accepted accounting principles. A company's internal control over financial reporting includes those policies and procedures that (1) pertain to the maintenance of records that, in reasonable detail, accurately and fairly reflect the transactions and dispositions of the assets of the company; (2) provide reasonable assurance that transactions are recorded as necessary to permit preparation of financial statements in accordance with generally accepted accounting principles, and that receipts and expenditures of the company are being made only in accordance with authorizations of management and directors of the company; and (3) provide reasonable assurance regarding prevention or timely detection of unauthorized acquisition, use, or disposition of the company's assets that could have a material effect on the financial statements.
Because of its inherent limitations, internal control over financial reporting may not prevent or detect misstatements. Also, projections of any evaluation of effectiveness to future periods are subject to the risk that controls may become inadequate because of changes in conditions, or that the degree of compliance with the policies or procedures may deteriorate.
In our opinion, the financial statements referred to above present fairly, in all material respects, the financial position of Einstein Noah as of January 1, 2008 and January 2, 2007, and the results of its operations and its cash flows for each of the three years in the period ended January 1, 2008 in conformity with accounting principles generally accepted in the United States of America. Also in our opinion, Einstein Noah maintained, in all material respects, effective internal control over financial
59
reporting as of January 1, 2008, based on criteria established inInternal Control—Integrated Framework issued by COSO.
�� Our audit was conducted for the purpose of forming an opinion on the basic financial statements taken as a whole. Schedule II is presented for purposes of additional analysis and is not a required part of the basic financial statements. This schedule has been subjected to the auditing procedures applied in the audit of the basic financial statements and in our opinion, is fairly stated in all material respects in relation to the basic financial statements taken as a whole.
/s/ GRANT THORNTON LLP
Denver, Colorado
February 28, 2008
60
EINSTEIN NOAH RESTAURANT GROUP, INC.
CONSOLIDATED BALANCE SHEETS
AS OF JANUARY 2, 2007 AND JANUARY 1, 2008
(in thousands, except share information)
| | January 2,
2007
| | January 1,
2008
| |
|---|
| ASSETS | | | | | | | |
| | Current assets: | | | | | | | |
| | | Cash and cash equivalents | | $ | 5,477 | | $ | 9,436 | |
| | | Restricted cash | | | 2,403 | | | 1,203 | |
| | | Franchise and other receivables, net of allowance of $505 and $606, respectively | | | 6,393 | | | 7,807 | |
| | | Inventories | | | 4,948 | | | 5,313 | |
| | | Prepaid expenses and other current assets | | | 4,529 | | | 5,281 | |
| | | Assets held for sale | | | 1,144 | | | — | |
| | |
| |
| |
| | | | Total current assets | | | 24,894 | | | 29,040 | |
| |
Restricted cash long-term |
|
|
284 |
|
|
— |
|
| | Property, plant and equipment, net | | | 33,889 | | | 47,714 | |
| | Trademarks and other intangibles, net | | | 63,806 | | | 63,831 | |
| | Goodwill | | | 4,875 | | | 4,981 | |
| | Debt issuance costs and other assets, net | | | 5,406 | | | 2,996 | |
| | |
| |
| |
| | | | Total assets | | $ | 133,154 | | $ | 148,562 | |
| | |
| |
| |
LIABILITIES AND STOCKHOLDERS' DEFICIT |
|
|
|
|
|
|
|
| | Current liabilities: | | | | | | | |
| | | Accounts payable | | $ | 3,347 | | $ | 5,072 | |
| | | Accrued expenses and other current liabilities | | | 25,855 | | | 19,279 | |
| | | Short term debt and current portion of long-term debt | | | 3,605 | | | 955 | |
| | | Current portion of obligations under capital leases | | | 76 | | | 80 | |
| | |
| |
| |
| | | | Total current liabilities | | | 32,883 | | | 25,386 | |
| |
Senior notes and other long-term debt, net of discount |
|
|
166,556 |
|
|
88,875 |
|
| | Long-term obligations under capital leases | | | 124 | | | 67 | |
| | Other liabilities | | | 8,822 | | | 10,841 | |
| | Mandatorily redeemable, Series Z Preferred Stock, $0.001 par value, $1,000 per share liquidation value; 57,000 shares authorized; 57,000 shares issued and outstanding | | | 57,000 | | | 57,000 | |
| | |
| |
| |
| | | | Total liabilities | | | 265,385 | | | 182,169 | |
| | |
| |
| |
| |
Commitments and contingencies (see Note 20) |
|
|
|
|
|
|
|
| | Stockholders' deficit: | | | | | | | |
| | Series A junior participating preferred stock, 700,000 shares authorized; no shares issued and outstanding | | | | | | | |
| | Common stock, $0.001 par value; 25,000,000 shares authorized; 10,596,419 and 15,878,811 shares issued and outstanding | | | 11 | | | 16 | |
| | Additional paid-in capital | | | 176,797 | | | 262,830 | |
| | Accumulated deficit | | | (309,039 | ) | | (296,453 | ) |
| | |
| |
| |
| | | | Total stockholders' deficit | | | (132,231 | ) | | (33,607 | ) |
| | |
| |
| |
| | | | | Total liabilities and stockholders' deficit | | $ | 133,154 | | $ | 148,562 | |
| | |
| |
| |
The accompanying notes are an integral part of these consolidated financial statements.
61
EINSTEIN NOAH RESTAURANT GROUP, INC.
CONSOLIDATED STATEMENTS OF OPERATIONS
FOR THE YEAR TO DATE PERIODS ENDED
JANUARY 3, 2006, JANUARY 2, 2007, AND JANUARY 1, 2008
(in thousands, except earnings per share and related share information)
| | January 3,
2006
| | January 2,
2007
| | January 1,
2008
|
|---|
| Revenues: | | | | | | | | | |
| | Company-owned restaurant sales | | $ | 363,044 | | $ | 363,699 | | $ | 372,997 |
| | Manufacturing and commissary revenues | | | 20,786 | | | 21,076 | | | 24,204 |
| | Franchise and license related revenues | | | 5,263 | | | 5,187 | | | 5,701 |
| | |
| |
| |
|
| Total revenues | | | 389,093 | | | 389,962 | | | 402,902 |
Cost of sales: |
|
|
|
|
|
|
|
|
|
| | Company-owned restaurant costs | | | 296,610 | | | 290,176 | | | 297,180 |
| | Manufacturing and commissary costs | | | 18,781 | | | 21,154 | | | 24,792 |
| | |
| |
| |
|
| Total cost of sales | | | 315,391 | | | 311,330 | | | 321,972 |
| | |
| |
| |
|
| Gross profit | | | 73,702 | | | 78,632 | | | 80,930 |
Operating expenses: |
|
|
|
|
|
|
|
|
|
| | General and administrative expenses | | | 36,096 | | | 37,484 | | | 40,635 |
| | Depreciation and amortization | | | 26,316 | | | 16,949 | | | 11,192 |
| | Loss (gain) on sale, disposal or abandonment of assets, net | | | 314 | | | 493 | | | 601 |
| | Charges of integration and reorganization cost | | | 5 | | | — | | | — |
| | Impairment charges and other related costs | | | 1,603 | | | 2,268 | | | 236 |
| | |
| |
| |
|
| Income from operations | | | 9,368 | | | 21,438 | | | 28,266 |
Other expense: |
|
|
|
|
|
|
|
|
|
| | Interest expense, net | | | 23,698 | | | 19,555 | | | 12,387 |
| | Write-off of debt discount upon redemption of senior notes | | | — | | | — | | | 528 |
| | Prepayment penalty upon redemption of senior notes | | | — | | | 4,800 | | | 240 |
| | Write-off of debt issuance costs upon redemption of senior notes | | | — | | | 3,956 | | | 2,071 |
| | Other | | | (312 | ) | | (5 | ) | | — |
| | |
| |
| |
|
| Income (loss) before income taxes | | | (14,018 | ) | | (6,868 | ) | | 13,040 |
| Provision for income taxes | | | — | | | — | | | 454 |
| | |
| |
| |
|
| Net income (loss) | | $ | (14,018 | ) | $ | (6,868 | ) | $ | 12,586 |
| | |
| |
| |
|
| Net income (loss) per common share—Basic | | $ | (1.42 | ) | $ | (0.66 | ) | $ | 0.93 |
| | |
| |
| |
|
| Net income (loss) per common share—Diluted | | $ | (1.42 | ) | $ | (0.66 | ) | $ | 0.88 |
| | |
| |
| |
|
| Weighted average number of common shares outstanding: | | | | | | | | | |
| | Basic | | | 9,878,665 | | | 10,356,415 | | | 13,497,841 |
| | |
| |
| |
|
| | Diluted | | | 9,878,665 | | | 10,356,415 | | | 14,235,625 |
| | |
| |
| |
|
The accompanying notes are an integral part of these consolidated financial statements.
62
EINSTEIN NOAH RESTAURANT GROUP, INC.
CONSOLIDATED STATEMENT OF CHANGES IN STOCKHOLDERS' DEFICIT
FOR THE YEAR TO DATE PERIODS ENDED
JANUARY 3, 2006, JANUARY 2, 2007 AND JANUARY 1, 2008
(in thousands, except share information)
| | Common Stock
| |
| |
| |
| |
| |
|---|
| | Additional
Paid In
Capital
| | Unamortized
Stock
Compensation
| | Accumulated
Deficit
Amount
| |
| |
|---|
| | Shares
| | Amount
| | Total
| |
|---|
| Balance, December 28, 2004 | | 9,848,713 | | $ | 10 | | $ | 175,797 | | $ | (137 | ) | $ | (288,153 | ) | $ | (112,483 | ) |
| | Net loss | | — | | | — | | | — | | | — | | | (14,018 | ) | | (14,018 | ) |
| | Common stock issued upon exercise of warrants | | 216,359 | | | — | | | 221 | | | — | | | — | | | 221 | |
| | Amortization of stock compensation expense | | — | | | — | | | — | | | 69 | | | — | | | 69 | |
| | |
| |
| |
| |
| |
| |
| |
| Balance, January 3, 2006 | | 10,065,072 | | $ | 10 | | $ | 176,018 | | $ | (68 | ) | $ | (302,171 | ) | $ | (126,211 | ) |
| | Net loss | | — | | | — | | | — | | | — | | | (6,868 | ) | | (6,868 | ) |
| | Common stock issued upon exercise of warrants | | 482,862 | | | 1 | | | 54 | | | — | | | — | | | 55 | |
| | Common stock issued upon stock option exercise | | 48,485 | | | — | | | 139 | | | — | | | — | | | 139 | |
| | Stock based compensation expense | | — | | | — | | | 654 | | | — | | | — | | | 654 | |
| | Reclassification upon adoption of SFAS 123R | | — | | | — | | | (68 | ) | | 68 | | | — | | | — | |
| | |
| |
| |
| |
| |
| |
| |
| Balance, January 2, 2007 | | 10,596,419 | | $ | 11 | | $ | 176,797 | | $ | — | | $ | (309,039 | ) | $ | (132,231 | ) |
| | Net income | | — | | | — | | | — | | | — | | | 12,586 | | | 12,586 | |
| | Common stock issued upon stock option exercise and restricted stock awards | | 282,392 | | | — | | | 1,017 | | | — | | | — | | | 1,017 | |
| | Common stock issued in secondary offering | | 5,000,000 | | | 5 | | | 89,995 | | | — | | | — | | | 90,000 | |
| | Costs to issue common stock | | — | | | — | | | (6,667 | ) | | — | | | — | | | (6,667 | ) |
| | Stock based compensation expense | | — | | | — | | | 1,688 | | | — | | | — | | | 1,688 | |
| | |
| |
| |
| |
| |
| |
| |
| Balance, January 1, 2008 | | 15,878,811 | | $ | 16 | | $ | 262,830 | | $ | — | | $ | (296,453 | ) | $ | (33,607 | ) |
| | |
| |
| |
| |
| |
| |
| |
The accompanying notes are an integral part of these consolidated financial statements.
63
EINSTEIN NOAH RESTAURANT GROUP, INC.
CONSOLIDATED STATEMENTS OF CASH FLOWS
FOR THE YEAR TO DATE PERIODS ENDED
JANUARY 3, 2006, JANUARY 2, 2007 AND JANUARY 1, 2008
(in thousands)
| | January 3,
2006
| | January 2,
2007
| | January 1,
2008
| |
|---|
| OPERATING ACTIVITIES: | | | | | | | | | | |
| Net income (loss) | | $ | (14,018 | ) | $ | (6,868 | ) | $ | 12,586 | |
| Adjustments to reconcile net income (loss) to net cash provided by operating activities: | | | | | | | | | | |
| | Depreciation and amortization | | | 26,316 | | | 16,949 | | | 11,192 | |
| | Stock based compensation expense | | | 69 | | | 654 | | | 1,688 | |
| | Loss, net of gains, on disposal of assets | | | 314 | | | 493 | | | 601 | |
| | Impairment charges and other related costs | | | 1,603 | | | 2,268 | | | 236 | |
| | Charges of integration and reorganization costs | | | 5 | | | — | | | — | |
| | Provision for losses on accounts receivable, net | | | (158 | ) | | 133 | | | 101 | |
| | Amortization of debt issuance and debt discount costs | | | 1,848 | | | 817 | | | 651 | |
| | Write-off of debt issuance costs | | | — | | | 3,956 | | | 2,071 | |
| | Write-off of debt discount | | | — | | | — | | | 528 | |
| | Paid-in-kind interest | | | — | | | 1,591 | | | 904 | |
| | Changes in operating assets and liabilities: | | | | | | | | | | |
| | | Restricted cash | | | 646 | | | 462 | | | 1,484 | |
| | | Franchise and other receivables | | | 1,775 | | | (1,020 | ) | | (1,515 | ) |
| | | Accounts payable and accrued expenses | | | (12,565 | ) | | (5,706 | ) | | (2,387 | ) |
| | | Other assets and liabilities | | | (3,760 | ) | | 267 | | | (3,254 | ) |
| | |
| |
| |
| |
| | | | Net cash provided by operating activities | | | 2,075 | | | 13,996 | | | 24,886 | |
INVESTING ACTIVITIES: |
|
|
|
|
|
|
|
|
|
|
| Purchase of property and equipment | | | (10,264 | ) | | (13,172 | ) | | (25,869 | ) |
| Proceeds from the sale of equipment | | | 180 | | | 209 | | | 1,168 | |
| Acquisition of restaurant assets | | | — | | | — | | | (375 | ) |
| | |
| |
| |
| |
| | | | Net cash used in investing activities | | | (10,084 | ) | | (12,963 | ) | | (25,076 | ) |
FINANCING ACTIVITIES: |
|
|
|
|
|
|
|
|
|
|
| Proceeds from secondary common stock offering | | | | | | — | | | 90,000 | |
| Costs incurred with offering of our common stock | | | | | | — | | | (6,667 | ) |
| Proceeds from line of credit | | | 5,455 | | | 24 | | | — | |
| Repayments of line of credit | | | (5,470 | ) | | (24 | ) | | — | |
| Repayments of other borrowings | | | (312 | ) | | (280 | ) | | (280 | ) |
| Payments under capital lease obligations | | | — | | | (53 | ) | | (53 | ) |
| Repayment of notes payable | | | — | | | (160,000 | ) | | — | |
| Borrowings under First Lien | | | — | | | 80,000 | | | 11,900 | |
| Repayments under First Lien | | | — | | | (1,425 | ) | | (925 | ) |
| Borrowing under Second Lien | | | — | | | 65,000 | | | — | |
| Repayments under Second Lien | | | — | | | — | | | (65,000 | ) |
| Borrowings under Subordinated Note | | | — | | | 24,375 | | | — | |
| Repayments under Subordinated Note | | | — | | | — | | | (25,000 | ) |
| Debt issuance costs | | | (81 | ) | | (4,923 | ) | | (843 | ) |
| Proceeds upon stock option and warrant exercises | | | 221 | | | 194 | | | 1,017 | |
| | |
| |
| |
| |
| | | | Net cash provided by (used in) financing activities | | | (187 | ) | | 2,888 | | | 4,149 | |
Net increase (decrease) in cash and cash equivalents |
|
|
(8,196 |
) |
|
3,921 |
|
|
3,959 |
|
| Cash and cash equivalents, beginning of period | | | 9,752 | | | 1,556 | | | 5,477 | |
| | |
| |
| |
| |
| Cash and cash equivalents, end of period | | $ | 1,556 | | $ | 5,477 | | $ | 9,436 | |
| | |
| |
| |
| |
The accompanying notes are an integral part of these consolidated financial statements.
64
EINSTEIN NOAH RESTAURANT GROUP, INC. AND SUBSIDIARIES
Notes to Consolidated Financial Statements
1. DESCRIPTION OF BUSINESS AND BASIS OF PRESENTATION
The consolidated financial statements of Einstein Noah Restaurant Group, Inc. and its wholly-owned subsidiaries (collectively, the "Company") have been prepared in conformity with accounting principles generally accepted in the United States of America. All inter-company accounts and transactions have been eliminated in consolidation. The Company owns, franchises or licenses various restaurant concepts under the brand names of Einstein Bros. Bagels ("Einstein Bros."), Noah's New York Bagels ("Noah's"), Manhattan Bagel Company ("Manhattan Bagel"), Chesapeake Bagel Bakery ("Chesapeake") and New World Coffee ("New World").
We have a 52/53-week fiscal year ending on the Tuesday closest to December 31. Fiscal year 2006 and 2007 which ended on January 2, 2007 and January 1, 2008, respectively, contained 52 weeks. Fiscal year 2005, which ended on January 3, 2006, contained 53 weeks.
Certain immaterial reclassifications have been made to conform previously reported data to the current presentation. These reclassifications have no effect on net income or financial position as previously reported.
2. SUMMARY OF SIGNIFICANT ACCOUNTING POLICIES
Use of Estimates
The preparation of the consolidated financial statements in conformity with accounting principles generally accepted in the United States of America requires us to make estimates and assumptions that affect reported amounts of assets and liabilities, disclosure of contingent assets and liabilities at the date of the financial statements, and the reported amounts of revenues, costs and expenses during the reporting period. Actual results could differ from the estimates.
Revenue Recognition
Company-owned restaurant sales—We record revenue from the sale of food, beverage and retail items as products are sold. Sales tax amounts collected from customers that are remitted to governmental authorities are recorded in revenue on a net basis.
Manufacturing and commissary revenues—Our manufacturing revenues are recorded at the time of shipment to customers. During fiscal year 2005, our manufacturing operations began selling bagels to a wholesaler and a distributor who takes possession in the United States and sells outside of the United States. As the product is shipped FOB domestic dock, there are no international risks of loss or foreign exchange currency issues. Approximately $2.1 million, $2.2 million and $3.3 million of sales shipped internationally are included in manufacturing revenues for fiscal years ended 2005, 2006 and 2007, respectively.
Franchise and license related revenues—Initial fees received from a franchisee or licensee to establish a new location are recognized as income when we have performed our obligations required to assist the franchisee or licensee in opening a new location, which is generally at the time the franchisee or licensee commences operations. Continuing royalties, which are a percentage of the net sales of franchised and licensed locations, are accrued as income each month.
Gift Cards—Proceeds from the sale of gift cards are recorded as deferred revenue within accrued expenses, and recognized as income when redeemed by the holder. The deferred revenue balance represents the Company's liability for gift cards that have been sold, but not yet redeemed. There are
65
EINSTEIN NOAH RESTAURANT GROUP, INC. AND SUBSIDIARIES
Notes to Consolidated Financial Statements (Continued)
2. SUMMARY OF SIGNIFICANT ACCOUNTING POLICIES (Continued)
no expiration dates on the Company's gift cards, nor do we charge any service fees that cause a decrement to customer balances.
While we will continue to honor all gift cards presented for payment, we may determine the likelihood to be remote for certain gift card balances due to the age of the unredeemed balance. In these circumstances, to the extent we determine there is no requirement for remitting balances to government agencies under unclaimed property laws, gift card balances may be recognized as gift card breakage in revenue. Twelve months after the gift card is issued, the Company recognizes breakage income for those cards with unredeemed balances. Gift card breakage is included in revenue within company-owned restaurant sales in our consolidated statements of operations. For the fiscal year ended January 1, 2008, income recognized from gift card breakage was $1.3 million, which relates to unredeemed balances from 2003 through 2006. There was no income recognized on unredeemed gift card balances during the fiscal years ended January 2, 2007 and January 3, 2006.
Allowance for doubtful accounts—The majority of our receivables are due from our licensees, franchisees, distributors and trade customers. Credit is extended based on our evaluation of the customer's financial condition and, generally, collateral is not required. Accounts receivable are due within 7-30 days and are stated at amounts due from customers net of an allowance for doubtful accounts. Accounts receivable that are outstanding longer than the contractual payment terms are considered past due. We determine our allowance by considering a number of factors, including the length of time trade accounts receivable are past due, our previous loss and payment history, the customer's current ability to pay its obligation to us, and the condition of the general economy and the industry as a whole. We write off accounts receivable when they become uncollectible, and payments subsequently received on such receivables are credited to the allowance for doubtful accounts.
Cash and Cash Equivalents
Cash and cash equivalents consist of cash on hand and highly liquid instruments with original maturities of three months or less when purchased. Amounts in-transit from credit card processors are also considered cash equivalents because they are both short-term and highly liquid in nature and are typically converted to cash within three days of the sales transaction.
Property, Plant and Equipment
Property, plant and equipment are recorded at cost. Furniture and equipment are depreciated using the straight-line method over the estimated useful life of the asset, which ranges from 3 to 12 years. Leasehold improvements are amortized using the straight-line method. The depreciable lives for our leasehold improvements, which are subject to a lease, are limited to the lesser of the useful life or the noncancelable lease term. In circumstances where we would incur an economic penalty by not exercising one or more option periods, we include one or more option periods when determining the depreciation period. In either circumstance, our policy requires consistency when calculating the depreciation period, in classifying the lease, and in computing straight-line rent expense. Costs incurred to repair and maintain our facilities and equipment are expensed as incurred.
In accordance with Statement of Financial Accounting Standard ("SFAS") No. 144,Accounting for the Impairment or Disposal of Long Lived Assets ("SFAS No. 144"), impairment losses are recorded on long-lived assets on a restaurant-by-restaurant basis whenever impairment indicators are determined to be present. We consider a history of cash flow losses to be the primary indicator of potential
66
EINSTEIN NOAH RESTAURANT GROUP, INC. AND SUBSIDIARIES
Notes to Consolidated Financial Statements (Continued)
2. SUMMARY OF SIGNIFICANT ACCOUNTING POLICIES (Continued)
impairment for individual restaurant locations. We determine whether a restaurant location is impaired based on expected undiscounted future cash flows, considering location, local competition, current restaurant management performance, existing pricing structure and alternatives available for the site. If impairment exists, the amount of impairment is measured as the excess of the carrying amount of the asset over its fair value as determined utilizing the estimated discounted future cash flows or the expected proceeds, net of costs to sell, upon sale of the asset.
Some of our manufacturing equipment was located at the plant of Harlan Bakeries, Inc. (Harlan), our frozen bagel dough supplier. In late 2006, we were notified of Harlan's intent, under the terms of the contract, to purchase the equipment and we agreed to sell the equipment to Harlan for $1.1 million. In order to adjust the assets down to their mutually agreed-upon fair value, we recorded an impairment charge of $2.2 million during the quarter ended January 2, 2007. The assets were classified as held for sale on the consolidated balance sheet as of January 2, 2007, and the assets were sold during the first quarter of fiscal year 2007.
During fiscal 2005, 2006 and 2007, we recorded approximately $0.3 million, $0.2 million and $0.2 million, respectively, in impairment charges and exit costs related to underperforming restaurants. During fiscal 2005, we recorded approximately $0.2 million in impairment charges related to company-owned stores and approximately $0.1 million in exit costs from the decision to close one restaurant. During fiscal 2006, we recorded approximately $0.2 million in impairment charges related to company-owned stores. During fiscal 2007, we recorded $0.2 million in exit costs from the decision to close one restaurant, and recorded a nominal impairment to write down the assets of our corporate headquarters when we relocated.
Leases and Deferred Rent Payable
We lease all of our restaurant properties. Leases are accounted for under the provisions of SFAS No. 13,Accounting for Leases ("SFAS No. 13"), as amended, which requires that leases be evaluated and classified as operating or capital leases for financial reporting purposes.
For a lease that contains rent escalations, we record the total rent payable during the lease term on a straight-line basis over the term of the lease and record the difference between rent paid and the straight-line rent expense as deferred rent payable. Incentive payments received from landlords are recorded as landlord incentives and are amortized on a straight-line basis over the lease term as a reduction of rent.
Goodwill, Trademarks and Other Intangibles
Intangible assets include both goodwill and identifiable intangibles arising from the allocation of the purchase prices of assets acquired. Goodwill represents the excess of cost over fair value of net assets acquired in the acquisition of Manhattan. Other intangibles consist mainly of trademarks, trade secrets and patents.
Goodwill and other intangible assets with indefinite lives are not subject to amortization but are tested for impairment annually or more frequently if events or changes in circumstances indicate that the asset might be impaired. SFAS No. 142,Goodwill and Other Intangible Assets, requires a two-step approach for testing impairment. For goodwill, the fair value of each reporting unit is compared to its carrying value to determine whether an indication of impairment exists. If impairment is indicated, the
67
EINSTEIN NOAH RESTAURANT GROUP, INC. AND SUBSIDIARIES
Notes to Consolidated Financial Statements (Continued)
2. SUMMARY OF SIGNIFICANT ACCOUNTING POLICIES (Continued)
fair value of the reporting unit's goodwill is determined by allocating the unit's fair value to its assets and liabilities (including any unrecognized intangible assets) as if the reporting unit had been acquired in a business combination. For intangibles with indefinite lives, the fair value is compared to the carrying value. The amount of impairment for goodwill and other intangible assets is measured as the excess of its carrying amount over its fair value. Intangible assets not subject to amortization consist primarily of the Einstein Bros. and Manhattan trademarks.
Intangible assets with lives restricted by contractual, legal or other means are amortized over their useful lives and consist primarily of patents used in our manufacturing process. Amortization expense is calculated using the straight-line method over the estimated useful lives of approximately 5 years. Intangible assets subject to amortization are reviewed for impairment whenever events or changes in circumstances indicate that the carrying amount of an asset may not be recoverable, in accordance with SFAS No. 144.
During the second quarter of fiscal 2004, we began an evaluation of whether each of our brands should be a part of our overall strategic business plan. As a result of this evaluation, we determined that the Chesapeake brand did not fit within our long-term business model. Accordingly, we performed an interim impairment analysis and determined that no impairment existed. We also performed a longevity analysis and determined that the brand had an estimated useful life of four years. The trademarks were previously treated as a non-amortizing intangible and were reclassified to an amortizing intangible at June 29, 2004. During the second quarter of fiscal 2005, we re-visited the long term strategic fit of Chesapeake, and as a result we began forming an exit strategy that we believed could be completed within one year. Because there had been a change in circumstances, it was necessary to review the asset for impairment. The analysis indicated that the carrying amount of the Chesapeake trademarks was greater than its fair value and accordingly we recorded an impairment charge of $1.2 million during fiscal 2005. As we continued to work with our remaining franchisees on an exit strategy, we also continued to review the carrying amount of the Chesapeake trademarks in relation to their fair value. We recorded an additional $0.1 million in impairment charges related to the Chesapeake trademarks during fiscal 2006, and as of January 2, 2007, there was no remaining value reflected in our consolidated financial statements related to the Chesapeake trademarks. Our ability to execute an exit strategy is dependent upon the agreement and cooperation of our franchisees and we cannot provide any assurance that we will be successful in fully completing an exit strategy.
As of January 3, 2006, January 2, 2007 and January 1, 2008, we performed an impairment analysis of the goodwill and indefinite lived intangible assets related to our Einstein Bros. and Manhattan Bagel brands. For the fiscal years ended 2005, 2006, and 2007 there was no indication of impairment in our goodwill and indefinite lived intangible assets.
Insurance Reserves
We are self-insured for certain claims related to medical insurance and workers' compensation. We maintain stop loss coverage with third party insurers to limit our total exposure. The self-insurance liability represents an estimate of the ultimate cost of claims incurred and unpaid as of the balance sheet date. The estimated liability is established based upon analysis of historical data to ensure that the liability is appropriate. If actual claims differ from our estimates, our financial results could be impacted. The estimated workers' compensation liability is established based on actuarial estimates, is discounted at 10% based upon a discrete analysis of actual claims and historical data and is reviewed
68
EINSTEIN NOAH RESTAURANT GROUP, INC. AND SUBSIDIARIES
Notes to Consolidated Financial Statements (Continued)
2. SUMMARY OF SIGNIFICANT ACCOUNTING POLICIES (Continued)
on a quarterly basis to ensure that the liability is appropriate. These estimated liabilities are included in accrued expenses in our consolidated balance sheets.
Guarantees
Prior to 2001, we would occasionally guarantee leases for the benefit of certain of our franchisees. None of the guarantees have been modified since their inception and we have since discontinued this practice. Current franchisees are the primary lessees under the vast majority of these leases. Under the lease guarantees, we may be required by the lessor to make all of the remaining monthly rental payments or property tax and common area maintenance payments if the franchisee does not make the required payments in a timely manner. However, we believe most, if not all, of the franchised locations could be subleased to third parties reducing our potential exposure. Additionally, we have indemnification agreements with our franchisees under which the franchisees would be obligated to reimburse us for any amounts paid under such guarantees. Historically, we have not been required to make such payments in significant amounts. We record a liability for our exposure under the guarantees in accordance with Financial Accounting Standards Board ("FASB") Interpretation ("FIN") No. 45,Guarantor's Accounting and Disclosure Requirements for Guarantees, Including Indirect Guarantees of Indebtedness of Others. In the event that trends change in the future, our financial results could be impacted. As of January 1, 2008, we had outstanding guarantees of indebtedness under certain leases of approximately $1.3 million. Approximately $36,000 is reflected in accrued expenses in our consolidated balance sheet at January 1, 2008 for the guarantee of a franchisee's lease.
Fair Value of Financial Instruments
As of January 2, 2007 and January 1, 2008, our financial instruments consist of cash equivalents, accounts receivable, accounts payable and debt. The fair value of accounts receivable and accounts payable approximate their carrying value, due to their short-term maturities. As of January 2, 2007 and January 1, 2008, the carrying amounts of long term debt under the senior secured credit facility approximate fair value because the interest rate adjusts to market interest rates.
The Mandatorily Redeemable Series Z Preferred Stock (Series Z) is recorded in the accompanying consolidated balance sheets at its full face value of $57.0 million, which represents the total required future cash payment. The current fair value of the Series Z, which was determined by using the remaining term of the Series Z and the effective dividend rate from the Certificate of Designation, is estimated to be $38.1 million and $49.2 million at January 2, 2007 and January 1, 2008, respectively.
Concentrations of Risk
We purchase a majority of our frozen bagel dough from Harlan who utilizes our proprietary processes and on whom we are dependent in the short-term. Additionally, we purchase all of our cream cheese from a single source. Historically, we have not experienced significant difficulties with our suppliers but our reliance on a limited number of suppliers subjects us to a number of risks, including possible delays or interruption in supplies, diminished control over quality and a potential lack of adequate raw material capacity. Any disruption in the supply or degradation in the quality of the materials provided by our suppliers could have a material adverse effect on our business, operating results and financial condition. In addition, any such disruptions in supply or degradations in quality
69
EINSTEIN NOAH RESTAURANT GROUP, INC. AND SUBSIDIARIES
Notes to Consolidated Financial Statements (Continued)
2. SUMMARY OF SIGNIFICANT ACCOUNTING POLICIES (Continued)
could have a long-term detrimental impact on our efforts to develop a strong brand identity and a loyal consumer base.
Advertising Costs
We expense advertising costs as incurred. Advertising costs were $6.6 million, $4.5 million, and $3.3 million for the fiscal years ended 2005, 2006, and 2007, respectively, and are included in restaurant costs of sales in the consolidated statements of operations.
Company Operations and Segments
We view our company as one business with four segments: company-owned restaurant sales, manufacturing and commissary revenues, franchise and license related revenues and corporate overhead. The restaurant segment includes our Einstein and Noah's brands, which have similar investment criteria and economic and operating characteristics. The manufacturing segment produces and distributes bagel dough, cream cheese and other products to our restaurants, licensees and franchisees and other third parties. Inter-company sales to our company-owned restaurants have been eliminated during consolidation. The franchise and license segment earns royalties and other fees from the use of trademarks and operating systems developed for the Manhattan, Einstein Bros. and Noah's brands. The last segment is our corporate office, where all overhead related to the prior segments, interest and depreciation are recorded.
We have considered the disclosure provisions of SFAS No. 131,Disclosures about Segments of an Enterprise and Related Information. Information regarding revenue and costs of sales for each of our business segments has been reported in the Consolidated Statements of Operations for the years ended January 3, 2006, January 2, 2007, and January 1, 2008. Our chief operating decision maker manages our business and allocates resources via a combination of restaurant sales reports and gross profit information related to our three sources of revenue, which are presented in their entirety within the consolidated statements of operations. We do not regularly review reports related to balance sheet or asset information during this process. Due to the immateriality of all other financial information in relation to the restaurant segment, including but not limited to assets, capital expenditures, depreciation and amortization and general and administrative expenses, our chief operating decision maker does not regularly review any additional information for purposes of making decisions about allocating resources and assessing performance for each business segment.
Our manufacturing operations, which include our United States Department of Agriculture approved commissaries, are ancillary and support our restaurant operations through the production and distribution of bagel dough, cream cheese and other products to our restaurants, licensees and franchisees and other third parties. These operations reduce costs via vertical integration, enable us to control the quality and consistency of ingredients delivered to our restaurants, manage inventory levels, and expose our brands to new product channels. Although the primary focus of our manufacturing and commissary operations is to produce and distribute products to our restaurants, our third party revenues have increased over time. The overall results of operations of our manufacturing operations historically have not and currently do not have a material impact on our operating profit. We report the results of manufacturing operations associated with our third party sales separately on our consolidated statements of operations. The net costs associated with internal "sales" to our restaurants are included in restaurant costs.
70
EINSTEIN NOAH RESTAURANT GROUP, INC. AND SUBSIDIARIES
Notes to Consolidated Financial Statements (Continued)
2. SUMMARY OF SIGNIFICANT ACCOUNTING POLICIES (Continued)
Our franchise and license operations complement our restaurant operations by expanding the awareness of our brands. We report royalties and other fees earned from the use of trademarks and operating systems developed for the Manhattan, Einstein Bros. and Noah's brands separately on our consolidated statements of operations. The overall results of operations of our franchise and license operations historically have not and currently do not have a material impact on our operating profit.
Net Income (Loss) per Common Share
In accordance with SFAS No. 128,Earnings per Share, we compute basic net loss per common share by dividing the net loss for the period by the weighted average number of shares of common stock outstanding during the period.
Diluted net income per share is computed by dividing the net income for the period by the weighted-average number of shares of common stock and potential common stock equivalents outstanding during the period using the treasury stock method. Potential common stock equivalents include incremental shares of common stock issuable upon the exercise of stock options and warrants. Potential common stock equivalents are excluded from the computation of diluted net income (loss) per share when their effect is anti-dilutive.
The following table summarizes the weighted average number of common shares outstanding, as well as sets forth the computation of basic and diluted net loss per common share for the periods indicated (in thousands of dollars, except share and per share data):
| | For the year to date periods ended
|
|---|
| | January 3,
2006
| | January 2,
2007
| | January 1,
2008
|
|---|
| | (In thousands of dollars, except share and per share data)
|
|---|
| Net income (loss) (a) | | $ | (14,018 | ) | $ | (6,868 | ) | $ | 12,586 |
| | |
| |
| |
|
| Basic weighted average shares outstanding (b) | | | 9,878,665 | | | 10,356,415 | | | 13,497,841 |
| Dilutive effect of stock options and SARs | | | — | | | — | | | 737,784 |
| | |
| |
| |
|
| Diluted weighted average shares outstanding (c) | | | 9,878,665 | | | 10,356,415 | | | 14,235,625 |
| | |
| |
| |
|
| Basic earnings (loss) per share (a)/(b) | | $ | (1.42 | ) | $ | (0.66 | ) | $ | 0.93 |
| | |
| |
| |
|
| Diluted earnings (loss) per share (a)/(c) | | $ | (1.42 | ) | $ | (0.66 | ) | $ | 0.88 |
| | |
| |
| |
|
| Antidilutive stock options, SARs and warrants | | | 1,737,113 | | | 993,707 | | | 293,898 |
| | |
| |
| |
|
Stock-Based Compensation
In December 2004, the FASB issued SFAS No. 123R,Share-Based Payment ("SFAS No. 123R"). SFAS 123R is a revision of SFAS No. 123,Accounting for Stock-Based Compensation ("SFAS No. 123"), and supersedes Accounting Principles Board Opinion ("APB") No. 25,Accounting for Stock Issued to Employees ("APB No. 25") and its related implementation guidance. SFAS No. 123R focuses primarily on accounting for transactions in which an entity obtains employee services in share-based payment transactions. The Statement requires entities to recognize compensation expense for awards of equity instruments to employees based on the grant-date fair value of those awards (with limited exceptions).
71
EINSTEIN NOAH RESTAURANT GROUP, INC. AND SUBSIDIARIES
Notes to Consolidated Financial Statements (Continued)
2. SUMMARY OF SIGNIFICANT ACCOUNTING POLICIES (Continued)
Effective January 4, 2006, we adopted the provisions of SFAS No. 123R using the modified prospective transition method. Results for periods prior to adoption have not been restated. Prior to the adoption of SFAS No. 123R, we applied the intrinsic value-based method of accounting prescribed by APB No. 25 and related interpretations, in accounting for our fixed award stock options to our employees. As such, compensation expense was recorded only if the current market price of the underlying common stock exceeded the exercise price of the option on the date of grant. We applied the fair value-basis of accounting as prescribed by SFAS No. 123 in accounting for our fixed award stock options to our consultants. Under SFAS No. 123, compensation expense was recognized based on the fair value of stock options granted.
Because we previously adopted only the pro forma disclosure provisions of SFAS No. 123, we are recognizing compensation cost, over the requisite service period, relating to the unvested portion of awards granted prior to the date of adoption using the same estimate of the grant-date fair value and the same attribution method used to determine the pro forma disclosures under SFAS No. 123, except that forfeiture rates are estimated for all options, as required by SFAS No. 123R.
Our stock-based compensation cost for the year ended January 3, 2006, January 2, 2007 and January 1, 1008 was $69,000, $654,000 and $1.7 million, respectively and has been included in general and administrative expenses. No tax benefits were recognized for these costs due to our cumulative losses as well as a full valuation reserve on our deferred tax assets.
The fair value of stock options is estimated using the Black-Scholes option-pricing model with the following weighted average assumptions:
| | January 3,
2006
| | January 2,
2007
| | January 1,
2008
|
|---|
| Expected life of options and SARs from date of grant | | 4.0 years | | 4.0 years | | 4.0 years |
| Risk-free interest rate | | 3.55 - 4.44% | | 4.35 - 4.84% | | 3.31 - 5.02% |
| Volatility | | 100.0% | | 100.0% | | 29.0% - 97.0% |
| Assumed dividend yield | | 0.0% | | 0.0% | | 0.0% |
The expected term of options is based upon evaluations of historical and expected future exercise behavior. The risk-free interest rate is based on the US Treasury rates at the date of grant with maturity dates approximately equal to the expected life at the grant date. Prior to the secondary offering that was completed in June 2007, our implied volatility was based on the mean reverting average of our stock's historical volatility. Our implied volatility is now based on the mean reverting average of our stock's historical volatility and that of an industry peer group. The use of mean reversion is supported by evidence of a correlation between stock price volatility and a company's leverage combined with the effects mandatory principal payments will have on our capital structure, as defined under our new debt facility. We have not historically paid any dividends and are precluded from doing so under our debt covenants.
Had compensation cost for stock options granted to employees been determined on the basis of fair value for periods prior to fiscal 2006 using the aforementioned assumptions, net loss and loss per
72
EINSTEIN NOAH RESTAURANT GROUP, INC. AND SUBSIDIARIES
Notes to Consolidated Financial Statements (Continued)
2. SUMMARY OF SIGNIFICANT ACCOUNTING POLICIES (Continued)
share would have been increased to the following pro forma amounts (in thousands of dollars, except per share amounts):
| | For the year to date periods ended
|
|---|
| | January 3,
2006
| | January 2,
2007
| | January 1,
2008
|
|---|
| Net income (loss), as reported | | $ | (14,018 | ) | $ | (6,868 | ) | $ | 12,586 |
| Deduct: fair value based compensation expense | | | (1,164 | ) | | — | | | — |
| | |
| |
| |
|
| Pro forma net income (loss) | | | (15,182 | ) | | (6,868 | ) | | 12,586 |
| | |
| |
| |
|
| Basic and diluted loss per common share: | | | | | | | | | |
| | As reported—Basic | | $ | (1.42 | ) | $ | (0.66 | ) | $ | 0.93 |
| | |
| |
| |
|
| | As reported—Diluted | | $ | (1.42 | ) | $ | (0.66 | ) | $ | 0.88 |
| | |
| |
| |
|
| | Pro forma—Basic | | $ | (1.54 | ) | $ | (0.66 | ) | $ | 0.93 |
| | |
| |
| |
|
| | Pro forma—Diluted | | $ | (1.54 | ) | $ | (0.66 | ) | $ | 0.88 |
| | |
| |
| |
|
As of January 1, 2008, we have approximately $1.6 million of total unrecognized compensation cost related to non-vested awards granted under our option plans, which we expect to recognize over a weighted-average period of 2.2 years. Total compensation costs related to the options outstanding as of January 1, 2008 will be fully recognized by fourth quarter of fiscal 2010, which represents the end of the requisite service period.
Recent Accounting Pronouncements
In September 2006, the FASB issued SFAS No. 157,Fair Value Measurements ("SFAS No. 157"), which defines fair value, establishes a framework for measuring fair value in accordance with GAAP and expands disclosures about fair value measurements. SFAS No. 157 is effective for fiscal years beginning after November 15, 2007. We do not believe such adoption will have a material impact on our consolidated financial statements.
In February 2007, the FASB issued SFAS No. 159,The Fair Value Option for Financial Assets and Financial Liabilities—Including an Amendment of SFAS No. 115 ("SFAS No. 159"), which becomes effective for fiscal periods beginning after November 15, 2007. Under SFAS No. 159, companies may elect to measure specified financial instruments and warranty and insurance contracts at fair value on a contract-by-contract basis, with changes in fair value recognized in earnings each reporting period. This election, called the "fair value option," will enable some companies to reduce volatility in reported earnings caused by measuring related assets and liabilities differently. We do not expect the impact of adoption to have a material impact on our consolidated financial statements.
In December 2007, the FASB issued SFAS 141 (revised 2007),Business Combinations, ("SFAS 141R"). SFAS 141R establishes principles and requirements for how an acquirer recognizes and measures in its financial statements the identifiable assets acquired, including goodwill, the liabilities assumed and any non-controlling interest in the acquiree. The Statement also establishes disclosure requirements to enable users of the financial statements to evaluate the nature and financial effects of the business combination. SFAS 141R is effective for business combinations for which the acquisition date is on or after the beginning of the first annual reporting period beginning on or after
73
EINSTEIN NOAH RESTAURANT GROUP, INC. AND SUBSIDIARIES
Notes to Consolidated Financial Statements (Continued)
2. SUMMARY OF SIGNIFICANT ACCOUNTING POLICIES (Continued)
December 15, 2008. The impact of adopting SFAS 141R will be dependent on the future business combinations that the Company may pursue after its effective date.
In December 2007, the SEC issued SAB 110Share-Based Payment. SAB 110 amends and replaces Question 6 of Section D.2 of Topic 14, "Share-Based Payment," of the Staff Accounting Bulletin series. Question 6 of Section D.2 of Topic 14 expresses the views of the staff regarding the use of the "simplified" method in developing an estimate of the expected term of "plain vanilla" share options and allows usage of the "simplified" method for share option grants prior to December 31, 2007. SAB 110 allows public companies which do not have historically sufficient experience to provide a reasonable estimate to continue use of the "simplified" method for estimating the expected term of "plain vanilla" share option grants after December 31, 2007. SAB 110 is effective January 1, 2008. We currently use the "simplified" method to estimate the expected term for share option grants as we do not have enough historical experience to provide a reasonable estimate. We will continue to use the "simplified" method until we have enough historical experience to provide a reasonable estimate of expected term in accordance with SAB 110. The Company does not expect SAB 110 will have a material impact on its consolidated balance sheets, statements of operations and cash flows.
We have considered all other recently issued accounting pronouncements and do not believe the adoption of such pronouncements will have a material impact on our consolidated financial statements.
3. RESTRICTED CASH
Restricted cash consisted of the following as of:
| | January 2,
2007
| | January 1,
2008
|
|---|
| | (in thousands of dollars)
|
|---|
| Advertising funds(a) | | $ | 300 | | $ | 266 |
| New Jersey Economic Development Authority(b) | | | 614 | | | 298 |
| Distributor collateral(c) | | | 1,500 | | | — |
| Lease deposit(d) | | | — | | | 400 |
| Other(e) | | | 273 | | | 239 |
| | |
| |
|
| | Total restricted cash | | | 2,687 | | | 1,203 |
| Less long-term portion of restricted cash | | | 284 | | | — |
| | |
| |
|
| | Current restricted cash | | $ | 2,403 | | $ | 1,203 |
| | |
| |
|
- (a)
- We act as custodian for certain funds paid by our franchisees that are earmarked as advertising fund contributions.
- (b)
- On July 3, 2003, we placed in escrow an advanced refunding of the New Jersey Economic Development Authority ("NJEDA") note dated December 1, 1998 to enact a debt defeasance as allowed for in the agreement. The NJEDA funds are included in both current portion and long-term portion of restricted cash as of the January 2, 2007 balance sheet date in accordance with payment terms of the note. The NJEDA note has a maturity date of December 1, 2008, and all restricted funds are current as of January 1, 2008. See Note 11 for additional information.
74
EINSTEIN NOAH RESTAURANT GROUP, INC. AND SUBSIDIARIES
Notes to Consolidated Financial Statements (Continued)
3. RESTRICTED CASH (Continued)
- (c)
- We had restricted cash held as collateral for a letter of credit issued to one of our distributors. Our distributor could access the letter of credit in the event that we fail to pay them for products delivered to our company-owned restaurants. This relationship was terminated and the letter of credit was subsequently cancelled.
- (d)
- The lease for our Corporate office required us to set aside funds in a restricted cash account along with $100,000 deposit that was held by the lessor. The deposit is included in other assets on our balance sheet as of January 1, 2008.
- (e)
- We also have various restricted cash accounts for the benefit of taxing and other government authorities.
4. LICENSE, FRANCHISE AND OTHER RECEIVABLES
Franchise and other receivables consist of the following:
| | January 2, 2007
| | January 1, 2008
|
|---|
| | (in thousands of dollars)
|
|---|
| Trade receivables | | $ | 3,553 | | $ | 3,838 |
| Franchisee and licensee receivables | | | 1,035 | | | 2,584 |
| Vendor rebates(a) | | | 1,197 | | | 203 |
| Tenant improvement allowance receivable(b) | | | 8 | | | 565 |
| Stop loss receivables(c) | | | 206 | | | 475 |
| Tax refunds | | | 549 | | | 511 |
| Other | | | 350 | | | 237 |
| | |
| |
|
| | Total franchise and other receivables | | | 6,898 | | | 8,413 |
| Less allowance for doubtful accounts | | | 505 | | | 606 |
| | |
| |
|
| | Total franchise and other receivables, net | | $ | 6,393 | | $ | 7,807 |
| | |
| |
|
- (a)
- Vendor rebates represent a rebate earned at the time products are purchased and are not contingent upon any level of purchases or period of time. Vendor rebates are recorded as a reduction to cost of sales when products are sold.
- (b)
- Tenant improvement allowance receivables are payments to be received from lessors related to new leases that we have signed. Pursuant to SFAS No. 13, we record these as deferred rent and amortize them over the life of the lease.
- (c)
- Stop loss receivables are payments that we made for claims over our self-insured limits, which will be reimbursed to us by our insurance carrier.
75
EINSTEIN NOAH RESTAURANT GROUP, INC. AND SUBSIDIARIES
Notes to Consolidated Financial Statements (Continued)
5. INVENTORIES
Inventories, which consist of food, beverage, paper supplies and bagel ingredients, are stated at the lower of cost or market, with cost being determined by the first-in, first-out method. Inventories consist of the following:
| | January 2,
2007
| | January 1,
2008
|
|---|
| | (in thousands of dollars)
|
|---|
| Finished goods | | $ | 3,835 | | $ | 4,056 |
| Raw materials | | | 1,113 | | | 1,257 |
| | |
| |
|
| | Total inventories | | $ | 4,948 | | $ | 5,313 |
| | |
| |
|
6. PREPAID EXPENSES AND OTHER CURRENT ASSETS
Prepaid expenses and other current assets consist of the following:
| | January 2,
2007
| | January 1,
2008
|
|---|
| | (in thousands of dollars)
|
|---|
| Prepaid rent | | $ | 2,768 | | $ | 2,886 |
| Short term deposits | | | 736 | | | 1,515 |
| Prepaid state franchise tax | | | 120 | | | 88 |
| Prepaid maintenance contracts | | | 259 | | | 364 |
| Prepaid insurance | | | 387 | | | 190 |
| Prepaid other | | | 259 | | | 238 |
| | |
| |
|
| | Total prepaid expenses and other current assets | | $ | 4,529 | | $ | 5,281 |
| | |
| |
|
7. PROPERTY, PLANT AND EQUIPMENT
Property, plant and equipment consist of the following:
| | January 2,
2007
| | January 1,
2008
|
|---|
| | (in thousands of dollars)
|
|---|
| Leasehold improvements | | $ | 61,688 | | $ | 76,139 |
| Store and manufacturing equipment | | | 72,763 | | | 68,714 |
| Furniture and fixtures | | | 1,379 | | | 1,527 |
| Office and computer equipment | | | 13,635 | | | 14,686 |
| Vehicles | | | 98 | | | 37 |
| | |
| |
|
| | Property, plant and equipment | | | 149,563 | | | 161,103 |
| Less accumulated depreciation | | | 115,674 | | | 113,389 |
| | |
| |
|
| | Property, plant and equipment, net | | $ | 33,889 | | $ | 47,714 |
| | |
| |
|
Included in our operating expenses is depreciation expense, which was $18.1 million, $13.0 million and $11.2 million for the fiscal years ended January 3, 2006, January 2, 2007 and January 1, 2008, respectively. There is no depreciation expense included in our cost of sales.
76
EINSTEIN NOAH RESTAURANT GROUP, INC. AND SUBSIDIARIES
Notes to Consolidated Financial Statements (Continued)
7. PROPERTY, PLANT AND EQUIPMENT (Continued)
As of January 2, 2007, we owned manufacturing equipment that was located at the plant of Harlan, our frozen bagel dough supplier. In late 2006, we were notified of Harlan's intent, under the terms of the contract, to purchase the equipment and we agreed to sell the equipment to Harlan for $1.1 million. In order to adjust the assets down to their mutually agreed-upon fair value, we recorded an impairment charge of $2.2 million during the year ended January 2, 2007. The assets were classified as held for sale on the consolidated balance sheet as of January 2, 2007, and were subsequently sold in fiscal year 2007.
8. TRADEMARKS AND OTHER INTANGIBLES
Trademarks and other intangibles consist of the following as of:
| | January 2,
2007
| | January 1,
2008
|
|---|
| | (in thousands of dollars)
|
|---|
| Amortizing intangibles: | | | | | | |
| | Trade secrets | | $ | 5,385 | | $ | 5,385 |
| | Patents-manufacturing process | | | 33,741 | | | 33,741 |
| | |
| |
|
| | | | 39,126 | | | 39,126 |
| Less accumulated amortization: | | | | | | |
| | Trade secrets | | | 5,385 | | | 5,385 |
| | Patents-manufacturing process | | | 33,741 | | | 33,741 |
| | |
| |
|
| | | | 39,126 | | | 39,126 |
| | |
| |
|
| Total amortizing intangibles, net | | $ | — | | $ | — |
| | |
| |
|
| Non-amortizing intangibles: | | | | | | |
| | Trademarks | | | 63,806 | | | 63,831 |
| | |
| |
|
| Total trademarks and other intangibles, net | | $ | 63,806 | | $ | 63,831 |
| | |
| |
|
Intangible amortization expense totaled approximately $8.2 million, $3.9 million, and $0 for the fiscal years ended 2005, 2006, and 2007, respectively. As of January 1, 2008, all amortizing intangibles have been fully amortized.
On January 1, 2008, we acquired the assets of a Manhattan Bagel restaurant from one of our franchisees for $382,000. We recorded the assets at their fair value of $251,000, goodwill of $106,000 and a non-amortizing intangible asset of $25,000 for the value of the Manhattan Bagel trademark, pursuant to EITF 04-01Accounting for Preexisting Relationships between the Parties to a Business Combination.
77
EINSTEIN NOAH RESTAURANT GROUP, INC. AND SUBSIDIARIES
Notes to Consolidated Financial Statements (Continued)
9. DEBT ISSUANCE COSTS AND OTHER ASSETS
Debt issuance costs and other assets consist of the following:
| | January 2,
2007
| | January 1,
2008
|
|---|
| | (in thousands of dollars)
|
|---|
| Security deposits | | $ | 1,006 | | $ | 439 |
| Debt issuance costs, net of amortization(a)(b) | | | 4,400 | | | 2,557 |
| | |
| |
|
| Total debt issue costs and other assets, net | | $ | 5,406 | | $ | 2,996 |
| | |
| |
|
- (a)
- As of January 2, 2007, this asset represented costs incurred related to the issuance of $170 million in new term loans and $15 million new revolving credit facility. Upon closing of our new debt facility, we began amortizing these costs. Direct costs incurred for the issuance of debt under the $170 million in new term loans and $15 million new revolving credit facility have been capitalized and amortized using the effective interest method over the term of the debt.
- (b)
- As of January 1, 2008, this asset represented the remaining debt issuance costs from the issuance of $170 million in term loans in fiscal 2006, and an additional $0.8 million related to our redemption of debt and amendment of our debt facility incurred in fiscal 2007 as discussed in Note 11. In the event that the debt is retired prior to the maturity date, debt issuance costs will be expensed in the period that the debt is retired.
The amortization of debt issuance costs is included in interest expense in the consolidated statements of operations. Amortization expense of approximately $1.8 million, $0.8 million, and $0.6 million was recorded for the fiscal years ended 2005, 2006, and 2007, respectively.
10. ACCRUED EXPENSES AND OTHER CURRENT LIABILITIES
Accrued expenses consist of the following:
| | January 2
2007
| | January 1,
2008
|
|---|
| | (in thousands of dollars)
|
|---|
| Payroll and related bonus expense | | $ | 12,027 | | $ | 8,934 |
| Sales, use and property tax expense | | | 1,998 | | | 2,553 |
| Unvouchered receipts for purchases of property, plant and equipment | | | 4,271 | | | 2,146 |
| Deferred gift card revenue | | | 3,127 | | | 1,643 |
| Utilities expense | | | 711 | | | 710 |
| Interest expense | | | 1,454 | | | 548 |
| Advertising expenses | | | 515 | | | 374 |
| Audit, tax and legal expenses | | | 390 | | | 363 |
| Deferred franchise and license revenue | | | 160 | | | 260 |
| Other current liabilities | | | 1,202 | | | 1,748 |
| | |
| |
|
| Total accrued expenses and other current liabilities | | $ | 25,855 | | $ | 19,279 |
| | |
| |
|
78
EINSTEIN NOAH RESTAURANT GROUP, INC. AND SUBSIDIARIES
Notes to Consolidated Financial Statements (Continued)
11. SENIOR NOTES AND OTHER LONG-TERM DEBT
Senior notes and other long-term debt consist of the following:
| | January 2,
2007
| | January 1,
2008
|
|---|
| | (in thousands of dollars)
|
|---|
| $90 Million Amended First Lien Term Loan | | $ | 78,575 | | $ | 89,550 |
| $65 Million Second Lien Term Loan | | | 65,000 | | | — |
| $25 Million Subordinated Note, net of unamortized discount | | | 26,026 | | | — |
| New Jersey Economic Development Authority Note Payable | | | 560 | | | 280 |
| | |
| |
|
| | Total senior notes and other debt, net of discount | | $ | 170,161 | | $ | 89,830 |
| Less short-term debt and current portion of long-term debt | | | 3,605 | | | 955 |
| | |
| |
|
| | Senior notes and other long-term debt, net of discount | | $ | 166,556 | | $ | 88,875 |
| | |
| |
|
June 2007 Debt Redemption and Amended First Lien Term Loan
On June 13, 2007, we completed a $90 million secondary public offering of 5 million shares of our common stock. After stock issuance costs of $6.7 million related to the offering, we received net proceeds of $83.3 million. The net proceeds were used to repay our $65.0 million Second Lien Term Loan, repay a portion of our $25 million Subordinated Note held by Greenlight Capital, L.L.C. ("Greenlight") and to pay for the offering costs. Additionally, on June 28, 2007, we repaid the remaining portion of the $25 million subordinated note held by Greenlight by using a portion of the incremental debt proceeds under the amended debt facility, as described below.
On June 28, 2007, we amended our debt facility to increase it to $110 million, comprised of a $20 million revolving credit facility and a modified term loan with a principal amount of $90 million. The revolving credit facility remains available, subject to certain conditions, to finance our ongoing working capital, capital expenditure and general corporate needs. In addition, all of the revolving credit facility is available for letters of credit. We are required to pay an unused credit line fee of 0.5% per annum on the average daily unused amount. The unused line fee is payable quarterly in arrears. Additionally, we are required to pay a letter of credit fee based on the ending daily undrawn face amount for each letter of credit issued, of an applicable margin being based on our consolidated leverage ratio with an applicable margin of 2.00% plus a 0.5% arranger fee payable quarterly. Letters of credit reduce our availability under the Revolving Facility. As of January 1, 2008, we had $6.7 million in letters of credit outstanding under this facility. The letters of credit expire on various dates during 2008, are automatically renewable for one additional year and are payable upon demand in the event that we fail to pay the underlying obligation. Our availability under the revolving facility was $13.3 million at January 1, 2008.
Both the revolving credit facility and the term loan facility have a five-year term and are secured by substantially all of our assets and guaranteed by our subsidiaries. Borrowings under this senior secured credit facility bear interest at a rate equal to an applicable margin plus, at our option, either a variable base rate or a Eurodollar rate. The applicable margin for LIBOR loans ranges from 1.75% to 2.25% and for base rate loans ranges from 0.75% to 1.25%, depending on the level of our consolidated leverage ratio (defined as in our current credit facilities). Upon the occurrence of a payment event of default which is continuing, all amounts due under the senior secured credit facility bear interest at 2.0% above the interest rate otherwise applicable. The outstanding amount of the term loan is
79
EINSTEIN NOAH RESTAURANT GROUP, INC. AND SUBSIDIARIES
Notes to Consolidated Financial Statements (Continued)
11. SENIOR NOTES AND OTHER LONG-TERM DEBT (Continued)
amortizable on a quarterly basis by an amount equal to 0.25% of the original principal amount of the term loan. Any amounts remaining unpaid will be due and payable on the maturity date. As of January 1, 2008 the stated interest rate under the First Lien Term Loan was 7.31%.
The term loan requires mandatory prepayments of
- •
- 50% of excess cash flow (as defined in the senior secured credit facility) subject to the ability to retain at least $5,000,000 in cash and cash equivalents;
- •
- 100% of net cash proceeds of asset sales by us above a threshold and subject to the ability to reinvest under certain circumstances;
- •
- 100% of net cash proceeds of any debt issued by us, subject to certain exceptions; and
- •
- 50% of the net cash proceeds of any equity issued by us, subject to certain exceptions.
The revolving facility and the first lien term loan contain usual and customary covenants including consolidated leverage ratios, fixed charge coverage ratios, limitations on capital expenditures, etc. The ratio covenants are based on a Consolidated Earnings Before Interest, Taxes, Depreciation and Amortization ("EBITDA") calculation (as defined in our loan agreement) and are measured on a twelve month period ending on the last day of each fiscal quarter. The loan is guaranteed by our material subsidiaries. The revolving facility, the first lien term loan and the related guarantees are secured by a first priority security interest in all of our assets and our material subsidiaries, including a pledge of 100% of our interest in all shares of capital stock (or other ownership or equity interests) of each material subsidiary. As of January 1, 2008, we were in compliance with all our financial and operating covenants.
The senior secured credit facility contains a number of negative covenants that limits us from taking certain actions including issuing debt, paying dividends and making investments. In addition, we are required to maintain:
- •
- a minimum consolidated fixed charge coverage ratio; and
- •
- a maximum consolidated leverage ratio of 2.75x.
The senior secured credit facility contains a limitation on annual capital expenditures, but allows for the greater of either (i) unused capital expenditure amounts to be used in the immediately following fiscal year up to a mutually agreed-upon amount or (ii) the capital expenditure limitation to be incrementally increased for the immediately following fiscal year by up to 25% of the current fiscal year excess cash flow. The senior secured credit facility contains customary events of default.
The facility is fully amortizing with annual aggregate principal reductions payable in quarterly installments over the term of the loan as shown in the table below. Through fiscal year 2011, payments of $225,000 are due on calendar quarter ends. However, due to the difference between our fiscal
80
EINSTEIN NOAH RESTAURANT GROUP, INC. AND SUBSIDIARIES
Notes to Consolidated Financial Statements (Continued)
11. SENIOR NOTES AND OTHER LONG-TERM DEBT (Continued)
quarter ends and calendar quarter ends, there will only be three payments in the fiscal year ending 2008, and five payments in the fiscal year ending 2011.
| For the 2008 fiscal year ending December 30, 2008 | | $ | 0.7 million |
| For the 2009 fiscal year ending December 29, 2009 | | $ | 0.9 million |
| For the 2010 fiscal year ending December 28, 2010 | | $ | 0.9 million |
| For the 2011 fiscal year ending January 3, 2012 | | $ | 1.1 million |
| For the 2012 fiscal year ending January 1, 2013 | | $ | 86.0 million |
In addition, we obtained a commitment for an incremental term loan in an aggregate principal amount of up to $57.0 million to be used by us, if needed, solely for the purpose of redeeming the zero coupon Series Z preferred stock due in June 2009. If we choose to draw down the incremental term loan, the outstanding amount of the incremental term loan will be amortized on a quarterly basis by an amount equal to 0.25% of the original principal amount of the incremental term loan. Borrowings under the incremental term loan, if any, bear interest at the same rate schedule as the new senior secured credit facility. Any amounts remaining unpaid are due and payable on the maturity date of the term loans. Availability of the incremental term loan is subject to customary borrowing conditions, including absence of any default or material adverse change, and to a requirement of successful syndication of such incremental term loan.
We may prepay amounts outstanding under the senior secured credit facility and may terminate commitments in whole at any time without penalty or premium upon prior written notice.
As of January 1, 2008, approximately $2.1 million and $0.5 million in debt issuance costs have been capitalized for the amended $90 Million First Lien Term Loan and the revolving facility, respectively, net of amortization.
For the revolving facility, the capitalized debt issuance costs are being amortized on a straight-line basis while the capitalized debt issuance costs for the first lien term loan are being amortized on the effective interest rate method.
February 2006 Debt Redemption and Refinancing
On February 28, 2006, we completed the refinancing of our AmSouth Revolver and $160 Million Notes. While our June 2007 offering of common stock, debt redemption and refinancing changed our capital structure as described above, our previous debt obligations consisted of the following:
- •
- $15 million revolving credit facility ("Revolving Facility");
- •
- $80 million first lien term loan ("First Lien Term Loan");
- •
- $65 million second lien term loan ("Second Lien Term Loan"); and
- •
- $25 million subordinated note ("Subordinated Note").
Proceeds from this debt facility were used to repay the $160 Million Notes plus a 3% redemption premium of $4.8 million and accrued and unpaid interest to the redemption date.
81
EINSTEIN NOAH RESTAURANT GROUP, INC. AND SUBSIDIARIES
Notes to Consolidated Financial Statements (Continued)
11. SENIOR NOTES AND OTHER LONG-TERM DEBT (Continued)
New Jersey Economic Development Authority Note Payable
In December 1998, Manhattan Bagel Company, Inc. entered into a note payable in the principal amount of $2.8 million with the New Jersey Economic Development Authority ("NJEDA") at an interest rate of 9% per annum. Principal is paid annually and interest is paid quarterly. The note matures on December 1, 2008 and is secured by the assets of Manhattan Bagel Company, Inc.
On July 3, 2003, we placed an advanced funding of the note in escrow to enact a debt defeasance as allowed for in the agreement. This advanced funding is included with restricted cash and the note is included in both the current and long-term portion of debt in the January 2, 2007 consolidated balance sheet, and as current debt in the January 1, 2008 consolidated balance sheet in accordance with the payment terms. This classification will continue until the note is fully paid from the escrow amount proceeds, at the end of 2008.
Our term loans and notes payable obligations for the five years following January 1, 2008 are as follows:
Fiscal year (in thousands of dollars):
| |
|
|---|
| 2008 | | $ | 955 |
| 2009 | | $ | 900 |
| 2010 | | $ | 900 |
| 2011 | | $ | 1,125 |
| 2012 | | $ | 85,950 |
| Thereafter | | | — |
| | |
|
| | | $ | 89,830 |
| | |
|
12. OTHER LONG-TERM LIABILITIES
Other long-term liabilities consist of the following (in thousands of dollars):
| | January 2,
2007
| | January 1,
2008
|
|---|
| | (In thousands of dollars)
|
|---|
| Vendor contractual agreements(a) | | $ | 7,099 | | $ | 6,881 |
| Deferred rent(b) | | | 1,648 | | | 3,960 |
| Other | | | 75 | | | — |
| | |
| |
|
| | Other liabilities | | $ | 8,822 | | $ | 10,841 |
| | |
| |
|
- (a)
- A strategic supplier of ours provided advance funding in the amount of $10.0 million to us in 1996 as part of a contract to continue buying products from the supplier. The contract terminates upon fulfillment of contractual purchase volumes. We account for this contract by recognizing a reduction of cost of goods sold based on the volume of purchases of the vendor's product.
- (b)
- During 2007, we received $1.7 million in leasehold improvements related to our new corporate headquarters, which is included in deferred rent.
82
EINSTEIN NOAH RESTAURANT GROUP, INC. AND SUBSIDIARIES
Notes to Consolidated Financial Statements (Continued)
13. MANDATORILY REDEEMABLE SERIES Z PREFERRED STOCK
In September 2003, we completed an equity recapitalization with our preferred stockholders, who held a substantial portion of our common stock. Among other things, the Halpern Denny Fund III, L.P. ("Halpern Denny") interest in our Mandatorily Redeemable Series F Preferred Stock ("Series F") was converted into 57,000 shares of Series Z Mandatorily Redeemable Preferred Stock ("Series Z"). The major provisions of our Series Z are as follows:
- •
- 2,000,000 shares authorized;
- •
- par value of $0.001 per share;
- •
- mandatory redemption upon the earlier of (i) a merger or change of control or (ii) June 30, 2009;
- •
- shares are non-voting (except for certain limited voting rights with respect to specified events);
- •
- liquidation value is $1,000 per share;
- •
- an annual dividend rate equal to 250 basis points higher than the highest rate paid on our funded indebtedness is payable if the shares are not redeemed by the redemption date; and
- •
- shares may be redeemed in whole or in part at an earlier date at our discretion.
The exchange of the Halpern Denny interest for Series Z resulted in a reduction of our effective dividend rate relative to that required by the Series F, and as a result of this and other factors, we accounted for this transaction as a troubled debt restructuring. Since a portion of this exchange included the receipt of our common stock and warrants previously held by Halpern Denny, we did not recognize a gain from troubled debt restructuring. The Series Z is recorded in the accompanying consolidated balance sheets at its full face value of $57.0 million, which represents the total cash payable upon liquidation.
14. STOCKHOLDERS' EQUITY
Common Stock
We are authorized to issue up to 25 million shares of common stock, par value $0.001 per share. As of January 2, 2007 and January 1, 2008, there were 10,596,419 and 15,878,811 shares outstanding, respectively.
Secondary Public Offering of Our Common Stock
On June 13, 2007, we completed a secondary public offering of 5 million shares of common stock resulting in gross proceeds of $90 million. After stock issuance costs of $6.7 million related to the offering, we received net proceeds of $83.3 million. Our common stock is now listed on the NASDAQ Global Market under the symbol "BAGL". We used the net proceeds from the offering to pay down our existing indebtedness.
Series A Junior Participating Preferred Stock
In June 1999, our board of directors authorized the issuance of a Series A junior participating preferred stock in the amount of 700,000 shares. This authorization was made in accordance with the Stockholder Protection Rights Plan discussed below. There are currently no issued shares.
83
EINSTEIN NOAH RESTAURANT GROUP, INC. AND SUBSIDIARIES
Notes to Consolidated Financial Statements (Continued)
14. STOCKHOLDERS' EQUITY (Continued)
Stockholder Protection Rights Plan
We maintain a Stockholder Protection Rights Plan (the "Plan"). Upon implementation of the Plan in June 1999, our Board declared a dividend distribution of one right on each outstanding share of common stock, as well as on each share later issued. Each right will allow stockholders to buy one one-hundredth of a share of Series A junior participating preferred stock at an exercise price of $10.00. The rights become exercisable if an individual or group acquires 15% or more of common stock, or if an individual or group announces a tender offer for 15% or more of common stock. The Board can redeem the rights at $0.001 per right at any time before any person acquires 15% or more of the outstanding common stock. In the event an individual (the "Acquiring Person") acquires 15% or more of the outstanding common stock, each right will entitle its holder to purchase, at the right's exercise price, one one-hundredth of a share of Series A junior participating preferred stock, which is convertible into common stock at one-half of the then value of the common stock, or to purchase such common stock directly if there are a sufficient number of shares of common stock authorized. Our Board has the ability to exclude any Acquiring Person from the provision of the stockholders rights plan, resulting in such Acquiring Person's purchase of our common stock not triggering the plan. Rights held by the Acquiring Person are void and will not be exercisable to purchase shares at the bargain purchase price. If we are acquired in a merger or other business combination transaction, each right will entitle its holder to purchase, at the right's then-current exercise price, a number of the acquiring company's common shares having a market value at that time of twice the right's exercise price.
15. STOCK OPTION AND WARRANT PLANS
1994 and 1995 Plans
Our 1994 Stock Plan (the "1994 Plan") provided for the granting to employees of incentive stock options and for the granting to employees and consultants of non-statutory stock options and stock purchase rights. On November 21, 2003, the board of directors terminated the authority to issue any additional options under the 1994 Plan. As of January 1, 2008, all options under the 1994 Plan had expired.
Our 1995 Directors' Stock Option Plan (the "Directors' Option Plan") provided for the automatic grant of non-statutory stock options to non-employee directors of the Company. On December 19, 2003, our board of directors terminated the authority to issue any additional options under the Directors' Option Plan. As of January 1, 2008, options to purchase 1,826 shares of common stock at a weighted average exercise price of $38.16 per share and a weighted average remaining contractual life of 3.43 years remained outstanding under this plan.
2003 Executive Employee Incentive Plan
On November 21, 2003, our board of directors adopted the Executive Employee Incentive Plan, as amended on December 19, 2003, March 1, 2005, February 28, 2007 and April 24, 2007 (the "2003 Plan"). The 2003 Plan provides for granting incentive stock options to employees and granting non-statutory stock options to employees and consultants. Unless terminated sooner, the 2003 Plan will terminate automatically in December 2013. The board of directors has the authority to amend, modify or terminate the 2003 Plan, subject to any required approval by our stockholders under applicable law or upon advice of counsel. No such action may affect any options previously granted under the 2003 Plan without the consent of the holders. There are 2,000,000 shares reserved for issuance pursuant to
84
EINSTEIN NOAH RESTAURANT GROUP, INC. AND SUBSIDIARIES
Notes to Consolidated Financial Statements (Continued)
15. STOCK OPTION AND WARRANT PLANS (Continued)
options granted under the 2003 Plan. Options generally are granted with an exercise price equal to the fair market value on the date of grant, have a contractual life of ten years and typically vest over a three-year service period. Generally, 50% of options granted vest upon service. We recognize compensation costs for these awards using a graded vesting attribution method over the requisite service period. The remaining 50% of options granted vest based on service and financial performance. Options that do not vest due to the failure to achieve specific financial performance criteria are forfeited. Options to purchase approximately 39,016 shares of our common stock, which are not yet exercisable, are subject to future financial performance conditions. We recognize compensation costs for performance based options over the requisite service period when conditions for achievement become probable. For fiscal year 2007, 106,738 shares were forfeited as we did not meet certain financial goals, and the related compensation expense that had been recorded during the year was reversed. As of January 1, 2008, there were 811,250 shares reserved for future issuance under the 2003 Plan.
In February 2007, we granted options to purchase 124,250 shares of our common stock relating to the secondary public offering as further described in Note 14. The option awards vested upon closing of the offering and we recognized approximately $651,000 in stock-based compensation expense.
2004 Stock Option Plan for Independent Directors
On December 19, 2003, our board of directors adopted the Stock Option Plan for Independent Directors, effective January 1, 2004, as amended on March 1, 2005 and February 28, 2007 (the "2004 Directors' Plan"). Our board of directors may amend, suspend, or terminate the 2004 Directors' Plan at any time, provided, however, that no such action may adversely affect any outstanding option without the option holders consent. A total of 300,000 shares of common stock have been reserved for issuance under the 2004 Directors' Plan. The 2004 Directors' Plan provides for the automatic grant of non-statutory stock options to independent directors on January 1 of each year and a prorated grant of options for any director elected during the year. Options are granted with an exercise price equal to the fair market value on the date of grant, become exercisable six months after the grant date and are exercisable for 5 years from the date of grant unless earlier terminated. As of January 1, 2008, there were 73,836 shares reserved for future issuance under the 2004 Directors' Plan.
Stock Appreciation Rights Plan
On February 17, 2007, our board of directors adopted the Stock Appreciation Rights Plan (the "SAR Plan"). The SAR Plan provides for granting stock appreciation rights to employees. Unless terminated sooner, the SAR Plan will terminate automatically on March 31, 2012. The board of directors has the authority to amend, modify or terminate the SAR Plan, subject to any required approval by our stockholders under applicable law or upon advice of counsel, provided that, with limited exception, no modification will adversely affect outstanding rights. There are 150,000 shares issuable pursuant to stock appreciation rights under the SAR Plan.
The value of a share from which appreciation is determined is 100% of the fair market value of a share on the date of grant and will be paid in stock when they are exercised by the employee. The rights expire upon the earlier of termination date of the SAR Plan or termination of employment and typically vest over a two-year service period, and have a contractual life of five years. Generally, 50% of rights granted vest based solely upon the passage of time. We recognize compensation costs for these
85
EINSTEIN NOAH RESTAURANT GROUP, INC. AND SUBSIDIARIES
Notes to Consolidated Financial Statements (Continued)
15. STOCK OPTION AND WARRANT PLANS (Continued)
awards using a graded vesting attribution method over the requisite service period. The remaining 50% of rights granted vest based on financial performance. Rights to approximately 27,488 shares of our common stock, which are not yet exercisable, are subject to financial performance conditions. We will recognize compensation costs for performance based stock appreciation rights over the requisite service period when conditions for achievement become probable. For fiscal year 2007, 26,487 shares were forfeited as we did not meet certain financial goals, and the related compensation expense that had been recorded during the year was reversed. Rights that do not vest are forfeited and are entered back into the pool of shares to be distributed. As of January 1, 2008, there were 73,087 shares reserved for future issuance under the SAR Plan.
James W. Hood Stock Award Agreement
On May 3, 2007, our board of directors adopted the James W. Hood Stock Award Agreement (the "Stock Award Plan"). The Stock Award Plan provides for the issuance of 22,000 shares of our common stock to Mr. Hood as inducement for accepting employment with us as our Chief Marketing Officer. The common stock award includes 7,333 shares that have no restrictions, 7,333 shares that become unrestricted on the first anniversary and 7,334 shares that become unrestricted on the second anniversary of the date of grant, provided that Mr. Hood is continuously employed by us on those dates. We recognize compensation costs for these awards using a graded vesting attribution method over the requisite service period. Included in our total stock based compensation expense of $1.7 million for the year to date period ended January 1, 2008 was $271,000 related to this agreement.
Stock Option Activity
Transactions for the 1994 Plan, Directors' Option Plan, the 2003 Plan, the 2004 Directors' Plan and the Stock Award Plan during fiscal 2005, 2006, and 2007 were as follows:
| | Number of Options
| | Weighted Average
Exercise Price
|
|---|
| | 2005
| | 2006
| | 2007
| | 2005
| | 2006
| | 2007
|
|---|
| Outstanding, beginning of year | | 803,341 | | 997,152 | | 993,707 | | $ | 3.95 | | $ | 3.31 | | $ | 3.79 |
| | Granted | | 606,308 | | 202,500 | | 554,314 | | | 2.62 | | | 5.24 | | | 13.24 |
| | Exercised | | — | | (48,485 | ) | (260,392 | ) | | — | | | 2.88 | | | 3.91 |
| | Forfeited | | (412,497 | ) | (157,460 | ) | (179,268 | ) | | 3.52 | | | 2.98 | | | 6.48 |
| | |
| |
| |
| |
| |
| |
|
| Outstanding, ending of year | | 997,152 | | 993,707 | | 1,108,361 | | $ | 3.31 | | $ | 3.79 | | $ | 8.06 |
| | |
| |
| |
| |
| |
| |
|
| Exercisable and vested, end of year | | 353,237 | | 623,662 | | 637,993 | | $ | 3.82 | | $ | 3.69 | | $ | 4.57 |
| | |
| |
| |
| |
| |
| |
|
86
EINSTEIN NOAH RESTAURANT GROUP, INC. AND SUBSIDIARIES
Notes to Consolidated Financial Statements (Continued)
15. STOCK OPTION AND WARRANT PLANS (Continued)
The aggregate intrinsic value of options exercised during 2006 and 2007 was $253,000 and $3.4 million. There were no options exercised during 2005.
| | Number of
Options
| | Weighted
Average
Grant Date
Fair Value
|
|---|
| Non-vested shares, January 2, 2007 | | 370,045 | | $ | 2.81 |
| | Granted | | 554,314 | | | 5.39 |
| | Vested | | (274,723 | ) | | 4.17 |
| | Forfeited | | (179,268 | ) | | 3.48 |
| | |
| |
|
| Non-vested shares, January 1, 2008 | | 470,368 | | $ | 4.80 |
| | |
| |
|
The weighted average fair value of options granted during the years ended January 3, 2006 and January 2, 2007 was $1.85 and $3.72, respectively.
As of January 1, 2008, the weighted-average remaining life of outstanding and exercisable options was 7.19 years and 6.08 years, respectively, and the aggregate intrinsic value of outstanding and exercisable options was $11.2 million and $8.7 million, respectively. The following table summarizes information about stock options outstanding at January 1, 2008:
| | Options Outstanding
| | Options Exercisable
|
|---|
Range of Exercise Prices
| | Number of
Options
| | Wt.Avg.
Exercise Price
| | Wt.Avg.
Remaining
Life (Years)
| | Number of
Options
| | Wt.Avg.
Exercise Price
|
|---|
| $0.00 - $2.00 | | 30,000 | | $ | 2.00 | | 2.00 | | 30,000 | | $ | 2.02 |
| $2.01 - $4.00 | | 445,300 | | | 3.45 | | 6.12 | | 410,747 | | | 3.54 |
| $4.01 - $8.00 | | 360,048 | | | 6.65 | | 7.72 | | 195,420 | | | 6.80 |
| $8.01 - $125.00 | | 273,013 | | | 18.09 | | 8.80 | | 1,826 | | | 38.16 |
| | |
| |
| |
| |
| |
|
| | | 1,108,361 | | $ | 8.06 | | 7.19 | | 637,993 | | $ | 4.57 |
| | |
| |
| |
| |
| |
|
Stock Appreciation Rights Plan Activity
Transactions during the year to date period ended January 1, 2008 were as follows:
| | Number
of SARs
| | Weighted
Average
Exercise Price
| | Weighted
Average
Fair Value
| | Aggregate
Intrinsic Value
| | Weighted
Average
Remaining
Life (Years)
|
|---|
| Outstanding, January 2, 2007 | | — | | $ | — | | | | | | | | |
| | Granted | | 117,300 | | | 11.30 | | | | | | | | |
| | Exercised | | — | | | — | | | | | | | | |
| | Forfeited | | (40,387 | ) | | 10.54 | | | | | | | | |
| | |
| |
| |
| |
| |
|
| Outstanding, January 1, 2008 | | 76,913 | | $ | 11.69 | | $ | 5.58 | | $ | 496,611 | | 4.26 |
| | |
| |
| |
| |
| |
|
| Exercisable and vested, January 1, 2008 | | — | | $ | — | | $ | — | | $ | — | | — |
| | |
| |
| |
| |
| |
|
87
EINSTEIN NOAH RESTAURANT GROUP, INC. AND SUBSIDIARIES
Notes to Consolidated Financial Statements (Continued)
15. STOCK OPTION AND WARRANT PLANS (Continued)
| | Number
of SARs
| | Weighted
Average
Grant Date
Fair Value
|
|---|
| Non-vested shares, January 2, 2007 | | — | | $ | — |
| | Granted | | 117,300 | | | 5.57 |
| | Vested | | — | | | — |
| | Forfeited | | (40,387 | ) | | 5.56 |
| | |
| |
|
| Non-vested shares, January 1, 2008 | | 76,913 | | $ | 5.60 |
| | |
| |
|
| | SARs Outstanding
| | SARs Exercisable
|
|---|
Range of Exercise Prices
| | Number
of SARs
| | Wt.Avg.
Exercise Price
| | Wt.Avg.
Remaining
Life (Years)
| | Number
of SARs
| | Wt.Avg.
Exercise Price
|
|---|
| $0.00 - $10.00 | | 50,700 | | $ | 8.00 | | 4.25 | | — | | $ | — |
| $10.01 - $20.00 | | 24,213 | | | 18.43 | | 4.25 | | — | | | — |
| $20.01 - $30.00 | | 2,000 | | | 23.70 | | 4.85 | | — | | | — |
| | |
| |
| |
| |
| |
|
| | | 76,913 | | $ | 11.69 | | 4.26 | | — | | $ | — |
| | |
| |
| |
| |
| |
|
Warrants
As of January 1, 2008, we had no warrants outstanding and exercisable to purchase shares of our common stock. The warrants were issued in connection with private financing transactions and certain other services that occurred between 2000 and 2003. Transactions during fiscal 2005 and 2006 were as follows:
| | 2005
| | 2006
| |
|---|
| Outstanding at beginning of year | | 961,391 | | 739,961 | |
| | Issued | | — | | — | |
| | Exercised | | (216,359 | ) | (482,862 | ) |
| | Converted | | — | | | |
| | Forfeited | | (5,071 | ) | (257,099 | ) |
| | |
| |
| |
| Outstanding and exercisable at end of year | | 739,961 | | — | |
| | |
| |
| |
During 2006, we received total consideration of $55,000 and issued 53,217 shares of our common stock in connection with the exercises of certain warrants previously granted to a number of investors, including Greenlight. Additionally we issued 429,645 shares of our common stock to Greenlight upon Greenlight's cashless exercises of certain warrants. Greenlight surrendered 56,953 shares of common stock in connection with such cashless exercises.
16. SAVINGS PLAN
We sponsor a qualified defined contribution retirement plan covering eligible employees of Einstein Noah Restaurant Group (the "401(k) Plan"). Employees, excluding officers, are eligible to participate in the plan if they meet certain compensation and eligibility requirements. The 401(k) Plan
88
EINSTEIN NOAH RESTAURANT GROUP, INC. AND SUBSIDIARIES
Notes to Consolidated Financial Statements (Continued)
16. SAVINGS PLAN (Continued)
allows participating employees to defer the receipt of a portion of their compensation and contribute such amount to one or more investment options. We did not accrue a discretionary match for 2007. Our contribution to the plan was $0.3 million, $0.2 million, and $0 million for 2005, 2006, and 2007, respectively. Employer contributions vest at the rate of 100% after three years of service.
We established the Einstein Noah Restaurant Group, Inc. Nonqualified Deferred Compensation Plan (the "DC Plan") in June of 2007 for key employees, generally officers of the Company. The DC Plan allows an eligible employee to defer up to 80% of the participant's base salary and bonus. In lieu of payments of the deferred amounts to the participant, the payments are to be invested with The Charles Schwab Trust Company under investment criteria directed by the participant.
17. INCOME TAXES
We record deferred tax assets and liabilities based on the difference between the financial statement and income tax basis of assets and liabilities using the enacted statutory tax rate in effect for the year differences are expected to be taxable or refunded. Deferred income tax expenses or credits are based on the changes in the asset or liability from period to period. The recorded deferred tax assets are reviewed for impairment on a quarterly basis by reviewing our internal estimates for future net income. Due to the uncertainty of future taxable income, deferred tax assets resulting from these net operating losses have been fully reserved. To date we have incurred substantial net losses, with the exception of 2007, that have created significant net operating loss carryforwards ("NOL's") for tax purposes. Our NOL's are one of our deferred income tax assets.
In accordance with SFAS No. 109 Accounting for Income Taxes ("SFAS No. 109"), we will assess the continuing need for a valuation allowance that results from uncertainty regarding our ability to realize the benefits of our deferred tax assets. The ultimate realization of deferred income tax assets is dependent upon generation of future taxable income during the periods in which those temporary differences become deductible. Although we achieved $12.6 million of net income for 2007, we will continue to review various qualitative and quantitative data, including events within the restaurant industry, the cyclical nature of our business, our future forecasts and historical trending. If we conclude that our prospects for the realization of our deferred tax assets are more likely than not, we will then reduce our valuation allowance as appropriate and credit income tax expense after considering the following factors:
- •
- The level of historical taxable income and projections for future taxable income over periods in which the deferred tax assets would be deductible, and
- •
- Accumulation of net income before tax utilizing a look-back period of three years.
As of January 1, 2008, net operating loss carryforwards of $148.8 million were available to be utilized against future taxable income for years through fiscal 2026, subject to annual limitations. As a result of prior ownership changes, approximately $102.2 million of our NOL carryforwards are subject to an annual usage limitation of $4.7 million. The occurrence of an additional ownership change would limit our ability to utilize the approximately $46.6 million of our NOLs that are not currently subject to limitation, and could further limit our ability to utilize our remaining NOLs and possibly other tax attributes.
On January 3, 2007, we adopted the provisions of FASB Interpretation No. 48,Accounting for Uncertainty in Income Taxes ("FIN 48"). Previously, we accounted for tax contingencies in accordance
89
EINSTEIN NOAH RESTAURANT GROUP, INC. AND SUBSIDIARIES
Notes to Consolidated Financial Statements (Continued)
17. INCOME TAXES (Continued)
with Statement of Financial Accounting Standards 5, Accounting for Contingencies. As Required by FIN 48, which clarifies SFAS No. 109, we recognize the financial statement benefit of a tax position only after determining that the relevant tax authority would more likely than not sustain the position following an audit. For tax positions meeting the more-likely-than-not threshold, the amount recognized in the financial statements is the largest benefit that has a greater than 50% likelihood of being realized upon ultimate settlement with the relevant tax authority. At the adoption date, we applied FIN 48 to all tax positions for which the statute of limitations remained open. As a result of the implementation of FIN 48, we recorded a reduction of approximately $1.8 million of the gross deferred tax asset and a corresponding reduction of the valuation allowance. There was no net effect to the financial statements and none of the unrecognized tax benefits will impact our effective tax rate.
The income tax uncertainties relate to periods in which net operating losses were generated. Upon adoption of FIN 48, the net operating loss carryforwards were reduced and thus no tax liability was recorded. Additionally, we maintain a full valuation allowance against our net deferred tax assets. Therefore, our valuation allowance was correspondingly reduced by $1.8 million. Due to the completion and the filing of Forms 3115, Application for Change in Accounting Method, it is highly certain that approximately $1.5 million of the unrecognized tax benefits will be realized. Additionally, we have refined our estimate of the unrecognized tax benefits related to the remaining $0.3 million. Accordingly, in the fourth quarter of 2007, we recorded an increase of approximately $1.8 million in our gross deferred tax asset and a corresponding increase in our valuation allowance. There was no net effect to the financial statements and none of the unrecognized tax benefits impacted our effective tax rate.
We are subject to income taxes in the U.S. federal jurisdiction, and various states and local jurisdictions. Tax regulations within each jurisdiction are subject to the interpretation of the related tax laws and regulations and require significant judgment to apply. We remain subject to examination by U.S. federal, state and local tax authorities for tax years 2003 through 2006. With a few exceptions, we are no longer subject to U.S. federal, state or local examinations by tax authorities for the tax year 2002 and prior.
The amount of the deferred tax asset considered realizable, however, could be reduced if estimates of future taxable income during the carryforward periods are reduced. As of January 1, 2008, our net
90
EINSTEIN NOAH RESTAURANT GROUP, INC. AND SUBSIDIARIES
Notes to Consolidated Financial Statements (Continued)
17. INCOME TAXES (Continued)
operating loss carryforwards for U.S. federal income tax purposes were $148.8 million, and were subject to the following expiration schedule (in thousands of dollars):
Net Operating Loss
Carryforwards
| | Expiration Date
|
|---|
| $ | 6,058 | | 12/31/2012 |
| | 14,553 | | 12/31/2018 |
| | 6,862 | | 12/31/2019 |
| | 10,424 | | 12/31/2020 |
| | 10,515 | | 12/31/2021 |
| | 35,688 | | 12/31/2022 |
| | 42,362 | | 12/31/2023 |
| | 12,003 | | 12/31/2024 |
| | 5,413 | | 12/31/2025 |
| | 4,900 | | 12/31/2026 |
| | |
| $ | 148,778 | | |
| | |
Our ability to utilize our net operating losses, could be limited or further limited if we have undergone an "ownership change" as that term is defined for purposes of Section 382 of the Internal Revenue Code. We are in the process of filing a request with the Internal Revenue Service to review our methodology for determining ownership changes in accordance with Internal Revenue Code Section 382. Upon acceptance of our request, we believe that our NOLs will be available for utilization. In the event that our request is not accepted, approximately $17.9 million of NOLs will be at risk to expire prior to utilization.
The provision for income taxes consists of the following:
| | 2005
| | 2006
| | 2007
| |
|---|
| Current | | | | | | | | | | |
| | Federal | | $ | — | | $ | — | | $ | 232 | |
| | State | | | — | | | — | | | 222 | |
| | |
| |
| |
| |
| | Total current income tax benefit | | | — | | | — | | | 454 | |
| | |
| |
| |
| |
| Deferred | | | | | | | | | | |
| | Federal | | | (4,201 | ) | | (2,329 | ) | | 4,957 | |
| | State | | | (390 | ) | | (216 | ) | | 1,132 | |
| | |
| |
| |
| |
| | Total deferred income tax benefit | | | (4,591 | ) | | (2,545 | ) | | 6,089 | |
| | |
| |
| |
| |
| | Change in valuation allowance | | | 4,591 | | | 2,545 | | | (6,089 | ) |
| | |
| |
| |
| |
| Total income tax provision | | $ | — | | $ | — | | $ | 454 | |
| | |
| |
| |
| |
91
EINSTEIN NOAH RESTAURANT GROUP, INC. AND SUBSIDIARIES
Notes to Consolidated Financial Statements (Continued)
17. INCOME TAXES (Continued)
A reconciliation between the reported provision for income taxes and the amount computed by applying the statutory federal income tax rate of 35% to loss before income taxes is as follows:
| | 2005
| | 2006
| | 2007
| |
|---|
| Expected tax provision (benefit) at 35% | | $ | (4,906 | ) | $ | (2,403 | ) | $ | 4,565 | |
| State tax provision (benefit), net of federal provision (benefit) | | | (390 | ) | | (216 | ) | | 1,157 | |
| Other, net | | | 705 | | | 74 | | | 421 | |
| Deferred taxes related to change in tax accounting method | | | — | | | — | | | 2,421 | |
| Expired tax carryforwards | | | — | | | — | | | 1,132 | |
| Effect of change in tax rate | | | — | | | — | | | (3,153 | ) |
| Change in valuation allowance | | | 4,591 | | | 2,545 | | | (6,089 | ) |
| | |
| |
| |
| |
| Total provision for taxes | | $ | — | | $ | — | | $ | 454 | |
| | |
| |
| |
| |
The income tax effects of temporary differences that give rise to significant portions of deferred tax assets as of January 3, 2006, January 2, 2007 and January 1, 2008 are as follows:
| | 2005
| | 2006
| | 2007
| |
|---|
| Deferred tax assets | | | | | | | | | | |
| | Operating loss carryforwards | | $ | 59,958 | | $ | 59,990 | | $ | 59,228 | |
| | Capital loss carryforwards | | | 1,237 | | | 1,237 | | | — | |
| | Accrued expenses | | | 1,317 | | | 2,003 | | | 493 | |
| | §481(a) tax accounting method change | | | — | | | — | | | (1,733 | ) |
| | Allowances for doubtful accounts | | | 183 | | | 193 | | | 513 | |
| | Other assets | | | 58 | | | — | | | (209 | ) |
| | Property, plant and equipment | | | 15,852 | | | 17,727 | | | 16,517 | |
| | Alternative minimum tax | | | — | | | — | | | 252 | |
| | |
| |
| |
| |
| | | Total gross deferred tax asset | | | 78,605 | | | 81,150 | | | 75,061 | |
| | | | Less valuation allowance | | | (78,605 | ) | | (81,150 | ) | | (75,061 | ) |
| | |
| |
| |
| |
| | | Total deferred tax asset | | $ | — | | $ | — | | $ | — | |
| | |
| |
| |
| |
92
EINSTEIN NOAH RESTAURANT GROUP, INC. AND SUBSIDIARIES
Notes to Consolidated Financial Statements (Continued)
18. SUPPLEMENTAL CASH FLOW INFORMATION
| | January 3,
2006
| | January 2,
2007
| | January 1,
2008
| |
|---|
| | (in thousands of dollars)
| |
|---|
| Cash paid during the year to date period ended: | | | | | | | | | | |
| | Interest related to: | | | | | | | | | | |
| | | $160 Million Notes | | $ | 31,200 | | $ | 3,293 | | $ | — | |
| | | Term Loans | | | — | | | 10,855 | | | 11,111 | |
| | | $25 Million Subordinated Note | | | — | | | 1,412 | | | 825 | |
| | | Other | | | 884 | | | 575 | | | 319 | |
| |
Prepayment penalty upon redemption of debt |
|
$ |
— |
|
$ |
4,800 |
|
$ |
240 |
|
Non-cash investing activities: |
|
|
|
|
|
|
|
|
|
|
| | Non-cash purchase of equipment through capital leasing | | $ | 33 | | $ | 205 | | $ | 24 | |
| | Non-cash addition of leasehold improvements provided by lessor | | $ | — | | $ | — | | $ | 1,672 | |
| | Change in accrued expenses for purchases of property and equipment | | $ | (289 | ) | $ | 2,955 | | $ | (2,125 | ) |
19. RELATED PARTY TRANSACTIONS
E. Nelson Heumann is the chairman of our board of directors and is a current employee of Greenlight. Greenlight and its affiliates beneficially own approximately 67.6 percent of our common stock on a fully diluted basis. As a result, Greenlight has sufficient voting power without the vote of any other stockholders to determine what matters will be submitted for approval by our stockholders, to approve actions by written consent without the approval of any other stockholders, to elect all of our board of directors, and among other things, to determine whether a change in control of our company occurs.
Greenlight owned $35.0 million of our $160 Million Notes when we called the Notes for redemption in January 2006. The Notes were redeemed from the proceeds of our refinancing in February 2006 as further described in Note 11.
We entered into the Subordinated Note with Greenlight in February 2006, and paid it in full during the second quarter of 2007. The Subordinated Note had a maturity date of February 28, 2013, carried a fixed interest rate of 13.75% per annum and required a quarterly cash interest payment in arrears at 6.5% and quarterly paid-in kind interest that is added to the principal balance outstanding at 7.25%. Total interest expense related to the Subordinated Note with Greenlight was $3.0 million for the year ended January 2, 2007, and $1.7 million for the year ended January 1, 2008. The Note was redeemed from the proceeds of our secondary offering and amended debt facility in June 2007 as further described in Note 11.
During 2006, we issued 429,645 shares of our common stock to Greenlight in connection with cashless exercises of certain warrants previously granted by us. Greenlight surrendered 56,953 shares of common stock to us in connection with such cashless exercises. We issued these warrants in private financing transactions that occurred between 2000 and 2003.
On December 8, 2003, we entered into a consulting agreement with Ms. Jill B. W. Sisson to provide legal, consulting and advisory services to us and to serve as General Counsel and Secretary. Currently, Ms. Sisson receives $18,750 per month under this agreement. In addition, Ms. Sisson has
93
EINSTEIN NOAH RESTAURANT GROUP, INC. AND SUBSIDIARIES
Notes to Consolidated Financial Statements (Continued)
19. RELATED PARTY TRANSACTIONS (Continued)
been granted options under the 2003 Executive Employee Incentive Plan, of which 102,199 are currently outstanding. Certain options vest in part, upon length of service and in part, upon the achievement of specified financial goals by us. Ms. Sisson is eligible to receive annual additional premium compensation based upon company performance and personal performance. Ms. Sisson will also be reimbursed for reasonable and necessary out-of-pocket expenses. The agreement provides for non-solicitation of our employees for a year after termination of the agreement, and can be terminated by either party upon 30 days notice.
20. COMMITMENTS AND CONTINGENCIES
Letters of Credit and Line of Credit
As of January 1, 2008, we had $7.2 million in letters of credit outstanding. The letters of credit expire on various dates during 2008, are automatically renewable for one additional year and are payable upon demand in the event that we fail to pay the underlying obligation. Of the total letters of credit outstanding, $6.7 million reduce our availability under the Revolving Facility. Our availability under the revolving facility was $13.3 million at January 1, 2008.
Capital Leases
We lease certain equipment under capital leases. Included in property, plant and equipment are the asset values of $268,000 and $262,000 and the related accumulated amortization of $81,000 and $169,000 at January 2, 2007 and January 1, 2008, respectively. Amortization of assets under capital leases is included in depreciation and amortization expense.
Operating Leases
We lease office space, restaurant space and certain equipment under operating leases having terms that expire at various dates through fiscal 2018. Our restaurant leases have renewal clauses of 1 to 20 years at our option and, in some cases, have provisions for contingent rent based upon a percentage of gross sales, as defined in the leases. Rent expense for fiscal 2005, 2006, and 2007 was approximately $27.7 million, $27.6 million, and $27.5 million, respectively. Contingent rent included in rent expense for fiscal 2005, 2006, and 2007 was approximately $140,000, $130,000, and $148,000, respectively. We sublease out a portion of our restaurant space on leases where we did not need the entire space for our operations. Our sublease income was $0.7 million, $0.5 million and $0.5 million for fiscal 2005, 2006 and 2007, respectively.
94
EINSTEIN NOAH RESTAURANT GROUP, INC. AND SUBSIDIARIES
Notes to Consolidated Financial Statements (Continued)
20. COMMITMENTS AND CONTINGENCIES (Continued)
Future Minimum Lease Payments
As of January 2, 2007, future minimum lease payments under capital and operating leases were as follows (in thousands of dollars):
Fiscal year:
| | Capital Leases
| | Operating Leases
|
|---|
| | (in thousands of dollars)
|
|---|
| 2008 | | $ | 92 | | $ | 25,969 |
| 2009 | | | 55 | | | 23,039 |
| 2010 | | | 15 | | | 20,415 |
| 2011 | | | 3 | | | 14,926 |
| 2012 | | | — | | | 6,742 |
| 2013 and thereafter | | | — | | | 12,631 |
| | |
| |
|
| | Total minimum lease payments | | | 165 | | $ | 103,722 |
| | | | | |
|
| | Less imputed interest (average rate of 4.75%) | | | 18 | | | |
| | |
| | | |
| | Present value of minimum lease payments | | | 147 | | | |
| | Less current portion of obligations under capital leases | | | 80 | | | |
| | |
| | | |
| | Obligations under capital leases, long-term | | $ | 67 | | | |
| | |
| | | |
In addition, the total of minimum sublease rentals to be received in the future under non-cancelable subleases as of January 1, 2008 is $1.3 million.
Purchase commitments
We have obligations with certain of our major suppliers of raw materials (primarily frozen bagel dough and cream cheese) for minimum purchases both in terms of quantity and pricing on an annual basis. Furthermore, from time to time, we will commit to the purchase price of certain commodities that are related to the ingredients used for the production of our bagels. On a periodic basis, we review the relationship of these purchase commitments to our business plan, general market trends and our assumptions in our operating plans. If these commitments are deemed to be in excess of the market, we will expense the excess purchase commitment to cost of sales, in the period in which the shortfall is determined. The total of our future purchase obligations at January 1, 2008 was approximately $29.5 million.
Litigation
We are subject to claims and legal actions in the ordinary course of our business, including claims by or against our franchisees, licensees and employees or former employees and/or contract disputes. We do not believe any currently pending or threatened matter, other than as described below, would have a material adverse effect on our business, results of operations or financial condition.
On August 31, 2007, the Company was served in an action brought by Fiera Foods Company in the Superior Court of Justice of Ontario, Canada. Fiera claims that the Company failed to negotiate in good faith for a frozen bagel dough supply agreement, which was not concluded, and made misrepresentations in the negotiations. Fiera is seeking damages of $17.0 million (Canadian) as well as
95
EINSTEIN NOAH RESTAURANT GROUP, INC. AND SUBSIDIARIES
Notes to Consolidated Financial Statements (Continued)
20. COMMITMENTS AND CONTINGENCIES (Continued)
interest and costs. The Company believes that these claims are not valid and is defending this action and has not recorded an accrual.
On September 18, 2007, Eric Mathistad, a former store manager, filed a putative class action against the Company in the Superior Court of California for the State of California, County of San Diego. The plaintiff alleges that defendants failed to pay overtime wages to "salaried restaurant employees" of its California stores who were improperly designated as exempt employees, and that these employees were deprived of mandated meal periods and rest breaks. Plaintiff alleges that these actions were in violation of the California Labor Code Sections 1194, et seq., 500, et seq., California Business and Professions Code Section 17200, et seq., and applicable wage order(s) issued by the Industrial Welfare Commission. Plaintiff seeks injunctive relief, declaratory relief, attorney's fees, restitution and an unspecified amount of damages for unpaid overtime and for missed meal and/or rest periods. The Company filed a Demurrer on October 18, 2007 claiming that, inter alia, plaintiff fails to state a claim against the Company; plaintiff does not state a claim for a joint venture, partnership, common enterprise, or aiding and abetting; plaintiff's definition of the class is deficient and plaintiff's claims for declaratory judgment regarding Labor Code violations should be dismissed. On November 14, 2007, Bernadette Mejia, another former store manager, filed a similar case. The Company filed a Demurrer on December 14, 2007 claiming that, inter alia, that another case, (the Mathistad case) was pending between the same putative parties on the same causes of action. It is the Company's understanding that Ms. Mejia and Mr. Mathistad have agreed to consolidate their actions. Because limited discovery has been conducted, no class certification proceeding has occurred and because the cases are in their infancy, we cannot predict the outcome of this matter.
96
EINSTEIN NOAH RESTAURANT GROUP, INC. AND SUBSIDIARIES
Notes to Consolidated Financial Statements (Continued)
21. QUARTERLY RESULTS OF OPERATIONS (UNAUDITED)
The following table summarizes the unaudited consolidated quarterly results of operations for fiscal 2005, 2006 and 2007:
| | Fiscal year 2005:
| |
|---|
| | 1st Quarter
(13 wks)
| | 2nd Quarter
(13 wks)
| | 3rd Quarter
(13 wks)
| | 4th Quarter
(14 wks)
| |
|---|
| | (in thousands of dollars, except per share amounts)
| |
|---|
| Revenue | | $ | 93,295 | | $ | 97,113 | | $ | 94,782 | | $ | 103,903 | |
| Gross profit | | $ | 17,158 | | $ | 19,150 | | $ | 15,861 | | $ | 21,533 | |
| Income from operations | | $ | 1,664 | | $ | 1,421 | | $ | 885 | | $ | 5,398 | |
| Net loss | | $ | (4,198 | ) | $ | (4,283 | ) | $ | (4,814 | ) | $ | (723 | ) |
| Net loss per common share—Basic and Diluted | | $ | (0.43 | ) | $ | (0.44 | ) | $ | (0.49 | ) | $ | (0.07 | ) |
| Weighted average number of common shares outstanding: | | | | | | | | | | | | | |
| | Basic and Diluted | | | 9,848,713 | | | 9,860,886 | | | 9,868,623 | | | 9,902,989 | |
| | |
| |
| |
| |
| |
| | Fiscal year 2006:
|
|---|
| | 1st Quarter
(13 wks)
| | 2nd Quarter
(13 wks)
| | 3rd Quarter
(13 wks)
| | 4th Quarter
(13 wks)
|
|---|
| | (in thousands of dollars, except per share amounts)
|
|---|
| Revenue | | $ | 97,076 | | $ | 97,956 | | $ | 95,752 | | $ | 99,178 |
| Gross profit | | $ | 18,545 | | $ | 18,490 | | $ | 18,120 | | $ | 23,477 |
| Income from operations | | $ | 1,883 | | $ | 3,170 | | $ | 5,486 | | $ | 10,899 |
| Net income (loss)(a) | | $ | (12,092 | ) | $ | (1,542 | ) | $ | 752 | | $ | 6,014 |
| Net income (loss) per common share—Basic | | $ | (1.20 | ) | $ | (0.15 | ) | $ | 0.07 | | $ | 0.57 |
| Net income (loss) per common share—Diluted | | $ | (1.20 | ) | $ | (0.15 | ) | $ | 0.07 | | $ | 0.54 |
| Weighted average number of common shares outstanding: | | | | | | | | | | | | |
| | Basic | | | 10,065,072 | | | 10,171,236 | | | 10,593,085 | | | 10,596,266 |
| | |
| |
| |
| |
|
| | Diluted | | | 10,065,072 | | | 10,171,236 | | | 11,036,527 | | | 11,110,643 |
| | |
| |
| |
| |
|
- (a)
- In connection with refinancing our $160 Million Notes, we wrote off $4.0 million of debt issuance costs and paid a 3% redemption premium in the amount of $4.8 million during the first quarter ended 2006.
97
EINSTEIN NOAH RESTAURANT GROUP, INC. AND SUBSIDIARIES
Notes to Consolidated Financial Statements (Continued)
21. QUARTERLY RESULTS OF OPERATIONS (UNAUDITED) (Continued)
| | Fiscal year 2007:
|
|---|
| | 1st Quarter
(13 wks)
| | 2nd Quarter
(13 wks)
| | 3rd Quarter
(13 wks)
| | 4th Quarter
(13 wks)
|
|---|
| | (in thousands of dollars, except per share amounts)
|
|---|
| Revenue | | $ | 96,255 | | $ | 101,055 | | $ | 100,378 | | $ | 105,214 |
| Gross profit | | $ | 19,501 | | $ | 20,418 | | $ | 19,521 | | $ | 21,490 |
| Income from operations | | $ | 5,958 | | $ | 6,743 | | $ | 6,806 | | $ | 8,759 |
| Net income (loss)(b) | | $ | 1,132 | | $ | (250 | ) | $ | 4,943 | | $ | 6,761 |
| Net income (loss) per common share—Basic | | $ | 0.11 | | $ | (0.02 | ) | $ | 0.31 | | $ | 0.43 |
| Net income (loss) per common share—Diluted | | $ | 0.10 | | $ | (0.02 | ) | $ | 0.30 | | $ | 0.41 |
| Weighted average number of common shares outstanding: | | | | | | | | | | | | |
| | Basic | | | 10,605,626 | | | 11,775,597 | | | 15,772,931 | | | 15,837,211 |
| | |
| |
| |
| |
|
| | Diluted | | | 11,136,669 | | | 11,775,597 | | | 16,572,486 | | | 16,623,629 |
| | |
| |
| |
| |
|
- (b)
- In connection with the debt redemption and amended first lien term loan, we wrote off $2.1 million of debt issuance costs and $0.5 million of debt discount, and paid a redemption premium in the amount of $0.2 million during the second quarter ended 2007.
98
EINSTEIN NOAH RESTAURANT GROUP, INC.
Schedule II—Valuation and Qualifying Accounts
| | Balance at
beginning
of period
| | Additions(a)
| | Deductions(b)
| | Balance at
end
of period
|
|---|
| | (In thousands of dollars)
|
|---|
| For the fiscal year ended January 3, 2006: | | | | | | | | | | |
| | Allowance for doubtful accounts | | $ | 2,475 | | (158 | ) | (1,837 | ) | $ | 480 |
| | Restructuring reserve | | $ | 21 | | — | | (21 | ) | $ | — |
| | Valuation allowance for deferred taxes | | $ | 74,014 | | 4,591 | | — | | $ | 78,605 |
| For the fiscal year ended January 2, 2007: | | | | | | | | | | |
| | Allowance for doubtful accounts | | $ | 480 | | 133 | | (108 | ) | $ | 505 |
| | Valuation allowance for deferred taxes | | $ | 78,605 | | 2,545 | | — | | $ | 81,150 |
| For the fiscal year ended January 1, 2008: | | | | | | | | | | |
| | Allowance for doubtful accounts | | $ | 505 | | 502 | | (401 | ) | $ | 606 |
| | Valuation allowance for deferred taxes | | $ | 81,150 | | — | | (6,089 | ) | $ | 75,061 |
Notes:
- (a)
- Amounts charged to costs and expenses.
- (b)
- Bad debt write-offs and charges to reserves.
See accompanying report of independent registered public accounting firm
99
ITEM 9. CHANGES IN AND DISAGREEMENTS WITH ACCOUNTANTS ON ACCOUNTING AND FINANCIAL DISCLOSURES
None
ITEM 9A. CONTROLS AND PROCEDURES
Disclosure Controls and Procedures
The Company carried out an evaluation, under the supervision and with the participation of the Company's management including the Company's Chief Executive Officer and the Company's Chief Financial Officer, of the effectiveness of the design and operation of the Company's disclosure controls and procedures as of the end of the period covered by this report pursuant to Securities Exchange Act Rule 13a-15. Based upon that evaluation, the Company's Chief Executive Officer and Chief Financial Officer concluded the Company's disclosure controls and procedures are effective in timely alerting them to material information relating to the Company (including its consolidated subsidiaries) required to be included in the Company's periodic SEC filings.
Disclosure controls and procedures are controls and other procedures that are designed to ensure that information required to be disclosed by us in the reports that we file or submit under the Exchange Act is recorded, processed, summarized and reported within the time periods specified in SEC's rules and forms. Disclosure controls and procedures include, without limitation, controls and procedures designed to ensure information required to be disclosed by us in the reports we file under the Exchange Act is accumulated and communicated to our management, including our Chief Executive Officer and Chief Financial Officer, as appropriate to allow timely decisions regarding required disclosure.
Management's Annual Report on Internal Control Over Financial Reporting
The Company's management is responsible for establishing and maintaining adequate internal control over financial reporting. The Company's internal control over financial reporting is a process designed under the supervision of the Company's Chief Executive Officer and Chief Financial Officer to provide reasonable assurance regarding the reliability of financial reporting and the preparation of the Company's financial statements for external reporting purposes in accordance with accounting principles generally accepted in the United States of America.
As of January 1, 2008, management conducted an assessment of the effectiveness of the Company's internal control over financial reporting based on the framework established in Internal Control—Integrated Framework issued by the Committee of Sponsoring Organizations of the Treadway Commission ("COSO"). Based on this assessment, management has determined that the Company's internal control over financial reporting as of January 1, 2008, is effective.
Our internal control over financial reporting includes policies and procedures that pertain to the maintenance of records that, in reasonable detail, accurately and fairly reflect transactions and dispositions of assets; provide reasonable assurances that transactions are recorded as necessary to permit preparation of financial statements in accordance with accounting principles generally accepted in the United States of America, and that receipts and expenditures are being made only in accordance with authorizations of management and the directors of the Company; and provide reasonable assurance regarding prevention or timely detection of unauthorized acquisition, use or disposition of the Company's assets that could have a material effect on our financial statements.
The effectiveness of the Company's internal control over financial reporting as of January 1, 2008 has been audited by Grant Thornton LLP, an independent registered public accounting firm, as stated in their report appearing under the heading "Report of Independent Registered Public Accounting Firm," which expresses unqualified opinions on the Company's financial statements and on the
100
effectiveness of the Company's internal control over financial reporting as of January 1, 2008, which is included in Item 8 of this Annual Report on Form 10-K.
Changes in Internal Control Over Financial Reporting
In addition, during the fourth quarter of 2007 no change in the Company's internal control over financial reporting was identified in connection with this evaluation that has materially affected or is reasonably likely to materially affect the Company's internal control over financial reporting.
ITEM 9B. OTHER INFORMATION
None
101
PART III
ITEM 10. DIRECTORS EXECUTIVE OFFICERS AND CORPORATE GOVERNANCE
Information relating to Directors required by Item 10 will be included in our 2008 Proxy Statement, which will be filed within 120 days after the close of the 2007 fiscal year, and is hereby incorporated by reference.
Information relating to compliance with Section 16(a) required by Item 10 will included in our 2008 Proxy Statement, which will be filed within 120 days after the close of the 2007 fiscal year, and is hereby incorporated by reference.
Information regarding executive officers is included in Part I of this Form 10-K, as permitted by General Instruction G(3).
ITEM 11. EXECUTIVE COMPENSATION
This information will be included in our 2008 Proxy Statement, which will be filed within 120 days after the close of the 2007 fiscal year, and is hereby incorporated by reference.
ITEM 12. SECURITY OWNERSHIP OF CERTAIN BENEFICIAL OWNERS AND MANAGEMENT AND RELATED STOCKHOLDER MATTERS
This information will be included in our 2008 Proxy Statement, which will be filed within 120 days after the close of the 2007 fiscal year, and is hereby incorporated by reference.
ITEM 13. CERTAIN RELATIONSHIPS AND RELATED TRANSACTIONS, AND DIRECTOR INDEPENDENCE
This information will be included in our 2008 Proxy Statement, which will be filed within 120 days after the close of the 2007 fiscal year, and is hereby incorporated by reference.
ITEM 14. PRINCIPAL ACCOUNTANT FEES AND SERVICES
This information will be included in our 2008 Proxy Statement, which will be filed within 120 days after the close of the 2007 fiscal year, and is hereby incorporated by reference.
102
PART IV
ITEM 15. EXHIBITS AND FINANCIAL STATEMENT SCHEDULES
- (1)
- Financial Statements
See the Index to Consolidated Financial Statements included on Page 58 for a list of the financial statements included in this Form 10-K.
- (2)
- Financial Statement Schedules
See Page 98 for Schedule II—Valuation and Qualifying Accounts. All other financial statement schedules are omitted because they are not required or are not applicable.
- (3)
- Exhibits
Exhibit No.
| | Description
|
|---|
| 3.1 | | Restated Certificate of Incorporation* |
3.2 |
|
Third Amended By-laws(1) |
3.3 |
|
Amendments to By-laws(3) |
4.2 |
|
New World Restaurant Group, Inc. Certificate of Designation, Preferences and Rights of Series Z Preferred Stock(4) |
10.1 |
|
1994 Stock Plan(1)+ |
10.2 |
|
Directors' Option Plan(1)+ |
10.3 |
|
Executive Employee Incentive Plan(6)+ |
10.4 |
|
Second Amendment to Executive Employee Incentive Plan(7)+ |
10.5 |
|
Third Amendment to the New World Restaurant Group, Inc. 2004 Executive Employee Incentive Plan(13)+ |
10.6 |
|
Stock Option Plan for Independent Directors(8)+ |
10.7 |
|
Amendment to Stock Option Plan for Independent Directors(9)+ |
10.8 |
|
Second Amendment to the New World Restaurant Group Inc. Stock Option Plan for (Non-Employee) Independent Directors(12)+ |
10.9 |
|
Consulting Agreement between Registrant and Jill B.W. Sisson effective as of December 8, 2003(5)+ |
10.10 |
|
Rights Agreement between Registrant and American Stock Transfer and Trust Company, as Rights Agent, dated as of June 7, 1999.(2) |
10.11 |
|
Approved Supplier Agreement dated as of November 30, 2006, by and among New World Restaurant Group, Inc., Einstein and Noah Corp., Manhattan Bagel Company, Inc., and Harlan Bagel Supply Company, LLC, and Harlan Bakeries, Inc. (Certain information contained in this exhibit has been omitted and filed separately with the Commission pursuant to a confidential treatment request under Rule 24b-2)(11) |
10.12 |
|
Amended and Restated Credit Agreement dated June 28, 2007, among the Registrant, Bear, Stearns & Co. Inc. ("Bear Stearns"), as sole lead arranger, Wells Fargo Foothill, Inc., as administrative agent and the other lenders from time to time parties thereto(15) |
10.13 |
|
New World Restaurant Group, Inc. Stock Appreciation Rights Plan(10)+ |
103
10.14 |
|
James W. Hood Stock Award Agreement(14)+ |
10.15 |
|
Einstein Noah Restaurant Group, Inc. Nonqualified Deferred Compensation Plan*+ |
21.1 |
|
List of Subsidiaries* |
23.1 |
|
Consent of Grant Thornton LLP* |
31.1 |
|
Certification of Chief Executive Officer of the Registrant pursuant to Section 906 of the Sarbanes-Oxley Act of 2002, with respect to the Registrant's Annual Report on Form 10-K for the year ended January 1, 2008* |
31.2 |
|
Certification of Chief Financial Officer of the Registrant pursuant to Section 906 of the Sarbanes-Oxley Act of 2002, with respect to the Registrant's Annual Report on Form 10-K for the year ended January 1, 2008* |
32.1 |
|
Certification of Chief Executive Officer pursuant to 18 U.S.C. Section 1350, as adopted pursuant to Section 906 of the Sarbanes-Oxley Act* |
32.2 |
|
Certification of Chief Financial Officer pursuant to 18 U.S.C. Section 1350, as adopted pursuant to Section 906 of the Sarbanes-Oxley Act* |
32.3 |
|
Certification of Principal Accounting Officer pursuant to 18 U.S.C. Section 1350, as adopted pursuant to Section 906 of the Sarbanes- Oxley Act* |
- *
- Filed herewith.
- +
- Management contract.
- (1)
- Incorporated by reference from Registrant's Registration Statement on Form SB-2 (33-95764).
- (2)
- Incorporated by reference from Registrant's Current Report on Form 8-K dated June 7, 1999.
- (3)
- Incorporated by reference from Registrant's Annual Report on Form 10-K for the Fiscal Year Ended December 31, 2002, filed on May 14, 2003.
- (4)
- Incorporated by reference from Registrant's Schedule 14A, filed on September 10, 2003 included as schedule 1 to annex B.
- (5)
- Incorporated by reference from Registrant's Annual Report on Form 10-K for the Fiscal Year Ended December 30, 2003, filed on March 26, 2004.
- (6)
- Incorporated by reference from Registrant's Schedule 14A, filed on April 29, 2005 included as annex A.
- (7)
- Incorporated by reference from Registrant's Schedule 14A, filed on April 29, 2005 included as annex B.
- (8)
- Incorporated by reference from Registrant's Schedule 14A, filed on April 29, 2005 included as annex C.
- (9)
- Incorporated by reference from Registrant's Schedule 14A, filed on April 29, 2005 included as annex D.
- (10)
- Incorporated by reference from Registrant's Registration Statement on Form S-8, filed on February 20, 2007.
- (11)
- Incorporated by reference from Registrant's Annual Report on Form 10-K, filed on March 7, 2007.
104
- (12)
- Incorporated by reference from Registrant's Schedule 14A, filed on April 4, 2007 included as Annex B.
- (13)
- Incorporated by reference from Registrant's Schedule 14A, filed on April 4, 2007 included as Annex D.
- (14)
- Incorporated by reference from Registrant's Registration Statement on Form S-8, filed on May 3, 2007.
- (15)
- Incorporated by reference from Registrant's Current Report on Form 8-K, filed on July 5, 2007.
105
SIGNATURES
Pursuant to the requirements of Section 13 or 15(d) of the Securities Exchange Act of 1934, the registrant has duly caused this report to be signed on its behalf by the undersigned, thereunto duly authorized.
|
|
|
|
EINSTEIN NOAH RESTAURANT GROUP, INC. |
Date: February 29, 2008 |
|
By: |
|
/s/ PAUL J.B. MURPHY, III
Paul J.B. Murphy, III
Chief Executive Officer |
Pursuant to the requirements of the Securities Exchange Act of 1934, this report has been signed below by the following persons on behalf of the registrant and in the capacities indicated on February 29, 2008.
Signature
| | Title
|
|---|
|
|
|
/s/ PAUL J.B. MURPHY, III
Paul J.B. Murphy, III | | President, Chief Executive Officer and Director
(Principal Executive Officer) |
/s/ RICHARD P. DUTKIEWICZ
Richard P. Dutkiewicz |
|
Chief Financial Officer
(Principal Financial Officer) |
/s/ ROBERT E. GOWDY, JR.
Robert E. Gowdy, Jr. |
|
Controller and Chief Accounting Officer
(Principal Accounting Officer) |
/s/ MICHAEL W. ARTHUR
Michael W. Arthur |
|
Director |
/s/ E. NELSON HEUMANN
E. Nelson Heumann |
|
Director |
/s/ JAMES W. HOOD
James W. Hood |
|
Director |
/s/ FRANK C. MEYER
Frank C. Meyer |
|
Director |
/s/ S. GARRETT STONEHOUSE, JR.
S. Garrett Stonehouse, Jr. |
|
Director |
/s/ THOMAS J. MUELLER
Thomas J. Mueller |
|
Director |
106
QuickLinks
EINSTEIN NOAH RESTAURANT GROUP, INC. FORM 10-K TABLE OF CONTENTSPART IPART IIMeasurement Period—Five Years(1)(2)REPORT OF INDEPENDENT REGISTERED PUBLIC ACCOUNTING FIRMEINSTEIN NOAH RESTAURANT GROUP, INC. CONSOLIDATED BALANCE SHEETS AS OF JANUARY 2, 2007 AND JANUARY 1, 2008 (in thousands, except share information)EINSTEIN NOAH RESTAURANT GROUP, INC. CONSOLIDATED STATEMENTS OF OPERATIONS FOR THE YEAR TO DATE PERIODS ENDED JANUARY 3, 2006, JANUARY 2, 2007, AND JANUARY 1, 2008 (in thousands, except earnings per share and related share information)EINSTEIN NOAH RESTAURANT GROUP, INC. CONSOLIDATED STATEMENT OF CHANGES IN STOCKHOLDERS' DEFICIT FOR THE YEAR TO DATE PERIODS ENDED JANUARY 3, 2006, JANUARY 2, 2007 AND JANUARY 1, 2008 (in thousands, except share information)EINSTEIN NOAH RESTAURANT GROUP, INC. CONSOLIDATED STATEMENTS OF CASH FLOWS FOR THE YEAR TO DATE PERIODS ENDED JANUARY 3, 2006, JANUARY 2, 2007 AND JANUARY 1, 2008 (in thousands)EINSTEIN NOAH RESTAURANT GROUP, INC. Schedule II—Valuation and Qualifying AccountsPART IIIPART IVSIGNATURES