UNITED STATES
SECURITIES AND EXCHANGE COMMISSION
Washington, D.C. 20549
FORM 10-K
(Mark One):
| x | ANNUAL REPORT PURSUANT TO SECTION 13 OR 15(d) OF THE SECURITIES EXCHANGE ACT OF 1934 |
For the fiscal year ended December 30, 2008
OR
| ¨ | TRANSITION REPORT UNDER SECTION 13 OR 15(d) OF THE SECURITIES EXCHANGE ACT OF 1934 |
For the transition period from to
Commission File Number 1-33515
EINSTEIN NOAH RESTAURANT GROUP, INC.
(Exact Name of Registrant as Specified in its Charter)
| | |
| Delaware | | 13-3690261 |
(State or other jurisdiction of incorporation or organization) | | (I.R.S. Employer Identification No.) |
| |
| 555 Zang Street, Suite 300, Lakewood, Colorado | | 80228 |
| (Address of principal executive offices) | | (Zip Code) |
Registrant’s telephone number, including area code: (303) 568-8000
Securities registered pursuant to Section 12(b) of the Act:
| | |
Title of each class: | | Name of each exchange on which registered: |
| Common Stock, $.001 par value | | The NASDAQ Global Market |
Securities registered pursuant to Section 12(g) of the Act: None
Indicate by check mark if the registrant is a well-known seasoned issuer, as defined in Rule 405 of the Securities Act. Yes ¨ No x
Indicate by check mark if the registrant is not required to file reports pursuant to Section 13 or Section 15(d) of the Act. Yes ¨ No x
Indicate by check mark whether the registrant: (1) has filed all reports required to be filed by Section 13 or 15(d) of the Securities Exchange Act of 1934 during the preceding 12 months (or for such shorter period that the registrant was required to file such reports), and (2) has been subject to such filing requirements for the past 90 days. Yes x No ¨
Indicate by check mark if disclosure of delinquent filers pursuant to Item 405 of Regulation S-K is not contained herein, and will not be contained, to the best of the registrant’s knowledge, in definitive proxy or information statements incorporated by reference in Part III of this Form 10-K or any amendments of this Form 10-K. ¨
Indicate by check mark whether the registrant is large accelerated filer, an accelerated filer, a non-accelerated filer, or a smaller reporting company. See the definitions of “large accelerated filer,” “accelerated filer” and “smaller reporting company” in Rule 12b-2 of the Exchange Act.
| | |
| Large accelerated filer¨ | | Accelerated filerx |
Non-accelerated filer¨ (Do not check if a smaller reporting company) | | Smaller reporting company¨ |
Indicate by check mark whether the registrant is a shell company (as defined in Rule 12b-2 of the Exchange Act). Yes ¨ No x
The aggregate market value of the voting common equity held by non-affiliates of the registrant as of the last business day of the second fiscal quarter, July 1, 2008 was $53,368,183 (computed by reference to the closing sale price as reported on the NASDAQ Global Market). As of February 26, 2009 there were 16,032,943 shares of the registrant’s Common Stock, par value of $0.001 per share outstanding.
DOCUMENTS INCORPORATED BY REFERENCE
The information required by Part III is incorporated herein by reference from the registrant’s definitive proxy statement for the 2009 annual meeting of stockholders, which will be filed with the SEC within 120 days after the close of the 2008 fiscal year.
EINSTEIN NOAH RESTAURANT GROUP, INC.
FORM 10-K
TABLE OF CONTENTS
1
PART I
General development of our Company:
Einstein Noah Restaurant Group, Inc. (the “Company”) operates primarily under the Einstein Bros. Bagels (“Einstein Bros.”), Noah’s New York Bagels (“Noah’s”) and Manhattan Bagel Company (“Manhattan Bagel”) brands. We commenced operations as an operator and franchisor of coffee cafes in 1993. Substantial growth in our restaurant counts occurred through a series of acquisitions. In 1998, we acquired the stock of Manhattan Bagel Company. In 1999, we acquired the assets of Chesapeake Bagel Bakery. Our largest acquisition was in 2001 when we acquired substantially all the assets of Einstein/Noah Bagel Corp. in an auction conducted by the bankruptcy court. To consummate this acquisition, we engaged in several rounds of financing that included the issuance of $165.0 million of debt and $65.0 million of mandatorily redeemable preferred stock. In mid-2003, we recapitalized our balance sheets with the issuance of $160.0 million of indentures and the issuance of $57.0 million of mandatorily redeemable preferred stock. In June 2007 we completed a secondary offering which provided $83.3 million which was used to pay down a substantial portion of the Company’s debt.
Financial information about segments:
We operate three business segments plus a corporate support unit:
| | • | | The company-owned restaurants segment includes our Einstein Bros. and Noah’s brands, which have similar investment criteria and economic and operating characteristics. |
| | • | | The manufacturing and commissary segment produces and distributes bagel dough and other products to our restaurants, licensees and franchisees and other third parties. Inter-company sales to our company-owned restaurants have been eliminated during consolidation. |
| | • | | The franchise and license segment earns royalties and other fees from the use of trademarks and operating systems developed for the Manhattan, Einstein Bros. and Noah’s brands. |
| | • | | Corporate support unit consists of overhead and other activities related to the prior business segments, as well as interest on our debt and depreciation on our assets. |
See Note 20 to the consolidated financial statements included in Item 8 of this 10-K for the financial results by segment for fiscal years 2006, 2007 and 2008.
Narrative description of business:
Einstein Noah Restaurant Group, Inc. is the largest owner/operator, franchisor and licensor of bagel specialty restaurants in the United States. As of December 30, 2008, we had 649 restaurants in 36 states plus the District of Columbia. As a leading fast-casual restaurant chain, our restaurants specialize in high-quality foods for breakfast, lunch and afternoon snacks in a bakery-café atmosphere with a neighborhood emphasis. Collectively, our concepts span the nation with Einstein Bros. restaurants in 26 states and in the District of Columbia, Noah’s restaurants in 3 states on the west coast and Manhattan Bagel restaurants concentrated in the Northeast. Currently, our Einstein Bros. and Noah’s restaurants are predominantly company-owned or licensed, while Manhattan Bagel restaurants are predominantly franchised, with one company-owned location.
Our product offerings include fresh bagels and other bakery items baked on-site, made-to-order breakfast and lunch sandwiches on a variety of bagels, breads or wraps, gourmet soups and salads, assorted pastries, premium coffees and an assortment of snacks. Our manufacturing and commissary operations prepare and assemble consistent, high-quality ingredients that are delivered fresh to our restaurants through our network of independent distributors.
2
We believe controlling the development, sourcing, manufacturing and distribution of our key products is an important element in ensuring both quality and profitability. To support this strategy, we have developed proprietary formulations, invested in processing technology and manufacturing capacity, and aligned ourselves with strategic suppliers.
Licensing and franchising our brands allows us to increase our geographic footprint and brand recognition. We also generate additional revenues without incurring significant additional expense, capital commitments and many of the other risks associated with opening new company-owned restaurants.
Company-owned restaurants
Approximately 91% of our 2008 total revenue was generated by restaurant sales at our Einstein Bros. and Noah’s company-owned restaurants. For the year to date period ended December 30, 2008, approximately 64% of our revenues were generated from restaurant sales during the breakfast hours, 28% were generated during the lunch hours and 8% were generated during the late afternoon hours.
| | • | | Principal products and services sold:Einstein Bros. offers a menu that specializes in high-quality foods for breakfast and lunch, including fresh-baked bagels and hot breakfast sandwiches, cream cheese and other spreads, specialty coffees and teas, creative soups, salads and sandwiches, and other unique menu offerings. During fiscal years 2006, 2007 and 2008, Einstein Bros. company-owned restaurants generated approximately 80% of our total company-owned restaurant sales. |
Noah’s is a neighborhood-based, deli-inspired restaurant that serves a variety of signature sandwiches, fresh baked breads, home-style soups, tempting sweets and our award-winning bagels. Noah’s offers a menu that specializes in high-quality foods for breakfast and lunch, including fresh-baked bagels and other baked goods, made-to-order deli-style sandwiches, including such favorites as pastrami, corned beef and roast beef on fresh breads and bagels baked on premises daily, hearty soups, innovative salads, desserts, fresh brewed premium coffees and other café beverages. During fiscal years 2006, 2007 and 2008, Noah’s company-owned restaurants generated approximately 20% of our total restaurant sales.
Manhattan Bagel offers over 17 varieties of fresh-baked bagels, as well as freshly baked muffins and other pastries, and up to 15 flavors of cream cheese, a variety of breakfast and lunch sandwiches, salads, soups, coffees and café beverages and desserts. In late 2007, we acquired a location from one of our franchisees, which made it our only company-owned Manhattan Bagel restaurant. We use this location for employee and manager training, and to test out new products and services before they are rolled out system-wide.
| | • | | Status of products/service:We are planning to open new company-owned restaurants under the Einstein Bros. and Noah’s brands within existing markets. Our expansion plans are intended to increase penetration of our restaurants in our most attractive markets. In 2008, we opened 17 new company-owned restaurants. In 2009, we plan to open six to eight new company-owned restaurants. |
We believe catering is an effective way to leverage our existing restaurant infrastructure with little or no additional capital investment and to expose more people to our food and our brands. We recognize that an effective catering program requires different skills for effectively selling to businesses that frequently utilize catering. Accordingly, we have assembled a dedicated staff of catering managers and coordinators to perform this function. We have catering operations in 22 major markets and plan on adding catering specialists in five additional markets during 2009. We are in the process of implementing the centralization and automation of the ordering process to ensure the order is routed to the restaurant best positioned to fulfill it in a timely manner.
| | • | | Product Supply:Our purchasing programs provide our company-owned restaurants and our franchise and license restaurants with high quality ingredients at competitive prices from reliable sources. Consistent product specifications, as well as purchasing guidelines, help to ensure freshness and |
3
| | quality. Because we utilize fresh ingredients in most of our menu offerings, inventory at our distributors and company-owned restaurants are maintained at modest levels. We negotiate price agreements and contracts depending on supply and demand for our products and commodity pressures. These agreements can range in duration from six months to five years. Additionally, in late 2007, we contracted with a third party advisor to manage our flour purchases for our company-owned production facility, and to advise us on commodity related purchases for our third-party contracted facility. |
| | • | | Trademarks and service marks:Our rights in our trademarks and service marks are a significant part of all segments of our business. We are the owners of the federal registration rights to the “Einstein Bros.,” “Noah’s New York Bagels” and “Manhattan Bagel” marks, as well as several related word marks and word and design marks related to our core brands. We license the rights to use certain trademarks we own or license to our franchisees and licensees in connection with their operations. Many of our core brand trademarks are also registered in numerous foreign countries. We are party to a co-existence agreement with the Hebrew University of Jerusalem (“HUJ”) which sets forth the terms under which we can use the name Einstein Bros. and the terms and restrictions under which HUJ could license the name and likenesses associated with the Estate of Albert Einstein to a business that competes with the Company. We also own numerous other trademarks and service marks related to our other business. We are aware of a number of companies that use various combinations of words in our marks, some of which may have senior rights to ours for such use, but we do not consider any of these uses, either individually or in the aggregate, to materially impair the use of our marks. It is our policy to defend our marks and their associated goodwill against encroachment by others. |
| | • | | Seasonality:Our business is subject to seasonal fluctuations. Significant portions of our net revenues and results of operations are realized during the fourth quarter of the fiscal year, which includes the December holiday season. Because of the seasonality of the business and the industry, results for any quarter are not necessarily indicative of the results that may be achieved for any other quarter or the full fiscal year. |
| | • | | Dependence on a single customer: We do not have a significant concentration of sales with any individual customer and, therefore, the loss of any one customer would not have a material impact on our business. No single customer has accounted for 10% or more of our total company-owned restaurant sales. |
| | • | | Government Regulation:Each of our restaurants is subject to licensing and regulation by a number of governmental authorities, which include health, safety, labor, sanitation, building and fire agencies in the state, county, or municipality in which the restaurant is located. A failure to comply with one or more regulations could result in the imposition of sanctions, including the closing of restaurants for an indeterminate period of time, fines or third party litigation. |
| | • | | Competition:The restaurant industry is intensely competitive. The industry is often affected by changes in demographics, consumers’ eating habits and preferences, local and national economic conditions affecting consumer spending habits, population trends, and local traffic patterns. |
We experience competition from numerous sources in our trade areas. Our restaurants compete based on guests’ needs for breakfast, lunch and afternoon snacks. Our competitors are different for each daypart. The competitive factors include brand awareness, advertising effectiveness, location and attractiveness of facilities, hospitality, environment, quality and speed of guest service and the price/value of products offered. We compete in the fast-casual segment of the restaurant industry, but we also consider other restaurants in the fast-food, specialty food and full-service segments to be our competitors.
| | • | | Associates:As of December 30, 2008, the Company had 7,698 associates, of whom 7,310 were restaurant personnel. Most restaurant personnel work part-time and are paid on an hourly basis. We have never experienced a work stoppage and our associates are not represented by a labor organization. |
4
Manufacturing and Commissaries:
Approximately 7% of our 2008 total revenue was generated by our manufacturing and commissary operations.
| | • | | Manufacturing:We currently operate a bagel dough manufacturing facility in Whittier, California and have a supply contract with a single supplier to produce bagel dough to our specifications. These facilities provide frozen dough and partially-baked frozen bagels for our company-owned restaurants, franchisees and licensees. We use excess capacity to produce bagels for sale to resellers, such as Costco Wholesale Corporation and Super Target. |
We have long-standing relationships with Costco, and Super Target. Costco sells our bagels, which are co-branded with the Kirkland® brand, and Super Target sells both bagels and cream cheese in retail kiosks. We also sell frozen dough in the U.S. to a third party foreign entity who sells that product under our Einstein Bros. brand in Asia.
| | • | | Commissaries:Currently we operate five United States Department of Agriculture (“USDA”) inspected commissaries geographically located to best serve our existing company-owned, franchise and license restaurants. We believe our commissary system provides a competitive cost advantage by buying in bulk and assembling or repacking the product into store-friendly sizes for use at our company-owned restaurants, franchise and license restaurants. These operations primarily provide our restaurants with critical food products such as sliced meats, cheeses, and pre-portioned kits that create our various salads. Our commissaries assure consistent quality, supply fresh products and improve efficiencies by reducing labor and inventory requirements at the restaurants. We distribute commissary products primarily through our regional distribution partners. |
| | • | | Status of products/service:There are currently no plans to open new commissaries or production facilities in the near future. |
| | • | | Product supply: We have developed or use proprietary recipes and production processes for our bagel dough, cream cheese and coffee to help ensure product consistency. We believe this system provides a variety of consistent, superior quality products at competitive market prices to our company-owned, franchised and licensed restaurants. |
Frozen bagel dough is shipped to all of our company-owned, franchised and licensed Einstein Bros., Noah’s and Manhattan Bagel restaurants and baked on-site. Our significant know-how and technical expertise for manufacturing and freezing mass quantities of raw dough produces a high-quality product more commonly associated with smaller bakeries.
Our cream cheese is manufactured to our specifications utilizing proprietary recipes. Our cream cheese and certain other cheese products are purchased from one supplier under a contract that has been extended through the end of 2013. We also have developed proprietary coffee blends for sale at our Einstein Bros., Noah’s and Manhattan Bagel company-owned, franchised and licensed restaurants.
We purchase other ingredients used in our restaurants, such as meat, lettuce, tomatoes and condiments, from a select group of third party suppliers. Our chicken products come from naturally raised chickens that are cared for in strict accordance with established animal care guidelines and without the use of growth accelerators such as antibiotics, steroids or hormones. Our roast beef is USDA Choice, Grade A, and comes only from corn-fed, domestic cattle. Where available, we buy high quality fruits, vegetables and specialty produce from local farmers and shippers through distributors.
| | • | | Seasonality: Seasonality related to this segment is driven by the seasonality at the restaurants. |
| | • | | Dependence on a single customer: A significant concentration of our manufacturing and commissary revenues is with several customers who resell our product; approximately half of this revenue is from one large customer; however, no single customer has accounted for 10% or more of our total Company revenues and, therefore, the loss of any one customer would not have a material impact on our business. |
5
| | • | | Backlog: Our manufacturing and commissary facilities do not have a material amount of backlog orders. |
| | • | | Government Regulation:Our manufacturing and commissary facilities are licensed and subject to regulation by either federal, state or local health and fire codes. We are subject to the regulations of keeping our facilities USDA compliant. Additionally, we are also subject to federal and state environmental regulations. |
| | • | | Competition: Our manufacturing and commissary operations are primarily ancillary and support our company-owned restaurant operations as well as our franchisees and licensees. Our competition would be from several large bakeries and from local bakeries in the states in which we operate. |
| | • | | Associates: As of December 30, 2008, the Company had 7,698 associates, of whom 155 were plant and support services personnel. We have never experienced a work stoppage and our associates are not represented by a labor organization. |
Franchise and Licensing
Approximately 2% of our 2008 total revenue was generated by our franchise and license operations.
| | • | | Einstein Bros. franchising:We are offering Einstein Bros. franchises to qualified area developers. As of December 30, 2008, we were registered to offer Einstein Bros. franchises in 49 states and are currently working to finalize our registration in the 50th state. During 2008, we actively marketed the Einstein Bros. brand franchise rights and signed several multi-location deals. We currently have seven development agreements in place for 47 restaurants that we expect will open on various dates through 2016. The first two Einstein Bros. franchise locations opened in 2008. |
Unlike past Manhattan Bagel franchises, which were sold as single franchised units, we plan to utilize a franchise area development model for the Einstein Bros. brand in which we will assign exclusive rights to develop restaurants within a defined geographic region within a specified period of time. We are targeting franchise area developers who have the existing infrastructure, operational experience and financial strength to develop several restaurants in a designated market. The franchise agreement requires an up-front fee of $35,000 per restaurant and a 5% royalty based on sales.
We intend to enter into franchise area development agreements in geographic markets where we either currently do not have Einstein Bros. restaurants or in markets that can support both franchised and company-owned restaurants. In markets where we have limited market penetration, we may also consider selling existing Einstein Bros. restaurants to a franchise area developer. In these instances, we plan to require the franchise area developer to open a minimum number of additional restaurants within a designated period of time.
| | • | | Manhattan Bagel Franchising:We currently have a franchise base in our Manhattan Bagel brand that generates a recurring revenue stream through royalty fee payments and revenue from the sale to our franchisees of products made from our proprietary recipes. The typical Manhattan Bagel franchise agreement requires an up-front fee of $25,000 per restaurant and a 5% royalty based on sales. Our Manhattan Bagel franchise base provides us with the ability to grow this brand with minimal commitment of capital by us, and creates a built-in customer base for our manufacturing operations. The core market for this brand is the northeastern United States with the majority of the Manhattan Bagel restaurants located in New Jersey, New York, and Pennsylvania. Our Manhattan Bagel franchise restaurants generally have average unit volumes of approximately $561,000. |
| | • | | Licensing:We have license relationships with Aramark, Sodexho, AAFES, HMS Host, Compass, and SSP. Our licensees are located primarily in airports, colleges and universities, hospitals and military bases and on turnpikes. Our license agreements vary by venue, but typically have a five-year term and provide that the licensee pays us an up-front license fee of $12,500 and a weighted average royalty fee of 6.2%. Our license restaurants generally have average unit volumes of approximately $495,000. |
6
| | • | | Status of development plans or expansion: We are planning to expand our presence through a significant expansion of franchise and license restaurants. This strategy allows us to generate additional revenues without incurring significant additional expense, capital commitments or many of the other risks associated with opening new company-owned restaurants. We also expect to increase our geographic footprint and guest recognition of our brands. |
At the end of 2008, we had 71 franchised locations throughout the United States. We intend to leverage our franchising experience with the Manhattan Bagel brand and to accelerate the franchising of our Einstein Bros. brand and expand the current Manhattan Bagel franchise system. We have identified specific markets in which we intend to grow through franchising and are currently in discussions with several parties to develop in these markets. We opened two franchise restaurants in 2008, and currently are planning to open six to eight more in 2009.
At the end of 2008, we had 152 license restaurants throughout the United States. We opened 32 new license restaurants in 2008 and currently are planning to open at 30 to 35 new license restaurants in 2009.
| | • | | Product Supply:Our franchisees and licensees are required to purchase proprietary products through our designated suppliers or directly from us. Our Manhattan Bagel franchisees are not required to buy all of their non-proprietary products directly from us, but rather their product sources must be approved by us. |
| | • | | Seasonality: This segment is subject to the same seasonal fluctuations as our company-owned restaurant segment. Additionally, as many of our license locations are on college and university campuses, they are impacted by school schedules which typically include a summer break and the December holiday season. Because of the seasonality of the business and the industry, results for any quarter are not necessarily indicative of the results that may be achieved for any other quarter or the full fiscal year. |
| | • | | Dependence on a single customer: A significant concentration of our franchise and licensing revenues is with several large customers who have licensed multiple locations. However, no single customer has accounted for 10% or more of our total Company revenues and, therefore, the loss of any one customer would not have a material impact on our business. |
| | • | | Government Regulation:Our franchise operations are subject to Federal Trade Commission (the “FTC”) regulation and various state laws which regulate the offer and sale of franchises. Several state laws also regulate substantive aspects of the franchisor/franchisee relationship. The FTC requires us to furnish to prospective franchisees a franchise disclosure document containing prescribed information. A number of states in which we might consider franchising also regulate the sale of franchises and require registration of the disclosure document with state authorities. Our ability to sell franchises in those states is dependent upon obtaining approval of our disclosure document by those authorities. |
| | • | | Competition:We compete against similar fast-casual and quick-casual restaurants which franchise and license their brands in the states in which we operate. |
| | • | | Associates:As of December 30, 2008, the Company had 7,698 associates, of whom 23 were corporate personnel who work primarily with franchising and licensing. In addition, there were 210 corporate personnel, many of which assist in the segment in one way or another. |
Corporate Support
| | • | | Principal products/services sold: The support center is not a profit center and is designed to manage and support all of our company-owned restaurants, the manufacturing facility and commissaries and support our franchisees and licensees as well as general corporate governance. |
| | • | | Associates:As of December 30, 2008, the Company had 7,698 associates, of whom 233 were corporate personnel. |
7
Financial information about geographic areas:
Our manufacturing operations sell bagels to a wholesaler and a distributor who take possession in the United States and sell outside of the United States. As the product is shipped FOB domestic dock, there are no international risks of loss or foreign exchange currency issues. Sales shipped internationally are included in manufacturing and commissary revenue. Approximately $2.2 million, $3.3 million and $4.8 million for 2006, 2007, and 2008 respectively, were included in manufacturing revenue for these international shipments. All other revenues were from external customers domiciled in the United States of America.
Available Information:
We are subject to the informational requirements of the Securities Exchange Act of 1934. We therefore file periodic reports, proxy statements and other information with the Securities Exchange Commission (the “SEC”). Such reports may be obtained by visiting the Public Reference Room of the SEC at 100 F Street, N.E., Washington, D.C. 20549, or by calling the SEC at 1-800-SEC-0330. In addition, the SEC maintains an internet site (www.sec.gov) that contains reports, proxy and information statements and other information regarding issuers that file electronically.
Additionally, copies of our reports on Forms 10-K, 10-Q and 8-K and any amendments to such reports are available for viewing and copying through our internet site (www.einsteinnoah.com), free of charge, as soon as reasonably practicable after filing such material with, or furnishing it to the SEC. We typically post information about the Company on our website under the Financials & Media tab.
We also make available on our website and in print to any stockholder who requests it, the Charters for our Audit and Compensation Committees, as well as the Code of Conduct that applies to all directors, officers, and associates of our company. Amendments to these documents or waivers related to the Code of Conduct will be made available on our website as soon as reasonably practicable after their execution.
Executive Officers:
| | | | |
Name | | Age | | Position |
Jeffery J. O’Neill | | 52 | | President, Chief Executive Officer and Director |
Daniel J. Dominguez | | 63 | | Chief Operating Officer |
Richard P. Dutkiewicz | | 53 | | Chief Financial Officer |
Jill B.W. Sisson | | 61 | | General Counsel and Secretary |
Jeffrey J. O’Neill. Mr. O’Neill joined us in December 2008 when he was appointed President and Chief Executive Officer. Previously, from January 2008 to October 2008, Mr. O’Neill was Chief Executive Officer of Priszm Income Fund, a publicly traded Canadian restaurant income trust with a portfolio of popular brands such as Pizza Hut and Taco Bell, which is also one of the largest independent KFC franchisees in the world. Prior to that, from April 2005 until January 2008, Mr. O’Neill was President and Chief Operating Officer of Priszm. Mr. O’Neill began his career in Brand Marketing with The Quaker Oats Company. In April 1999, he joined PepsiCo as the President of Pepsi Cola Canada. In 2002 PepsiCo acquired the Quaker Oats Company and in January 2003 Mr. O’Neill returned to his old company in Chicago to help lead the integration of the Quaker Oats/Gatorade acquisition. Mr. O’Neill has an Honors Bachelor of Business degree from the University of Ottawa.
Daniel J. Dominguez. Mr. Dominguez was appointed Chief Operating Officer in December 2005. Mr. Dominguez joined us in November 1995 and served as Senior Vice President of Operations for Noah’s New York Bagels from April 1998 to December 2005. From 1995 to April 1998, Mr. Dominguez served as the Director of Operations for Einstein Bros. Midwest. Prior to joining us, Mr. Dominguez was Executive Vice President of JB Patt America, Beverly Hills, CA, dba Koo Koo Roo Restaurants, from July 1994 to October 1995. From May 1987 to July 1994, he was the Divisional Vice President of Food Services for Carter
8
Hawley Hale in San Francisco, California. From November 1976 to May 1987 he was the Vice President of Operations for Bakers Square Restaurants in California.
Richard P. Dutkiewicz. Mr. Dutkiewicz joined us in October 2003 as Chief Financial Officer. From May 2003 to October 2003, Mr. Dutkiewicz was Vice President—Information Technology of Sirenza Microdevices, Inc. In May 2003, Sirenza Microdevices, Inc. acquired Vari-L Company, Inc. From January 2001 to May 2003, Mr. Dutkiewicz was Vice President—Finance, and Chief Financial Officer of Vari-L Company, Inc. From April 1995 to January 2001, Mr. Dutkiewicz was Vice President—Finance, Chief Financial Officer, Secretary and Treasurer of Coleman Natural Products, Inc., located in Denver, Colorado. Mr. Dutkiewicz’s previous experience includes senior financial management positions at Tetrad Corporation, MicroLithics Corporation and various divisions of United Technologies Corporation. Mr. Dutkiewicz began his career as an Audit Manager at KPMG LLP. Mr. Dutkiewicz received a B.B.A. degree from Loyola University of Chicago.
Jill B. W. Sisson.Ms. Sisson joined us as a consultant in December 2003. She most recently served as General Counsel and Secretary of Graphic Packaging International Corporation from September 1992 until its merger with Riverwood Holding, Inc. in August 2003. From 1974 to September 1992, she engaged in private law practice in Denver, Colorado. She has a B.A. degree from Middlebury College and received her J.D. degree from the University of Colorado Law School.
We wish to caution our readers that the following important factors, among others, could cause the actual results to differ materially from those indicated by forward-looking statements made in this report and from time to time in news releases, reports, proxy statements, registration statements and other written communications, as well as verbal forward-looking statements made from time to time by representatives of the Company. Such forward-looking statements involve risks and uncertainties that may cause our actual results, performance or achievements to be materially different from any future performance or achievements expressed or implied by these forward-looking statements. Factors that might cause actual events or results to differ materially from those indicated by these forward-looking statements may include matters such as future economic performance, restaurant openings or closings, operating margins, the availability of acceptable real estate locations, the sufficiency of our cash balances and cash generated from operating and financing activities for our future liquidity and capital resource needs, and other matters, and are generally accompanied by words such as: believes, anticipates, plans, intends, estimates, predicts, targets, expects, contemplates and similar expressions that convey the uncertainty of future events or outcomes. An expanded discussion of some of these risk factors follows.
Risk Factors Relating to Our Business and Our Industry
General economic conditions have affected, and could continue to affect, discretionary consumer spending, particularly spending for meals prepared away from home.
International, national and local economic conditions, including credit and mortgage markets, energy costs, lay-offs, foreclosure rates, bankruptcies, and similar adverse economic news and factors affect discretionary consumer spending. These factors could reduce consumers’ discretionary spending which in turn could reduce our guest traffic or average check. In 2007 and 2008, restaurants industry-wide were adversely affected as a result of reduced consumer spending due to rising fuel and energy costs, lay-offs and general economic conditions. The conditions experienced recently also include reduced consumer confidence, on-going concerns about down-sizing and lay-offs, the housing market, concerns over the stability of financial institutions, and increased health care and energy costs. Adverse changes in consumer discretionary spending, which could be affected by many different factors which are out of our control, including those listed above, could harm our business prospects, financial condition, operating results and cash flows. Our success will depend in part upon our ability to anticipate, identify and respond to changing economic and other conditions.
9
The economic turmoil that has arisen in the credit markets and in the housing markets as well as job losses throughout various sectors of the economy during and following fiscal 2008 may continue to suppress discretionary spending and other consumer purchasing habits and, as a result, adversely affect our results of operations.
Failure to protect food supplies and adhere to food safety standards could result in food-borne illnesses.
Food safety and reputation for quality is the most significant risk to any company that operates in the restaurant industry. Food safety is the focus of increased government regulatory initiatives at the local, state and federal levels.
Failure to protect our food supply or enforce food safety policies, such as proper food temperatures and adherence to shelf life dates, could result in food-borne illnesses and/or injuries to our guests. Also, our reputation of providing high quality food is an important factor in choosing our restaurants. Instances of food borne illness, including listeriosis, salmonella and e-coli, whether or not traced to our restaurants, could reduce demand for our menu offerings. If any of our guests become ill from consuming our products, the affected restaurants may be forced to close. An instance of food contamination originating from one of our restaurants, our commissaries or suppliers, or our manufacturing plant could have far-reaching effects, as the contamination, or the perception of contamination could affect substantially all of our restaurants. In addition, publicity related to either product contamination or recalls may cause our guests to cease frequenting our restaurants based on fear of such illnesses.
Volatile commodity prices would adversely affect our gross profit.
Global demand for commodities such as wheat has resulted, and could in the future result, in higher prices for flour which would increase our costs. The prices of our main ingredients are directly associated with the changing weather conditions as well as economic factors such as supply and demand of certain commodities within the United States and other countries. Our ability to forecast and manage our commodities could significantly affect our gross margins. Any increase in the prices of the ingredients most critical to our products, such as wheat, could adversely affect our operating results.
Additionally, in the event of destruction of products such as tomatoes or peppers or massive culling of specific animals such as chickens or turkeys to prevent the spread of disease, the supply and availability of ingredients may become limited. This could dramatically increase the price of certain menu items which could decrease sales of those items or could force us to eliminate those items from our menus entirely. All of these factors could adversely affect our business, reputation and financial results.
We may not be successful in implementing any or all of the initiatives of our business strategy.
Our success depends in part on our ability to understand and satisfy the needs of our guests, franchisees and licensees. Our business strategy consists of several initiatives:
| | • | | expand sales at our existing company-owned restaurants; |
| | • | | open new company-owned restaurants; and |
| | • | | open new franchise and license restaurants. |
Our ability to achieve any or all of these initiatives is uncertain. Our success in expanding sales at company-owned restaurants through various sub-initiatives including: promoting and offering value to our customers through discounts, coupons and new menu offerings and broadening our offerings across multiple dayparts, improving our ordering and production systems, expanding our catering program and upgrading our restaurants is dependent in part on our ability to offer value to consumers, attract new customers, predict and satisfy consumer preferences and as mentioned above, consumer’s ability to respond positively in a troublesome economic
10
environment. Our success in growing our business through opening new company-owned restaurants is dependent on a number of factors, including our ability to: find suitable locations, reach acceptable lease terms, have adequate capital, find acceptable contractors, obtain licenses and permits, recruit and train appropriate staff and properly manage the new restaurant. Our success in opening new franchise and license restaurants is dependent upon, among other factors, our ability to: attract quality businesses to invest in our core brands, maintain the effectiveness of our franchise disclosure documents in target states, offer restaurant solutions for a variety of location types and the ability of our franchisees and licensees to: find suitable locations, reach acceptable lease terms, have adequate capital, secure reasonable financing, find available contractors, obtain licenses and permits, locate and train staff appropriately and properly manage the new restaurants. If we are not successful in implementing any or all of the initiatives of our business strategy, it could have a material adverse effect on our business, results of operations, and financial condition.
Competition in the restaurant industry is intense.
Our industry is highly competitive and there are many well-established competitors. While we operate in the fast-casual segment of the restaurant industry, we also consider restaurants in the fast-food and full-service segments to be our competitors. Several fast-casual and fast-food chains are focusing more on breakfast offerings and expanding their coffee offerings. This could further increase competition in the breakfast daypart. In addition to current competitors, one or more new major competitors with substantially greater financial, marketing and operating resources could enter the market at any time and compete directly against us. Also, in virtually every major metropolitan area in which we operate or expect to enter, local or regional competitors already exist. This may make it more difficult to attract and retain guests.
Numerous factors including changes in consumer tastes and preferences often affect restaurants. Shifts in consumer preferences away from our type of cuisine and/or the fast-casual style could have a material effect on our results of operations. Dietary trends, such as the consumption of food low in carbohydrate content have, in the past, and may, in the future, negatively impact our sales. Changes in our guests’ spending habits and preferences could have a material adverse effect on our sales. Our results will depend on our ability to respond to changing consumer preferences and tastes. In addition, recent local and state regulations mandating prominent disclosure of nutritional and calorie information may result in reduced demand for some of our products which could be viewed as containing too much fat or too many calories.
We occupy our company-owned restaurants under long-term non-cancelable leases, and we may be unable to renew leases at the end of their lease periods or obtain new leases on acceptable terms.
We do not own any real property, and all of our company-owned restaurants are located in leased premises. Many of our current leases are non-cancelable and typically have terms ranging from five to ten years with two three- to five-year renewal options. We believe leases that we enter into in the future likely will also be long-term and non-cancelable and have similar renewal options. Most of our leases provide that the landlord may increase the rent over the term of the lease, and require us to pay our proportionate share of the cost of insurance, taxes, maintenance and utilities. If we close a restaurant, we generally remain committed to perform our obligations under the applicable lease, which would include, among other things, payment of the base rent for the balance of the lease term. In some instances, we may be unable to close an underperforming restaurant due to continuous operation clauses in our lease agreements. Our obligation to continue making rental payments in respect of leases for closed or underperforming restaurants could have an adverse effect on our business and results of operations.
If we are unable to renew our restaurant leases, we may be forced to close or relocate a restaurant, which could subject us to construction and other costs and risks, and could have a material adverse effect on our business and results of operations. For example, closing a restaurant, even during the time of relocation, will reduce the sales that the restaurant would have contributed to our revenues. Additionally, the revenue and profit, if any, generated at a relocated restaurant may not equal the revenue and profit generated at the existing restaurant. We also face competition from both restaurants and other retailers for suitable sites for new restaurants.
11
Our operations may be negatively impacted by adverse weather conditions and natural disasters.
Adverse weather conditions and natural disasters may at times affect regions in which our company-owned, franchised and licensed restaurants are located, regions that produce raw ingredients for our restaurants, or locations of our distribution network. If adverse weather conditions or natural disasters such as fires and hurricanes affect our restaurants, we could experience closures, repair and restoration costs, food spoilage, and other significant reopening costs as well as increased food costs and delayed supply shipments, any of which would adversely affect our business. In addition, if adverse weather or natural disasters affect our distribution network, we could experience shortages or delayed shipments at our restaurants, which could adversely affect them. Additionally, during periods of extreme temperatures (either hot or cold) or precipitation, many individuals choose to stay inside. This impacts transaction counts in our restaurants and could adversely affect our business and results of operations.
The effects of hurricanes, fires, snowstorms, freezes and other adverse weather conditions are likely to affect supply of and costs for raw ingredients and natural resources, near-term construction costs for our new restaurants as well as sales in our restaurants going forward. If we are not able to anticipate or react to changing costs of food and other raw materials by adjusting our purchasing practices or menu prices, our operating margins would likely deteriorate.
We have single suppliers for most of our key products, and the failure of any of these suppliers to perform could harm our business.
We currently purchase our raw materials from various suppliers; however, we have only one supplier for most of our key products. We purchase all of our cream cheese from a single source. Also, we purchase a majority of our frozen bagel dough from a single supplier, who utilizes our proprietary processes and on whom we are dependent in the short-term. All of our remaining frozen bagel dough is produced at our dough manufacturing facility in Whittier, California. Although to date we have not experienced significant difficulties with our suppliers, our reliance on a single supplier for most of our key ingredients subjects us to a number of risks, including possible delays or interruption in supplies, diminished control over quality and a potential lack of adequate raw material capacity. Any disruption in the supply or degradation in the quality of the materials provided by our suppliers could have a material adverse effect on our business, operating results and financial condition. In addition, any such disruptions in supply or degradations in quality could have a long-term detrimental impact on our efforts to maintain a strong brand identity and a loyal consumer base.
Disruptions or supply issues could adversely affect our business and reputation.
We depend on our network of independent regional distributors to distribute frozen bagel dough and other products and materials to our company-owned, franchised and licensed restaurants. Any failure by one or more of our distributors to perform as anticipated, or any disruption in any of our distribution relationships for any reason, would subject us to a number of risks, including inadequate products delivered to our restaurants, diminished control over quality of products delivered, and increased operating costs to prevent delays in deliveries. Any of these events could harm our relationships with our franchisees or licensees, or diminish the reputation of our menu offerings or our brands in the marketplace. In addition, a negative change in the volume of products ordered from our distributors by our company-owned, franchised and/or licensed restaurants could increase our distribution costs. These risks could have a material adverse effect on our business, financial condition and results of operations.
Additionally, increased costs and distribution issues related to fuel and utilities could also materially impact our business and results of operations.
12
Increasing labor costs could adversely affect our results of operations and cash flows.
We are dependent upon an available labor pool of associates, many of whom are hourly employees whose wages may be affected by increases in the federal, state or municipal “living wage” rates. Numerous increases have been made on federal, state and local levels to increase minimum wage levels. Increases in the federal and state minimum hourly wage rates in some of the states in which we operate became effective throughout 2008 and additional increases will become effective throughout 2009. Increases in the minimum wage may create pressure to increase the pay scale for our associates, which would increase our labor costs and those of our franchisees and licensees.
A shortage in the labor pool or other general inflationary pressures or changes could also increase labor costs. Changes in the labor laws or reclassifications of associates from management to hourly employees could affect our labor cost. An increase in labor costs could have a material adverse effect on our income from operations and decrease our profitability and cash flows if we are unable to recover these increases by raising the prices we charge our guests.
We may not be able to comply with certain debt covenants or generate sufficient cash flow to make payments on our substantial amount of debt or redeem our mandatorily redeemable preferred stock when due.
Our current debt agreements contain certain covenants, which, among others, include certain financial covenants such as limitations on capital expenditures, maintenance of the business, use of proceeds from sales of assets and consolidated leverage and fixed charge coverage ratios as defined in the agreements. The covenants also preclude the declaration and payment of dividends or other distributions to holders of our common stock. We are subject to multiple economic, financial, competitive, legal and other risks that are beyond our control and could harm our future financial results. Any adverse effect on our business or financial results could affect our ability to maintain compliance with our debt covenants, and any failure by us to comply with these covenants could result in an event of default. If we were to default under our covenants and such default were not cured or waived, our indebtedness could become immediately due and payable, which could render us insolvent.
We have a considerable amount of debt and are substantially leveraged. In addition, we may, subject to certain restrictions, incur substantial additional indebtedness in the future. Our high level of debt, among other things, could:
| | • | | make it difficult for us to satisfy our obligations under our indebtedness; |
| | • | | limit our ability to obtain additional financing for working capital, capital expenditures, acquisitions and general corporate purposes; |
| | • | | increase our vulnerability to downturns in our business or the economy generally; |
| | • | | increase our vulnerability to volatility in interest rates; and |
| | • | | limit our ability to withstand competitive pressures from our less leveraged competitors. |
Economic, financial, competitive, legislative and other factors beyond our control may affect our ability to generate cash flow from operations to make payments on our indebtedness and to fund necessary working capital. A significant reduction in operating cash flow would likely increase the need for alternative sources of liquidity. If we are unable to generate sufficient cash flow to make payments on our debt, we will have to pursue one or more alternatives, such as reducing or delaying capital expenditures, refinancing our debt on terms that are not favorable to us, selling assets or issuing additional equity securities. We may not be able to accomplish any of these alternatives on satisfactory terms, if at all, and even if accomplished, they may not yield sufficient funds to service our debt.
We have $57.0 million of mandatorily redeemable preferred stock due June 30, 2009. Given the current state of the credit markets as well as the financial condition of some of our lenders, our ability to borrow
13
additional funds on our First Lien credit facility could be unlikely. Failure to redeem all of the preferred stock on June 30, 2009 will result in us paying additional redemption price to redeem the remaining shares in the future.
We face the risk of adverse publicity and litigation in connection with our operations.
We are from time to time the subject of complaints or litigation from our consumers alleging illness, injury or other food quality, health or operational concerns. Adverse publicity resulting from these allegations may materially adversely affect us, regardless of whether the allegations are valid or whether we are liable. In addition, employee claims against us based on, among other things, discrimination, harassment or wrongful termination, or labor code violations may divert financial and management resources that would otherwise be used to benefit our future performance. For example, we recently settled two class actions in California as described in Note 19 to our Consolidated Financial Statements set forth in Item 8 of this report. There is also a risk of litigation from our franchisees and licensees. We have been subject to a variety of these and other claims from time to time and a significant increase in the number of these claims or the number that are successful could materially adversely affect our business, prospects, financial condition, operating results or cash flows.
A regional or global health pandemic could severely affect our business.
A health pandemic is a disease that spreads rapidly and widely by infection and affects many individuals in an area or population at the same time. If a regional or global health pandemic were to occur, depending upon its duration and severity, our business could be severely affected. We have positioned ourselves as a “neighborhood atmosphere” between home and work where people can gather for human connection and high quality food. Customers might avoid public gathering places in the event of a health pandemic, and local, regional or national governments might limit or ban public gatherings to halt or delay the spread of disease. A regional or global pandemic might also adversely impact our business by disrupting or delaying production and delivery of products and materials in our supply chain and causing staff shortages in our restaurants. The impact of a health pandemic might be disproportionately greater on us than on other companies that depend less on the gathering of people in a neighborhood atmosphere.
Our franchisees and licensees may not help us develop our business as we expect, or could actually harm our business.
We rely in part on our franchisees and licensees and the manner in which they operate their restaurants to develop and promote our business. Although we have developed criteria to evaluate and screen prospective candidates, the candidates may not have the business acumen or financial resources necessary to operate successful restaurants in their respective areas. In addition, franchisees and licensees are subject to business risks similar to what we face such as competition, consumer acceptance, fluctuations in the cost, availability and quality of raw ingredients, and increasing labor costs. The failure of franchisees and licensees to operate successfully could have a material adverse effect on us, our reputation, our ability to collect royalties, our brands and our ability to attract prospective candidates. Potential franchisees and licensees may have difficulty obtaining proper financing as a result of the downturn in the credit markets. As we offer and grant franchises for our Einstein Bros. brand, our reliance on our franchisees is expected to increase in proportion to growth of the franchisee base. With respect to franchising our Einstein Bros. brand, we may not be able to identify franchisees that meet our criteria, or to enter into franchise area development agreements with prospective franchisee candidates that we identify. As a result, our franchise program for the Einstein Bros. brand may not grow at the rate we currently expect, or at all.
14
Our restaurants and products are subject to numerous and changing government regulations. Failure to comply could negatively affect our sales, increase our costs or result in fines or other penalties against us.
Each of our restaurants is subject to licensing and regulation by the health, sanitation, safety, labor, building and fire agencies of the respective states, counties, cities and municipalities in which it is located. A failure to comply with one or more regulations could result in the imposition of sanctions, including the closing of facilities for an indeterminate period of time, or third party litigation, any of which could have a material adverse effect on us and our results of operations.
Recently, many government bodies have begun to legislate or regulate high-fat and high sodium foods and disclosure of nutritional information as a way of combating concerns about obesity and health. In addition to the phase-out of artificial trans-fats, public interest groups have focused attention on the marketing of high-fat and high-sodium foods to children in a stated effort to combat childhood obesity. Some cities and states have recently adopted or are considering regulations requiring disclosure of nutritional facts, including calorie information, on menus and/or menu boards. Additional cities or states may propose or adopt similar regulations. The cost of complying with these regulations could increase our expenses and the possible negative publicity arising from such legislative initiatives could reduce our future sales.
Our franchising operations are subject to regulation by the Federal Trade Commission. We must also comply with state franchising laws and a wide range of other state and local rules and regulations applicable to our business. The failure to comply with federal, state and local rules and regulations would have an adverse effect on us.
Under various federal, state and local laws, an owner or operator of real estate may be liable for the costs of removal or remediation of certain hazardous or toxic substances on or in such property. Such liability may be imposed without regard to whether the owner or operator knew of, or was responsible for, the presence of such hazardous or toxic substances. Although we are not aware of any environmental conditions that require remediation by us under federal, state or local law at our properties, we have not conducted a comprehensive environmental review of our properties or operations. We may not have identified all of the potential environmental liabilities at our properties, and any such liabilities that are identified in the future may have a material adverse effect on our financial condition.
We may not be able to protect our trademarks, service marks and other proprietary rights.
We believe our trademarks, service marks and other proprietary rights are important to our success and our competitive position. Accordingly, we devote substantial resources to the establishment and protection of our trademarks, service marks and proprietary rights. However, the actions we take may be inadequate to prevent imitation of our products and concepts by others, to prevent various challenges to our registrations or applications or denials of applications for the registration of trademarks, service marks and proprietary rights in the U.S. or other countries, or to prevent others from claiming violations of their trademarks and proprietary marks. In addition, others may assert rights in our trademarks, service marks and other proprietary rights.
Our ability to use net operating loss carryforwards to offset future taxable income for U.S. federal income tax purposes is subject to limitation.
In general, under Section 382 of the Internal Revenue Code, a corporation that undergoes an “ownership change” is subject to limitations on its ability to utilize its pre-change net operating loss (“NOL”) carryforwards to offset future taxable income. A corporation generally undergoes an “ownership change” when the stock ownership percentage (by value) of its “5 percent stockholders” increases by more than 50 percentage points over any three-year testing period.
As of December 30, 2008, our NOL carryforwards for U.S. federal income tax purposes were approximately $135.4 million. As a result of prior ownership changes, approximately $29.8 million of our NOL carryforwards
15
are subject to an annual usage limitation of $2.5 million. Due to transactions involving the sale or other transfer of our stock from the date of our last ownership change through the date of the secondary public offering of our common stock, and changes in the value of our stock during that period, such offering may result in an additional ownership change for purposes of Section 382 or will significantly increase the likelihood that we will undergo an additional ownership change in the future (which could occur as a result of transactions involving our stock that are outside of our control). In either event, the occurrence of an additional ownership change would limit our ability to utilize the approximately $105.6 million of our NOL carryforwards that are not currently subject to limitation, and could further limit our ability to utilize our remaining NOL carryforwards and possibly other tax attributes. Limitations imposed on our ability to use NOL carryforwards and other tax attributes to offset future taxable income could cause us to pay U.S. federal income taxes earlier than we otherwise would if such limitations were not in effect, and could cause such NOL carryforwards and other tax attributes to expire unused, in each case reducing or eliminating the benefit of such NOL carryforwards and other tax attributes to us and adversely affecting our future cash flow. We filed a request with the Internal Revenue Service to review our methodology for determining ownership changes in accordance with Internal Revenue Code Section 382 on December 30, 2008. In the event that our request is not accepted, approximately $40.5 million of NOL carryforwards will be at risk to expire prior to utilization. Similar rules and limitations may apply for state income tax purposes as well.
Risk Factors Relating to Our Common Stock
We have a majority stockholder.
Greenlight Capital, L.L.C. and its affiliates (“Greenlight”) beneficially own approximately 67% of our common stock as of December 30, 2008. As a result, Greenlight has sufficient voting power, without the vote of any other stockholders, to determine what matters will be submitted for approval by our stockholders to elect all of the members of our board of directors, and to determine whether a change in control of our company occurs. Greenlight’s interests on matters submitted to stockholders may be different from those of other stockholders. Greenlight has voted its shares to elect our current board of directors, and the chairman of our board of directors is a current employee of Greenlight.
We have listed our common stock on the NASDAQ Global Market. NASDAQ rules require us to have an audit committee consisting entirely of independent directors. However, under NASDAQ rules, if a single stockholder holds more than 50% of the voting power of a listed company, that company is considered a controlled company, and is exempt from several other corporate governance rules, including the requirement that companies have a majority of independent directors and independent director involvement in the selection of director nominees and in the determination of executive compensation. As a result, our stockholders do not have, and may never have, the protections that these rules are intended to provide. The Company currently has a majority of independent directors on the board of directors.
Future sales of shares of our common stock by our stockholders could cause our stock price to fall.
If a substantial number of shares of our common stock are sold in the public market, the market price of our common stock could fall. The perception among investors that these sales will occur could also produce this effect. Our majority stockholder, Greenlight, beneficially owns approximately 67% of our common stock as of December 30, 2008 and sales by Greenlight or a perception that Greenlight will sell could cause a decrease in the market price of our common stock.
16
| ITEM 1B. | UNRESOLVED STAFF COMMENTS |
None
Our Properties
All of our restaurants are located on leased premises. As of December 30, 2008, leases for approximately 26 restaurants are set to expire within the next 12 months and most of these leases contain a renewal option, usually with modified pricing terms to reflect current market rents. Lease terms are usually five to 10 years, with either two, three or five year renewal option periods, for total lease terms that average approximately 11 to 20 years. Our leases generally require us to pay a proportionate share of real estate taxes, insurance, common charges and other operating costs.
As of December 30, 2008, we have identified approximately 10 to 15 company-owned restaurants that we anticipate closing over the next three years as their leases expire. Generally, these restaurants have an average unit volume of less than $650,000 and contribute negative or negligible cash flow. Additionally, there are four restaurants with average unit volumes greater than $650,000 that we anticipate closing over the next three years as they are either in areas being taken over by eminent domain or the landlord is completely redeveloping the area and will not renew our lease.
The average Einstein Bros. restaurant is approximately 2,200 to 2,500 square feet in size with approximately 40 seats and is generally located in a neighborhood or regional shopping center. We design each restaurant to create a comfortable, casual environment that is consumer friendly, inviting and reflective of the brand’s personality and strong neighborhood identity.
The average Noah’s restaurant is approximately 1,800 to 2,400 square feet in size with approximately 30 to 40 seats and is located in urban neighborhoods or regional shopping centers. We use elaborate tile work and wood accents in the brand’s design to create an environment reminiscent of a Lower East Side New York deli, which reinforces the brand’s urban focus with an emphasis on the authenticity of a New York deli experience.
The average Manhattan Bagel restaurant is approximately 1,400 to 2,500 square feet with 24 to 50 seats and is primarily located in suburban neighborhoods or regional shopping centers. Manhattan Bagel restaurants are designed to combine the authentic atmosphere of a bagel bakery with the comfortable setting of a neighborhood meeting place.
Information with respect to our headquarters, production and commissary facilities is presented below:
| | | | | | |
Location | | Facility | | Square
Feet | | Lease
Expiration |
Lakewood, Colorado | | Headquarters, Support Center, Test Kitchen | | 44,574 | | 5/31/2017 |
Whittier, California | | Production Facility and USDA Approved Commissary | | 54,640 | | 11/30/2013 |
Walnut Creek, California | | Administration Office-Noah’s | | 1,672 | | 3/31/2013 |
Carrolton, Texas | | USDA Approved Commissary | | 26,820 | | 7/31/2011 |
Orlando, Florida | | USDA Approved Commissary | | 7,422 | | 10/31/2010 |
Denver, Colorado | | USDA Approved Commissary | | 9,200 | | 10/14/2013 |
Grove City, Ohio | | USDA Approved Commissary | | 20,644 | | 8/31/2012 |
17
Our Current Restaurants
As of December 30, 2008, we owned and operated, franchised or licensed 649 restaurants. Our current base of company-owned restaurants under our core brands includes 347 Einstein Bros. restaurants, 77 Noah’s restaurants and one Manhattan Bagel restaurant. Also, we franchise 69 Manhattan Bagel restaurants and two Einstein Bros. restaurants, and license 147 Einstein Bros. restaurants and five Noah’s restaurants. In addition, we have one restaurant which we own and operate under a non-core brand.
The following table details our restaurant openings and closings for each respective fiscal year:
| | | | | | | | | | | | | | | | | | | | | | | | |
| | | 52 weeks ended January 1, 2008 | | | 52 weeks ended December 30, 2008 | |
| | | Company
Owned | | | Franchised | | | Licensed* | | | Total | | | Company
Owned | | | Franchised | | | Licensed * | | | Total | |
Einstein Bros. | | | | | | | | | | | | | | | | | | | | | | | | |
Beginning balance | | 341 | | | — | | | 93 | | | 434 | | | 337 | | | — | | | 121 | | | 458 | |
Opened restaurants | | 8 | | | — | | | 31 | | | 39 | | | 16 | | | 2 | | | 30 | | | 48 | |
Closed restaurants | | (12 | ) | | — | | | (3 | ) | | (15 | ) | | (6 | ) | | — | | | (4 | ) | | (10 | ) |
| | | | | | | | | | | | | | | | | | | | | | | | |
Ending balance | | 337 | | | — | | | 121 | | | 458 | | | 347 | | | 2 | | | 147 | | | 496 | |
| | | | | | | | | | | | | | | | | | | | | | | | |
| | | | | | | | |
Noah’s | | | | | | | | | | | | | | | | | | | | | | | | |
Beginning balance | | 73 | | | — | | | 3 | | | 76 | | | 77 | | | — | | | 3 | | | 80 | |
Opened restaurants | | 4 | | | — | | | — | | | 4 | | | 1 | | | — | | | 2 | | | 3 | |
Closed restaurants | | — | | | — | | | — | | | — | | | (1 | ) | | — | | | — | | | (1 | ) |
| | | | | | | | | | | | | | | | | | | | | | | | |
Ending balance | | 77 | | | — | | | 3 | | | 80 | | | 77 | | | — | | | 5 | | | 82 | |
| | | | | | | | | | | | | | | | | | | | | | | | |
| | | | | | | | |
Manhattan Bagel | | | | | | | | | | | | | | | | | | | | | | | | |
Beginning balance | | — | | | 80 | | | — | | | 80 | | | 1 | | | 69 | | | — | | | 70 | |
Opened restaurants | | 1 | | | 2 | | | — | | | 3 | | | — | | | — | | | — | | | — | |
Closed restaurants | | — | | | (13 | ) | | — | | | (13 | ) | | — | | | — | | | — | | | — | |
| | | | | | | | | | | | | | | | | | | | | | | | |
Ending balance | | 1 | | | 69 | | | — | | | 70 | | | 1 | | | 69 | | | — | | | 70 | |
| | | | | | | | | | | | | | | | | | | | | | | | |
| | | | | | | | |
Non-Core Brands | | | | | | | | | | | | | | | | | | | | | | | | |
Beginning balance | | 2 | | | 6 | | | — | | | 8 | | | 1 | | | 3 | | | — | | | 4 | |
Opened restaurants | | — | | | — | | | — | | | — | | | — | | | — | | | — | | | — | |
Closed restaurants | | (1 | ) | | (3 | ) | | — | | | (4 | ) | | — | | | (3 | ) | | — | | | (3 | ) |
| | | | | | | | | | | | | | | | | | | | | | | | |
Ending balance | | 1 | | | 3 | | | — | | | 4 | | | 1 | | | — | | | — | | | 1 | |
| | | | | | | | | | | | | | | | | | | | | | | | |
| | | | | | | | |
Consolidated Total | | | | | | | | | | | | | | | | | | | | | | | | |
Total beginning balance | | 416 | | | 86 | | | 96 | | | 598 | | | 416 | | | 72 | | | 124 | | | 612 | |
Opened restaurants | | 13 | | | 2 | | | 31 | | | 46 | | | 17 | | | 2 | | | 32 | | | 51 | |
Closed restaurants | | (13 | ) | | (16 | ) | | (3 | ) | | (32 | ) | | (7 | ) | | (3 | ) | | (4 | ) | | (14 | ) |
| | | | | | | | | | | | | | | | | | | | | | | | |
Total ending balance | | 416 | | | 72 | | | 124 | | | 612 | | | 426 | | | 71 | | | 152 | | | 649 | |
| | | | | | | | | | | | | | | | | | | | | | | | |
| * | We use franchise agreements to contract with qualified disadvantaged business enterprises, non-profit and other entities, either as licensees, fractional franchisees, or franchisees under a traditional franchise agreement, who do not meet the fractional franchise exemption to open restaurants in our traditional licensee venues. As of January 1, 2008 and December 30, 2008, we had five and six franchisees operating Einstein Bros. restaurants in airport locations which operationally fall under our licensing group, respectively. |
18
As of December 30, 2008, our company-owned facilities, franchisees and licensees operated in various states and in the District of Columbia as follows:
| | | | | | |
Location | | Company
Operated | | Franchised
or Licensed | | Total |
Alabama | | — | | 1 | | 1 |
Arkansas | | — | | 1 | | 1 |
Arizona | | 26 | | 6 | | 32 |
California | | 79 | | 17 | | 96 |
Colorado | | 31 | | 7 | | 38 |
Connecticut | | 1 | | — | | 1 |
Delaware | | 1 | | 1 | | 2 |
District of Columbia | | 1 | | 4 | | 5 |
Florida | | 54 | | 20 | | 74 |
Georgia | | 15 | | 12 | | 27 |
Illinois | | 31 | | 6 | | 37 |
Indiana | | 10 | | 1 | | 11 |
Kansas | | 6 | | 1 | | 7 |
Kentucky | | — | | 4 | | 4 |
Louisiana | | — | | 3 | | 3 |
Maryland | | 11 | | 3 | | 14 |
Massachusetts | | 2 | | 3 | | 5 |
Michigan | | 15 | | 5 | | 20 |
Minnesota | | 5 | | 3 | | 8 |
Mississippi | | — | | 2 | | 2 |
Missouri | | 12 | | 4 | | 16 |
Nevada | | 14 | | — | | 14 |
New Hampshire | | 1 | | — | | 1 |
New Jersey | | 5 | | 27 | | 32 |
New Mexico | | 5 | | — | | 5 |
New York | | 1 | | 7 | | 8 |
North Carolina | | 2 | | 5 | | 7 |
Ohio | | 10 | | 11 | | 21 |
Oregon | | 9 | | 1 | | 10 |
Pennsylvania | | 9 | | 27 | | 36 |
South Carolina | | — | | 6 | | 6 |
Tennessee | | — | | 8 | | 8 |
Texas | | 26 | | 13 | | 39 |
Utah | | 18 | | — | | 18 |
Virginia | | 10 | | 10 | | 20 |
Washington | | 6 | | 2 | | 8 |
Wisconsin | | 10 | | 2 | | 12 |
| | | | | | |
Total | | 426 | | 223 | | 649 |
| | | | | | |
19
We are subject to claims and legal actions in the ordinary course of business, including claims by or against our franchisees, licensees and employees or former employees and/or contract disputes. We do not believe any currently pending or threatened matter, other than as described below, would have a material adverse effect on our business, results of operations or financial condition.
On September 18, 2007, Eric Mathistad, a former store manager, filed a putative class action against the Company in the Superior Court of California for the State of California, County of San Diego. The plaintiff alleged that we failed to pay overtime wages to “salaried restaurant employees” of our California stores who were misclassified as exempt employees, and that these employees were deprived of mandated meal periods and rest breaks. On November 14, 2007, Bernadette Mejia, another former store manager, filed a similar case and these cases were subsequently consolidated. On August 27, 2008, we settled this litigation with the plaintiffs.
On February 8, 2008, Gloria Weber and Hakan Mikado, non-exempt employees, filed a putative class action against the Company in the Superior Court of California for the State of California, County of San Diego. The plaintiff alleged that we failed to pay minimum wages, failed to pay overtime and failed to provide rest periods and meal breaks, among other charges. On August 27, 2008, we settled this litigation with the plaintiffs.
These settlements provide for payment of up to an aggregate of $2.5 million by the Company. Each settlement is subject to final court approvals and other conditions. There can be no assurance that the court will approve the settlements or that these other conditions will be satisfied. The final hearings are scheduled for March 20, 2009.
We recorded a liability in accrued expenses and a charge in operating expenses during the third quarter of 2008 pursuant to SFAS No. 5,Accounting for Contingencies,in the amount of $1.9 million to satisfy these settlements. This charge represents our current estimate of the aggregate amount that is probable to be paid pursuant to these settlements, but there can be no assurance that amounts actually paid will not be more or less than the amount recorded by the Company.
| ITEM 4. | SUBMISSION OF MATTERS TO A VOTE OF SECURITY HOLDERS |
No items were submitted to a vote of security holders in the fourth quarter of the fiscal year ended December 30, 2008.
20
PART II
| ITEM 5. | MARKET FOR REGISTRANT’S COMMON EQUITY, RELATED STOCKHOLDER MATTERS AND ISSUER PURCHASES OF EQUITY SECURITIES |
Our common stock was quoted on the Pink Sheets OTC market under the symbol “NWRG.PK” through June 12, 2007. Our common stock was moved to the NASDAQ Global Market under the symbol “BAGL” as part of our secondary public offering, which was completed on June 13, 2007. The following table sets forth the high and low sale prices (in the case of the NASDAQ Global Market) and the high and low bid information (in the case of the Pink Sheets) for our common stock for each fiscal quarter during the periods indicated. Bid information quoted reflects inter-dealer prices without retail mark-up, markdown or commission and may not necessarily represent actual transactions.
| | | | | | |
Year ended December 30, 2008 (fiscal 2008): | | High | | Low |
First Quarter | | $ | 19.17 | | $ | 8.35 |
Second Quarter | | $ | 15.46 | | $ | 9.30 |
Third Quarter | | $ | 15.04 | | $ | 9.07 |
Fourth Quarter | | $ | 10.59 | | $ | 2.50 |
| | |
Year ended January 1, 2008 (fiscal 2007): | | High | | Low |
First Quarter | | $ | 11.00 | | $ | 5.05 |
Second Quarter | | $ | 25.00 | | $ | 10.95 |
Third Quarter | | $ | 19.77 | | $ | 14.08 |
Fourth Quarter | | $ | 24.90 | | $ | 15.74 |
As of February 26, 2009, there were 351 holders of record of our common stock. This number does not include individual stockholders who own common stock registered in the name of a nominee under nominee security listings.
We have not declared or paid any cash dividends on our common stock since our inception. We do not intend to pay any cash dividends in the foreseeable future, and we are precluded from paying cash dividends on our common stock under our financing agreements.
21
Performance Graph
The included performance graph covers the fiscal five-year period from December 30, 2003 through December 30, 2008. The graph compares the total return of our common stock (BAGL) to our current peer group of companies (PGI) and the NASDAQ Composite Index. The PGI was selected representing our competitive peer group, comprised of multi-concept companies and/or companies with a similar organizational structure. The companies selected are participants of the restaurant industry with a sufficient period of operating history for continuous inclusion in the Index.
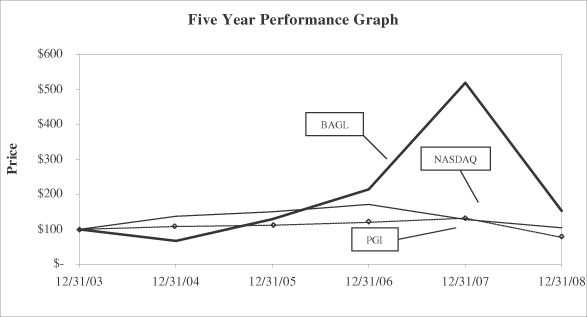
| | | | | | | | | | | | | | | | | | |
| | | Measurement period - five years (1) (2) |
| | | Fiscal
2003 | | Fiscal
2004 | | Fiscal
2005 | | Fiscal
2006 | | Fiscal
2007 | | Fiscal
2008 |
BAGL | | $ | 100.00 | | $ | 67.14 | | $ | 128.57 | | $ | 214.29 | | $ | 518.57 | | $ | 152.57 |
PGI (3) | | $ | 100.00 | | $ | 136.92 | | $ | 150.20 | | $ | 171.12 | | $ | 128.05 | | $ | 104.01 |
NASDAQ | | $ | 100.00 | | $ | 108.32 | | $ | 111.64 | | $ | 120.17 | | $ | 131.96 | | $ | 77.15 |
| (1) | Assumes all distributions to stockholders are reinvested on the payment dates. |
| (2) | Assumes $100 initial investment on December 30, 2003 in BAGL, the PGI, and the NASDAQ Composite Index. |
| (3) | The PGI is a price-weighted index. The index includes: |
| | • | | Jack in the Box Incorporated |
| | • | | CKE Restaurants Incorporated (Hardee’s, Carl’s Jr., La Salsa, and Green Burrito restaurant chains) |
| | • | | AFC Enterprises Incorporated (Popeyes Chicken and Biscuits restaurant chain) |
| | • | | YUM! Brands, Incorporated (A&W, KFC, Long John Silver’s, Pizza Hut and Taco Bell restaurant chains) |
22
| ITEM 6. | SELECTED FINANCIAL DATA |
The following selected financial data for each fiscal year was extracted or derived from our consolidated financial statements which have been audited by Grant Thornton LLP, our independent registered public accounting firm.
| | | | | | | | | | | | | | | | | | | | |
| | | Fiscal years ended (1): | |
| | | 2004
(52 weeks) | | | 2005
(53 weeks) | | | 2006
(52 weeks) | | | 2007
(52 weeks) | | | 2008
(52 weeks) | |
| | | (in thousands of dollars, except per share data and as otherwise indicated) | |
Selected Statements of Operations Data: | | | | | | | | | | | | | | | | | | | | |
Revenues | | $ | 373,860 | | | $ | 389,093 | | | $ | 389,962 | | | $ | 402,902 | | | $ | 413,450 | |
Gross profit | | | 67,199 | | | | 73,702 | | | | 78,632 | | | | 80,930 | | | | 81,768 | |
Gross profit percentage | | | 18.0 | % | | | 18.9 | % | | | 20.2 | % | | | 20.1 | % | | | 19.8 | % |
General and administrative expenses | | | 32,755 | | | | 36,096 | | | | 37,484 | | | | 40,635 | | | | 36,356 | |
California wage and hour settlements | | | — | | | | — | | | | — | | | | — | | | | 1,900 | |
Senior management transition costs | | | — | | | | — | | | | — | | | | — | | | | 1,335 | |
Income from operations | | | 5,458 | | | | 9,368 | | | | 21,438 | | | | 28,266 | | | | 27,616 | |
Interest expense, net(2) | | | 23,196 | | | | 23,698 | | | | 19,555 | | | | 12,387 | | | | 5,439 | |
Write-off of debt discount upon redemption of senior notes | | | — | | | | — | | | | — | | | | 528 | | | | — | |
Prepayment penalty upon redemption of senior notes | | | — | | | | — | | | | 4,800 | | | | 240 | | | | — | |
Write-off of debt issuance costs upon redemption of senior notes | | | — | | | | — | | | | 3,956 | | | | 2,071 | | | | — | |
Income (loss) before income taxes | | | (17,454 | ) | | | (14,018 | ) | | | (6,868 | ) | | | 13,040 | | | | 22,177 | |
Provision (benefit) for income taxes | | | (49 | ) | | | — | | | | — | | | | 454 | | | | 1,100 | |
| | | | | | | | | | | | | | | | | | | | |
Net income (loss) | | $ | (17,405 | ) | | $ | (14,018 | ) | | $ | (6,868 | ) | | $ | 12,586 | | | $ | 21,077 | |
| | | | | | | | | | | | | | | | | | | | |
| | | | | |
Per share data: | | | | | | | | | | | | | | | | | | | | |
Weighted average number of common shares outstanding - | | | | | | | | | | | | | | | | | | | | |
Basic | | | 9,842,414 | | | | 9,878,665 | | | | 10,356,415 | | | | 13,497,841 | | | | 15,934,796 | |
Diluted | | | 9,842,414 | | | | 9,878,665 | | | | 10,356,415 | | | | 14,235,625 | | | | 16,378,965 | |
Net income (loss) available to common stockholders per share - | | | | | | | | | | | | | | | | | | | | |
Basic | | $ | (1.77 | ) | | $ | (1.42 | ) | | $ | (0.66 | ) | | $ | 0.93 | | | $ | 1.32 | |
Diluted | | $ | (1.77 | ) | | $ | (1.42 | ) | | $ | (0.66 | ) | | $ | 0.88 | | | $ | 1.29 | |
Cash dividends declared | | $ | — | | | $ | — | | | $ | — | | | $ | — | | | $ | — | |
| | | | | |
Other Data: | | | | | | | | | | | | | | | | | | | | |
Capital expenditures(4) | | $ | 9,393 | | | $ | 10,264 | | | $ | 13,172 | | | $ | 25,869 | | | $ | 26,690 | |
Percent increase (decrease) in comparable store sales for company-owned restaurants(5) | | | (1.9 | %) | | | 5.2 | % | | | 4.5 | % | | | 3.7 | % | | | (0.1 | %) |
23
| | | | | | | | | | | | | | | | | | | | |
| | | As of fiscal year ended (1): | |
| | | 2004 | | | 2005 | | | 2006 | | | 2007 | | | 2008 | |
| | | (in thousands of dollars, except per share data and as otherwise
indicated) | |
Selected Balance Sheet Data: | | | | | | | | | | | | | | | | | | | | |
Cash and cash equivalents | | $ | 9,752 | | | $ | 1,556 | | | $ | 5,477 | | | $ | 9,436 | | | $ | 24,216 | |
Property, plant and equipment, net | | | 41,855 | | | | 33,359 | | | | 33,889 | | | | 47,714 | | | | 59,747 | |
Total assets | | | 158,456 | | | | 130,924 | | | | 133,154 | | | | 148,562 | | | | 172,929 | |
Short-term debt, capital leases and current portion of long-term debt | | | 311 | | | | 299 | | | | 3,681 | | | | 1,035 | | | | 8,088 | |
Mandatorily redeemable Series Z preferred stock, $.001 par value, $1,000 per share liquidation value(3) | | | 57,000 | | | | 57,000 | | | | 57,000 | | | | 57,000 | | | | 57,000 | |
Senior notes, capital leases and other long-term debt, net of discount | | | 160,871 | | | | 160,589 | | | | 166,680 | | | | 88,942 | | | | 79,787 | |
Total stockholders’ deficit | | | (112,483 | ) | | | (126,211 | ) | | | (132,231 | ) | | | (33,607 | ) | | | (13,651 | ) |
| | | | | |
Other Data: | | | | | | | | | | | | | | | | | | | | |
Number of locations at end of period | | | 690 | | | | 626 | | | | 598 | | | | 612 | | | | 649 | |
Franchised and licensed | | | 237 | | | | 191 | | | | 182 | | | | 196 | | | | 223 | |
Company-owned and operated | | | 453 | | | | 435 | | | | 416 | | | | 416 | | | | 426 | |
| (1) | We have a 52/53-week fiscal year ending on the Tuesday closest to December 31. Fiscal years 2004, 2006, 2007 and 2008 which ended on December 28, 2004, January 2, 2007, January 1, 2008 and December 30, 2008, respectively, contained 52 weeks, while fiscal year 2005, which ended on January 3, 2006, contained 53 weeks. |
| (2) | Net interest expense is comprised of interest paid or payable in cash and non-cash interest expense resulting from the amortization of debt discount, notes paid-in-kind, debt issuance costs and the amortization of warrants issued in connection with debt financings, and interest income from our money market cash accounts. |
| (3) | The adoption of Statement of Financial Accounting Standard No. 150 Accounting for Certain Financial Instruments with Characteristics of Both Liabilities and Equity resulted in the Series Z Preferred Stock being presented as a liability. |
| (4) | Excludes fixed asset purchases for which payment had not occurred as of each year end. |
(5) | Comparable store sales represent sales at restaurants open for one full year that have not been relocated or closed during the current year. Comparable store sales include company-owned restaurants only and represent the change in period-over-period sales for the comparable restaurant base. A restaurant becomes comparable in its 13th full month of operation. |
24
| ITEM 7. | MANAGEMENT’S DISCUSSION AND ANALYSIS OF FINANCIAL CONDITION AND RESULTS OF OPERATION |
Overview
We are a leading fast-casual restaurant chain, specializing in high-quality foods for breakfast and lunch in a bakery-café atmosphere with a neighborhood emphasis. As of December 30, 2008, we owned and operated, franchised or licensed 649 restaurants in 36 states and in the District of Columbia, primarily under the Einstein Bros., Noah’s and Manhattan Bagel brands. Einstein Bros. is a national fast-casual restaurant chain. Noah’s is a regional fast-casual restaurant chain operated exclusively on the West Coast and Manhattan Bagel is a regional fast-casual chain operated predominantly in the Northeast. Our product offerings include fresh bagels and other goods baked on-site, made-to-order sandwiches on a variety of bagels, breads and wraps, gourmet soups and salads, desserts, snacks, premium coffees and other café beverages. Our manufacturing and commissary operations prepare and assemble consistent, high-quality ingredients and we deliver them to our restaurants quickly and efficiently through our network of independent distributors. These operations support our main business focus, restaurant operations, by exposing our brands to new product channels as well as enabling sales of our products to third parties.
We have a 52/53-week fiscal year ending on the Tuesday closest to December 31. Fiscal years 2006, 2007 and 2008 ended on January 2, 2007, January 1, 2008 and December 30, 2008, respectively, each contained 52 weeks.
Executive Summary
The most important themes or significant matters on which management was primarily focused during fiscal 2008 are as follows:
| | |
• Economy—Our results depend on consumer spending, which is influenced by consumer confidence, disposable income and general economic conditions. In particular, the effects of higher energy, food costs, job losses, increases in the rate of foreclosures, market uncertainty, and a reduction in the availability of credit, among other things, may impact discretionary consumer spending in restaurants. Accordingly, we experience declines in comparable store sales during economic downturns or during periods of economic uncertainty. Any material decline in the amount of discretionary spending could have a material adverse effect on our sales and income. | | See page 42 |
| |
• Commodities—We have utilized a third party advisor to manage our wheat purchases, and have secured our wheat requirements as well as established the price for wheat for approximately 90% of our 2009 anticipated needs as of December 30, 2008, at virtually flat prices compared to 2008. | | See pages 28
and 42 |
| |
• Debt—Our mandatorily redeemable Series Z Preferred Stock (“Series Z”) has a mandatory redemption on June 30, 2009. To the extent that we do not redeem the full amount on that date, the unredeemed portion requires additional redemption at a rate of 250 basis points higher than our highest rate paid on our funded debt which is currently 5.52%. | | See page 39 |
| |
• Interest expense—The Company entered into an interest rate swap on May 7, 2008 with an effective date of August 28, 2008. The net effect of the swap is to fix the interest rate on $60 million of our First Lien Term Loan at 3.52% plus an applicable margin. The fair value of the swap as of December 30, 2008 was a liability of $2.5 million, which was recorded as an unrealized loss in other liabilities and accumulated other comprehensive loss in stockholders’ deficit. | | See pages 32
and 45 |
25
| | |
• Realization of deferred tax assets—Our deferred income tax assets have been fully reserved. We reviewed various qualitative and quantitative data in regards to the realization of our deferred tax assets and due to the current economic climate did not adjust our valuation allowance at December 30, 2008. | | See pages 32
and 44 |
| |
• California wage and hour settlements—The Company accrued $1.9 million to cover the estimated settlement amounts. | | See page 31 |
| |
• Senior management transition—$1.3 million was accrued to pay for recruiting and severance charges related to changes in senior management. | | See page 31 |
2009 Outlook
New Restaurant Openings
We intend to continue to expand our company-owned restaurants in 2009 with the addition of six to eight new units in markets that are underpenetrated. The reduction of development in 2009 from the levels in 2007 and 2008 will reduce the amount of cash required for development and provide free cash flow to permit the Company to redeem outstanding shares of the Series Z Preferred Stock. We believe this strategy is appropriate given the current state of the economy and consumer sentiment.
Our site selection process focuses on identifying markets, trade areas and specific sites based on several factors including visibility, ready accessibility (particularly for morning and lunch time traffic), parking, signage and adaptability of any current structures.
The Company has several franchise and license agreements in place and plans on moving forward with the opening of locations within this segment. We opened two franchise restaurants in 2008 and have three locations which were in various stages of development during the fourth quarter of 2008 with openings scheduled for the first half of 2009. In 2009 we plan to open six to eight franchise locations. During fiscal year ended December 30, 2008 we opened 32 Einstein Bros. and Noah’s license restaurants. We plan to open 30 to 35 license restaurants in fiscal year 2009.
Results of Operations for fiscal year 2008 as compared to fiscal year 2007
Consolidated Results
| | | | | | | | | |
| | | (dollars in thousands) | | Increase/
(Decrease) | |
| | | Fiscal
2007 | | Fiscal
2008 | | 2008
vs. 2007 | |
Revenue | | | 402,902 | | | 413,450 | | 2.6 | % |
Cost of sales | | | 321,972 | | | 331,682 | | 3.0 | % |
| | | | | | | | | |
Total gross profit | | | 80,930 | | | 81,768 | | 1.0 | % |
Operating expenses | | | 52,664 | | | 54,152 | | 2.8 | % |
| | | | | | | | | |
Income from operations | | | 28,266 | | | 27,616 | | (2.3 | %) |
Other expenses | | | 15,226 | | | 5,439 | | (64.3 | %) |
| | | | | | | | | |
Income before income taxes | | | 13,040 | | | 22,177 | | 70.1 | % |
Income taxes | | | 454 | | | 1,100 | | 142.3 | % |
| | | | | | | | | |
Net income | | $ | 12,586 | | $ | 21,077 | | 67.5 | % |
| | | | | | | | | |
For the fiscal period ended December 30, 2008 compared to the same period in fiscal 2007 ended January 1, 2008, total revenue increased $10.5 million, gross profit increased $0.8 million, income from operations declined
26
$0.7 million, and our income before income taxes increased $9.1 million. This growth is primarily due to having 10 additional company-owned restaurants and 27 additional franchise and license locations from a year ago, which increased our sales and cost of sales. System-wide comparable store sales increased 1.4% in fiscal 2008 compared to the same period a year ago. Additionally, revenues have increased as a result of increased locations, offset by increased cost of sales which was primarily driven by volatile commodity costs and labor costs for both the company-owned restaurants and our manufacturing and commissary operations. Adding to this was a decrease in our general and administrative expenses related to decreased stock-based compensation expense and other cost savings, decreased interest expense related to the debt redemption in 2007, offset by an increase in depreciation expense from the new restaurants that have been opened and upgrades that have been completed. Additionally, general and administrative expenses included expenses of $1.9 million related to the settlement of two class-action lawsuits in California and the $1.3 million from the senior management transition costs.
Company-Owned Restaurant Operations
Our company-owned restaurants vary in their unit volume, profitability and recent comparable store sales performance. As of December 30, 2008, we had 123 restaurants that generate an average unit volume in excess of $1 million. These 123 restaurants had an average unit volume of approximately $1.2 million and an average gross profit of $322,000. In the aggregate, these restaurants contribute approximately 39.5% of total restaurant sales and 53.8% of total restaurant operating profit.
The following table includes only restaurants that have been open for one full year and have not been relocated or closed during the current year. It summarizes our financial performance since 2006 by reporting company-owned restaurants by sales level and the related revenue (in thousands of dollars) and gross profit percentage:
| | | | | | | | | | | | | | | | | | | | | | | | |
| | | Fiscal 2006 | | | Fiscal 2007 | | | Fiscal 2008 | |
Sales Level: | | Number of
Restaurants | | Net
Revenue | | Gross
Profit | | | Number of
Restaurants | | Net
Revenue | | Gross
Profit | | | Number of
Restaurants | | Net
Revenue | | Gross
Profit | |
greater than $1,000 | | 96 | | $ | 115,000 | | 28.5 | % | | 119 | | $ | 143,000 | | 26.9 | % | | 123 | | $ | 148,700 | | 26.6 | % |
$900 - $1,000 | | 57 | | $ | 54,300 | | 23.2 | % | | 63 | | $ | 59,800 | | 21.2 | % | | 55 | | $ | 51,800 | | 21.0 | % |
$800 - $900 | | 76 | | $ | 64,600 | | 19.7 | % | | 72 | | $ | 61,100 | | 18.7 | % | | 79 | | $ | 66,700 | | 18.3 | % |
$700 - $800 | | 73 | | $ | 55,200 | | 16.7 | % | | 74 | | $ | 55,700 | | 14.9 | % | | 70 | | $ | 52,600 | | 14.8 | % |
$600 - $700 | | 72 | | $ | 46,700 | | 12.6 | % | | 49 | | $ | 32,100 | | 11.5 | % | | 58 | | $ | 38,000 | | 10.0 | % |
less than $600 | | 35 | | $ | 18,700 | | 4.8 | % | | 25 | | $ | 13,700 | | 3.6 | % | | 22 | | $ | 12,000 | | 2.5 | % |
| | | | | | | | | | | | | | | | | | | | | | | | |
Totals | | 409 | | $ | 354,500 | | 20.9 | % | | 402 | | $ | 365,400 | | 20.6 | % | | 407 | | $ | 369,800 | | 20.2 | % |
| | | | | | | | | | | | | | | | | | | | | | | | |
Revenue
| | | | | | | | | | | |
| | | (dollars in thousands) | | | Increase/
(Decrease) | |
| | | Fiscal
2007 | | | Fiscal
2008 | | | 2008
vs. 2007 | |
Company-owned restaurant sales | | $ | 372,997 | | | $ | 376,664 | | | 1.0 | % |
Percent of total revenue | | | 92.6 | % | | | 91.1 | % | | | |
Company-owned restaurant gross margin | | | 20.3 | % | | | 19.5 | % | | (3.9 | %) |
Number of company-owned restaurants | | | 416 | | | | 426 | | | | |
Company-owned restaurant sales for the fifty-two weeks ended December 30, 2008 increased $3.7 million, when compared to the same period in 2007. These results were primarily due to price increases at Einstein Bros. and Noah’s coupled with a net increase in the number of restaurants opened over the last twelve months, partially offset by a decline in volume. On average, the restaurants opened since January 1, 2008 had higher volumes relative to those that were closed over the same period, which positively contributed to our sales. Additionally, restaurant sales for 2008 benefited from $0.3 million in gift card breakage.
27
For the fifty-two weeks ended December 30, 2008, our restaurant comparable store sales were relatively flat with a decrease of 0.1% over the same periods in 2007. This was due to a decrease in the number of units sold, which we believe was mostly related to both the economic climate and its negative impact on consumer discretionary spending and from a decrease in our hours of operation. This was offset by system-wide price increases since January 1, 2008 and a shift in product mix to higher priced items.
Comparable store sales for our restaurants for each quarter in fiscal 2007 and 2008, compared to the same periods in the previous year were as follows:
| | | | | | |
| | | Fiscal 2007 | | | Fiscal 2008 | |
First Quarter | | 1.0 | % | | 3.6 | % |
Second Quarter | | 5.2 | % | | 1.0 | % |
Third Quarter | | 5.2 | % | | -1.7 | % |
Fourth Quarter | | 3.2 | % | | -3.3 | % |
Cost of sales
Cost of sales consists of cost of goods sold, labor expenses, other operating costs, and rent and related and marketing costs.
Cost of goods sold
| | | | | | | | | | | |
| | | (dollars in thousands) | | | Increase/
(Decrease) | |
| | | Fiscal
2007 | | | Fiscal
2008 | | | 2008
vs. 2007 | |
Cost of goods sold | | $ | 110,397 | | | $ | 112,675 | | | 2.1 | % |
As a percentage of company-owned restaurant sales | | | 29.6 | % | | | 29.9 | % | | | |
As a percentage of total revenue | | | 27.4 | % | | | 27.3 | % | | | |
Food, beverage and packaging costs are three elements that make up cost of goods sold and constitute a large portion of the cost of sales at our company-owned restaurants. Cost of goods sold increased predominantly due to an increase in commodity costs, an increase in distribution costs that were driven by higher fuel costs during the year, and increased costs associated with a net opening of 10 stores over the last twelve months, partially offset by a reduction in the average volume of products sold.
Compared to 2007, most of our commodity-based food costs increased in 2008. Flour represents the most significant raw ingredient we purchase. The market cost of wheat and in turn the cost to produce flour increased substantially in the last half of 2007 but stabilized by the end of the second quarter of 2008 and stayed at these levels through the remainder of 2008. To mitigate the risk of increasing market prices, we have utilized a third party advisor to manage our wheat purchases for our company-owned production facility. As a result of this relationship, our wheat costs remained relatively constant throughout fiscal year 2008. We will continue to work with our third party advisor to strategically source our wheat purchases. However, there can be no assurance that we will benefit from a decline in the cost of any of the commodity-based products that we purchase.
Labor expenses
| | | | | | | | | | | |
| | | (dollars in thousands) | | | Increase/
(Decrease) | |
| | | Fiscal
2007 | | | Fiscal
2008 | | | 2008
vs. 2007 | |
Labor costs | | $ | 111,453 | | | $ | 112,007 | | | 0.5 | % |
As a percentage of company-owned restaurant sales | | | 29.9 | % | | | 29.7 | % | | | |
As a percentage of total revenue | | | 27.7 | % | | | 27.1 | % | | | |
28
For the fifty-two weeks ended December 30, 2008 compared to the same period in 2007, labor costs increased $0.6 million from a combination of the growth of new restaurant openings that occurred throughout 2007 and 2008, an increase in base pay year-over-year from a combination of merit and an overall inflationary shift in our compensation structure caused by a July 2008 increase in minimum wage rates at the federal level and in several states in which we operate and an increase in workers’ compensation, partially offset by a decrease in incentive compensation and insurance costs.
Other operating costs
| | | | | | | | | | | |
| | | (dollars in thousands) | | | Increase/
(Decrease) | |
| | | Fiscal
2007 | | | Fiscal
2008 | | | 2008
vs. 2007 | |
Other operating costs | | $ | 35,786 | | | $ | 37,781 | | | 5.6 | % |
As a percentage of company-owned restaurant sales | | | 9.6 | % | | | 10.0 | % | | | |
As a percentage of total revenue | | | 8.9 | % | | | 9.1 | % | | | |
Other operating costs consist of other restaurant-level occupancy expenses such as utilities, repairs and maintenance costs, credit card fees and supplies. For the fifty-two weeks ended December 30, 2008, other operating costs increased $2.0 million compared to the same period in 2007. This increase was primarily attributable to an increase in utilities due primarily to escalating energy costs, an increase in credit card fees due to a shift in consumer payment practices from using cash to using credit cards, and an increase in maintenance on our restaurants.
Rent and related, and marketing costs
| | | | | | | | | | | |
| | | (dollars in thousands) | | | Increase/
(Decrease) | |
| | | Fiscal
2007 | | | Fiscal
2008 | | | 2008
vs. 2007 | |
Rent and related, and marketing costs | | $ | 39,544 | | | $ | 40,653 | | | 2.8 | % |
As a percentage of company-owned restaurant sales | | | 10.6 | % | | | 10.8 | % | | | |
As a percentage of total revenue | | | 9.8 | % | | | 9.8 | % | | | |
Rent and related, and marketing costs consist of restaurant-level rent expense, common area maintenance expense, property taxes and marketing expense. For the fifty-two weeks ended December 30, 2008, rent and related and marketing costs increased $1.1 million compared to the same period in 2007. The increase was principally attributable to an increase in rent and related expense due to new restaurants as well as increases in the cost of rent on renewed leases, partially offset by a decrease in marketing expense from $3.3 million in fiscal 2007 to $2.3 million in fiscal 2008.
Manufacturing and Commissary Operations
Revenues
| | | | | | | | | | | |
| | | (dollars in thousands) | | | Increase/
(Decrease) | |
| | | Fiscal
2007 | | | Fiscal
2008 | | | 2008
vs. 2007 | |
Manufacturing and commissary revenues | | $ | 24,204 | | | $ | 30,369 | | | 25.5 | % |
Percent of total revenue | | | 6.0 | % | | | 7.3 | % | | | |
Manufacturing and commissary gross margin | | | (2.4 | %) | | | 5.9 | % | | * | * |
** not meaningful
29
Manufacturing and commissary revenues for the fifty-two weeks ended December 30, 2008 increased $6.2 million compared to the same period in 2007. This increase to revenue and gross margin was attributed to price increases and our expanded role within the distribution chain for sales to our franchise and license locations. For the fifty-two weeks ended December 30, 2008, we saw a moderate rise in volume of units sold to our more significant third-party customers compared to the same periods in 2007.
Cost of sales
Cost of sales consists of cost of goods sold, labor expenses and other operating costs and expenses.
| | | | | | | | | | | |
| | | (dollars in thousands) | | | Increase/
(Decrease) | |
| | | Fiscal
2007 | | | Fiscal
2008 | | | 2008
vs. 2007 | |
Manufacturing and commissary costs | | $ | 24,792 | | | $ | 28,566 | | | 15.2 | % |
As a percentage of manufacturing and commissary revenue | | | 102.4 | % | | | 94.1 | % | | | |
As a percentage of total revenue | | | 6.2 | % | | | 6.9 | % | | | |
Manufacturing cost of sales are composed of cost of goods sold, labor costs and other operating costs. For the fifty-two weeks ended December 30, 2008, manufacturing cost of sales increased $3.8 million compared to the same period in 2007. The component change within manufacturing cost of sales was as follows:
| | • | | Manufacturing costs of goods sold increased predominantly due to an increase in commodity costs and, to a lesser extent, a rise in volume of units sold. |
| | • | | Labor expenses decreased in fiscal 2008 compared to the same period in 2007. This was due to a decrease in incentive compensation and a decrease in personnel that occurred late in the second quarter of 2008, partially offset by an increase in merit pay year-over-year coupled with increased minimum wage rates at the federal level and in some states in which we operate. |
| | • | | The changes in other operating costs and expenses for the fifty-two weeks ended December 30, 2008 compared to the same period in 2007 decreased primarily related to a decrease in travel expenses, bad debt expense which was higher in 2007 related to our closed commissaries, cost of utilities due to production efficiencies, and marketing costs. |
Franchise and License Operations
| | | | | | | | | | | |
| | | (dollars in thousands) | | | Increase/
(Decrease) | |
| | | Fiscal
2007 | | | Fiscal
2008 | | | 2008
vs. 2007 | |
Franchise and license related revenues | | $ | 5,701 | | | $ | 6,417 | | | 12.6 | % |
Percent of total revenue | | | 1.4 | % | | | 1.6 | % | | | |
Franchise and license gross margin | | | 100.0 | % | | | 100.0 | % | | 0.0 | % |
Number of franchise and license restaurants | | | 196 | | | | 223 | | | | |
Overall, licensee and franchisee revenue improved predominantly due to improved comparable sales by franchisees and licensees of the Manhattan Bagel and Einstein Bros. brands of 8.6% in fiscal 2008 compared to the same period in 2007 and a net increase of 28 license restaurants, partially offset by a net decrease of one franchise restaurant since January 1, 2008.
30
General and Administrative Expenses
| | | | | | | | | |
| | | (dollars in thousands) | | | Increase/
(Decrease) | |
| | | Fiscal
2007 | | | Fiscal
2008 | | | 2008
vs. 2007 | |
General and administrative expenses | | 40,635 | | | 36,356 | | | (10.5 | %) |
California wage and hour settlements | | — | | | 1,900 | | | * | * |
Senior management transition costs | | — | | | 1,335 | | | * | * |
| | | | | | | | | |
Total general and administrative, labor settlements and transition expense | | 40,635 | | | 39,591 | | | | |
As a percentage of total revenue | | 10.1 | % | | 9.6 | % | | | |
Our general and administrative expenses decreased $4.3 million for the fifty-two weeks ended December 30, 2008, respectively, compared to the same period in 2007. The overall decrease was partially related to a decrease in stock-based compensation expense that was primarily due to the additional options that were granted and vested in the second quarter of 2007 related to the secondary public offering, which did not occur again in 2008. Additionally, in 2008 compared to 2007, the Company had decreases in travel expense, recruiting and referral fees, sales and use tax expense and relocation expense related to our corporate headquarters, partially offset by an increase in our professional service fees.
In addition, the Company experienced a decrease in compensation and related benefits as a result of a reduction in administrative positions that occurred in the latter half of 2008, decreased insurance costs, partially offset by an increase in incentive compensation expense.
The Company recorded $1.9 million in operating expenses during 2008 pursuant to SFAS No. 5,Accounting for Contingencies,to satisfy the two California wage and hour settlements. This accrual represents the Company’s current estimate of the aggregate amount that is probable to be paid pursuant to these settlements, but there can be no assurance that amounts actually paid will not be more or less than the amount recorded by the Company.
In late 2008 we experienced turnover at the senior management level. In November, our Chief Marketing Officer left the Company, and in December we transitioned to a new Chief Executive Officer. These events resulted in $0.9 million in severance charges and $0.4 million in recruiting and other costs.
Depreciation and Amortization, Disposal and Impairment Charges
| | | | | | | | | |
| | | (dollars in thousands) | | | Increase/
(Decrease) | |
| | | Fiscal
2007 | | | Fiscal
2008 | | | 2008
vs. 2007 | |
Depreciation and amortization | | 11,192 | | | 14,100 | | | 26.0 | % |
As a percentage of total revenue | | 2.8 | % | | 3.4 | % | | | |
Loss on sale, disposal or abandonment of assets, net | | 601 | | | 198 | | | (67.1 | %) |
Impairment charges and other related costs | | 236 | | | 263 | | | 11.4 | % |
| | | | | | | | | |
Total depreciation and amortization, disposal and impairment charges | | 12,029 | | | 14,561 | | | | |
As a percentage of total revenue | | 3.0 | % | | 3.5 | % | | | |
Depreciation and amortization expenses increased $2.9 million for the fifty-two weeks ended December 30, 2008, when compared to the same periods in 2007. The increase is due to the additional depreciation expense on our new corporate headquarters that we occupied in May 2007 and the additional assets invested in the company-owned restaurants that were added or upgraded since the end of 2007.
31
Interest Expense, Net and Other Expenses
| | | | | | | | | |
| | | (dollars in thousands) | | | Increase/
(Decrease) | |
| | | Fiscal
2007 | | | Fiscal
2008 | | | 2008
vs. 2007 | |
Interest expense, net | | 12,387 | | | 5,439 | | | (56.1 | %) |
As a percentage of revenue | | 3.1 | % | | 1.3 | % | | | |
Other expense: | | | | | | | | | |
Write-off of debt discount upon redemption of senior notes | | 528 | | | — | | | * | * |
Prepayment penalty upon redemption of senior notes | | 240 | | | — | | | * | * |
Write-off of debt issuance costs upon redemption of senior notes | | 2,071 | | | — | | | * | * |
| | | | | | | | | |
Total other expense | | 2,839 | | | — | | | | |
As a percentage of total revenue | | 0.7 | % | | 0.0 | % | | | |
In June 2007, we amended our debt facility and reduced our debt outstanding to $90 million, substantially decreasing our interest expense. The outstanding senior notes and other long-term debt as of December 30, 2008 was $87.9 million compared to $89.8 million as of January 1, 2008. Borrowings under this senior secured credit facility bear interest at either a Eurodollar rate or a variable base rate plus an applicable margin, as defined by our amended and restated credit agreement. We are currently using LIBOR as our base rate but can switch to U.S. prime rate if we choose to do so.
As part of the debt redemption in 2007 we wrote off a discount related to the repayment of the $25 Million Subordinated Note, paid a redemption premium related to the repayment of the $65 Million Second Lien Term Loan, and wrote off debt issuance costs.
The Company entered into an interest rate swap which became effective in August 2008 and will expire in two years. The net effect of the swap fixed our interest rate on $60.0 million of our First Lien Term Loan at 3.52% plus an applicable margin. The one-month LIBOR rate has been lower than our fixed rate for all but one month since we entered into the swap. On a prospective basis, we cannot estimate the impact of LIBOR due to the uncertainties in the current credit market. The fair market value of the interest rate swap as of December 30, 2008 was a liability of $2.5 million, which is recorded in other liabilities on the Company’s consolidated balance sheet. As of December 30, 2008, the unrealized loss associated with this cash flow hedging instrument is recorded in accumulated other comprehensive loss within stockholders’ deficit.
Income Taxes
| | | | | | | | | |
| | | (dollars in thousands) | | | Increase/
(Decrease) | |
| | | Fiscal
2007 | | | Fiscal
2008 | | | 2008
vs. 2007 | |
Provision for income taxes | | 454 | | | 1,100 | | | 142.3 | % |
As a percentage of revenue | | 0.1 | % | | 0.3 | % | | | |
For tax purposes, utilization of our fully reserved net operating loss (“NOL”) carryforwards reduced our effective tax rate and our federal and state income tax liability incurred for 2008. Although we have substantial NOL carryforwards available to offset federal taxable income, we are still required to pay income taxes at the state level and required to pay alternative minimum tax at the federal level. For the fifty-two weeks ended December 30, 2008 compared to the same period in 2007, the provision for income taxes increased $0.6 million.
32
The increase was primarily driven by the considerable improvement in income before income taxes since the second quarter of 2007 when the Company paid down a substantial portion of its outstanding debt, thereby reducing interest expense.
Due to the uncertainty of future taxable income, deferred tax assets resulting from these net operating losses have been fully reserved. In accordance with SFAS No. 109 we will assess the continuing need for a valuation allowance that results from uncertainty regarding our ability to realize the benefits of our deferred tax assets. If we conclude that our prospects for the realization of our deferred tax assets are more likely than not, we will then reduce our valuation allowance as appropriate and credit income tax expense.
Results of Operations for fiscal year 2007 as compared to fiscal year 2006
Total Revenues, Cost of Sales and Gross Profit
| | | | | | | | | | |
| | | (dollars in thousands) | | Increase/
(Decrease) | |
| | | Fiscal
2006 | | | Fiscal
2007 | | 2007
vs. 2006 | |
Revenue | | | 389,962 | | | | 402,902 | | 3.3 | % |
Cost of sales | | | 311,330 | | | | 321,972 | | 3.4 | % |
| | | | | | | | | | |
Total gross profit | | | 78,632 | | | | 80,930 | | 2.9 | % |
Operating expenses | | | 57,194 | | | | 52,664 | | (7.9 | %) |
| | | | | | | | | | |
Income from operations | | | 21,438 | | | | 28,266 | | 31.8 | % |
Other expenses | | | 28,306 | | | | 15,226 | | (46.2 | %) |
| | | | | | | | | | |
Income before income taxes | | | (6,868 | ) | | | 13,040 | | * | * |
Income taxes | | | — | | | | 454 | | * | * |
| | | | | | | | | | |
Net income | | $ | (6,868 | ) | | $ | 12,586 | | * | * |
| | | | | | | | | | |
** not meaningful
Total revenues increased 3.3% to $402.9 million from $390.0 million. Total cost of sales increased 3.4% to $322.0 million from $311.3 million. Total gross profit increased 2.9% to $80.9 million from $78.6 million. System-wide comparable store sales increased 4.0% in fiscal 2007 compared to fiscal 2006.
Restaurant Operations
| | | | | | | | | | | |
| | | (dollars in thousands) | | | Increase/
(Decrease) | |
| | | Fiscal
2006 | | | Fiscal
2007 | | | 2007
vs. 2006 | |
Company-owned restaurant sales | | $ | 363,699 | | | $ | 372,997 | | | 2.6 | % |
Percent of total revenue | | | 93.3 | % | | | 92.6 | % | | | |
Company-owned restaurant gross margin | | | 20.2 | % | | | 20.3 | % | | 0.5 | % |
Number of company-owned restaurants | | | 416 | | | | 416 | | | | |
Fiscal years 2006 and 2007, which ended on January 2, 2007 and January 1, 2008, respectively, contained 52 weeks.
Restaurant sales for 2007 improved 2.6% when compared to 2006. Our 2007 comparable store sales increased 3.7% over 2006 due primarily to a system-wide price increase, a slight shift in product mix to higher priced items, partially offset by a decrease in the volume of units sold. Additionally, restaurant sales for 2007 benefited from $1.3 million in gift card breakage, which relates to unredeemed balances from 2003 through 2006. We expect the benefit that will be received in future years will be considerably less than this amount.
33
Comparable store sales represent sales at restaurants open for one full year that have not been relocated or closed during the current year. Comparable store sales include company-owned restaurants only and represent the change in period-over-period sales for the comparable restaurant base. A restaurant becomes comparable in its 13th full month of operation.
Comparable store sales for our restaurants for each quarter in fiscal 2006 and 2007, compared to the same periods in the previous year are as follows:
| | | | | | |
| | | Fiscal 2006 | | | Fiscal 2007 | |
First Quarter | | 6.2 | % | | 1.0 | % |
Second Quarter | | 3.6 | % | | 5.2 | % |
Third Quarter | | 3.2 | % | | 5.2 | % |
Fourth Quarter | | 4.7 | % | | 3.2 | % |
Our restaurant gross profit increased $2.3 million, or 3.1%, in 2007 compared to 2006. Our restaurant margins are impacted by various restaurant-level operating and non-operating expenses such as the cost of products sold, salaries and benefits, insurance, supplies, repair and maintenance expenses, advertising, rent, utilities and property taxes. Because certain elements of cost of sales such as rent, utilities, property taxes and manager salaries are fixed in nature, incremental sales positively impact gross profit. Depreciation, amortization and income taxes do not impact our restaurant contribution margins.
Our restaurant gross profit margins (company-owned restaurant gross profit divided by company-owned restaurant sales) improved slightly to 20.3% in 2007 compared to 20.2% in 2006. Price increases implemented in 2007 and $1.3 million of gift card breakage were offset primarily by higher commodities costs, labor and labor related costs, and other store level expenses. The cost of flour, cheese, coffee and butter collectively increased $3.4 million. Wheat and, in turn, flour have reached unprecedented price levels and volatility during 2007. Increased wage rates, including mandatory minimum wage rate increases, raised our labor costs by approximately $2 million in 2007 compared to 2006. In addition, increased staffing due to extended hours in company-owned stores increased our labor costs in 2007 compared to 2006 by approximately $2.2 million. Labor related costs increased by approximately $1 million for health care coverage and workers compensation claims. Additionally, in 2007 we spent more for taxes, maintenance and insurance related to our company-owned stores.
Manufacturing Operations
| | | | | | | | | | | |
| | | (dollars in thousands) | | | Increase/
(Decrease) | |
| | | Fiscal
2006 | | | Fiscal
2007 | | | 2007
vs. 2006 | |
Manufacturing and commissary revenues | | $ | 21,076 | | | $ | 24,204 | | | 14.8 | % |
Percent of total revenue | | | 5.4 | % | | | 6.0 | % | | | |
Manufacturing and commissary gross margin | | | (0.4 | %) | | | (2.4 | %) | | (500.0 | %) |
Our manufacturing operations, which include our USDA approved commissaries, predominantly support our company-owned restaurants and generate revenue from the sale of food products to franchisees, licensees, third-party distributors and other third parties. All inter-company transactions have been eliminated during consolidation.
During 2007, our manufacturing operations experienced negative margins primarily due to increases in raw material costs, freight costs and incremental start-up costs associated with new products and customers. Additionally, our margins declined in late 2007 due to the increases in the price of wheat.
In addition, we incurred one-time charges of approximately $0.5 million associated with our closed commissaries and write-down of inventory associated with conversion from an old inventory system to the current information technology system.
34
Franchise and License Operations
| | | | | | | | | | | |
| | | (dollars in thousands) | | | Increase/
(Decrease) | |
| | | Fiscal
2006 | | | Fiscal
2007 | | | 2007
vs. 2006 | |
Franchise and license related revenues | | $ | 5,187 | | | $ | 5,701 | | | 9.9 | % |
Percent of total revenue | | | 1.3 | % | | | 1.4 | % | | | |
Franchise and license gross margin | | | 100.0 | % | | | 100.0 | % | | 0.0 | % |
Number of franchise and license restaurants | | | 182 | | | | 196 | | | | |
Revenues for the franchised and licensed operations consist primarily of initial fees and royalty income earned as a result of sales within franchise and license restaurants. Overall, licensee and franchisee royalty income improved 9.9%, or $0.5 million in 2007 as compared to 2006. The percentage increase was predominantly due to improved comparable sales of 5.8% in the Manhattan Bagel and Einstein Bros. brands in fiscal 2007 compared to the same period in the prior year and an increase in the number of Einstein Bros. license restaurants and Manhattan Bagel franchises of 31 and two, respectively. This was offset by the closure of two Einstein Bros. license restaurants, 12 Manhattan Bagel franchises, and one Manhattan Bagel restaurant that was sold to the Company. The initial franchise and license fees that were recognized for 2007 and 2006 were $0.6 million and $0.5 million, respectively.
General and Administrative Expenses
| | | | | | | | | |
| | | (dollars in thousands) | | | Increase/
(Decrease) | |
| | | Fiscal
2006 | | | Fiscal
2007 | | | 2007
vs. 2006 | |
General and administrative expenses | | 37,484 | | | 40,635 | | | 8.4 | % |
As a percentage of total revenue | | 9.6 | % | | 10.1 | % | | | |
Our general and administrative expenses increased 8.4%, or $3.2 million, in 2007 when compared to 2006. As a percentage of sales, our general and administrative expenses were 10.1% in 2007 compared to 9.6% in 2006. Predominantly contributing to the increase was approximately $1.0 million in increased stock-based compensation expense, of which $0.7 million was from the additional options that were granted related to the completion of our secondary public offering; $1.0 million related to increased travel costs; $2.9 million in increased costs in salaries and benefits, which was a function of merit increases, increased salaries related to our field training program, an expanded headcount in our franchise and license department to support future growth and an increase in recruiting expenses; and increase of $1.0 million related to sales and use tax assessments, some of which remain under protest. These increases were off-set by a $2.6 million decrease in bonus expense for 2007 as compared to 2006, and a decrease in other expenses of $0.1 million.
Depreciation and Amortization
| | | | | | | | | |
| | | (dollars in
thousands) | | | Increase/
(Decrease) | |
| | | Fiscal
2006 | | | Fiscal
2007 | | | 2007 vs.
2006 | |
Depreciation and amortization | | 16,949 | | | 11,192 | | | (34.0 | %) |
As a percentage of total revenue | | 4.3 | % | | 2.8 | % | | | |
Loss (gain) on sale, disposal or abandonment of assets, net | | 493 | | | 601 | | | 21.9 | % |
Impairment charges and other related costs | | 2,268 | | | 236 | | | (89.6 | %) |
| | | | | | | | | |
Total depreciation and amortization, disposal and impairment charges | | 19,710 | | | 12,029 | | | | |
As a percentage of total revenue | | 5.1 | % | | 3.0 | % | | | |
35
Depreciation and amortization expenses decreased 34.0%, or $5.8 million, in 2007 compared to 2006. The decrease is primarily due to all of our amortizing intangible assets becoming fully amortized in the second quarter of 2006, which represents $3.9 million of the decrease, and a substantial portion of our leasehold improvements becoming fully depreciated in 2006 and 2007. Through 2006, depreciation and amortization expense was predominantly related to the assets of Einstein/Noah Bagel Corp. that we acquired in bankruptcy proceedings in June 2001. As most of these assets had five year lives, they became fully depreciated in 2006. From that point forward, the depreciation expense is related to assets purchased subsequent to the acquisition.
Loss on the Disposal, Sale or Abandonment of Assets
Loss on the disposal, sale or abandonment of assets represents the excess of book value over proceeds received, if any, over the net book value of an asset. We establish estimated useful lives for our assets, which range from three to fifteen years, and depreciate using the straight-line method. Leasehold improvements are limited to the lesser of the useful life or the non-cancelable lease term. The useful lives of the assets are based upon our expectations of the period of time that the asset will be used to generate revenue. We periodically review the assets for changes in circumstances, which may impact their useful lives. During 2007, we recorded a $0.6 million loss on the disposal of assets, compared to $0.5 million recorded in 2006.
Impairment Charges and other Related Costs
Impairment losses are non-cash charges recorded on long-lived assets, goodwill, trademarks and our other intangible assets, and other related costs are typically costs associated with closing a company-owned restaurant. Generally, an indicator of impairment would include significant change in an asset’s ability to generate positive cash flow in the future or in the fair value of an asset. Whenever impairment indicators are determined to be present, the amount of impairment is measured as the excess of the carrying amount of the asset over its fair value. During 2007, we recorded $0.2 million in impairment charges and other related costs compared to $0.1 million in 2006 which excludes the write down of equipment that was subsequently sold to our bagel dough supplier.
Until early 2007, we owned certain manufacturing equipment which was located at the plant of our frozen bagel dough supplier. In late 2006, we were notified of their intent, under the terms of the contract, to purchase the equipment and we agreed to sell the equipment to them for $1.1 million. In order to adjust the assets down to their mutually agreed-upon fair value, we recorded an impairment charge of $2.2 million during the quarter ended January 2, 2007. The assets were classified as held for sale on the consolidated balance sheet as of January 2, 2007 and sold in the first quarter of 2007.
Other Expense (Income)
| | | | | | | | | |
| | | (dollars in
thousands) | | | Increase/
(Decrease) | |
| | | Fiscal
2006 | | | Fiscal
2007 | | | 2007 vs.
2006 | |
Interest expense, net | | 19,555 | | | 12,387 | | | (36.7 | %) |
As a percentage of revenue | | 5.0 | % | | 3.1 | % | | | |
| | | |
Other expense: | | | | | | | | | |
Write-off of debt discount upon redemption of senior notes | | — | | | 528 | | | * | * |
Prepayment penalty upon redemption of senior notes | | 4,800 | | | 240 | | | (95.0 | %) |
Write-off of debt issuance costs upon redemption of senior notes | | 3,956 | | | 2,071 | | | (47.6 | %) |
Other | | (5 | ) | | — | | | * | * |
| | | | | | | | | |
Total other expense | | 8,751 | | | 2,839 | | | (67.6 | %) |
As a percentage of total revenue | | 2.2 | % | | 0.7 | % | | | |
36
During 2007, we wrote off $2.1 million of debt issuance costs and paid a $0.2 million redemption premium related to the $65 Million Second Lien Term Loan, and wrote off a $0.5 million discount related to the $25 Million Subordinated Note. During 2006, we wrote off $4.0 million of debt issuance costs and paid a 3% redemption premium on the $160 Million Notes in the amount of $4.8 million.
In 2007, there was a 35.2% decrease in interest expense, or $7.0 million compared to 2006, which related to the amendment of our first lien indebtedness that occurred in June 2007.
Interest income increased 61.0% to $483,000 in 2007 from $300,000 in 2006. This is directly related to our increase in our interest-earning cash and cash equivalents in 2007 from 2006.
Income Taxes
| | | | | | | | | |
| | | (dollars in
thousands) | | | Increase/
(Decrease) | |
| | | Fiscal
2006 | | | Fiscal
2007 | | | 2007 vs.
2006 | |
Provision for income taxes | | — | | | 454 | | | * | * |
As a percentage of revenue | | 0.0 | % | | 0.1 | % | | | |
For our financial statements prepared in accordance with generally accepted accounting principles (“GAAP”), we reported net income for 2007 of $12.6 million, versus the net loss of $6.9 million we reported for 2006. This increase is due to improved operations, the result of the interest savings from the reduction of the principal and the interest rate on our debt facility which we amended during 2007, the reduction of depreciation expense as many of our assets became fully depreciated in 2006, and the reduction of expense on our amortizing intangible assets became fully amortized in 2006.
For tax purposes, our net operating loss carryforward reduced our federal and state income tax liability incurred for 2007. We have recorded a provision for income taxes in the amount of $0.5 million for 2007 as a result of our estimate of state income tax and alternative minimum tax, and there was no provision recorded for 2006.
As of January 1, 2008, our net operating loss carryforwards for U.S. federal income tax purposes were $148.8 million, $102.2 million of which are subject to an annual usage limitation of $4.7 million.
37
Contractual Obligations
The following table summarizes the amounts of payments due under specified contractual obligations as of December 30, 2008:
| | | | | | | | | | | | | | | |
| | | Payments Due by Fiscal Period |
| | | 2009 | | 2010 to
2011 | | 2012 to
2013 | | 2014 and
thereafter | | Total |
| | | (in thousands of dollars) |
Accounts payable and accrued expenses | | $ | 27,533 | | $ | — | | $ | — | | $ | — | | $ | 27,533 |
Debt | | | 8,088 | | | 2,025 | | | 77,762 | | | — | | | 87,875 |
Estimated interest expense on our debt facility(a) | | | 4,241 | | | 5,811 | | | 1,473 | | | — | | | 11,525 |
Mandatorily Redeemable Series Z | | | 57,000 | | | — | | | — | | | — | | | 57,000 |
Minimum lease payments under capital leases | | | 67 | | | 42 | | | — | | | — | | | 109 |
Minimum lease payments under operating leases | | | 29,268 | | | 46,933 | | | 19,591 | | | 19,566 | | | 115,358 |
Purchase obligations(b) | | | 21,878 | | | 6,144 | | | — | | | — | | | 28,022 |
Other long-term obligations(c) | | | — | | | 500 | | | 500 | | | 5,659 | | | 6,659 |
| | | | | | | | | | | | | | | |
Total | | $ | 148,075 | | $ | 61,455 | | $ | 99,326 | | $ | 25,225 | | $ | 334,081 |
| | | | | | | | | | | | | | | |
| (a) | Calculated as of December 30, 2008, using the fixed rate from the debt associated with the interest rate swap, and the variable LIBOR and U.S. Prime rates, plus the applicable margin in effect for the remainder. Because the interest rates on the first lien term loan facility and the revolving credit facility are variable, actual payments could differ materially. |
| (b) | Purchase obligations consist of non-cancelable minimum purchases of frozen dough and certain other raw ingredients that are used in our products. |
| (c) | Other long-term obligations primarily consist of the remaining liability related to minimum future purchase commitments with a supplier that advanced us $10.0 million in 1996. |
Financial Condition, Liquidity and Capital Resources
The restaurant industry is predominantly a cash business where cash is received at the time of the transaction. We believe we will generate sufficient cash flow and have sufficient availability under our revolving credit facility to fund operations, capital expenditures and required debt and interest payments. Our inventory turns frequently since our products are perishable. Accordingly, our investment in inventory is minimal. Our accounts payable are on terms that we believe are consistent with those of other companies within the industry.
The primary driver of our operating cash flow is our restaurant operations, specifically the gross margin from our company-owned restaurants. Therefore, we focus on the elements of those operations including comparable store sales and cash flows to ensure a steady stream of operating profits that enable us to meet our cash obligations.
Excluding tenant improvement allowances that we typically receive from the landlord, the cost of a new restaurant is approximately $600,000, depending on square footage, layout and location. The cost includes equipment, leasehold improvements, furniture and fixtures, and other related capital. For 2009, we anticipate that our tenant improvement allowances will average approximately $50,000 per restaurant which will reduce our cost. However, the amount of the allowance can vary widely depending on the location of the restaurant and other terms of the lease. We also intend to upgrade at least 45 of our current restaurants during 2009, which will include approximately $80,000 in capital costs and approximately $49,000 in deferred maintenance costs, for a total cost of approximately $129,000 per restaurant.
38
We anticipate that the majority of our capital expenditures for fiscal 2009 will be focused on the addition of six to eight new company-owned restaurants and upgrades in existing restaurants. Based on our current purchases of capital assets, our existing base of assets, and our projections for new purchases of fixed assets, we believe depreciation expense for 2009 will be approximately $17.9 million.
Our mandatorily redeemable Series Z Preferred Stock has been reclassified to a current liability as the redemption date is now within one year. As part of the amended First Lien Term Loan in June 2007, we obtained a commitment for an incremental term loan in the aggregate amount of up to $57.0 million to be used by us, if needed, solely for the purpose of redeeming the mandatorily redeemable Series Z Preferred Stock due on June 30, 2009. Availability of the incremental term loan is subject to customary borrowing conditions, including absence of any default or material adverse change, and to a requirement of successful syndication of such incremental term loan. We have had discussions with Wells Fargo Foothill, the administrative agent for the Term Loan, regarding the status of the current credit market and the likelihood of a successful syndication under the same terms as our existing Term Loan. Given the current state of the credit market we do not believe that the incremental term loan could be syndicated at the same price and under the same terms as our existing Term Loan. While it still remains an option for us to consider, due to the current state of the credit market, it is not likely that we will pursue this strategy at this time.
To the extent that we do not have adequate unrestricted cash and capacity under the revolver portion of our First Lien Term Loan the unredeemed portion would be required to accrue additional redemption prospectively at a rate that is 250 basis points higher than our highest rate paid on our funded debt, which is currently 5.52%. As of December 30, 2008, we have $24.2 million of unrestricted cash and $13.0 million of borrowing capacity under the revolving portion of our First Lien Term Loan. During 2008 we generated $16.4 million of free cash flow. As a result of this, we made a $7.2 million excess cash flow payment on the First Lien Term Loan on February 27, 2009.
We plan to continue focusing on generating free cash flow through June 30, 2009 that would continue to build our balance of unrestricted cash. On June 30, 2009 we intend to make a redemption payment on the mandatorily redeemable Series Z Preferred Stock. In addition, we also continue to monitor the state of the credit and capital markets and could satisfy any unredeemed portion with additional indebtedness, new capital or a combination of both.
Based upon our projections for 2009, including the partial redemption of our mandatorily redeemable Series Z Preferred Stock, we believe our various sources of capital, including availability under existing debt facilities, and cash flow from operating activities of continuing operations, are adequate to finance operations as well as the repayment of current debt obligations.
June 2007 Debt Redemption and Amended First Lien Term Loan
In June 2007, we amended our debt facility from $95.0 million to $110.0 million. Our amended financing consisted of a:
| | • | | $20.0 million revolving credit facility maturing on June 28, 2012; and |
| | • | | $90.0 million first lien term loan maturing in June 28, 2012. |
As part of this amendment we increased the amount of our existing revolving credit facility from $15.0 million to $20.0 million and modified our term loan from a principal amount of $80.0 million to $90.0 million and repaid the remaining amount of the $25 Million Subordinated Note as noted above. The revolving credit facility remains available, subject to certain conditions, to finance our ongoing working capital, capital expenditure and general corporate needs. In addition, all of the revolving credit facility is available for letters of
39
credit. We are required to pay an unused credit line fee of 0.5% per annum on the average daily unused amount. The unused line fee is payable quarterly in arrears. Additionally, we are required to pay a letter of credit fee based on the ending daily undrawn face amount for each letter of credit issued, being based on our consolidated leverage ratio with an applicable margin of 2.00% plus a 0.5% arranger fee payable quarterly. Letters of credit reduce our availability under the revolving credit facility. As of December 30, 2008, we had $7.0 million in letters of credit outstanding associated with this line. The letters of credit expire on various dates during 2009, are automatically renewable for one additional year and are payable upon demand in the event that we fail to pay the underlying obligation. Our availability under the revolving credit facility was $13.0 million as of December 30, 2008.
We may prepay amounts outstanding under the senior secured credit facility and may terminate commitments in whole at any time without penalty or premium upon prior written notice.
Working Capital Deficit
On December 30, 2008, we had unrestricted cash of $24.2 million and restricted cash of $0.5 million. Under the revolving credit facility, there were no outstanding borrowings, $7.0 million in letters of credit outstanding and borrowing availability of $13.0 million. On June 30, 2008 we reclassified the $57 million mandatorily redeemable Series Z Preferred Stock as a short-term liability which resulted in our working capital shifting to a deficit, which was $51.4 million on December 30, 2008 compared to a surplus of $3.7 million on January 1, 2008. Adding to the deficit was a decrease in our non-cash current assets and an increase in current liabilities for the following primary reasons:
| | • | | accounts receivable has decreased due to improved collection efforts; |
| | • | | other assets decreased as we were able to recover several deposits that were held by our vendors; |
| | • | | accrued expenses increased primarily due to the two California wage and hour settlements and the accrual for senior management transition costs; and |
| | • | | short-term debt and the current portion of long-term debt increased by $7.1 million related to an excess cash flow payment that is due on our debt, as defined by our debt agreement. |
These deficit increases were partially offset by the $14.8 million improvement in cash and cash equivalents that was primarily due to the improved cash flow from our company-owned restaurant operations, and the reduction in interest expense paid on our debt.
On January 1, 2008, we had unrestricted cash of $9.4 million and restricted cash of $1.2 million. Under the revolving credit facility, there were no outstanding borrowings, $6.7 million in letters of credit outstanding and borrowing availability of $13.3 million. Our working capital deficit improved $11.6 million to a working capital surplus of $3.7 million in 2007 compared to a working capital deficit of $8.0 million in 2006, primarily due to the increased cash flow stemming from an increase in profitability at our company-owned restaurants and lower interest expense under our new debt structure, a decrease in accrued expenses related to lower accrued bonuses, a reduction in the gift card liability for estimated breakage and lower accrual for property, plant and equipment that has been received but not paid, partially offset by the sale of equipment to our frozen bagel dough supplier. Finally, short-term debt and the current portion of our long-term debt decreased by $2.6 million in fiscal 2007 compared to fiscal 2006.
Cash Provided by Operations
Primarily due to increased profitability at our company-owned restaurants and the reduction of interest expense related to our debt redemption, net cash generated by operating activities was $43.1 million for 2008 compared to $24.9 million for 2007.
40
Cash Used in Investing Activities
During the year to date period ended December 30, 2008, we used approximately $26.7 million of cash to purchase additional property and equipment that included the following:
| | • | | $18.9 million to open new restaurants and upgrade existing restaurants in 2007 and 2008; |
| | • | | $5.4 million for replacement of equipment at our existing company-owned restaurants and at our manufacturing operations; and |
| | • | | $2.4 million for general corporate purposes. |
The majority of our capital expenditures for fiscal 2008 were for the addition of 17 new company-owned restaurants during 2008 at an average capital investment of approximately $560,000 per restaurant, which varies depending upon square footage, layout and location.
During the year to date period ended January 1, 2008, we used approximately $25.9 million of cash to purchase additional property and equipment that included the following:
| | • | | $11.4 million to open new restaurants and upgrade existing restaurants in 2006 and 2007; |
| | • | | $10.2 million for replacement of equipment at our existing company-owned restaurants and at our manufacturing operations; |
| | • | | $1.8 million for general corporate purposes; and |
| | • | | $2.5 million for leasehold improvements and build-out related to our new corporate headquarters. |
On January 1, 2008, we purchased a restaurant from a Manhattan Bagel franchisee for $382,000. We made a $375,000 cash payment in 2007, and the remaining $7,000 was paid in 2008.
Cash Used in Financing Activities
For the year ended December 30, 2008, we made payments on our debt totaling $2.0 million and received $0.4 million in proceeds from stock option exercises.
As a result of our June 13, 2007 secondary public offering of common stock, we received $90.0 million in cash, and incurred $6.7 million in stock issuance costs. Concurrent with our June 28, 2007 amendment to our First Lien Term Loan, we drew down an additional $11.9 million in debt and incurred an additional $0.9 million in debt issuance costs. The funds from these two transactions were used to pay off the $65.0 million Second Lien Term Loan and the $25.0 Million Subordinated Note and $2.5 million of related paid-in-kind interest on the Subordinated Note.
Off-Balance Sheet Arrangements
Guarantees
Prior to 2001, we would occasionally guarantee leases for the benefit of certain of our franchisees. None of the guarantees have been modified since their inception and we have since discontinued this practice. Current franchisees are the primary lessees under the vast majority of these leases. Under the lease guarantees, we may be required by the lessor to make all of the remaining monthly rental payments or property tax and common area maintenance payments if the franchisee does not make the required payments in a timely manner. However, we believe that most, if not all, of the franchised restaurants could be subleased to third parties, minimizing our potential exposure. Additionally, we have indemnification agreements with our franchisees under which the franchisees would be obligated to reimburse us for any amounts paid under such guarantees. Historically, we
41
have not been required to make such payments in significant amounts. As of December 30, 2008, we do not have a liability recorded for our exposure under the guarantees in accordance with Financial Accounting Standards Board (“FASB”) Interpretation (“FIN”) No. 45,Guarantor’s Accounting and Disclosure Requirements for Guarantees, Including Indirect Guarantees of Indebtedness of Others, following a probability related approach. Minimum future rental payments for all remaining guaranteed leases that expire on various dates through July 2012 were approximately $0.9 million as of December 30, 2008. We believe the ultimate disposition of these matters will not have a material adverse effect on our financial position or results of operations.
Letters of Credit
We have $7.0 million in letters of credit outstanding under our Revolving Facility at December 30, 2008. The letters of credit expire on various dates during 2009 and 2010, are generally automatically renewable for one additional year and are payable upon demand in the event that we fail to pay the underlying obligation related to certain workers’ compensation claims.
Economic Environment and Commodity Volatility
Economic Environment
Our results depend on consumer spending, which is influenced by consumer confidence and disposable income. In particular, the effects of changing energy and food costs, and increasing interest rates, among other things, may impact discretionary consumer spending in restaurants. Accordingly, we believe we experience declines in comparable store sales during economic downturns or during periods of economic uncertainty. Any material decline in the amount of discretionary spending could have a material adverse effect on our sales and income.
We have experienced only a modest impact from inflation. However, the impact of inflation on labor, food and occupancy costs could, in the future, significantly affect our operations. We pay many of our employees’ hourly rates slightly above the applicable federal, state or municipal “living wage” rates. Recent changes in minimum wage laws may create pressure to increase the pay scale for our associates, which would increase our labor costs. Costs for construction, taxes, repairs, maintenance and insurance all impact our occupancy costs. We believe our current strategy, which is to seek to maintain operating margins through a combination of menu price increases, cost controls, efficient purchasing practices and careful evaluation of property and equipment needs, has been an effective tool for dealing with inflation.
Impact of Agricultural Commodities
Our cost of sales consist of cost of goods sold, which is made up of food and product costs, compensation costs and operating costs. Wheat, butter and cheese are our primary agricultural commodities and in addition, coffee, chicken and turkey are the other major agricultural commodities which are included in our cost of goods sold. For the last few years, cost increases in one or more of our agricultural commodities were generally modest in relation to our total cost of sales. Because of the increasing commodity costs, we raised our prices twice at both Einstein Bros. and Noah’s during 2007 and once during 2008 for both concepts. We implemented a price increase at Noah’s during the first quarter of 2009.
Recent Accounting Pronouncements
See Note 2 to the consolidated financial statements included in Item 8 of this 10-K.
42
Critical Accounting Estimates
The discussion and analysis of our financial condition and results of operations are based upon our consolidated financial statements, which have been prepared in accordance with accounting principles generally accepted in the United States of America. The preparation of these consolidated financial statements requires us to make estimates and judgments that affect the reported amounts of assets, liabilities, revenues and expenses. On an on-going basis, we evaluate our estimates based on historical experience and on various other assumptions that are believed to be reasonable under the circumstances, the results of which form the basis for making judgments about the carrying value of assets and liabilities that are not readily apparent from other sources. Actual results may differ from these estimates under different assumptions or conditions. Additionally, any estimates for contingent liabilities that arise as result of any legal proceedings are discussed in Item 3 of this report.
Our significant accounting policies are discussed in Note 2 to our consolidated financial statements set forth in Item 8 of this report.
Impairment of Long-Lived Assets
We review property and equipment and amortizing intangible assets for impairment when events or circumstances indicate that the carrying amount of a restaurant’s assets may not be recoverable. We test for impairment using historical cash flows and other relevant facts and circumstances as the primary basis for our estimate of future cash flows. Relevant facts and circumstances may include, but are not limited to, local competition in the area, the ability of existing restaurant management, the necessity of tiered pricing structures and the impact that upgrading our restaurants may have on our estimates. This process requires the use of estimates and assumptions, which are subject to high degree of judgment. In the event that these estimates and assumptions change in the future, we may be required to record impairment charges for these assets. Given a substantial portion of our property and equipment (related to the assets of Einstein/Noah Bagel Corp. that we acquired in bankruptcy proceedings in June 2001) became fully depreciated within the second and third quarters of fiscal 2006, and considering the improvement in the profitability and cash flows from each of our restaurants, we believe a significant change in any of the aforementioned assumptions would not have a material impact to our consolidated financial statements. As of January 2, 2007, all amortizing intangible assets have been fully amortized and a change in any of the aforementioned assumptions would have no impact to our consolidated financial statements.
At least annually, we assess the recoverability of goodwill and other intangible assets not subject to amortization related to our restaurant concepts. These impairment tests require us to estimate the fair values of our restaurant concepts by making assumptions regarding future profits and cash flows, expected growth rates, terminal values, discount rates and other factors. As of December 30, 2008, the fair value of goodwill and other intangible assets not subject to amortization sufficiently exceeded the carrying values. The assumptions used in the estimate of fair value are generally consistent with the past performance of each reporting unit and other intangible assets and are also consistent with the projections and assumptions that are used in current operating plans. These assumptions are subject to change as a result of changing economic and competitive conditions. In the event that these assumptions change in the future, we may be required to record impairment charges for these assets.
Insurance Reserves
The Company uses a combination of insurance and self-insurance mechanisms to provide for the potential liabilities for workers’ compensation, healthcare benefits and general liability. The insurance liability represents an estimate of the ultimate cost of claims incurred and unpaid as of the balance sheet date. The estimated liabilities are established and are not discounted, with the exception of the workers’ compensation, which is discounted at 10% based upon analysis of historical data and actuarial estimates, and they are reviewed on a
43
quarterly basis to ensure that the liabilities are appropriate. If actual trends, including the severity or frequency of claims differ from our estimates, our financial results could be favorably or unfavorably impacted.
Stock-Based Compensation
We use the Black-Scholes model to estimate the fair value of our option awards under SFAS No. 123R,Share-Based Payment (“SFAS 123R”). The Black-Scholes model requires estimates of the expected term of the option, as well as future volatility and the risk-free interest rate. Our stock options generally vest over a period of 6 months to 3 years and have contractual terms to exercise of 5 to 10 years. The expected term of options is based upon evaluations of historical and expected future exercise behavior. The risk-free interest rate is based on the U.S. Treasury rates at the date of grant with maturity dates approximately equal to the expected life at the grant date. Implied volatility is based on the mean reverting average of our stock’s historical volatility and that of an industry peer group. The use of mean reversion is supported by evidence of a correlation between stock price volatility and a company’s leverage combined with the effects mandatory principal payments will have on our capital structure, as defined under our new debt facility. We have not historically paid any dividends and are precluded from doing so under our debt covenants.
There is a risk that our estimates of the fair values of our share-based compensation awards on the grant dates may differ from the actual values realized upon the exercise, expiration, early termination or forfeiture of those share-based payments in the future. Certain share-based payments, such as employee stock options, may expire worthless or otherwise result in zero intrinsic value as compared to the fair values originally estimated on the grant date and reported in our financial statements. Alternatively, value may be realized from these instruments that are significantly in excess of the fair values originally estimated on the grant date and reported in our financial statements. Although the fair value of our share-based awards is determined in accordance with SFAS 123R and the Securities and Exchange Commission’s Staff Accounting Bulletin No. 107 (“SAB 107”) using an option-pricing model, the value calculated may not be indicative of the fair value observed in a willing buyer / willing seller market transaction.
Estimates of share-based compensation expenses do have an impact on our financial statements, but these expenses are based on the aforementioned option valuation model and will never result in the payment of cash by us. For this reason, and because we do not view share-based compensation as related to our operational performance, we exclude estimated share-based compensation expense when evaluating our performance.
Gift Card Breakage
Proceeds from the sale of gift cards are recorded as deferred revenue and recognized as income when redeemed by the holder. While we will continue to honor all gift cards presented for payment, we may determine the likelihood of redemption to be remote for certain gift card balances due to the age of the unredeemed balance. In these circumstances, to the extent we determine there is no requirement for remitting balances to government agencies under unclaimed property laws, gift card balances may be recognized as gift card breakage and recorded as a reduction to deferred revenue and an increase to company-owned restaurant revenues. For the fiscal year ended December 30, 2008, we recognized $0.3 million in gift card breakage.
Income Taxes and Realization of Deferred Tax Assets
The ultimate realization of deferred income tax assets is dependent upon generation of future taxable income during the periods in which those temporary differences become deductible. Although we achieved $12.6 million and $21.1 million of net income for 2007 and 2008, respectively, we reviewed various qualitative and quantitative data in regards to the realization of our deferred tax assets, including:
| | • | | The level of historical taxable income and projections for future taxable income over periods in which the deferred tax assets would be deductible, and |
44
| | • | | Accumulation of income (loss) before taxes utilizing a look-back period of three years. |
| | • | | Events within the restaurant industry, |
| | • | | The cyclical nature of our business, |
| | • | | The health of the economy, |
| | • | | Our future forecasts of taxable income and |
After consideration of these qualitative and quantitative data, we concluded not to reduce our valuation allowance in the fourth quarter of 2008 because of the current macroeconomic climate and uncertainty around credit markets and consumer behavior. Our deferred tax assets remain fully reserved by a valuation allowance.
| ITEM 7A. | QUANTITATIVE AND QUALITATIVE DISCLOSURES ABOUT MARKET RISK |
During fiscal 2007 and fiscal 2008, our results of operations, financial position and cash flows have not been materially affected by changes in the relative values of non-U.S. currencies to the U.S. dollar. We do not use derivative financial instruments to limit our foreign currency risk exposure since virtually all of our business is conducted in the United States. Our manufacturing operations sell bagels to a wholesaler and a distributor who take possession in the United States and sell outside of the United States. As the product is shipped FOB domestic dock, there are no international risks of loss or foreign exchange currency issues.
Our debt as of December 30, 2008 was principally composed of the amended revolving credit facility and First Lien Term Loan. For fixed rate debt, interest rate changes affect the fair market value of such debt but do not impact earnings or cash flows. Conversely for variable rate debt, including borrowings under our revolving credit facility and First Lien Term Loan, interest rate changes generally do not affect the fair market value of such debt, but do impact future earnings and cash flows, assuming other factors are held constant.
On May 7, 2008, we entered into an interest rate swap agreement, to fix our rate on $60 million of our debt to 3.52% plus an applicable margin for the next two years, effective August 2008.
Assuming no change in the size or composition of debt as of December 30, 2008, and presuming the utilization of our accumulated net operating losses would minimize the tax implications for the next several years, a 100 basis point increase in short-term effective interest rates would increase our interest expense on our Revolving Facility and First Lien Term Loan, including the interest rate swap, by approximately $0.3 million annually. Currently, the interest rates on our revolving facility and first lien term loan are predominantly at LIBOR rates plus an applicable margin through short-term fixed rate financing and the interest rate swap has fixed our rate on $60 million of our outstanding debt. The estimated increase in interest expense incorporates the fixed interest financing into its assumptions.
On an annual basis, we purchase a substantial amount of agricultural products that are subject to fluctuations in price based upon market conditions. Our purchase arrangements may contain contractual features that limit the price paid by establishing certain price floors or caps. We do not use financial instruments to hedge commodity prices. We have utilized a third party advisor to manage our wheat purchases for our company-owned production facility. In addition to wheat, we have established contracts and entered into commitments with our vendors for turkey, butter, cheese and coffee.
This market risk discussion contains forward-looking statements. Actual results may differ materially from this discussion based upon general market conditions and changes in domestic and global financial markets, among other factors.
45
| ITEM 8. | FINANCIAL STATEMENTS AND SUPPLEMENTARY DATA |
| | |
| | | Page |
Audited Annual Financial Statements | | |
Report of Independent Registered Public Accounting Firm | | 47 |
Consolidated Balance Sheets as of January 1, 2008 and December 30, 2008 | | 49 |
Consolidated Statements of Operations for the Years Ended January 2, 2007, January 1, 2008 and December 30, 2008 | | 50 |
Consolidated Statements of Changes in Stockholders’ Deficit for the Years Ended January 2, 2007, January 1, 2008 and December 30, 2008 | | 51 |
Consolidated Statements of Cash Flows for the Years Ended January 2, 2007, January 1, 2008 and December 30, 2008 | | 52 |
Notes to Consolidated Financial Statements | | 53 |
46
REPORT OF INDEPENDENT REGISTERED PUBLIC ACCOUNTING FIRM
Board of Directors and Stockholders
Einstein Noah Restaurant Group, Inc.
We have audited the accompanying balance sheets of Einstein Noah Restaurant Group, Inc. (“Einstein Noah”) (a Delaware corporation) as of December 30, 2008 and January 1, 2008, and the related statements of operations, stockholders’ deficit, and cash flows for each of the three years in the period ended December 30, 2008. We also have audited Einstein Noah’s internal control over financial reporting as of December 30, 2008, based on criteria established inInternal Control—Integrated Framework issued by the Committee of Sponsoring Organizations of the Treadway Commission (“COSO”). Einstein Noah’s management is responsible for these financial statements, for maintaining effective internal control over financial reporting, and for its assessment of the effectiveness of internal control over financial reporting, included in the accompanying Management’s Annual Report on Internal Control Over Financial Reporting included in Item 9A. Our responsibility is to express an opinion on these financial statements and an opinion on Einstein Noah’s internal control over financial reporting based on our audits.
We conducted our audits in accordance with the standards of the Public Company Accounting Oversight Board (United States). Those standards require that we plan and perform the audits to obtain reasonable assurance about whether the financial statements are free of material misstatement and whether effective internal control over financial reporting was maintained in all material respects. Our audits of the financial statements included examining, on a test basis, evidence supporting the amounts and disclosures in the financial statements, assessing the accounting principles used and significant estimates made by management, and evaluating the overall financial statement presentation. Our audit of internal control over financial reporting included obtaining an understanding of internal control over financial reporting, assessing the risk that a material weakness exists, and testing and evaluating the design and operating effectiveness of internal control based on the assessed risk. Our audits also included performing such other procedures as we considered necessary in the circumstances. We believe that our audits provide a reasonable basis for our opinions.
A company’s internal control over financial reporting is a process designed to provide reasonable assurance regarding the reliability of financial reporting and the preparation of financial statements for external purposes in accordance with generally accepted accounting principles. A company’s internal control over financial reporting includes those policies and procedures that (1) pertain to the maintenance of records that, in reasonable detail, accurately and fairly reflect the transactions and dispositions of the assets of the company; (2) provide reasonable assurance that transactions are recorded as necessary to permit preparation of financial statements in accordance with generally accepted accounting principles, and that receipts and expenditures of the company are being made only in accordance with authorizations of management and directors of the company; and (3) provide reasonable assurance regarding prevention or timely detection of unauthorized acquisition, use, or disposition of the company’s assets that could have a material effect on the financial statements.
Because of its inherent limitations, internal control over financial reporting may not prevent or detect misstatements. Also, projections of any evaluation of effectiveness to future periods are subject to the risk that controls may become inadequate because of changes in conditions, or that the degree of compliance with the policies or procedures may deteriorate.
In our opinion, the financial statements referred to above present fairly, in all material respects, the financial position of Einstein Noah as of December 30, 2008 and January 1, 2008, and the results of its operations and its cash flows for each of the three years in the period ended December 30, 2008 in conformity with accounting principles generally accepted in the United States of America. Also in our opinion, Einstein Noah maintained, in all material respects, effective internal control over financial reporting as of December 30, 2008, based on criteria established inInternal Control—Integrated Framework issued by COSO.
47
Our audit was conducted for the purpose of forming an opinion on the basic financial statements taken as a whole. Schedule II is presented for purposes of additional analysis and is not a required part of the basic financial statements. This schedule has been subjected to the auditing procedures applied in the audit of the basic financial statements and in our opinion, is fairly stated in all material respects in relation to the basic financial statements taken as a whole.
/s/ GRANT THORNTON LLP
Denver, Colorado
March 2, 2009
48
EINSTEIN NOAH RESTAURANT GROUP, INC.
CONSOLIDATED BALANCE SHEETS
(in thousands, except share information)
| | | | | | | | |
| | | January 1,
2008 | | | December 30,
2008 | |
ASSETS | | | | | | | | |
Current assets: | | | | | | | | |
Cash and cash equivalents | | $ | 9,436 | | | $ | 24,216 | |
Restricted cash | | | 1,203 | | | | 526 | |
Accounts receivable, net of allowance of $606 and $216, respectively | | | 7,807 | | | | 6,459 | |
Inventories | | | 5,313 | | | | 5,290 | |
Prepaid expenses and other current assets | | | 5,281 | | | | 4,774 | |
| | | | | | | | |
Total current assets | | | 29,040 | | | | 41,265 | |
Property, plant and equipment, net | | | 47,714 | | | | 59,747 | |
Trademarks and other intangibles, net | | | 63,831 | | | | 63,831 | |
Goodwill | | | 4,981 | | | | 4,981 | |
Other assets | | | 2,996 | | | | 3,105 | |
| | | | | | | | |
Total assets | | $ | 148,562 | | | $ | 172,929 | |
| | | | | | | | |
LIABILITIES AND STOCKHOLDERS’ DEFICIT | | | | | | | | |
Current liabilities: | | | | | | | | |
Accounts payable | | $ | 5,072 | | | $ | 5,123 | |
Accrued expenses and other current liabilities | | | 19,279 | | | | 22,410 | |
Short-term debt and current portion of long-term debt | | | 955 | | | | 8,088 | |
Current portion of obligations under capital leases | | | 80 | | | | 61 | |
Mandatorily redeemable, Series Z Preferred Stock, $.001 par value, $1,000 per share liquidation value; 57,000 shares authorized; 57,000 shares issued and outstanding | | | — | | | | 57,000 | |
| | | | | | | | |
Total current liabilities | | | 25,386 | | | | 92,682 | |
Senior notes and other long-term debt | | | 88,875 | | | | 79,787 | |
Long-term obligations under capital leases | | | 67 | | | | 38 | |
Other liabilities | | | 10,841 | | | | 14,073 | |
Mandatorily redeemable, Series Z Preferred Stock, $.001 par value, $1,000 per share liquidation value; 57,000 shares authorized; 57,000 shares issued and outstanding | | | 57,000 | | | | — | |
| | | | | | | | |
Total liabilities | | | 182,169 | | | | 186,580 | |
| | | | | | | | |
Commitments and contingencies | | | | | | | | |
Stockholders’ deficit: | | | | | | | | |
Series A junior participating preferred stock, 700,000 shares authorized; no shares issued and outstanding | | | | | | | | |
Common stock, $.001 par value; 25,000,000 shares authorized; 15,878,811 and 15,969,167 shares issued and outstanding | | | 16 | | | | 16 | |
Additional paid-in capital | | | 262,830 | | | | 264,179 | |
Accumulated other comprehensive loss | | | — | | | | (2,470 | ) |
Accumulated deficit | | | (296,453 | ) | | | (275,376 | ) |
| | | | | | | | |
Total stockholders’ deficit | | | (33,607 | ) | | | (13,651 | ) |
| | | | | | | | |
Total liabilities and stockholders’ deficit | | $ | 148,562 | | | $ | 172,929 | |
| | | | | | | | |
The accompanying notes are an integral part of these consolidated financial statements.
49
EINSTEIN NOAH RESTAURANT GROUP, INC.
CONSOLIDATED STATEMENTS OF OPERATIONS
(in thousands, except earnings per share and related share information)
| | | | | | | | | | |
| | | 52 weeks ended |
| | | January 2,
2007 | | | January 1,
2008 | | December 30,
2008 |
Revenues: | | | | | | | | | | |
Company-owned restaurant sales | | $ | 363,699 | | | $ | 372,997 | | $ | 376,664 |
Manufacturing and commissary revenues | | | 21,076 | | | | 24,204 | | | 30,369 |
Franchise and license related revenues | | | 5,187 | | | | 5,701 | | | 6,417 |
| | | | | | | | | | |
Total revenues | | | 389,962 | | | | 402,902 | | | 413,450 |
Cost of sales: | | | | | | | | | | |
Company-owned restaurant costs | | | 290,176 | | | | 297,180 | | | 303,116 |
Manufacturing and commissary costs | | | 21,154 | | | | 24,792 | | | 28,566 |
| | | | | | | | | | |
Total cost of sales | | | 311,330 | | | | 321,972 | | | 331,682 |
| | | | | | | | | | |
Gross profit | | | 78,632 | | | | 80,930 | | | 81,768 |
Operating expenses: | | | | | | | | | | |
General and administrative expenses | | | 37,484 | | | | 40,635 | | | 36,356 |
California wage and hour settlements | | | — | | | | — | | | 1,900 |
Senior management transition costs | | | — | | | | — | | | 1,335 |
Depreciation and amortization | | | 16,949 | | | | 11,192 | | | 14,100 |
Loss on sale, disposal or abandonment of assets, net of gains | | | 493 | | | | 601 | | | 198 |
Impairment charges and other related costs | | | 2,268 | | | | 236 | | | 263 |
| | | | | | | | | | |
Income from operations | | | 21,438 | | | | 28,266 | | | 27,616 |
Other expense: | | | | | | | | | | |
Interest expense, net | | | 19,555 | | | | 12,387 | | | 5,439 |
Write-off of debt discount upon redemption of senior notes | | | — | | | | 528 | | | — |
Prepayment penalty upon redemption of senior notes | | | 4,800 | | | | 240 | | | — |
Write-off of debt issuance costs upon redemption of senior notes | | | 3,956 | | | | 2,071 | | | — |
Other | | | (5 | ) | | | — | | | — |
| | | | | | | | | | |
Income (loss) before income taxes | | | (6,868 | ) | | | 13,040 | | | 22,177 |
Provision for income taxes | | | — | | | | 454 | | | 1,100 |
| | | | | | | | | | |
Net income (loss) | | $ | (6,868 | ) | | $ | 12,586 | | $ | 21,077 |
| | | | | | | | | | |
Net income (loss) per common share – Basic | | $ | (0.66 | ) | | $ | 0.93 | | $ | 1.32 |
| | | | | | | | | | |
Net income (loss) per common share – Diluted | | $ | (0.66 | ) | | $ | 0.88 | | $ | 1.29 |
| | | | | | | | | | |
Weighted average number of common shares outstanding: | | | | | | | | | | |
Basic | | | 10,356,415 | | | | 13,497,841 | | | 15,934,796 |
| | | | | | | | | | |
Diluted | | | 10,356,415 | | | | 14,235,625 | | | 16,378,965 |
| | | | | | | | | | |
The accompanying notes are an integral part of these consolidated financial statements.
50
EINSTEIN NOAH RESTAURANT GROUP, INC.
CONSOLIDATED STATEMENT OF CHANGES IN STOCKHOLDERS’ DEFICIT
(in thousands, except share information)
| | | | | | | | | | | | | | | | | | | | | | | | | | |
| | | Common Stock | | Additional
paid in
capital | | | Unamortized
stock
compensation | | | Accumulated
other
comprehensive
loss | | | Accumulated
deficit
amount | | | Total | |
| | | Shares | | | Amount | | | | | |
Balance, January 3, 2006 | | 10,065,072 | | | $ | 10 | | $ | 176,018 | | | $ | (68 | ) | | $ | — | | | $ | (302,171 | ) | | $ | (126,211 | ) |
Net loss | | — | | | | — | | | — | | | | — | | | | — | | | | (6,868 | ) | | | (6,868 | ) |
Common stock issued upon exercise of warrants | | 482,862 | | | | 1 | | | 54 | | | | — | | | | — | | | | — | | | | 55 | |
Common stock issued upon stock option exercise | | 48,485 | | | | — | | | 139 | | | | — | | | | — | | | | — | | | | 139 | |
Stock based compensation expense | | — | | | | — | | | 654 | | | | — | | | | — | | | | — | | | | 654 | |
Reclassification upon adoption of SFAS 123R | | — | | | | — | | | (68 | ) | | | 68 | | | | — | | | | — | | | | — | |
| | | | | | | | | | | | | | | | | | | | | | | | | | |
Balance, January 2, 2007 | | 10,596,419 | | | $ | 11 | | $ | 176,797 | | | $ | — | | | $ | — | | | $ | (309,039 | ) | | $ | (132,231 | ) |
Net income | | — | | | | — | | | — | | | | — | | | | — | | | | 12,586 | | | | 12,586 | |
Common stock issued upon stock option exercise and restricted stock awards | | 282,392 | | | | — | | | 1,017 | | | | — | | | | — | | | | — | | | | 1,017 | |
Common stock issued in secondary offering | | 5,000,000 | | | | 5 | | | 89,995 | | | | — | | | | — | | | | — | | | | 90,000 | |
Costs to issue common stock | | — | | | | — | | | (6,667 | ) | | | — | | | | — | | | | — | | | | (6,667 | ) |
Stock based compensation expense | | — | | | | — | | | 1,688 | | | | — | | | | — | | | | — | | | | 1,688 | |
| | | | | | | | | | | | | | | | | | | | | | | | | | |
Balance, January 1, 2008 | | 15,878,811 | | | $ | 16 | | $ | 262,830 | | | $ | — | | | $ | — | | | $ | (296,453 | ) | | $ | (33,607 | ) |
Net income | | — | | | | — | | | — | | | | — | | | | — | | | | 21,077 | | | | 21,077 | |
Common stock issued upon stock option exercise | | 97,526 | | | | — | | | 404 | | | | — | | | | — | | | | — | | | | 404 | |
Restricted stock forfeited | | (7,334 | ) | | | — | | | — | | | | — | | | | — | | | | — | | | | — | |
Common stock issued upon stock appreciation right exercise | | 164 | | | | — | | | — | | | | — | | | | — | | | | — | | | | — | |
Stock based compensation expense | | — | | | | — | | | 945 | | | | — | | | | — | | | | — | | | | 945 | |
Unrealized loss on derivative securities | | — | | | | — | | | — | | | | — | | | | (2,470 | ) | | | — | | | | (2,470 | ) |
| | | | | | | | | | | | | | | | | | | | | | | | | | |
Balance, December 30, 2008 | | 15,969,167 | | | $ | 16 | | $ | 264,179 | | | $ | — | | | $ | (2,470 | ) | | $ | (275,376 | ) | | $ | (13,651 | ) |
| | | | | | | | | | | | | | | | | | | | | | | | | | |
The accompanying notes are an integral part of these consolidated financial statements.
51
EINSTEIN NOAH RESTAURANT GROUP, INC.
CONSOLIDATED STATEMENTS OF CASH FLOWS
(in thousands)
| | | | | | | | | | | | |
| | | 52 weeks ended | |
| | | January 2,
2007 | | | January 1,
2008 | | | December 30,
2008 | |
OPERATING ACTIVITIES: | | | | | | | | | | | | |
Net income (loss) | | $ | (6,868 | ) | | $ | 12,586 | | | $ | 21,077 | |
Adjustments to reconcile net income (loss) to net cash provided by operating activities: | | | | | | | | | | | | |
Depreciation and amortization | | | 16,949 | | | | 11,192 | | | | 14,100 | |
Stock-based compensation expense | | | 654 | | | | 1,688 | | | | 945 | |
Loss, net of gains, on disposal of assets | | | 493 | | | | 601 | | | | 198 | |
Impairment charges and other related costs | | | 2,268 | | | | 236 | | | | 263 | |
Provision for losses on accounts receivable | | | 133 | | | | 101 | | | | 157 | |
Amortization of debt issuance and debt discount costs | | | 817 | | | | 651 | | | | 487 | |
Write-off of debt issuance costs | | | 3,956 | | | | 2,071 | | | | — | |
Write-off of debt discount | | | — | | | | 528 | | | | — | |
Paid-in-kind interest | | | 1,591 | | | | 904 | | | | — | |
Changes in operating assets and liabilities: | | | | | | | | | | | | |
Restricted cash | | | 462 | | | | 1,484 | | | | 677 | |
Accounts receivable | | | (1,020 | ) | | | (1,515 | ) | | | 1,191 | |
Accounts payable and accrued expenses | | | (5,706 | ) | | | (2,387 | ) | | | 3,297 | |
Other assets and liabilities | | | 267 | | | | (3,254 | ) | | | 703 | |
| | | | | | | | | | | | |
Net cash provided by operating activities | | | 13,996 | | | | 24,886 | | | | 43,095 | |
| | | |
INVESTING ACTIVITIES: | | | | | | | | | | | | |
Purchase of property and equipment | | | (13,172 | ) | | | (25,869 | ) | | | (26,690 | ) |
Proceeds from the sale of equipment | | | 209 | | | | 1,168 | | | | 17 | |
Acquisition of restaurant assets | | | — | | | | (375 | ) | | | (7 | ) |
| | | | | | | | | | | | |
Net cash used in investing activities | | | (12,963 | ) | | | (25,076 | ) | | | (26,680 | ) |
| | | |
FINANCING ACTIVITIES: | | | | | | | | | | | | |
Proceeds from secondary common stock offering | | | — | | | | 90,000 | | | | — | |
Costs incurred with offering of our common stock | | | — | | | | (6,667 | ) | | | — | |
Proceeds from line of credit | | | 24 | | | | — | | | | — | |
Repayments of line of credit | | | (24 | ) | | | — | | | | — | |
Repayments of other borrowings | | | (280 | ) | | | (280 | ) | | | (280 | ) |
Payments under capital lease obligations | | | (53 | ) | | | (53 | ) | | | (84 | ) |
Repayment of notes payable | | | (160,000 | ) | | | — | | | | — | |
Borrowings under First Lien Term Loan | | | 80,000 | | | | 11,900 | | | | — | |
Repayments under First Lien Term Loan | | | (1,425 | ) | | | (925 | ) | | | (1,675 | ) |
Borrowing under Second Lien | | | 65,000 | | | | — | | | | — | |
Repayments under Second Lien Term Loan | | | — | | | | (65,000 | ) | | | — | |
Borrowings under Subordinated Note | | | 24,375 | | | | — | | | | — | |
Repayments under Subordinated Note | | | — | | | | (25,000 | ) | | | — | |
Debt issuance costs | | | (4,923 | ) | | | (843 | ) | | | — | |
Proceeds upon stock option exercises | | | 194 | | | | 1,017 | | | | 404 | |
| | | | | | | | | | | | |
Net cash provided by (used in) financing activities | | | 2,888 | | | | 4,149 | | | | (1,635 | ) |
Net increase in cash and cash equivalents | | | 3,921 | | | | 3,959 | | | | 14,780 | |
Cash and cash equivalents, beginning of period | | | 1,556 | | | | 5,477 | | | | 9,436 | |
| | | | | | | | | | | | |
Cash and cash equivalents, end of period | | $ | 5,477 | | | $ | 9,436 | | | $ | 24,216 | |
| | | | | | | | | | | | |
The accompanying notes are an integral part of these consolidated financial statements.
See Note 17 for the supplemental cash flow information.
52
EINSTEIN NOAH RESTAURANT GROUP, INC. AND SUBSIDIARIES
Notes to Consolidated Financial Statements
1. DESCRIPTION OF BUSINESS AND BASIS OF PRESENTATION
The consolidated financial statements of Einstein Noah Restaurant Group, Inc. and its wholly-owned subsidiaries (collectively, the “Company”) have been prepared in conformity with accounting principles generally accepted in the United States of America. All inter-company accounts and transactions have been eliminated in consolidation. As of December 30, 2008, the Company owned, franchised or licensed various restaurant concepts under the brand names of Einstein Bros. Bagels (“Einstein Bros.”), Noah’s New York Bagels (“Noah’s”), Manhattan Bagel Company (“Manhattan Bagel”), and New World Coffee (“New World”).
We have a 52/53-week fiscal year ending on the Tuesday closest to December 31. Fiscal years 2006, 2007 and 2008 which ended on January 2, 2007, January 1, 2008, and December 30, 2008 respectively, contained 52 weeks.
Certain immaterial reclassifications have been made to conform previously reported data to the current presentation. These reclassifications have no effect on net income or financial position as previously reported.
2. SUMMARY OF SIGNIFICANT ACCOUNTING POLICIES
Use of Estimates
The preparation of the consolidated financial statements in conformity with accounting principles generally accepted in the United States of America requires us to make estimates and assumptions that affect reported amounts of assets and liabilities, disclosure of contingent assets and liabilities at the date of the financial statements, and the reported amounts of revenues, costs and expenses during the reporting period. Actual results could differ from the estimates.
Revenue Recognition
Company-owned restaurant sales—We record revenue from the sale of food, beverage and retail items as products are sold. Sales tax amounts collected from customers that are remitted to governmental authorities are recorded in revenue on a net basis.
Manufacturing and commissary revenues—Our manufacturing revenues are recorded at the time of shipment to customers. During fiscal year 2005, our manufacturing operations began selling bagels to a wholesaler and a distributor who take possession in the United States and sells outside of the United States. As the product is shipped FOB domestic dock, there are no international risks of loss or foreign exchange currency issues. Approximately $2.2 million, $3.3 million and $4.8 million of sales shipped internationally are included in manufacturing revenues for fiscal years ended 2006, 2007 and 2008, respectively.
Franchise and license related revenues—Initial fees received from a franchisee or licensee to establish a new location are recognized as income when we have performed our obligations required to assist the franchisee or licensee in opening a new location, which is generally at the time the franchisee or licensee commences operations. Continuing royalties, which are a percentage of the net sales of franchised and licensed locations, are accrued as income each month.
Gift Cards—Proceeds from the sale of gift cards are recorded as deferred revenue within accrued expenses, and recognized as income when redeemed by the holder. The deferred revenue balance represents the Company’s liability for gift cards that have been sold, but not yet redeemed. There are no expiration dates on the Company’s gift cards, nor do we charge any service fees that decrease customer balances.
53
EINSTEIN NOAH RESTAURANT GROUP, INC. AND SUBSIDIARIES
Notes to Consolidated Financial Statements (Continued)
While we will continue to honor all gift cards presented for payment, we may determine the likelihood to be remote for certain gift card balances due to the age of the unredeemed balance. In these circumstances, to the extent we determine there is no requirement for remitting balances to government agencies under unclaimed property laws, gift card balances may be recognized as gift card breakage in revenue. Gift card breakage is included in revenue within company-owned restaurant sales in our consolidated statements of operations.
For the fiscal year ended December 30, 2008, income from gift card breakage was $0.3 million. For the fiscal year ended January 1, 2008, income recognized from gift card breakage was $1.3 million, which relates to unredeemed balances from 2003 through 2006 and resulted from the Company entering into an agreement in December 2007, with an unrelated third party that assumed the unredeemed liability for gift cards that had not yet reached the statutory term for unclaimed property. As a result of the agreement, certain third-party claims on unredeemed gift cards for certain jurisdictions had been removed. There was no income recognized on unredeemed gift card balances during the fiscal year ended January 2, 2007. Our estimate of gift card breakage is based upon reasonable and reliable company-specific historical information that the Company believes is predictive of the future and relates to a large pool of homogenous gift card transactions over a sufficient time frame.
Allowance for doubtful accounts—The majority of our receivables are due from our licensees, franchisees, distributors and trade customers. Credit is extended based on our evaluation of the customer’s financial condition and, generally, collateral is not required. Accounts receivable are due within 7-30 days and are stated at amounts due from customers net of an allowance for doubtful accounts. Accounts receivable that are outstanding longer than the contractual payment terms are considered past due. We determine our allowance by considering a number of factors, including the length of time trade accounts receivable are past due, our previous loss and payment history, the customer’s current ability to pay its obligation to us and the condition of the general economy and the industry as a whole. We write off accounts receivable when they become uncollectible, and payments subsequently received on such receivables are credited to the allowance for doubtful accounts.
Cash and Cash Equivalents
Cash and cash equivalents consist of cash on hand and highly liquid instruments with original maturities of three months or less when purchased. Amounts in-transit from credit card processors are also considered cash equivalents because they are both short-term and highly liquid in nature and are typically converted to cash within three days of the sales transaction. Restricted cash consists of funds paid by our franchisees that are earmarked as advertising fund contributions, monies set aside for the lease on our corporate office and restricted cash accounts for the benefit of taxing and other government authorities. The Company maintains cash and cash equivalent balances with financial institutions that exceed federally insured limits. The Company has not experienced any losses related to these balances and management believes its credit risk to be minimal.
Property, Plant and Equipment
Property, plant and equipment are recorded at cost. Furniture and equipment are depreciated using the straight-line method over the estimated useful life of the asset, which ranges from 3 to 12 years. Leasehold improvements are amortized using the straight-line method. The depreciable lives for our leasehold improvements are limited to the lesser of the useful life or the non-cancelable lease term. In circumstances where we would incur an economic penalty by not exercising one or more option periods, we include one or more option periods when determining the depreciation period. In either circumstance, our policy requires consistency when calculating the depreciation period, in classifying the lease and in computing straight-line rent expense. Costs incurred to repair and maintain our facilities and equipment are expensed as incurred.
54
EINSTEIN NOAH RESTAURANT GROUP, INC. AND SUBSIDIARIES
Notes to Consolidated Financial Statements (Continued)
In the first quarter of 2008, we reviewed the depreciable lives of our assets and determined that the economic useful life for leasehold improvements on new restaurants should be the shorter of 10 years or the life of the lease, which is typically 10 years. We also determined that the economic useful lives of our restaurant upgrades should be the shorter of 5 years or the life of the lease. However, as we approve our restaurants to be upgraded, we simultaneously review the lease, and typically only upgrade those locations that have a renewal option and we are reasonably assured that the lease will be renewed. The effect on both income from operations and net income was a reduction of $0.9 million in depreciation expenses, which increased both basic and diluted earnings per share by $0.05.
In accordance with Statement of Financial Accounting Standard (“SFAS”) No. 144,Accounting for the Impairment or Disposal of Long Lived Assets (“SFAS No. 144”), impairment losses are recorded on long-lived assets on a restaurant-by-restaurant basis whenever impairment indicators are determined to be present. We consider a history of cash flow losses to be the primary indicator of potential impairment for individual restaurant locations. We determine whether a restaurant location is impaired based on expected undiscounted future cash flows, considering location, local competition, current restaurant management performance, existing pricing structure and alternatives available for the site. If impairment exists, the amount of impairment is measured as the excess of the carrying amount of the asset over its fair value as determined utilizing the estimated discounted future cash flows or the expected proceeds, net of costs to sell, upon sale of the asset.
Some of our manufacturing equipment was located at the plant of our frozen bagel dough supplier. In late 2006, we were notified of their intent, under the terms of the contract, to purchase the equipment and we agreed to sell the equipment to them for $1.1 million. In order to adjust the assets down to their mutually agreed-upon fair value, we recorded an impairment charge of $2.2 million during the quarter ended January 2, 2007. The assets were classified as held for sale on the consolidated balance sheet as of January 2, 2007, and the assets were sold during the first quarter of fiscal year 2007.
During fiscal years ended 2006, 2007 and 2008, we recorded approximately $0.2 million, $0.2 million, and $0.3 million, respectively, in impairment charges and exit costs related to underperforming restaurants.
Leases and Deferred Rent Payable
We lease all of our restaurant properties. Leases are accounted for under the provisions of SFAS No. 13,Accounting for Leases(“SFAS No. 13”), as amended, which requires that leases be evaluated and classified as operating or capital leases for financial reporting purposes.
For a lease that contains rent escalations, we record the total rent payable during the lease term on a straight-line basis over the term of the lease and record the difference between rent paid and the straight-line rent expense as deferred rent payable. Incentive payments received from landlords are recorded as landlord incentives and are amortized on a straight-line basis over the lease term as a reduction of rent.
Goodwill, Trademarks and Other Intangibles
Intangible assets include both goodwill and identifiable intangibles arising from the allocation of the purchase prices of assets acquired. Goodwill represents the excess of cost over fair value of net assets acquired in the acquisition of Manhattan Bagel. Other intangibles consist mainly of trademarks, trade secrets and patents.
Goodwill and other intangible assets with indefinite lives are not subject to amortization, but are tested for impairment annually or more frequently if events or changes in circumstances indicate that the asset might be
55
EINSTEIN NOAH RESTAURANT GROUP, INC. AND SUBSIDIARIES
Notes to Consolidated Financial Statements (Continued)
impaired. SFAS No. 142,Goodwill and Other Intangible Assets (“SFAS No. 142”), requires a two-step approach for testing impairment. For goodwill, the fair value of each reporting unit is compared to its carrying value to determine whether an indication of impairment exists. If impairment is indicated, the fair value of the reporting unit’s goodwill is determined by allocating the unit’s fair value to its assets and liabilities (including any unrecognized intangible assets) as if the reporting unit had been acquired in a business combination. For intangibles with indefinite lives, the fair value is compared to the carrying value. The amount of impairment for goodwill and other intangible assets is measured as the excess of its carrying amount over its fair value. Intangible assets not subject to amortization consist primarily of the Einstein Bros. and Manhattan Bagel trademarks.
As of January 2, 2007, January 1, 2008 and December 30, 2008, we performed an impairment analysis of the goodwill and indefinite lived intangible assets related to our Einstein Bros. and Manhattan Bagel brands. For the fiscal years ended 2006, 2007, and 2008 there was no indication of impairment in our goodwill and indefinite lived intangible assets.
Insurance Reserves
We are self-insured for certain claims related to medical insurance, general liability and workers’ compensation. We maintain coverage with third party insurers which limit our total exposure from medical and workers’ compensation claims. The self-insurance liability and general liability represent an estimate of the ultimate cost of claims incurred and unpaid as of the balance sheet date. The estimated liabilities are established based upon analysis of historical data to ensure that the liability is appropriate. If actual claims differ from our estimates, our financial results could be impacted. The estimated workers’ compensation liability is established based on actuarial estimates, is discounted at 10% based upon a discrete analysis of actual claims and historical data and is reviewed on a quarterly basis to ensure that the liability is appropriate. These estimated liabilities are included in accrued expenses in our consolidated balance sheets.
Guarantees
Prior to 2001, we would occasionally guarantee leases for the benefit of certain of our franchisees. None of the guarantees have been modified since their inception and we have since discontinued this practice. Current franchisees are the primary lessees under the vast majority of these leases. Under the lease guarantees, we may be required by the lessor to make all of the remaining monthly rental payments or property tax and common area maintenance payments if the franchisee does not make the required payments in a timely manner. However, we believe most, if not all, of the franchised locations could be subleased to third parties reducing our potential exposure. Additionally, we have indemnification agreements with our franchisees under which the franchisees would be obligated to reimburse us for any amounts paid under such guarantees. Historically, we have not been required to make such payments in significant amounts. We record a liability for our exposure under the guarantees in accordance with Financial Accounting Standards Board (“FASB”) Interpretation (“FIN”) No. 45,Guarantor’s Accounting and Disclosure Requirements for Guarantees, Including Indirect Guarantees of Indebtedness of Others. In the event that trends change in the future, our financial results could be impacted. As of December 30, 2008, we had outstanding guarantees of indebtedness under certain leases of approximately $0.9 million and no liability has been recorded.
Fair Value of Financial Instruments
As of January 1, 2008 and December 30, 2008, our financial instruments consist of cash equivalents, accounts receivable, accounts payable and debt. The fair value of accounts receivable and accounts payable approximate
56
EINSTEIN NOAH RESTAURANT GROUP, INC. AND SUBSIDIARIES
Notes to Consolidated Financial Statements (Continued)
their carrying value, due to their short-term maturities. As of December 30, 2008, our total debt under the senior secured credit facility was $87.9 million and had a fair value of $69.6 million due to the changing credit markets. The fair value of the Company’s debt was estimated based on the current rates found in the market place for debt with the same remaining maturities.
The Mandatorily Redeemable Series Z Preferred Stock (“Series Z”) is recorded in the accompanying consolidated balance sheets at its full face value of $57.0 million, which represents the total required future cash payment. The current fair value of the Series Z, which was determined by using the remaining term of the Series Z and the effective dividend rate from the Certificate of Designation, is estimated to be $49.2 million and $54.7 million at January 1, 2008 and December 30, 2008, respectively.
Concentrations of Risk
We purchase a majority of our frozen bagel dough from a single supplier who utilizes our proprietary processes and on whom we are dependent in the short-term. Additionally, we purchase all of our cream cheese from a single source. Historically, we have not experienced significant difficulties with our suppliers but our reliance on a limited number of suppliers subject us to a number of risks, including possible delays or interruption in supplies, diminished control over quality and a potential lack of adequate raw material capacity. Any disruption in the supply or degradation in the quality of the materials provided by our suppliers could have a material adverse effect on our business, operating results and financial condition. In addition, any such disruptions in supply or degradations in quality could have a long-term detrimental impact on our efforts to develop a strong brand identity and a loyal consumer base.
Advertising Costs
We expense advertising costs as incurred. Advertising costs were $4.5 million, $3.3 million, and $2.3 million for the fiscal years ended 2006, 2007 and 2008, respectively, and are included in restaurant costs of sales in the consolidated statements of operations.
Company Operations and Segments
We operate three business segments: company-owned restaurants, manufacturing and commissaries and franchise and license related revenues. Our corporate support unit facilitates all of our company-owned restaurants, the manufacturing facility and commissaries, supports our franchisees and licensees and handles general corporate governance. The company-owned restaurants segment includes our Einstein Bros. and Noah’s brands, which have similar investment criteria and economic and operating characteristics. The manufacturing segment produces and distributes bagel dough and other products to our restaurants, licensees, franchisees and other third parties. Inter-company sales to our company-owned restaurants have been eliminated during consolidation. The franchise and license segment earns royalties and other fees from the use of trademarks and operating systems developed for the Manhattan Bagel, Einstein Bros. and Noah’s brands.
We have considered the disclosure provisions of SFAS No. 131,Disclosures about Segments of an Enterprise and Related Information. Information regarding revenue and costs of sales for each of our business segments has been reported in the consolidated statements of operations for the years ended January 2, 2007, January 1, 2008, and December 30, 2008. Our president and the senior management team manages our business and allocates resources via a combination of restaurant sales reports and gross profit information related to our three sources of revenue, which are presented in their entirety within the consolidated statements of operations. While we do
57
EINSTEIN NOAH RESTAURANT GROUP, INC. AND SUBSIDIARIES
Notes to Consolidated Financial Statements (Continued)
review balance sheet and other asset information on a consolidated basis, we do not review it on a business segment basis as we base our resource allocation decisions on sales and gross profit information. Due to the immateriality of all other financial information in relation to the restaurant segment, including but not limited to assets, capital expenditures, depreciation and amortization and general and administrative expenses, our senior management does not regularly review any additional information for purposes of making decisions about allocating resources and assessing performance for each business segment.
Our manufacturing operations, which includes our bagel dough manufacturing facility and our United States Department of Agriculture inspected commissaries, are ancillary and support our restaurant operations through the production and distribution of bagel dough and other products to our restaurants, licensees, franchisees and other third parties. These operations reduce costs via vertical integration, enable us to control the quality and consistency of ingredients delivered to our restaurants, manage inventory levels and expose our brands to new product channels. Although the primary focus of our manufacturing and commissary operations is to produce and distribute products to our restaurants, our third party revenues have increased over time. The overall results of operations of our manufacturing operations historically have not and currently do not have a material impact on our operating profit. We report the results of our manufacturing segment associated with third party sales separately on our consolidated statements of operations. The product costs associated with internal “sales” to our restaurants are included in restaurant costs.
Our franchise and license operations complement our restaurant operations by expanding the awareness of our brands. We report royalties and other fees earned from the use of trademarks and operating systems developed for the Manhattan Bagel, Einstein Bros. and Noah’s brands separately on our consolidated statements of operations. The overall results of operations of our franchise and license operations historically have not and currently do not have a material impact on our operating profit.
Net Income (Loss) per Common Share
In accordance with SFAS No. 128,Earnings per Share, we compute basic net income (loss) per common share by dividing the net income (loss) for the period by the weighted-average number of shares of common stock outstanding during the period.
Diluted net income (loss) per share is computed by dividing the net income for the period by the weighted-average number of shares of common stock and potential common stock equivalents outstanding during the period using the treasury stock method. Potential common stock equivalents include incremental shares of common stock issuable upon the exercise of stock options and warrants. Potential common stock equivalents are excluded from the computation of diluted net income (loss) per share when their effect is anti-dilutive.
58
EINSTEIN NOAH RESTAURANT GROUP, INC. AND SUBSIDIARIES
Notes to Consolidated Financial Statements (Continued)
The following table summarizes the weighted-average number of common shares outstanding, as well as sets forth the computation of basic and diluted net income (loss) per common share for the periods:
| | | | | | | | | | |
| | | 52 weeks ended |
| | | January 2,
2007 | | | January 1,
2008 | | December 30,
2008 |
| | | (in thousands, except earnings per share and
related share information) |
Net income (loss)(a) | | $ | (6,868 | ) | | $ | 12,586 | | $ | 21,077 |
| | | | | | | | | | |
Basic weighted average shares outstanding(b) | | | 10,356,415 | | | | 13,497,841 | | | 15,934,796 |
Dilutive effect of stock options and SARs | | | — | | | | 737,784 | | | 444,169 |
| | | | | | | | | | |
Diluted weighted average shares outstanding(c) | | | 10,356,415 | | | | 14,235,625 | | | 16,378,965 |
| | | | | | | | | | |
Basic earnings (loss) per share(a)/(b) | | $ | (0.66 | ) | | $ | 0.93 | | $ | 1.32 |
| | | | | | | | | | |
Diluted earnings (loss) per share(a)/(c) | | $ | (0.66 | ) | | $ | 0.88 | | $ | 1.29 |
| | | | | | | | | | |
Antidilutive stock options, SARs and warrants | | | 993,707 | | | | 293,898 | | | 262,414 |
| | | | | | | | | | |
Stock-Based Compensation
Our stock-based compensation cost for the years ended January 2, 2007, January 1, 2008, and December 30, 2008 was $0.7 million, $1.7 million and $0.9 million, respectively, and has been included in general and administrative expenses. No tax benefits were recognized for these costs due to our cumulative losses as well as a full valuation reserve on our deferred tax assets. Included in the cost for the year ended January 1, 2008 was approximately $0.7 million of expense from the options granted related to the secondary public offering as further described in Note 13.
The fair value of stock options is estimated using the Black-Scholes option-pricing model with the following weighted-average assumptions:
| | | | | | |
| | | January 2,
2007 | | January 1,
2008 | | December 30,
2008 |
Expected life of options and SARs from date of grant | | 4.0 years | | 4.0 years | | 3.25 - 6.0 years |
Risk-free interest rate | | 4.35 - 4.84% | | 3.31 - 5.02% | | 1.30 - 2.92% |
Volatility | | 100.0% | | 29.0% - 97.0% | | 31.0% - 38.0% |
Assumed dividend yield | | 0.0% | | 0.0% | | 0.0% |
The expected term of options is based upon evaluations of historical and expected future exercise behavior. The risk-free interest rate is based on the U.S. Treasury rates at the date of grant with maturity dates approximately equal to the expected life at the grant date. Prior to the secondary offering that was completed in June of 2007, our implied volatility was based on the mean reverting average of our stock’s historical volatility. Our implied volatility is now based on the mean reverting average of our stock’s historical volatility and that of an industry peer group. The use of mean reversion is supported by evidence of a correlation between stock price volatility and a company’s leverage combined with the effects mandatory principal payments will have on our capital structure, as defined under our new debt facility. We have not historically paid any dividends and are precluded from doing so under our debt covenants.
As of December 30, 2008, we have approximately $1.5 million of total unrecognized compensation cost related to non-vested awards granted under our option plans, which we expect to recognize over a weighted-average
59
EINSTEIN NOAH RESTAURANT GROUP, INC. AND SUBSIDIARIES
Notes to Consolidated Financial Statements (Continued)
period of 2.2 years. Total compensation costs related to the options outstanding as of December 30, 2008 will be fully recognized by the fourth quarter of fiscal 2011, which represents the end of the requisite service period.
Recent Accounting Pronouncements
In March 2008, the FASB issued SFAS No. 161,Disclosures about Derivative Instruments and Hedging Activities (“SFAS No. 161”). SFAS No. 161 requires enhanced disclosures about an entity’s derivative and hedging activities, including (i) how and why an entity uses derivative instruments, (ii) how derivative instruments and related hedged items are accounted for under SFAS No. 133, and (iii) how derivative instruments and the related hedged item affect an entity’s results of operations, financial performance, and cash flows. This statement is effective for us on December 31, 2008. Since SFAS No. 161 requires enhanced disclosures, without a change to existing standards relative to measurement and recognition, our adoption of SFAS No. 161 will not have any effect on its earnings or financial position.
In April 2008, the FASB issued FASB Staff Position 142-3,Determination of the Useful Life of Intangible Assets (“FSP 142-3”). FSP 142-3 amends the factors that should be considered in developing renewal or extension assumptions used to determine the useful life of a recognized intangible asset under SFAS No. 142. The objective of FSP 142-3 is to improve the consistency between the useful life of a recognized intangible asset under SFAS 142 and the period of expected cash flows used to measure the fair value of the asset under SFAS 141(R),Business Combinations, and other U.S. generally accepted accounting principles. FSP 142-3 will be effective beginning in fiscal year 2010. We are currently evaluating the impact that FSP 142-3 will have on its financial statements and disclosures.
We have considered all other recently issued accounting pronouncements and do not believe the adoption of such pronouncements will have a material impact on our consolidated financial statements.
3. ACCOUNTS RECEIVABLE
Accounts receivable consist of the following as of:
| | | | | | |
| | | January 1,
2008 | | December 30,
2008 |
| | | (in thousands of dollars) |
Trade receivables | | $ | 3,838 | | $ | 4,499 |
Franchisee and licensee receivables | | | 2,584 | | | 904 |
Tenant improvement allowance receivable (a) | | | 565 | | | 881 |
Other | | | 1,426 | | | 391 |
| | | | | | |
Total accounts receivable | | | 8,413 | | | 6,675 |
Less allowance for doubtful accounts | | | 606 | | | 216 |
| | | | | | |
Accounts receivable, net | | $ | 7,807 | | $ | 6,459 |
| | | | | | |
| (a) | Tenant improvement allowance receivables are payments to be received from lessors related to new leases that we have signed. Pursuant to SFAS No. 13, we record these as deferred rent and amortize them over the life of the lease. |
60
EINSTEIN NOAH RESTAURANT GROUP, INC. AND SUBSIDIARIES
Notes to Consolidated Financial Statements (Continued)
4. INVENTORIES
Inventories, which consist of food, beverage, paper supplies and bagel ingredients, are stated at the lower of cost or market, with cost being determined by the first-in, first-out method. Inventories consist of the following as of:
| | | | | | |
| | | January 1,
2008 | | December 30,
2008 |
| | | (in thousands of dollars) |
Finished goods | | $ | 4,056 | | $ | 4,067 |
Raw materials | | | 1,257 | | | 1,223 |
| | | | | | |
Total inventories | | $ | 5,313 | | $ | 5,290 |
| | | | | | |
5. PREPAID EXPENSES AND OTHER CURRENT ASSETS
Prepaid expenses and other current assets consist of the following as of:
| | | | | | |
| | | January 1,
2008 | | December 30,
2008 |
| | | (in thousands of dollars) |
Prepaid rent | | $ | 2,886 | | $ | 3,153 |
Prepaid other | | | 880 | | | 1,022 |
Other current assets | | | 1,515 | | | 599 |
| | | | | | |
Total prepaid expenses and other current assets | | $ | 5,281 | | $ | 4,774 |
| | | | | | |
6. PROPERTY, PLANT AND EQUIPMENT
Property, plant and equipment consist of the following as of:
| | | | | | |
| | | January 1,
2008 | | December 30,
2008 |
| | | (in thousands of dollars) |
Leasehold improvements | | $ | 76,139 | | $ | 90,723 |
Store and manufacturing equipment | | | 68,714 | | | 77,045 |
Furniture and fixtures | | | 1,527 | | | 1,493 |
Office and computer equipment | | | 14,686 | | | 16,523 |
Vehicles | | | 37 | | | 41 |
| | | | | | |
Property, plant and equipment | | | 161,103 | | | 185,825 |
Less accumulated depreciation | | | 113,389 | | | 126,078 |
| | | | | | |
Property, plant and equipment, net | | $ | 47,714 | | $ | 59,747 |
| | | | | | |
Included in our operating expenses is depreciation expense, which was $13.0 million, $11.2 million and $14.1 million for the fiscal years ended 2006, 2007 and 2008, respectively. There is no depreciation expense included in our cost of sales.
61
EINSTEIN NOAH RESTAURANT GROUP, INC. AND SUBSIDIARIES
Notes to Consolidated Financial Statements (Continued)
7. GOODWILL, TRADEMARKS AND OTHER INTANGIBLES
Goodwill, trademarks and other intangibles consist of the following as of:
| | | | | | |
| | | January 1, | | December 30, |
| | | 2008 | | 2008 |
| | | (in thousands of dollars) |
Amortizing intangibles: | | | 39,126 | | | 39,126 |
Less accumulated amortization: | | | 39,126 | | | 39,126 |
| | | | | | |
Total amortizing intangibles, net | | $ | — | | $ | — |
| | | | | | |
Non-amortizing intangibles: | | | | | | |
Trademarks | | | 63,831 | | | 63,831 |
| | | | | | |
Total trademarks and other intangibles, net | | $ | 63,831 | | $ | 63,831 |
| | | | | | |
Intangible amortization expense totaled approximately $3.9 million for the fiscal year ended 2006. As of January 2, 2007, all amortizing intangibles had been fully amortized.
On January 1, 2008, we acquired the assets of a Manhattan Bagel restaurant from one of our franchisees for $382,000. We recorded the assets at their fair value of $251,000, goodwill of $106,000 and a non-amortizing intangible asset of $25,000 for the value of the Manhattan Bagel trademark, pursuant to EITF 04-01,Accounting for Preexisting Relationships between the Parties to a Business Combination.
8. ACCRUED EXPENSES AND OTHER CURRENT LIABILITIES
Accrued expenses and other current liabilities consist of the following as of:
| | | | | | |
| | | January 1, | | December 30, |
| | | 2008 | | 2008 |
| | | (in thousands of dollars) |
Payroll and related expense | | $ | 8,934 | | $ | 9,913 |
Sales, use and property tax expense | | | 2,920 | | | 2,720 |
Unvouchered receipts for purchases of property, plant and equipment | | | 2,146 | | | 2,031 |
California wage and hour settlements | | | — | | | 1,900 |
Accrued expenses | | | 2,334 | | | 1,623 |
Accrued senior management transition costs | | | — | | | 1,297 |
Deferred gift card revenue | | | 1,643 | | | 1,415 |
Other current liabilities | | | 1,302 | | | 1,511 |
| | | | | | |
Total accrued expenses and other current liabilities | | $ | 19,279 | | $ | 22,410 |
| | | | | | |
62
EINSTEIN NOAH RESTAURANT GROUP, INC. AND SUBSIDIARIES
Notes to Consolidated Financial Statements (Continued)
9. SENIOR NOTES AND OTHER LONG-TERM DEBT
Senior notes and other long-term debt consist of the following as of:
| | | | | | |
| | | January 1,
2008 | | December 30,
2008 |
| | | (in thousands of dollars) |
$90 Million Amended First Lien Term Loan | | $ | 89,550 | | $ | 87,875 |
New Jersey Economic Development Authority Note Payable | | | 280 | | | — |
| | | | | | |
Total senior notes and other debt, net of discount | | $ | 89,830 | | $ | 87,875 |
Less short-term debt and current portion of long-term debt | | | 955 | | | 8,088 |
| | | | | | |
Senior notes and other long-term debt, net of discount | | $ | 88,875 | | $ | 79,787 |
| | | | | | |
June 2007 Debt Redemption and Amended First Lien Term Loan
On June 13, 2007, we completed a $90 million secondary public offering of 5 million shares of our common stock. After stock issuance costs of $6.7 million related to the offering, we received net proceeds of $83.3 million. The net proceeds were used to repay our $65.0 million Second Lien Term Loan, repay a portion of our $25 million Subordinated Note held by Greenlight Capital, L.L.C. (“Greenlight”) and to pay for the offering costs. Additionally, on June 28, 2007, we repaid the remaining portion of the $25 million subordinated note held by Greenlight by using a portion of the incremental debt proceeds under our amended debt facility.
Our debt is composed of a modified term loan with a principal amount of $90 million and a $20 million revolving credit facility. We may prepay amounts outstanding under the senior secured credit facility and may terminate commitments in whole at any time without penalty or premium upon prior written notice. Both the revolving credit facility and the term loan facility have a five-year term and are secured by substantially all of our assets and guaranteed by our subsidiaries. Borrowings under this senior secured credit facility bear interest at a rate equal to an applicable margin plus, at our option, either a variable base rate or a Eurodollar rate. As of December 30, 2008, the weighted-average interest rate under the $90 million First Lien Term Loan (“First Lien Term Loan”) was 2.65%. The revolving facility and the First Lien Term Loan contain usual and customary covenants including consolidated leverage ratios, fixed charge coverage ratios, limitations on capital expenditures, etc. As of January 1, 2008 and December 30, 2008 we were in compliance with all our financial and operating covenants.
Letters of credit reduce our availability under our revolving facility. As of December 30, 2008, we had $7.0 million in letters of credit outstanding under this facility. The letters of credit expire on various dates during 2009, are automatically renewable for one additional year and are payable upon demand in the event that we fail to pay the underlying obligation. Our availability under the revolving facility was $13.0 million as of December 30, 2008.
The term loan requires mandatory prepayments of:
| | • | | 50% of excess cash flow (as defined in the senior secured credit facility) subject to the ability to retain at least $5 million in cash and cash equivalents; |
| | • | | 100% of net cash proceeds of asset sales by us above a threshold and subject to the ability to reinvest under certain circumstances; |
| | • | | 100% of net cash proceeds of any debt issued by us, subject to certain exceptions; and |
| | • | | 50% of the net cash proceeds of any equity issued by us, subject to certain exceptions. |
63
EINSTEIN NOAH RESTAURANT GROUP, INC. AND SUBSIDIARIES
Notes to Consolidated Financial Statements (Continued)
Our mandatorily redeemable Series Z Preferred Stock has been reclassified to a current liability as the redemption date is now within one year. As part of the amended First Lien Term Loan in June 2007, we obtained a commitment for an incremental term loan in the aggregate amount of up to $57.0 million to be used by us, if needed, solely for the purpose of redeeming the mandatorily redeemable Series Z Preferred Stock due on June 30, 2009. Availability of the incremental term loan is subject to customary borrowing conditions, including absence of any default or material adverse change, and to a requirement of successful syndication of such incremental term loan.
Debt issuance costs were capitalized as part of the First Lien Term Loan and Amended First Lien Term Loan and are being amortized over a period of 5 years. For the revolving facility, the capitalized debt issuance costs are being amortized on a straight-line basis while the capitalized debt issuance costs for the First Lien Term Loan are being amortized on the effective interest rate method. In the event that the debt is retired prior to the maturity date, debt issuance costs will be expensed in the period that the debt is retired.
As of January 1, 2008 and December 30, 2008, debt issuance costs, net of amortization of approximately $2.6 million and $2.1 million, respectively, have been capitalized in other assets for the Amended $90 Million First Lien Term Loan and the revolving facility. The amortization of debt issuance costs is included in interest expense in the consolidated statements of operations. Amortization expense of approximately $0.8 million, $0.6 million and $0.5 million was recorded for the fiscal years ended 2006, 2007, and 2008, respectively.
In 2009, we will make a $7.2 million prepayment related to the excess cash flow provision in our debt agreement. For all subsequent years we have included the minimum contractual amounts as these future pre-payments cannot be estimated. Our loan obligations for the five years following December 30, 2008 are as follows:
| | | |
Fiscal year (in thousands of dollars): |
2009 | | $ | 8,088 |
2010 | | $ | 900 |
2011 | | $ | 1,125 |
2012 | | $ | 77,762 |
Thereafter | | | — |
| | | |
| | $ | 87,875 |
| | | |
Through fiscal year 2011, payments of $225,000 are due on calendar quarter ends. However, due to the difference between our fiscal quarter ends and calendar quarter ends, there were only three payments in fiscal year ending December 30, 2008, and there are five payments scheduled for fiscal year ending 2011.
New Jersey Economic Development Authority Note Payable
In December 1998, Manhattan Bagel Company, Inc. entered into a note payable in the principal amount of $2.8 million with the New Jersey Economic Development Authority (“NJEDA”) at an interest rate of 9% per annum. Principal is paid annually and interest is paid quarterly. The note matured on December 1, 2008 and was fully paid.
10. INTEREST RATE SWAP AND OTHER COMPREHENSIVE INCOME
On May 7, 2008, we entered into an interest rate swap agreement relating to our First Lien Term Loan for the next two years, effective August 2008. We are required to make payments based on a fixed interest rate of 3.52%
64
EINSTEIN NOAH RESTAURANT GROUP, INC. AND SUBSIDIARIES
Notes to Consolidated Financial Statements (Continued)
calculated on an initial notional amount of $60 million. In exchange we receive interest on $60 million of notional amount at a variable rate. The variable rate interest we receive is based on the one-month London InterBank Offered Rate (“LIBOR”). The net effect of the swap is to fix the interest rate on $60 million of our First Lien Term Loan at 3.52% plus an applicable margin. As of December 30, 2008 the weighted-average interest rate under the First Lien Term Loan including this swap was 4.74%.
The interest rate swap agreement qualifies as a cash flow hedge, as defined by SFAS 133,Accounting for Derivative Instruments and Hedging Activities. The fair value of the interest rate swap agreement, which will be adjusted regularly, will be recorded in the Company’s balance sheet as an asset or liability, as necessary, with a corresponding adjustment to accumulated other comprehensive loss within stockholders’ deficit.
There was no impact for adoption of SFAS No. 157,Fair Value Measurements (“SFAS No. 157”) to the consolidated financial statements as of December 30, 2008. SFAS No. 157 requires fair value measurement to be classified and disclosed in one of the following three categories:
| | • | | Level 1: Unadjusted quoted prices in active markets that are accessible at the measurement date for identical, unrestricted assets or liabilities. |
| | • | | Level 2: Quoted prices in markets that are not active or inputs which are observable, either directly or indirectly, for substantially the full term of the asset or liability. |
| | • | | Level 3: Prices or valuation techniques that require inputs that are both significant to the fair value measurement and unobservable (i.e., supported by little or no market activity). |
The interest rate swap discussed above falls into the Level 2 category under the guidance of SFAS 157. The fair market value of the interest rate swap as of December 30, 2008 was a liability of $2.5 million, which is recorded in other liabilities on the consolidated balance sheet. As of December 30, 2008, the unrealized loss associated with this cash flow hedging instrument is recorded in accumulated other comprehensive loss within stockholders’ deficit.
Comprehensive income consisted of the following as of:
| | | | |
| | | 52 weeks ended
December 30,
2008 | |
| | | (in thousands) | |
Net income | | $ | 21,077 | |
Unrealized loss on cash flow hedge | | | (2,470 | ) |
| | | | |
Total comprehensive income | | $ | 18,607 | |
| | | | |
We will reclassify any gain or loss from accumulated other comprehensive loss, net of tax, on the consolidated balance sheet to other expense/income on the consolidated statements of operations when the interest rate swap expires or at the time the we choose to terminate the swap.
65
EINSTEIN NOAH RESTAURANT GROUP, INC. AND SUBSIDIARIES
Notes to Consolidated Financial Statements (Continued)
11. OTHER LIABILITIES
Other long-term liabilities consist of the following as of:
| | | | | | |
| | | January 1,
2008 | | December 30,
2008 |
| | | (In thousands of dollars) |
Vendor contractual agreements (a) | | $ | 6,881 | | $ | 6,659 |
Deferred rent | | | 3,960 | | | 4,944 |
Unrealized loss—interest rate swap | | | — | | | 2,470 |
| | | | | | |
Other liabilities | | $ | 10,841 | | $ | 14,073 |
| | | | | | |
| (a) | A strategic supplier of ours provided advance funding in the amount of $10.0 million to us in 1996 as part of a contract to continue buying products from the supplier. The contract terminates upon fulfillment of contractual purchase volumes. We account for this contract by recognizing a reduction of cost of goods sold based on the volume of purchases of the vendor’s product. |
12. MANDATORILY REDEEMABLE SERIES Z PREFERRED STOCK
In September 2003, we completed an equity recapitalization with our preferred stockholders, who held a substantial portion of our common stock. Among other things, the Halpern Denny Fund III, L.P. (“Halpern Denny”) interest in our Mandatorily Redeemable Series F Preferred Stock (“Series F”) was converted into 57,000 shares of Series Z Mandatorily Redeemable Preferred Stock (“Series Z”). The major provisions of our Series Z are as follows:
| | • | | 2,000,000 shares authorized; |
| | • | | par value of $0.001 per share; |
| | • | | mandatory redemption upon the earlier of (i) a merger or change of control or (ii) June 30, 2009; |
| | • | | shares are non-voting (except for certain limited voting rights with respect to specified events); |
| | • | | liquidation value is $1,000 per share; |
| | • | | an annual dividend rate equal to 250 basis points higher than the highest rate paid on our funded indebtedness is payable if the shares are not redeemed by the redemption date. The dividend is accrued prospectively based on the outstanding balance; |
| | • | | shares may be redeemed in whole or in part at an earlier date at our discretion; and |
| | • | | unpaid dividends accrue and must be paid as additional redemption price at the time the shares are redeemed. |
The exchange of the Halpern Denny interest for Series Z resulted in a reduction of our effective dividend rate relative to that required by the Series F, and, as a result of this and other factors, we accounted for this transaction as a troubled debt restructuring. Since a portion of this exchange included the receipt of our common stock and warrants previously held by Halpern Denny, we did not recognize a gain from troubled debt restructuring. The Series Z is recorded in the accompanying consolidated balance sheets at its full face value of $57.0 million, which represents the total cash payable upon redemption on June 30, 2009.
In accordance with the mandatory redemption provisions of the Series Z Preferred Stock, we currently plan on redeeming a substantial portion of the Series Z Preferred Stock with our unrestricted cash on June 30, 2009. Under the terms of the Series Z Preferred Stock, we would be required to pay additional redemption price in the
66
EINSTEIN NOAH RESTAURANT GROUP, INC. AND SUBSIDIARIES
Notes to Consolidated Financial Statements (Continued)
future to redeem any shares not redeemed on June 30, 2009. The additional redemption price would accrue at a rate that is 250 basis points higher than our highest rate paid on our funded debt.
13. STOCKHOLDERS’ DEFICIT
Common Stock
We are authorized to issue up to 25 million shares of common stock, par value $0.001 per share. As of January 1, 2008 and December 30, 2008, there were 15,878,811 and 15,969,167 shares outstanding, respectively.
On June 13, 2007, we completed a secondary public offering of 5 million shares of common stock resulting in gross proceeds of $90 million. After stock issuance costs of $6.7 million related to the offering, we received net proceeds of $83.3 million. Our common stock is now listed on the NASDAQ Global Market under the symbol “BAGL”. We used the net proceeds from the offering to pay down our existing indebtedness.
Series A Junior Participating Preferred Stock
In June 1999, our Board of Directors (“BOD”) authorized the issuance of a Series A junior participating preferred stock in the amount of 700,000 shares. This authorization was made in accordance with the Stockholder Protection Rights Plan discussed below. There are currently no issued shares.
Stockholder Protection Rights Plan
We maintain a Stockholder Protection Rights Plan (the “Plan”). Upon implementation of the Plan in June 1999, our BOD declared a dividend distribution of one right on each outstanding share of common stock, as well as on each share later issued. Each right will allow stockholders to buy one one-hundredth of a share of Series A junior participating preferred stock at an exercise price of $10.00. The rights become exercisable if an individual or group acquires 15% or more of common stock, or if an individual or group announces a tender offer for 15% or more of common stock. The BOD can redeem the rights at $0.001 per right at any time before any person acquires 15% or more of the outstanding common stock. In the event an individual (the “Acquiring Person”) acquires 15% or more of the outstanding common stock, each right will entitle its holder to purchase, at the right’s exercise price, one one-hundredth of a share of Series A junior participating preferred stock, which is convertible into common stock at one-half of the then value of the common stock, or to purchase such common stock directly if there are a sufficient number of shares of common stock authorized. Our BOD has the ability to exclude any Acquiring Person from the provision of the Plan, resulting in such Acquiring Person’s purchase of our common stock not triggering the Plan. Rights held by the Acquiring Person are void and will not be exercisable to purchase shares at the bargain purchase price. If we are acquired in a merger or other business combination transaction, each right will entitle its holder to purchase, at the right’s then-current exercise price, a number of the acquiring company’s common shares having a market value at that time of twice the right’s exercise price.
14. STOCK OPTION AND WARRANT PLANS
1994 and 1995 Plans
Our 1994 Stock Plan (the “1994 Plan”) provided for the granting to employees of incentive stock options and for the granting to employees and consultants of non-statutory stock options and stock purchase rights. On November 21, 2003, the BOD terminated the authority to issue any additional options under the 1994 Plan. As of January 1, 2008, all options under the 1994 Plan had expired.
67
EINSTEIN NOAH RESTAURANT GROUP, INC. AND SUBSIDIARIES
Notes to Consolidated Financial Statements (Continued)
Our 1995 Directors’ Stock Option Plan (the “Directors’ Option Plan”) provided for the automatic grant of non-statutory stock options to non-employee directors of the Company. On December 19, 2003, our BOD terminated the authority to issue any additional options under the Directors’ Option Plan. As of December 30, 2008, options to purchase 996 shares of common stock at a weighted-average exercise price of $10.23 per share and a weighted-average remaining contractual life of 4.74 years remained outstanding under this plan.
2003 Executive Employee Incentive Plan
On November 21, 2003, our BOD adopted the Executive Employee Incentive Plan, as amended on December 19, 2003, March 1, 2005, February 28, 2007 and April 24, 2007 (the “2003 Plan”). The 2003 Plan provides for granting incentive stock options to employees and granting non-statutory stock options to employees and consultants. Unless terminated sooner, the 2003 Plan will terminate automatically in December 2013. The BOD has the authority to amend, modify or terminate the 2003 Plan, subject to any required approval by our stockholders under applicable law or upon advice of counsel. No such action may affect any options previously granted under the 2003 Plan without the consent of the holders. There are 2,000,000 shares reserved for issuance pursuant to options granted under the 2003 Plan. Options generally are granted with an exercise price equal to the fair market value on the date of grant, have a contractual life of ten years and typically vest over a three-year service period. Generally, 50% of options granted vest upon service. We recognize compensation costs for these awards using a graded vesting attribution method over the requisite service period. The remaining 50% of options granted vest based on service and financial performance. Options that do not vest due to the failure to achieve specific financial performance criteria are canceled. As of December 30, 2008, options to purchase approximately 161,413 shares of our common stock, which are not yet exercisable, are subject to future financial performance conditions. We recognize compensation costs for performance based options over the requisite service period when conditions for achievement become probable. For fiscal years 2007 and 2008, 106,738 and 73,967 shares, respectively, were canceled as we did not meet certain financial goals and the related compensation expense that had been recorded during the year was reversed. As of December 30, 2008, there were 619,979 shares reserved for future issuance under the 2003 Plan.
2004 Stock Option Plan for Independent Directors
On December 19, 2003, our BOD adopted the Stock Option Plan for Independent Directors, effective January 1, 2004, as amended on March 1, 2005 and February 28, 2007 (the “2004 Directors’ Plan”). Our BOD may amend, suspend, or terminate the 2004 Directors’ Plan at any time, provided, however, that no such action may adversely affect any outstanding option without the option holder’s consent. A total of 300,000 shares of common stock have been reserved for issuance under the 2004 Directors’ Plan. The 2004 Directors’ Plan provides for the automatic grant of non-statutory stock options to independent directors on January 1 of each year and a prorated grant of options for any director elected during the year. Options are granted with an exercise price equal to the fair market value on the date of grant, become exercisable six months after the grant date and are exercisable for five years from the date of grant unless earlier terminated. As of December 30, 2008, there were 73,836 shares reserved for future issuance under the 2004 Directors’ Plan.
Stock Appreciation Rights Plan
On February 17, 2007, our BOD adopted the Stock Appreciation Rights Plan (the “SAR Plan”). The SAR Plan provides for granting stock appreciation rights to employees. Unless terminated sooner, the SAR Plan will terminate automatically on March 31, 2012. The BOD has the authority to amend, modify or terminate the SAR Plan, subject to any required approval by our stockholders under applicable law or upon advice of counsel, provided that, with limited exception, no modification will adversely affect outstanding rights. There are 150,000 shares issuable pursuant to stock appreciation rights under the SAR Plan.
68
EINSTEIN NOAH RESTAURANT GROUP, INC. AND SUBSIDIARIES
Notes to Consolidated Financial Statements (Continued)
The value of a share from which appreciation is determined is 100% of the fair market value of a share on the date of grant and will be paid in stock when they are exercised by the employee. The rights expire upon the earlier of termination date of the SAR Plan or termination of employment, and typically vest over a two-year service period, and have a contractual life of five years. Generally, 50% of rights granted vest based solely upon the passage of time. We recognize compensation costs for these awards using a graded vesting attribution method over the requisite service period. The remaining 50% of rights granted vest based on financial performance. As of December 30, 2008, rights to approximately 2,487 shares of our common stock, which are not yet exercisable, are subject to financial performance conditions. We will recognize compensation costs for performance based stock appreciation rights over the requisite service period when conditions for achievement become probable. For fiscal year 2007 and 2008, 26,487 and 21,841 shares, respectively, were canceled as we did not meet certain financial goals and the related compensation expense that had been recorded during the year was reversed. Rights that do not vest are forfeited and are entered back into the pool of shares to be distributed. As of December 30, 2008, there were 103,235 shares reserved for future issuance under the SAR Plan.
James W. Hood Stock Award Agreement
On May 3, 2007, our BOD adopted the James W. Hood Stock Award Agreement (the “Stock Award Plan”). The Stock Award Plan provided for the issuance of 22,000 shares of our common stock to Mr. Hood as inducement for accepting employment with us as our Chief Marketing Officer. The common stock award included 7,333 shares that have no restrictions, 7,333 shares that became unrestricted on the first anniversary and 7,334 shares that would become unrestricted on the second anniversary of the date of grant, provided that Mr. Hood was continuously employed by us on those dates.
On November 25, 2008, Mr. Hood was no longer employed by the Company and the remaining 7,334 shares of restricted stock were forfeited. We recognized compensation costs for these awards using a graded vesting attribution method over the requisite service period. Included in our total stock-based compensation expense for fiscal years ended 2007 and 2008, was $271,000 and $0, respectively, related to this agreement.
Stock Option Activity
Transactions for the 1994 Plan, Directors’ Option Plan, the 2003 Plan, the 2004 Directors’ Plan and the Stock Award Plan during fiscal years ended 2006, 2007 and 2008 were as follows:
| | | | | | | | | | | | | | | | | | |
| | | Number of Options | | | Weighted-Average Exercise
Price |
| | | 2006 | | | 2007 | | | 2008 | | | 2006 | | 2007 | | 2008 |
Outstanding, beginning of year | | 997,152 | | | 993,707 | | | 1,108,361 | | | $ | 3.31 | | $ | 3.79 | | $ | 8.06 |
Granted | | 202,500 | | | 554,314 | | | 391,738 | | | | 5.24 | | | 13.24 | | | 10.55 |
Exercised | | (48,485 | ) | | (260,392 | ) | | (97,526 | ) | | | 2.88 | | | 3.91 | | | 4.14 |
Forfeited | | (157,460 | ) | | (179,268 | ) | | (201,131 | ) | | | 2.98 | | | 6.48 | | | 14.92 |
| | | | | | | | | | | | | | | | | | |
Outstanding, ending of year | | 993,707 | | | 1,108,361 | | | 1,201,442 | | | $ | 3.79 | | $ | 8.06 | | $ | 8.04 |
| | | | | | | | | | | | | | | | | | |
Exercisable and vested, end of year | | 623,662 | | | 637,993 | | | 730,033 | | | $ | 3.69 | | $ | 4.57 | | $ | 6.37 |
| | | | | | | | | | | | | | | | | | |
The aggregate intrinsic value of options exercised during 2006, 2007 and 2008 was $0.3 million, $3.4 million and $0.8 million, respectively.
69
EINSTEIN NOAH RESTAURANT GROUP, INC. AND SUBSIDIARIES
Notes to Consolidated Financial Statements (Continued)
| | | | | | |
| | | Number
of
Options | | | Weighted-Average
Grant Date
Fair Value |
Non-vested shares, January 1, 2008 | | 470,368 | | | $ | 4.80 |
Granted | | 391,738 | | | | 3.86 |
Vested | | (197,521 | ) | | | 4.36 |
Forfeited | | (193,176 | ) | | | 5.15 |
| | | | | | |
Non-vested shares, December 30, 2008 | | 471,409 | | | $ | 4.06 |
| | | | | | |
The weighted-average fair value of options granted during the years ended January 2, 2007 and January 1, 2008 was $3.72 and $5.39, respectively.
As of January 1, 2008, the weighted-average remaining life of total outstanding options, and exercisable and vested options was 7.19 years and 6.08 years, respectively, and the aggregate intrinsic value of outstanding options, and exercisable and vested options was $11.2 million and $8.7 million, respectively.
As of December 30, 2008, the weighted-average remaining life of total outstanding options, and exercisable and vested options was 5.84 years and 3.67 years, respectively, and the aggregate intrinsic value of outstanding options, and exercisable and vested options was $0.9 million and $0.8 million, respectively.
The following table summarizes information about stock options outstanding at December 30, 2008:
| | | | | | | | | | | | |
| | | Options Outstanding | | Options Exercisable |
Range of Exercise Prices | | Number of
Options | | Wt.Avg.
Exercise
Price | | Wt.Avg.
Remaining
Life
(Years) | | Number
of
Options | | Wt.Avg.
Exercise
Price |
$0.00 - $2.00 | | 20,000 | | $ | 2.00 | | 1.01 | | 20,000 | | $ | 2.00 |
$2.01 - $4.00 | | 401,133 | | | 3.52 | | 2.95 | | 401,133 | | | 3.52 |
$4.01 - $8.00 | | 391,327 | | | 6.27 | | 7.06 | | 208,268 | | | 6.85 |
$8.01 - $15.00 | | 147,829 | | | 10.96 | | 9.54 | | 1,829 | | | 10.81 |
$15.01 - $20.00 | | 241,153 | | | 17.13 | | 6.82 | | 98,803 | | | 17.69 |
| | | | | | | | | | | | |
| | 1,201,442 | | $ | 8.04 | | 5.84 | | 730,033 | | $ | 6.37 |
| | | | | | | | | | | | |
Stock Appreciation Rights Plan Activity
Transactions for fiscal years ended 2007 and 2008 were as follows:
| | | | | | | | | | | | |
| | | | | | | | | Weighted-average |
| | | Number of SARs | | | Exercise price |
| | | 2007 | | | 2008 | | | 2007 | | 2008 |
Outstanding, beginning of year | | — | | | 76,913 | | | $ | — | | $ | 11.69 |
Granted | | 117,300 | | | 7,452 | | | | 11.30 | | | 12.51 |
Exercised | | — | | | (388 | ) | | | — | | | 8.00 |
Forfeited | | (40,387 | ) | | (37,600 | ) | | | 10.54 | | | 11.65 |
| | | | | | | | | | | | |
Outstanding, ending of year | | 76,913 | | | 46,377 | | | $ | 11.69 | | $ | 11.89 |
| | | | | | | | | | | | |
Exercisable and vested, end of year | | — | | | 19,563 | | | $ | — | | $ | 11.52 |
| | | | | | | | | | | | |
70
EINSTEIN NOAH RESTAURANT GROUP, INC. AND SUBSIDIARIES
Notes to Consolidated Financial Statements (Continued)
The aggregate intrinsic value of SARs exercised during 2008 was $2,000.
| | | | | | |
| | | Number
of
SARs | | | Weighted-
Average
Grant Date
Fair Value |
Non-vested shares, January 1, 2008 | | 76,913 | | | $ | 5.58 |
Granted | | 7,452 | | | | 3.22 |
Vested | | (24,212 | ) | | | 5.55 |
Forfeited | | (33,339 | ) | | | 5.46 |
| | | | | | |
Non-vested shares, December 30, 2008 | | 26,814 | | | $ | 5.10 |
| | | | | | |
The weighted-average fair value of SARs granted during the year ended January 1, 2008 and December 30, 2008 was $5.57 and $3.22, respectively.
As of January 1, 2008, the weighted-average remaining life of total outstanding SARs was 4.26 years, and the aggregate intrinsic value of outstanding SARs was $0.5 million. There were no SARs exercisable and vested as of January 1, 2008.
As of December 30, 2008, the weighted-average remaining life of total outstanding SARs, and exercisable and vested SARs was 3.41 years and 3.25 years, respectively, and the aggregate intrinsic value for both the outstanding SARs, and exercisable and vested SARs was $0.
The following table summarizes information about stock SARs outstanding at December 30, 2008:
| | | | | | | | | | | | |
| | | SARs Outstanding | | SARs Exercisable |
Range of Exercise Prices | | Number of
SARs | | Wt. Avg.
Exercise
Price | | Wt. Avg.
Remaining
Life (Years) | | Number of
SARs | | Wt. Avg.
Exercise
Price |
$0.00 - $10.00 | | 27,512 | | $ | 7.94 | | 3.32 | | 12,962 | | $ | 8.00 |
$10.01 - $20.00 | | 17,590 | | | 17.21 | | 3.52 | | 6,601 | | | 18.44 |
$20.01 - $30.00 | | 1,275 | | | 23.70 | | 3.85 | | — | | | — |
| | | | | | | | | | | | |
| | 46,377 | | $ | 11.89 | | 3.41 | | 19,563 | | $ | 11.52 |
| | | | | | | | | | | | |
Warrants
As of December 30, 2008, we had no warrants outstanding and exercisable to purchase shares of our common stock. Previously, warrants were issued in connection with private financing transactions and certain other services that occurred between 2000 and 2003. Transactions during fiscal year 2006 were as follows:
| | | |
| | | 2006 | |
Outstanding at beginning of year | | 739,961 | |
Issued | | — | |
Exercised | | (482,862 | ) |
Converted | | — | |
Forfeited | | (257,099 | ) |
| | | |
Outstanding and exercisable at end of year | | — | |
| | | |
71
EINSTEIN NOAH RESTAURANT GROUP, INC. AND SUBSIDIARIES
Notes to Consolidated Financial Statements (Continued)
During 2006, we received total consideration of $55,000 and issued 53,217 shares of our common stock in connection with the exercises of certain warrants previously granted to a number of investors, including Greenlight. Additionally, we issued 429,645 shares of our common stock to Greenlight upon Greenlight’s cashless exercises of certain warrants. Greenlight surrendered 56,953 shares of common stock in connection with such cashless exercises.
15. SAVINGS PLAN
We sponsor a qualified defined contribution retirement plan covering eligible employees of Einstein Noah Restaurant Group (the “401(k) Plan”). Employees, excluding officers, are eligible to participate in the 401(k) Plan if they meet certain compensation and eligibility requirements. The 401(k) Plan allows participating employees to defer the receipt of a portion of their compensation and contribute such amount to one or more investment options. We did not accrue a discretionary match for fiscal years ended 2007 or 2008. Our contribution to the plan was $0.2 million for the fiscal year ended 2006. Employer contributions vest at the rate of 100% after three years of service.
We established the Einstein Noah Restaurant Group, Inc. Nonqualified Deferred Compensation Plan (the “DC Plan”) in June of 2007 for key employees, generally officers of the Company. The DC Plan allows an eligible employee to defer up to 80% of the participant’s base salary and bonus. In lieu of payments of the deferred amounts to the participant, the payments are to be invested with The Charles Schwab Trust Company under investment criteria directed by the participant.
16. INCOME TAXES
Utilization of our fully reserved net operating loss (“NOL”) carryforwards reduced our federal and state income tax liability incurred in 2008. We have recorded a provision for income taxes related to our estimate of income taxes due on taxable earnings for 2007 and 2008 of $0.5 million and $1.1 million, respectively.
In accordance with SFAS 109,Accounting for Income Taxes (“SFAS No. 109”), we will assess the continuing need for a valuation allowance that results from uncertainty regarding our ability to realize the benefits of our deferred tax assets. The ultimate realization of deferred income tax assets is dependent upon generation of future taxable income during the periods in which those temporary differences become deductible. Although we achieved $12.6 million and $21.1 million of net income for 2007 and 2008, respectively, we will continue to review various qualitative and quantitative data in regards to the realization of our deferred tax assets, including:
| | • | | The level of historical taxable income and projections for future taxable income over periods in which the deferred tax assets would be deductible; |
| | • | | Accumulation of income (loss) before taxes utilizing a look-back period of three years; |
| | • | | Events within the restaurant industry; |
| | • | | The cyclical nature of our business; |
| | • | | The health of the economy; |
| | • | | Our future forecasts of taxable income; and |
After consideration of this qualitative and quantitative data, we concluded not to reduce our valuation allowance in the fourth quarter of 2008 because of the current macroeconomic climate and the uncertainty around credit markets and consumer behavior. Our deferred tax assets remain fully reserved by a valuation allowance.
72
EINSTEIN NOAH RESTAURANT GROUP, INC. AND SUBSIDIARIES
Notes to Consolidated Financial Statements (Continued)
As of December 30, 2008, NOL carryforwards of $135.4 million were available to be utilized against future taxable income for years through fiscal 2026, subject to annual limitations. Our NOL’s are one of our deferred income tax assets. As a result of prior ownership changes, approximately $29.8 million of our NOL carryforwards are subject to an annual usage limitation of $2.5 million. The occurrence of an additional ownership change would limit our ability to utilize the approximately $105.6 million of our NOL carryforwards that are not currently subject to limitation, and could further limit our ability to utilize our remaining NOL carryforwards and possibly other tax attributes.
On January 3, 2007, we adopted the provisions of FASB Interpretation No. 48,Accounting for Uncertainty in Income Taxes (“FIN 48”). Previously, we accounted for tax contingencies in accordance with Statement of Financial Accounting Standards 5,Accounting for Contingencies. As required by FIN 48, which clarifies SFAS No. 109, we recognize the financial statement benefit of a tax position only after determining that the relevant tax authority would more likely than not sustain the position following an audit. For tax positions meeting the more-likely-than-not threshold, the amount recognized in the financial statements is the largest benefit that has a greater than 50% likelihood of being realized upon ultimate settlement with the relevant tax authority. At the adoption date, we applied FIN 48 to all tax positions for which the statute of limitations remained open. As a result of the implementation of FIN 48, we recorded a reduction of approximately $1.8 million of the gross deferred tax asset and a corresponding reduction of the valuation allowance. There was no net effect to the financial statements and none of the unrecognized tax benefits will impact our effective tax rate.
The income tax uncertainties relate to periods in which net operating losses were generated. Upon adoption of FIN 48, the net operating loss carryforwards were reduced and thus no tax liability was recorded. Additionally, we maintain a full valuation allowance against our net deferred tax assets. Therefore, our valuation allowance was correspondingly reduced by $1.8 million. Due to the completion and the filing of Forms 3115, Application for Change in Accounting Method, it is highly certain that approximately $1.5 million of the unrecognized tax benefits will be realized. Additionally, we have refined our estimate of the unrecognized tax benefits related to the remaining $0.3 million. Accordingly, in the fourth quarter of 2007, we recorded an increase of approximately $1.8 million in our gross deferred tax asset and a corresponding increase in our valuation allowance. There was no net effect to the financial statements and none of the unrecognized tax benefits impacted our effective tax rate.
We are subject to income taxes in the U.S. federal jurisdiction, and various states and local jurisdictions. Tax regulations within each jurisdiction are subject to the interpretation of the related tax laws and regulations and require significant judgment to apply. We remain subject to examination by U.S. federal, state and local tax authorities for tax years 2004 through 2007. With a few exceptions, we are no longer subject to U.S. federal, state or local examinations by tax authorities for the tax year 2003 and prior.
73
EINSTEIN NOAH RESTAURANT GROUP, INC. AND SUBSIDIARIES
Notes to Consolidated Financial Statements (Continued)
The amount of the deferred tax asset considered realizable could be reduced if estimates of future taxable income during the carryforward periods are reduced. As of December 30, 2008, our net operating loss carryforwards for U.S. federal income tax purposes were $135.4 million and were subject to the following expiration schedule (in thousands of dollars):
| | | |
| Net Operating Loss Carryforwards |
Expiration Date | | Amount |
| | | (in thousands
of dollars) |
December 31, 2012 | | $ | 6,088 |
December 31, 2018 | | | 5,774 |
December 31, 2019 | | | 6,862 |
December 31, 2020 | | | 10,424 |
December 31, 2021 | | | 5,876 |
December 31, 2022 | | | 35,668 |
December 31, 2023 | | | 42,362 |
December 31, 2024 | | | 12,023 |
December 31, 2025 | | | 5,413 |
December 31, 2026 | | | 4,900 |
| | | |
| | $ | 135,390 |
| | | |
Our ability to utilize our net operating losses could be limited or further limited if we have undergone an “ownership change” as defined by Section 382 of the Internal Revenue Code. We filed a request with the Internal Revenue Service to review our methodology for determining ownership changes in accordance with Internal Revenue Code Section 382. If our request is accepted, we believe that our NOLs will be available for utilization. In the event that our request is not accepted, approximately $40.5 million of additional NOLs will be at risk to be disallowed prior to utilization.
We record deferred tax assets and liabilities based on the difference between the financial statement and income tax basis of assets and liabilities using the enacted statutory tax rate in effect for the year differences are expected to be taxable or refunded. Deferred income tax expenses or credits are based on the changes in the asset or liability from period to period.
The provision for income taxes consists of the following:
| | | | | | | | | | | | |
| | | 2006 | | | 2007 | | | 2008 | |
| | | (in thousands) | |
Current | | | | | | | | | | | | |
Federal | | $ | — | | | $ | 232 | | | $ | 359 | |
State | | | — | | | | 222 | | | | 741 | |
| | | | | | | | | | | | |
Total current income tax benefit | | | — | | | | 454 | | | | 1,100 | |
| | | | | | | | | | | | |
Deferred | | | | | | | | | | | | |
Federal | | | (2,329 | ) | | | 4,957 | | | | 8,239 | |
State | | | (216 | ) | | | 1,132 | | | | 870 | |
| | | | | | | | | | | | |
Total deferred income tax benefit | | | (2,545 | ) | | | 6,089 | | | | 9,199 | |
| | | | | | | | | | | | |
Change in valuation allowance | | | 2,545 | | | | (6,089 | ) | | | (9,199 | ) |
| | | | | | | | | | | | |
Total income tax provision | | $ | — | | | $ | 454 | | | $ | 1,100 | |
| | | | | | | | | | | | |
74
EINSTEIN NOAH RESTAURANT GROUP, INC. AND SUBSIDIARIES
Notes to Consolidated Financial Statements (Continued)
A reconciliation between the reported provision for income taxes and the amount computed by applying the statutory federal income tax rate of 35% to loss before income taxes is as follows:
| | | | | | | | | | | | |
| | | 2006 | | | 2007 | | | 2008 | |
| | | (in thousands) | |
Expected tax provision (benefit) at 35% | | $ | (2,403 | ) | | $ | 4,565 | | | $ | 7,762 | |
State tax provision (benefit), net of federal provision (benefit) | | | (216 | ) | | | 1,157 | | | | 1,381 | |
Interest rate swap | | | — | | | | — | | | | (865 | ) |
Other, net | | | 74 | | | | 421 | | | | 824 | |
Deferred taxes related to change in tax accounting method | | | — | | | | 2,421 | | | | — | |
Expired tax carryforwards | | | — | | | | 1,132 | | | | — | |
Effect of change in tax rate | | | — | | | | (3,153 | ) | | | 1,197 | |
Change in valuation allowance | | | 2,545 | | | | (6,089 | ) | | | (9,199 | ) |
| | | | | | | | | | | | |
Total provision for taxes | | $ | — | | | $ | 454 | | | $ | 1,100 | |
| | | | | | | | | | | | |
The income tax effects of temporary differences that give rise to significant portions of deferred tax assets as of January 2, 2007, January 1, 2008 and December 30, 2008 are as follows:
| | | | | | | | | | | | |
| | | 2006 | | | 2007 | | | 2008 | |
| | | (in thousands) | |
Deferred tax assets | | | | | | | | | | | | |
Operating loss carryforwards | | $ | 59,990 | | | $ | 59,228 | | | $ | 52,937 | |
Interest rate swap | | | — | | | | — | | | | 966 | |
California wage and hour settlements | | | — | | | | — | | | | 743 | |
Senior management transition costs | | | — | | | | — | | | | 326 | |
Capital loss carryforwards | | | 1,237 | | | | — | | | | — | |
Accrued expenses | | | 1,999 | | | | 493 | | | | (911 | ) |
§481(a) tax accounting method change | | | — | | | | (1,733 | ) | | | (1,028 | ) |
Allowances for doubtful accounts | | | 193 | | | | 241 | | | | 84 | |
Deferred rent | | | 4 | | | | 272 | | | | 809 | |
Other assets | | | — | | | | (209 | ) | | | (52 | ) |
Property, plant and equipment | | | 17,727 | | | | 16,517 | | | | 11,449 | |
Alternative minimum tax | | | — | | | | 252 | | | | 539 | |
| | | | | | | | | | | | |
Total gross deferred tax asset | | | 81,150 | | | | 75,061 | | | | 65,862 | |
Less valuation allowance | | | (81,150 | ) | | | (75,061 | ) | | | (65,862 | ) |
| | | | | | | | | | | | |
Total deferred tax asset | | $ | — | | | $ | — | | | $ | — | |
| | | | | | | | | | | | |
75
EINSTEIN NOAH RESTAURANT GROUP, INC. AND SUBSIDIARIES
Notes to Consolidated Financial Statements (Continued)
17. SUPPLEMENTAL CASH FLOW INFORMATION
| | | | | | | | | | | |
| | | 52 weeks ended | |
| | | January 2, | | January 1, | | | December 30, | |
| | | 2007 | | 2008 | | | 2008 | |
| | | (in thousands) | |
Cash paid during the year to date period ended: | | | | | | | | | | | |
Interest related to: | | | | | | | | | | | |
$160 Million Notes | | $ | 3,293 | | $ | — | | | $ | — | |
Term Loans | | | 10,855 | | | 11,111 | | | | 5,477 | |
$25 Million Subordinated Note | | | 1,412 | | | 825 | | | | — | |
Other | | | 575 | | | 319 | | | | 226 | |
Prepayment penalty upon redemption of debt | | $ | 4,800 | | $ | 240 | | | $ | — | |
Income taxes | | $ | 184 | | $ | 274 | | | $ | 1,092 | |
Non-cash investing activities: | | | | | | | | | | | |
Non-cash purchase of equipment through capital leasing | | $ | 205 | | $ | 24 | | | $ | 36 | |
Non-cash addition of leasehold improvements provided by lessor | | $ | — | | $ | 1,672 | | | $ | — | |
Change in accrued expenses for purchases of property and equipment | | $ | 2,955 | | $ | (2,125 | ) | | $ | (115 | ) |
18. RELATED PARTY TRANSACTIONS
E. Nelson Heumann is the chairman of our BOD and is a current employee of Greenlight. Greenlight and its affiliates beneficially own approximately 67 percent of our common stock on a fully diluted basis. As a result, Greenlight has sufficient voting power without the vote of any other stockholders to determine what matters will be submitted for approval by our stockholders, to elect all of our BOD, and among other things, to determine whether a change in control of our company occurs.
We entered into the Subordinated Note with Greenlight in February 2006 and paid it in full during the second quarter of 2007. The Subordinated Note had a maturity date of February 28, 2013, carried a fixed interest rate of 13.75% per annum, required a quarterly cash interest payment in arrears at 6.5% and quarterly paid-in kind interest that is added to the principal balance outstanding at 7.25%. Total interest expense related to the Subordinated Note with Greenlight was $3.0 million for the year ended January 2, 2007, and $1.7 million for the year ended January 1, 2008. The Note was repaid from the proceeds of our secondary offering and amended debt facility in June 2007 as further described in Note 13.
During 2006, we issued 429,645 shares of our common stock to Greenlight in connection with cashless exercises of certain warrants previously granted by us. Greenlight surrendered 56,953 shares of common stock to us in connection with such cashless exercises. We issued these warrants in private financing transactions that occurred between 2000 and 2003.
19. COMMITMENTS AND CONTINGENCIES
Letters of Credit and Line of Credit
As of December 30, 2008, we had $7.2 million in letters of credit outstanding. The letters of credit expire on various dates during 2009 and 2010, are generally automatically renewable for one additional year and are payable upon demand in the event that we fail to pay the underlying obligation. Of the total letters of credit outstanding, $7.0 million reduces our availability under our revolving facility. Our availability under the revolving facility was $13.0 million at December 30, 2008.
76
EINSTEIN NOAH RESTAURANT GROUP, INC. AND SUBSIDIARIES
Notes to Consolidated Financial Statements (Continued)
Capital Leases
We lease certain equipment under capital leases. Included in property, plant and equipment are the asset values of $262,000 and $265,000 and the related accumulated amortization of $139,000 and $194,000 as of January 1, 2008 and December 30, 2008, respectively. Amortization of assets under capital leases is included in depreciation and amortization expense.
Operating Leases
We lease office space, restaurant space and certain equipment under operating leases having terms that expire at various dates through the fiscal year ended 2019. Our restaurant leases have renewal clauses of 1 to 20 years at our option and, in some cases, have provisions for contingent rent based upon a percentage of gross sales, as defined in the leases. Rent expense for fiscal years ended 2006, 2007 and 2008 was approximately $27.6 million, $27.5 million and $29.3 million, respectively. Contingent rent included in rent expense for fiscal years ended 2006, 2007 and 2008 was approximately $130,000, $148,000 and $140,000, respectively. We sublease out a portion of our restaurant space on leases where we did not need the entire space for our operations. Our sublease income was $0.5 million for each of the fiscal years ended 2006, 2007 and 2008, respectively.
Future Minimum Lease Payments
As of December 30, 2008, future minimum lease payments under capital and operating leases were as follows (in thousands of dollars):
| | | | | | |
Fiscal year: | | Capital
Leases | | Operating
Leases |
| | | (in thousands of dollars) |
2009 | | | 67 | | | 29,268 |
2010 | | | 28 | | | 26,141 |
2011 | | | 14 | | | 20,792 |
2012 | | | — | | | 12,634 |
2013 | | | — | | | 6,957 |
2014 and thereafter | | | — | | | 19,566 |
| | | | | | |
Total minimum lease payments | | | 109 | | $ | 115,358 |
| | | | | | |
Less imputed interest (average rate of 12.0%) | | | 10 | | | |
| | | | | | |
Present value of minimum lease payments | | | 99 | | | |
Less current portion of obligations under capital leases | | | 61 | | | |
| | | | | | |
Obligations under capital leases, long-term | | $ | 38 | | | |
| | | | | | |
In addition, the total of minimum sublease rentals to be received in the future under non-cancelable subleases as of December 30, 2008 was $1.1 million.
Purchase Commitments
We have obligations with certain of our major suppliers of raw materials (primarily frozen bagel dough) for minimum purchases both in terms of quantity and pricing on an annual basis. Furthermore, from time to time, we will commit to the purchase price of certain commodities that are related to the ingredients used for the production of our bagels. On a periodic basis, we review the relationship of these purchase commitments to
77
EINSTEIN NOAH RESTAURANT GROUP, INC. AND SUBSIDIARIES
Notes to Consolidated Financial Statements (Continued)
our business plan, general market trends and our assumptions in our operating plans. If these commitments are deemed to be in excess of the market, we will expense the excess purchase commitment to cost of sales in the period in which the shortfall is determined. The total of our future purchase obligations as of December 30, 2008 was approximately $28.0 million.
Litigation
We are subject to claims and legal actions in the ordinary course of our business, including claims by or against our franchisees, licensees and employees or former employees and/or contract disputes. We do not believe any currently pending or threatened matter, other than as described below, would have a material adverse effect on our business, results of operations or financial condition.
On September 18, 2007, Eric Mathistad, a former store manager, filed a putative class action against the Company in the Superior Court of California for the State of California, County of San Diego. The plaintiff alleged that we failed to pay overtime wages to “salaried restaurant employees” of our California stores who were misclassified as exempt employees, and that these employees were deprived of mandated meal periods and rest breaks. On November 14, 2007, Bernadette Mejia, another former store manager, filed a similar case and these cases were subsequently consolidated. On August 27, 2008, we settled this litigation with the plaintiffs.
On February 8, 2008, Gloria Weber and Hakan Mikado, non-exempt employees, filed a putative class action against the Company in the Superior Court of California for the State of California, County of San Diego. The plaintiff alleged that we failed to pay minimum wages, failed to pay overtime and failed to provide rest periods and meal breaks, among other charges. On August 27, 2008, we settled this litigation with the plaintiffs.
These settlements provide for payment of up to an aggregate of $2.5 million by the Company. Each settlement is subject to final court approvals and other conditions. There can be no assurance that the court will approve the settlements or that these other conditions will be satisfied. The final hearings are scheduled for March 20, 2009.
We recorded a liability in accrued expenses and a charge in operating expenses during the third quarter of 2008 pursuant to SFAS No. 5,Accounting for Contingencies,in the amount of $1.9 million to satisfy these settlements. This charge represents our current estimate of the aggregate amount that is probable to be paid pursuant to these settlements, but there can be no assurance that amounts actually paid will not be more or less than the amount recorded by the Company.
78
EINSTEIN NOAH RESTAURANT GROUP, INC. AND SUBSIDIARIES
Notes to Consolidated Financial Statements (Continued)
20. SEGMENTS
Financial results for fiscal years 2006, 2007 and 2008 are as follows:
| | | | | | | | | | | | | | | | | | |
| Fiscal 2006: | | Segments | | | | | | |
| | | Company-
owned
restaurants | | Manufacturing
and
commissary | | | Franchise
and
license | | Corporate
support | | | Consolidated | |
| | | (in thousands of dollars) | |
Revenues: | | | | | | | | | | | | | | | | | | |
Company-owned restaurant sales | | $ | 363,699 | | | | | | | | | | | | | $ | 363,699 | |
Manufacturing and commissary revenues | | | | | $ | 21,076 | | �� | | | | | | | | | 21,076 | |
Franchise and license related revenues | | | | | | | | | $ | 5,187 | | | | | | | 5,187 | |
| | | | | | | | | | | | | | | | | | |
Total revenues | | | 363,699 | | | 21,076 | | | | 5,187 | | | | | | | 389,962 | |
Cost of sales: | | | | | | | | | | | | | | | | | | |
Company-owned restaurant costs | | | 290,176 | | | | | | | | | | | | | | 290,176 | |
Manufacturing and commissary costs | | | | | | 21,154 | | | | | | | | | | | 21,154 | |
Franchise and license related costs | | | | | | | | | | — | | | | | | | — | |
| | | | | | | | | | | | | | | | | | |
Total cost of sales | | | 290,176 | | | 21,154 | | | | — | | | | | | | 311,330 | |
| | | | | | | | | | | | | | | | | | |
Gross profit | | | 73,523 | | | (78 | ) | | | 5,187 | | | | | | | 78,632 | |
Operating expenses | | | | | | | | | | | | $ | 57,194 | | | | 57,194 | |
Other expenses | | | | | | | | | | | | | 28,306 | | | | 28,306 | |
| | | | | | | | | | | | | | | | | | |
Net income (loss) | | $ | 73,523 | | $ | (78 | ) | | $ | 5,187 | | $ | (85,500 | ) | | $ | (6,868 | ) |
| | | | | | | | | | | | | | | | | | |
| | | |
| Fiscal 2007: | | Segments | | | | | | |
| | | Company-
owned
restaurants | | Manufacturing
and
commissary | | | Franchise
and
license | | Corporate
support | | | Consolidated | |
| | | (in thousands of dollars) | |
Revenues: | | | | | | | | | | | | | | | | | | |
Company-owned restaurant sales | | $ | 372,997 | | | | | | | | | | | | | $ | 372,997 | |
Manufacturing and commissary revenues | | | | | $ | 24,204 | | | | | | | | | | | 24,204 | |
Franchise and license related revenues | | | | | | | | | $ | 5,701 | | | | | | | 5,701 | |
| | | | | | | | | | | | | | | | | | |
Total revenues | | | 372,997 | | | 24,204 | | | | 5,701 | | | | | | | 402,902 | |
Cost of sales: | | | | | | | | | | | | | | | | | | |
Company-owned restaurant costs | | | 297,180 | | | | | | | | | | | | | | 297,180 | |
Manufacturing and commissary costs | | | | | | 24,792 | | | | | | | | | | | 24,792 | |
Franchise and license related costs | | | | | | | | | | — | | | | | | | — | |
| | | | | | | | | | | | | | | | | | |
Total cost of sales | | | 297,180 | | | 24,792 | | | | — | | | | | | | 321,972 | |
| | | | | | | | | | | | | | | | | | |
Gross profit | | | 75,817 | | | (588 | ) | | | 5,701 | | | | | | | 80,930 | |
Operating expenses | | | | | | | | | | | | $ | 52,664 | | | | 52,664 | |
Other expenses | | | | | | | | | | | | | 15,226 | | | | 15,226 | |
Provision for income taxes | | | | | | | | | | | | | 454 | | | | 454 | |
| | | | | | | | | | | | | | | | | | |
Net income (loss) | | $ | 75,817 | | $ | (588 | ) | | $ | 5,701 | | $ | (68,344 | ) | | $ | 12,586 | |
| | | | | | | | | | | | | | | | | | |
| | | |
| Fiscal 2008: | | Segments | | | | | | |
| | | Company-
owned
restaurants | | Manufacturing
and
commissary | | | Franchise
and
license | | Corporate
support | | | Consolidated | |
| | | (in thousands of dollars) | |
Revenues: | | | | | | | | | | | | | | | | | | |
Company-owned restaurant sales | | $ | 376,664 | | | | | | | | | | | | | $ | 376,664 | |
Manufacturing and commissary revenues | | | | | $ | 30,369 | | | | | | | | | | | 30,369 | |
Franchise and license related revenues | | | | | | | | | $ | 6,417 | | | | | | | 6,417 | |
| | | | | | | | | | | | | | | | | | |
Total revenues | | | 376,664 | | | 30,369 | | | | 6,417 | | | | | | | 413,450 | |
Cost of sales: | | | | | | | | | | | | | | | | | | |
Company-owned restaurant costs | | | 303,116 | | | | | | | | | | | | | | 303,116 | |
Manufacturing and commissary costs | | | | | | 28,566 | | | | | | | | | | | 28,566 | |
Franchise and license related costs | | | | | | | | | | — | | | | | | | — | |
| | | | | | | | | | | | | | | | | | |
Total cost of sales | | | 303,116 | | | 28,566 | | | | — | | | | | | | 331,682 | |
| | | | | | | | | | | | | | | | | | |
Gross profit | | | 73,548 | | | 1,803 | | | | 6,417 | | | | | | | 81,768 | |
Operating expenses | | | | | | | | | | | | $ | 54,152 | | | | 54,152 | |
Other expenses | | | | | | | | | | | | | 5,439 | | | | 5,439 | |
Provision for income taxes | | | | | | | | | | | | | 1,100 | | | | 1,100 | |
| | | | | | | | | | | | | | | | | | |
Net income (loss) | | $ | 73,548 | | $ | 1,803 | | | $ | 6,417 | | $ | (60,691 | ) | | $ | 21,077 | |
| | | | | | | | | | | | | | | | | | |
79
EINSTEIN NOAH RESTAURANT GROUP, INC. AND SUBSIDIARIES
Notes to Consolidated Financial Statements (Continued)
21. QUARTERLY RESULTS OF OPERATIONS (UNAUDITED)
The following table summarizes the unaudited consolidated quarterly results of operations for fiscal years ended 2006, 2007 and 2008:
| | | | | | | | | | | | | | |
| | | Fiscal year 2006: |
| | | 1st Quarter
(13 wks) | | | 2nd Quarter
(13 wks) | | | 3rd Quarter
(13 wks) | | 4th Quarter
(13 wks) |
| | | (in thousands of dollars, except per share amounts) |
Revenue | | $ | 97,076 | | | $ | 97,956 | | | $ | 95,752 | | $ | 99,178 |
Gross profit | | $ | 18,545 | | | $ | 18,490 | | | $ | 18,120 | | $ | 23,477 |
Income from operations | | $ | 1,883 | | | $ | 3,170 | | | $ | 5,486 | | $ | 10,899 |
Net income (loss) (a) | | $ | (12,092 | ) | | $ | (1,542 | ) | | $ | 752 | | $ | 6,014 |
Net income (loss) per common share – Basic | | $ | (1.20 | ) | | $ | (0.15 | ) | | $ | 0.07 | | $ | 0.57 |
Net income (loss) per common share – Diluted | | $ | (1.20 | ) | | $ | (0.15 | ) | | $ | 0.07 | | $ | 0.54 |
Weighted average number of common shares outstanding: | | | | | | | | | | | | | | |
Basic | | | 10,065,072 | | | | 10,171,236 | | | | 10,593,085 | | | 10,596,266 |
| | | | | | | | | | | | | | |
Diluted | | | 10,065,072 | | | | 10,171,236 | | | | 11,036,527 | | | 11,110,643 |
| | | | | | | | | | | | | | |
| |
| | | Fiscal year 2007: |
| | | 1st Quarter
(13 wks) | | | 2nd Quarter
(13 wks) | | | 3rd Quarter
(13 wks) | | 4th Quarter
(13 wks) |
| | | (in thousands of dollars, except per share amounts) |
Revenue | | $ | 96,255 | | | $ | 101,055 | | | $ | 100,378 | | $ | 105,214 |
Gross profit | | $ | 19,501 | | | $ | 20,418 | | | $ | 19,521 | | $ | 21,490 |
Income from operations | | $ | 5,958 | | | $ | 6,743 | | | $ | 6,806 | | $ | 8,759 |
Net income (loss) (b) | | $ | 1,132 | | | $ | (250 | ) | | $ | 4,943 | | $ | 6,761 |
Net income (loss) per common share – Basic | | $ | 0.11 | | | $ | (0.02 | ) | | $ | 0.31 | | $ | 0.43 |
Net income (loss) per common share – Diluted | | $ | 0.10 | | | $ | (0.02 | ) | | $ | 0.30 | | $ | 0.41 |
Weighted average number of common shares outstanding: | | | | | | | | | | | | | | |
Basic | | | 10,605,626 | | | | 11,775,597 | | | | 15,772,931 | | | 15,837,211 |
| | | | | | | | | | | | | | |
Diluted | | | 11,136,669 | | | | 11,775,597 | | | | 16,572,486 | | | 16,623,629 |
| | | | | | | | | | | | | | |
80
EINSTEIN NOAH RESTAURANT GROUP, INC. AND SUBSIDIARIES
Notes to Consolidated Financial Statements (Continued)
| | | | | | | | | | | | |
| |
| | | Fiscal year 2008: |
| | | 1st Quarter
(13 wks) | | 2nd Quarter
(13 wks) | | 3rd Quarter
(13 wks) | | 4th Quarter
(13 wks) |
| | | (in thousands of dollars, except per share amounts) |
Revenue | | $ | 103,264 | | $ | 105,414 | | $ | 100,895 | | $ | 103,877 |
Gross profit | | $ | 19,579 | | $ | 21,542 | | $ | 19,183 | | $ | 21,464 |
Income from operations | | $ | 5,563 | | $ | 8,540 | | $ | 5,997 | | $ | 7,516 |
Net income | | $ | 3,842 | | $ | 6,914 | | $ | 4,537 | | $ | 5,784 |
Net income per common share – Basic | | $ | 0.24 | | $ | 0.43 | | $ | 0.28 | | $ | 0.36 |
Net income per common share – Diluted | | $ | 0.23 | | $ | 0.42 | | $ | 0.28 | | $ | 0.36 |
Weighted average number of common shares outstanding: | | | | | | | | | | | | |
Basic | | | 15,890,879 | | | 15,925,876 | | | 15,948,180 | | | 15,974,248 |
| | | | | | | | | | | | |
Diluted | | | 16,451,556 | | | 16,398,822 | | | 16,412,748 | | | 16,179,269 |
| | | | | | | | | | | | |
| (a) | In connection with refinancing our $160 Million Notes, we wrote off $4.0 million of debt issuance costs and paid a 3% redemption premium in the amount of $4.8 million during the first quarter ended 2006. |
| (b) | In connection with the debt redemption and Amended First Lien Term Loan, we wrote off $2.1 million of debt issuance costs and $0.5 million of debt discount, and paid a redemption premium in the amount of $0.2 million during the second quarter ended 2007. |
22. SUBSEQUENT EVENTS
As an inducement to Mr. O’Neill’s employment, on January 9, 2009, he was granted 63,776 shares of restricted stock with a value of $375,000 which will vest in three equal annual installments starting January 9, 2009, provided that Mr. O’Neill remains employed by the Company. The number of shares issued was determined by the closing price of the Company’s common stock on January 9, 2009, the effective date of the grant.
81
EINSTEIN NOAH RESTAURANT GROUP, INC.
Schedule II – Valuation and Qualifying Accounts
| | | | | | | | | | | |
| | | Balance at
beginning
of period | | Additions (a) | | Deductions (b) | | | Balance at
end of
period |
| | | (In thousands of dollars) |
For the fiscal year ended January 2, 2007: | | | | | | | | | | | |
Allowance for doubtful accounts | | $ | 480 | | 133 | | (108 | ) | | $ | 505 |
Valuation allowance for deferred taxes | | $ | 78,605 | | 2,545 | | — | | | $ | 81,150 |
For the fiscal year ended January 1, 2008: | | | | | | | | | | | |
Allowance for doubtful accounts | | $ | 505 | | 502 | | (401 | ) | | $ | 606 |
Valuation allowance for deferred taxes | | $ | 81,150 | | — | | (6,089 | ) | | $ | 75,061 |
For the fiscal year ended December 30, 2008: | | | | | | | | | | | |
Allowance for doubtful accounts | | $ | 606 | | 173 | | (563 | ) | | $ | 216 |
Valuation allowance for deferred taxes | | $ | 75,061 | | — | | (9,199 | ) | | $ | 65,862 |
Notes:
| (a) | Amounts charged to costs and expenses. |
| (b) | Bad debt write-offs and charges to reserves. |
See accompanying report of independent registered public accounting firm
82
| ITEM 9. | CHANGES IN AND DISAGREEMENTS WITH ACCOUNTANTS ON ACCOUNTING AND FINANCIAL DISCLOSURES |
None
| ITEM 9A. | CONTROLS AND PROCEDURES |
Disclosure Controls and Procedures
The Company carried out an evaluation, under the supervision and with the participation of the Company’s management including the Company’s Chief Executive Officer and the Company’s Chief Financial Officer, of the effectiveness of the design and operation of the Company’s disclosure controls and procedures as of December 30, 2008 pursuant to Securities Exchange Act Rule 13a-15. Based upon that evaluation, the Company’s Chief Executive Officer and Chief Financial Officer concluded, as of December 30, 2008, that the Company’s disclosure controls and procedures are effective in timely alerting them to material information relating to the Company (including its consolidated subsidiaries) required to be included in the Company’s periodic SEC filings.
Disclosure controls and procedures are controls and other procedures that are designed to ensure that information required to be disclosed by us in the reports that we file or submit under the Securities Exchange Act is recorded, processed, summarized and reported within the time periods specified in SEC’s rules and forms. Disclosure controls and procedures include, without limitation, controls and procedures designed to ensure information required to be disclosed by us in the reports we file under the Securities Exchange Act is accumulated and communicated to our management, including our Chief Executive Officer and Chief Financial Officer, as appropriate to allow timely decisions regarding required disclosure.
Management’s Annual Report on Internal Control Over Financial Reporting
The Company’s management is responsible for establishing and maintaining adequate internal control over financial reporting. The Company’s internal control over financial reporting is a process designed under the supervision of the Company’s Chief Executive Officer and Chief Financial Officer to provide reasonable assurance regarding the reliability of financial reporting and the preparation of the Company’s financial statements for external reporting purposes in accordance with accounting principles generally accepted in the United States of America.
As of December 30, 2008, management conducted an assessment of the effectiveness of the Company’s internal control over financial reporting based on the framework established in Internal Control—Integrated Framework issued by the Committee of Sponsoring Organizations of the Treadway Commission (“COSO”). Based on this assessment, management has determined that the Company’s internal control over financial reporting as of December 30, 2008, is effective.
Our internal control over financial reporting includes policies and procedures that pertain to the maintenance of records that, in reasonable detail, accurately and fairly reflect transactions and dispositions of assets; provide reasonable assurances that transactions are recorded as necessary to permit preparation of financial statements in accordance with accounting principles generally accepted in the United States of America; receipts and expenditures are being made only in accordance with authorizations of management and the directors of the Company; and provide reasonable assurance regarding prevention or timely detection of unauthorized acquisition, use or disposition of the Company’s assets that could have a material effect on our financial statements.
The effectiveness of the Company’s internal control over financial reporting as of December 30, 2008 has been audited by Grant Thornton LLP, an independent registered public accounting firm, as stated in their report appearing under the heading “Report of Independent Registered Public Accounting Firm,” which expresses
83
unqualified opinions on the Company’s financial statements and on the effectiveness of the Company’s internal control over financial reporting as of December 30, 2008, which is included in Item 8 of this Annual Report on Form 10-K.
Changes in Internal Control Over Financial Reporting
During the fourth quarter of 2008 no change in the Company’s internal control over financial reporting was identified in connection with this evaluation that has materially affected or is reasonably likely to materially affect the Company’s internal control over financial reporting.
| ITEM 9B. | OTHER INFORMATION |
None
84
PART III
| ITEM 10. | DIRECTORS EXECUTIVE OFFICERS AND CORPORATE GOVERNANCE |
Information relating to Directors required by Item 10 will be included in our 2008 Proxy Statement, which will be filed within 120 days after the close of the 2008 fiscal year, and is hereby incorporated by reference.
Information relating to compliance with Section 16(a) required by Item 10 will included in our 2009 Proxy Statement, which will be filed within 120 days after the close of the 2008 fiscal year, and is hereby incorporated by reference.
Information regarding executive officers is included in Part I of this Form 10-K, as permitted by General Instruction G(3).
The Company adopted a Code of Conduct applicable to its chief executive officer, chief financial officer, controller and other finance leaders, which is a “code of ethics” as defined by applicable rules of the SEC. This code is publicly available on the Company’s website. If the Company makes any amendments to this code other than technical, administrative or other non-substantive amendments, or grants any waivers, including implicit waivers, from a provision of this code to the Company’s chief executive officer, chief financial officer or controller, the Company will disclose the nature of the amendment or waiver, its effective date and to whom it applies on its website or in a report on Form 8-K filed with the SEC.
| ITEM 11. | EXECUTIVE COMPENSATION |
This information will be included in our 2008 Proxy Statement, which will be filed within 120 days after the close of the 2008 fiscal year, and is hereby incorporated by reference.
| ITEM 12. | SECURITY OWNERSHIP OF CERTAIN BENEFICIAL OWNERS AND MANAGEMENT AND RELATED STOCKHOLDER MATTERS |
This information will be included in our 2008 Proxy Statement, which will be filed within 120 days after the close of the 2008 fiscal year, and is hereby incorporated by reference.
| ITEM 13. | CERTAIN RELATIONSHIPS AND RELATED TRANSACTIONS, AND DIRECTOR INDEPENDENCE |
This information will be included in our 2008 Proxy Statement, which will be filed within 120 days after the close of the 2008 fiscal year, and is hereby incorporated by reference.
| ITEM 14. | PRINCIPAL ACCOUNTANT FEES AND SERVICES |
This information will be included in our 2008 Proxy Statement, which will be filed within 120 days after the close of the 2008 fiscal year, and is hereby incorporated by reference.
85
PART IV
| ITEM 15. | EXHIBITS AND FINANCIAL STATEMENT SCHEDULES |
See the Index to Consolidated Financial Statements included on Page 48 for a list of the financial statements included in this Form 10-K.
| (2) | Financial Statement Schedules |
See Page 84 for Schedule II—Valuation and Qualifying Accounts. All other financial statement schedules are omitted because they are not required or are not applicable.
| | |
Exhibit
No. | | Description |
| |
| 3.1 | | Restated Certificate of Incorporation (16) |
| |
| 3.2 | | Third Amended By-laws (1) |
| |
| 3.3 | | Amendments to By-laws (3) |
| |
| 4.2 | | New World Restaurant Group, Inc. Certificate of Designation, Preferences and Rights of Series Z Preferred Stock (4) |
| |
| 10.1 | | 1994 Stock Plan (1)+ |
| |
| 10.2 | | Directors’ Option Plan (1)+ |
| |
| 10.3 | | Executive Employee Incentive Plan (6)+ |
| |
| 10.4 | | Second Amendment to Executive Employee Incentive Plan (7)+ |
| |
| 10.5 | | Third Amendment to the New World Restaurant Group, Inc. 2004 Executive Employee Incentive Plan (13)+ |
| |
| 10.6 | | Stock Option Plan for Independent Directors (8)+ |
| |
| 10.7 | | Amendment to Stock Option Plan for Independent Directors (9)+ |
| |
| 10.8 | | Second Amendment to the New World Restaurant Group Inc. Stock Option Plan for (Non-Employee) Independent Directors (12)+ |
| |
| 10.9 | | Consulting Agreement between Registrant and Jill B.W. Sisson effective as of December 8, 2003(5)+ |
| |
| 10.10 | | Rights Agreement between Registrant and American Stock Transfer and Trust Company, as Rights Agent, dated as of June 7, 1999. (2) |
| |
| 10.11 | | Approved Supplier Agreement dated as of November 30, 2006, by and among New World Restaurant Group, Inc., Einstein and Noah Corp., Manhattan Bagel Company, Inc., and Harlan Bagel Supply Company, LLC, and Harlan Bakeries, Inc. (Certain information contained in this exhibit has been omitted and filed separately with the Commission pursuant to a confidential treatment request under Rule 24b-2) (11) |
| |
| 10.12 | | Amended and Restated Credit Agreement dated June 28, 2007, among the Registrant, Bear, Stearns & Co. Inc. (“Bear Stearns”), as sole lead arranger, Wells Fargo Foothill, Inc., as administrative agent and the other lenders from time to time parties thereto (15) |
| |
| 10.13 | | New World Restaurant Group, Inc. Stock Appreciation Rights Plan (10)+ |
| |
| 10.14 | | James W. Hood Stock Award Agreement (14)+ |
86
| | |
Exhibit
No. | | Description |
| 10.15 | | Einstein Noah Restaurant Group, Inc. Nonqualified Deferred Compensation Plan (16)+ |
| |
| 10.16 | | Paul J.B. Murphy, III Executive Separation Agreement dated December 3, 2008 * + |
| |
| 10.17 | | Jeffrey J. O’Neill Offer of Employment dated December 3, 2008 * + |
| |
| 21.1 | | List of Subsidiaries* |
| |
| 23.1 | | Consent of Grant Thornton LLP* |
| |
| 31.1 | | Certification of Chief Executive Officer of the Registrant pursuant to Section 302 of the Sarbanes-Oxley Act of 2002, with respect to the Registrant’s Annual Report on Form 10-K for the year ended January 1, 2008* |
| |
| 31.2 | | Certification of Chief Financial Officer of the Registrant pursuant to Section 302 of the Sarbanes-Oxley Act of 2002, with respect to the Registrant’s Annual Report on Form 10-K for the year ended January 1, 2008* |
| |
| 32.1 | | Certification of Chief Executive Officer pursuant to 18 U.S.C. Section 1350, as adopted pursuant to Section 906 of the Sarbanes-Oxley Act** |
| |
| 32.2 | | Certification of Chief Financial Officer pursuant to 18 U.S.C. Section 1350, as adopted pursuant to Section 906 of the Sarbanes-Oxley Act** |
| |
| 32.3 | | Certification of Principal Accounting Officer pursuant to 18 U.S.C. Section 1350, as adopted pursuant to Section 906 of the Sarbanes-Oxley Act** |
| (1) | Incorporated by reference from Registrant’s Registration Statement on Form SB-2 (33-95764). |
| (2) | Incorporated by reference from Registrant’s Current Report on Form 8-K dated June 7, 1999. |
| (3) | Incorporated by reference from Registrant’s Annual Report on Form 10-K for the Fiscal Year Ended December 31, 2002, filed on May 14, 2003. |
| (4) | Incorporated by reference from Registrant’s Schedule 14A, filed on September 10, 2003 included as schedule 1 to annex B. |
| (5) | Incorporated by reference from Registrant’s Annual Report on Form 10-K for the Fiscal Year Ended December 30, 2003, filed on March 26, 2004. |
| (6) | Incorporated by reference from Registrant’s Schedule 14A, filed on April 29, 2005 included as annex A. |
| (7) | Incorporated by reference from Registrant’s Schedule 14A, filed on April 29, 2005 included as annex B. |
| (8) | Incorporated by reference from Registrant’s Schedule 14A, filed on April 29, 2005 included as annex C. |
| (9) | Incorporated by reference from Registrant’s Schedule 14A, filed on April 29, 2005 included as annex D. |
| (10) | Incorporated by reference from Registrant’s Registration Statement on Form S-8, filed on February 20, 2007. |
| (11) | Incorporated by reference from Registrant’s Annual Report on Form 10-K, filed on March 7, 2007. |
| (12) | Incorporated by reference from Registrant’s Schedule 14A, filed on April 4, 2007 included as Annex B. |
| (13) | Incorporated by reference from Registrant’s Schedule 14A, filed on April 4, 2007 included as Annex D. |
| (14) | Incorporated by reference from Registrant’s Registration Statement on Form S-8, filed on May 3, 2007. |
| (15) | Incorporated by reference from Registrant’s Current Report on Form 8-K, filed on July 5, 2007. |
| (16) | Incorporated by reference from Registrant’s Annual Report on Form 10-K for the Fiscal Year Ended January 1, 2008, filed on March 3, 2008. |
87
SIGNATURES
Pursuant to the requirements of Section 13 or 15(d) of the Securities Exchange Act of 1934, the registrant has duly caused this report to be signed on its behalf by the undersigned, thereunto duly authorized.
| | | | | | |
| | | | EINSTEIN NOAH RESTAURANT GROUP, INC. |
| | | |
| Date: March 2, 2009 | | | | By: | | /s/ Jeffrey J. O’Neill |
| | | | | | Jeffrey J. O’Neill |
| | | | | | Chief Executive Officer |
Pursuant to the requirements of the Securities Exchange Act of 1934, this report has been signed below by the following persons on behalf of the registrant and in the capacities indicated on March 2, 2009.
| | |
Signature | | Title |
| |
/s/ Jeffrey J. O’Neill Jeffrey J. O’Neill | | President, Chief Executive Officer and Director (Principal Executive Officer) |
| |
/s/ Richard P. Dutkiewicz Richard P. Dutkiewicz | | Chief Financial Officer (Principal Financial Officer) |
| |
/s/ Robert E. Gowdy, Jr. Robert E. Gowdy, Jr. | | Controller and Chief Accounting Officer (Principal Accounting Officer) |
| |
/s/ Michael W. Arthur Michael W. Arthur | | Director |
| |
/s/ E. Nelson Heumann E. Nelson Heumann | | Director |
| |
/s/ Frank C. Meyer Frank C. Meyer | | Director |
| |
/s/ S. Garrett Stonehouse, Jr. S. Garrett Stonehouse, Jr. | | Director |
| |
/s/ Thomas J. Mueller Thomas J. Mueller | | Director |
88